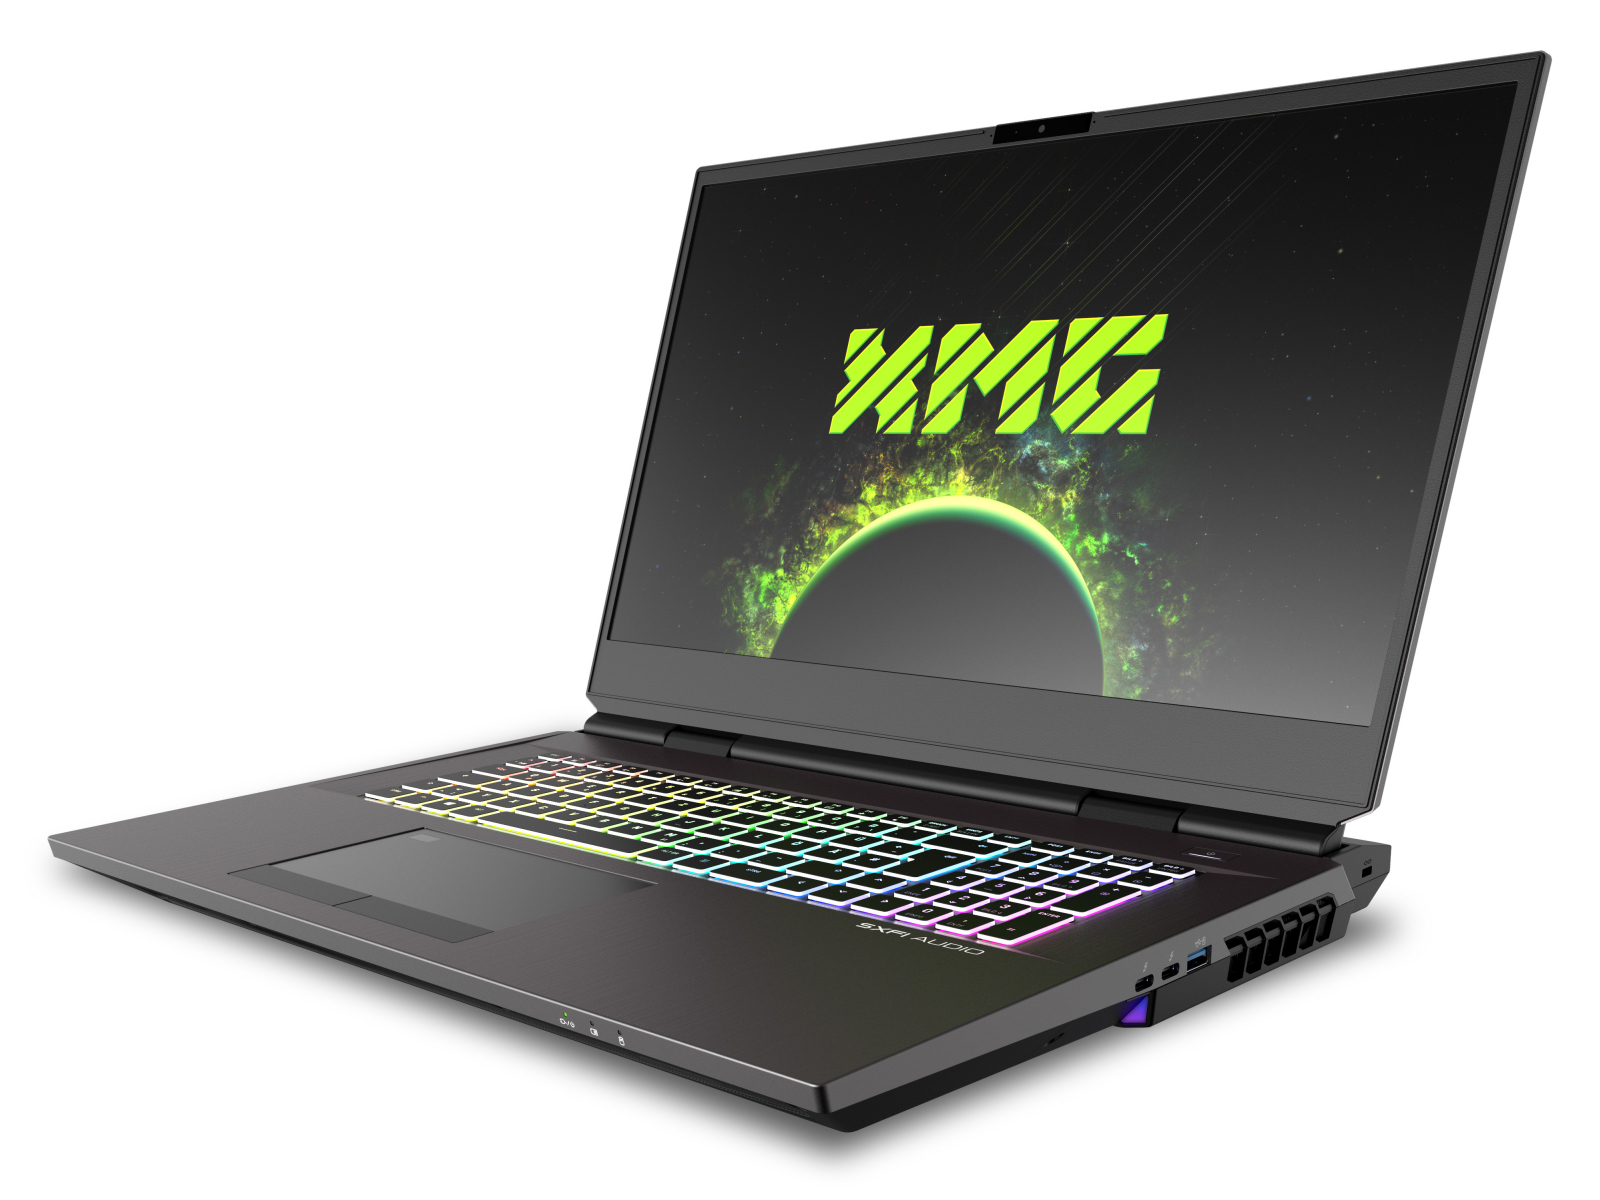
Revisión del Schenker XMG Ultra 17 (Clevo X170KM-G): Una potencia masiva con un equipamiento exuberante

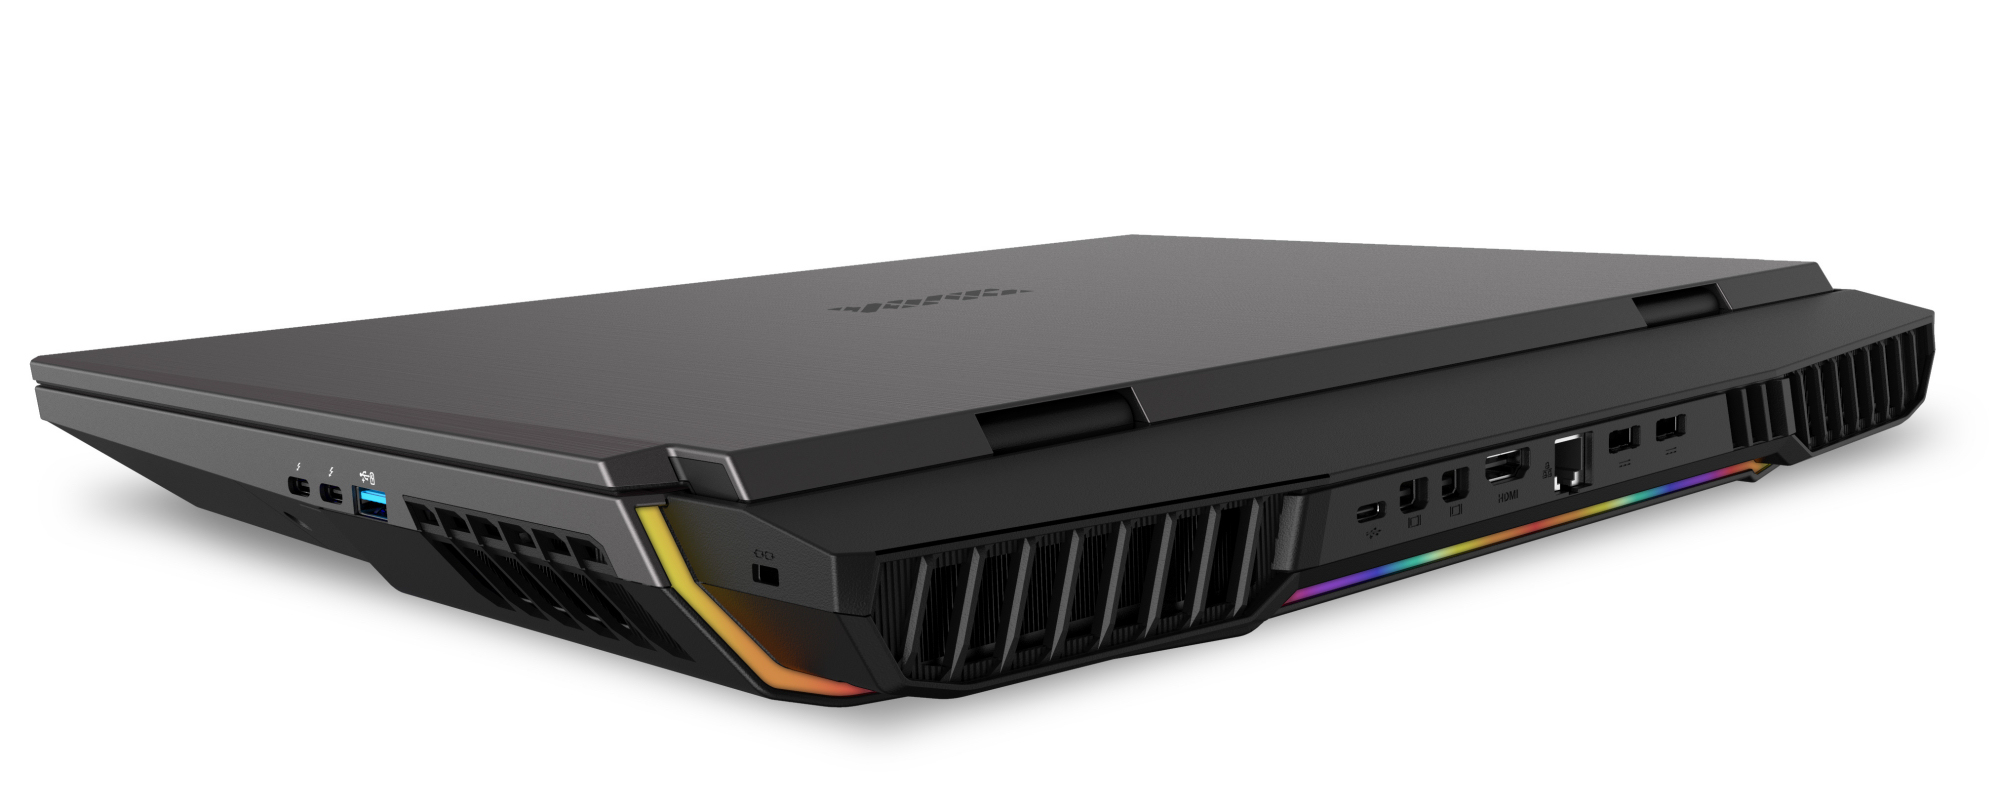
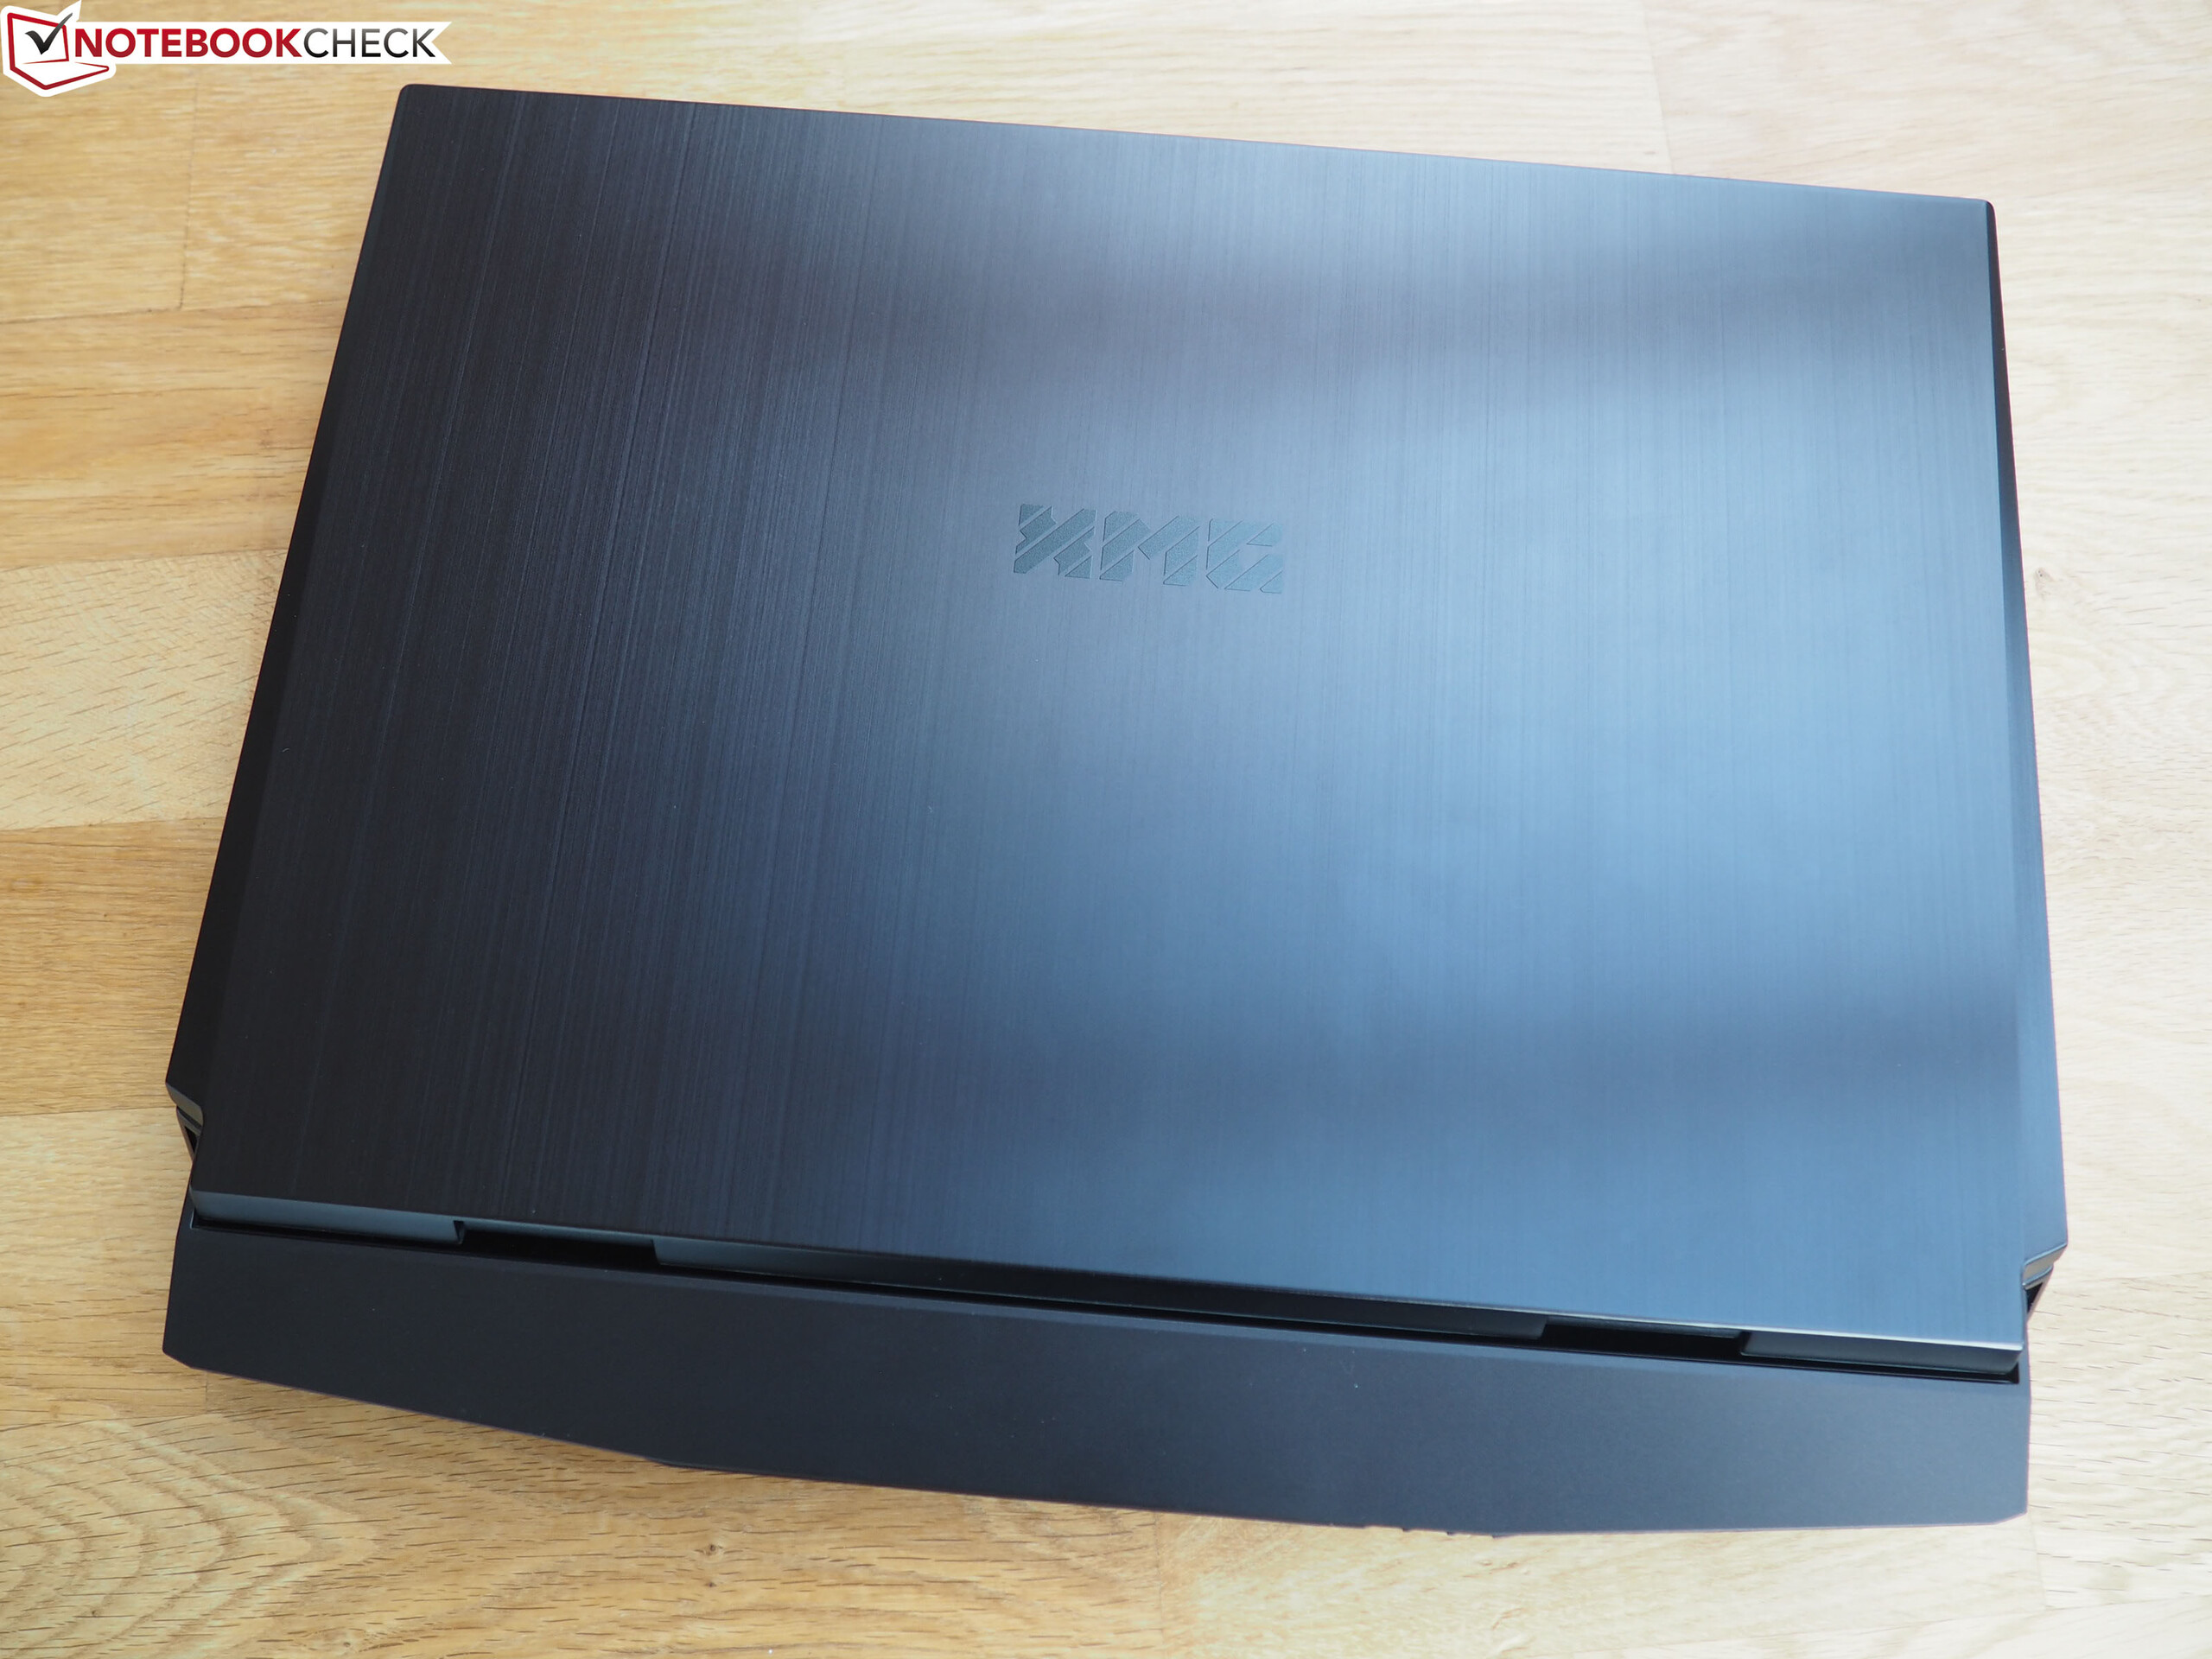
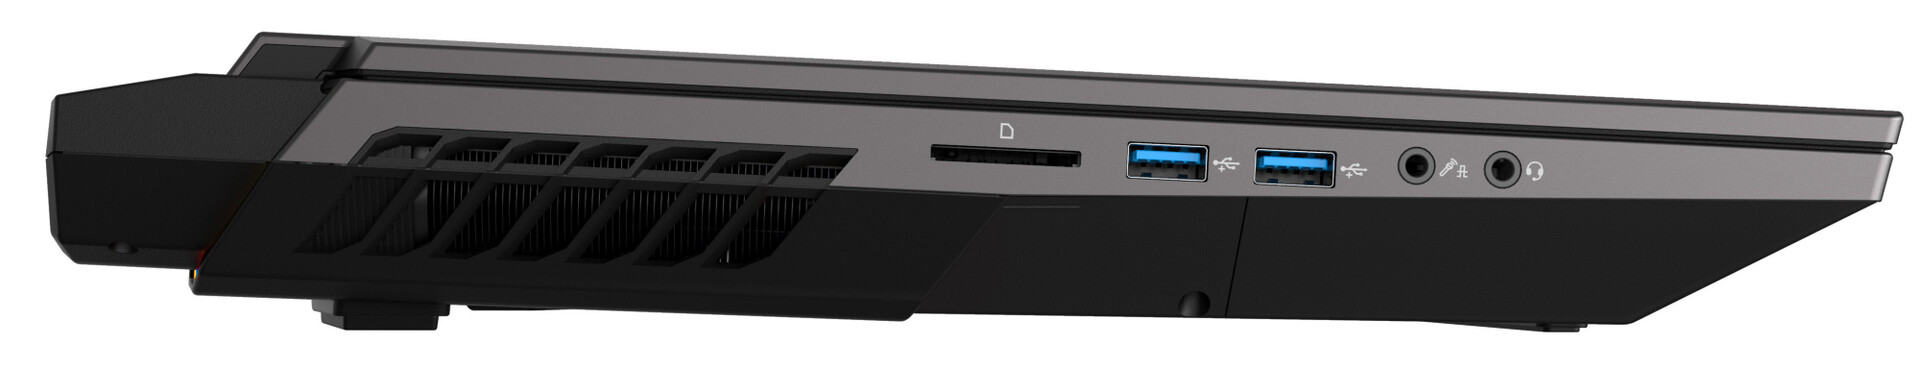
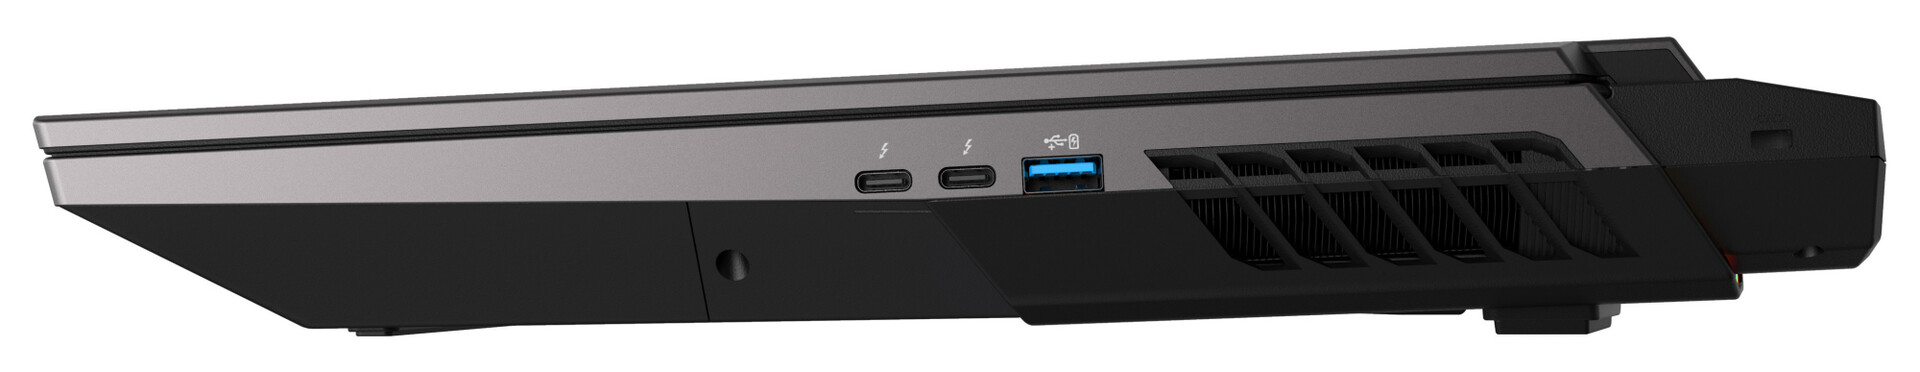
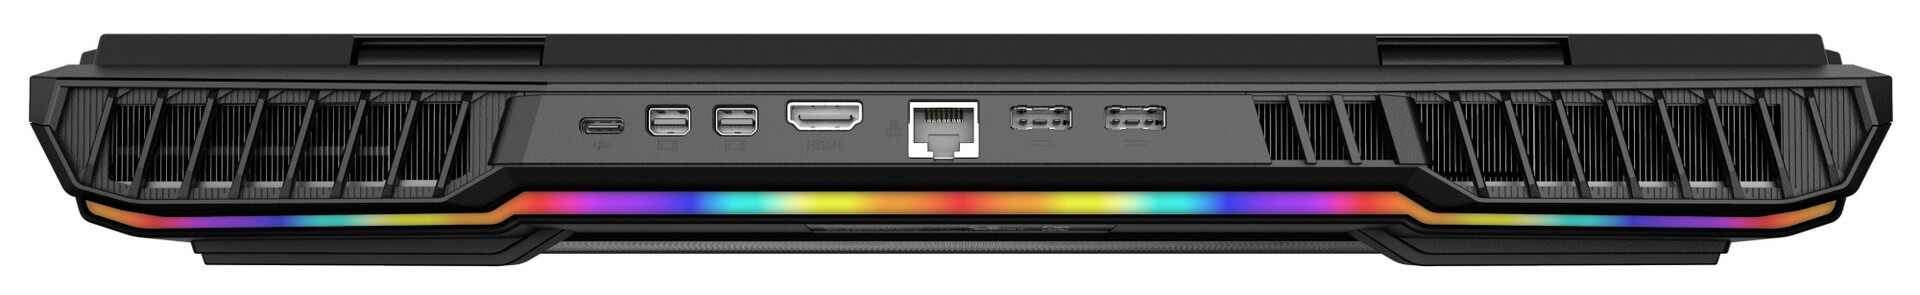
Visualmente, el modelo 2021 del XMG Ultra 17 no ha cambiado en comparación con suPredecesor. Las innovaciones se encuentran en el aspecto técnico. Ahora se usan procesadores Rocket Lake (las CPUs Comet Lake siguen estando disponibles) y GPUs Ampere. En lugar de una ranura Thunderbolt 3, se usan dos ranuras Thunderbolt 4/USB 4. Entre los competidores se encuentran dispositivos como el MSI GT76 Titanium DT 10SGSy el Alienware m17 R4 y el Asus Strix Scar 17 G732LXS.
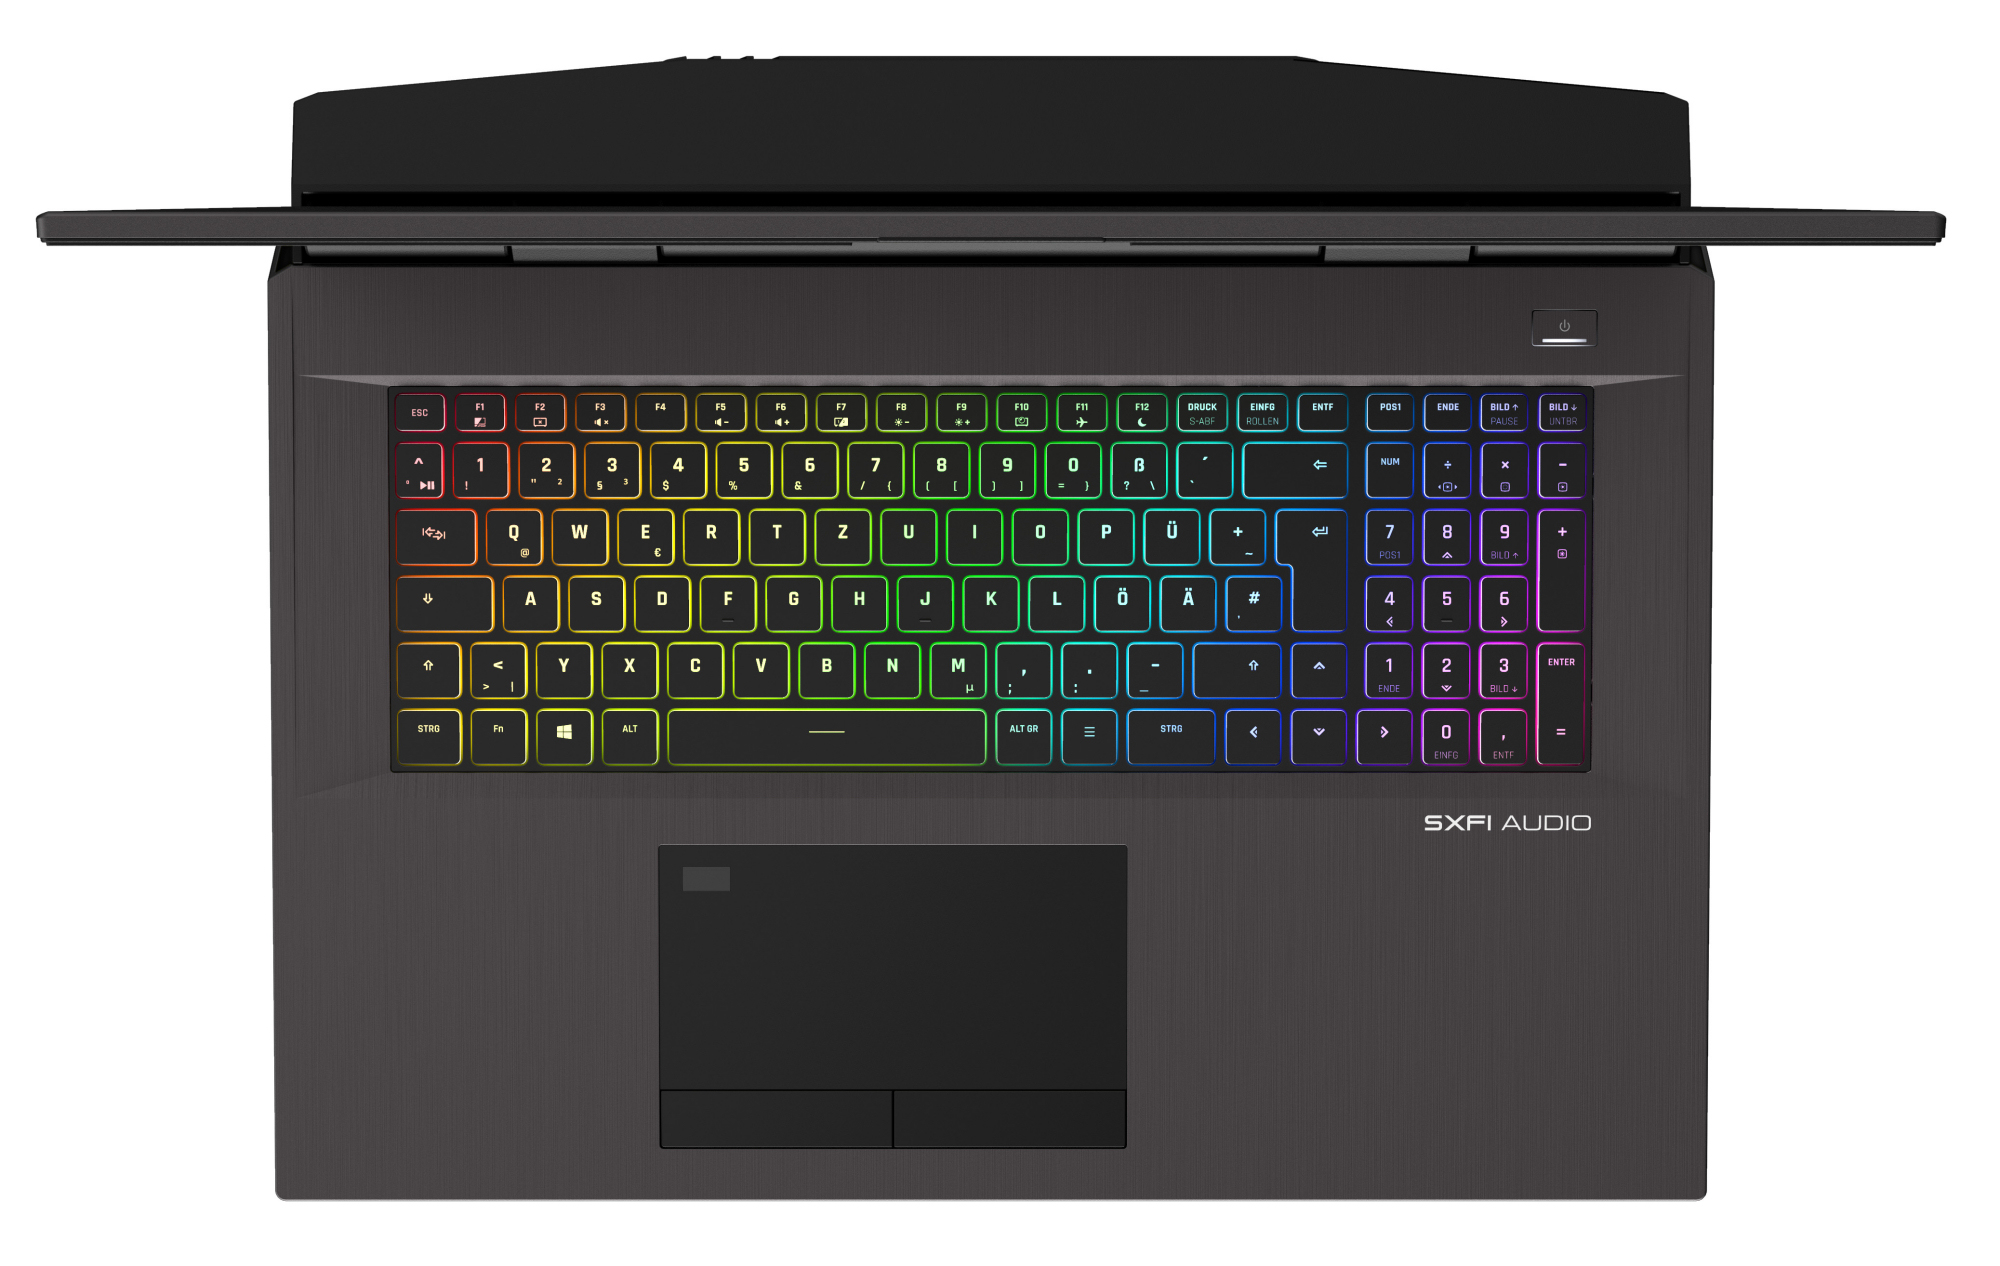
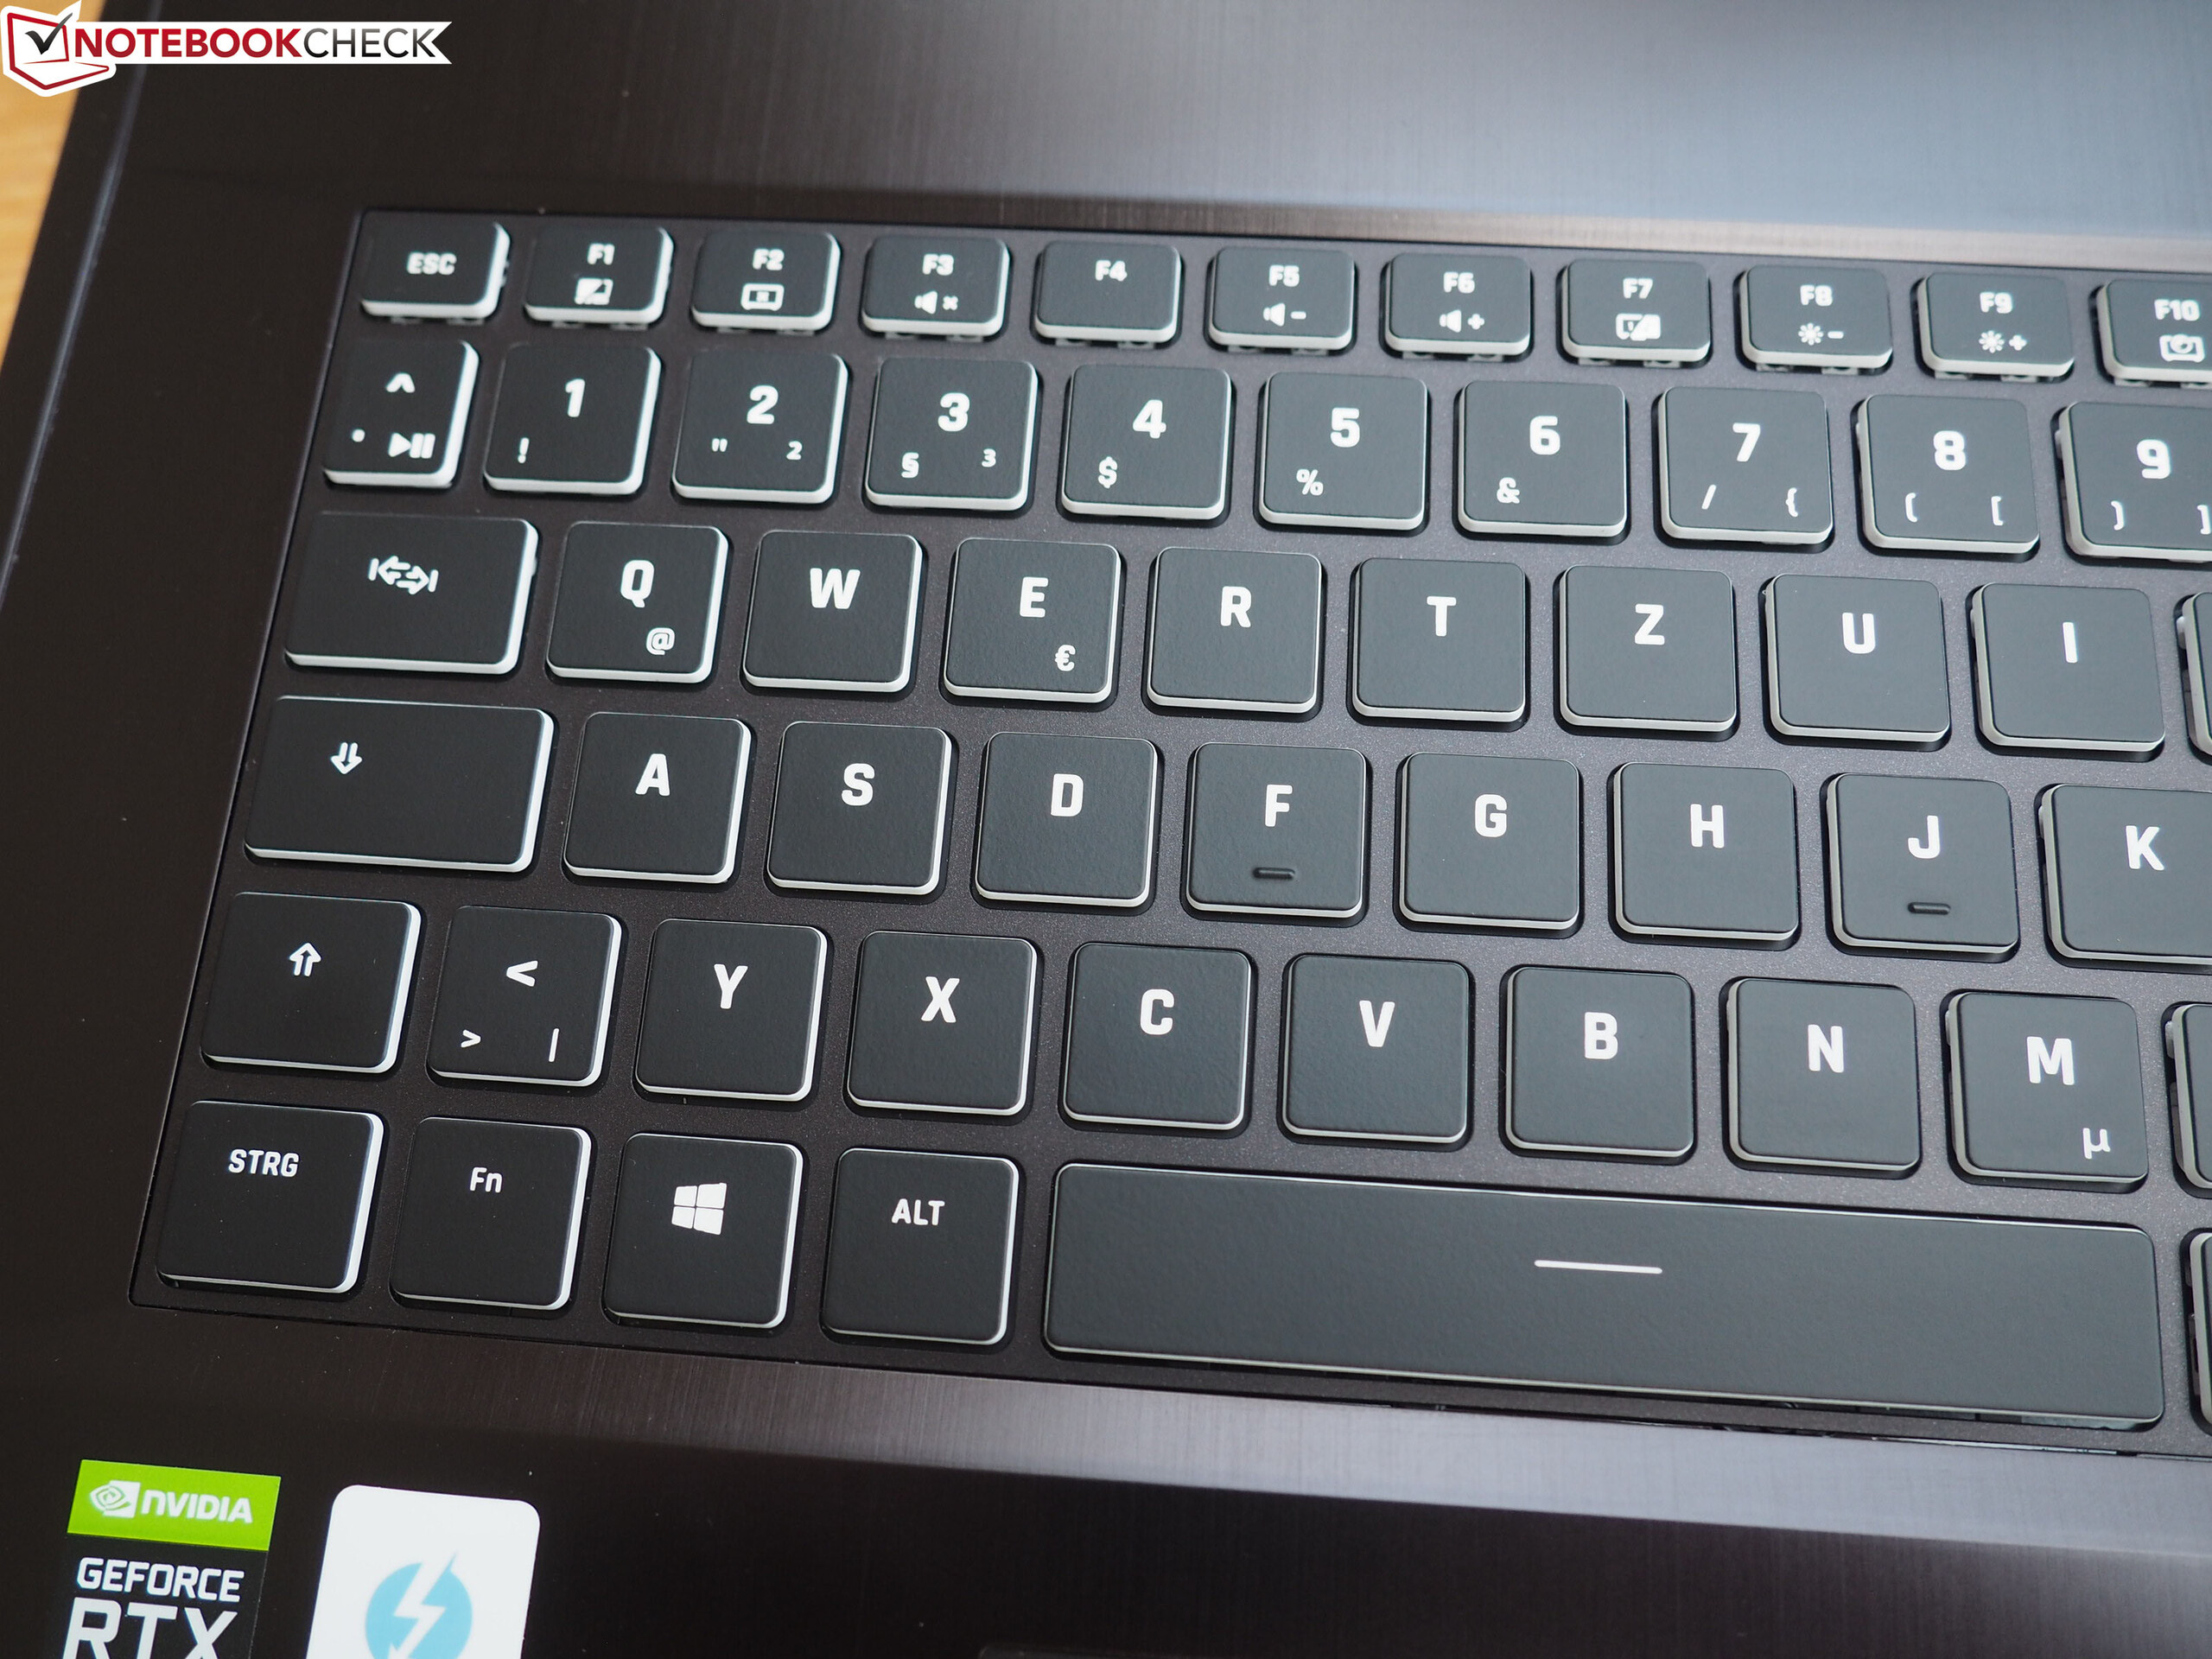
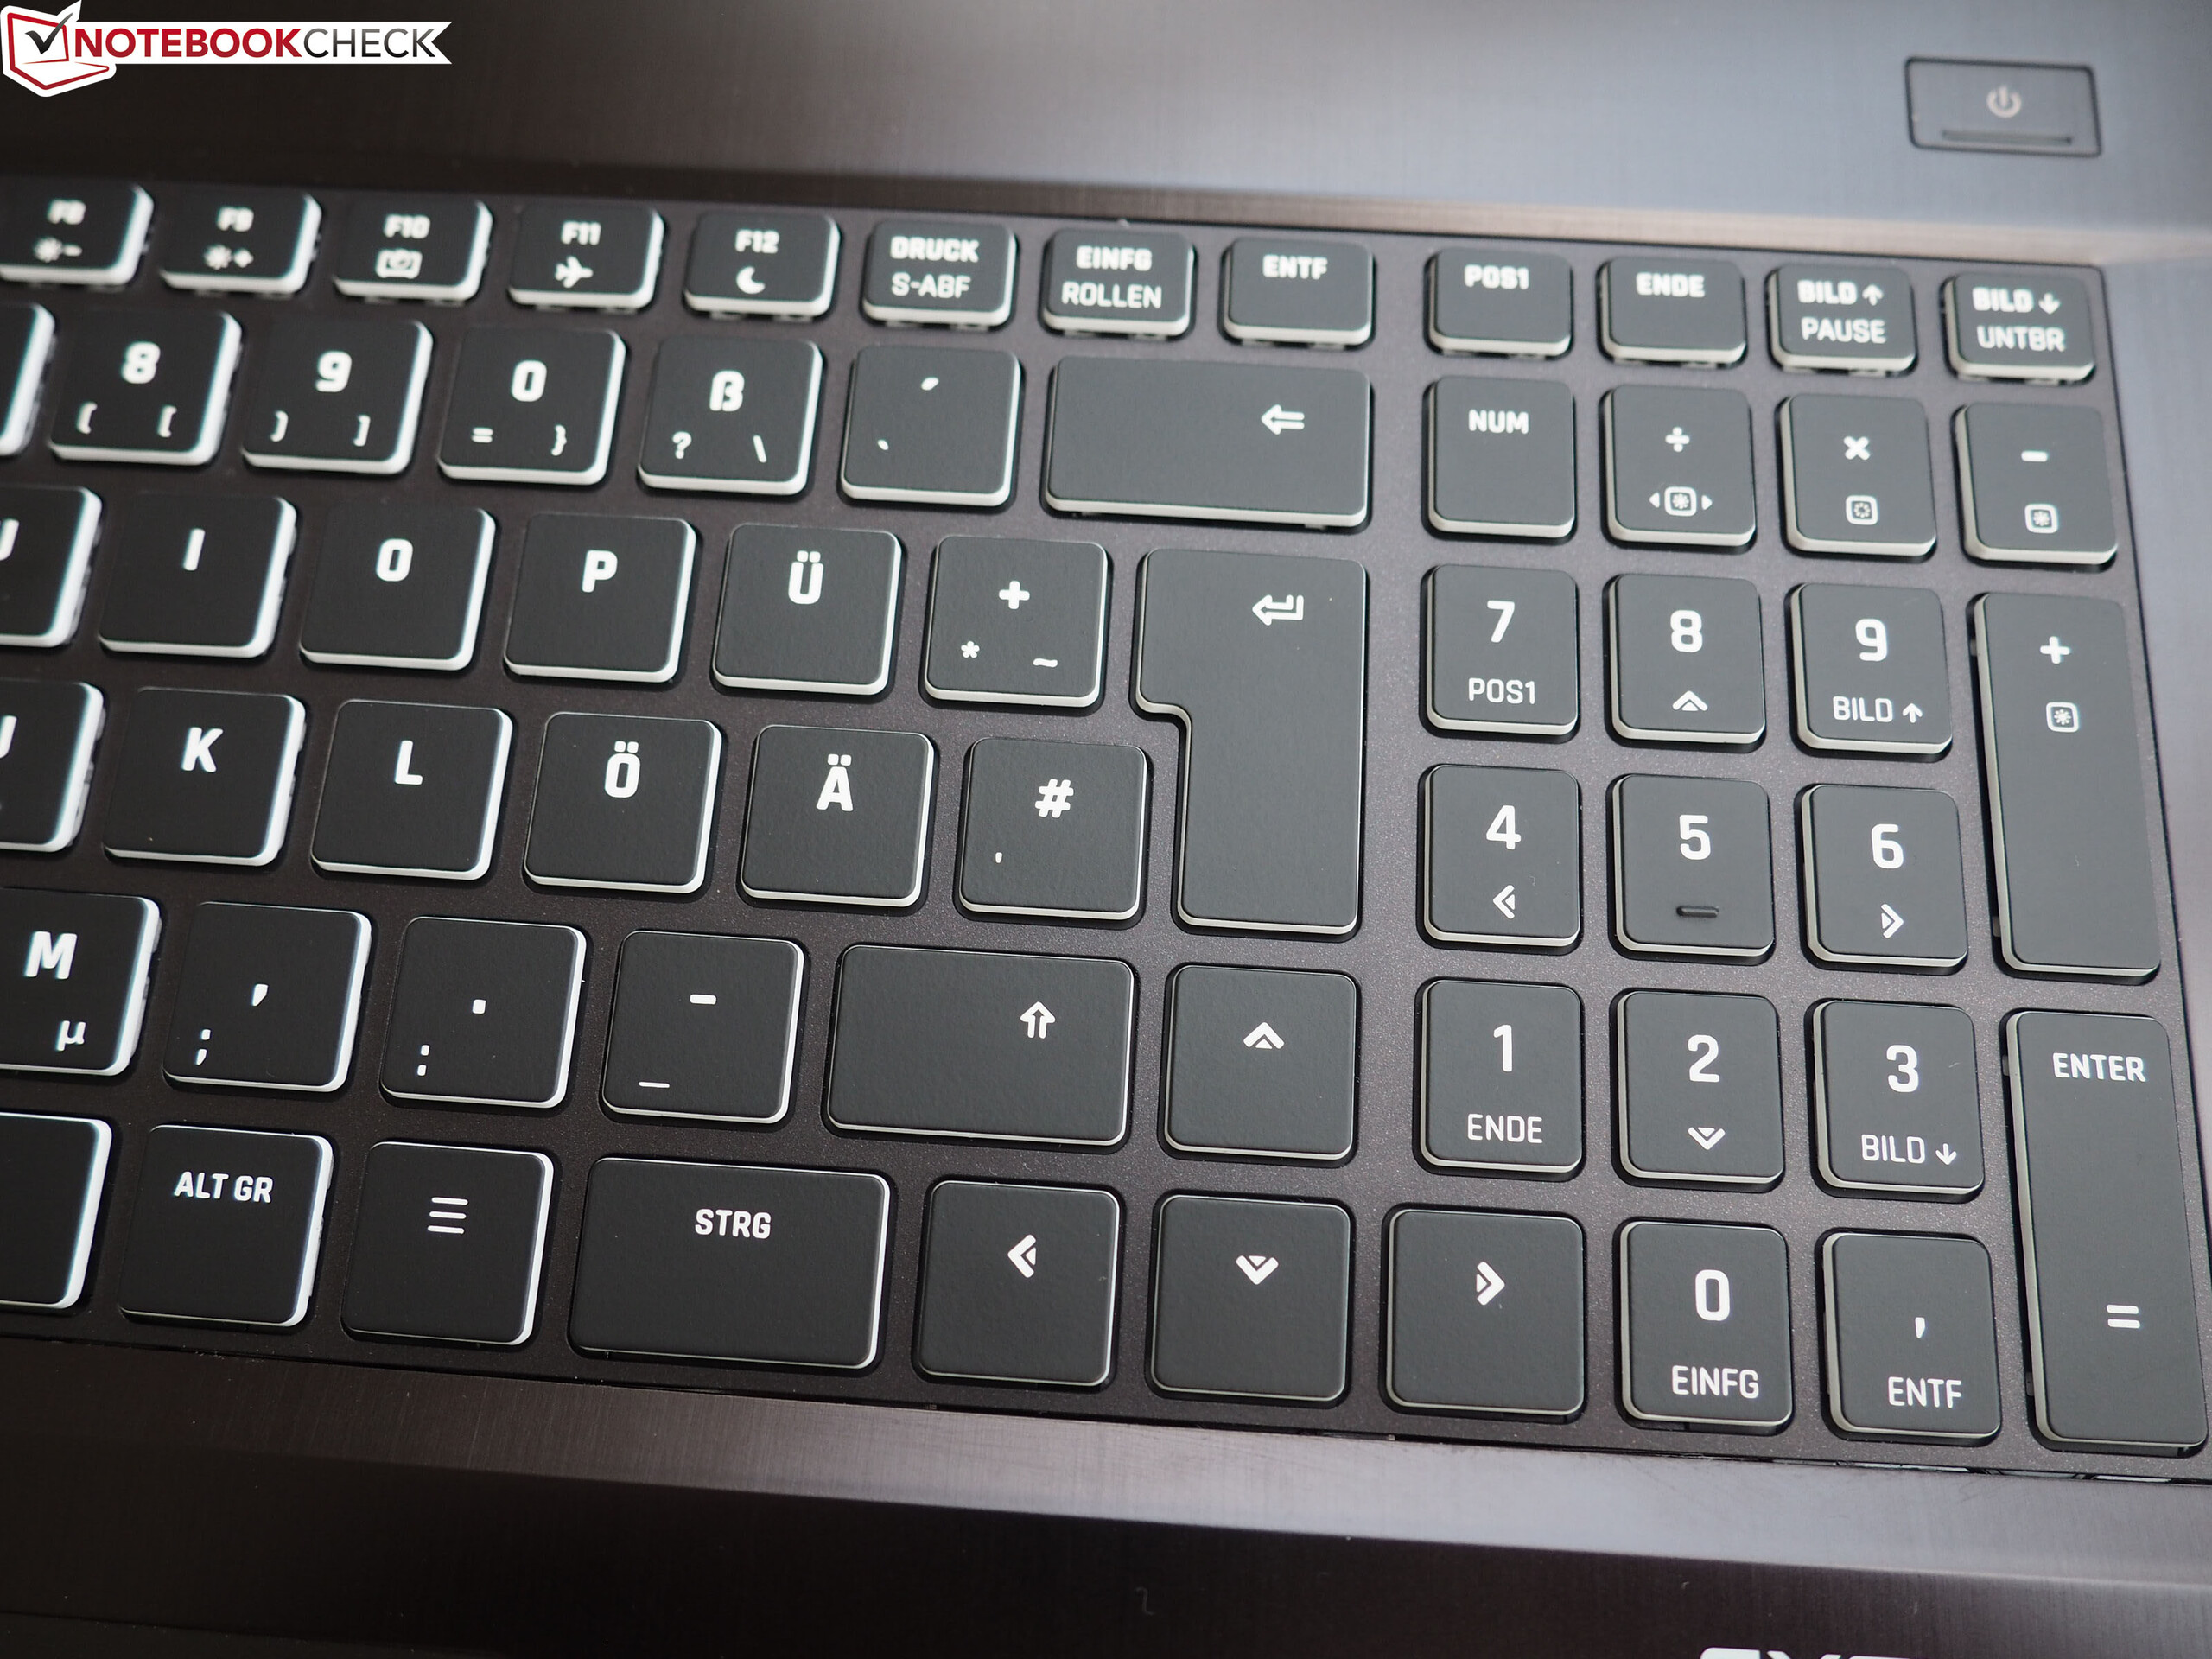
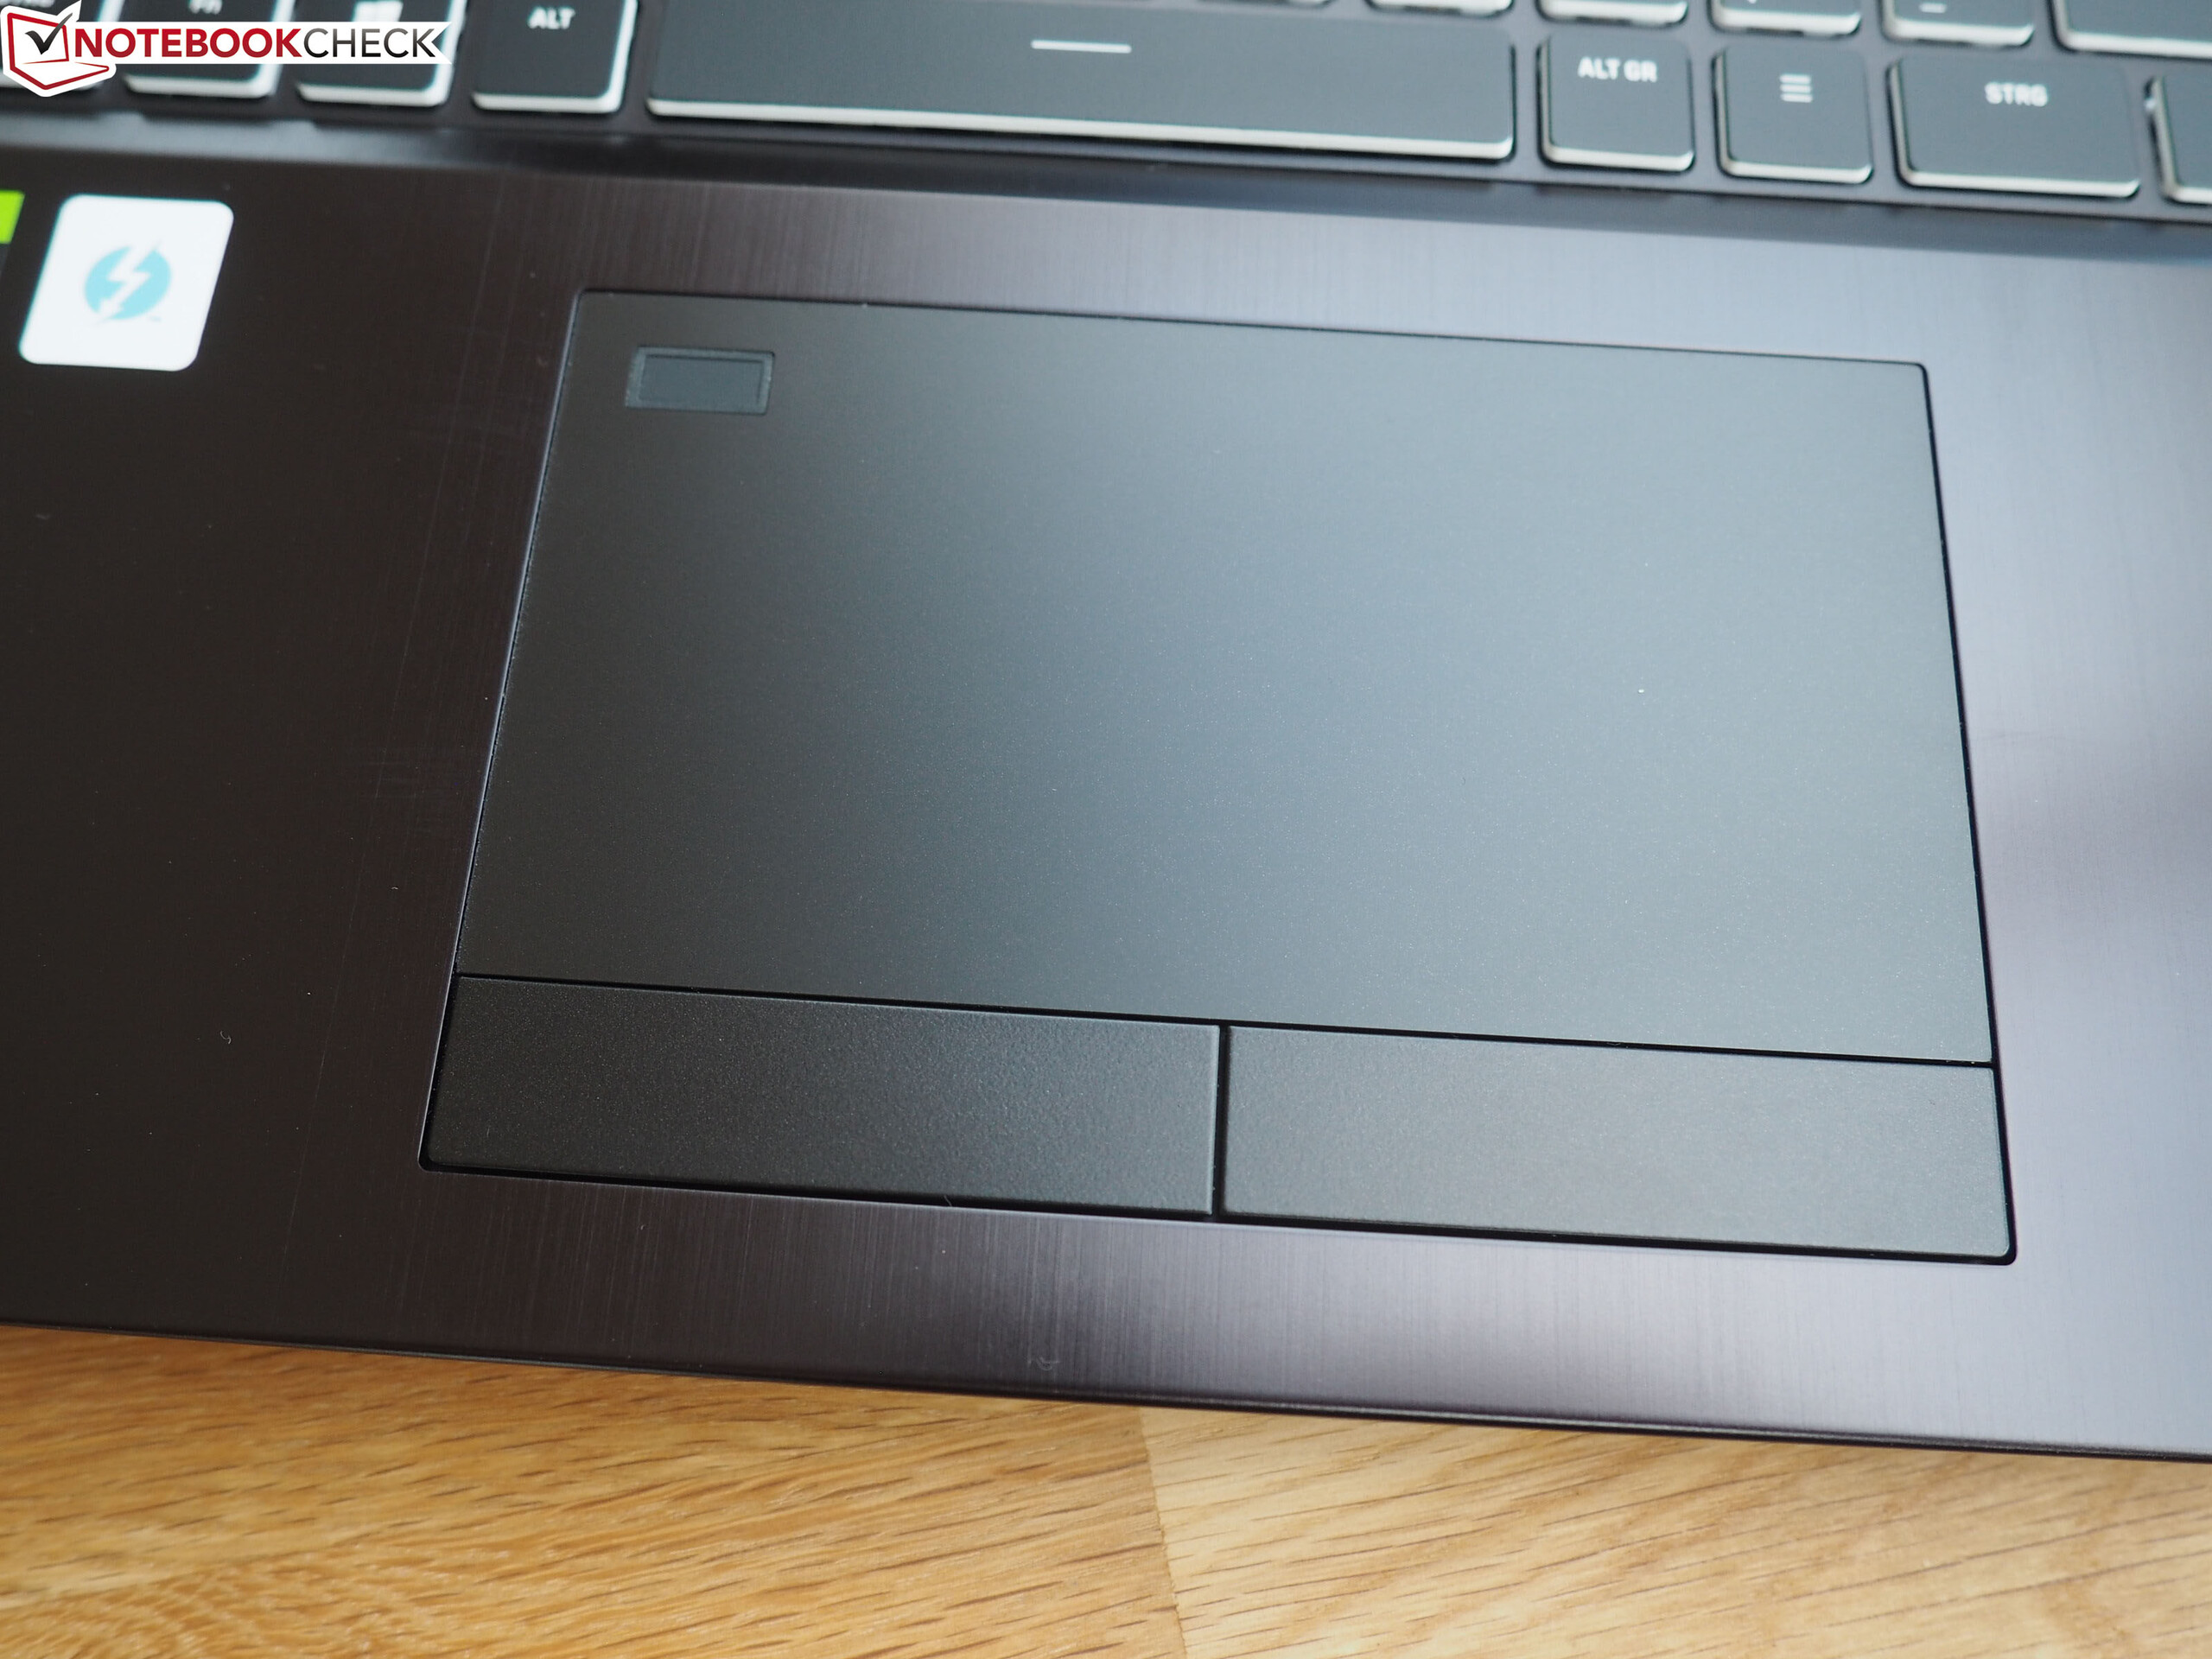
Dado que el XMG Ultra 17 es idéntico en construcción al modelo 2020, no profundizaremos en la carcasa, el equipo, los dispositivos de entrada y los altavoces. La información correspondiente se puede encontrar en la Revisión del Schenker XMG Ultra 17 (2020).
Possible competitors in comparison
Valoración | Fecha | Modelo | Peso | Altura | Tamaño | Resolución |
|---|---|---|---|---|---|---|
| 84.9 % v7 (old) | 04/2021 | Schenker XMG Ultra 17 Rocket Lake i9-11900K, GeForce RTX 3080 Laptop GPU | 4.7 kg | 43.5 mm | 17.30" | 1920x1080 |
| 87.4 % v7 (old) | 10/2020 | MSI GT76 Titan DT 10SGS i9-10900K, GeForce RTX 2080 Super Mobile | 4.2 kg | 42 mm | 17.30" | 3840x2160 |
| 82.7 % v7 (old) | 07/2020 | Asus Strix Scar 17 G732LXS i9-10980HK, GeForce RTX 2080 Super Mobile | 2.9 kg | 26.5 mm | 17.30" | 1920x1080 |
| 85.3 % v7 (old) | 04/2021 | Alienware m17 R4 i9-10980HK, GeForce RTX 3080 Laptop GPU | 3 kg | 22 mm | 17.30" | 1920x1080 |
| SD Card Reader | |
| average JPG Copy Test (av. of 3 runs) | |
| Schenker XMG Ultra 17 Rocket Lake | |
| Schenker XMG Ultra 17 Comet Lake (Toshiba Exceria Pro SDXC 64 GB UHS-II) | |
| Alienware m17 R4 (AV PRO microSD 128 GB V60) | |
| MSI GT76 Titan DT 10SGS (Toshiba Exceria Pro M501 UHS-II) | |
| Media de la clase Gaming (20.9 - 210, n=54, últimos 2 años) | |
| maximum AS SSD Seq Read Test (1GB) | |
| Alienware m17 R4 (AV PRO microSD 128 GB V60) | |
| Schenker XMG Ultra 17 Comet Lake (Toshiba Exceria Pro SDXC 64 GB UHS-II) | |
| Schenker XMG Ultra 17 Rocket Lake (AV PRO microSD 128 GB V60) | |
| MSI GT76 Titan DT 10SGS (Toshiba Exceria Pro M501 UHS-II) | |
| Media de la clase Gaming (25.5 - 261, n=51, últimos 2 años) | |
| Networking | |
| iperf3 transmit AX12 | |
| Alienware m17 R4 | |
| Schenker XMG Ultra 17 Rocket Lake | |
| Schenker XMG Ultra 17 Comet Lake | |
| MSI GT76 Titan DT 10SGS | |
| Medio Intel Wi-Fi 6 AX201 (49.8 - 1775, n=324) | |
| Asus Strix Scar 17 G732LXS | |
| iperf3 receive AX12 | |
| Alienware m17 R4 | |
| Schenker XMG Ultra 17 Comet Lake | |
| Schenker XMG Ultra 17 Rocket Lake | |
| MSI GT76 Titan DT 10SGS | |
| Asus Strix Scar 17 G732LXS | |
| Medio Intel Wi-Fi 6 AX201 (136 - 1743, n=324) | |


")
")


")
")


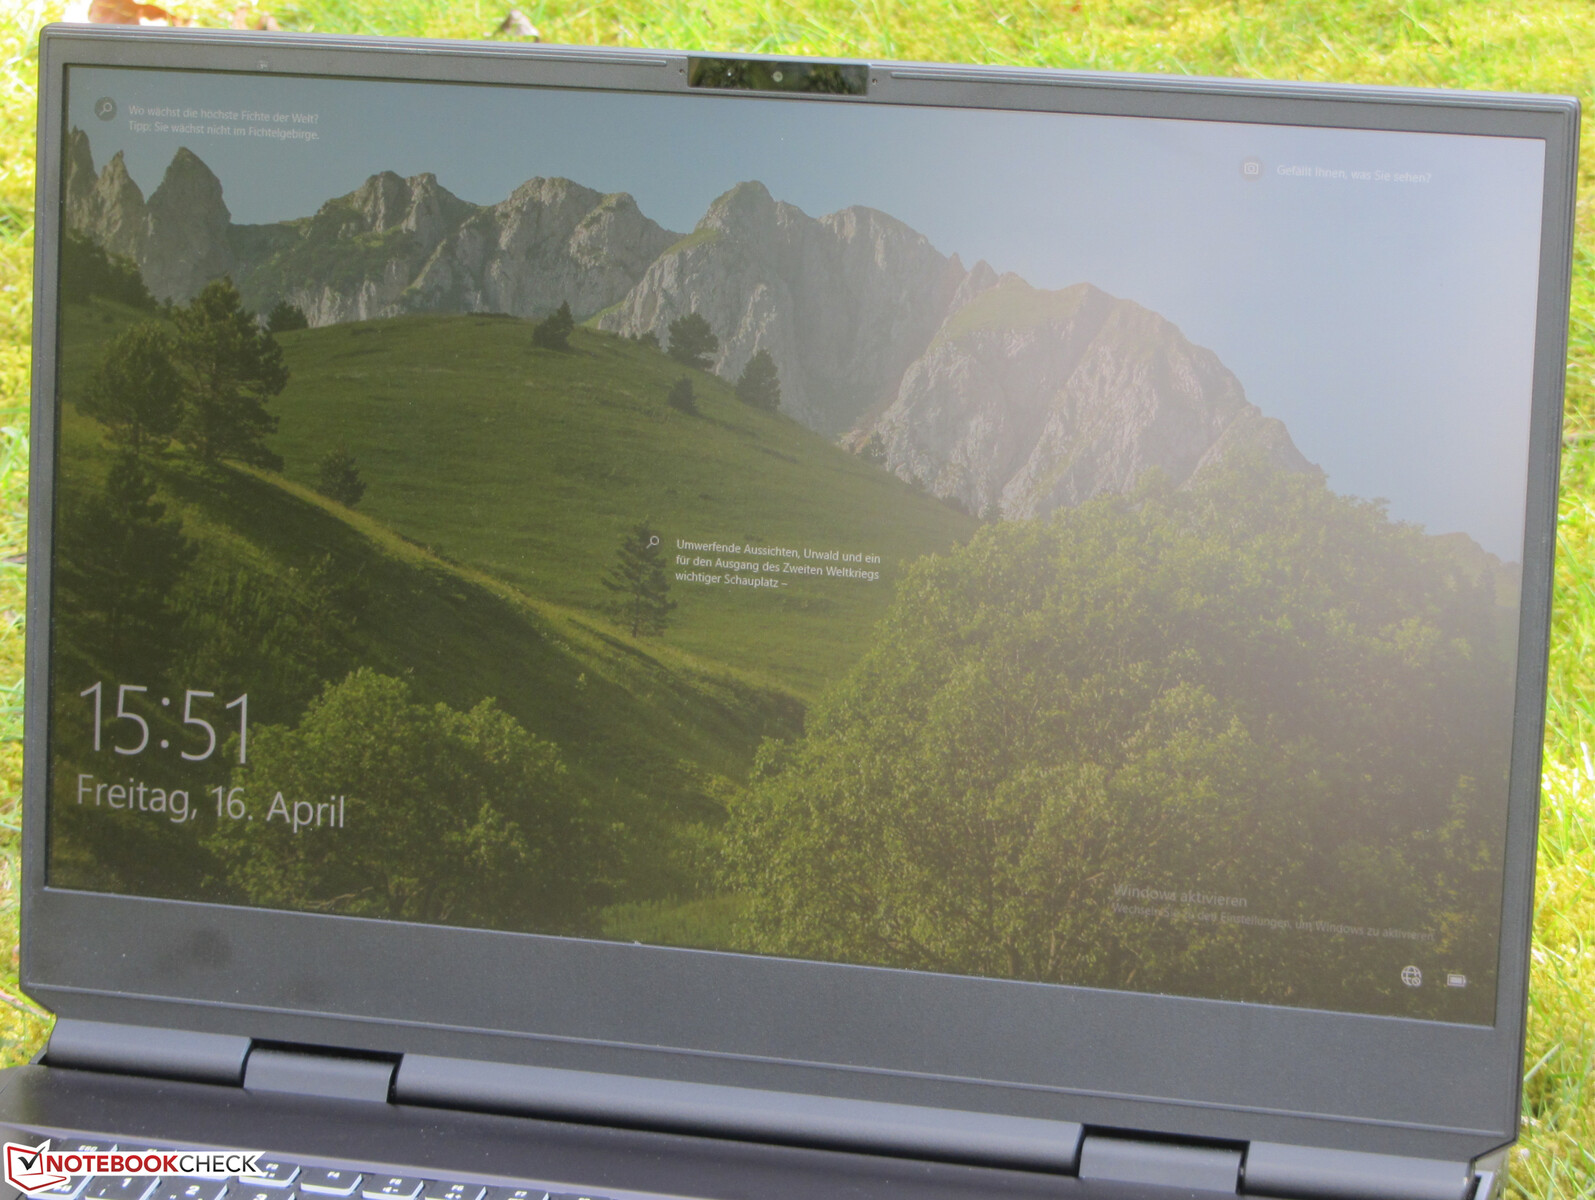
Pantalla - 300 Hz IPS
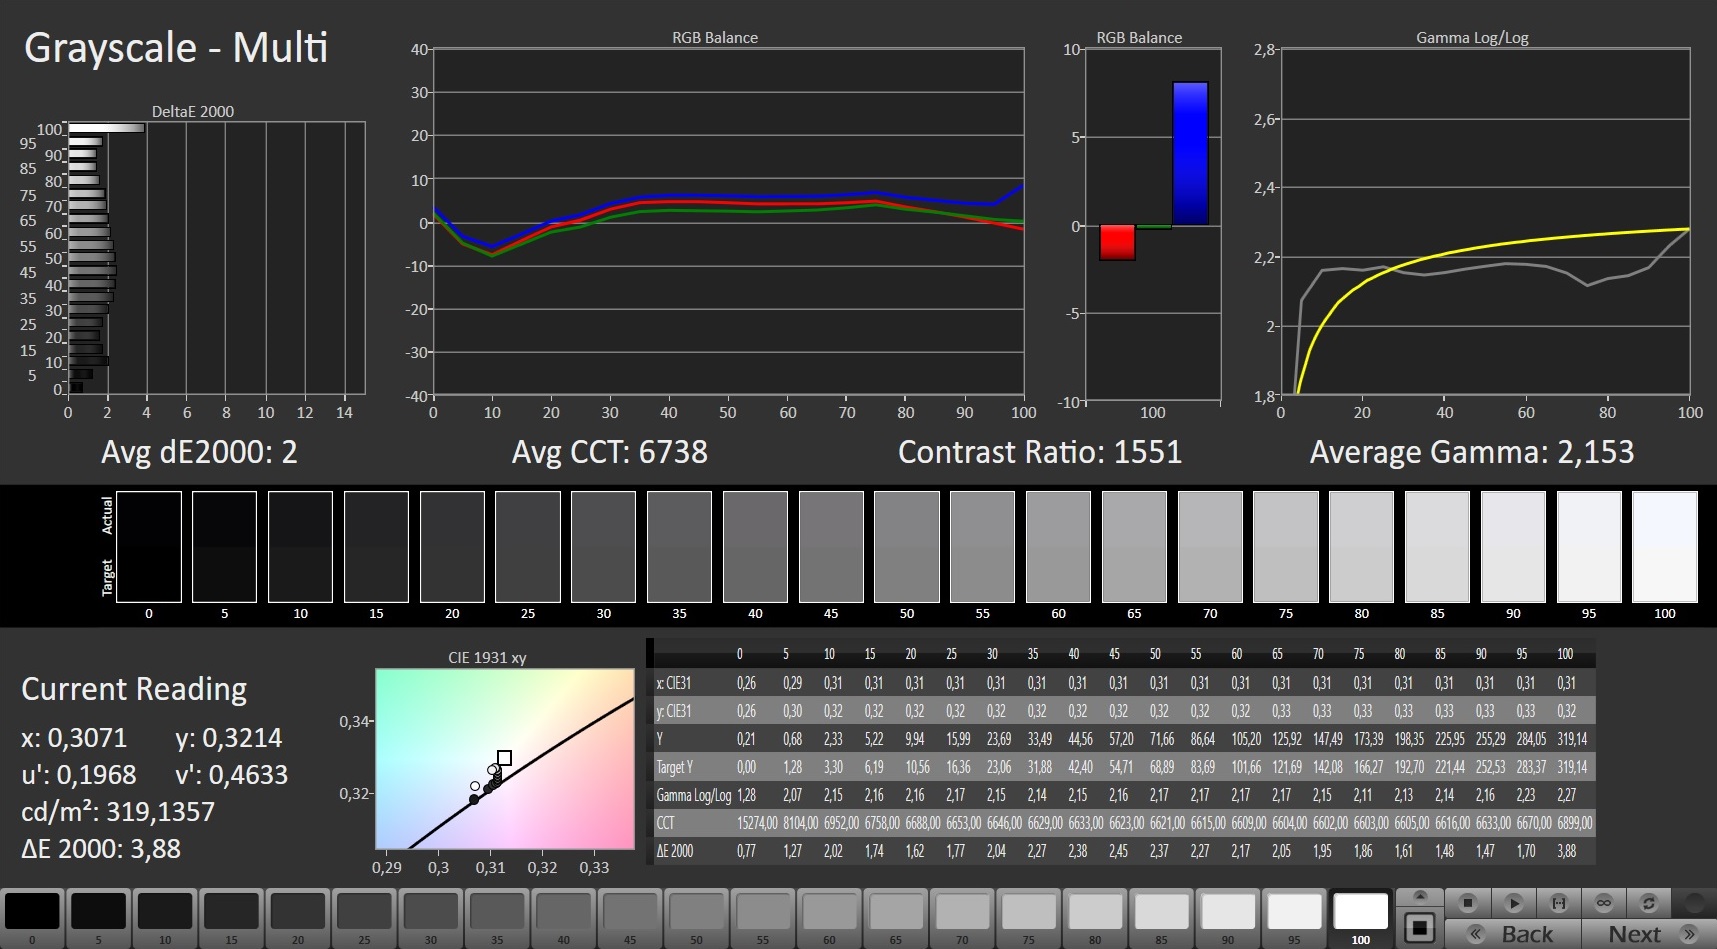
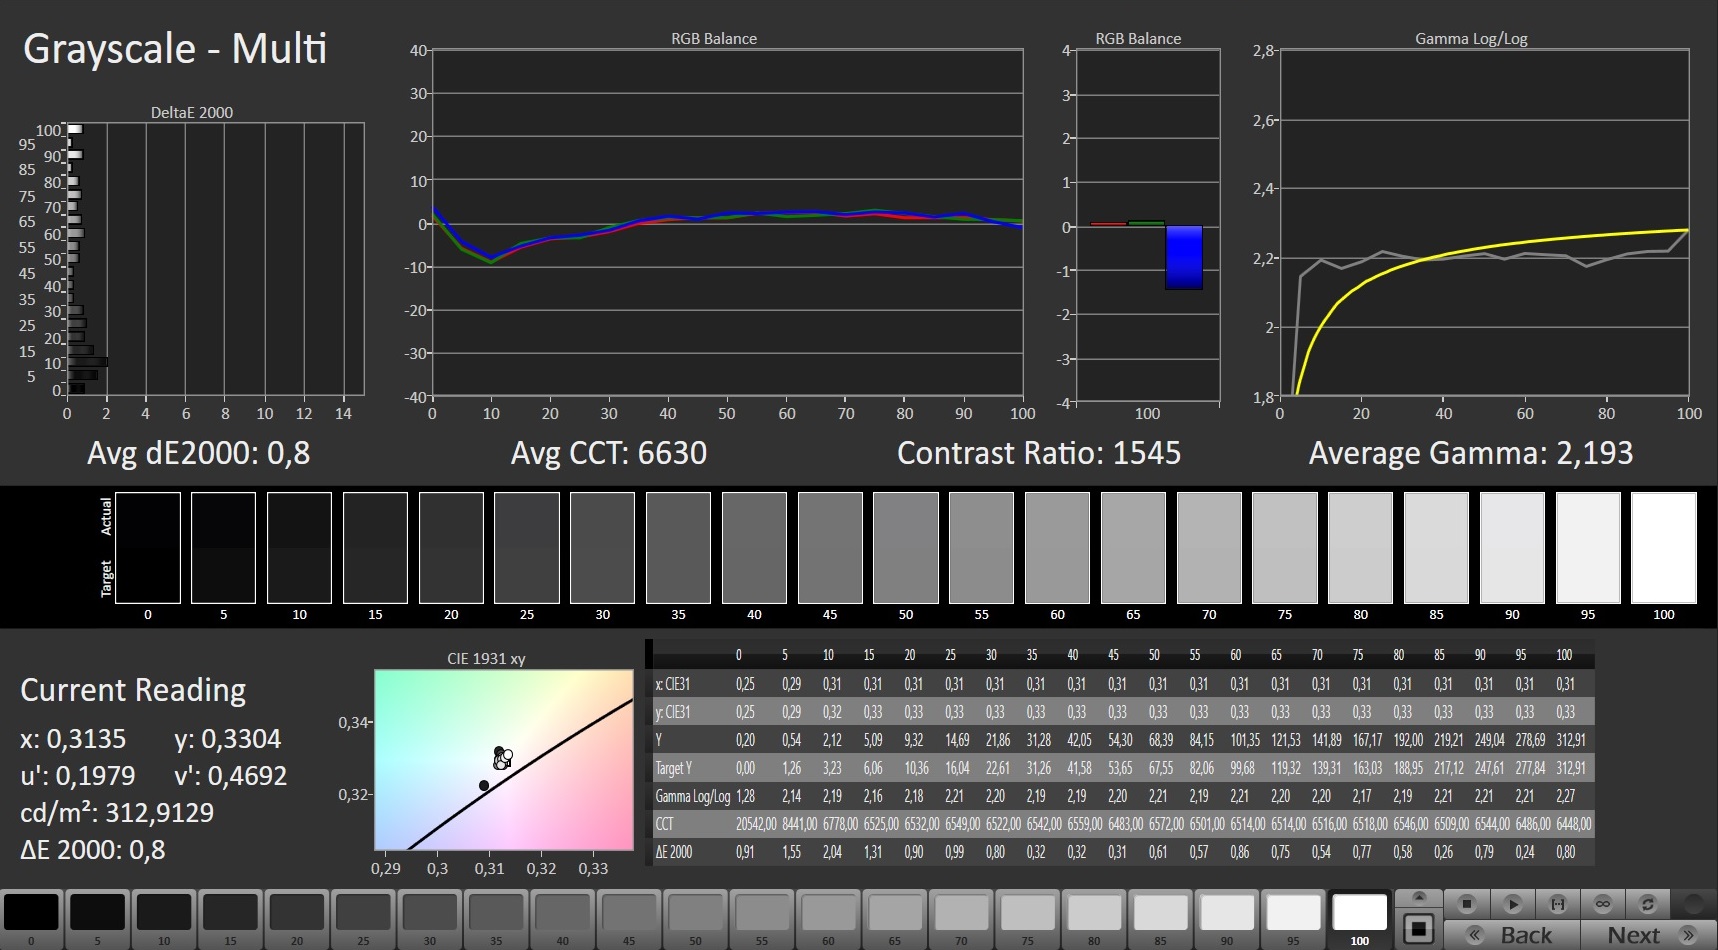
Mientras que la pantalla mate de 17,3 pulgadas (1.920 x 1.080 píxeles) ofrece un buen contraste (1.391:1), el brillo (299,3 cd/m²) apenas alcanza el objetivo (> 300 cd/m²). El panel de 300 Hz ofrece tiempos de respuesta cortos y no muestra parpadeo PWM
La pantalla soporta la tecnología G-Sync de Nvidia. Ésta ajusta dinámicamente las frecuencias de refresco de la pantalla y la GPU entre sí. Se supone que esto crea la imagen más fluida posible, especialmente en los juegos de ordenador.
| |||||||||||||||||||||||||
iluminación: 93 %
Brillo con batería: 306 cd/m²
Contraste: 1391:1 (Negro: 0.22 cd/m²)
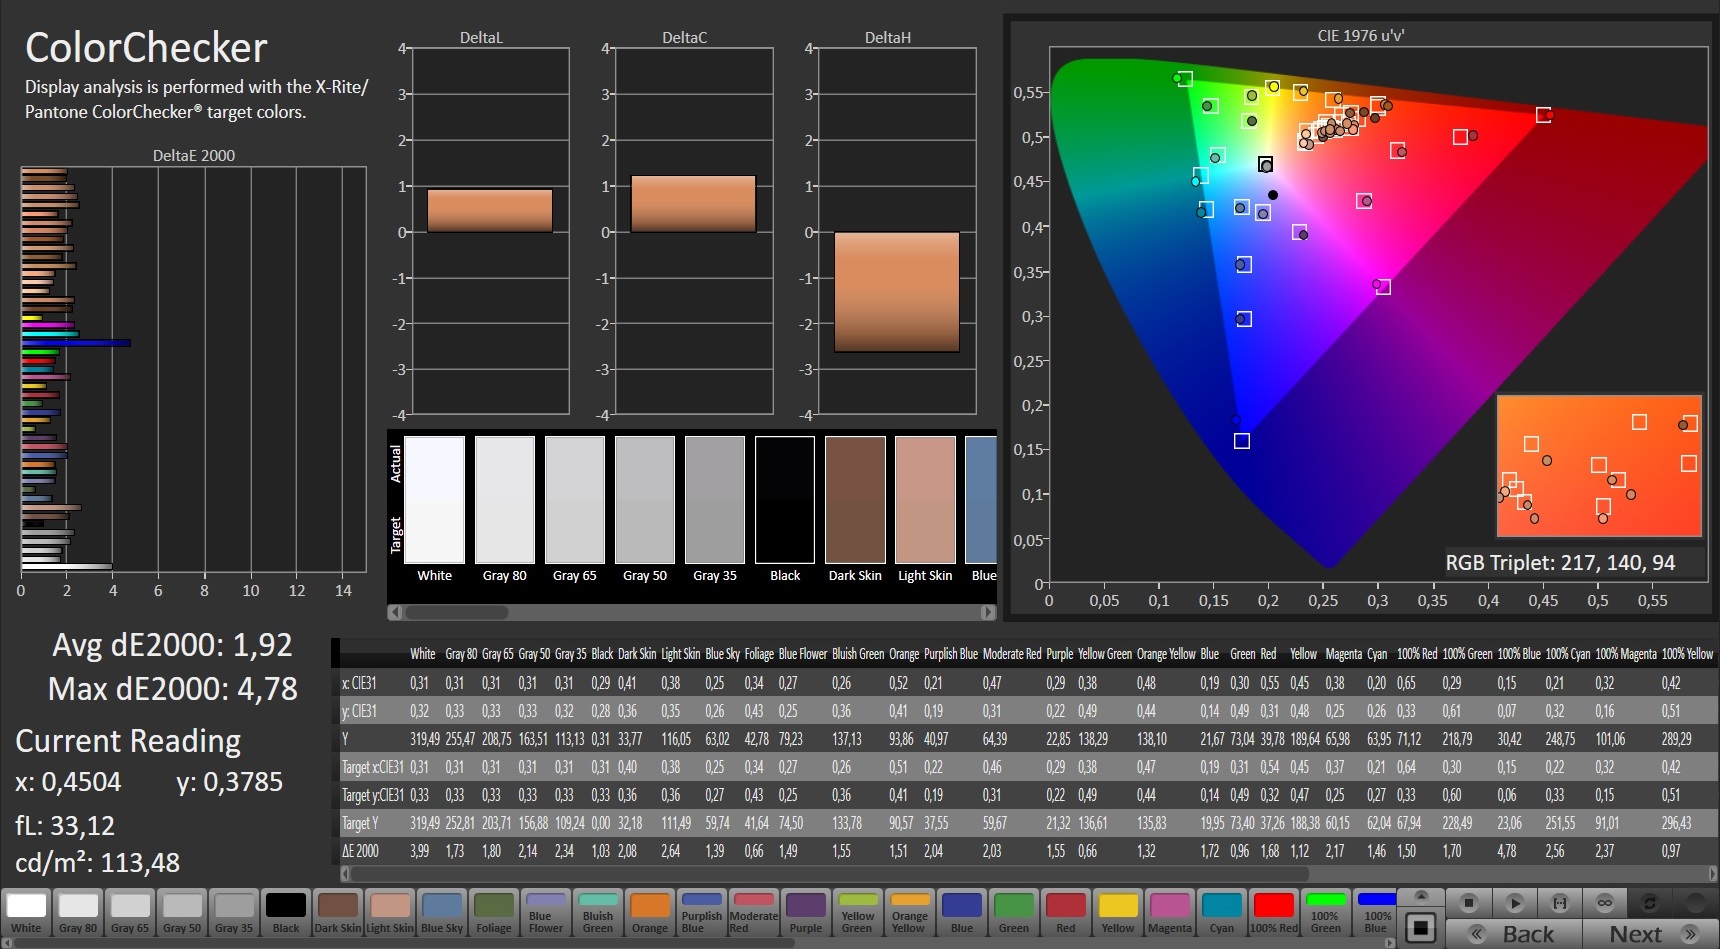
ΔE ColorChecker Calman: 1.92 | ∀{0.5-29.43 Ø4.71}
calibrated: 1.34
ΔE Greyscale Calman: 2 | ∀{0.09-98 Ø4.96}
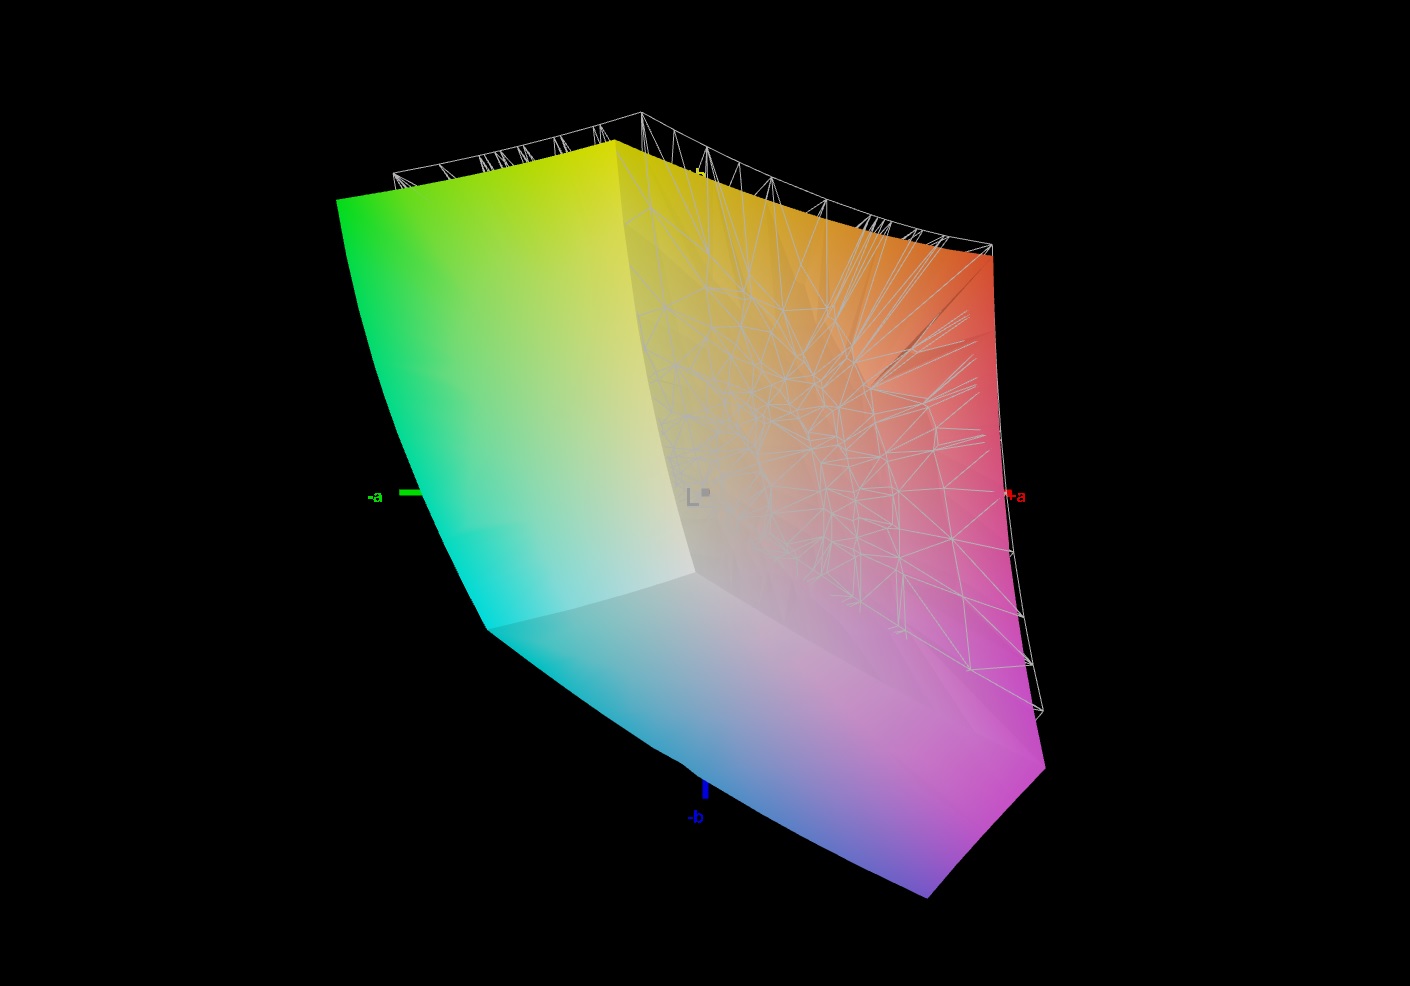
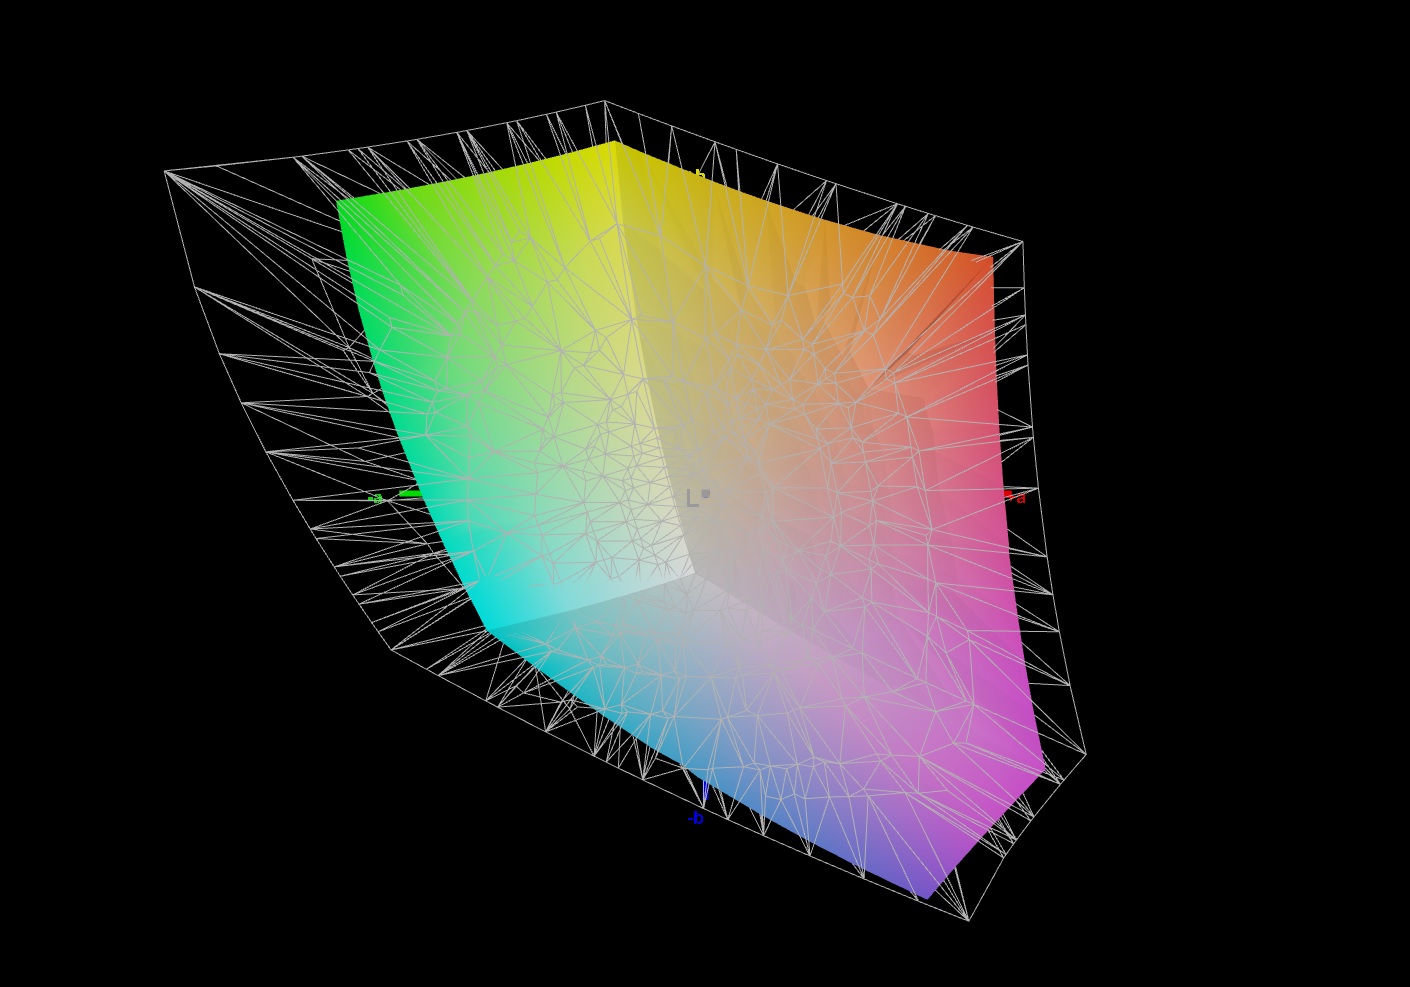
93% sRGB (Argyll 1.6.3 3D)
72% AdobeRGB 1998 (Argyll 1.6.3 3D)
72% AdobeRGB 1998 (Argyll 3D)
97.2% sRGB (Argyll 3D)
69.8% Display P3 (Argyll 3D)
Gamma: 2.153
CCT: 6738 K
| Schenker XMG Ultra 17 Rocket Lake AU Optronics B173HAN05.1, IPS, 1920x1080, 17.3" | MSI GT76 Titan DT 10SGS AU Optronics B173ZAN03.3, IPS, 3840x2160, 17.3" | Asus Strix Scar 17 G732LXS LQ173M1JW03 (SHP14DC), IPS, 1920x1080, 17.3" | Schenker XMG Ultra 17 Comet Lake AUO B173ZAN03.0 (AUO309B), IPS, 3840x2160, 17.3" | Alienware m17 R4 AU Optronics AUOEC91, IPS, 1920x1080, 17.3" | |
|---|---|---|---|---|---|
| Display | 18% | 1% | 19% | 1% | |
| Display P3 Coverage (%) | 69.8 | 82.5 18% | 71 2% | 83 19% | 69.8 0% |
| sRGB Coverage (%) | 97.2 | 98 1% | 99 2% | 99.1 2% | 99.7 3% |
| AdobeRGB 1998 Coverage (%) | 72 | 96.6 34% | 71.6 -1% | 97.9 36% | 71.6 -1% |
| Response Times | -170% | 3% | -468% | -68% | |
| Response Time Grey 50% / Grey 80% * (ms) | 5.6 ? | 23.2 ? -314% | 5.8 ? -4% | 50.4 ? -800% | 13.2 ? -136% |
| Response Time Black / White * (ms) | 9.2 ? | 11.6 ? -26% | 8.4 ? 9% | 21.6 ? -135% | 9.2 ? -0% |
| PWM Frequency (Hz) | |||||
| Screen | -26% | -31% | -38% | 12% | |
| Brightness middle (cd/m²) | 306 | 419.5 37% | 310 1% | 442 44% | 305 0% |
| Brightness (cd/m²) | 299 | 413 38% | 311 4% | 423 41% | 301 1% |
| Brightness Distribution (%) | 93 | 93 0% | 82 -12% | 92 -1% | 93 0% |
| Black Level * (cd/m²) | 0.22 | 0.4 -82% | 0.41 -86% | 0.36 -64% | 0.19 14% |
| Contrast (:1) | 1391 | 1049 -25% | 756 -46% | 1228 -12% | 1605 15% |
| Colorchecker dE 2000 * | 1.92 | 3.4 -77% | 2.41 -26% | 4.38 -128% | 1.31 32% |
| Colorchecker dE 2000 max. * | 4.78 | 7.4 -55% | 8.59 -80% | 10.85 -127% | 2.32 51% |
| Colorchecker dE 2000 calibrated * | 1.34 | 3.28 -145% | 1.13 16% | 0.66 51% | 0.91 32% |
| Greyscale dE 2000 * | 2 | 2 -0% | 4.3 -115% | 7.3 -265% | 2.3 -15% |
| Gamma | 2.153 102% | 2.14 103% | 2.149 102% | 2.17 101% | 2.281 96% |
| CCT | 6738 96% | 6858 95% | 7059 92% | 6906 94% | 6449 101% |
| Color Space (Percent of AdobeRGB 1998) (%) | 72 | 84.6 17% | 72 0% | 98 36% | 72 0% |
| Color Space (Percent of sRGB) (%) | 93 | 97.9 5% | 94 1% | 98 5% | 94 1% |
| Media total (Programa/Opciones) | -59% /
-36% | -9% /
-21% | -162% /
-81% | -18% /
-0% |
* ... más pequeño es mejor
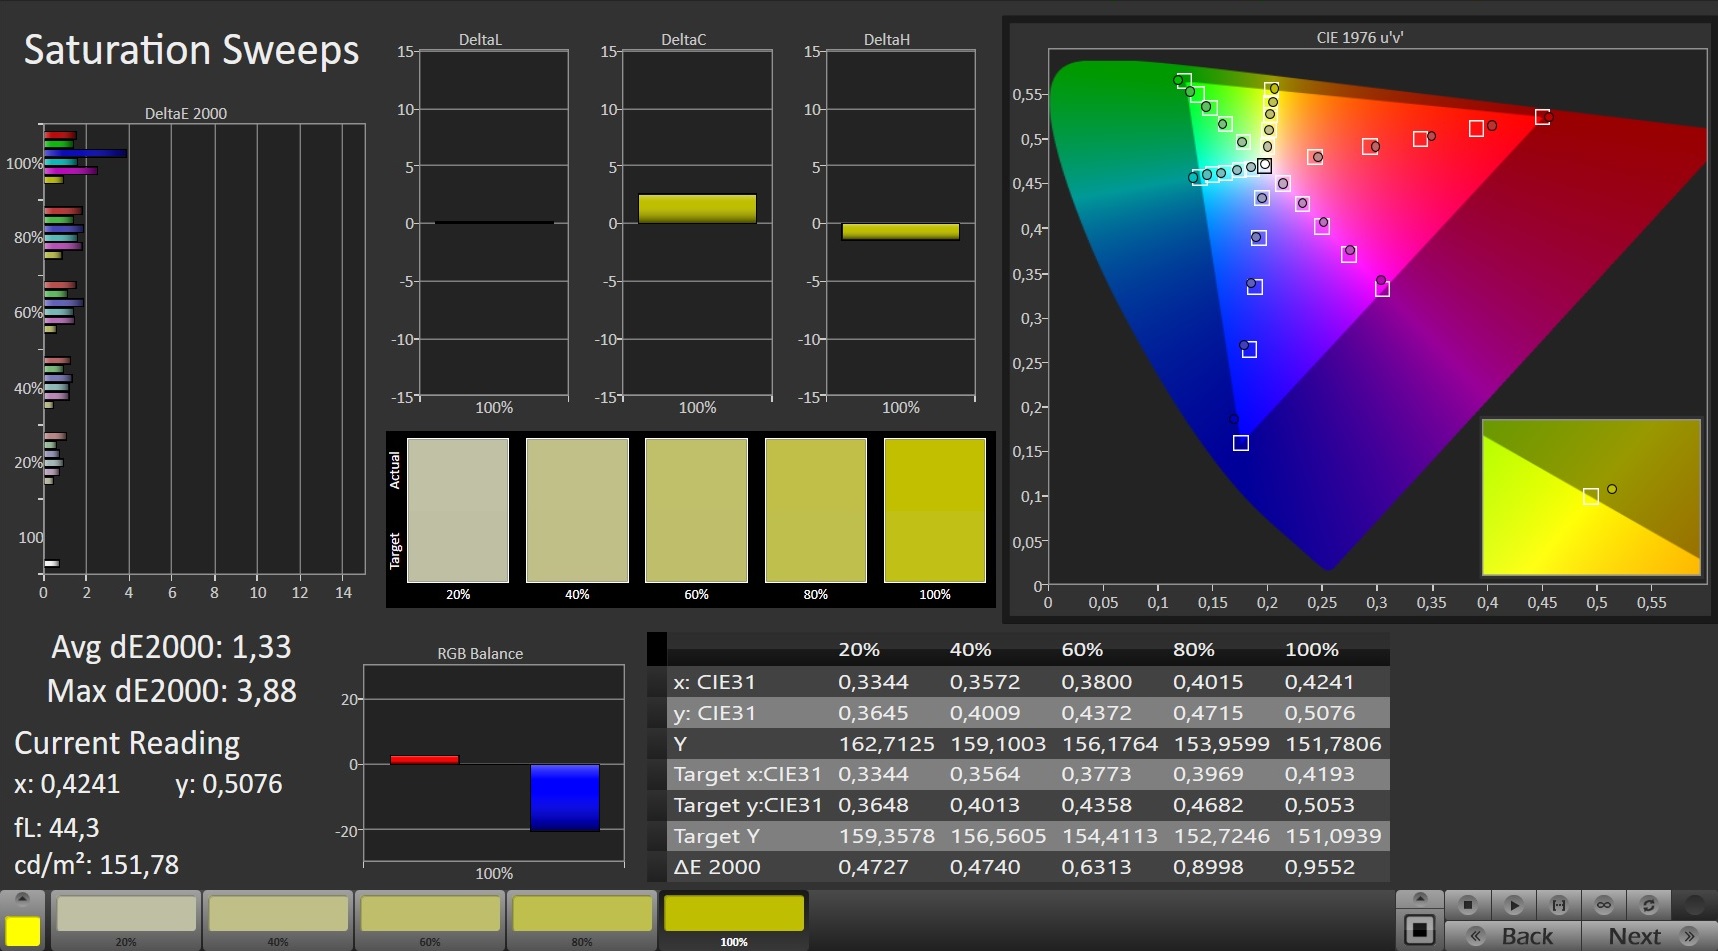
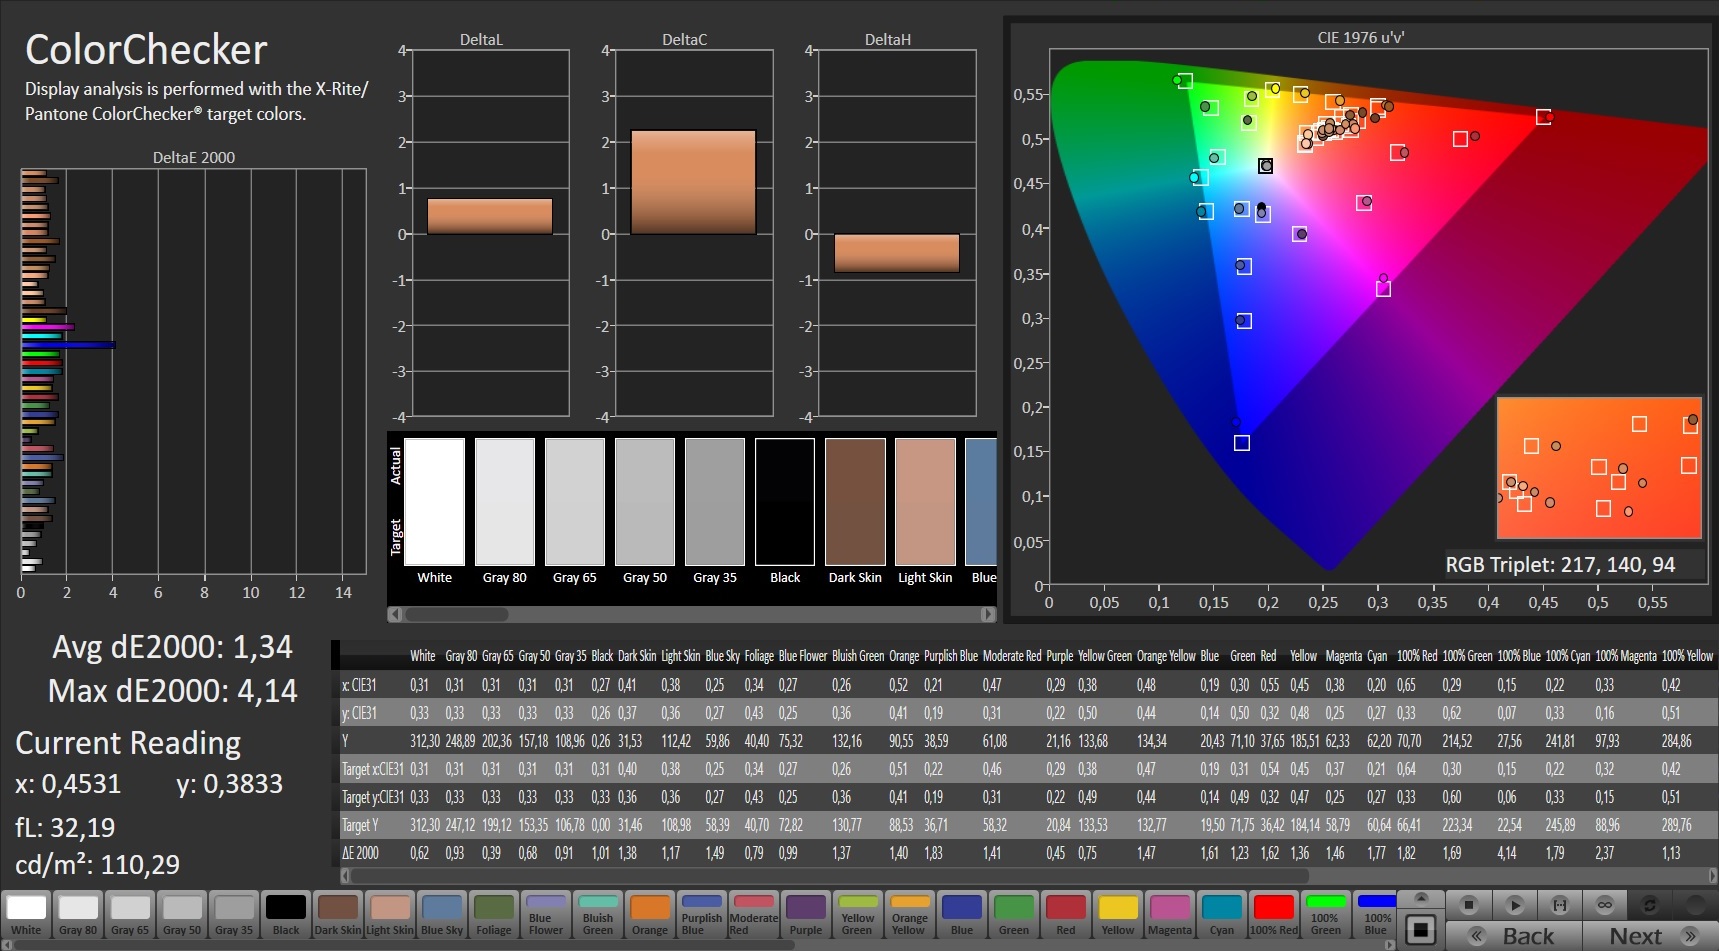
La pantalla ya muestra una buena reproducción del color en su estado de entrega y cumple el objetivo con una desviación de algo menos de 2 (Delta E menos de 3). No sufre de un tinte azul. Una calibración proporciona mejoras: La desviación del color baja a 1,34 y los niveles de la escala de grises se muestran más equilibrados. La pantalla no puede reproducir completamente los espacios de color AdobeRGB (72%) y sRGB (93%)

Tiempos de respuesta del display
| ↔ Tiempo de respuesta de Negro a Blanco | ||
|---|---|---|
| 9.2 ms ... subida ↗ y bajada ↘ combinada | ↗ 4.8 ms subida | 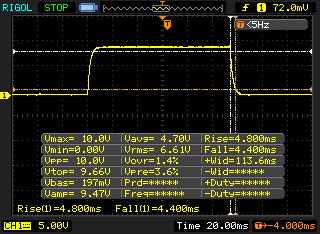 |
| ↘ 4.4 ms bajada | ||
| La pantalla mostró tiempos de respuesta rápidos en nuestros tests y debería ser adecuada para juegos. En comparación, todos los dispositivos de prueba van de ##min### (mínimo) a 240 (máximo) ms. » 26 % de todos los dispositivos son mejores. Esto quiere decir que el tiempo de respuesta medido es mejor que la media (19.8 ms) de todos los dispositivos testados. | ||
| ↔ Tiempo de respuesta 50% Gris a 80% Gris | ||
| 5.6 ms ... subida ↗ y bajada ↘ combinada | ↗ 2.8 ms subida | 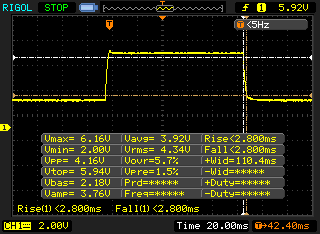 |
| ↘ 2.8 ms bajada | ||
| La pantalla mostró tiempos de respuesta muy rápidos en nuestros tests y debería ser adecuada para juegos frenéticos. En comparación, todos los dispositivos de prueba van de ##min### (mínimo) a 636 (máximo) ms. » 18 % de todos los dispositivos son mejores. Esto quiere decir que el tiempo de respuesta medido es mejor que la media (30.9 ms) de todos los dispositivos testados. | ||
Parpadeo de Pantalla / PWM (Pulse-Width Modulation)
| Parpadeo de Pantalla / PWM no detectado | 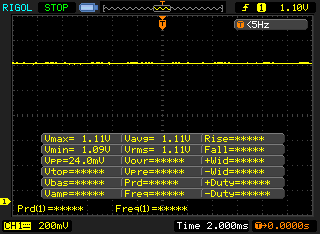 | ||
Comparación: 52 % de todos los dispositivos testados no usaron PWM para atenuar el display. Si se usó, medimos una media de 7744 (mínimo: 5 - máxmo: 343500) Hz. | |||
El panel IPS de ángulo de visión estable puede leerse desde cualquier posición. Es muy posible leer la pantalla en exteriores si el sol no es demasiado brillante

Rendimiento: XMG Ultra 17 permite intercambiar la CPU y la GPU
El portátil sustituto del ordenador de sobremesa de Schenker ofrece una gran potencia de cálculo y rinde adecuadamente en todas las áreas de aplicación habituales. El dispositivo puede configurarse de forma muy individualizada
Condiciones de la prueba
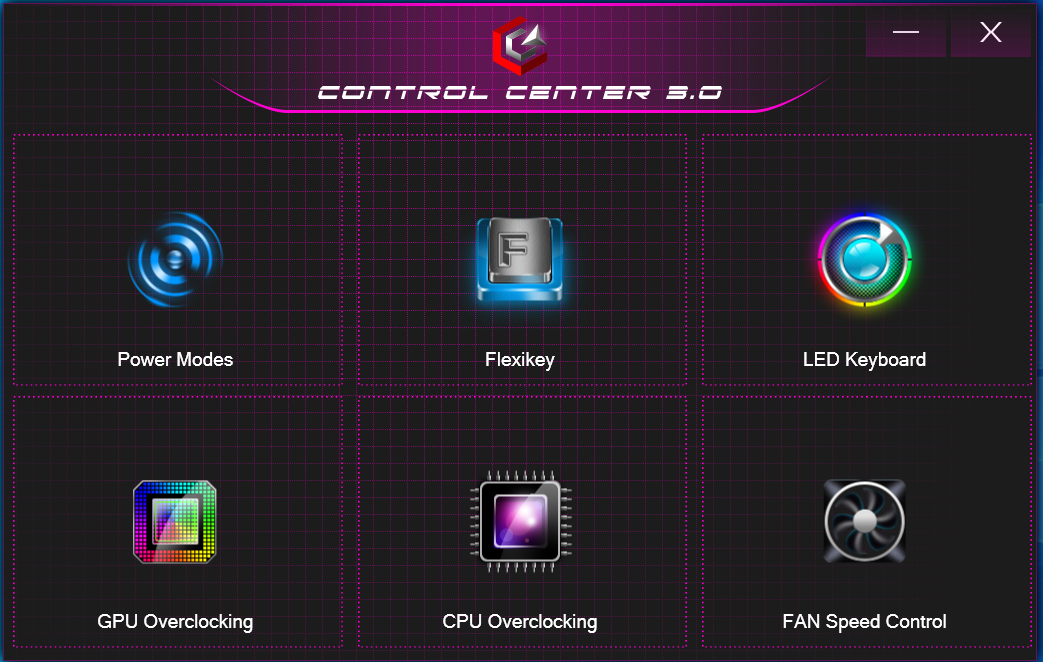
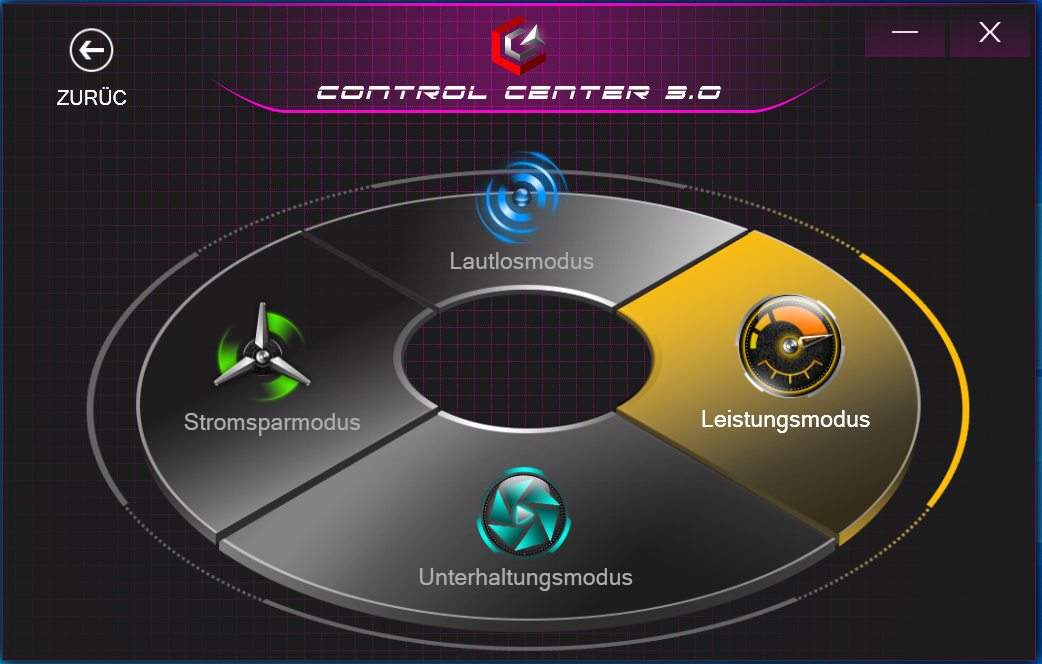
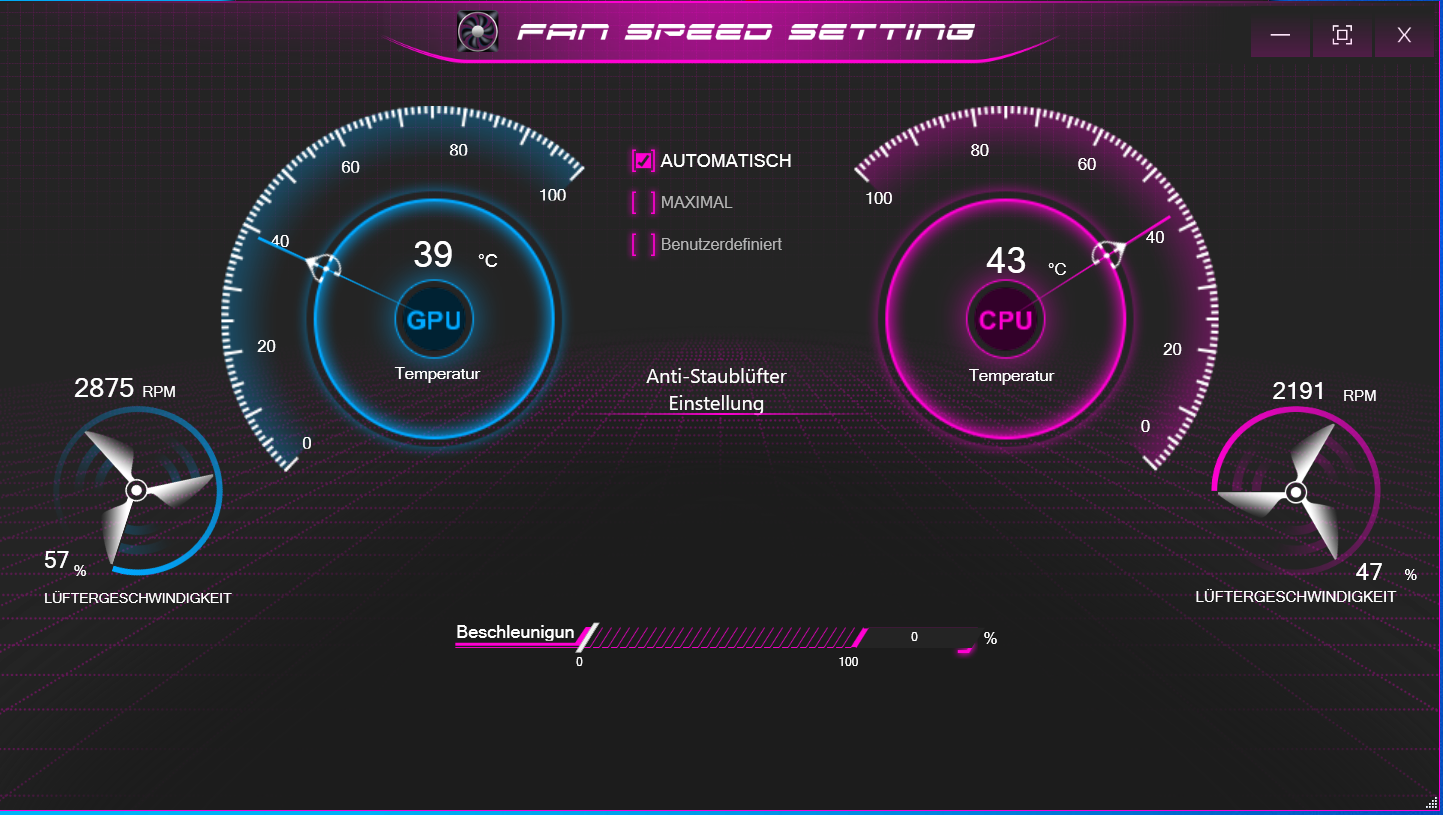
El Centro de Control preinstalado permite seleccionar un perfil de rendimiento, entre otras cosas. Realizamos nuestras pruebas 3D con el perfil "Modo Rendimiento" activo y el control automático del ventilador. Usamos el perfil "Modo Entretenimiento" para las pruebas en reposo y de batería.
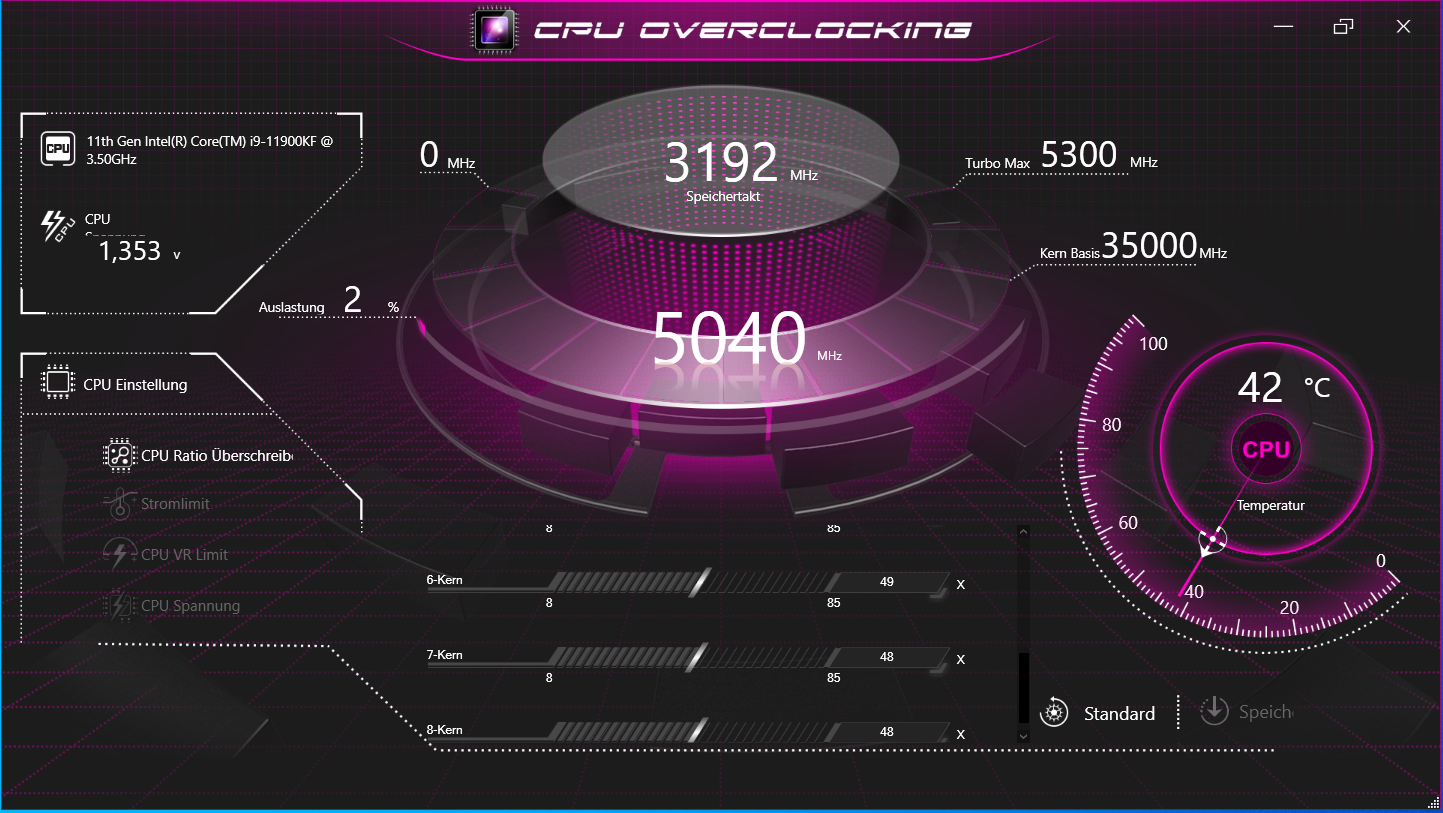
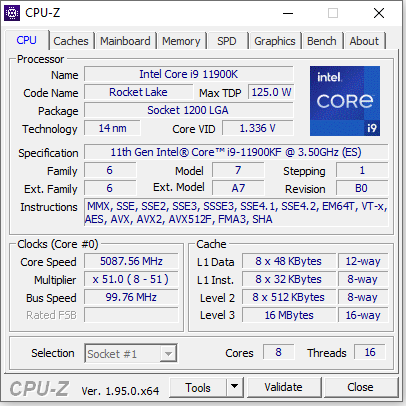
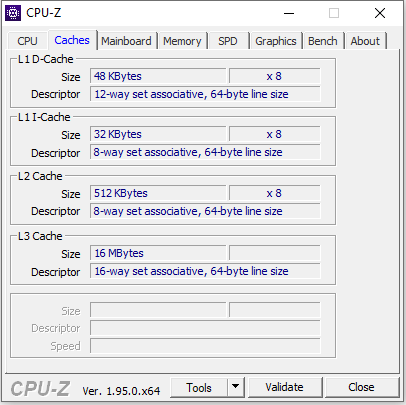
Procesador
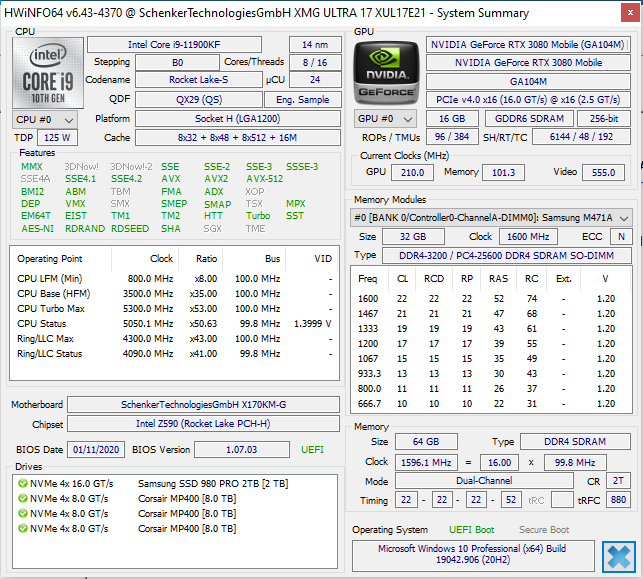
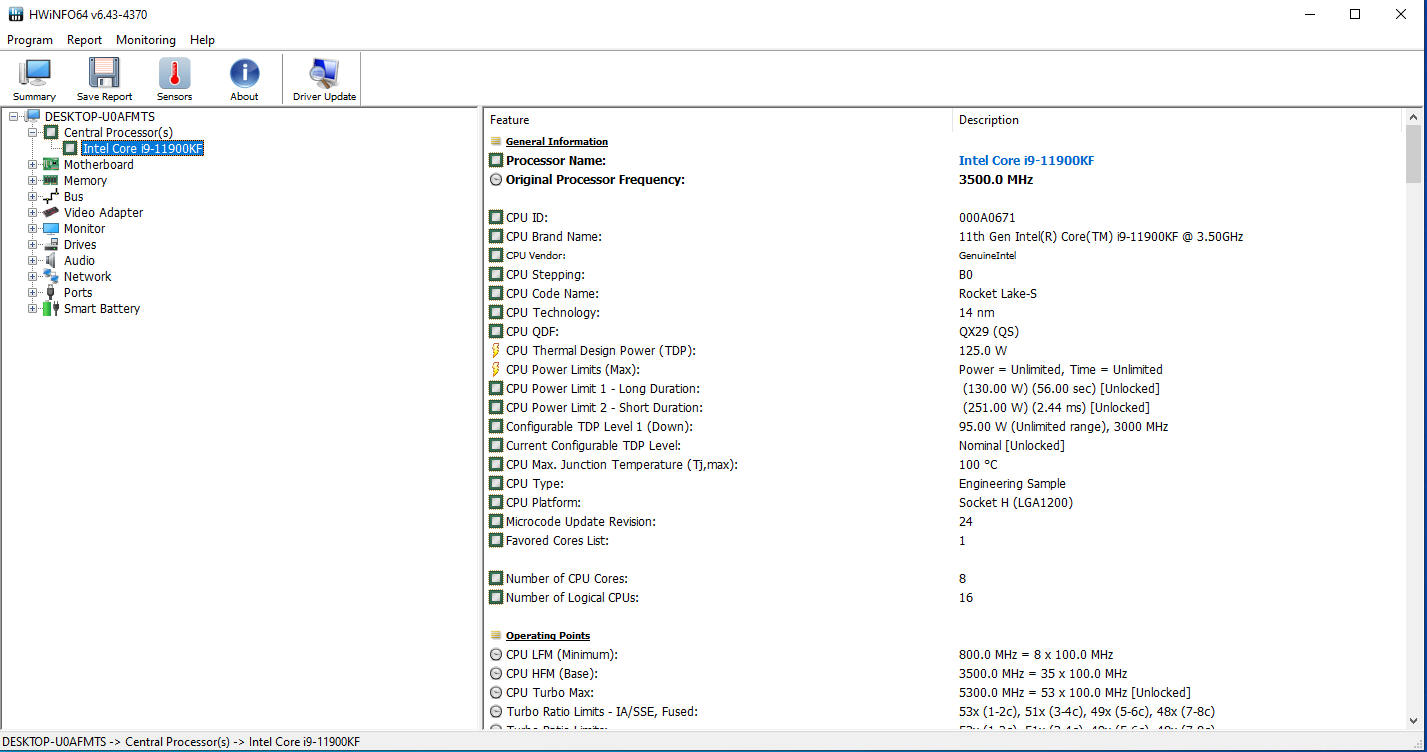
El Core-i9-11900Kde ocho núcleos (Rocket Lake) funciona con un reloj base de 3,5 GHz. El reloj se puede aumentar hasta 4,8 GHz (ocho núcleos) y hasta 5,3 GHz (un solo núcleo) mediante Turbo. Soporta Hyperthreading (dos hilos por núcleo). Gracias al multiplicador libre, el procesador puede ser overclockeado con bastante facilidad. La CPU está en un zócalo y, por lo tanto, se puede intercambiar.
Las pruebas de CPU del benchmark Cinebench R15 se ejecutan con 4,6 a 4,8 GHz (multihilo) y 4,8 a 5,3 GHz (un solo hilo). En batería, la CPU funciona a 800 MHz a 4,8 GHz (multihilo) o 3,6 a 5,1 GHz (un solo hilo)
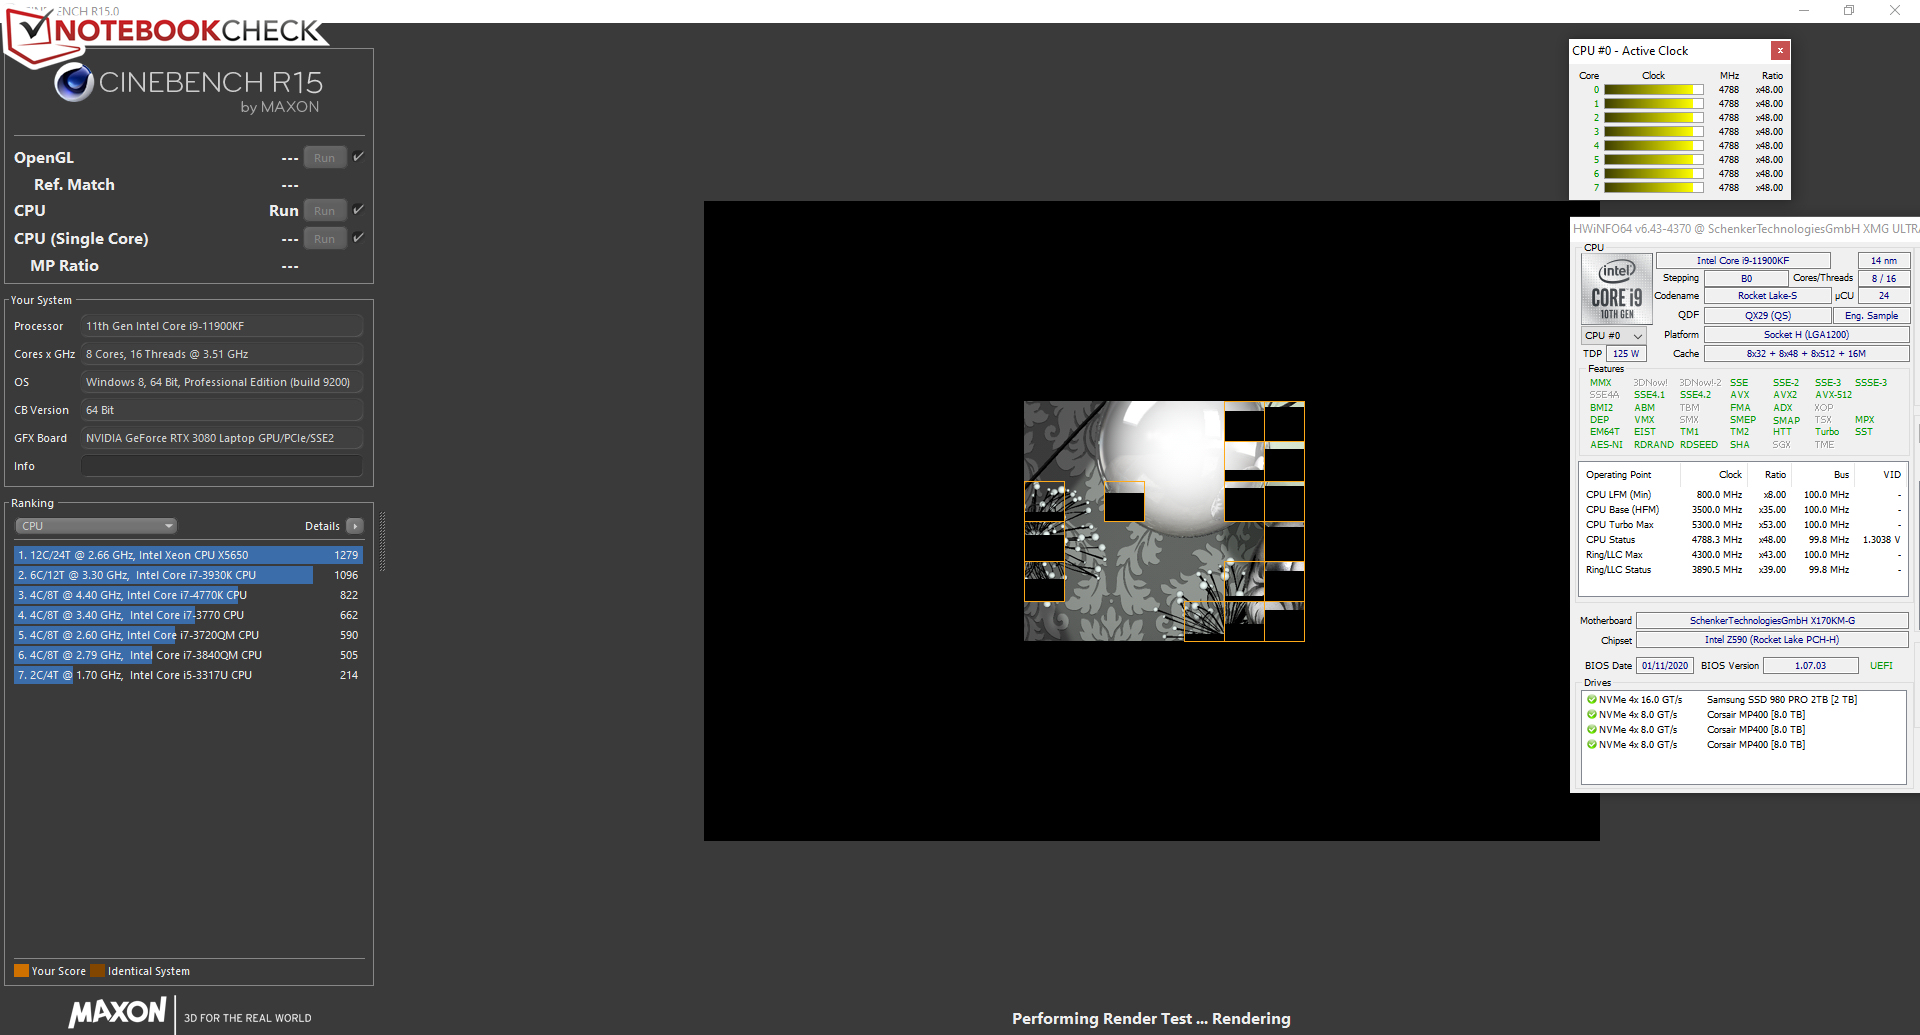
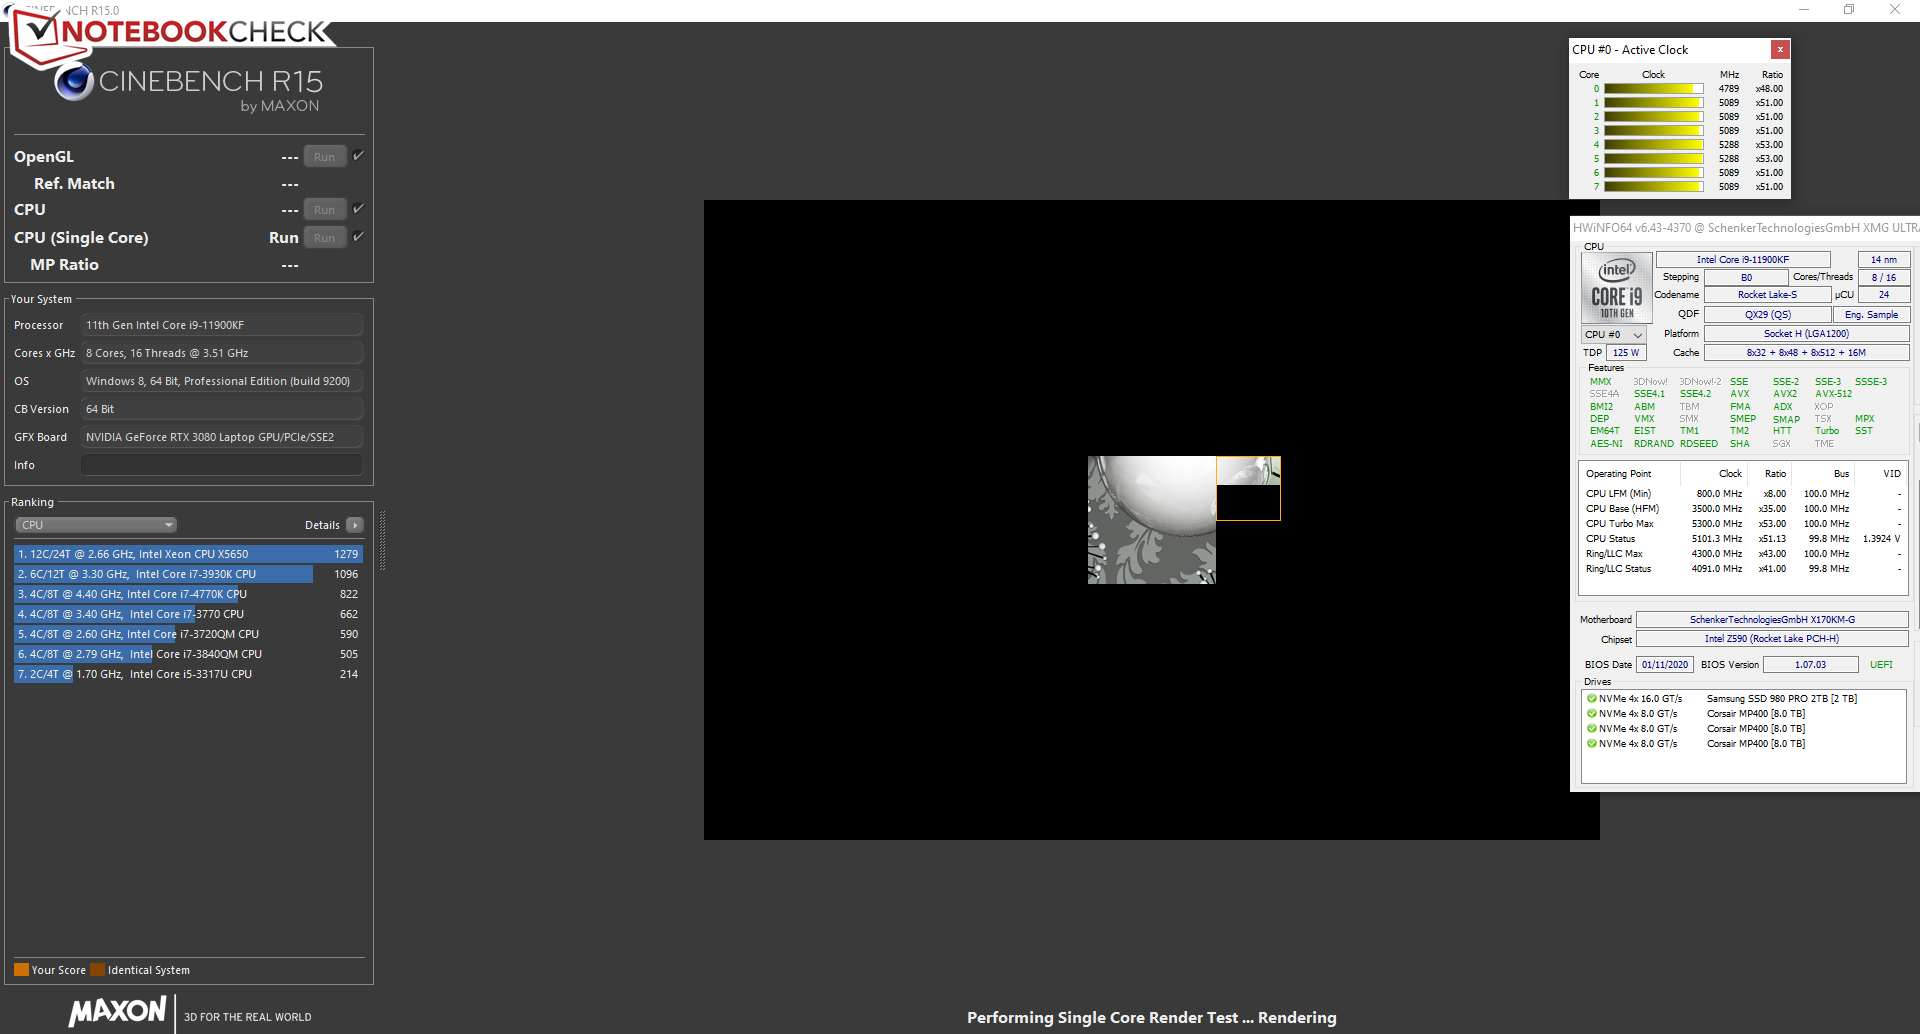
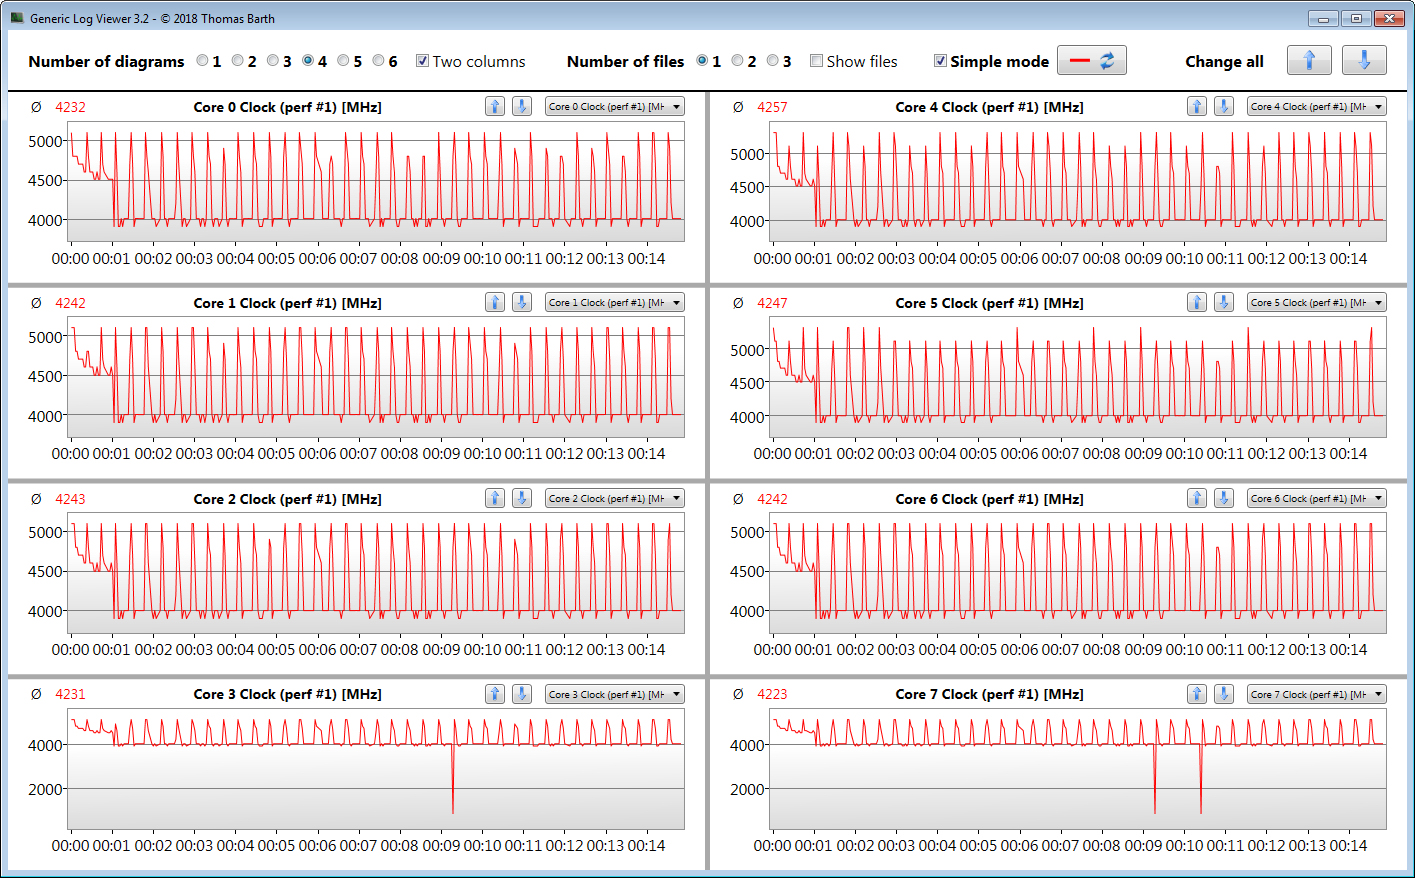
Comprobamos si el Turbo de la CPU también se utiliza permanentemente en el funcionamiento de la red eléctrica ejecutando la prueba multihilo del benchmark Cinebench R15 en un bucle. Se alcanzan altas velocidades en el primer minuto de la prueba. Después, el reloj cae a valores en torno a los 4 GHz.
Rocket Lake deja una buena impresión. Intel pudo aumentar el rendimiento por MHz de forma significativa. Como resultado, la falta de dos núcleos de CPU en comparación con el predecesor Comet Lake (Core i9-10900K) puede compensarsehasta ciertopunto en aplicaciones multihilo.El11900Kpuede lucirseentérminos derendimiento deun solohilo.Aquíestá por delantede su predecesor.
| Cinebench R15 | |
| CPU Single 64Bit | |
| Media de la clase Gaming (188.8 - 350, n=103, últimos 2 años) | |
| Medio Intel Core i9-11900K (254 - 262, n=4) | |
| Schenker XMG Ultra 17 Rocket Lake | |
| Schenker XMG Ultra 17 Comet Lake | |
| Alienware m17 R4 | |
| MSI GT76 Titan DT 10SGS | |
| Asus Strix Scar 17 G732LXS | |
| CPU Multi 64Bit | |
| Media de la clase Gaming (1578 - 6330, n=102, últimos 2 años) | |
| Schenker XMG Ultra 17 Comet Lake | |
| MSI GT76 Titan DT 10SGS | |
| Schenker XMG Ultra 17 Rocket Lake | |
| Medio Intel Core i9-11900K (2238 - 2436, n=4) | |
| Alienware m17 R4 | |
| Asus Strix Scar 17 G732LXS | |
| Blender - v2.79 BMW27 CPU | |
| Asus Strix Scar 17 G732LXS | |
| Alienware m17 R4 | |
| Schenker XMG Ultra 17 Rocket Lake | |
| Medio Intel Core i9-11900K (190.3 - 229, n=4) | |
| Schenker XMG Ultra 17 Comet Lake | |
| MSI GT76 Titan DT 10SGS | |
| Media de la clase Gaming (79 - 330, n=101, últimos 2 años) | |
| 7-Zip 18.03 | |
| 7z b 4 -mmt1 | |
| Media de la clase Gaming (4824 - 7436, n=102, últimos 2 años) | |
| Medio Intel Core i9-11900K (6174 - 6652, n=4) | |
| Schenker XMG Ultra 17 Rocket Lake | |
| Schenker XMG Ultra 17 Comet Lake | |
| Alienware m17 R4 | |
| MSI GT76 Titan DT 10SGS | |
| Asus Strix Scar 17 G732LXS | |
| 7z b 4 | |
| Media de la clase Gaming (33491 - 148086, n=102, últimos 2 años) | |
| Schenker XMG Ultra 17 Comet Lake | |
| MSI GT76 Titan DT 10SGS | |
| Medio Intel Core i9-11900K (54125 - 62746, n=4) | |
| Schenker XMG Ultra 17 Rocket Lake | |
| Alienware m17 R4 | |
| Asus Strix Scar 17 G732LXS | |
| Cinebench R20 | |
| CPU (Single Core) | |
| Media de la clase Gaming (622 - 913, n=103, últimos 2 años) | |
| Schenker XMG Ultra 17 Rocket Lake | |
| Medio Intel Core i9-11900K (619 - 647, n=5) | |
| Schenker XMG Ultra 17 Comet Lake | |
| Alienware m17 R4 | |
| MSI GT76 Titan DT 10SGS | |
| Asus Strix Scar 17 G732LXS | |
| CPU (Multi Core) | |
| Media de la clase Gaming (4029 - 16433, n=103, últimos 2 años) | |
| MSI GT76 Titan DT 10SGS | |
| Schenker XMG Ultra 17 Comet Lake | |
| Medio Intel Core i9-11900K (5055 - 5997, n=6) | |
| Schenker XMG Ultra 17 Rocket Lake | |
| Alienware m17 R4 | |
| Asus Strix Scar 17 G732LXS | |
| Geekbench 5.5 | |
| Single-Core | |
| Media de la clase Gaming (1403 - 2474, n=102, últimos 2 años) | |
| Medio Intel Core i9-11900K (1748 - 1885, n=6) | |
| Schenker XMG Ultra 17 Rocket Lake | |
| Schenker XMG Ultra 17 Comet Lake | |
| Alienware m17 R4 | |
| MSI GT76 Titan DT 10SGS | |
| Asus Strix Scar 17 G732LXS | |
| Multi-Core | |
| Media de la clase Gaming (6460 - 28263, n=102, últimos 2 años) | |
| Schenker XMG Ultra 17 Comet Lake | |
| MSI GT76 Titan DT 10SGS | |
| Schenker XMG Ultra 17 Rocket Lake | |
| Medio Intel Core i9-11900K (9547 - 11035, n=6) | |
| Asus Strix Scar 17 G732LXS | |
| Alienware m17 R4 | |
| HWBOT x265 Benchmark v2.2 - 4k Preset | |
| Media de la clase Gaming (11.5 - 44.4, n=102, últimos 2 años) | |
| MSI GT76 Titan DT 10SGS | |
| Schenker XMG Ultra 17 Comet Lake | |
| Medio Intel Core i9-11900K (16.6 - 19.8, n=4) | |
| Schenker XMG Ultra 17 Rocket Lake | |
| Alienware m17 R4 | |
| Asus Strix Scar 17 G732LXS | |
| LibreOffice - 20 Documents To PDF | |
| Asus Strix Scar 17 G732LXS | |
| Alienware m17 R4 | |
| Media de la clase Gaming (33.2 - 88.8, n=102, últimos 2 años) | |
| Schenker XMG Ultra 17 Comet Lake | |
| Medio Intel Core i9-11900K (37 - 72.5, n=4) | |
| MSI GT76 Titan DT 10SGS | |
| Schenker XMG Ultra 17 Rocket Lake | |
| R Benchmark 2.5 - Overall mean | |
| Asus Strix Scar 17 G732LXS | |
| Alienware m17 R4 | |
| MSI GT76 Titan DT 10SGS | |
| Schenker XMG Ultra 17 Comet Lake | |
| Schenker XMG Ultra 17 Rocket Lake | |
| Medio Intel Core i9-11900K (0.4733 - 0.4981, n=4) | |
| Media de la clase Gaming (0.3439 - 0.59, n=102, últimos 2 años) | |
* ... más pequeño es mejor
Rendimiento del sistema
El hecho de que no falte potencia de cálculo no debería sorprender a la vista del equipamiento de hardware. El portátil es impresionante en todas las áreas de aplicación habituales. Los muy buenos resultados de PCMark lo confirman
| PCMark 8 Home Score Accelerated v2 | 5529 puntos | |
| PCMark 8 Creative Score Accelerated v2 | 7020 puntos | |
| PCMark 8 Work Score Accelerated v2 | 6151 puntos | |
| PCMark 10 Score | 7884 puntos | |
ayuda | ||
Latencias del CPD
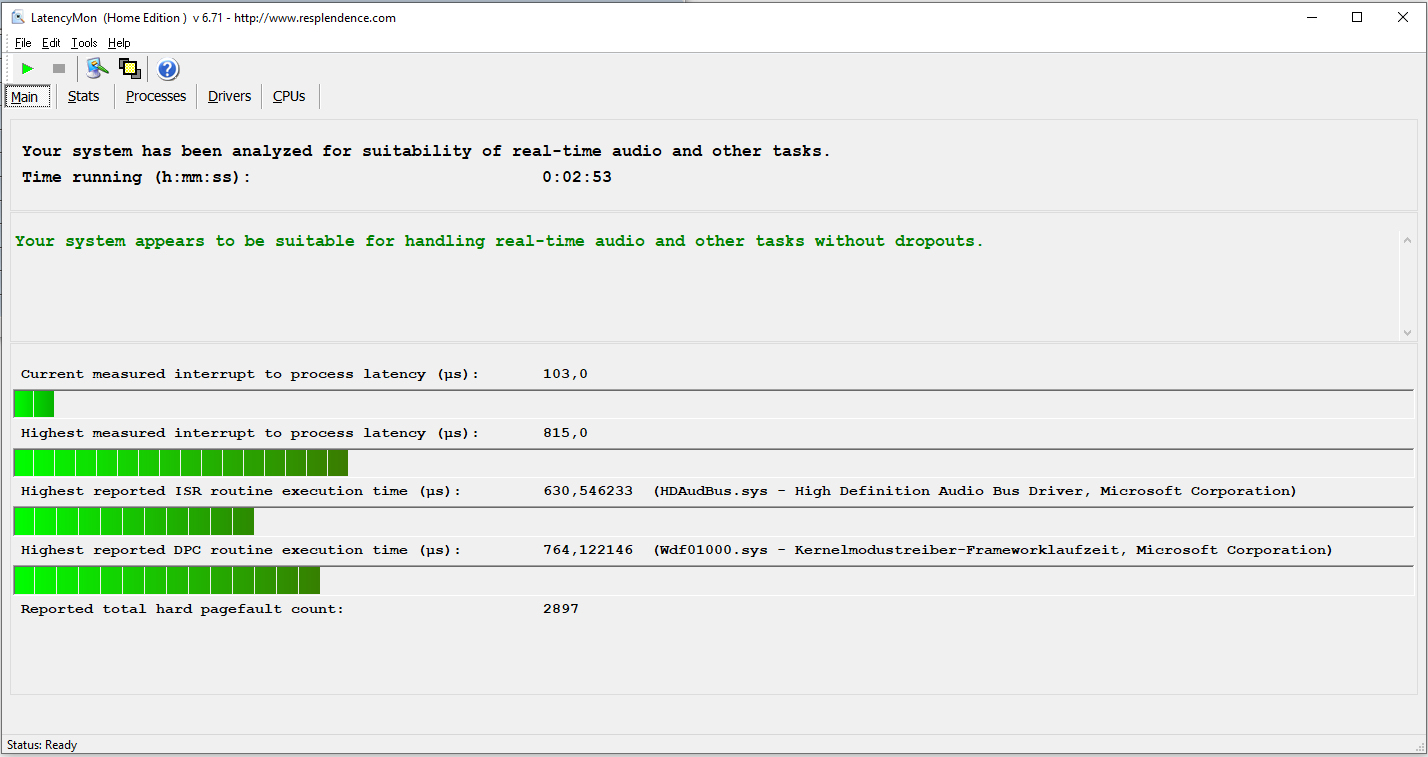
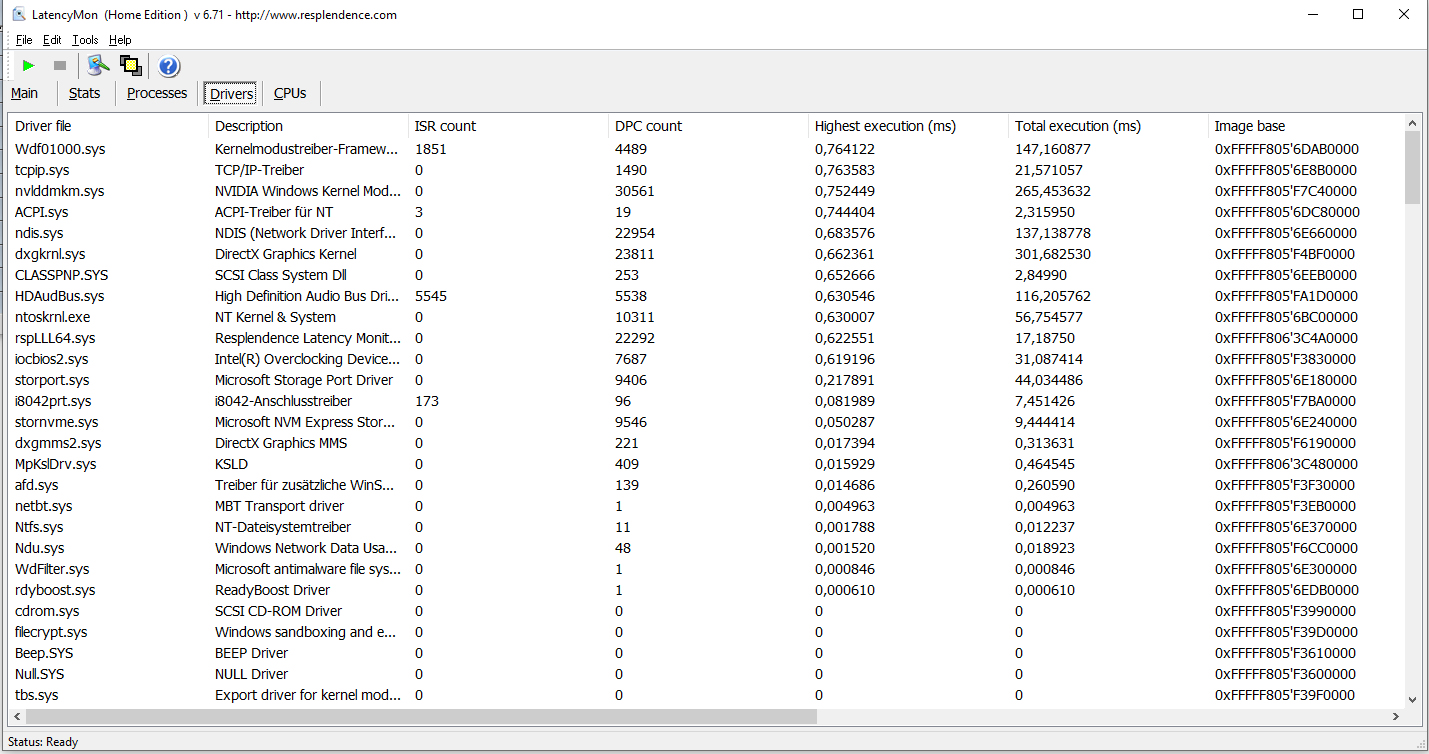
En nuestra prueba de monitorización de latencia estandarizada (navegación web, reproducción de vídeo 4K, Prime95 de alta carga), no observamos ninguna anomalía en las latencias del CPD. El sistema parece adecuado para la edición de vídeo y audio en tiempo real
| DPC Latencies / LatencyMon - interrupt to process latency (max), Web, Youtube, Prime95 | |
| MSI GT76 Titan DT 10SGS | |
| Asus Strix Scar 17 G732LXS | |
| Schenker XMG Ultra 17 Rocket Lake | |
| Alienware m17 R4 | |
| Schenker XMG Ultra 17 Comet Lake | |
* ... más pequeño es mejor
Almacenamiento masivo
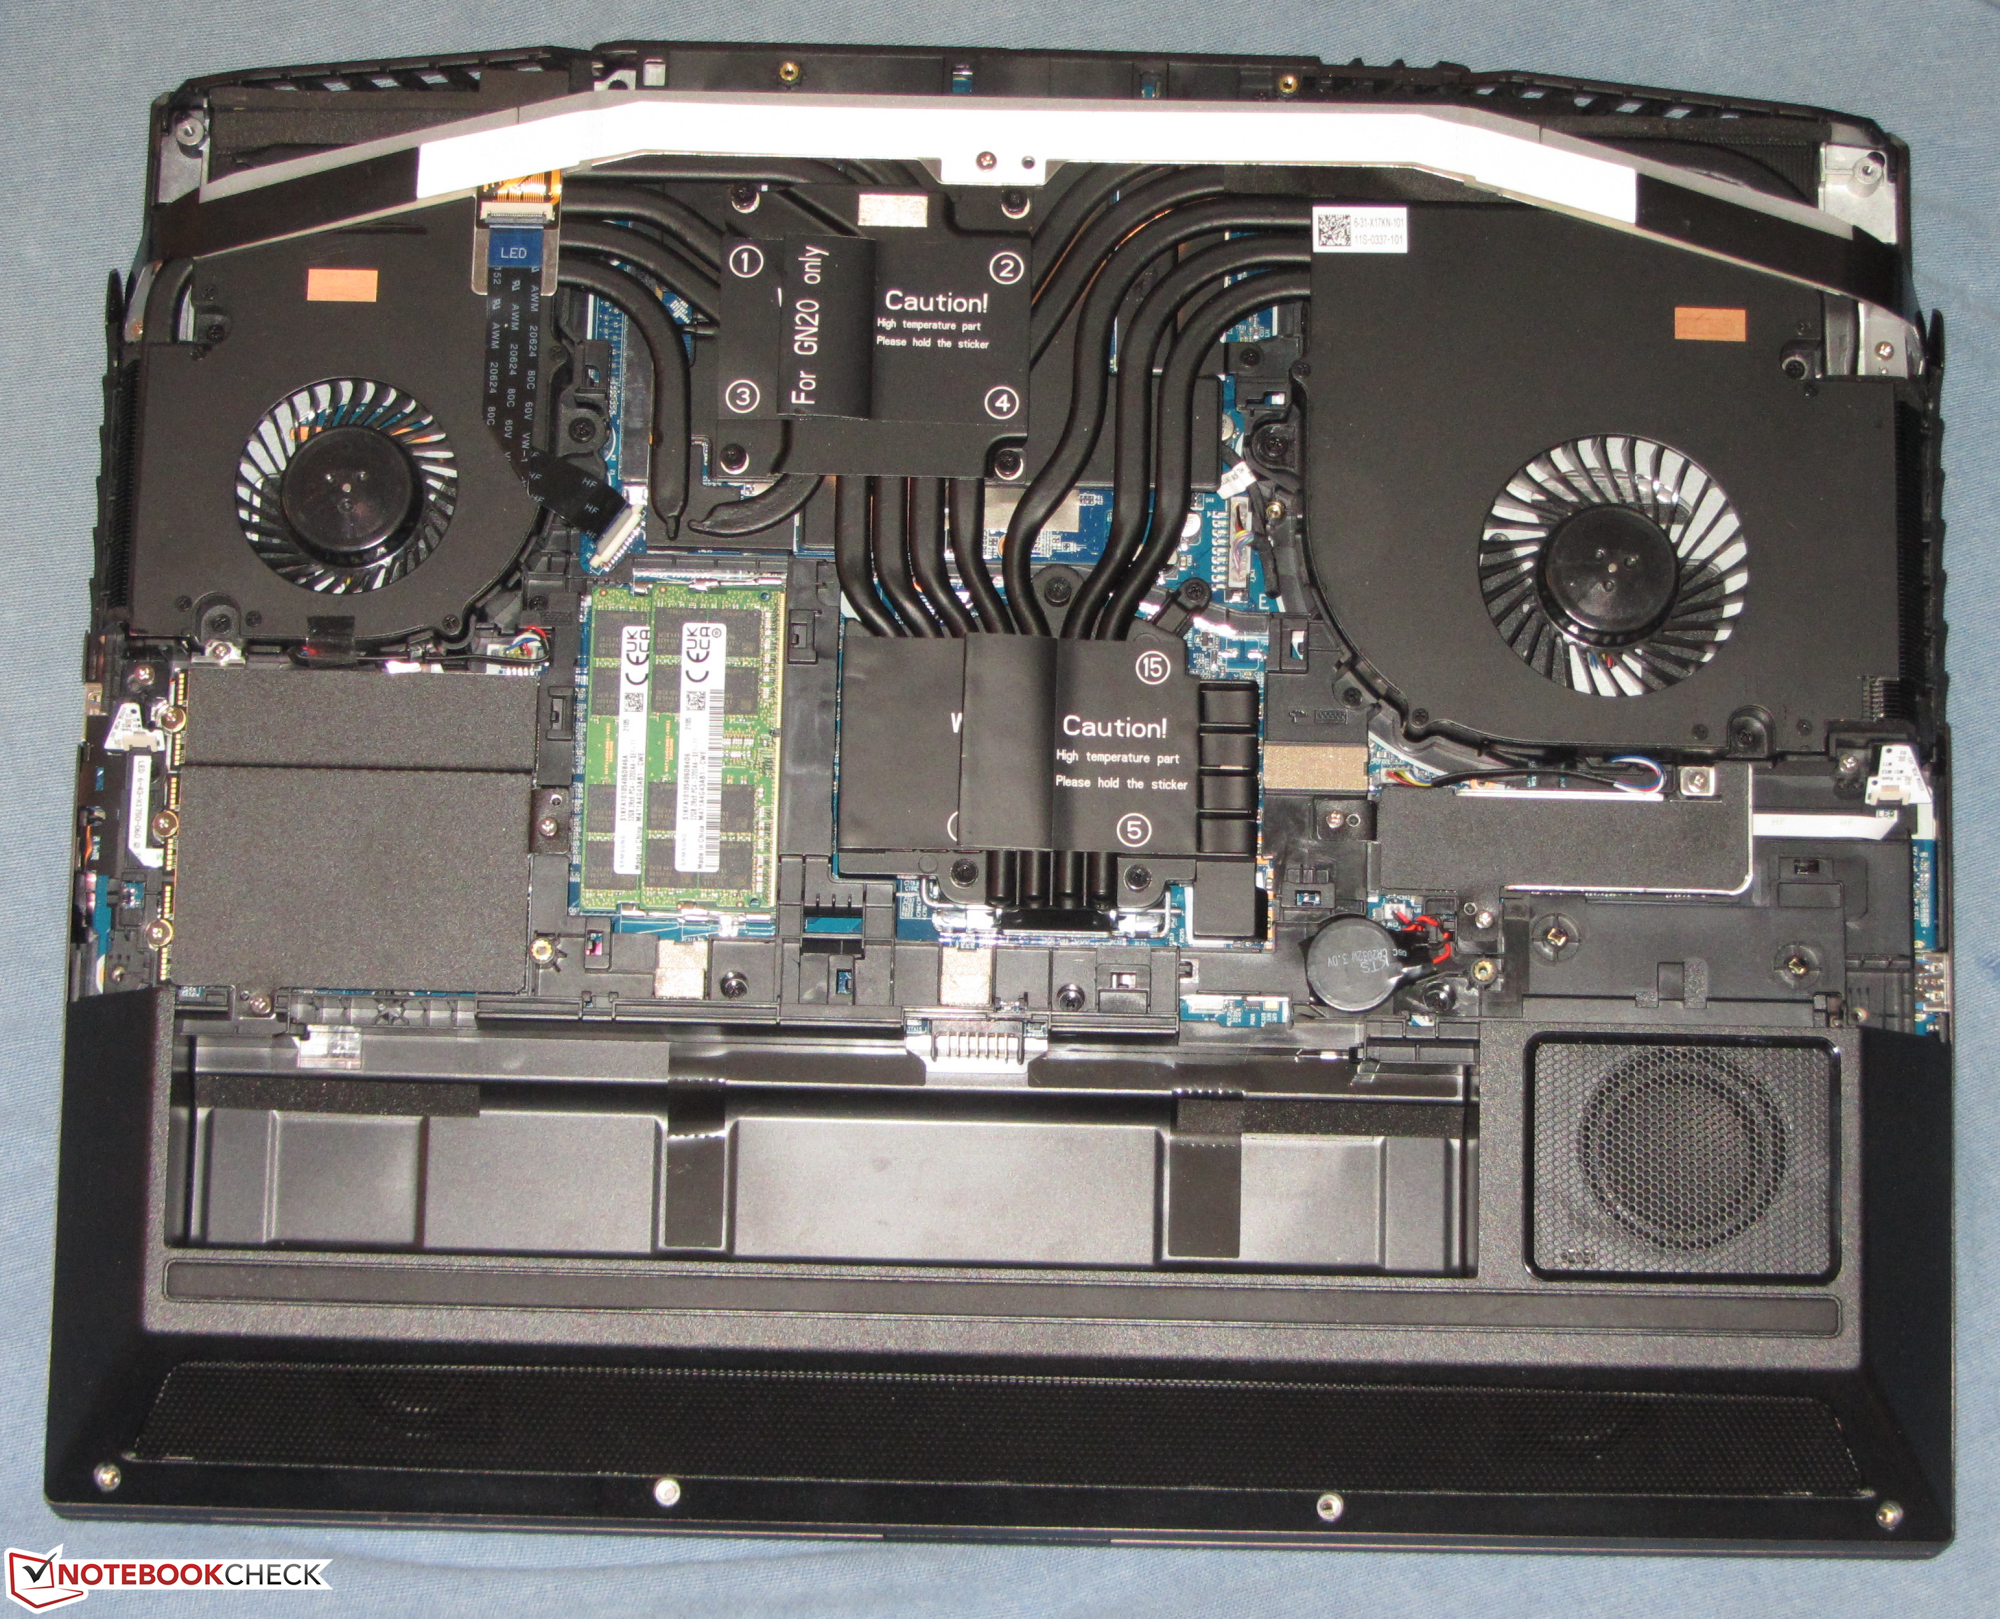
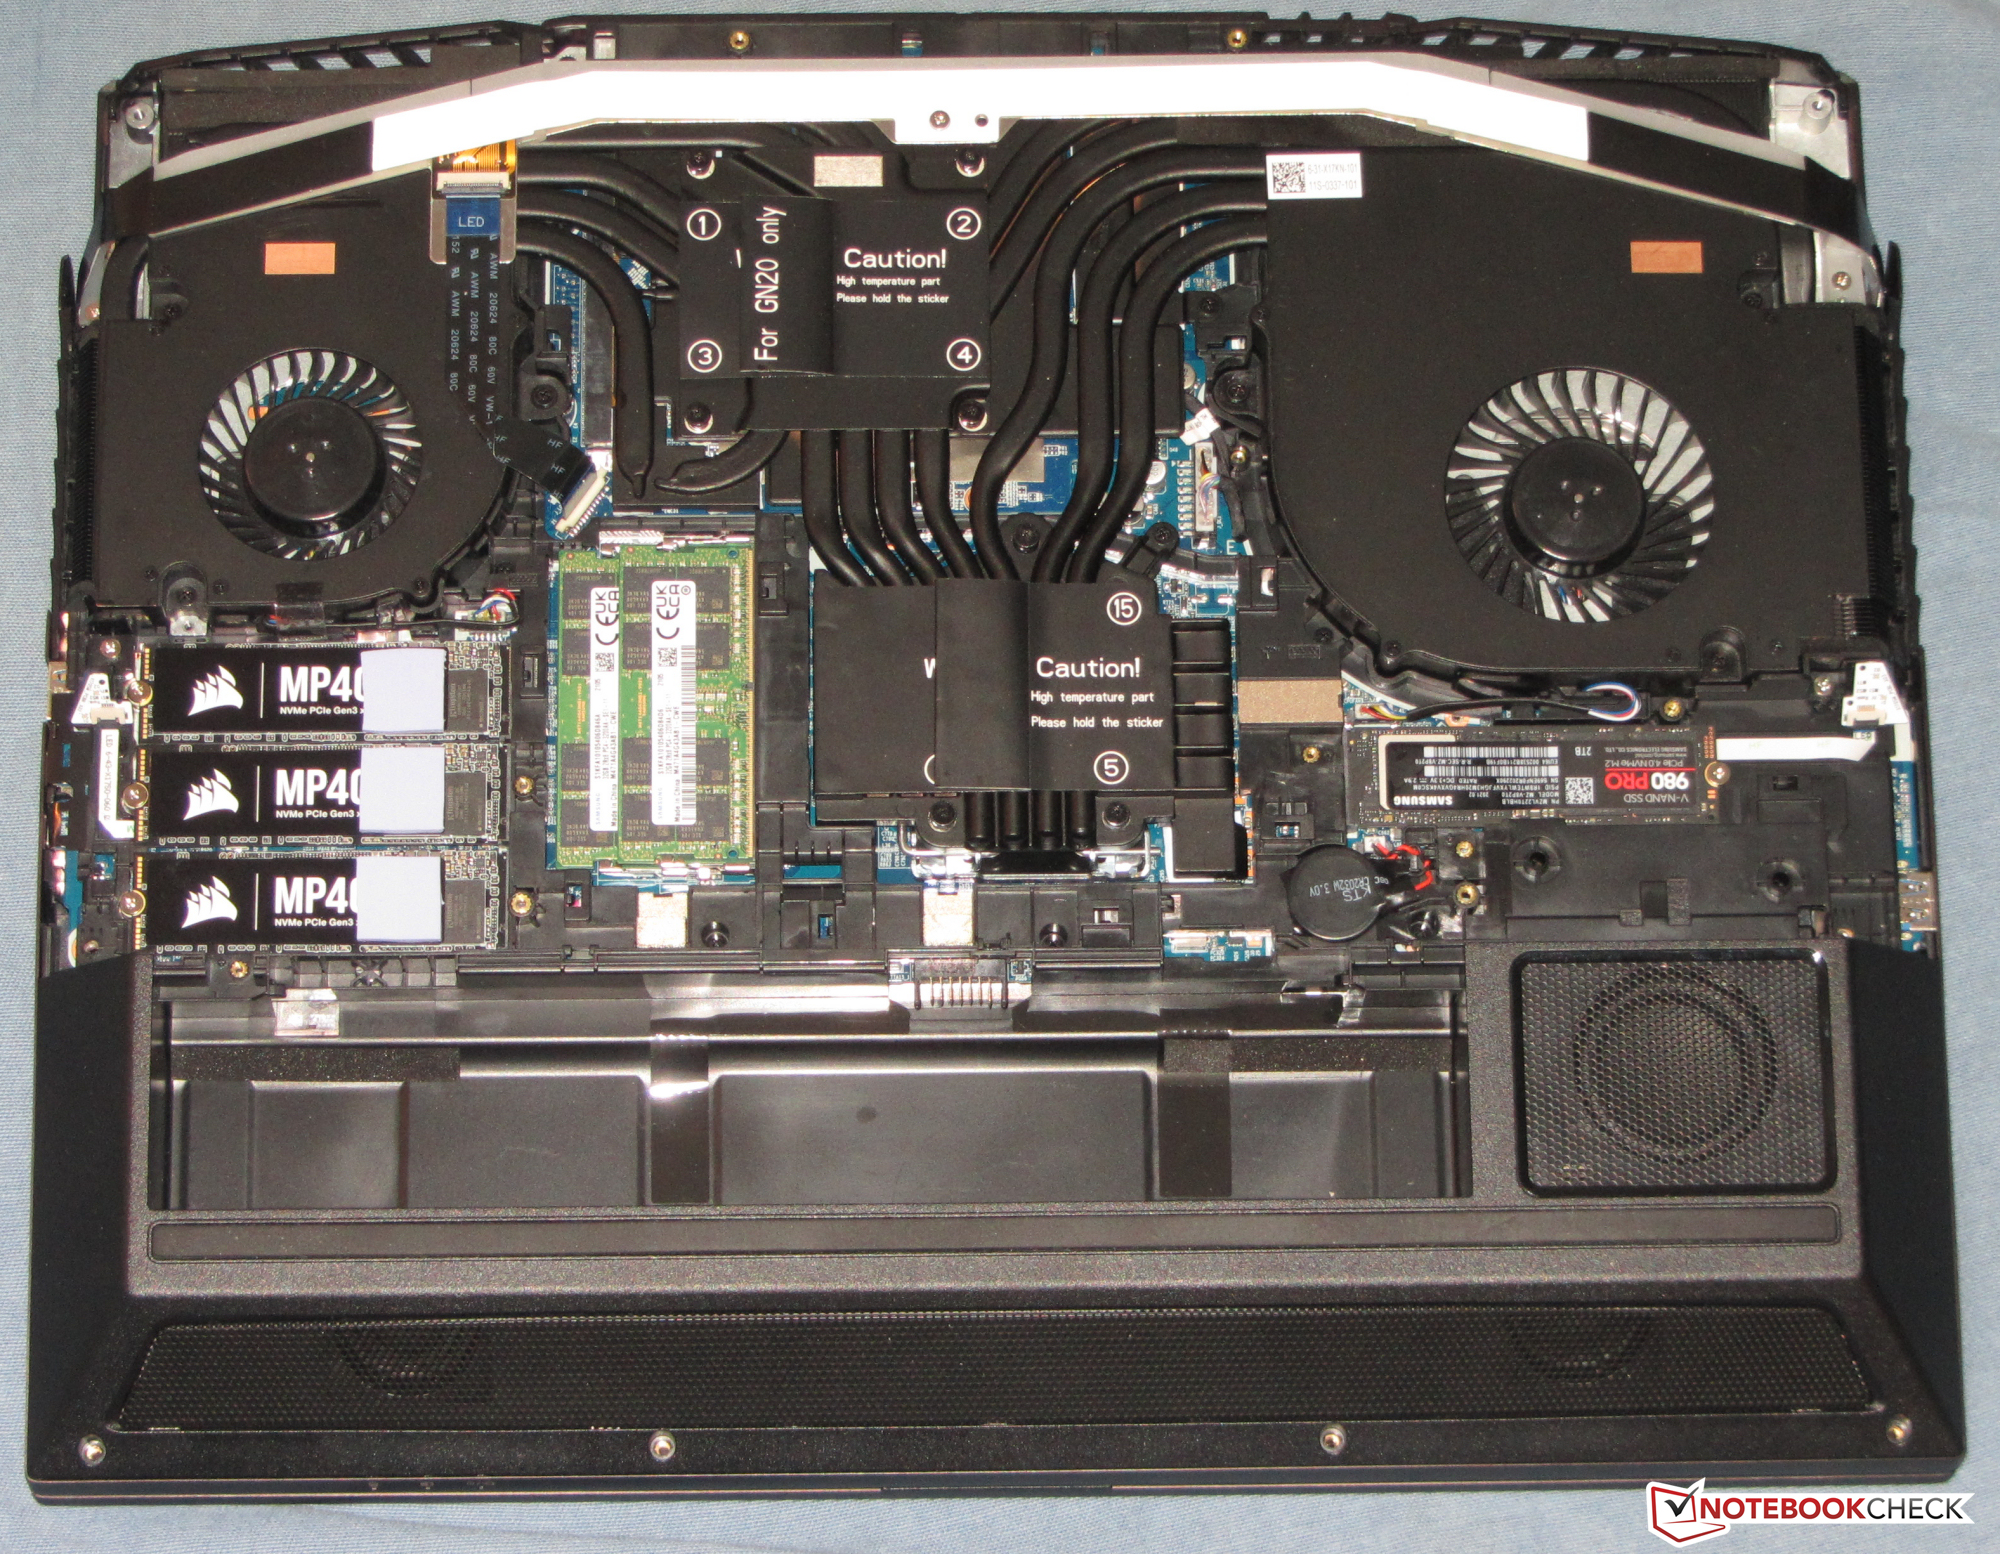
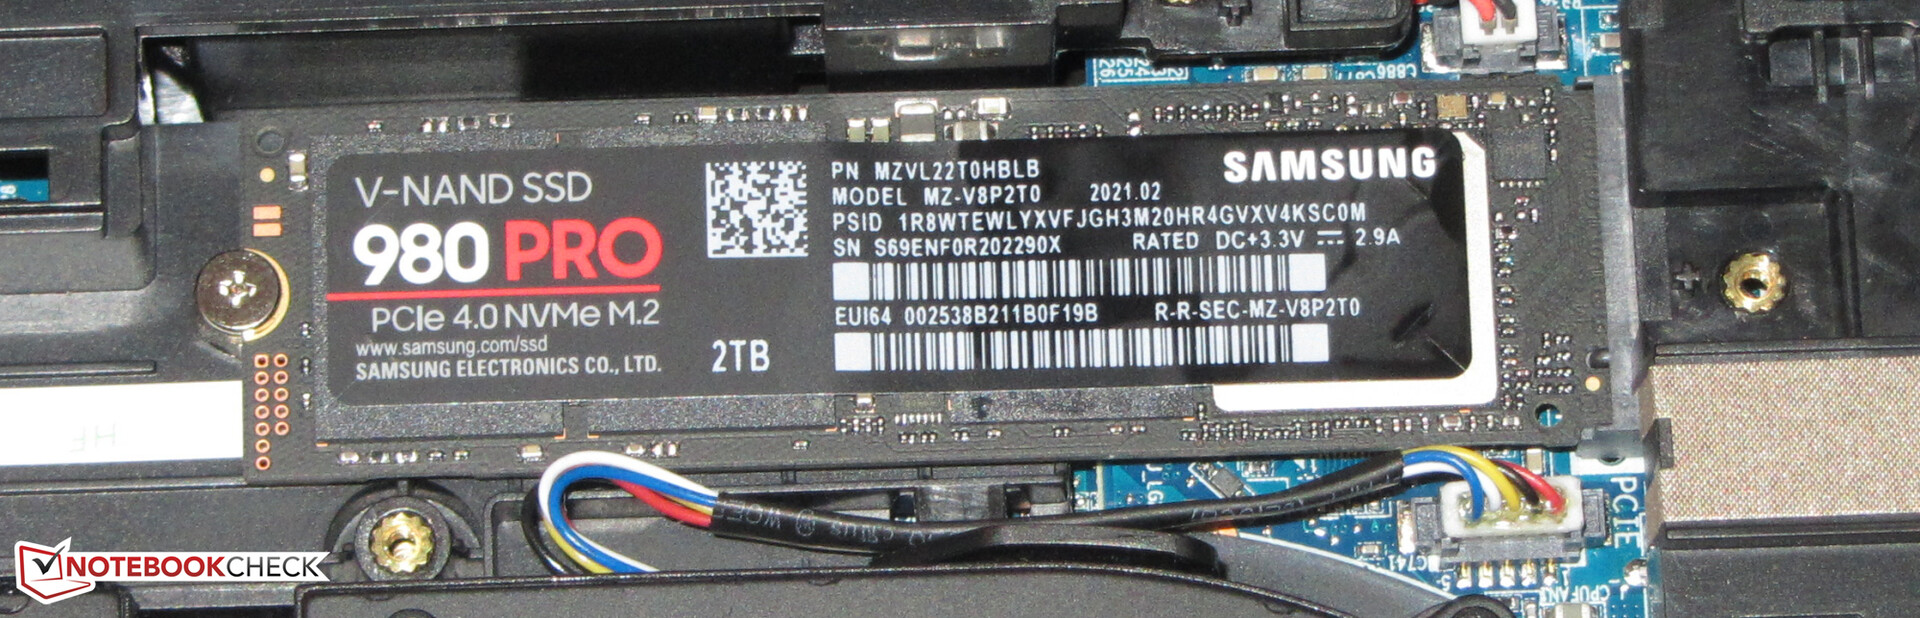
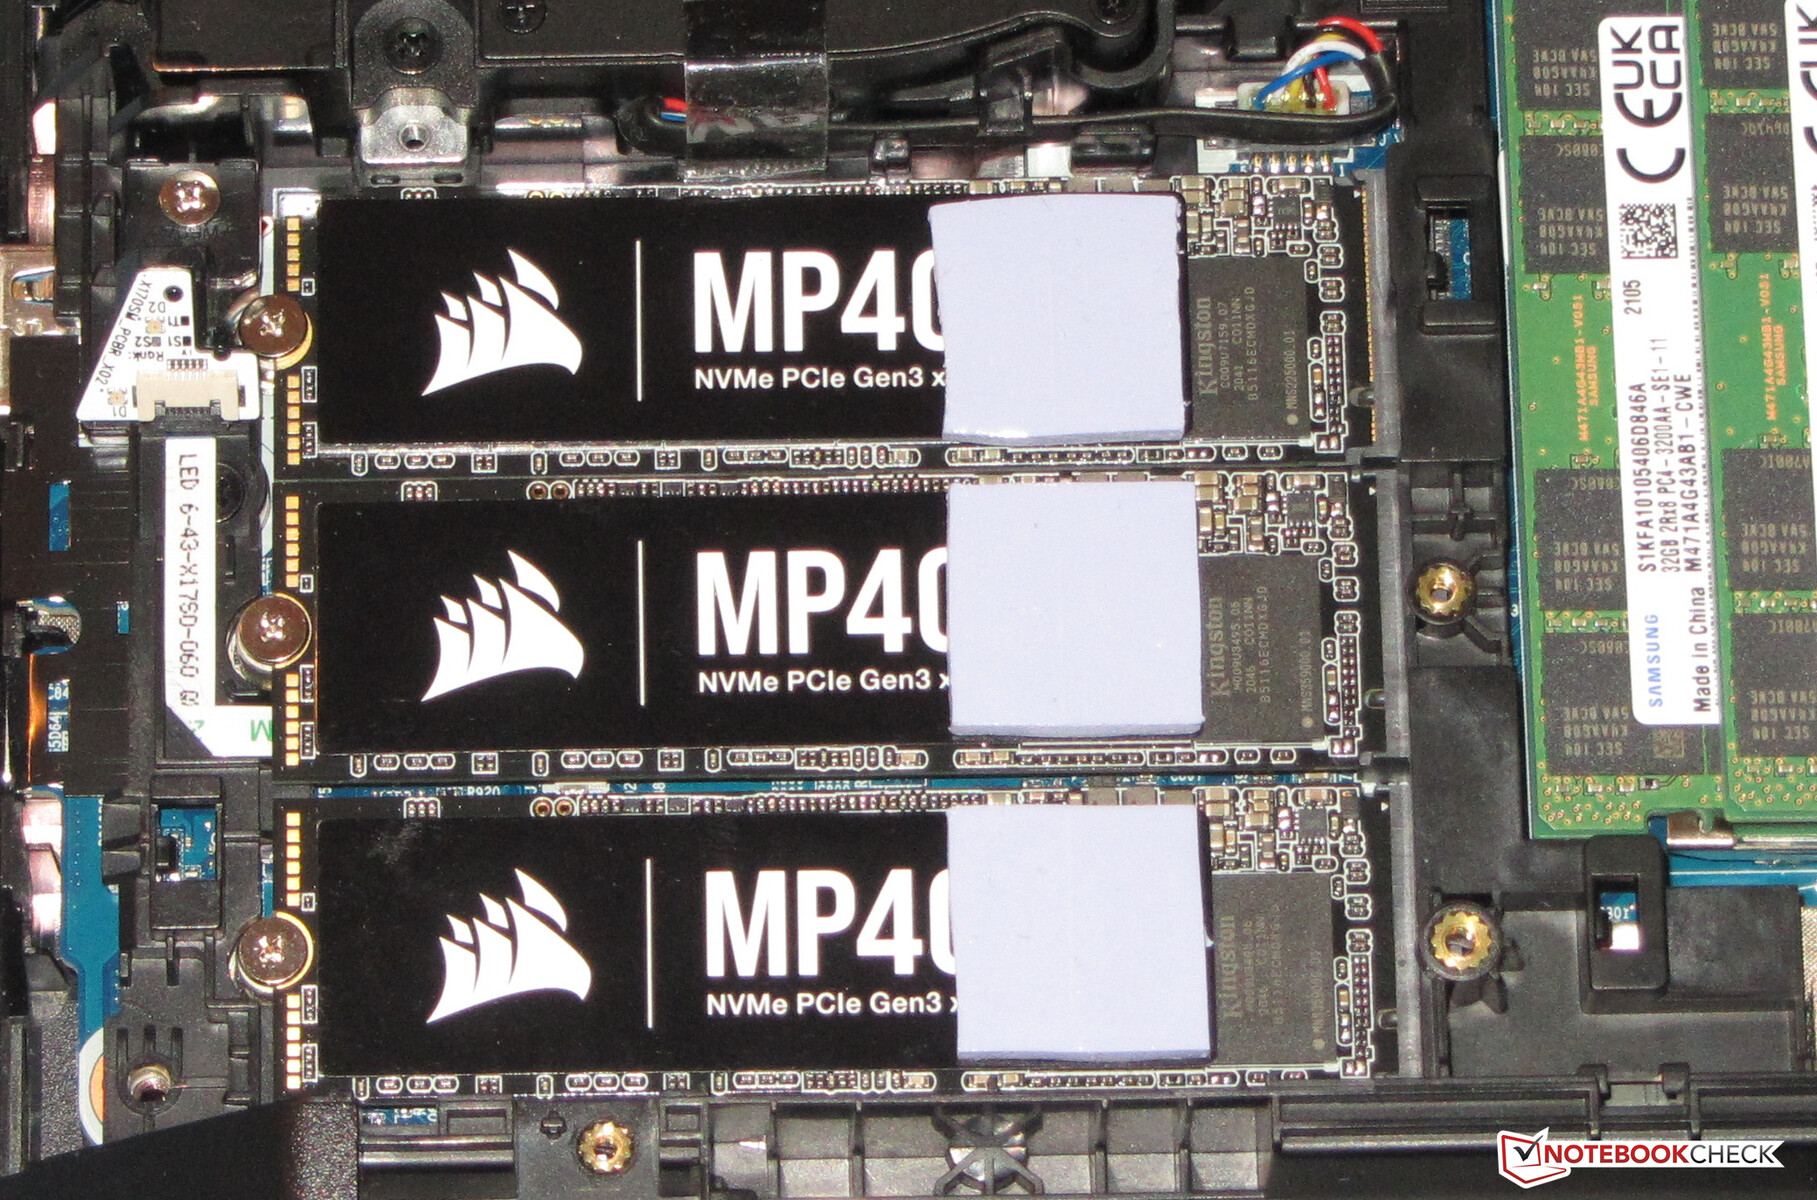
Un SSD NVMe (M.2-2280) de Samsung sirve como unidad del sistema. Proporciona 2 TB de espacio de almacenamiento y ofrece excelentes tasas de transferencia gracias a la conexión PCI Express 4. El portátil tiene tres ranuras M.2-2280 adicionales que pueden equiparse con SSD NVMe (conexión mediante PCI Express 3.0). Dos de las tres ranuras pueden alojar alternativamente discos SSD SATA. Se admite RAID 0/1/5

| Schenker XMG Ultra 17 Rocket Lake Samsung SSD 980 Pro 2TB MZ-V8P2T0 | MSI GT76 Titan DT 10SGS 2x WDC PC SN730 SDBPNTY-1T00 (RAID 0) | Asus Strix Scar 17 G732LXS 2x Intel SSD 660p 1TB SSDPEKNW010T8 (RAID 0) | Schenker XMG Ultra 17 Comet Lake Samsung SSD 970 EVO Plus 2TB | Alienware m17 R4 2x Micron 2300 512 GB (RAID 0) | |
|---|---|---|---|---|---|
| CrystalDiskMark 5.2 / 6 | -42% | -48% | -35% | -42% | |
| Write 4K (MB/s) | 240 | 116.4 -51% | 125.8 -48% | 172 -28% | 93.1 -61% |
| Read 4K (MB/s) | 87.8 | 43.85 -50% | 52.9 -40% | 47.3 -46% | 46.79 -47% |
| Write Seq (MB/s) | 4281 | 2927 -32% | 1795 -58% | 2980 -30% | 2853 -33% |
| Read Seq (MB/s) | 4228 | 1997 -53% | 2315 -45% | 2790 -34% | 2556 -40% |
| Write 4K Q32T1 (MB/s) | 696 | 467.6 -33% | 407.1 -42% | 481.8 -31% | 475 -32% |
| Read 4K Q32T1 (MB/s) | 778 | 538 -31% | 411.9 -47% | 565 -27% | 529 -32% |
| Write Seq Q32T1 (MB/s) | 5195 | 3362 -35% | 2844 -45% | 3295 -37% | 3331 -36% |
| Read Seq Q32T1 (MB/s) | 7099 | 3558 -50% | 3130 -56% | 3550 -50% | 3319 -53% |
| AS SSD | -52% | -54% | -16% | -53% | |
| Seq Read (MB/s) | 5010 | 2406 -52% | 2450 -51% | 2980 -41% | 2733 -45% |
| Seq Write (MB/s) | 3974 | 2867 -28% | 1436 -64% | 2585 -35% | 2822 -29% |
| 4K Read (MB/s) | 51.9 | 41.51 -20% | 49.48 -5% | 52.7 2% | 45.04 -13% |
| 4K Write (MB/s) | 156.8 | 108.8 -31% | 119.4 -24% | 163.1 4% | 88.4 -44% |
| 4K-64 Read (MB/s) | 2611 | 1525 -42% | 1032 -60% | 1954 -25% | 1388 -47% |
| 4K-64 Write (MB/s) | 3859 | 1424 -63% | 1229 -68% | 2347 -39% | 1227 -68% |
| Access Time Read * (ms) | 0.072 | 0.041 43% | 0.145 -101% | 0.039 46% | 0.079 -10% |
| Access Time Write * (ms) | 0.026 | 0.102 -292% | 0.036 -38% | 0.023 12% | 0.095 -265% |
| Score Read (Points) | 3164 | 1807 -43% | 1327 -58% | 2304 -27% | 1706 -46% |
| Score Write (Points) | 4414 | 1819 -59% | 1492 -66% | 2768 -37% | 1598 -64% |
| Score Total (Points) | 9134 | 4573 -50% | 3456 -62% | 6232 -32% | 4184 -54% |
| Copy ISO MB/s (MB/s) | 3424 | 2605 -24% | 2414 -29% | ||
| Copy Program MB/s (MB/s) | 1091 | 651 -40% | 1030 -6% | ||
| Copy Game MB/s (MB/s) | 2365 | 1709 -28% | 1991 -16% | ||
| Media total (Programa/Opciones) | -47% /
-48% | -51% /
-51% | -26% /
-24% | -48% /
-49% |
* ... más pequeño es mejor
Continuous reading: DiskSpd Read Loop, Queue Depth 8
Tarjeta gráfica
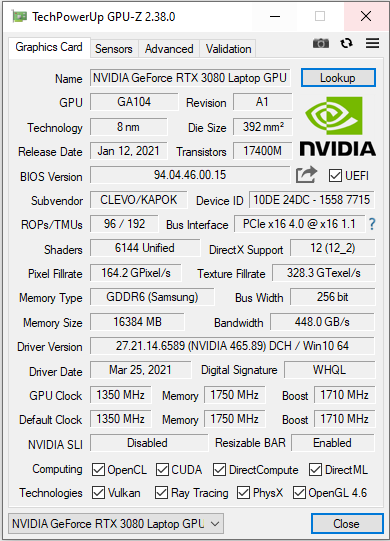
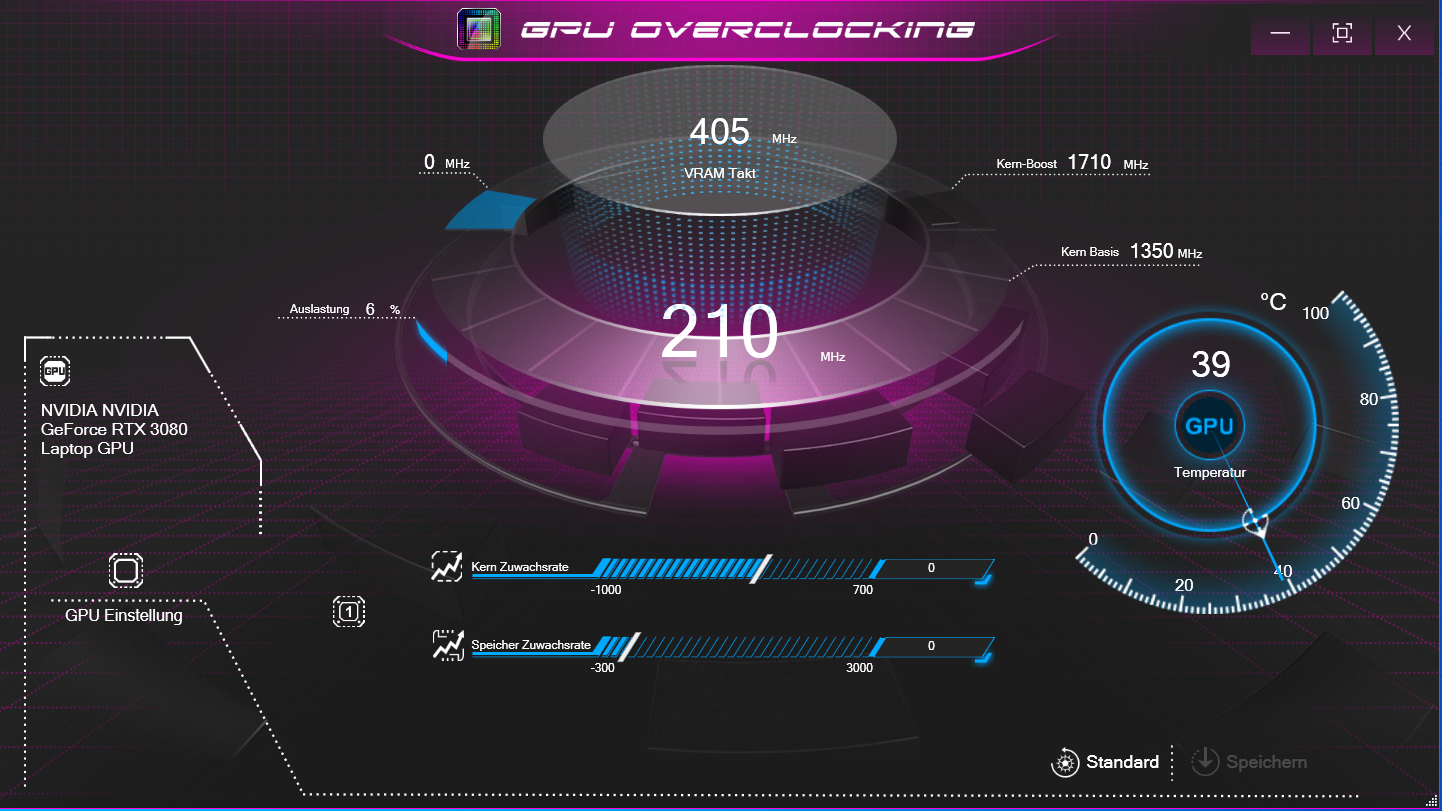
El GeForce RTX-3080 para portátilesrepresenta la GPU para portátiles máspotente de Nvidia en la actualidad. Puede utilizar la rápida memoria gráfica GDDR6 (16.384 MB). La GPU y la memoria no están soldadas permanentemente a la placa base, sino que se encuentran en una tarjeta enchufable MXM. Es posible intercambiar la tarjeta. El procesador integrado UHD Graphics Xe-750-32EUs La GPU integrada en el procesador está desactivada de fábrica y el portátil no funciona con la solución gráfica conmutable Optimus de Nvidia.
Los fabricantes de portátiles pueden elegir el TGP y, por tanto, la máxima potencia de cálculo disponible de un núcleo gráfico RTX-3000 con bastante libertad dentro de los límites definidos por Nvidia (Resumen de todos los portátiles RTX-3080, incluidos los TGP) Schenkerelige el máximo de 165 vatios (150 vatios + 15 vatios de Dynamic Boost). Como resultado, el Ultra 17rinde muy bien en las pruebas de GPU y juegos.
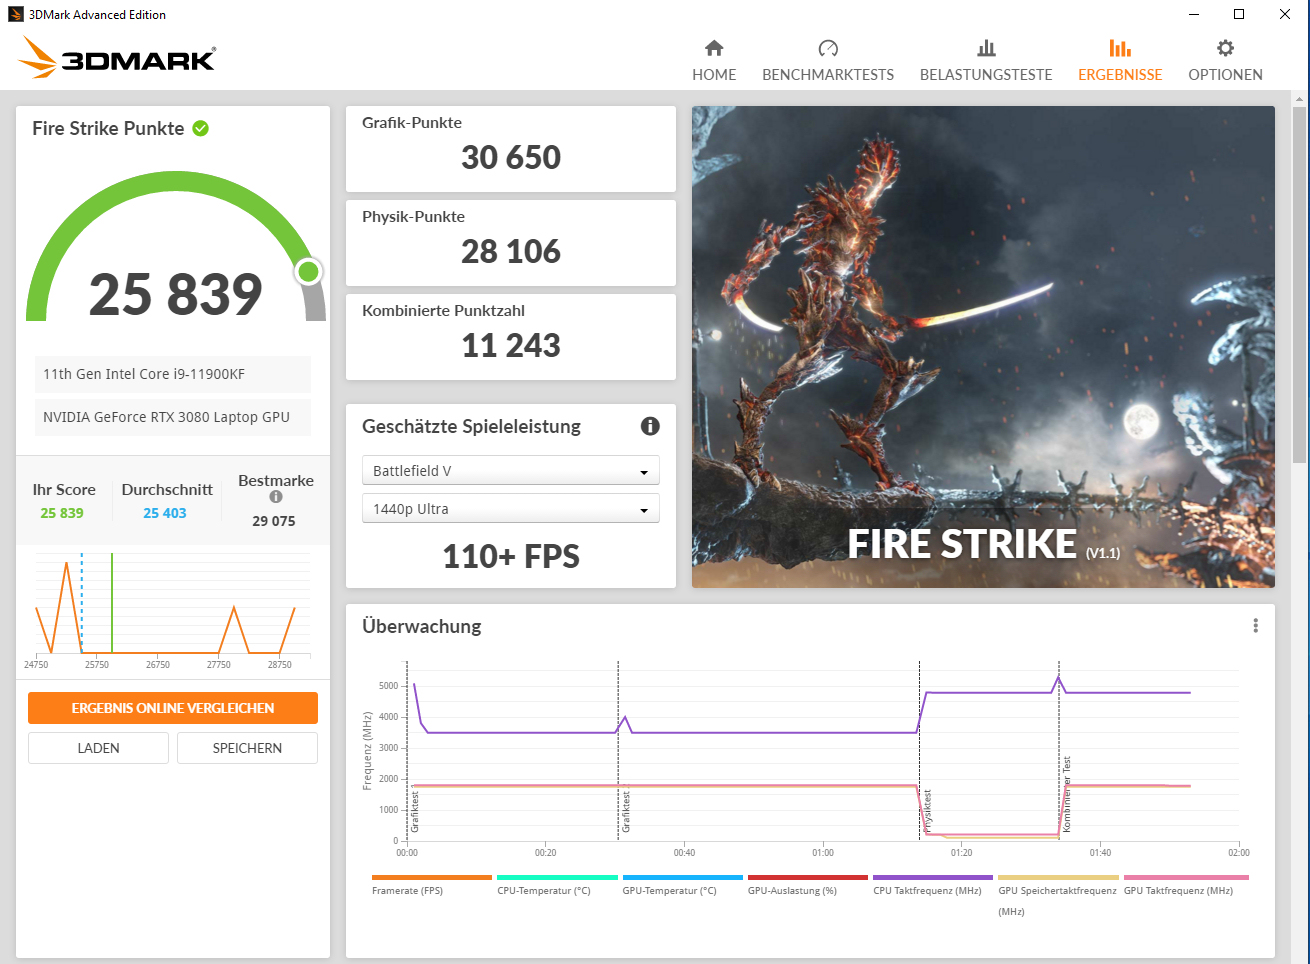
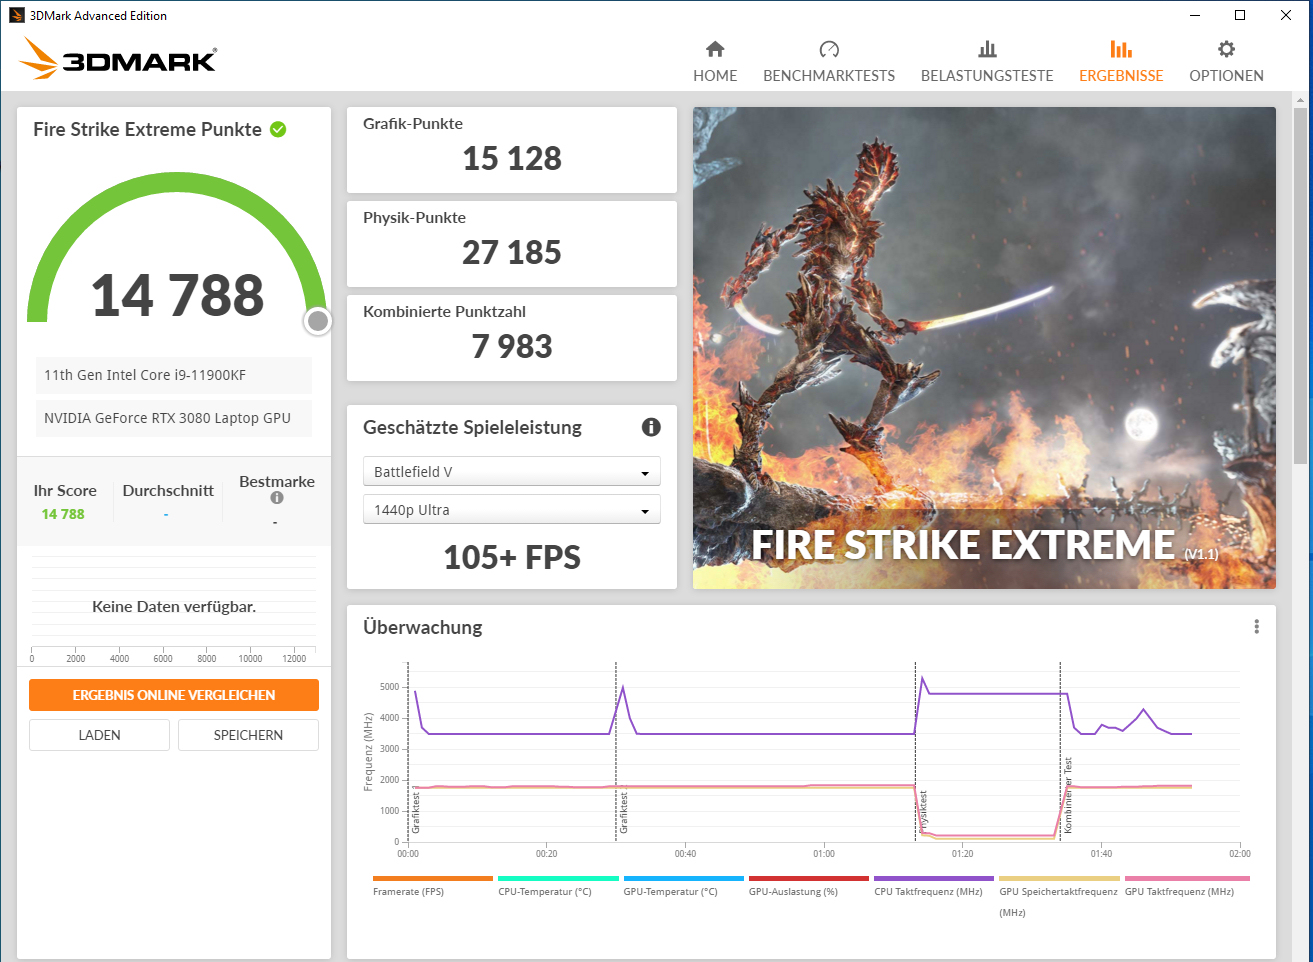
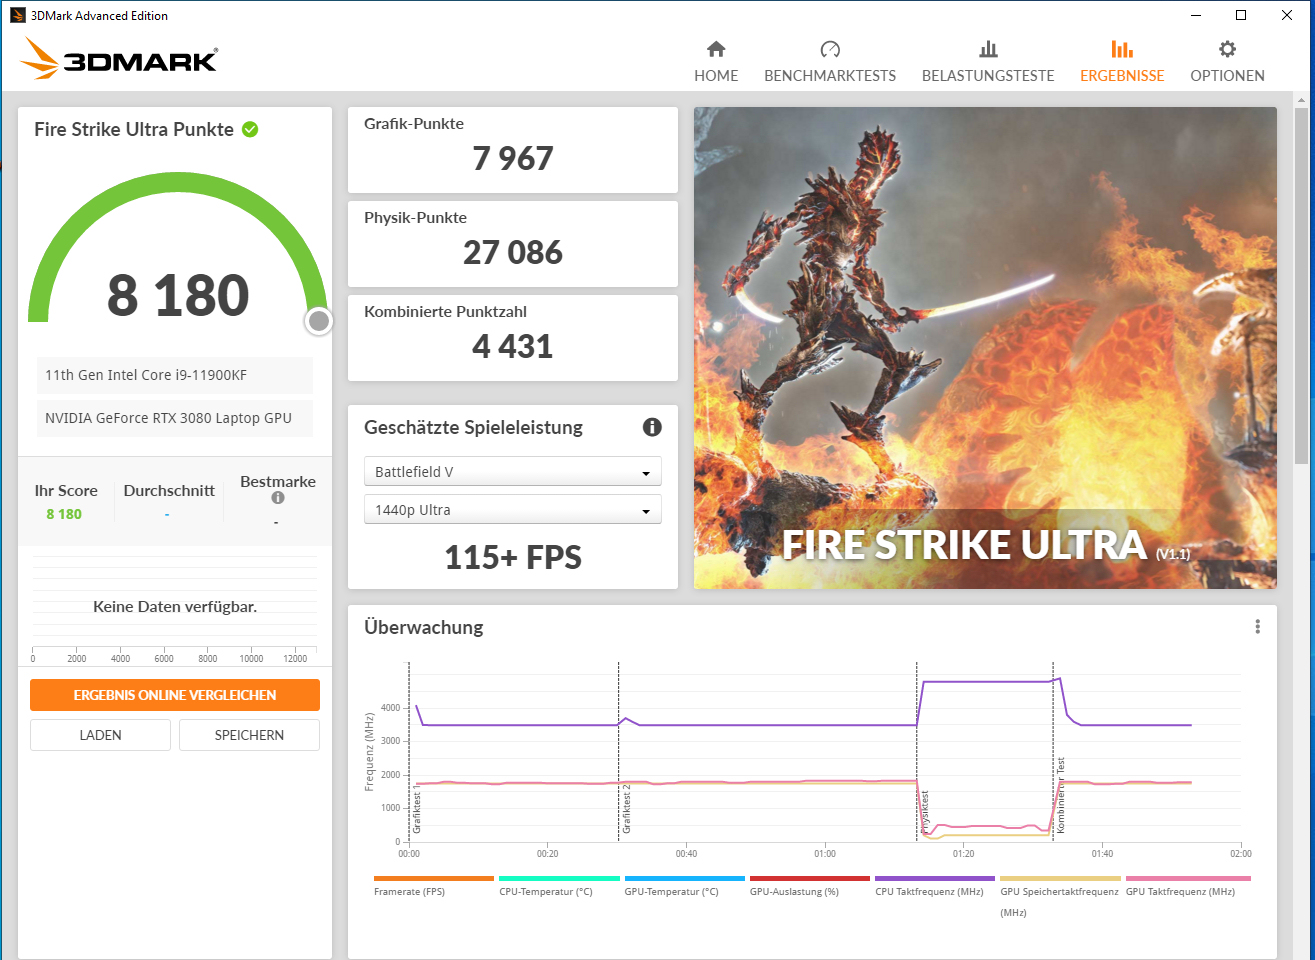
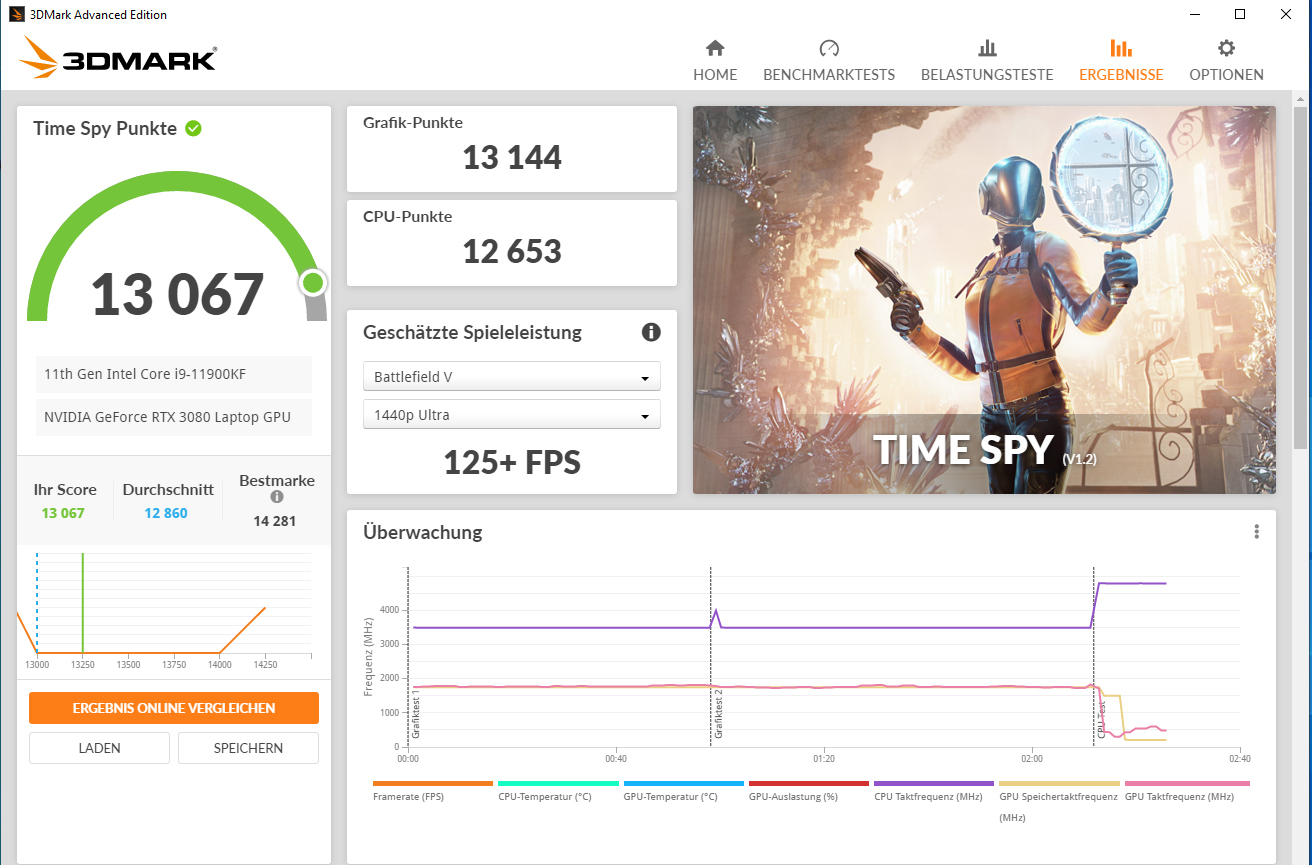
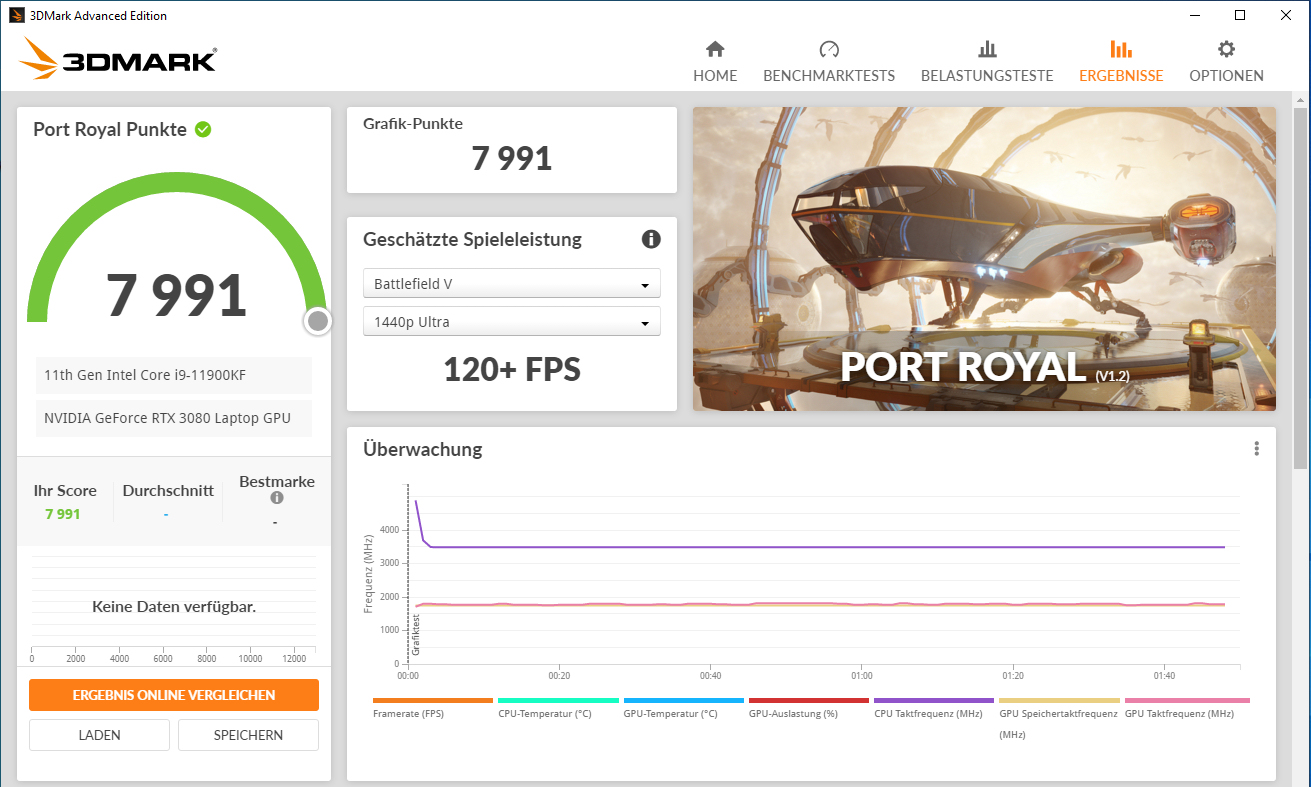
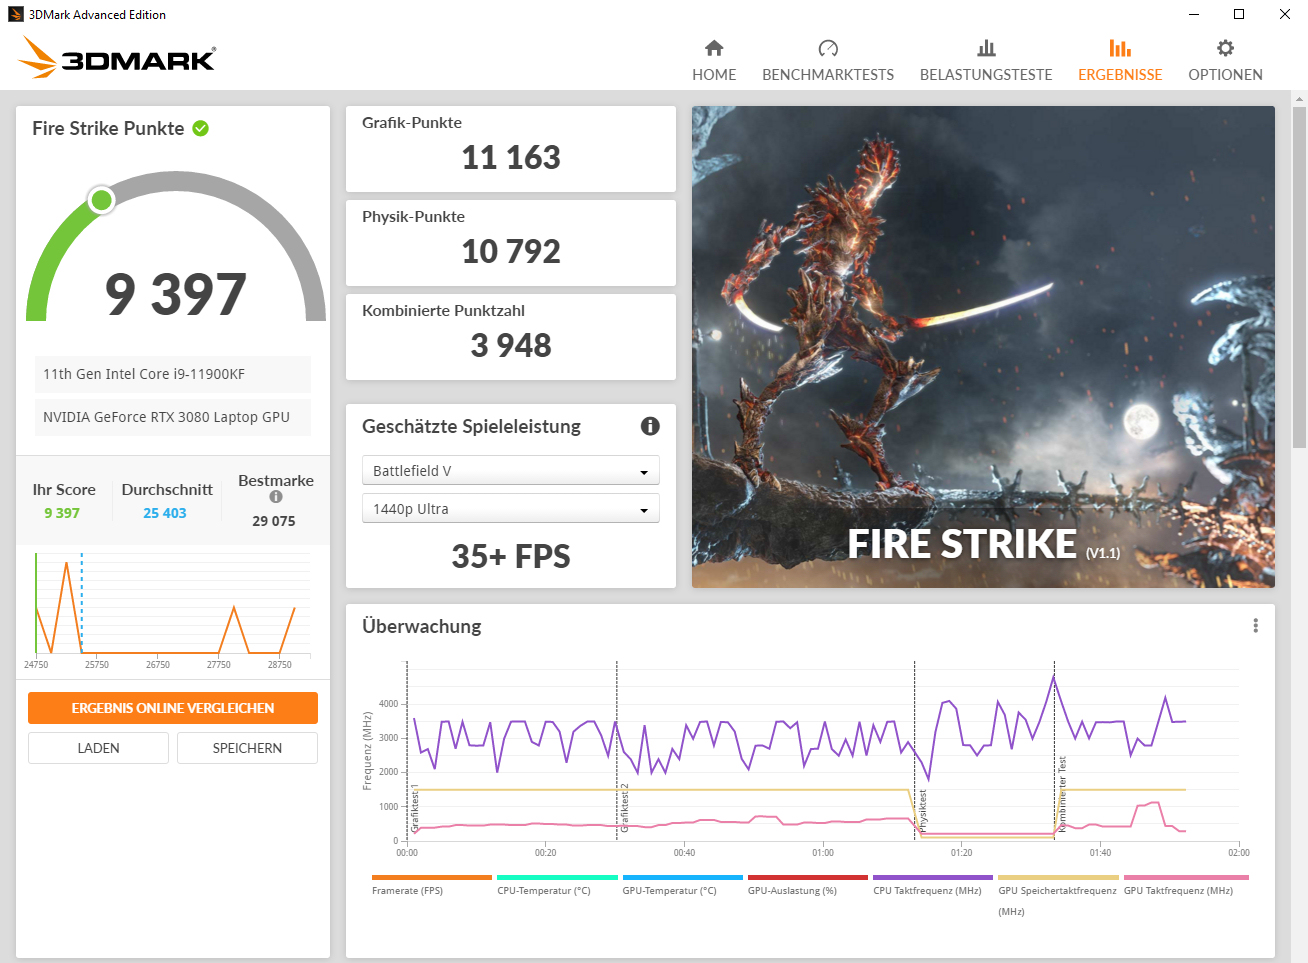
| 3DMark 11 Performance | 32922 puntos | |
| 3DMark Cloud Gate Standard Score | 65479 puntos | |
| 3DMark Fire Strike Score | 25839 puntos | |
| 3DMark Fire Strike Extreme Score | 14788 puntos | |
| 3DMark Time Spy Score | 13067 puntos | |
ayuda | ||
| 3DMark 11 - 1280x720 Performance GPU | |
| Media de la clase Gaming (21841 - 80022, n=103, últimos 2 años) | |
| Alienware m17 R4 | |
| Schenker XMG Ultra 17 Rocket Lake | |
| Medio NVIDIA GeForce RTX 3080 Laptop GPU (31288 - 43744, n=40) | |
| Razer Blade Pro 17 2021 (QHD Touch) | |
| Schenker XMG Ultra 17 Comet Lake | |
| Alienware m17 R3 P45E | |
| MSI GT76 Titan DT 10SGS | |
| Asus Strix Scar 17 G732LXS | |
Rendimiento de los juegos
El ordenador lleva a la pantalla todos los juegos actuales sin problemas. Normalmente, se puede seleccionar la resolución FHD y los ajustes de máxima calidad. Las resoluciones más altas (para ello habría que conectar un monitor correspondiente) también son gestionadas por la GPU
| The Witcher 3 - 1920x1080 Ultra Graphics & Postprocessing (HBAO+) | |
| Media de la clase Gaming (104.7 - 240, n=7, últimos 2 años) | |
| Schenker XMG Ultra 17 Rocket Lake | |
| Alienware m17 R4 | |
| MSI GT76 Titan DT 10SGS | |
| Schenker XMG Ultra 17 Comet Lake | |
| Medio NVIDIA GeForce RTX 3080 Laptop GPU (85.1 - 123, n=40) | |
| Asus Strix Scar 17 G732LXS | |
| Dota 2 Reborn - 1920x1080 ultra (3/3) best looking | |
| Schenker XMG Ultra 17 Comet Lake | |
| Schenker XMG Ultra 17 Rocket Lake | |
| Media de la clase Gaming (84.8 - 252, n=104, últimos 2 años) | |
| MSI GT76 Titan DT 10SGS | |
| Asus Strix Scar 17 G732LXS | |
| Alienware m17 R4 | |
| Medio NVIDIA GeForce RTX 3080 Laptop GPU (98 - 156, n=45) | |
| X-Plane 11.11 - 1920x1080 high (fps_test=3) | |
| Schenker XMG Ultra 17 Rocket Lake | |
| Schenker XMG Ultra 17 Comet Lake | |
| Media de la clase Gaming (55.5 - 148.5, n=106, últimos 2 años) | |
| MSI GT76 Titan DT 10SGS | |
| Asus Strix Scar 17 G732LXS | |
| Alienware m17 R4 | |
| Medio NVIDIA GeForce RTX 3080 Laptop GPU (65.6 - 113, n=44) | |
| Far Cry 5 - 1920x1080 Ultra Preset AA:T | |
| Schenker XMG Ultra 17 Rocket Lake | |
| Alienware m17 R4 | |
| Media de la clase Gaming (70 - 151, n=6, últimos 2 años) | |
| Medio NVIDIA GeForce RTX 3080 Laptop GPU (75 - 146, n=33) | |
| Shadow of the Tomb Raider - 1920x1080 Highest Preset AA:T | |
| Schenker XMG Ultra 17 Rocket Lake | |
| Schenker XMG Ultra 17 Comet Lake | |
| Asus Strix Scar 17 G732LXS | |
| Medio NVIDIA GeForce RTX 3080 Laptop GPU (76.6 - 151, n=13) | |
| Media de la clase Gaming (96 - 116, n=2, últimos 2 años) | |
| Doom Eternal - 1920x1080 Ultra Preset | |
| Schenker XMG Ultra 17 Comet Lake | |
| Asus Strix Scar 17 G732LXS | |
| Schenker XMG Ultra 17 Rocket Lake | |
| Medio NVIDIA GeForce RTX 3080 Laptop GPU (163 - 190, n=4) | |
| Serious Sam 4 - 1920x1080 Ultra (DX12) AA:2xMS | |
| Schenker XMG Ultra 17 Rocket Lake | |
| Schenker XMG Ultra 17 Comet Lake | |
| Medio NVIDIA GeForce RTX 3080 Laptop GPU (72.6 - 107, n=5) | |
| Cyberpunk 2077 1.0 | |
| 1920x1080 Ultra Preset | |
| Schenker XMG Ultra 17 Rocket Lake | |
| Alienware m17 R4 | |
| Medio NVIDIA GeForce RTX 3080 Laptop GPU (52.9 - 84.3, n=9) | |
| 1920x1080 Ray Tracing Ultra Preset (DLSS off) | |
| Schenker XMG Ultra 17 Rocket Lake | |
| Alienware m17 R4 | |
| Medio NVIDIA GeForce RTX 3080 Laptop GPU (30.6 - 43.2, n=5) | |
| Watch Dogs Legion | |
| 1920x1080 Ultra Preset (DX12) | |
| Schenker XMG Ultra 17 Rocket Lake | |
| Medio NVIDIA GeForce RTX 3080 Laptop GPU (65 - 91.1, n=6) | |
| 1920x1080 Ultra Preset + Ultra Ray Tracing (DX12) | |
| Schenker XMG Ultra 17 Rocket Lake | |
| Medio NVIDIA GeForce RTX 3080 Laptop GPU (41 - 61, n=6) | |
| Hitman 3 - 1920x1080 Maximum Settings AF:16x | |
| Schenker XMG Ultra 17 Rocket Lake | |
| Medio NVIDIA GeForce RTX 3080 Laptop GPU (129.1 - 201, n=3) | |
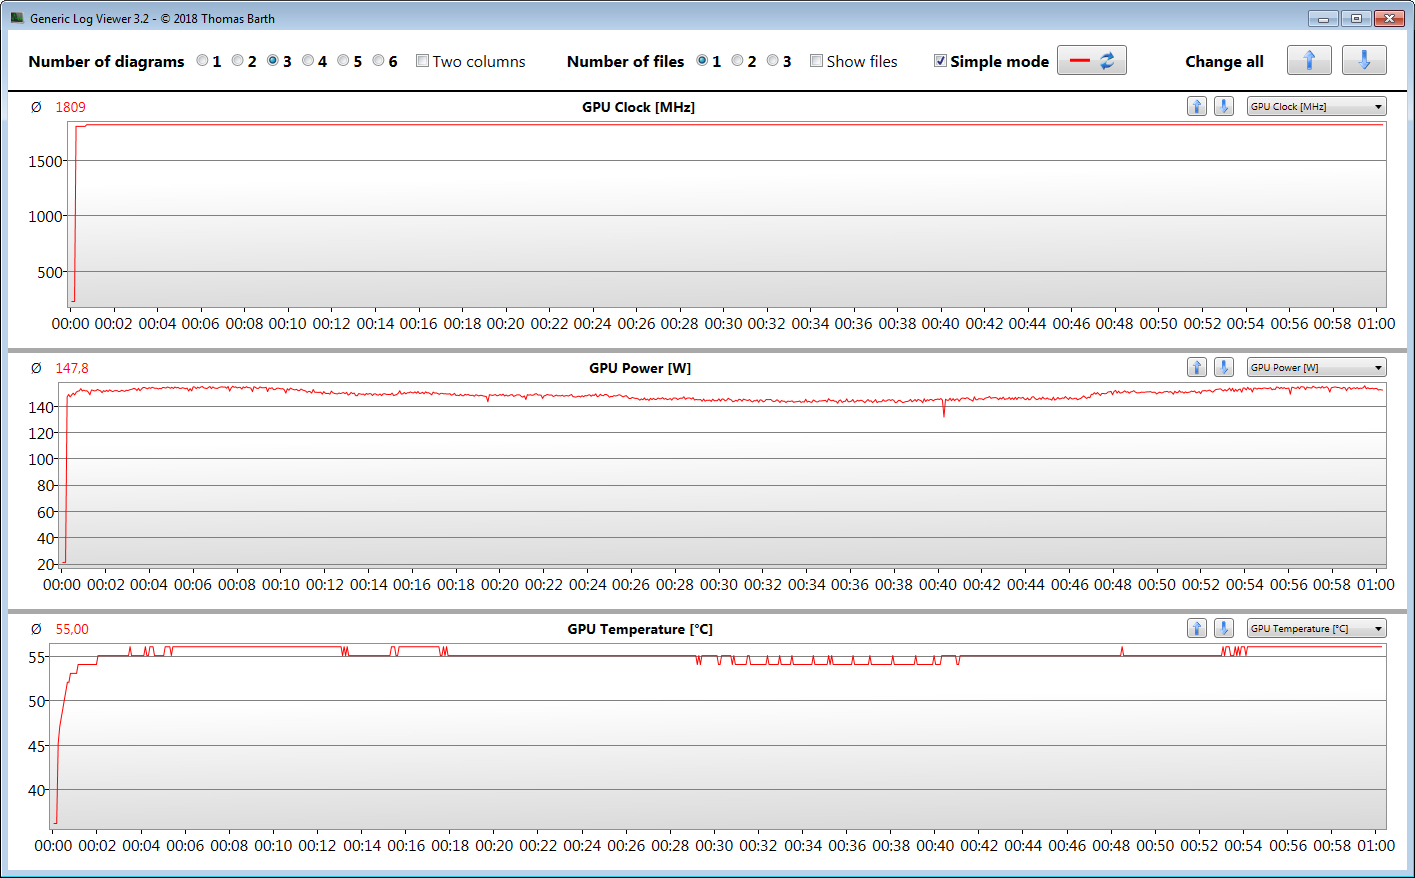
Para comprobar si la velocidad de fotogramas se mantiene prácticamente constante durante un periodo más largo, ejecutamos el juego"The Witcher 3" durante unos 60 minutos con resolución Full HD y ajustes de máxima calidad. El personaje del juego no se mueve. No se nota una caída de la velocidad de fotogramas
| bajo | medio | alto | ultra | |
|---|---|---|---|---|
| The Witcher 3 (2015) | 453 | 374 | 242 | 123 |
| Dota 2 Reborn (2015) | 183 | 170 | 161 | 156 |
| X-Plane 11.11 (2018) | 156 | 139 | 113 | |
| Far Cry 5 (2018) | 189 | 162 | 155 | 146 |
| Shadow of the Tomb Raider (2018) | 181 | 164 | 160 | 151 |
| Doom Eternal (2020) | 211 | 199 | 193 | 190 |
| Serious Sam 4 (2020) | 162 | 118 | 111 | 107 |
| Watch Dogs Legion (2020) | 127 | 123 | 110 | 91.1 |
| Dirt 5 (2020) | 110 | 97.1 | 93.3 | 92.4 |
| Immortals Fenyx Rising (2020) | 172 | 125 | 116 | 108 |
| Cyberpunk 2077 1.0 (2020) | 147 | 116 | 96.1 | 84.3 |
| Hitman 3 (2021) | 255.1 | 216.6 | 207.7 | 200.5 |
Emisiones - El ordenador Schenker puede ser muy ruidoso
Emisiones acústicas
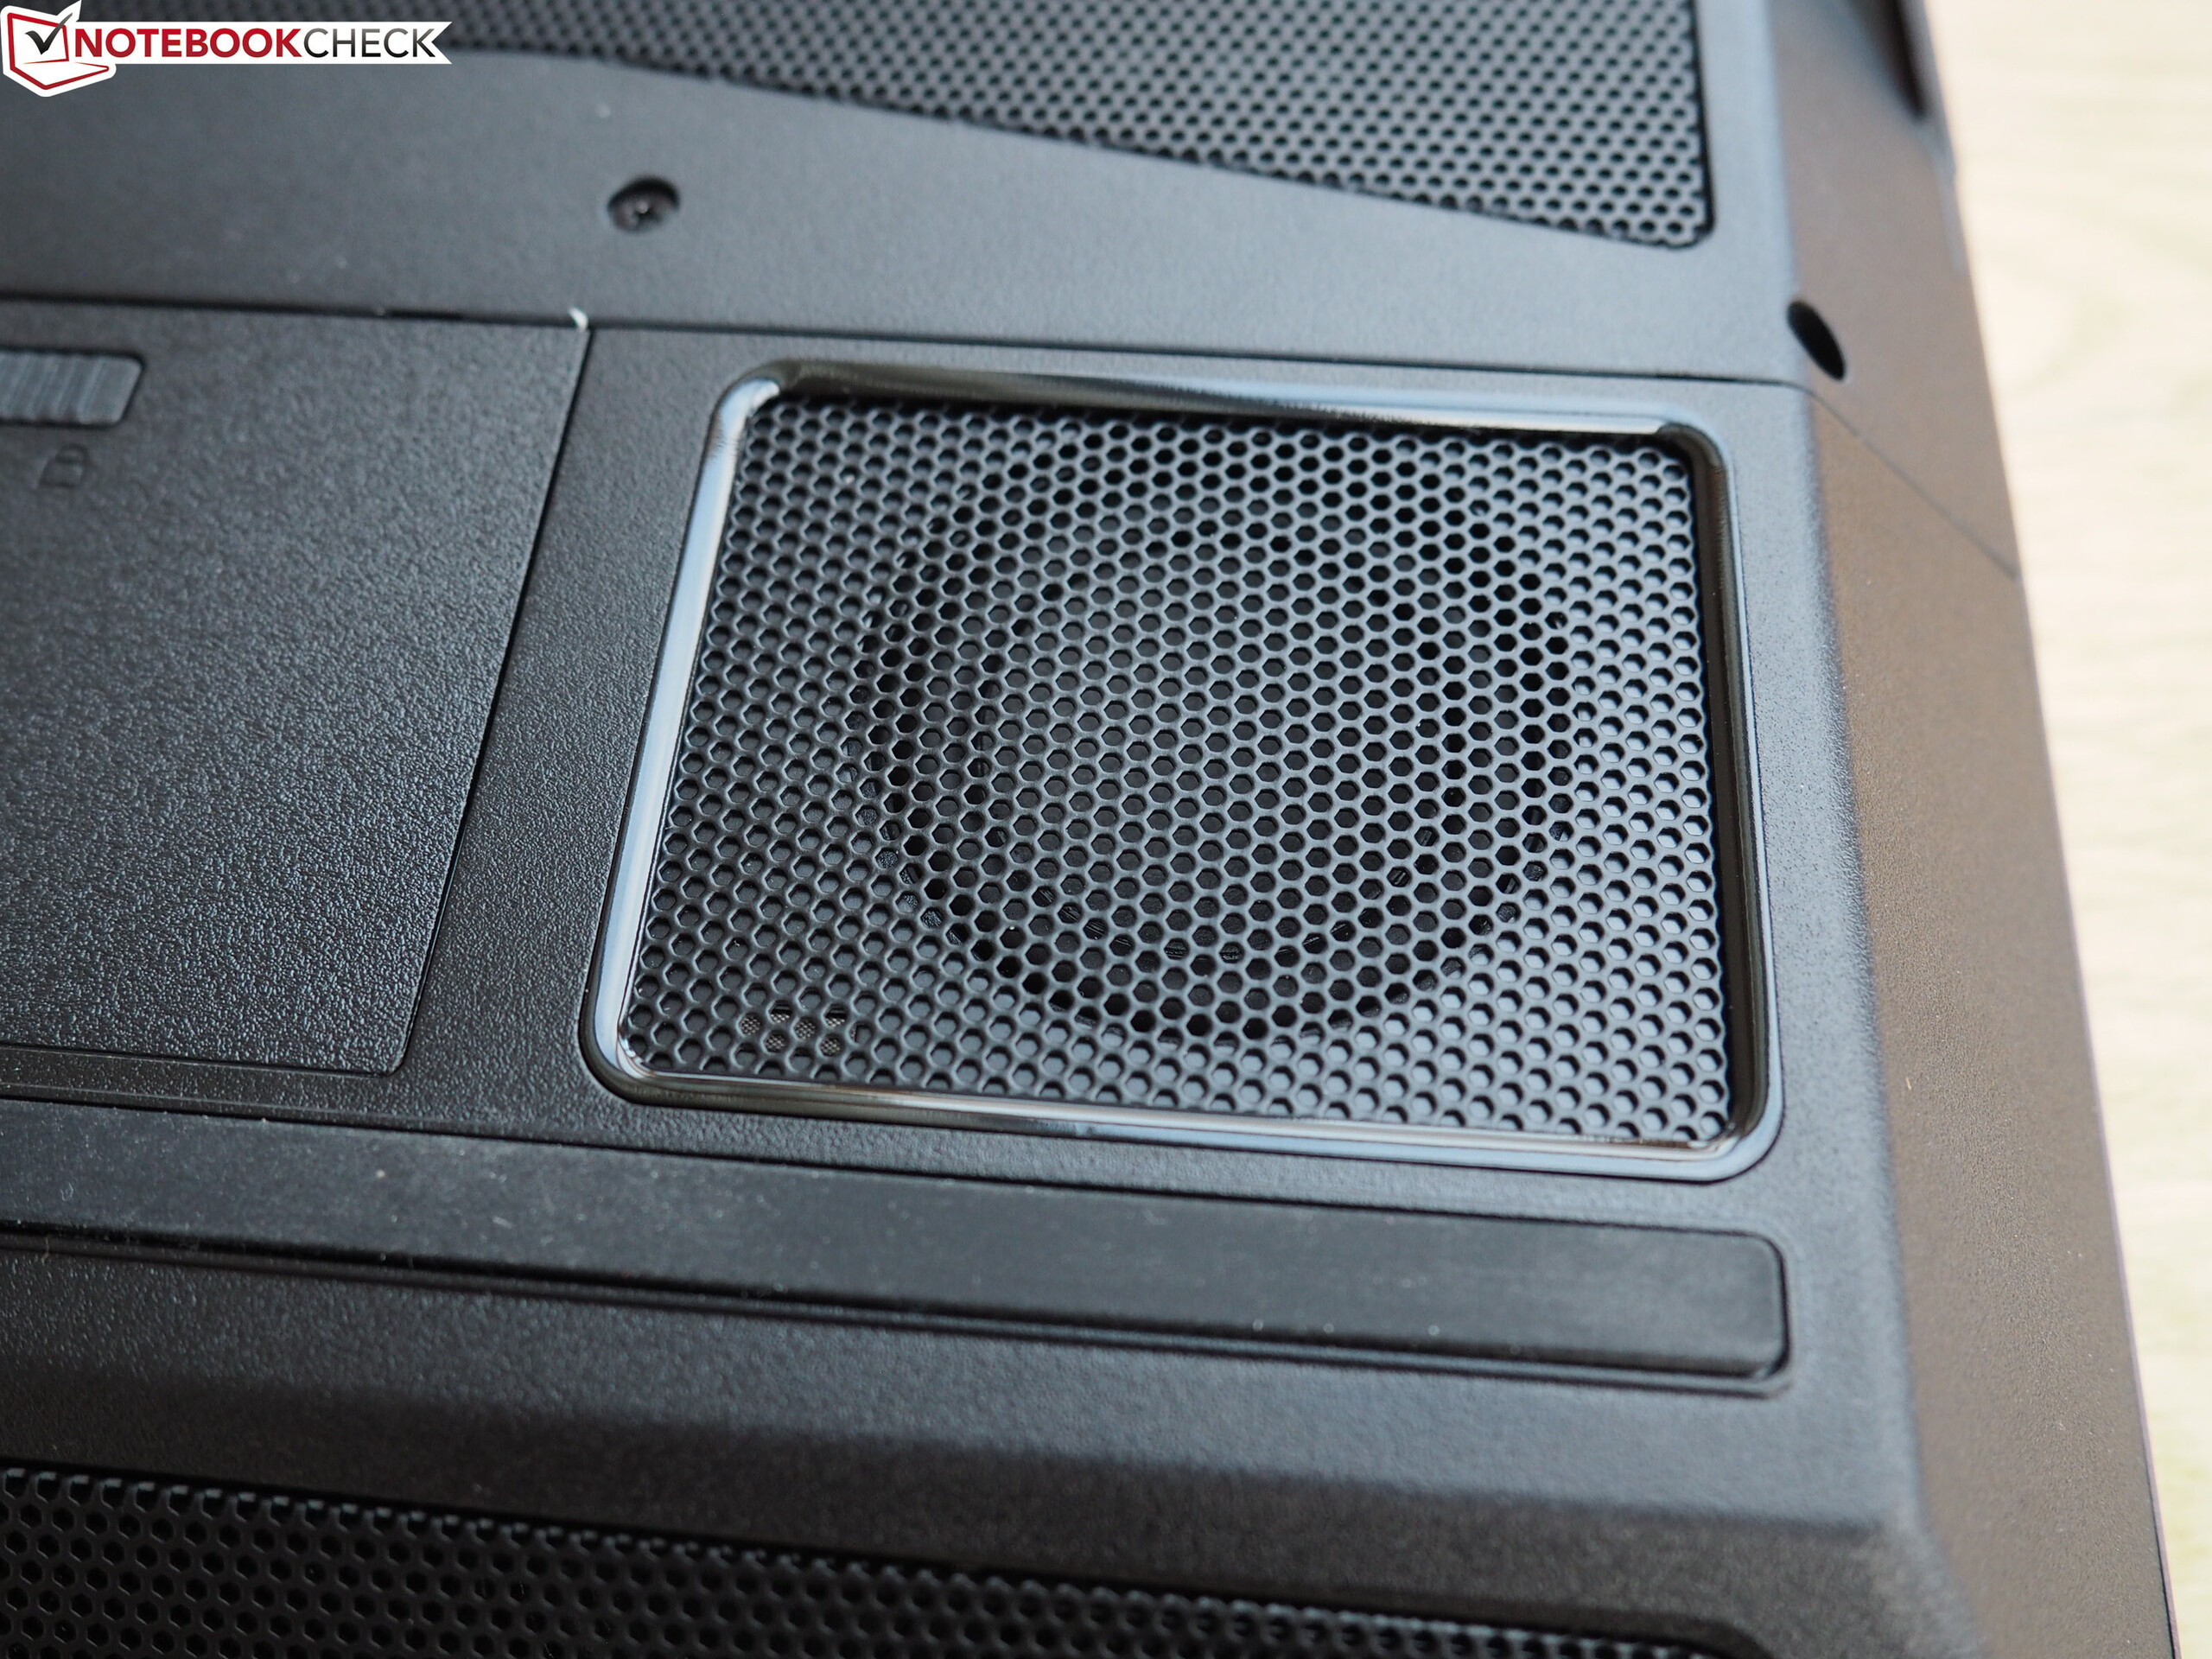
Al ralentí y con poca carga, los ventiladores suelen ser silenciosos y apenas audibles. Sin embargo, de vez en cuando, también se aceleran con fuerza durante un breve periodo de tiempo en ralentí, alcanzando un nivel de ruido que es casi el mismo que a plena carga. En otras palabras: Es muy ruidoso. Con niveles máximos de presión sonora de 63 dB(A) (prueba de esfuerzo) y 61 dB(A) (Witcher 3 prueba), apenas se puede evitar el uso de auriculares. Los perfiles energéticos "Modo silencioso" y "Modo de ahorro de energía" reducen el desarrollo del ruido, pero a costa de la potencia de cálculo.
Ruido
| Ocioso |
| 30 / 31 / 57 dB(A) |
| Carga |
| 63 / 63 dB(A) |
 | ||
30 dB silencioso 40 dB(A) audible 50 dB(A) ruidosamente alto |
||
min: | ||
| Schenker XMG Ultra 17 Rocket Lake i9-11900K, GeForce RTX 3080 Laptop GPU | MSI GT76 Titan DT 10SGS i9-10900K, GeForce RTX 2080 Super Mobile | Asus Strix Scar 17 G732LXS i9-10980HK, GeForce RTX 2080 Super Mobile | Schenker XMG Ultra 17 Comet Lake i9-10900K, GeForce RTX 2080 Super Mobile | Alienware m17 R4 i9-10980HK, GeForce RTX 3080 Laptop GPU | Media de la clase Gaming | |
|---|---|---|---|---|---|---|
| Noise | 15% | 4% | 4% | 21% | 20% | |
| apagado / medio ambiente * (dB) | 24 | 26.4 -10% | 25 -4% | 25 -4% | 24 -0% | 24.1 ? -0% |
| Idle Minimum * (dB) | 30 | 27.5 8% | 33 -10% | 27 10% | 24 20% | 25.9 ? 14% |
| Idle Average * (dB) | 31 | 27.5 11% | 38 -23% | 32 -3% | 25 19% | 27.4 ? 12% |
| Idle Maximum * (dB) | 57 | 29.8 48% | 45 21% | 57 -0% | 36 37% | 30.1 ? 47% |
| Load Average * (dB) | 63 | 30.9 51% | 54 14% | 56 11% | 45 29% | 43.7 ? 31% |
| Witcher 3 ultra * (dB) | 61 | 60.7 -0% | 50 18% | 55 10% | 47 23% | |
| Load Maximum * (dB) | 63 | 66.6 -6% | 55 13% | 62 2% | 50 21% | 54.3 ? 14% |
* ... más pequeño es mejor
Temperatura
En nuestra prueba de estrés (Prime95 y FurMark se ejecutan durante al menos una hora), la CPU y la GPU funcionan a 3,4 GHz y 1.725 MHz, respectivamente. La prueba de estrés es un escenario extremo que no se da en el uso diario. Utilizamos esta prueba para comprobar si el sistema funciona de forma estable incluso a plena carga
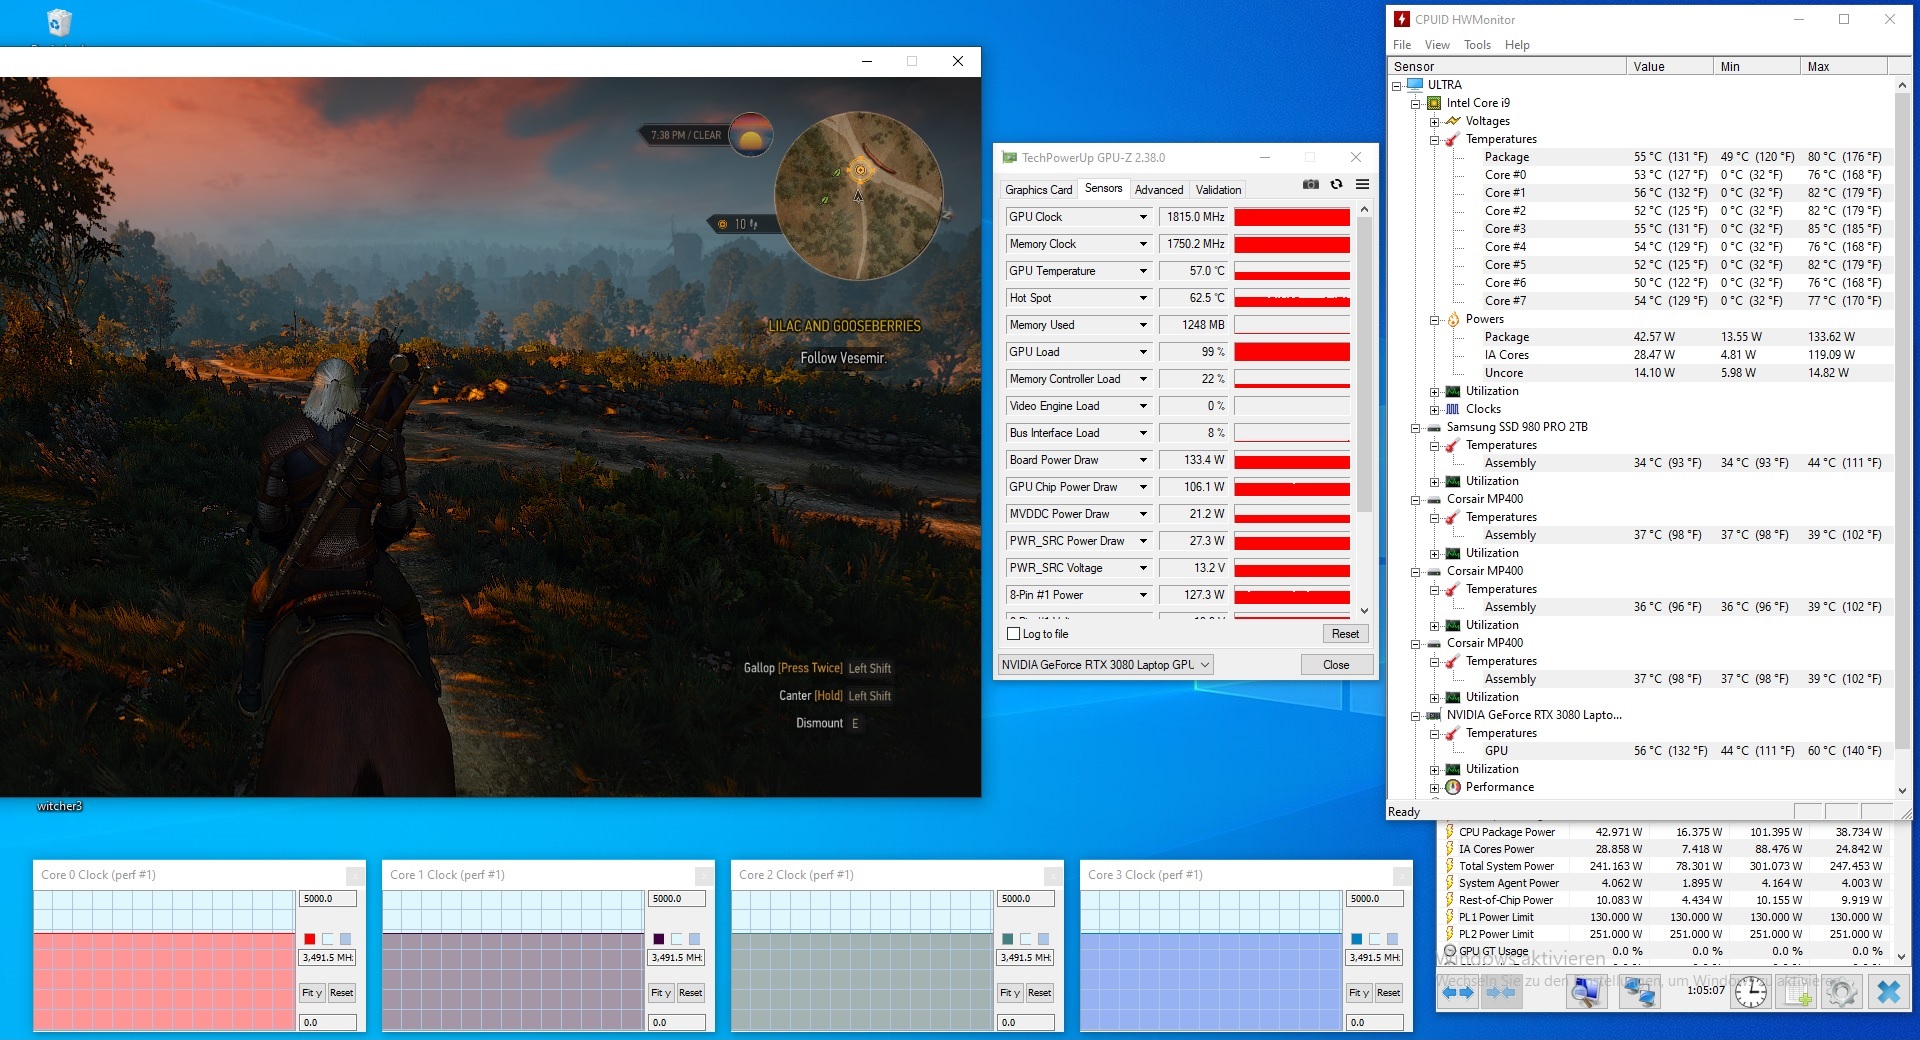
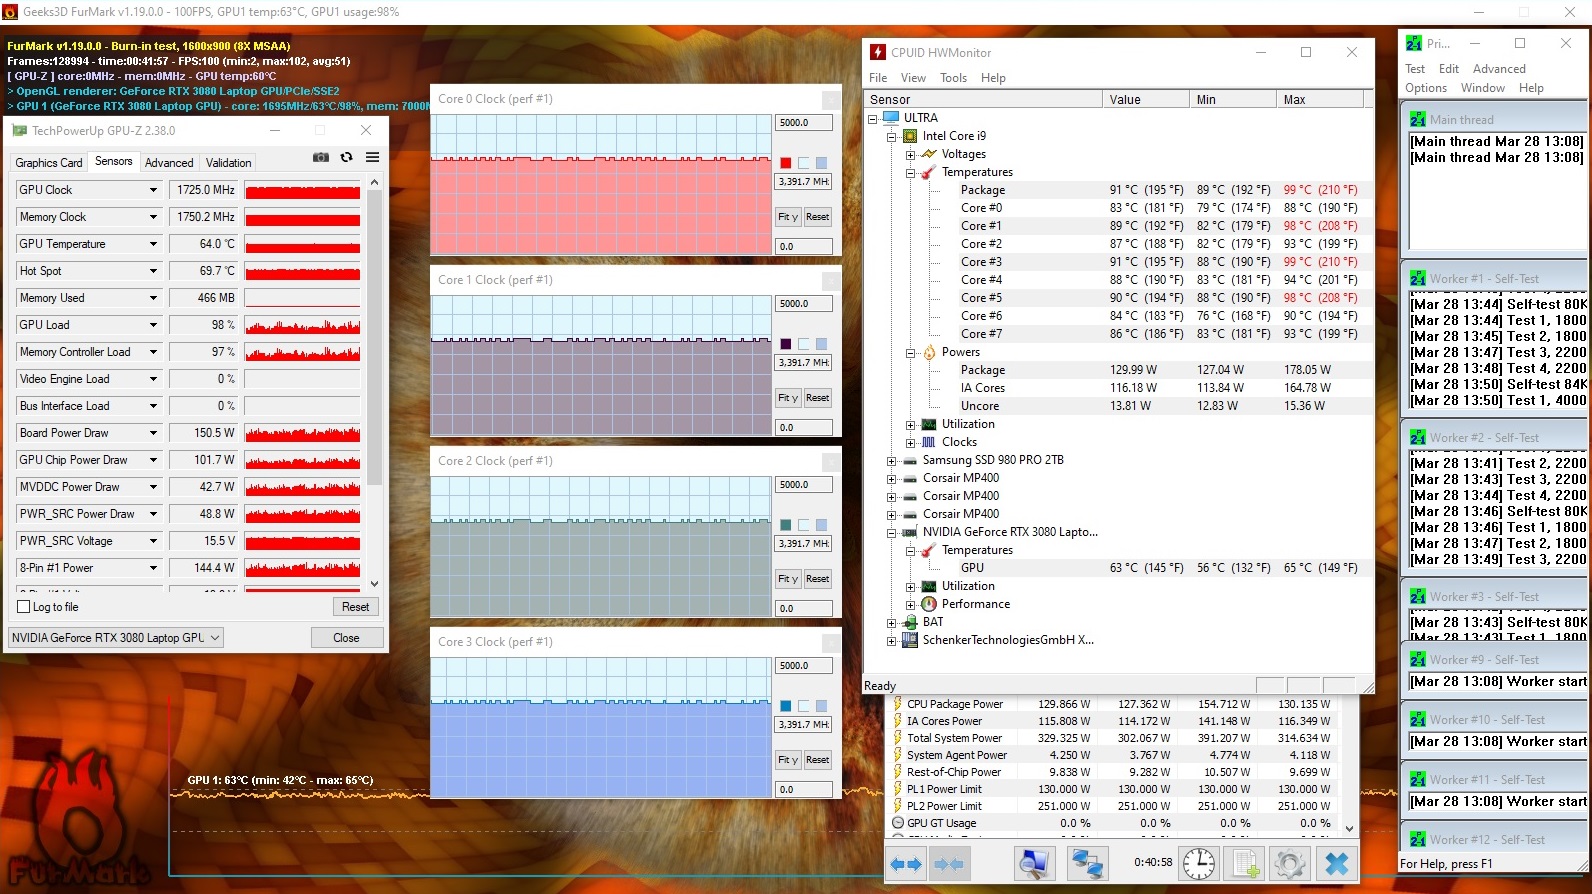
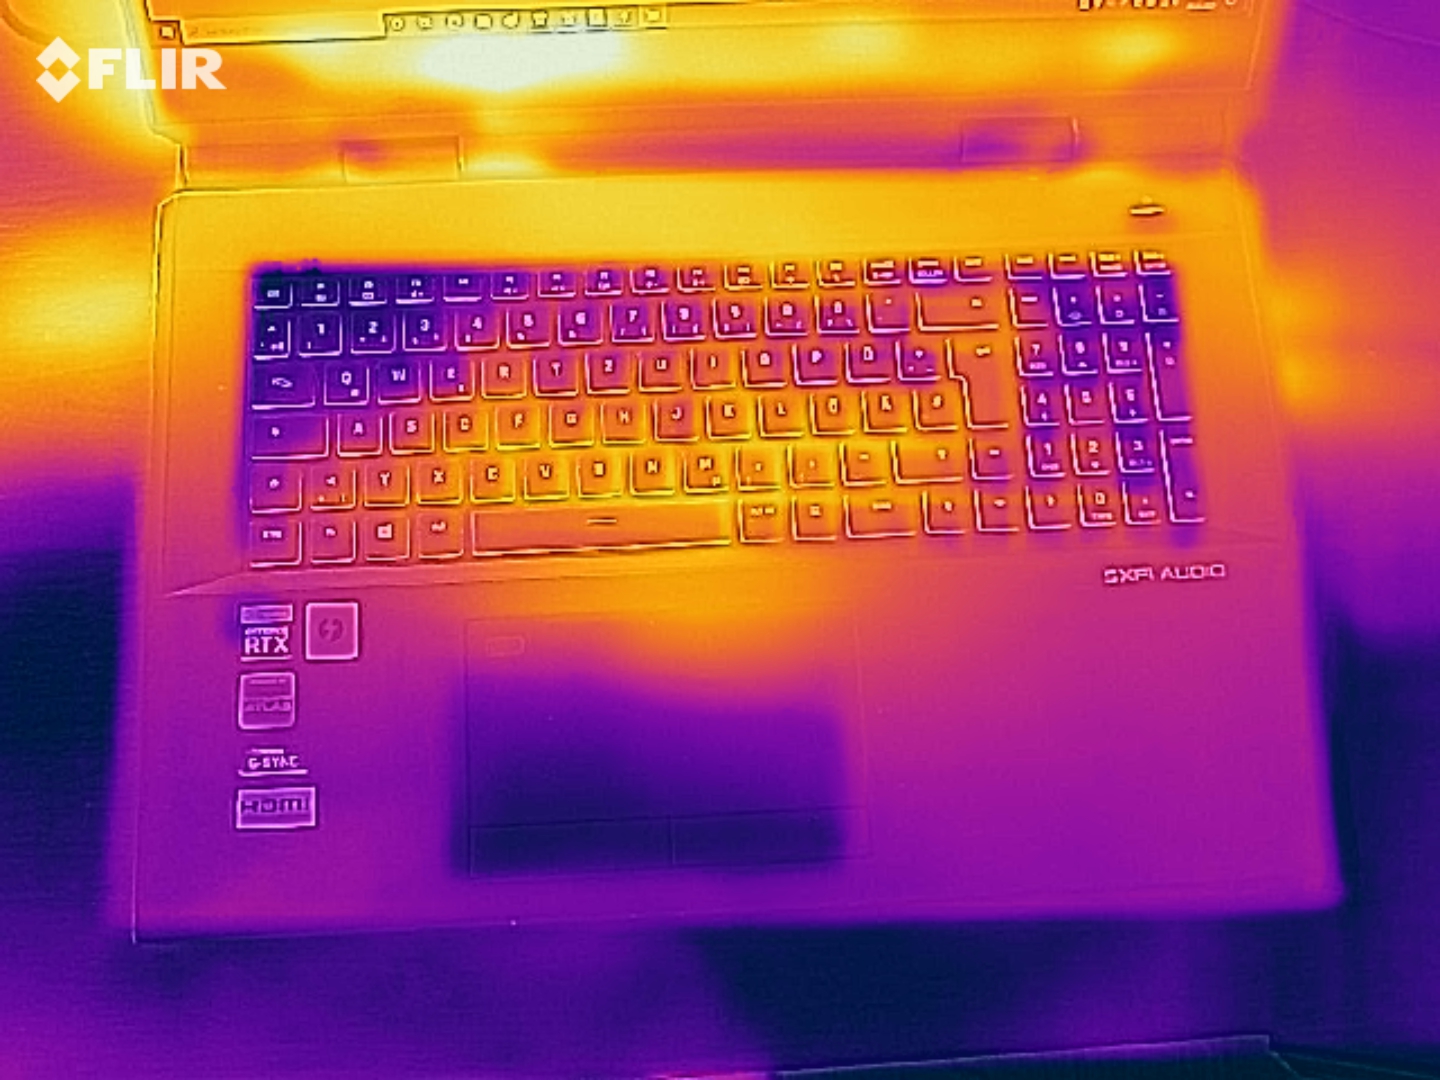
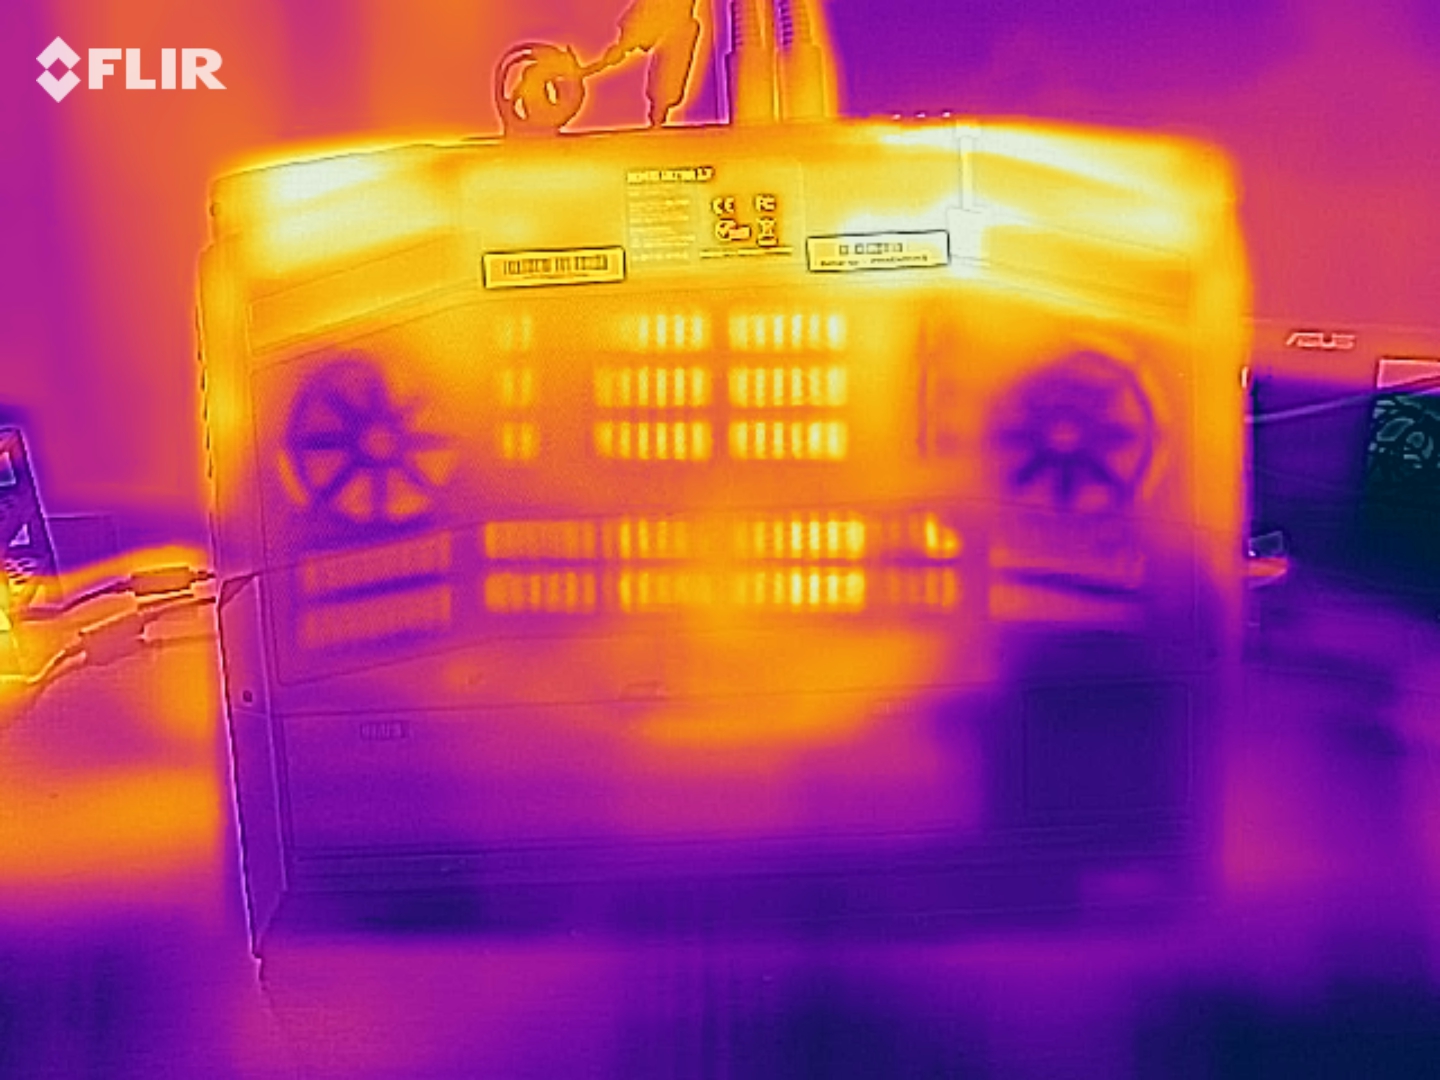
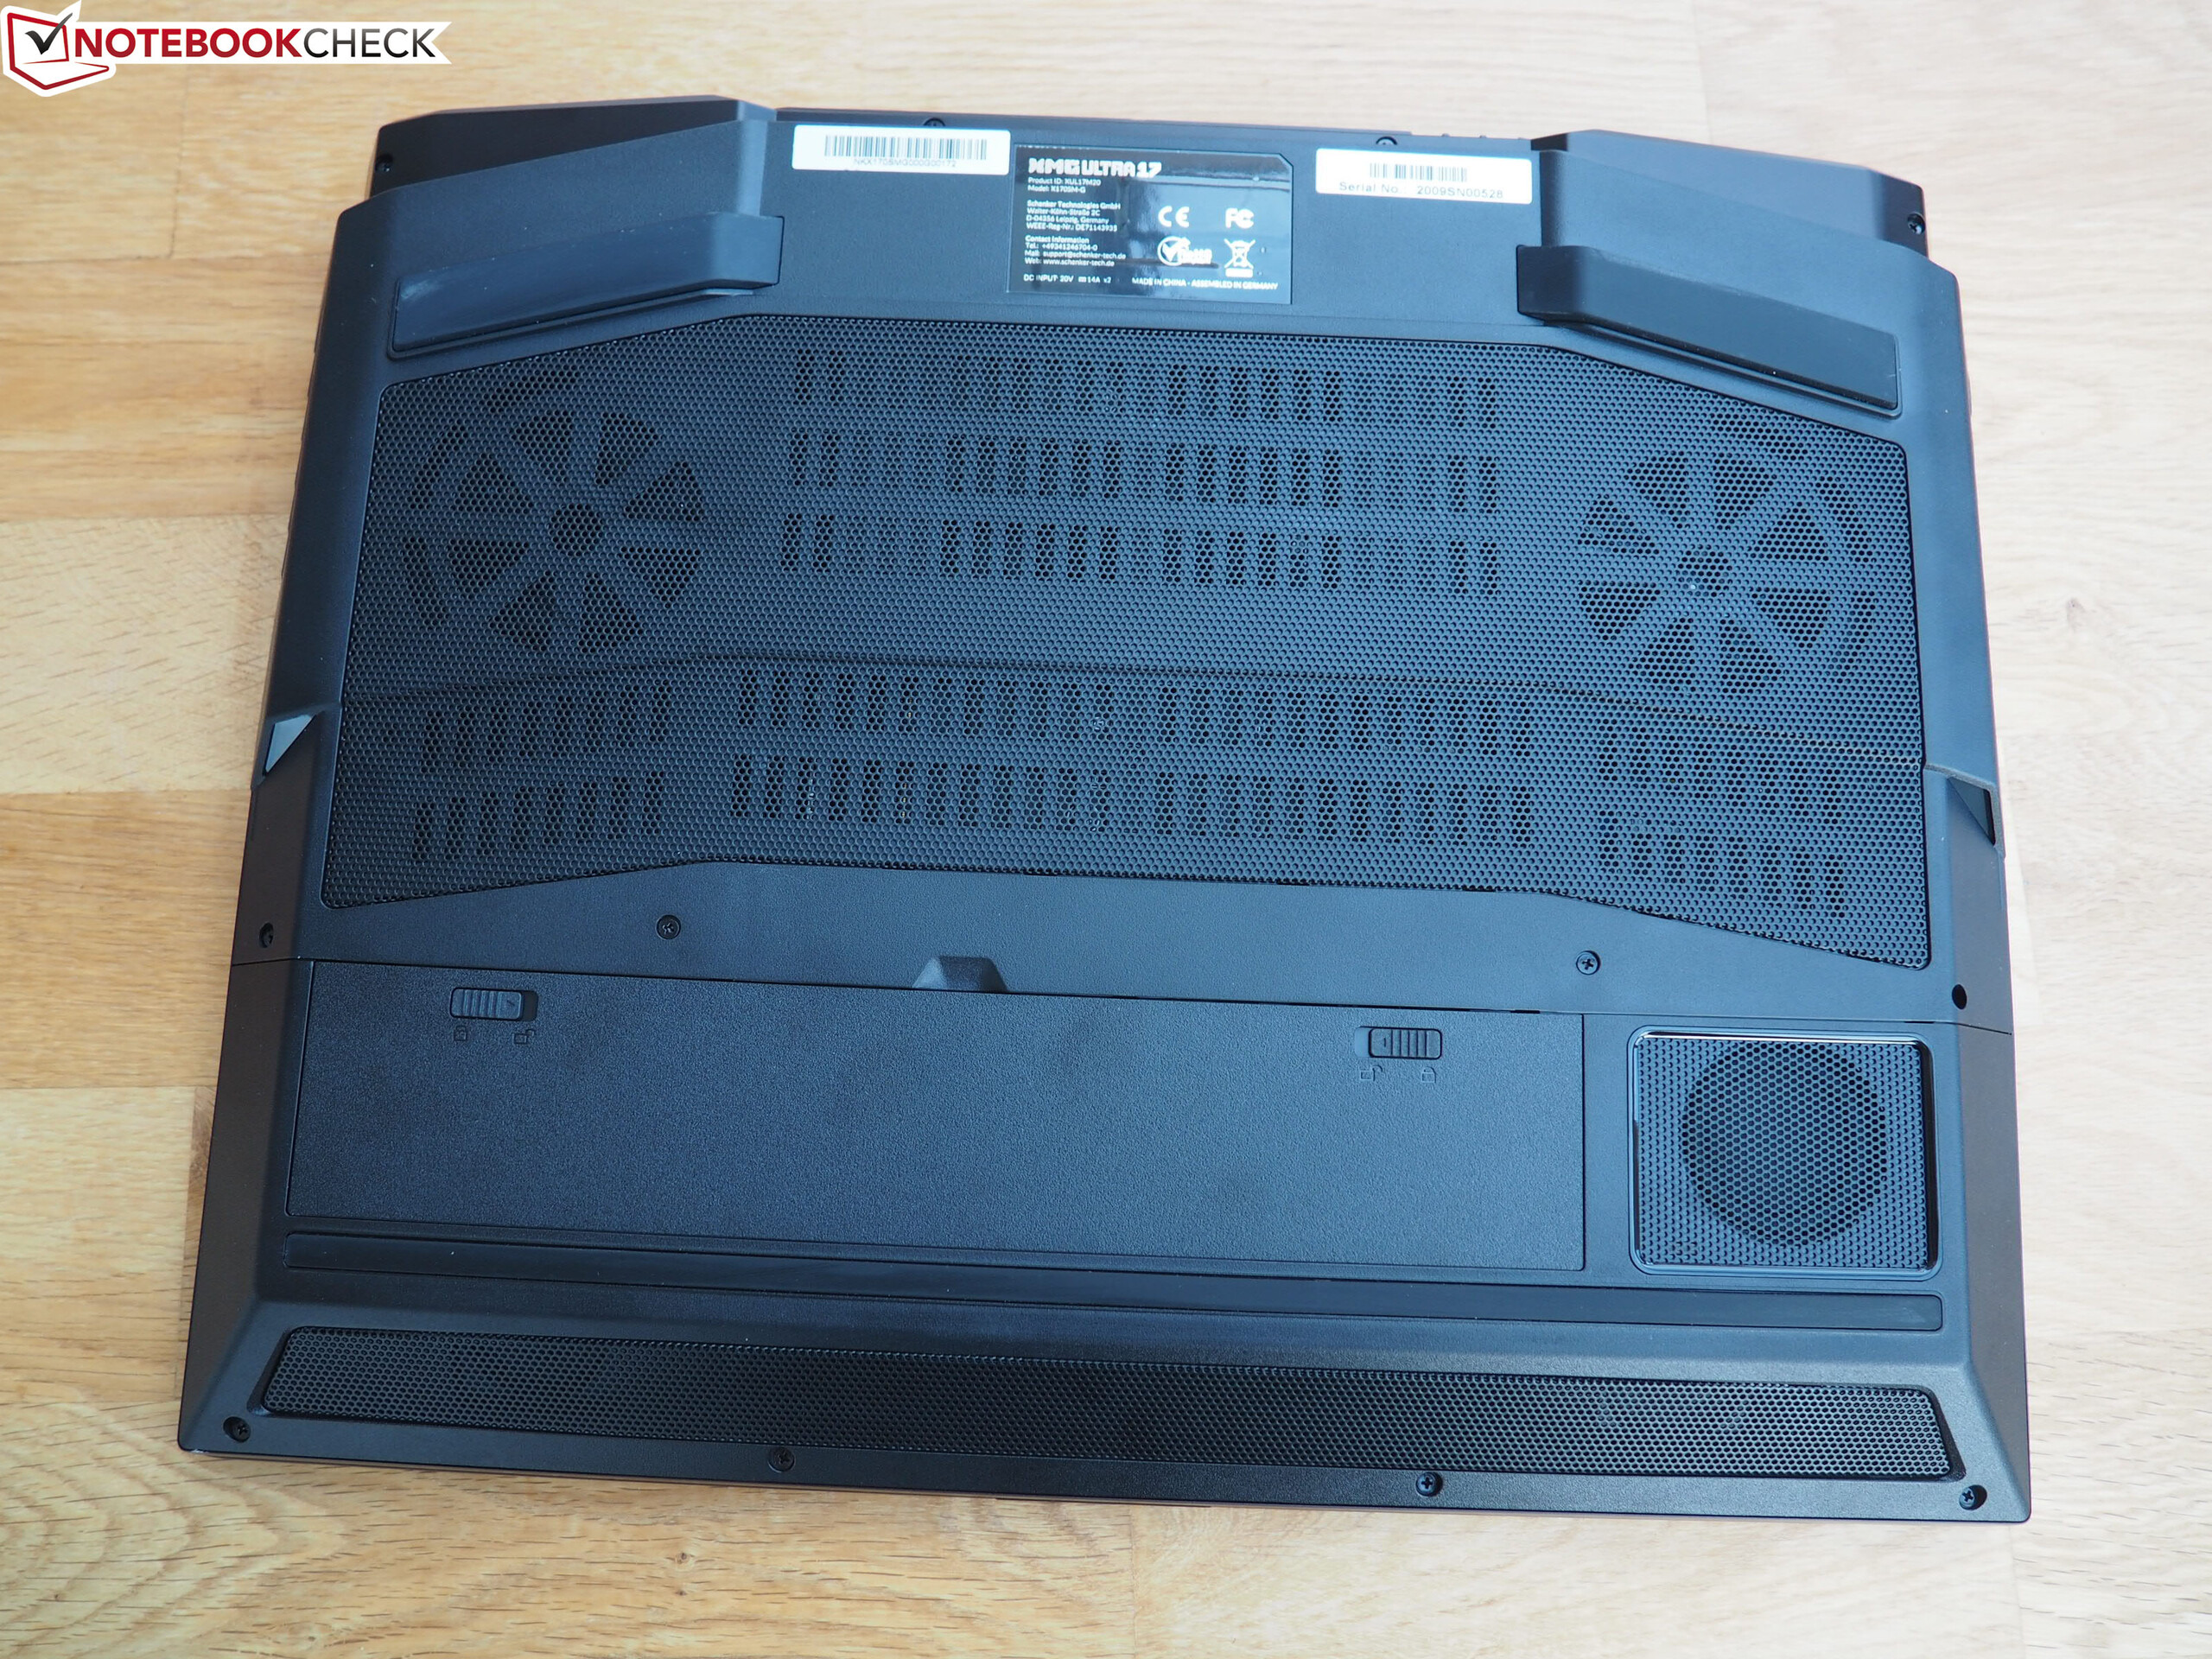
El XMG Ultra no se calienta mucho. Registramos temperaturas por debajo de los 40 grados Celsius (104 grados Fahrenheit) en tres puntos de medición durante la prueba de estrés. El calentamiento es menor cuando ejecutamos la prueba Witcher 3. Las temperaturas en reposo son a veces más altas que bajo carga porque los ventiladores sólo funcionan a bajas velocidades
(+) La temperatura máxima en la parte superior es de 34 °C / 93 F, frente a la media de 40.4 °C / 105 F, que oscila entre 21.2 y 68.8 °C para la clase Gaming.
(±) El fondo se calienta hasta un máximo de 43 °C / 109 F, frente a la media de 43.2 °C / 110 F
(±) En reposo, la temperatura media de la parte superior es de 33 °C / 91# F, frente a la media del dispositivo de 33.9 °C / 93 F.
(+) Jugando a The Witcher 3, la temperatura media de la parte superior es de 28.2 °C / 83 F, frente a la media del dispositivo de 33.9 °C / 93 F.
(+) El reposamanos y el panel táctil están a una temperatura inferior a la de la piel, con un máximo de 30 °C / 86 F y, por tanto, son fríos al tacto.
(±) La temperatura media de la zona del reposamanos de dispositivos similares fue de 28.8 °C / 83.8 F (-1.2 °C / -2.2 F).
| Schenker XMG Ultra 17 Rocket Lake i9-11900K, GeForce RTX 3080 Laptop GPU | MSI GT76 Titan DT 10SGS i9-10900K, GeForce RTX 2080 Super Mobile | Asus Strix Scar 17 G732LXS i9-10980HK, GeForce RTX 2080 Super Mobile | Schenker XMG Ultra 17 Comet Lake i9-10900K, GeForce RTX 2080 Super Mobile | Alienware m17 R4 i9-10980HK, GeForce RTX 3080 Laptop GPU | Media de la clase Gaming | |
|---|---|---|---|---|---|---|
| Heat | 8% | -12% | 1% | -29% | -4% | |
| Maximum Upper Side * (°C) | 34 | 36.4 -7% | 59 -74% | 39 -15% | 58 -71% | 45.1 ? -33% |
| Maximum Bottom * (°C) | 43 | 43 -0% | 52 -21% | 46 -7% | 46 -7% | 48.1 ? -12% |
| Idle Upper Side * (°C) | 38 | 28 26% | 30 21% | 32 16% | 45 -18% | 31 ? 18% |
| Idle Bottom * (°C) | 39 | 33.4 14% | 29 26% | 35 10% | 46 -18% | 34.2 ? 12% |
* ... más pequeño es mejor
Altavoz
Schenker XMG Ultra 17 Rocket Lake análisis de audio
(+) | los altavoces pueden reproducir a un volumen relativamente alto (#91 dB)
Graves 100 - 315 Hz
(±) | lubina reducida - en promedio 8.1% inferior a la mediana
(+) | el bajo es lineal (5.9% delta a la frecuencia anterior)
Medios 400 - 2000 Hz
(+) | medios equilibrados - a sólo 3.4% de la mediana
(+) | los medios son lineales (3.8% delta a la frecuencia anterior)
Altos 2 - 16 kHz
(±) | máximos más altos - de media 5.2% más altos que la mediana
(+) | los máximos son lineales (6.4% delta a la frecuencia anterior)
Total 100 - 16.000 Hz
(+) | el sonido global es lineal (10.3% de diferencia con la mediana)
En comparación con la misma clase
» 6% de todos los dispositivos probados de esta clase eran mejores, 2% similares, 93% peores
» El mejor tuvo un delta de 6%, la media fue 18%, el peor fue ###max##%
En comparación con todos los dispositivos probados
» 5% de todos los dispositivos probados eran mejores, 1% similares, 94% peores
» El mejor tuvo un delta de 4%, la media fue 23%, el peor fue ###max##%
Gestión de la energía - Schenker DTR con un gran apetito energético
Consumo de energía
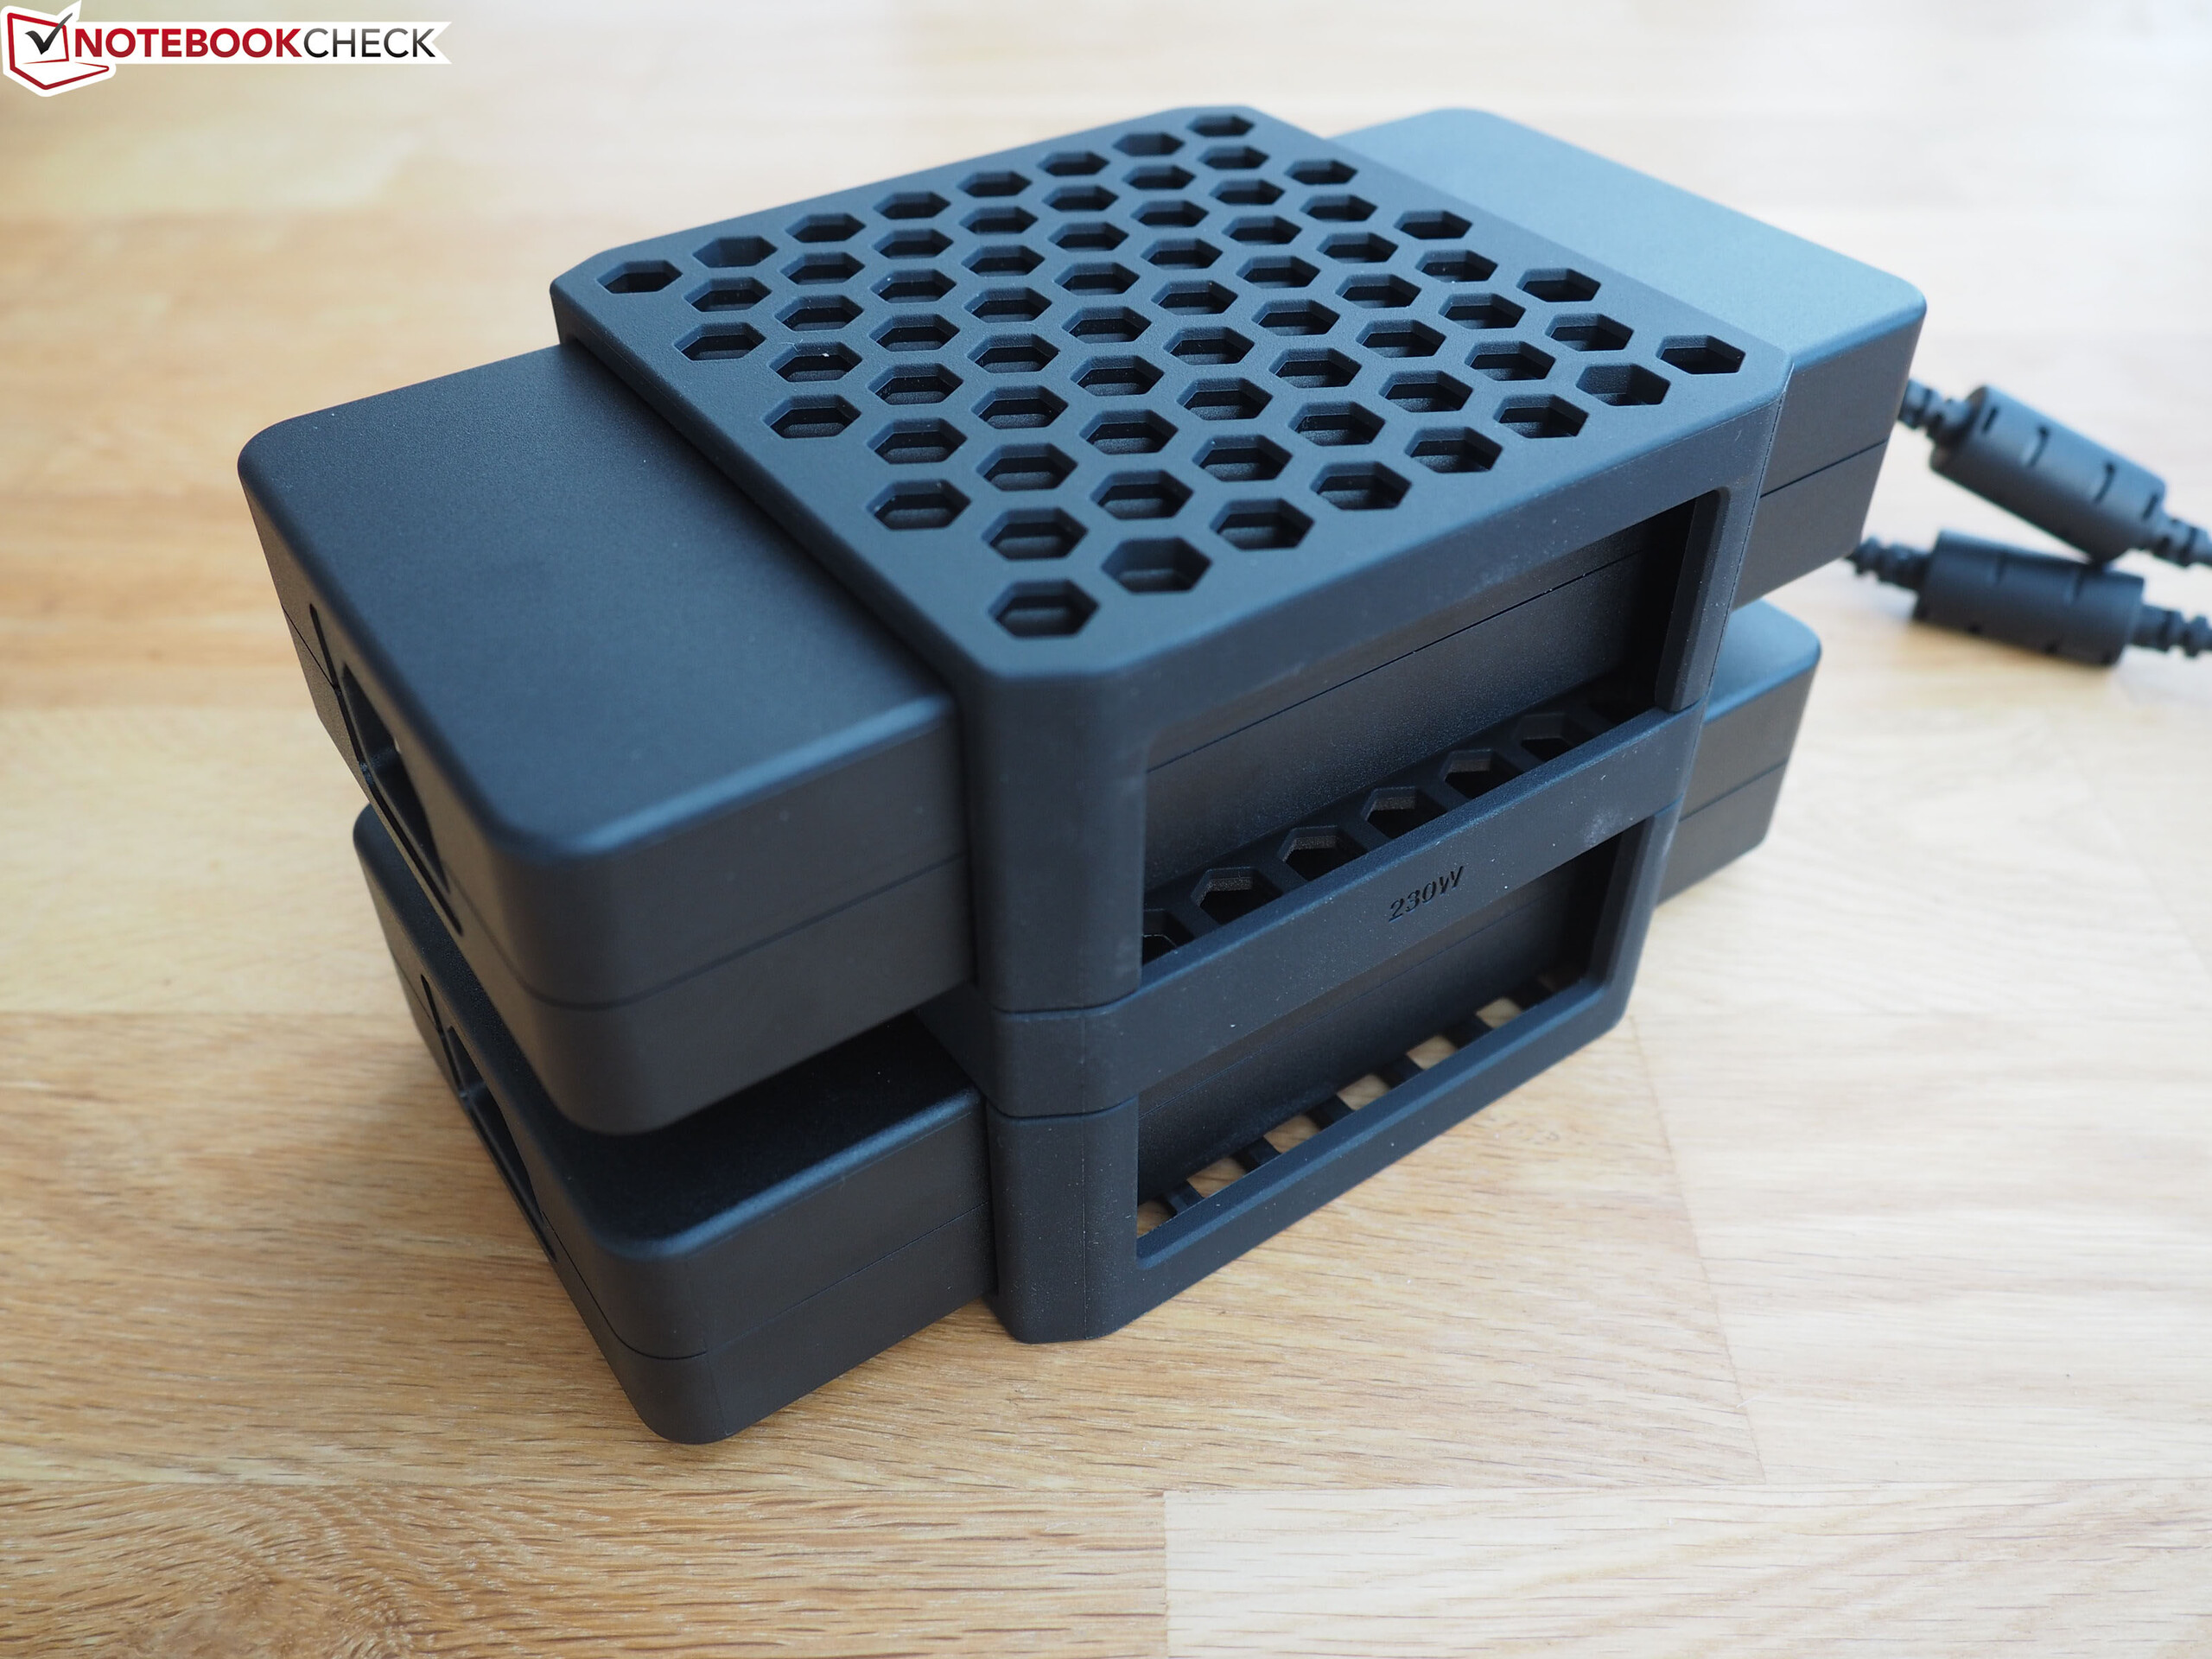
Registramos un consumo máximo de energía de 69 vatios en reposo, un valor que muchos portátiles de oficina no alcanzan a plena carga. La combinación de una CPU de alto rendimiento y una GPU GeForce permanentemente activa se nota aquí. La prueba de estrés y Witcher 3 test aumentan la demanda hasta 368 vatios y 297 vatios de media, respectivamente. Las dos fuentes de alimentación ofrecen una potencia nominal de 280 vatios cada una
| Off / Standby | |
| Ocioso | |
| Carga |
|
Clave:
min: | |
| Schenker XMG Ultra 17 Rocket Lake i9-11900K, GeForce RTX 3080 Laptop GPU | MSI GT76 Titan DT 10SGS i9-10900K, GeForce RTX 2080 Super Mobile | Asus Strix Scar 17 G732LXS i9-10980HK, GeForce RTX 2080 Super Mobile | Schenker XMG Ultra 17 Comet Lake i9-10900K, GeForce RTX 2080 Super Mobile | Alienware m17 R4 i9-10980HK, GeForce RTX 3080 Laptop GPU | Media de la clase Gaming | |
|---|---|---|---|---|---|---|
| Power Consumption | 21% | 39% | 16% | 23% | 56% | |
| Idle Minimum * (Watt) | 62 | 25.9 58% | 16 74% | 34 45% | 42 32% | 13.1 ? 79% |
| Idle Average * (Watt) | 64 | 38 41% | 25 61% | 40 37% | 48 25% | 19 ? 70% |
| Idle Maximum * (Watt) | 69 | 53.2 23% | 35 49% | 47 32% | 58 16% | 24.6 ? 64% |
| Load Average * (Watt) | 183 | 123.8 32% | 177 3% | 130 29% | 124 32% | 111.3 ? 39% |
| Witcher 3 ultra * (Watt) | 297 | 312.5 -5% | 227 24% | 318 -7% | 219 26% | |
| Load Maximum * (Watt) | 368 | 459.8 -25% | 280 24% | 512 -39% | 337 8% | 260 ? 29% |
* ... más pequeño es mejor
Duración de la batería
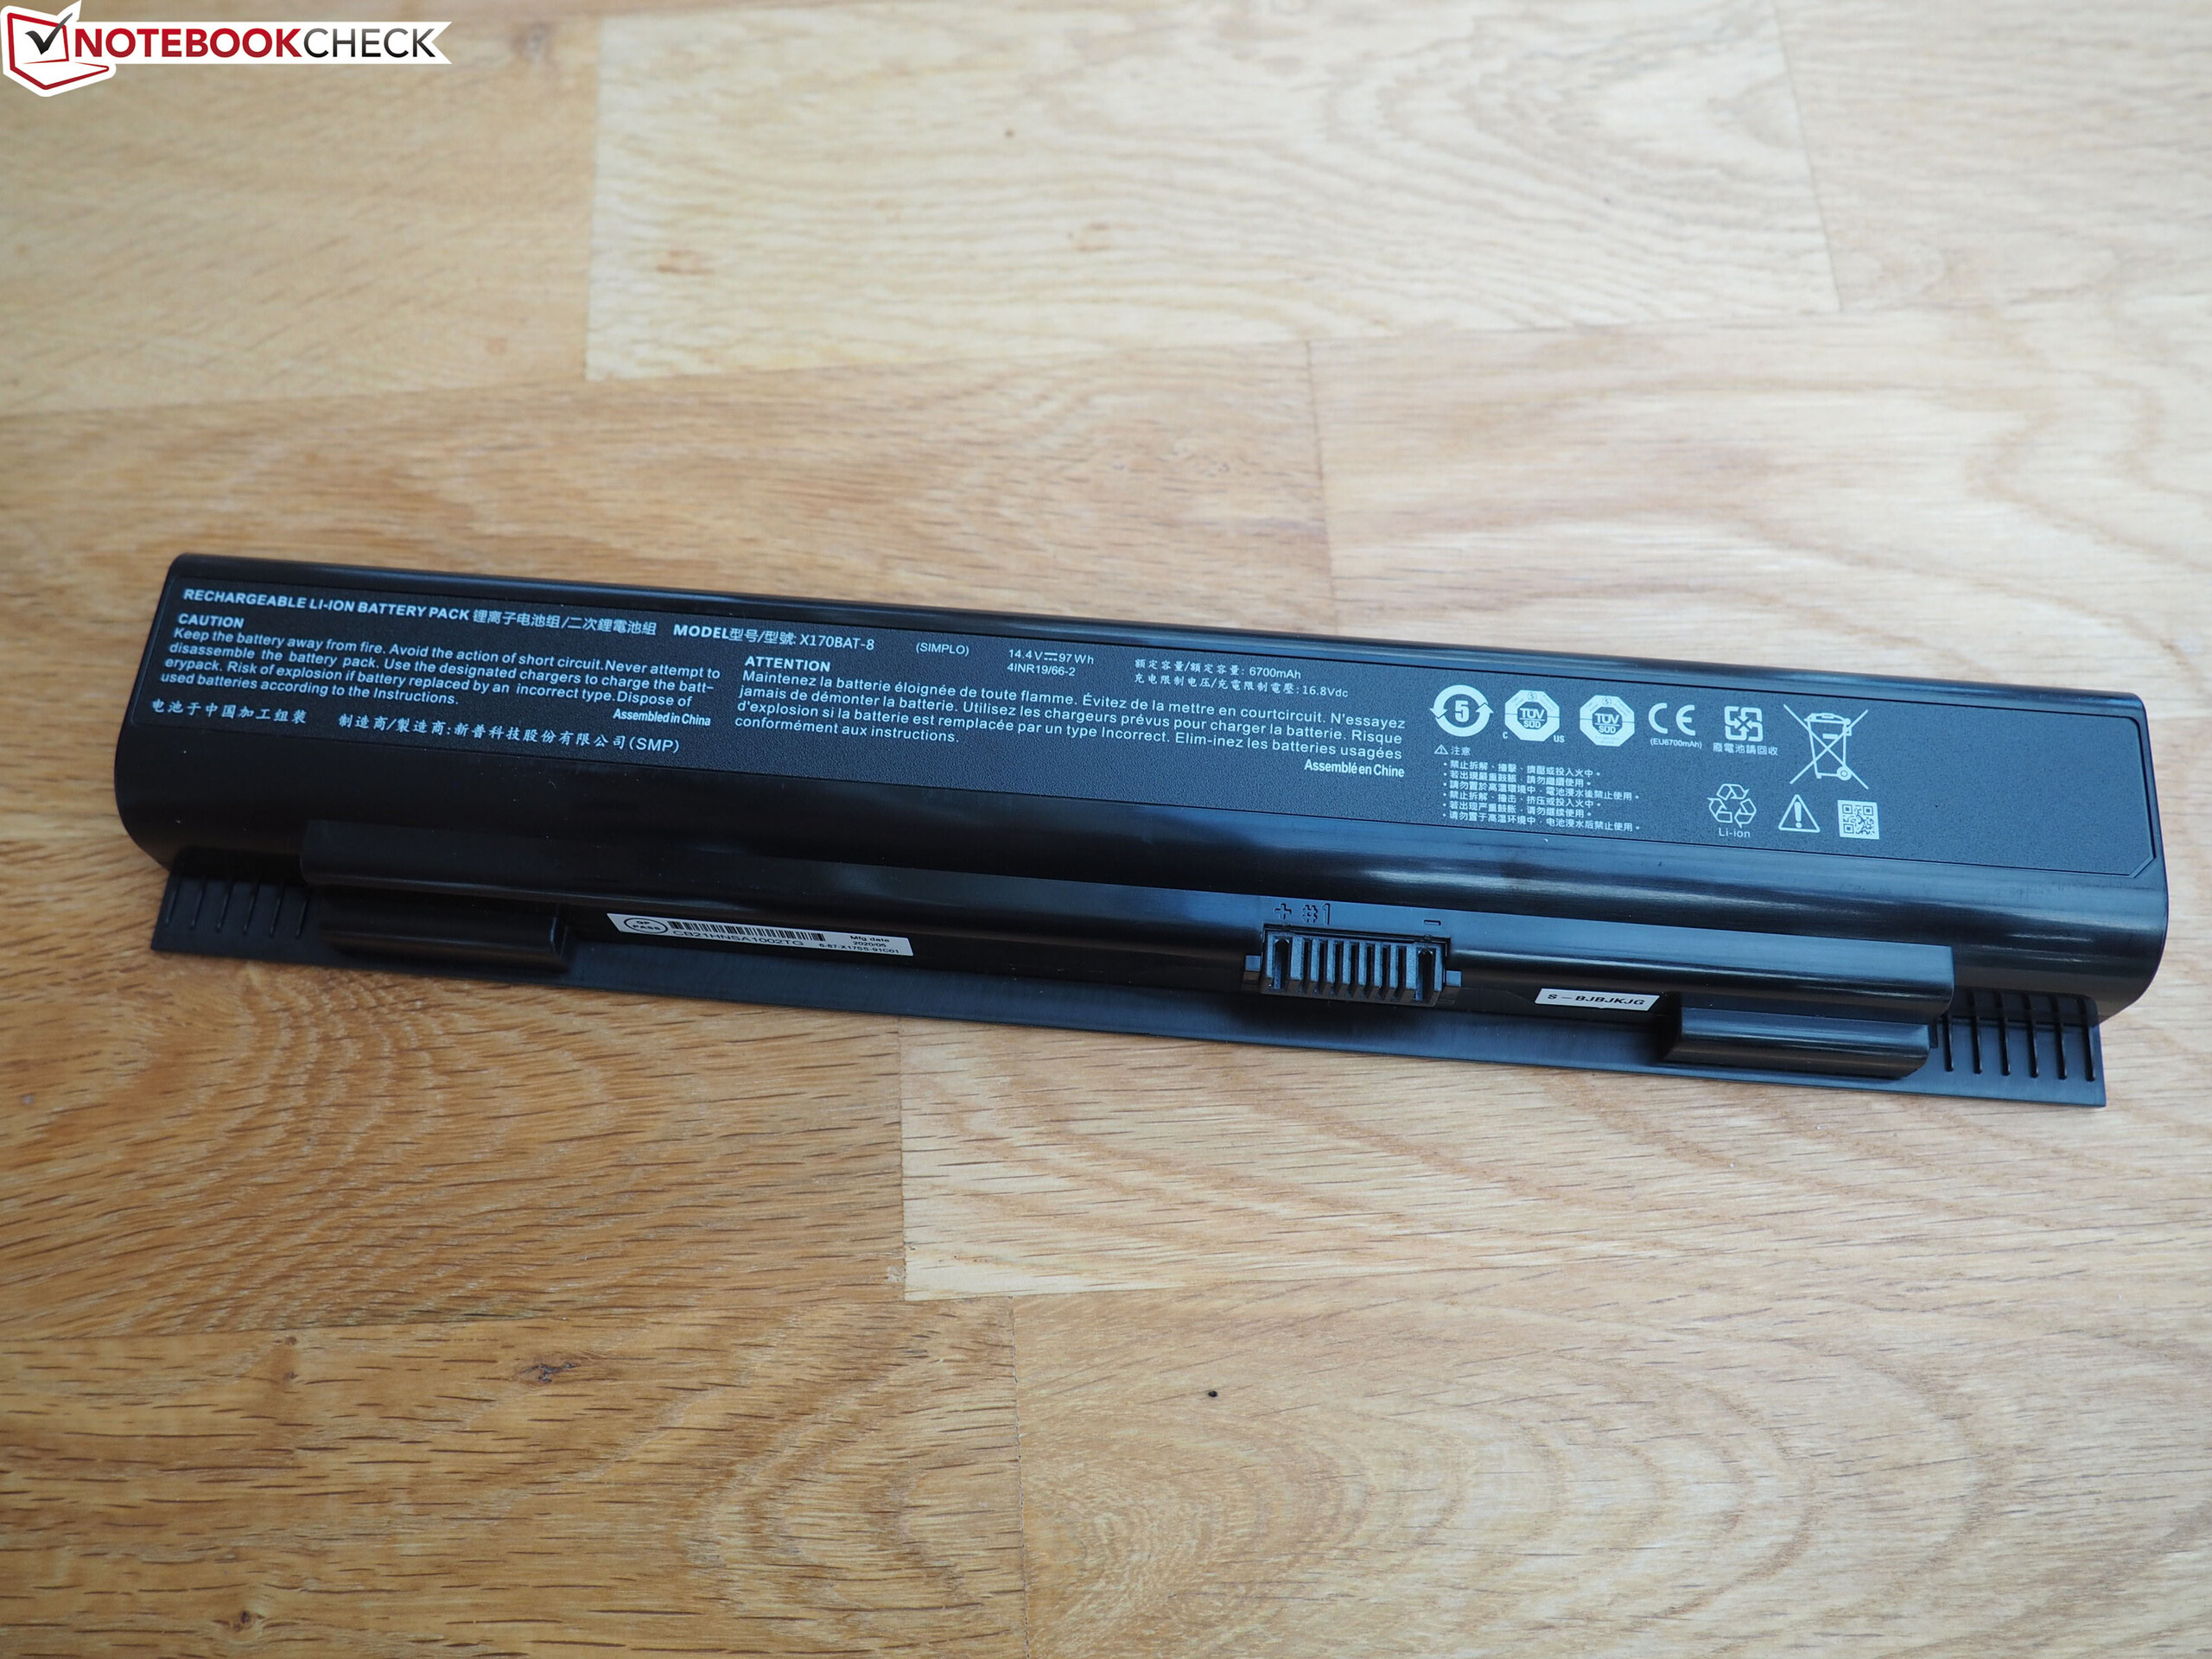
El ansia desenfrenada de energía del hardware hace que incluso la batería de 97 Wh instalada sólo sirva para una mísera duración. El 17,3 pulgadas logra duraciones de 1:50 h y 1:55 h en la prueba WLAN (llamando a sitios web a través de un guión) y la prueba de vídeo (cortometraje Big Buck Bunny (codificación H.264, FHD) en bucle), respectivamente. La batería sirve más como fuente de alimentación de emergencia que como factor de movilidad en un dispositivo como el Ultra 17.
| Schenker XMG Ultra 17 Rocket Lake i9-11900K, GeForce RTX 3080 Laptop GPU, 97 Wh | MSI GT76 Titan DT 10SGS i9-10900K, GeForce RTX 2080 Super Mobile, 90 Wh | Asus Strix Scar 17 G732LXS i9-10980HK, GeForce RTX 2080 Super Mobile, 66 Wh | Schenker XMG Ultra 17 Comet Lake i9-10900K, GeForce RTX 2080 Super Mobile, 97 Wh | Alienware m17 R4 i9-10980HK, GeForce RTX 3080 Laptop GPU, 86 Wh | Media de la clase Gaming | |
|---|---|---|---|---|---|---|
| Duración de Batería | 33% | 166% | 61% | 19% | 206% | |
| Reader / Idle (h) | 3 | 10 233% | 4.9 63% | 7.84 ? 161% | ||
| H.264 (h) | 1.9 | 2.2 16% | 8.27 ? 335% | |||
| WiFi v1.3 (h) | 1.8 | 2.4 33% | 5.9 228% | 3.8 111% | 2.4 33% | 7.08 ? 293% |
| Load (h) | 1.1 | 1.5 36% | 1.2 9% | 1.2 9% | 1.496 ? 36% |
Pro
Contra
Veredicto
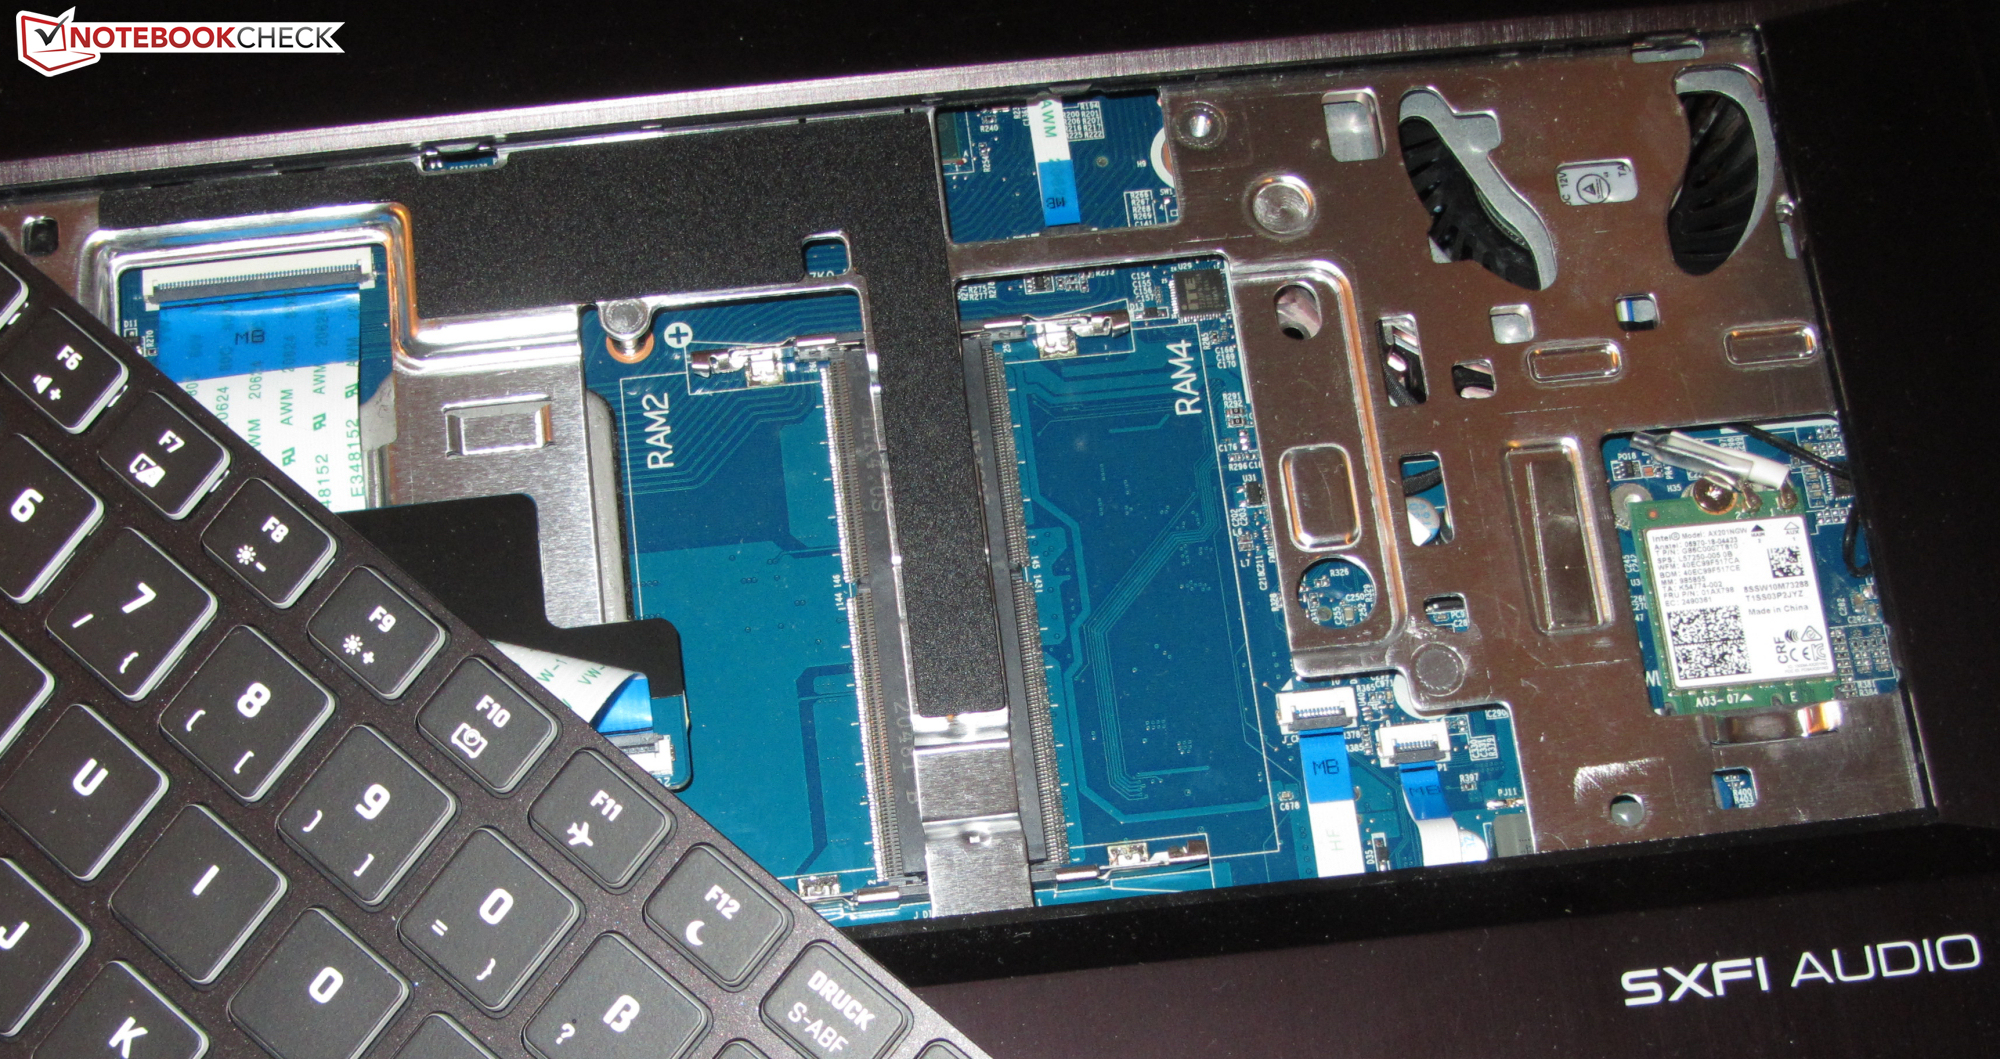
El enorme portátil sustituto del ordenador de sobremesa de Schenker no hace concesiones en cuanto a equipamiento y potencia informática. Dado que no sólo laRAM y los medios de almacenamiento, sino también la CPU (con zócalo) y la GPU (MXM) son intercambiables, el portátil puede adaptarse individualmente según las necesidades. Hay tres GPUs (Ampere) y diez CPUs (Comet Lake, Rocket Lake) para elegir.
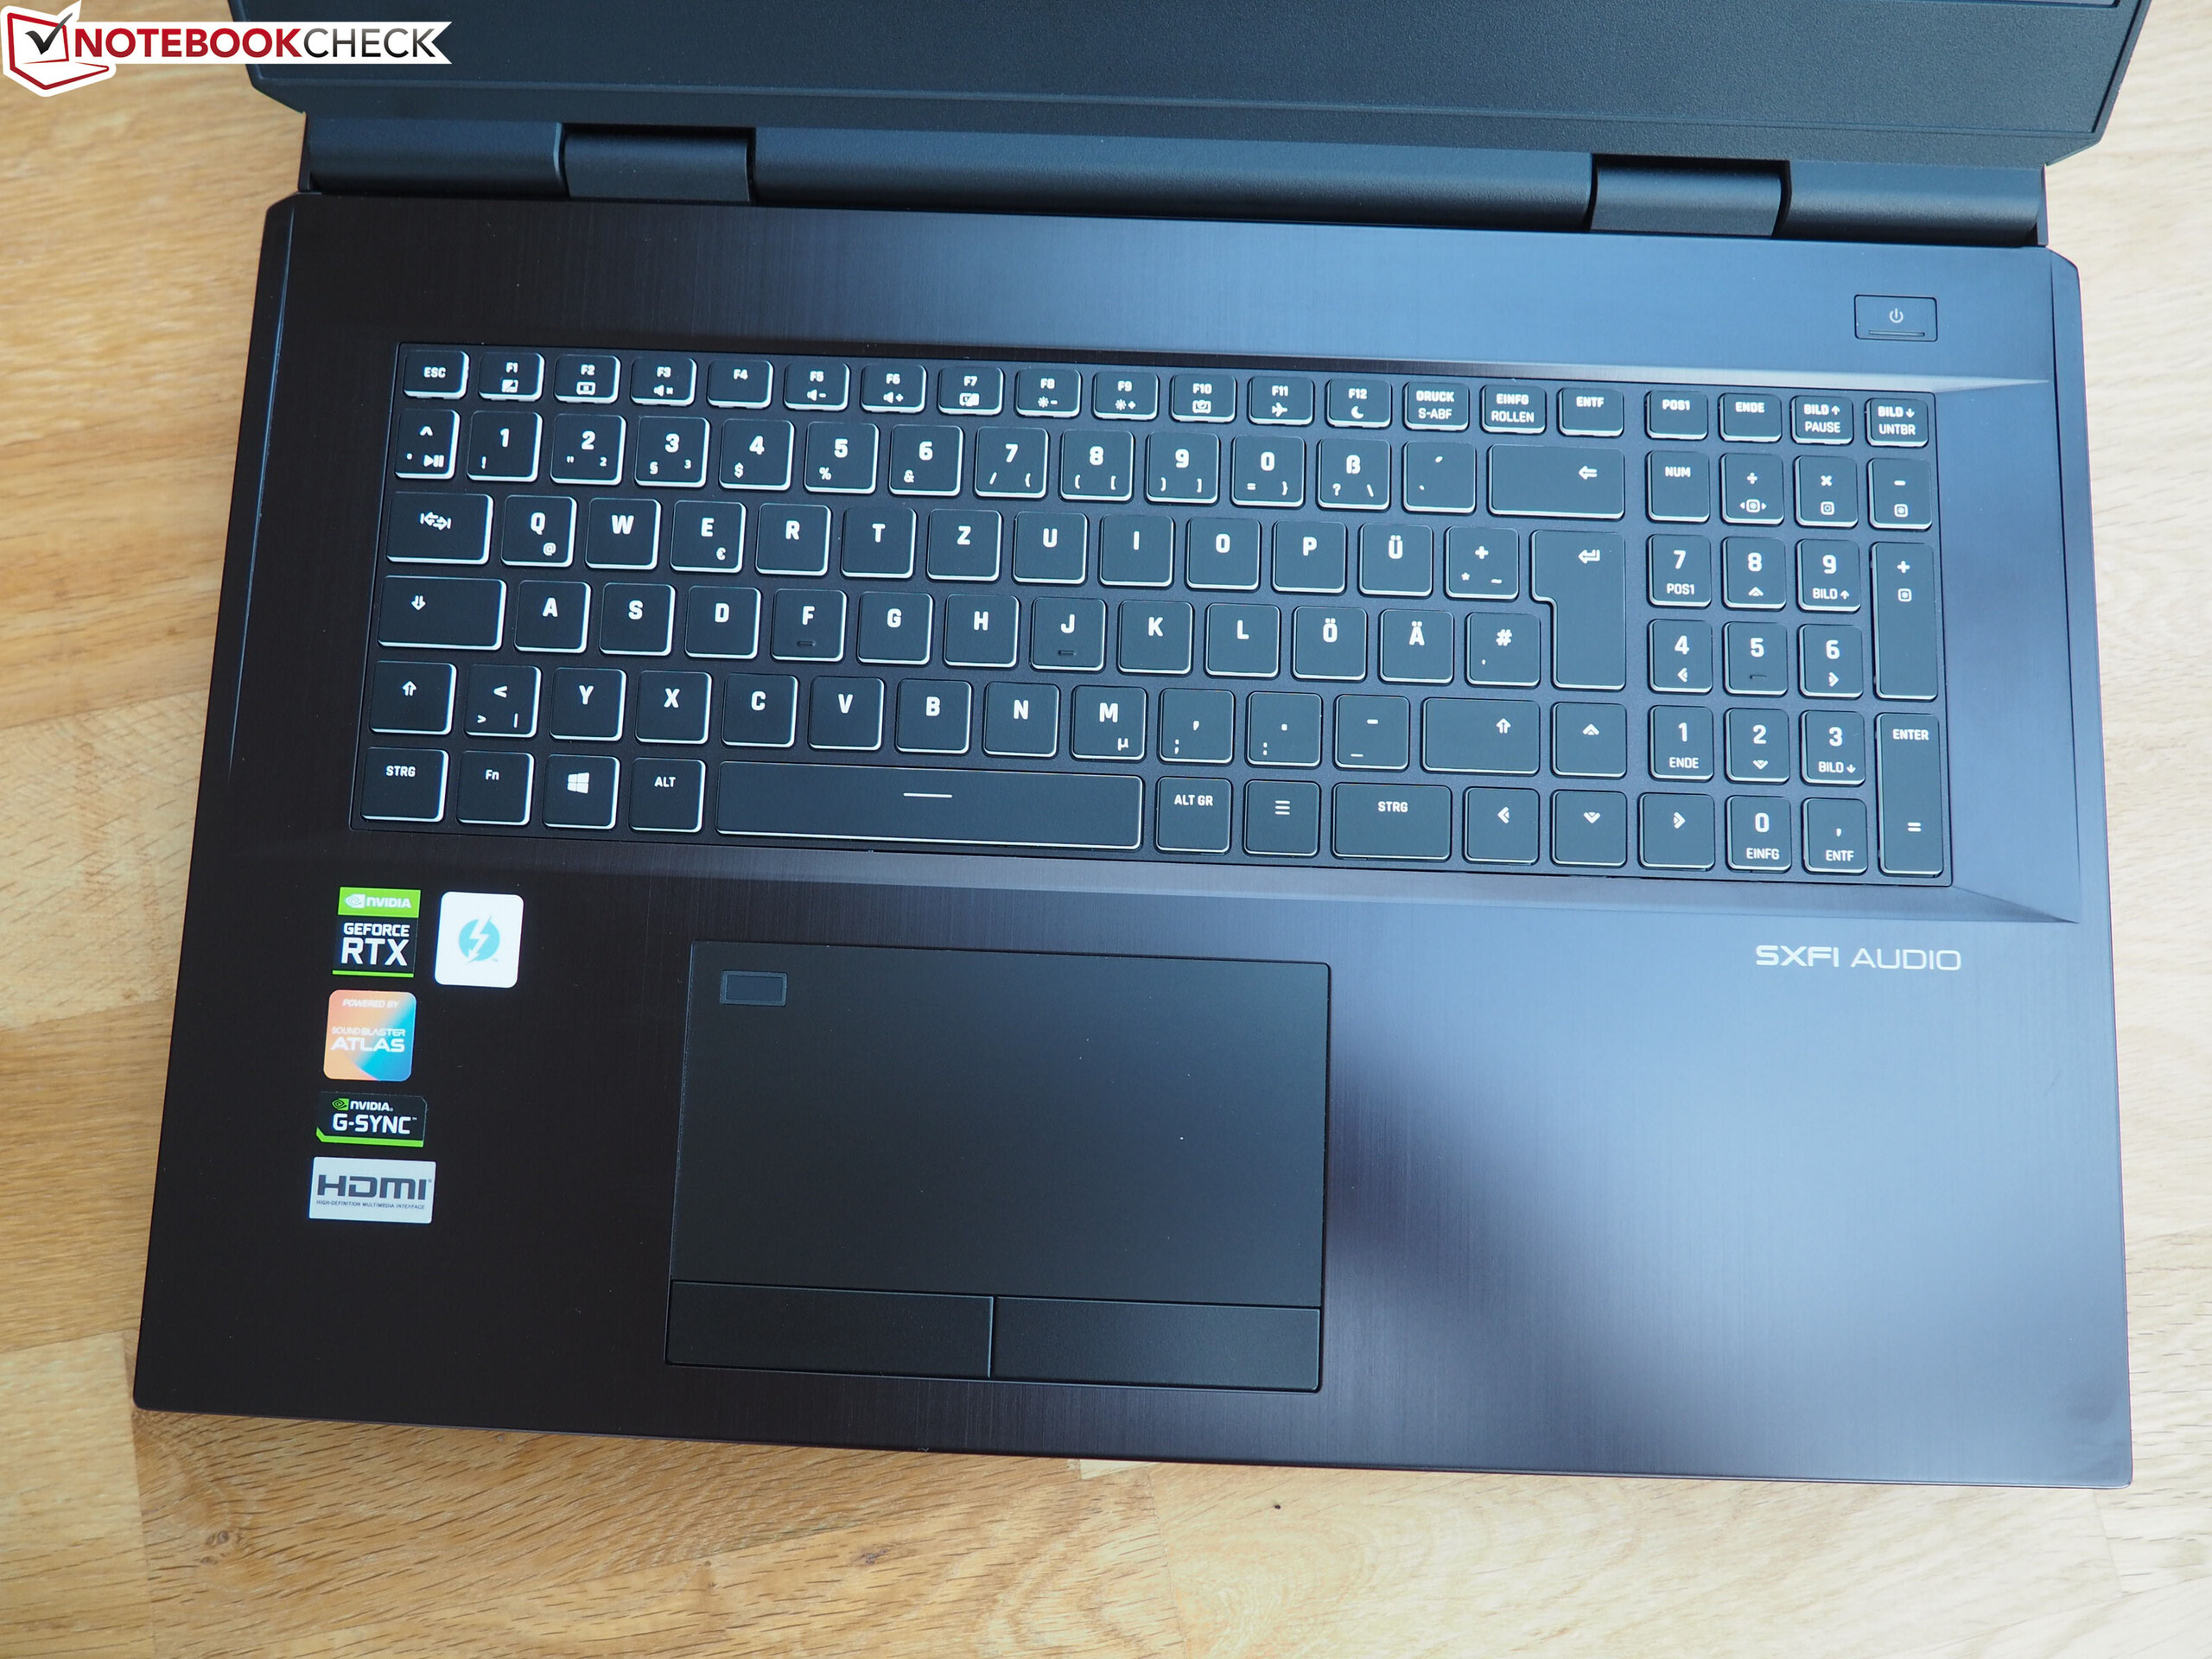
El Schenker XMG Ultra 17 ofrece mucha potencia de cálculo, numerosas interfaces y muchas opciones de expansión.
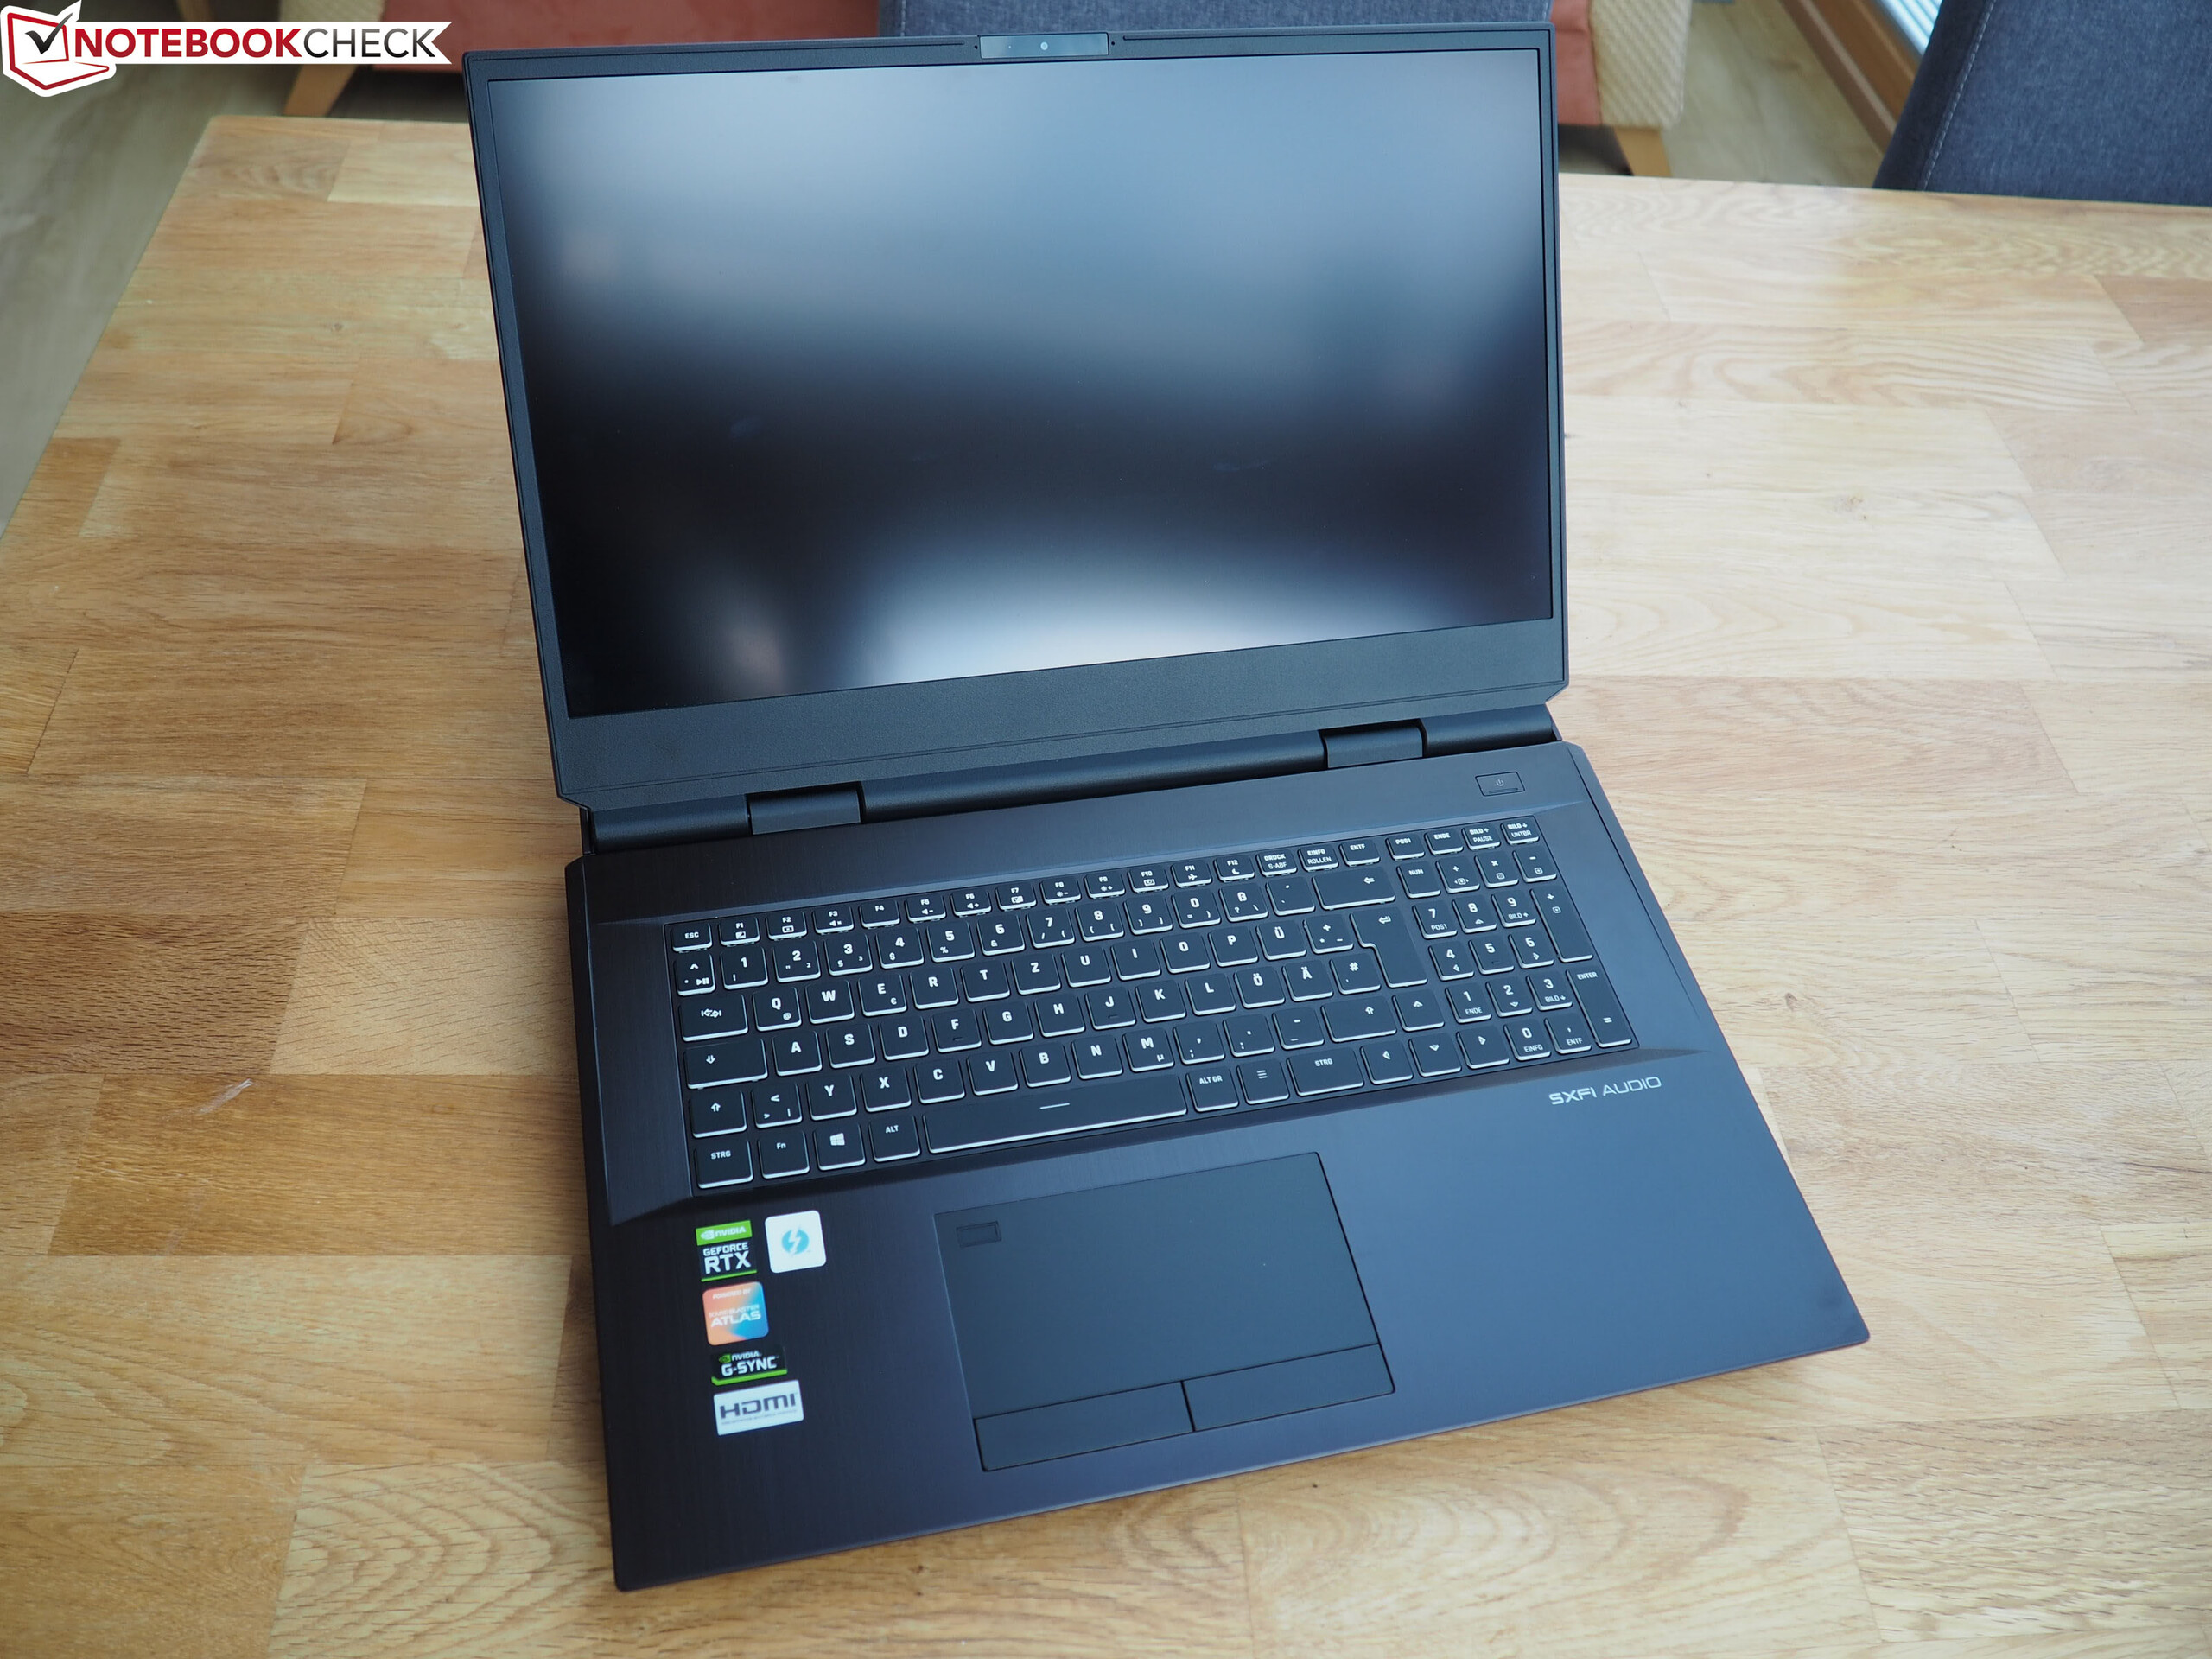
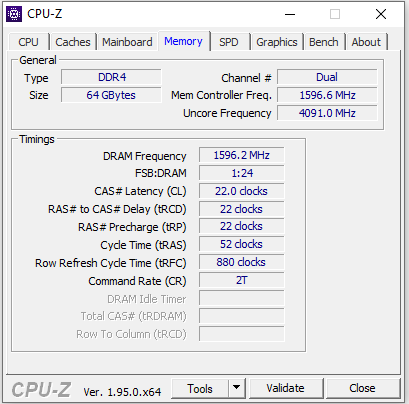
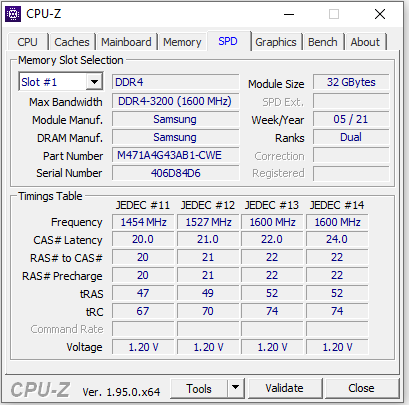
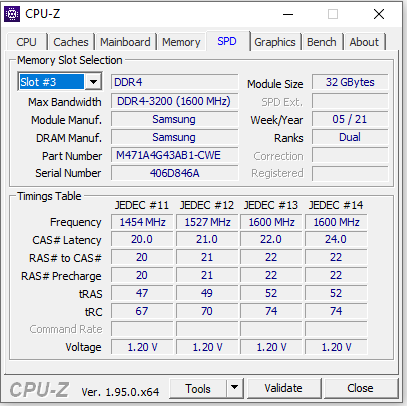
La muestra de revisión que nos han proporcionado es muy buena gracias a la combinación del Core-i9-11900K procesador, GeForce RTX-3080 portátil GPU, 64 GB de memoria de trabajo (máx. 128 GB) y 4 SSDs NVMe con un total de 26 TB de espacio de almacenamiento, el dispositivo de pruebas que nos han proporcionado está más que equipado para todas las áreas de aplicación habituales. Oficina, internet, edición de vídeo, procesamiento de imágenes, streaming y juegos se manejan sin problemas.
La tecnología G-Sync de Nvidia garantiza una visualización de imágenes fluida en la pantalla IPS de 300 Hz. Esta última puntúa con una superficie mate, buen contraste, cortos tiempos de respuesta, ángulos de visión estables, gran reproducción del color y una decente cobertura del espacio de color. Sin embargo, el brillo máximo debería ser un poco mayor. Dado que el dispositivo se usará principalmente en interiores debido a su escasa movilidad, es aceptable.
Precio y disponibilidad
El Schenker XMG Ultra 17 (2021) se puede configurar individualmente en la tienda online Schenker. La variante de configuración que nos han proporcionado está disponible por algo menos de 9.000 euros (~10.887 dólares). Los modelos básicos están disponibles a partir de unos 2.500 euros (~3.024 dólares)
Schenker XMG Ultra 17 Rocket Lake
- 04/19/2021 v7 (old)
Sascha Mölck
Price comparison
