Review del portátil MSI GT76 Titan DT 10SGS: El último juego de Exotic Gear

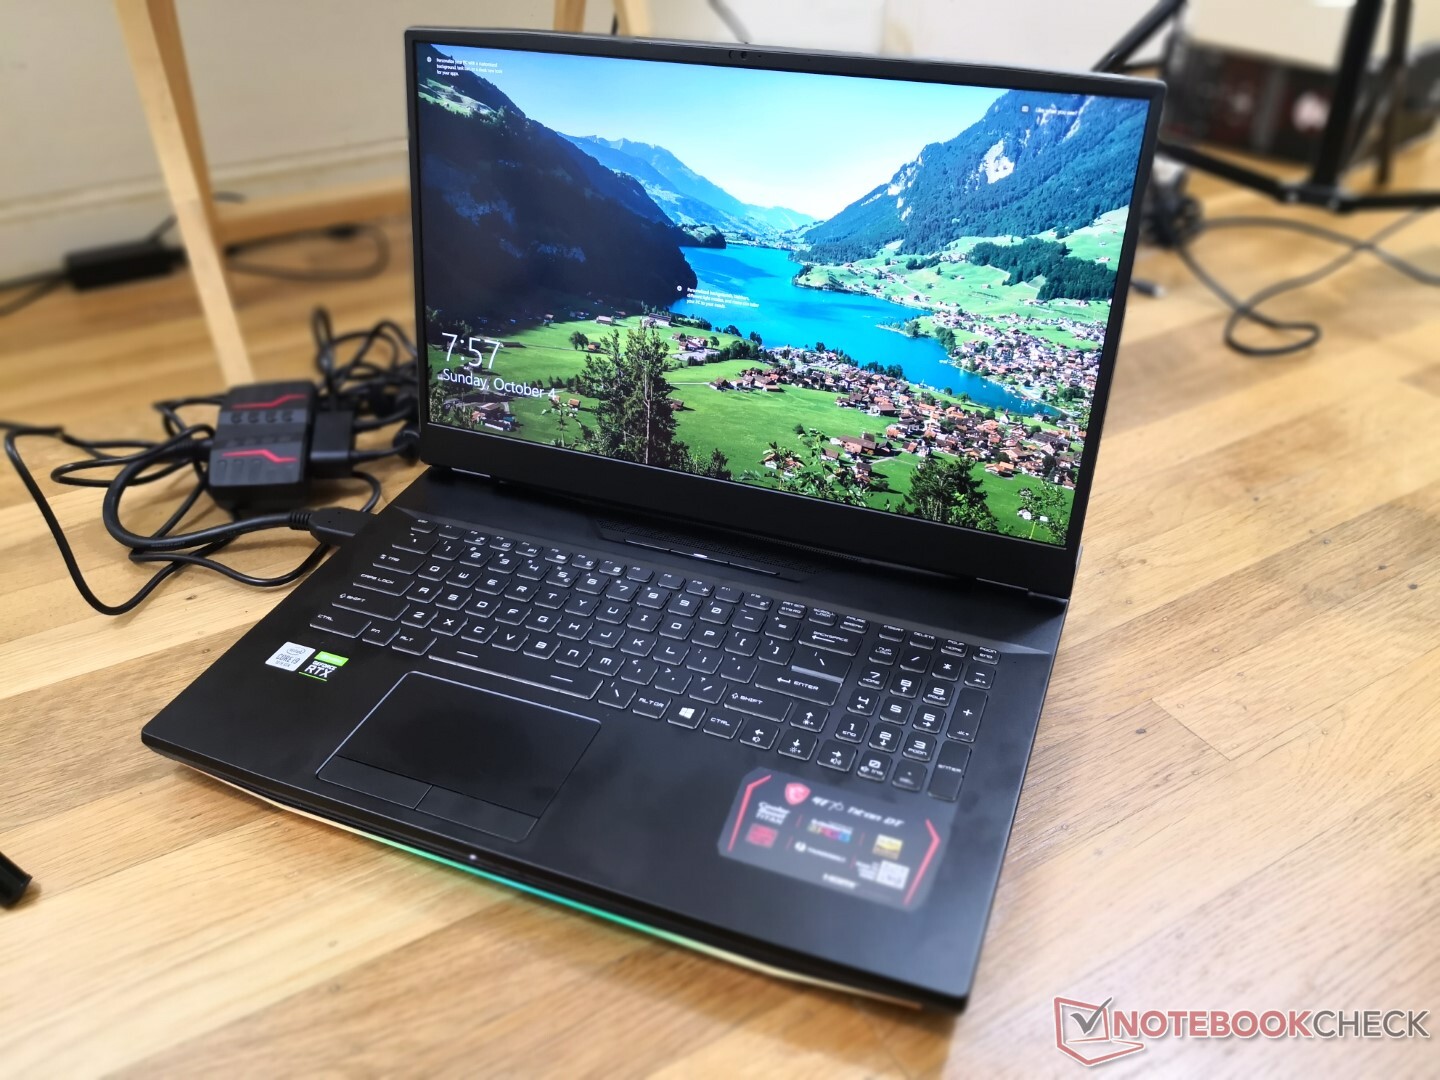
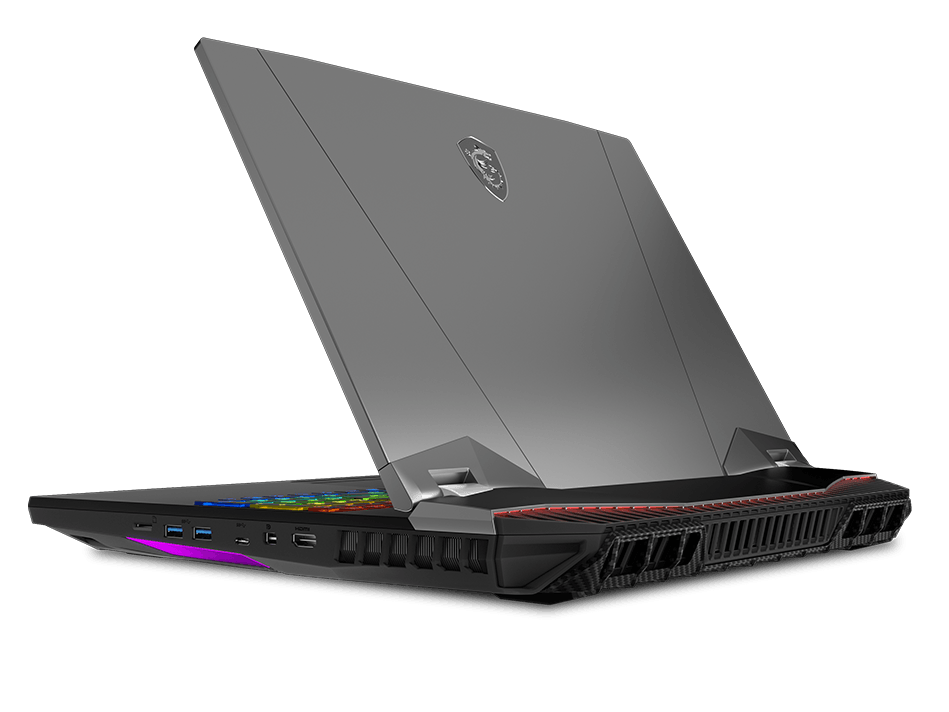
Si el MSI GS75 fuera tu clase de cazador sigiloso y veloz, entonces el MSI GT76 sería tu clase de tanque voluminoso dependiente de engranajes. El GT76 Titan tiene la CPU y la GPU más rápidas que se pueden encontrar en el chasis de un portátil diseñado para sustituir a un PC tradicional.
Comprobamos por primera vez el GT76 cuando se lanzó el año pasado con el Core i9-9900K de 9ª generación, GeForce RTX 2080 y pantalla FHD. Esta actualización de 2020 se envía con el Core i9-10900K de 10ª generación, GeForce RTX 2080 Super, y una pantalla 4K UHD de 120 Hz en su lugar. Las características físicas siguen siendo idénticas, por lo que la mayoría de nuestros comentarios sobre el chasis, el teclado, los altavoces y los elementos internos también se aplican aquí.
Los competidores directos del GT76 incluyen otros DTR de 17,3 pulgadas como el Dell Alienware Area-51m, Asus ROG G703 Chimera, Eurocom Sky X7C, o Schenker XMG Ultra 17.
Más reviews de MSI:
Valoración | Fecha | Modelo | Peso | Altura | Tamaño | Resolución | Precio |
|---|---|---|---|---|---|---|---|
| 87.4 % v7 (old) | 10/2020 | MSI GT76 Titan DT 10SGS i9-10900K, GeForce RTX 2080 Super Mobile | 4.2 kg | 42 mm | 17.30" | 3840x2160 | |
| 85.8 % v7 (old) | 10/2019 | Asus ROG G703GXR i7-9750H, GeForce RTX 2080 Mobile | 4.7 kg | 48 mm | 17.30" | 1920x1080 | |
| 85.8 % v7 (old) | 03/2019 | Alienware Area-51m i9-9900K RTX 2080 i9-9900K, GeForce RTX 2080 Mobile | 3.9 kg | 42 mm | 17.30" | 1920x1080 | |
| 82.7 % v7 (old) | 07/2020 | Asus Strix Scar 17 G732LXS i9-10980HK, GeForce RTX 2080 Super Mobile | 2.9 kg | 26.5 mm | 17.30" | 1920x1080 | |
| 83.2 % v7 (old) | 02/2020 | Schenker XMG Pro 17 PB71RD-G i7-9750H, GeForce RTX 2060 Mobile | 2.8 kg | 30 mm | 17.30" | 1920x1080 |
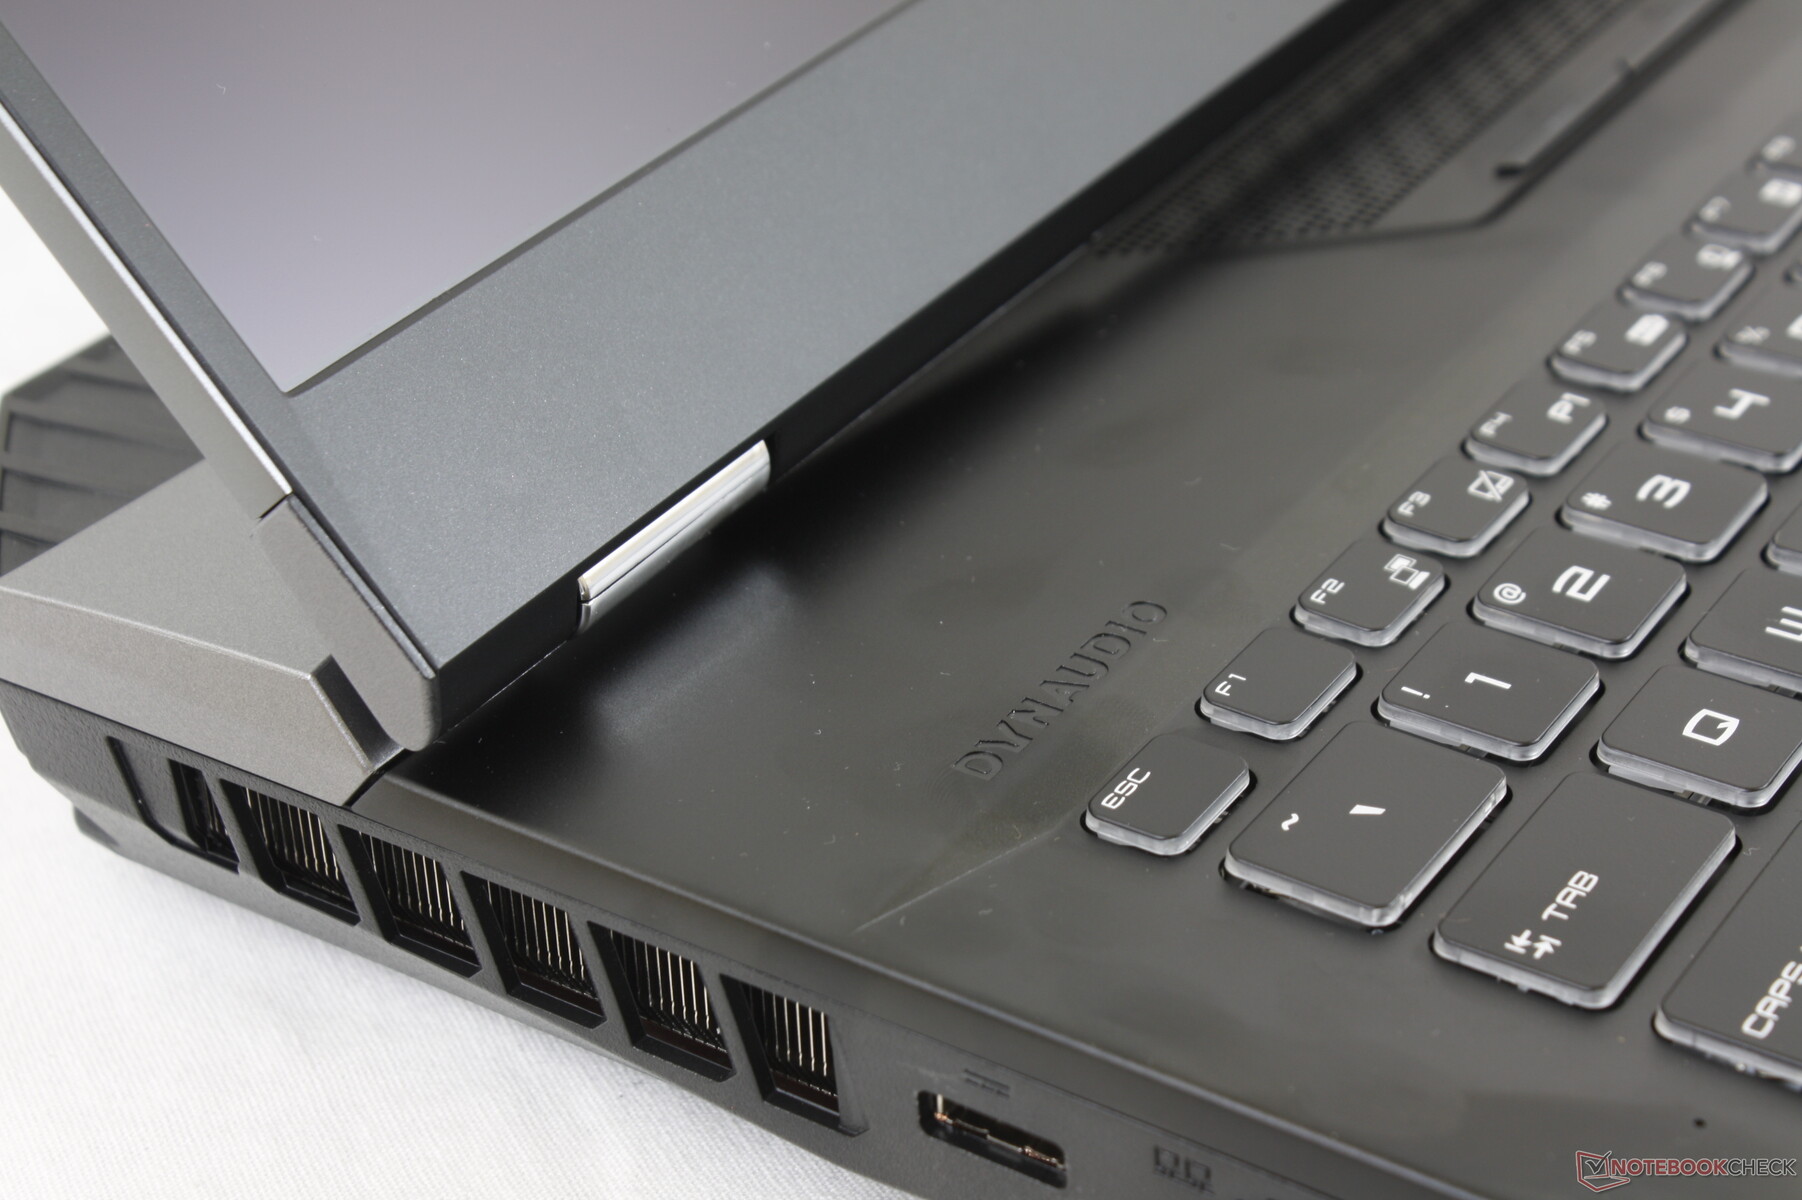
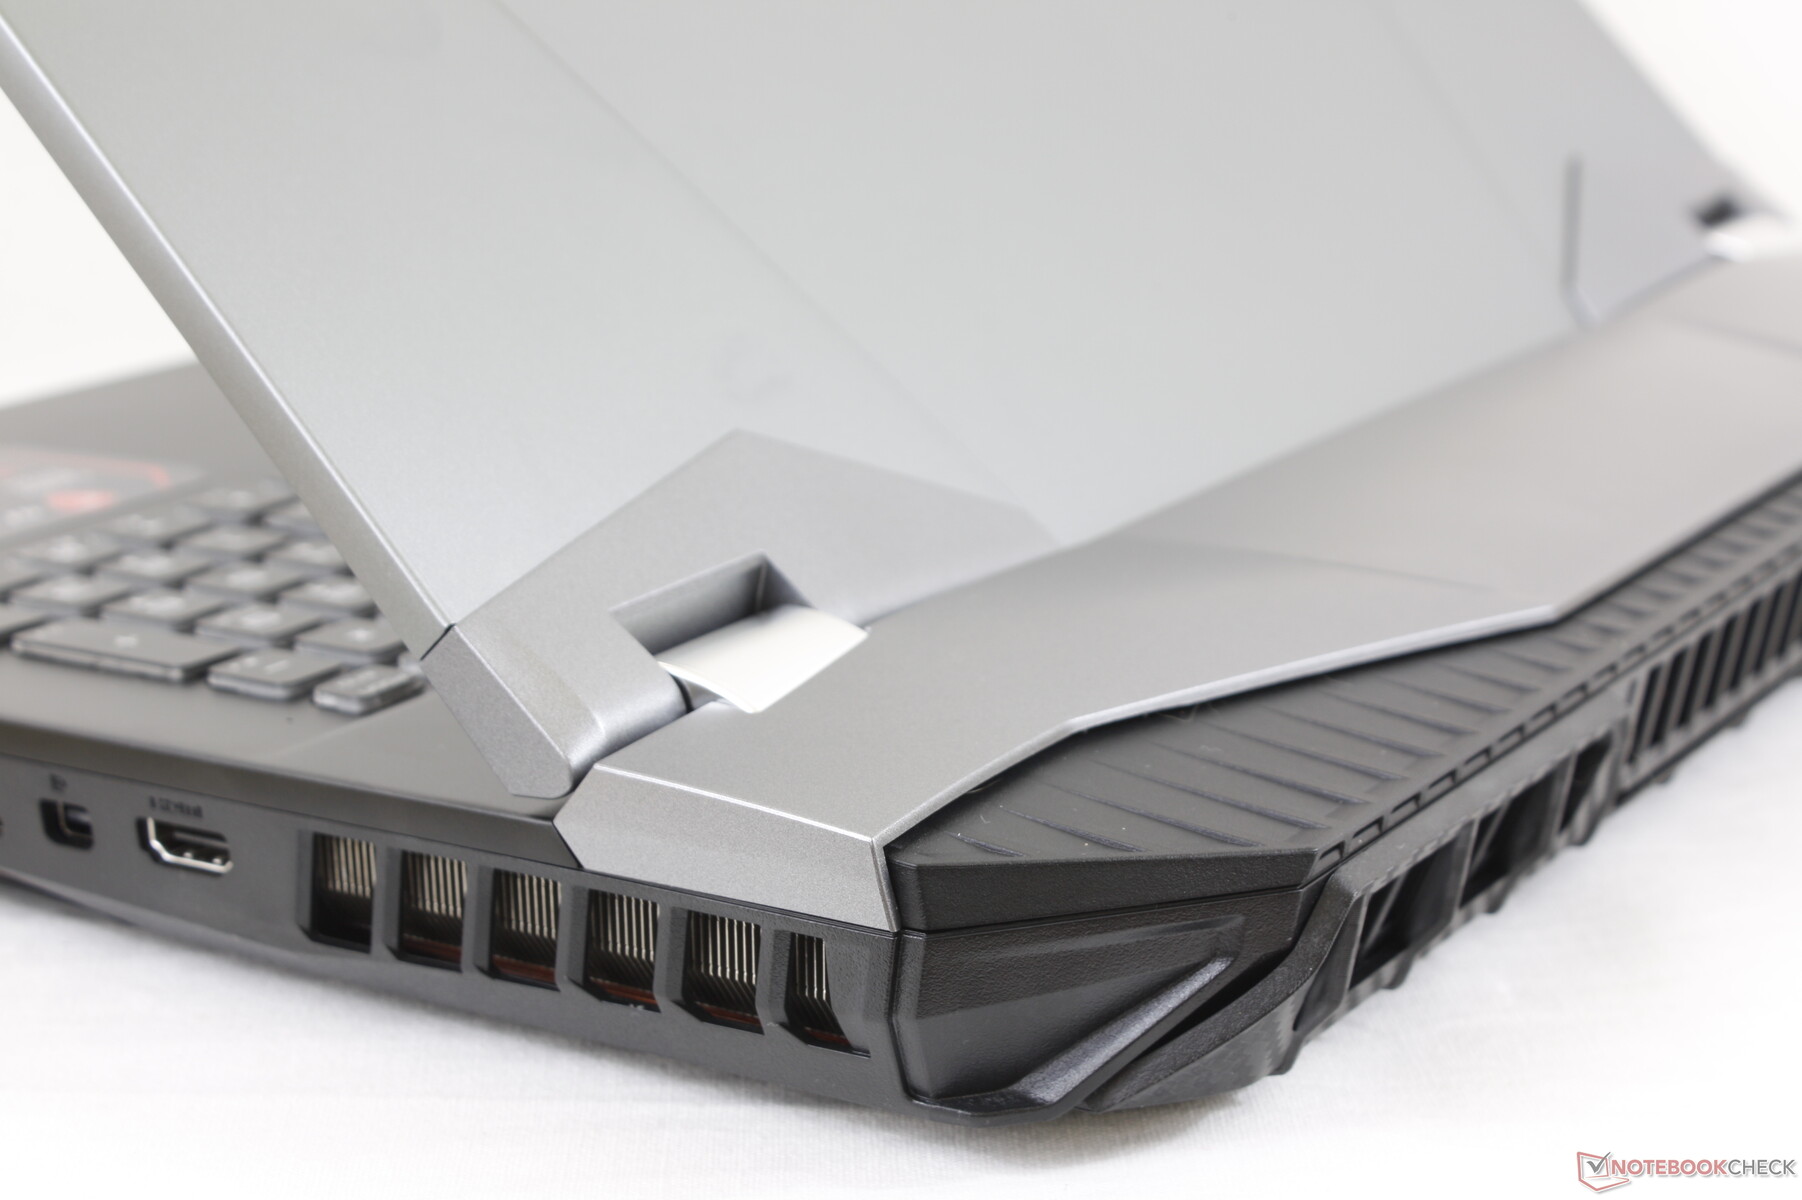
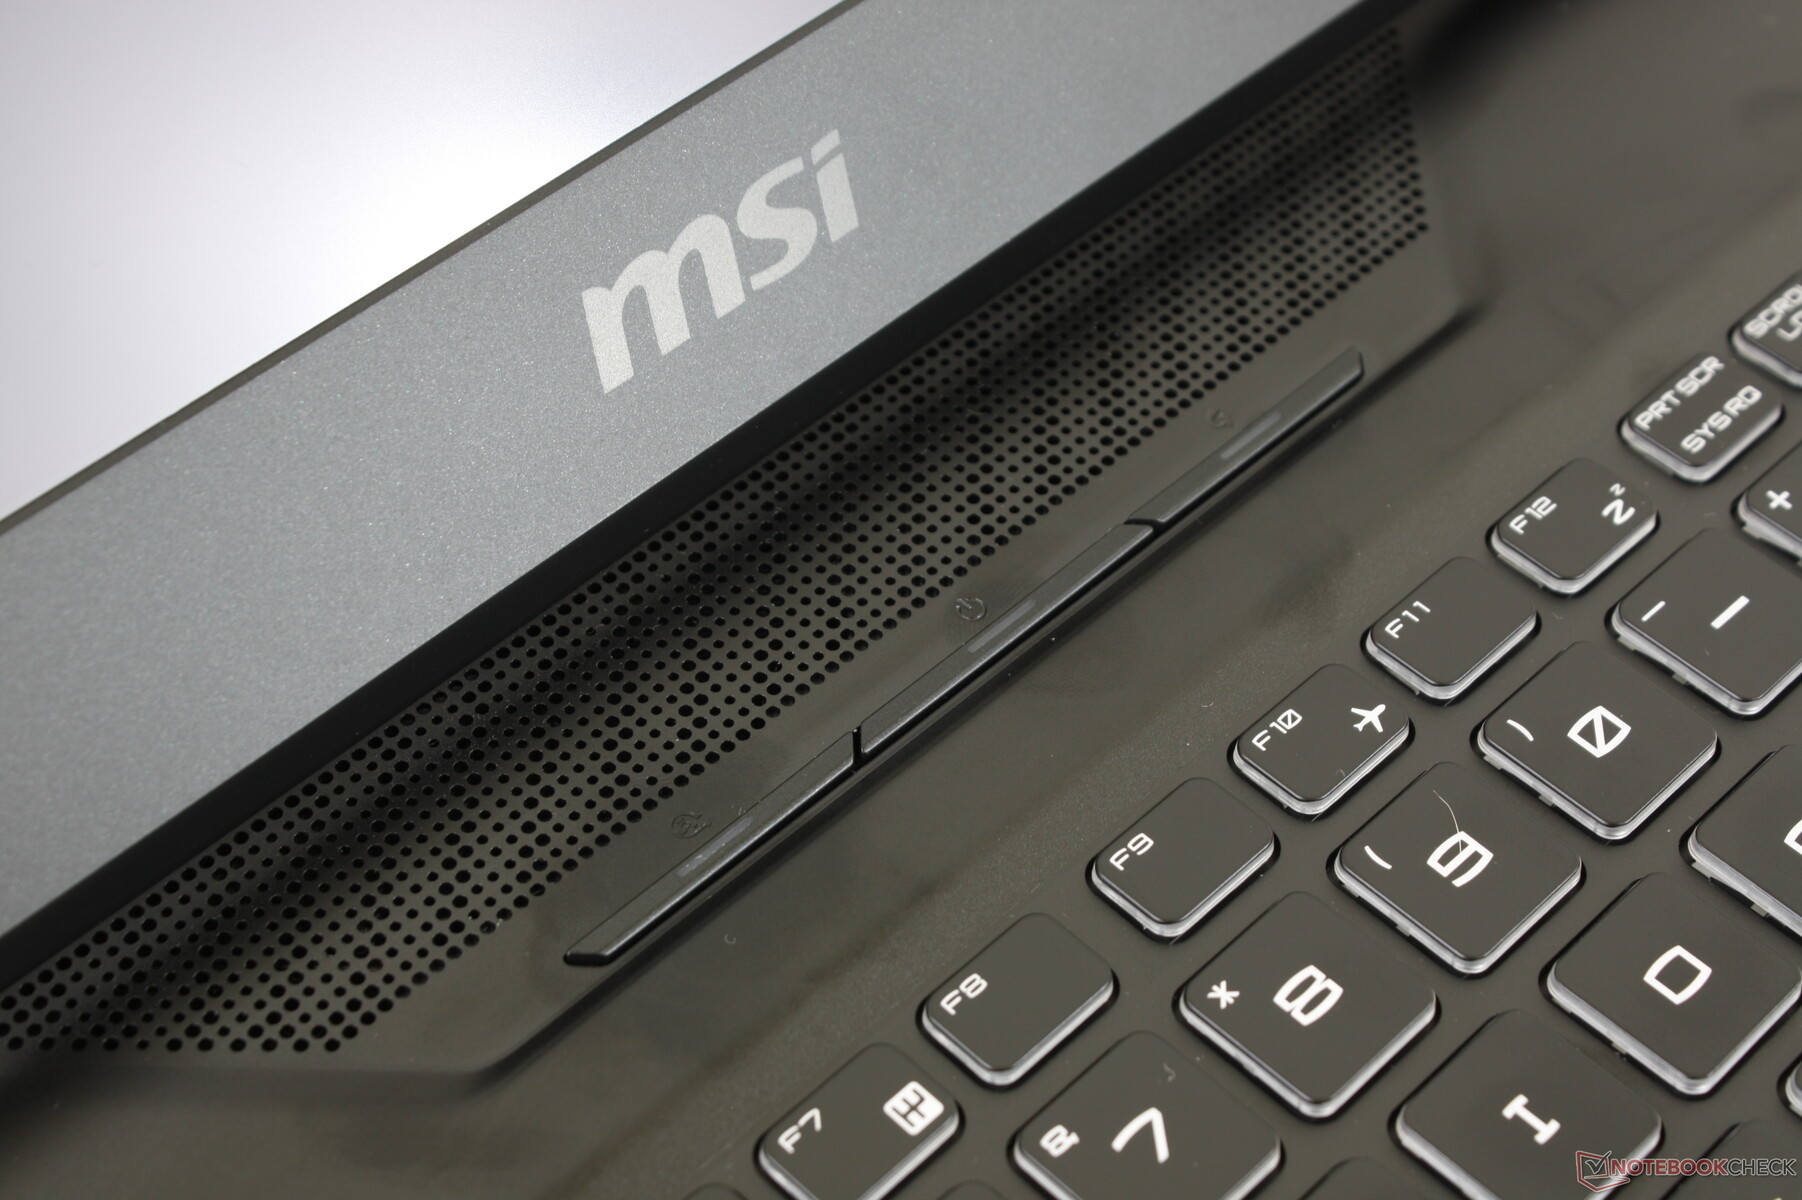
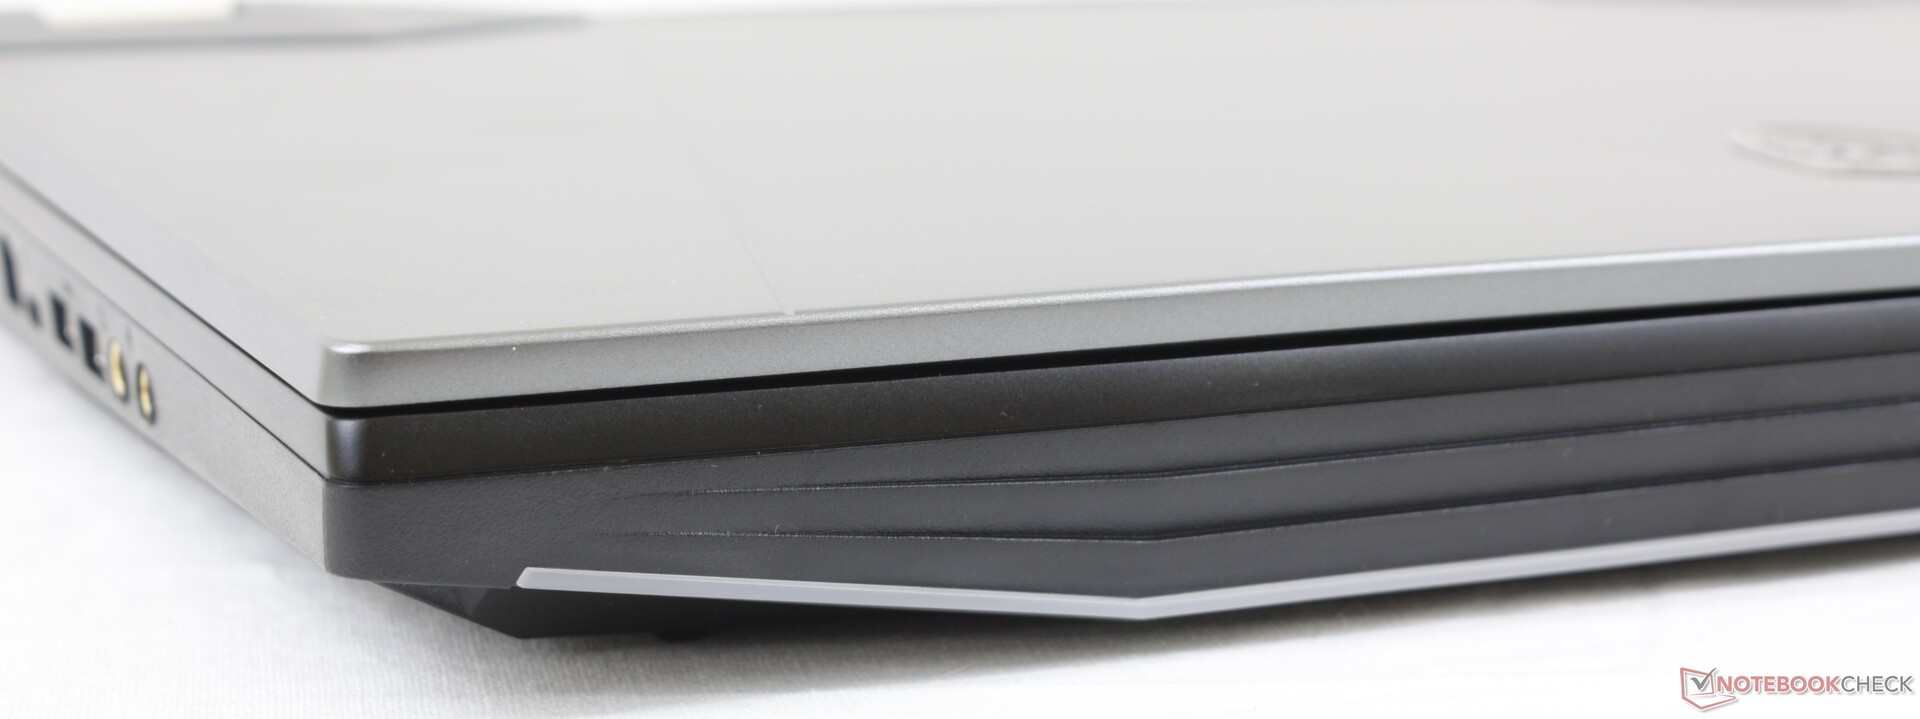
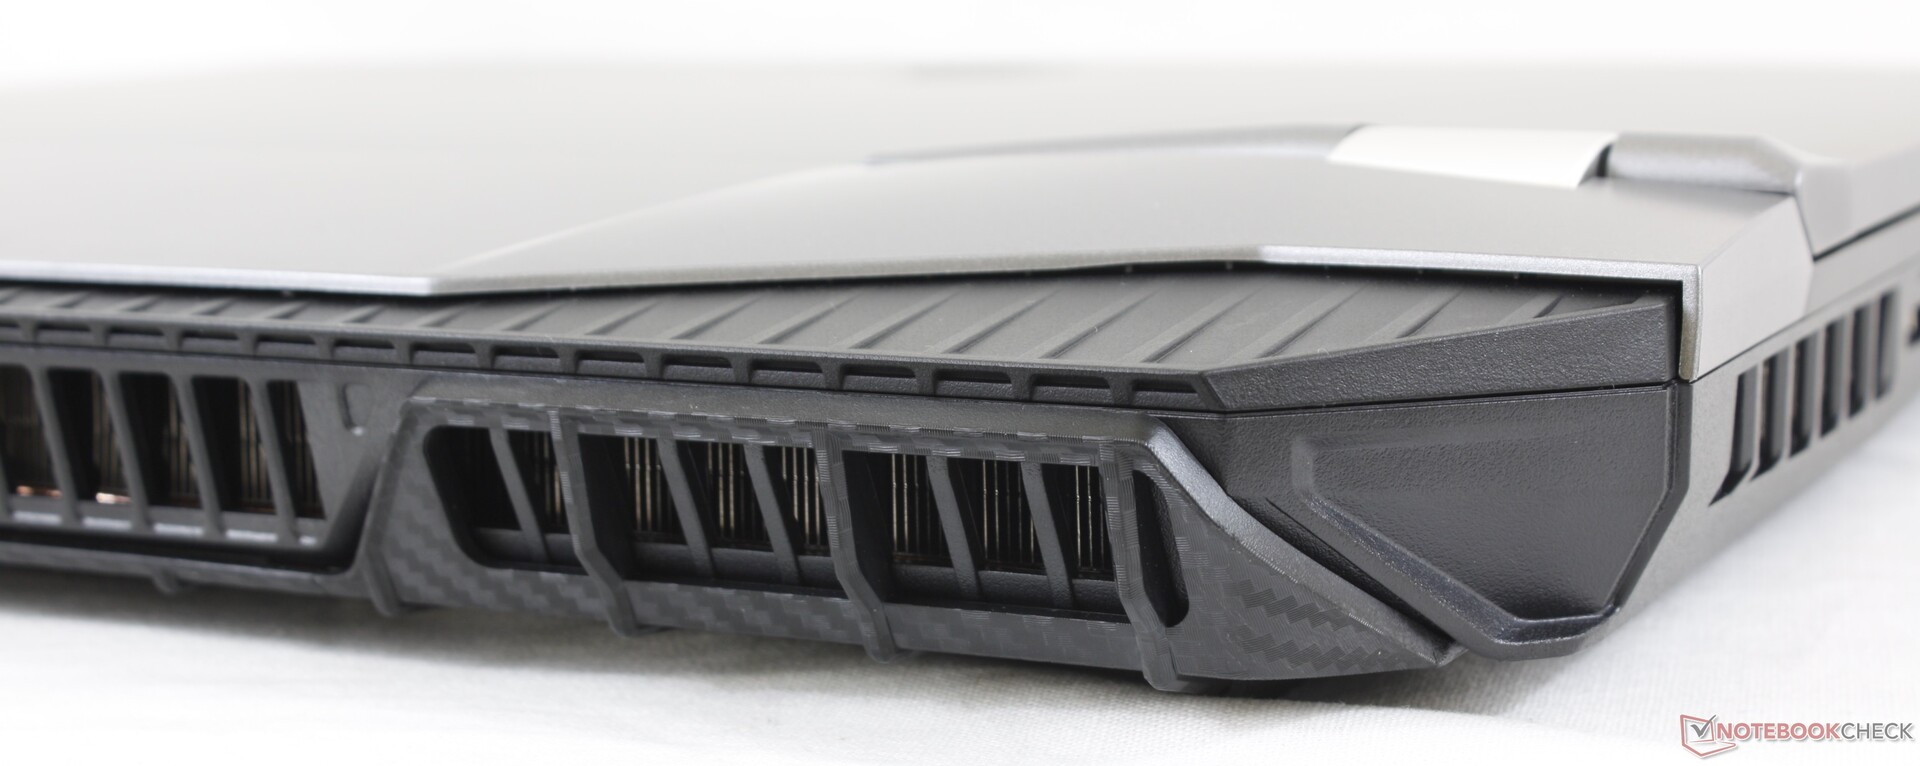
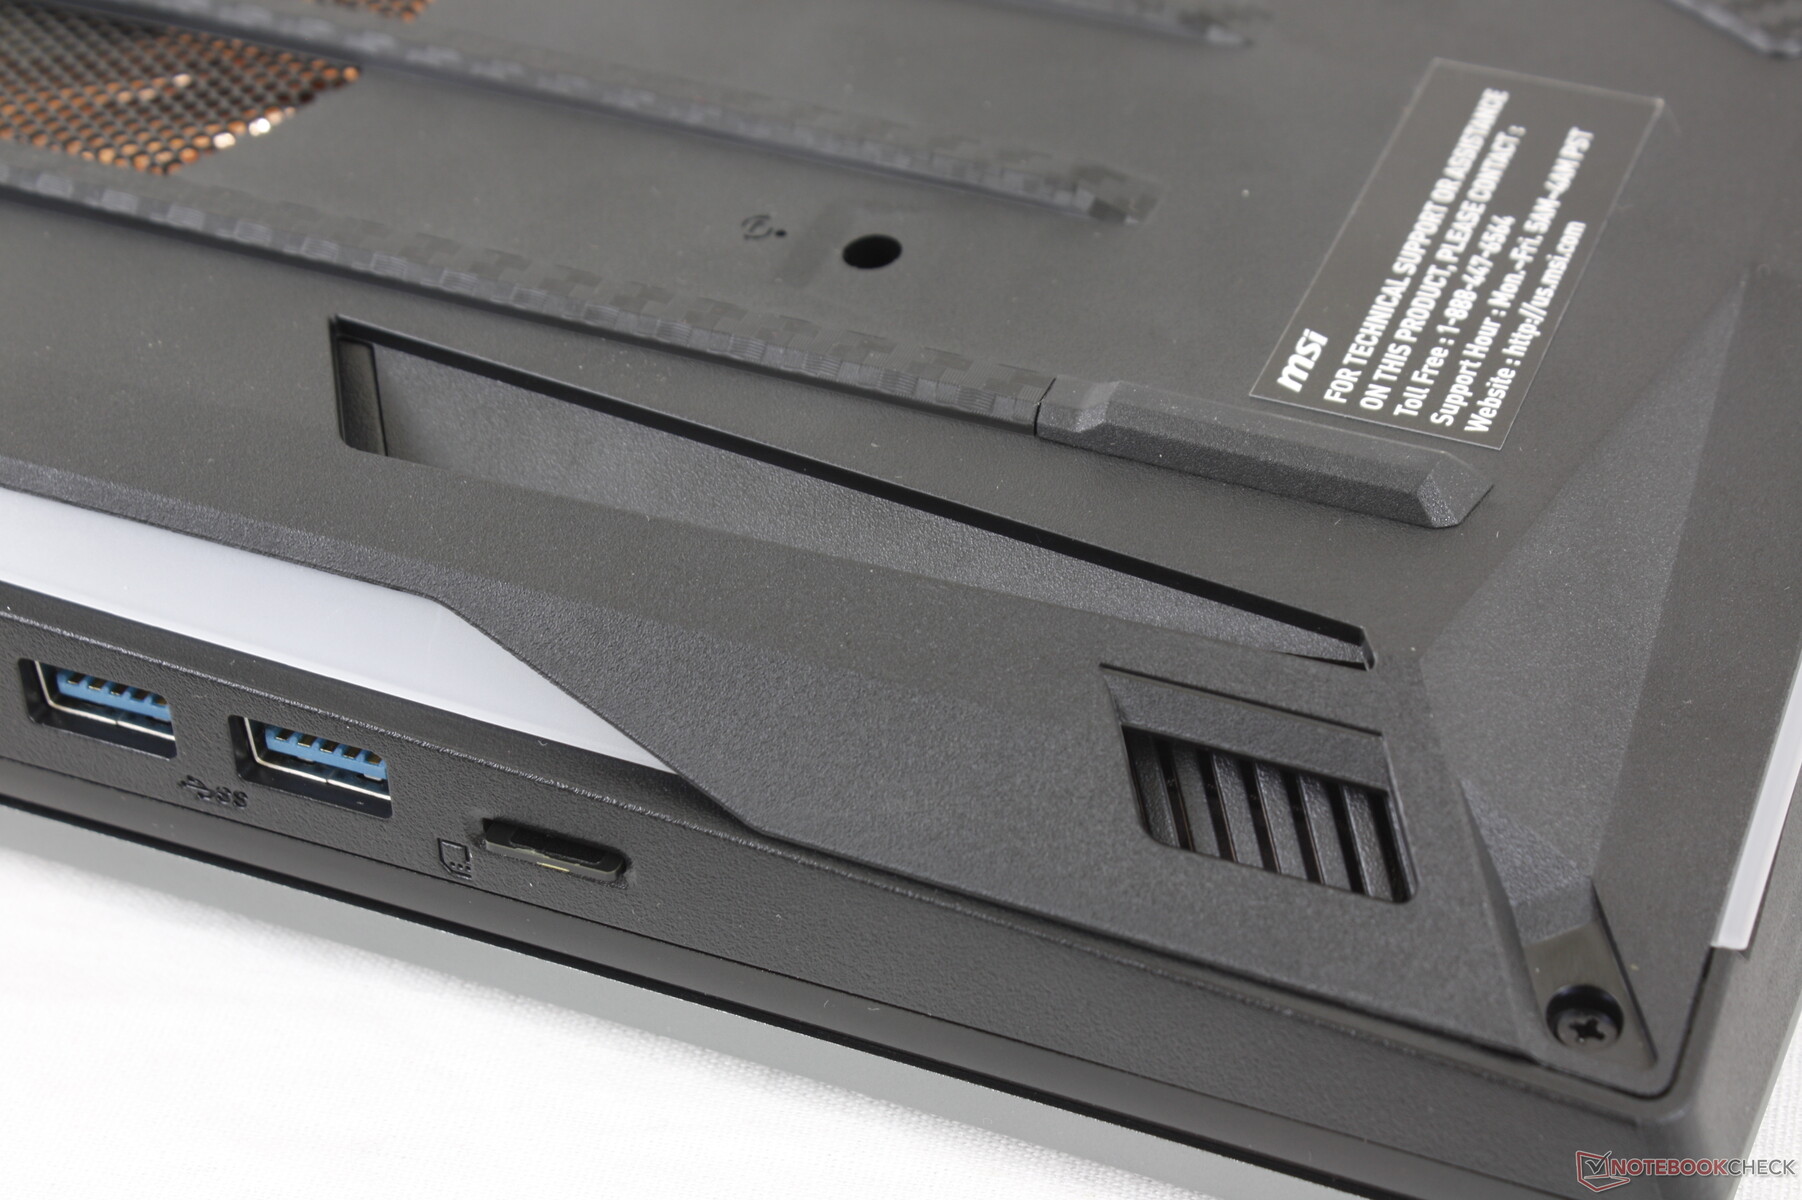
Carcasa
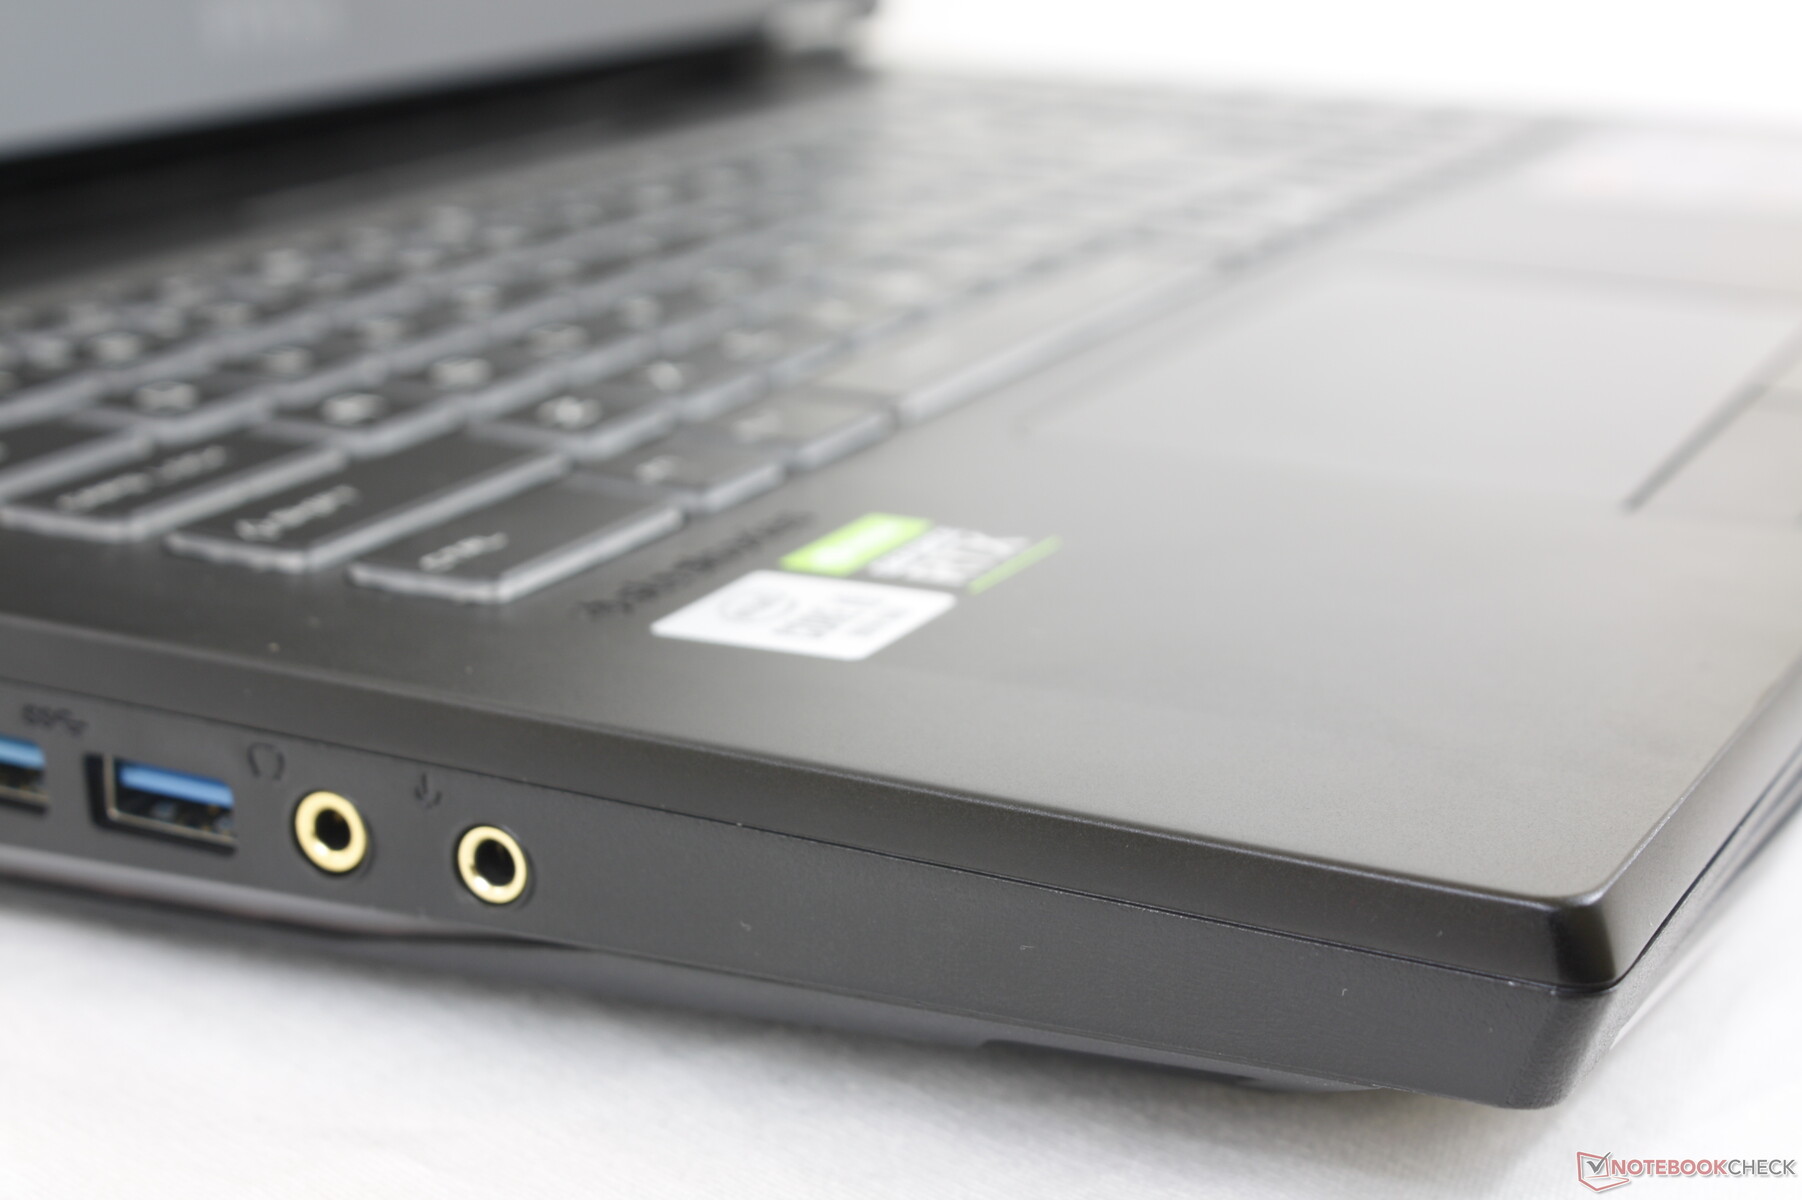
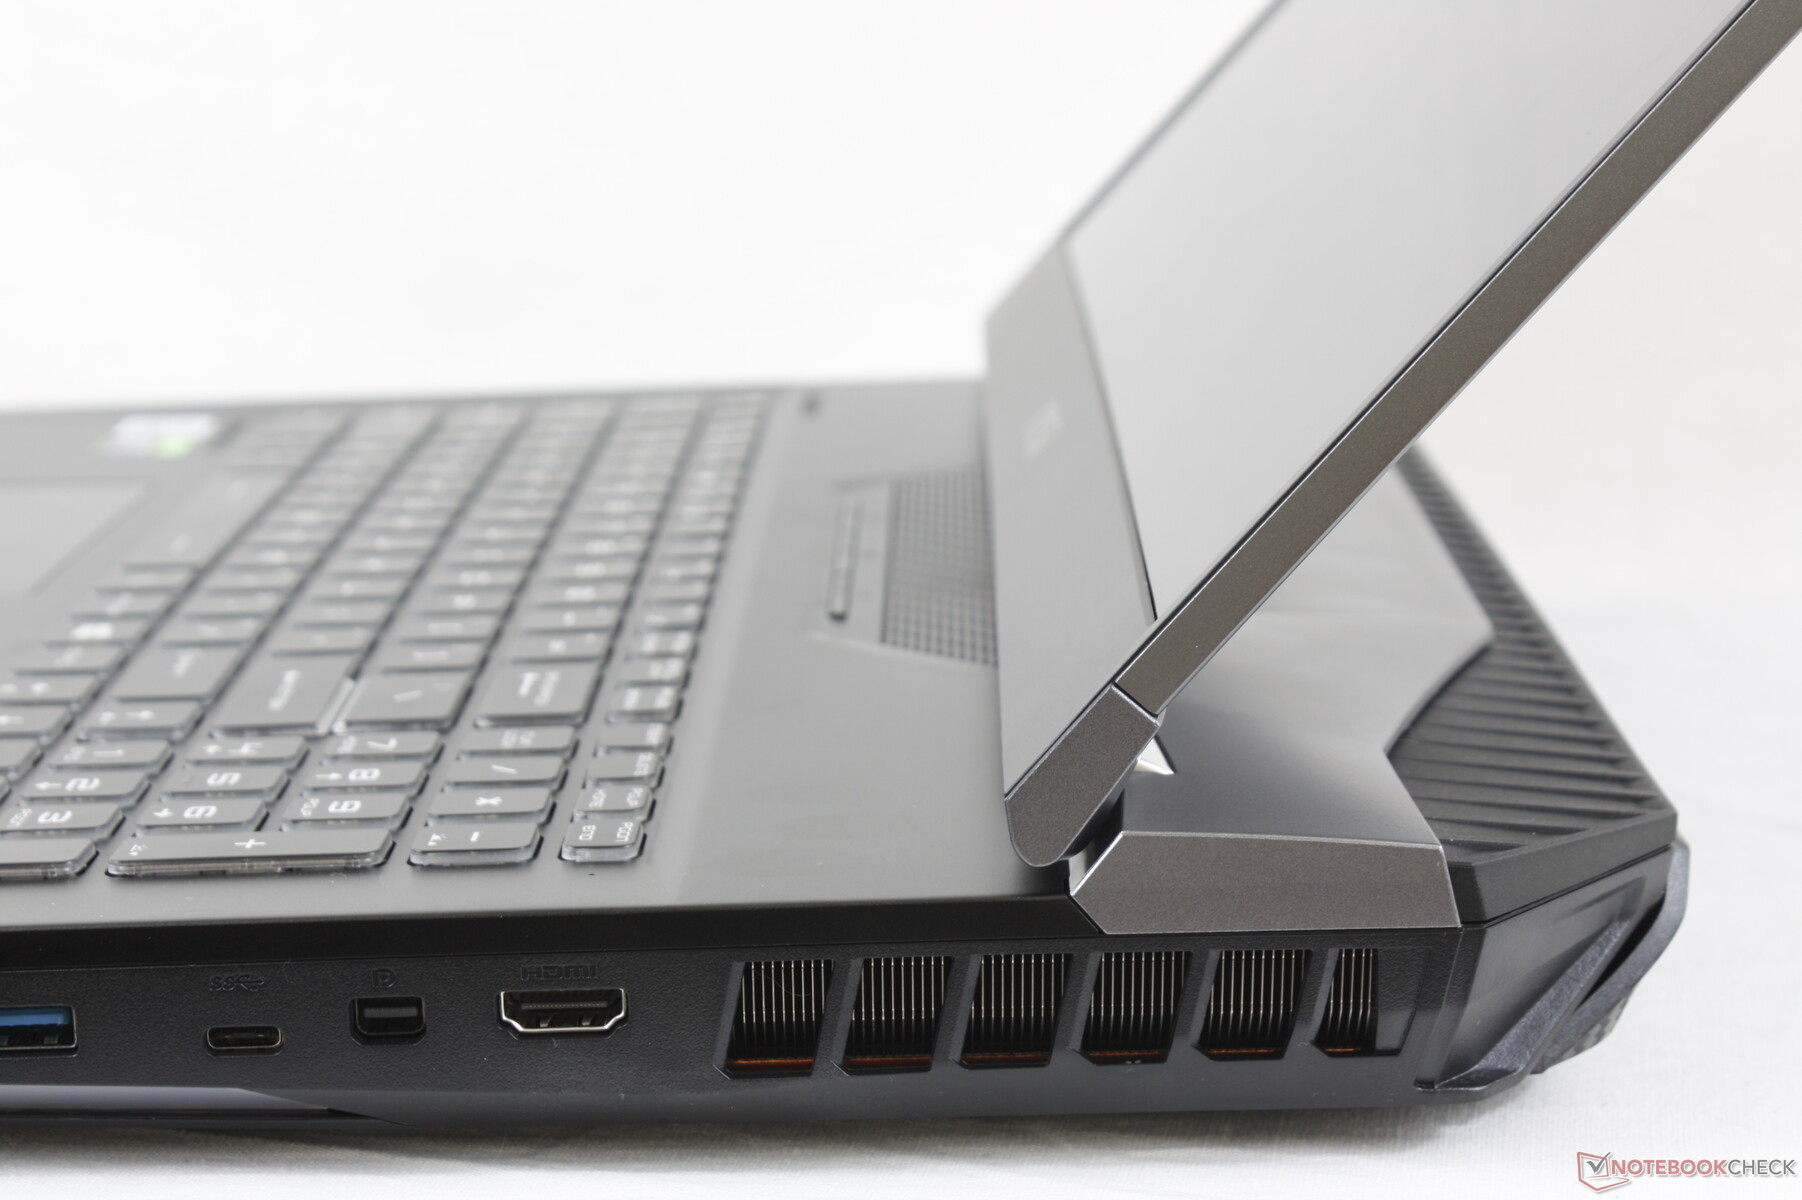
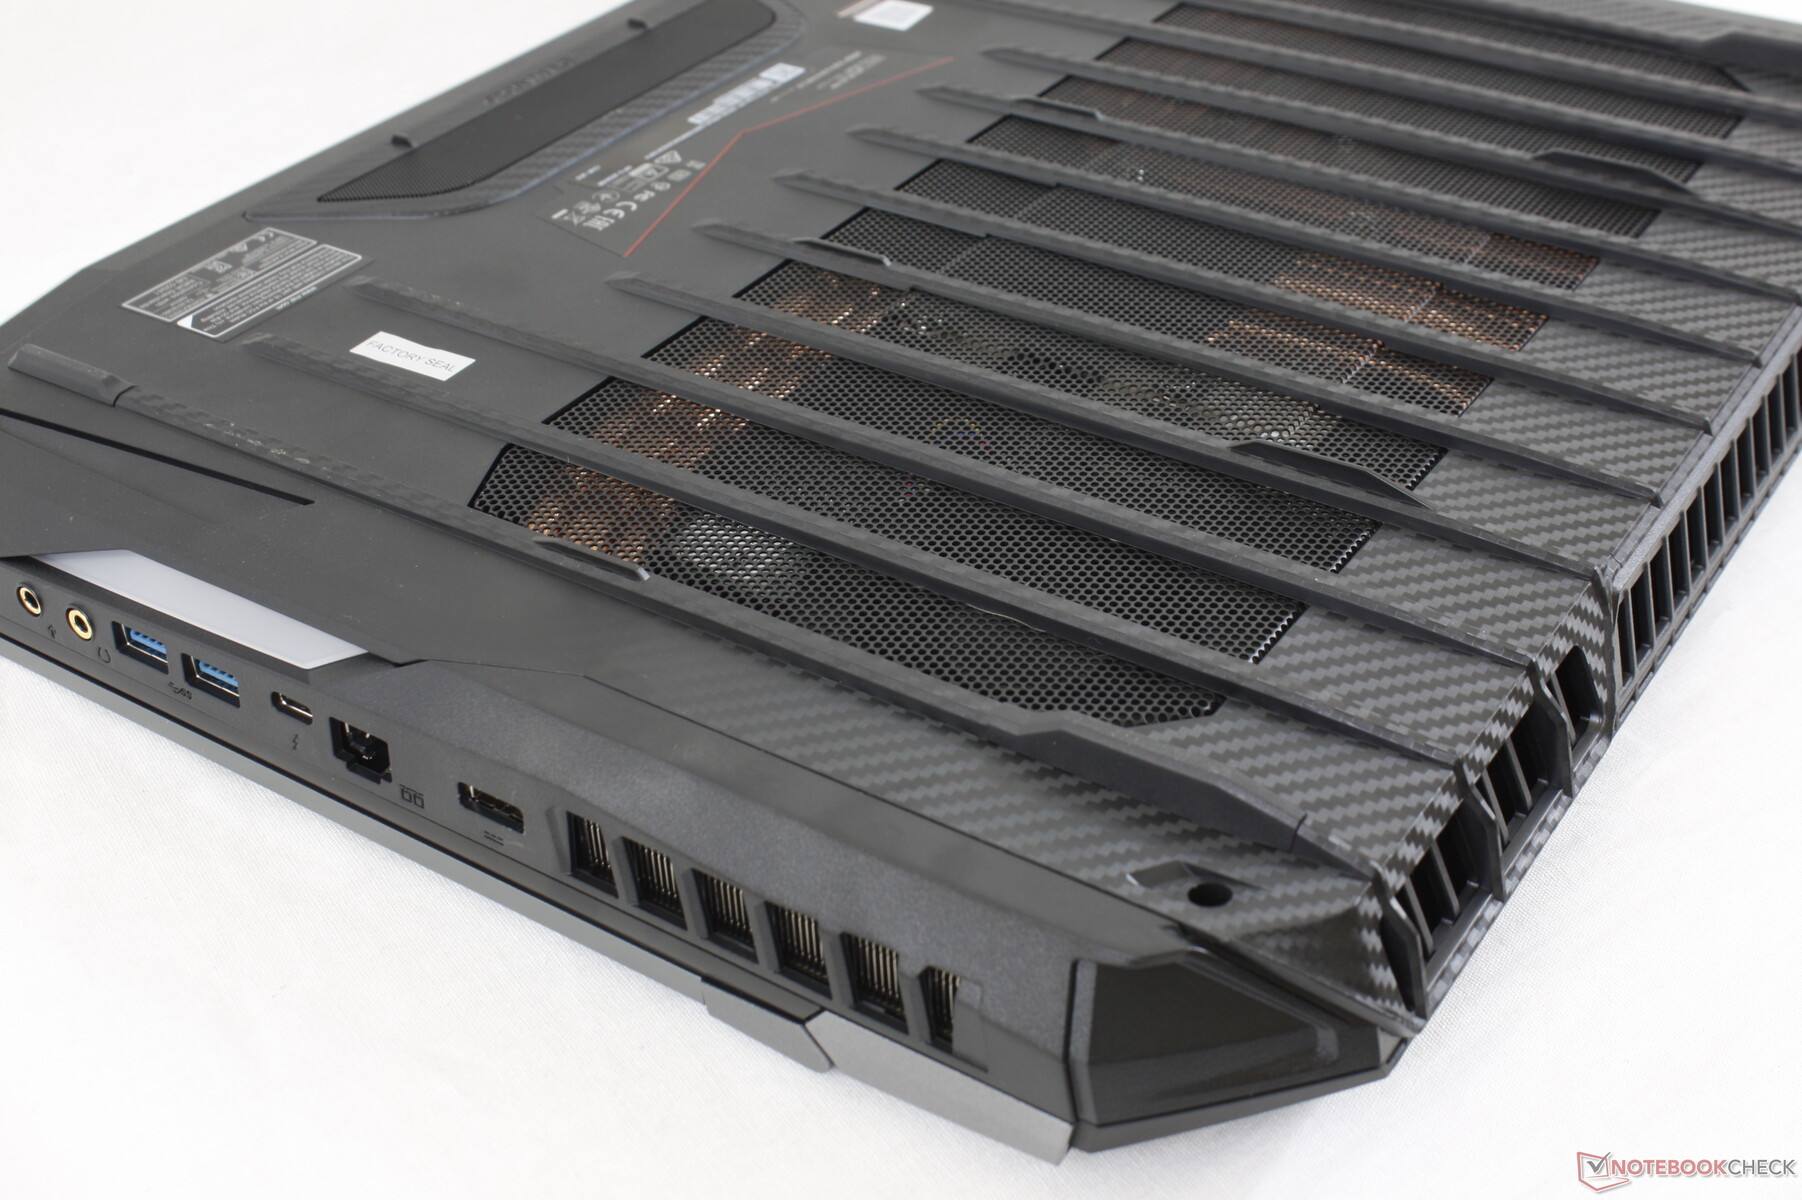
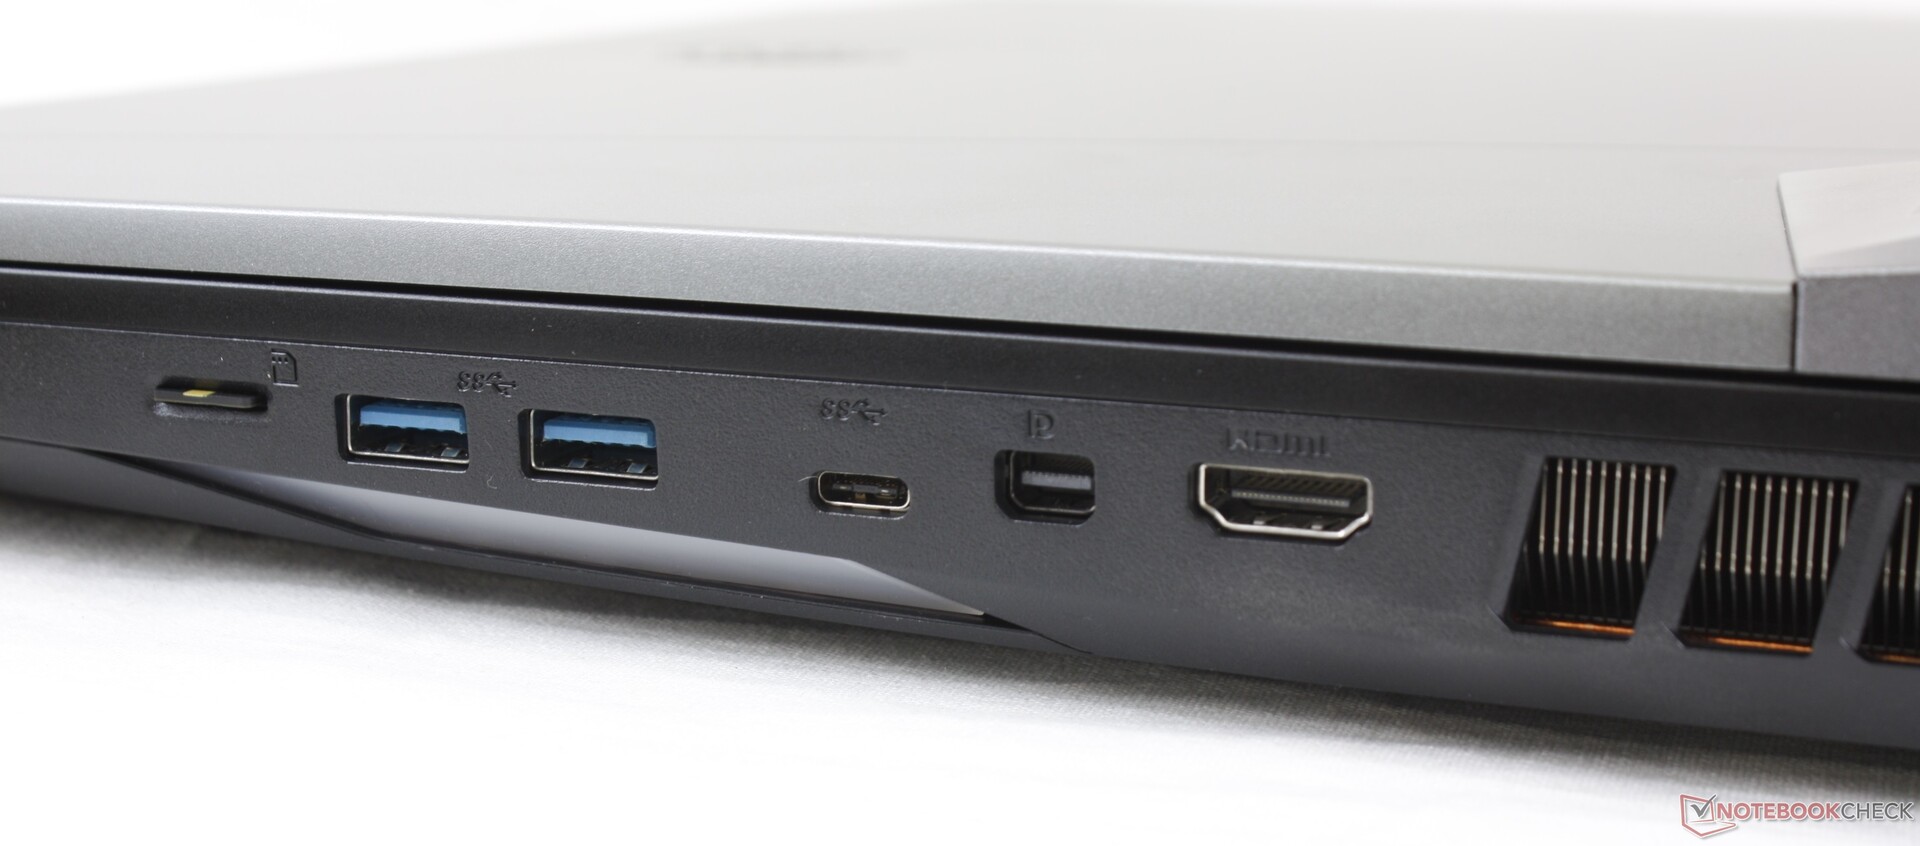
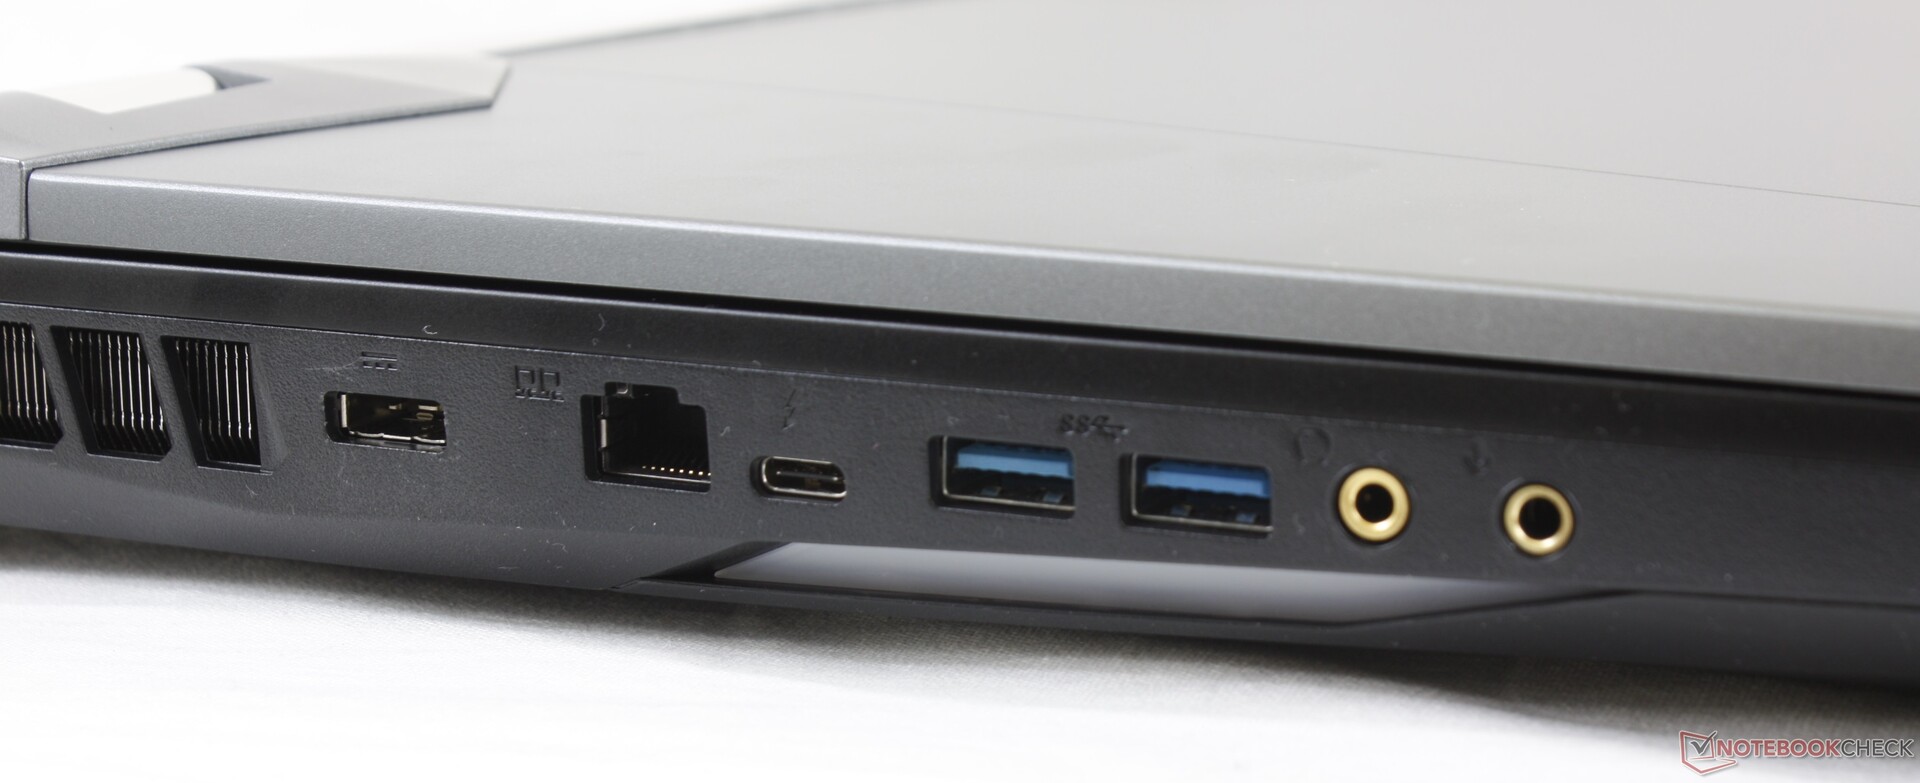
Conectividad
Lector de tarjetas SD
| SD Card Reader | |
| average JPG Copy Test (av. of 3 runs) | |
| Schenker XMG Pro 17 PB71RD-G (Toshiba Exceria Pro SDXC 64 GB UHS-II) | |
| Asus ROG G703GXR (Toshiba Exceria Pro SDXC 64 GB UHS-II) | |
| MSI GT76 Titan DT 10SGS (Toshiba Exceria Pro M501 UHS-II) | |
| MSI GE75 9SG (Toshiba Exceria Pro SDXC 64 GB UHS-II) | |
| maximum AS SSD Seq Read Test (1GB) | |
| Asus ROG G703GXR (Toshiba Exceria Pro SDXC 64 GB UHS-II) | |
| Schenker XMG Pro 17 PB71RD-G (Toshiba Exceria Pro SDXC 64 GB UHS-II) | |
| MSI GT76 Titan DT 10SGS (Toshiba Exceria Pro M501 UHS-II) | |
| MSI GE75 9SG (Toshiba Exceria Pro SDXC 64 GB UHS-II) | |
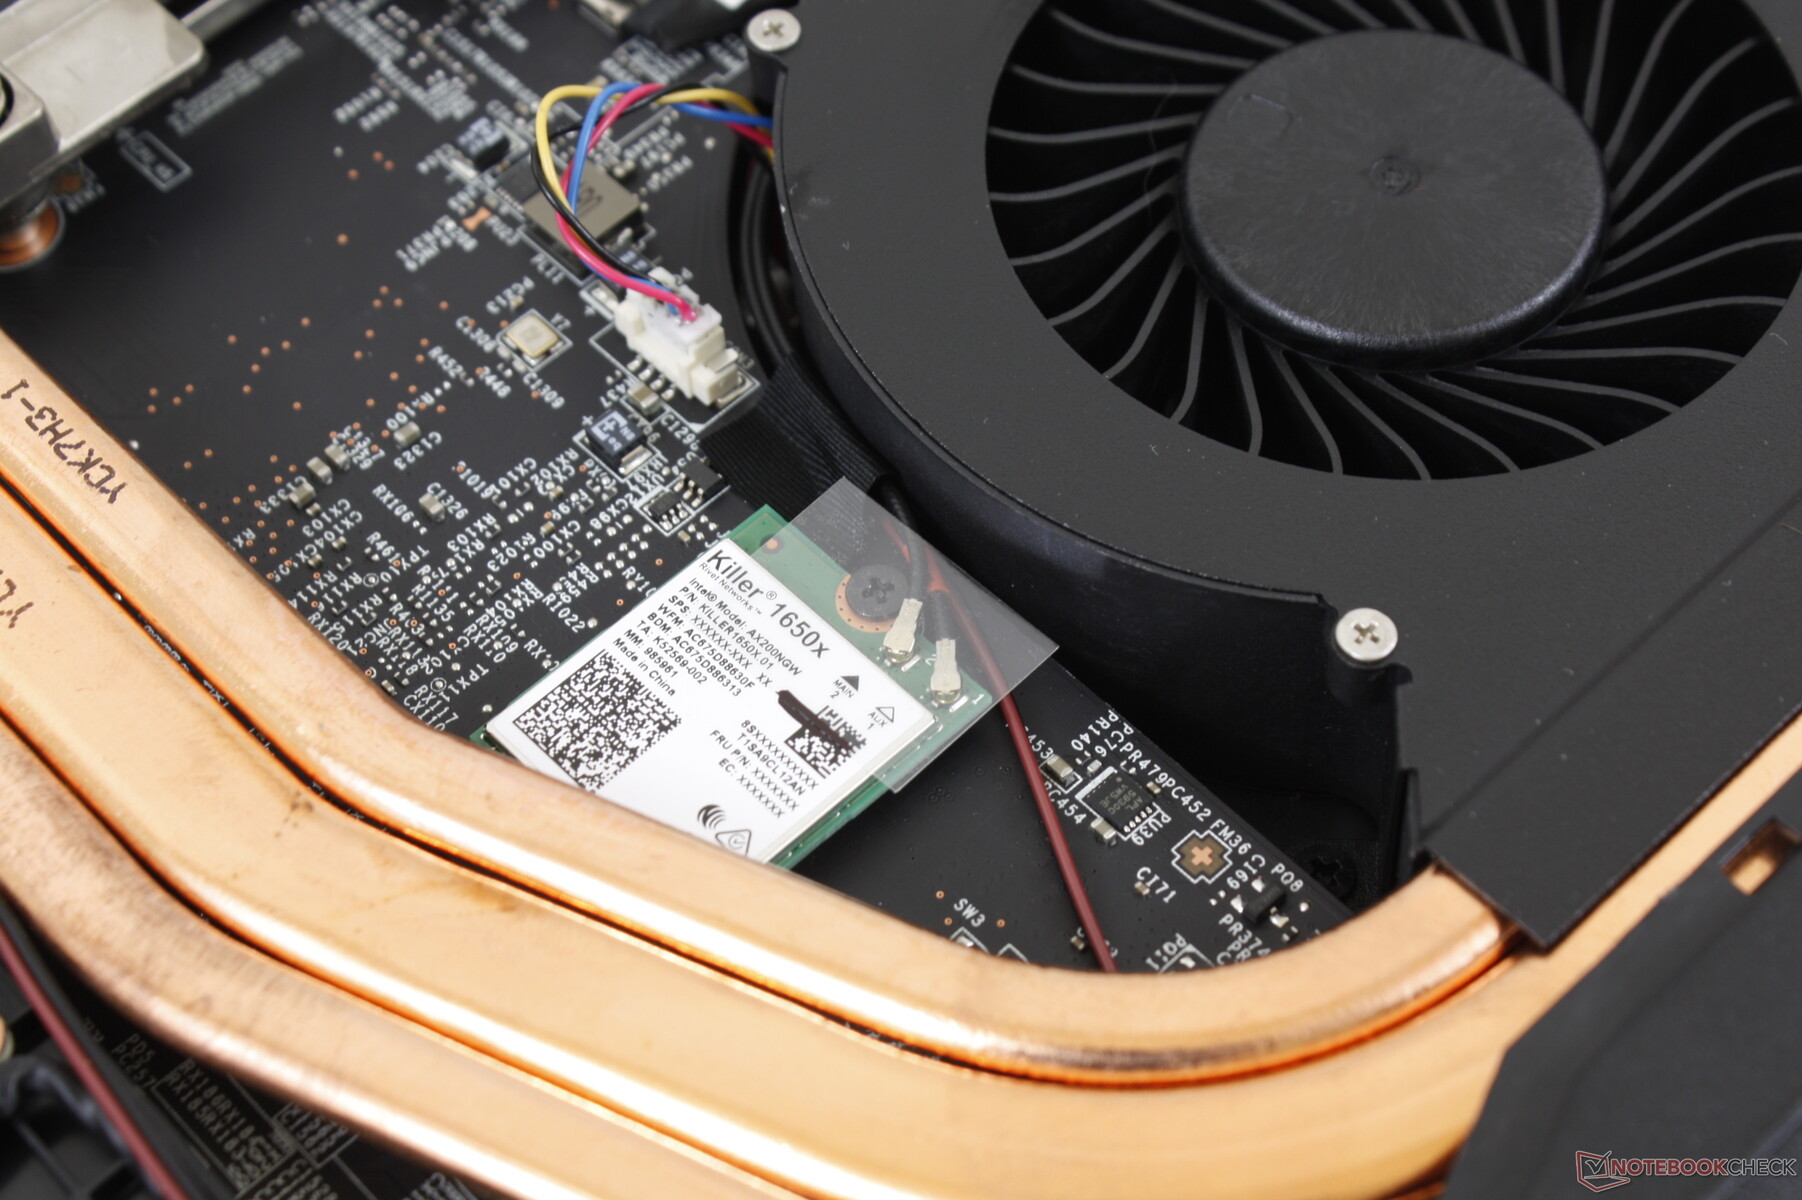
Comunicación
Webcam

")
")
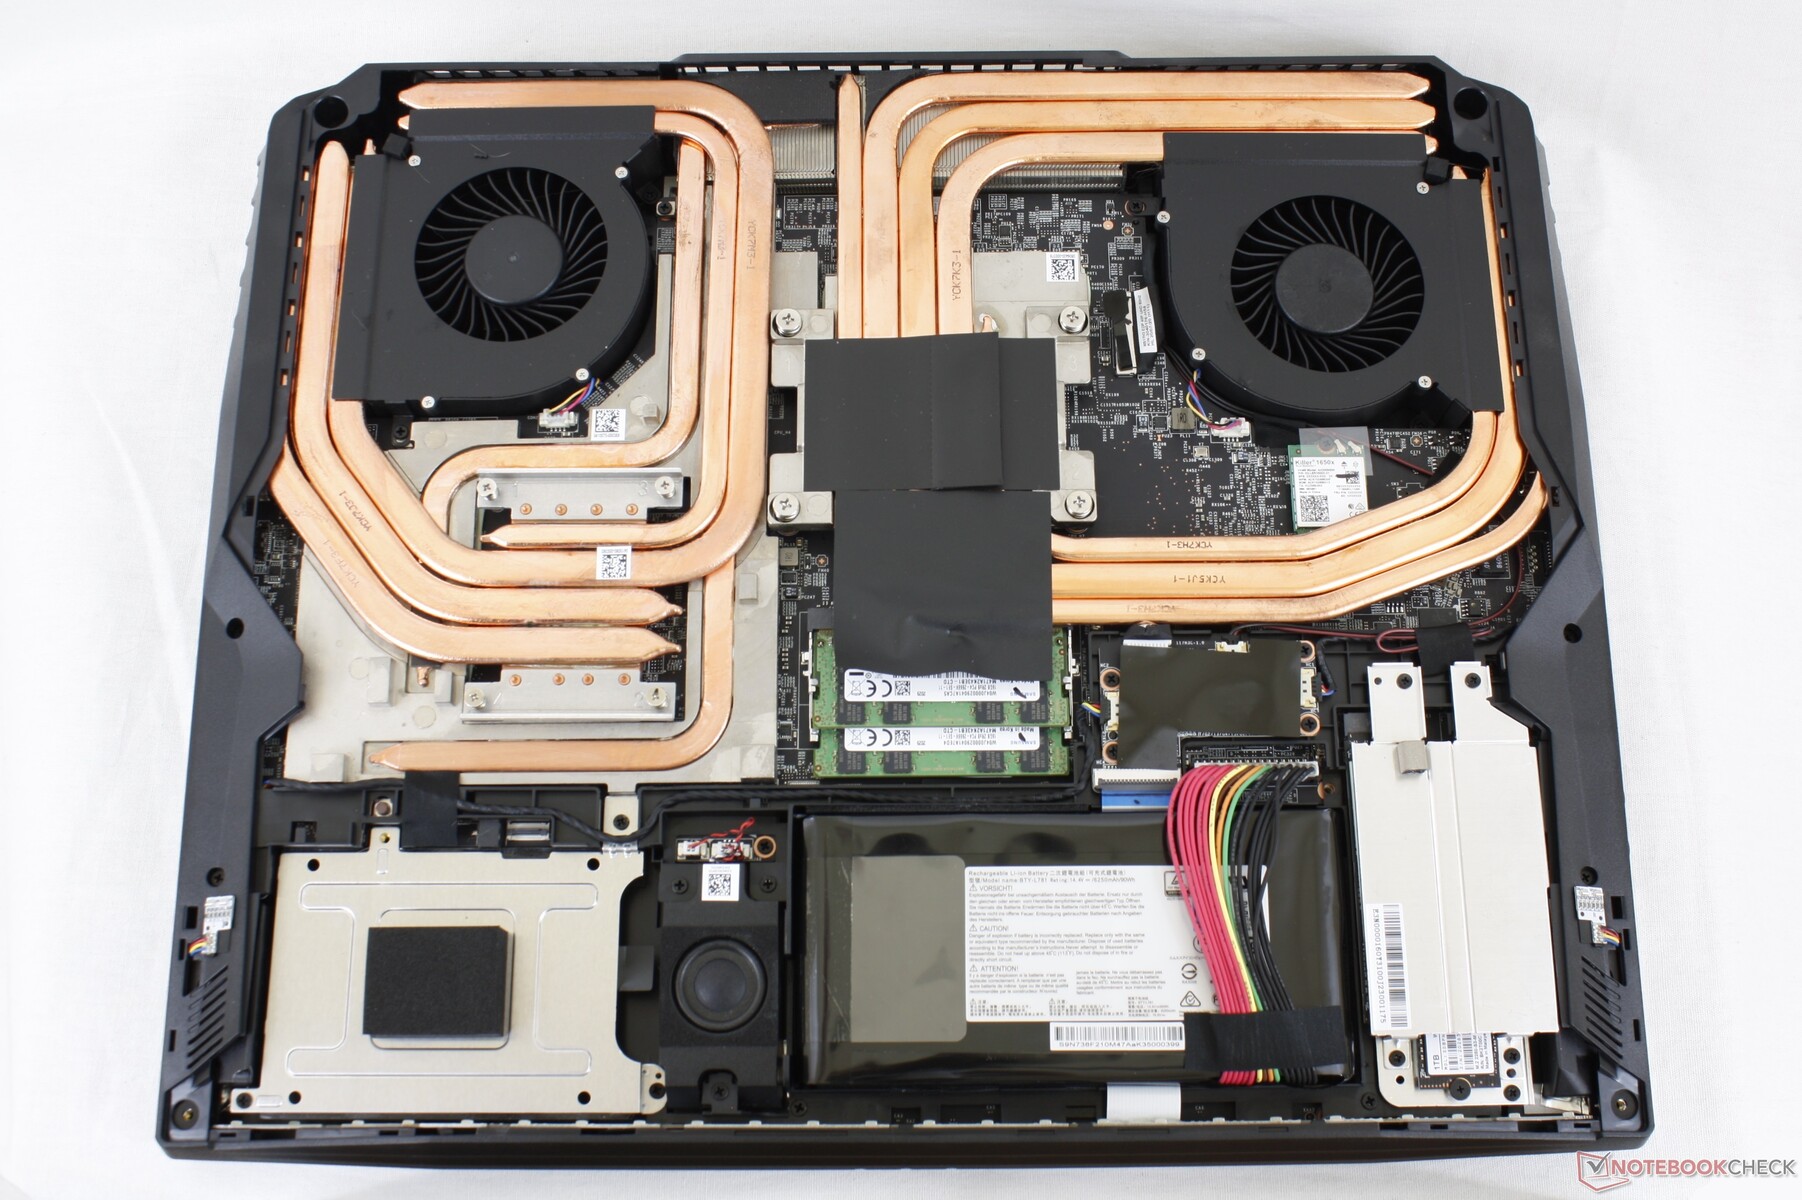
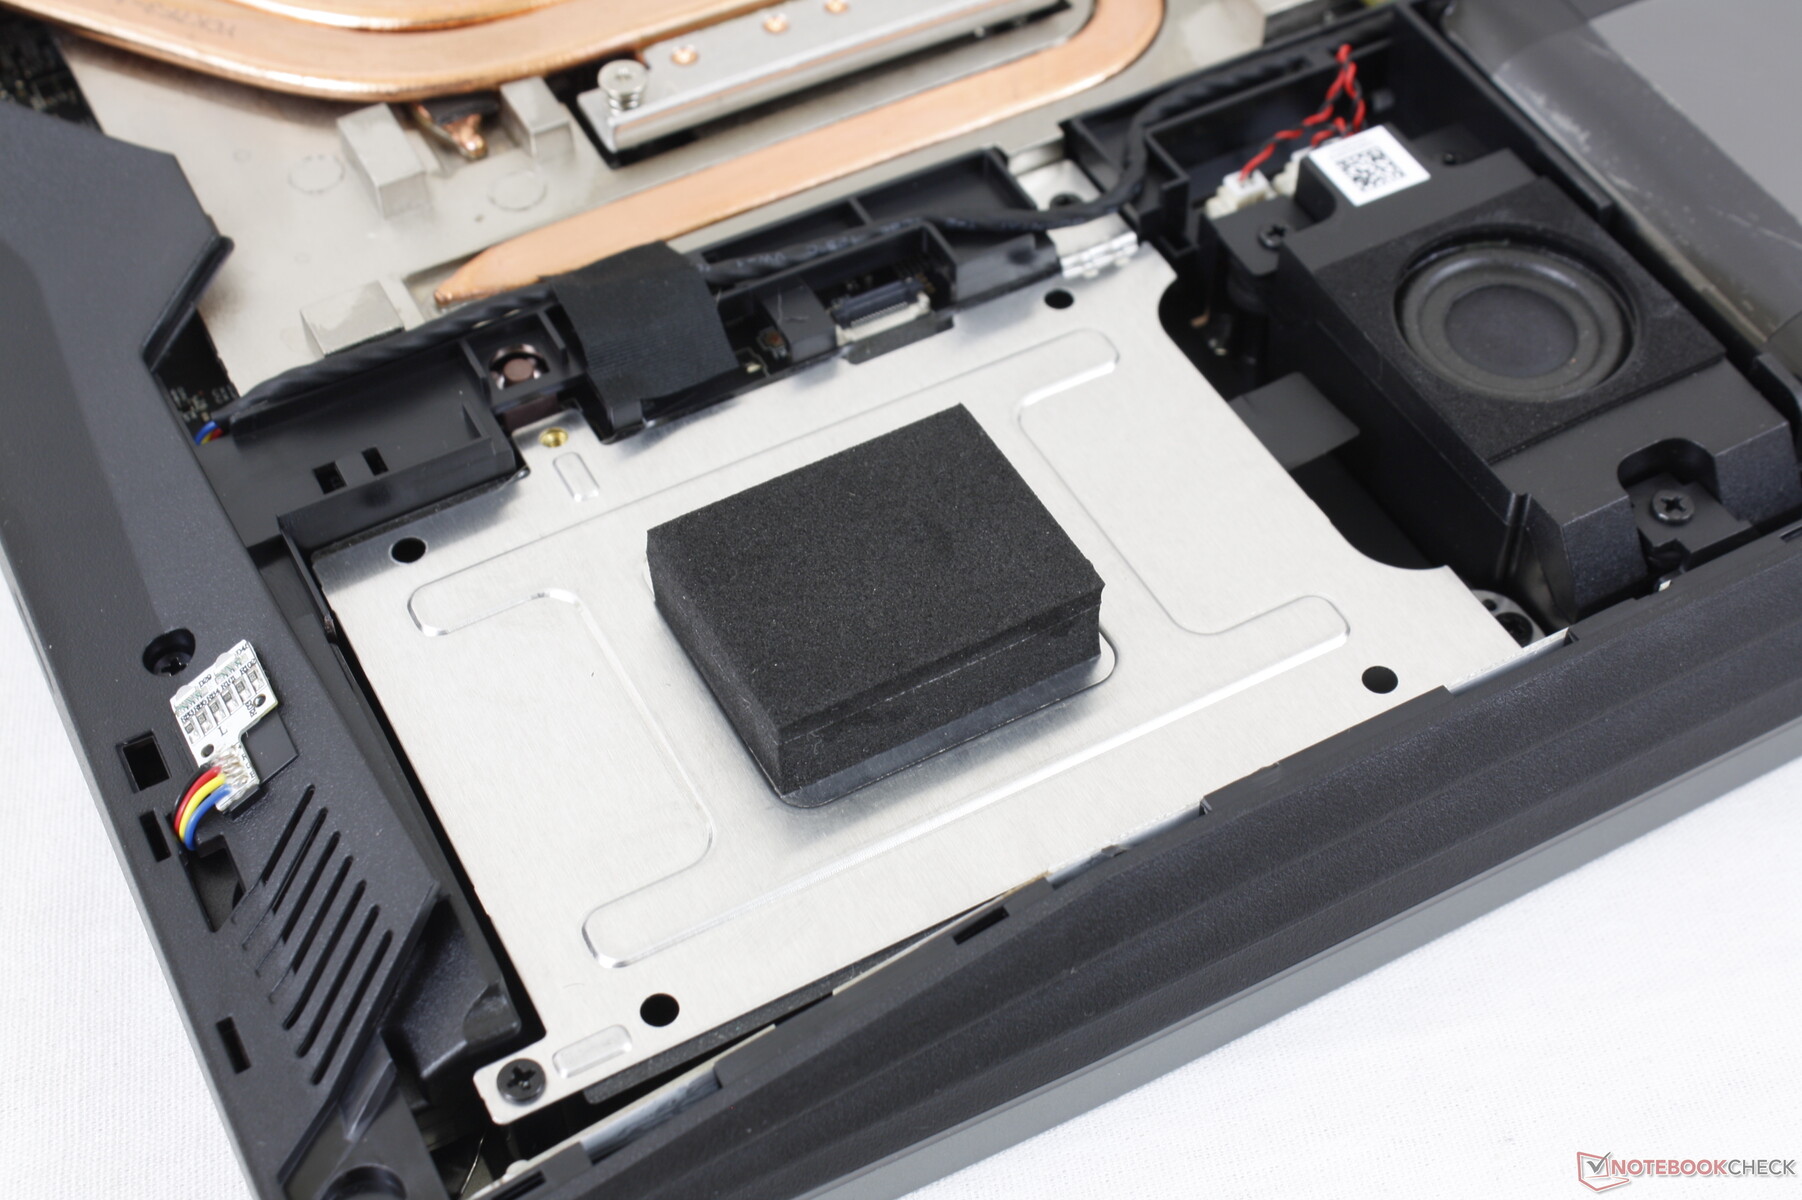
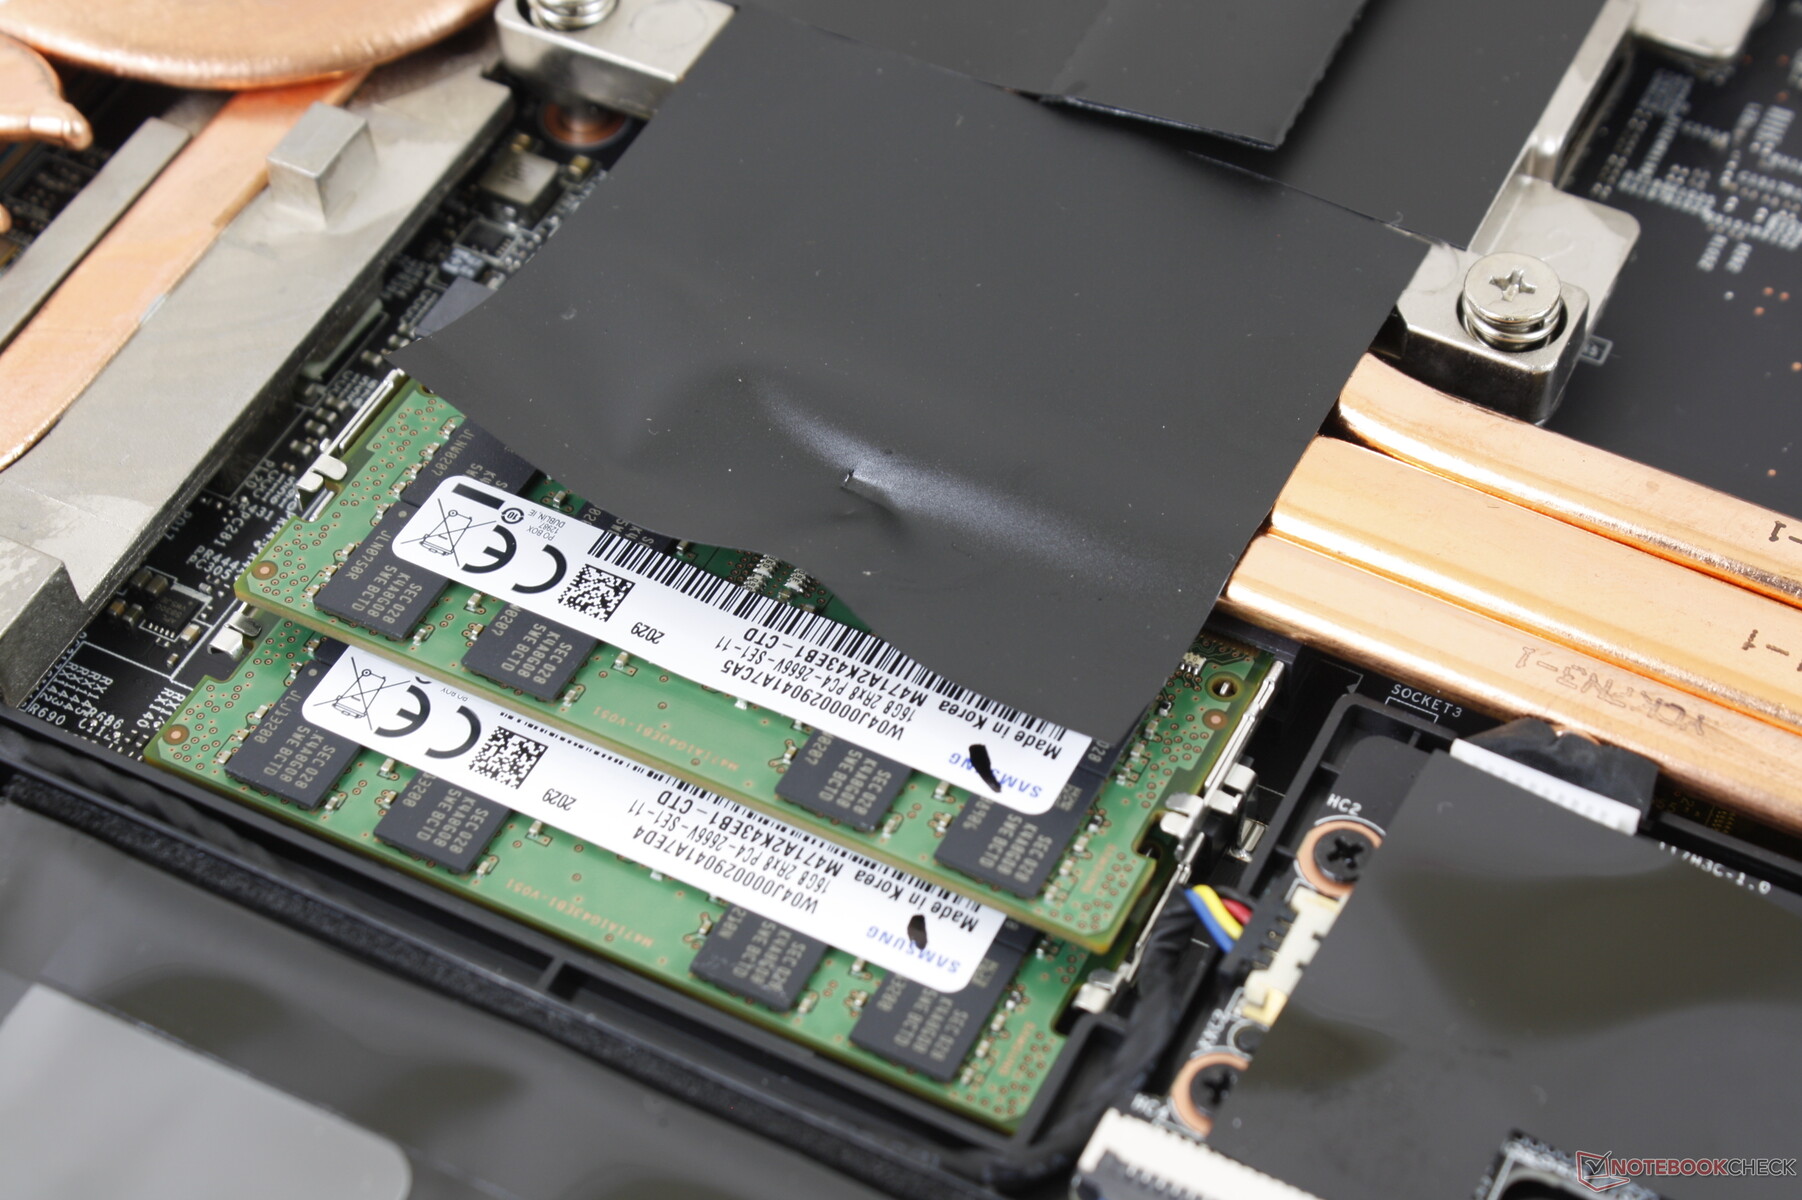
Maintenance
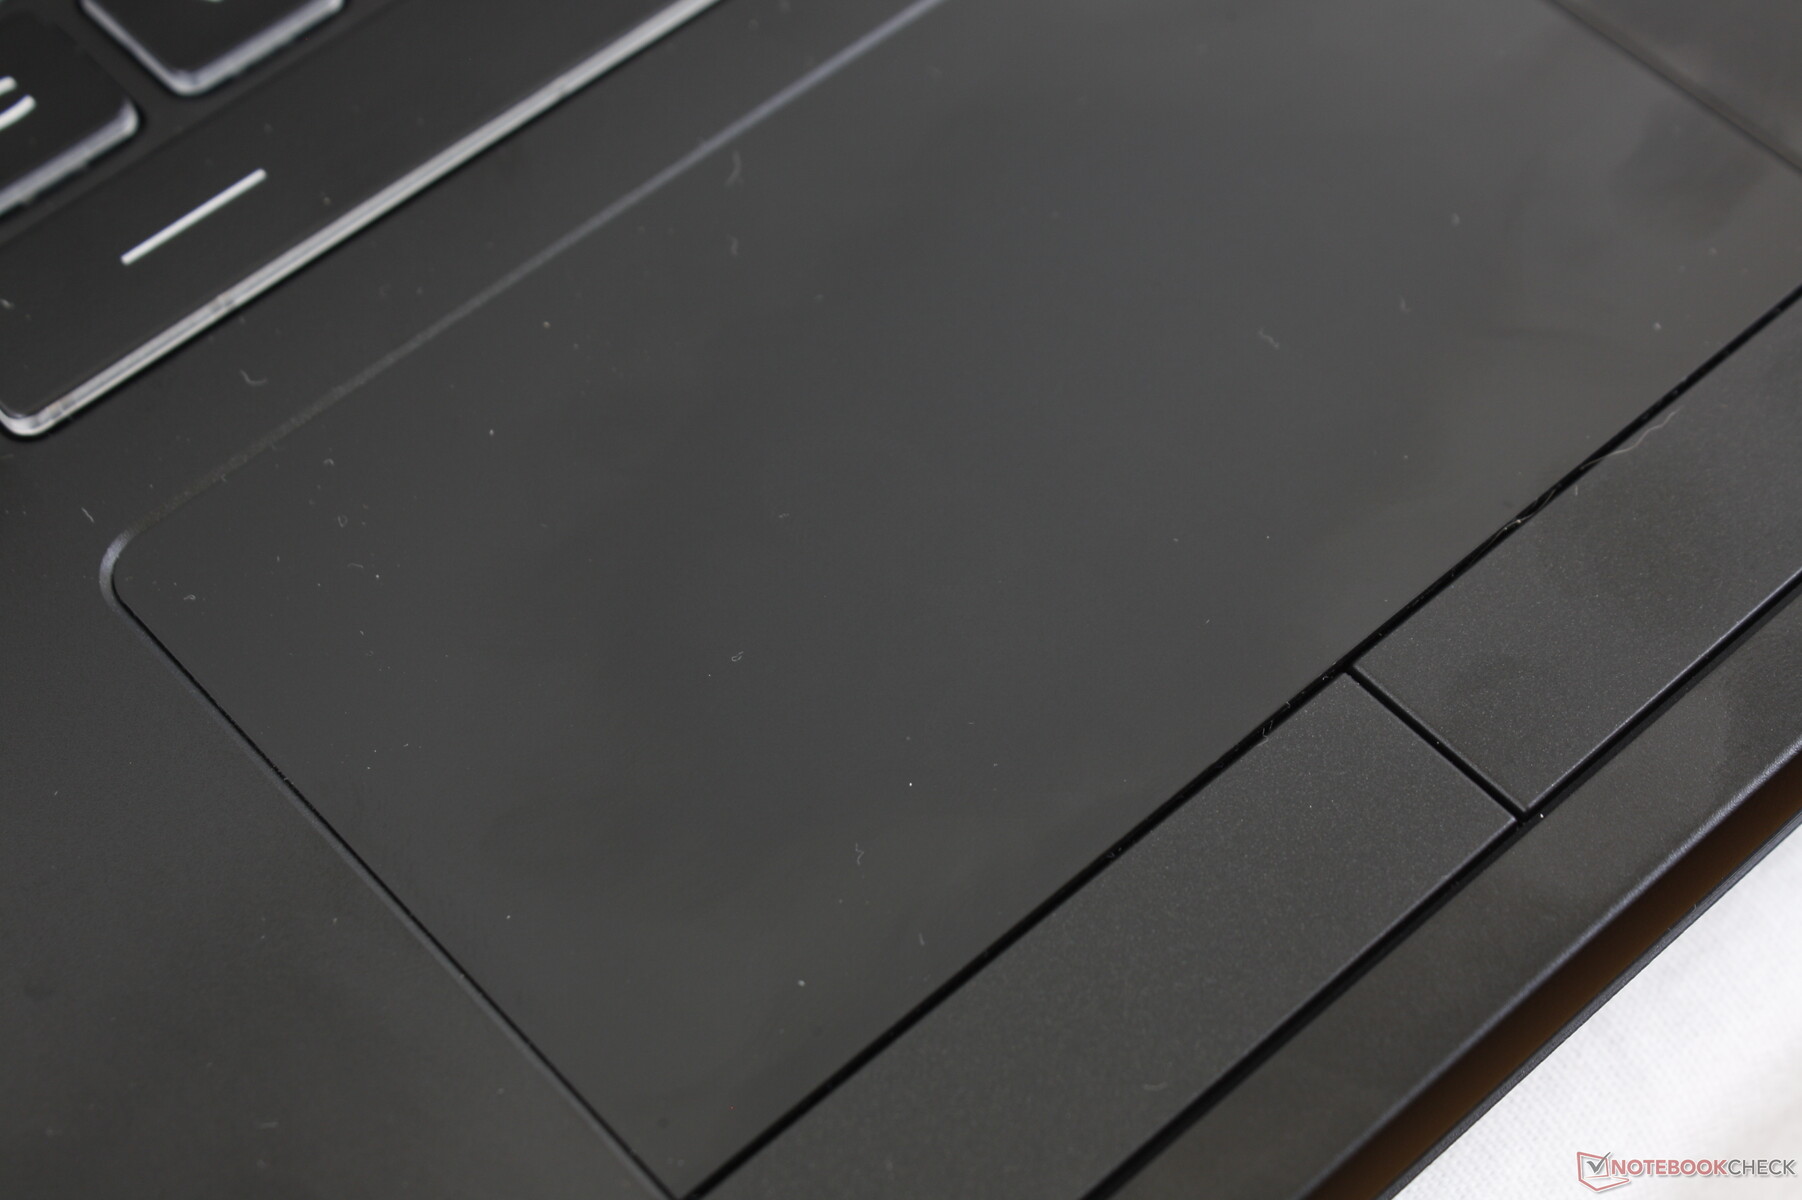
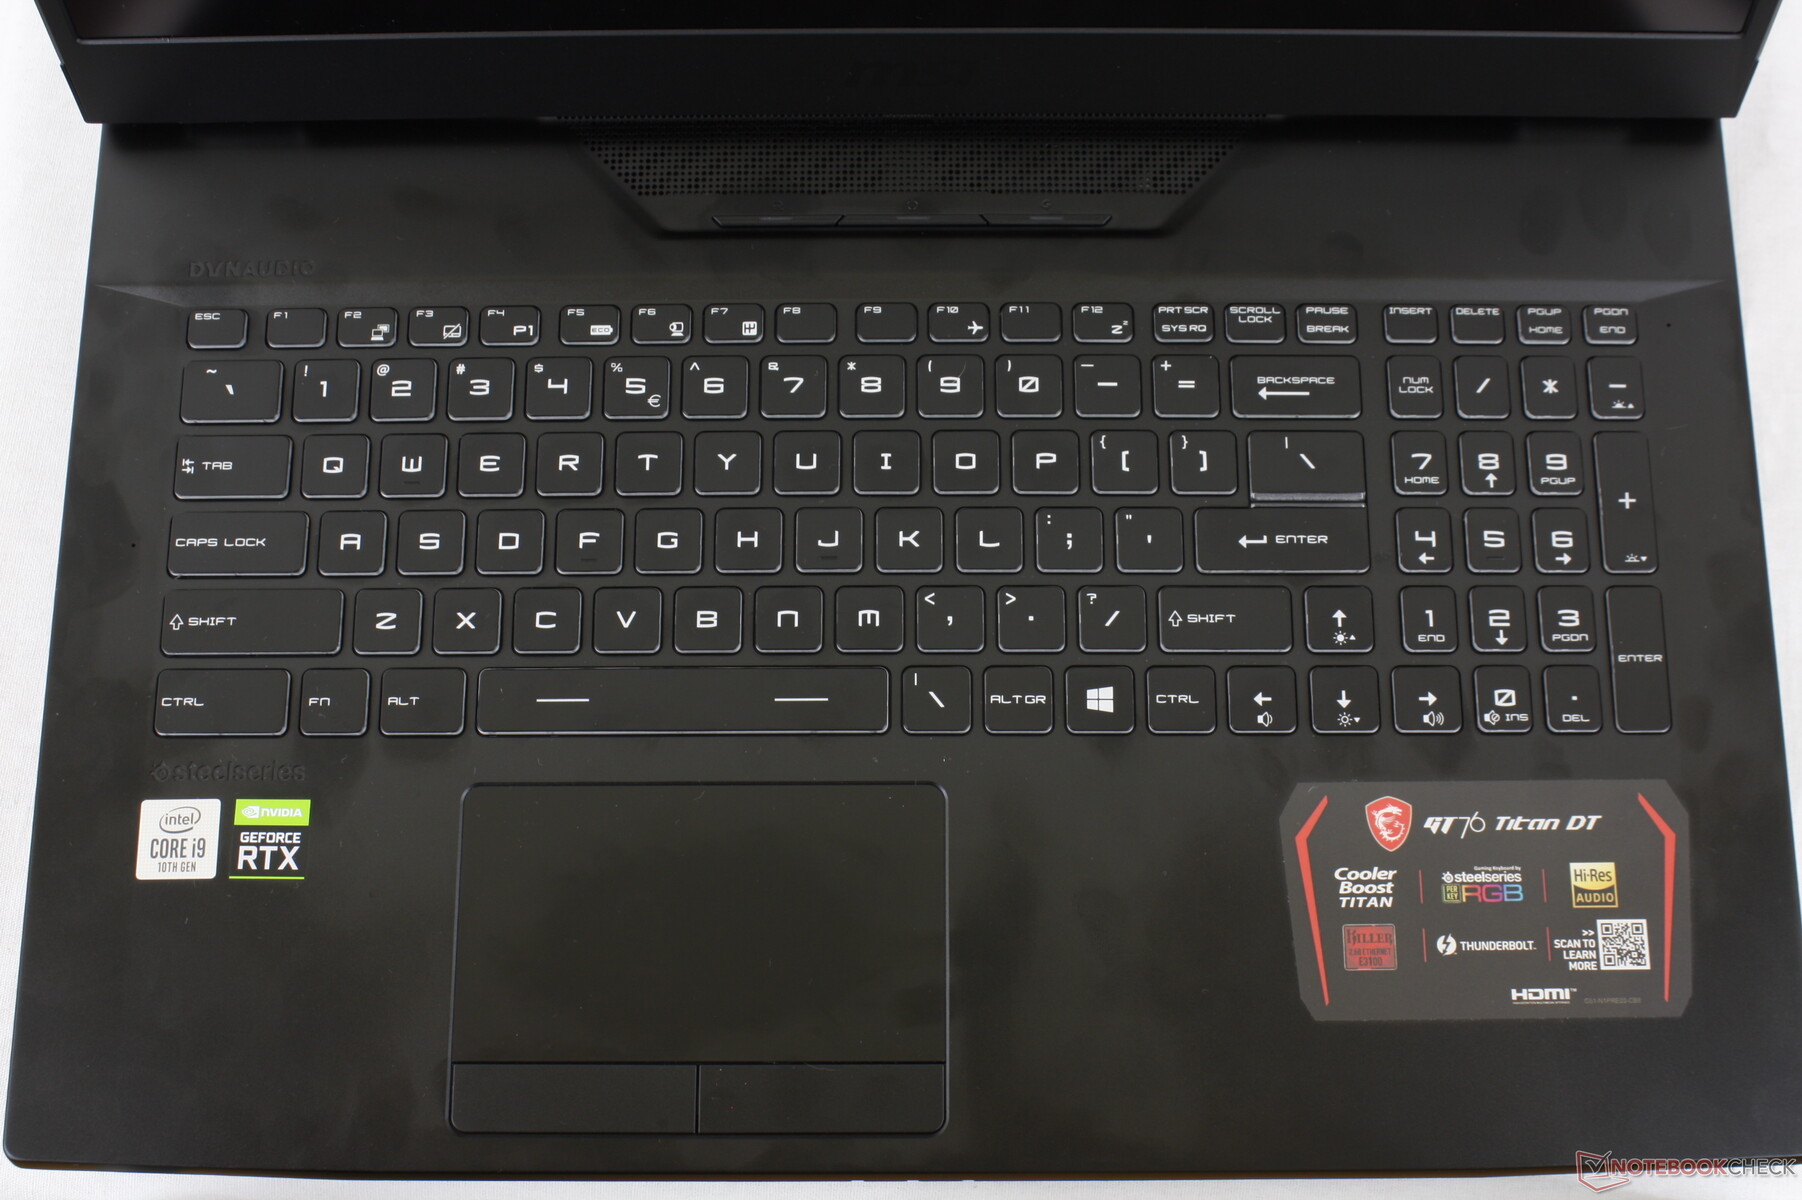
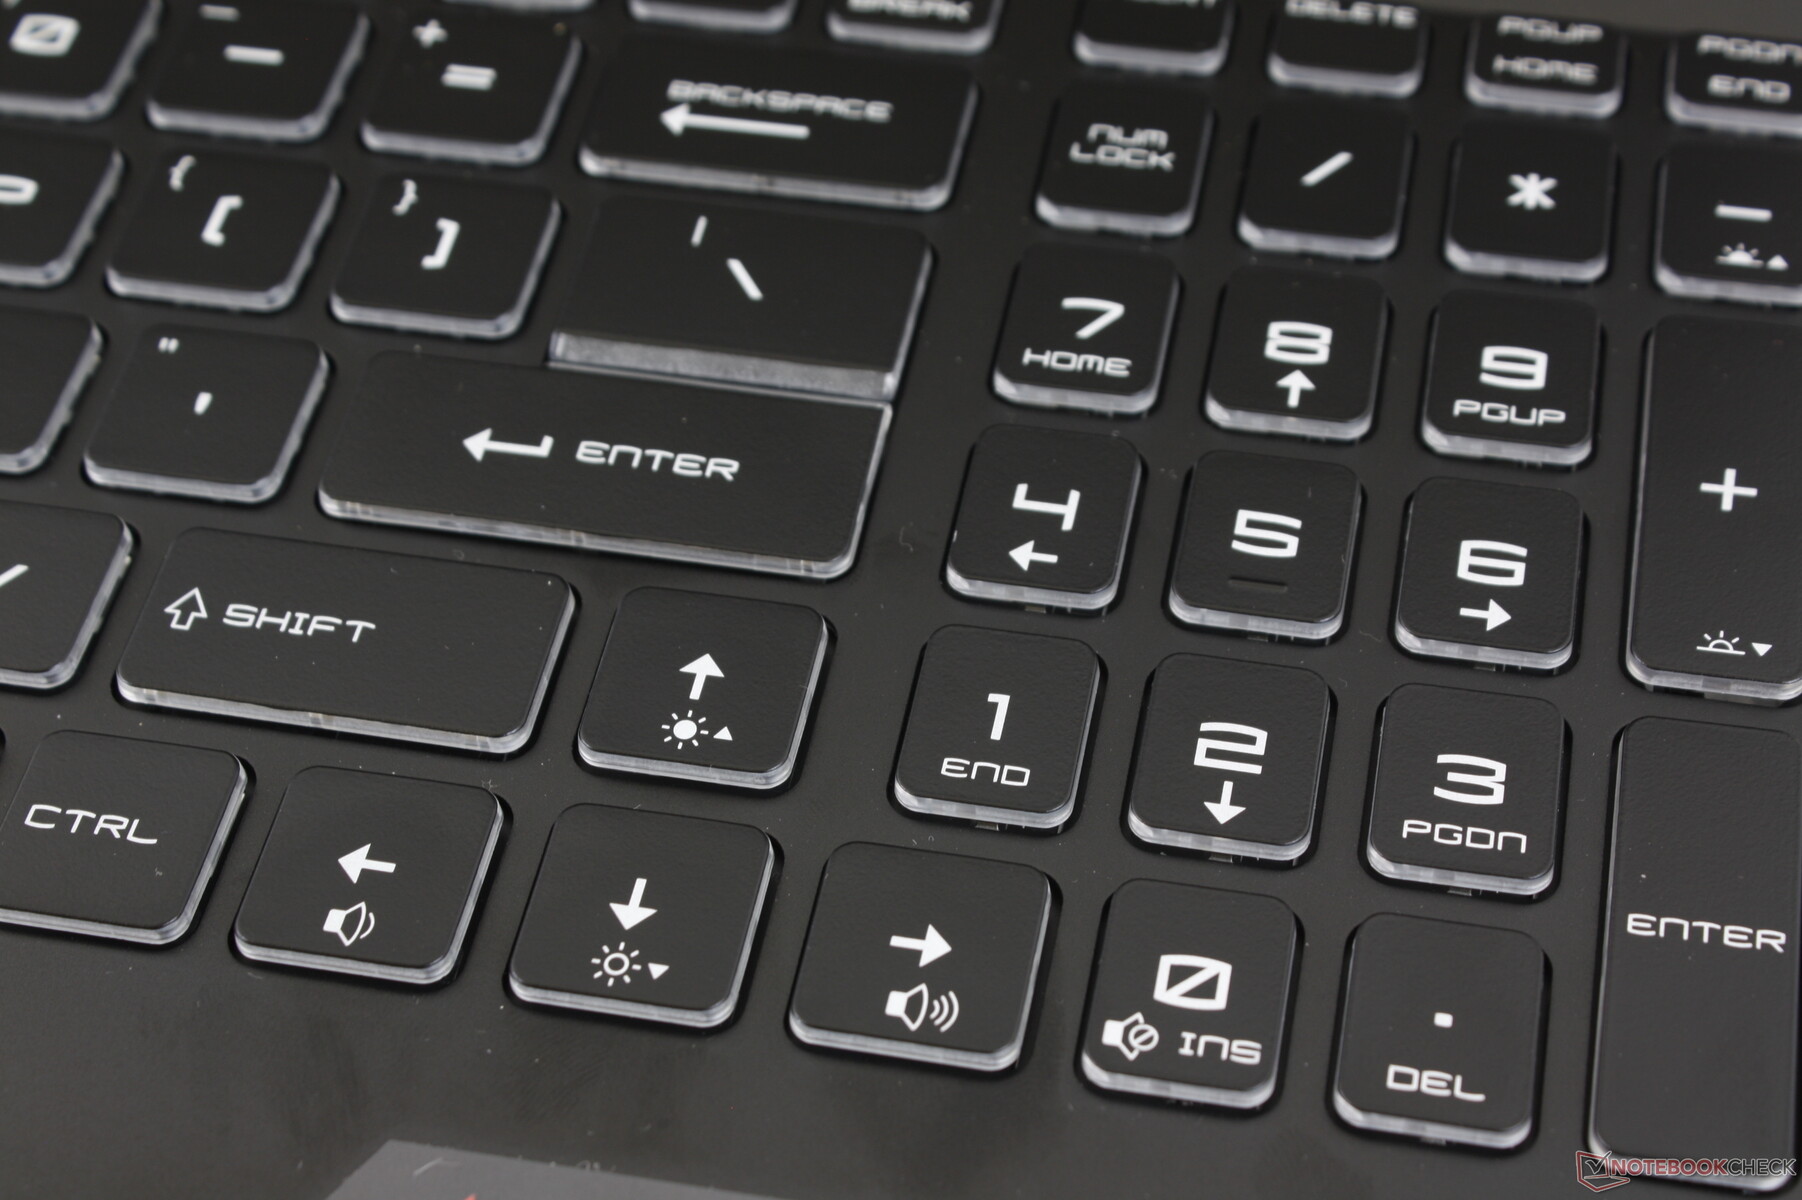
Dispositivos de entrada

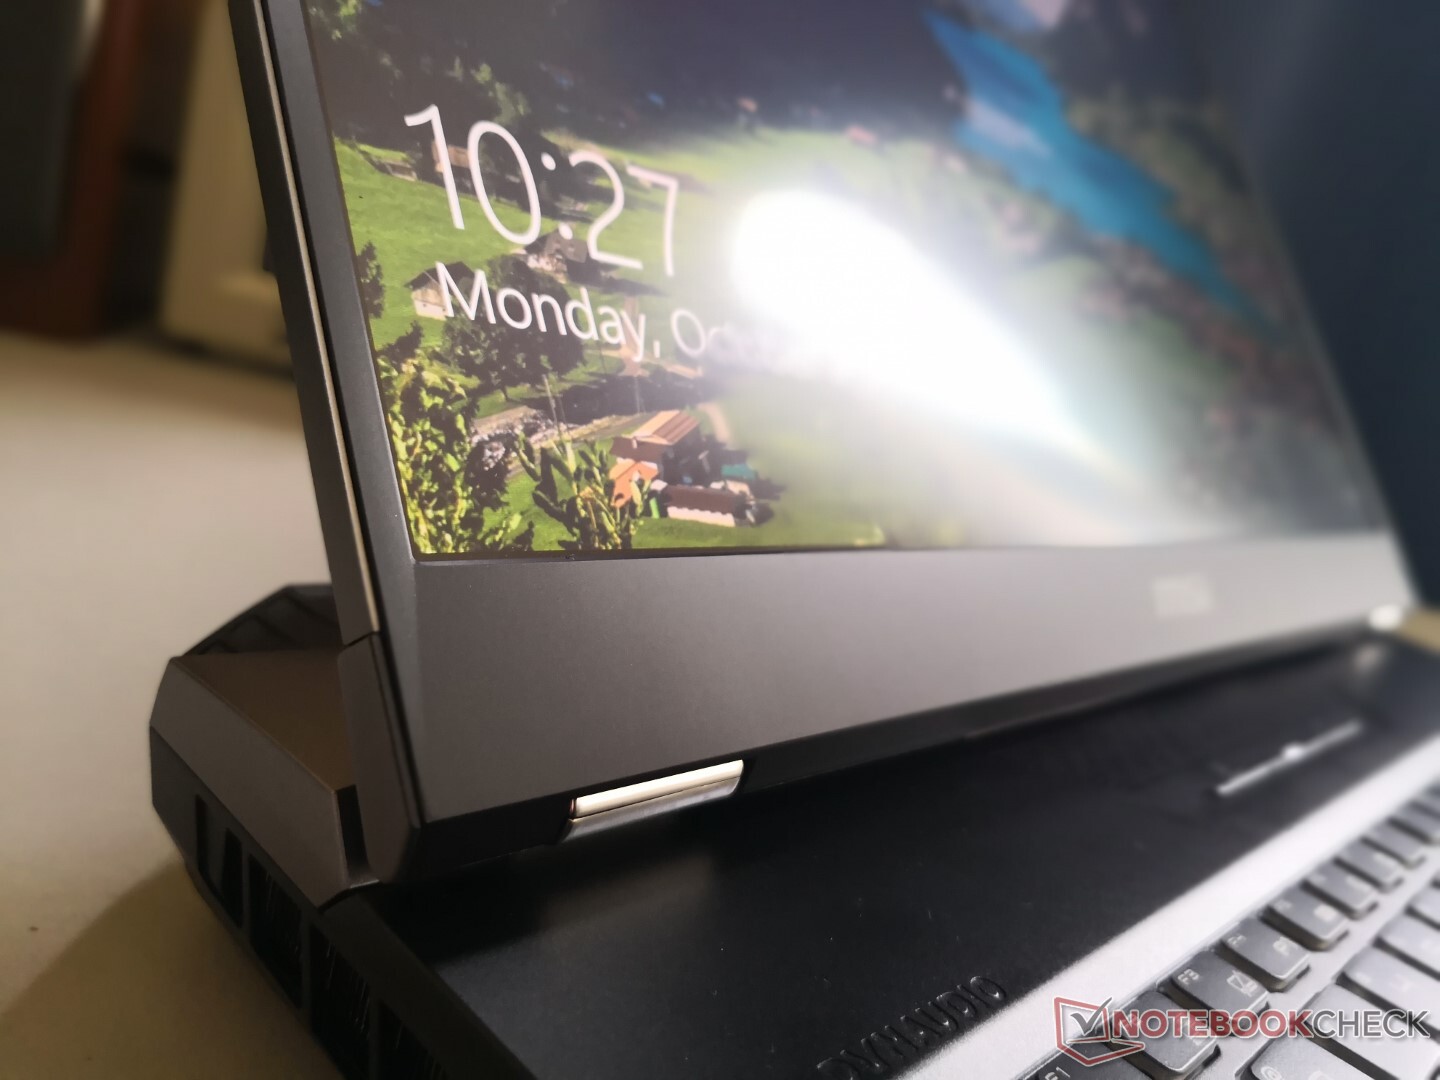
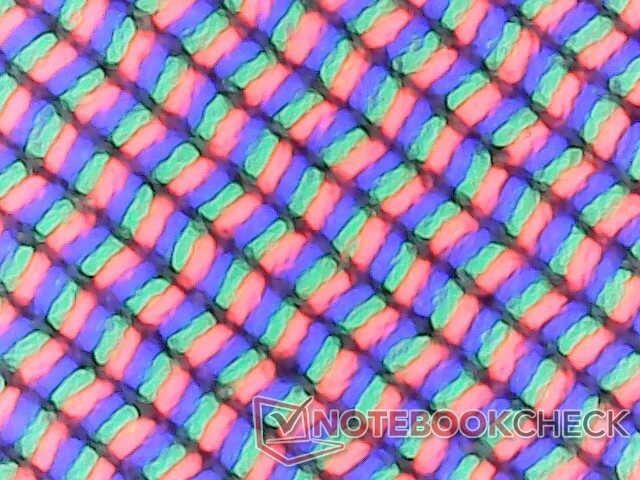
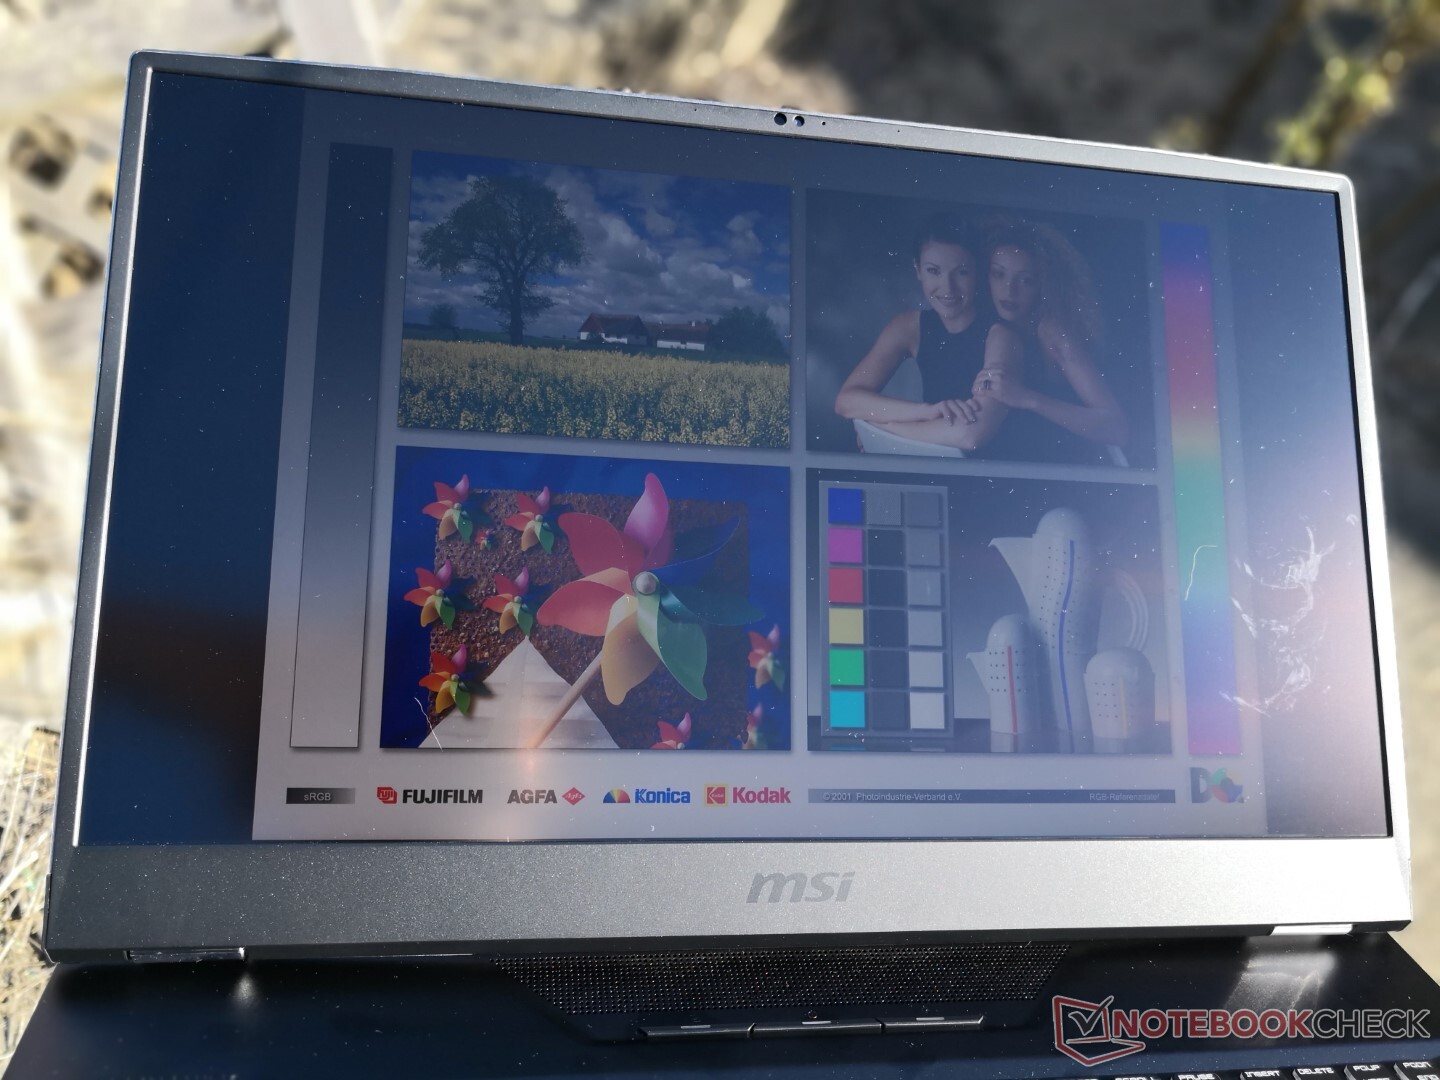
Display
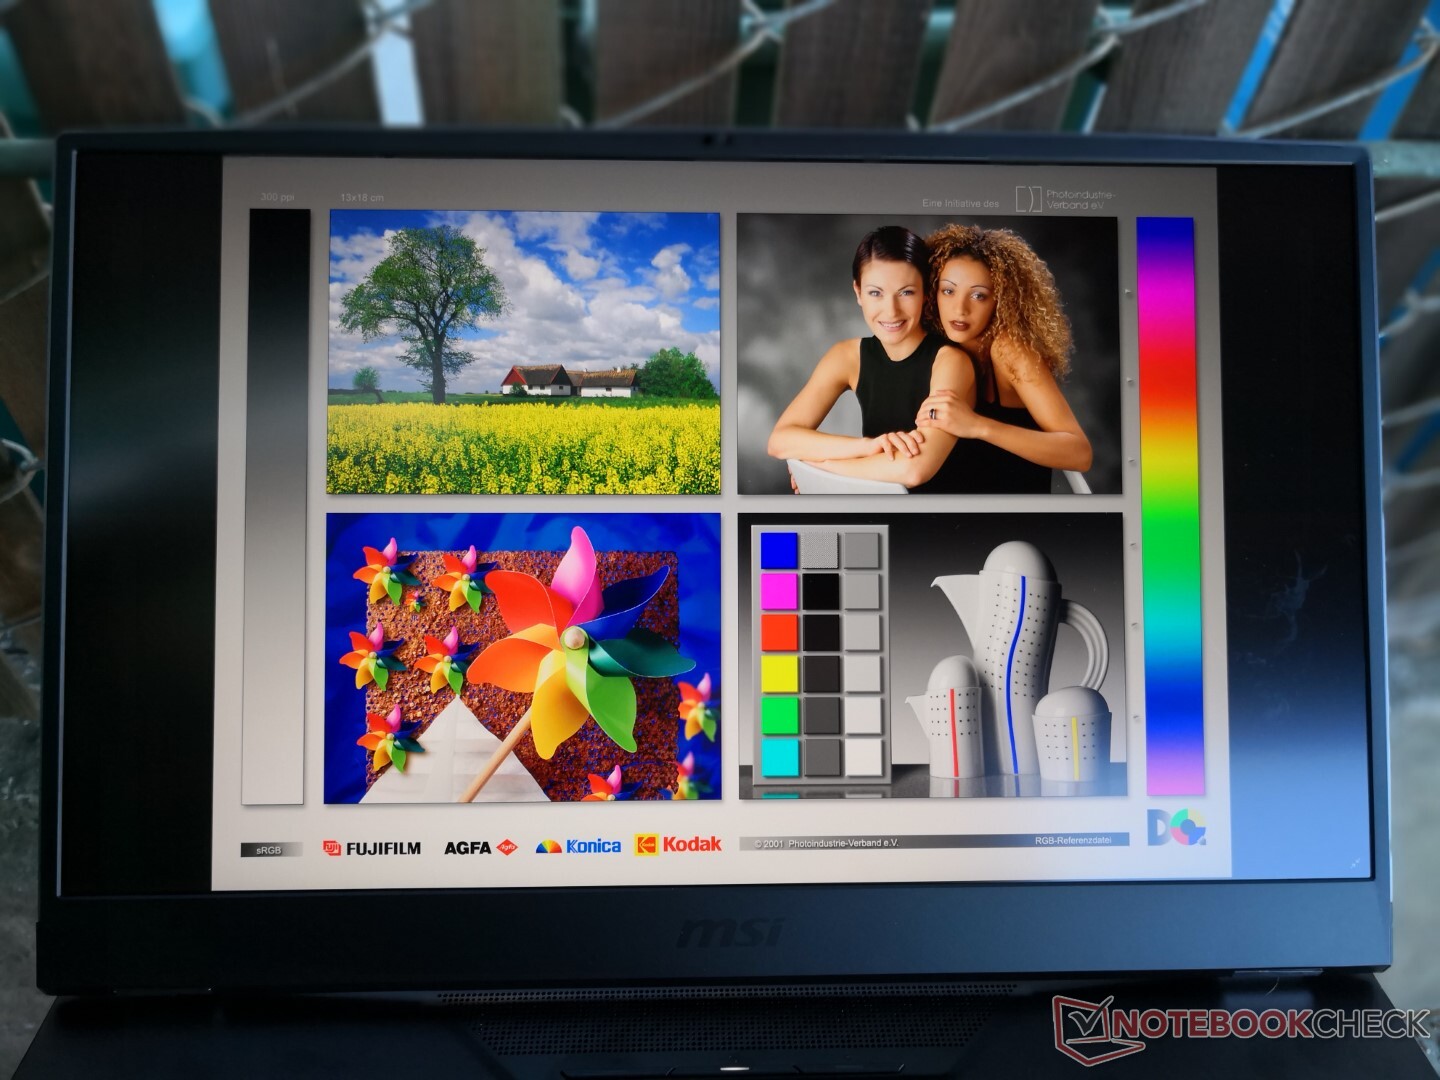
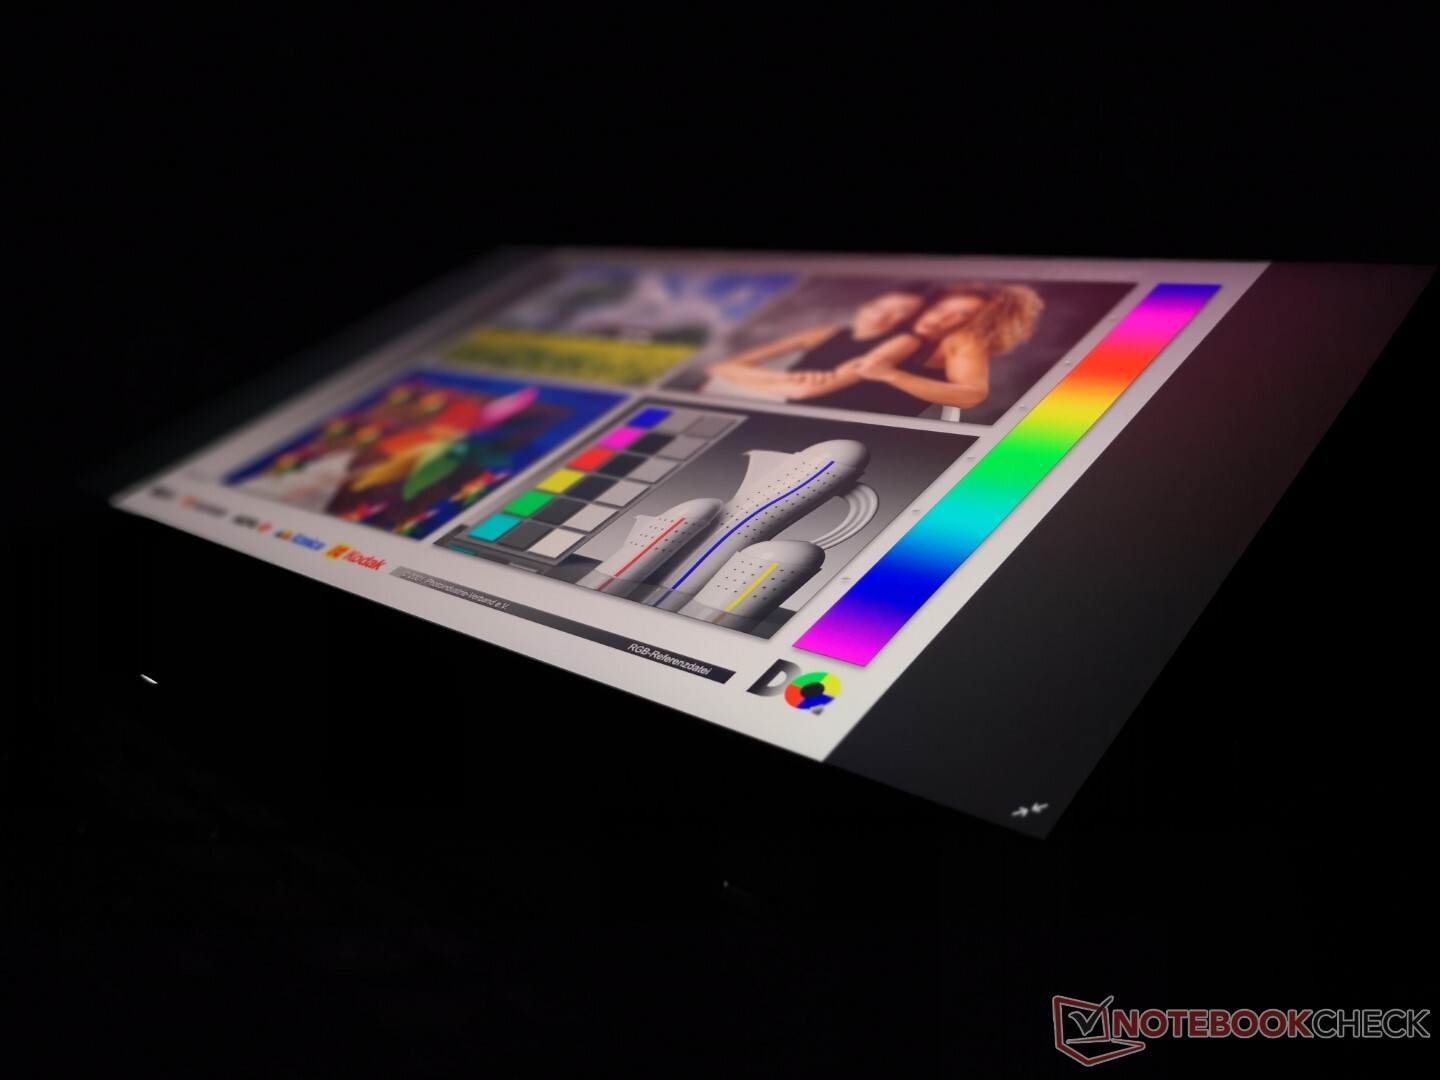
Nuestro panel AU Optronics B173ZAN03.3 4K UHD aquí también se puede encontrar en el último Razer Blade Pro 17. Este panel en particular es notable por su tasa de refresco nativa de 120 Hz y sus rápidos tiempos de respuesta en relación a la mayoría de los otros paneles 4K UHD que se limitan a 60 Hz solamente. Los paneles de 1080p siguen teniendo la ventaja en términos de tasas de refresco y tiempos de respuesta y es por estas razones que el GT76 también puede ser configurado con paneles de 300 Hz 1080p si se desea.

| |||||||||||||||||||||||||
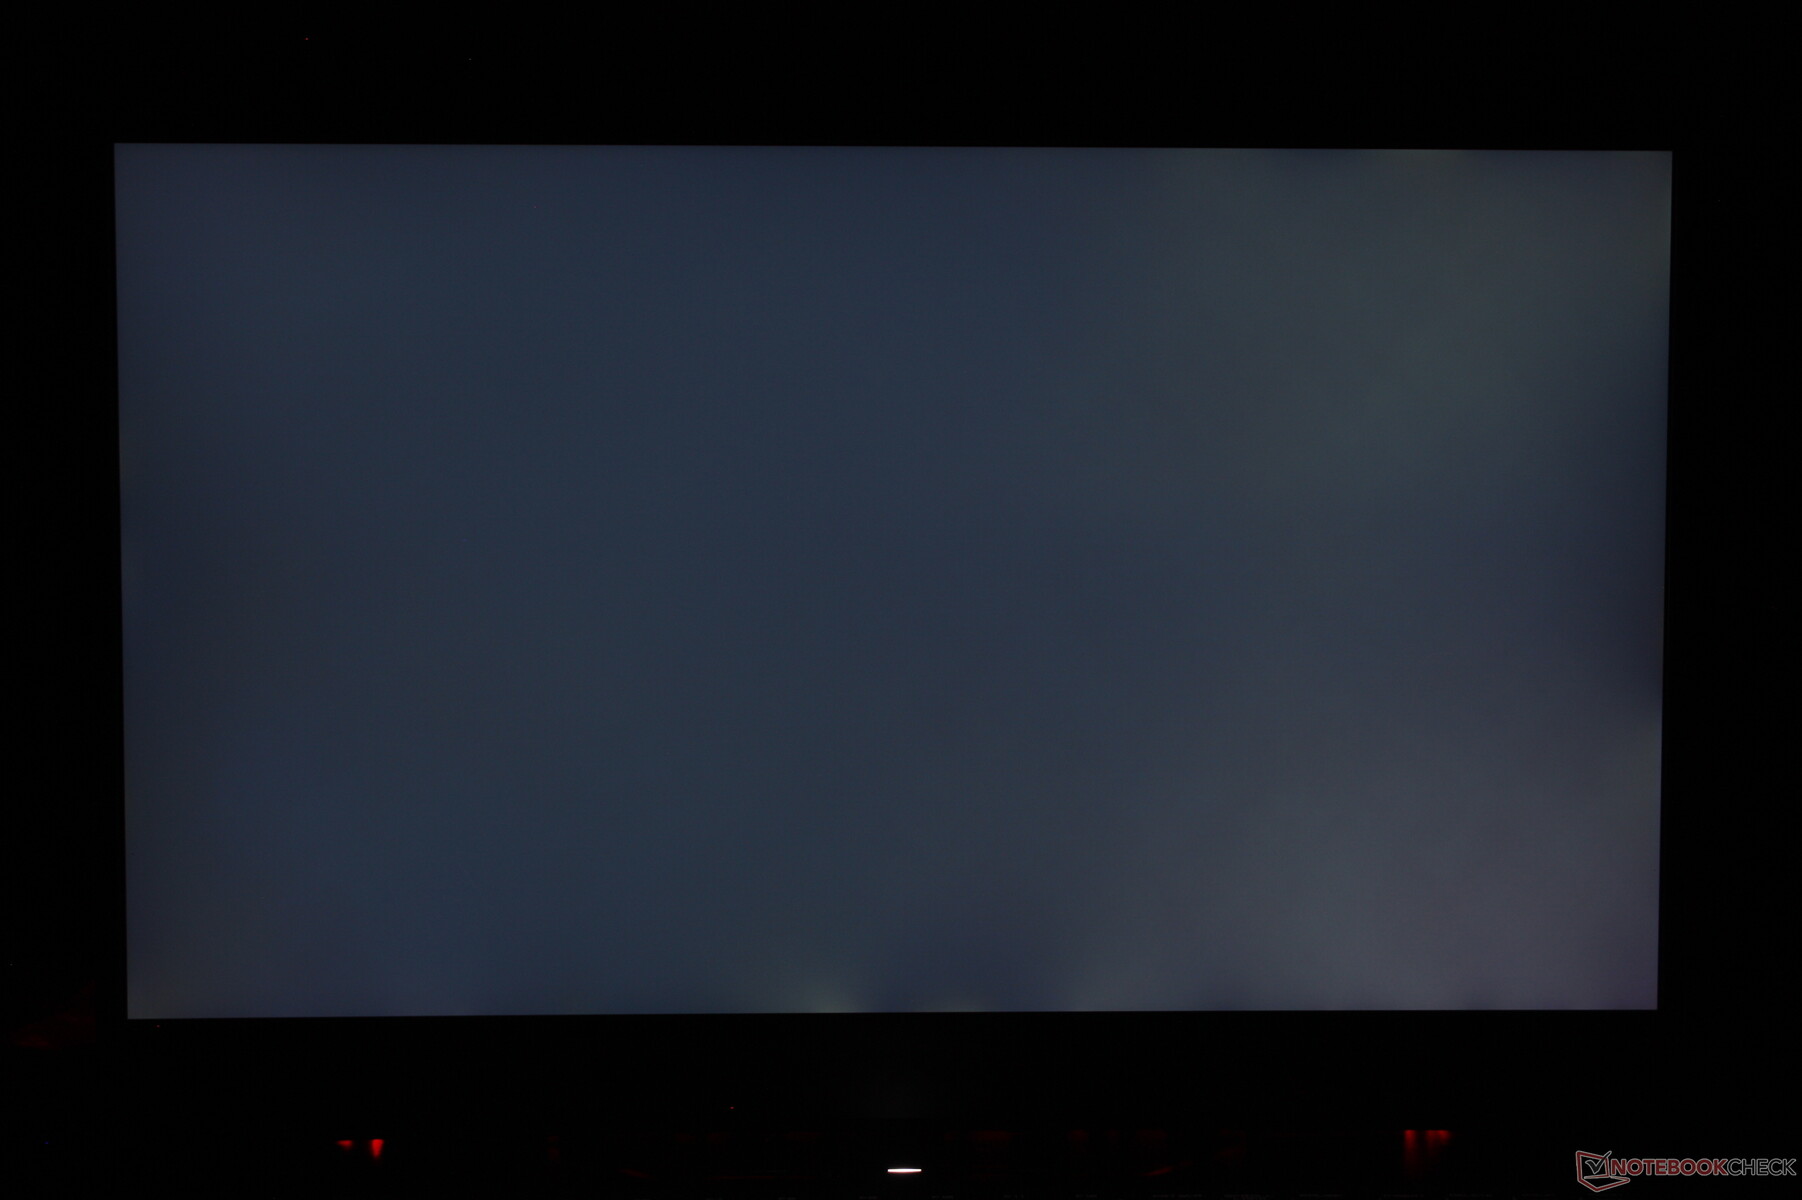
iluminación: 93 %
Brillo con batería: 419.5 cd/m²
Contraste: 1049:1 (Negro: 0.4 cd/m²)
ΔE ColorChecker Calman: 3.4 | ∀{0.5-29.43 Ø4.71}
calibrated: 3.28
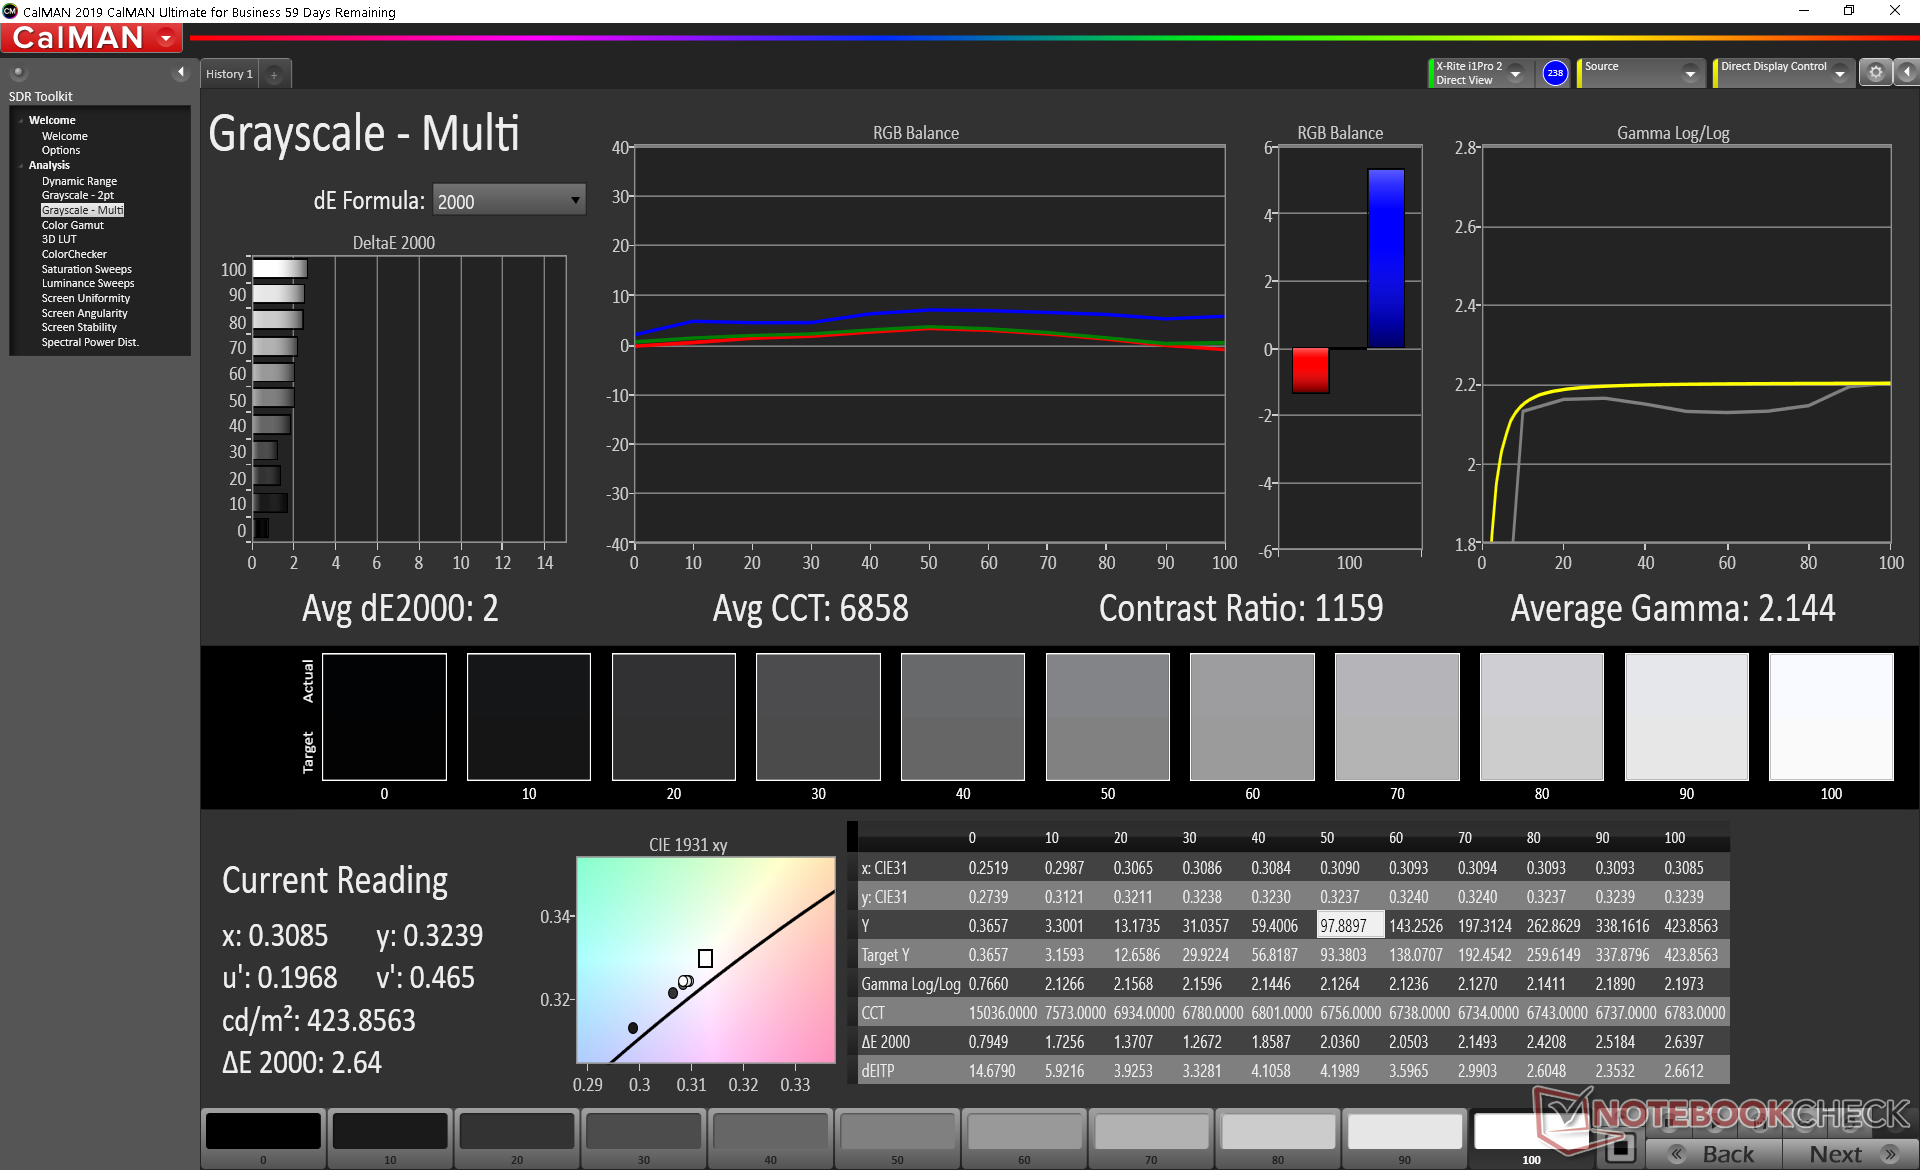
ΔE Greyscale Calman: 2 | ∀{0.09-98 Ø4.96}
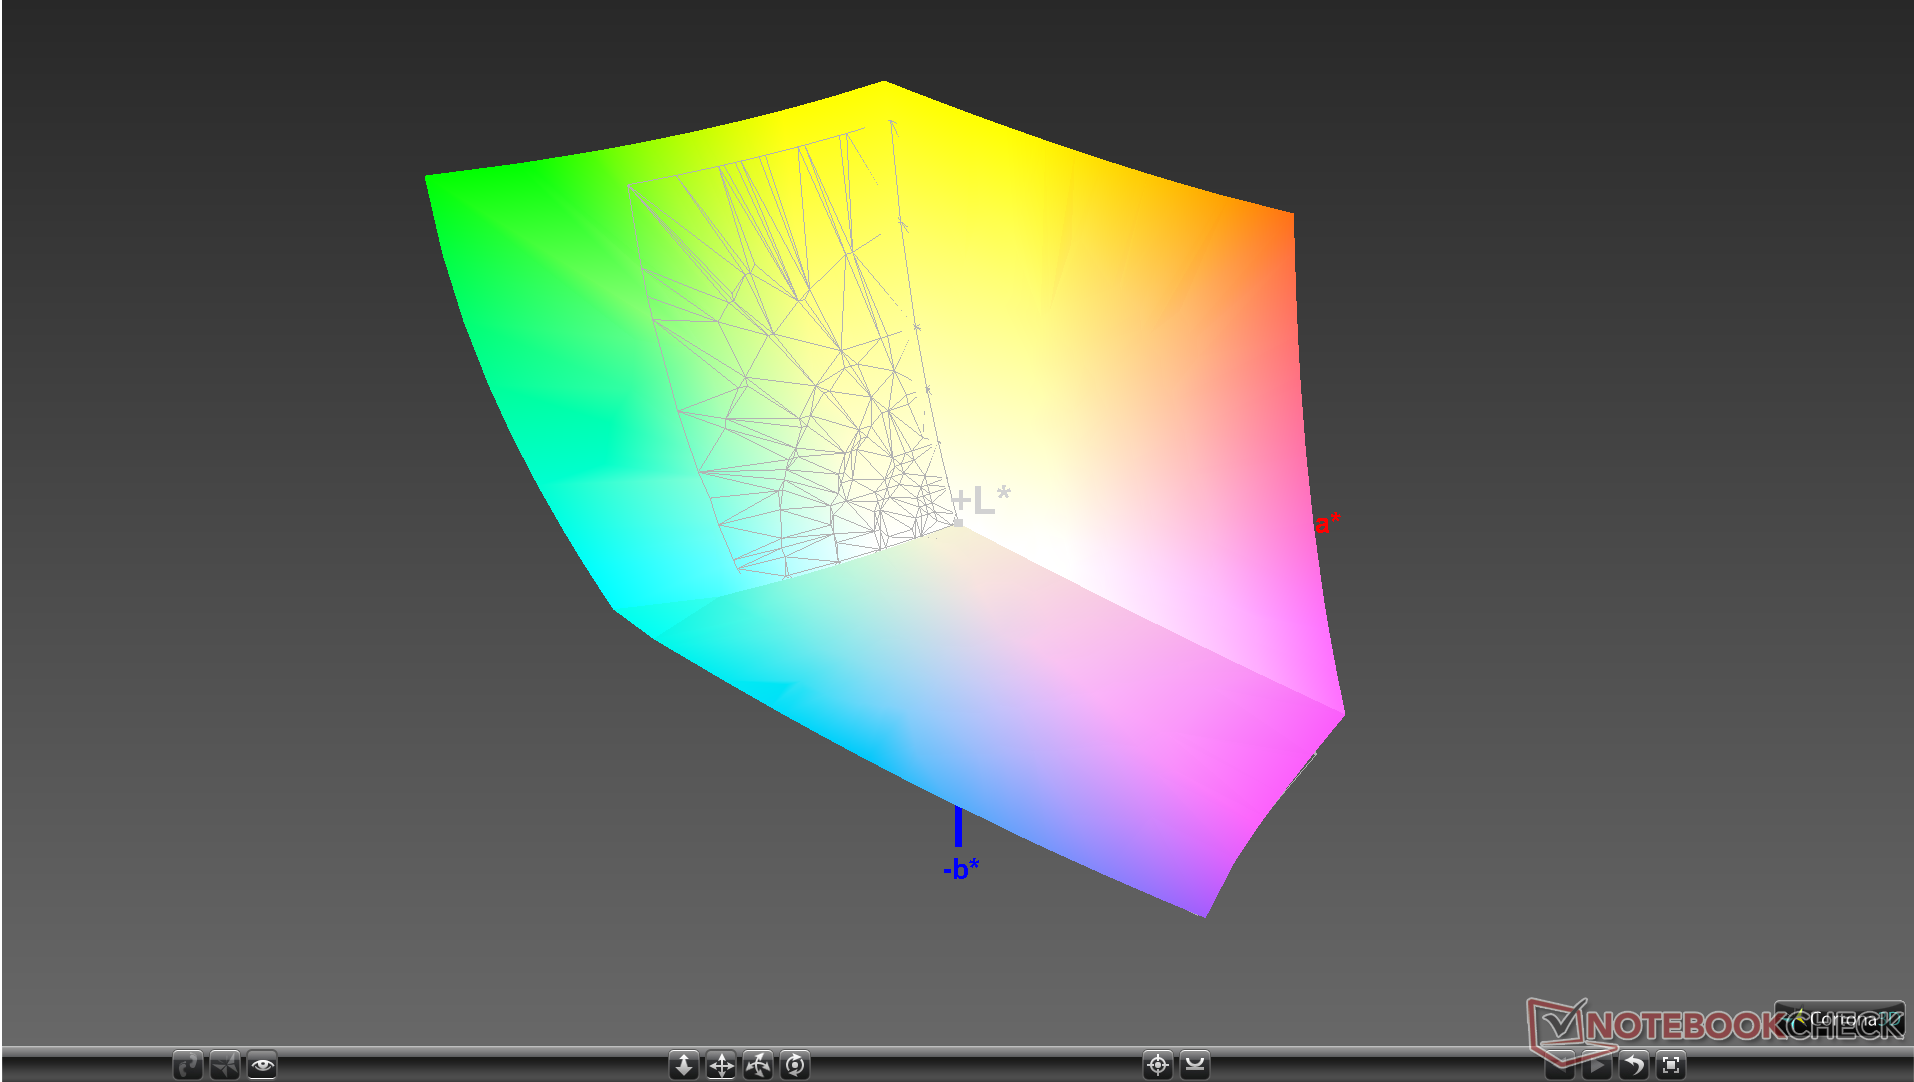
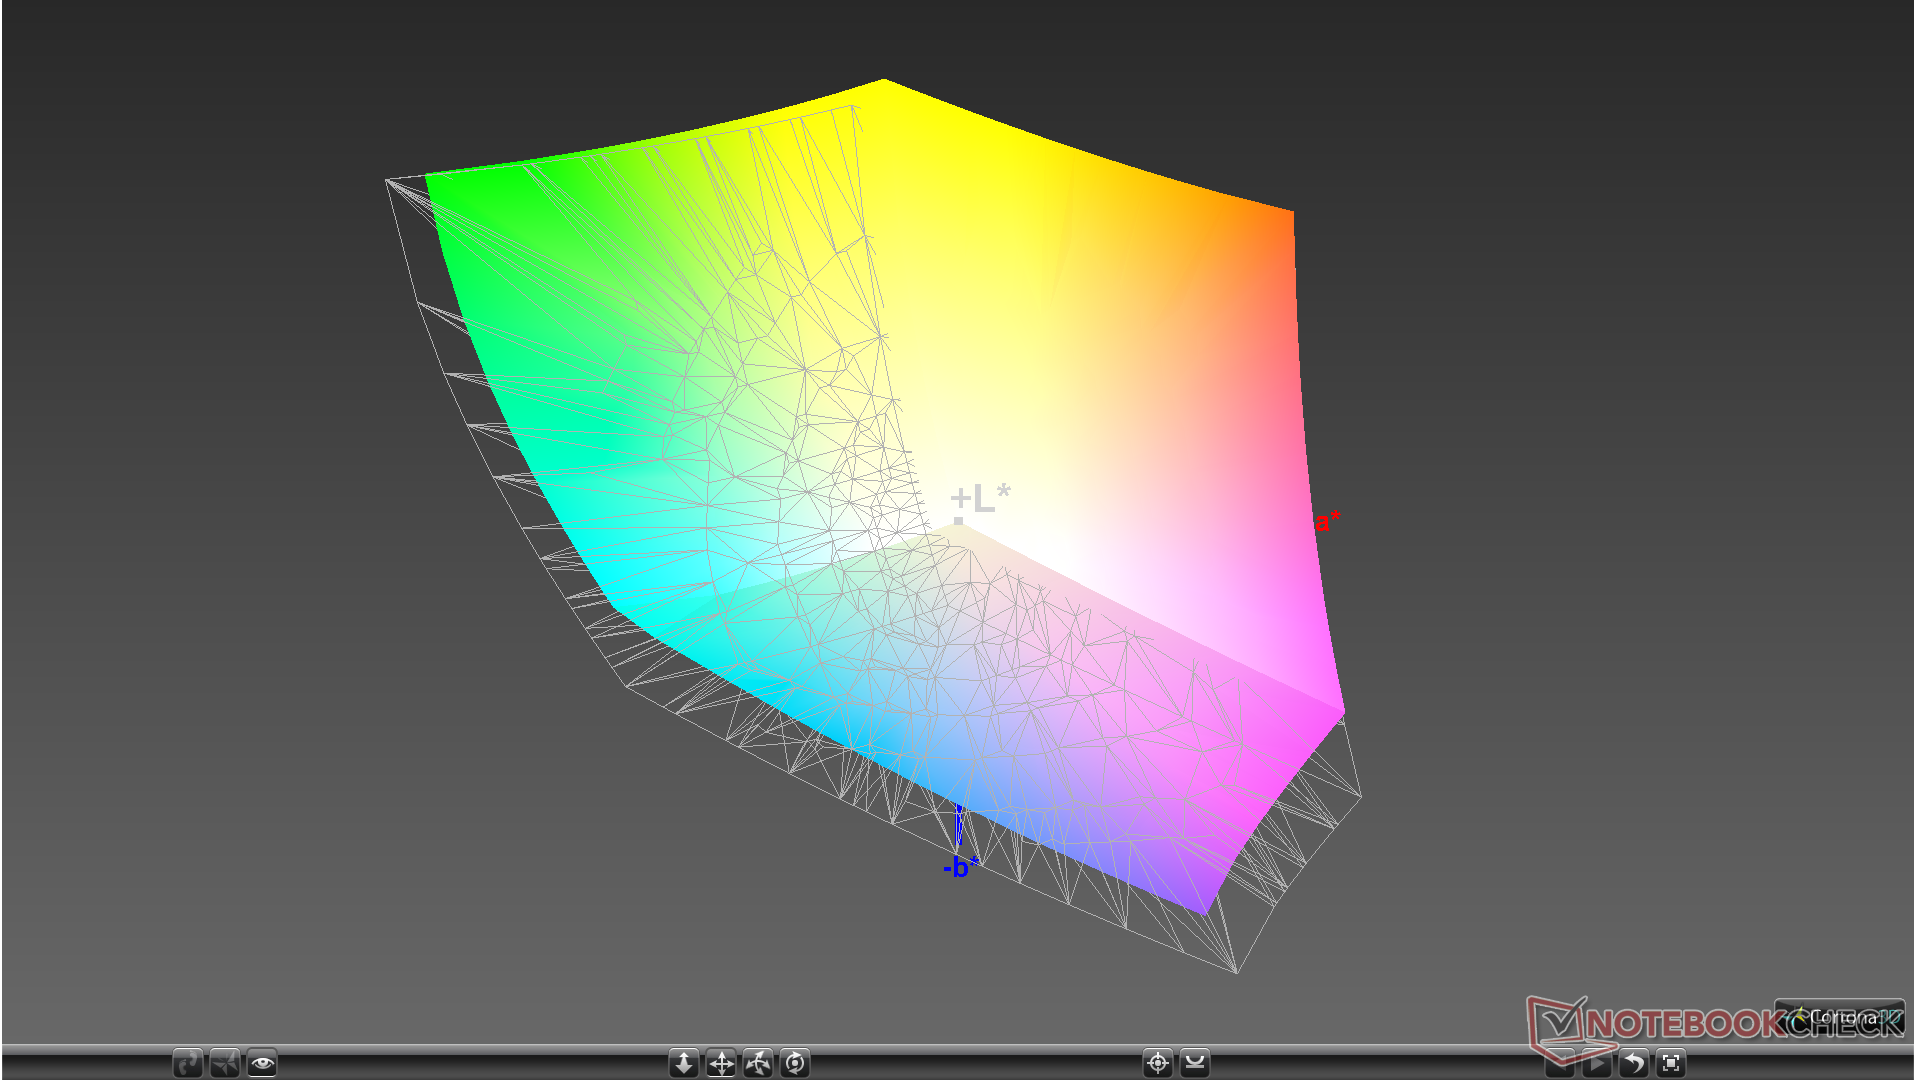
97.9% sRGB (Argyll 1.6.3 3D)
84.6% AdobeRGB 1998 (Argyll 1.6.3 3D)
96.6% AdobeRGB 1998 (Argyll 3D)
98% sRGB (Argyll 3D)
82.5% Display P3 (Argyll 3D)
Gamma: 2.14
CCT: 6858 K
| MSI GT76 Titan DT 10SGS AU Optronics B173ZAN03.3, IPS, 17.3", 3840x2160 | Asus ROG G703GXR AU Optronics B173HAN04.0 (AUO409D), IPS, 17.3", 1920x1080 | Alienware Area-51m i9-9900K RTX 2080 LG Philips 173WFG, IPS, 17.3", 1920x1080 | Asus Strix Scar 17 G732LXS LQ173M1JW03 (SHP14DC), IPS, 17.3", 1920x1080 | Schenker XMG Pro 17 PB71RD-G AU Optronics B173HAN04.0 (AUO409D), IPS, 17.3", 1920x1080 | MSI GE75 9SG Chi Mei N173HCE-G33, AHVA, 17.3", 1920x1080 | MSI GT76 Titan DT 9SG Chi Mei N173HCE-G33 (CMN175C), IPS, 17.3", 1920x1080 | |
|---|---|---|---|---|---|---|---|
| Display | -21% | -17% | -13% | -22% | -22% | -21% | |
| Display P3 Coverage (%) | 82.5 | 63.2 -23% | 66.3 -20% | 71 -14% | 62.8 -24% | 61.5 -25% | 62.3 -24% |
| sRGB Coverage (%) | 98 | 92 -6% | 96.9 -1% | 99 1% | 89.8 -8% | 92 -6% | 93.4 -5% |
| AdobeRGB 1998 Coverage (%) | 96.6 | 64.7 -33% | 66.5 -31% | 71.6 -26% | 64.2 -34% | 63.5 -34% | 64.3 -33% |
| Response Times | 31% | 25% | 52% | 13% | 56% | 40% | |
| Response Time Grey 50% / Grey 80% * (ms) | 23.2 ? | 6.4 ? 72% | 13.2 ? 43% | 5.8 ? 75% | 16.8 ? 28% | 7.2 ? 69% | 8 ? 66% |
| Response Time Black / White * (ms) | 11.6 ? | 12.8 ? -10% | 10.8 ? 7% | 8.4 ? 28% | 12 ? -3% | 6.6 ? 43% | 10 ? 14% |
| PWM Frequency (Hz) | 26040 ? | 26040 ? | |||||
| Screen | -19% | -14% | -13% | -21% | 16% | 9% | |
| Brightness middle (cd/m²) | 419.5 | 290 -31% | 335.2 -20% | 310 -26% | 274 -35% | 400.7 -4% | 396 -6% |
| Brightness (cd/m²) | 413 | 281 -32% | 297 -28% | 311 -25% | 273 -34% | 372 -10% | 373 -10% |
| Brightness Distribution (%) | 93 | 91 -2% | 82 -12% | 82 -12% | 95 2% | 89 -4% | 89 -4% |
| Black Level * (cd/m²) | 0.4 | 0.2 50% | 0.66 -65% | 0.41 -2% | 0.26 35% | 0.34 15% | 0.33 17% |
| Contrast (:1) | 1049 | 1450 38% | 508 -52% | 756 -28% | 1054 0% | 1179 12% | 1200 14% |
| Colorchecker dE 2000 * | 3.4 | 4.77 -40% | 2.02 41% | 2.41 29% | 4.62 -36% | 1.33 61% | 2.04 40% |
| Colorchecker dE 2000 max. * | 7.4 | 9.08 -23% | 7.23 2% | 8.59 -16% | 7.66 -4% | 3.51 53% | 3.85 48% |
| Colorchecker dE 2000 calibrated * | 3.28 | 1.46 55% | 1.17 64% | 1.13 66% | 1.93 41% | 1.39 58% | 0.82 75% |
| Greyscale dE 2000 * | 2 | 5.83 -192% | 3.2 -60% | 4.3 -115% | 5.3 -165% | 1.3 35% | 2.83 -42% |
| Gamma | 2.14 103% | 2.47 89% | 2.16 102% | 2.149 102% | 2.34 94% | 2.24 98% | 2.49 88% |
| CCT | 6858 95% | 8076 80% | 6746 96% | 7059 92% | 7619 85% | 6735 97% | 7113 91% |
| Color Space (Percent of AdobeRGB 1998) (%) | 84.6 | 59 -30% | 61.3 -28% | 72 -15% | 58 -31% | 58.2 -31% | 59 -30% |
| Color Space (Percent of sRGB) (%) | 97.9 | 92 -6% | 96.9 -1% | 94 -4% | 90 -8% | 92.1 -6% | 94 -4% |
| Media total (Programa/Opciones) | -3% /
-13% | -2% /
-10% | 9% /
-5% | -10% /
-17% | 17% /
14% | 9% /
7% |
* ... más pequeño es mejor
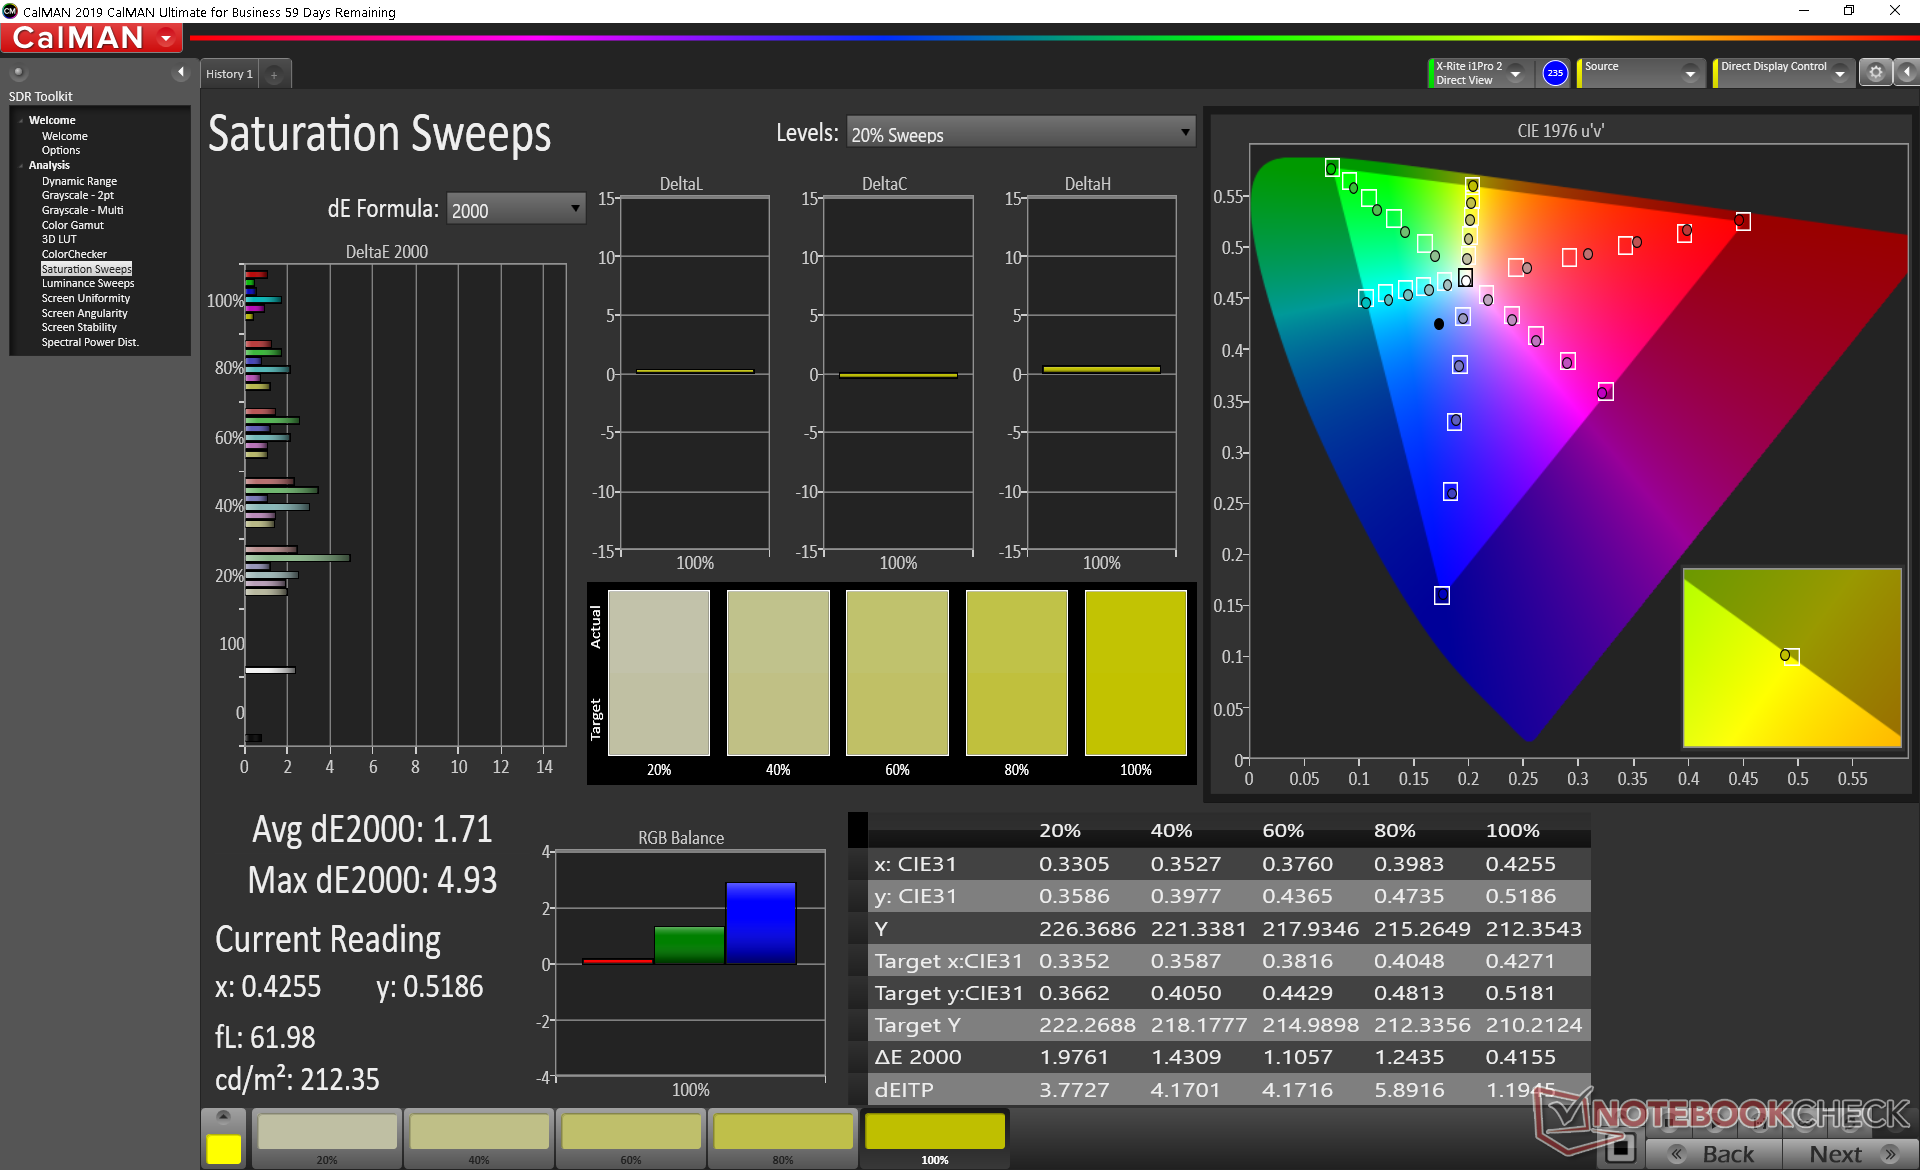
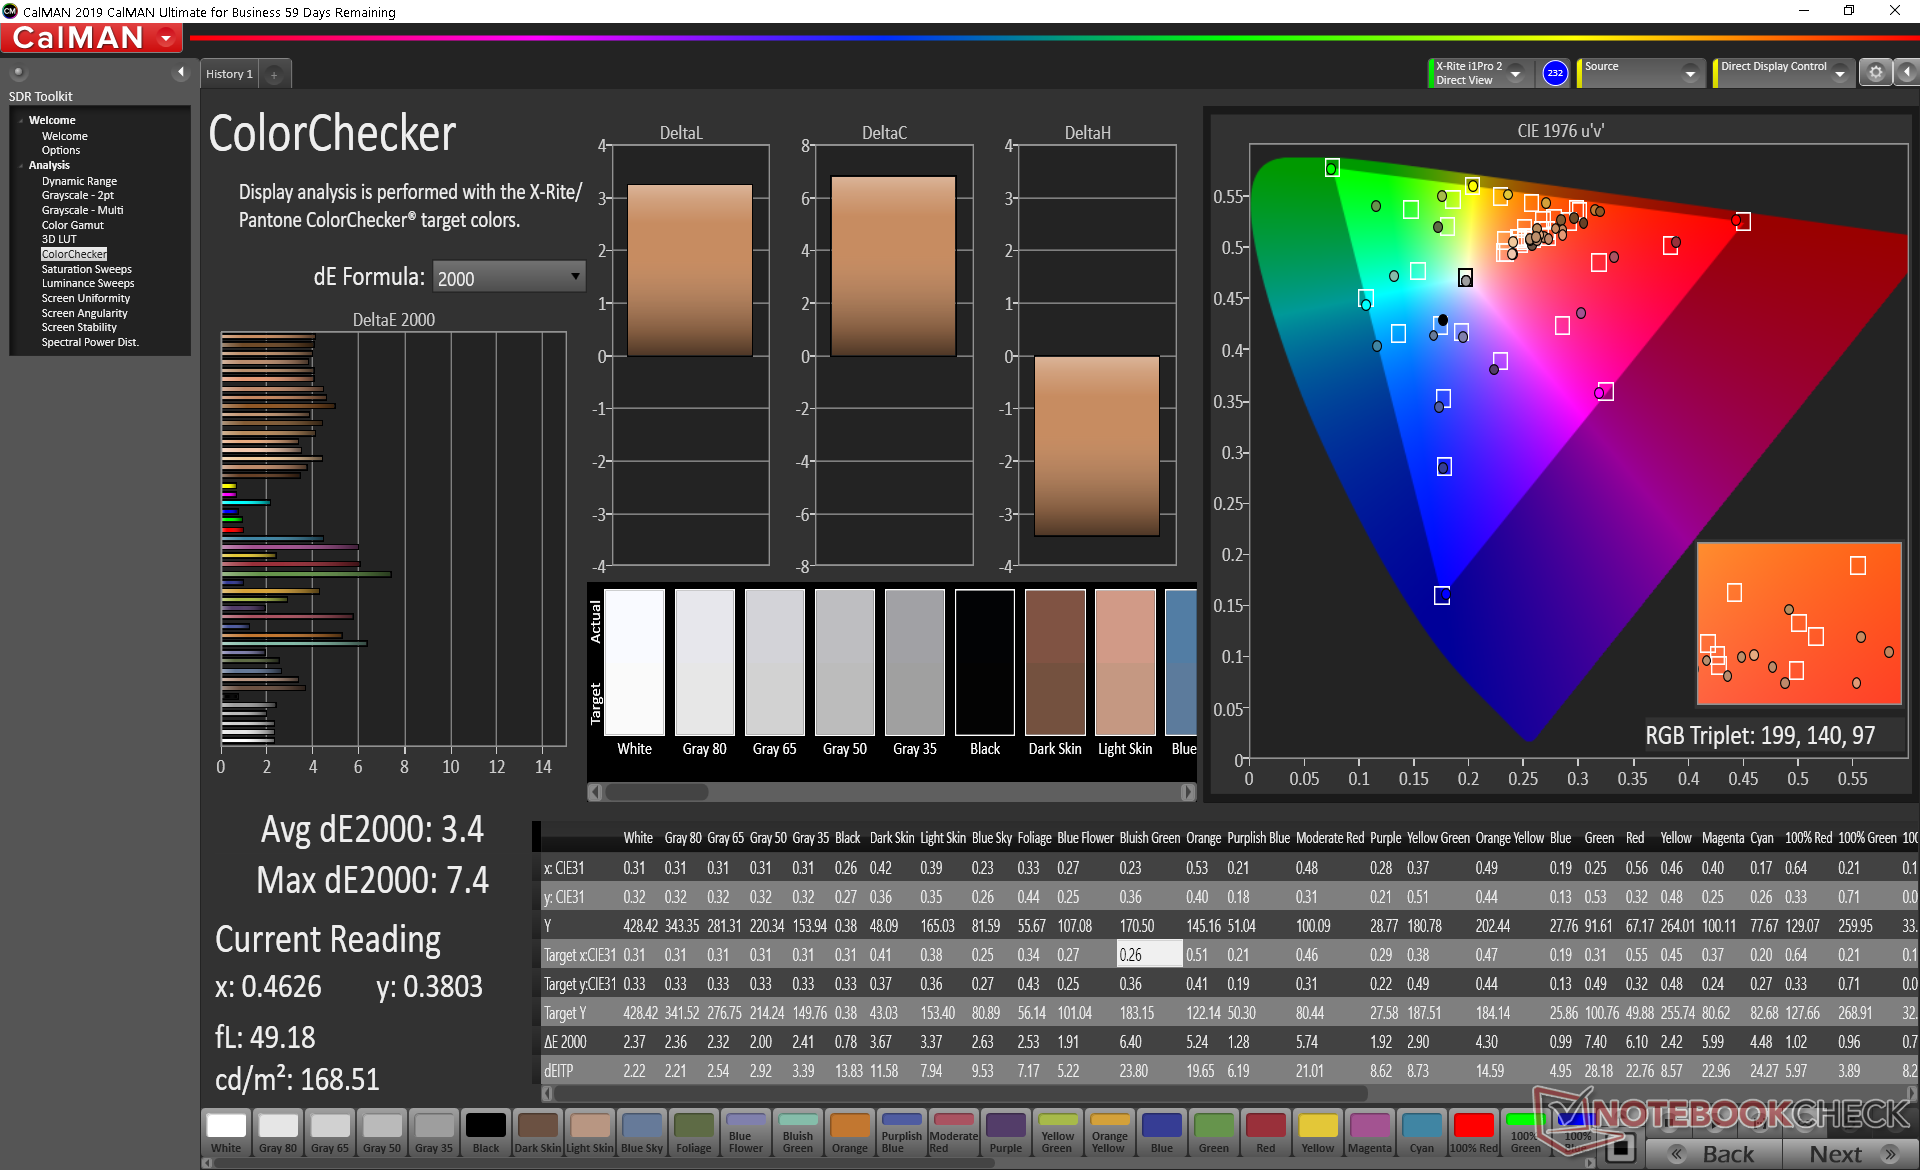
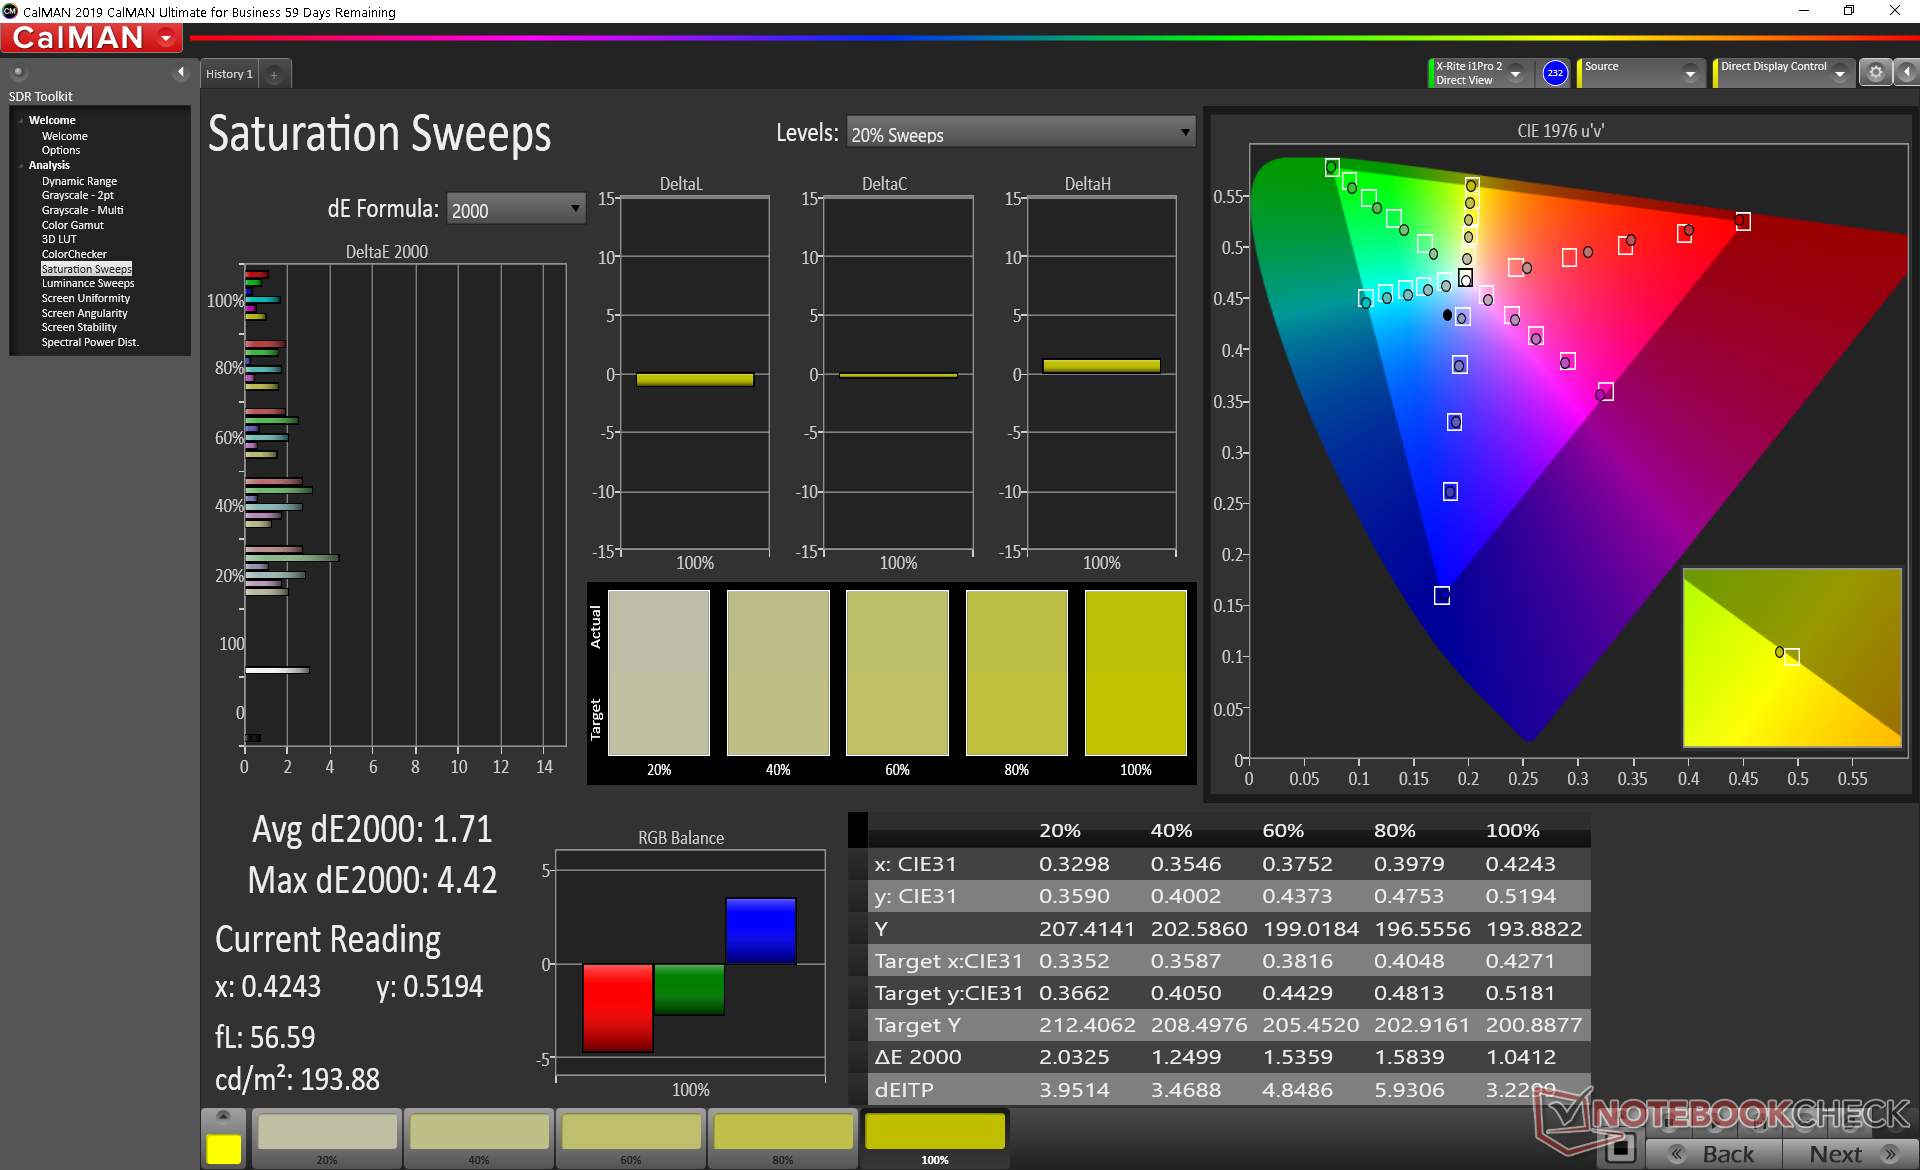
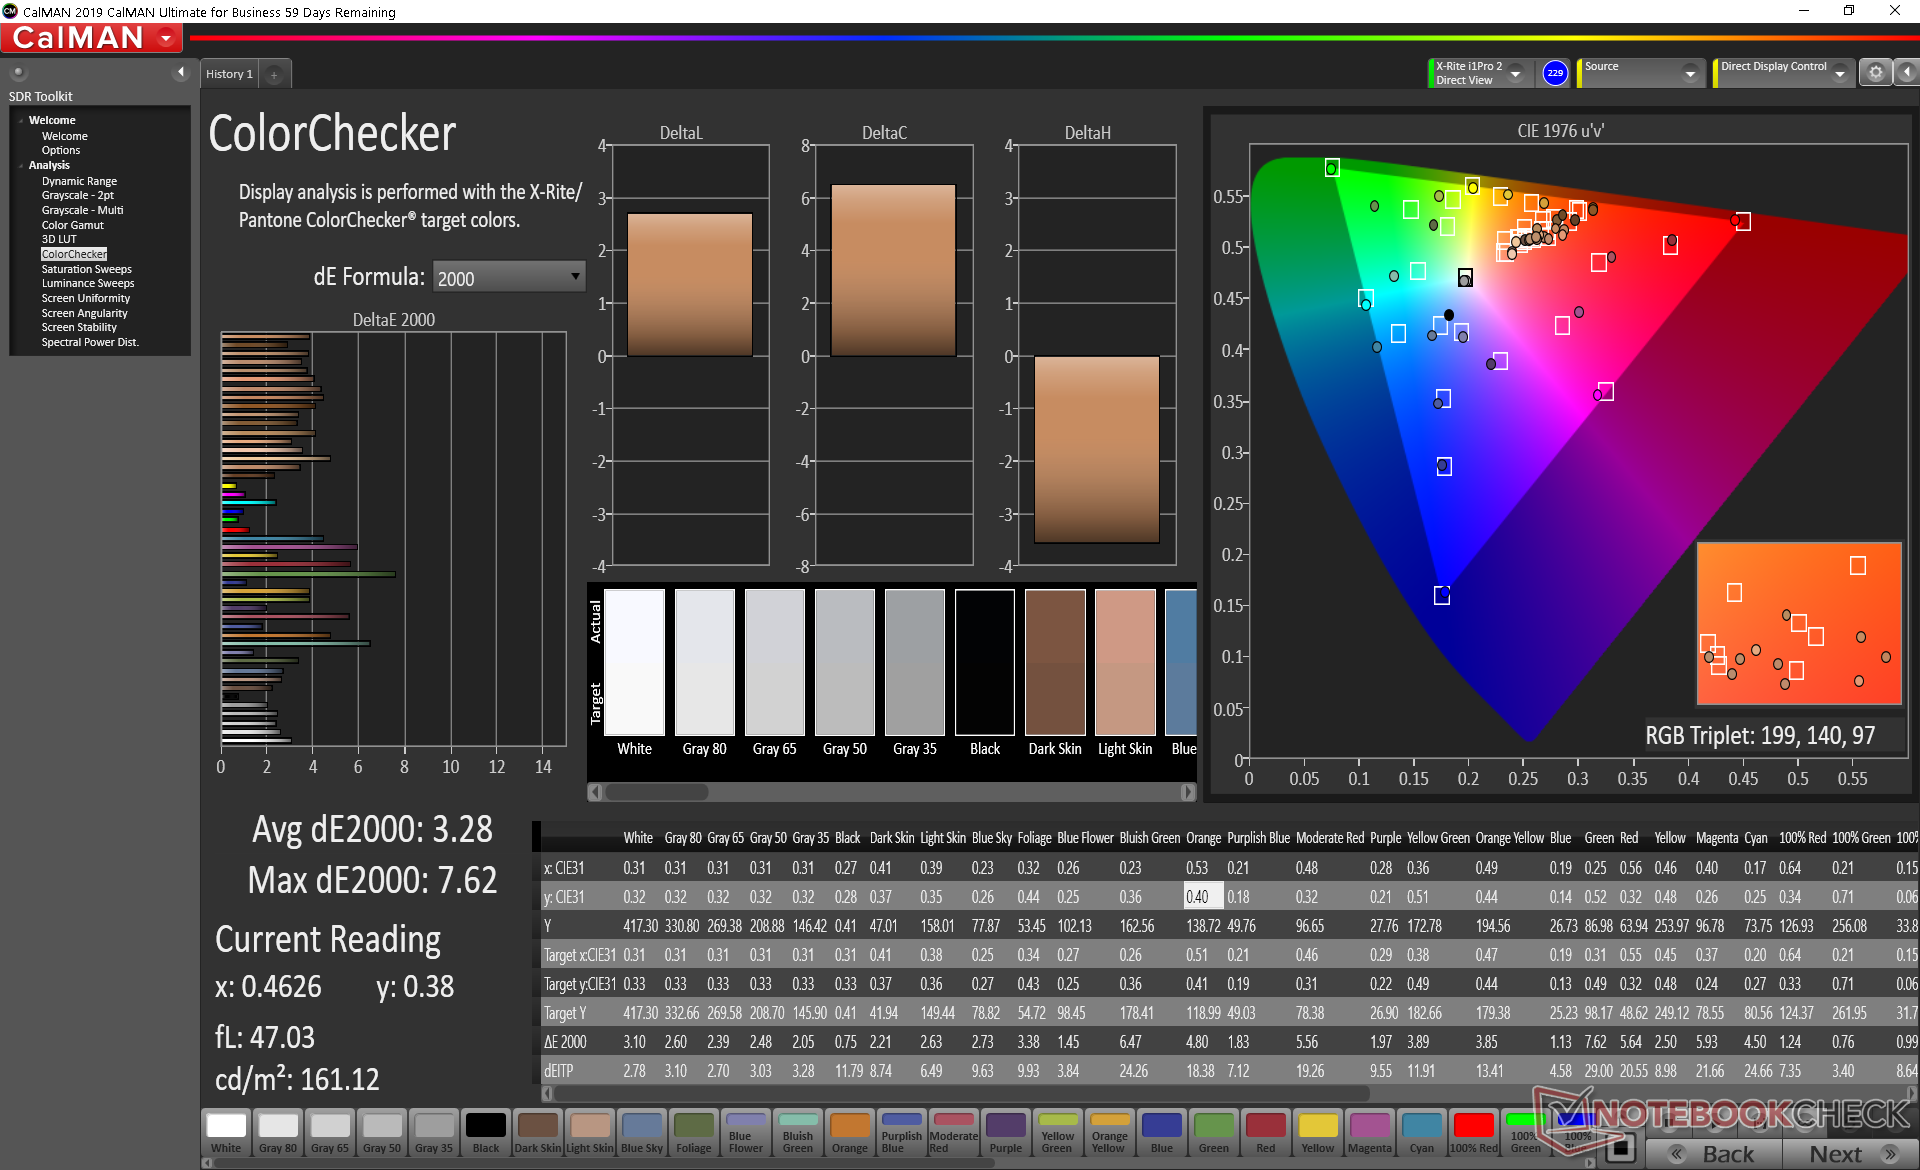
El espacio de color es amplio en aproximadamente el 85 por ciento del estándar AdobeRGB 3D comparado con el 59 por ciento de la opción 1080p del año pasado. MSI True Color permite ajustes de color y perfiles rápidos y fáciles.
Las mediciones del colorímetro de X-Rite revelan una pantalla bien calibrada con valores promedio de escala de grises y deltaE de color de sólo 2 y 3,2, respectivamente. Calibrar el panel aún más nosotros mismos no resultaría en ninguna mejora notable.

Tiempos de respuesta del display
| ↔ Tiempo de respuesta de Negro a Blanco | ||
|---|---|---|
| 11.6 ms ... subida ↗ y bajada ↘ combinada | ↗ 6.4 ms subida | 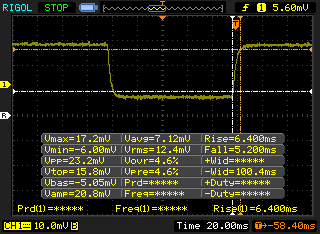 |
| ↘ 5.2 ms bajada | ||
| La pantalla mostró buenos tiempos de respuesta en nuestros tests pero podría ser demasiado lenta para los jugones competitivos. En comparación, todos los dispositivos de prueba van de ##min### (mínimo) a 240 (máximo) ms. » 31 % de todos los dispositivos son mejores. Esto quiere decir que el tiempo de respuesta medido es mejor que la media (19.8 ms) de todos los dispositivos testados. | ||
| ↔ Tiempo de respuesta 50% Gris a 80% Gris | ||
| 23.2 ms ... subida ↗ y bajada ↘ combinada | ↗ 12.4 ms subida | 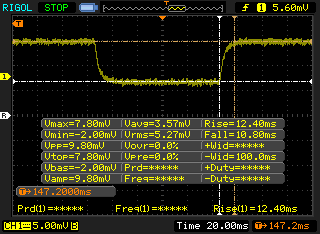 |
| ↘ 10.8 ms bajada | ||
| La pantalla mostró buenos tiempos de respuesta en nuestros tests pero podría ser demasiado lenta para los jugones competitivos. En comparación, todos los dispositivos de prueba van de ##min### (mínimo) a 636 (máximo) ms. » 34 % de todos los dispositivos son mejores. Esto quiere decir que el tiempo de respuesta medido es mejor que la media (31 ms) de todos los dispositivos testados. | ||
Parpadeo de Pantalla / PWM (Pulse-Width Modulation)
| Parpadeo de Pantalla / PWM no detectado | 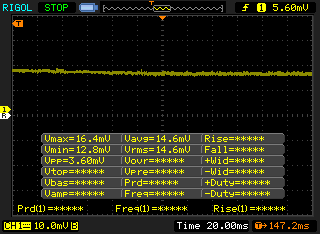 | ||
Comparación: 52 % de todos los dispositivos testados no usaron PWM para atenuar el display. Si se usó, medimos una media de 7754 (mínimo: 5 - máxmo: 343500) Hz. | |||
Rendimiento
Procesador
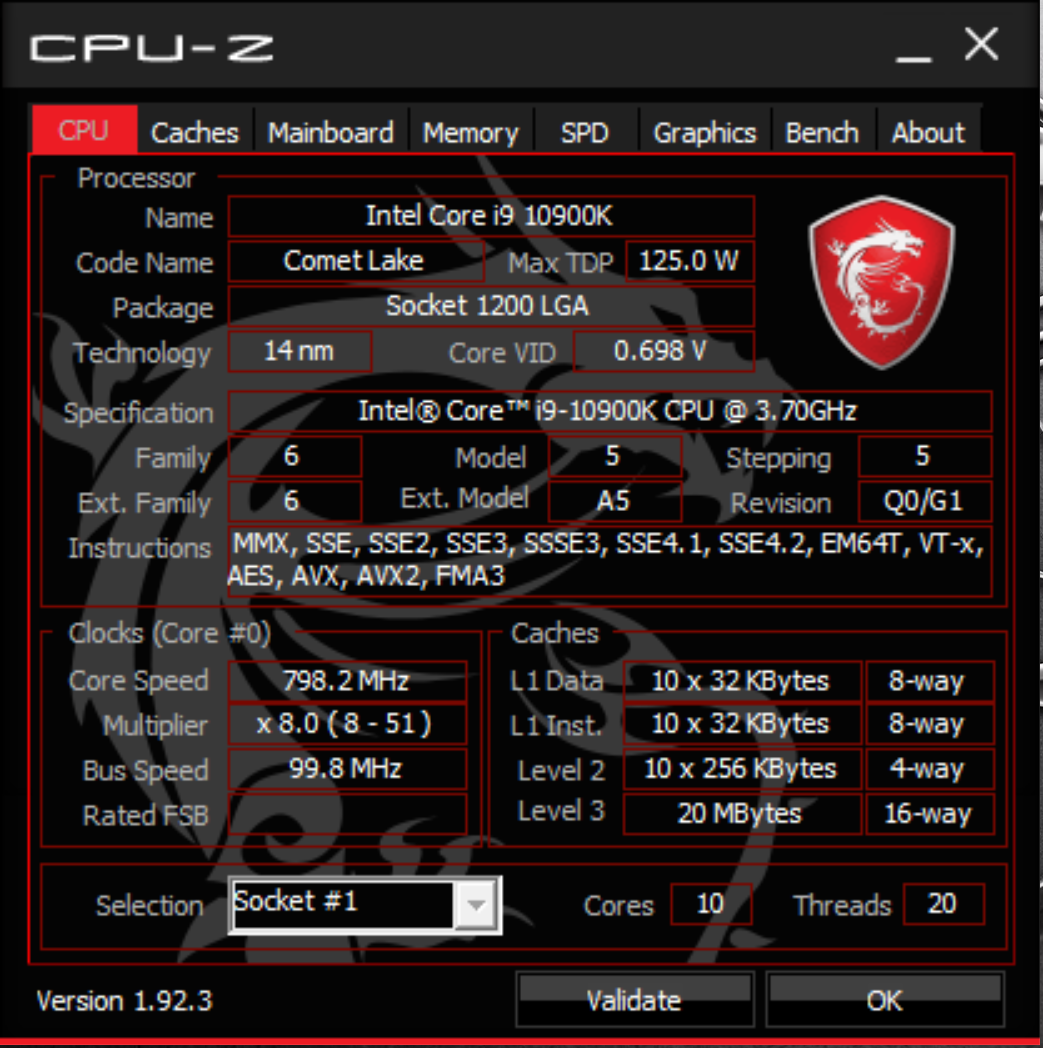
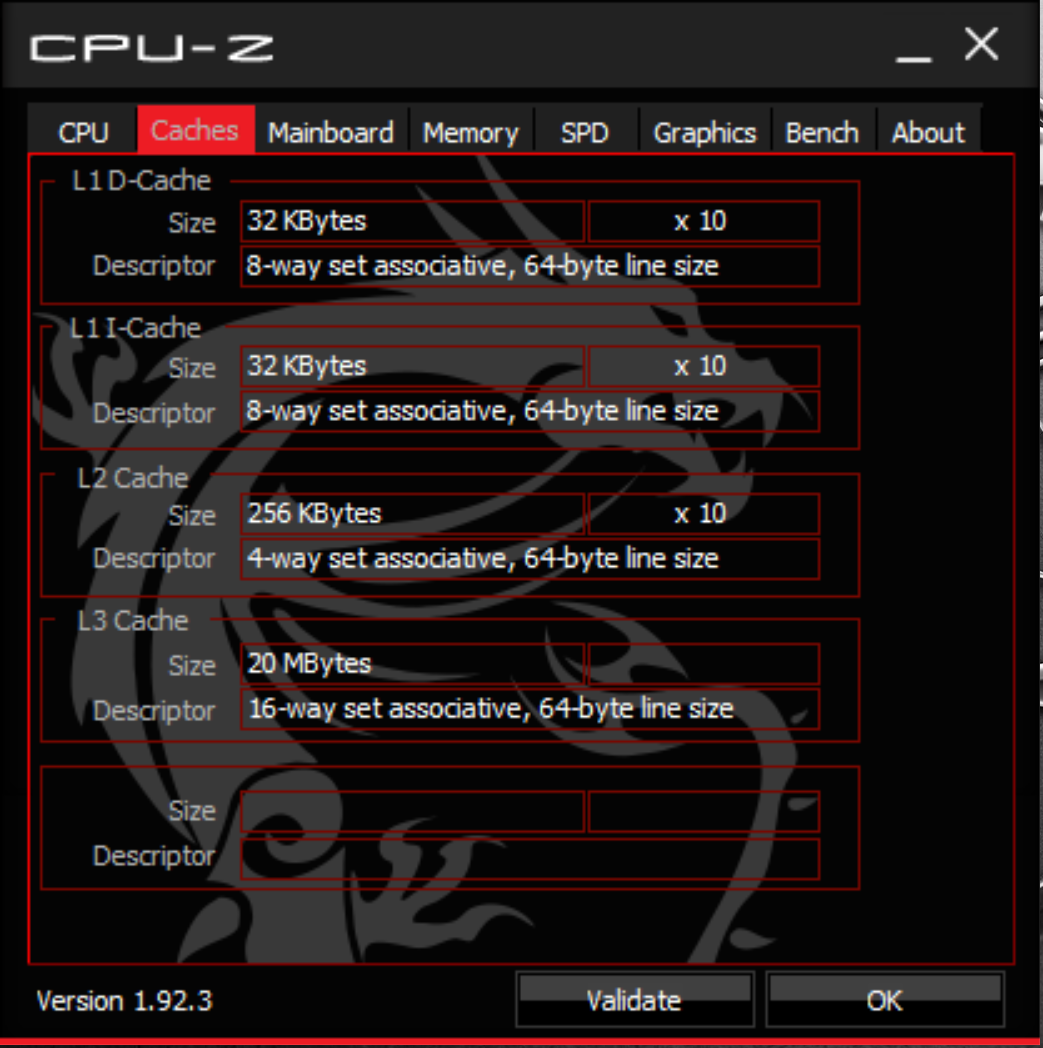
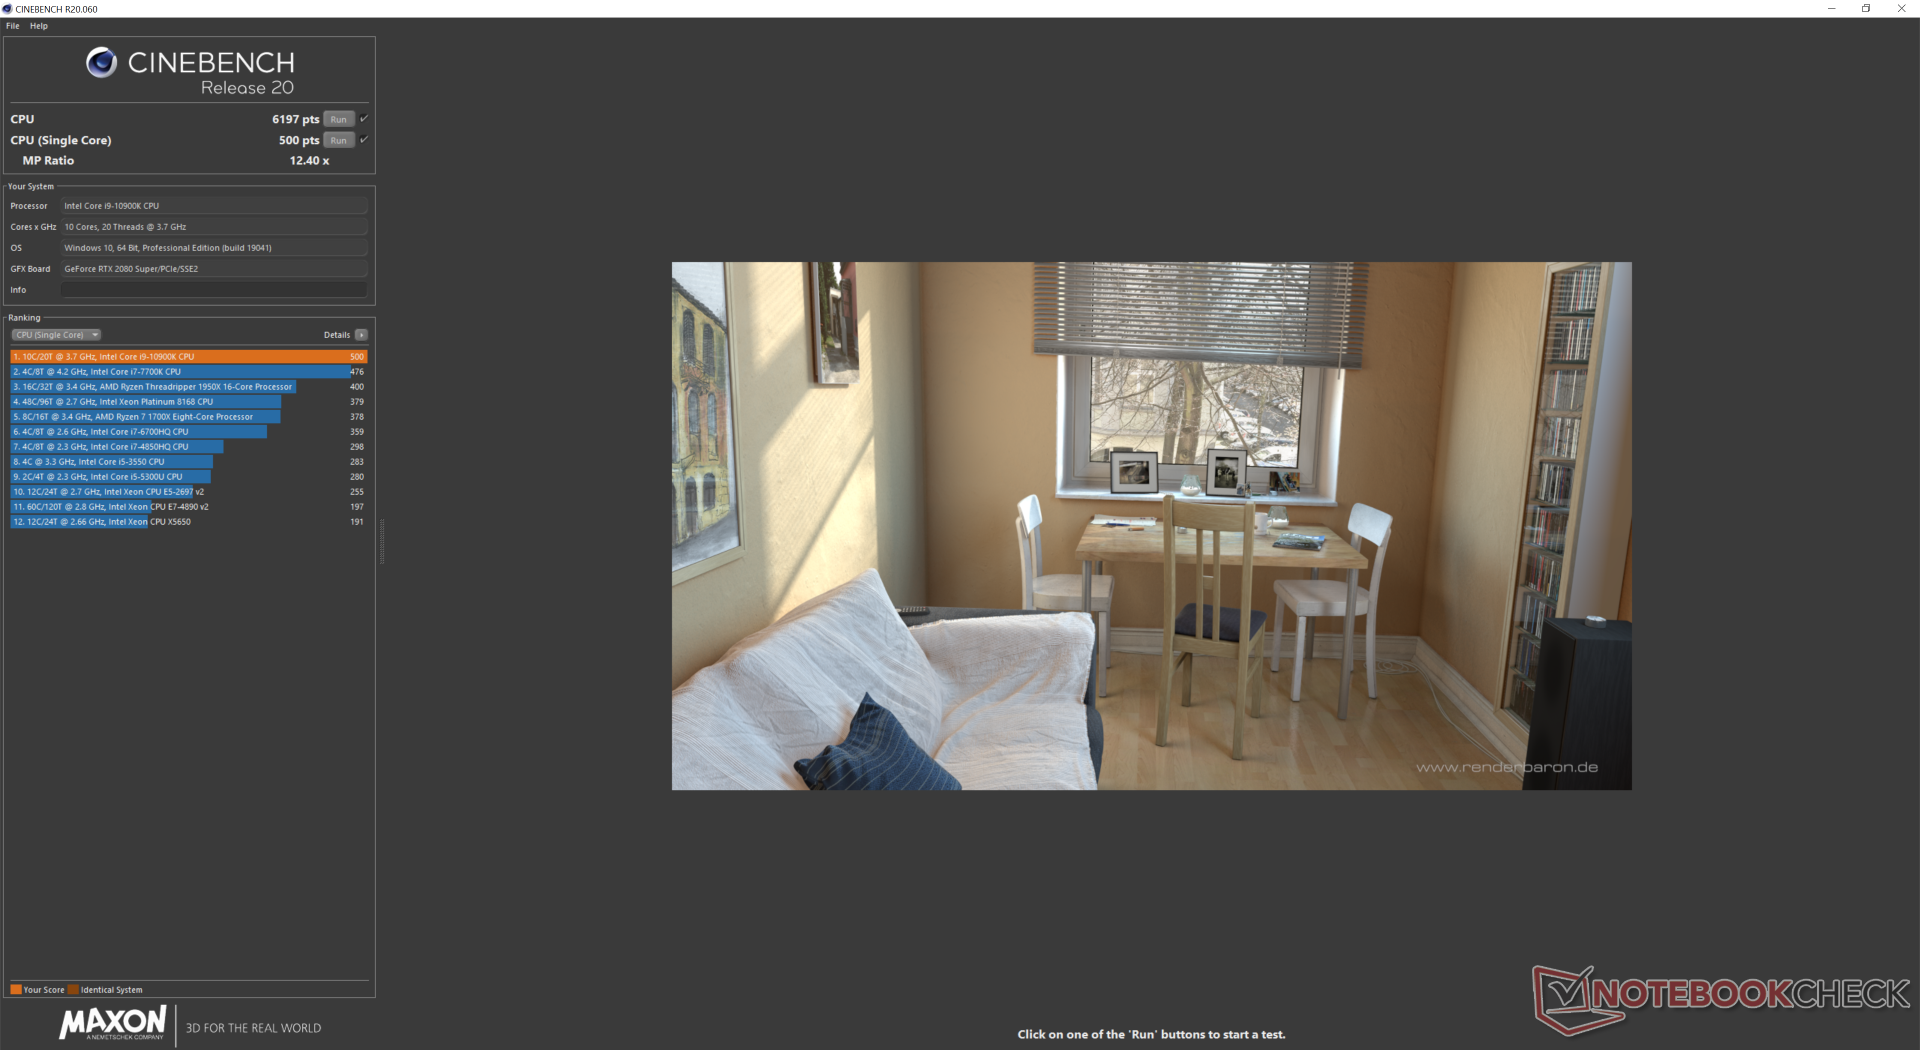
Cuando se compara con nuestra referencia Core i9-10900K de escritorio, el rendimiento de la CPU en el GT76 es sólo un 5 o 6 por ciento más lento. Los núcleos físicos adicionales (10 frente a 8) otorgan un rendimiento multihilo aproximadamente un 25 por ciento más rápido que el Core i9-9900K en el GT76 del año pasado, mientras que el rendimiento de los núcleos simples sigue siendo casi el mismo. La sostenibilidad del rendimiento es excelente, sin grandes caídas en el rendimiento a lo largo del tiempo.
Consulte nuestra página dedicada al Core i9-10900K para obtener más información técnica y puntos de referencia. Los usuarios pueden reemplazar el CPU en el GT76 ya que utiliza un enchufe estándar FCLGA1200, pero primero se debe retirar toda la solución de refrigeración.
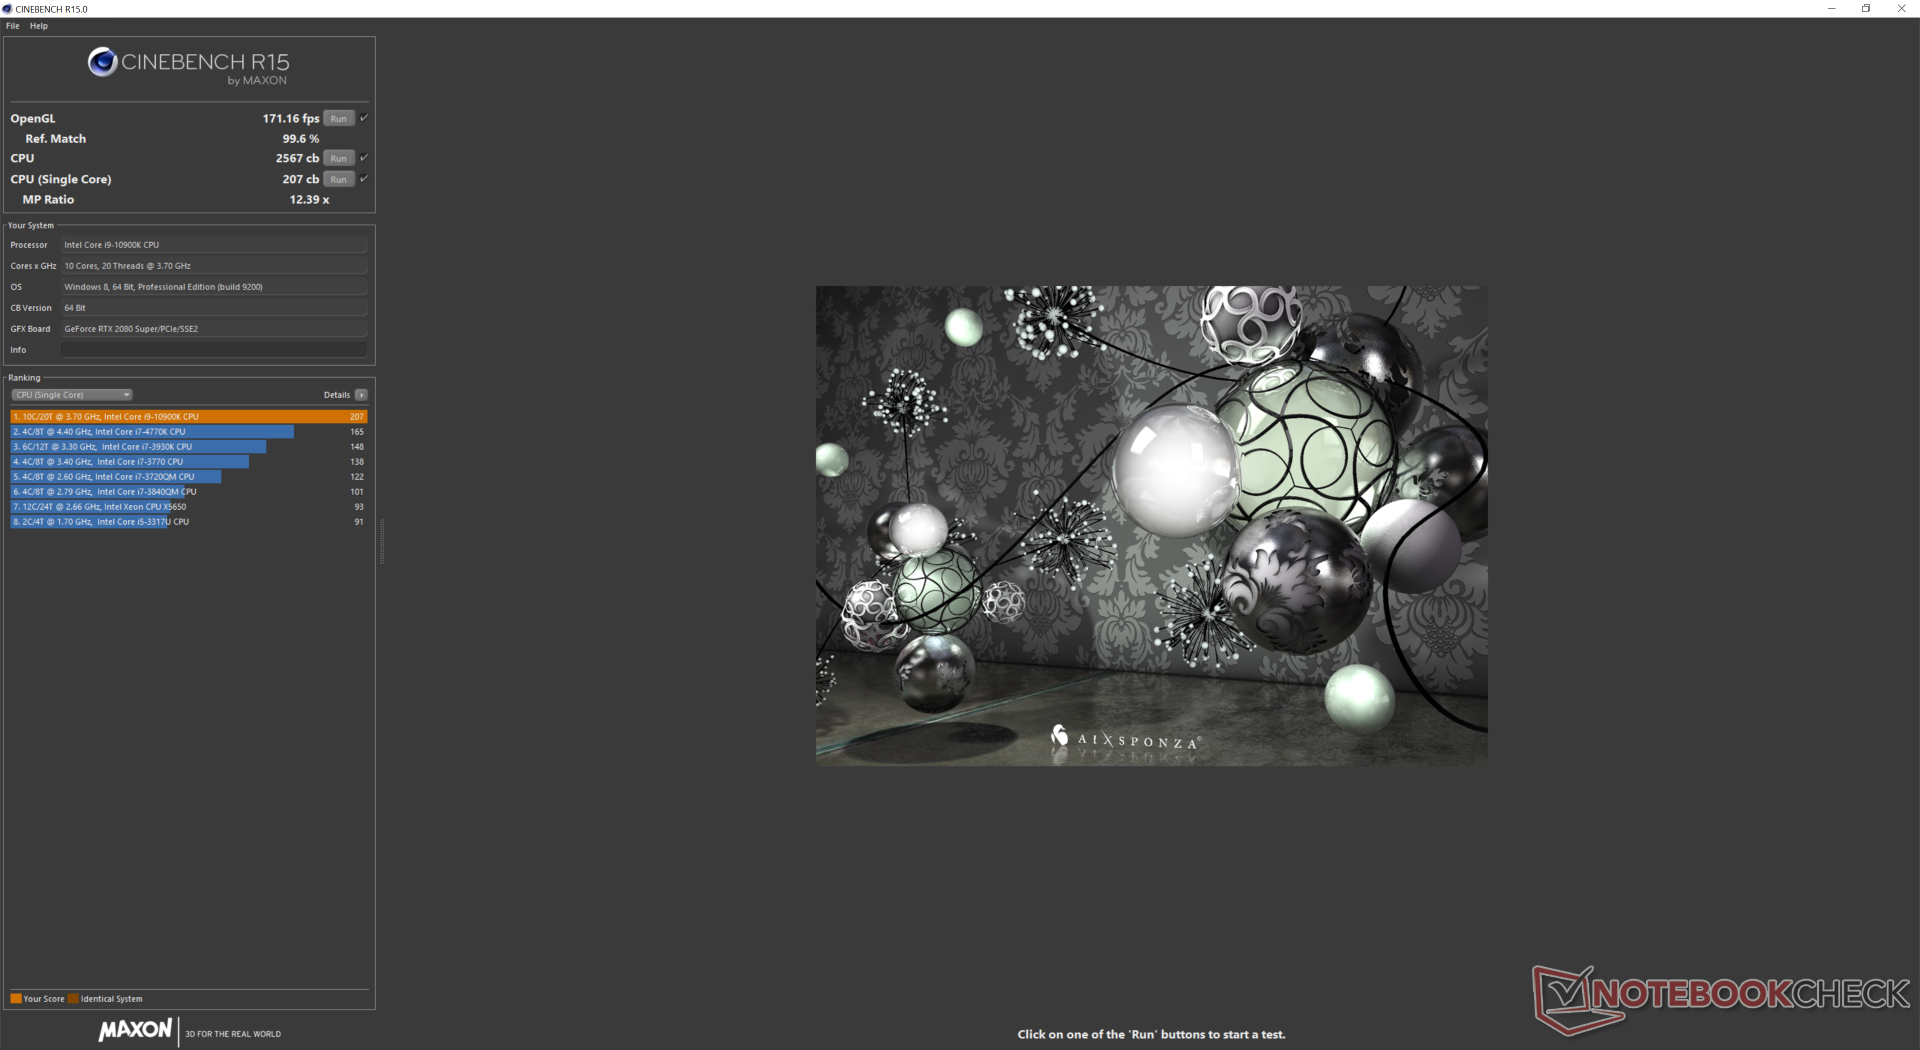
Cinebench R15: CPU Multi 64Bit | CPU Single 64Bit
Blender: v2.79 BMW27 CPU
7-Zip 18.03: 7z b 4 -mmt1 | 7z b 4
Geekbench 5.5: Single-Core | Multi-Core
HWBOT x265 Benchmark v2.2: 4k Preset
LibreOffice : 20 Documents To PDF
R Benchmark 2.5: Overall mean
| Cinebench R20 / CPU (Single Core) | |
| Medio Intel Core i9-10900K (493 - 532, n=3) | |
| MSI GT76 Titan DT 9SG | |
| Eurocom Sky X4C i9-9900KS | |
| KFA2 GeForce GTX 1650 EX One Click Plus | |
| Asus Zephyrus G14 GA401IV | |
| MSI GT76 Titan DT 10SGS | |
| Eluktronics RP-17 | |
| Alienware m17 R2 P41E | |
| MSI GE65 Raider 9SF-049US | |
| Alienware m17 R3 P45E | |
| Gigabyte Aero 15-Y9 | |
| Blender / v2.79 BMW27 CPU | |
| Asus Zephyrus G14 GA401IV | |
| Eluktronics RP-17 | |
| Eurocom Sky X4C i9-9900KS | |
| Alienware m17 R3 P45E | |
| MSI GT76 Titan DT 10SGS | |
| Medio Intel Core i9-10900K (167.3 - 190, n=3) | |
| KFA2 GeForce GTX 1650 EX One Click Plus | |
| 7-Zip 18.03 / 7z b 4 -mmt1 | |
| Medio Intel Core i9-10900K (5349 - 5954, n=3) | |
| Eurocom Sky X4C i9-9900KS | |
| Alienware m17 R3 P45E | |
| MSI GT76 Titan DT 10SGS | |
| KFA2 GeForce GTX 1650 EX One Click Plus | |
| Asus Zephyrus G14 GA401IV | |
| Eluktronics RP-17 | |
| 7-Zip 18.03 / 7z b 4 | |
| KFA2 GeForce GTX 1650 EX One Click Plus | |
| Medio Intel Core i9-10900K (67252 - 70968, n=3) | |
| MSI GT76 Titan DT 10SGS | |
| Eurocom Sky X4C i9-9900KS | |
| Eluktronics RP-17 | |
| Asus Zephyrus G14 GA401IV | |
| Alienware m17 R3 P45E | |
| Geekbench 5.5 / Single-Core | |
| Medio Intel Core i9-10900K (1336 - 1449, n=3) | |
| Eurocom Sky X4C i9-9900KS | |
| Alienware m17 R3 P45E | |
| MSI GT76 Titan DT 10SGS | |
| MSI GT76 Titan DT 9SG | |
| KFA2 GeForce GTX 1650 EX One Click Plus | |
| KFA2 GeForce GTX 1650 EX One Click Plus | |
| Asus Zephyrus G14 GA401IV | |
| Eluktronics RP-17 | |
| HWBOT x265 Benchmark v2.2 / 4k Preset | |
| KFA2 GeForce GTX 1650 EX One Click Plus | |
| MSI GT76 Titan DT 10SGS | |
| Medio Intel Core i9-10900K (18.2 - 21, n=3) | |
| Eurocom Sky X4C i9-9900KS | |
| Alienware m17 R3 P45E | |
| Eluktronics RP-17 | |
| Asus Zephyrus G14 GA401IV | |
| LibreOffice / 20 Documents To PDF | |
| Eluktronics RP-17 | |
| KFA2 GeForce GTX 1650 EX One Click Plus | |
| Medio Intel Core i9-10900K (46.2 - 76, n=3) | |
| Alienware m17 R3 P45E | |
| MSI GT76 Titan DT 10SGS | |
| R Benchmark 2.5 / Overall mean | |
| Eluktronics RP-17 | |
| MSI GT76 Titan DT 10SGS | |
| Alienware m17 R3 P45E | |
| Medio Intel Core i9-10900K (0.528 - 0.567, n=3) | |
| KFA2 GeForce GTX 1650 EX One Click Plus | |
* ... más pequeño es mejor
Rendimiento del sistema
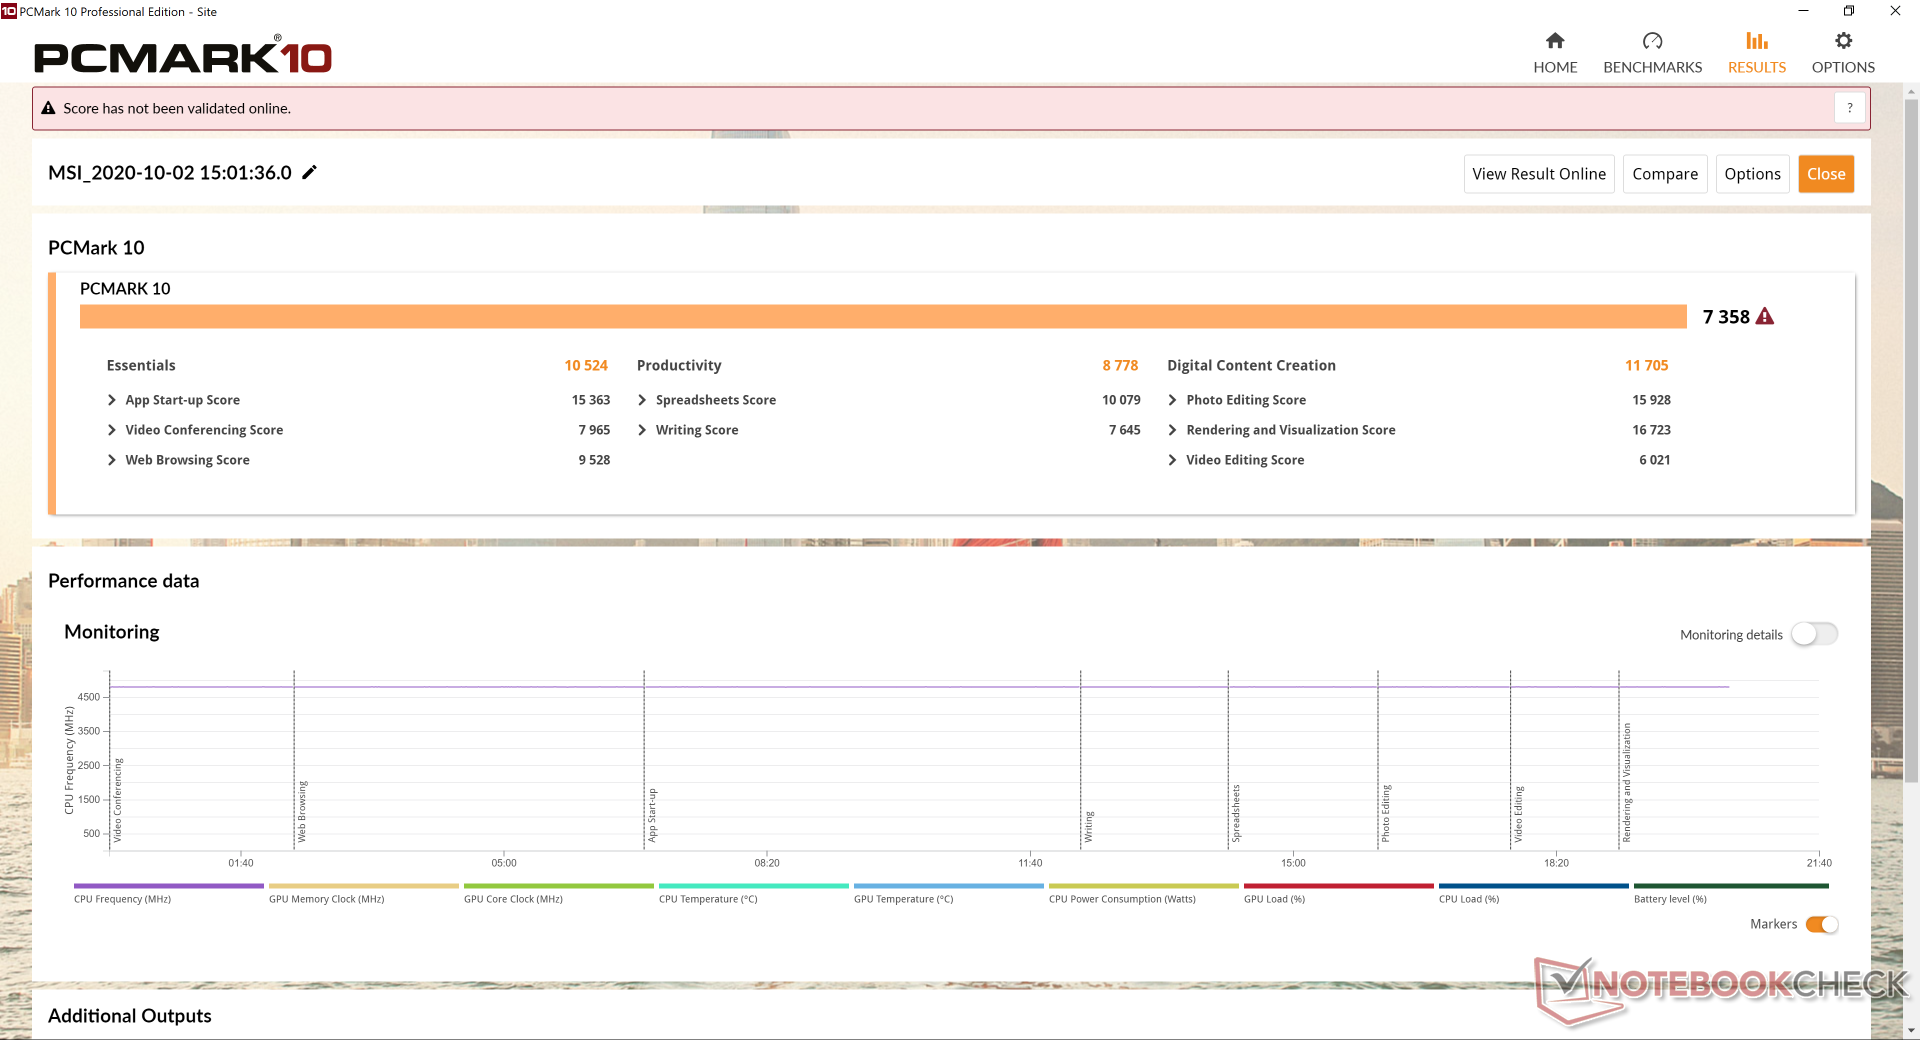
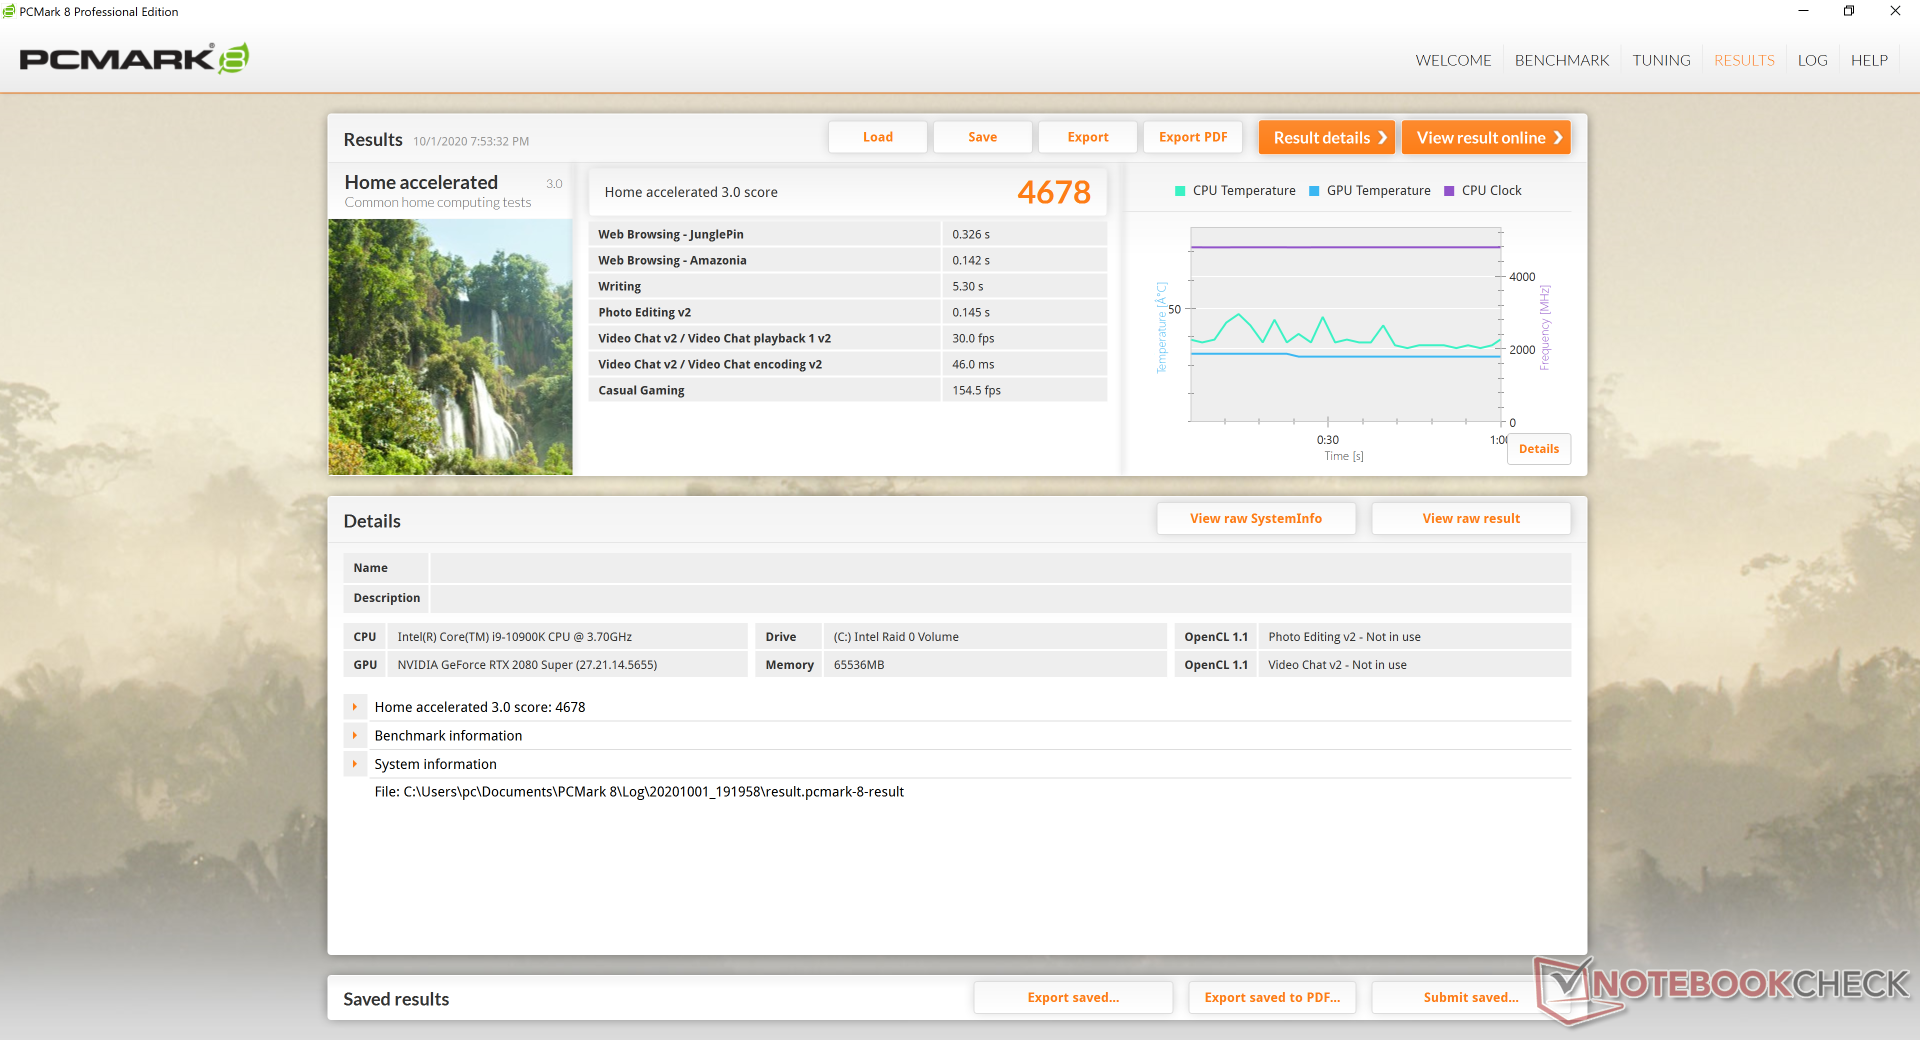
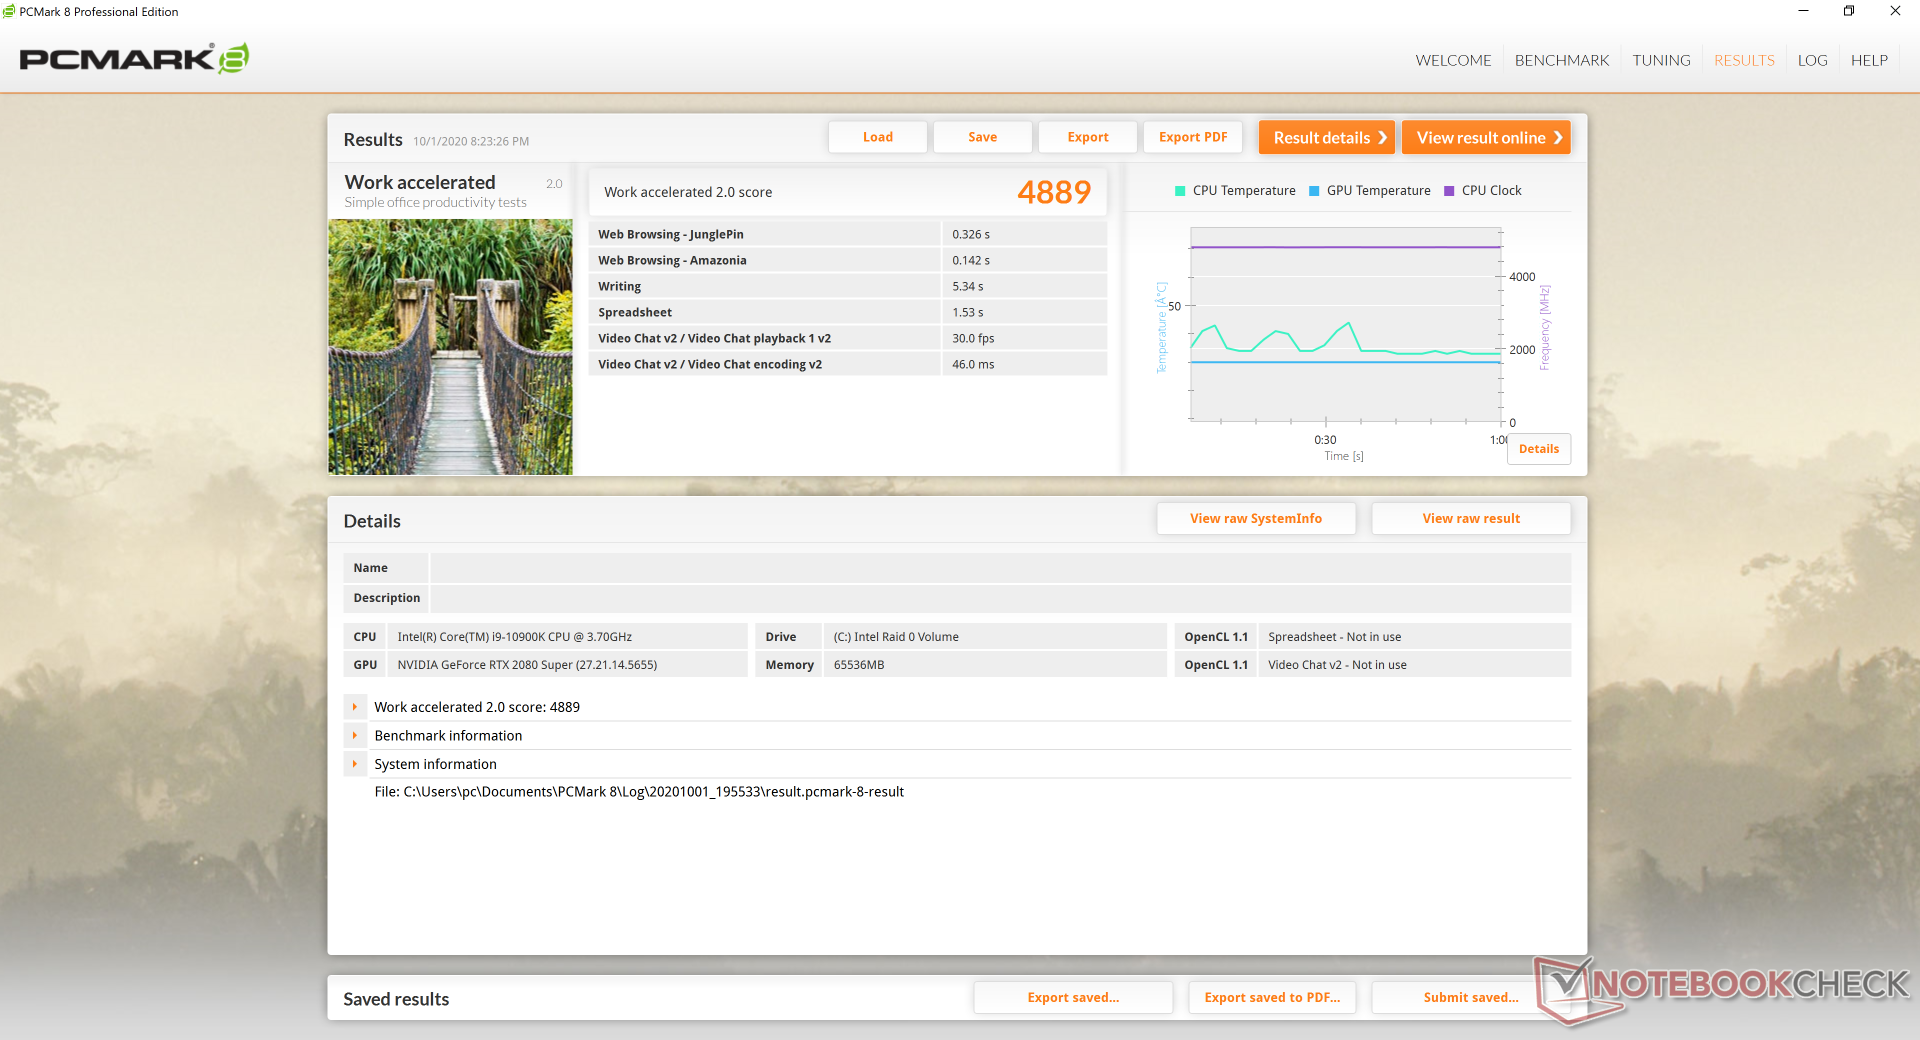
Los resultados de PCMark son unos de los más altos que hemos registrado en cualquier portátil para juegos con puntuaciones que están consistentemente por encima tanto del GT76 9SG como del Alienware Area-51m. Sin embargo, las diferencias son mayormente marginales.
| PCMark 8 | |
| Home Score Accelerated v2 | |
| Alienware Area-51m i9-9900K RTX 2080 | |
| Media de la clase Gaming (n=1últimos 2 años) | |
| MSI GT76 Titan DT 10SGS | |
| MSI GE75 9SG | |
| Work Score Accelerated v2 | |
| Alienware Area-51m i9-9900K RTX 2080 | |
| MSI GE75 9SG | |
| MSI GT76 Titan DT 10SGS | |
| Media de la clase Gaming (n=1últimos 2 años) | |
| PCMark 8 Home Score Accelerated v2 | 4678 puntos | |
| PCMark 8 Work Score Accelerated v2 | 4889 puntos | |
| PCMark 10 Score | 7358 puntos | |
ayuda | ||
Latencia DPC
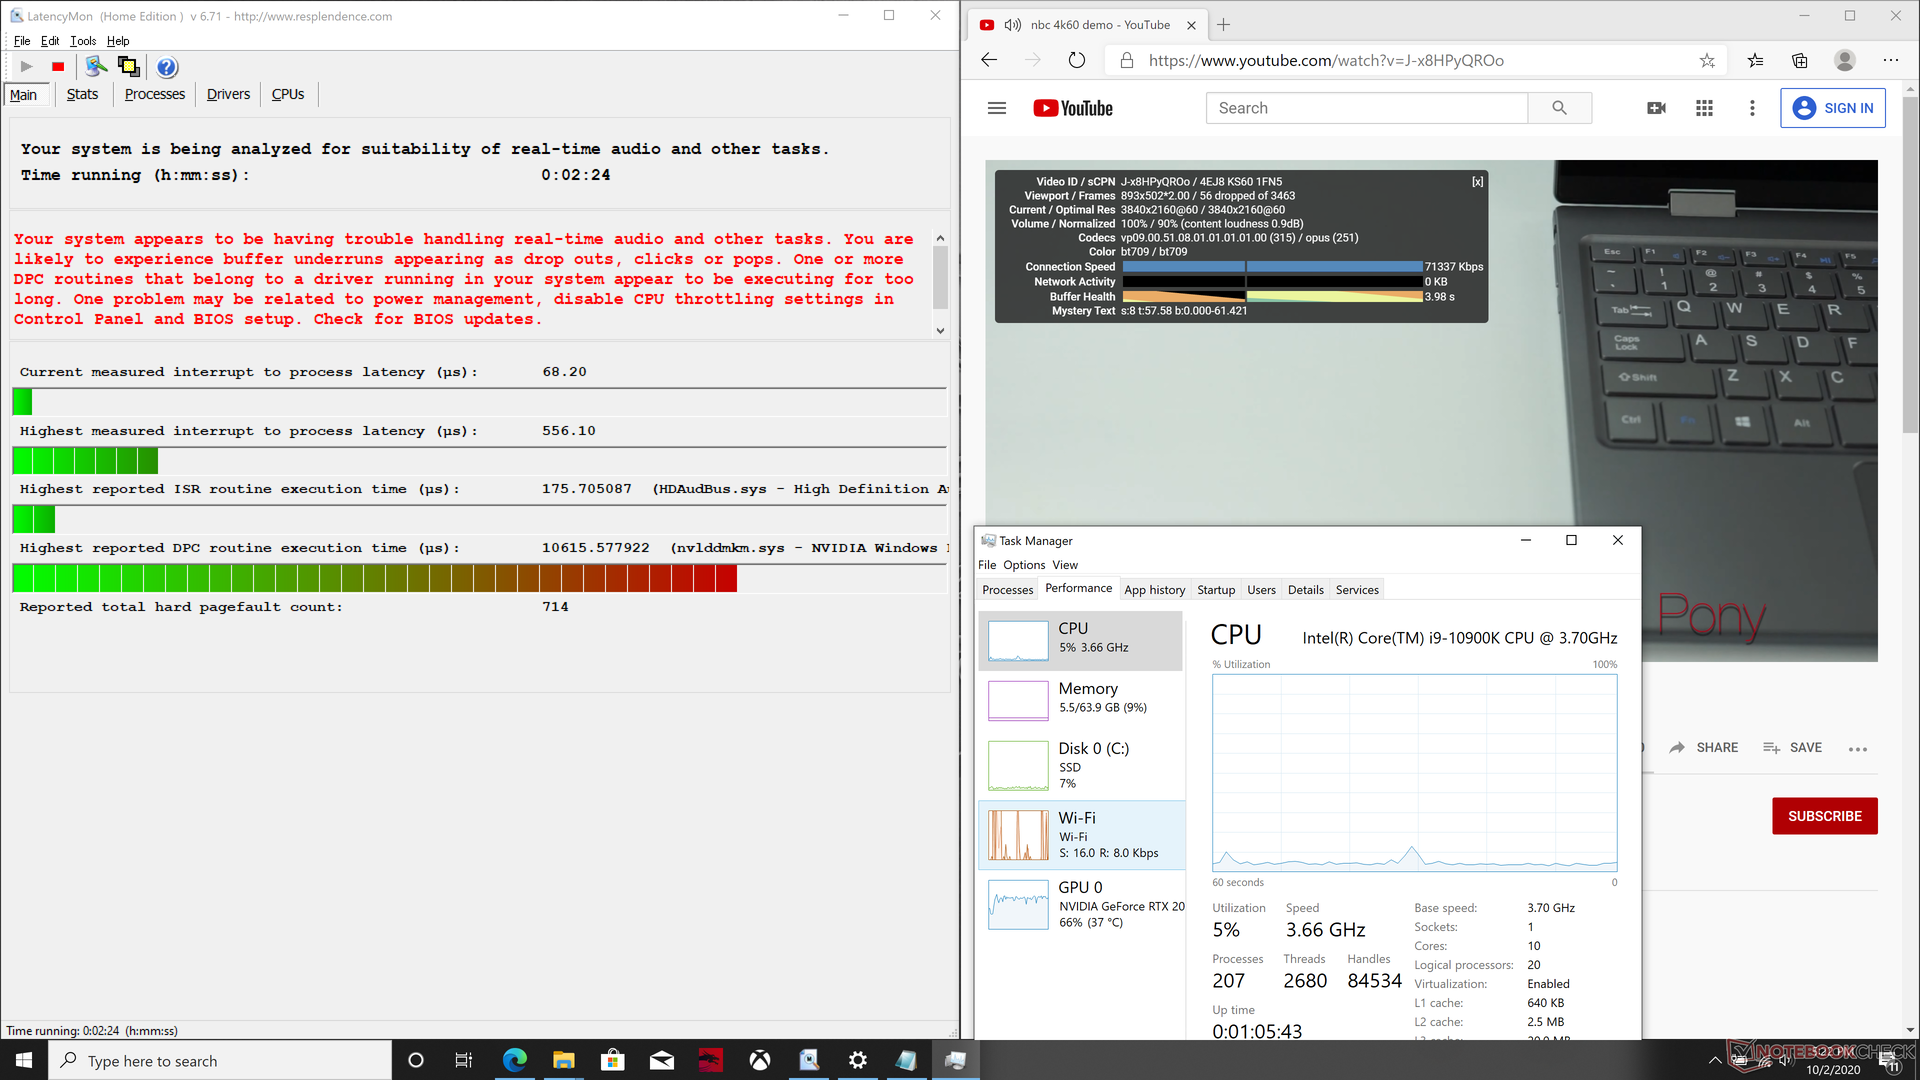
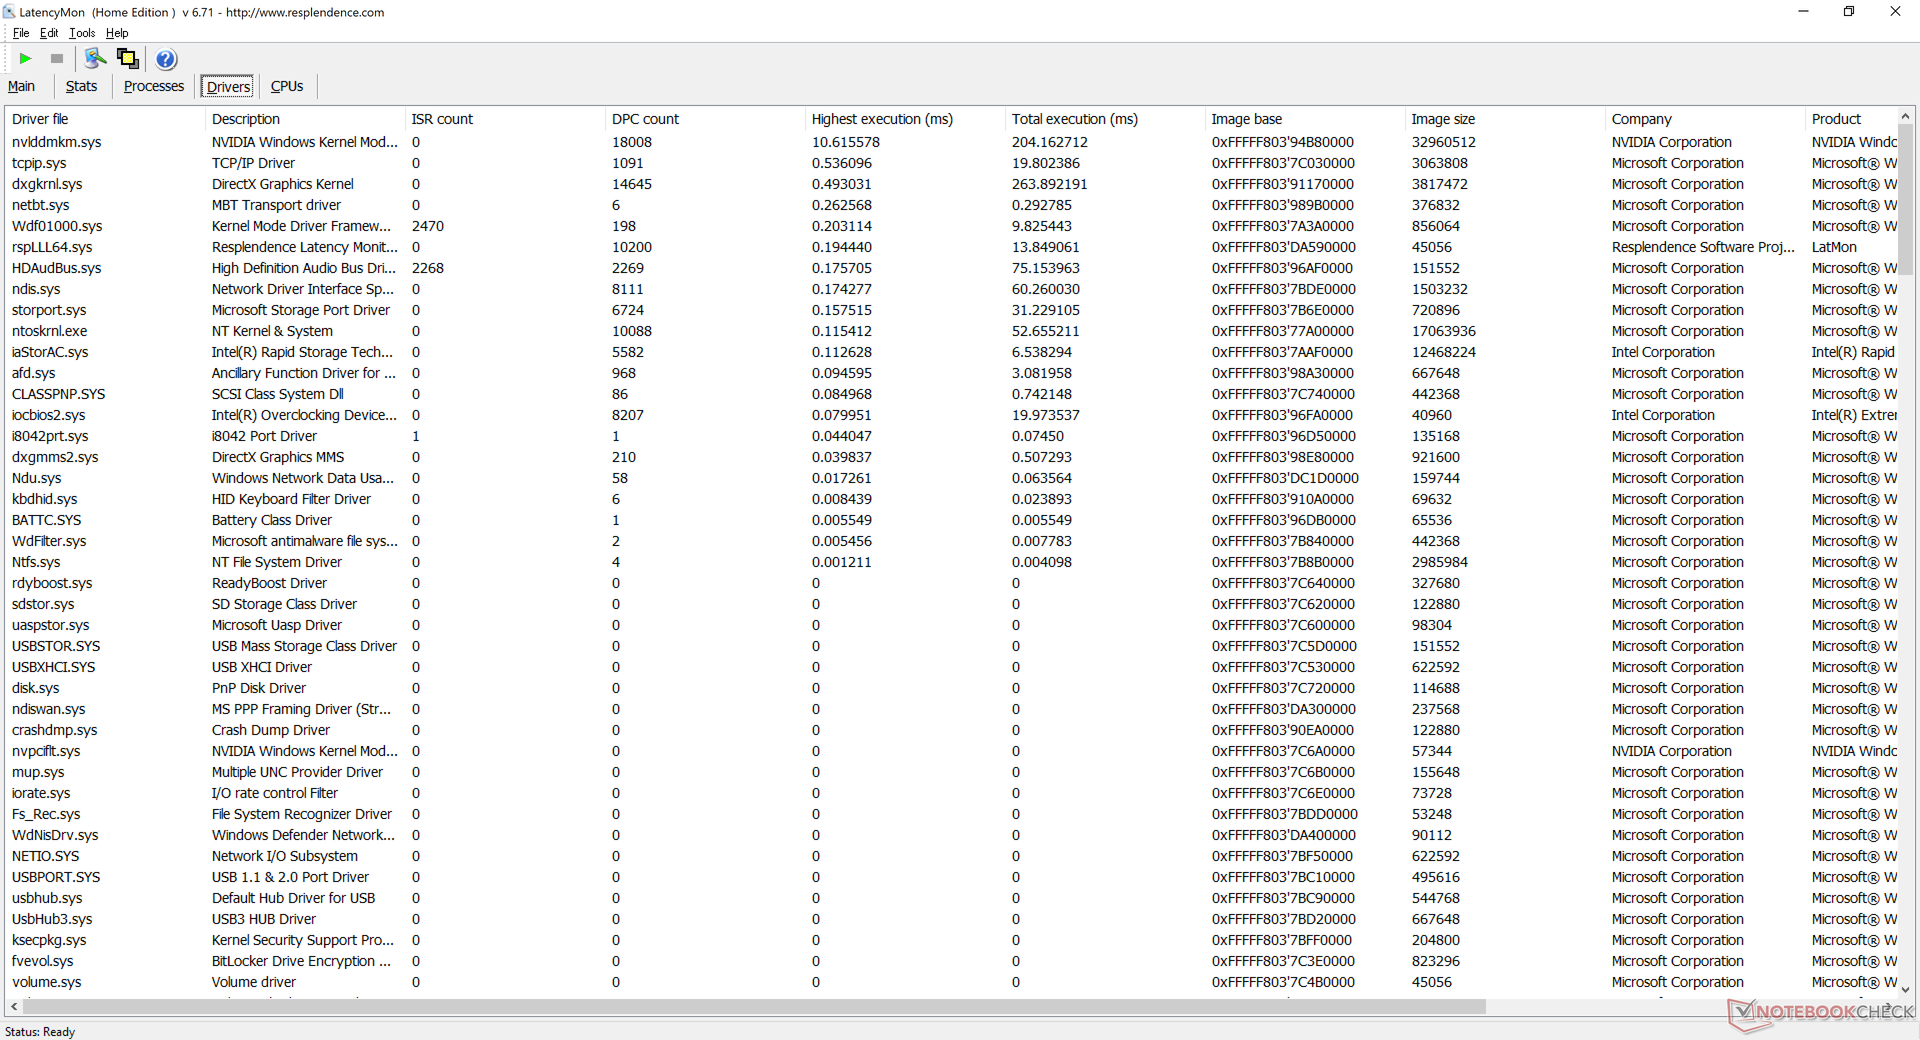
LatencyMon muestra los problemas de latencia de DPC relacionados con nvlddmkm.sys al abrir varias pestañas en nuestra página principal. La reproducción de video 4K UHD a 60 FPS tampoco es perfecta con 56 cuadros caídos durante nuestra prueba de un minuto en YouTube. Estos resultados son decepcionantes considerando el hardware involucrado.
| DPC Latencies / LatencyMon - interrupt to process latency (max), Web, Youtube, Prime95 | |
| MSI GT76 Titan DT 10SGS | |
| Asus Strix Scar 17 G732LXS | |
| Asus Zephyrus G14 GA401IV | |
| Eluktronics RP-17 | |
| Alienware m17 R3 P45E | |
* ... más pequeño es mejor
Dispositivos de almacenamiento
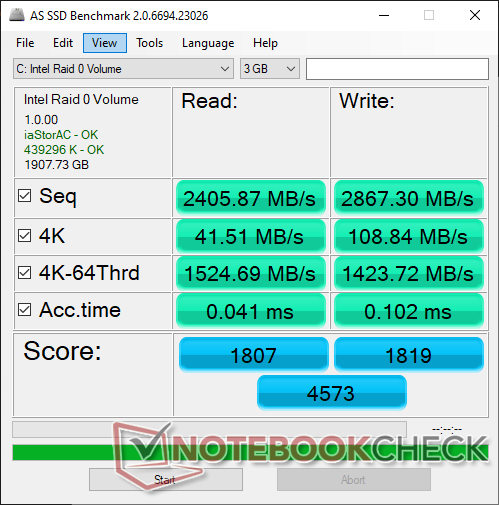
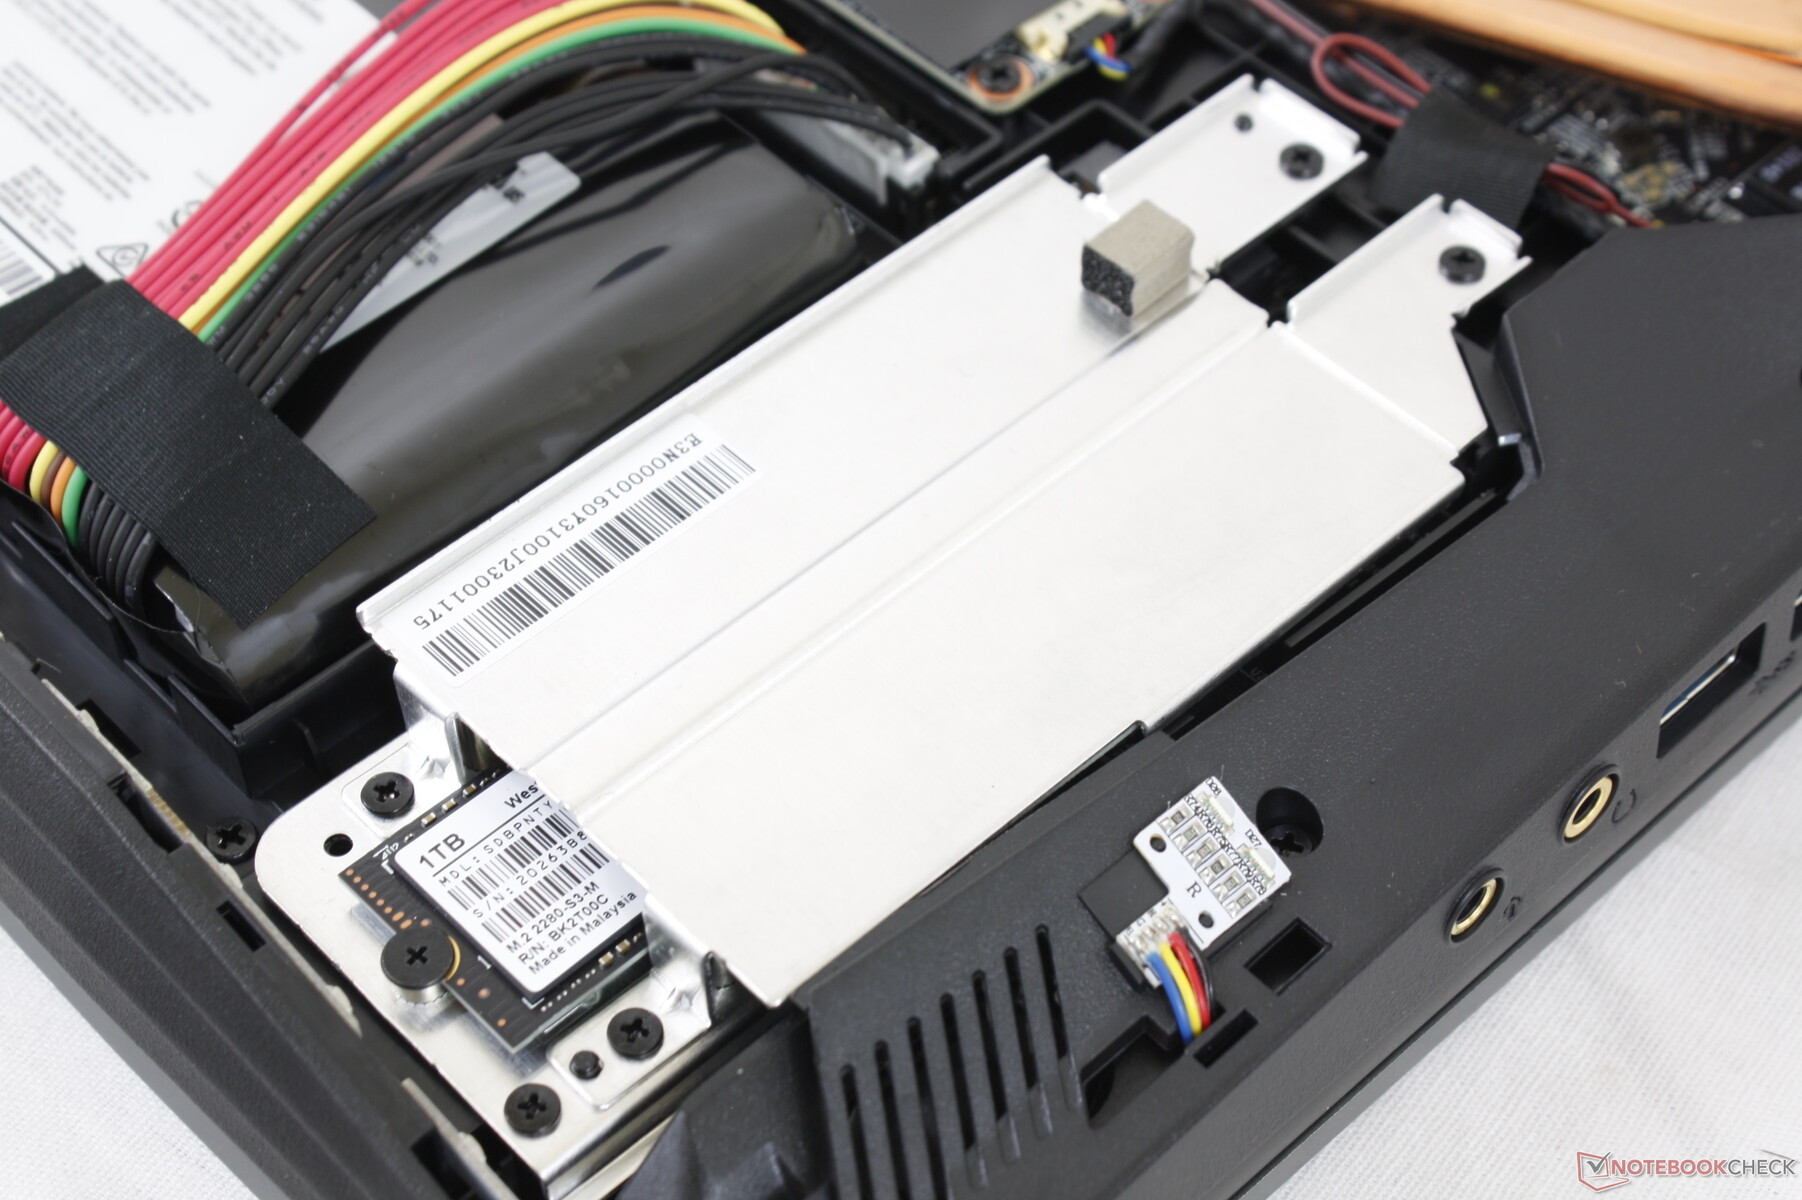
| MSI GT76 Titan DT 10SGS 2x WDC PC SN730 SDBPNTY-1T00 (RAID 0) | Alienware Area-51m i9-9900K RTX 2080 2x SK Hynix PC400 512GB (RAID 0) | Asus Strix Scar 17 G732LXS 2x Intel SSD 660p 1TB SSDPEKNW010T8 (RAID 0) | MSI GE75 9SG Samsung SSD PM981 MZVLB1T0HALR | MSI GT76 Titan DT 9SG 2x Samsung PM961 MZVLW256HEHP (RAID 0) | |
|---|---|---|---|---|---|
| AS SSD | -20% | -29% | -11% | -16% | |
| Seq Read (MB/s) | 2406 | 2082 -13% | 2450 2% | 1358 -44% | 2646 10% |
| Seq Write (MB/s) | 2867 | 2335 -19% | 1436 -50% | 2381 -17% | 2214 -23% |
| 4K Read (MB/s) | 41.51 | 24.14 -42% | 49.48 19% | 27.02 -35% | 30.42 -27% |
| 4K Write (MB/s) | 108.8 | 91.8 -16% | 119.4 10% | 89.2 -18% | 95.9 -12% |
| 4K-64 Read (MB/s) | 1525 | 1561 2% | 1032 -32% | 1642 8% | 1609 6% |
| 4K-64 Write (MB/s) | 1424 | 1350 -5% | 1229 -14% | 1799 26% | 1573 10% |
| Access Time Read * (ms) | 0.041 | 0.121 -195% | 0.145 -254% | 0.067 -63% | 0.128 -212% |
| Access Time Write * (ms) | 0.102 | 0.039 62% | 0.036 65% | 0.05 51% | 0.039 62% |
| Score Read (Points) | 1807 | 1793 -1% | 1327 -27% | 1805 0% | 1904 5% |
| Score Write (Points) | 1819 | 1675 -8% | 1492 -18% | 2127 17% | 1890 4% |
| Score Total (Points) | 4573 | 4390 -4% | 3456 -24% | 4899 7% | 4740 4% |
| Copy ISO MB/s (MB/s) | 2605 | 2175 -17% | 3193 23% | ||
| Copy Program MB/s (MB/s) | 651 | 582 -11% | 198.2 -70% | ||
| Copy Game MB/s (MB/s) | 1709 | 1479 -13% | 1054 -38% | ||
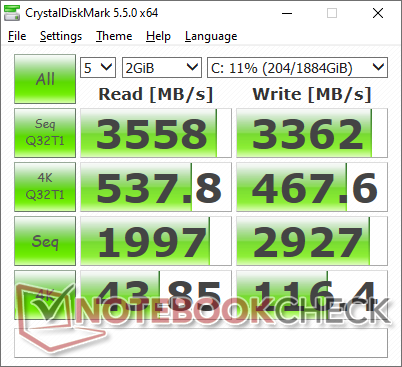
| CrystalDiskMark 5.2 / 6 | 3% | -7% | -16% | -12% | |
| Write 4K (MB/s) | 116.4 | 111.1 -5% | 125.8 8% | 116.1 0% | 101.4 -13% |
| Read 4K (MB/s) | 43.85 | 45.47 4% | 52.9 21% | 44.98 3% | 40.57 -7% |
| Write Seq (MB/s) | 2927 | 2454 -16% | 1795 -39% | 2370 -19% | 2229 -24% |
| Read Seq (MB/s) | 1997 | 2212 11% | 2315 16% | 1465 -27% | 2528 27% |
| Write 4K Q32T1 (MB/s) | 467.6 | 622 33% | 407.1 -13% | 337.5 -28% | 379.6 -19% |
| Read 4K Q32T1 (MB/s) | 538 | 695 29% | 411.9 -23% | 453.6 -16% | 421.9 -22% |
| Write Seq Q32T1 (MB/s) | 3362 | 2675 -20% | 2844 -15% | 2399 -29% | 2439 -27% |
| Read Seq Q32T1 (MB/s) | 3558 | 3184 -11% | 3130 -12% | 3087 -13% | 3199 -10% |
| Media total (Programa/Opciones) | -9% /
-12% | -18% /
-20% | -14% /
-13% | -14% /
-14% |
* ... más pequeño es mejor

Estrangulamiento del disco: DiskSpd Read Loop, Queue Depth 8
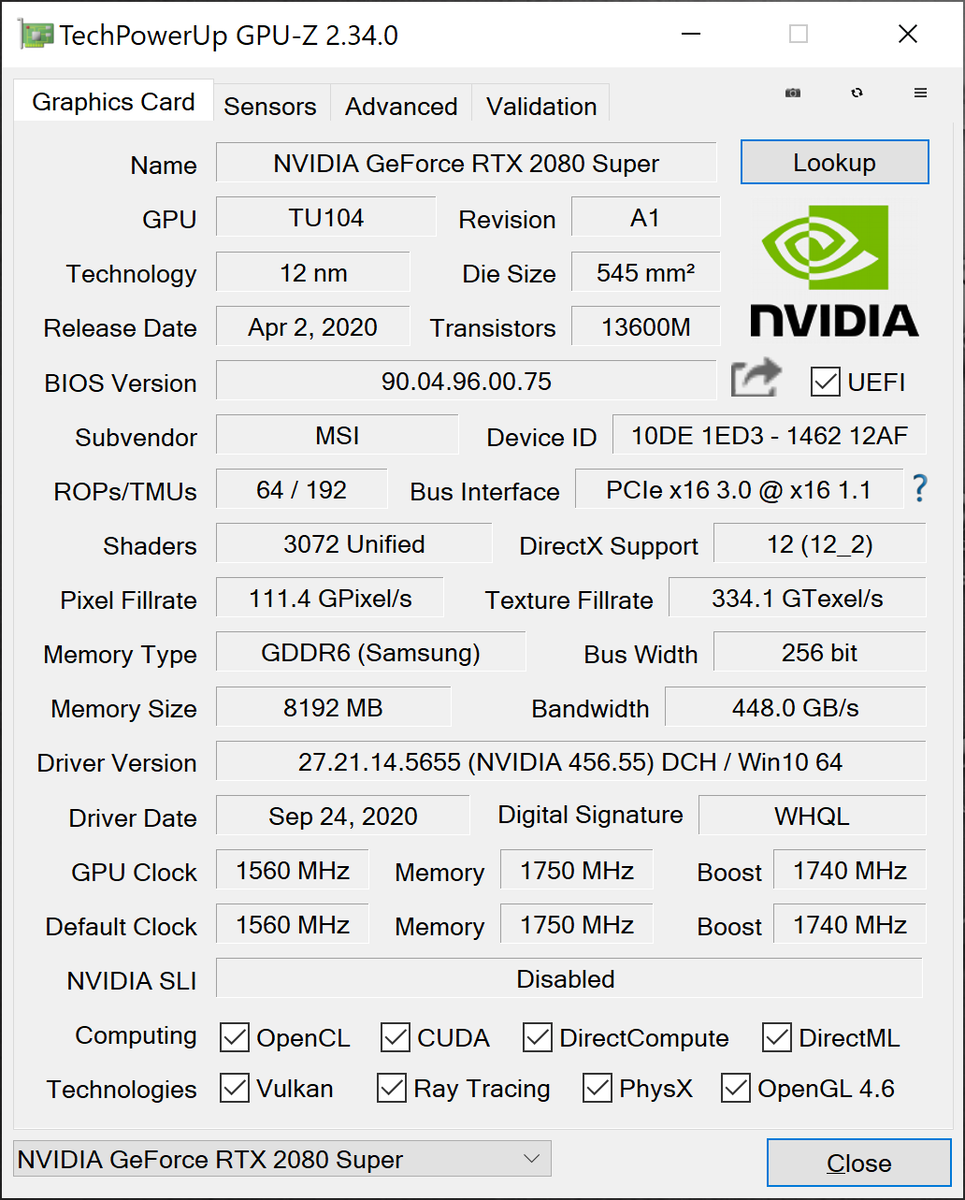
Rendimiento de la GPU
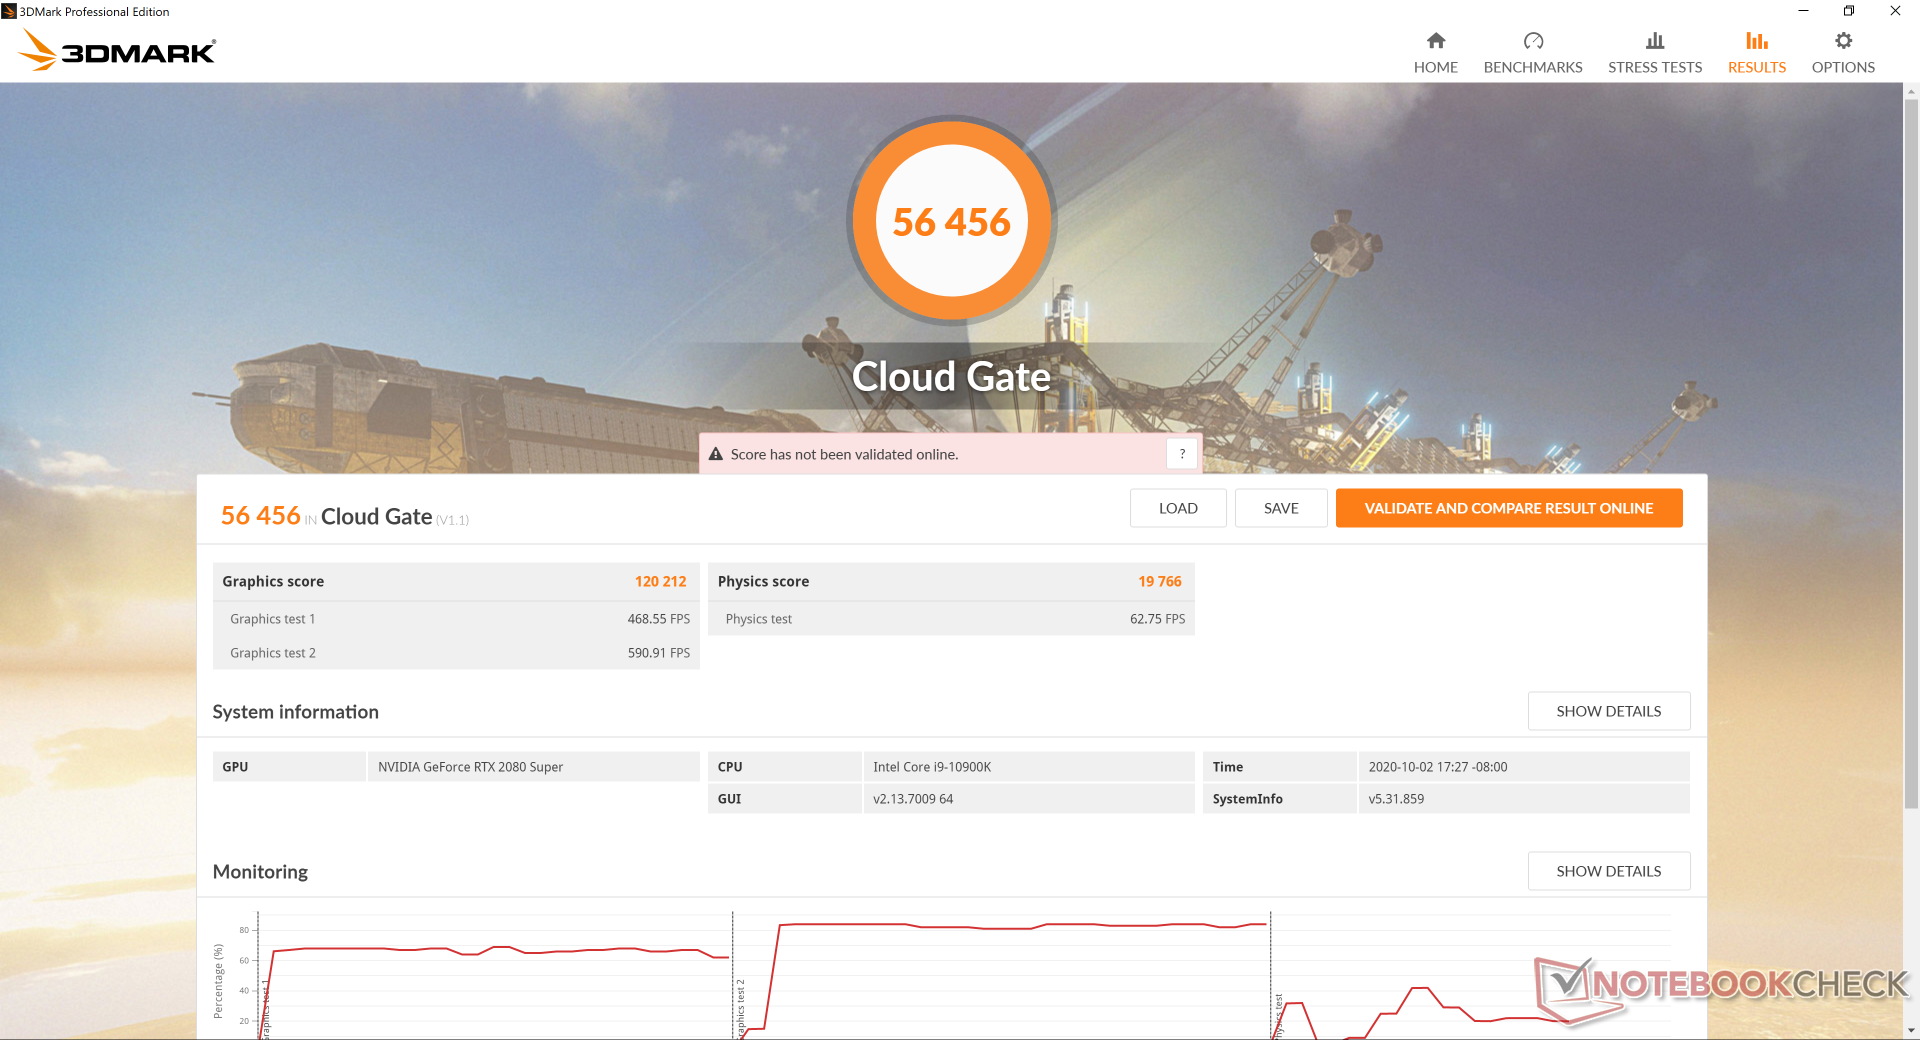
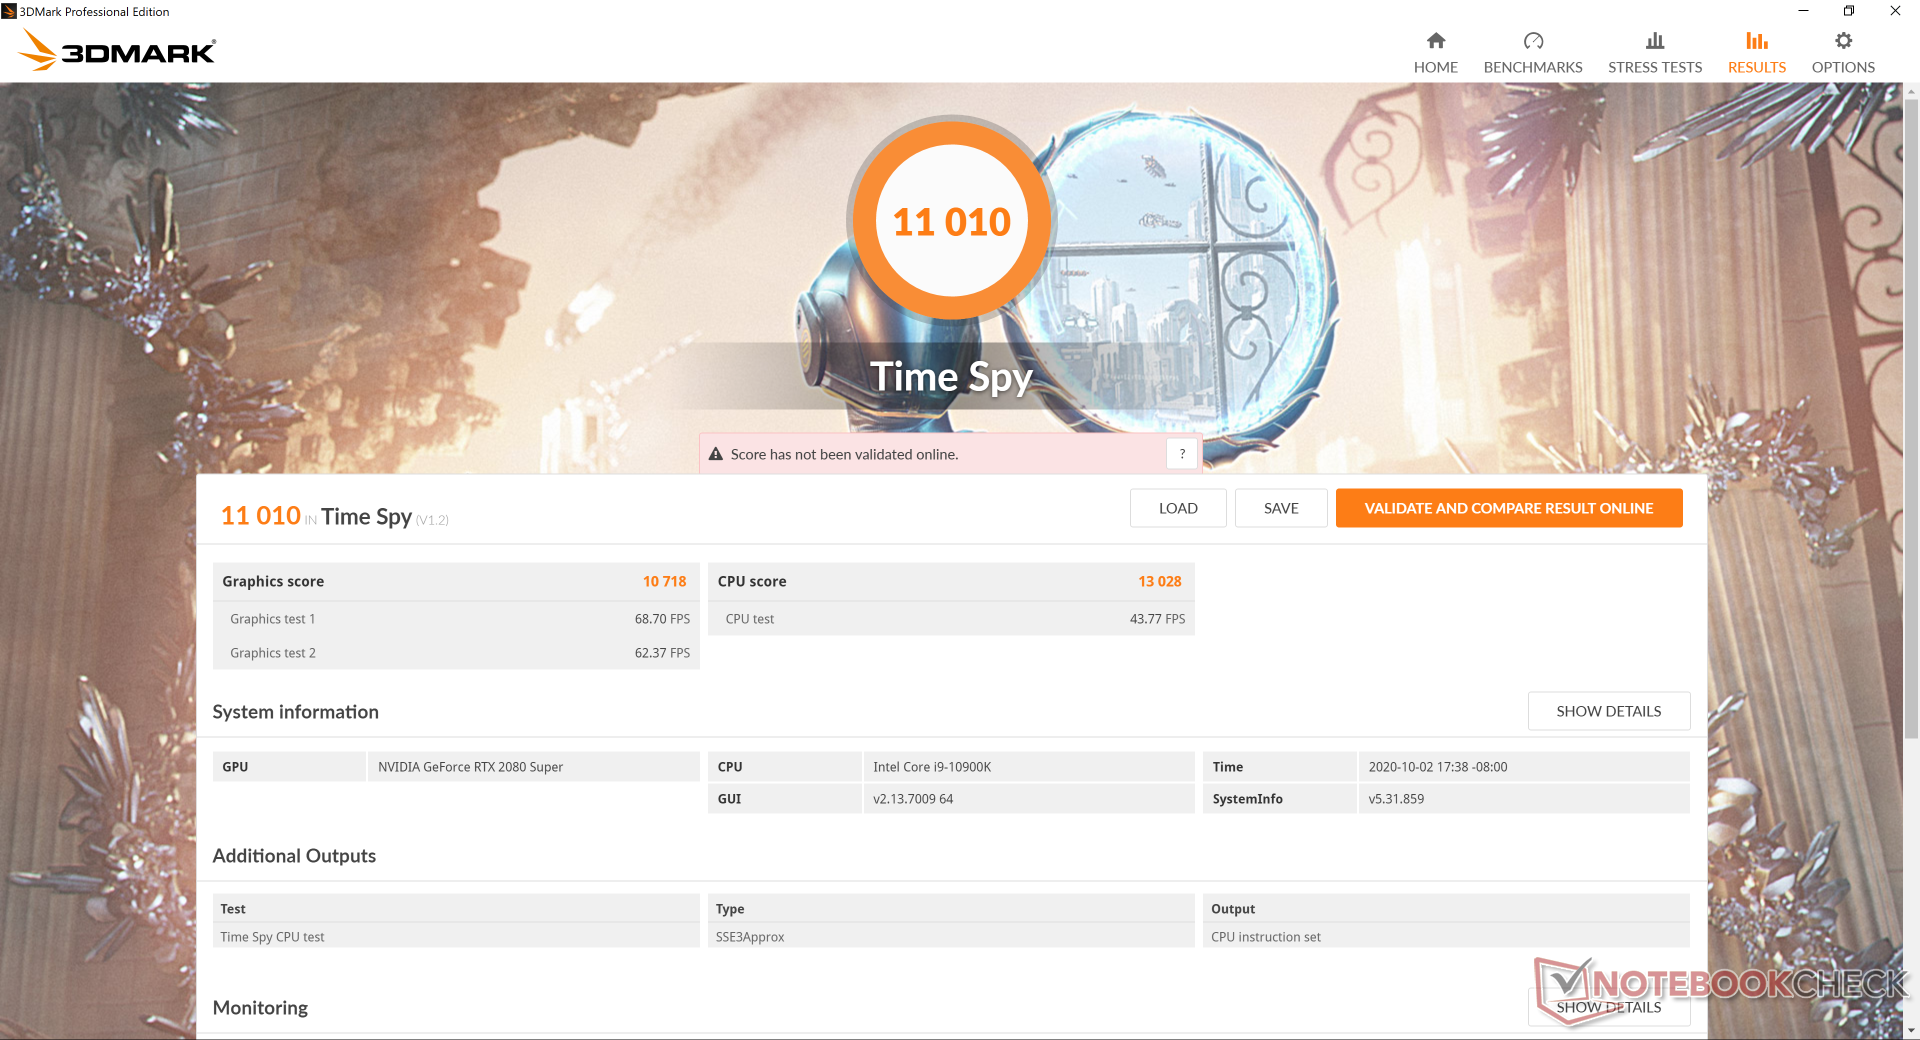
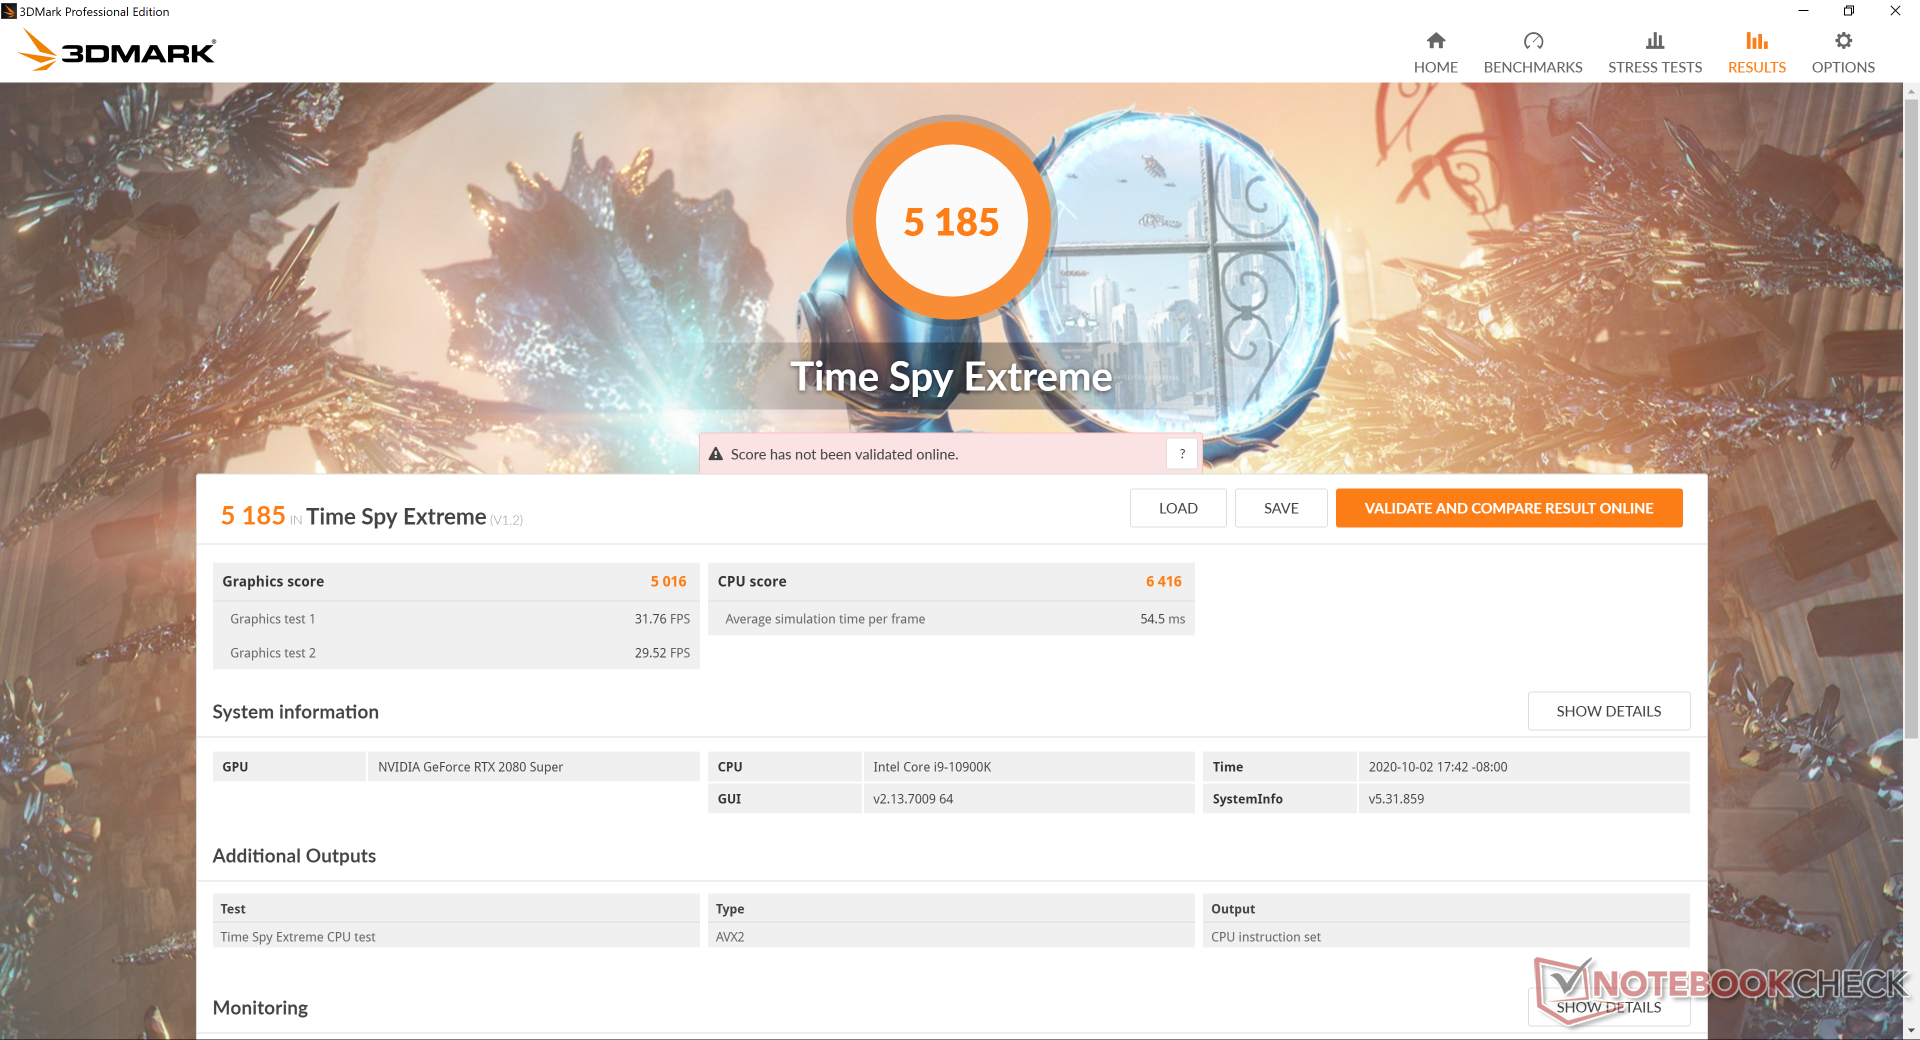
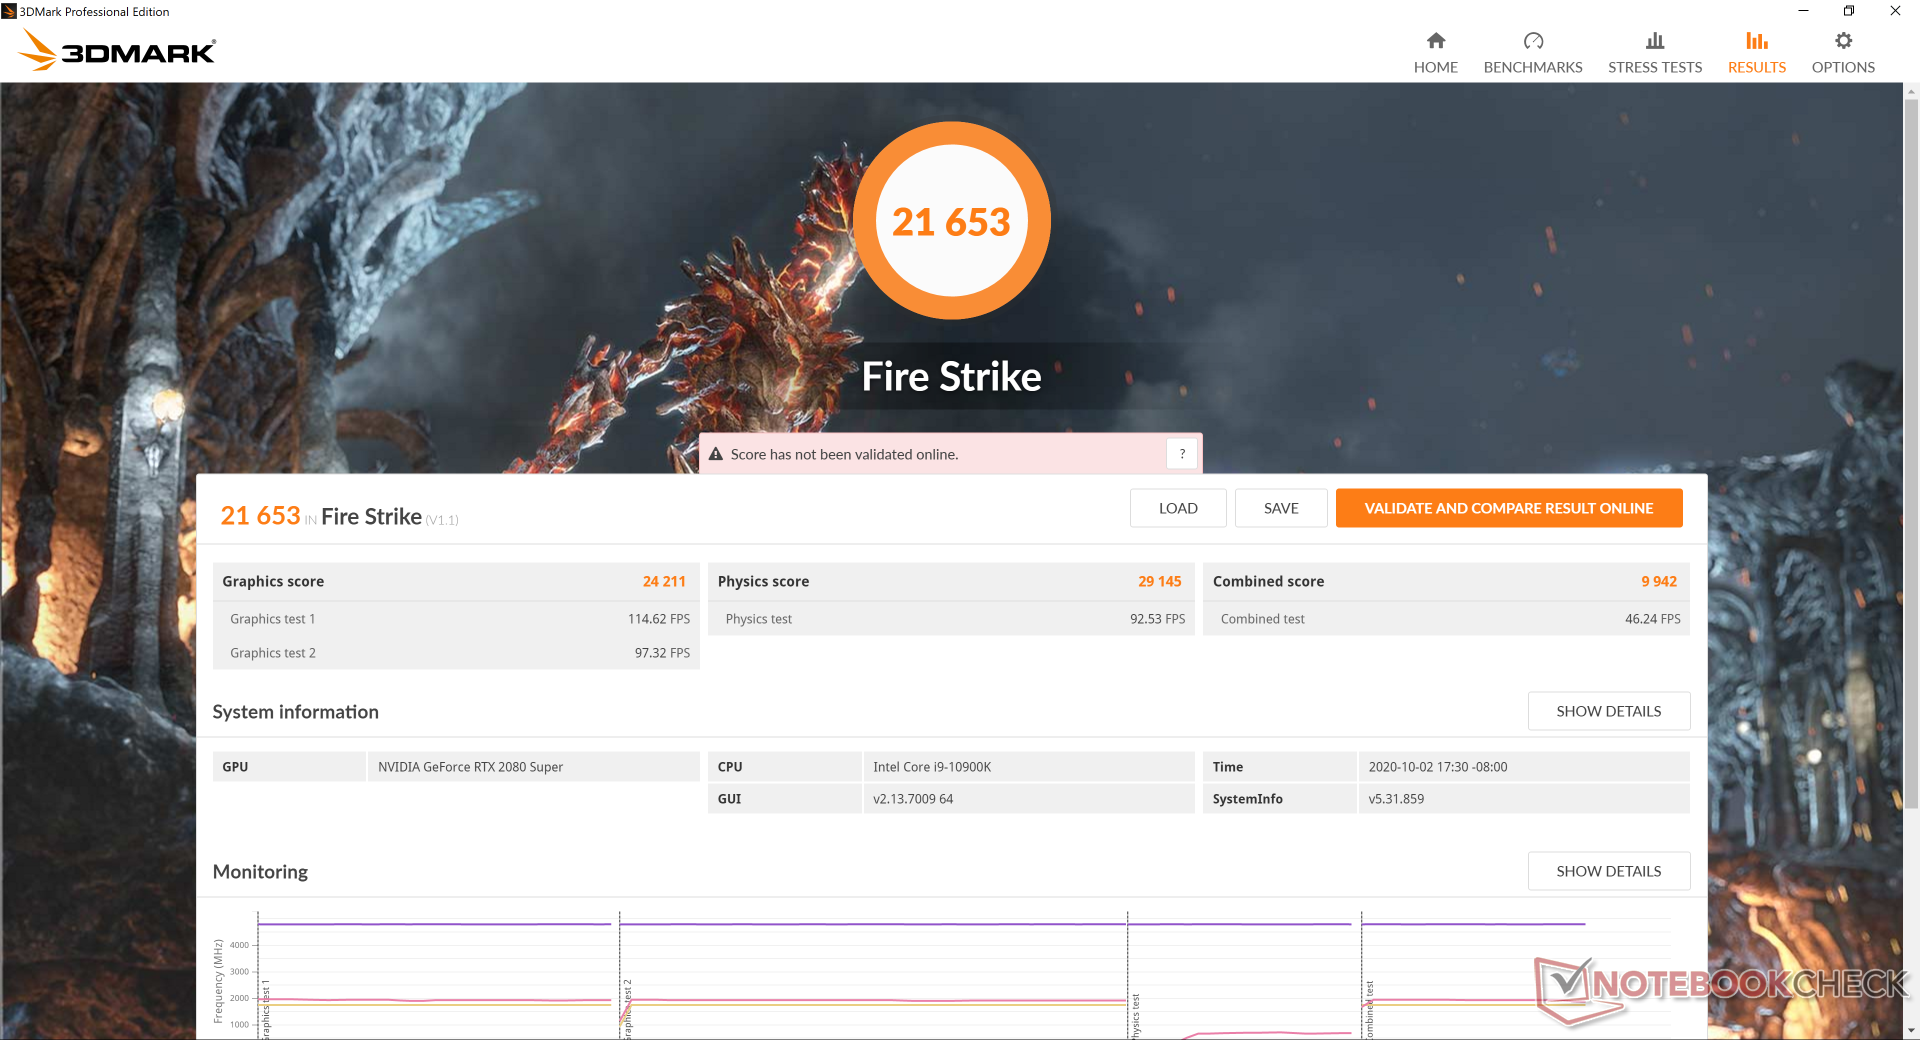
Los resultados de 3DMark son de hecho más rápidos que los del GT76 9SG del año pasado, aunque sólo marginalmente por unos pocos puntos porcentuales. El rendimiento de los gráficos en bruto es muy inferior a nuestra referencia RTX 2080 Super de escritorio. Consulte nuestra página sobre la GeForce RTX 2080 Super móvil para obtener más información técnica y comparaciones de referencia.
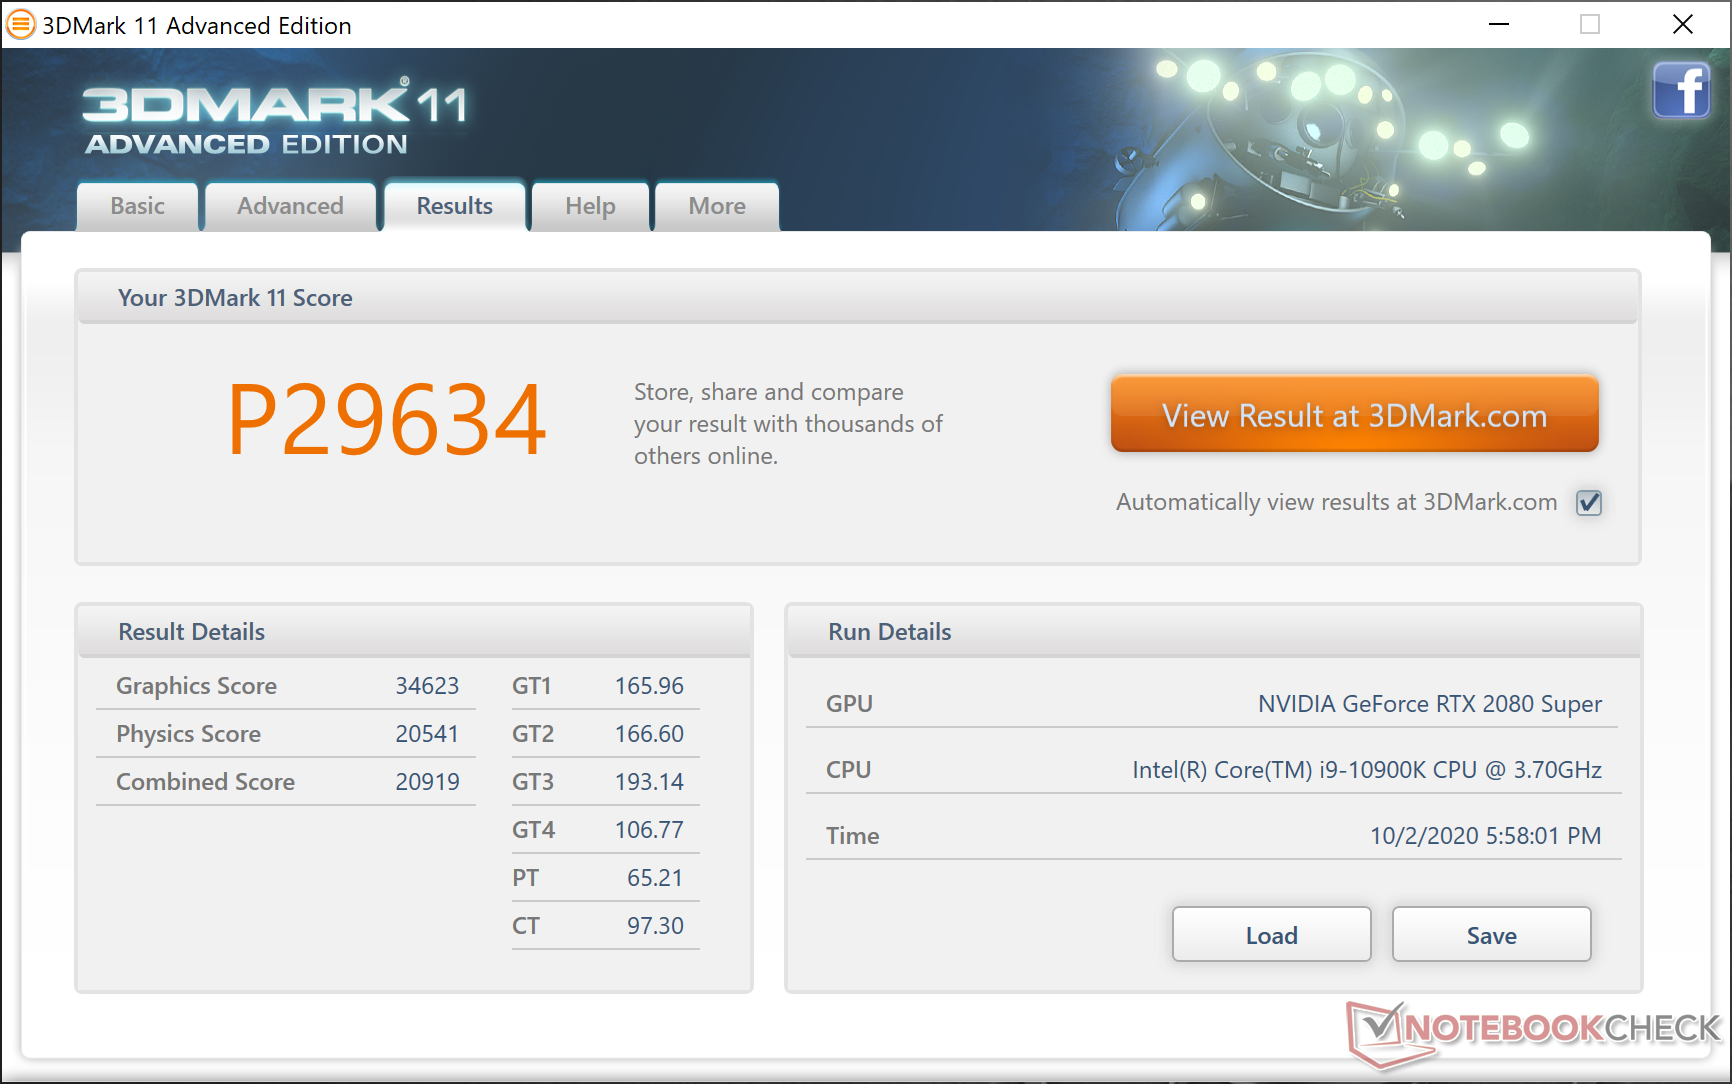
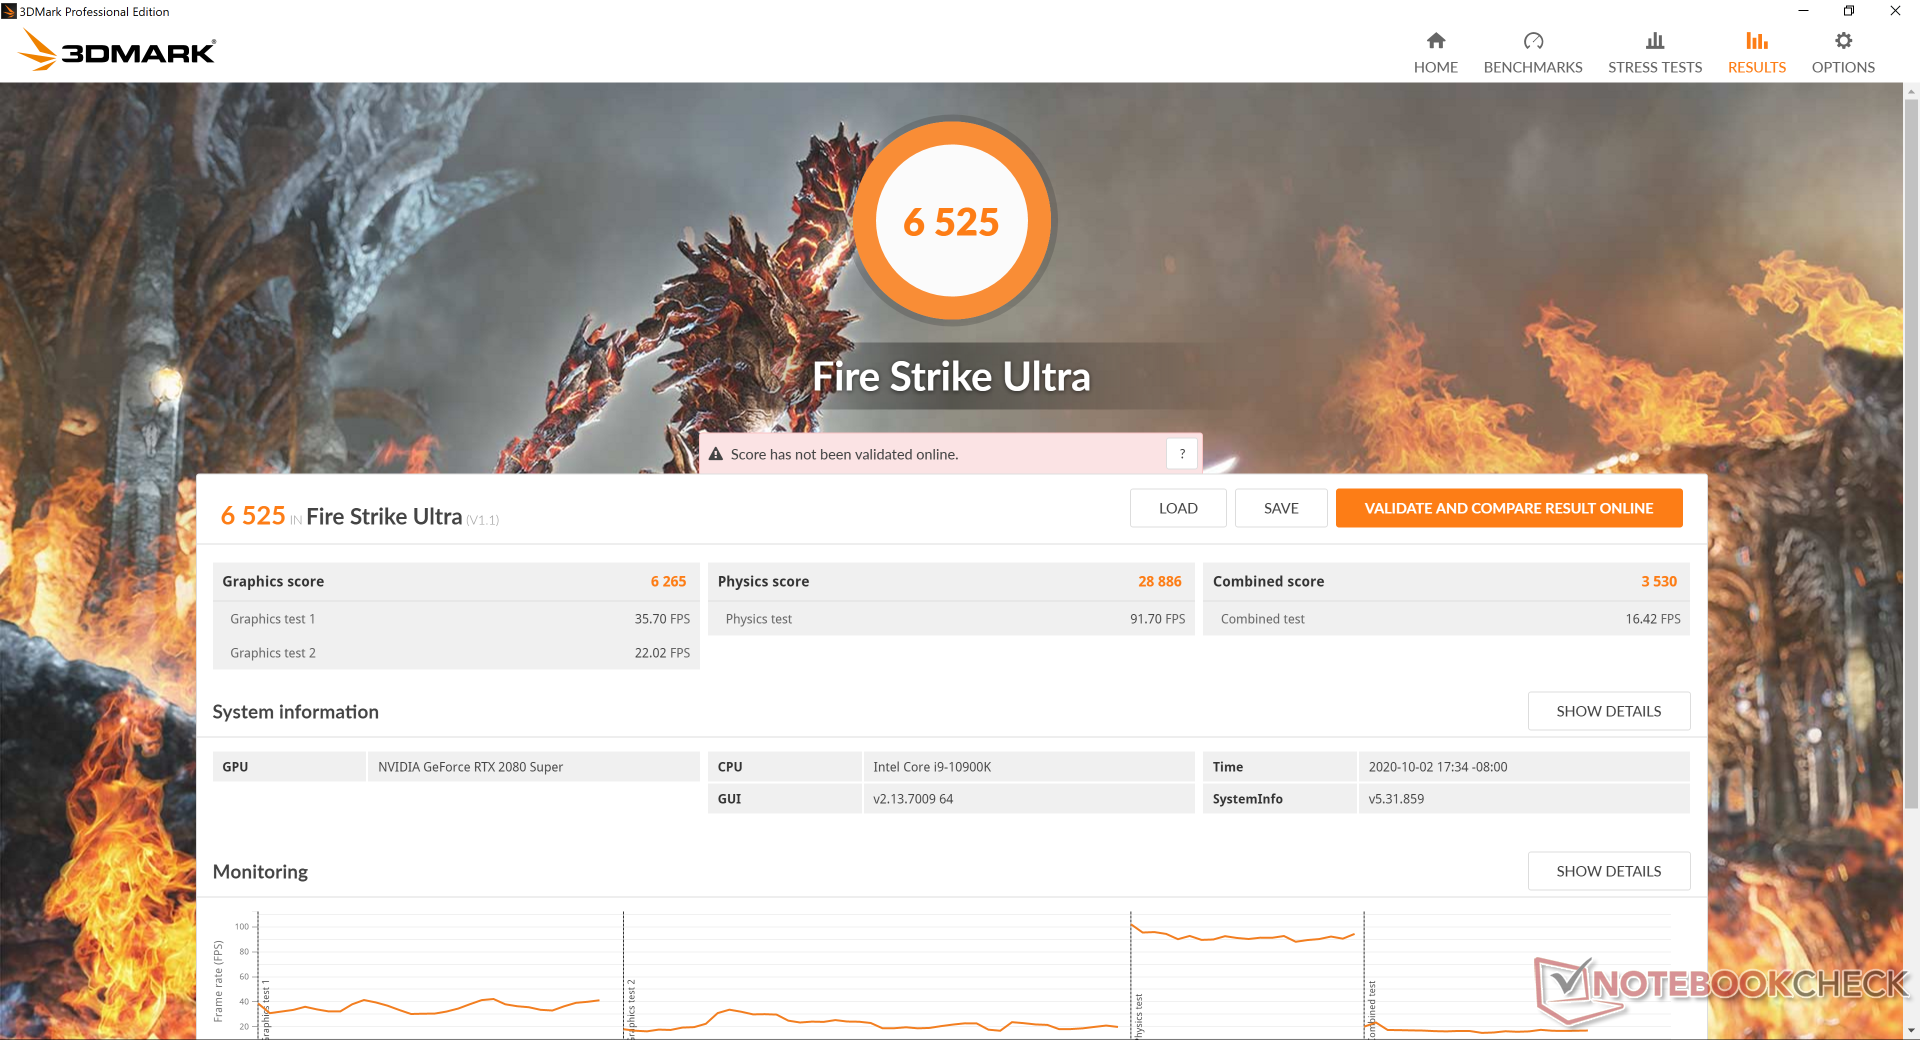
| 3DMark 11 Performance | 29634 puntos | |
| 3DMark Cloud Gate Standard Score | 56456 puntos | |
| 3DMark Fire Strike Score | 21653 puntos | |
| 3DMark Time Spy Score | 11010 puntos | |
ayuda | ||
| GTA V | |
| 1920x1080 Lowest Settings possible | |
| MSI GT76 Titan DT 10SGS | |
| Medio NVIDIA GeForce RTX 2080 Super Mobile (182 - 185, n=2) | |
| Asus Strix Scar 17 G732LXS | |
| Aorus 17G XB | |
| 3840x2160 Highest AA:4xMSAA + FX AF:16x | |
| Medio NVIDIA GeForce RTX 2080 Super Mobile (47.9 - 49.3, n=3) | |
| MSI GT76 Titan DT 10SGS | |
| 3840x2160 High/On (Advanced Graphics Off) AA:FX AF:8x | |
| KFA2 GeForce RTX 2080 Ti EX | |
| Asus ROG Strix RTX 2080 OC | |
| Nvidia GeForce RTX 2080 Super | |
| Asus ROG Strix RTX 2070 OC | |
| Nvidia GeForce RTX 2070 Super | |
| Medio NVIDIA GeForce RTX 2080 Super Mobile (96 - 98.9, n=2) | |
| MSI GT76 Titan DT 10SGS | |
| Gigabyte Aero 15-Y9 | |
| Strange Brigade | |
| 1280x720 lowest AF:1 | |
| MSI GT76 Titan DT 10SGS | |
| Medio NVIDIA GeForce RTX 2080 Super Mobile (n=1) | |
| KFA2 GeForce GTX 1650 EX One Click Plus | |
| 1920x1080 high AA:high AF:8 | |
| MSI GT76 Titan DT 10SGS | |
| Medio NVIDIA GeForce RTX 2080 Super Mobile (n=1) | |
| KFA2 GeForce GTX 1650 EX One Click Plus | |
| 1920x1080 ultra AA:ultra AF:16 | |
| MSI GT76 Titan DT 10SGS | |
| Medio NVIDIA GeForce RTX 2080 Super Mobile (n=1) | |
| KFA2 GeForce GTX 1650 EX One Click Plus | |
| bajo | medio | alto | ultra | QHD | 4K | |
|---|---|---|---|---|---|---|
| GTA V (2015) | 185 | 183 | 176 | 101 | 90.2 | 96 |
| The Witcher 3 (2015) | 471.7 | 332 | 223.2 | 113.2 | 80.5 | |
| Dota 2 Reborn (2015) | 179 | 163 | 158 | 148 | 136 | |
| Final Fantasy XV Benchmark (2018) | 196 | 140 | 107 | 80.2 | 47 | |
| X-Plane 11.11 (2018) | 138 | 122 | 98 | 84.2 | ||
| Strange Brigade (2018) | 515 | 265 | 217 | 183 | 137 | 78.4 |
Emisiones
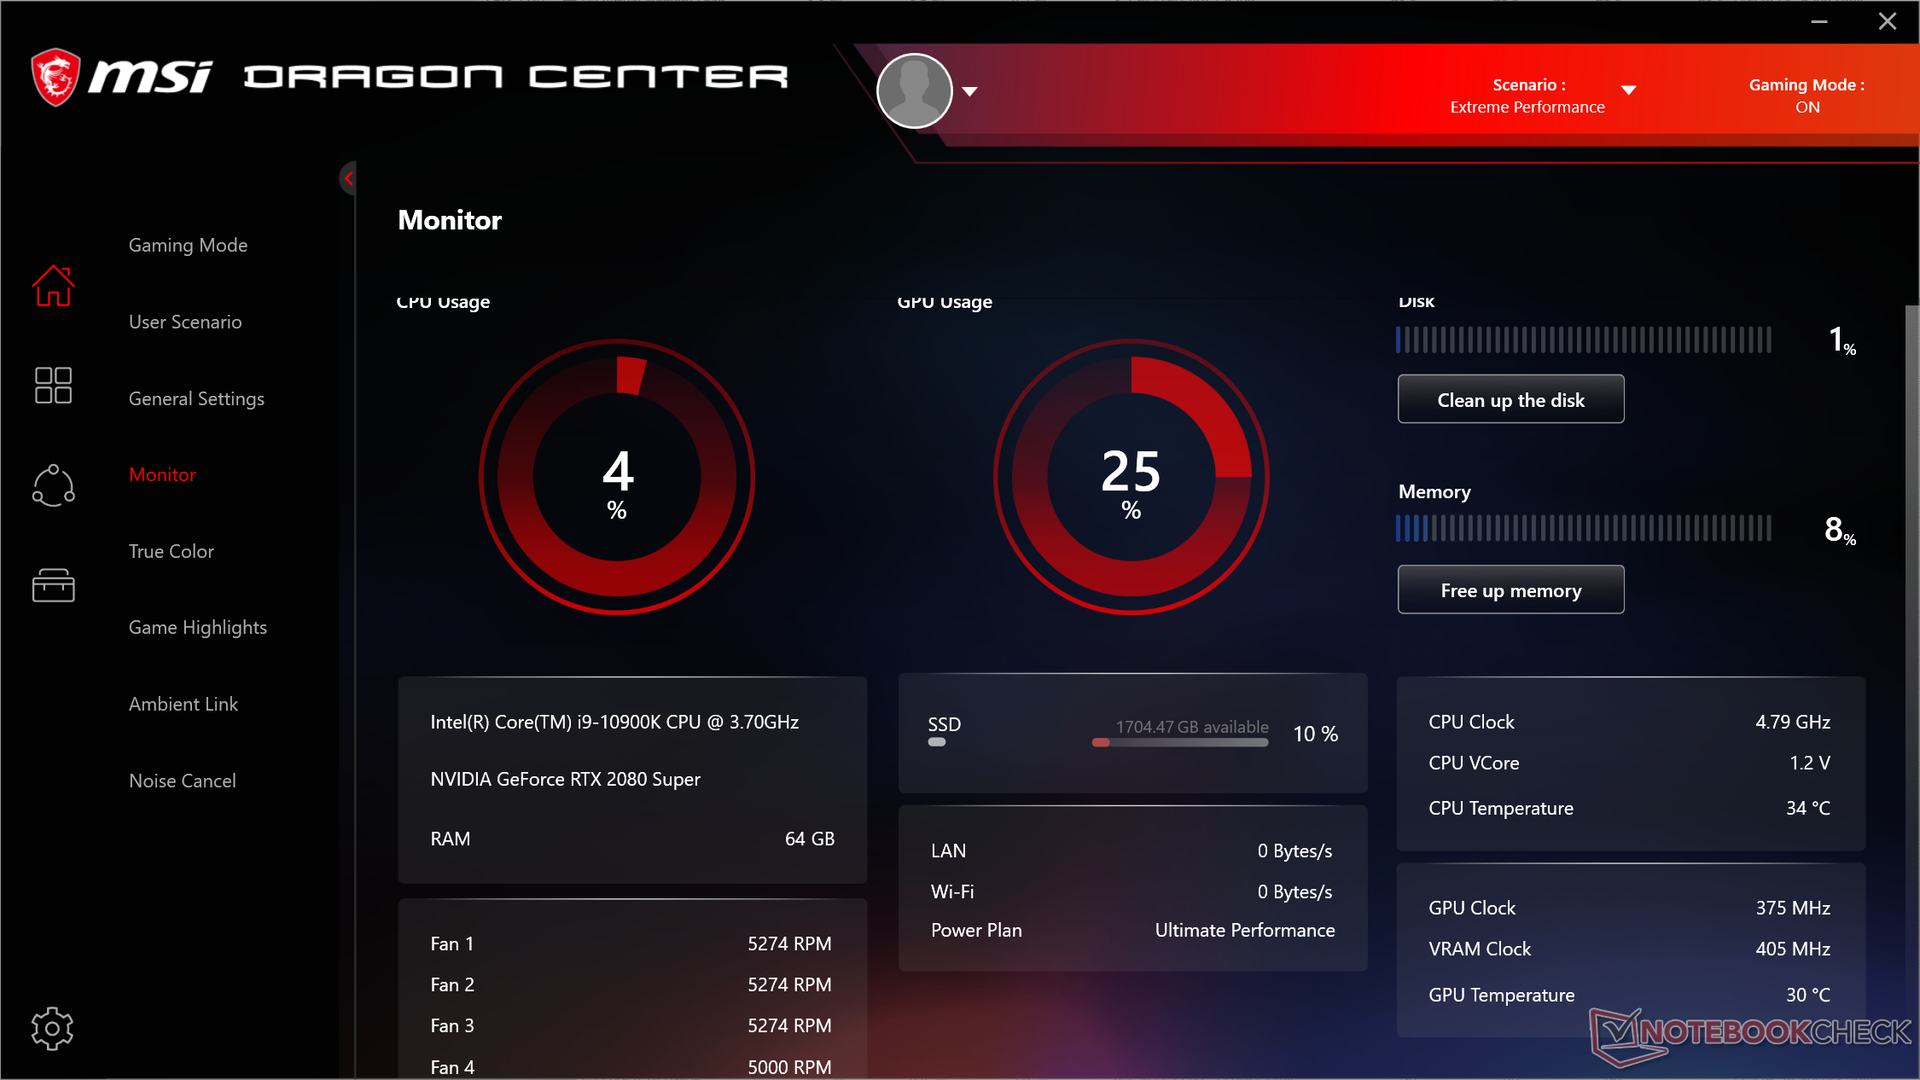
Ruido de sistema
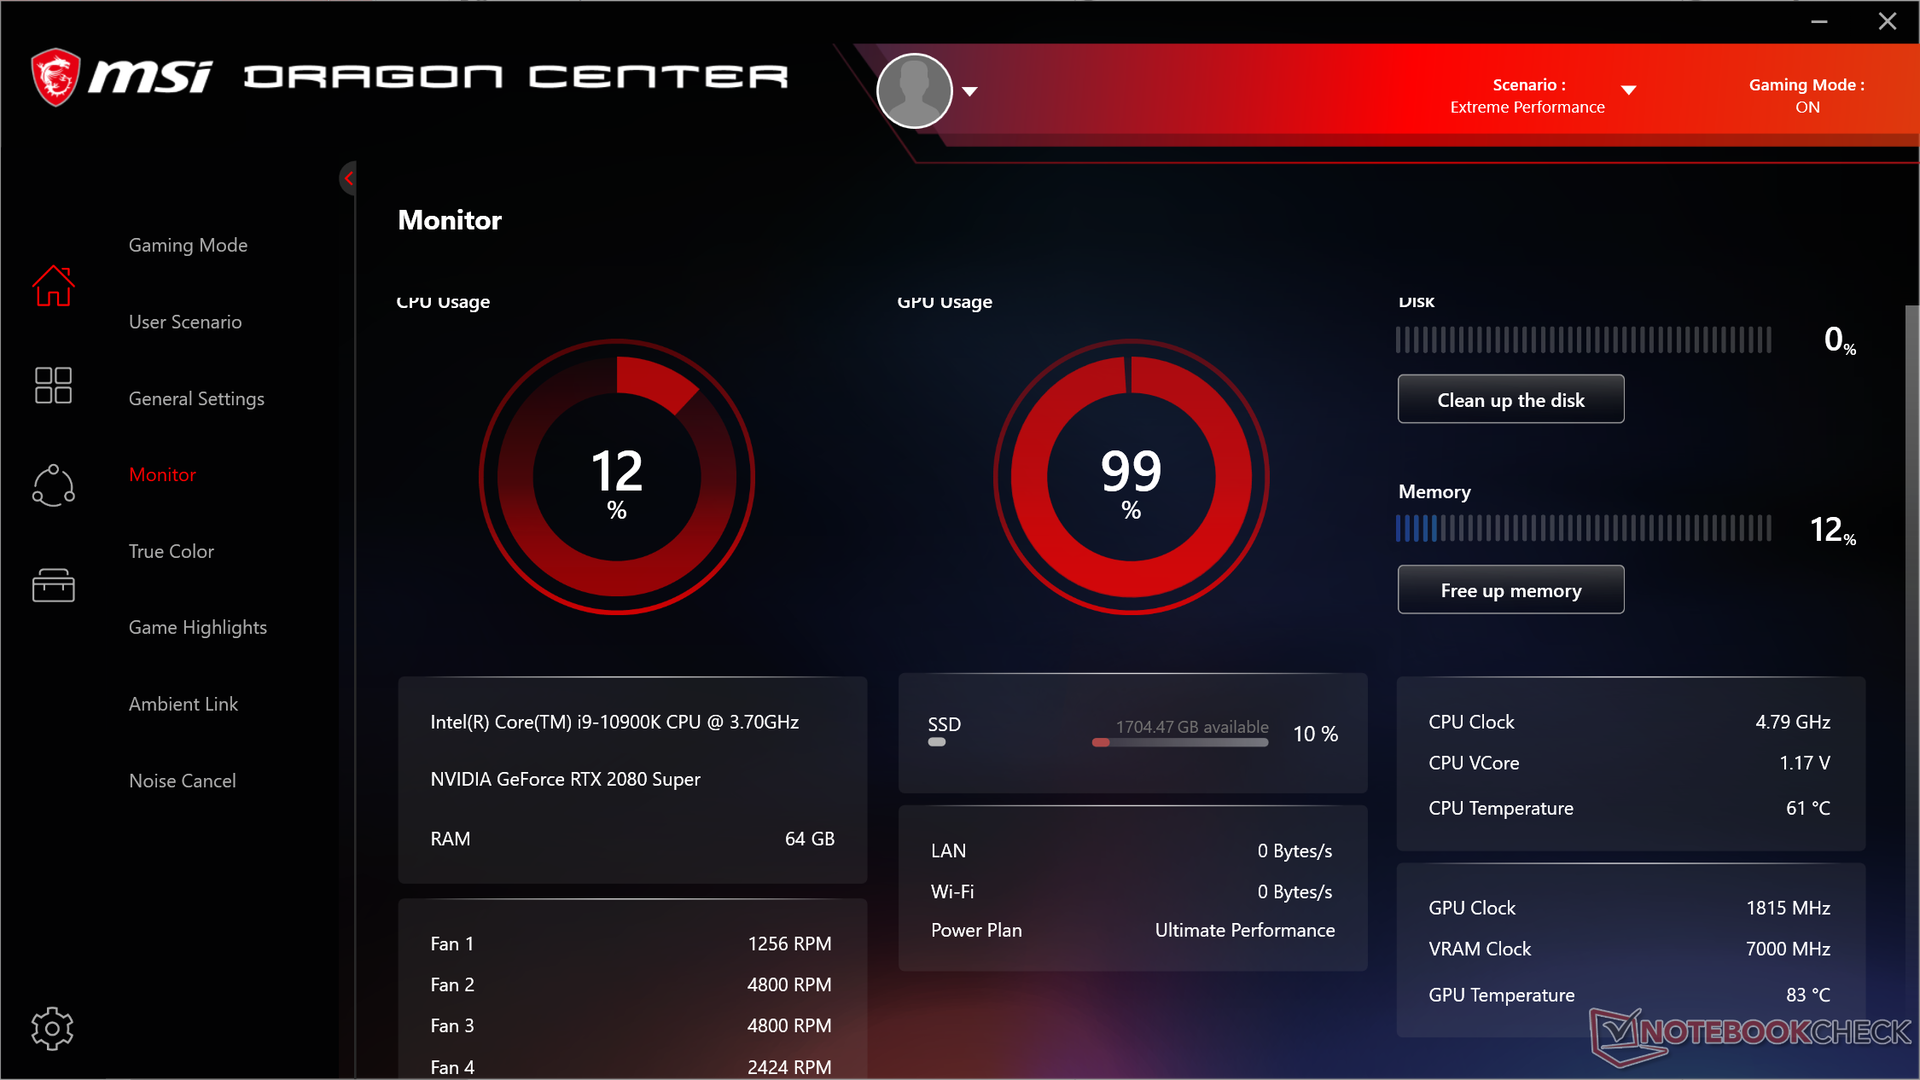
El ruido de los ventiladores está ligado directamente al software MSI Dragon Center. Cuando se configura en modo silencioso, los ventiladores oscilarán entre 27,5 y 29,8 dB(A) sobre un fondo de 26,5 dB(A). Aunque no es realmente "silencioso", sigue siendo silencioso especialmente para el hardware involucrado. Recomendamos que se ejecute en modo silencioso si simplemente se navega por la web o se transmiten vídeos en los que no se necesita la potencia extra.
Si juegas en el modo de rendimiento extremo, el ruido del ventilador será de unos 60,7 dB(A), mucho más alto que en la mayoría de los demás portátiles para juegos, y eso antes de activar la función Turbo Fan/Cooler Boost. Una vez activada, el ruido del ventilador saltaría a 66,6 dB(A) para ser uno de los más altos que hayamos registrado en cualquier portátil.
| MSI GT76 Titan DT 10SGS GeForce RTX 2080 Super Mobile, i9-10900K, 2x WDC PC SN730 SDBPNTY-1T00 (RAID 0) | Asus ROG G703GXR GeForce RTX 2080 Mobile, i7-9750H, Samsung SSD PM981 MZVLB512HAJQ | Alienware Area-51m i9-9900K RTX 2080 GeForce RTX 2080 Mobile, i9-9900K, 2x SK Hynix PC400 512GB (RAID 0) | Asus Strix Scar 17 G732LXS GeForce RTX 2080 Super Mobile, i9-10980HK, 2x Intel SSD 660p 1TB SSDPEKNW010T8 (RAID 0) | Schenker XMG Pro 17 PB71RD-G GeForce RTX 2060 Mobile, i7-9750H, Samsung SSD 970 EVO Plus 500GB | MSI GE75 9SG GeForce RTX 2080 Mobile, i9-9880H, Samsung SSD PM981 MZVLB1T0HALR | MSI GT76 Titan DT 9SG GeForce RTX 2080 Mobile, i9-9900K, 2x Samsung PM961 MZVLW256HEHP (RAID 0) | |
|---|---|---|---|---|---|---|---|
| Noise | -9% | -16% | -21% | -15% | -5% | -19% | |
| apagado / medio ambiente * (dB) | 26.4 | 30 -14% | 28.1 -6% | 25 5% | 30 -14% | 28.2 -7% | 30 -14% |
| Idle Minimum * (dB) | 27.5 | 33 -20% | 28.1 -2% | 33 -20% | 30 -9% | 30.4 -11% | 33 -20% |
| Idle Average * (dB) | 27.5 | 34 -24% | 28.6 -4% | 38 -38% | 32 -16% | 30.4 -11% | 34 -24% |
| Idle Maximum * (dB) | 29.8 | 35 -17% | 51 -71% | 45 -51% | 39 -31% | 33.4 -12% | 44 -48% |
| Load Average * (dB) | 30.9 | 38 -23% | 51 -65% | 54 -75% | 51 -65% | 37.1 -20% | 47 -52% |
| Witcher 3 ultra * (dB) | 60.7 | 50 18% | 51 16% | 50 18% | 54 11% | 54.2 11% | 53 13% |
| Load Maximum * (dB) | 66.6 | 54 19% | 51 23% | 55 17% | 54 19% | 56.4 15% | 59 11% |
* ... más pequeño es mejor
Ruido
| Ocioso |
| 27.5 / 27.5 / 29.8 dB(A) |
| Carga |
| 30.9 / 66.6 dB(A) |
 | ||
30 dB silencioso 40 dB(A) audible 50 dB(A) ruidosamente alto |
||
min: | ||
Temperatura
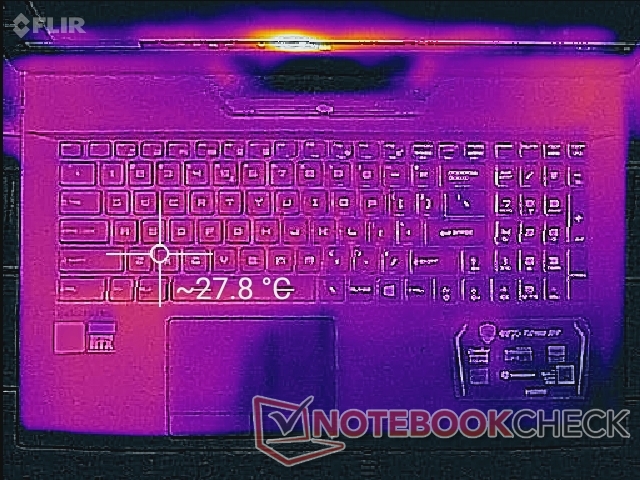
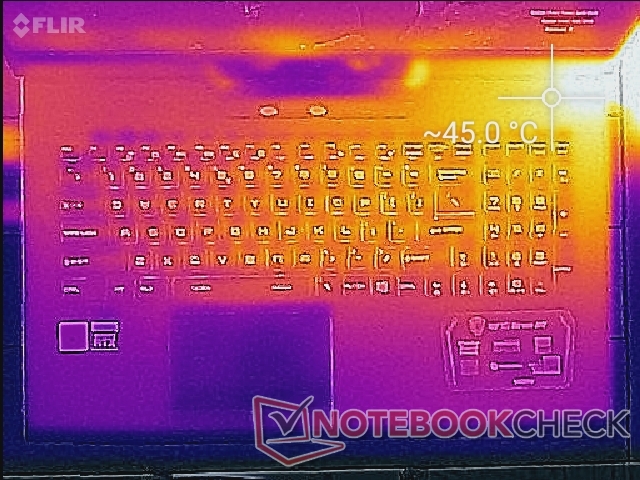
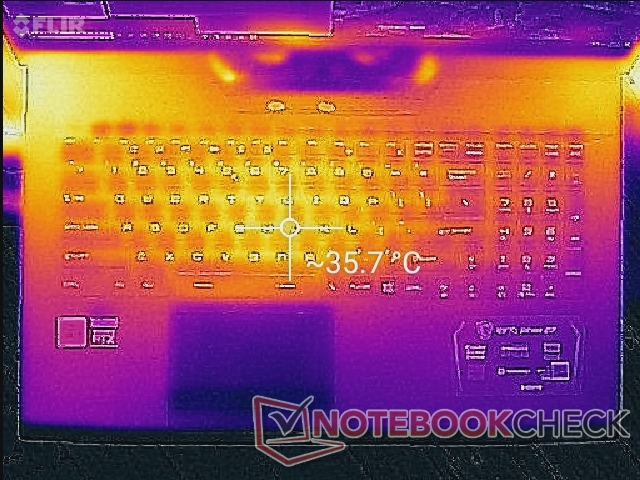
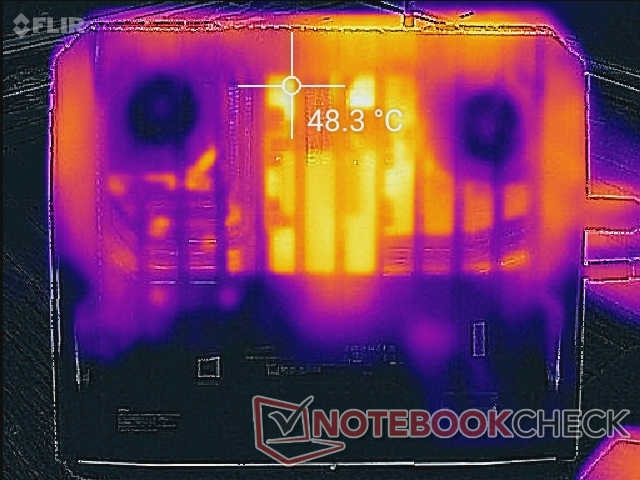
Las temperaturas de la superficie nunca son incómodamente cálidas, aunque tenemos algunos de los componentes más rápidos en el interior debido a la abundancia de rejillas de ventilación y una solución de refrigeración pesada. Cuando se juega, por ejemplo, el centro del teclado está a sólo 36 C en comparación con los 42 C a 47 C del ultrafino MSI GS75. Los puntos calientes están más cerca de las esquinas traseras donde es poco probable que las manos de los usuarios se toquen.
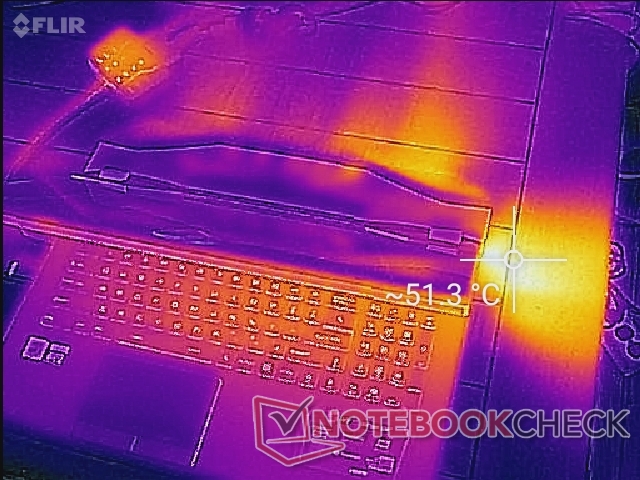
(+) La temperatura máxima en la parte superior es de 36.4 °C / 98 F, frente a la media de 40.4 °C / 105 F, que oscila entre 21.2 y 68.8 °C para la clase Gaming.
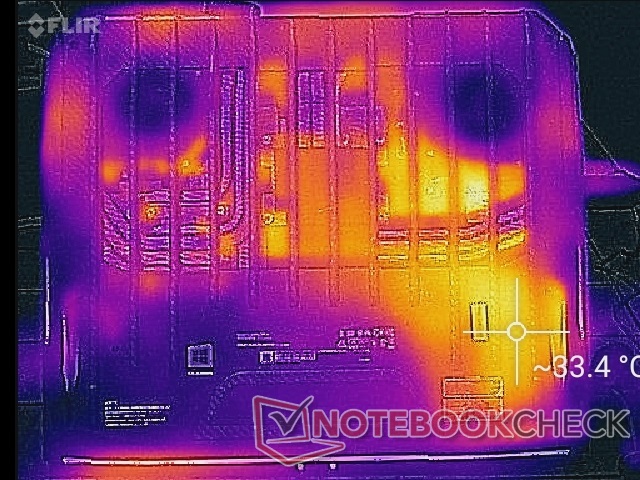
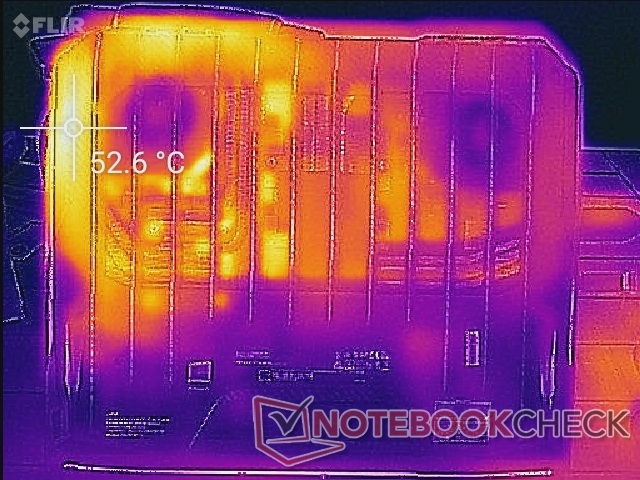
(±) El fondo se calienta hasta un máximo de 43 °C / 109 F, frente a la media de 43.2 °C / 110 F
(+) En reposo, la temperatura media de la parte superior es de 27.3 °C / 81# F, frente a la media del dispositivo de 33.9 °C / 93 F.
(±) Jugando a The Witcher 3, la temperatura media de la parte superior es de 34.8 °C / 95 F, frente a la media del dispositivo de 33.9 °C / 93 F.
(+) El reposamanos y el panel táctil están a una temperatura inferior a la de la piel, con un máximo de 31.6 °C / 88.9 F y, por tanto, son fríos al tacto.
(-) La temperatura media de la zona del reposamanos de dispositivos similares fue de 28.8 °C / 83.8 F (-2.8 °C / -5.1 F).
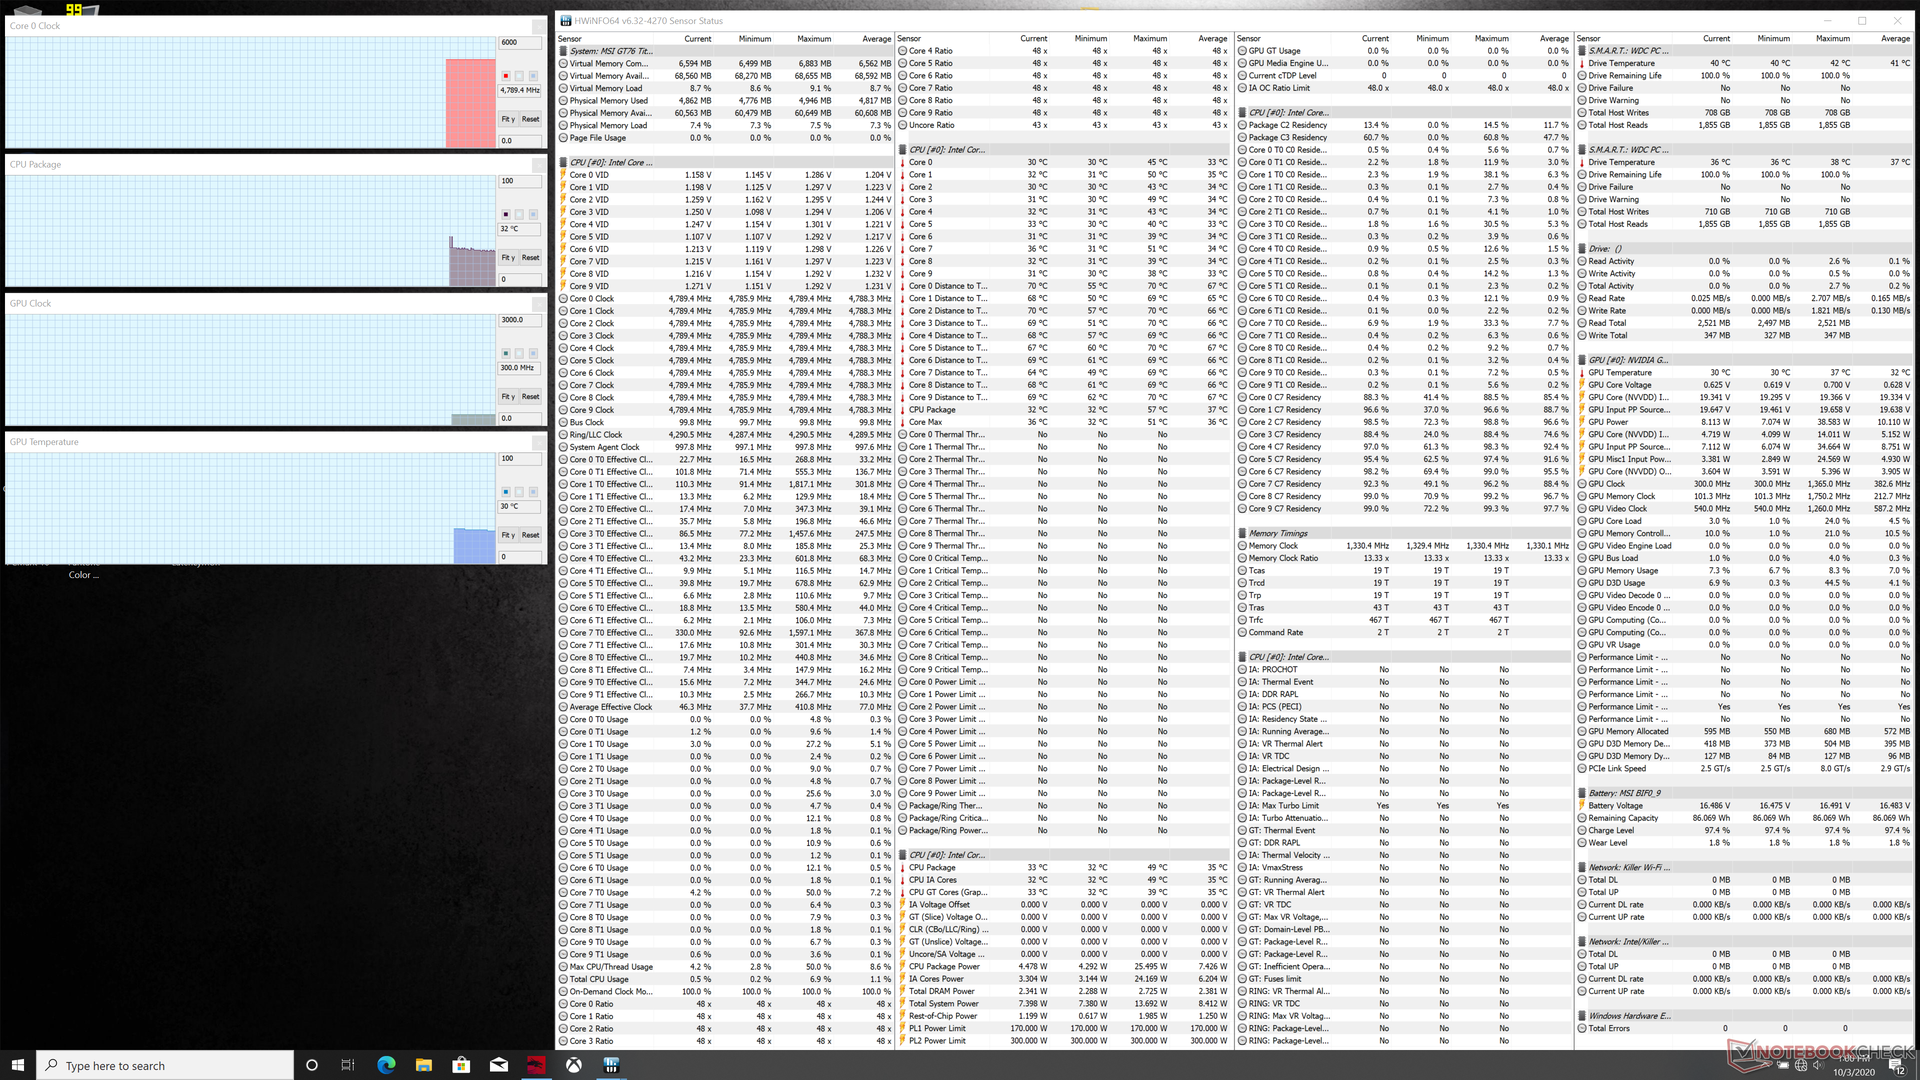
Prueba de estrés
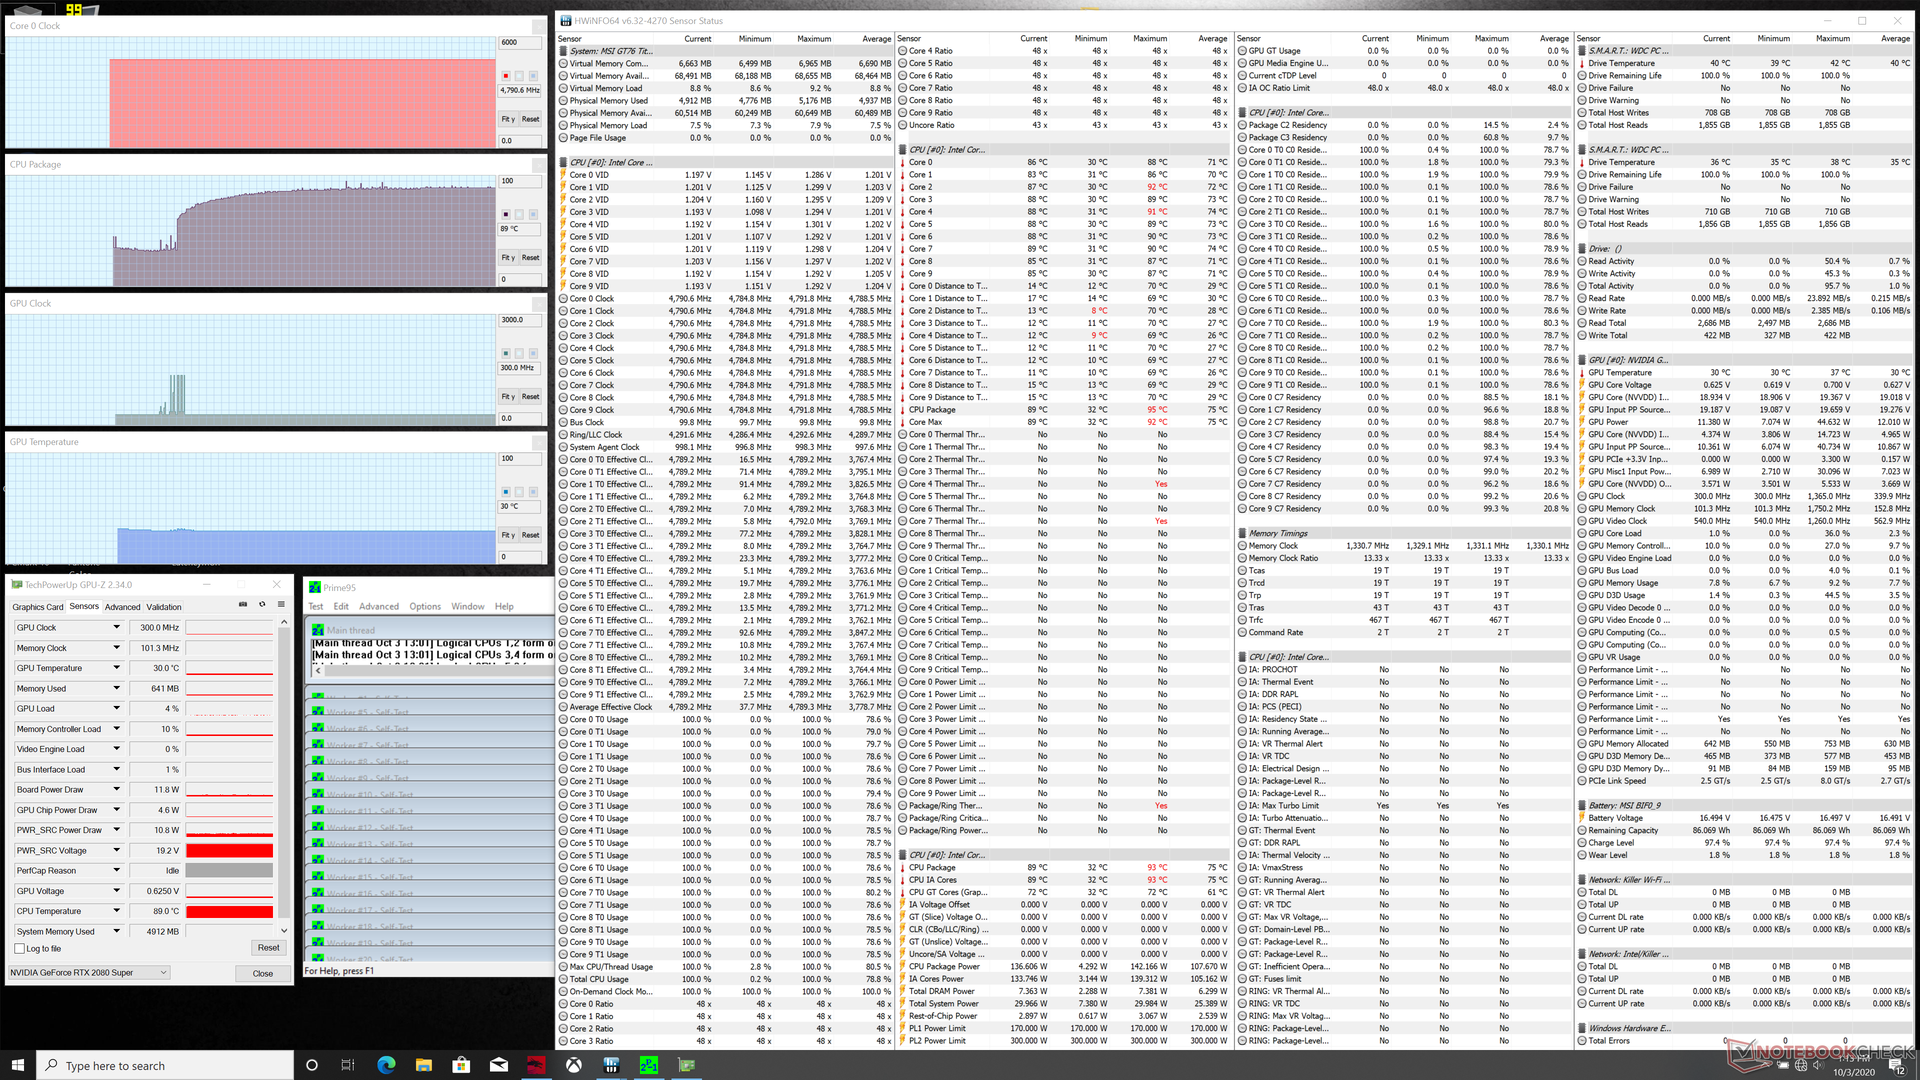
When running Prime95 to stress the CPU on Turbo Fan/Cooler Boost mode, clock rates would boost to and stabilize at 4.8 GHz. Intel rates its Core i9-10900K for a maximum Turbo Boost of 4.8 GHz meaning that the GT76 is able to maintain this clock rate ceiling — an impressive feat for a laptop running on a CPU designed for desktops. Core temperature would stabilize at a blistering 89 C, however, and so there is almost no headroom for any end-user overclocking. Temperatures are still better than what we observed on the Alienware Area-51m nonetheless.
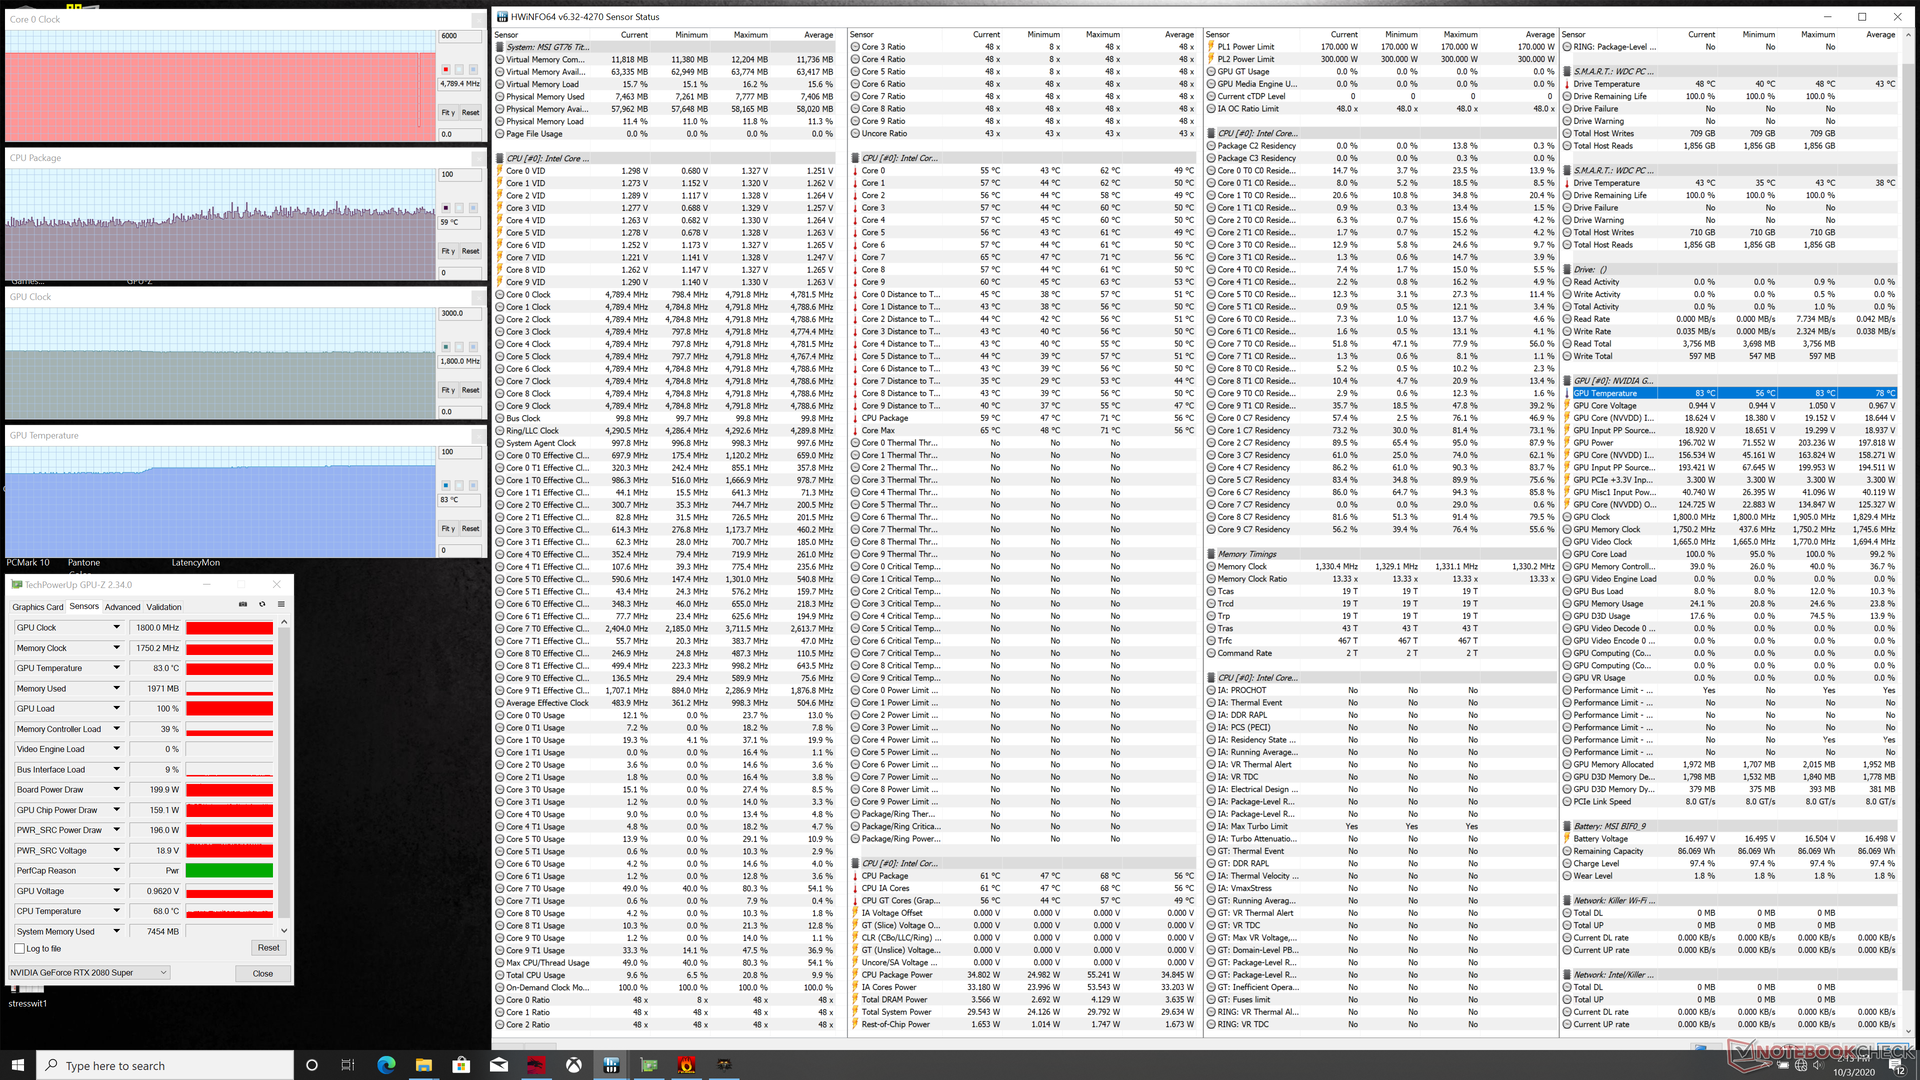
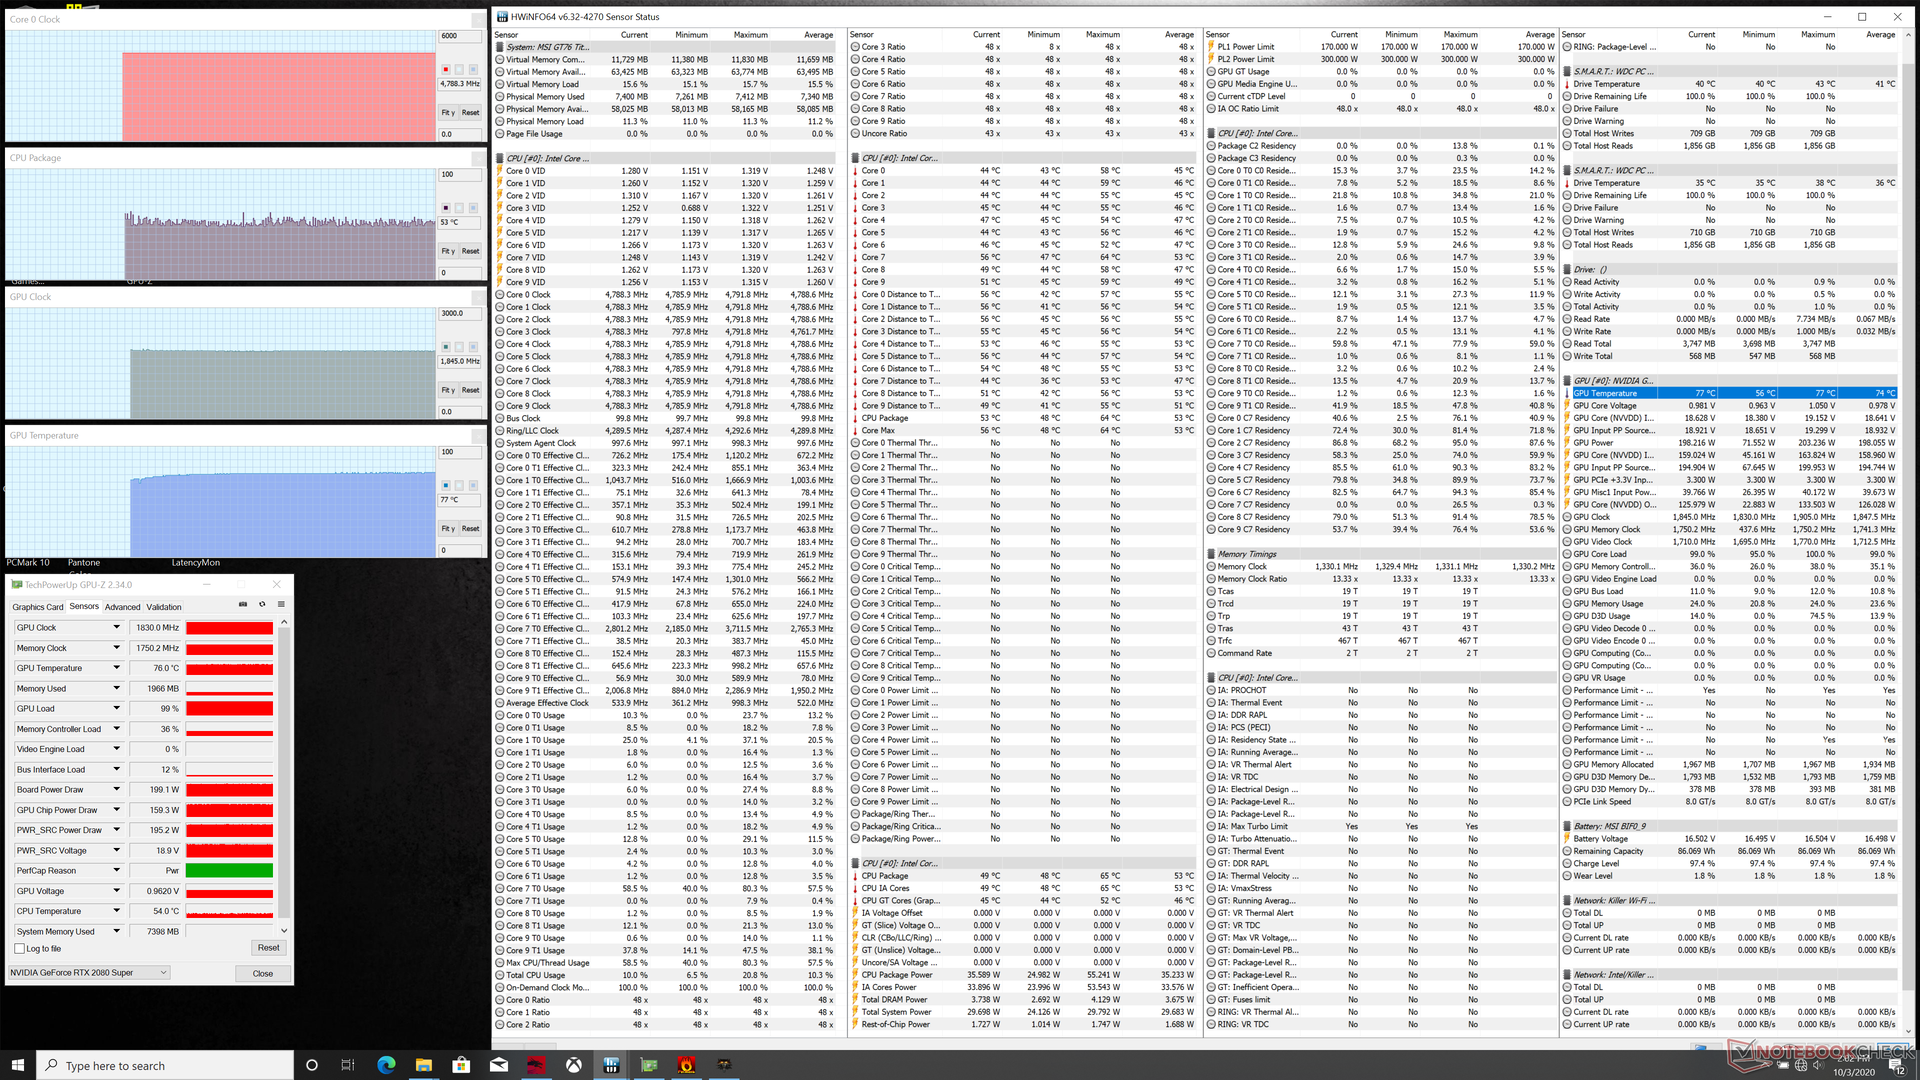
Running Witcher 3 on Turbo Fan mode would result in stable CPU and GPU temperatures of 53 C and 77 C. If Turbo Fan is off, then temperatures would stabilize at 59 C and 83 C while clock rates remain the same. Thus, it's not necessary to play games on Turbo Fan mode as performance will not be impacted. Instead, the feature becomes more useful if running extreme loads at 100 percent CPU or GPU utilization.
Running on battery power will limit performance. A Fire Strike run on batteries would return Physics and Graphics scores of 17234 and 11304 points, respectively, compared to 29145 and 24211 points on mains.
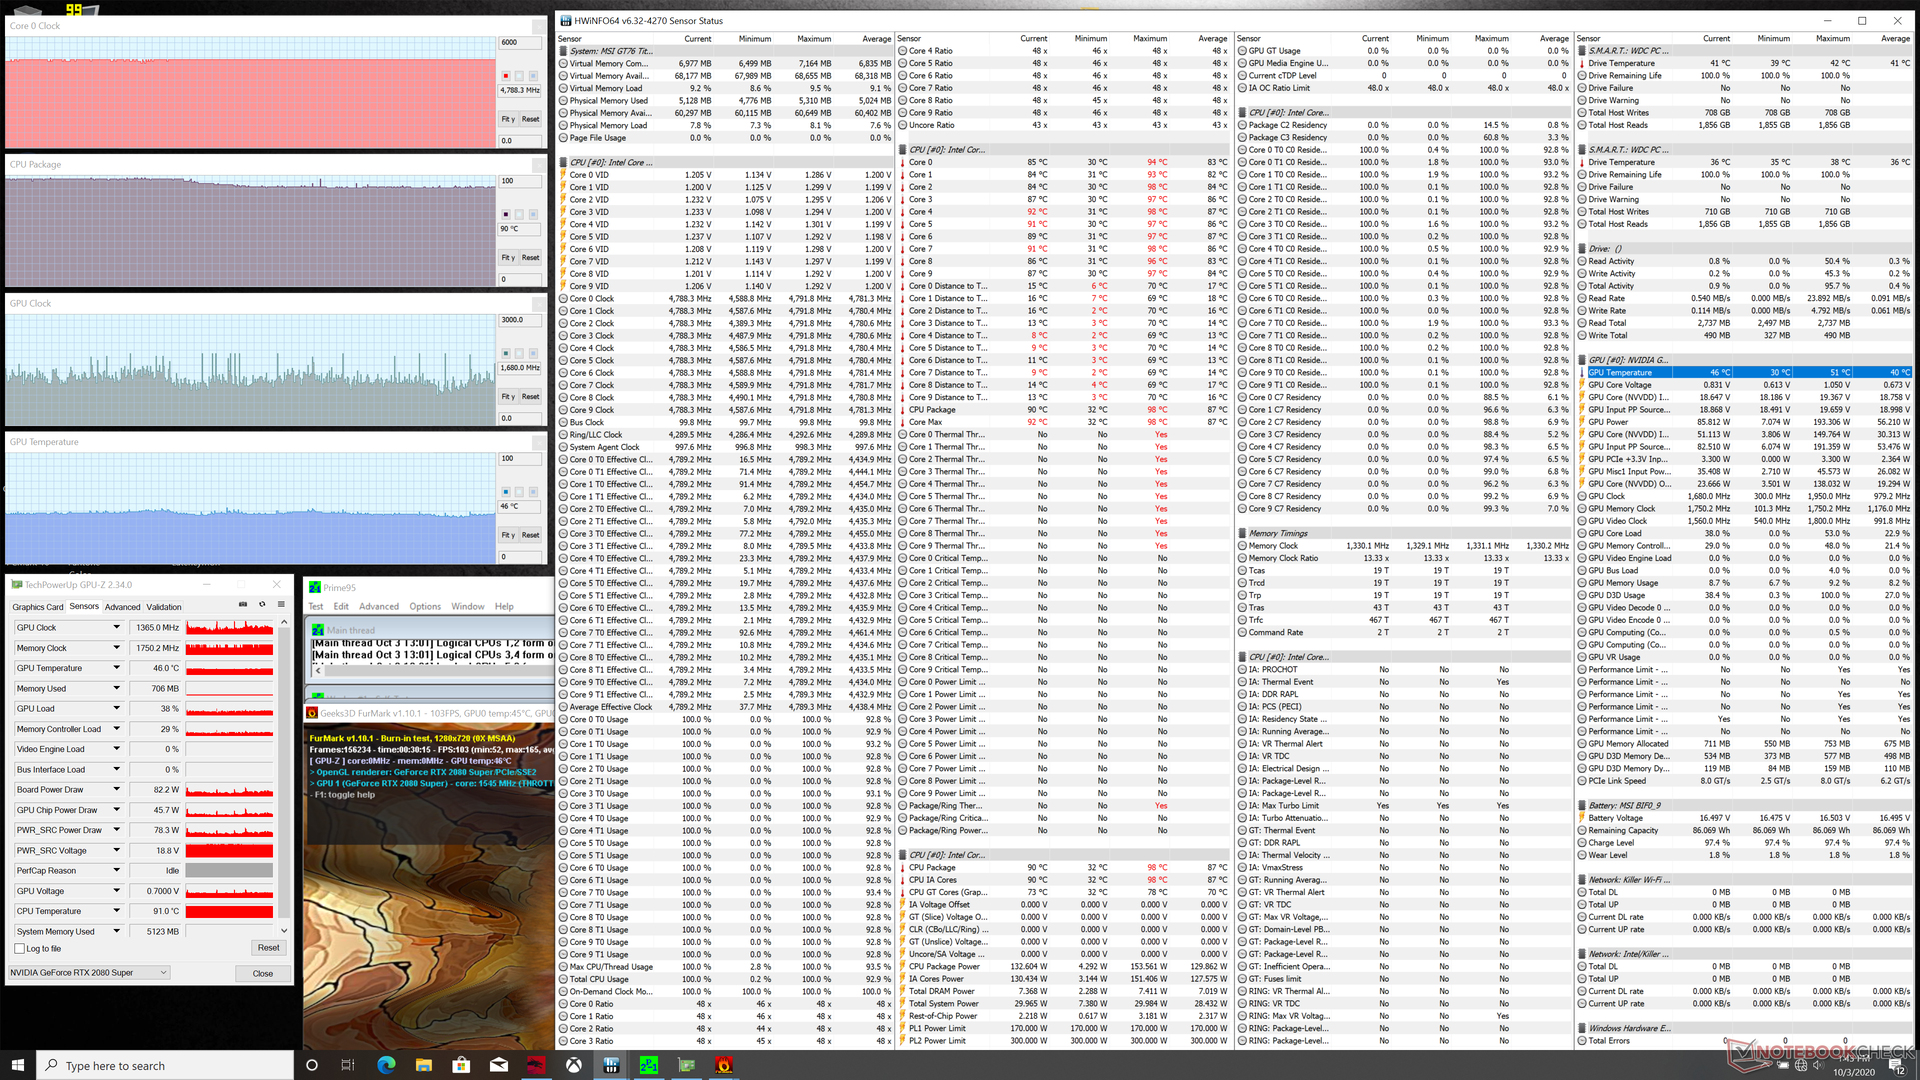
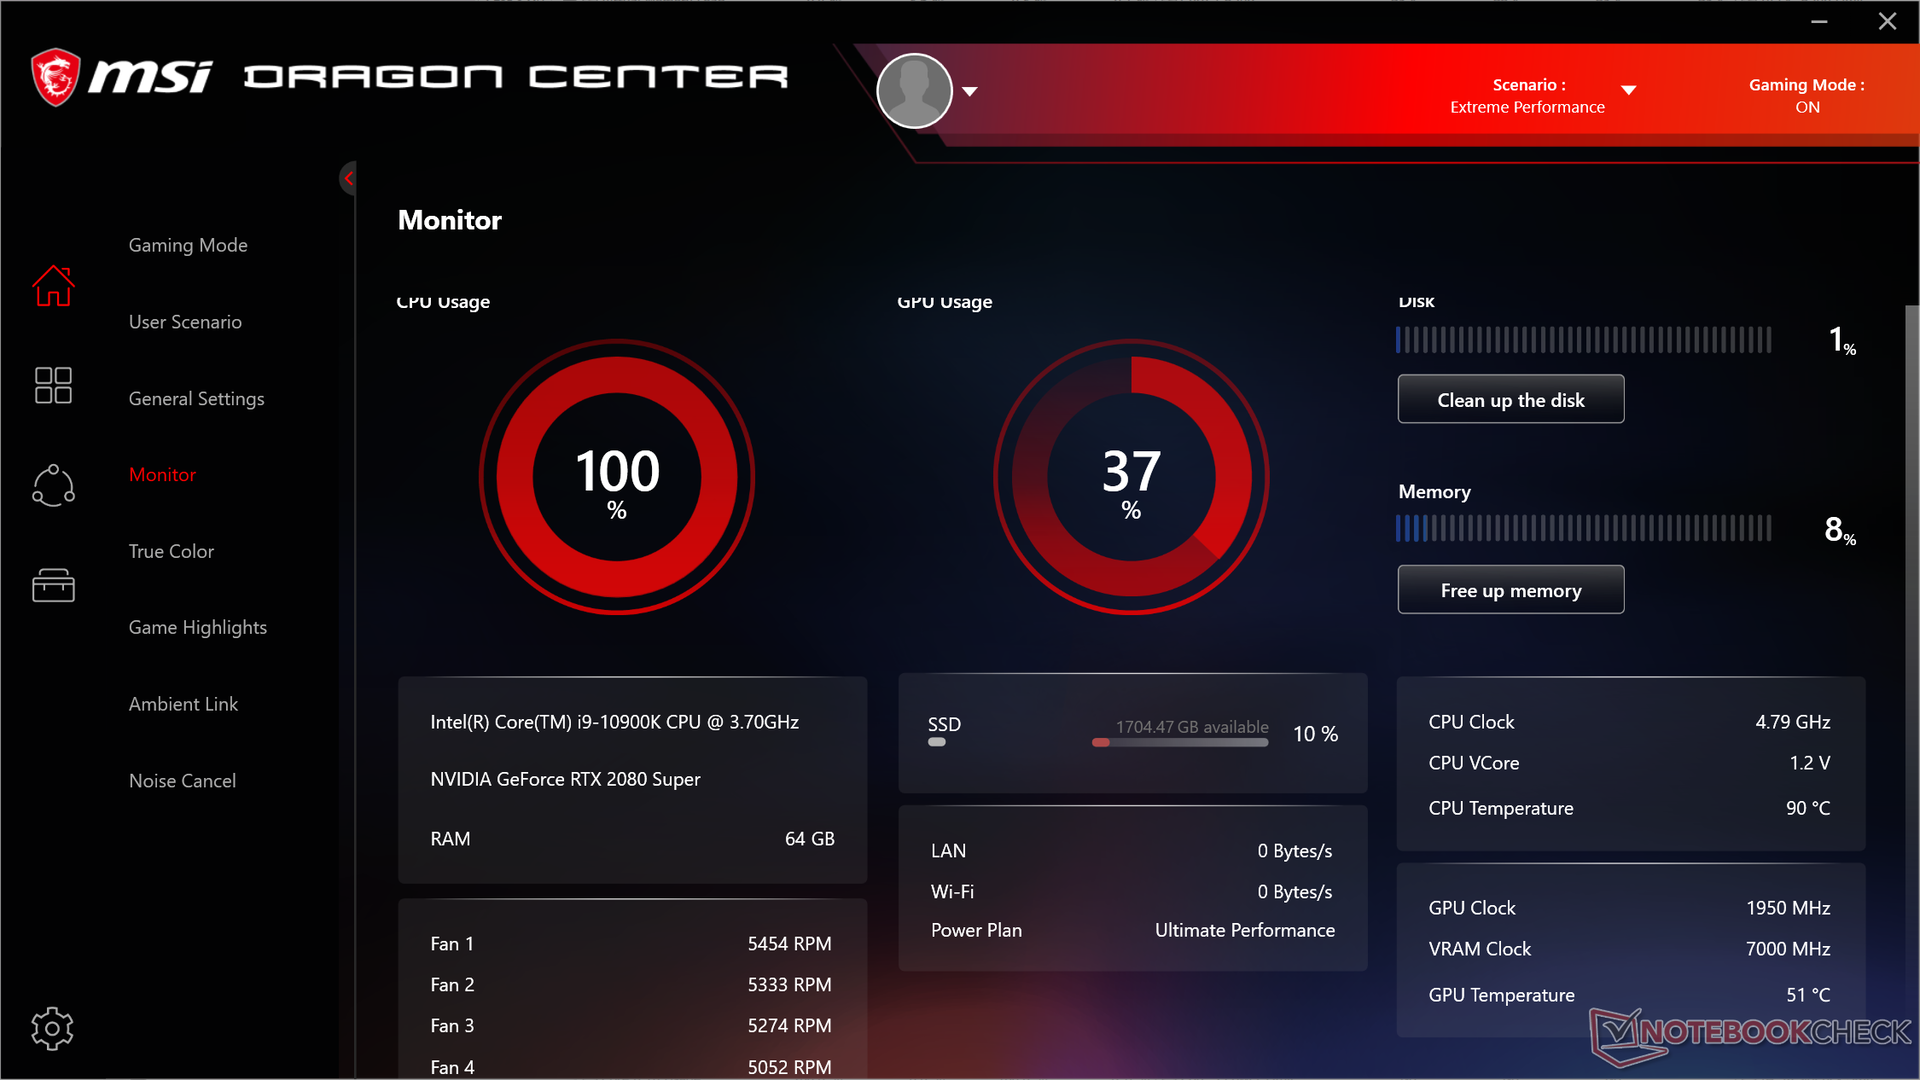
| CPU Clock (GHz) | GPU Clock (MHz) | Average CPU Temperature (°C) | Average GPU Temperature (°C) | |
| System Idle (Turbo Fan on) | -- | -- | 32 | 30 |
| Prime95 Stress (Turbo Fan on) | 4.8 | -- | 89 | 30 |
| Prime95 + FurMark Stress (Turbo Fan on) | 4.8 | ~1365 | 90 - 98 | 46 |
| Witcher 3 Stress (Turbo Fan on) | 4.8 | 1830 | ~53 | 77 |
| Witcher 3 Stress (Turbo Fan off) | 4.8 | 1800 | ~59 | 83 |
Altavoces


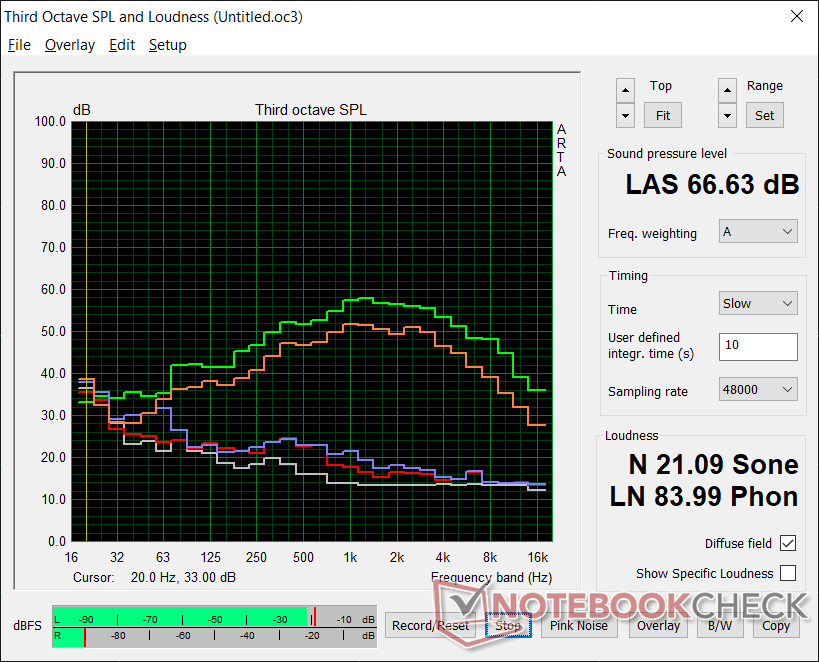
MSI GT76 Titan DT 10SGS análisis de audio
(+) | los altavoces pueden reproducir a un volumen relativamente alto (#83.2 dB)
Graves 100 - 315 Hz
(±) | lubina reducida - en promedio 8.6% inferior a la mediana
(±) | la linealidad de los graves es media (11% delta a frecuencia anterior)
Medios 400 - 2000 Hz
(+) | medios equilibrados - a sólo 3.1% de la mediana
(+) | los medios son lineales (6.9% delta a la frecuencia anterior)
Altos 2 - 16 kHz
(+) | máximos equilibrados - a sólo 3% de la mediana
(+) | los máximos son lineales (5.5% delta a la frecuencia anterior)
Total 100 - 16.000 Hz
(+) | el sonido global es lineal (9.9% de diferencia con la mediana)
En comparación con la misma clase
» 5% de todos los dispositivos probados de esta clase eran mejores, 2% similares, 94% peores
» El mejor tuvo un delta de 6%, la media fue 18%, el peor fue ###max##%
En comparación con todos los dispositivos probados
» 4% de todos los dispositivos probados eran mejores, 1% similares, 95% peores
» El mejor tuvo un delta de 4%, la media fue 23%, el peor fue ###max##%
Apple MacBook 12 (Early 2016) 1.1 GHz análisis de audio
(+) | los altavoces pueden reproducir a un volumen relativamente alto (#83.6 dB)
Graves 100 - 315 Hz
(±) | lubina reducida - en promedio 11.3% inferior a la mediana
(±) | la linealidad de los graves es media (14.2% delta a frecuencia anterior)
Medios 400 - 2000 Hz
(+) | medios equilibrados - a sólo 2.4% de la mediana
(+) | los medios son lineales (5.5% delta a la frecuencia anterior)
Altos 2 - 16 kHz
(+) | máximos equilibrados - a sólo 2% de la mediana
(+) | los máximos son lineales (4.5% delta a la frecuencia anterior)
Total 100 - 16.000 Hz
(+) | el sonido global es lineal (10.2% de diferencia con la mediana)
En comparación con la misma clase
» 7% de todos los dispositivos probados de esta clase eran mejores, 2% similares, 90% peores
» El mejor tuvo un delta de 5%, la media fue 18%, el peor fue ###max##%
En comparación con todos los dispositivos probados
» 5% de todos los dispositivos probados eran mejores, 1% similares, 94% peores
» El mejor tuvo un delta de 4%, la media fue 23%, el peor fue ###max##%
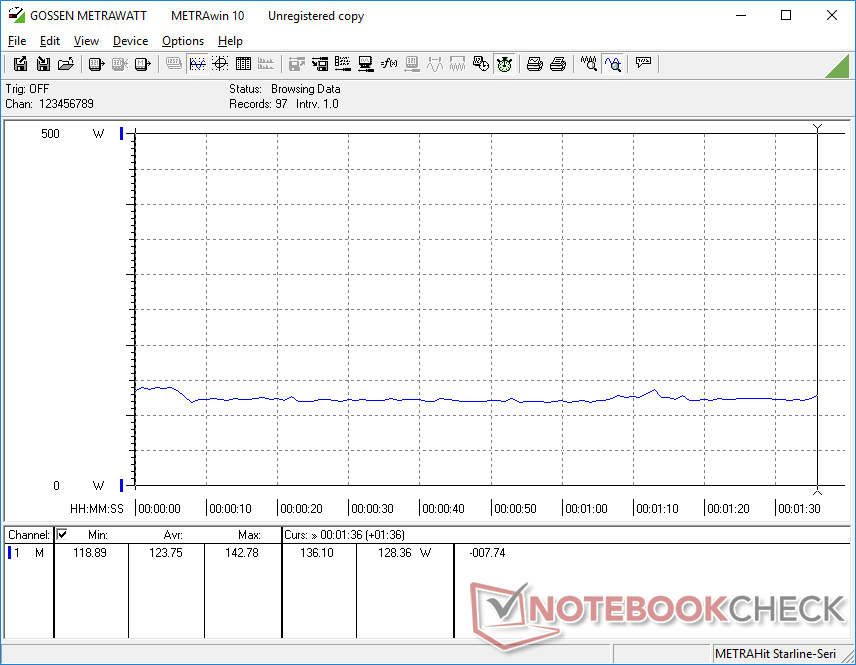
Gestión de la energía
Power Consumption
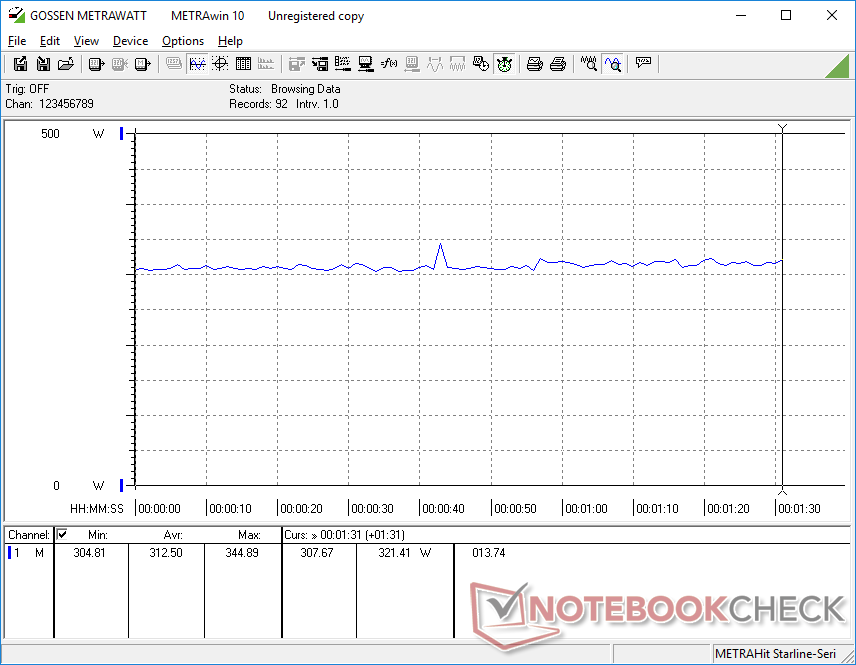
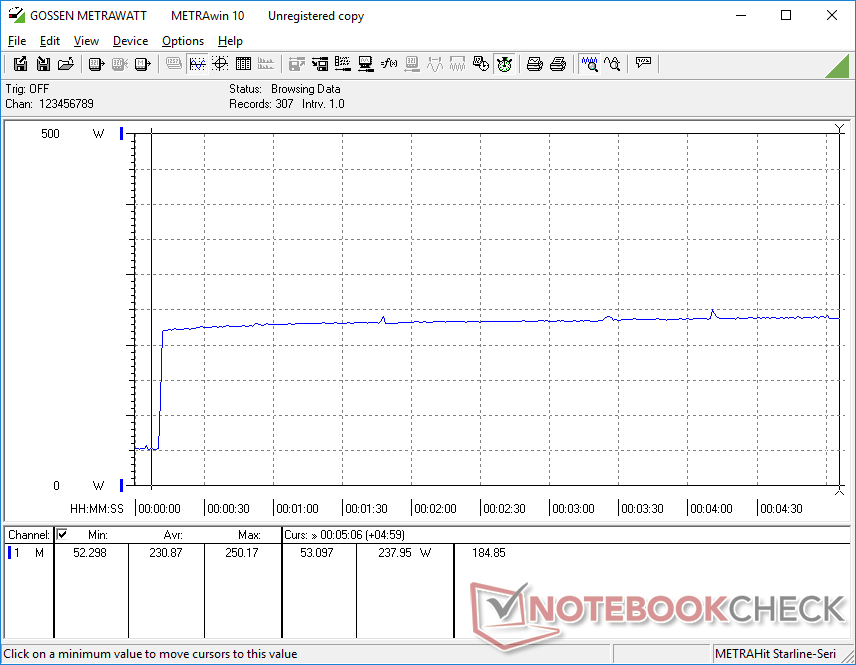
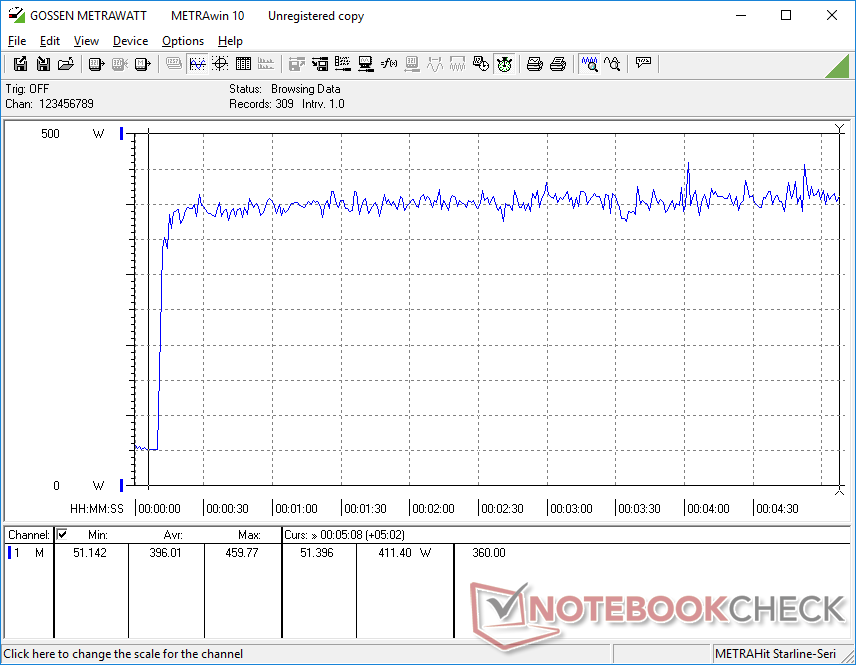
El consumo de energía es muy alto y rivaliza con el del Área de Alienware-51m. El ralentí en el escritorio consume 26 W hasta un máximo de 54 W cuando está en el modo Ultimate Performance con Turbo Fan activo. Correr Witcher 3 demanda 313 W o un 11 por ciento más que el GT76 Titan del año pasado con la GeForce RTX 2080 normal. Este aumento es aceptable en relación con la ventaja del 6 por ciento de GPU entre el RTX 2080 y el RTX 2080 Super y el 25 por ciento de ventaja de multihilo entre el i9-9900K y el i9-10900K.
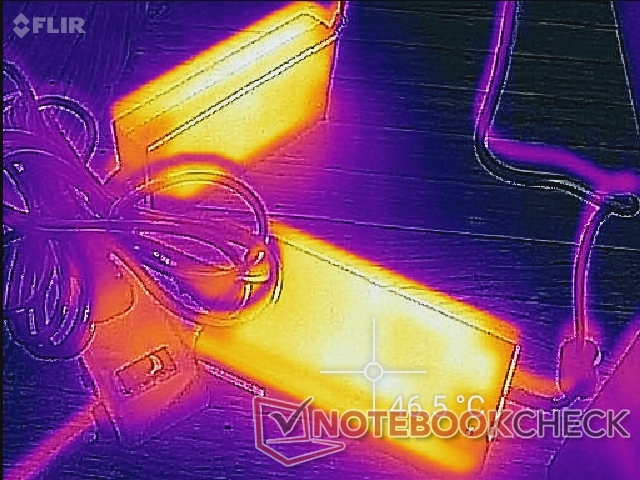
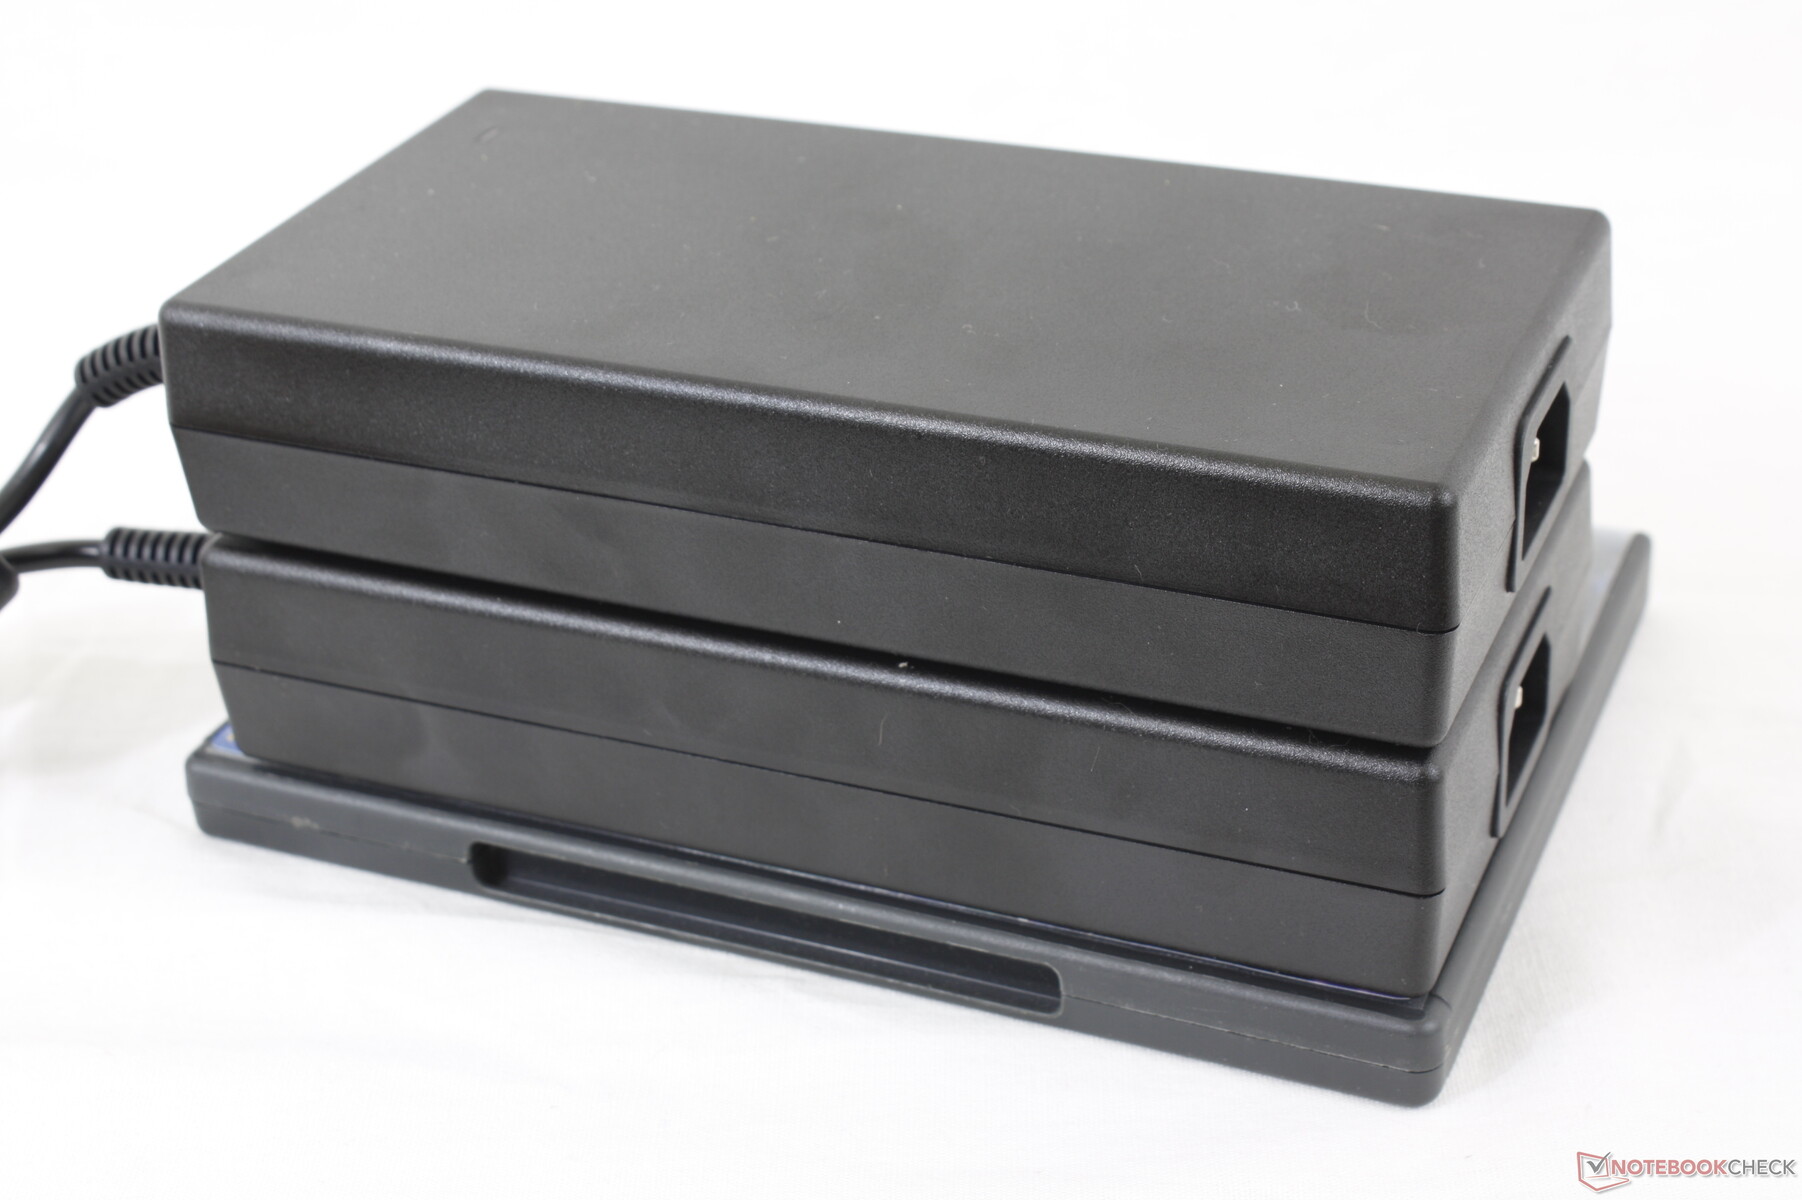
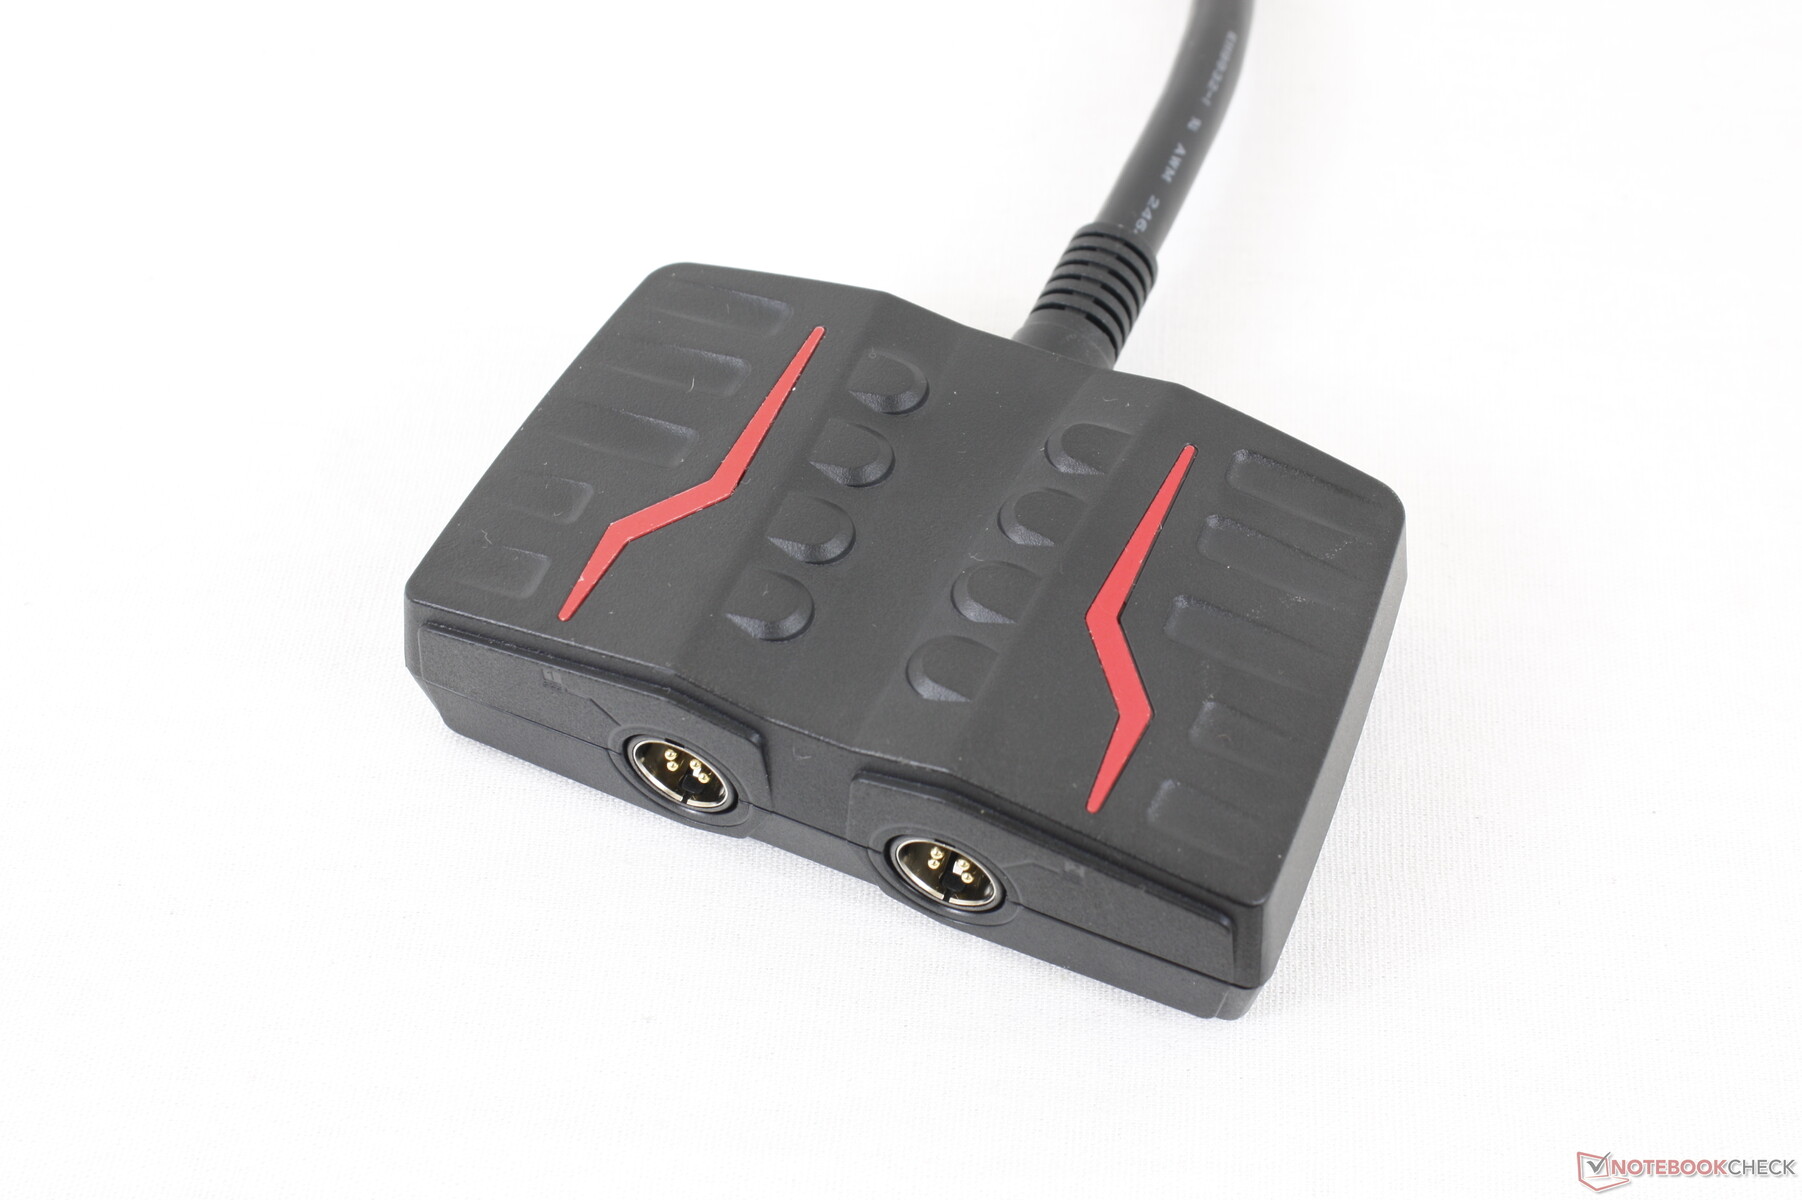
Somos capaces de registrar un consumo máximo combinado de 459,8 W de los dos grandes (2x ~17,8 x 9 x 3,6 cm) adaptadores de CA de 230 W. Estos adaptadores de CA de Chicony se utilizan en otros portátiles MSI de alto rendimiento como el GS75. Cada adaptador tiene su propio cable de alimentación de tres puntas que se conectan a un adaptador MSI propietario antes de llegar al portátil. Juntos, estos cables y adaptadores necesarios pesan un poco más de 2,4 kg.
| Off / Standby | |
| Ocioso | |
| Carga |
|
Clave:
min: | |
| MSI GT76 Titan DT 10SGS i9-10900K, GeForce RTX 2080 Super Mobile, 2x WDC PC SN730 SDBPNTY-1T00 (RAID 0), IPS, 3840x2160, 17.3" | Asus ROG G703GXR i7-9750H, GeForce RTX 2080 Mobile, Samsung SSD PM981 MZVLB512HAJQ, IPS, 1920x1080, 17.3" | Alienware Area-51m i9-9900K RTX 2080 i9-9900K, GeForce RTX 2080 Mobile, 2x SK Hynix PC400 512GB (RAID 0), IPS, 1920x1080, 17.3" | Asus Strix Scar 17 G732LXS i9-10980HK, GeForce RTX 2080 Super Mobile, 2x Intel SSD 660p 1TB SSDPEKNW010T8 (RAID 0), IPS, 1920x1080, 17.3" | Schenker XMG Pro 17 PB71RD-G i7-9750H, GeForce RTX 2060 Mobile, Samsung SSD 970 EVO Plus 500GB, IPS, 1920x1080, 17.3" | MSI GE75 9SG i9-9880H, GeForce RTX 2080 Mobile, Samsung SSD PM981 MZVLB1T0HALR, AHVA, 1920x1080, 17.3" | MSI GT76 Titan DT 9SG i9-9900K, GeForce RTX 2080 Mobile, 2x Samsung PM961 MZVLW256HEHP (RAID 0), IPS, 1920x1080, 17.3" | |
|---|---|---|---|---|---|---|---|
| Power Consumption | 13% | 7% | 22% | 48% | 38% | 30% | |
| Idle Minimum * (Watt) | 25.9 | 27 -4% | 23.3 10% | 16 38% | 11 58% | 13.9 46% | 14 46% |
| Idle Average * (Watt) | 38 | 32 16% | 33.5 12% | 25 34% | 18 53% | 18.8 51% | 18 53% |
| Idle Maximum * (Watt) | 53.2 | 39 27% | 38.4 28% | 35 34% | 28 47% | 23.1 57% | 23 57% |
| Load Average * (Watt) | 123.8 | 124 -0% | 114.1 8% | 177 -43% | 99 20% | 112.3 9% | 114 8% |
| Witcher 3 ultra * (Watt) | 312.5 | 274 12% | 339.5 -9% | 227 27% | 146 53% | 231 26% | 283 9% |
| Load Maximum * (Watt) | 459.8 | 338 26% | 485.1 -6% | 280 39% | 210 54% | 291.5 37% | 443 4% |
* ... más pequeño es mejor
Duración de la batería
Los tiempos de ejecución son cortos, poco menos de 2,5 horas de uso de la WLAN en el mundo real cuando se está en el perfil de Balance, a pesar de la gran batería de 90 Wh. La recarga desde la capacidad vacía a la plena capacidad toma dos horas completas. Tenga en cuenta que ambos adaptadores de CA deben estar conectados o de lo contrario la computadora portátil no se recargará en absoluto a diferencia de en el Área de Alienware-51m.
El sistema no puede ser recargado a través de USB-C.
| MSI GT76 Titan DT 10SGS i9-10900K, GeForce RTX 2080 Super Mobile, 90 Wh | Asus ROG G703GXR i7-9750H, GeForce RTX 2080 Mobile, 96 Wh | Alienware Area-51m i9-9900K RTX 2080 i9-9900K, GeForce RTX 2080 Mobile, 90 Wh | Asus Strix Scar 17 G732LXS i9-10980HK, GeForce RTX 2080 Super Mobile, 66 Wh | Schenker XMG Pro 17 PB71RD-G i7-9750H, GeForce RTX 2060 Mobile, 62 Wh | MSI GE75 9SG i9-9880H, GeForce RTX 2080 Mobile, 65 Wh | MSI GT76 Titan DT 9SG i9-9900K, GeForce RTX 2080 Mobile, 90 Wh | |
|---|---|---|---|---|---|---|---|
| Duración de Batería | 154% | -12% | 146% | 71% | 104% | 108% | |
| WiFi v1.3 (h) | 2.4 | 6.1 154% | 2.1 -12% | 5.9 146% | 4.1 71% | 4.9 104% | 5 108% |
| Reader / Idle (h) | 8.1 | 2.6 | 10 | 5.2 | 6.8 | ||
| Load (h) | 1 | 1.1 | 1.5 | 1.3 | 0.9 |
Pro
Contra
Veredicto
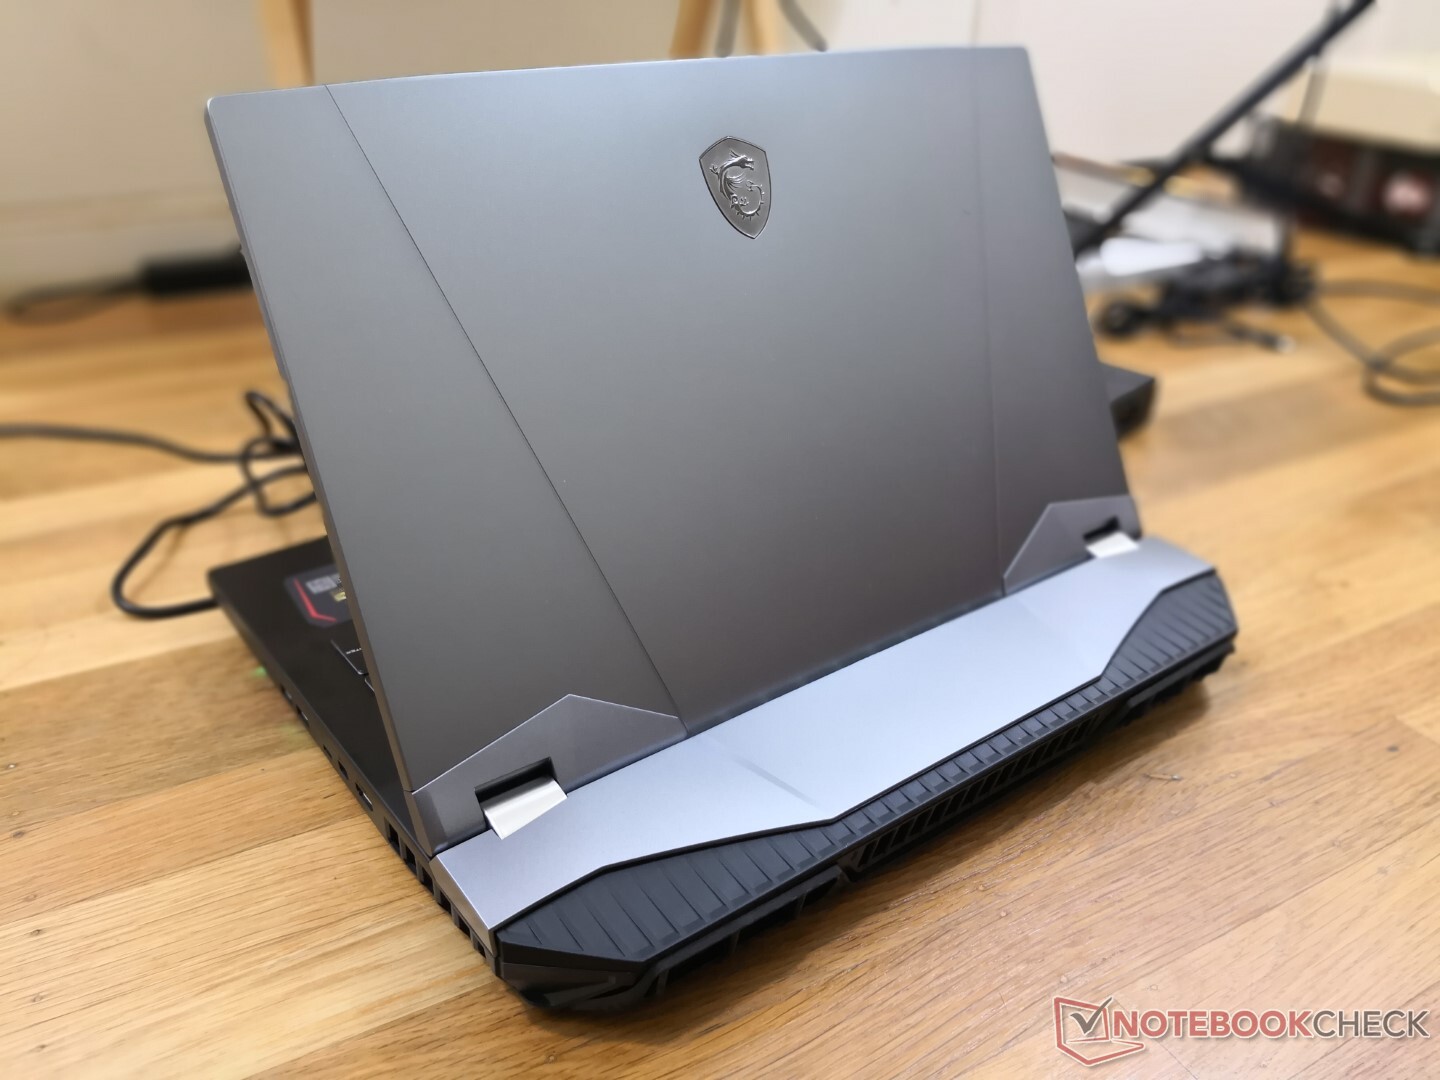
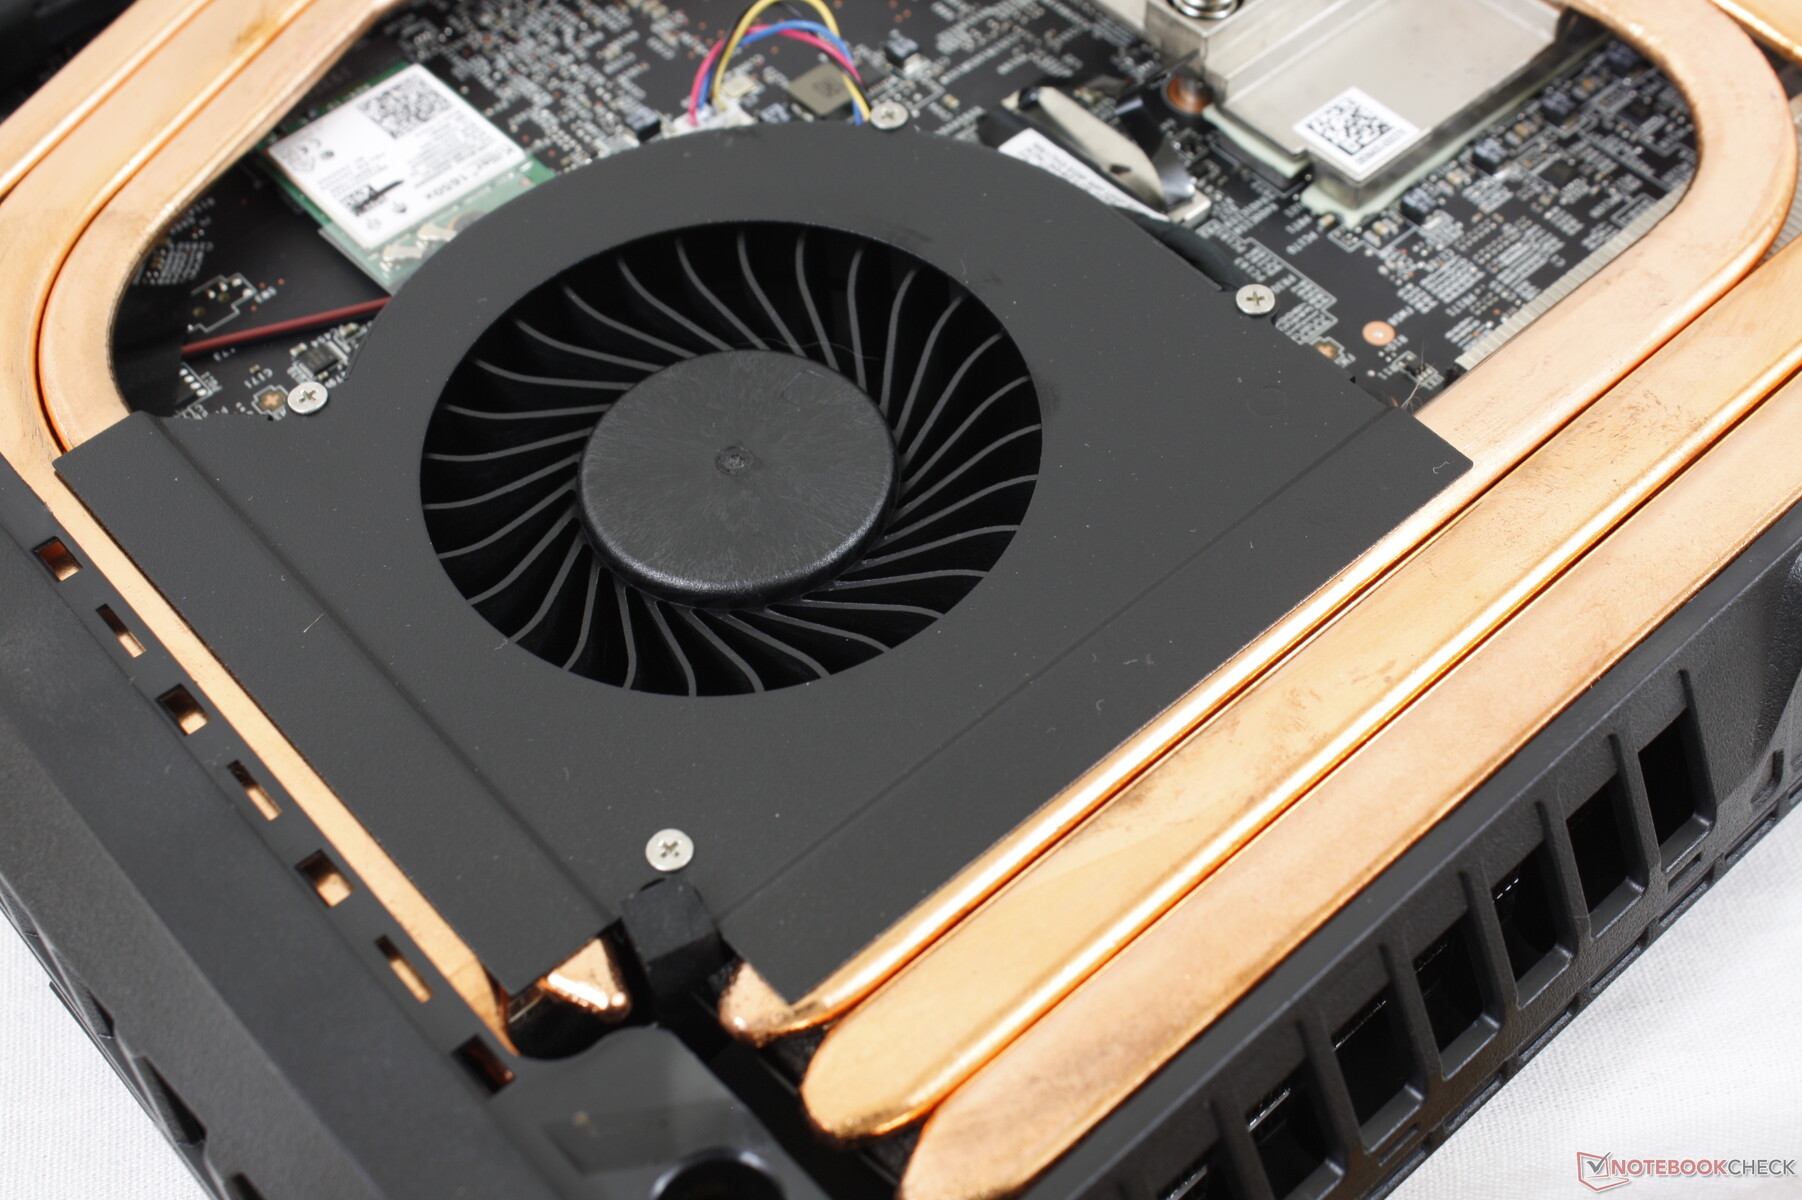
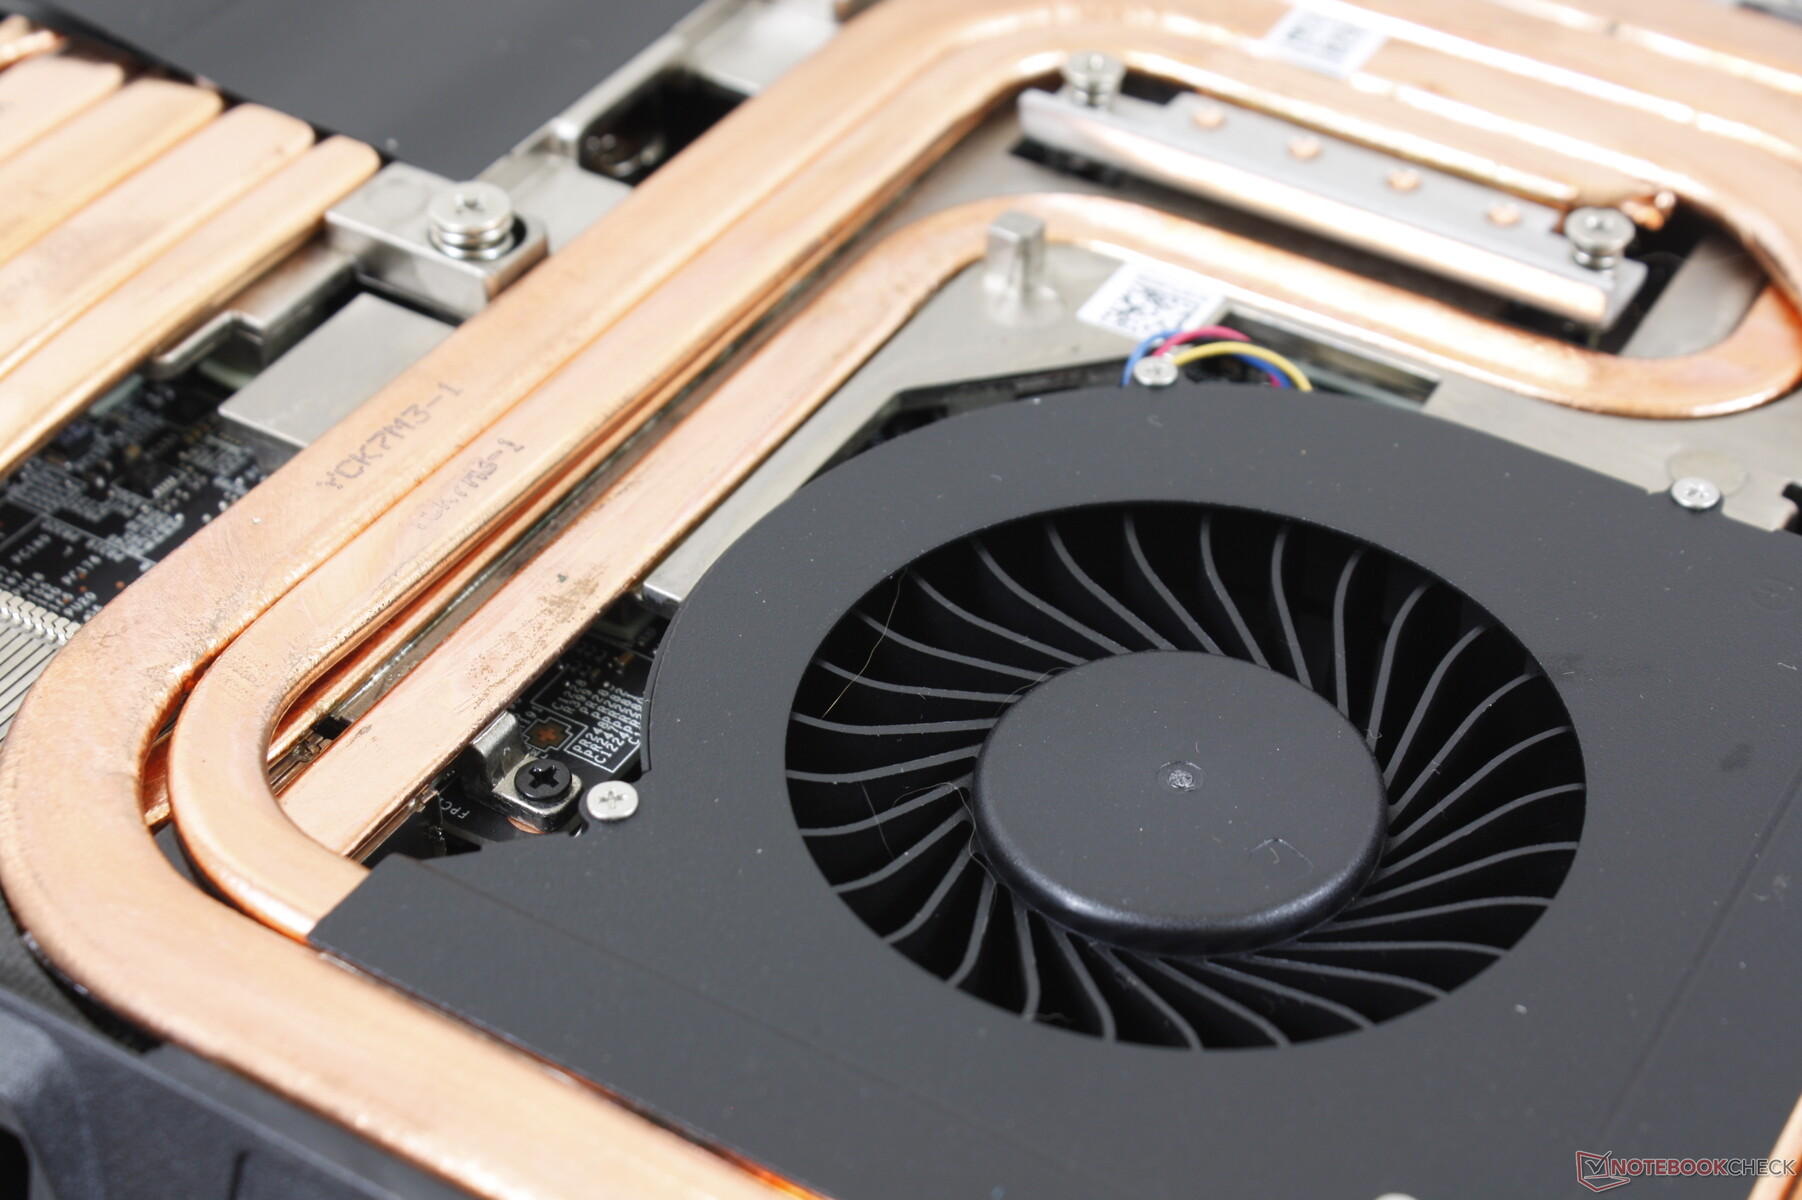
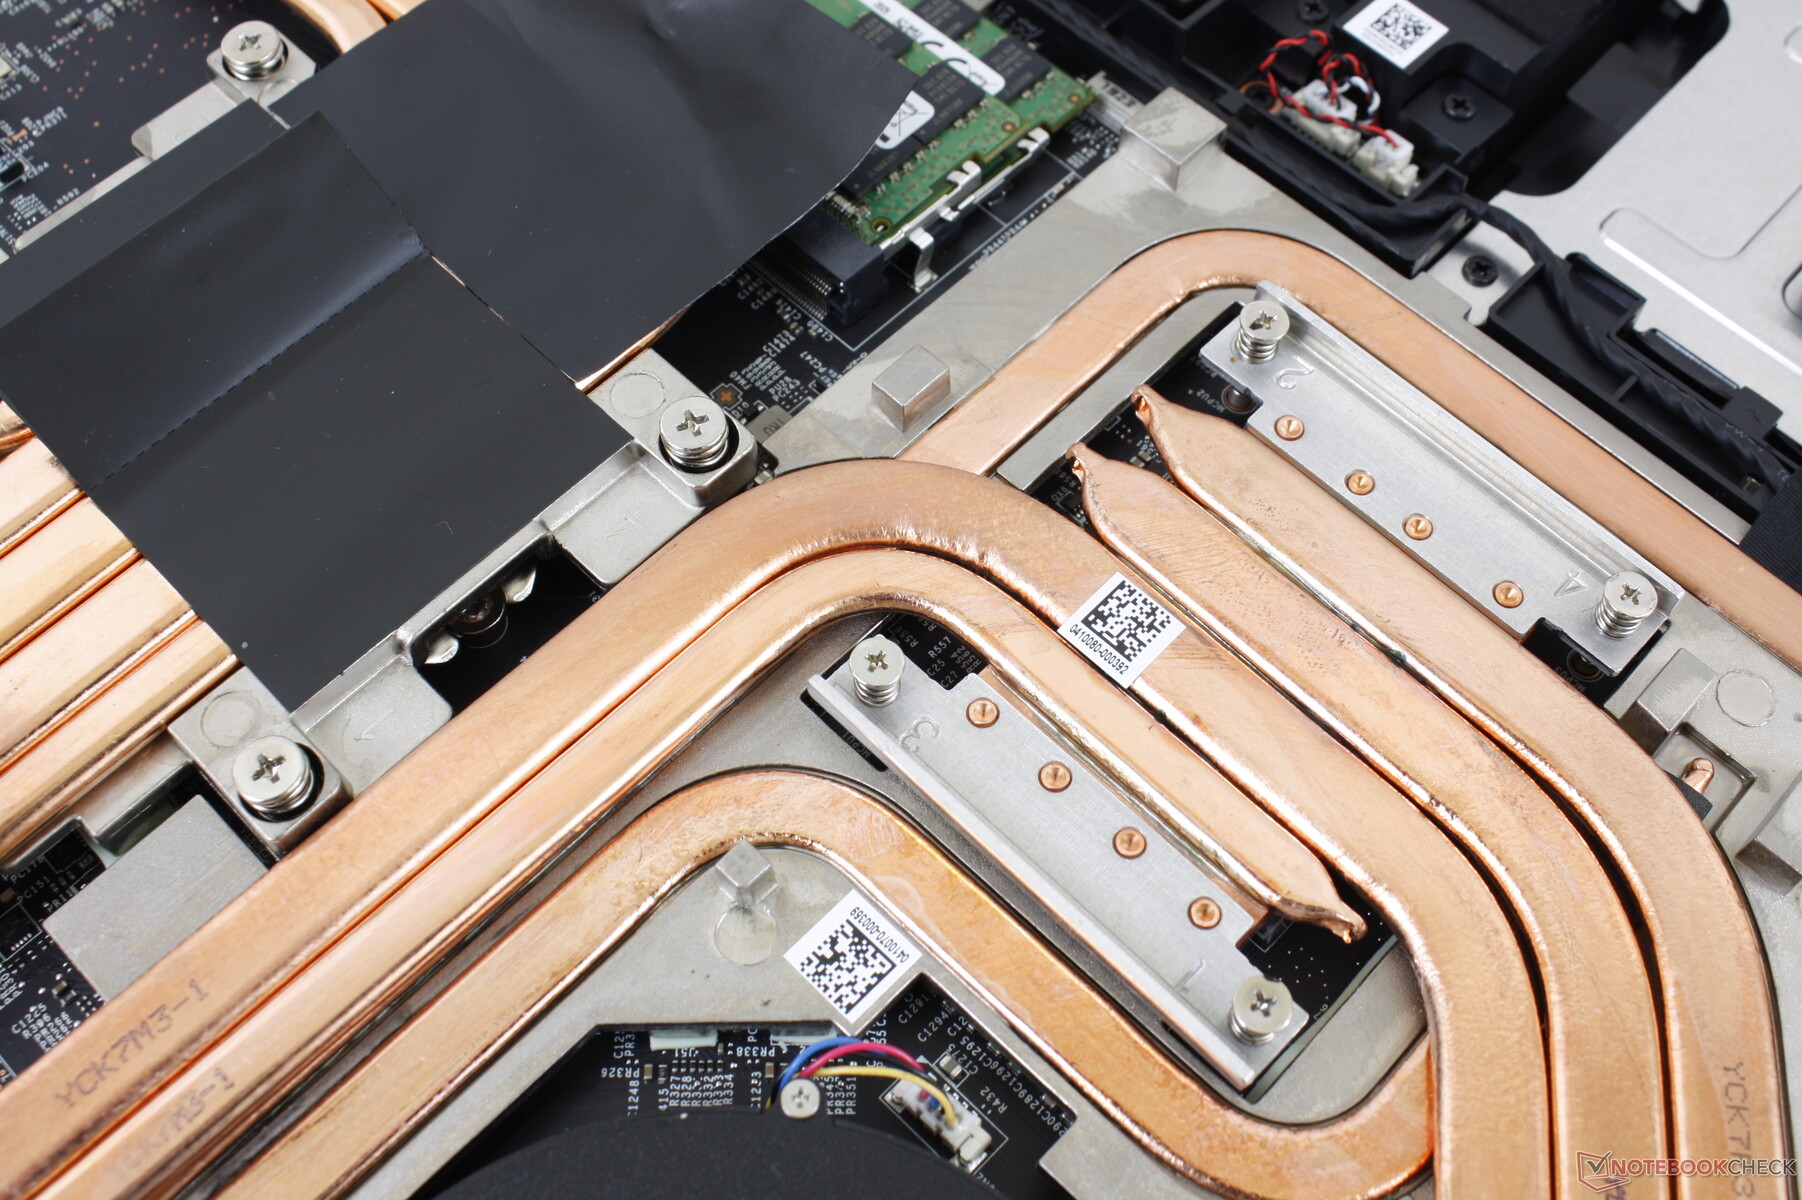
El GT76 Titan tiene una ventaja clave sobre el Dell Alienware Area-51m y el Asus ROG G703: las temperaturas del núcleo. El sistema MSI es capaz de hacer funcionar sus procesadores más fríos cuando se encuentran bajo cargas exigentes como las de los juegos, lo que no es sorprendente dado que su red de 11 tubos de calor internos es la más grande que hemos visto en un portátil de 17,3 pulgadas. La CPU y la GPU se refrigeran independientemente sin que se superpongan los tubos de calor para soportar mejor los esfuerzos de overclocking.
Otras ventajas notables incluyen el fuerte diseño del chasis, un servicio más fácil y la opción de pantalla 4K UHD de 120 Hz, que todavía no es una característica común.
Hay una serie de desventajas. El ruido del ventilador sigue siendo muy fuerte cuando se trabaja con cargas exigentes y los dos adaptadores de CA y los cables pueden ser aún más voluminosos para llevarlos que el propio portátil. El tamaño del chasis es también muy grande incluso para la categoría debido a la parte trasera saliente y la solución de refrigeración ampliada. El panel inferior puede ser difícil de encajar en su lugar y la falta de carga USB-C y G-Sync es una oportunidad perdida.
Las temperaturas del núcleo son más frescas que las de muchos competidores de esta categoría con las mismas opciones del Core i9 y el RTX Super de sobremesa. Tendrás que pasar por alto los ruidosos ventiladores y los voluminosos adaptadores de CA para sacar el máximo provecho de este reemplazo de escritorio.
MSI GT76 Titan DT 10SGS
- 10/05/2020 v7 (old)
Allen Ngo
Price comparison
