 Deutsch
 English
 Español
 Français
 Italiano
 Nederlands
 Polski
 Português
 Русский
 Türkçe
 Svenska
 Chinese
 Magyar
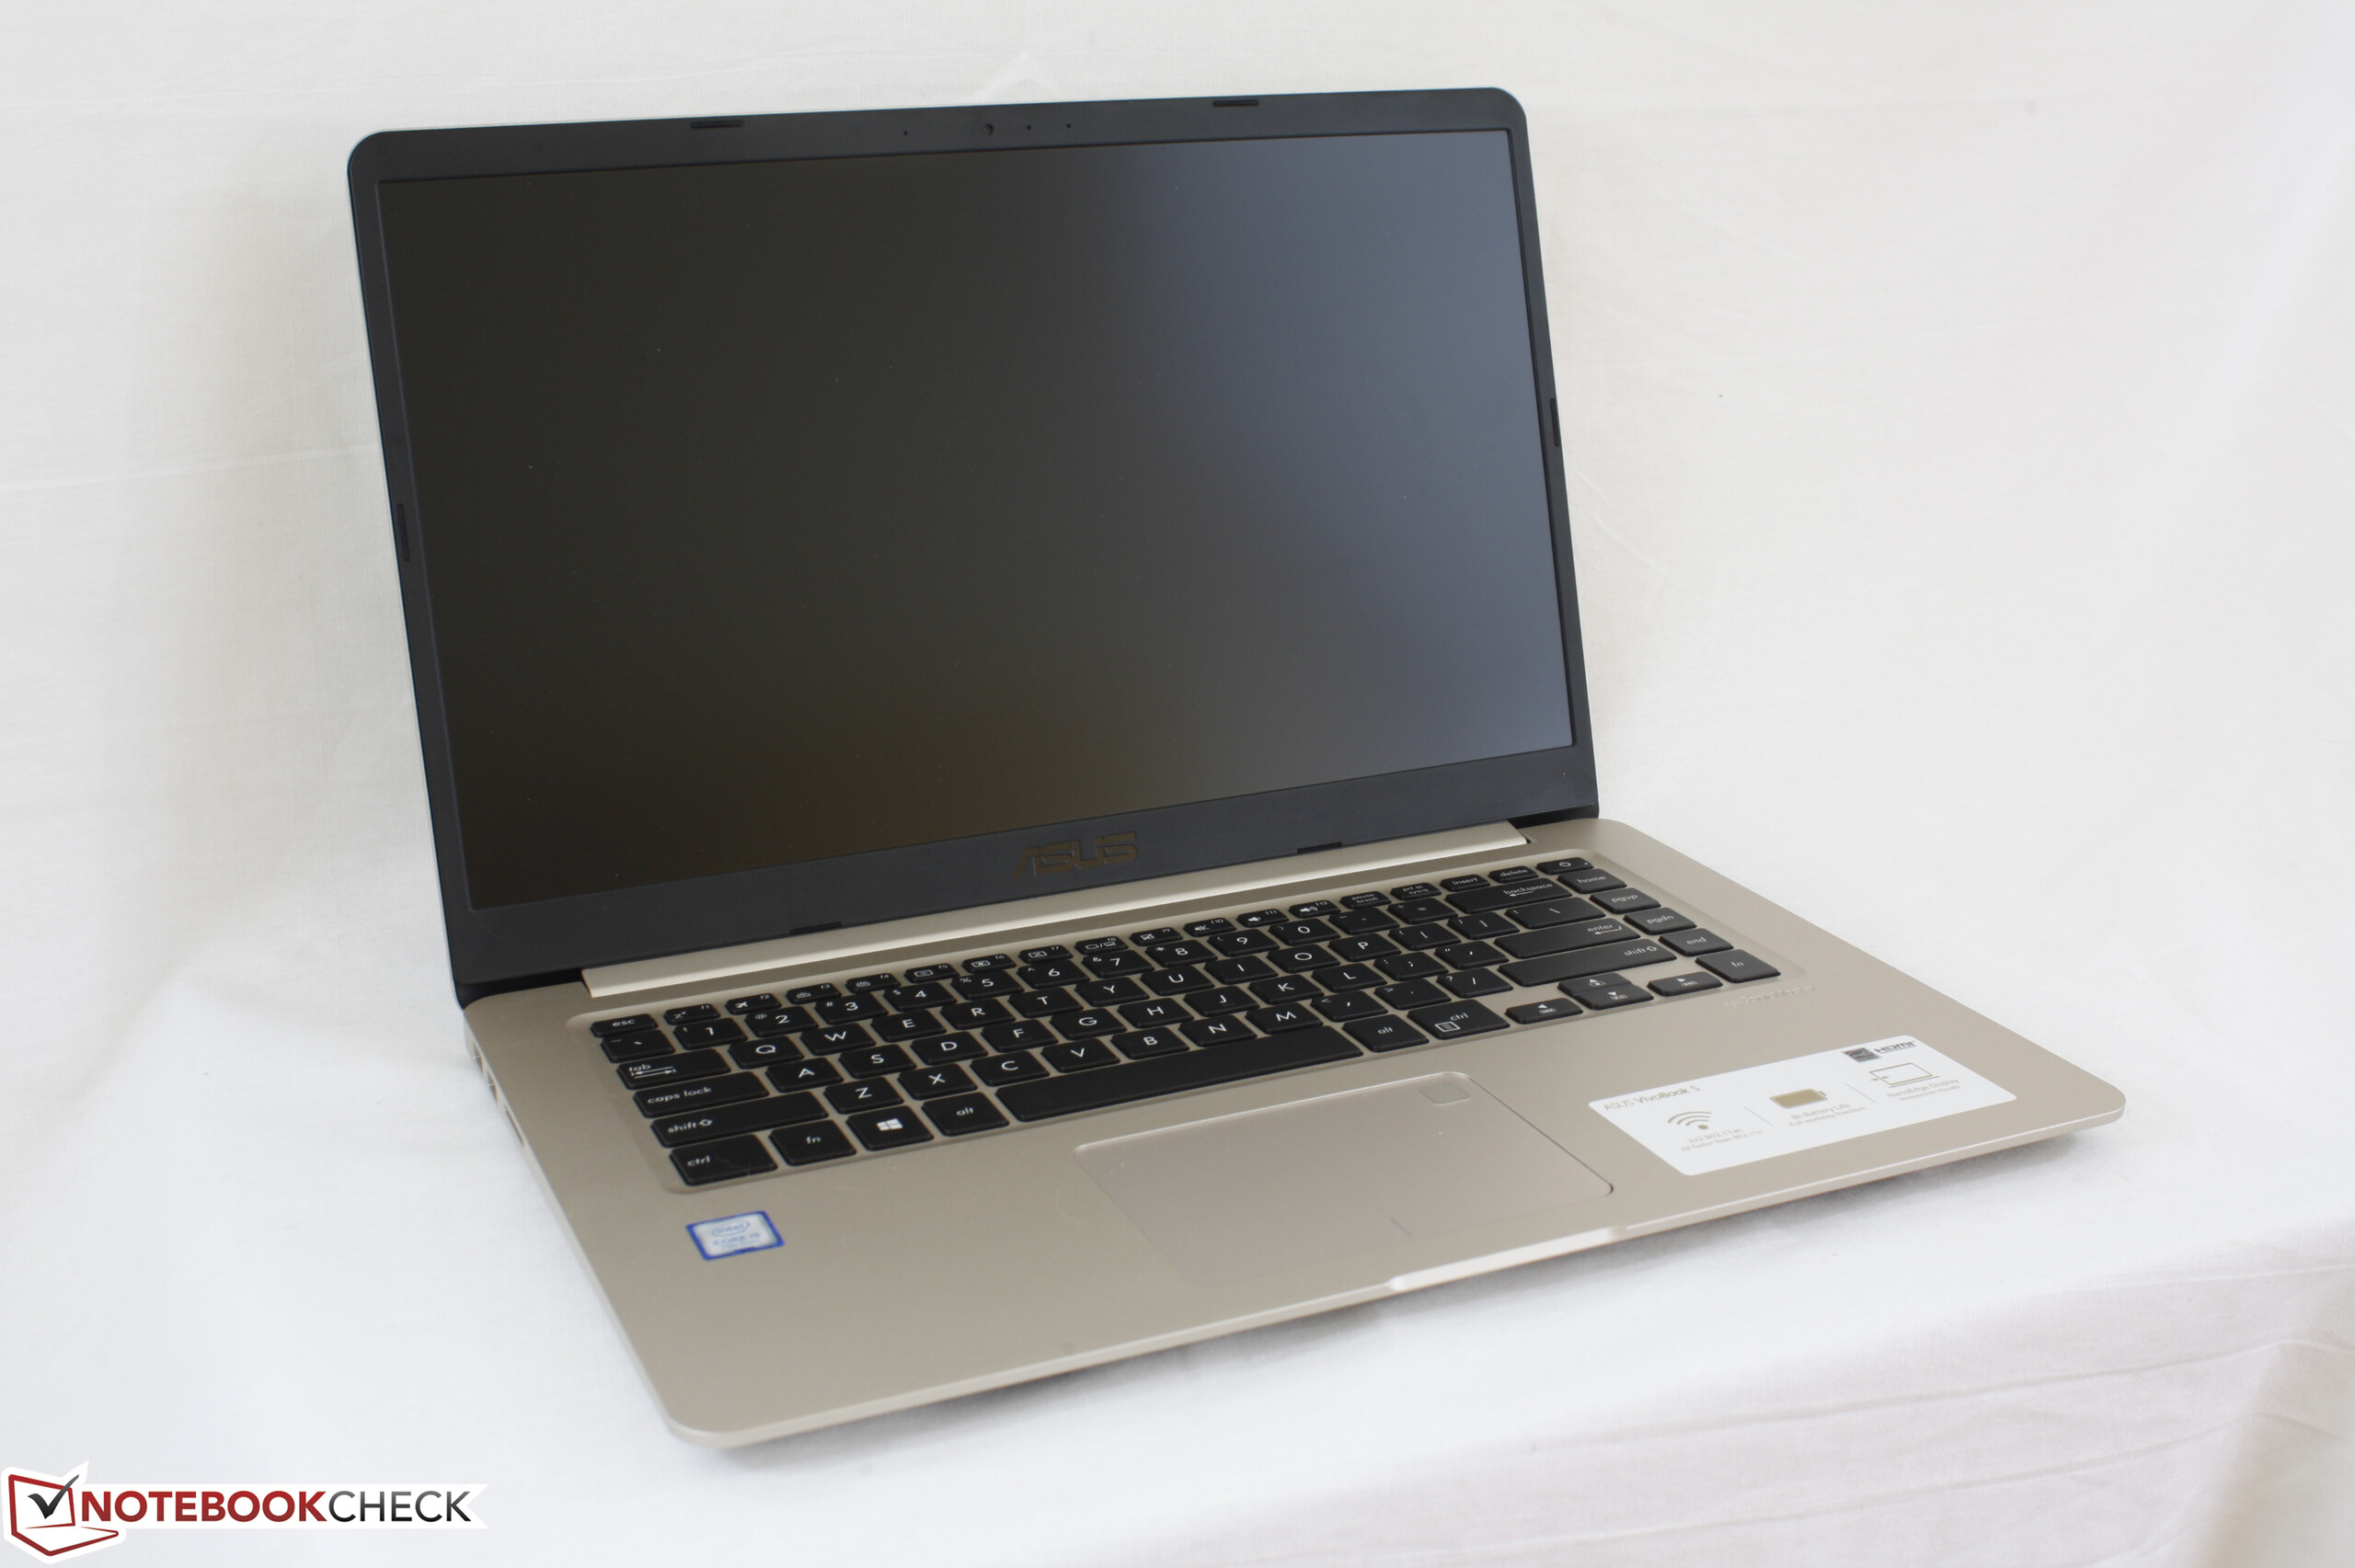
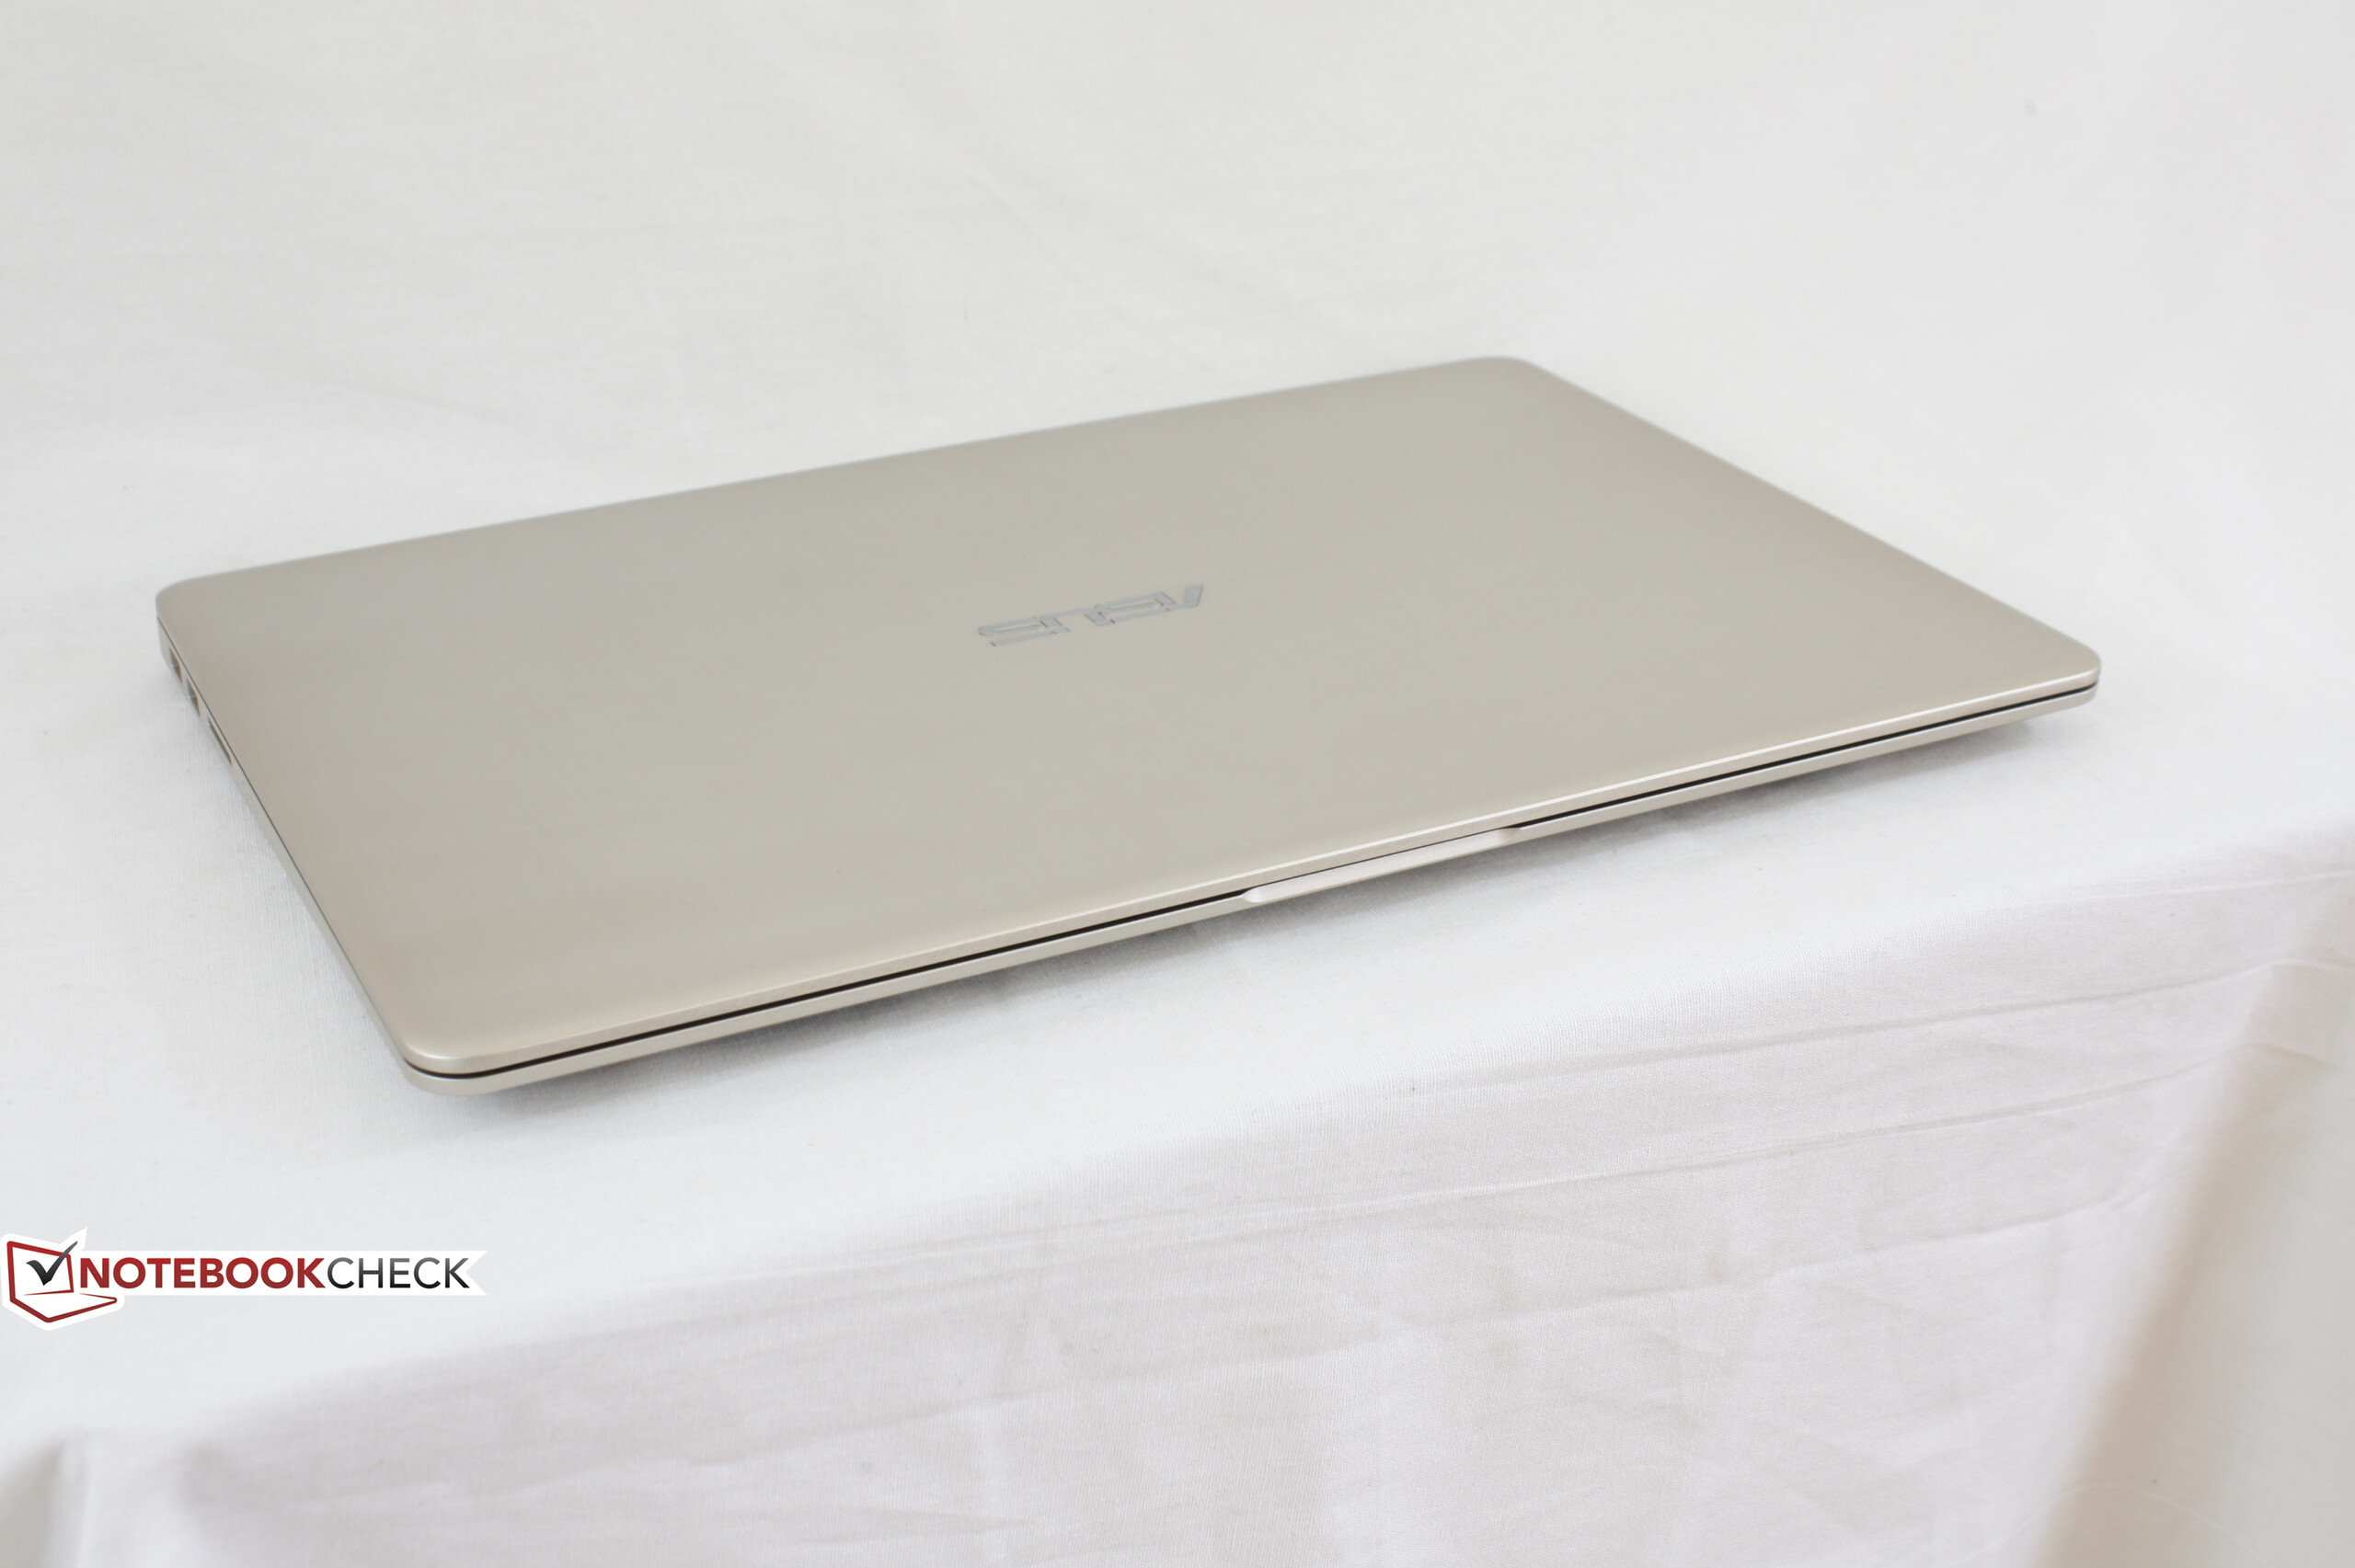
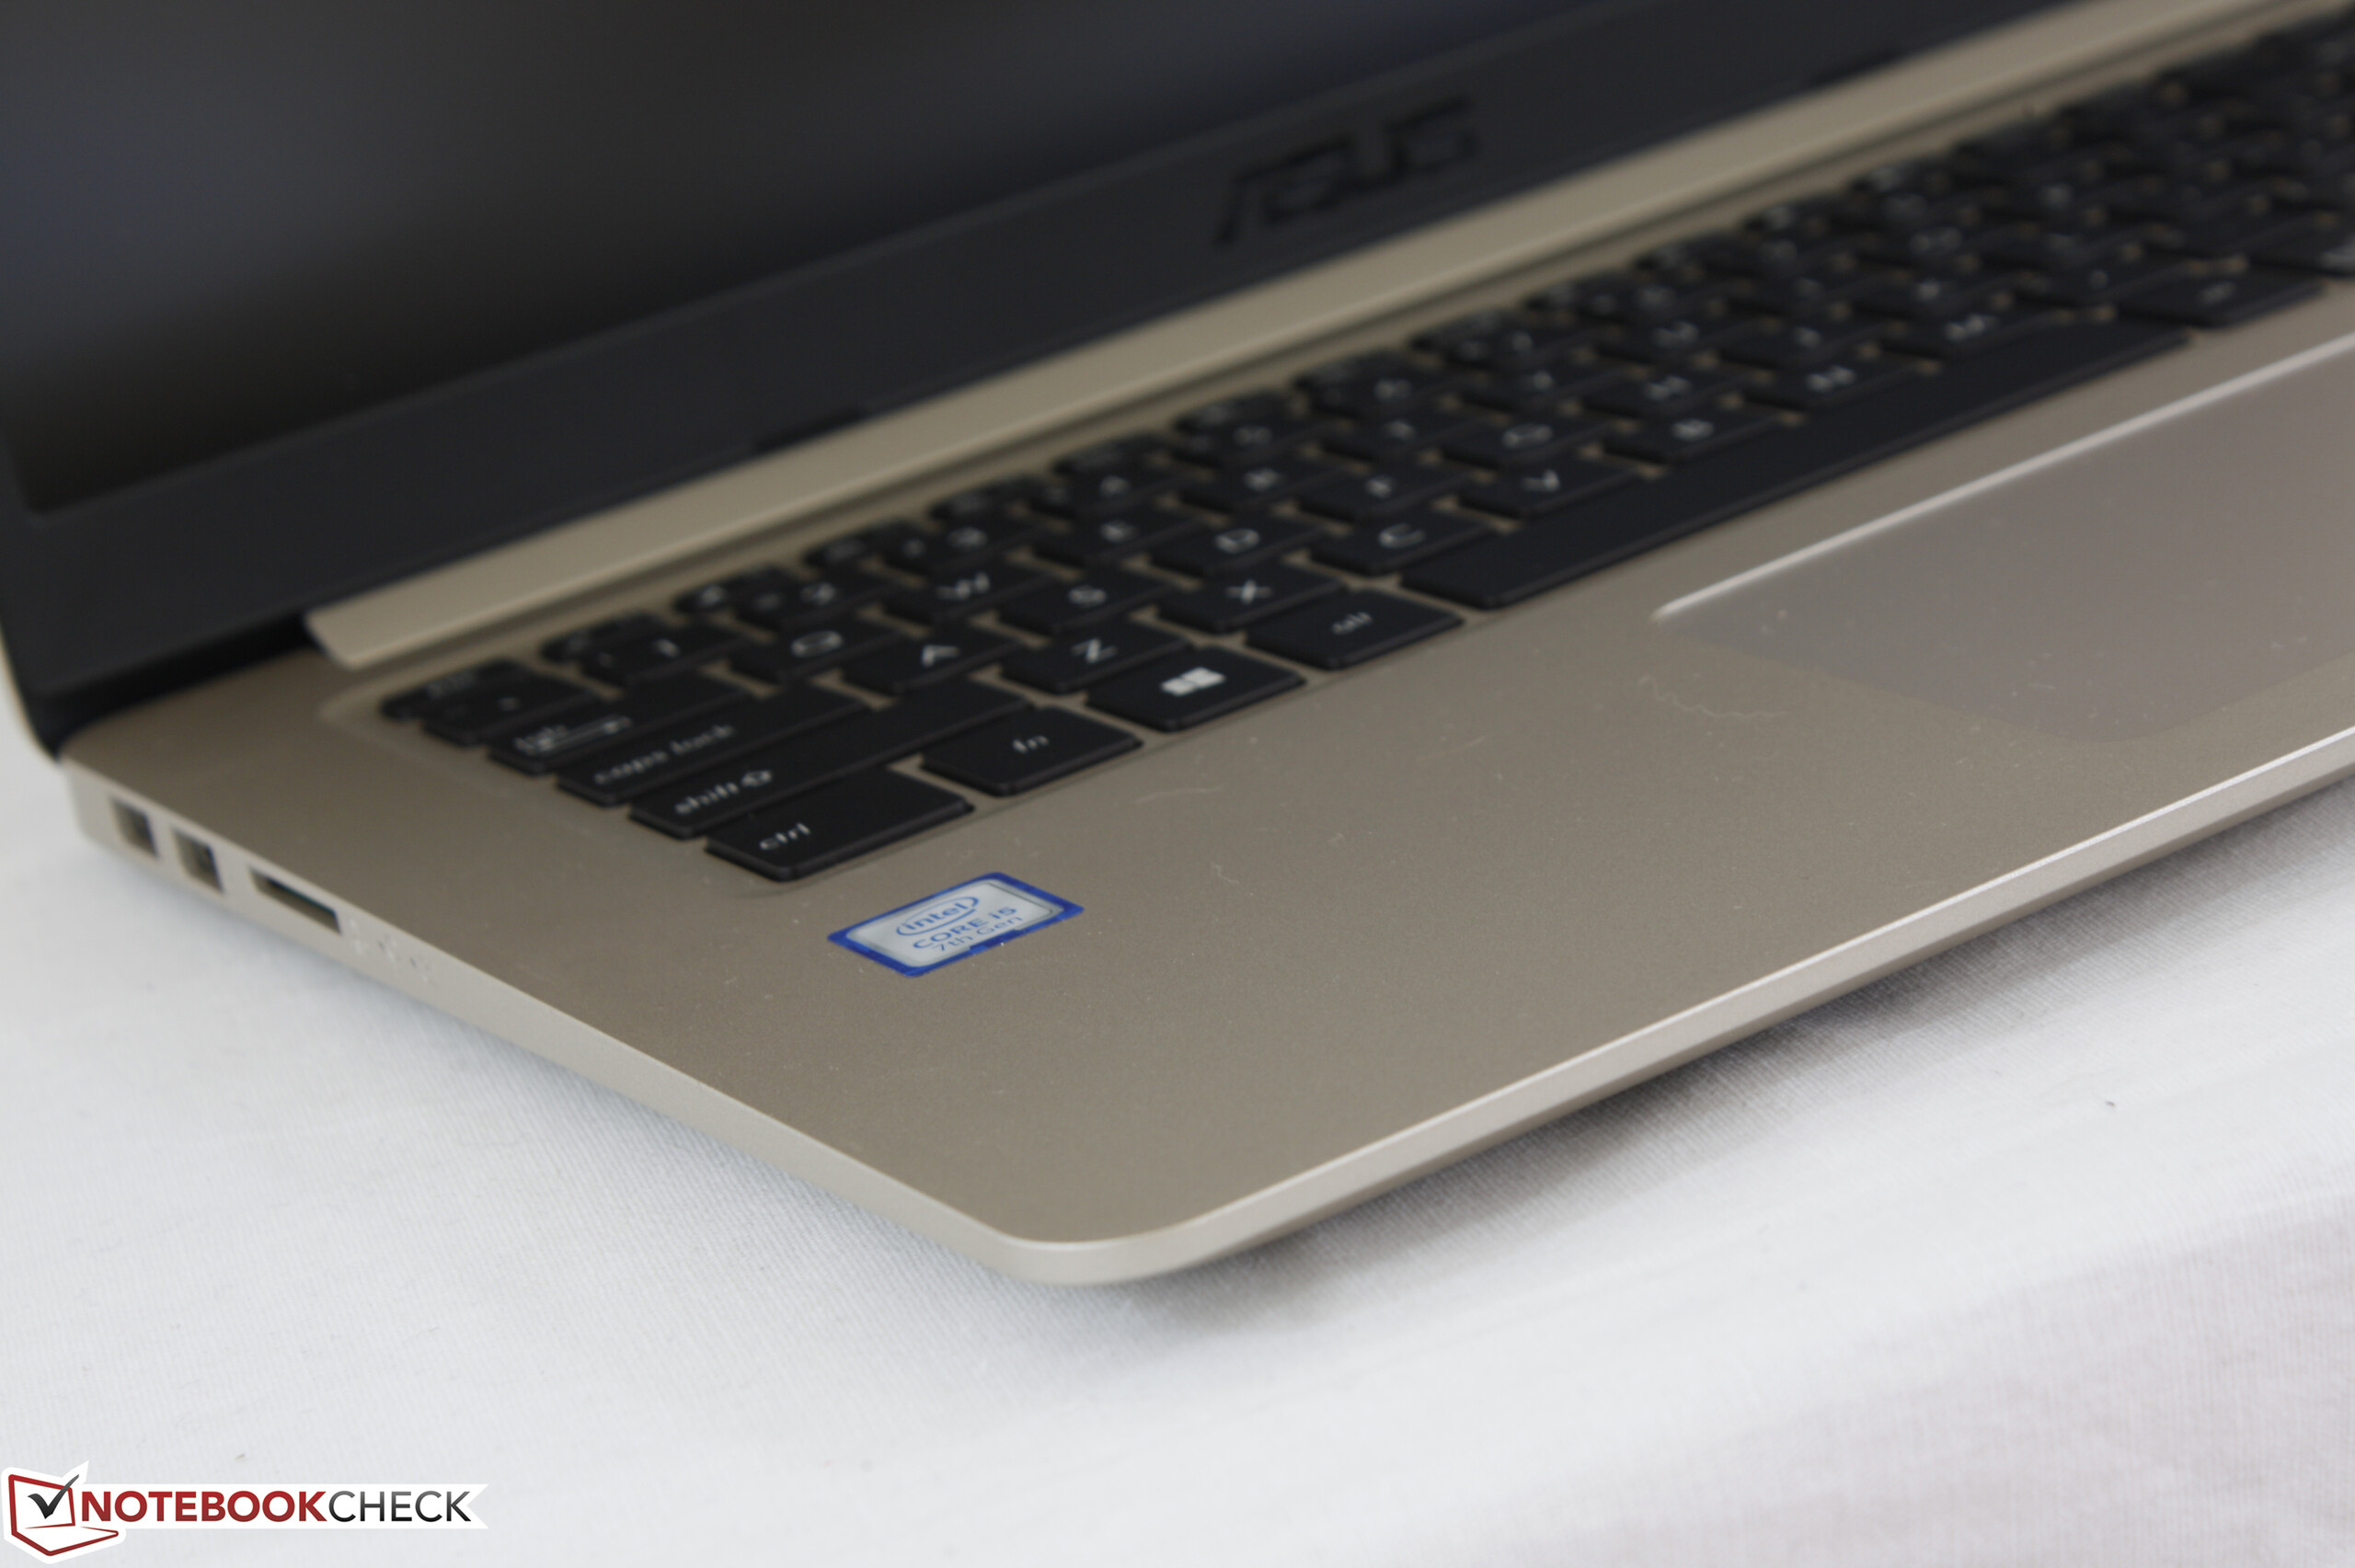
Breve análisis del Asus VivoBook S15 S510UQ (i5-7200U, 940MX)

| SD Card Reader | |
| average JPG Copy Test (av. of 3 runs) | |
| HP Pavilion 15 Power 1GK62AV (Toshiba Exceria Pro SDXC 64 GB UHS-II) | |
| Lenovo ThinkPad E570-20H6S00000 (Toshiba Exceria Pro SDXC 64 GB UHS-II) | |
| Asus Vivobook S15 S510UQ-BQ189T (Toshiba Exceria Pro SDXC 64 GB UHS-II) | |
| Acer Swift 3 SF315-51G-55Z9 (Toshiba Exceria Pro SDXC 64 GB UHS-II) | |
| maximum AS SSD Seq Read Test (1GB) | |
| HP Pavilion 15 Power 1GK62AV (Toshiba Exceria Pro SDXC 64 GB UHS-II) | |
| Lenovo ThinkPad E570-20H6S00000 (Toshiba Exceria Pro SDXC 64 GB UHS-II) | |
| Asus Vivobook S15 S510UQ-BQ189T (Toshiba Exceria Pro SDXC 64 GB UHS-II) | |
| Acer Swift 3 SF315-51G-55Z9 (Toshiba Exceria Pro SDXC 64 GB UHS-II) | |
| |||||||||||||||||||||||||
iluminación: 86 %
Brillo con batería: 293 cd/m²
Contraste: 1172:1 (Negro: 0.25 cd/m²)
ΔE Color 3.81 | 0.5-29.43 Ø5
ΔE Greyscale 2.66 | 0.57-98 Ø5.2
58% sRGB (Argyll 1.6.3 3D)
37% AdobeRGB 1998 (Argyll 1.6.3 3D)
40.23% AdobeRGB 1998 (Argyll 2.2.0 3D)
58.5% sRGB (Argyll 2.2.0 3D)
38.94% Display P3 (Argyll 2.2.0 3D)
Gamma: 2.54
| Asus Vivobook S15 S510UQ-BQ189T AU Optronics B156W02 / AUO B156HAN02.1, , 1920x1080, 15.60 | Acer Swift 3 SF315-51G-55Z9 BOE0700 / BOE CQ NV156FHM-N48, , 1920x1080, 15.60 | Lenovo ThinkPad E570-20H6S00000 AUO B156HAN04.4, , 1920x1080, 15.60 | HP Pavilion 15 Power 1GK62AV ID: AU Optronics AUO41ED, , 1920x1080, 15.60 | |
|---|---|---|---|---|
| Display | -0% | -1% | -0% | |
| Display P3 Coverage | 38.94 | 39.02 0% | 38.65 -1% | 38.81 0% |
| sRGB Coverage | 58.5 | 57.7 -1% | 58 -1% | 57.9 -1% |
| AdobeRGB 1998 Coverage | 40.23 | 40.31 0% | 39.94 -1% | 40.03 0% |
| Response Times | -2% | 7% | 9% | |
| Response Time Grey 50% / Grey 80% * | 47 ? | 42 ? 11% | 44.8 ? 5% | 38.8 ? 17% |
| Response Time Black / White * | 28 ? | 32 ? -14% | 25.6 ? 9% | 28 ? -0% |
| PWM Frequency | 1087 ? | |||
| Screen | -10% | -15% | -23% | |
| Brightness middle | 293 | 248 -15% | 242 -17% | 256.6 -12% |
| Brightness | 275 | 239 -13% | 243 -12% | 243 -12% |
| Brightness Distribution | 86 | 69 -20% | 75 -13% | 81 -6% |
| Black Level * | 0.25 | 0.18 28% | 0.24 4% | 0.19 24% |
| Contrast | 1172 | 1378 18% | 1008 -14% | 1351 15% |
| Colorchecker dE 2000 * | 3.81 | 4.85 -27% | 4.65 -22% | 5 -31% |
| Colorchecker dE 2000 max. * | 6.64 | 8.34 -26% | 9.64 -45% | 20.1 -203% |
| Greyscale dE 2000 * | 2.66 | 3.84 -44% | 3.39 -27% | 2.7 -2% |
| Gamma | 2.54 87% | 2.29 96% | 2.7 81% | 2.32 95% |
| CCT | 6541 99% | 6790 96% | 6246 104% | 6599 98% |
| Color Space (Percent of AdobeRGB 1998) | 37 | 37 0% | 36.69 -1% | 36.7 -1% |
| Color Space (Percent of sRGB) | 58 | 57 -2% | 57.66 -1% | 57.7 -1% |
| Media total (Programa/Opciones) | -4% /
-7% | -3% /
-9% | -5% /
-14% |
* ... más pequeño es mejor


Tiempos de respuesta del display
| ↔ Tiempo de respuesta de Negro a Blanco | ||
|---|---|---|
| 28 ms ... subida ↗ y bajada ↘ combinada | ↗ 16 ms subida |  |
| ↘ 12 ms bajada | ||
| La pantalla mostró tiempos de respuesta relativamente lentos en nuestros tests pero podría ser demasiado lenta para los jugones. En comparación, todos los dispositivos de prueba van de ##min### (mínimo) a 240 (máximo) ms. » 67 % de todos los dispositivos son mejores. Eso quiere decir que el tiempo de respuesta es peor que la media (21.4 ms) de todos los dispositivos testados. | ||
| ↔ Tiempo de respuesta 50% Gris a 80% Gris | ||
| 47 ms ... subida ↗ y bajada ↘ combinada | ↗ 21 ms subida |  |
| ↘ 26 ms bajada | ||
| La pantalla mostró tiempos de respuesta lentos en nuestros tests y podría ser demasiado lenta para los jugones. En comparación, todos los dispositivos de prueba van de ##min### (mínimo) a 636 (máximo) ms. » 78 % de todos los dispositivos son mejores. Eso quiere decir que el tiempo de respuesta es peor que la media (33.6 ms) de todos los dispositivos testados. | ||
Parpadeo de Pantalla / PWM (Pulse-Width Modulation)
| Parpadeo de Pantalla / PWM no detectado | ||
Comparación: 53 % de todos los dispositivos testados no usaron PWM para atenuar el display. Si se usó, medimos una media de 17753 (mínimo: 5 - máxmo: 3846000) Hz. | ||


| PCMark 8 | |
| Home Score Accelerated v2 | |
| HP Pavilion 15 Power 1GK62AV | |
| Acer Swift 3 SF315-51G-55Z9 | |
| Lenovo ThinkPad E570-20H6S00000 | |
| Asus Vivobook S15 S510UQ-BQ189T | |
| Work Score Accelerated v2 | |
| HP Pavilion 15 Power 1GK62AV | |
| Lenovo ThinkPad E570-20H6S00000 | |
| Acer Swift 3 SF315-51G-55Z9 | |
| Asus Vivobook S15 S510UQ-BQ189T | |
| PCMark 8 Home Score Accelerated v2 | 3468 puntos | |
| PCMark 8 Work Score Accelerated v2 | 4483 puntos | |
ayuda | ||
| Asus Vivobook S15 S510UQ-BQ189T Toshiba SG5 THNSNK128GVN8 | Acer Swift 3 SF315-51G-55Z9 Kingston RBUSNS8180DS3128GH | Lenovo ThinkPad E570-20H6S00000 Toshiba THNSF5256GPUK | HP Pavilion 15 Power 1GK62AV SK Hynix HFS256G39TND-N210A | |
|---|---|---|---|---|
| CrystalDiskMark 3.0 | 46% | 139% | 4% | |
| Read Seq | 437.6 | 462.2 6% | 1140 161% | 491.6 12% |
| Write Seq | 138.6 | 409.9 196% | 468.1 238% | 141.7 2% |
| Read 512 | 368.6 | 310.3 -16% | 759 106% | 345.6 -6% |
| Write 512 | 138.2 | 216.6 57% | 414 200% | 142.6 3% |
| Read 4k | 16.05 | 31.89 99% | 34.3 114% | 18.83 17% |
| Write 4k | 86.2 | 73.2 -15% | 123.4 43% | 76.3 -11% |
| Read 4k QD32 | 279.1 | 287.9 3% | 530 90% | 348.5 25% |
| Write 4k QD32 | 121.8 | 170.6 40% | 319.2 162% | 104.8 -14% |

| 3DMark 11 - 1280x720 Performance GPU | |
| HP Pavilion 15 Power 1GK62AV | |
| Acer Swift 3 SF315-51G-55Z9 | |
| Lenovo ThinkPad E570-20H6S00000 | |
| Asus Vivobook S15 S510UQ-BQ189T | |
| 3DMark | |
| 1280x720 Cloud Gate Standard Graphics | |
| HP Pavilion 15 Power 1GK62AV | |
| Lenovo ThinkPad E570-20H6S00000 | |
| Acer Swift 3 SF315-51G-55Z9 | |
| Asus Vivobook S15 S510UQ-BQ189T | |
| 1920x1080 Fire Strike Graphics | |
| HP Pavilion 15 Power 1GK62AV | |
| Acer Swift 3 SF315-51G-55Z9 | |
| Lenovo ThinkPad E570-20H6S00000 | |
| Asus Vivobook S15 S510UQ-BQ189T | |
| 3DMark 11 Performance | 2843 puntos | |
| 3DMark Cloud Gate Standard Score | 7748 puntos | |
| 3DMark Fire Strike Score | 1944 puntos | |
ayuda | ||
| bajo | medio | alto | ultra | |
| The Witcher 3 (2015) | 41.4 | 25.4 | ||
| Rise of the Tomb Raider (2016) | 46.9 | 26.1 | ||
| Farming Simulator 17 (2016) | 43.8 | 29.8 |
Ruido
| Ocioso |
| 31.2 / 31.2 / 31.2 dB(A) |
| HDD |
| 31.6 dB(A) |
| Carga |
| 43.3 / 43.3 dB(A) |
 | ||
30 dB silencioso 40 dB(A) audible 50 dB(A) ruidosamente alto |
||
min: | ||
(+) The maximum temperature on the upper side is 38.2 °C / 101 F, compared to the average of 36.9 °C / 98 F, ranging from 21.1 to 71 °C for the class Multimedia.
(-) The bottom heats up to a maximum of 49 °C / 120 F, compared to the average of 39.1 °C / 102 F
(+) In idle usage, the average temperature for the upper side is 21.9 °C / 71 F, compared to the device average of 31.2 °C / 88 F.
(+) The palmrests and touchpad are cooler than skin temperature with a maximum of 26 °C / 78.8 F and are therefore cool to the touch.
(+) The average temperature of the palmrest area of similar devices was 28.8 °C / 83.8 F (+2.8 °C / 5 F).
Asus Vivobook S15 S510UQ-BQ189T audio analysis
(±) | speaker loudness is average but good (73.4 dB)
Bass 100 - 315 Hz
(-) | nearly no bass - on average 19% lower than median
(±) | linearity of bass is average (10.7% delta to prev. frequency)
Mids 400 - 2000 Hz
(+) | balanced mids - only 2% away from median
(+) | mids are linear (4.3% delta to prev. frequency)
Highs 2 - 16 kHz
(+) | balanced highs - only 3.6% away from median
(+) | highs are linear (3.3% delta to prev. frequency)
Overall 100 - 16.000 Hz
(±) | linearity of overall sound is average (17.1% difference to median)
Compared to same class
» 40% of all tested devices in this class were better, 8% similar, 51% worse
» The best had a delta of 5%, average was 18%, worst was 45%
Compared to all devices tested
» 26% of all tested devices were better, 8% similar, 66% worse
» The best had a delta of 4%, average was 25%, worst was 134%
Acer Swift 3 SF315-51G-55Z9 audio analysis
(±) | speaker loudness is average but good (77.5 dB)
Bass 100 - 315 Hz
(-) | nearly no bass - on average 27.8% lower than median
(±) | linearity of bass is average (11.1% delta to prev. frequency)
Mids 400 - 2000 Hz
(+) | balanced mids - only 4.4% away from median
(+) | mids are linear (5.1% delta to prev. frequency)
Highs 2 - 16 kHz
(±) | higher highs - on average 6% higher than median
(±) | linearity of highs is average (7.2% delta to prev. frequency)
Overall 100 - 16.000 Hz
(±) | linearity of overall sound is average (20.8% difference to median)
Compared to same class
» 67% of all tested devices in this class were better, 8% similar, 24% worse
» The best had a delta of 5%, average was 18%, worst was 45%
Compared to all devices tested
» 51% of all tested devices were better, 8% similar, 41% worse
» The best had a delta of 4%, average was 25%, worst was 134%
Lenovo ThinkPad E570-20H6S00000 audio analysis
(±) | speaker loudness is average but good (80.7 dB)
Bass 100 - 315 Hz
(-) | nearly no bass - on average 16.8% lower than median
(-) | bass is not linear (16.4% delta to prev. frequency)
Mids 400 - 2000 Hz
(±) | higher mids - on average 5.1% higher than median
(±) | linearity of mids is average (9.5% delta to prev. frequency)
Highs 2 - 16 kHz
(+) | balanced highs - only 2.7% away from median
(+) | highs are linear (6.5% delta to prev. frequency)
Overall 100 - 16.000 Hz
(±) | linearity of overall sound is average (19.6% difference to median)
Compared to same class
» 60% of all tested devices in this class were better, 8% similar, 33% worse
» The best had a delta of 5%, average was 18%, worst was 45%
Compared to all devices tested
» 44% of all tested devices were better, 7% similar, 49% worse
» The best had a delta of 4%, average was 25%, worst was 134%
HP Pavilion 15 Power 1GK62AV audio analysis
(-) | not very loud speakers (68.5 dB)
Bass 100 - 315 Hz
(-) | nearly no bass - on average 17.7% lower than median
(±) | linearity of bass is average (13.4% delta to prev. frequency)
Mids 400 - 2000 Hz
(+) | balanced mids - only 4.2% away from median
(±) | linearity of mids is average (8.8% delta to prev. frequency)
Highs 2 - 16 kHz
(+) | balanced highs - only 3.5% away from median
(±) | linearity of highs is average (11.6% delta to prev. frequency)
Overall 100 - 16.000 Hz
(±) | linearity of overall sound is average (26.8% difference to median)
Compared to same class
» 91% of all tested devices in this class were better, 2% similar, 7% worse
» The best had a delta of 5%, average was 18%, worst was 45%
Compared to all devices tested
» 79% of all tested devices were better, 4% similar, 17% worse
» The best had a delta of 4%, average was 25%, worst was 134%
| Off / Standby | |
| Ocioso | |
| Carga |
|
| Asus Vivobook S15 S510UQ-BQ189T i5-7200U, GeForce 940MX, Toshiba SG5 THNSNK128GVN8, IPS, 1920x1080, 15.60 | Lenovo IdeaPad 320-15IKB 80XL01NEGE i5-7200U, GeForce 940MX, SK Hynix HFS256G3BTND, TN LED, 1920x1080, 15.60 | Acer Swift 3 SF315-51G-55Z9 i5-7200U, GeForce MX150, Kingston RBUSNS8180DS3128GH, IPS, 1920x1080, 15.60 | Lenovo ThinkPad E570-20H6S00000 i5-7200U, GeForce GTX 950M, Toshiba THNSF5256GPUK, IPS LED, 1920x1080, 15.60 | HP Pavilion 15 Power 1GK62AV i7-7700HQ, GeForce GTX 1050 Mobile, SK Hynix HFS256G39TND-N210A, IPS, 1920x1080, 15.60 | |
|---|---|---|---|---|---|
| Power Consumption | 21% | 1% | 6% | -84% | |
| Idle Minimum * | 3.6 | 2.9 19% | 3.7 -3% | 2.8 22% | 9.4 -161% |
| Idle Average * | 6.8 | 5.9 13% | 6.2 9% | 6.3 7% | 9.7 -43% |
| Idle Maximum * | 9.5 | 7.3 23% | 8.4 12% | 6.9 27% | 16.8 -77% |
| Load Average * | 51.6 | 39.5 23% | 50 3% | 51.6 -0% | 76.5 -48% |
| Load Maximum * | 56 | 42 25% | 65.2 -16% | 69.7 -24% | 105.6 -89% |
| Witcher 3 ultra * | 86.5 |
* ... más pequeño es mejor
| Asus Vivobook S15 S510UQ-BQ189T i5-7200U, GeForce 940MX, 42 Wh | Acer Swift 3 SF315-51G-55Z9 i5-7200U, GeForce MX150, 49 Wh | Lenovo ThinkPad E570-20H6S00000 i5-7200U, GeForce GTX 950M, 41 Wh | HP Pavilion 15 Power 1GK62AV i7-7700HQ, GeForce GTX 1050 Mobile, 70 Wh | |
|---|---|---|---|---|
| Duración de Batería | 108% | 91% | 91% | |
| Reader / Idle | 423 | 916 117% | 883 109% | 971 130% |
| WiFi v1.3 | 255 | 509 100% | 462 81% | 481 89% |
| Load | 71 | 146 106% | 129 82% | 110 55% |
Pro
Contra

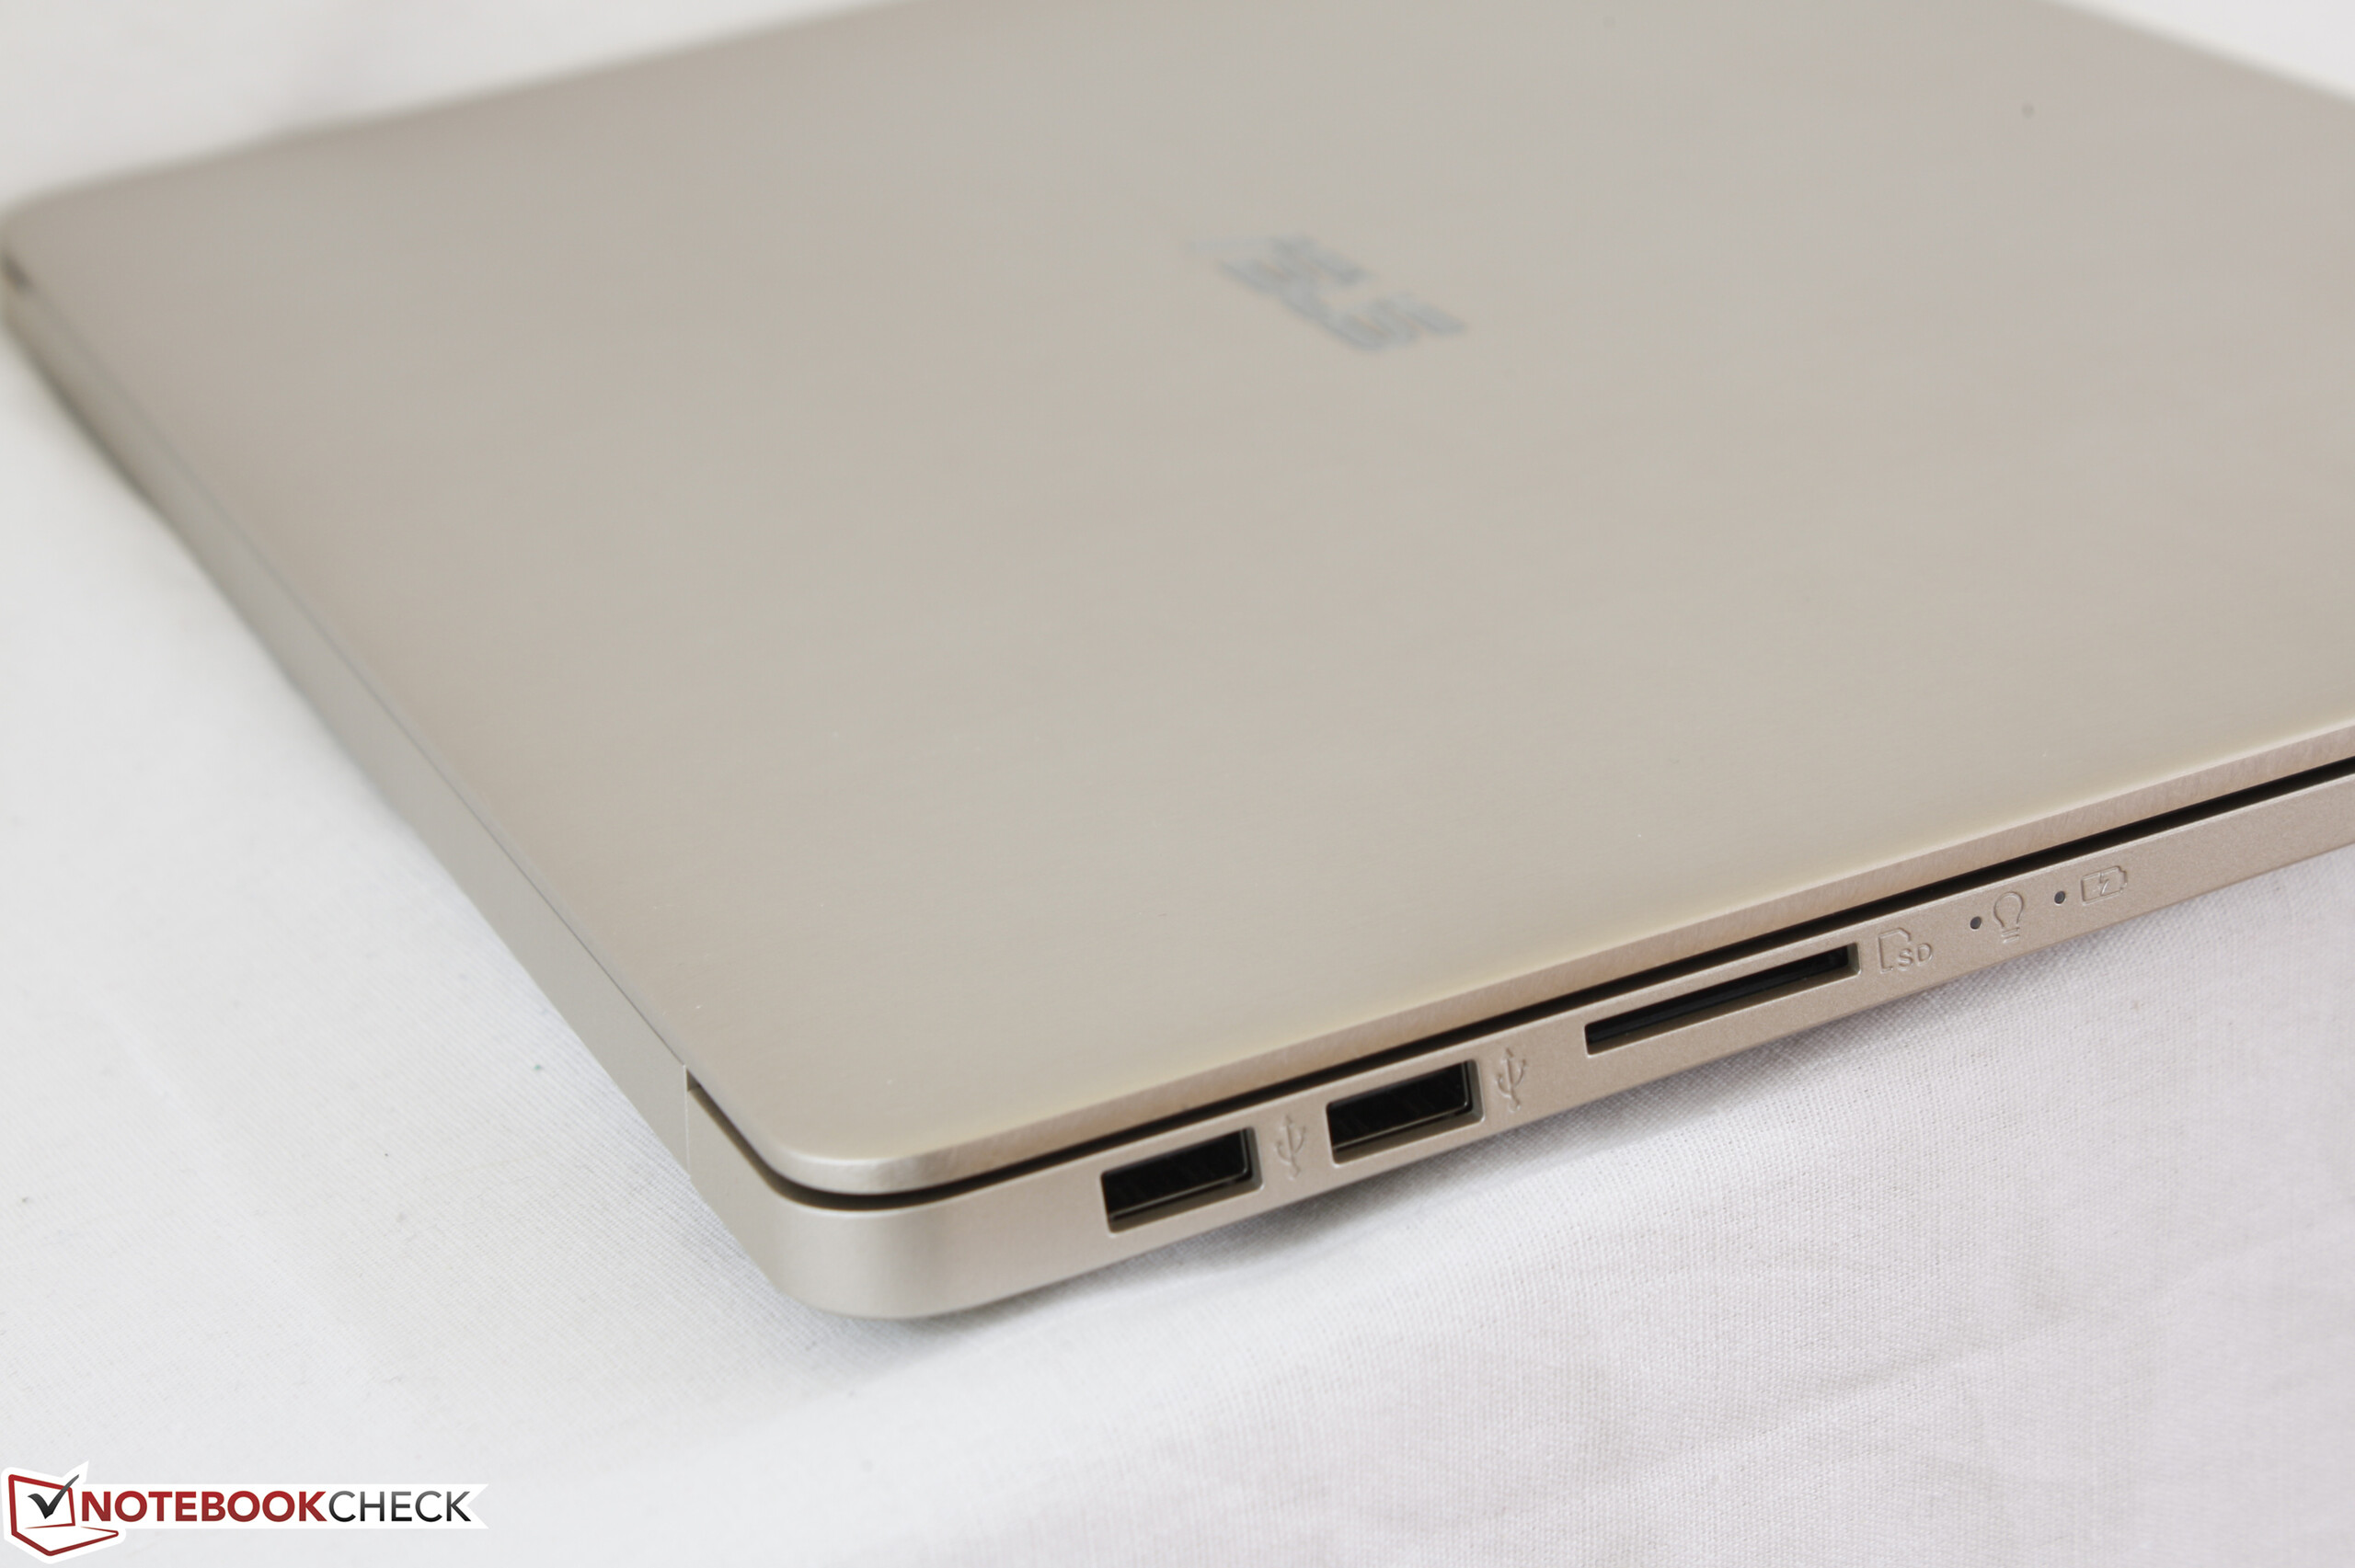
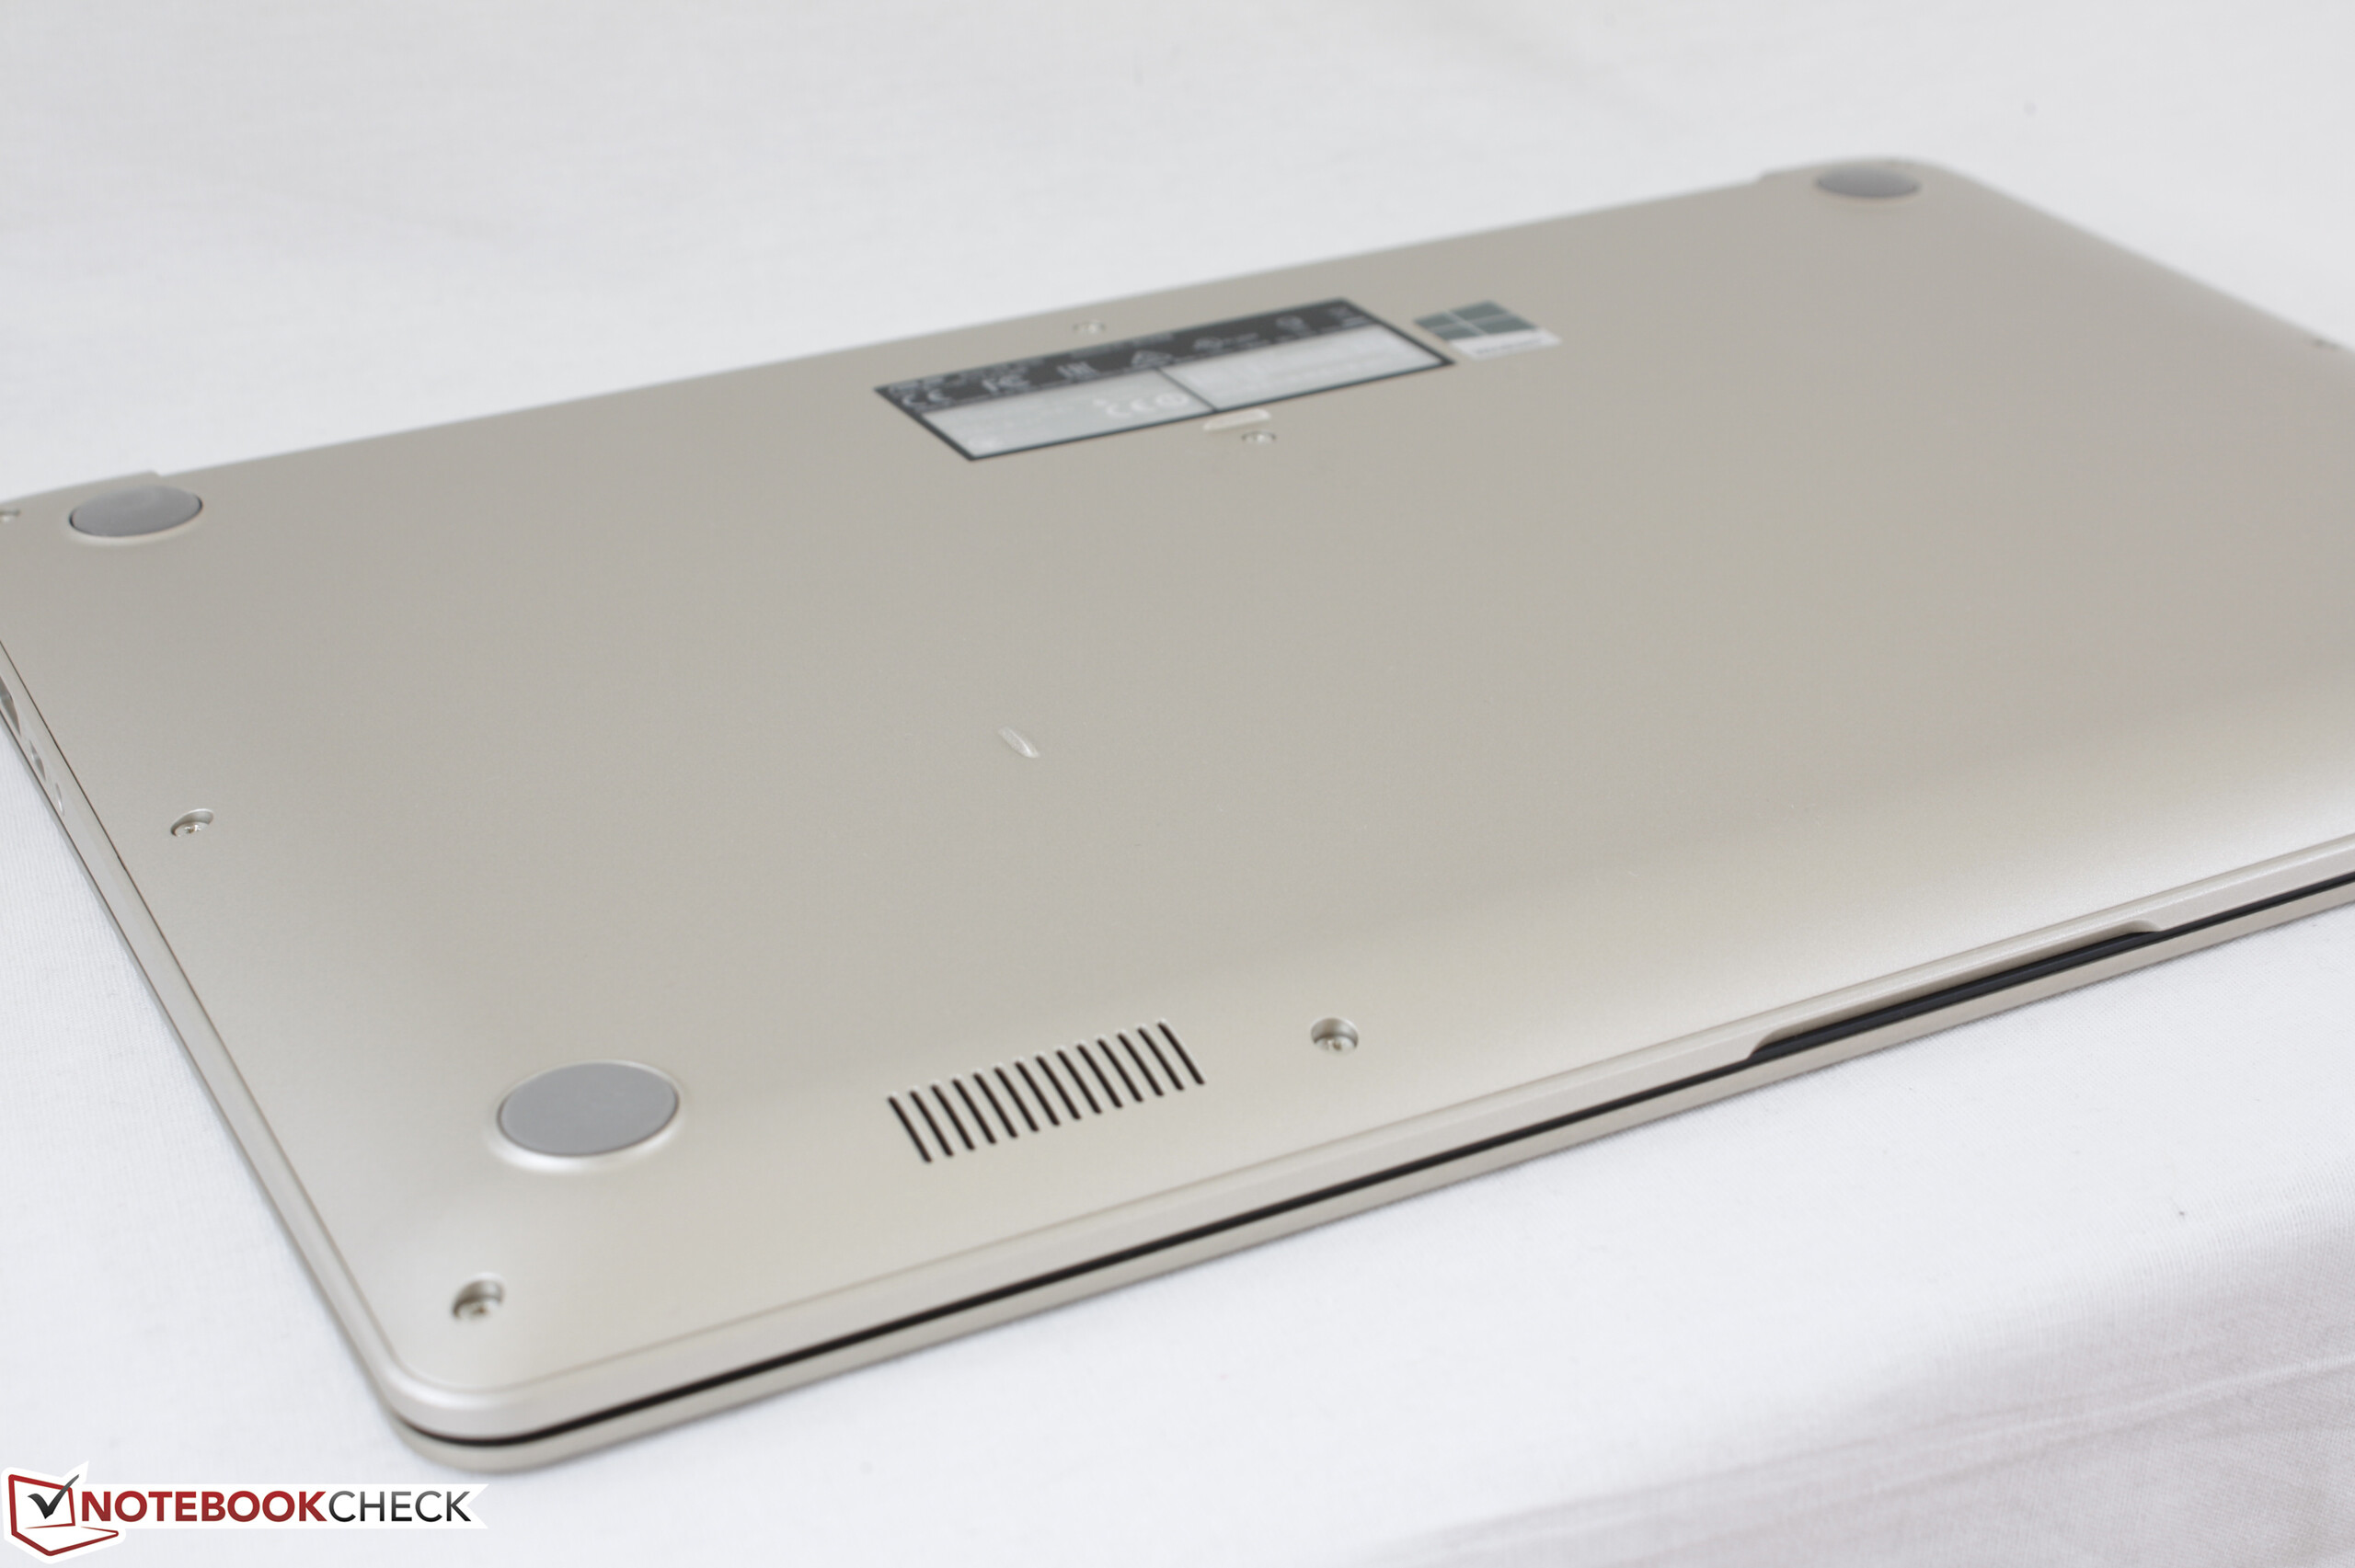
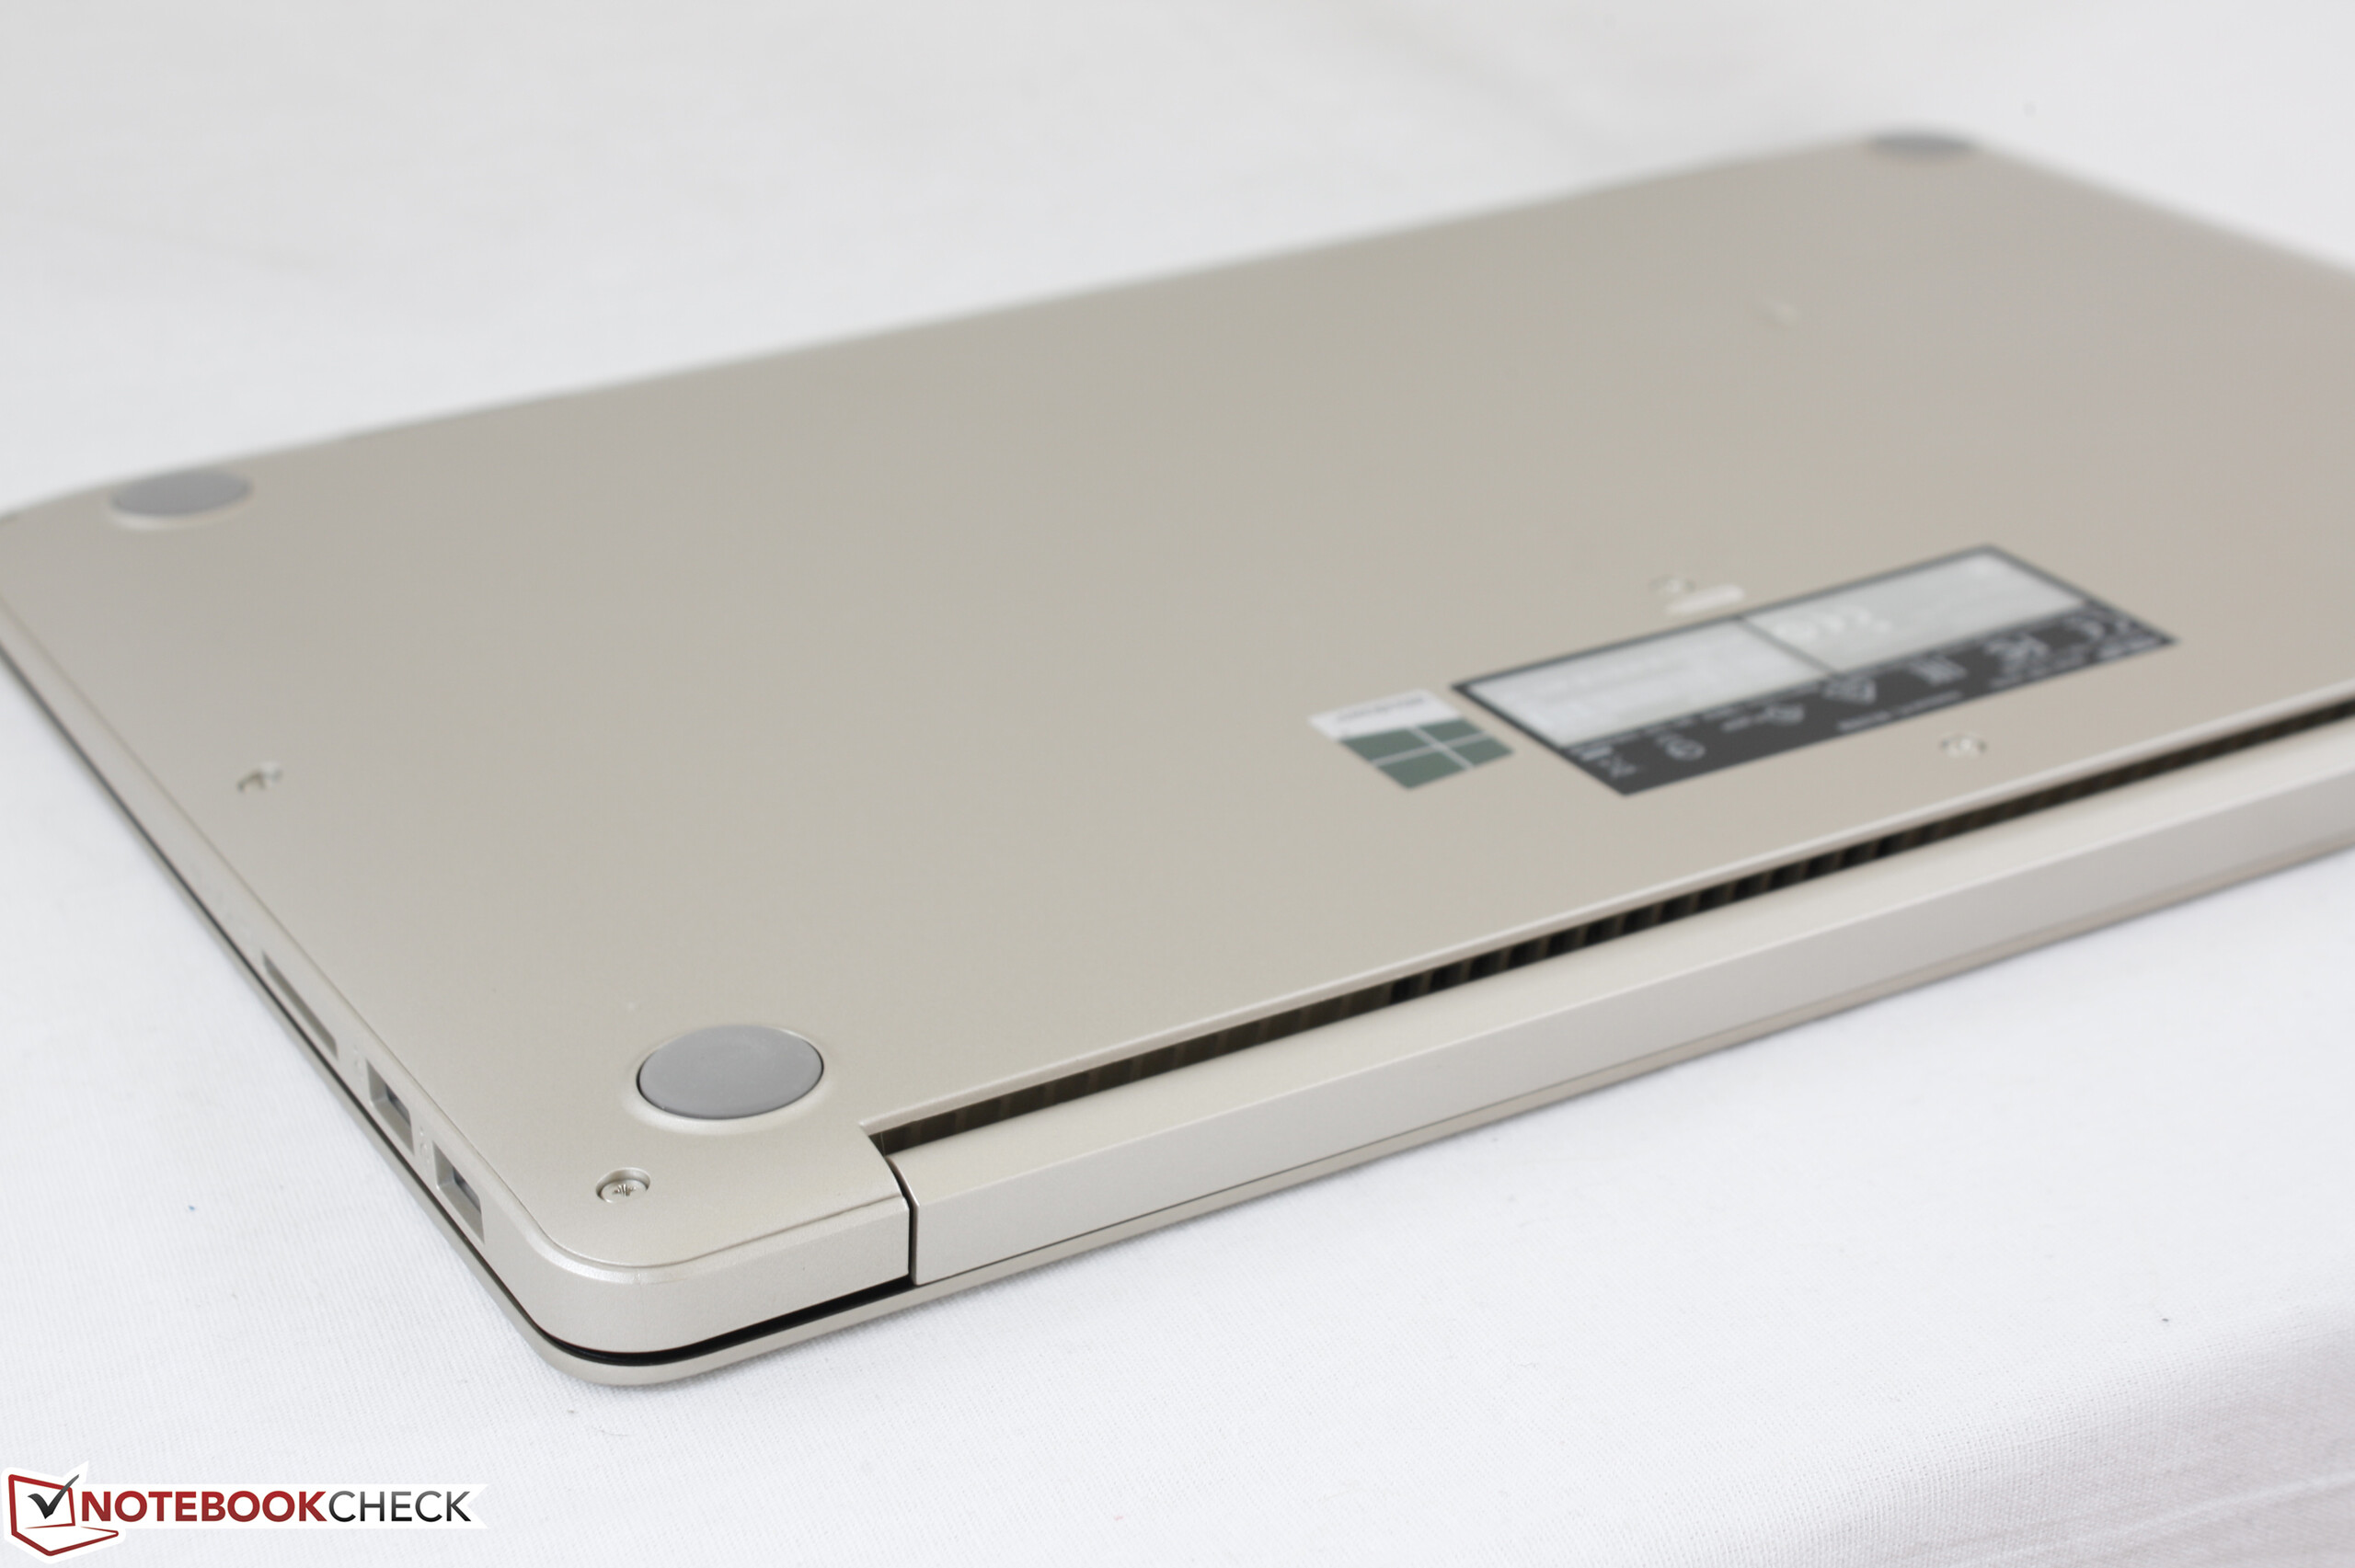
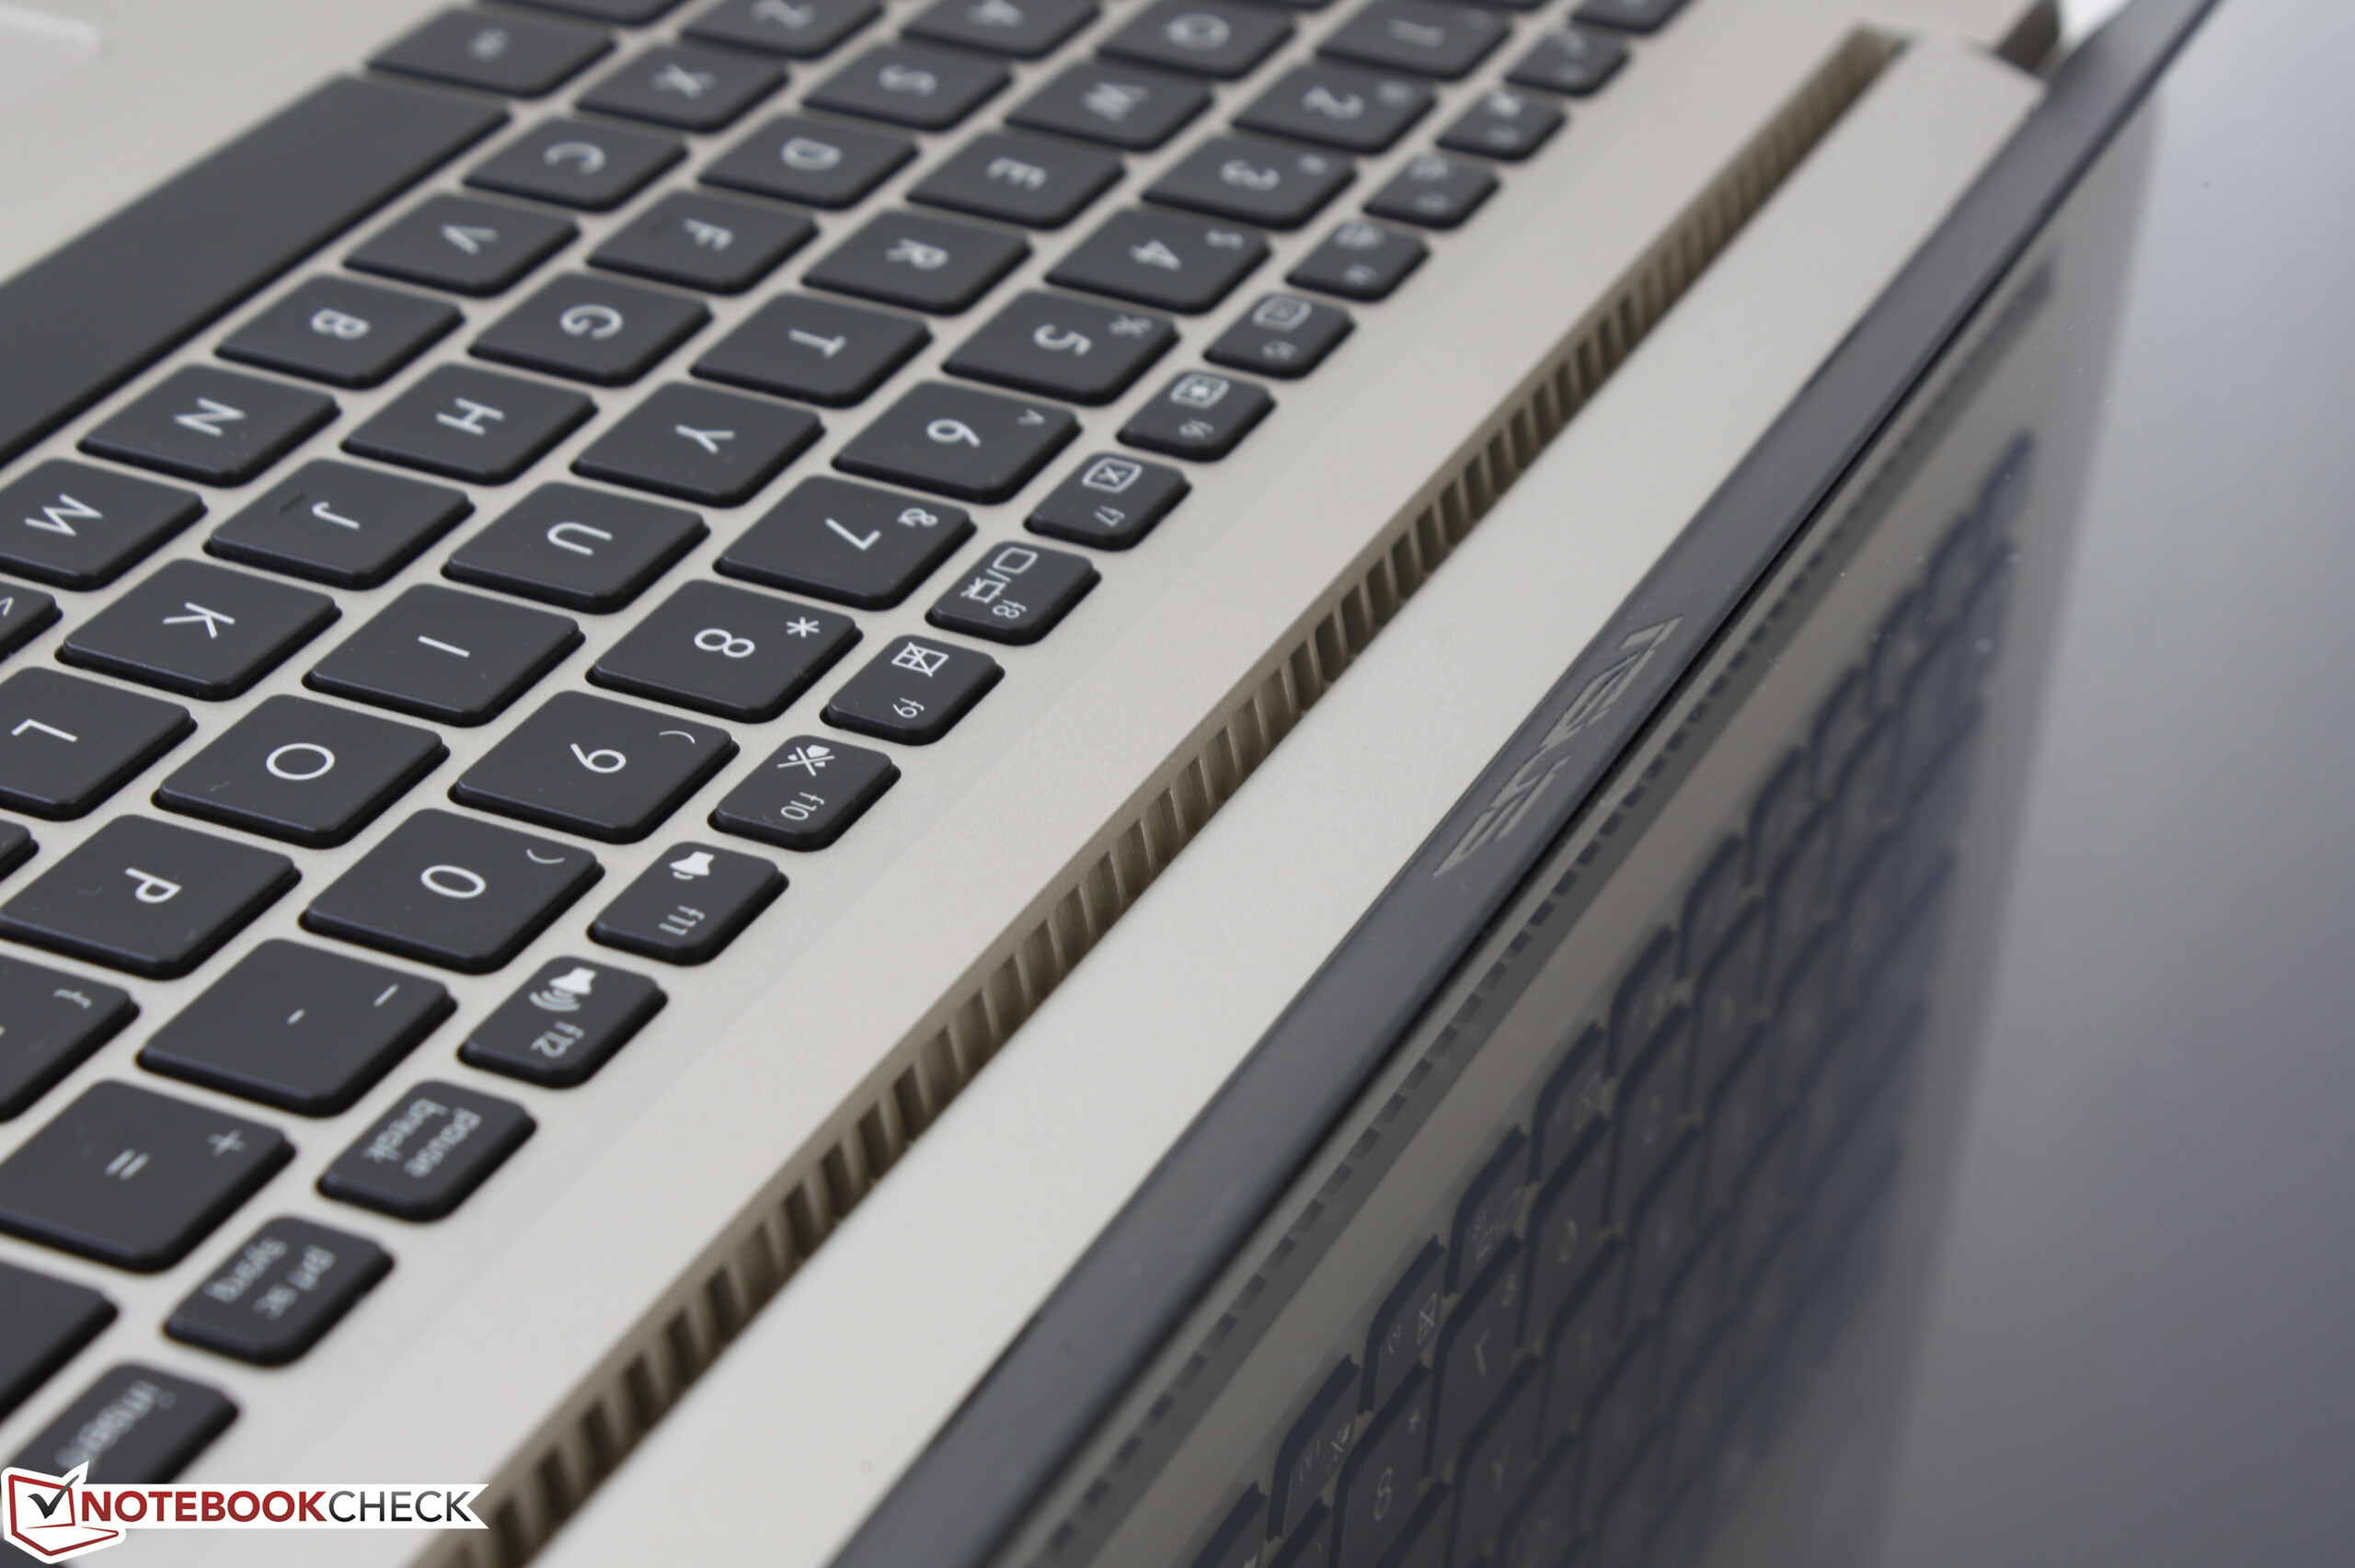
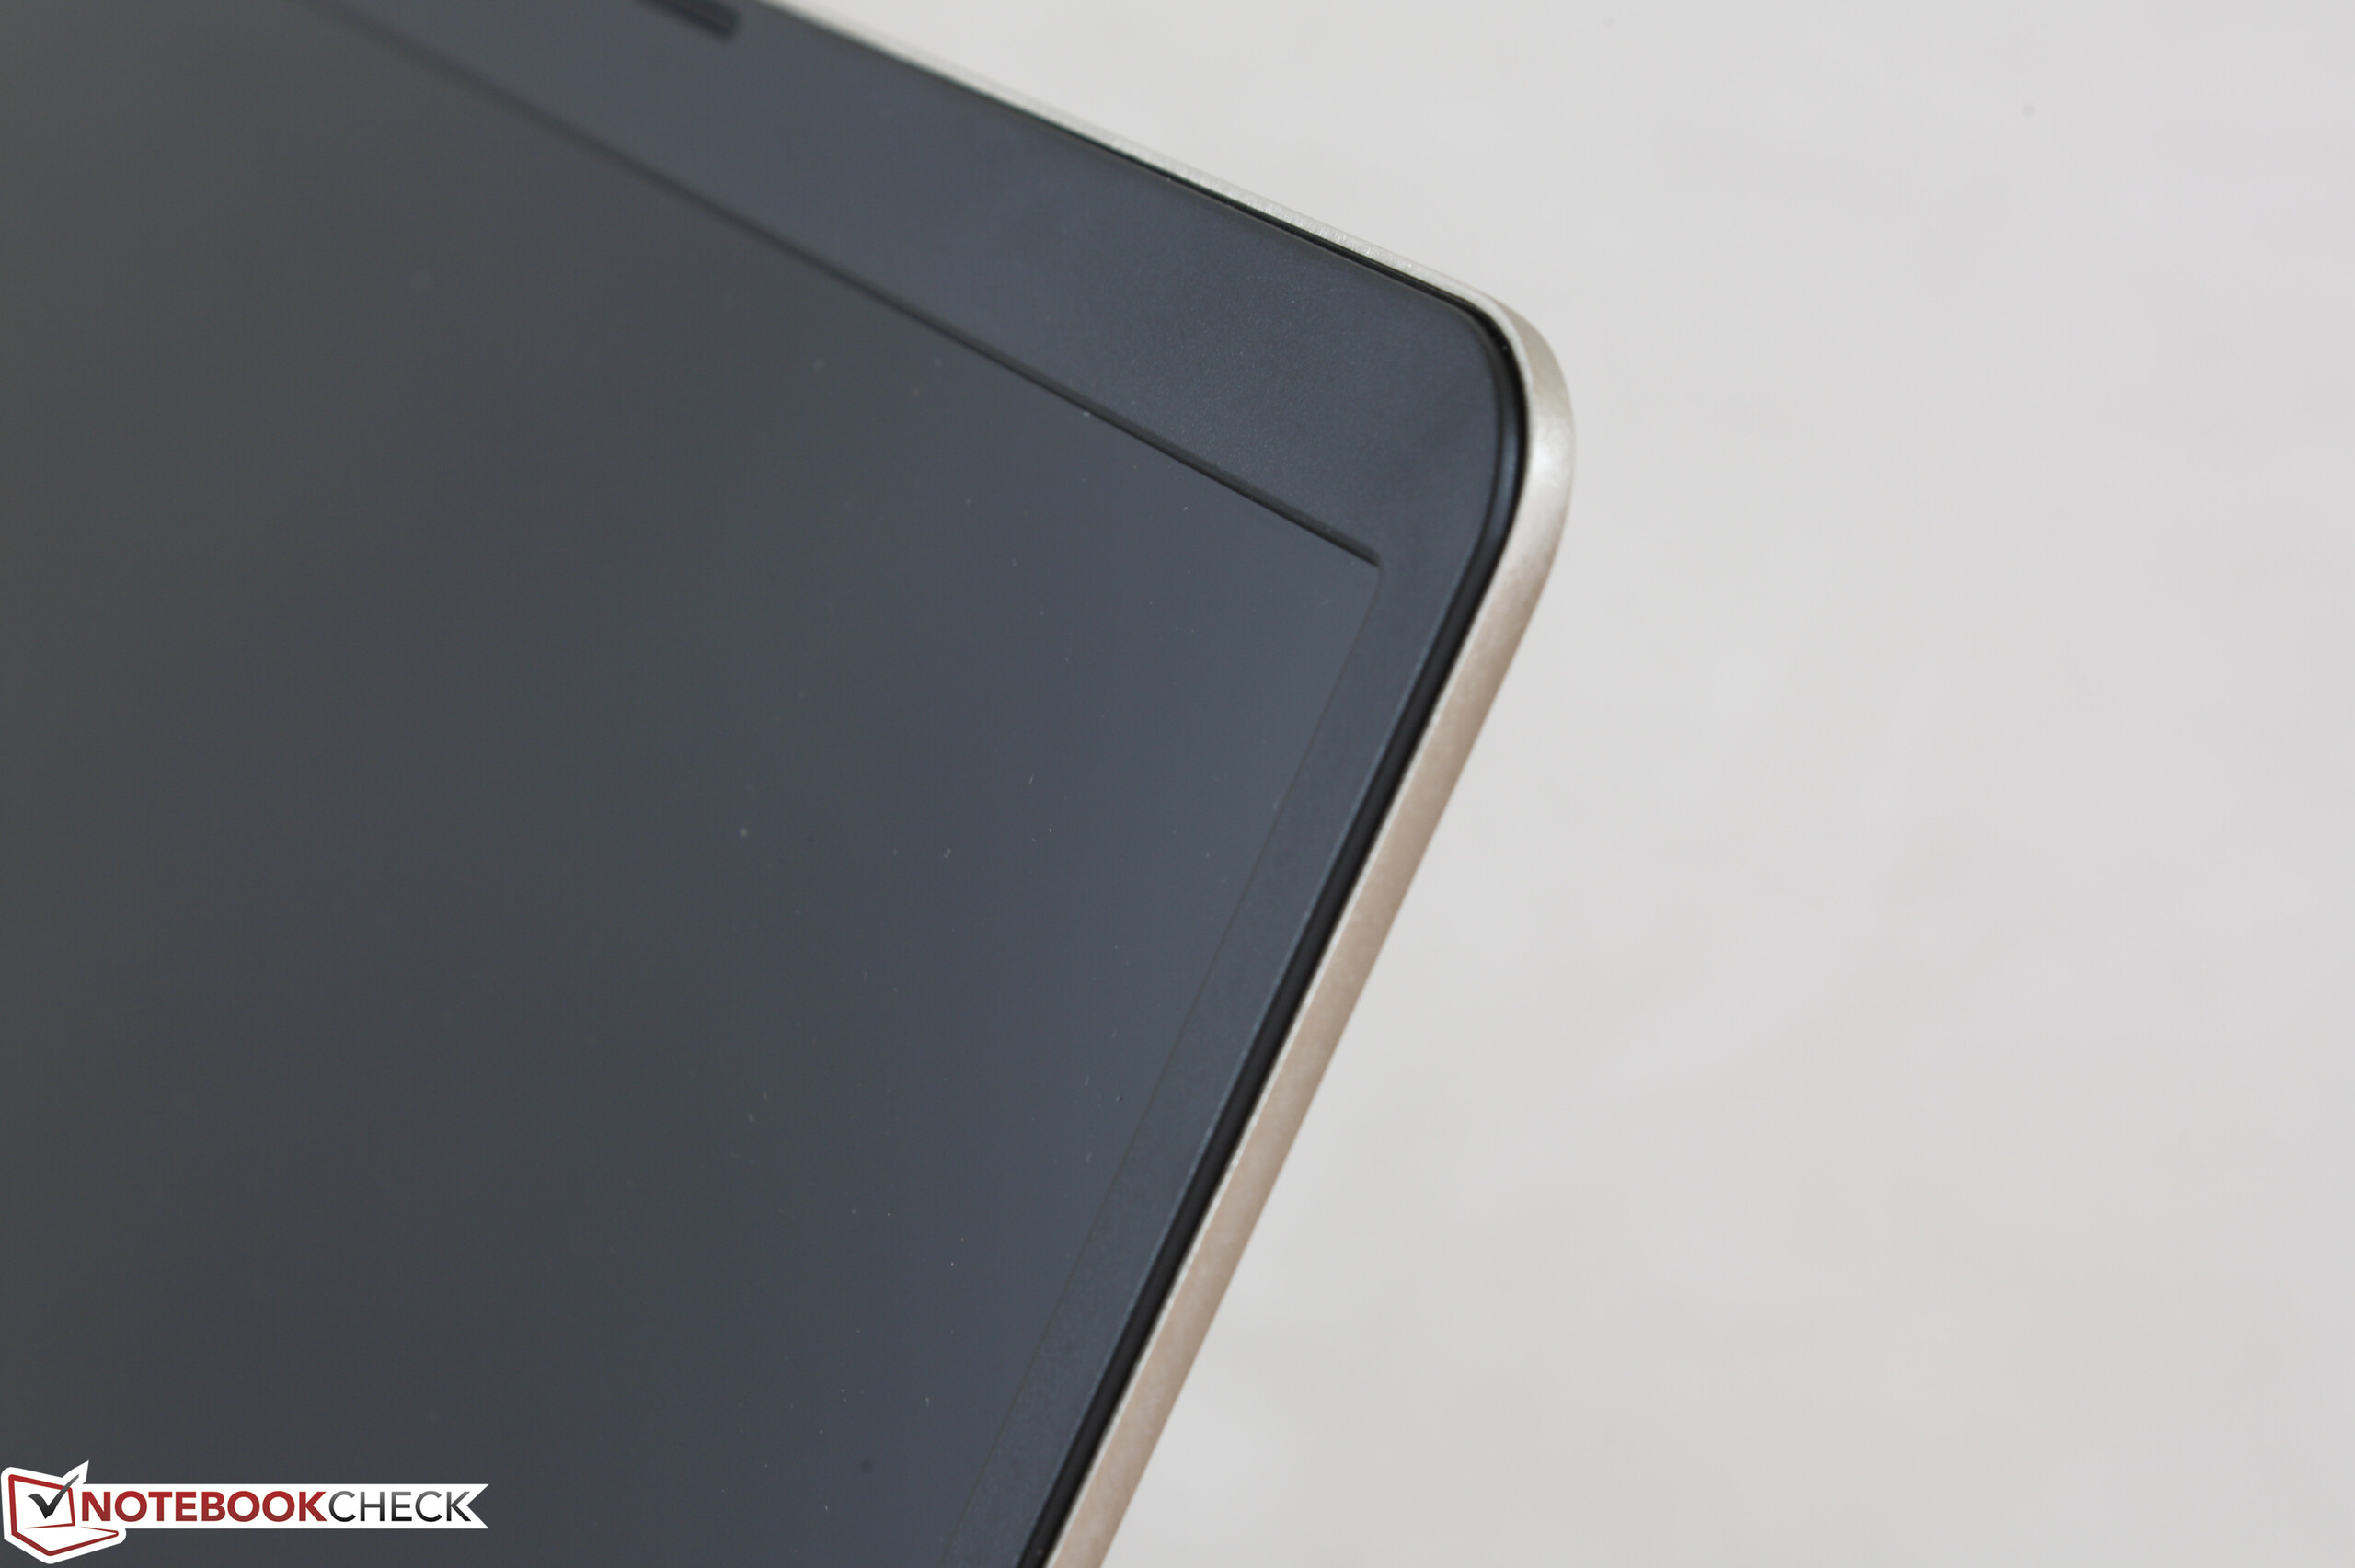
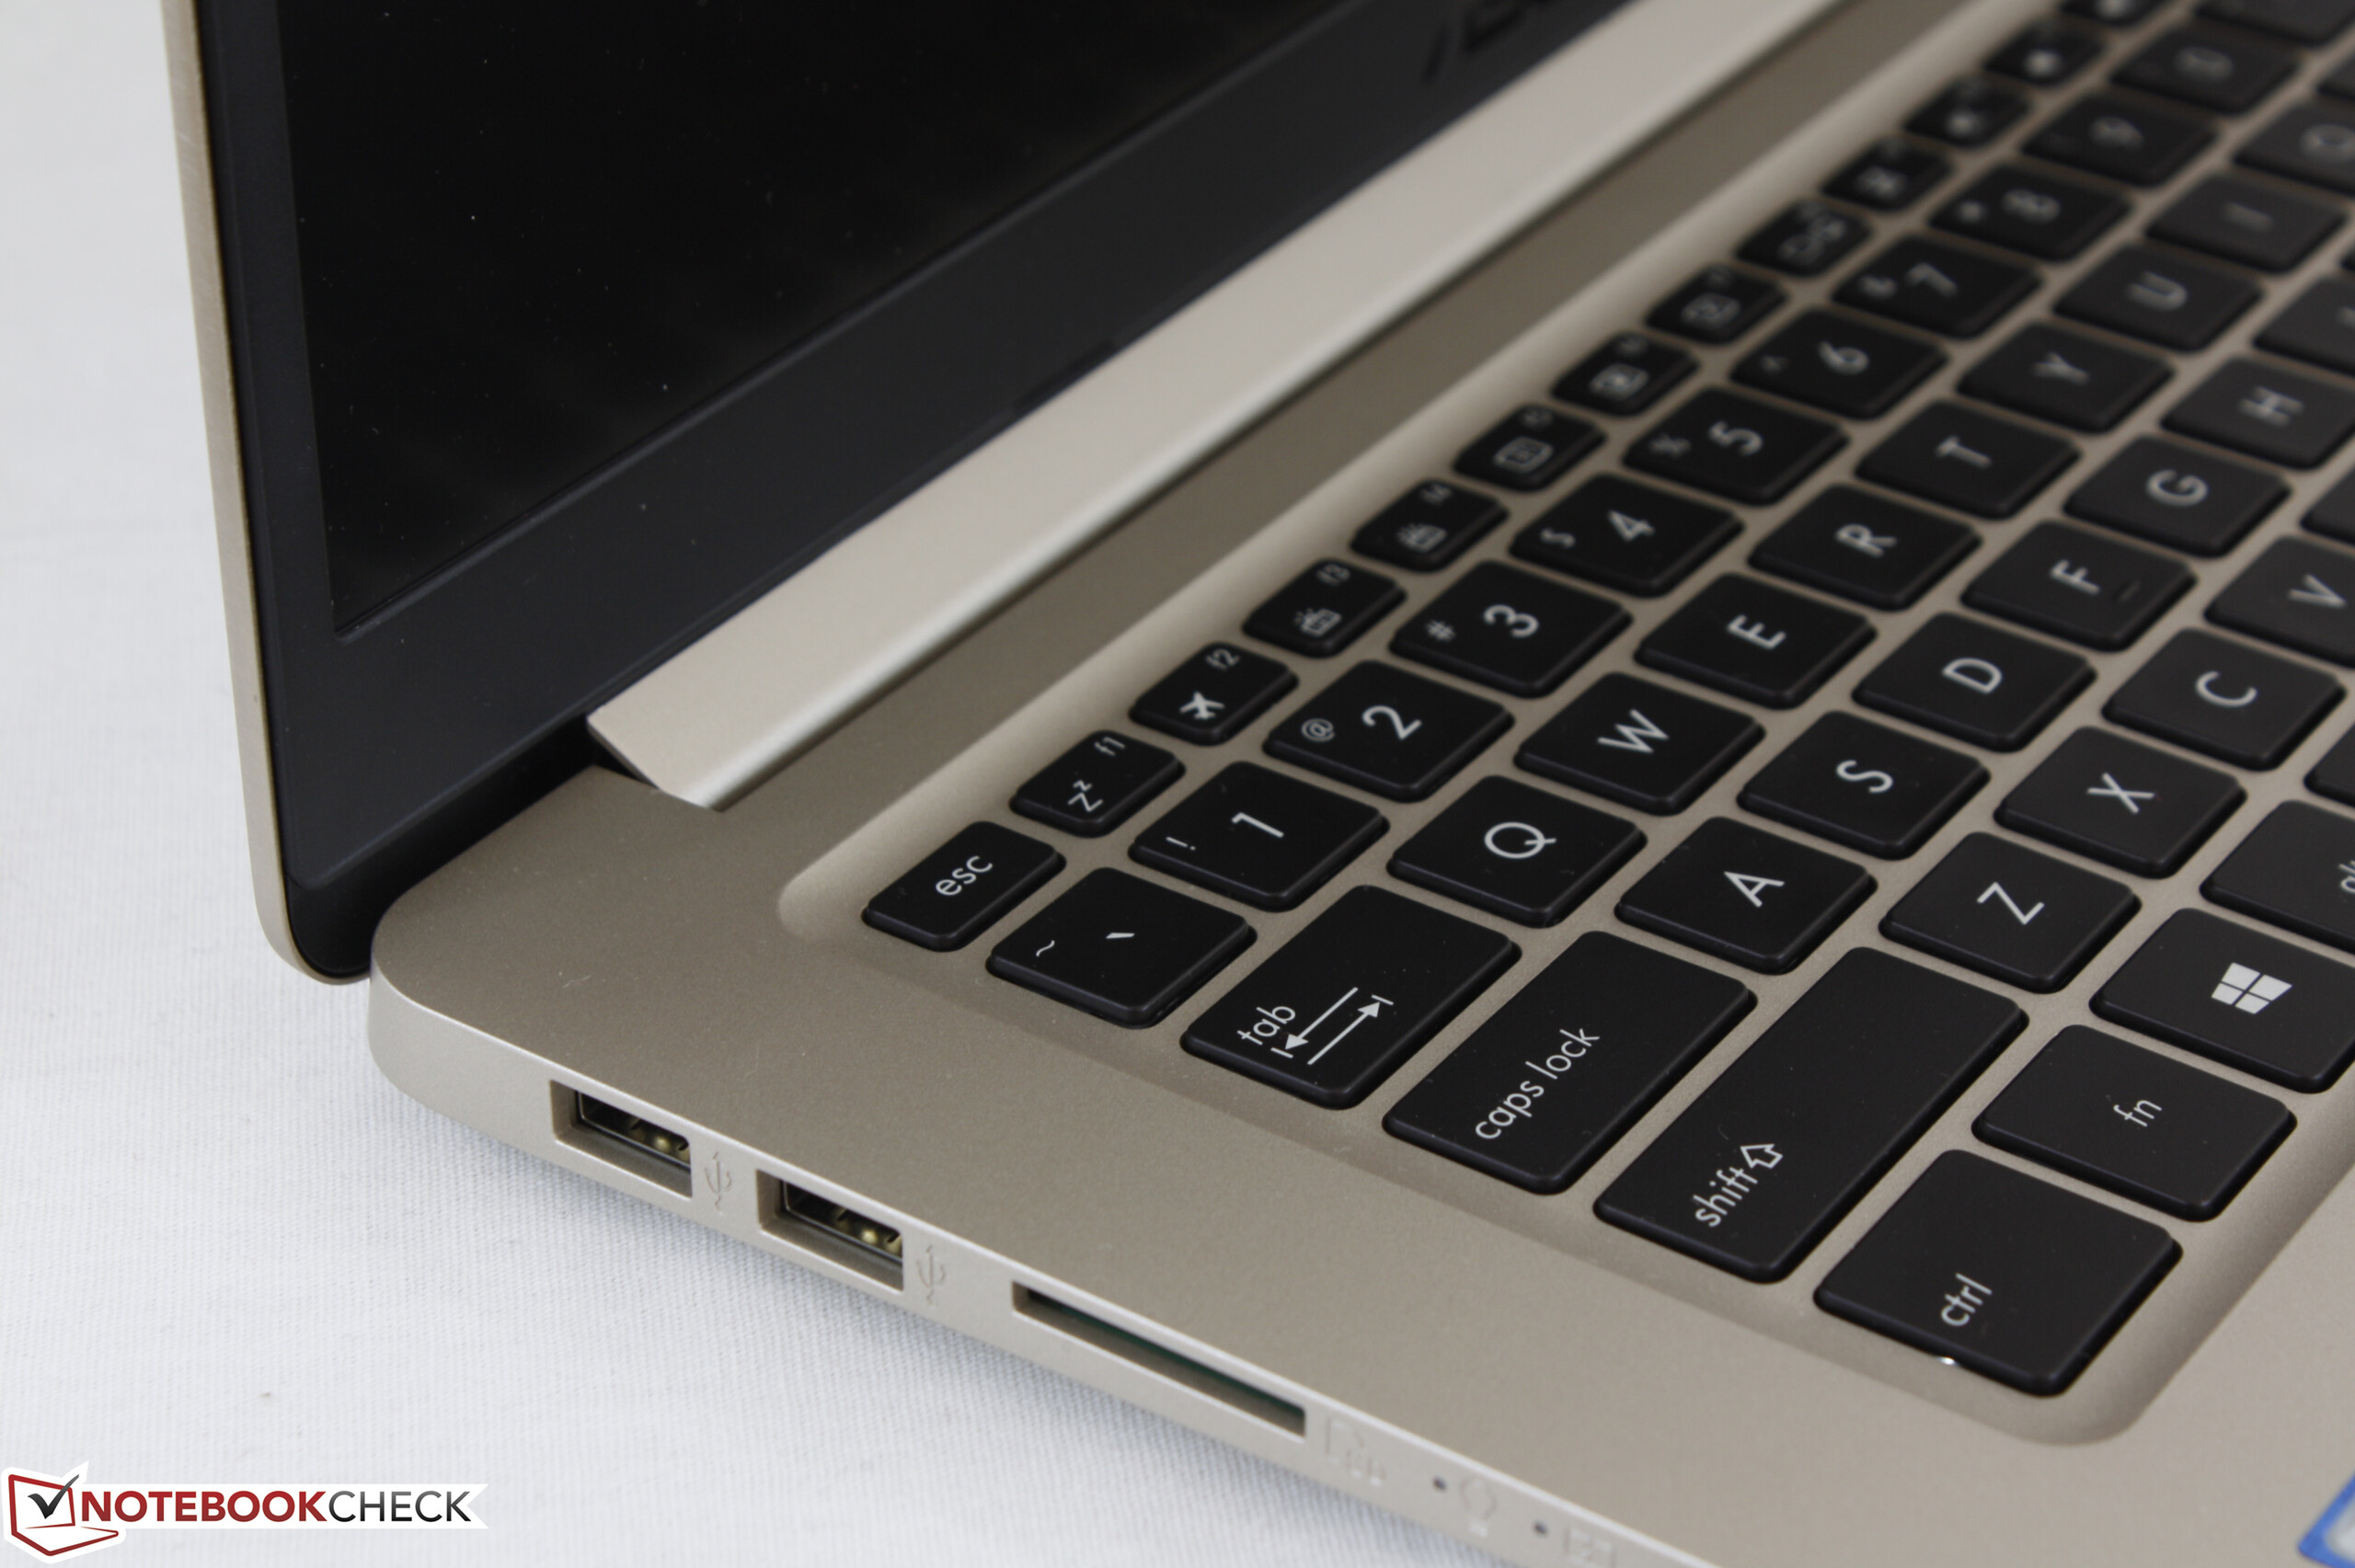
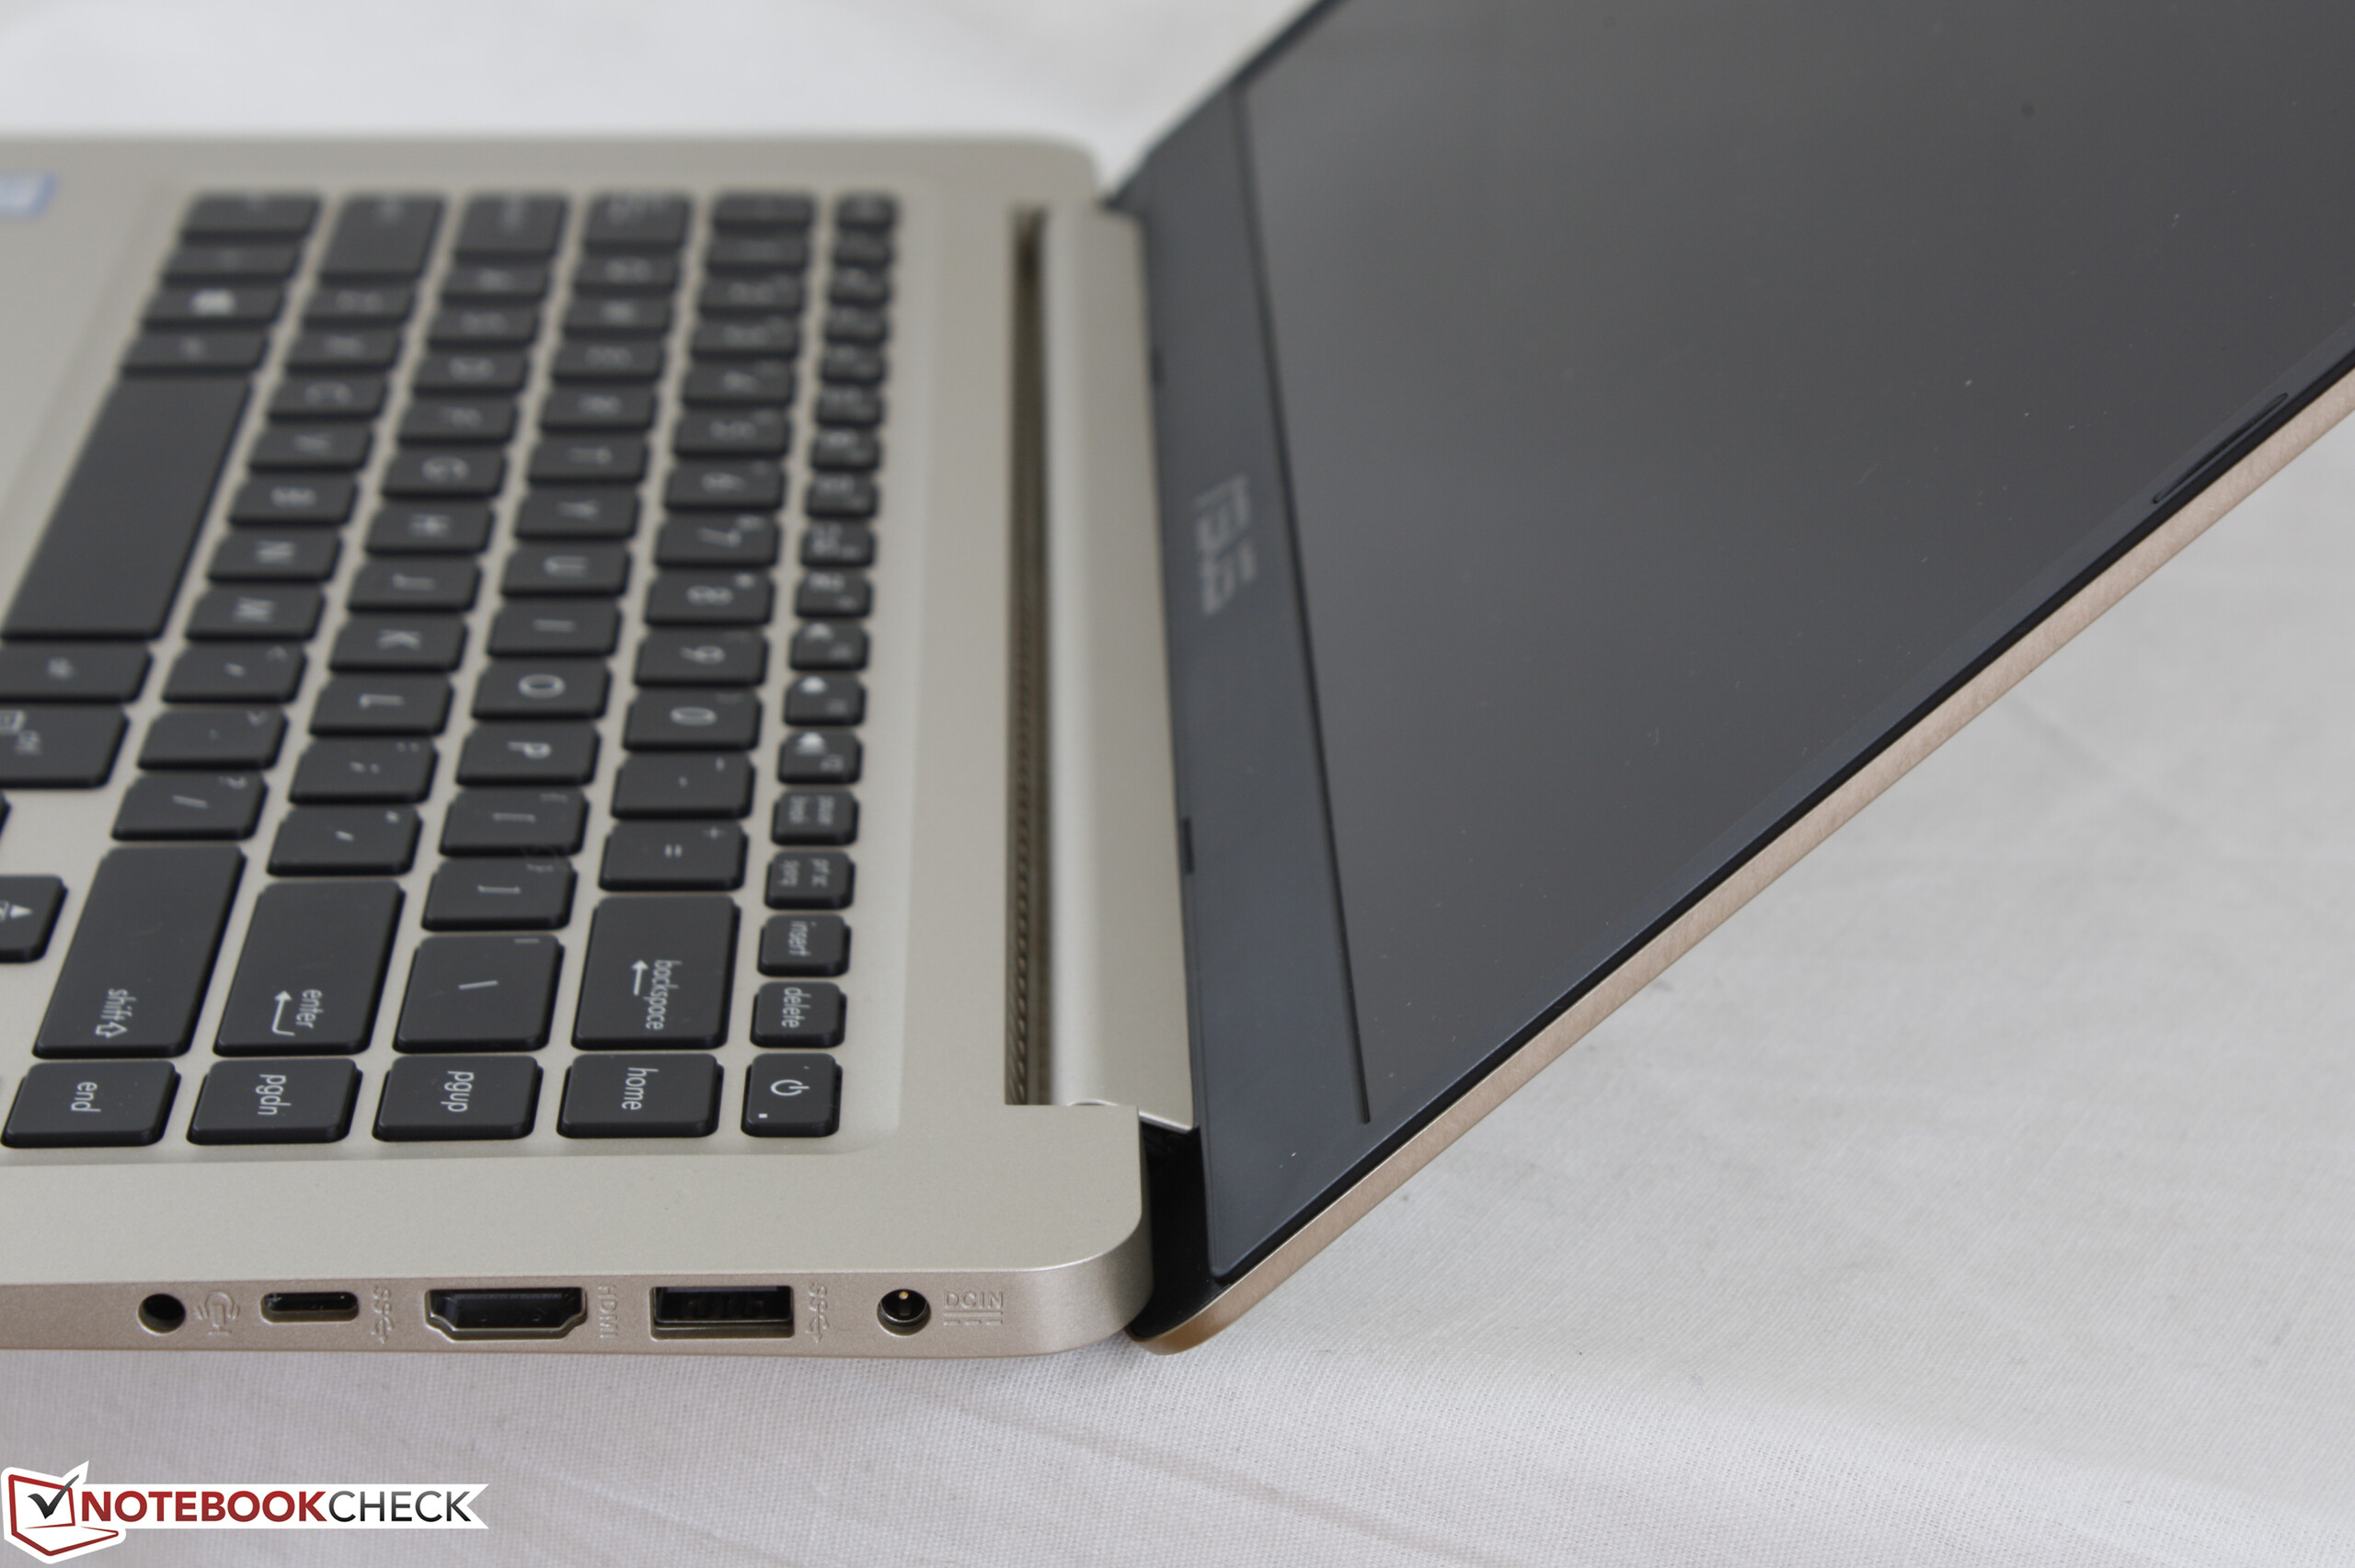
Lo sentimos Asus, pero tu estiloso VivoBook S15 S510UQ es un fallo hasta cierto punto. El modelo de pruebas se vende por casi 1000 Euros en el mercado, y eso no pega ni con la mediocre carcasa de la estabilidad ni con un teclado que es meramente aceptable. ¿Y de qué valen TPM, un lector de huellas, un tamaño compacto y peso reducido, si la batería se agota tras apenas cuatro horas?¿Cómo puede beneficiarse el procesado de imagen del buen contraste y los colores adecuados si ni siquiera se cubre rudimentariamente el espacio de color sRGB. ¿Por qué usa Asus una gráfica que no mejora mucho las cosas en vez de decidirse por la mucho más rápida GeForce MX150? ¿Dónde encontraron los taiwaneses el SSD de tempo tan anticuado?¿Cómo encajan con el precio 2 puertos USB 2.0, el lector de tarjetas lentísimo, y la malísima webcam?
A nuestro parecer, Asus se ha convertido en víctima de su propia estrategia de modelos. Las variantes de la serie empiezan en precios en los que podríamos tolerar tales medidas de ahorro, pero por unos 1000 Euros esperamos más. Quién esté buscando un portátil multimedia compacto de 15" para el camino quedará mucho mejor servido con el Acer Swift 3 SF315 en una de sus muchas variantes que testamos recientemente.
Ésta es una versión acortada del análisis original. Puedes leer el análisis completo en inglés aquí.
Asus Vivobook S15 S510UQ-BQ189T
-
10/17/2017 v6(old)
Sven Kloevekorn