Breve análisis del portátil Acer Swift 3 SF315 (8250U, MX150, FHD)
| SD Card Reader | |
| average JPG Copy Test (av. of 3 runs) | |
| Asus FX553VD-DM249T (Toshiba Exceria Pro SDXC 64 GB UHS-II) | |
| HP Pavilion 15 Power 1GK62AV (Toshiba Exceria Pro SDXC 64 GB UHS-II) | |
| HP Pavilion Power 15t-cb2000 (Toshiba Exceria Pro SDXC 64 GB UHS-II) | |
| Acer Swift 3 SF315-51G-55Z9 (Toshiba Exceria Pro SDXC 64 GB UHS-II) | |
| Dell Inspiron 15 5000 5567-1753 (Toshiba Exceria Pro SDXC 64 GB UHS-II) | |
| Acer Swift 3 SF315-51G-57E5 (Toshiba Exceria Pro SDXC 64 GB UHS-II) | |
| maximum AS SSD Seq Read Test (1GB) | |
| HP Pavilion Power 15t-cb2000 (Toshiba Exceria Pro SDXC 64 GB UHS-II) | |
| Asus FX553VD-DM249T (Toshiba Exceria Pro SDXC 64 GB UHS-II) | |
| HP Pavilion 15 Power 1GK62AV (Toshiba Exceria Pro SDXC 64 GB UHS-II) | |
| Dell Inspiron 15 5000 5567-1753 (Toshiba Exceria Pro SDXC 64 GB UHS-II) | |
| Acer Swift 3 SF315-51G-57E5 (Toshiba Exceria Pro SDXC 64 GB UHS-II) | |
| Acer Swift 3 SF315-51G-55Z9 (Toshiba Exceria Pro SDXC 64 GB UHS-II) | |
| |||||||||||||||||||||||||
iluminación: 79 %
Brillo con batería: 249 cd/m²
Contraste: 1181:1 (Negro: 0.21 cd/m²)
ΔE ColorChecker Calman: 4.98 | ∀{0.5-29.43 Ø4.72}
ΔE Greyscale Calman: 4.26 | ∀{0.09-98 Ø4.97}
58% sRGB (Argyll 1.6.3 3D)
38% AdobeRGB 1998 (Argyll 1.6.3 3D)
41.18% AdobeRGB 1998 (Argyll 3D)
58.7% sRGB (Argyll 3D)
39.86% Display P3 (Argyll 3D)
Gamma: 2.37
CCT: 7149 K
| Acer Swift 3 SF315-51G-57E5 IPS, 1920x1080, 15.6" | HP Pavilion Power 15t-cb2000 IPS, 1920x1080, 15.6" | Asus FX553VD-DM249T TN, 1920x1080, 15.6" | Dell Inspiron 15 5000 5567-1753 TN LED, 1920x1080, 15.6" | HP Pavilion 15 Power 1GK62AV IPS, 1920x1080, 15.6" | Acer Swift 3 SF315-51G-55Z9 IPS, 1920x1080, 15.6" | |
|---|---|---|---|---|---|---|
| Display | -1% | -4% | -8% | -2% | -2% | |
| Display P3 Coverage (%) | 39.86 | 39.28 -1% | 37.98 -5% | 36.24 -9% | 38.81 -3% | 39.02 -2% |
| sRGB Coverage (%) | 58.7 | 58.9 0% | 57.1 -3% | 54.6 -7% | 57.9 -1% | 57.7 -2% |
| AdobeRGB 1998 Coverage (%) | 41.18 | 40.59 -1% | 39.24 -5% | 37.44 -9% | 40.03 -3% | 40.31 -2% |
| Response Times | -7% | 32% | 27% | 10% | 0% | |
| Response Time Grey 50% / Grey 80% * (ms) | 42 ? | 51.6 ? -23% | 43 ? -2% | 43 ? -2% | 38.8 ? 8% | 42 ? -0% |
| Response Time Black / White * (ms) | 32 ? | 29.2 ? 9% | 11 ? 66% | 14 ? 56% | 28 ? 12% | 32 ? -0% |
| PWM Frequency (Hz) | 21000 ? | 1087 ? | ||||
| Screen | -10% | -11% | -66% | -7% | 3% | |
| Brightness middle (cd/m²) | 248 | 256 3% | 225 -9% | 145 -42% | 256.6 3% | 248 0% |
| Brightness (cd/m²) | 237 | 241 2% | 215 -9% | 144 -39% | 243 3% | 239 1% |
| Brightness Distribution (%) | 79 | 88 11% | 91 15% | 90 14% | 81 3% | 69 -13% |
| Black Level * (cd/m²) | 0.21 | 0.21 -0% | 0.46 -119% | 0.49 -133% | 0.19 10% | 0.18 14% |
| Contrast (:1) | 1181 | 1219 3% | 489 -59% | 296 -75% | 1351 14% | 1378 17% |
| Colorchecker dE 2000 * | 4.98 | 5.2 -4% | 3.94 21% | 9.27 -86% | 5 -0% | 4.85 3% |
| Colorchecker dE 2000 max. * | 8.41 | 19.3 -129% | 6.83 19% | 16.9 -101% | 20.1 -139% | 8.34 1% |
| Greyscale dE 2000 * | 4.26 | 3.5 18% | 2.68 37% | 12.28 -188% | 2.7 37% | 3.84 10% |
| Gamma | 2.37 93% | 2.35 94% | 2.35 94% | 2.03 108% | 2.32 95% | 2.29 96% |
| CCT | 7149 91% | 6576 99% | 6709 97% | 10732 61% | 6599 98% | 6790 96% |
| Color Space (Percent of AdobeRGB 1998) (%) | 38 | 37 -3% | 36 -5% | 35 -8% | 36.7 -3% | 37 -3% |
| Color Space (Percent of sRGB) (%) | 58 | 59 2% | 57 -2% | 55 -5% | 57.7 -1% | 57 -2% |
| Media total (Programa/Opciones) | -6% /
-8% | 6% /
-4% | -16% /
-42% | 0% /
-4% | 0% /
1% |
* ... más pequeño es mejor
Parpadeo de Pantalla / PWM (Pulse-Width Modulation)
| Parpadeo de Pantalla / PWM detectado | 21000 Hz | ≤ 80 % de brillo | 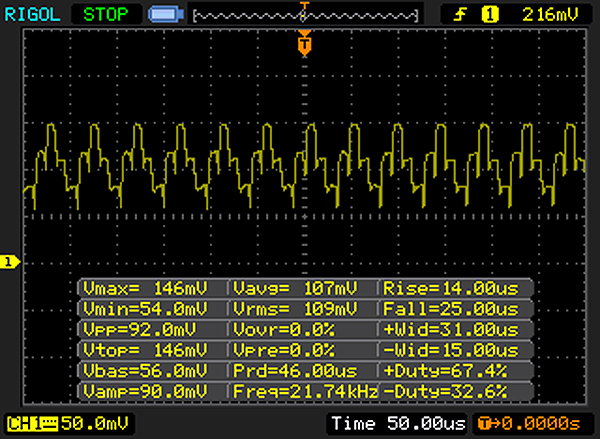 |
La retroiluminación del display parpadea a 21000 Hz (seguramente usa PWM - Pulse-Width Modulation) a un brillo del 80 % e inferior. Sobre este nivel de brillo no debería darse parpadeo / PWM. La frecuencia de 21000 Hz es bastante alta, por lo que la mayoría de gente sensible al parpadeo no debería ver parpadeo o tener fatiga visual. Comparación: 52 % de todos los dispositivos testados no usaron PWM para atenuar el display. Si se usó, medimos una media de 7772 (mínimo: 5 - máxmo: 343500) Hz. | |||
Tiempos de respuesta del display
| ↔ Tiempo de respuesta de Negro a Blanco | ||
|---|---|---|
| 32 ms ... subida ↗ y bajada ↘ combinada | ↗ 17 ms subida | 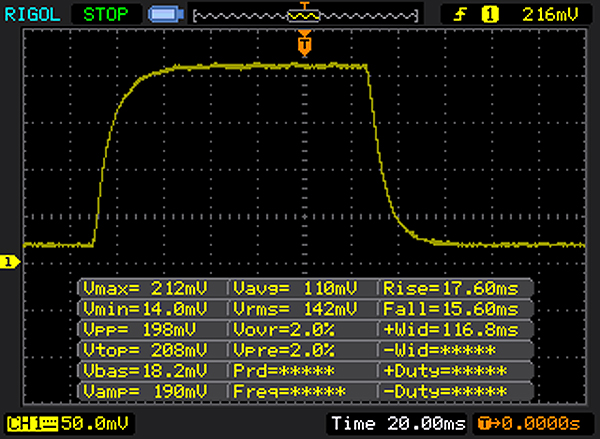 |
| ↘ 15 ms bajada | ||
| La pantalla mostró tiempos de respuesta lentos en nuestros tests y podría ser demasiado lenta para los jugones. En comparación, todos los dispositivos de prueba van de ##min### (mínimo) a 240 (máximo) ms. » 86 % de todos los dispositivos son mejores. Eso quiere decir que el tiempo de respuesta es peor que la media (19.8 ms) de todos los dispositivos testados. | ||
| ↔ Tiempo de respuesta 50% Gris a 80% Gris | ||
| 42 ms ... subida ↗ y bajada ↘ combinada | ↗ 22 ms subida |  |
| ↘ 20 ms bajada | ||
| La pantalla mostró tiempos de respuesta lentos en nuestros tests y podría ser demasiado lenta para los jugones. En comparación, todos los dispositivos de prueba van de ##min### (mínimo) a 636 (máximo) ms. » 67 % de todos los dispositivos son mejores. Eso quiere decir que el tiempo de respuesta es peor que la media (31 ms) de todos los dispositivos testados. | ||
| Geekbench 3 | |
| 32 Bit Multi-Core Score | |
| Acer Nitro 5 AN515-51-788E | |
| Acer Swift 3 SF315-51G-57E5 | |
| Lenovo Legion Y520-15IKBN 80WK0042GE | |
| Acer Aspire VX15 VX5-591G-589S | |
| 32 Bit Single-Core Score | |
| Acer Nitro 5 AN515-51-788E | |
| Acer Swift 3 SF315-51G-57E5 | |
| Acer Aspire VX15 VX5-591G-589S | |
| Lenovo Legion Y520-15IKBN 80WK0042GE | |
| Geekbench 4.0 | |
| 64 Bit Multi-Core Score | |
| Acer Nitro 5 AN515-51-788E | |
| Acer Swift 3 SF315-51G-57E5 | |
| Lenovo Legion Y520-15IKBN 80WK0042GE | |
| Acer Aspire VX15 VX5-591G-589S | |
| 64 Bit Single-Core Score | |
| Acer Nitro 5 AN515-51-788E | |
| Acer Swift 3 SF315-51G-57E5 | |
| Lenovo Legion Y520-15IKBN 80WK0042GE | |
| Acer Aspire VX15 VX5-591G-589S | |
* ... más pequeño es mejor
| PCMark 8 Home Score Accelerated v2 | 3935 puntos | |
| PCMark 8 Creative Score Accelerated v2 | 5065 puntos | |
| PCMark 8 Work Score Accelerated v2 | 4992 puntos | |
| PCMark 10 Score | 3802 puntos | |
ayuda | ||

| Acer Swift 3 SF315-51G-57E5 Hynix HFS128G39TND | Asus FX553VD-DM249T Hynix HFS128G39TND | Dell Inspiron 15 5000 5567-1753 SanDisk X400 SED 256GB, SATA (SD8TB8U-256G) | HP Pavilion 15 Power 1GK62AV SK Hynix HFS256G39TND-N210A | Acer Swift 3 SF315-51G-55Z9 Kingston RBUSNS8180DS3128GH | |
|---|---|---|---|---|---|
| CrystalDiskMark 3.0 | 2% | 61% | -5% | 34% | |
| Read Seq (MB/s) | 481.5 | 504 5% | 502 4% | 491.6 2% | 462.2 -4% |
| Write Seq (MB/s) | 131.5 | 136.2 4% | 458.1 248% | 141.7 8% | 409.9 212% |
| Read 512 (MB/s) | 324.8 | 340.9 5% | 382.8 18% | 345.6 6% | 310.3 -4% |
| Write 512 (MB/s) | 130.6 | 136.9 5% | 385.7 195% | 142.6 9% | 216.6 66% |
| Read 4k (MB/s) | 30.81 | 29.74 -3% | 29.25 -5% | 18.83 -39% | 31.89 4% |
| Write 4k (MB/s) | 84.8 | 76.8 -9% | 55.9 -34% | 76.3 -10% | 73.2 -14% |
| Read 4k QD32 (MB/s) | 345 | 348.2 1% | 285.2 -17% | 348.5 1% | 287.9 -17% |
| Write 4k QD32 (MB/s) | 131.6 | 136.4 4% | 239.6 82% | 104.8 -20% | 170.6 30% |
| 3DMark 06 Standard Score | 22407 puntos | |
| 3DMark 11 Performance | 4918 puntos | |
| 3DMark Ice Storm Standard Score | 82307 puntos | |
| 3DMark Cloud Gate Standard Score | 13562 puntos | |
| 3DMark Fire Strike Score | 3289 puntos | |
| 3DMark Time Spy Score | 1201 puntos | |
ayuda | ||
| bajo | medio | alto | ultra | |
|---|---|---|---|---|
| BioShock Infinite (2013) | 139.6 | 108 | 89.5 | 34 |
| X-Plane 10.25 (2013) | 104.2 | 54.6 | 29.8 | 21.9 |
| Dirt Rally (2015) | 229.2 | 99.3 | 52.2 | 27 |
| XCOM 2 (2016) | 72.8 | 25.9 | 15.8 | 7.1 |
| Hitman 2016 (2016) | 45.2 | 45.5 | 25.9 | 24.5 |
| Need for Speed 2016 (2016) | 95.8 | 61.7 | 31.4 | 22.7 |
| Overwatch (2016) | 121.7 | 87.4 | 66.8 | 41.9 |
| Mirror's Edge Catalyst (2016) | 81.4 | 54.5 | 39.5 | 23.4 |
| Titanfall 2 (2016) | 99.7 | 70.7 | 28.5 | 22.2 |
| Team Fortress 2 (2017) | 101 | 94 | 80.3 | 75.1 |
| Ark Survival Evolved (2017) | 52.7 | 13.3 | 10.2 | |
| FIFA 18 (2017) | 174.2 | 99.8 | 76.6 | 59.5 |
| BioShock Infinite - 1366x768 High Preset | |
| Acer Nitro 5 AN515-51-788E | |
| HP Pavilion Power 15t-cb2000 | |
| Acer Swift 3 SF315-51G-57E5 | |
| Dell Inspiron 15 5000 5567-1753 | |
| Titanfall 2 - 1366x768 Medium / Disabled AF:4x | |
| Acer Swift 3 SF315-51G-57E5 | |
| Dell Inspiron 15 5000 5567-1753 | |
| Overwatch - 1920x1080 High (Render Scale 100 %) AA:SM AF:4x | |
| HP Pavilion 15 Power 1GK62AV | |
| Acer Swift 3 SF315-51G-57E5 | |
| Apple MacBook Pro 15 2017 (2.8 GHz, 555) | |
| Dell Inspiron 15 5000 5567-1753 | |
Ruido
| Ocioso |
| 30.5 / 30.5 / 30.9 dB(A) |
| Carga |
| 35.7 / 35.6 dB(A) |
 | ||
30 dB silencioso 40 dB(A) audible 50 dB(A) ruidosamente alto |
||
min: | ||
(±) La temperatura máxima en la parte superior es de 43.4 °C / 110 F, frente a la media de 36.8 °C / 98 F, que oscila entre 21 y 71 °C para la clase Multimedia.
(+) El fondo se calienta hasta un máximo de 38.1 °C / 101 F, frente a la media de 39.1 °C / 102 F
(+) En reposo, la temperatura media de la parte superior es de 24 °C / 75# F, frente a la media del dispositivo de 31.3 °C / 88 F.
(+) El reposamanos y el panel táctil están a una temperatura inferior a la de la piel, con un máximo de 27.2 °C / 81 F y, por tanto, son fríos al tacto.
(±) La temperatura media de la zona del reposamanos de dispositivos similares fue de 28.7 °C / 83.7 F (+1.5 °C / 2.7 F).
Acer Swift 3 SF315-51G-57E5 análisis de audio
(±) | la sonoridad del altavoz es media pero buena (75.3 dB)
Graves 100 - 315 Hz
(-) | casi sin bajos - de media 26.7% inferior a la mediana
(±) | la linealidad de los graves es media (10.2% delta a frecuencia anterior)
Medios 400 - 2000 Hz
(+) | medios equilibrados - a sólo 4.6% de la mediana
(+) | los medios son lineales (5.2% delta a la frecuencia anterior)
Altos 2 - 16 kHz
(+) | máximos equilibrados - a sólo 3.7% de la mediana
(+) | los máximos son lineales (3.3% delta a la frecuencia anterior)
Total 100 - 16.000 Hz
(±) | la linealidad del sonido global es media (19.7% de diferencia con la mediana)
En comparación con la misma clase
» 65% de todos los dispositivos probados de esta clase eran mejores, 6% similares, 29% peores
» El mejor tuvo un delta de 5%, la media fue 17%, el peor fue ###max##%
En comparación con todos los dispositivos probados
» 50% de todos los dispositivos probados eran mejores, 7% similares, 43% peores
» El mejor tuvo un delta de 4%, la media fue 24%, el peor fue ###max##%
Apple MacBook 12 (Early 2016) 1.1 GHz análisis de audio
(+) | los altavoces pueden reproducir a un volumen relativamente alto (#83.6 dB)
Graves 100 - 315 Hz
(±) | lubina reducida - en promedio 11.3% inferior a la mediana
(±) | la linealidad de los graves es media (14.2% delta a frecuencia anterior)
Medios 400 - 2000 Hz
(+) | medios equilibrados - a sólo 2.4% de la mediana
(+) | los medios son lineales (5.5% delta a la frecuencia anterior)
Altos 2 - 16 kHz
(+) | máximos equilibrados - a sólo 2% de la mediana
(+) | los máximos son lineales (4.5% delta a la frecuencia anterior)
Total 100 - 16.000 Hz
(+) | el sonido global es lineal (10.2% de diferencia con la mediana)
En comparación con la misma clase
» 7% de todos los dispositivos probados de esta clase eran mejores, 2% similares, 91% peores
» El mejor tuvo un delta de 5%, la media fue 18%, el peor fue ###max##%
En comparación con todos los dispositivos probados
» 5% de todos los dispositivos probados eran mejores, 1% similares, 94% peores
» El mejor tuvo un delta de 4%, la media fue 24%, el peor fue ###max##%
| Off / Standby | |
| Ocioso | |
| Carga |
|
Clave:
min: | |
Pro
Contra
La máquina multimedia multitalentantosa de 15,6" de Acer reproduce sin problemas los juegos actuales en su pantalla Full HD brillante. También da una buena impresión en todos los demás ámbitos, sin importar el tipo de aplicación. El dispositivo nunca parece particularmente cálido o ruidoso. El nuevo procesador de cuatro núcleos ULV ofrece mucha potencia.
Un SSD permite que el sistema se ejecute rápidamente. Además, Acer instaló un HDD de 1 TB y 2,5" en la carcasa del portátil. El teclado retroiluminado Swift 3 nos impresionó y es adecuado para usuarios que escriben mucho. Un excelente aguante de la batería condecora el paquete.
Acer Swift 3 SF315-51G es una máquina multimedia todoterreno y multitalentosa, pero tiene algunas debilidades.
Acer cometió algunos errores en el ámbito de la pantalla. Sí, el panel IPS muestra el contenido de la pantalla con precisión desde cualquier ángulo de visión, el contraste es bueno y la representación del color es razonablemente fiel. Pero para un portátil en este rango de precios, el brillo de la pantalla es demasiado bajo. Para empeorar las cosas, Acer eligió un panel con una superficie lustrosa. Una pantalla como esta no pertenece a un dispositivo móvil.
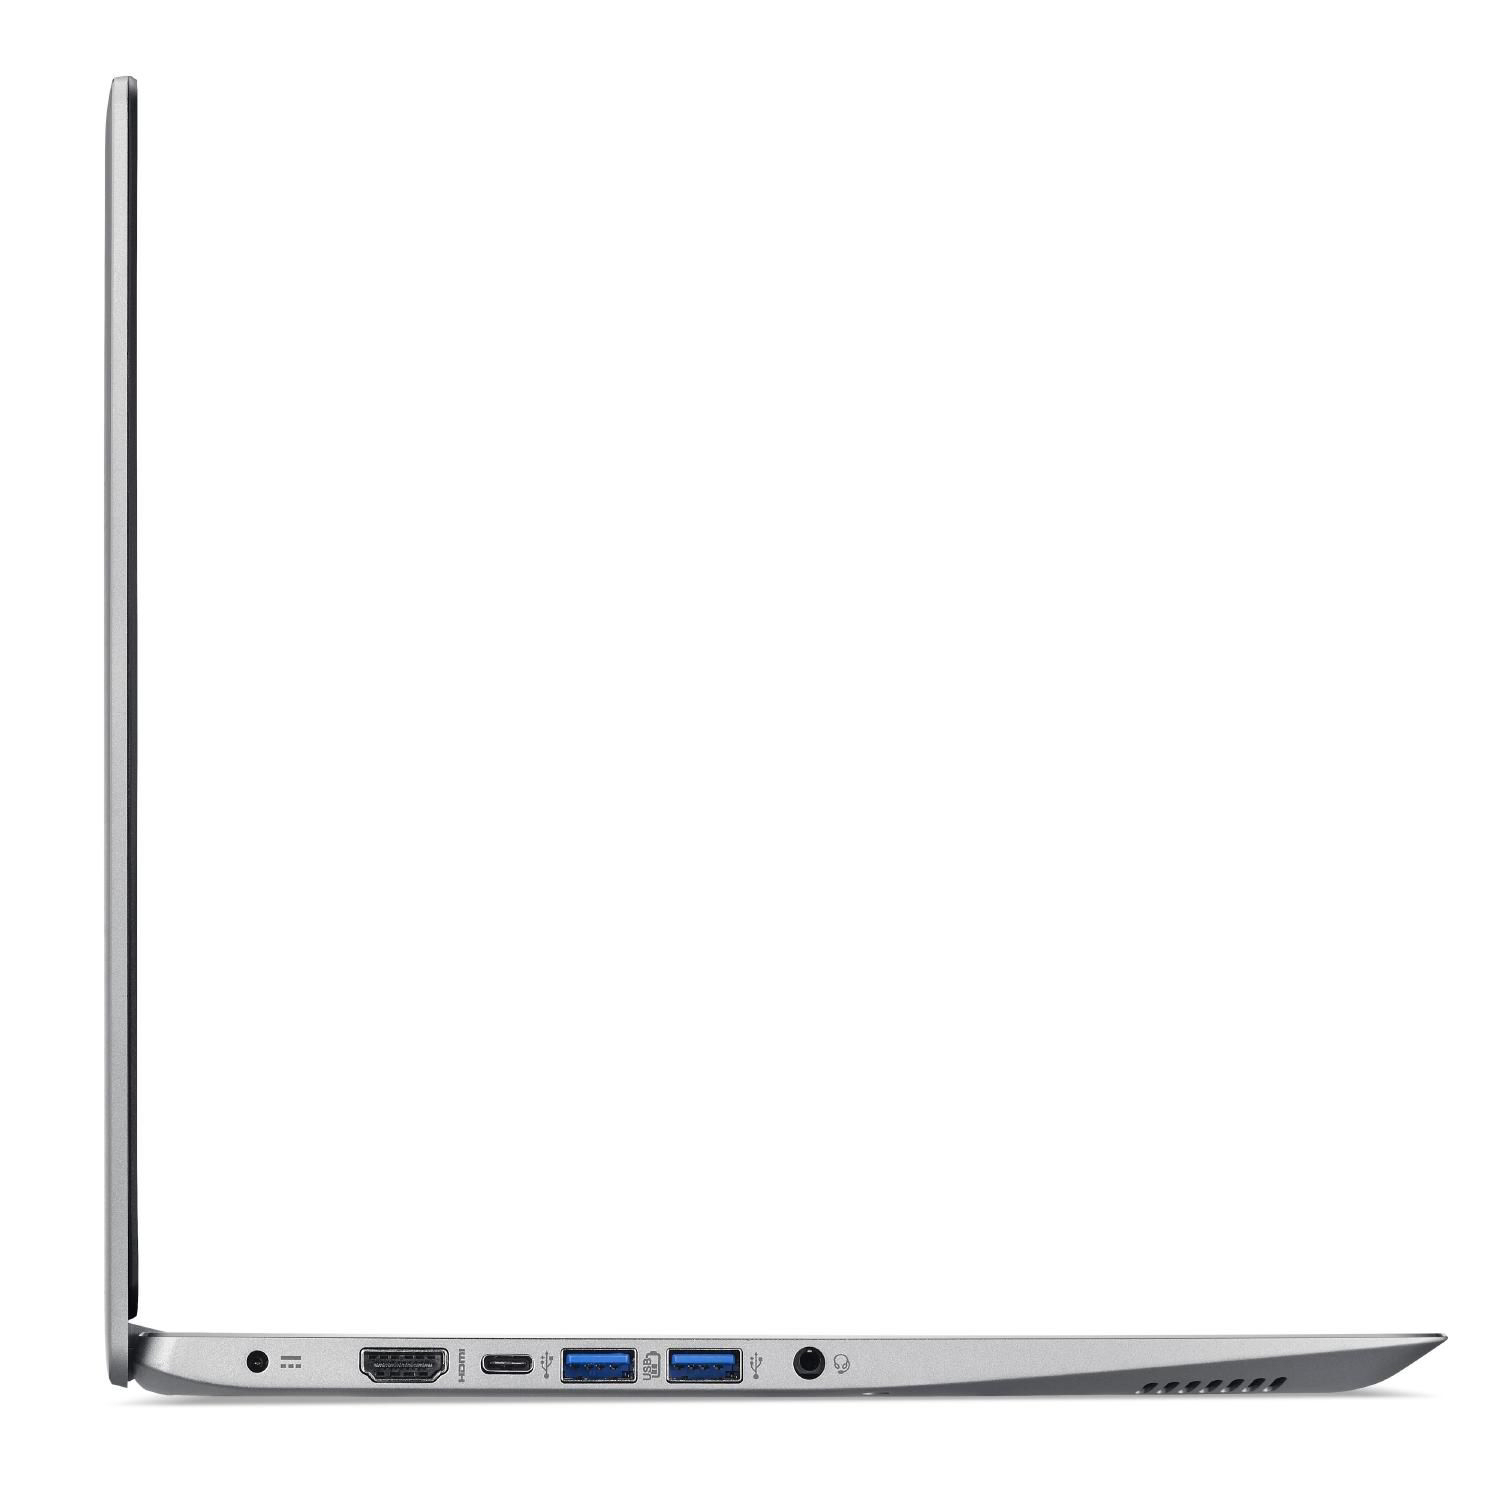
La siguiente crítica es la elección de los altavoces. El sonido no es adecuado para un portátil multimedia. Felicitamos a Acer por equipar el ordenador con un puerto USB 3.1 de Tipo C, pero debería haber sido un puerto Gen 2. Acer eligió un puerto Gen 1 en su lugar.
Ésta es una versión acortada del análisis original. Puedes leer el análisis completo en inglés aquí.
Acer Swift 3 SF315-51G-57E5
- 10/16/2017 v6 (old)
Sascha Mölck