Breve análisis del portátil Lenovo IdeaPad 320-15IKB (7200U, 940MX, FHD)
I/O
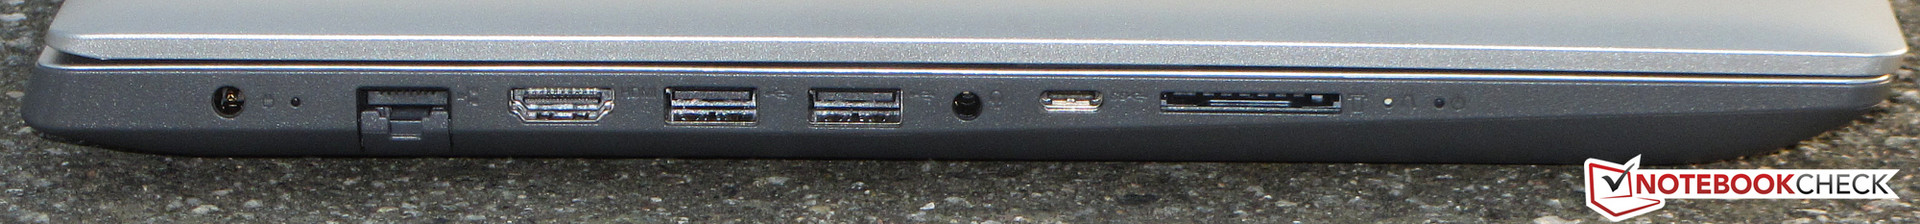
| SD Card Reader | |
| average JPG Copy Test (av. of 3 runs) | |
| HP ProBook 450 G4 Y8B60EA | |
| Acer Aspire 5 A515-51G-51RL (Toshiba Exceria Pro SDXC 64 GB UHS-II) | |
| Lenovo IdeaPad 320-15IKB 80XL01NEGE (Toshiba Exceria Pro SDXC 64 GB UHS-II) | |
| Dell Inspiron 15 5000 5567-1753 (Toshiba Exceria Pro SDXC 64 GB UHS-II) | |
| maximum AS SSD Seq Read Test (1GB) | |
| HP ProBook 450 G4 Y8B60EA | |
| Acer Aspire 5 A515-51G-51RL (Toshiba Exceria Pro SDXC 64 GB UHS-II) | |
| Lenovo IdeaPad 320-15IKB 80XL01NEGE (Toshiba Exceria Pro SDXC 64 GB UHS-II) | |
| Dell Inspiron 15 5000 5567-1753 (Toshiba Exceria Pro SDXC 64 GB UHS-II) | |
| Networking | |
| iperf3 transmit AX12 | |
| Lenovo IdeaPad 320-15IKB 80XL01NEGE | |
| Acer Aspire 5 A515-51G-51RL | |
| Dell Inspiron 15 5000 5567-1753 | |
| iperf3 receive AX12 | |
| Dell Inspiron 15 5000 5567-1753 | |
| Acer Aspire 5 A515-51G-51RL | |
| Lenovo IdeaPad 320-15IKB 80XL01NEGE | |
| |||||||||||||||||||||||||
iluminación: 81 %
Brillo con batería: 236 cd/m²
Contraste: 516:1 (Negro: 0.44 cd/m²)
ΔE ColorChecker Calman: 11.52 | ∀{0.5-29.43 Ø4.71}
ΔE Greyscale Calman: 12.01 | ∀{0.09-98 Ø4.96}
59% sRGB (Argyll 1.6.3 3D)
38% AdobeRGB 1998 (Argyll 1.6.3 3D)
40.81% AdobeRGB 1998 (Argyll 3D)
59% sRGB (Argyll 3D)
39.47% Display P3 (Argyll 3D)
Gamma: 2.23
CCT: 13330 K
| Lenovo IdeaPad 320-15IKB 80XL01NEGE TN LED, 1920x1080, 15.6" | Acer Aspire 5 A515-51G-51RL IPS, 1920x1080, 15.6" | Dell Inspiron 15 5000 5567-1753 TN LED, 1920x1080, 15.6" | HP ProBook 450 G4 Y8B60EA TN LED, 1920x1080, 15.6" | |
|---|---|---|---|---|
| Display | -3% | -8% | 1% | |
| Display P3 Coverage (%) | 39.47 | 38.3 -3% | 36.24 -8% | 39.89 1% |
| sRGB Coverage (%) | 59 | 57.6 -2% | 54.6 -7% | 59.5 1% |
| AdobeRGB 1998 Coverage (%) | 40.81 | 39.57 -3% | 37.44 -8% | 41.24 1% |
| Response Times | -42% | -1% | -68% | |
| Response Time Grey 50% / Grey 80% * (ms) | 42 ? | 41 ? 2% | 43 ? -2% | 51 ? -21% |
| Response Time Black / White * (ms) | 14 ? | 26 ? -86% | 14 ? -0% | 30 ? -114% |
| PWM Frequency (Hz) | 25000 ? | 50 ? | ||
| Screen | 43% | -9% | 1% | |
| Brightness middle (cd/m²) | 227 | 235 4% | 145 -36% | 214 -6% |
| Brightness (cd/m²) | 207 | 236 14% | 144 -30% | 201 -3% |
| Brightness Distribution (%) | 81 | 80 -1% | 90 11% | 77 -5% |
| Black Level * (cd/m²) | 0.44 | 0.17 61% | 0.49 -11% | 0.43 2% |
| Contrast (:1) | 516 | 1382 168% | 296 -43% | 498 -3% |
| Colorchecker dE 2000 * | 11.52 | 4.69 59% | 9.27 20% | 10.68 7% |
| Colorchecker dE 2000 max. * | 19.97 | 7.9 60% | 16.9 15% | 18.07 10% |
| Greyscale dE 2000 * | 12.01 | 3.34 72% | 12.28 -2% | 11.32 6% |
| Gamma | 2.23 99% | 2.63 84% | 2.03 108% | 2.26 97% |
| CCT | 13330 49% | 6801 96% | 10732 61% | 12204 53% |
| Color Space (Percent of AdobeRGB 1998) (%) | 38 | 36 -5% | 35 -8% | 38 0% |
| Color Space (Percent of sRGB) (%) | 59 | 57 -3% | 55 -7% | 59 0% |
| Media total (Programa/Opciones) | -1% /
22% | -6% /
-8% | -22% /
-8% |
* ... más pequeño es mejor
Parpadeo de Pantalla / PWM (Pulse-Width Modulation)
| Parpadeo de Pantalla / PWM detectado | 25000 Hz | ≤ 70 % de brillo | 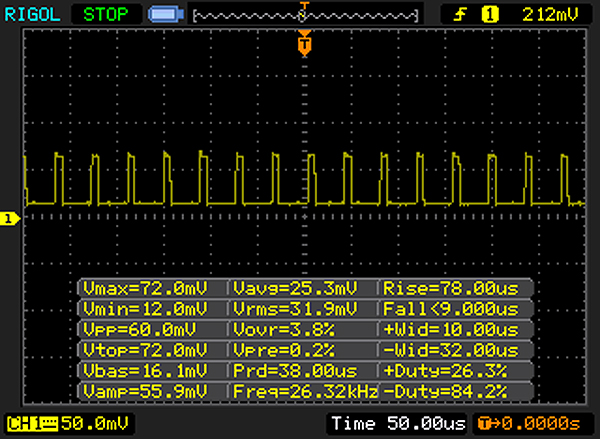 |
La retroiluminación del display parpadea a 25000 Hz (seguramente usa PWM - Pulse-Width Modulation) a un brillo del 70 % e inferior. Sobre este nivel de brillo no debería darse parpadeo / PWM. La frecuencia de 25000 Hz es bastante alta, por lo que la mayoría de gente sensible al parpadeo no debería ver parpadeo o tener fatiga visual. Comparación: 52 % de todos los dispositivos testados no usaron PWM para atenuar el display. Si se usó, medimos una media de 7744 (mínimo: 5 - máxmo: 343500) Hz. | |||
Tiempos de respuesta del display
| ↔ Tiempo de respuesta de Negro a Blanco | ||
|---|---|---|
| 14 ms ... subida ↗ y bajada ↘ combinada | ↗ 10 ms subida | 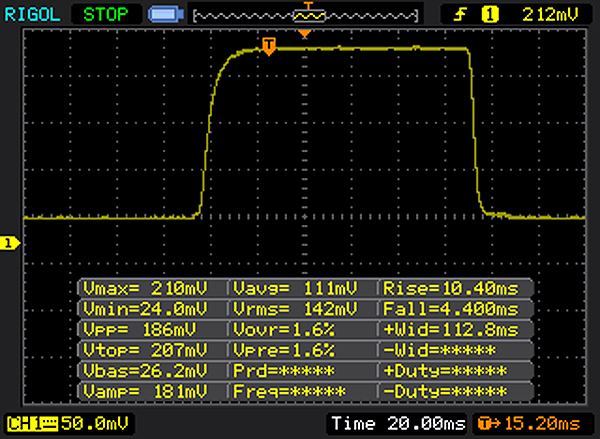 |
| ↘ 4 ms bajada | ||
| La pantalla mostró buenos tiempos de respuesta en nuestros tests pero podría ser demasiado lenta para los jugones competitivos. En comparación, todos los dispositivos de prueba van de ##min### (mínimo) a 240 (máximo) ms. » 34 % de todos los dispositivos son mejores. Esto quiere decir que el tiempo de respuesta medido es mejor que la media (19.8 ms) de todos los dispositivos testados. | ||
| ↔ Tiempo de respuesta 50% Gris a 80% Gris | ||
| 42 ms ... subida ↗ y bajada ↘ combinada | ↗ 24 ms subida | 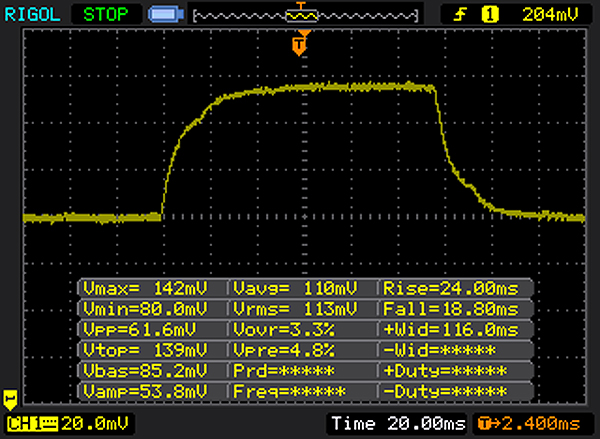 |
| ↘ 18 ms bajada | ||
| La pantalla mostró tiempos de respuesta lentos en nuestros tests y podría ser demasiado lenta para los jugones. En comparación, todos los dispositivos de prueba van de ##min### (mínimo) a 636 (máximo) ms. » 67 % de todos los dispositivos son mejores. Eso quiere decir que el tiempo de respuesta es peor que la media (30.9 ms) de todos los dispositivos testados. | ||
| Cinebench R15 | |
| CPU Single 64Bit | |
| HP ProBook 450 G4 Y8B60EA | |
| Dell Inspiron 15 5000 5567-1753 | |
| Acer Aspire 5 A515-51G-51RL | |
| Lenovo IdeaPad 320-15IKB 80XL01NEGE | |
| CPU Multi 64Bit | |
| HP ProBook 450 G4 Y8B60EA | |
| Dell Inspiron 15 5000 5567-1753 | |
| Acer Aspire 5 A515-51G-51RL | |
| Lenovo IdeaPad 320-15IKB 80XL01NEGE | |
| Cinebench R10 | |
| Rendering Single 32Bit | |
| Dell Inspiron 15 5000 5567-1753 | |
| Acer Aspire 5 A515-51G-51RL | |
| Lenovo IdeaPad 320-15IKB 80XL01NEGE | |
| Rendering Multiple CPUs 32Bit | |
| Dell Inspiron 15 5000 5567-1753 | |
| Lenovo IdeaPad 320-15IKB 80XL01NEGE | |
| Acer Aspire 5 A515-51G-51RL | |
| Geekbench 3 | |
| 32 Bit Multi-Core Score | |
| Acer Aspire 5 A515-51G-51RL | |
| Lenovo IdeaPad 320-15IKB 80XL01NEGE | |
| 32 Bit Single-Core Score | |
| Lenovo IdeaPad 320-15IKB 80XL01NEGE | |
| Acer Aspire 5 A515-51G-51RL | |
| Geekbench 4.0 | |
| 64 Bit Multi-Core Score | |
| Lenovo IdeaPad 320-15IKB 80XL01NEGE | |
| Acer Aspire 5 A515-51G-51RL | |
| 64 Bit Single-Core Score | |
| Lenovo IdeaPad 320-15IKB 80XL01NEGE | |
| Acer Aspire 5 A515-51G-51RL | |
| Geekbench 4.4 | |
| 64 Bit Multi-Core Score | |
| Lenovo IdeaPad 320-15IKB 80XL01NEGE | |
| Acer Aspire 5 A515-51G-51RL | |
| 64 Bit Single-Core Score | |
| Lenovo IdeaPad 320-15IKB 80XL01NEGE | |
| Acer Aspire 5 A515-51G-51RL | |
| JetStream 1.1 - 1.1 Total | |
| HP ProBook 450 G4 Y8B60EA | |
| Dell Inspiron 15 5000 5567-1753 | |
| Lenovo IdeaPad 320-15IKB 80XL01NEGE | |
| Acer Aspire 5 A515-51G-51RL | |
| PCMark 8 Home Score Accelerated v2 | 3677 puntos | |
| PCMark 8 Creative Score Accelerated v2 | 4418 puntos | |
| PCMark 8 Work Score Accelerated v2 | 4623 puntos | |
| PCMark 10 Score | 2918 puntos | |
ayuda | ||
| PCMark 8 - Home Score Accelerated v2 | |
| Dell Inspiron 15 5000 5567-1753 | |
| Lenovo IdeaPad 320-15IKB 80XL01NEGE | |
| Acer Aspire 5 A515-51G-51RL | |
| HP ProBook 450 G4 Y8B60EA | |

| Lenovo IdeaPad 320-15IKB 80XL01NEGE SK Hynix HFS256G3BTND | Acer Aspire 5 A515-51G-51RL Kingston RBUSNS8180DS3128GH | Dell Inspiron 15 5000 5567-1753 SanDisk X400 SED 256GB, SATA (SD8TB8U-256G) | |
|---|---|---|---|
| CrystalDiskMark 3.0 | -24% | 12% | |
| Read Seq (MB/s) | 466.4 | 407.5 -13% | 502 8% |
| Write Seq (MB/s) | 259.3 | 283.5 9% | 458.1 77% |
| Read 512 (MB/s) | 314.5 | 282.4 -10% | 382.8 22% |
| Write 512 (MB/s) | 259.4 | 72.7 -72% | 385.7 49% |
| Read 4k (MB/s) | 31.47 | 26.81 -15% | 29.25 -7% |
| Write 4k (MB/s) | 78.3 | 73.7 -6% | 55.9 -29% |
| Read 4k QD32 (MB/s) | 346.1 | 294.8 -15% | 285.2 -18% |
| Write 4k QD32 (MB/s) | 260.4 | 89.6 -66% | 239.6 -8% |
| 3DMark 11 Performance | 3050 puntos | |
| 3DMark Ice Storm Standard Score | 51684 puntos | |
| 3DMark Cloud Gate Standard Score | 8042 puntos | |
| 3DMark Fire Strike Score | 2136 puntos | |
ayuda | ||
| 3DMark 11 - 1280x720 Performance GPU | |
| Acer Aspire 5 A515-51G-51RL | |
| Lenovo IdeaPad 320-15IKB 80XL01NEGE | |
| Acer TravelMate P259-MG-71UU | |
| Asus AsusPro P4540UQ-FY0056R | |
| MSI CX62 7QL | |
| Dell Inspiron 15 5000 5567-1753 | |
| HP ProBook 450 G4 Y8B60EA | |
| HP 15-ba077ng | |
| Lenovo Ideapad 110-15ACL 80TJ00H0GE | |
| 3DMark | |
| 1280x720 Cloud Gate Standard Graphics | |
| Acer Aspire 5 A515-51G-51RL | |
| Lenovo IdeaPad 320-15IKB 80XL01NEGE | |
| Acer TravelMate P259-MG-71UU | |
| Asus AsusPro P4540UQ-FY0056R | |
| Dell Inspiron 15 5000 5567-1753 | |
| MSI CX62 7QL | |
| HP ProBook 450 G4 Y8B60EA | |
| HP 15-ba077ng | |
| 1920x1080 Fire Strike Graphics | |
| Acer Aspire 5 A515-51G-51RL | |
| Lenovo IdeaPad 320-15IKB 80XL01NEGE | |
| Acer TravelMate P259-MG-71UU | |
| Asus AsusPro P4540UQ-FY0056R | |
| MSI CX62 7QL | |
| HP ProBook 450 G4 Y8B60EA | |
| Dell Inspiron 15 5000 5567-1753 | |
| HP 15-ba077ng | |
| Geekbench 4.0 - Compute OpenCL Score | |
| Acer Aspire 5 A515-51G-51RL | |
| Lenovo IdeaPad 320-15IKB 80XL01NEGE | |
| Asus AsusPro P4540UQ-FY0056R | |
| HP 15-ba077ng | |
| Lenovo Ideapad 110-15ACL 80TJ00H0GE | |
| Geekbench 4.4 - Compute OpenCL Score | |
| Acer Aspire 5 A515-51G-51RL | |
| Lenovo IdeaPad 320-15IKB 80XL01NEGE | |
| bajo | medio | alto | ultra | |
|---|---|---|---|---|
| BioShock Infinite (2013) | 122.1 | 68.4 | 59.7 | 22.8 |
| Warhammer 40.000: Dawn of War III (2017) | 52.3 | 18.2 | 16.7 | 14.4 |
| Prey (2017) | 73.2 | 28.2 | 22.2 | 18.7 |
| Rocket League (2017) | 112.5 | 45.8 | 32 | |
| Dirt 4 (2017) | 87.6 | 31.7 | 16.3 | 9.9 |
| Team Fortress 2 (2017) | 88 | 82.3 | 71 | 59.7 |
| Playerunknown's Battlegrounds (PUBG) (2017) | 44.9 | 16.9 | 15.3 | 10.1 |
| F1 2017 (2017) | 51 | 25 | 20 | 13 |
| Ark Survival Evolved (2017) | 33.2 | 9 | 6.2 | 3.1 |
| FIFA 18 (2017) | 115.2 | 70.3 | 58.5 | 56.3 |
| BioShock Infinite - 1366x768 High Preset | |
| Acer Aspire 5 A515-51G-51RL | |
| Acer TravelMate P259-MG-71UU | |
| Lenovo IdeaPad 320-15IKB 80XL01NEGE | |
| Asus AsusPro P4540UQ-FY0056R | |
| Dell Inspiron 15 5000 5567-1753 | |
| MSI CX62 7QL | |
| HP ProBook 450 G4 Y8B60EA | |
| HP 15-ba077ng | |
| Lenovo Ideapad 110-15ACL 80TJ00H0GE | |
Ruido
| Ocioso |
| 30.5 / 30.5 / 30.5 dB(A) |
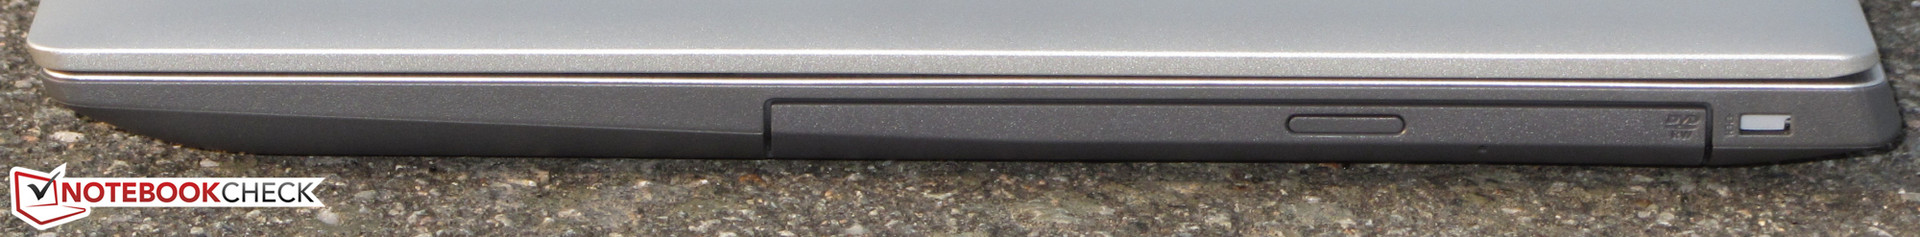
| DVD |
| 0 / dB(A) |
| Carga |
| 35.1 / 35.4 dB(A) |
 | ||
30 dB silencioso 40 dB(A) audible 50 dB(A) ruidosamente alto |
||
min: | ||
(±) La temperatura máxima en la parte superior es de 43.8 °C / 111 F, frente a la media de 36.8 °C / 98 F, que oscila entre 21 y 71 °C para la clase Multimedia.
(±) El fondo se calienta hasta un máximo de 43.7 °C / 111 F, frente a la media de 39.1 °C / 102 F
(+) En reposo, la temperatura media de la parte superior es de 25 °C / 77# F, frente a la media del dispositivo de 31.3 °C / 88 F.
(±) El reposamanos y el touchpad pueden calentarse mucho al tacto con un máximo de 38.4 °C / 101.1 F.
(-) La temperatura media de la zona del reposamanos de dispositivos similares fue de 28.7 °C / 83.7 F (-9.7 °C / -17.4 F).
Lenovo IdeaPad 320-15IKB 80XL01NEGE análisis de audio
(-) | altavoces no muy altos (#68.1 dB)
Graves 100 - 315 Hz
(-) | casi sin bajos - de media 21.7% inferior a la mediana
(±) | la linealidad de los graves es media (13.7% delta a frecuencia anterior)
Medios 400 - 2000 Hz
(+) | medios equilibrados - a sólo 3.4% de la mediana
(±) | la linealidad de los medios es media (7% delta respecto a la frecuencia anterior)
Altos 2 - 16 kHz
(±) | máximos más altos - de media 5.3% más altos que la mediana
(±) | la linealidad de los máximos es media (8.8% delta a frecuencia anterior)
Total 100 - 16.000 Hz
(±) | la linealidad del sonido global es media (24.4% de diferencia con la mediana)
En comparación con la misma clase
» 86% de todos los dispositivos probados de esta clase eran mejores, 5% similares, 9% peores
» El mejor tuvo un delta de 5%, la media fue 17%, el peor fue ###max##%
En comparación con todos los dispositivos probados
» 74% de todos los dispositivos probados eran mejores, 6% similares, 20% peores
» El mejor tuvo un delta de 4%, la media fue 23%, el peor fue ###max##%
Apple MacBook 12 (Early 2016) 1.1 GHz análisis de audio
(+) | los altavoces pueden reproducir a un volumen relativamente alto (#83.6 dB)
Graves 100 - 315 Hz
(±) | lubina reducida - en promedio 11.3% inferior a la mediana
(±) | la linealidad de los graves es media (14.2% delta a frecuencia anterior)
Medios 400 - 2000 Hz
(+) | medios equilibrados - a sólo 2.4% de la mediana
(+) | los medios son lineales (5.5% delta a la frecuencia anterior)
Altos 2 - 16 kHz
(+) | máximos equilibrados - a sólo 2% de la mediana
(+) | los máximos son lineales (4.5% delta a la frecuencia anterior)
Total 100 - 16.000 Hz
(+) | el sonido global es lineal (10.2% de diferencia con la mediana)
En comparación con la misma clase
» 7% de todos los dispositivos probados de esta clase eran mejores, 2% similares, 90% peores
» El mejor tuvo un delta de 5%, la media fue 18%, el peor fue ###max##%
En comparación con todos los dispositivos probados
» 5% de todos los dispositivos probados eran mejores, 1% similares, 94% peores
» El mejor tuvo un delta de 4%, la media fue 23%, el peor fue ###max##%
| Off / Standby | |
| Ocioso | |
| Carga |
|
Clave:
min: | |
| Battery Runtime - WiFi Websurfing | |
| Acer Aspire 5 A515-51G-51RL | |
| HP ProBook 450 G4 Y8B60EA | |
| Dell Inspiron 15 5000 5567-1753 | |
| Lenovo IdeaPad 320-15IKB 80XL01NEGE | |
Pro
Contra
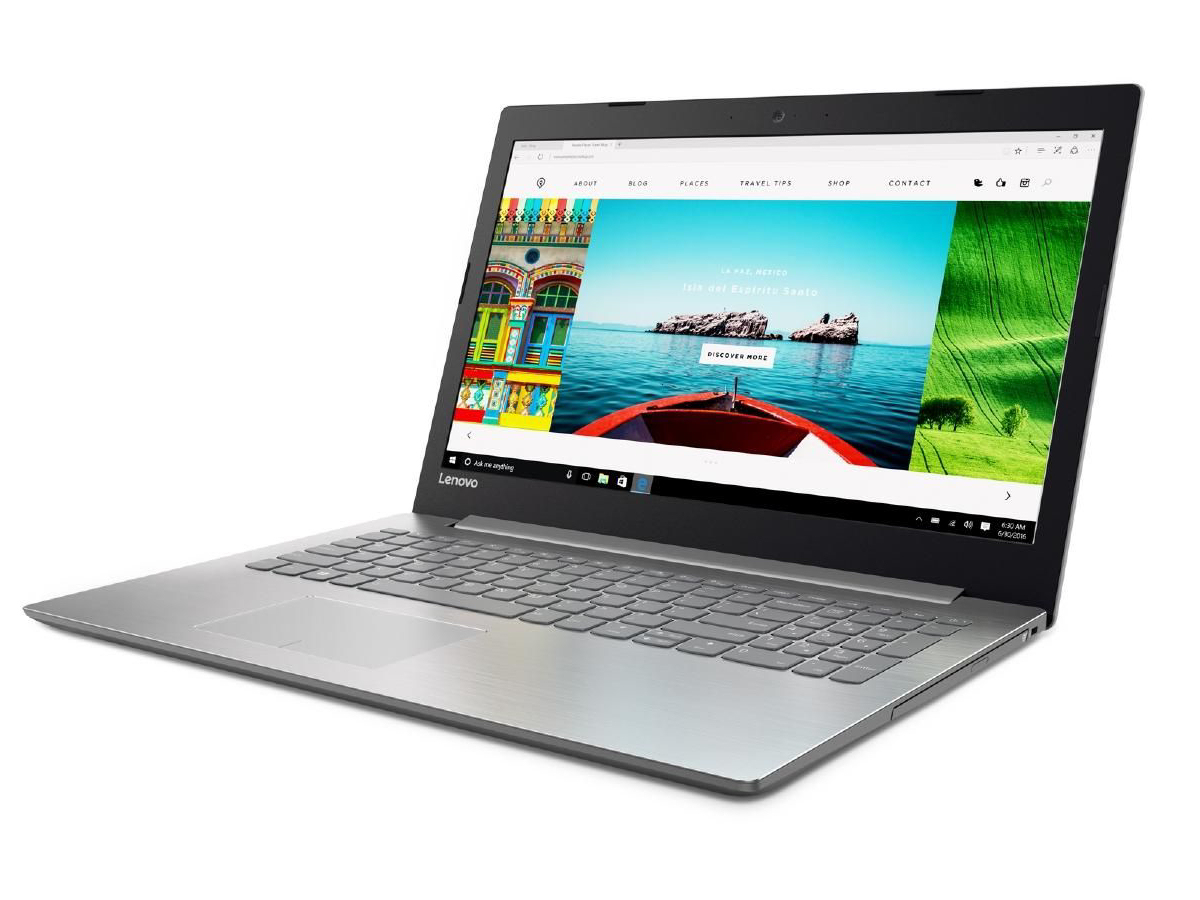
Con el IdeaPad 320-15IKB, Lenovo ofrece un todo terreno de 15.6". El procesador Kaby Lake proporciona toda la potencia computacional necesaria. La gráfica dedicada hace posible ejecutar una amplia gama de juegos de ordenador. Sin embargo, uno debe mostrar cierta moderación con la resolución y la configuración de los gráficos, si se quiere lograr una buena cantidad de frames reproducibles. El dispositivo no se calienta mucho y funciona en silencio la mayor parte del tiempo. Un SSD asegura un sistema altamente veloz en respuesta.
El IdeaPad 320-15lKB es un todoterreno para usar en casa.
El teclado del portátil ha dejado una impresión positiva y es apto para el trabajo de oficina habitual. Sin embargo, echamos de menos que sea retroiluminado. Debería ser una función estándar con un portátil de 800 euros.
La calidad de la pantalla no coincide con la etiqueta de precio del dispositivo. Aquí, Lenovo usa un panel con brillo, contraste y ángulos de visión pobres, lo que hubiera sido aceptable si se hubiera tratado de un portátil de bajo precio. La duración de la batería tampoco es nada especial. Debido a que Lenovo ha escatimado en la capacidad de la batería (30 Wh), el portátil logra aguantar tan solo 4 horas y 39 minutos en nuestra prueba de Wi-Fi con la batería. Por lo tanto, no podemos decir que este portátil sea adecuado para uso móvil.
Ésta es una versión acortada del análisis original. Puedes leer el análisis completo en inglés aquí.
Lenovo IdeaPad 320-15IKB 80XL01NEGE
- 10/19/2017 v6 (old)
Sascha Mölck