 Deutsch
 English
 Español
 Français
 Italiano
 Nederlands
 Polski
 Português
 Русский
 Türkçe
 Svenska
 Chinese
 Magyar
Breve análisis del MSI GT80 2QD Titan
| |||||||||||||||||||||||||
iluminación: 86 %
Brillo con batería: 365 cd/m²
Contraste: 971:1 (Negro: 0.376 cd/m²)
ΔE Color 4.4 | 0.5-29.43 Ø5
ΔE Greyscale 4.33 | 0.57-98 Ø5.3
88% sRGB (Argyll 1.6.3 3D)
57% AdobeRGB 1998 (Argyll 1.6.3 3D)
64.6% AdobeRGB 1998 (Argyll 2.2.0 3D)
88.3% sRGB (Argyll 2.2.0 3D)
64.6% Display P3 (Argyll 2.2.0 3D)
Gamma: 2.06
| MSI GT80 Titan SLI | Alienware 18 | MSI GT72-2QE16SR21BW | Asus G751JY | Eurocom P7 Pro | |
|---|---|---|---|---|---|
| Display | -3% | 0% | -3% | -1% | |
| Display P3 Coverage | 64.6 | 62.7 -3% | 68.1 5% | 65.9 2% | 67.2 4% |
| sRGB Coverage | 88.3 | 85.9 -3% | 86.7 -2% | 83.1 -6% | 85.3 -3% |
| AdobeRGB 1998 Coverage | 64.6 | 62.9 -3% | 63.4 -2% | 60.8 -6% | 62.4 -3% |
| Screen | -10% | -14% | 1% | -5% | |
| Brightness middle | 365 | 342 -6% | 285 -22% | 329 -10% | 335.4 -8% |
| Brightness | 332 | 315 -5% | 278 -16% | 320 -4% | 319 -4% |
| Brightness Distribution | 86 | 87 1% | 87 1% | 92 7% | 88 2% |
| Black Level * | 0.376 | 0.38 -1% | 0.45 -20% | 0.34 10% | 0.384 -2% |
| Contrast | 971 | 900 -7% | 633 -35% | 968 0% | 873 -10% |
| Colorchecker dE 2000 * | 4.4 | 5.85 -33% | 5.1 -16% | 4.13 6% | 5.14 -17% |
| Greyscale dE 2000 * | 4.33 | 5.6 -29% | 5.23 -21% | 3.72 14% | 4.44 -3% |
| Gamma | 2.06 107% | 2.04 108% | 2.32 95% | 2.36 93% | 1.98 111% |
| CCT | 7199 90% | 6645 98% | 7565 86% | 6352 102% | 6464 101% |
| Color Space (Percent of AdobeRGB 1998) | 57 | 59 4% | 57 0% | 55 -4% | 56.1 -2% |
| Color Space (Percent of sRGB) | 88 | 87 -1% | 83 -6% | 85.3 -3% | |
| Colorchecker dE 2000 max. * | 8.01 | ||||
| Media total (Programa/Opciones) | -7% /
-8% | -7% /
-11% | -1% /
0% | -3% /
-4% |
* ... más pequeño es mejor
| Cinebench R15 | |
| CPU Single 64Bit (ordenar por valor) | |
| MSI GT80 Titan SLI | |
| Eurocom P5 Pro Extreme | |
| MSI GT80 Titan SLI PL | |
| Aorus X3 Plus v3 | |
| Asus UX501JW-DS71T | |
| Lenovo IdeaPad Y50 | |
| CPU Multi 64Bit (ordenar por valor) | |
| MSI GT80 Titan SLI | |
| Eurocom P5 Pro Extreme | |
| MSI GT80 Titan SLI PL | |
| Aorus X3 Plus v3 | |
| Asus UX501JW-DS71T | |
| Lenovo IdeaPad Y50 | |
| Cinebench R11.5 | |
| CPU Single 64Bit (ordenar por valor) | |
| MSI GT80 Titan SLI | |
| Eurocom P5 Pro Extreme | |
| MSI GT80 Titan SLI PL | |
| Aorus X3 Plus v3 | |
| Asus UX501JW-DS71T | |
| Lenovo IdeaPad Y50 | |
| CPU Multi 64Bit (ordenar por valor) | |
| MSI GT80 Titan SLI | |
| Eurocom P5 Pro Extreme | |
| MSI GT80 Titan SLI PL | |
| Aorus X3 Plus v3 | |
| Asus UX501JW-DS71T | |
| Lenovo IdeaPad Y50 | |
| Cinebench R10 | |
| Rendering Single CPUs 64Bit (ordenar por valor) | |
| MSI GT80 Titan SLI | |
| Eurocom P5 Pro Extreme | |
| MSI GT80 Titan SLI PL | |
| Aorus X3 Plus v3 | |
| Asus UX501JW-DS71T | |
| Lenovo IdeaPad Y50 | |
| Rendering Multiple CPUs 64Bit (ordenar por valor) | |
| MSI GT80 Titan SLI | |
| Eurocom P5 Pro Extreme | |
| MSI GT80 Titan SLI PL | |
| Aorus X3 Plus v3 | |
| Asus UX501JW-DS71T | |
| Lenovo IdeaPad Y50 | |
| wPrime 2.10 - 1024m (ordenar por valor) | |
| Eurocom P5 Pro Extreme | |
| MSI GT80 Titan SLI PL | |
| Aorus X3 Plus v3 | |
| Asus UX501JW-DS71T | |
| Lenovo IdeaPad Y50 | |
| Super Pi Mod 1.5 XS 32M - 32M (ordenar por valor) | |
| MSI GT80 Titan SLI | |
| Eurocom P5 Pro Extreme | |
| MSI GT80 Titan SLI PL | |
| Aorus X3 Plus v3 | |
| Asus UX501JW-DS71T | |
| Lenovo IdeaPad Y50 | |
| 3DMark | |
| Fire Strike Extreme Physics (ordenar por valor) | |
| MSI GT80 Titan SLI | |
| Eurocom P5 Pro Extreme | |
| Aorus X3 Plus v3 | |
| Lenovo IdeaPad Y50 | |
| 1920x1080 Fire Strike Physics (ordenar por valor) | |
| MSI GT80 Titan SLI | |
| Eurocom P5 Pro Extreme | |
| MSI GT80 Titan SLI PL | |
| Aorus X3 Plus v3 | |
| Asus UX501JW-DS71T | |
| Lenovo IdeaPad Y50 | |
| 1280x720 Cloud Gate Standard Physics (ordenar por valor) | |
| MSI GT80 Titan SLI | |
| Eurocom P5 Pro Extreme | |
| MSI GT80 Titan SLI PL | |
| Aorus X3 Plus v3 | |
| Asus UX501JW-DS71T | |
| Lenovo IdeaPad Y50 | |
| 1280x720 offscreen Ice Storm Unlimited Physics (ordenar por valor) | |
| MSI GT80 Titan SLI | |
| Eurocom P5 Pro Extreme | |
| Aorus X3 Plus v3 | |
| 1920x1080 Ice Storm Extreme Physics (ordenar por valor) | |
| MSI GT80 Titan SLI | |
| Eurocom P5 Pro Extreme | |
| Aorus X3 Plus v3 | |
| 1280x720 Ice Storm Standard Physics (ordenar por valor) | |
| MSI GT80 Titan SLI | |
| Eurocom P5 Pro Extreme | |
| MSI GT80 Titan SLI PL | |
| Aorus X3 Plus v3 | |
| Asus UX501JW-DS71T | |
| Lenovo IdeaPad Y50 | |
* ... más pequeño es mejor
| PCMark 7 Score | 6841 puntos | |
| PCMark 8 Home Score Accelerated v2 | 4483 puntos | |
| PCMark 8 Creative Score Accelerated v2 | 6585 puntos | |
| PCMark 8 Work Score Accelerated v2 | 5014 puntos | |
ayuda | ||

| 3DMark 06 Standard Score | 29186 puntos | |
| 3DMark 11 Performance | 15300 puntos | |
| 3DMark Ice Storm Standard Score | 149799 puntos | |
| 3DMark Cloud Gate Standard Score | 28674 puntos | |
| 3DMark Fire Strike Score | 11358 puntos | |
| 3DMark Fire Strike Extreme Score | 6299 puntos | |
ayuda | ||
| 3DMark 11 - 1280x720 Performance GPU (ordenar por valor) | |
| MSI GT80 Titan SLI | |
| MSI GT80-2QES32SR311BW | |
| Aorus X5 | |
| Eurocom P5 Pro Extreme | |
| Aorus X3 Plus v3 | |
| Asus G501JW-CN168H | |
| 3DMark | |
| Fire Strike Extreme Graphics (ordenar por valor) | |
| MSI GT80 Titan SLI | |
| Aorus X5 | |
| Eurocom P5 Pro Extreme | |
| Aorus X3 Plus v3 | |
| 1920x1080 Fire Strike Graphics (ordenar por valor) | |
| MSI GT80 Titan SLI | |
| MSI GT80-2QES32SR311BW | |
| Aorus X5 | |
| Eurocom P5 Pro Extreme | |
| Aorus X3 Plus v3 | |
| Asus G501JW-CN168H | |
| 1280x720 Cloud Gate Standard Graphics (ordenar por valor) | |
| MSI GT80 Titan SLI | |
| MSI GT80-2QES32SR311BW | |
| Aorus X5 | |
| Eurocom P5 Pro Extreme | |
| Aorus X3 Plus v3 | |
| Asus G501JW-CN168H | |
| bajo | medio | alto | ultra | |
| Sleeping Dogs (2012) | 182.8 | 92.5 | ||
| Guild Wars 2 (2012) | 66.4 | 62.5 | ||
| Tomb Raider (2013) | 363.7 | 175.1 | ||
| StarCraft II: Heart of the Swarm (2013) | 138.1 | 85.9 | ||
| BioShock Infinite (2013) | 206.9 | 132 | ||
| Metro: Last Light (2013) | 120.6 | 82.6 | ||
| Thief (2014) | 98.5 | 83.8 | ||
| Middle-earth: Shadow of Mordor (2014) | 133.5 | 106.5 | ||
| Ryse: Son of Rome (2014) | 68.7 | 68 | ||
| F1 2014 (2014) | 118 | 105 | ||
| Dragon Age: Inquisition (2014) | 100.3 | 70 | ||
| Battlefield Hardline (2015) | 102.5 | 101.3 | ||
| Batman: Arkham Knight (2015) | 62 | 44 |
| Thief | |
| 1366x768 High Preset AA:FXAA & Low SS AF:4x (ordenar por valor) | |
| MSI GT80 Titan SLI | |
| Eurocom X8 | |
| Aorus X5 | |
| Eurocom P7 Pro | |
| Aorus X3 Plus v3 | |
| Razer Blade Pro 17 inch 2015 | |
| 1920x1080 Very High Preset AA:FXAA & High SS AF:8x (ordenar por valor) | |
| MSI GT80 Titan SLI | |
| Eurocom X8 | |
| Aorus X5 | |
| Eurocom P7 Pro | |
| Aorus X3 Plus v3 | |
| Razer Blade Pro 17 inch 2015 | |
| Metro: Last Light | |
| 1366x768 High (DX11) AF:16x (ordenar por valor) | |
| MSI GT80 Titan SLI | |
| Eurocom X8 | |
| Aorus X5 | |
| Eurocom P7 Pro | |
| Aorus X3 Plus v3 | |
| Razer Blade Pro 17 inch 2015 | |
| 1920x1080 Very High (DX11) AF:16x (ordenar por valor) | |
| MSI GT80 Titan SLI | |
| Eurocom X8 | |
| Aorus X5 | |
| Eurocom P7 Pro | |
| Aorus X3 Plus v3 | |
| Razer Blade Pro 17 inch 2015 | |
| Sleeping Dogs | |
| 1366x768 High Preset AA:High (ordenar por valor) | |
| MSI GT80 Titan SLI | |
| Eurocom X8 | |
| Aorus X5 | |
| Eurocom P7 Pro | |
| Aorus X3 Plus v3 | |
| Razer Blade Pro 17 inch 2015 | |
| 1920x1080 Extreme Preset AA:Extreme (ordenar por valor) | |
| MSI GT80 Titan SLI | |
| Eurocom X8 | |
| Aorus X5 | |
| Eurocom P7 Pro | |
| Aorus X3 Plus v3 | |
| Razer Blade Pro 17 inch 2015 | |
| Guild Wars 2 | |
| 1366x768 Best Appearance Preset AA:FX (ordenar por valor) | |
| MSI GT80 Titan SLI | |
| Eurocom X8 | |
| Aorus X5 | |
| Eurocom P7 Pro | |
| Aorus X3 Plus v3 | |
| Razer Blade Pro 17 inch 2015 | |
| 1920x1080 All Maximum / On AA:FX (ordenar por valor) | |
| MSI GT80 Titan SLI | |
| Eurocom X8 | |
| Aorus X5 | |
| Eurocom P7 Pro | |
| Aorus X3 Plus v3 | |
| Razer Blade Pro 17 inch 2015 | |
| Tomb Raider | |
| 1366x768 High Preset AA:FX AF:8x (ordenar por valor) | |
| MSI GT80 Titan SLI | |
| Eurocom X8 | |
| Aorus X5 | |
| Eurocom P7 Pro | |
| Aorus X3 Plus v3 | |
| Razer Blade Pro 17 inch 2015 | |
| 1920x1080 Ultra Preset AA:FX AF:16x (ordenar por valor) | |
| MSI GT80 Titan SLI | |
| Eurocom X8 | |
| Aorus X5 | |
| Eurocom P7 Pro | |
| Aorus X3 Plus v3 | |
| Razer Blade Pro 17 inch 2015 | |
| StarCraft II: Heart of the Swarm | |
| 1366x768 High AA:on (ordenar por valor) | |
| MSI GT80 Titan SLI | |
| Eurocom X8 | |
| Aorus X5 | |
| Eurocom P7 Pro | |
| Aorus X3 Plus v3 | |
| Razer Blade Pro 17 inch 2015 | |
| 1920x1080 Ultra / Extreme AA:on (ordenar por valor) | |
| MSI GT80 Titan SLI | |
| Eurocom X8 | |
| Aorus X5 | |
| Eurocom P7 Pro | |
| Aorus X3 Plus v3 | |
| Razer Blade Pro 17 inch 2015 | |
| BioShock Infinite | |
| 1366x768 High Preset (ordenar por valor) | |
| MSI GT80 Titan SLI | |
| Eurocom X8 | |
| Aorus X5 | |
| Eurocom P7 Pro | |
| Aorus X3 Plus v3 | |
| Razer Blade Pro 17 inch 2015 | |
| 1920x1080 Ultra Preset, DX11 (DDOF) (ordenar por valor) | |
| MSI GT80 Titan SLI | |
| Eurocom X8 | |
| Aorus X5 | |
| Eurocom P7 Pro | |
| Aorus X3 Plus v3 | |
| Razer Blade Pro 17 inch 2015 | |
| Middle-earth: Shadow of Mordor | |
| 1920x1080 High Preset (ordenar por valor) | |
| MSI GT80 Titan SLI | |
| Aorus X5 | |
| Eurocom P7 Pro | |
| Aorus X3 Plus v3 | |
| Razer Blade Pro 17 inch 2015 | |
| 1920x1080 Ultra Preset (HD Package) (ordenar por valor) | |
| MSI GT80 Titan SLI | |
| Aorus X5 | |
| Eurocom P7 Pro | |
| Aorus X3 Plus v3 | |
| Razer Blade Pro 17 inch 2015 | |
| Ryse: Son of Rome | |
| 1920x1080 High Texture Res. + High Graphics Quality (Rest Off/Disabled) AF:8x (ordenar por valor) | |
| MSI GT80 Titan SLI | |
| Eurocom X8 | |
| Aorus X5 | |
| Eurocom P7 Pro | |
| Aorus X3 Plus v3 | |
| Razer Blade Pro 17 inch 2015 | |
| 1920x1080 Very High Texture Res. + High Graphics Quality (Motion Blur & Temporal AA On, Rest Off/Disabled) AF:8x (ordenar por valor) | |
| MSI GT80 Titan SLI | |
| Eurocom X8 | |
| Aorus X5 | |
| Eurocom P7 Pro | |
| Aorus X3 Plus v3 | |
| Razer Blade Pro 17 inch 2015 | |
| F1 2014 | |
| 1920x1080 High Preset (ordenar por valor) | |
| MSI GT80 Titan SLI | |
| Eurocom X8 | |
| Aorus X5 | |
| Eurocom P7 Pro | |
| Aorus X3 Plus v3 | |
| Razer Blade Pro 17 inch 2015 | |
| 1920x1080 Ultra Preset AA:4x MS (ordenar por valor) | |
| MSI GT80 Titan SLI | |
| Eurocom X8 | |
| Aorus X5 | |
| Eurocom P7 Pro | |
| Aorus X3 Plus v3 | |
| Razer Blade Pro 17 inch 2015 | |
| Dragon Age: Inquisition | |
| 1920x1080 High Graphics Quality (ordenar por valor) | |
| MSI GT80 Titan SLI | |
| Eurocom X8 | |
| Aorus X5 | |
| Eurocom P7 Pro | |
| 1920x1080 Ultra Graphics Quality AA:2x MS (ordenar por valor) | |
| MSI GT80 Titan SLI | |
| Eurocom X8 | |
| Aorus X5 | |
| Eurocom P7 Pro | |
| Battlefield Hardline | |
| 1920x1080 High Graphics Quality (DX11) (ordenar por valor) | |
| MSI GT80 Titan SLI | |
| Aorus X5 | |
| Eurocom P7 Pro | |
| 1920x1080 Ultra Graphics Quality (DX11) AA:4x MS (ordenar por valor) | |
| MSI GT80 Titan SLI | |
| Aorus X5 | |
| Eurocom P7 Pro | |
| Batman: Arkham Knight | |
| 1920x1080 High / On (Interactive Smoke & Paper Debris Off) AA:SM AF:8x (ordenar por valor) | |
| MSI GT80 Titan SLI | |
| Aorus X5 | |
| 1920x1080 High / On AA:SM AF:16x (ordenar por valor) | |
| MSI GT80 Titan SLI | |
| Aorus X5 | |
Ruido
| Ocioso |
| 34.2 / 36.2 / 37.8 dB(A) |
| DVD |
| 36.8 / dB(A) |
| Carga |
| 47.6 / 59.8 dB(A) |
 | ||
30 dB silencioso 40 dB(A) audible 50 dB(A) ruidosamente alto |
||
min: | ||
(+) The maximum temperature on the upper side is 38.4 °C / 101 F, compared to the average of 40.4 °C / 105 F, ranging from 21.2 to 68.8 °C for the class Gaming.
(-) The bottom heats up to a maximum of 46.6 °C / 116 F, compared to the average of 43.2 °C / 110 F
(+) In idle usage, the average temperature for the upper side is 30.5 °C / 87 F, compared to the device average of 33.8 °C / 93 F.
(+) The palmrests and touchpad are cooler than skin temperature with a maximum of 27.8 °C / 82 F and are therefore cool to the touch.
(±) The average temperature of the palmrest area of similar devices was 28.9 °C / 84 F (+1.1 °C / 2 F).
| MSI GT80 Titan SLI 75 Wh | MSI GT80-2QES32SR311BW 75 Wh | Alienware 18 86 Wh | MSI GT72-2QE16SR21BW 87 Wh | Asus G751JY-T7009H 88 Wh | Eurocom X8 89 Wh | Aorus X7 Pro 73 Wh | |
|---|---|---|---|---|---|---|---|
| Duración de Batería | -34% | -19% | -2% | 8% | -24% | -5% | |
| Reader / Idle | 370 | 191 -48% | 203 -45% | 225 -39% | 272 -26% | 148 -60% | 178 -52% |
| WiFi v1.3 | 231 | ||||||
| Load | 60 | 48 -20% | 64 7% | 81 35% | 85 42% | 68 13% | 86 43% |
| WiFi | 146 | 146 | 220 | 88 |
Pro
Contra
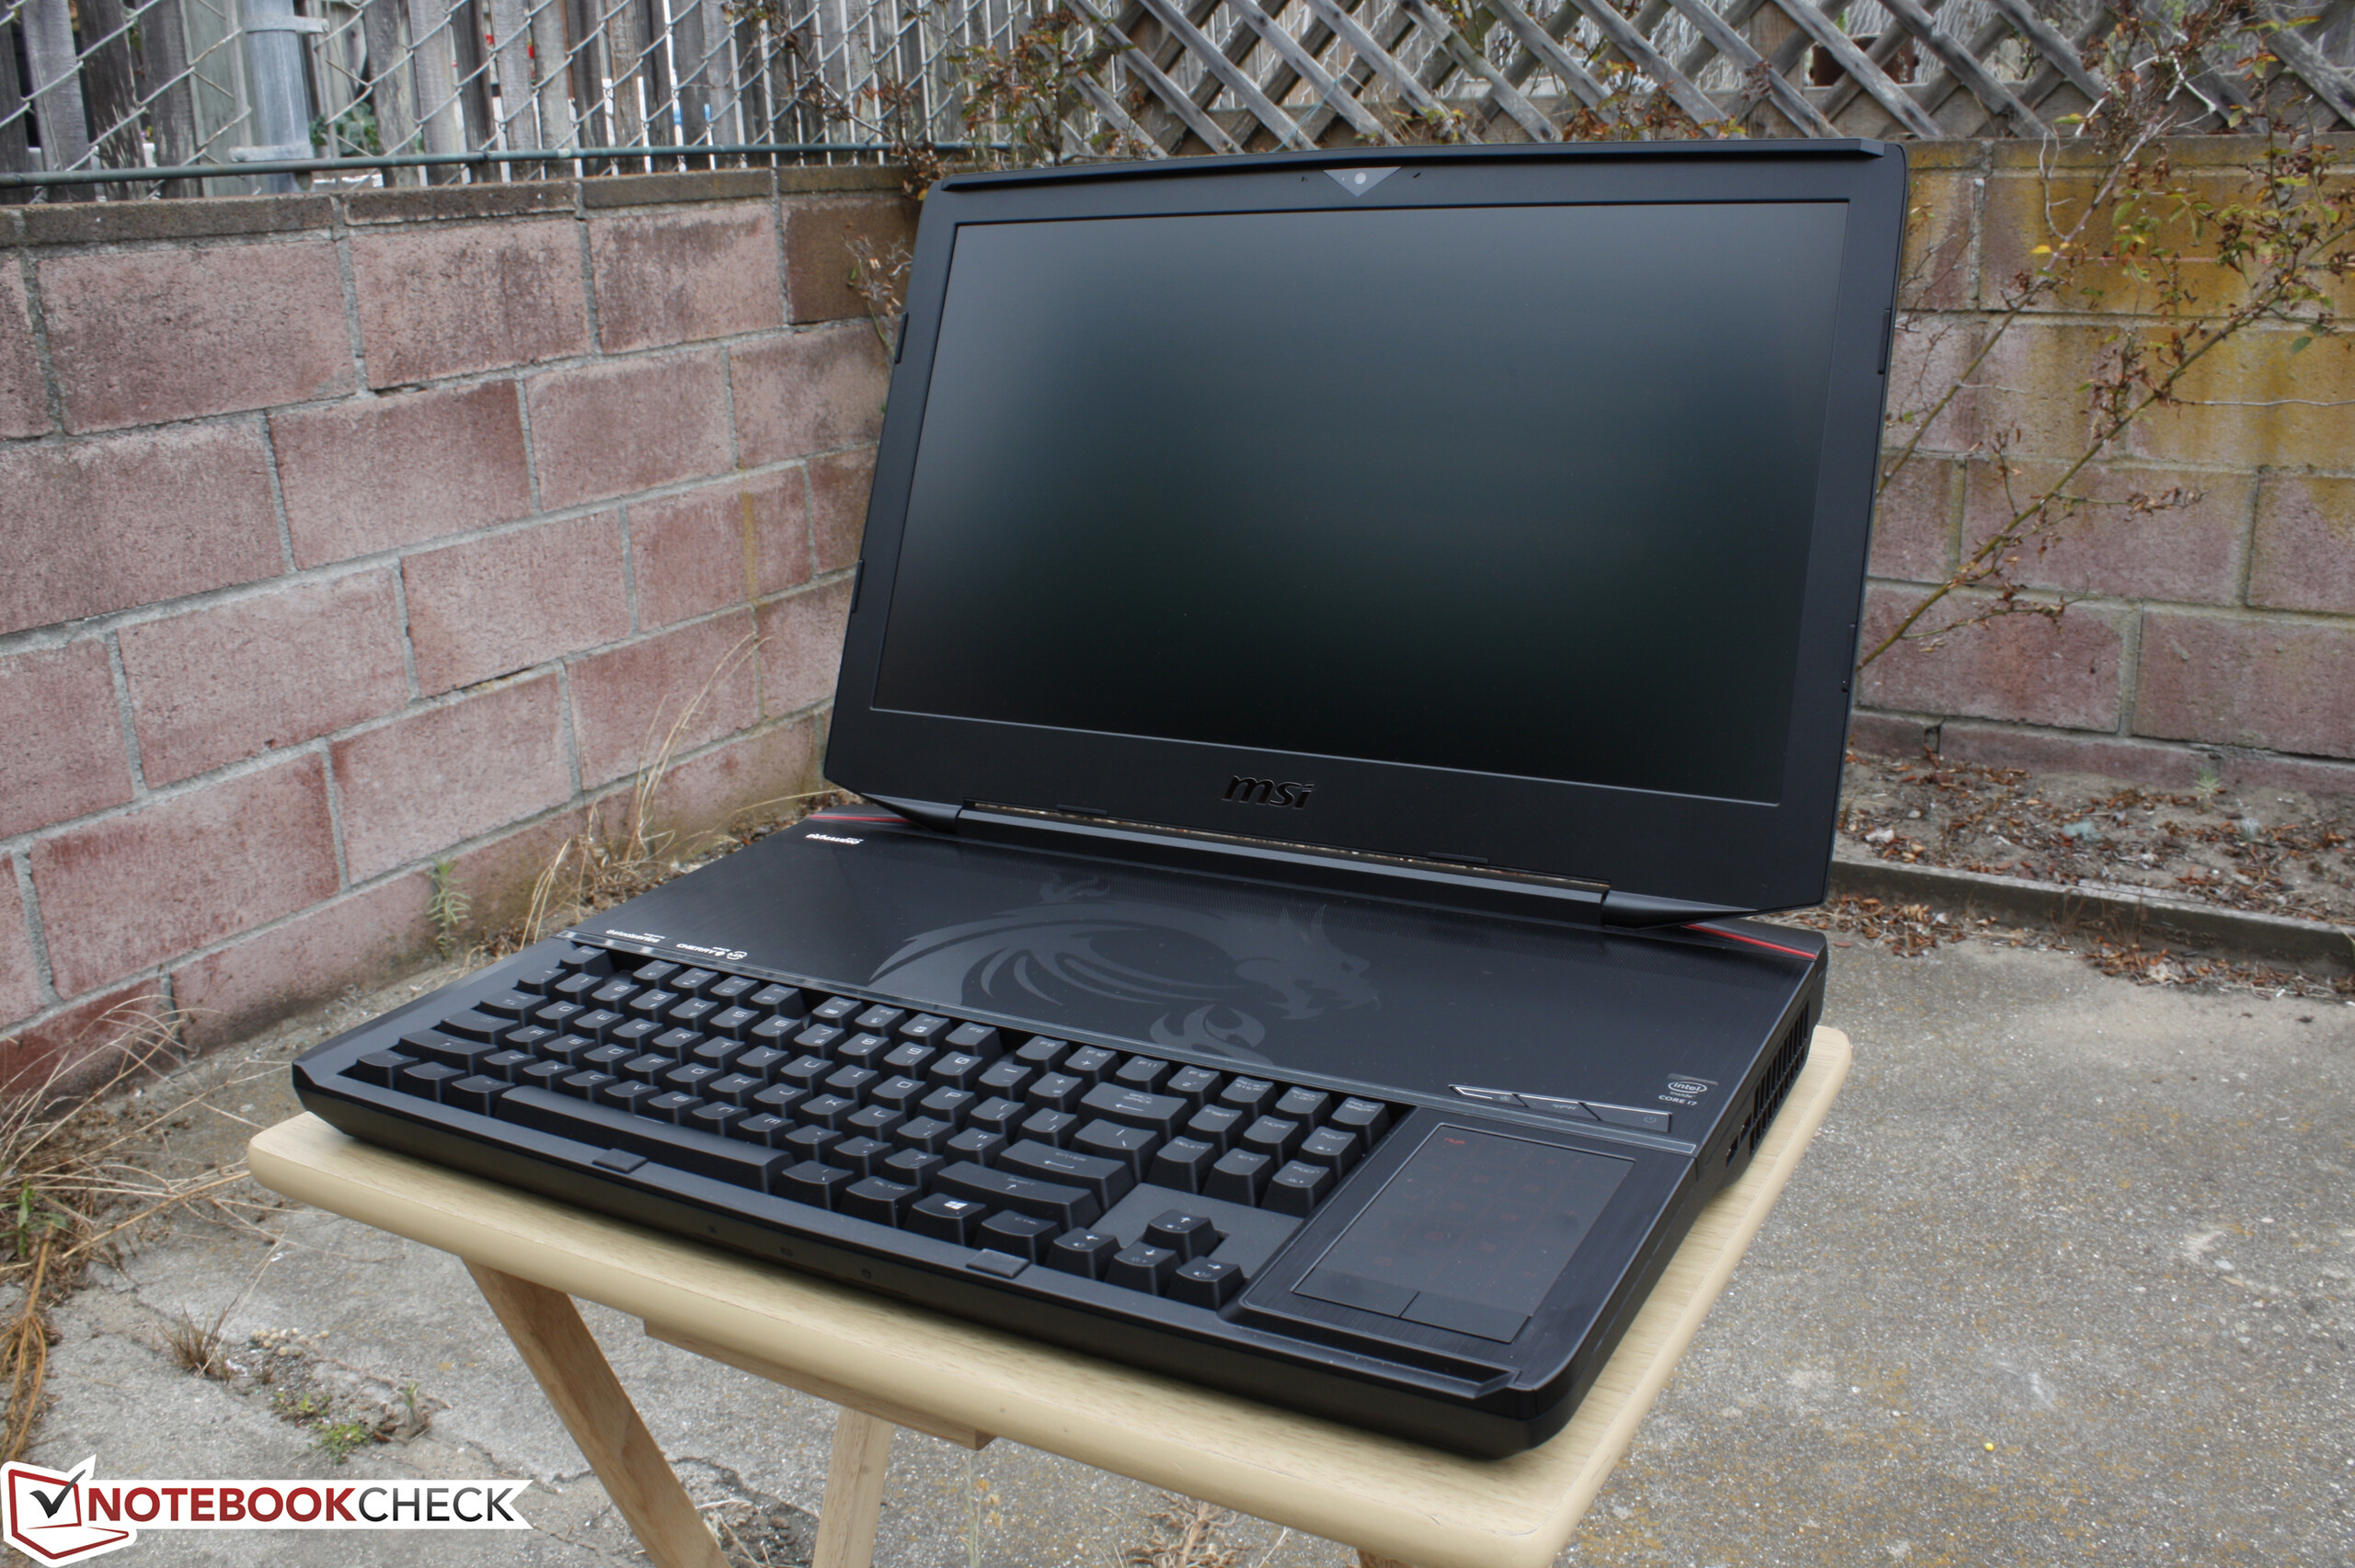
La conclusión es que si te vas a comprar un portátil de juego de 18.4", que sea el MSI GT80.
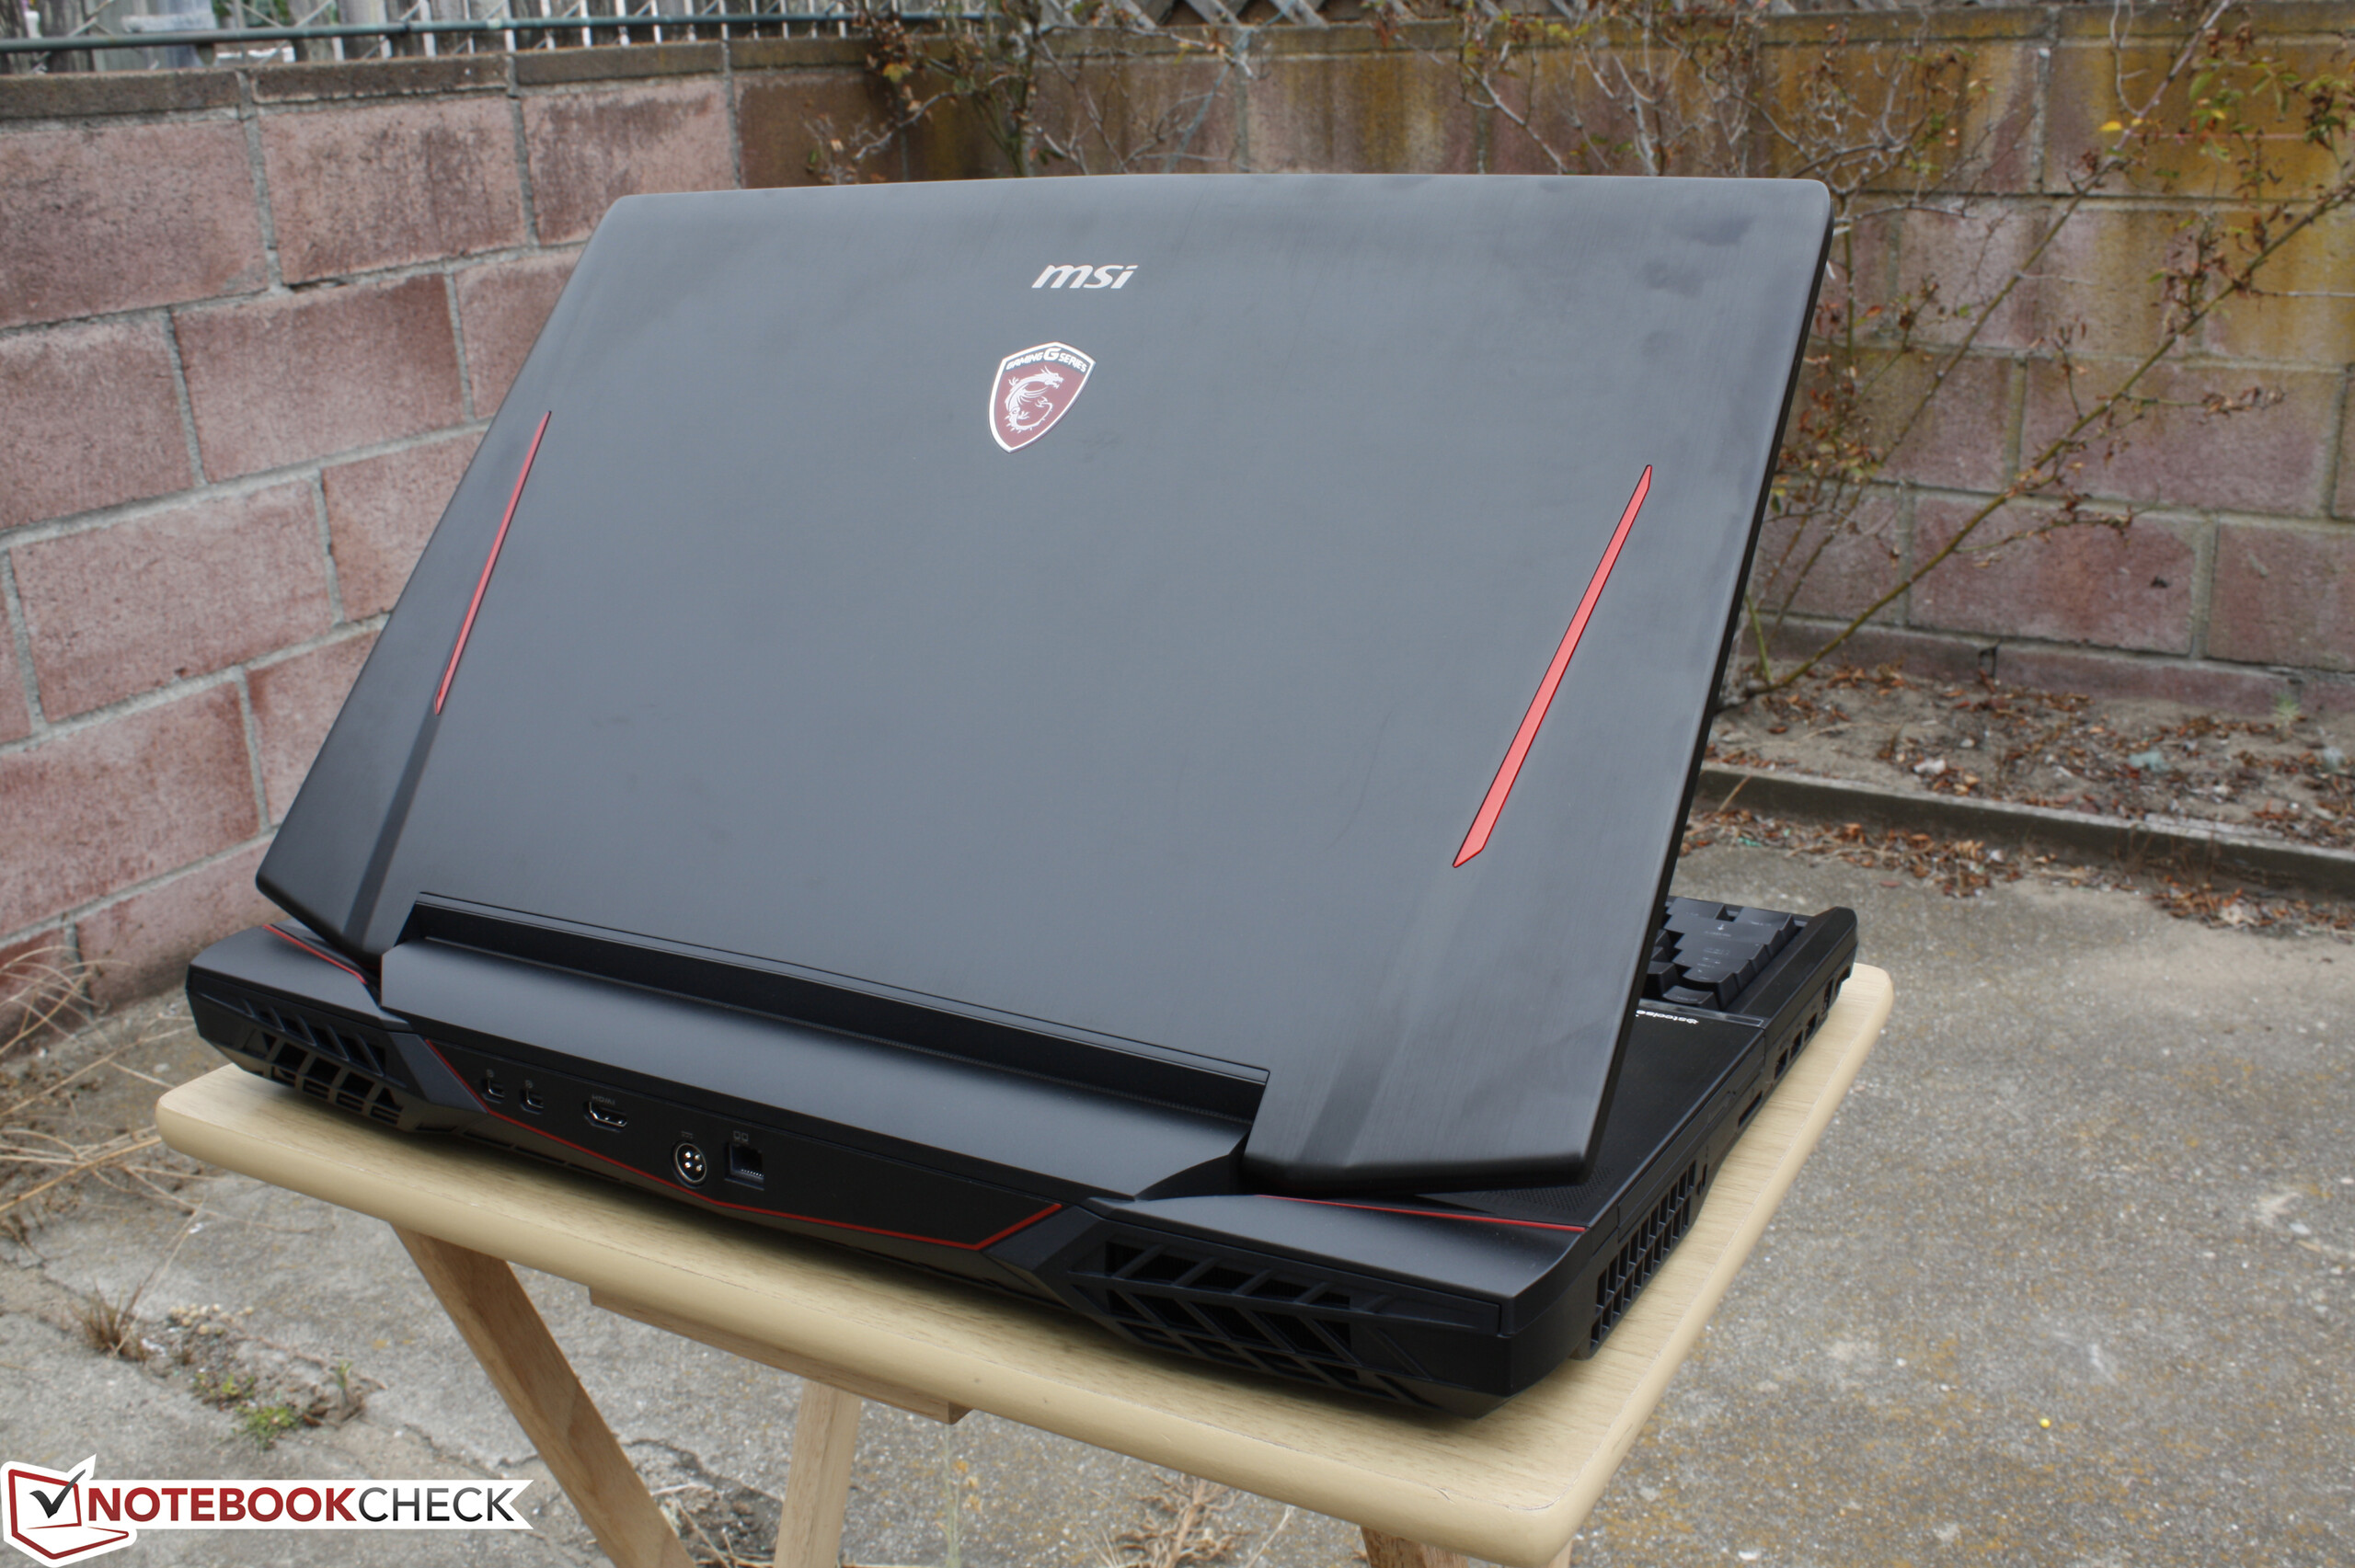
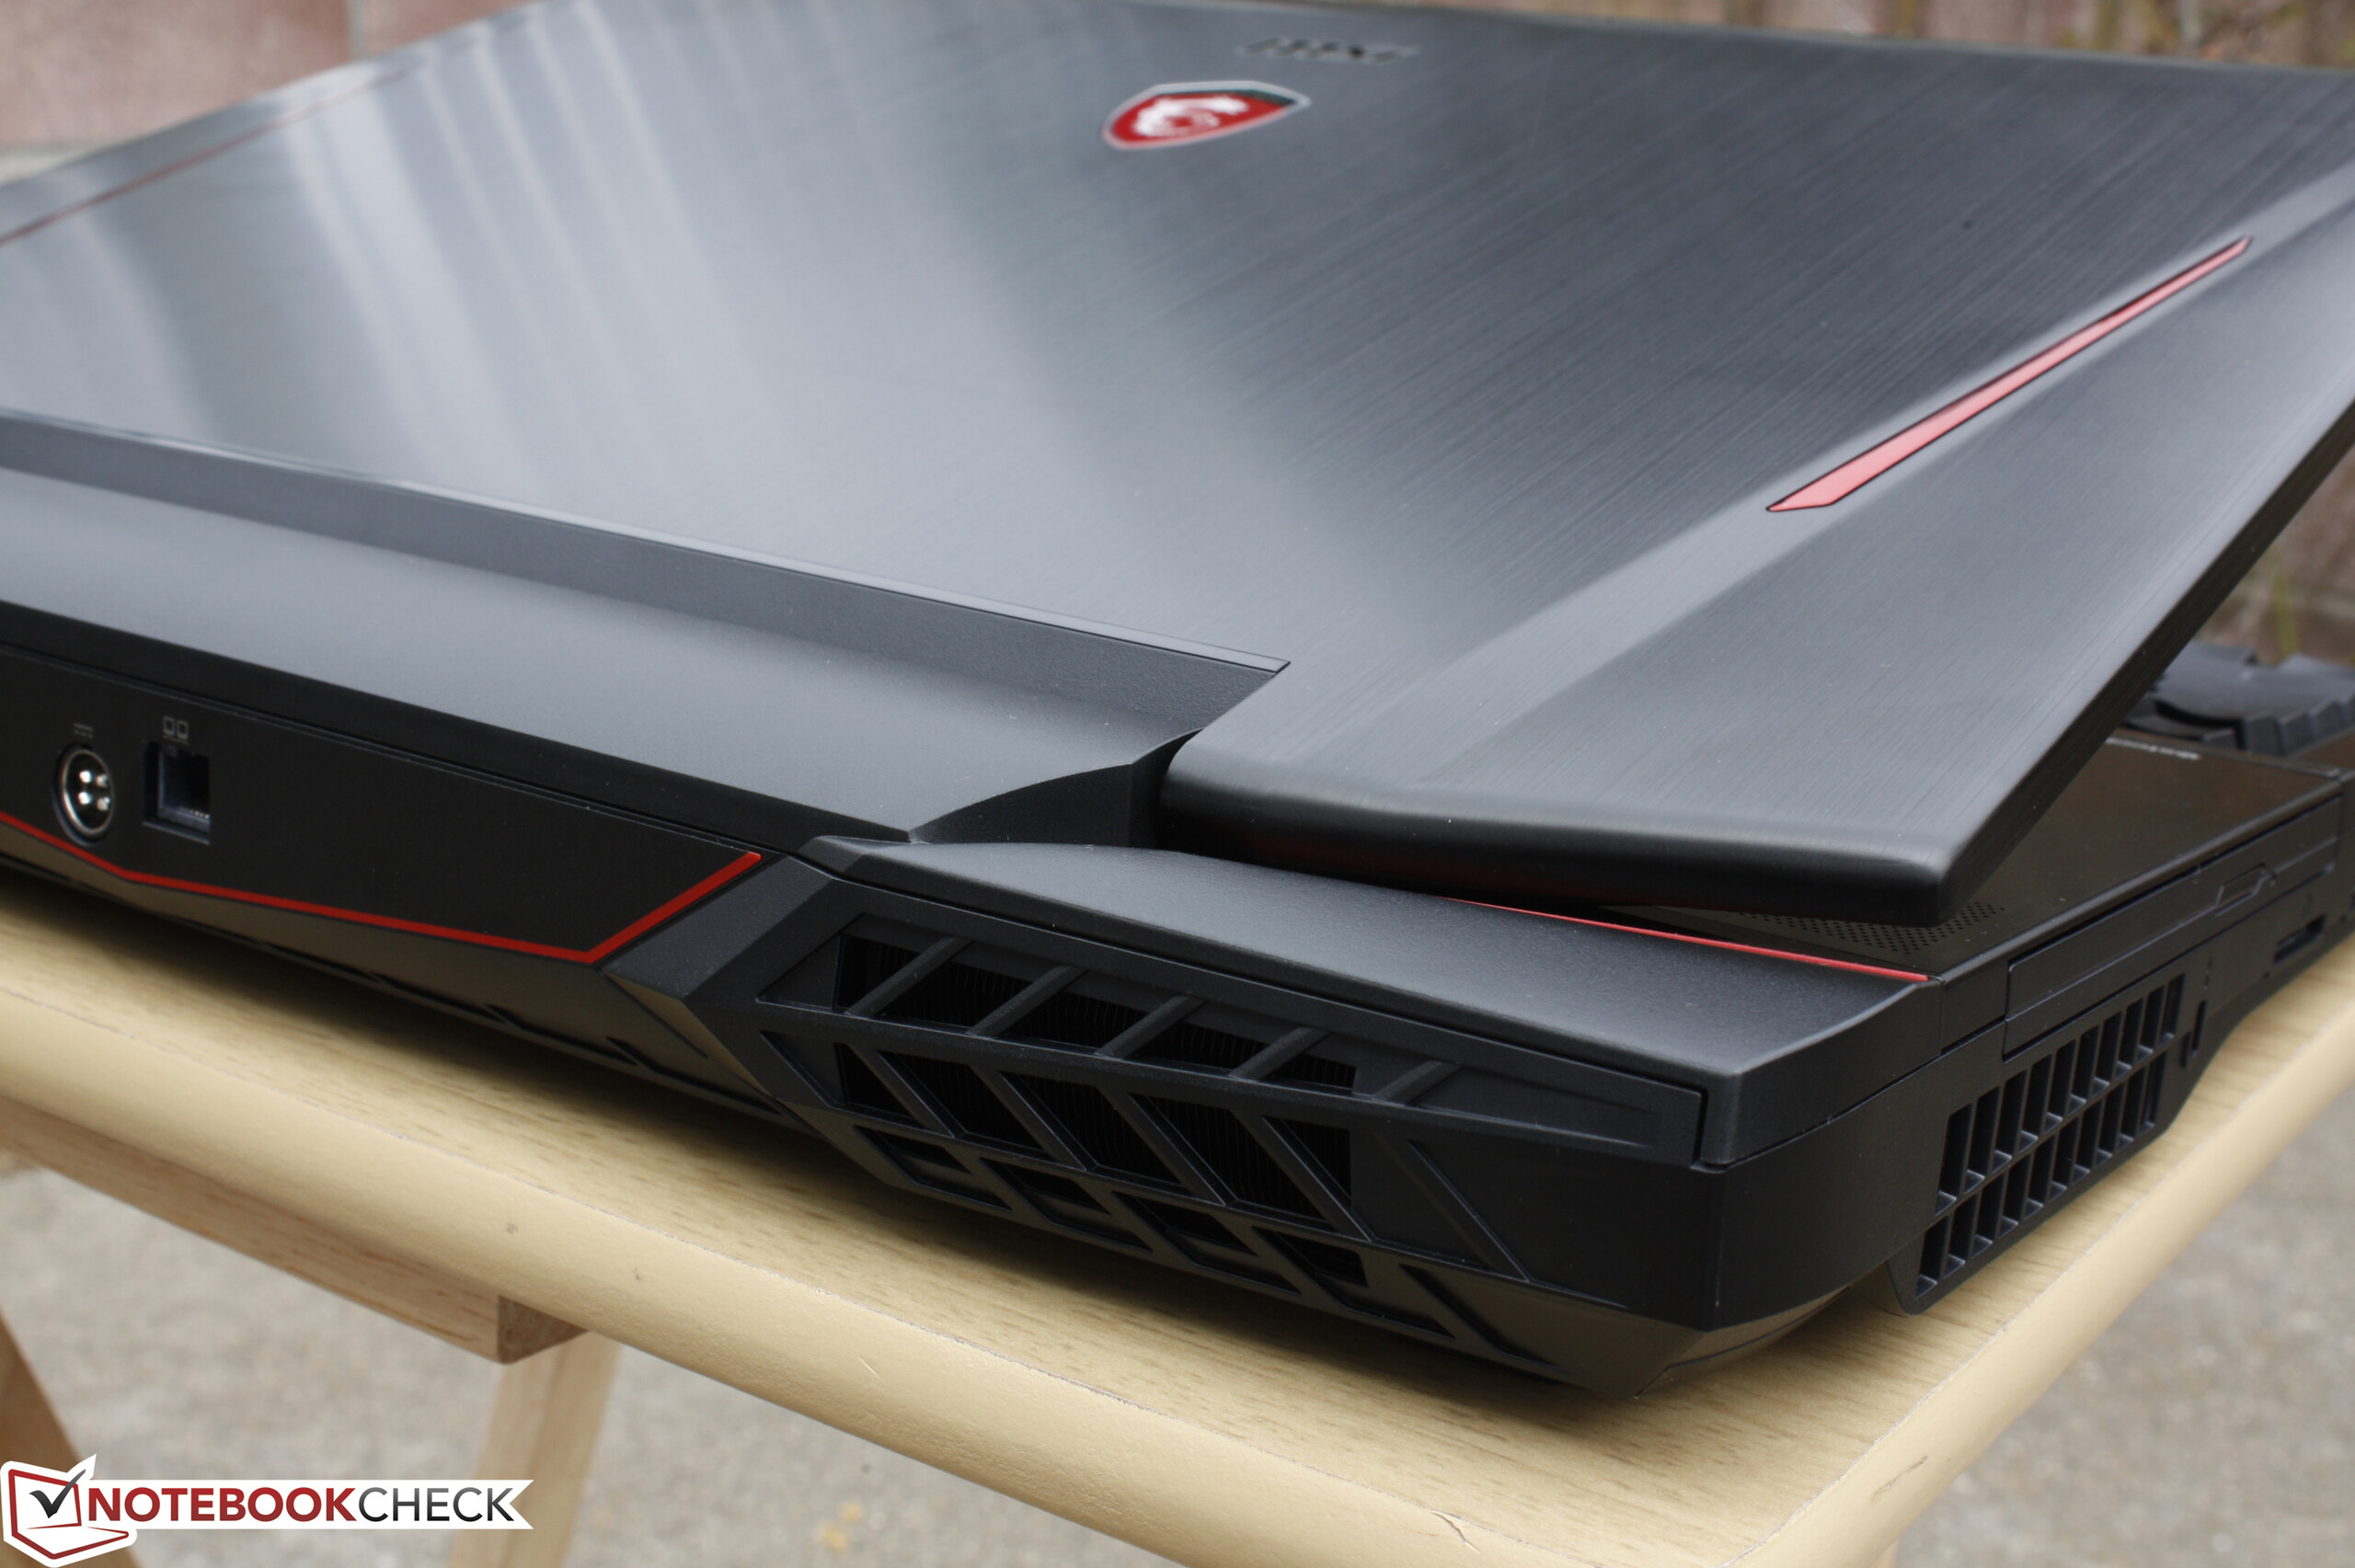
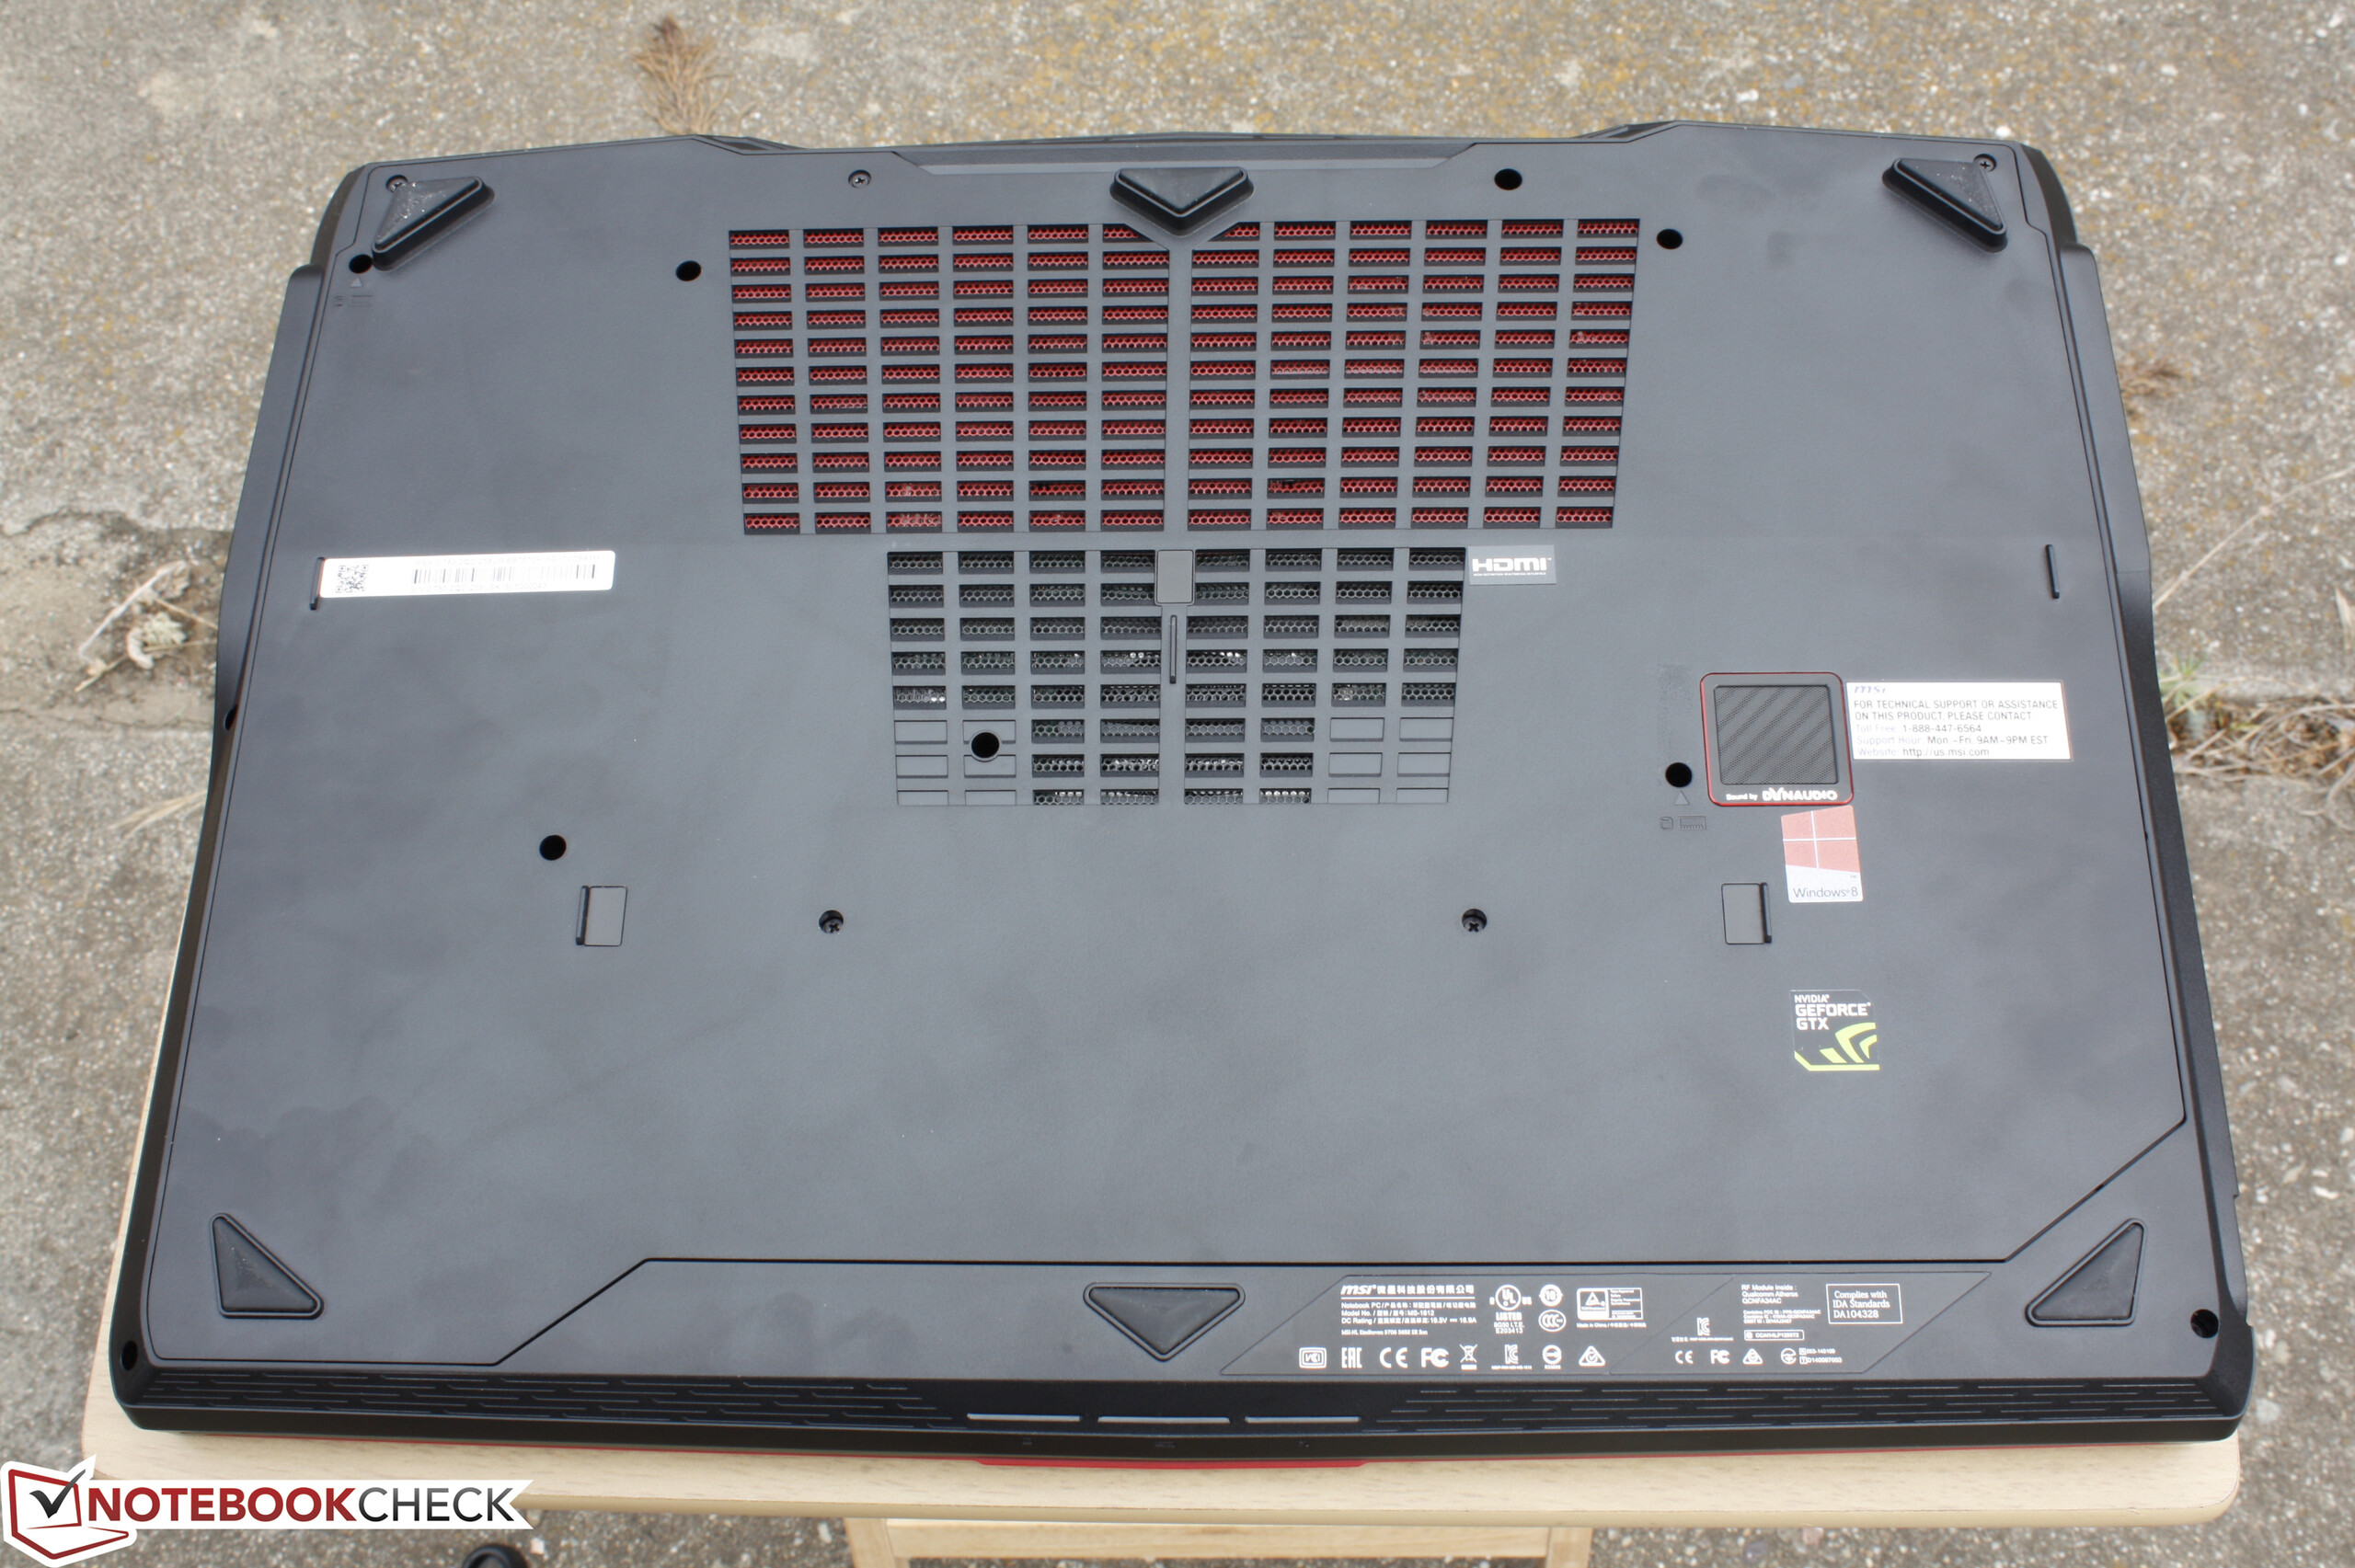
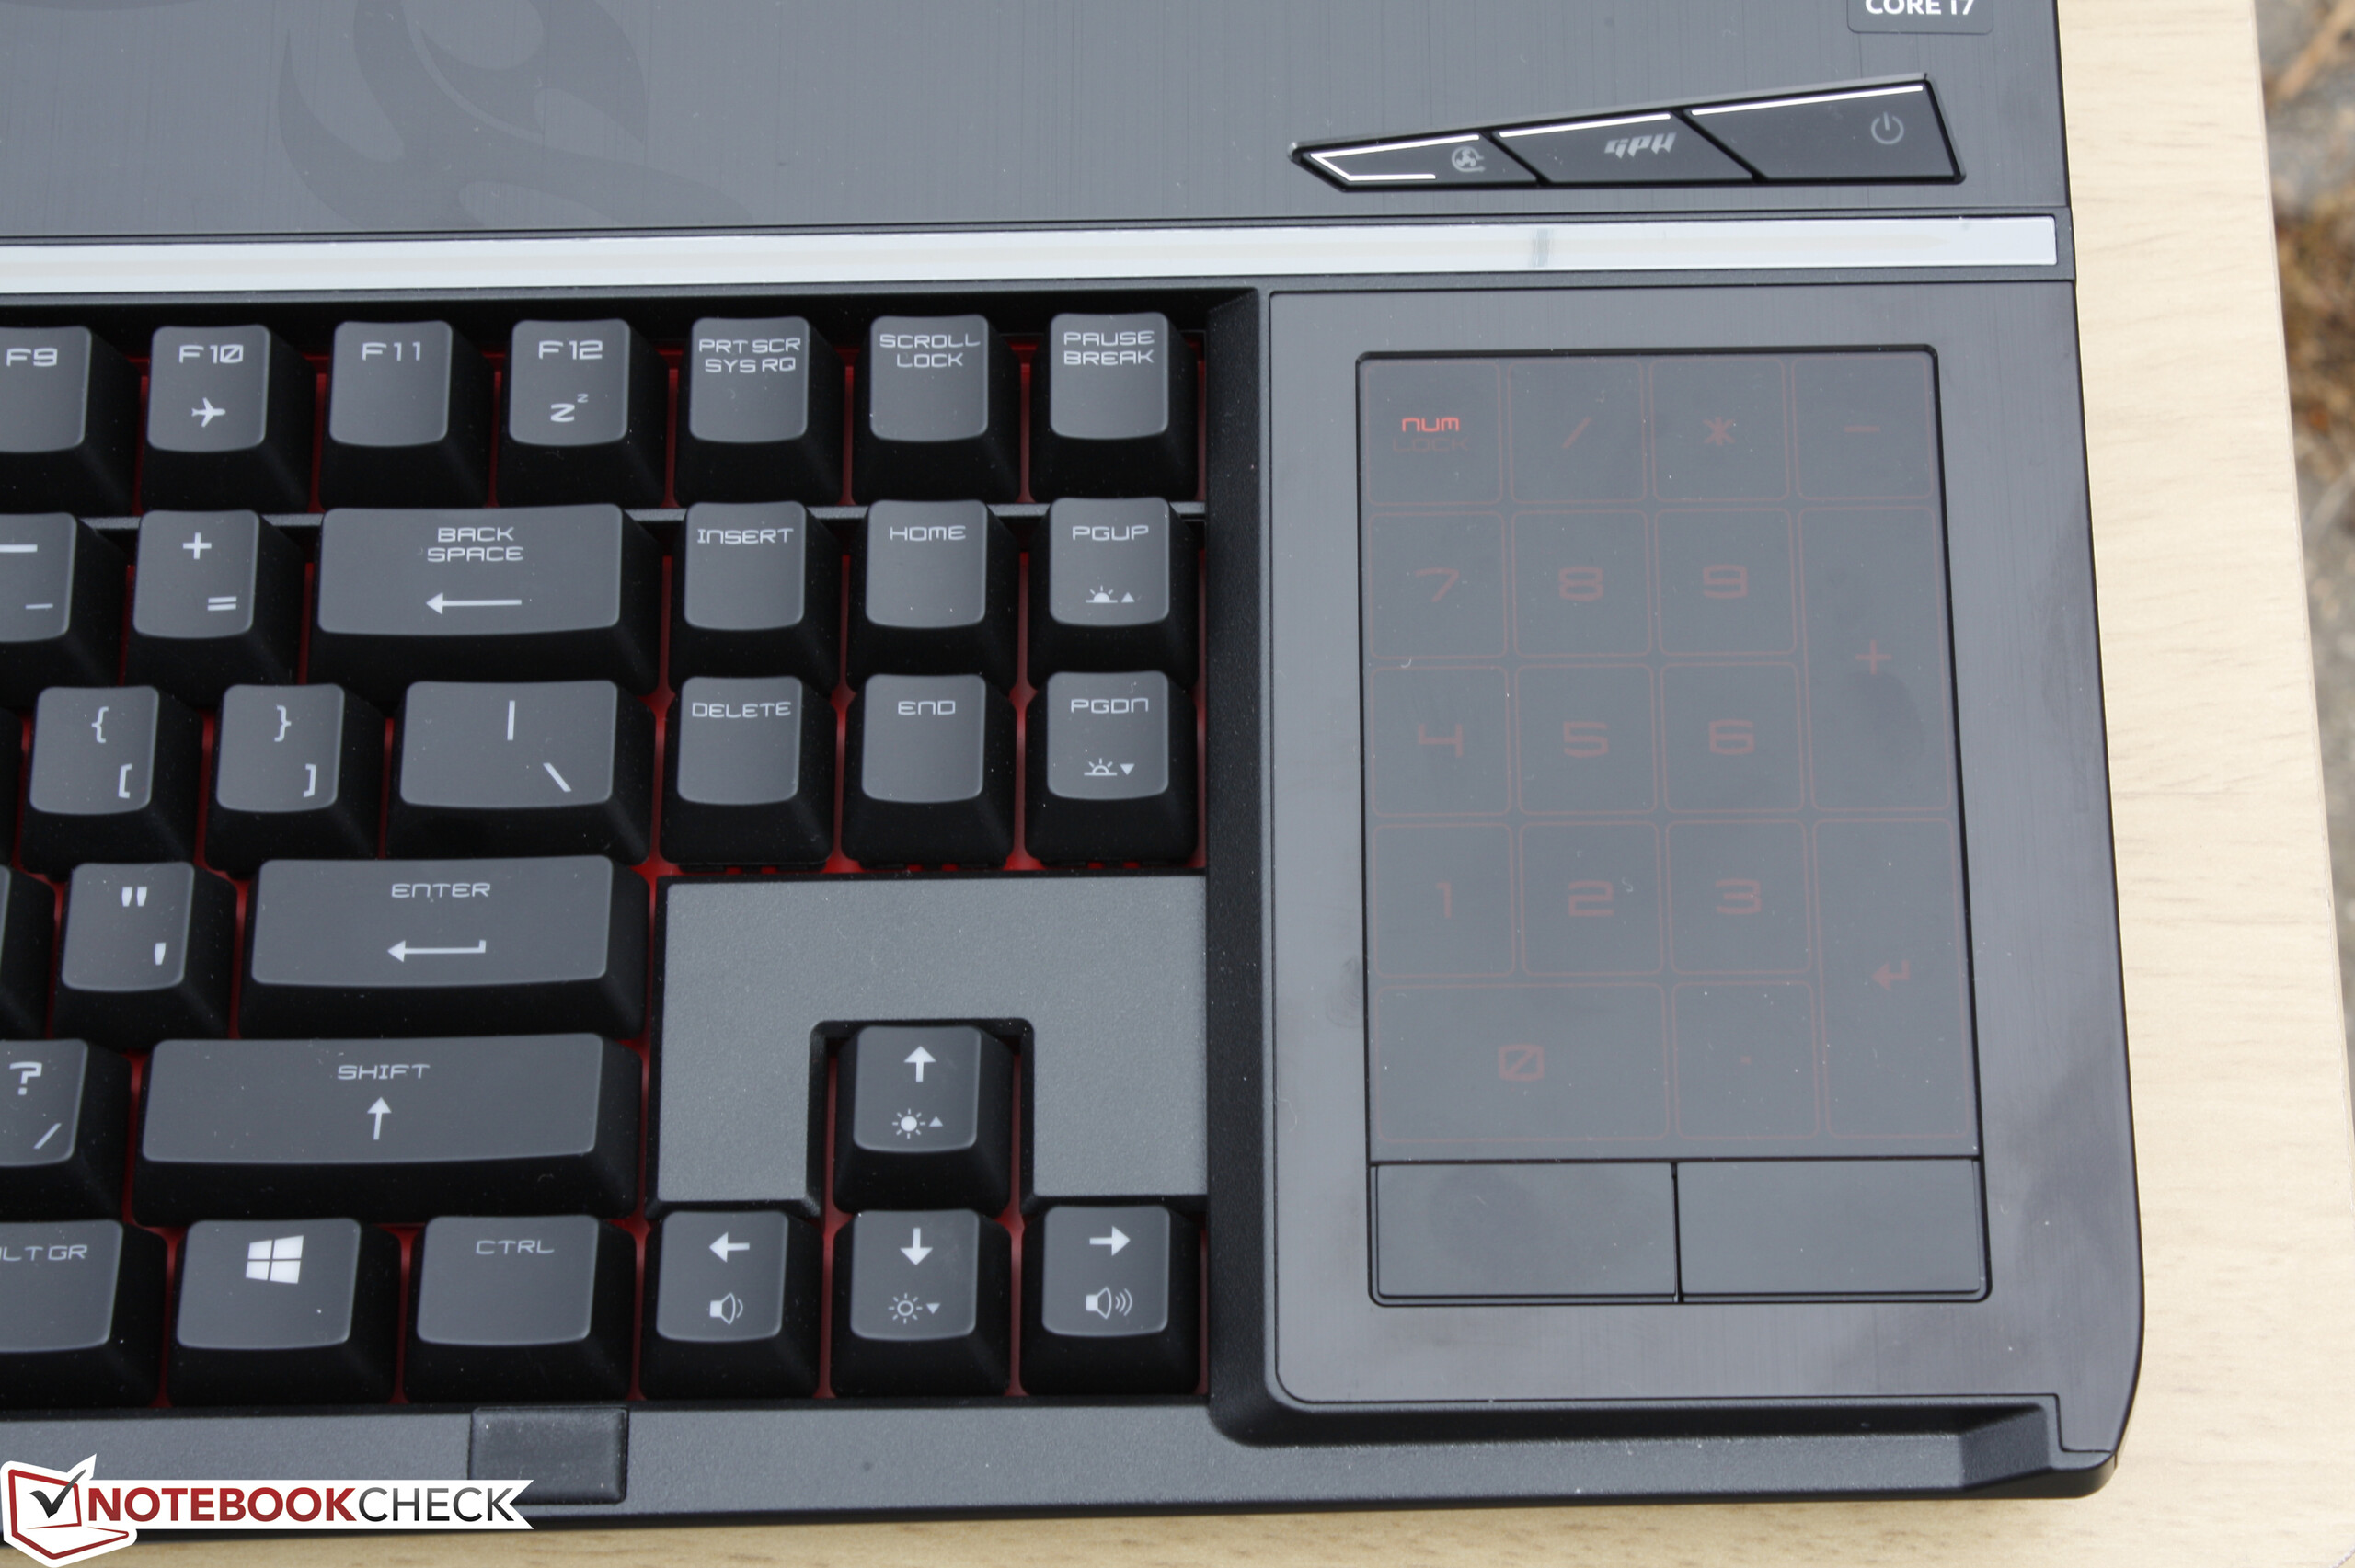
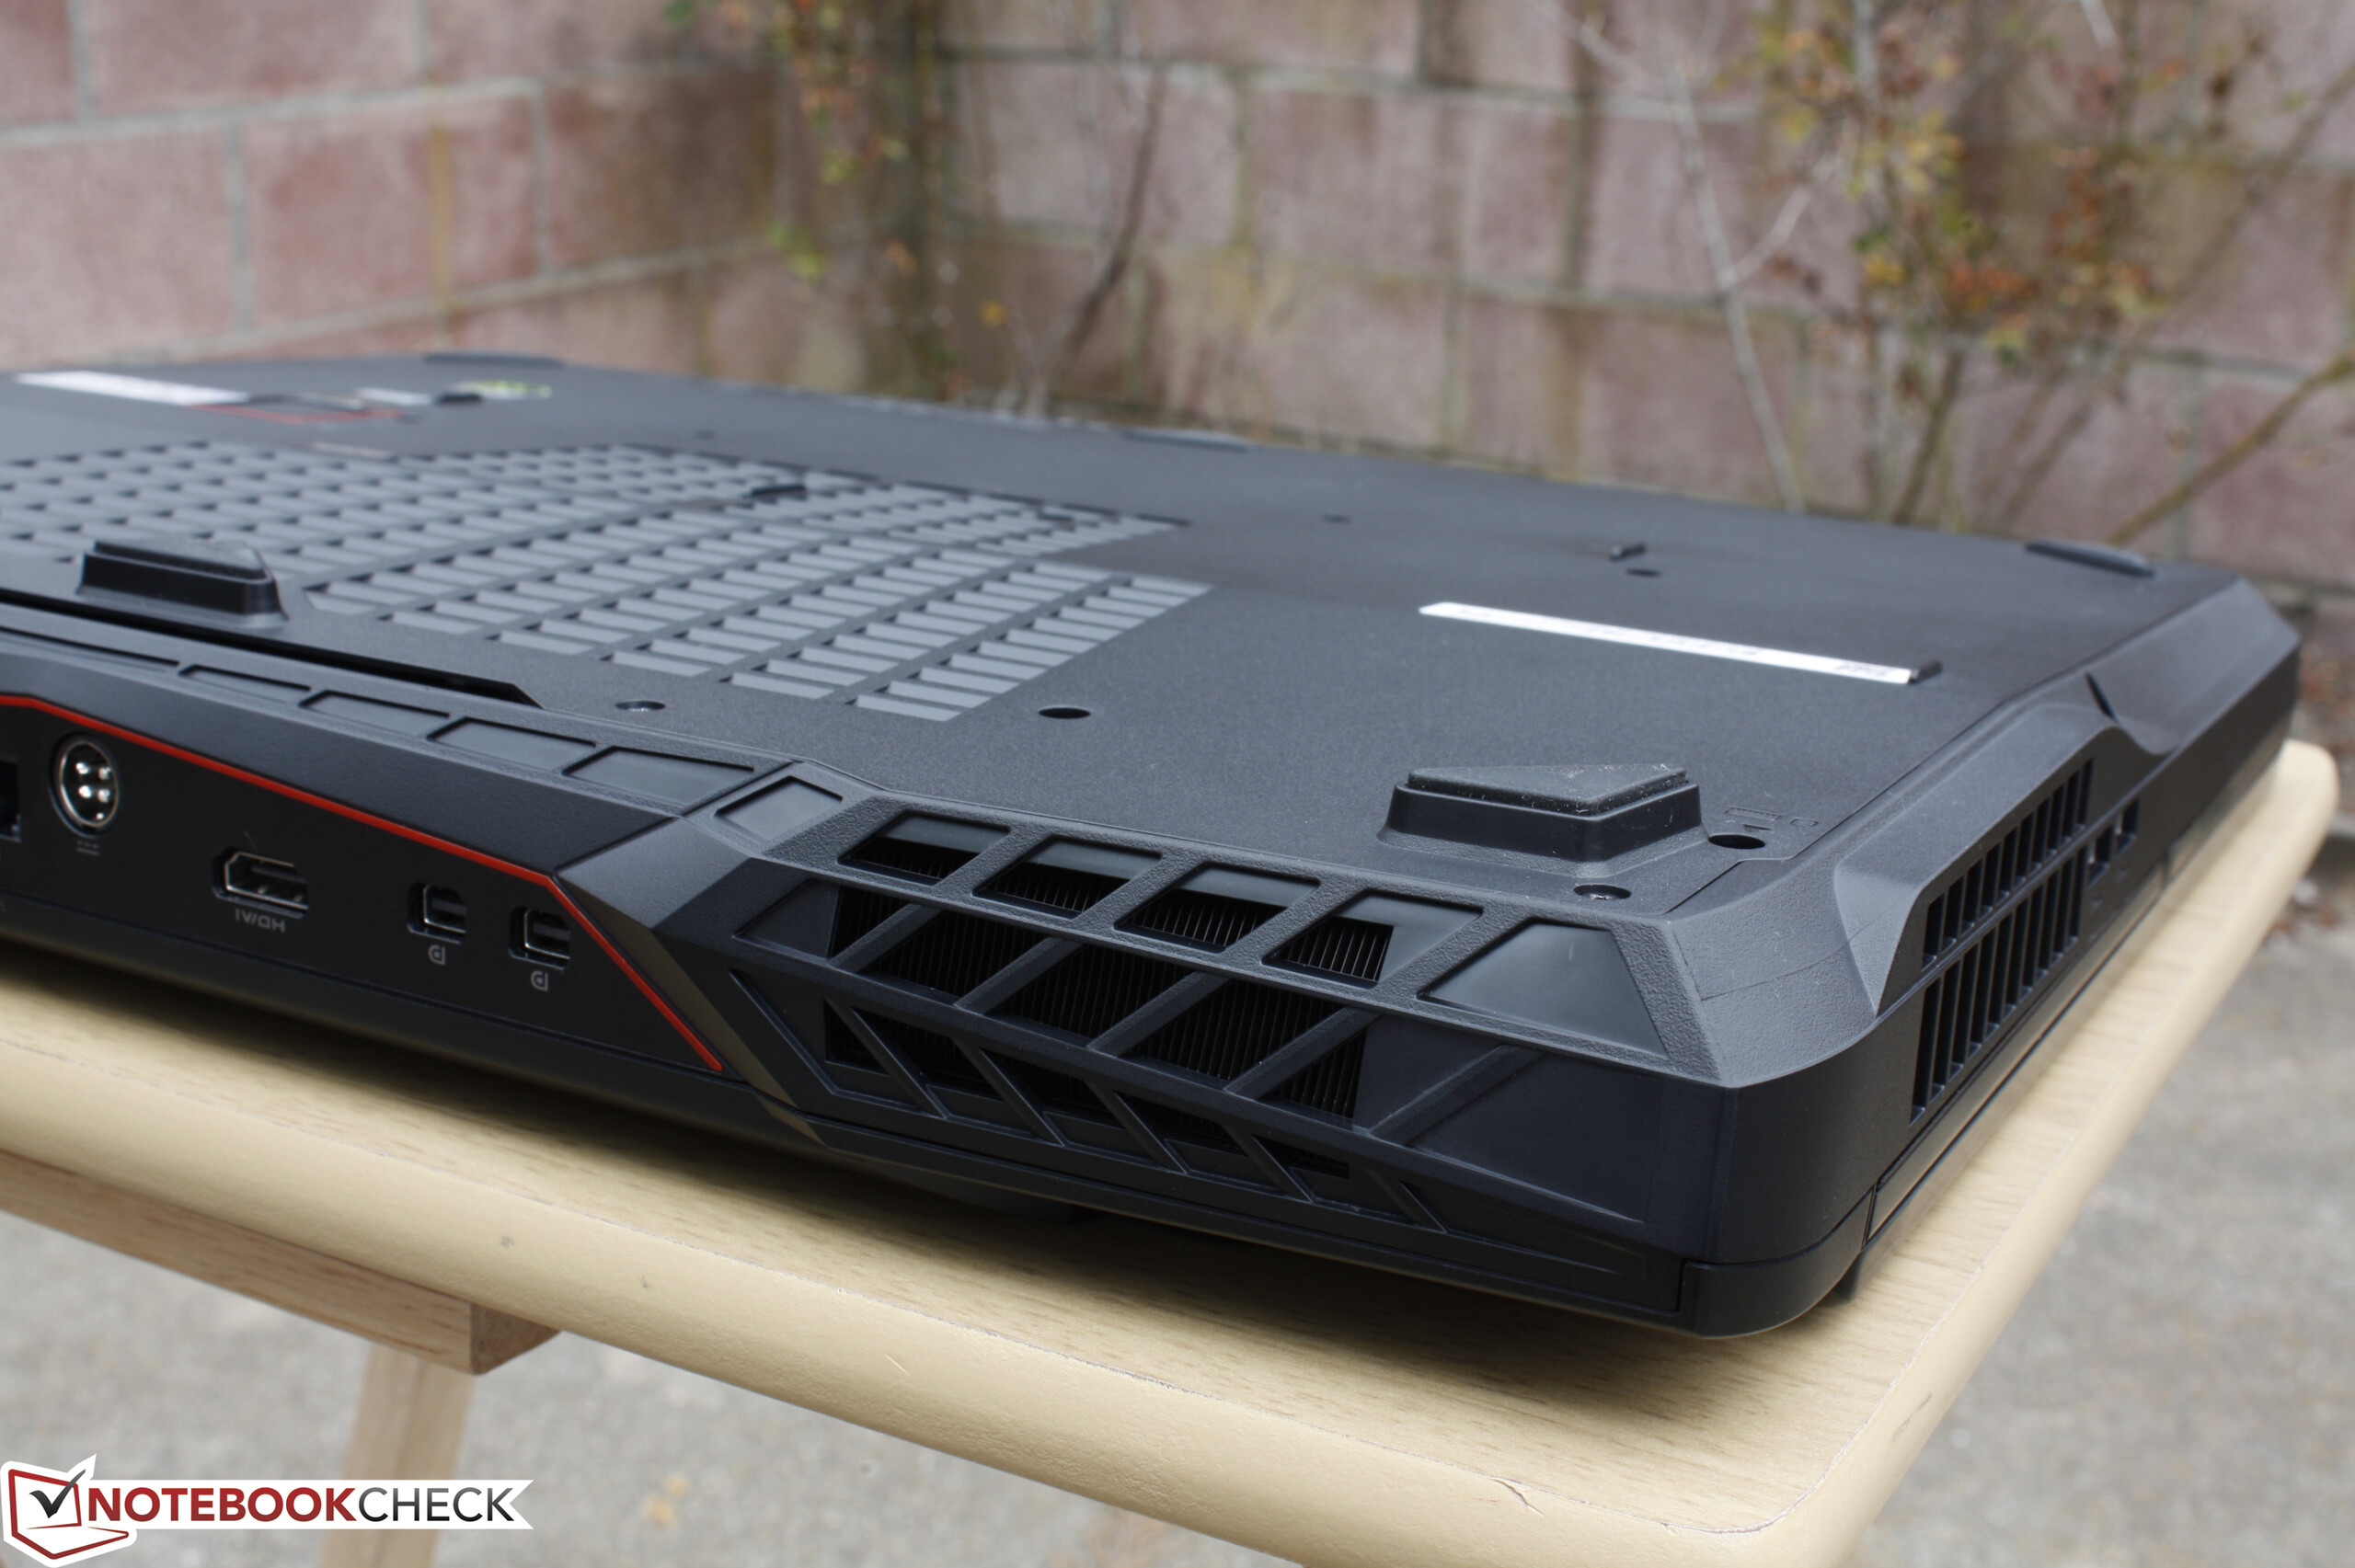
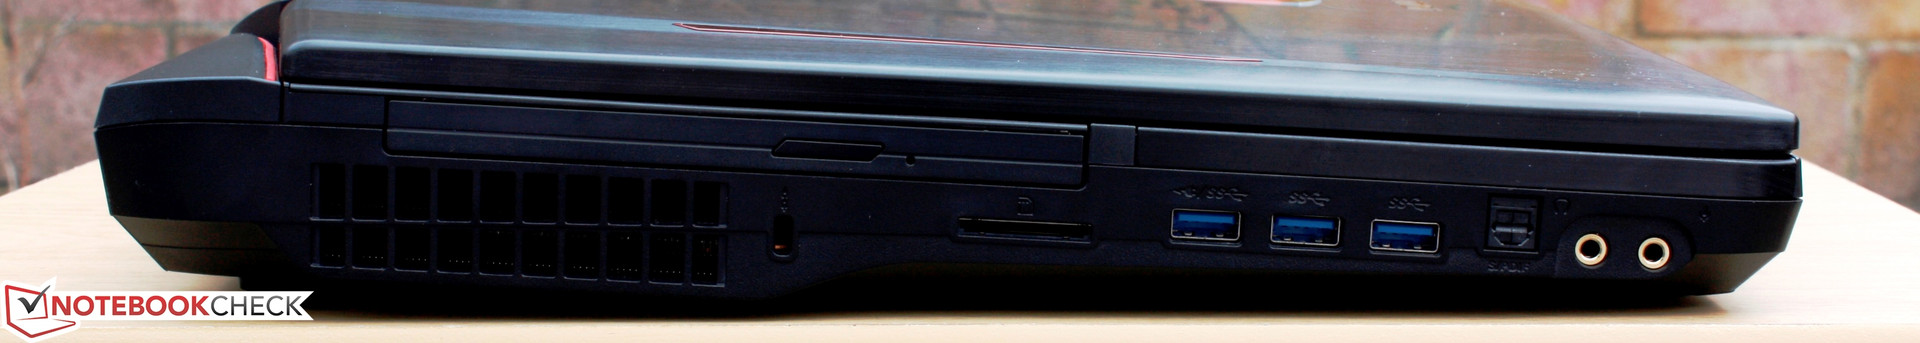
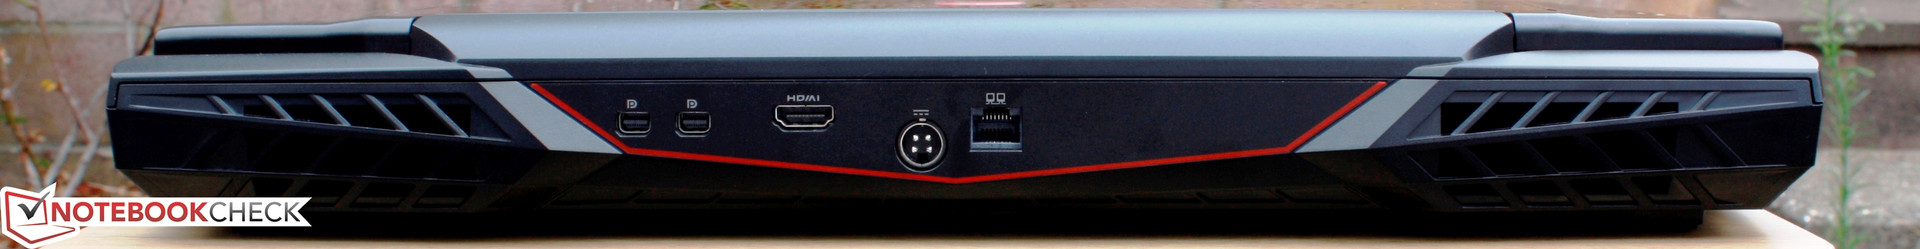
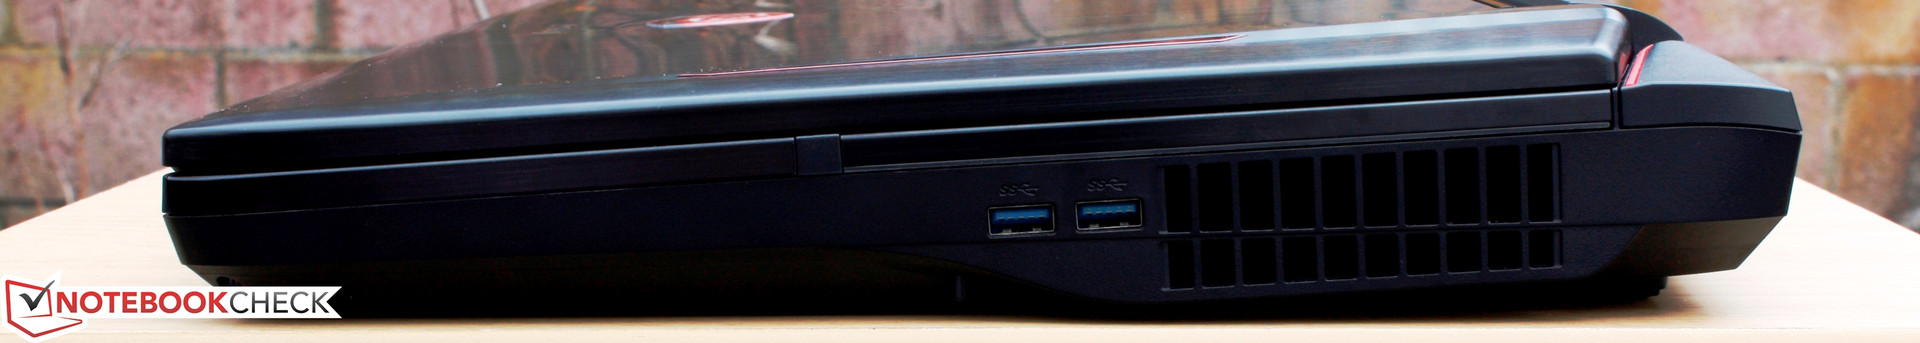
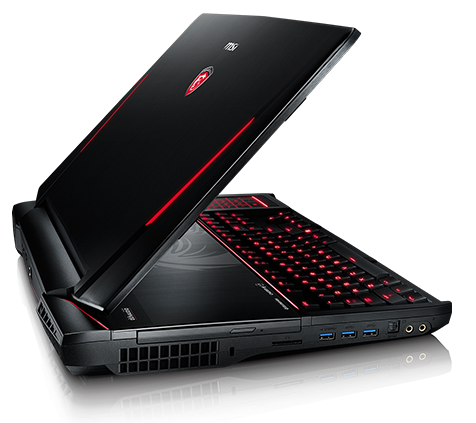
Dicho eso, hay algunos defectos a tener en cuenta. Su tamaño titánico puede implicar un montón de características, pero no es precisamente el caso. Si bien su media docena de bahías de almacenamiento, 4x altavoces más subwoofer, 3x salidas de vídeo y teclado mecánico son todos muy bienvenidos, nos habría gustado ver ranuras PCIe x4, Thunderbolt, CPU mejorable, display G-Sync, un teclado de tamaño completo y opciones de mayor resolución nativa.
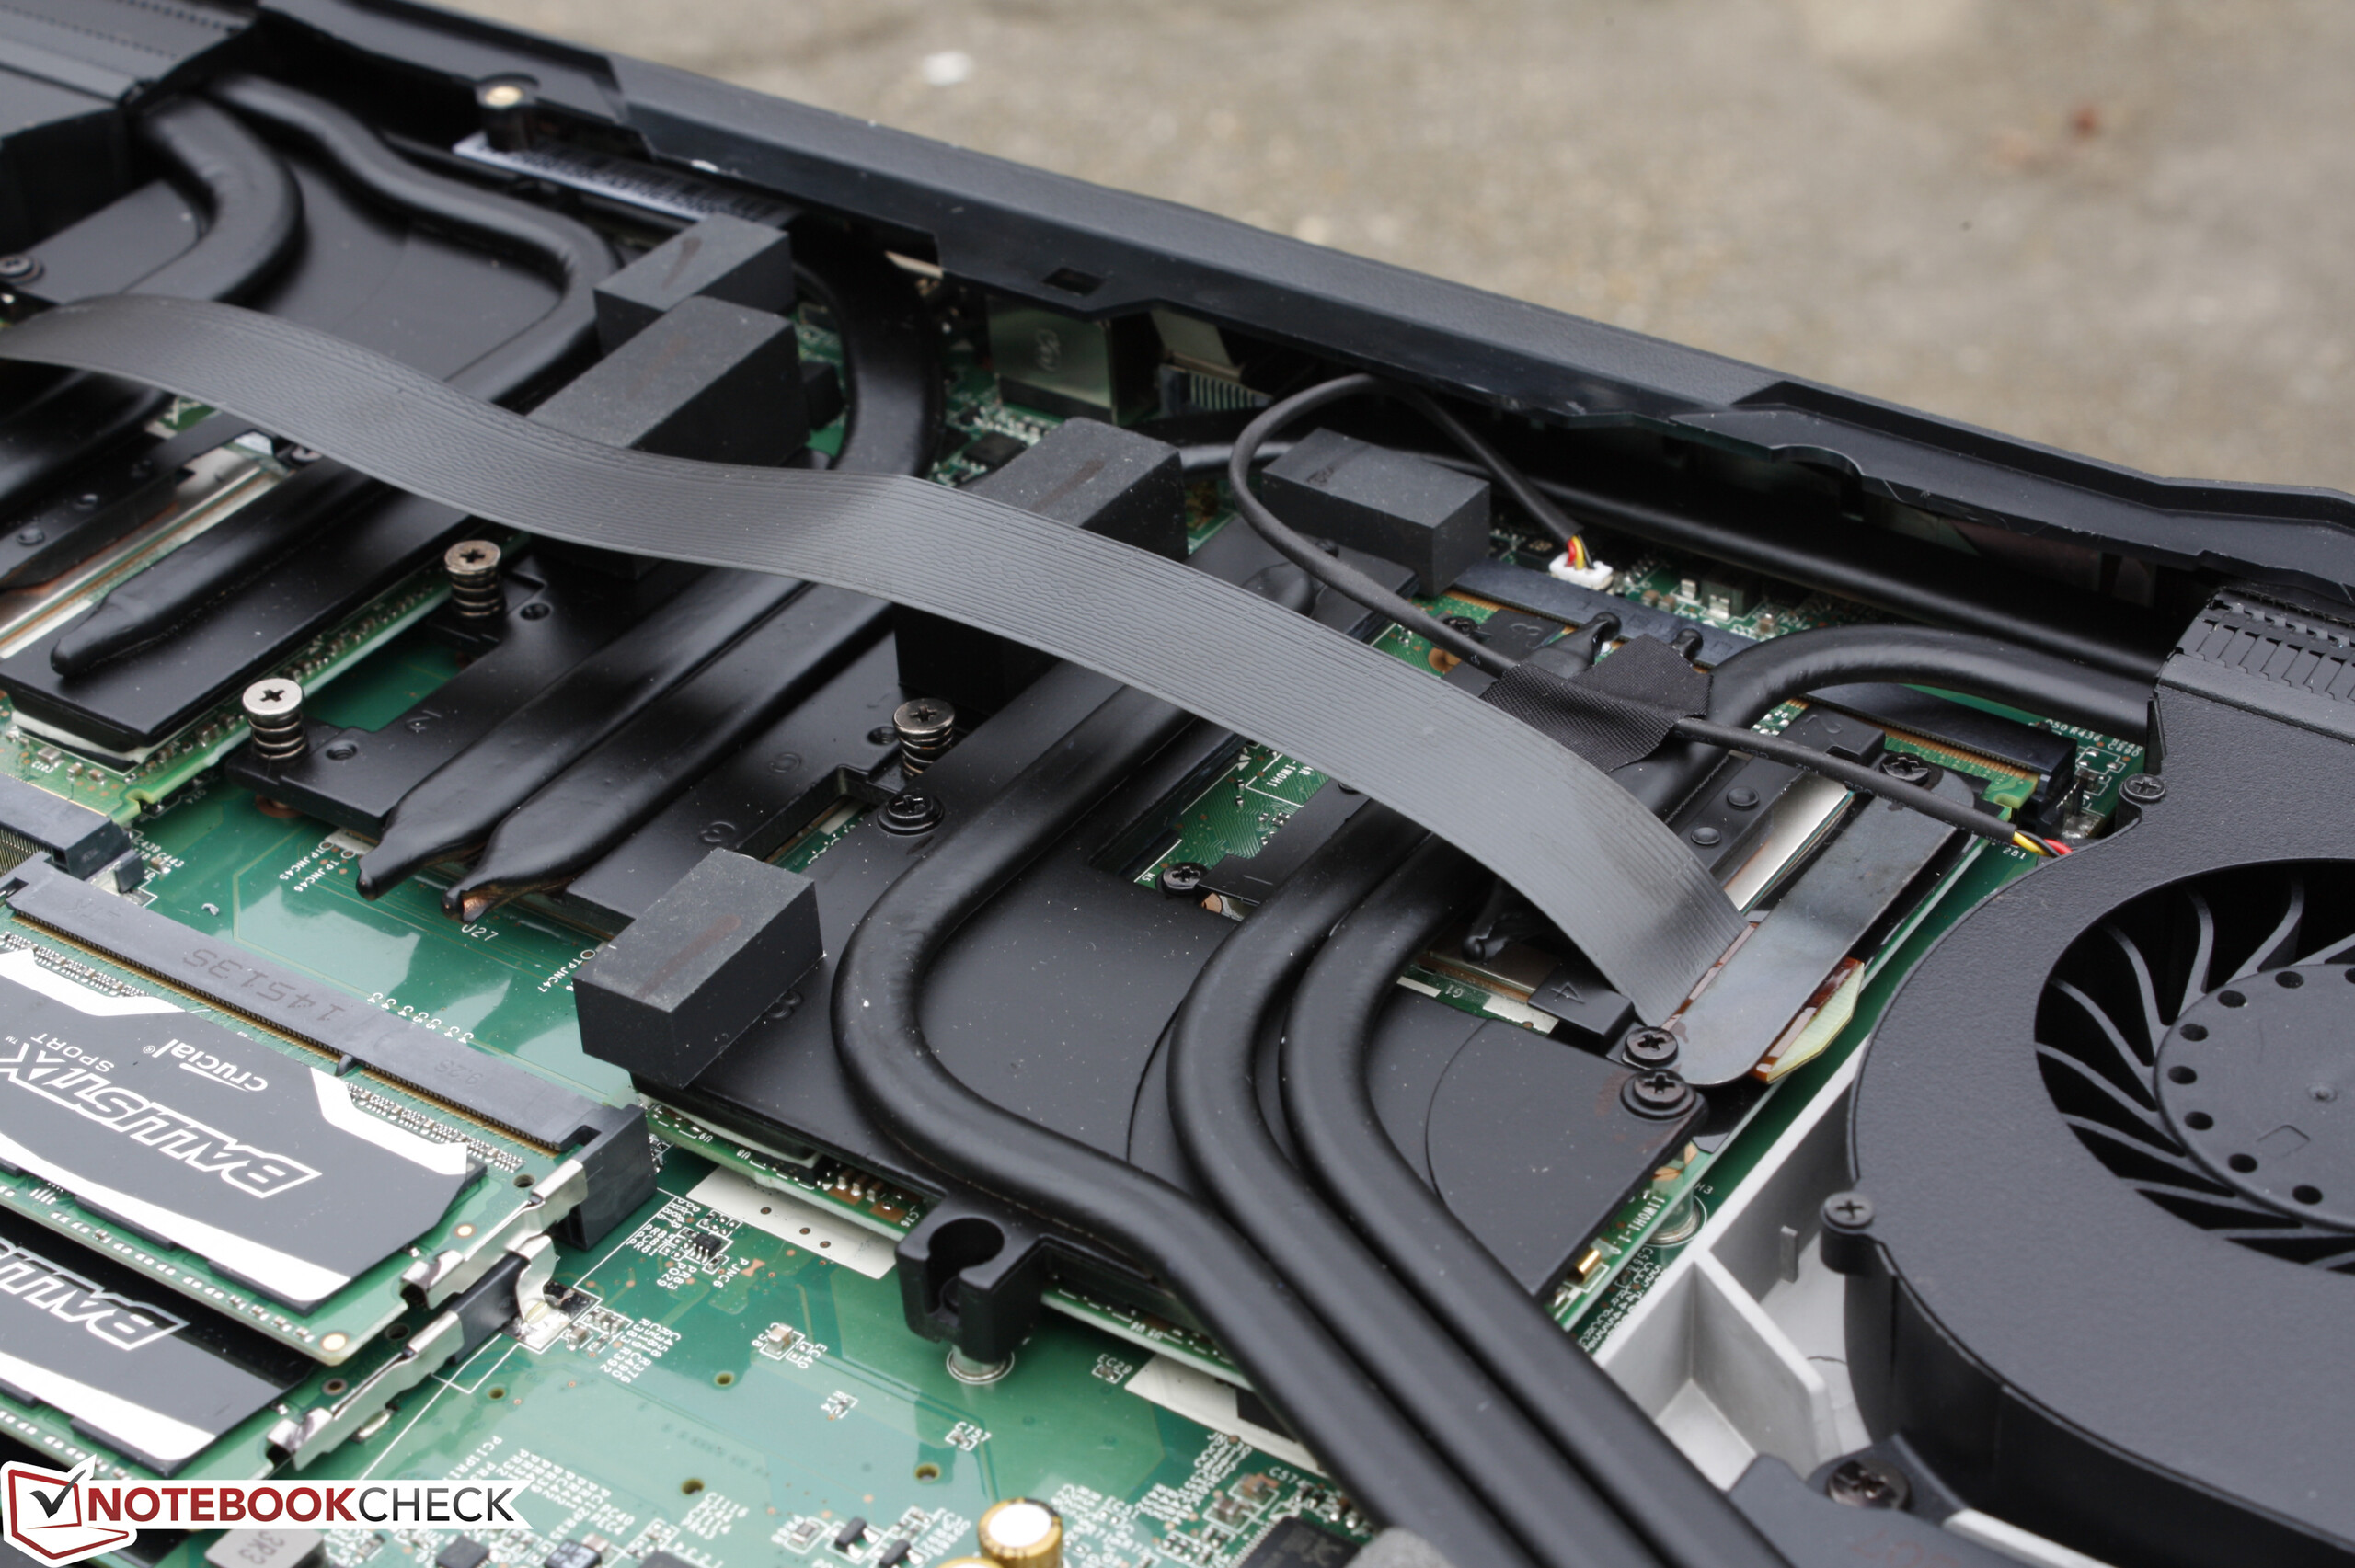
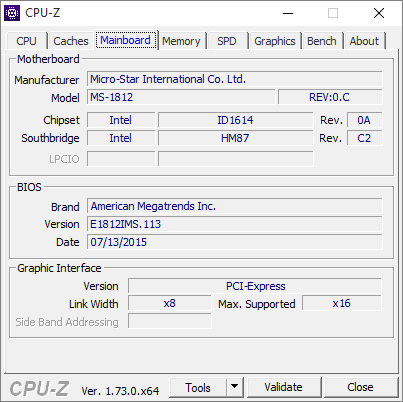
Muchas de estas características ausentes seguramente llegarán en la inevitable renovación del GT80. El Eurocom P5 Pro de 15.6", por ejemplo, usa un procesador de sobremesa y el sucesor GT80 puede hacer lo mismo. Lo que es más irritante es la falta de control a fondo de los ventiladores y de teclas Macro dedicadas para el juego. El hardware y el sistema de ventilación están particularmente bien hechos, si bien Aorus y Gigabyte con sus portátiles de juego delgados y ligeros pueden ofrecer mejor control manual del ventilador y un puñado de teclas Macro.
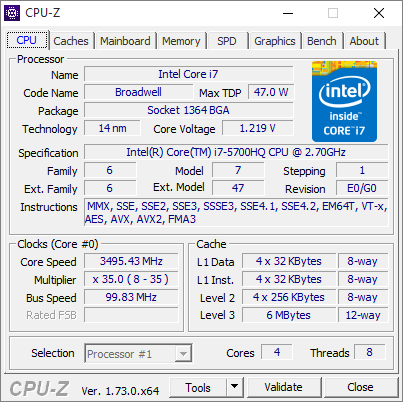
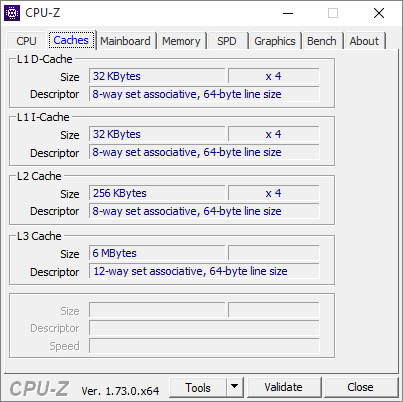
Nuestra configuración permite un montón de holgura para overclocking si los usuarios quisieran hacerlo ya que las temperaturas de los núcleos son bastante bajas para un portátil de juego. El overclocking oficial de las CPUs móviles de Intel, empero, no será soportado oficialmente hasta el lanzamiento de Skylake. Hasta entonces, esto es lo más cerca que puedes estar de tener una plataforma de juego todo-en-uno.
Ésta es una versión acortada del análisis original. Puedes leer el análisis completo en inglés aquí.
MSI GT80 Titan SLI
-
08/23/2015 v4(old)
Allen Ngo
Pricecompare
