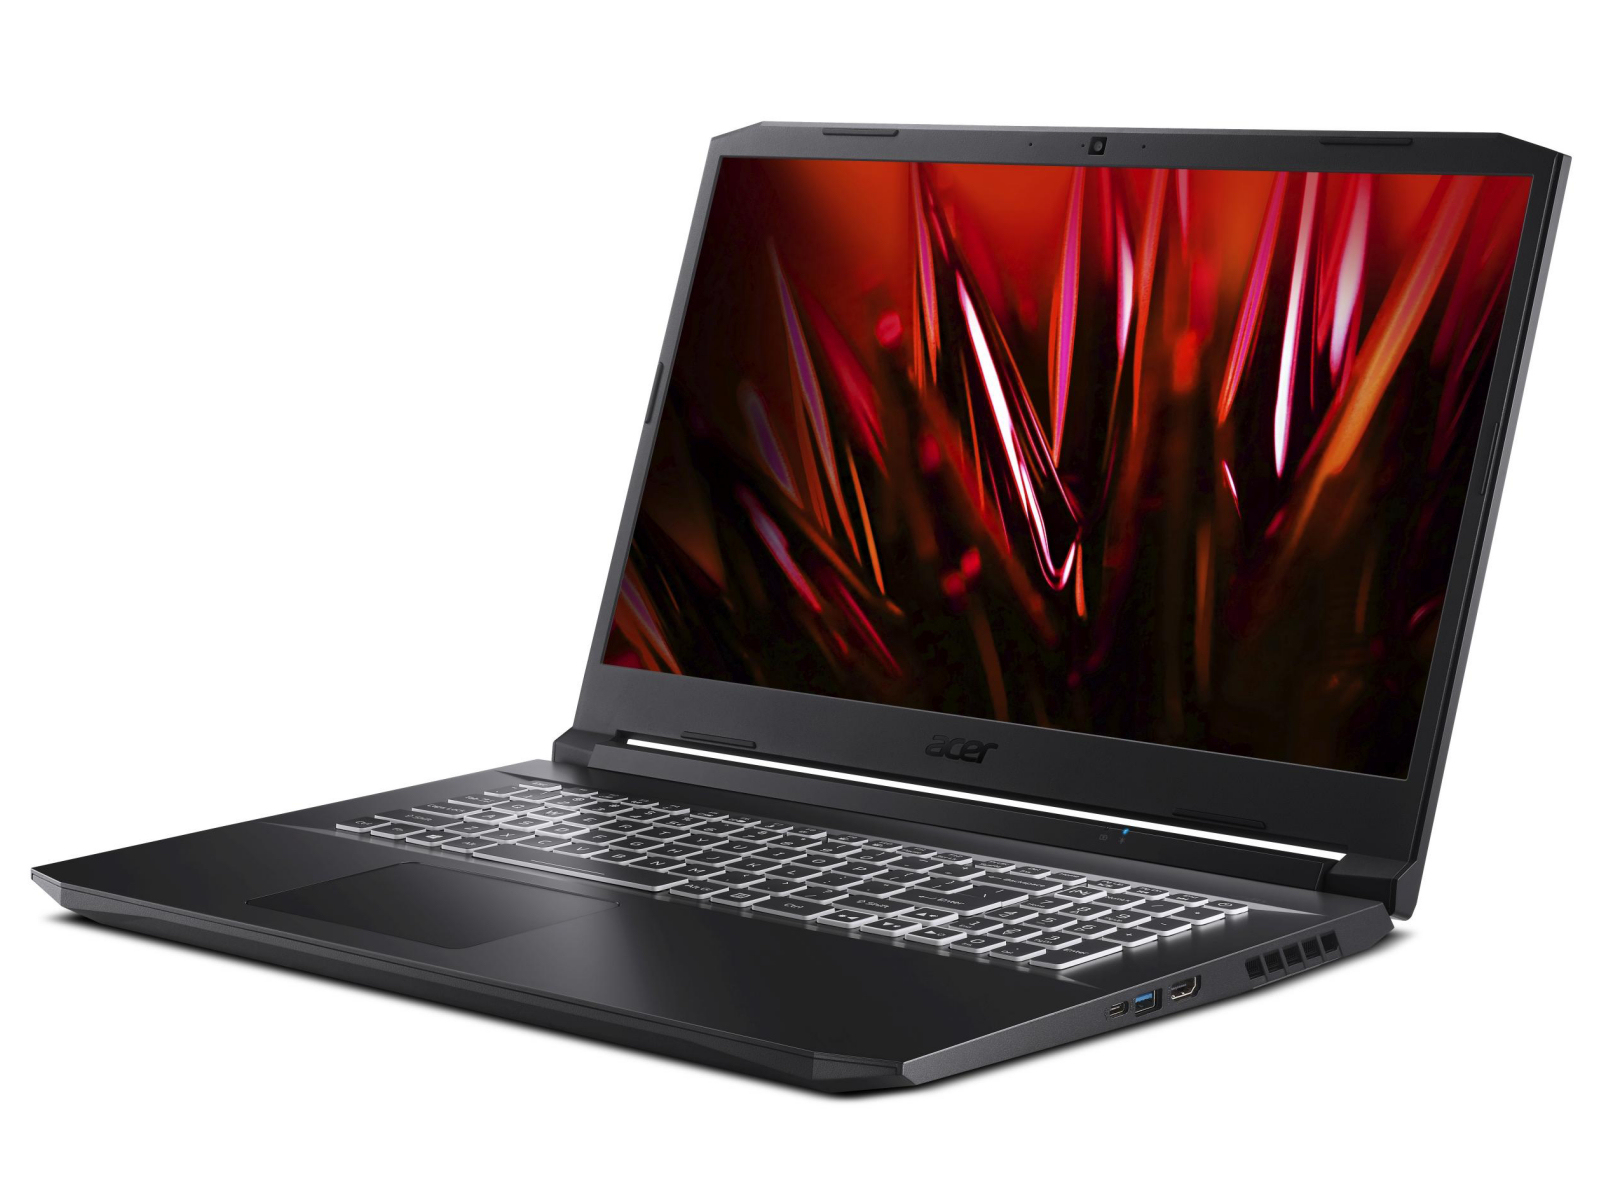
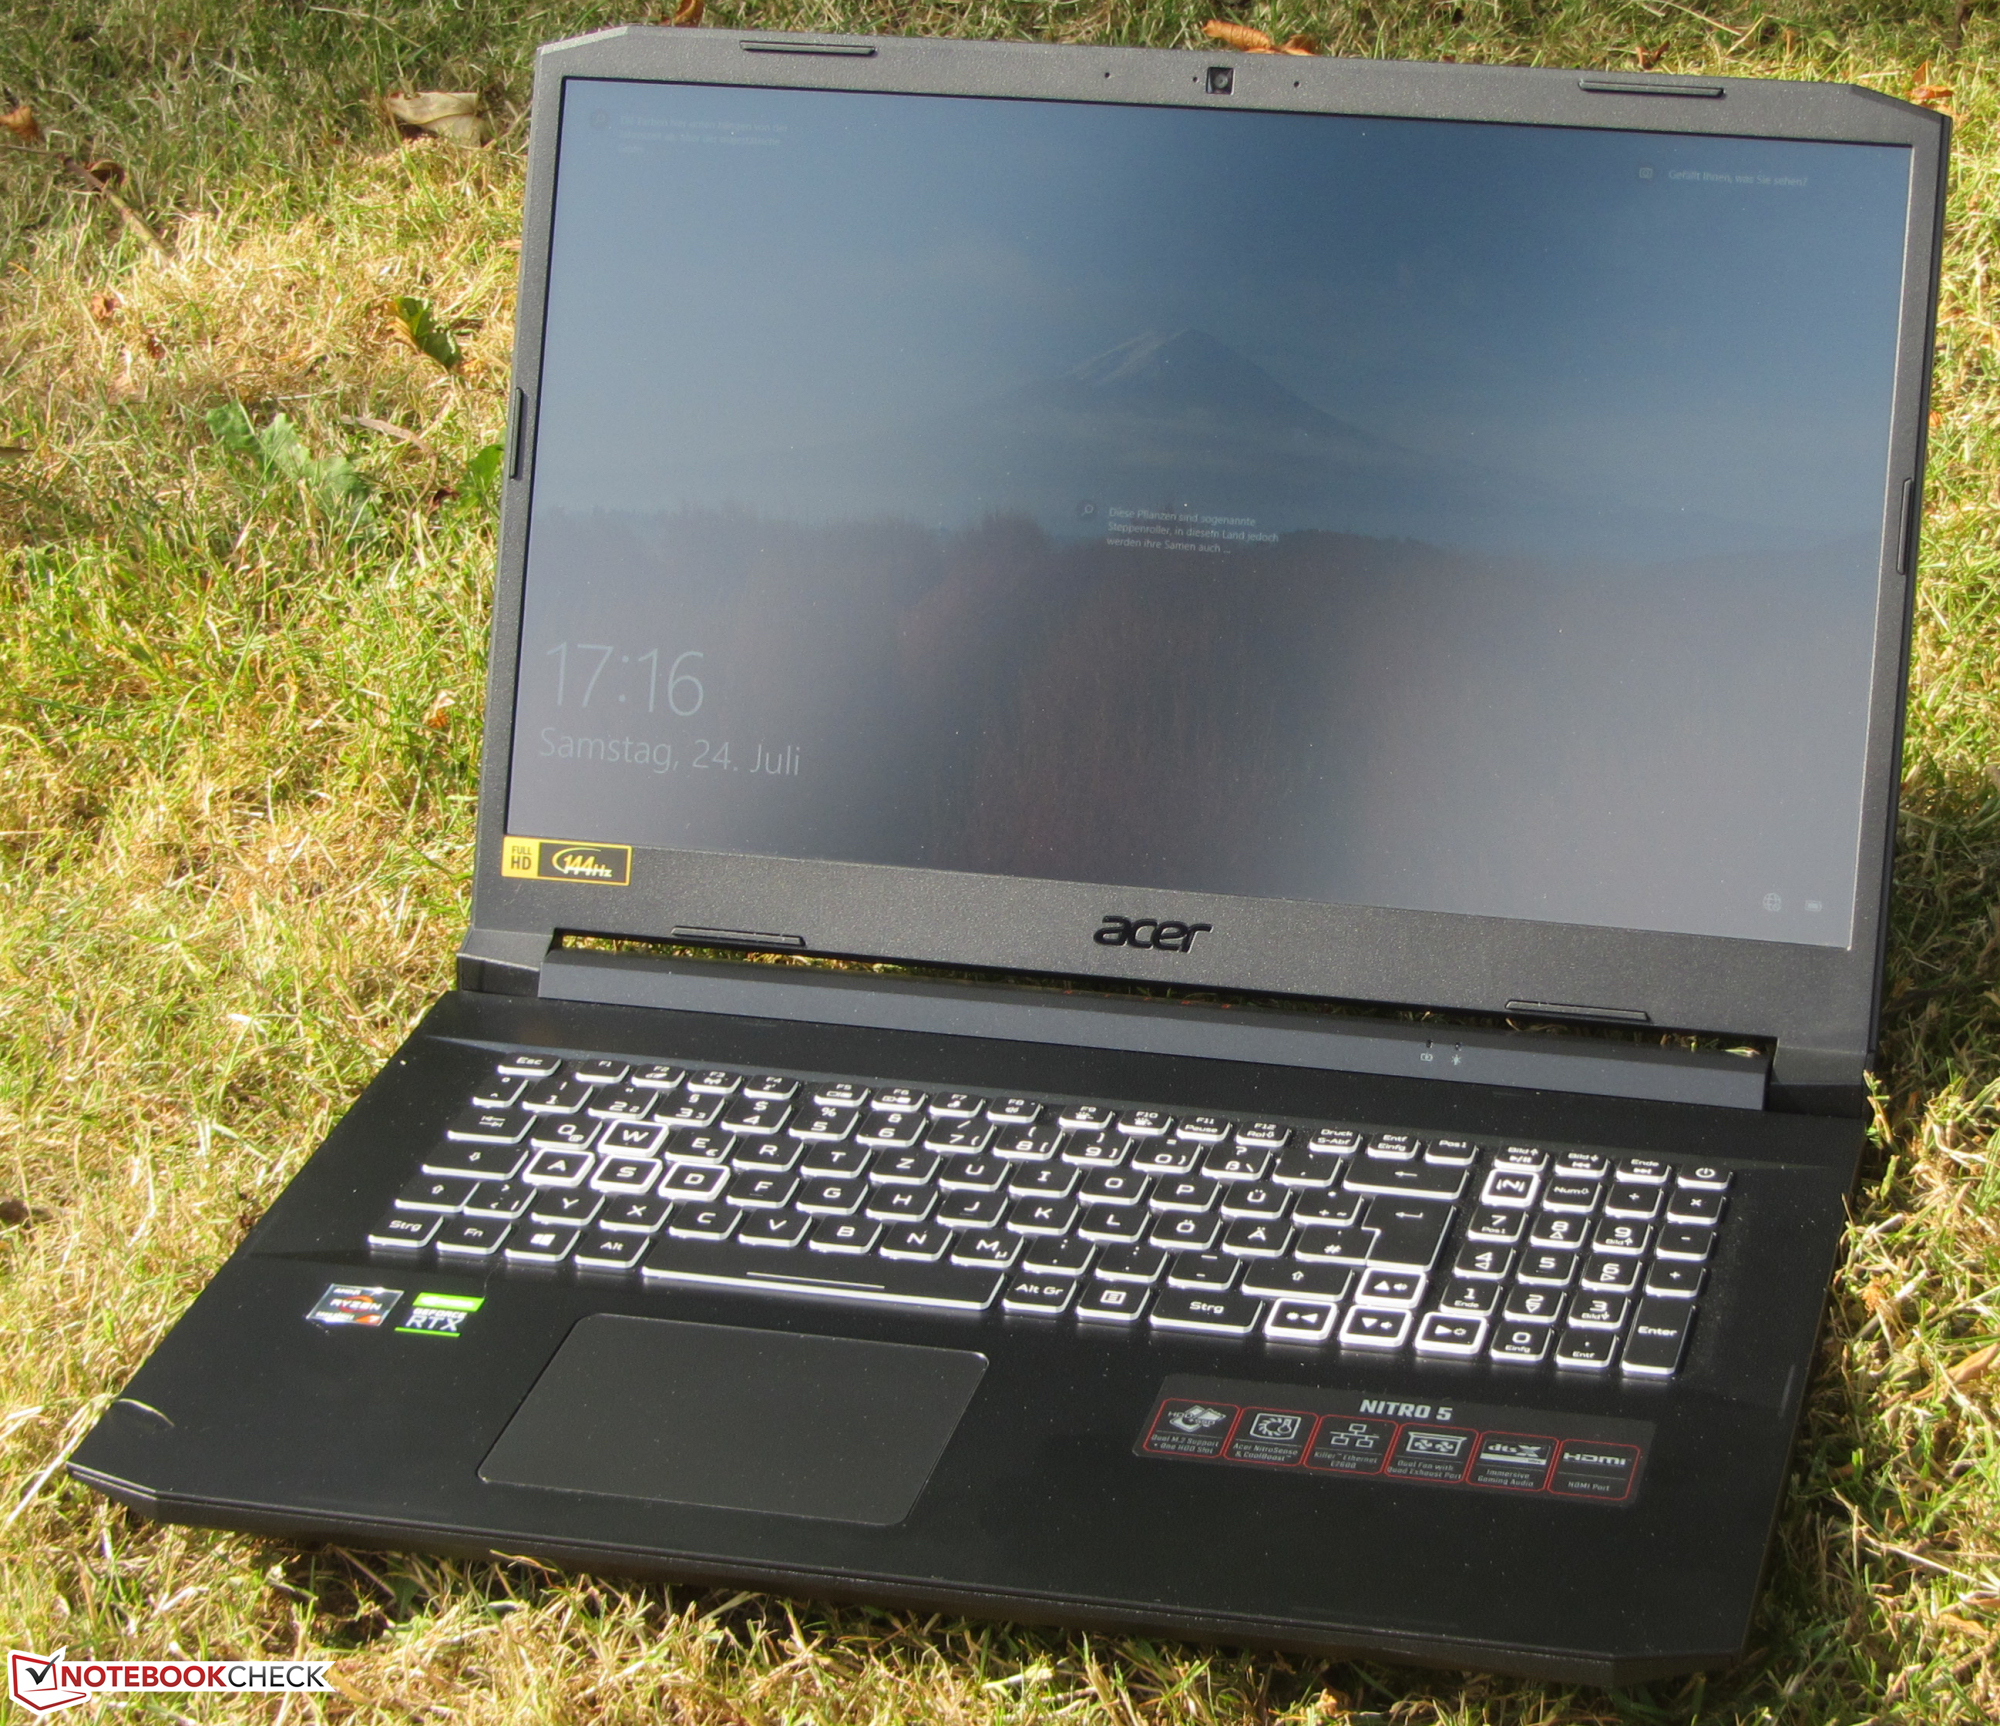
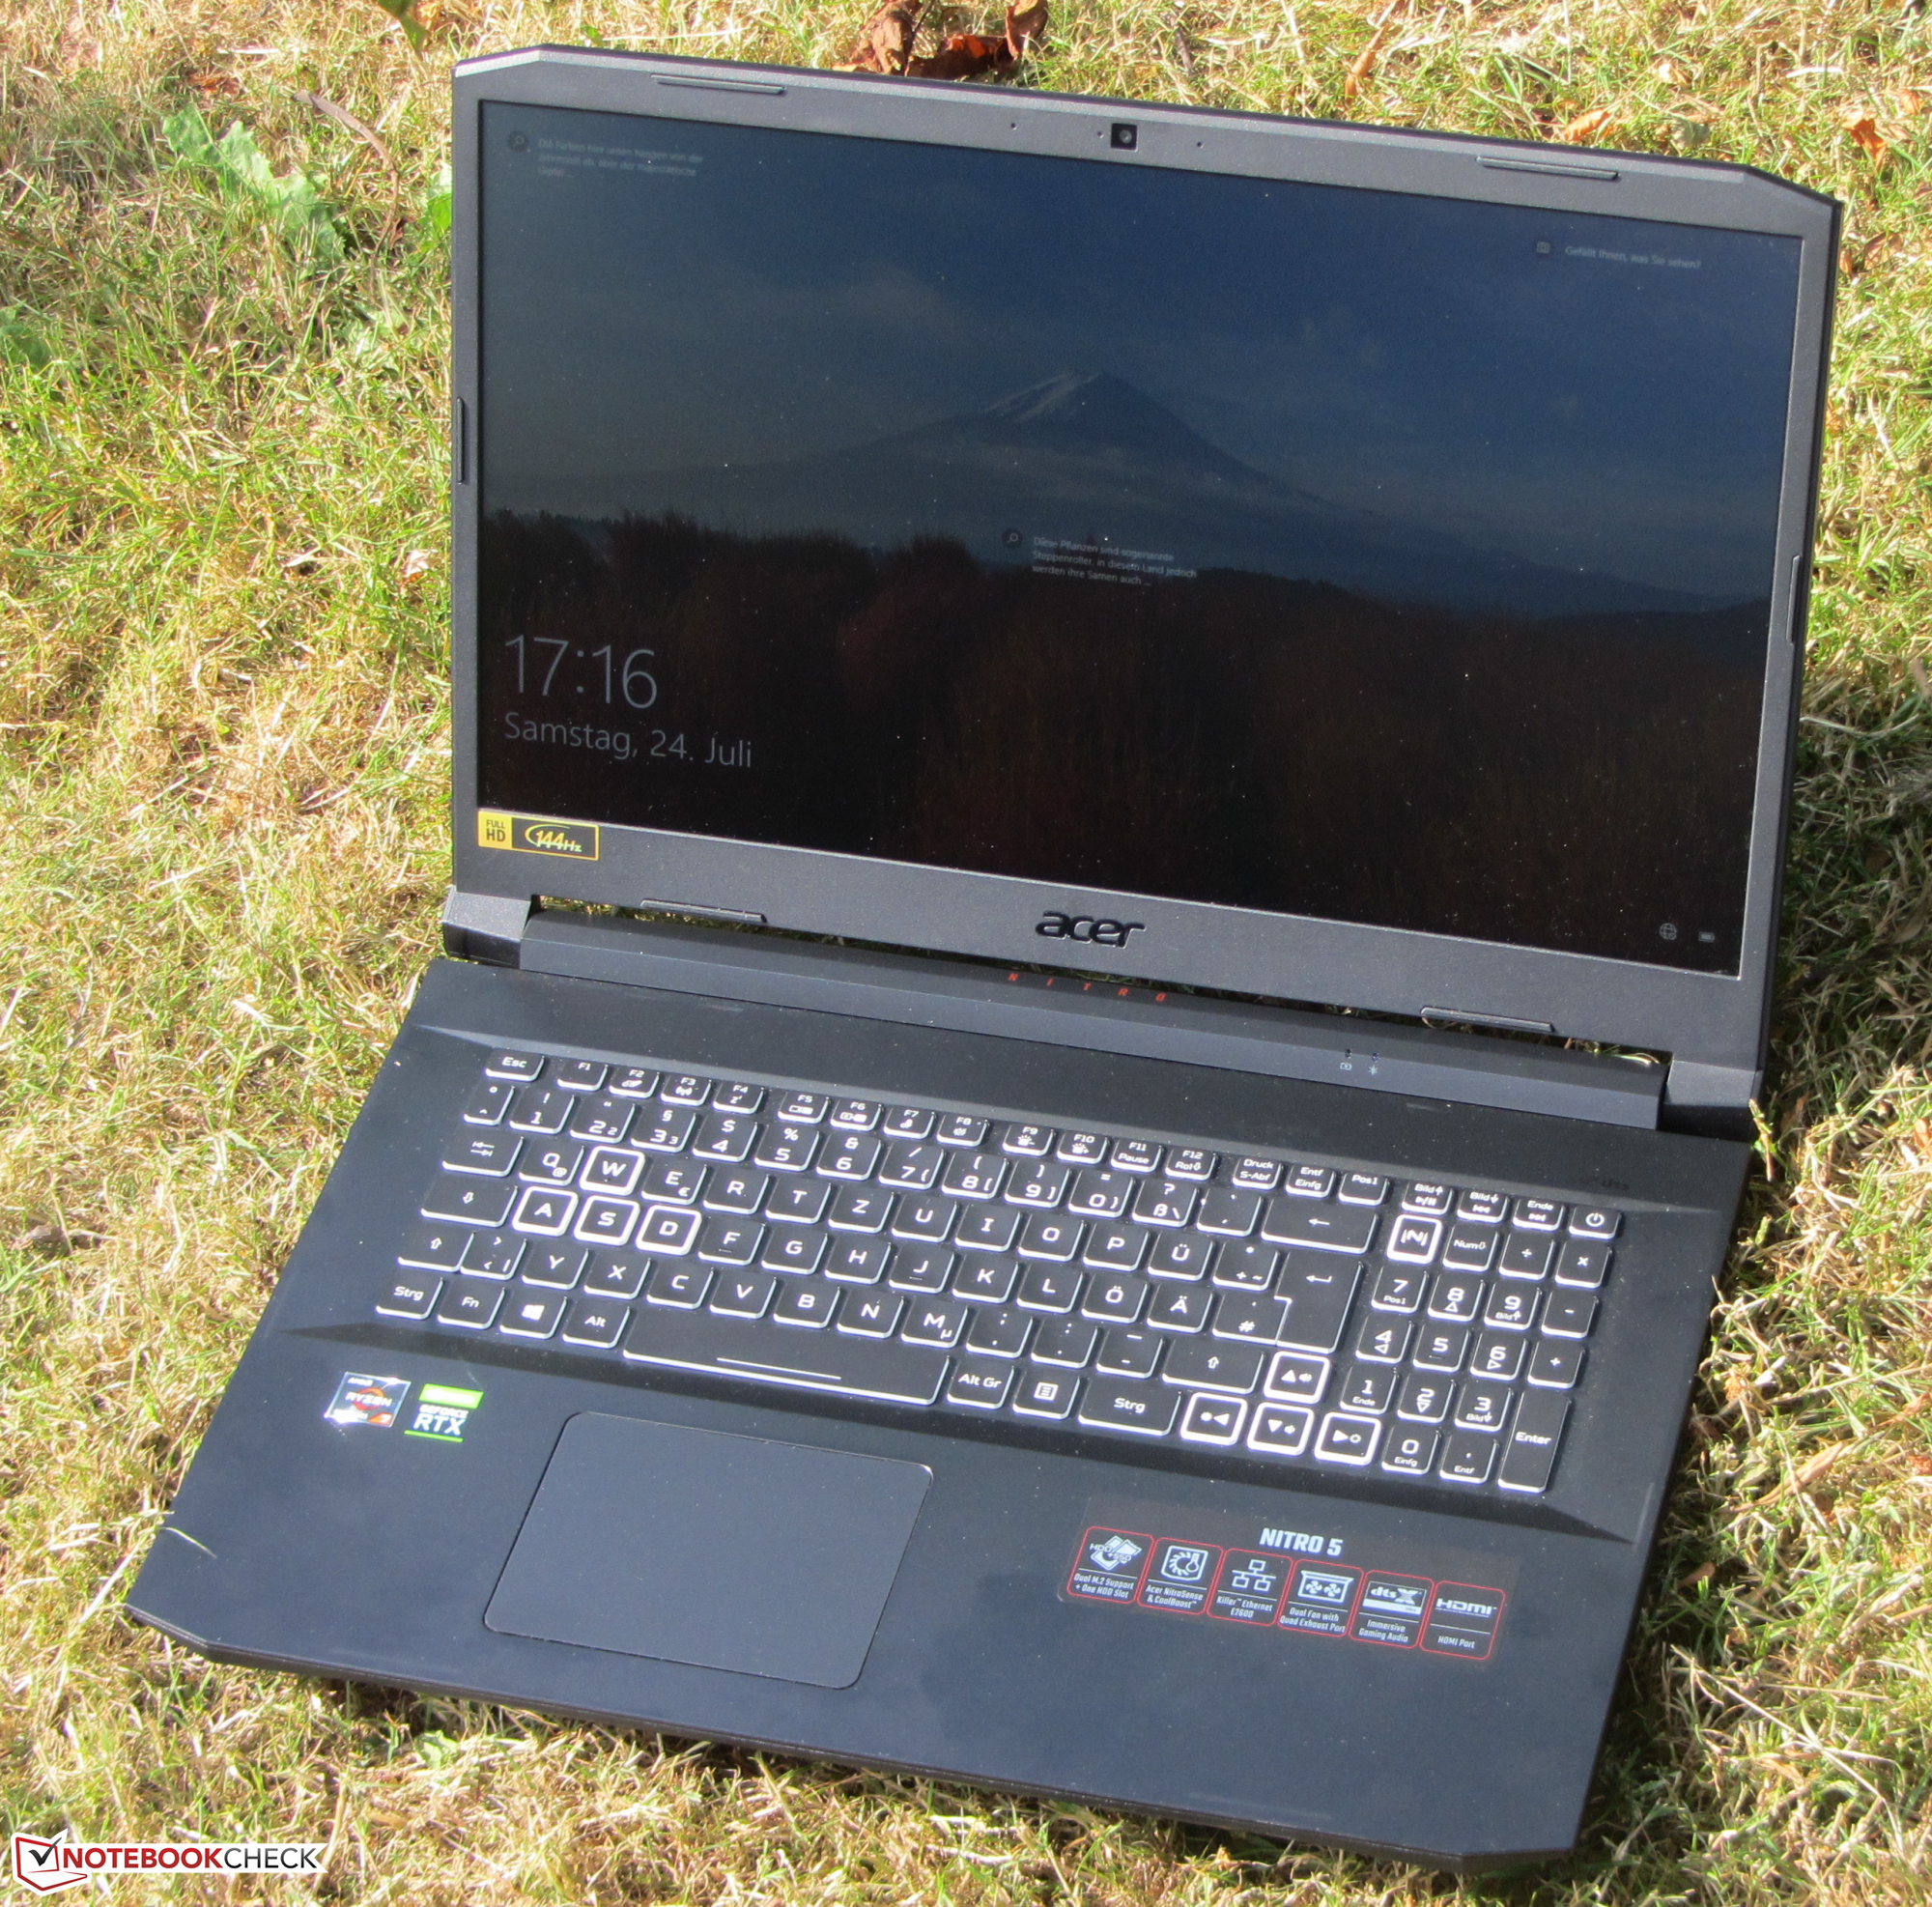
Acer Nitro 5 AN517-41 en revisión: La RTX 3080 sólo puede desarrollarse de forma limitada

El portátil para juegos de 17,3 pulgadas de Acer está equipado con un Ryzen 7-5800Hy una GeForce RTX-3080 portátil GPU. La variante de configuración que tenemos está disponible por algo menos de 2,000 Euros. Los competidores incluyen dispositivos como el Medion Erazer Beast X25, el MSI GP76 Leopard 10UGy el Schenker XMG Neo 17.
Como ya hemos probado un modelo hermano con la misma construcción, no entraremos en la carcasa, el equipo, los dispositivos de entrada, los altavoces y la pantalla en este análisis. La información correspondiente se puede encontrar en el Análisis del RTX-3070 Nitro 5.
Possible competitors in comparison
Valoración | Fecha | Modelo | Peso | Altura | Tamaño | Resolución | Precio |
|---|---|---|---|---|---|---|---|
| 82 % v7 (old) | 08/2021 | Acer Nitro 5 AN517-41-R9S5 R7 5800H, GeForce RTX 3080 Laptop GPU | 2.7 kg | 24.9 mm | 17.30" | 1920x1080 | |
| 85.1 % v7 (old) | 03/2021 | MSI GP76 Leopard 10UG i7-10750H, GeForce RTX 3070 Laptop GPU | 2.9 kg | 26 mm | 17.30" | 1920x1080 | |
| 85.1 % v7 (old) | 01/2021 | Schenker XMG Neo 17 (Early 2021, RTX 3070, 5800H) R7 5800H, GeForce RTX 3070 Laptop GPU | 2.5 kg | 27 mm | 17.30" | 2560x1440 | |
| 85 % v7 (old) | 07/2021 | Medion Erazer Beast X25 R9 5900HX, GeForce RTX 3080 Laptop GPU | 2.3 kg | 23 mm | 17.30" | 1920x1080 |
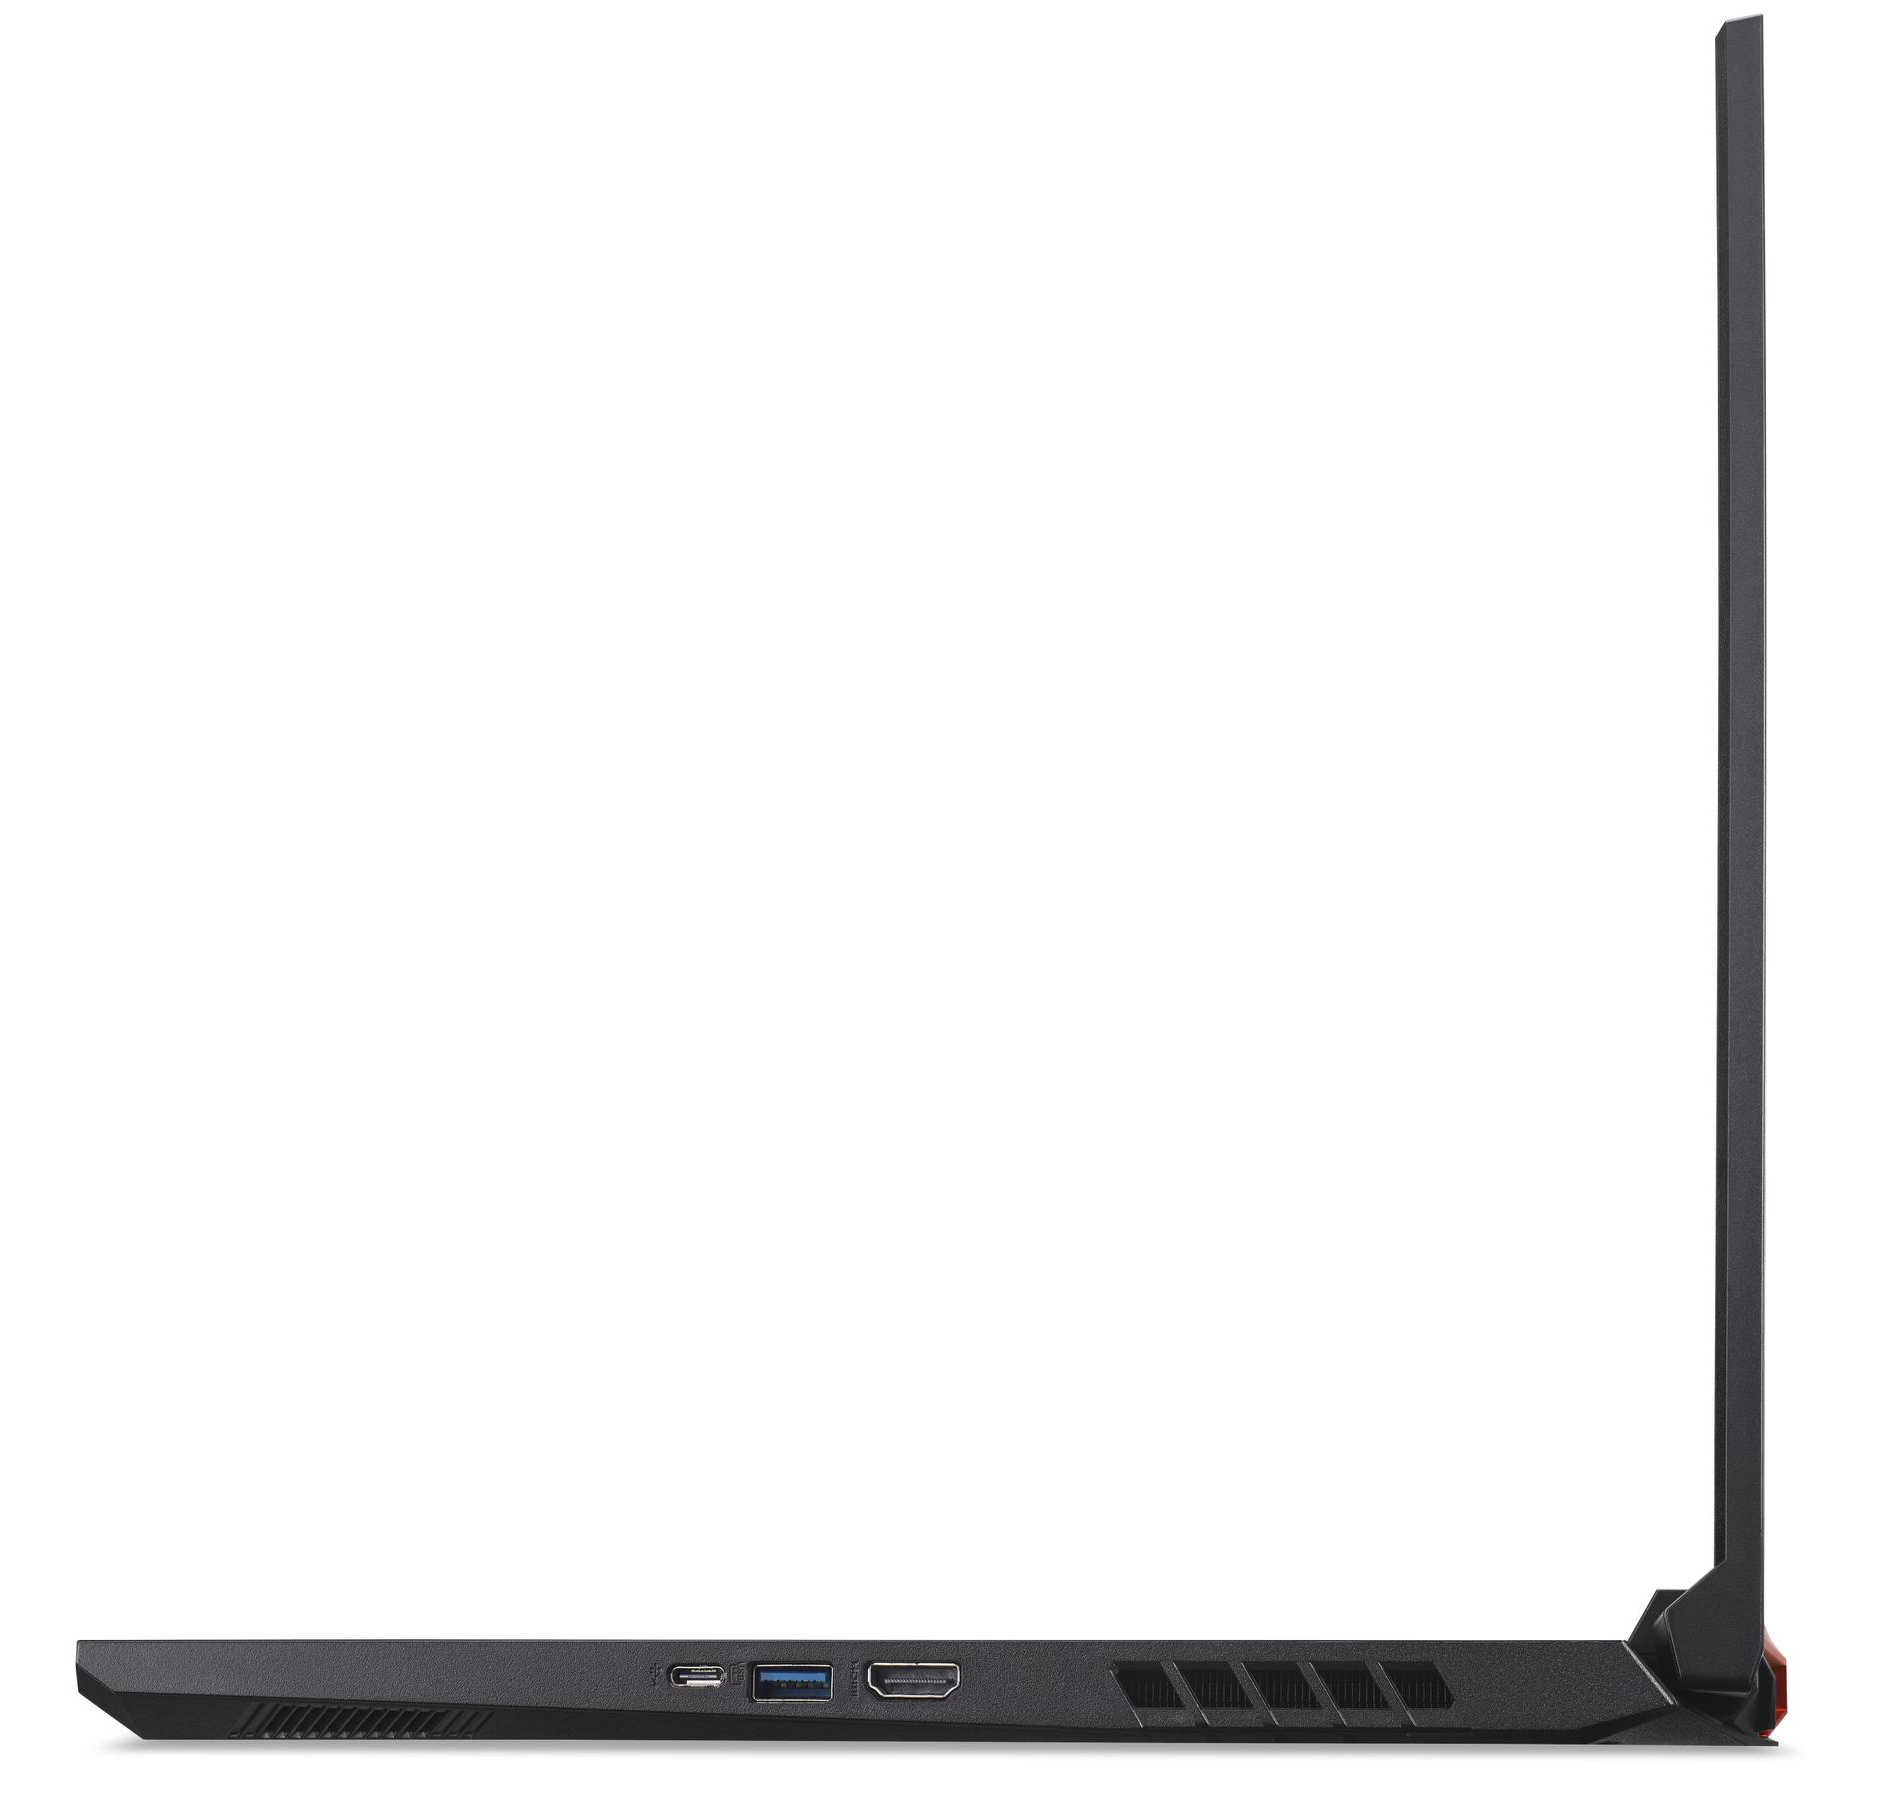
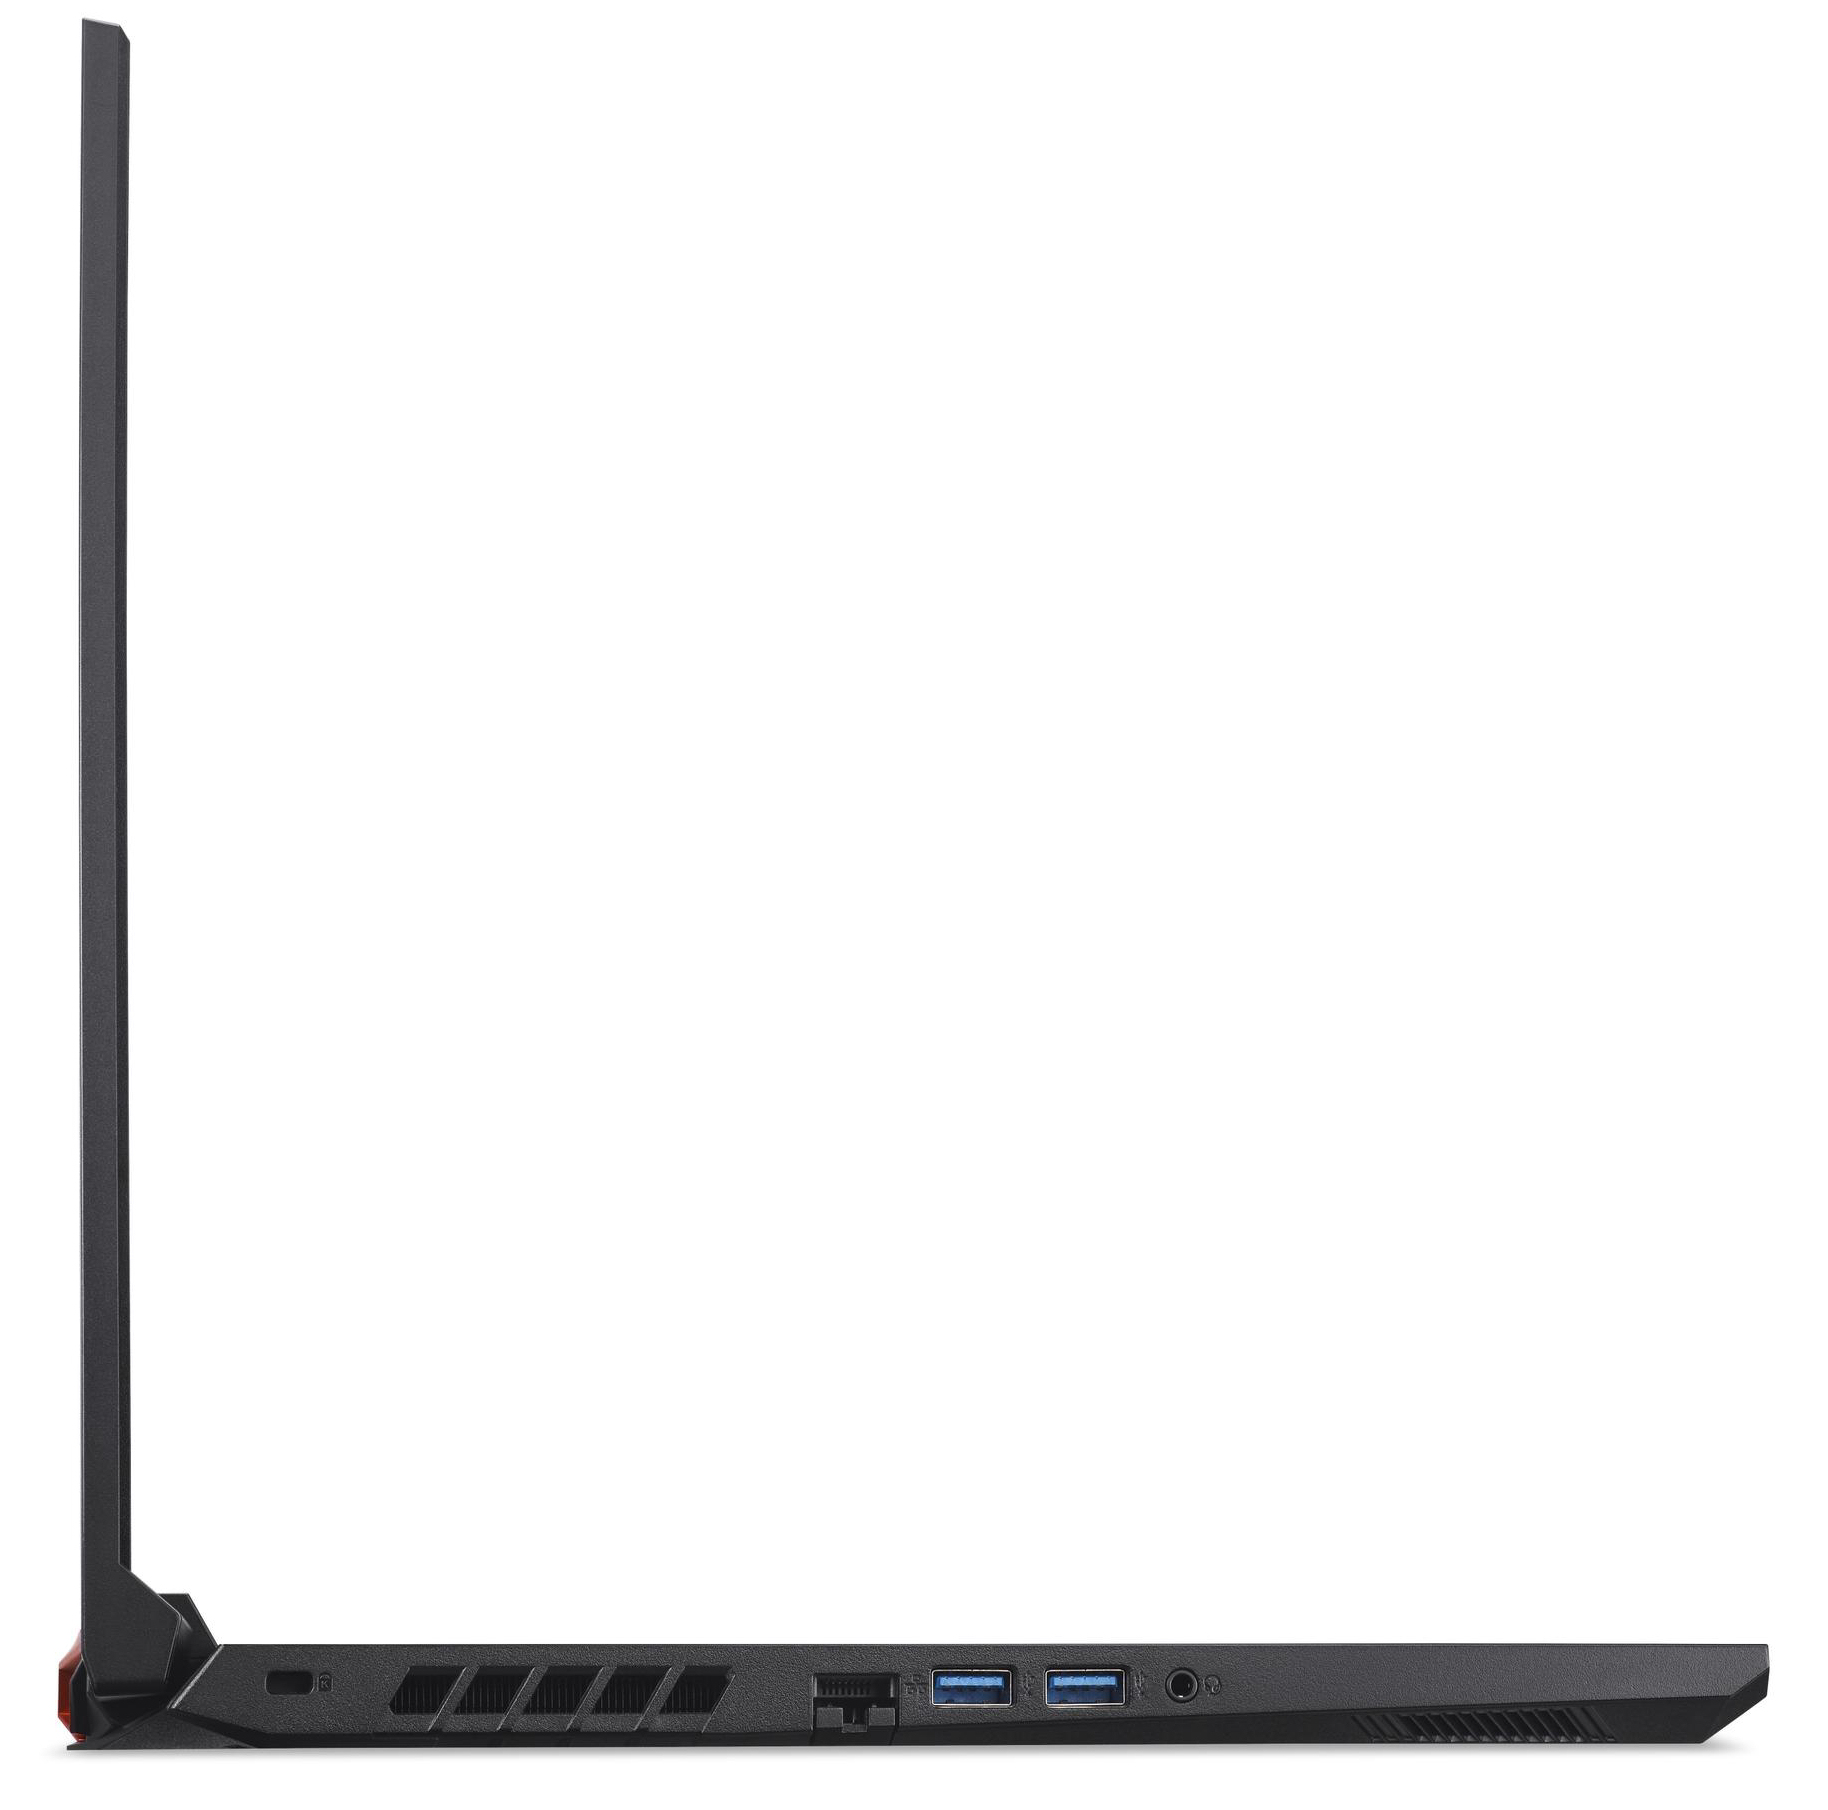
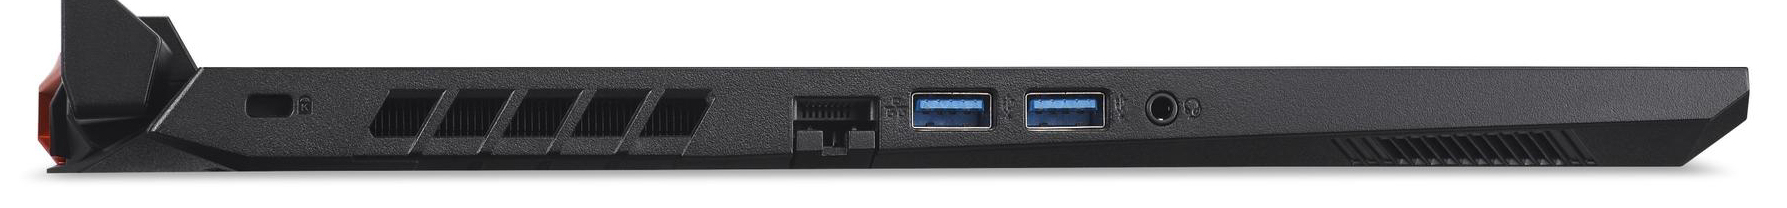
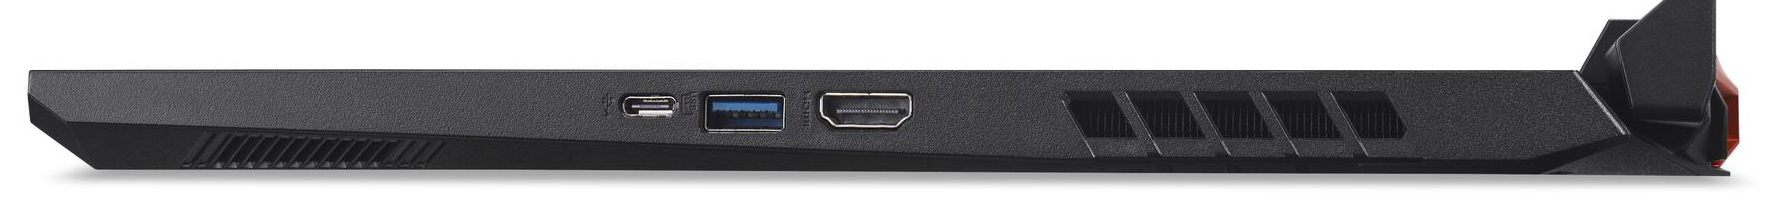
Equipo de conexión


 GeForce RTX 3070 Laptop GPU, R7 5800H, Samsung SSD 970 EVO Plus 500GB")
 GeForce RTX 3070 Laptop GPU, R7 5800H, Samsung SSD 970 EVO Plus 500GB")


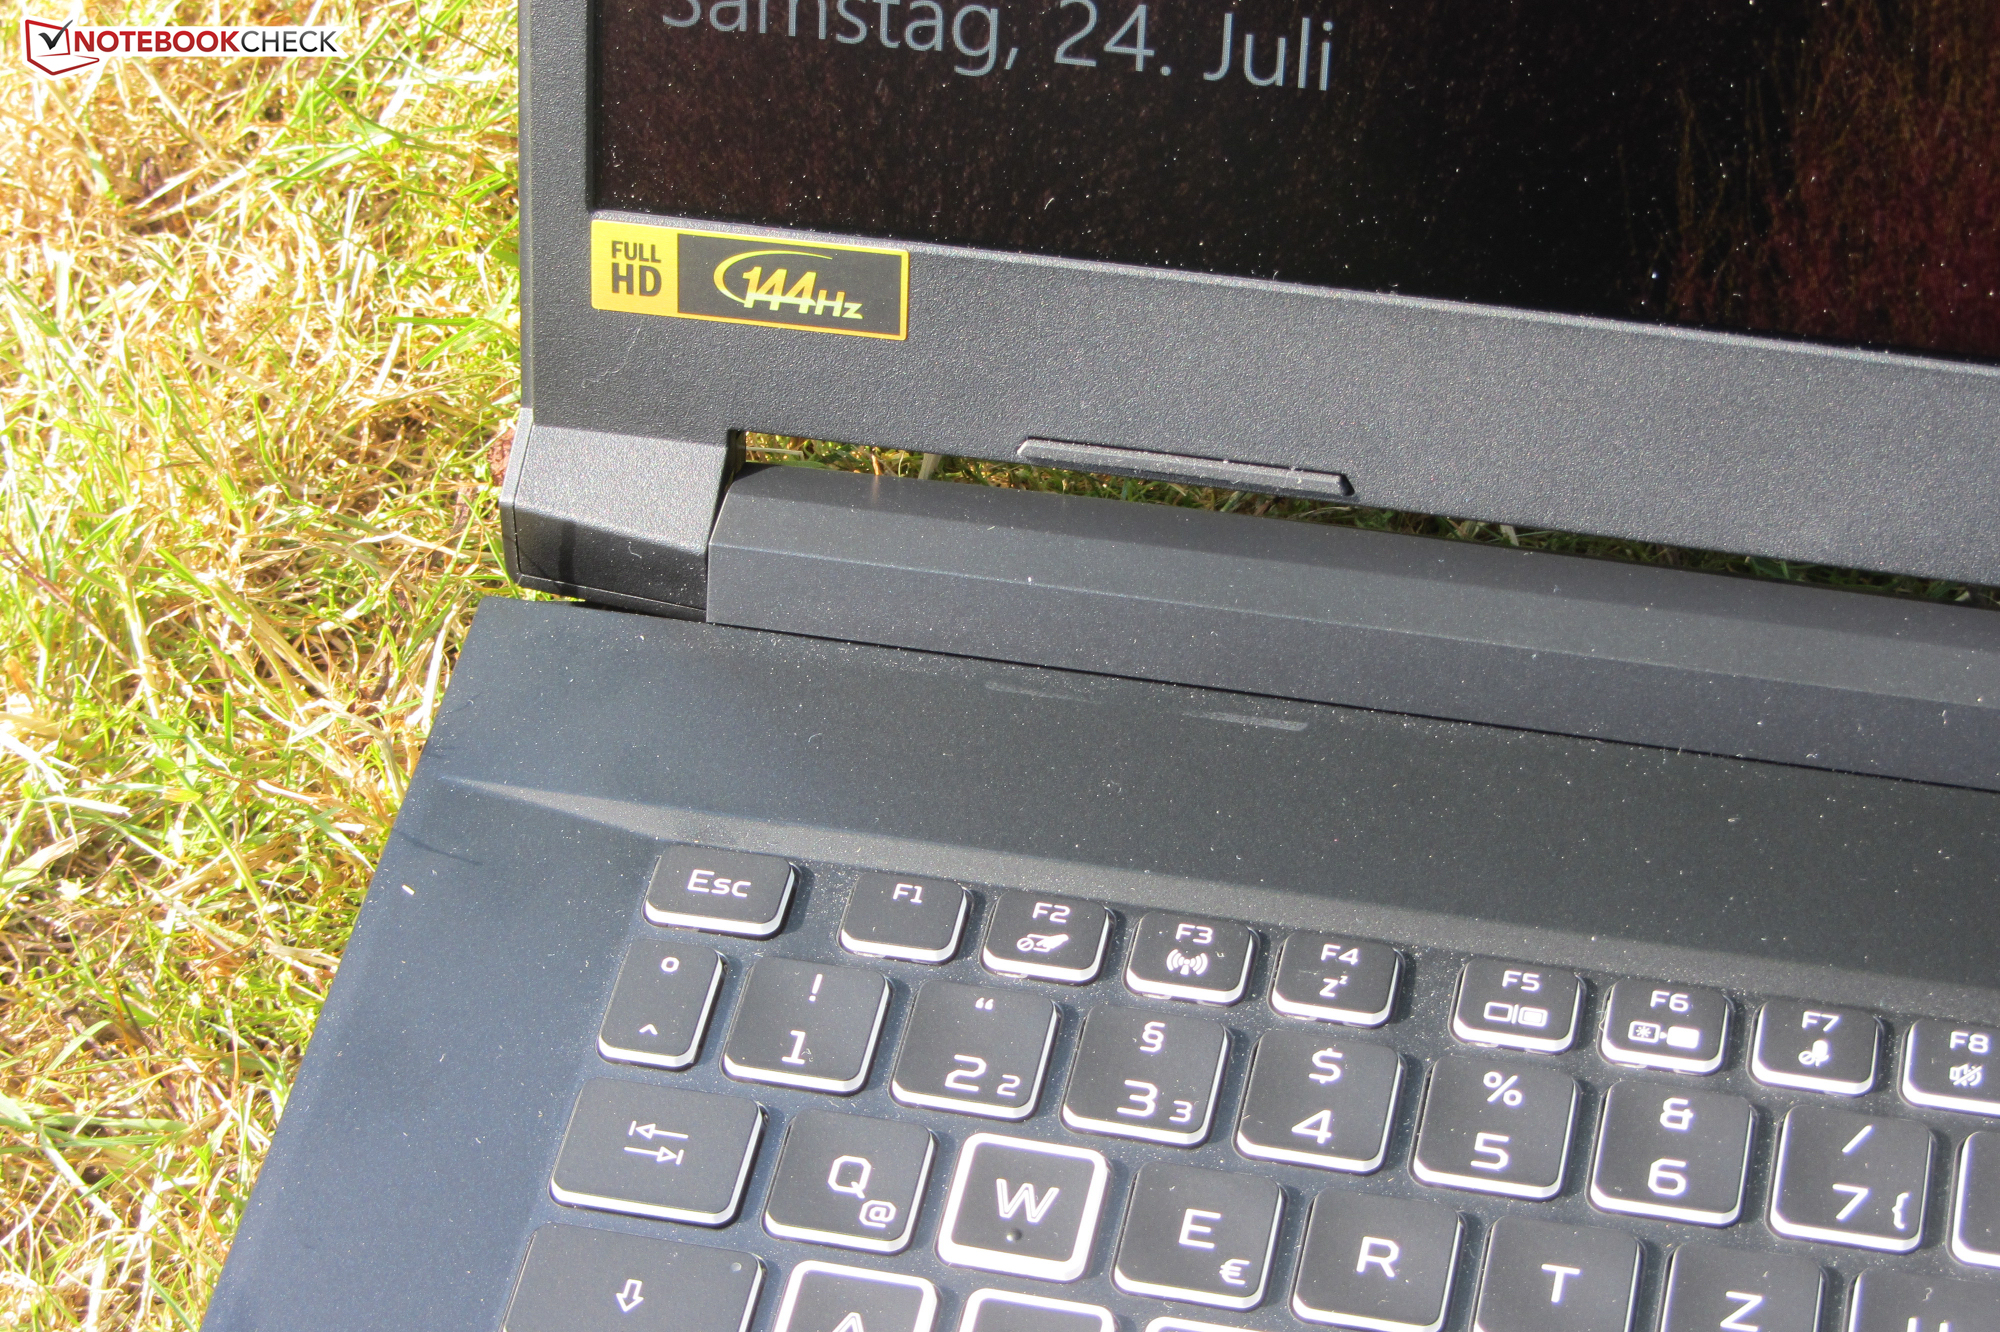
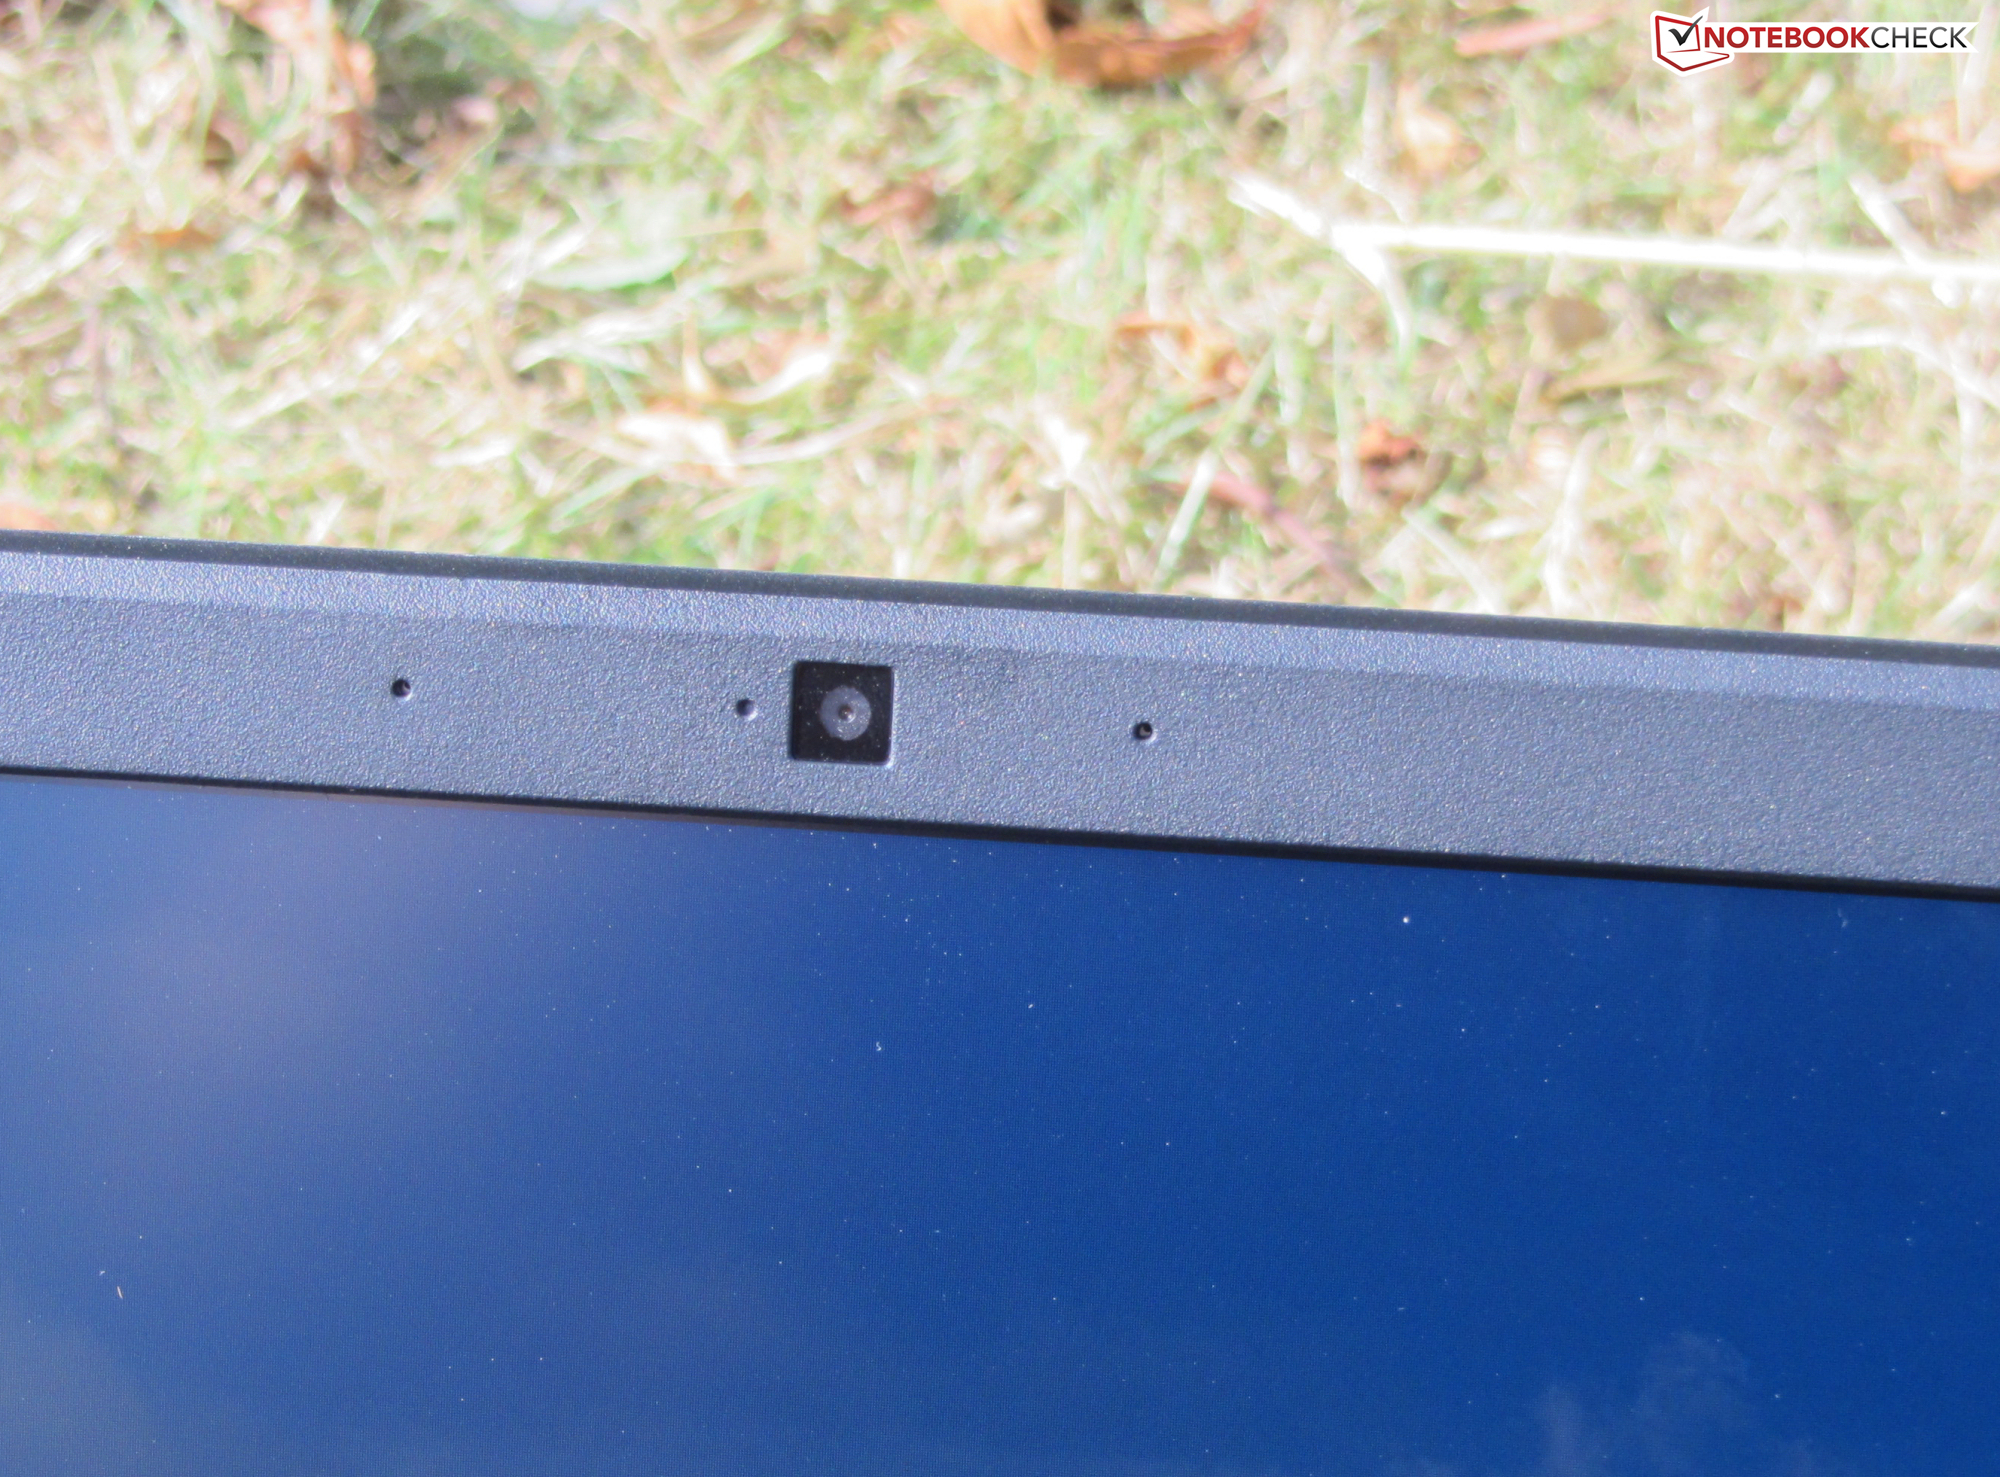
Pantalla - 144 Hz IPS
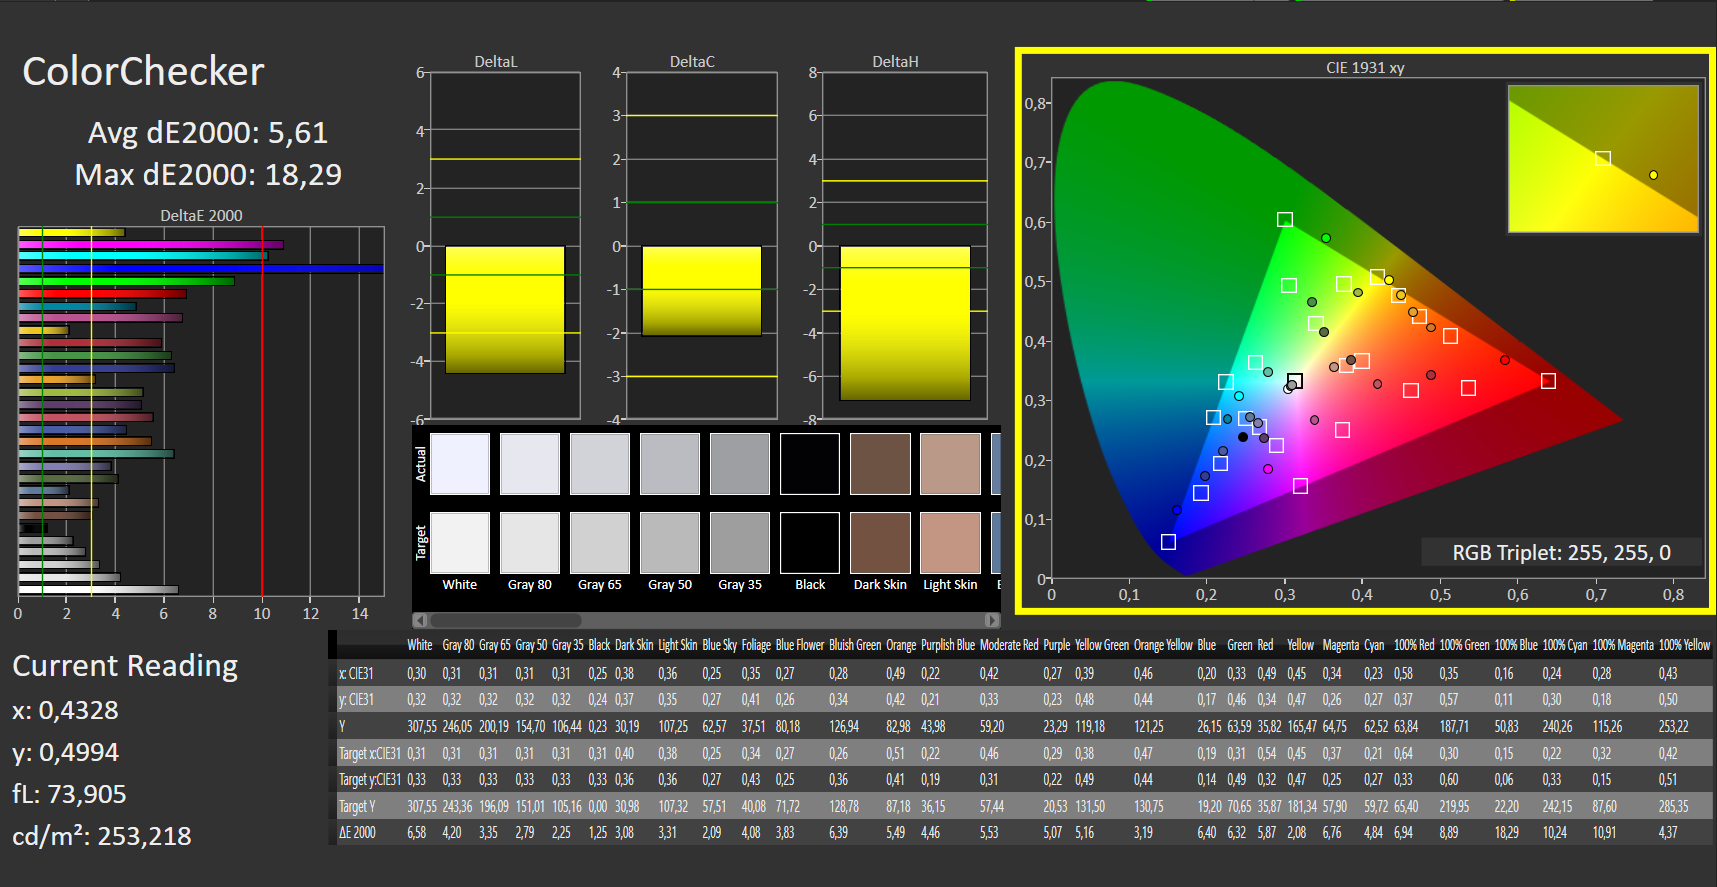
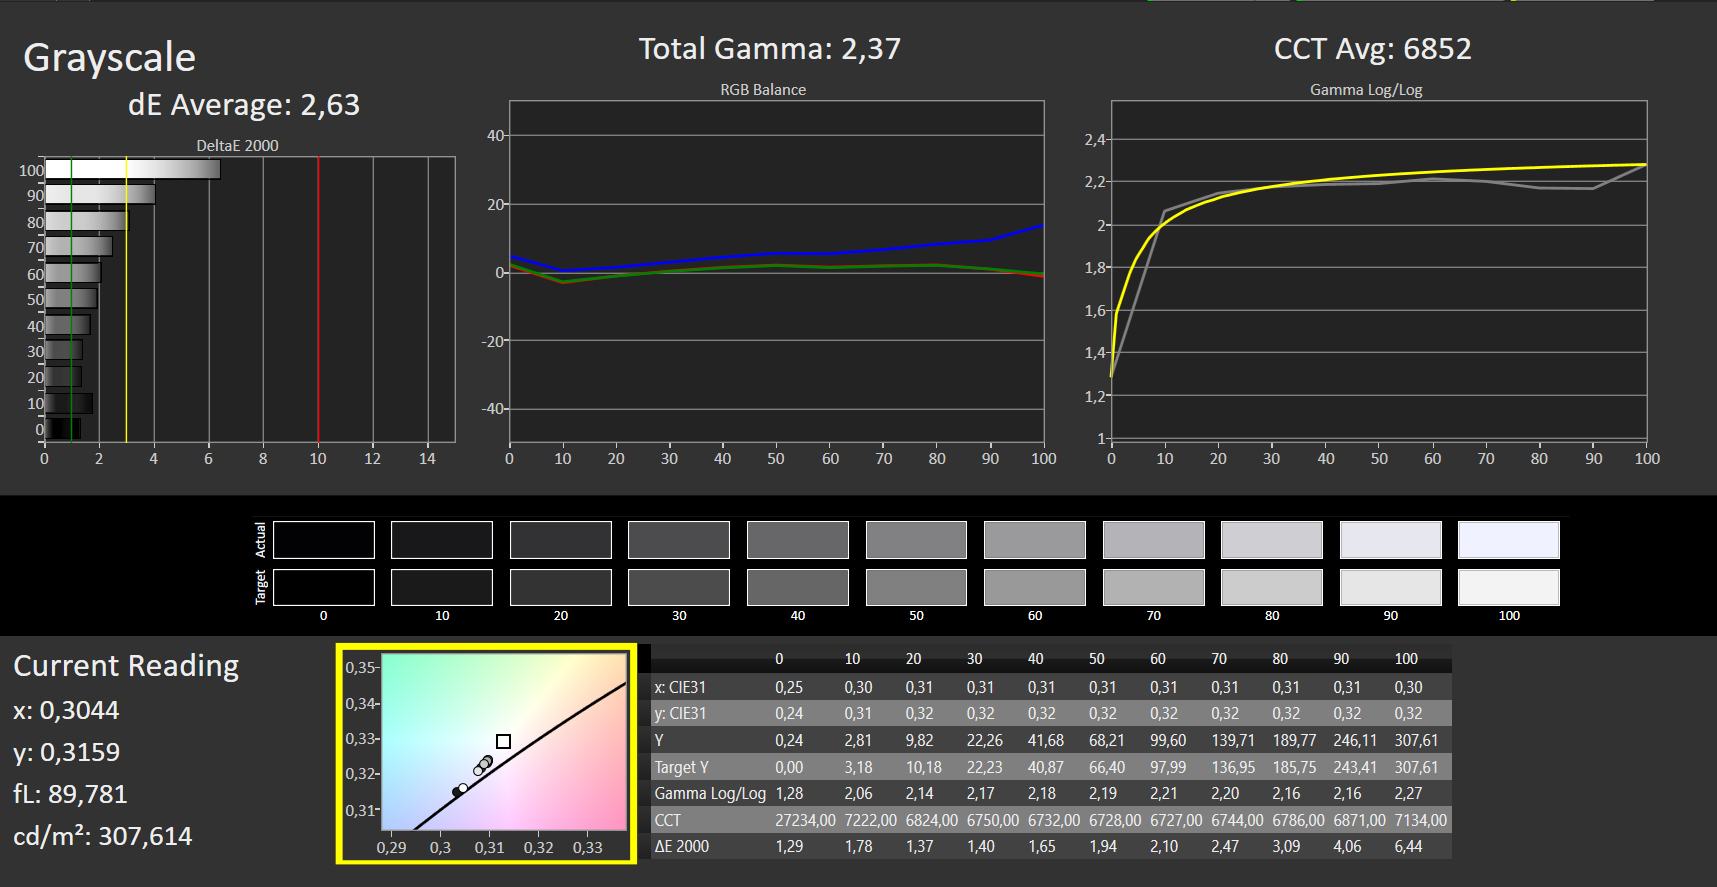
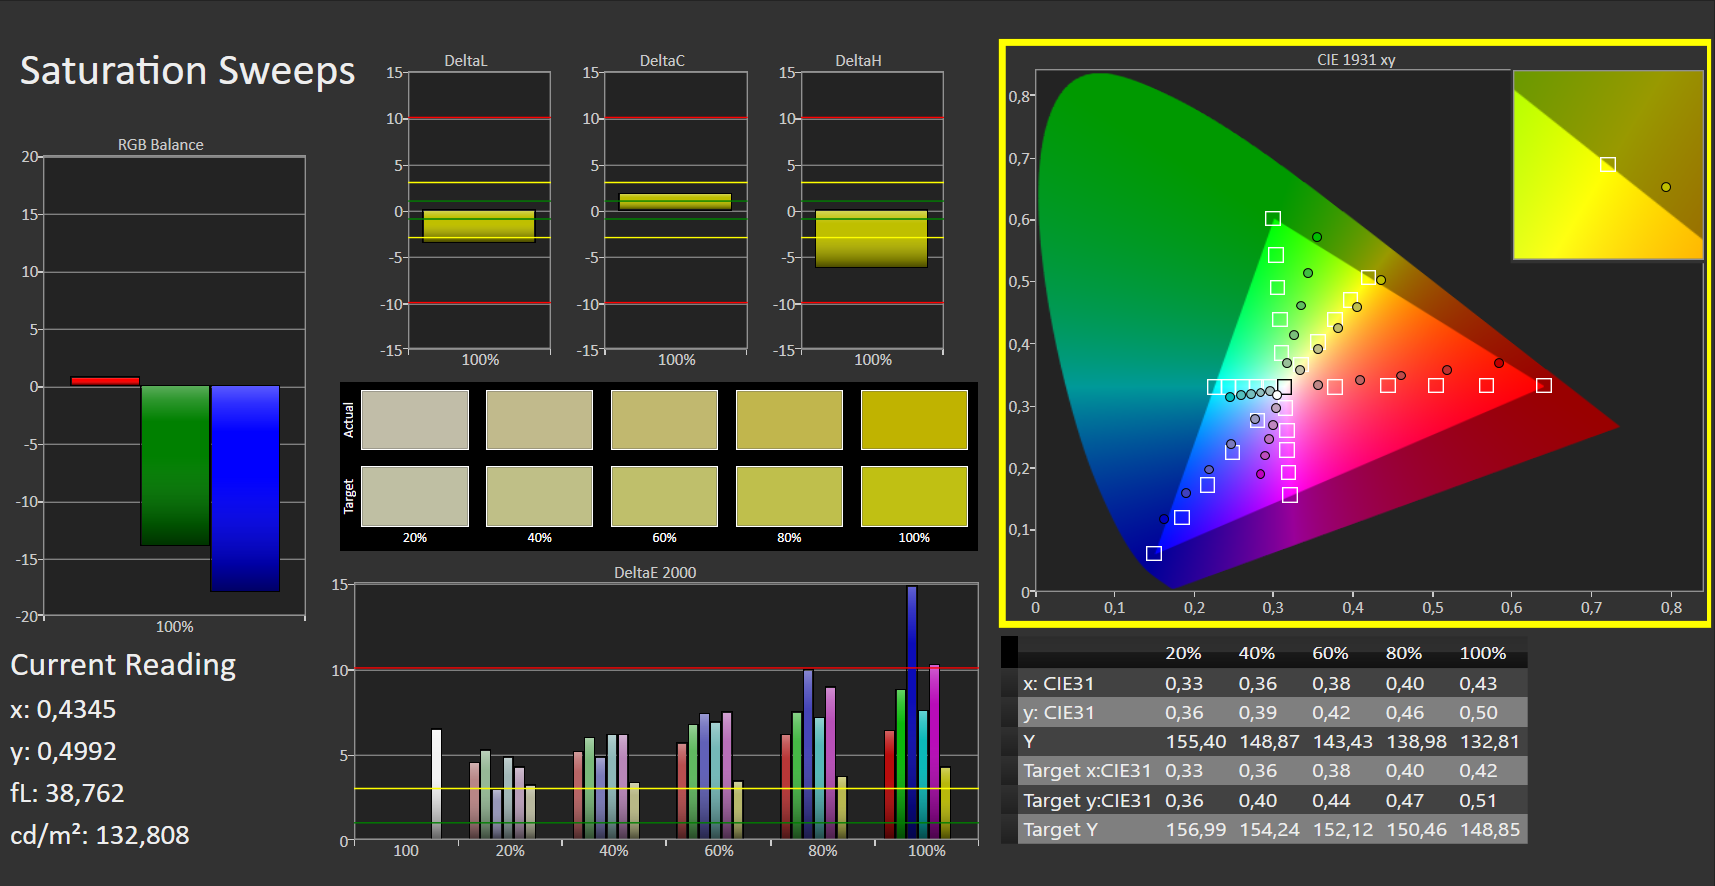
Mientras que el contraste (1,279:1) de la pantalla de 17.3 pulgadas (FHD, IPS, 144 Hz), estable en ángulo de visión, cumple el objetivo (> 1,000:1), el brillo medio (263.9 cd/m²) es demasiado bajo. Consideramos que los valores superiores a 300 cd/m² son buenos. La reproducción del color en el estado de entrega es decente.
Este es el mismo panel que también se utiliza en el Modelo hermano RTX-3070. Sin embargo, los valores medidos difieren ligeramente - una condición normal. Dos pantallas idénticas nunca coinciden completamente
| |||||||||||||||||||||||||
iluminación: 76 %
Brillo con batería: 307 cd/m²
Contraste: 1279:1 (Negro: 0.24 cd/m²)
ΔE ColorChecker Calman: 5.61 | ∀{0.5-29.43 Ø4.71}
ΔE Greyscale Calman: 2.63 | ∀{0.09-98 Ø4.96}
55% sRGB (Argyll 1.6.3 3D)
35% AdobeRGB 1998 (Argyll 1.6.3 3D)
37.9% AdobeRGB 1998 (Argyll 3D)
55.3% sRGB (Argyll 3D)
36.7% Display P3 (Argyll 3D)
Gamma: 2.37
CCT: 6852 K
| Acer Nitro 5 AN517-41-R9S5 BOE NV173FHM-NX4, IPS, 1920x1080, 17.3" | Acer Nitro 5 AN517-41-R5Z7 BOE NV173FHM-NX4, IPS, 1920x1080, 17.3" | MSI GP76 Leopard 10UG Chi Mei CMN176E, IPS, 1920x1080, 17.3" | Schenker XMG Neo 17 (Early 2021, RTX 3070, 5800H) BOE NE173QHM-NY2 (BOE0977), IPS, 2560x1440, 17.3" | Medion Erazer Beast X25 BOE NE173FHM-NZ1 (BOE0884), IPS, 1920x1080, 17.3" | |
|---|---|---|---|---|---|
| Display | 0% | 76% | 87% | 87% | |
| Display P3 Coverage (%) | 36.7 | 36.7 0% | 64.7 76% | 70.5 92% | 70.4 92% |
| sRGB Coverage (%) | 55.3 | 55.3 0% | 96.4 74% | 99.5 80% | 99.8 80% |
| AdobeRGB 1998 Coverage (%) | 37.9 | 37.9 0% | 66.9 77% | 71.8 89% | 71.6 89% |
| Response Times | 0% | 41% | 18% | 55% | |
| Response Time Grey 50% / Grey 80% * (ms) | 18 ? | 18 ? -0% | 7.4 ? 59% | 16.8 ? 7% | 9.2 ? 49% |
| Response Time Black / White * (ms) | 14 ? | 14 ? -0% | 10.8 ? 23% | 10 ? 29% | 5.6 ? 60% |
| PWM Frequency (Hz) | 24510 ? | ||||
| Screen | -9% | 29% | 31% | 10% | |
| Brightness middle (cd/m²) | 307 | 282 -8% | 328 7% | 410 34% | 329 7% |
| Brightness (cd/m²) | 264 | 255 -3% | 314 19% | 381 44% | 315 19% |
| Brightness Distribution (%) | 76 | 85 12% | 87 14% | 88 16% | 88 16% |
| Black Level * (cd/m²) | 0.24 | 0.24 -0% | 0.29 -21% | 0.37 -54% | 0.33 -38% |
| Contrast (:1) | 1279 | 1175 -8% | 1131 -12% | 1108 -13% | 997 -22% |
| Colorchecker dE 2000 * | 5.61 | 5.91 -5% | 1.93 66% | 2.55 55% | 2.03 64% |
| Colorchecker dE 2000 max. * | 18.29 | 10.98 40% | 4.94 73% | 4.33 76% | 5.5 70% |
| Greyscale dE 2000 * | 2.63 | 5.85 -122% | 2.8 -6% | 3.4 -29% | 3.5 -33% |
| Gamma | 2.37 93% | 2.32 95% | 2.18 101% | 2.275 97% | 2.223 99% |
| CCT | 6852 95% | 7372 88% | 7023 93% | 6637 98% | 6526 100% |
| Color Space (Percent of AdobeRGB 1998) (%) | 35 | 35 0% | 67 91% | 72 106% | |
| Color Space (Percent of sRGB) (%) | 55 | 55 0% | 89 62% | 95 73% | |
| Colorchecker dE 2000 calibrated * | 0.68 | 1.28 | 0.82 | ||
| Media total (Programa/Opciones) | -3% /
-6% | 49% /
40% | 45% /
40% | 51% /
35% |
* ... más pequeño es mejor
Tiempos de respuesta del display
| ↔ Tiempo de respuesta de Negro a Blanco | ||
|---|---|---|
| 14 ms ... subida ↗ y bajada ↘ combinada | ↗ 7 ms subida |  |
| ↘ 7 ms bajada | ||
| La pantalla mostró buenos tiempos de respuesta en nuestros tests pero podría ser demasiado lenta para los jugones competitivos. En comparación, todos los dispositivos de prueba van de ##min### (mínimo) a 240 (máximo) ms. » 34 % de todos los dispositivos son mejores. Esto quiere decir que el tiempo de respuesta medido es mejor que la media (19.8 ms) de todos los dispositivos testados. | ||
| ↔ Tiempo de respuesta 50% Gris a 80% Gris | ||
| 18 ms ... subida ↗ y bajada ↘ combinada | ↗ 8 ms subida |  |
| ↘ 10 ms bajada | ||
| La pantalla mostró buenos tiempos de respuesta en nuestros tests pero podría ser demasiado lenta para los jugones competitivos. En comparación, todos los dispositivos de prueba van de ##min### (mínimo) a 636 (máximo) ms. » 32 % de todos los dispositivos son mejores. Esto quiere decir que el tiempo de respuesta medido es mejor que la media (31 ms) de todos los dispositivos testados. | ||
Parpadeo de Pantalla / PWM (Pulse-Width Modulation)
| Parpadeo de Pantalla / PWM no detectado |  | ||
Comparación: 52 % de todos los dispositivos testados no usaron PWM para atenuar el display. Si se usó, medimos una media de 7754 (mínimo: 5 - máxmo: 343500) Hz. | |||
Rendimiento - RTX-3080 con TGP bajo
Con el Nitro 5 AN517-41, Acer tiene un portátil para juegos de 17,3 pulgadas en su línea que lleva todos los juegos actuales con fluidez a la pantalla y también hace un buen papel en todas las demás áreas de aplicación.
Condiciones de la prueba
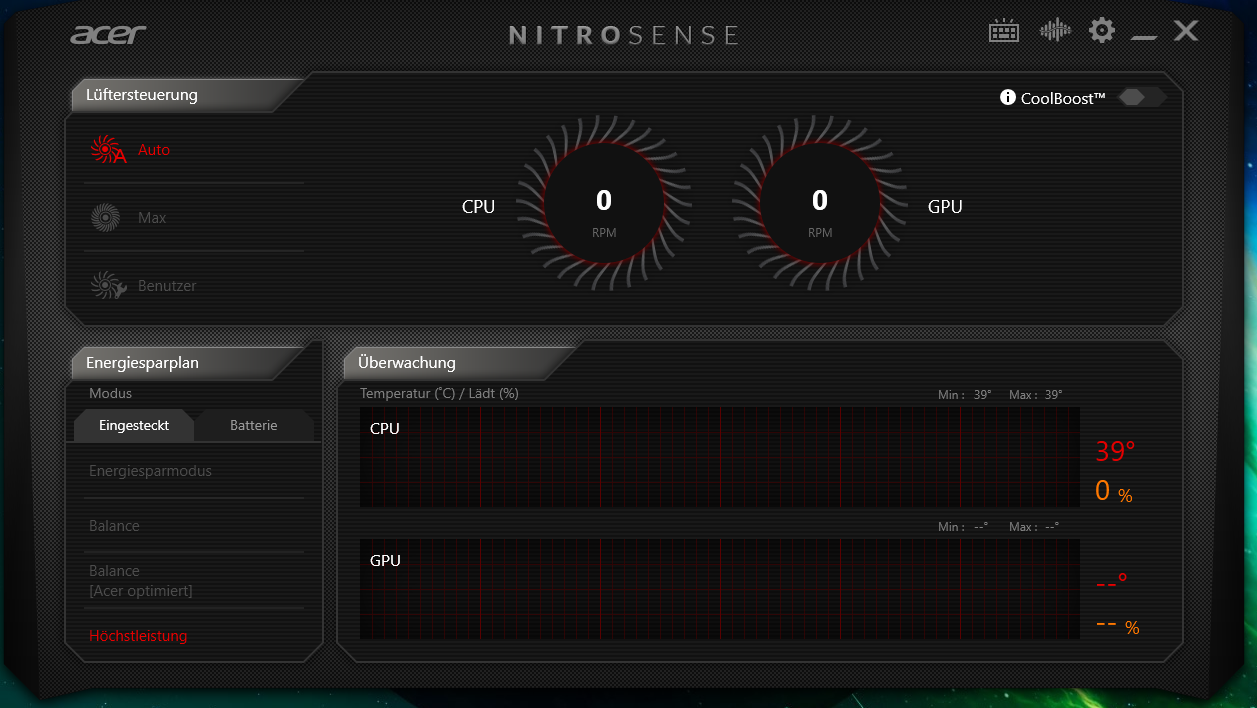
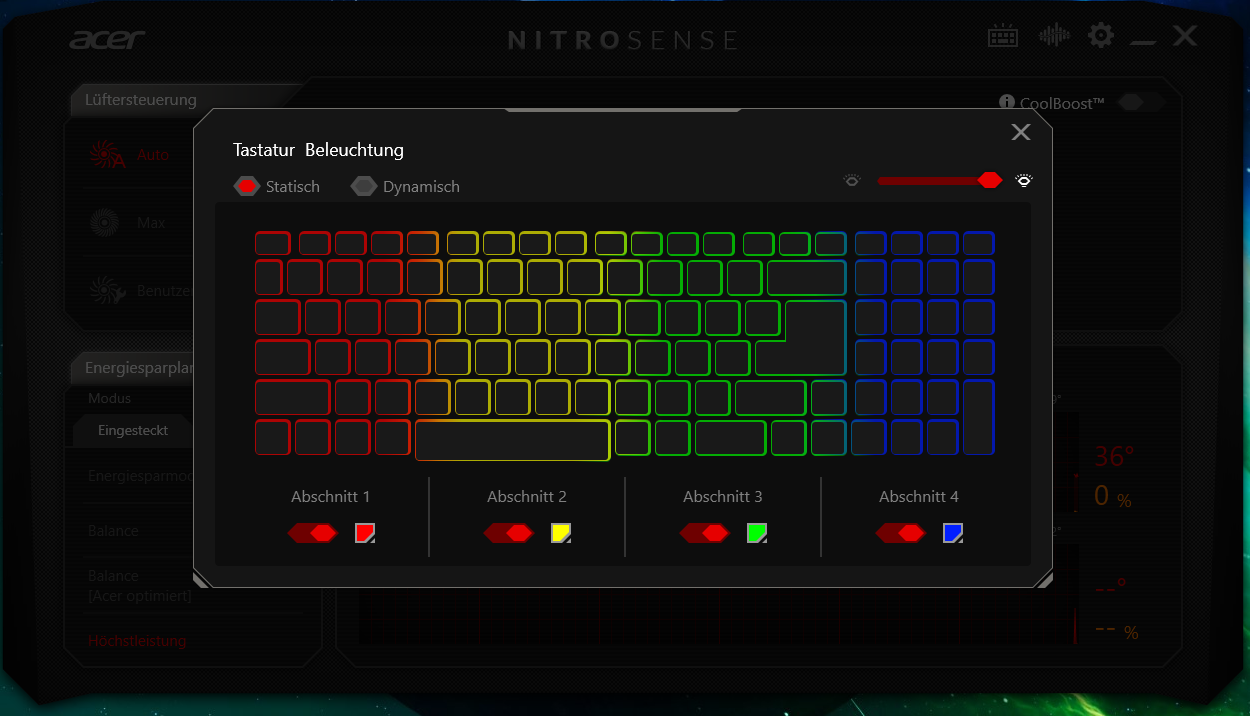
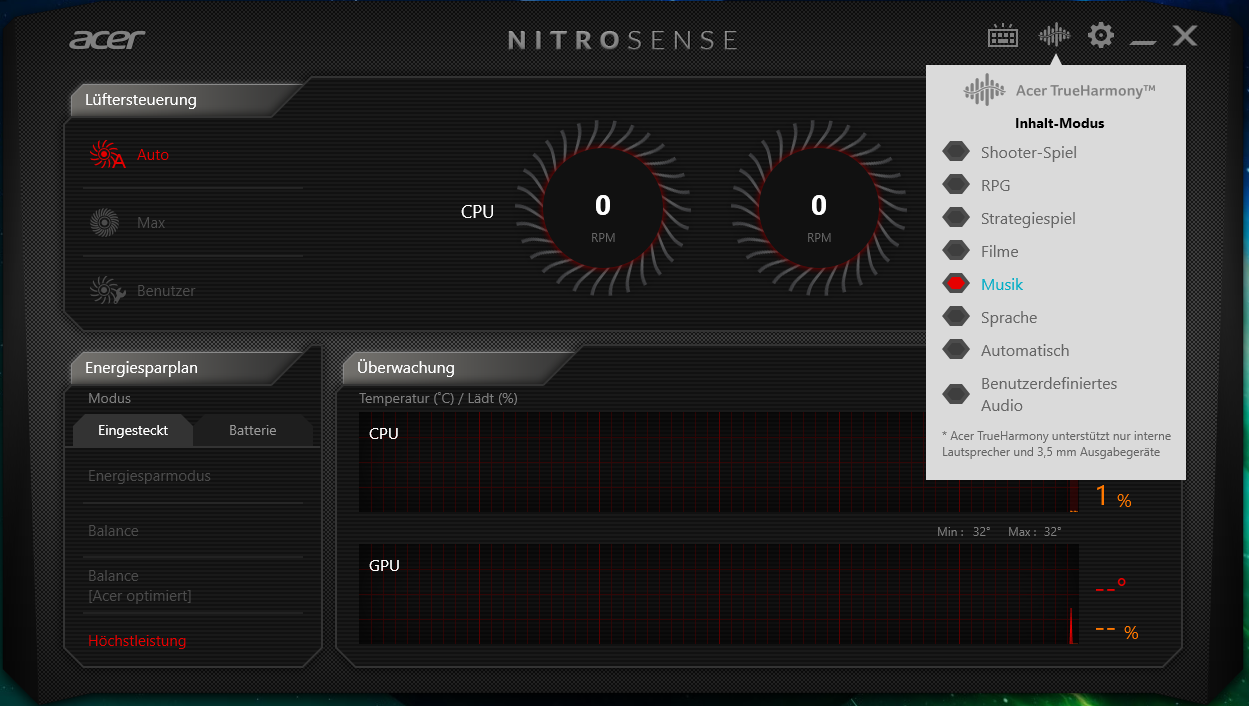
El software NitroSense preinstalado ofrece varios perfiles de rendimiento y permite influir en los dos ventiladores. Realizamos todas las pruebas con el perfil de rendimiento "Alto Rendimiento" y usamos el control automático del ventilador. Los perfiles de rendimiento corresponden a los perfiles estándar de Windows 10.
Procesador
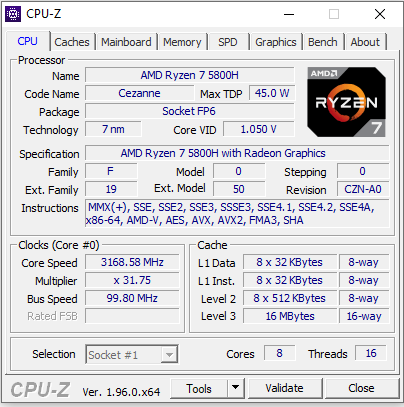
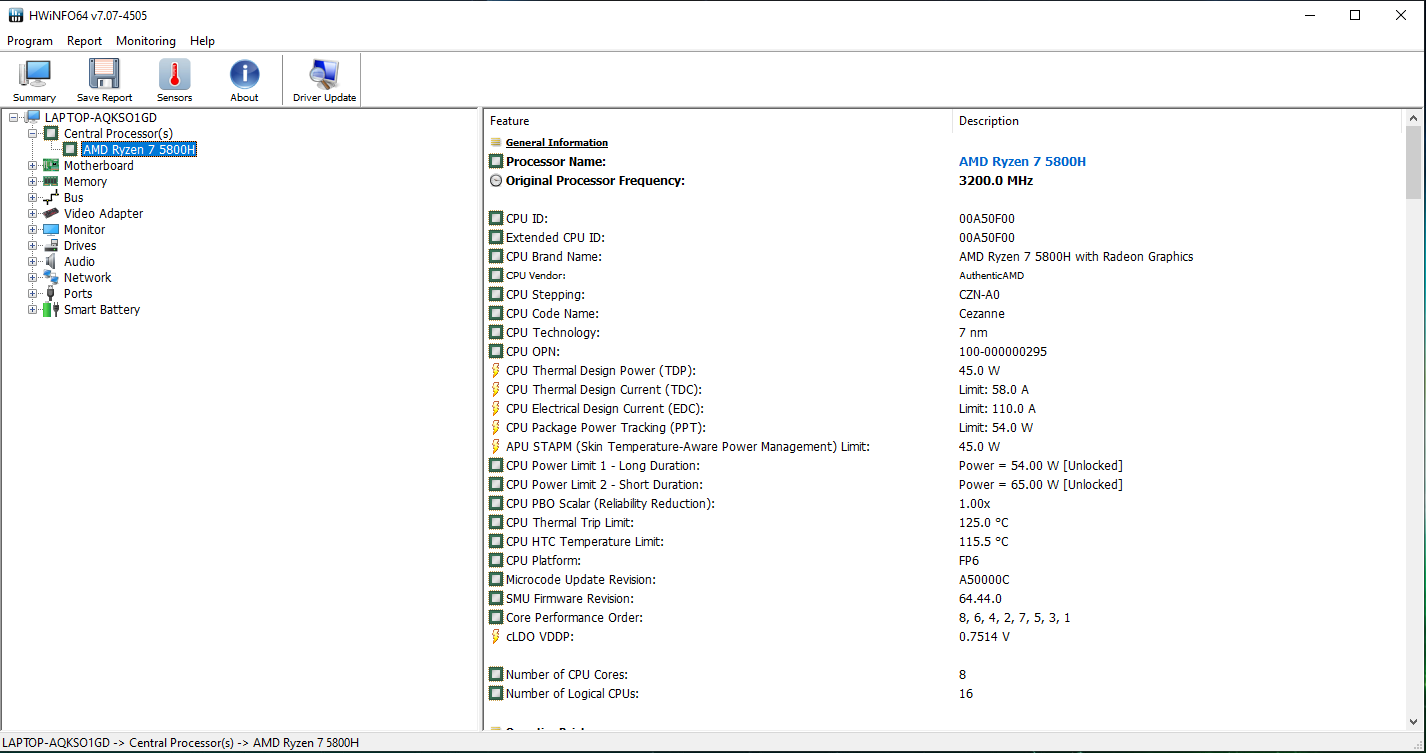
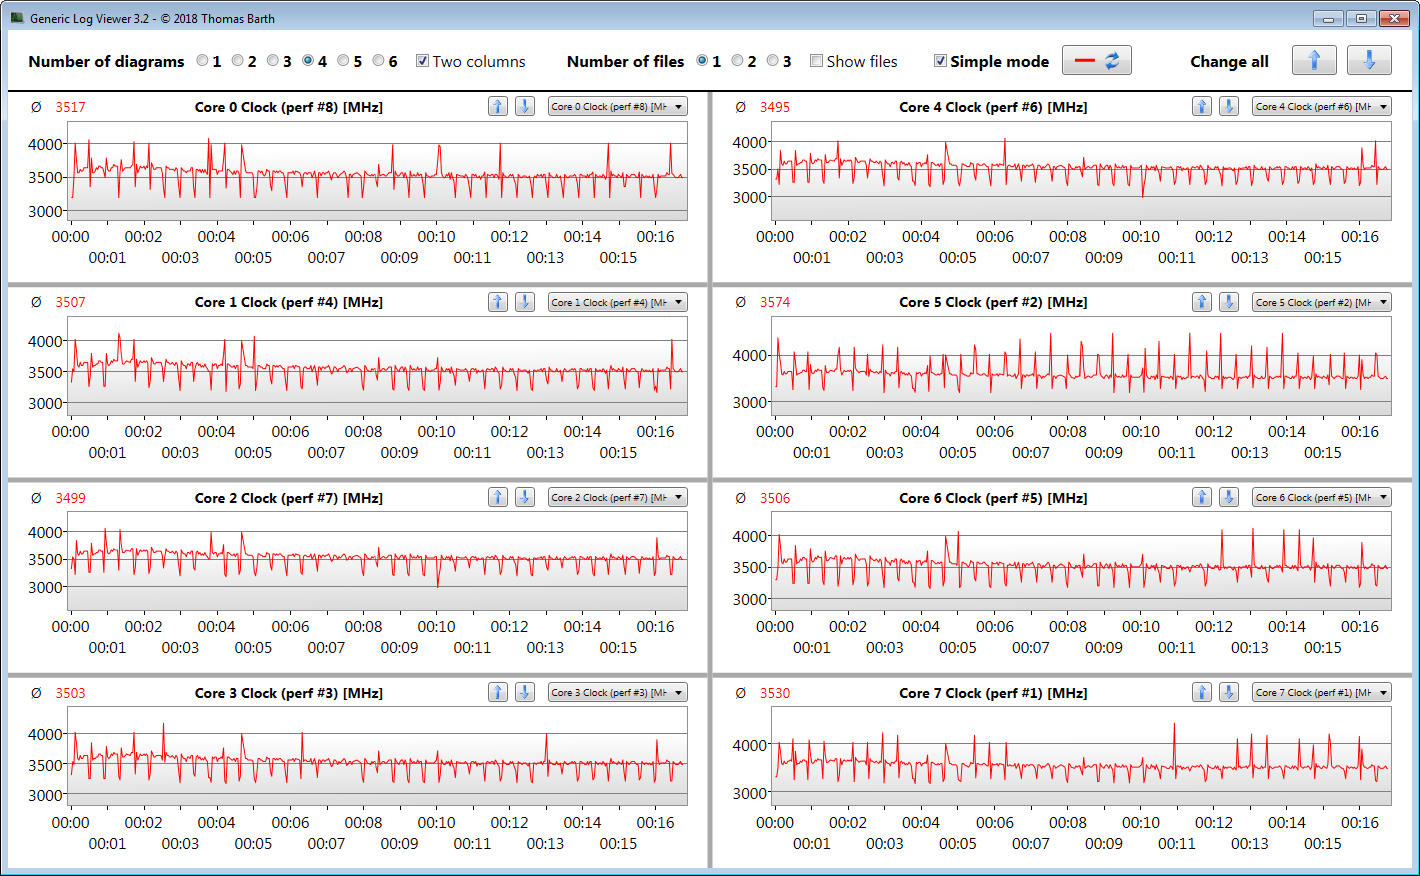
La parte de la CPU del Ryzen 7-5800H (Cezanne) consiste en un procesador de ocho núcleos que funciona con un reloj base de 3,2 GHz. Es posible aumentar hasta 4,4 GHz a través de Turbo. Soporta multithreading simultáneo (dos hilos por núcleo).
Las pruebas de CPU del benchmark Cinebench R15 se procesan con 3,7 GHz (funcionamiento en red) y de 3,2 a 4,4 GHz (hilo único). Las velocidades de reloj son de 1,9 GHz (multihilo) y de 1,5 a 1,9 GHz (un solo hilo) en modo de batería.
Comprobamos si el Turbo de la CPU también se utiliza permanentemente en el funcionamiento de la red eléctrica ejecutando la prueba multihilo del benchmark Cinebench R15 en un bucle durante al menos 30 minutos. El Turbo se utiliza en un nivel bajo
Cinebench R15 Multi Endurance test
* ... más pequeño es mejor
Rendimiento del sistema
El sistema funciona sin problemas. No se han producido problemas. El hardware ofrece suficiente potencia de cálculo incluso para aplicaciones más allá de los juegos. Esto queda confirmado por los buenos resultados de PCMark
| PCMark 8 Home Score Accelerated v2 | 5252 puntos | |
| PCMark 8 Creative Score Accelerated v2 | 6230 puntos | |
| PCMark 8 Work Score Accelerated v2 | 6177 puntos | |
| PCMark 10 Score | 6758 puntos | |
ayuda | ||
| PCMark 10 / Score | |
| Media de la clase Gaming (5828 - 12414, n=93, últimos 2 años) | |
| Schenker XMG Neo 17 (Early 2021, RTX 3070, 5800H) | |
| Medion Erazer Beast X25 | |
| Acer Nitro 5 AN517-41-R9S5 | |
| Medio AMD Ryzen 7 5800H, NVIDIA GeForce RTX 3080 Laptop GPU (n=1) | |
| Acer Nitro 5 AN517-41-R5Z7 | |
| MSI GP76 Leopard 10UG | |
| PCMark 10 / Essentials | |
| Media de la clase Gaming (8810 - 11935, n=97, últimos 2 años) | |
| Acer Nitro 5 AN517-41-R9S5 | |
| Medio AMD Ryzen 7 5800H, NVIDIA GeForce RTX 3080 Laptop GPU (n=1) | |
| Acer Nitro 5 AN517-41-R5Z7 | |
| Schenker XMG Neo 17 (Early 2021, RTX 3070, 5800H) | |
| Medion Erazer Beast X25 | |
| MSI GP76 Leopard 10UG | |
| PCMark 10 / Productivity | |
| Media de la clase Gaming (6845 - 25323, n=95, últimos 2 años) | |
| Medion Erazer Beast X25 | |
| Acer Nitro 5 AN517-41-R9S5 | |
| Medio AMD Ryzen 7 5800H, NVIDIA GeForce RTX 3080 Laptop GPU (n=1) | |
| Acer Nitro 5 AN517-41-R5Z7 | |
| Schenker XMG Neo 17 (Early 2021, RTX 3070, 5800H) | |
| MSI GP76 Leopard 10UG | |
| PCMark 10 / Digital Content Creation | |
| Media de la clase Gaming (7602 - 19954, n=95, últimos 2 años) | |
| Schenker XMG Neo 17 (Early 2021, RTX 3070, 5800H) | |
| Medion Erazer Beast X25 | |
| Acer Nitro 5 AN517-41-R5Z7 | |
| Acer Nitro 5 AN517-41-R9S5 | |
| Medio AMD Ryzen 7 5800H, NVIDIA GeForce RTX 3080 Laptop GPU (n=1) | |
| MSI GP76 Leopard 10UG | |
Latencias del CPD
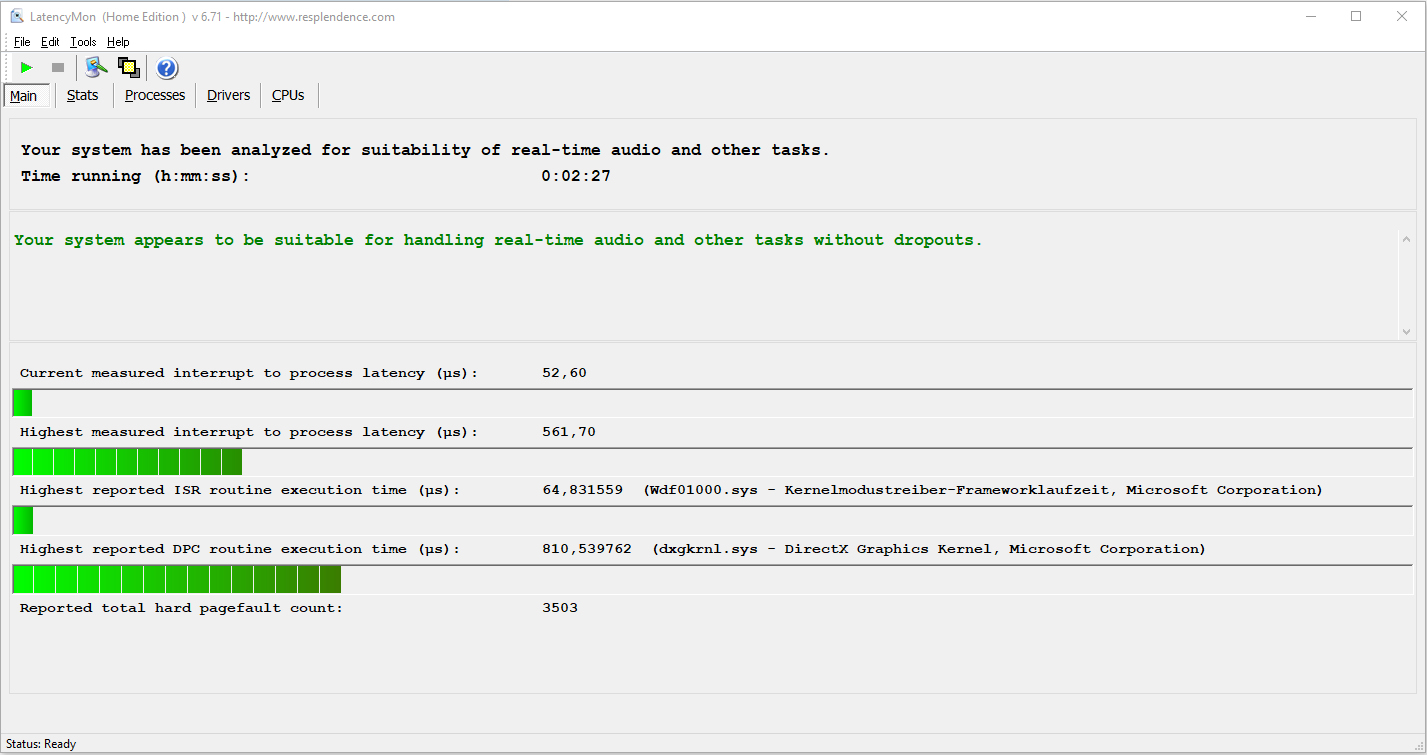
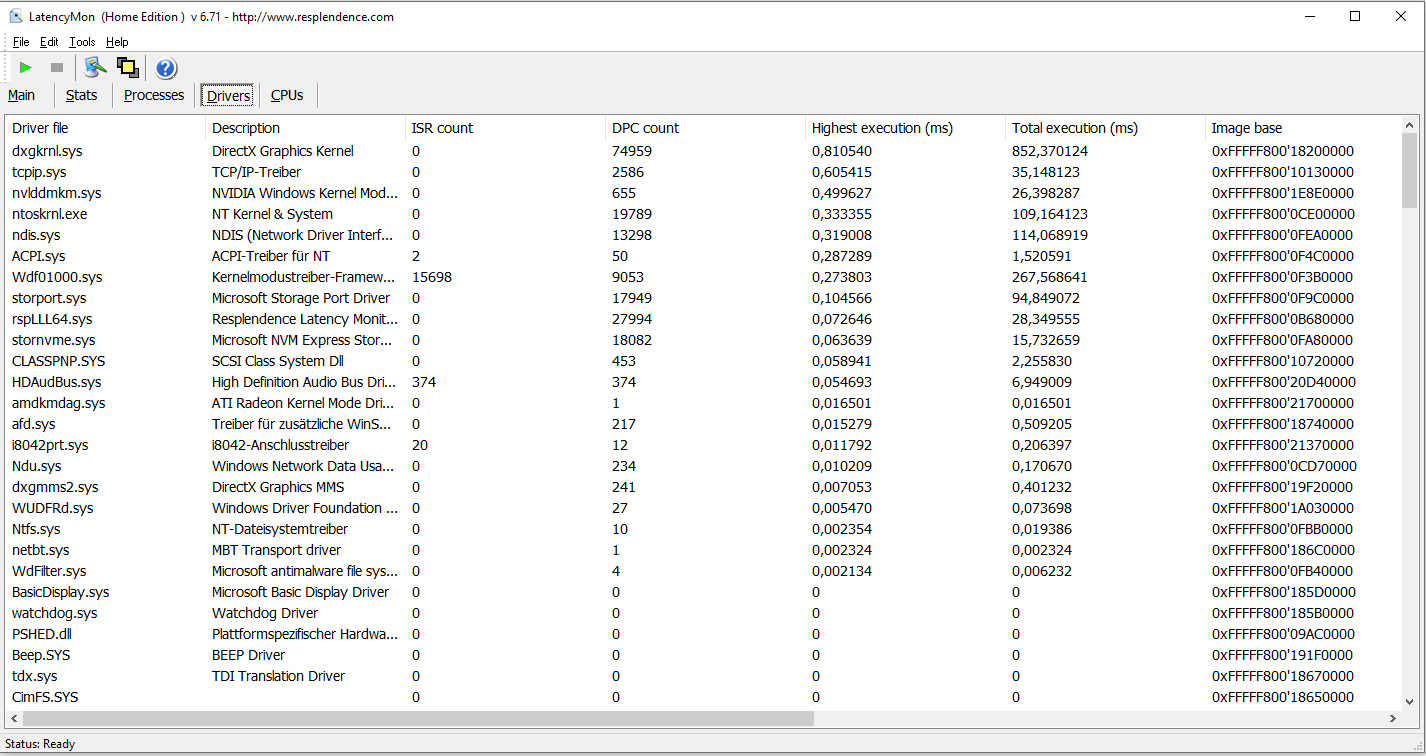
| DPC Latencies / LatencyMon - interrupt to process latency (max), Web, Youtube, Prime95 | |
| Schenker XMG Neo 17 (Early 2021, RTX 3070, 5800H) | |
| Acer Nitro 5 AN517-41-R5Z7 | |
| MSI GP76 Leopard 10UG | |
| Medion Erazer Beast X25 | |
| Acer Nitro 5 AN517-41-R9S5 | |
* ... más pequeño es mejor
Almacenamiento masivo
Un SSD NVMe (M.2-2280) de SK Hynix sirve como unidad del sistema. Ofrece 1 TB de espacio de almacenamiento y ofrece buenas tasas de transferencia. El portátil también tiene espacio para un segundo SSD M.2-2280 (NVMe) y un dispositivo de almacenamiento de 2,5 pulgadas (ranura SATA, tornillos y marco de montaje incluidos)

| Acer Nitro 5 AN517-41-R9S5 SK Hynix BC711 1TB HFM001TD3JX016N | MSI GP76 Leopard 10UG Kingston OM8PCP3512F-AB | Schenker XMG Neo 17 (Early 2021, RTX 3070, 5800H) Samsung SSD 970 EVO Plus 500GB | Acer Nitro 5 AN517-41-R5Z7 SK Hynix BC711 1TB HFM001TD3JX016N | Medion Erazer Beast X25 Samsung PM9A1 MZVL22T0HBLB | Medio SK Hynix BC711 1TB HFM001TD3JX016N | Media de la clase Gaming | |
|---|---|---|---|---|---|---|---|
| CrystalDiskMark 5.2 / 6 | -35% | 12% | 1% | -1% | 1% | 50% | |
| Write 4K (MB/s) | 133.4 | 143.7 8% | 206.1 54% | 146.7 10% | 129.7 -3% | 140.1 ? 5% | 199.6 ? 50% |
| Read 4K (MB/s) | 64.7 | 45.1 -30% | 53 -18% | 63.7 -2% | 62.4 -4% | 64.2 ? -1% | 78.6 ? 21% |
| Write Seq (MB/s) | 2934 | 978 -67% | 3018 3% | 2954 1% | 2436 -17% | 2944 ? 0% | 3758 ? 28% |
| Read Seq (MB/s) | 2364 | 1163 -51% | 2575 9% | 1974 -16% | 2354 0% | 2169 ? -8% | 3633 ? 54% |
| Write 4K Q32T1 (MB/s) | 438.4 | 519 18% | 535 22% | 496.9 13% | 512 17% | 468 ? 7% | 614 ? 40% |
| Read 4K Q32T1 (MB/s) | 516 | 302.7 -41% | 608 18% | 549 6% | 436.2 -15% | 533 ? 3% | 710 ? 38% |
| Write Seq Q32T1 (MB/s) | 3083 | 981 -68% | 3242 5% | 3062 -1% | 3541 15% | 3073 ? 0% | 5333 ? 73% |
| Read Seq Q32T1 (MB/s) | 3584 | 1983 -45% | 3617 1% | 3580 0% | 3568 0% | 3582 ? 0% | 7102 ? 98% |
| AS SSD | -46% | 1% | -5% | -8% | -3% | 30% | |
| Seq Read (MB/s) | 2974 | 1659 -44% | 3020 2% | 2891 -3% | 2591 -13% | 2933 ? -1% | 5591 ? 88% |
| Seq Write (MB/s) | 2733 | 921 -66% | 2631 -4% | 2692 -2% | 1900 -30% | 2713 ? -1% | 3972 ? 45% |
| 4K Read (MB/s) | 55.7 | 51 -8% | 60.3 8% | 52.6 -6% | 53.9 -3% | 54.2 ? -3% | 71.1 ? 28% |
| 4K Write (MB/s) | 134 | 120.1 -10% | 171.6 28% | 134.9 1% | 112.6 -16% | 134.5 ? 0% | 215 ? 60% |
| 4K-64 Read (MB/s) | 1854 | 463.5 -75% | 1410 -24% | 1845 0% | 1335 -28% | 1850 ? 0% | 1618 ? -13% |
| 4K-64 Write (MB/s) | 2165 | 909 -58% | 2324 7% | 2142 -1% | 2966 37% | 2154 ? -1% | 2935 ? 36% |
| Access Time Read * (ms) | 0.179 | 0.045 | 0.038 | 0.06364 ? | |||
| Access Time Write * (ms) | 0.028 | 0.032 -14% | 0.024 14% | 0.028 -0% | 0.036 -29% | 0.028 ? -0% | 0.03794 ? -36% |
| Score Read (Points) | 2207 | 680 -69% | 1773 -20% | 2186 -1% | 1648 -25% | 2197 ? 0% | 2248 ? 2% |
| Score Write (Points) | 2573 | 1121 -56% | 2759 7% | 2546 -1% | 3269 27% | 2560 ? -1% | 3547 ? 38% |
| Score Total (Points) | 5899 | 2130 -64% | 5429 -8% | 5842 -1% | 5733 -3% | 5871 ? 0% | 6872 ? 16% |
| Copy ISO MB/s (MB/s) | 2260 | 2130 -6% | 2195 ? -3% | 3168 ? 40% | |||
| Copy Program MB/s (MB/s) | 677 | 642 -5% | 660 ? -3% | 981 ? 45% | |||
| Copy Game MB/s (MB/s) | 1493 | 821 -45% | 1157 ? -23% | 2112 ? 41% | |||
| Media total (Programa/Opciones) | -41% /
-41% | 7% /
6% | -2% /
-3% | -5% /
-5% | -1% /
-1% | 40% /
38% |
* ... más pequeño es mejor
Continuous load read: DiskSpd Read Loop, Queue Depth 8
Tarjeta gráfica
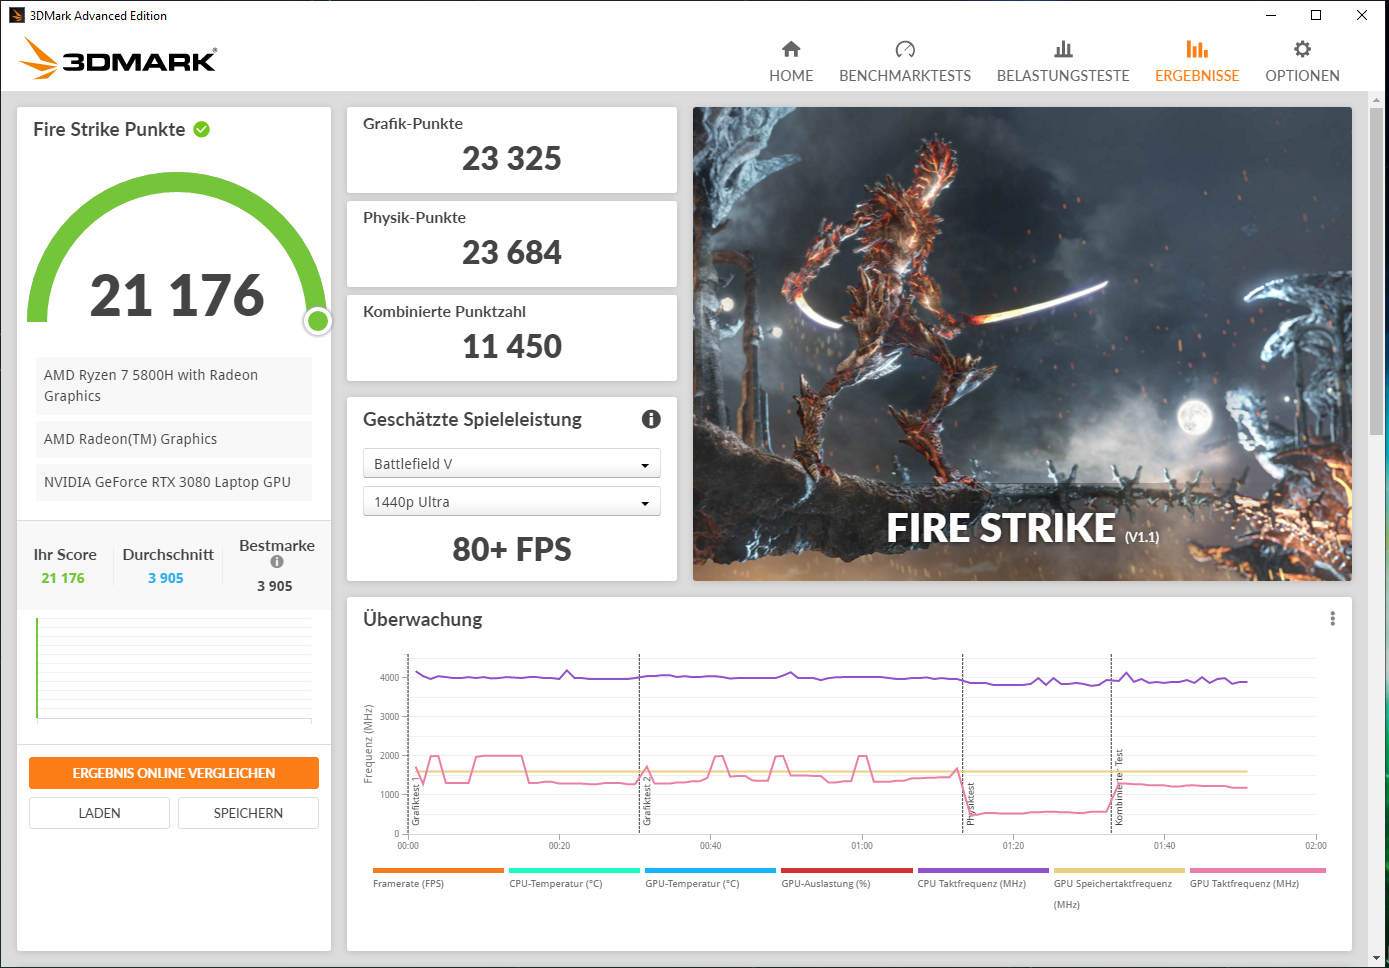
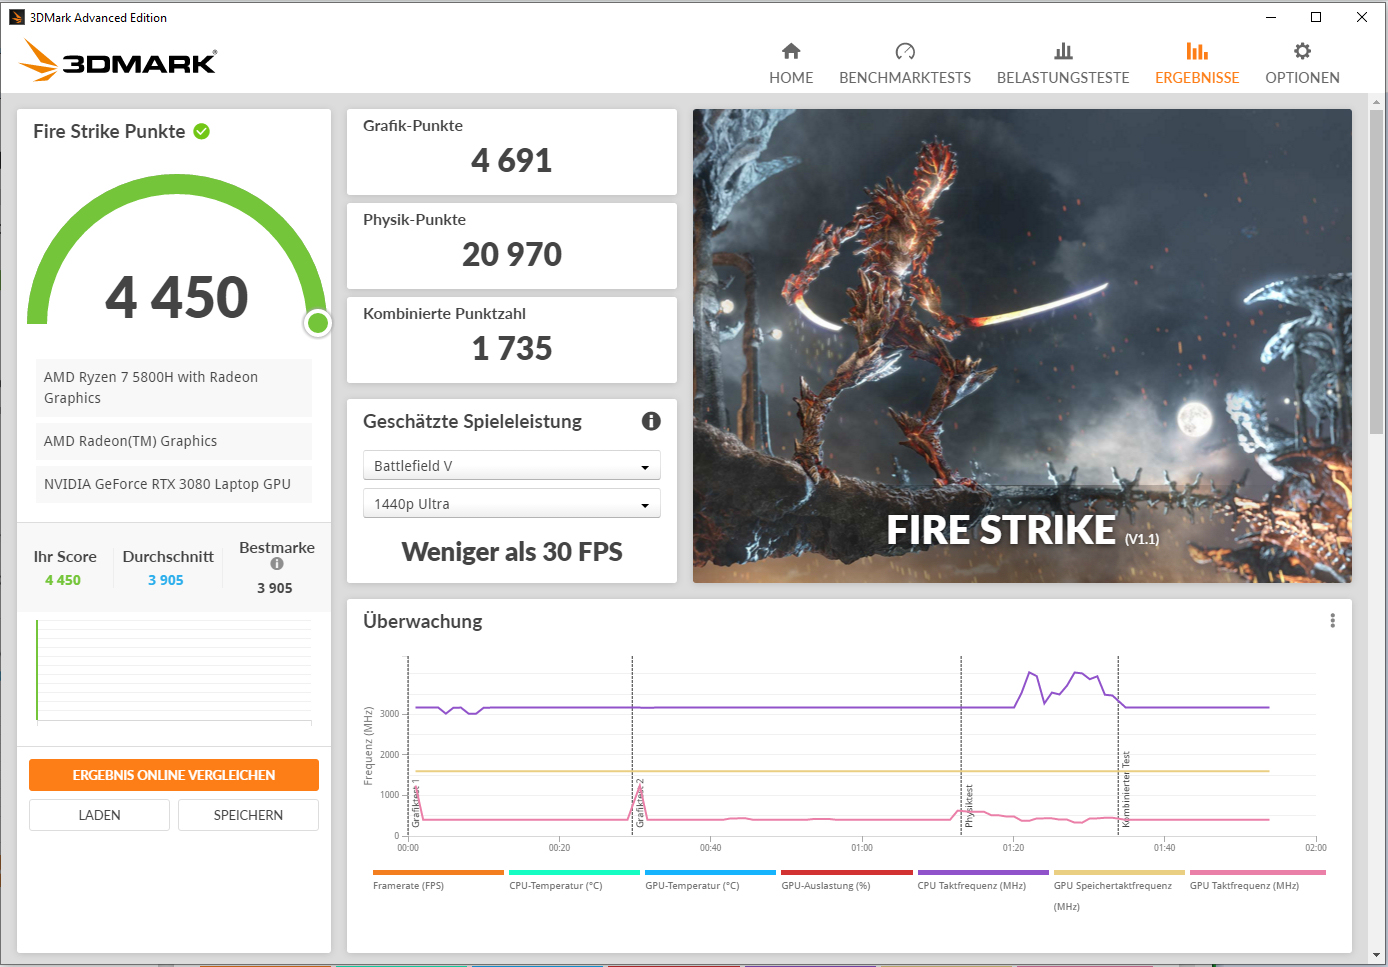
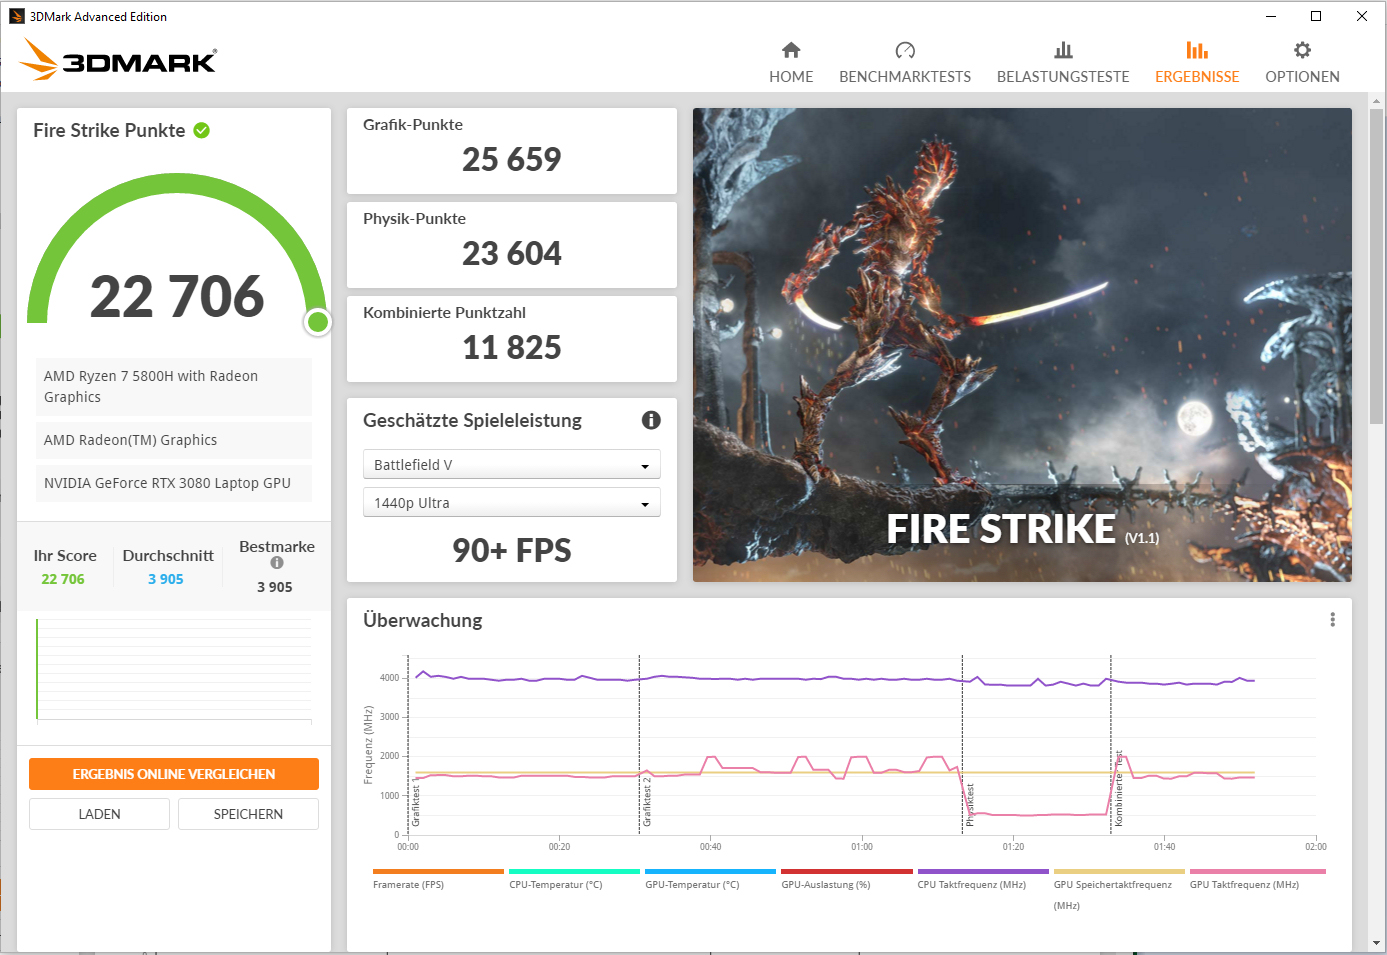
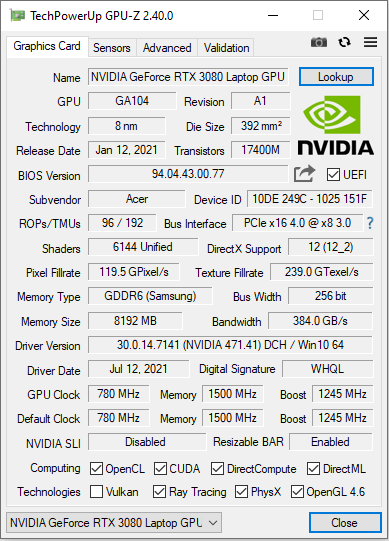
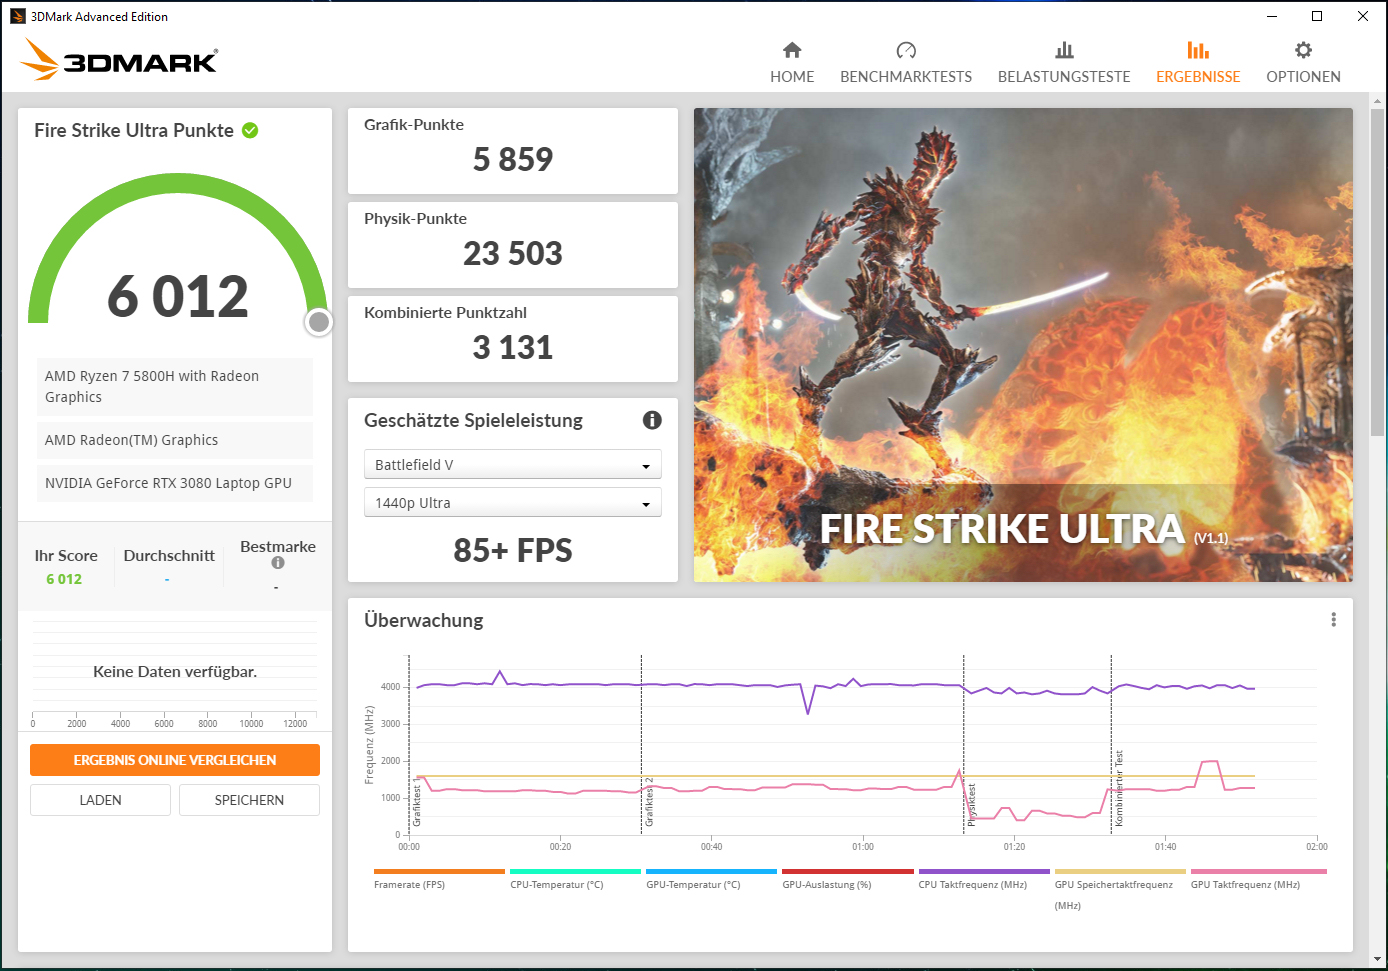
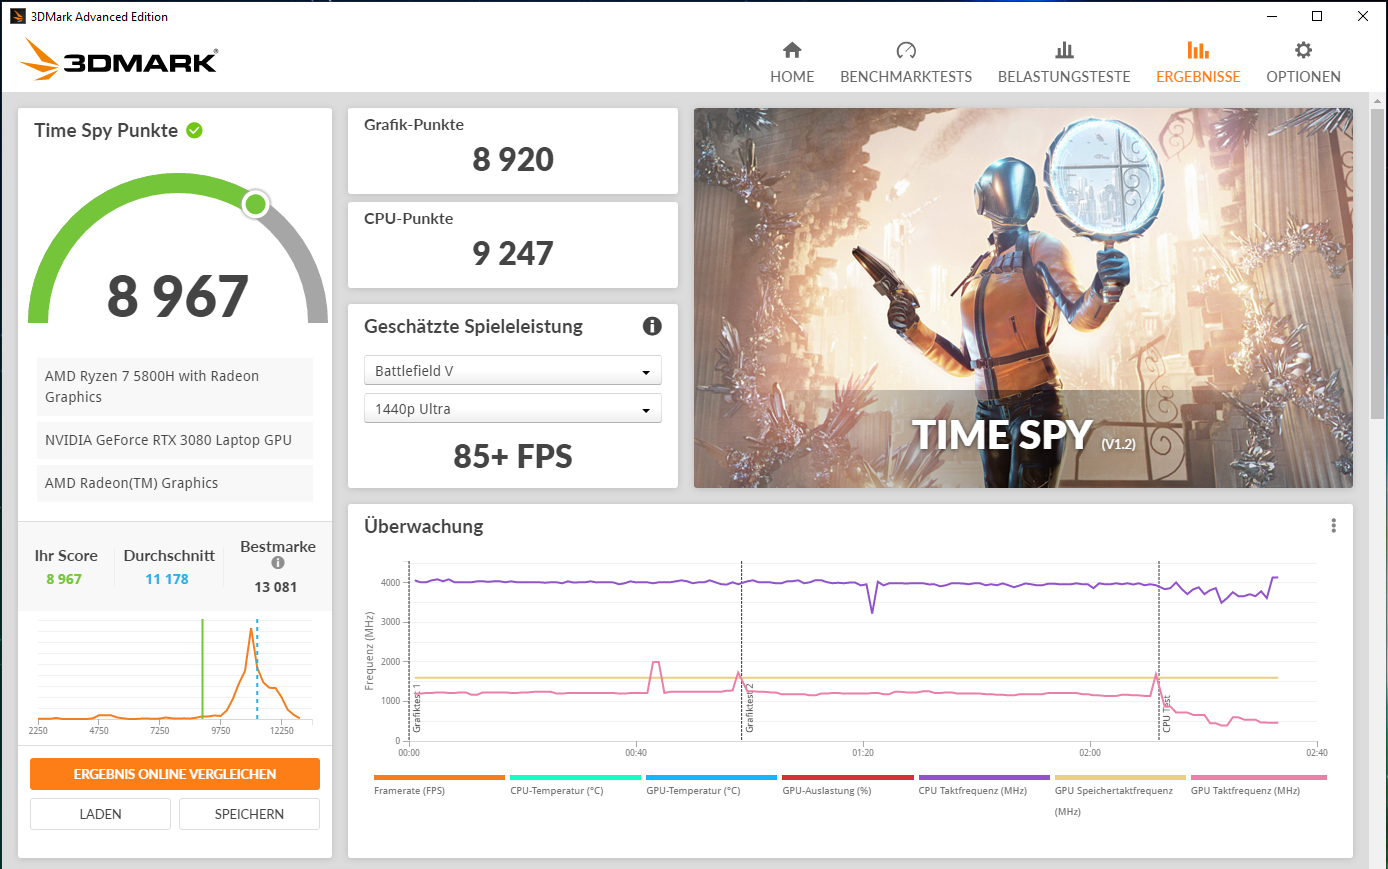
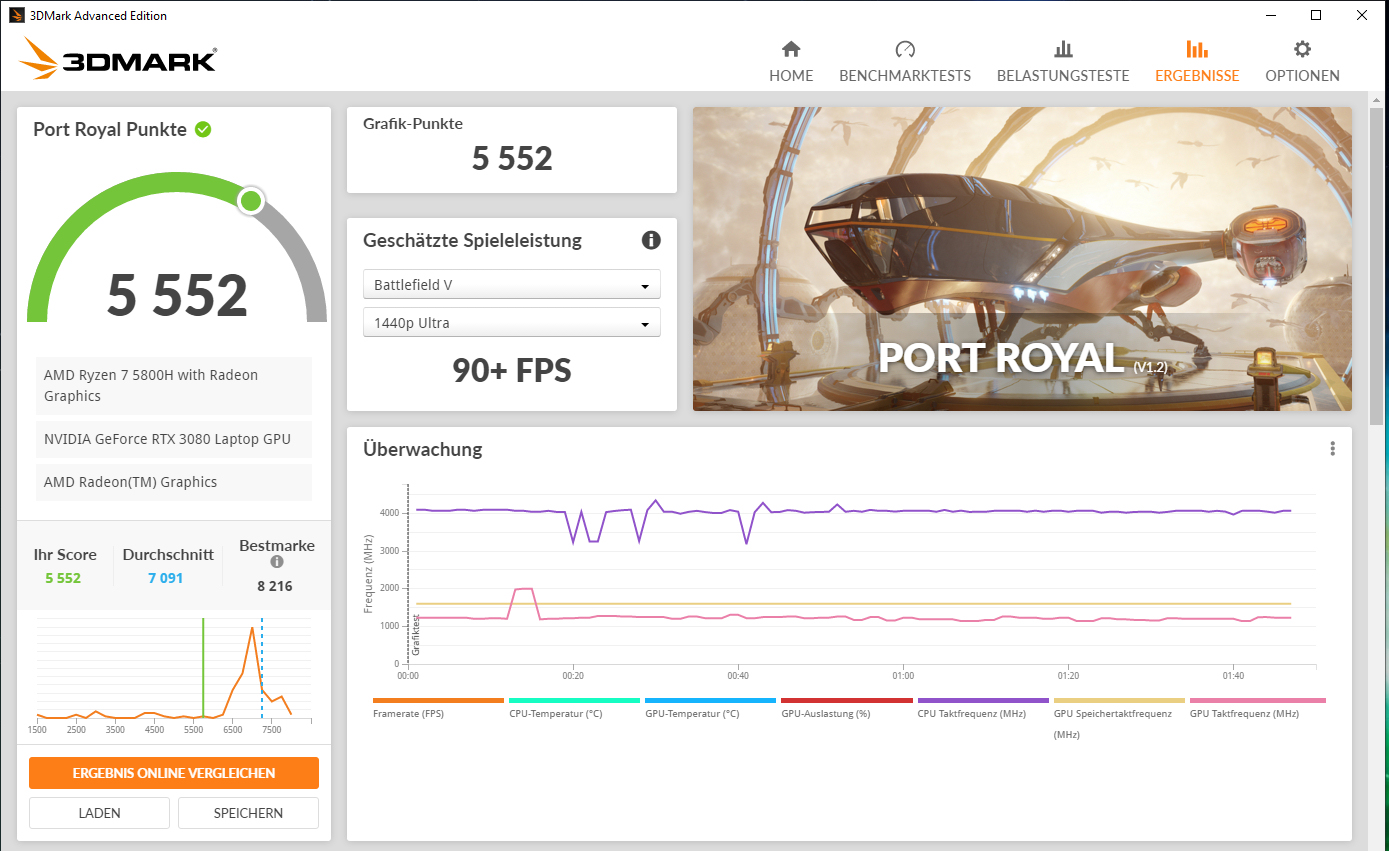
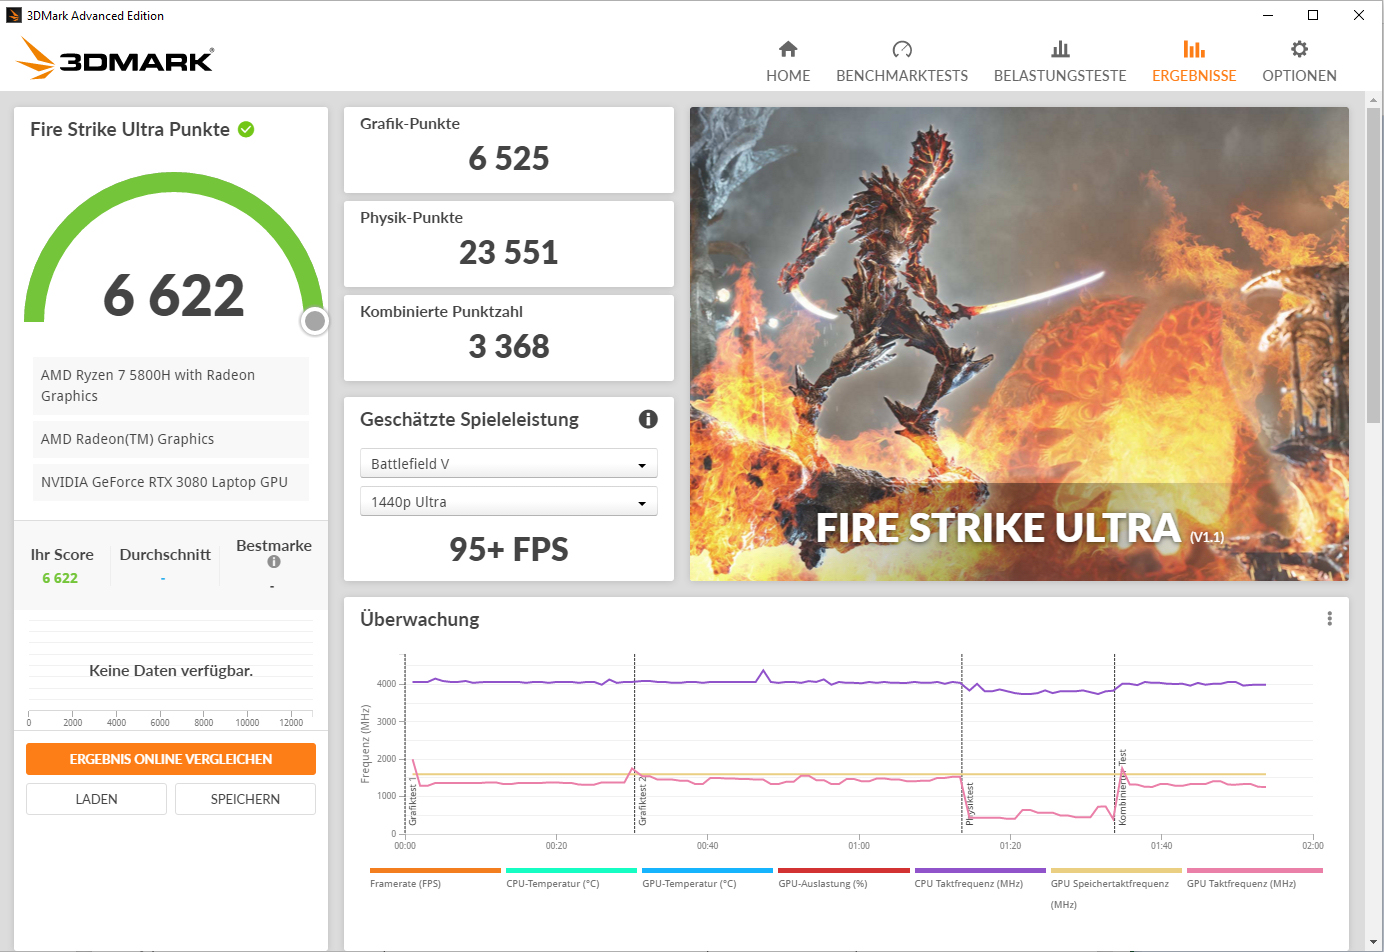
El rendimiento real de un núcleo gráfico RTX-3000 depende en gran medida del TGP máximo que elija el fabricante del portátil dentro de los límites definidos por Nvidia. Acer concede el GeForce Portátil RTX-3080 GPU (Resumen de todos los portátiles RTX-3080 incluyendo los TGP) un TGP máximo de 100 vatios.
La GPU ofrece parcialmente los resultados de pruebas más bajos que hemos determinado con la RTX-3080 hasta ahora. Hay potencial de mejora: Una actualización de firmware aumenta un poco el rendimiento de la GPU y acerca los resultados a la media del RTX-3080. La actualizaciónno aumenta el TGP. Presumiblemente, Acer ha subido los límites de temperatura - al menos el test Witcher 3 lo muestra.
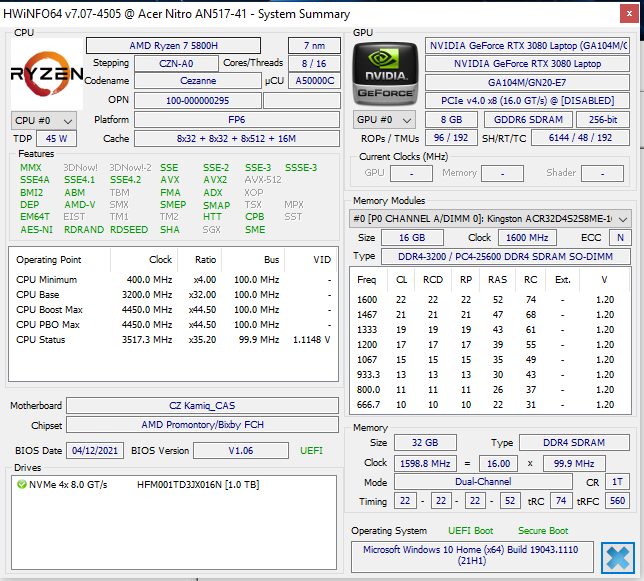
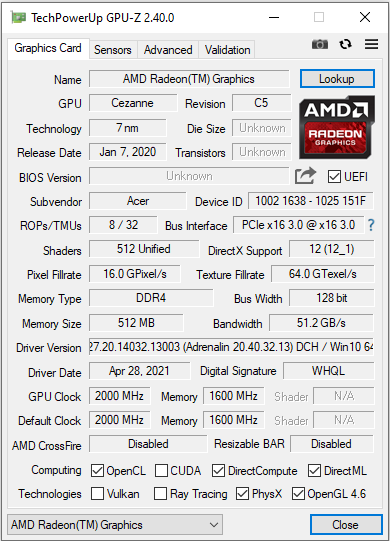
La RTX-3080 puede recurrir a la rápida memoria gráfica GDDR6 (8.192 MB). El procesador integrado Vega-8integrado en el procesador está activo y el portátil funciona con la solución gráfica de conmutación Nvidia Optimus.
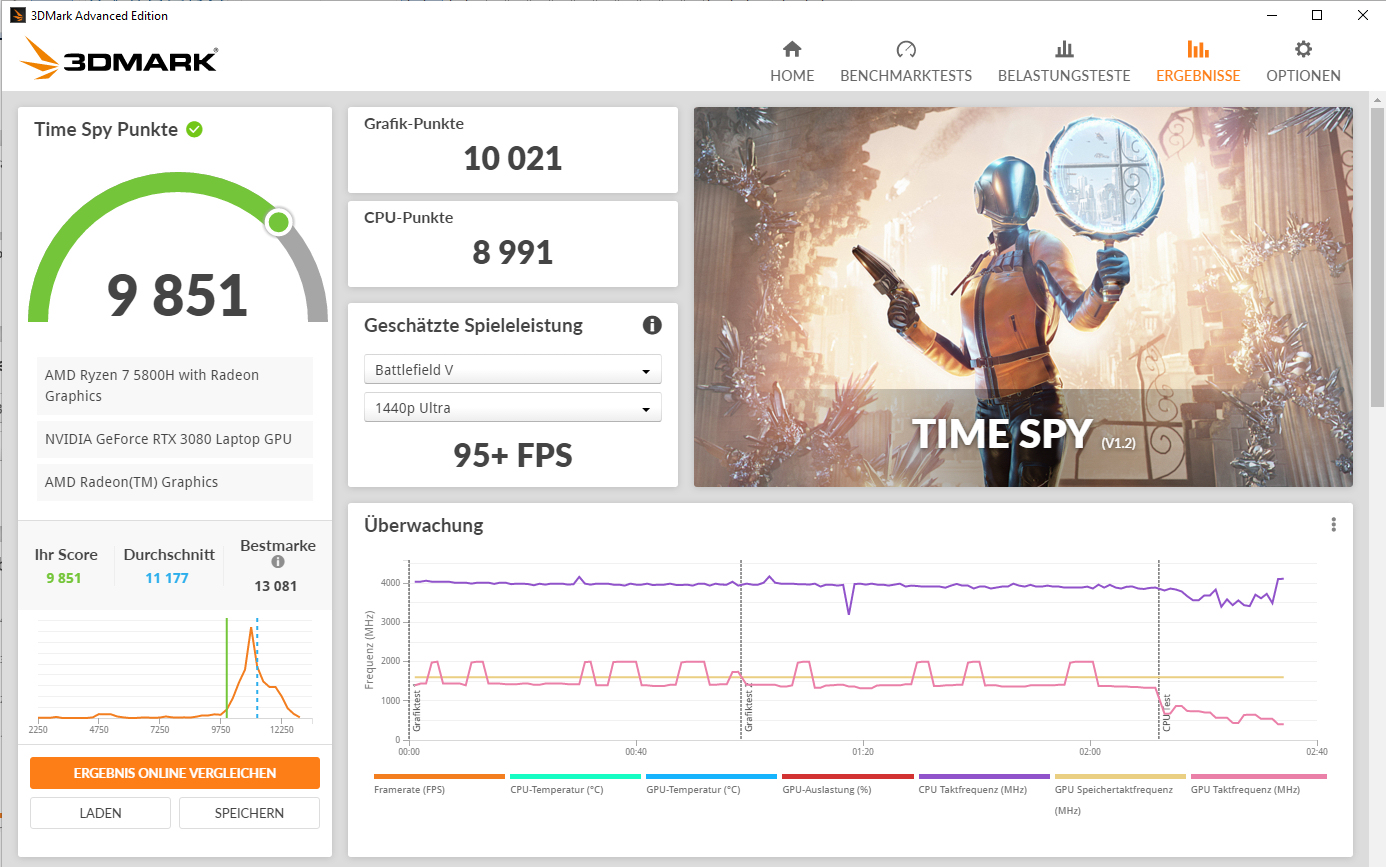

| 3DMark 11 Performance | 25155 puntos | |
| 3DMark Cloud Gate Standard Score | 46255 puntos | |
| 3DMark Fire Strike Score | 21176 puntos | |
| 3DMark Time Spy Score | 8967 puntos | |
ayuda | ||
| 3DMark 11 - 1280x720 Performance GPU | |
| Media de la clase Gaming (21841 - 80022, n=104, últimos 2 años) | |
| MSI GP76 Leopard 10UG | |
| Medio NVIDIA GeForce RTX 3080 Laptop GPU (31288 - 43744, n=40) | |
| Aorus 17G YD | |
| Medion Erazer Beast X25 | |
| Acer Nitro 5 AN517-41-R9S5 | |
| Acer Nitro 5 AN517-41-R9S5 | |
| Acer Nitro 5 AN517-41-R5Z7 | |
Rendimiento de los juegos
El ordenador lleva a la pantalla todos los juegos actuales sin problemas. La resolución FHD y los ajustes de máxima calidad pueden seleccionarse normalmente. Las tasas de frames están por debajo de la media en la comparación con la RTX-3080.
Las tasas de frames de los juegos que probamos aumentan hasta un 15% tras instalar la mencionada actualización de firmware. No se observa un aumento general del rendimiento. Sin embargo: Incluso después de ejecutar la actualización, el Nitro sigue por detrás de un portátil RTX-3070 nominalmente más débil como el MSI GP76 Leopard 10UG. Aquí, el GP76 se beneficia del mayor TGP (140 vatios frente a 100 vatios).
| The Witcher 3 - 1920x1080 Ultra Graphics & Postprocessing (HBAO+) | |
| Media de la clase Gaming (104.7 - 240, n=7, últimos 2 años) | |
| MSI GP76 Leopard 10UG | |
| Aorus 17G YD | |
| Medio NVIDIA GeForce RTX 3080 Laptop GPU (85.1 - 123, n=40) | |
| Schenker XMG Neo 17 (Early 2021, RTX 3070, 5800H) | |
| Medion Erazer Beast X25 | |
| Acer Nitro 5 AN517-41-R9S5 (FW-Update) | |
| Acer Nitro 5 AN517-41-R9S5 | |
| Acer Nitro 5 AN517-41-R5Z7 | |
| Dota 2 Reborn - 1920x1080 ultra (3/3) best looking | |
| Media de la clase Gaming (84.8 - 248, n=107, últimos 2 años) | |
| Aorus 17G YD | |
| Schenker XMG Neo 17 (Early 2021, RTX 3070, 5800H) | |
| Medio NVIDIA GeForce RTX 3080 Laptop GPU (98 - 156, n=45) | |
| Medion Erazer Beast X25 | |
| MSI GP76 Leopard 10UG | |
| Acer Nitro 5 AN517-41-R9S5 | |
| Acer Nitro 5 AN517-41-R9S5 (FW-Update) | |
| Acer Nitro 5 AN517-41-R5Z7 | |
| X-Plane 11.11 - 1920x1080 high (fps_test=3) | |
| Media de la clase Gaming (55.5 - 143.5, n=109, últimos 2 años) | |
| Medio NVIDIA GeForce RTX 3080 Laptop GPU (65.6 - 113, n=44) | |
| Aorus 17G YD | |
| MSI GP76 Leopard 10UG | |
| Schenker XMG Neo 17 (Early 2021, RTX 3070, 5800H) | |
| Acer Nitro 5 AN517-41-R9S5 (FW-Update) | |
| Medion Erazer Beast X25 | |
| Acer Nitro 5 AN517-41-R9S5 | |
| Acer Nitro 5 AN517-41-R5Z7 | |
| Final Fantasy XV Benchmark - 1920x1080 High Quality | |
| Media de la clase Gaming (41 - 215, n=95, últimos 2 años) | |
| Medio NVIDIA GeForce RTX 3080 Laptop GPU (55.5 - 115, n=34) | |
| Medion Erazer Beast X25 | |
| Aorus 17G YD (1.3) | |
| Acer Nitro 5 AN517-41-R9S5 (1.3, FW-Update) | |
| MSI GP76 Leopard 10UG | |
| Acer Nitro 5 AN517-41-R9S5 (1.3) | |
| Acer Nitro 5 AN517-41-R5Z7 (1.3) | |
| GTA V - 1920x1080 Highest AA:4xMSAA + FX AF:16x | |
| Media de la clase Gaming (48.3 - 186.9, n=94, últimos 2 años) | |
| Medio NVIDIA GeForce RTX 3080 Laptop GPU (68.6 - 114.6, n=34) | |
| Schenker XMG Neo 17 (Early 2021, RTX 3070, 5800H) | |
| Aorus 17G YD | |
| Medion Erazer Beast X25 | |
| Acer Nitro 5 AN517-41-R9S5 | |
| Acer Nitro 5 AN517-41-R9S5 (FW-Update) | |
| Acer Nitro 5 AN517-41-R5Z7 | |
| Strange Brigade - 1920x1080 ultra AA:ultra AF:16 | |
| Media de la clase Gaming (76.3 - 458, n=87, últimos 2 años) | |
| Medio NVIDIA GeForce RTX 3080 Laptop GPU (117 - 219, n=34) | |
| Medion Erazer Beast X25 (1.47.22.14 D3D12) | |
| Aorus 17G YD (1.47.22.14 D3D12) | |
| Acer Nitro 5 AN517-41-R9S5 (1.47.22.14 D3D12, FW-Update) | |
| Acer Nitro 5 AN517-41-R9S5 (1.47.22.14 D3D12) | |
| Acer Nitro 5 AN517-41-R5Z7 (1.47.22.14 D3D12) | |
| Dirt 5 - 1920x1080 Ultra High Preset | |
| Acer Nitro 5 AN517-41-R9S5 (FW-Update) | |
| Aorus 17G YD | |
| Medio NVIDIA GeForce RTX 3080 Laptop GPU (52 - 110, n=11) | |
| Acer Nitro 5 AN517-41-R9S5 | |
| Acer Nitro 5 AN517-41-R5Z7 | |
| Far Cry 5 - 1920x1080 Ultra Preset AA:T | |
| Media de la clase Gaming (70 - 151, n=6, últimos 2 años) | |
| MSI GP76 Leopard 10UG | |
| Medio NVIDIA GeForce RTX 3080 Laptop GPU (75 - 146, n=33) | |
| Medion Erazer Beast X25 | |
| Aorus 17G YD | |
| Acer Nitro 5 AN517-41-R9S5 | |
| Acer Nitro 5 AN517-41-R9S5 (FW-Update) | |
| Acer Nitro 5 AN517-41-R5Z7 | |
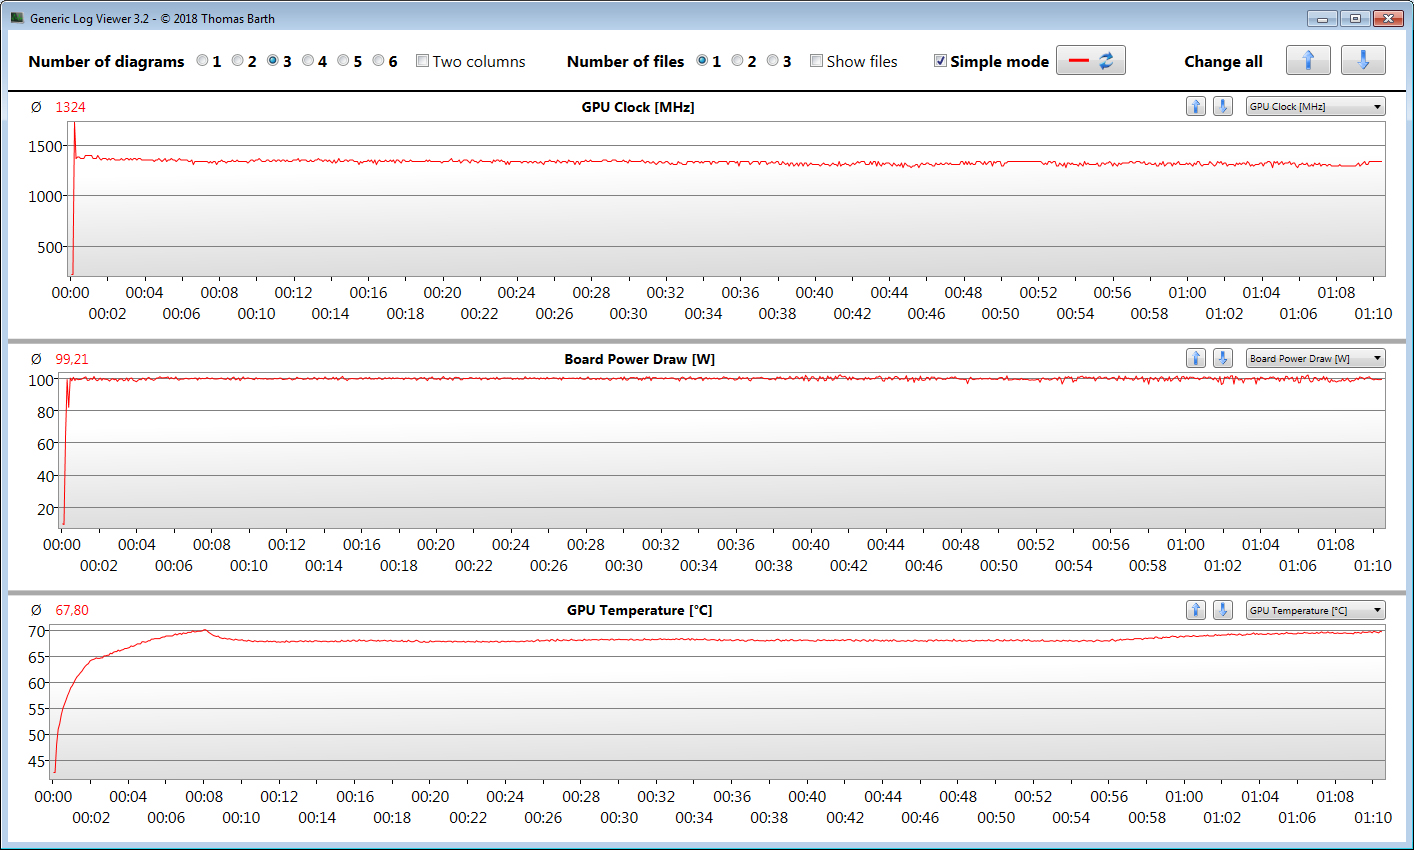
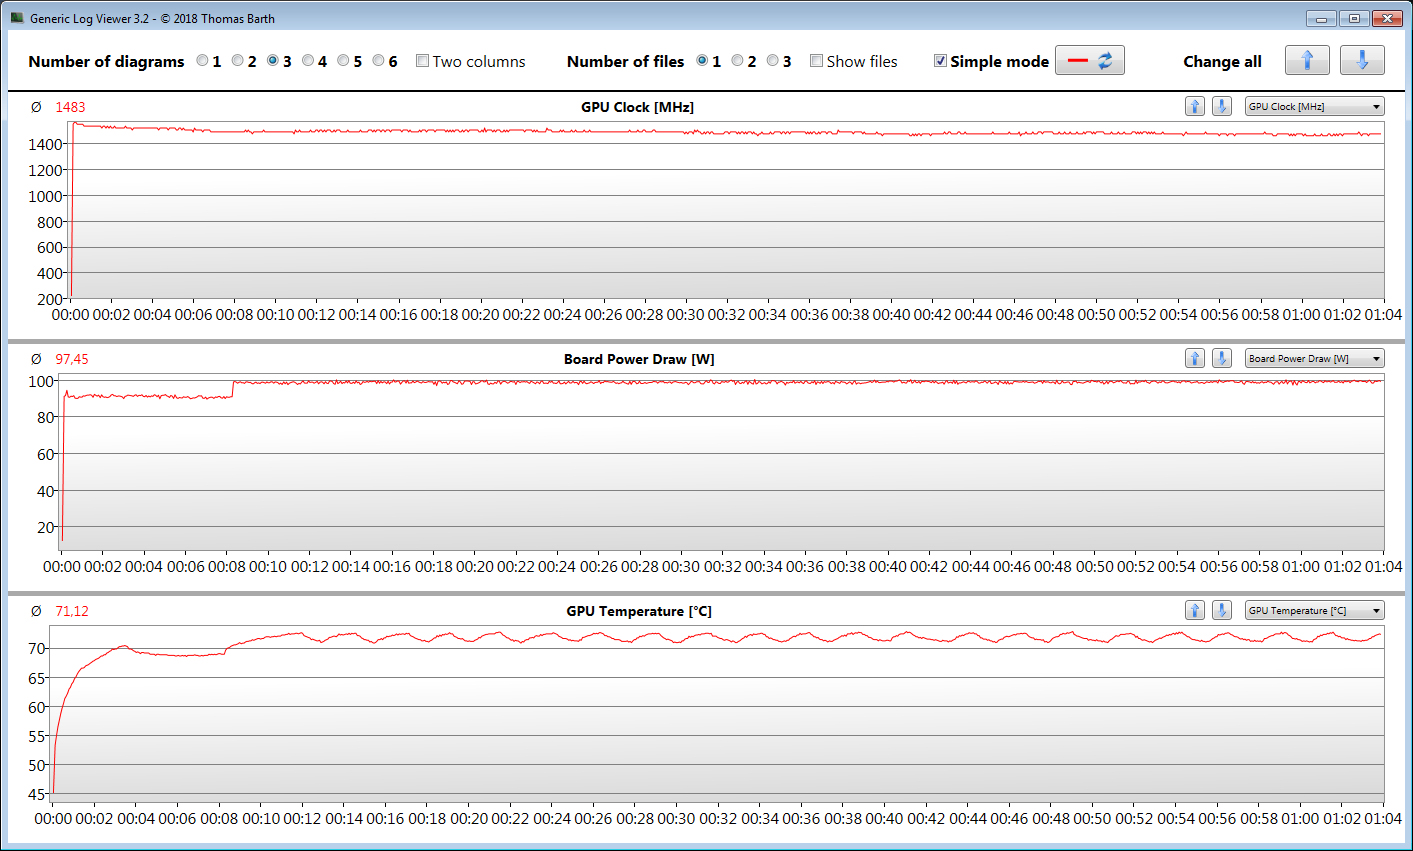
Para comprobar si la velocidad de fotogramas se mantiene prácticamente constante durante un periodo más largo, ejecutamos el juego"The Witcher 3" durante unos 60 minutos con resolución Full HD y ajustes de máxima calidad. El personaje del juego no se mueve. No se nota una caída de la velocidad de fotogramas
Witcher 3 FPS-Diagram
| bajo | medio | alto | ultra | |
|---|---|---|---|---|
| GTA V (2015) | 178 | 172 | 148 | 89.9 |
| The Witcher 3 (2015) | 293 | 262 | 151 | 87.7 |
| Dota 2 Reborn (2015) | 144 | 139 | 123 | 116 |
| Final Fantasy XV Benchmark (2018) | 165 | 113 | 85.4 | |
| X-Plane 11.11 (2018) | 98.1 | 85.8 | 72 | |
| Far Cry 5 (2018) | 134 | 115 | 110 | 103 |
| Strange Brigade (2018) | 313 | 186 | 165 | 151 |
| Dirt 5 (2020) | 190 | 120 | 97.3 | 76.5 |
Emissions & Energy - Acer computer does not generate excessive heat and noise
Emisiones acústicas
Los dos ventiladores funcionan a baja velocidad en ralentí y son apenas audibles. Ocasionalmente se quedan parados. Esto no es así en caso de uso intensivo. El nivel máximo de presión sonora es de algo menos de 49 dB(A) (prueba de esfuerzo).
Ruido
| Ocioso |
| 26 / 28 / dB(A) |
| HDD |
| 0 dB(A) |
| Carga |
| 41.6 / 48.6 dB(A) |
 | ||
30 dB silencioso 40 dB(A) audible 50 dB(A) ruidosamente alto |
||
min: | ||
| Acer Nitro 5 AN517-41-R9S5 AMD Ryzen 7 5800H, NVIDIA GeForce RTX 3080 Laptop GPU | Acer Nitro 5 AN517-41-R5Z7 AMD Ryzen 7 5800H, NVIDIA GeForce RTX 3070 Laptop GPU | MSI GP76 Leopard 10UG Intel Core i7-10750H, NVIDIA GeForce RTX 3070 Laptop GPU | Schenker XMG Neo 17 (Early 2021, RTX 3070, 5800H) AMD Ryzen 7 5800H, NVIDIA GeForce RTX 3070 Laptop GPU | Medion Erazer Beast X25 AMD Ryzen 9 5900HX, NVIDIA GeForce RTX 3080 Laptop GPU | Aorus 17G YD Intel Core i7-11800H, NVIDIA GeForce RTX 3080 Laptop GPU | |
|---|---|---|---|---|---|---|
| Noise | -8% | -9% | -10% | -9% | -13% | |
| apagado / medio ambiente * (dB) | 26 | 26 -0% | 24 8% | 24 8% | 25 4% | 25 4% |
| Idle Minimum * (dB) | 26 | 26 -0% | 25 4% | 29 -12% | 26 -0% | 32 -23% |
| Idle Average * (dB) | 28 | 33.1 -18% | 32 -14% | 32 -14% | 30 -7% | 33 -18% |
| Load Average * (dB) | 41.6 | 49.8 -20% | 54 -30% | 49 -18% | 54 -30% | 43 -3% |
| Load Maximum * (dB) | 48.6 | 49.6 -2% | 54 -11% | 55 -13% | 55 -13% | 61 -26% |
| Idle Maximum * (dB) | 31.3 | 34 | 38 | 43 | 39 | |
| Witcher 3 ultra * (dB) | 51 | 53 | 52 | 52 |
* ... más pequeño es mejor
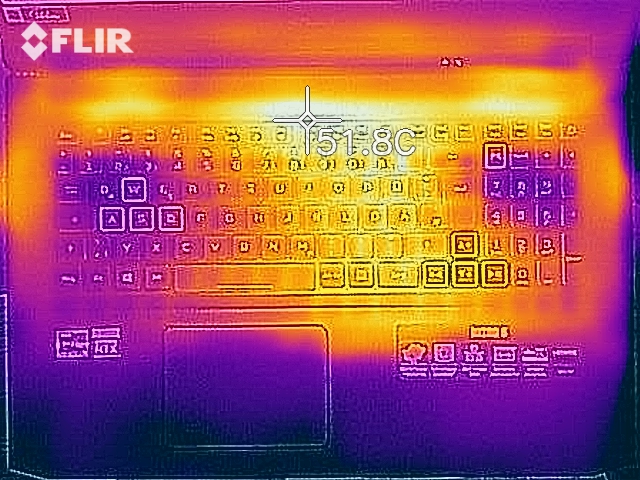
Temperatura
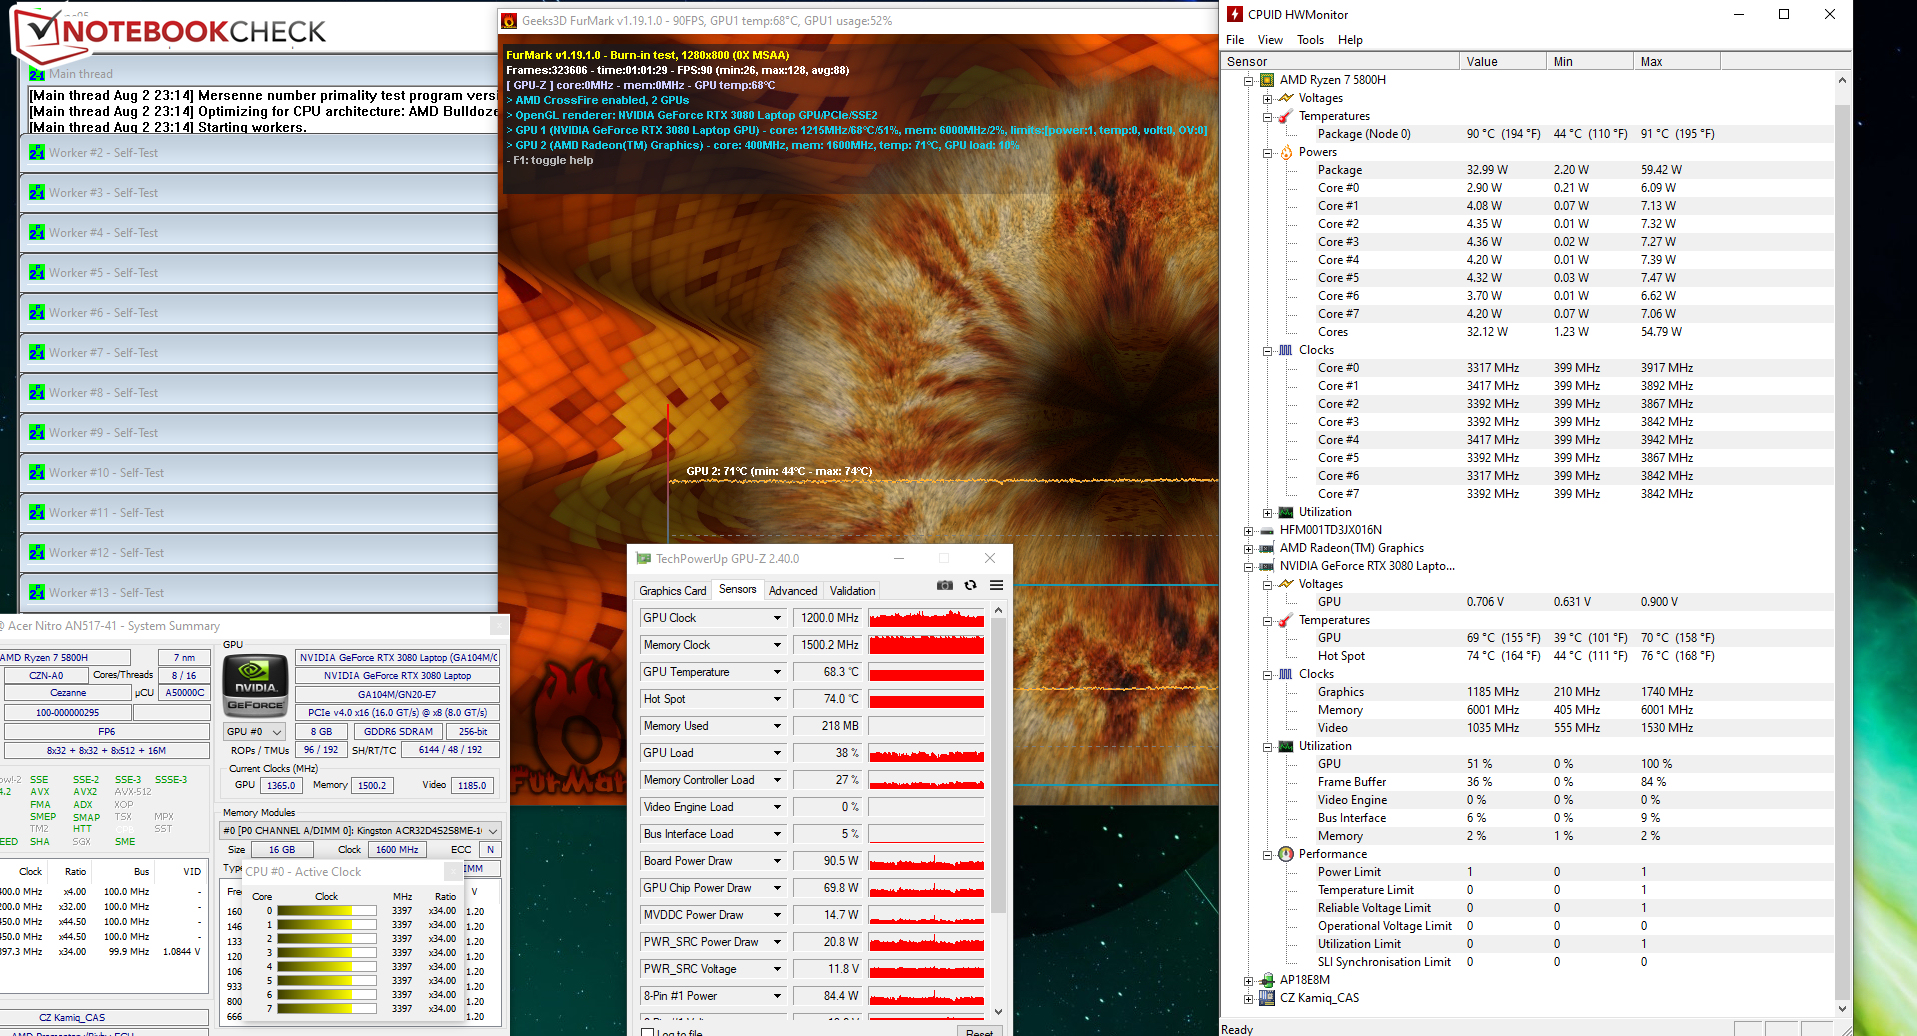
La prueba de estrés (Prime95 y FurMark se ejecutan durante una hora) se realiza con la CPU y la GPU a 3,4 GHz y entre 500 y 1.200 MHz, respectivamente. Este escenario extremo se utiliza para comprobar si el sistema funciona de forma estable bajo carga completa.
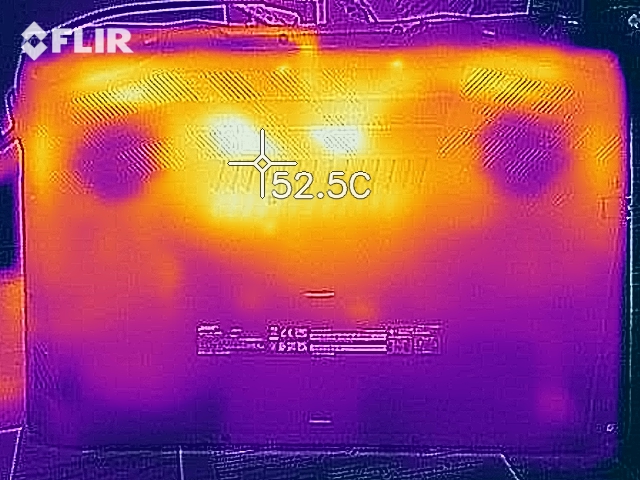
El portátil se calienta notablemente bajo carga, pero no excesivamente. Durante la prueba de estrés, la marca de 50 grados Celsius (122 Fahrenheit) se supera en dos puntos de medición. Las temperaturas están dentro de la zona verde en el uso diario
(-) La temperatura máxima en la parte superior es de 46.4 °C / 116 F, frente a la media de 40.4 °C / 105 F, que oscila entre 21.2 y 68.8 °C para la clase Gaming.
(-) El fondo se calienta hasta un máximo de 56.5 °C / 134 F, frente a la media de 43.2 °C / 110 F
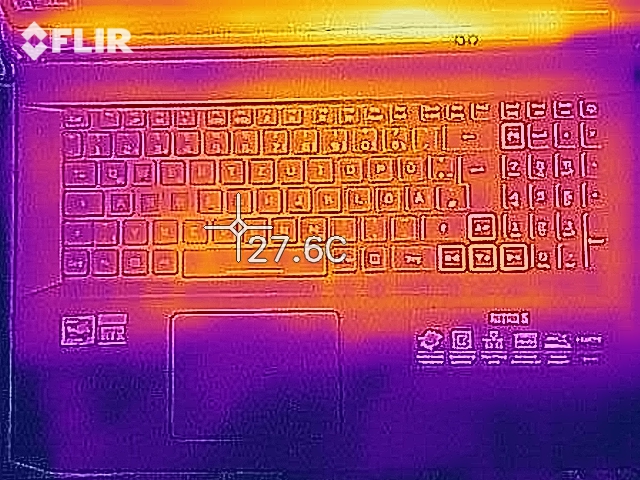
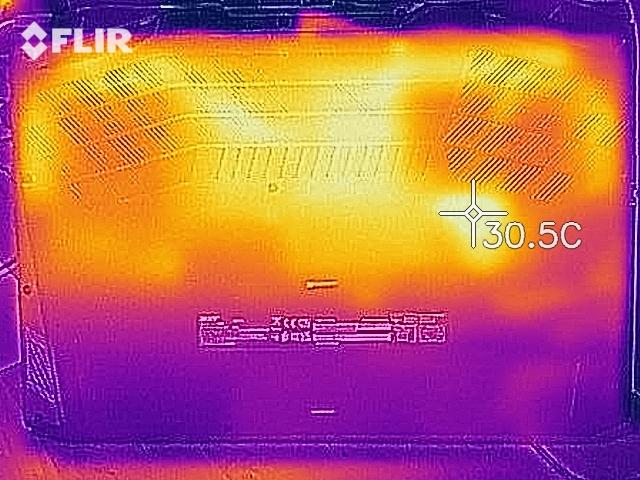
(+) En reposo, la temperatura media de la parte superior es de 25.6 °C / 78# F, frente a la media del dispositivo de 33.9 °C / 93 F.
(+) El reposamanos y el panel táctil están a una temperatura inferior a la de la piel, con un máximo de 24.5 °C / 76.1 F y, por tanto, son fríos al tacto.
(+) La temperatura media de la zona del reposamanos de dispositivos similares fue de 28.8 °C / 83.8 F (+4.3 °C / 7.7 F).
| Acer Nitro 5 AN517-41-R9S5 AMD Ryzen 7 5800H, NVIDIA GeForce RTX 3080 Laptop GPU | Acer Nitro 5 AN517-41-R5Z7 AMD Ryzen 7 5800H, NVIDIA GeForce RTX 3070 Laptop GPU | MSI GP76 Leopard 10UG Intel Core i7-10750H, NVIDIA GeForce RTX 3070 Laptop GPU | Schenker XMG Neo 17 (Early 2021, RTX 3070, 5800H) AMD Ryzen 7 5800H, NVIDIA GeForce RTX 3070 Laptop GPU | Medion Erazer Beast X25 AMD Ryzen 9 5900HX, NVIDIA GeForce RTX 3080 Laptop GPU | Aorus 17G YD Intel Core i7-11800H, NVIDIA GeForce RTX 3080 Laptop GPU | |
|---|---|---|---|---|---|---|
| Heat | -1% | 4% | -5% | -11% | 6% | |
| Maximum Upper Side * (°C) | 46.4 | 44 5% | 43 7% | 47 -1% | 54 -16% | 36 22% |
| Maximum Bottom * (°C) | 56.5 | 52.7 7% | 47 17% | 51 10% | 57 -1% | 52 8% |
| Idle Upper Side * (°C) | 29.4 | 32.6 -11% | 30 -2% | 32 -9% | 34 -16% | 29 1% |
| Idle Bottom * (°C) | 31.2 | 32.1 -3% | 33 -6% | 37 -19% | 35 -12% | 33 -6% |
* ... más pequeño es mejor
Altavoz
Acer Nitro 5 AN517-41-R9S5 análisis de audio
(±) | la sonoridad del altavoz es media pero buena (75.5 dB)
Graves 100 - 315 Hz
(-) | casi sin bajos - de media 27.4% inferior a la mediana
(±) | la linealidad de los graves es media (11.3% delta a frecuencia anterior)
Medios 400 - 2000 Hz
(+) | medios equilibrados - a sólo 4.1% de la mediana
(±) | la linealidad de los medios es media (8.7% delta respecto a la frecuencia anterior)
Altos 2 - 16 kHz
(±) | máximos más altos - de media 6% más altos que la mediana
(+) | los máximos son lineales (5% delta a la frecuencia anterior)
Total 100 - 16.000 Hz
(±) | la linealidad del sonido global es media (22.5% de diferencia con la mediana)
En comparación con la misma clase
» 81% de todos los dispositivos probados de esta clase eran mejores, 5% similares, 14% peores
» El mejor tuvo un delta de 6%, la media fue 18%, el peor fue ###max##%
En comparación con todos los dispositivos probados
» 66% de todos los dispositivos probados eran mejores, 6% similares, 28% peores
» El mejor tuvo un delta de 4%, la media fue 23%, el peor fue ###max##%
Consumo de energía
Registramos un consumo máximo de 12 vatios en reposo, aproximadamente la mitad que el Modelo hermano RTX-3070. Presumiblemente, una aplicación en segundo plano hizo subir el consumo de energía del modelo hermano. Las pruebas de estrés y Witcher 3 respectivamente dejaron que el consumo de energía subiera hasta 152,5 vatios y 132 vatios de media. El siguiente diagrama ilustra el consumo de energía bastante constante del portátil durante la Witcher 3 prueba y la prueba de estrés. La potencia nominal de la fuente de alimentación es de 180 vatios
| Off / Standby | |
| Ocioso | |
| Carga |
|
Clave:
min: | |
Energy absorption Witcher 3 / Stresstest
| Acer Nitro 5 AN517-41-R9S5 AMD Ryzen 7 5800H, NVIDIA GeForce RTX 3080 Laptop GPU | Acer Nitro 5 AN517-41-R5Z7 AMD Ryzen 7 5800H, NVIDIA GeForce RTX 3070 Laptop GPU | MSI GP76 Leopard 10UG Intel Core i7-10750H, NVIDIA GeForce RTX 3070 Laptop GPU | Schenker XMG Neo 17 (Early 2021, RTX 3070, 5800H) AMD Ryzen 7 5800H, NVIDIA GeForce RTX 3070 Laptop GPU | Medion Erazer Beast X25 AMD Ryzen 9 5900HX, NVIDIA GeForce RTX 3080 Laptop GPU | Aorus 17G YD Intel Core i7-11800H, NVIDIA GeForce RTX 3080 Laptop GPU | |
|---|---|---|---|---|---|---|
| Power Consumption | -54% | -45% | -52% | -92% | -96% | |
| Idle Minimum * (Watt) | 8.5 | 18.7 -120% | 12 -41% | 13 -53% | 22 -159% | 24 -182% |
| Idle Average * (Watt) | 11.7 | 22 -88% | 16 -37% | 16 -37% | 26 -122% | 26 -122% |
| Idle Maximum * (Watt) | 12 | 25.2 -110% | 28 -133% | 26 -117% | 34 -183% | 38 -217% |
| Load Average * (Watt) | 132 | 134.7 -2% | 92 30% | 125 5% | 120 9% | 101 23% |
| Witcher 3 ultra * (Watt) | 132 | 135 -2% | 198 -50% | 187 -42% | 189 -43% | 164 -24% |
| Load Maximum * (Watt) | 152.5 | 157 -3% | 210 -38% | 259 -70% | 231 -51% | 230 -51% |
* ... más pequeño es mejor
Duración de la batería
El AN517-41 alcanza un tiempo de ejecución de 5:41 h en nuestra prueba práctica de WLAN. La carga al llamar a los sitios web se asigna mediante un script
Pro
Contra
Veredicto - Nitro frenado
Por algo menos de 2.000 euros, el Nitro 5 es un portátil para juegos muy completo y bien equipado. ElRyzen 7-5800H APU, GeForce RTX-3080 portátil GPU, 32 GB de RAM (modo de doble canal, máx. 64 GB) y un SSD de 1 TB equipan el ordenador para todas las áreas de aplicación habituales.
El Nitro 5 ocupa un lugar en la parte inferior de la tabla entre los portátiles RTX-3080. Sin embargo, Acer ha reunido un paquete bien redondeado aquí.
El rendimiento en juegos, por debajo de la media, se debe al relativamente bajo TGP de 100 vatios. Por tanto, el Nitro tiene que competir con un portátil RTX-3070 nominalmente más débil como el MSI GP76 Leopard 10UG. Elrendimientode la GPUpuede aumentarse mediante una actualización de firmware, pero la ganancia es sólo moderada. El Nitro sigue sin poder superar al MSI GP76.
La CPU y la GPU pueden desplegar constantemente su rendimiento a un alto nivel. El portátil se calienta notablemente bajo carga, pero no en exceso. El desarrollo de ruido está en un nivel de clase. La instalación de la actualización del FW debería aumentar un poco el desarrollo de calor y ruido.
La pantalla (FHD, IPS, 144 Hz) ofrece ángulos de visión estables, buen contraste, una superficie mate, cortos tiempos de respuesta y una decente reproducción del color. El brillo medio y la cobertura del espacio de color son demasiado bajos.
Una alternativa al Nitro 5 sería el precio comparable de MSI GP76 Leopard 10UG. Ofrece un poco más de GPU, pero un rendimiento de CPU significativamente menor que el Nitro 5. Además, el portátil MSI sólo tiene 16 GB de RAM y un SSD de 512 GB.
Precio y disponibilidad
El Acer Nitro 5 AN517-41-R9S5 (Ryzen 7-5800H, GeForce RTX-3080, 32 GB de RAM, 1 TB de SSD, Windows 10 Home) está disponible por un precio de 1.999 euros en Cyberport.de
Acer Nitro 5 AN517-41-R9S5
- 08/06/2021 v7 (old)
Sascha Mölck
Price comparison
