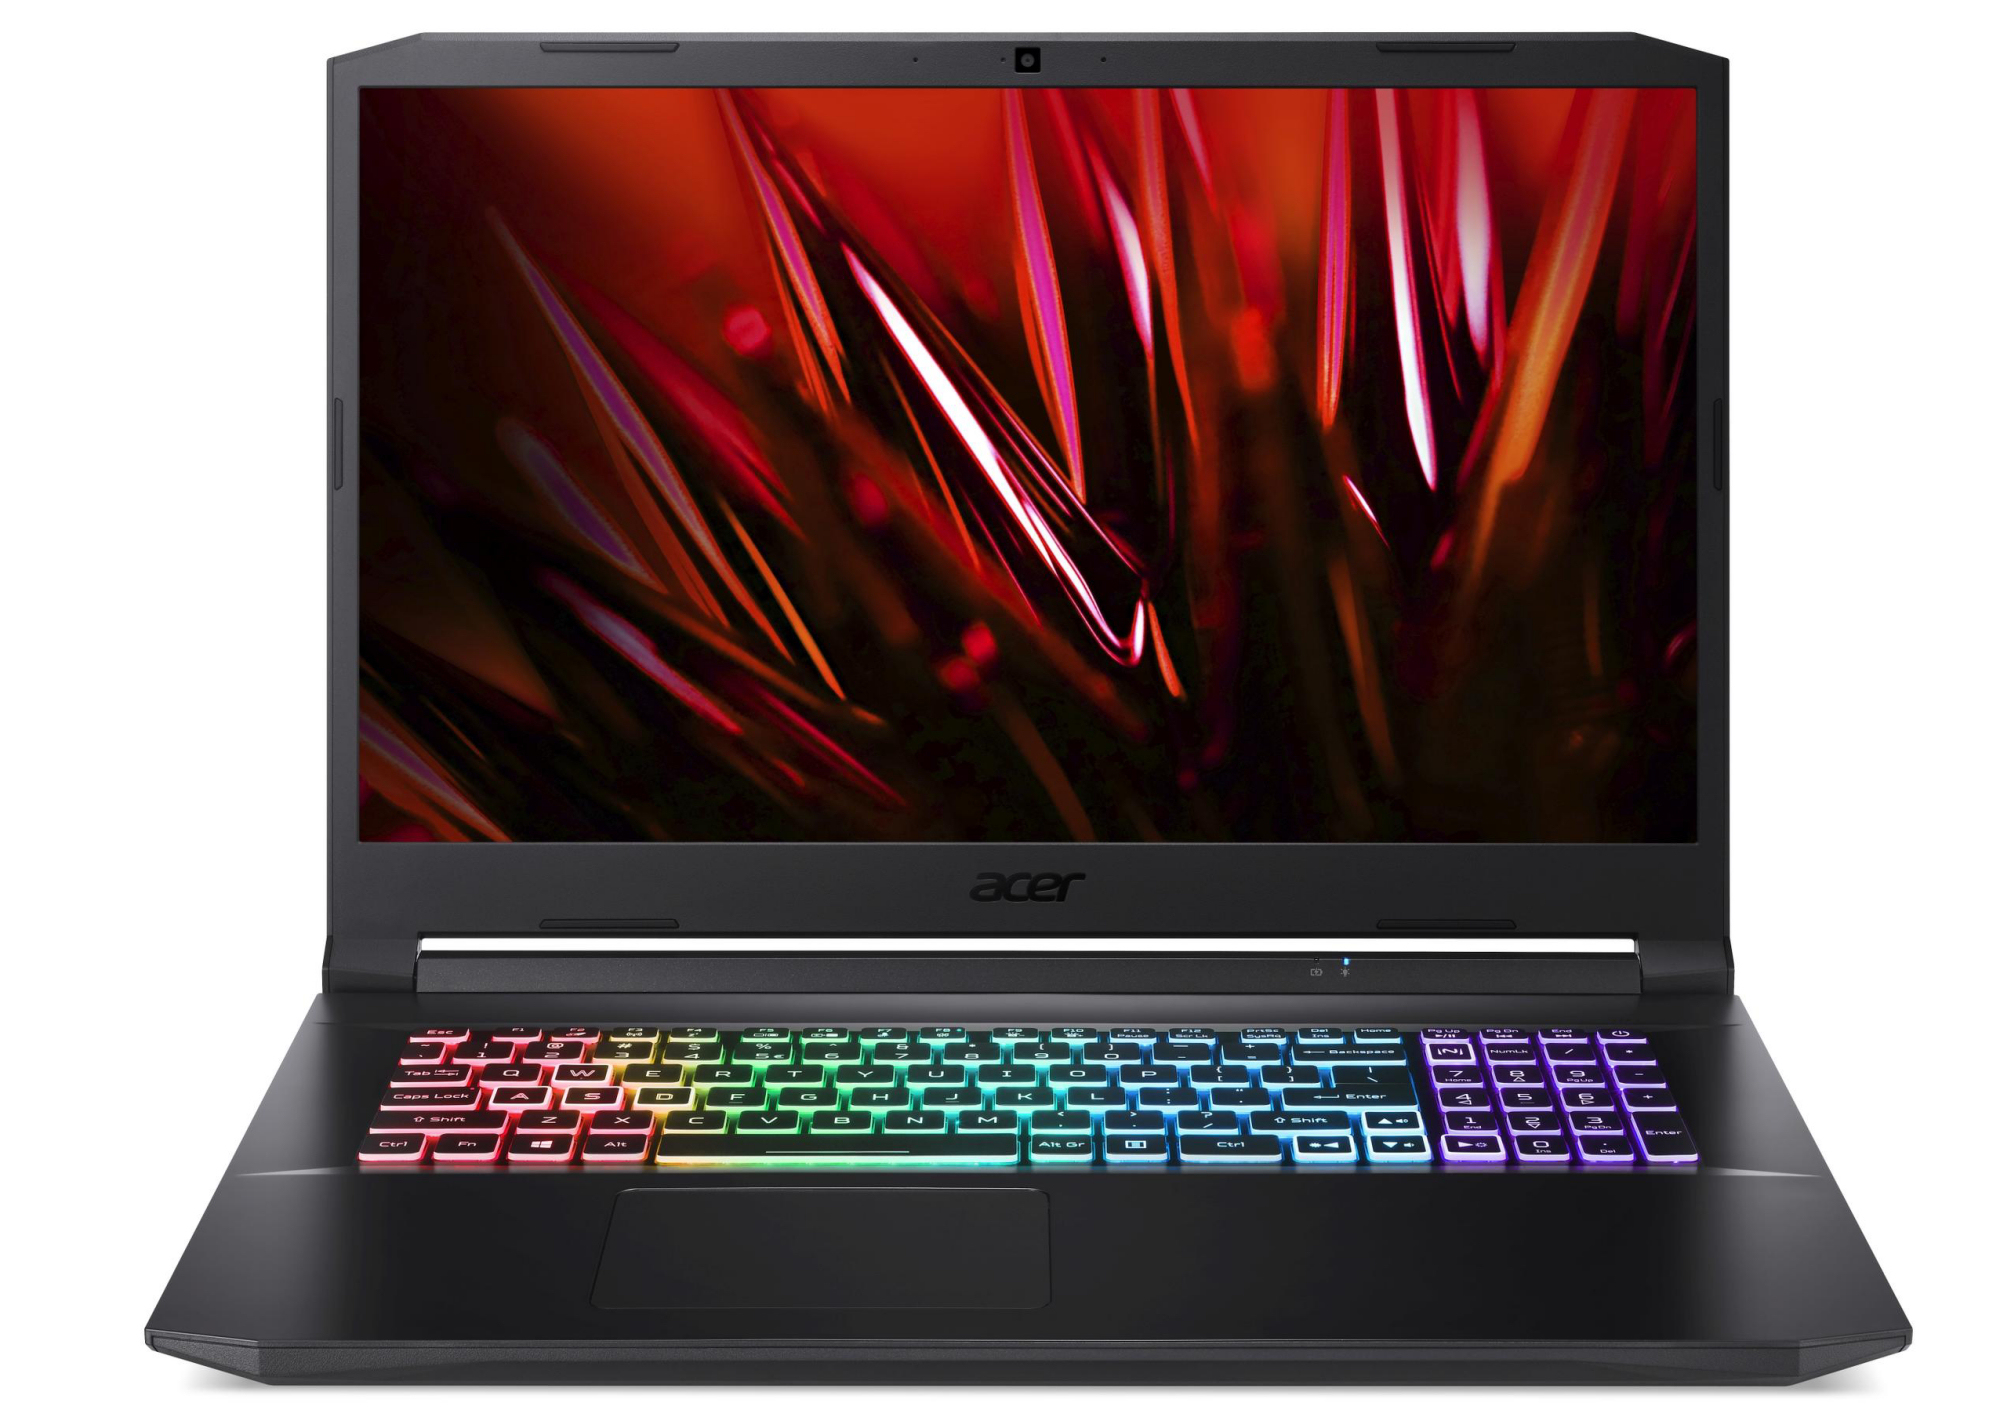
Análisis de la Acer Nitro 5 AN517-41: GeForce RTX 3070 en el punto de mira

Acer tiene un portátil gaming de gama media en la categoría de 17,3 pulgadas en su línea con el Nitro 5, que está impulsado por un Ryzen 7-5800Hy una GeForce RTX-3070 portátil Núcleo gráfico. La variante de configuración que tenemos está disponible por algo menos de 1.500 euros (~1764 dólares). Los competidores incluyen dispositivos como elMSI GP76 Leopard 10UG, elSchenker XMG Core 17 (Early 2021), elAsus TUF Gaming F17 FX706HM, y elMSI Katana GF76 11UE - los tres últimos son portátiles RTX 3060 que tienen un precio similar al del Nitro 5.
Los portátiles RTX 3070 de 17,3 pulgadas de precio comparable apenas se encuentran actualmente en nuestra base de datos. Por tanto, también consideramos dispositivos RTX 3070 de 15,6 pulgadas, como el Asus TUF Gaming A15 FA506QR y el Aorus 15G XC. 17.Existen homólogos de 3 pulgadas de ambos equipos.
Possible competitors in comparison
Valoración | Fecha | Modelo | Peso | Altura | Tamaño | Resolución | Precio |
|---|---|---|---|---|---|---|---|
| 81.3 % v7 (old) | 08/2021 | Acer Nitro 5 AN517-41-R5Z7 R7 5800H, GeForce RTX 3070 Laptop GPU | 2.7 kg | 24.9 mm | 17.30" | 1920x1080 | |
| 80.4 % v7 (old) | 06/2021 | MSI Katana GF76 11UE i7-11800H, GeForce RTX 3060 Laptop GPU | 2.7 kg | 25.2 mm | 17.30" | 1920x1080 | |
| 83.9 % v7 (old) | 06/2021 | Schenker XMG Core 17 (Early 2021) i7-10870H, GeForce RTX 3060 Laptop GPU | 2.5 kg | 30.05 mm | 17.30" | 2560x1440 | |
| 82.8 % v7 (old) | 06/2021 | Asus TUF Gaming F17 FX706HM i9-11900H, GeForce RTX 3060 Laptop GPU | 2.7 kg | 26 mm | 17.30" | 1920x1080 | |
| 85.1 % v7 (old) | 03/2021 | MSI GP76 Leopard 10UG i7-10750H, GeForce RTX 3070 Laptop GPU | 2.9 kg | 26 mm | 17.30" | 1920x1080 | |
| 86.4 % v7 (old) | 02/2021 | Aorus 15G XC i7-10870H, GeForce RTX 3070 Laptop GPU | 2.1 kg | 23 mm | 15.60" | 1920x1080 | |
| 85 % v7 (old) | 07/2021 | Asus TUF Gaming A15 FA506QR-AZ061T R7 5800H, GeForce RTX 3070 Laptop GPU | 2.3 kg | 24 mm | 15.60" | 1920x1080 |
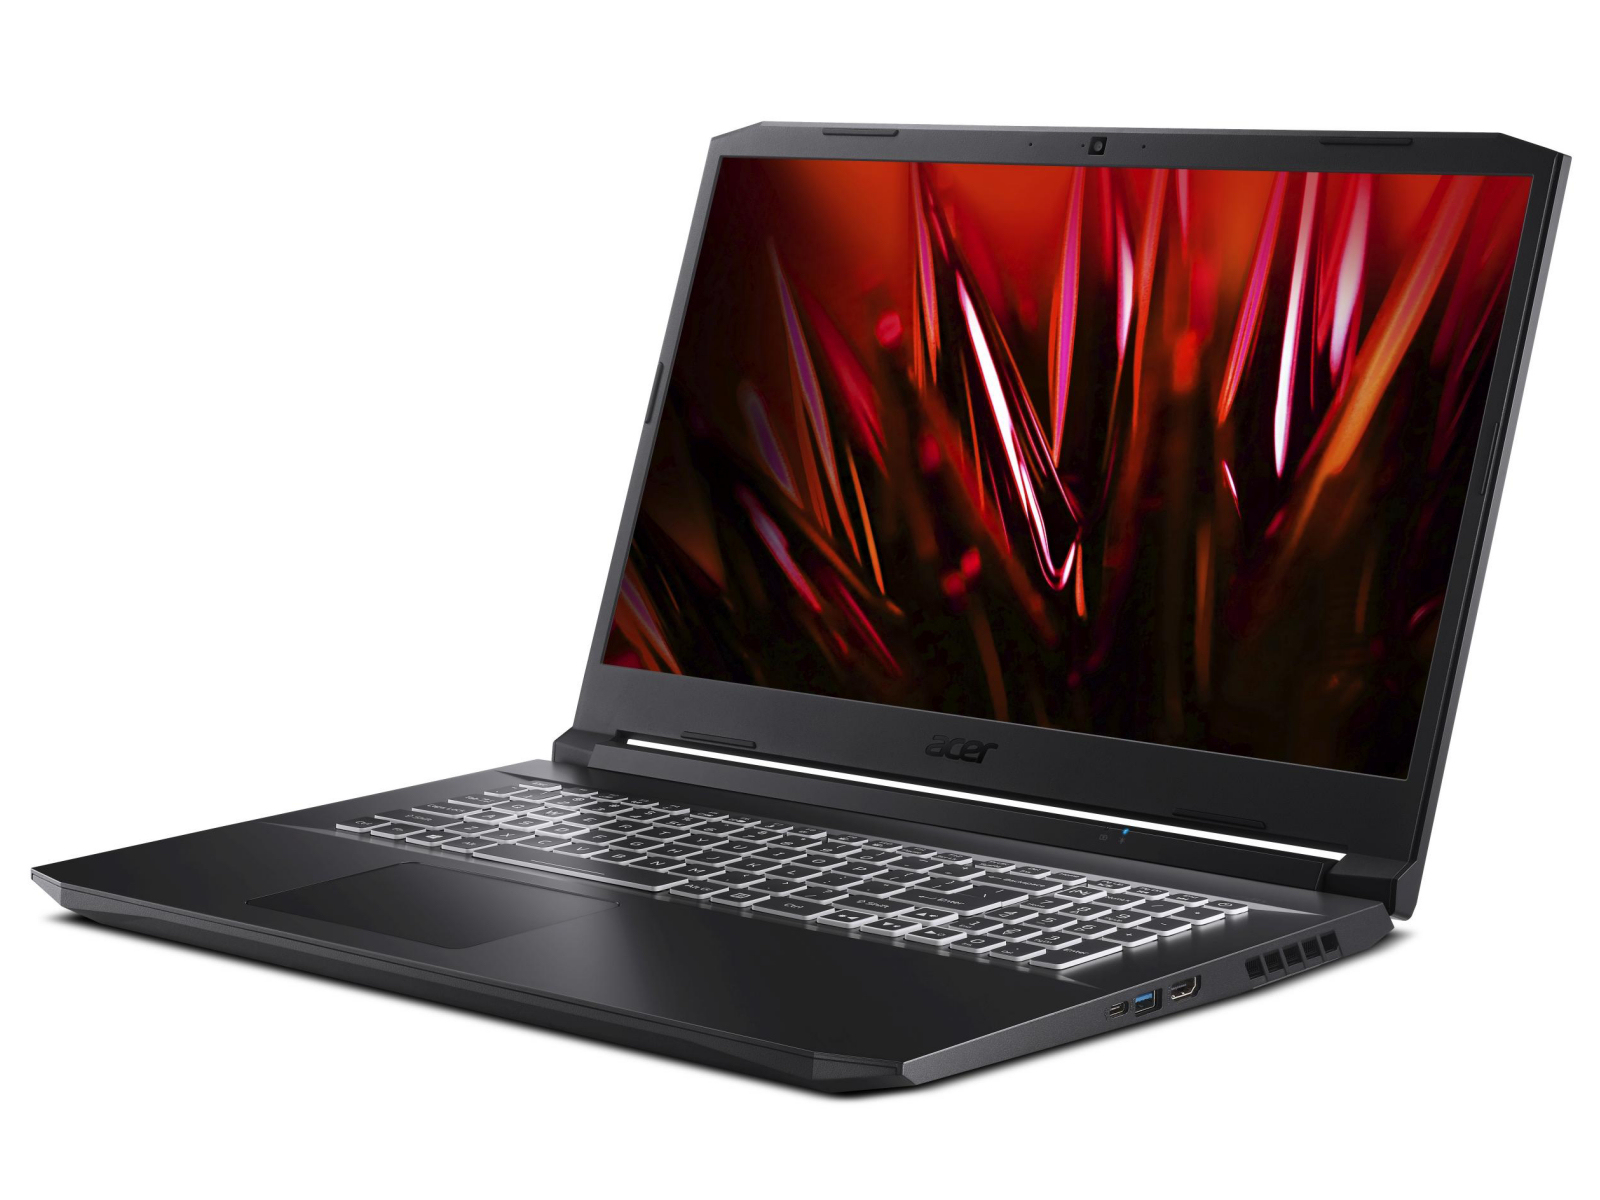
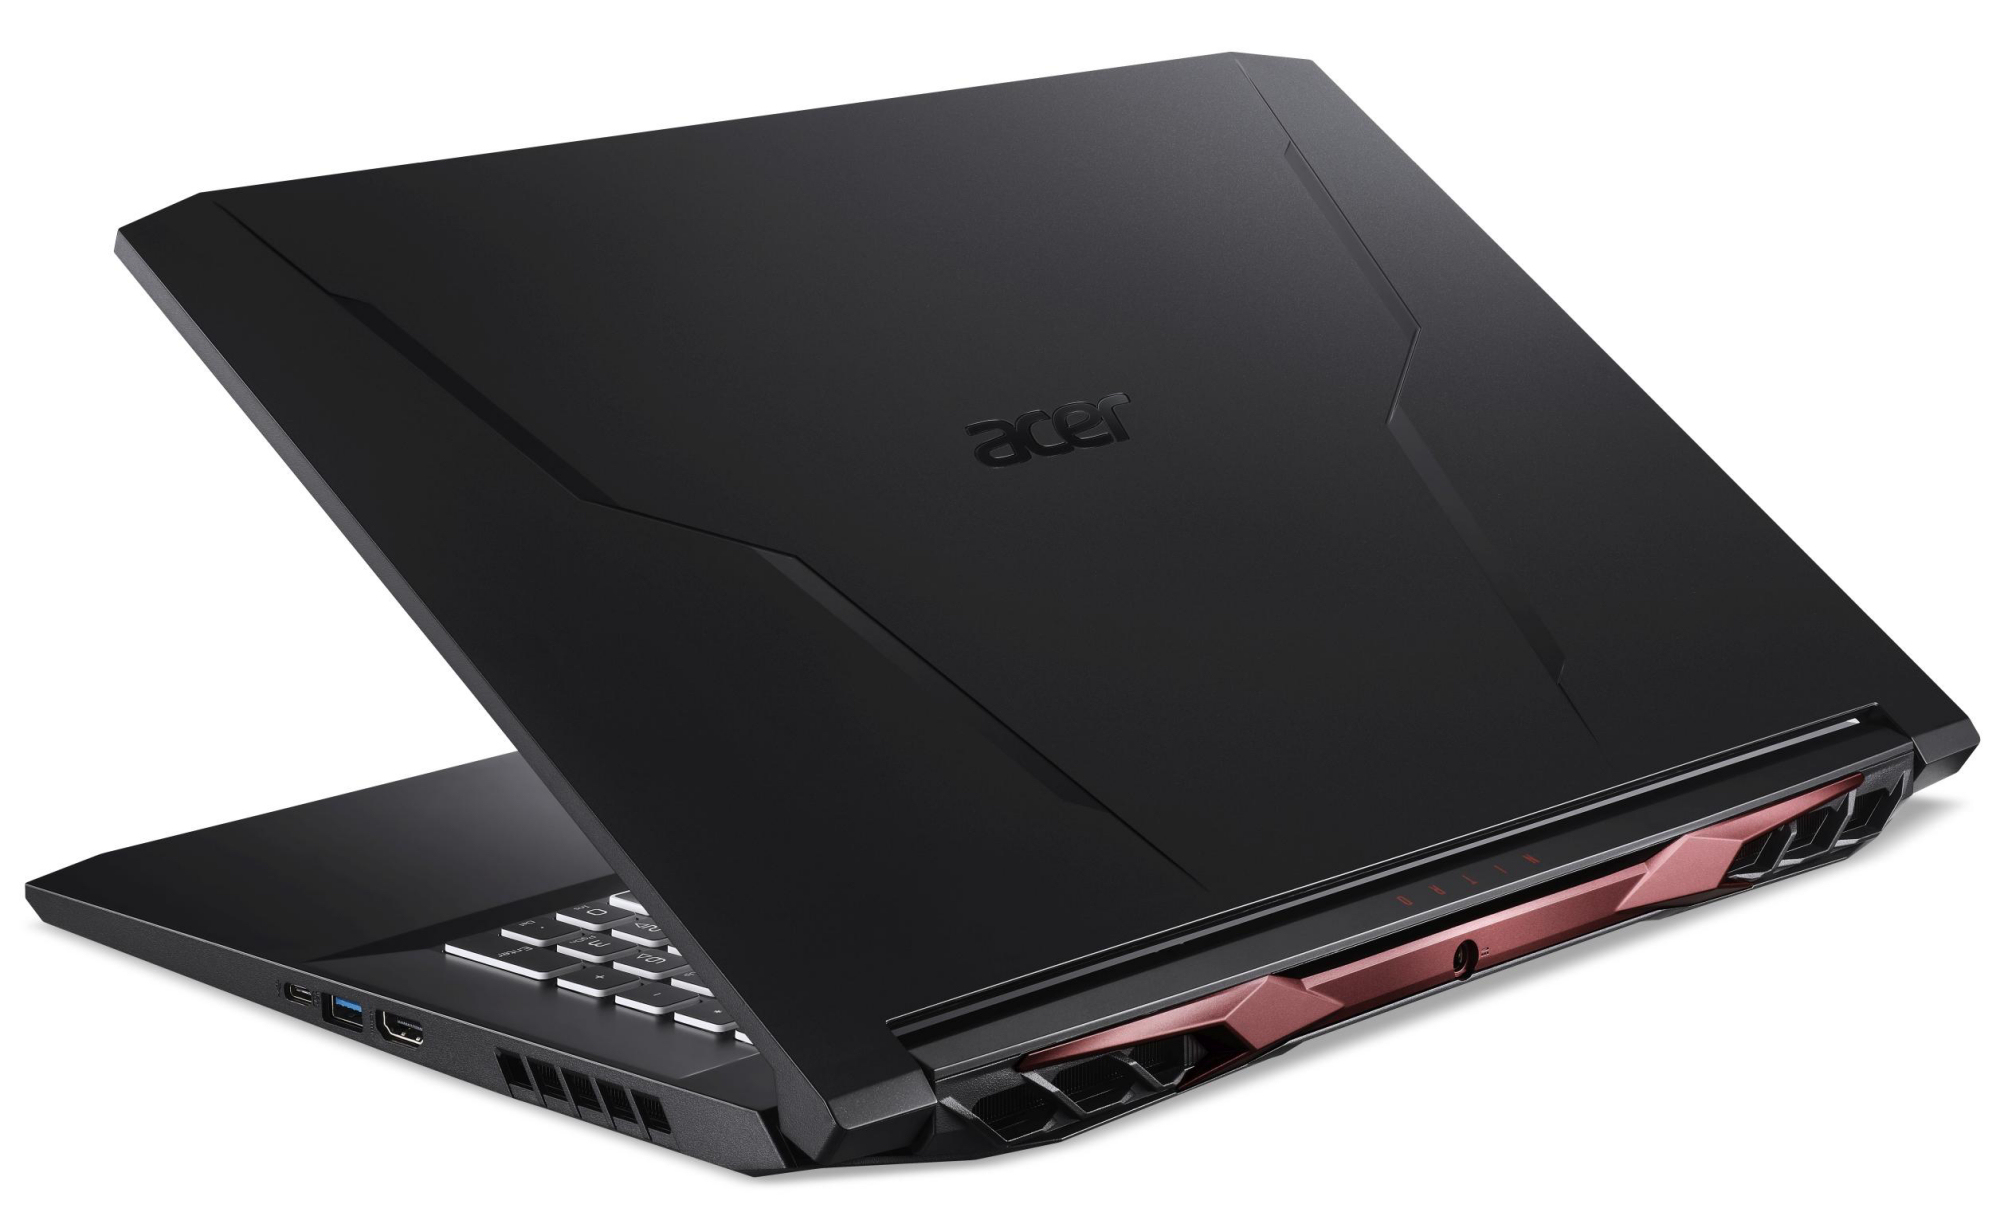
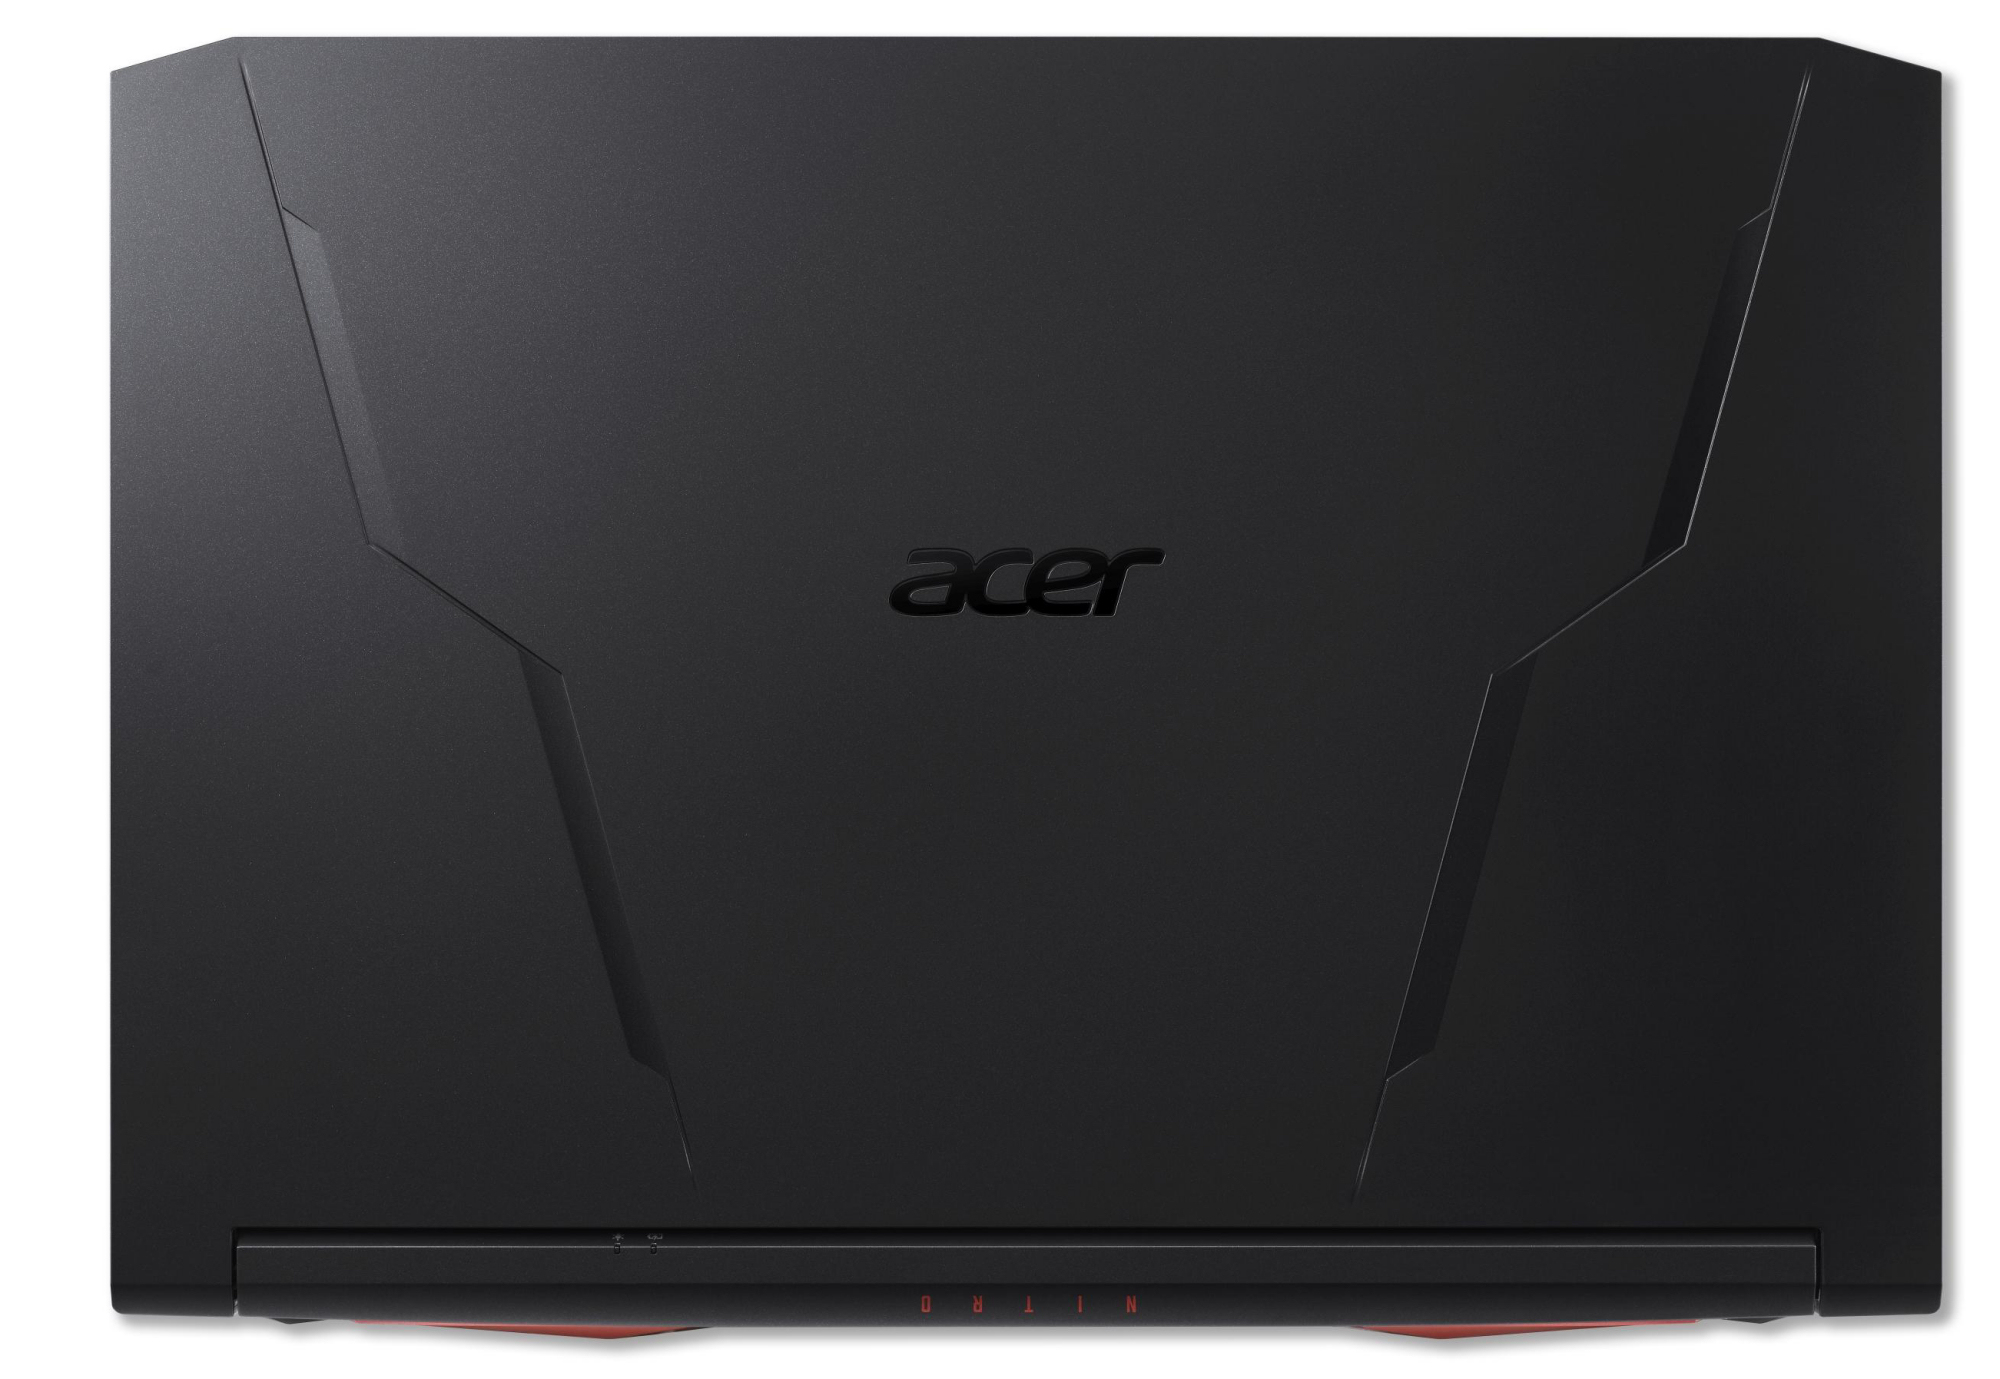
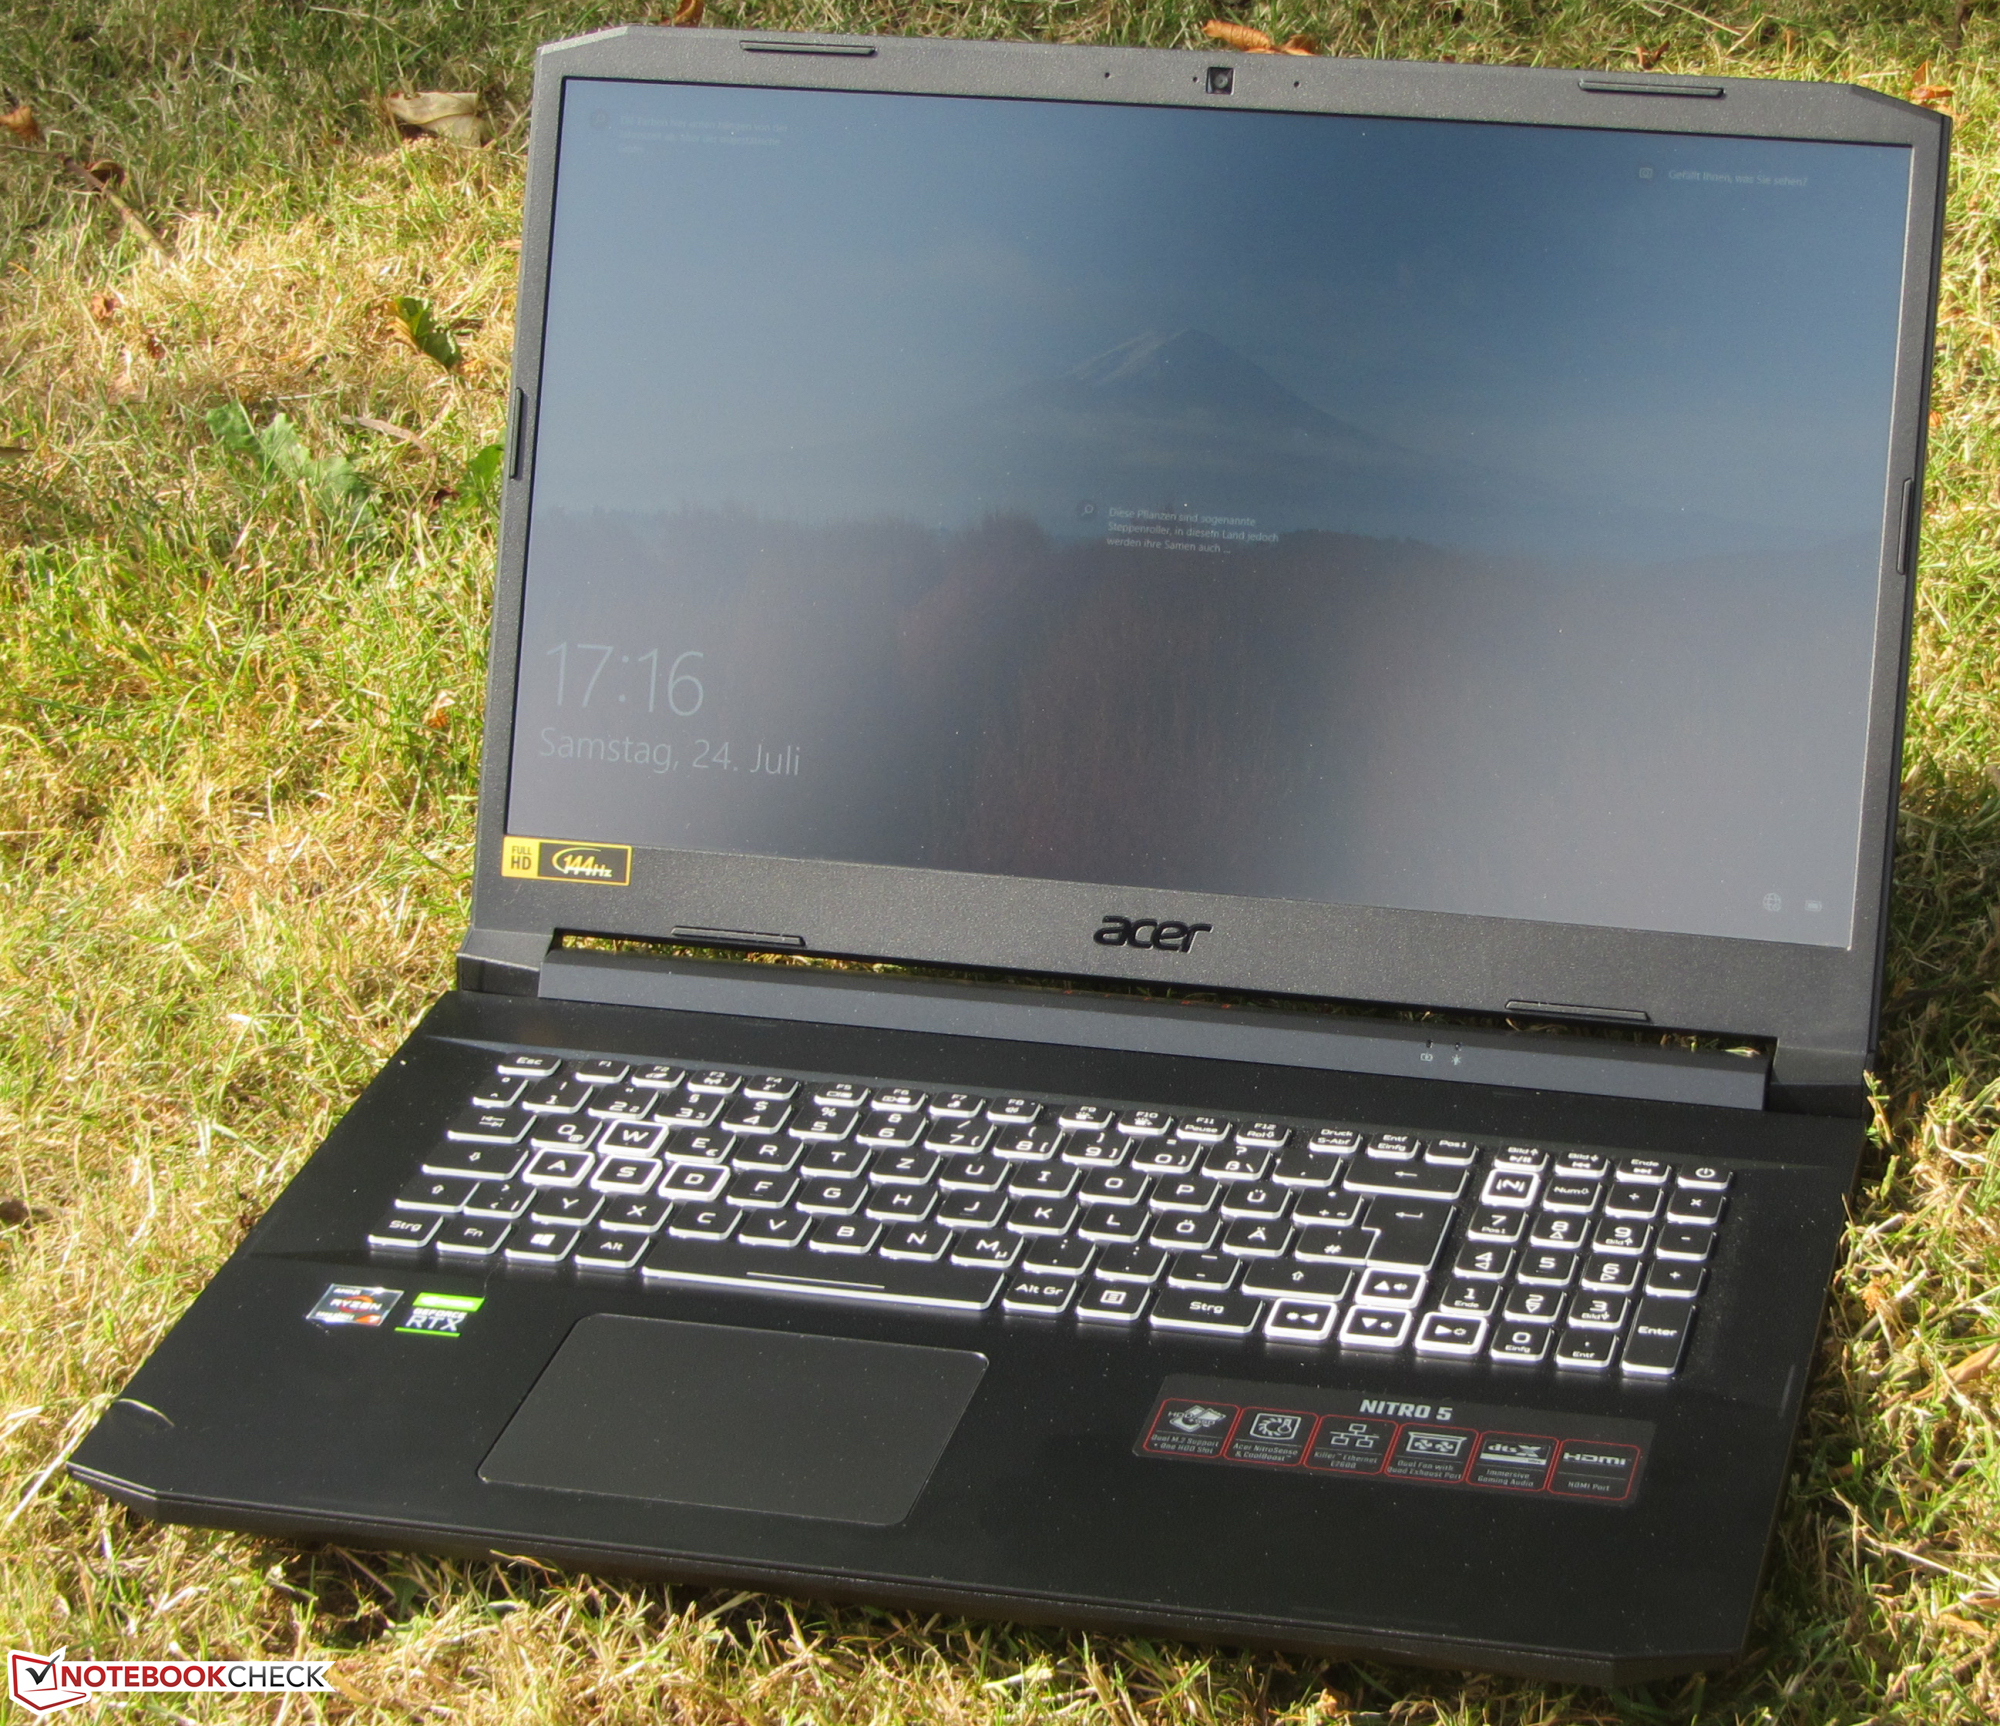
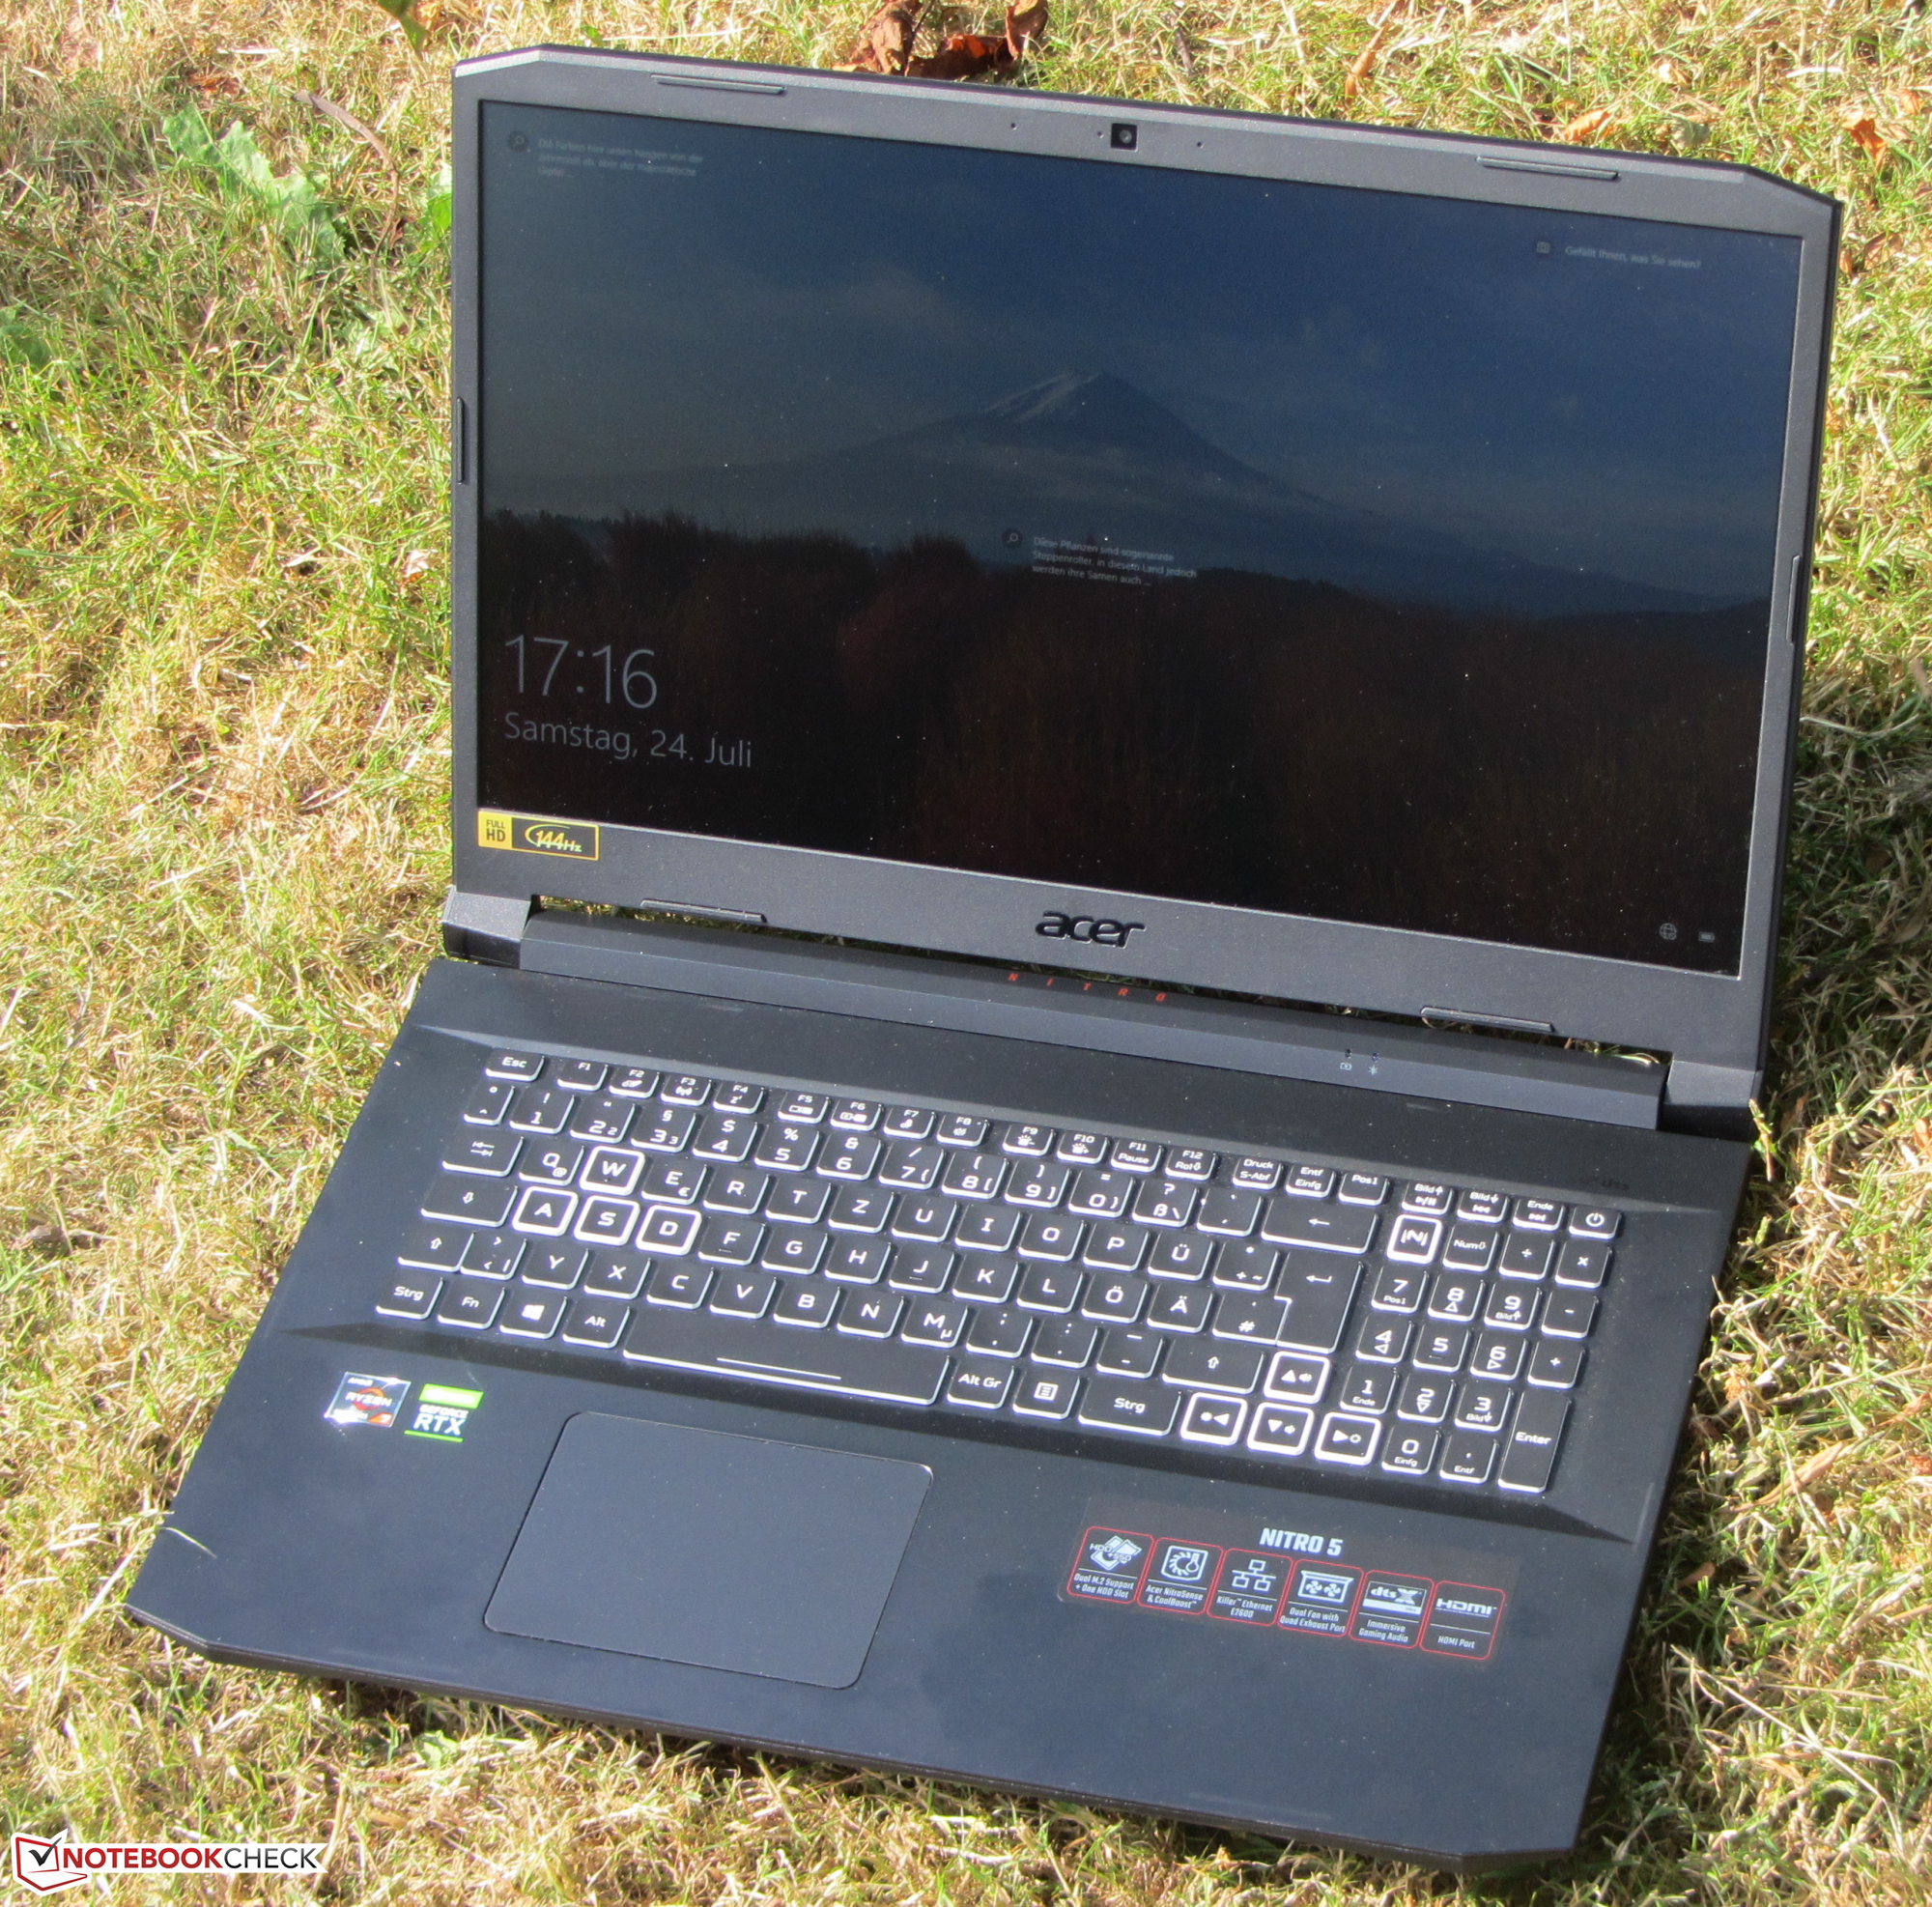
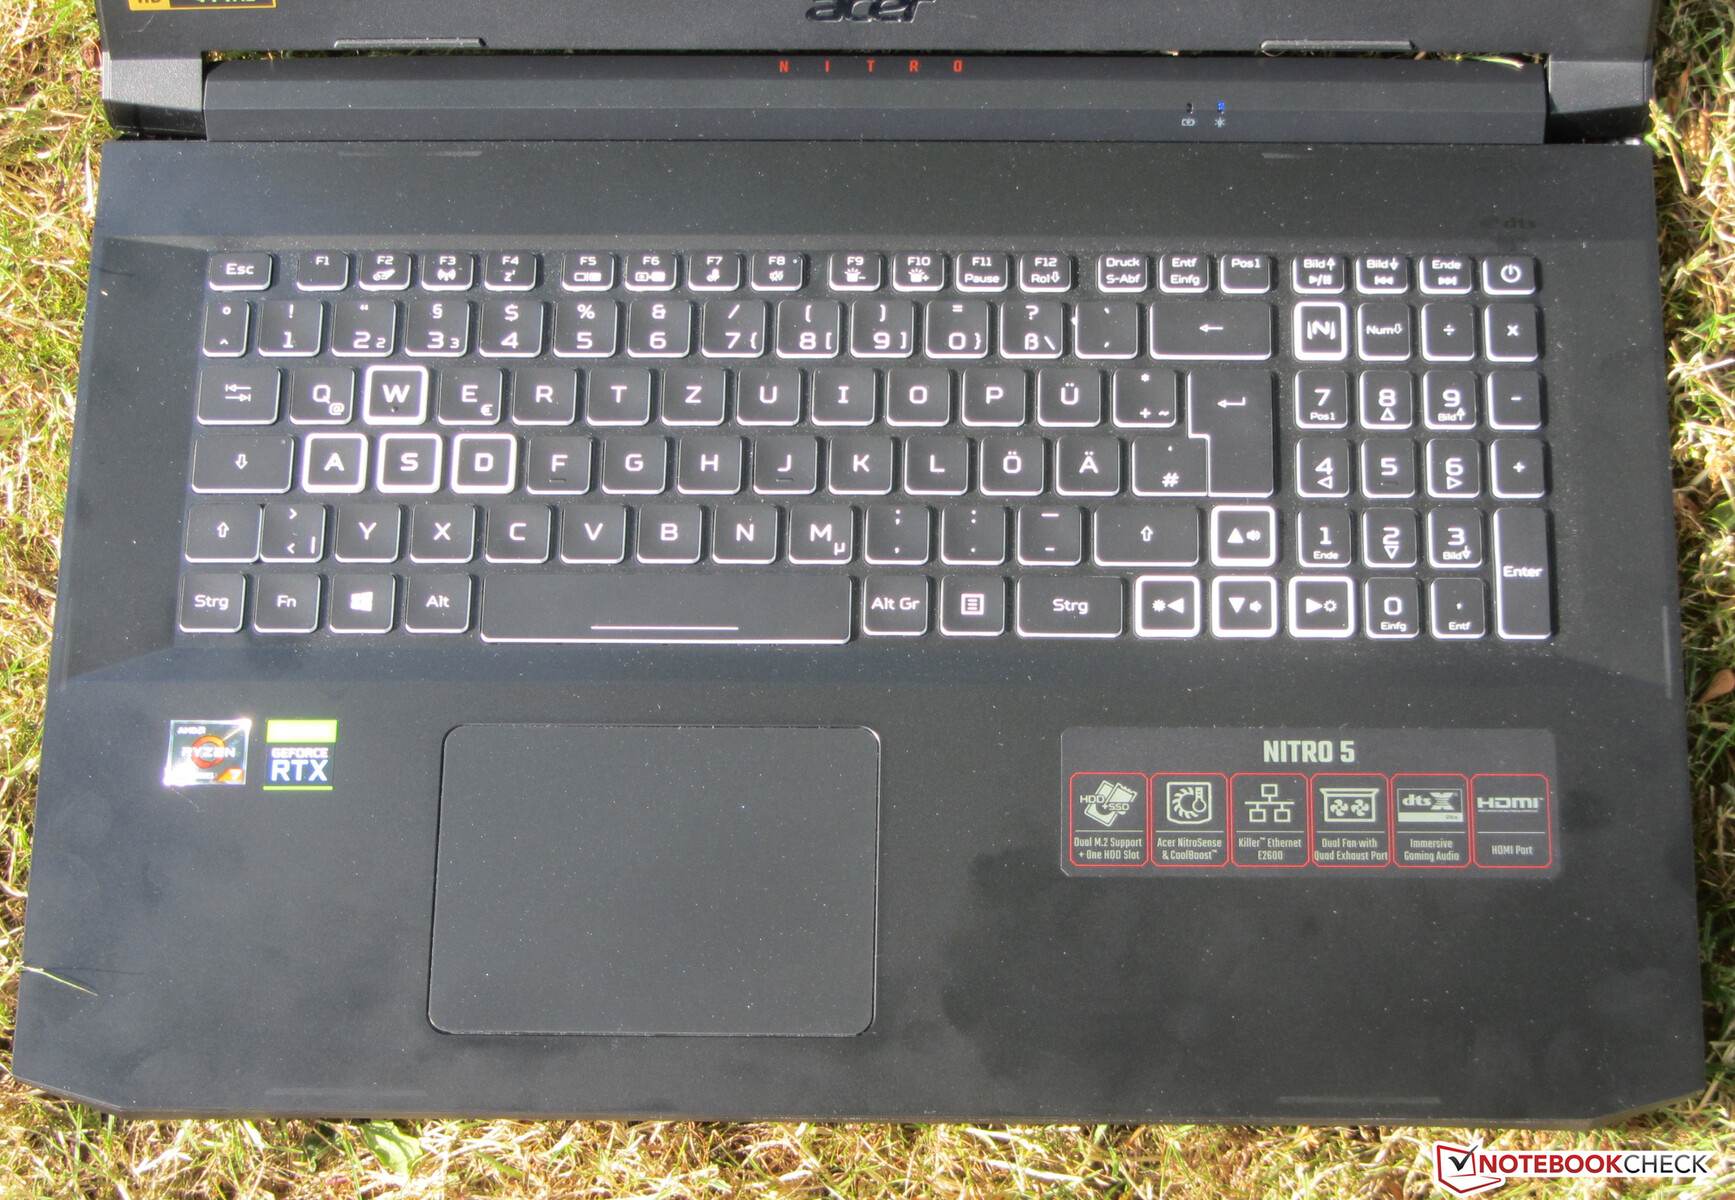
Estuche - Nitro 5 con estuche de plástico
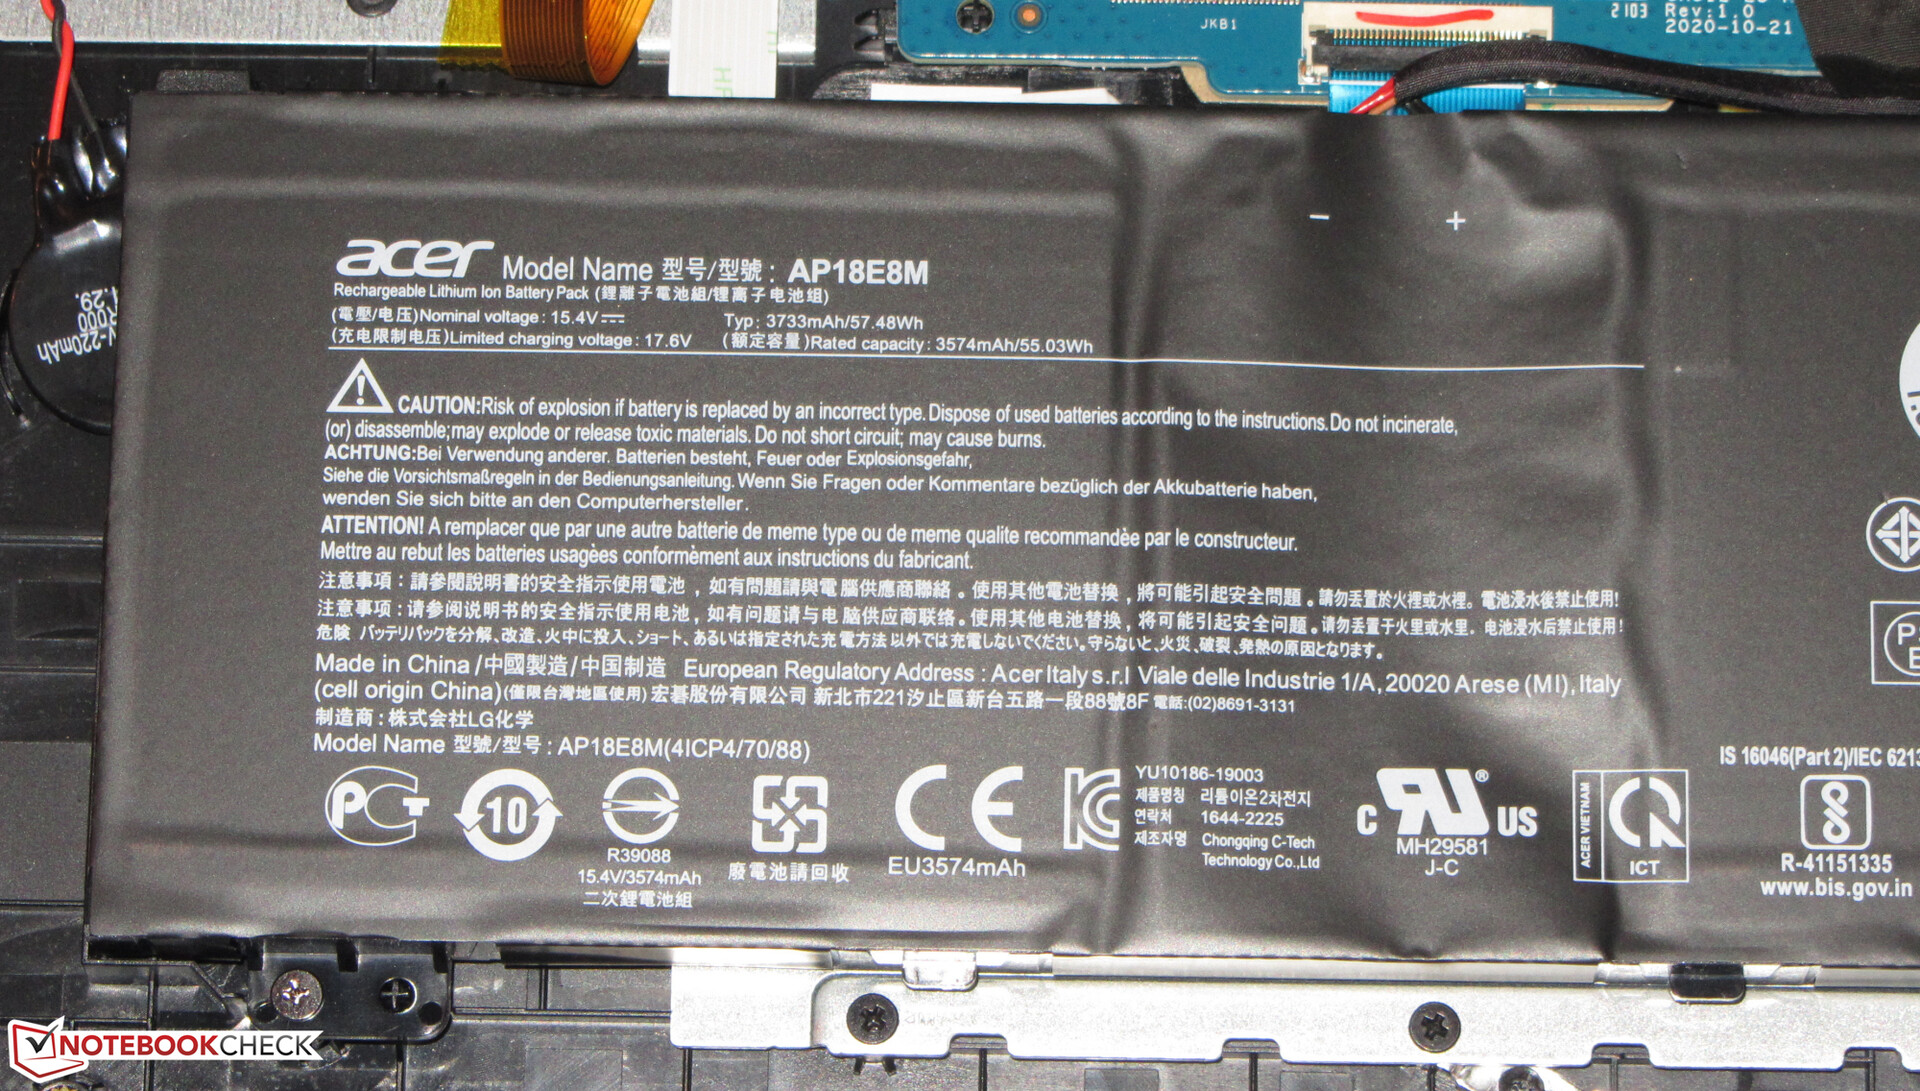
Acer no utiliza materiales de carcasa de alta gama para el Nitro 5. La carcasa está hecha de plástico negro. El área de color rojo vino entre las rejillas de ventilación traseras y las letras rojas "Nitro" en la cubierta de la bisagra añaden un poco de color. Las superficies lisas del chasis son bastante susceptibles a las huellas dactilares. No hay escotilla de mantenimiento. La batería está atornillada en el interior.
El ordenador no revela ningún defecto de fabricación. Los huecos son correctos y no hay salientes de material. Hay espacio para mejorar en términos de estabilidad y rigidez: La unidad base y especialmente la tapa pueden torcerse demasiado. La presión en la parte posterior de la tapa no provoca cambios de imagen. Las bisagras mantienen la tapa firmemente en su posición. Es posible abrir la tapa con una sola mano.
Dentro de nuestro campo de comparación, el Nitro 5 y elMSI GP76 son los dispositivos más grandes en términos de superficie. En términos de peso, la mayoría de los portátiles están a la par. El Schenker XMG Core 17 (principios de 2021) es bastante más compacto y ligero que la competencia, mientras que el MSI GP76 es el que más pesa.
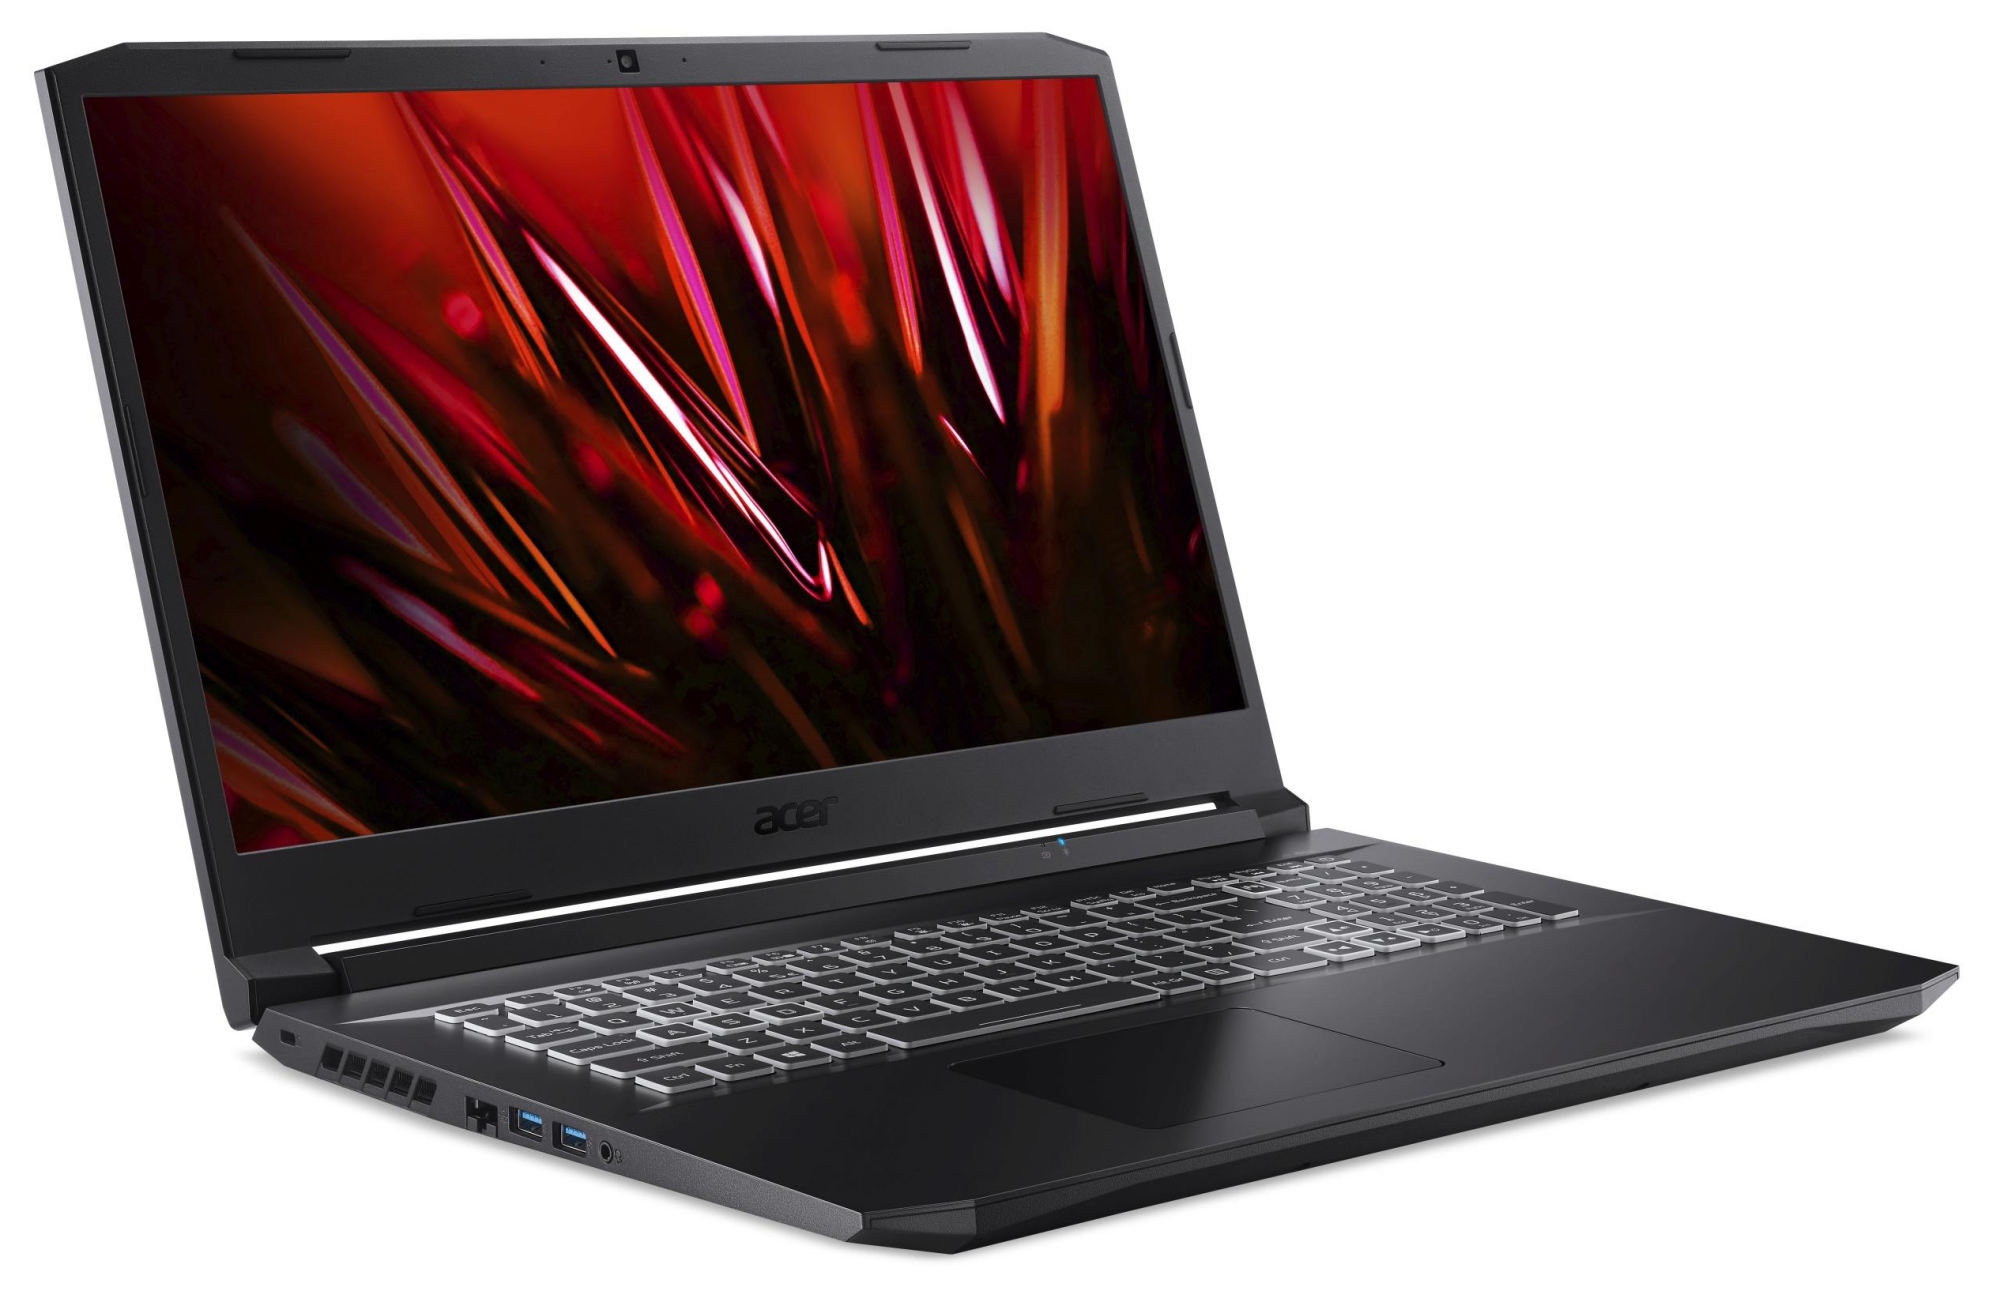
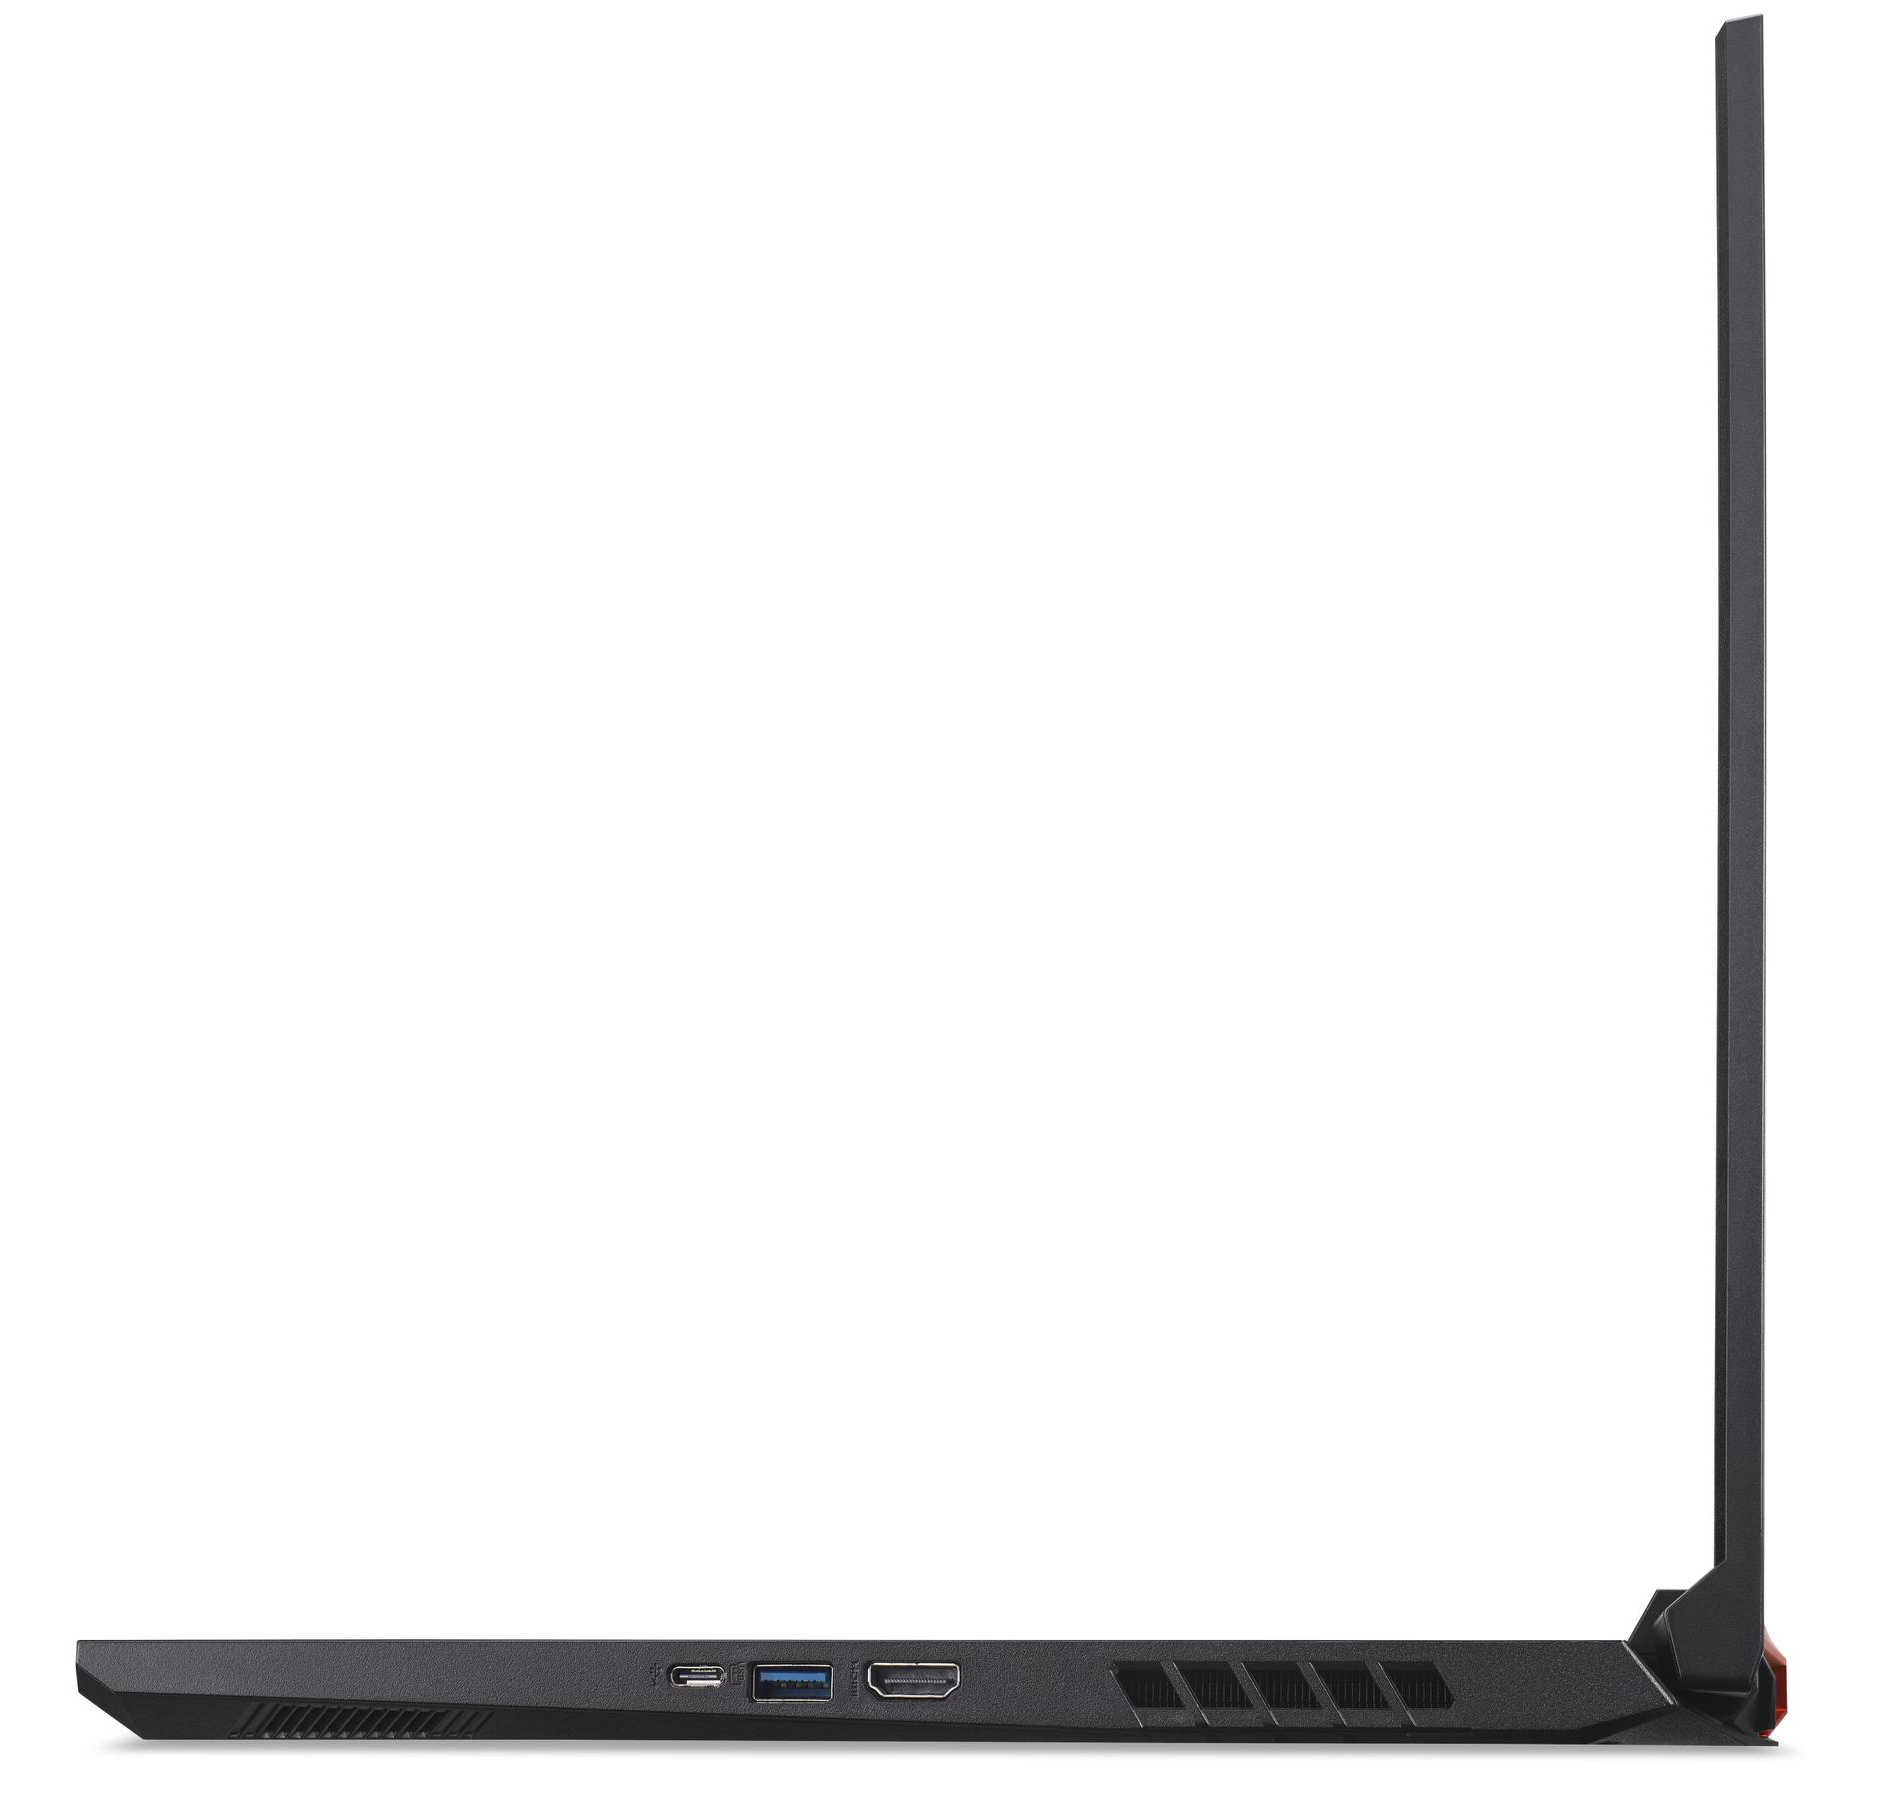
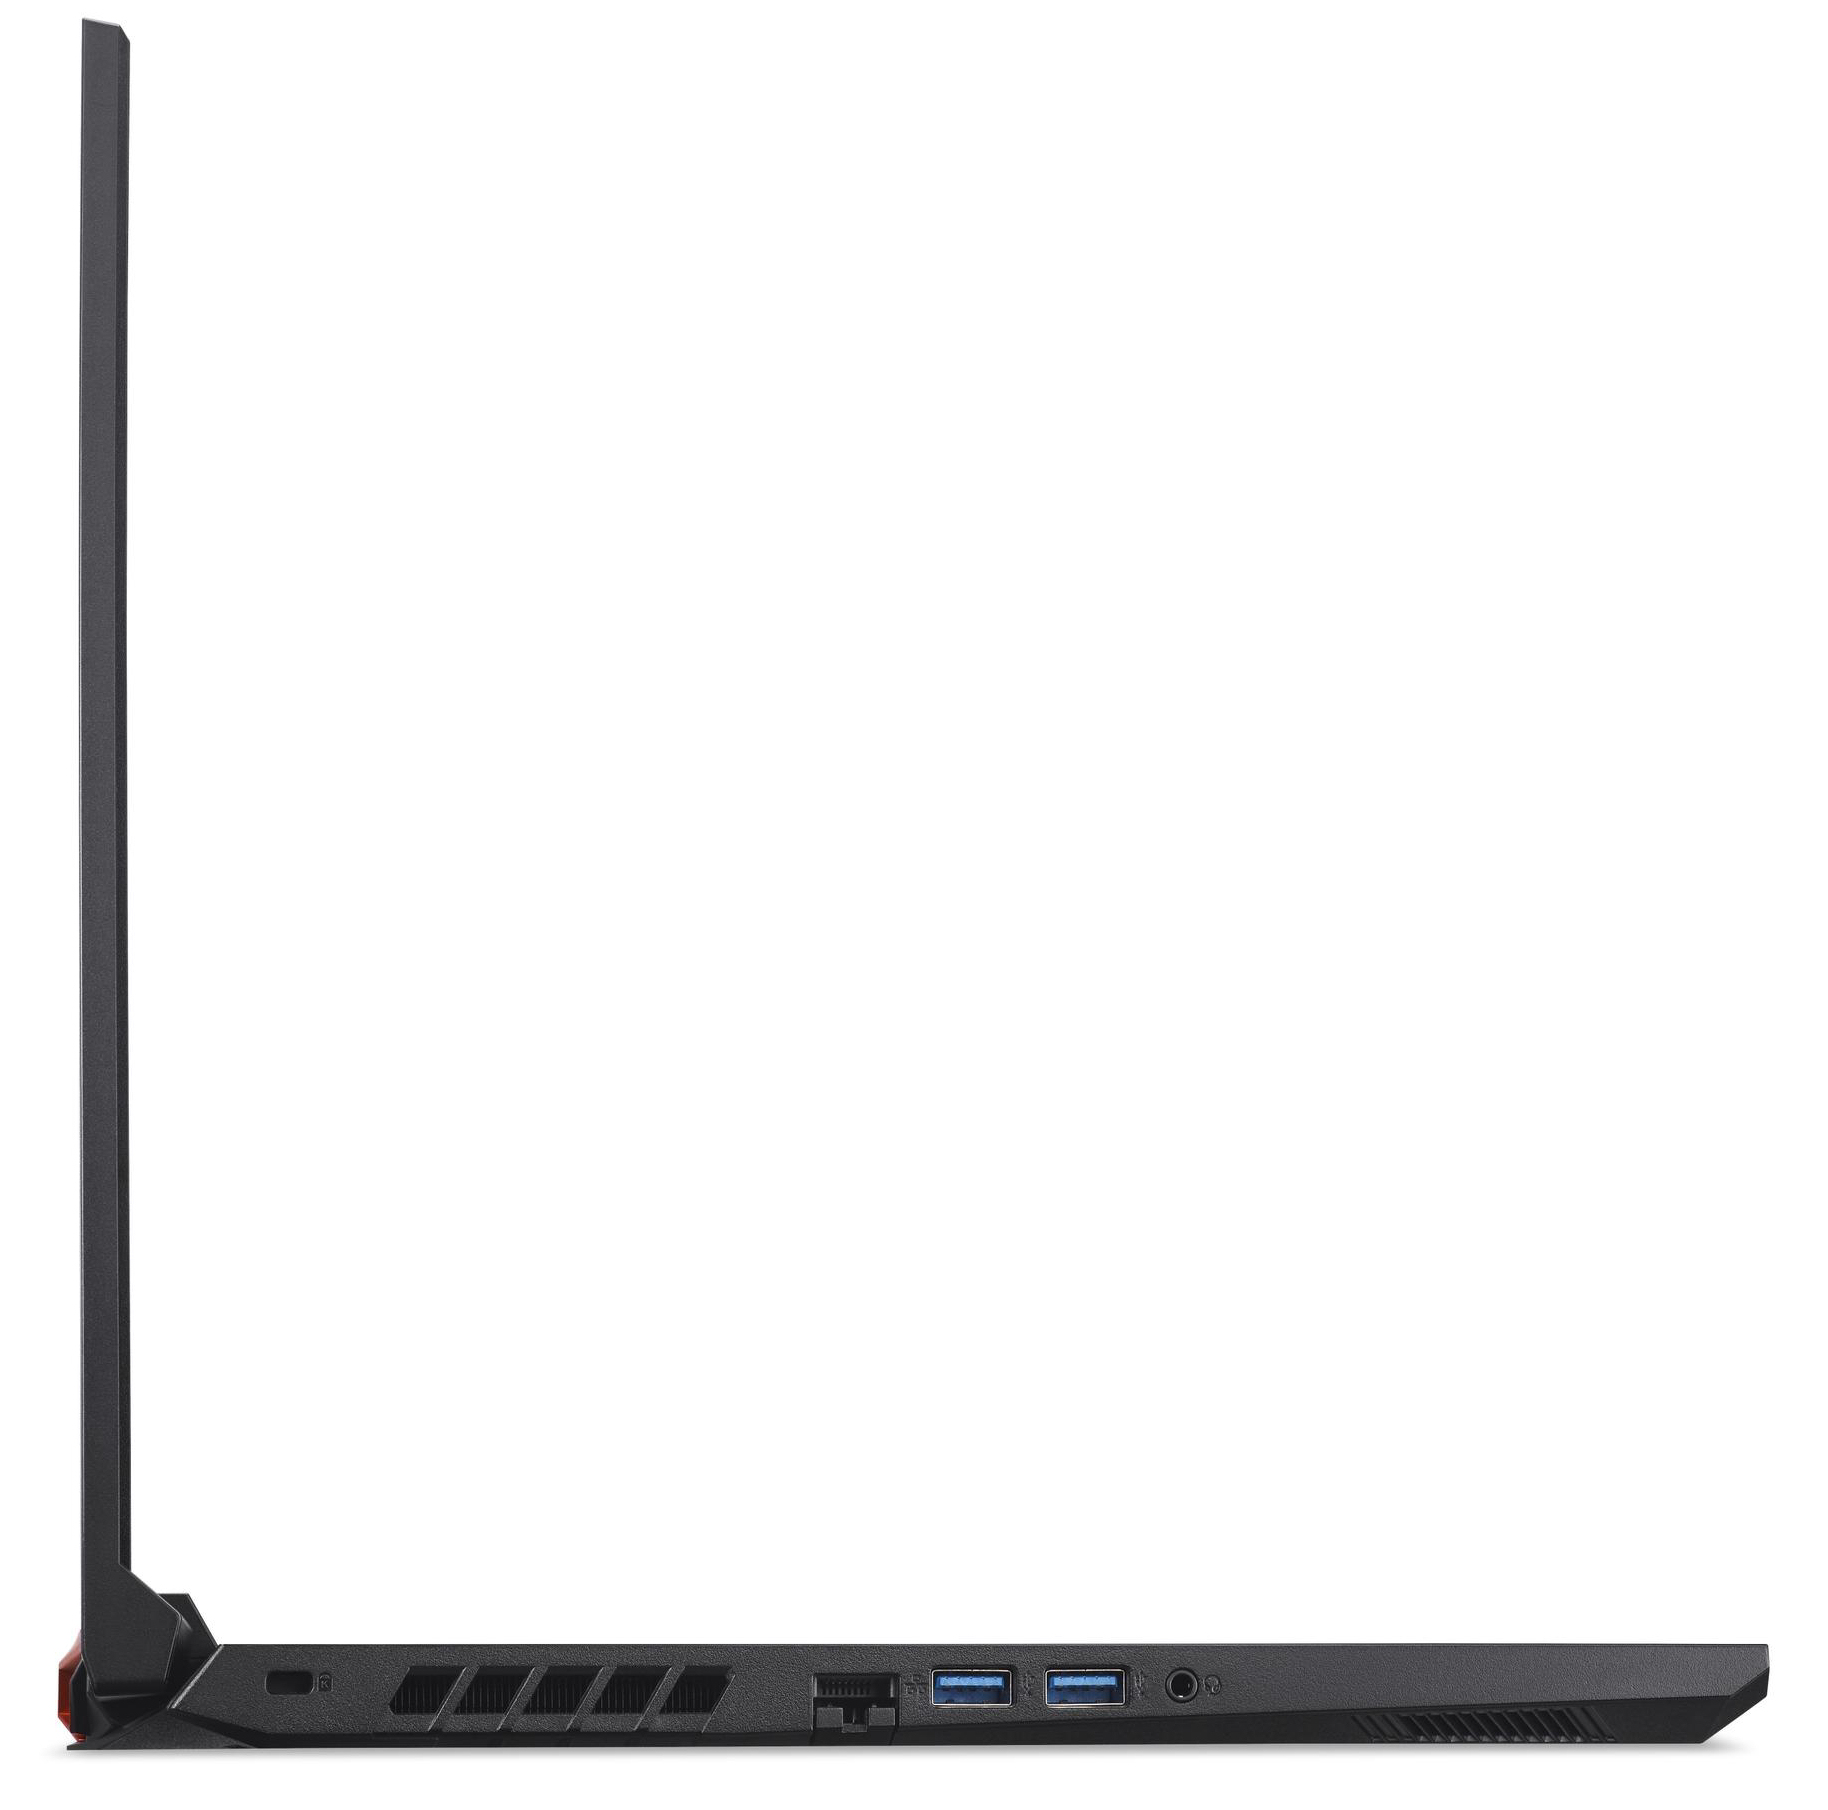
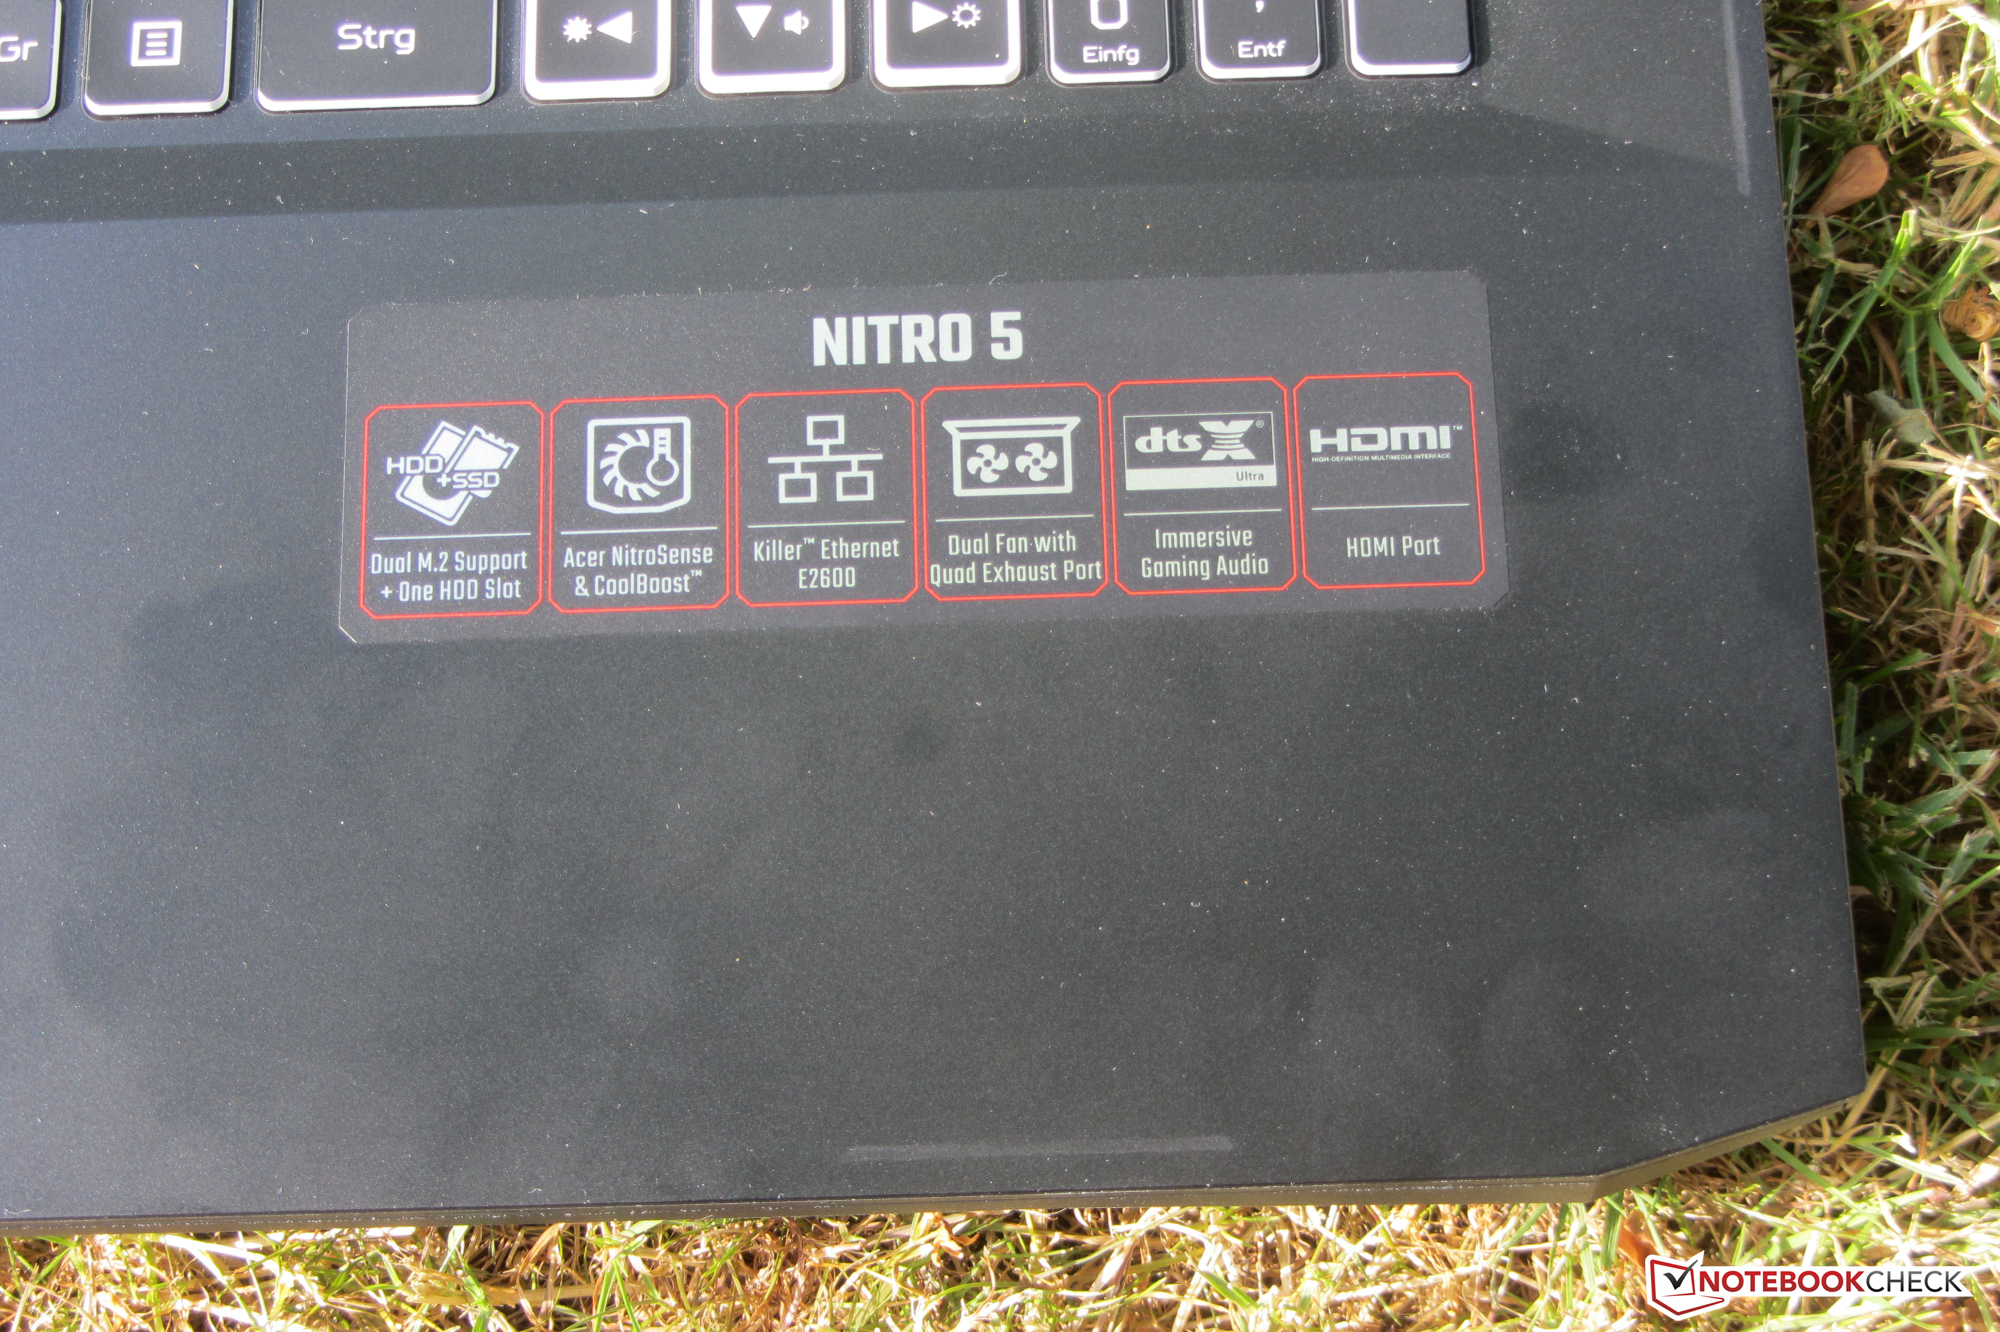
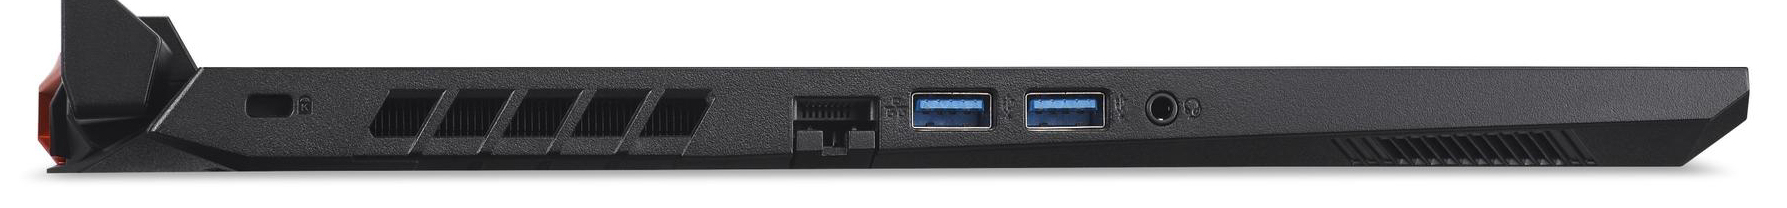
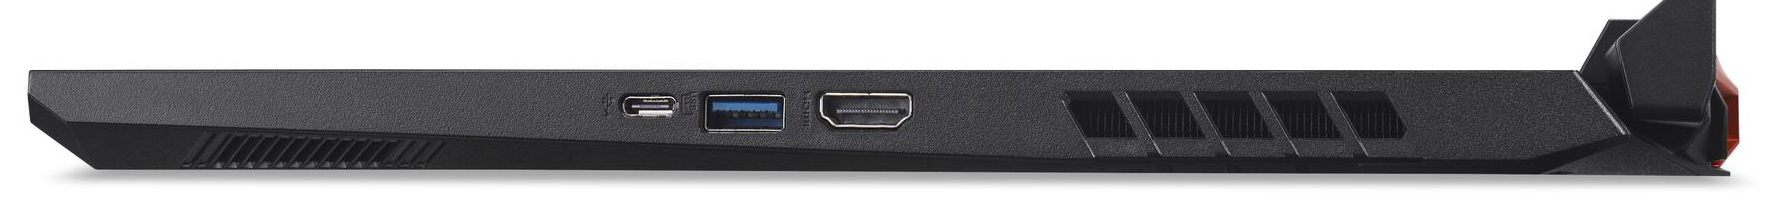
Equipo - el ordenador Acer no tiene Thunderbolt para ofrecer
El Nitro ofrece tres puertos USB-A (2x USB 3.2 Gen 1, 1x USB 3.2 Gen 2) y un puerto USB-C (USB 3.2 Gen 2). Este último no soporta PowerDeliveryo Displayport-per-USB-C. Así, sólo hay una salida de vídeo con el puerto HDMI. Acer no ha equipado el portátil con un lector de tarjetas de memoria
Comunicación
El chip WLAN (Mediatek MT7921) es compatible con el estándar 802.11ax y ofrece funcionalidad Bluetooth 5. Las velocidades de datos determinadas en condiciones óptimas (ningún otro dispositivo WLAN en las proximidades, poca distancia entre el portátil y el PC servidor) no alcanzan las capacidades del chip. Sospechamos que se trata de un problema de controladores. Lasconexiones de redpor cableson gestionadas por un controlador Killer E2600 Gigabit Ethernet. Realiza sus tareas sin problemas.
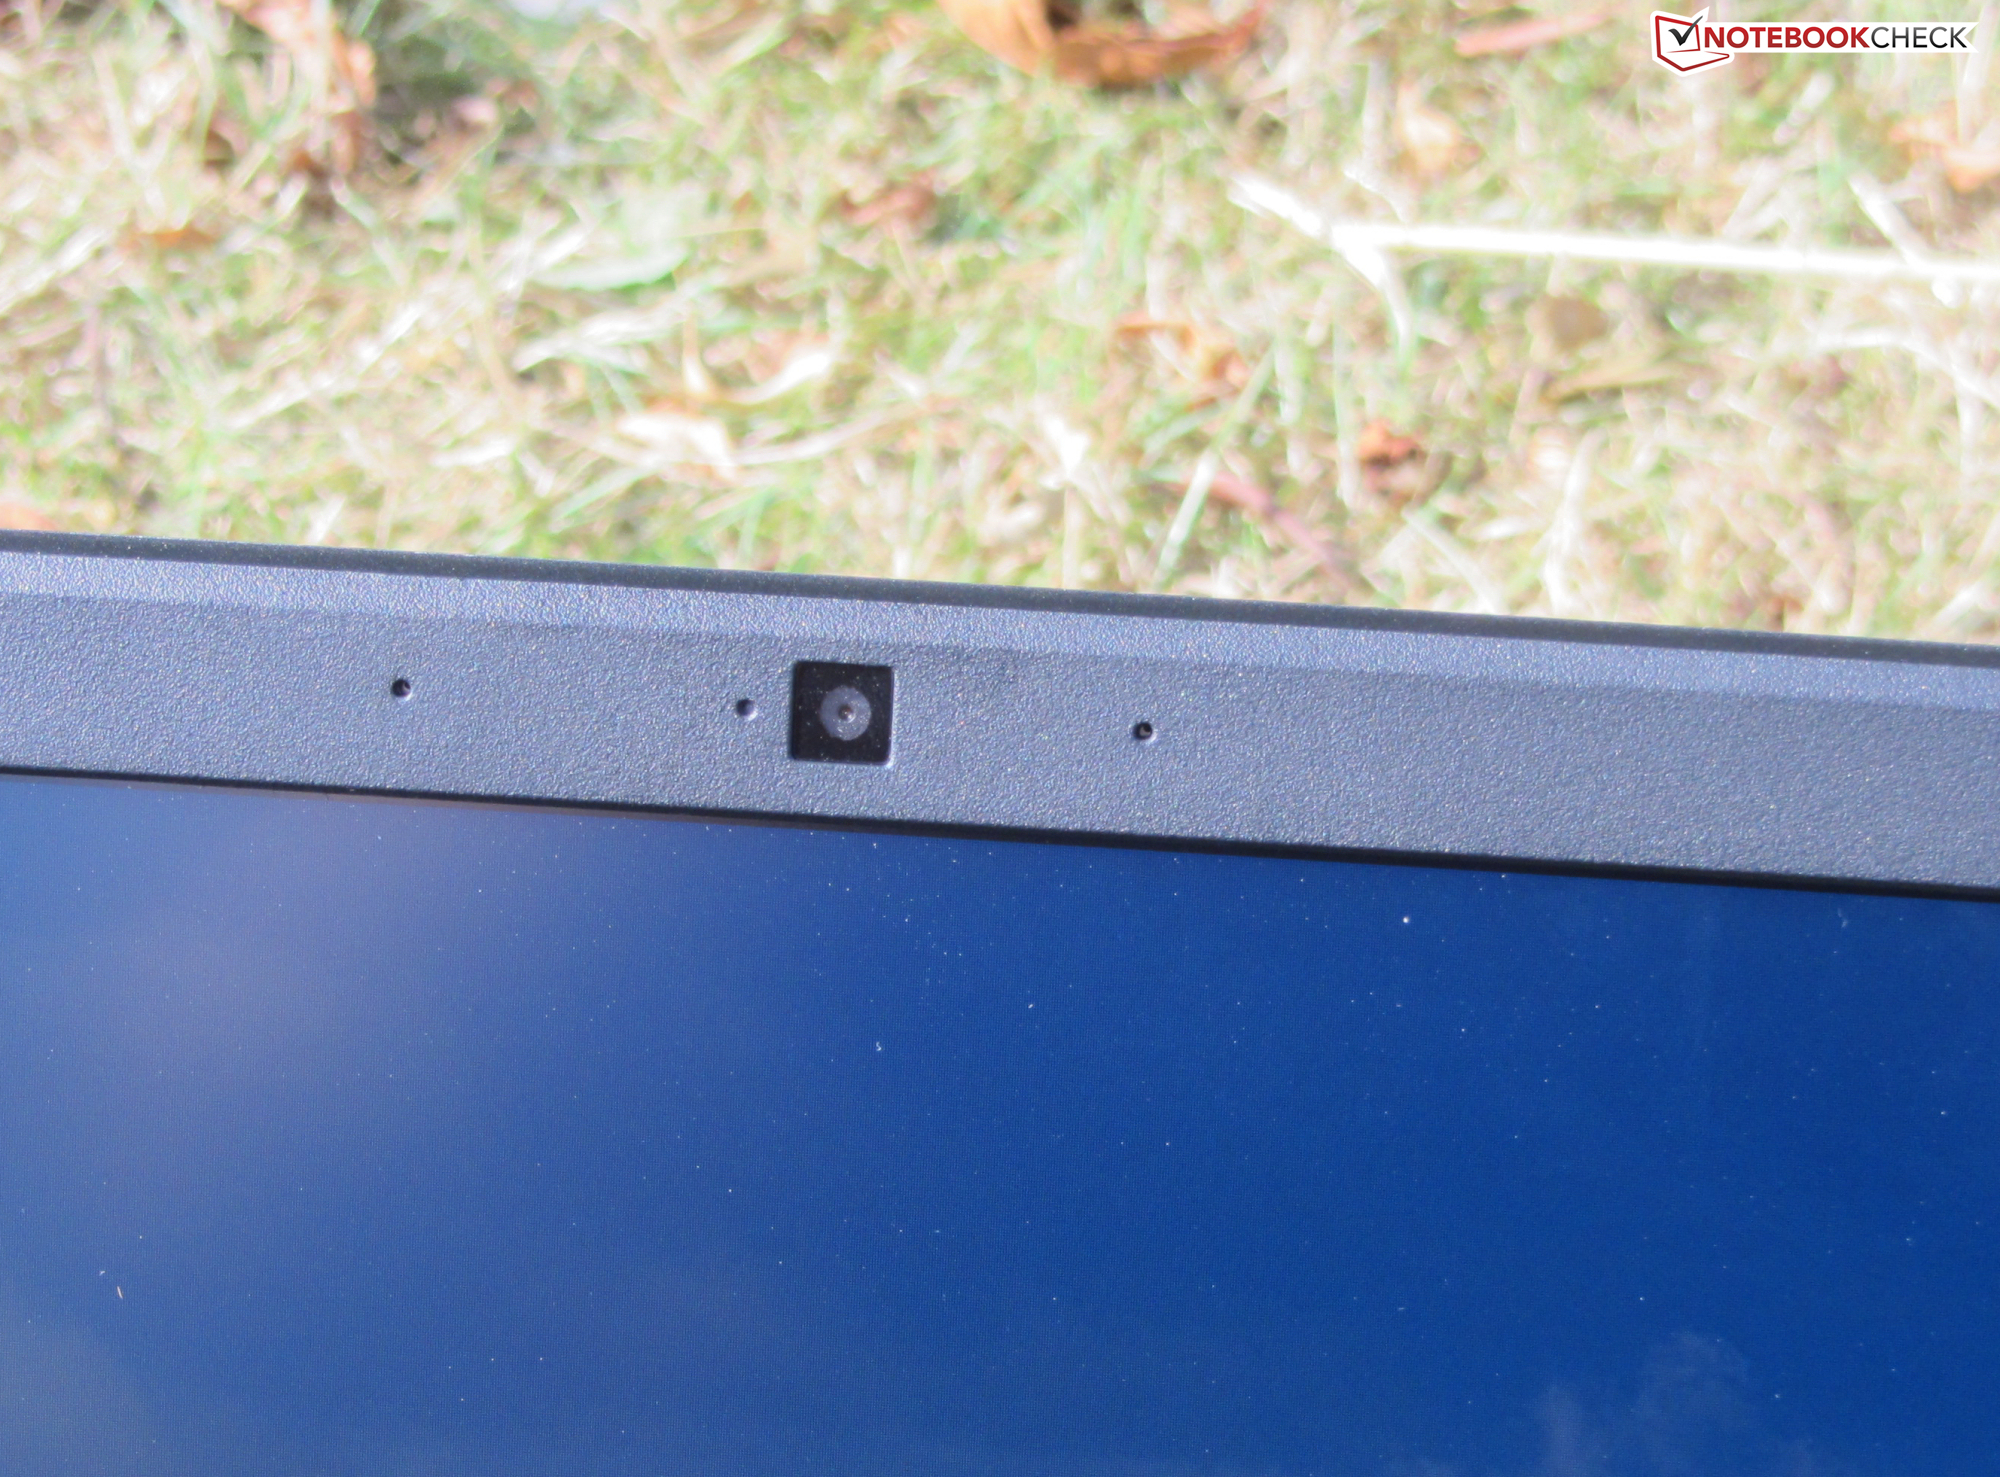
Cámara web
La cámara web (0,9 MP) produce imágenes con una resolución máxima de 1.280 x 720 píxeles. La precisión del color es un problema. Con una desviación de casi 12, el objetivo (DeltaE inferior a 3) se pierde claramente


Accesorios
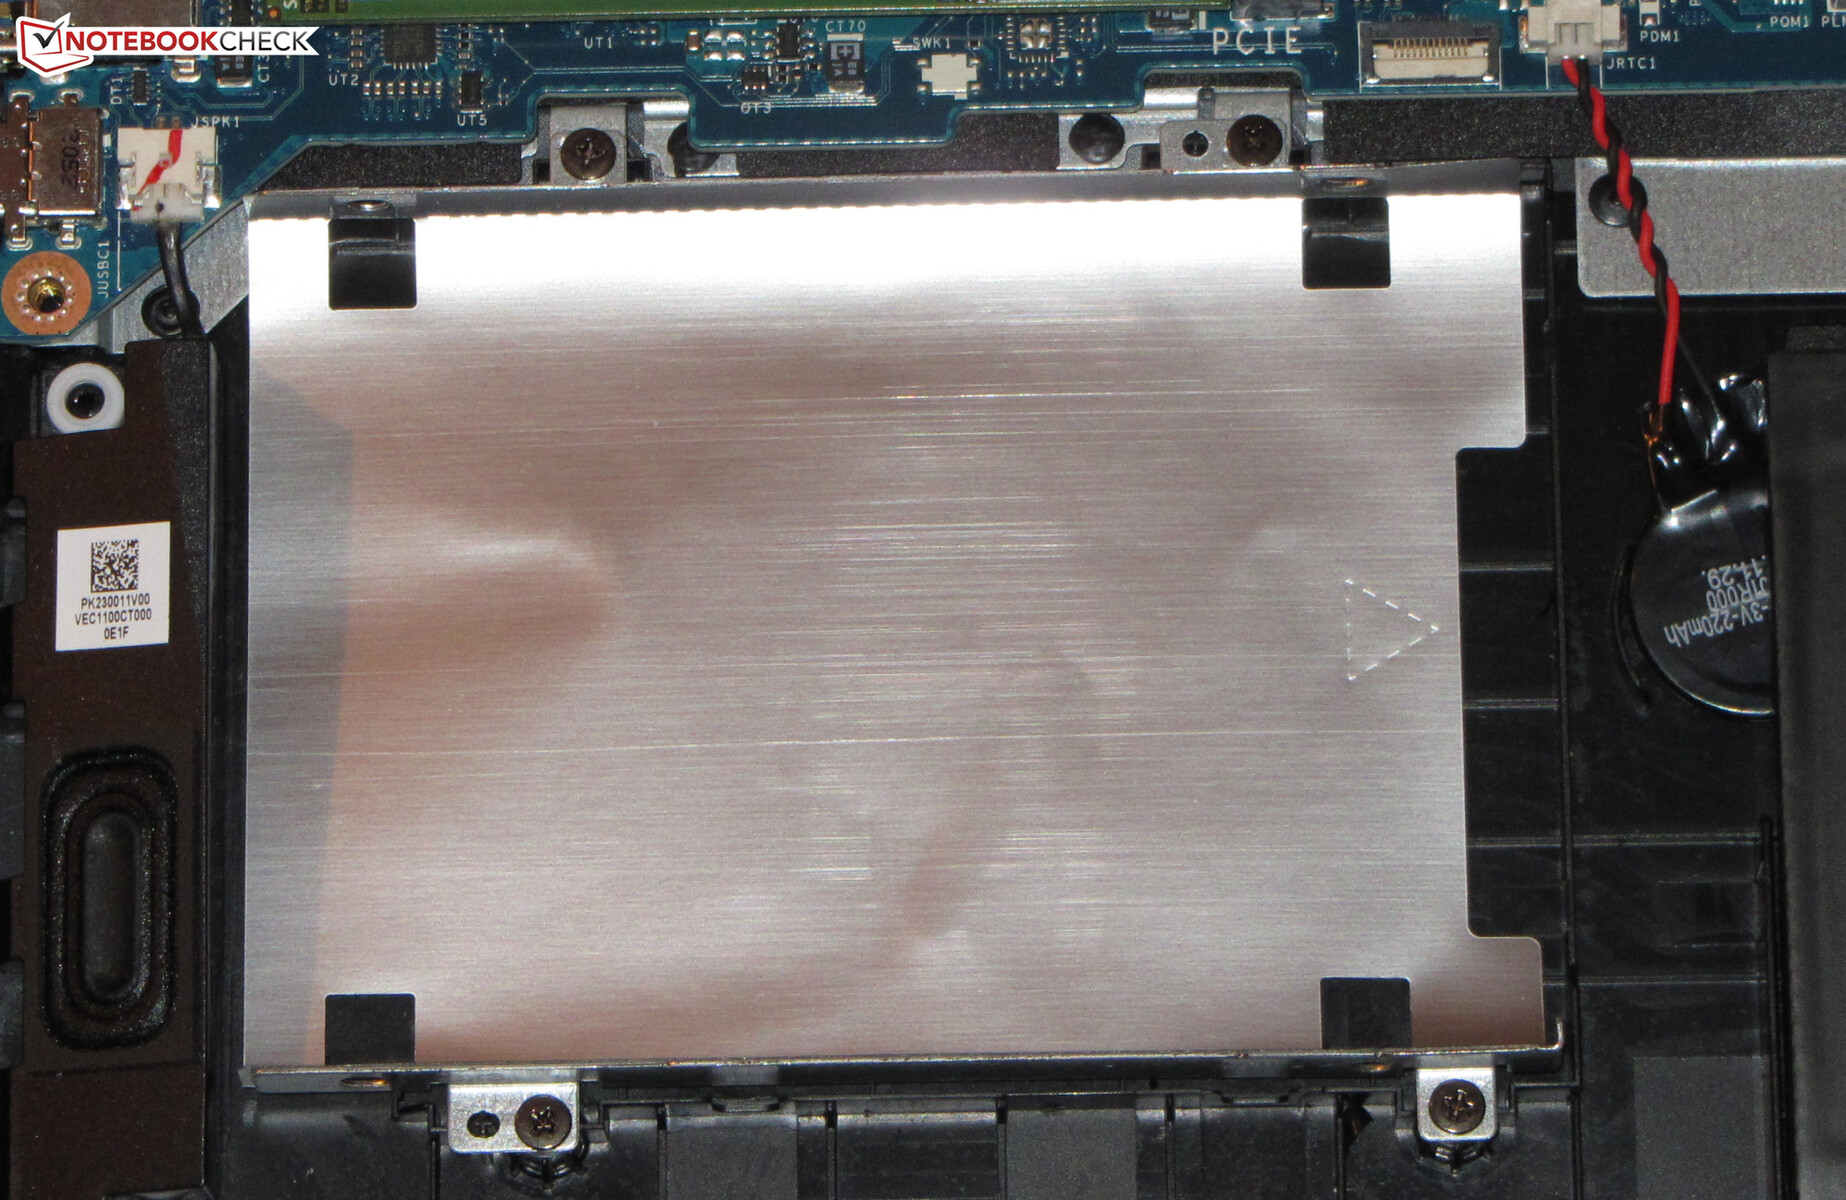
El portátil viene con los documentos habituales: Una guía de inicio rápido e información sobre la garantía. Además, se incluye un cable plano corto que incluye un conector SATA, que sería necesario para instalar un medio de almacenamiento de 2,5 pulgadas. El marco de montaje correspondiente ya está dentro del portátil
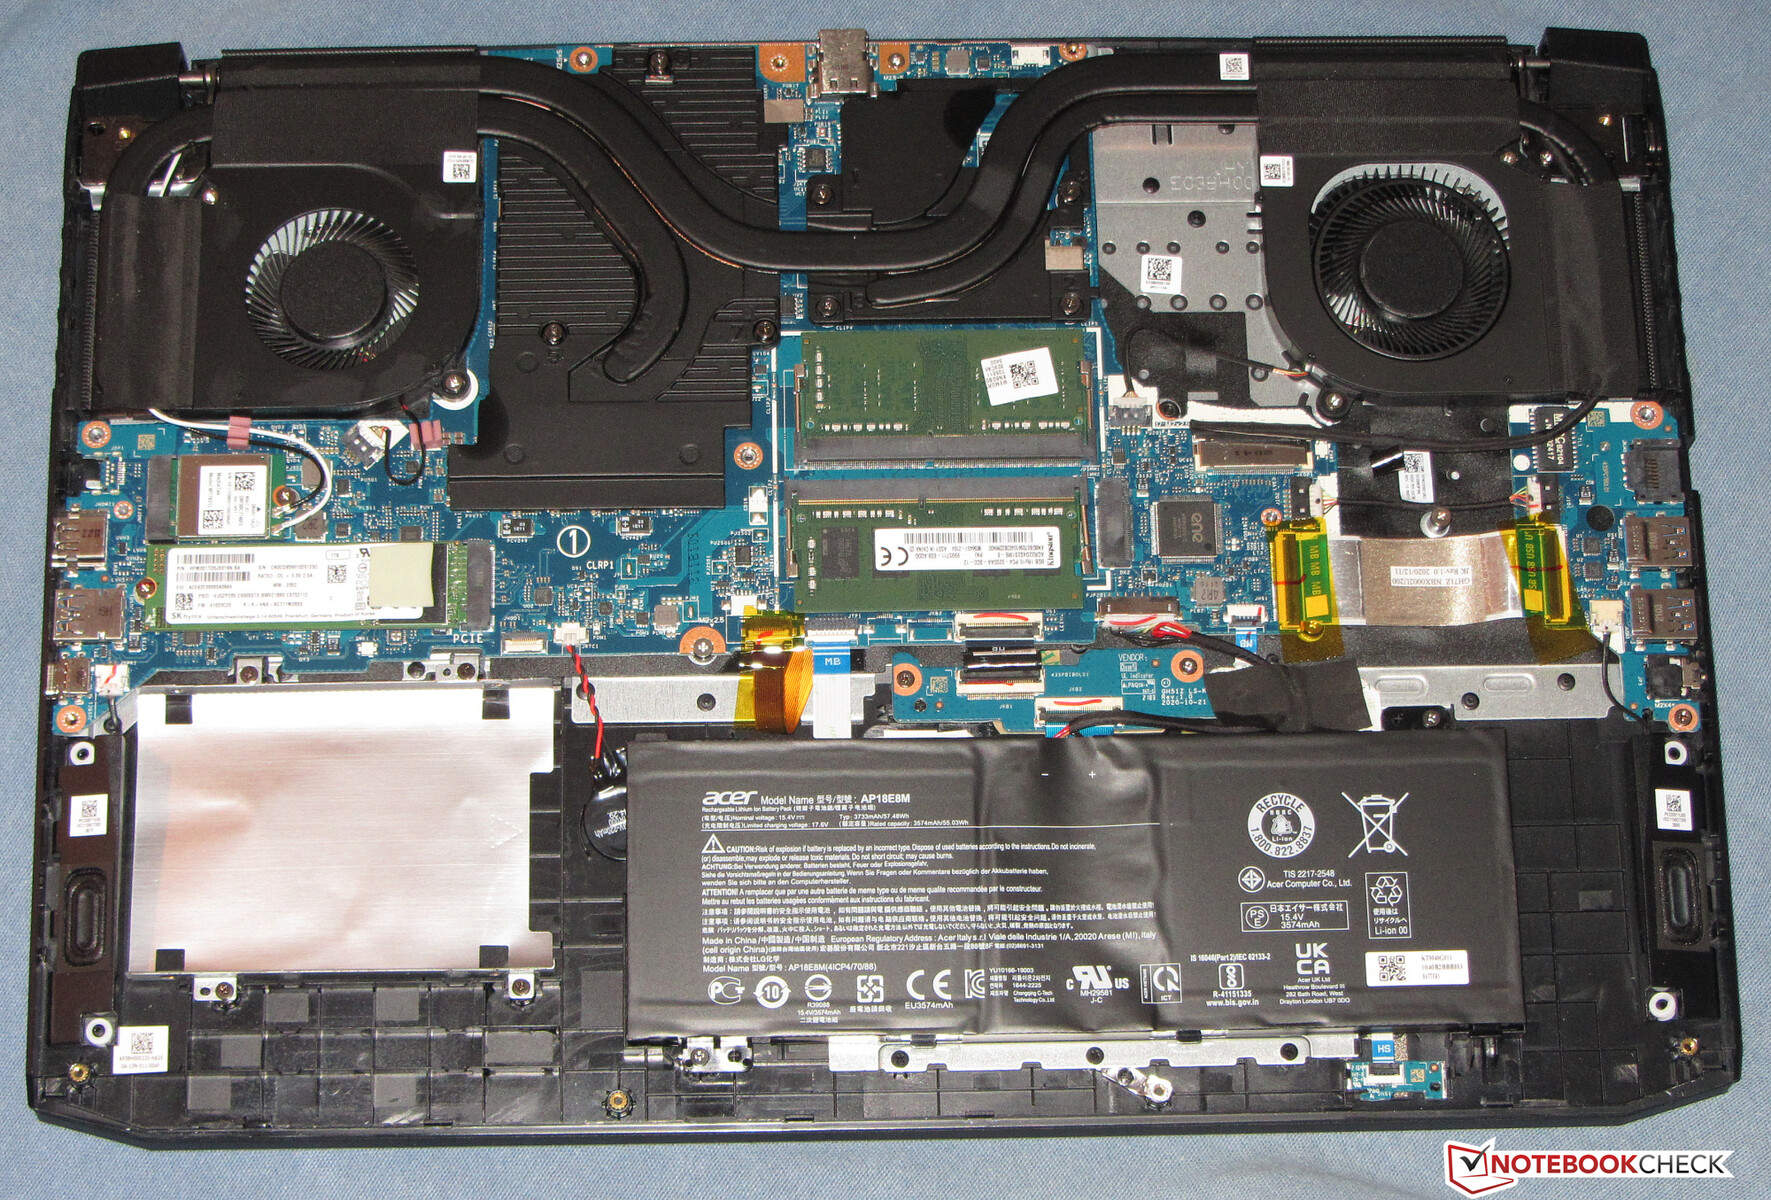
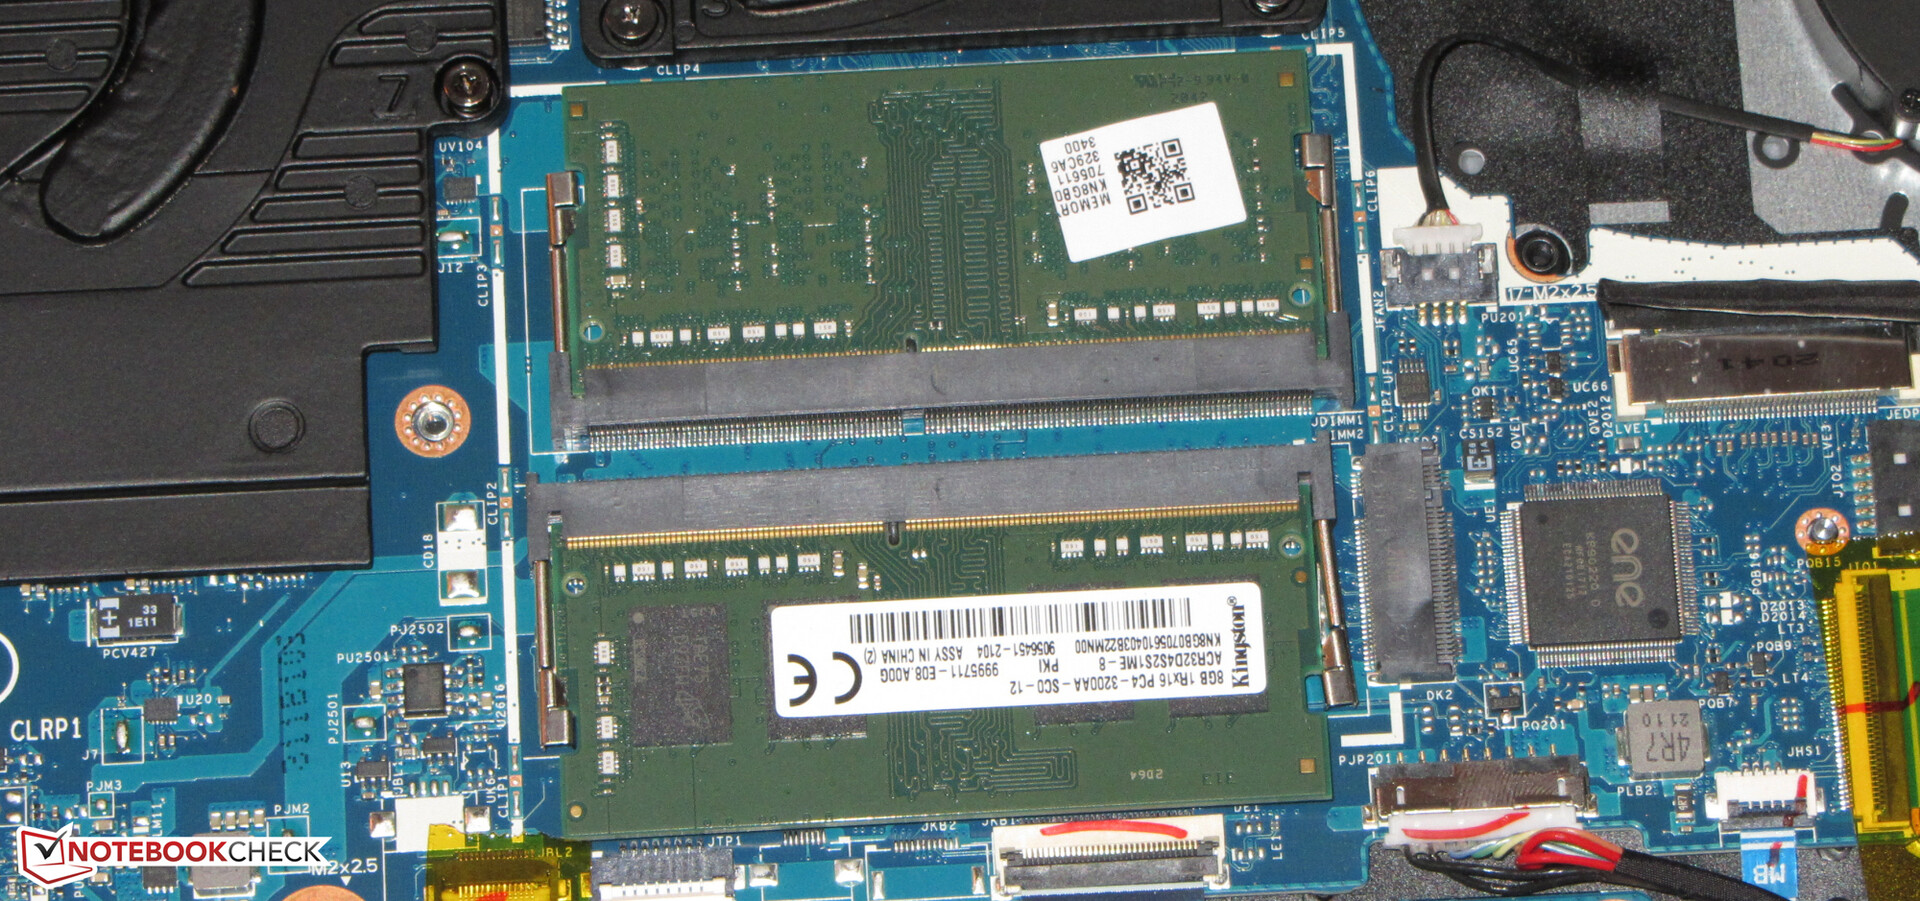
Mantenimiento
El acceso a las entrañas requiere el desmontaje de la carcasa inferior. Después de retirar todos los tornillos de la parte inferior del aparato, la carcasa inferior se puede separar con la ayuda de una espátula plana o un alisador de juntas. Aquí hay que tener cuidado: La carcasa inferior a veces está bastante apretada.
Garantía
Acer concede al 17,3 pulgadas una garantía de dos años. Una extensión a tres años cuesta algo menos de 100 euros
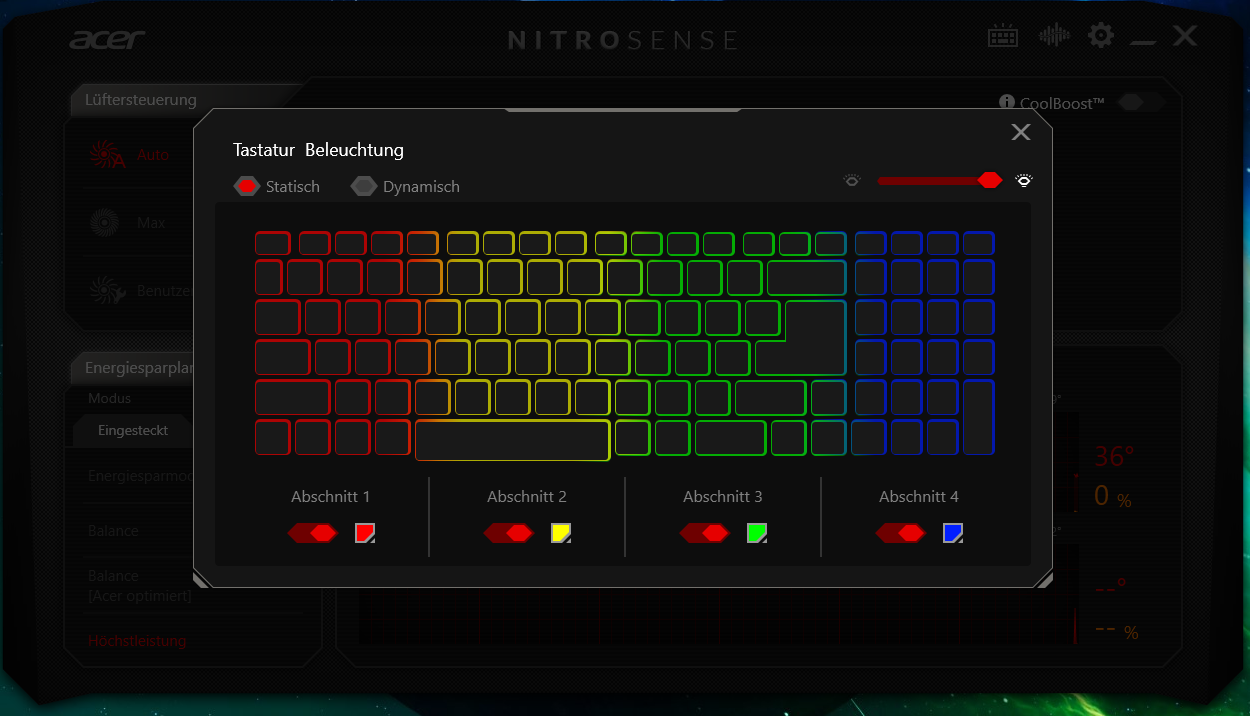
Dispositivos de entrada - Teclado con iluminación RGB
Teclado
Las teclas principales (letras, fila de números) del teclado chiclet iluminado tienen una curvatura ligeramente cóncava. Las demás teclas (teclas de función, teclado numérico) tienen un diseño plano. Ofrecen un recorrido medio y un punto de presión claro. La resistencia de las teclas es bastante aceptable, pero podría ser más nítida para nuestro gusto. El teclado cede un poco durante la escritura. Esto no resultó ser molesto. En general, Acer ofrece un teclado adecuado para el uso diario
Panel táctil
La superficie lisa del ClickPad multitáctil (unos 10,6 x 7,8 cm/~4,2 x 3,1 pulgadas) facilita el deslizamiento de los dedos. También responde a las entradas en las esquinas. El pad tiene un recorrido corto y un punto de presión claro
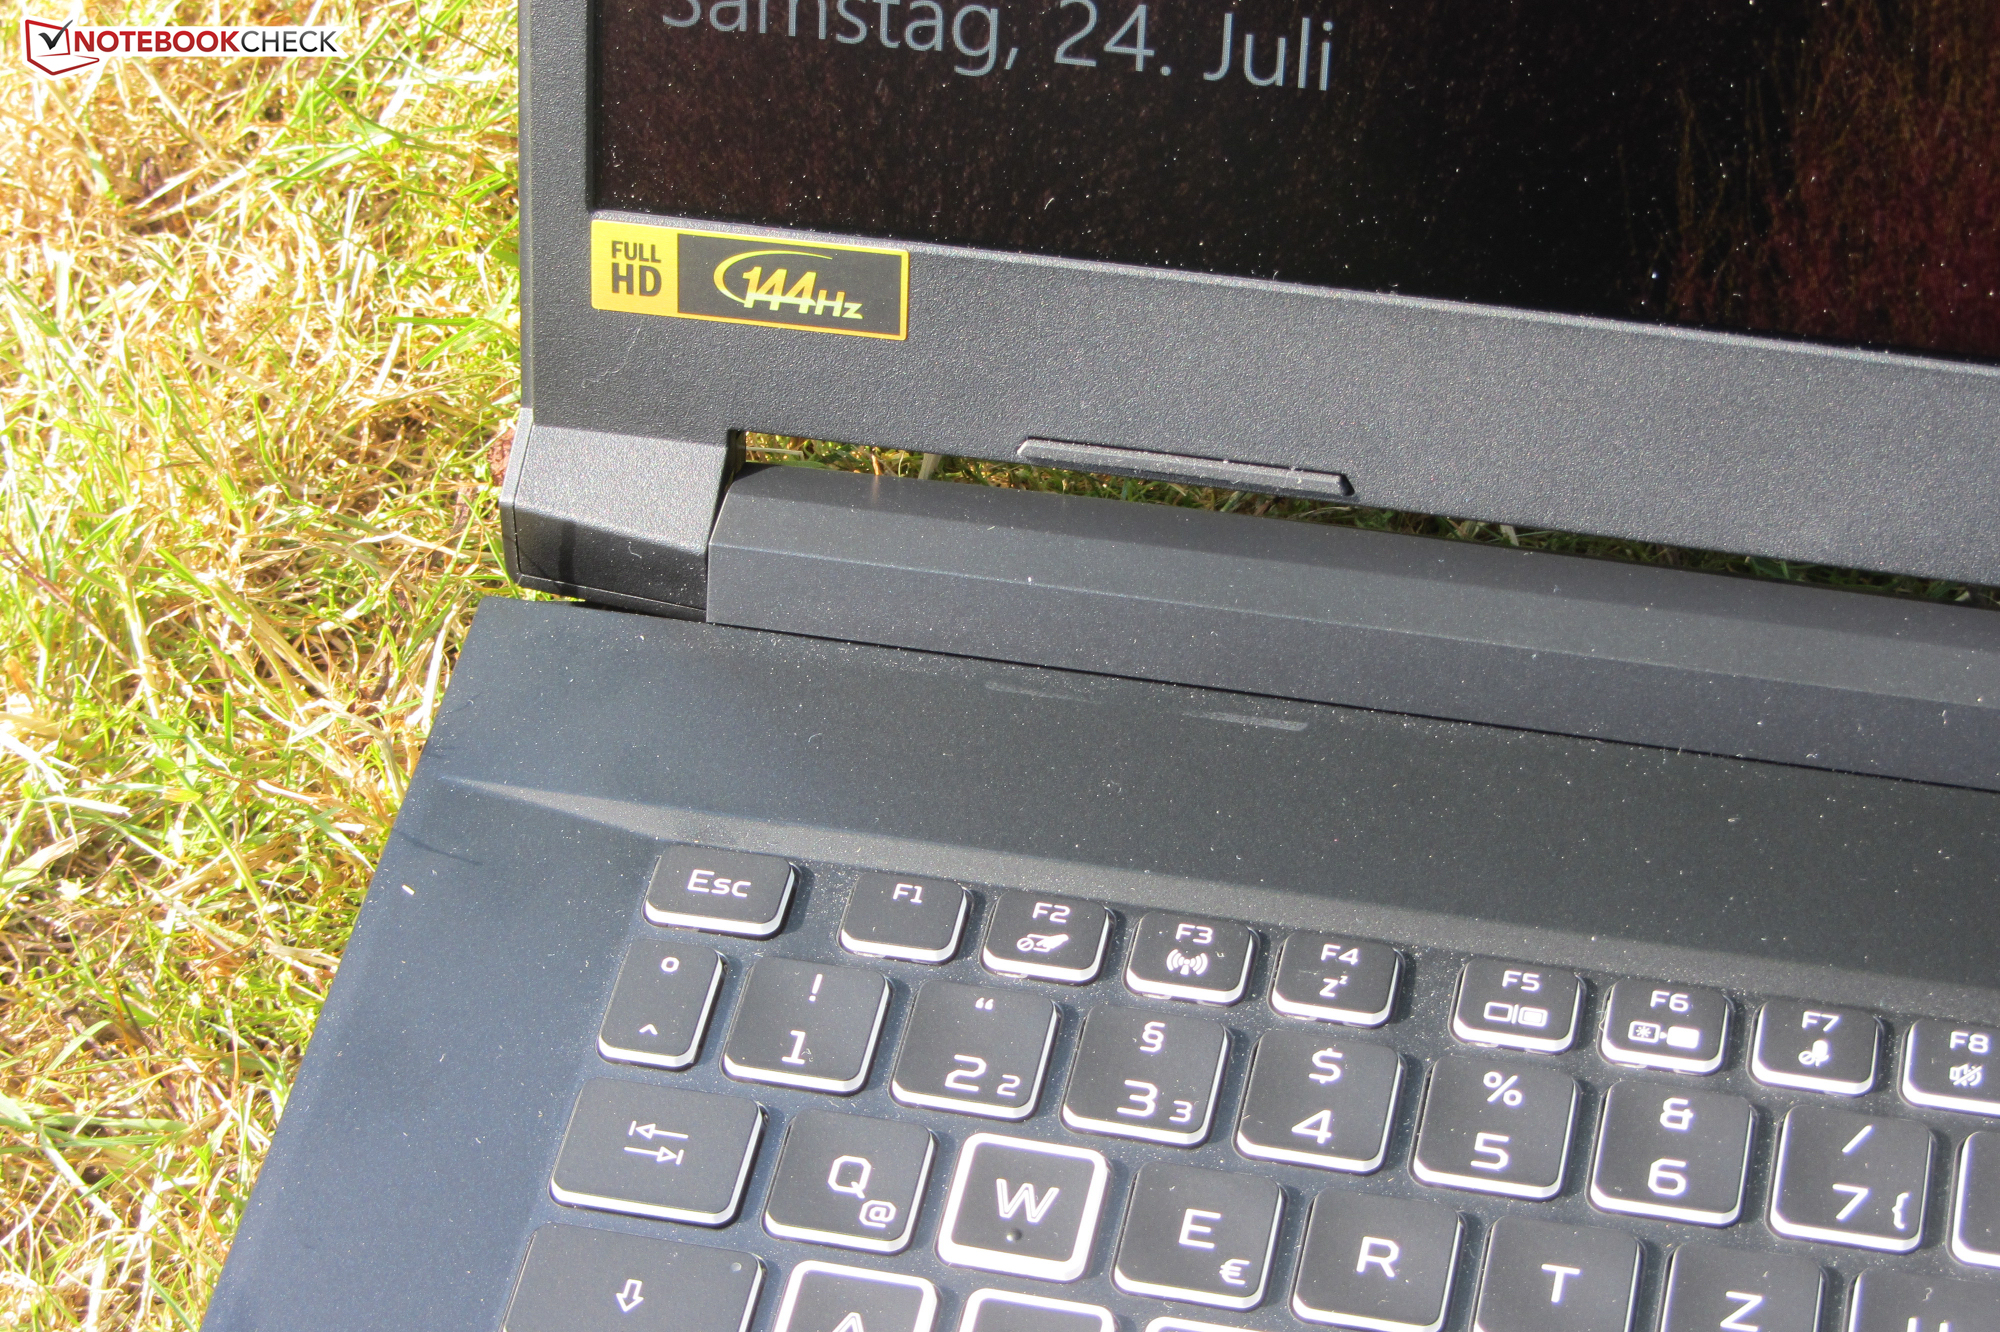
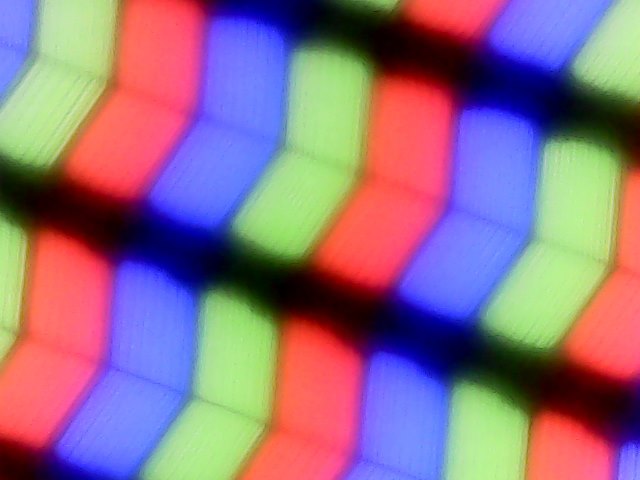
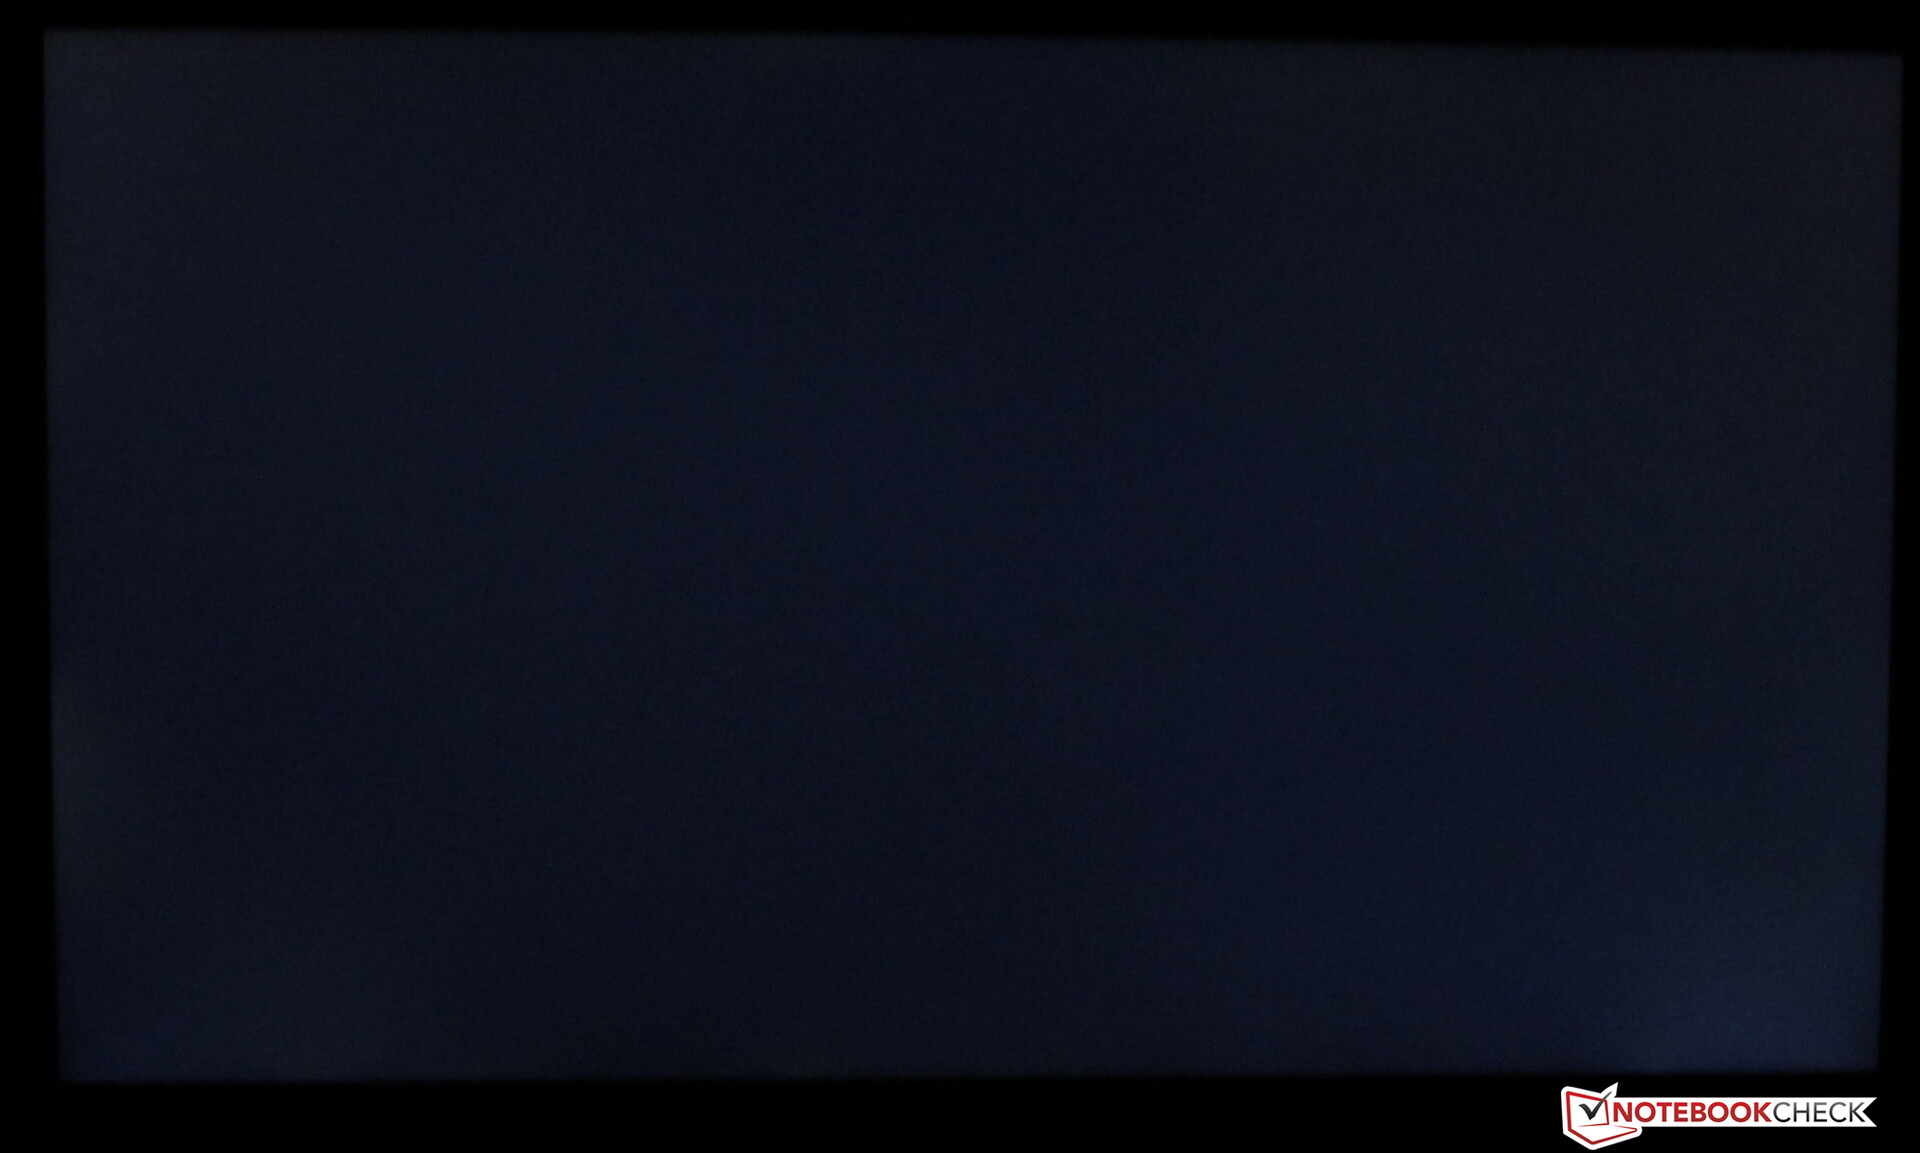
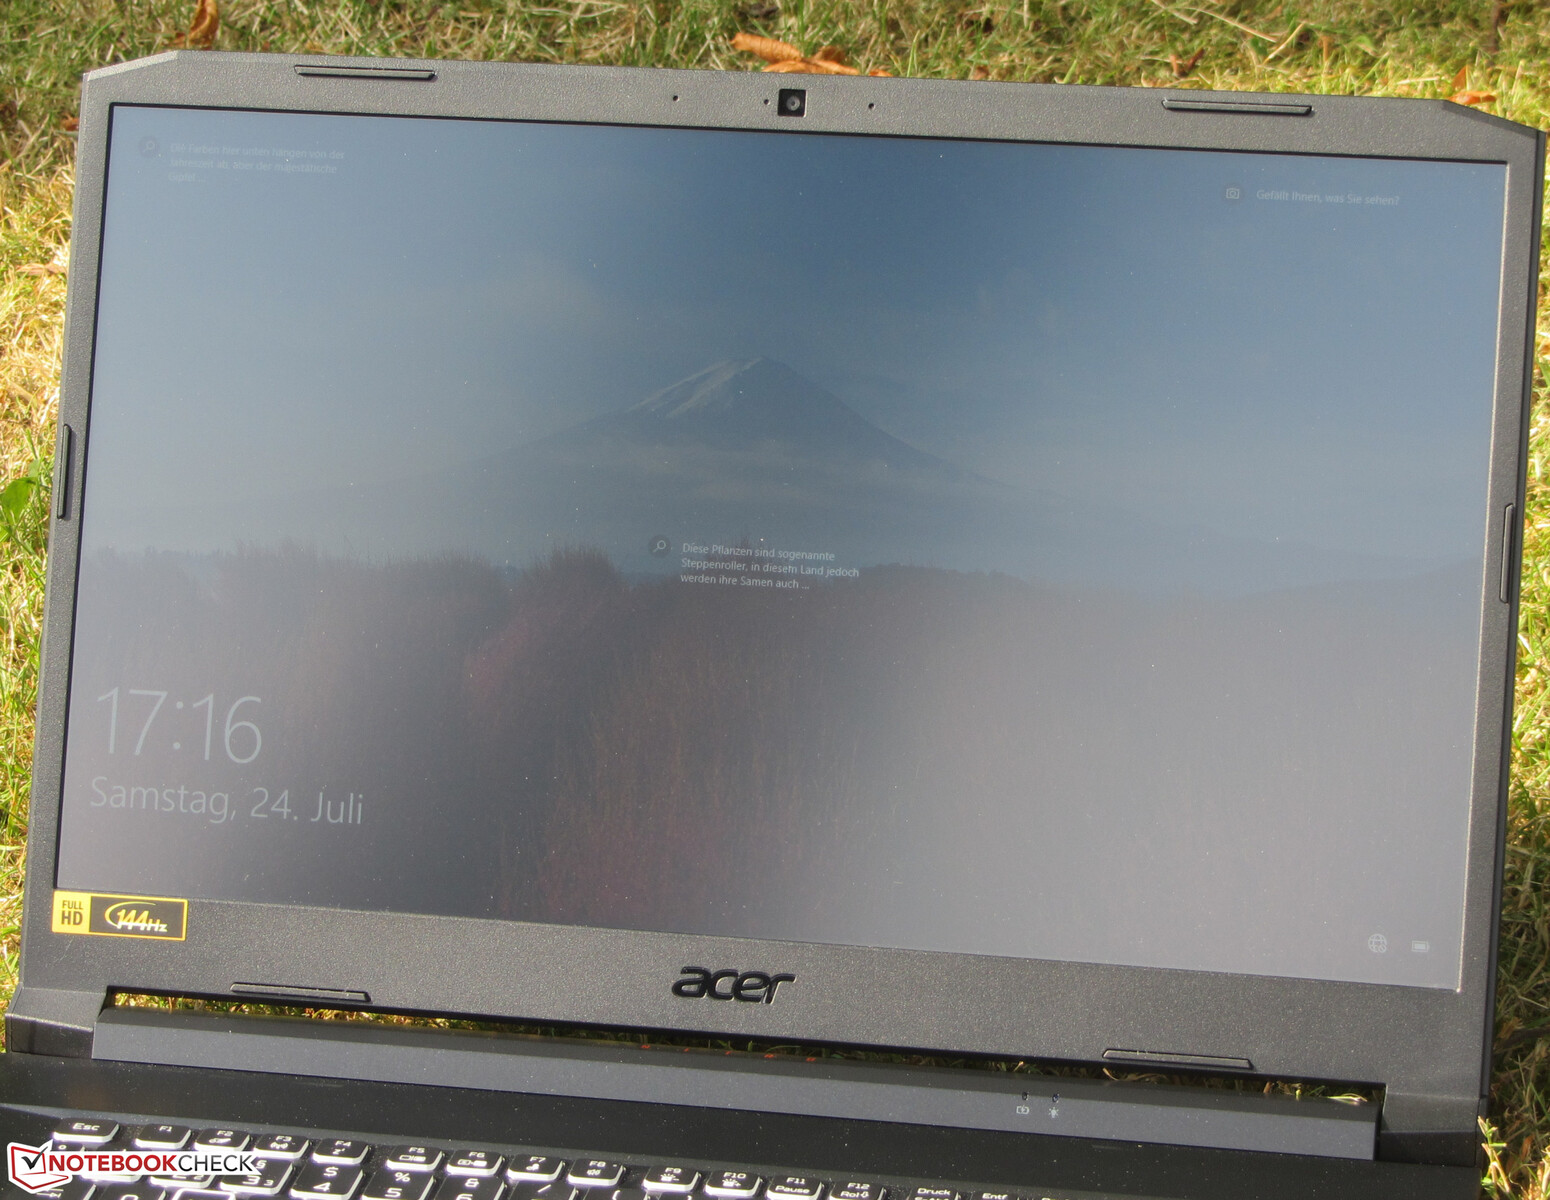
Pantalla - 144 Hz IPS
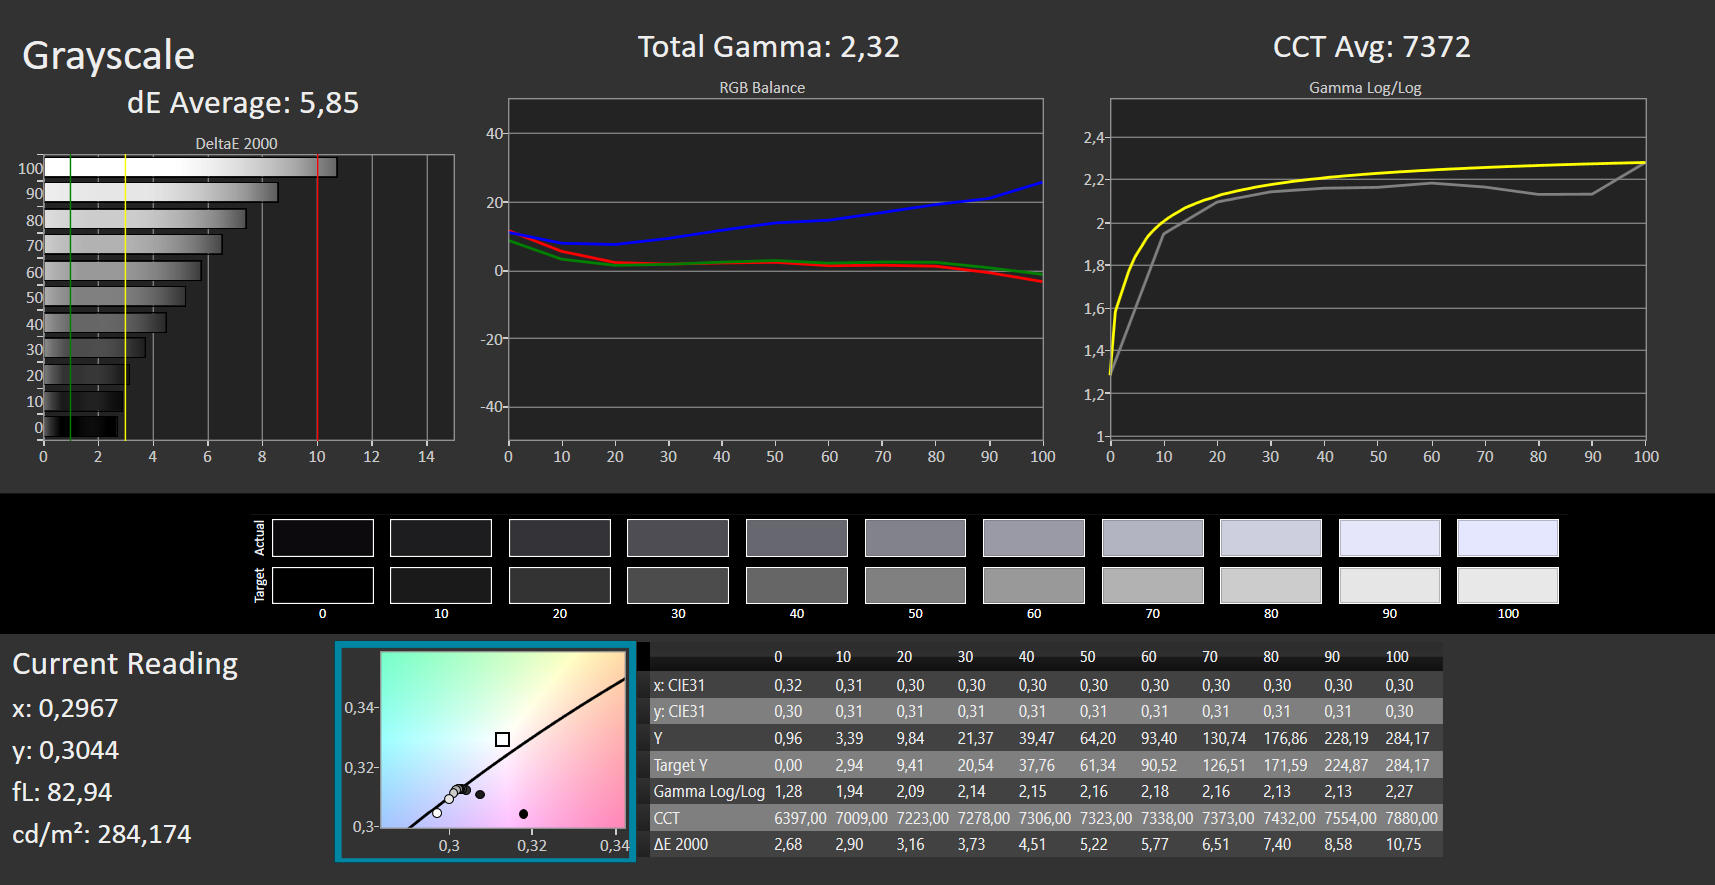
Aunque la pantalla mate de 17,3 pulgadas (1.920 x 1.080 píxeles) ofrece un buen contraste (1.175:1), el brillo medio (255,1 cd/m²) es demasiado bajo.Consideramos que los valores superiores a 300 cd/m² son buenos. El panel de 144 Hz ofrece tiempos de respuesta cortos. No se pudo detectar el parpadeo PWM
| |||||||||||||||||||||||||
iluminación: 85 %
Brillo con batería: 283 cd/m²
Contraste: 1175:1 (Negro: 0.24 cd/m²)
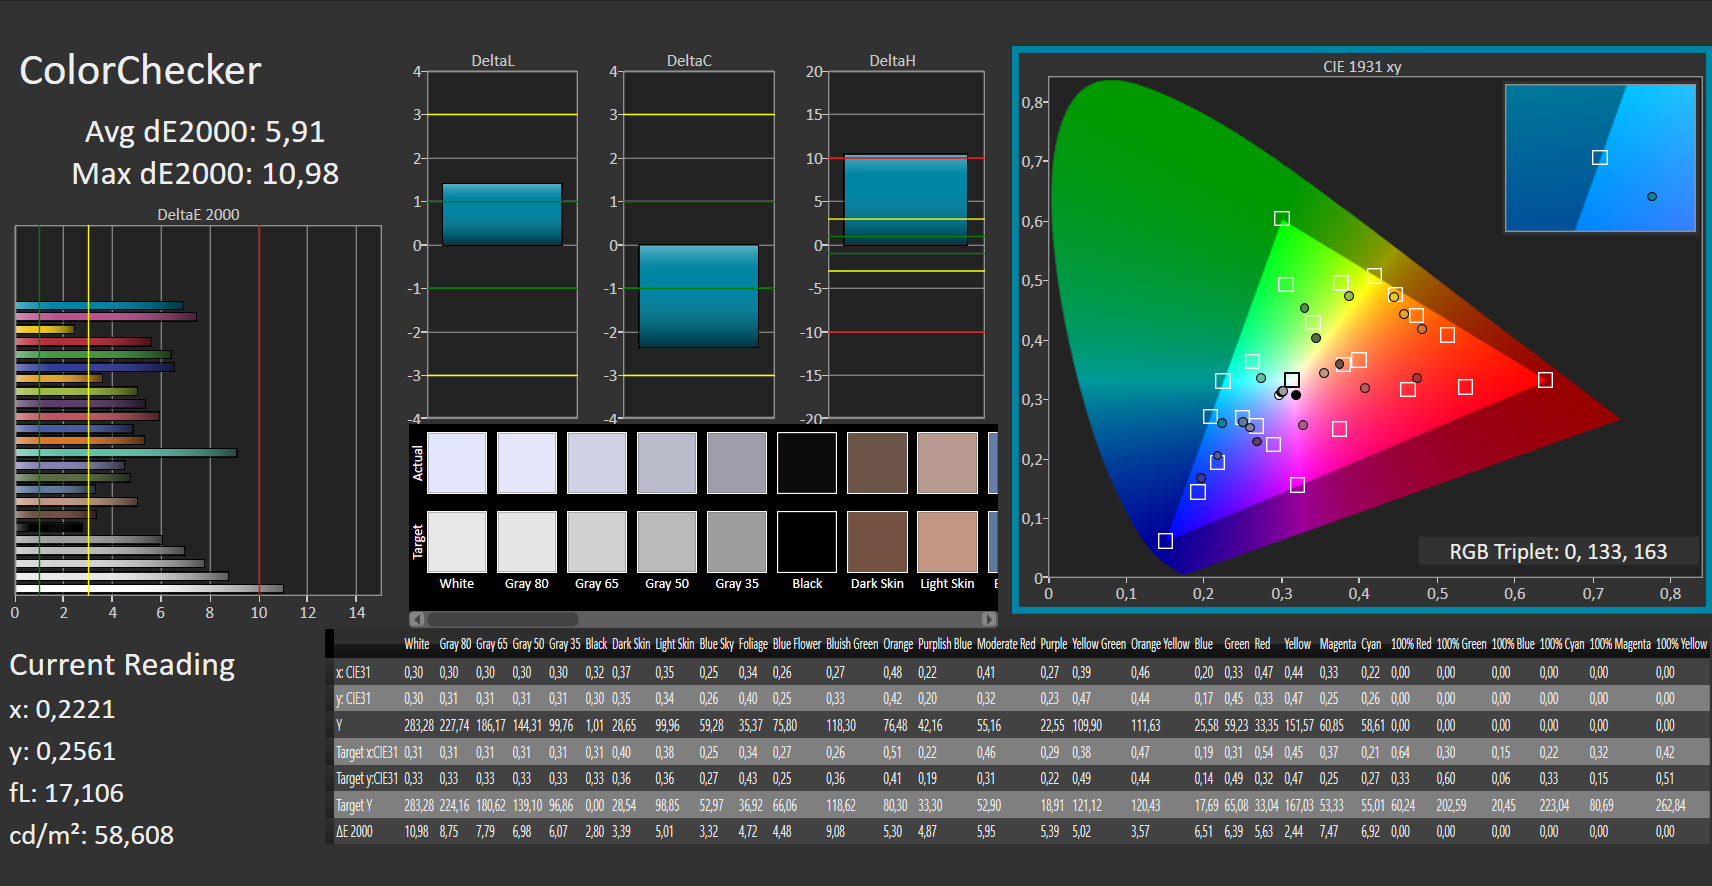
ΔE ColorChecker Calman: 5.91 | ∀{0.5-29.43 Ø4.71}
ΔE Greyscale Calman: 5.85 | ∀{0.09-98 Ø4.96}
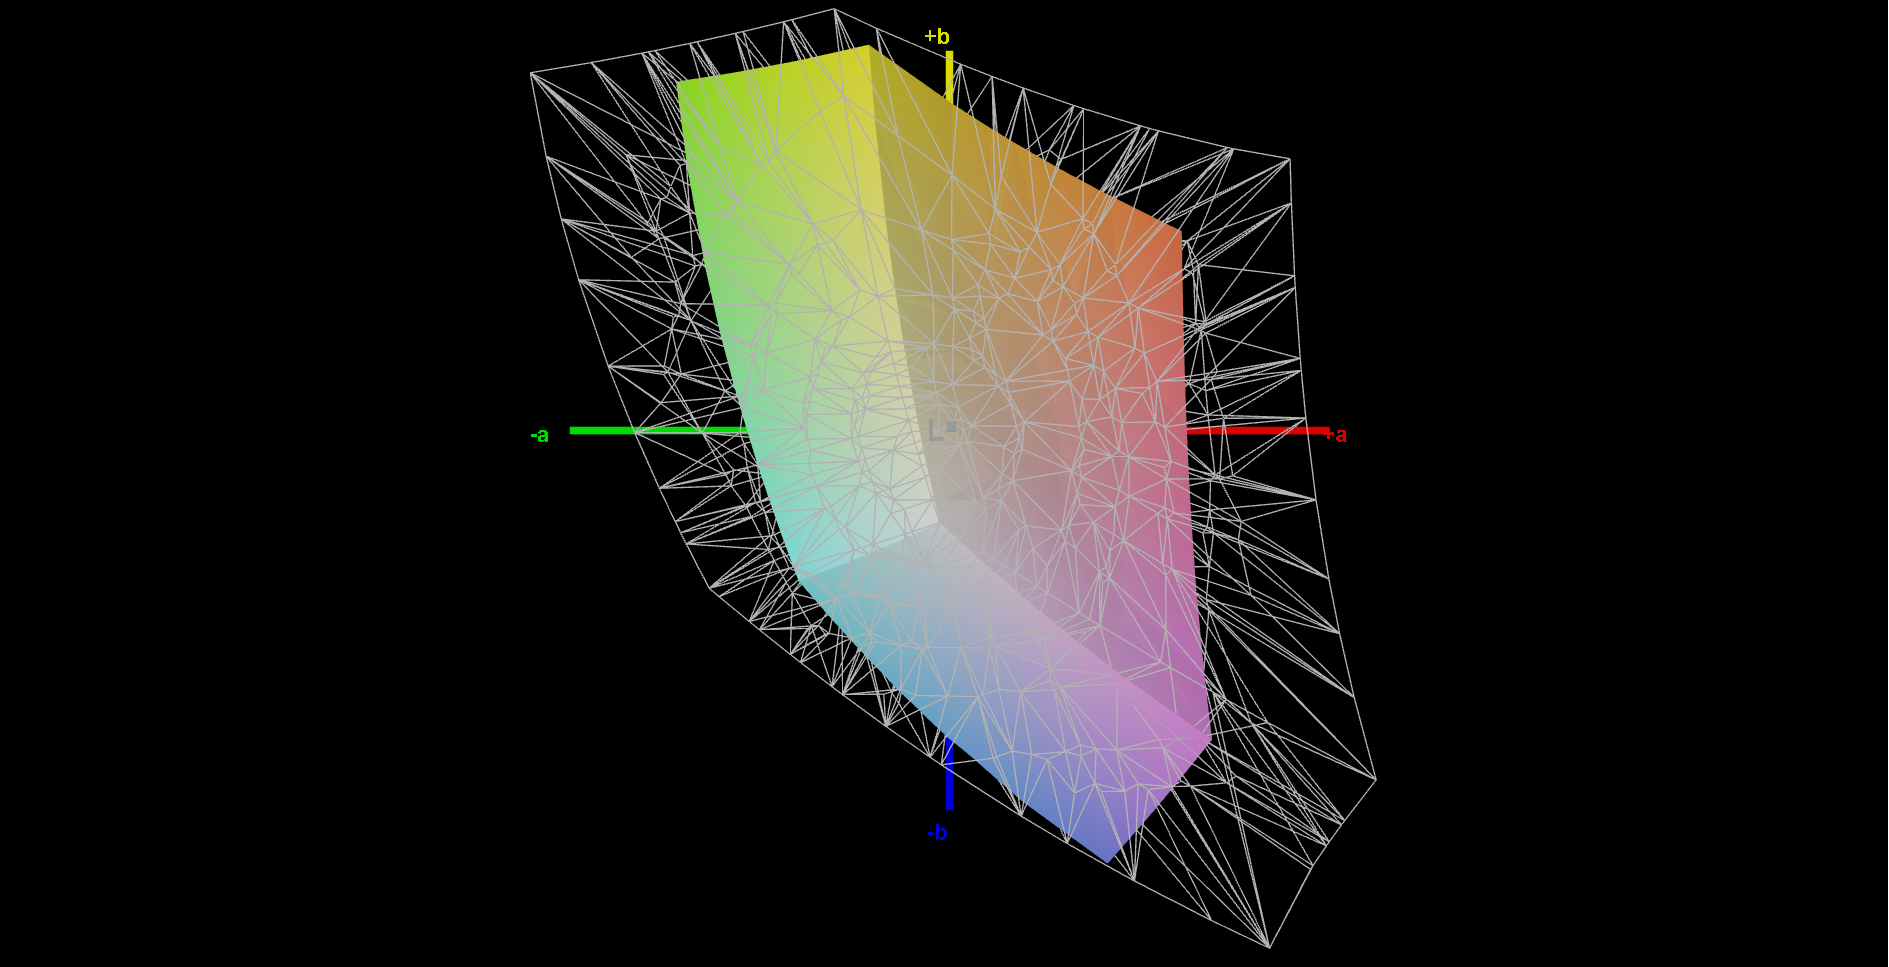
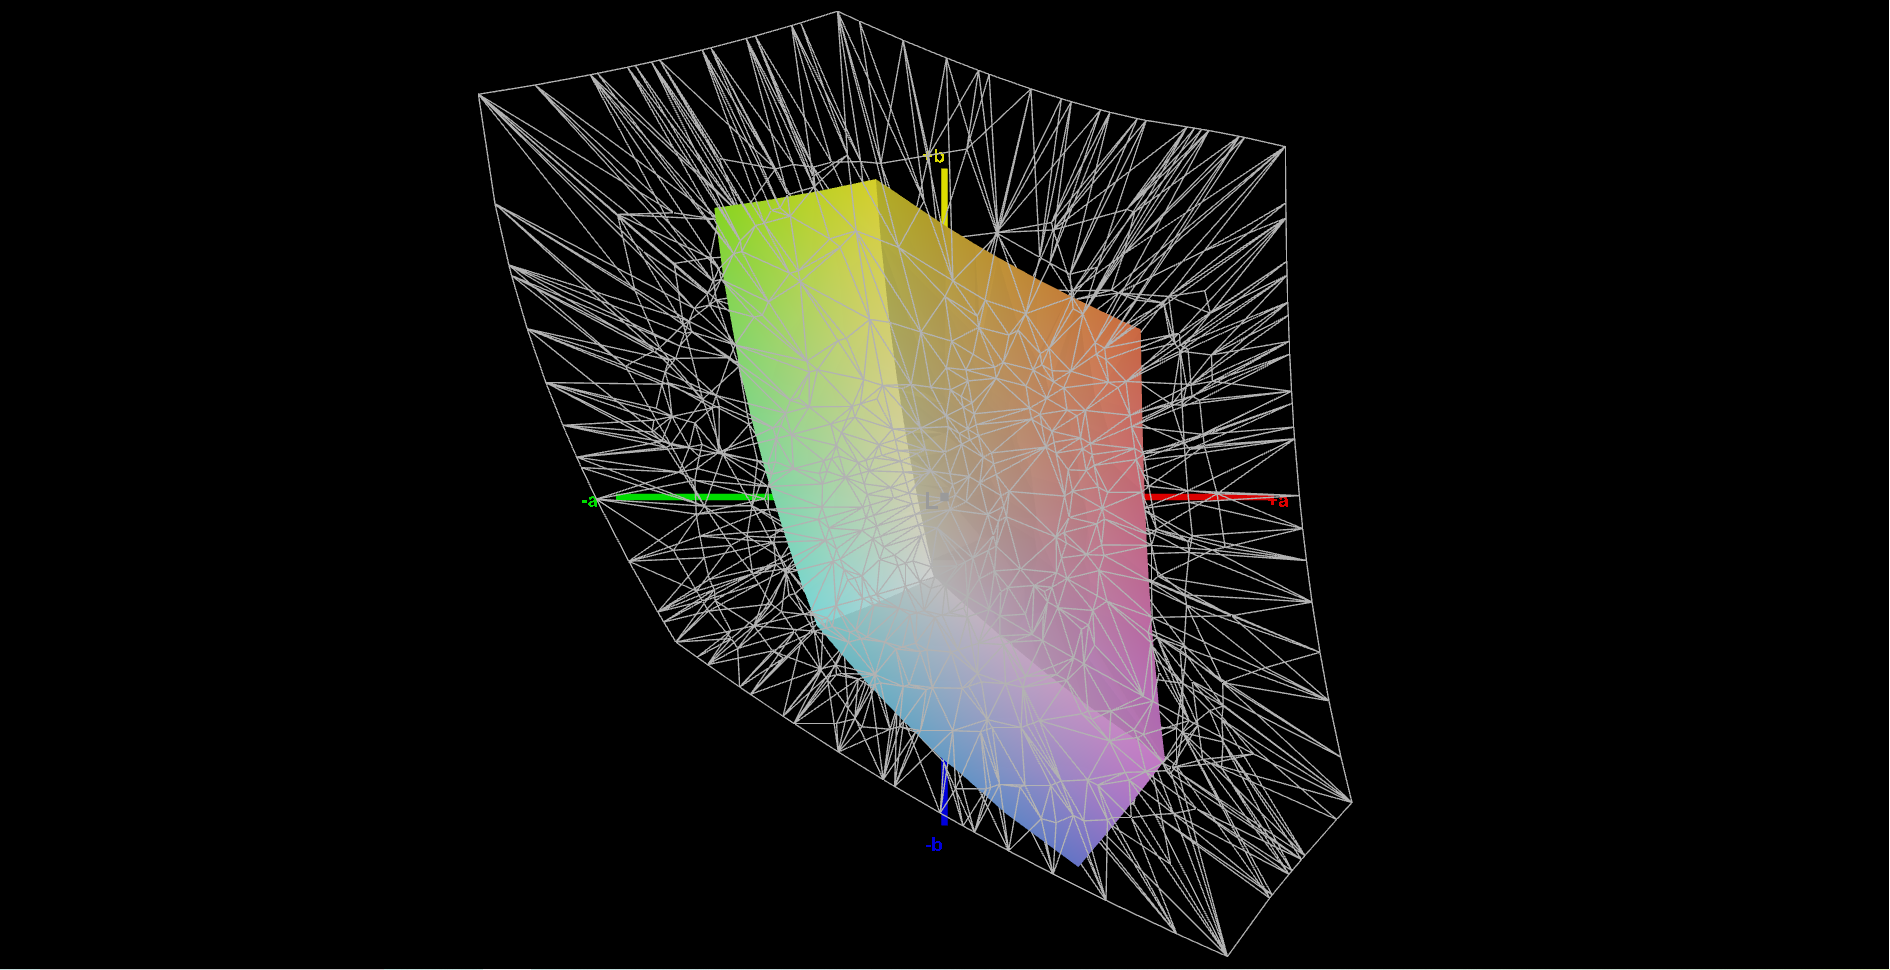
55% sRGB (Argyll 1.6.3 3D)
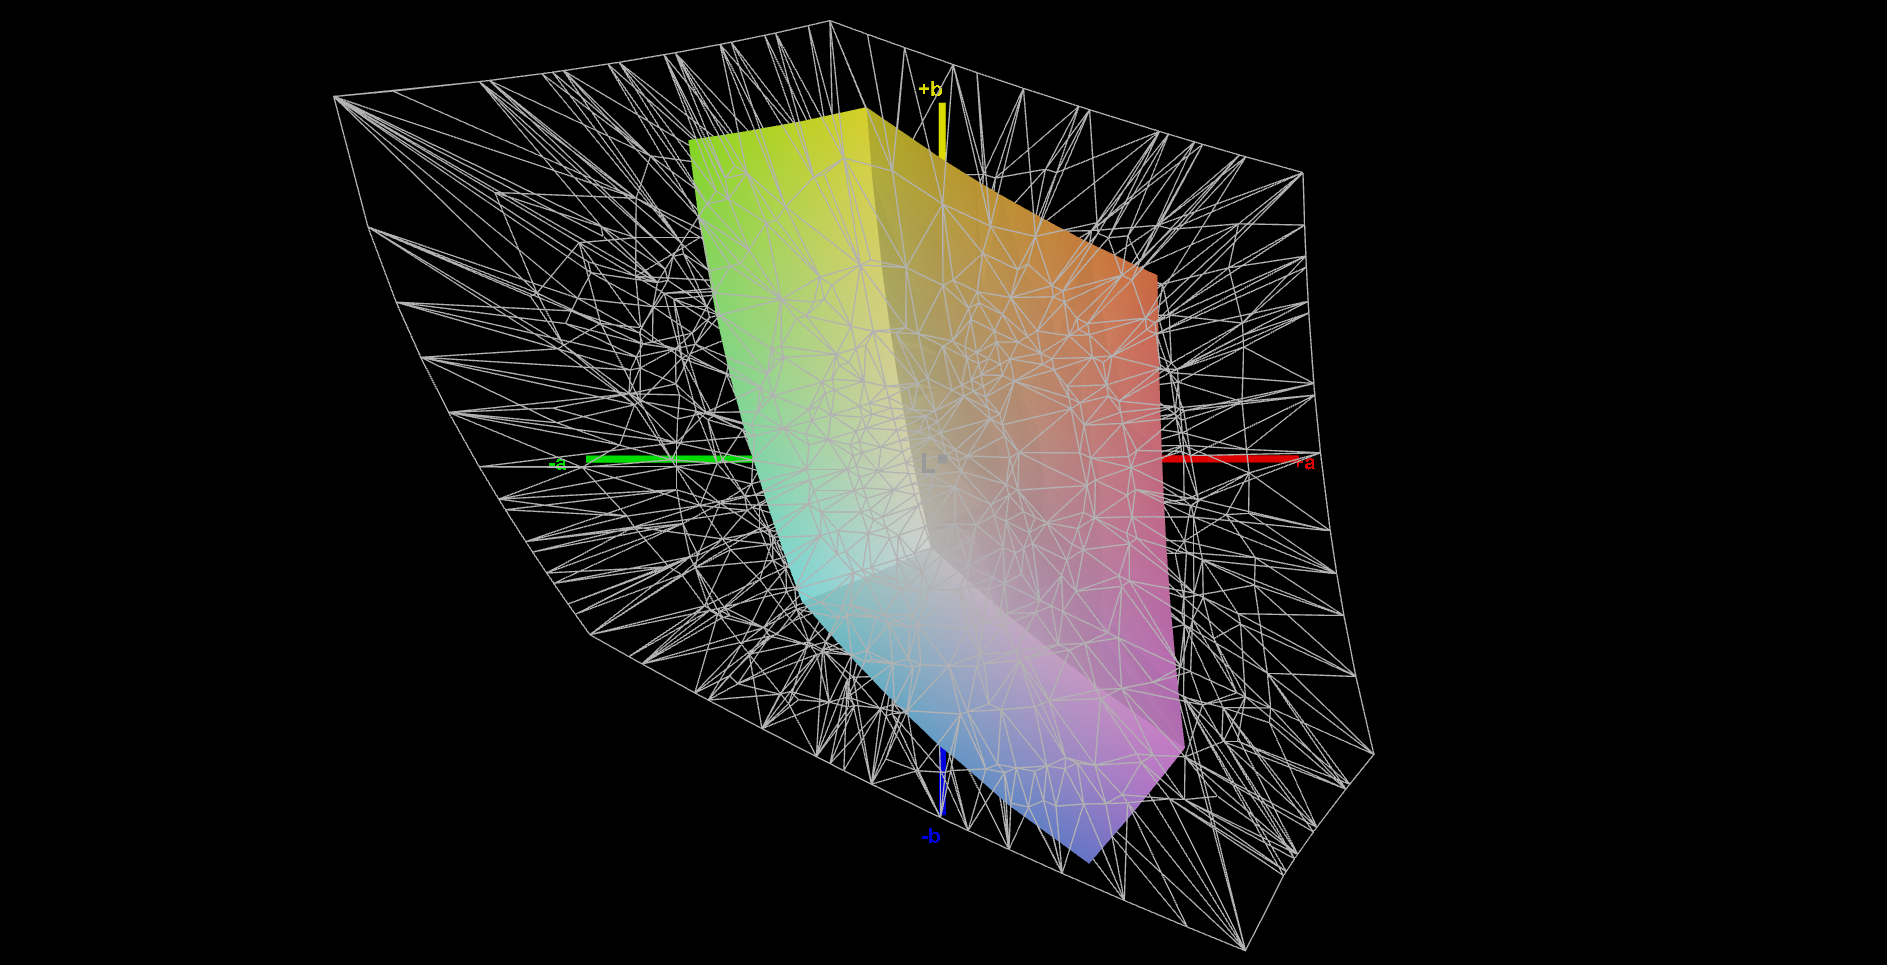
35% AdobeRGB 1998 (Argyll 1.6.3 3D)
37.9% AdobeRGB 1998 (Argyll 3D)
55.3% sRGB (Argyll 3D)
36.7% Display P3 (Argyll 3D)
Gamma: 2.32
CCT: 7372 K
| Acer Nitro 5 AN517-41-R5Z7 BOE NV173FHM-NX4, IPS, 1920x1080, 17.3" | MSI Katana GF76 11UE AU Optronics B173HAN04.9, IPS, 1920x1080, 17.3" | Schenker XMG Core 17 (Early 2021) BOE CQ NE173QHM-NY2, IPS, 2560x1440, 17.3" | Asus TUF Gaming F17 FX706HM AU Optronics AUI8294 (B173HAN04.9), IPS, 1920x1080, 17.3" | MSI GP76 Leopard 10UG Chi Mei CMN176E, IPS, 1920x1080, 17.3" | |
|---|---|---|---|---|---|
| Display | 8% | 82% | 9% | 76% | |
| Display P3 Coverage (%) | 36.7 | 39.8 8% | 68.1 86% | 40.1 9% | 64.7 76% |
| sRGB Coverage (%) | 55.3 | 59.5 8% | 98.5 78% | 60 8% | 96.4 74% |
| AdobeRGB 1998 Coverage (%) | 37.9 | 41.12 8% | 69.3 83% | 41.4 9% | 66.9 77% |
| Response Times | -95% | 18% | -70% | 41% | |
| Response Time Grey 50% / Grey 80% * (ms) | 18 ? | 36.8 ? -104% | 16.8 ? 7% | 32.4 -80% | 7.4 ? 59% |
| Response Time Black / White * (ms) | 14 ? | 26 ? -86% | 10 ? 29% | 22.4 -60% | 10.8 ? 23% |
| PWM Frequency (Hz) | 24510 ? | ||||
| Screen | -2% | 28% | 8% | 34% | |
| Brightness middle (cd/m²) | 282 | 260 -8% | 370 31% | 266 -6% | 328 16% |
| Brightness (cd/m²) | 255 | 251 -2% | 333 31% | 264 4% | 314 23% |
| Brightness Distribution (%) | 85 | 85 0% | 84 -1% | 79 -7% | 87 2% |
| Black Level * (cd/m²) | 0.24 | 0.26 -8% | 0.38 -58% | 0.32 -33% | 0.29 -21% |
| Contrast (:1) | 1175 | 1000 -15% | 974 -17% | 831 -29% | 1131 -4% |
| Colorchecker dE 2000 * | 5.91 | 3.9 34% | 2.41 59% | 3.97 33% | 1.93 67% |
| Colorchecker dE 2000 max. * | 10.98 | 20.64 -88% | 7.32 33% | 8.93 19% | 4.94 55% |
| Greyscale dE 2000 * | 5.85 | 1.6 73% | 3.9 33% | 1.8 69% | 2.8 52% |
| Gamma | 2.32 95% | 2.068 106% | 2.287 96% | 2.31 95% | 2.18 101% |
| CCT | 7372 88% | 6511 100% | 7302 89% | 6754 96% | 7023 93% |
| Color Space (Percent of AdobeRGB 1998) (%) | 35 | 69 97% | 41.4 18% | 67 91% | |
| Color Space (Percent of sRGB) (%) | 55 | 93 69% | 60 9% | 89 62% | |
| Colorchecker dE 2000 calibrated * | 3.71 | 1.19 | 3.5 | 0.68 | |
| Media total (Programa/Opciones) | -30% /
-14% | 43% /
37% | -18% /
-2% | 50% /
43% |
* ... más pequeño es mejor
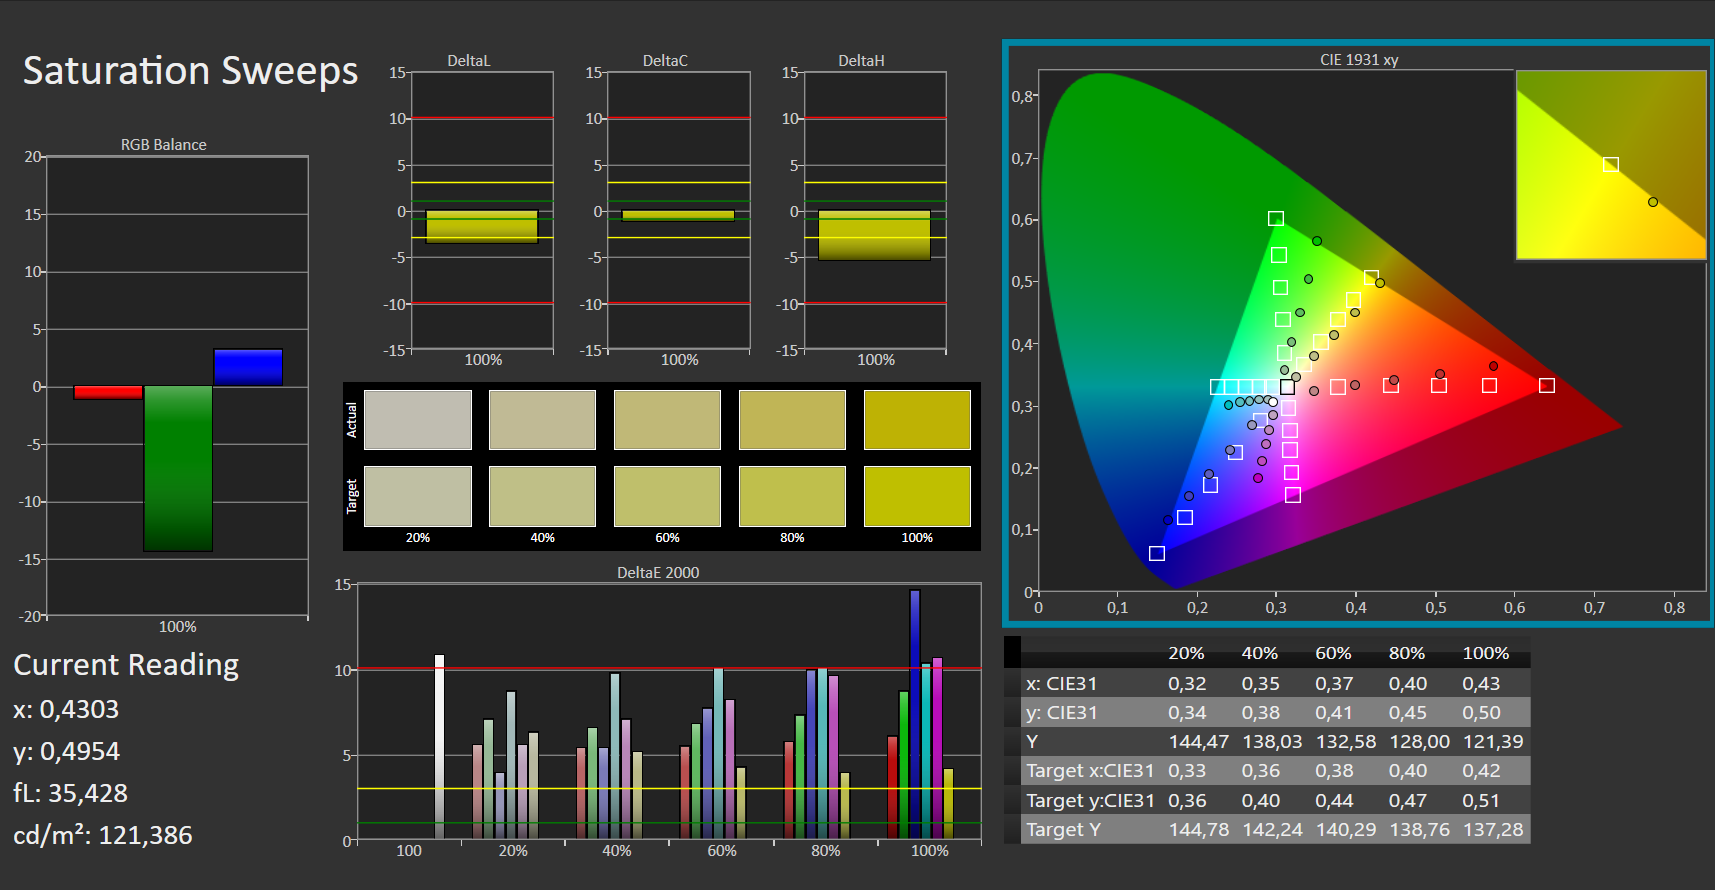
La pantalla muestra una reproducción del color bastante decente en su estado de entrega. Sin embargo, el objetivo (Delta E inferior a 3) no se alcanza con una desviación de color Delta E 2000 de casi 6. La pantalla no sufre de un tinte azul. Los espacios de color AdobeRGB (38%), sRGB (55%) y DCI-P3 (37%) no se reproducen completamente.
Tiempos de respuesta del display
| ↔ Tiempo de respuesta de Negro a Blanco | ||
|---|---|---|
| 14 ms ... subida ↗ y bajada ↘ combinada | ↗ 7 ms subida |  |
| ↘ 7 ms bajada | ||
| La pantalla mostró buenos tiempos de respuesta en nuestros tests pero podría ser demasiado lenta para los jugones competitivos. En comparación, todos los dispositivos de prueba van de ##min### (mínimo) a 240 (máximo) ms. » 34 % de todos los dispositivos son mejores. Esto quiere decir que el tiempo de respuesta medido es mejor que la media (19.8 ms) de todos los dispositivos testados. | ||
| ↔ Tiempo de respuesta 50% Gris a 80% Gris | ||
| 18 ms ... subida ↗ y bajada ↘ combinada | ↗ 8 ms subida |  |
| ↘ 10 ms bajada | ||
| La pantalla mostró buenos tiempos de respuesta en nuestros tests pero podría ser demasiado lenta para los jugones competitivos. En comparación, todos los dispositivos de prueba van de ##min### (mínimo) a 636 (máximo) ms. » 32 % de todos los dispositivos son mejores. Esto quiere decir que el tiempo de respuesta medido es mejor que la media (31 ms) de todos los dispositivos testados. | ||
Parpadeo de Pantalla / PWM (Pulse-Width Modulation)
| Parpadeo de Pantalla / PWM no detectado |  | ||
Comparación: 52 % de todos los dispositivos testados no usaron PWM para atenuar el display. Si se usó, medimos una media de 7754 (mínimo: 5 - máxmo: 343500) Hz. | |||
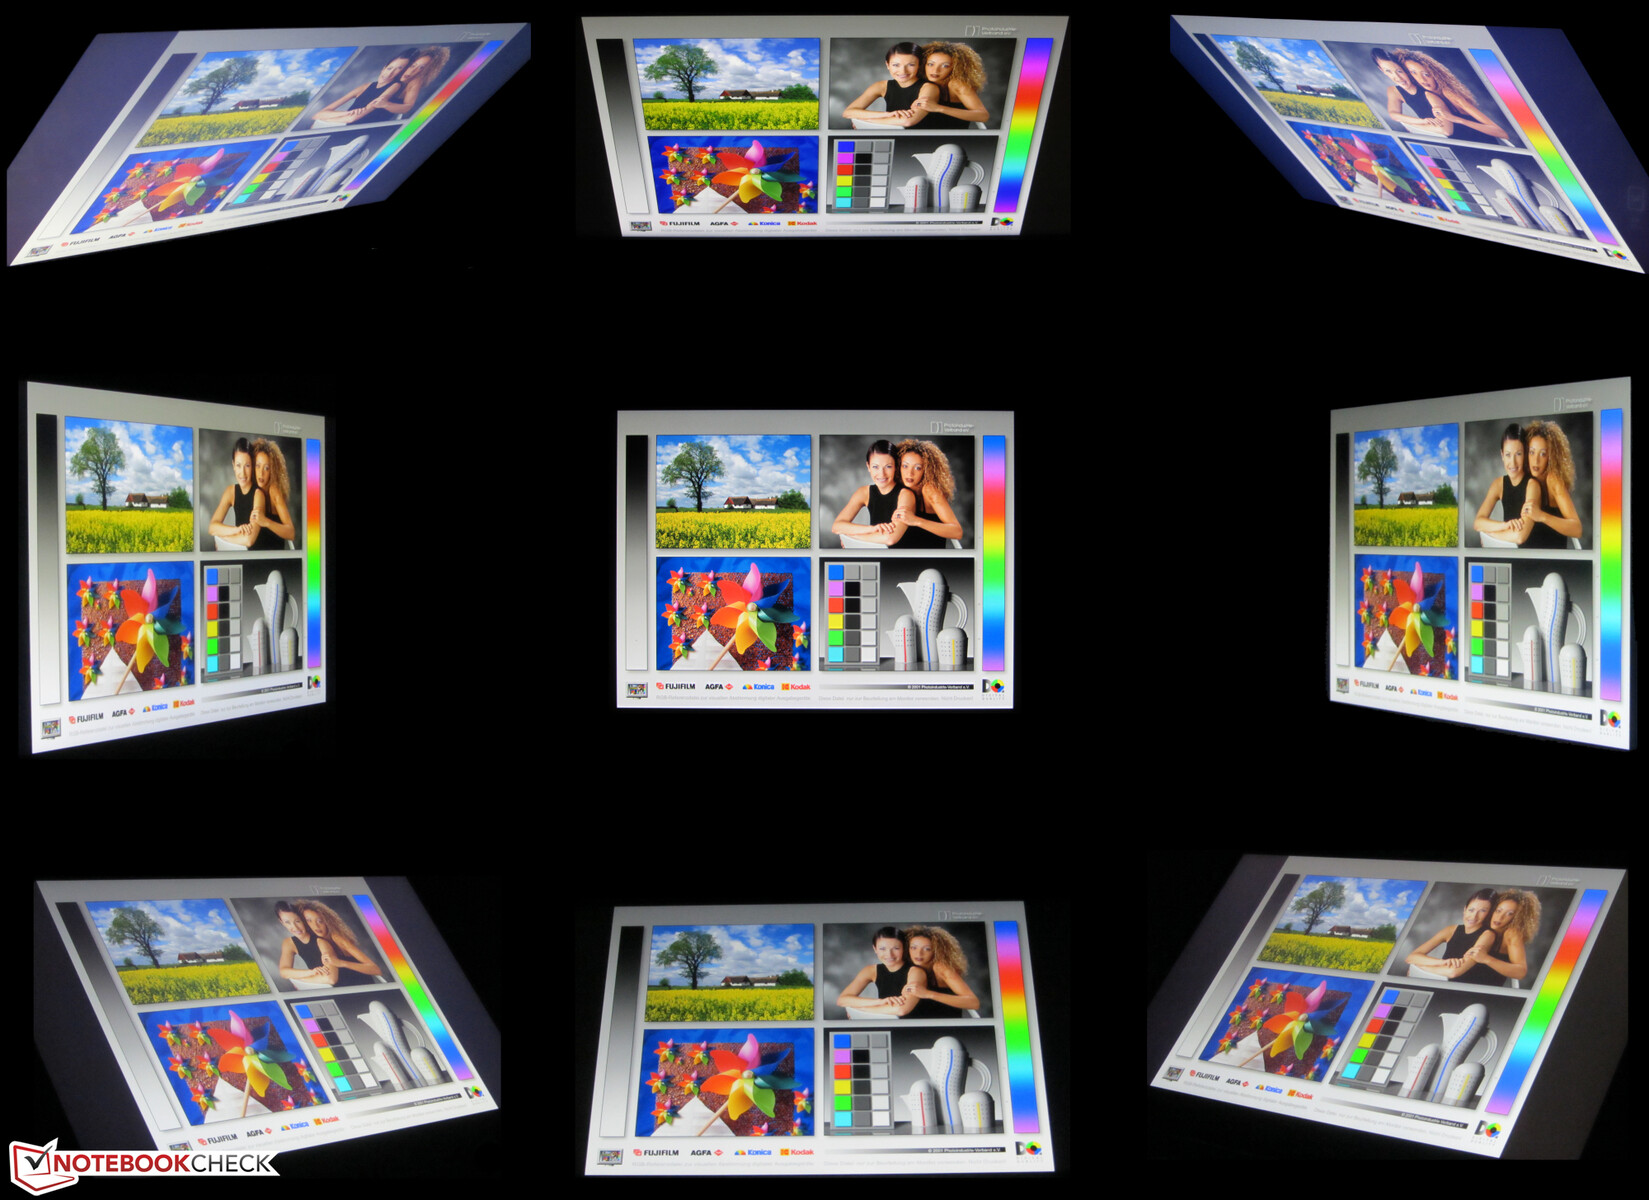
El panel IPS de ángulo de visión estable se puede leer desde cualquier posición. En exteriores, la lectura de la pantalla es posible a la sombra o bajo cielos nublados
Rendimiento - Ryzen 7 Power
Con el Nitro 5 AN517-41, Acer tiene un portátil para juegos de 17,3 pulgadas en su línea que lleva todos los juegos actuales con fluidez a la pantalla y también hace un buen papel en todas las demás áreas de aplicación
Condiciones de la prueba
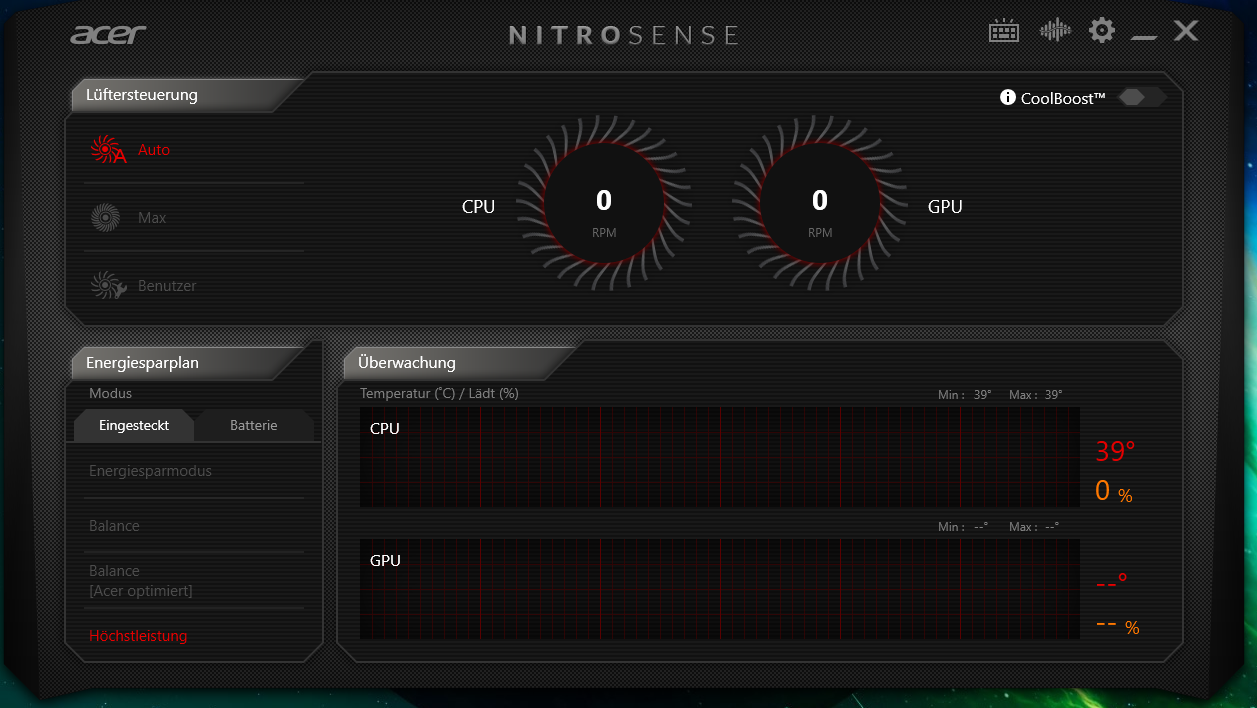
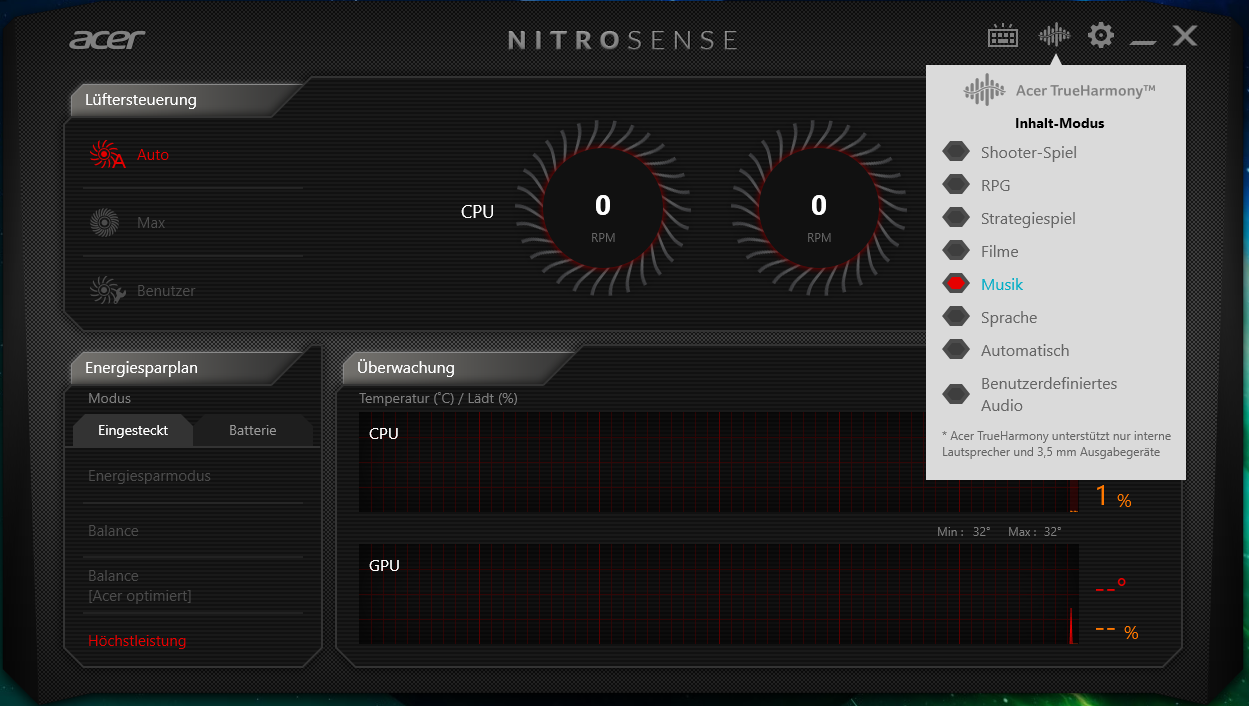
El software NitroSense preinstalado ofrece varios perfiles de rendimiento y permite influir en los dos ventiladores. Realizamos todas las pruebas con el perfil de rendimiento "Alto Rendimiento" y usamos el control automático del ventilador. Los perfiles de rendimiento corresponden a los perfiles estándar de Windows 10.
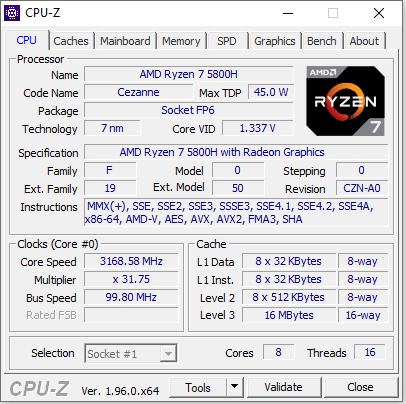
Procesador
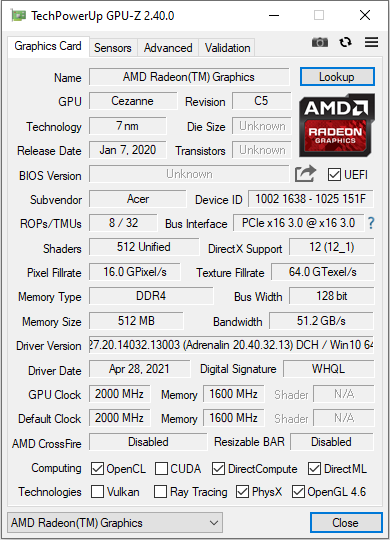
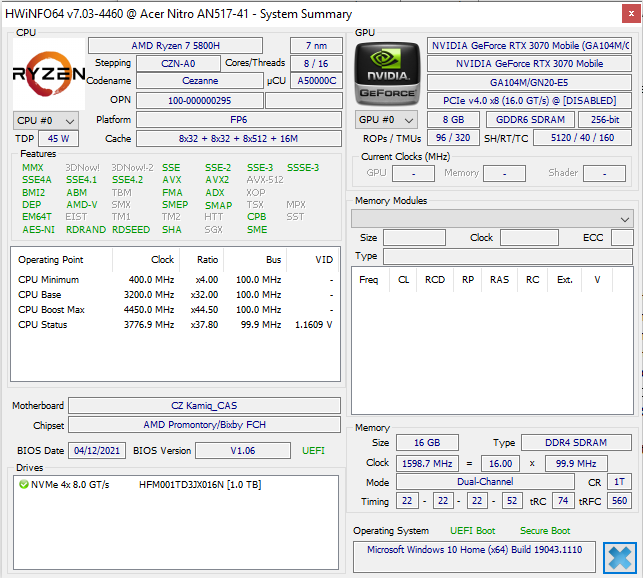
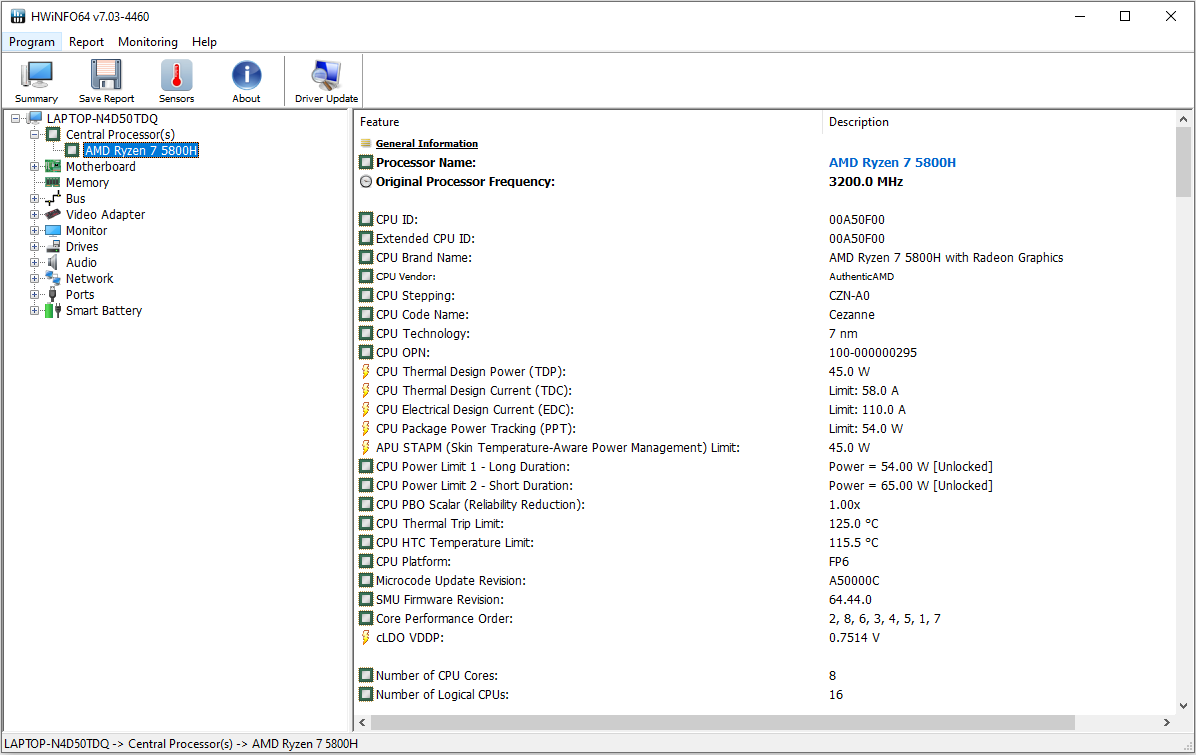
La parte de la CPU del Ryzen 7-5800H(Cezanne) consiste en un procesador de ocho núcleos que funciona con una velocidad base de 3,2 GHz. Es posible aumentar hasta 4,4 GHz a través de Turbo. Soporta multithreading simultáneo (se pueden procesar dos hilos por núcleo).
La prueba multihilo del benchmark Cinebench R15 se procesa a 3,7 GHz (funcionamiento en red) o de 2,5 a 3,5 GHz (funcionamiento en batería). La prueba monohilo se ejecuta siempre con 3,4 a 4,4 GHz.
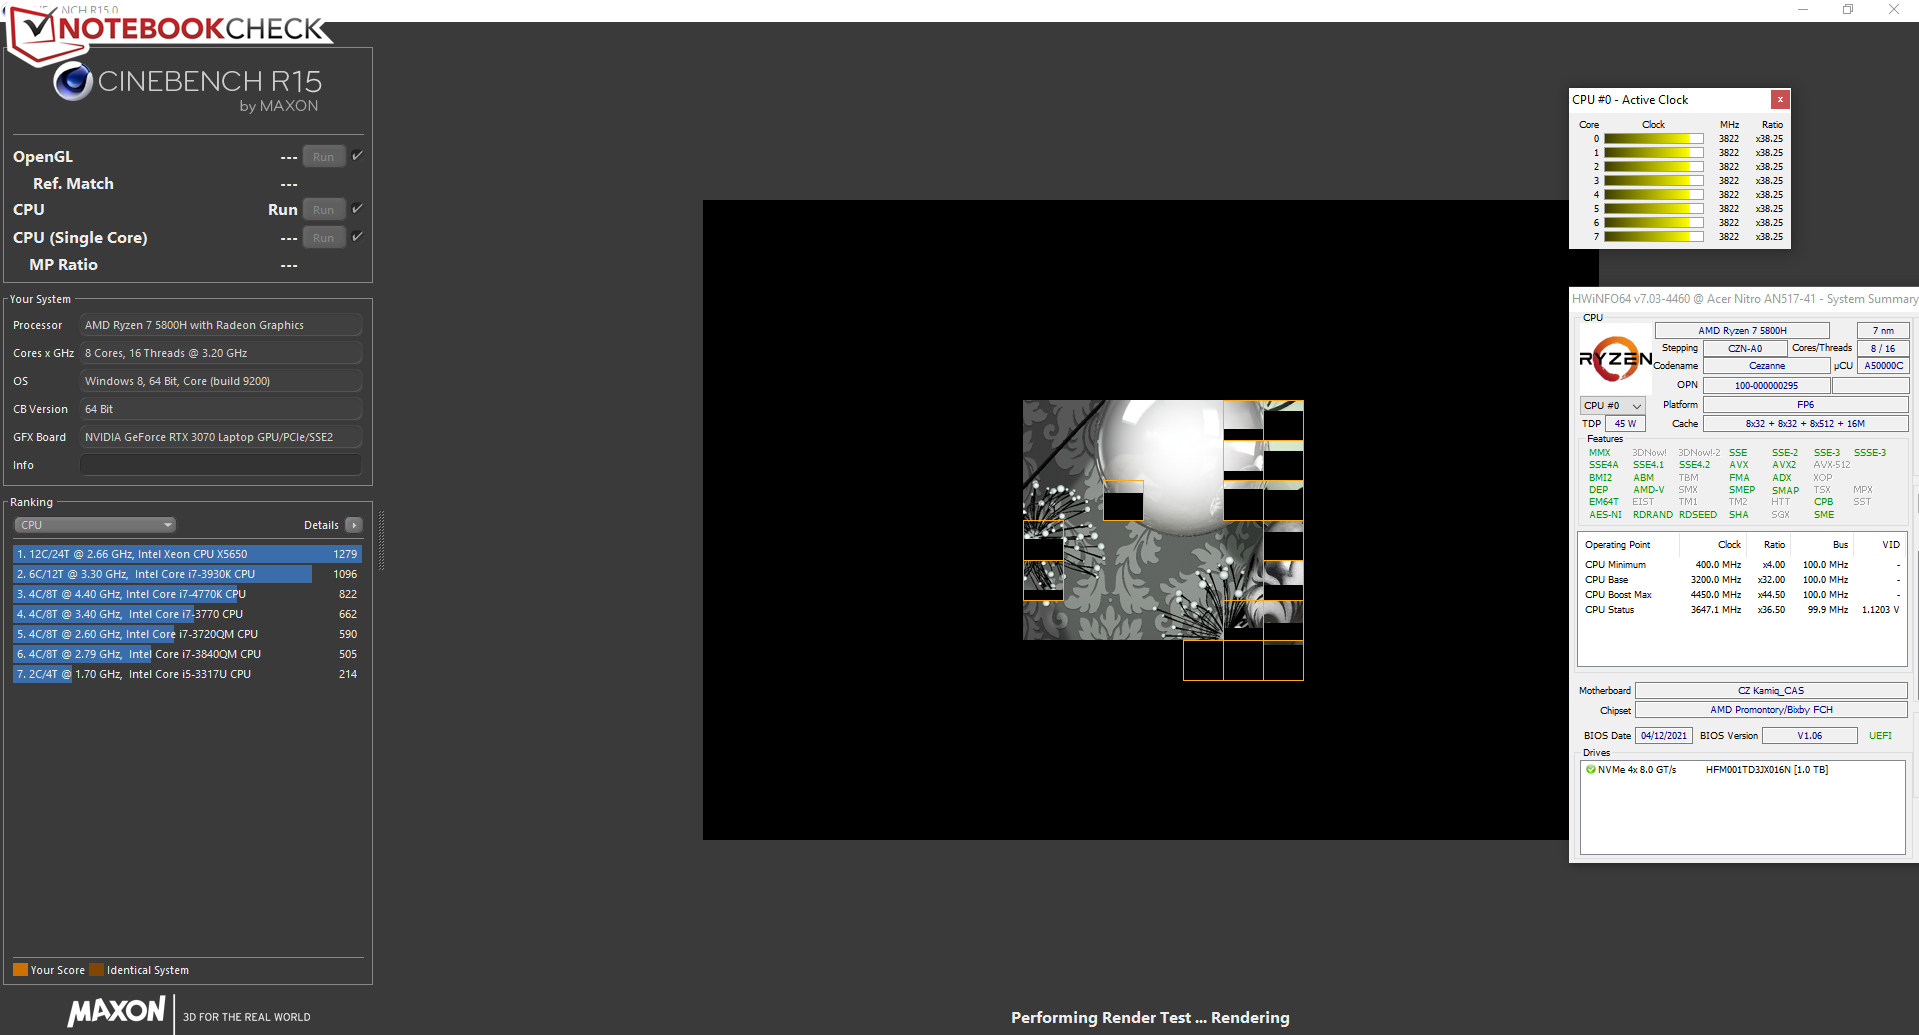
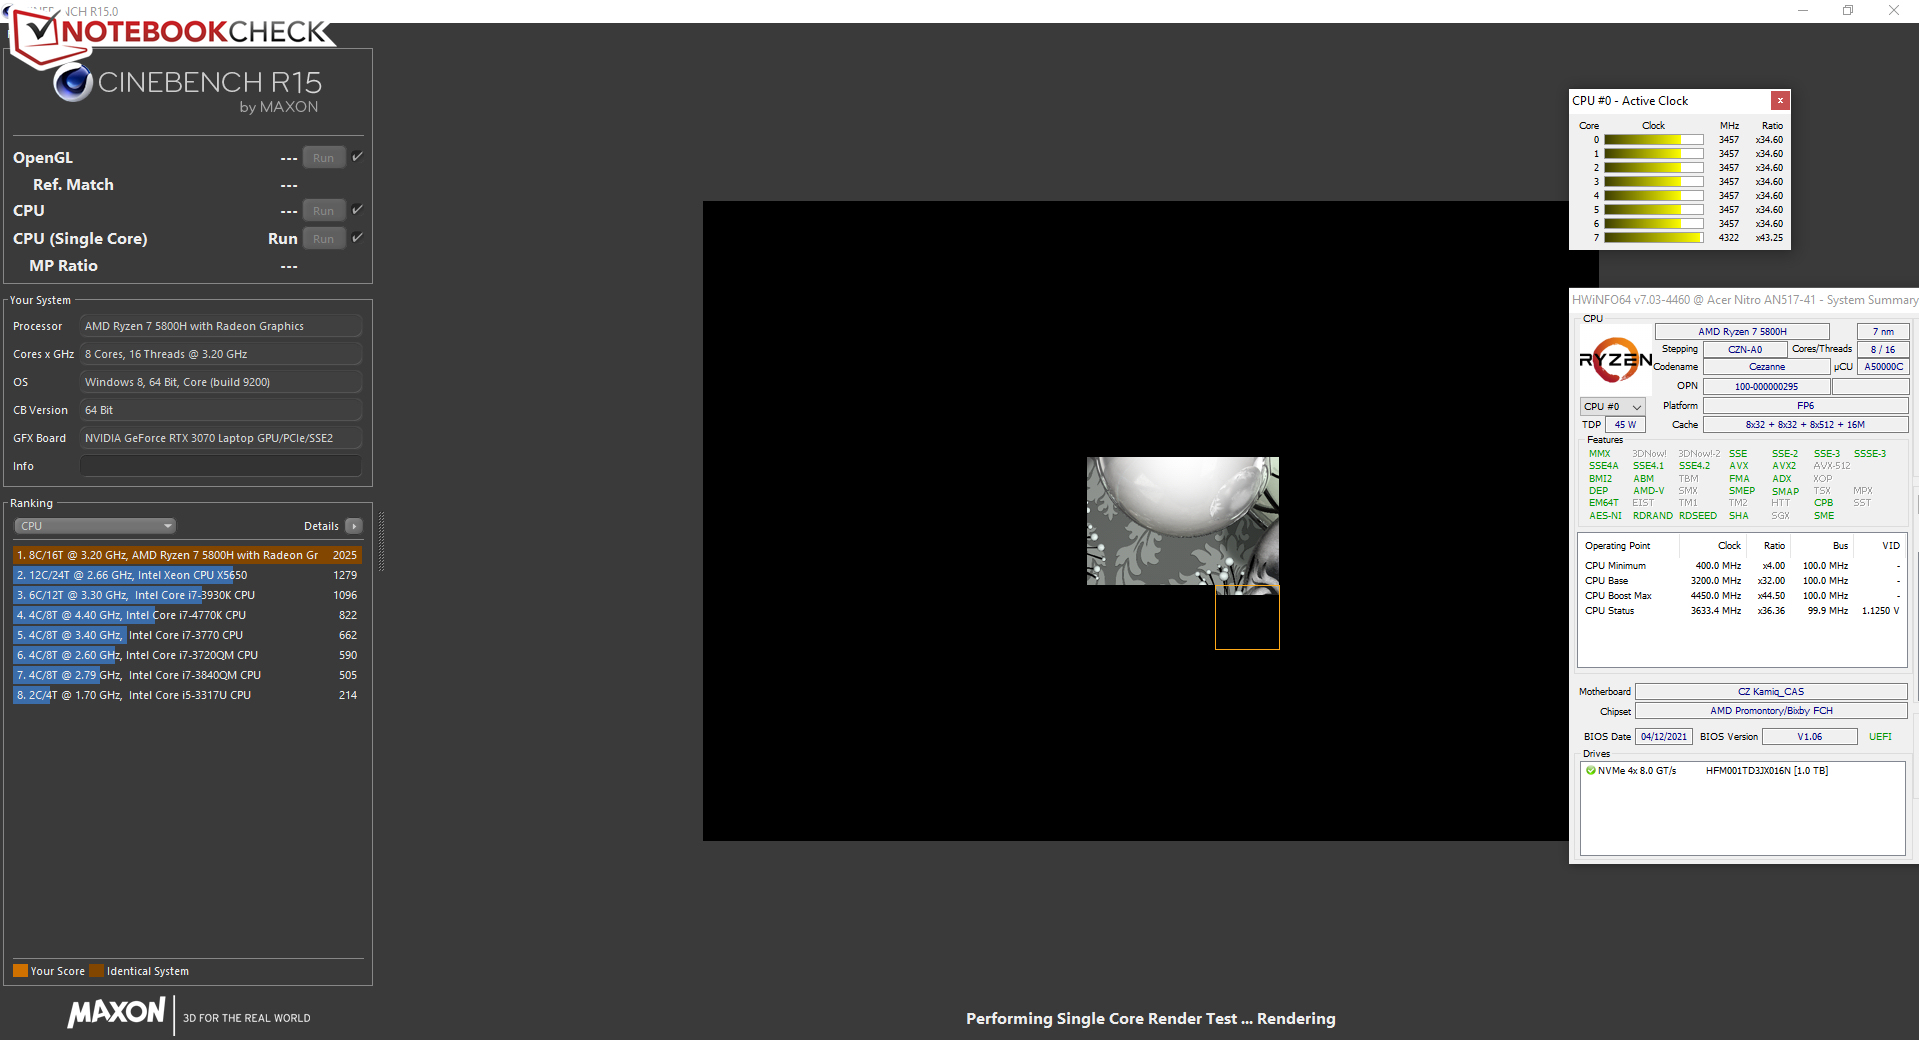
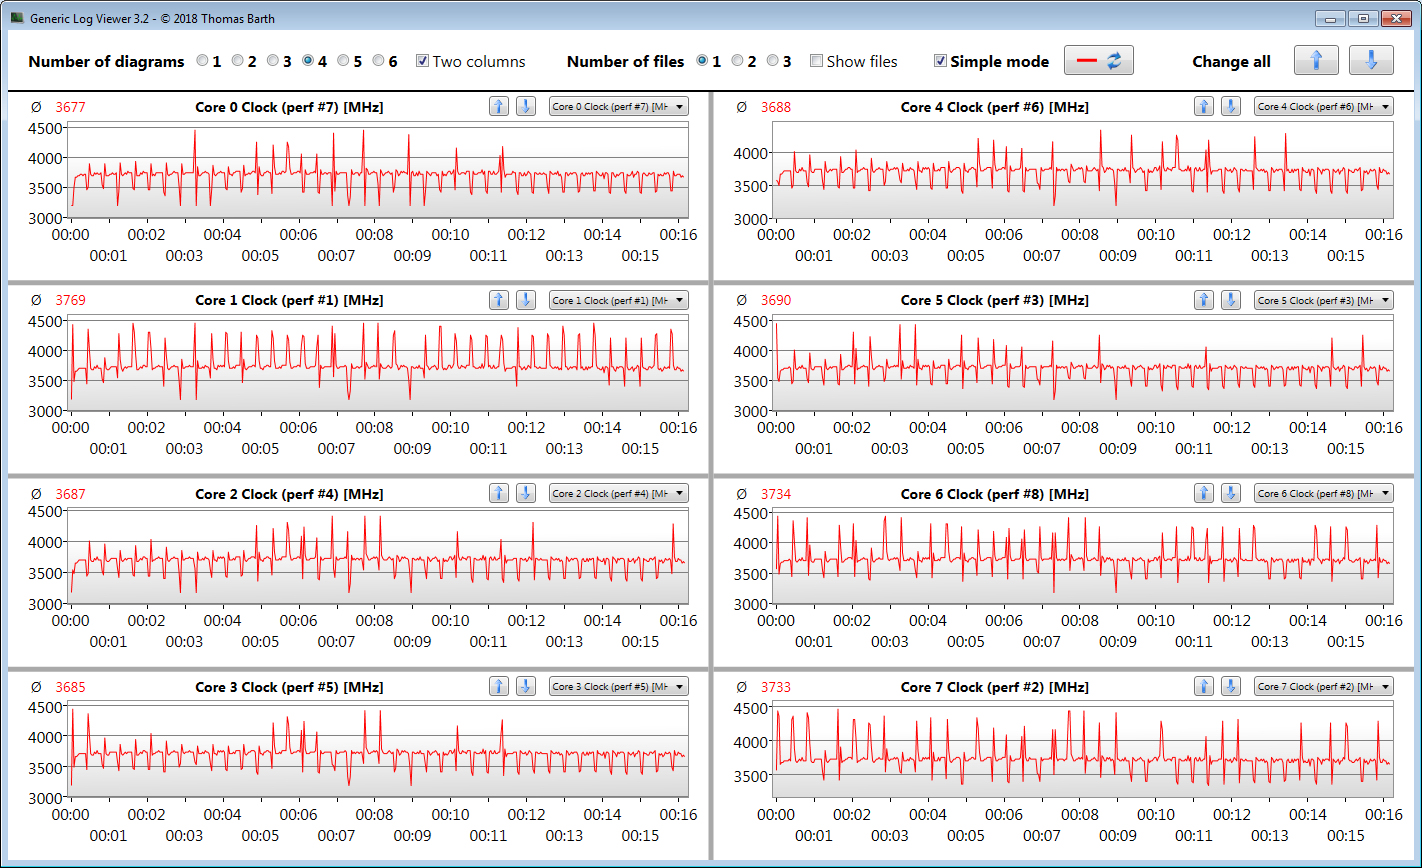
Comprobamos si el Turbo de la CPU también se usa permanentemente en el funcionamiento de red ejecutando la prueba multihilo del benchmark Cinebench R15 en un bucle durante al menos 30 minutos. El Turbo se utiliza en un nivel medio.
* ... más pequeño es mejor
Rendimiento del sistema
El sistema, ágil y de funcionamiento fluido, ofrece suficiente potencia de cálculo para las áreas de aplicación más exigentes en cuanto a rendimiento, como los juegos, la edición de vídeo y el procesamiento de imágenes en los próximos años. Además, los resultados de PCMark son muy buenos
| PCMark 8 Home Score Accelerated v2 | 5154 puntos | |
| PCMark 8 Creative Score Accelerated v2 | 6097 puntos | |
| PCMark 8 Work Score Accelerated v2 | 6217 puntos | |
| PCMark 10 Score | 6749 puntos | |
ayuda | ||
| PCMark 10 / Score | |
| Media de la clase Gaming (5828 - 12414, n=93, últimos 2 años) | |
| Asus TUF Gaming A15 FA506QR-AZ061T | |
| Asus TUF Gaming F17 FX706HM | |
| Medio AMD Ryzen 7 5800H, NVIDIA GeForce RTX 3070 Laptop GPU (6717 - 6983, n=6) | |
| Acer Nitro 5 AN517-41-R5Z7 | |
| MSI Katana GF76 11UE | |
| Aorus 15G XC | |
| MSI GP76 Leopard 10UG | |
| Schenker XMG Core 17 (Early 2021) | |
| PCMark 10 / Essentials | |
| Media de la clase Gaming (8810 - 11935, n=97, últimos 2 años) | |
| Asus TUF Gaming F17 FX706HM | |
| Asus TUF Gaming A15 FA506QR-AZ061T | |
| Acer Nitro 5 AN517-41-R5Z7 | |
| Medio AMD Ryzen 7 5800H, NVIDIA GeForce RTX 3070 Laptop GPU (9548 - 10226, n=6) | |
| MSI Katana GF76 11UE | |
| Aorus 15G XC | |
| Schenker XMG Core 17 (Early 2021) | |
| MSI GP76 Leopard 10UG | |
| PCMark 10 / Productivity | |
| Media de la clase Gaming (6845 - 25323, n=95, últimos 2 años) | |
| Asus TUF Gaming A15 FA506QR-AZ061T | |
| Acer Nitro 5 AN517-41-R5Z7 | |
| Medio AMD Ryzen 7 5800H, NVIDIA GeForce RTX 3070 Laptop GPU (8849 - 9514, n=6) | |
| Asus TUF Gaming F17 FX706HM | |
| MSI Katana GF76 11UE | |
| Aorus 15G XC | |
| MSI GP76 Leopard 10UG | |
| Schenker XMG Core 17 (Early 2021) | |
| PCMark 10 / Digital Content Creation | |
| Media de la clase Gaming (7602 - 19954, n=95, últimos 2 años) | |
| Medio AMD Ryzen 7 5800H, NVIDIA GeForce RTX 3070 Laptop GPU (8948 - 10389, n=6) | |
| Asus TUF Gaming F17 FX706HM | |
| Asus TUF Gaming A15 FA506QR-AZ061T | |
| Acer Nitro 5 AN517-41-R5Z7 | |
| Aorus 15G XC | |
| MSI Katana GF76 11UE | |
| MSI GP76 Leopard 10UG | |
| Schenker XMG Core 17 (Early 2021) | |
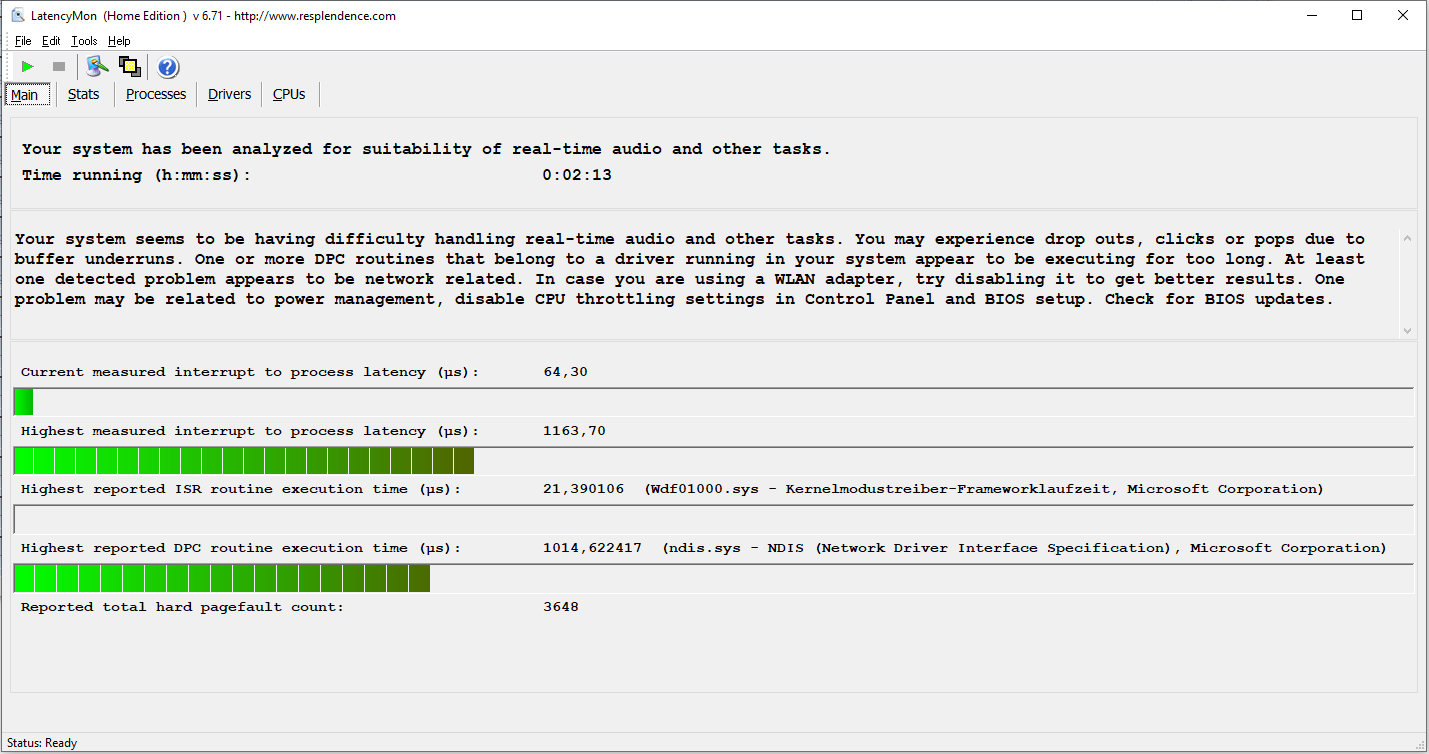
Latencias del CPD
La prueba de monitorización de latencia estandarizada (navegación web, reproducción de vídeo 4K, Prime95 de alta carga) reveló llamativas latencias del CPD. El sistema no parece adecuado para la edición de vídeo y audio en tiempo real
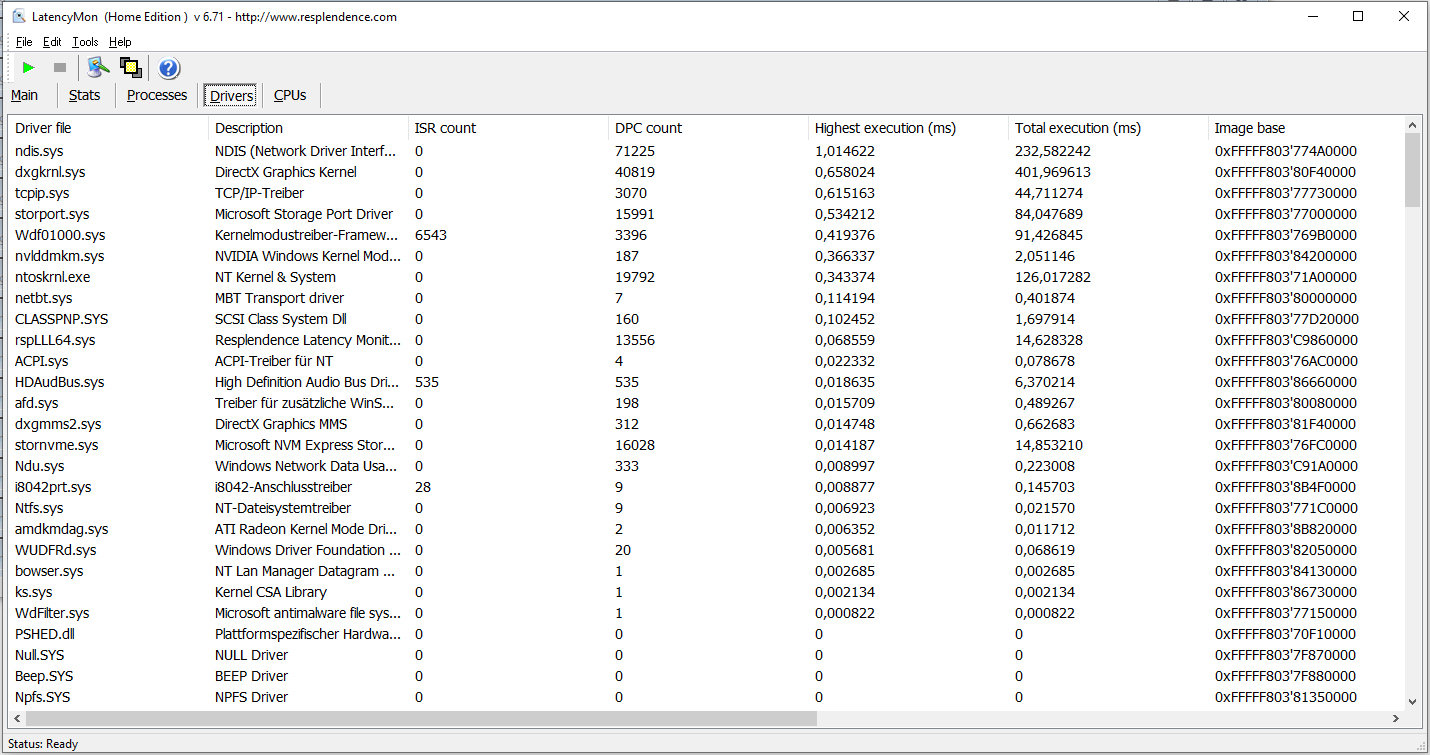
| DPC Latencies / LatencyMon - interrupt to process latency (max), Web, Youtube, Prime95 | |
| MSI Katana GF76 11UE | |
| Asus TUF Gaming F17 FX706HM | |
| Acer Nitro 5 AN517-41-R5Z7 | |
| MSI GP76 Leopard 10UG | |
| Schenker XMG Core 17 (Early 2021) | |
* ... más pequeño es mejor
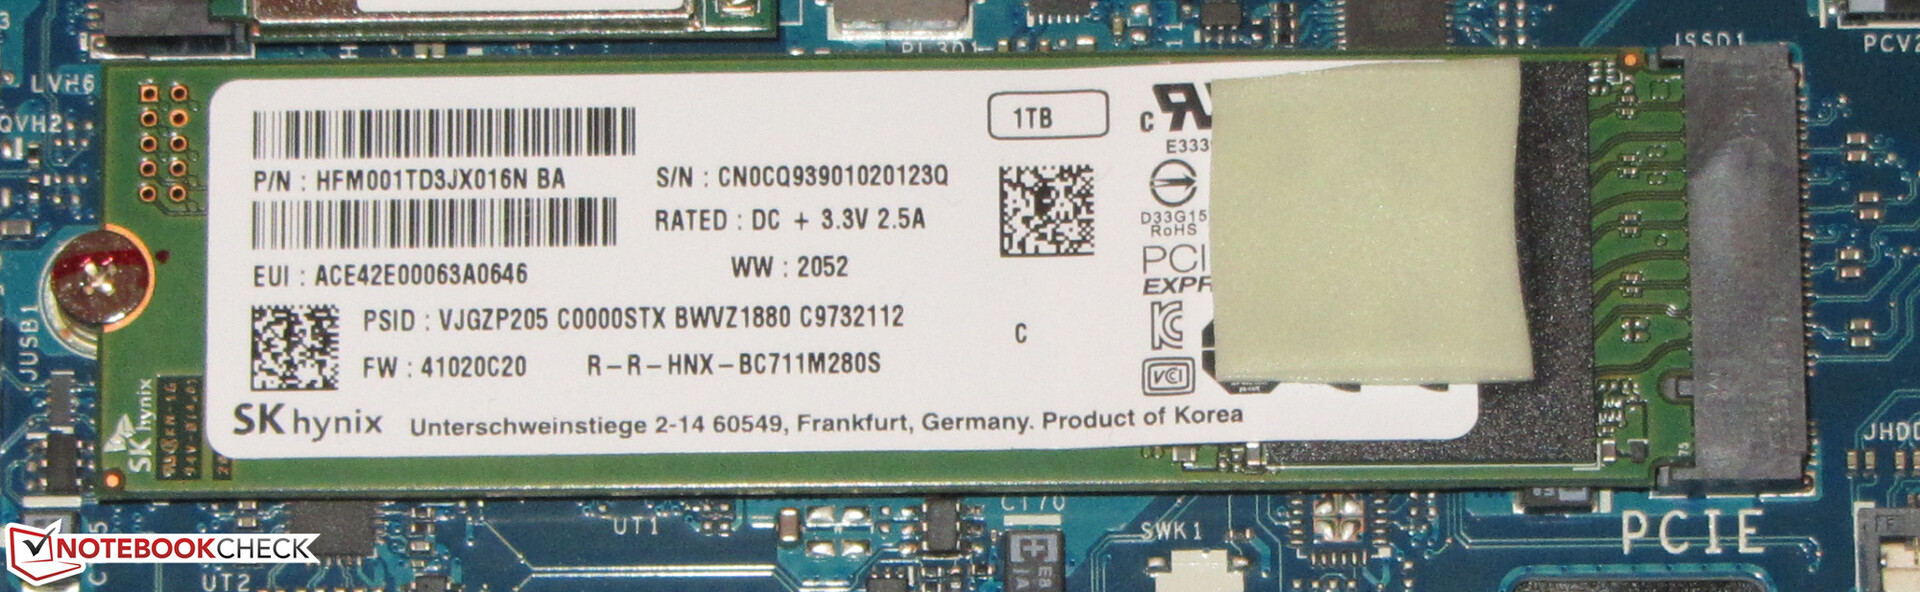
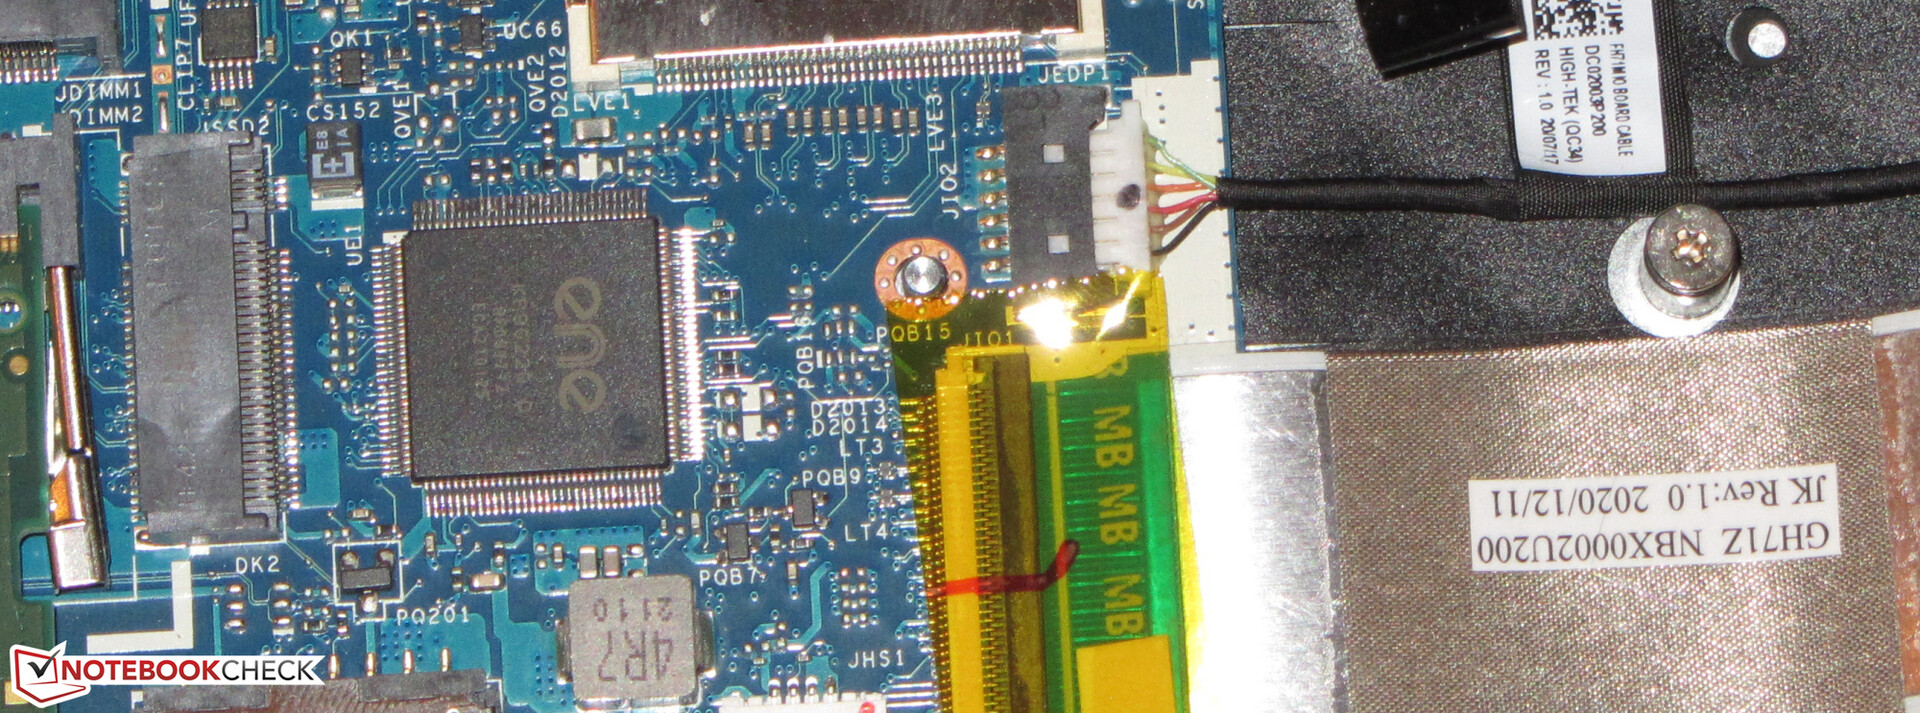
Almacenamiento masivo
Un SSD NVMe (M.2-2280) de SK Hynix sirve como unidad del sistema. Ofrece 1 TB de espacio de almacenamiento y ofrece buenas tasas de transferencia. No es uno de los mejores modelos de SSD.
El portátil también tiene espacio para un segundo SSD M.2-2280 (NVMe) y un dispositivo de almacenamiento de 2.5 pulgadas (la ranura SATA y los tornillos están en la caja, el marco de montaje está dentro del portátil).

| Acer Nitro 5 AN517-41-R5Z7 SK Hynix BC711 1TB HFM001TD3JX016N | MSI Katana GF76 11UE Kingston OM8PCP3512F-AB | Schenker XMG Core 17 (Early 2021) Samsung SSD 970 EVO Plus 1TB | Asus TUF Gaming F17 FX706HM SK Hynix HFM001TD3JX013N | MSI GP76 Leopard 10UG Kingston OM8PCP3512F-AB | Aorus 15G XC ESR512GTLCG-EAC-4 | Asus TUF Gaming A15 FA506QR-AZ061T SK Hynix HFM001TD3JX013N | Medio SK Hynix BC711 1TB HFM001TD3JX016N | |
|---|---|---|---|---|---|---|---|---|
| CrystalDiskMark 5.2 / 6 | -38% | 5% | 1% | -37% | -10% | 3% | -0% | |
| Write 4K (MB/s) | 146.7 | 107.3 -27% | 145.7 -1% | 168.8 15% | 143.7 -2% | 137.6 -6% | 182.5 24% | 140.1 ? -4% |
| Read 4K (MB/s) | 63.7 | 45.46 -29% | 51.3 -19% | 72 13% | 45.1 -29% | 45.87 -28% | 73.2 15% | 64.2 ? 1% |
| Write Seq (MB/s) | 2954 | 978 -67% | 3036 3% | 978 -67% | 2304 -22% | 3005 2% | 2944 ? 0% | |
| Read Seq (MB/s) | 1974 | 1255 -36% | 2837 44% | 1163 -41% | 1052 -47% | 2358 19% | 2169 ? 10% | |
| Write 4K Q32T1 (MB/s) | 496.9 | 579 17% | 511 3% | 459.5 -8% | 519 4% | 601 21% | 389.5 -22% | 468 ? -6% |
| Read 4K Q32T1 (MB/s) | 549 | 299.6 -45% | 582 6% | 473.1 -14% | 302.7 -45% | 677 23% | 463.8 -16% | 533 ? -3% |
| Write Seq Q32T1 (MB/s) | 3062 | 978 -68% | 3294 8% | 3129 2% | 981 -68% | 2536 -17% | 3166 3% | 3073 ? 0% |
| Read Seq Q32T1 (MB/s) | 3580 | 1977 -45% | 3522 -2% | 3529 -1% | 1983 -45% | 3372 -6% | 3590 0% | 3582 ? 0% |
| Write 4K Q8T8 (MB/s) | 484.5 | |||||||
| Read 4K Q8T8 (MB/s) | 1518 | |||||||
| AS SSD | -63% | 1% | -1% | -46% | -21% | -1% | 4% | |
| Seq Read (MB/s) | 2891 | 1704 -41% | 2876 -1% | 2837 -2% | 1659 -43% | 2048 -29% | 3133 8% | 2933 ? 1% |
| Seq Write (MB/s) | 2692 | 716 -73% | 2803 4% | 1565 -42% | 921 -66% | 2403 -11% | 2969 10% | 2713 ? 1% |
| 4K Read (MB/s) | 52.6 | 37.77 -28% | 55.3 5% | 55.4 5% | 51 -3% | 48.27 -8% | 55.2 5% | 54.2 ? 3% |
| 4K Write (MB/s) | 134.9 | 66 -51% | 106.9 -21% | 152.9 13% | 120.1 -11% | 101.6 -25% | 129.7 -4% | 134.5 ? 0% |
| 4K-64 Read (MB/s) | 1845 | 441.2 -76% | 1662 -10% | 1327 -28% | 463.5 -75% | 1606 -13% | 1891 2% | 1850 ? 0% |
| 4K-64 Write (MB/s) | 2142 | 735 -66% | 2101 -2% | 1922 -10% | 909 -58% | 1473 -31% | 1795 -16% | 2154 ? 1% |
| Access Time Read * (ms) | 0.191 | 0.067 | 0.035 | 0.179 | 0.131 | 0.052 | ||
| Access Time Write * (ms) | 0.028 | 0.053 -89% | 0.037 -32% | 0.028 -0% | 0.032 -14% | 0.038 -36% | 0.028 -0% | 0.028 ? -0% |
| Score Read (Points) | 2186 | 649 -70% | 2005 -8% | 1666 -24% | 680 -69% | 1859 -15% | 2259 3% | 2197 ? 1% |
| Score Write (Points) | 2546 | 872 -66% | 2488 -2% | 2232 -12% | 1121 -56% | 1815 -29% | 2221 -13% | 2560 ? 1% |
| Score Total (Points) | 5842 | 1816 -69% | 5520 -6% | 4695 -20% | 2130 -64% | 4645 -20% | 5630 -4% | 5871 ? 0% |
| Copy ISO MB/s (MB/s) | 2130 | 912 -57% | 2029 -5% | 2081 -2% | 1188 -44% | 2195 ? 3% | ||
| Copy Program MB/s (MB/s) | 642 | 278.9 -57% | 691 8% | 734 14% | 488.1 -24% | 660 ? 3% | ||
| Copy Game MB/s (MB/s) | 821 | 144.6 -82% | 1513 84% | 1617 97% | 878 7% | 1157 ? 41% | ||
| Media total (Programa/Opciones) | -51% /
-54% | 3% /
3% | 0% /
-0% | -42% /
-42% | -16% /
-17% | 1% /
1% | 2% /
3% |
* ... más pequeño es mejor
Continuous load read: DiskSpd Read Loop, Queue Depth 8
Tarjeta gráfica
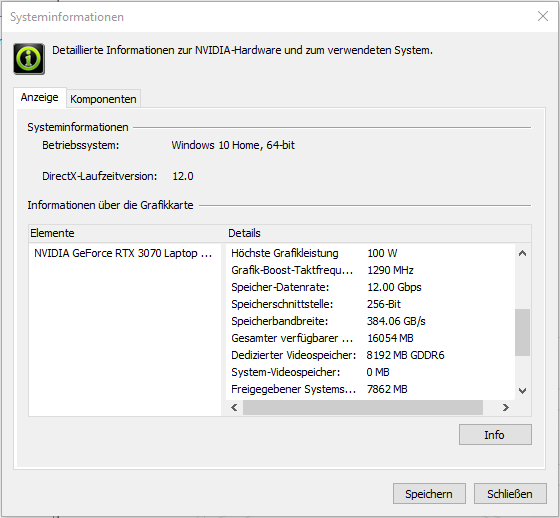
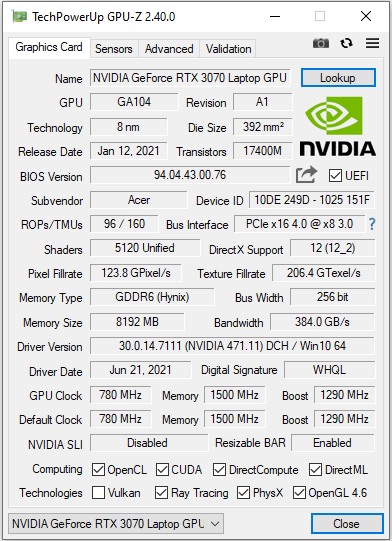
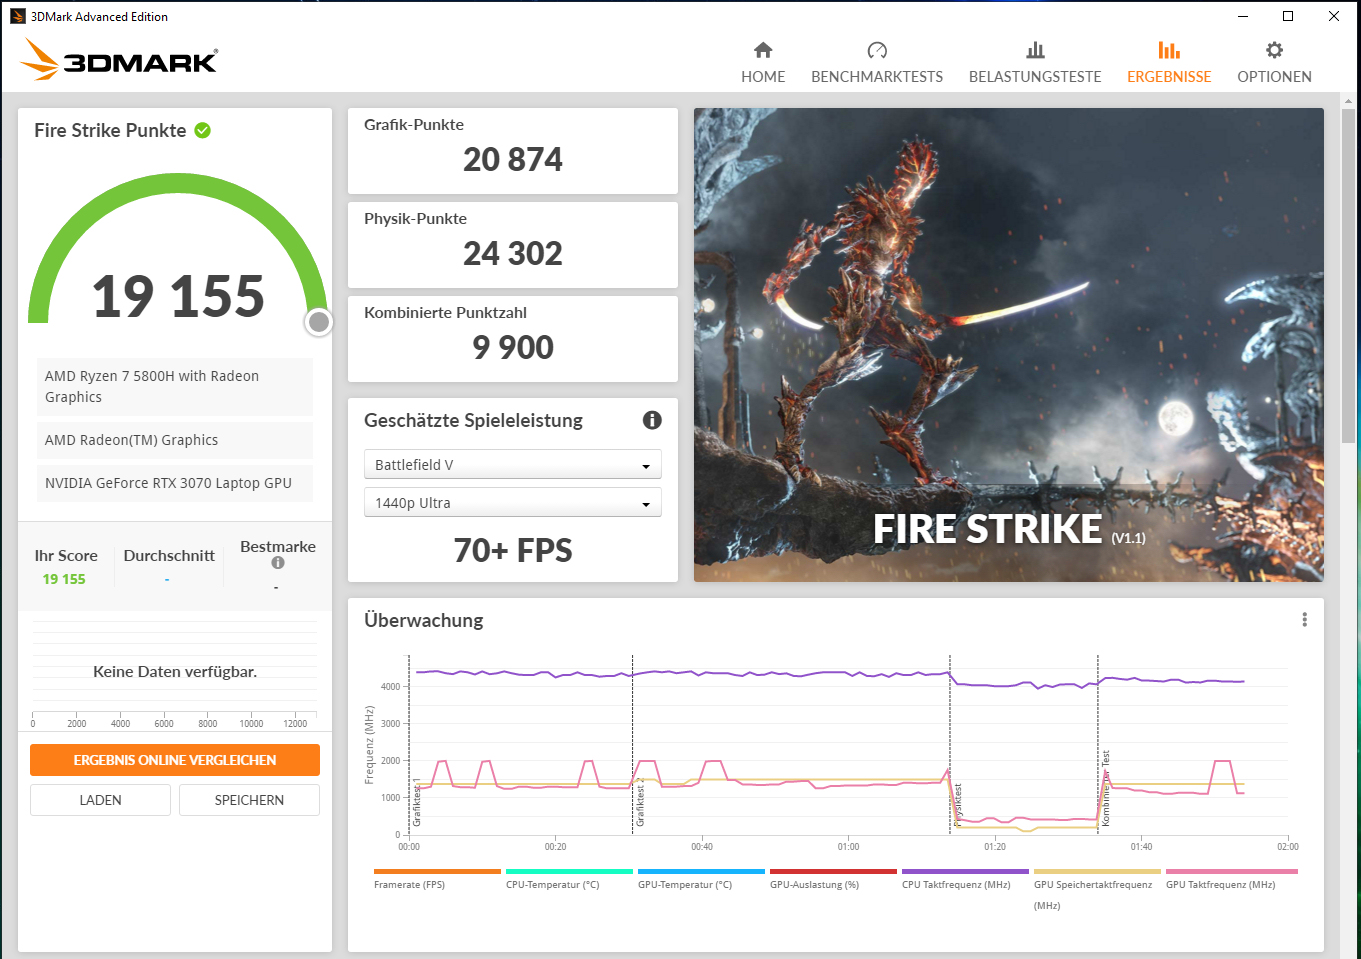
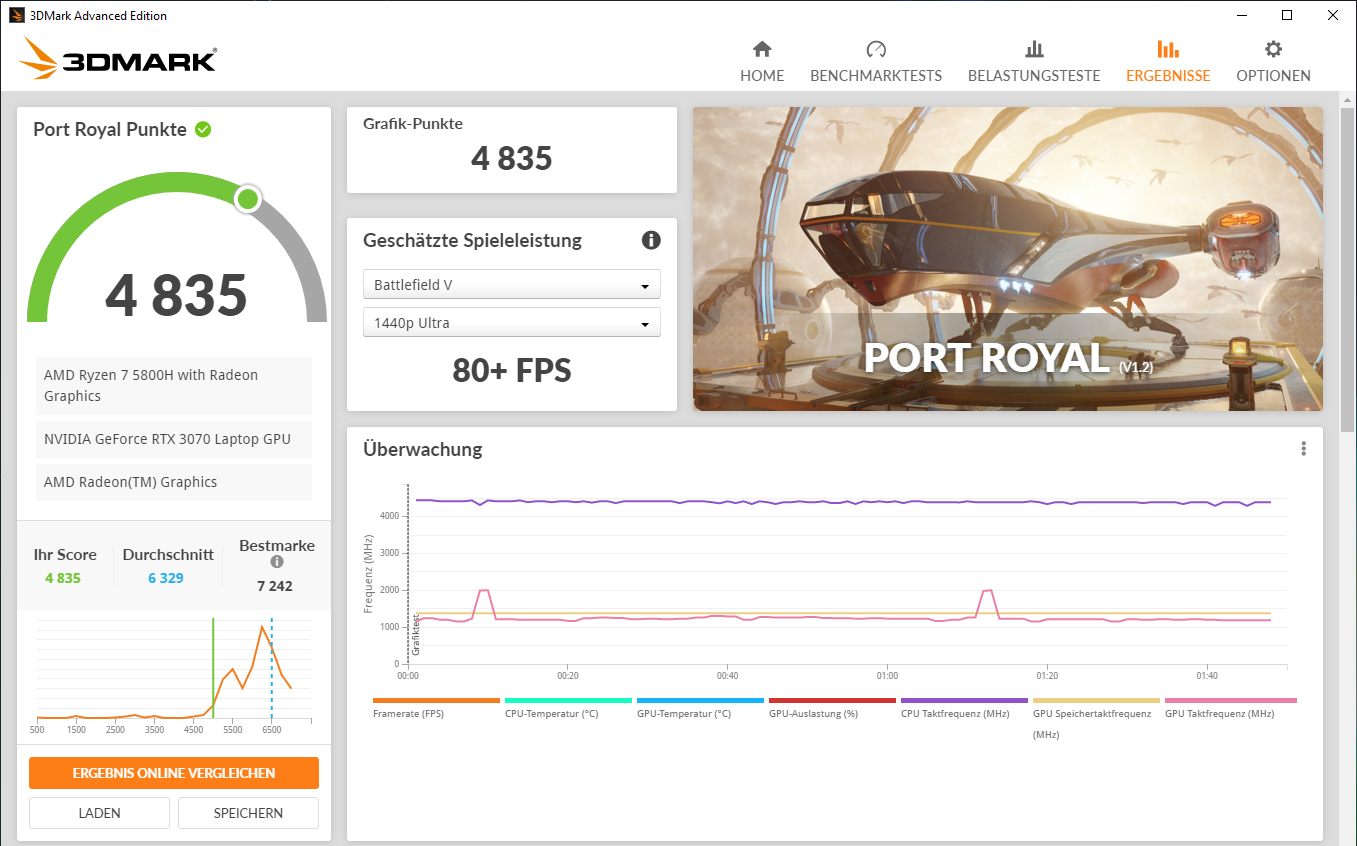
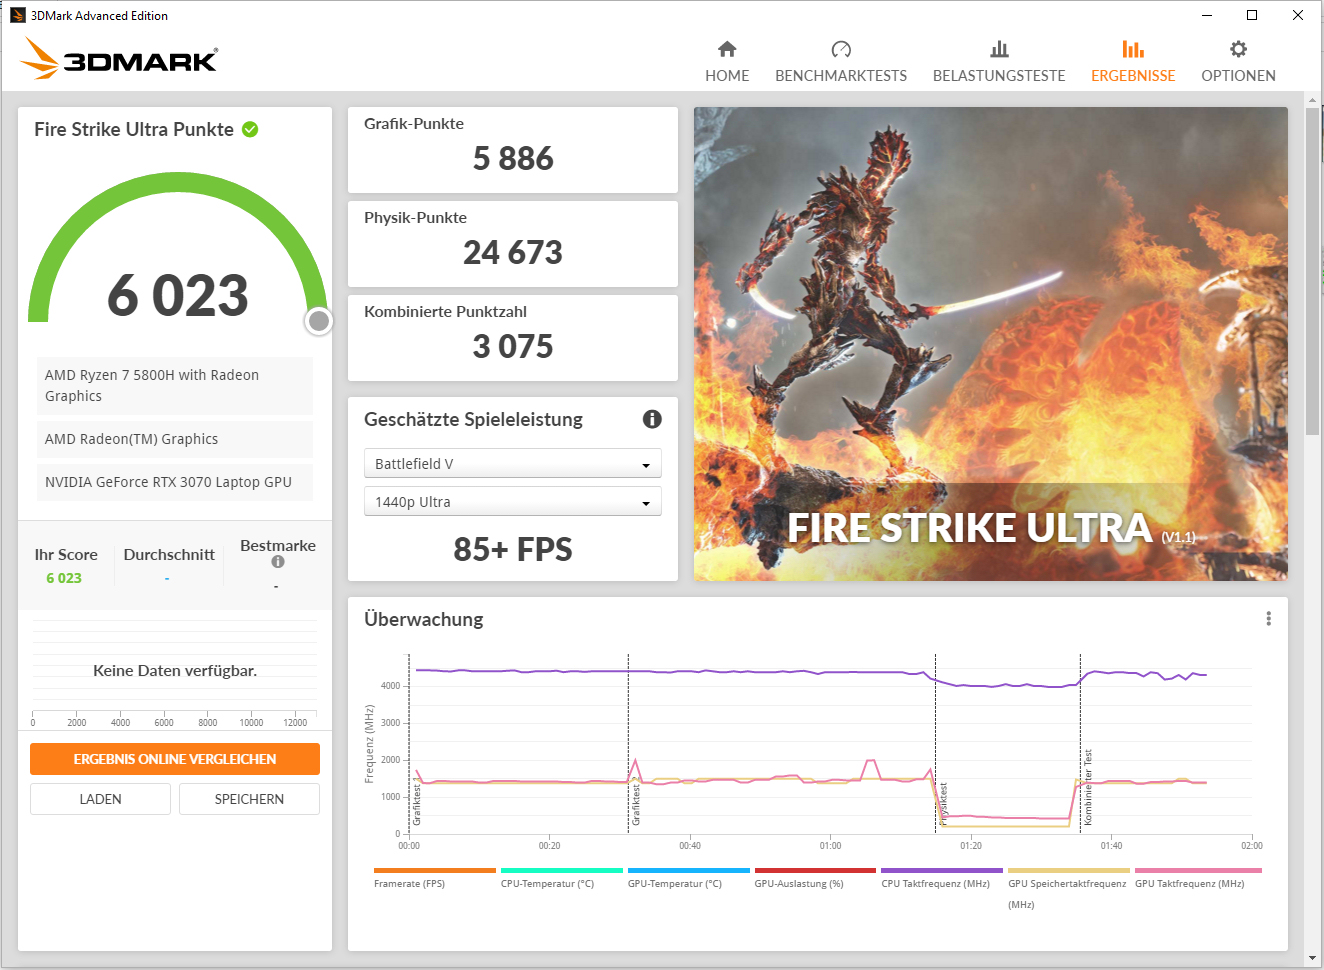
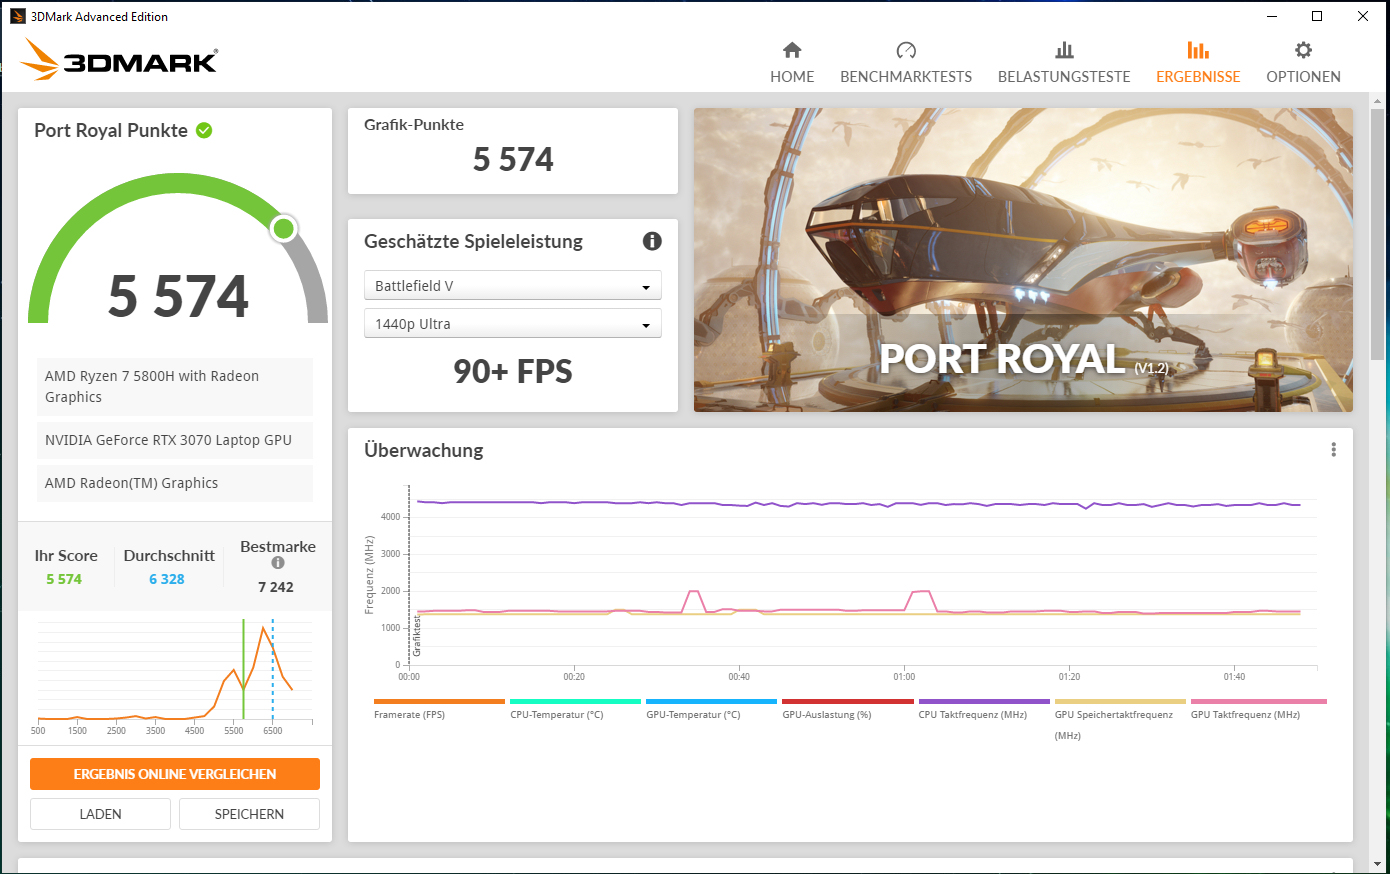
El rendimiento real de un núcleo gráfico RTX-3000 depende del TGP máximo que elija el fabricante del portátil dentro de los límites definidos por Nvidia. Acer concede a laGeForce Portátil RTX-3070 GPU (Resumen de todos los portátiles RTX-3070 incluyendo los TGP) un TGP máximo de 100 vatios.
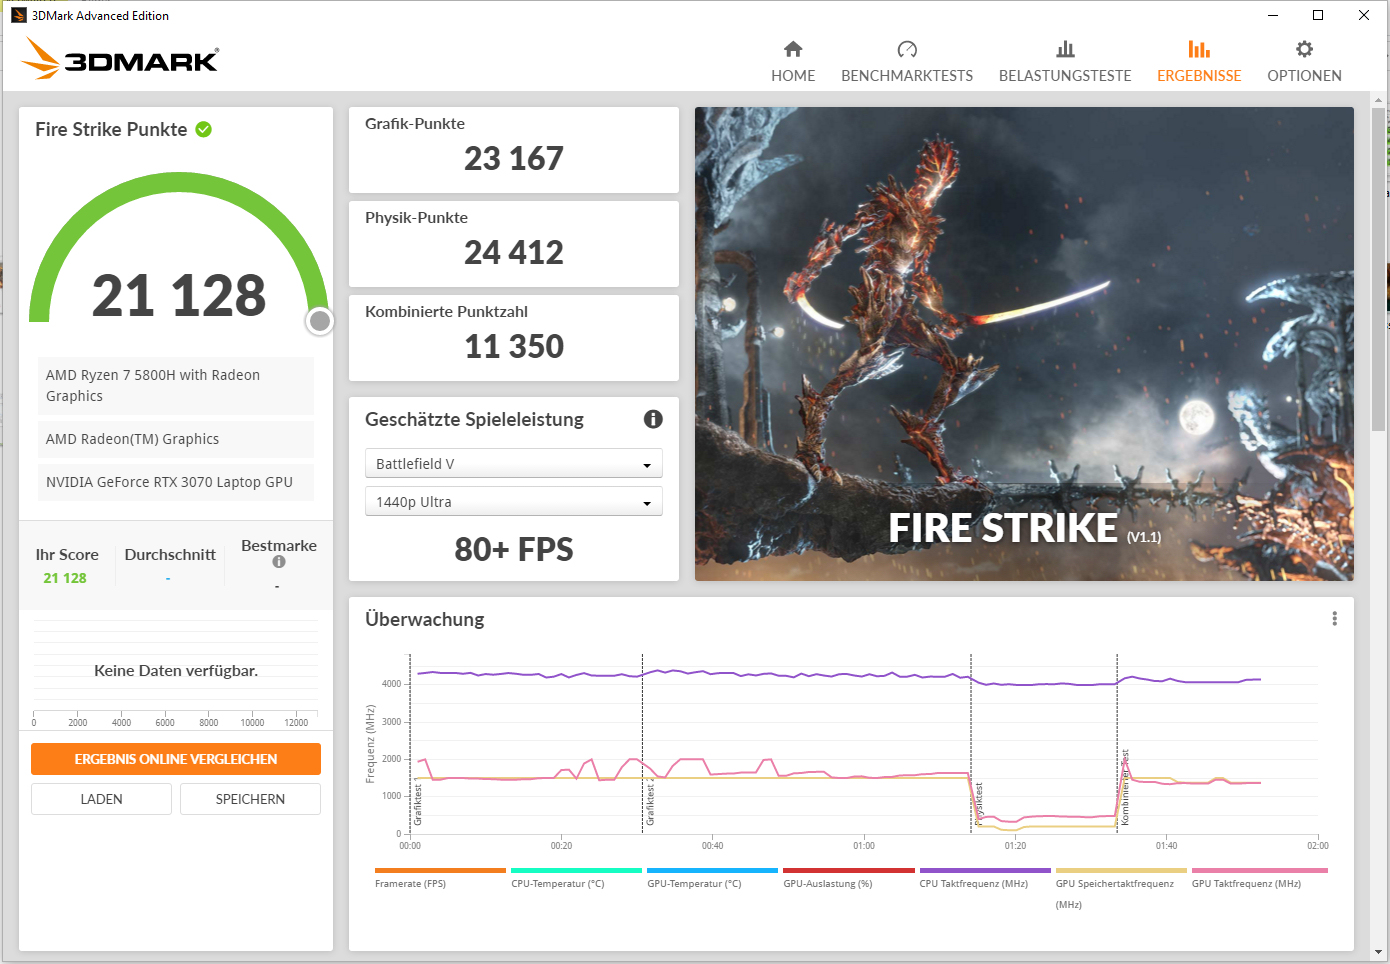
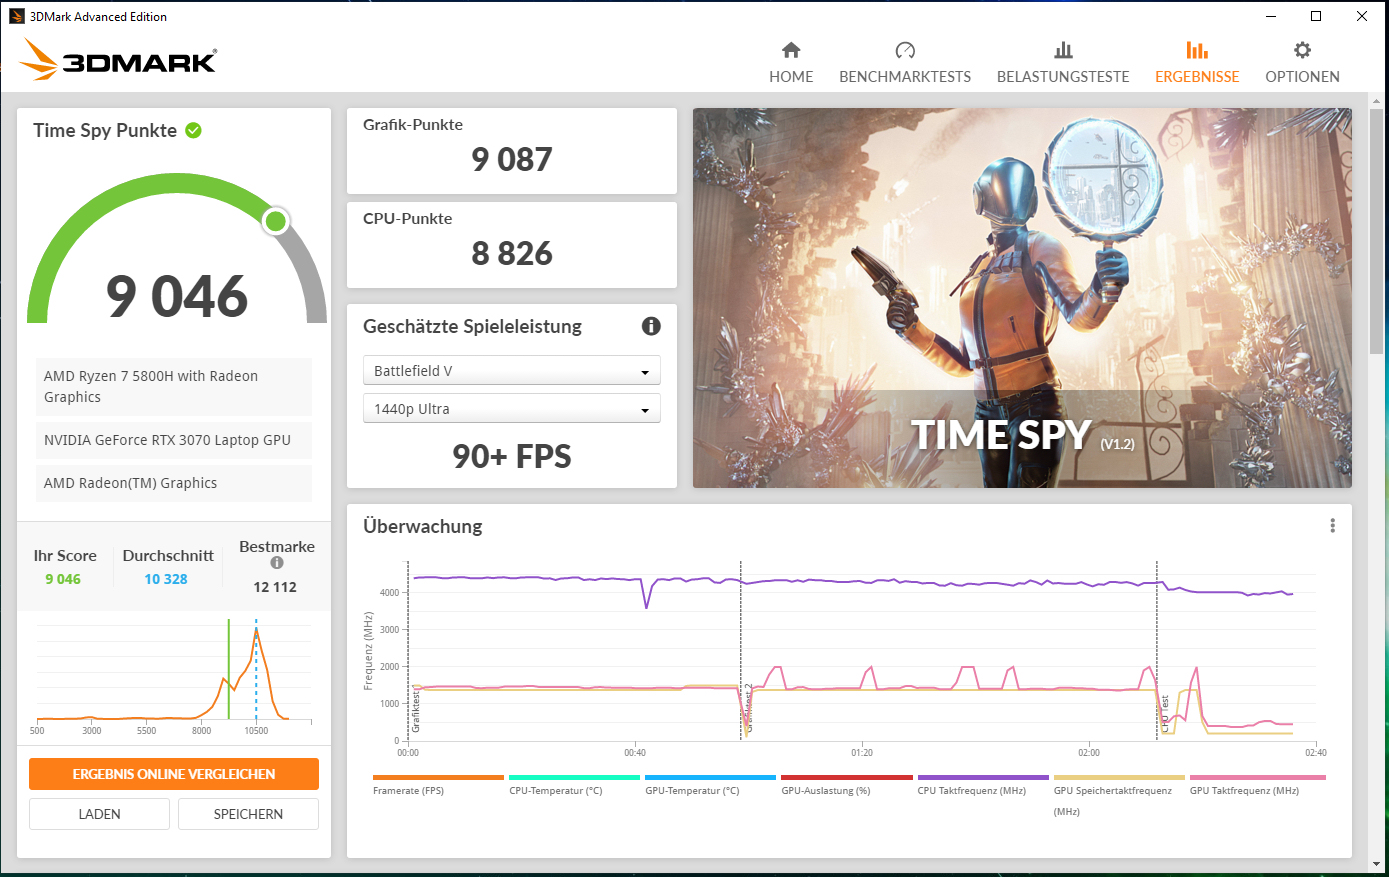
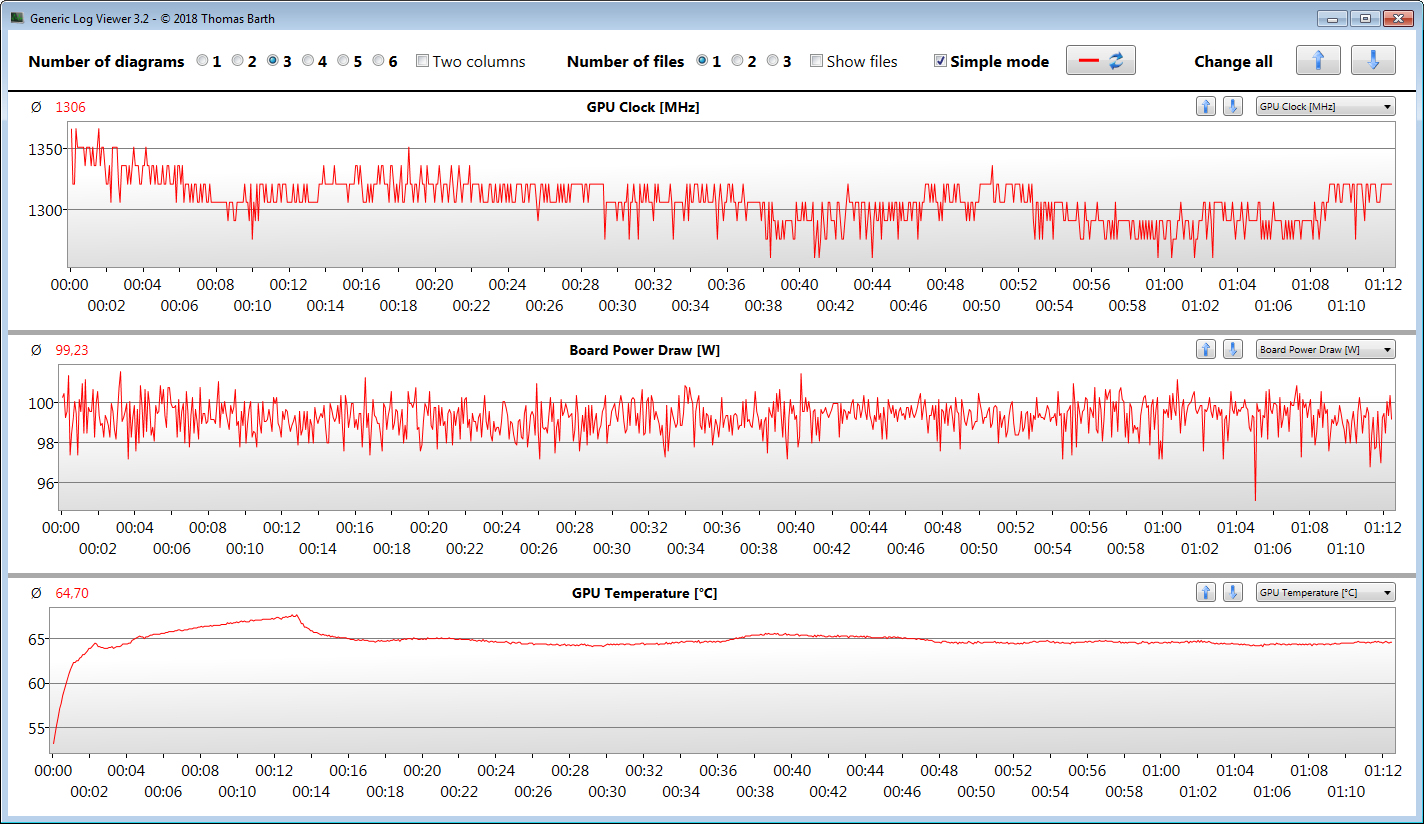
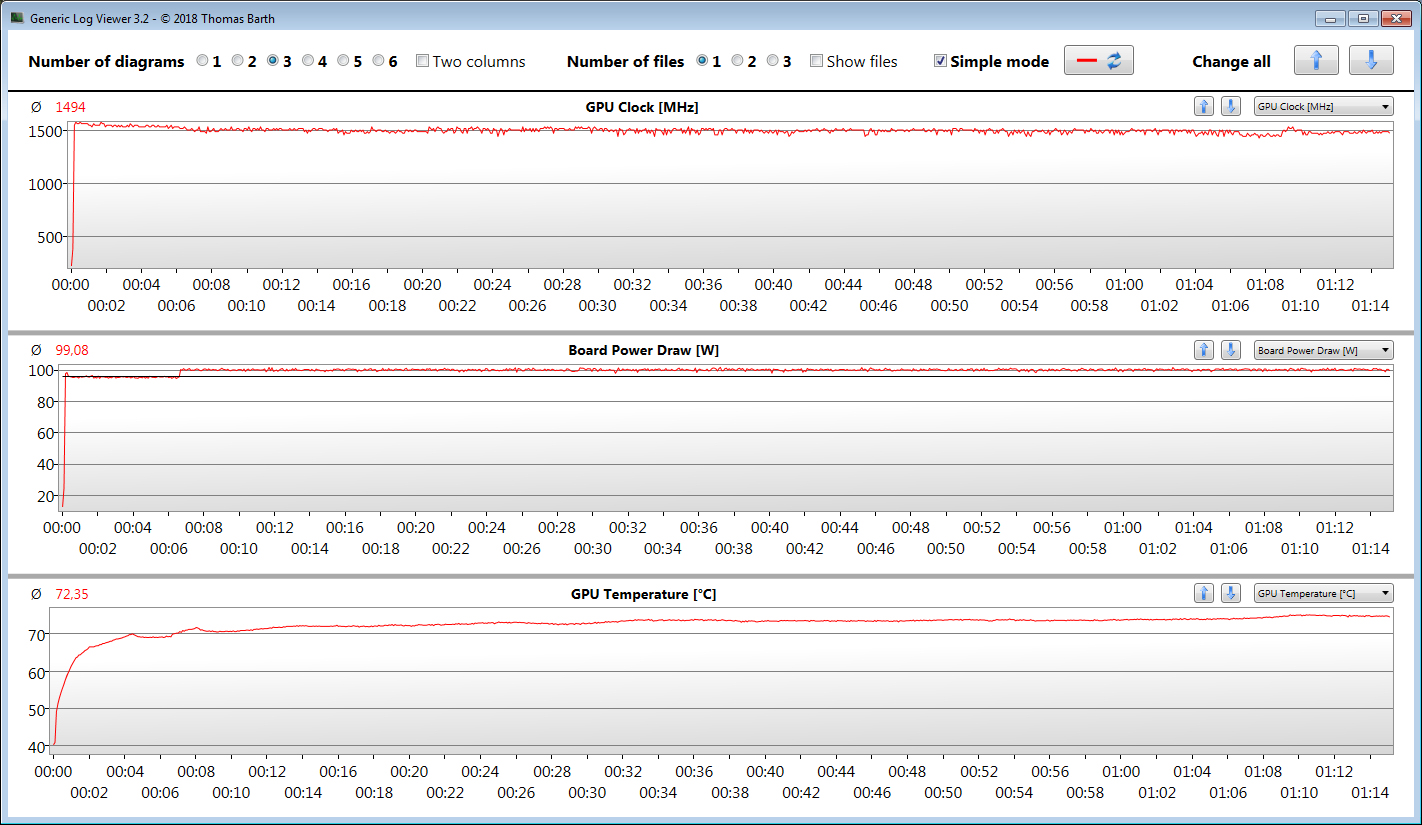
La GPU lo hace decentemente y ofrece resultados en un nivel de RTX-3070 por debajo de la media. Hay margen de mejora: Una actualización de firmware lanzada por Acer aumenta un poco el rendimiento de la GPU y acerca los resultados del benchmark a la media de la RTX-3070.
Sin embargo, la actualización no provoca un aumento del TGP - se mantiene en 100 vatios según la información del sistema de Nvidia. Presumiblemente, Acer ha movido los límites de temperatura hacia arriba -al menos esoes lo quemuestralapruebaWitcher 3. Tras la actualización del FW, la GPU pasa la prueba con un reloj más alto y alcanza una temperatura media más alta (65 °C frente a 72 °C/149 °F frente a ~162 °F).
La RTX 3070 puede utilizar la rápida memoria gráfica GDDR6 (8.192 MB). El núcleo gráfico Vega-8 integrado en el procesador está activo y el portátil funciona con la solución gráfica de conmutación Optimus de Nvidia.
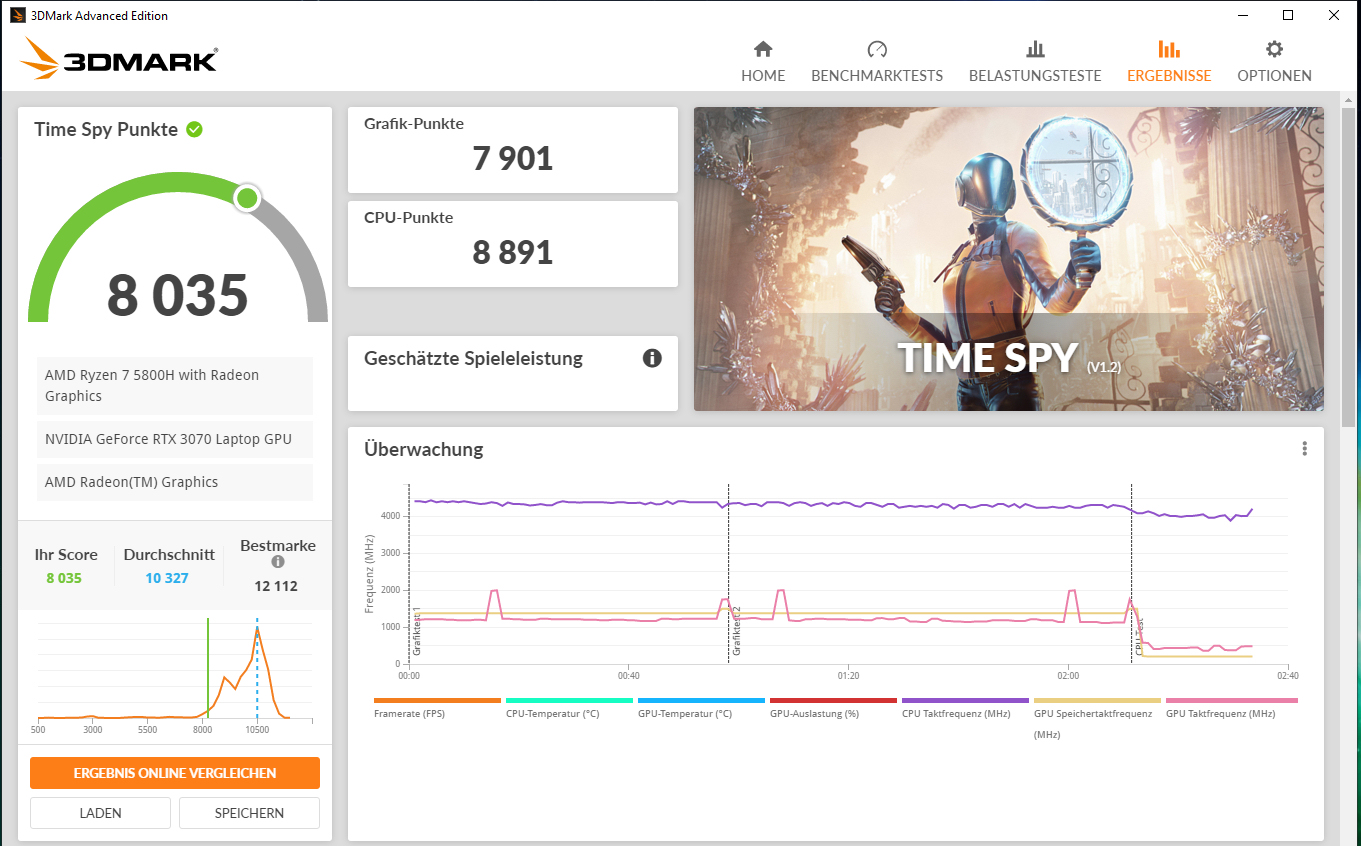
| 3DMark 11 Performance | 22631 puntos | |
| 3DMark Cloud Gate Standard Score | 45032 puntos | |
| 3DMark Fire Strike Score | 19155 puntos | |
| 3DMark Time Spy Score | 8035 puntos | |
ayuda | ||
| 3DMark 11 - 1280x720 Performance GPU | |
| Media de la clase Gaming (21841 - 80022, n=104, últimos 2 años) | |
| MSI GP76 Leopard 10UG | |
| Aorus 15G XC | |
| Medio NVIDIA GeForce RTX 3070 Laptop GPU (12535 - 38275, n=54) | |
| Acer Nitro 5 AN517-41-R5Z7 (FW-Update) | |
| Asus TUF Gaming A15 FA506QR-AZ061T | |
| Acer Nitro 5 AN517-41-R5Z7 | |
| Schenker XMG Core 17 (Early 2021) | |
| Asus TUF Gaming F17 FX706HM | |
| MSI Katana GF76 11UE | |
Rendimiento de los juegos
El portátil muestra todos los juegos actuales sin problemas en la pantalla. La resolución FHD (1.920 x 1.080 píxeles) y los ajustes de máxima calidad pueden seleccionarse normalmente. El Nitro ofrece tasas de frames por debajo de la media de los portátiles RTX-3070 probados hasta ahora. Tras ejecutar la mencionada actualización del FW, las velocidades de fotogramas de algunos juegos aumentan ligeramente y se acercan a la media de la RTX-3070
| The Witcher 3 - 1920x1080 Ultra Graphics & Postprocessing (HBAO+) | |
| Media de la clase Gaming (104.7 - 240, n=7, últimos 2 años) | |
| MSI GP76 Leopard 10UG | |
| Aorus 15G XC | |
| Medio NVIDIA GeForce RTX 3070 Laptop GPU (34.9 - 109, n=52) | |
| Acer Nitro 5 AN517-41-R5Z7 (FW-Update) | |
| Schenker XMG Core 17 (Early 2021) | |
| Acer Nitro 5 AN517-41-R5Z7 | |
| Asus TUF Gaming A15 FA506QR-AZ061T | |
| Asus TUF Gaming F17 FX706HM | |
| MSI Katana GF76 11UE | |
| Dota 2 Reborn - 1920x1080 ultra (3/3) best looking | |
| Media de la clase Gaming (84.8 - 248, n=107, últimos 2 años) | |
| MSI Katana GF76 11UE | |
| Asus TUF Gaming F17 FX706HM | |
| Medio NVIDIA GeForce RTX 3070 Laptop GPU (26.9 - 163.9, n=58) | |
| Aorus 15G XC | |
| Schenker XMG Core 17 (Early 2021) | |
| MSI GP76 Leopard 10UG | |
| Acer Nitro 5 AN517-41-R5Z7 | |
| Asus TUF Gaming A15 FA506QR-AZ061T | |
| Acer Nitro 5 AN517-41-R5Z7 (FW-Update) | |
| X-Plane 11.11 - 1920x1080 high (fps_test=3) | |
| Media de la clase Gaming (55.5 - 143.5, n=109, últimos 2 años) | |
| MSI Katana GF76 11UE | |
| Medio NVIDIA GeForce RTX 3070 Laptop GPU (12.4 - 118.8, n=61) | |
| MSI GP76 Leopard 10UG | |
| Asus TUF Gaming F17 FX706HM | |
| Aorus 15G XC | |
| Acer Nitro 5 AN517-41-R5Z7 (FW-Update) | |
| Acer Nitro 5 AN517-41-R5Z7 | |
| Schenker XMG Core 17 (Early 2021) | |
| Asus TUF Gaming A15 FA506QR-AZ061T | |
| Final Fantasy XV Benchmark - 1920x1080 High Quality | |
| Media de la clase Gaming (41 - 215, n=95, últimos 2 años) | |
| MSI GP76 Leopard 10UG | |
| Medio NVIDIA GeForce RTX 3070 Laptop GPU (27.9 - 107, n=49) | |
| Acer Nitro 5 AN517-41-R5Z7 (1.3, FW-Update) | |
| Asus TUF Gaming A15 FA506QR-AZ061T (1.3) | |
| Schenker XMG Core 17 (Early 2021) (1.3) | |
| Acer Nitro 5 AN517-41-R5Z7 (1.3) | |
| MSI Katana GF76 11UE (1.3) | |
| Asus TUF Gaming F17 FX706HM (1.3) | |
| GTA V - 1920x1080 Highest AA:4xMSAA + FX AF:16x | |
| Media de la clase Gaming (48.3 - 186.9, n=94, últimos 2 años) | |
| Medio NVIDIA GeForce RTX 3070 Laptop GPU (21.7 - 125.8, n=50) | |
| Schenker XMG Core 17 (Early 2021) | |
| Acer Nitro 5 AN517-41-R5Z7 (FW-Update) | |
| Asus TUF Gaming A15 FA506QR-AZ061T | |
| Acer Nitro 5 AN517-41-R5Z7 | |
| MSI Katana GF76 11UE | |
| Asus TUF Gaming F17 FX706HM | |
| Strange Brigade - 1920x1080 ultra AA:ultra AF:16 | |
| Media de la clase Gaming (76.3 - 458, n=87, últimos 2 años) | |
| Medio NVIDIA GeForce RTX 3070 Laptop GPU (36.2 - 194, n=46) | |
| Acer Nitro 5 AN517-41-R5Z7 (1.47.22.14 D3D12, FW-Update) | |
| Asus TUF Gaming A15 FA506QR-AZ061T (1.47.22.14 D3D12) | |
| Acer Nitro 5 AN517-41-R5Z7 (1.47.22.14 D3D12) | |
| Schenker XMG Core 17 (Early 2021) (1.47.22.14 D3D12) | |
| Asus TUF Gaming F17 FX706HM (1.47.22.14 D3D12) | |
| MSI Katana GF76 11UE (1.47.22.14 D3D12) | |
| Dirt 5 - 1920x1080 Ultra High Preset | |
| Medio NVIDIA GeForce RTX 3070 Laptop GPU (50 - 96, n=11) | |
| Acer Nitro 5 AN517-41-R5Z7 (FW-Update) | |
| Schenker XMG Core 17 (Early 2021) | |
| Acer Nitro 5 AN517-41-R5Z7 | |
| MSI Katana GF76 11UE | |
| Far Cry 5 - 1920x1080 Ultra Preset AA:T | |
| Media de la clase Gaming (70 - 151, n=6, últimos 2 años) | |
| MSI GP76 Leopard 10UG | |
| Medio NVIDIA GeForce RTX 3070 Laptop GPU (89 - 140, n=36) | |
| Schenker XMG Core 17 (Early 2021) | |
| Asus TUF Gaming A15 FA506QR-AZ061T | |
| Acer Nitro 5 AN517-41-R5Z7 (FW-Update) | |
| Acer Nitro 5 AN517-41-R5Z7 | |
| Asus TUF Gaming F17 FX706HM | |
| MSI Katana GF76 11UE | |
Para comprobar si las velocidades de fotogramas se mantienen en gran medida constantes durante un período más largo, ejecutamos el juego "The Witcher 3" durante unos 60 minutos con resolución Full HD y ajustes de máxima calidad. El personaje del juego no se mueve. No se nota una caída de la velocidad de fotogramas
Witcher 3 FPS-Diagram
| bajo | medio | alto | ultra | |
|---|---|---|---|---|
| GTA V (2015) | 172 | 134 | 81.3 | |
| The Witcher 3 (2015) | 253 | 213 | 135 | 78.4 |
| Dota 2 Reborn (2015) | 140 | 134 | 116 | 110 |
| Final Fantasy XV Benchmark (2018) | 148 | 101 | 76.7 | |
| X-Plane 11.11 (2018) | 96.5 | 83.4 | 70.4 | |
| Far Cry 5 (2018) | 123 | 103 | 98 | 94 |
| Strange Brigade (2018) | 303 | 172 | 152 | 138 |
| Dirt 5 (2020) | 181 | 105 | 86.5 | 71.5 |
Emisiones - El ordenador Acer se calienta moderadamente
Emisiones acústicas
Los dos ventiladores funcionan a baja velocidad en ralentí y son apenas audibles. Ocasionalmente se quedan parados, pero este estado termina bajo carga. El nivel máximo de presión sonora es de algo menos de 50 dB(A) (test de estrés, carga media). El desarrollo del ruido es aceptable en el modo de juego
Ruido
| Ocioso |
| 26 / 33.1 / 31.3 dB(A) |
| Carga |
| 49.8 / 49.6 dB(A) |
 | ||
30 dB silencioso 40 dB(A) audible 50 dB(A) ruidosamente alto |
||
min: | ||
| Acer Nitro 5 AN517-41-R5Z7 R7 5800H, GeForce RTX 3070 Laptop GPU | MSI Katana GF76 11UE i7-11800H, GeForce RTX 3060 Laptop GPU | Schenker XMG Core 17 (Early 2021) i7-10870H, GeForce RTX 3060 Laptop GPU | Asus TUF Gaming F17 FX706HM i9-11900H, GeForce RTX 3060 Laptop GPU | Medio NVIDIA GeForce RTX 3070 Laptop GPU | Media de la clase Gaming | |
|---|---|---|---|---|---|---|
| Noise | -10% | -6% | 2% | 3% | 5% | |
| apagado / medio ambiente * (dB) | 26 | 25 4% | 25 4% | 25 4% | 24.9 ? 4% | 24.1 ? 7% |
| Idle Minimum * (dB) | 26 | 33 -27% | 30 -15% | 26 -0% | 26.7 ? -3% | 26 ? -0% |
| Idle Average * (dB) | 33.1 | 34 -3% | 32 3% | 31 6% | 28.7 ? 13% | 27.4 ? 17% |
| Idle Maximum * (dB) | 31.3 | 35 -12% | 36 -15% | 33 -5% | 31.7 ? -1% | 30.1 ? 4% |
| Load Average * (dB) | 49.8 | 53 -6% | 53 -6% | 48 4% | 45 ? 10% | 43.6 ? 12% |
| Load Maximum * (dB) | 49.6 | 57 -15% | 54 -9% | 49 1% | 52.6 ? -6% | 54.2 ? -9% |
| Witcher 3 ultra * (dB) | 49 | 51 | 47 |
* ... más pequeño es mejor
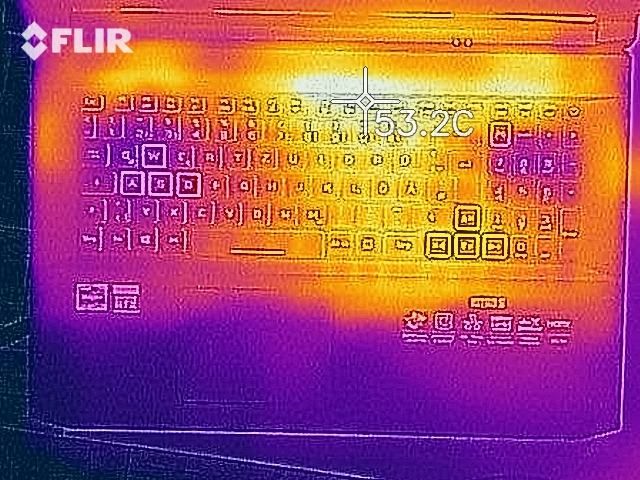
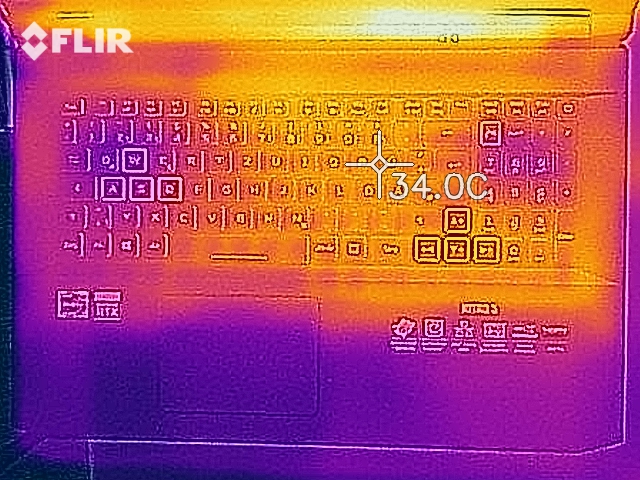
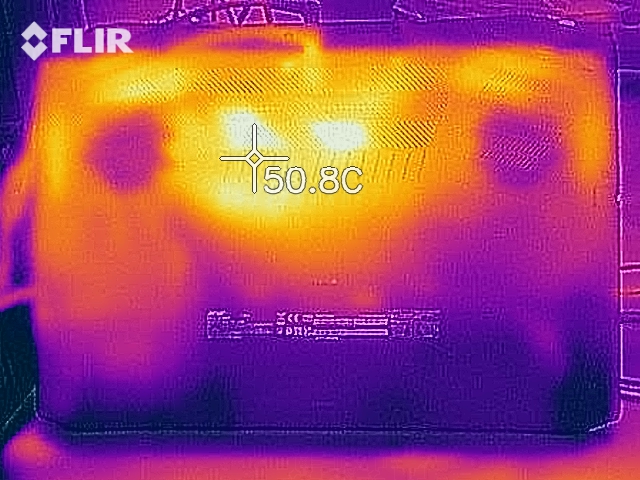
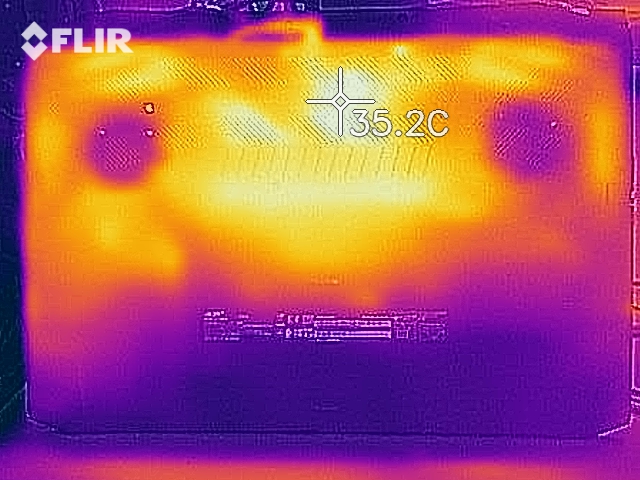
Temperatura
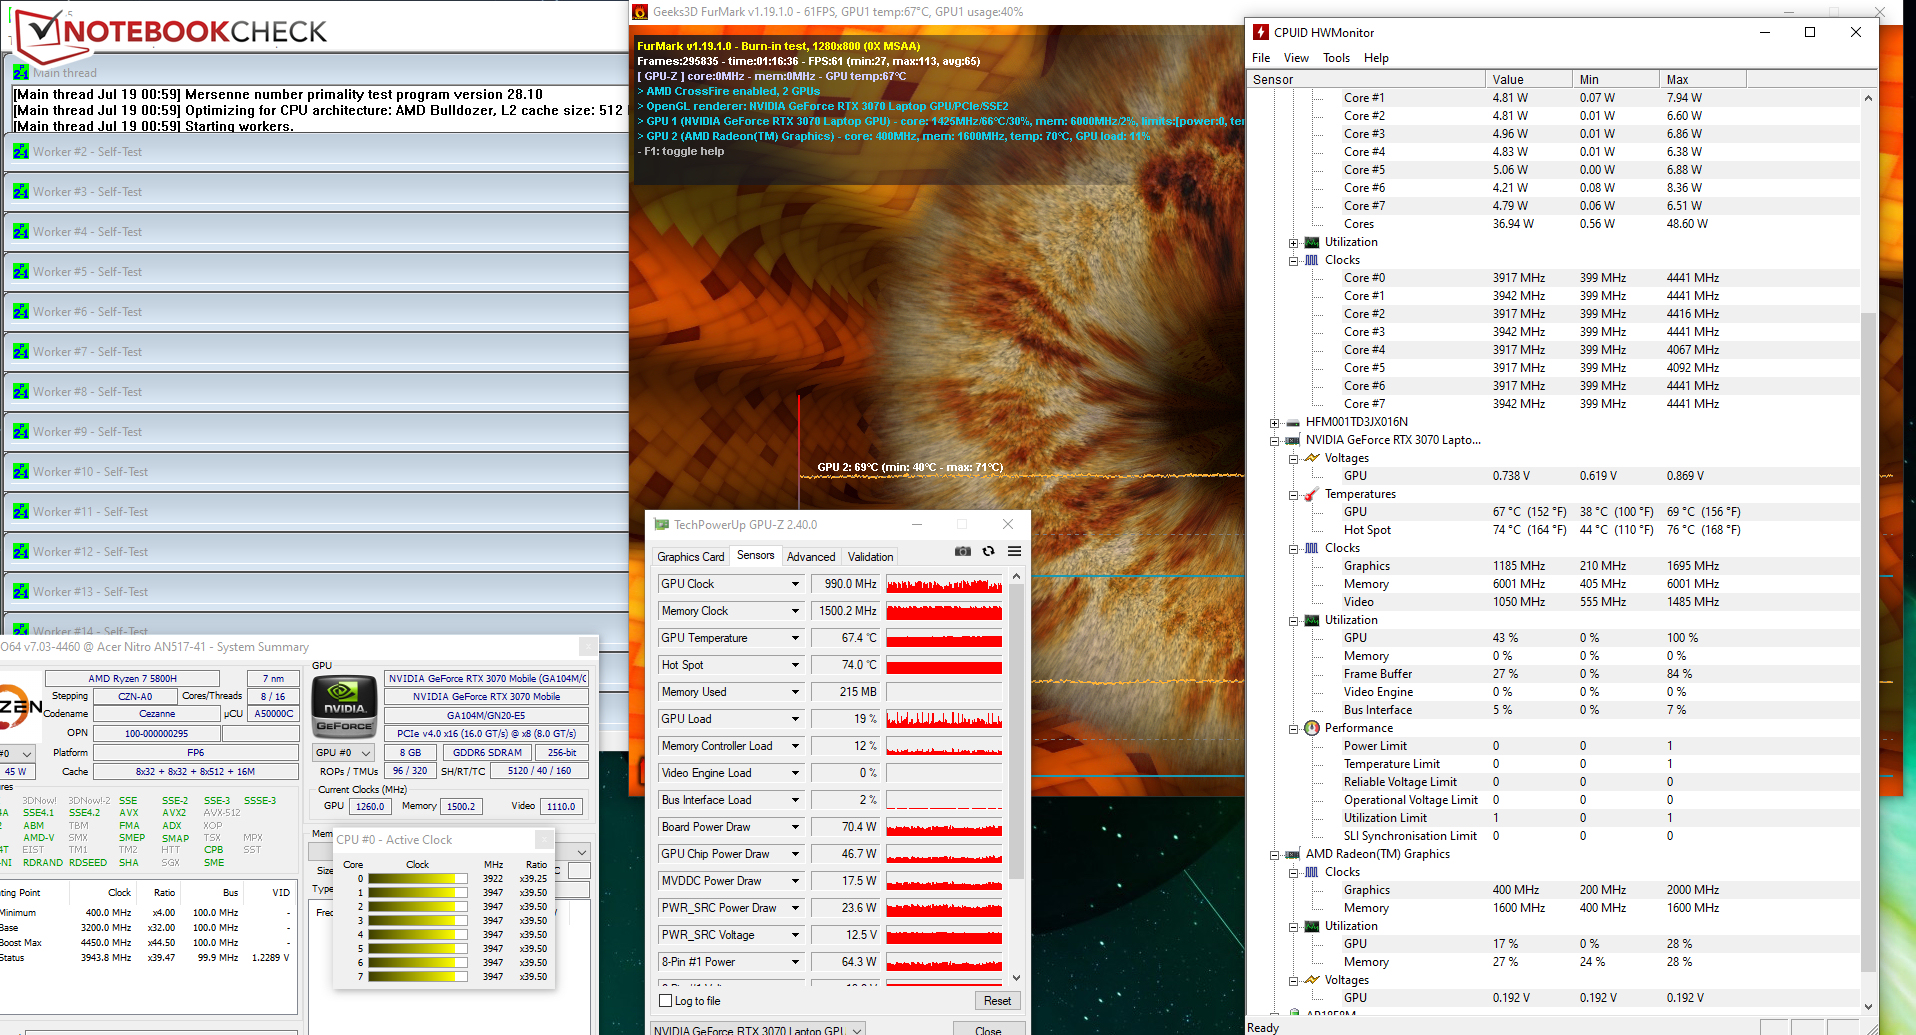
Nuestra prueba de estrés (Prime95 y FurMark se ejecutan durante al menos una hora) hace funcionar la CPU y la GPU a 3,9 GHz y entre 500 y 1000 MHz, respectivamente. La prueba de estrés representa un escenario extremo. Utilizamos esta prueba para comprobar si el sistema funciona de forma estable a plena carga
El portátil se calienta moderadamente. Durante la prueba de estrés, sólose alcanzó una temperatura superior a los 50 °C en un punto de medición. Las temperaturas están dentro de una zona verde en el uso diario
(±) La temperatura máxima en la parte superior es de 44 °C / 111 F, frente a la media de 40.4 °C / 105 F, que oscila entre 21.2 y 68.8 °C para la clase Gaming.
(-) El fondo se calienta hasta un máximo de 52.7 °C / 127 F, frente a la media de 43.2 °C / 110 F
(+) En reposo, la temperatura media de la parte superior es de 28.9 °C / 84# F, frente a la media del dispositivo de 33.9 °C / 93 F.
(+) El reposamanos y el panel táctil están a una temperatura inferior a la de la piel, con un máximo de 26.9 °C / 80.4 F y, por tanto, son fríos al tacto.
(±) La temperatura media de la zona del reposamanos de dispositivos similares fue de 28.8 °C / 83.8 F (+1.9 °C / 3.4 F).
| Acer Nitro 5 AN517-41-R5Z7 R7 5800H, GeForce RTX 3070 Laptop GPU | MSI Katana GF76 11UE i7-11800H, GeForce RTX 3060 Laptop GPU | Schenker XMG Core 17 (Early 2021) i7-10870H, GeForce RTX 3060 Laptop GPU | Asus TUF Gaming F17 FX706HM i9-11900H, GeForce RTX 3060 Laptop GPU | Medio NVIDIA GeForce RTX 3070 Laptop GPU | Media de la clase Gaming | |
|---|---|---|---|---|---|---|
| Heat | -1% | 0% | -21% | -4% | 1% | |
| Maximum Upper Side * (°C) | 44 | 51 -16% | 44 -0% | 58.5 -33% | 47.8 ? -9% | 45.2 ? -3% |
| Maximum Bottom * (°C) | 52.7 | 52 1% | 50 5% | 58.5 -11% | 52.9 ? -0% | 48.1 ? 9% |
| Idle Upper Side * (°C) | 32.6 | 32 2% | 30 8% | 38 -17% | 32.4 ? 1% | 31 ? 5% |
| Idle Bottom * (°C) | 32.1 | 29 10% | 36 -12% | 39 -21% | 34.2 ? -7% | 34.2 ? -7% |
* ... más pequeño es mejor
Altavoz
Los altavoces estéreo producen un sonido decente al que le faltan los graves. Se recomiendan auriculares o altavoces externos para una mejor experiencia de sonido
Acer Nitro 5 AN517-41-R5Z7 análisis de audio
(±) | la sonoridad del altavoz es media pero buena (75.5 dB)
Graves 100 - 315 Hz
(-) | casi sin bajos - de media 27.4% inferior a la mediana
(±) | la linealidad de los graves es media (11.3% delta a frecuencia anterior)
Medios 400 - 2000 Hz
(+) | medios equilibrados - a sólo 4.1% de la mediana
(±) | la linealidad de los medios es media (8.7% delta respecto a la frecuencia anterior)
Altos 2 - 16 kHz
(±) | máximos más altos - de media 6% más altos que la mediana
(+) | los máximos son lineales (5% delta a la frecuencia anterior)
Total 100 - 16.000 Hz
(±) | la linealidad del sonido global es media (22.5% de diferencia con la mediana)
En comparación con la misma clase
» 81% de todos los dispositivos probados de esta clase eran mejores, 5% similares, 14% peores
» El mejor tuvo un delta de 6%, la media fue 18%, el peor fue ###max##%
En comparación con todos los dispositivos probados
» 66% de todos los dispositivos probados eran mejores, 6% similares, 28% peores
» El mejor tuvo un delta de 4%, la media fue 23%, el peor fue ###max##%
MSI GP76 Leopard 10UG análisis de audio
(+) | los altavoces pueden reproducir a un volumen relativamente alto (#85 dB)
Graves 100 - 315 Hz
(-) | casi sin bajos - de media 18.5% inferior a la mediana
(±) | la linealidad de los graves es media (10.8% delta a frecuencia anterior)
Medios 400 - 2000 Hz
(+) | medios equilibrados - a sólo 2.9% de la mediana
(+) | los medios son lineales (2.4% delta a la frecuencia anterior)
Altos 2 - 16 kHz
(+) | máximos equilibrados - a sólo 2.8% de la mediana
(+) | los máximos son lineales (4.2% delta a la frecuencia anterior)
Total 100 - 16.000 Hz
(+) | el sonido global es lineal (13.2% de diferencia con la mediana)
En comparación con la misma clase
» 19% de todos los dispositivos probados de esta clase eran mejores, 4% similares, 77% peores
» El mejor tuvo un delta de 6%, la media fue 18%, el peor fue ###max##%
En comparación con todos los dispositivos probados
» 14% de todos los dispositivos probados eran mejores, 3% similares, 84% peores
» El mejor tuvo un delta de 4%, la media fue 23%, el peor fue ###max##%
Gestión de la energía: el portátil para juegos Nitro ofrece una sólida duración de la batería
Consumo de energía
Registramos un consumo máximo de energía de 25,2 vatios en reposo. La prueba de estrés y la Witcher 3 aumentan el consumo de energía hasta 157 vatios y 135 vatios de media, respectivamente. El siguiente diagrama ilustra el consumo de energía bastante constante del portátil durante la Witcher 3 prueba. La potencia nominal de la fuente de alimentación es de 180 vatios
| Off / Standby | |
| Ocioso | |
| Carga |
|
Clave:
min: | |
Energy consumption Witcher 3
| Acer Nitro 5 AN517-41-R5Z7 R7 5800H, GeForce RTX 3070 Laptop GPU | MSI Katana GF76 11UE i7-11800H, GeForce RTX 3060 Laptop GPU | Schenker XMG Core 17 (Early 2021) i7-10870H, GeForce RTX 3060 Laptop GPU | Asus TUF Gaming F17 FX706HM i9-11900H, GeForce RTX 3060 Laptop GPU | MSI GP76 Leopard 10UG i7-10750H, GeForce RTX 3070 Laptop GPU | Aorus 15G XC i7-10870H, GeForce RTX 3070 Laptop GPU | Asus TUF Gaming A15 FA506QR-AZ061T R7 5800H, GeForce RTX 3070 Laptop GPU | Medio NVIDIA GeForce RTX 3070 Laptop GPU | Media de la clase Gaming | |
|---|---|---|---|---|---|---|---|---|---|
| Power Consumption | 18% | 1% | 21% | 1% | 2% | 19% | -2% | -0% | |
| Idle Minimum * (Watt) | 18.7 | 9 52% | 13 30% | 10.3 45% | 12 36% | 13 30% | 10.2 45% | 15.6 ? 17% | 13 ? 30% |
| Idle Average * (Watt) | 22 | 13 41% | 16 27% | 13.1 40% | 16 27% | 16 27% | 12.8 42% | 20.1 ? 9% | 19 ? 14% |
| Idle Maximum * (Watt) | 25.2 | 20 21% | 29 -15% | 14.1 44% | 28 -11% | 30 -19% | 15 40% | 29.4 ? -17% | 24.6 ? 2% |
| Load Average * (Watt) | 134.7 | 102 24% | 100 26% | 110 18% | 92 32% | 92 32% | 130 3% | 110.8 ? 18% | 110.7 ? 18% |
| Witcher 3 ultra * (Watt) | 135 | 149 -10% | 173 -28% | 138 -2% | 198 -47% | 154 -14% | 137 -1% | ||
| Load Maximum * (Watt) | 157 | 187 -19% | 213 -36% | 190 -21% | 210 -34% | 223 -42% | 184 -17% | 214 ? -36% | 259 ? -65% |
* ... más pequeño es mejor
Duración de la batería
El portátil de 17,3 pulgadas logra tiempos de ejecución de 5:34 h y 7:00 h en la prueba WLAN (llamando a sitios web a través de un script) y la prueba de vídeo (película corta Big Buck Bunny (codificación H.264, FHD) en bucle), respectivamente. Durante ambas pruebas, las funciones de ahorro de energía del portátil están desactivadas y el brillo de la pantalla está ajustado a unos 150 cd/m². Los módulos inalámbricos también están desactivados para la prueba de vídeo
| Acer Nitro 5 AN517-41-R5Z7 R7 5800H, GeForce RTX 3070 Laptop GPU, 57.5 Wh | MSI Katana GF76 11UE i7-11800H, GeForce RTX 3060 Laptop GPU, 53 Wh | Schenker XMG Core 17 (Early 2021) i7-10870H, GeForce RTX 3060 Laptop GPU, 62 Wh | Asus TUF Gaming F17 FX706HM i9-11900H, GeForce RTX 3060 Laptop GPU, 90 Wh | MSI GP76 Leopard 10UG i7-10750H, GeForce RTX 3070 Laptop GPU, 65 Wh | Aorus 15G XC i7-10870H, GeForce RTX 3070 Laptop GPU, 99 Wh | Asus TUF Gaming A15 FA506QR-AZ061T R7 5800H, GeForce RTX 3070 Laptop GPU, 90 Wh | Media de la clase Gaming | |
|---|---|---|---|---|---|---|---|---|
| Duración de Batería | -34% | -19% | 45% | -38% | 16% | 82% | 9% | |
| Reader / Idle (h) | 10.1 | 4.8 -52% | 7.7 -24% | 5.6 -45% | 9.6 -5% | 17.4 72% | 8.27 ? -18% | |
| H.264 (h) | 7 | 3.9 -44% | 4.7 -33% | 8.5 21% | 6.5 -7% | 8.32 ? 19% | ||
| WiFi v1.3 (h) | 5.6 | 3.7 -34% | 4.9 -12% | 7.6 36% | 4.2 -25% | 6.3 13% | 11.4 104% | 7.11 ? 27% |
| Load (h) | 1.4 | 1.3 -7% | 1.3 -7% | 2.5 79% | 0.8 -43% | 2.3 64% | 2.4 71% | 1.502 ? 7% |
| Witcher 3 ultra (h) | 0.8 |
Pro
Contra
Veredicto - Sólido jugador de gama media
El Nitro 5 no pertenece al grupo superior de portátiles RTX 3070: Comparado con los portátiles RTX 3070 probados hasta ahora, el ordenador ofrece tasas de frames por debajo de la media - esto se debe al TGP de 100 vatios. El rendimiento de la GPU puede aumentar un poco con una actualización de firmware. El dispositivo puntúa con un alto nivel de rendimiento de la CPU.
El Acer Nitro 5 AN517-41 ofrece mucho rendimiento por el euro.
La ralentización no es una preocupación. La CPU y la GPU pueden producir su rendimiento constantemente. El portátil se calienta moderadamente bajo carga. El desarrollo de ruido está en el nivel habitual de la clase. La instalación de la actualización del FW debería aumentar un poco el desarrollo de calor y ruido.
La pantalla (FHD, IPS, 144 Hz) ofrece ángulos de visión estables, buen contraste, una superficie mate, cortos tiempos de respuesta y una decente reproducción del color. El brillo medio y la cobertura del espacio de color son demasiado bajos.
Una alternativa a la Nitro 5 sería la MSI GP76 Leopard 10UG. El ordenador viene con una GPU para portátiles GeForce RTX-3070 que funciona con el máximo TGP posible de 140 vatios. Sin embargo, el GP76 ofrece menos potencia de CPU que el Nitro 5.
Dentro de unos días, al análisis del Nitro 5 RTX-3070 le seguirá el de un modelo hermano equipado con una GPU para portátiles GeForce RTX-3080.
Precio y disponibilidad
El Acer Nitro 5 AN517-41-R5Z7 (Ryzen 7-5800H, GeForce RTX 3070, 16 GB RAM, 1 TB SSD, Windows 10 Home) está disponible por un precio de 1.499 euros (~1763 dólares) en Notebooksbilliger.de. El dispositivo está actualmente agotado
Acer Nitro 5 AN517-41-R5Z7
- 08/02/2021 v7 (old)
Sascha Mölck
Price comparison
