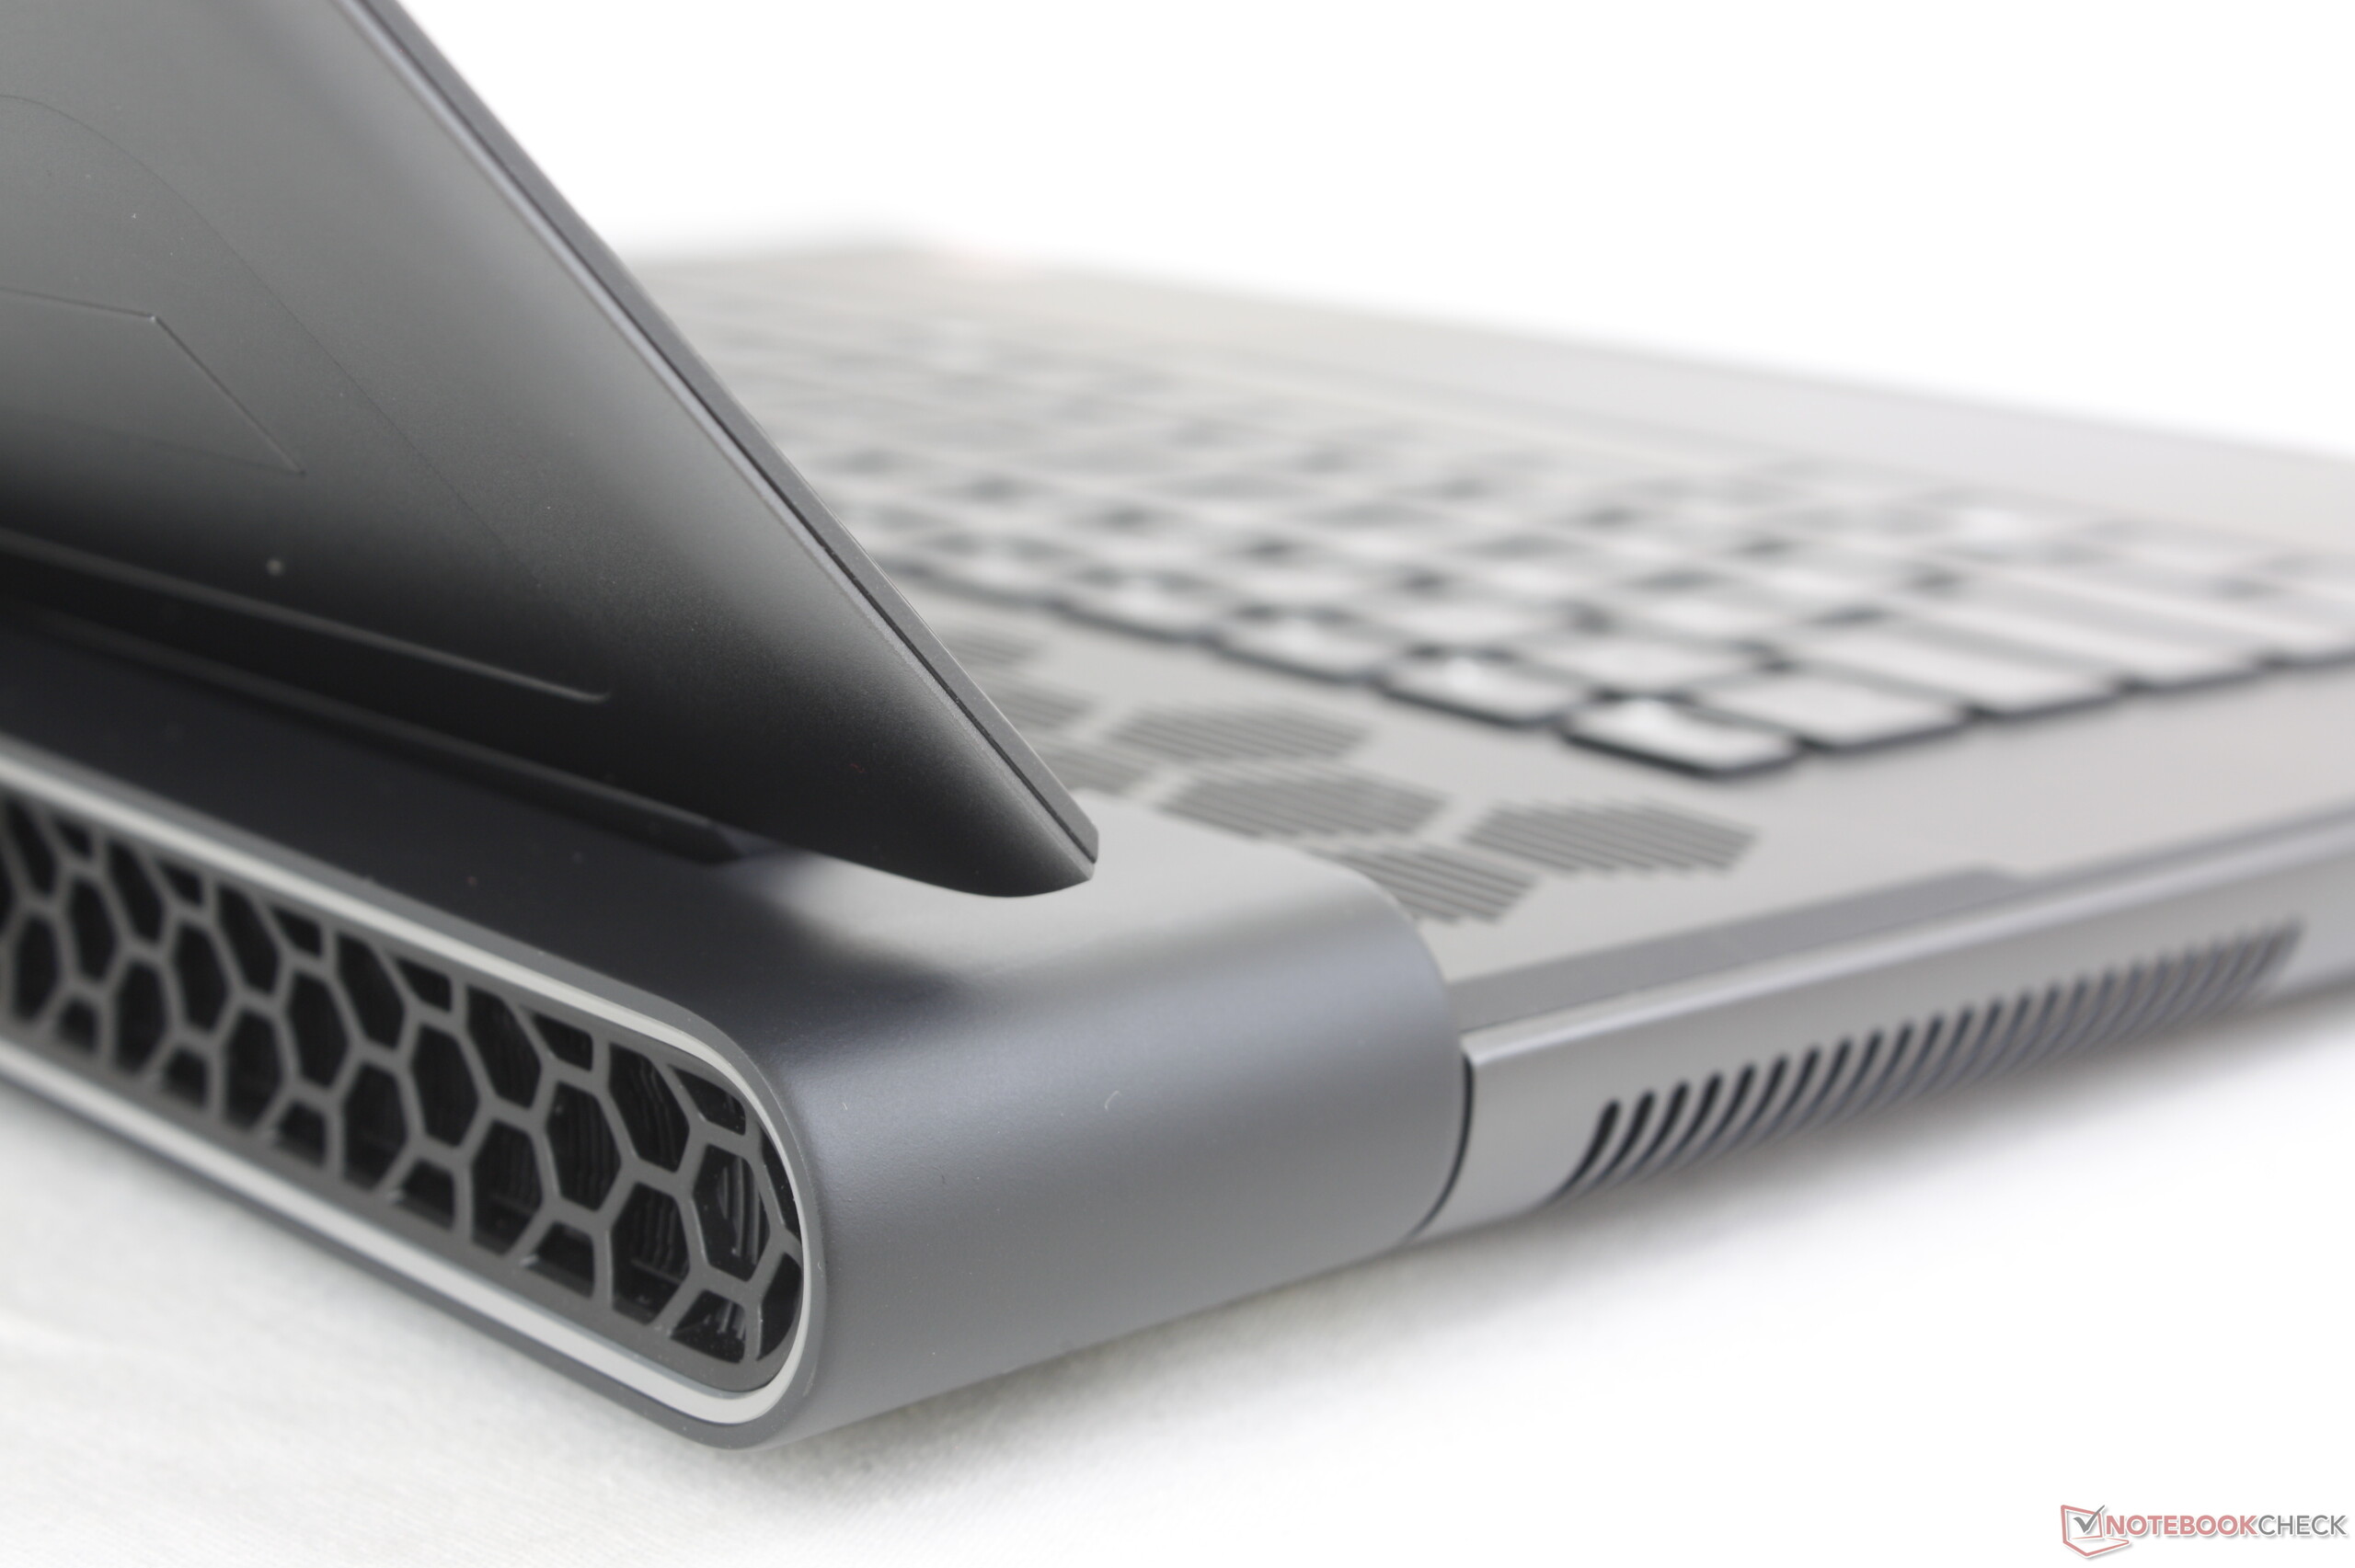
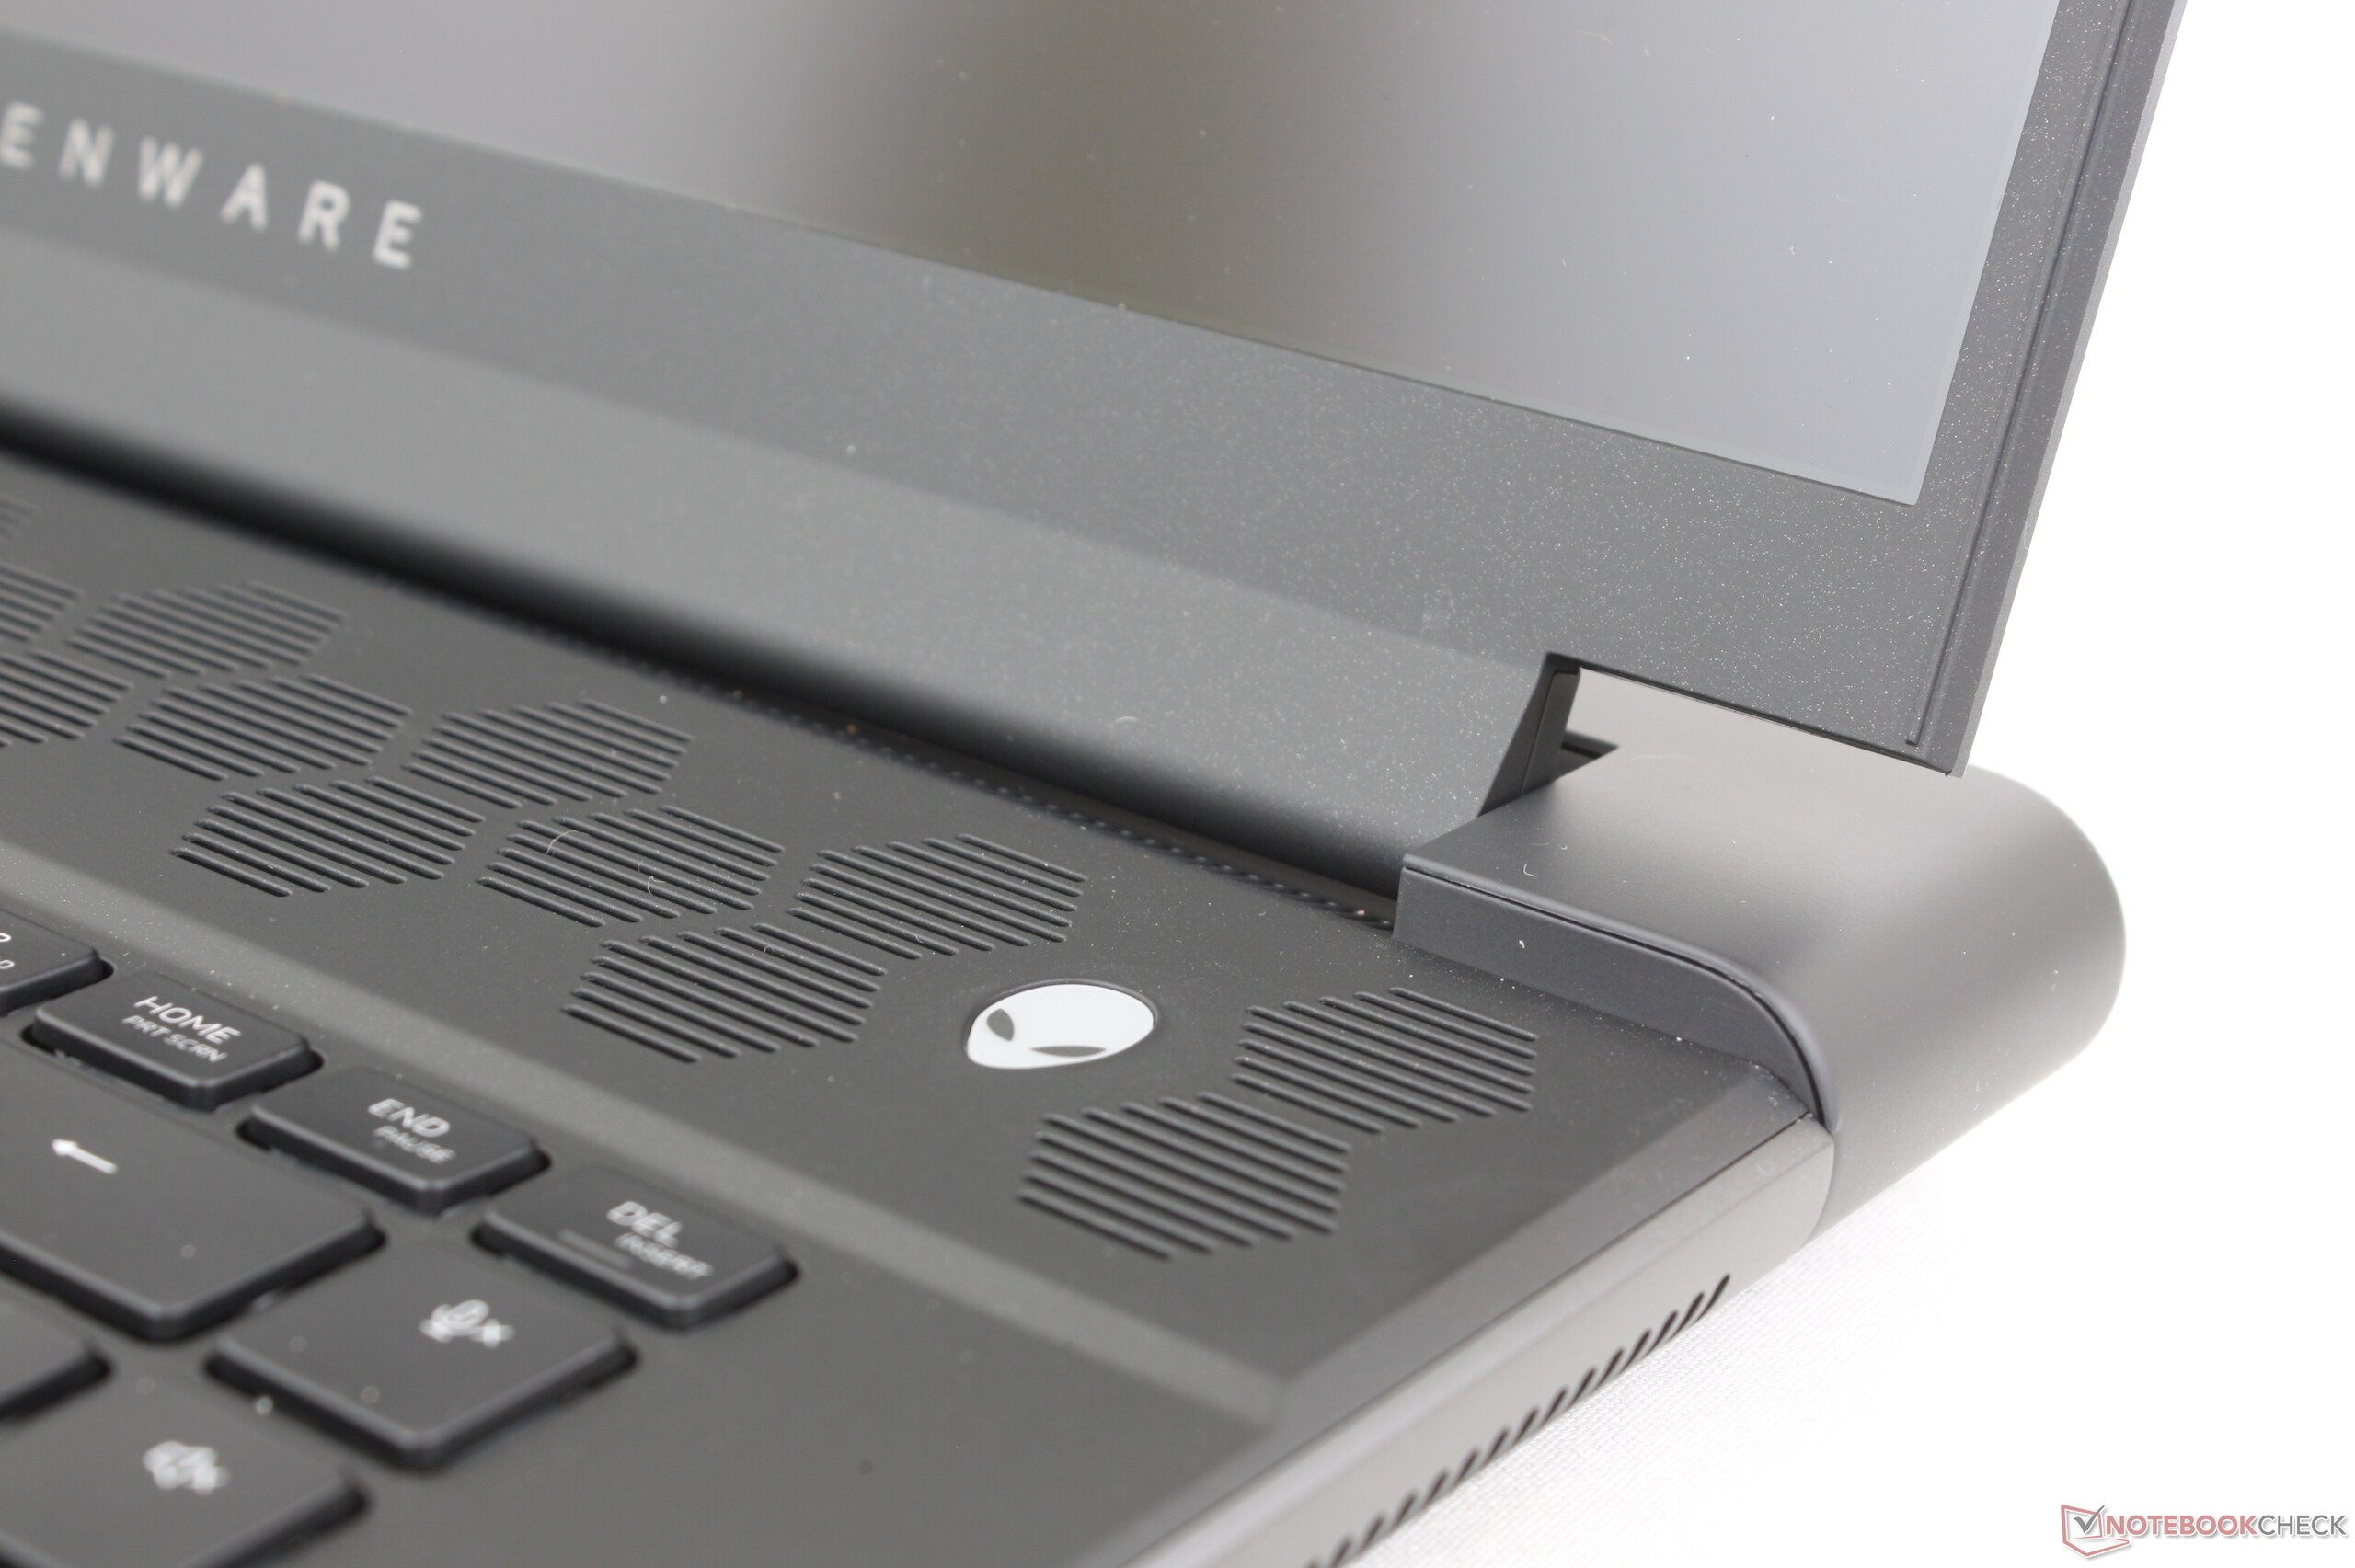
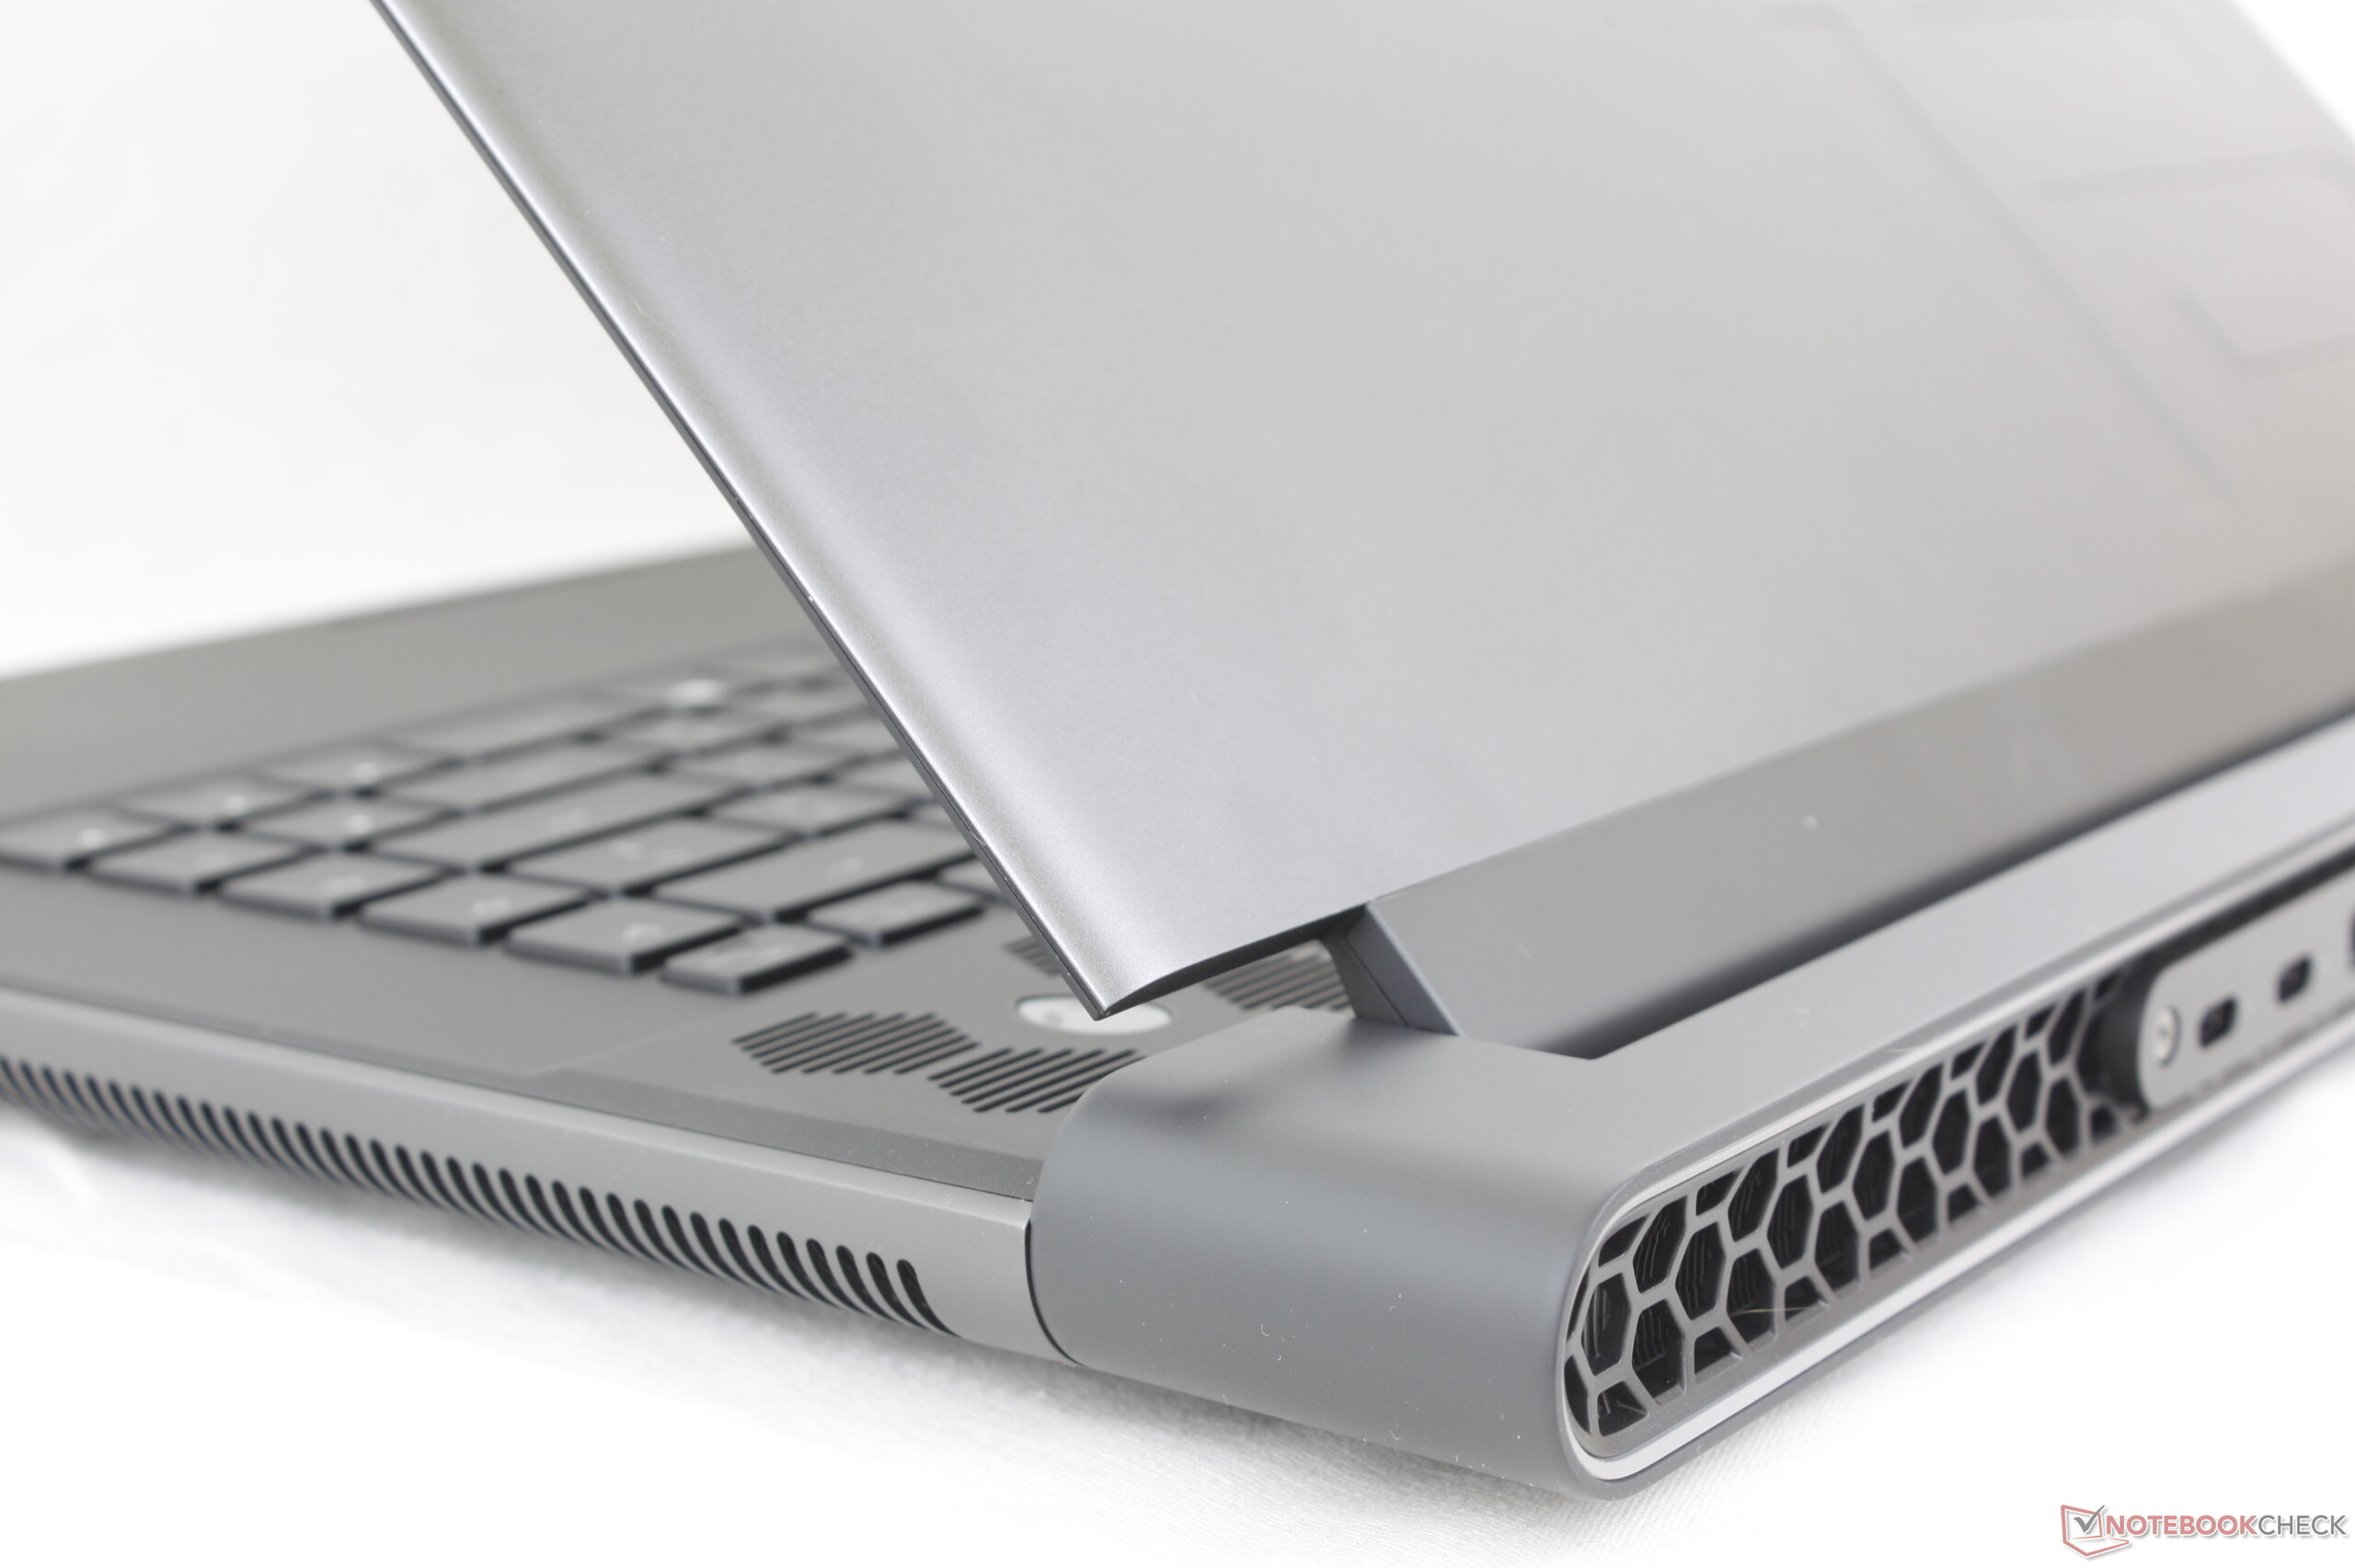
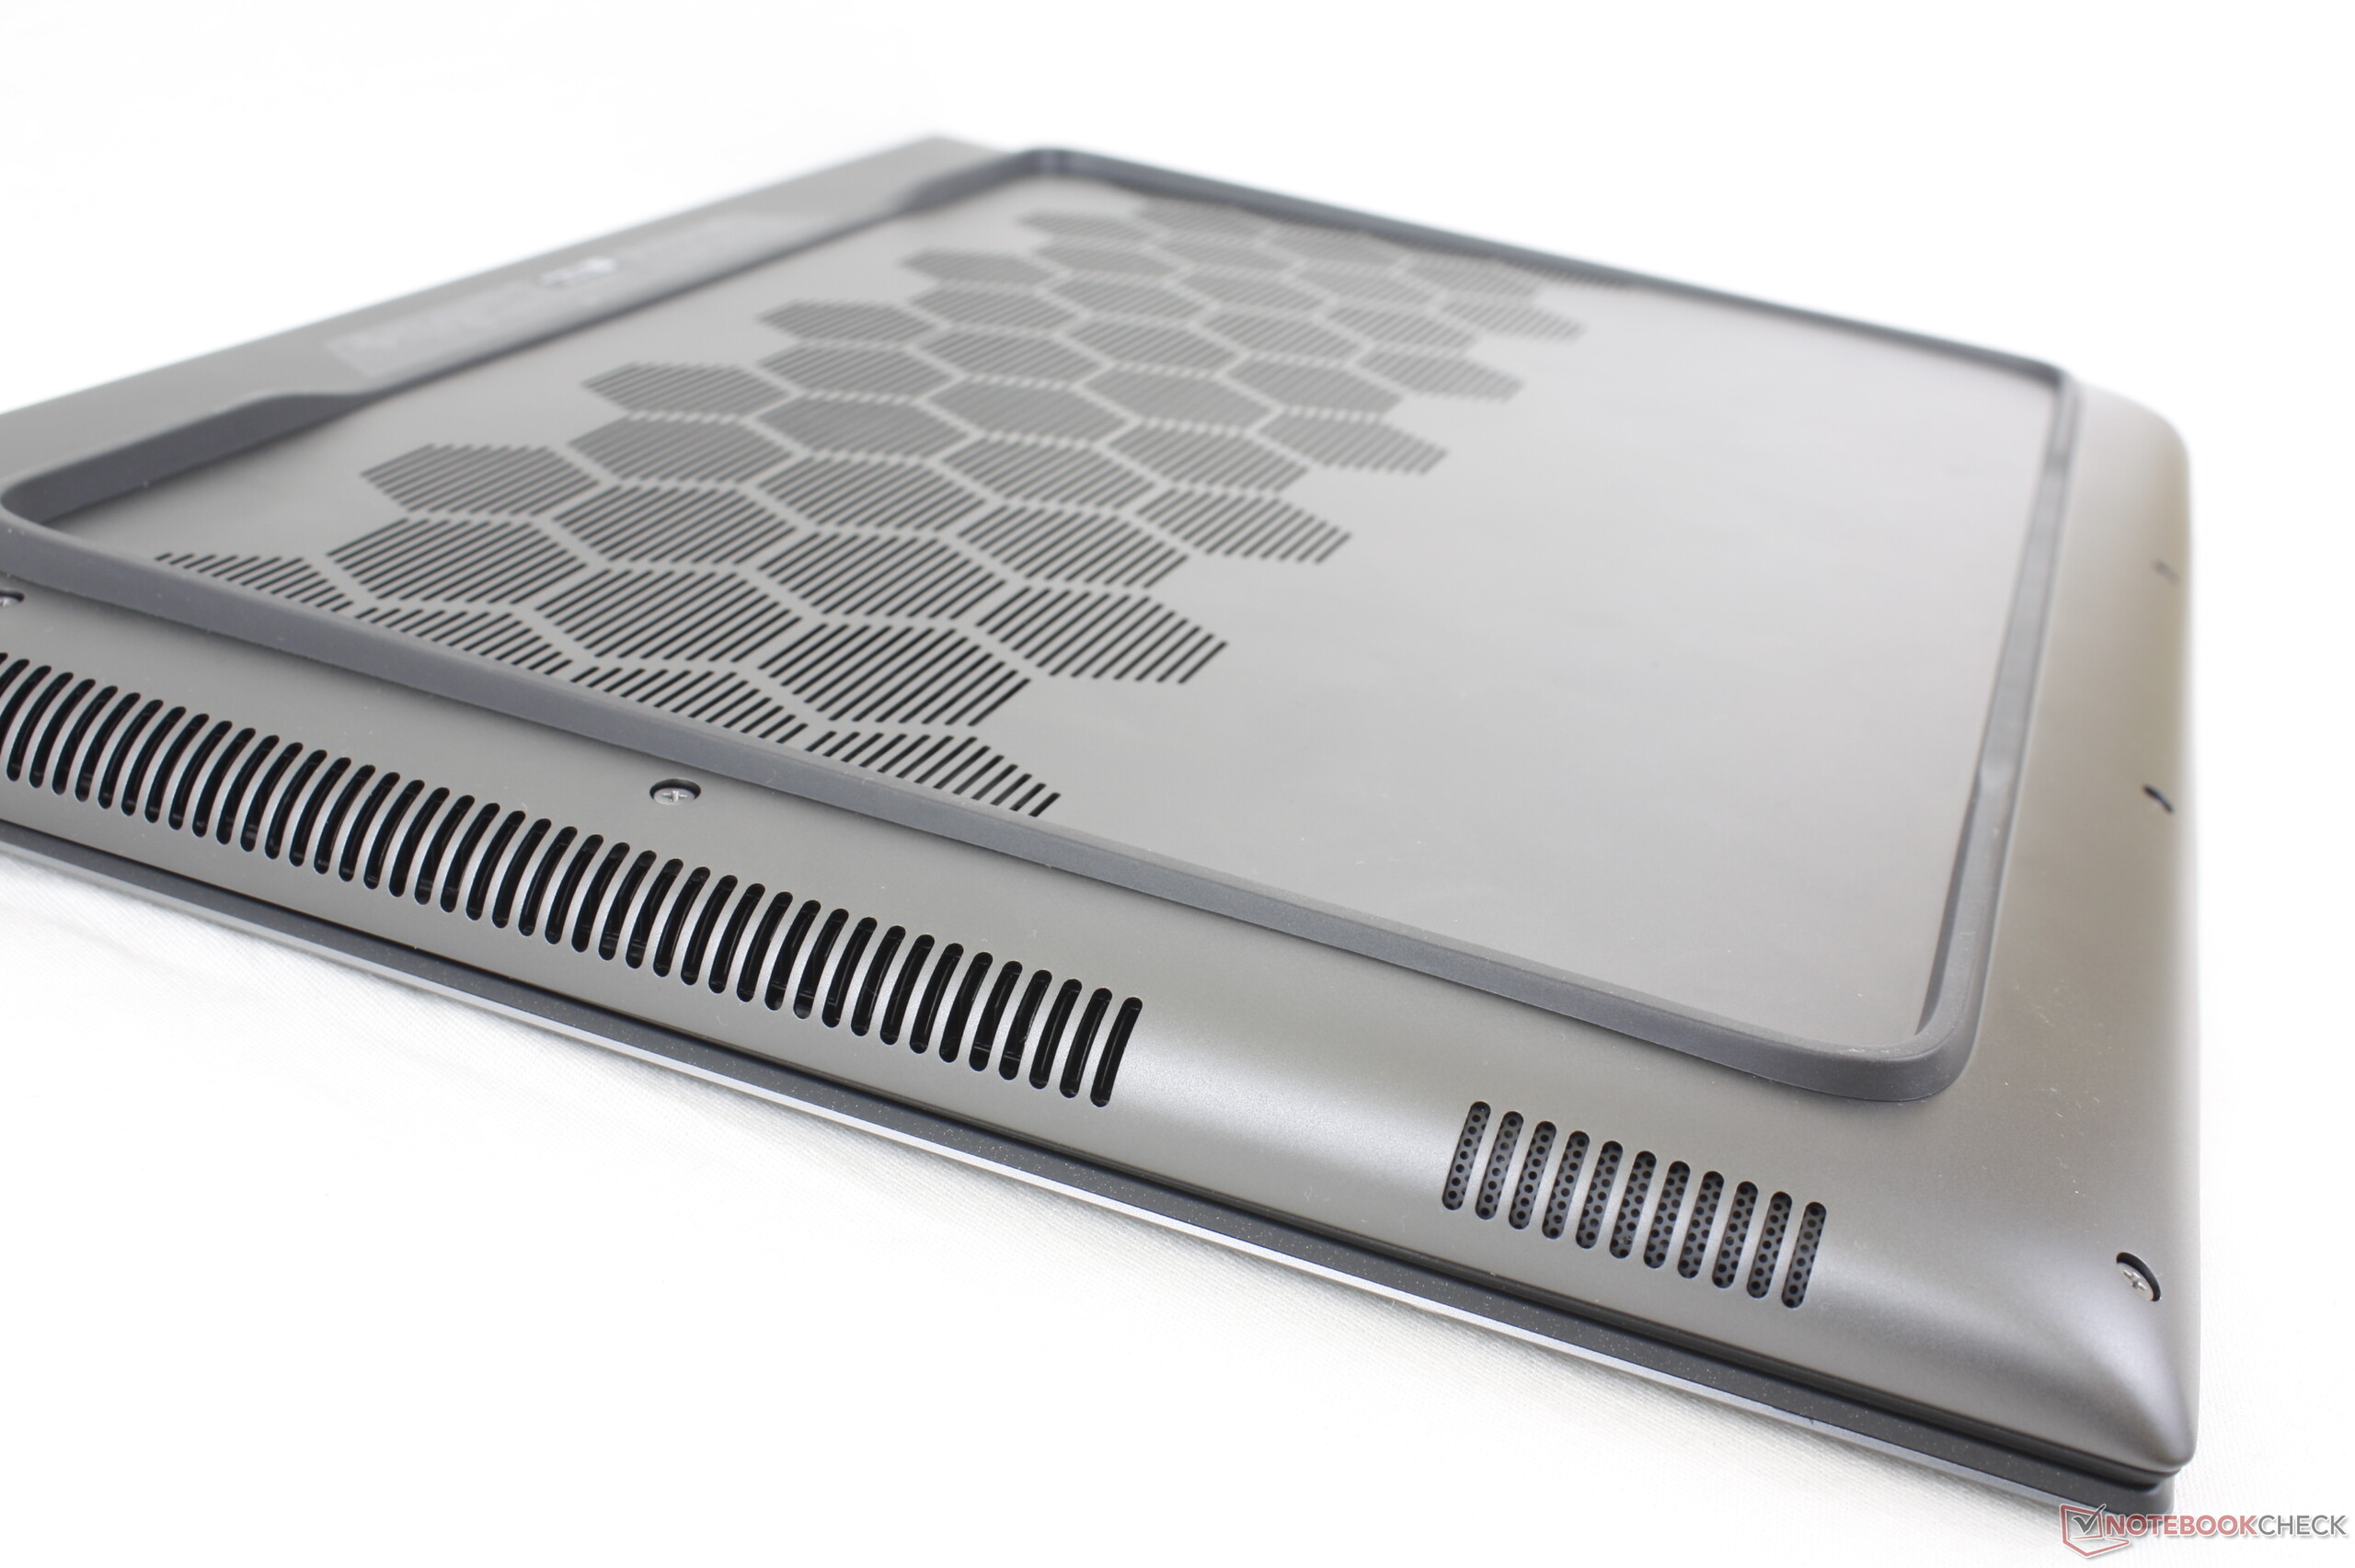
Análisis del Alienware m16 R1: Máquina de juegos QHD con RTX 4060 y Thunderbolt 4
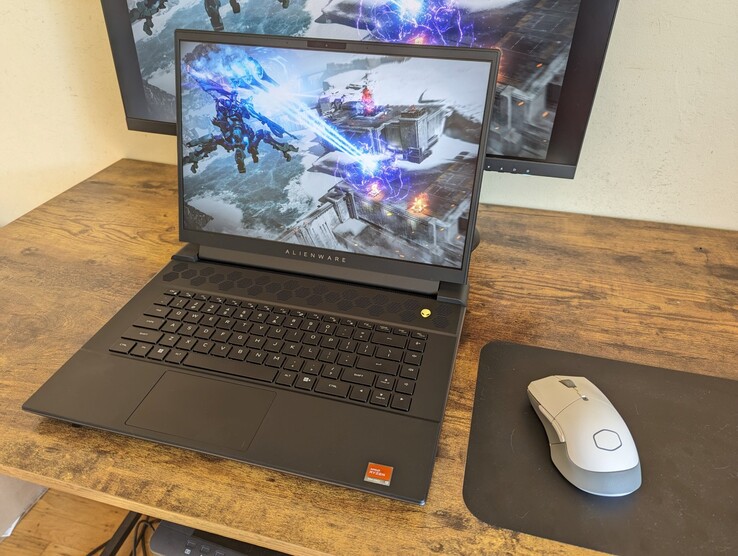
Los juegos, el renderizado y la creación de contenidos serán probablemente las principales áreas de aplicación del Alienware m16 R1. Raptor Lake y Ada Lovelace ofrecen la potencia de cálculo necesaria. Nuestra variante es un modelo básico de la serie m16-R1; hace poco tuvimos unmodelo hermano del extremo superior de la escala de rendimiento. Entre los dispositivos de la competencia se encuentran el Acer Predator Helios 16 PH16-71el Medion Erazer Defender P40y el Lenovo Legion Pro 5 16IRX8el XMG Pro 15 (E23) y elAorus 15 BSF.
Encontrará información sobre la carcasa, el equipo y los dispositivos de entrada ennuestro análisis del modelo hermano casi idéntico.
Posibles contendientes en la comparación
Valoración | Fecha | Modelo | Peso | Altura | Tamaño | Resolución | Precio |
|---|---|---|---|---|---|---|---|
| 88.3 % v7 (old) | 09/2023 | Alienware m16 R1 Intel i7-13700HX, GeForce RTX 4060 Laptop GPU | 3 kg | 25.4 mm | 16.00" | 2560x1600 | |
| 89.5 % v7 (old) | 07/2023 | Acer Predator Helios 16 PH16-71-731Q i7-13700HX, GeForce RTX 4060 Laptop GPU | 2.6 kg | 26.9 mm | 16.00" | 2560x1600 | |
| 84.6 % v7 (old) | 05/2023 | Medion Erazer Defender P40 i7-13700HX, GeForce RTX 4060 Laptop GPU | 2.9 kg | 33 mm | 17.30" | 2560x1440 | |
| 87.9 % v7 (old) | 05/2023 | Lenovo Legion Pro 5 16IRX8 i7-13700HX, GeForce RTX 4060 Laptop GPU | 2.5 kg | 26.8 mm | 16.00" | 2560x1600 | |
| 86.2 % v7 (old) | 07/2023 | Schenker XMG Pro 15 (E23) i9-13900HX, GeForce RTX 4060 Laptop GPU | 2.4 kg | 24.9 mm | 15.60" | 2560x1440 | |
| 85.7 % v7 (old) | 08/2023 | Aorus 15 BSF i7-13700H, GeForce RTX 4070 Laptop GPU | 2.4 kg | 20.9 mm | 15.60" | 2560x1440 |
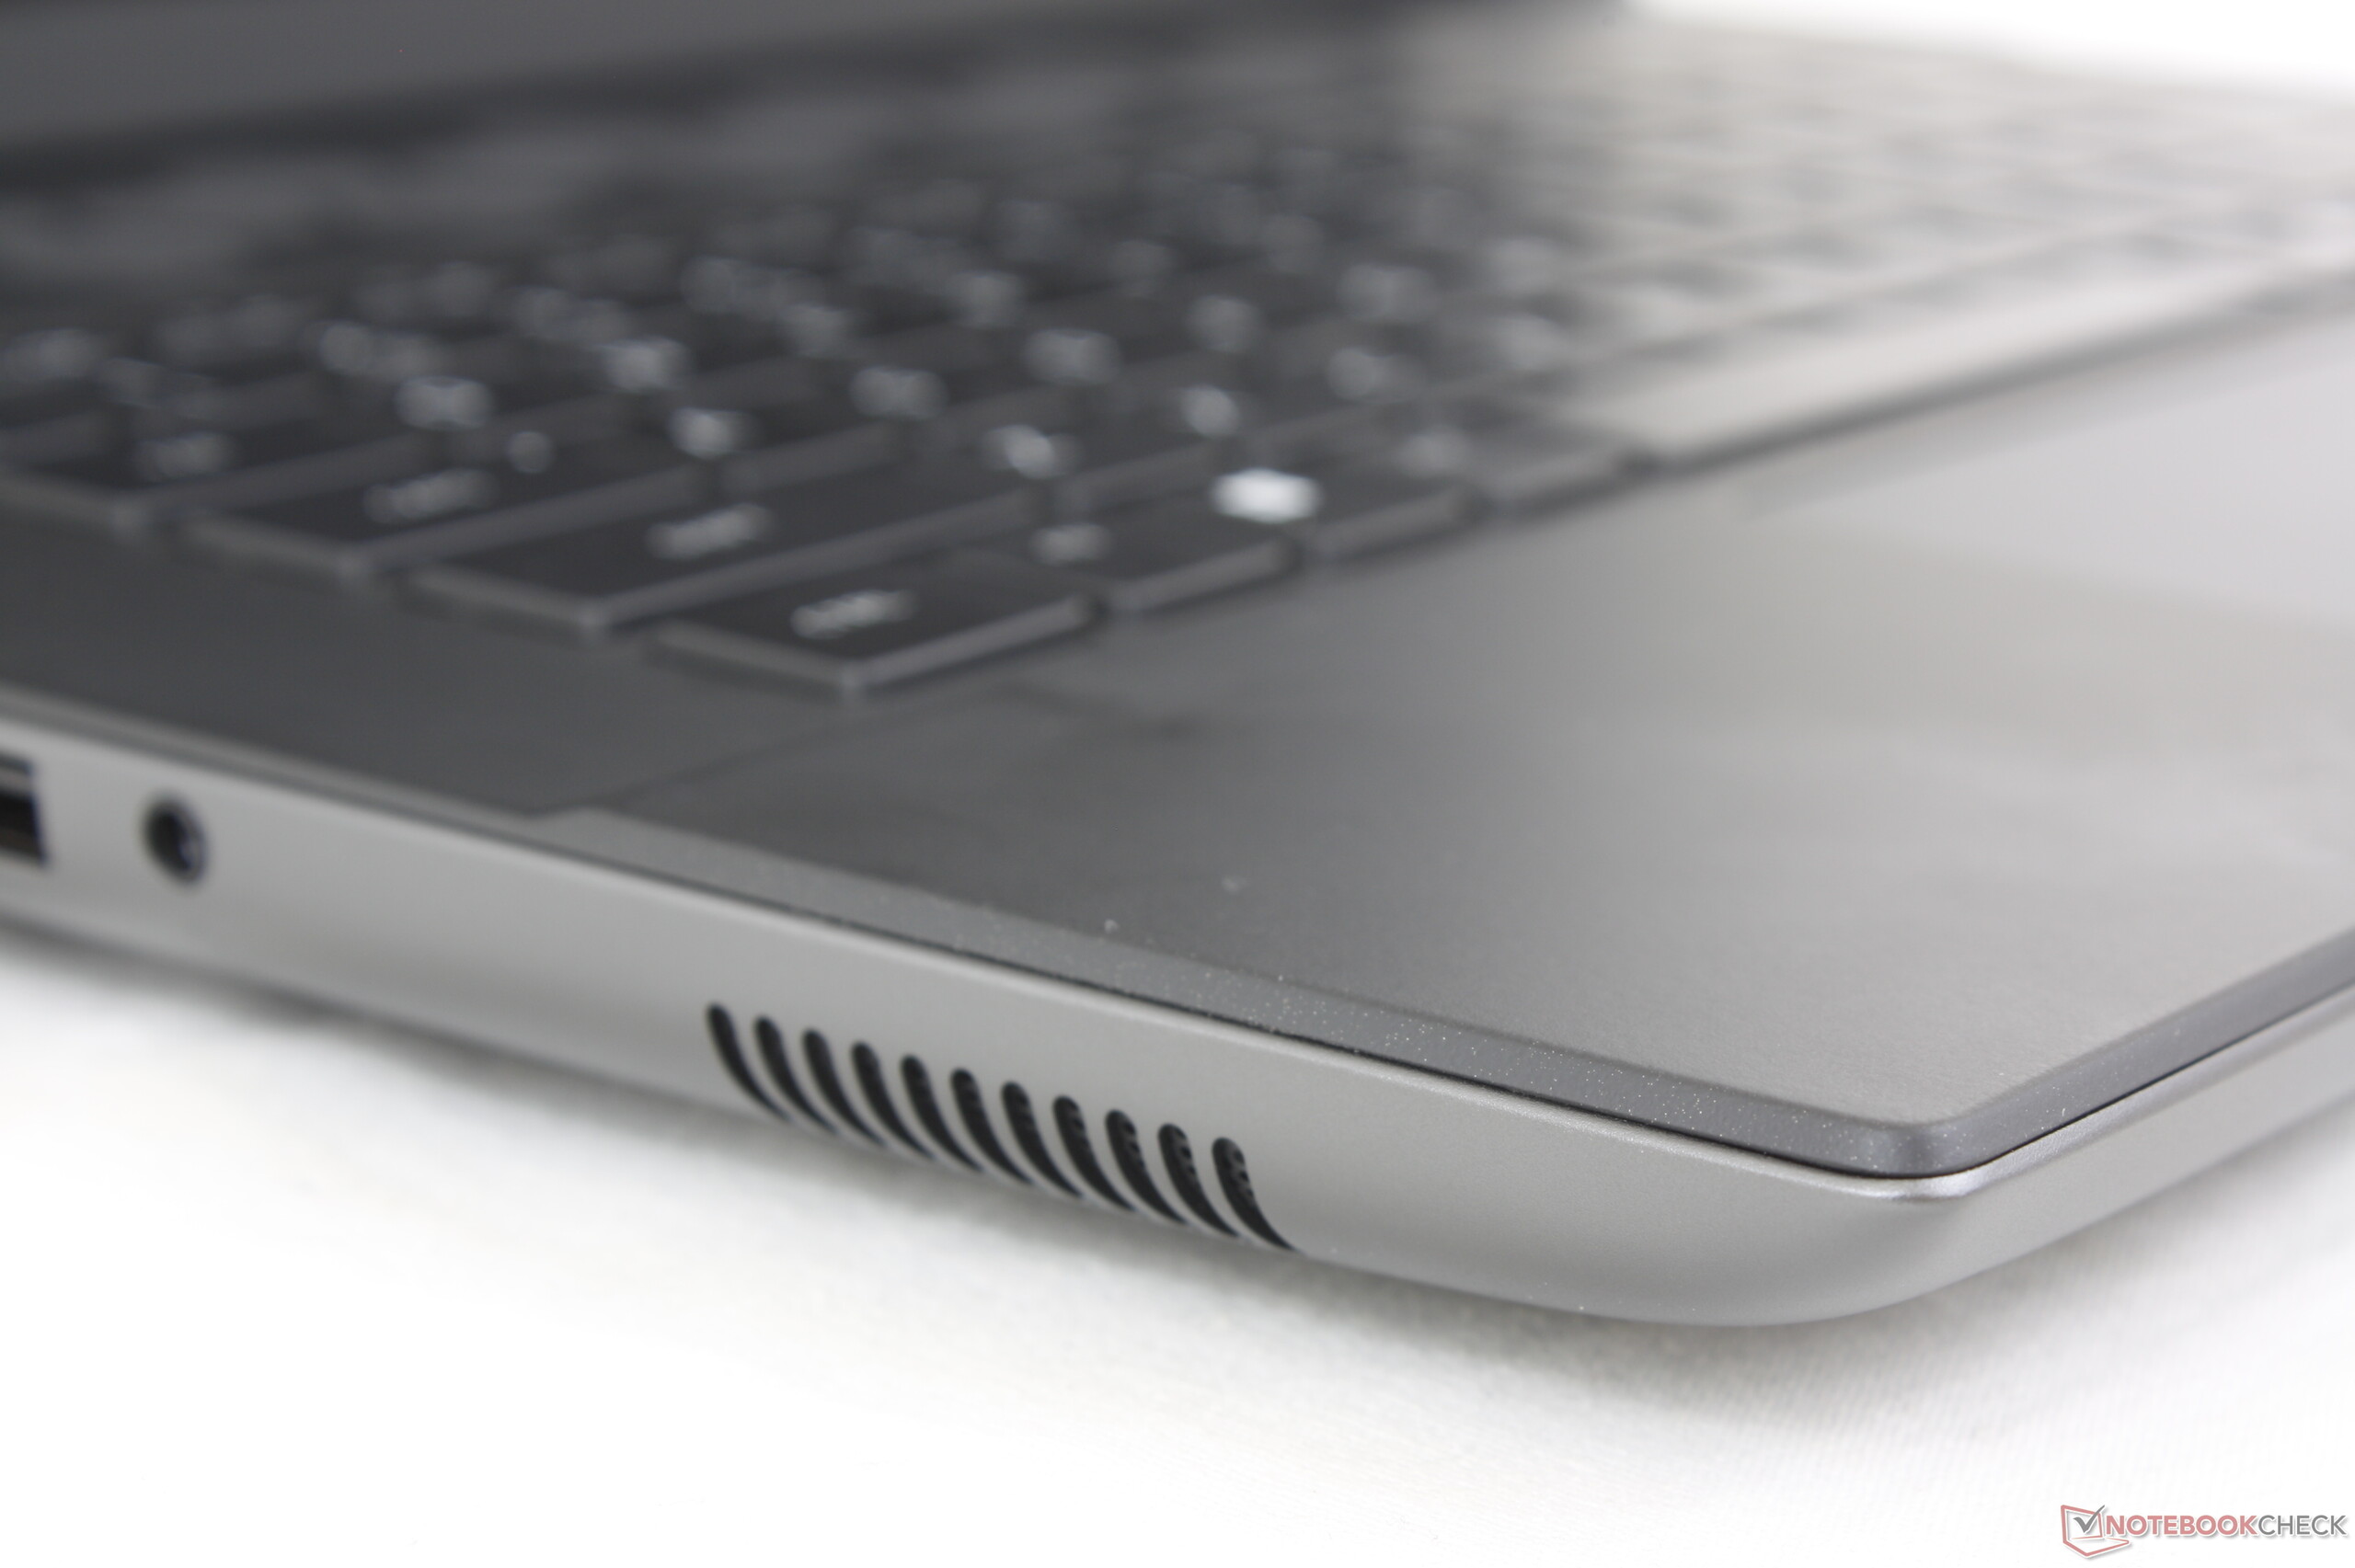
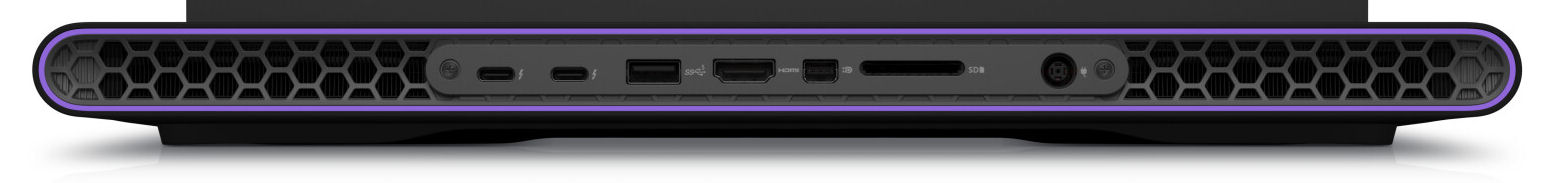
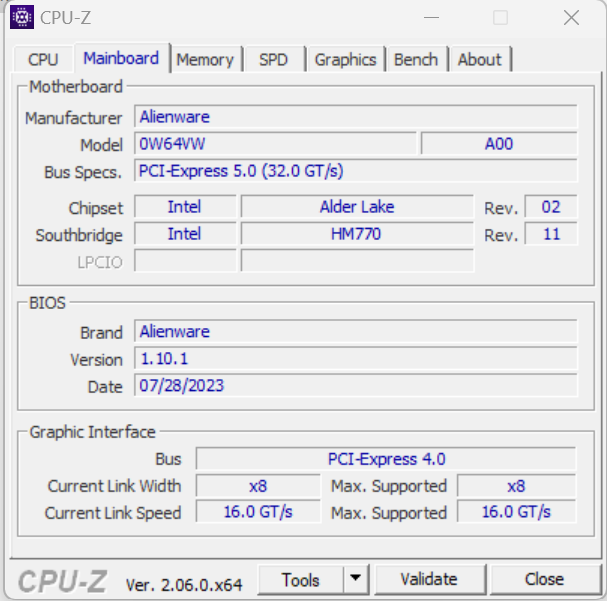
Equipos y dispositivos de entrada - Diferencias con el modelo AMD
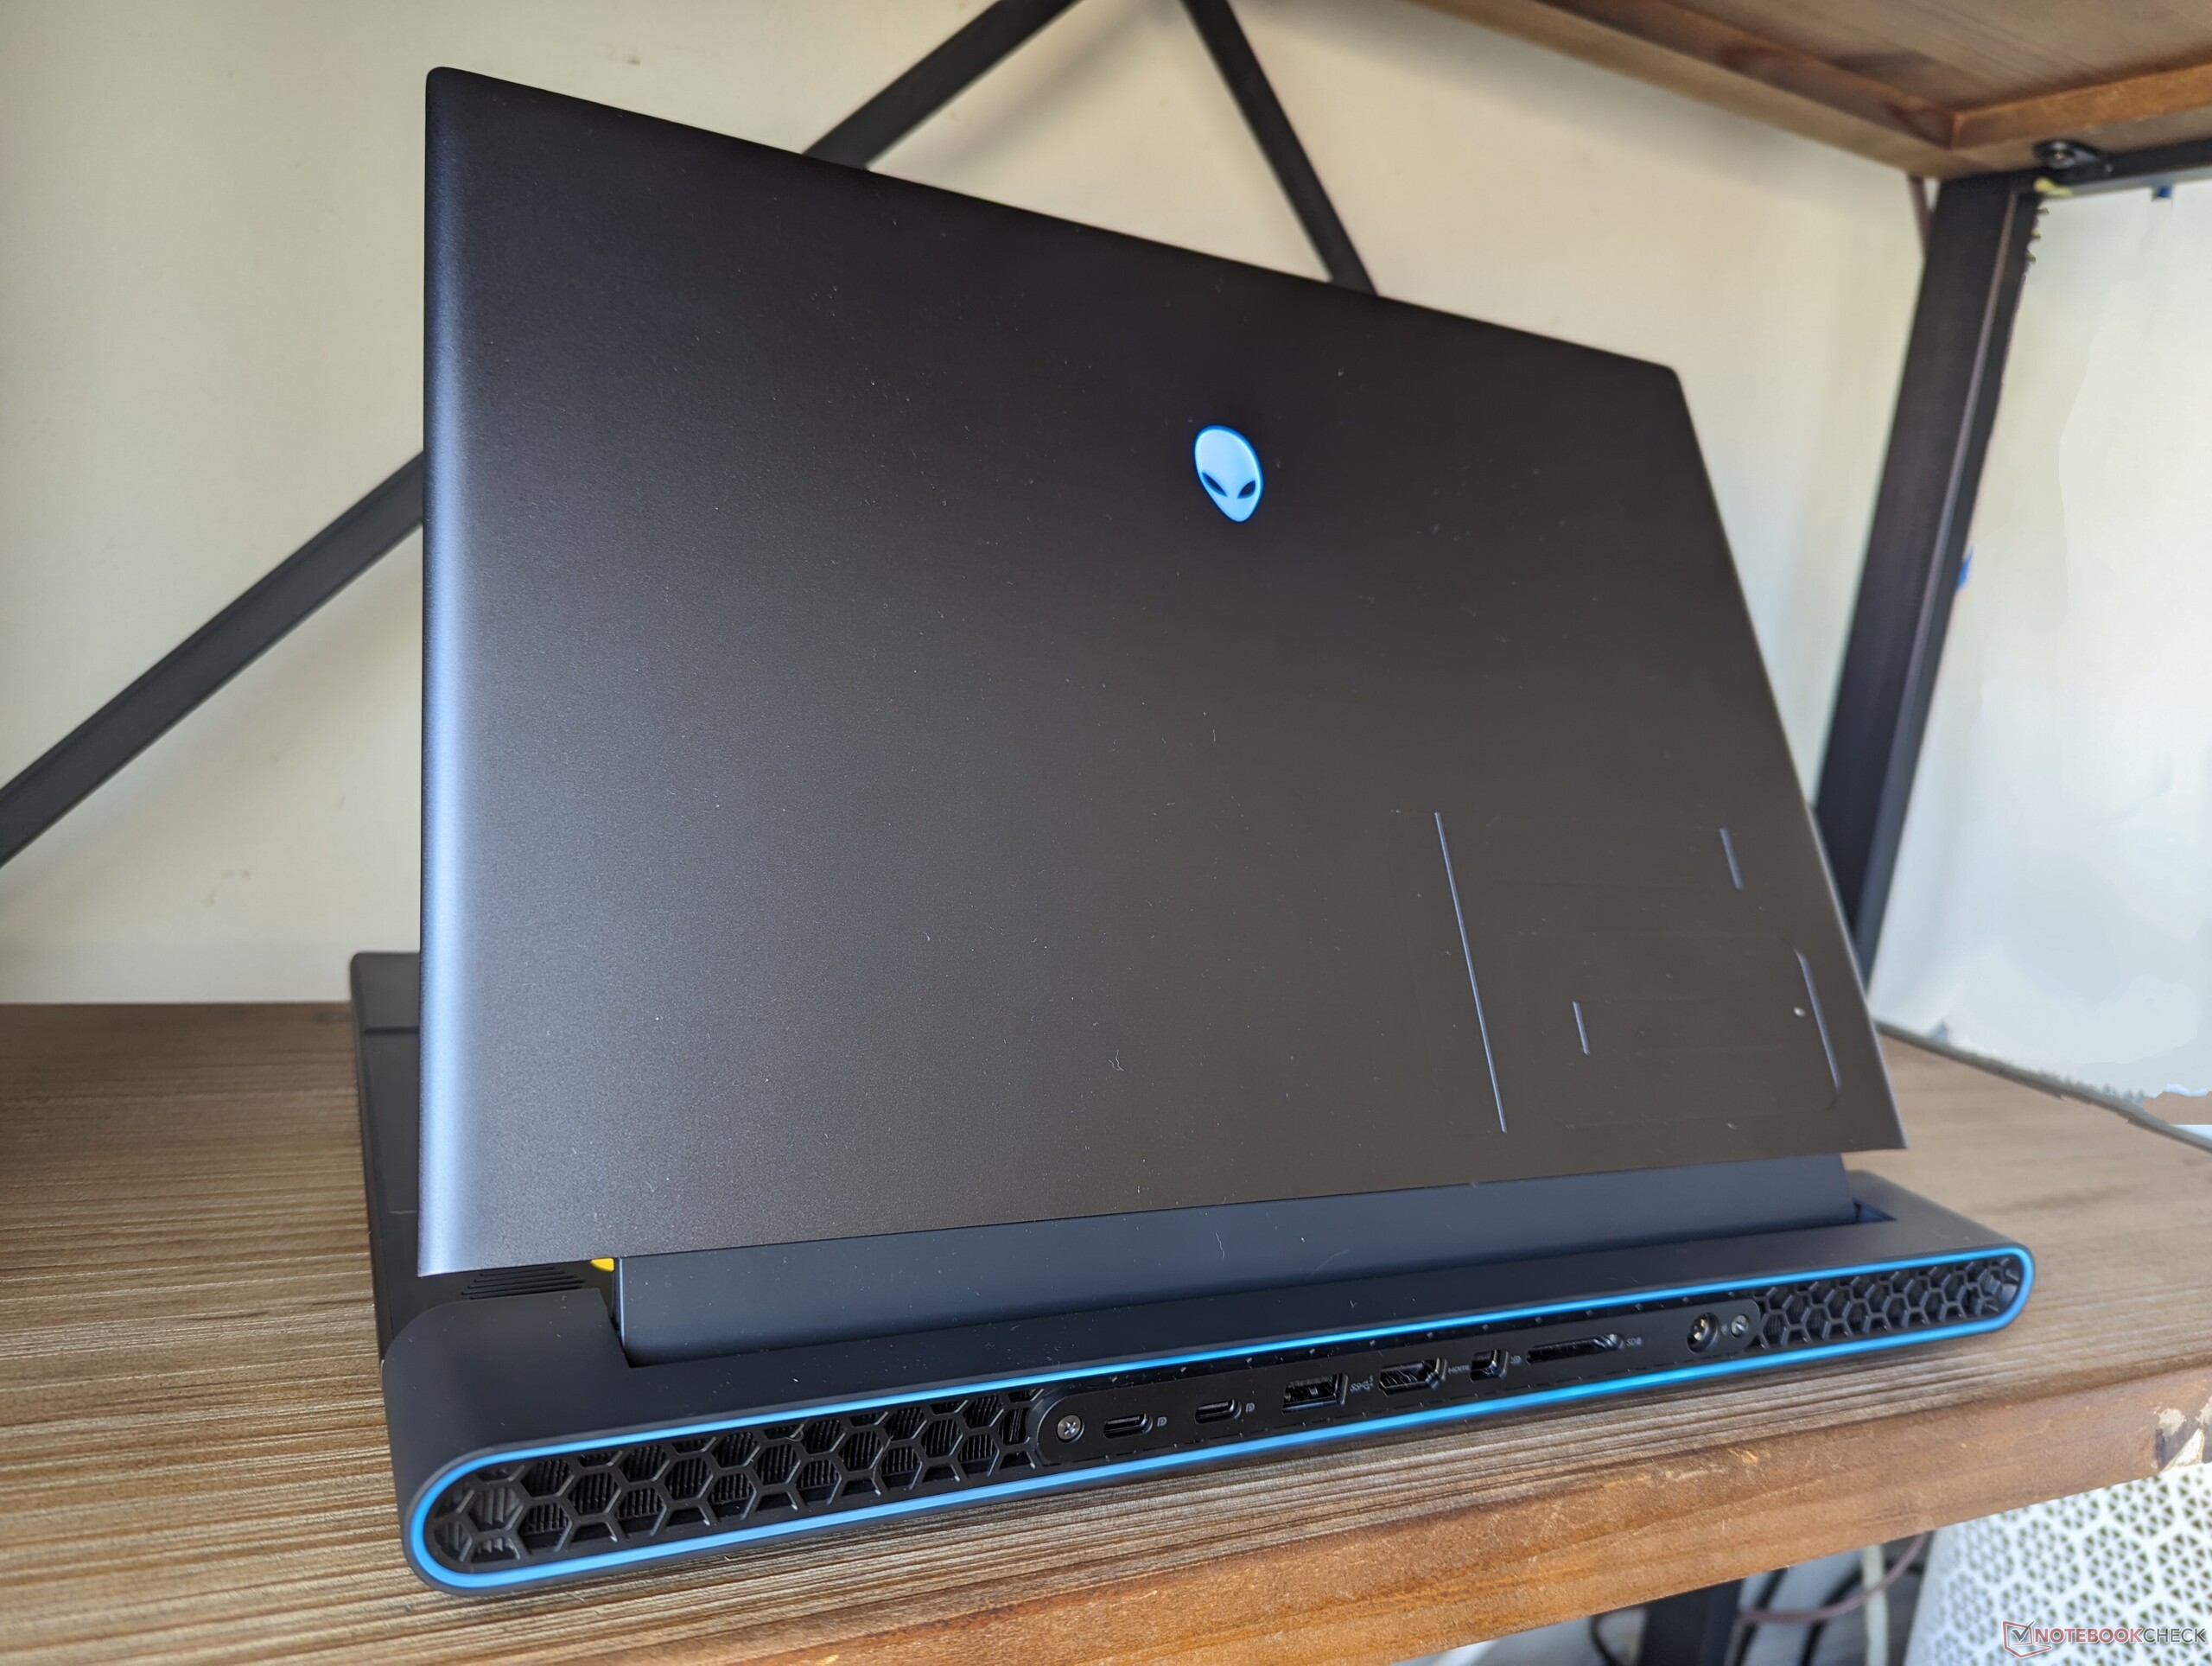
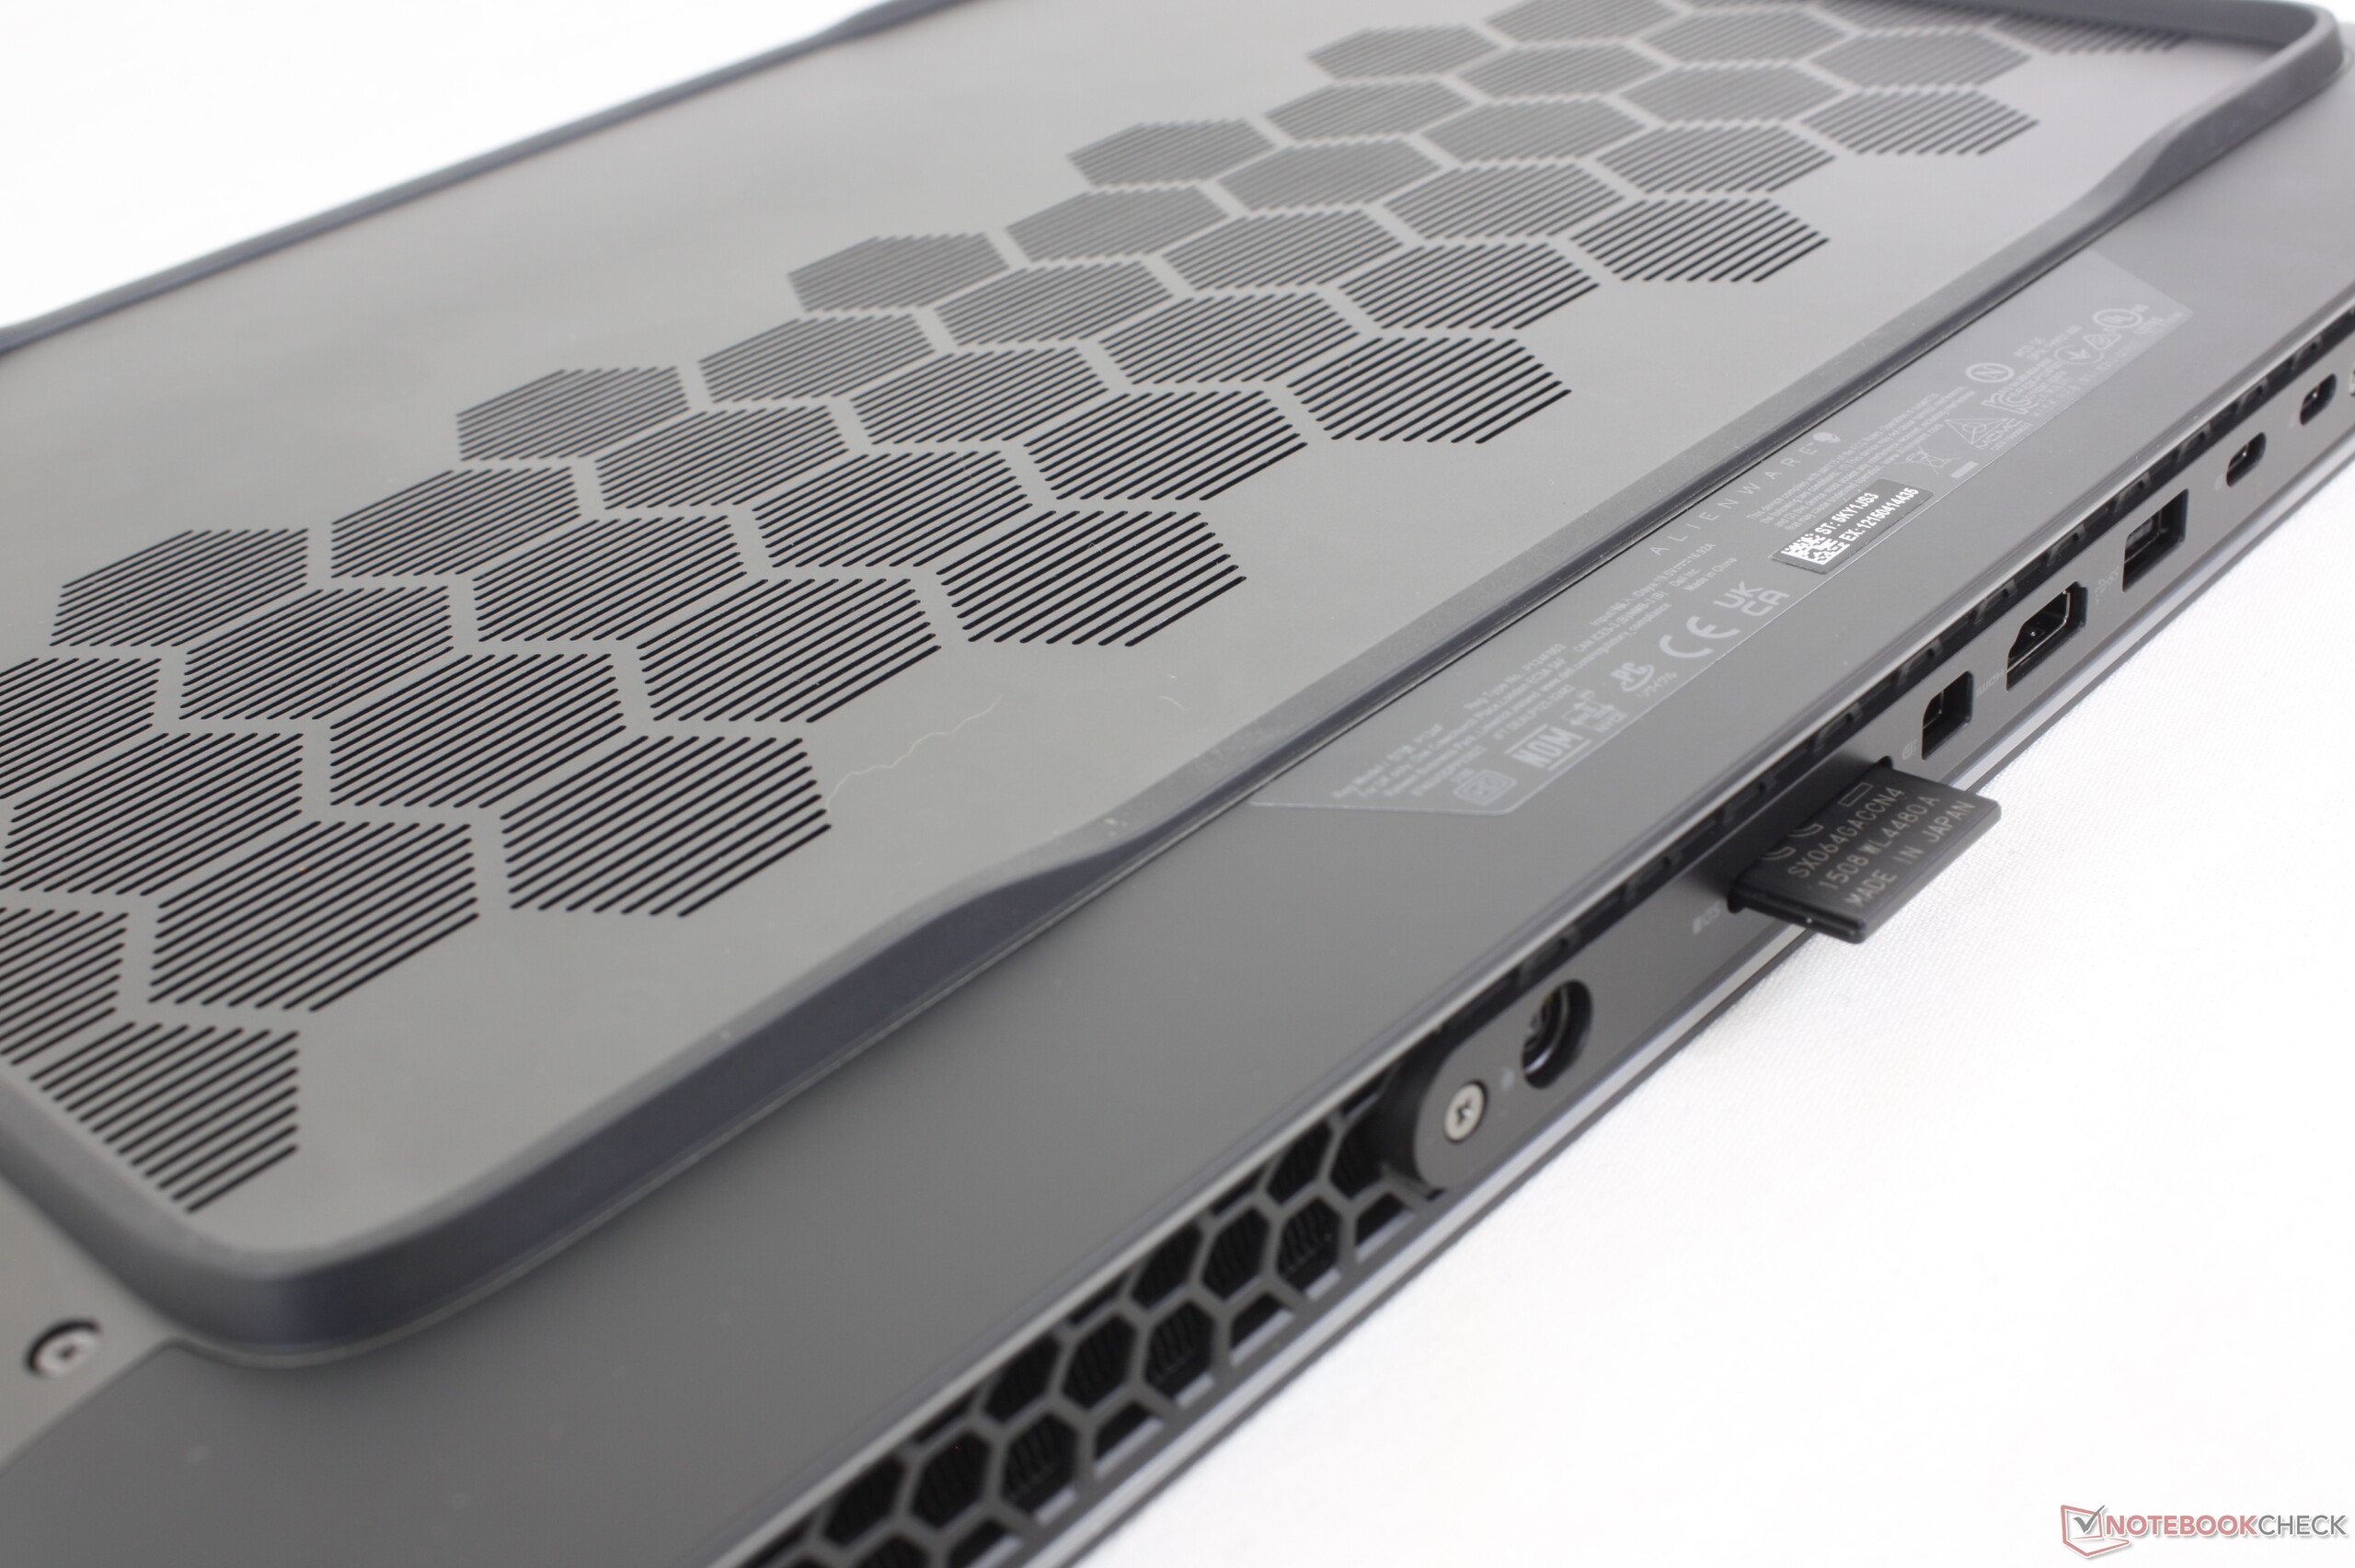
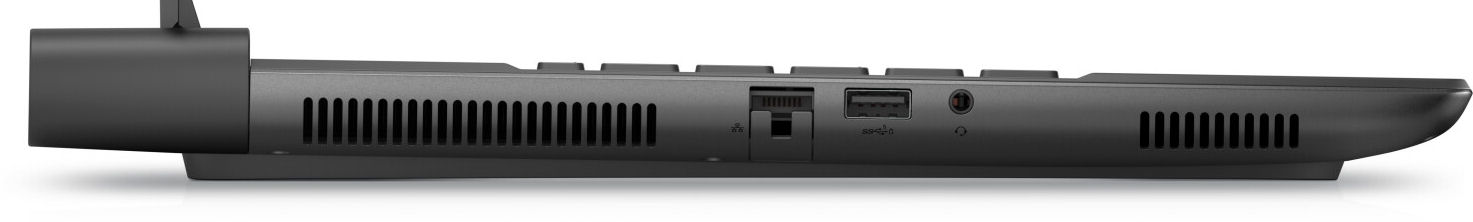
- Los dos puertos USB-C de los modelos m16 basados en Intel soportan Thunderbolt 4 (AMD: sólo USB 3.2 Gen 2), incluyendo DisplayPort y Power Delivery. Pero cuidado: alimentar el portátil o cargar la batería por USB-C no es posible. Los puertos USB-C sólo pueden suministrar energía.
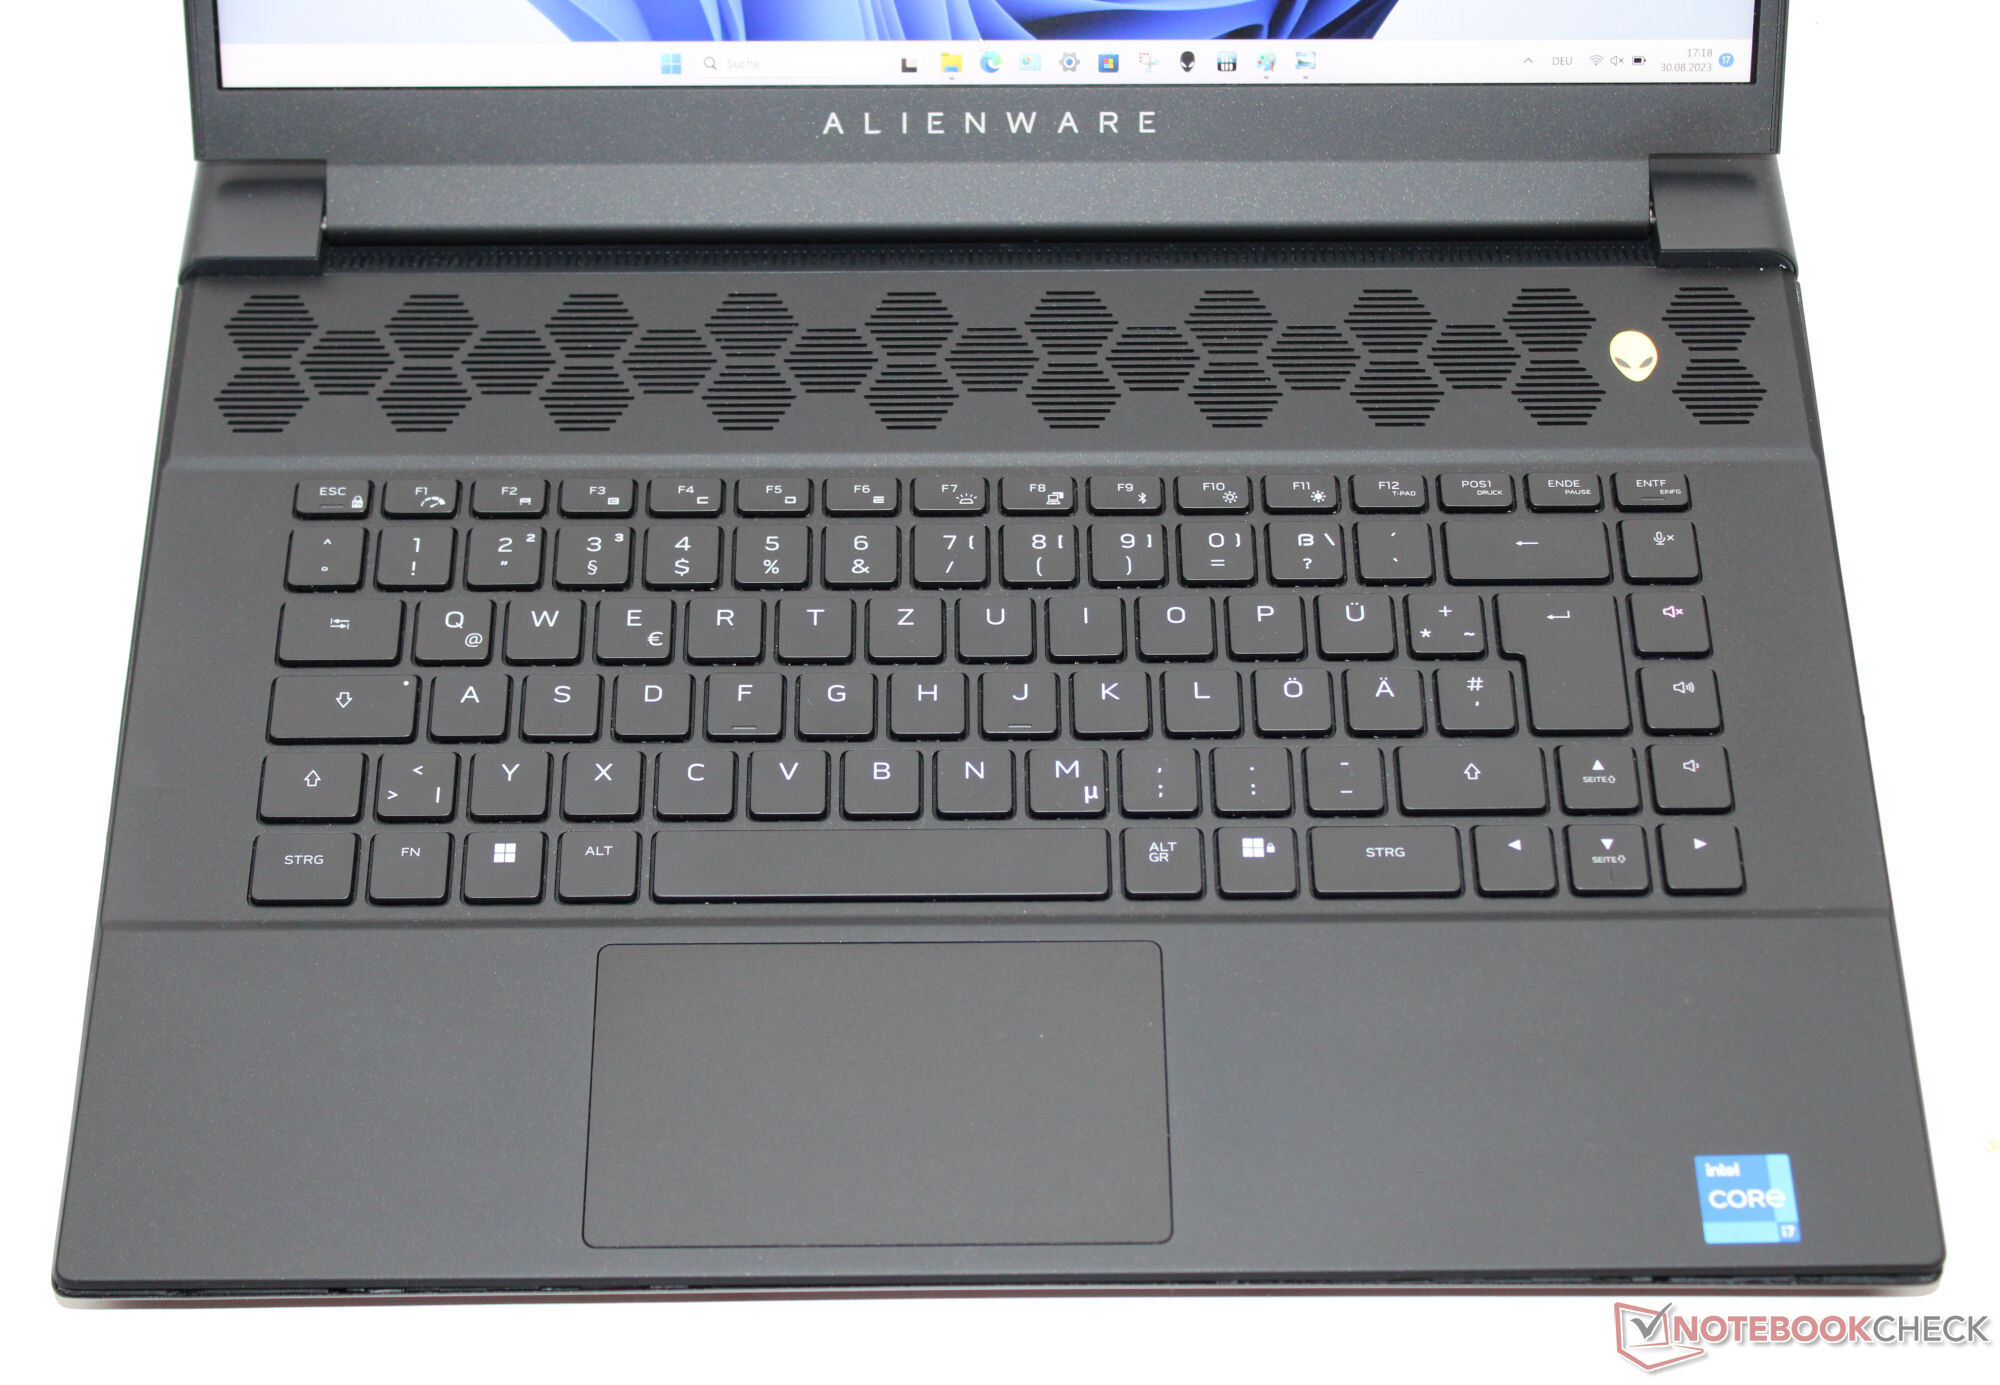
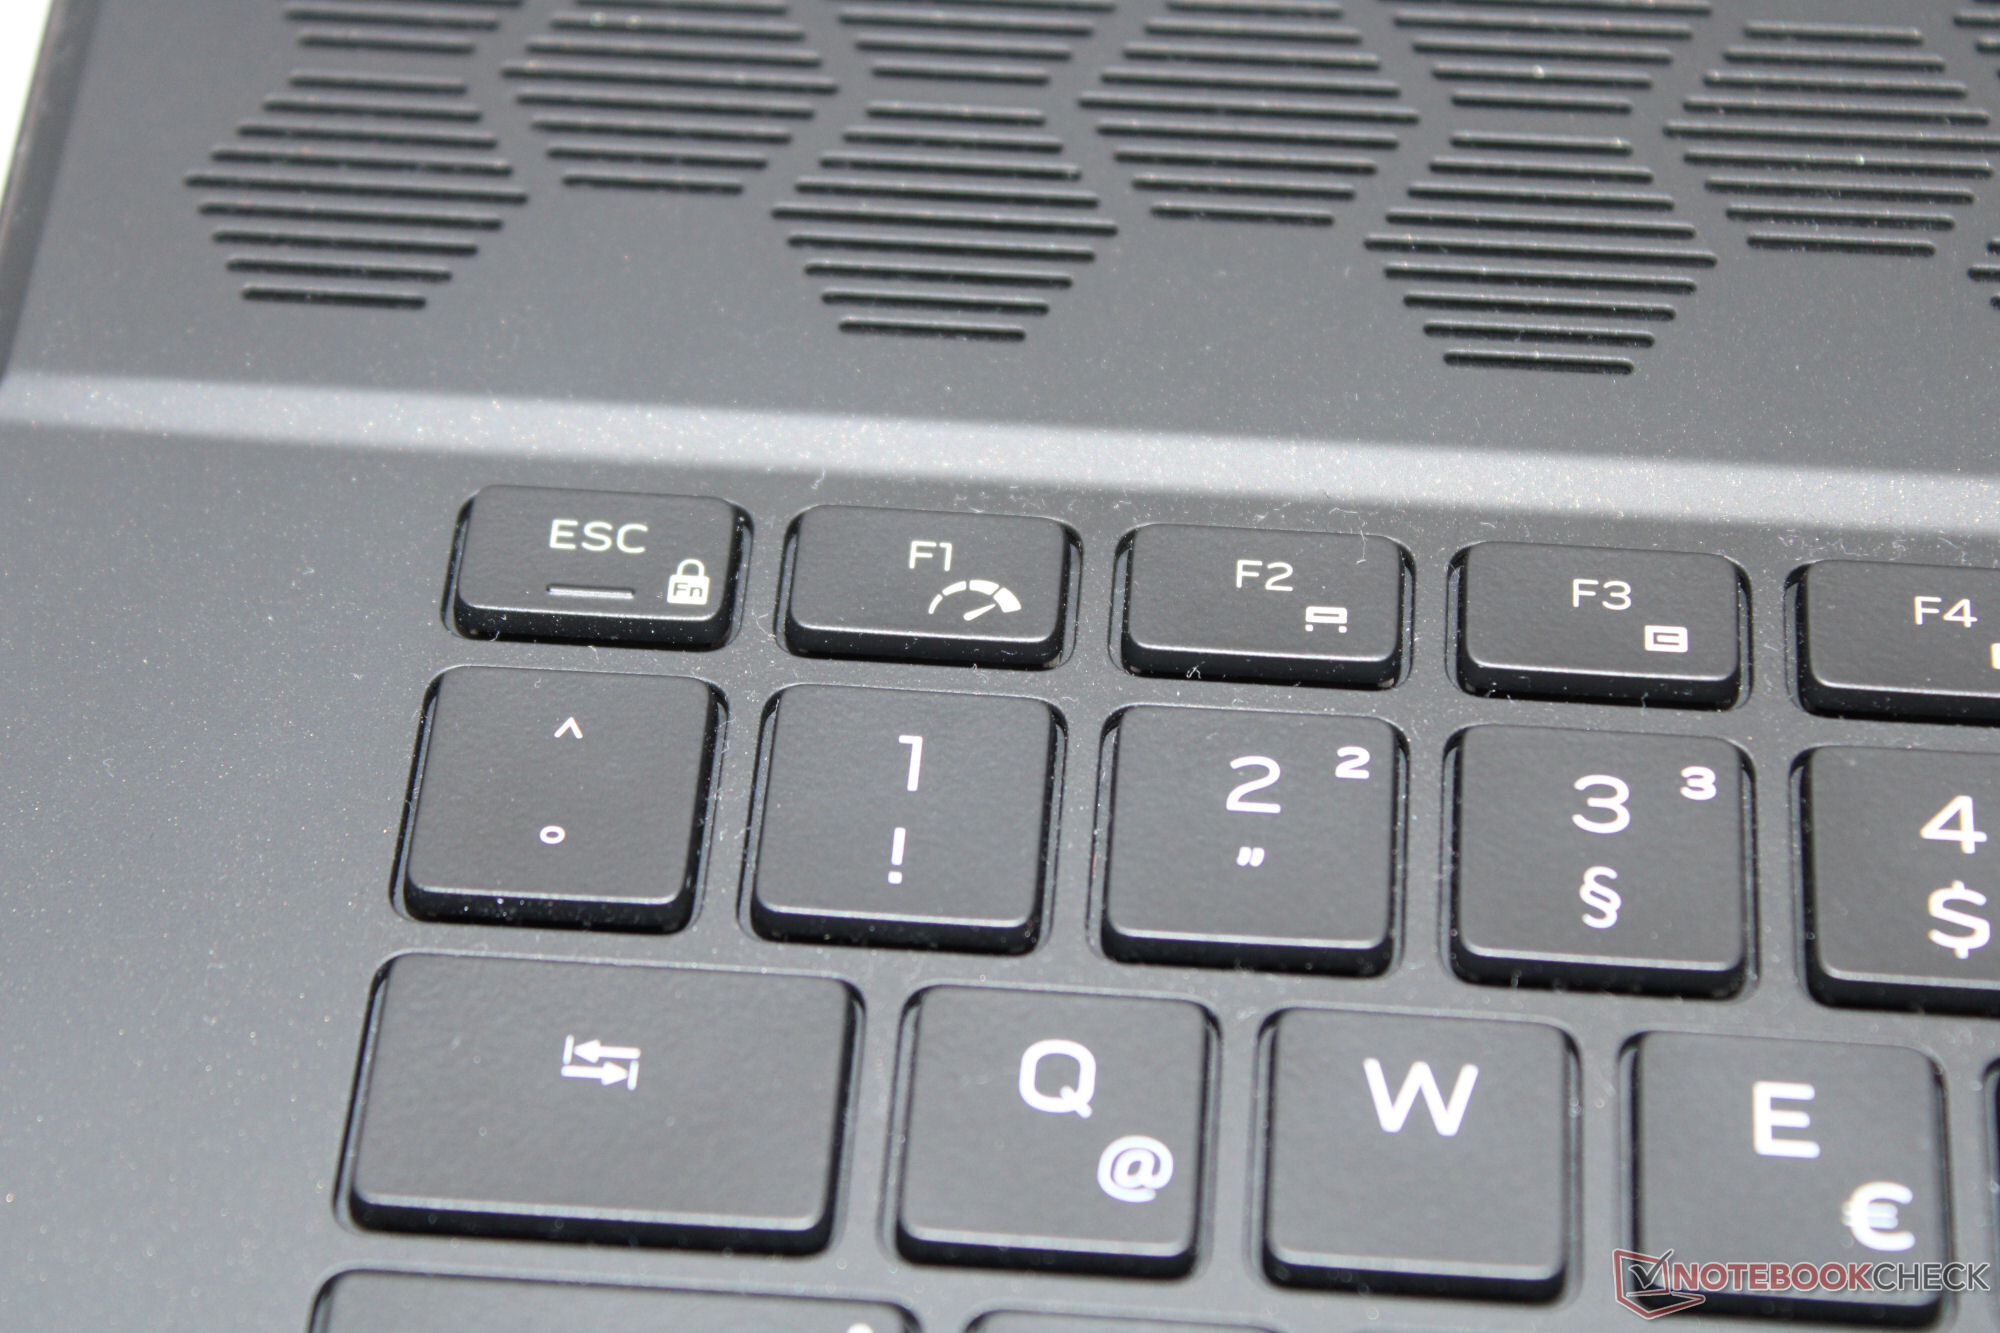
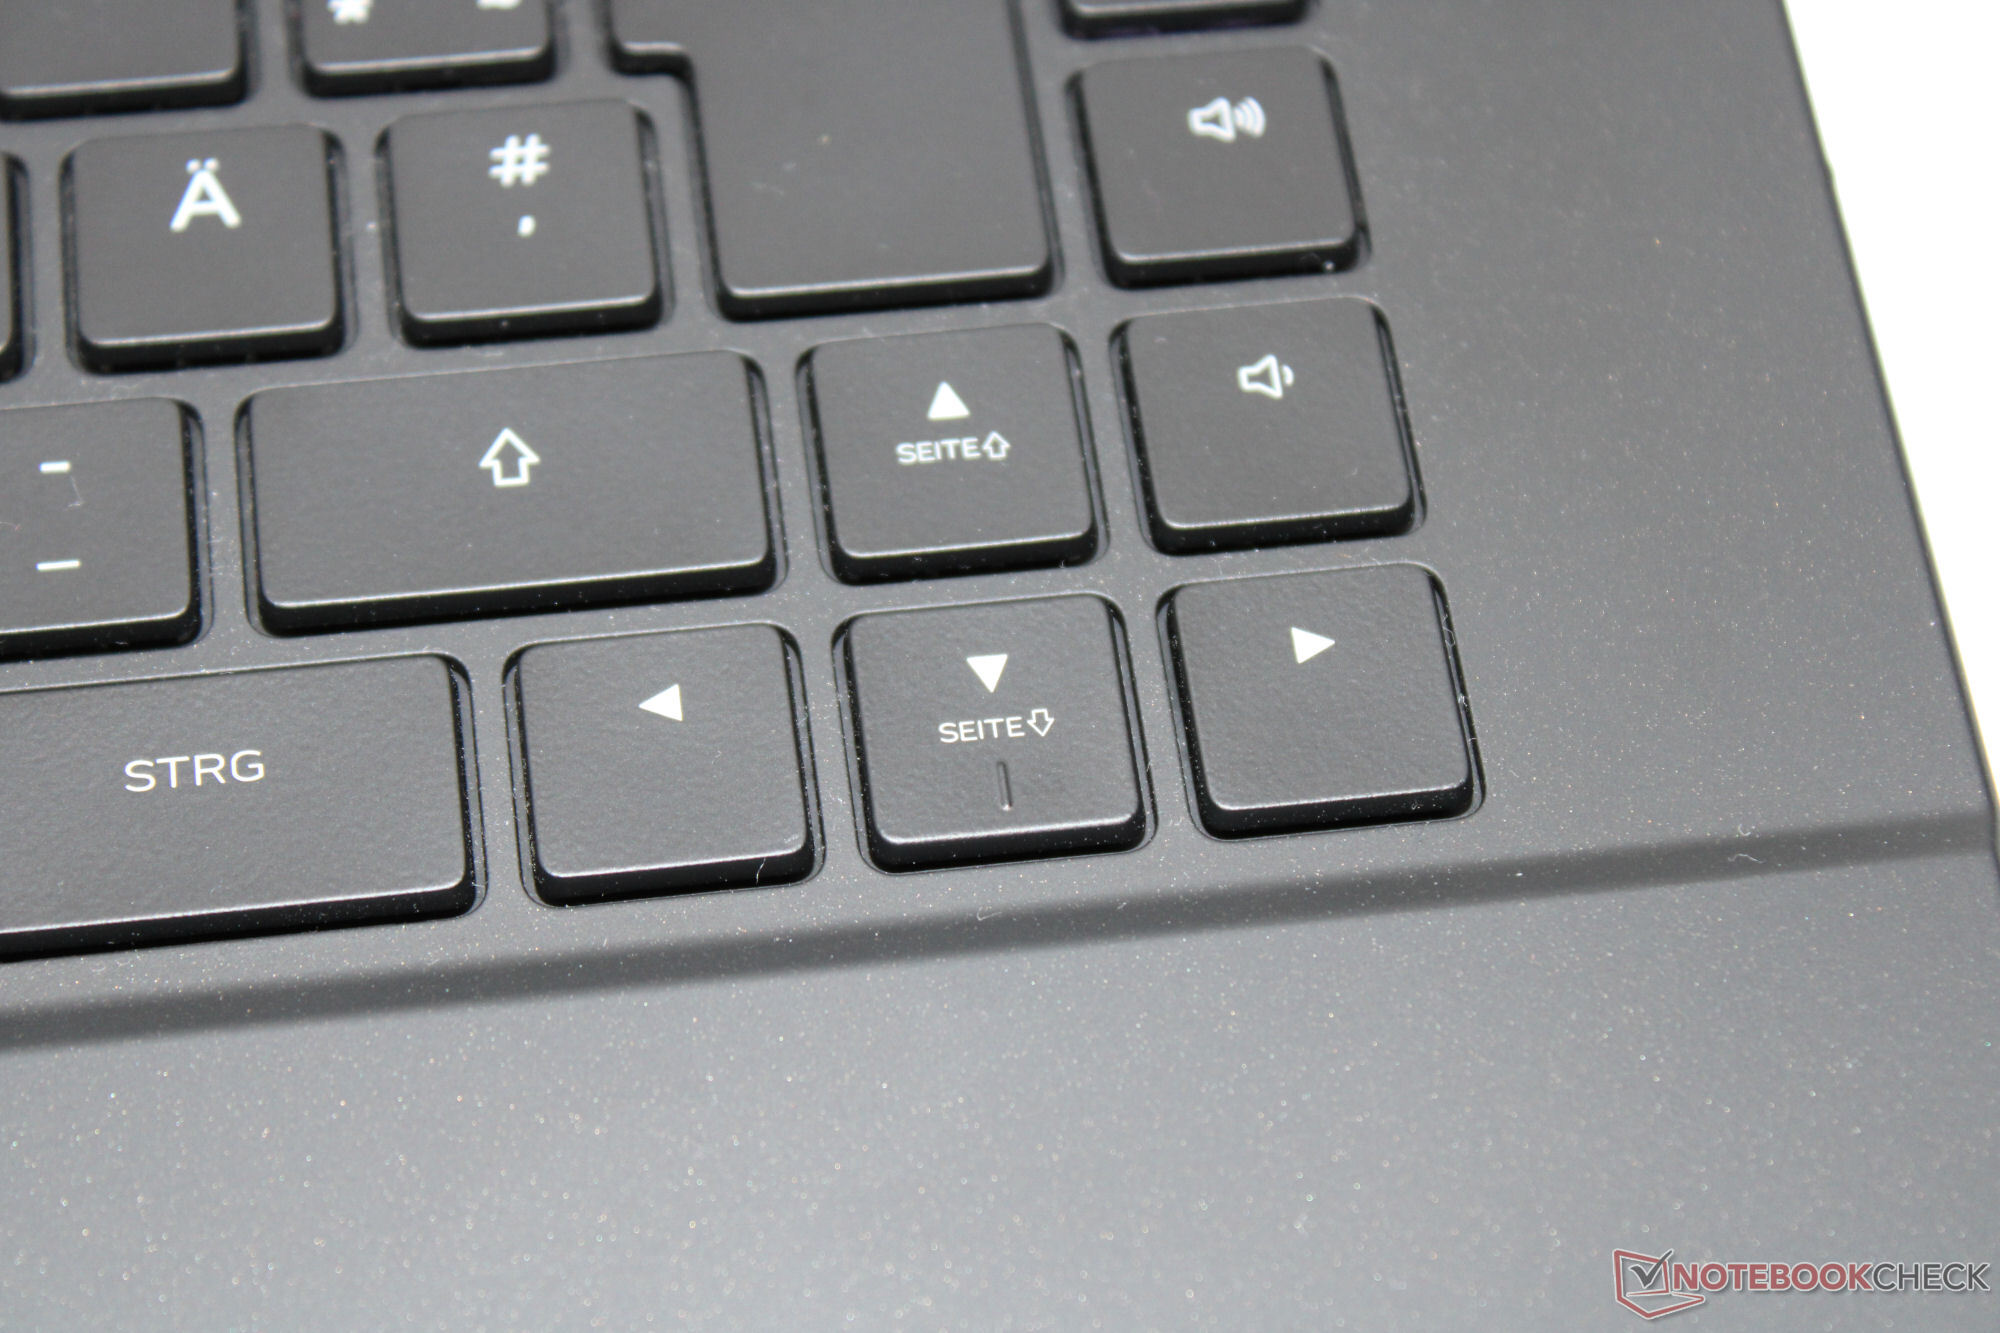
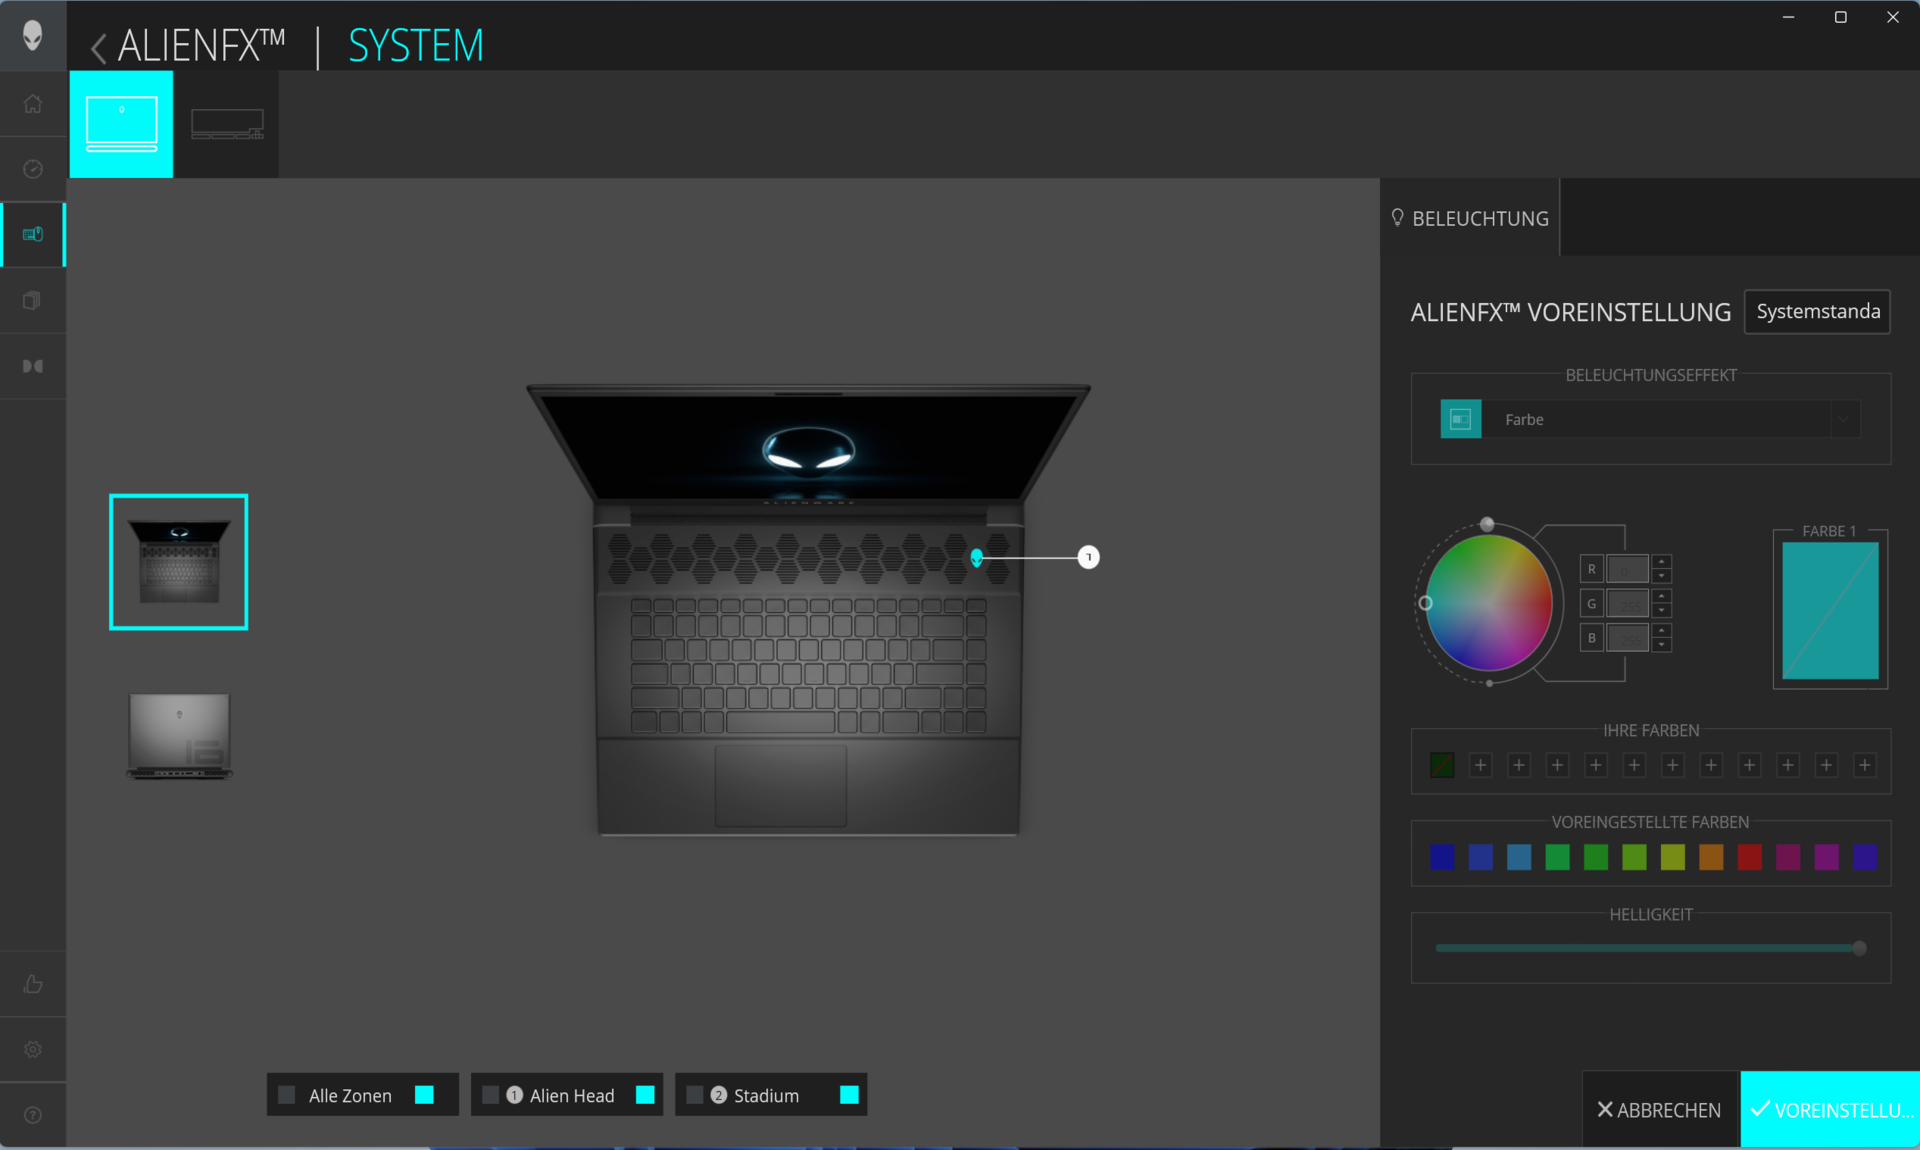
- En lugar del teclado mecánico (CherryMX) delmodelo hermano, nuestro dispositivo de pruebas tiene un teclado de membrana. Sus teclas ofrecen un desplazamiento medio, un punto de presión muy claro y una resistencia muy firme. También es posible la iluminación individual de las teclas (RGB).
| SD Card Reader | |
| average JPG Copy Test (av. of 3 runs) | |
| Alienware m16 R1 AMD (Toshiba Exceria Pro SDXC 64 GB UHS-II) | |
| Alienware m16 R1 Intel (AV PRO microSD 128 GB V60) | |
| Media de la clase Gaming (20.9 - 210, n=54, últimos 2 años) | |
| Medion Erazer Defender P40 (AV PRO microSD 128 GB V60) | |
| Schenker XMG Pro 15 (E23) | |
| Acer Predator Helios 16 PH16-71-731Q | |
| maximum AS SSD Seq Read Test (1GB) | |
| Alienware m16 R1 AMD (Toshiba Exceria Pro SDXC 64 GB UHS-II) | |
| Alienware m16 R1 Intel (AV PRO microSD 128 GB V60) | |
| Media de la clase Gaming (25.5 - 261, n=51, últimos 2 años) | |
| Medion Erazer Defender P40 (AV PRO microSD 128 GB V60) | |
| Schenker XMG Pro 15 (E23) | |
| Acer Predator Helios 16 PH16-71-731Q | |


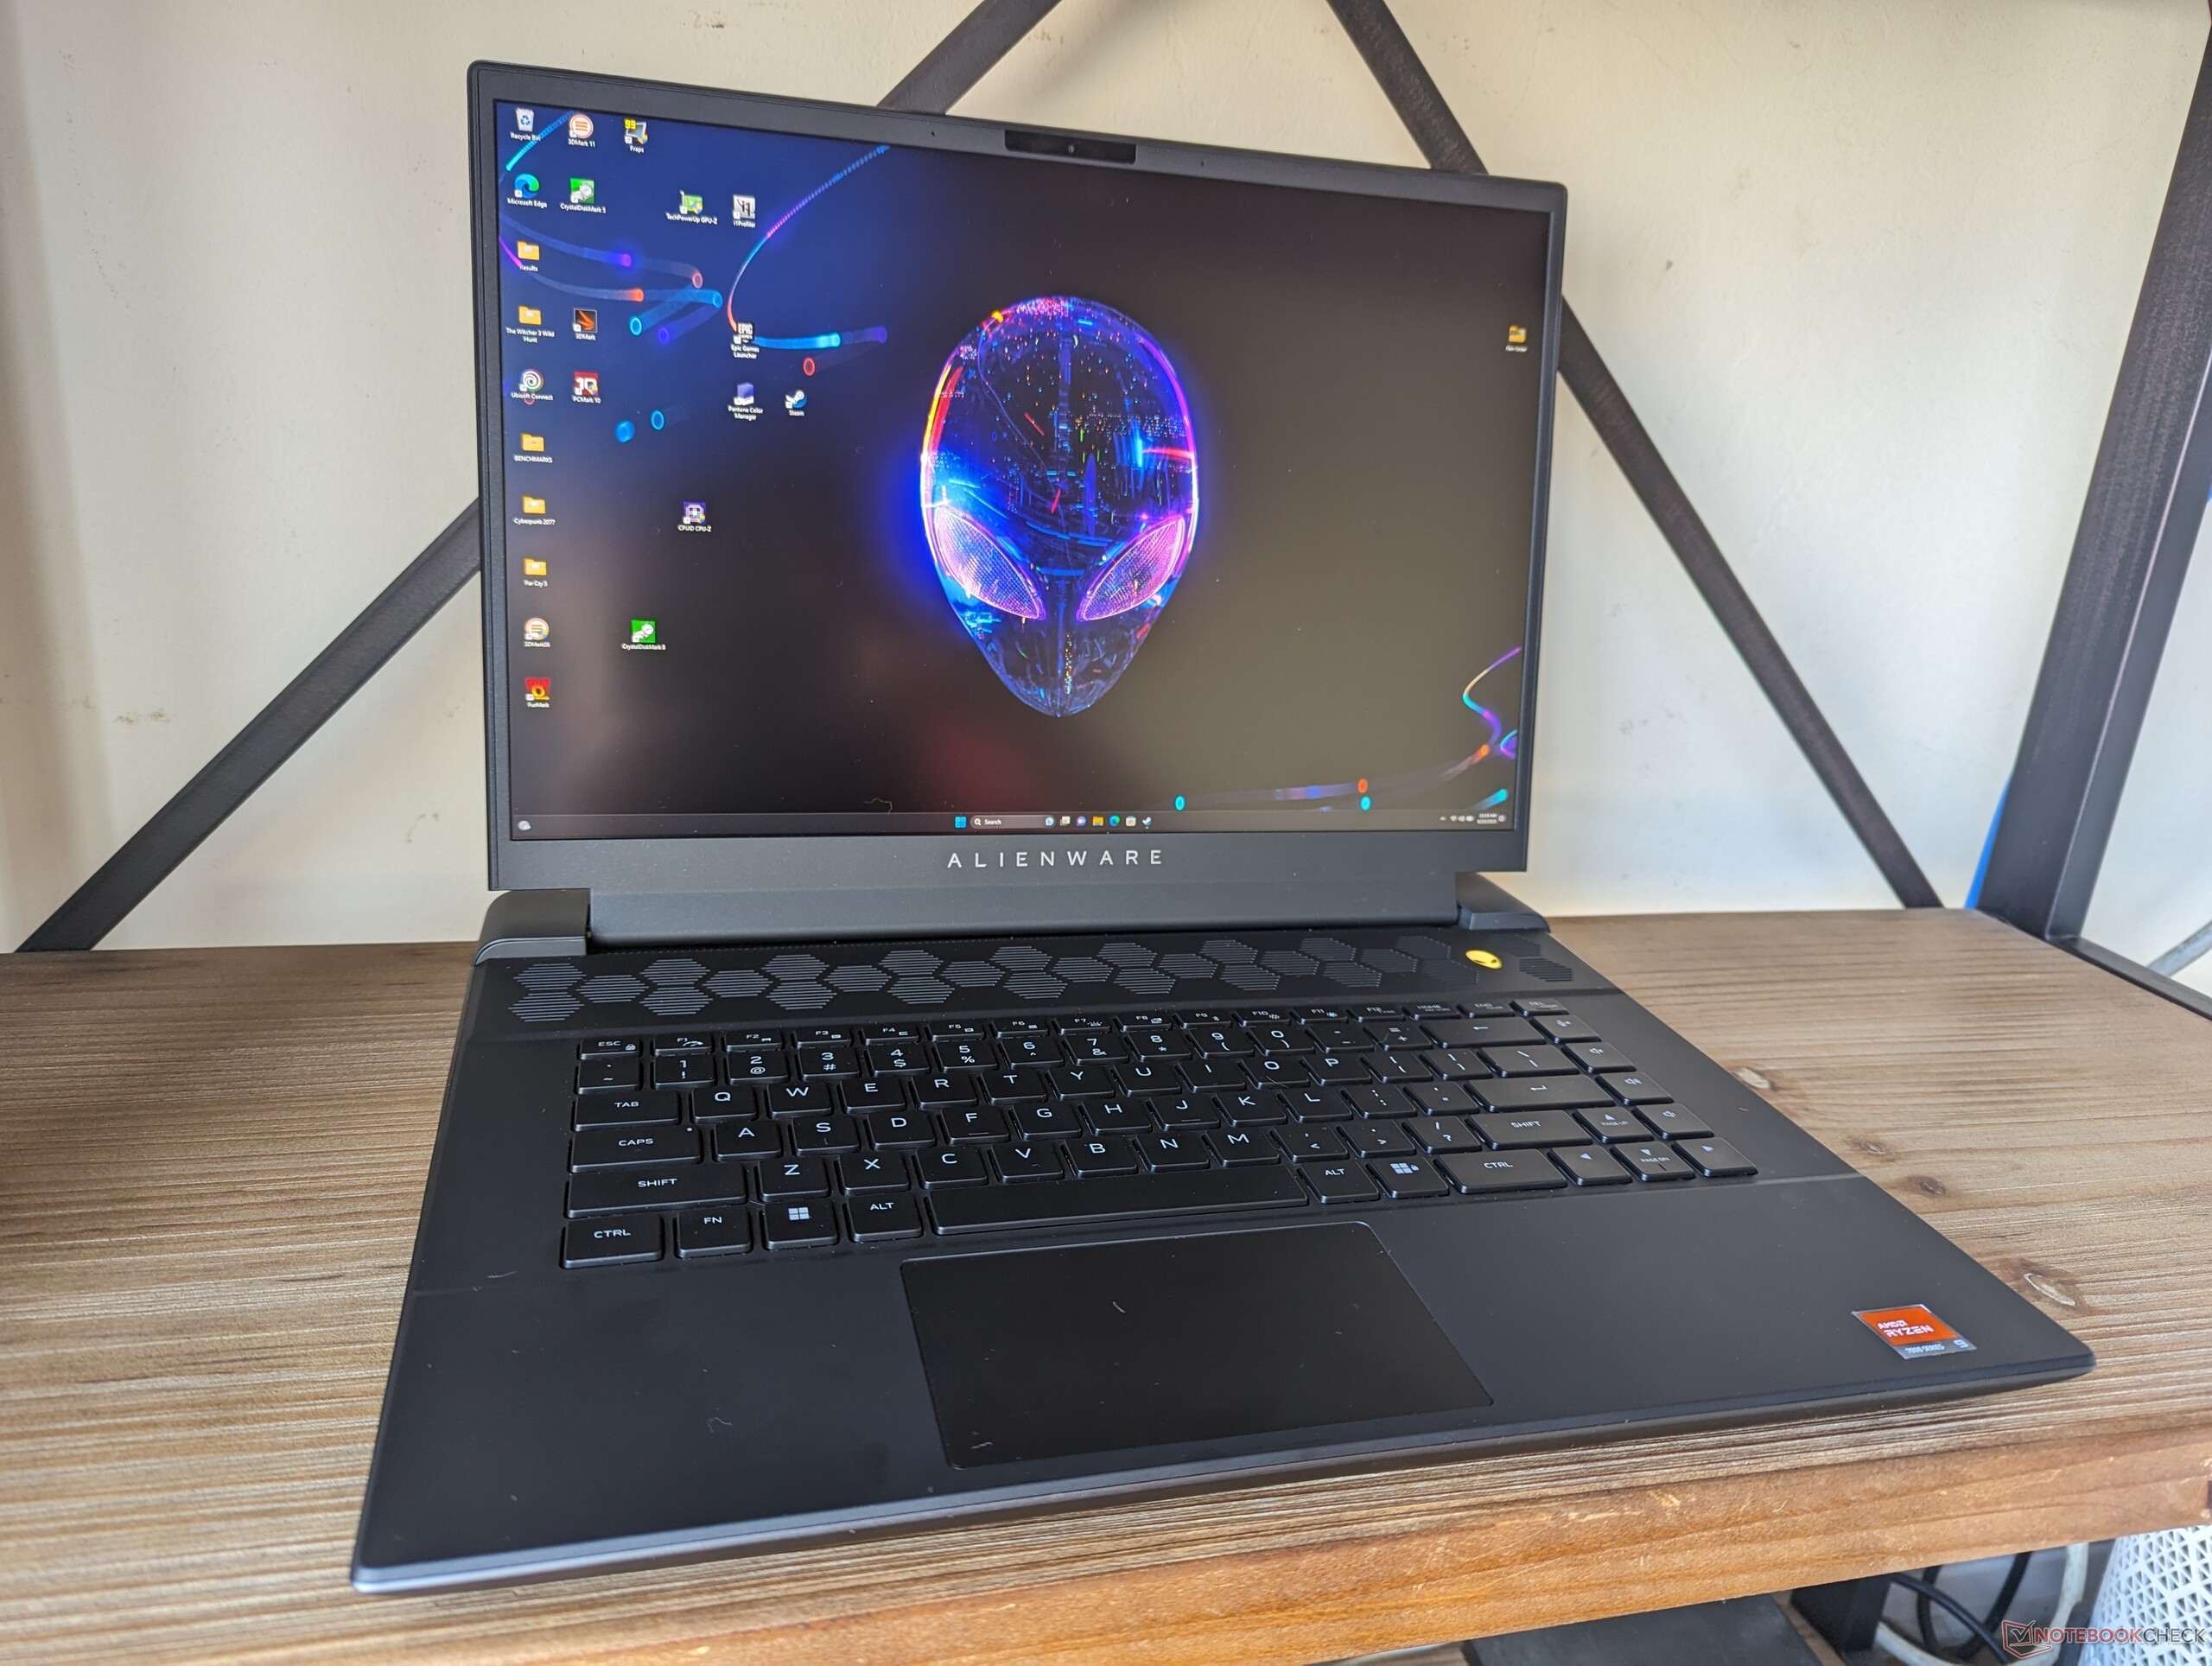
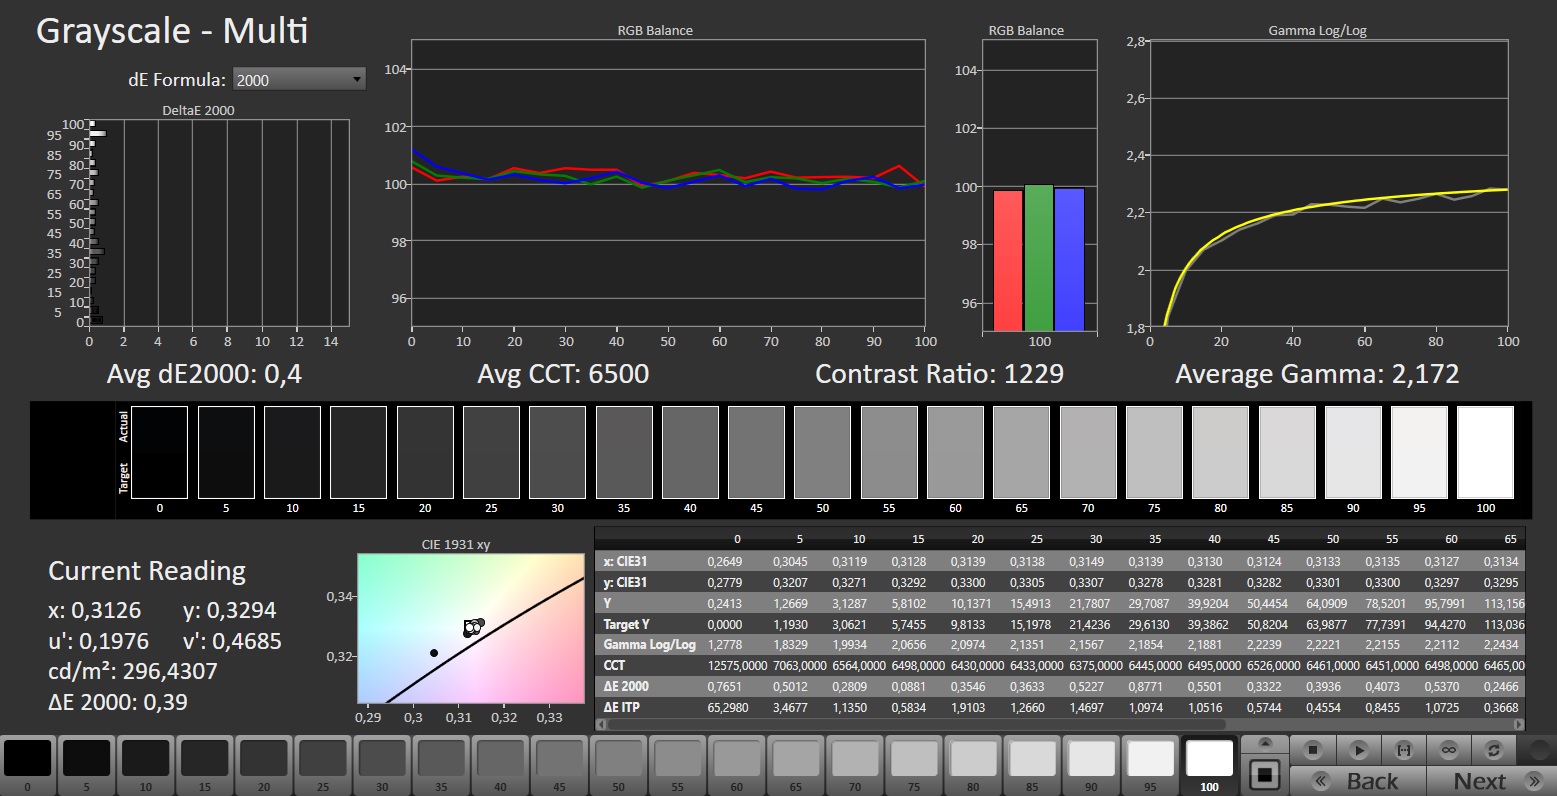
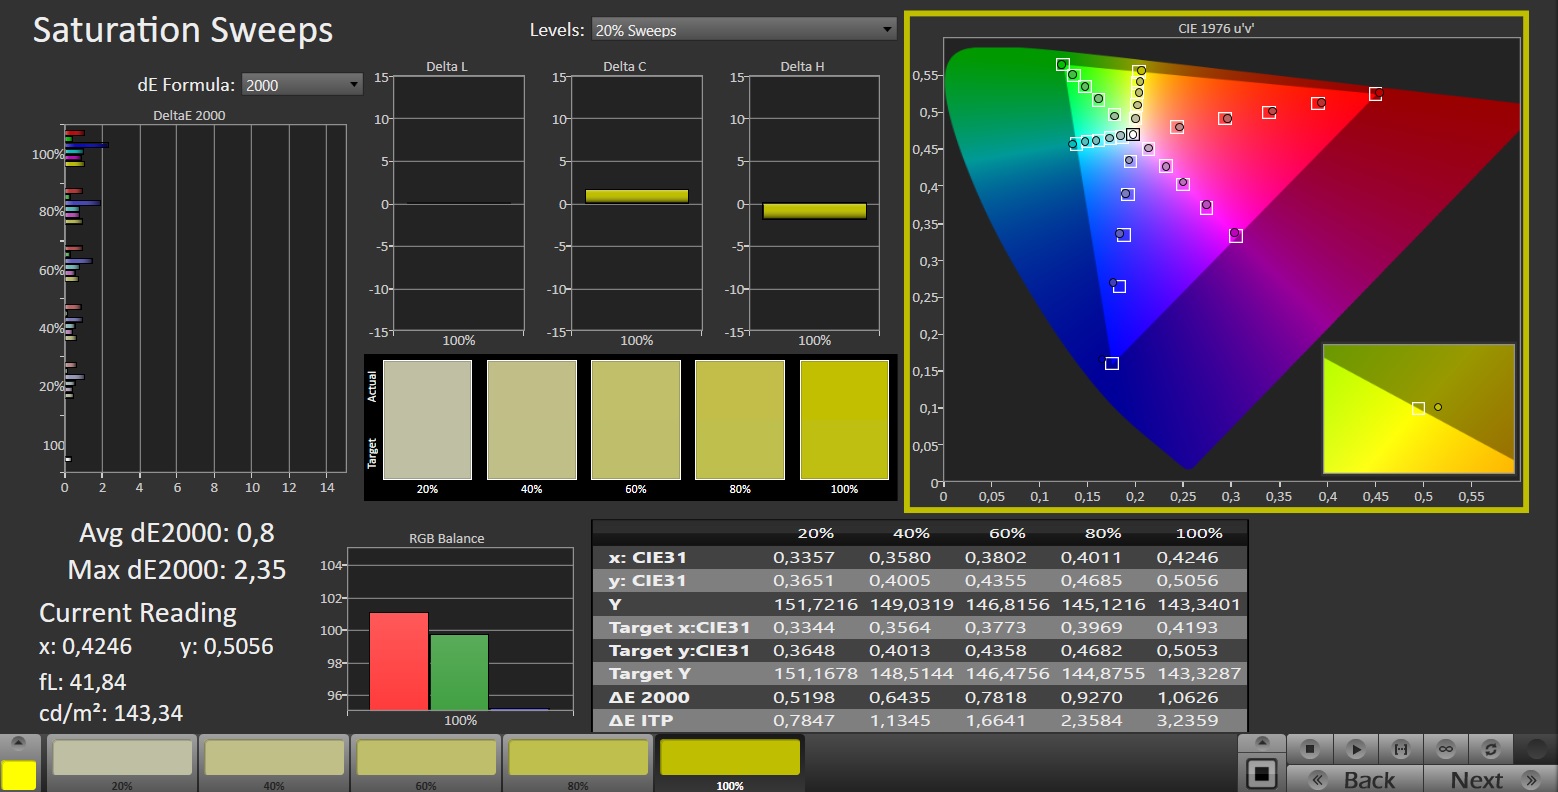
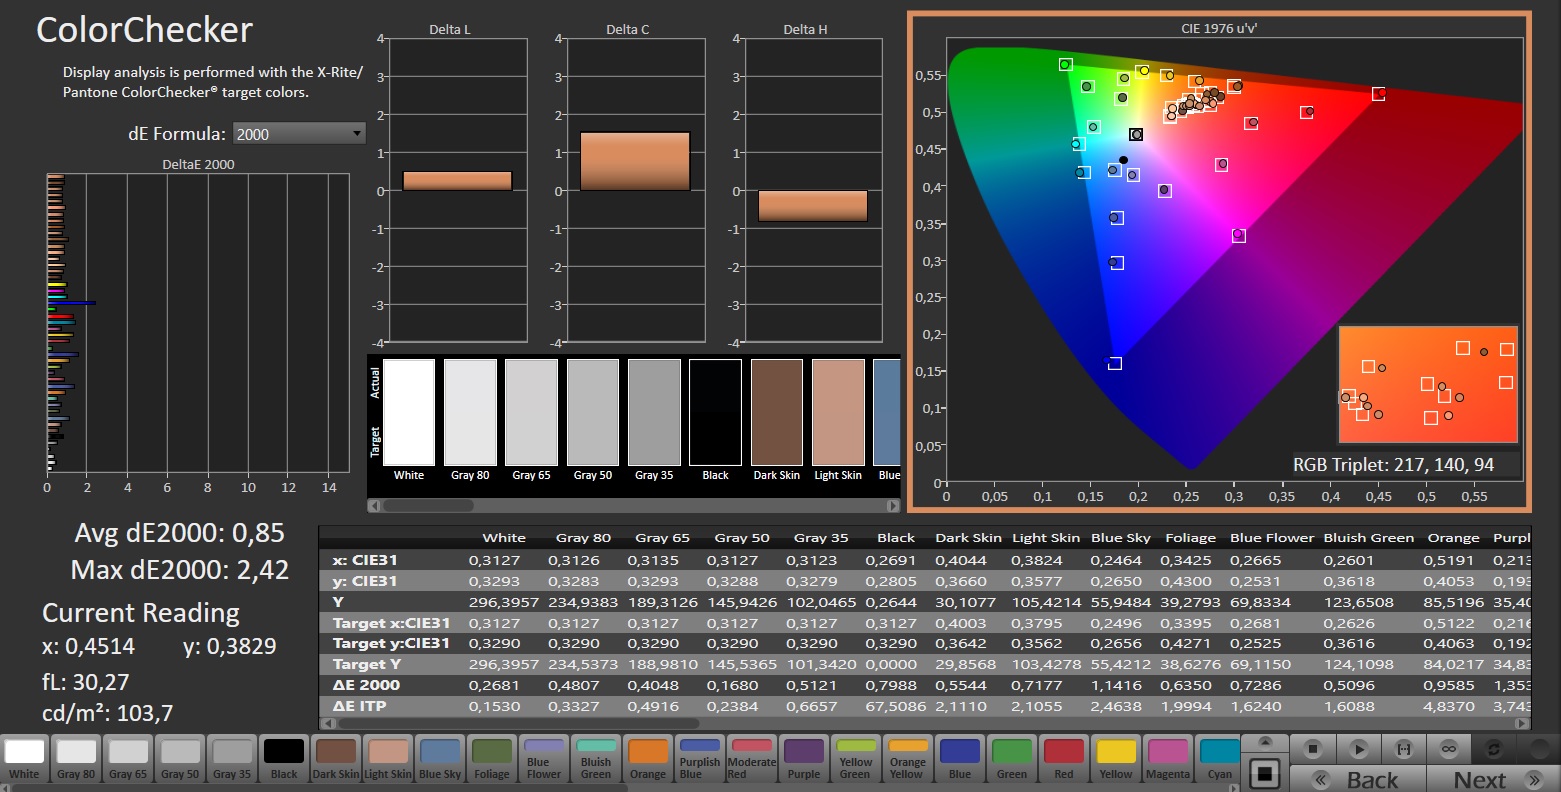
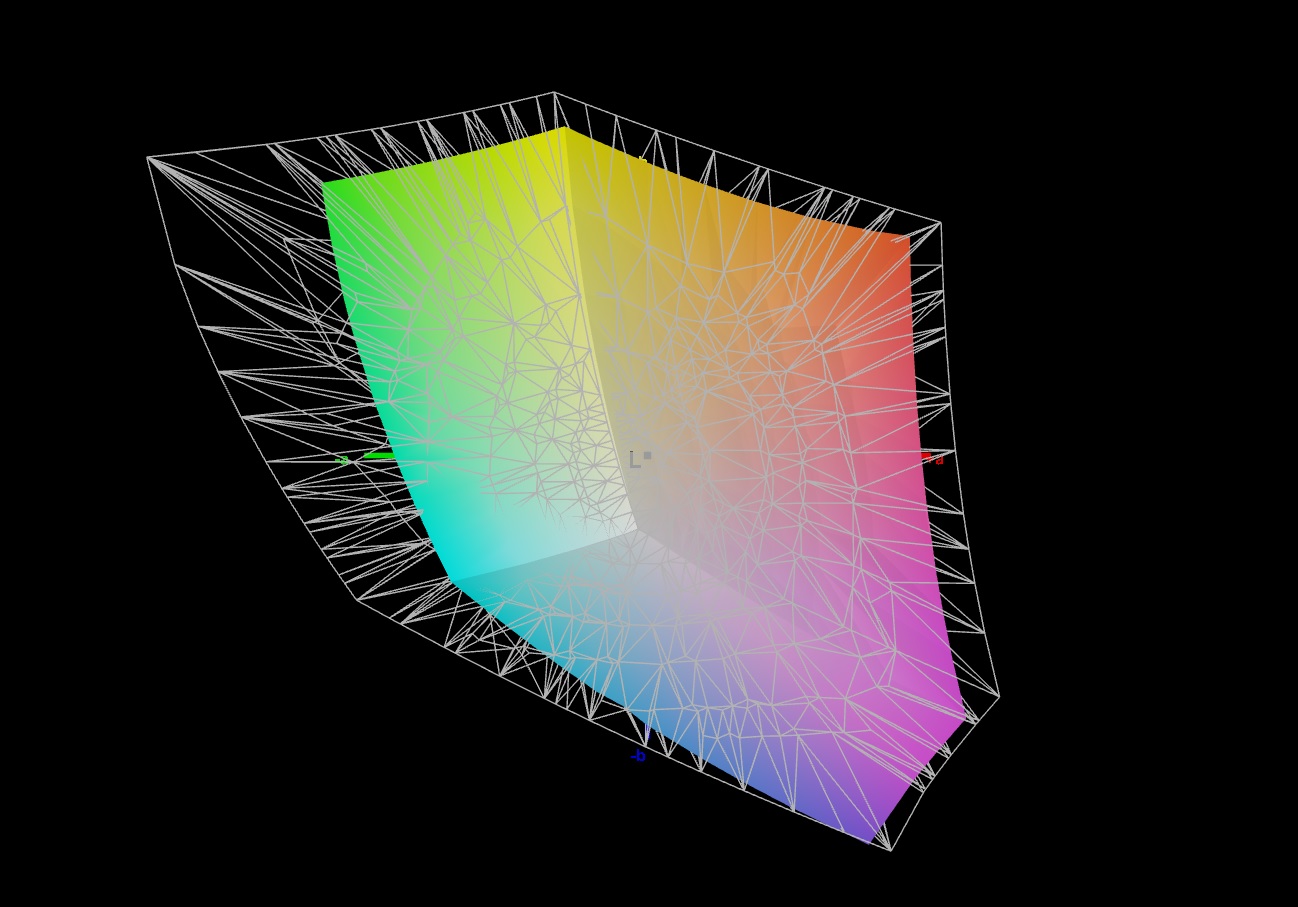
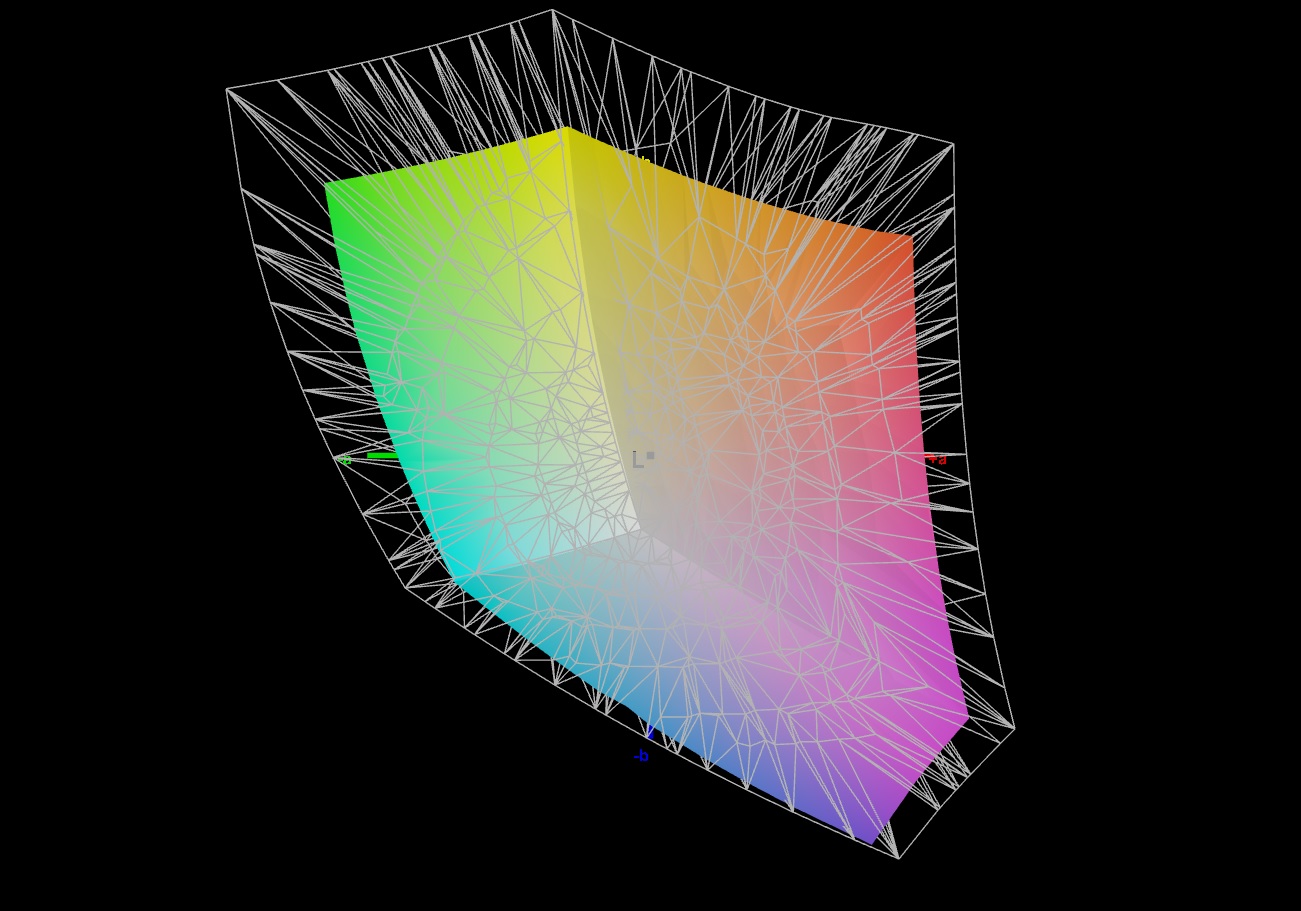
Pantalla - QHD+ con cobertura sRGB
En el lado positivo de la pantalla mate de 16 pulgadas (2560x1600, IPS) en formato 16:10 está la ausencia de parpadeo PWM, el soporte G-Sync (sólo para los modelos Intel m16) y los cortos tiempos de respuesta. El brillo y el contraste del panel de 165 Hz alcanzan el objetivo respectivo (> 300 cd/m² o 1000:1).
Como alternativa, hay otras dos pantallas (1x QHD+, 1x FHD+) que ofrecen frecuencias de actualización más altas y mayor cobertura del espacio de color. las opciones 4k, OLED o mini-LED no están disponibles.
| |||||||||||||||||||||||||
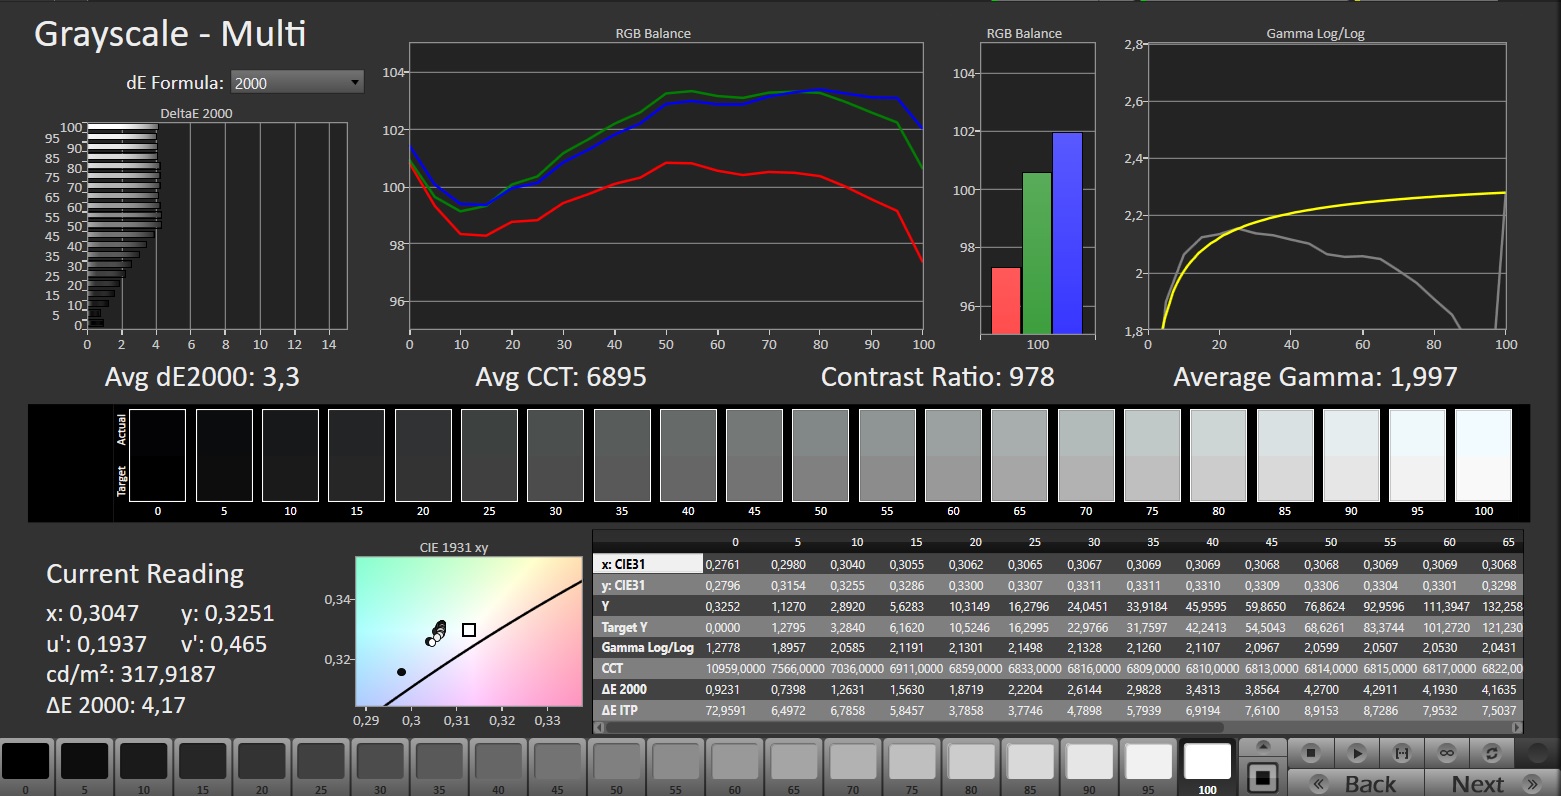
iluminación: 89 %
Brillo con batería: 306 cd/m²
Contraste: 1020:1 (Negro: 0.3 cd/m²)
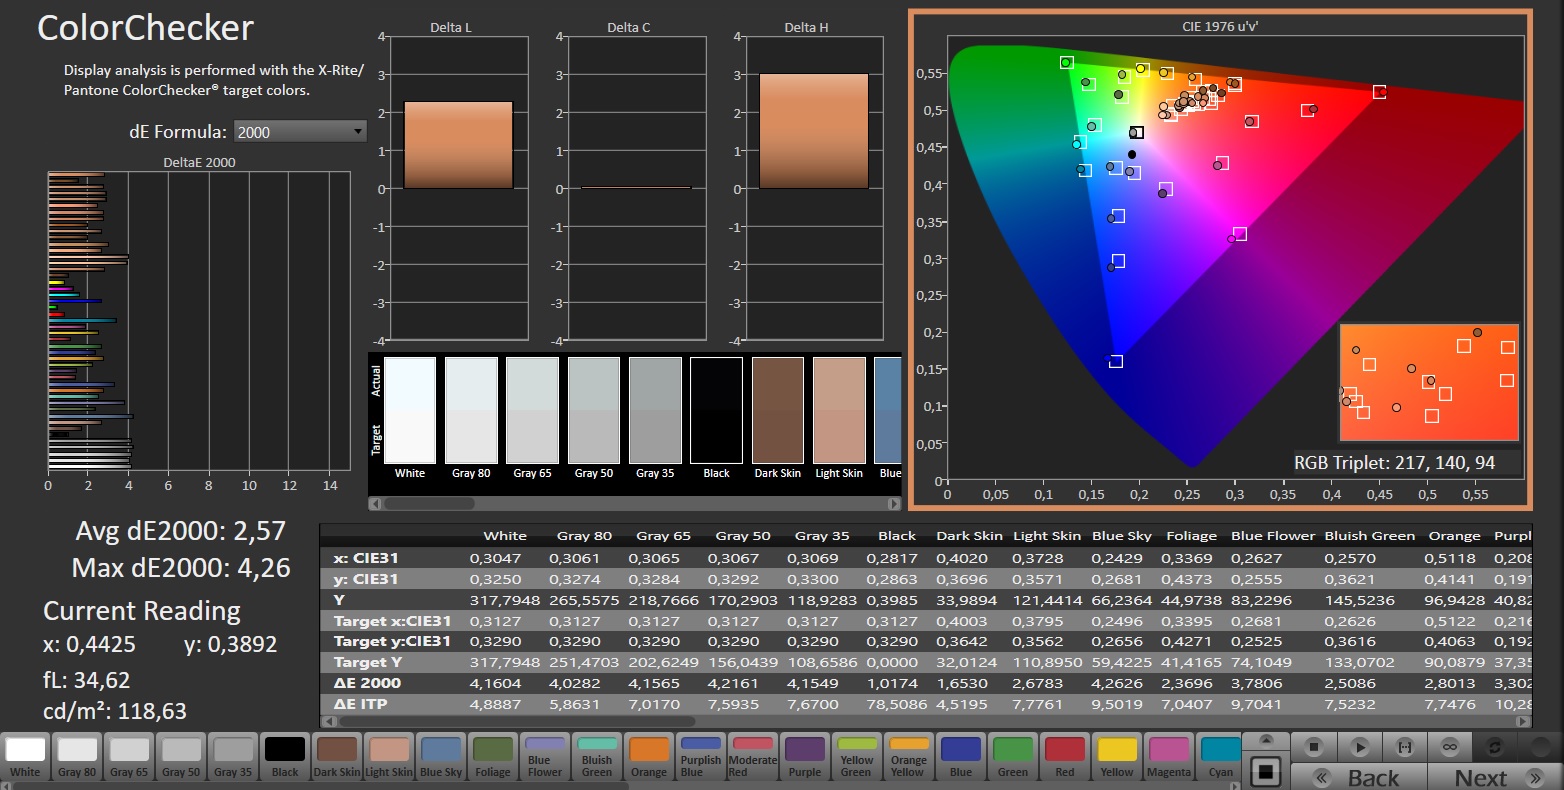
ΔE ColorChecker Calman: 2.57 | ∀{0.5-29.43 Ø4.71}
calibrated: 0.85
ΔE Greyscale Calman: 3.3 | ∀{0.09-98 Ø4.96}
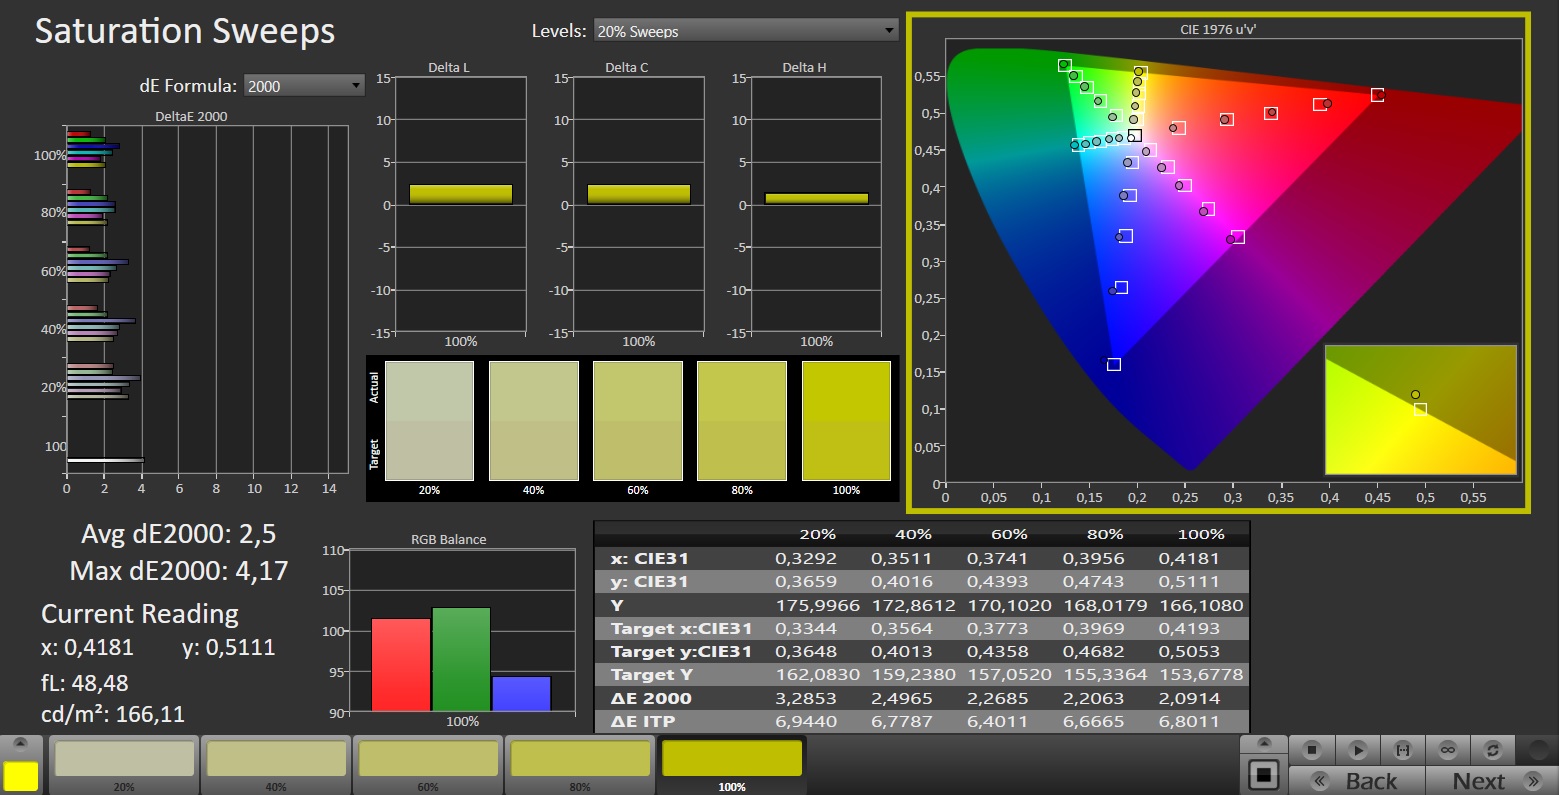
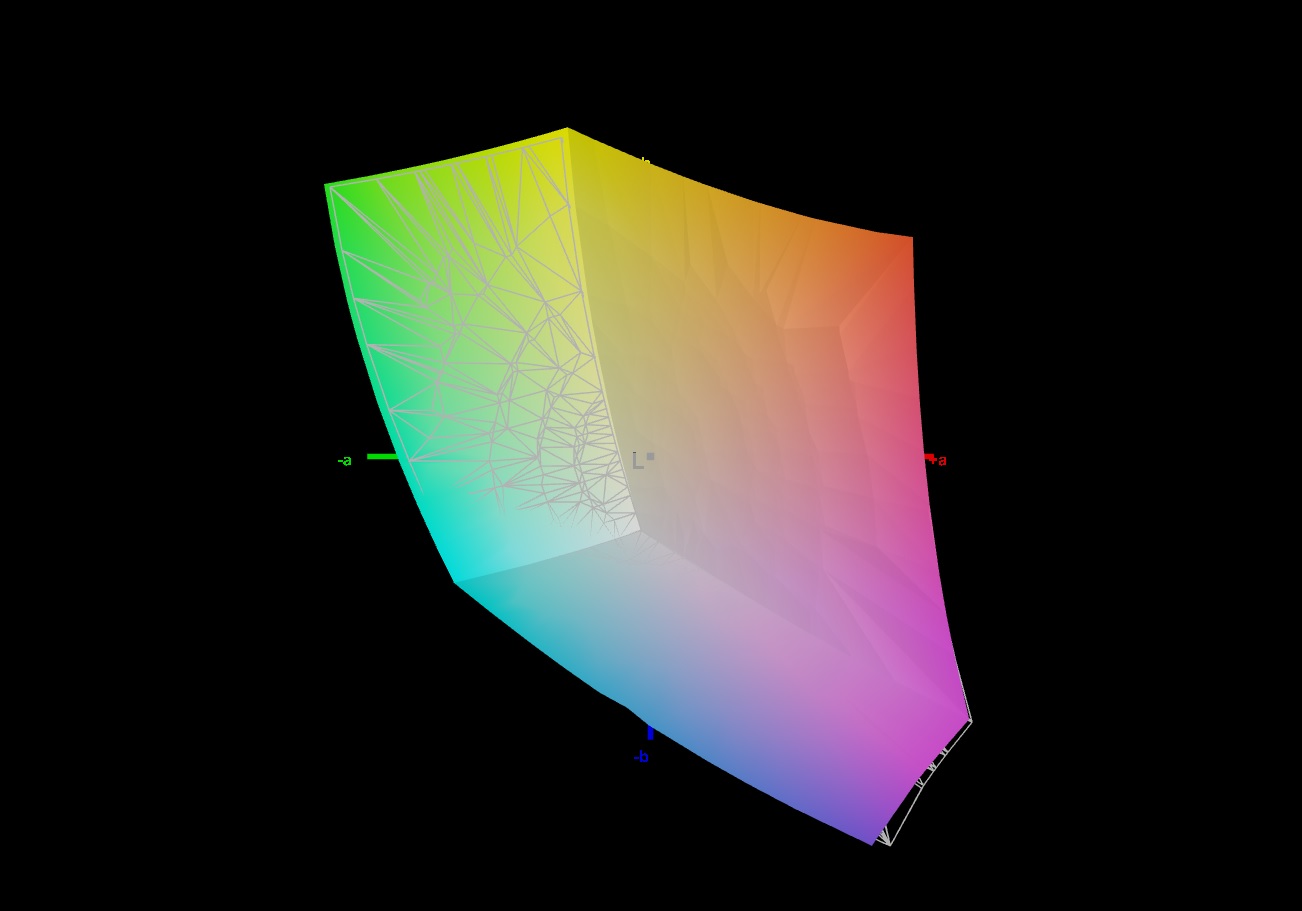
70% AdobeRGB 1998 (Argyll 3D)
97.2% sRGB (Argyll 3D)
67.7% Display P3 (Argyll 3D)
Gamma: 1.997
CCT: 6895 K
| Alienware m16 R1 Intel BOE NE16NYB, IPS, 2560x1600, 16" | Acer Predator Helios 16 PH16-71-731Q BOE NE160QDM-NZ2, IPS-LED, 2560x1600, 16" | Medion Erazer Defender P40 BOE CQ NE173QHM-NZ3, IPS, 2560x1440, 17.3" | Lenovo Legion Pro 5 16IRX8 AU Optronics B160QAN03.1, IPS, 2560x1600, 16" | Schenker XMG Pro 15 (E23) BOE0AD1, IPS, 2560x1440, 15.6" | Aorus 15 BSF Sharp LQ156T1JW05, IPS, 2560x1440, 15.6" | Alienware m16 R1 AMD BOE NE16NZ4, IPS, 2560x1600, 16" | |
|---|---|---|---|---|---|---|---|
| Display | 22% | 1% | 4% | 23% | 23% | 25% | |
| Display P3 Coverage (%) | 67.7 | 97.1 43% | 68.3 1% | 71.2 5% | 97.8 44% | 98.2 45% | 98.6 46% |
| sRGB Coverage (%) | 97.2 | 100 3% | 98.1 1% | 98.8 2% | 99.9 3% | 99.9 3% | 99.9 3% |
| AdobeRGB 1998 Coverage (%) | 70 | 84.7 21% | 69.8 0% | 73.3 5% | 85.4 22% | 85.7 22% | 88.9 27% |
| Response Times | -114% | -142% | -153% | -141% | -90% | -25% | |
| Response Time Grey 50% / Grey 80% * (ms) | 4 ? | 13.6 ? -240% | 14.6 ? -265% | 14.5 ? -263% | 14 ? -250% | 11.3 ? -183% | 5.1 ? -27% |
| Response Time Black / White * (ms) | 7.3 ? | 6.4 ? 12% | 8.7 ? -19% | 10.4 ? -42% | 9.6 ? -32% | 7 ? 4% | 9 ? -23% |
| PWM Frequency (Hz) | |||||||
| Screen | 14% | 18% | 19% | -15% | -24% | -34% | |
| Brightness middle (cd/m²) | 306 | 511 67% | 364 19% | 405.7 33% | 322 5% | 299 -2% | 329 8% |
| Brightness (cd/m²) | 302 | 498 65% | 343 14% | 368 22% | 301 0% | 282 -7% | 317 5% |
| Brightness Distribution (%) | 89 | 94 6% | 86 -3% | 87 -2% | 85 -4% | 82 -8% | 89 0% |
| Black Level * (cd/m²) | 0.3 | 0.36 -20% | 0.28 7% | 0.38 -27% | 0.36 -20% | 0.31 -3% | 0.32 -7% |
| Contrast (:1) | 1020 | 1419 39% | 1300 27% | 1068 5% | 894 -12% | 965 -5% | 1028 1% |
| Colorchecker dE 2000 * | 2.57 | 1.76 32% | 1.67 35% | 1.65 36% | 1.98 23% | 2.24 13% | 3.71 -44% |
| Colorchecker dE 2000 max. * | 4.26 | 3.7 13% | 2.78 35% | 4.2 1% | 5.24 -23% | 4.29 -1% | 7.23 -70% |
| Colorchecker dE 2000 calibrated * | 0.85 | 1.56 -84% | 1.14 -34% | 0.53 38% | 1.98 -133% | 2.62 -208% | 2.82 -232% |
| Greyscale dE 2000 * | 3.3 | 3 9% | 1.4 58% | 1.2 64% | 2.44 26% | 3 9% | 2.2 33% |
| Gamma | 1.997 110% | 2.33 94% | 2.091 105% | 2.3 96% | 2.42 91% | 2.086 105% | 2.3 96% |
| CCT | 6895 94% | 6341 103% | 6568 99% | 6453 101% | 6984 93% | 6289 103% | 6270 104% |
| Media total (Programa/Opciones) | -26% /
-2% | -41% /
-9% | -43% /
-9% | -44% /
-25% | -30% /
-23% | -11% /
-20% |
* ... más pequeño es mejor
La pantalla muestra una buena representación del color de fábrica: el objetivo (DeltaE < 3) se alcanza con una desviación de alrededor de 2,6. El calibrado reduce aún más esta desviación a 0,85 y garantiza unos niveles de gris más equilibrados. El panel es capaz de reproducir completamente el espacio de color sRGB, pero no los espacios de color AdobeRGB y DCI P3. En cambio, el espacio P3 puede reproducirse en las pantallas alternativas.
Tiempos de respuesta del display
| ↔ Tiempo de respuesta de Negro a Blanco | ||
|---|---|---|
| 7.3 ms ... subida ↗ y bajada ↘ combinada | ↗ 3.6 ms subida | 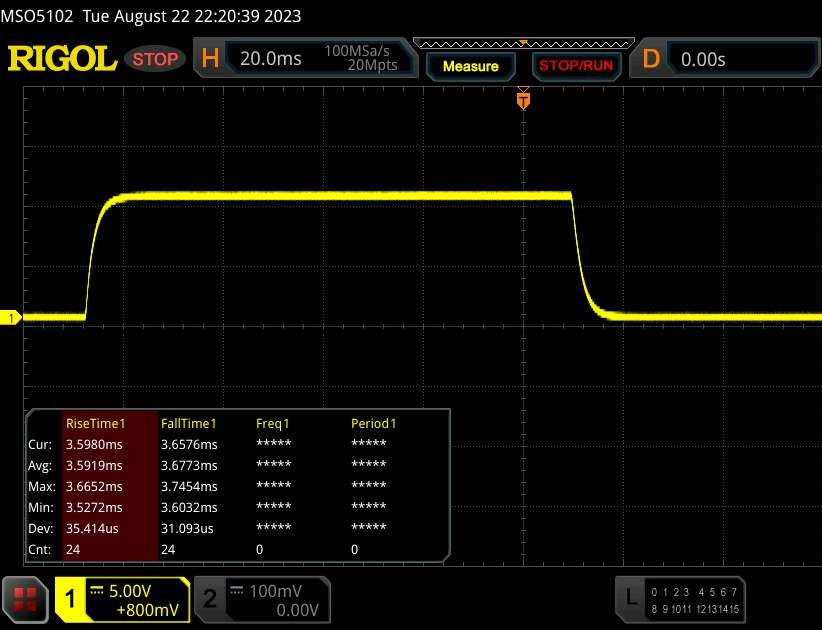 |
| ↘ 3.7 ms bajada | ||
| La pantalla mostró tiempos de respuesta muy rápidos en nuestros tests y debería ser adecuada para juegos frenéticos. En comparación, todos los dispositivos de prueba van de ##min### (mínimo) a 240 (máximo) ms. » 22 % de todos los dispositivos son mejores. Esto quiere decir que el tiempo de respuesta medido es mejor que la media (19.8 ms) de todos los dispositivos testados. | ||
| ↔ Tiempo de respuesta 50% Gris a 80% Gris | ||
| 4 ms ... subida ↗ y bajada ↘ combinada | ↗ 1.7 ms subida | 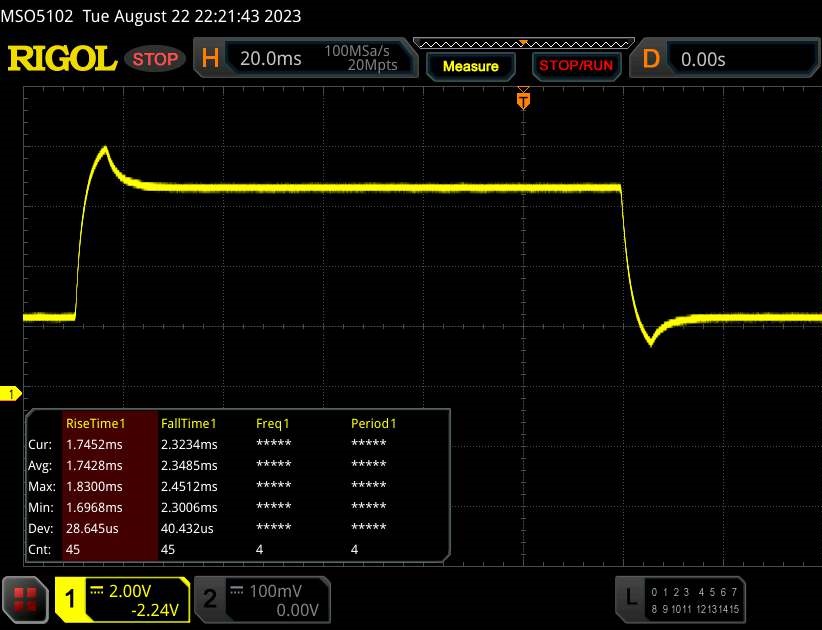 |
| ↘ 2.3 ms bajada | ||
| La pantalla mostró tiempos de respuesta muy rápidos en nuestros tests y debería ser adecuada para juegos frenéticos. En comparación, todos los dispositivos de prueba van de ##min### (mínimo) a 636 (máximo) ms. » 15 % de todos los dispositivos son mejores. Esto quiere decir que el tiempo de respuesta medido es mejor que la media (31 ms) de todos los dispositivos testados. | ||
Parpadeo de Pantalla / PWM (Pulse-Width Modulation)
| Parpadeo de Pantalla / PWM no detectado |  | ||
Comparación: 52 % de todos los dispositivos testados no usaron PWM para atenuar el display. Si se usó, medimos una media de 7757 (mínimo: 5 - máxmo: 343500) Hz. | |||
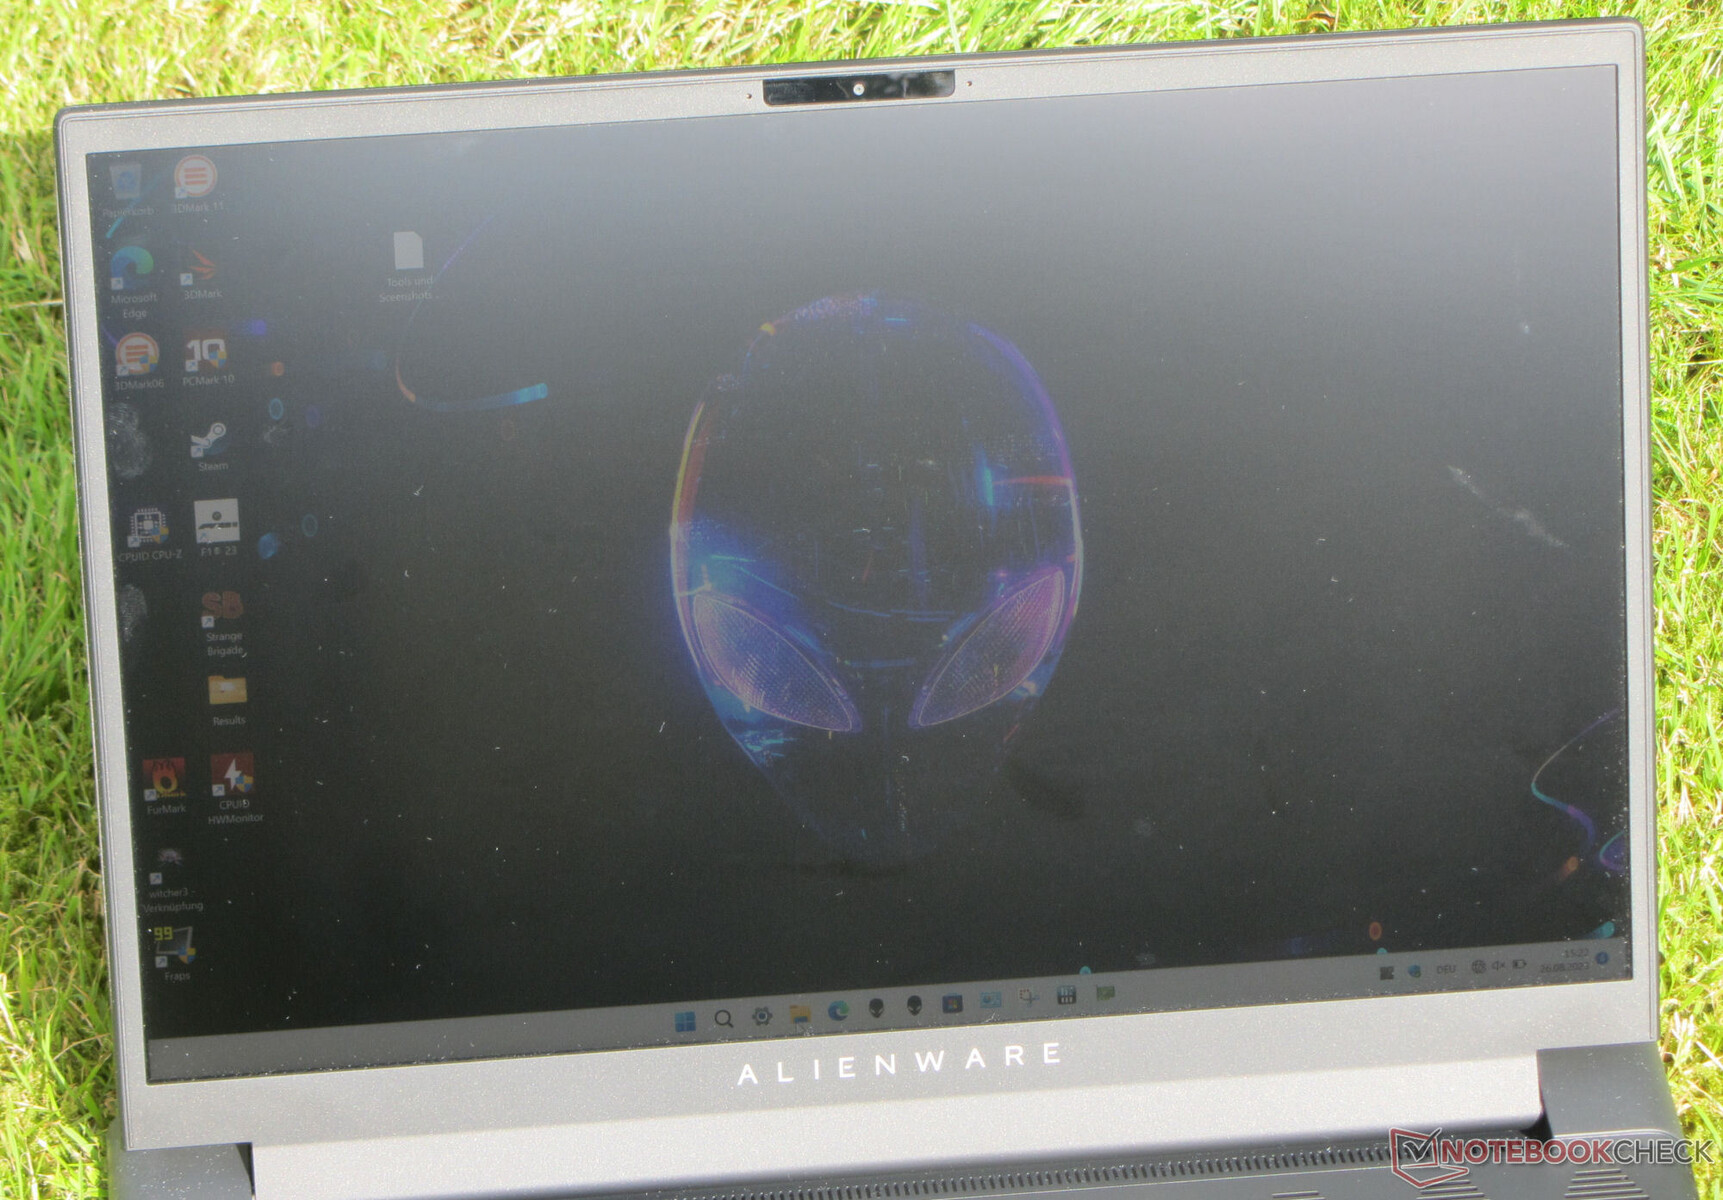
El panel IPS de ángulo de visión estable se puede leer desde cualquier posición. En exteriores, la lectura de la pantalla es bastante posible siempre que el sol no brille demasiado.

Rendimiento - El portátil Alienware ofrece un alto rendimiento del sistema
Dentro de la gama Alienware m16 R1, las GPU Ada Lovelace (RTX 4060, 4070, 4080) se combinan con CPU de Intel o AMD. Hay dos excepciones: algunos modelos AMD sólo pueden pedirse con una Radeon RX 7600M XT y determinados modelos de Intel con una GeForce RTX 4090. Nuestro dispositivo m16 basado en Intel está disponible por unos 1.900 euros, lo que lo convierte actualmente en uno de los representantes más baratos de la serie.
Condiciones de ensayo
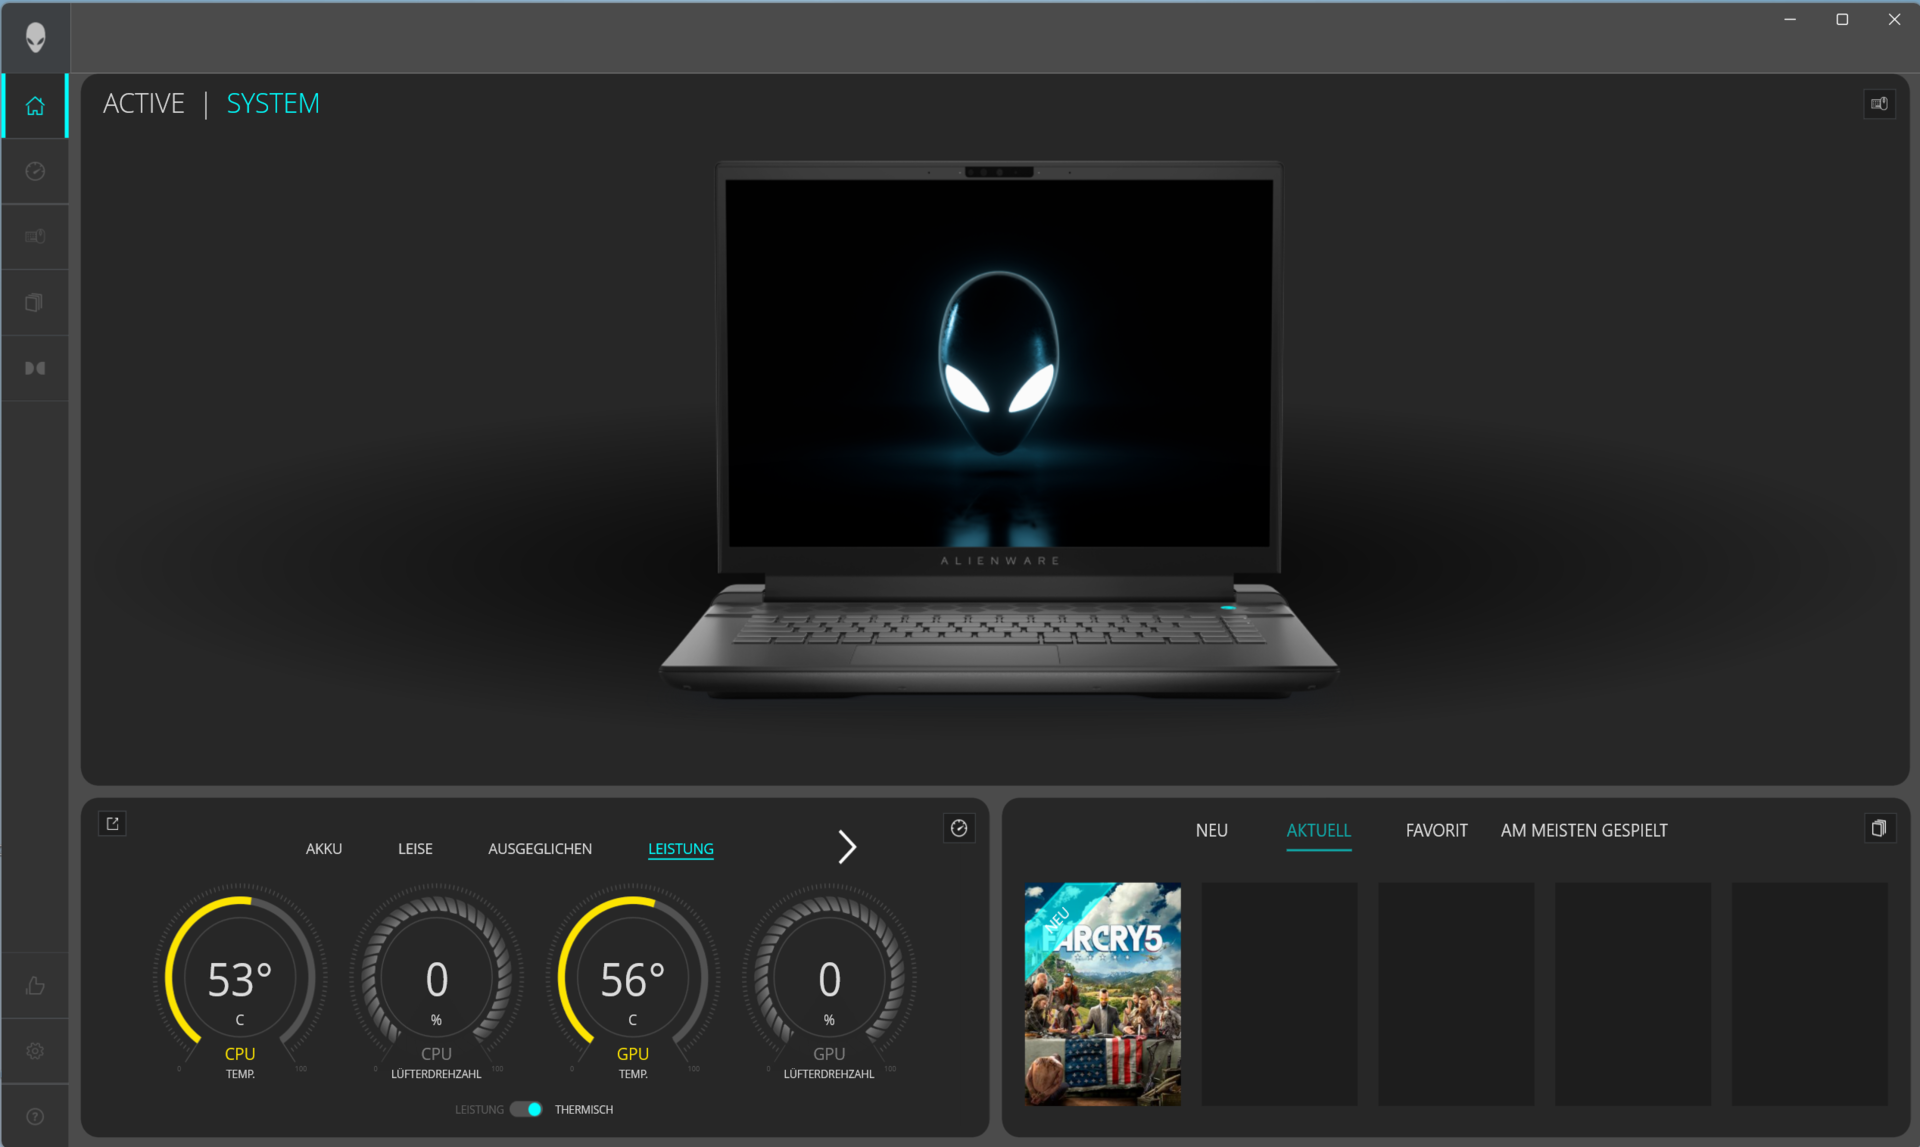
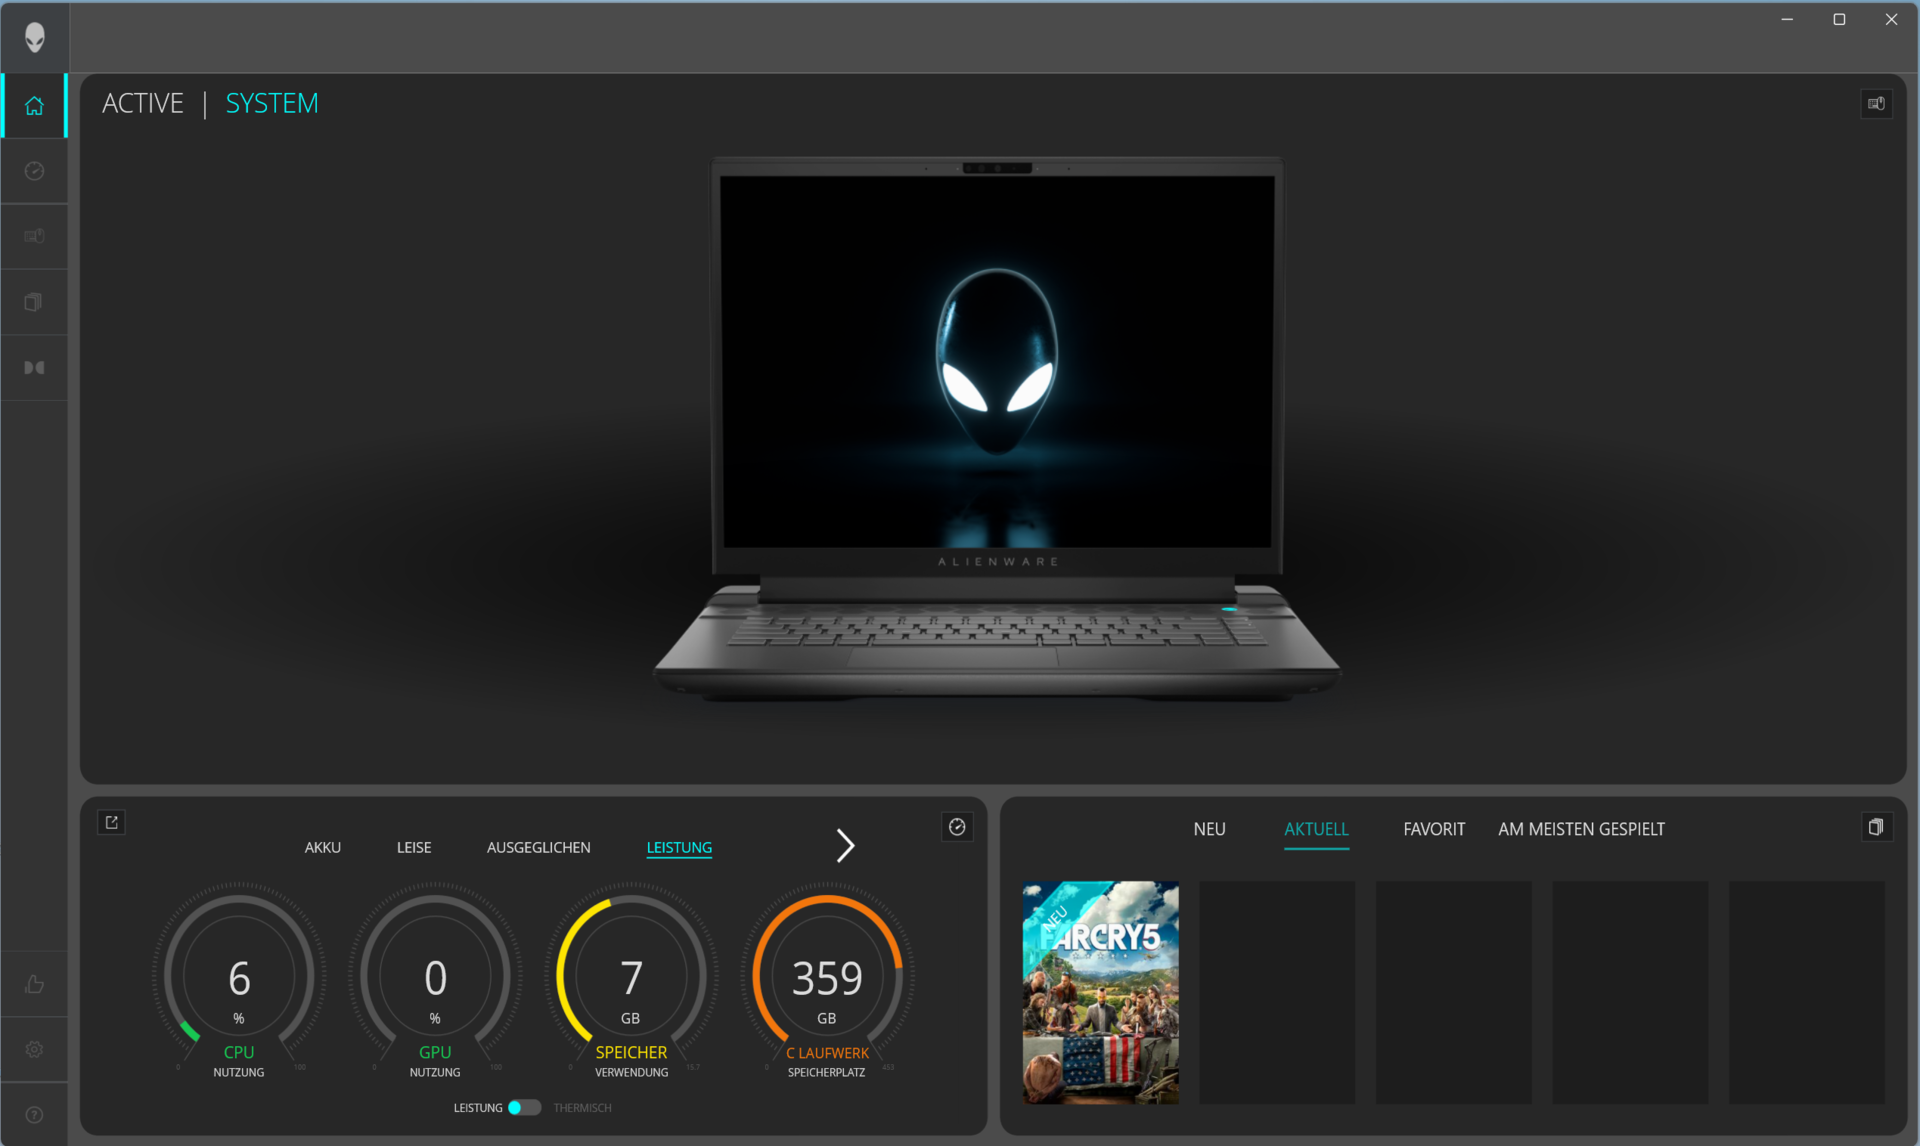
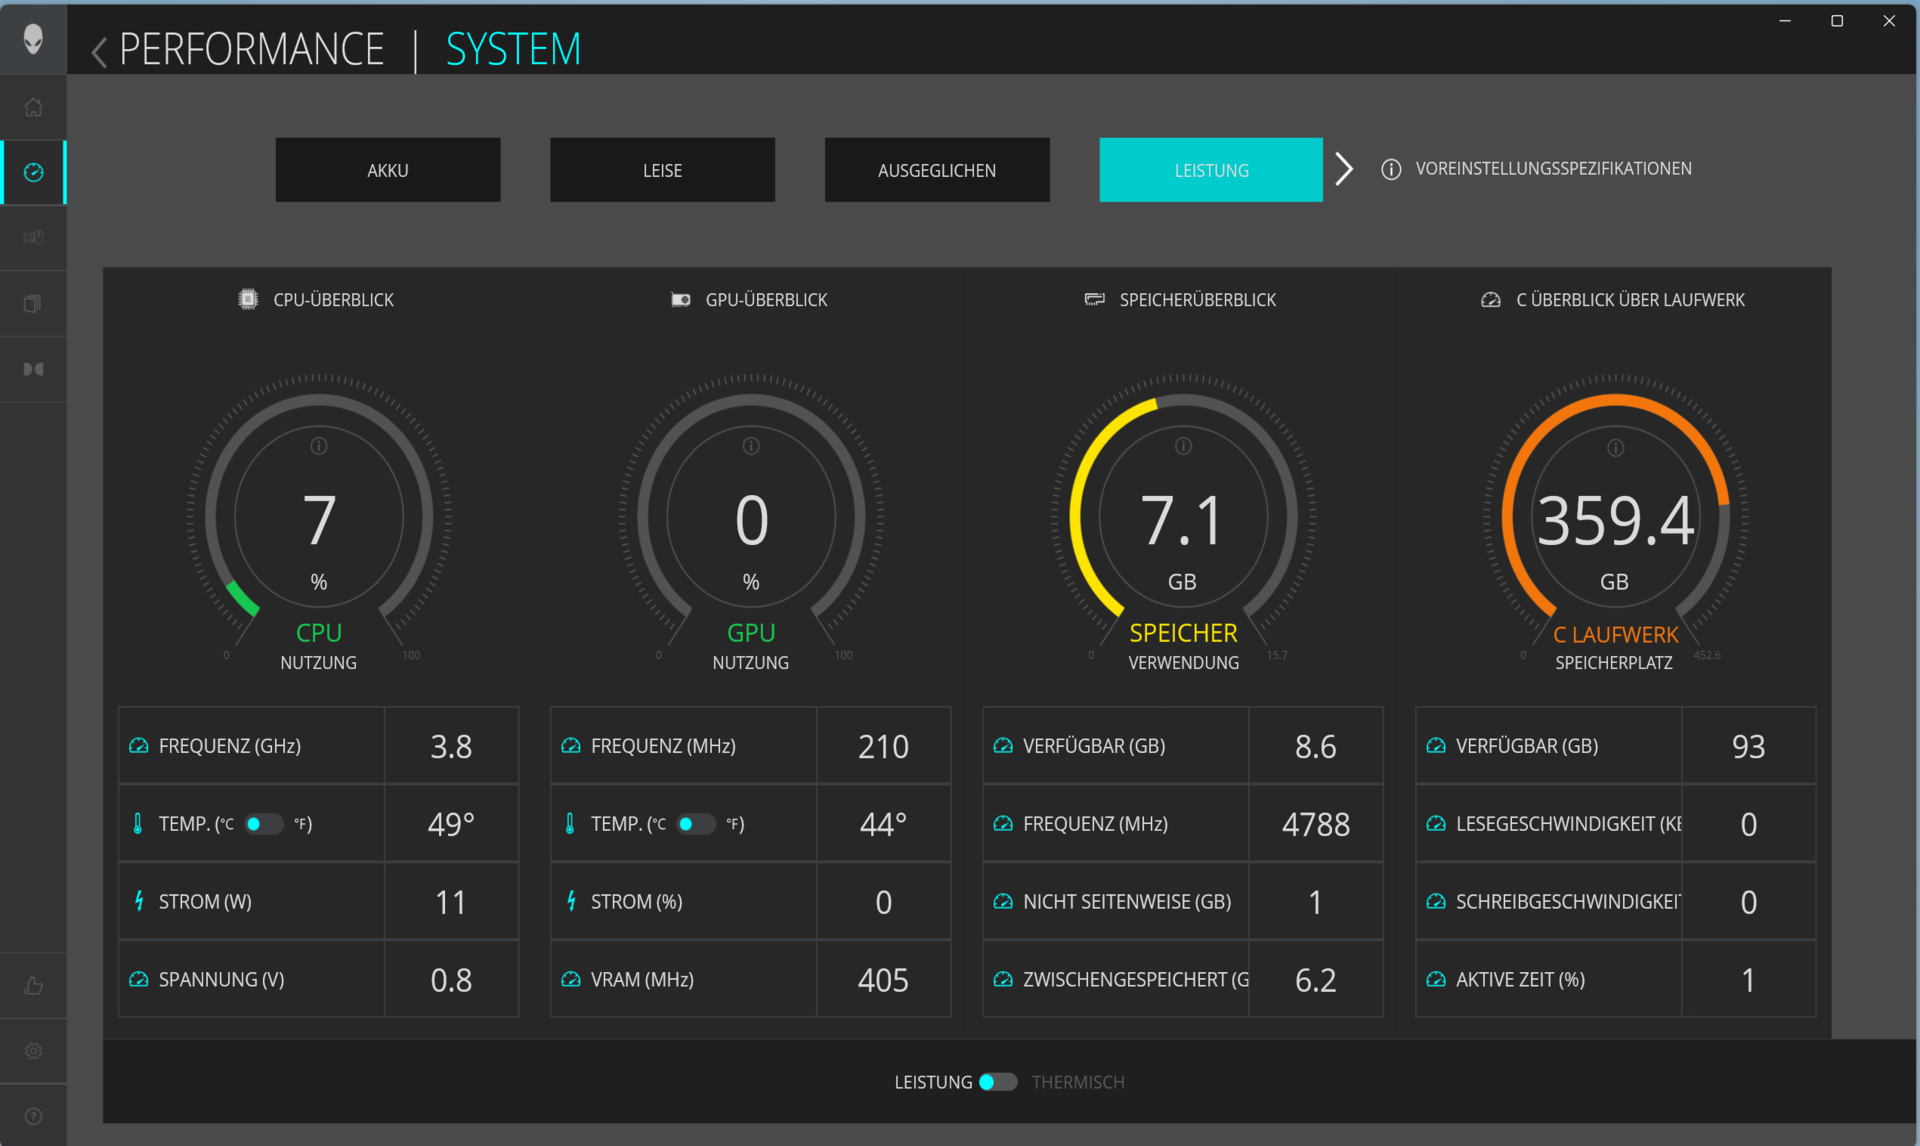
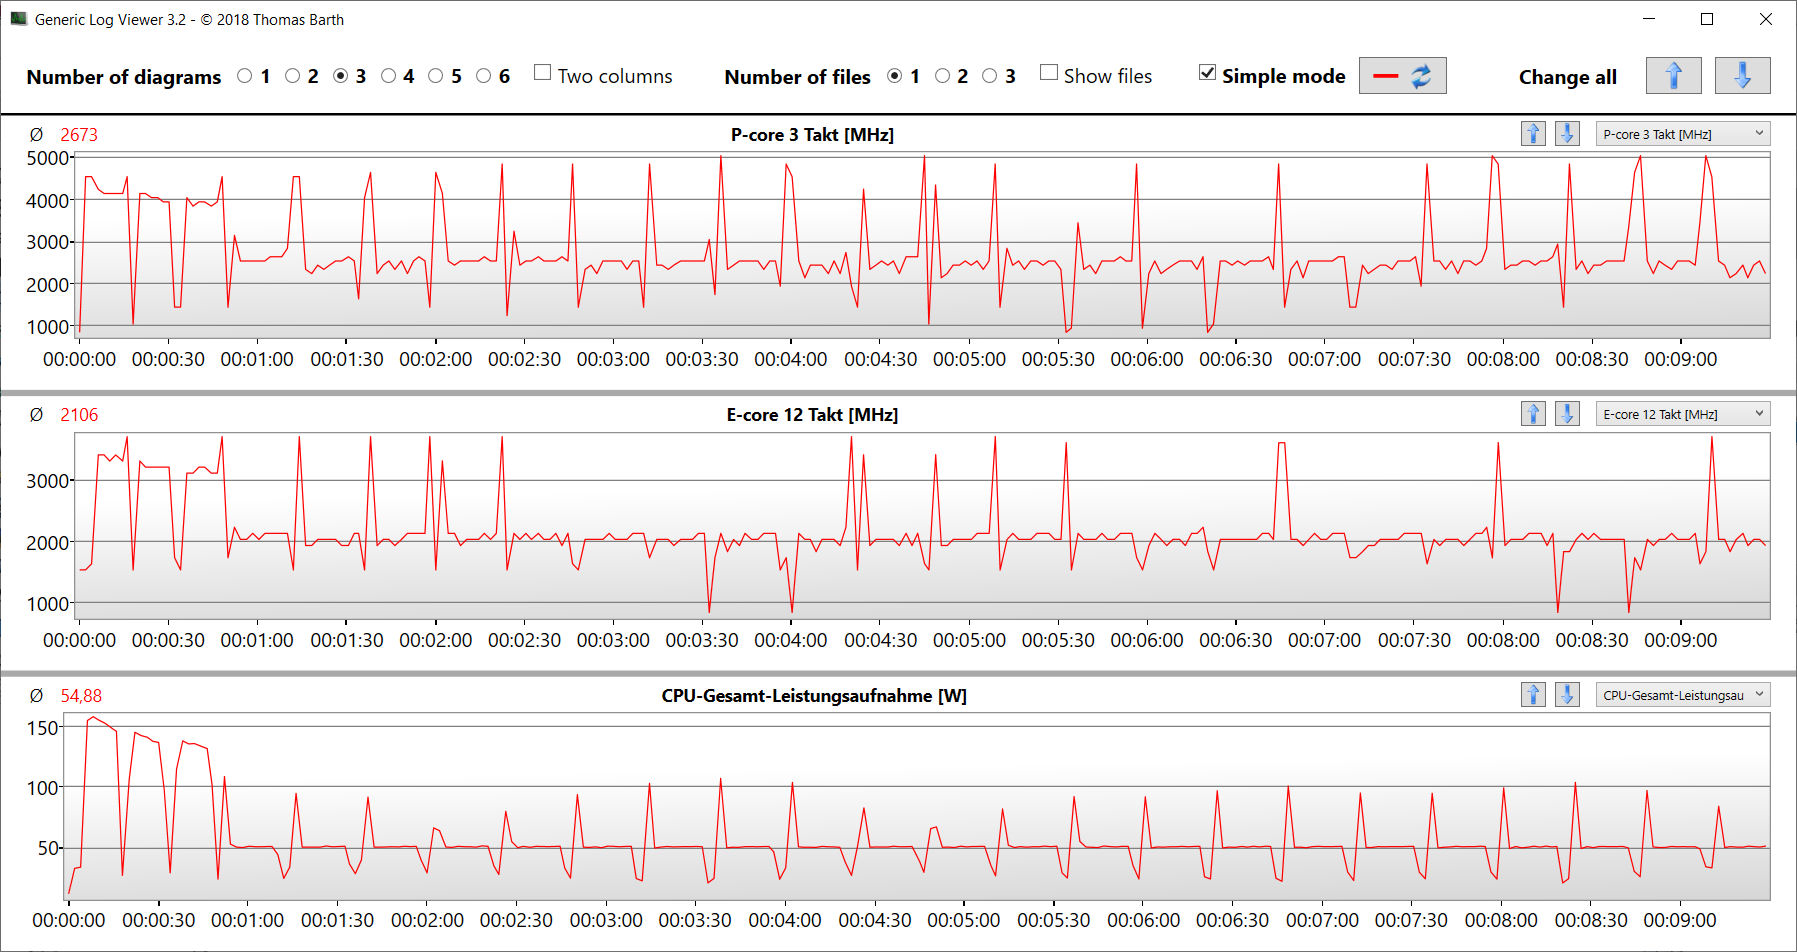
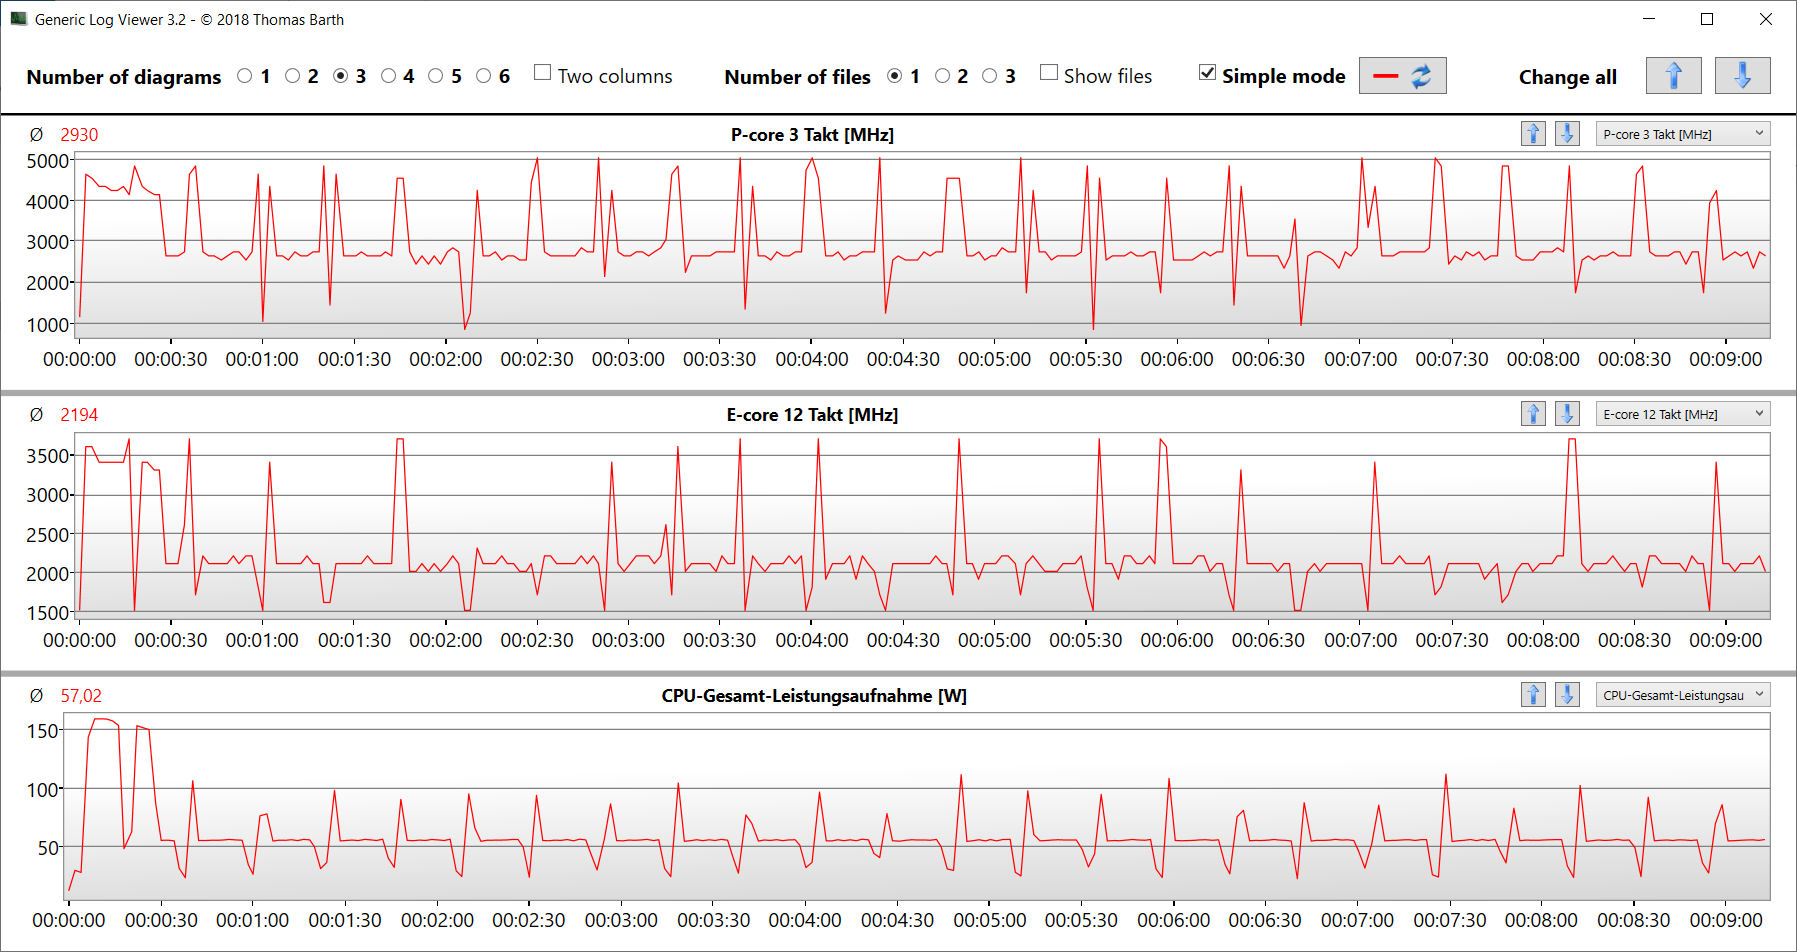
Los usuarios pueden cambiar entre cinco modos de rendimiento específicos del fabricante a través del Alienware Command Center (centro de control del portátil). Se puede activar un modo de alto rendimiento (máximo rendimiento, ventiladores a pleno rendimiento) mediante la tecla "F1". En nuestras pruebas, se usaron los modos "Rendimiento" (benchmarks) y "Equilibrado" (pruebas de batería).
Nota: El modelo hermano Debut del rendimiento de AMD Ryzen 9 7845HX: Análisis del portátil Alienware m16 R1 se probó con el perfil "Overdrive" y el modo dGPU activo. Por tanto, los resultados de las pruebas no siempre son directamente comparables.
| Rendimiento | Overdrive | Equilibrado | Silencioso | Batería | |
|---|---|---|---|---|---|
| Límite de potencia 1 (HWInfo) | 157 vatios | 165 vatios | 157 vatios | 50 vatios | 55 vatios |
| Límite de potencia 2 (HWInfo) | 157 vatios | 165 vatios | 157 vatios | 157 vatios | 157 vatios |
| Rendimiento (Witcher 3) | 104fps | 104fps | 103fps | 102fps | 103fps |
| Ruido (Witcher 3) | 51dB(A) | 58dB(A) | 49dB(A) | 43dB(A) | 47dB(A) |

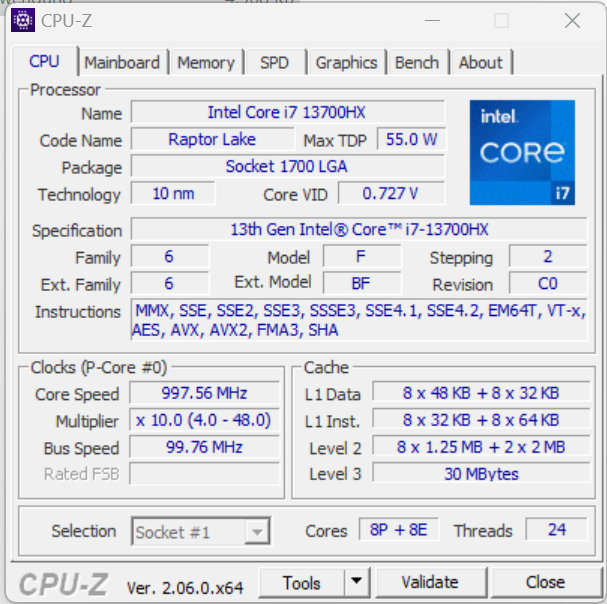
Procesador
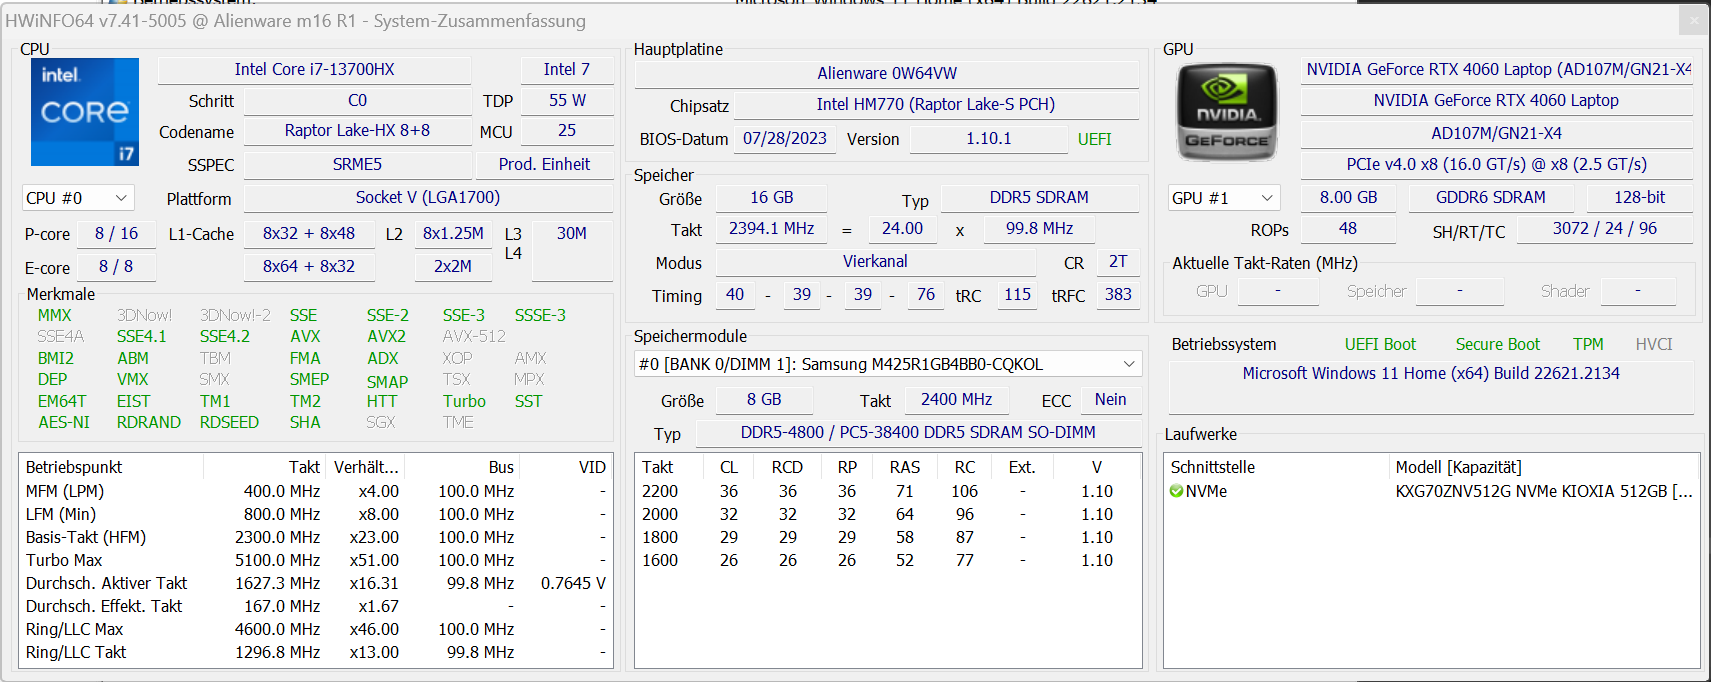
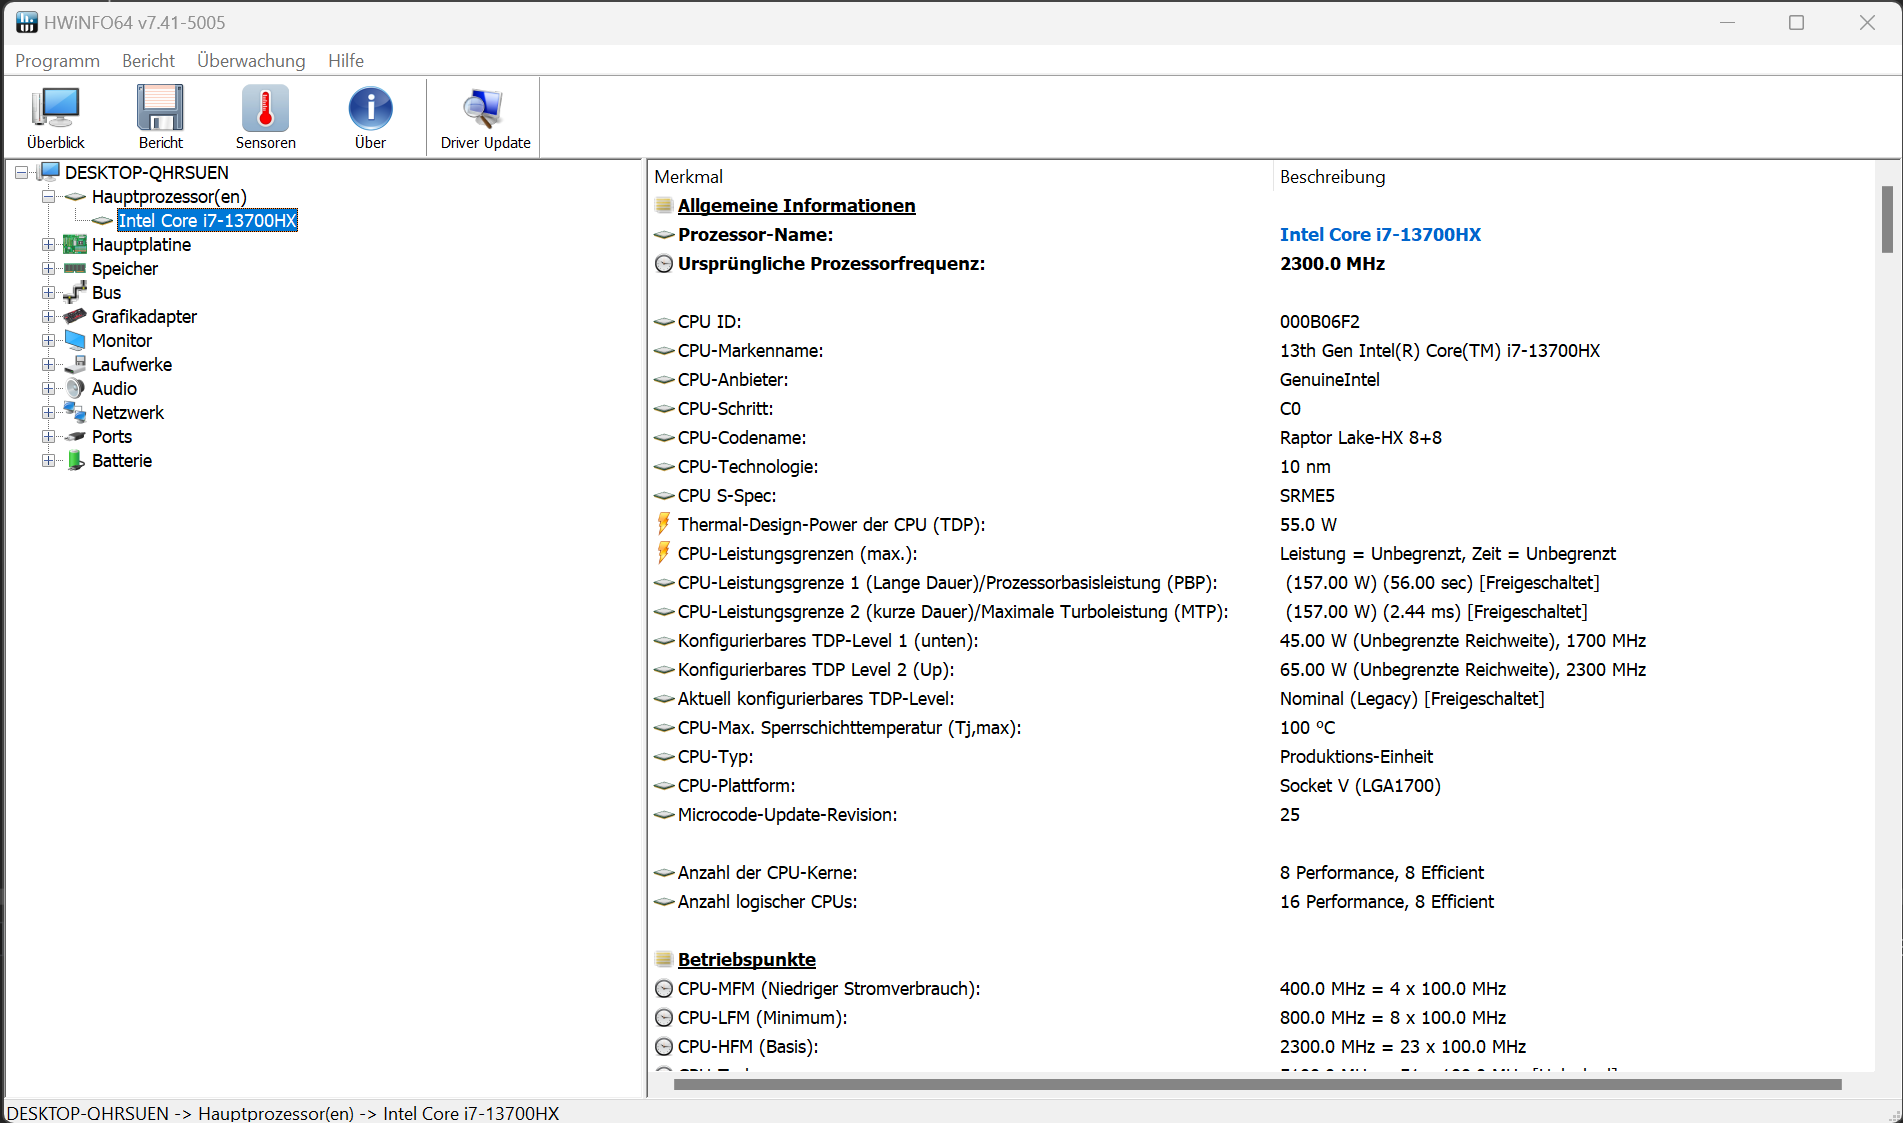
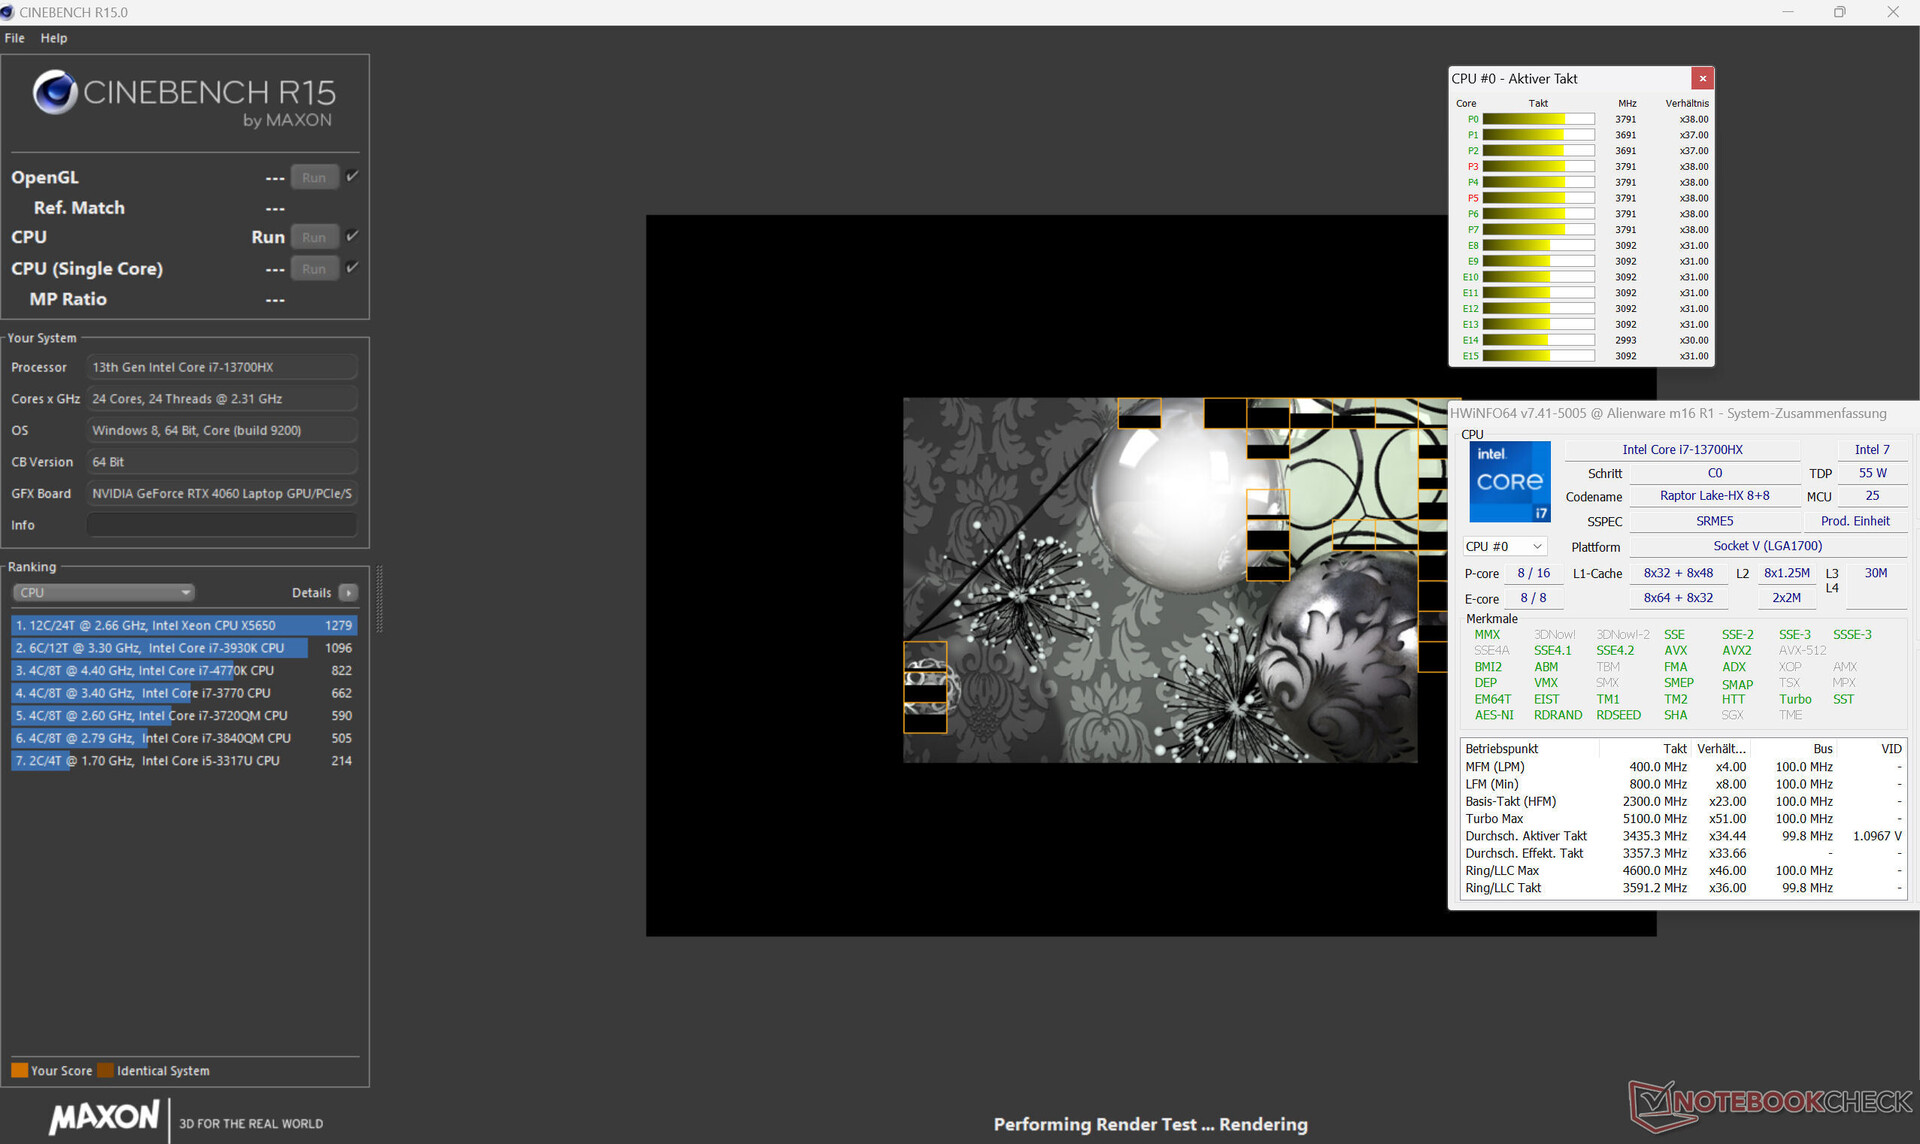
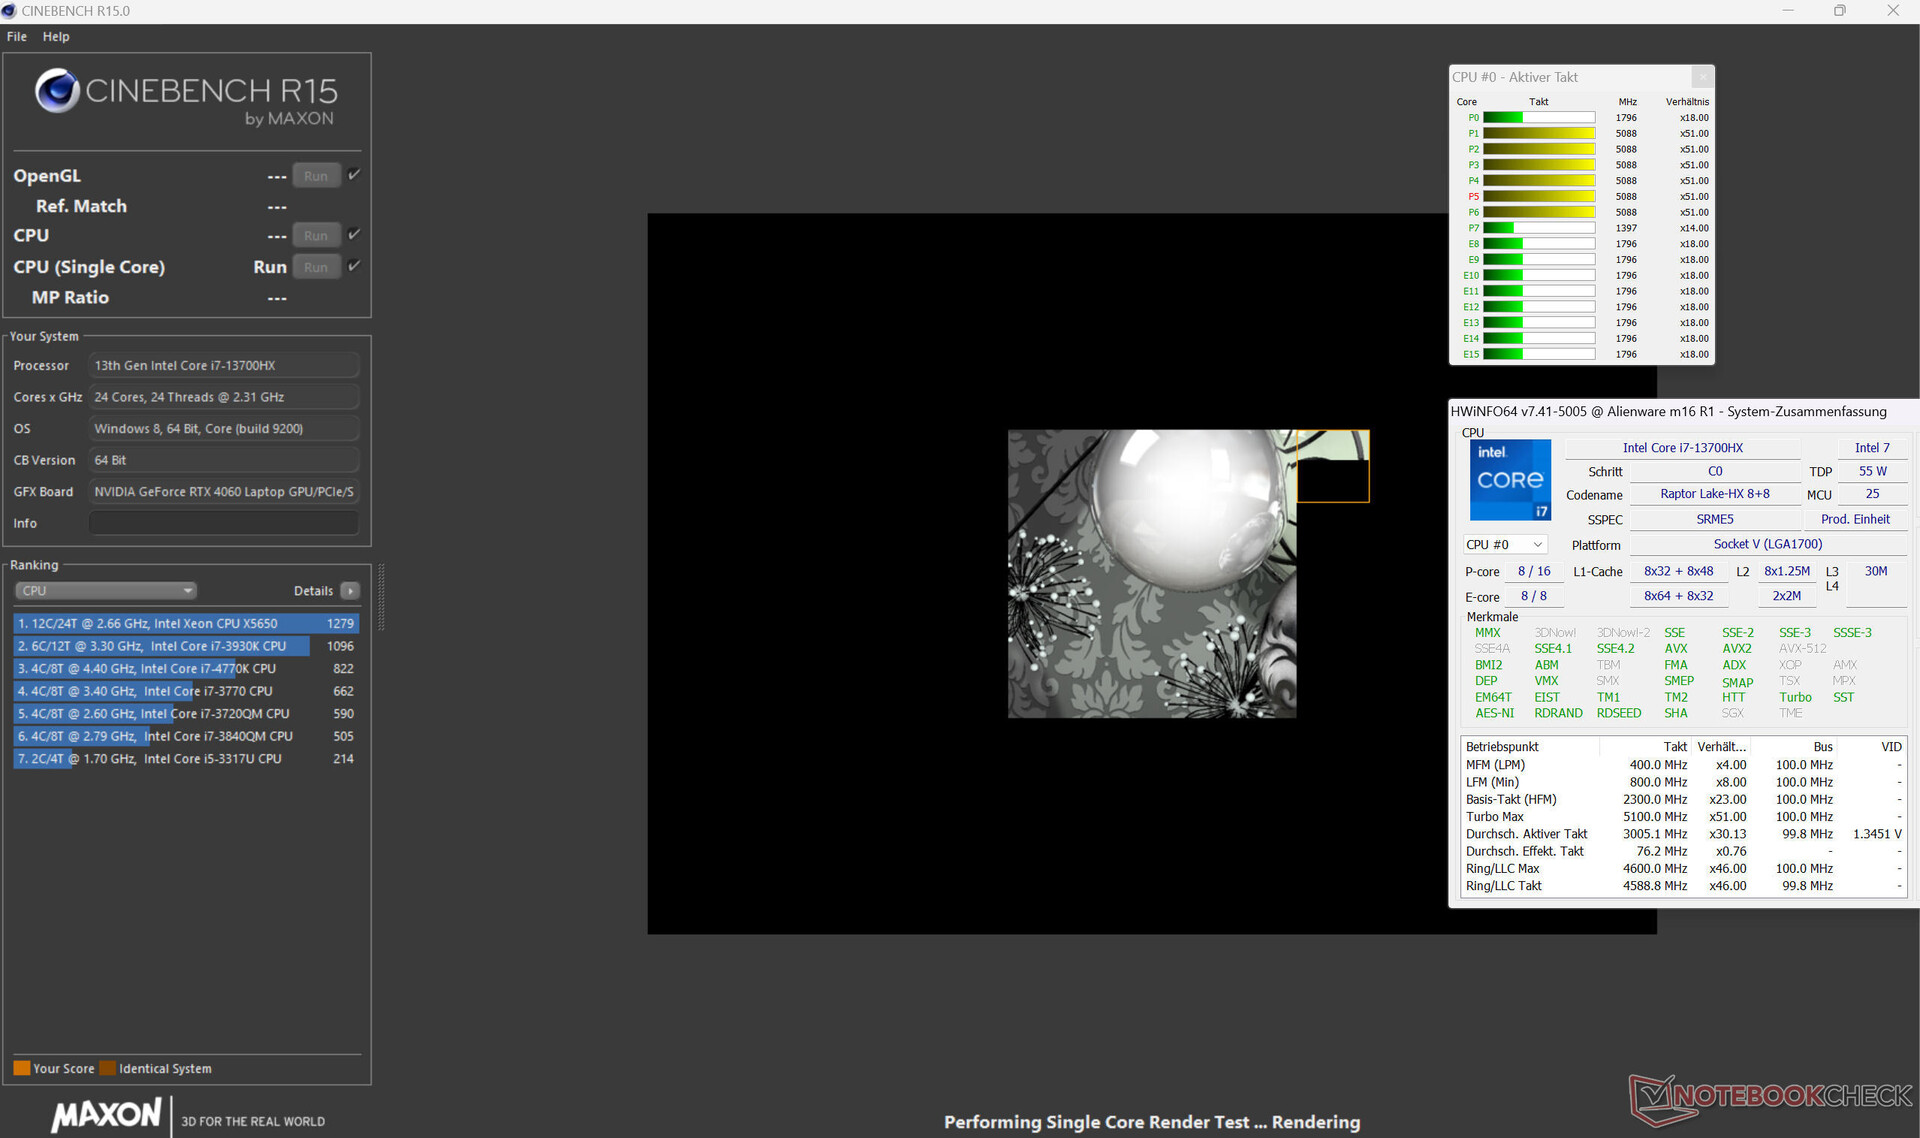
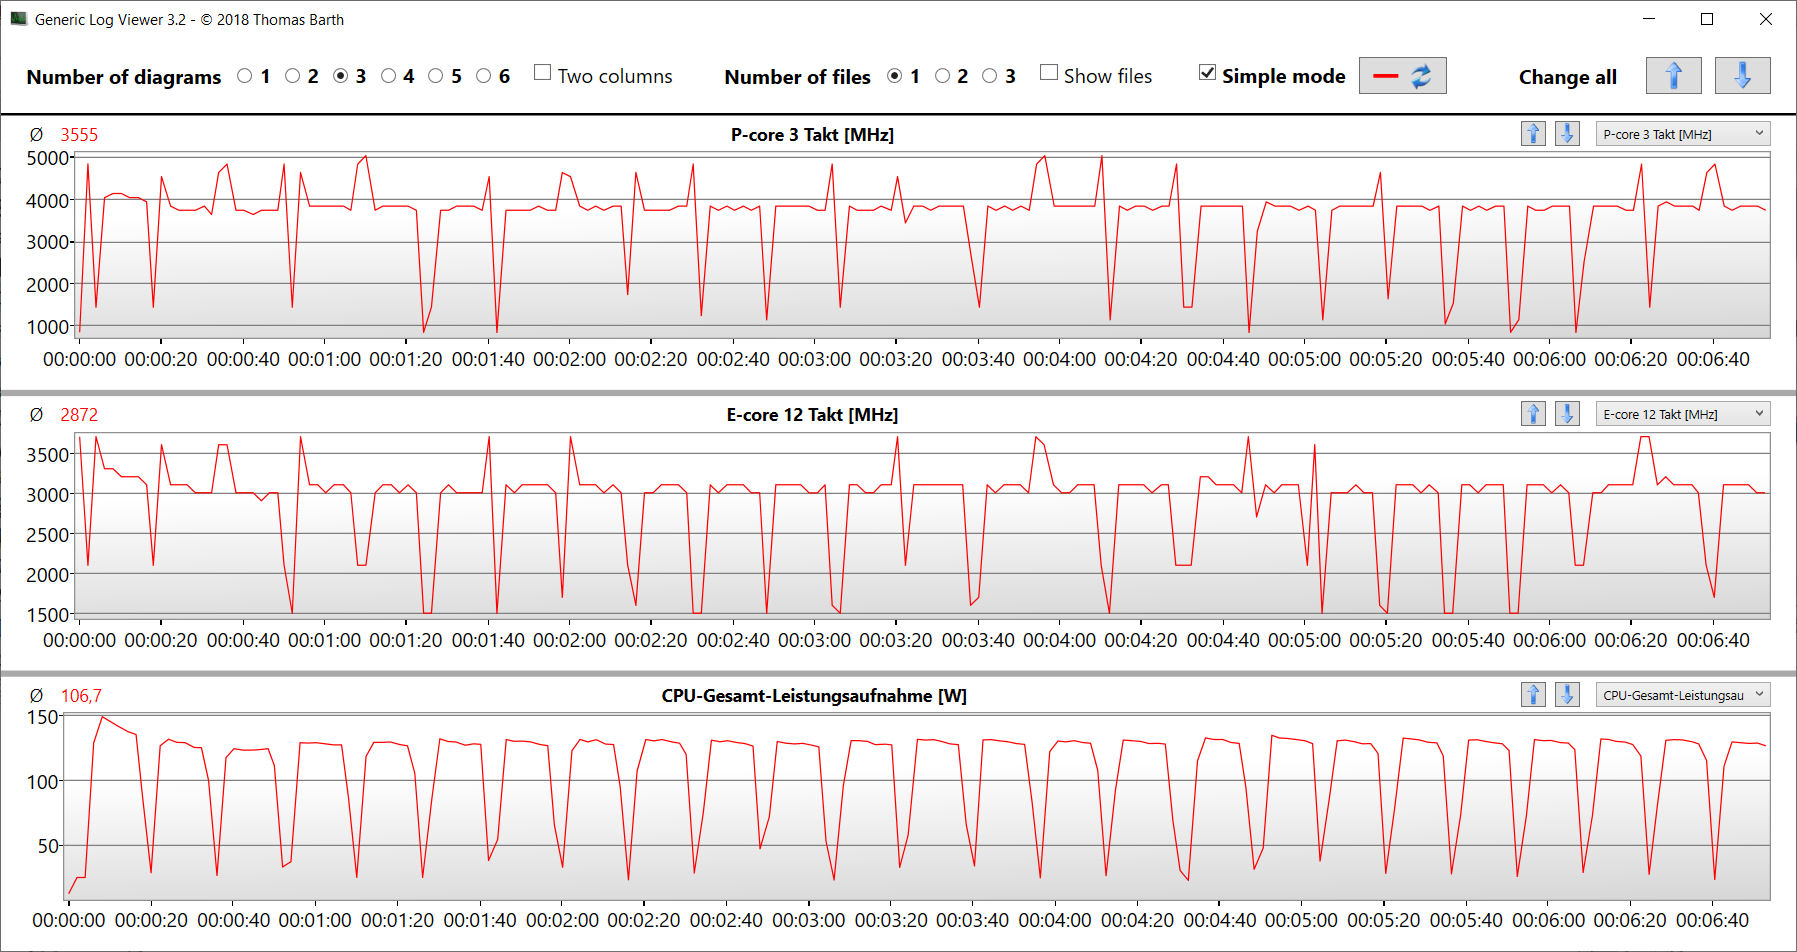
El Core-i7-13700HX (Raptor Lake) consta de ocho núcleos de eficiencia (sin hyperthreading, de 1,5 a 3,7 GHz) y ocho núcleos de rendimiento (hyperthreading, de 2,1 a 5 GHz). En total hay 24 núcleos lógicos de CPU.
Los resultados del benchmark están por encima de la media de la CPU en funcionamiento en red. En modo batería, el rendimiento más relevante de un solo hilo (160 puntos) cae de forma similar al rendimiento multihilo (2.134 puntos).
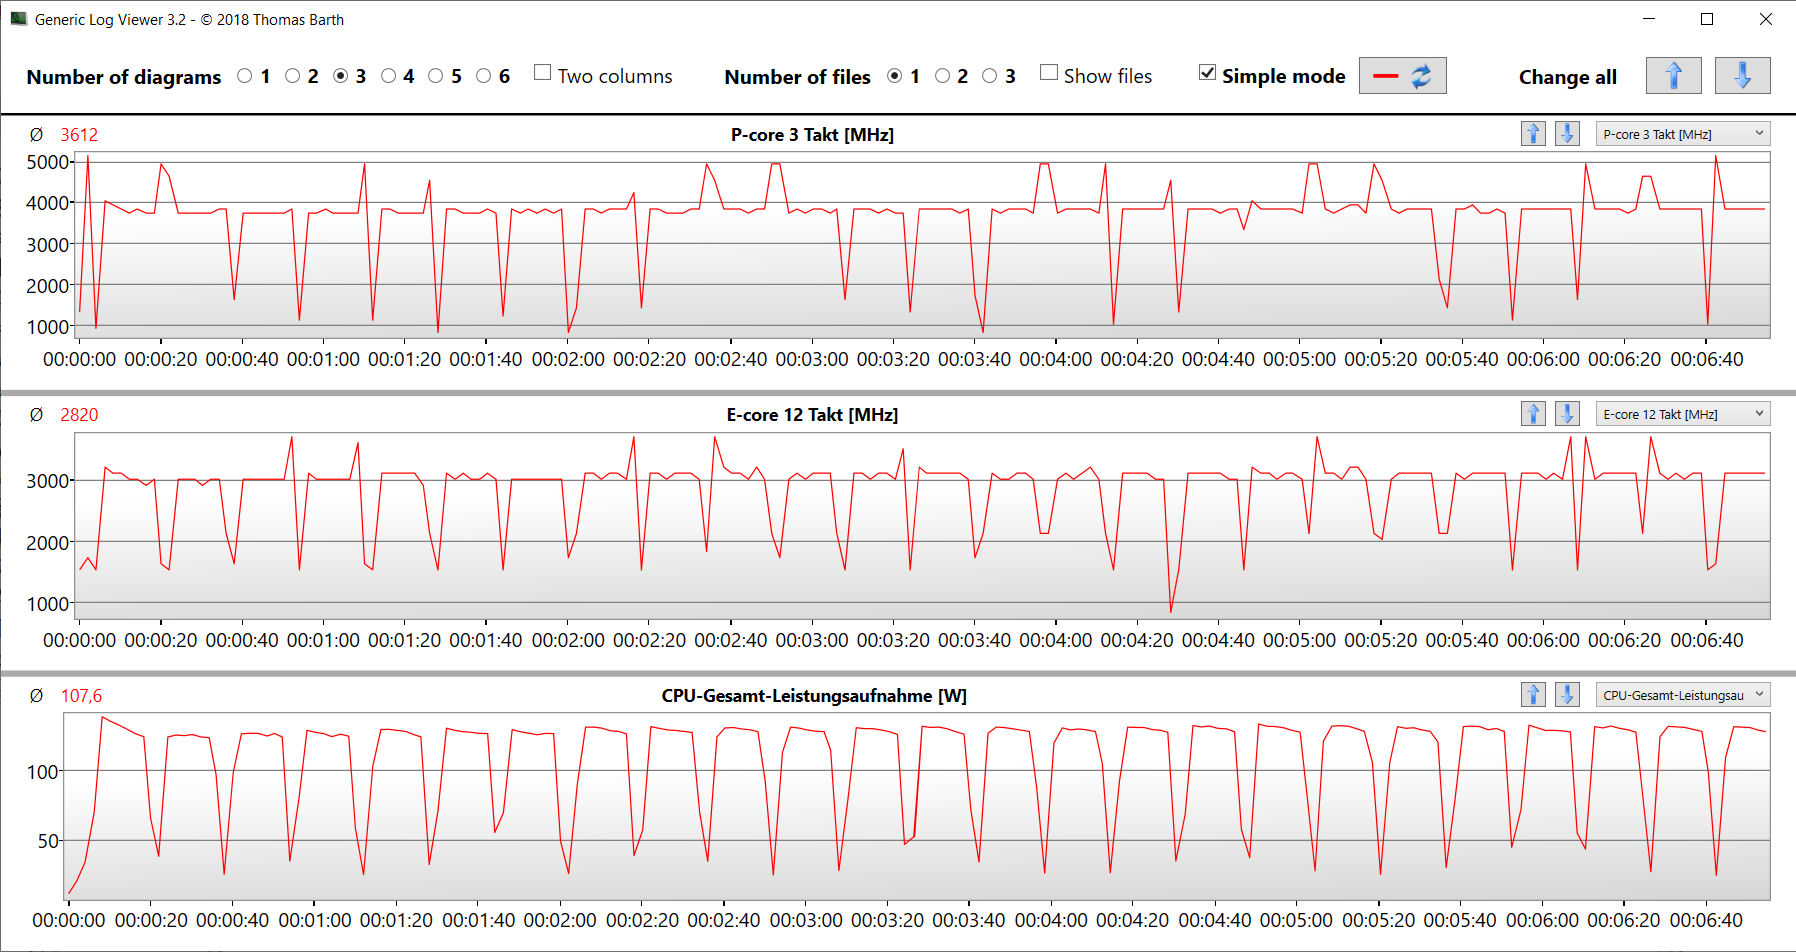
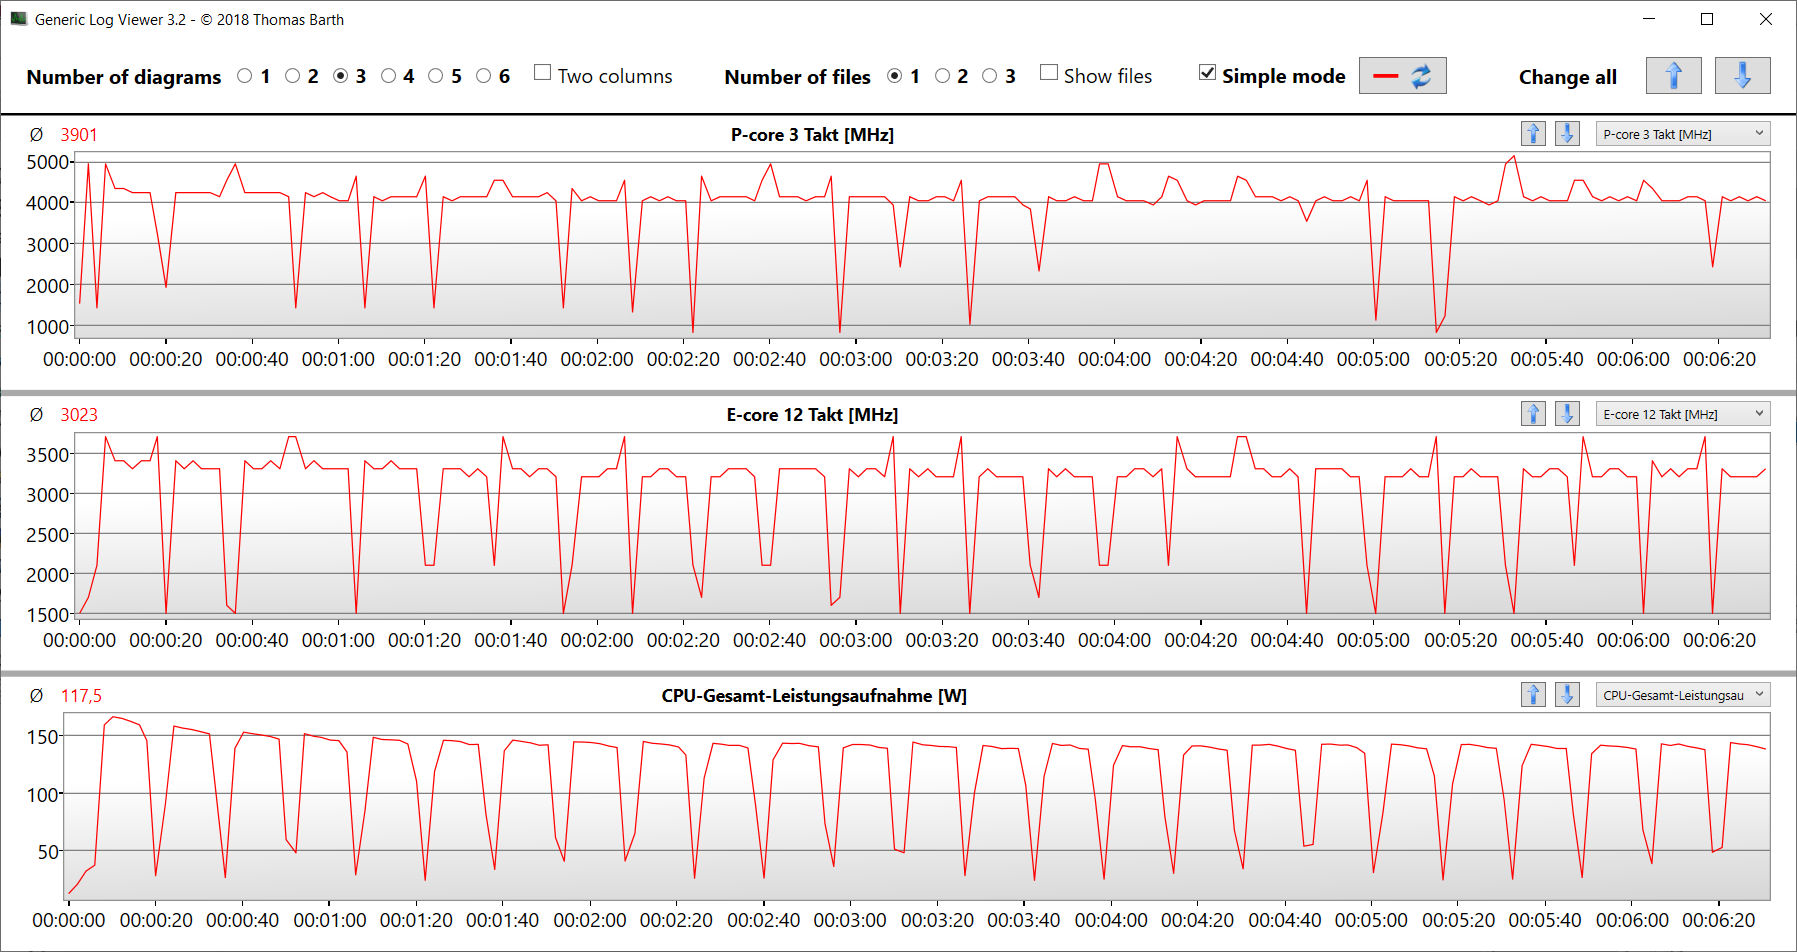
La prueba en bucle CB15 confirma que el turbo de la CPU puede mantenerse de forma permanente. Sin embargo, la velocidad de reloj cae ligeramente tras la primera ejecución, independientemente del perfil utilizado. "Overdrive" garantiza el mayor nivel general de rendimiento.
Cinebench R15 Multi Sustained Load
* ... más pequeño es mejor
AIDA64: FP32 Ray-Trace | FPU Julia | CPU SHA3 | CPU Queen | FPU SinJulia | FPU Mandel | CPU AES | CPU ZLib | FP64 Ray-Trace | CPU PhotoWorxx
| Performance rating | |
| Alienware m16 R1 AMD | |
| Media de la clase Gaming | |
| Alienware m16 R1 Intel | |
| Acer Predator Helios 16 PH16-71-731Q | |
| Schenker XMG Pro 15 (E23) | |
| Lenovo Legion Pro 5 16IRX8 | |
| Medio Intel Core i7-13700HX | |
| Medion Erazer Defender P40 | |
| Aorus 15 BSF | |
| AIDA64 / FP32 Ray-Trace | |
| Alienware m16 R1 AMD | |
| Media de la clase Gaming (10227 - 85542, n=105, últimos 2 años) | |
| Lenovo Legion Pro 5 16IRX8 | |
| Alienware m16 R1 Intel | |
| Acer Predator Helios 16 PH16-71-731Q | |
| Medio Intel Core i7-13700HX (14261 - 21999, n=11) | |
| Schenker XMG Pro 15 (E23) | |
| Medion Erazer Defender P40 | |
| Aorus 15 BSF | |
| AIDA64 / FPU Julia | |
| Alienware m16 R1 AMD | |
| Media de la clase Gaming (51376 - 238426, n=105, últimos 2 años) | |
| Lenovo Legion Pro 5 16IRX8 | |
| Alienware m16 R1 Intel | |
| Acer Predator Helios 16 PH16-71-731Q | |
| Medio Intel Core i7-13700HX (74636 - 109364, n=11) | |
| Schenker XMG Pro 15 (E23) | |
| Medion Erazer Defender P40 | |
| Aorus 15 BSF | |
| AIDA64 / CPU SHA3 | |
| Alienware m16 R1 AMD | |
| Media de la clase Gaming (2180 - 10115, n=105, últimos 2 años) | |
| Alienware m16 R1 Intel | |
| Schenker XMG Pro 15 (E23) | |
| Lenovo Legion Pro 5 16IRX8 | |
| Acer Predator Helios 16 PH16-71-731Q | |
| Medio Intel Core i7-13700HX (3359 - 5053, n=11) | |
| Medion Erazer Defender P40 | |
| Aorus 15 BSF | |
| AIDA64 / CPU Queen | |
| Alienware m16 R1 AMD | |
| Schenker XMG Pro 15 (E23) | |
| Media de la clase Gaming (49785 - 173351, n=90, últimos 2 años) | |
| Alienware m16 R1 Intel | |
| Acer Predator Helios 16 PH16-71-731Q | |
| Lenovo Legion Pro 5 16IRX8 | |
| Medion Erazer Defender P40 | |
| Medio Intel Core i7-13700HX (86532 - 114717, n=11) | |
| Aorus 15 BSF | |
| AIDA64 / FPU SinJulia | |
| Alienware m16 R1 AMD | |
| Media de la clase Gaming (4424 - 33636, n=105, últimos 2 años) | |
| Alienware m16 R1 Intel | |
| Lenovo Legion Pro 5 16IRX8 | |
| Acer Predator Helios 16 PH16-71-731Q | |
| Schenker XMG Pro 15 (E23) | |
| Medio Intel Core i7-13700HX (9290 - 13519, n=11) | |
| Medion Erazer Defender P40 | |
| Aorus 15 BSF | |
| AIDA64 / FPU Mandel | |
| Alienware m16 R1 AMD | |
| Media de la clase Gaming (25115 - 128721, n=105, últimos 2 años) | |
| Lenovo Legion Pro 5 16IRX8 | |
| Alienware m16 R1 Intel | |
| Acer Predator Helios 16 PH16-71-731Q | |
| Medio Intel Core i7-13700HX (35751 - 53484, n=11) | |
| Schenker XMG Pro 15 (E23) | |
| Medion Erazer Defender P40 | |
| Aorus 15 BSF | |
| AIDA64 / CPU AES | |
| Alienware m16 R1 Intel | |
| Acer Predator Helios 16 PH16-71-731Q | |
| Aorus 15 BSF | |
| Medio Intel Core i7-13700HX (67846 - 182575, n=11) | |
| Alienware m16 R1 AMD | |
| Media de la clase Gaming (39258 - 247074, n=105, últimos 2 años) | |
| Lenovo Legion Pro 5 16IRX8 | |
| Schenker XMG Pro 15 (E23) | |
| Medion Erazer Defender P40 | |
| AIDA64 / CPU ZLib | |
| Alienware m16 R1 AMD | |
| Media de la clase Gaming (574 - 2531, n=105, últimos 2 años) | |
| Acer Predator Helios 16 PH16-71-731Q | |
| Schenker XMG Pro 15 (E23) | |
| Alienware m16 R1 Intel | |
| Lenovo Legion Pro 5 16IRX8 | |
| Medio Intel Core i7-13700HX (981 - 1451, n=11) | |
| Medion Erazer Defender P40 | |
| Aorus 15 BSF | |
| AIDA64 / FP64 Ray-Trace | |
| Alienware m16 R1 AMD | |
| Media de la clase Gaming (5509 - 45446, n=105, últimos 2 años) | |
| Lenovo Legion Pro 5 16IRX8 | |
| Alienware m16 R1 Intel | |
| Acer Predator Helios 16 PH16-71-731Q | |
| Medio Intel Core i7-13700HX (7728 - 11837, n=11) | |
| Schenker XMG Pro 15 (E23) | |
| Medion Erazer Defender P40 | |
| Aorus 15 BSF | |
| AIDA64 / CPU PhotoWorxx | |
| Schenker XMG Pro 15 (E23) | |
| Media de la clase Gaming (12271 - 89891, n=105, últimos 2 años) | |
| Aorus 15 BSF | |
| Lenovo Legion Pro 5 16IRX8 | |
| Medion Erazer Defender P40 | |
| Alienware m16 R1 Intel | |
| Acer Predator Helios 16 PH16-71-731Q | |
| Medio Intel Core i7-13700HX (19678 - 42415, n=11) | |
| Alienware m16 R1 AMD | |
Rendimiento del sistema
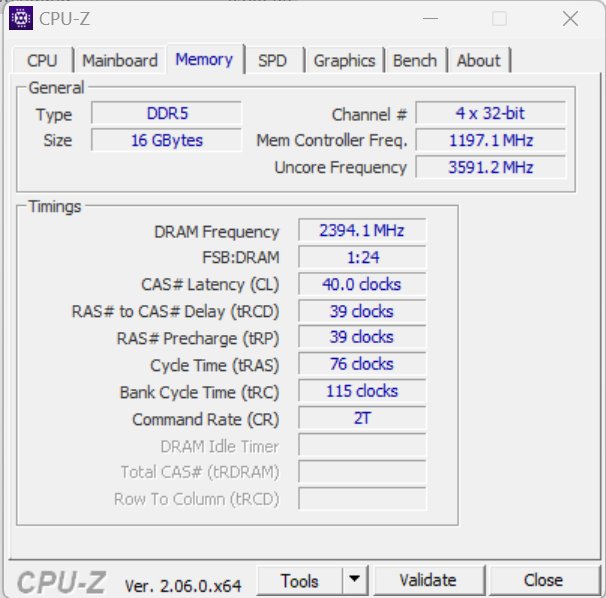
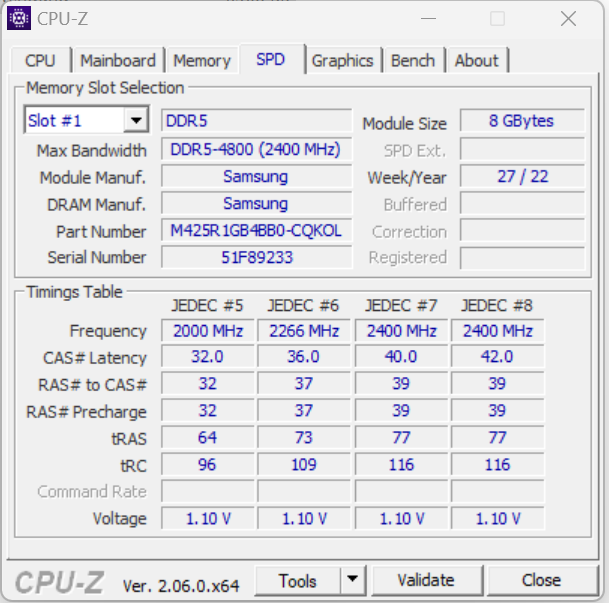
El buen funcionamiento del sistema no muestra falta de potencia de cálculo. El portátil maneja renderizado, edición de vídeo y juegos sin problemas. Las tasas de transferencia de RAM están a un nivel normal para una memoria DDR5-4800.
CrossMark: Overall | Productivity | Creativity | Responsiveness
| PCMark 10 / Score | |
| Alienware m16 R1 AMD | |
| Media de la clase Gaming (5828 - 12414, n=93, últimos 2 años) | |
| Acer Predator Helios 16 PH16-71-731Q | |
| Lenovo Legion Pro 5 16IRX8 | |
| Schenker XMG Pro 15 (E23) | |
| Medio Intel Core i7-13700HX, NVIDIA GeForce RTX 4060 Laptop GPU (6909 - 7743, n=5) | |
| Aorus 15 BSF | |
| Alienware m16 R1 Intel | |
| Medion Erazer Defender P40 | |
| PCMark 10 / Essentials | |
| Alienware m16 R1 AMD | |
| Schenker XMG Pro 15 (E23) | |
| Acer Predator Helios 16 PH16-71-731Q | |
| Lenovo Legion Pro 5 16IRX8 | |
| Aorus 15 BSF | |
| Alienware m16 R1 Intel | |
| Media de la clase Gaming (8810 - 11935, n=97, últimos 2 años) | |
| Medio Intel Core i7-13700HX, NVIDIA GeForce RTX 4060 Laptop GPU (9760 - 11313, n=5) | |
| Medion Erazer Defender P40 | |
| PCMark 10 / Productivity | |
| Media de la clase Gaming (6845 - 25323, n=95, últimos 2 años) | |
| Acer Predator Helios 16 PH16-71-731Q | |
| Schenker XMG Pro 15 (E23) | |
| Alienware m16 R1 AMD | |
| Medion Erazer Defender P40 | |
| Medio Intel Core i7-13700HX, NVIDIA GeForce RTX 4060 Laptop GPU (9131 - 11018, n=5) | |
| Alienware m16 R1 Intel | |
| Lenovo Legion Pro 5 16IRX8 | |
| Aorus 15 BSF | |
| PCMark 10 / Digital Content Creation | |
| Alienware m16 R1 AMD | |
| Media de la clase Gaming (7602 - 19954, n=95, últimos 2 años) | |
| Lenovo Legion Pro 5 16IRX8 | |
| Medio Intel Core i7-13700HX, NVIDIA GeForce RTX 4060 Laptop GPU (9393 - 12434, n=5) | |
| Aorus 15 BSF | |
| Acer Predator Helios 16 PH16-71-731Q | |
| Alienware m16 R1 Intel | |
| Schenker XMG Pro 15 (E23) | |
| Medion Erazer Defender P40 | |
| CrossMark / Overall | |
| Acer Predator Helios 16 PH16-71-731Q | |
| Aorus 15 BSF | |
| Alienware m16 R1 Intel | |
| Alienware m16 R1 AMD | |
| Media de la clase Gaming (1366 - 2409, n=94, últimos 2 años) | |
| Schenker XMG Pro 15 (E23) | |
| Medio Intel Core i7-13700HX, NVIDIA GeForce RTX 4060 Laptop GPU (1663 - 2105, n=5) | |
| Medion Erazer Defender P40 | |
| Lenovo Legion Pro 5 16IRX8 | |
| CrossMark / Productivity | |
| Aorus 15 BSF | |
| Acer Predator Helios 16 PH16-71-731Q | |
| Alienware m16 R1 Intel | |
| Alienware m16 R1 AMD | |
| Media de la clase Gaming (1386 - 2254, n=94, últimos 2 años) | |
| Schenker XMG Pro 15 (E23) | |
| Medio Intel Core i7-13700HX, NVIDIA GeForce RTX 4060 Laptop GPU (1618 - 1989, n=5) | |
| Medion Erazer Defender P40 | |
| Lenovo Legion Pro 5 16IRX8 | |
| CrossMark / Creativity | |
| Acer Predator Helios 16 PH16-71-731Q | |
| Media de la clase Gaming (1343 - 2786, n=94, últimos 2 años) | |
| Alienware m16 R1 Intel | |
| Schenker XMG Pro 15 (E23) | |
| Alienware m16 R1 AMD | |
| Aorus 15 BSF | |
| Medio Intel Core i7-13700HX, NVIDIA GeForce RTX 4060 Laptop GPU (1710 - 2274, n=5) | |
| Medion Erazer Defender P40 | |
| Lenovo Legion Pro 5 16IRX8 | |
| CrossMark / Responsiveness | |
| Aorus 15 BSF | |
| Acer Predator Helios 16 PH16-71-731Q | |
| Alienware m16 R1 Intel | |
| Schenker XMG Pro 15 (E23) | |
| Alienware m16 R1 AMD | |
| Media de la clase Gaming (1226 - 2334, n=94, últimos 2 años) | |
| Medio Intel Core i7-13700HX, NVIDIA GeForce RTX 4060 Laptop GPU (1269 - 1983, n=5) | |
| Lenovo Legion Pro 5 16IRX8 | |
| Medion Erazer Defender P40 | |
| PCMark 10 Score | 7224 puntos | |
ayuda | ||
| AIDA64 / Memory Copy | |
| Schenker XMG Pro 15 (E23) | |
| Media de la clase Gaming (21750 - 129946, n=105, últimos 2 años) | |
| Aorus 15 BSF | |
| Lenovo Legion Pro 5 16IRX8 | |
| Medion Erazer Defender P40 | |
| Alienware m16 R1 Intel | |
| Acer Predator Helios 16 PH16-71-731Q | |
| Medio Intel Core i7-13700HX (36125 - 63990, n=11) | |
| Alienware m16 R1 AMD | |
| AIDA64 / Memory Read | |
| Schenker XMG Pro 15 (E23) | |
| Media de la clase Gaming (22956 - 118858, n=105, últimos 2 años) | |
| Aorus 15 BSF | |
| Lenovo Legion Pro 5 16IRX8 | |
| Medion Erazer Defender P40 | |
| Alienware m16 R1 Intel | |
| Acer Predator Helios 16 PH16-71-731Q | |
| Medio Intel Core i7-13700HX (36510 - 69729, n=11) | |
| Alienware m16 R1 AMD | |
| AIDA64 / Memory Write | |
| Aorus 15 BSF | |
| Acer Predator Helios 16 PH16-71-731Q | |
| Media de la clase Gaming (22297 - 135096, n=105, últimos 2 años) | |
| Schenker XMG Pro 15 (E23) | |
| Lenovo Legion Pro 5 16IRX8 | |
| Medio Intel Core i7-13700HX (33598 - 85675, n=11) | |
| Alienware m16 R1 Intel | |
| Medion Erazer Defender P40 | |
| Alienware m16 R1 AMD | |
| AIDA64 / Memory Latency | |
| Media de la clase Gaming (75.3 - 259, n=105, últimos 2 años) | |
| Medion Erazer Defender P40 | |
| Aorus 15 BSF | |
| Alienware m16 R1 AMD | |
| Alienware m16 R1 Intel | |
| Medio Intel Core i7-13700HX (81.5 - 97.9, n=11) | |
| Acer Predator Helios 16 PH16-71-731Q | |
| Schenker XMG Pro 15 (E23) | |
| Lenovo Legion Pro 5 16IRX8 | |
* ... más pequeño es mejor
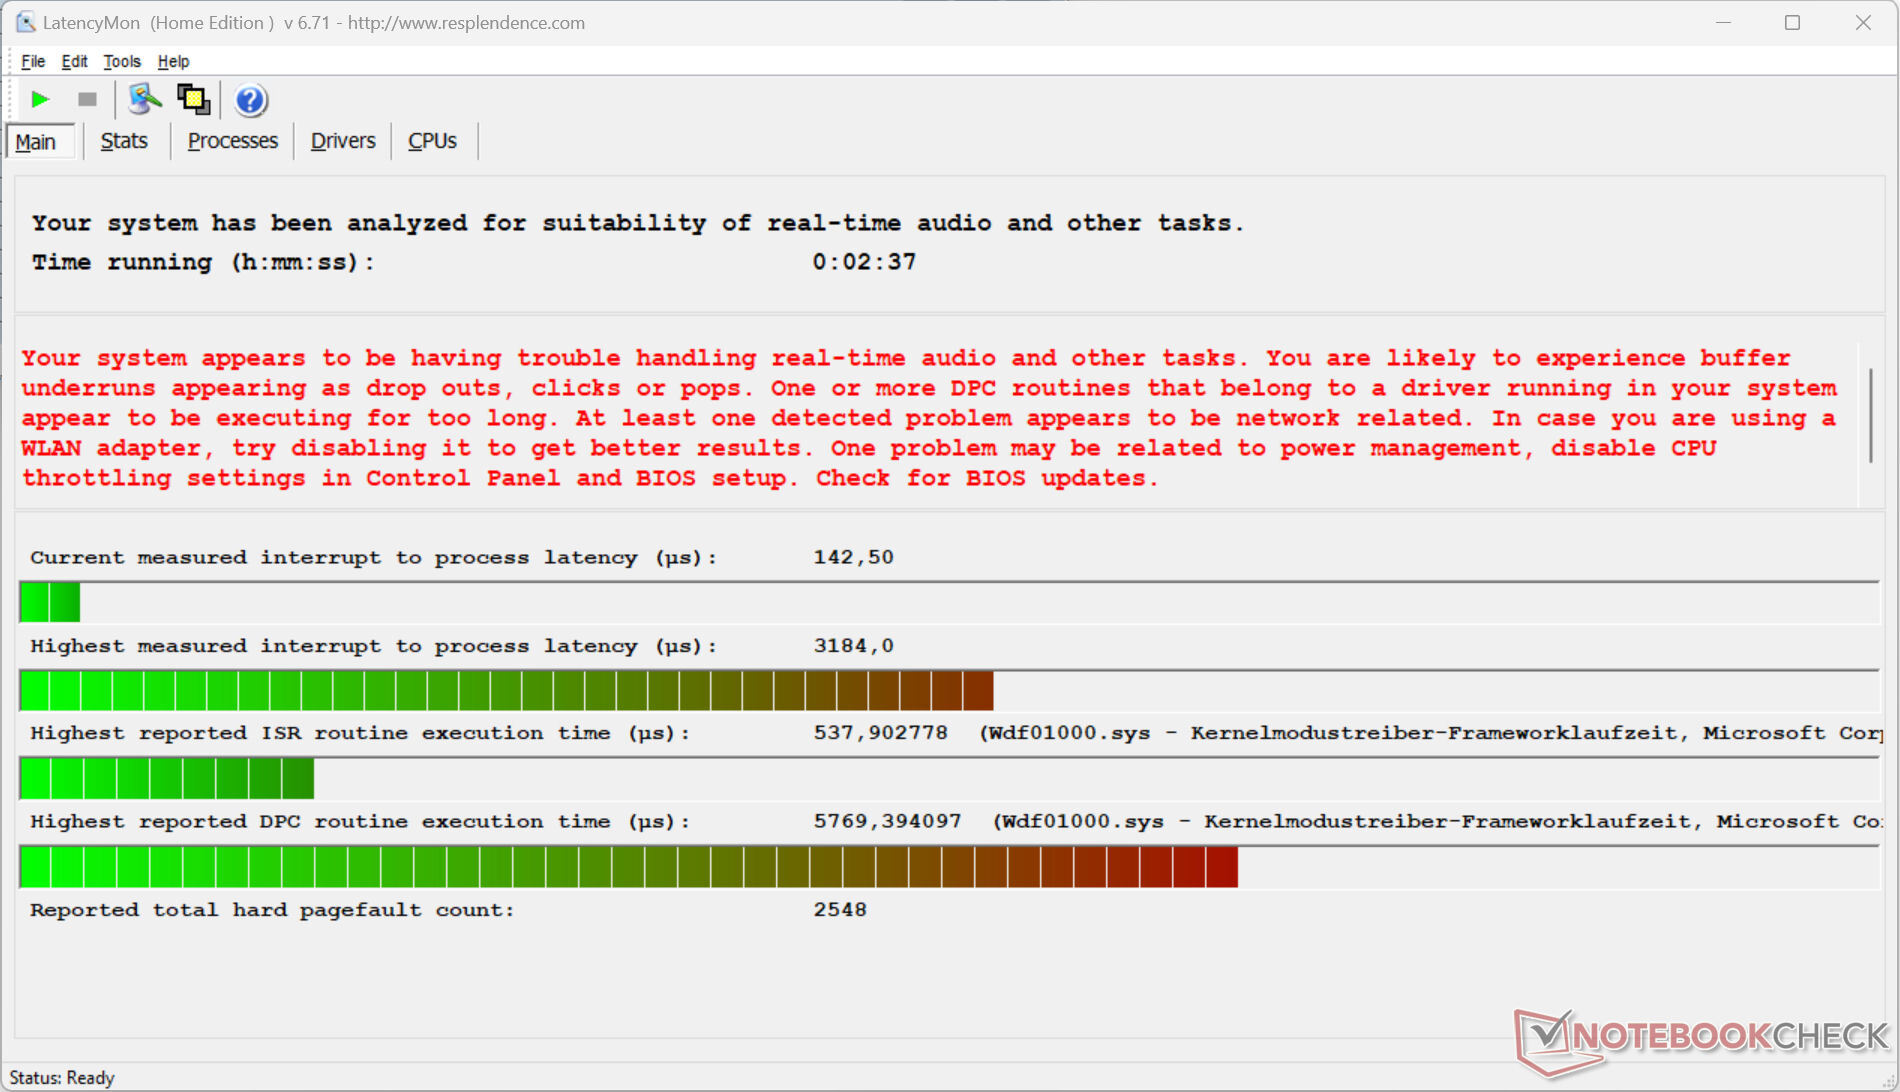
Latencia del CPD
La prueba de monitorización de latencia estandarizada (navegación web, reproducción de vídeo 4k, Prime95 con carga alta) reveló anomalías. El sistema no parece adecuado para la edición de vídeo y audio en tiempo real. Las futuras actualizaciones de software pueden suponer una mejora o una mayor degradación.
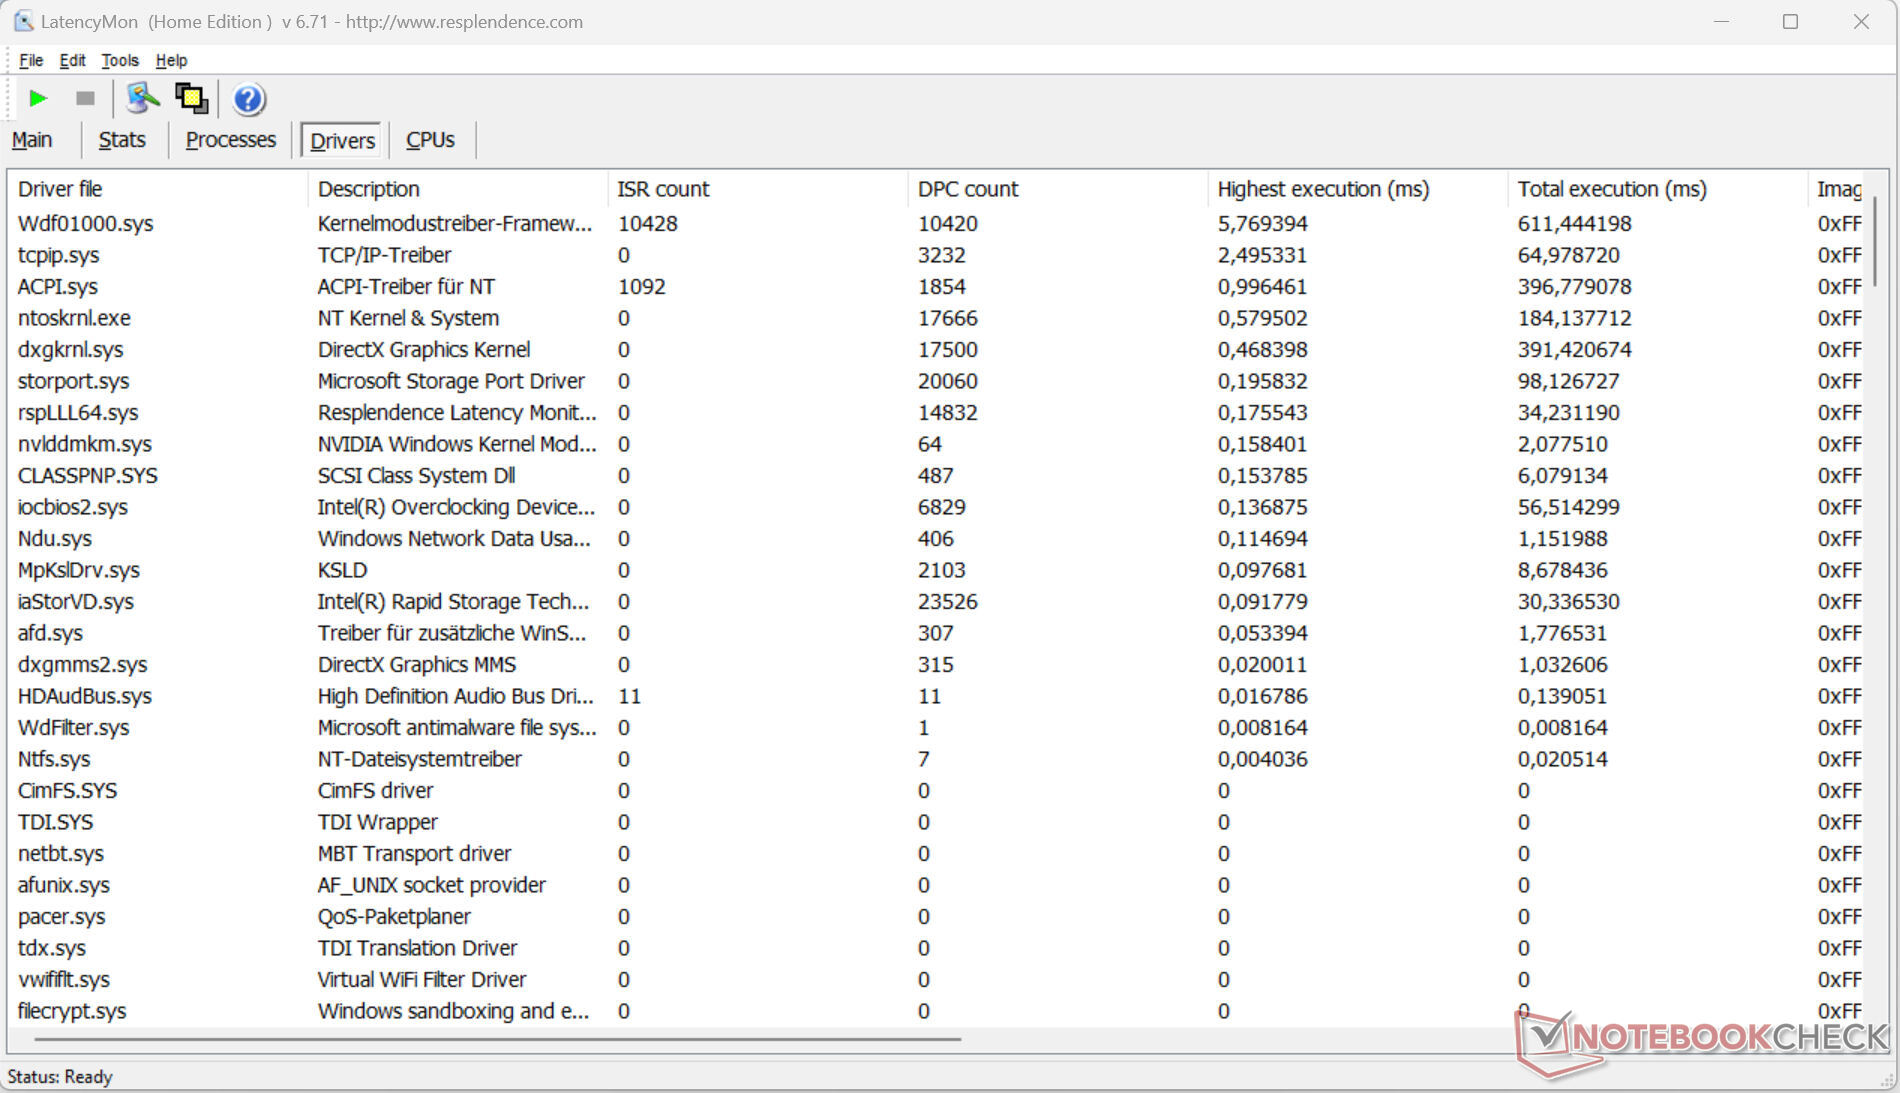
| DPC Latencies / LatencyMon - interrupt to process latency (max), Web, Youtube, Prime95 | |
| Medion Erazer Defender P40 | |
| Alienware m16 R1 Intel | |
| Alienware m16 R1 AMD | |
| Aorus 15 BSF | |
| Acer Predator Helios 16 PH16-71-731Q | |
| Schenker XMG Pro 15 (E23) | |
| Lenovo Legion Pro 5 16IRX8 | |
* ... más pequeño es mejor
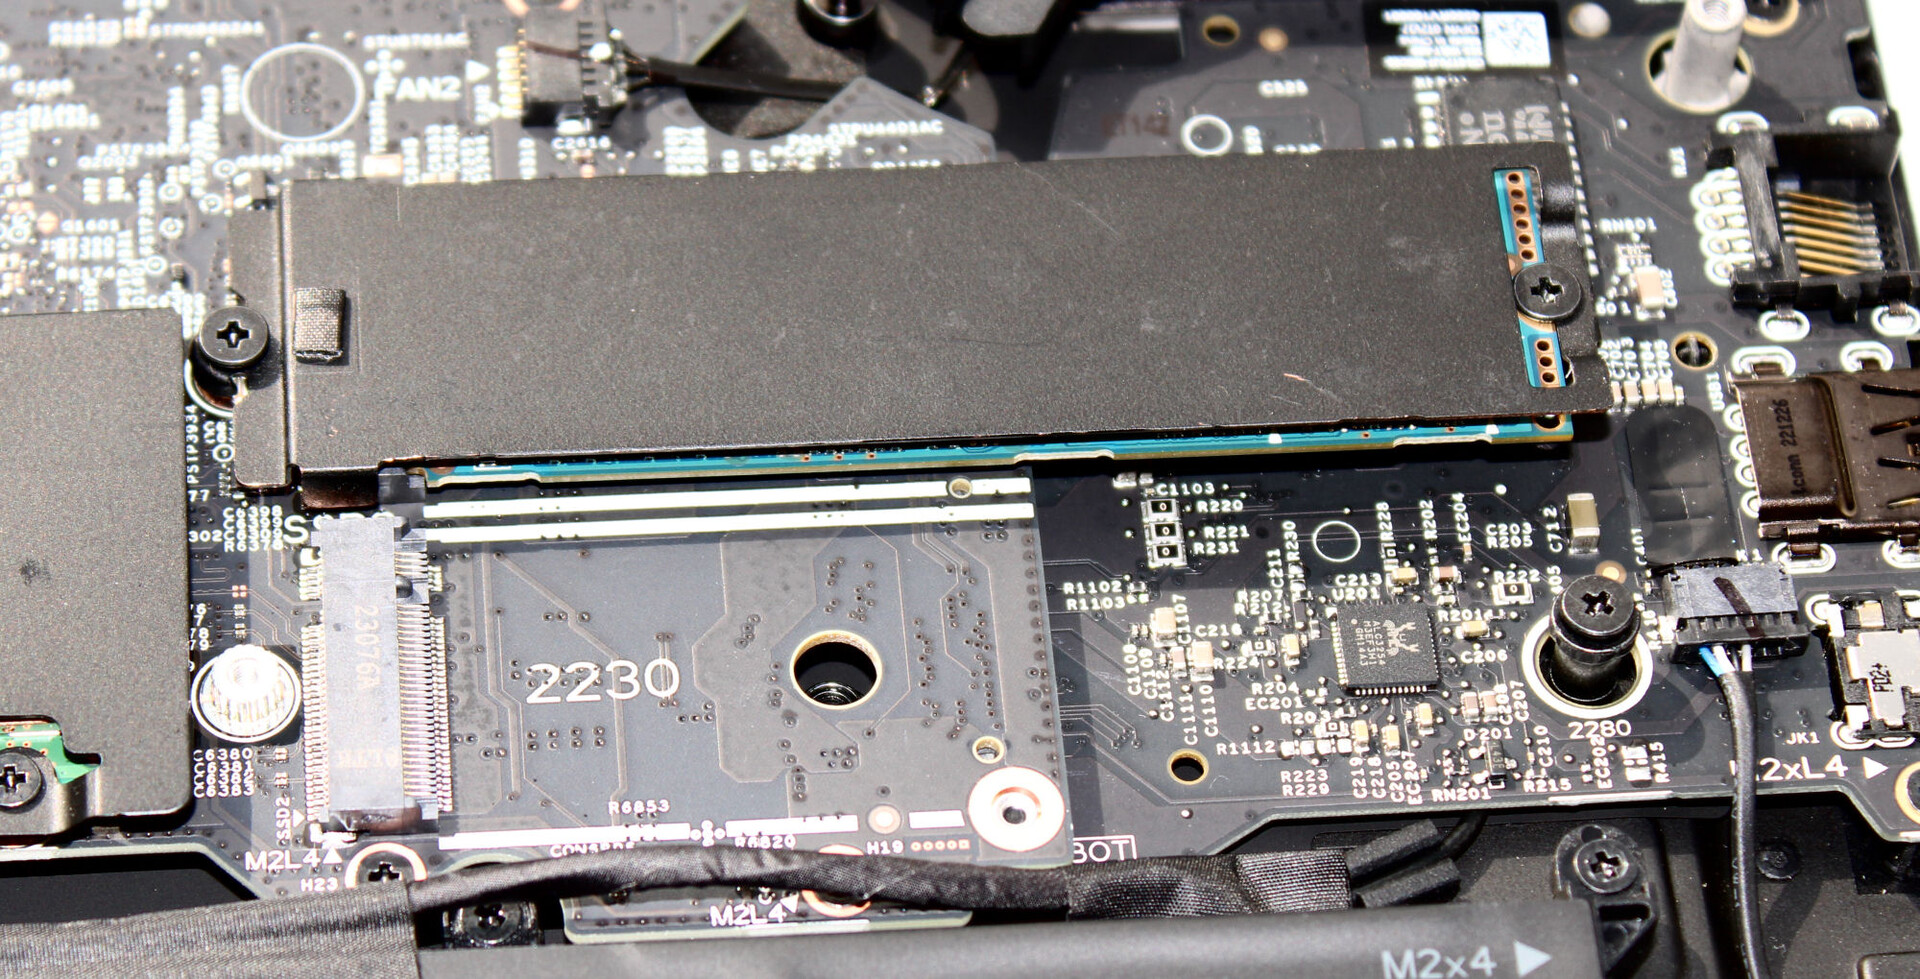
Dispositivos de almacenamiento
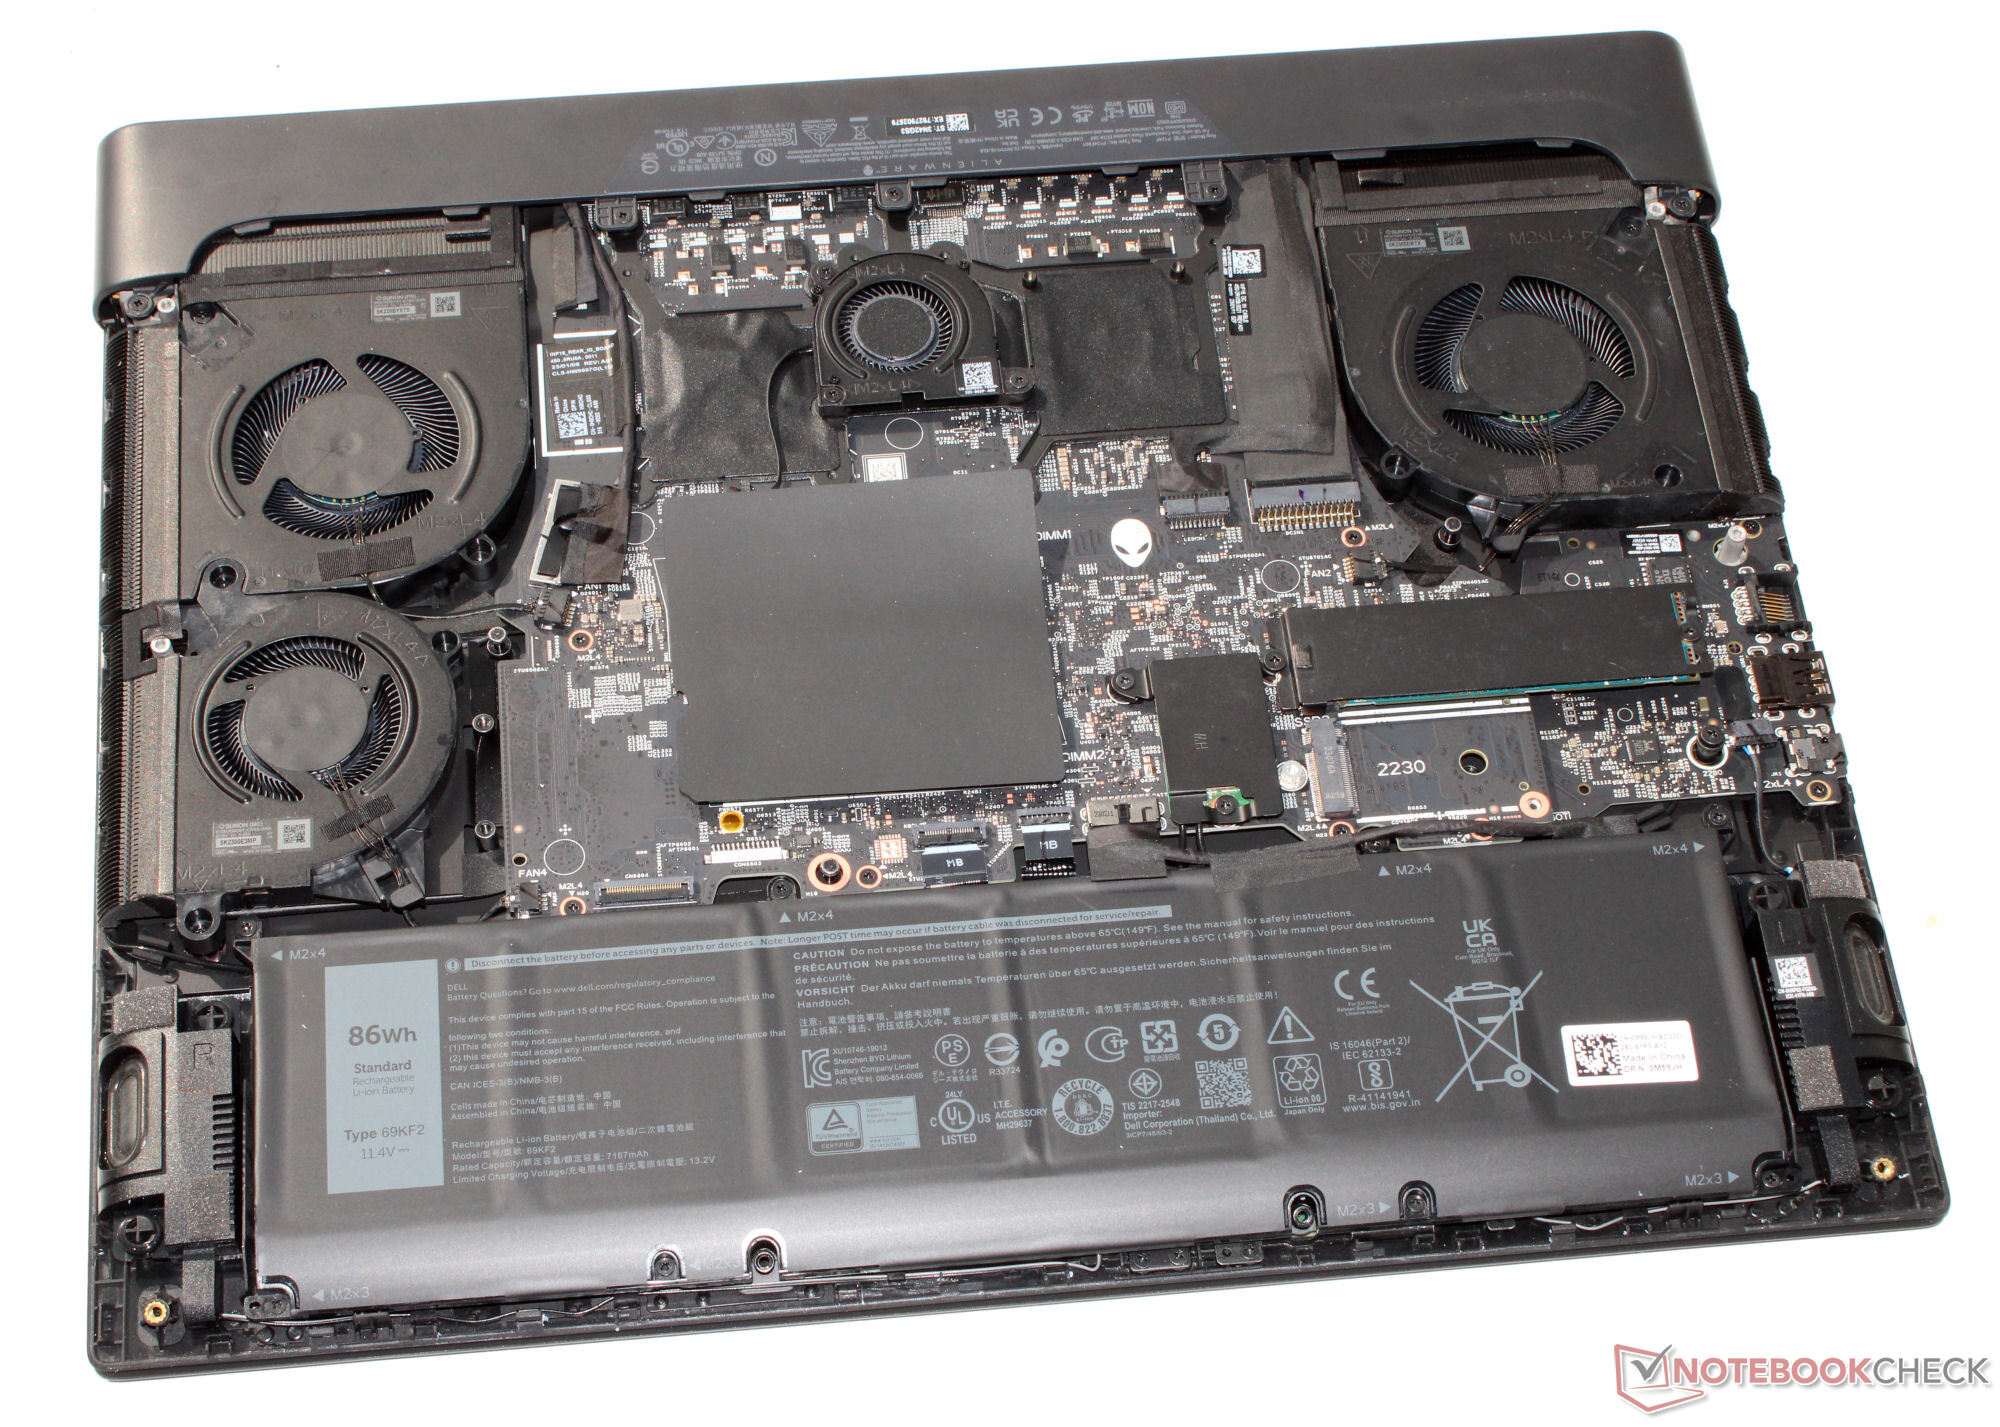
Un SSD de 512 GB (PCIe 4, M.2 2280) de Kioxia sirve como unidad del sistema. Ofrece buenas tasas de datos, pero no es uno de los mejores modelos SSD. No se produjo estrangulamiento térmico. El portátil tiene espacio para otro PCIe-4-SSD (M.2 2230 o M.2 2280). Otras configuraciones del m16 pueden incluso acomodar hasta cuatro SSDs.

* ... más pequeño es mejor
Sustained Read Performance: DiskSpd Read Loop, Queue Depth 8
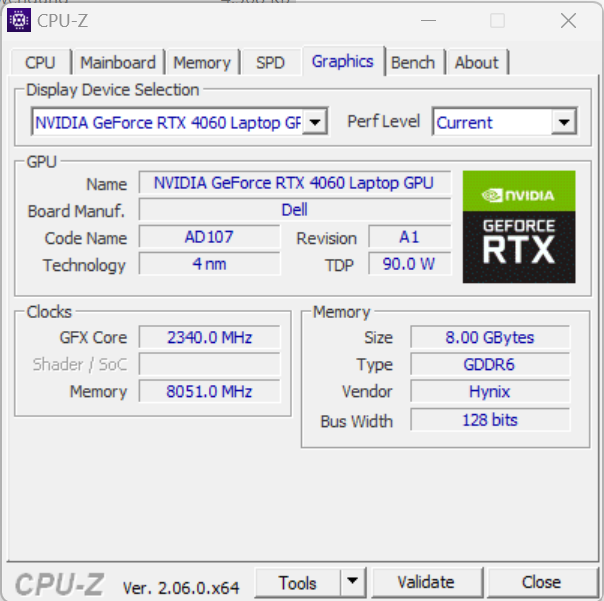
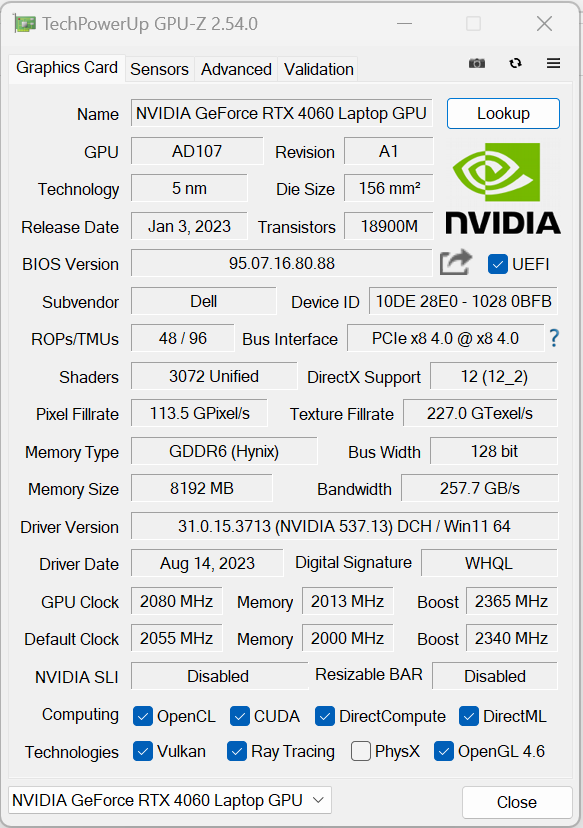
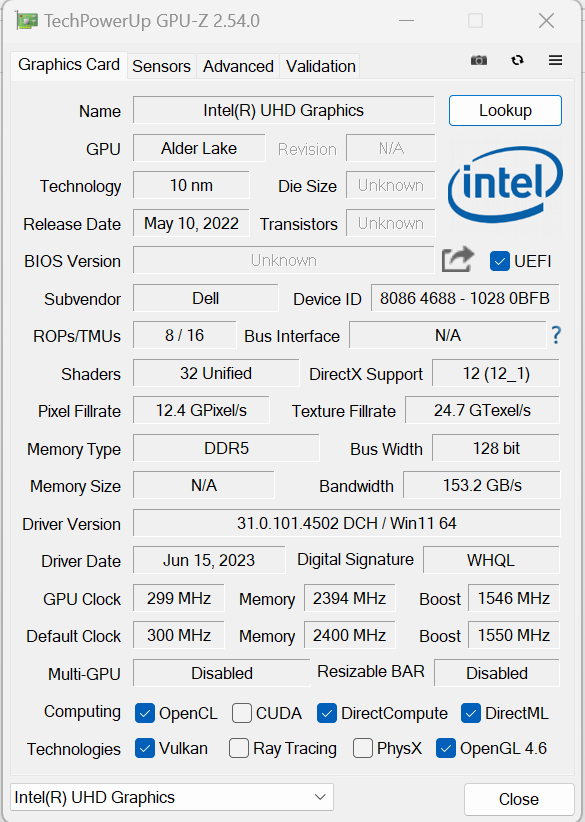
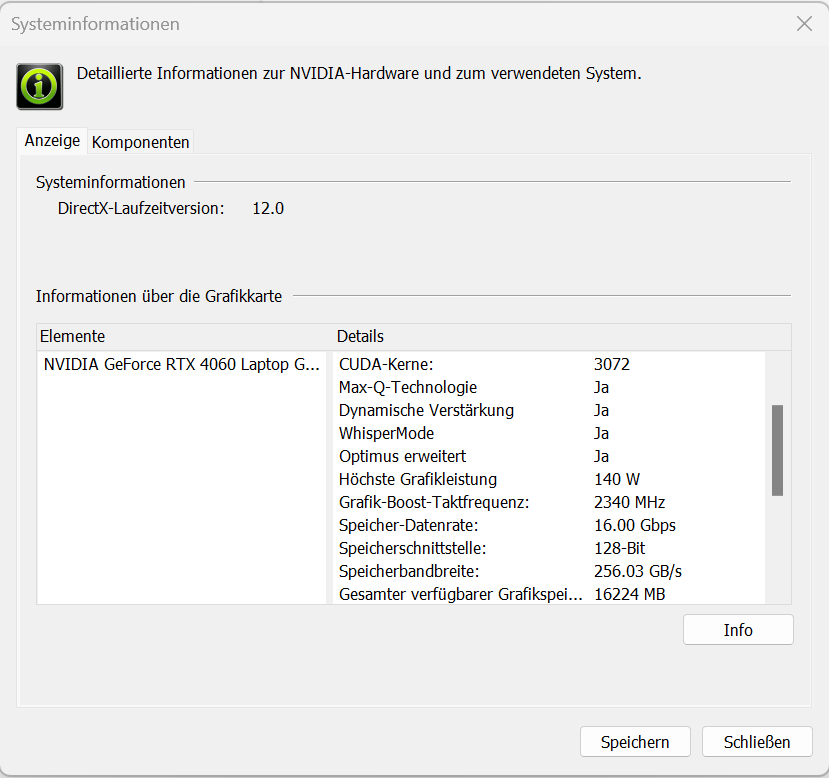
Tarjeta gráfica
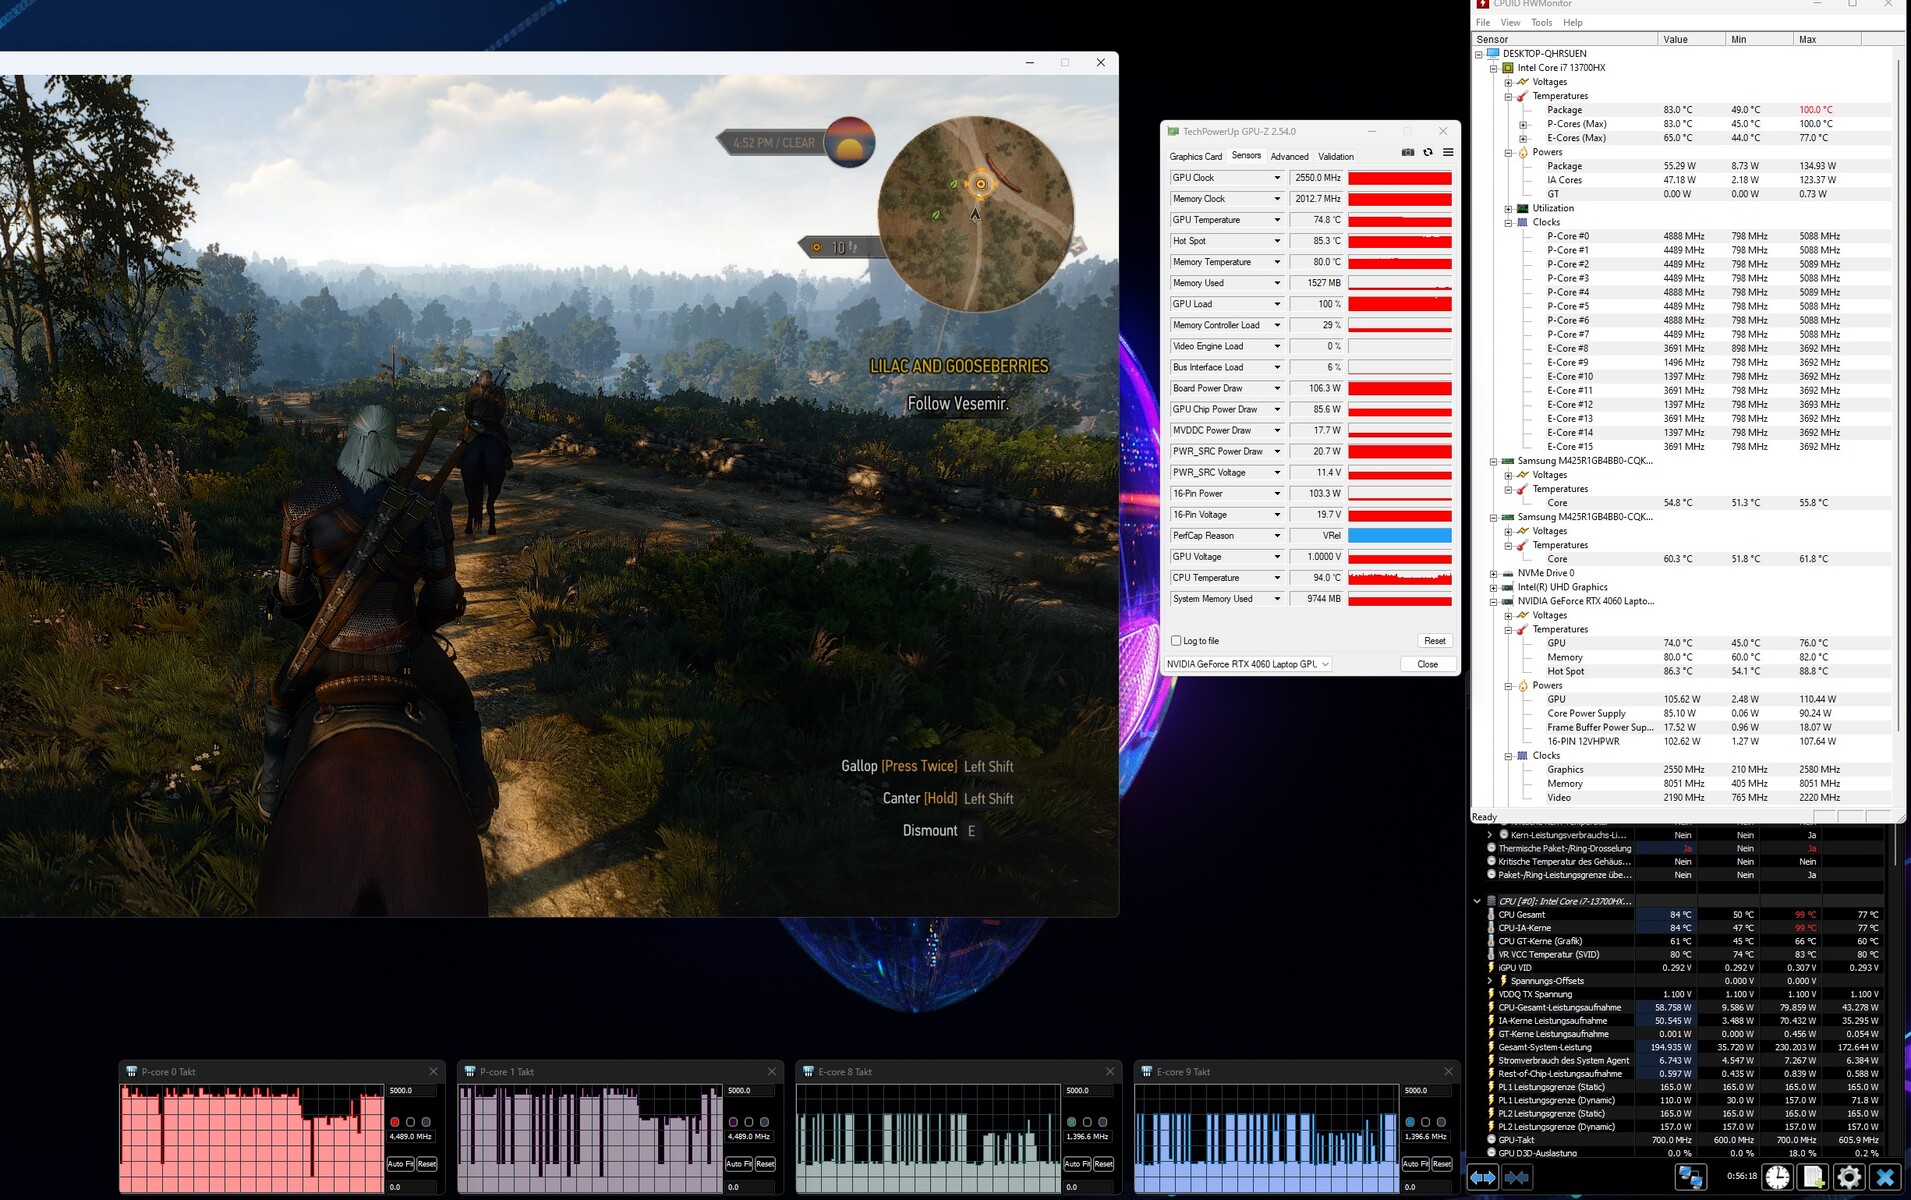
La GeForce RTX 4060ofrece 3072 shaders, un bus de 128 bits de ancho y una rápida memoria GDDR6 (8.192 MB). Dell permite un TGP máximo de 140 vatios (115 vatios + 25 vatios Dynamic Boost) - más no es posible. Según el test Witcher 3, el TGP no se utiliza del todo. Los resultados del benchmark están por encima de la media anterior de la RTX 4060 y están entre los mejores valores registrados con esta GPU hasta la fecha. El cambio entre dGPU y Optimus no requiere reiniciar - Optimus avanzado es compatible.

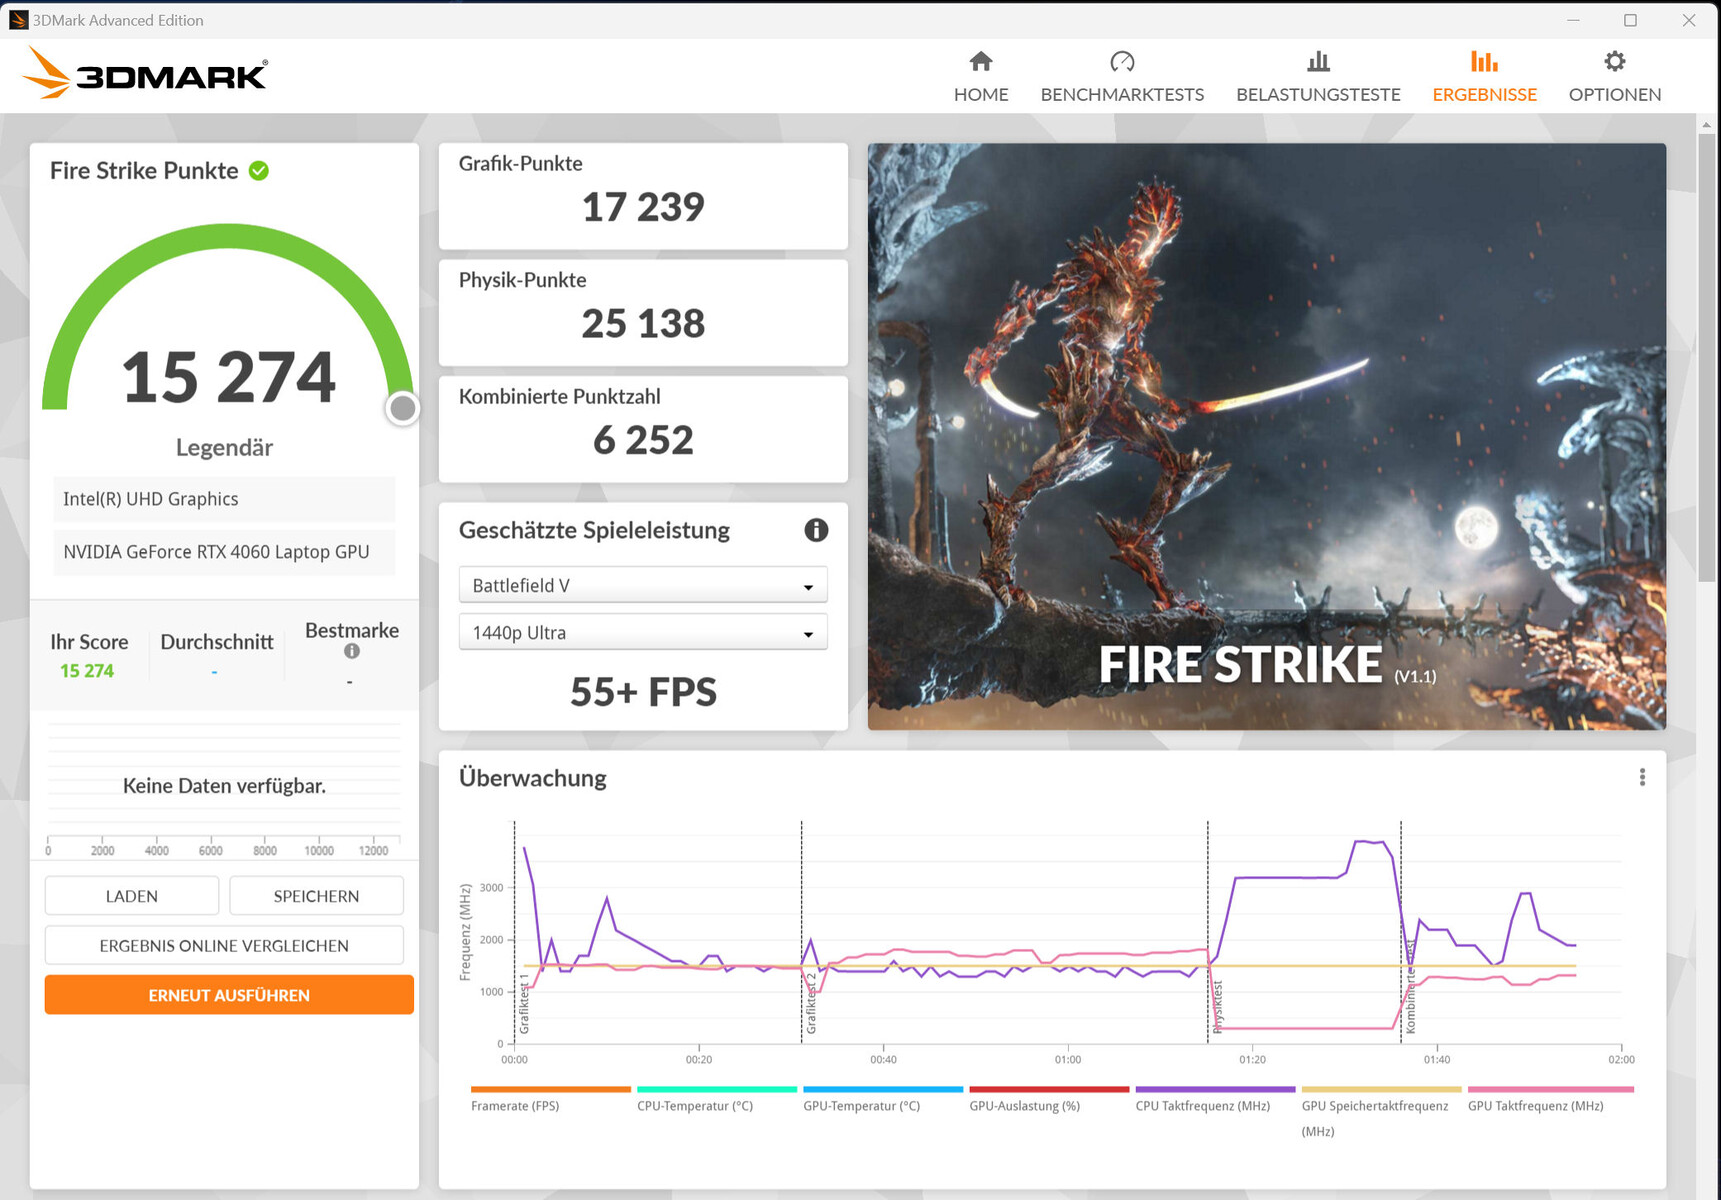
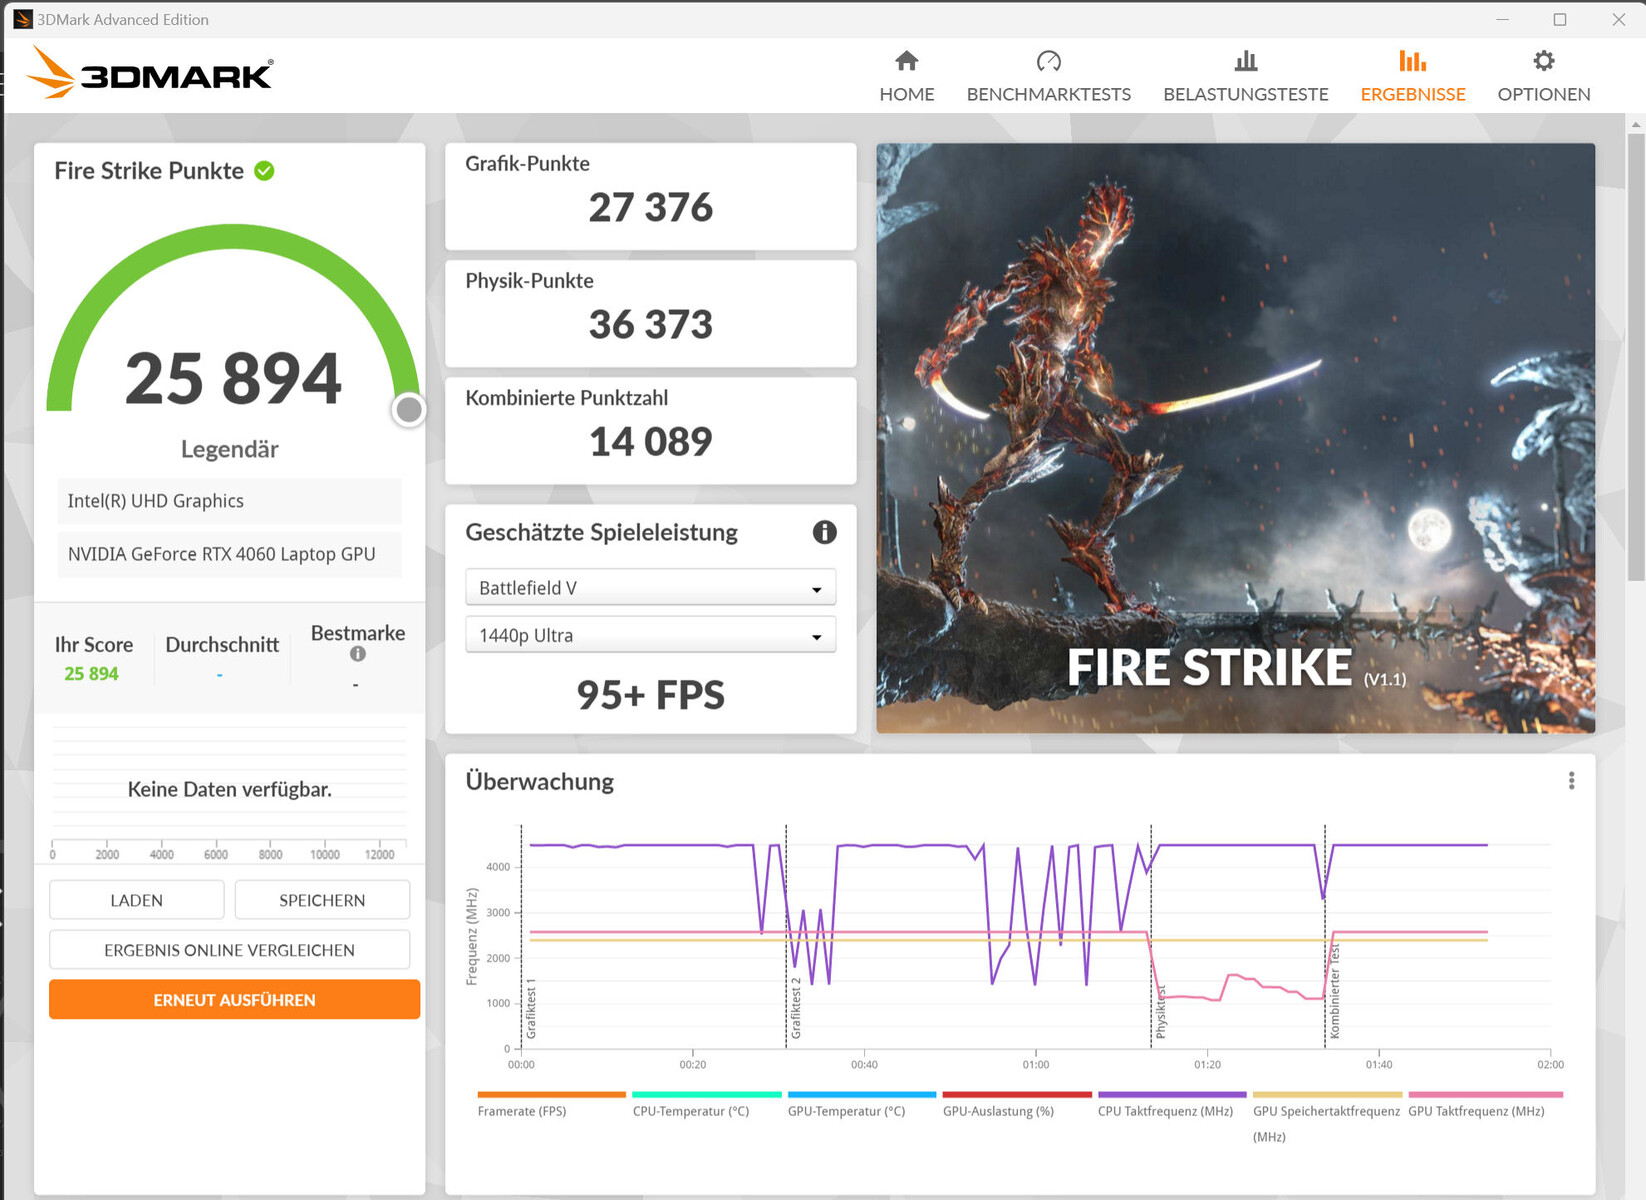
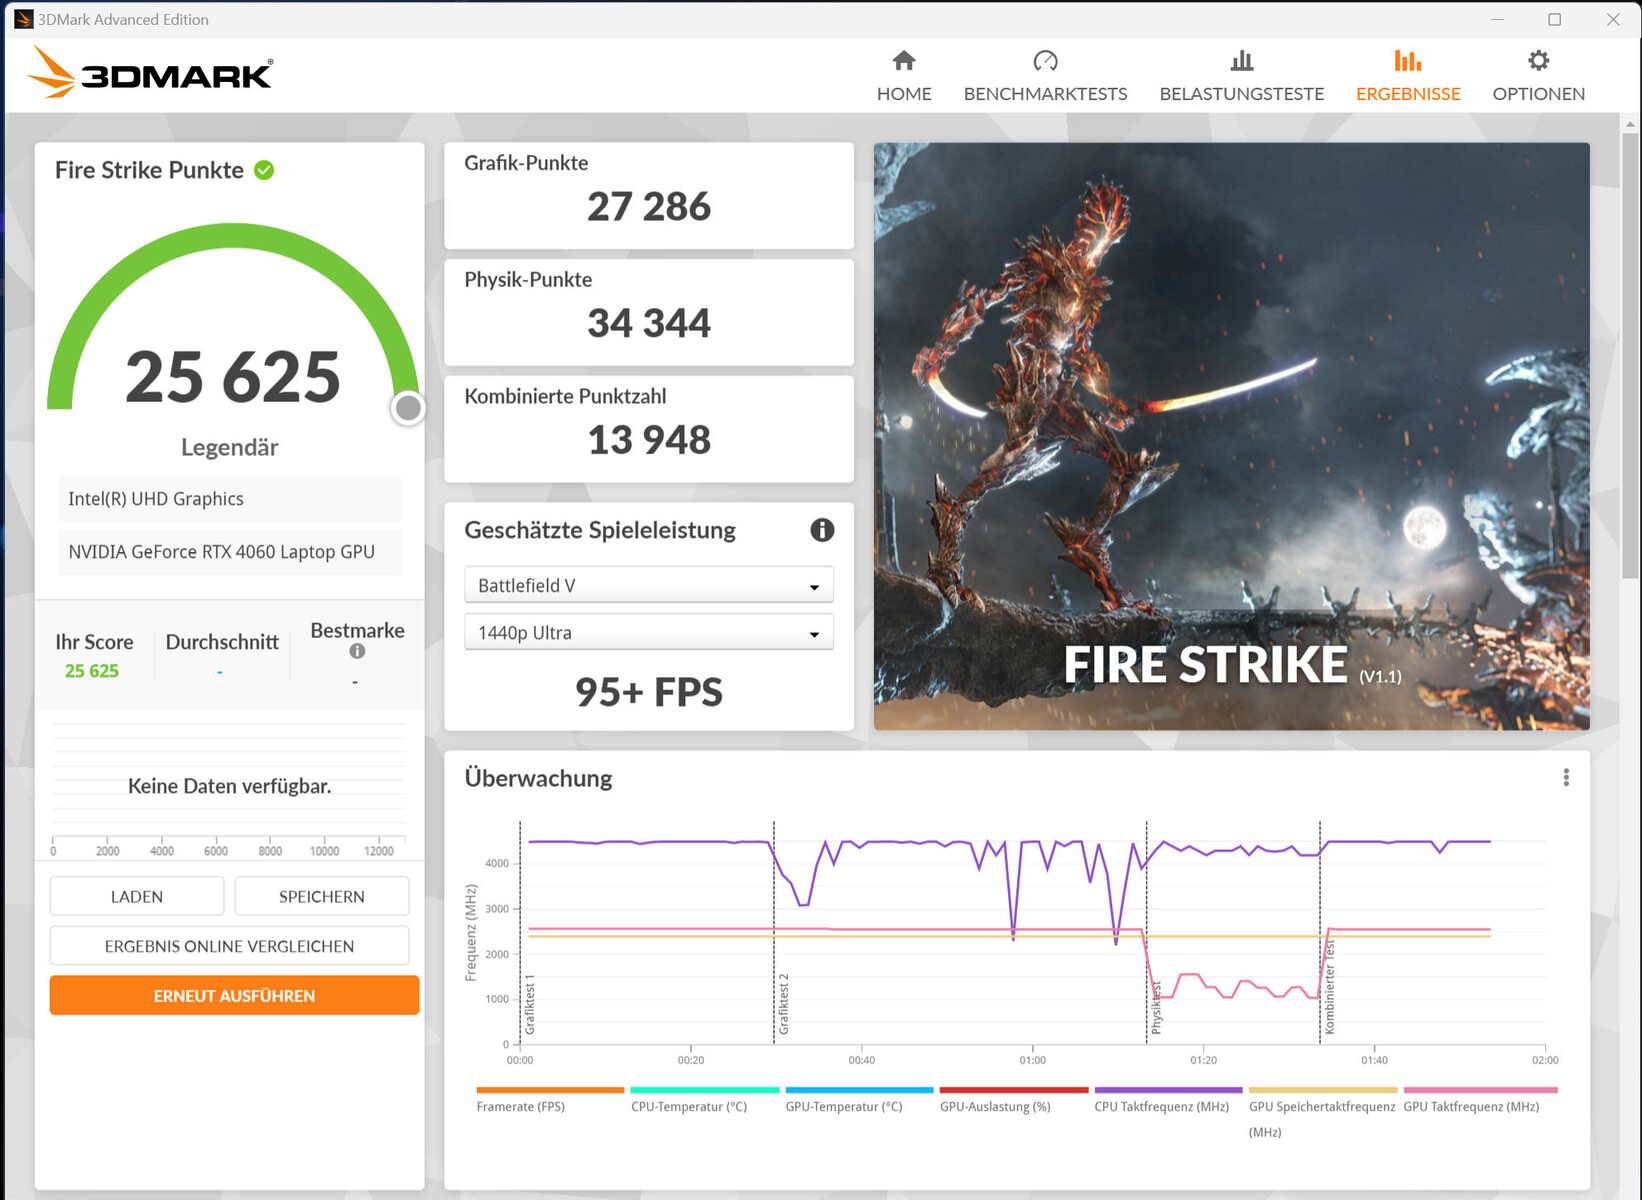
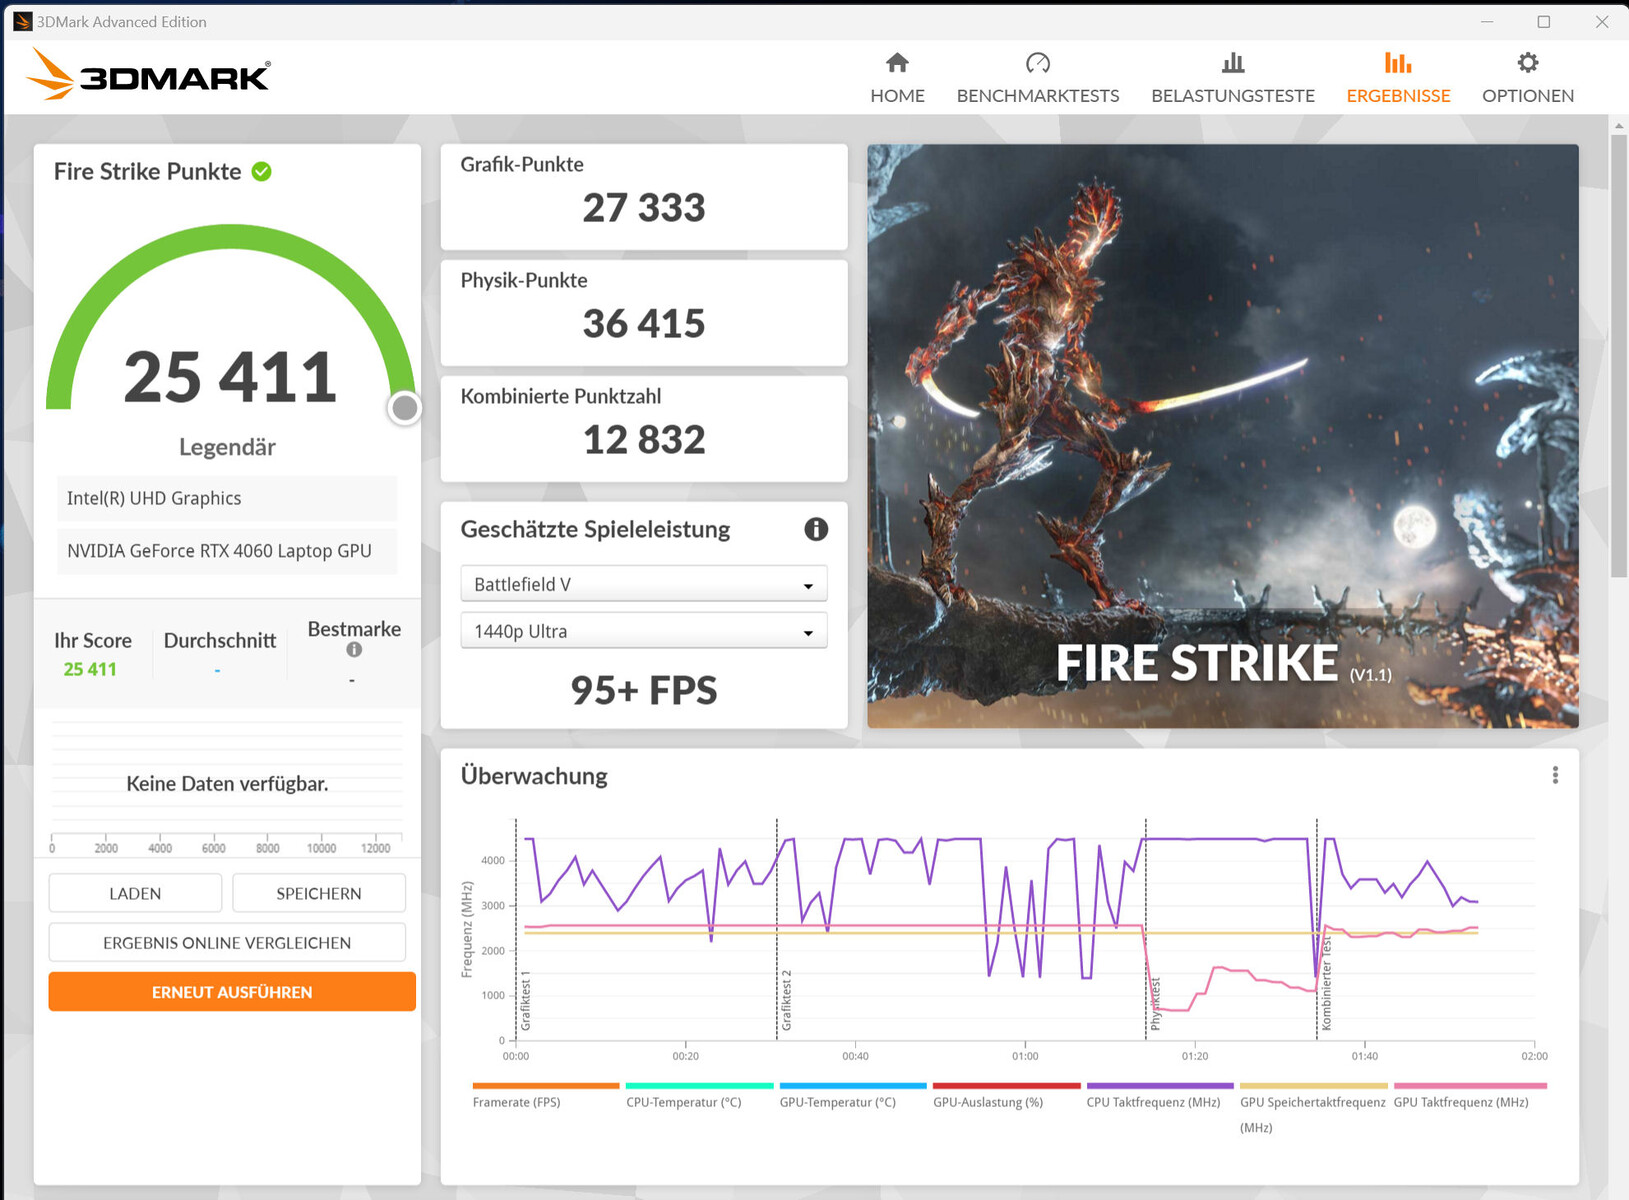
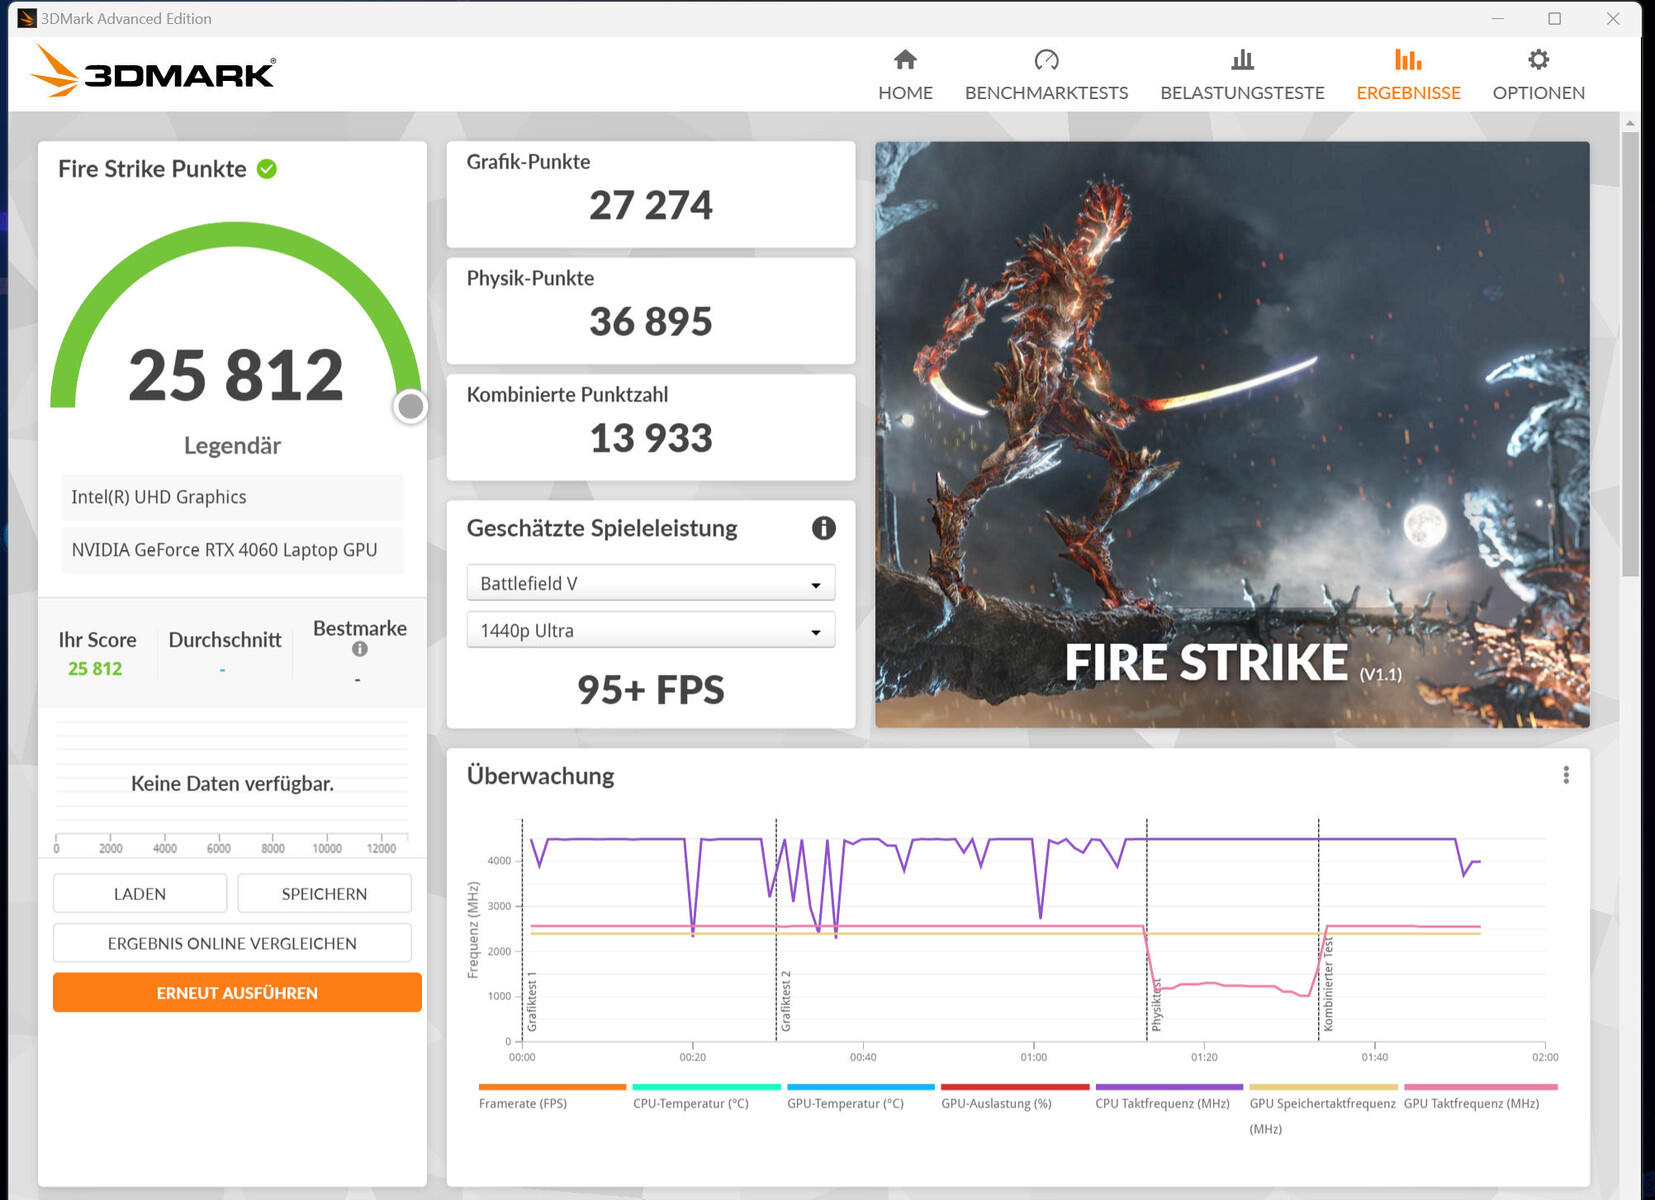
| 3DMark 06 Standard Score | 55811 puntos | |
| 3DMark 11 Performance | 33427 puntos | |
| 3DMark Cloud Gate Standard Score | 67224 puntos | |
| 3DMark Fire Strike Score | 25869 puntos | |
| 3DMark Time Spy Score | 11090 puntos | |
ayuda | ||
* ... más pequeño es mejor
Rendimiento en juegos
El m16 está diseñado para juegos QHD+ con configuraciones de altas a máximas. Se pueden alcanzar resoluciones superiores si se conecta la pantalla correspondiente, con ajustes parcialmente reducidos. Se consiguen frecuencias de cuadro superiores a la media de RTX 4060.
| The Witcher 3 - 1920x1080 Ultra Graphics & Postprocessing (HBAO+) | |
| Media de la clase Gaming (104.7 - 240, n=7, últimos 2 años) | |
| Alienware m16 R1 AMD | |
| Schenker XMG Pro 15 (E23) | |
| Aorus 15 BSF | |
| Lenovo Legion Pro 5 16IRX8 | |
| Alienware m16 R1 Intel | |
| Medion Erazer Defender P40 | |
| Acer Predator Helios 16 PH16-71-731Q | |
| Medio NVIDIA GeForce RTX 4060 Laptop GPU (77 - 159.7, n=42) | |
| Atlas Fallen - 1920x1080 Very High Preset | |
| Alienware m16 R1 Intel | |
| Medio NVIDIA GeForce RTX 4060 Laptop GPU (88.2 - 114.4, n=3) | |
| Ratchet & Clank Rift Apart | |
| 1920x1080 Very High Preset AA:T | |
| Aorus 15 BSF | |
| Alienware m16 R1 Intel | |
| Medio NVIDIA GeForce RTX 4060 Laptop GPU (51.6 - 54.8, n=4) | |
| 1920x1080 Very High Preset + Very High Raytracing AA:T | |
| Aorus 15 BSF | |
| Alienware m16 R1 Intel | |
| Medio NVIDIA GeForce RTX 4060 Laptop GPU (39.1 - 44.5, n=3) | |
| Immortals of Aveum - 1920x1080 Ultra AF:16x | |
| Alienware m16 R1 Intel | |
| Medio NVIDIA GeForce RTX 4060 Laptop GPU (33 - 48.9, n=4) | |
| The Callisto Protocol | |
| 1920x1080 Ultra Preset (without FSR Upscaling) | |
| Aorus 15 BSF | |
| Alienware m16 R1 Intel | |
| Medio NVIDIA GeForce RTX 4060 Laptop GPU (54.4 - 81.1, n=3) | |
| 1920x1080 Ultra Preset (without FSR Upscaling) + Full Ray-Tracing | |
| Aorus 15 BSF | |
| Alienware m16 R1 Intel | |
| Medio NVIDIA GeForce RTX 4060 Laptop GPU (38.6 - 69.8, n=2) | |
| Star Wars Jedi Survivor | |
| 1920x1080 Epic Preset | |
| Alienware m16 R1 Intel | |
| Medion Erazer Defender P40 | |
| Medio NVIDIA GeForce RTX 4060 Laptop GPU (45.5 - 66.7, n=10) | |
| 1920x1080 Epic Preset + Ray Tracing | |
| Alienware m16 R1 Intel | |
| Medio NVIDIA GeForce RTX 4060 Laptop GPU (47 - 52.8, n=4) | |
| Medion Erazer Defender P40 | |
Para comprobar si la frecuencia de imagen se mantiene constante durante largos periodos de tiempo, se ejecuta "The Witcher 3" durante unos 60 minutos en resolución Full HD y con los ajustes de máxima calidad. El personaje del juego no se mueve. No se observa una caída de la velocidad de fotogramas.
Witcher 3 FPS-Diagramm
| bajo | medio | alto | ultra | QHD | |
|---|---|---|---|---|---|
| The Witcher 3 (2015) | 497 | 340.9 | 206.2 | 106.5 | 78.8 |
| Dota 2 Reborn (2015) | 189.5 | 169.6 | 165.8 | 153.2 | |
| Final Fantasy XV Benchmark (2018) | 232 | 150.8 | 104.7 | 77.1 | |
| X-Plane 11.11 (2018) | 170.4 | 156.7 | 120.4 | ||
| Far Cry 5 (2018) | 199 | 163 | 155 | 146 | 107 |
| Strange Brigade (2018) | 580 | 283 | 223 | 190.3 | 128.5 |
| Cyberpunk 2077 1.6 (2022) | 134.6 | 104.5 | 89.3 | 82.1 | 49.9 |
| The Callisto Protocol (2022) | 165.4 | 135.4 | 128 | 81.1 | 62.8 |
| Star Wars Jedi Survivor (2023) | 86 | 75.8 | 70.9 | 66.7 | 41.7 |
| F1 23 (2023) | 291 | 272 | 187.6 | 119.9 | 38.9 |
| Ratchet & Clank Rift Apart (2023) | 86 | 74.7 | 60.6 | 54.8 | 46.6 |
| Atlas Fallen (2023) | 145.9 | 137.5 | 132.1 | 114.4 | 79.2 |
| Immortals of Aveum (2023) | 61.6 | 54.6 | 48.9 | 32.8 |
Emisiones - El portátil Dell puede producir mucho ruido
Ruido
El nivel de presión sonora puede subir hasta 58 dB(A) ("Overdrive") en modo de juego. el modo "Rendimiento" rinde mejor con 51 dB(A). El favorito entre los modos es el perfil "Silencioso": un nivel de 43 dB(A) a costa de un rendimiento de juego ligeramente reducido.
En reposo y en el uso cotidiano (oficina, Internet), los cuatro ventiladores suelen quedarse quietos y reina el silencio.
Ruido
| Ocioso |
| 25 / 26 / 27 dB(A) |
| Carga |
| 52 / 53 dB(A) |
 | ||
30 dB silencioso 40 dB(A) audible 50 dB(A) ruidosamente alto |
||
min: | ||
| Alienware m16 R1 Intel GeForce RTX 4060 Laptop GPU, i7-13700HX, Kioxia KXG70ZNV512G | Acer Predator Helios 16 PH16-71-731Q GeForce RTX 4060 Laptop GPU, i7-13700HX, Micron 3400 1TB MTFDKBA1T0TFH | Medion Erazer Defender P40 GeForce RTX 4060 Laptop GPU, i7-13700HX, Phison PS5021-E21 1TB | Lenovo Legion Pro 5 16IRX8 GeForce RTX 4060 Laptop GPU, i7-13700HX, SK hynix PC801 HFS512GEJ9X115N | Schenker XMG Pro 15 (E23) GeForce RTX 4060 Laptop GPU, i9-13900HX, Crucial P5 Plus 1TB CT1000P5PSSD8 | Aorus 15 BSF GeForce RTX 4070 Laptop GPU, i7-13700H, Gigabyte AG470S1TB-SI B10 | Alienware m16 R1 AMD GeForce RTX 4080 Laptop GPU, R9 7845HX, Kioxia XG8 KXG80ZNV1T02 | |
|---|---|---|---|---|---|---|---|
| Noise | 5% | -9% | 9% | 3% | -10% | 4% | |
| apagado / medio ambiente * (dB) | 25 | 24 4% | 25 -0% | 23 8% | 24 4% | 24 4% | 22.9 8% |
| Idle Minimum * (dB) | 25 | 24 4% | 26 -4% | 23.1 8% | 24 4% | 25 -0% | 22.9 8% |
| Idle Average * (dB) | 26 | 24 8% | 27 -4% | 23.1 11% | 24 8% | 31 -19% | 29.7 -14% |
| Idle Maximum * (dB) | 27 | 32.32 -20% | 32 -19% | 26.6 1% | 24 11% | 37 -37% | 29.7 -10% |
| Load Average * (dB) | 52 | 36.66 29% | 53 -2% | 34.7 33% | 53.65 -3% | 51 2% | 29.8 43% |
| Witcher 3 ultra * (dB) | 51 | 49.06 4% | 56 -10% | 47.6 7% | 53.53 -5% | 54.7 -7% | |
| Load Maximum * (dB) | 53 | 49.49 7% | 64 -21% | 54.8 -3% | 53.65 -1% | 57 -8% | 54.7 -3% |
* ... más pequeño es mejor
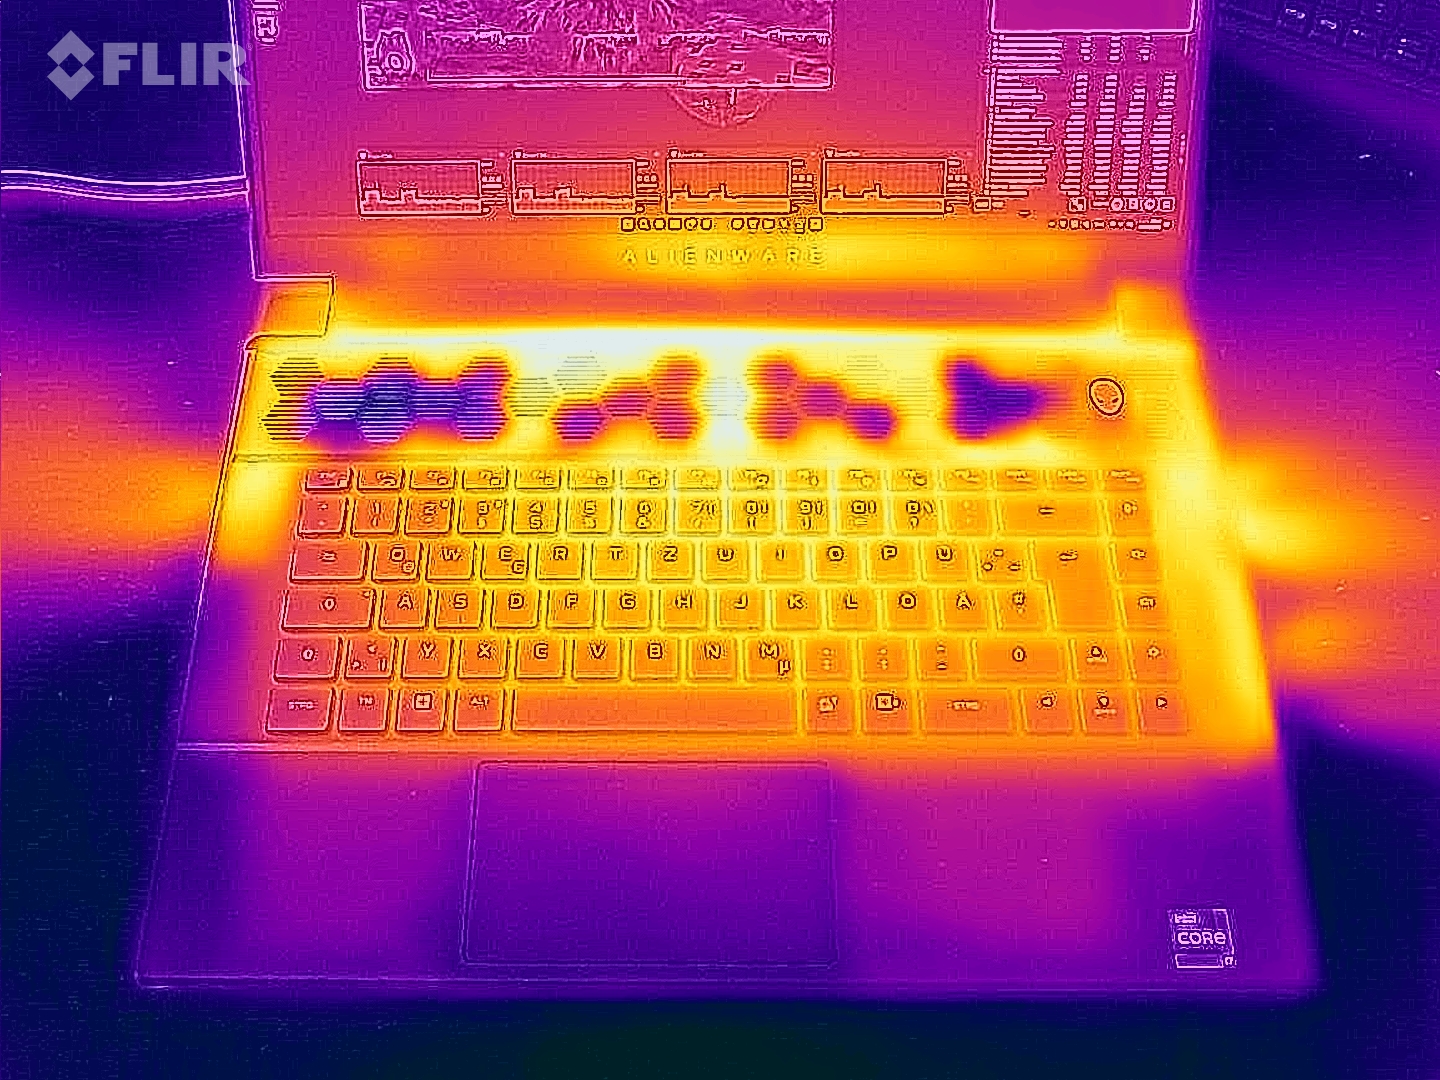
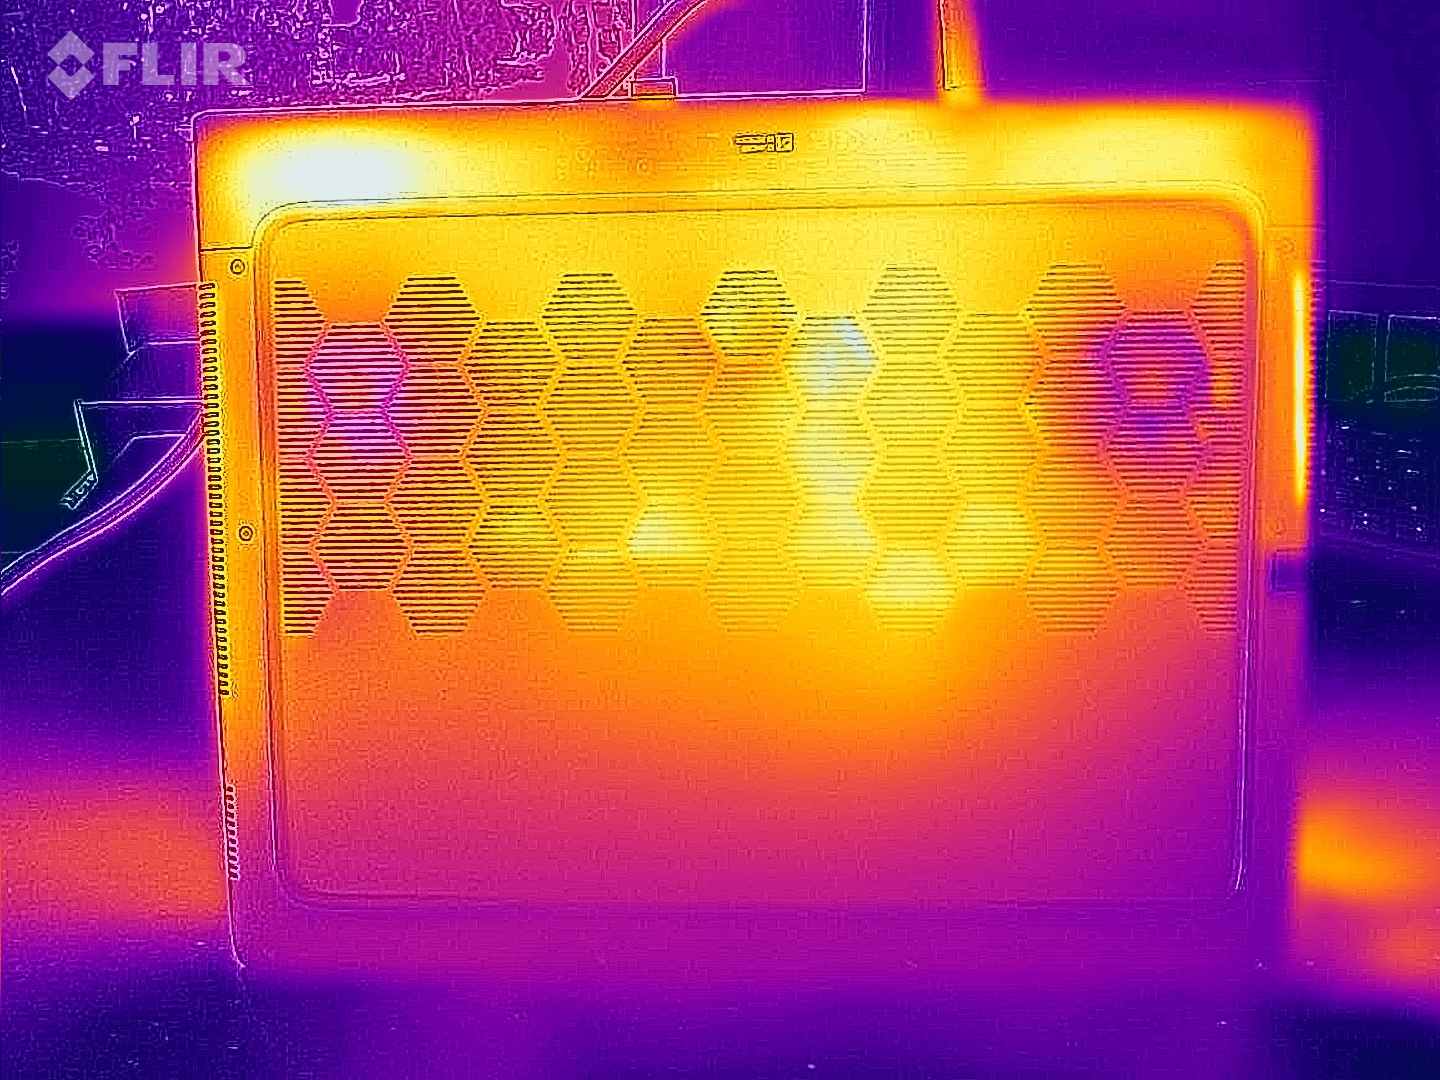
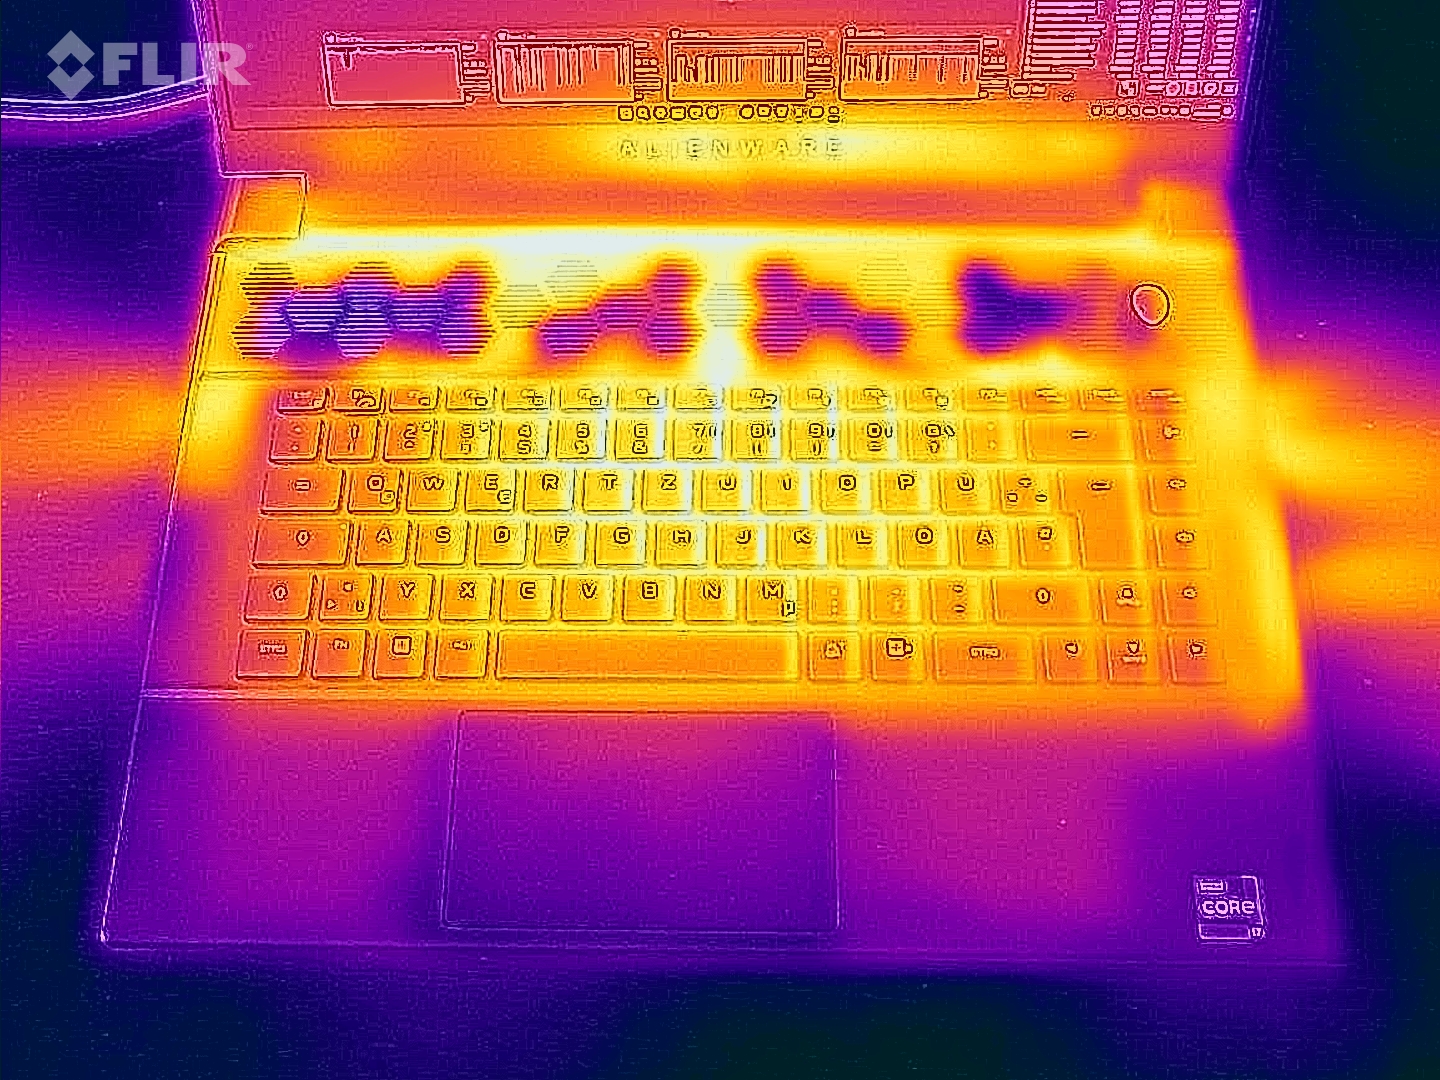
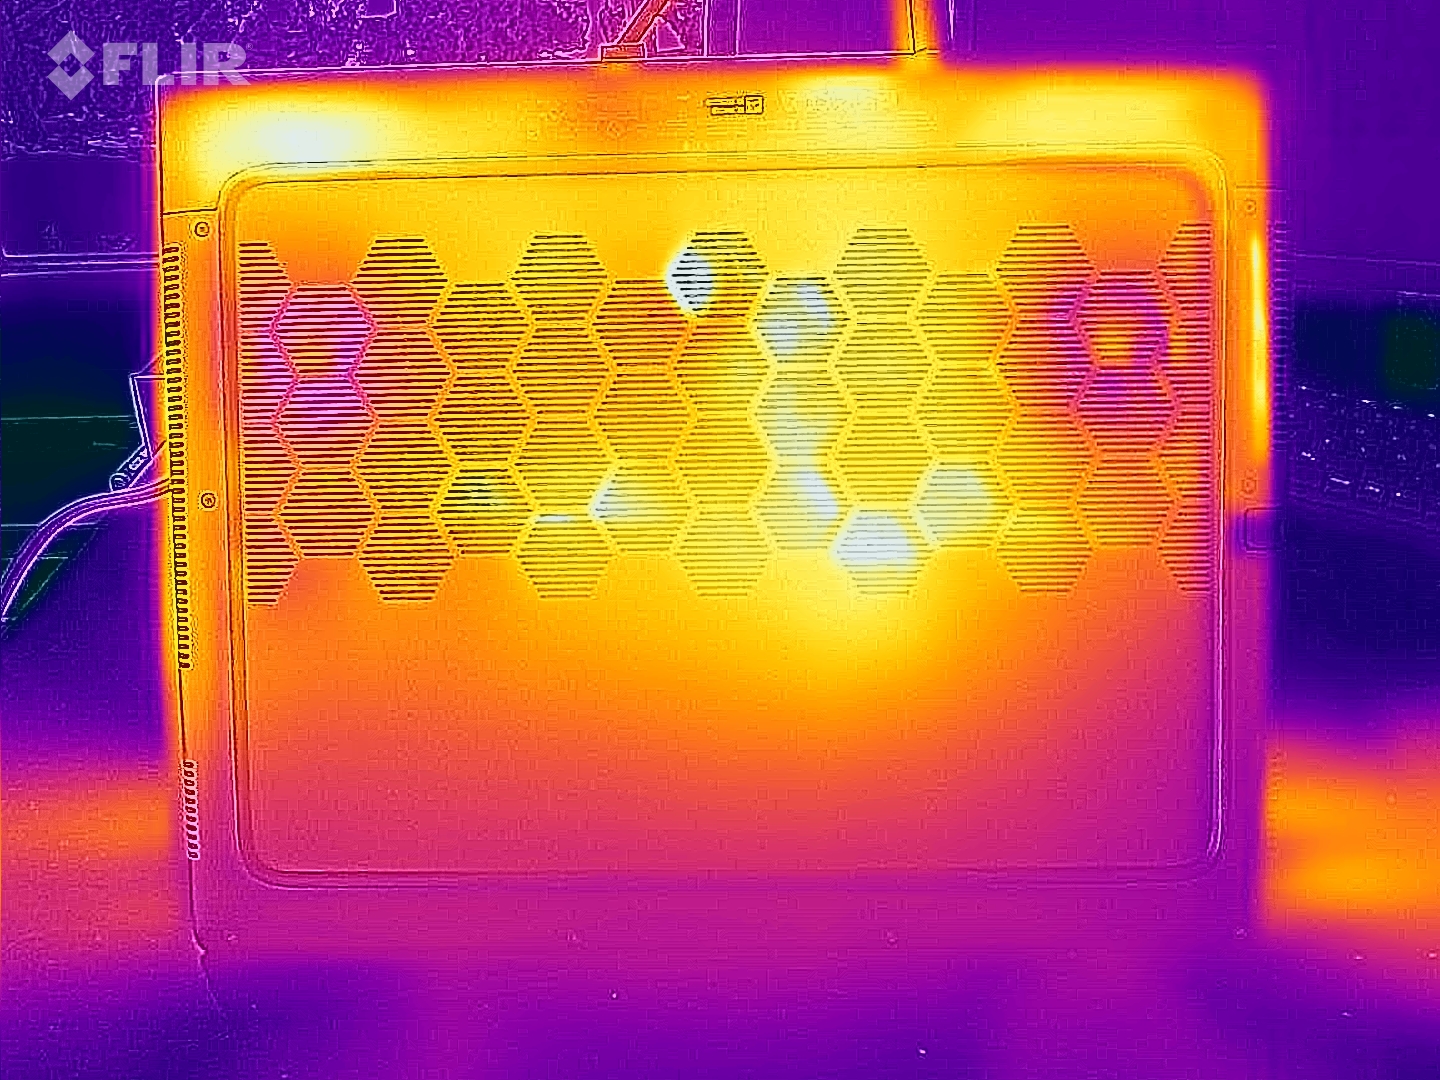
Temperatura
Las pruebas de estrés y Witcher 3 causan un notable calentamiento del portátil, pero todo permanece dentro de límites aceptables. En el uso diario (oficina, internet), las temperaturas de la carcasa permanecen básicamente en la zona verde, pero están a un nivel demasiado alto comparado con portátiles comparables.
El portátil se calienta más bajo carga que su homólogo AMD Debut del rendimiento de AMD Ryzen 9 7845HX: Análisis del portátil Alienware m16 R1 equipado con hardware más potente. Este último se beneficia de la APU más frugal.
(-) La temperatura máxima en la parte superior es de 49 °C / 120 F, frente a la media de 40.4 °C / 105 F, que oscila entre 21.2 y 68.8 °C para la clase Gaming.
(-) El fondo se calienta hasta un máximo de 48 °C / 118 F, frente a la media de 43.2 °C / 110 F
(±) En reposo, la temperatura media de la parte superior es de 37 °C / 99# F, frente a la media del dispositivo de 33.9 °C / 93 F.
(-) Jugando a The Witcher 3, la temperatura media de la parte superior es de 46 °C / 115 F, frente a la media del dispositivo de 33.9 °C / 93 F.
(-) El reposamanos y el touchpad pueden calentarse mucho al tacto con un máximo de 44 °C / 111.2 F.
(-) La temperatura media de la zona del reposamanos de dispositivos similares fue de 28.8 °C / 83.8 F (-15.2 °C / -27.4 F).
| Alienware m16 R1 Intel Intel Core i7-13700HX, NVIDIA GeForce RTX 4060 Laptop GPU | Acer Predator Helios 16 PH16-71-731Q Intel Core i7-13700HX, NVIDIA GeForce RTX 4060 Laptop GPU | Medion Erazer Defender P40 Intel Core i7-13700HX, NVIDIA GeForce RTX 4060 Laptop GPU | Lenovo Legion Pro 5 16IRX8 Intel Core i7-13700HX, NVIDIA GeForce RTX 4060 Laptop GPU | Schenker XMG Pro 15 (E23) Intel Core i9-13900HX, NVIDIA GeForce RTX 4060 Laptop GPU | Aorus 15 BSF Intel Core i7-13700H, NVIDIA GeForce RTX 4070 Laptop GPU | Alienware m16 R1 AMD AMD Ryzen 9 7845HX, NVIDIA GeForce RTX 4080 Laptop GPU | |
|---|---|---|---|---|---|---|---|
| Heat | -2% | 18% | 12% | 7% | 4% | 9% | |
| Maximum Upper Side * (°C) | 49 | 41 16% | 42 14% | 42.8 13% | 50 -2% | 48 2% | 48 2% |
| Maximum Bottom * (°C) | 48 | 66 -38% | 45 6% | 50 -4% | 50 -4% | 47 2% | 39 19% |
| Idle Upper Side * (°C) | 40 | 36 10% | 28 30% | 29.6 26% | 33 17% | 39 2% | 37 7% |
| Idle Bottom * (°C) | 39 | 37 5% | 30 23% | 34 13% | 32 18% | 35 10% | 36.2 7% |
* ... más pequeño es mejor
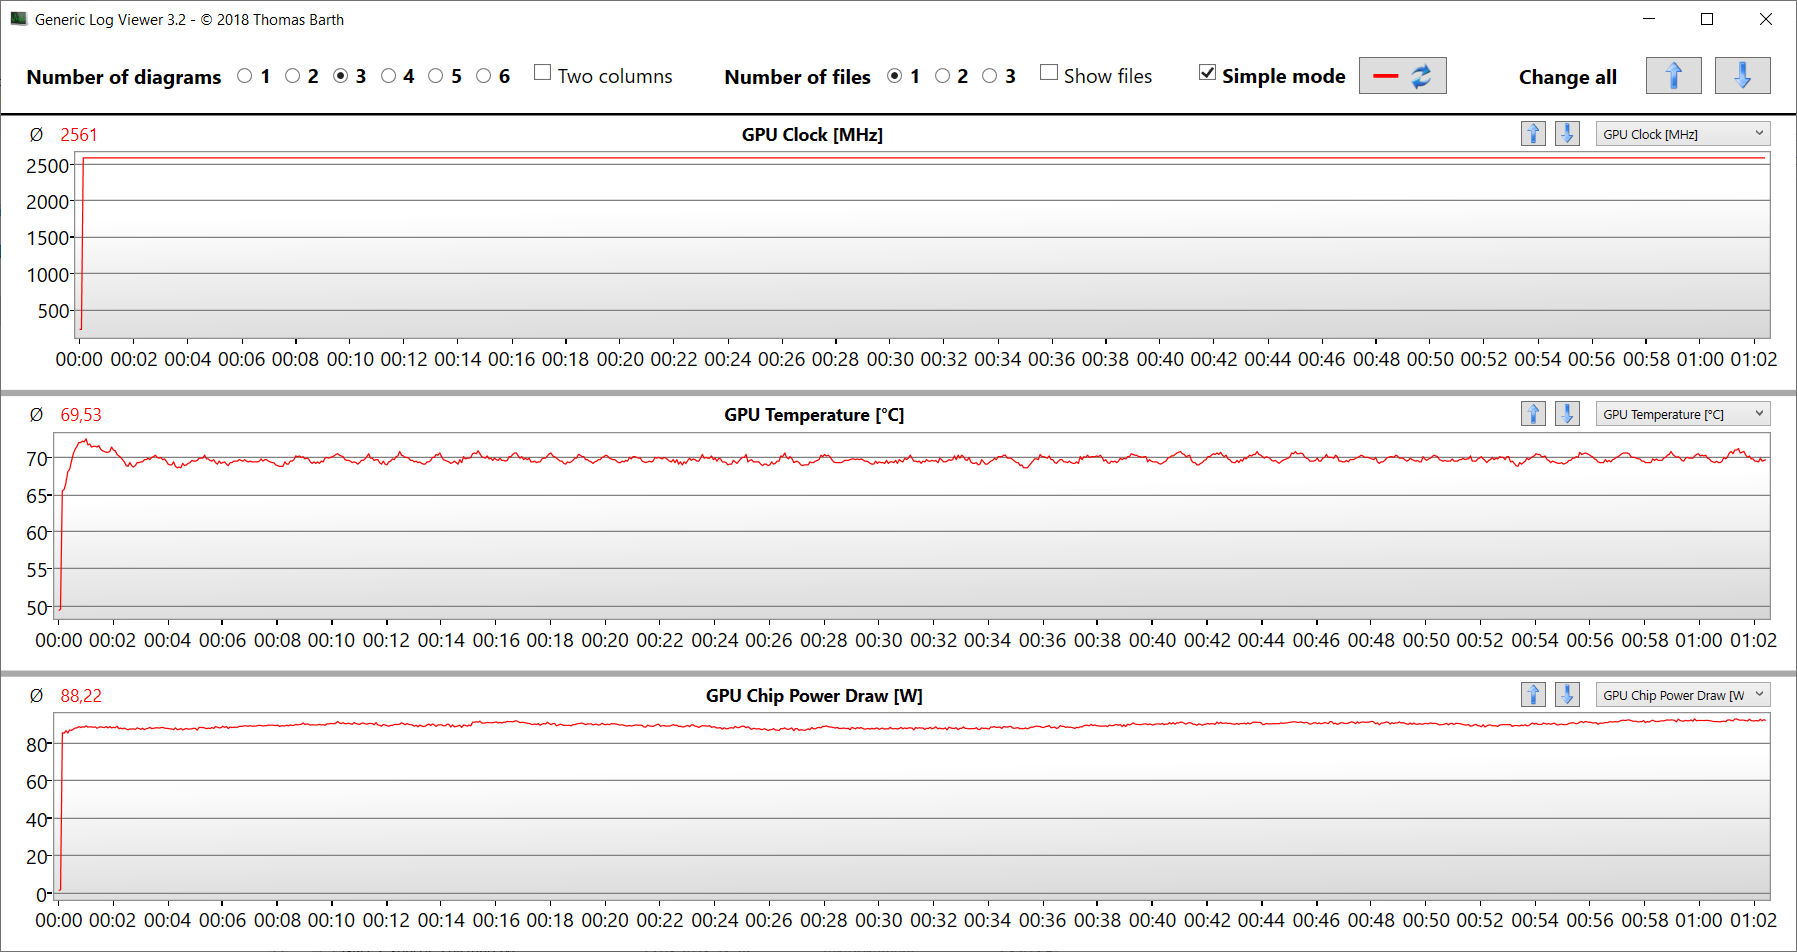
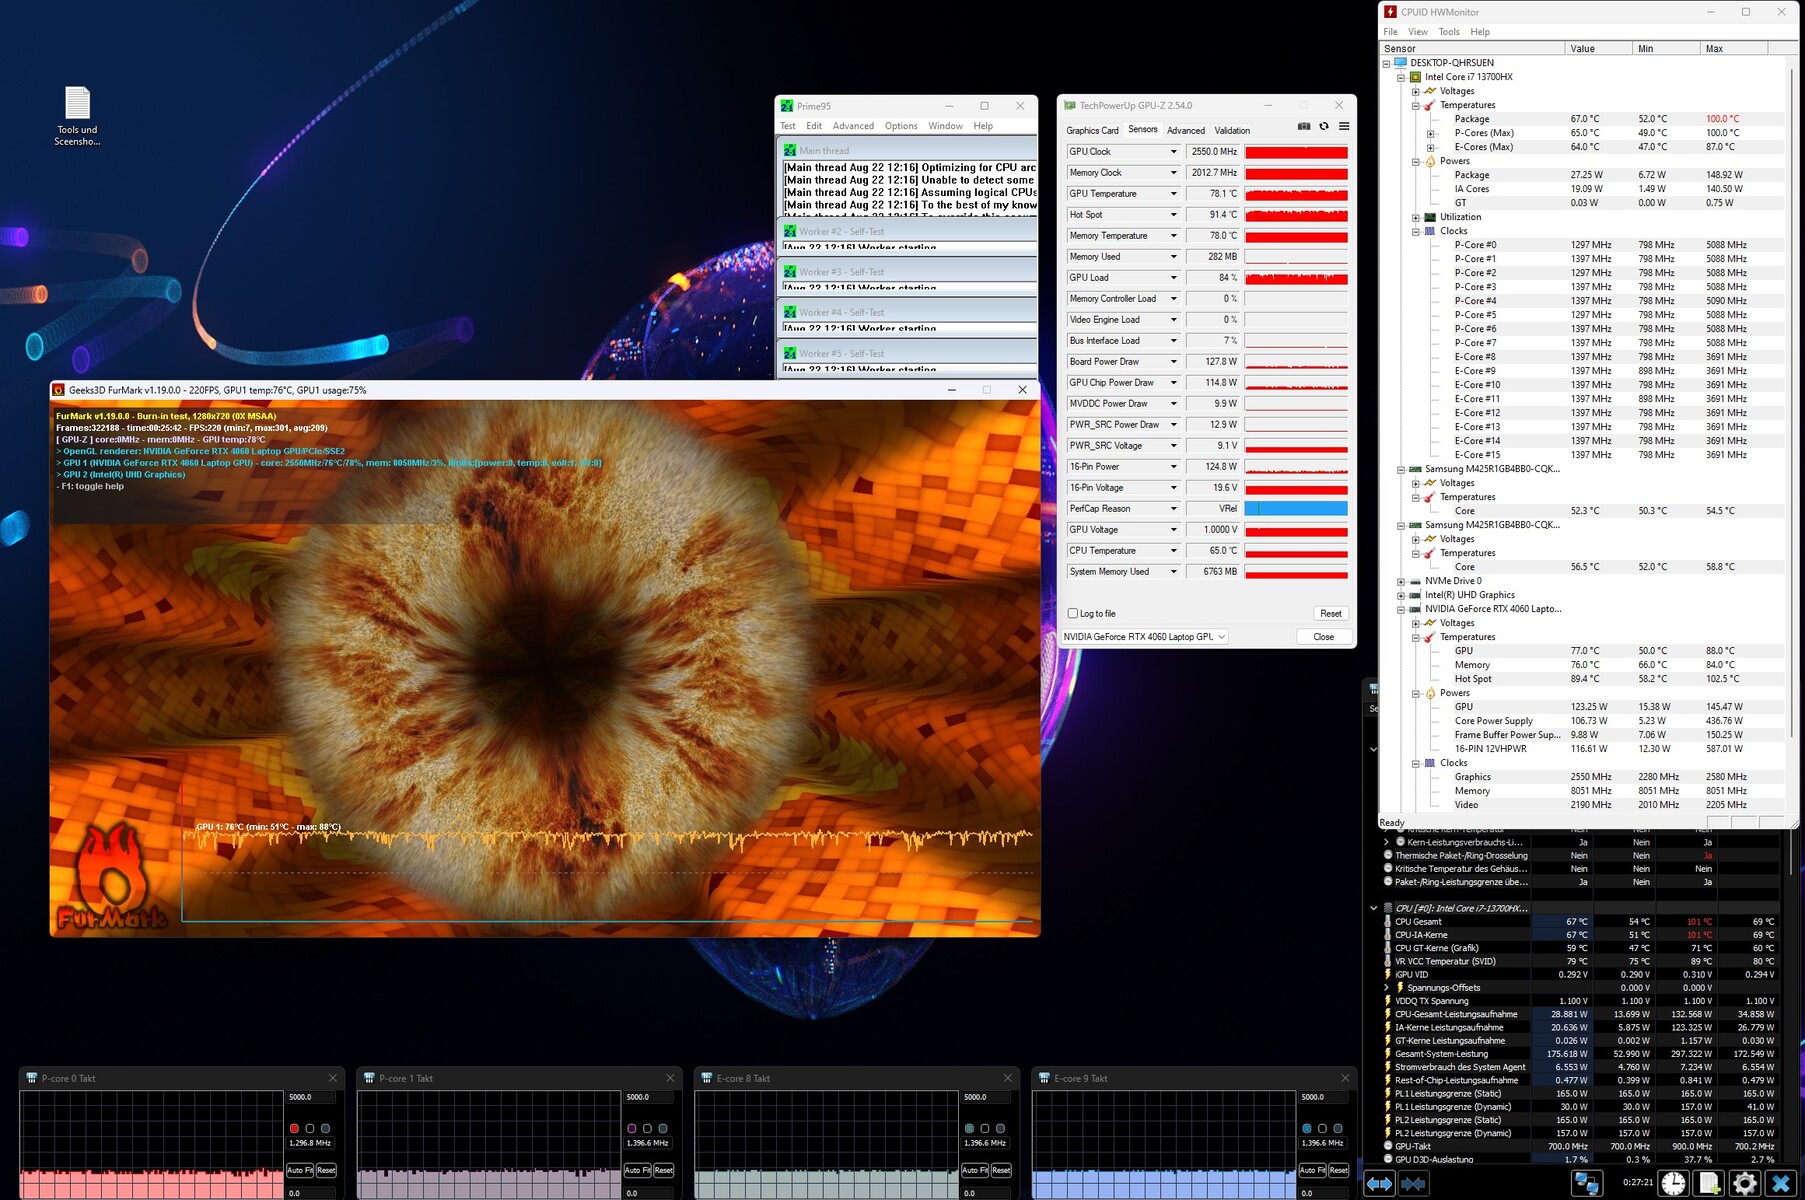
Pruebas de resistencia
La prueba de estrés (Prime95 y Furmark en funcionamiento continuo) representa un escenario extremo para comprobar la estabilidad del sistema a plena carga. La CPU (P: 4,2 GHz, E: 3,4 GHz) comienza la prueba con velocidades de reloj elevadas. A medida que avanza la prueba, el reloj desciende ligeramente hasta que, al cabo de unos 30 minutos, cae repentinamente a valores inferiores al reloj base. La GPU funciona constantemente a plena potencia.
Altavoces
Los altavoces estéreo producen un sonido decente, pero apenas hay graves. Se recomiendan auriculares o altavoces externos para una mejor experiencia de sonido.
Alienware m16 R1 Intel análisis de audio
(+) | los altavoces pueden reproducir a un volumen relativamente alto (#87 dB)
Graves 100 - 315 Hz
(-) | casi sin bajos - de media 24% inferior a la mediana
(±) | la linealidad de los graves es media (13.5% delta a frecuencia anterior)
Medios 400 - 2000 Hz
(+) | medios equilibrados - a sólo 1.4% de la mediana
(+) | los medios son lineales (3.3% delta a la frecuencia anterior)
Altos 2 - 16 kHz
(+) | máximos equilibrados - a sólo 3.5% de la mediana
(+) | los máximos son lineales (4.6% delta a la frecuencia anterior)
Total 100 - 16.000 Hz
(+) | el sonido global es lineal (13.4% de diferencia con la mediana)
En comparación con la misma clase
» 19% de todos los dispositivos probados de esta clase eran mejores, 7% similares, 74% peores
» El mejor tuvo un delta de 6%, la media fue 18%, el peor fue ###max##%
En comparación con todos los dispositivos probados
» 14% de todos los dispositivos probados eran mejores, 4% similares, 82% peores
» El mejor tuvo un delta de 4%, la media fue 23%, el peor fue ###max##%
Acer Predator Helios 16 PH16-71-731Q análisis de audio
(±) | la sonoridad del altavoz es media pero buena (76.12 dB)
Graves 100 - 315 Hz
(-) | casi sin bajos - de media 15% inferior a la mediana
(-) | los graves no son lineales (15% delta a la frecuencia anterior)
Medios 400 - 2000 Hz
(+) | medios equilibrados - a sólo 2.5% de la mediana
(+) | los medios son lineales (5.9% delta a la frecuencia anterior)
Altos 2 - 16 kHz
(+) | máximos equilibrados - a sólo 2.9% de la mediana
(±) | la linealidad de los máximos es media (8.4% delta a frecuencia anterior)
Total 100 - 16.000 Hz
(+) | el sonido global es lineal (13.6% de diferencia con la mediana)
En comparación con la misma clase
» 20% de todos los dispositivos probados de esta clase eran mejores, 7% similares, 73% peores
» El mejor tuvo un delta de 6%, la media fue 18%, el peor fue ###max##%
En comparación con todos los dispositivos probados
» 15% de todos los dispositivos probados eran mejores, 4% similares, 82% peores
» El mejor tuvo un delta de 4%, la media fue 23%, el peor fue ###max##%
Gestión de la energía - El m16 ofrece tiempos de ejecución escasos
Consumo de energía
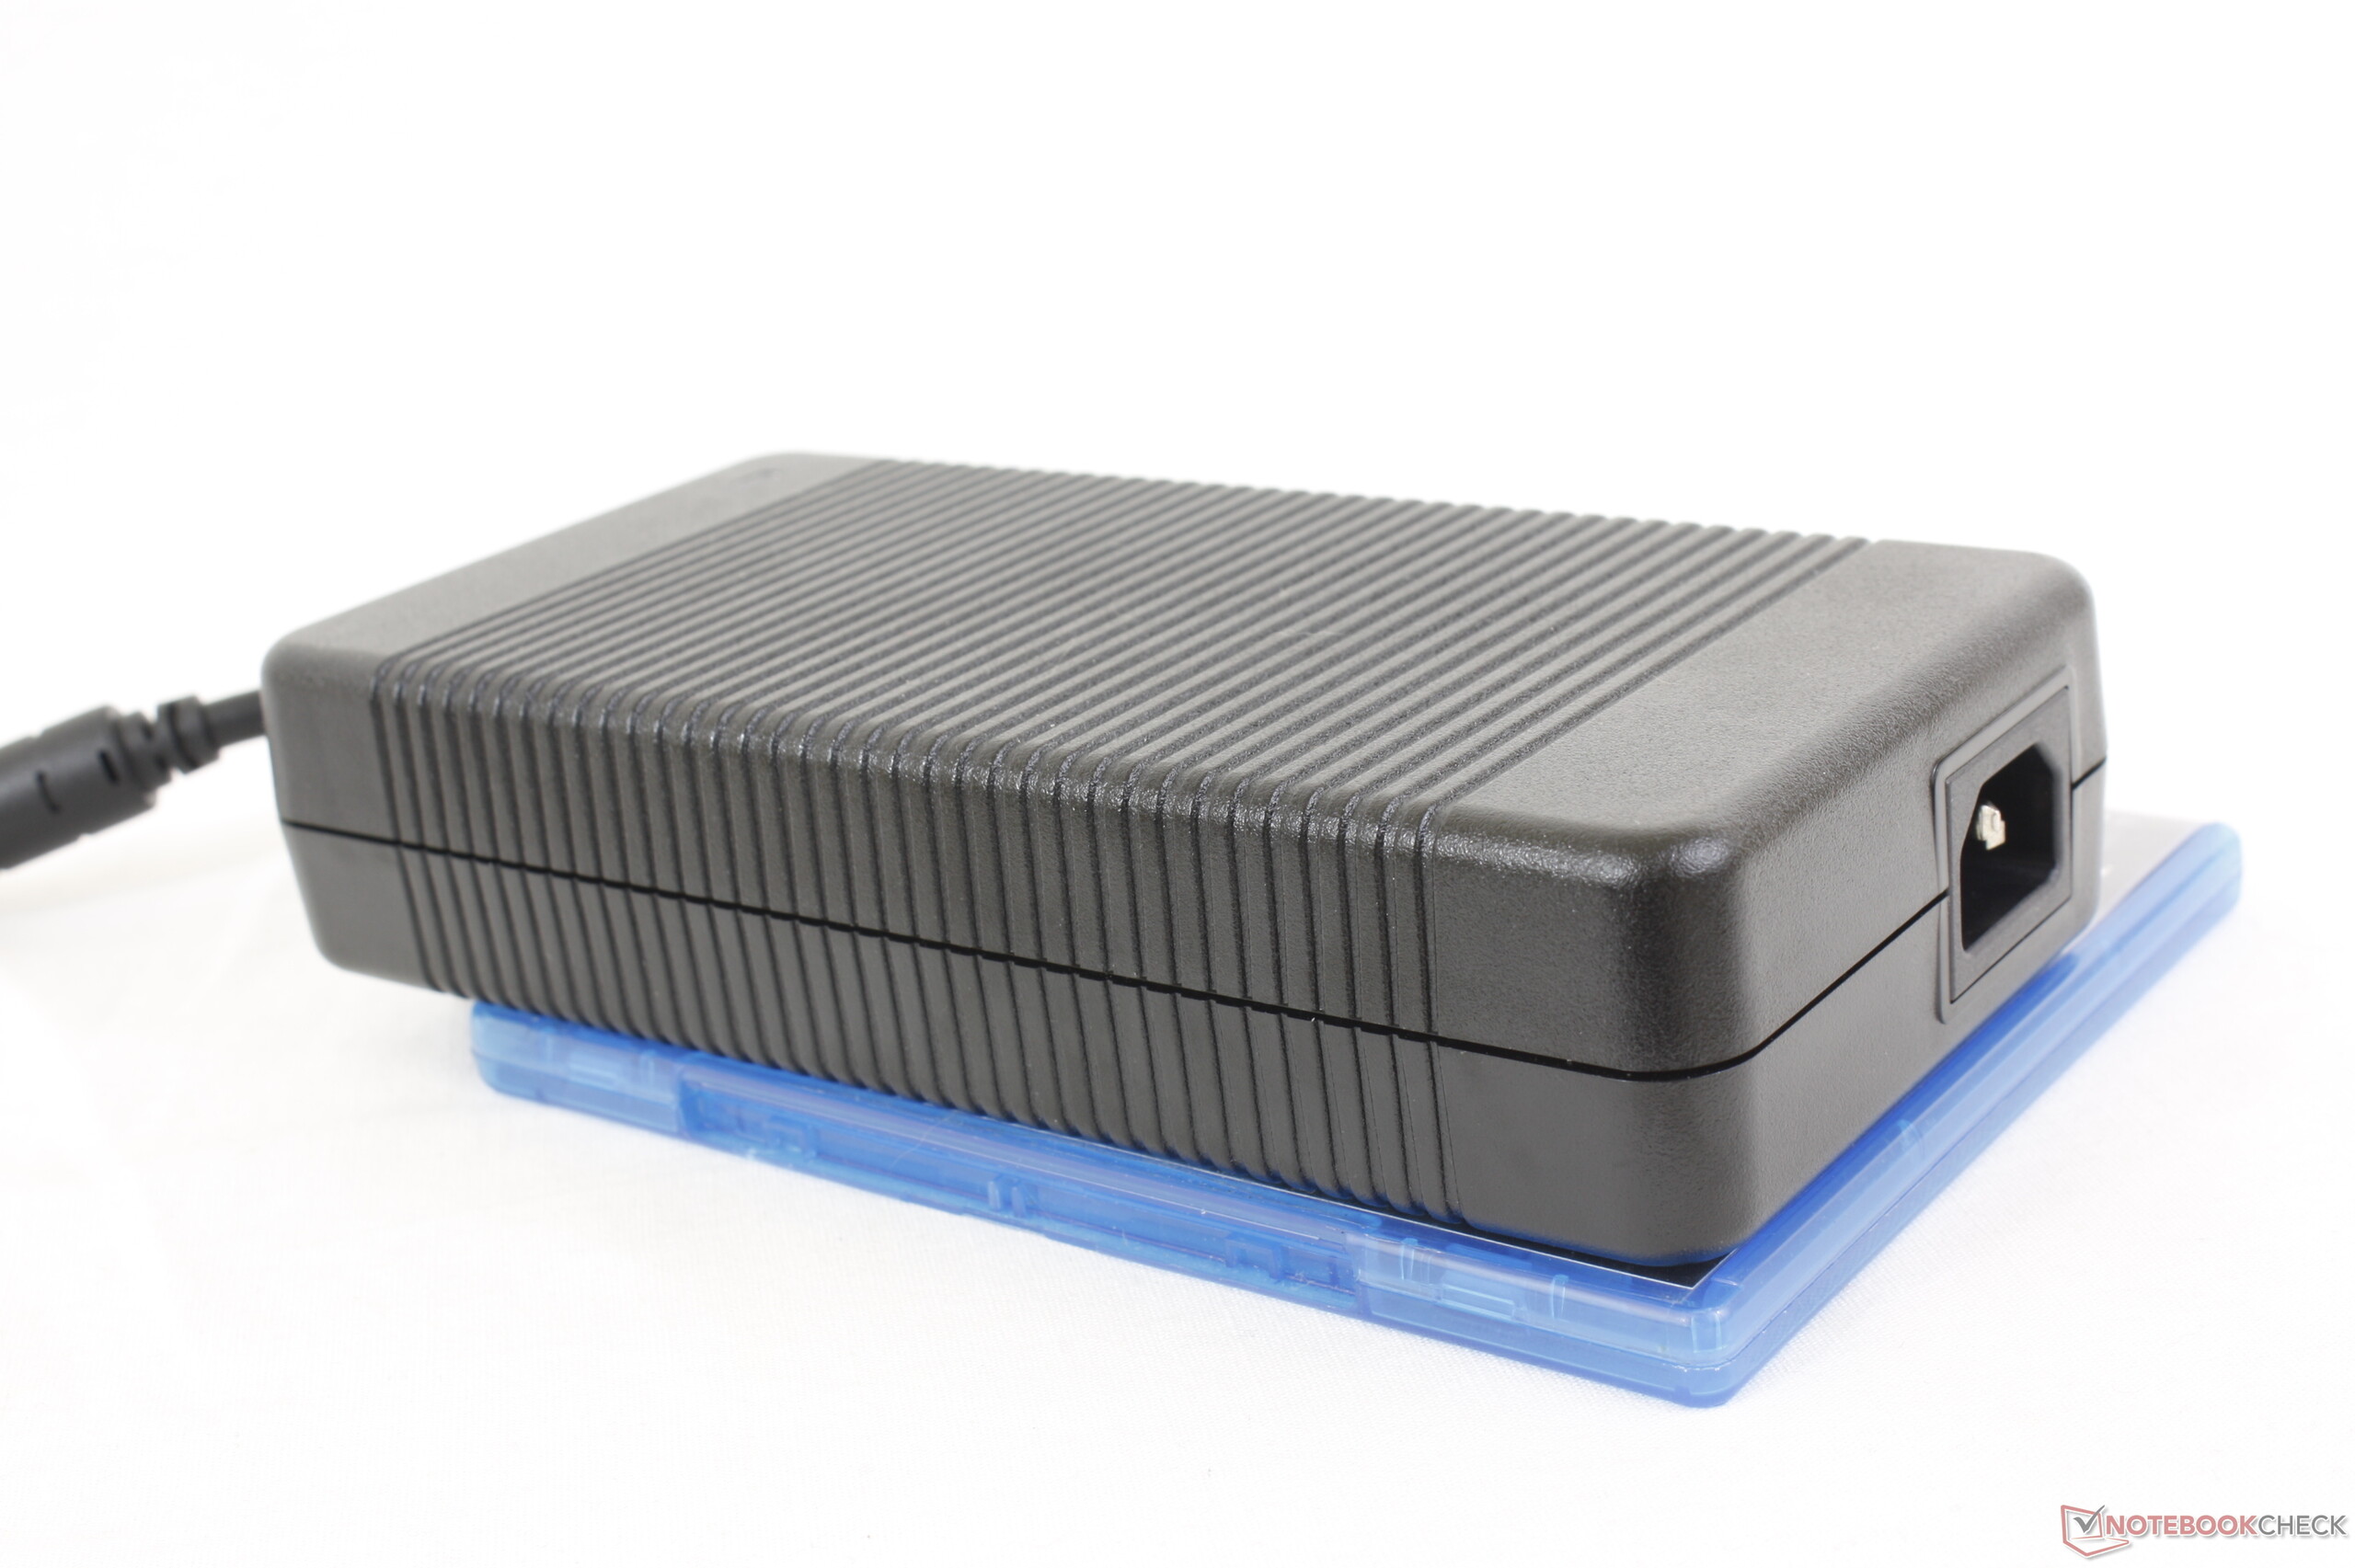
El m16 no muestra ninguna anomalía en términos de consumo de energía: los valores se sitúan en un nivel normal para el hardware instalado. La prueba Witcher 3 se ejecuta con un consumo de energía constante. Durante la prueba de estrés, la demanda disminuye significativamente con el tiempo. Por tanto, la fuente de alimentación (330 vatios) está suficientemente dimensionada.
| Off / Standby | |
| Ocioso | |
| Carga |
|
Clave:
min: | |
| Alienware m16 R1 Intel i7-13700HX, GeForce RTX 4060 Laptop GPU | Acer Predator Helios 16 PH16-71-731Q i7-13700HX, GeForce RTX 4060 Laptop GPU | Medion Erazer Defender P40 i7-13700HX, GeForce RTX 4060 Laptop GPU | Lenovo Legion Pro 5 16IRX8 i7-13700HX, GeForce RTX 4060 Laptop GPU | Schenker XMG Pro 15 (E23) i9-13900HX, GeForce RTX 4060 Laptop GPU | Aorus 15 BSF i7-13700H, GeForce RTX 4070 Laptop GPU | Alienware m16 R1 AMD R9 7845HX, GeForce RTX 4080 Laptop GPU | Medio NVIDIA GeForce RTX 4060 Laptop GPU | Media de la clase Gaming | |
|---|---|---|---|---|---|---|---|---|---|
| Power Consumption | -12% | 13% | -46% | -62% | 17% | -133% | 6% | -11% | |
| Idle Minimum * (Watt) | 10 | 15.9 -59% | 8 20% | 24.5 -145% | 21.6 -116% | 7 30% | 39 -290% | 11.5 ? -15% | 13 ? -30% |
| Idle Average * (Watt) | 14 | 20.5 -46% | 12 14% | 29.2 -109% | 29 -107% | 12 14% | 44.6 -219% | 16 ? -14% | 19 ? -36% |
| Idle Maximum * (Watt) | 21 | 20.9 -0% | 18 14% | 34.3 -63% | 42.7 -103% | 20 5% | 68.1 -224% | 20.3 ? 3% | 24.6 ? -17% |
| Load Average * (Watt) | 119 | 106 11% | 101 15% | 98.7 17% | 190 -60% | 94 21% | 129.8 -9% | 92.9 ? 22% | 110.7 ? 7% |
| Witcher 3 ultra * (Watt) | 186.7 | 175 6% | 180.8 3% | 178.6 4% | 189 -1% | 175.8 6% | 285 -53% | ||
| Load Maximum * (Watt) | 323 | 276 15% | 284 12% | 249.6 23% | 269 17% | 247 24% | 327.3 -1% | 210 ? 35% | 259 ? 20% |
* ... más pequeño es mejor
Power consumption Witcher 3 / Stress test
Power consumption with an external monitor
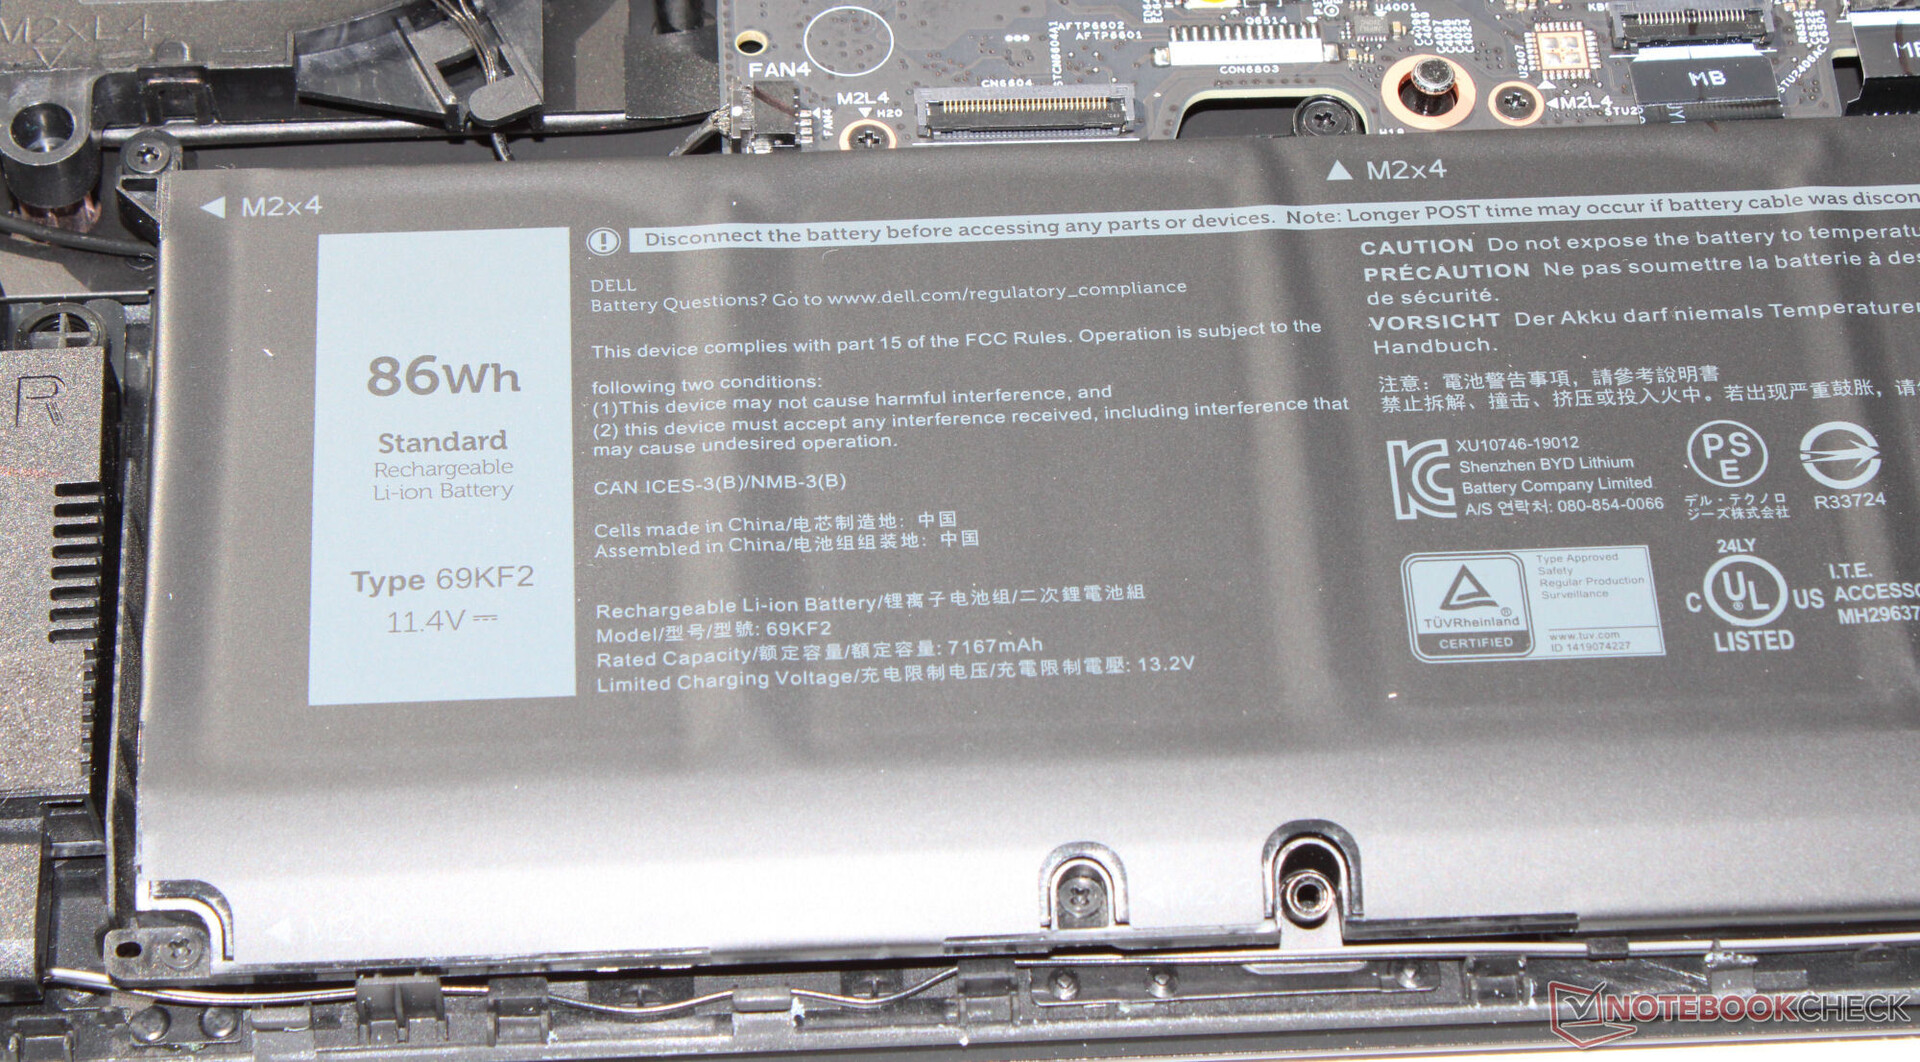
Duración de la batería
El portátil de 16 pulgadas logra tiempos de ejecución de 4:46 h y 5:36 h en la prueba WLAN (carga de sitios web a través de un script) y la prueba de vídeo (cortometraje Big Buck Bunny, codificación H.264, FHD, en bucle), respectivamente. Durante ambas pruebas, se desactivaron las funciones de ahorro de energía del portátil y se ajustó el brillo de la pantalla a unos 150 cd/m². Los módulos inalámbricos también se desactivaron para la prueba de vídeo.
En general, el m16 ofrece tiempos de ejecución escasos. Algunos competidores ofrecen tasas mucho mejores aquí. La ventaja sobreModelo hermano de AMDse debe probablemente al modo dGPU activo de este último.
| Alienware m16 R1 Intel i7-13700HX, GeForce RTX 4060 Laptop GPU, 86 Wh | Acer Predator Helios 16 PH16-71-731Q i7-13700HX, GeForce RTX 4060 Laptop GPU, 90 Wh | Medion Erazer Defender P40 i7-13700HX, GeForce RTX 4060 Laptop GPU, 73 Wh | Lenovo Legion Pro 5 16IRX8 i7-13700HX, GeForce RTX 4060 Laptop GPU, 80 Wh | Schenker XMG Pro 15 (E23) i9-13900HX, GeForce RTX 4060 Laptop GPU, 80 Wh | Aorus 15 BSF i7-13700H, GeForce RTX 4070 Laptop GPU, 99 Wh | Alienware m16 R1 AMD R9 7845HX, GeForce RTX 4080 Laptop GPU, 86 Wh | Media de la clase Gaming | |
|---|---|---|---|---|---|---|---|---|
| Duración de Batería | 18% | 25% | -18% | 55% | 92% | -27% | 44% | |
| Reader / Idle (h) | 6.4 | 8.8 38% | 6.7 5% | 10.9 70% | 4 -37% | 8.27 ? 29% | ||
| H.264 (h) | 5.6 | 4.8 -14% | 5.7 2% | 9 61% | 8.32 ? 49% | |||
| WiFi v1.3 (h) | 4.8 | 5.6 17% | 6.2 29% | 3.4 -29% | 5.7 19% | 10.3 115% | 3.7 -23% | 7.11 ? 48% |
| Load (h) | 1 | 1.5 50% | 1.3 30% | 0.7 -30% | 1.9 90% | 2.2 120% | 0.8 -20% | 1.502 ? 50% |
| Witcher 3 ultra (h) | 1.5 |
Pro
Contra
Veredicto - Potente máquina de juego
Nuestra variante del Alienware m16 R1 -el modelo básico de la serie- está diseñada para juegos y renderizado QHD+. El Core i7-13700HX y la GeForce RTX 4060 proporcionan la potencia necesaria. Ambos componentes trabajan a velocidades de reloj mayormente altas y es posible un compromiso aceptable entre rendimiento y ruido.
Dell ofrece un potente portátil de juego QHD+ en el Alienware m16 R1. Sólo las características secundarias merecen crítica.
El panel IPS (16 pulgadas, 2560x1600, sRGB, G-Sync) causó una buena impresión en general. Como alternativa, se pueden elegir otros dos paneles con frecuencias de refresco superiores y mayor cobertura del espacio de color (DCI-P3). La oferta de disco duro (512 GB) es más bien escasa; 1 TB o 2 TB serían más adecuados para el precio de 1900 euros. La duración de la batería también es bastante mediocre.
Dos puertos Thunderbolt 4 (Power Delivery, Displayport) aseguran abundantes opciones de expansión (GPU externa, docking). No es posible alimentar el portátil por USB C; los puertos USB C sólo dan energía.
Una alternativa es el Acer Predator Helios 16 PH16-71. Ofrece prácticamente la misma configuración de hardware, pero más espacio de disco duro (1 TB). Además, tiene una pantalla más brillante.
Precio y disponibilidad
Una configuración similar a nuestra variante del Alienware m16 R1, pero con un disco duro de 1 TB, está disponible en EE.UU. a través de Best Buy a un precio de 1.999,99 dólares.
Los precios son a fecha 05.09.2023 y están sujetos a cambios.
Alienware m16 R1 Intel
- 09/04/2023 v7 (old)
Sascha Mölck
Transparencia
La selección de los dispositivos que se van a reseñar corre a cargo de nuestro equipo editorial. La muestra de prueba fue proporcionada al autor en calidad de préstamo por el fabricante o el minorista a los efectos de esta reseña. El prestamista no tuvo ninguna influencia en esta reseña, ni el fabricante recibió una copia de la misma antes de su publicación. No había ninguna obligación de publicar esta reseña. Como empresa de medios independiente, Notebookcheck no está sujeta a la autoridad de fabricantes, minoristas o editores.
Así es como prueba Notebookcheck
Cada año, Notebookcheck revisa de forma independiente cientos de portátiles y smartphones utilizando procedimientos estandarizados para asegurar que todos los resultados son comparables. Hemos desarrollado continuamente nuestros métodos de prueba durante unos 20 años y hemos establecido los estándares de la industria en el proceso. En nuestros laboratorios de pruebas, técnicos y editores experimentados utilizan equipos de medición de alta calidad. Estas pruebas implican un proceso de validación en varias fases. Nuestro complejo sistema de clasificación se basa en cientos de mediciones y puntos de referencia bien fundamentados, lo que mantiene la objetividad.Price comparison

