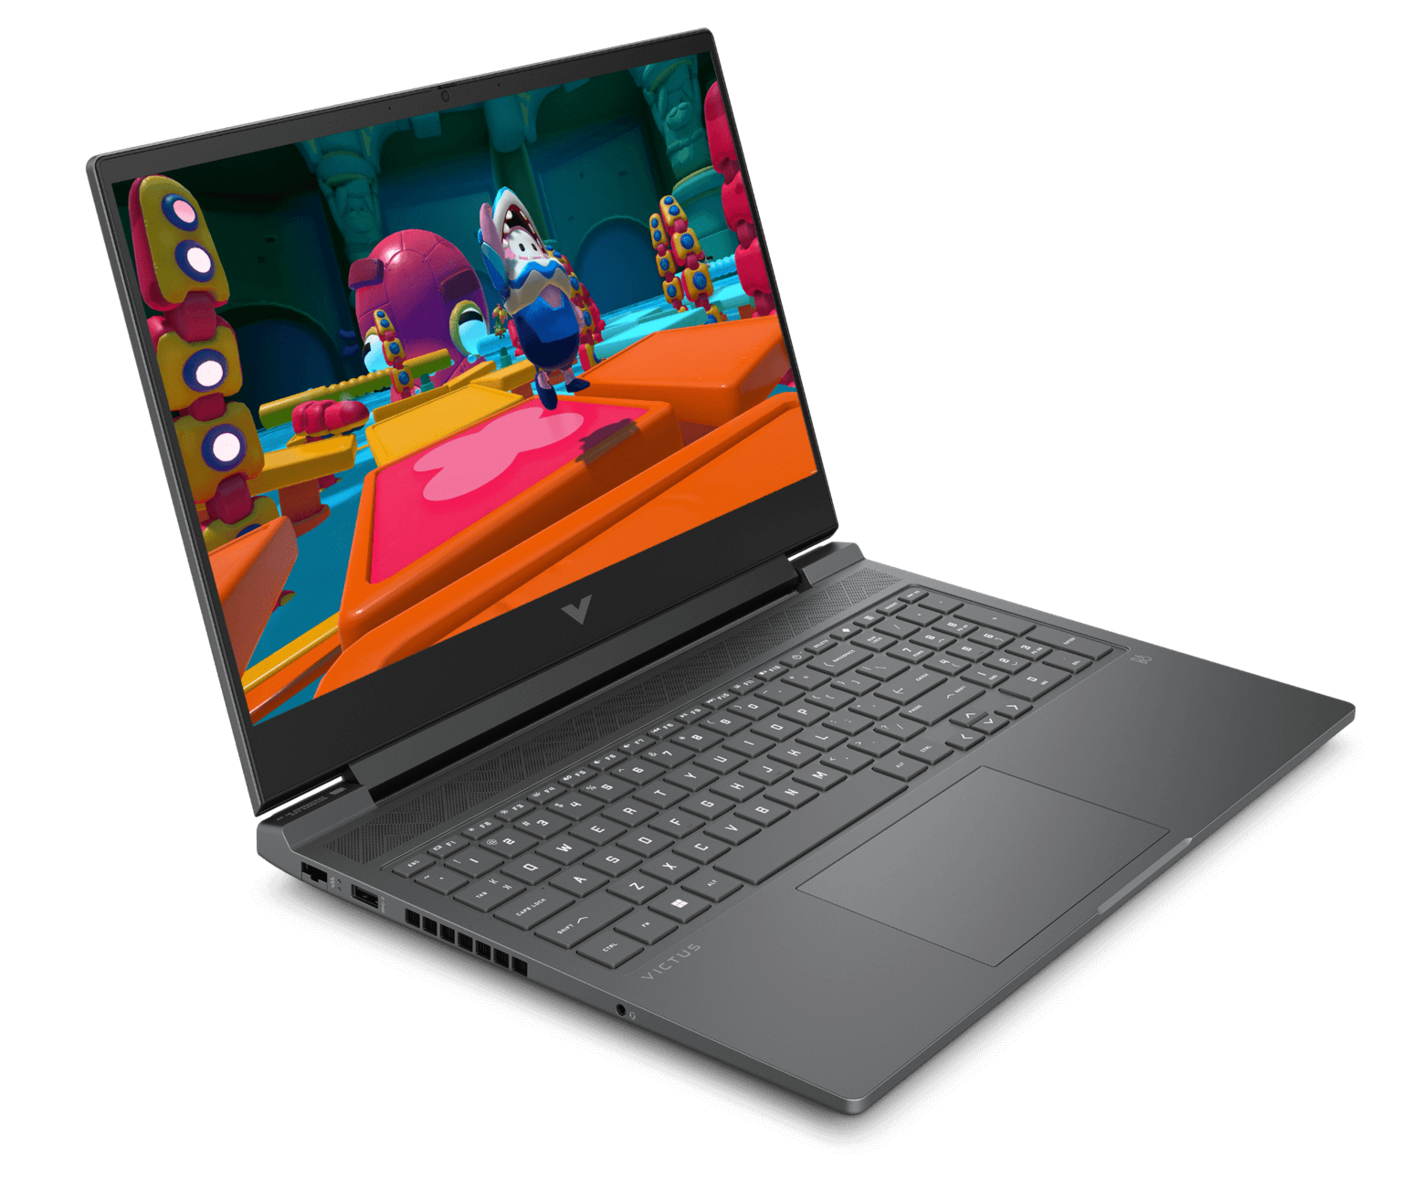
Análisis del portátil HP Victus 16: Una potencia para jugar a 1080p con pocas concesiones

La línea de portátiles Victus de HP está dirigida a un público de bajo presupuesto que busca soluciones para juegos. Sin embargo, ejecuta bastante software Omen, lo que consolida su posición en el repertorio de portátiles para juegos de HP.
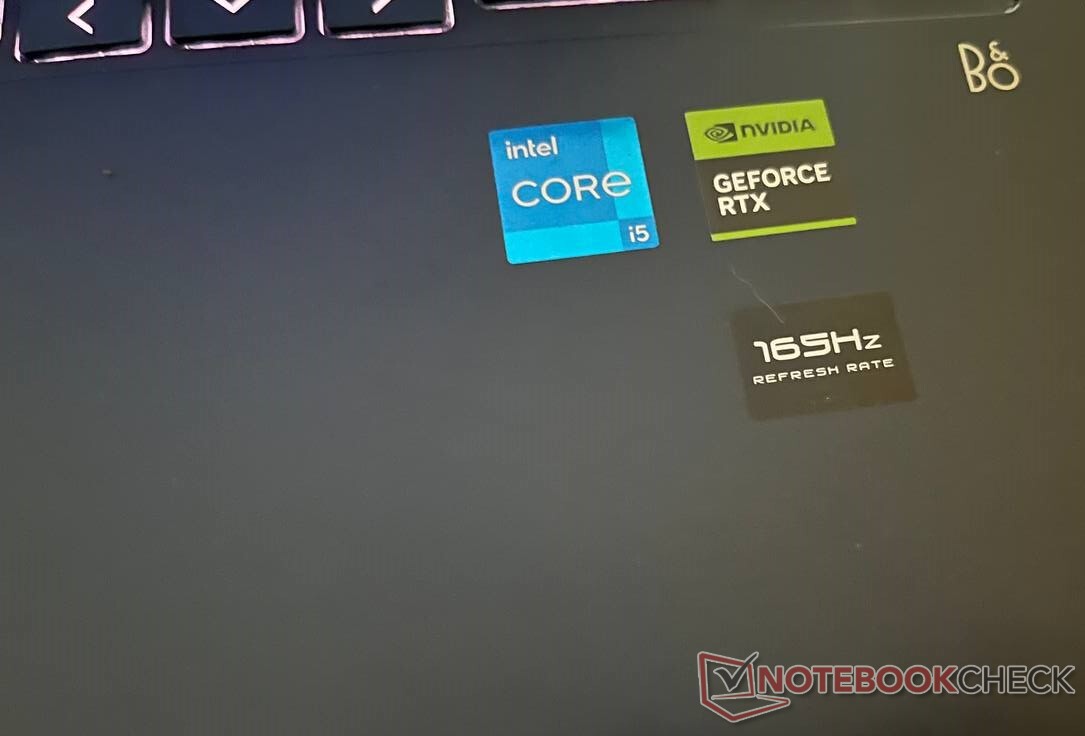
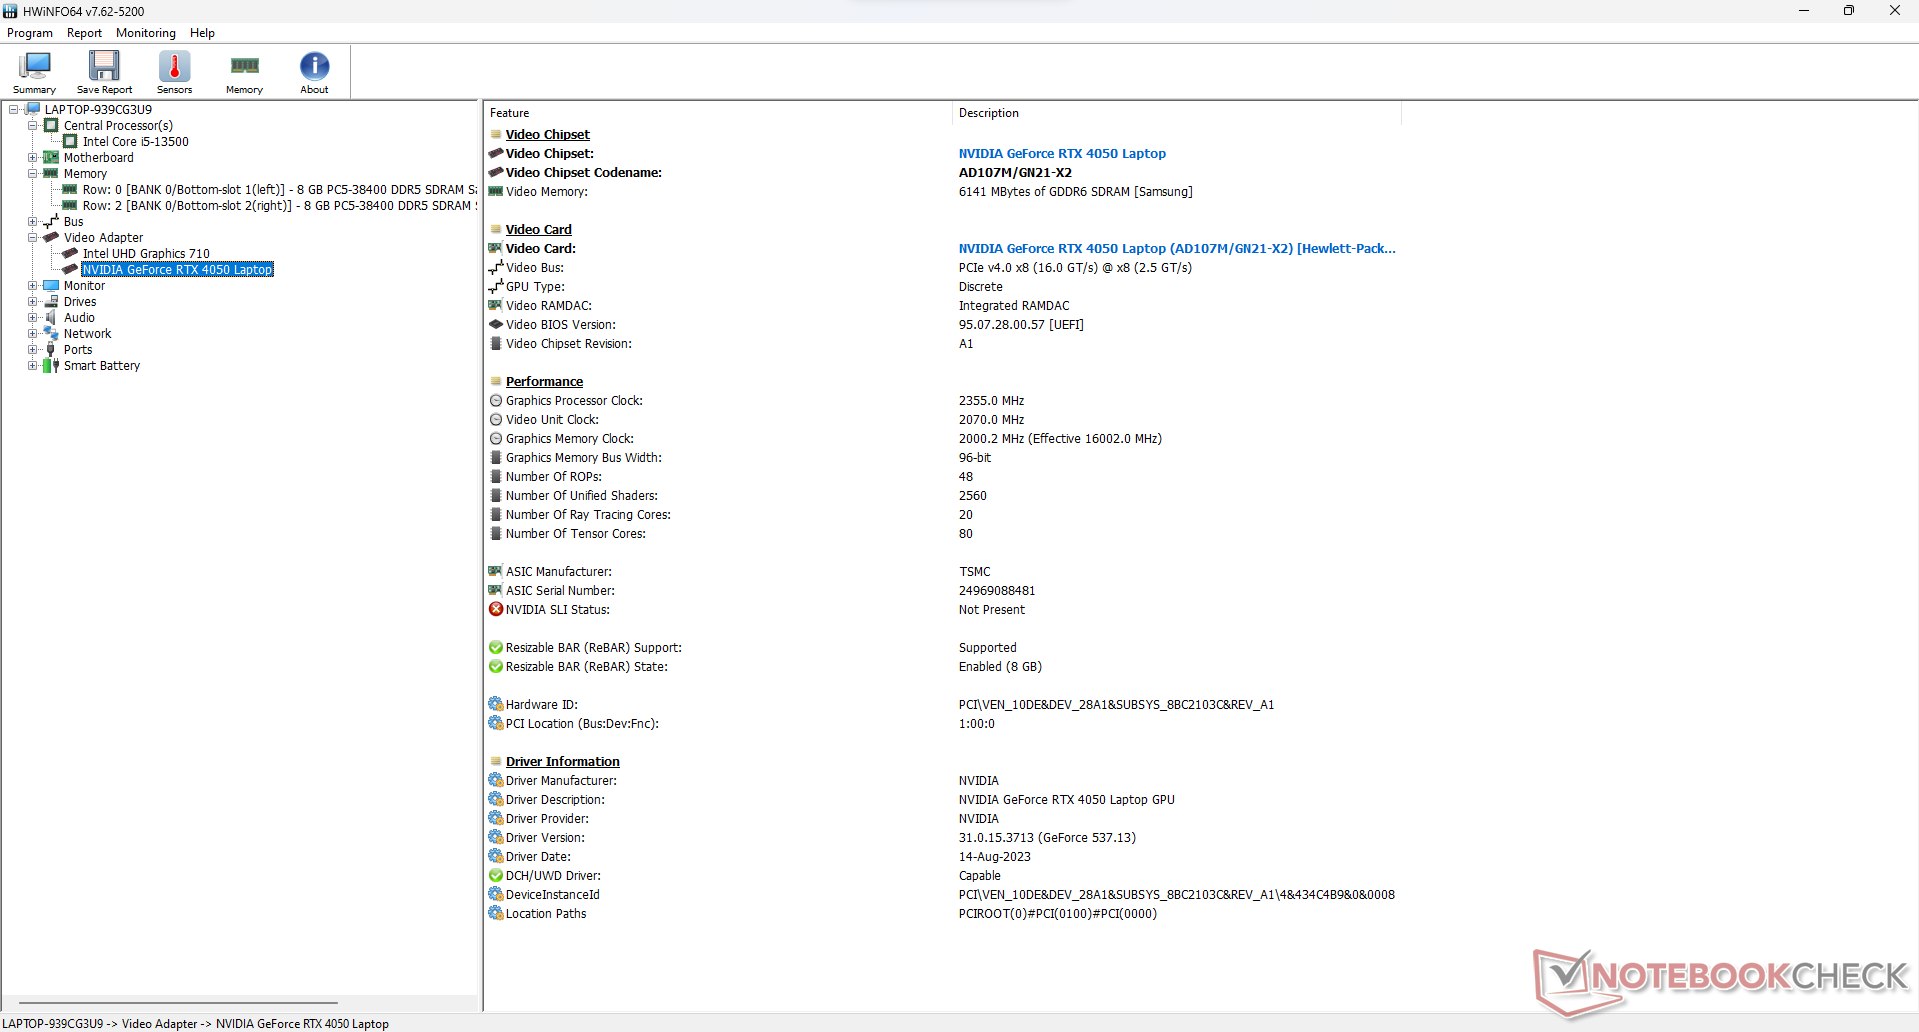
El HP Victus 16-r0076TX ofrece una interesante mezcla de hardware de gama media, un Intel Core i5-13500HXraptor Lake-HX y una tarjeta gráfica Nvidia GeForce RTX 4050 (Ada Lovelace).
Supone una mejora significativa respecto a su última iteración, el HP Victus 16-e0145ngque funcionaba con un AMD Ryzen 5 5600H y Nvidia GeForce RTX 3050 Ti. Sin embargo, la mejora de las especificaciones también conlleva el correspondiente aumento de coste.
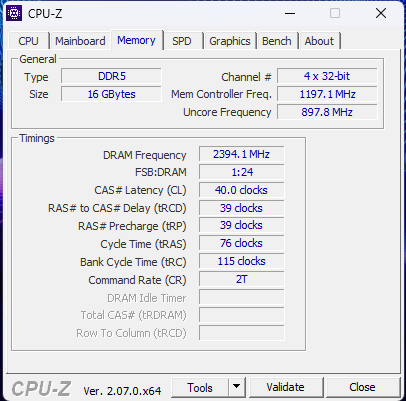
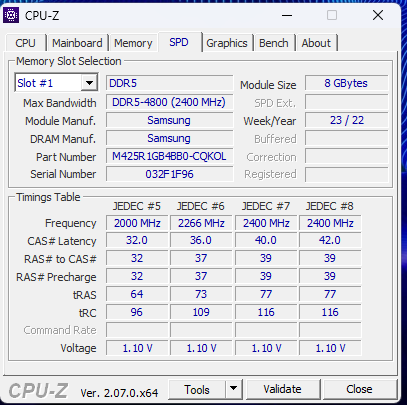
Otras especificaciones incluyen un panel IPS FHD (1.920 x 1.080) de 16 pulgadas a 165 Hz, un SSD NVMe de 512 GB y 16 GB de RAM DDR5 (4.800 MT/s). Es una máquina interesante que puede saciar el picor de la mayoría de gamers.
Posibles contendientes en la comparación
Valoración | Fecha | Modelo | Peso | Altura | Tamaño | Resolución | Precio |
|---|---|---|---|---|---|---|---|
| 85.6 % v7 (old) | 09/2023 | HP Victus 16-r0076TX i5-13500HX, GeForce RTX 4050 Laptop GPU | 2.3 kg | 22.9 mm | 16.10" | 1920x1080 | |
| 86.7 % v7 (old) | 08/2023 | Acer Nitro 16 AN16-41-R7YE R5 7535HS, GeForce RTX 4050 Laptop GPU | 2.6 kg | 27.9 mm | 16.00" | 1920x1200 | |
| 87.3 % v7 (old) | 07/2023 | Acer Predator Triton 14 PT14-51 i7-13700H, GeForce RTX 4050 Laptop GPU | 1.7 kg | 19.81 mm | 14.00" | 2560x1600 | |
| 88.3 % v7 (old) | 09/2023 | Alienware m16 R1 Intel i7-13700HX, GeForce RTX 4060 Laptop GPU | 3 kg | 25.4 mm | 16.00" | 2560x1600 | |
| 89.5 % v7 (old) | 07/2023 | Acer Predator Helios 16 PH16-71-731Q i7-13700HX, GeForce RTX 4060 Laptop GPU | 2.6 kg | 26.9 mm | 16.00" | 2560x1600 | |
| 84.2 % v7 (old) | 06/2023 | Dell G15 5530 i7-13650HX, GeForce RTX 4060 Laptop GPU | 3 kg | 26.95 mm | 15.60" | 1920x1080 | |
| 89 % v7 (old) | 08/2023 | Lenovo Legion Pro 5 16ARX8 (R5 7645HX, RTX 4050) R5 7645HX, GeForce RTX 4050 Laptop GPU | 2.5 kg | 27.3 mm | 16.00" | 2560x1600 | |
| 85.7 % v7 (old) | 07/2023 | Lenovo LOQ 15APH8 R7 7840HS, GeForce RTX 4050 Laptop GPU | 2.5 kg | 25.2 mm | 15.60" | 1920x1080 |
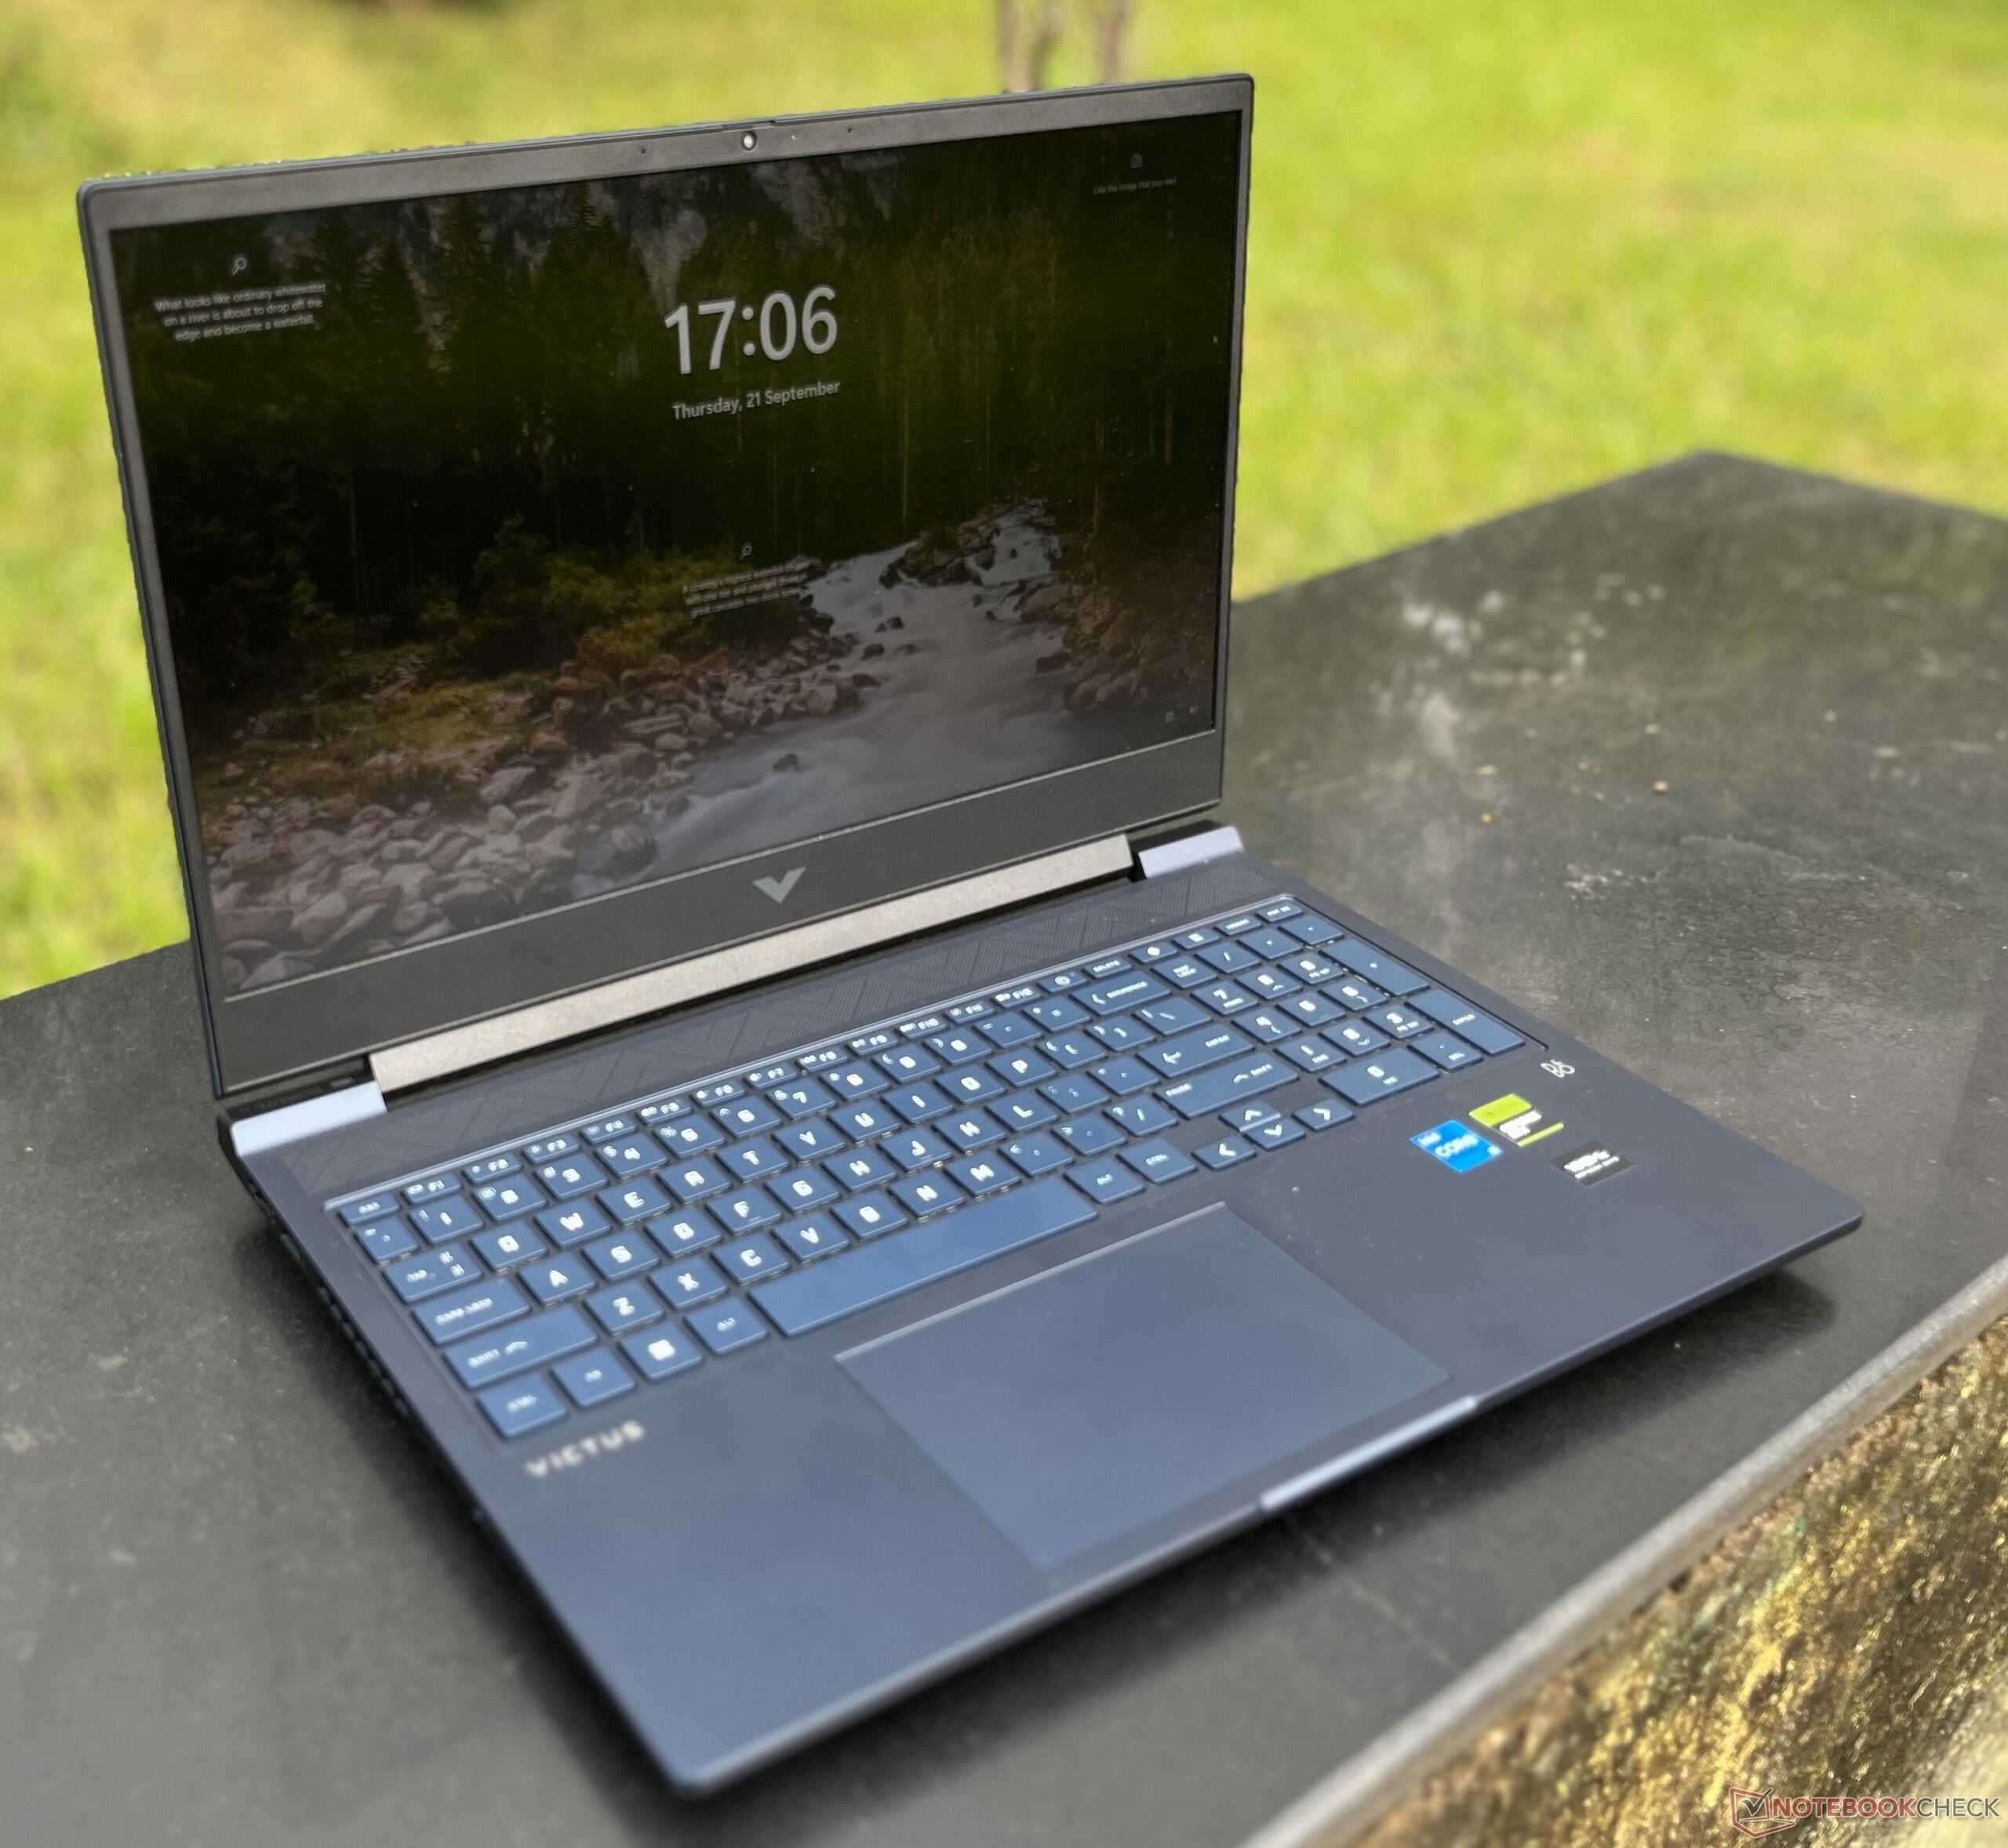
Carcasa: cuerpo de plástico resistente con una pantalla endeble
Nada más sacarlo de la caja, salta a la vista que el HP Victus 16 no es muy portátil. Por otra parte, los portátiles para juegos rara vez son ligeros, y con 2,3 kg, el portátil se sitúa en el extremo más ligero del espectro.
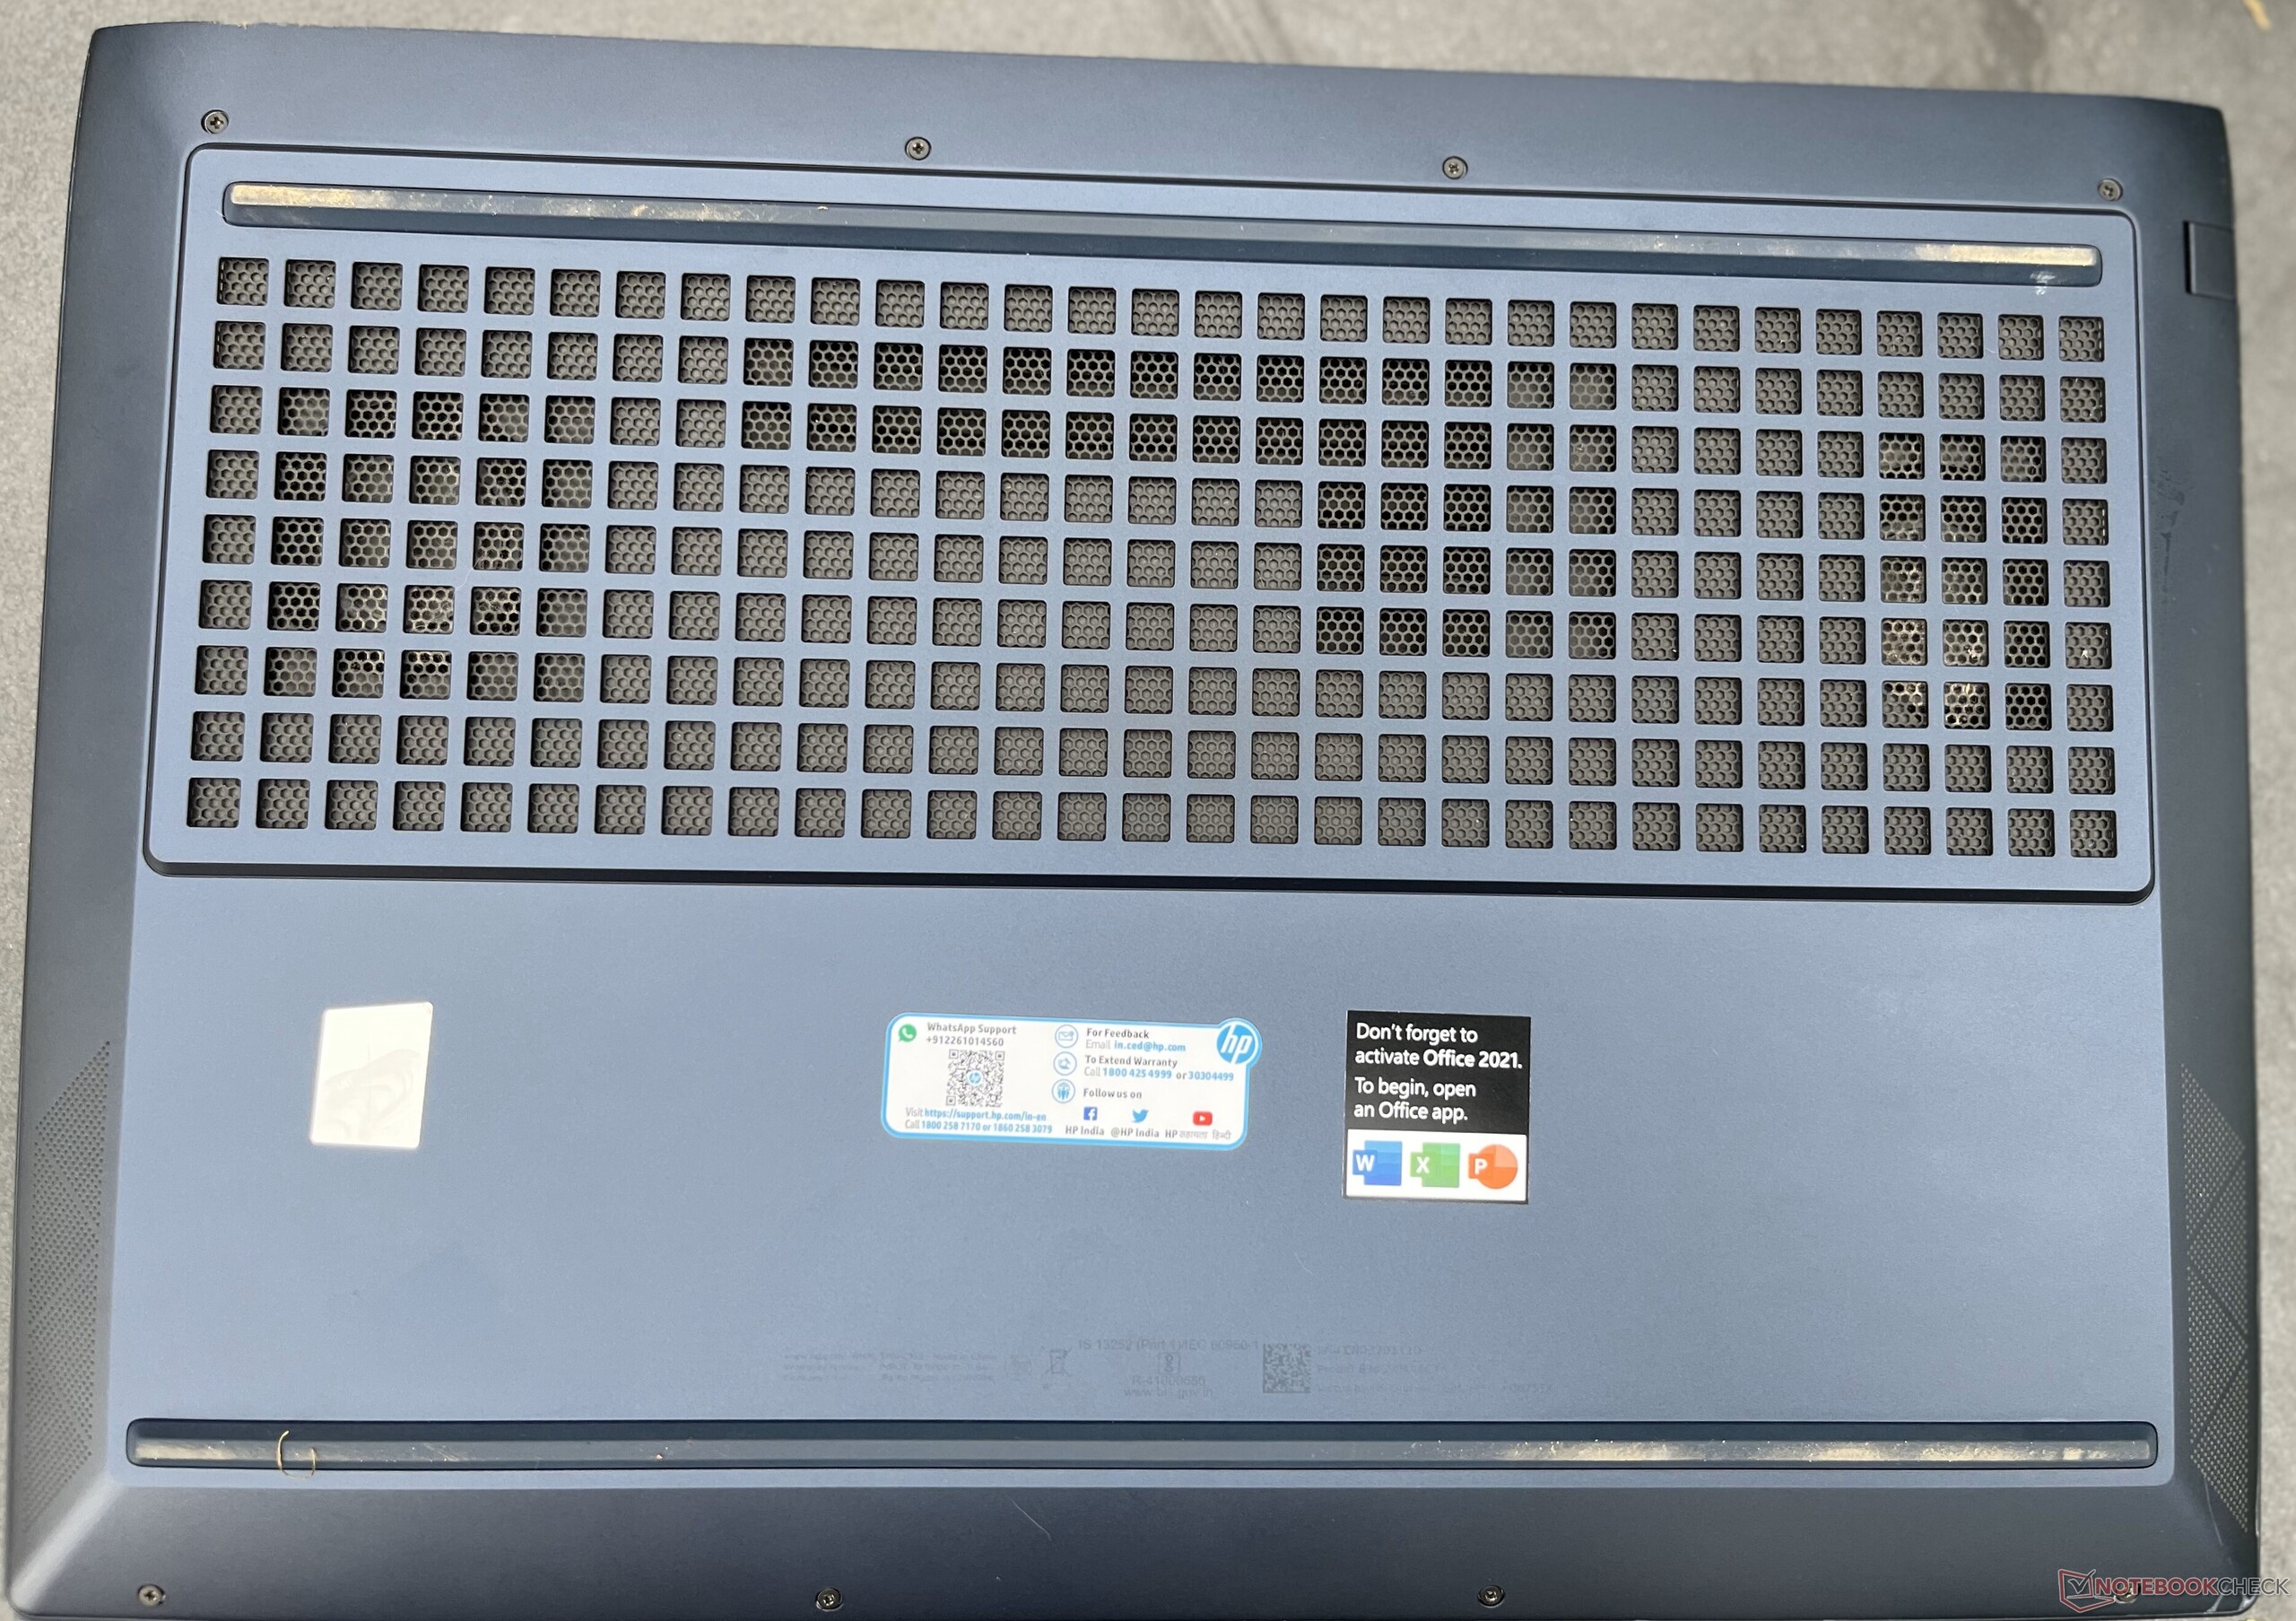
El chasis totalmente negro no tiene mucho que destacar, salvo una "V" en la parte trasera y una serie de pegatinas en la parte delantera. HP intenta mantener el portátil limpio incluyendo un filtro antipolvo en todas las rejillas de ventilación.
Una pantalla de 16 pulgadas permite a HP incluir un teclado completo (teclado numérico incluido) en el Victus 16. La pantalla se flexiona un poco más de la cuenta. La pantalla se flexiona un poco demasiado, y estaría bien que HP lo revisara en versiones posteriores.
Conectividad: Podría haber tenido más E/S
Las E/S del HP Victus 16 son sorprendentemente ligeras para un portátil de juego. A la derecha hay un puerto USB-C, dos puertos USB-A (los tres a 5 Gbps) y un puerto HDMI 2.1 en un extremo. Al lado, hay un conector de barril para el cargador. Los puertos USB y HDMI están demasiado cerca, sobre todo el HDMI.
En el otro lado, sólo hay una toma Ethernet RJ-45, un puerto USB Tipo-A y una toma de audio de 3,5 mm. Habría estado bien alguna E/S adicional en la trasera. El puerto USB-C casi parece una ocurrencia tardía, dada su escasa velocidad.


Comunicación
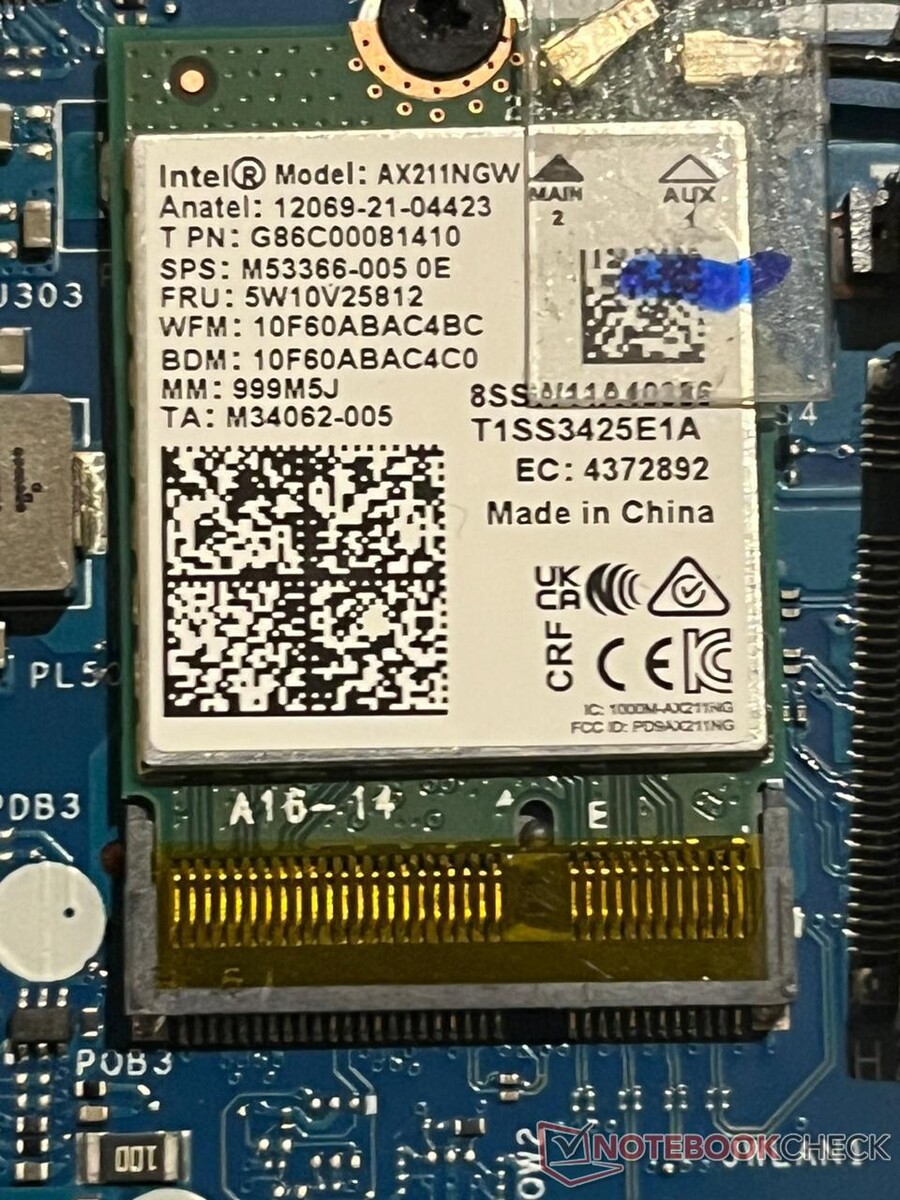
Para ser un portátil básico, el HP Victus 16 tiene una buena selección de opciones de red. Tienes Wi-Fi 6E y un puerto Ethernet, que te permiten transferir archivos a alta velocidad.
En iPerf3, el módem Wi-Fi 6E de Intel pudo recibir datos a 1.646 Mbps con nuestro router Asus ROG Rapture AXE11000. Esto es mucho más rápido que sus competidores, que a menudo carecen por completo de la funcionalidad Wi-Fi 6.
| Networking / iperf3 transmit AXE11000 | |
| Lenovo Legion Pro 5 16ARX8 (R5 7645HX, RTX 4050) | |
| Dell G15 5530 | |
| HP Victus 16-r0076TX | |
| Acer Predator Triton 14 PT14-51 | |
| Acer Nitro 16 AN16-41-R7YE | |
| Acer Predator Helios 16 PH16-71-731Q | |
| Alienware m16 R1 Intel | |
| Media de la clase Gaming (560 - 1862, n=94, últimos 2 años) | |
| Medio Intel Wi-Fi 6E AX211 (64 - 1921, n=276) | |
| Lenovo LOQ 15APH8 | |
| Networking / iperf3 receive AXE11000 | |
| Acer Predator Triton 14 PT14-51 | |
| Acer Nitro 16 AN16-41-R7YE | |
| Alienware m16 R1 Intel | |
| Lenovo Legion Pro 5 16ARX8 (R5 7645HX, RTX 4050) | |
| Dell G15 5530 | |
| HP Victus 16-r0076TX | |
| Media de la clase Gaming (680 - 1745, n=94, últimos 2 años) | |
| Acer Predator Helios 16 PH16-71-731Q | |
| Medio Intel Wi-Fi 6E AX211 (582 - 1890, n=276) | |
| Lenovo LOQ 15APH8 | |
| Networking / iperf3 transmit AXE11000 6GHz | |
| Lenovo Legion Pro 5 16ARX8 (R5 7645HX, RTX 4050) | |
| Acer Predator Helios 16 PH16-71-731Q | |
| HP Victus 16-r0076TX | |
| Media de la clase Gaming (723 - 2355, n=38, últimos 2 años) | |
| Medio Intel Wi-Fi 6E AX211 (385 - 1851, n=226) | |
| Networking / iperf3 receive AXE11000 6GHz | |
| Lenovo Legion Pro 5 16ARX8 (R5 7645HX, RTX 4050) | |
| HP Victus 16-r0076TX | |
| Media de la clase Gaming (975 - 1775, n=37, últimos 2 años) | |
| Medio Intel Wi-Fi 6E AX211 (700 - 1857, n=226) | |
| Acer Predator Helios 16 PH16-71-731Q | |
Cámara web
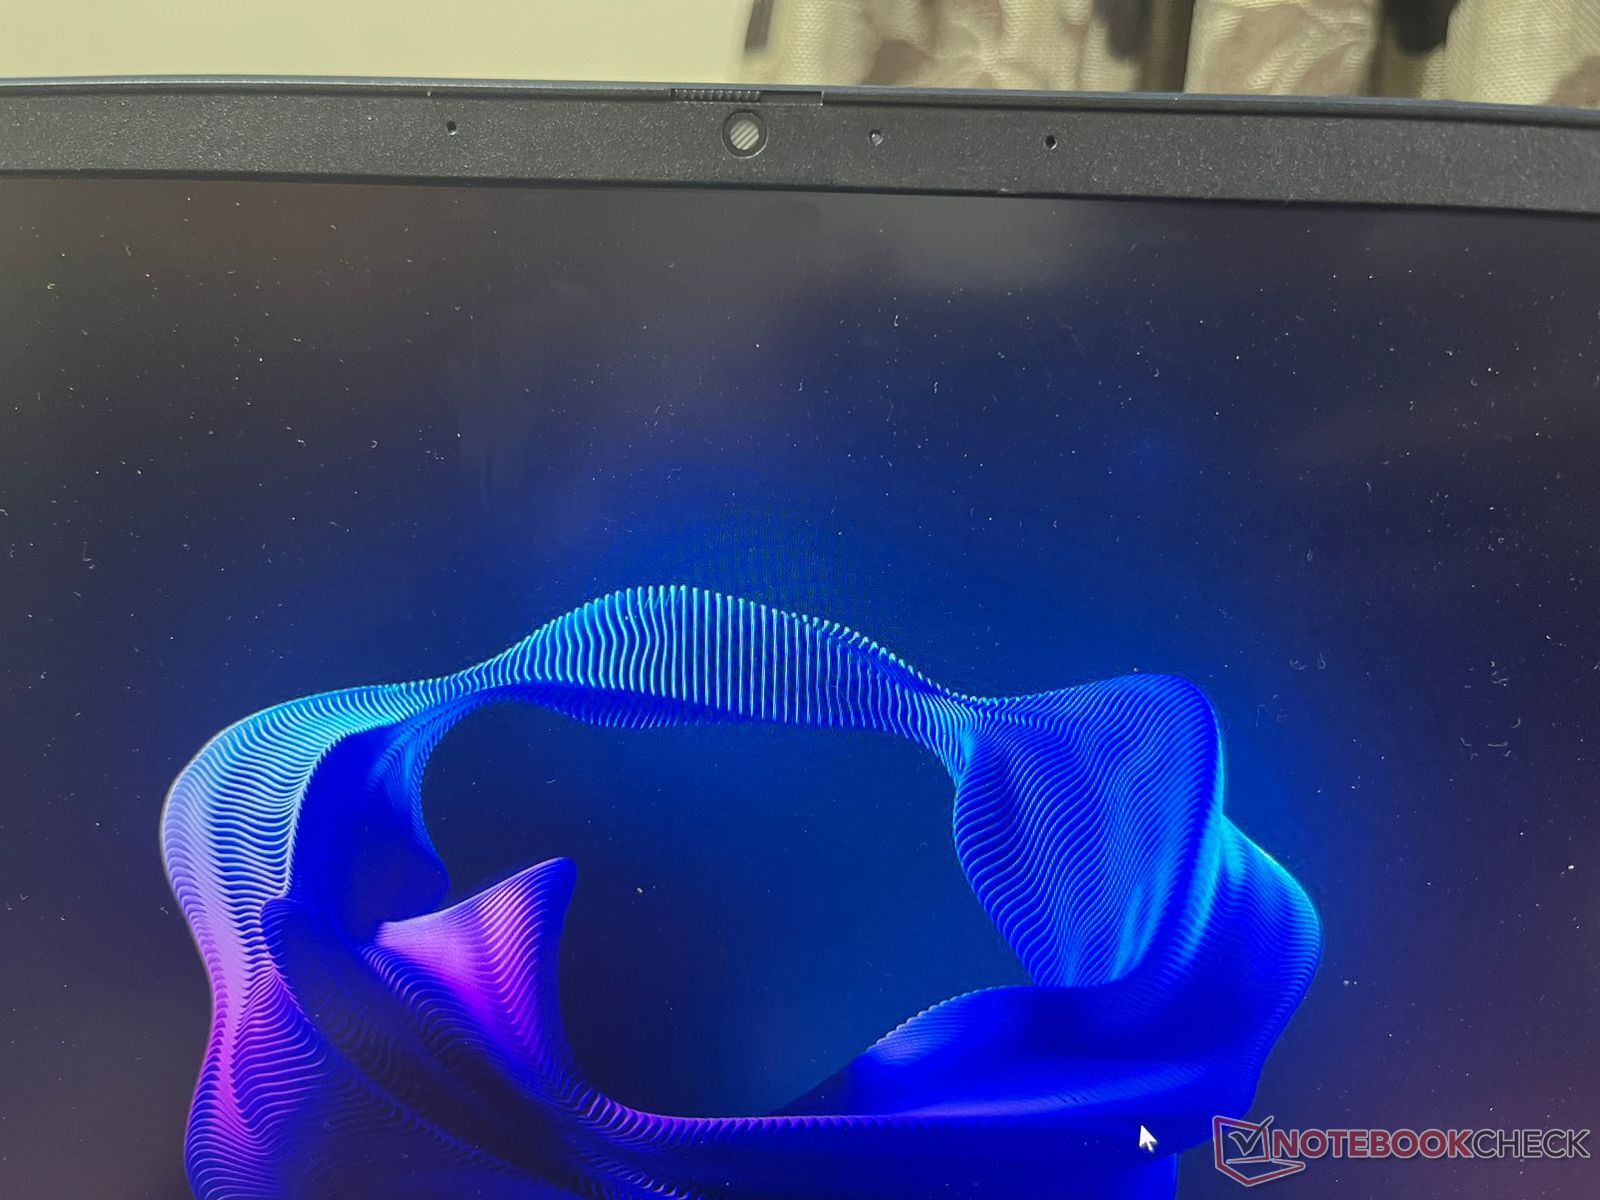
Las webcams son una rareza en los portátiles de juego, y el hecho de que el HP Victus 16 incluya un módulo 1080p (~2 MP) es nada menos que una ventaja. No es muy precisa en color, pero debería cubrir tareas básicas como videoconferencias y llamadas.
Incluso hay un obturador de privacidad físico (difícil de encontrar) que corta la cámara por completo. Además, hay una sección dedicada en Omen Gaming Hub para mejorar la cámara y el micrófono con Nvidia Broadcast.


Seguridad
Las características de seguridad están completamente ausentes en el HP Victus 16, salvo por un módulo TPM, necesario para Windows 11. No hay rastro de sensor de huellas dactilares, Windows Hello ni siquiera ranura de bloqueo Kensington.
Accesorios y garantía
El embalaje del HP Victus 16 no tiene mucho que decir. En su mayor parte está desnudo, con sólo el portátil y una fuente de alimentación. Sin embargo, este último es notablemente grande, como ocurre con la mayoría de los portátiles para juegos.
HP India ofrece con el Victus 16 una garantía limitada de un año. Por 2.999 ₹ más se obtienen dos años más de garantía y un plan antivirus durante tres años. Sin embargo, la oferta es válida por tiempo limitado.
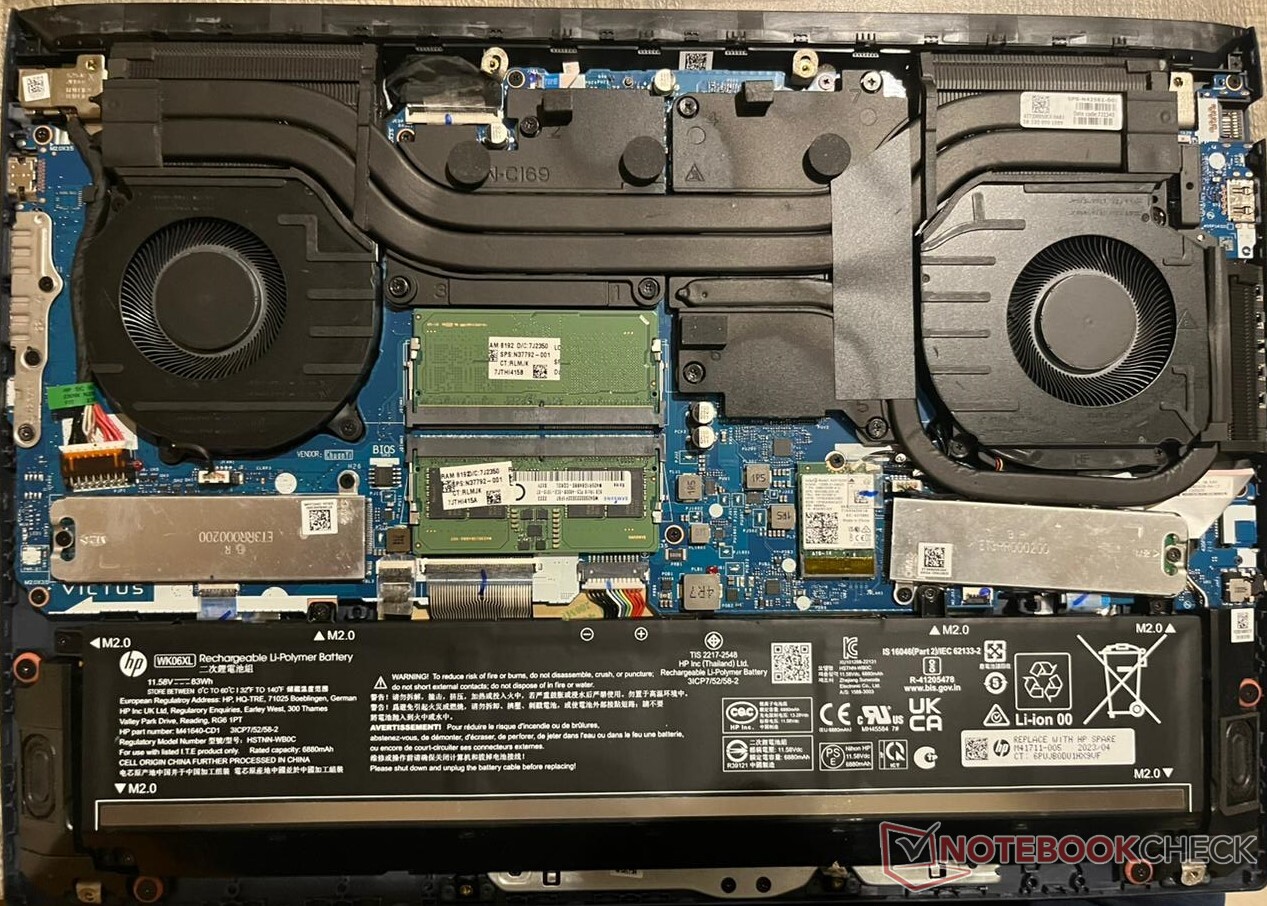
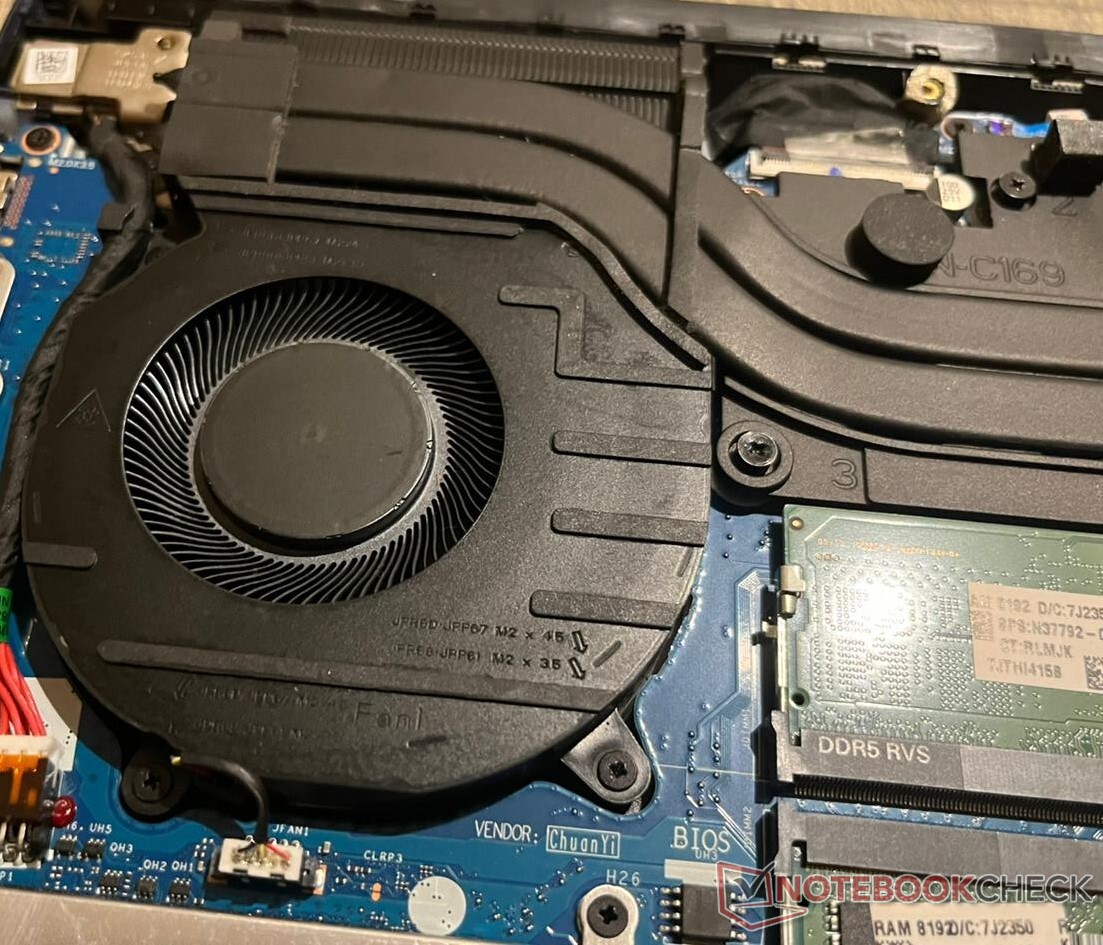
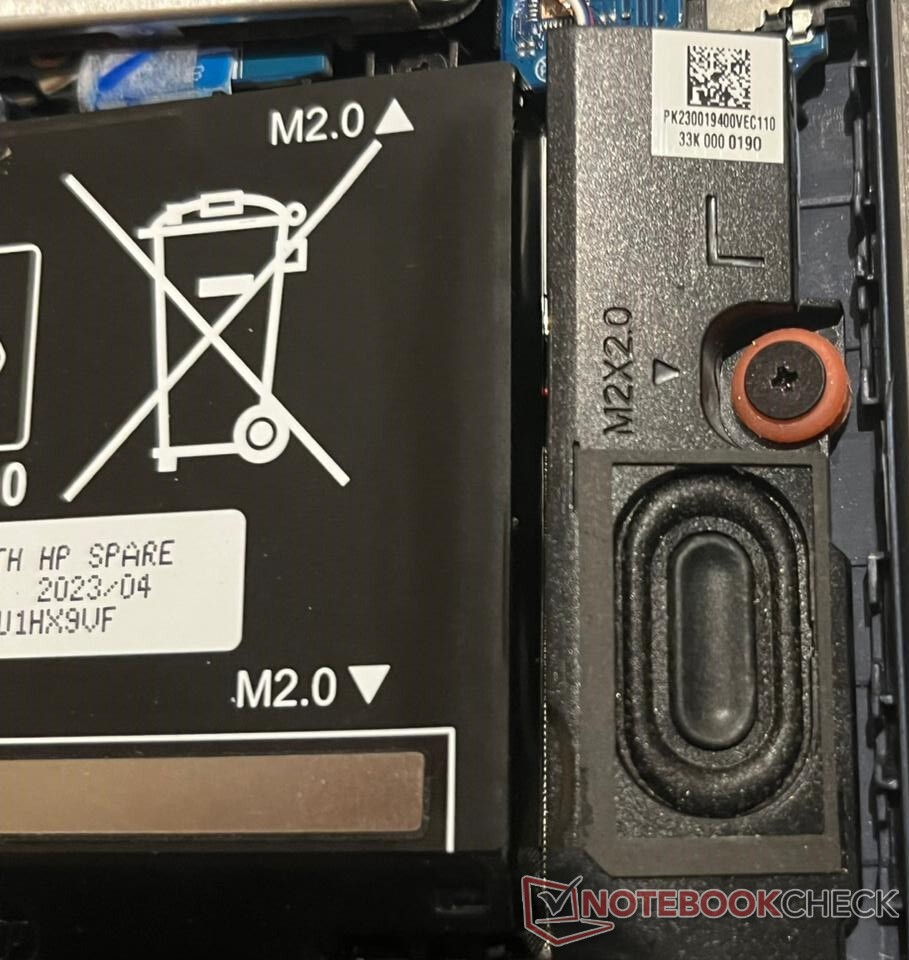
Mantenimiento
Entrar en el HP Victus 16 es muy fácil. Todo lo que se necesita es un destornillador Philips, aflojar ocho tornillos de la parte trasera y abrir la cubierta. La tarjeta WLAN, la RAM DDR5 y el SSD NVMe se pueden cambiar. La batería puede desatornillarse y sustituirse si es necesario.
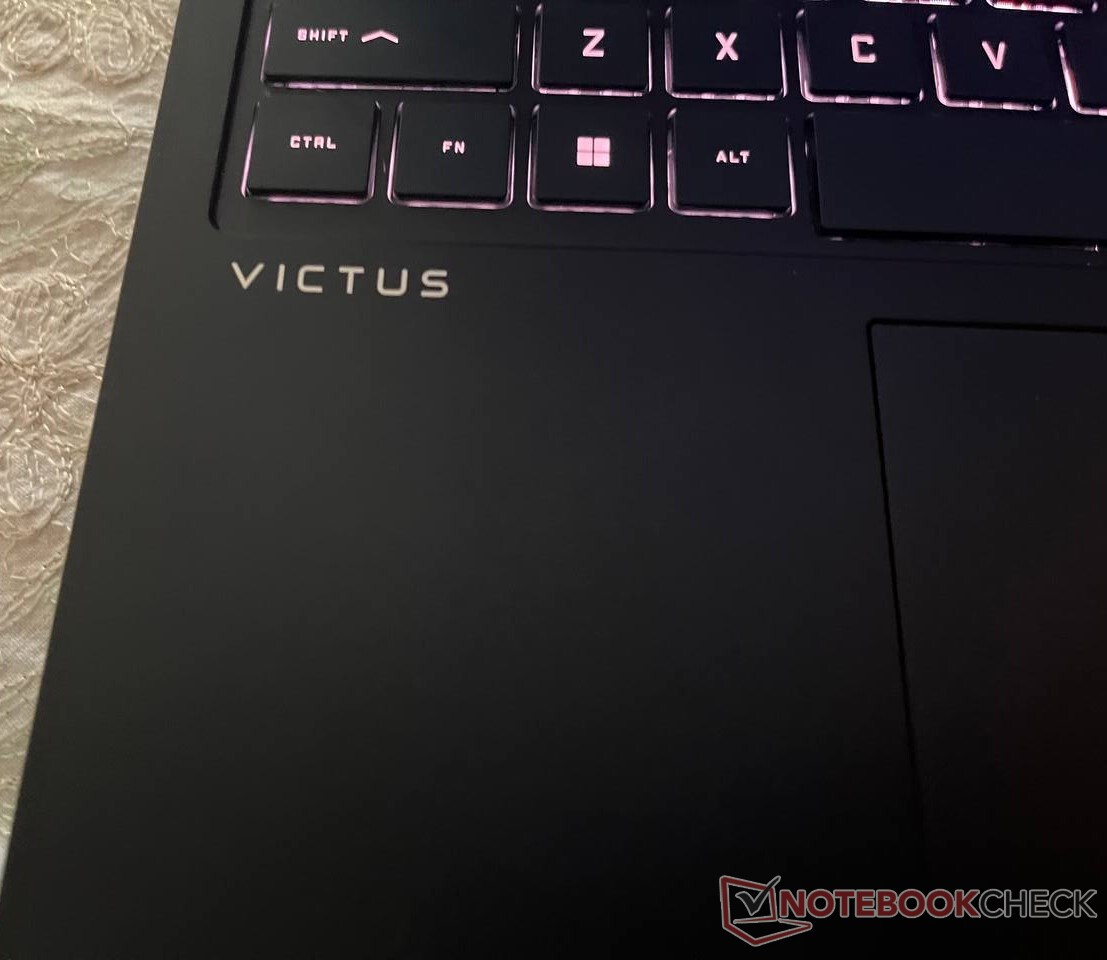
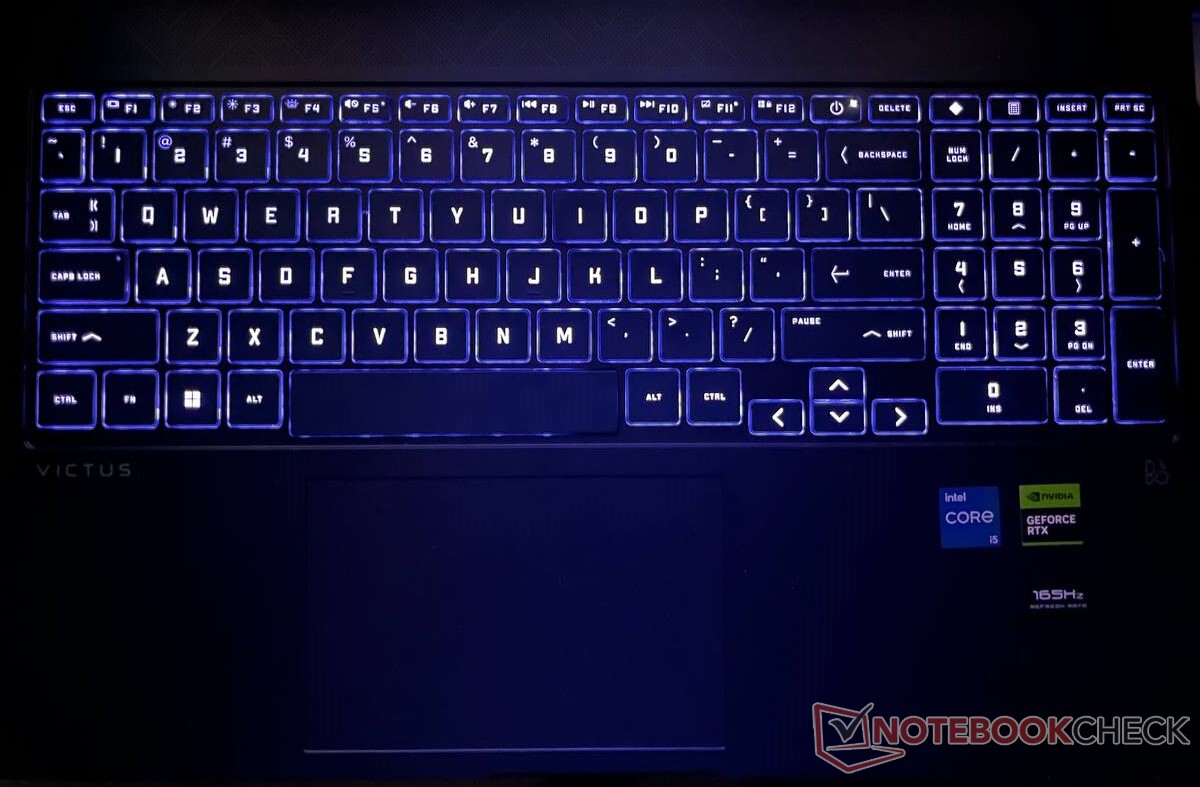
Dispositivos de entrada: Teclado decente con iluminación RGB
El HP Victus 16 viene con un teclado muy completo y un trackpad suficientemente grande. Sus teclas son grandes, y los usuarios de sobremesa no deberían tardar mucho en reprogramar su memoria muscular para trabajar con el portátil. Su teclado numérico es una adición bienvenida, pero HP ha optado por poner el botón de encendido en el peor lugar posible, junto a la tecla de borrar. Tardamos un minuto en encontrar el botón de encendido la primera vez, y estamos seguros de que no seremos los únicos.
Teclado
Las teclas son un poco blandas, pero no rompen la inmersión. Los que quieran personalizar la iluminación del teclado pueden hacerlo con la aplicación Omen Lighting.
Hay un botón dedicado para abrir la aplicación Omen Gaming Hub y otro para la calculadora.
A pesar de su chasis de plástico, el teclado es bastante robusto y no se flexiona mucho bajo presión.
Panel táctil
El touchpad cubre todos los gestos de Windows Precision. Sin embargo, no se puede hacer clic en todo el panel táctil, ya que parte de la parte superior es rígida.
El rechazo de la palma de la mano también es correcto, ya que no tiene en cuenta los deslizamientos y clics accidentales al escribir. El seguimiento y los gestos a lo largo de los bordes funcionan sin problemas.
Pantalla: Una pantalla de 165 Hz con un brillo por debajo de la media
Nuestro HP Victus 16 de muestra viene con un panel LCD IPS de 16,1 pulgadas FHD (1.920 x 1.080) de Chi Mei. HP ofrece dos opciones de pantalla adicionales con Victus 16 SKUs, 144 Hz FHD y 240 Hz QHD (2,550 x 1,440).
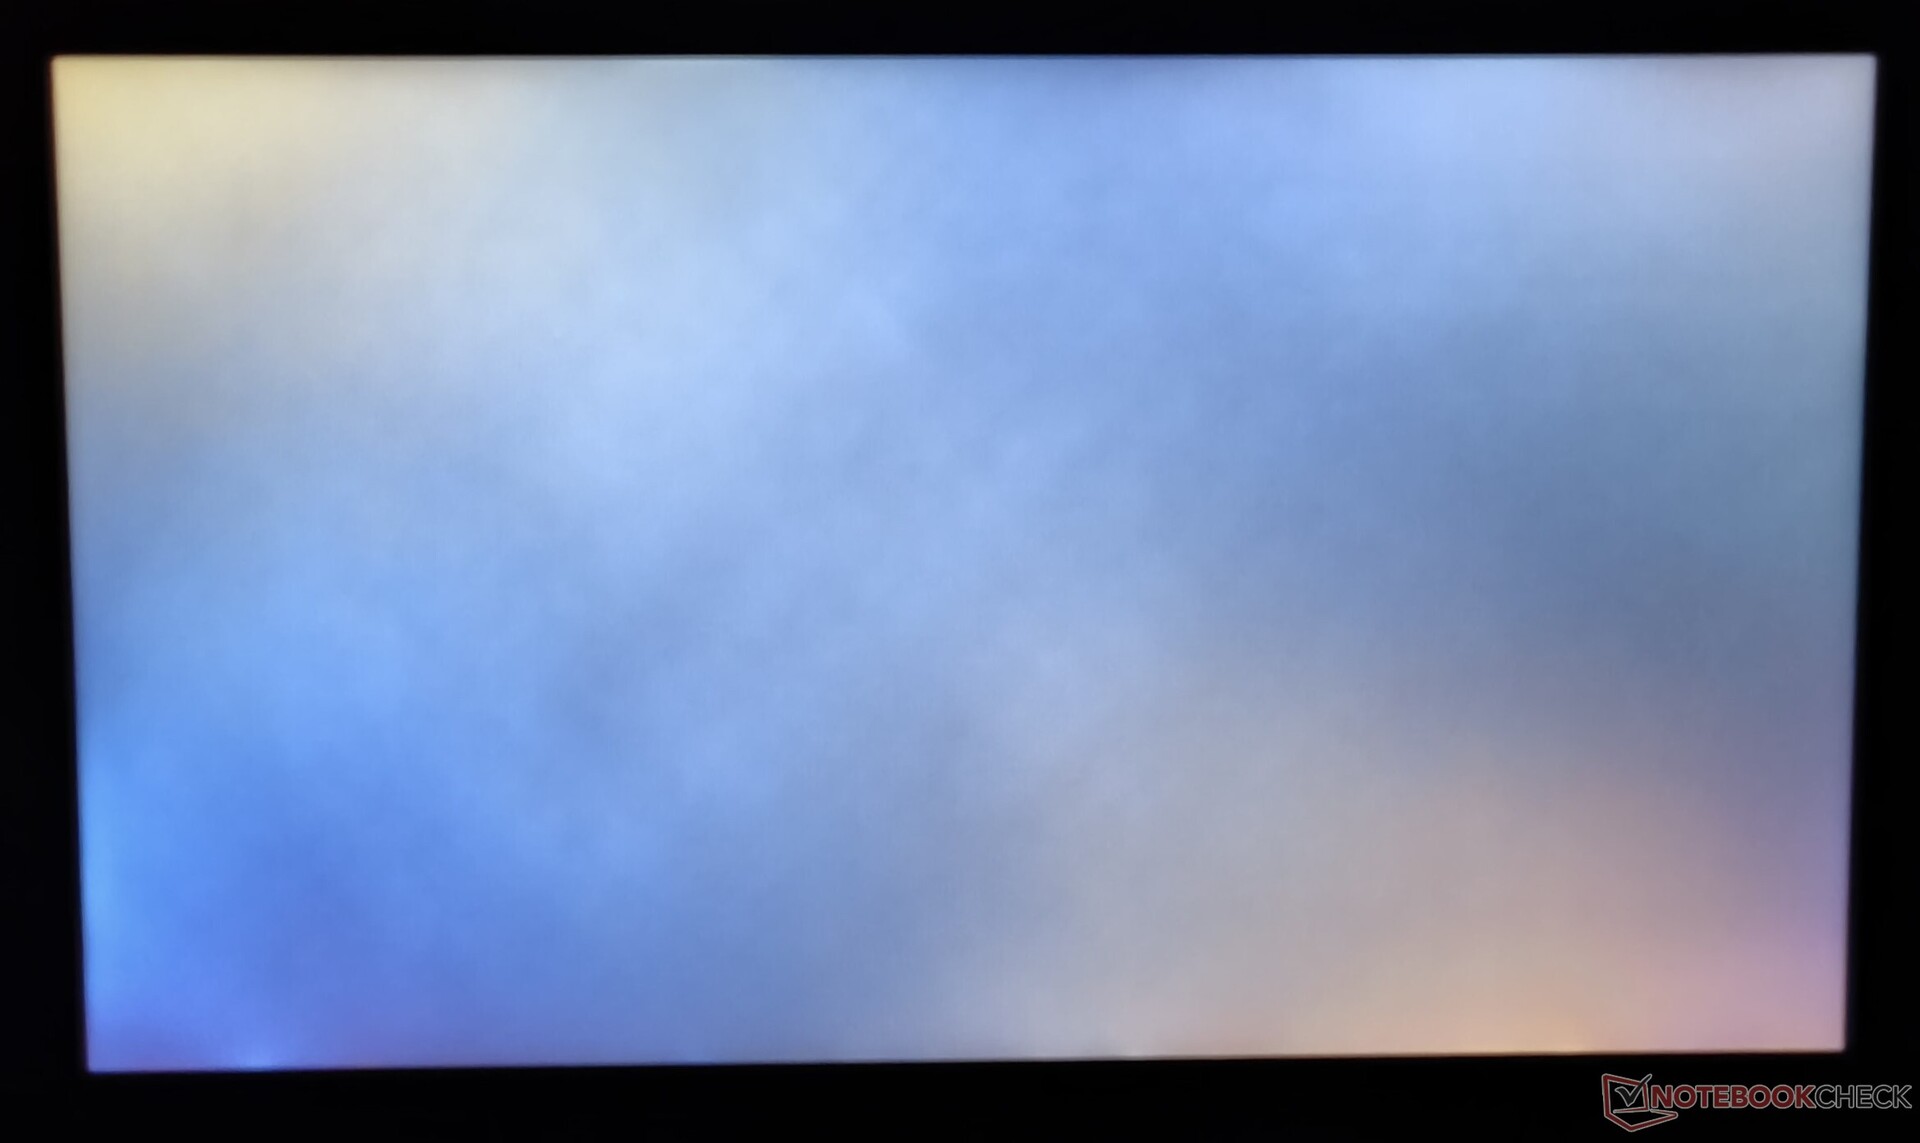
El sitio web de HP afirma que este panel en particular tiene un brillo máximo de 300 nits. Nuestras pruebas confirman la cifra, pero la distribución está en el extremo inferior (82%). También es un poco desigual, sobre todo hacia el centro-derecha.
Por último, su relación de contraste de 1.381:1 se sitúa cómodamente en un rango aceptable. Sin embargo, el panel está afectado por una mala retroiluminación, un problema recurrente en las pantallas IPS en general.

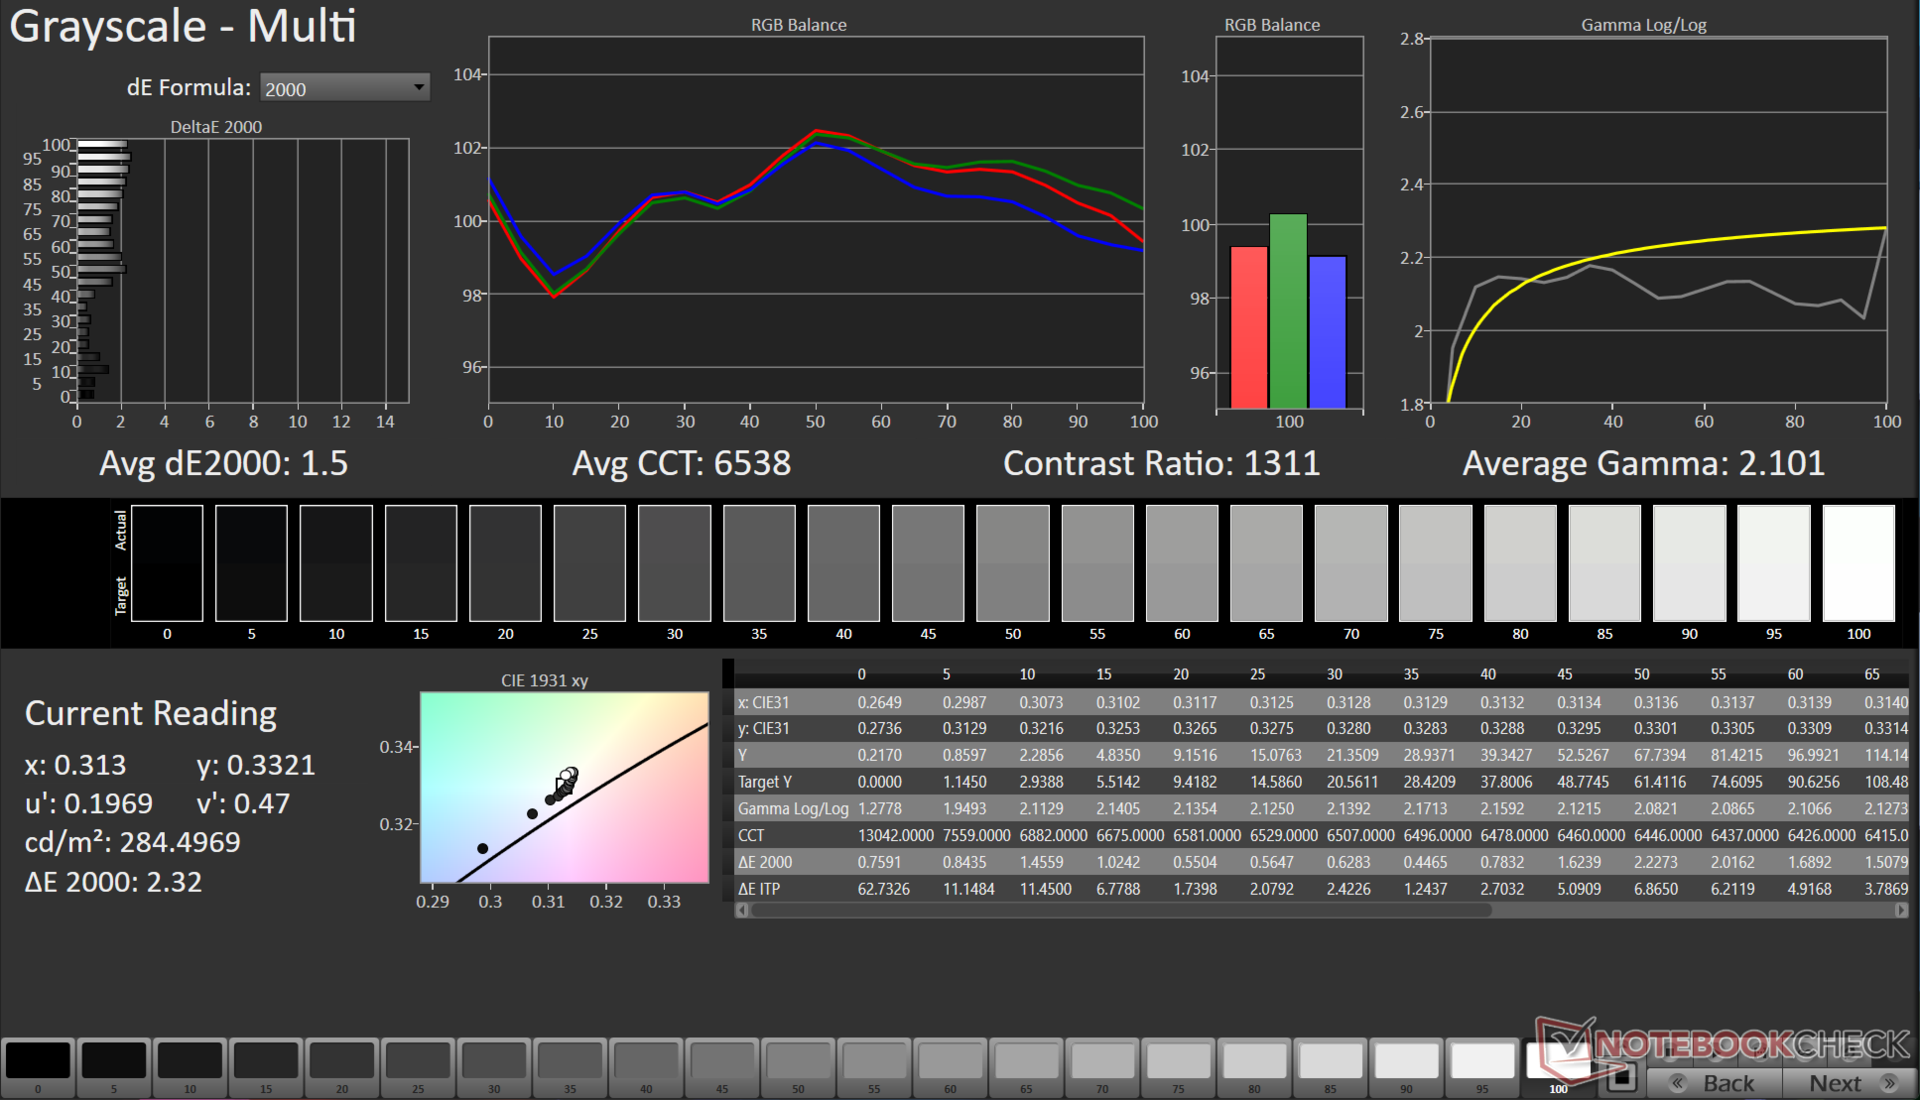
| |||||||||||||||||||||||||
iluminación: 82 %
Brillo con batería: 287 cd/m²
Contraste: 1381:1 (Negro: 0.21 cd/m²)
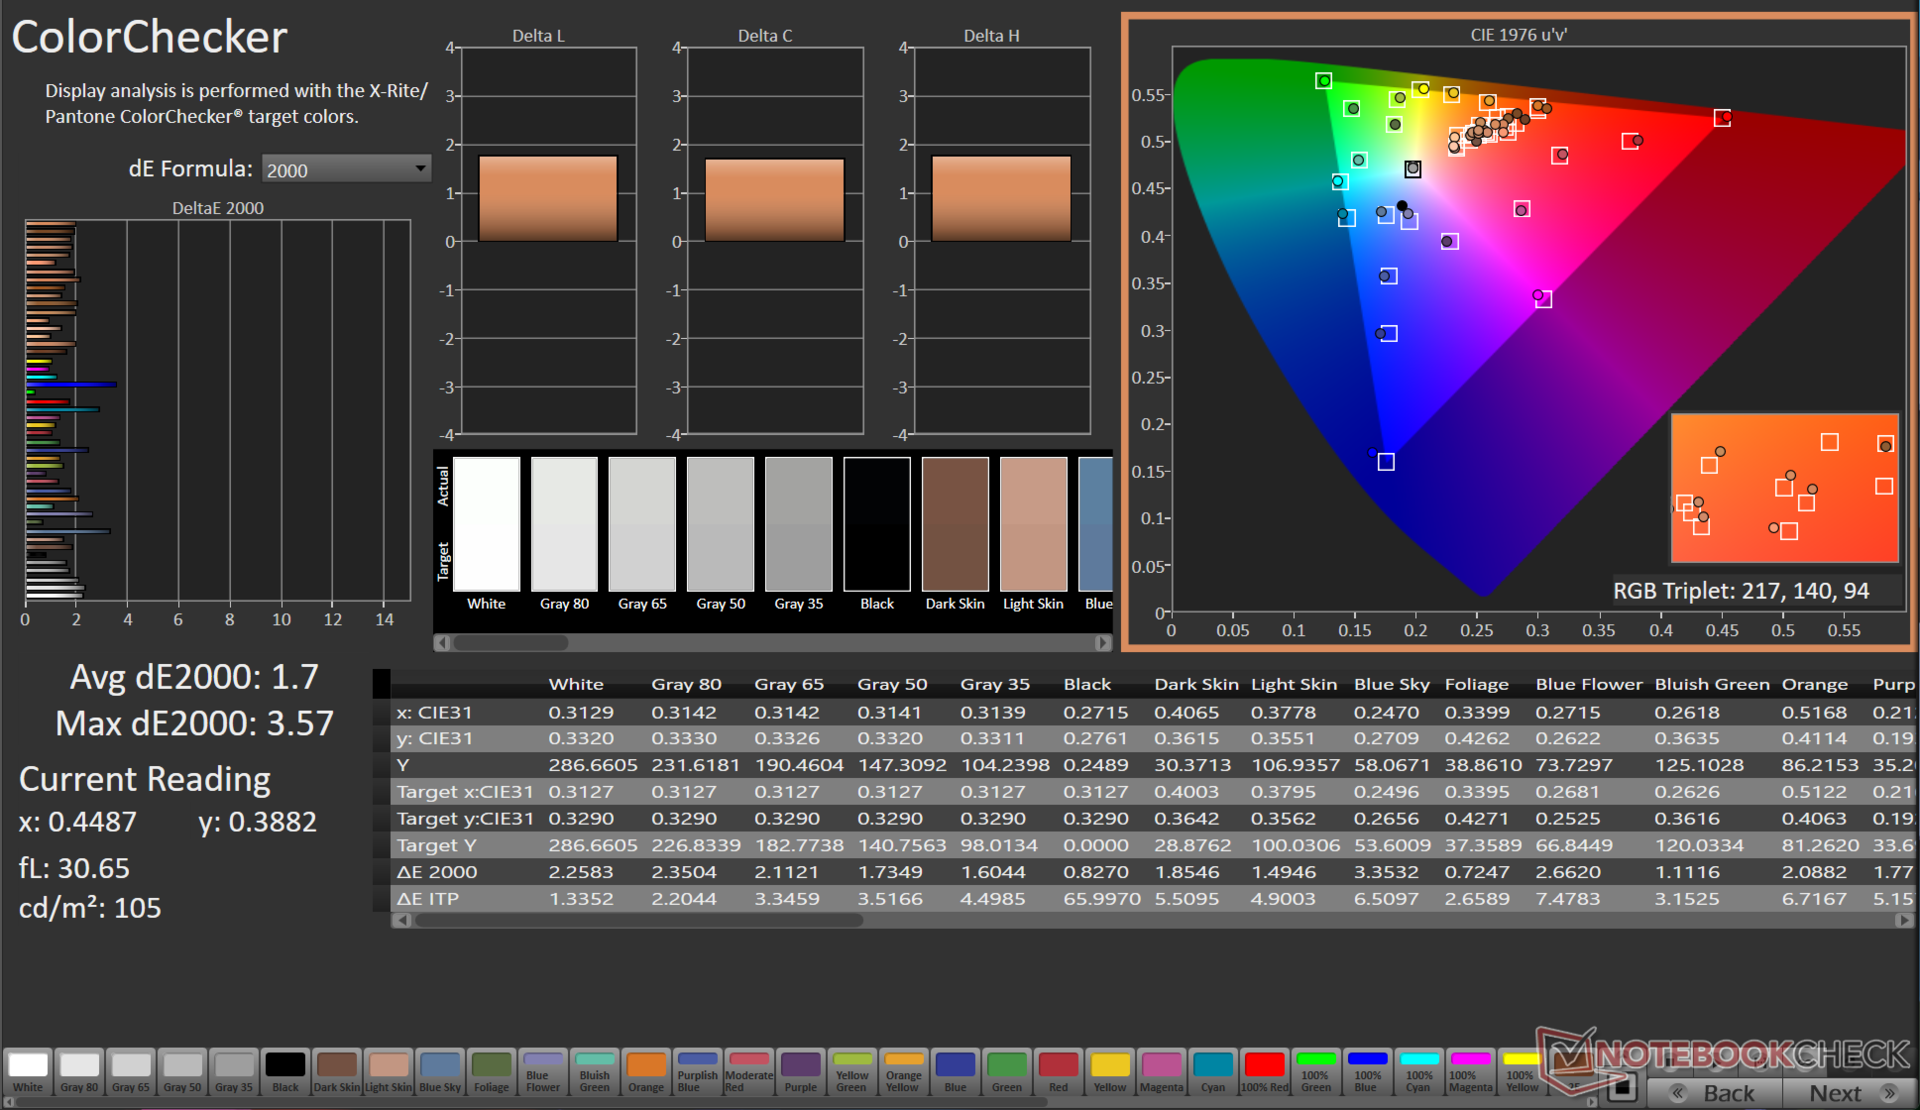
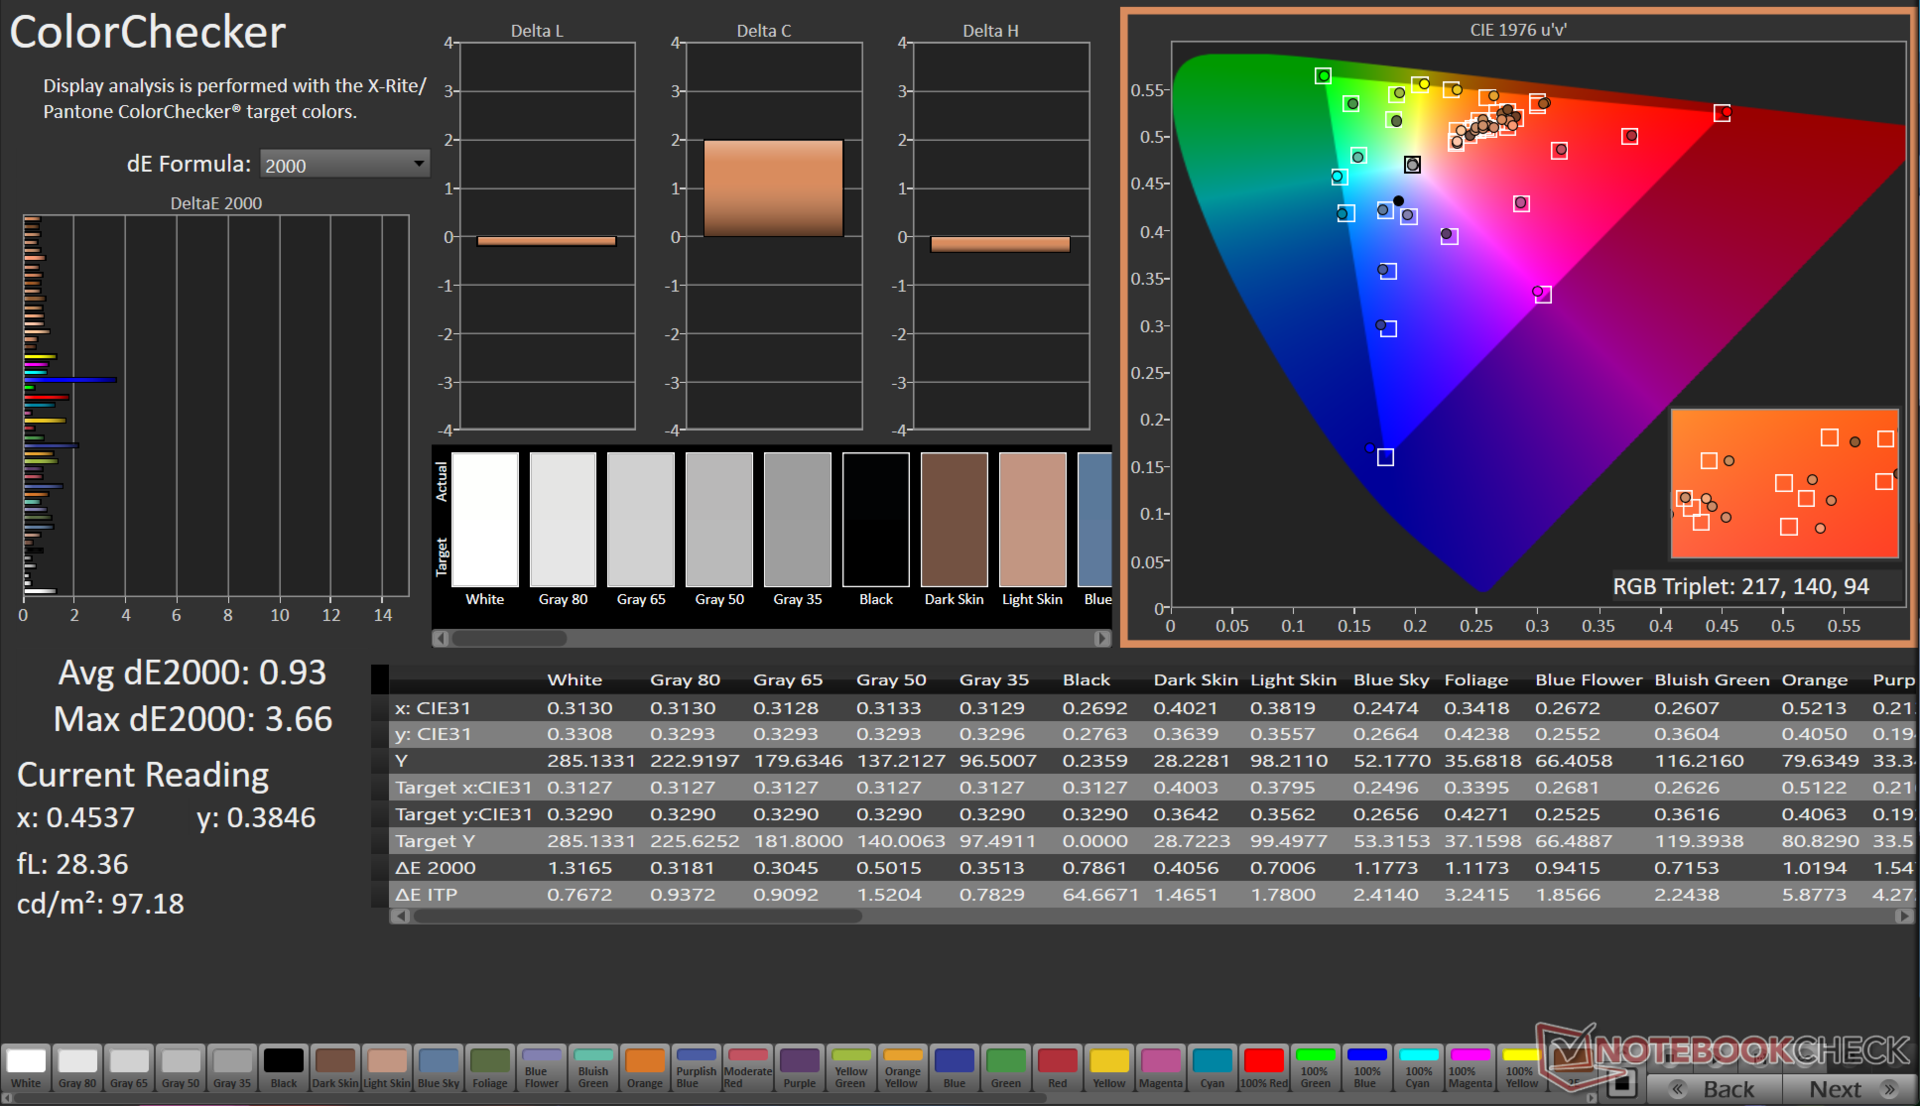
ΔE ColorChecker Calman: 1.7 | ∀{0.5-29.43 Ø4.73}
calibrated: 0.93
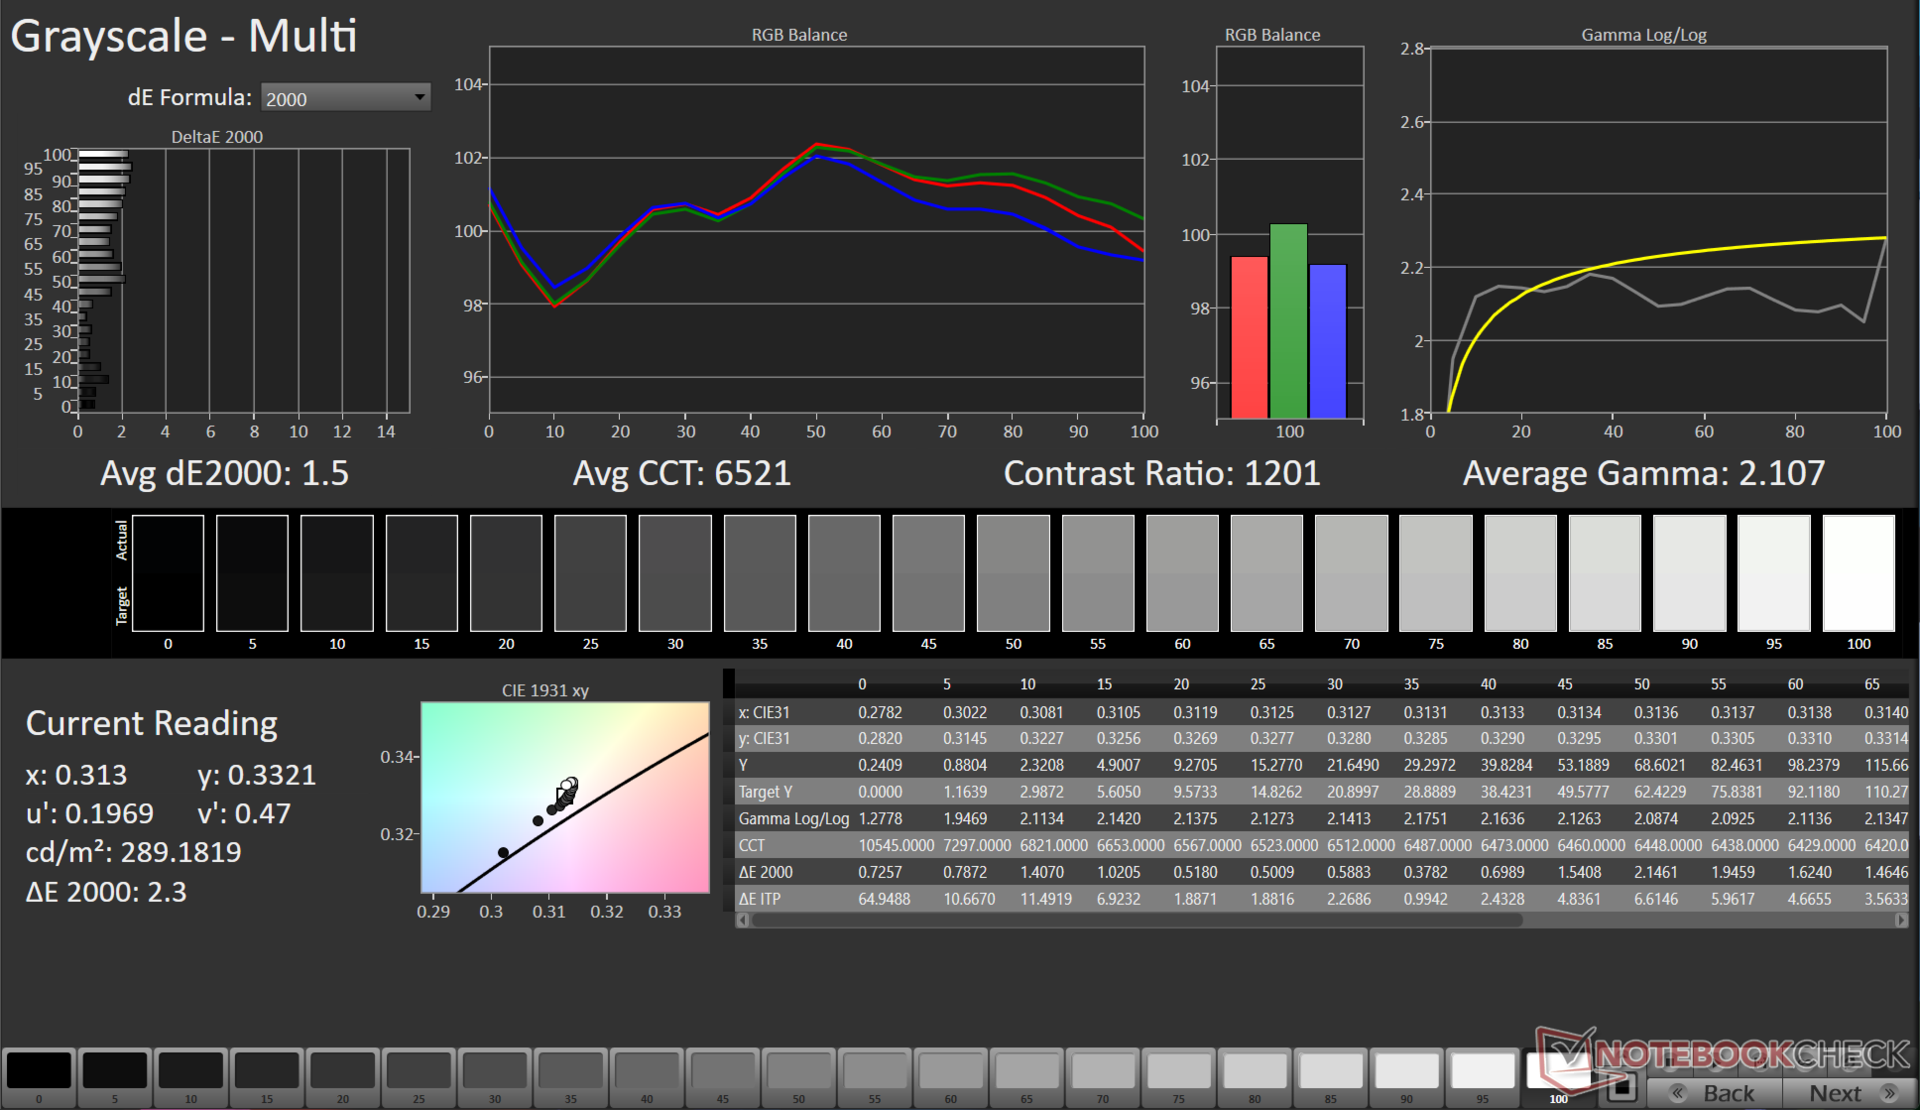
ΔE Greyscale Calman: 1.5 | ∀{0.09-98 Ø4.97}
69.7% AdobeRGB 1998 (Argyll 3D)
97.5% sRGB (Argyll 3D)
67.5% Display P3 (Argyll 3D)
Gamma: 2.1
CCT: 6538 K
| HP Victus 16-r0076TX Chi Mei CMN1629, IPS, 1920x1080, 16.1" | Acer Nitro 16 AN16-41-R7YE AU Optronics B160UAN01.Q, IPS, 1920x1200, 16" | Dell G15 5530 AUO B156HAN, IPS, 1920x1080, 15.6" | Lenovo Legion Pro 5 16ARX8 (R5 7645HX, RTX 4050) CSOT T3 MNG007DA2-2, IPS, 2560x1600, 16" | Lenovo LOQ 15APH8 BOE NJ NE156FHM-NX3, IPS, 1920x1080, 15.6" | |
|---|---|---|---|---|---|
| Display | 11% | 5% | 4% | -39% | |
| Display P3 Coverage (%) | 67.5 | 80 19% | 73.1 8% | 71.6 6% | 40.2 -40% |
| sRGB Coverage (%) | 97.5 | 99.4 2% | 98.4 1% | 99.8 2% | 60.2 -38% |
| AdobeRGB 1998 Coverage (%) | 69.7 | 77.4 11% | 74.4 7% | 72.9 5% | 41.5 -40% |
| Response Times | -25% | 38% | -31% | -407% | |
| Response Time Grey 50% / Grey 80% * (ms) | 6.18 ? | 11.2 ? -81% | 3.39 ? 45% | 12 ? -94% | 42.7 ? -591% |
| Response Time Black / White * (ms) | 7.62 ? | 5.2 ? 32% | 5.35 ? 30% | 5.2 ? 32% | 24.5 ? -222% |
| PWM Frequency (Hz) | 21620 ? | ||||
| Screen | -67% | -74% | -1% | -85% | |
| Brightness middle (cd/m²) | 290 | 415 43% | 320 10% | 543 87% | 346.2 19% |
| Brightness (cd/m²) | 275 | 380 38% | 316 15% | 516 88% | 329 20% |
| Brightness Distribution (%) | 82 | 84 2% | 94 15% | 87 6% | 81 -1% |
| Black Level * (cd/m²) | 0.21 | 0.36 -71% | 0.21 -0% | 0.58 -176% | 0.31 -48% |
| Contrast (:1) | 1381 | 1153 -17% | 1524 10% | 936 -32% | 1117 -19% |
| Colorchecker dE 2000 * | 1.7 | 4.71 -177% | 4.55 -168% | 1.35 21% | 4.19 -146% |
| Colorchecker dE 2000 max. * | 3.57 | 6.98 -96% | 9.83 -175% | 3.22 10% | 19.19 -438% |
| Colorchecker dE 2000 calibrated * | 0.93 | 2.68 -188% | 1.51 -62% | 1.31 -41% | 1.66 -78% |
| Greyscale dE 2000 * | 1.5 | 3.6 -140% | 6.2 -313% | 1.03 31% | 2.6 -73% |
| Gamma | 2.1 105% | 2.182 101% | 2.07 106% | 2.38 92% | 2.19 100% |
| CCT | 6538 99% | 7153 91% | 6479 100% | 6452 101% | 6749 96% |
| Media total (Programa/Opciones) | -27% /
-45% | -10% /
-41% | -9% /
-4% | -177% /
-121% |
* ... más pequeño es mejor
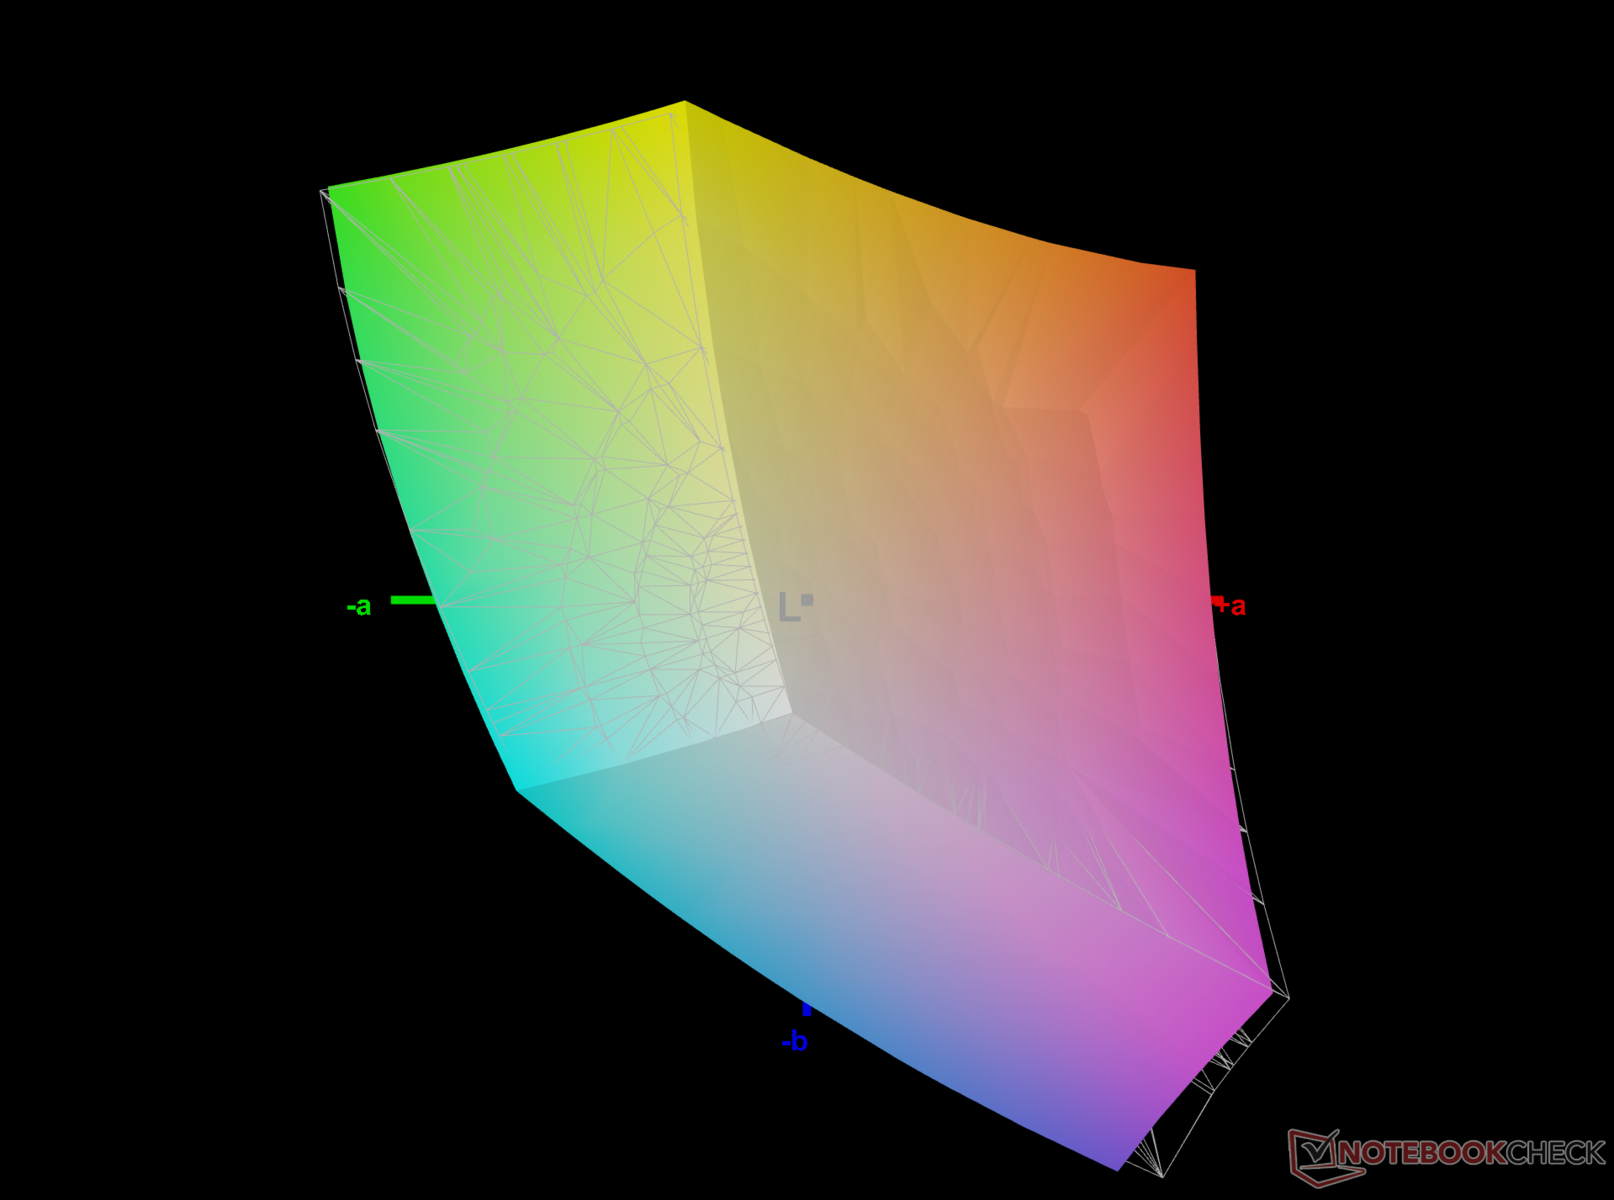
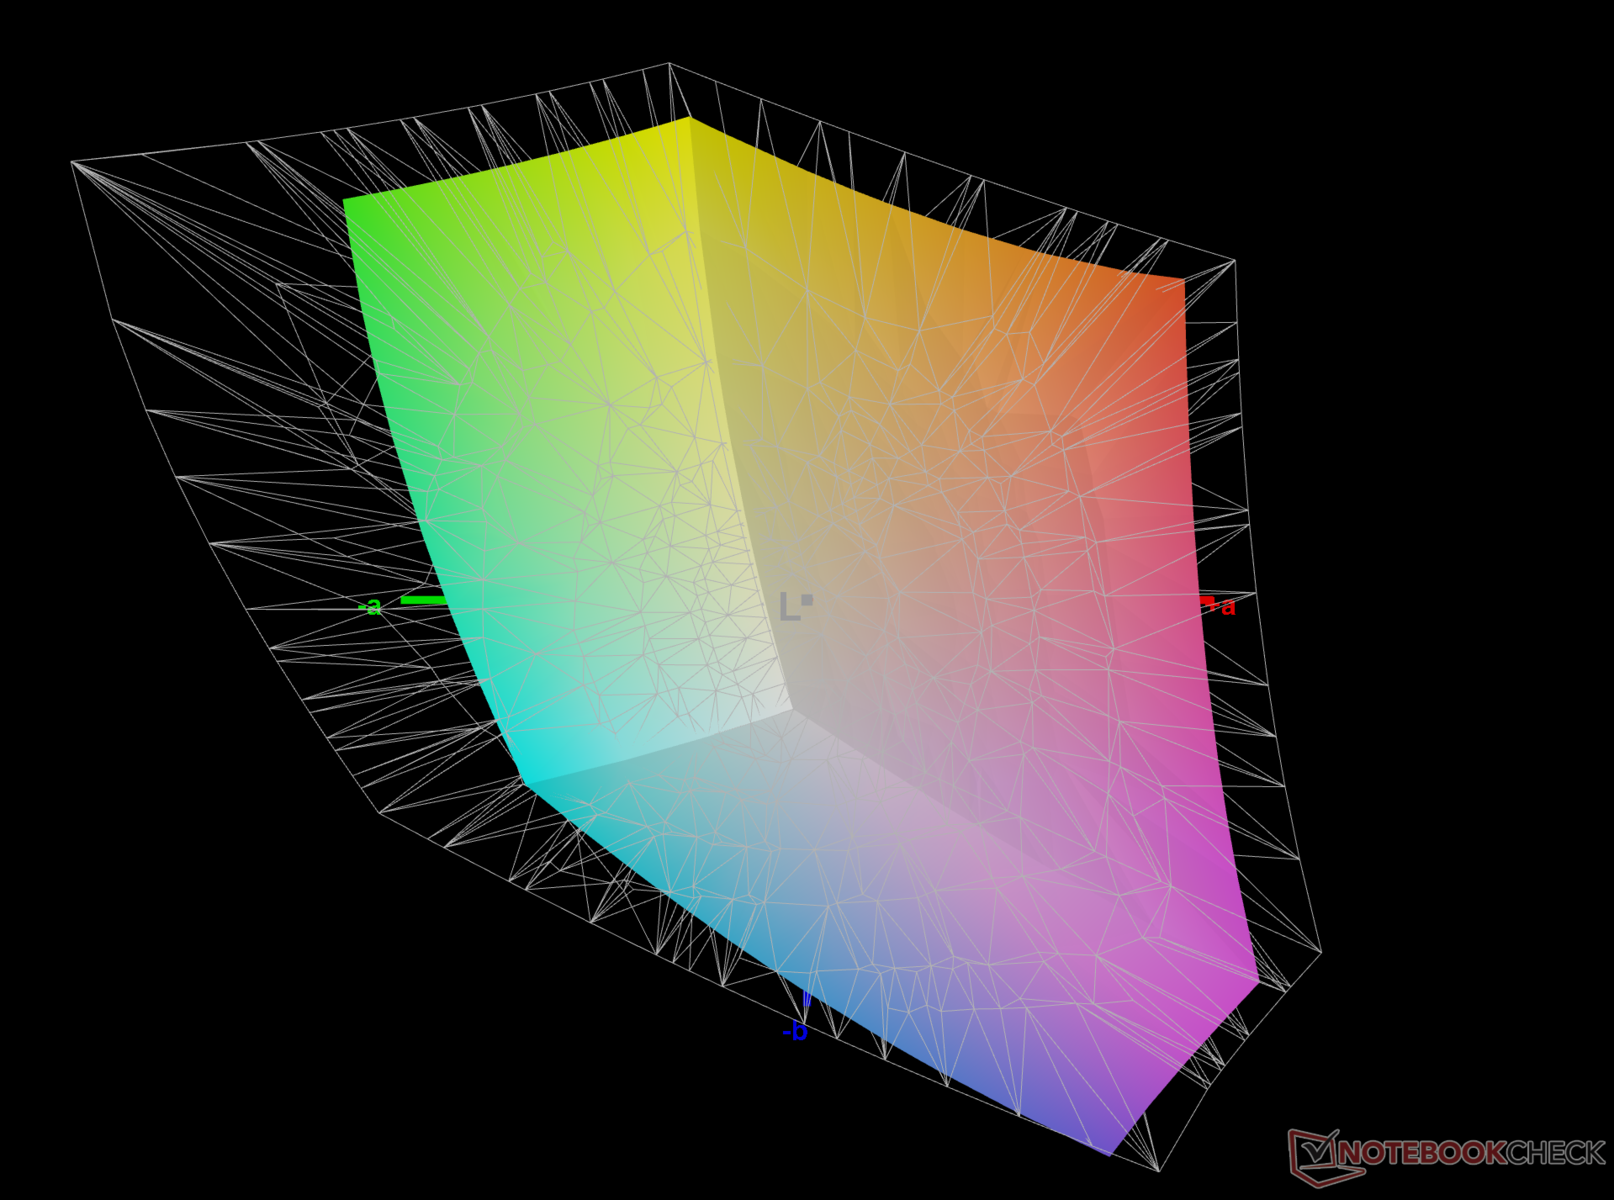
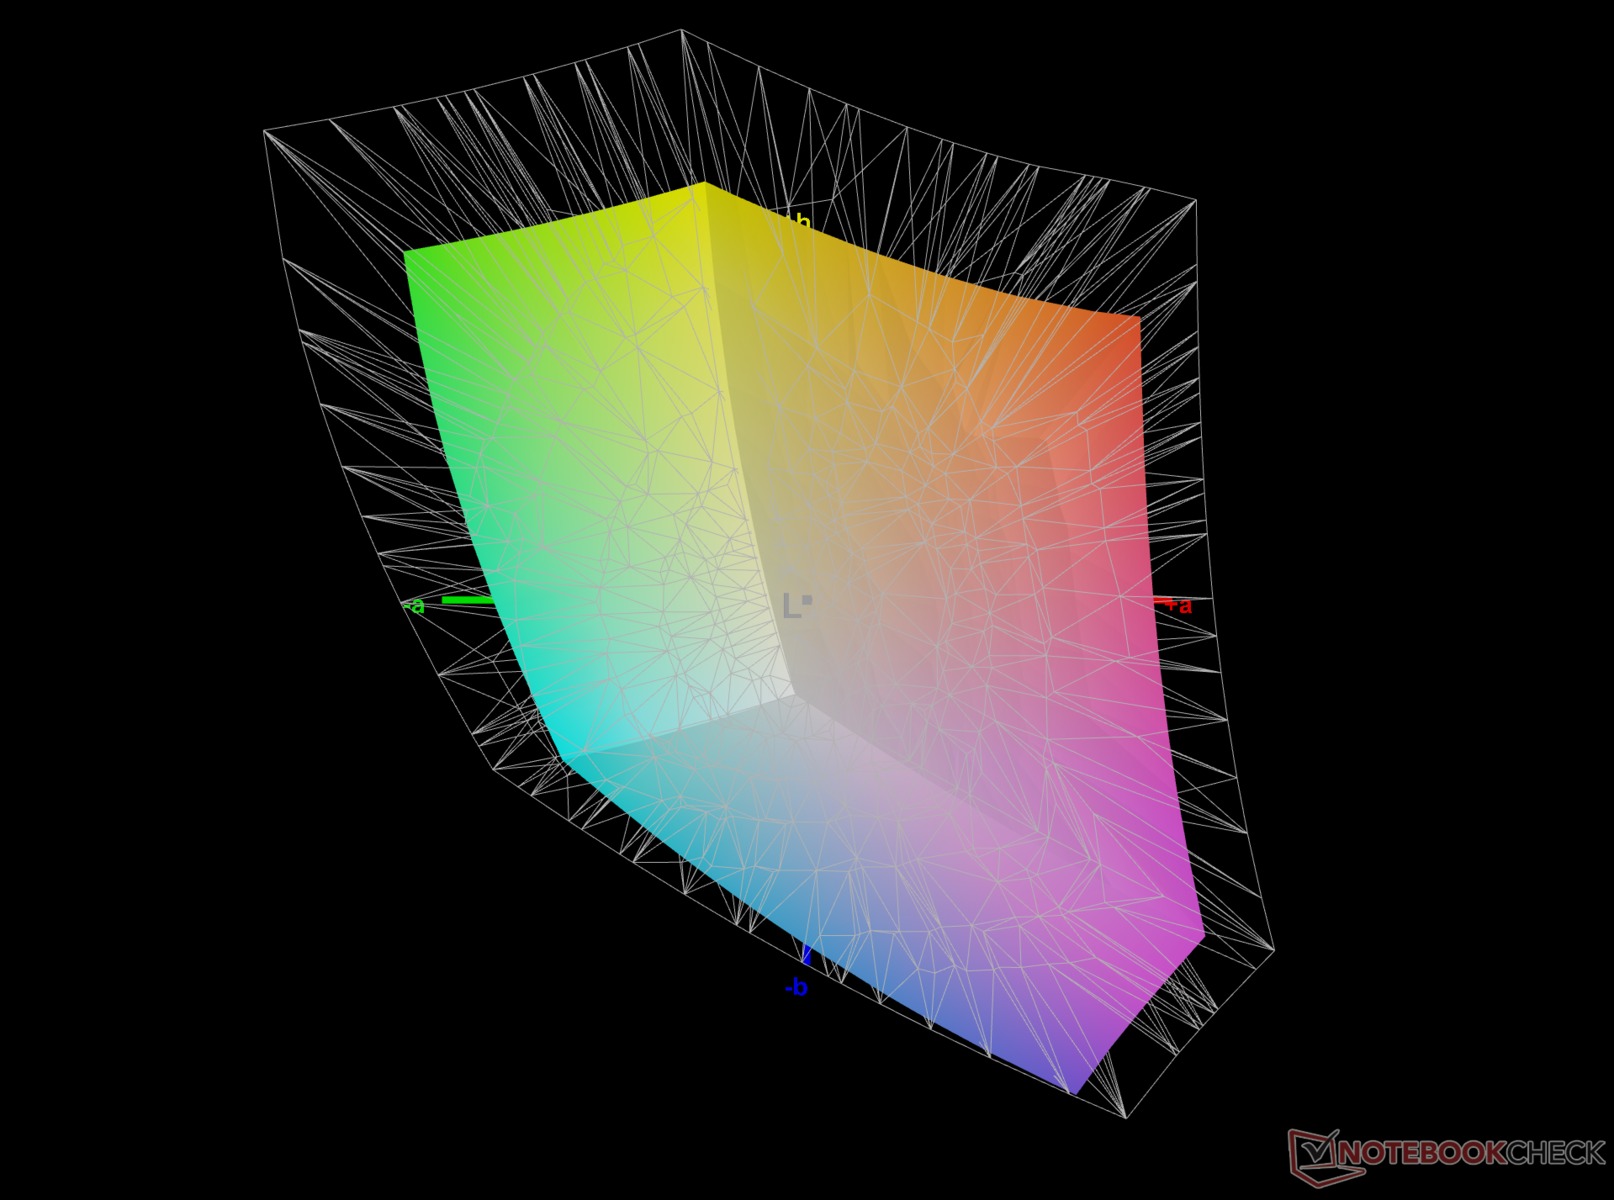
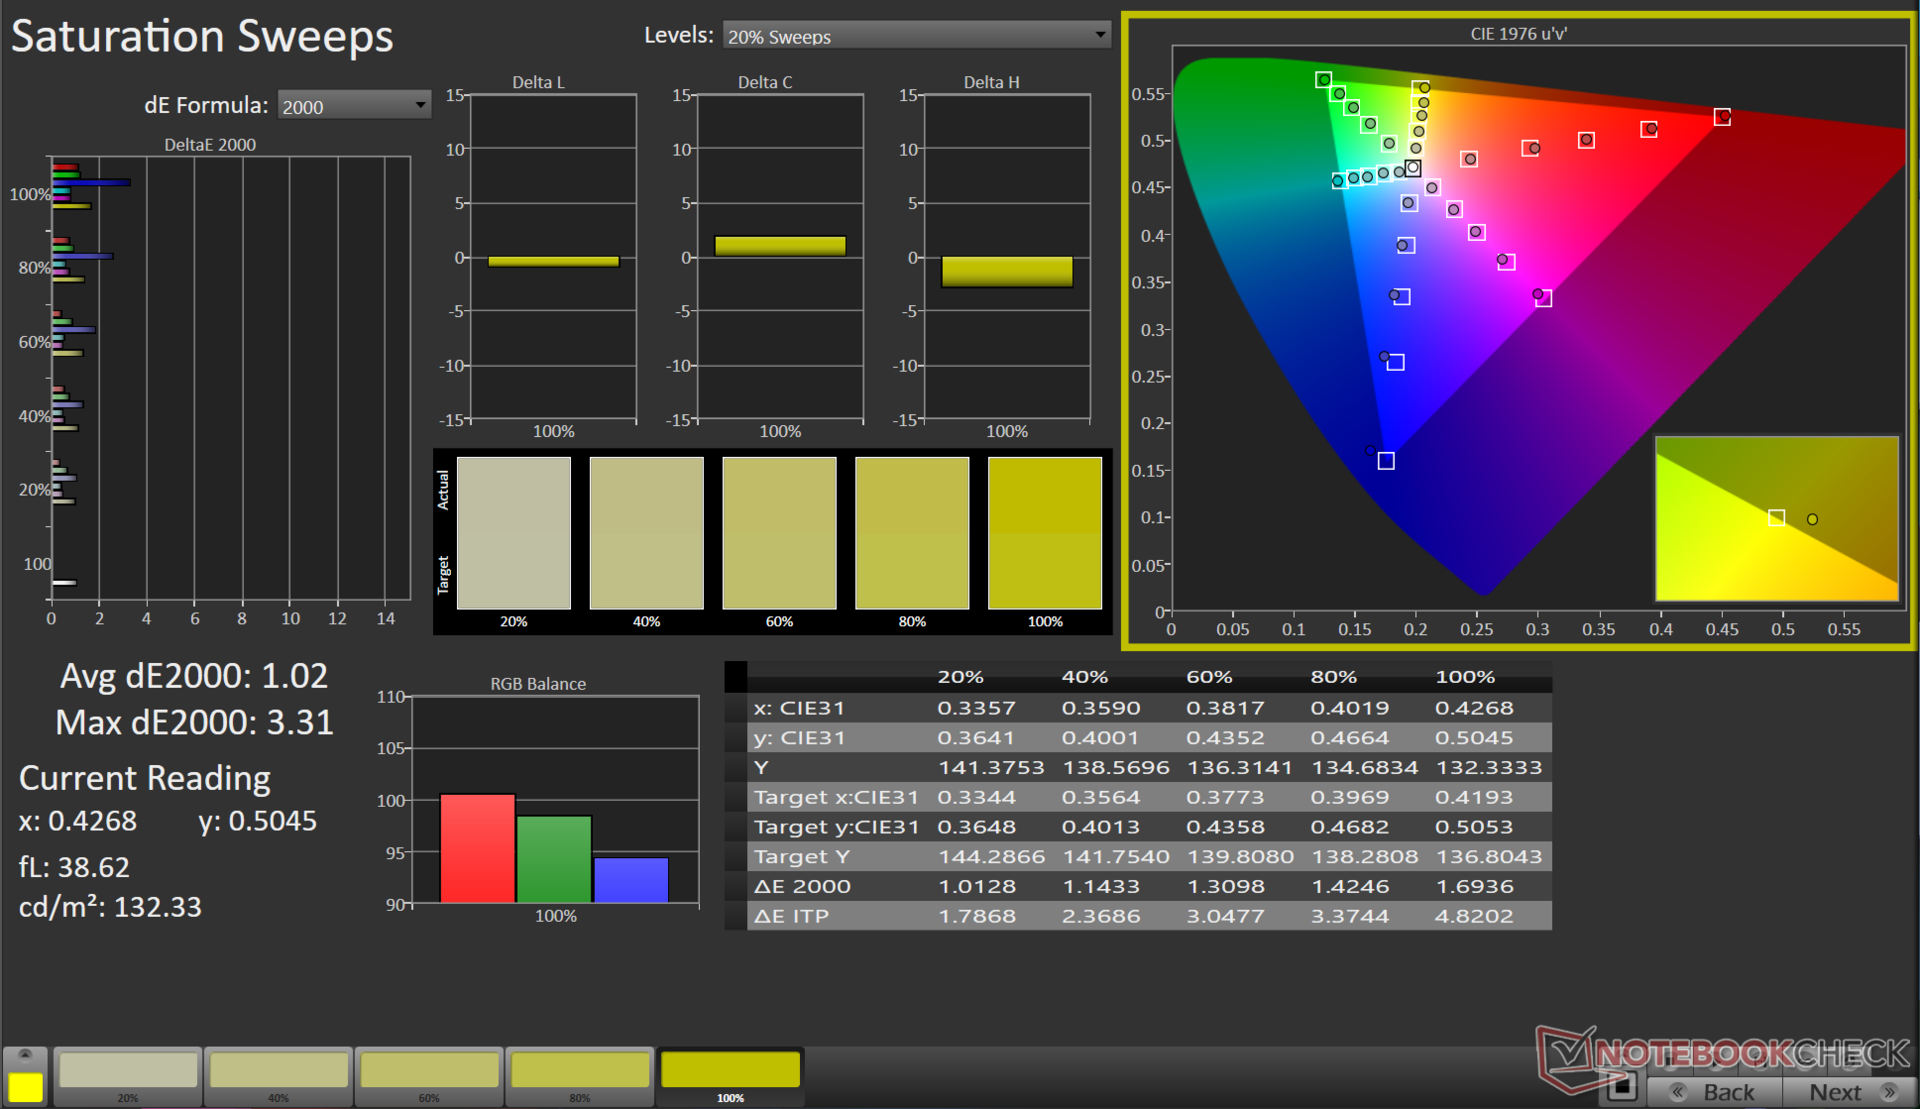
El HP Victus 16 escatima en precisión cromática para disfrutar de una experiencia de mayor frecuencia de refresco. Cubre el 97,5% de la gama de colores sRGB, el 69,7% de Adobe RGB y el 67,5% de DCI-P3. Como muchos monitores, tiene problemas para reproducir las distintas tonalidades de azul.
Tiempos de respuesta del display
| ↔ Tiempo de respuesta de Negro a Blanco | ||
|---|---|---|
| 7.62 ms ... subida ↗ y bajada ↘ combinada | ↗ 4.07 ms subida | 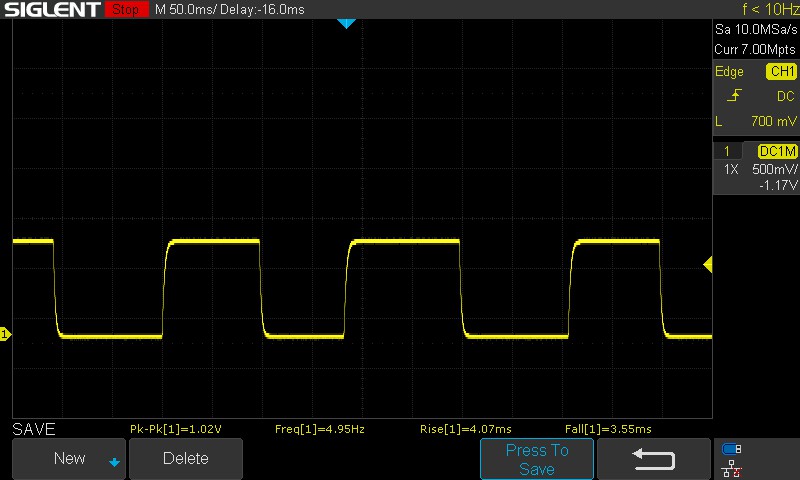 |
| ↘ 3.55 ms bajada | ||
| La pantalla mostró tiempos de respuesta muy rápidos en nuestros tests y debería ser adecuada para juegos frenéticos. En comparación, todos los dispositivos de prueba van de ##min### (mínimo) a 240 (máximo) ms. » 22 % de todos los dispositivos son mejores. Esto quiere decir que el tiempo de respuesta medido es mejor que la media (19.9 ms) de todos los dispositivos testados. | ||
| ↔ Tiempo de respuesta 50% Gris a 80% Gris | ||
| 6.18 ms ... subida ↗ y bajada ↘ combinada | ↗ 3.01 ms subida | 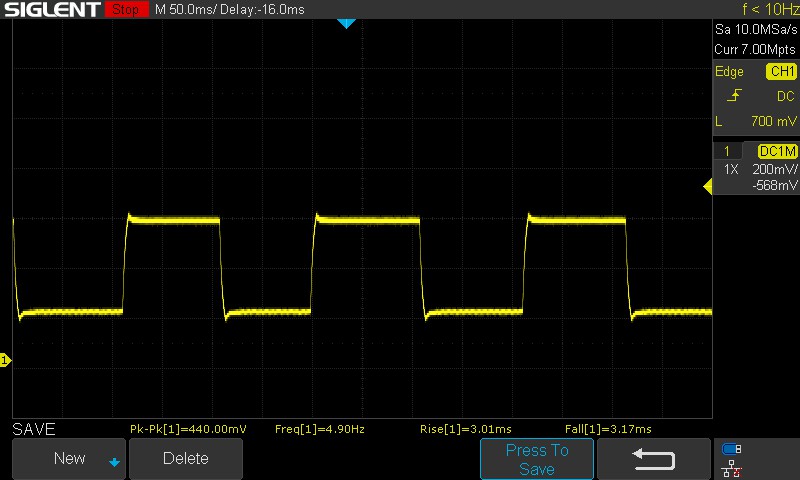 |
| ↘ 3.17 ms bajada | ||
| La pantalla mostró tiempos de respuesta muy rápidos en nuestros tests y debería ser adecuada para juegos frenéticos. En comparación, todos los dispositivos de prueba van de ##min### (mínimo) a 636 (máximo) ms. » 19 % de todos los dispositivos son mejores. Esto quiere decir que el tiempo de respuesta medido es mejor que la media (31.1 ms) de todos los dispositivos testados. | ||
Parpadeo de Pantalla / PWM (Pulse-Width Modulation)
| Parpadeo de Pantalla / PWM no detectado | ≤ 100 % de brillo | 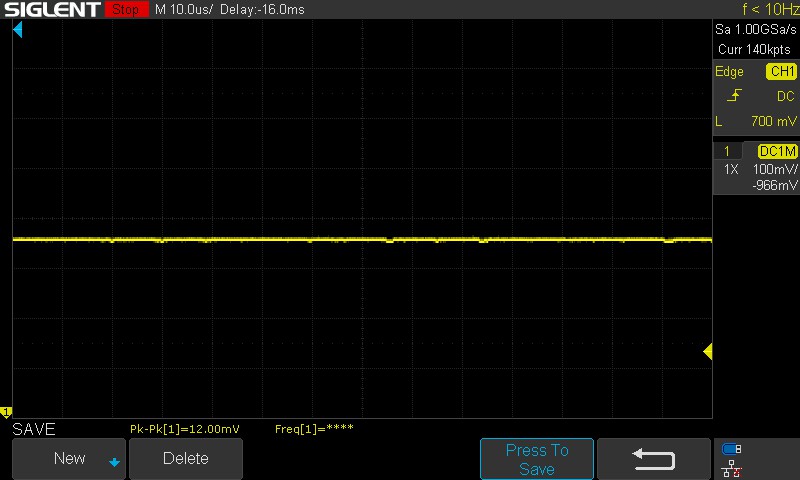 | |
Comparación: 52 % de todos los dispositivos testados no usaron PWM para atenuar el display. Si se usó, medimos una media de 7784 (mínimo: 5 - máxmo: 343500) Hz. | |||
El tiempo de respuesta anunciado por HP (de gris a gris) es de 7 ms, lo que confirman nuestras pruebas, en las que el valor fue de 6,18 ms. Del mismo modo, los tiempos de respuesta de negro a blanco se situaron en unos respetables 7,62 ms.
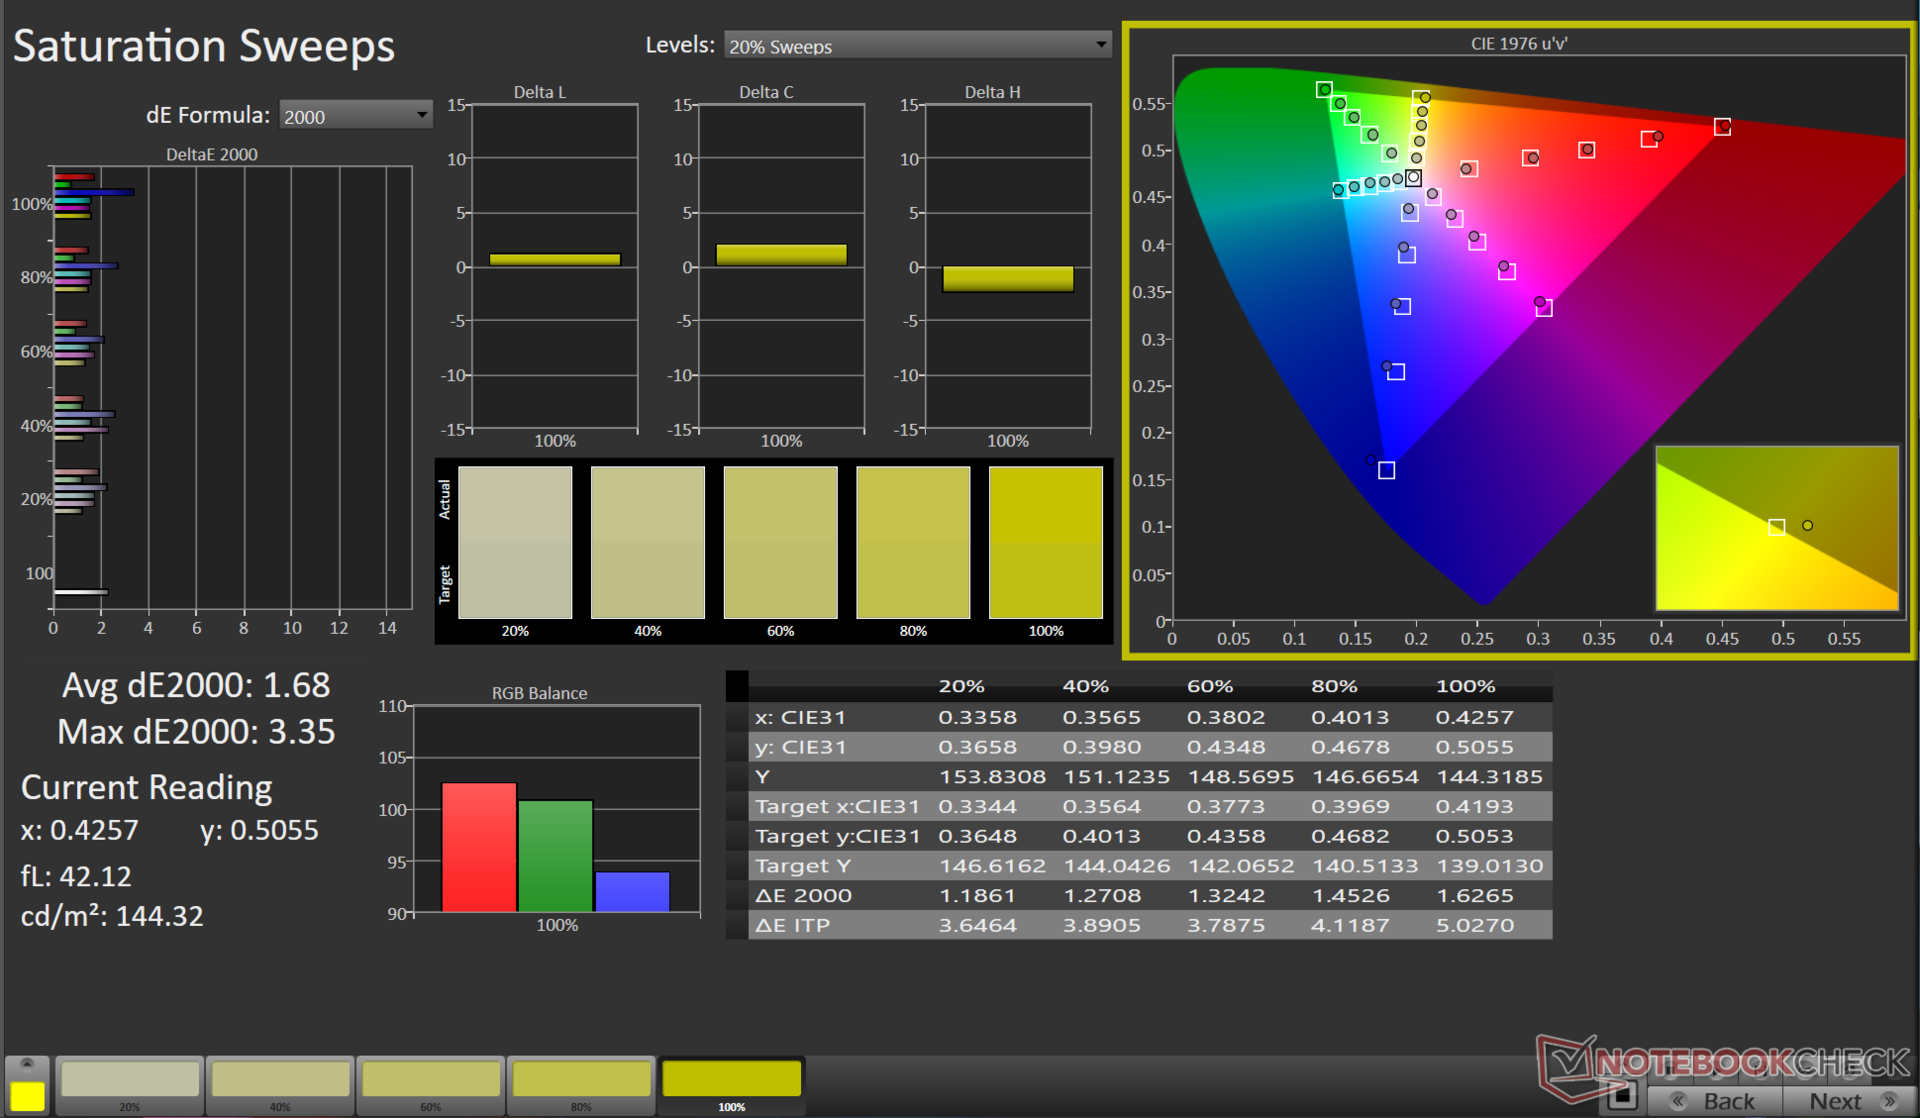
Algunos trabajos con un espectrofotómetro X-rite i1Basic Pro 3 y el software de calibración Calman de Portrait Displays arrojan resultados sólo marginalmente mejores, con los valores de desviación de la escala de grises, ColourChecker y Saturation Sweep Delta E mejorando sólo marginalmente.
Una pantalla IPS suele garantizar unos ángulos de visión decentes. Sin embargo, ese no es el caso con el panel Chi Mei del HP Omen 16. Hay una notable pérdida de detalles al ver la pantalla desde ángulos extremos.
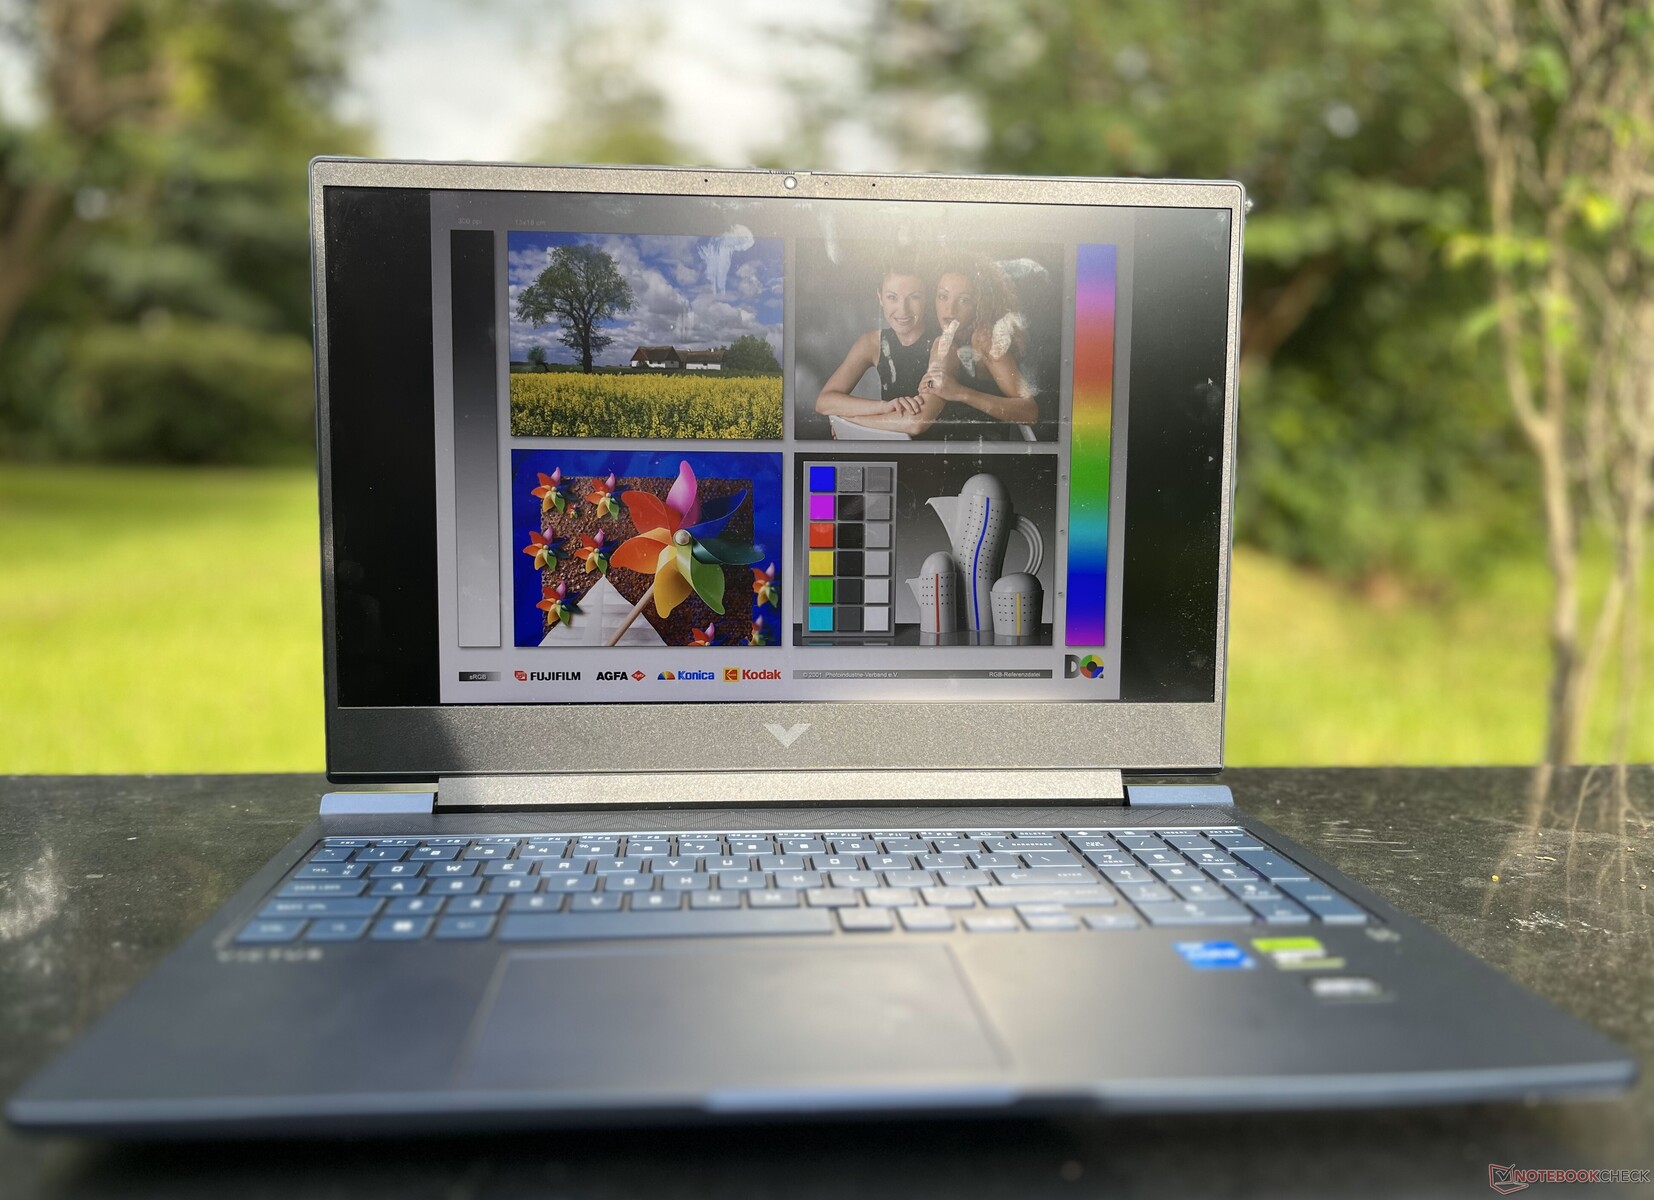
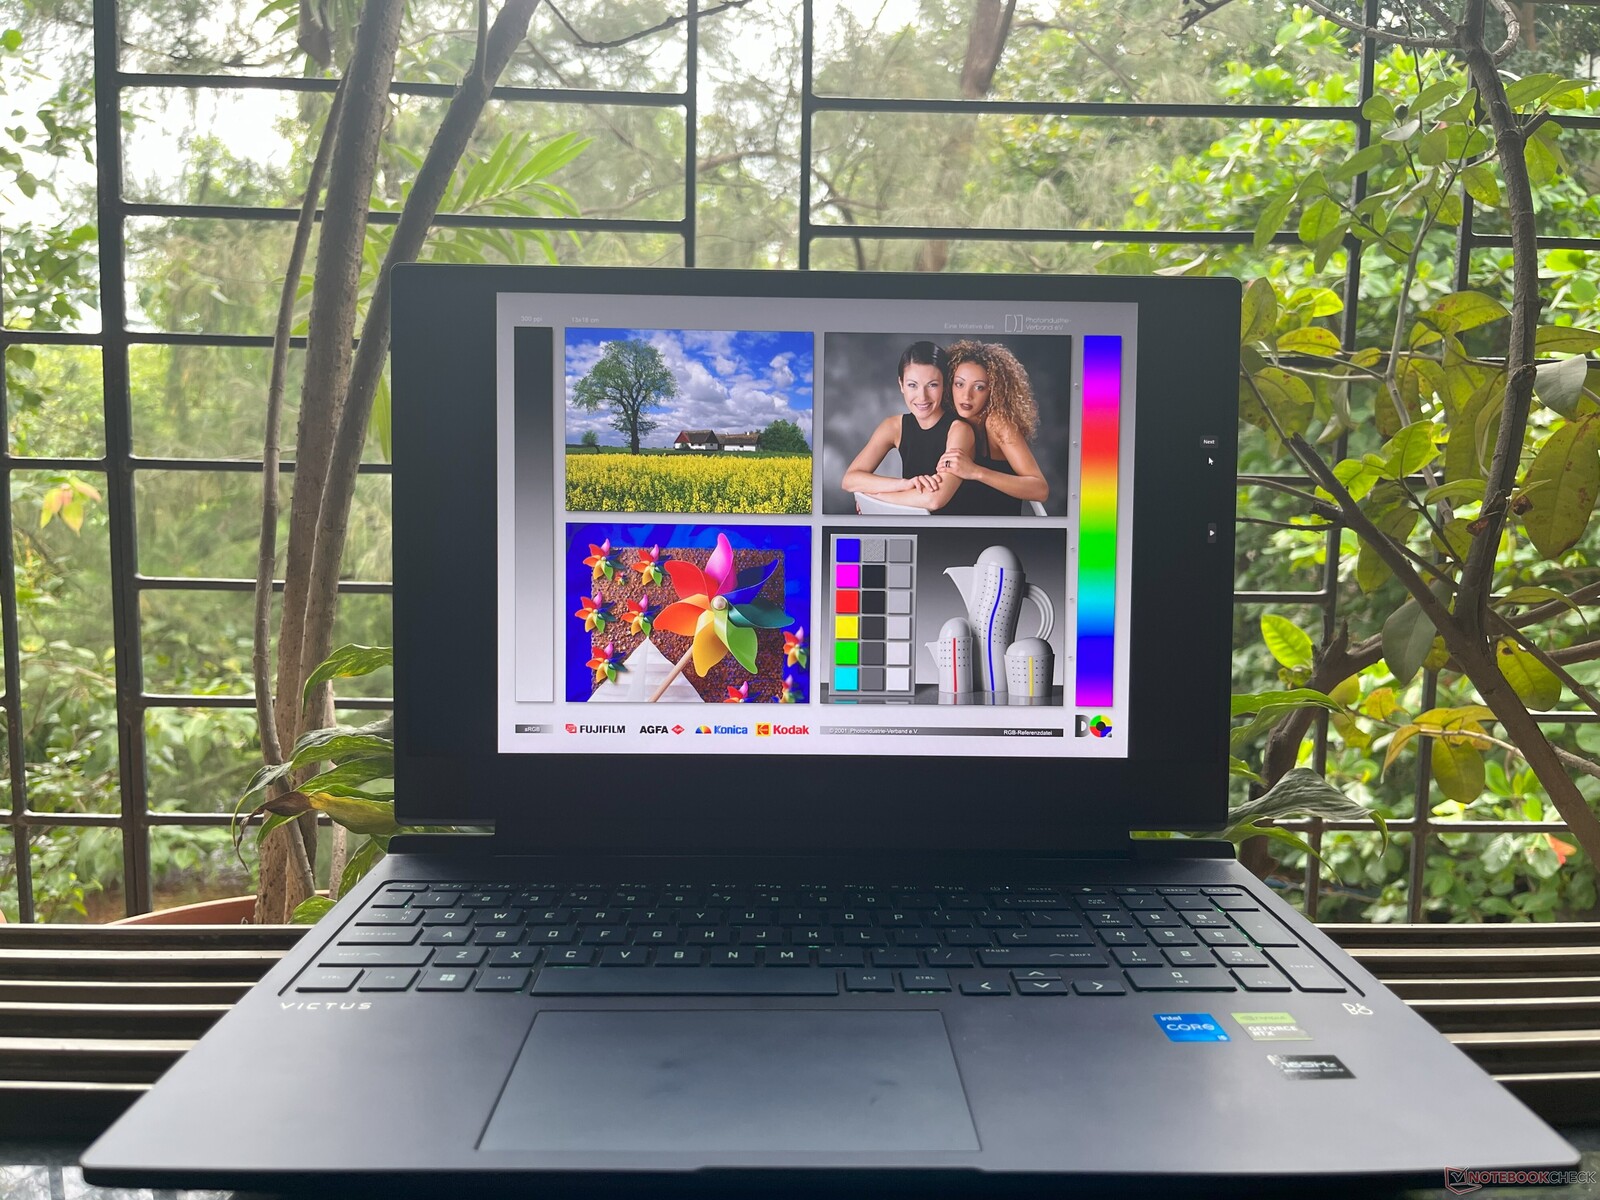
La visualización en exteriores está por encima de la media, especialmente para un dispositivo con sólo 300 nits de brillo. La pérdida de detalle fue mínima a la sombra y bajo la luz directa del sol. Sin embargo, recomendaríamos mantener el portátil en interiores, ya que no es precisamente portátil.

Actuación: Raptor Lake y Ada Lovelace aparecen a lo grande
El HP Victus 16 está disponible en varias configuraciones. La nuestra es la variante base con un Intel Core i5-13500HX y GPU Nvidia GeForce RTX 4050 para portátil. Se puede optar por una GeForce RTX 4060 y RTX 4070 si es necesario.
Los que busquen una CPU más potente pueden optar por el Core i7-13700HX que solo puede combinarse con una RTX 4070 de GeForce. Los usuarios que busquen memoria extra también pueden optar por una versión con 32 GB de RAM y 1 TB de almacenamiento.
Condiciones de ensayo
Elegimos el plan "Rendimiento" para llevar el hardware al límite. Se realizaron algunas pruebas con la batería en modo "Eco" para comprobar si se degradaba el rendimiento. HWInfo no pudo mostrar la información correcta de PL1 y PL2 para diferentes perfiles, así que obtuvimos estos valores durante la prueba en bucle Cinebench R15.
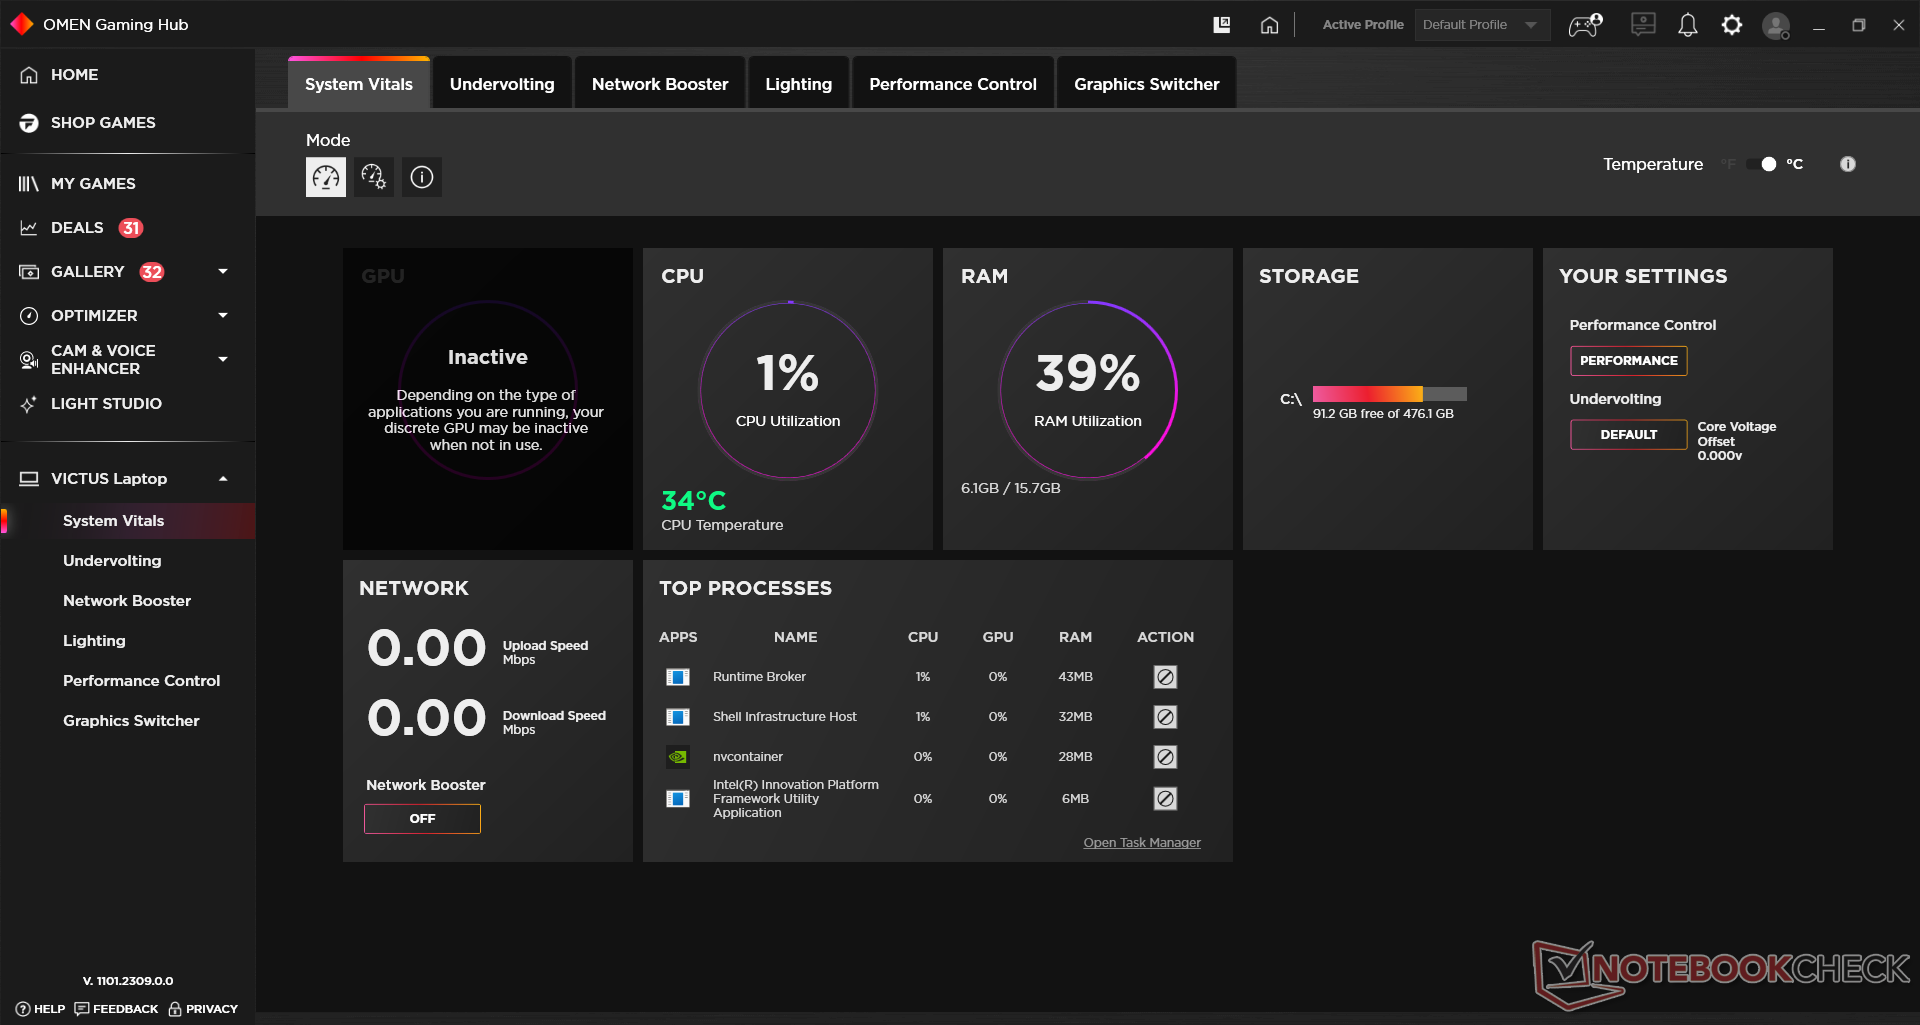
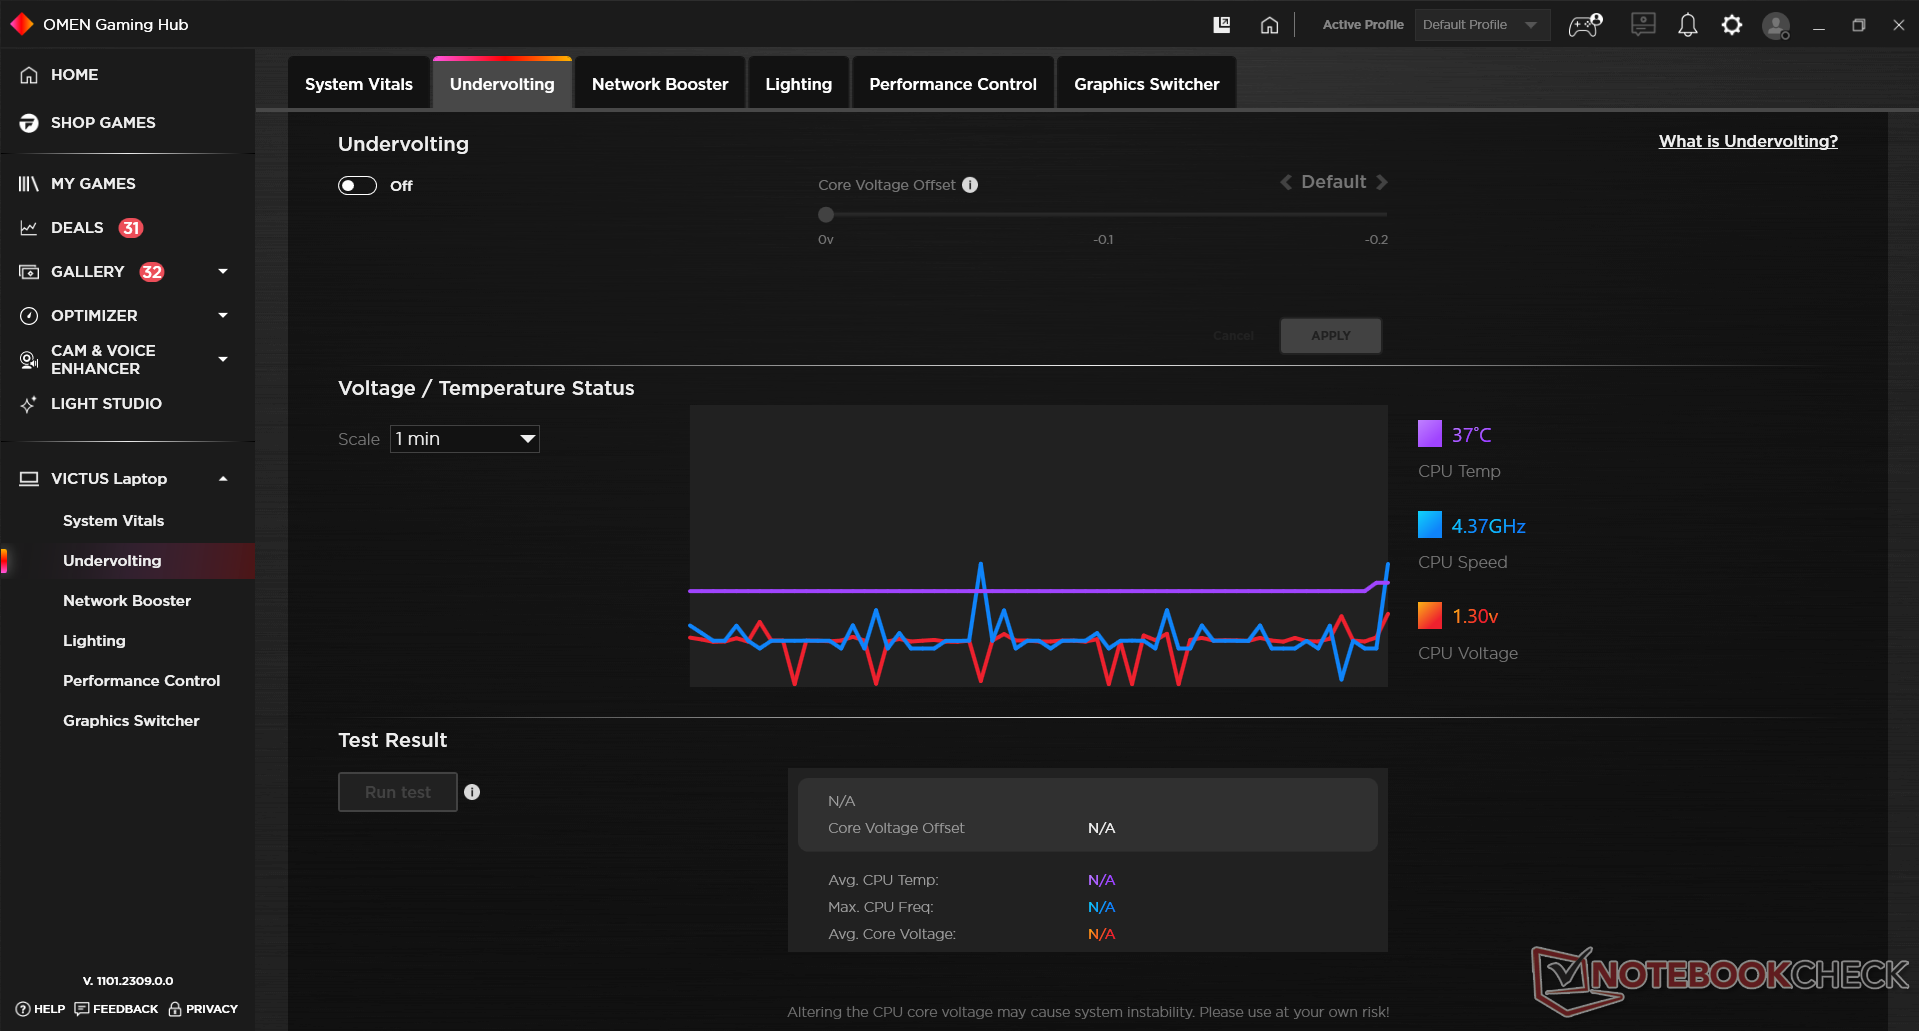
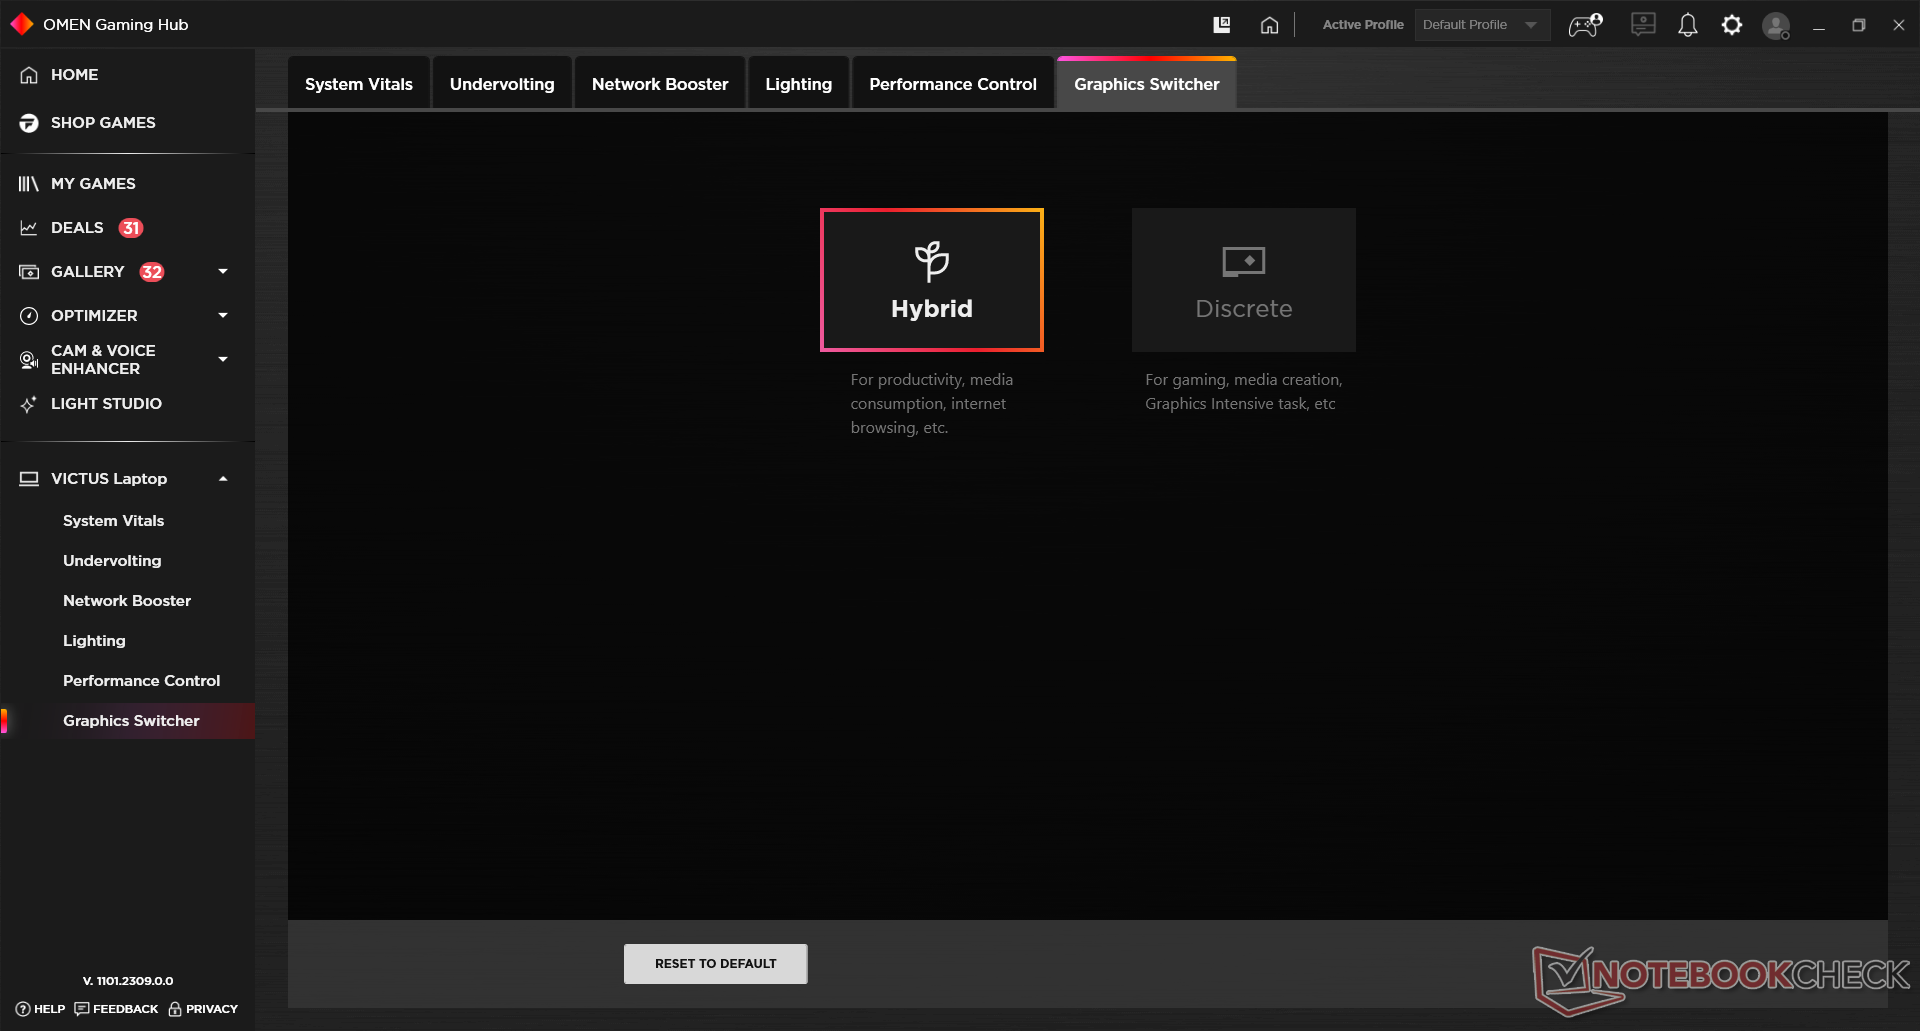
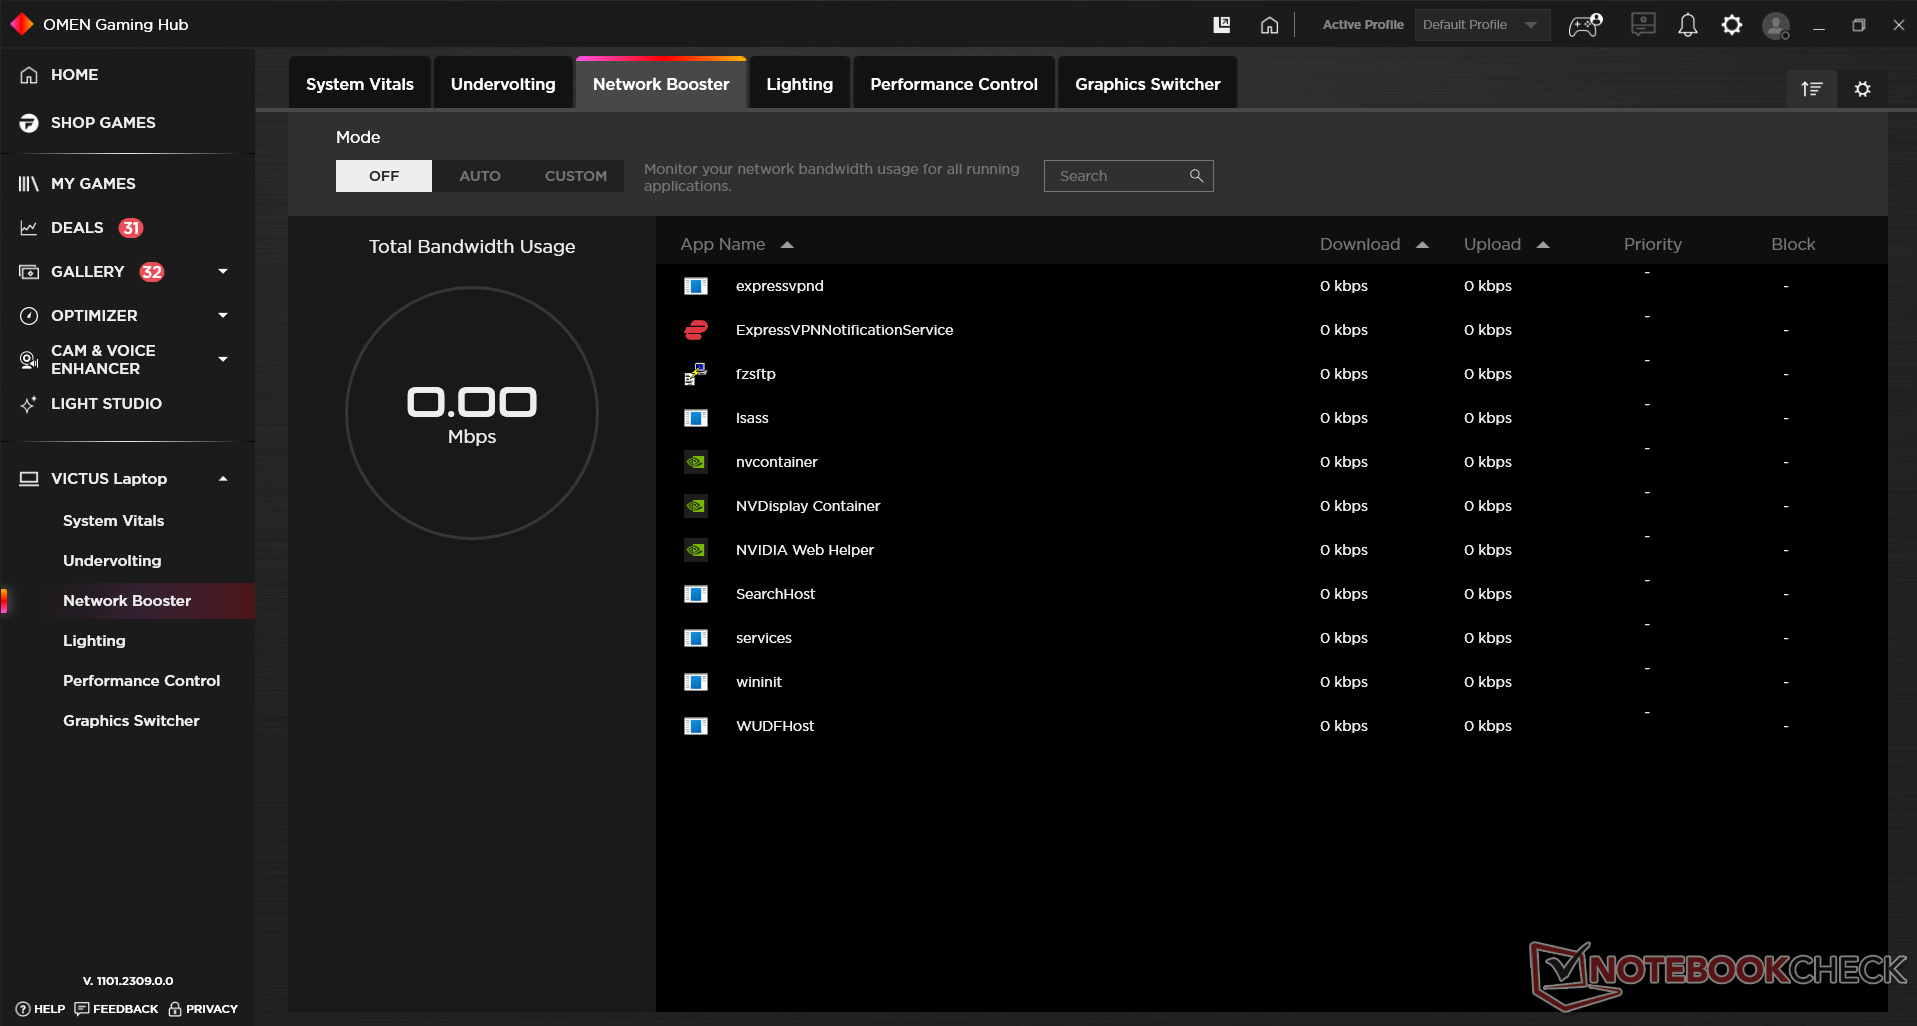
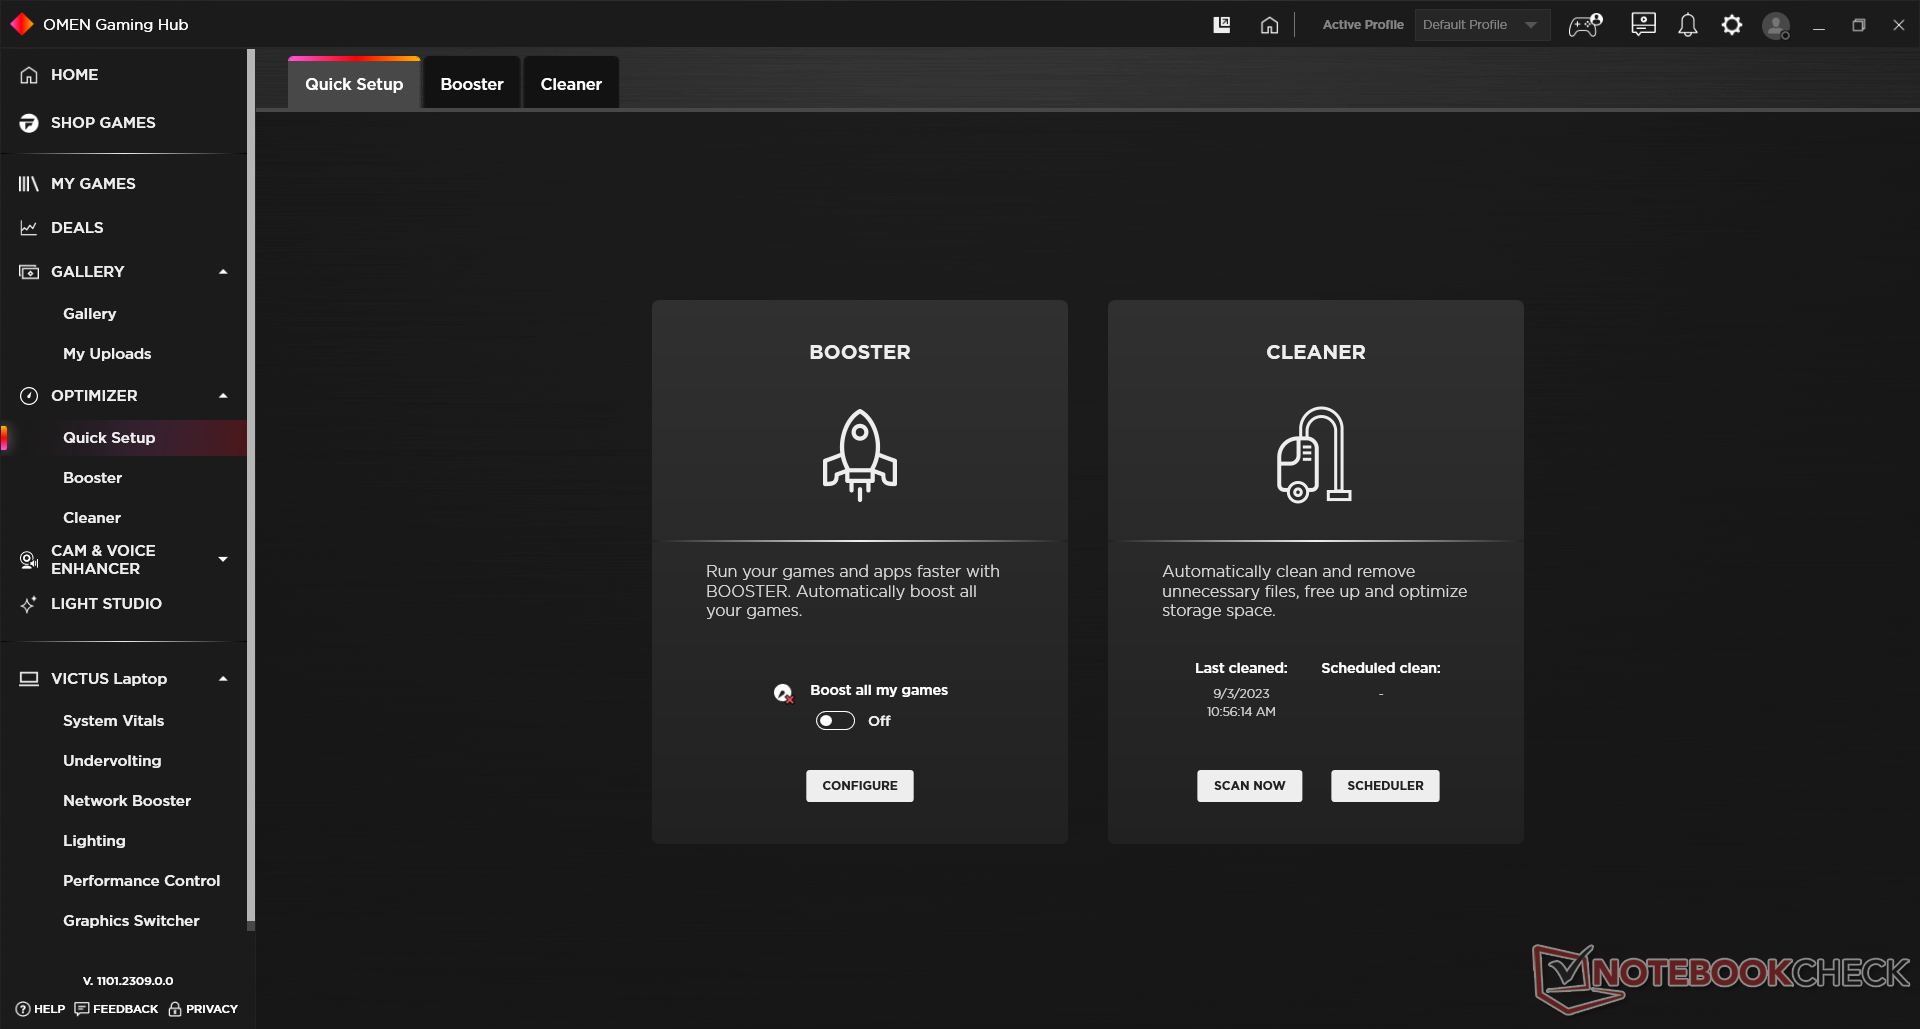
Si te interesa trastear con tu portátil, pasarás mucho tiempo en el Omen Gaming Hub. Ofrece una vista de pájaro de todo, desde las temperaturas de la CPU, los relojes y los voltajes. Incluso permite a los entusiastas subvoltear sus portátiles sin tener que navegar por la BIOS.
También hay una pestaña de "refuerzo de red" que prioriza el tráfico hacia las tareas en ejecución y una sección de "control de rendimiento" que te da acceso a los planes de energía antes mencionados. También te permite configurar curvas de ventilador personalizadas o tenerlo a toda potencia en todo momento.
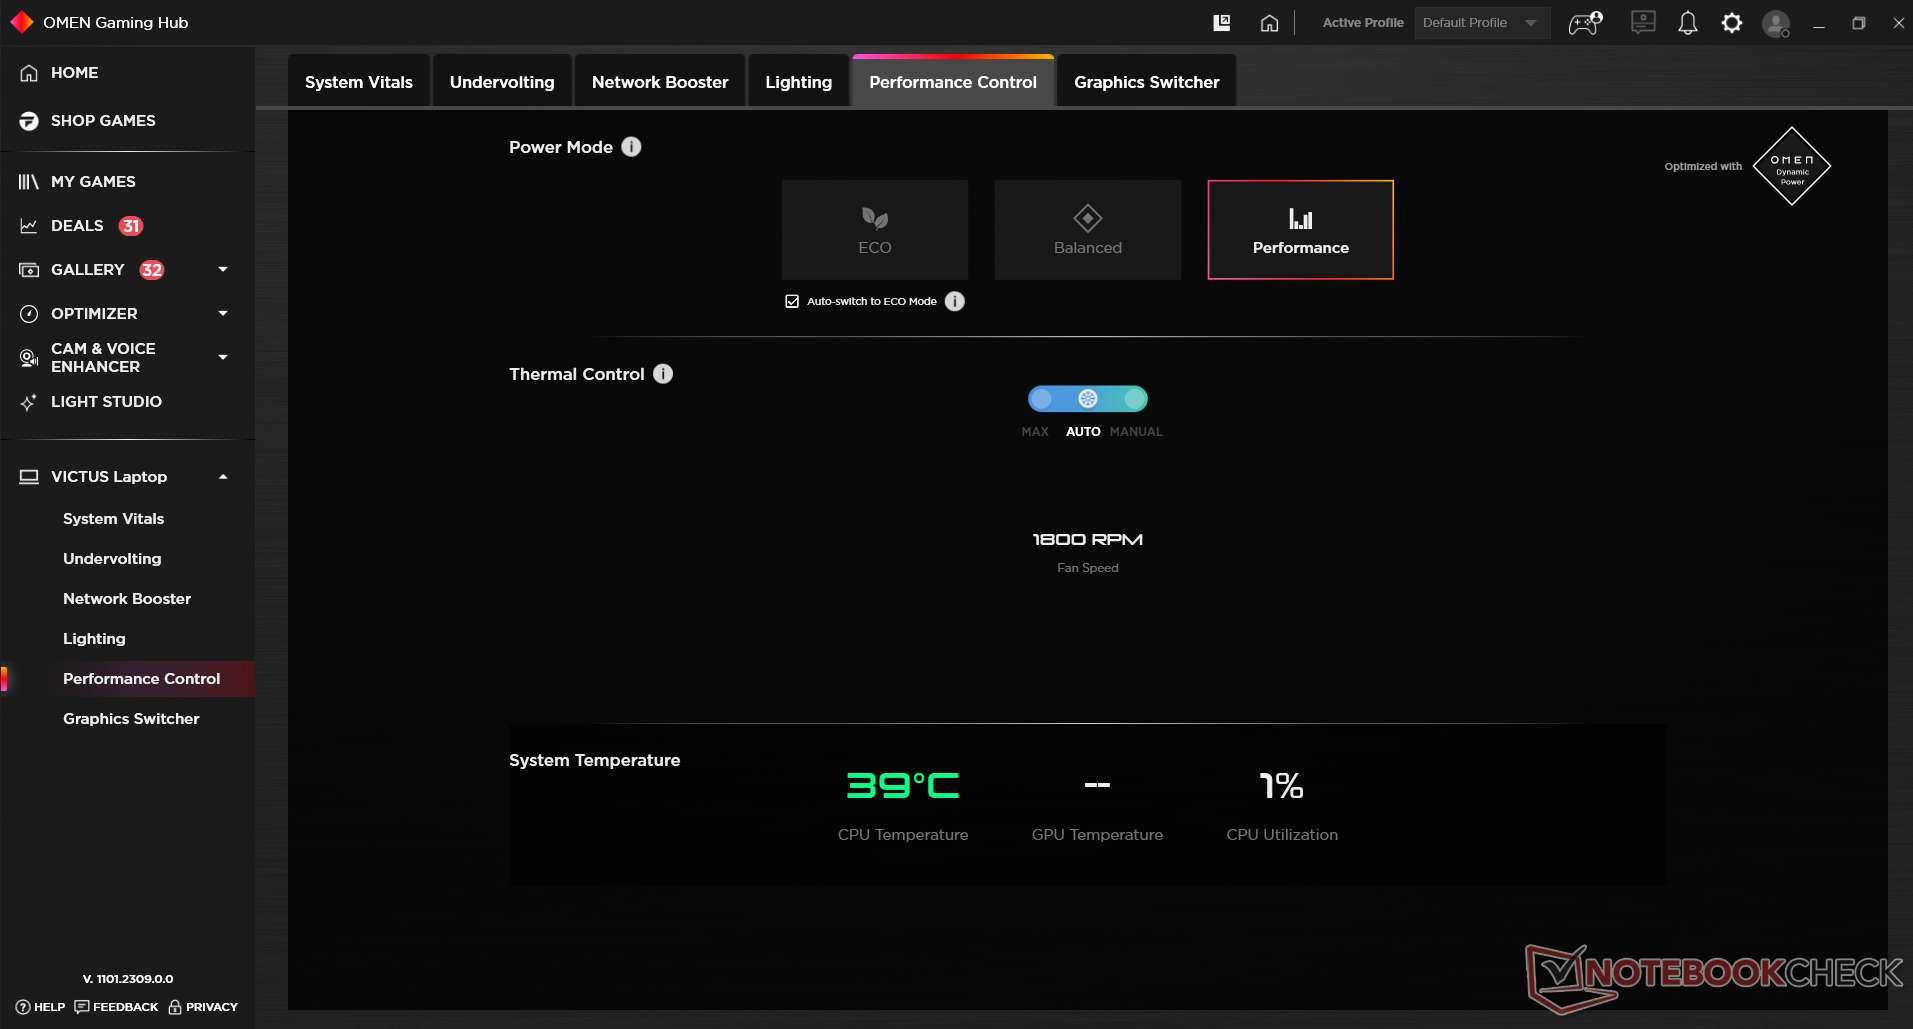
| Perfil | PL1 | PL2 | PL4 |
|---|---|---|---|
| Eco | 35 W | 46 W | 200 W |
| Equilibrado | 51 W | 130 W | 200 W |
| Rendimiento | 78 W | 130 W | 200 W |
Procesador
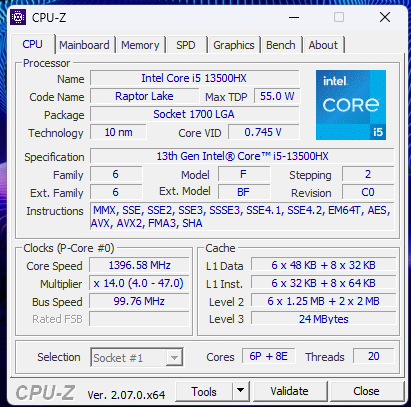
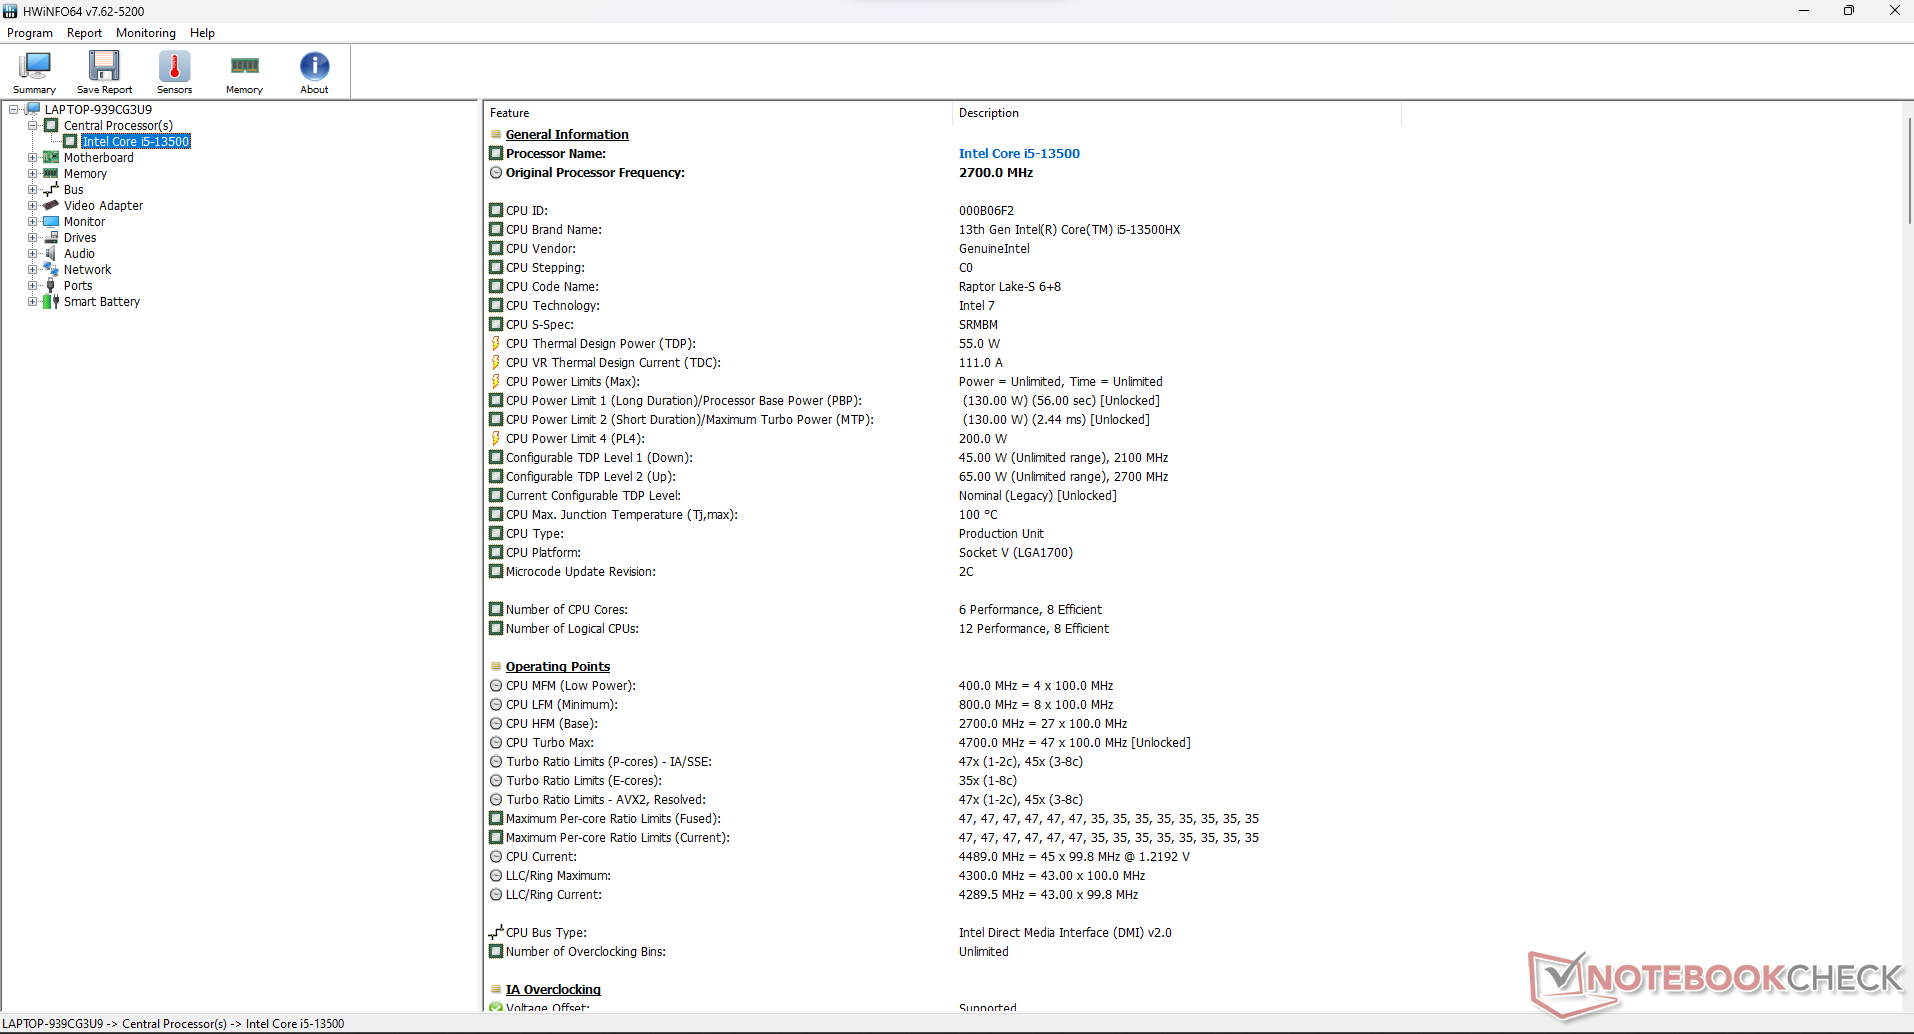
El Intel Core i5-13500HX de nuestro HP Victus 16 es una CPU Raptor Lake de 14 núcleos (6 de rendimiento más 8 de eficiencia) y 20 hilos. Se lanzó como parte de la serie de chips Raptor Lake-HX que aumentaron el TDP base (55 vatios) frente a sus homólogos de la marca H. Además del TDP adicional, también aumenta el número de núcleos de rendimiento.
A pesar de ser la pieza Raptor Lake-HX de gama más baja, el Core i5-13500HX está muy por encima de su categoría. En su estado PL2, el procesador puede consumir hasta 131 vatios de energía. Sin embargo, la cifra se reduce a 83 vatios bajo cargas sostenidas.
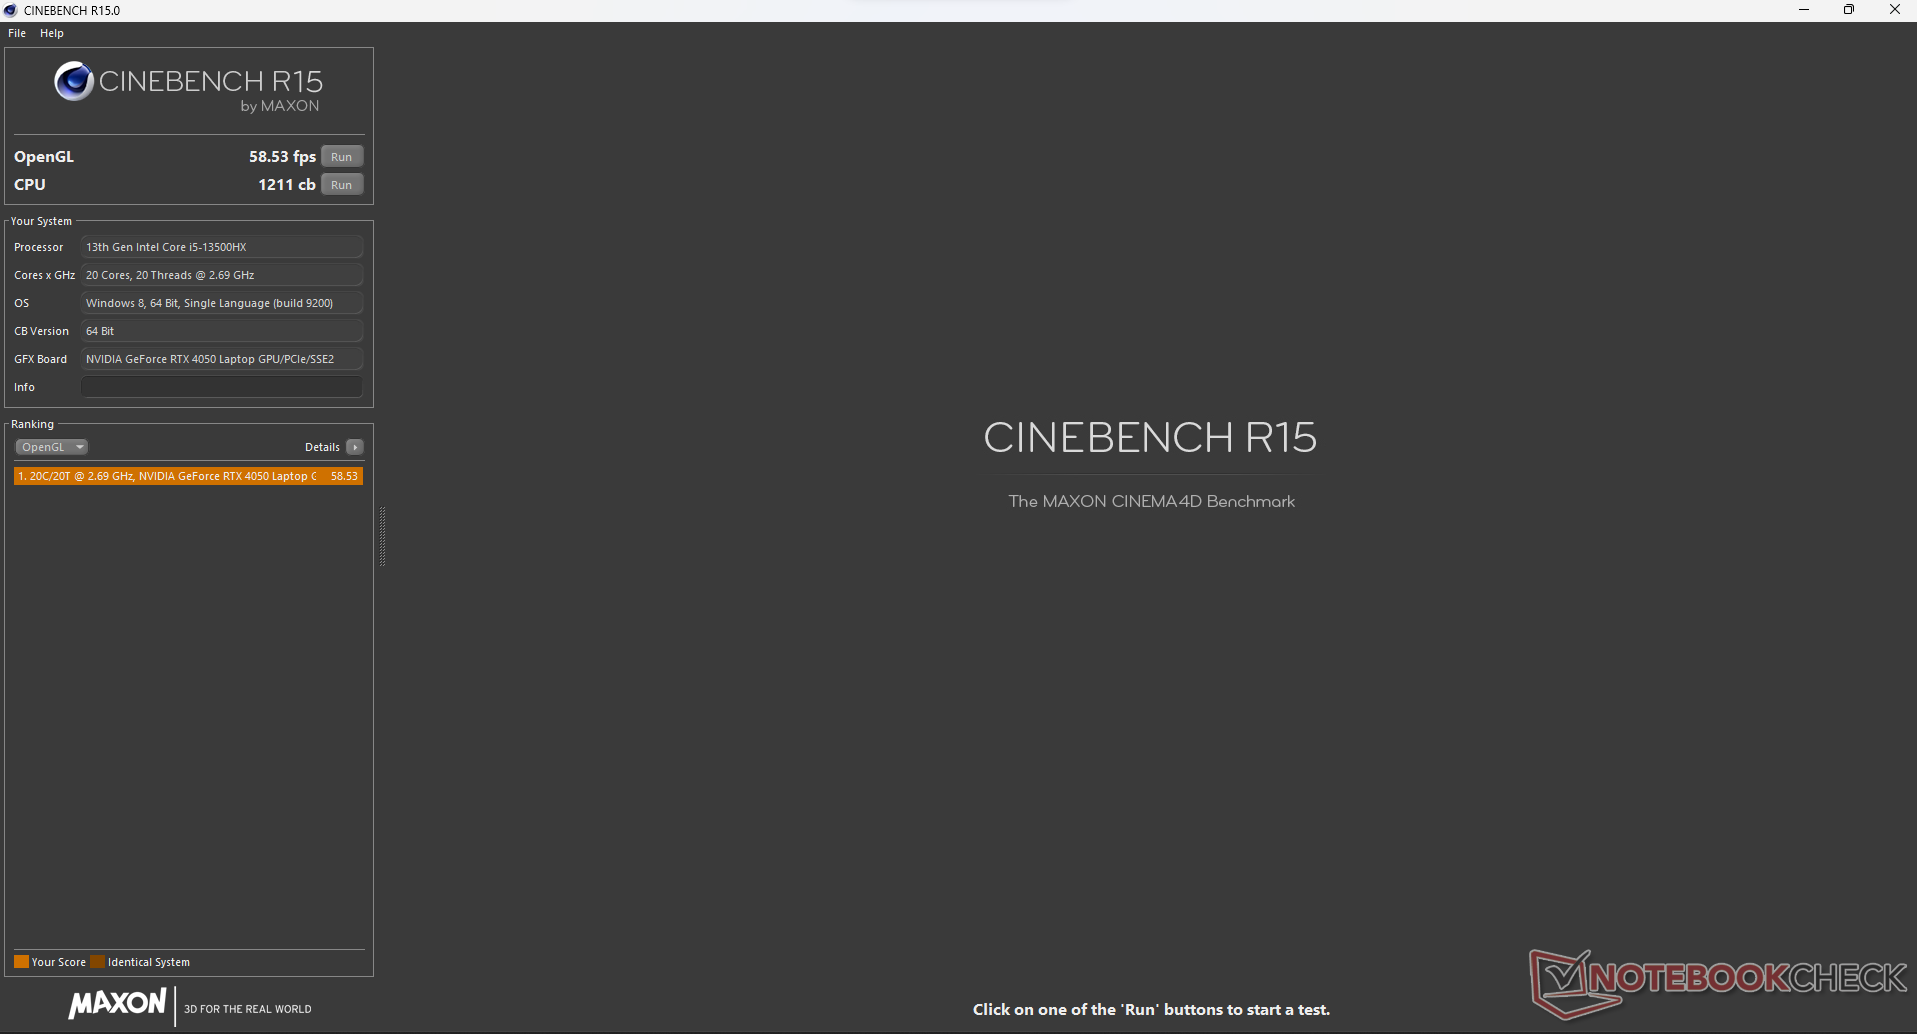
Los portátiles para juegos son conocidos por perder mucho rendimiento con la batería, y el HP Victus 16 no es diferente. Por ejemplo, su puntuación Cinebench R15 cae un ~58% de 2,863 a 1,211 puntos cuando se desconecta la corriente.
Cinebench R15 Multi Loop
Cinebench R23: Multi Core | Single Core
Cinebench R20: CPU (Multi Core) | CPU (Single Core)
Cinebench R15: CPU Multi 64Bit | CPU Single 64Bit
Blender: v2.79 BMW27 CPU
7-Zip 18.03: 7z b 4 | 7z b 4 -mmt1
Geekbench 5.5: Multi-Core | Single-Core
HWBOT x265 Benchmark v2.2: 4k Preset
LibreOffice : 20 Documents To PDF
R Benchmark 2.5: Overall mean
| CPU Performance rating | |
| Media de la clase Gaming | |
| Acer Predator Helios 16 PH16-71-731Q | |
| Alienware m16 R1 Intel | |
| HP Victus 16-r0076TX -1! | |
| Medio Intel Core i5-13500HX | |
| Acer Predator Triton 14 PT14-51 | |
| Aorus 15 BSF | |
| MSI Katana 15 B12VEK | |
| Asus TUF A15 FA507 | |
| Acer Nitro 16 AN16-41-R7YE | |
| Cinebench R23 / Multi Core | |
| Media de la clase Gaming (10488 - 40970, n=110, últimos 2 años) | |
| Acer Predator Helios 16 PH16-71-731Q | |
| Alienware m16 R1 Intel | |
| Acer Predator Triton 14 PT14-51 | |
| Medio Intel Core i5-13500HX (18235 - 19176, n=3) | |
| HP Victus 16-r0076TX | |
| Aorus 15 BSF | |
| MSI Katana 15 B12VEK | |
| Asus TUF A15 FA507 | |
| Acer Nitro 16 AN16-41-R7YE | |
| Cinebench R23 / Single Core | |
| Media de la clase Gaming (1166 - 2356, n=110, últimos 2 años) | |
| Alienware m16 R1 Intel | |
| Aorus 15 BSF | |
| Acer Predator Helios 16 PH16-71-731Q | |
| Medio Intel Core i5-13500HX (1689 - 1772, n=2) | |
| MSI Katana 15 B12VEK | |
| HP Victus 16-r0076TX | |
| Acer Predator Triton 14 PT14-51 | |
| Asus TUF A15 FA507 | |
| Acer Nitro 16 AN16-41-R7YE | |
| Cinebench R20 / CPU (Multi Core) | |
| Media de la clase Gaming (4029 - 16108, n=109, últimos 2 años) | |
| Acer Predator Helios 16 PH16-71-731Q | |
| Alienware m16 R1 Intel | |
| Acer Predator Triton 14 PT14-51 | |
| Medio Intel Core i5-13500HX (6978 - 7371, n=3) | |
| HP Victus 16-r0076TX | |
| Aorus 15 BSF | |
| MSI Katana 15 B12VEK | |
| Asus TUF A15 FA507 | |
| Acer Nitro 16 AN16-41-R7YE | |
| Cinebench R20 / CPU (Single Core) | |
| Media de la clase Gaming (442 - 895, n=109, últimos 2 años) | |
| Alienware m16 R1 Intel | |
| Aorus 15 BSF | |
| Acer Predator Helios 16 PH16-71-731Q | |
| Medio Intel Core i5-13500HX (648 - 695, n=3) | |
| MSI Katana 15 B12VEK | |
| Acer Predator Triton 14 PT14-51 | |
| HP Victus 16-r0076TX | |
| Asus TUF A15 FA507 | |
| Acer Nitro 16 AN16-41-R7YE | |
| Cinebench R15 / CPU Multi 64Bit | |
| Media de la clase Gaming (1578 - 6271, n=109, últimos 2 años) | |
| Acer Predator Helios 16 PH16-71-731Q | |
| Acer Predator Helios 16 PH16-71-731Q | |
| Alienware m16 R1 Intel | |
| Acer Predator Triton 14 PT14-51 | |
| Medio Intel Core i5-13500HX (2856 - 2964, n=3) | |
| HP Victus 16-r0076TX | |
| Aorus 15 BSF | |
| Asus TUF A15 FA507 | |
| MSI Katana 15 B12VEK | |
| Acer Nitro 16 AN16-41-R7YE | |
| Cinebench R15 / CPU Single 64Bit | |
| Media de la clase Gaming (188.8 - 343, n=109, últimos 2 años) | |
| Alienware m16 R1 Intel | |
| Acer Predator Helios 16 PH16-71-731Q | |
| Aorus 15 BSF | |
| Medio Intel Core i5-13500HX (242 - 263, n=3) | |
| Asus TUF A15 FA507 | |
| MSI Katana 15 B12VEK | |
| Acer Predator Triton 14 PT14-51 | |
| HP Victus 16-r0076TX | |
| Acer Nitro 16 AN16-41-R7YE | |
| Blender / v2.79 BMW27 CPU | |
| Acer Nitro 16 AN16-41-R7YE | |
| MSI Katana 15 B12VEK | |
| Asus TUF A15 FA507 | |
| Aorus 15 BSF | |
| HP Victus 16-r0076TX | |
| Medio Intel Core i5-13500HX (178 - 193, n=3) | |
| Acer Predator Triton 14 PT14-51 | |
| Acer Predator Helios 16 PH16-71-731Q | |
| Alienware m16 R1 Intel | |
| Media de la clase Gaming (80 - 330, n=107, últimos 2 años) | |
| 7-Zip 18.03 / 7z b 4 | |
| Media de la clase Gaming (33491 - 148086, n=108, últimos 2 años) | |
| Alienware m16 R1 Intel | |
| Acer Predator Helios 16 PH16-71-731Q | |
| Acer Predator Triton 14 PT14-51 | |
| Medio Intel Core i5-13500HX (68923 - 73701, n=3) | |
| HP Victus 16-r0076TX | |
| Aorus 15 BSF | |
| Asus TUF A15 FA507 | |
| MSI Katana 15 B12VEK | |
| Acer Nitro 16 AN16-41-R7YE | |
| 7-Zip 18.03 / 7z b 4 -mmt1 | |
| Alienware m16 R1 Intel | |
| Media de la clase Gaming (4199 - 7436, n=108, últimos 2 años) | |
| Acer Predator Helios 16 PH16-71-731Q | |
| Aorus 15 BSF | |
| Asus TUF A15 FA507 | |
| Acer Nitro 16 AN16-41-R7YE | |
| Medio Intel Core i5-13500HX (5377 - 5850, n=3) | |
| MSI Katana 15 B12VEK | |
| Acer Predator Triton 14 PT14-51 | |
| HP Victus 16-r0076TX | |
| Geekbench 5.5 / Multi-Core | |
| Media de la clase Gaming (6460 - 27010, n=108, últimos 2 años) | |
| Acer Predator Helios 16 PH16-71-731Q | |
| Alienware m16 R1 Intel | |
| Acer Predator Triton 14 PT14-51 | |
| Aorus 15 BSF | |
| Medio Intel Core i5-13500HX (12683 - 13767, n=3) | |
| HP Victus 16-r0076TX | |
| MSI Katana 15 B12VEK | |
| Asus TUF A15 FA507 | |
| Acer Nitro 16 AN16-41-R7YE | |
| Geekbench 5.5 / Single-Core | |
| Media de la clase Gaming (986 - 2474, n=108, últimos 2 años) | |
| Acer Predator Helios 16 PH16-71-731Q | |
| Aorus 15 BSF | |
| Alienware m16 R1 Intel | |
| Medio Intel Core i5-13500HX (1688 - 1779, n=3) | |
| Acer Predator Triton 14 PT14-51 | |
| HP Victus 16-r0076TX | |
| MSI Katana 15 B12VEK | |
| Asus TUF A15 FA507 | |
| Acer Nitro 16 AN16-41-R7YE | |
| HWBOT x265 Benchmark v2.2 / 4k Preset | |
| Media de la clase Gaming (11.5 - 44.3, n=108, últimos 2 años) | |
| Acer Predator Helios 16 PH16-71-731Q | |
| Alienware m16 R1 Intel | |
| Acer Predator Triton 14 PT14-51 | |
| Medio Intel Core i5-13500HX (20.3 - 20.9, n=3) | |
| HP Victus 16-r0076TX | |
| MSI Katana 15 B12VEK | |
| Asus TUF A15 FA507 | |
| Aorus 15 BSF | |
| Acer Nitro 16 AN16-41-R7YE | |
| LibreOffice / 20 Documents To PDF | |
| Asus TUF A15 FA507 | |
| Media de la clase Gaming (19 - 88.8, n=108, últimos 2 años) | |
| Acer Predator Triton 14 PT14-51 | |
| Aorus 15 BSF | |
| MSI Katana 15 B12VEK | |
| Acer Nitro 16 AN16-41-R7YE | |
| Alienware m16 R1 Intel | |
| Medio Intel Core i5-13500HX (42.5 - 45, n=2) | |
| Acer Predator Helios 16 PH16-71-731Q | |
| R Benchmark 2.5 / Overall mean | |
| Acer Nitro 16 AN16-41-R7YE | |
| Asus TUF A15 FA507 | |
| MSI Katana 15 B12VEK | |
| HP Victus 16-r0076TX | |
| Acer Predator Triton 14 PT14-51 | |
| Medio Intel Core i5-13500HX (0.4512 - 0.4891, n=3) | |
| Alienware m16 R1 Intel | |
| Aorus 15 BSF | |
| Media de la clase Gaming (0.3439 - 0.759, n=109, últimos 2 años) | |
| Acer Predator Helios 16 PH16-71-731Q | |
* ... más pequeño es mejor
AIDA64: FP32 Ray-Trace | FPU Julia | CPU SHA3 | CPU Queen | FPU SinJulia | FPU Mandel | CPU AES | CPU ZLib | FP64 Ray-Trace | CPU PhotoWorxx
| Performance rating | |
| Media de la clase Gaming | |
| Alienware m16 R1 Intel | |
| Acer Predator Helios 16 PH16-71-731Q | |
| Acer Predator Triton 14 PT14-51 | |
| Medio Intel Core i5-13500HX | |
| HP Victus 16-r0076TX | |
| Asus TUF A15 FA507 | |
| Aorus 15 BSF | |
| MSI Katana 15 B12VEK | |
| Acer Nitro 16 AN16-41-R7YE | |
| AIDA64 / FP32 Ray-Trace | |
| Media de la clase Gaming (10227 - 85542, n=107, últimos 2 años) | |
| Alienware m16 R1 Intel | |
| Acer Predator Helios 16 PH16-71-731Q | |
| Asus TUF A15 FA507 | |
| Medio Intel Core i5-13500HX (15888 - 16544, n=3) | |
| Acer Predator Triton 14 PT14-51 | |
| HP Victus 16-r0076TX | |
| MSI Katana 15 B12VEK | |
| Aorus 15 BSF | |
| Acer Nitro 16 AN16-41-R7YE | |
| AIDA64 / FPU Julia | |
| Media de la clase Gaming (51376 - 238426, n=107, últimos 2 años) | |
| Alienware m16 R1 Intel | |
| Asus TUF A15 FA507 | |
| Acer Predator Helios 16 PH16-71-731Q | |
| Acer Predator Triton 14 PT14-51 | |
| HP Victus 16-r0076TX | |
| Medio Intel Core i5-13500HX (80761 - 85623, n=3) | |
| Acer Nitro 16 AN16-41-R7YE | |
| MSI Katana 15 B12VEK | |
| Aorus 15 BSF | |
| AIDA64 / CPU SHA3 | |
| Media de la clase Gaming (2180 - 9817, n=107, últimos 2 años) | |
| Alienware m16 R1 Intel | |
| Acer Predator Helios 16 PH16-71-731Q | |
| Acer Predator Triton 14 PT14-51 | |
| Medio Intel Core i5-13500HX (3868 - 4017, n=3) | |
| HP Victus 16-r0076TX | |
| Asus TUF A15 FA507 | |
| MSI Katana 15 B12VEK | |
| Aorus 15 BSF | |
| Acer Nitro 16 AN16-41-R7YE | |
| AIDA64 / CPU Queen | |
| Media de la clase Gaming (49785 - 173351, n=98, últimos 2 años) | |
| Alienware m16 R1 Intel | |
| Acer Predator Helios 16 PH16-71-731Q | |
| Medio Intel Core i5-13500HX (105168 - 107075, n=3) | |
| Aorus 15 BSF | |
| HP Victus 16-r0076TX | |
| Asus TUF A15 FA507 | |
| Acer Predator Triton 14 PT14-51 | |
| MSI Katana 15 B12VEK | |
| Acer Nitro 16 AN16-41-R7YE | |
| AIDA64 / FPU SinJulia | |
| Media de la clase Gaming (4424 - 33636, n=107, últimos 2 años) | |
| Alienware m16 R1 Intel | |
| Acer Predator Helios 16 PH16-71-731Q | |
| Asus TUF A15 FA507 | |
| Medio Intel Core i5-13500HX (10334 - 10793, n=3) | |
| Acer Predator Triton 14 PT14-51 | |
| HP Victus 16-r0076TX | |
| Acer Nitro 16 AN16-41-R7YE | |
| Aorus 15 BSF | |
| MSI Katana 15 B12VEK | |
| AIDA64 / FPU Mandel | |
| Media de la clase Gaming (25115 - 128721, n=107, últimos 2 años) | |
| Asus TUF A15 FA507 | |
| Alienware m16 R1 Intel | |
| Acer Predator Helios 16 PH16-71-731Q | |
| Acer Nitro 16 AN16-41-R7YE | |
| Medio Intel Core i5-13500HX (39805 - 41418, n=3) | |
| HP Victus 16-r0076TX | |
| Acer Predator Triton 14 PT14-51 | |
| MSI Katana 15 B12VEK | |
| Aorus 15 BSF | |
| AIDA64 / CPU AES | |
| Alienware m16 R1 Intel | |
| Acer Predator Helios 16 PH16-71-731Q | |
| Acer Predator Triton 14 PT14-51 | |
| Aorus 15 BSF | |
| Medio Intel Core i5-13500HX (79903 - 154368, n=3) | |
| Media de la clase Gaming (39258 - 247074, n=107, últimos 2 años) | |
| Acer Nitro 16 AN16-41-R7YE | |
| HP Victus 16-r0076TX | |
| MSI Katana 15 B12VEK | |
| Asus TUF A15 FA507 | |
| AIDA64 / CPU ZLib | |
| Media de la clase Gaming (574 - 2531, n=107, últimos 2 años) | |
| Acer Predator Helios 16 PH16-71-731Q | |
| Alienware m16 R1 Intel | |
| Acer Predator Triton 14 PT14-51 | |
| Medio Intel Core i5-13500HX (1104 - 1233, n=3) | |
| HP Victus 16-r0076TX | |
| Aorus 15 BSF | |
| MSI Katana 15 B12VEK | |
| Acer Nitro 16 AN16-41-R7YE | |
| Asus TUF A15 FA507 | |
| AIDA64 / FP64 Ray-Trace | |
| Media de la clase Gaming (5509 - 45446, n=107, últimos 2 años) | |
| Alienware m16 R1 Intel | |
| Acer Predator Helios 16 PH16-71-731Q | |
| Medio Intel Core i5-13500HX (8587 - 9008, n=3) | |
| Acer Predator Triton 14 PT14-51 | |
| HP Victus 16-r0076TX | |
| Asus TUF A15 FA507 | |
| MSI Katana 15 B12VEK | |
| Aorus 15 BSF | |
| Acer Nitro 16 AN16-41-R7YE | |
| AIDA64 / CPU PhotoWorxx | |
| Acer Predator Triton 14 PT14-51 | |
| Media de la clase Gaming (12271 - 89891, n=107, últimos 2 años) | |
| Medio Intel Core i5-13500HX (36861 - 42683, n=3) | |
| Aorus 15 BSF | |
| MSI Katana 15 B12VEK | |
| HP Victus 16-r0076TX | |
| Alienware m16 R1 Intel | |
| Acer Predator Helios 16 PH16-71-731Q | |
| Acer Nitro 16 AN16-41-R7YE | |
| Asus TUF A15 FA507 | |
eche un vistazo a nuestro Core i5-13500HX para obtener más información y comparaciones
Rendimiento del sistema
Aunque el HP Victus 16 funcionará bien como vehículo de uso diario, queda por detrás de la competencia en PCMark 10, donde sólo obtuvo 6.125 puntos.
Su puntuación CrossMark de 1.701 lo sitúa por delante del Lenovo LOQ 15 y Acer Nitro 16.
La situación es más o menos la misma en AIDA64, donde el procesador Raptor Lake-HX se mantiene constantemente por delante de sus homólogos AMD.
CrossMark: Overall | Productivity | Creativity | Responsiveness
AIDA64: Memory Copy | Memory Read | Memory Write | Memory Latency
| PCMark 10 / Score | |
| Media de la clase Gaming (5828 - 11574, n=94, últimos 2 años) | |
| Lenovo Legion Pro 5 16ARX8 (R5 7645HX, RTX 4050) | |
| Acer Predator Helios 16 PH16-71-731Q | |
| Lenovo LOQ 15APH8 | |
| Acer Predator Triton 14 PT14-51 | |
| Alienware m16 R1 Intel | |
| Dell G15 5530 | |
| Acer Nitro 16 AN16-41-R7YE | |
| Medio Intel Core i5-13500HX, NVIDIA GeForce RTX 4050 Laptop GPU (6125 - 6565, n=2) | |
| HP Victus 16-r0076TX | |
| PCMark 10 / Essentials | |
| Lenovo Legion Pro 5 16ARX8 (R5 7645HX, RTX 4050) | |
| Acer Predator Helios 16 PH16-71-731Q | |
| Dell G15 5530 | |
| Alienware m16 R1 Intel | |
| Media de la clase Gaming (8810 - 12600, n=98, últimos 2 años) | |
| Lenovo LOQ 15APH8 | |
| Acer Predator Triton 14 PT14-51 | |
| Medio Intel Core i5-13500HX, NVIDIA GeForce RTX 4050 Laptop GPU (9625 - 10618, n=2) | |
| Acer Nitro 16 AN16-41-R7YE | |
| HP Victus 16-r0076TX | |
| PCMark 10 / Productivity | |
| Lenovo Legion Pro 5 16ARX8 (R5 7645HX, RTX 4050) | |
| Acer Predator Helios 16 PH16-71-731Q | |
| Media de la clase Gaming (6845 - 18766, n=96, últimos 2 años) | |
| Dell G15 5530 | |
| Lenovo LOQ 15APH8 | |
| Acer Predator Triton 14 PT14-51 | |
| Alienware m16 R1 Intel | |
| Medio Intel Core i5-13500HX, NVIDIA GeForce RTX 4050 Laptop GPU (8471 - 9005, n=2) | |
| HP Victus 16-r0076TX | |
| Acer Nitro 16 AN16-41-R7YE | |
| PCMark 10 / Digital Content Creation | |
| Media de la clase Gaming (7602 - 19657, n=96, últimos 2 años) | |
| Lenovo LOQ 15APH8 | |
| Lenovo Legion Pro 5 16ARX8 (R5 7645HX, RTX 4050) | |
| Acer Predator Triton 14 PT14-51 | |
| Acer Nitro 16 AN16-41-R7YE | |
| Acer Predator Helios 16 PH16-71-731Q | |
| Alienware m16 R1 Intel | |
| Dell G15 5530 | |
| Medio Intel Core i5-13500HX, NVIDIA GeForce RTX 4050 Laptop GPU (7649 - 8031, n=2) | |
| HP Victus 16-r0076TX | |
| CrossMark / Overall | |
| Acer Predator Helios 16 PH16-71-731Q | |
| Alienware m16 R1 Intel | |
| Media de la clase Gaming (1366 - 2409, n=96, últimos 2 años) | |
| Lenovo Legion Pro 5 16ARX8 (R5 7645HX, RTX 4050) | |
| Acer Predator Triton 14 PT14-51 | |
| Dell G15 5530 | |
| Medio Intel Core i5-13500HX, NVIDIA GeForce RTX 4050 Laptop GPU (1701 - 1964, n=2) | |
| HP Victus 16-r0076TX | |
| Lenovo LOQ 15APH8 | |
| Acer Nitro 16 AN16-41-R7YE | |
| CrossMark / Productivity | |
| Acer Predator Helios 16 PH16-71-731Q | |
| Alienware m16 R1 Intel | |
| Lenovo Legion Pro 5 16ARX8 (R5 7645HX, RTX 4050) | |
| Media de la clase Gaming (1386 - 2254, n=96, últimos 2 años) | |
| Acer Predator Triton 14 PT14-51 | |
| Dell G15 5530 | |
| Medio Intel Core i5-13500HX, NVIDIA GeForce RTX 4050 Laptop GPU (1585 - 1878, n=2) | |
| Lenovo LOQ 15APH8 | |
| HP Victus 16-r0076TX | |
| Acer Nitro 16 AN16-41-R7YE | |
| CrossMark / Creativity | |
| Acer Predator Helios 16 PH16-71-731Q | |
| Alienware m16 R1 Intel | |
| Media de la clase Gaming (1343 - 2729, n=96, últimos 2 años) | |
| Dell G15 5530 | |
| Lenovo Legion Pro 5 16ARX8 (R5 7645HX, RTX 4050) | |
| Acer Predator Triton 14 PT14-51 | |
| Medio Intel Core i5-13500HX, NVIDIA GeForce RTX 4050 Laptop GPU (1912 - 2022, n=2) | |
| HP Victus 16-r0076TX | |
| Lenovo LOQ 15APH8 | |
| Acer Nitro 16 AN16-41-R7YE | |
| CrossMark / Responsiveness | |
| Acer Predator Helios 16 PH16-71-731Q | |
| Alienware m16 R1 Intel | |
| Lenovo Legion Pro 5 16ARX8 (R5 7645HX, RTX 4050) | |
| Medio Intel Core i5-13500HX, NVIDIA GeForce RTX 4050 Laptop GPU (1478 - 2053, n=2) | |
| Acer Predator Triton 14 PT14-51 | |
| Media de la clase Gaming (1226 - 2334, n=96, últimos 2 años) | |
| Dell G15 5530 | |
| HP Victus 16-r0076TX | |
| Lenovo LOQ 15APH8 | |
| Acer Nitro 16 AN16-41-R7YE | |
| AIDA64 / Memory Copy | |
| Acer Predator Triton 14 PT14-51 | |
| Media de la clase Gaming (21750 - 129946, n=107, últimos 2 años) | |
| Dell G15 5530 | |
| Medio Intel Core i5-13500HX, NVIDIA GeForce RTX 4050 Laptop GPU (56320 - 62153, n=3) | |
| Alienware m16 R1 Intel | |
| Acer Predator Helios 16 PH16-71-731Q | |
| HP Victus 16-r0076TX | |
| Acer Nitro 16 AN16-41-R7YE | |
| Lenovo Legion Pro 5 16ARX8 (R5 7645HX, RTX 4050) | |
| Lenovo LOQ 15APH8 | |
| AIDA64 / Memory Read | |
| Media de la clase Gaming (22956 - 118858, n=107, últimos 2 años) | |
| Dell G15 5530 | |
| Alienware m16 R1 Intel | |
| Acer Predator Helios 16 PH16-71-731Q | |
| Acer Predator Triton 14 PT14-51 | |
| Medio Intel Core i5-13500HX, NVIDIA GeForce RTX 4050 Laptop GPU (66057 - 66667, n=3) | |
| HP Victus 16-r0076TX | |
| Acer Nitro 16 AN16-41-R7YE | |
| Lenovo Legion Pro 5 16ARX8 (R5 7645HX, RTX 4050) | |
| Lenovo LOQ 15APH8 | |
| AIDA64 / Memory Write | |
| Acer Predator Helios 16 PH16-71-731Q | |
| Acer Predator Triton 14 PT14-51 | |
| Media de la clase Gaming (22297 - 135096, n=107, últimos 2 años) | |
| Medio Intel Core i5-13500HX, NVIDIA GeForce RTX 4050 Laptop GPU (56956 - 66135, n=3) | |
| Dell G15 5530 | |
| Alienware m16 R1 Intel | |
| HP Victus 16-r0076TX | |
| Acer Nitro 16 AN16-41-R7YE | |
| Lenovo Legion Pro 5 16ARX8 (R5 7645HX, RTX 4050) | |
| Lenovo LOQ 15APH8 | |
| AIDA64 / Memory Latency | |
| Media de la clase Gaming (75.3 - 259, n=107, últimos 2 años) | |
| Acer Predator Triton 14 PT14-51 | |
| HP Victus 16-r0076TX | |
| Lenovo LOQ 15APH8 | |
| Medio Intel Core i5-13500HX, NVIDIA GeForce RTX 4050 Laptop GPU (87.1 - 96.8, n=3) | |
| Dell G15 5530 | |
| Alienware m16 R1 Intel | |
| Acer Nitro 16 AN16-41-R7YE | |
| Acer Predator Helios 16 PH16-71-731Q | |
| Lenovo Legion Pro 5 16ARX8 (R5 7645HX, RTX 4050) | |
* ... más pequeño es mejor
| PCMark 8 Home Score Accelerated | 4602 puntos | |
| PCMark 8 Work Score Accelerated | 6227 puntos | |
| PCMark 10 Score | 6125 puntos | |
ayuda | ||
Latencia del CPD
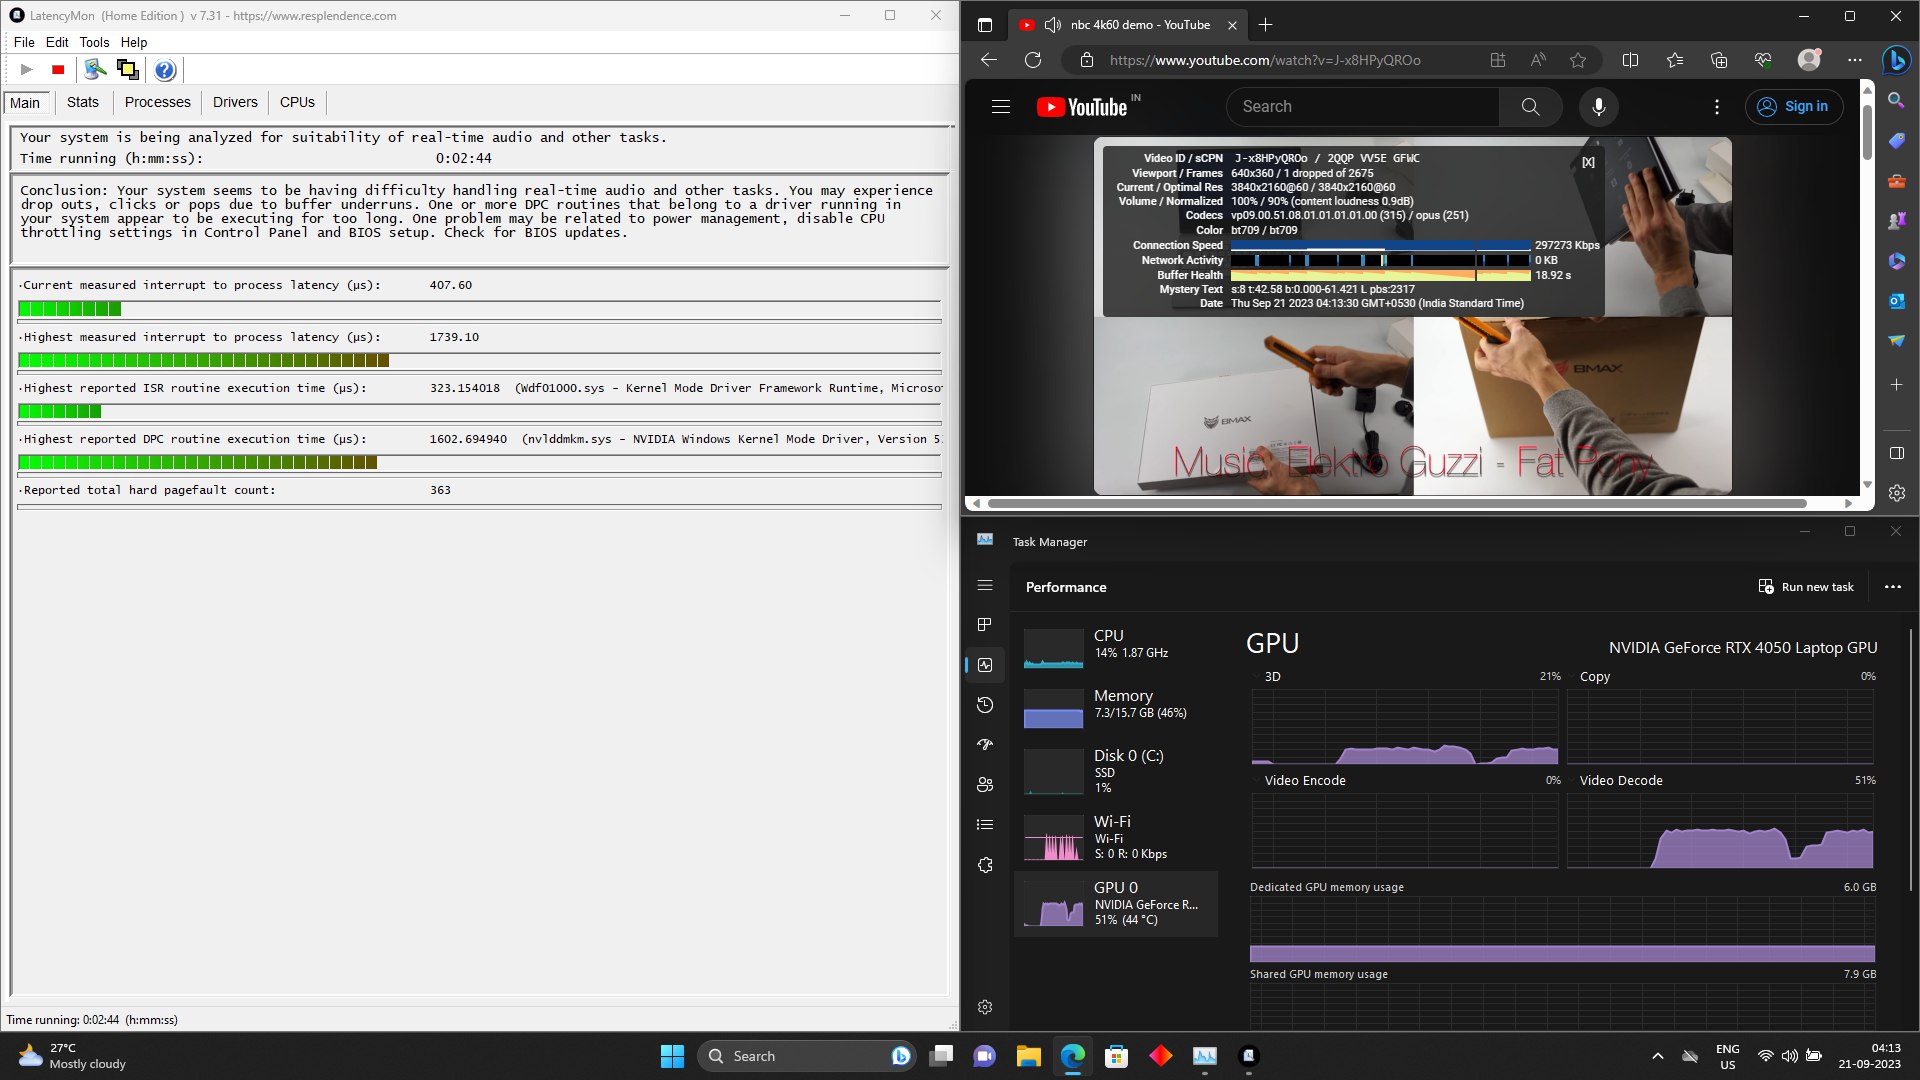
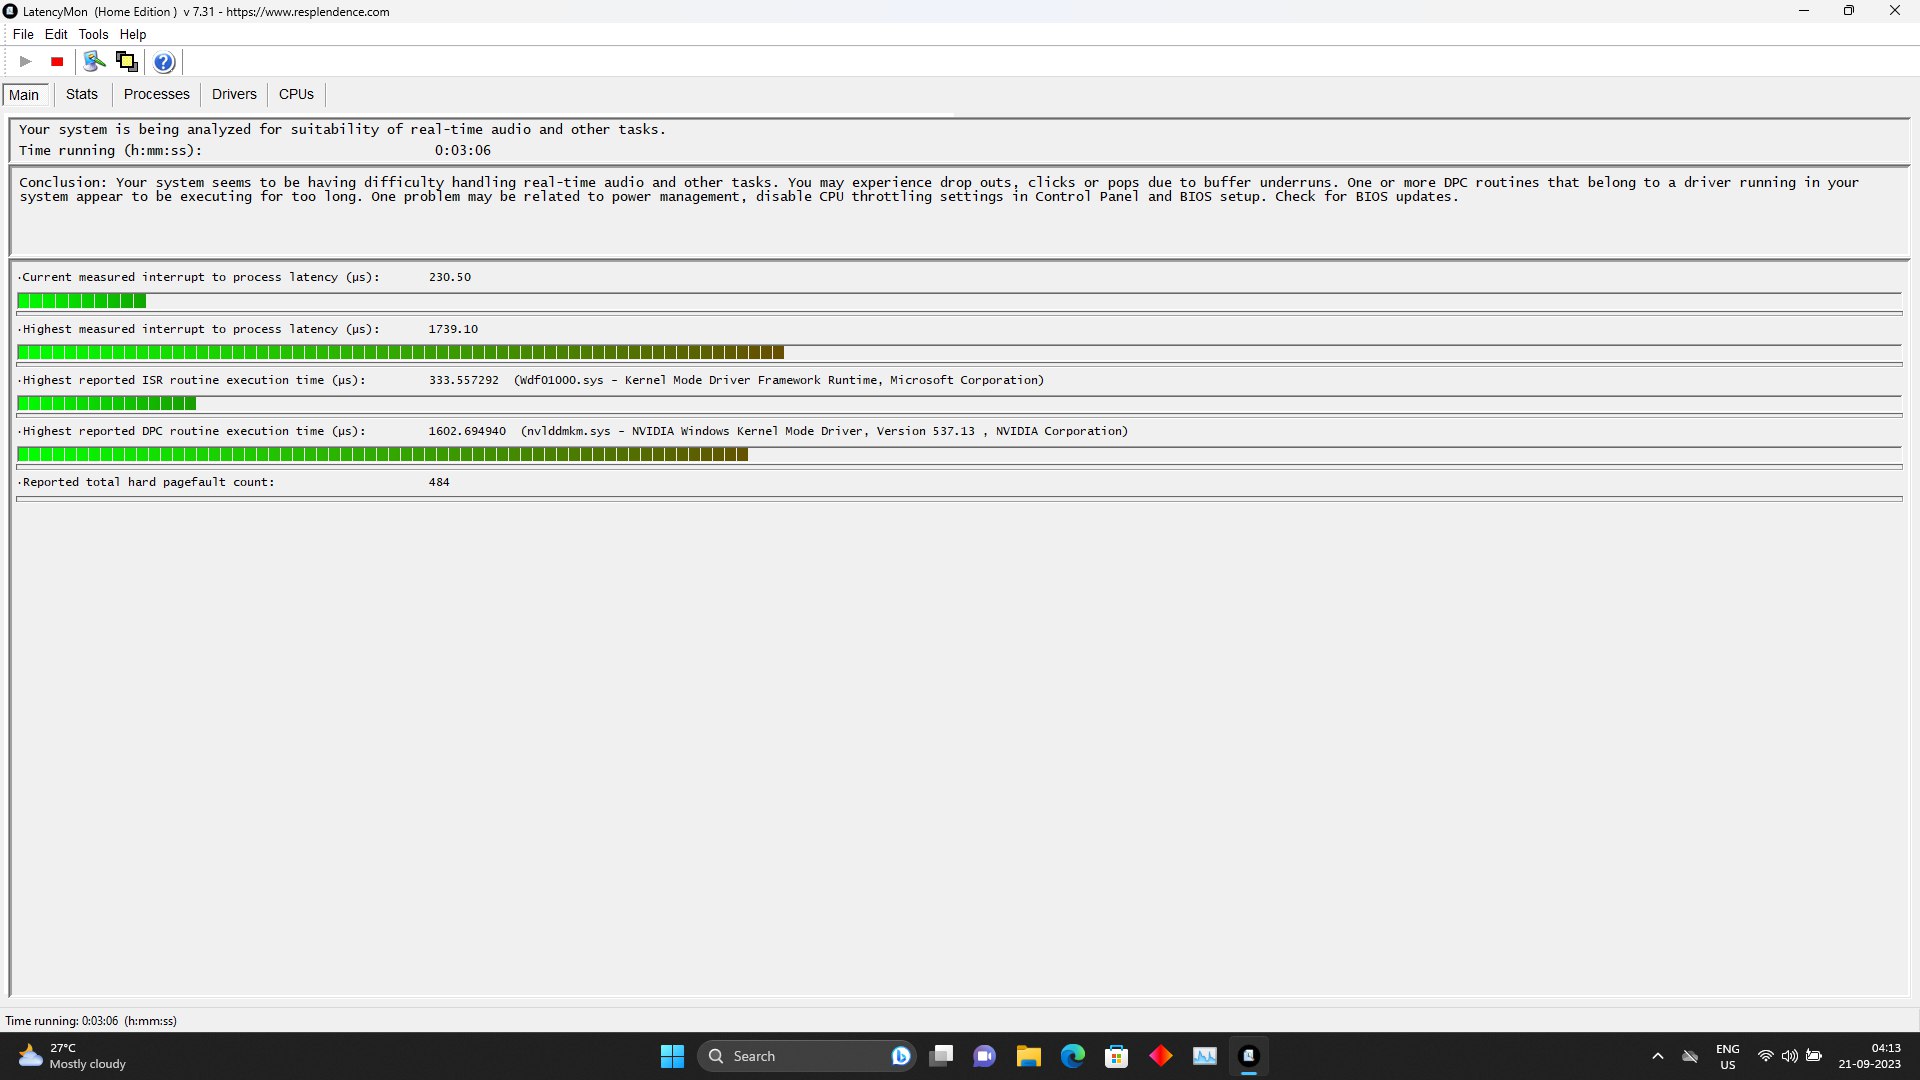
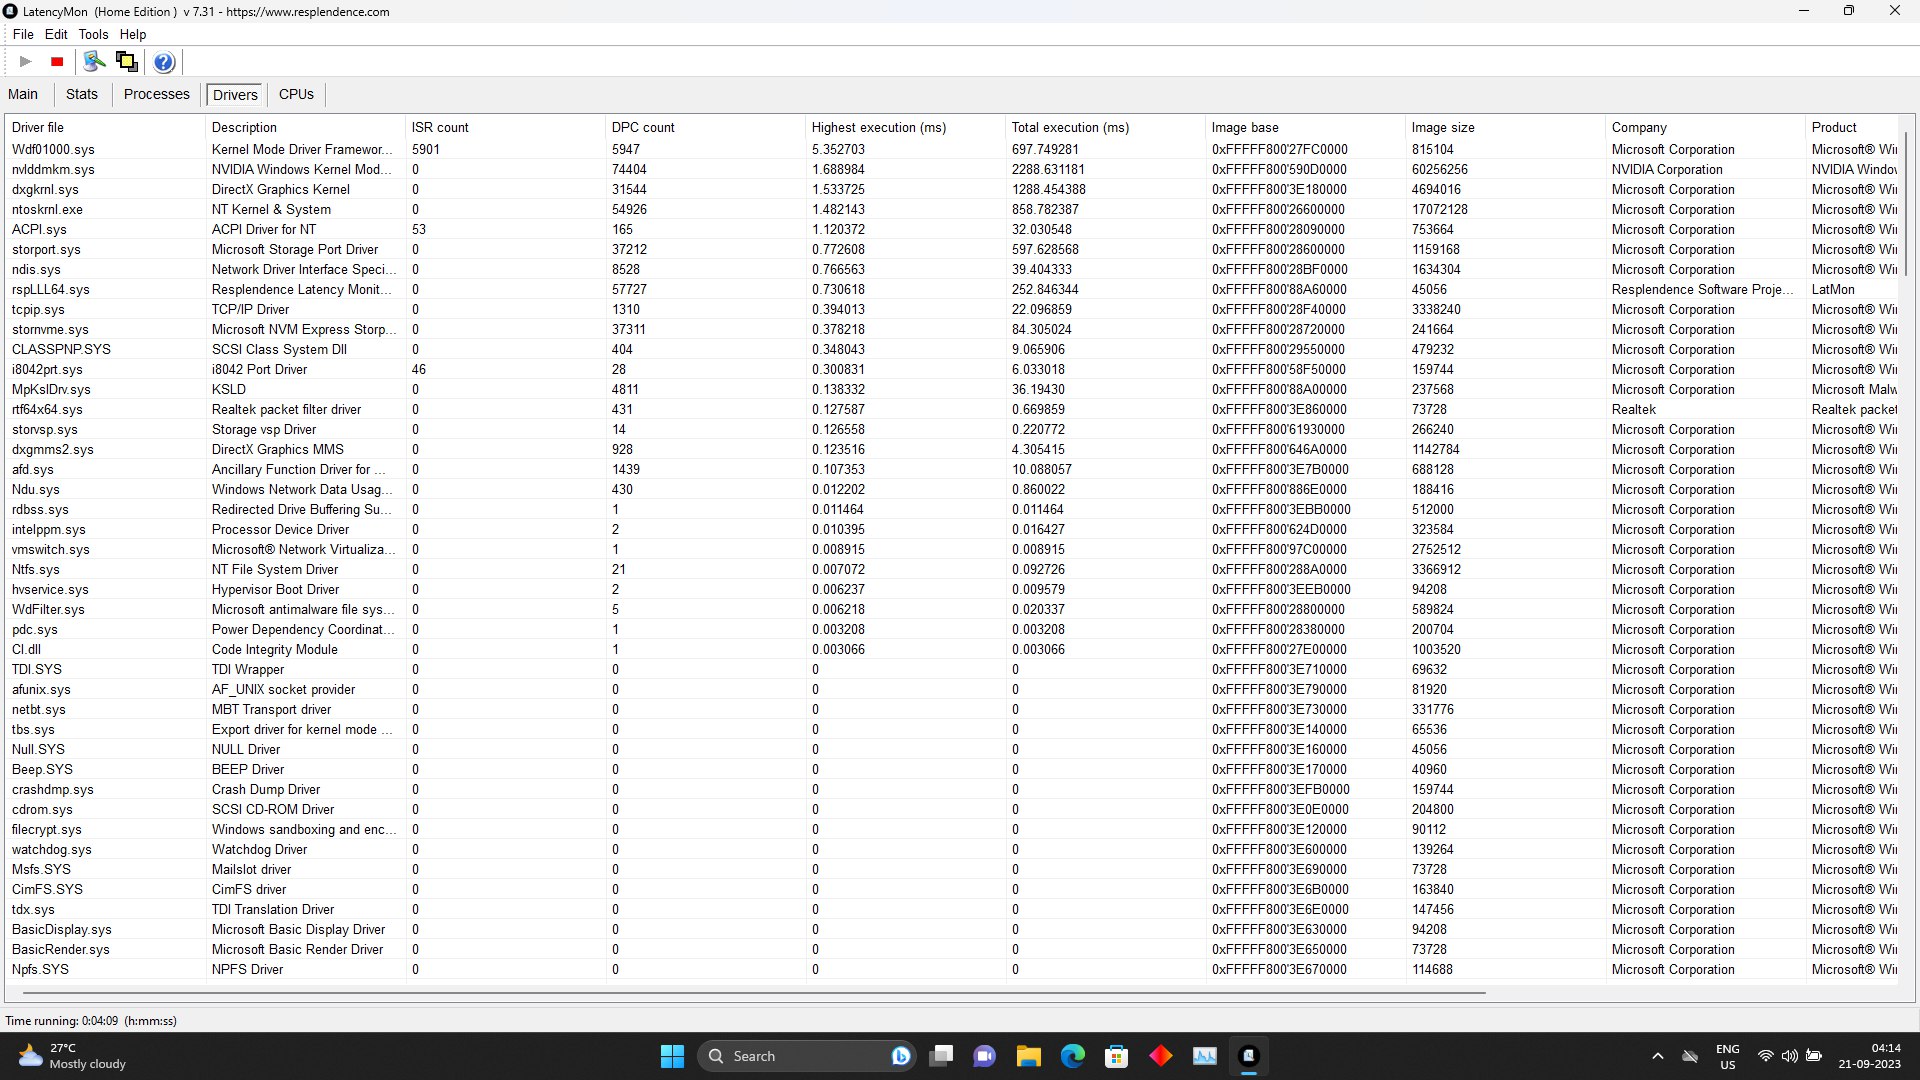
La alta latencia del CPD ha sido un problema constante en las tarjetas gráficas Ada Lovelace de sobremesa desde su lanzamiento. El problema parece haberse trasladado también a sus variantes para portátiles. Un vistazo rápido a LatencyMon indica que los culpables son "Wdf0100.sys" (Windows Driver Framework) y "Nvlddmkm.sys" (Nvidia Windows Kernel Module), lo que indica que una actualización de software podría resolver el problema más adelante.
Consulte Página de clasificación de latencia para obtener más resultados.
| DPC Latencies / LatencyMon - interrupt to process latency (max), Web, Youtube, Prime95 | |
| Dell G15 5530 | |
| Alienware m16 R1 Intel | |
| HP Victus 16-r0076TX | |
| Acer Predator Helios 16 PH16-71-731Q | |
| Acer Predator Triton 14 PT14-51 | |
| Lenovo LOQ 15APH8 | |
| Acer Nitro 16 AN16-41-R7YE | |
| Lenovo Legion Pro 5 16ARX8 (R5 7645HX, RTX 4050) | |
* ... más pequeño es mejor
Dispositivos de almacenamiento
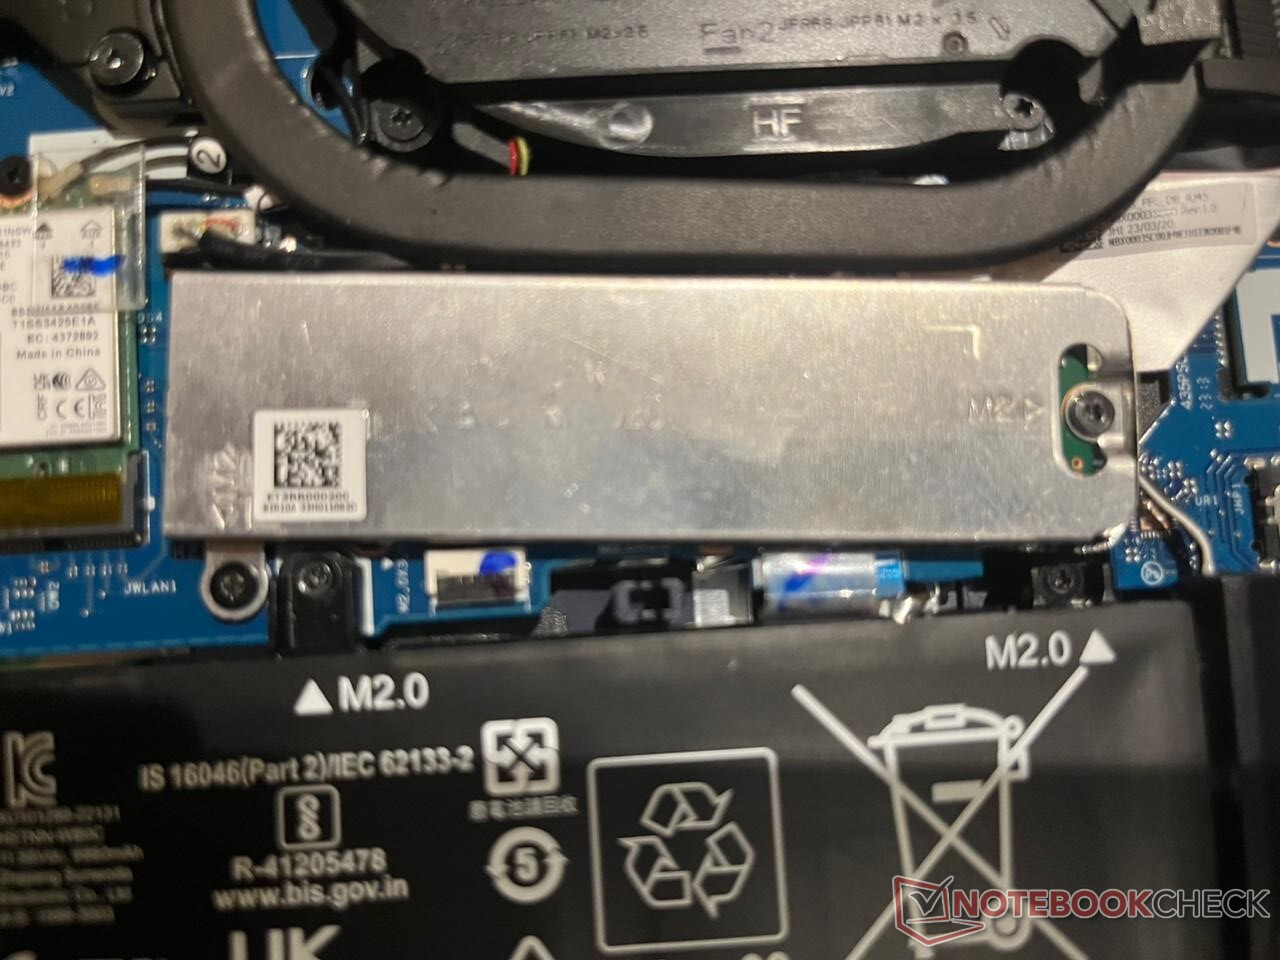
El SSD NVMe SK Hynix PC801 del HP Victus 16 ofrece velocidades de transferencia decentes en diversas cargas de trabajo. Nuestras pruebas determinaron que no se ralentiza ni siquiera tras un uso prolongado gracias a su grueso blindaje metálico.
Sin embargo, 512 GB son muy pocos en 2023, sobre todo teniendo en cuenta que los juegos de gran tamaño se están convirtiendo en la norma. Por suerte, HP permite a los usuarios instalar una unidad adicional con relativa facilidad.

* ... más pequeño es mejor
Disk Throttling: DiskSpd Read Loop, Queue Depth 8
Más información sobre nuestros HDD y SSD y SSD.
Rendimiento de la GPU
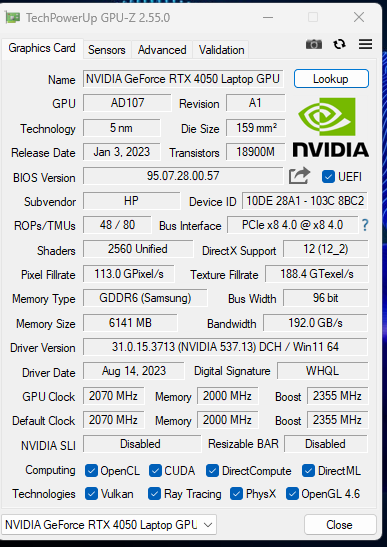
A primera vista, la Nvidia GeForce RTX 4050 no parece la GPU más potente del mercado. Tiene 6 GB de VRAM GDDR6 en un bus de 96 bits, 2.560 núcleos CUDA y un valor TGP de entre 35 y 115 vatios.
Si indagamos un poco en el panel de control de Nvidia, veremos que su TGP máximo se sitúa en torno a los 100 vatios, una cifra respetable. Curiosamente, la GeForce RTX 4050 puede "tomar prestados" hasta 20 vatios de potencia de la CPU.
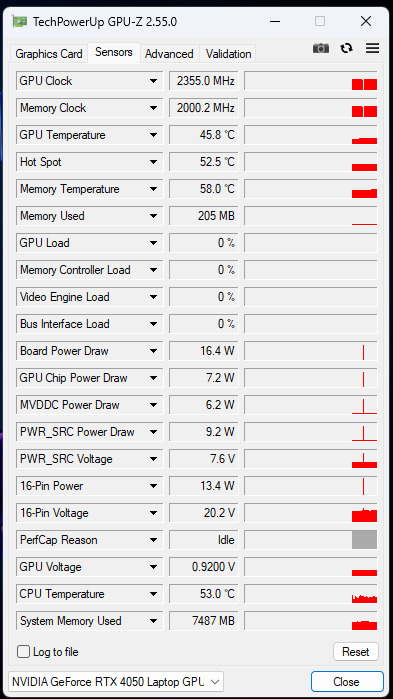
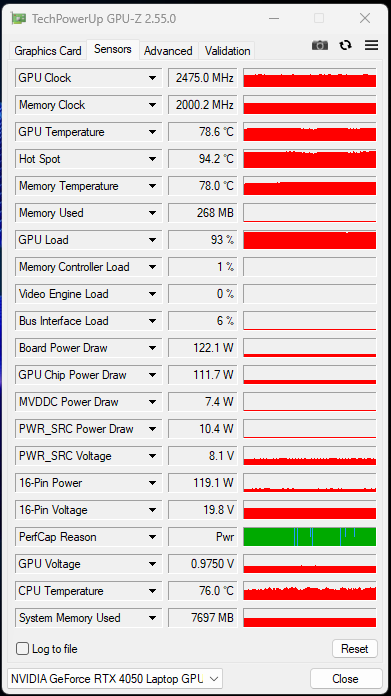
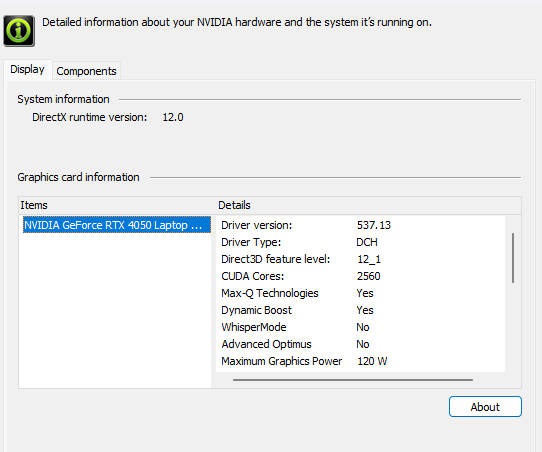
Esto se refleja en FurMark, donde la potencia máxima de la placa salta hasta los 122,1 vatios bajo carga. Sin embargo, no puede permanecer en ese estado mucho tiempo y se asienta en una cifra inferior al cabo de un rato.
El HP Victus 16 rinde marginalmente mejor que otros portátiles RTX 4050 en 3DMark 11, con una puntuación de 31.571 puntos. La diferencia es menos evidente en pruebas 3DMark más antiguas, como Ice Storm, Fire Strike y Time Spy.
En conclusión, la GeForce RTX 4050, a pesar de su decepcionante hoja de especificaciones, sigue estando a la altura de la competencia y es una tarjeta gráfica básica impecable.
| 3DMark 06 Standard Score | 46228 puntos | |
| 3DMark 11 Performance | 28214 puntos | |
| 3DMark Ice Storm Standard Score | 198276 puntos | |
| 3DMark Cloud Gate Standard Score | 61259 puntos | |
| 3DMark Fire Strike Score | 21070 puntos | |
| 3DMark Fire Strike Extreme Score | 10180 puntos | |
| 3DMark Time Spy Score | 9069 puntos | |
ayuda | ||
| Blender / v3.3 Classroom OPTIX/RTX | |
| Medio NVIDIA GeForce RTX 4050 Laptop GPU (25 - 37, n=40) | |
| HP Victus 16-r0076TX | |
| MSI Katana 15 B12VEK | |
| Asus TUF A15 FA507 | |
| Asus TUF A15 FA507 | |
| Acer Predator Triton 14 PT14-51 | |
| Acer Nitro 16 AN16-41-R7YE | |
| Alienware m16 R1 Intel | |
| Aorus 15 BSF | |
| Acer Predator Helios 16 PH16-71-731Q | |
| Media de la clase Gaming (9 - 32, n=109, últimos 2 años) | |
| Blender / v3.3 Classroom CUDA | |
| Medio NVIDIA GeForce RTX 4050 Laptop GPU (47 - 68, n=39) | |
| MSI Katana 15 B12VEK | |
| Acer Predator Triton 14 PT14-51 | |
| Asus TUF A15 FA507 | |
| Asus TUF A15 FA507 | |
| Acer Nitro 16 AN16-41-R7YE | |
| HP Victus 16-r0076TX | |
| Acer Predator Helios 16 PH16-71-731Q | |
| Alienware m16 R1 Intel | |
| Aorus 15 BSF | |
| Media de la clase Gaming (15 - 228, n=109, últimos 2 años) | |
| Blender / v3.3 Classroom CPU | |
| Acer Nitro 16 AN16-41-R7YE | |
| MSI Katana 15 B12VEK | |
| Medio NVIDIA GeForce RTX 4050 Laptop GPU (243 - 907, n=40) | |
| Aorus 15 BSF | |
| Asus TUF A15 FA507 | |
| Asus TUF A15 FA507 | |
| HP Victus 16-r0076TX | |
| Acer Predator Triton 14 PT14-51 | |
| Acer Predator Helios 16 PH16-71-731Q | |
| Alienware m16 R1 Intel | |
| Media de la clase Gaming (122 - 565, n=105, últimos 2 años) | |
* ... más pequeño es mejor
Echa un vistazo a nuestro Nvidia GeForce RTX 4050 para más información y comparaciones.
Rendimiento en juegos
La GeForce RTX 4050 es sorprendentemente competente en juegos, incluso con sólo 6 GB de VRAM. Pudo ejecutar todos los juegos que le propusimos a 1080p y 60 FPS, con todos los ajustes al máximo.
El rendimiento estelar de Cyberpunk 2077 podría explicarse por la exhaustiva optimización del juego por parte de Nvidia. Títulos de deportes electrónicos como DOTA 2 también funcionan bien en el portátil.
Las mejoras arquitectónicas aportadas por Ada Lovelace dan a la RTX 4050 una oportunidad decente como máquina de juegos a 1080p. Sin embargo, no recomendaríamos activar el raytracing sin DLSS, ya que consume mucha VRAM.
| The Witcher 3 - 1920x1080 Ultra Graphics & Postprocessing (HBAO+) | |
| Media de la clase Gaming (95 - 240, n=8, últimos 2 años) | |
| Alienware m16 R1 Intel | |
| Dell G15 5530 | |
| Acer Predator Helios 16 PH16-71-731Q | |
| HP Victus 16-r0076TX | |
| Lenovo Legion Pro 5 16ARX8 (R5 7645HX, RTX 4050) | |
| Acer Nitro 16 AN16-41-R7YE | |
| Lenovo LOQ 15APH8 | |
| Acer Predator Triton 14 PT14-51 | |
En nuestras pruebas sostenidas, The Witcher 3 pudo funcionar bastante bien a un mínimo de 90 fps en todo momento. Mientras que la velocidad de fotogramas rondó los 100 fps en algunos casos, se redujo debido a la ralentización térmica. En esencia, el portátil puede hacer un buen trabajo en juegos exigentes con una tasa de imágenes por segundo bastante constante.
Witcher 3 FPS Chart
| bajo | medio | alto | ultra | |
|---|---|---|---|---|
| The Witcher 3 (2015) | 365 | 282 | 160.2 | 94.7 |
| Dota 2 Reborn (2015) | 181.5 | 163.4 | 159 | 145 |
| Final Fantasy XV Benchmark (2018) | 190.5 | 120.3 | 84.8 | |
| X-Plane 11.11 (2018) | 157.2 | 138.8 | 106.5 | |
| Far Cry 5 (2018) | 155 | 122 | 110 | 109 |
| Strange Brigade (2018) | 355 | 213 | 171.8 | 149.3 |
| Cyberpunk 2077 1.6 (2022) | 111.2 | 85.3 | 65.5 | 71.8 |
| F1 22 (2022) | 214 | 207 | 154.4 | 54.1 |
| F1 23 (2023) | 217 | 210 | 156.2 | 60.8 |
Emisiones: Funciona un poco demasiado alto y caliente
Ruido del sistema
Aunque HP ha hecho todo lo posible para refrigerar el Victus 16, le cuesta mantener el hardware a raya. Una de las primeras cosas que notarás es lo ruidoso que se vuelve el portátil bajo la más mínima carga, con el ruido haciéndose progresivamente más fuerte al jugar.
Nuestras pruebas determinaron que la salida máxima de ruido era de 55 dB(A). Aunque está muy por debajo del umbral de lo que se puede considerar ruidoso, no es algo que pueda pasar desapercibido, no sin un par de auriculares.
Ruido
| Ocioso |
| 23.68 / 23.68 / 23.68 dB(A) |
| Carga |
| 39.44 / 55.37 dB(A) |
 | ||
30 dB silencioso 40 dB(A) audible 50 dB(A) ruidosamente alto |
||
min: | ||
| Modo de rendimiento | Al ralentí dB(A) | Carga media dB(A) | Carga máxima dB(A) | El Witcher 3 1080p Ultra dB(A) |
|---|---|---|---|---|
| Eco | 23,67 | 32,50 | 40,80 | 41,03 / 84 fps |
| Equilibrada | 23,87 | 35,06 | 44,72 | 44,78 / 86 fps |
| Rendimiento | 23.68 | 39.44 | 55.37 | 55.42 / 87 fps |
| HP Victus 16-r0076TX i5-13500HX, GeForce RTX 4050 Laptop GPU | Acer Nitro 16 AN16-41-R7YE R5 7535HS, GeForce RTX 4050 Laptop GPU | Acer Predator Triton 14 PT14-51 i7-13700H, GeForce RTX 4050 Laptop GPU | Alienware m16 R1 Intel i7-13700HX, GeForce RTX 4060 Laptop GPU | Acer Predator Helios 16 PH16-71-731Q i7-13700HX, GeForce RTX 4060 Laptop GPU | Dell G15 5530 i7-13650HX, GeForce RTX 4060 Laptop GPU | Lenovo Legion Pro 5 16ARX8 (R5 7645HX, RTX 4050) R5 7645HX, GeForce RTX 4050 Laptop GPU | Lenovo LOQ 15APH8 R7 7840HS, GeForce RTX 4050 Laptop GPU | |
|---|---|---|---|---|---|---|---|---|
| Noise | -1% | -7% | -9% | -3% | 3% | 5% | 0% | |
| apagado / medio ambiente * (dB) | 21.57 | 24 -11% | 25 -16% | 25 -16% | 24 -11% | 20.41 5% | 23 -7% | 23.1 -7% |
| Idle Minimum * (dB) | 23.68 | 25 -6% | 27 -14% | 25 -6% | 24 -1% | 26.85 -13% | 23 3% | 23.1 2% |
| Idle Average * (dB) | 23.68 | 26 -10% | 29 -22% | 26 -10% | 24 -1% | 26.85 -13% | 23 3% | 23.1 2% |
| Idle Maximum * (dB) | 23.68 | 27 -14% | 31 -31% | 27 -14% | 32.32 -36% | 26.85 -13% | 24.42 -3% | 25.2 -6% |
| Load Average * (dB) | 39.44 | 42 -6% | 42 -6% | 52 -32% | 36.66 7% | 27.65 30% | 34.94 11% | 44.3 -12% |
| Witcher 3 ultra * (dB) | 55.4 | 43 22% | 43 22% | 51 8% | 49.06 11% | 47.9 14% | 43.79 21% | 45.8 17% |
| Load Maximum * (dB) | 55.37 | 45 19% | 45 19% | 53 4% | 49.49 11% | 47.86 14% | 50 10% | 52 6% |
* ... más pequeño es mejor
Temperatura
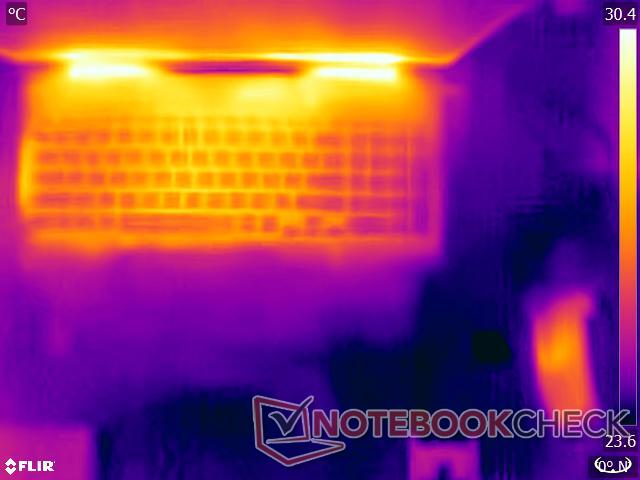
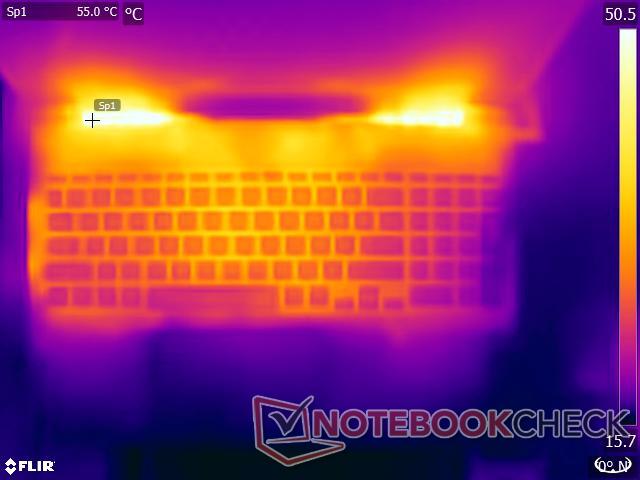
De buenas a primeras, el HP Victus 16 se calienta al tacto después de un rato jugando. Su chasis de plástico no aísla bien el calor generado por sus componentes de alto consumo. El teclado, en particular, se calienta notablemente después de unos minutos de juego.
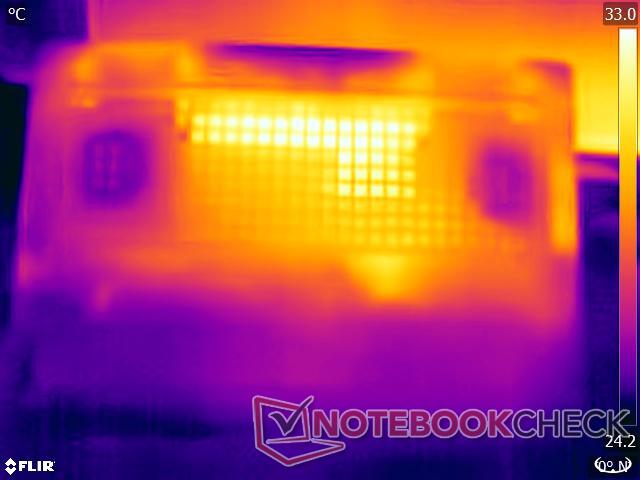
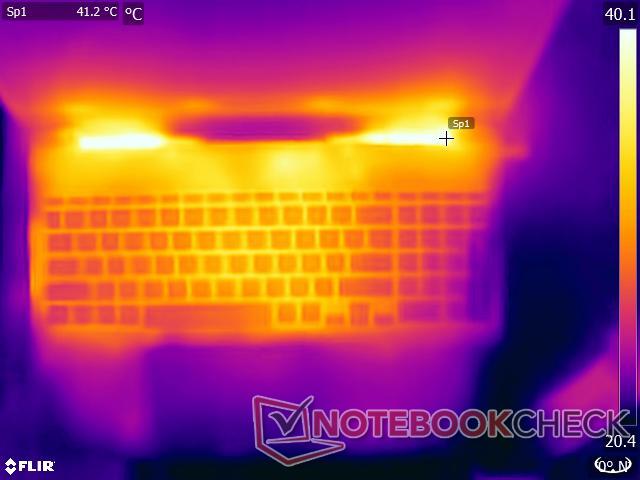
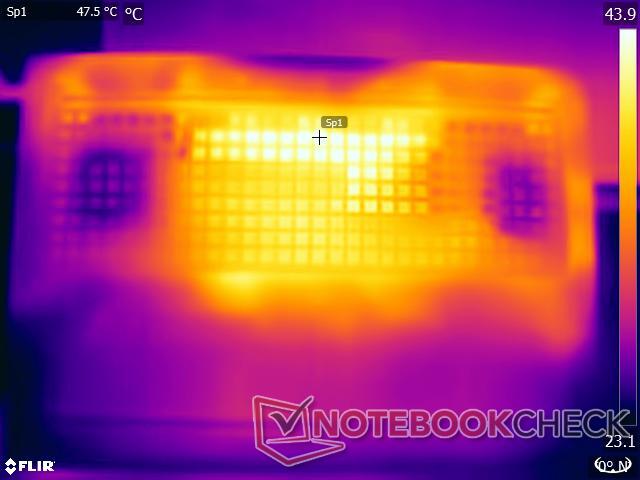
Las decisiones de diseño de HP hacen que parte del calor se expulse en todas direcciones. Nuestras pruebas determinaron que el área directamente adyacente a la ventilación podía calentarse hasta 48ºC bajo carga. Eso es lo más caliente que se pone el portátil, con sus áreas circundantes rondando los 44° C y 45.8 °C.
(-) La temperatura máxima en la parte superior es de 48 °C / 118 F, frente a la media de 40.4 °C / 105 F, que oscila entre 21.2 y 68.8 °C para la clase Gaming.
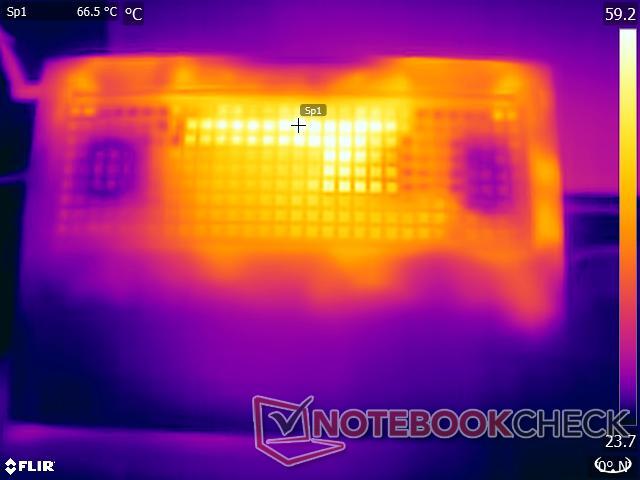
(-) El fondo se calienta hasta un máximo de 48 °C / 118 F, frente a la media de 43.2 °C / 110 F
(+) En reposo, la temperatura media de la parte superior es de 28 °C / 82# F, frente a la media del dispositivo de 33.9 °C / 93 F.
(-) Jugando a The Witcher 3, la temperatura media de la parte superior es de 38.7 °C / 102 F, frente a la media del dispositivo de 33.9 °C / 93 F.
(+) El reposamanos y el panel táctil están a una temperatura inferior a la de la piel, con un máximo de 31.2 °C / 88.2 F y, por tanto, son fríos al tacto.
(-) La temperatura media de la zona del reposamanos de dispositivos similares fue de 28.8 °C / 83.8 F (-2.4 °C / -4.4 F).
| HP Victus 16-r0076TX Intel Core i5-13500HX, NVIDIA GeForce RTX 4050 Laptop GPU | Acer Nitro 16 AN16-41-R7YE AMD Ryzen 5 7535HS, NVIDIA GeForce RTX 4050 Laptop GPU | Acer Predator Triton 14 PT14-51 Intel Core i7-13700H, NVIDIA GeForce RTX 4050 Laptop GPU | Alienware m16 R1 Intel Intel Core i7-13700HX, NVIDIA GeForce RTX 4060 Laptop GPU | Acer Predator Helios 16 PH16-71-731Q Intel Core i7-13700HX, NVIDIA GeForce RTX 4060 Laptop GPU | Dell G15 5530 Intel Core i7-13650HX, NVIDIA GeForce RTX 4060 Laptop GPU | Lenovo Legion Pro 5 16ARX8 (R5 7645HX, RTX 4050) AMD Ryzen 5 7645HX, NVIDIA GeForce RTX 4050 Laptop GPU | Lenovo LOQ 15APH8 AMD Ryzen 7 7840HS, NVIDIA GeForce RTX 4050 Laptop GPU | |
|---|---|---|---|---|---|---|---|---|
| Heat | -15% | -10% | -17% | -17% | -17% | -14% | 2% | |
| Maximum Upper Side * (°C) | 48 | 51 -6% | 54 -13% | 49 -2% | 41 15% | 54 -13% | 45 6% | 44.4 7% |
| Maximum Bottom * (°C) | 48 | 63 -31% | 56 -17% | 48 -0% | 66 -38% | 62.2 -30% | 54 -13% | 52 -8% |
| Idle Upper Side * (°C) | 29.6 | 34 -15% | 31 -5% | 40 -35% | 36 -22% | 33.4 -13% | 36 -22% | 28 5% |
| Idle Bottom * (°C) | 30.2 | 32 -6% | 31 -3% | 39 -29% | 37 -23% | 33.4 -11% | 38 -26% | 29.6 2% |
* ... más pequeño es mejor
Prueba de resistencia
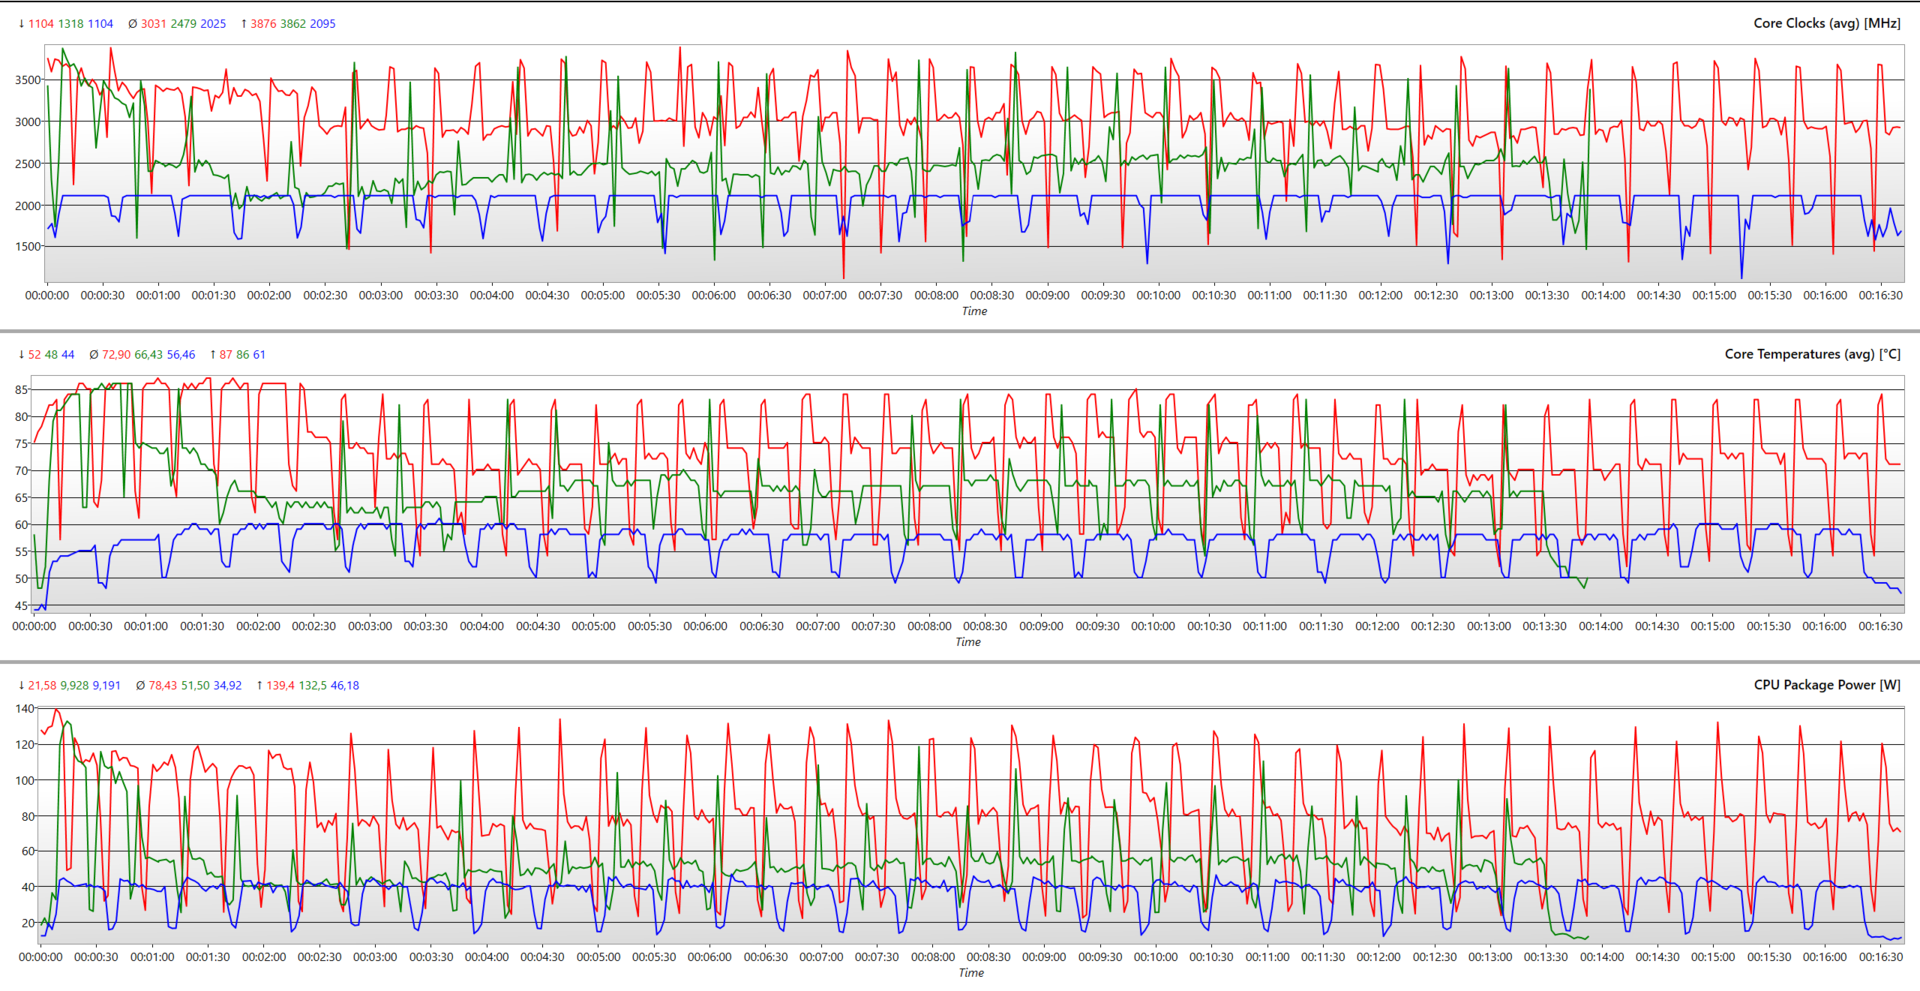
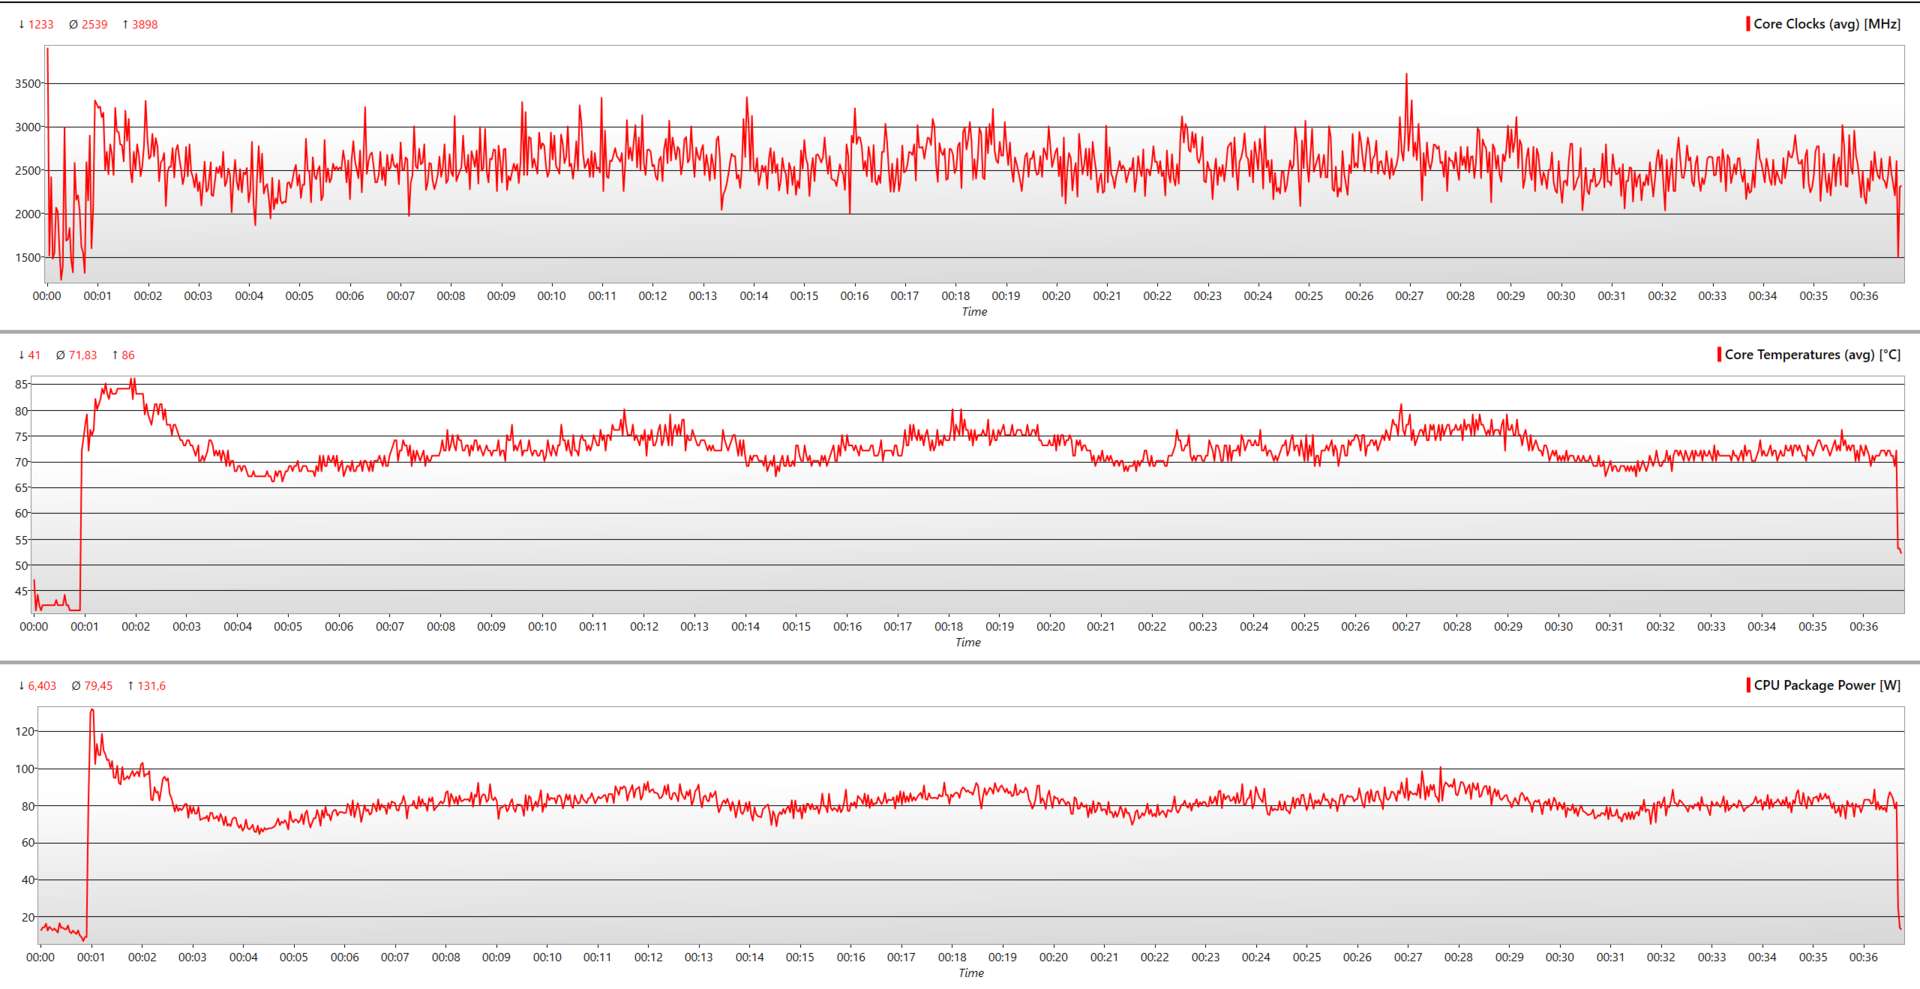
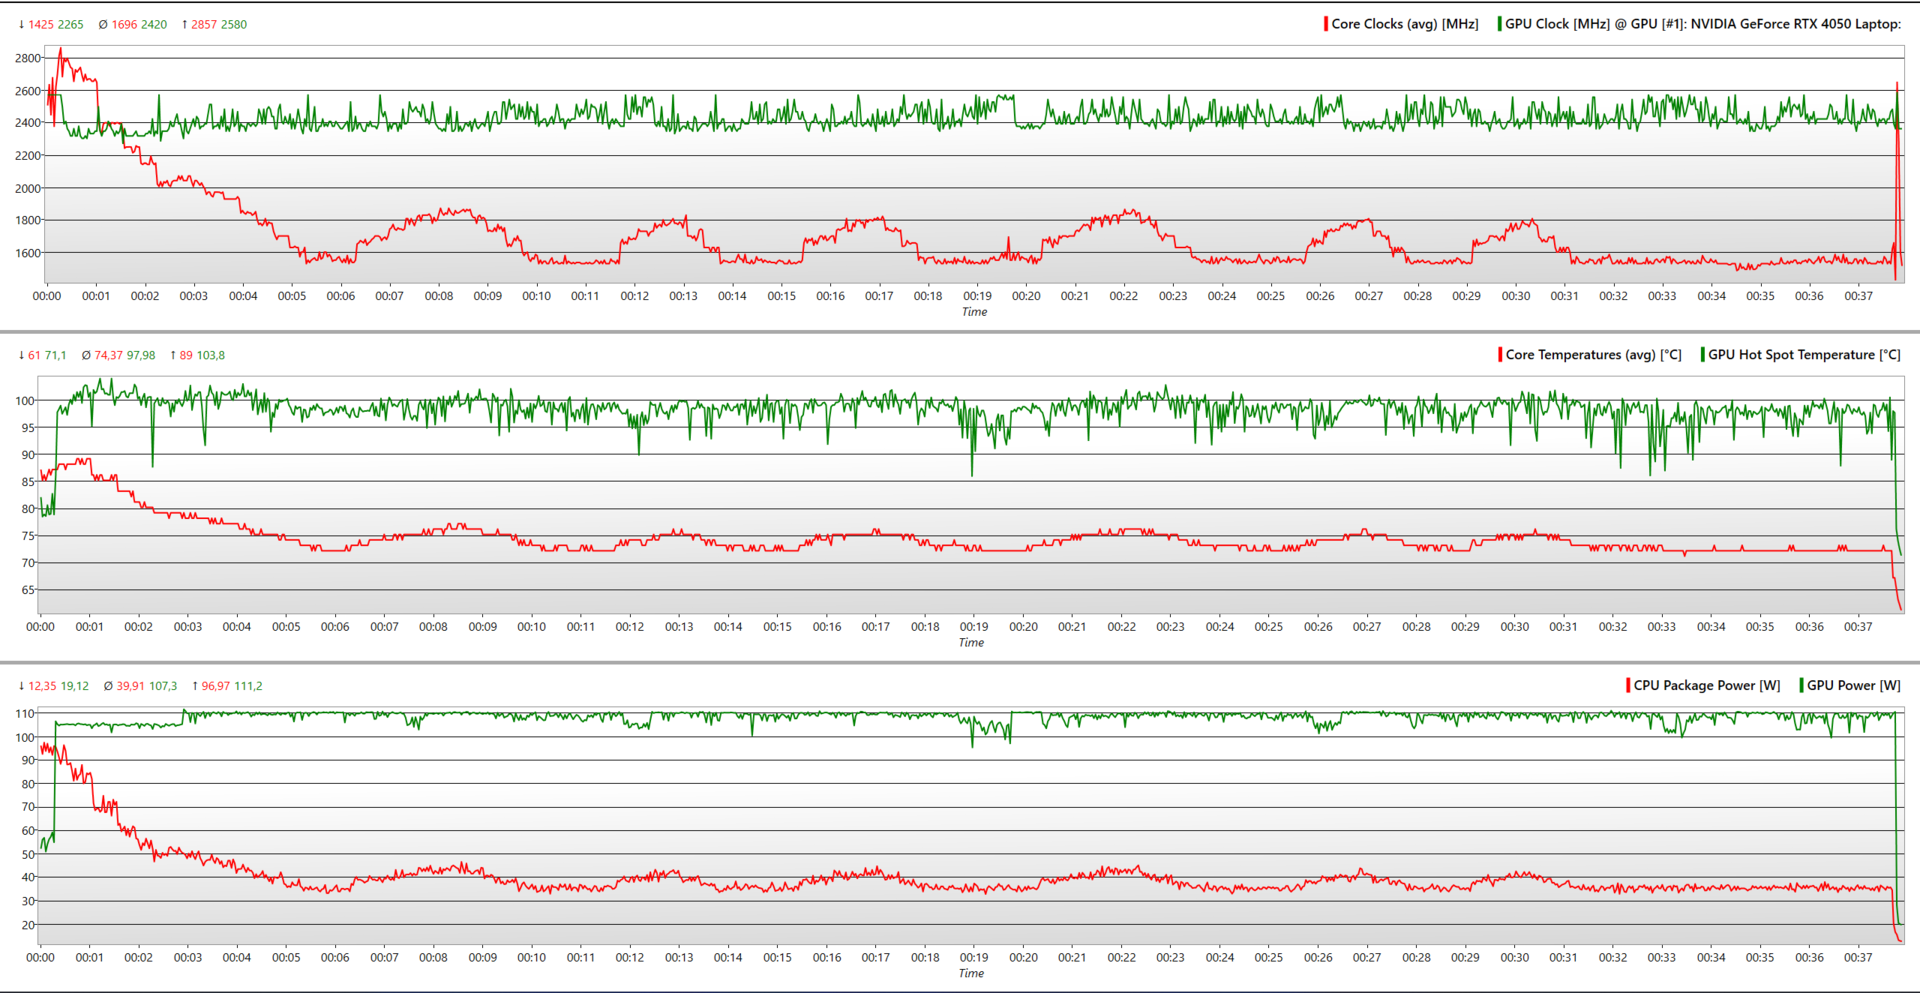
Bajo cargas sostenidas, la CPU y la GPU del HP Victus 16 sufren una notable caída de velocidad. El procesador Core i5-13500HX puede alcanzar los 2.8 GHz durante un rato antes de estabilizarse en torno a los 1.69 GHz. Su temperatura ronda los 77 °C.
De forma similar, la GeForce RTX 4050 intenta mantener sus frecuencias a 2.580 MHz, pero al final se queda en 2.420 MHz, que entra dentro de las frecuencias de aceleración anunciadas por Nvidia. Se calienta un poco más que la CPU, con una temperatura media de 82,5 °C, gracias a los dos robustos ventiladores y a los conductos de calor que canalizan el calor a través de los orificios de ventilación.
El núcleo P puede acelerar hasta 4,4 GHz durante un breve periodo, un poco menos que la cifra anunciada por Intel de 4,7 GHz. Del mismo modo, su núcleo E alcanza un máximo de 3,49 GHz, un pelín por debajo de los 3,50 GHz. De media, el reloj boost general alcanza los 3,8 GHz. Al cabo de un rato, se estabiliza en torno a los 2,53 GHz.
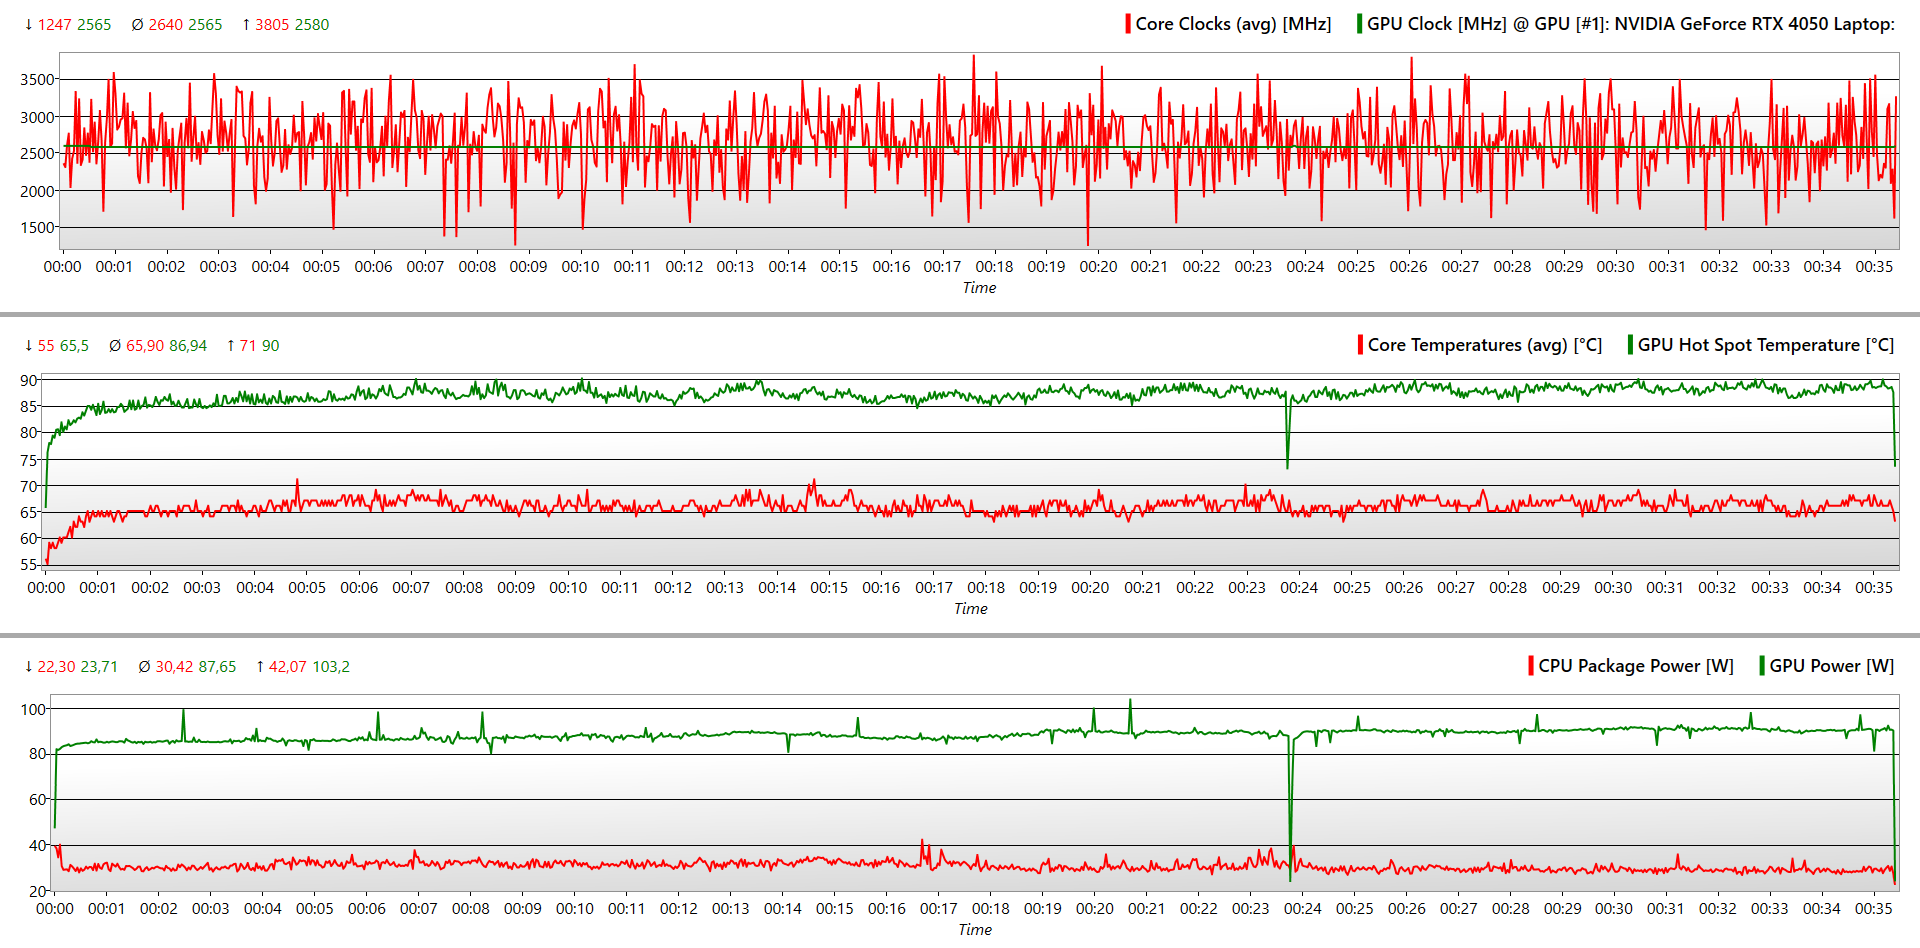
| Estrés | Reloj CPU (GHz) | Reloj GPU (MHz) | Temperatura mediaCPU (°C) | Temperatura media GPU (°C) |
| Sistema en reposo | 1.755 | 700 | 41 | 45 |
| Prime95 | 2.539 | 500 | 82,5 | 63,1 |
| Prime95+ FurMark | 1.696 | 2.420 | 77,2 | 82,5 |
| El Witcher 3 1080p Ultra | 3.047 | 2.565 | 80 | 74 |
Altavoces
Con un volumen máximo de 70,7 dB(A), apenas son más ruidosos que el ventilador en condiciones de estrés. Los transductores en sí son minúsculos y nada del otro mundo.
Dicho esto, HP se ha esforzado un poco y ha incluido un ajuste B&O (Bang and Olufsen). El resultado son unos medios y agudos respetables, pero no se puede decir lo mismo de los graves. Está bien para el consumo de vídeo, pero la calidad de audio podría verse comprometida si los ventiladores deciden acelerar.
Como alternativa, se pueden conectar unos auriculares/altavoces a través de la toma de audio de 3,5 mm o de forma totalmente inalámbrica con Bluetooth 5.3.
HP Victus 16-r0076TX análisis de audio
(-) | altavoces no muy altos (#70.7 dB)
Graves 100 - 315 Hz
(±) | lubina reducida - en promedio 9.7% inferior a la mediana
(±) | la linealidad de los graves es media (7.6% delta a frecuencia anterior)
Medios 400 - 2000 Hz
(+) | medios equilibrados - a sólo 3.2% de la mediana
(+) | los medios son lineales (2.5% delta a la frecuencia anterior)
Altos 2 - 16 kHz
(+) | máximos equilibrados - a sólo 4% de la mediana
(+) | los máximos son lineales (5.7% delta a la frecuencia anterior)
Total 100 - 16.000 Hz
(±) | la linealidad del sonido global es media (15.4% de diferencia con la mediana)
En comparación con la misma clase
» 34% de todos los dispositivos probados de esta clase eran mejores, 7% similares, 59% peores
» El mejor tuvo un delta de 6%, la media fue 18%, el peor fue ###max##%
En comparación con todos los dispositivos probados
» 22% de todos los dispositivos probados eran mejores, 4% similares, 73% peores
» El mejor tuvo un delta de 4%, la media fue 24%, el peor fue ###max##%
Apple MacBook Pro 16 2021 M1 Pro análisis de audio
(+) | los altavoces pueden reproducir a un volumen relativamente alto (#84.7 dB)
Graves 100 - 315 Hz
(+) | buen bajo - sólo 3.8% lejos de la mediana
(+) | el bajo es lineal (5.2% delta a la frecuencia anterior)
Medios 400 - 2000 Hz
(+) | medios equilibrados - a sólo 1.3% de la mediana
(+) | los medios son lineales (2.1% delta a la frecuencia anterior)
Altos 2 - 16 kHz
(+) | máximos equilibrados - a sólo 1.9% de la mediana
(+) | los máximos son lineales (2.7% delta a la frecuencia anterior)
Total 100 - 16.000 Hz
(+) | el sonido global es lineal (4.6% de diferencia con la mediana)
En comparación con la misma clase
» 0% de todos los dispositivos probados de esta clase eran mejores, 0% similares, 100% peores
» El mejor tuvo un delta de 5%, la media fue 17%, el peor fue ###max##%
En comparación con todos los dispositivos probados
» 0% de todos los dispositivos probados eran mejores, 0% similares, 100% peores
» El mejor tuvo un delta de 4%, la media fue 24%, el peor fue ###max##%
Gestión de la energía: La duración de la batería podría haber sido mejor
Consumo de energía
El procesador Raptor Lake-HX del HP Victus 16 y la GPU Ada Lovelace no dan abasto con el bloque de 230W consumiendo hasta 237W. Sin embargo, la situación es mucho mejor en inactivo, con un consumo máximo de 22.1W.
Ese valor no cambia mucho en los procesadores AMD de marca HX que se encuentran en sus competidores. Curiosamente, el Dell G5 15's Core i7-13700HX es un poco más eficiente en inactivo, con un consumo medio de 14,98 vatios.
| Off / Standby | |
| Ocioso | |
| Carga |
|
Clave:
min: | |
| HP Victus 16-r0076TX i5-13500HX, GeForce RTX 4050 Laptop GPU, SK hynix PC801 HFS512GEJ9X101N BF, IPS, 1920x1080, 16.1" | Acer Nitro 16 AN16-41-R7YE R5 7535HS, GeForce RTX 4050 Laptop GPU, SK hynix HFS512GEJ9X125N, IPS, 1920x1200, 16" | Acer Predator Helios 16 PH16-71-731Q i7-13700HX, GeForce RTX 4060 Laptop GPU, Micron 3400 1TB MTFDKBA1T0TFH, IPS-LED, 2560x1600, 16" | Dell G15 5530 i7-13650HX, GeForce RTX 4060 Laptop GPU, SSTC CL4-3D512-Q11, IPS, 1920x1080, 15.6" | Lenovo Legion Pro 5 16ARX8 (R5 7645HX, RTX 4050) R5 7645HX, GeForce RTX 4050 Laptop GPU, SK hynix PC801 HFS512GEJ9X115N, IPS, 2560x1600, 16" | Lenovo LOQ 15APH8 R7 7840HS, GeForce RTX 4050 Laptop GPU, Micron 2450 512GB MTFDKCD512TFK, IPS, 1920x1080, 15.6" | Medio NVIDIA GeForce RTX 4050 Laptop GPU | Media de la clase Gaming | |
|---|---|---|---|---|---|---|---|---|
| Power Consumption | 7% | -5% | 13% | 12% | 15% | 21% | -1% | |
| Idle Minimum * (Watt) | 16.12 | 19 -18% | 15.9 1% | 8.4 48% | 13 19% | 15 7% | 9.95 ? 38% | 13.2 ? 18% |
| Idle Average * (Watt) | 20.47 | 20 2% | 20.5 -0% | 14.98 27% | 17.4 15% | 17.7 14% | 15.8 ? 23% | 18.9 ? 8% |
| Idle Maximum * (Watt) | 22.11 | 23 -4% | 20.9 5% | 15.56 30% | 21.8 1% | 21.5 3% | 20.1 ? 9% | 24.3 ? -10% |
| Load Average * (Watt) | 94.8 | 80 16% | 106 -12% | 96.8 -2% | 96.4 -2% | 73.5 22% | 88 ? 7% | 108.3 ? -14% |
| Witcher 3 ultra * (Watt) | 166.9 | 125.8 25% | 175 -5% | 186 -11% | 125 25% | 138.6 17% | ||
| Load Maximum * (Watt) | 237 | 184 22% | 276 -16% | 271.42 -15% | 204 14% | 176.5 26% | 176.3 ? 26% | 254 ? -7% |
* ... más pequeño es mejor
Power Consumption: The Witcher 3 / Stress test
Power Consumption: External monitor
Duración de la batería
El HP Victus 16 tiene una respetable batería de 83 Wh. Una unidad de 99 Wh habría sido ideal, pero están reservadas para los modelos de gama alta.
En nuestra prueba de navegación web Wi-Fi con el brillo ajustado a 150 nits, obtuvimos unas 8 horas y 51 minutos de duración de la batería. Si aumentamos el brillo al máximo, la duración se redujo a 8 horas y 10 minutos.
Curiosamente, al portátil le fue peor en la prueba Big Buck Bunny FHD H.264 con el brillo ajustado a 150 nits y todas las radios (Wi-Fi, Bluetooth) apagadas. Duró sólo 7 horas y 39 minutos. En un escenario ideal, esta cifra debería haber sido superior.
Por último, en nuestra prueba The Witcher 3 , con un brillo de 150 nits y el juego en modo "Ultra", sólo duró 1 hora y 31 minutos. Esa cifra bajó a 1 hora y 11 minutos con una carga combinada de Prime95 y FurMark.
| HP Victus 16-r0076TX i5-13500HX, GeForce RTX 4050 Laptop GPU, 83 Wh | Alienware m16 R1 Intel i7-13700HX, GeForce RTX 4060 Laptop GPU, 86 Wh | Acer Predator Helios 16 PH16-71-731Q i7-13700HX, GeForce RTX 4060 Laptop GPU, 90 Wh | Dell G15 5530 i7-13650HX, GeForce RTX 4060 Laptop GPU, 86 Wh | Lenovo Legion Pro 5 16ARX8 (R5 7645HX, RTX 4050) R5 7645HX, GeForce RTX 4050 Laptop GPU, 80 Wh | Lenovo LOQ 15APH8 R7 7840HS, GeForce RTX 4050 Laptop GPU, 60 Wh | Media de la clase Gaming | |
|---|---|---|---|---|---|---|---|
| Duración de Batería | -30% | -13% | -30% | -38% | -13% | 3% | |
| H.264 (h) | 7.7 | 5.6 -27% | 4.8 -38% | 6.8 -12% | 5.4 -30% | 8.26 ? 7% | |
| WiFi v1.3 (h) | 8.9 | 4.8 -46% | 5.6 -37% | 6.5 -27% | 5.6 -37% | 7.4 -17% | 7.04 ? -21% |
| Witcher 3 ultra (h) | 1.5 | 1.5 0% | 0.8 -47% | 0.8 -47% | |||
| Load (h) | 1.2 | 1 -17% | 1.5 25% | 0.8 -33% | 1.1 -8% | 1.47 ? 23% | |
| Reader / Idle (h) | 6.4 | 9.8 | 8.71 ? |
Pro
Contra
Veredicto: Un portátil decente para jugar a 1080p con un presupuesto ajustado
El HP Victus 16 es un portátil de juegos decente, pero no exento de defectos. A pesar de los esfuerzos de la compañía por mantener las temperaturas bajo control con sus dos ventiladores y un laberinto de disipadores, seguimos encontrando emisiones térmicas elevadas.
De entrada, el procesador Raptor Lake-HX saca lo mejor de sí, lo que permite al portátil superar a competidores con mejores especificaciones como el Lenovo Legion Pro 5 16ARX8 con el procesador Ryzen 5 7645HX y la misma GPU.
Luego está el tema del bloatware. A todos nos gusta un buen servicio VPN, pero resulta molesto cuando aparecen ventanas emergentes de ExpressVPN cada pocos minutos. Y no, el portátil no incluye un plan de ExpressVPN.
El HP Victus 16 es una máquina de juegos 1080p ideal para los entusiastas de los e-sports con un presupuesto ajustado gracias a su potente procesador y su pantalla de 165 Hz, si puedes aguantar su ruido y sus térmicas.
Actualmente hay muy pocos portátiles en el mercado con procesadores Raptor Lake-HX de gama básica. Solo por eso, el HP Victus 16 tiene una ventaja significativa sobre el Acer Nitro 16 AN16-41 y Lenovo LOQ 15.
Precio y disponibilidad
La HP Victus 16 puede adquirirse en el sitio web de HP India por 129.990 ₹. Una variante más barata con las mismas especificaciones (Core i5-13500HX, GeForce RTX 4050, 16 GB RAM) y una pantalla inferior de 144 Hz se puede conseguir por ₹124.990€. Alternativamente, su versión de última generación se puede comprar en Amazon India por 68.400 yenes. En Amazon US, una versión con mejores especificaciones, pantalla QHD (2.560 x 1.440), procesador AMD Ryzen 7 7840HSy una GeForce RTX 4060 puede adquirirse por 1.279 dólares.
HP Victus 16-r0076TX
- 09/25/2023 v7 (old)
Anil Ganti
Transparencia
La selección de los dispositivos que se van a reseñar corre a cargo de nuestro equipo editorial. La muestra de prueba fue proporcionada al autor en calidad de préstamo por el fabricante o el minorista a los efectos de esta reseña. El prestamista no tuvo ninguna influencia en esta reseña, ni el fabricante recibió una copia de la misma antes de su publicación. No había ninguna obligación de publicar esta reseña. Como empresa de medios independiente, Notebookcheck no está sujeta a la autoridad de fabricantes, minoristas o editores.
Así es como prueba Notebookcheck
Cada año, Notebookcheck revisa de forma independiente cientos de portátiles y smartphones utilizando procedimientos estandarizados para asegurar que todos los resultados son comparables. Hemos desarrollado continuamente nuestros métodos de prueba durante unos 20 años y hemos establecido los estándares de la industria en el proceso. En nuestros laboratorios de pruebas, técnicos y editores experimentados utilizan equipos de medición de alta calidad. Estas pruebas implican un proceso de validación en varias fases. Nuestro complejo sistema de clasificación se basa en cientos de mediciones y puntos de referencia bien fundamentados, lo que mantiene la objetividad.Price comparison

