Análisis para el AMD Ryzen 7 7840HS procesador
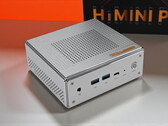
¿Un mini PC potente por poco dinero? Peladn HA-4 desafía a Geekom, Minisforum y compañía: el milagro de la eficiencia con el análisis de Ryzen 7 7840HS
El Peladn HA-4 es un mini PC potente pero compacto con el procesador AMD Ryzen 7 7840HS, 8 núcleos Zen4 y gráficos Radeon 780M integrados. Gracias a la rápida memoria RAM DDR5 y a una veloz unidad SSD PCIe, ofrece un potente rendimiento en una carcasa que ahorra espacio. Con un precio que ronda los 505 dólares, el Peladn HA-4 es uno de los mini PC más eficientes de su categoría de precio.
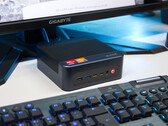
AMD Ryzen 7 7840HS, Radeon 780M, 965 gPrueba del Bosgame M4 Neo: la alternativa asequible a los caros mini PC
Pequeño, potente y flexible: con el procesador AMD Ryzen 7 7840HS, la iGPU Radeon 780M y la conexión OCuLink, el Bosgame M4 Neo ofrece mucho rendimiento en un formato mini. Pero, ¿cómo se comporta este PC compacto en el uso diario? Hemos probado en detalle esta potencia económica.
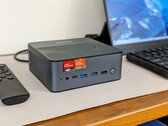
AMD Ryzen 7 7840HS, Radeon 780M, 560 gAnálisis del mini PC BOSGAME M1: Ryzen 7 7840HS sigue siendo una bestia
Si no le importa la aceleración de la IA, el Bosgame M1 es uno de los mini PC más rápidos que puede conseguir por su tamaño. Incluso incluye altavoces estéreo integrados, a diferencia de la mayoría de los demás de la categoría.
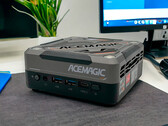
AMD Ryzen 7 7840HS, Radeon 780M, 766 gAnálisis del Acemagic AM18: Mini PC para juegos de llamativo aspecto ciberpunk con AMD Ryzen 7 7840HS y 32 GB de RAM
El Acemagic AM18 se anuncia como un PC de juegos compacto. Junto con el AMD Ryzen 7 780HS y la AMD Radeon 780M, contiene un hardware apasionante que puede encontrarse en muchos dispositivos portátiles. Hemos analizado lo bien que funciona el hardware integrado del Acemagic AM18 basándonos en muchas mediciones y pruebas comparativas.
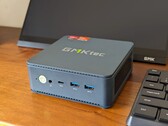
AMD Ryzen 7 7840HS, Radeon 780M, 600 gReseña del mini PC GMK NucBox K6: Tan potente como los últimos portátiles Intel Core Ultra
El mini PC viene con 16 GB de RAM, 1 TB de almacenamiento y un potente Ryzen 7 7840HS, todo ello por menos de 500 dólares para ser una alternativa atractiva al NUC de Intel. Hay algunos inconvenientes, sin duda, pero palidecen en comparación con la larga lista de puntos fuertes.
AMD Ryzen 7 7840HS, Radeon 780M, 514 gGigabyte Aorus RTX 4090 Gaming Box (eGPU): , 0.00"
análise » Análisis de la Gigabyte Aorus RTX 4090 Gaming Box: La tarjeta gráfica de consumo más rápida de Nvidia se ve enormemente limitada por Thunderbolt
Tuxedo Pulse 14 Gen3: AMD Radeon 780M, 14.00", 1.4 kg
análise » Análisis del Tuxedo Pulse 14 Gen3 - El Ultrabook Linux con AMD Zen4 y una pantalla de 120-Hz
Lenovo Yoga Pro 7 14APH G8: AMD Radeon 780M, 14.50", 1.5 kg
análise » Análisis del portátil Lenovo Yoga Pro 7 14 G8 - AMD Zen4 no es automáticamente mejor
Minisforum EliteMini UM780 XTX: AMD Radeon 780M, 0.8 kg
análise » Reseña del Minisforum EliteMini UM780 XTX: El mini PC con un AMD Ryzen 7 7840HS y una Radeon 780M ha recibido conexiones OCuLink y USB-4
Lenovo Legion Slim 7 16APH8: NVIDIA GeForce RTX 4060 Laptop GPU, 16.00", 2.1 kg
análise » Análisis del portátil para juegos Lenovo Legion Slim 7 16: Convence incluso con AMD Ryzen
Schenker XMG Apex 15 (Late 23): NVIDIA GeForce RTX 4050 Laptop GPU, 15.60", 2.2 kg
análise » Análisis del XMG Apex 15 (23º): El portátil para juegos con una RTX 4050 que ofrece buenos tiempos de ejecución
Schenker XMG CORE 16 (L23): NVIDIA GeForce RTX 4070 Laptop GPU, 16.00", 2.4 kg
análise » Análisis del portátil para juegos SCHENKER XMG Core 16 - Un auténtico competidor del Lenovo Legion Pro 5 16
Schenker XMG Apex 17 (Late 23): NVIDIA GeForce RTX 4060 Laptop GPU, 17.30", 2.5 kg
análise » Análisis del XMG Apex 17 (finales del 23): un portátil gaming QHD con una RTX 4060
Lenovo Legion Slim 5 14APH8: NVIDIA GeForce RTX 4060 Laptop GPU, 14.50", 1.7 kg
análise » Análisis del portátil Lenovo Legion Slim 5 14APH8: el punto dulce de la OLED 2.8K de 120 Hz
HP Omen 16-xf0376ng: NVIDIA GeForce RTX 4070 Laptop GPU, 16.10", 2.4 kg
análise » Análisis del portátil HP Omen 16: Una buena elección para jugadores incluso con Zen 4
Beelink SER7: AMD Radeon 780M, 0.6 kg
análise » Análisis del mini PC SER7 de Beelink: Ryzen 7 7840HS con refrigeración por cámara de vapor
Lenovo Legion Slim 5 16APH8: NVIDIA GeForce RTX 4060 Laptop GPU, 16.00", 2.4 kg
análise » Análisis del portátil Lenovo Legion Slim 5 16APH8: Diseño infravalorado con una GPU de bajo rendimiento
Lenovo LOQ 15APH8: NVIDIA GeForce RTX 4050 Laptop GPU, 15.60", 2.5 kg
análise » Análisis del portátil Lenovo LOQ 15 Ryzen 7 7840HS: No lo llames Legion
Beelink GTR7 7840HS: AMD Radeon 780M, 0.9 kg
análise » Debut del rendimiento de AMD Ryzen 7 7840HS: Análisis del mini PC Beelink GTR7
Acer Nitro 16 AN16-41, R7 7840HS RTX 4060: NVIDIA GeForce RTX 4060 Laptop GPU, 16.00", 2.7 kg
análise externo » Acer Nitro 16 AN16-41, R7 7840HS RTX 4060
HP ZBook Firefly 14 G10, R7 7840HS: AMD Radeon 780M, 14.00", 1.5 kg
análise externo » HP ZBook Firefly 14 G10, R7 7840HS
Acer Nitro 16 AN16-41-R6KQ: NVIDIA GeForce RTX 4070 Laptop GPU, 16.00", 2.7 kg
análise externo » Acer Nitro 16 AN16-41-R6KQ
HP Omen 16-xf0079ng: NVIDIA GeForce RTX 4070 Laptop GPU, 16.10", 2.4 kg
análise externo » HP Omen 16-xf0079ng
Lenovo IdeaPad Pro 5 16APH8: AMD Radeon 780M, 16.00", 1.9 kg
análise externo » Lenovo IdeaPad Pro 5 16APH8
Acer Swift X SFX16-61G-R0SU: NVIDIA GeForce RTX 4050 Laptop GPU, 16.00", 2 kg
análise externo » Acer Swift X SFX16-61G-R0SU
HP Victus 16-s0475ng: NVIDIA GeForce RTX 4060 Laptop GPU, 16.10", 2.3 kg
análise externo » HP Victus 16-s0475ng
Acer Nitro 17 AN17-41-R182: NVIDIA GeForce RTX 4060 Laptop GPU, 17.30", 3 kg
análise externo » Acer Nitro 17 AN17-41-R182
Acer Nitro 17 AN17-41: NVIDIA GeForce RTX 4070 Laptop GPU, 17.30", 3 kg
análise externo » Acer Nitro 17 AN17-41
Schenker XMG CORE 16 (L23): NVIDIA GeForce RTX 4070 Laptop GPU, 16.00", 2.4 kg
análise externo » SCHENKER XMG CORE 16 (L23)
HP Omen 16-xf0000: NVIDIA GeForce RTX 4060 Laptop GPU, 16.10", 2.4 kg
análise externo » HP Omen 16-xf0000
Lenovo LOQ 15, R7 7840HS RTX 4060: NVIDIA GeForce RTX 4060 Laptop GPU, 15.60", 2.4 kg
análise externo » Lenovo LOQ 15, R7 7840HS RTX 4060
Lenovo Yoga Pro 7 14APH G8: AMD Radeon 780M, 14.50", 1.5 kg
análise externo » Lenovo Yoga Pro 7 14APH8
HP Victus 16-s0000ng: NVIDIA GeForce RTX 4050 Laptop GPU, 16.10", 2.3 kg
análise externo » HP Victus 16-s0000ng
Lenovo IdeaPad 5 Pro 16APH8: AMD Radeon 780M, 16.00", 1.9 kg
análise externo » Lenovo IdeaPad 5 Pro 16APH8
HP Victus 16-s0000: NVIDIA GeForce RTX 4070 Laptop GPU, 16.10", 2.3 kg
análise externo » HP Victus 16-s0000
Lenovo Legion Slim 5 14APH8: NVIDIA GeForce RTX 4060 Laptop GPU, 14.50", 1.7 kg
análise externo » Lenovo Legion Slim 5 14APH8
Xiaomi RedmiBook Pro 15 2023: AMD Radeon 780M, 15.60", 1.8 kg
análise externo » Xiaomi RedmiBook Pro 15 2023
Lenovo LOQ 15APH8: NVIDIA GeForce RTX 4050 Laptop GPU, 15.60", 2.5 kg
análise externo » Lenovo LOQ 15APH8
Acer Nitro 17 AN17-41-R6L9: NVIDIA GeForce RTX 4050 Laptop GPU, 17.30", 3 kg
análise externo » Acer Nitro 17 AN17-41-R6L9
Lenovo Legion Slim 5 16APH8: NVIDIA GeForce RTX 4060 Laptop GPU, 16.00", 2.4 kg
análise externo » Lenovo Legion Slim 5 16APH8
Acemagic AM18: AMD Radeon 780M, 0.6 kg
» Aniversario de Acemagic 2026: gran campaña de descuentos en mini PC, portátiles y sistemas NAS
Peladn HA-4, R7 7840HS: AMD Radeon 780M, 1 kg
» Elegante mini PC Ryzen 7 a prueba - Peladn HA-4 puntúa con la máxima eficiencia e iluminación RGB