Análisis del portátil Medion Erazer Crawler E40: Gamer asequible con buen rendimiento RTX 4050
El Medion Erazer Crawler E40 sustituye al E30 (con Intel Gen12 y RTX 30xx) y lleva la serie al estado actual de la técnica con Intel Gen 13 y RTX 4050. Este portátil para juegos de gama básica tiene actualmente un precio ligeramente inferior a ~1100 dólares estadounidenses.
Compitiendo con otros portátiles para juegos económicos, el Medion Erazer Crawler E40 se enfrenta a rivales como el Lenovo LOQ 15el Asus TUF Gaming A15, el XMG Apex 15o el MSI Katana 15.
Medion engloba numerosos modelos bajo la marca "Erazer", lo que hace difícil seguirles la pista a todos. Mientras que otros fabricantes organizan series en las que combinan distintas configuraciones en una misma carcasa, Medion parece creer que cada configuración justifica un nuevo nombre de serie. La Erazer Crawler E40 sólo está disponible en esta configuración específica y, por tanto, sólo se vende como este único modelo. No hay opciones en cuanto a CPU, GPU o pantalla.
Otros modelos Medion Erazer que hemos probado anteriormente incluyen:
Posibles contendientes en la comparación
Valoración | Fecha | Modelo | Peso | Altura | Tamaño | Resolución | Precio |
|---|---|---|---|---|---|---|---|
| 85.4 % v7 (old) | 12/2023 | Medion Erazer Crawler E40 - MD 62518 i5-13500H, GeForce RTX 4050 Laptop GPU | 2.3 kg | 28 mm | 15.60" | 1920x1080 | |
| 85.9 % v7 (old) | 10/2023 | Lenovo LOQ 15IRH8 Core i7 i7-13620H, GeForce RTX 4050 Laptop GPU | 2.4 kg | 25.2 mm | 15.60" | 2560x1440 | |
| 86.3 % v7 (old) | 06/2023 | Asus TUF A15 FA507 R7 7735HS, GeForce RTX 4050 Laptop GPU | 2.2 kg | 24.9 mm | 15.60" | 1920x1080 | |
| 86.2 % v7 (old) | 10/2023 | Schenker XMG Apex 15 (Late 23) R7 7840HS, GeForce RTX 4050 Laptop GPU | 2.2 kg | 26.7 mm | 15.60" | 2560x1440 | |
| 82.9 % v7 (old) | 03/2023 | MSI Katana 15 B12VEK i7-12650H, GeForce RTX 4050 Laptop GPU | 2.3 kg | 24.9 mm | 15.60" | 1920x1080 |
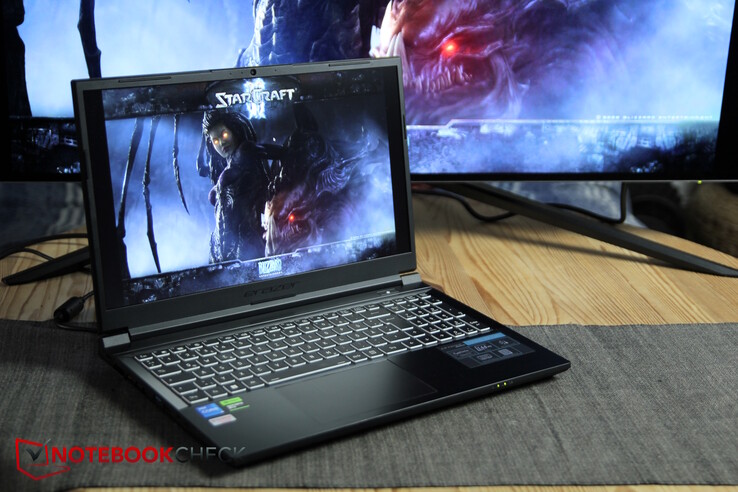
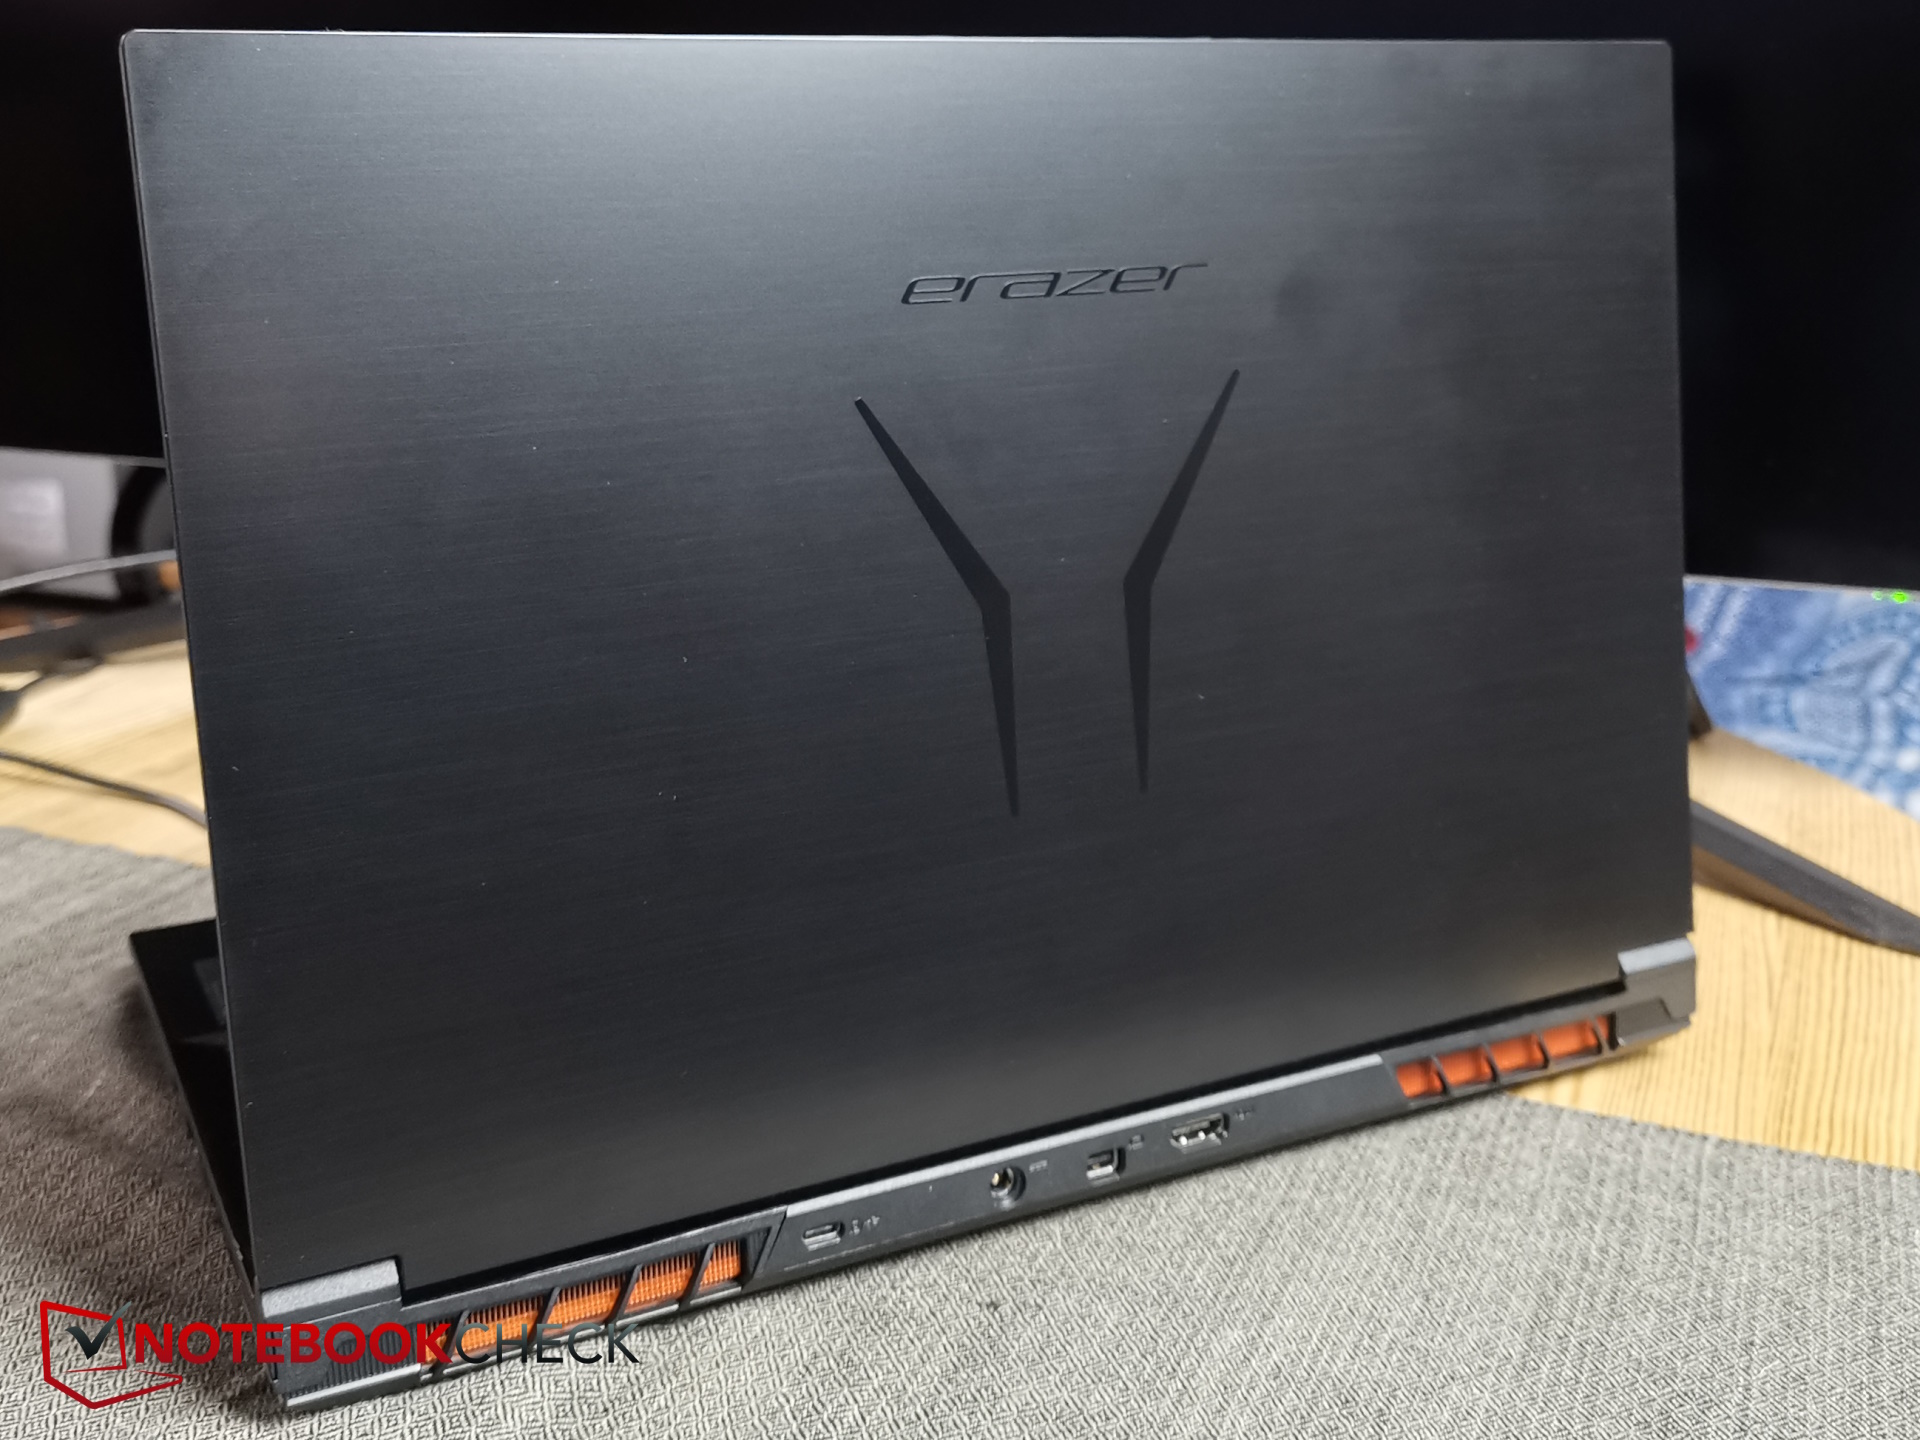
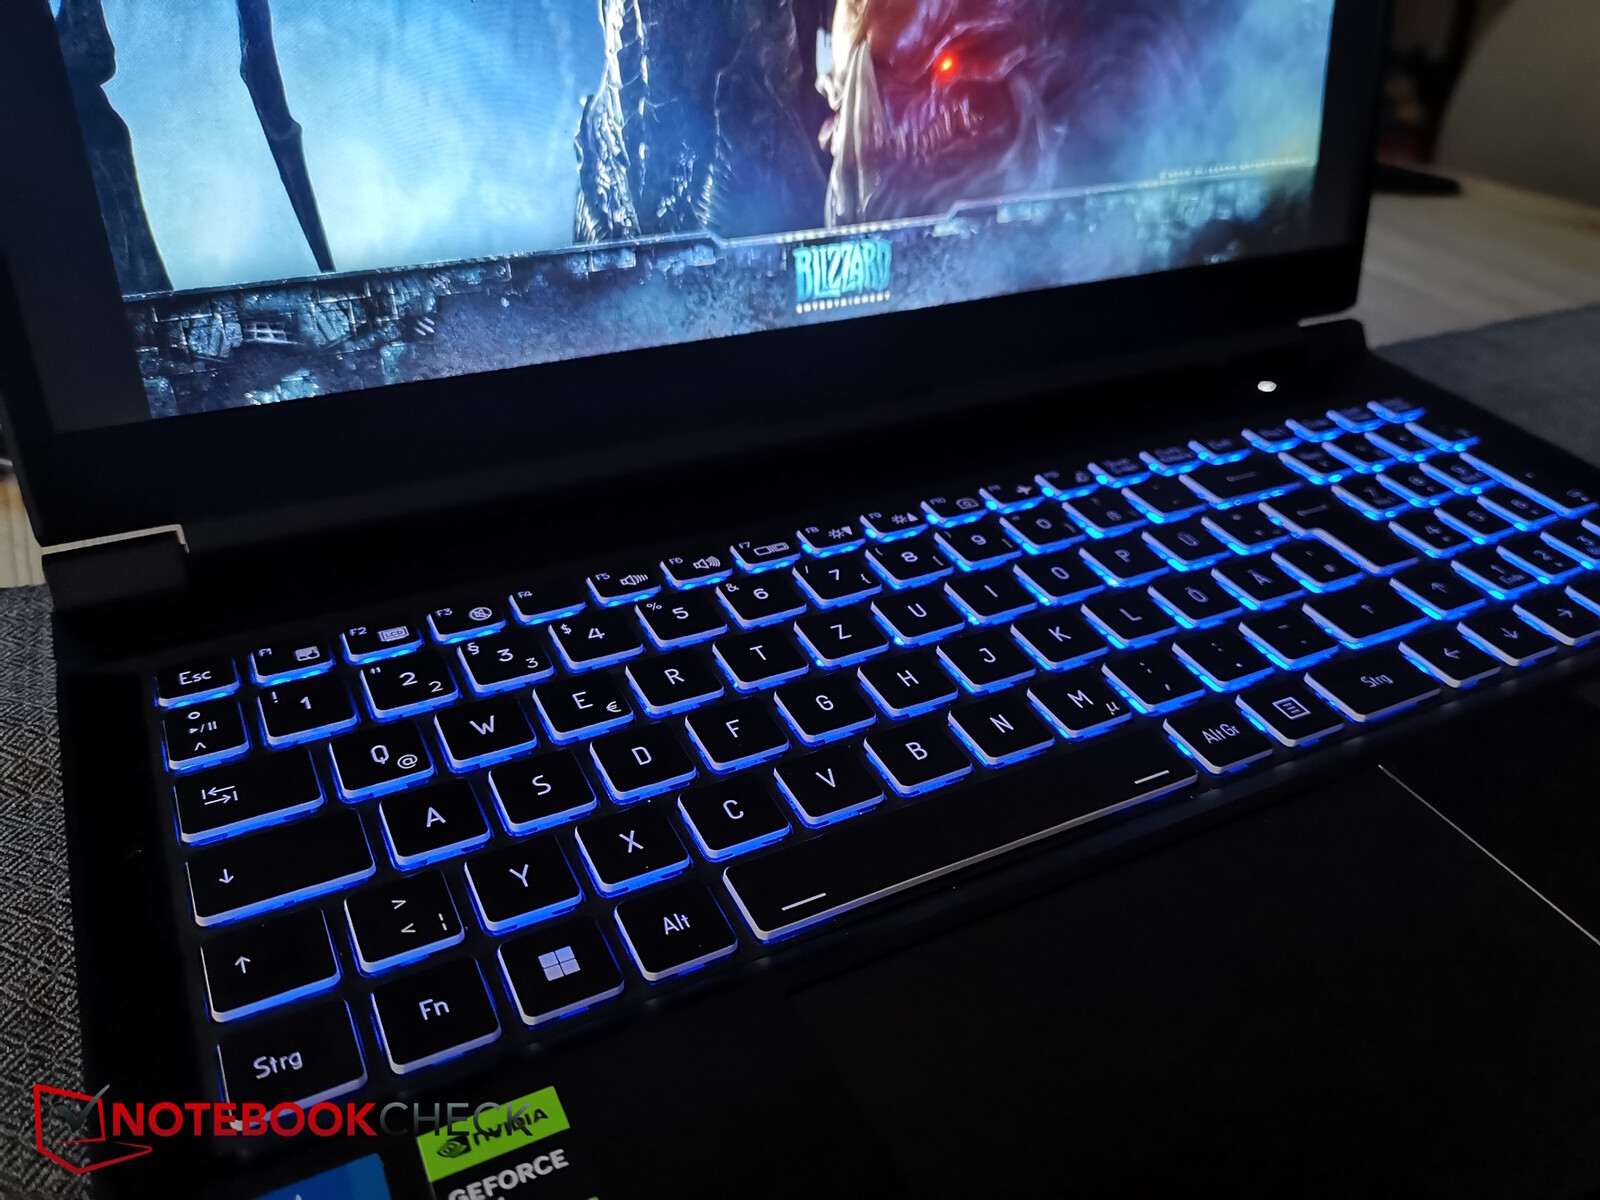
Carcasa y conectividad - Crawler E40 en acabado de plástico cepillado
La tapa de la pantalla y la base están construidas con un plástico robusto que se asemeja mucho al aluminio, lo que le da un aspecto intencionado. Los bordes de la pantalla y la parte inferior del portátil son de plástico blando. Tanto la tapa lisa como la base son propensas a atraer las huellas dactilares.
Con un diseño totalmente negro, incluido el logotipo de Erazer en la tapa, el portátil tiene una estética relativamente sencilla. La base exhibe un alto nivel de resistencia a la torsión, mientras que la tapa, aunque menos, parece notablemente "blanda" y se flexiona considerablemente al retorcerla, aunque la pantalla lo soporta estoicamente. La mano de obra en general es de un buen nivel, y no hay huecos visibles.
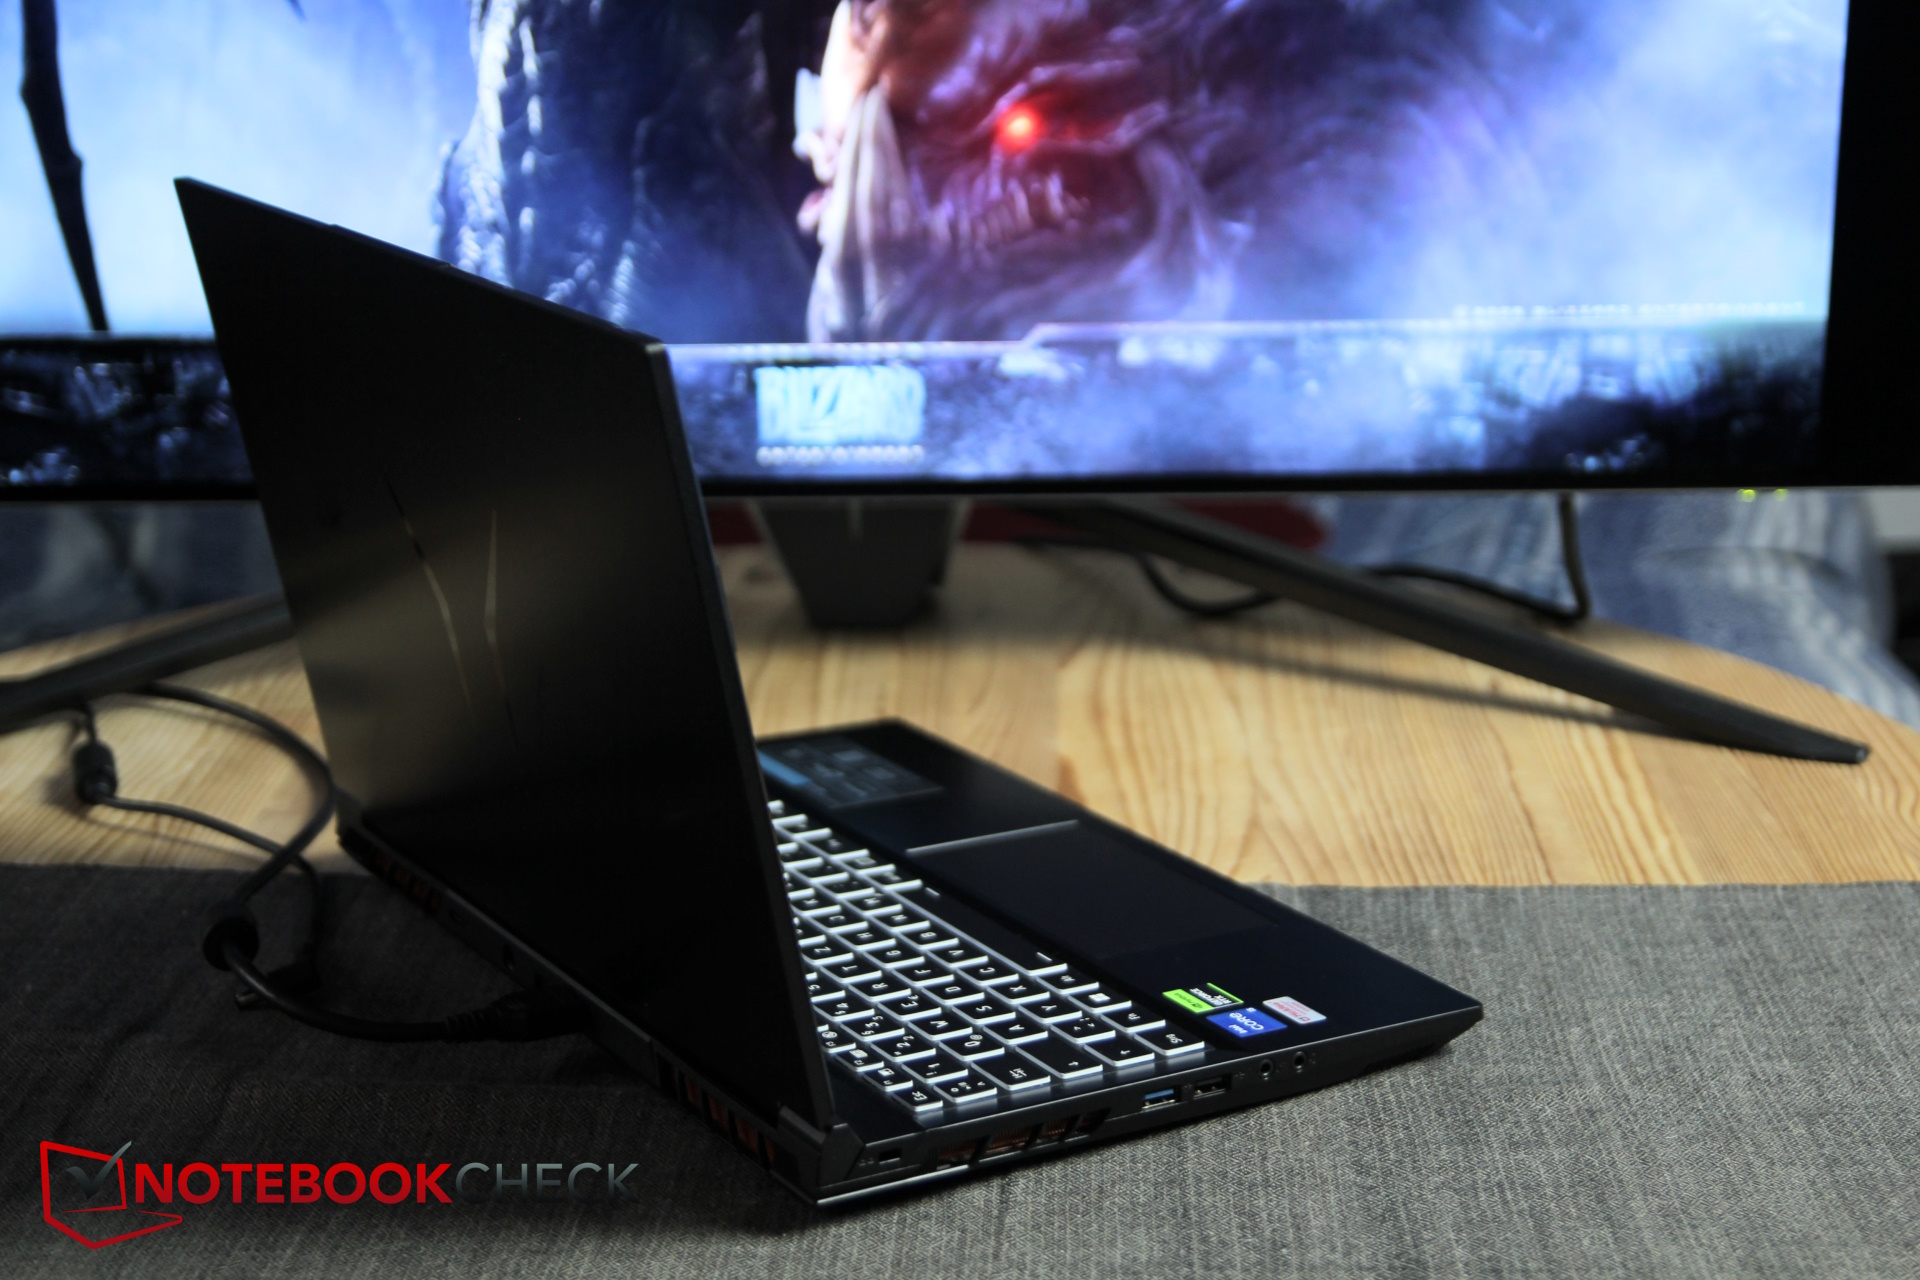
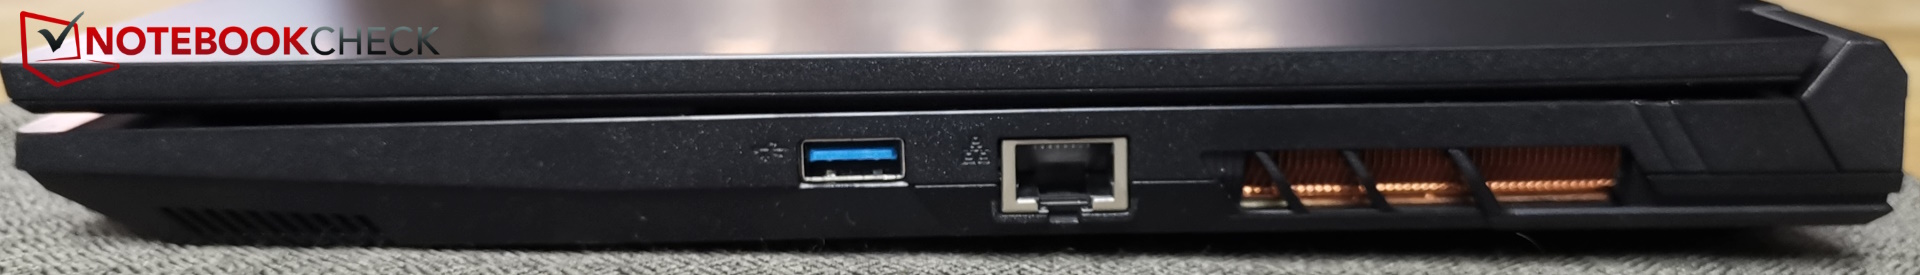
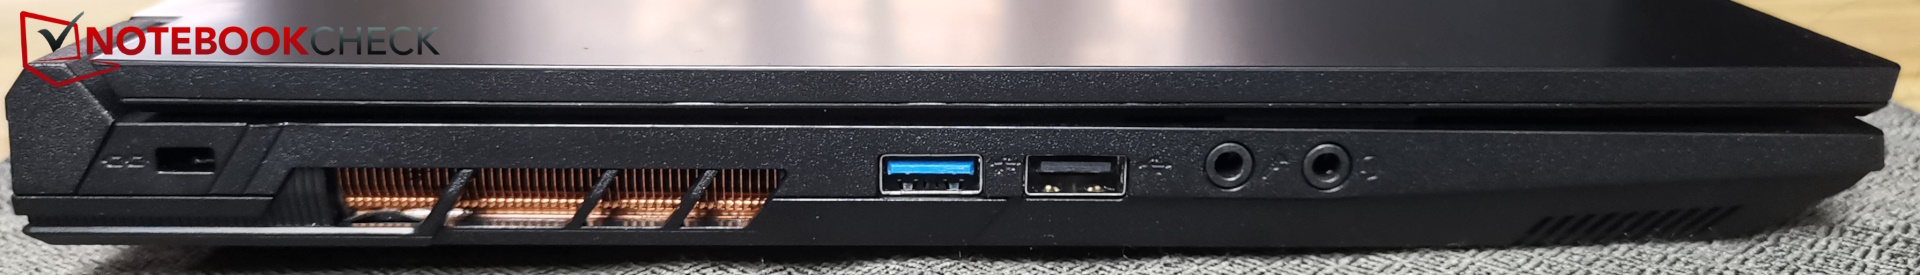
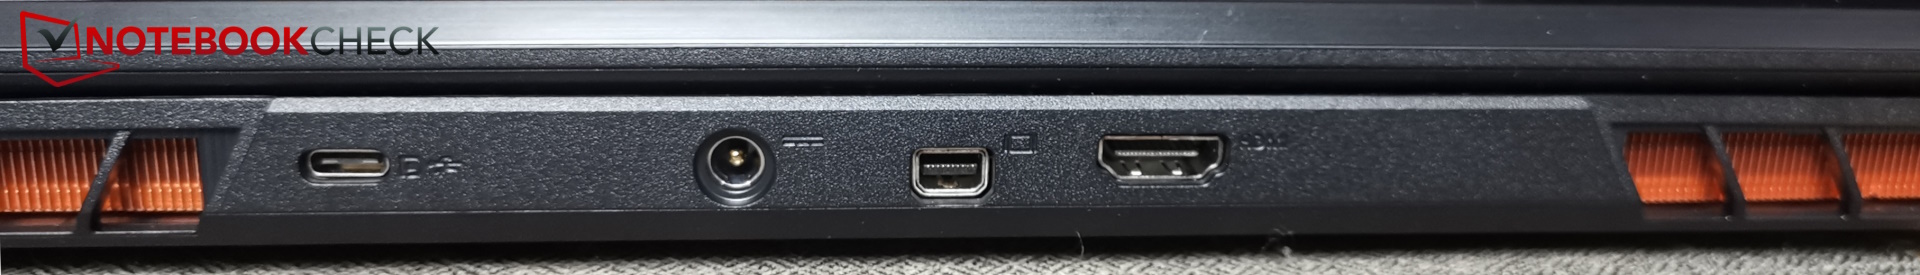
Conexiones - Sin Thunderbolt, pero con USB 2.0 en su lugar
A pesar de contar con una CPU Intel, el E40 carece de soporte Thunderbolt. Incluye USB-C con una velocidad de 10 Gb/s. Sin embargo, también incorpora un anticuado puerto USB-A 2.0, que potencialmente podría actualizarse a una alternativa más rápida. Cabe destacar que no dispone de lector de tarjetas.


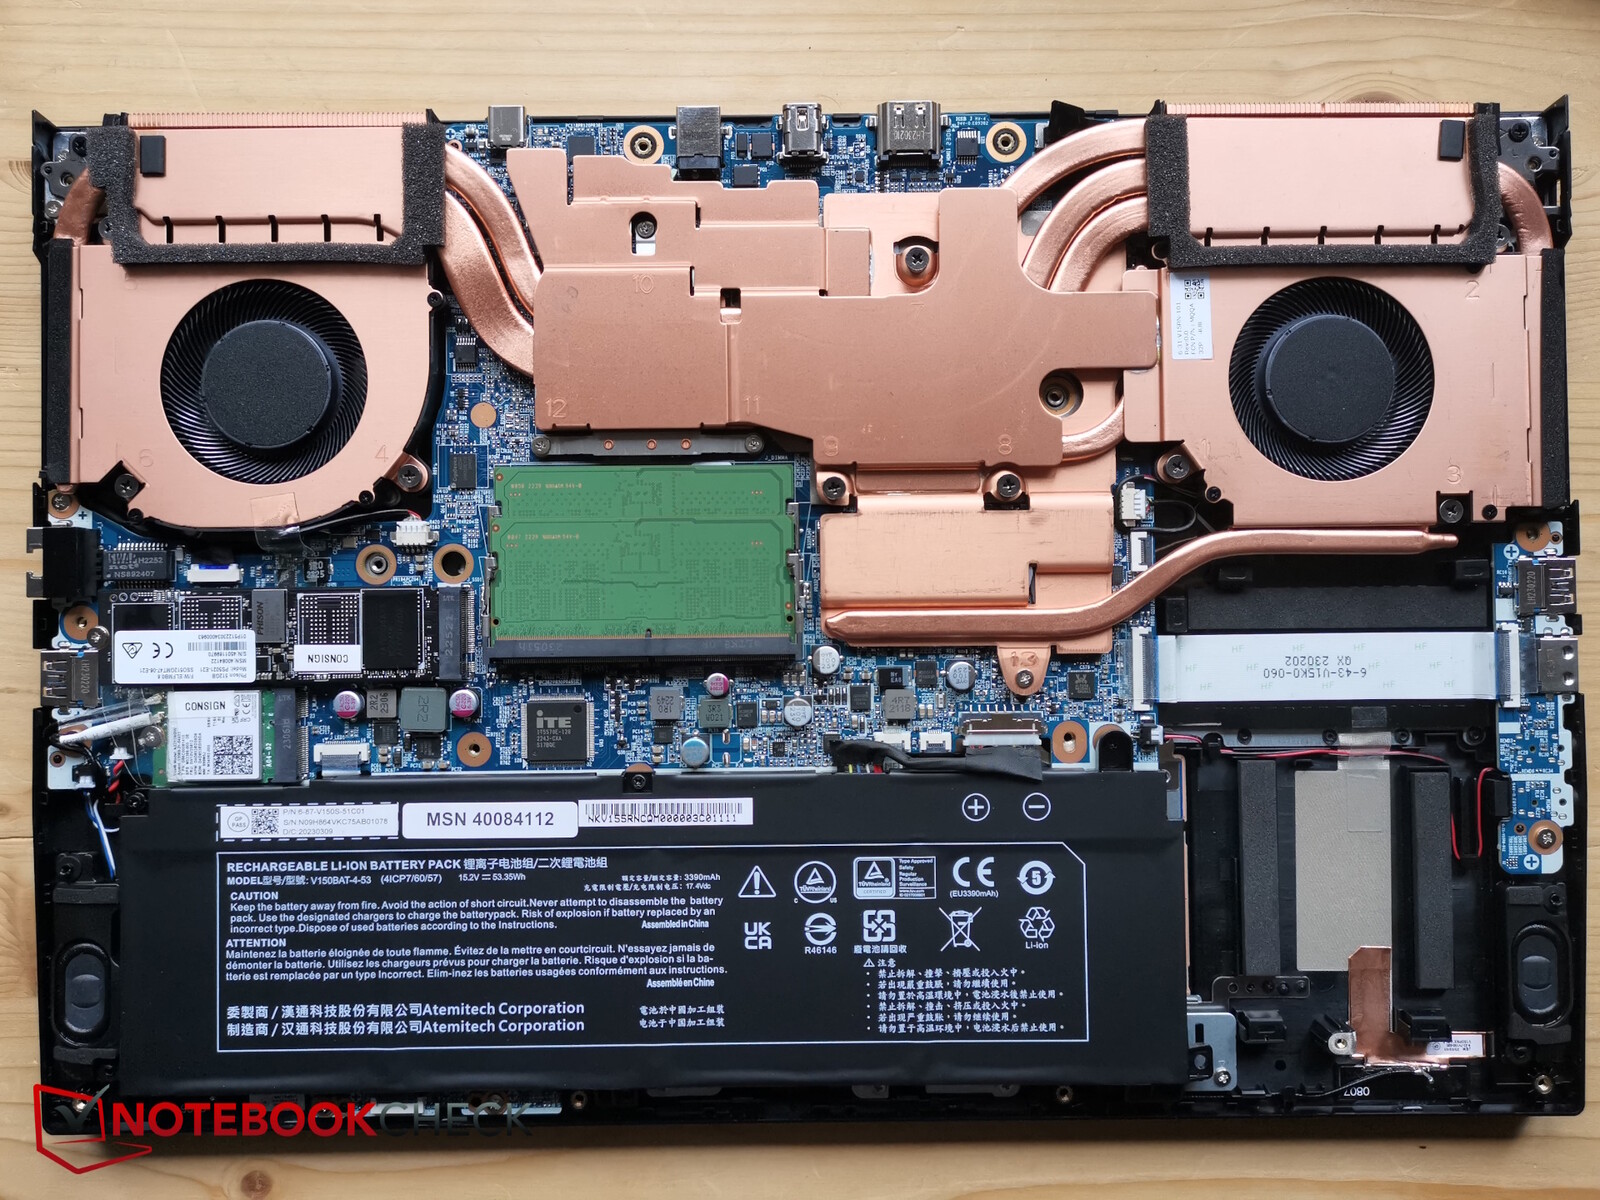
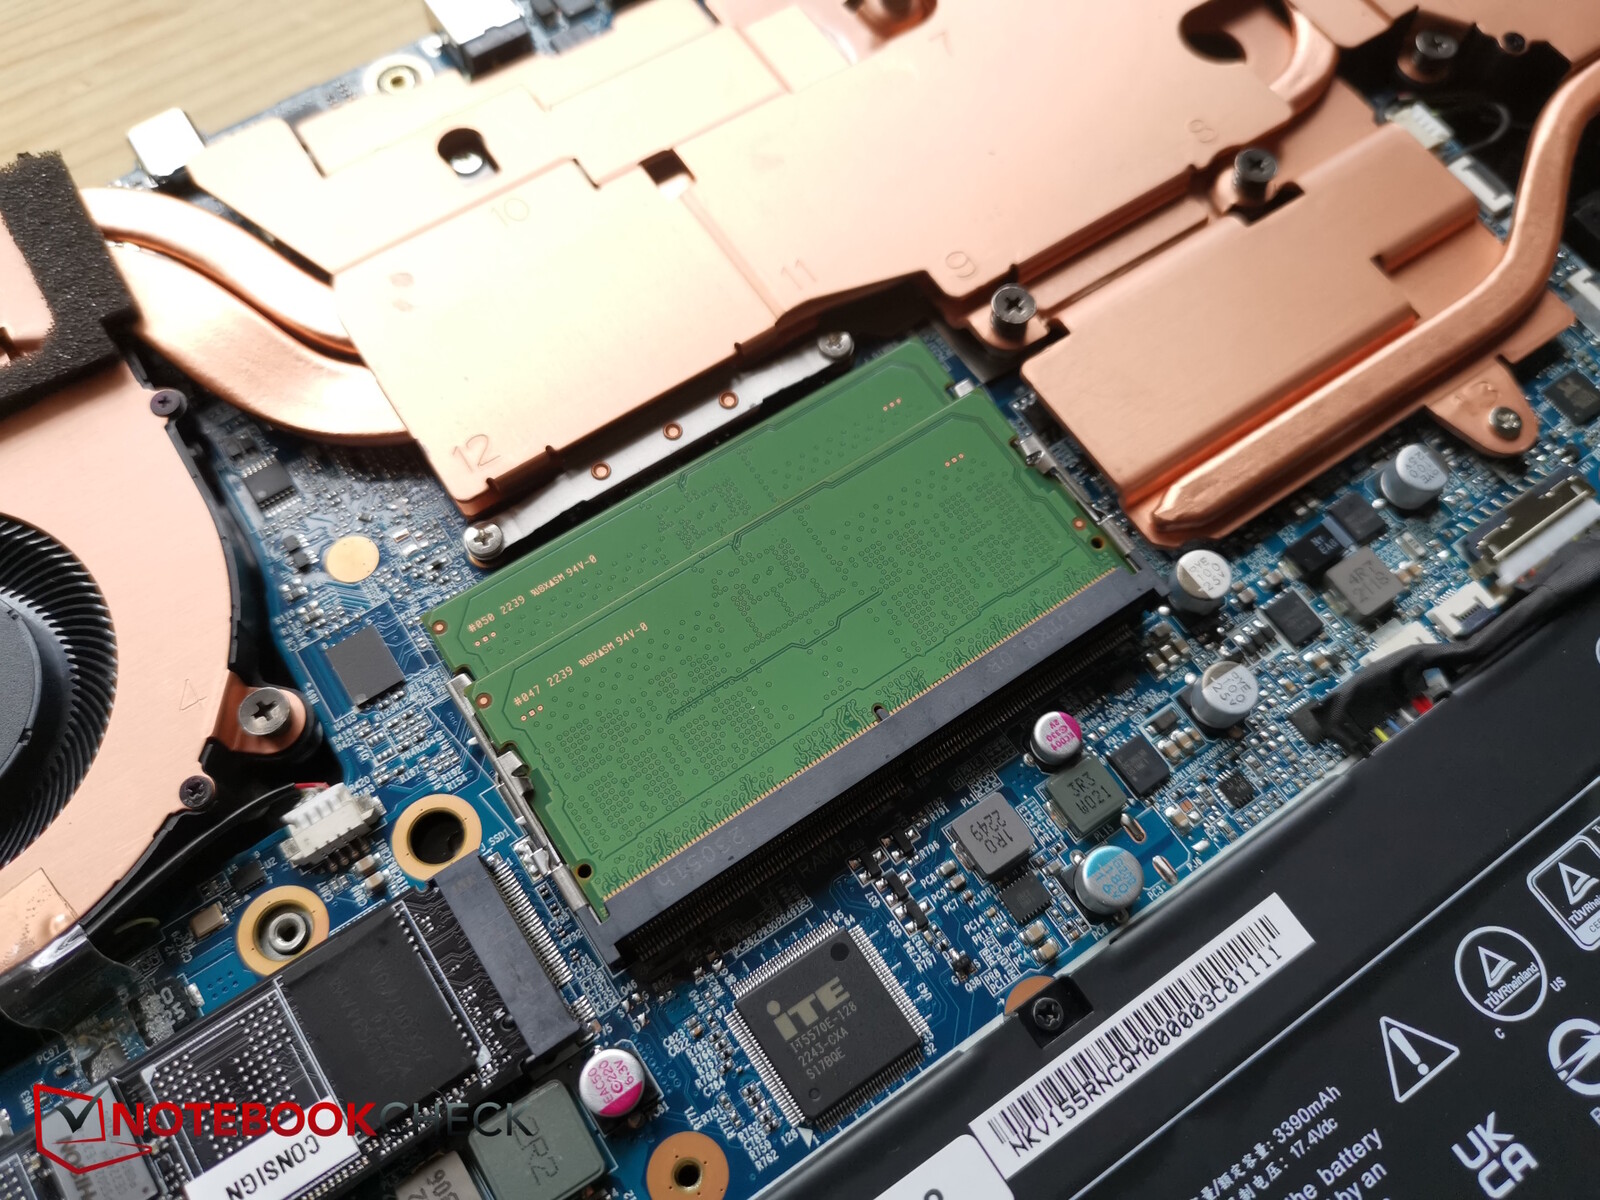
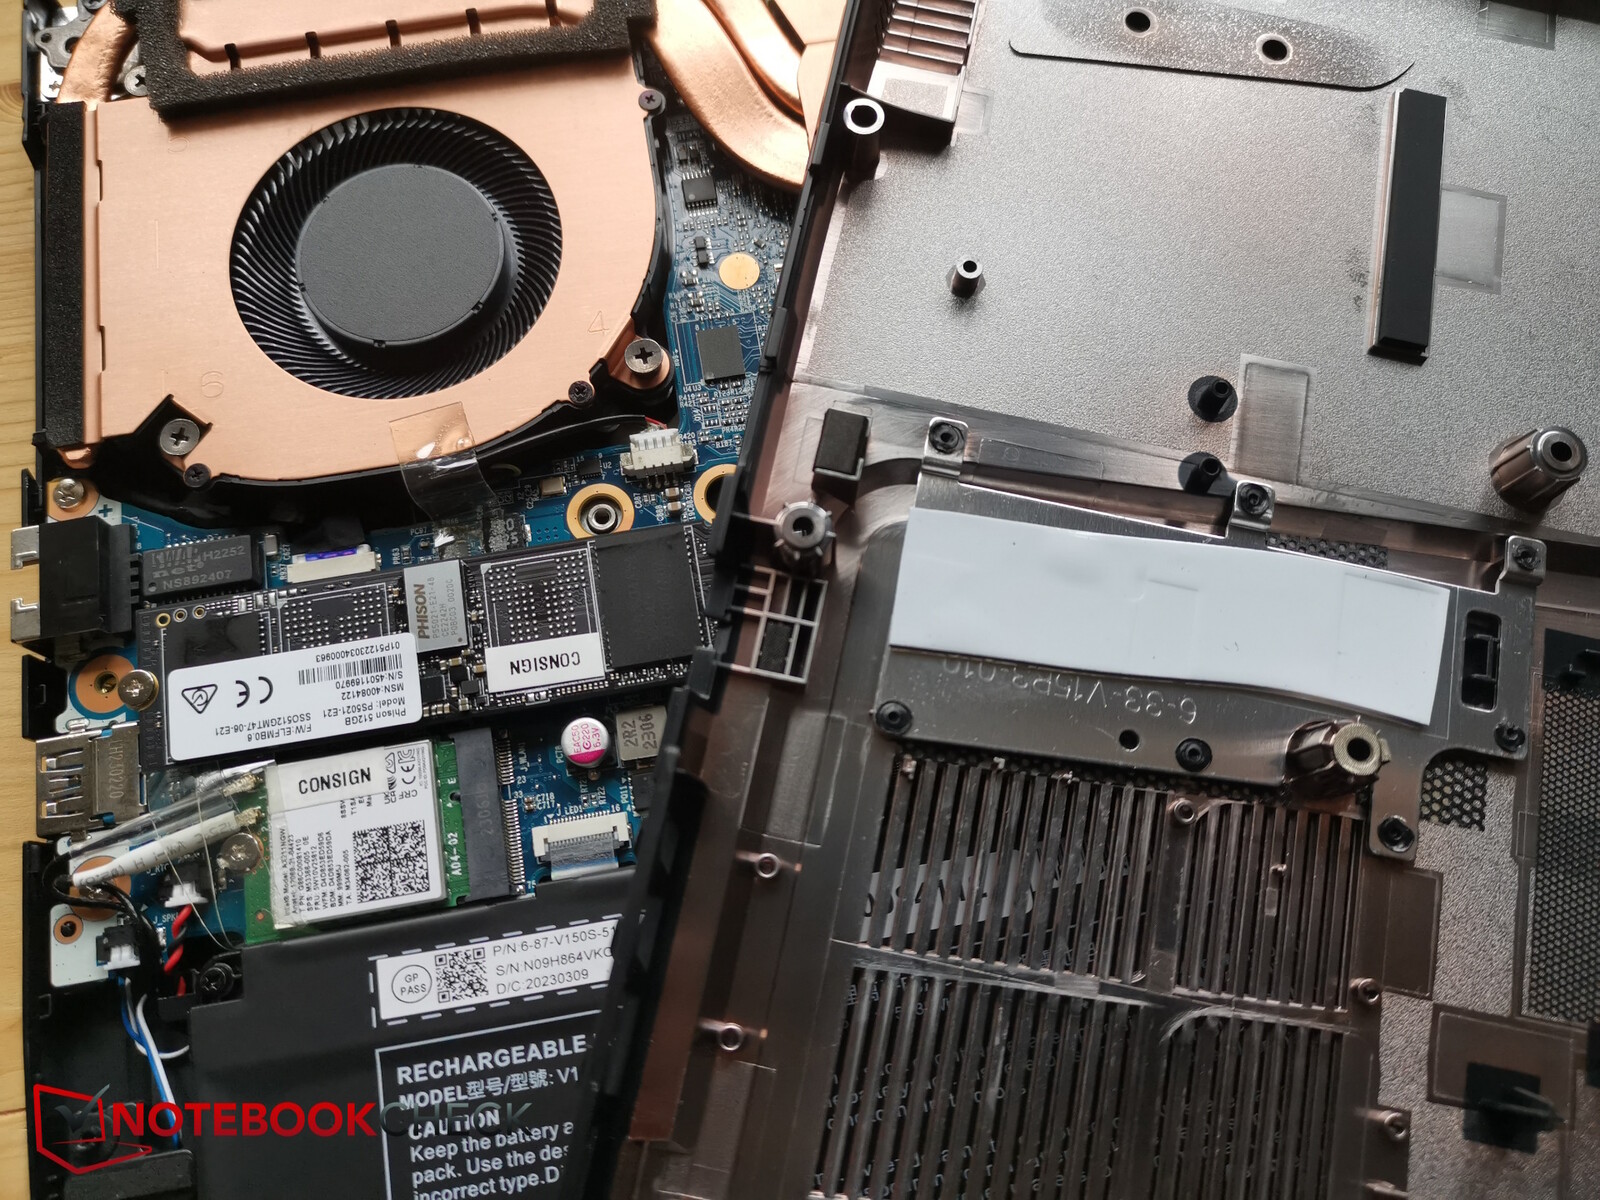
Mantenimiento
Para acceder a los componentes internos, es necesario retirar 14 tornillos Phillips del mismo tamaño. A continuación, la placa base de plástico se puede retirar fácilmente haciendo palanca. Debajo, encontrará un sistema de refrigeración con abundante cobre, una batería atornillada, dos ranuras para RAM, la SSD refrigerada por dos almohadillas y el módulo WiFi reemplazable.
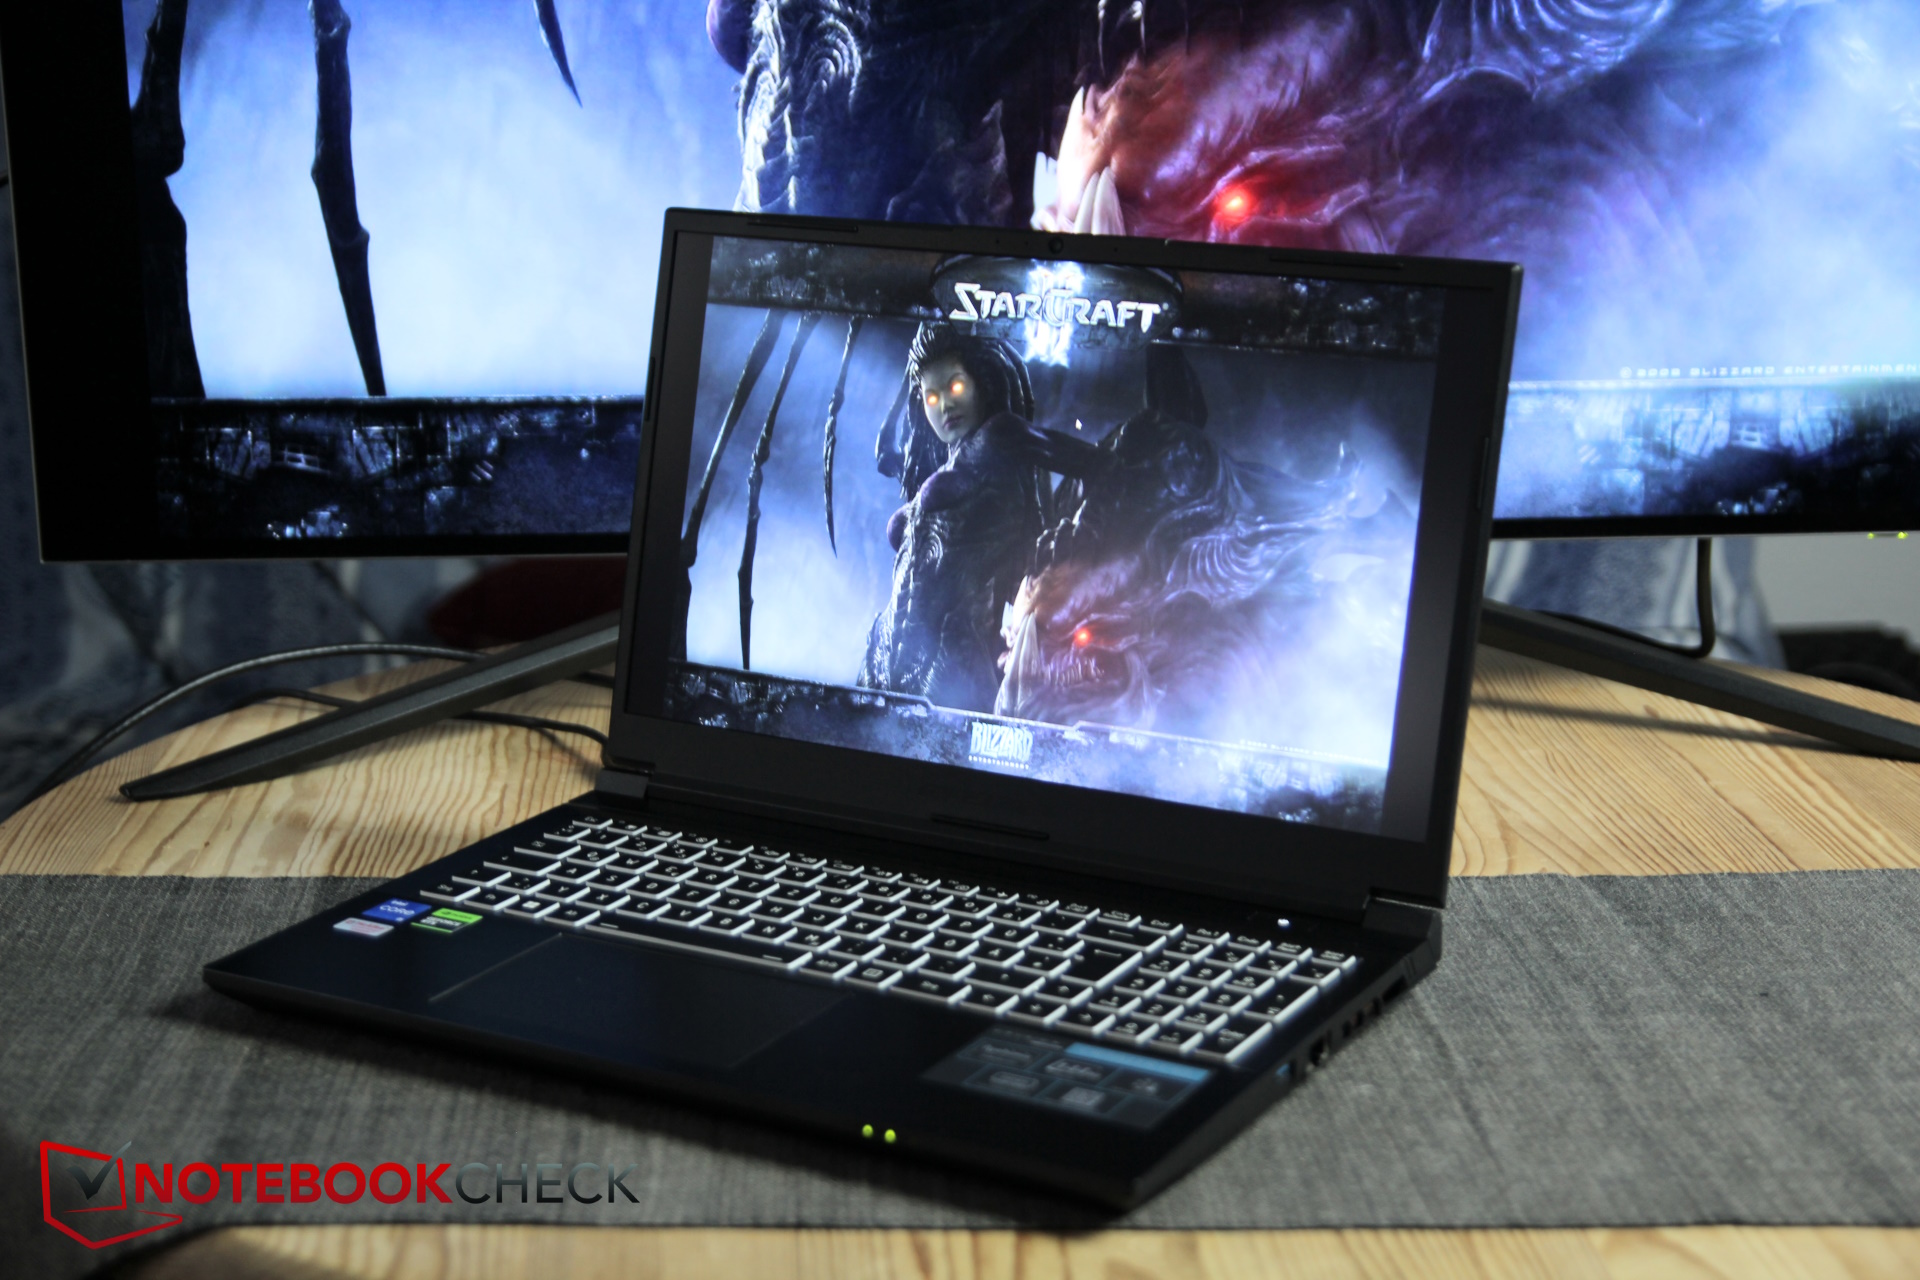
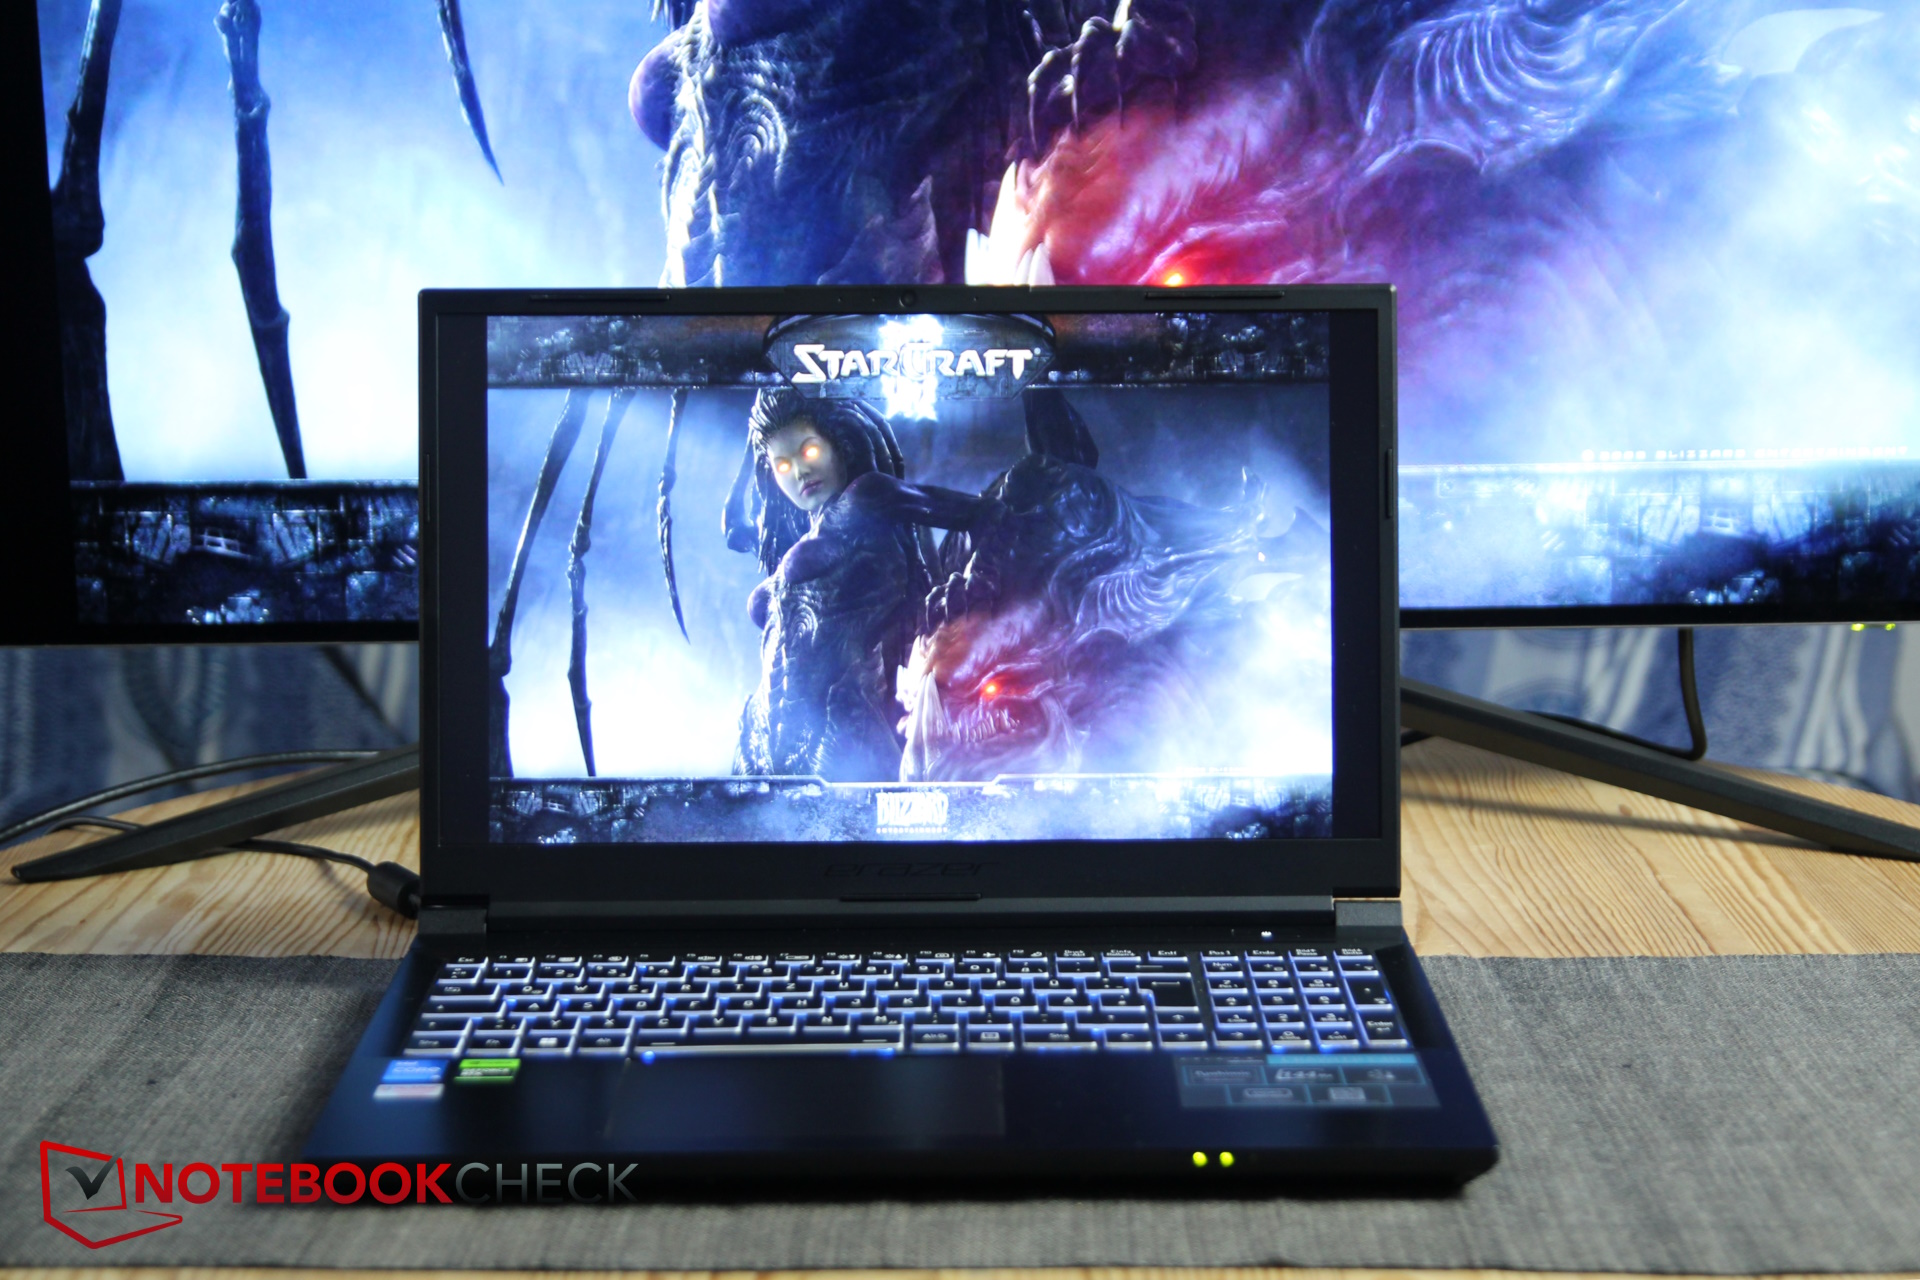
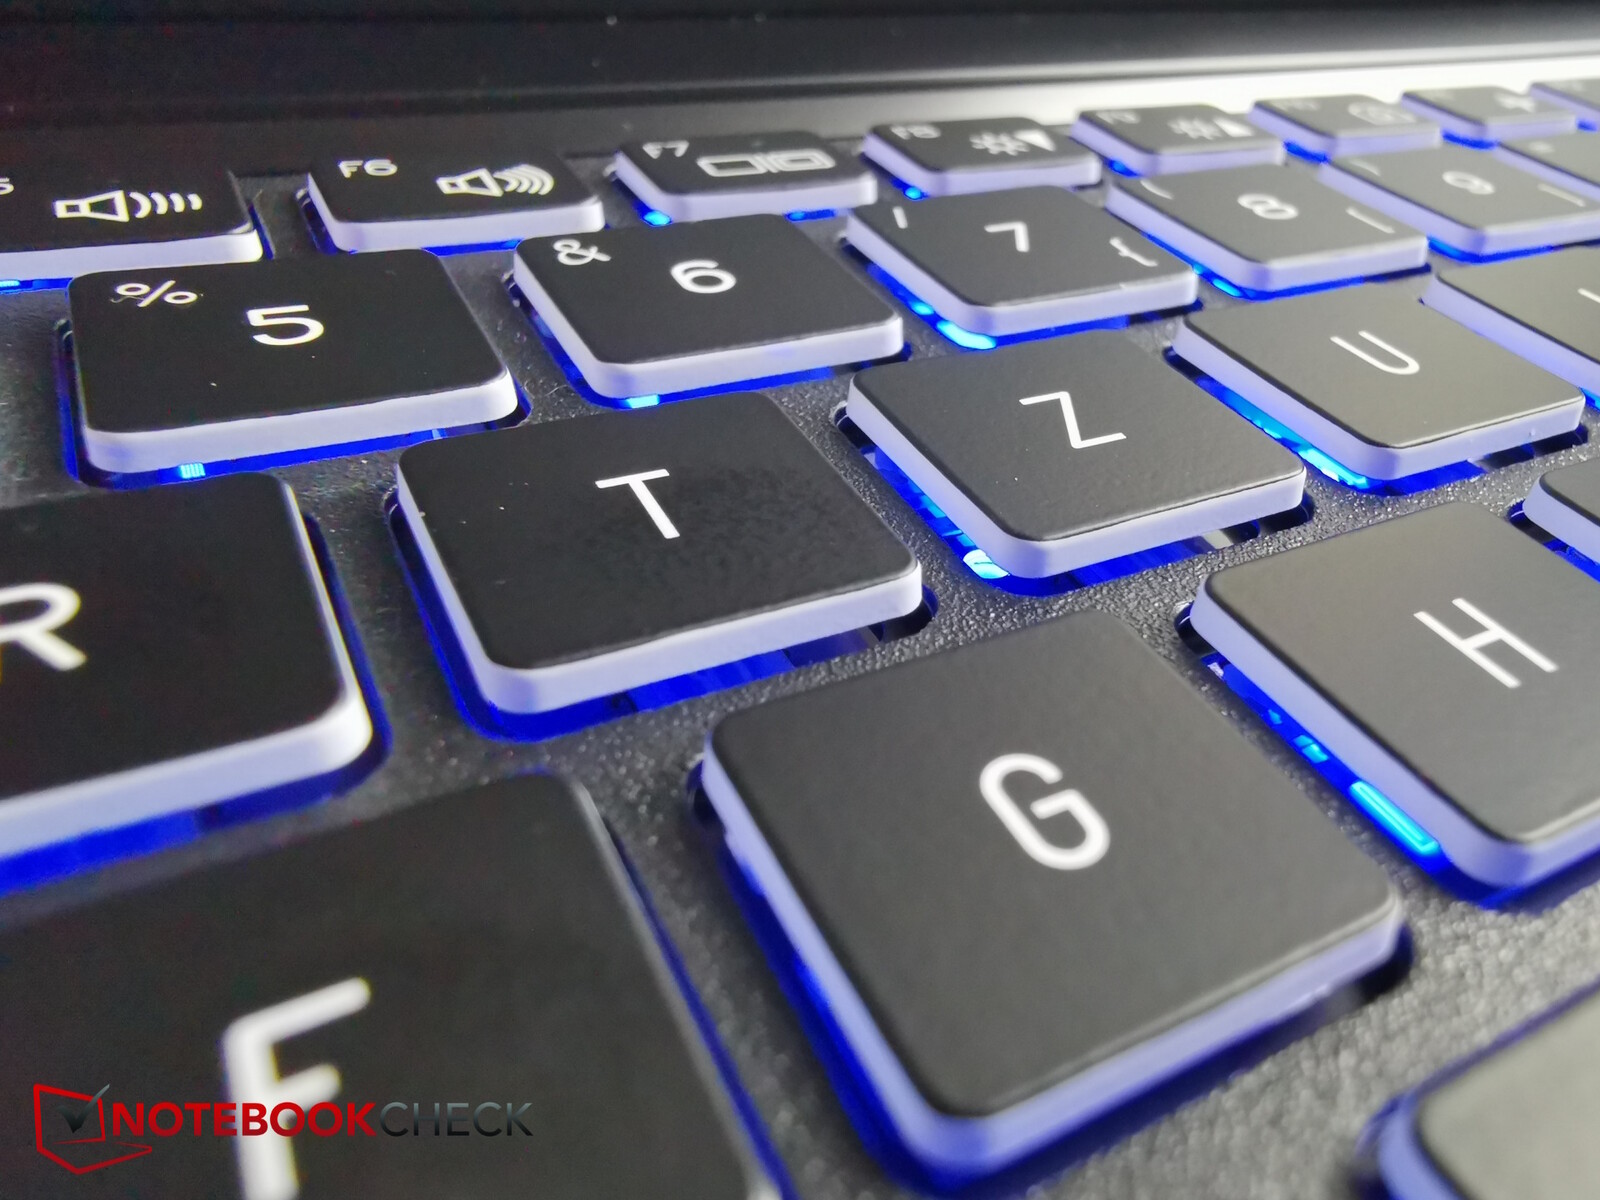
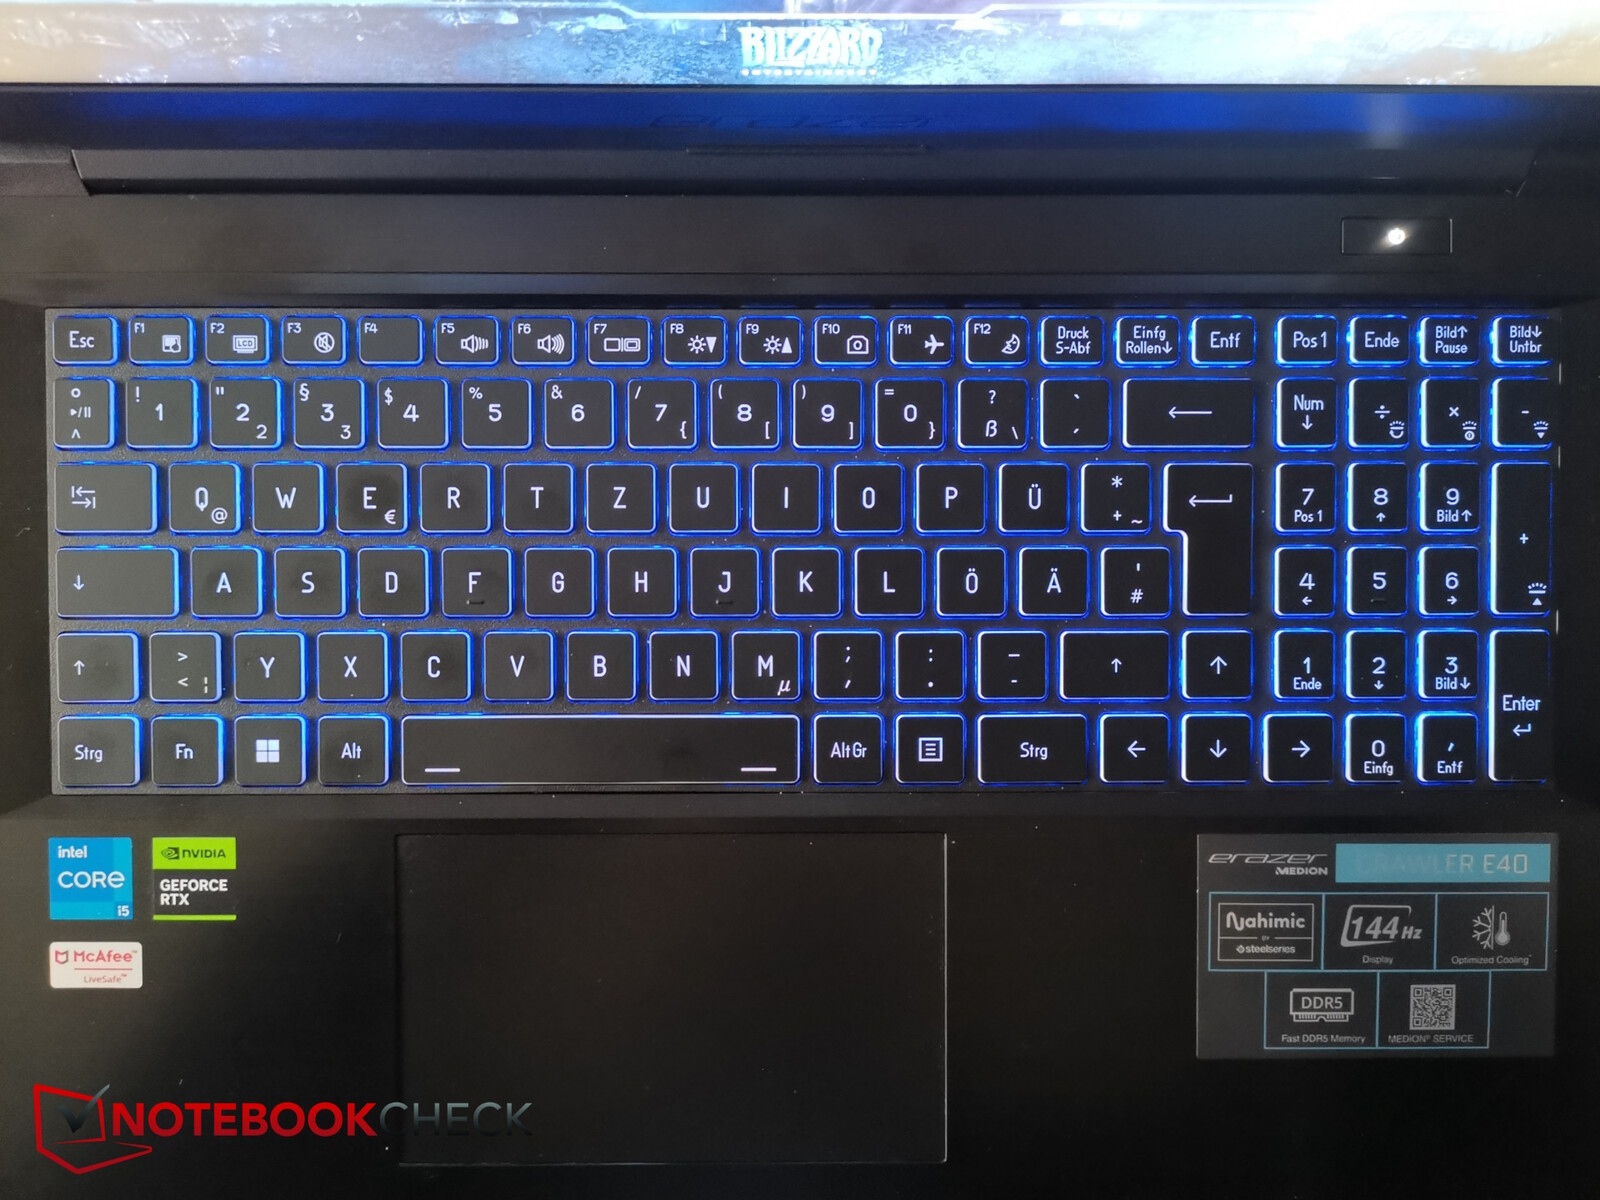
Dispositivos de entrada - Sólido en general
La disposición del teclado, como la de otros dispositivos Medion revisados este año, es bastante limpia. Las teclas, sin embargo, son más bien pequeñas (1,4 cm), aunque están correctamente espaciadas. A la derecha, hay un teclado numérico con teclas aún más pequeñas.
El recorrido de las teclas es medio y la respuesta es algo suave. No obstante, es fácil y rápido teclear en él.
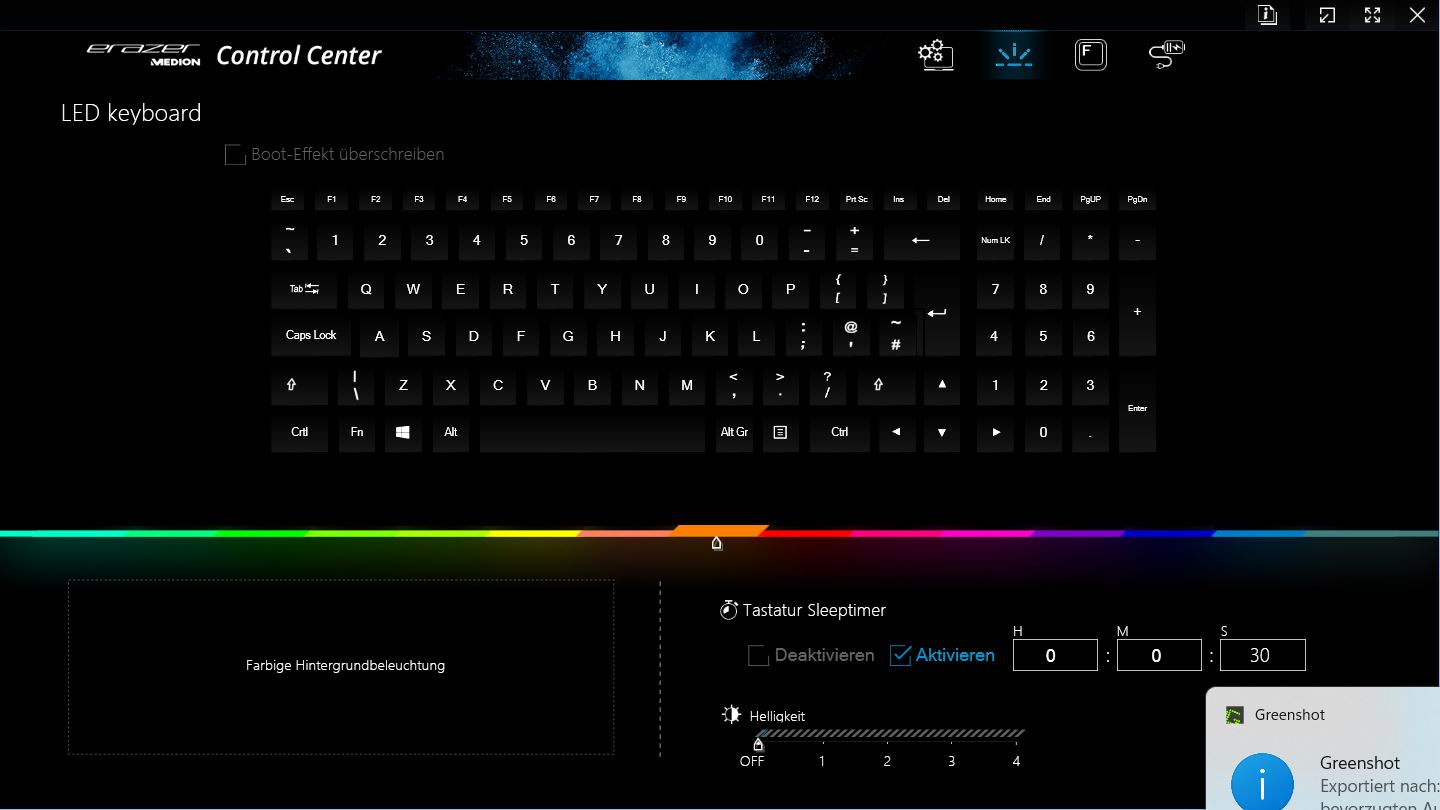
La retroiluminación RGB de dos niveles, que puede configurarse a través del Centro de Control (varios colores) y controlarse mediante teclas especiales, ayuda en entornos oscuros. Pero sólo es de una zona.
El panel táctil (aprox. 12,1 x 7,3 cm) está ligeramente desplazado hacia la izquierda para que quede lo más centrado posible bajo las demás teclas debido al teclado numérico. La superficie es deslizante, pero los ruidos de clic no precisamente silenciosos parecen un poco baratos.
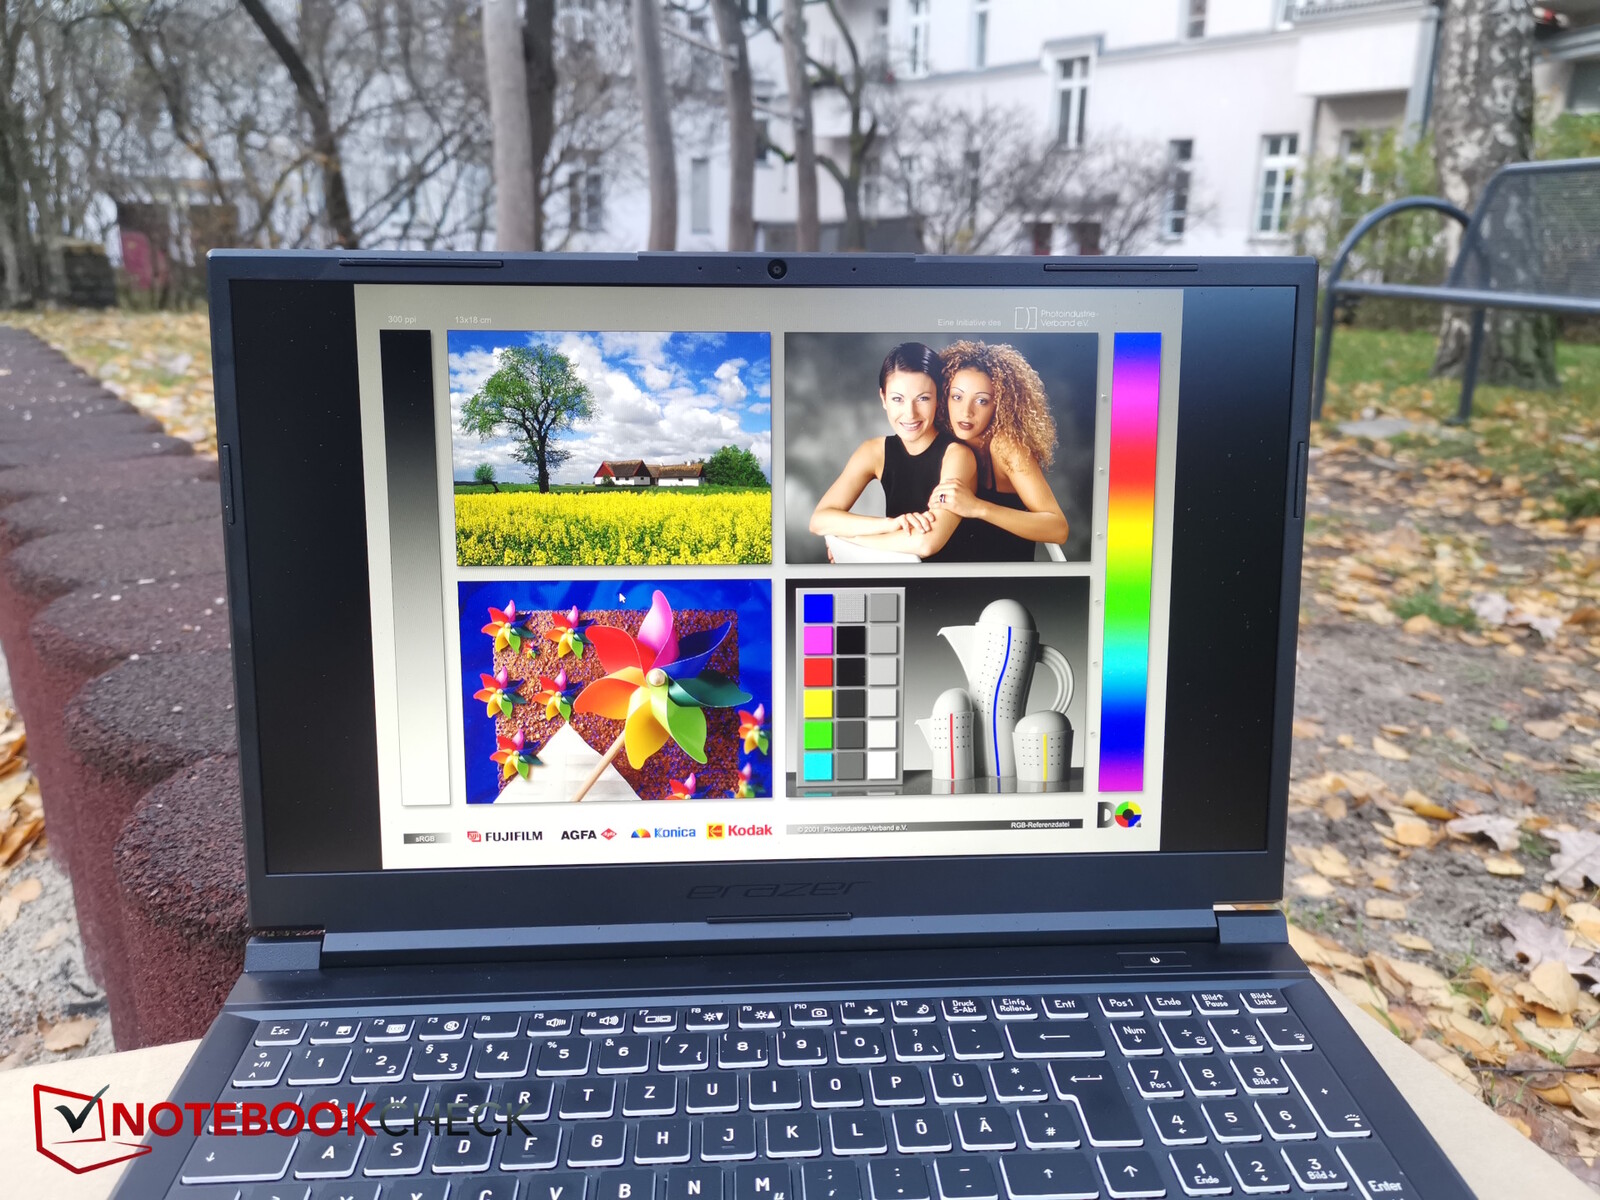
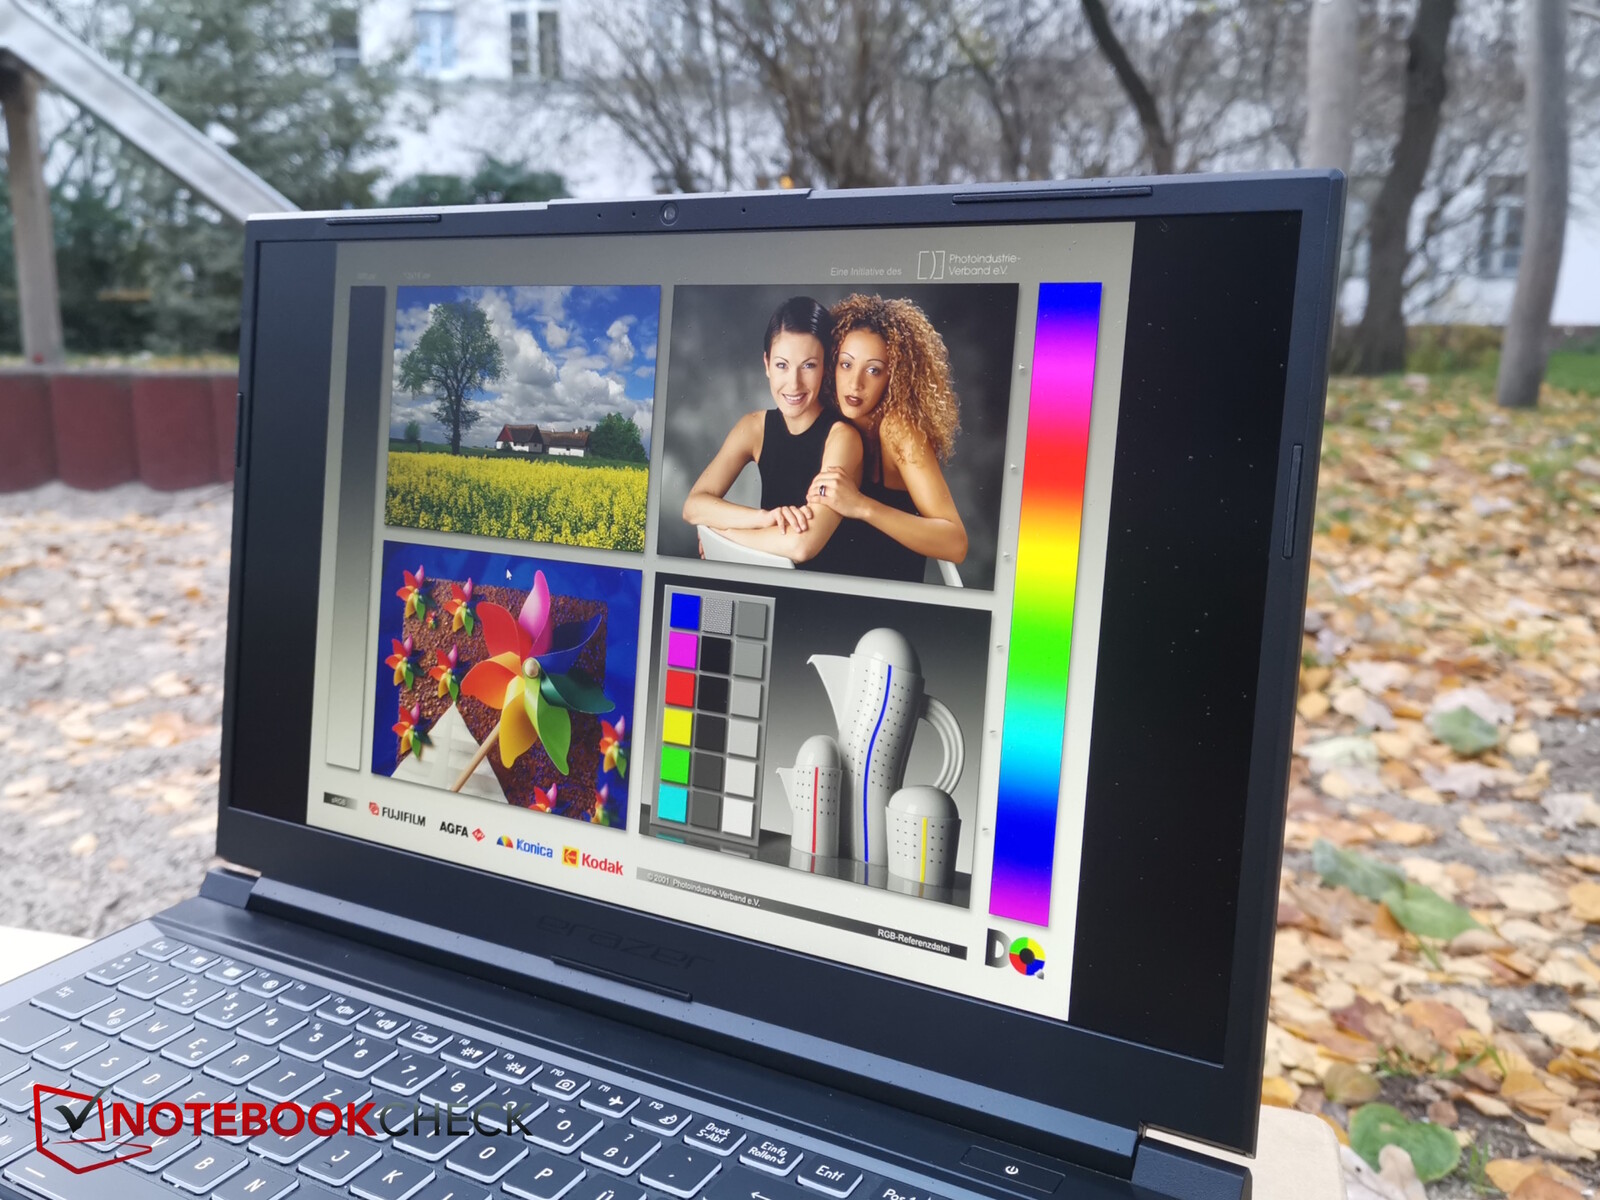
Pantalla - Un viejo conocido de 2019
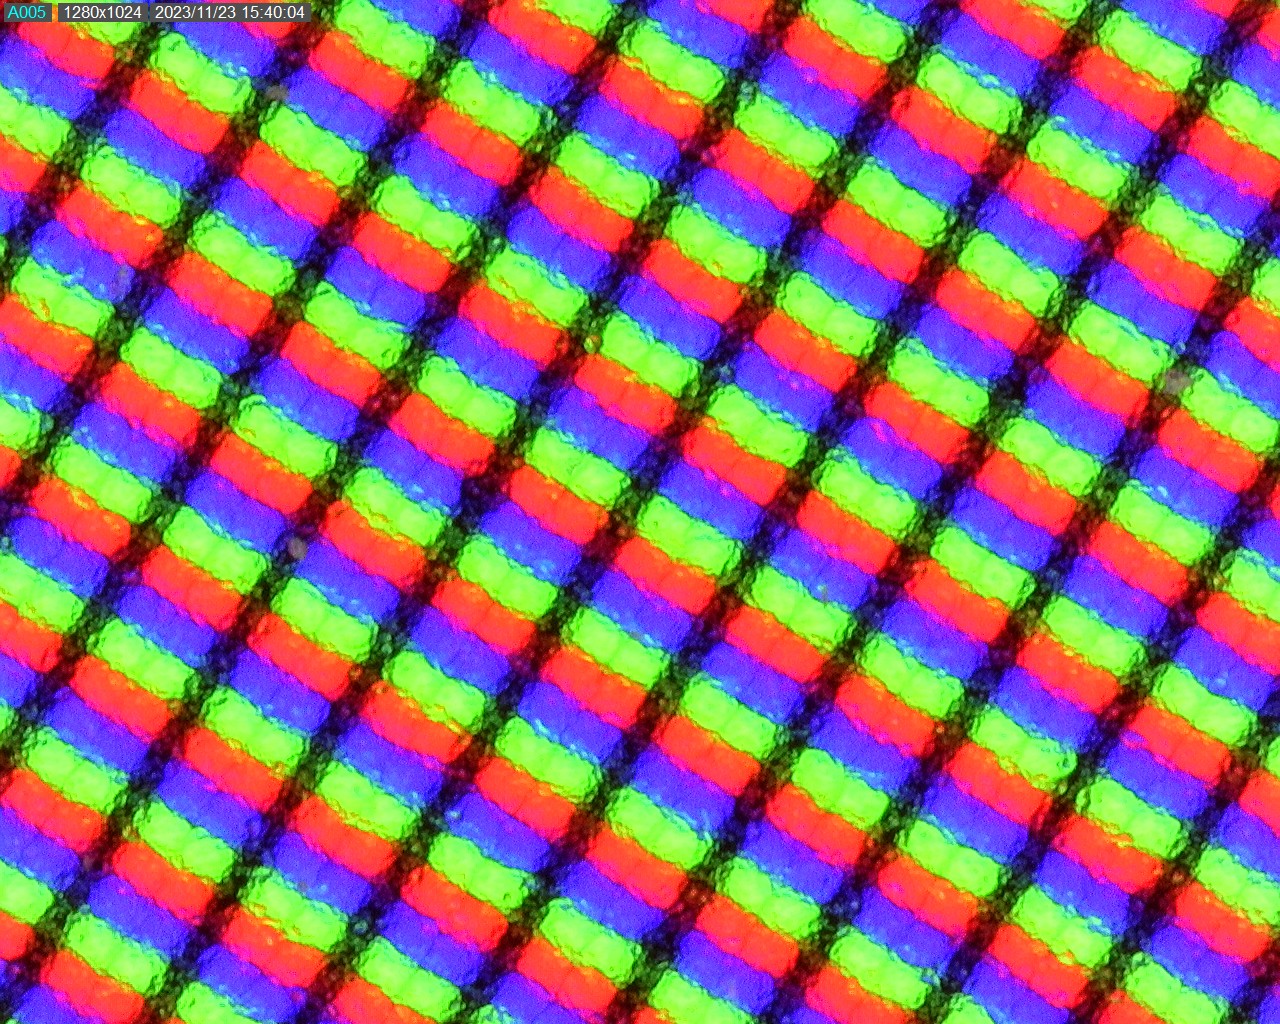
El Medion Erazer Crawler E40 cuenta con una pantalla familiar, que se ha utilizado en varios portátiles anteriormente. La pantalla IPS Full HD mate con una frecuencia de actualización de 144 Hz no es lo último, ya que se utilizó en el XMG Fusion 15 en 2019.
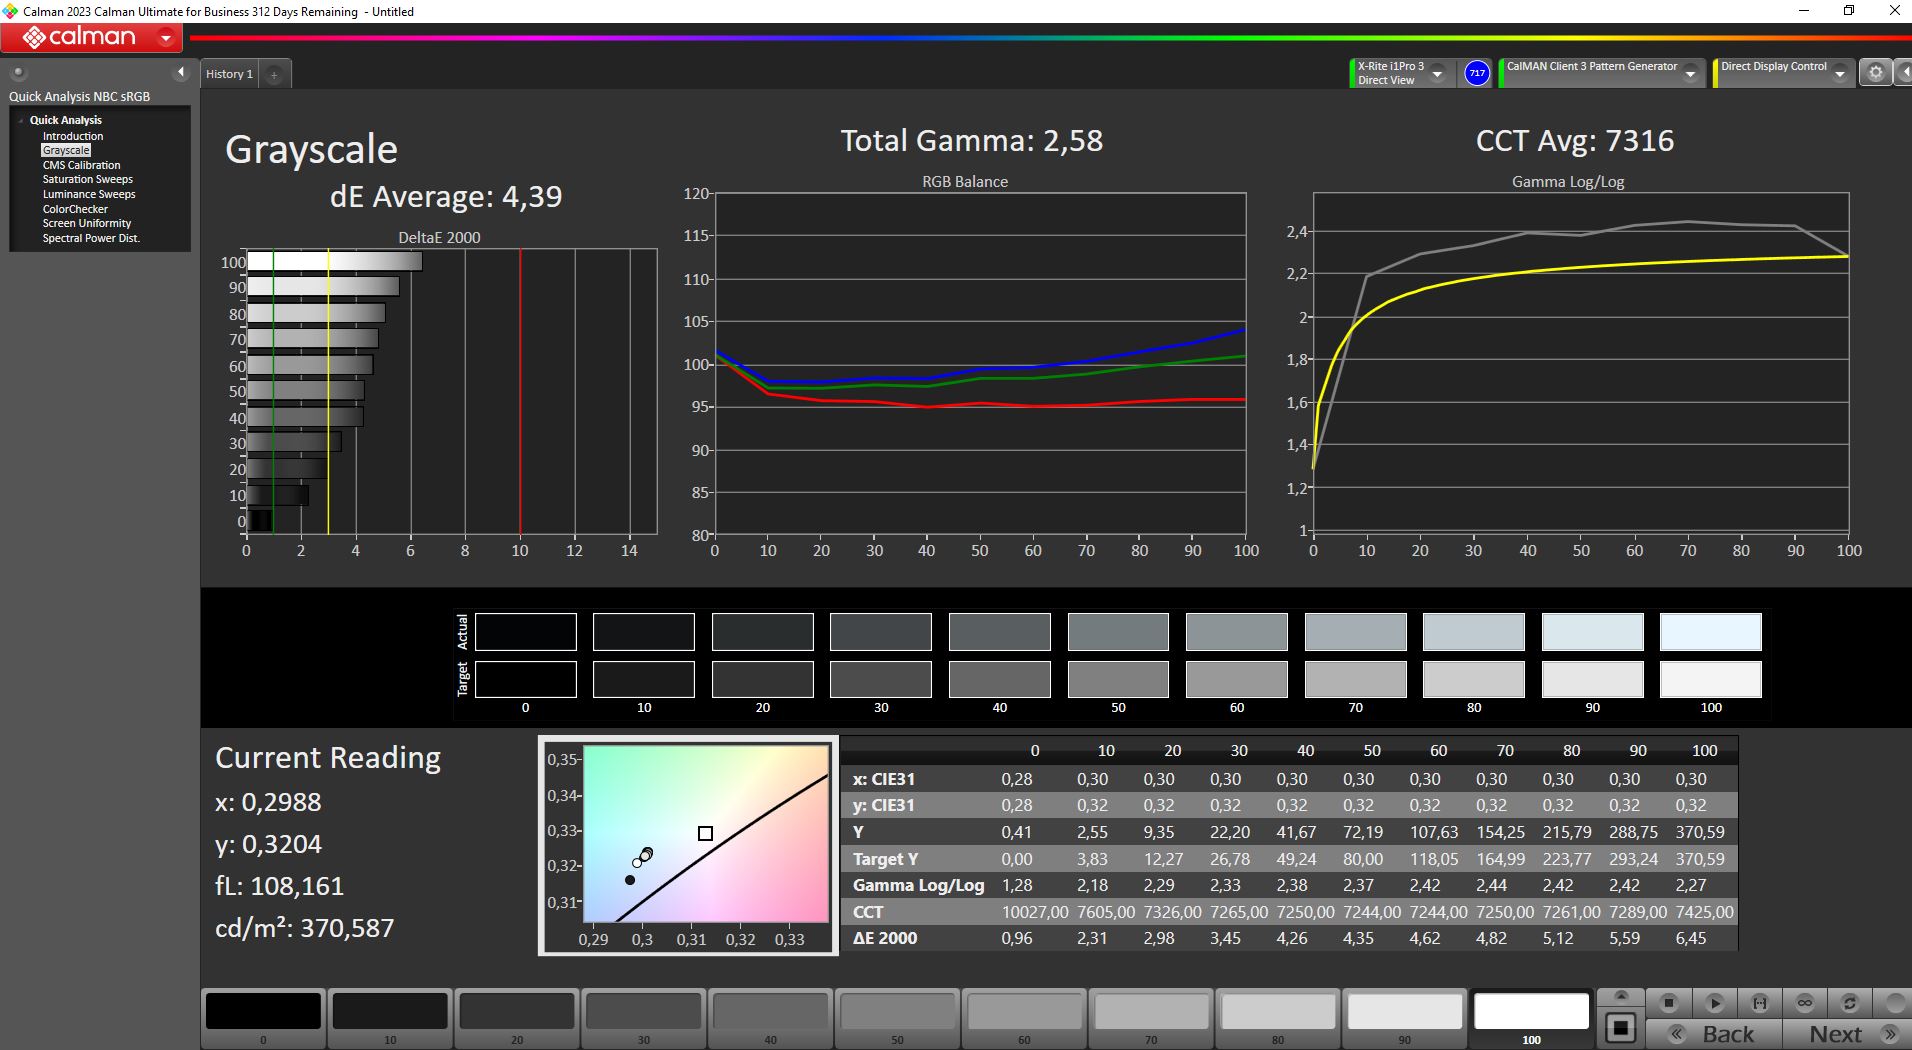
El brillo medio de la pantalla de 350 nits es aceptable, aunque el contraste se ve algo comprometido por el débil valor de negro.
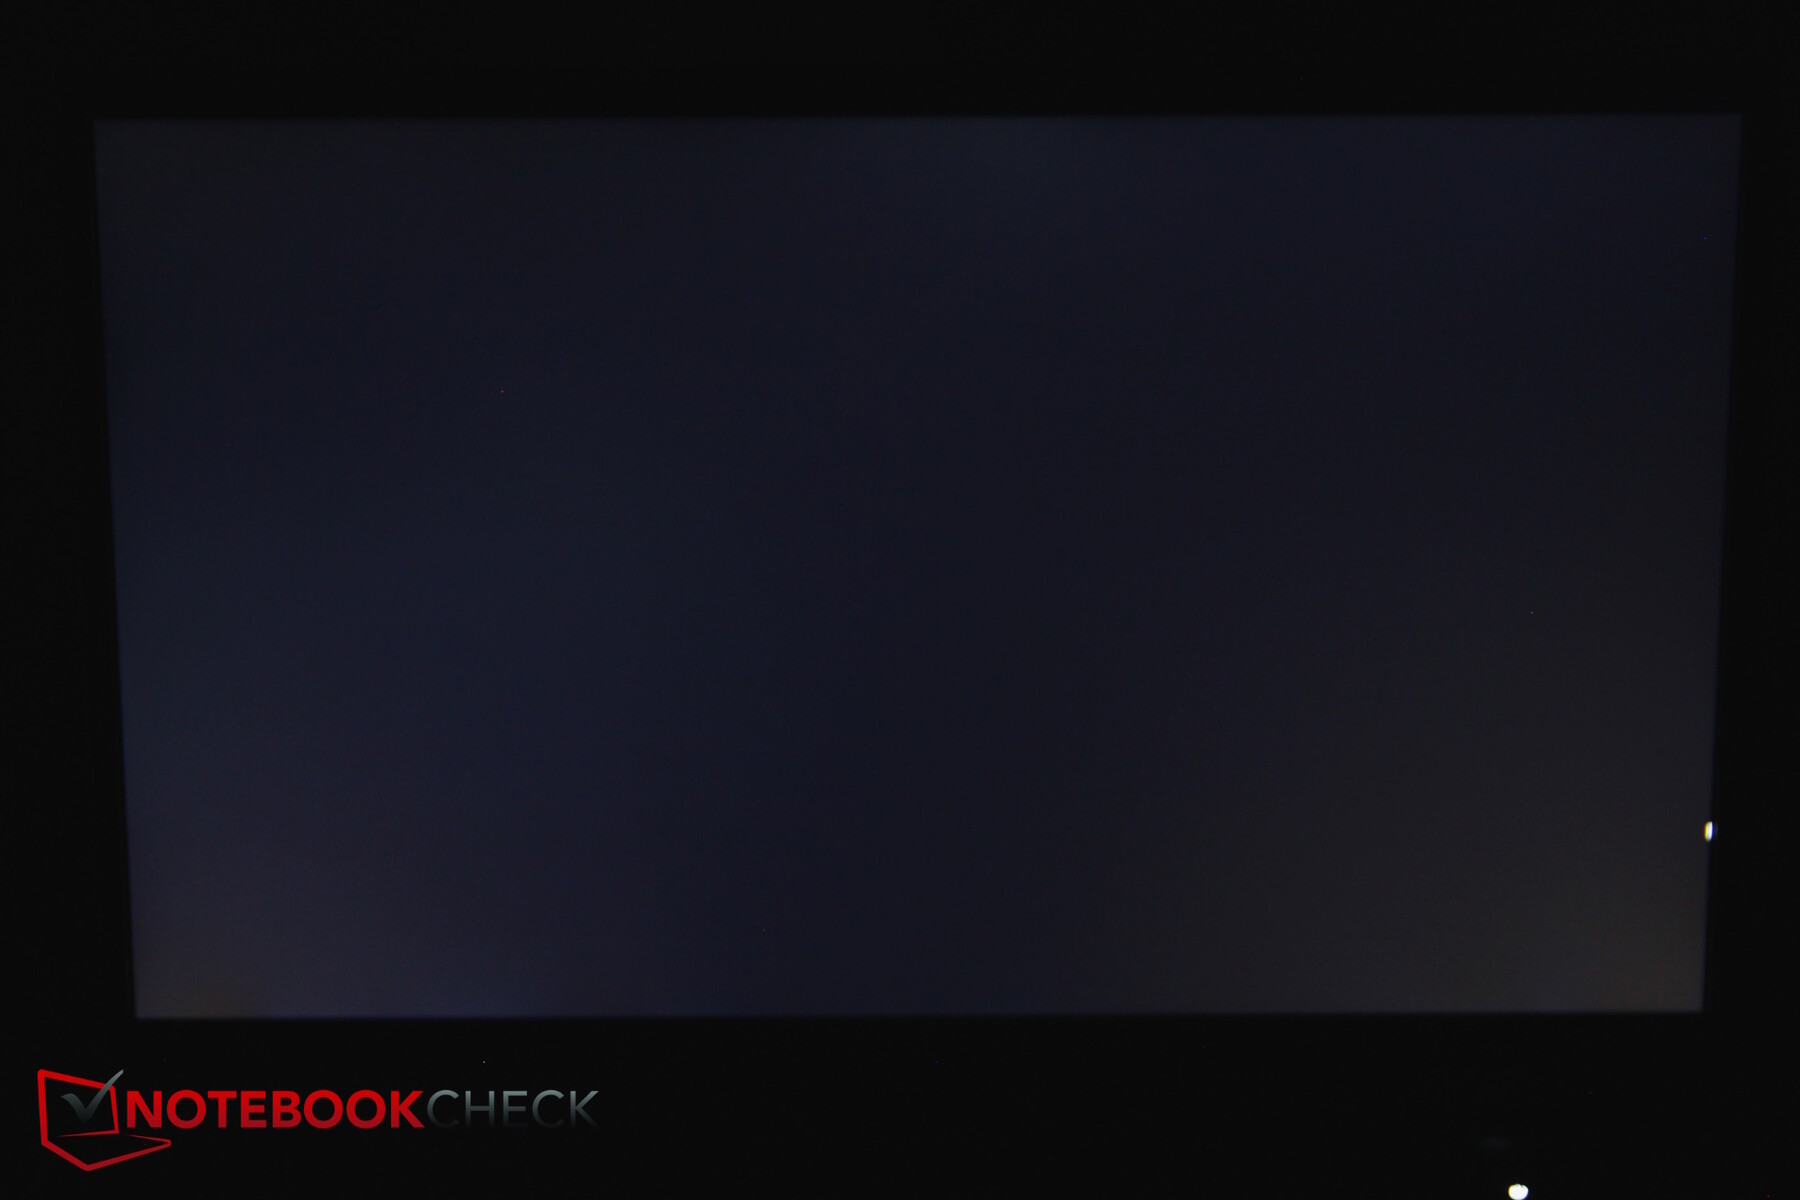
Los tiempos de respuesta son decentes para un portátil de juegos, y hay una ligera presencia de sangrado de retroiluminación.
| |||||||||||||||||||||||||
iluminación: 91 %
Brillo con batería: 356 cd/m²
Contraste: 847:1 (Negro: 0.43 cd/m²)
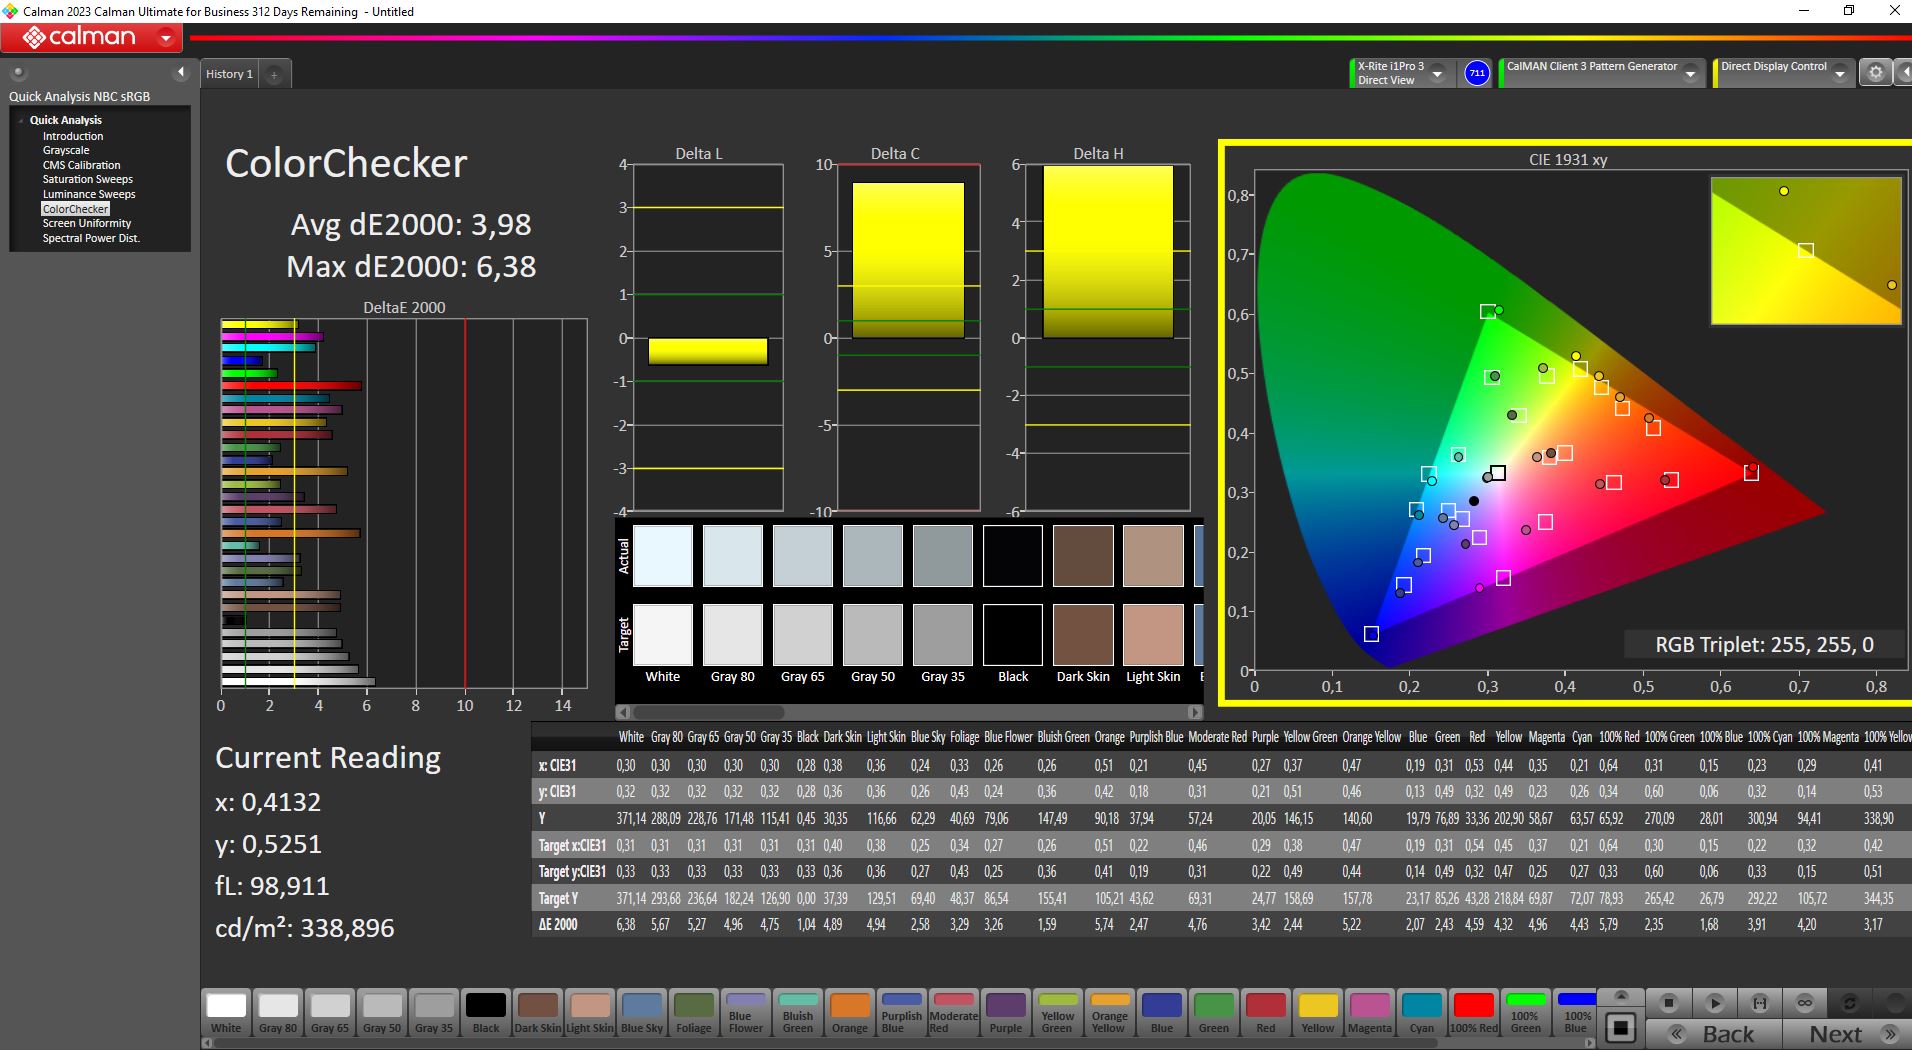
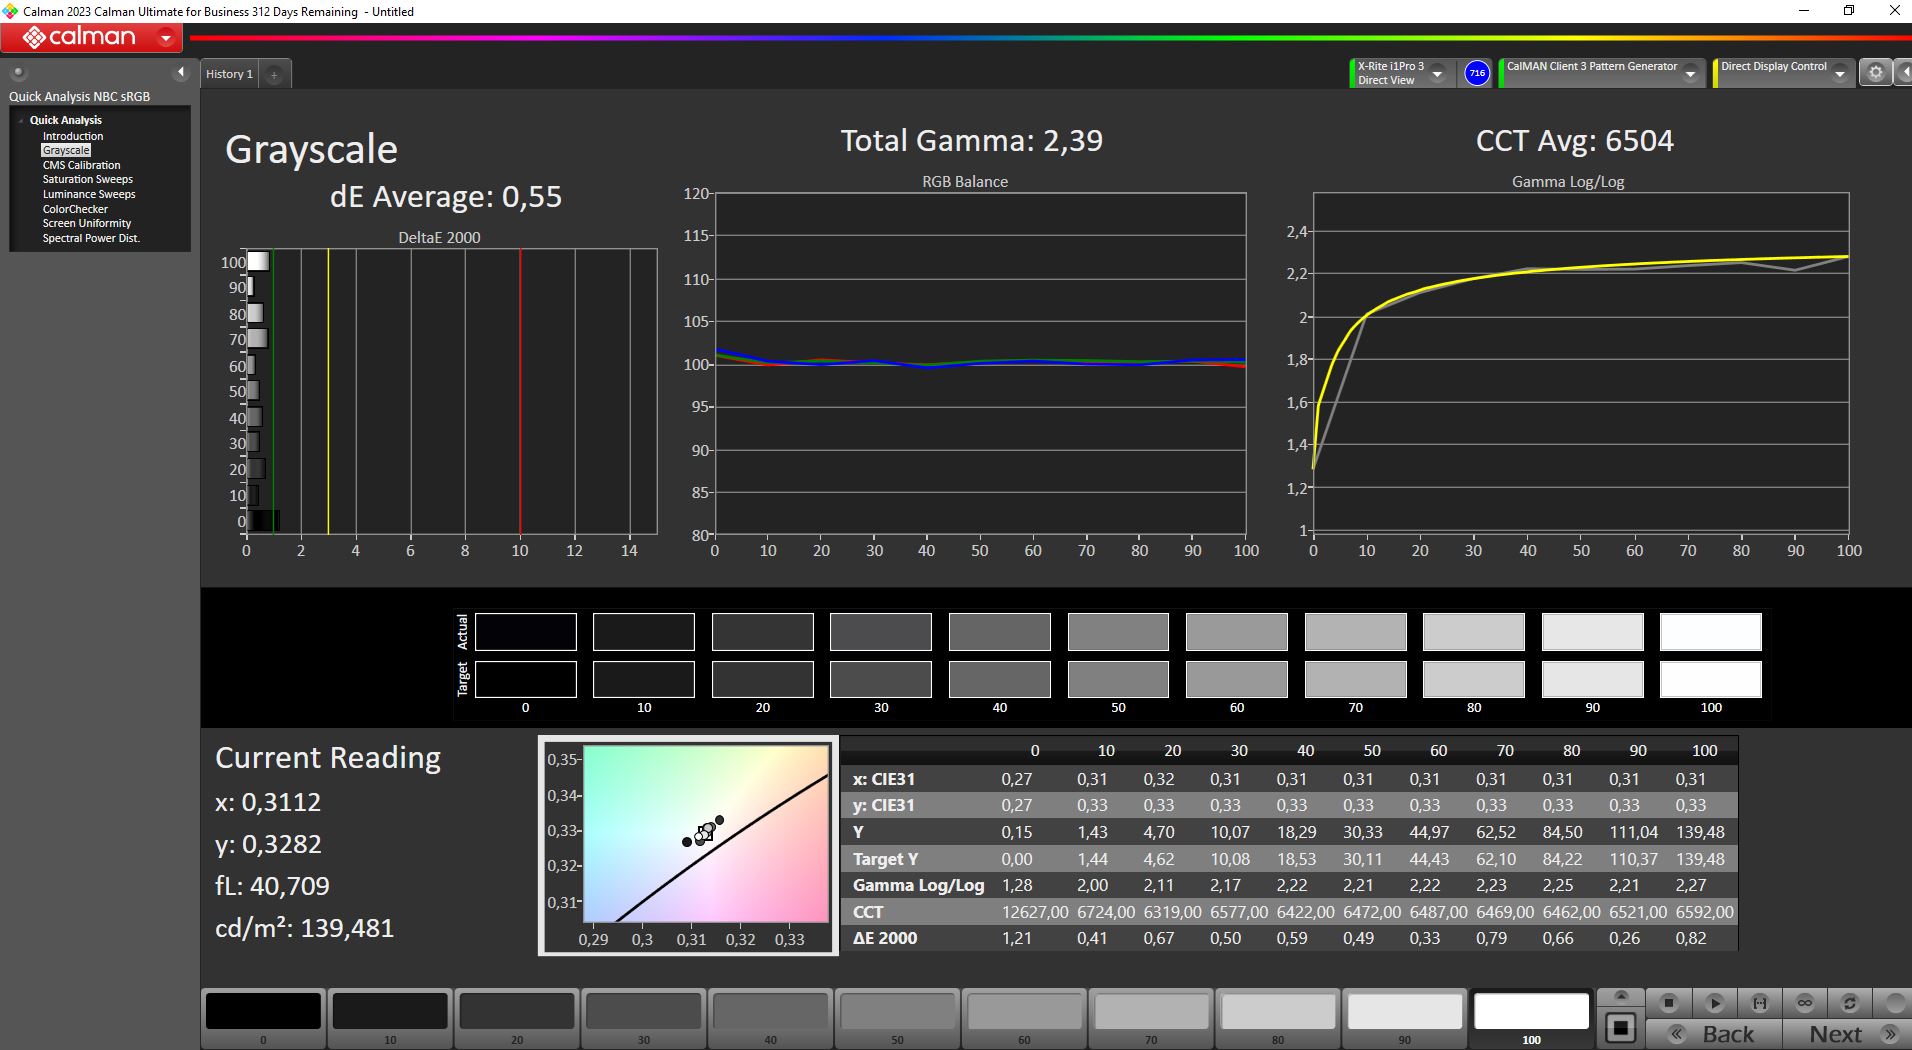
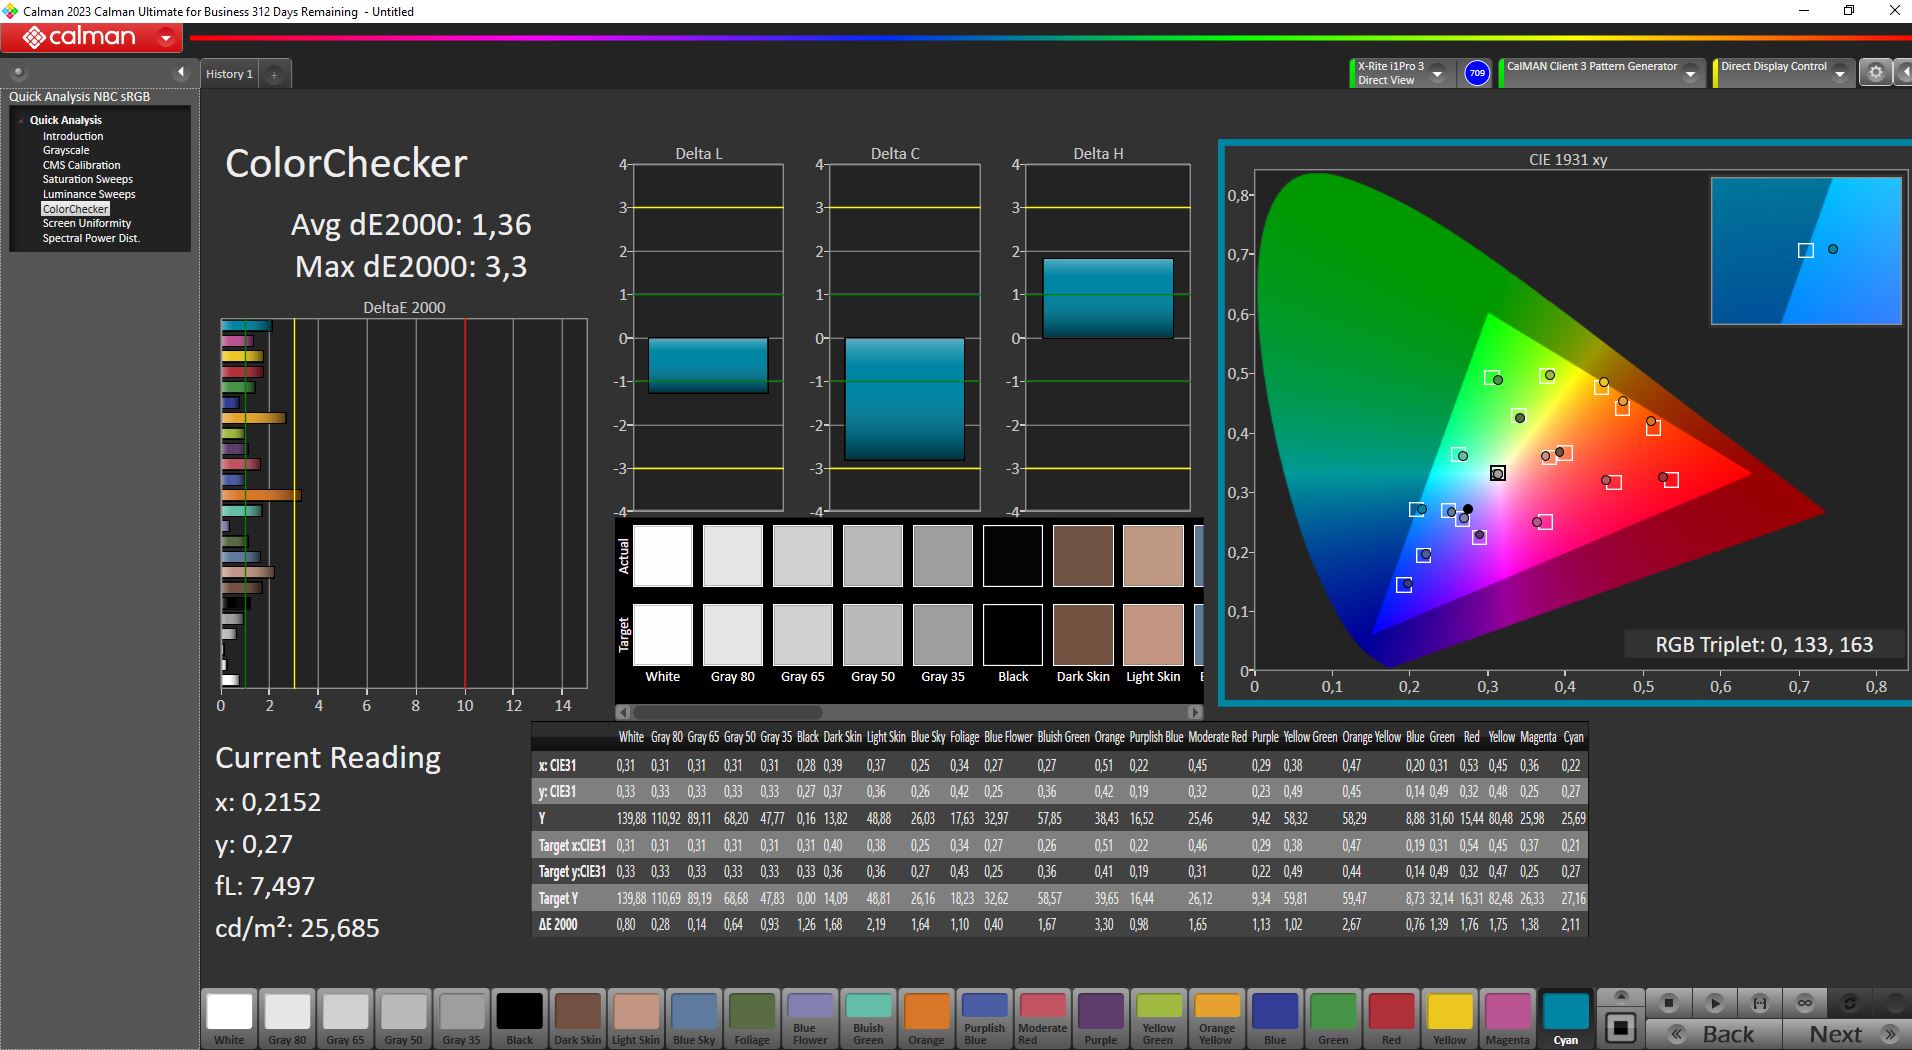
ΔE ColorChecker Calman: 3.98 | ∀{0.5-29.43 Ø4.71}
calibrated: 1.36
ΔE Greyscale Calman: 4.39 | ∀{0.09-98 Ø4.96}
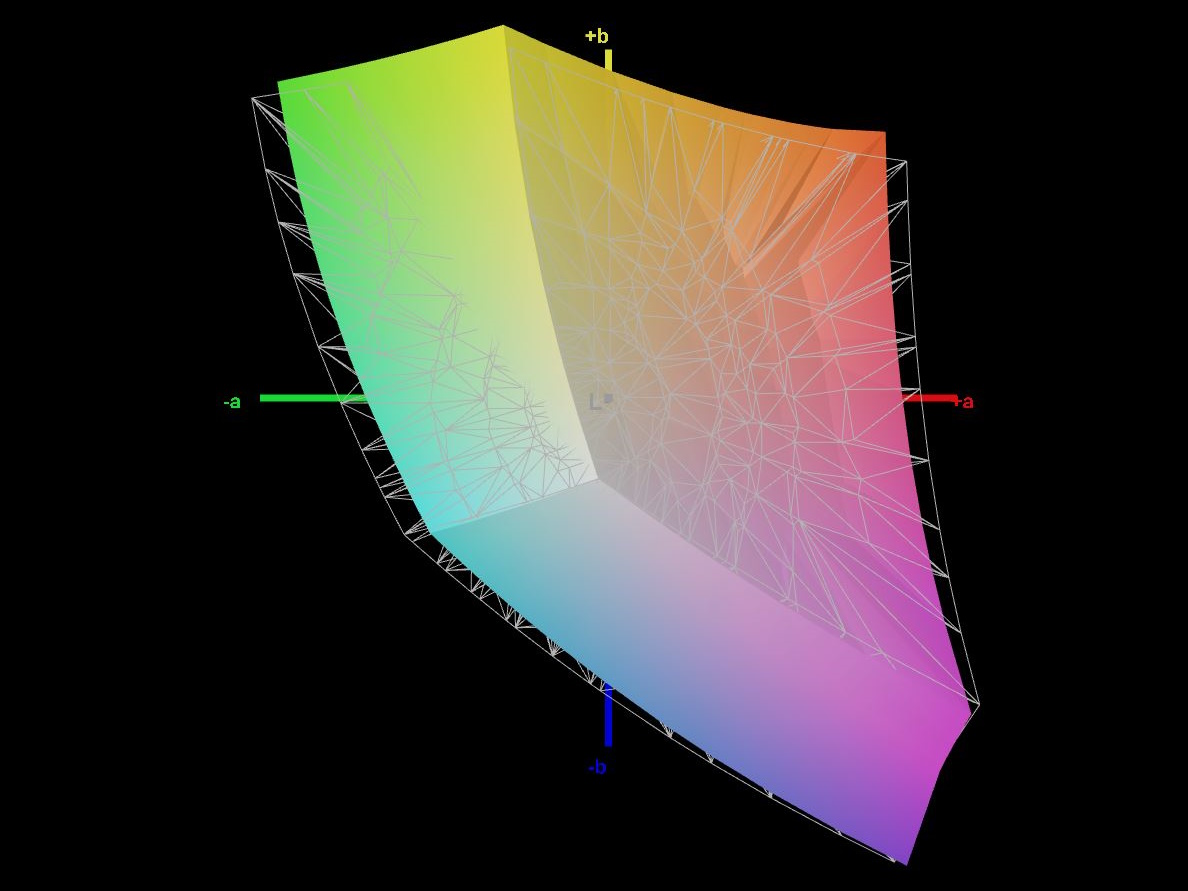
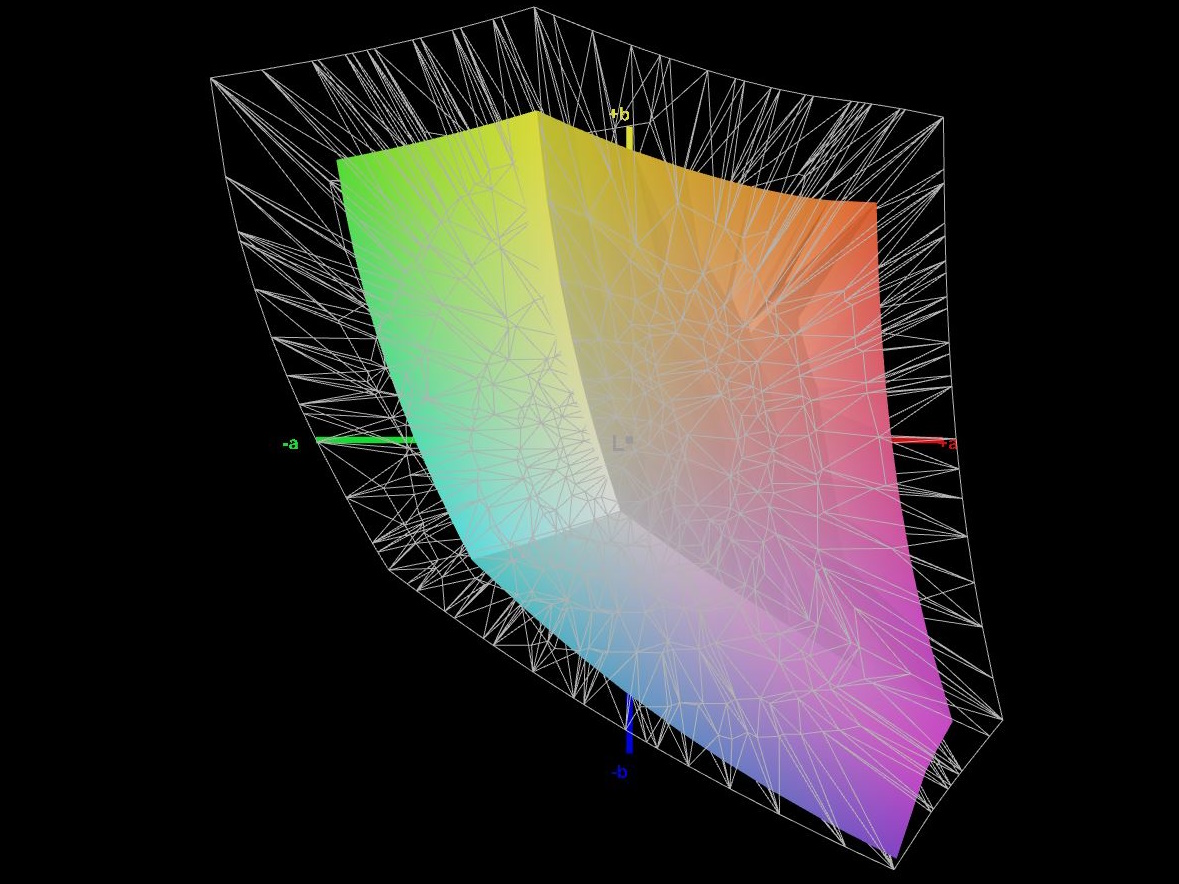
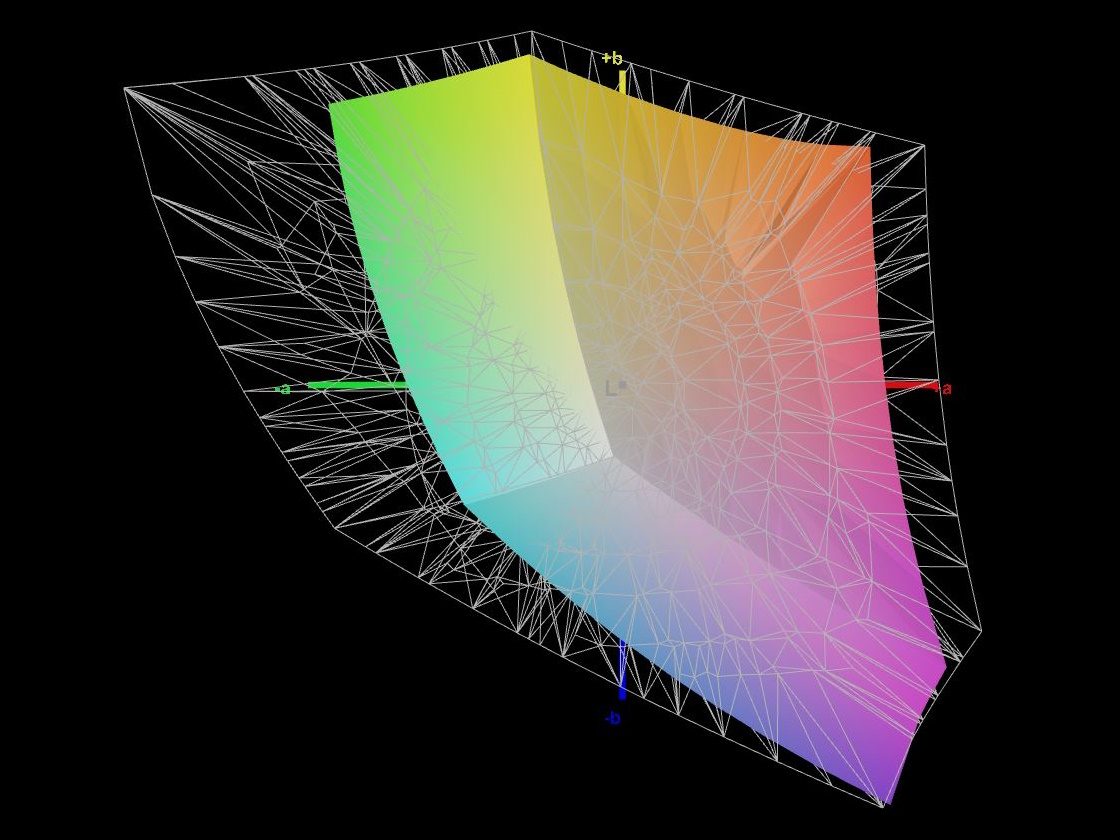
63.2% AdobeRGB 1998 (Argyll 3D)
89.7% sRGB (Argyll 3D)
61.4% Display P3 (Argyll 3D)
Gamma: 2.58
CCT: 7316 K
| Medion Erazer Crawler E40 - MD 62518 BOE HF NV156FHM-N4G, IPS, 1920x1080, 15.6" | Lenovo LOQ 15IRH8 Core i7 BOE CQ NE156QHM-NY4, IPS, 2560x1440, 15.6" | Asus TUF A15 FA507 N156HMA-GA1, IPS, 1920x1080, 15.6" | Schenker XMG Apex 15 (Late 23) BOE CQ NE156QHM-NY2, IPS, 2560x1440, 15.6" | MSI Katana 15 B12VEK AUOAF90 (B156HAN08.4), IPS, 1920x1080, 15.6" | |
|---|---|---|---|---|---|
| Display | 8% | 6% | 9% | -38% | |
| Display P3 Coverage (%) | 61.4 | 66.3 8% | 64.9 6% | 67.5 10% | 38.1 -38% |
| sRGB Coverage (%) | 89.7 | 96.6 8% | 96.5 8% | 97.6 9% | 56.8 -37% |
| AdobeRGB 1998 Coverage (%) | 63.2 | 67.7 7% | 66.6 5% | 68.9 9% | 39.3 -38% |
| Response Times | 25% | -199% | -29% | -282% | |
| Response Time Grey 50% / Grey 80% * (ms) | 8 ? | 5 ? 37% | 30.4 ? -280% | 13.2 ? -65% | 38.8 ? -385% |
| Response Time Black / White * (ms) | 9.6 ? | 8.41 ? 12% | 20.8 ? -117% | 8.8 ? 8% | 26.8 ? -179% |
| PWM Frequency (Hz) | |||||
| Screen | 3% | 32% | 12% | -46% | |
| Brightness middle (cd/m²) | 364 | 373 2% | 288 -21% | 336 -8% | 261 -28% |
| Brightness (cd/m²) | 351 | 365 4% | 271 -23% | 307 -13% | 258 -26% |
| Brightness Distribution (%) | 91 | 90 -1% | 91 0% | 77 -15% | 92 1% |
| Black Level * (cd/m²) | 0.43 | 0.33 23% | 0.17 60% | 0.38 12% | 0.19 56% |
| Contrast (:1) | 847 | 1130 33% | 1694 100% | 884 4% | 1374 62% |
| Colorchecker dE 2000 * | 3.98 | 4.19 -5% | 1.9 52% | 1.96 51% | 5.57 -40% |
| Colorchecker dE 2000 max. * | 6.38 | 8.47 -33% | 3.3 48% | 5.07 21% | 20.6 -223% |
| Colorchecker dE 2000 calibrated * | 1.36 | 1.07 21% | 0.9 34% | 1.27 7% | 4.63 -240% |
| Greyscale dE 2000 * | 4.39 | 5 -14% | 2.7 38% | 2.3 48% | 3.19 27% |
| Gamma | 2.58 85% | 1.93 114% | 2.32 95% | 2.017 109% | 2.45 90% |
| CCT | 7316 89% | 7520 86% | 6535 99% | 6644 98% | 6146 106% |
| Media total (Programa/Opciones) | 12% /
7% | -54% /
-6% | -3% /
6% | -122% /
-78% |
* ... más pequeño es mejor
El rendimiento inicial de la pantalla es subóptimo, con valores DeltaE para los colores y la escala de grises muy por encima del objetivo, y el nivel de negro es excesivamente alto. Sin embargo, calibrar el panel y reducir el brillo mejora significativamente la calidad de la pantalla. Tras la calibración, los valores DeltaE se reducen a unos encomiables 0,55 para la escala de grises y 1,36 para ColorChecker.
Puede descargar gratuitamente nuestro perfil de color calibrado más arriba.
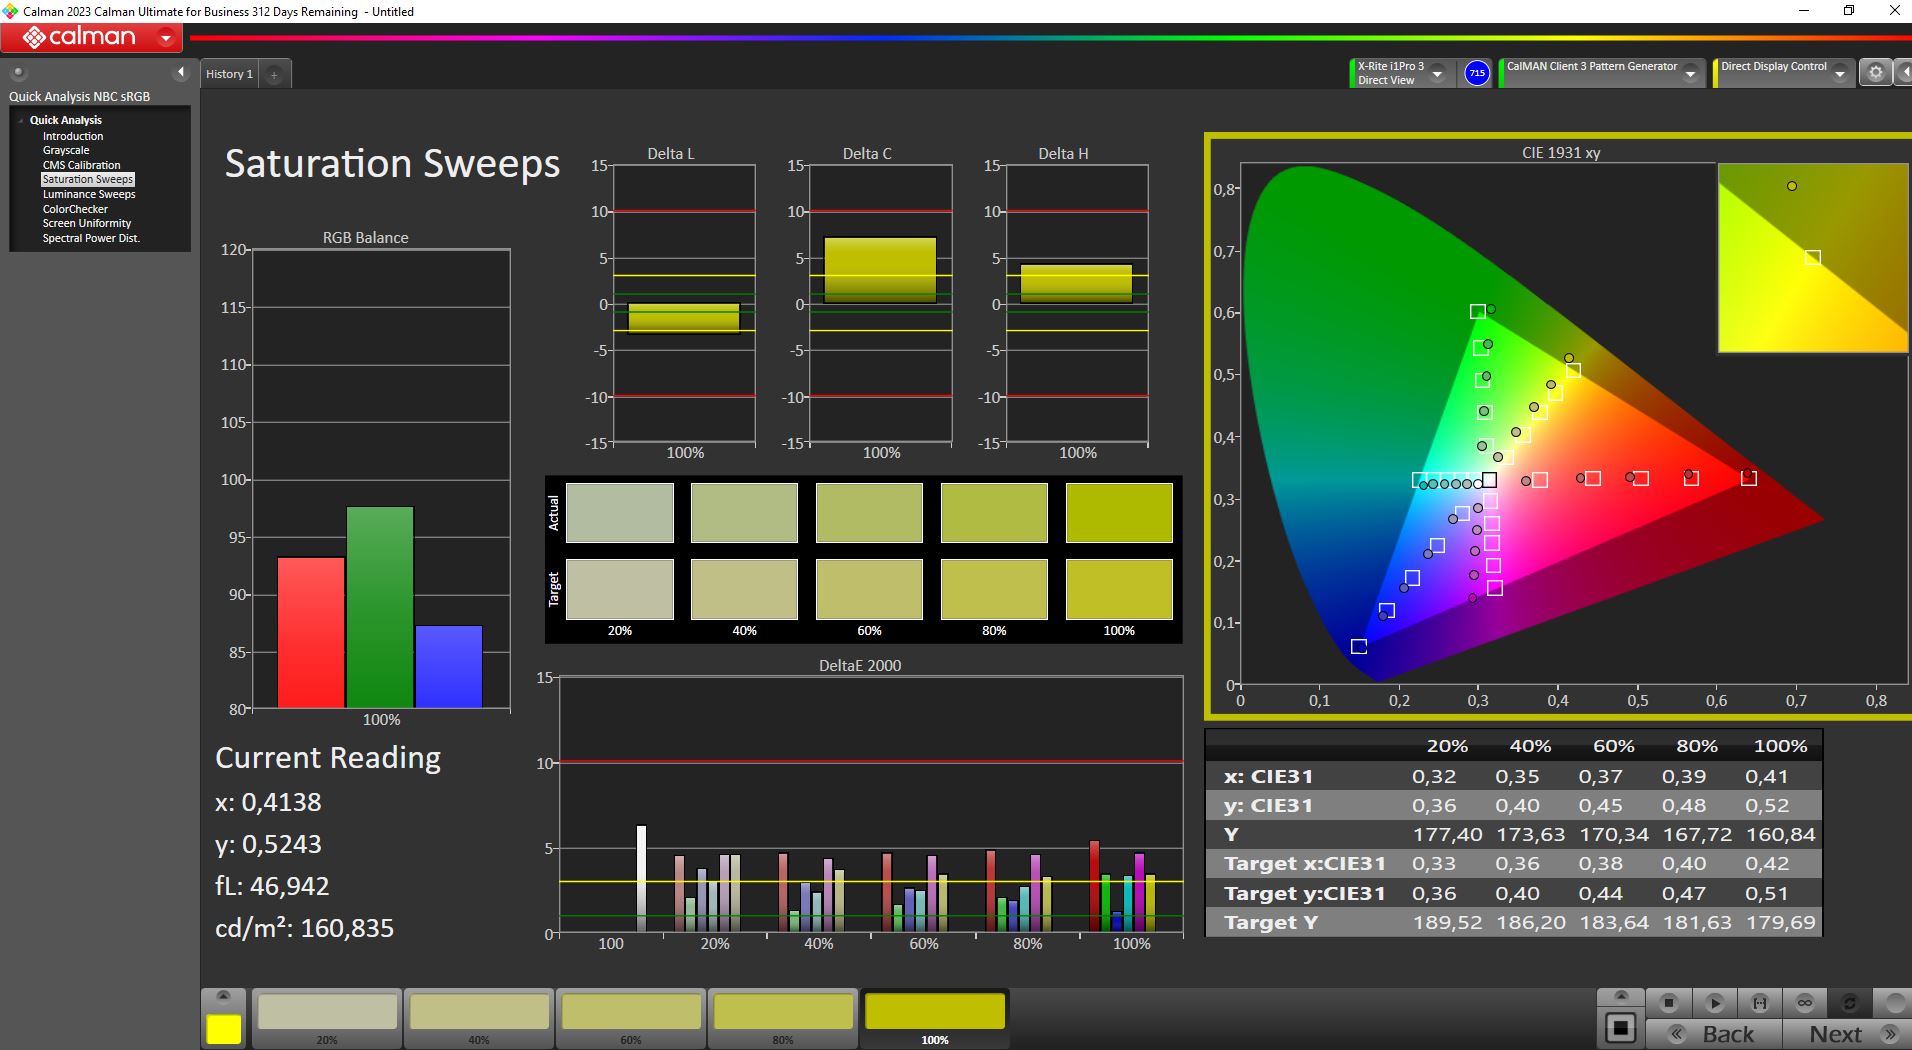
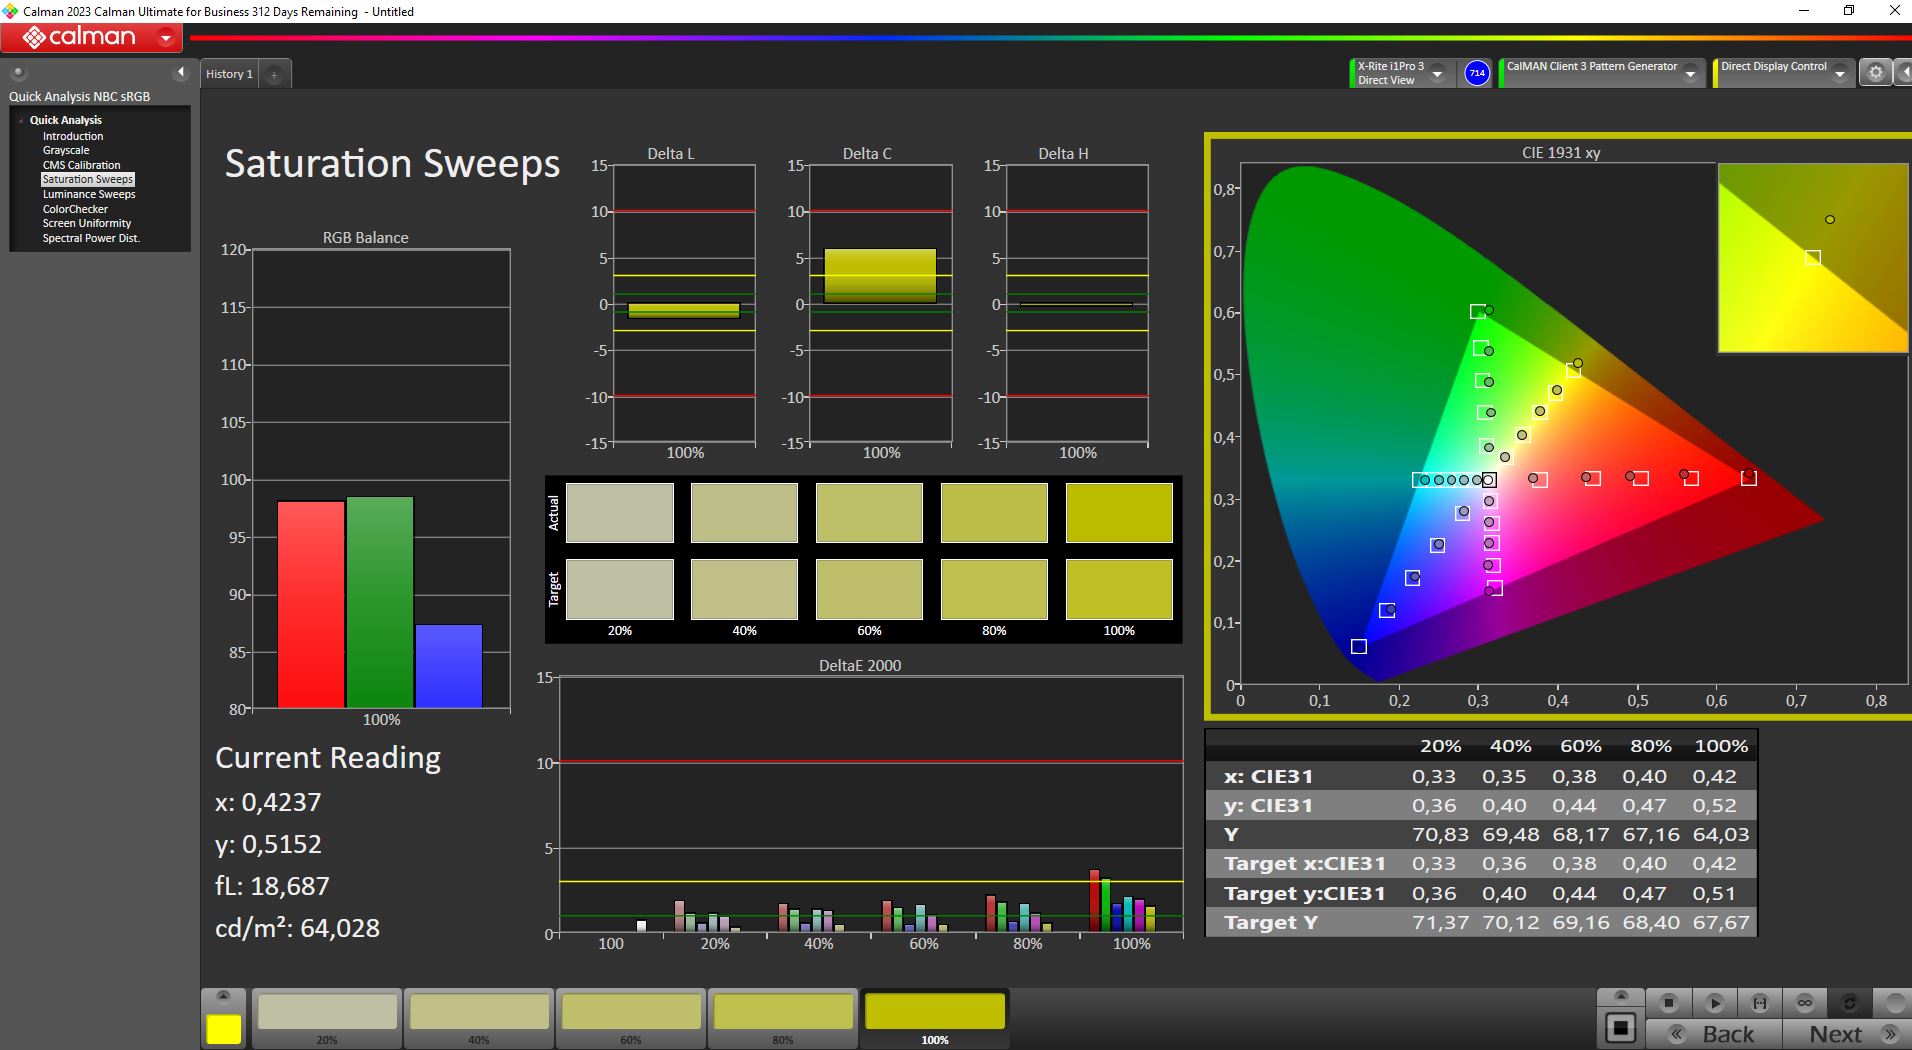
El panel más antiguo muestra claras debilidades en términos de cobertura del espacio de color, con una cobertura incluso de sRGB de sólo el 90% en el mejor de los casos. A pesar de sus buenos valores DeltaE, el panel puede resultar menos adecuado para los creadores de contenidos.
Tiempos de respuesta del display
| ↔ Tiempo de respuesta de Negro a Blanco | ||
|---|---|---|
| 9.6 ms ... subida ↗ y bajada ↘ combinada | ↗ 5.4 ms subida | 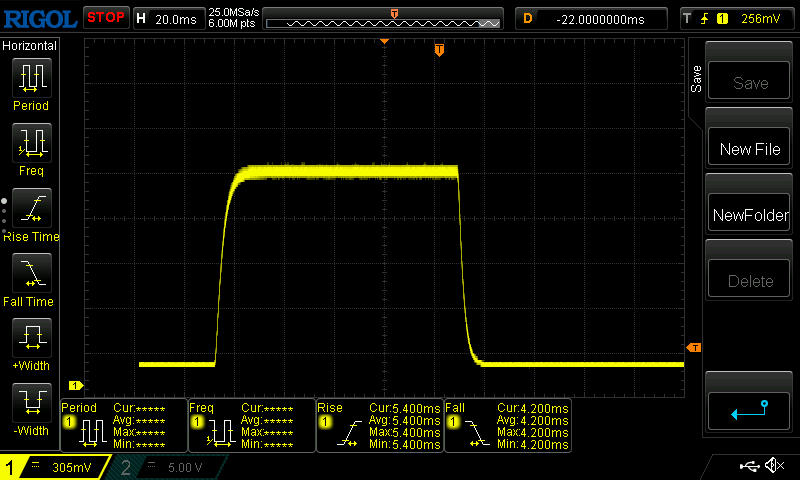 |
| ↘ 4.2 ms bajada | ||
| La pantalla mostró tiempos de respuesta rápidos en nuestros tests y debería ser adecuada para juegos. En comparación, todos los dispositivos de prueba van de ##min### (mínimo) a 240 (máximo) ms. » 26 % de todos los dispositivos son mejores. Esto quiere decir que el tiempo de respuesta medido es mejor que la media (19.8 ms) de todos los dispositivos testados. | ||
| ↔ Tiempo de respuesta 50% Gris a 80% Gris | ||
| 8 ms ... subida ↗ y bajada ↘ combinada | ↗ 3.8 ms subida | 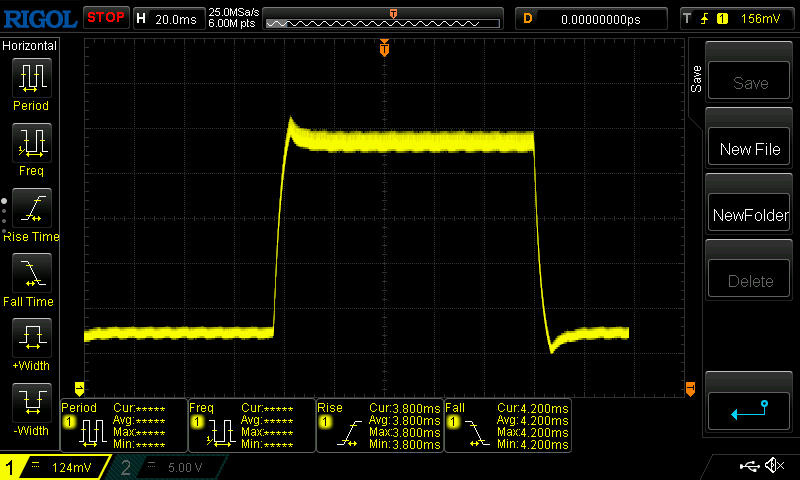 |
| ↘ 4.2 ms bajada | ||
| La pantalla mostró tiempos de respuesta rápidos en nuestros tests y debería ser adecuada para juegos. En comparación, todos los dispositivos de prueba van de ##min### (mínimo) a 636 (máximo) ms. » 21 % de todos los dispositivos son mejores. Esto quiere decir que el tiempo de respuesta medido es mejor que la media (31 ms) de todos los dispositivos testados. | ||
Parpadeo de Pantalla / PWM (Pulse-Width Modulation)
| Parpadeo de Pantalla / PWM no detectado |  | ||
Comparación: 52 % de todos los dispositivos testados no usaron PWM para atenuar el display. Si se usó, medimos una media de 7754 (mínimo: 5 - máxmo: 343500) Hz. | |||
La superficie mate, junto con la luminosidad de 350 nits, garantiza que trabajar en exteriores, al menos en un lugar sombreado, no sea un reto.

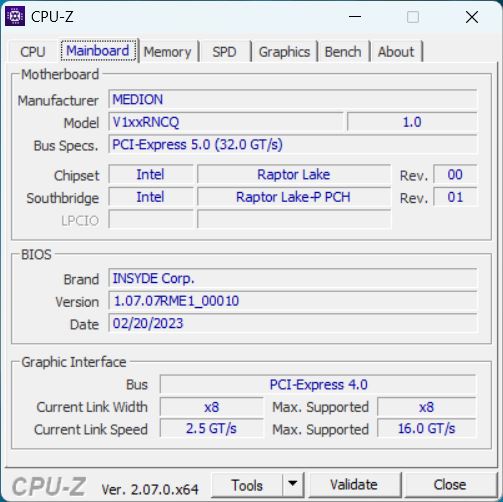
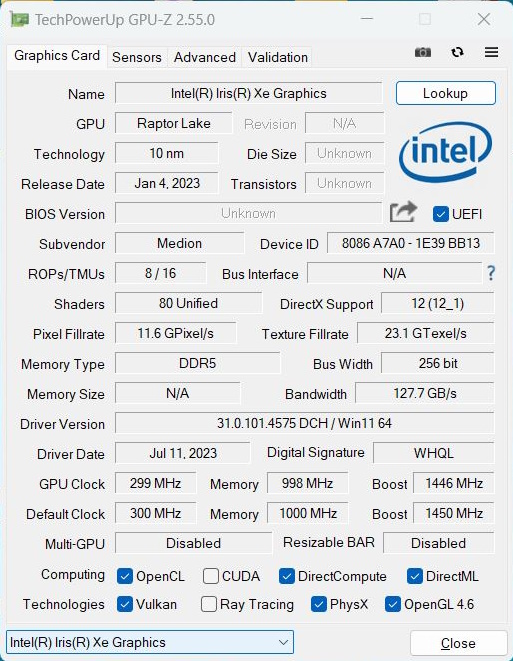
Rendimiento - Una buena combinación de i5-13500H y RTX 4050
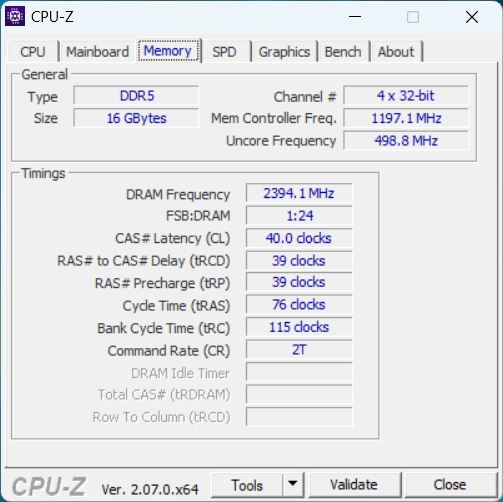
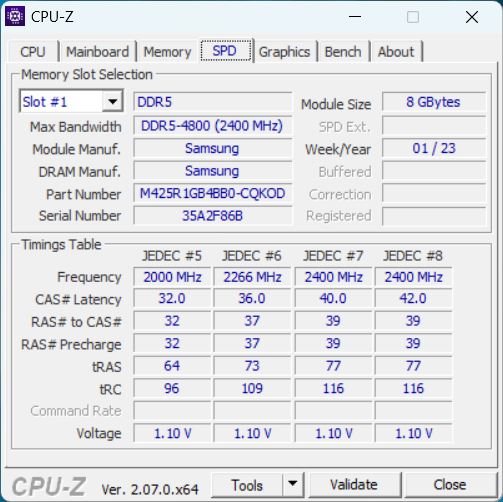
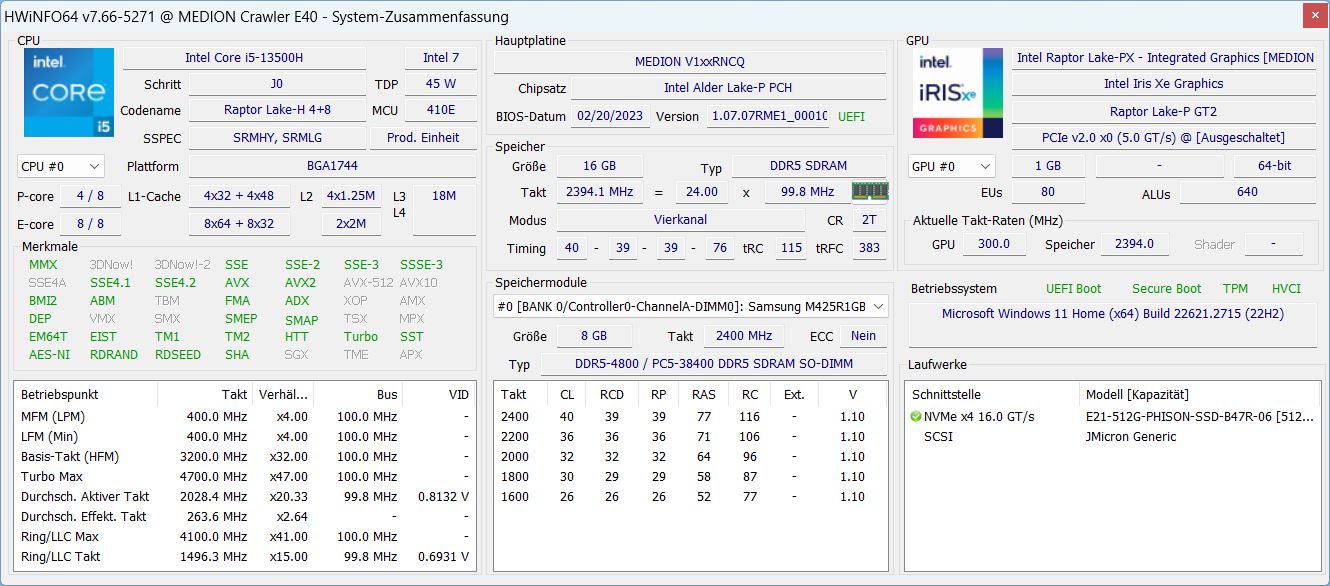
Con el Crawler, tenemos un portátil para juegos de nivel básico, como indica la Nvidia GeForce RTX 4050 y el Intel Core i5-13500Hambos de los cuales son sólidas variantes de presupuesto entre los componentes para juegos. También hay 16 GB de memoria RAM moderna DDR5-4800 y una SSD NVMe de 512 GB, y el espacio de almacenamiento también es más bien una opción económica.
Esto hace que el portátil sea adecuado para cualquiera que no tenga que jugar necesariamente a todos los juegos actuales con el máximo detalle. Para muchos juegos, sin embargo, el rendimiento en la resolución nativa de 1080p debería ser suficiente para detalles altos. Los creadores de contenidos también pueden estar interesados en el rendimiento y el diseño sencillo, pero es probable que la pantalla sea un criterio de nocaut para el trabajo creativo real (imágenes, vídeos).
Condiciones de prueba
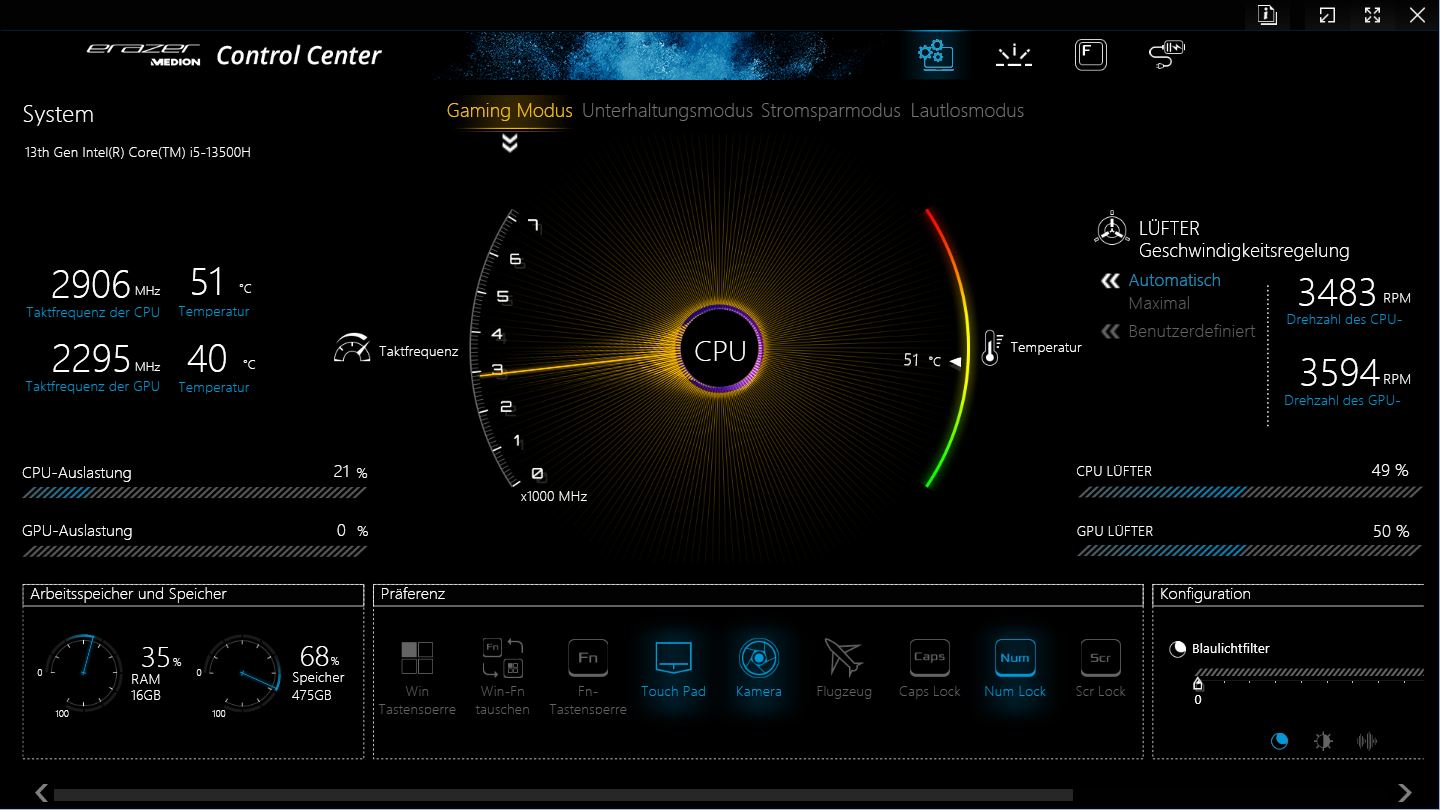
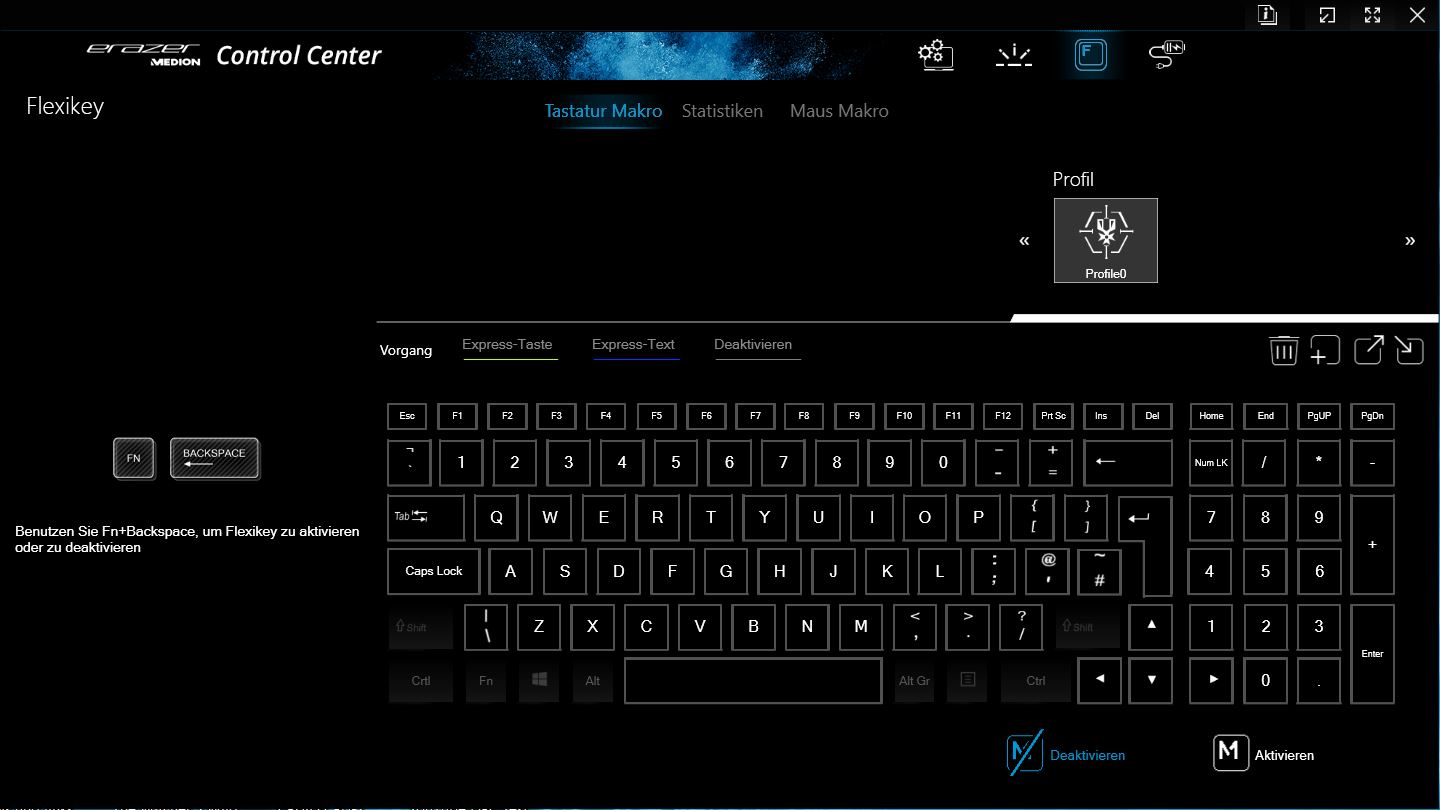
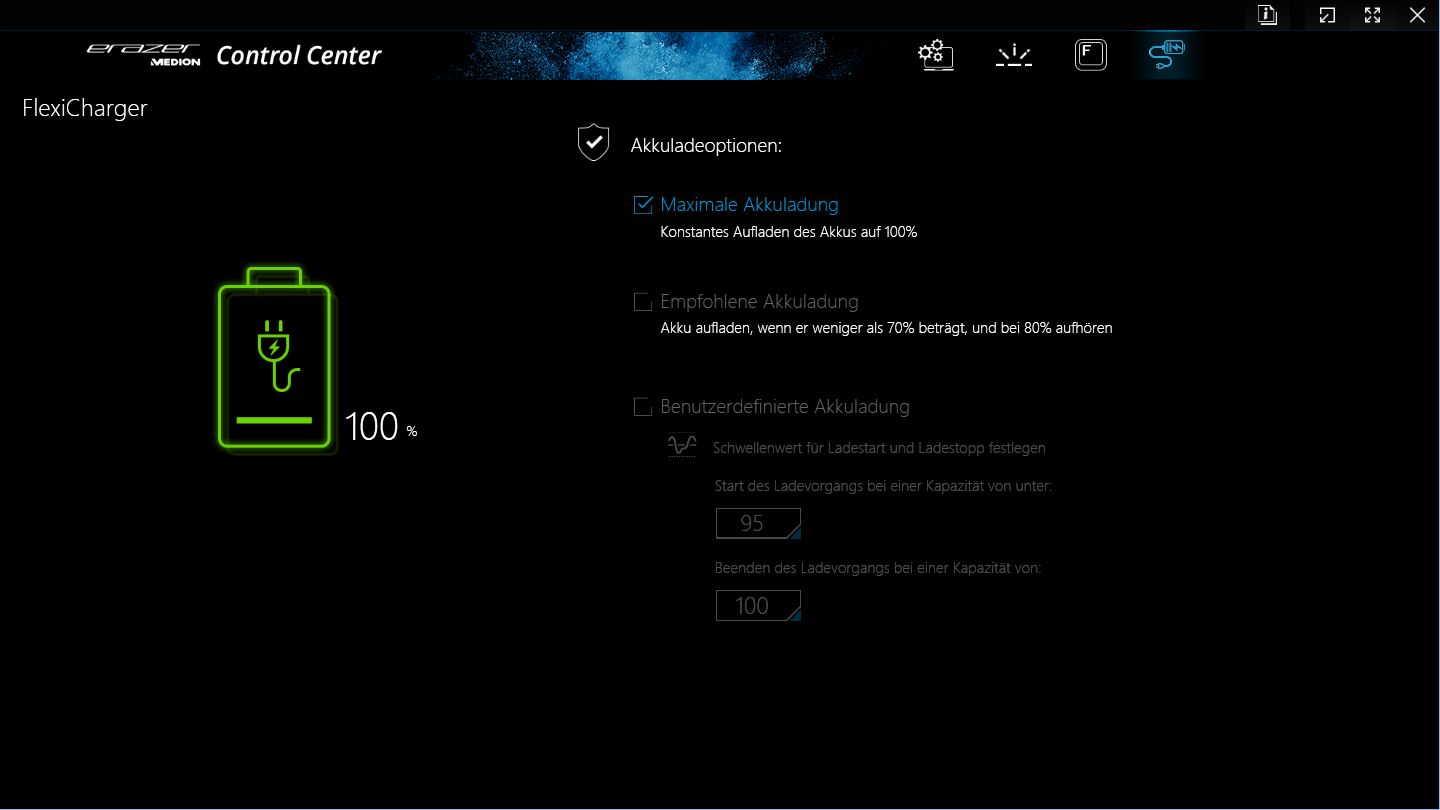
Medion ha preinstalado un Centro de Control genérico en el Crawler E40, que alberga los perfiles de rendimiento, la iluminación del teclado y otros ajustes. La aplicación no es especialmente rápida y a menudo sólo procesa las entradas con un ligero retraso.
En la pantalla principal, también resulta un poco molesto tener que desplazarse hasta la parte inferior derecha para acceder al interruptor de la GPU (MSHybrid frente a dGPU, reinicio necesario), por ejemplo, que podría diseñarse de forma más clara con un poco de esfuerzo.
Utilizamos el modo de juego para las pruebas de rendimiento y el modo de ahorro de energía para las pruebas de batería, ya que aquí se desactiva la dGPU y toma el relevo la GPU integrada.
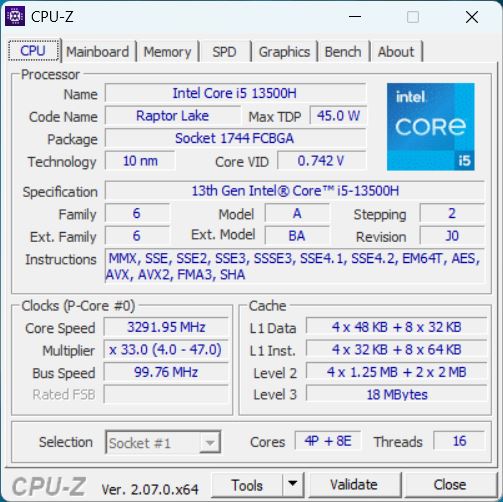
Procesador
El Intel Core i5-13500H es una CPU de gama media de la actual serie Raptor Lake-H (Intel Gen13). Cuenta con 4 de los 6 núcleos P y 8 núcleos E posibles. En conjunto, tiene 12 núcleos y 16 hilos (sólo los núcleos P soportan hyperthreading). El reloj base del E es de 1,9 GHz, los núcleos P pueden alcanzar individualmente hasta 4,7 GHz y en conjunto hasta 4,6 GHz.
Por cierto, existe un Medion Erazer Crawler E50 con Intel Gen 12 i5-12450H. El esquema de nomenclatura de Medion es realmente muy opaco y puede inducir a error a los compradores, ¡así que tenga cuidado al comprar!
En nuestras pruebas comparativas, la CPU ofreció un buen rendimiento y está más o menos a la par con un i5-13500 medio de nuestra base de datos.
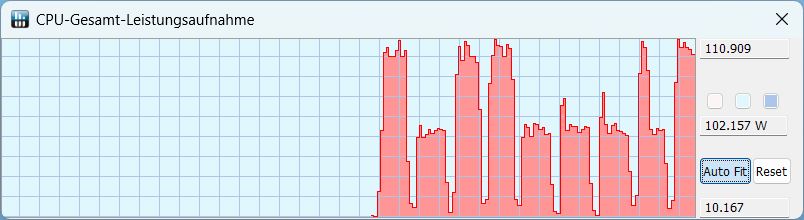
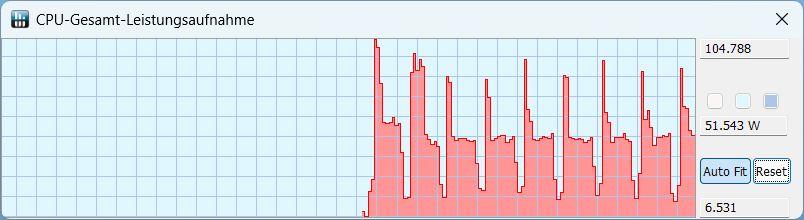
Durante el bucle Cinebench R15, el procesador muestra un rendimiento muy consistente desde el principio sin una caída después de las primeras ejecuciones. La siguiente tabla muestra el comportamiento en los distintos modos de rendimiento, incluido el modo batería.
| Modo/Valor | Puntuación Cinebench R15 | Consumo de energía de la CPU Rango | Consumo de energía de la CPU típico |
|---|---|---|---|
| Juegos | 2.331 | 60 - 110 W | 105 |
| Entretenimiento | 2.135 | 50-105 | 51 |
| Silencioso | 835 | 15-23 | 15 |
| Batería | 1.065 | 19-21 | 21 |
Cinebench R15 Multi Loop
Cinebench R23: Multi Core | Single Core
Cinebench R20: CPU (Multi Core) | CPU (Single Core)
Cinebench R15: CPU Multi 64Bit | CPU Single 64Bit
Blender: v2.79 BMW27 CPU
7-Zip 18.03: 7z b 4 | 7z b 4 -mmt1
Geekbench 5.5: Multi-Core | Single-Core
HWBOT x265 Benchmark v2.2: 4k Preset
LibreOffice : 20 Documents To PDF
R Benchmark 2.5: Overall mean
| CPU Performance rating | |
| Media de la clase Gaming | |
| Schenker XMG Apex 15 (Late 23) | |
| Lenovo LOQ 15IRH8 Core i7 | |
| MSI Katana 15 B12VEK | |
| Medion Erazer Crawler E40 - MD 62518 | |
| Medio Intel Core i5-13500H | |
| Asus TUF A15 FA507 | |
| Cinebench R23 / Multi Core | |
| Media de la clase Gaming (10488 - 42661, n=107, últimos 2 años) | |
| Schenker XMG Apex 15 (Late 23) | |
| MSI Katana 15 B12VEK | |
| Lenovo LOQ 15IRH8 Core i7 | |
| Medio Intel Core i5-13500H (13542 - 16335, n=5) | |
| Medion Erazer Crawler E40 - MD 62518 | |
| Asus TUF A15 FA507 | |
| Cinebench R23 / Single Core | |
| Media de la clase Gaming (1166 - 2415, n=107, últimos 2 años) | |
| Lenovo LOQ 15IRH8 Core i7 | |
| Medion Erazer Crawler E40 - MD 62518 | |
| Schenker XMG Apex 15 (Late 23) | |
| Medio Intel Core i5-13500H (1704 - 1799, n=5) | |
| MSI Katana 15 B12VEK | |
| Asus TUF A15 FA507 | |
| Cinebench R20 / CPU (Multi Core) | |
| Media de la clase Gaming (4029 - 16433, n=106, últimos 2 años) | |
| Schenker XMG Apex 15 (Late 23) | |
| MSI Katana 15 B12VEK | |
| Lenovo LOQ 15IRH8 Core i7 | |
| Medio Intel Core i5-13500H (5108 - 6212, n=5) | |
| Asus TUF A15 FA507 | |
| Medion Erazer Crawler E40 - MD 62518 | |
| Cinebench R20 / CPU (Single Core) | |
| Media de la clase Gaming (442 - 913, n=106, últimos 2 años) | |
| Lenovo LOQ 15IRH8 Core i7 | |
| Schenker XMG Apex 15 (Late 23) | |
| Medion Erazer Crawler E40 - MD 62518 | |
| Medio Intel Core i5-13500H (655 - 687, n=5) | |
| MSI Katana 15 B12VEK | |
| Asus TUF A15 FA507 | |
| Cinebench R15 / CPU Multi 64Bit | |
| Media de la clase Gaming (1578 - 6330, n=105, últimos 2 años) | |
| Schenker XMG Apex 15 (Late 23) | |
| Medion Erazer Crawler E40 - MD 62518 | |
| Medio Intel Core i5-13500H (2234 - 2475, n=5) | |
| Lenovo LOQ 15IRH8 Core i7 | |
| Asus TUF A15 FA507 | |
| MSI Katana 15 B12VEK | |
| Cinebench R15 / CPU Single 64Bit | |
| Media de la clase Gaming (188.8 - 350, n=106, últimos 2 años) | |
| Schenker XMG Apex 15 (Late 23) | |
| Lenovo LOQ 15IRH8 Core i7 | |
| Medio Intel Core i5-13500H (243 - 261, n=5) | |
| Asus TUF A15 FA507 | |
| Medion Erazer Crawler E40 - MD 62518 | |
| MSI Katana 15 B12VEK | |
| Blender / v2.79 BMW27 CPU | |
| Lenovo LOQ 15IRH8 Core i7 | |
| Medio Intel Core i5-13500H (205 - 263, n=6) | |
| MSI Katana 15 B12VEK | |
| Asus TUF A15 FA507 | |
| Medion Erazer Crawler E40 - MD 62518 | |
| Schenker XMG Apex 15 (Late 23) | |
| Media de la clase Gaming (79 - 330, n=104, últimos 2 años) | |
| 7-Zip 18.03 / 7z b 4 | |
| Media de la clase Gaming (33491 - 148086, n=105, últimos 2 años) | |
| Schenker XMG Apex 15 (Late 23) | |
| Asus TUF A15 FA507 | |
| MSI Katana 15 B12VEK | |
| Medion Erazer Crawler E40 - MD 62518 | |
| Lenovo LOQ 15IRH8 Core i7 | |
| Medio Intel Core i5-13500H (50846 - 58567, n=6) | |
| 7-Zip 18.03 / 7z b 4 -mmt1 | |
| Schenker XMG Apex 15 (Late 23) | |
| Media de la clase Gaming (4199 - 7436, n=105, últimos 2 años) | |
| Lenovo LOQ 15IRH8 Core i7 | |
| Asus TUF A15 FA507 | |
| Medio Intel Core i5-13500H (5500 - 5885, n=6) | |
| MSI Katana 15 B12VEK | |
| Medion Erazer Crawler E40 - MD 62518 | |
| Geekbench 5.5 / Multi-Core | |
| Media de la clase Gaming (6460 - 28263, n=105, últimos 2 años) | |
| Schenker XMG Apex 15 (Late 23) | |
| Lenovo LOQ 15IRH8 Core i7 | |
| MSI Katana 15 B12VEK | |
| Medion Erazer Crawler E40 - MD 62518 | |
| Medio Intel Core i5-13500H (9312 - 11465, n=5) | |
| Asus TUF A15 FA507 | |
| Geekbench 5.5 / Single-Core | |
| Media de la clase Gaming (986 - 2474, n=105, últimos 2 años) | |
| Schenker XMG Apex 15 (Late 23) | |
| Lenovo LOQ 15IRH8 Core i7 | |
| Medio Intel Core i5-13500H (1674 - 1762, n=5) | |
| Medion Erazer Crawler E40 - MD 62518 | |
| MSI Katana 15 B12VEK | |
| Asus TUF A15 FA507 | |
| HWBOT x265 Benchmark v2.2 / 4k Preset | |
| Media de la clase Gaming (11.5 - 44.4, n=105, últimos 2 años) | |
| Schenker XMG Apex 15 (Late 23) | |
| Medion Erazer Crawler E40 - MD 62518 | |
| MSI Katana 15 B12VEK | |
| Asus TUF A15 FA507 | |
| Lenovo LOQ 15IRH8 Core i7 | |
| Medio Intel Core i5-13500H (14.4 - 17.9, n=6) | |
| LibreOffice / 20 Documents To PDF | |
| Medion Erazer Crawler E40 - MD 62518 | |
| Medio Intel Core i5-13500H (44 - 65.5, n=5) | |
| Asus TUF A15 FA507 | |
| Media de la clase Gaming (33.2 - 88.8, n=105, últimos 2 años) | |
| MSI Katana 15 B12VEK | |
| Schenker XMG Apex 15 (Late 23) | |
| Lenovo LOQ 15IRH8 Core i7 | |
| R Benchmark 2.5 / Overall mean | |
| Asus TUF A15 FA507 | |
| MSI Katana 15 B12VEK | |
| Medio Intel Core i5-13500H (0.471 - 0.51, n=6) | |
| Medion Erazer Crawler E40 - MD 62518 | |
| Lenovo LOQ 15IRH8 Core i7 | |
| Schenker XMG Apex 15 (Late 23) | |
| Media de la clase Gaming (0.3439 - 0.759, n=106, últimos 2 años) | |
* ... más pequeño es mejor
AIDA64: FP32 Ray-Trace | FPU Julia | CPU SHA3 | CPU Queen | FPU SinJulia | FPU Mandel | CPU AES | CPU ZLib | FP64 Ray-Trace | CPU PhotoWorxx
| Performance rating | |
| Media de la clase Gaming | |
| Schenker XMG Apex 15 (Late 23) | |
| Asus TUF A15 FA507 | |
| MSI Katana 15 B12VEK | |
| Medion Erazer Crawler E40 - MD 62518 | |
| Medio Intel Core i5-13500H | |
| Lenovo LOQ 15IRH8 Core i7 | |
| AIDA64 / FP32 Ray-Trace | |
| Media de la clase Gaming (10227 - 85542, n=105, últimos 2 años) | |
| Schenker XMG Apex 15 (Late 23) | |
| Asus TUF A15 FA507 | |
| MSI Katana 15 B12VEK | |
| Medion Erazer Crawler E40 - MD 62518 | |
| Medio Intel Core i5-13500H (11081 - 15390, n=6) | |
| Lenovo LOQ 15IRH8 Core i7 | |
| AIDA64 / FPU Julia | |
| Media de la clase Gaming (51376 - 238426, n=105, últimos 2 años) | |
| Schenker XMG Apex 15 (Late 23) | |
| Asus TUF A15 FA507 | |
| MSI Katana 15 B12VEK | |
| Medion Erazer Crawler E40 - MD 62518 | |
| Medio Intel Core i5-13500H (56813 - 74251, n=6) | |
| Lenovo LOQ 15IRH8 Core i7 | |
| AIDA64 / CPU SHA3 | |
| Media de la clase Gaming (2180 - 10115, n=105, últimos 2 años) | |
| Schenker XMG Apex 15 (Late 23) | |
| Medion Erazer Crawler E40 - MD 62518 | |
| Asus TUF A15 FA507 | |
| MSI Katana 15 B12VEK | |
| Medio Intel Core i5-13500H (2621 - 3623, n=6) | |
| Lenovo LOQ 15IRH8 Core i7 | |
| AIDA64 / CPU Queen | |
| Media de la clase Gaming (49785 - 173351, n=90, últimos 2 años) | |
| Schenker XMG Apex 15 (Late 23) | |
| Asus TUF A15 FA507 | |
| MSI Katana 15 B12VEK | |
| Medion Erazer Crawler E40 - MD 62518 | |
| Medio Intel Core i5-13500H (77835 - 85727, n=6) | |
| Lenovo LOQ 15IRH8 Core i7 | |
| AIDA64 / FPU SinJulia | |
| Schenker XMG Apex 15 (Late 23) | |
| Media de la clase Gaming (4424 - 33636, n=105, últimos 2 años) | |
| Asus TUF A15 FA507 | |
| MSI Katana 15 B12VEK | |
| Medion Erazer Crawler E40 - MD 62518 | |
| Medio Intel Core i5-13500H (7249 - 8086, n=6) | |
| Lenovo LOQ 15IRH8 Core i7 | |
| AIDA64 / FPU Mandel | |
| Media de la clase Gaming (25115 - 128721, n=105, últimos 2 años) | |
| Schenker XMG Apex 15 (Late 23) | |
| Asus TUF A15 FA507 | |
| MSI Katana 15 B12VEK | |
| Medion Erazer Crawler E40 - MD 62518 | |
| Medio Intel Core i5-13500H (27820 - 38336, n=6) | |
| Lenovo LOQ 15IRH8 Core i7 | |
| AIDA64 / CPU AES | |
| Schenker XMG Apex 15 (Late 23) | |
| Media de la clase Gaming (39258 - 247074, n=105, últimos 2 años) | |
| Medio Intel Core i5-13500H (62657 - 120493, n=6) | |
| MSI Katana 15 B12VEK | |
| Asus TUF A15 FA507 | |
| Medion Erazer Crawler E40 - MD 62518 | |
| Lenovo LOQ 15IRH8 Core i7 | |
| AIDA64 / CPU ZLib | |
| Media de la clase Gaming (574 - 2531, n=105, últimos 2 años) | |
| Schenker XMG Apex 15 (Late 23) | |
| Medion Erazer Crawler E40 - MD 62518 | |
| Medio Intel Core i5-13500H (782 - 992, n=6) | |
| MSI Katana 15 B12VEK | |
| Lenovo LOQ 15IRH8 Core i7 | |
| Asus TUF A15 FA507 | |
| AIDA64 / FP64 Ray-Trace | |
| Media de la clase Gaming (5509 - 45446, n=105, últimos 2 años) | |
| Schenker XMG Apex 15 (Late 23) | |
| Asus TUF A15 FA507 | |
| MSI Katana 15 B12VEK | |
| Medion Erazer Crawler E40 - MD 62518 | |
| Medio Intel Core i5-13500H (5955 - 8495, n=6) | |
| Lenovo LOQ 15IRH8 Core i7 | |
| AIDA64 / CPU PhotoWorxx | |
| Media de la clase Gaming (12271 - 89891, n=105, últimos 2 años) | |
| MSI Katana 15 B12VEK | |
| Medion Erazer Crawler E40 - MD 62518 | |
| Schenker XMG Apex 15 (Late 23) | |
| Lenovo LOQ 15IRH8 Core i7 | |
| Medio Intel Core i5-13500H (20212 - 37618, n=6) | |
| Asus TUF A15 FA507 | |
Rendimiento del sistema
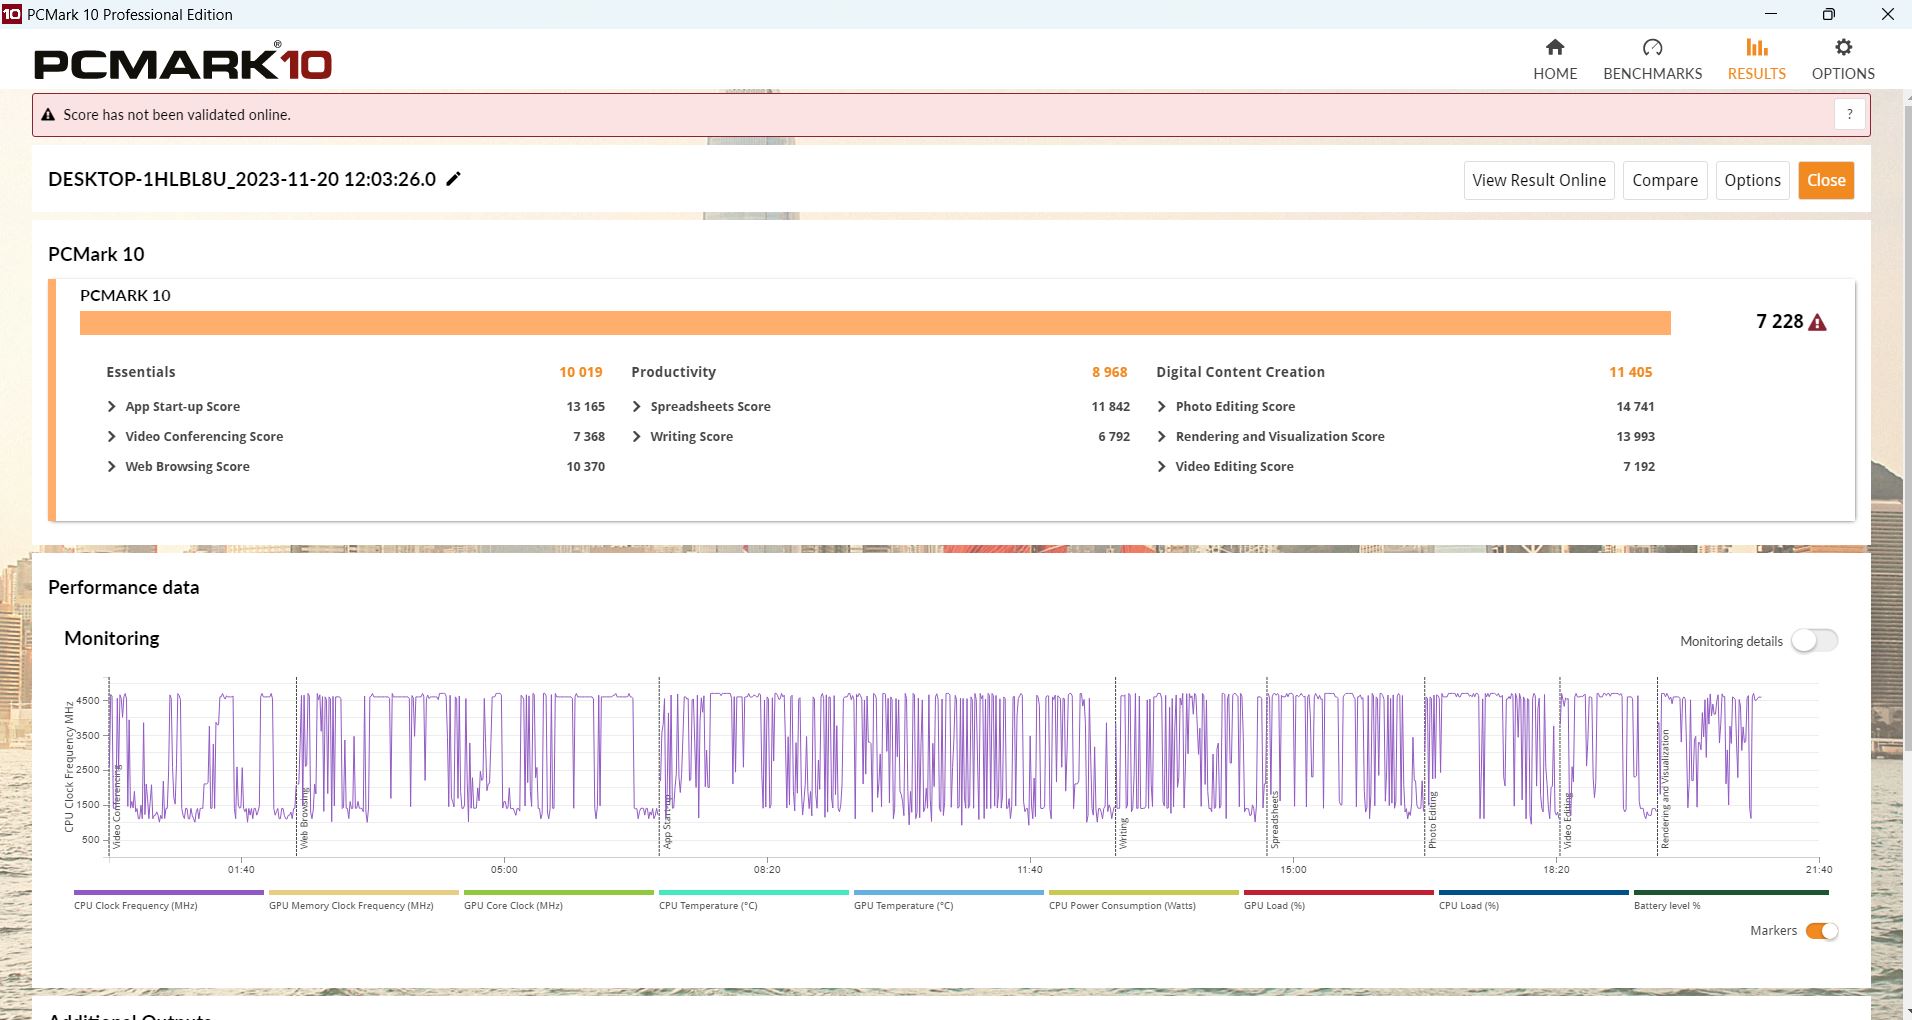
En PCMark 10, el XMG Apex 15 y el Lenovo LOQ 15 están ligeramente por delante, especialmente en Productividad y Essentials. El Crawler está igualado en Creación de Contenidos Digitales. Sólo el LOQ 15 es ligeramente más rápido en Crossmark.
CrossMark: Overall | Productivity | Creativity | Responsiveness
| PCMark 10 / Score | |
| Media de la clase Gaming (5828 - 12414, n=93, últimos 2 años) | |
| Schenker XMG Apex 15 (Late 23) | |
| Lenovo LOQ 15IRH8 Core i7 | |
| Medion Erazer Crawler E40 - MD 62518 | |
| Asus TUF A15 FA507 | |
| Medio Intel Core i5-13500H, NVIDIA GeForce RTX 4050 Laptop GPU (6812 - 7228, n=2) | |
| MSI Katana 15 B12VEK | |
| PCMark 10 / Essentials | |
| Lenovo LOQ 15IRH8 Core i7 | |
| Schenker XMG Apex 15 (Late 23) | |
| Media de la clase Gaming (8810 - 11935, n=97, últimos 2 años) | |
| Asus TUF A15 FA507 | |
| MSI Katana 15 B12VEK | |
| Medion Erazer Crawler E40 - MD 62518 | |
| Medio Intel Core i5-13500H, NVIDIA GeForce RTX 4050 Laptop GPU (9521 - 10019, n=2) | |
| PCMark 10 / Productivity | |
| Media de la clase Gaming (6845 - 25323, n=95, últimos 2 años) | |
| Schenker XMG Apex 15 (Late 23) | |
| MSI Katana 15 B12VEK | |
| Lenovo LOQ 15IRH8 Core i7 | |
| Asus TUF A15 FA507 | |
| Medion Erazer Crawler E40 - MD 62518 | |
| Medio Intel Core i5-13500H, NVIDIA GeForce RTX 4050 Laptop GPU (8890 - 8968, n=2) | |
| PCMark 10 / Digital Content Creation | |
| Media de la clase Gaming (7602 - 19954, n=95, últimos 2 años) | |
| Lenovo LOQ 15IRH8 Core i7 | |
| Schenker XMG Apex 15 (Late 23) | |
| Medion Erazer Crawler E40 - MD 62518 | |
| Medio Intel Core i5-13500H, NVIDIA GeForce RTX 4050 Laptop GPU (10134 - 11405, n=2) | |
| Asus TUF A15 FA507 | |
| MSI Katana 15 B12VEK | |
| CrossMark / Overall | |
| Media de la clase Gaming (1366 - 2409, n=94, últimos 2 años) | |
| Lenovo LOQ 15IRH8 Core i7 | |
| Medion Erazer Crawler E40 - MD 62518 | |
| Medio Intel Core i5-13500H, NVIDIA GeForce RTX 4050 Laptop GPU (n=1) | |
| Schenker XMG Apex 15 (Late 23) | |
| MSI Katana 15 B12VEK | |
| Asus TUF A15 FA507 | |
| CrossMark / Productivity | |
| Media de la clase Gaming (1386 - 2254, n=94, últimos 2 años) | |
| Lenovo LOQ 15IRH8 Core i7 | |
| Medion Erazer Crawler E40 - MD 62518 | |
| Medio Intel Core i5-13500H, NVIDIA GeForce RTX 4050 Laptop GPU (n=1) | |
| Schenker XMG Apex 15 (Late 23) | |
| MSI Katana 15 B12VEK | |
| Asus TUF A15 FA507 | |
| CrossMark / Creativity | |
| Media de la clase Gaming (1343 - 2786, n=94, últimos 2 años) | |
| Lenovo LOQ 15IRH8 Core i7 | |
| Schenker XMG Apex 15 (Late 23) | |
| Medion Erazer Crawler E40 - MD 62518 | |
| Medio Intel Core i5-13500H, NVIDIA GeForce RTX 4050 Laptop GPU (n=1) | |
| MSI Katana 15 B12VEK | |
| Asus TUF A15 FA507 | |
| CrossMark / Responsiveness | |
| Lenovo LOQ 15IRH8 Core i7 | |
| Medion Erazer Crawler E40 - MD 62518 | |
| Medio Intel Core i5-13500H, NVIDIA GeForce RTX 4050 Laptop GPU (n=1) | |
| Media de la clase Gaming (1226 - 2334, n=94, últimos 2 años) | |
| MSI Katana 15 B12VEK | |
| Schenker XMG Apex 15 (Late 23) | |
| Asus TUF A15 FA507 | |
| PCMark 10 Score | 7228 puntos | |
ayuda | ||
| AIDA64 / Memory Copy | |
| Media de la clase Gaming (21750 - 129946, n=105, últimos 2 años) | |
| Schenker XMG Apex 15 (Late 23) | |
| Medion Erazer Crawler E40 - MD 62518 | |
| MSI Katana 15 B12VEK | |
| Lenovo LOQ 15IRH8 Core i7 | |
| Medio Intel Core i5-13500H (36916 - 57830, n=6) | |
| Asus TUF A15 FA507 | |
| AIDA64 / Memory Read | |
| Media de la clase Gaming (22956 - 118858, n=105, últimos 2 años) | |
| MSI Katana 15 B12VEK | |
| Medion Erazer Crawler E40 - MD 62518 | |
| Lenovo LOQ 15IRH8 Core i7 | |
| Schenker XMG Apex 15 (Late 23) | |
| Medio Intel Core i5-13500H (41676 - 65633, n=6) | |
| Asus TUF A15 FA507 | |
| AIDA64 / Memory Write | |
| Schenker XMG Apex 15 (Late 23) | |
| Media de la clase Gaming (22297 - 135096, n=105, últimos 2 años) | |
| Medion Erazer Crawler E40 - MD 62518 | |
| MSI Katana 15 B12VEK | |
| Asus TUF A15 FA507 | |
| Lenovo LOQ 15IRH8 Core i7 | |
| Medio Intel Core i5-13500H (36826 - 60523, n=6) | |
| AIDA64 / Memory Latency | |
| Lenovo LOQ 15IRH8 Core i7 | |
| Media de la clase Gaming (75.3 - 259, n=105, últimos 2 años) | |
| Medion Erazer Crawler E40 - MD 62518 | |
| MSI Katana 15 B12VEK | |
| Medio Intel Core i5-13500H (86.2 - 96.1, n=6) | |
| Schenker XMG Apex 15 (Late 23) | |
| Asus TUF A15 FA507 | |
* ... más pequeño es mejor
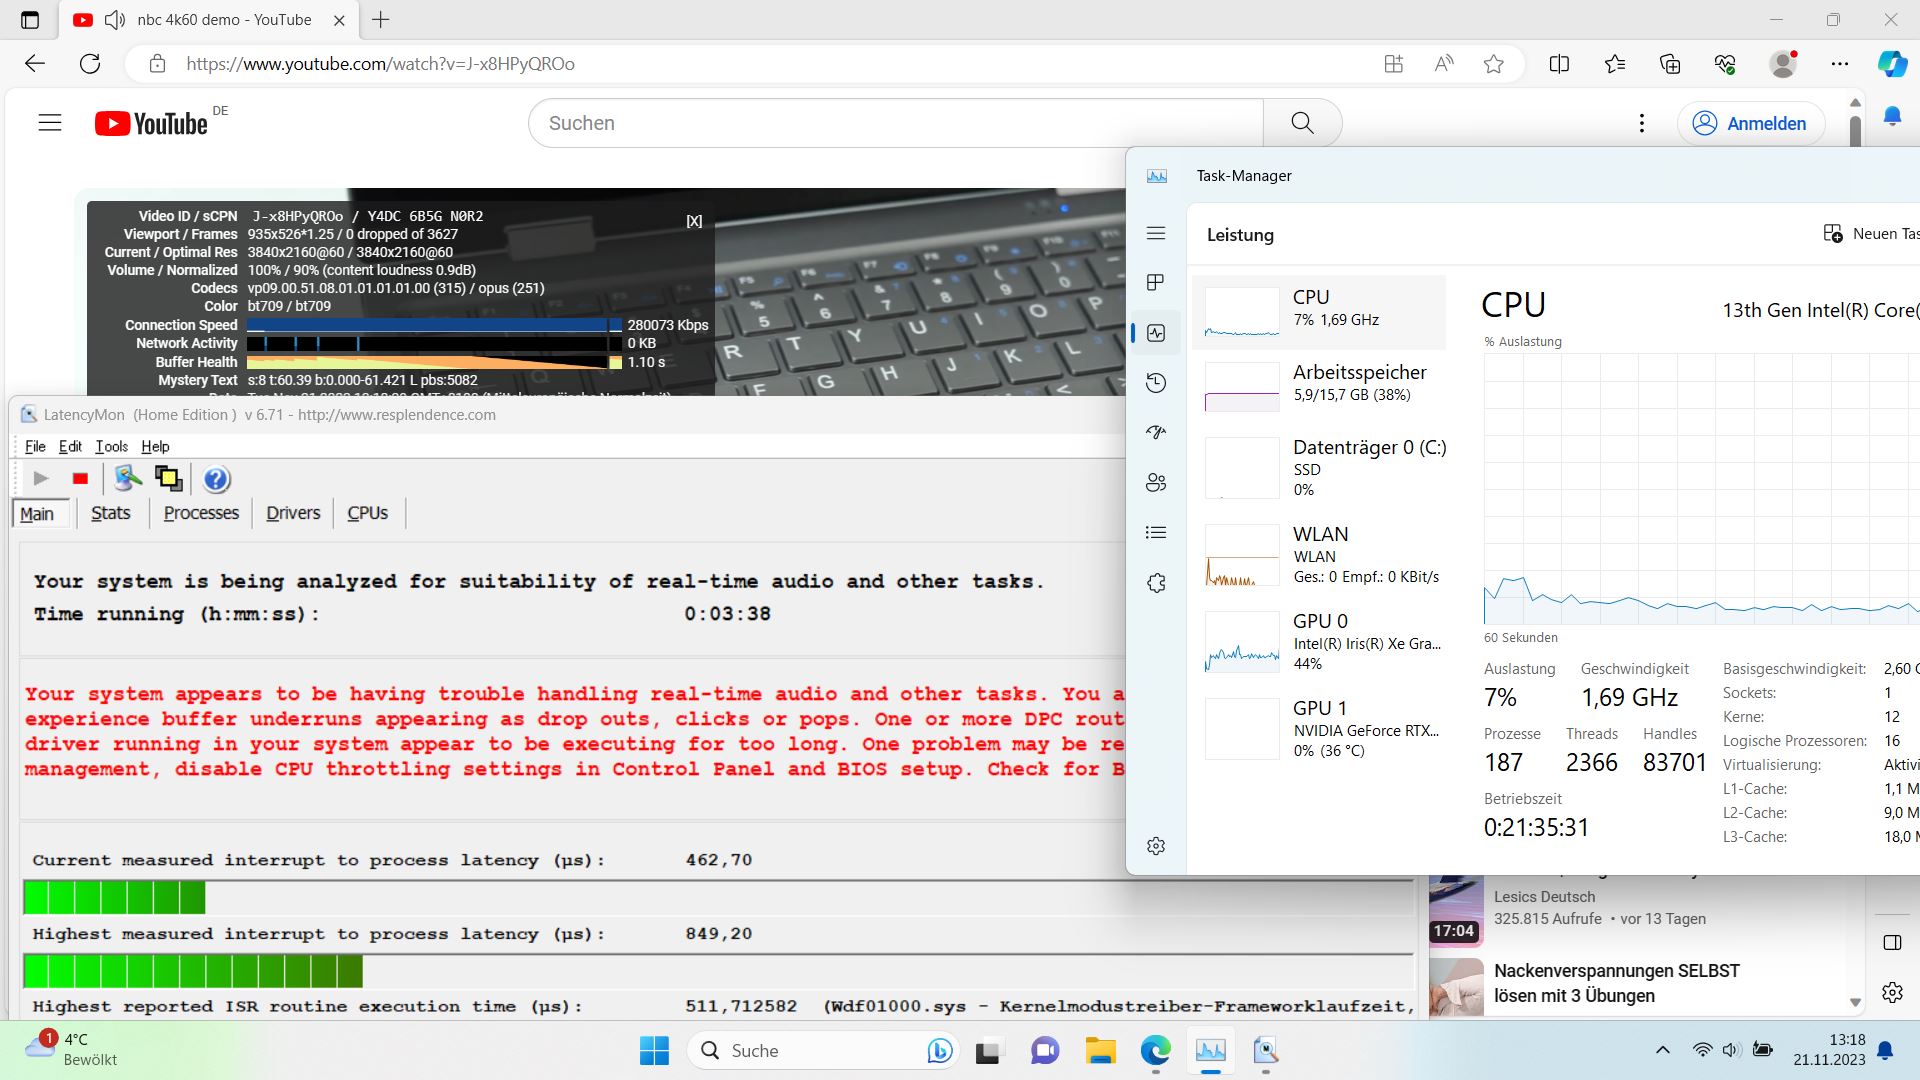
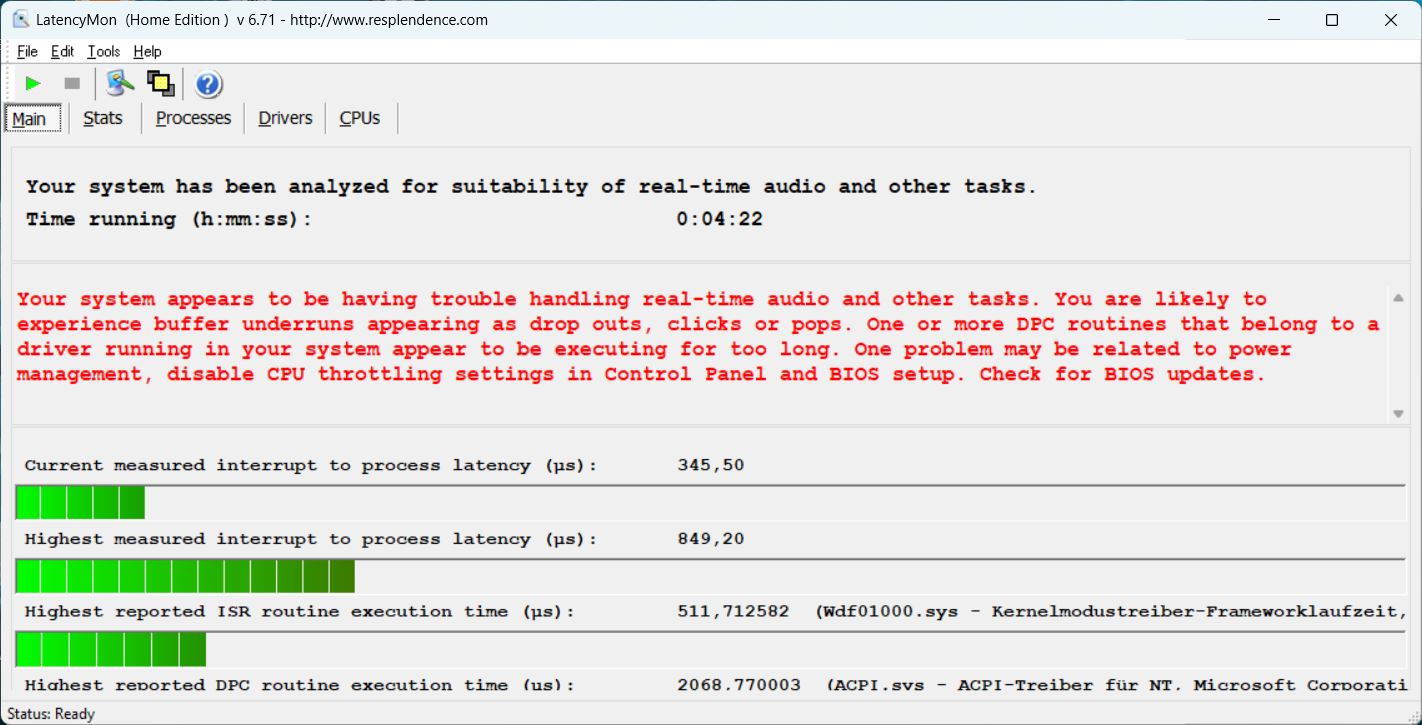
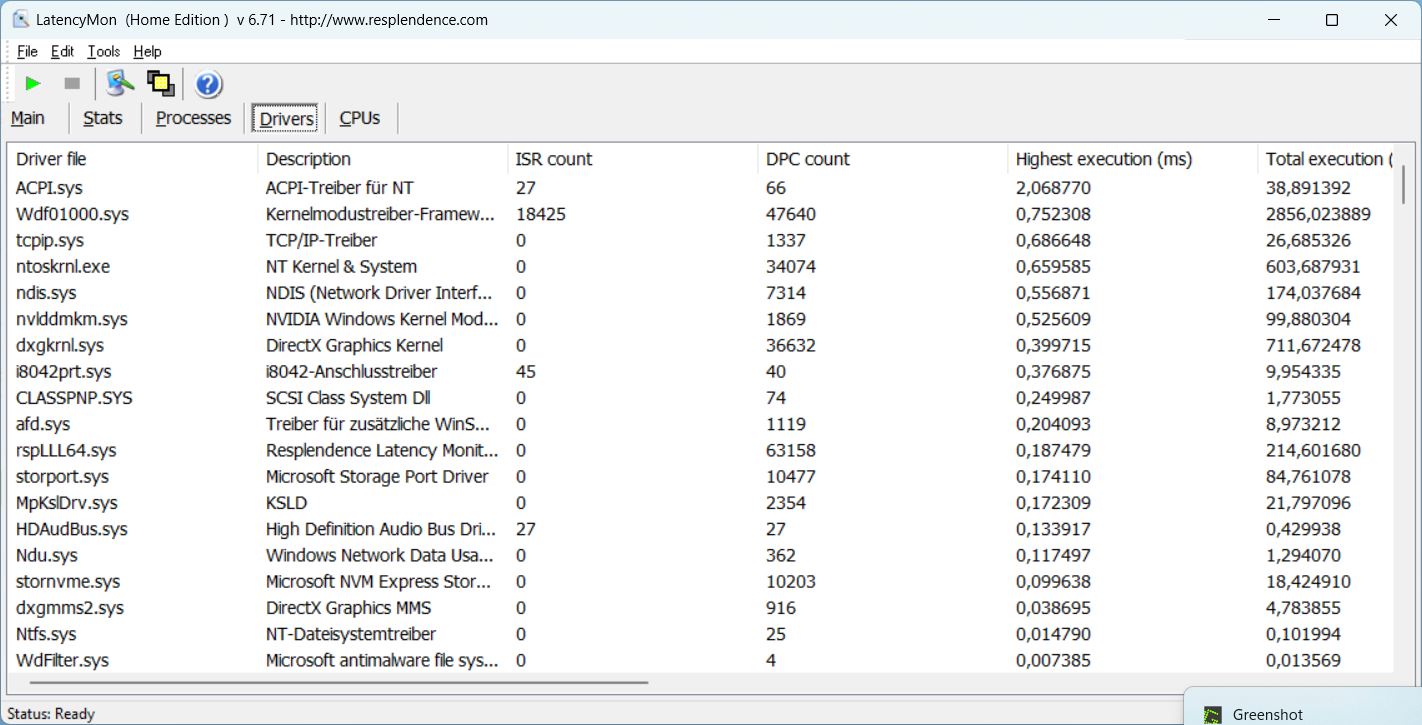
Latencia del CPD
No hay problemas al abrir el navegador o varias pestañas. Sin embargo, LatencyMon detecta algunos problemas al reproducir nuestro vídeo 4K/60 fps de YouTube. Al menos éste se reproduce sin caídas de fotogramas. El valor de latencia aumenta ligeramente bajo Prime95.
| DPC Latencies / LatencyMon - interrupt to process latency (max), Web, Youtube, Prime95 | |
| MSI Katana 15 B12VEK | |
| Medion Erazer Crawler E40 - MD 62518 | |
| Lenovo LOQ 15IRH8 Core i7 | |
| Schenker XMG Apex 15 (Late 23) | |
* ... más pequeño es mejor
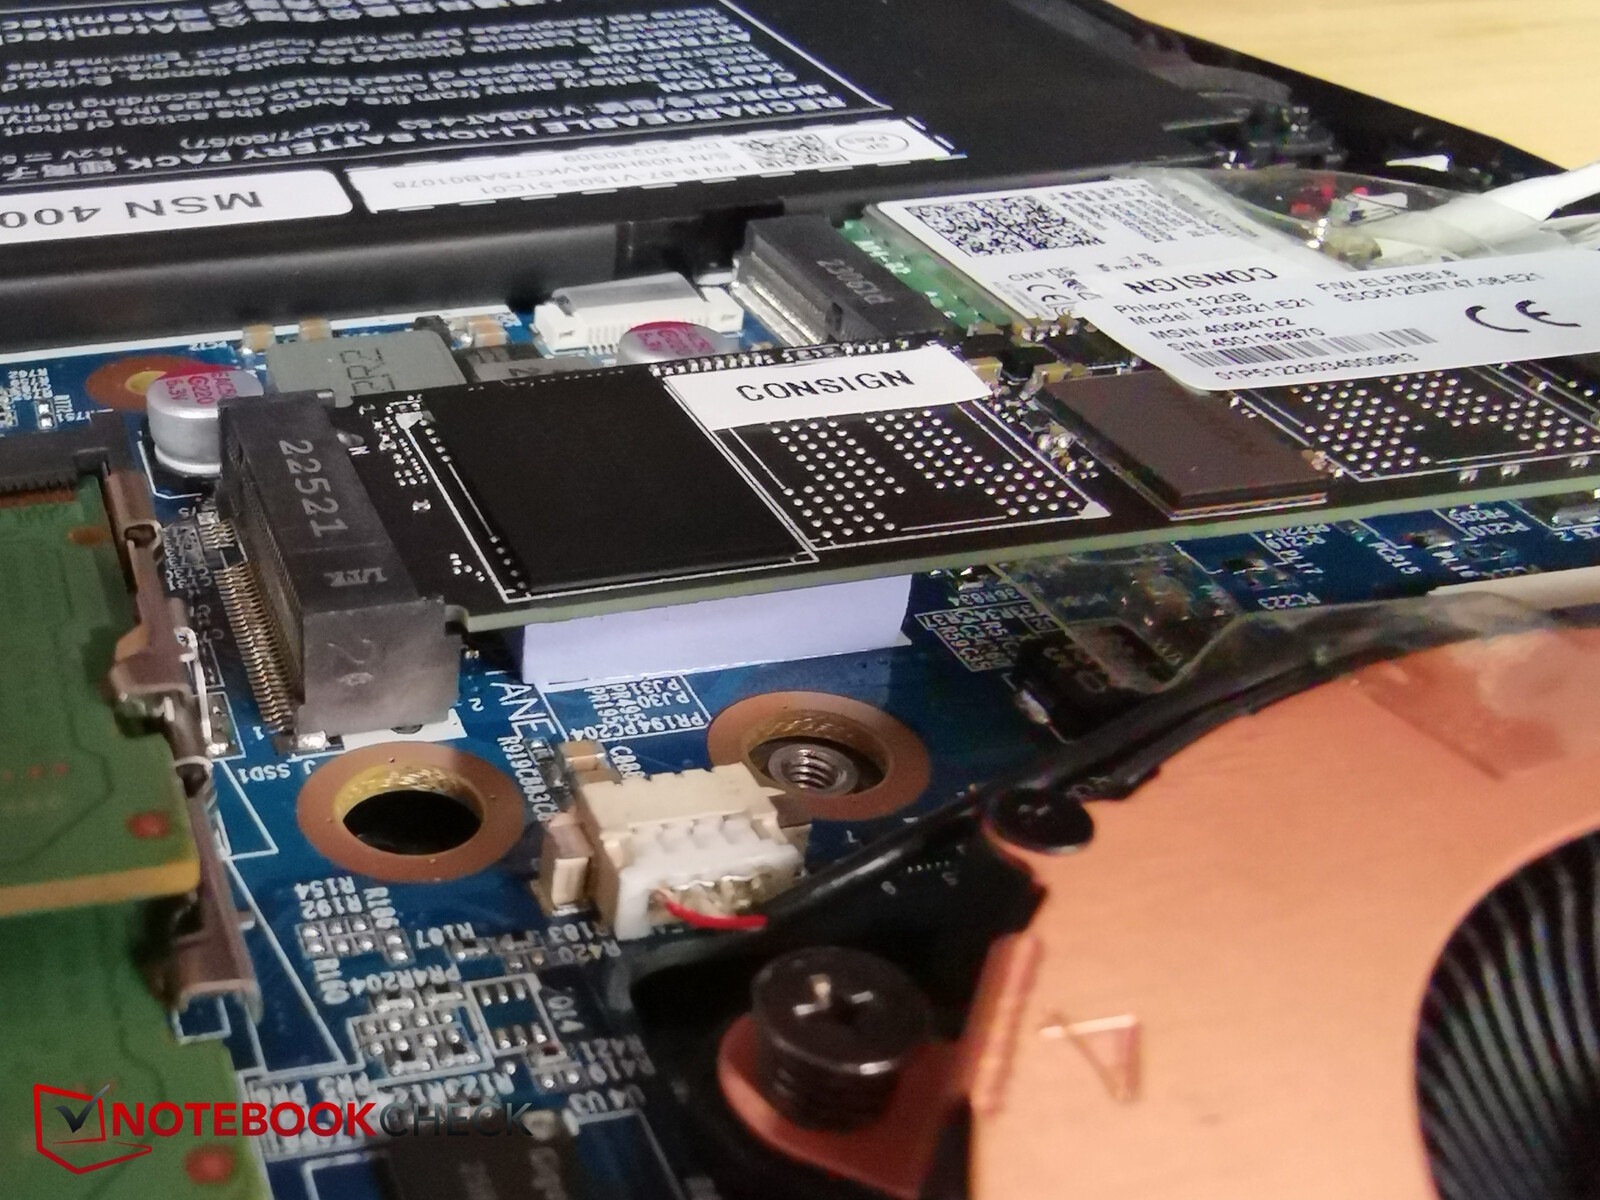
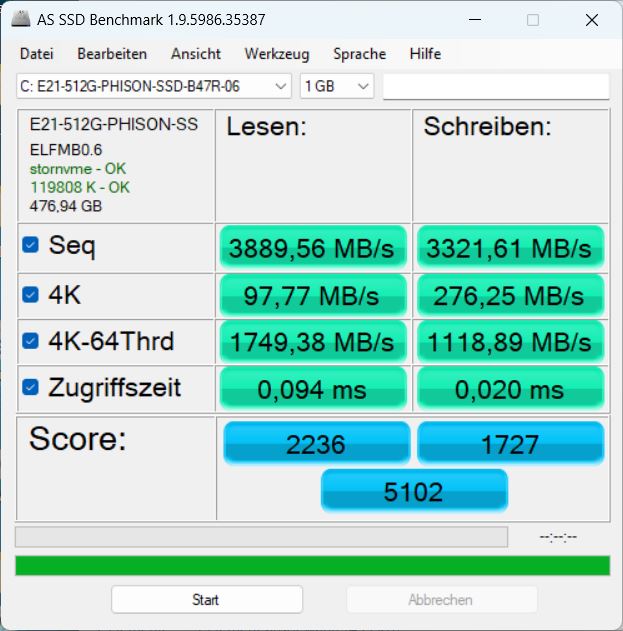
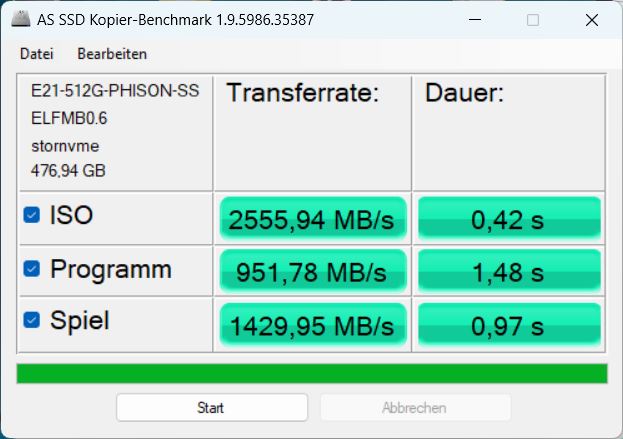
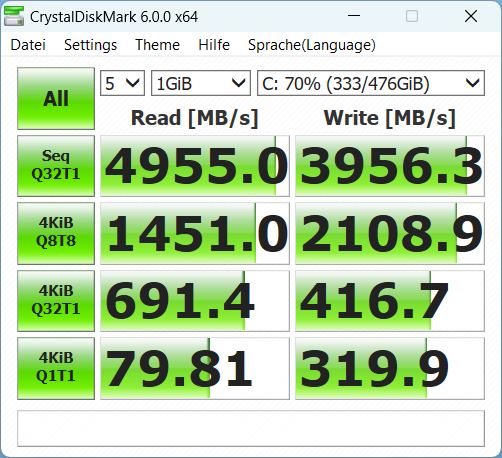
Dispositivos de almacenamiento
Medion utiliza una SSD NVMe de 512 GB de Phison. Aunque no se acerca a la velocidad del Samsung 990 Pro en el XMG Apex 15, supera el almacenamiento de los otros tres competidores y su rendimiento es también muy constante durante un periodo de tiempo más largo. Hay más comparaciones de SSD en nuestra lista de las mejores SSD.

* ... más pequeño es mejor
Continuous power read: DiskSpd Read Loop, Queue Depth 8
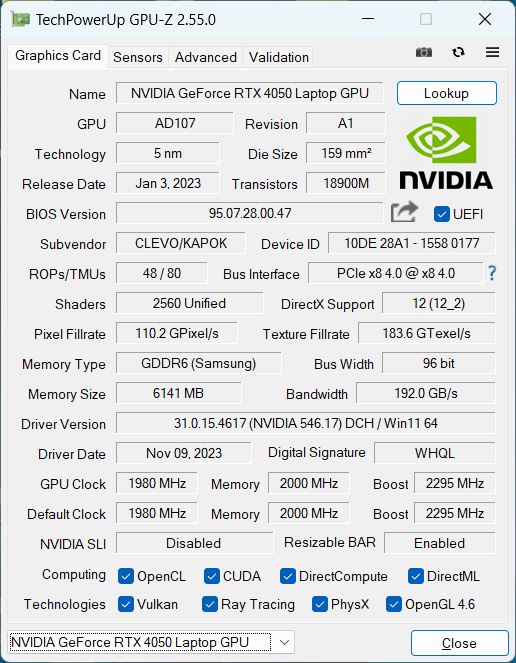
Tarjeta gráfica
En nuestra oruga E40, una RTX 4050 con una potencia máxima de 100 W.
El E40 rinde realmente bien en las pruebas 3DMark, está ligeramente por encima de una RTX 4050 media y a la par con el XMG Apex 15 y el MSI Katana 15, que también son fuertes en esta categoría.
En modo batería, el rendimiento 3D en Fire Strike desciende todo un 70 por ciento.
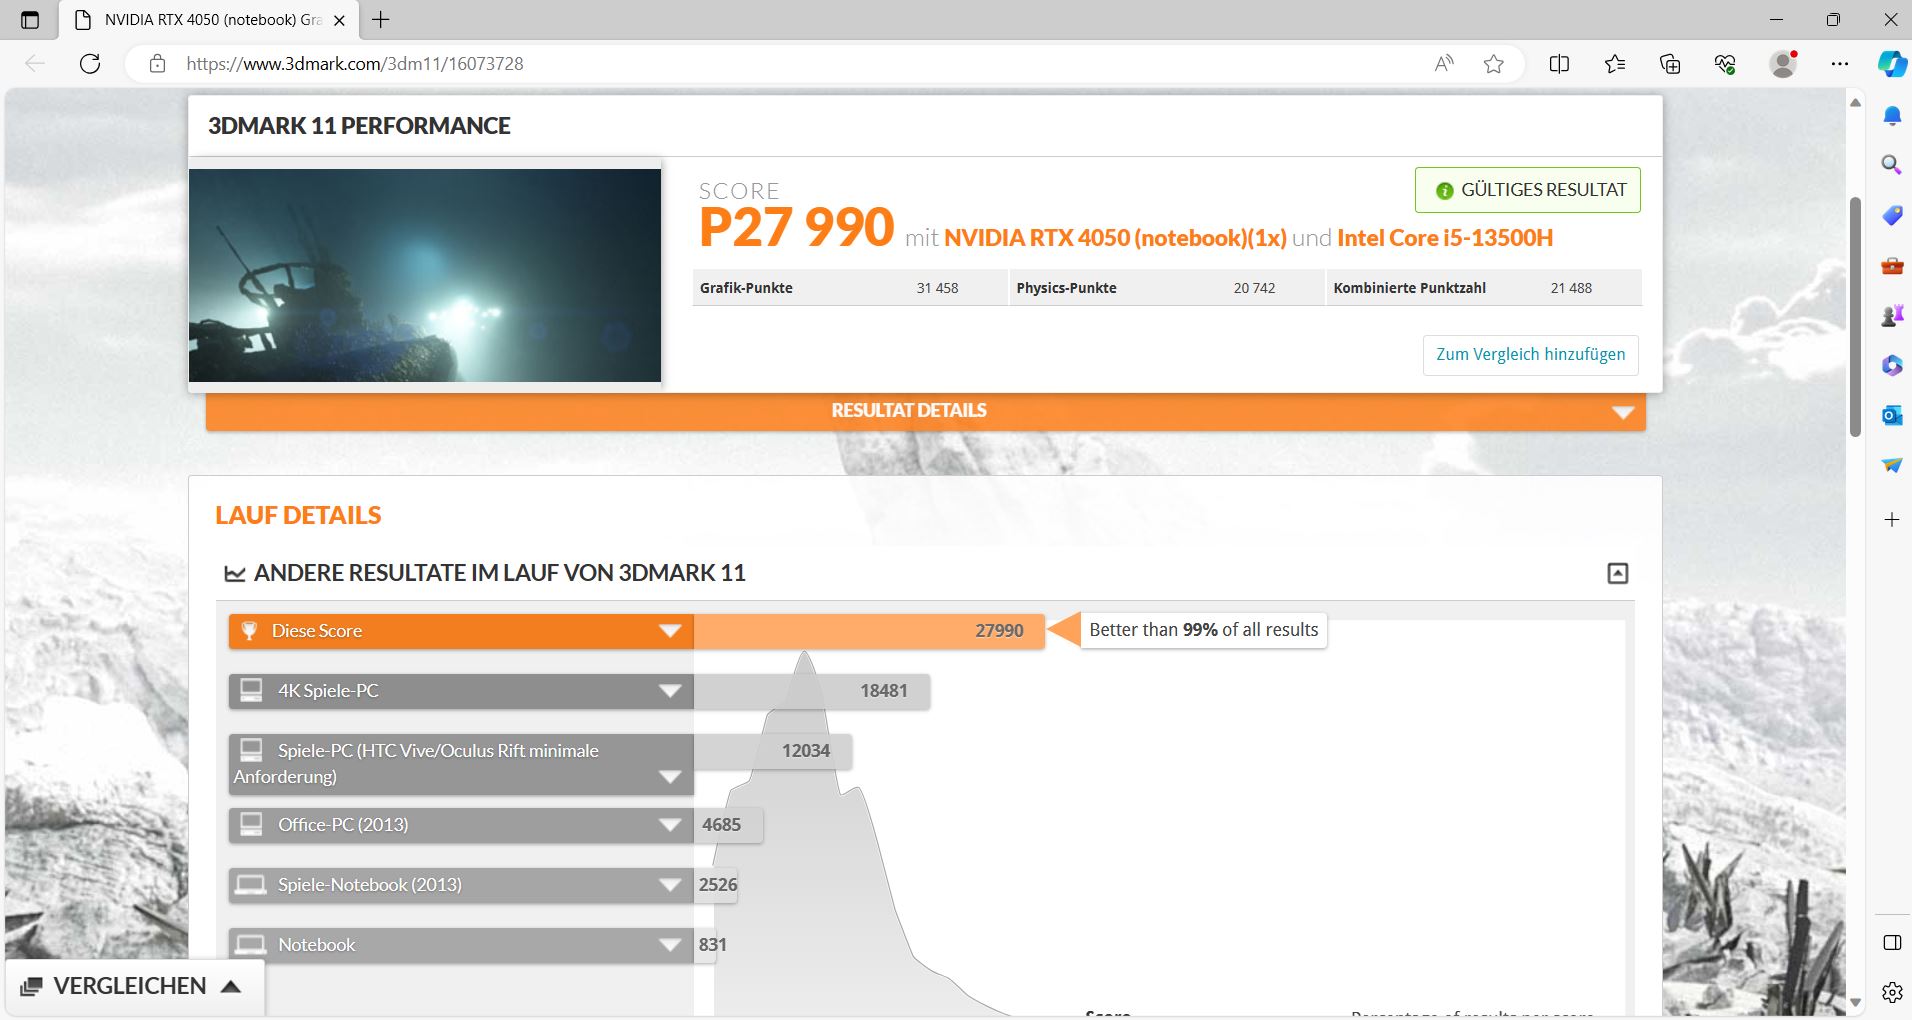
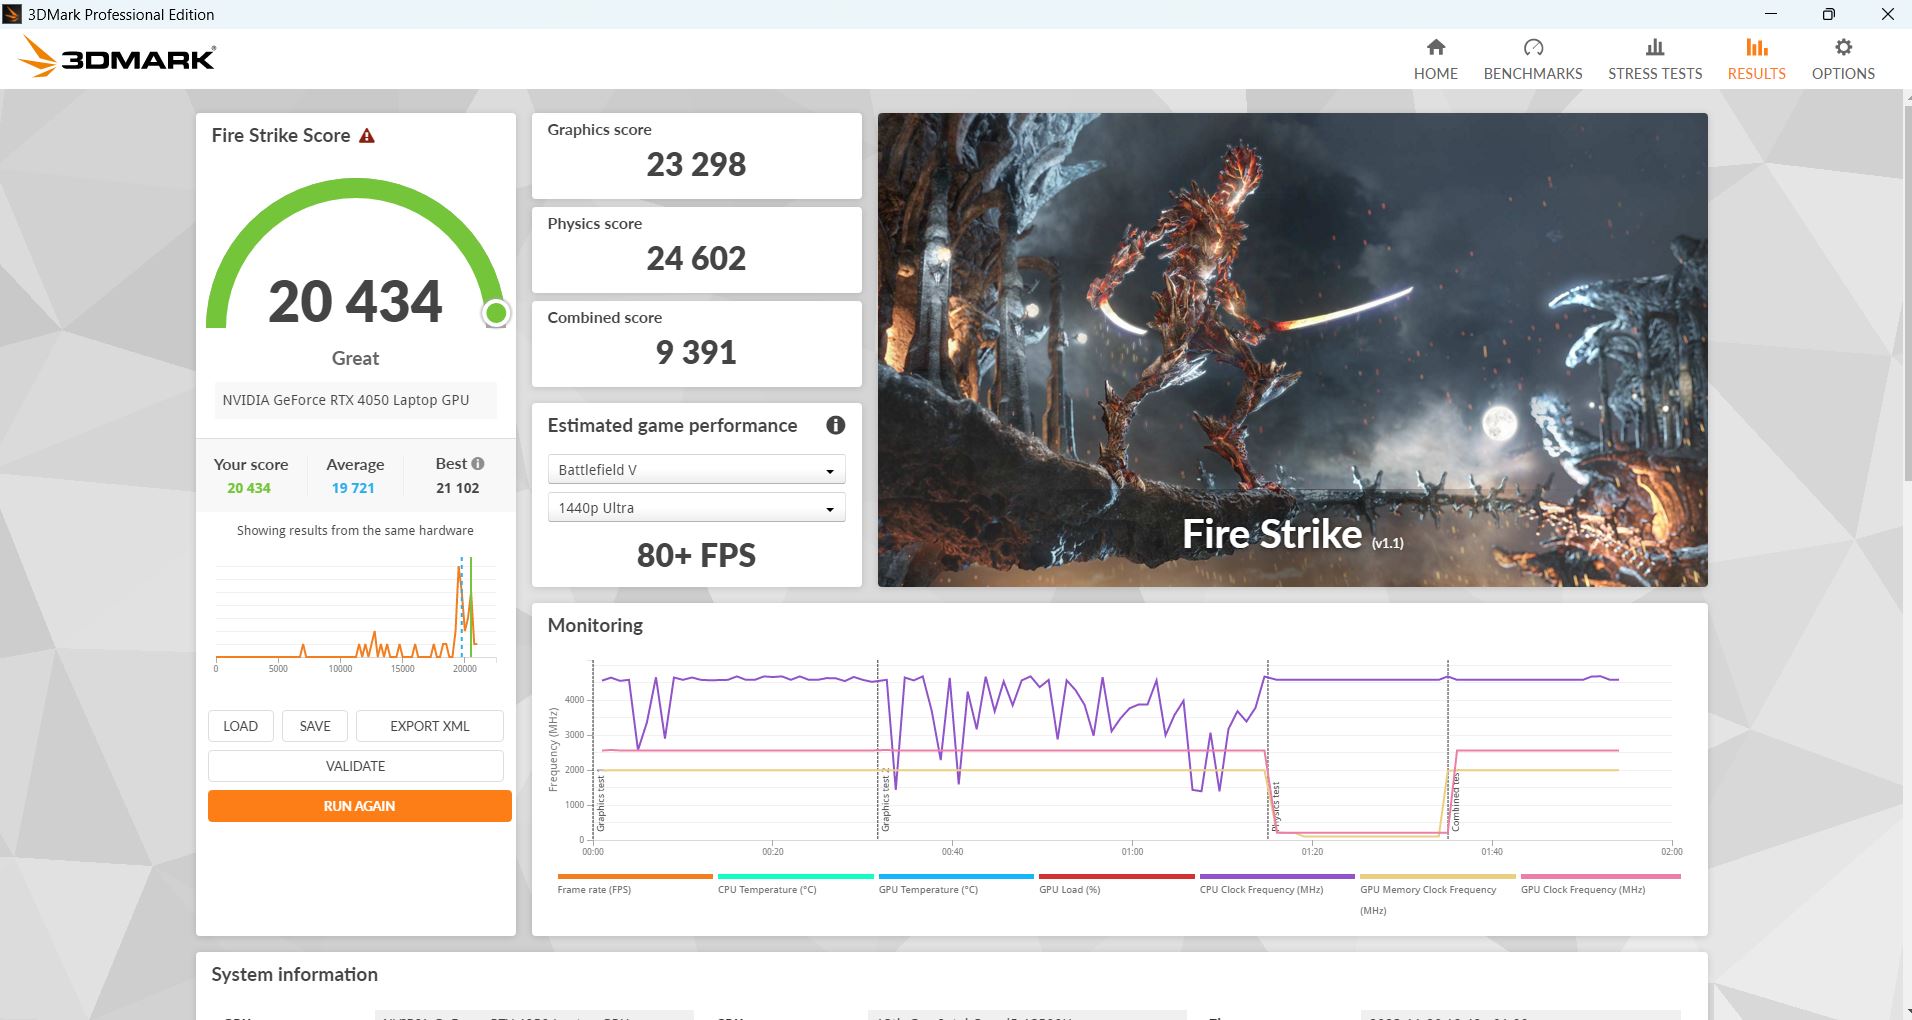
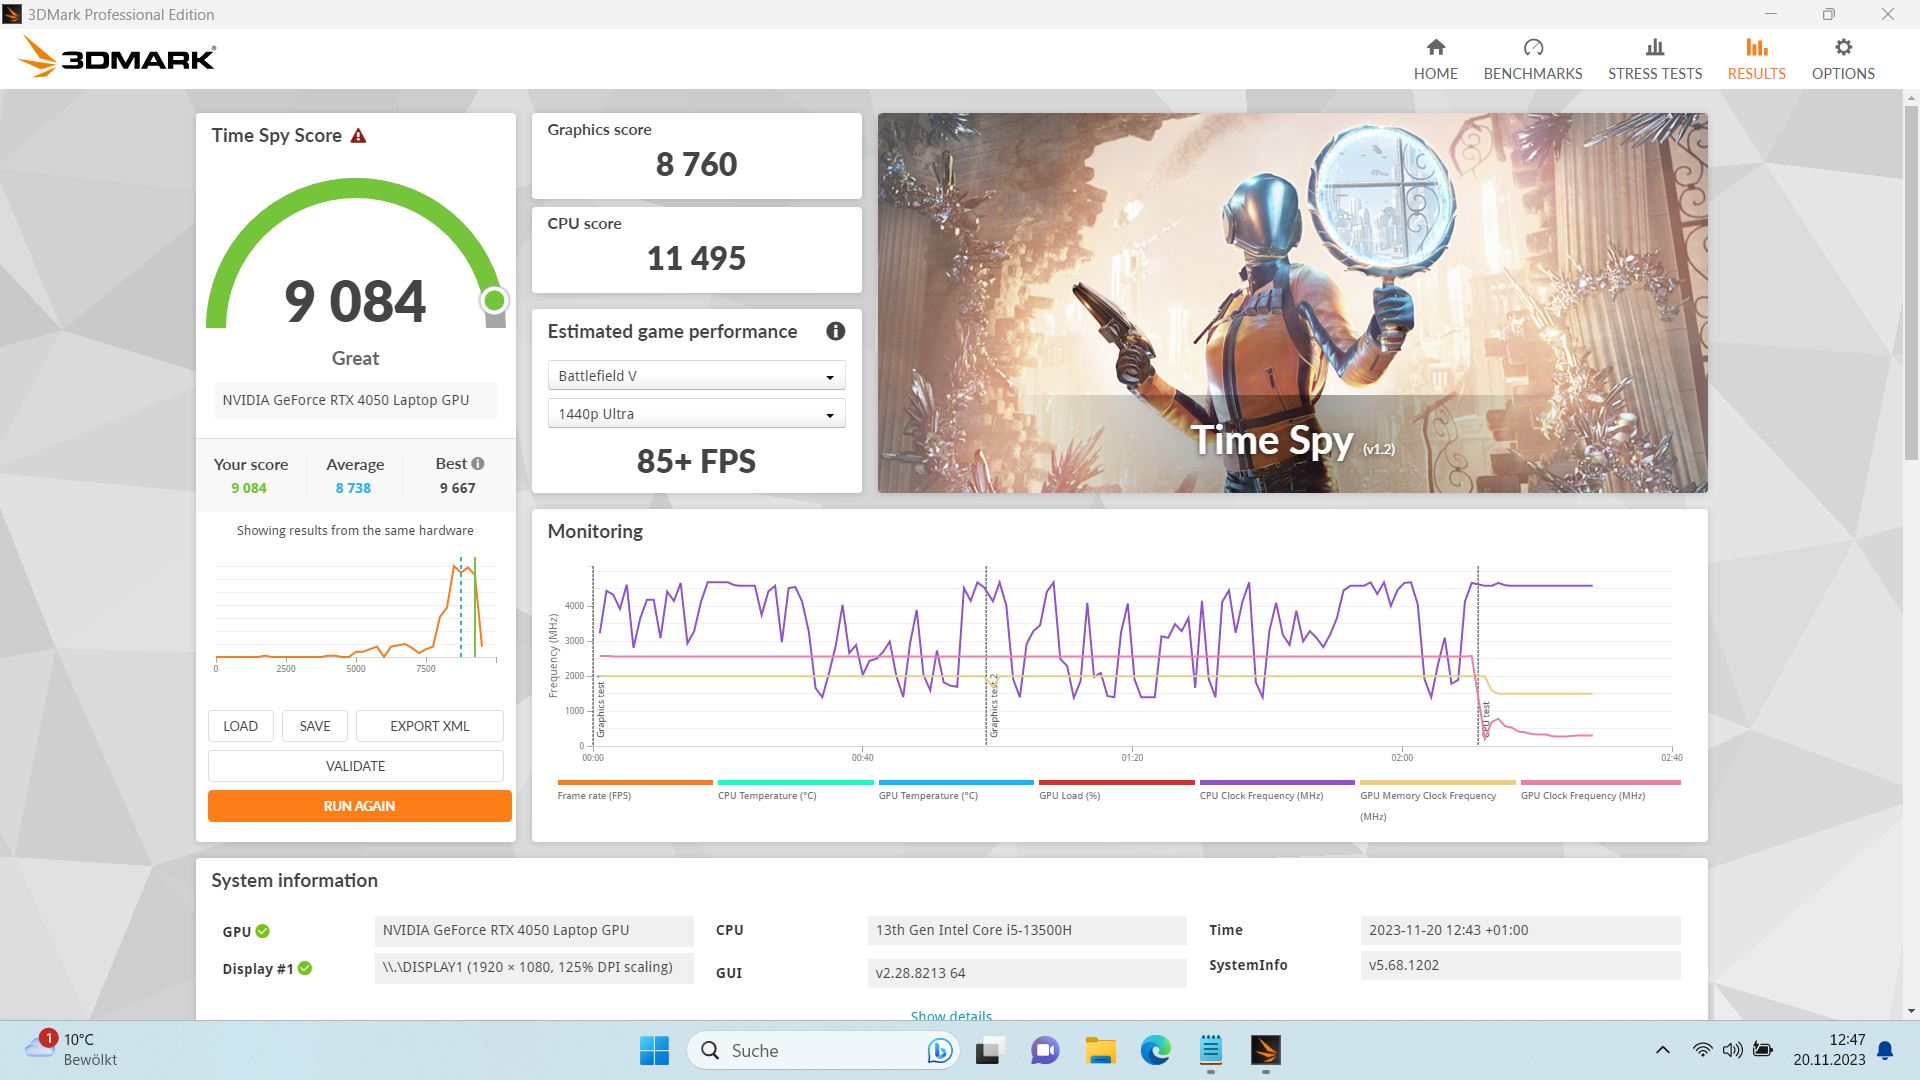
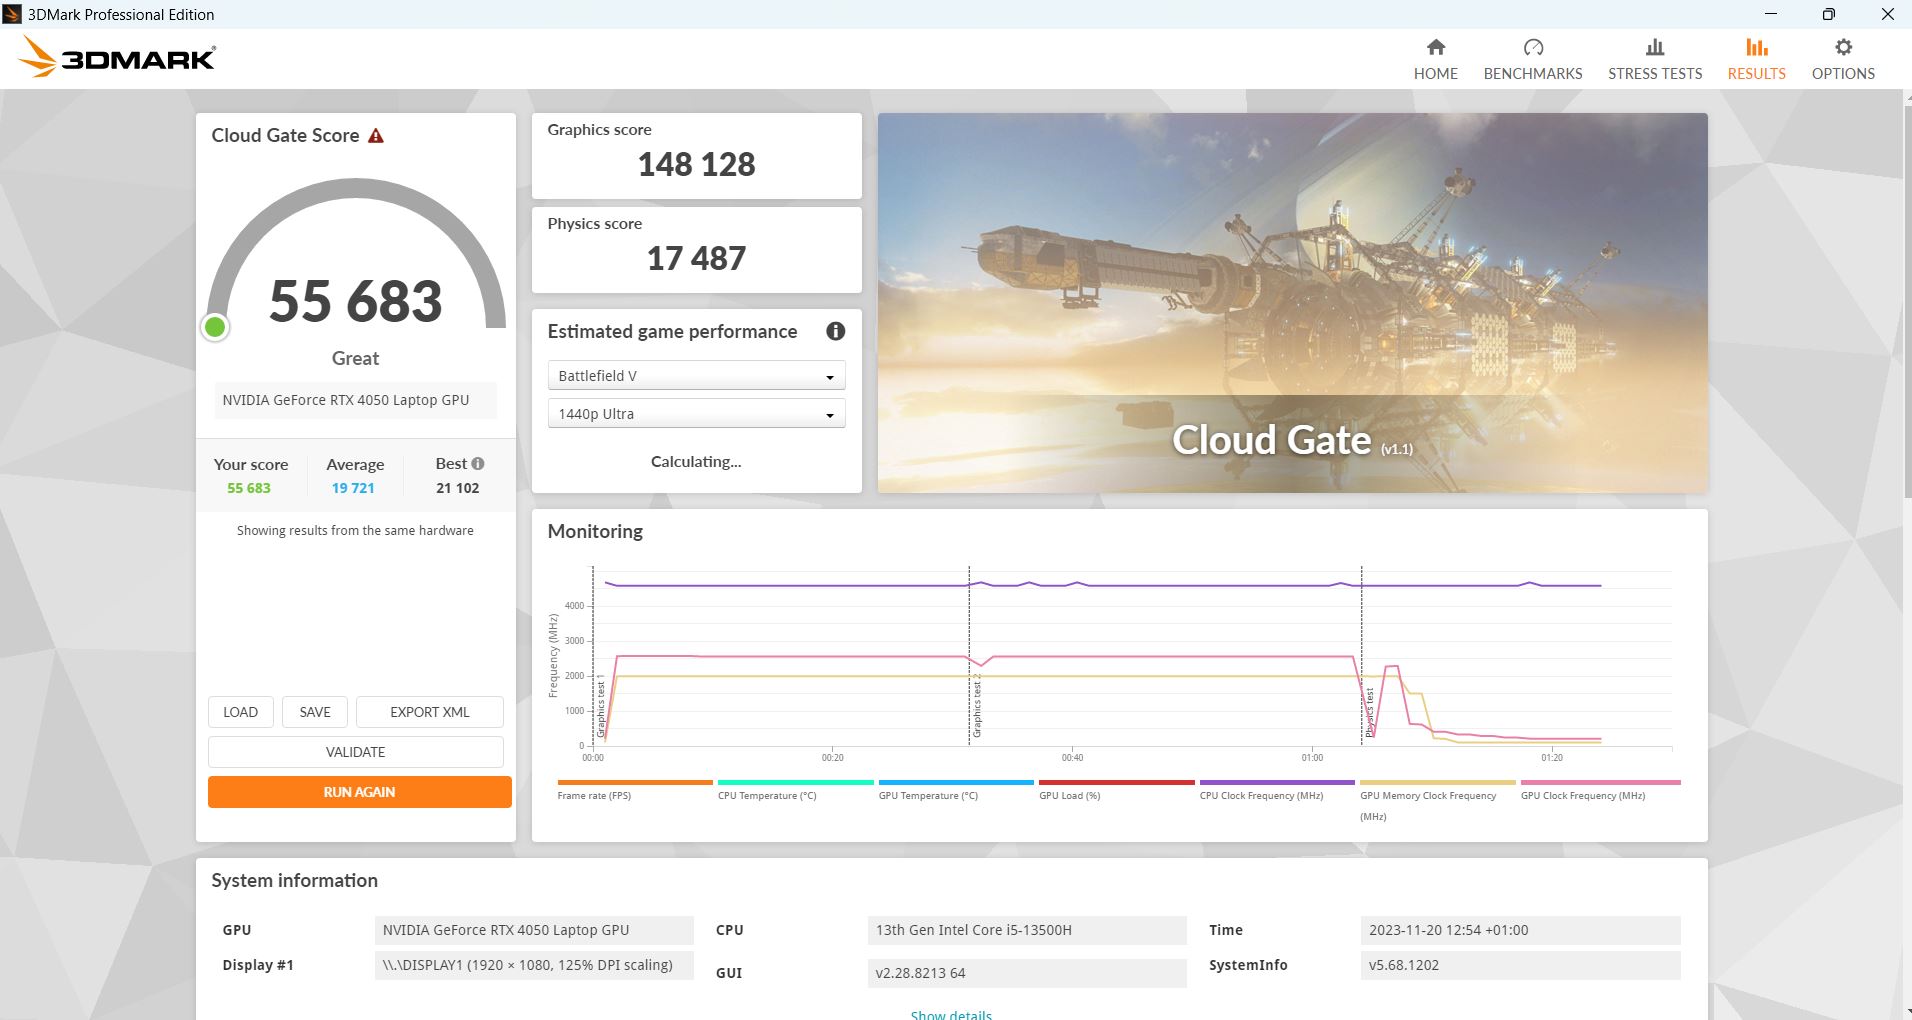
| 3DMark 11 Performance | 27990 puntos | |
| 3DMark Cloud Gate Standard Score | 55683 puntos | |
| 3DMark Fire Strike Score | 20434 puntos | |
| 3DMark Time Spy Score | 9084 puntos | |
ayuda | ||
* ... más pequeño es mejor
Juegos
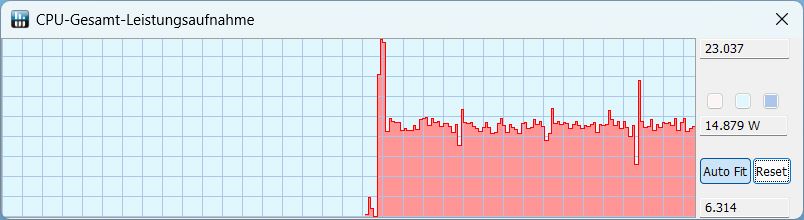
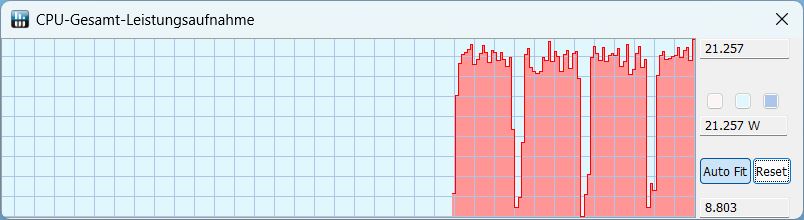
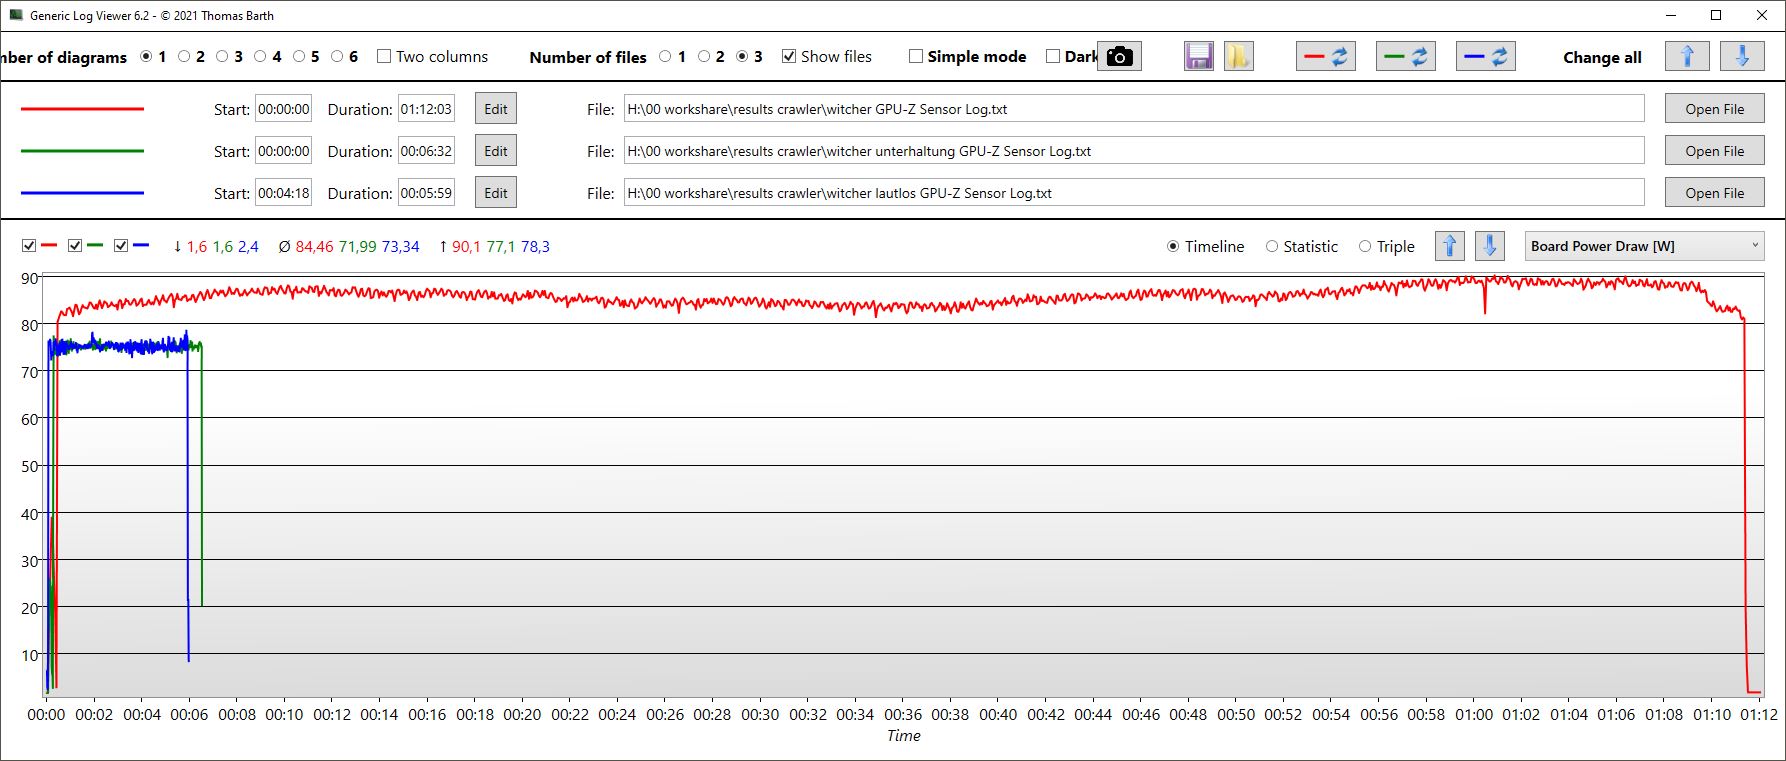
En nuestros datos de registro de Witcher 3 (ver capturas de pantalla más abajo), puede ver que el reloj de la GPU y el consumo de energía en los modos de entretenimiento y silencioso son casi exactamente iguales y sólo ligeramente inferiores a los del modo de juego. En consecuencia, las velocidades de fotogramas apenas difieren. La única diferencia entre los modos es el comportamiento del ventilador, que conduce a un desarrollo diferente del volumen y la temperatura. En el modo silencioso, la GPU se calienta más que en los otros modos. En el modo de juego, la tasa de fotogramas de Witcher 3 es muy constante.
En comparación con la competencia, la E40 tiene un buen rendimiento. En particular, ocupa el primer puesto en Far Cry 5. En Witcher 3, en cambio, queda en último lugar, pero las diferencias son muy pequeñas. En el resultado global de juegos, la competencia está muy igualada, el LOQ 15 es ligeramente mejor que nuestro rastreador, el Katana 15 está más o menos igual y el Apex 15 y sobre todo el Asus TUF A15 son más débiles.
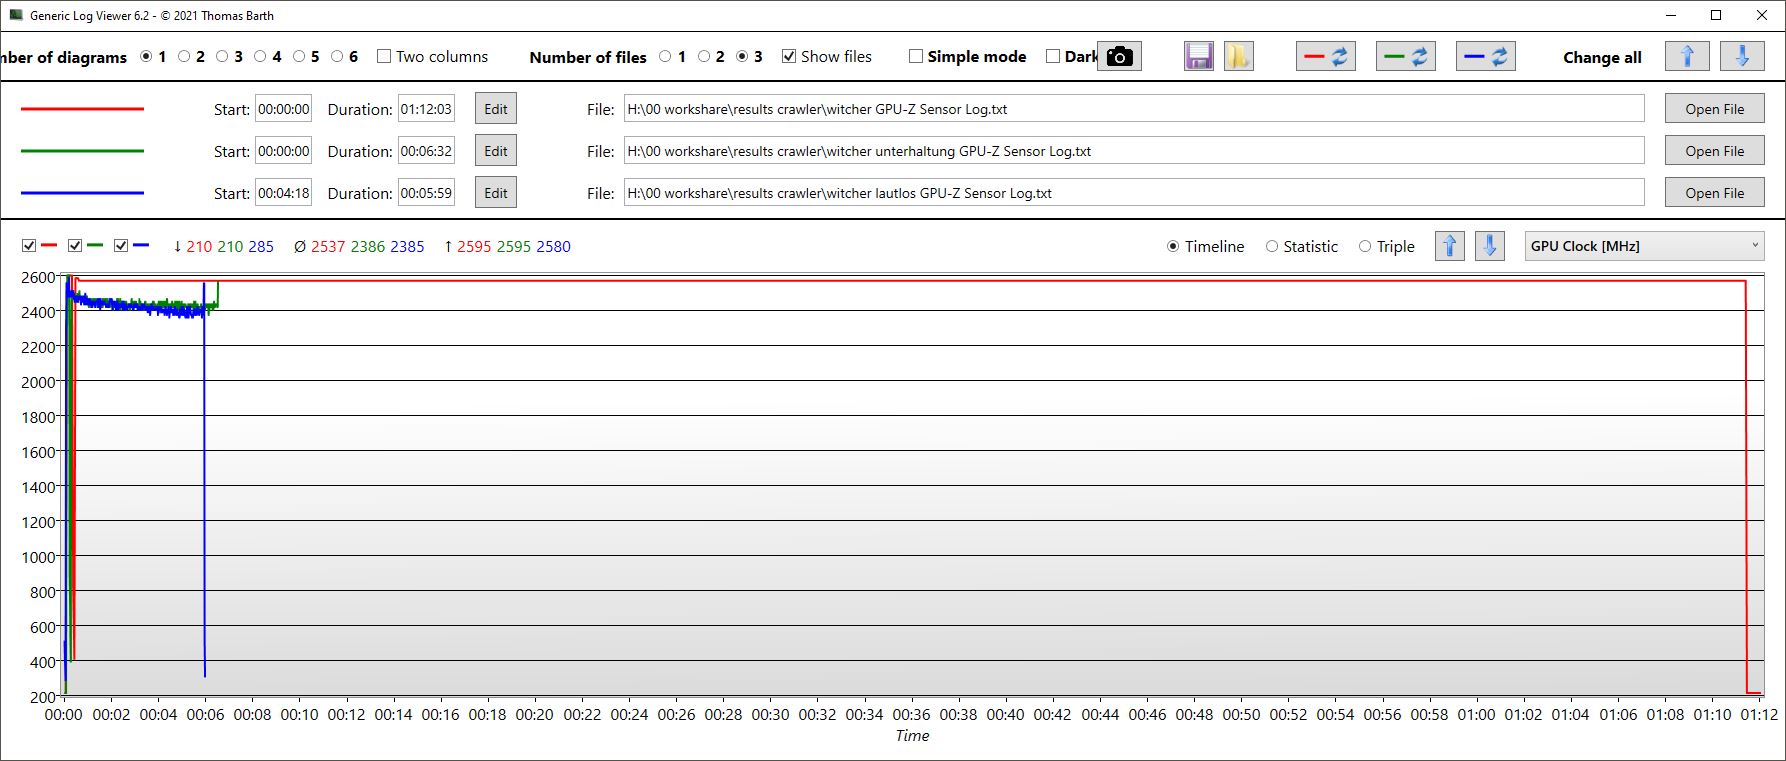
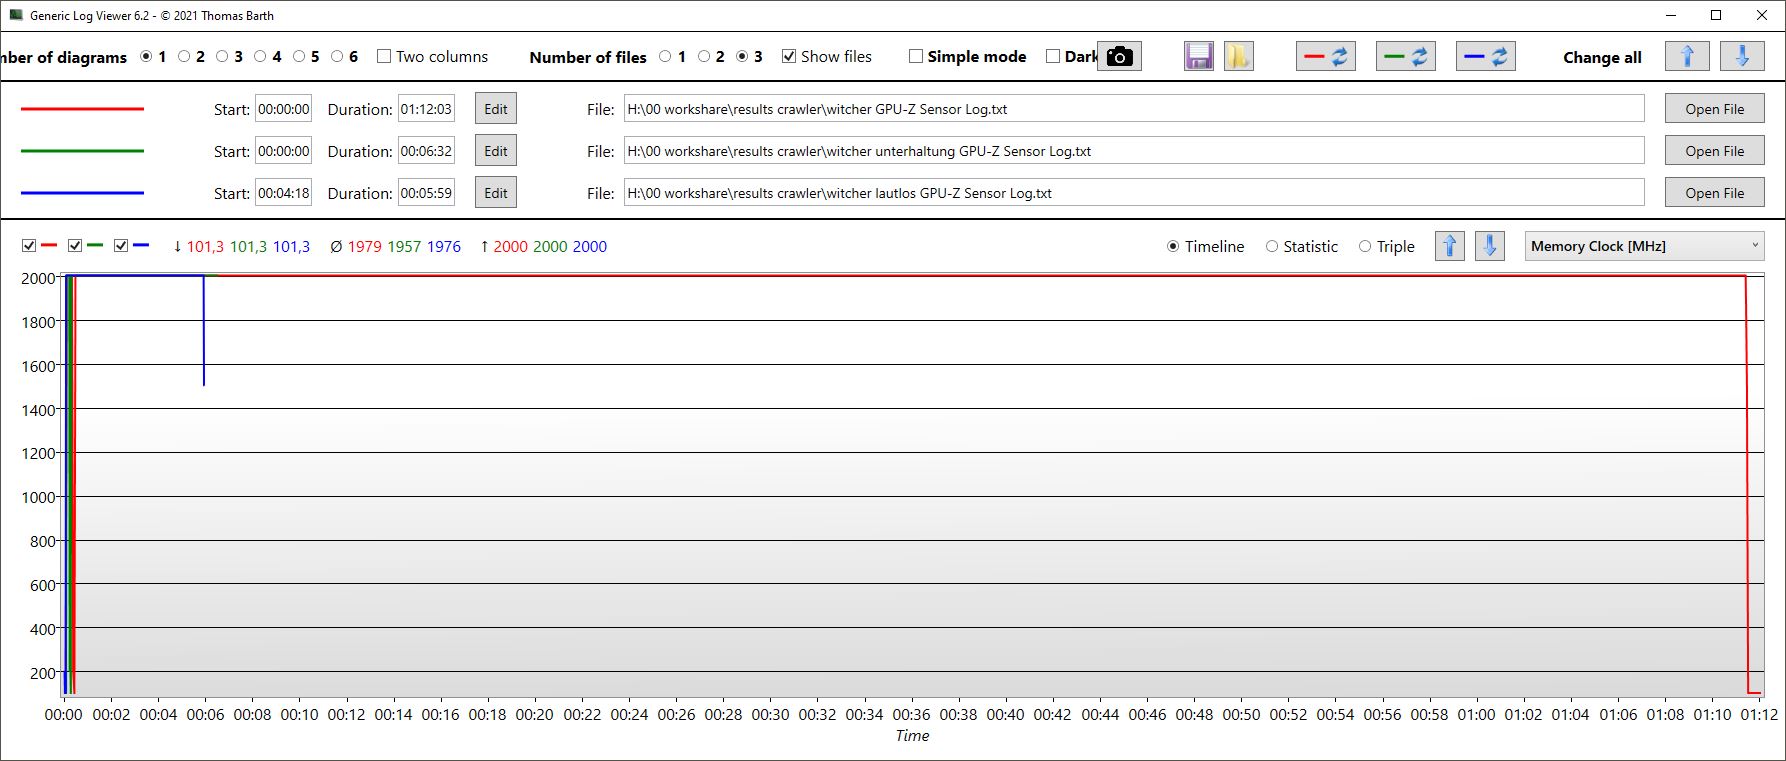
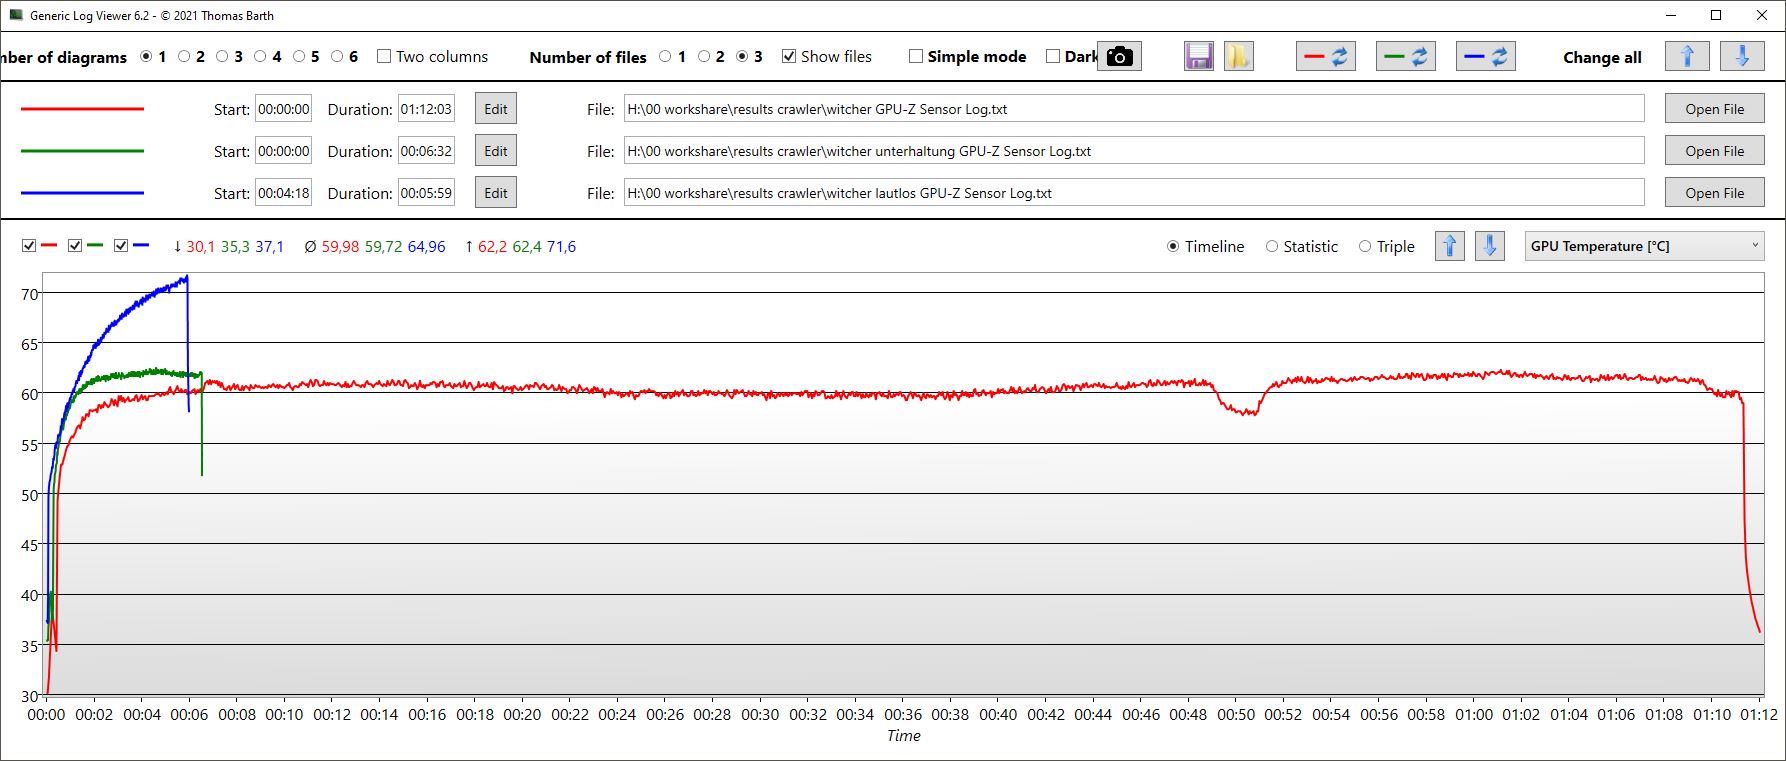
| Modo/Witcher 3 Medida de la GPU | FPS medios | Reloj de la GPU | Reloj de la memoria | Temperatura media | Consumo de energía |
|---|---|---|---|---|---|
| Juegos | 79,5 | 2.595 MHz | 2.000 MHz | 60 °C | 85 W |
| Entretenimiento | 77 | 2.400 MHz | 2.000 MHz | aprox. 62 °C | 72 W |
| Silencioso | 78 | 2.400 MHz | 2.000 MHz | aprox. 75 °C | 73 W |
| Performance rating - Percent | |
| Media de la clase Gaming | |
| Lenovo LOQ 15IRH8 Core i7 | |
| Medion Erazer Crawler E40 - MD 62518 | |
| MSI Katana 15 B12VEK | |
| Schenker XMG Apex 15 (Late 23) -1! | |
| Asus TUF A15 FA507 | |
| The Witcher 3 - 1920x1080 Ultra Graphics & Postprocessing (HBAO+) | |
| Media de la clase Gaming (104.7 - 240, n=7, últimos 2 años) | |
| Lenovo LOQ 15IRH8 Core i7 | |
| Schenker XMG Apex 15 (Late 23) | |
| MSI Katana 15 B12VEK | |
| Asus TUF A15 FA507 | |
| Medion Erazer Crawler E40 - MD 62518 | |
| GTA V - 1920x1080 Highest AA:4xMSAA + FX AF:16x | |
| Media de la clase Gaming (48.3 - 186.9, n=94, últimos 2 años) | |
| Medion Erazer Crawler E40 - MD 62518 | |
| Lenovo LOQ 15IRH8 Core i7 | |
| MSI Katana 15 B12VEK | |
| Asus TUF A15 FA507 | |
| Final Fantasy XV Benchmark - 1920x1080 High Quality | |
| Media de la clase Gaming (41 - 215, n=95, últimos 2 años) | |
| Schenker XMG Apex 15 (Late 23) | |
| Medion Erazer Crawler E40 - MD 62518 | |
| Lenovo LOQ 15IRH8 Core i7 | |
| MSI Katana 15 B12VEK | |
| Asus TUF A15 FA507 | |
| Strange Brigade - 1920x1080 ultra AA:ultra AF:16 | |
| Media de la clase Gaming (76.3 - 458, n=87, últimos 2 años) | |
| Lenovo LOQ 15IRH8 Core i7 | |
| MSI Katana 15 B12VEK | |
| Schenker XMG Apex 15 (Late 23) | |
| Asus TUF A15 FA507 | |
| Medion Erazer Crawler E40 - MD 62518 | |
| Dota 2 Reborn - 1920x1080 ultra (3/3) best looking | |
| Lenovo LOQ 15IRH8 Core i7 | |
| Media de la clase Gaming (84.8 - 248, n=107, últimos 2 años) | |
| MSI Katana 15 B12VEK | |
| Medion Erazer Crawler E40 - MD 62518 | |
| Schenker XMG Apex 15 (Late 23) | |
| Asus TUF A15 FA507 | |
| X-Plane 11.11 - 1920x1080 high (fps_test=3) | |
| Lenovo LOQ 15IRH8 Core i7 | |
| Media de la clase Gaming (55.5 - 143.5, n=109, últimos 2 años) | |
| Medion Erazer Crawler E40 - MD 62518 | |
| MSI Katana 15 B12VEK | |
| Schenker XMG Apex 15 (Late 23) | |
| Asus TUF A15 FA507 | |
Witcher 3 FPS chart
| bajo | medio | alto | ultra | |
|---|---|---|---|---|
| GTA V (2015) | 182.2 | 176.4 | 169.1 | 97.7 |
| The Witcher 3 (2015) | 369 | 283 | 170 | 81 |
| Dota 2 Reborn (2015) | 162.7 | 152.7 | 147.9 | 140.2 |
| Final Fantasy XV Benchmark (2018) | 183.5 | 122.9 | 84.6 | |
| X-Plane 11.11 (2018) | 128.5 | 121.8 | 98.6 | |
| Far Cry 5 (2018) | 146 | 140 | 133 | 124 |
| Strange Brigade (2018) | 391 | 205 | 167.6 | 146.9 |
Emisiones y energía - Sistema de refrigeración agresivo y ruidoso
Ruido del sistema
El Crawler no es en absoluto un jugador silencioso. En comparación con la competencia, es el gamer más ruidoso, medimos hasta 56 dB en la prueba de estrés y aún más de 51 dB bajo Witcher 3, la competencia suele mantenerse aquí muy por debajo de los 50 dB. Lo mismo se aplica a una ejecución 3DMark06: Mientras que otros portátiles permanecen completamente silenciosos aquí en las fases y sólo dejan girar los ventiladores de forma bastante silenciosa en la segunda mitad de la prueba, en el E40 ya giran a 50 dB.
El sistema de refrigeración es demasiado agresivo y ruidoso para nosotros. Como puede ver en la siguiente sección, las temperaturas son tan bajas que unos ventiladores más silenciosos serían fácilmente posibles aquí. Recomendamos jugar en modo de entretenimiento o incluso silencioso.
Al menos en modo inactivo, el E40 suele permanecer en silencio, sólo cuando los procesos en segundo plano generan más carga de la deseada en modo inactivo se encienden los ventiladores. Pero incluso si el Crawler E40 ha estado expuesto a una carga mayor, los ventiladores no se calman por completo. Incluso en modo silencioso, los ventiladores no se apagan en un futuro previsible.
| Modo/Witcher 3 medición | Volumen | Consumo del sistema |
|---|---|---|
| Juegos | 51,46 dB | 155 W |
| Entretenimiento | 48,21 | 139 W |
| Silencioso | 31,37 dB | 117 W |
Ruido
| Ocioso |
| 23 / 23 / 28.02 dB(A) |
| Carga |
| 50.21 / 56.79 dB(A) |
 | ||
30 dB silencioso 40 dB(A) audible 50 dB(A) ruidosamente alto |
||
min: | ||
| Medion Erazer Crawler E40 - MD 62518 GeForce RTX 4050 Laptop GPU, i5-13500H, Phison PS5021-E21 512GB | Lenovo LOQ 15IRH8 Core i7 GeForce RTX 4050 Laptop GPU, i7-13620H, Kioxia BG5 KBG50ZNT512G | Asus TUF A15 FA507 GeForce RTX 4050 Laptop GPU, R7 7735HS, Micron 2400 MTFDKBA512QFM | Schenker XMG Apex 15 (Late 23) GeForce RTX 4050 Laptop GPU, R7 7840HS, Samsung 990 Pro 1 TB | MSI Katana 15 B12VEK GeForce RTX 4050 Laptop GPU, i7-12650H, Micron 2400 MTFDKBA1T0QFM | |
|---|---|---|---|---|---|
| Noise | -5% | 14% | -2% | 6% | |
| apagado / medio ambiente * (dB) | 23 | 23.69 -3% | 23.3 -1% | 24 -4% | 24 -4% |
| Idle Minimum * (dB) | 23 | 29.03 -26% | 23.3 -1% | 25 -9% | 24 -4% |
| Idle Average * (dB) | 23 | 29.03 -26% | 23.3 -1% | 29 -26% | 24 -4% |
| Idle Maximum * (dB) | 28.02 | 29.03 -4% | 23.3 17% | 33 -18% | 24 14% |
| Load Average * (dB) | 50.21 | 48.7 3% | 29.6 41% | 36 28% | 37.71 25% |
| Witcher 3 ultra * (dB) | 51.46 | 48.5 6% | 43 16% | 48 7% | 45.75 11% |
| Load Maximum * (dB) | 56.79 | 48.7 14% | 43 24% | 53 7% | 54.55 4% |
* ... más pequeño es mejor
Temperatura
Gracias al agresivo sistema de refrigeración, las temperaturas superficiales son casi asombrosamente bajas. Incluso bajo carga máxima, apenas superan los 96,8 °F en modo juego (temperatura ambiente 64,4 °F). Aquí aún hay mucho margen para un sistema de refrigeración más silencioso.
(+) La temperatura máxima en la parte superior es de 36 °C / 97 F, frente a la media de 40.4 °C / 105 F, que oscila entre 21.2 y 68.8 °C para la clase Gaming.
(+) El fondo se calienta hasta un máximo de 36 °C / 97 F, frente a la media de 43.2 °C / 110 F
(+) En reposo, la temperatura media de la parte superior es de 23.7 °C / 75# F, frente a la media del dispositivo de 33.9 °C / 93 F.
(+) Jugando a The Witcher 3, la temperatura media de la parte superior es de 27.4 °C / 81 F, frente a la media del dispositivo de 33.9 °C / 93 F.
(+) El reposamanos y el panel táctil están a una temperatura inferior a la de la piel, con un máximo de 24 °C / 75.2 F y, por tanto, son fríos al tacto.
(+) La temperatura media de la zona del reposamanos de dispositivos similares fue de 28.8 °C / 83.8 F (+4.8 °C / 8.6 F).
| Medion Erazer Crawler E40 - MD 62518 Intel Core i5-13500H, NVIDIA GeForce RTX 4050 Laptop GPU | Lenovo LOQ 15IRH8 Core i7 Intel Core i7-13620H, NVIDIA GeForce RTX 4050 Laptop GPU | Asus TUF A15 FA507 AMD Ryzen 7 7735HS, NVIDIA GeForce RTX 4050 Laptop GPU | Schenker XMG Apex 15 (Late 23) AMD Ryzen 7 7840HS, NVIDIA GeForce RTX 4050 Laptop GPU | MSI Katana 15 B12VEK Intel Core i7-12650H, NVIDIA GeForce RTX 4050 Laptop GPU | |
|---|---|---|---|---|---|
| Heat | -40% | -17% | -31% | -35% | |
| Maximum Upper Side * (°C) | 36 | 46.4 -29% | 48.9 -36% | 52 -44% | 47 -31% |
| Maximum Bottom * (°C) | 36 | 59.2 -64% | 44.6 -24% | 47 -31% | 48 -33% |
| Idle Upper Side * (°C) | 26 | 34.4 -32% | 27.1 -4% | 33 -27% | 35 -35% |
| Idle Bottom * (°C) | 27 | 36.2 -34% | 27.5 -2% | 33 -22% | 38 -41% |
* ... más pequeño es mejor
Altavoces
Los altavoces estéreo están situados en las esquinas delanteras e irradian hacia abajo. Los agudos están equilibrados, pero apenas hay graves. Recomendamos conectar unos auriculares a través de la salida jack.
Medion Erazer Crawler E40 - MD 62518 análisis de audio
(±) | la sonoridad del altavoz es media pero buena (81.47 dB)
Graves 100 - 315 Hz
(-) | casi sin bajos - de media 32.7% inferior a la mediana
(±) | la linealidad de los graves es media (11% delta a frecuencia anterior)
Medios 400 - 2000 Hz
(+) | medios equilibrados - a sólo 4.6% de la mediana
(±) | la linealidad de los medios es media (7.1% delta respecto a la frecuencia anterior)
Altos 2 - 16 kHz
(+) | máximos equilibrados - a sólo 3.1% de la mediana
(+) | los máximos son lineales (5.7% delta a la frecuencia anterior)
Total 100 - 16.000 Hz
(±) | la linealidad del sonido global es media (21.8% de diferencia con la mediana)
En comparación con la misma clase
» 78% de todos los dispositivos probados de esta clase eran mejores, 6% similares, 16% peores
» El mejor tuvo un delta de 6%, la media fue 18%, el peor fue ###max##%
En comparación con todos los dispositivos probados
» 62% de todos los dispositivos probados eran mejores, 7% similares, 31% peores
» El mejor tuvo un delta de 4%, la media fue 23%, el peor fue ###max##%
Lenovo LOQ 15IRH8 Core i7 análisis de audio
(±) | la sonoridad del altavoz es media pero buena (75.9 dB)
Graves 100 - 315 Hz
(-) | casi sin bajos - de media 18.6% inferior a la mediana
(±) | la linealidad de los graves es media (10.2% delta a frecuencia anterior)
Medios 400 - 2000 Hz
(+) | medios equilibrados - a sólo 2.2% de la mediana
(+) | los medios son lineales (3.1% delta a la frecuencia anterior)
Altos 2 - 16 kHz
(+) | máximos equilibrados - a sólo 2.3% de la mediana
(+) | los máximos son lineales (4.4% delta a la frecuencia anterior)
Total 100 - 16.000 Hz
(+) | el sonido global es lineal (13.7% de diferencia con la mediana)
En comparación con la misma clase
» 21% de todos los dispositivos probados de esta clase eran mejores, 7% similares, 72% peores
» El mejor tuvo un delta de 6%, la media fue 18%, el peor fue ###max##%
En comparación con todos los dispositivos probados
» 15% de todos los dispositivos probados eran mejores, 4% similares, 81% peores
» El mejor tuvo un delta de 4%, la media fue 23%, el peor fue ###max##%
Consumo de energía
El consumo de energía es algo elevado en ralentí y en la prueba de estrés, pero no destaca realmente. Bajo carga normal, el consumo está dentro de la media de la competencia. En juegos, está a la par con el Lenovo LOQ 15, pero es superior al de los demás competidores.
Medimos un consumo máximo temporal de 202,5 W durante nuestra prueba de estrés simultánea de CPU y GPU. La fuente de alimentación de 230 W de LiteOn no debería tener problemas aquí.
| Off / Standby | |
| Ocioso | |
| Carga |
|
Clave:
min: | |
| Medion Erazer Crawler E40 - MD 62518 GeForce RTX 4050 Laptop GPU, i5-13500H, Phison PS5021-E21 512GB | Lenovo LOQ 15IRH8 Core i7 GeForce RTX 4050 Laptop GPU, i7-13620H, Kioxia BG5 KBG50ZNT512G | Asus TUF A15 FA507 GeForce RTX 4050 Laptop GPU, R7 7735HS, Micron 2400 MTFDKBA512QFM | Schenker XMG Apex 15 (Late 23) GeForce RTX 4050 Laptop GPU, R7 7840HS, Samsung 990 Pro 1 TB | MSI Katana 15 B12VEK GeForce RTX 4050 Laptop GPU, i7-12650H, Micron 2400 MTFDKBA1T0QFM | |
|---|---|---|---|---|---|
| Power Consumption | 1% | 23% | 15% | 18% | |
| Idle 150cd/m2 * (Watt) | 15.3 | 9.48 38% | 10.8 29% | 9.8 36% | |
| 3DMark06 Return To Proxycon * (Watt) | 88 | 94.5 -7% | 84 5% | ||
| Witcher 3 ultra * (Watt) | 155 | 154.4 -0% | 136.6 12% | 136.5 12% | 128 17% |
| 1280x720 Prime95 28.10 and Furmark 1.25 * (Watt) | 190 | 169.2 11% | 156.7 18% | 181 5% | 165 13% |
* ... más pequeño es mejor
Power consumption Witcher 3 / stress test
Power consumption with external monitor
Duración de las pilas
Medion utiliza una batería de 54 Wh. Sólo el MSI Katana tiene una batería igual de pequeña, pero aún así dura un poco más en todas las pruebas. El resto de la competencia tiene baterías de al menos 60 Wh, y el Asus TUF A15 tiene incluso una batería de 90 Wh. En resumen: el Medion tiene la menor autonomía en una comparación directa. En nuestra prueba de vídeo o navegación con brillo reducido, el portátil alcanza una autonomía de unas 4 horas, lo que no es estimulante.
| Medion Erazer Crawler E40 - MD 62518 i5-13500H, GeForce RTX 4050 Laptop GPU, 54 Wh | Lenovo LOQ 15IRH8 Core i7 i7-13620H, GeForce RTX 4050 Laptop GPU, 60 Wh | Asus TUF A15 FA507 R7 7735HS, GeForce RTX 4050 Laptop GPU, 90 Wh | Schenker XMG Apex 15 (Late 23) R7 7840HS, GeForce RTX 4050 Laptop GPU, 62.32 Wh | MSI Katana 15 B12VEK i7-12650H, GeForce RTX 4050 Laptop GPU, 53.5 Wh | Media de la clase Gaming | |
|---|---|---|---|---|---|---|
| Duración de Batería | 50% | 130% | 73% | 14% | 70% | |
| H.264 (h) | 3.9 | 6.1 56% | 12.5 221% | 8.3 113% | 4.4 13% | 8.32 ? 113% |
| WiFi v1.3 (h) | 4.1 | 5.9 44% | 11.7 185% | 7.1 73% | 4.3 5% | 7.11 ? 73% |
| Load (h) | 1.2 | 1 -17% | 1.6 33% | 1.5 25% | 1.502 ? 25% | |
| Reader / Idle (h) | 8.4 | 8.27 ? |
Pro
Contra
Veredicto - Jugador económico con concesiones pero buen rendimiento

Con un precio de ~1300 dólares, el Medion Crawler E40 ofrece una opción económica para un portátil de juegos con una RTX 4050. Aunque entra dentro de la gama económica, hay modelos aún más baratos disponibles, lo que provoca un análisis más detallado de la relación precio-rendimiento. El Crawler E40 revela sus orígenes presupuestarios con características como el i5-13500H en lugar del i7-13700H, una pantalla de 2019, una webcam de 720p y una ranura USB 2.0, entre otros aspectos. En consecuencia, puede que no cumpla las expectativas de los jugadores más exigentes. Sin embargo, el rendimiento de la CPU y la GPU es encomiable, y la SSD rinde bien. La pantalla, aunque no es la más moderna, es suficientemente brillante con 350 nits, responde bien y ofrece una frecuencia de actualización de 144 Hz, aunque no cubra totalmente los espacios de color típicos.
Aunque hay algunos puntos criticables, muchos de ellos son aceptables en un portátil económico. Por otro lado, la duración notablemente débil de la batería y el sistema de refrigeración excesivamente ruidoso son preocupaciones más relevantes. La optimización del software podría solucionar el problema del sistema de refrigeración, ya que parece haber margen de mejora dadas las bajas temperaturas.
En resumen, el Medion Crawler E40 es un portátil para juegos asequible con algunos compromisos, pero el rendimiento de sus componentes es encomiable. Las principales críticas residen en el ruidoso y agresivo sistema de refrigeración, así como en la escasa duración de la batería.
Cada uno de los competidores analizados en la prueba tiene sus méritos, y las diferencias entre ellos son relativamente menores. El Asus TUF A15, aunque ofrece un rendimiento ligeramente inferior, destaca por la impresionante duración de su batería. Si una mayor duración de la batería con un rendimiento comparable es una prioridad y está dispuesto a gastar un poco más, el Lenovo LOQ 15 podría ser una opción adecuada, a pesar de tener algunos inconvenientes. Es esencial tener en cuenta que no hay un claro ganador, especialmente si se tiene en cuenta que el XMG Apex 15 tiene un precio casi ~US$550 superior.
Precio y disponibilidad
El Medion Erazer Crawler E40 cuesta alrededor de ~US$1300 directamente de Medion.
Medion Erazer Crawler E40 - MD 62518
- 11/28/2023 v7 (old)
Christian Hintze
Transparencia
La selección de los dispositivos que se van a reseñar corre a cargo de nuestro equipo editorial. La muestra de prueba fue proporcionada al autor en calidad de préstamo por el fabricante o el minorista a los efectos de esta reseña. El prestamista no tuvo ninguna influencia en esta reseña, ni el fabricante recibió una copia de la misma antes de su publicación. No había ninguna obligación de publicar esta reseña. Como empresa de medios independiente, Notebookcheck no está sujeta a la autoridad de fabricantes, minoristas o editores.
Así es como prueba Notebookcheck
Cada año, Notebookcheck revisa de forma independiente cientos de portátiles y smartphones utilizando procedimientos estandarizados para asegurar que todos los resultados son comparables. Hemos desarrollado continuamente nuestros métodos de prueba durante unos 20 años y hemos establecido los estándares de la industria en el proceso. En nuestros laboratorios de pruebas, técnicos y editores experimentados utilizan equipos de medición de alta calidad. Estas pruebas implican un proceso de validación en varias fases. Nuestro complejo sistema de clasificación se basa en cientos de mediciones y puntos de referencia bien fundamentados, lo que mantiene la objetividad.Price comparison

