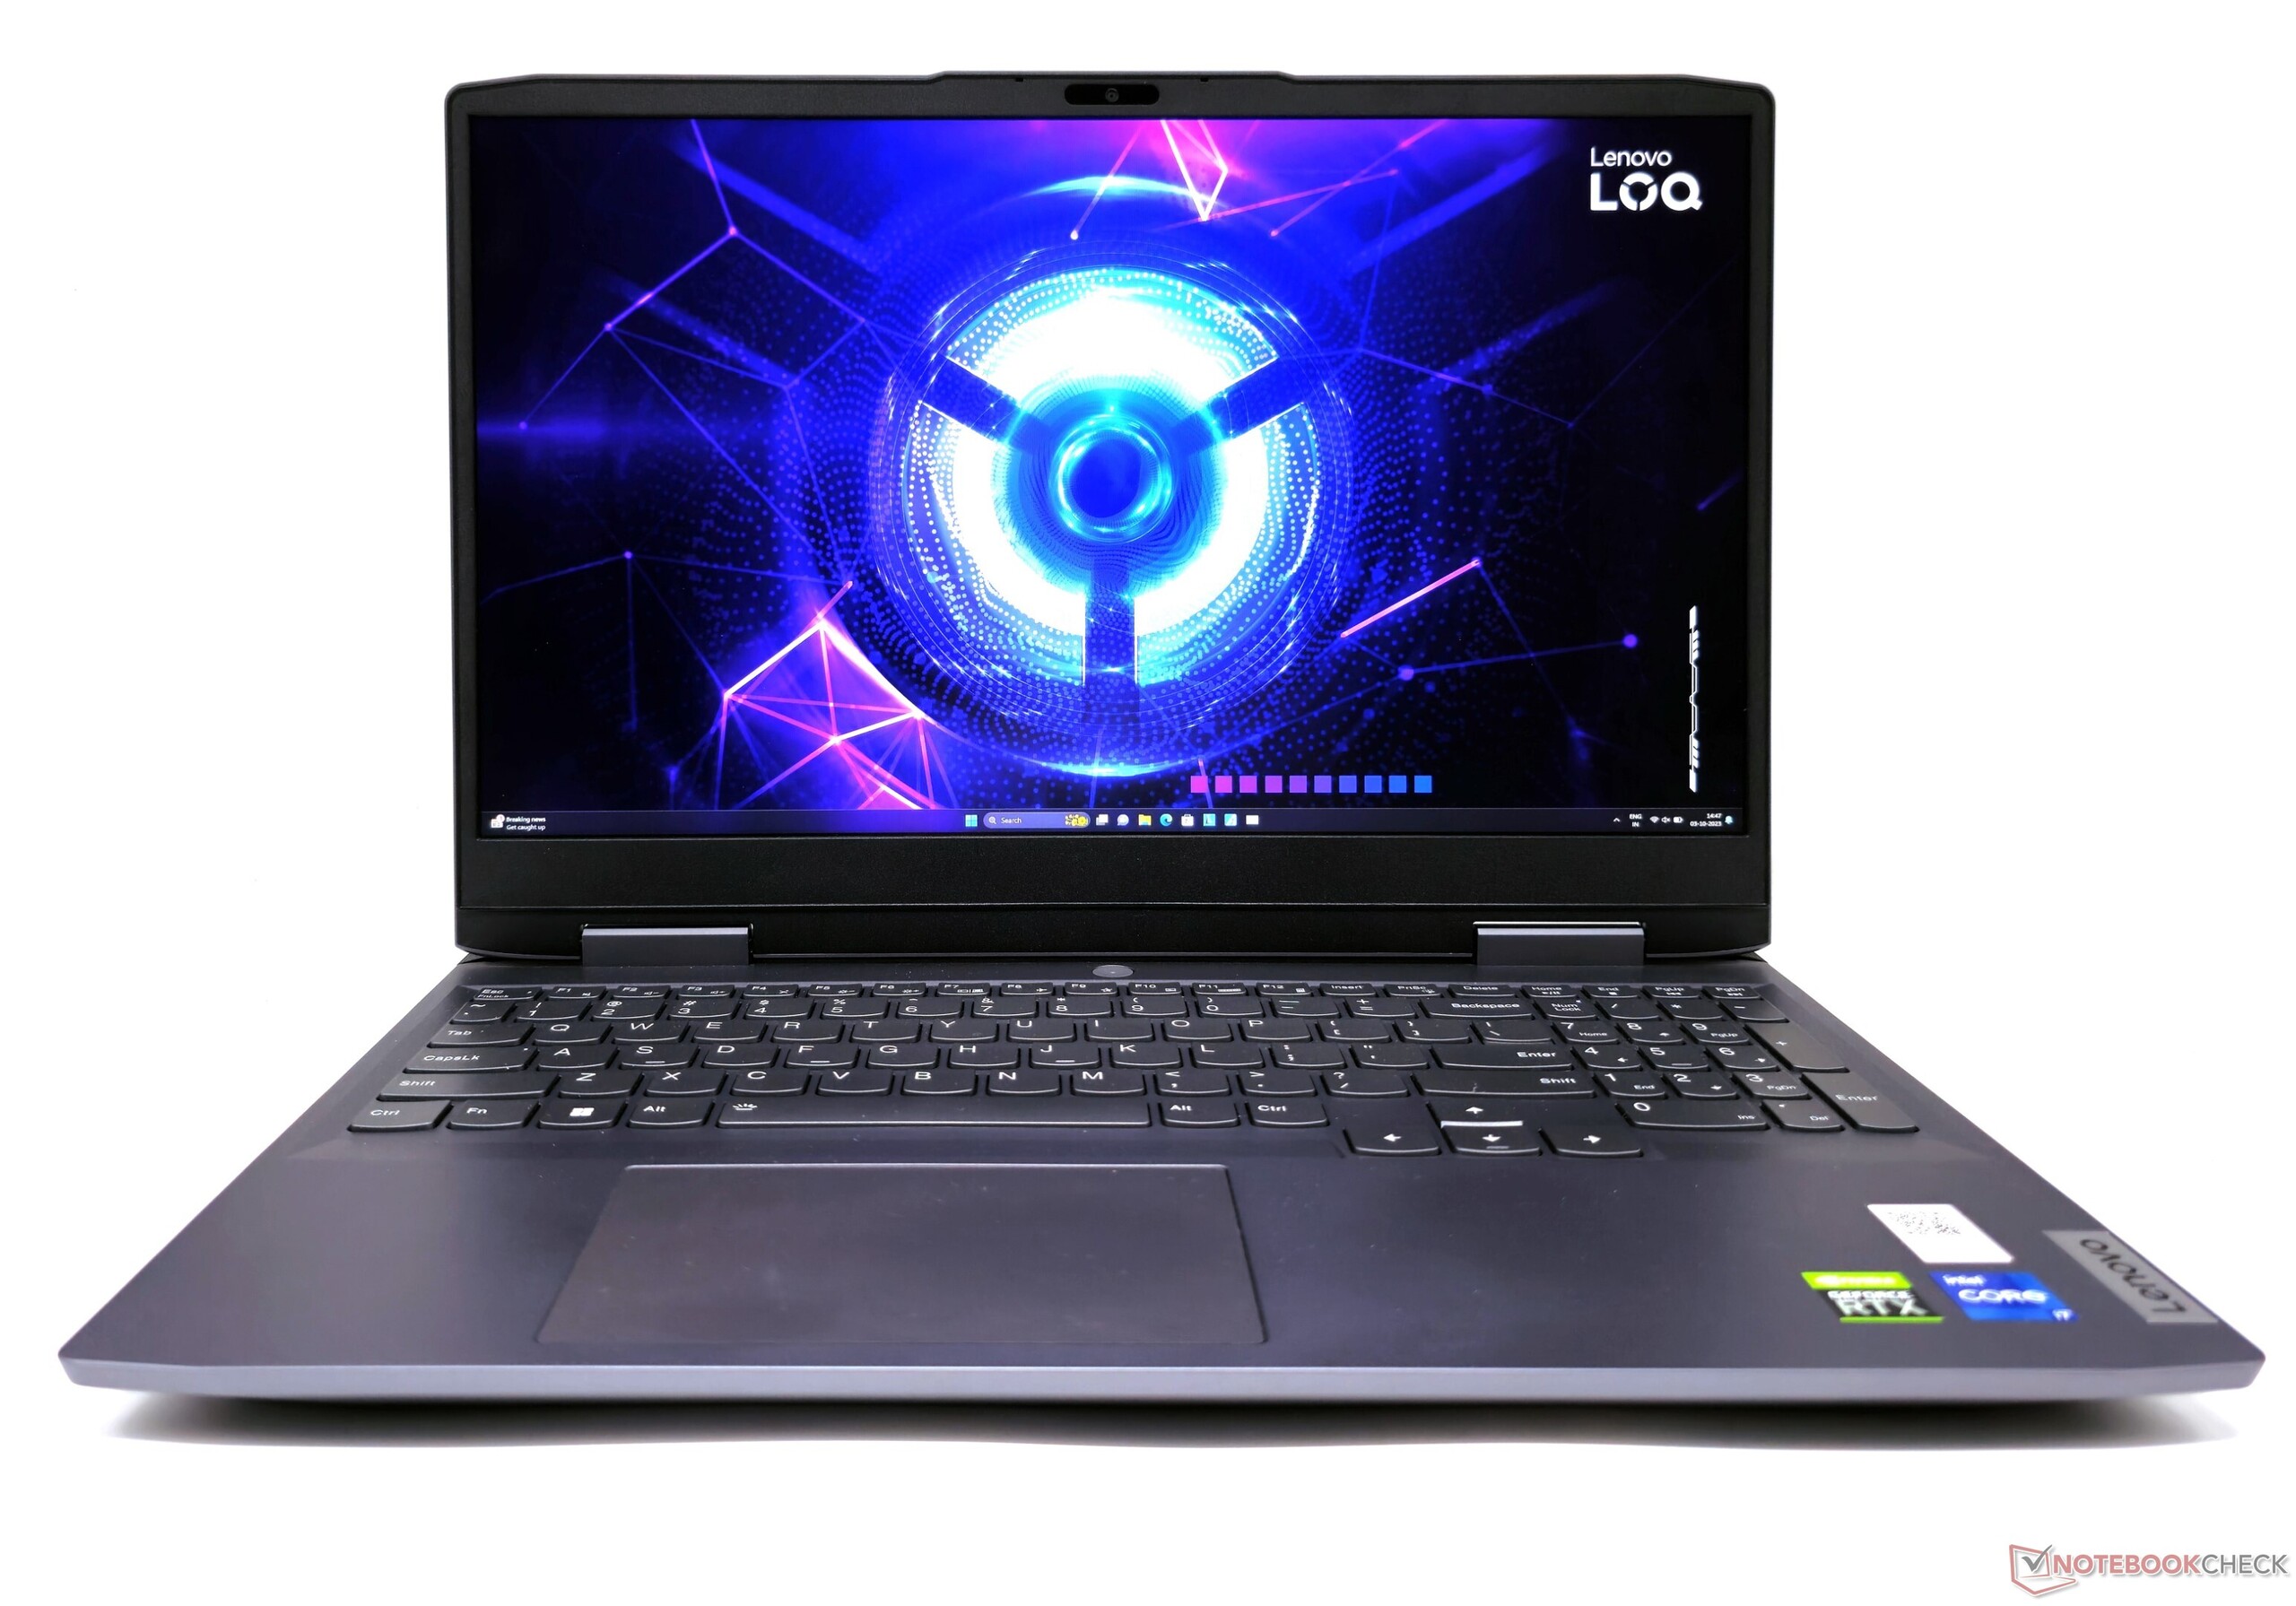
Análisis del Lenovo LOQ 15 Core i7: Alternativa asequible a Legion que plantea un dilema Intel vs AMD

La serie LOQ de Lenovo está dirigida a jugadores de nivel básico y económico, similar a las gamas Dell Serie G, HP Victus, Asus TUF, MSI Katana y Acer Nitro. Recientemente revisamos el LOQ 15APH8 con unAMD Ryzen 7 7840HSyGPU Nvidia RTX 4050 para portátiles. El LOQ 16IRH8 también combinó silicio Intel y Nvidia, emparejando un Core i7-13620H con RTX 4060 gráficos.
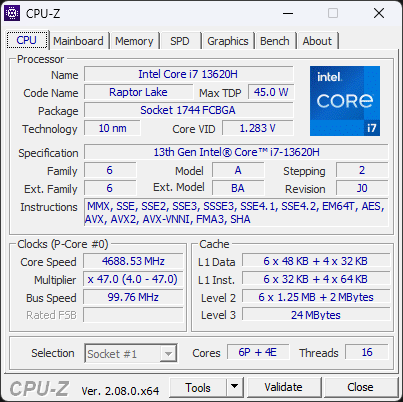
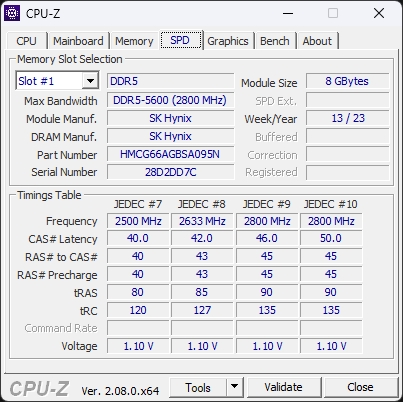
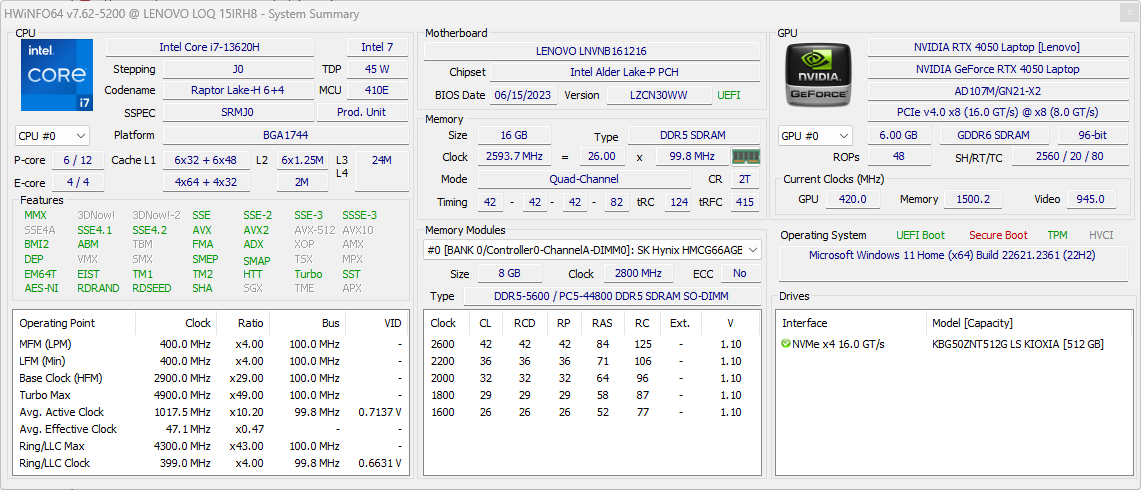
Ahora está en nuestros laboratorios el LOQ 15IRH8 de 15 pulgadas, impulsado por el Core i7-13620H y RTX 4050. Nuestro modelo de pruebas también venía equipado con 16 GB de memoria DDR5-5200, una SSD PCIe Gen4 NVMe de 512 GB y una pantalla QHD G-Sync de 165 Hz.
Esta configuración de gama media alta hace sonar las cajas registradoras a ₹1.01.988 (1.224 dólares) en la India, mientras que la variante 1080p 144Hz se puede conseguir por ₹97.790 (1.050 dólares).
Posibles contendientes en la comparación
Valoración | Fecha | Modelo | Peso | Altura | Tamaño | Resolución | Precio |
|---|---|---|---|---|---|---|---|
| 85.9 % v7 (old) | 10/2023 | Lenovo LOQ 15IRH8 Core i7 i7-13620H, GeForce RTX 4050 Laptop GPU | 2.4 kg | 25.2 mm | 15.60" | 2560x1440 | |
| 87.3 % v7 (old) | 09/2023 | Lenovo LOQ 16IRH8 i7-13620H, GeForce RTX 4060 Laptop GPU | 2.7 kg | 25.9 mm | 16.00" | 2560x1600 | |
| 85.7 % v7 (old) | 07/2023 | Lenovo LOQ 15APH8 R7 7840HS, GeForce RTX 4050 Laptop GPU | 2.5 kg | 25.2 mm | 15.60" | 1920x1080 | |
| 82.1 % v7 (old) | 02/2023 | MSI Katana 17 B13VFK i7-13620H, GeForce RTX 4060 Laptop GPU | 2.8 kg | 25.2 mm | 17.30" | 1920x1080 | |
| 89 % v7 (old) | 08/2023 | Lenovo Legion Pro 5 16ARX8 (R5 7645HX, RTX 4050) R5 7645HX, GeForce RTX 4050 Laptop GPU | 2.5 kg | 27.3 mm | 16.00" | 2560x1600 | |
| 85.1 % v7 (old) | 09/2023 | HP Victus 16-r0077ng i7-13700H, GeForce RTX 4070 Laptop GPU | 2.4 kg | 24 mm | 16.10" | 1920x1080 | |
| 84.2 % v7 (old) | 06/2023 | Dell G15 5530 i7-13650HX, GeForce RTX 4060 Laptop GPU | 3 kg | 26.95 mm | 15.60" | 1920x1080 | |
| 86.9 % v7 (old) | 06/2023 | Asus TUF Gaming A16 FA617XS R9 7940HS, Radeon RX 7600S | 2.2 kg | 22.1 mm | 16.00" | 1920x1200 |
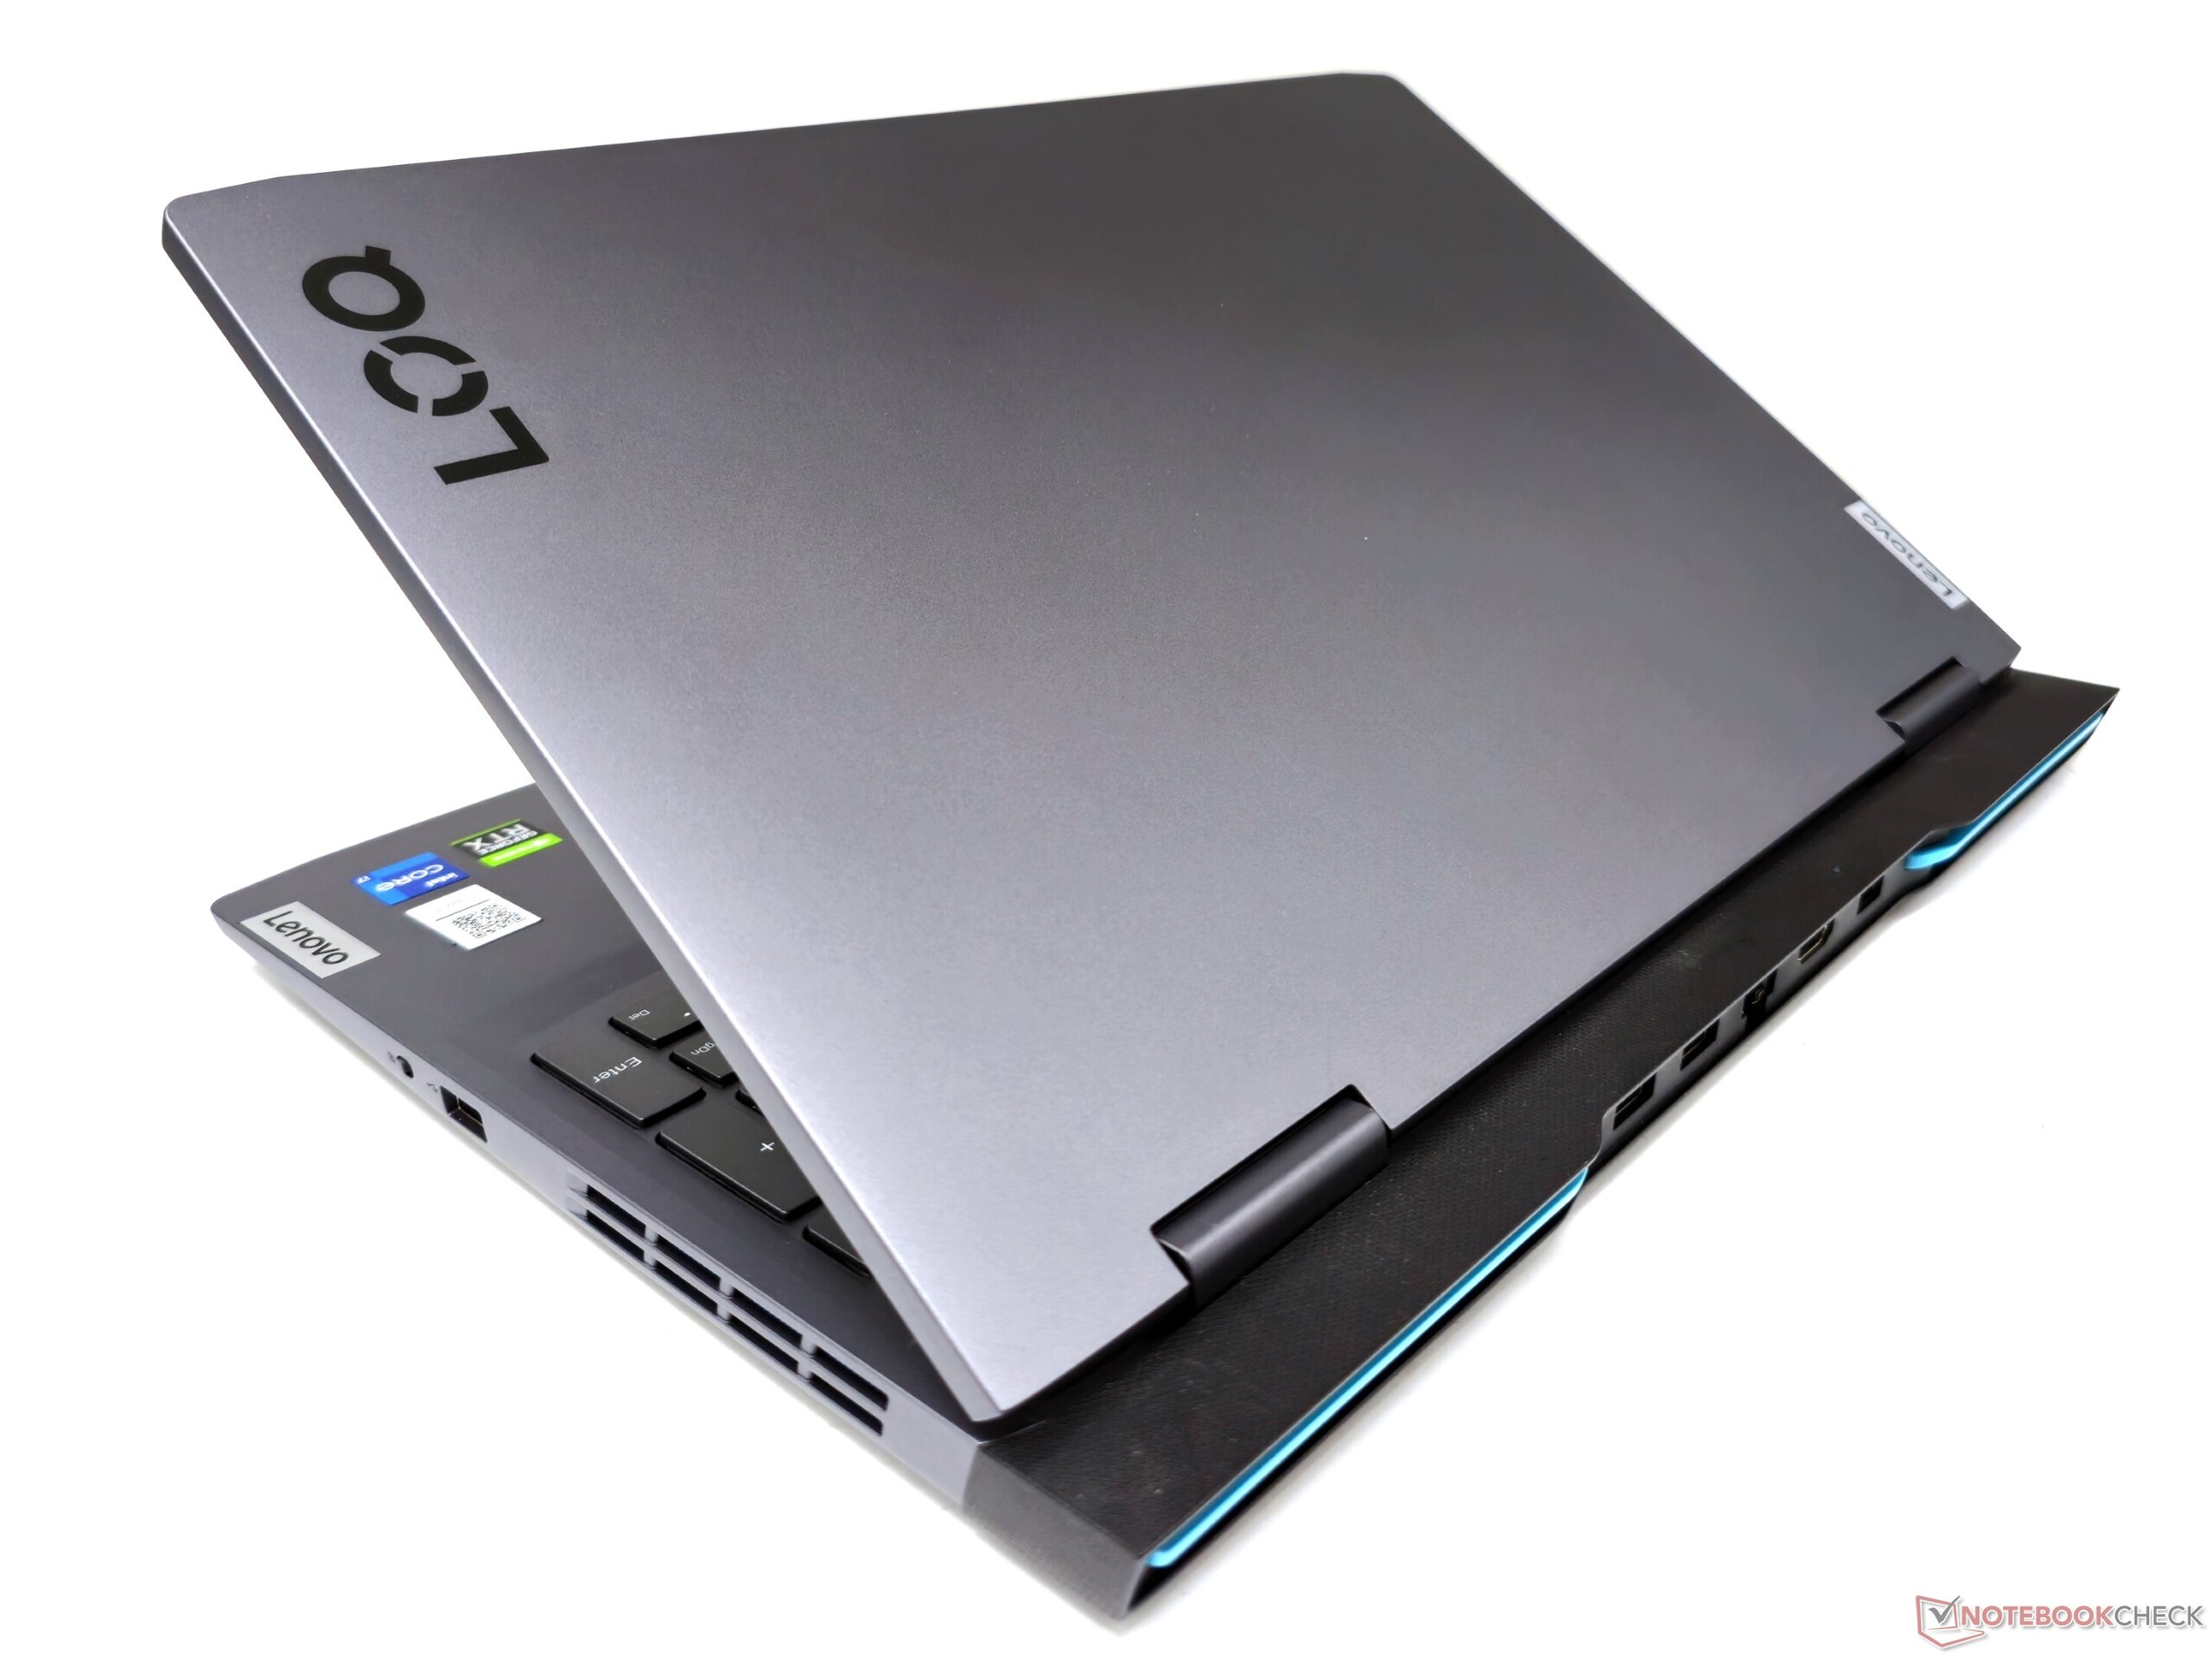
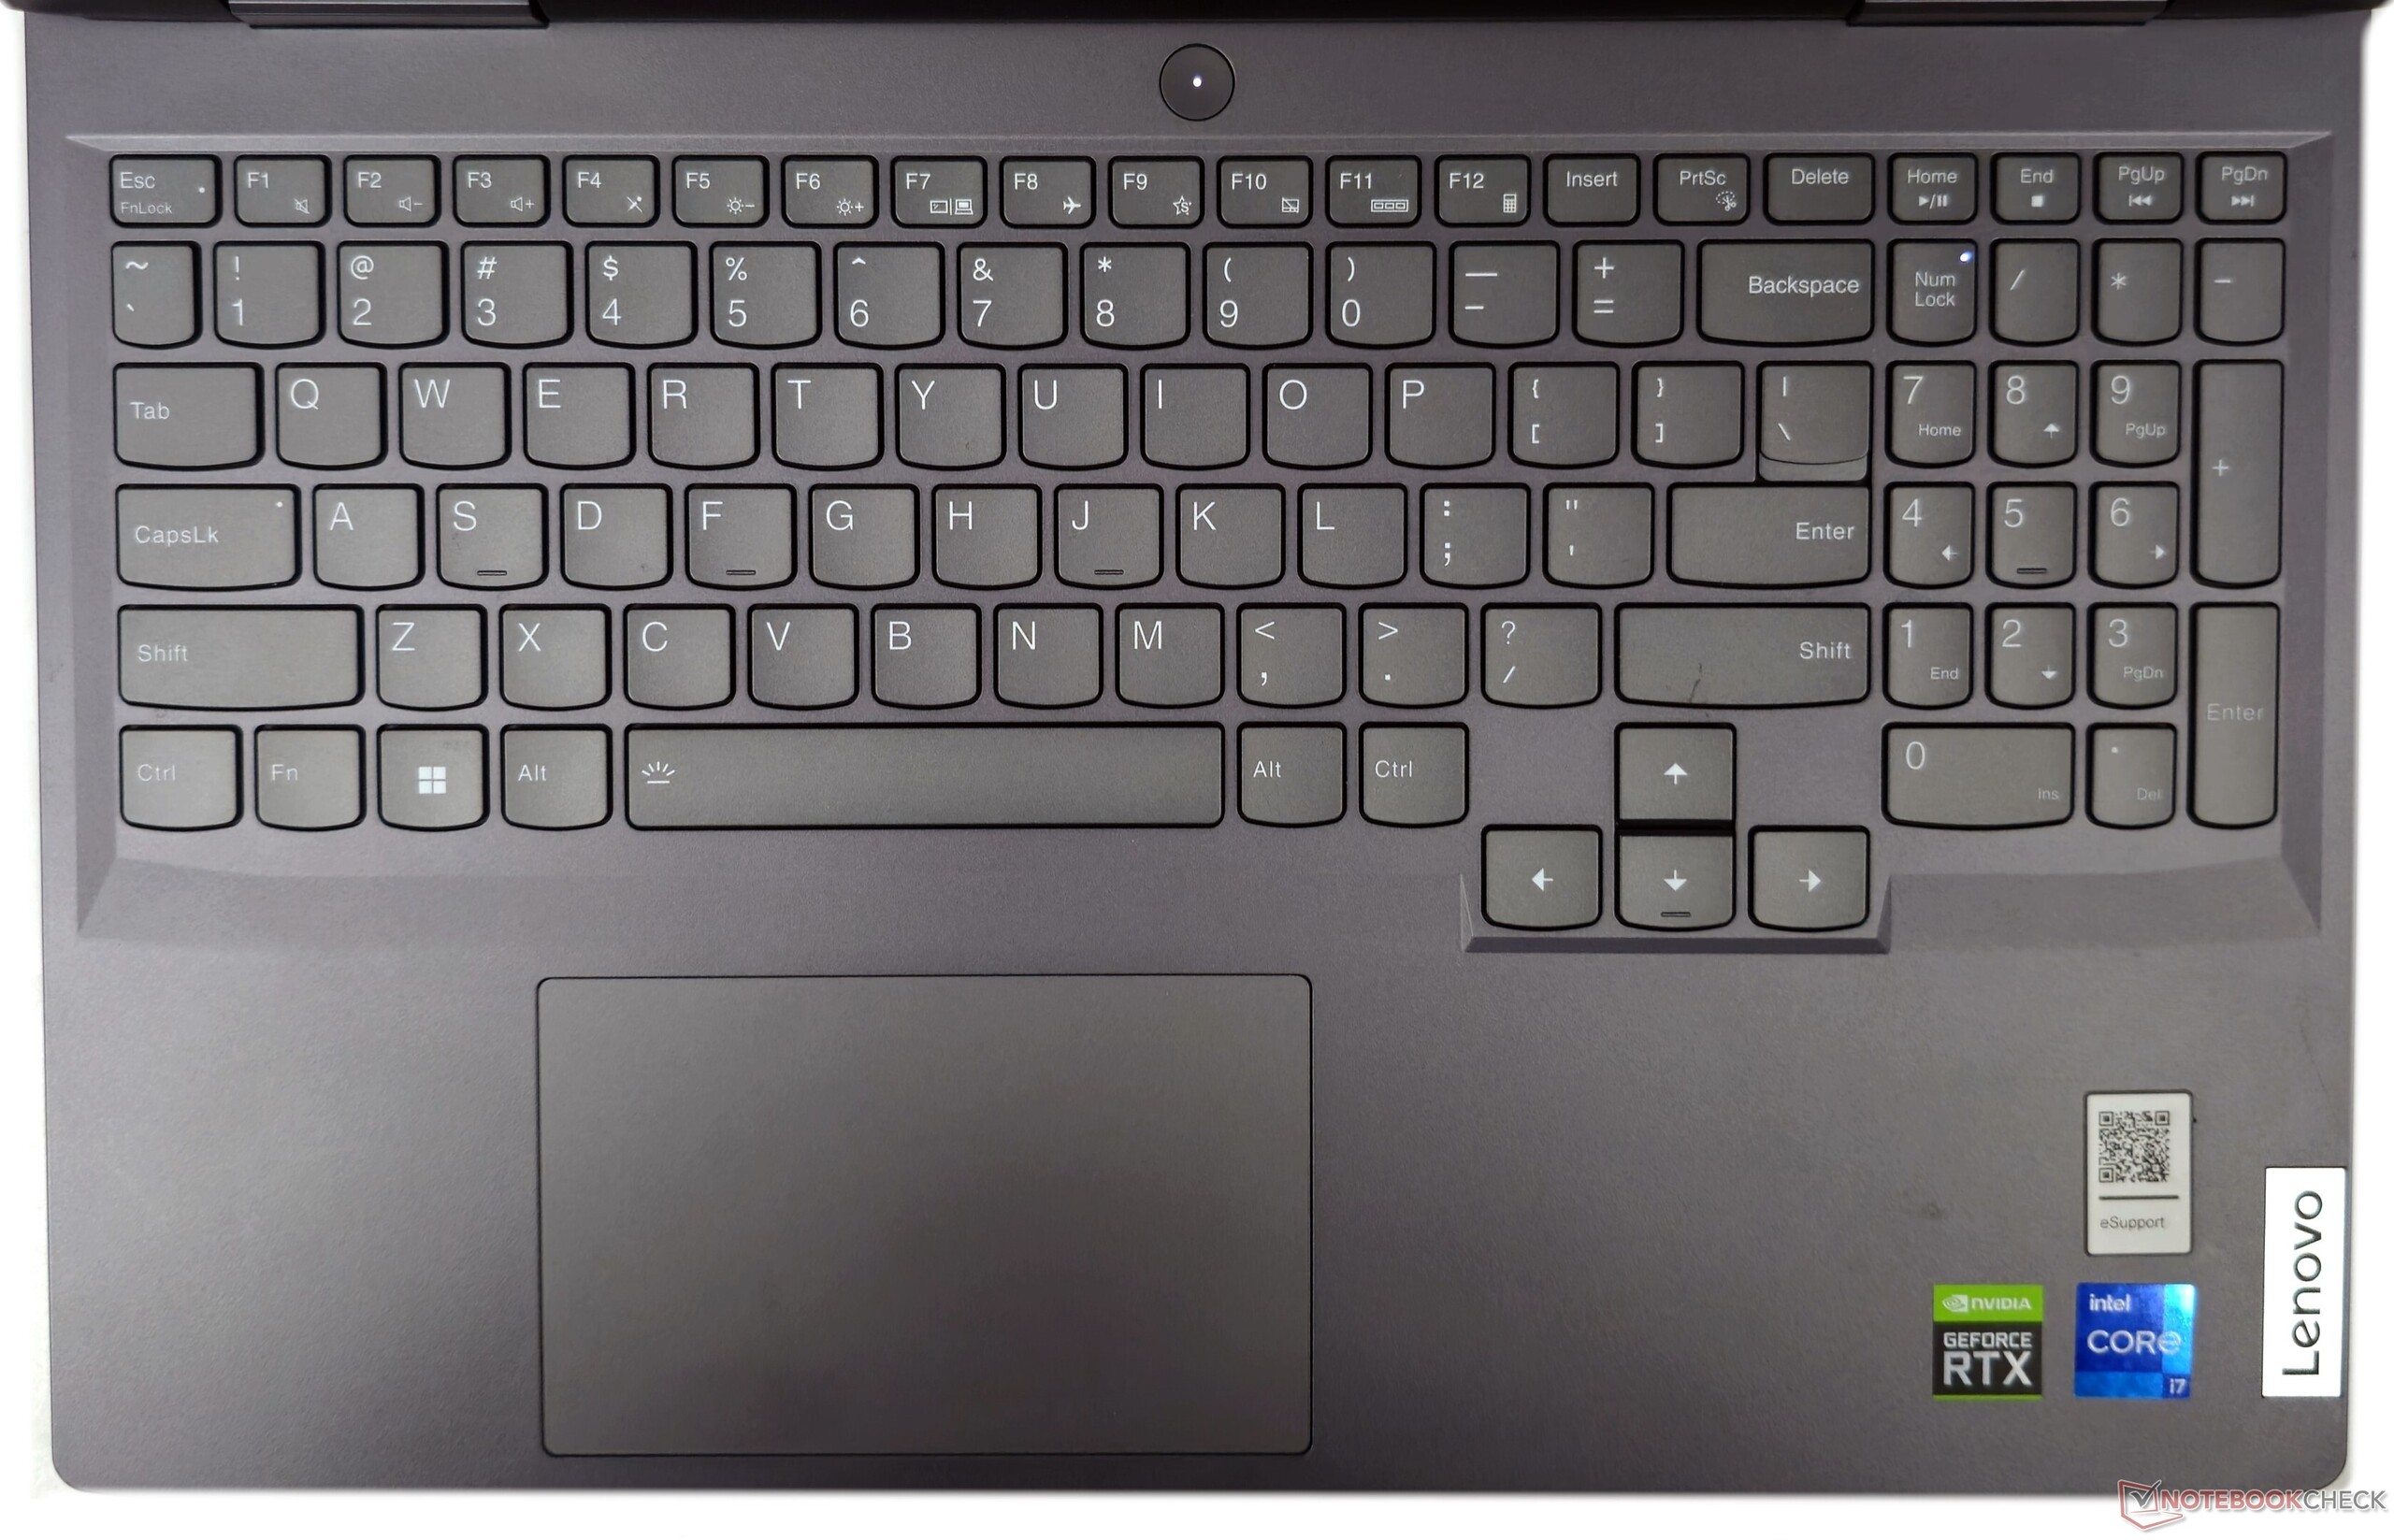
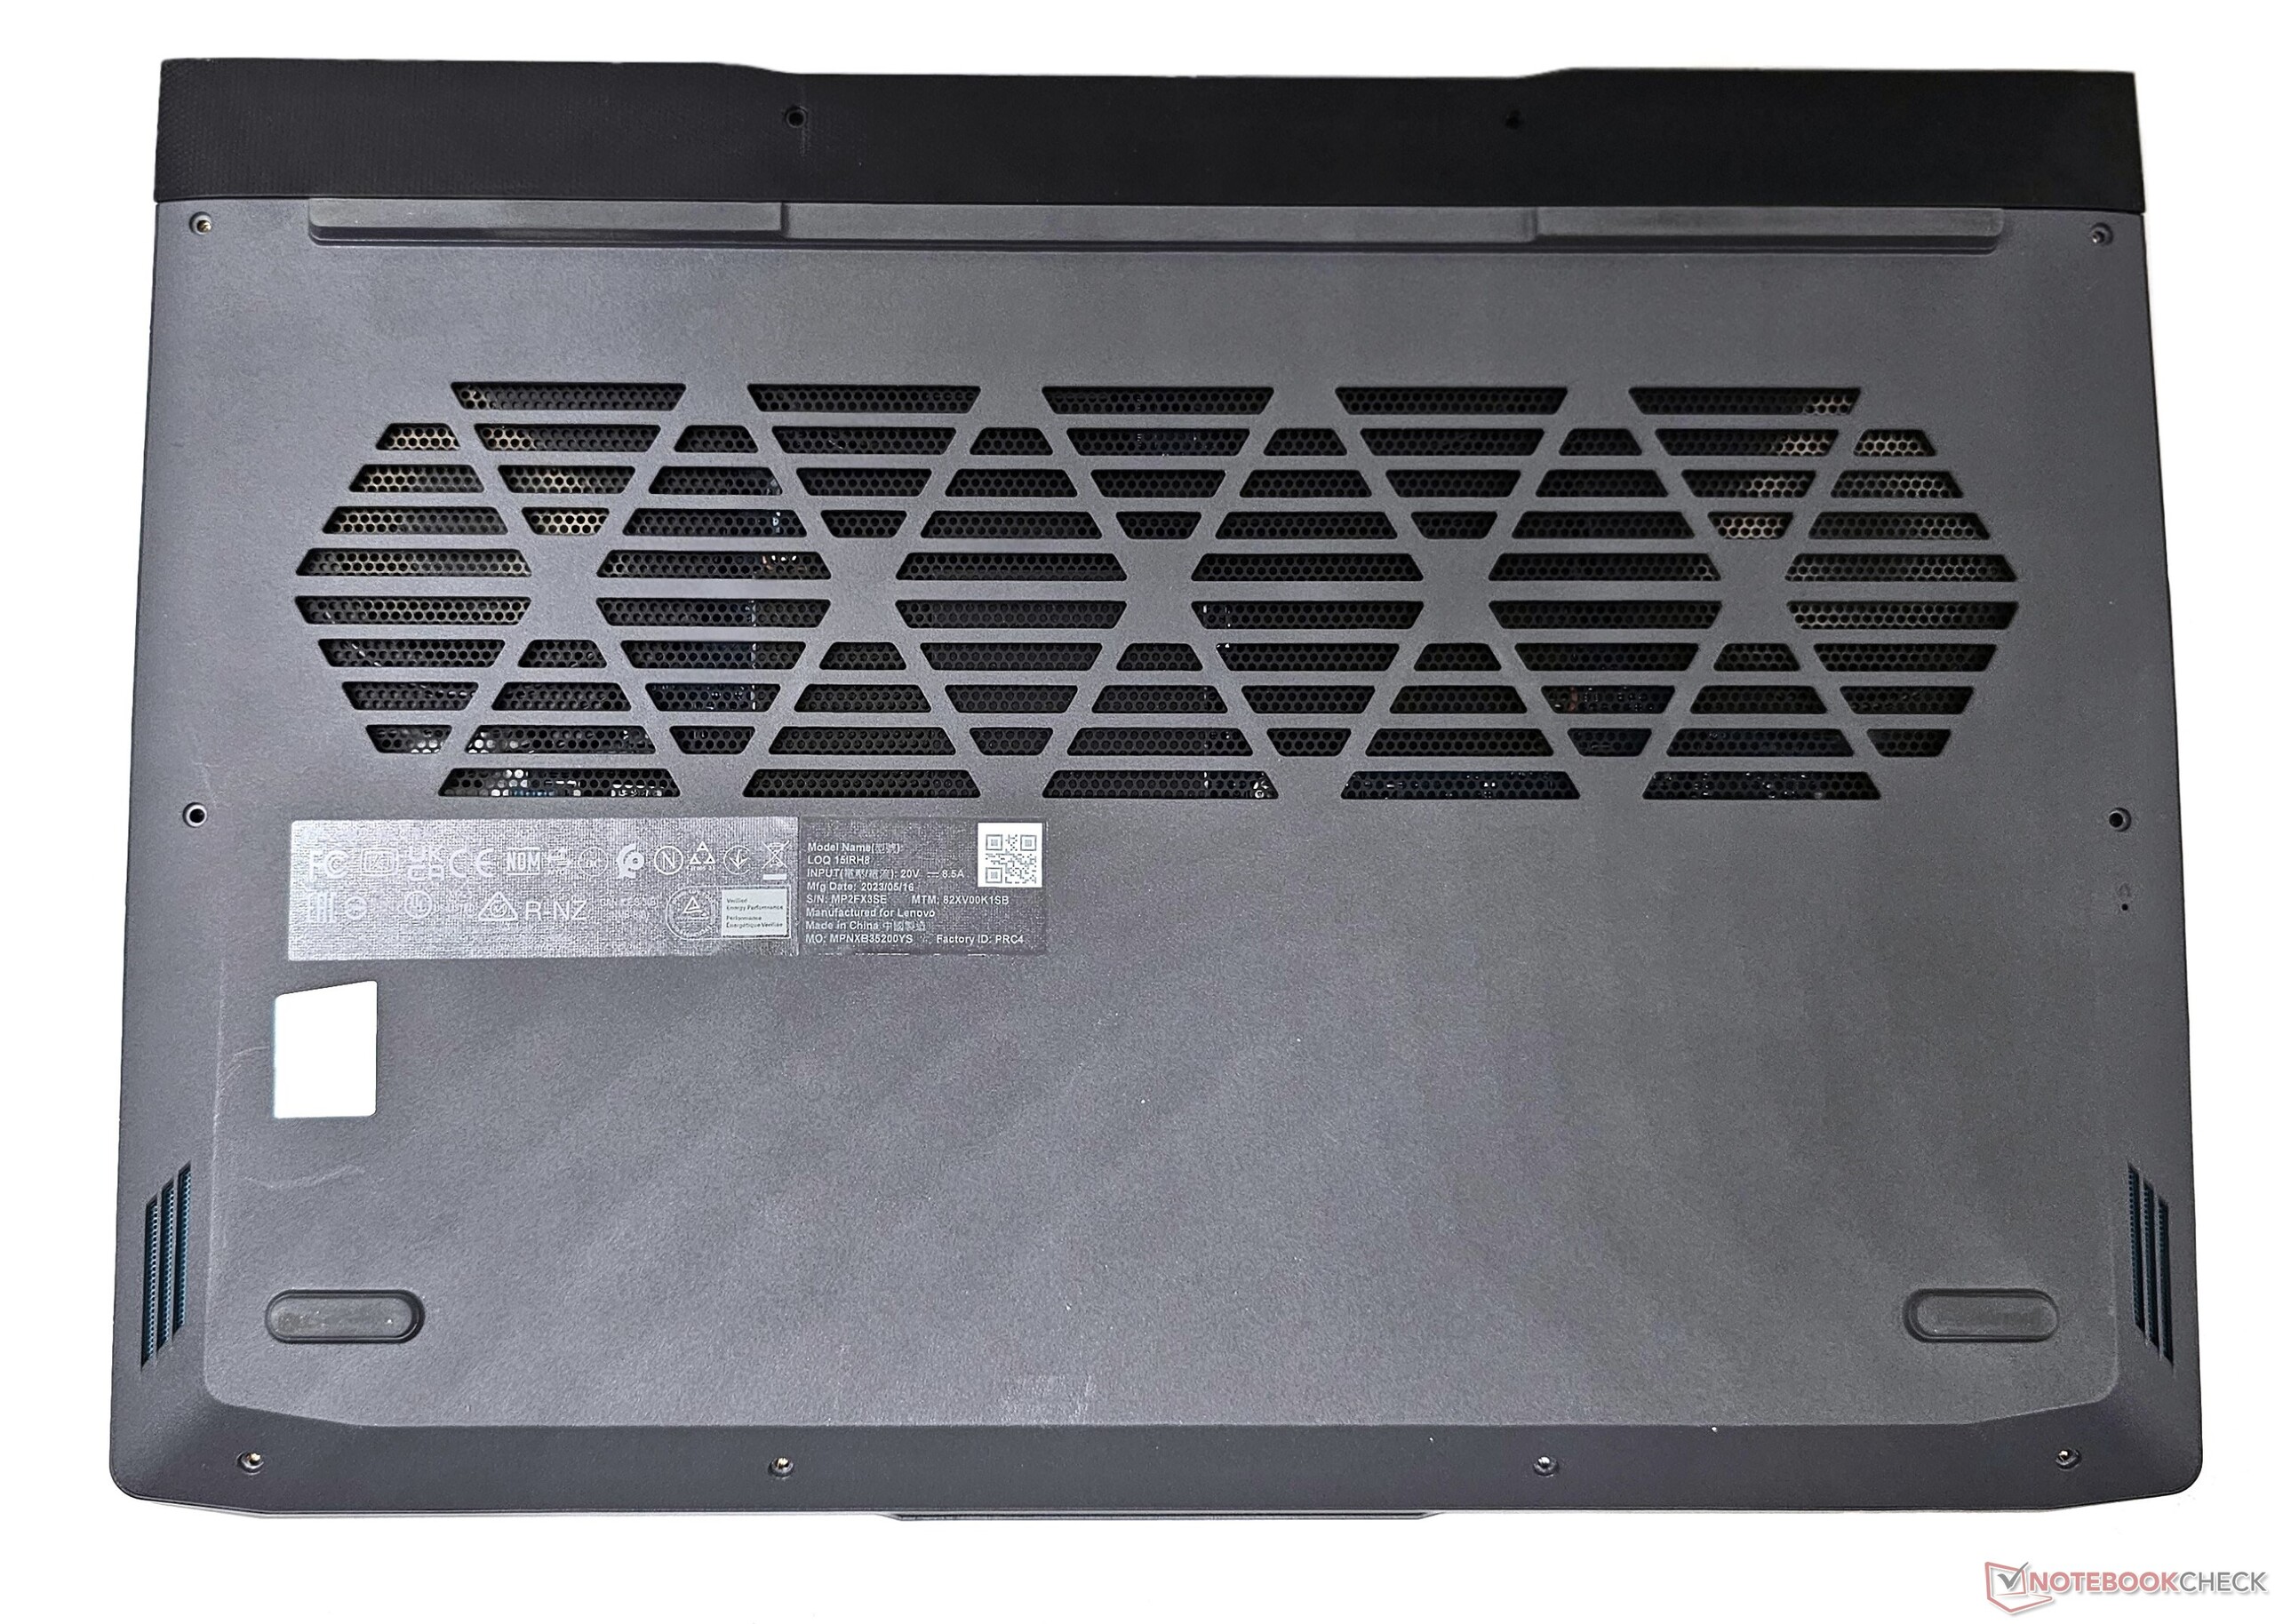
Chasis y dispositivos de entrada: Misma construcción de plástico que la variante AMD
Para más detalles sobre el chasis, el mantenimiento y los dispositivos de entrada del Lenovo LOQ 15IRH8, consulte nuestro Análisis del LOQ 15APH8- estos aspectos son idénticos entre los portátiles LOQ de Lenovo basados en Intel y AMD.
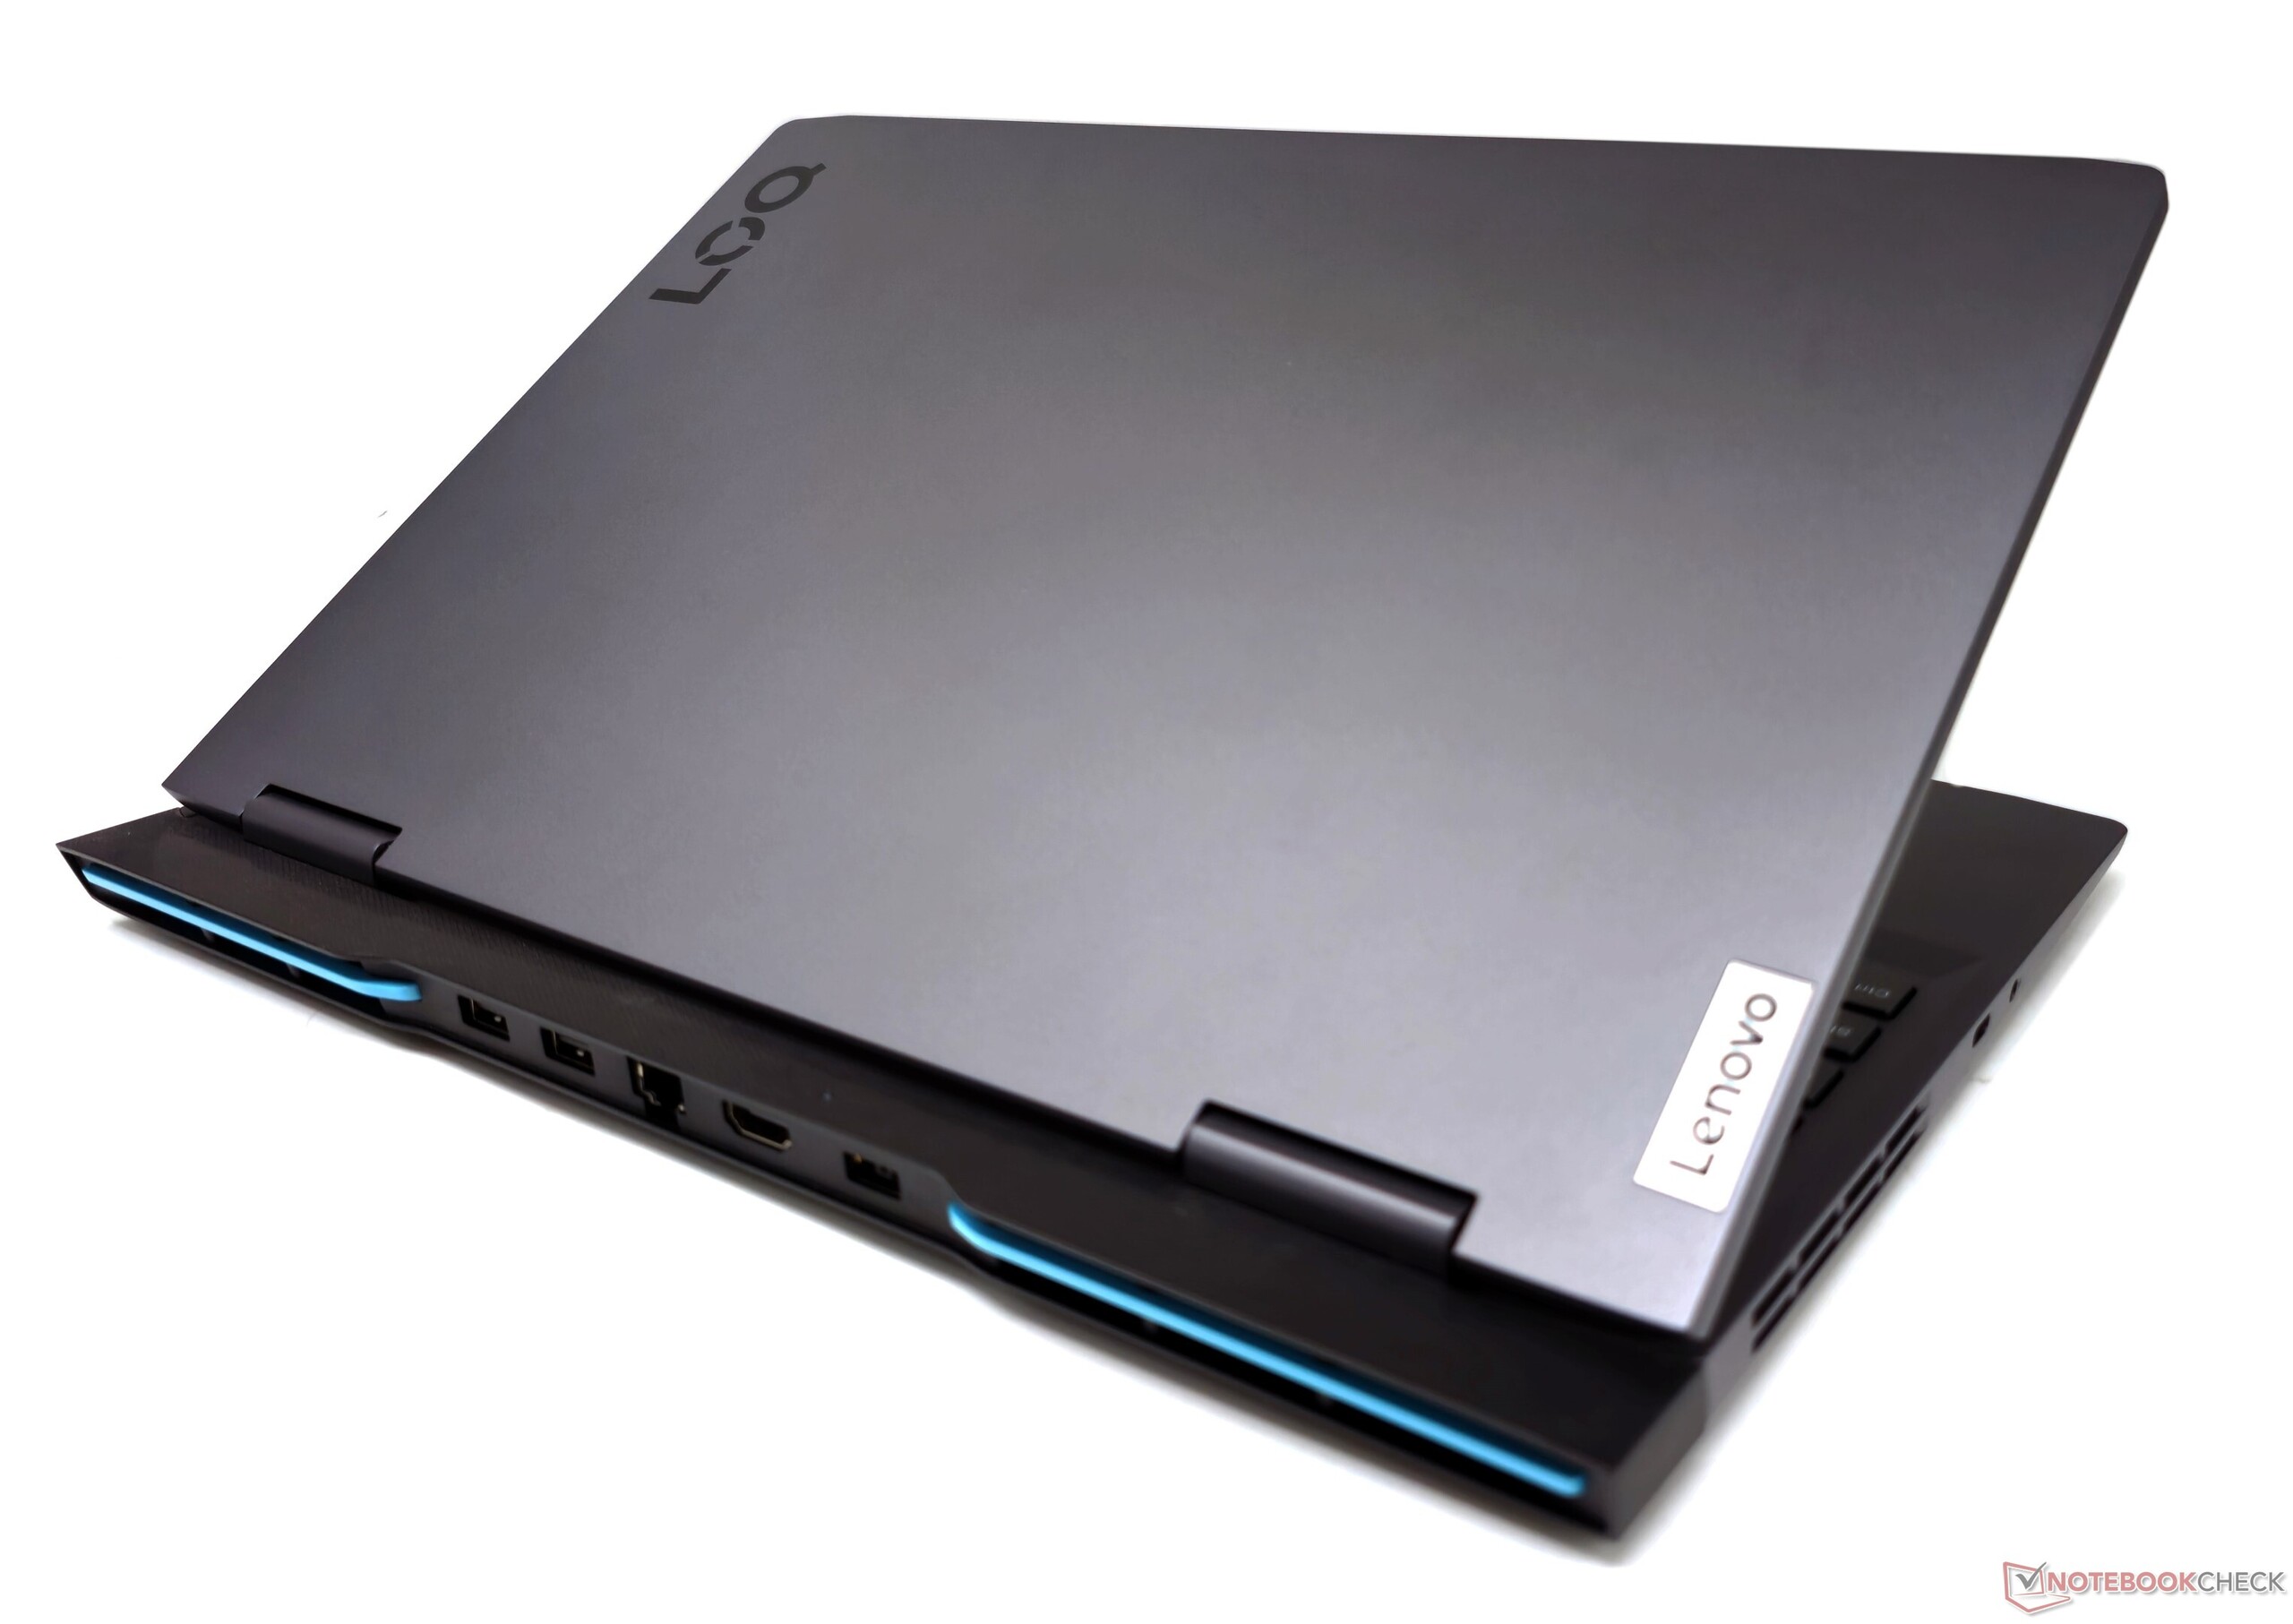
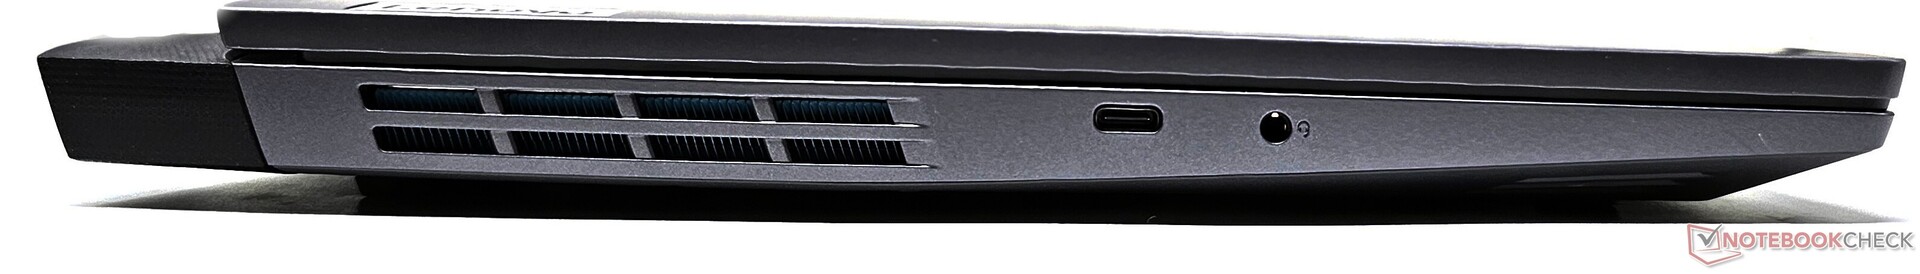
Conectividad: suministro de energía USB-C de 140 W pero sin Thunderbolt 4
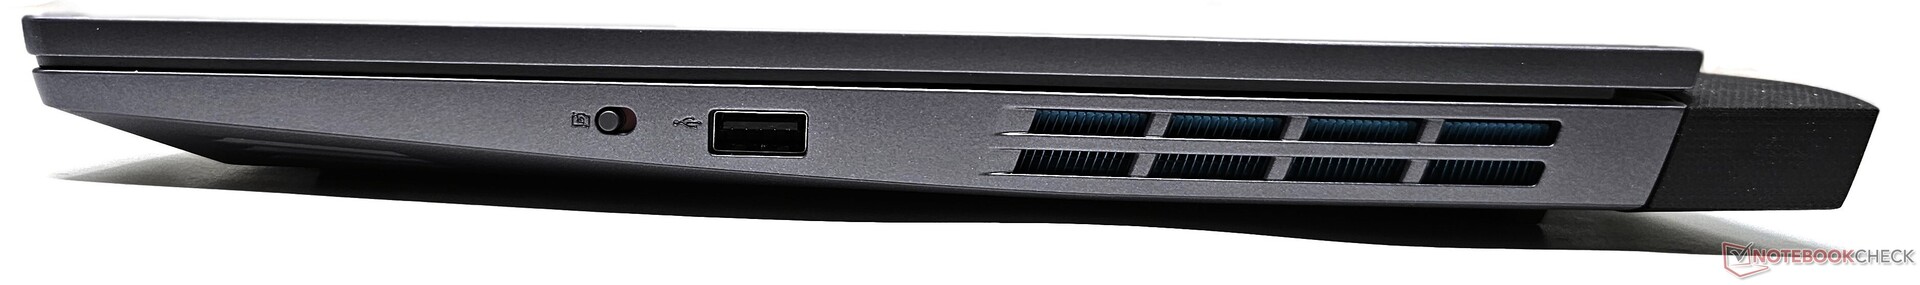
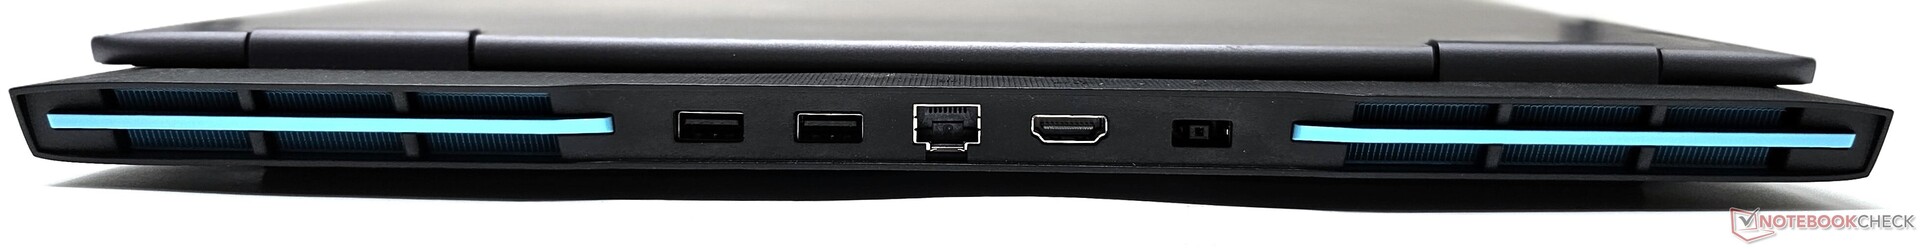
La selección y colocación de los puertos es exactamente la misma que en el LOQ 16 basado en Intel. A diferencia del uso por parte del LOQ 15APH8 de un puerto USB 2.0 entre otros puertos USB 3.2, las variantes de Intel estandarizan totalmente la conectividad USB 3.2.
Según Lenovo, el único puerto USB 3.2 Gen2 Tipo-C es capaz de suministrar 140 W de potencia. No se proporciona ninguna opción USB4 o Thunderbolt 4.
Comunicación
El rendimiento inalámbrico está en la línea esperada para un módulo Realtek Wi-Fi 6. Tanto las pruebas de transmisión como las de recepción mostraron un rendimiento estable cuando se probaron con nuestro router de referencia Asus ROG Rapture GT-AXE11000.
| Networking / iperf3 transmit AXE11000 | |
| Lenovo Legion Pro 5 16ARX8 (R5 7645HX, RTX 4050) | |
| Dell G15 5530 | |
| MSI Katana 17 B13VFK | |
| Media de la clase Gaming (560 - 1862, n=88, últimos 2 años) | |
| Lenovo LOQ 15IRH8 Core i7 | |
| Lenovo LOQ 15APH8 | |
| Medio Realtek RTL8852BE (536 - 943, n=71) | |
| Asus TUF Gaming A16 FA617XS | |
| Lenovo LOQ 16IRH8 | |
| HP Victus 16-r0077ng | |
| Networking / iperf3 receive AXE11000 | |
| MSI Katana 17 B13VFK | |
| Lenovo Legion Pro 5 16ARX8 (R5 7645HX, RTX 4050) | |
| Dell G15 5530 | |
| Media de la clase Gaming (680 - 1745, n=88, últimos 2 años) | |
| Lenovo LOQ 15IRH8 Core i7 | |
| Asus TUF Gaming A16 FA617XS | |
| Medio Realtek RTL8852BE (455 - 985, n=72) | |
| Lenovo LOQ 16IRH8 | |
| Lenovo LOQ 15APH8 | |
| HP Victus 16-r0077ng | |
Cámara web
La webcam 1080p muestra altas desviaciones en todos los colores excepto el blanco. La calidad de imagen sigue siendo utilizable para videollamadas con buena luz ambiental. En el lado derecho del dispositivo hay un interruptor de obturador electrónico de la cámara.


Garantía
En la India, Lenovo ofrece una garantía estándar in situ de un año para el LOQ 15. Los compradores pueden optar además por varias opciones de mejora de la garantía y de protección contra daños accidentales directamente desde Lenovo.
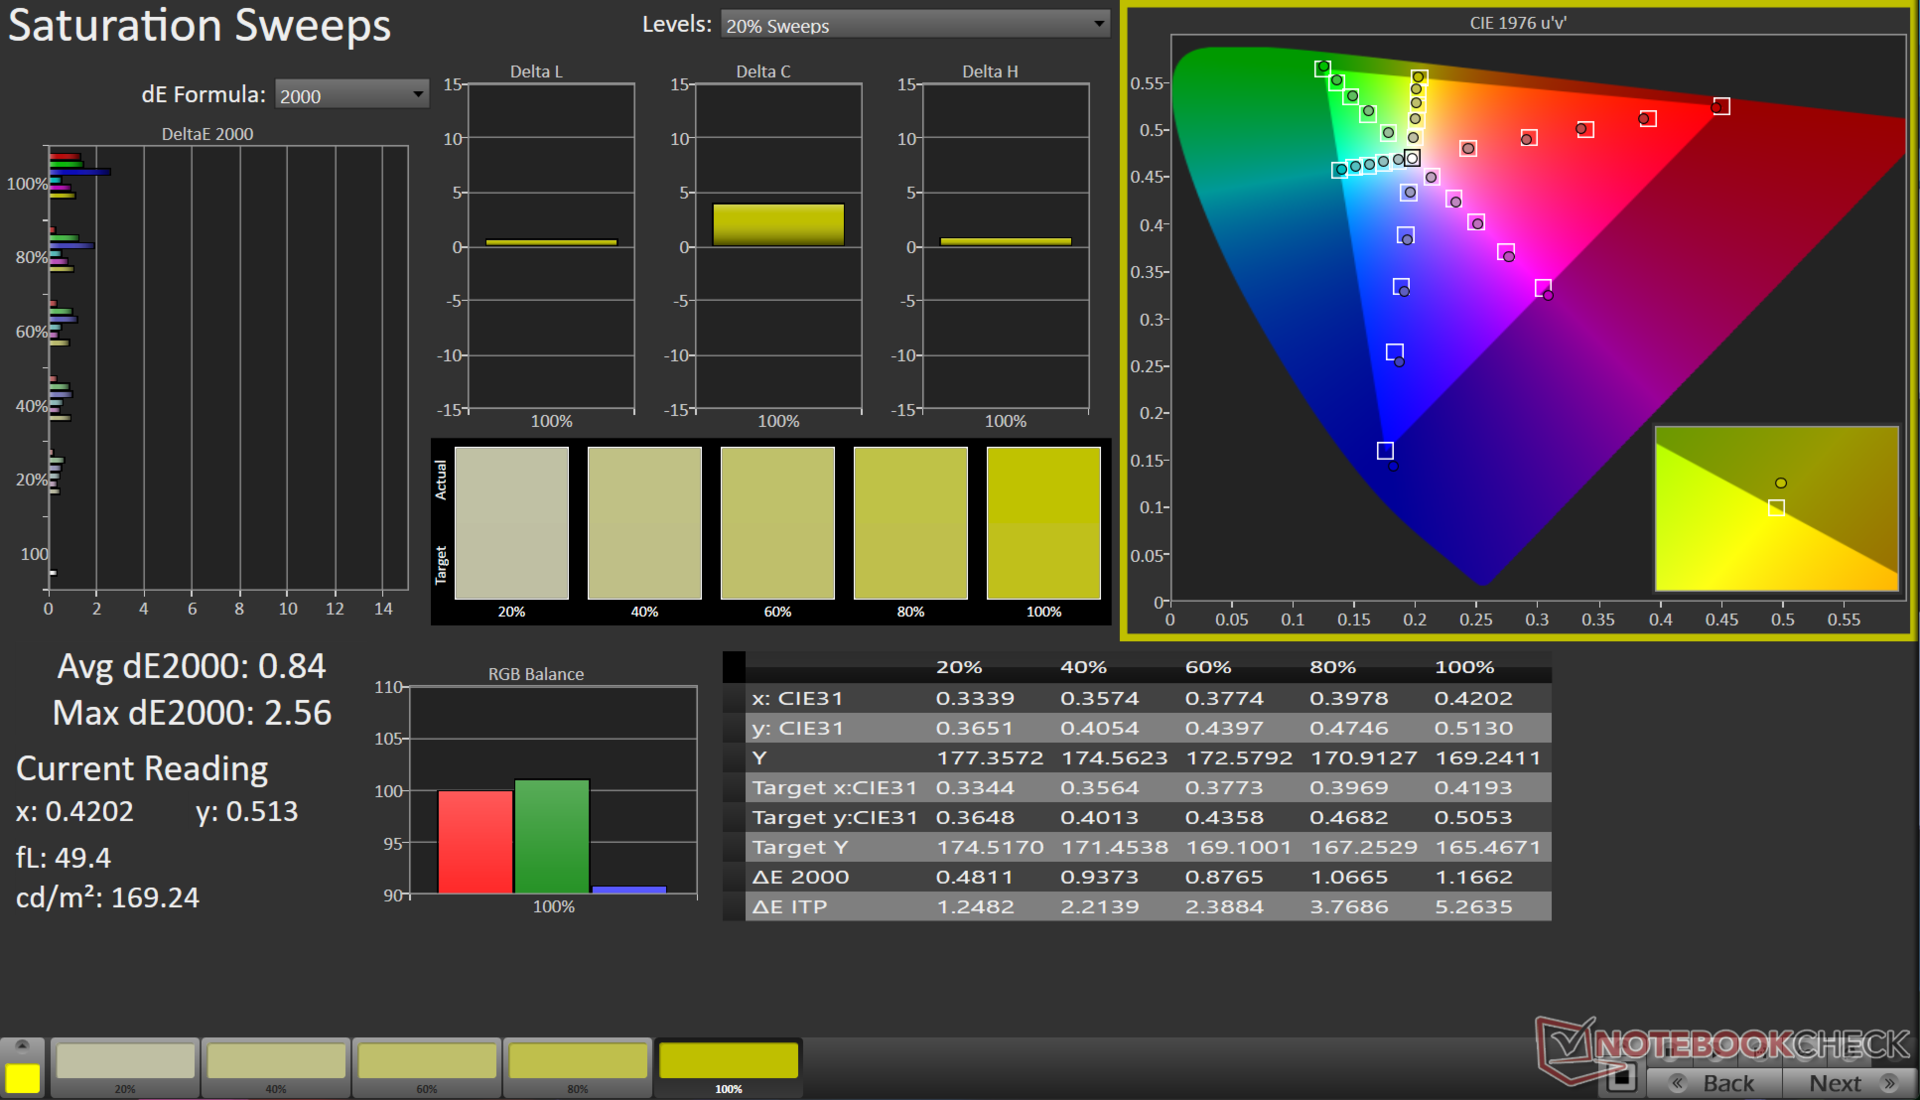
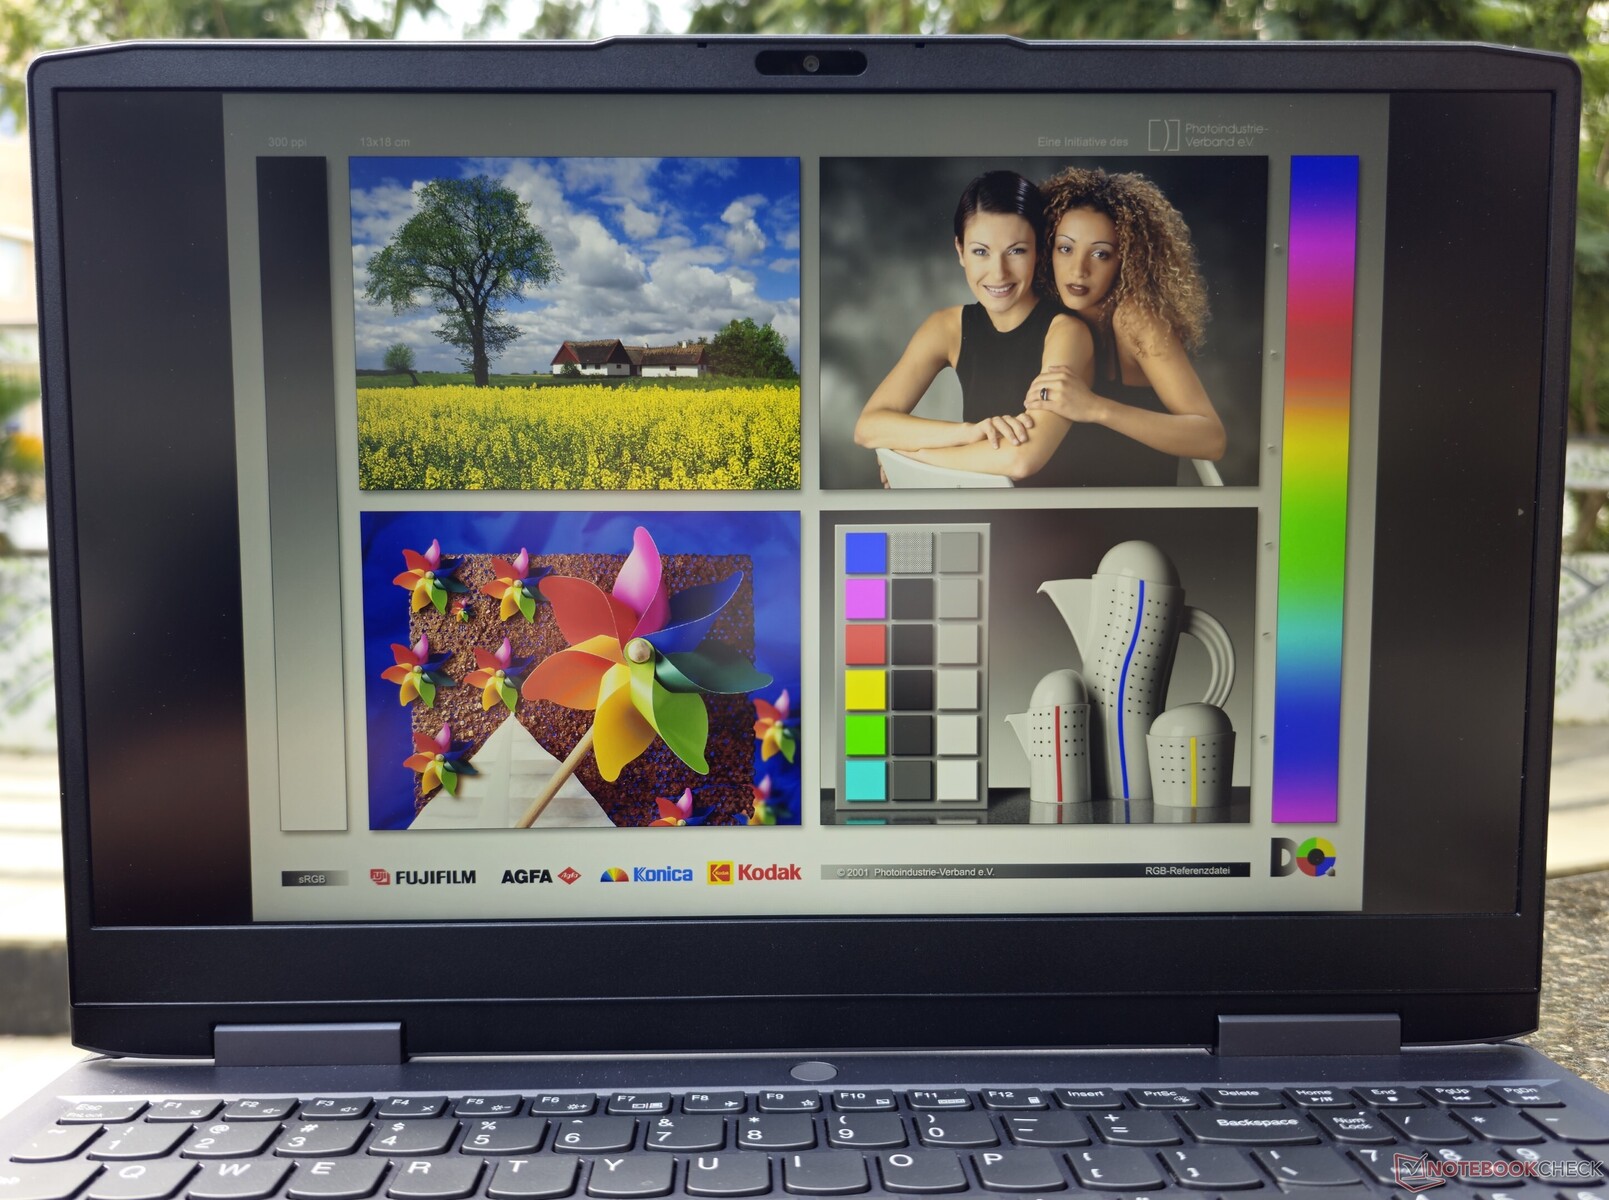
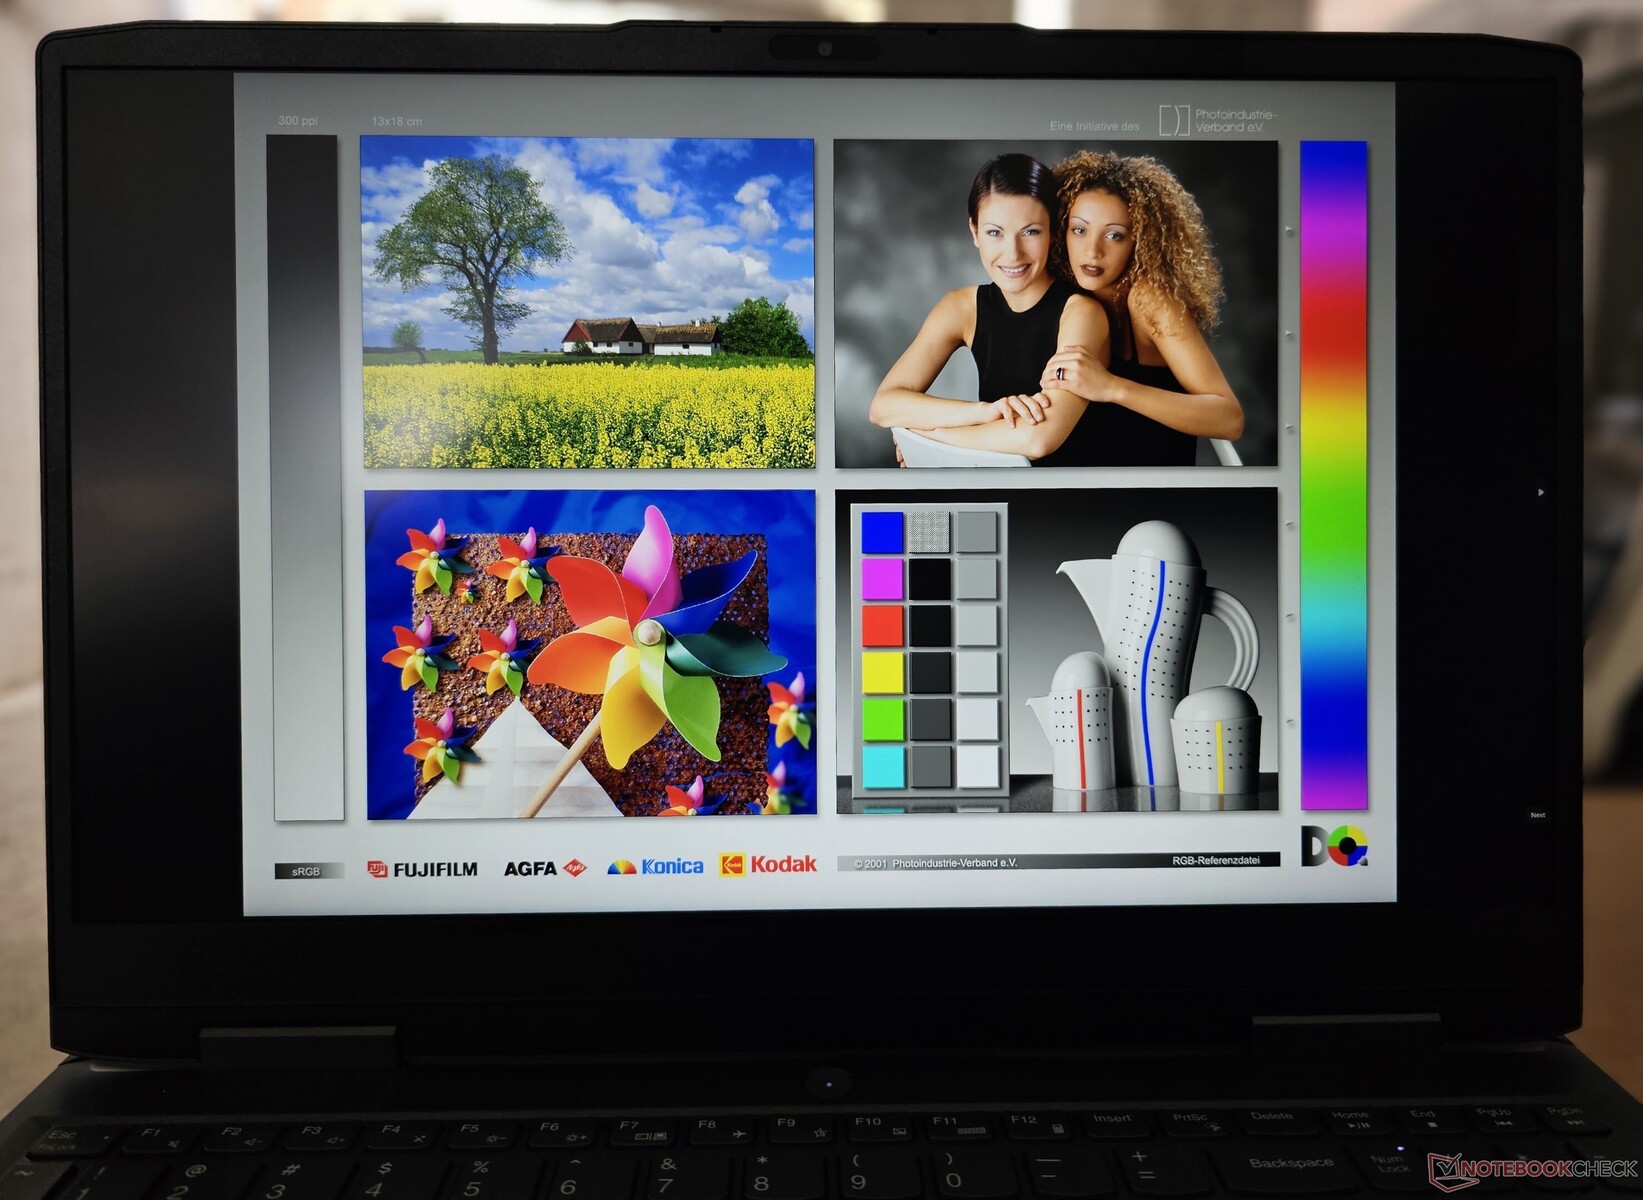
Pantalla: el panel QHD G-Sync de 165 Hz presenta una importante opción de mejora
Nuestra unidad LOQ 15 venía equipada con un panel BOE QHD con una frecuencia de actualización de 165 Hz. El panel es compatible con Nvidia G-Sync en el modo de GPU discreta. Lenovo clasifica el brillo en 350 nits, pero registramos hasta 383 nits en el punto más brillante de la pantalla.
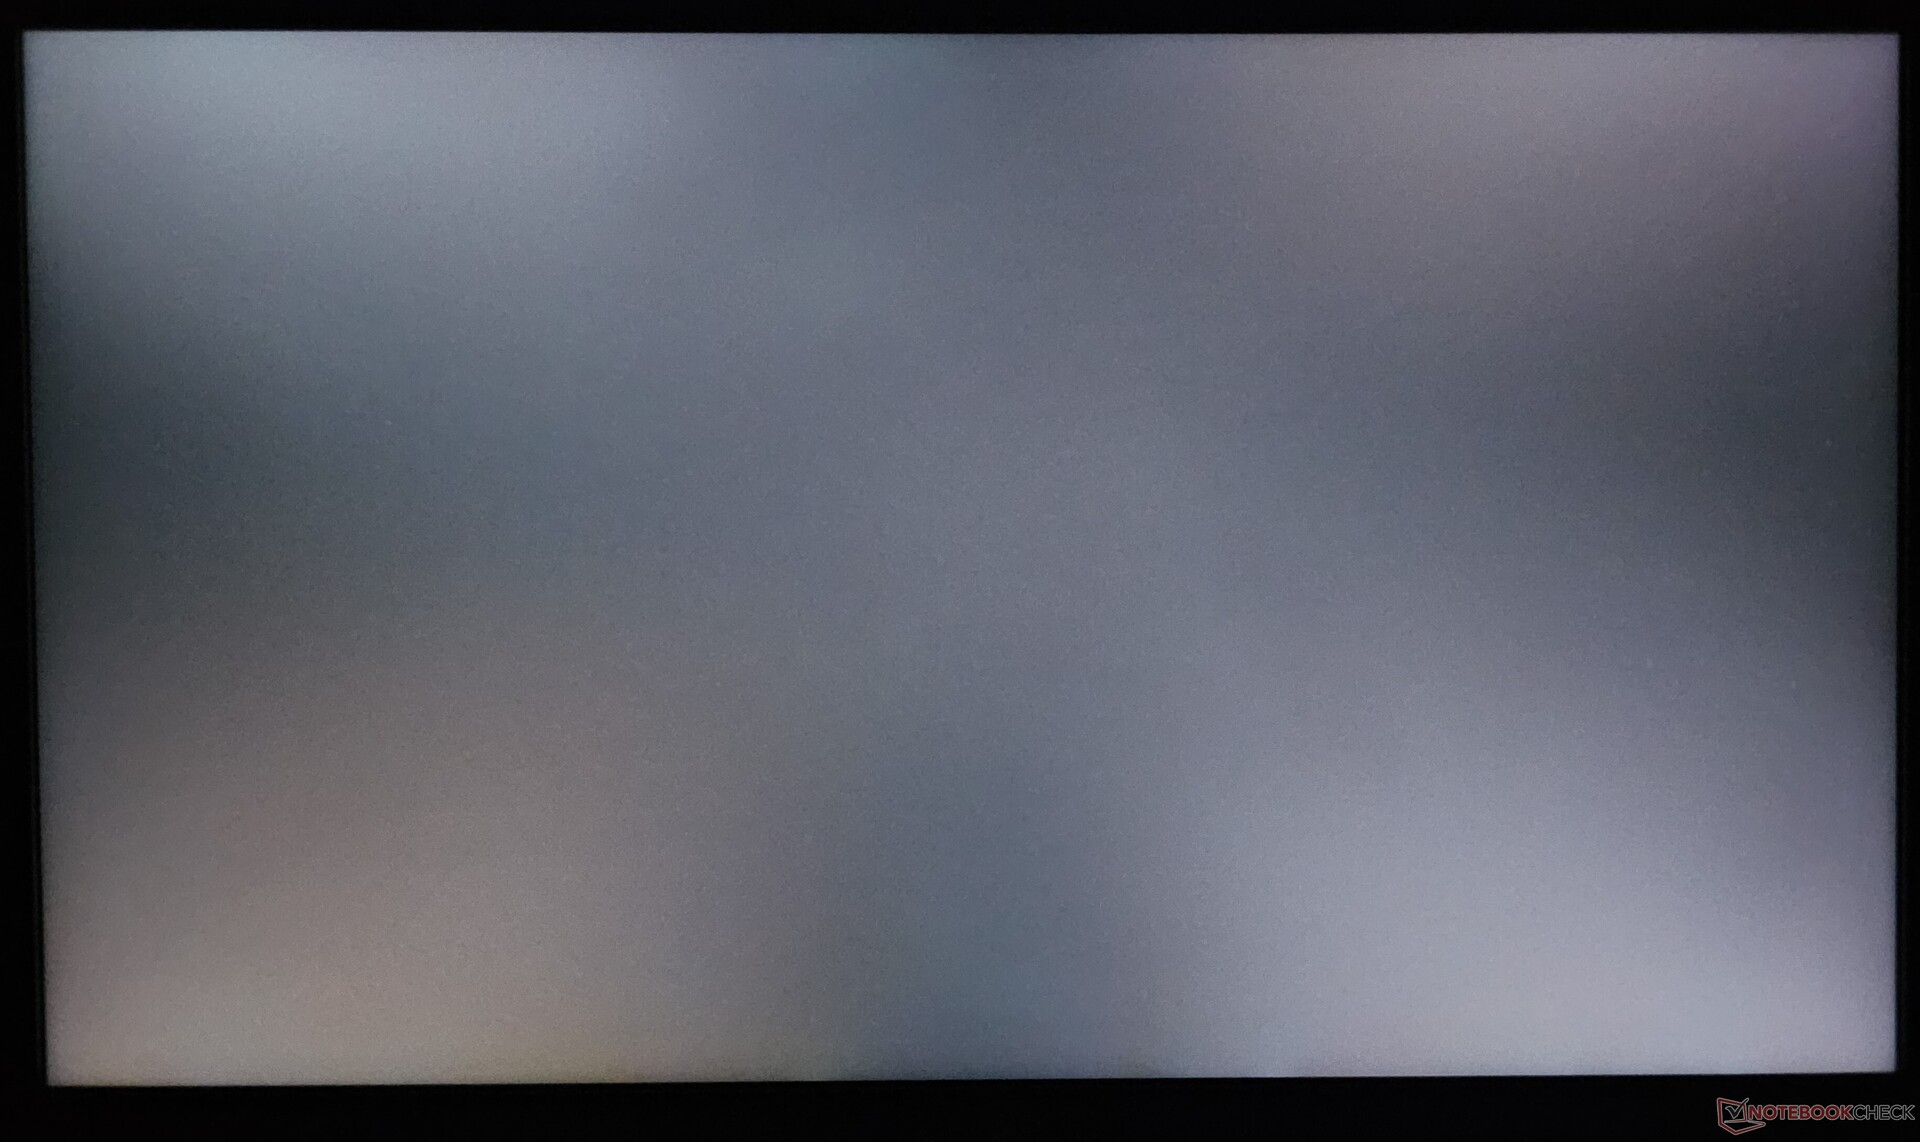
Hay sangrado de retroiluminación en las esquinas, pero la uniformidad general del brillo es buena con un 90%. Los niveles de negro y la relación de contraste superan al panel QHD+ fabricado por AUO en el LOQ 16IRH8.
| |||||||||||||||||||||||||
iluminación: 90 %
Brillo con batería: 372 cd/m²
Contraste: 1130:1 (Negro: 0.33 cd/m²)
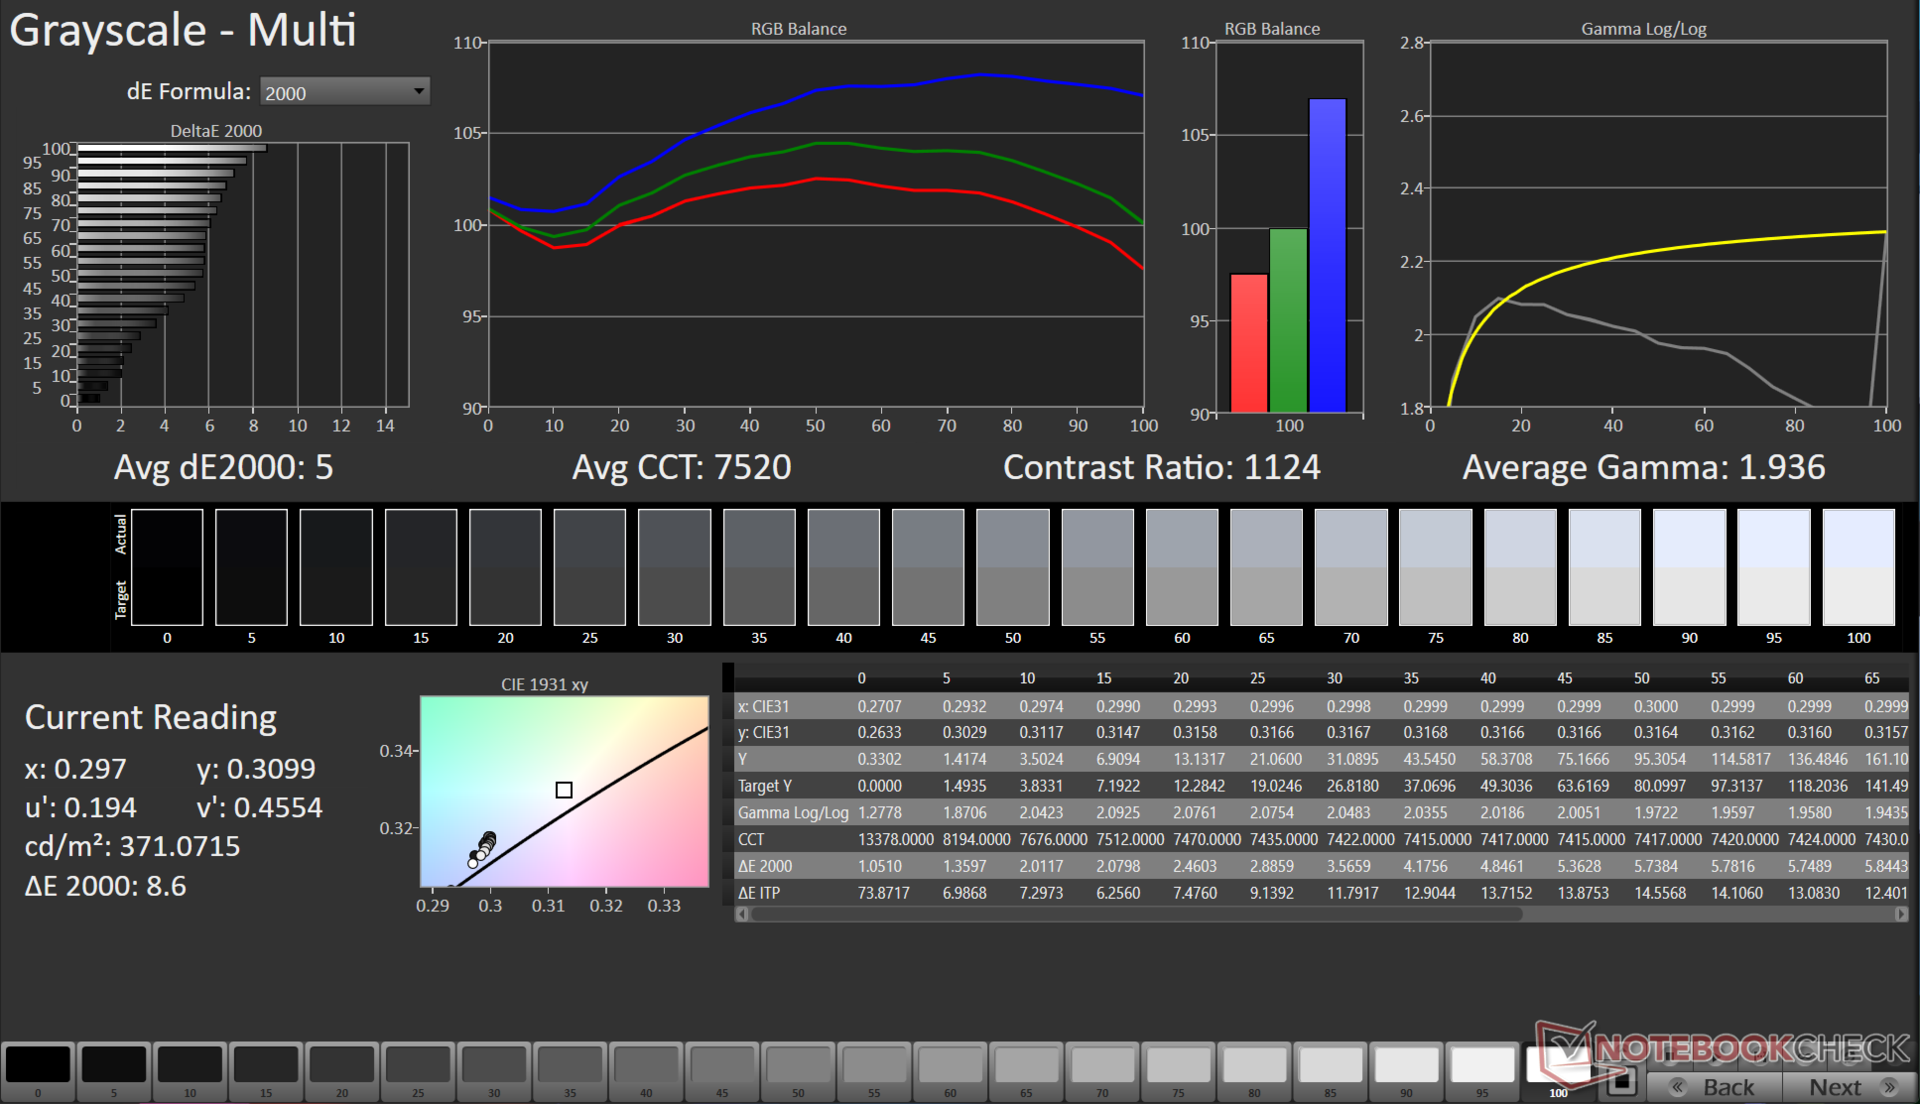
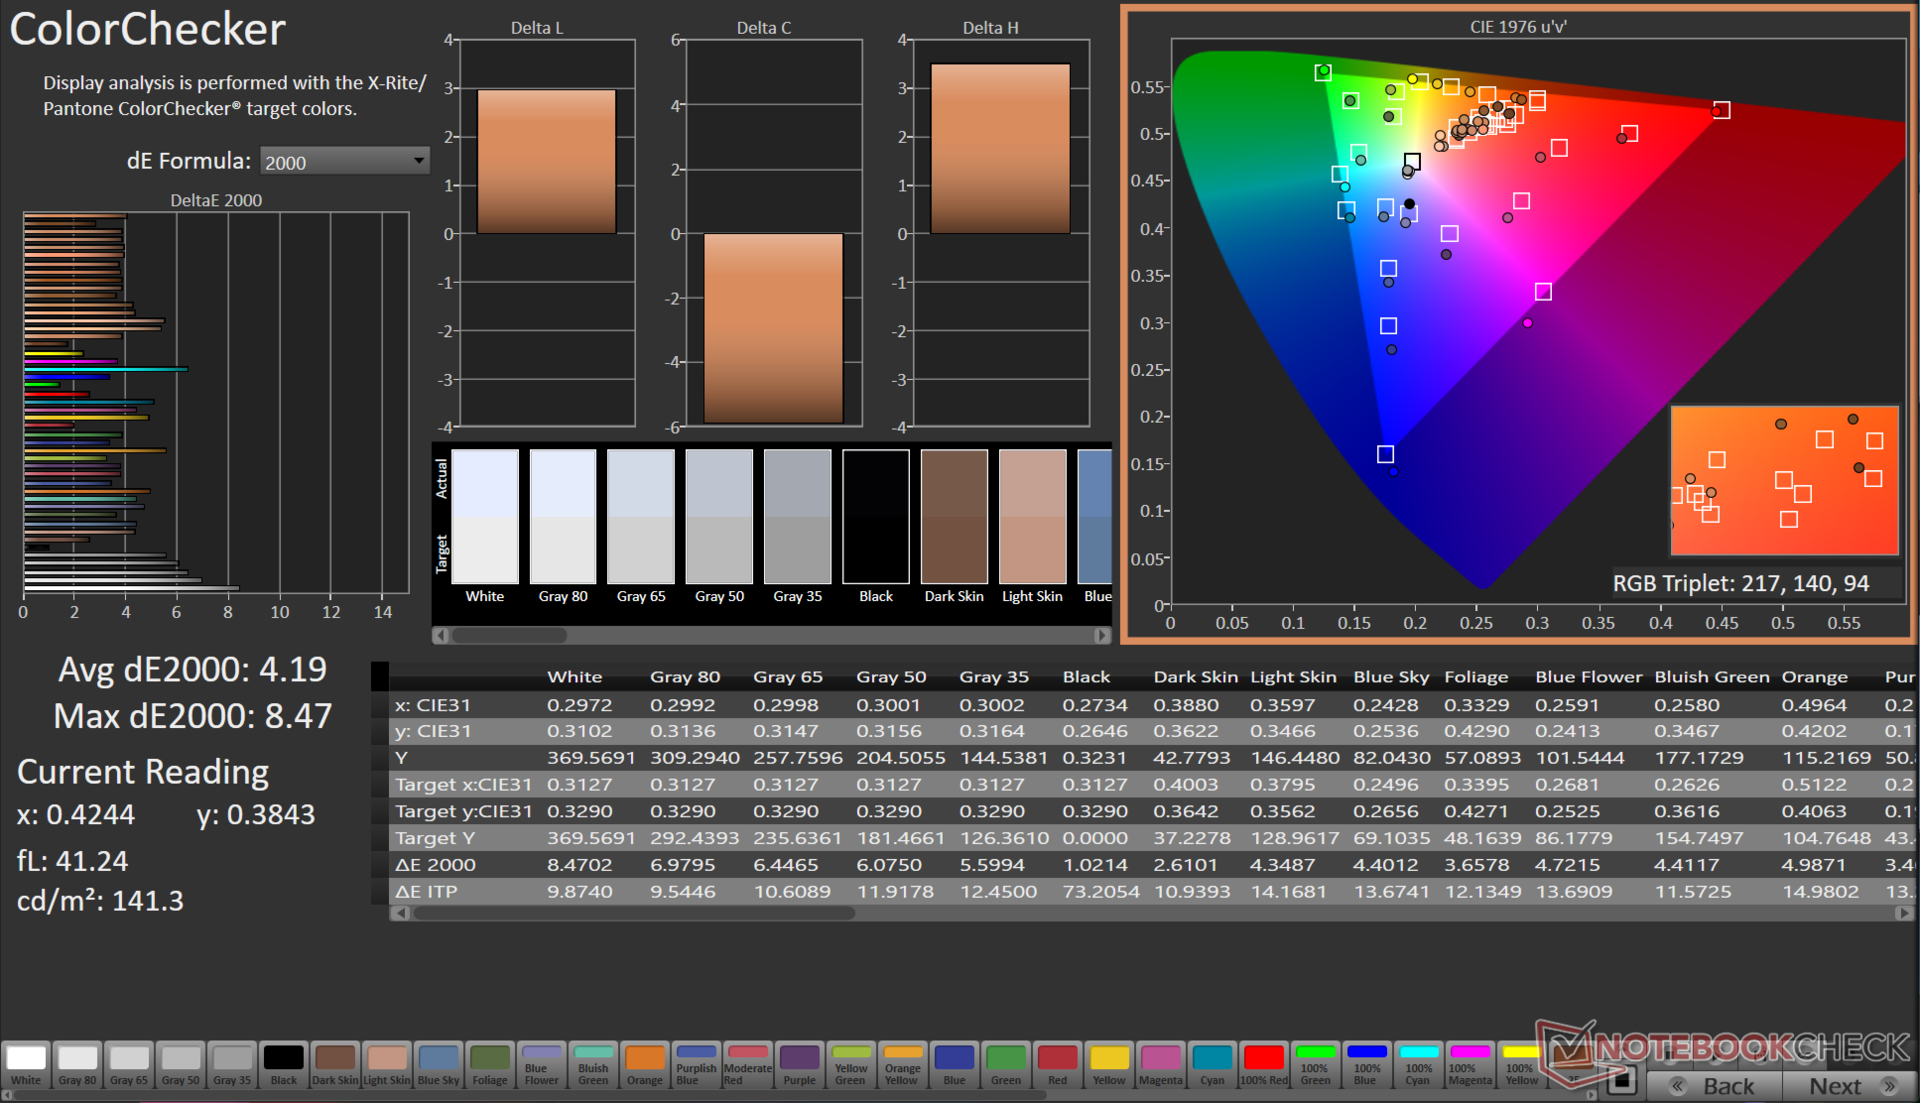
ΔE ColorChecker Calman: 4.19 | ∀{0.5-29.43 Ø4.71}
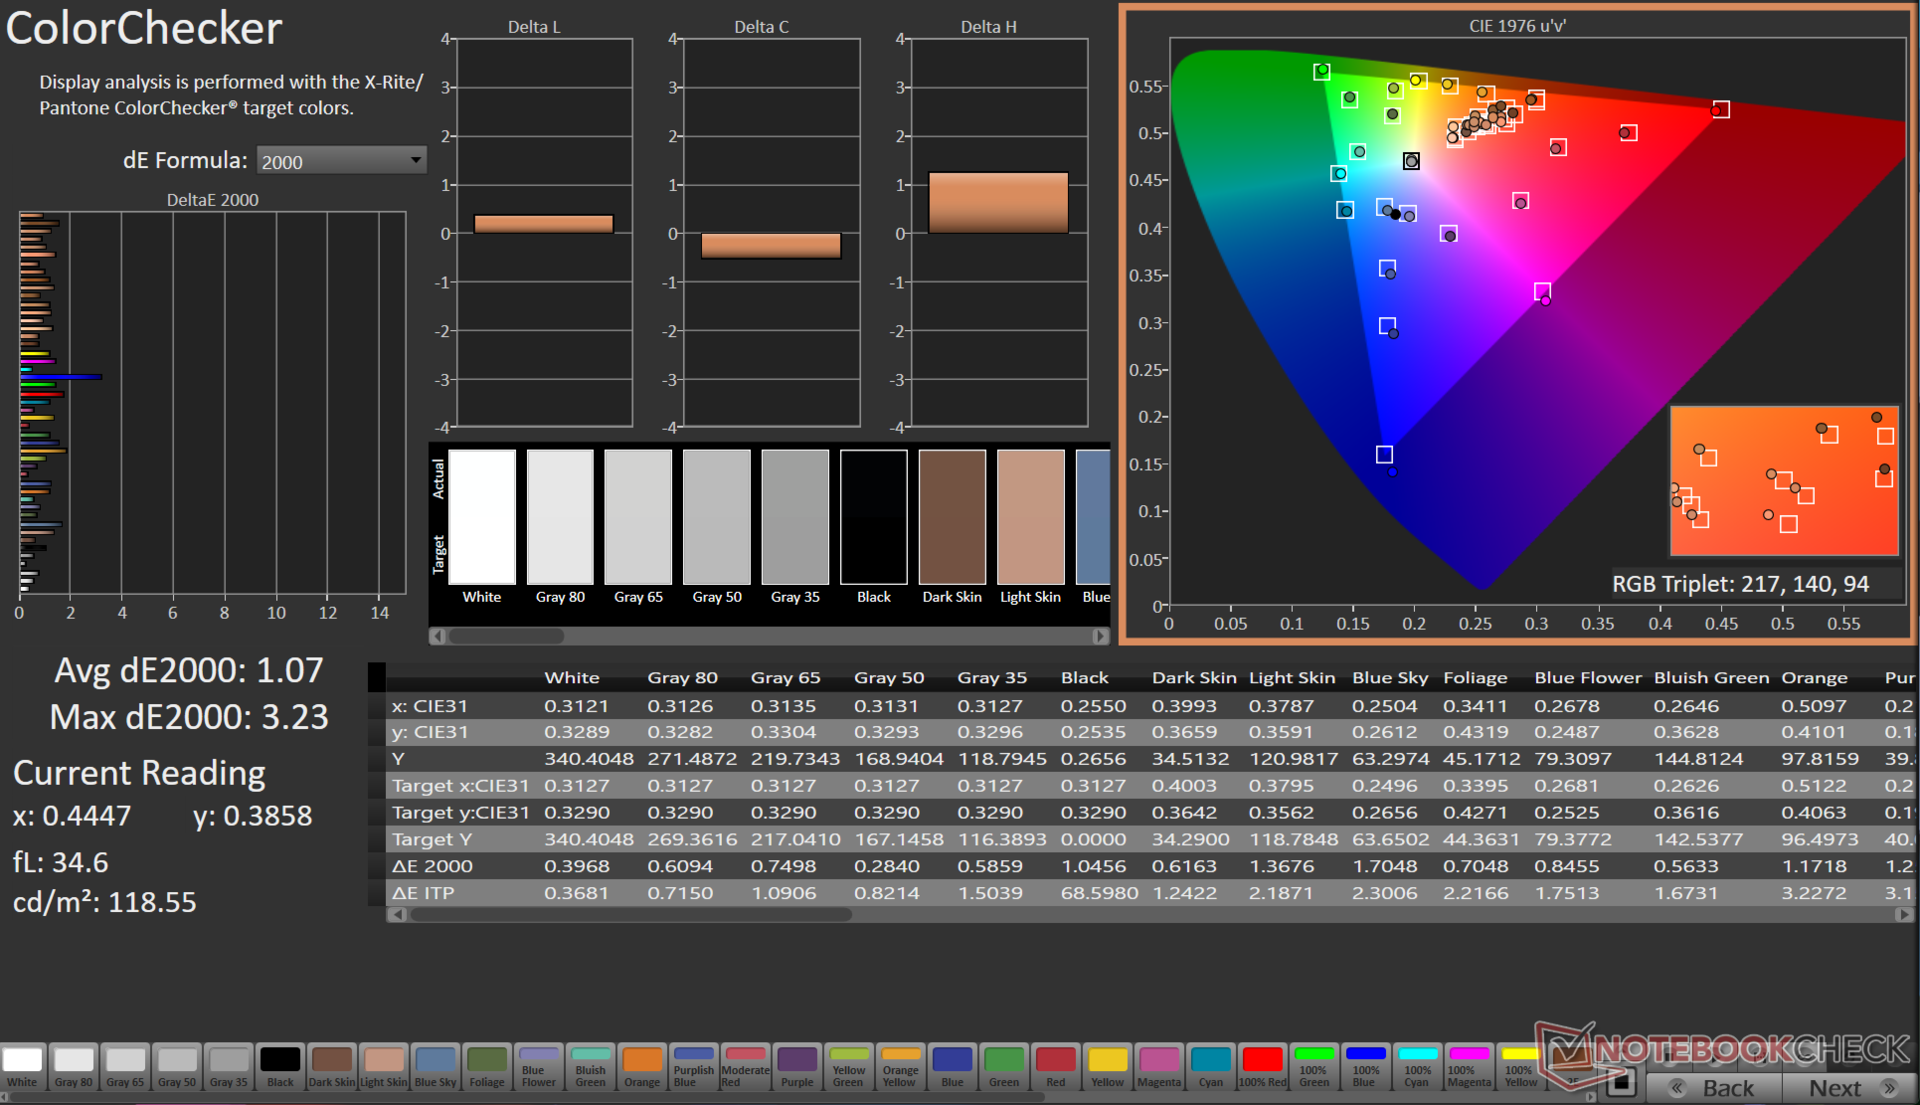
calibrated: 1.07
ΔE Greyscale Calman: 5 | ∀{0.09-98 Ø4.96}
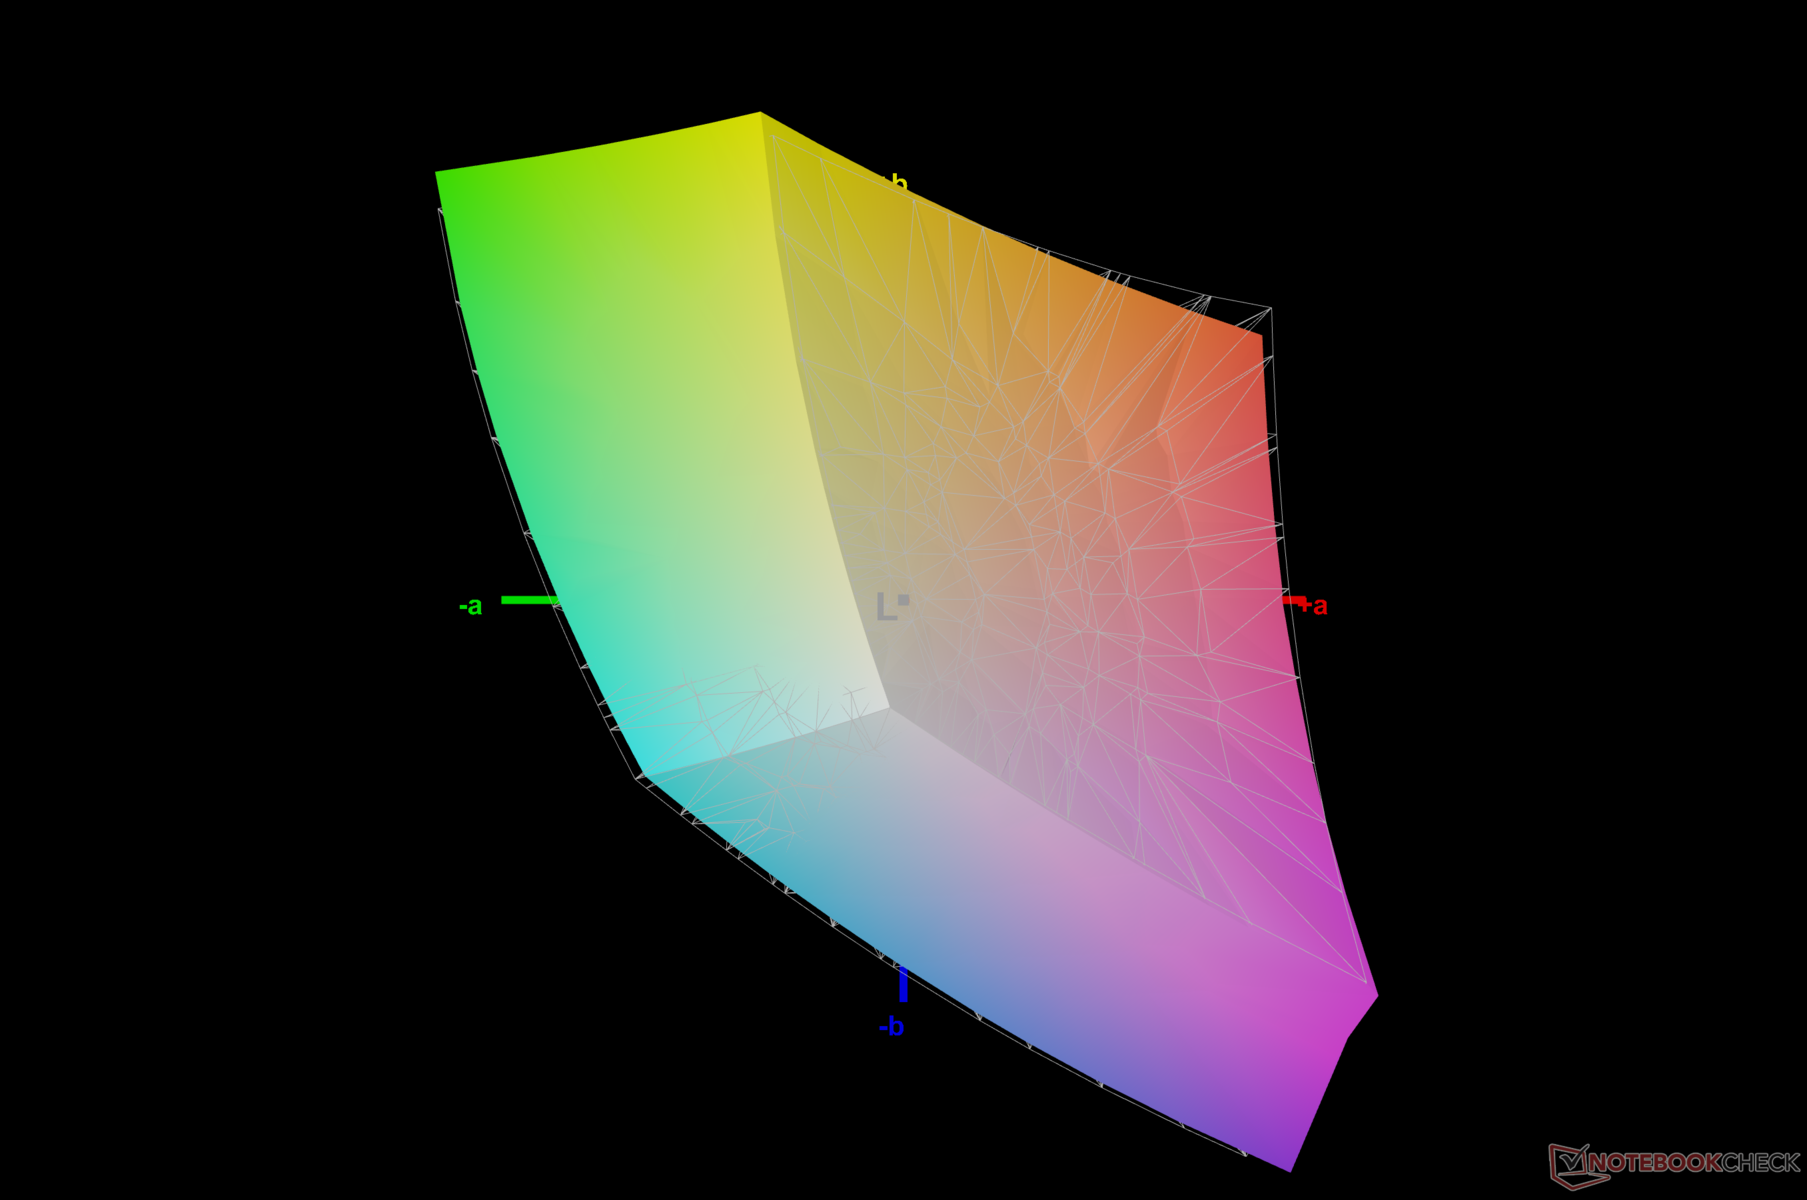
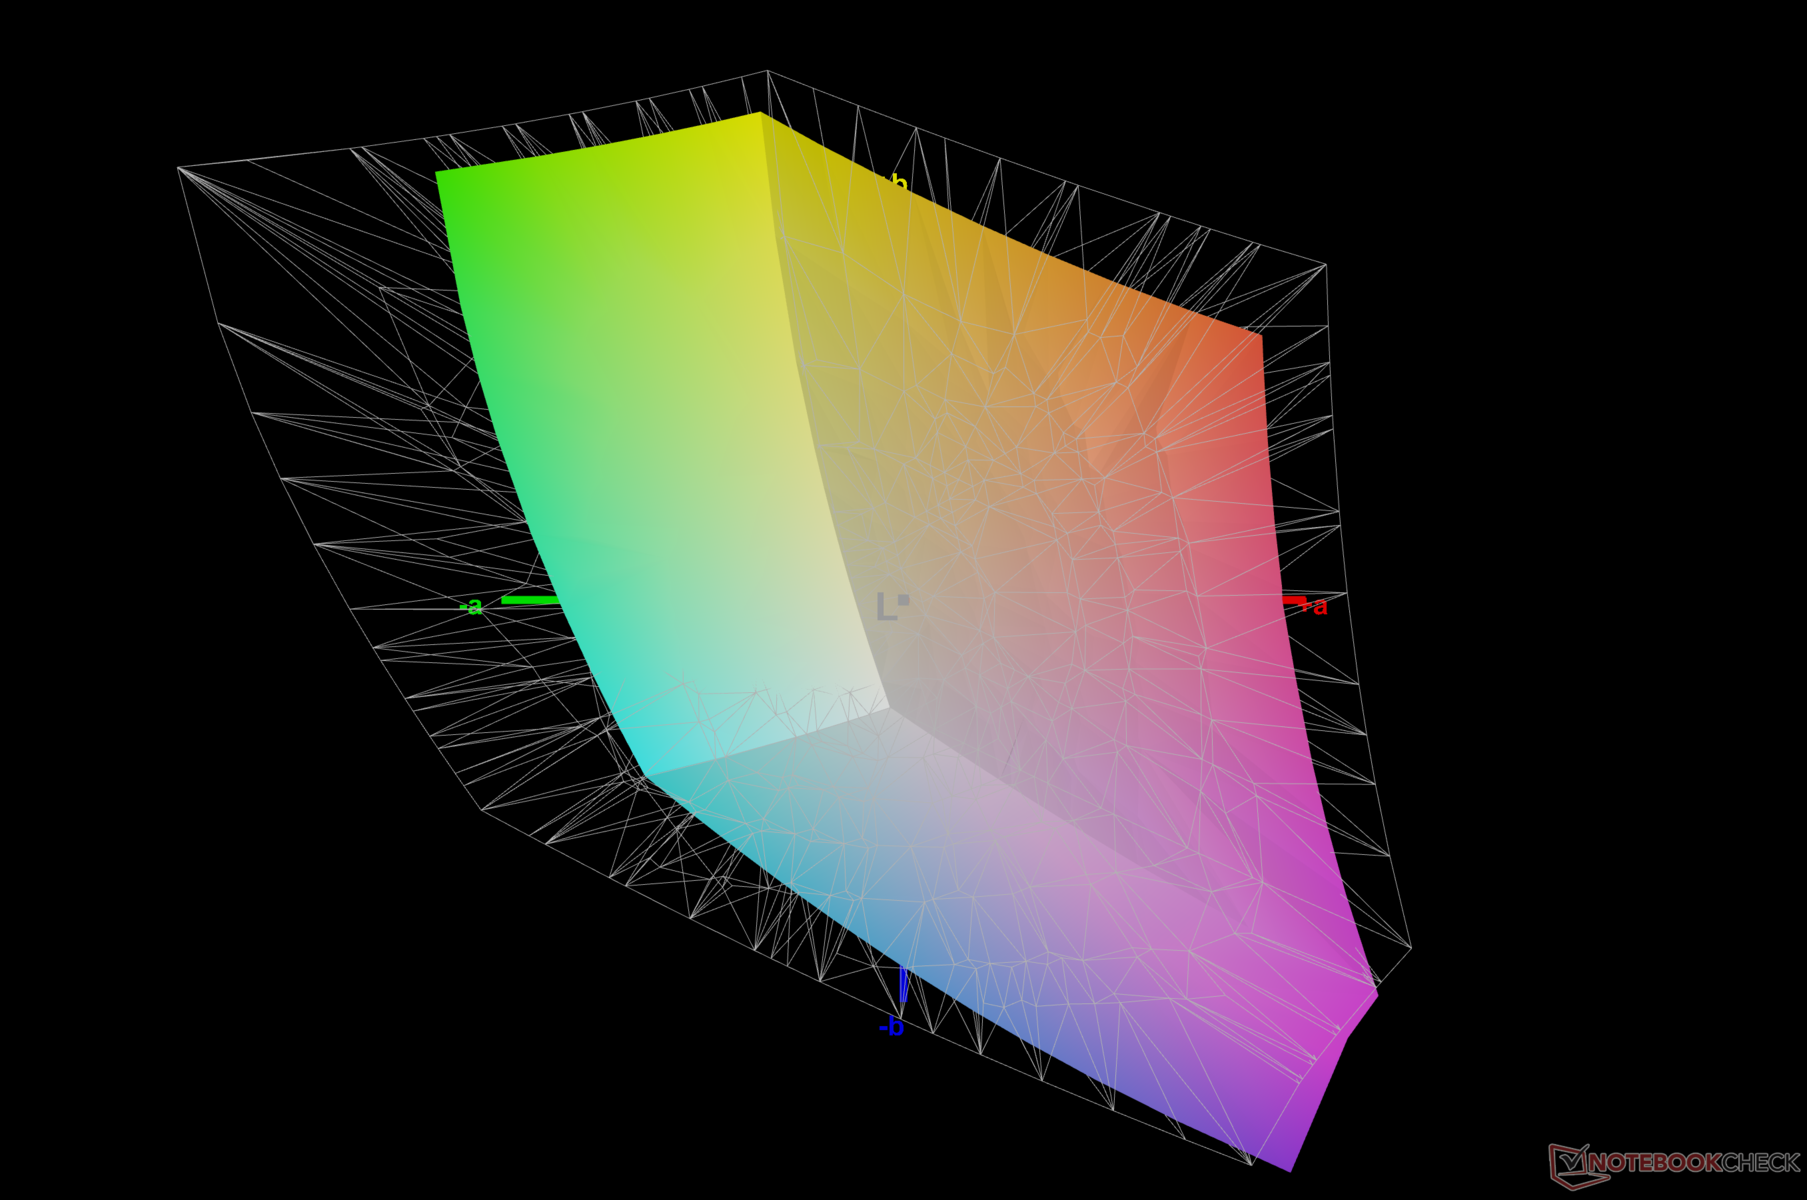
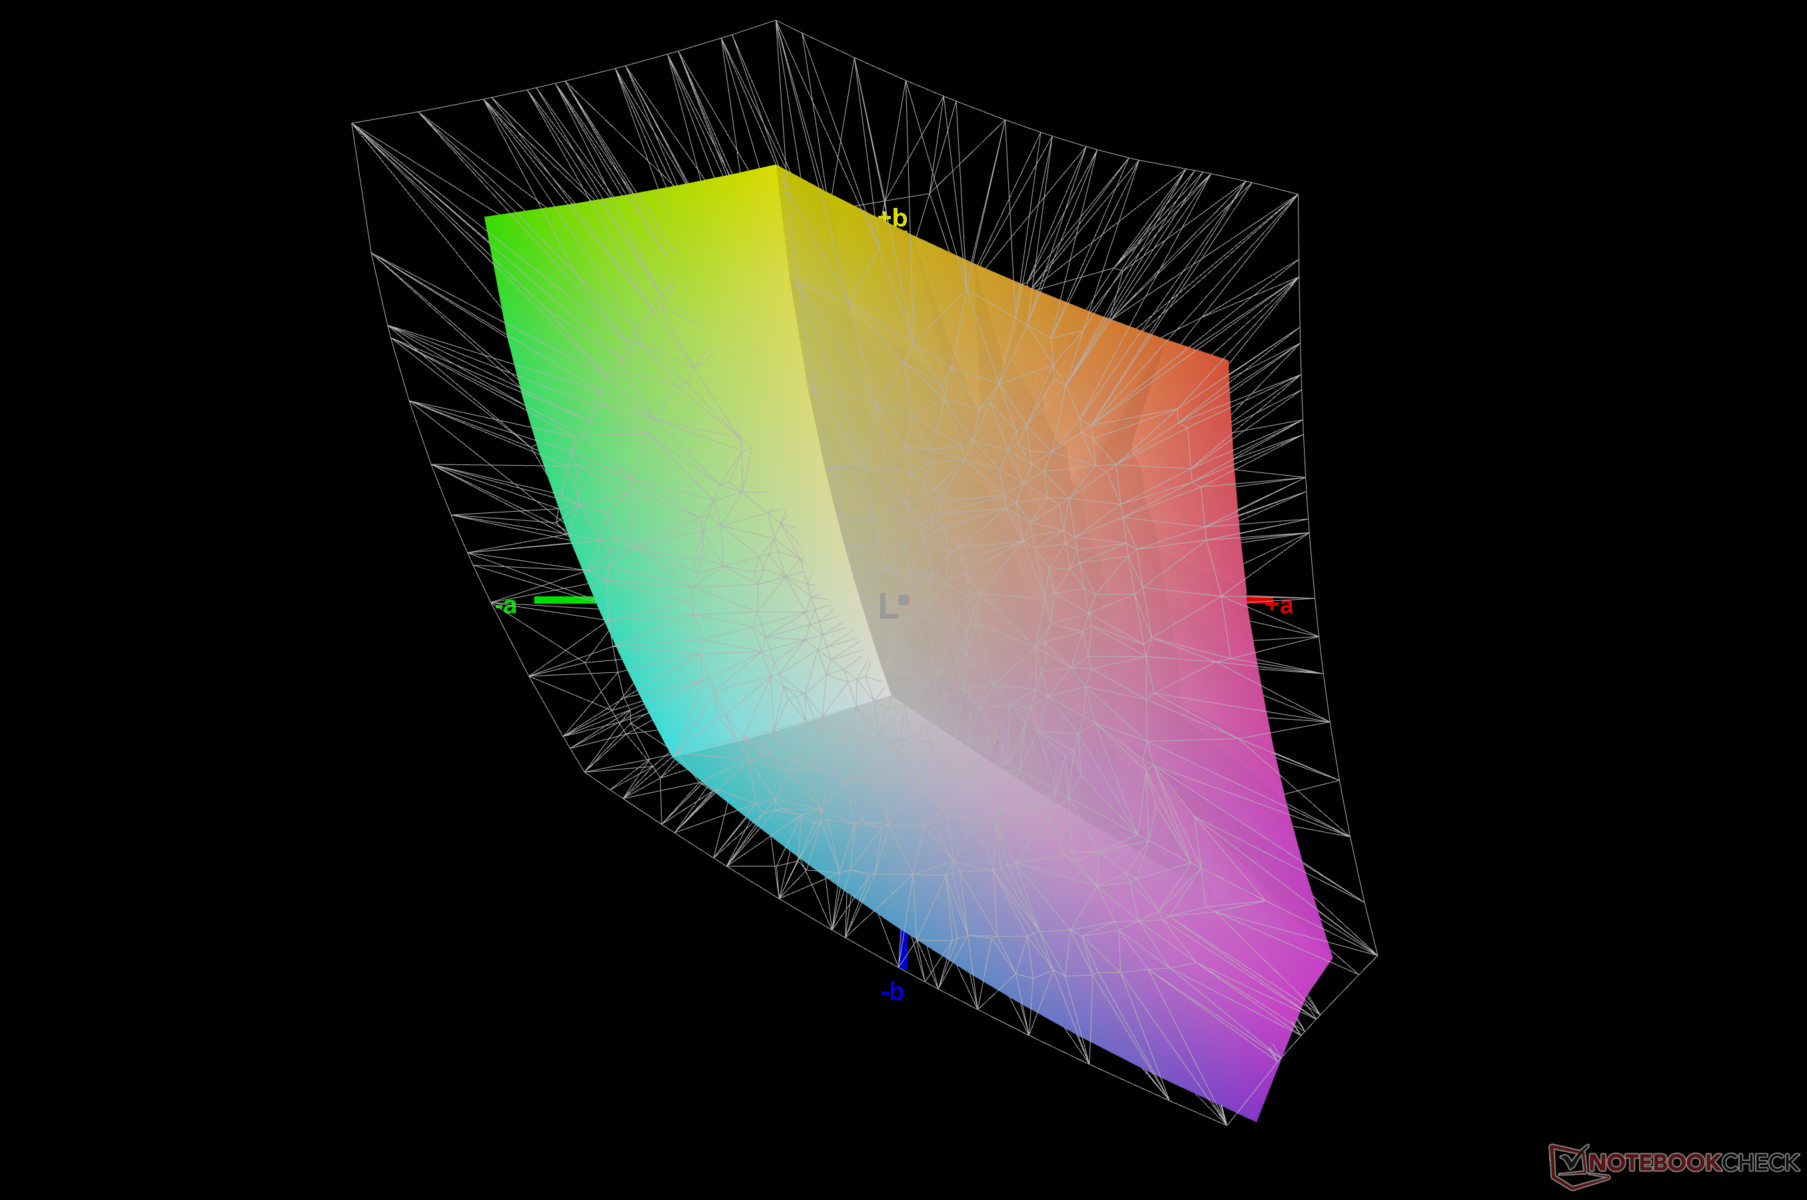
67.7% AdobeRGB 1998 (Argyll 3D)
96.6% sRGB (Argyll 3D)
66.3% Display P3 (Argyll 3D)
Gamma: 1.93
CCT: 7520 K
| Lenovo LOQ 15IRH8 Core i7 BOE CQ NE156QHM-NY4, IPS, 2560x1440, 15.6" | Lenovo LOQ 16IRH8 AUOC1A5 (B160QAN03.L), IPS, 2560x1600, 16" | Lenovo LOQ 15APH8 BOE NJ NE156FHM-NX3, IPS, 1920x1080, 15.6" | MSI Katana 17 B13VFK B173HAN04.9, IPS LED, 1920x1080, 17.3" | Lenovo Legion Pro 5 16ARX8 (R5 7645HX, RTX 4050) CSOT T3 MNG007DA2-2, IPS, 2560x1600, 16" | HP Victus 16-r0077ng CMN162D, IPS, 1920x1080, 16.1" | Dell G15 5530 AUO B156HAN, IPS, 1920x1080, 15.6" | Asus TUF Gaming A16 FA617XS BOE NE160WUM-NX2, IPS, 1920x1200, 16" | |
|---|---|---|---|---|---|---|---|---|
| Display | 5% | -39% | -38% | 6% | 1% | 7% | 3% | |
| Display P3 Coverage (%) | 66.3 | 70.5 6% | 40.2 -39% | 40.8 -38% | 71.6 8% | 66.7 1% | 73.1 10% | 69.3 5% |
| sRGB Coverage (%) | 96.6 | 98.9 2% | 60.2 -38% | 61 -37% | 99.8 3% | 98 1% | 98.4 2% | 97.3 1% |
| AdobeRGB 1998 Coverage (%) | 67.7 | 72.6 7% | 41.5 -39% | 42.2 -38% | 72.9 8% | 69 2% | 74.4 10% | 70.7 4% |
| Response Times | -16% | -473% | -385% | -51% | -82% | 34% | -116% | |
| Response Time Grey 50% / Grey 80% * (ms) | 5 ? | 7.2 ? -44% | 42.7 ? -754% | 33 ? -560% | 12 ? -140% | 13.3 ? -166% | 3.39 ? 32% | 15.6 ? -212% |
| Response Time Black / White * (ms) | 8.41 ? | 7.4 ? 12% | 24.5 ? -191% | 26 ? -209% | 5.2 ? 38% | 8.2 ? 2% | 5.35 ? 36% | 10 ? -19% |
| PWM Frequency (Hz) | 21620 ? | |||||||
| Screen | 17% | -17% | -46% | 20% | 23% | -5% | 20% | |
| Brightness middle (cd/m²) | 373 | 407 9% | 346.2 -7% | 267 -28% | 543 46% | 308 -17% | 320 -14% | 301 -19% |
| Brightness (cd/m²) | 365 | 369 1% | 329 -10% | 256 -30% | 516 41% | 285 -22% | 316 -13% | 294 -19% |
| Brightness Distribution (%) | 90 | 85 -6% | 81 -10% | 93 3% | 87 -3% | 85 -6% | 94 4% | 94 4% |
| Black Level * (cd/m²) | 0.33 | 0.45 -36% | 0.31 6% | 0.21 36% | 0.58 -76% | 0.25 24% | 0.21 36% | 0.21 36% |
| Contrast (:1) | 1130 | 904 -20% | 1117 -1% | 1271 12% | 936 -17% | 1232 9% | 1524 35% | 1433 27% |
| Colorchecker dE 2000 * | 4.19 | 1.43 66% | 4.19 -0% | 4.7 -12% | 1.35 68% | 1.3 69% | 4.55 -9% | 1.79 57% |
| Colorchecker dE 2000 max. * | 8.47 | 3.58 58% | 19.19 -127% | 20.4 -141% | 3.22 62% | 2.76 67% | 9.83 -16% | 3.48 59% |
| Colorchecker dE 2000 calibrated * | 1.07 | 1.07 -0% | 1.66 -55% | 4.5 -321% | 1.31 -22% | 0.92 14% | 1.51 -41% | 1.2 -12% |
| Greyscale dE 2000 * | 5 | 1.13 77% | 2.6 48% | 1.5 70% | 1.03 79% | 1.7 66% | 6.2 -24% | 2.5 50% |
| Gamma | 1.93 114% | 2.5 88% | 2.19 100% | 2.12 104% | 2.38 92% | 2.167 102% | 2.07 106% | 2.265 97% |
| CCT | 7520 86% | 6526 100% | 6749 96% | 6552 99% | 6452 101% | 6767 96% | 6479 100% | 6157 106% |
| Media total (Programa/Opciones) | 2% /
9% | -176% /
-87% | -156% /
-92% | -8% /
7% | -19% /
3% | 12% /
3% | -31% /
-3% |
* ... más pequeño es mejor
La pantalla cubre casi el 97% de la gama de colores sRGB, lo que debería ser suficientemente bueno para la mayoría de los juegos y contenidos web. Sin embargo, la cobertura Adobe RGB y Display P3 es sólo mediocre.
Dicho esto, el panel QHD del LOQ 15IRH8 tiene unas características de color mucho mejores en comparación con el panel 1080p 144 Hz del LOQ 15APH8 potenciado por AMD.
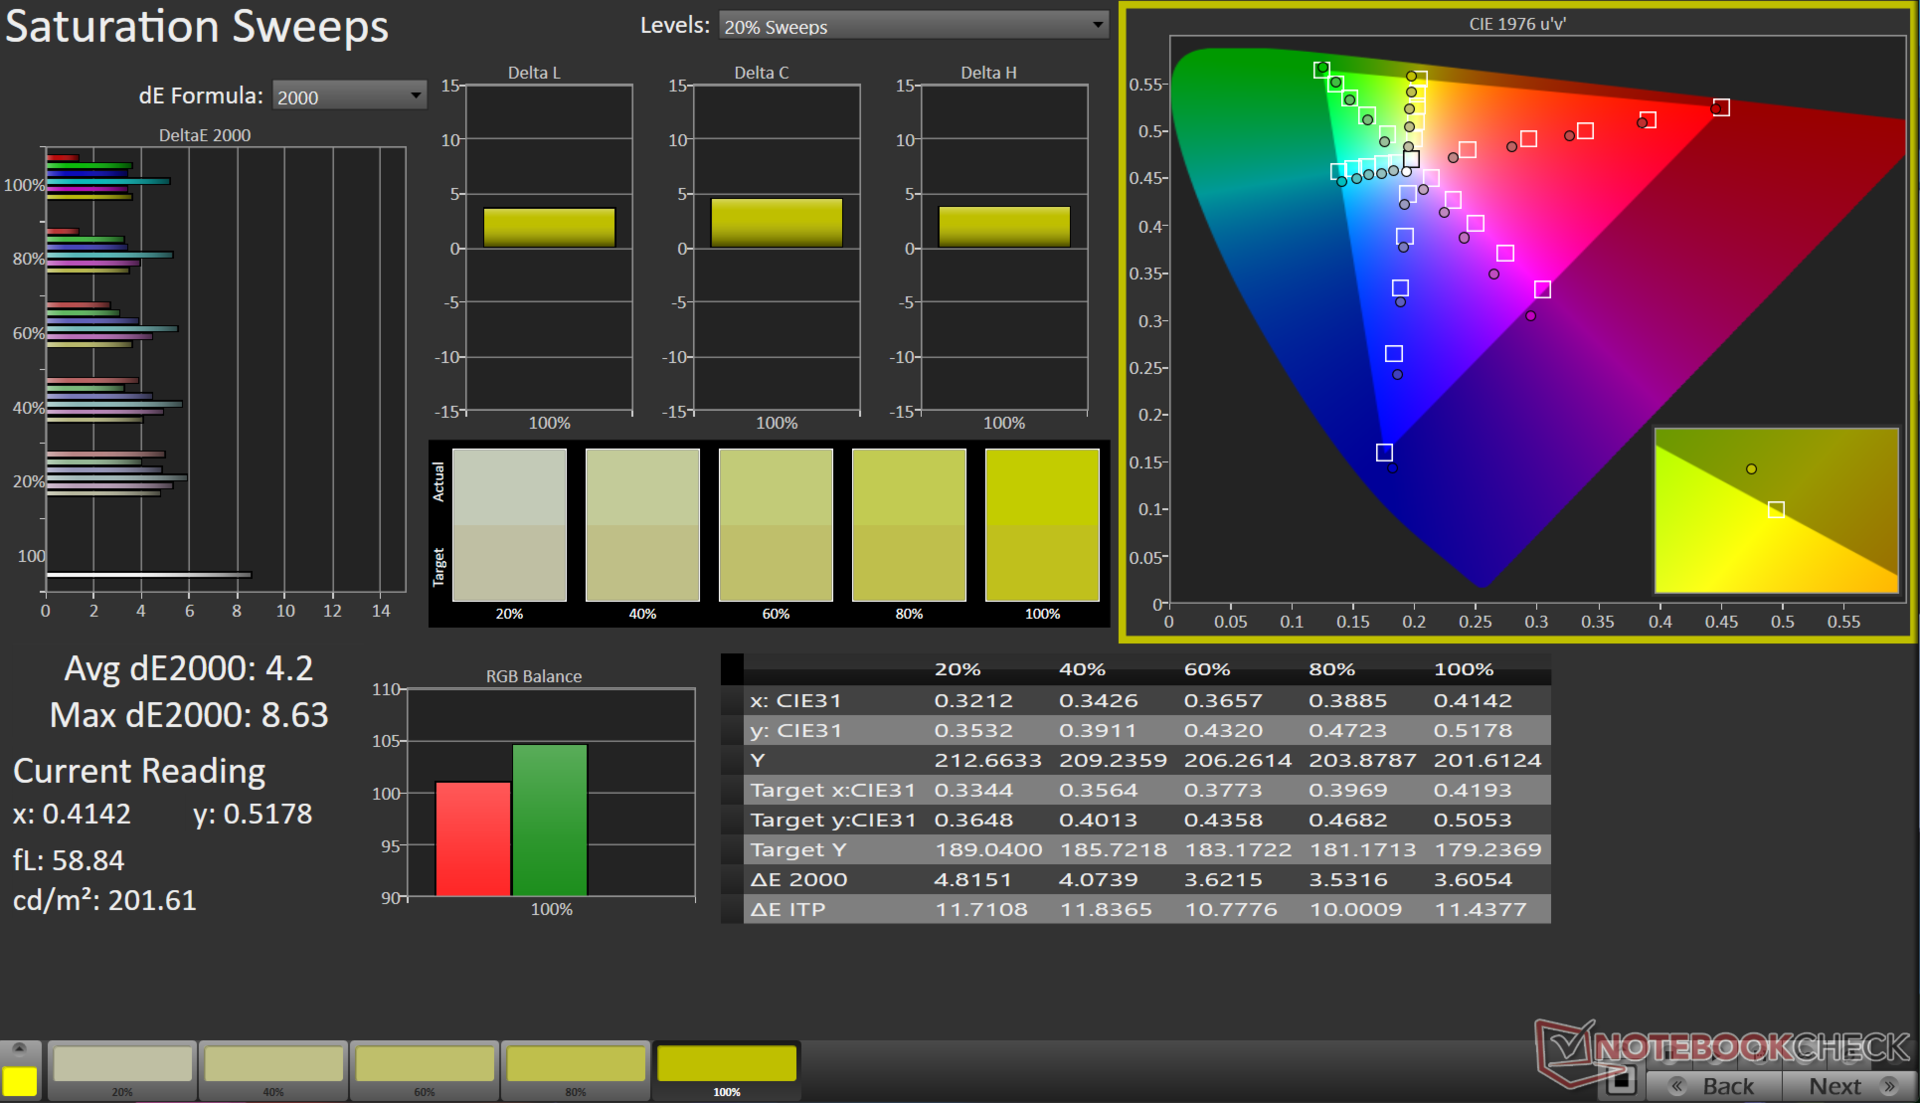
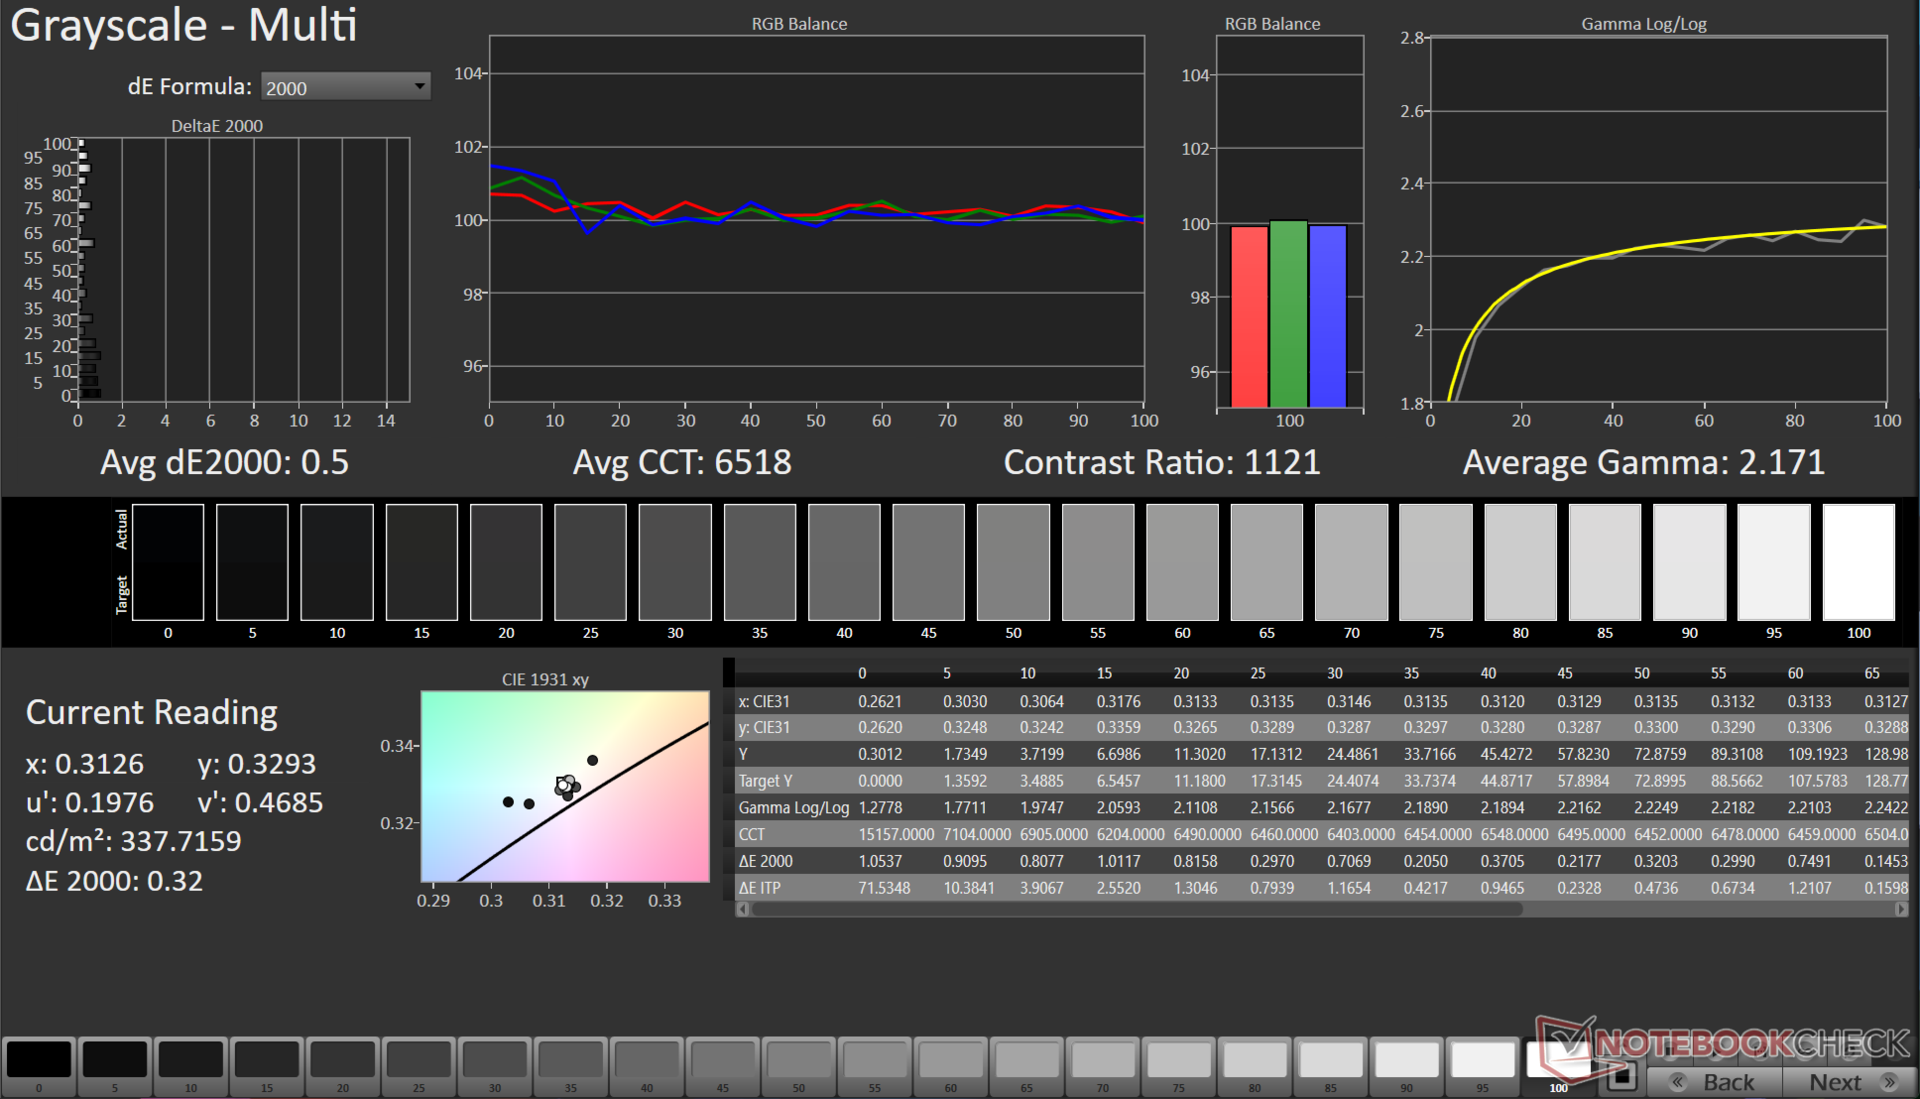
Los colores listos para usar muestran grandes desviaciones, pero nuestra rutina de calibración con el espectrofotómetro X-Rite i1Basic Pro 3 y el software Calman Ultimate de Portrait Displays muestra mejoras significativas en los valores de escala de grises y Delta E de ColorChecker.
El panel sigue teniendo problemas para reproducir con precisión la parte 100% azul del espectro.
Puede descargar nuestro archivo ICC calibrado en el enlace anterior.
Tiempos de respuesta del display
| ↔ Tiempo de respuesta de Negro a Blanco | ||
|---|---|---|
| 8.41 ms ... subida ↗ y bajada ↘ combinada | ↗ 3.96 ms subida | 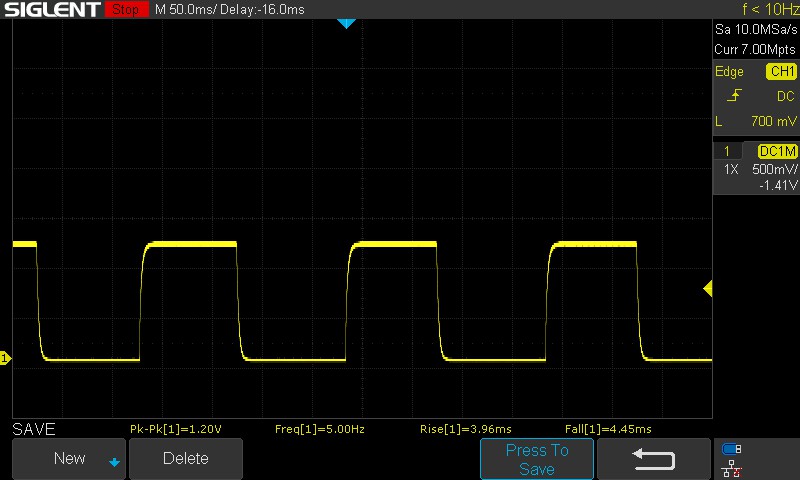 |
| ↘ 4.45 ms bajada | ||
| La pantalla mostró tiempos de respuesta rápidos en nuestros tests y debería ser adecuada para juegos. En comparación, todos los dispositivos de prueba van de ##min### (mínimo) a 240 (máximo) ms. » 24 % de todos los dispositivos son mejores. Esto quiere decir que el tiempo de respuesta medido es mejor que la media (19.8 ms) de todos los dispositivos testados. | ||
| ↔ Tiempo de respuesta 50% Gris a 80% Gris | ||
| 5 ms ... subida ↗ y bajada ↘ combinada | ↗ 2.16 ms subida | 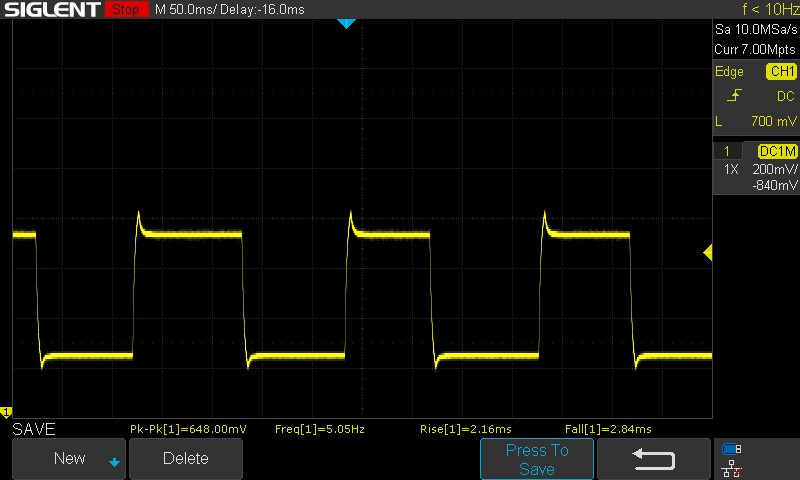 |
| ↘ 2.84 ms bajada | ||
| La pantalla mostró tiempos de respuesta muy rápidos en nuestros tests y debería ser adecuada para juegos frenéticos. En comparación, todos los dispositivos de prueba van de ##min### (mínimo) a 636 (máximo) ms. » 17 % de todos los dispositivos son mejores. Esto quiere decir que el tiempo de respuesta medido es mejor que la media (31 ms) de todos los dispositivos testados. | ||
Los tiempos de respuesta son una gran mejora con respecto al panel 1080p del LOQ 15APH8. El panel utiliza la sobremarcha por defecto, lo que ayuda en las rápidas transiciones del 50% de gris al 80% de gris de 5 ms. Desactivar la sobremarcha desde la aplicación Lenovo Vantage aumenta el tiempo de respuesta combinado de 50% gris a 80% gris a 11 ms.
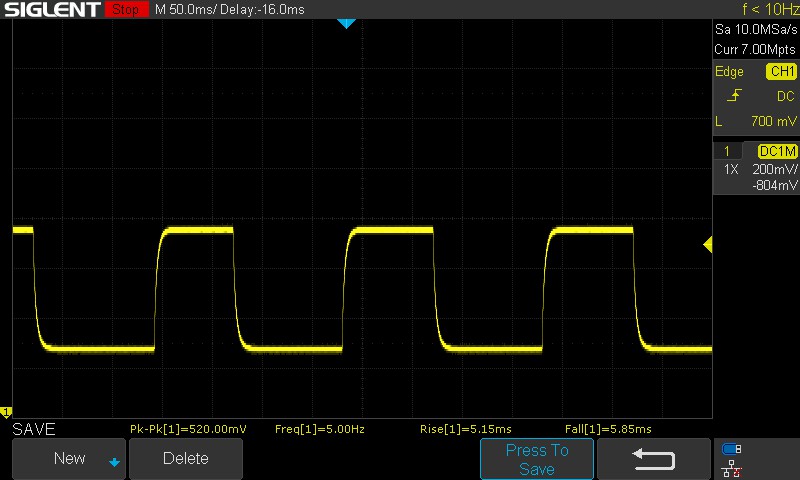
El panel no muestra parpadeo PWM en todos los niveles de brillo probados. Para más información, consulte nuestro artículo "Por qué el PWM es un dolor de cabeza" y también nuestra Tabla de clasificación PWM para una comparación del PWM medido en todos los dispositivos revisados.
Parpadeo de Pantalla / PWM (Pulse-Width Modulation)
| Parpadeo de Pantalla / PWM no detectado | ≤ 100 % de brillo | 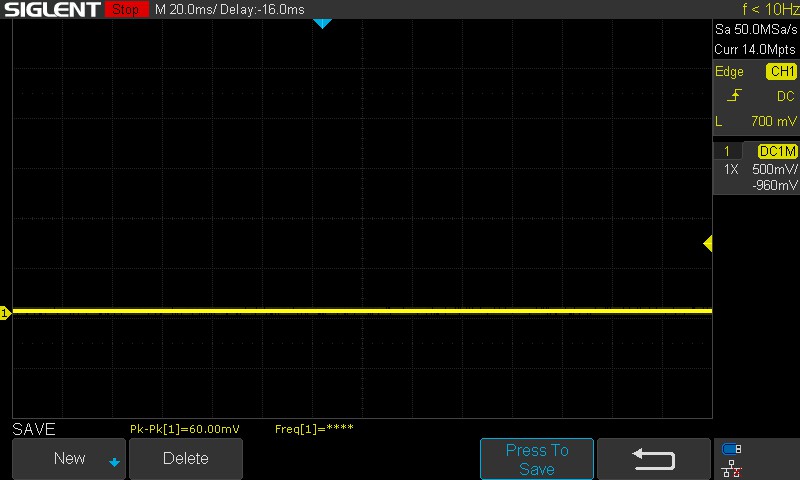 | |
Comparación: 52 % de todos los dispositivos testados no usaron PWM para atenuar el display. Si se usó, medimos una media de 7757 (mínimo: 5 - máxmo: 343500) Hz. | |||
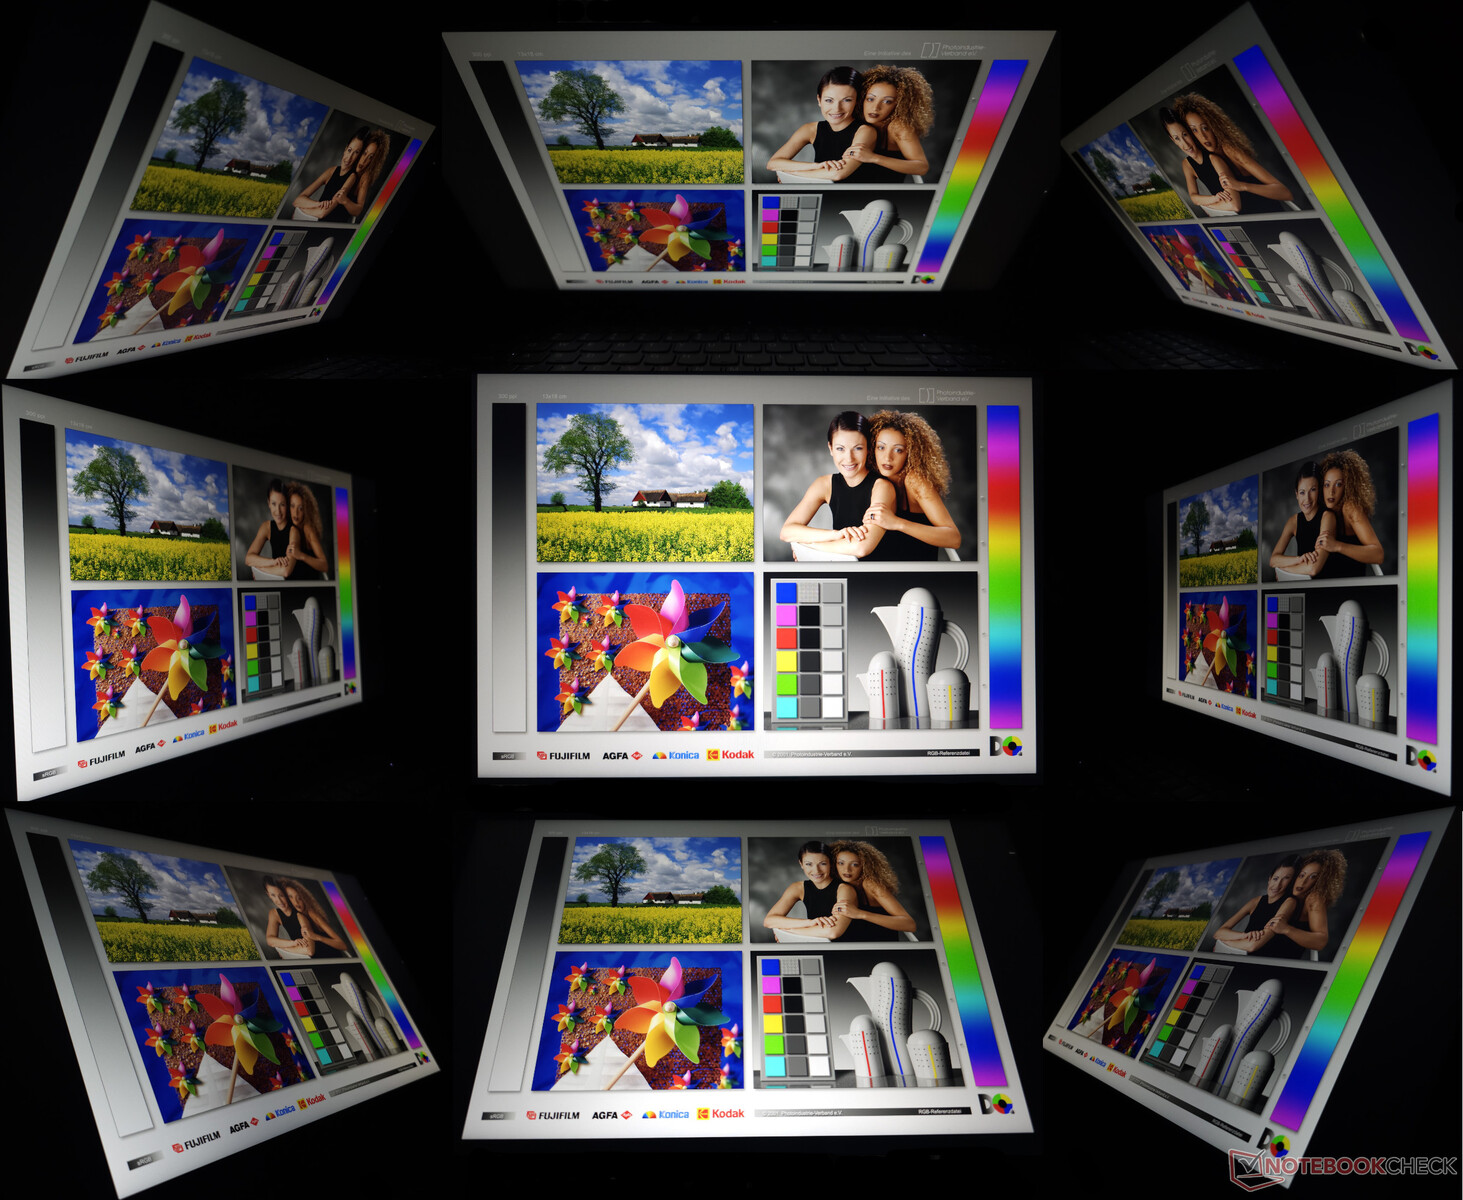
La visibilidad en exteriores está bien para un uso general, aunque los días soleados especialmente brillantes pueden resultar abrumadores para el panel de 350 nits. Los ángulos de visión son relativamente estables con una mínima pérdida de brillo y color en los extremos.
Rendimiento: El Core i7-13620H tiene dificultades para ofrecer un rendimiento estable
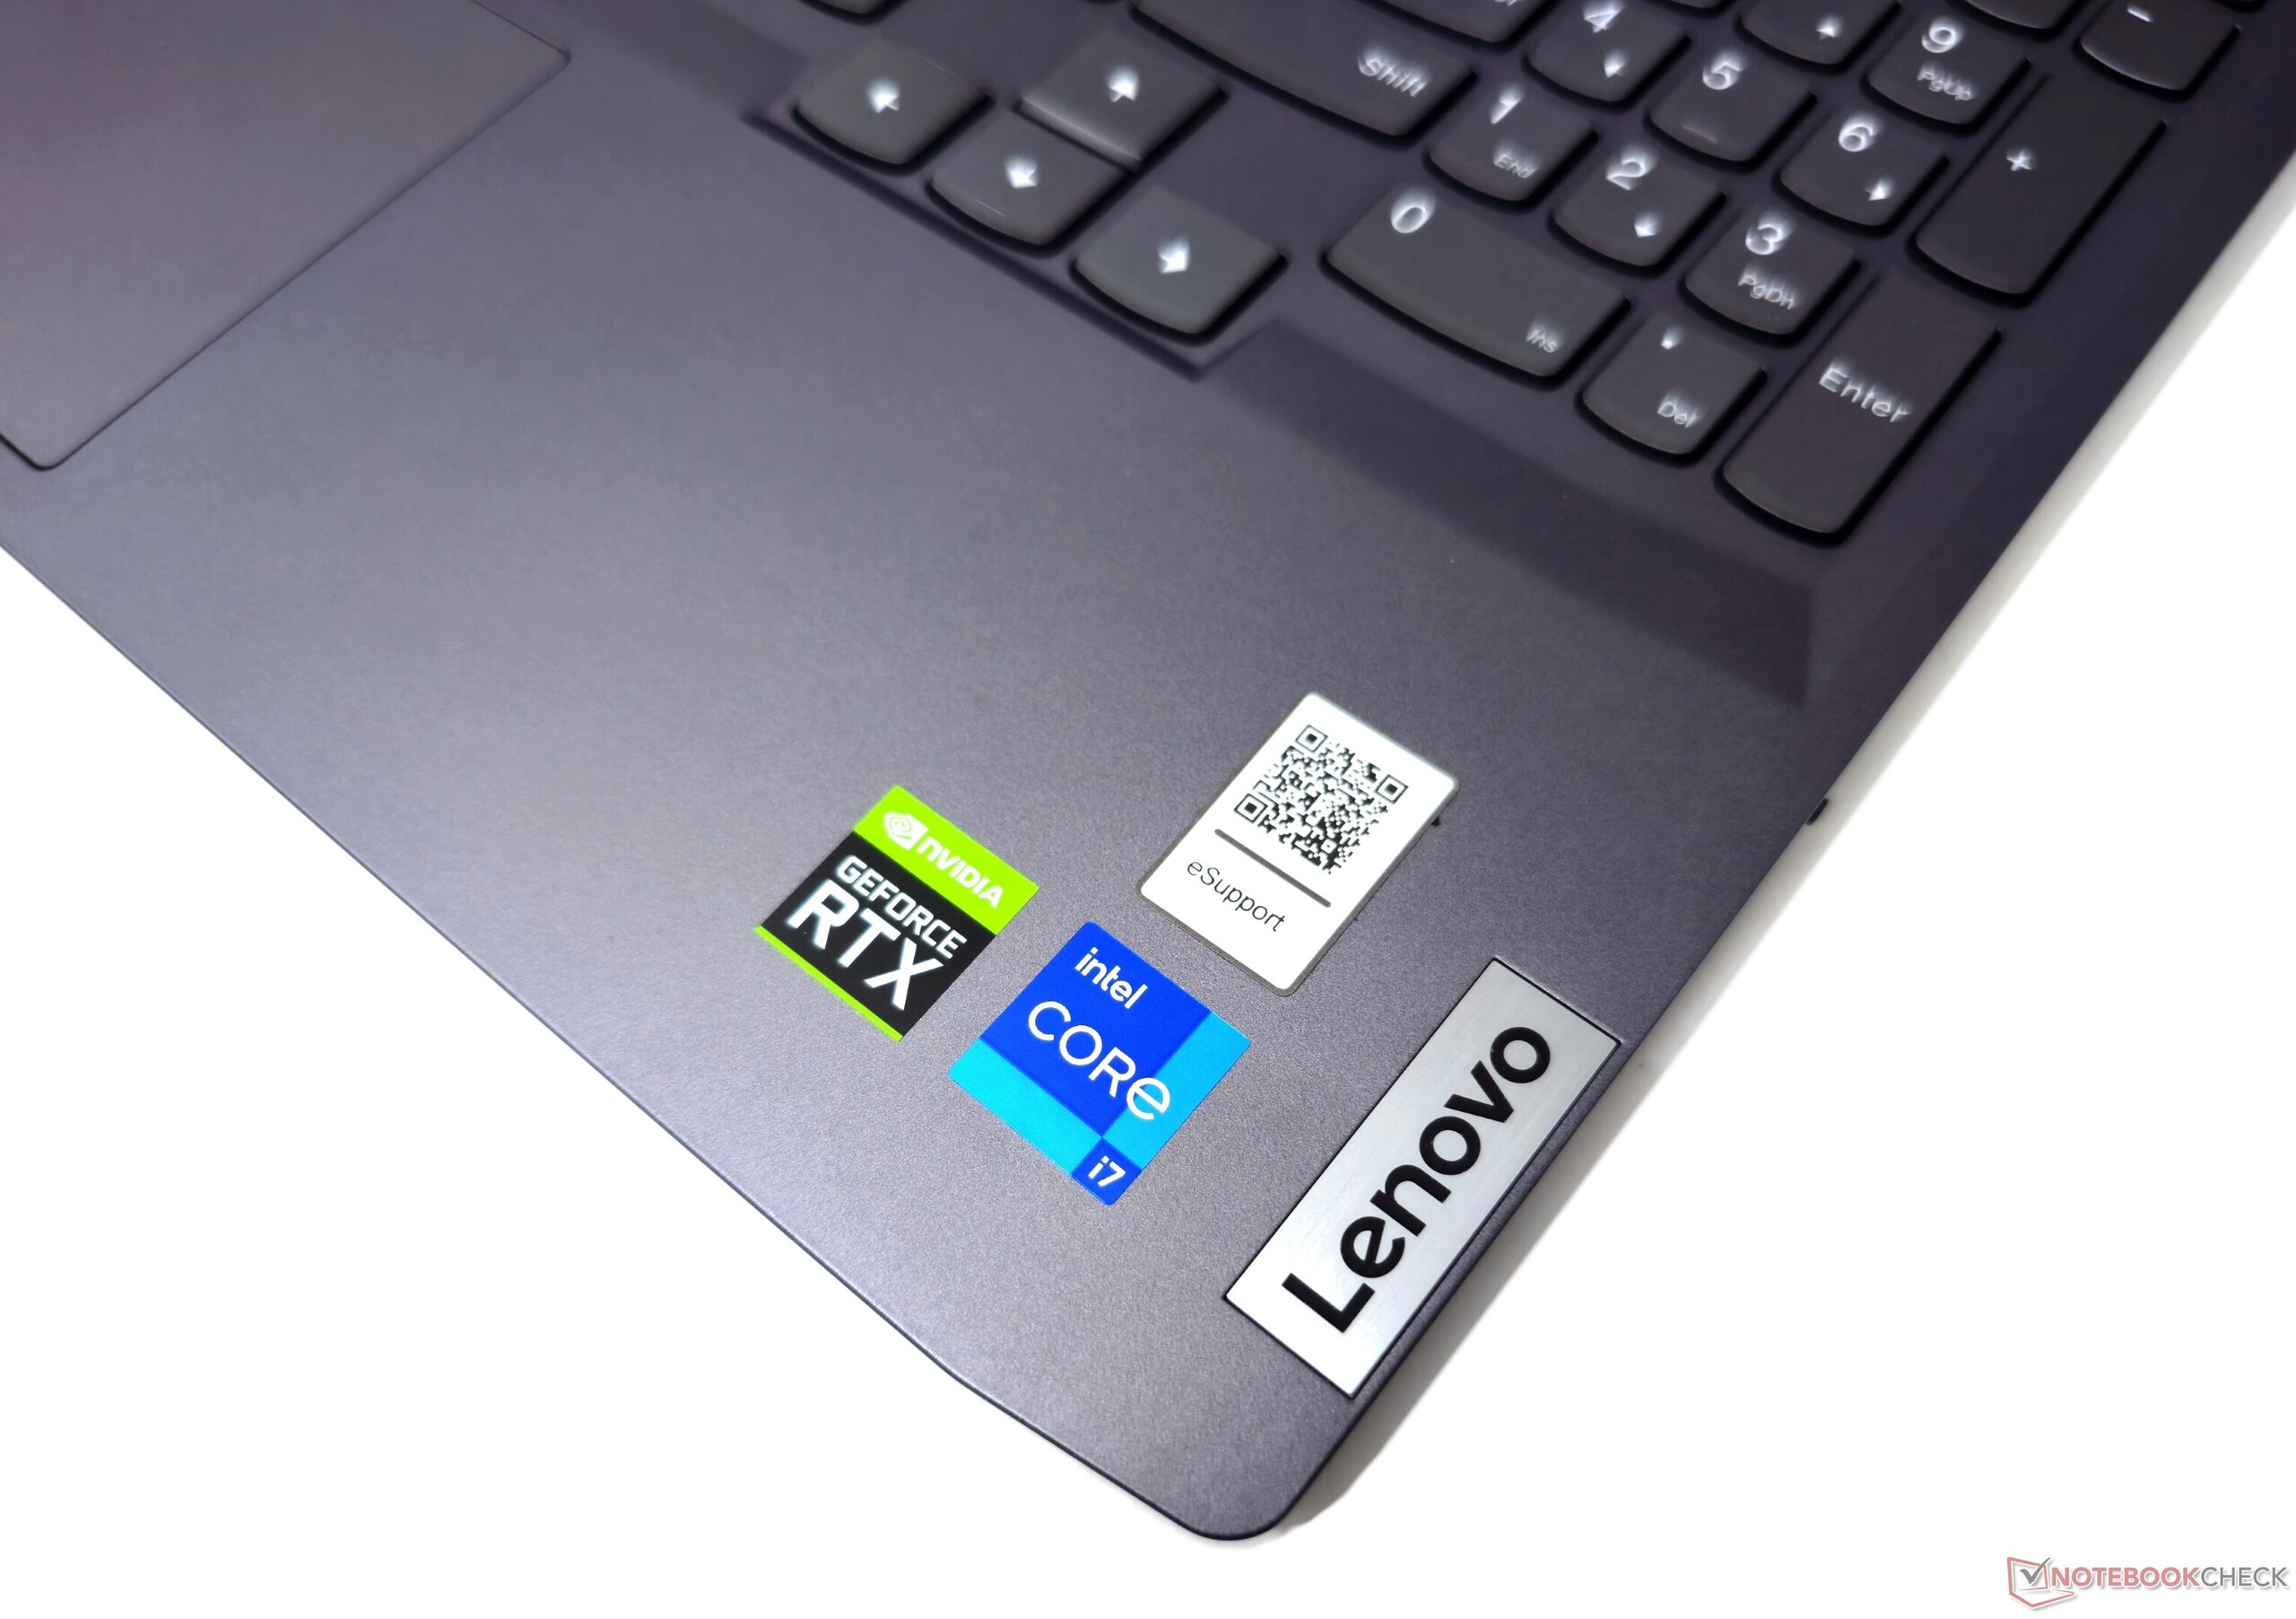
En la India, Lenovo ofrece múltiples opciones de configuración del LOQ 15 tanto con procesadores Intel como AMD. Los modelos basados en Intel permiten elegir entre el Core i5-12450H y Core i7-13620H Mientras que las variantes AMD incluyen el procesador Ryzen 5 7640HS o Ryzen 7 7840HSde AMD. En cuanto a los gráficos, los clientes pueden elegir las versiones para portátiles de la serie RTX 2050, RTX 3050, RTX 4050o RTX 4060 GPU.
Para el mercado estadounidense, Lenovo configura el LOQ 15 con el procesador Core i7-13700H emparejado con la RTX 4050 o el Core i5-13420H emparejado con la RTX 2050.
Condiciones de prueba
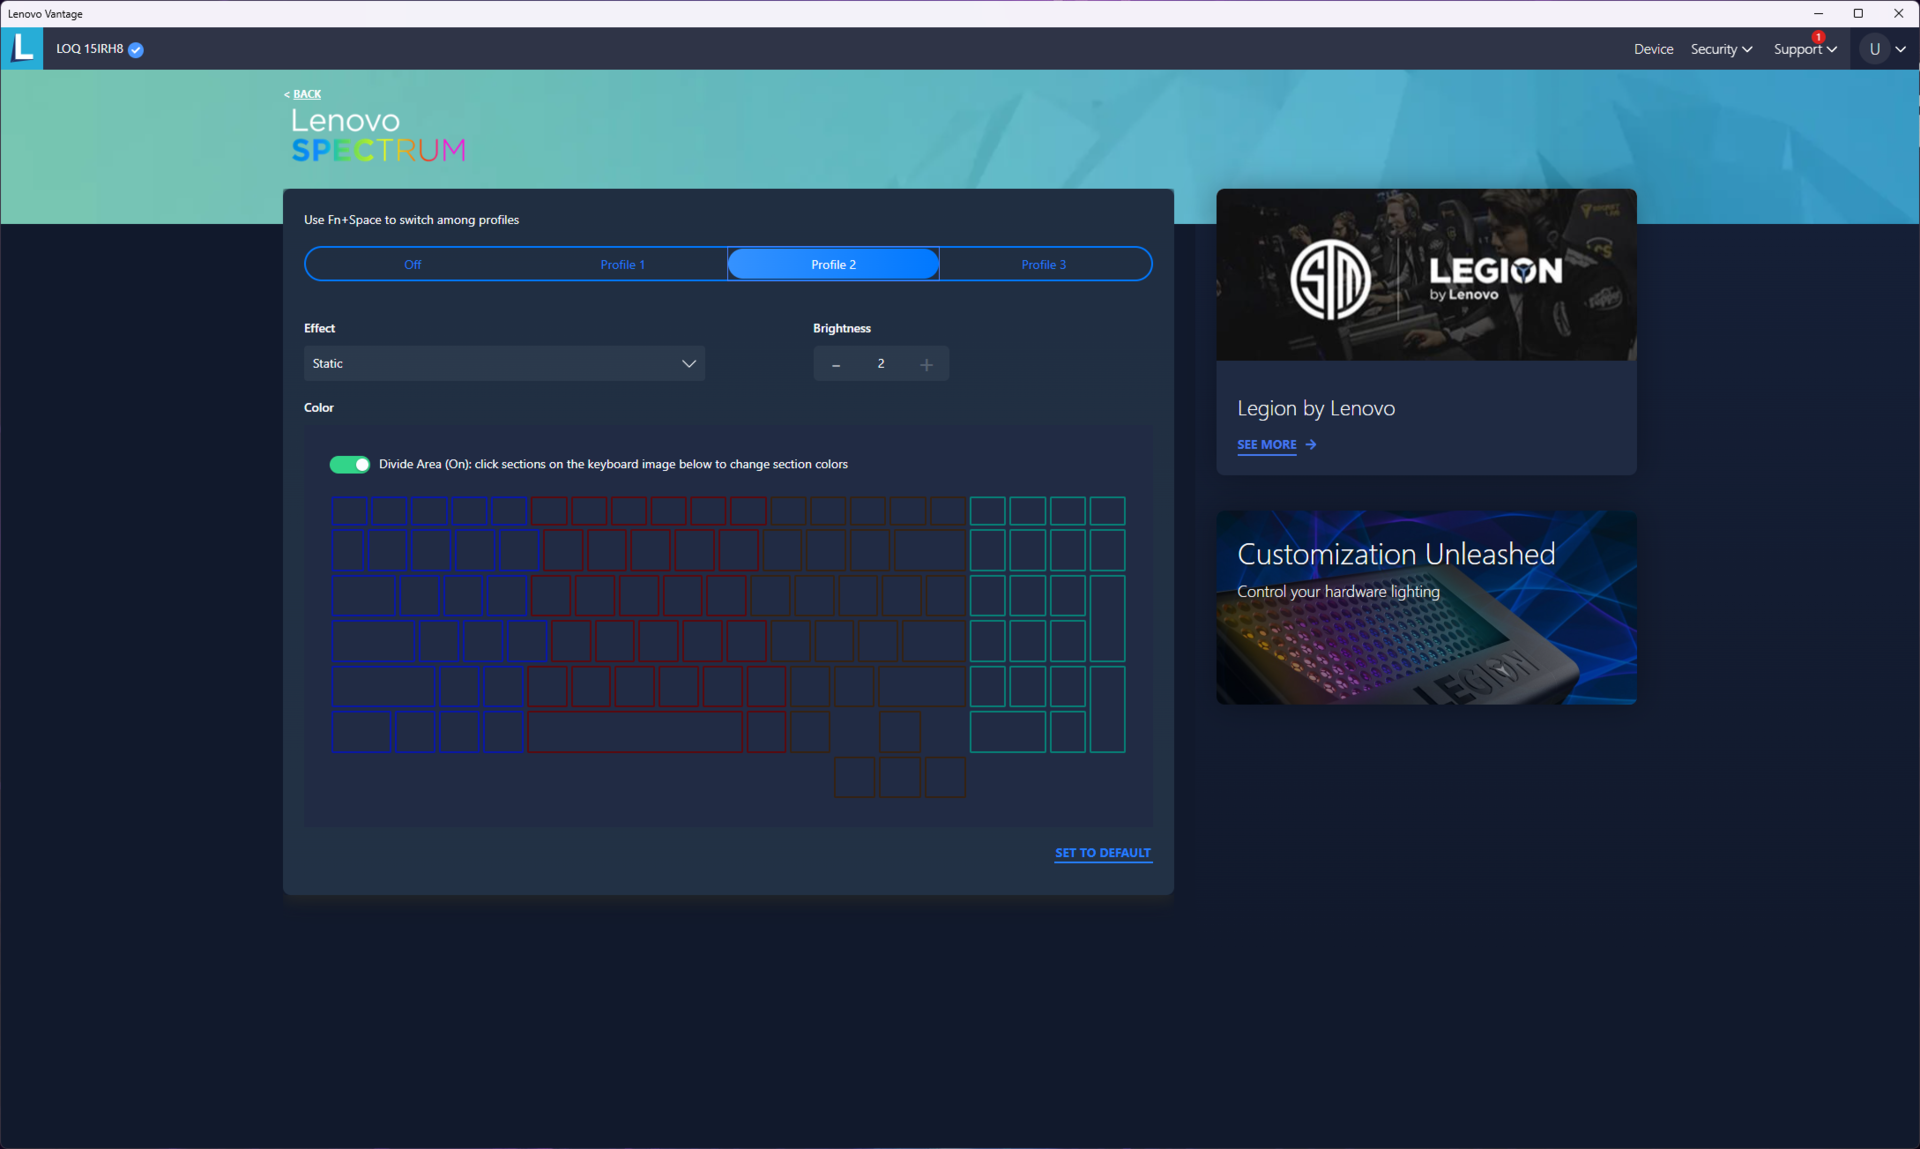
Lenovo Vantage permite cambiar fácilmente los perfiles de potencia, los efectos RGB y otras propiedades del LOQ 15. La aplicación también permite a los usuarios experimentados establecer sus propios límites de potencia de la CPU, la duración, el TDP de la GPU, el refuerzo dinámico de la GPU a la CPU y los límites de temperatura que deseen.
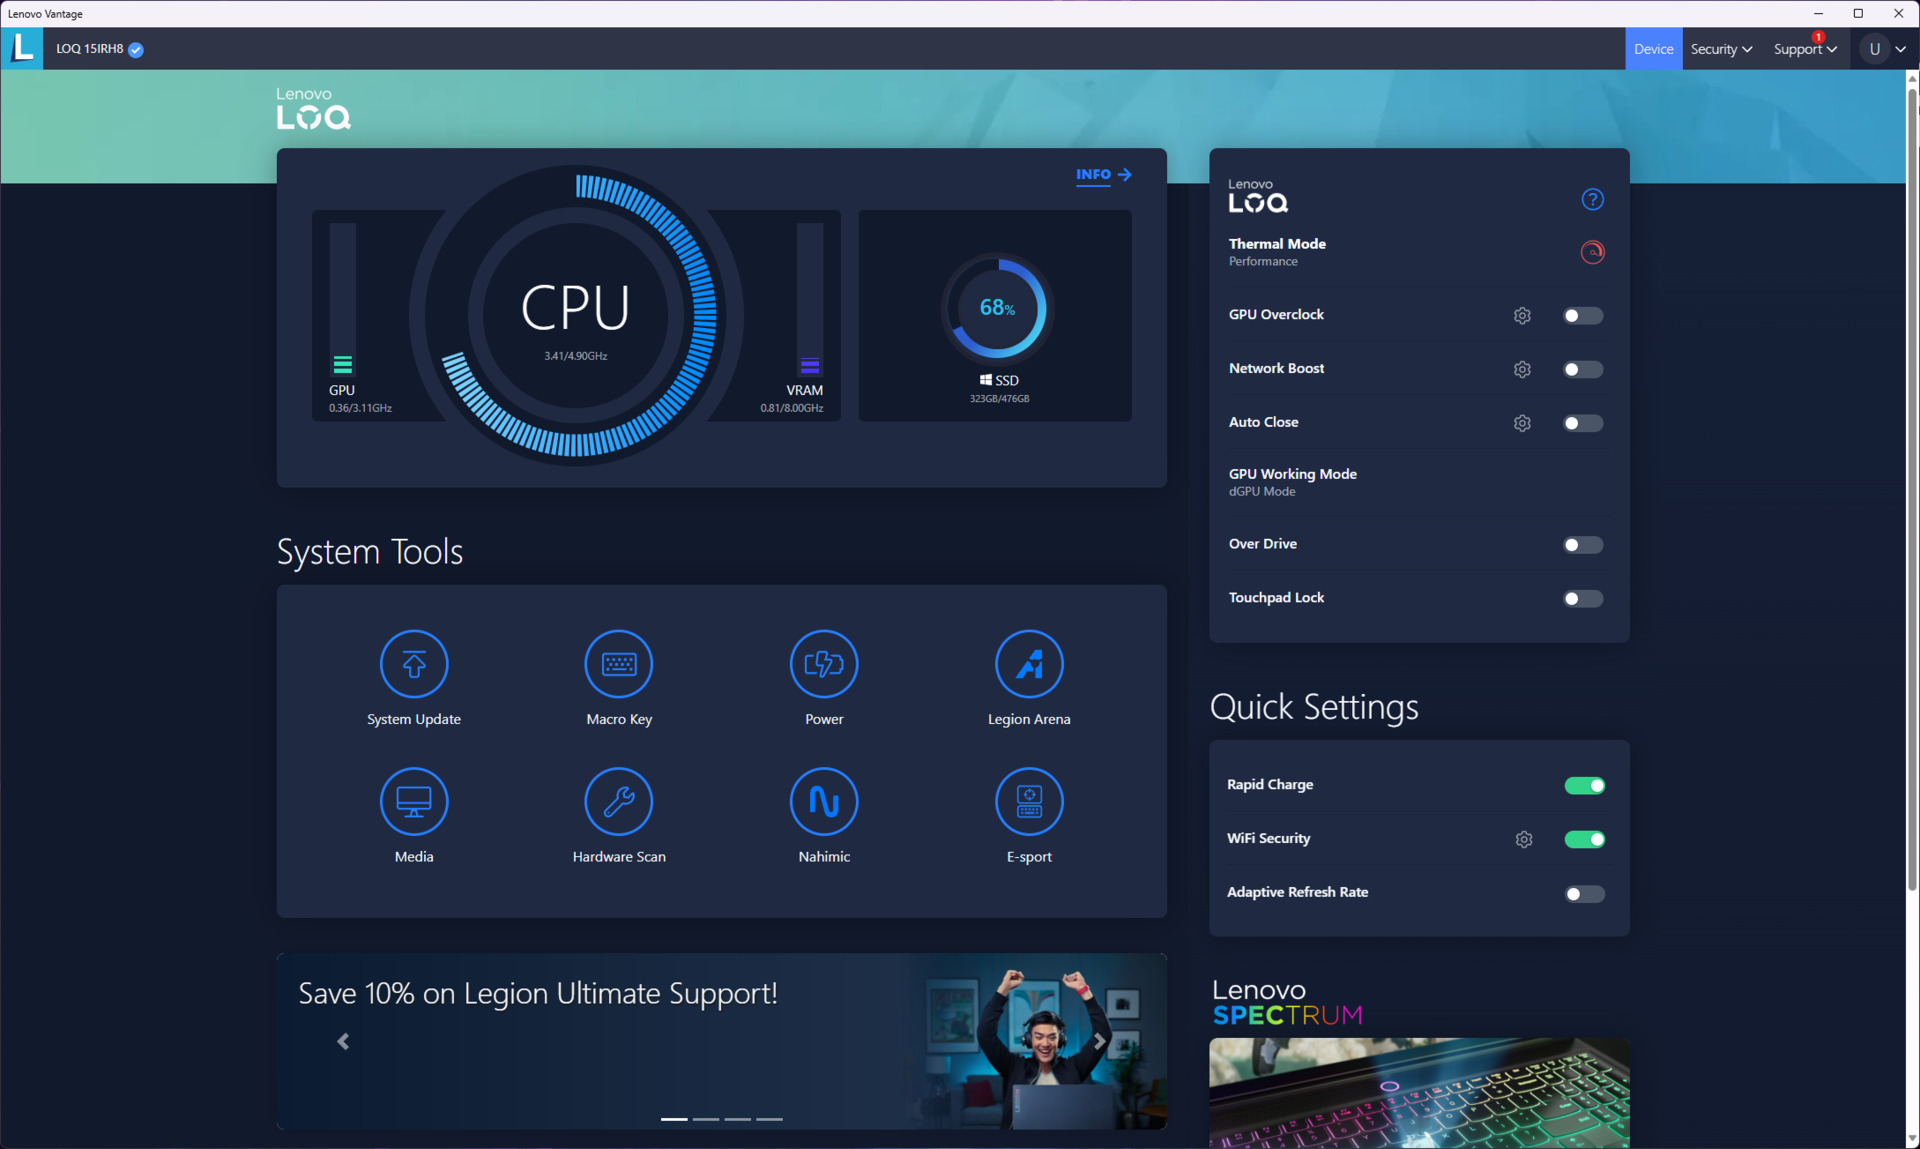
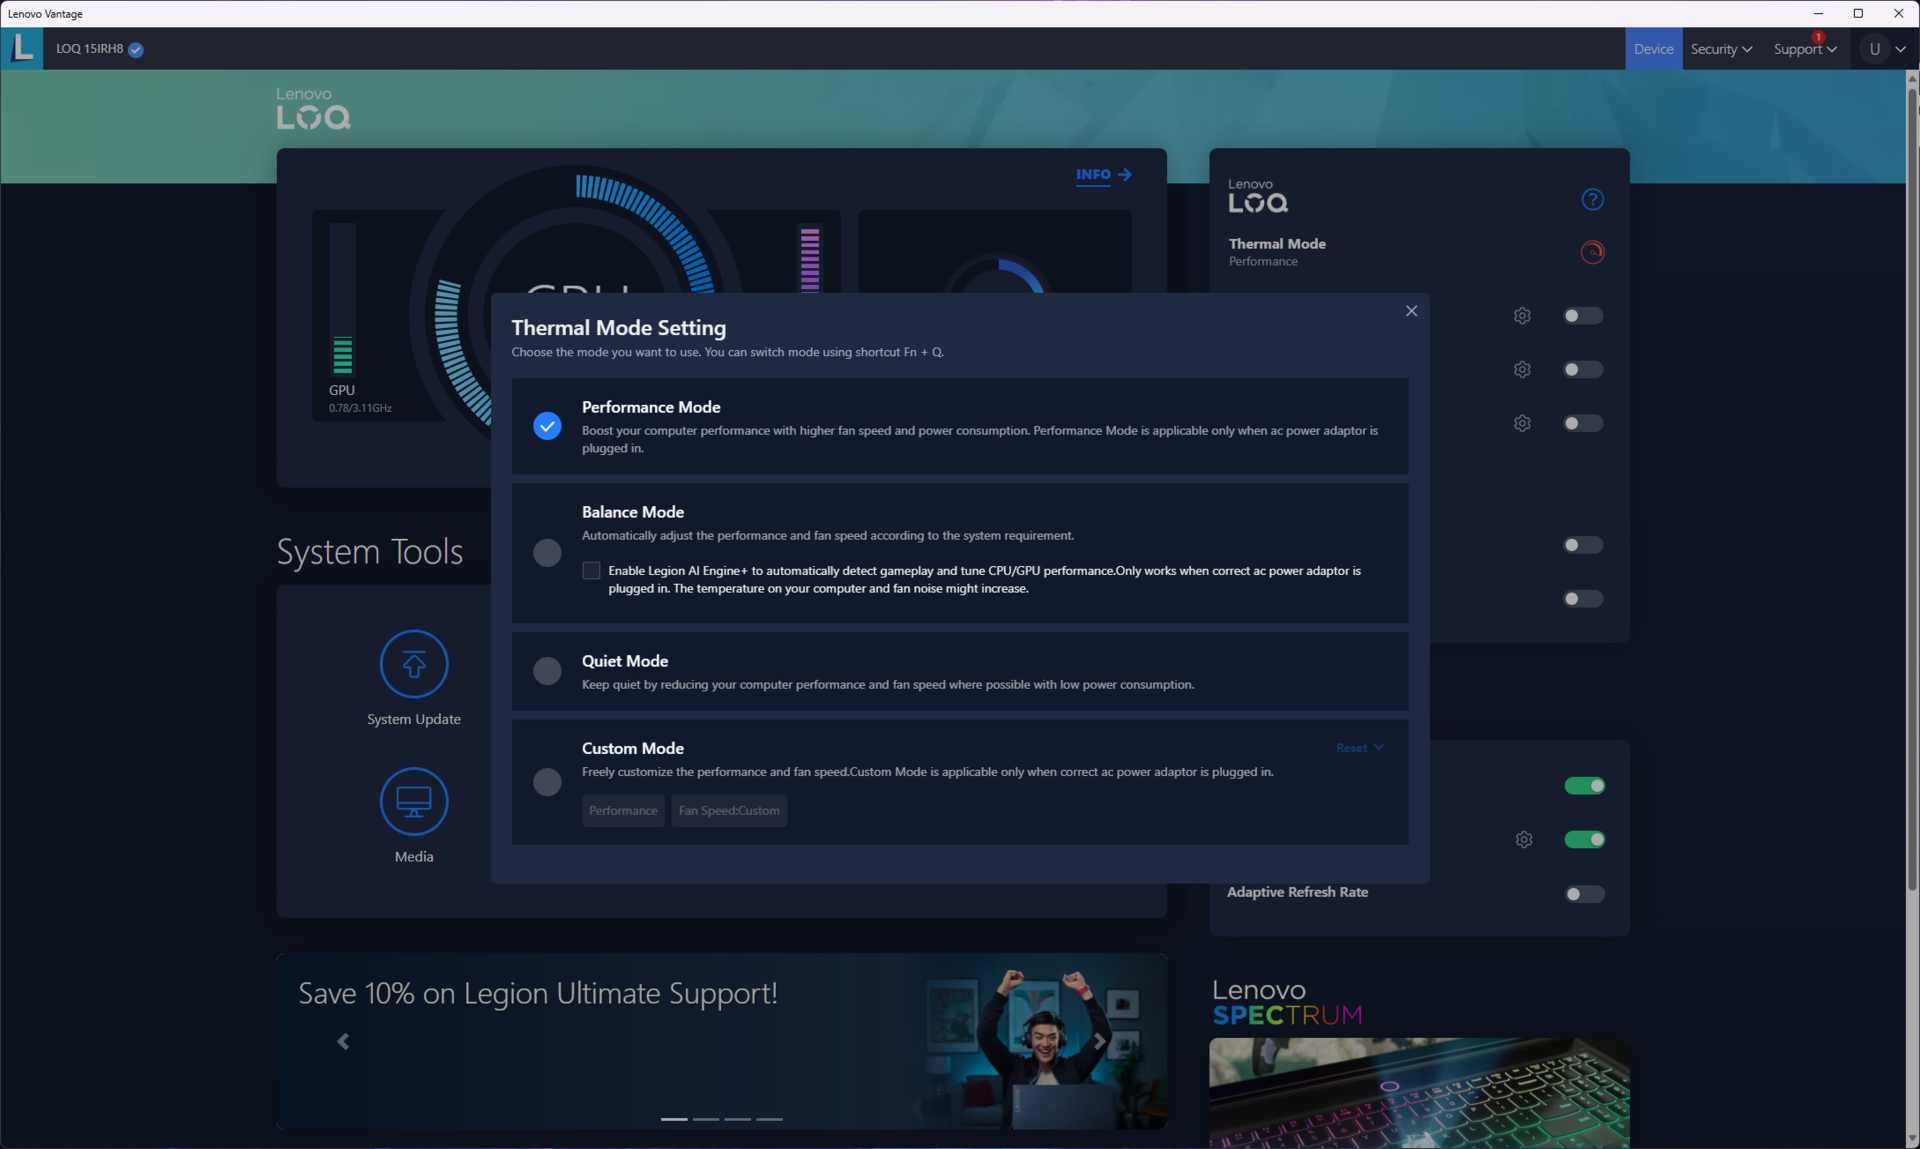
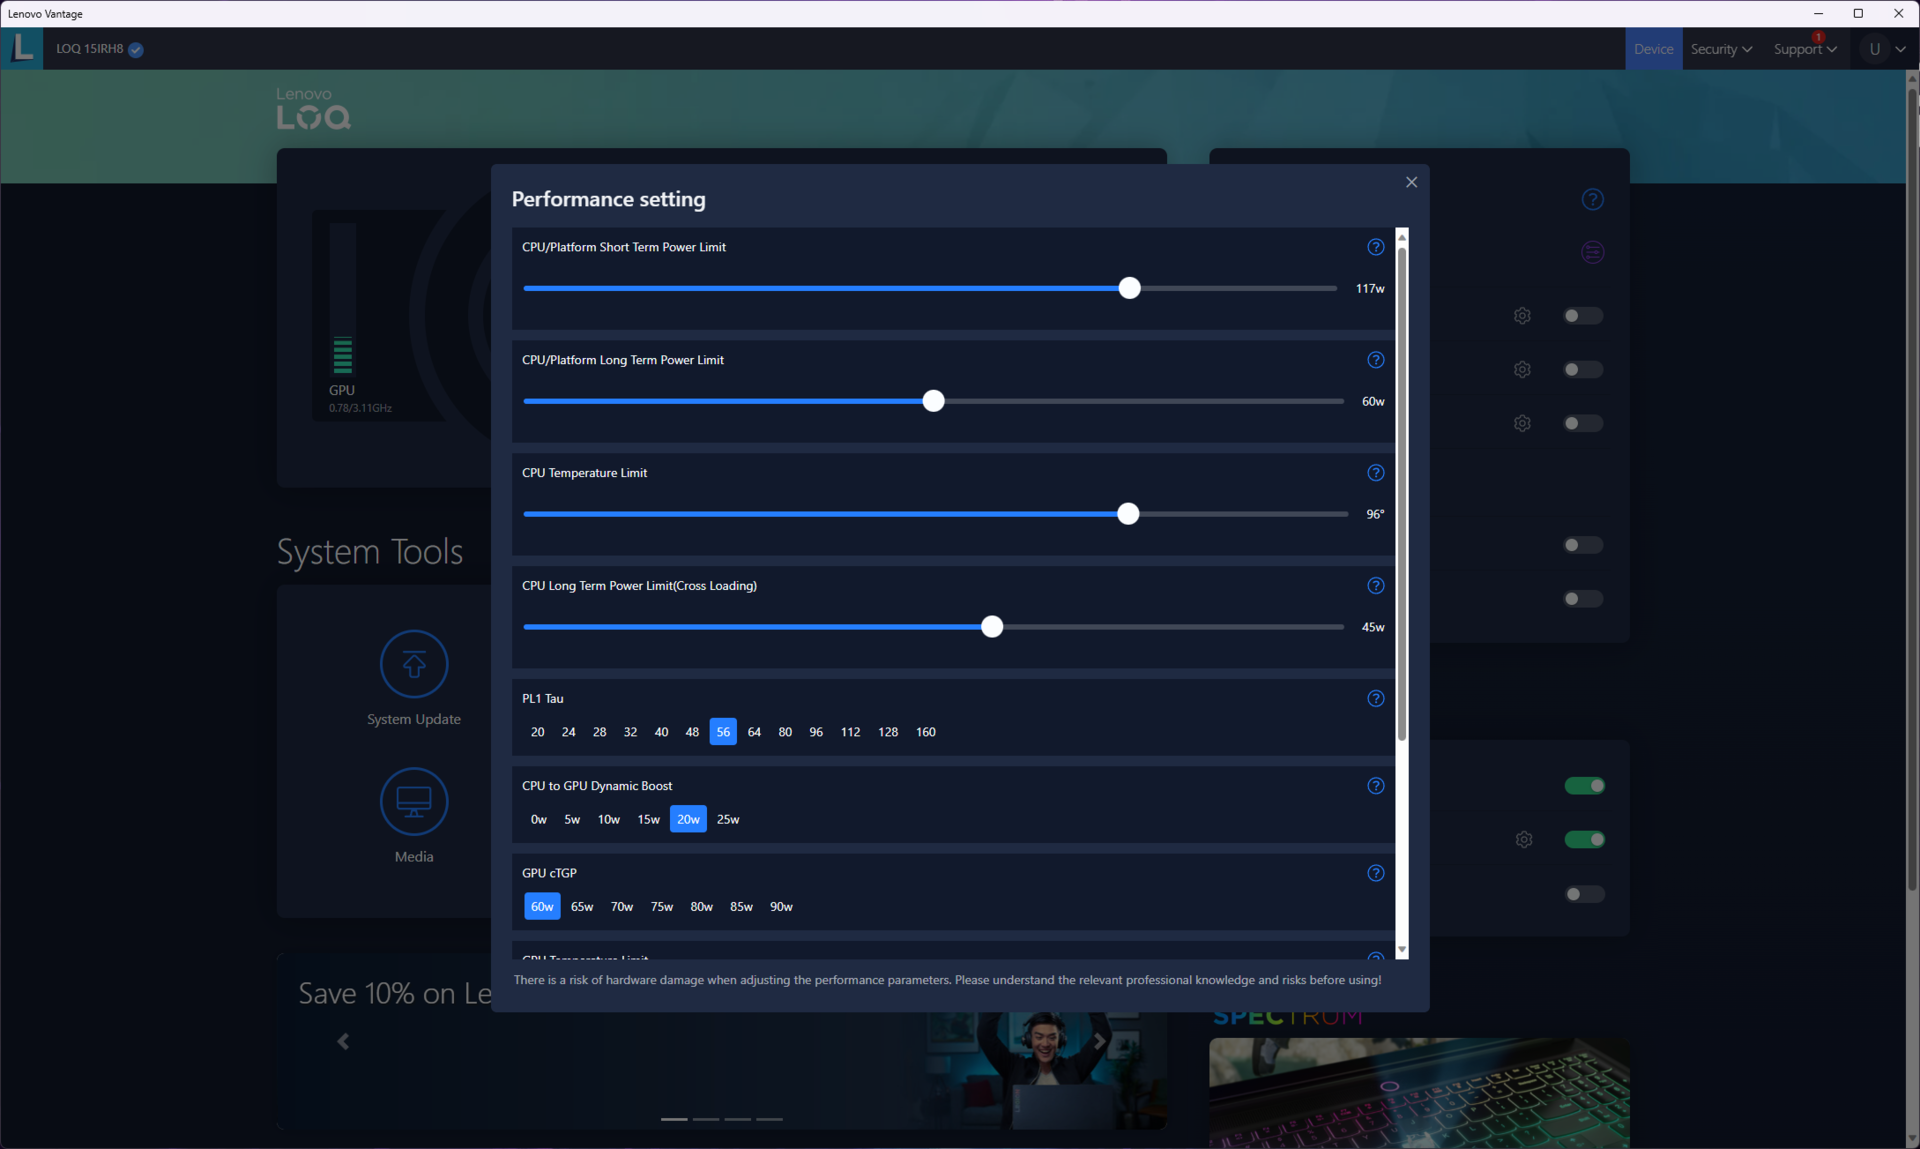
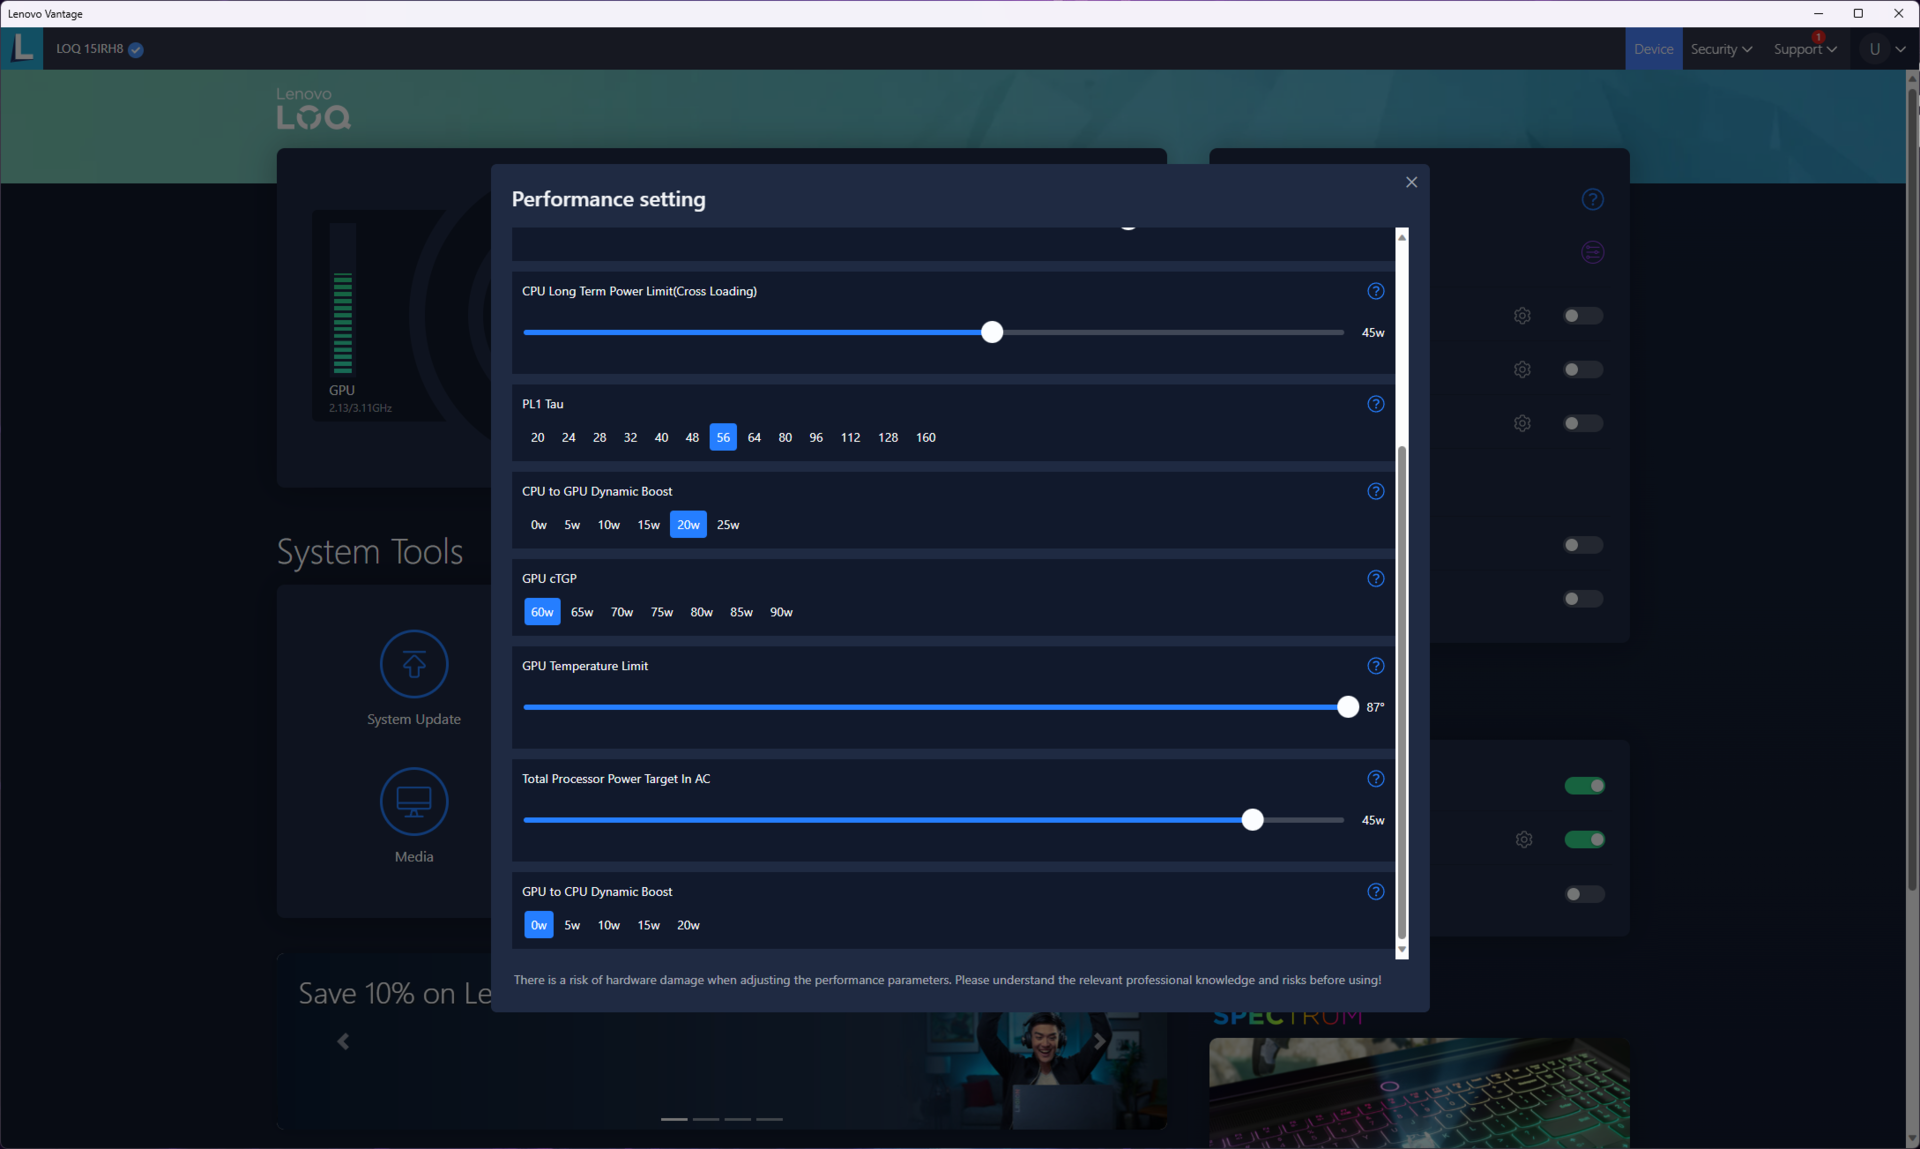
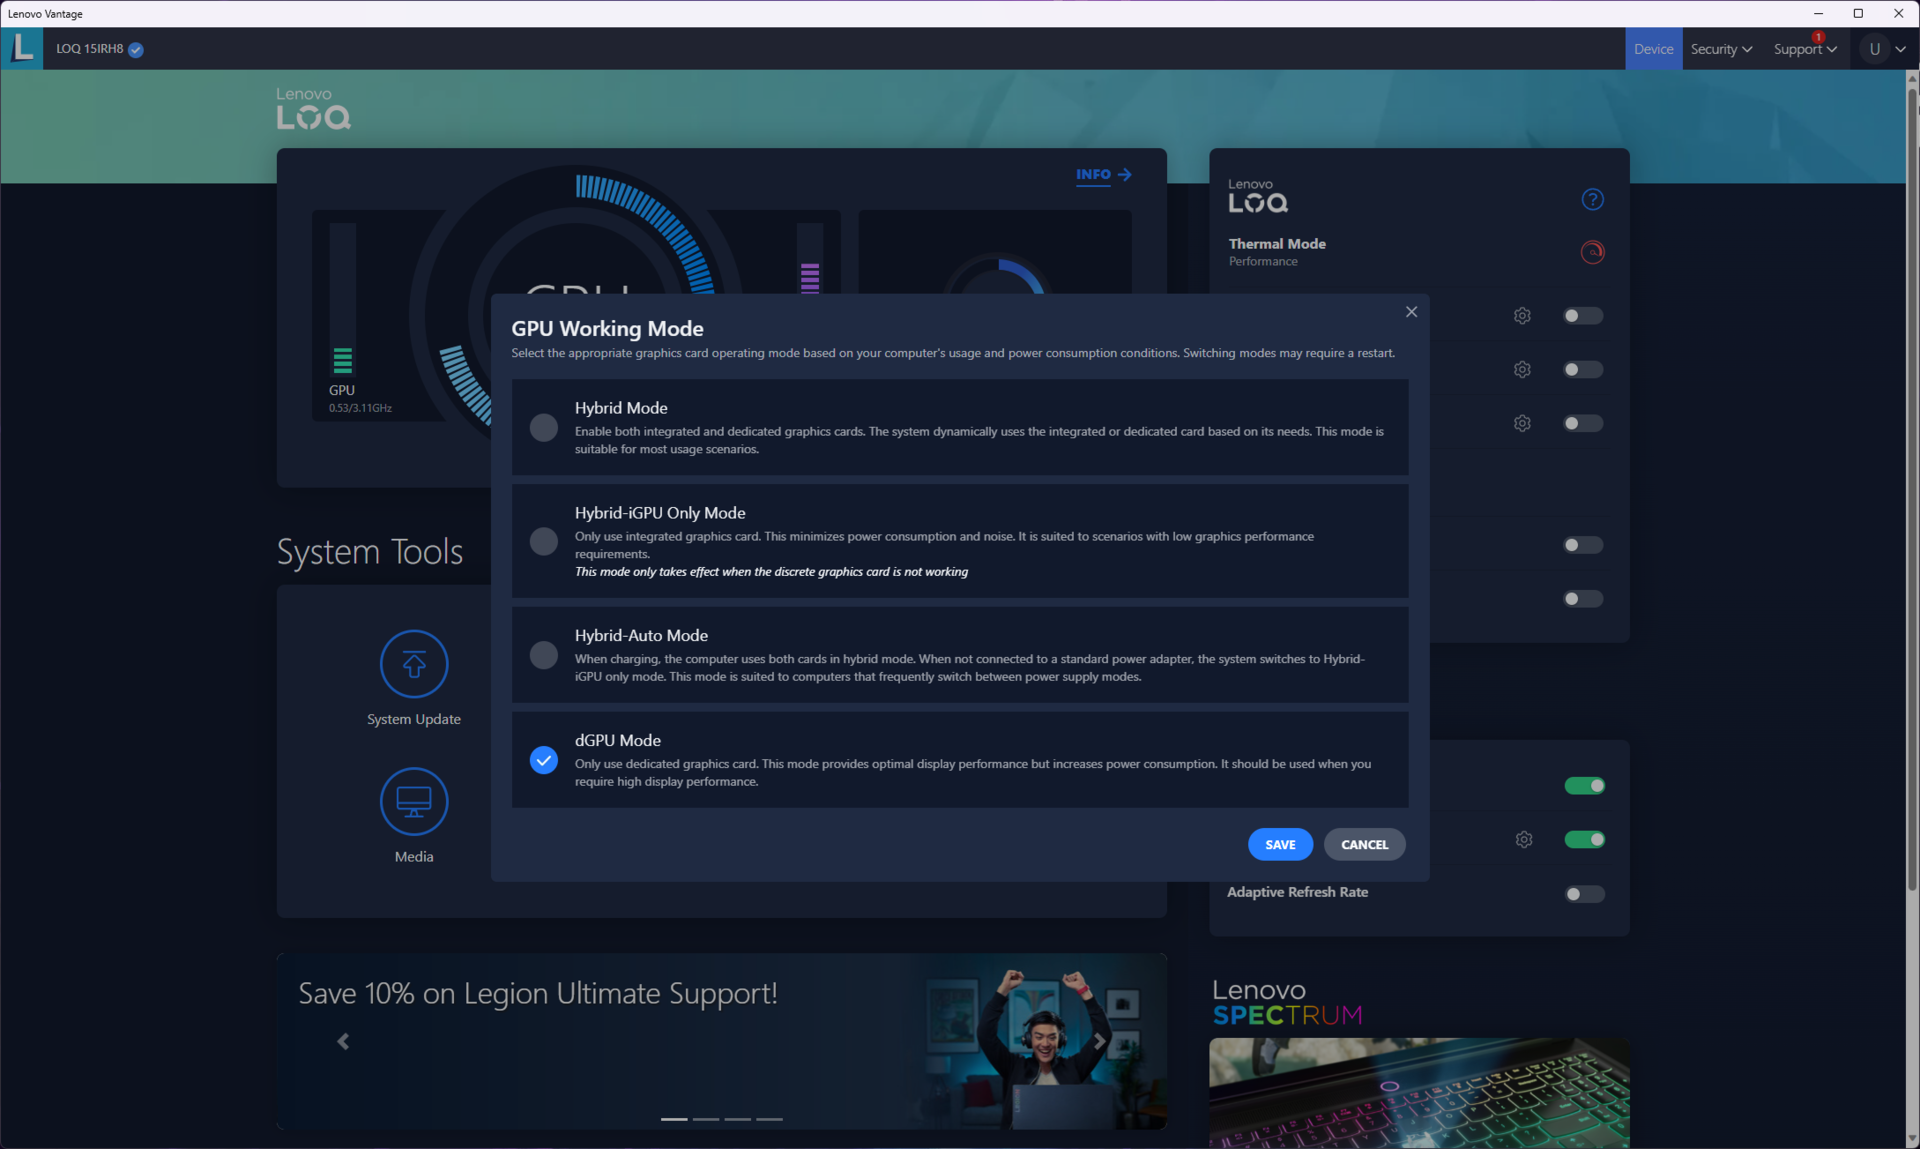
La siguiente tabla muestra cómo afectan los perfiles de potencia predeterminados al PL1 y PL2 del procesador. Para nuestras pruebas, utilizamos el perfil Rendimiento y activamos el modo dGPU para permitir que el Core i7-13620H y la RTX 4050 sacaran todo su potencial. Las pruebas de batería se ejecutaron en el perfil Silencio con la GPU configurada en modo Híbrido.
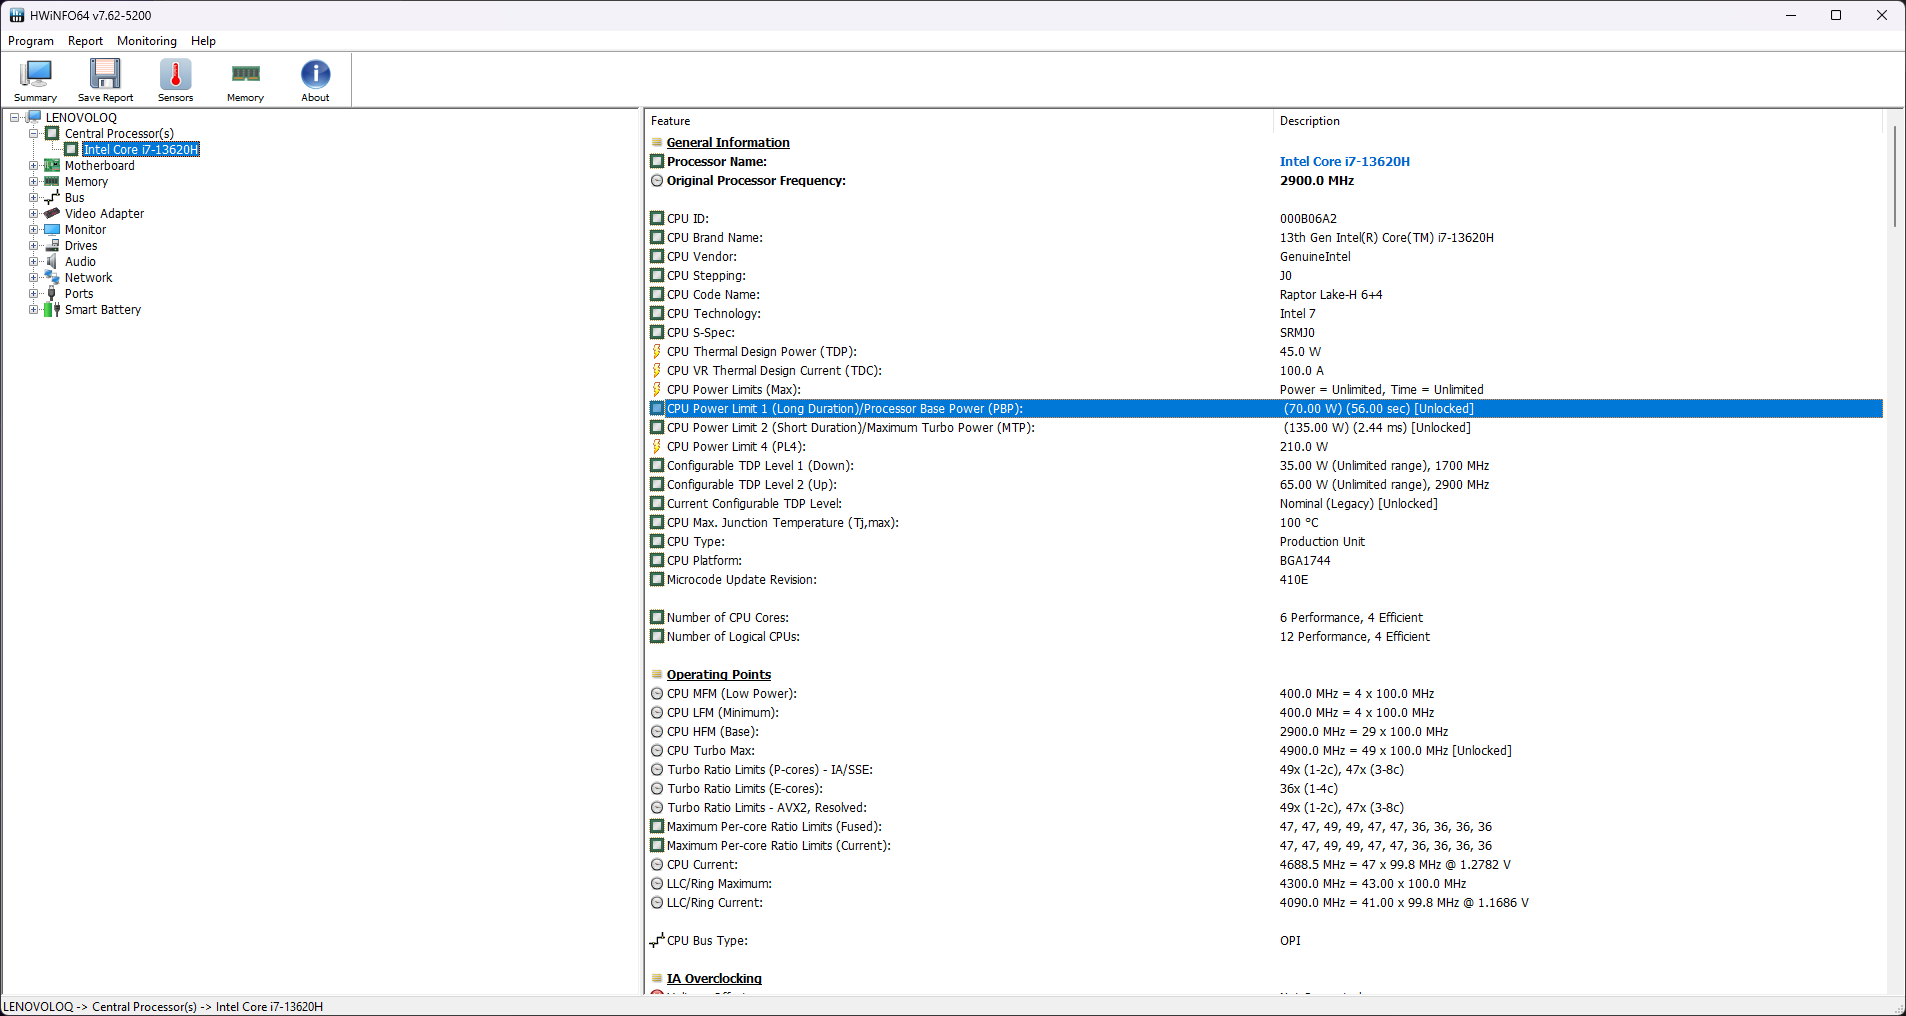
| Modo de rendimiento | PL1 (PBP) / Tau | PL2 (MTP) / Tau | PL4 | Cinebench R15 Puntuación múltiple | Cinebench R15 Puntuación múltiple (30 bucles) |
|---|---|---|---|---|---|
| Silencioso | 45 W / 56 s | 55 W / 2,44 ms | 210 W | 1.879 (-17,98%) | 1.412 (-26,34%) |
| Equilibrio | 60 W / 56 s | 117 W / 2,44 ms | 210 W | 2.178 (-4,93%) | 1.657 (-13,56%) |
| Rendimiento | 70 W / 56 s | 135 W / 2,44 ms | 210 W | 2.291 (100%) | 1.917 (100%) |
Procesador
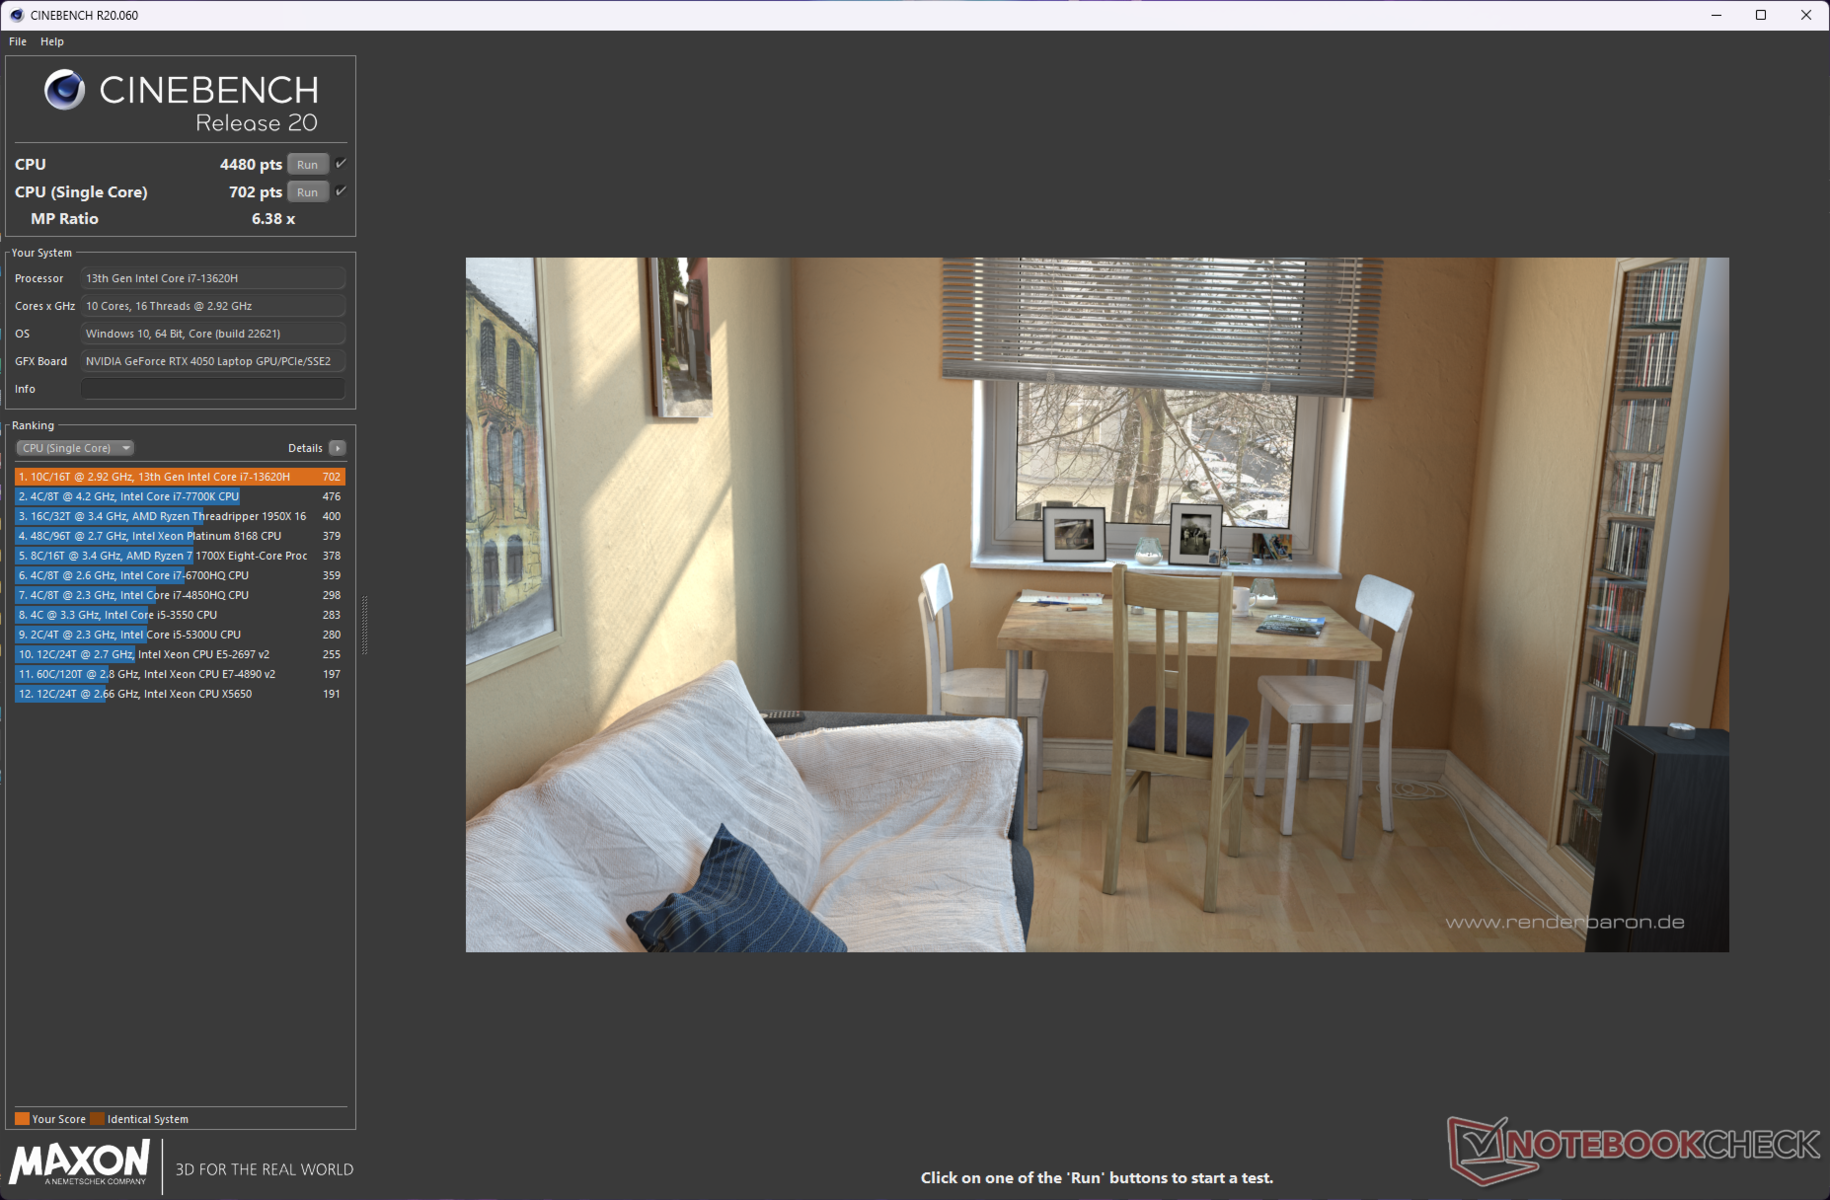
El Core i7-13620H del LOQ 15IRH8 queda por detrás del LOQ 15APH8 con Ryzen 7 7840HS hasta en un 16% en las pruebas multinúcleo de Cinebench a pesar de contar con el mismo número de hilos, probablemente debido a los mayores relojes de este último. Sin embargo, vemos una inversión de papeles en Geekbench multi-core. El chip Intel también ofrece un buen rendimiento en la mayoría de las pruebas comparativas mononúcleo.
El chasis y la refrigeración del LOQ 15IRH8 parecen tener problemas para sostener adecuadamente una prueba de bucle multinúcleo Cinebench R15. El Core i7-13620H encuentra un mejor hogar en el LOQ 16IRH8 donde el rendimiento del procesador es muy estable.
Cinebench R15 Multi Loop
Cinebench R23: Multi Core | Single Core
Cinebench R20: CPU (Multi Core) | CPU (Single Core)
Cinebench R15: CPU Multi 64Bit | CPU Single 64Bit
Blender: v2.79 BMW27 CPU
7-Zip 18.03: 7z b 4 | 7z b 4 -mmt1
Geekbench 5.5: Multi-Core | Single-Core
HWBOT x265 Benchmark v2.2: 4k Preset
LibreOffice : 20 Documents To PDF
R Benchmark 2.5: Overall mean
| CPU Performance rating | |
| Media de la clase Gaming | |
| Dell G15 5530 | |
| Asus TUF Gaming A16 FA617XS | |
| Lenovo LOQ 15APH8 | |
| Lenovo LOQ 16IRH8 | |
| Lenovo Legion Pro 5 16ARX8 (R5 7645HX, RTX 4050) | |
| Lenovo LOQ 15IRH8 Core i7 | |
| MSI Katana 17 B13VFK | |
| Medio Intel Core i7-13620H | |
| HP Victus 16-r0077ng | |
| Cinebench R23 / Multi Core | |
| Media de la clase Gaming (10488 - 42661, n=107, últimos 2 años) | |
| Dell G15 5530 | |
| Lenovo LOQ 15APH8 | |
| Asus TUF Gaming A16 FA617XS | |
| MSI Katana 17 B13VFK | |
| HP Victus 16-r0077ng | |
| Lenovo LOQ 16IRH8 | |
| Lenovo LOQ 15IRH8 Core i7 | |
| Medio Intel Core i7-13620H (10819 - 15496, n=7) | |
| Lenovo Legion Pro 5 16ARX8 (R5 7645HX, RTX 4050) | |
| Cinebench R23 / Single Core | |
| Media de la clase Gaming (1166 - 2415, n=107, últimos 2 años) | |
| Lenovo LOQ 16IRH8 | |
| Lenovo LOQ 15IRH8 Core i7 | |
| Dell G15 5530 | |
| Medio Intel Core i7-13620H (1716 - 1871, n=7) | |
| Lenovo Legion Pro 5 16ARX8 (R5 7645HX, RTX 4050) | |
| MSI Katana 17 B13VFK | |
| Asus TUF Gaming A16 FA617XS | |
| Lenovo LOQ 15APH8 | |
| HP Victus 16-r0077ng | |
| Cinebench R20 / CPU (Multi Core) | |
| Media de la clase Gaming (4029 - 16433, n=106, últimos 2 años) | |
| Dell G15 5530 | |
| Lenovo LOQ 15APH8 | |
| Asus TUF Gaming A16 FA617XS | |
| MSI Katana 17 B13VFK | |
| HP Victus 16-r0077ng | |
| Lenovo LOQ 15IRH8 Core i7 | |
| Lenovo LOQ 16IRH8 | |
| Lenovo Legion Pro 5 16ARX8 (R5 7645HX, RTX 4050) | |
| Medio Intel Core i7-13620H (4214 - 5905, n=7) | |
| Cinebench R20 / CPU (Single Core) | |
| Media de la clase Gaming (442 - 913, n=106, últimos 2 años) | |
| Lenovo LOQ 15IRH8 Core i7 | |
| Dell G15 5530 | |
| Lenovo LOQ 16IRH8 | |
| Asus TUF Gaming A16 FA617XS | |
| Lenovo Legion Pro 5 16ARX8 (R5 7645HX, RTX 4050) | |
| Medio Intel Core i7-13620H (657 - 719, n=7) | |
| Lenovo LOQ 15APH8 | |
| MSI Katana 17 B13VFK | |
| HP Victus 16-r0077ng | |
| Cinebench R15 / CPU Multi 64Bit | |
| Media de la clase Gaming (1578 - 6330, n=105, últimos 2 años) | |
| Dell G15 5530 | |
| Lenovo LOQ 15APH8 | |
| Asus TUF Gaming A16 FA617XS | |
| Lenovo LOQ 16IRH8 | |
| MSI Katana 17 B13VFK | |
| HP Victus 16-r0077ng | |
| Lenovo LOQ 15IRH8 Core i7 | |
| Lenovo Legion Pro 5 16ARX8 (R5 7645HX, RTX 4050) | |
| Medio Intel Core i7-13620H (1681 - 2492, n=7) | |
| Cinebench R15 / CPU Single 64Bit | |
| Media de la clase Gaming (188.8 - 350, n=106, últimos 2 años) | |
| Lenovo Legion Pro 5 16ARX8 (R5 7645HX, RTX 4050) | |
| Asus TUF Gaming A16 FA617XS | |
| Lenovo LOQ 15APH8 | |
| Dell G15 5530 | |
| Lenovo LOQ 16IRH8 | |
| Lenovo LOQ 15IRH8 Core i7 | |
| Medio Intel Core i7-13620H (250 - 269, n=7) | |
| MSI Katana 17 B13VFK | |
| HP Victus 16-r0077ng | |
| Blender / v2.79 BMW27 CPU | |
| Lenovo LOQ 15IRH8 Core i7 | |
| Medio Intel Core i7-13620H (215 - 297, n=7) | |
| Lenovo Legion Pro 5 16ARX8 (R5 7645HX, RTX 4050) | |
| Lenovo LOQ 16IRH8 | |
| MSI Katana 17 B13VFK | |
| HP Victus 16-r0077ng | |
| Asus TUF Gaming A16 FA617XS | |
| Lenovo LOQ 15APH8 | |
| Dell G15 5530 | |
| Media de la clase Gaming (79 - 330, n=104, últimos 2 años) | |
| 7-Zip 18.03 / 7z b 4 | |
| Media de la clase Gaming (33491 - 148086, n=105, últimos 2 años) | |
| Dell G15 5530 | |
| Asus TUF Gaming A16 FA617XS | |
| HP Victus 16-r0077ng | |
| MSI Katana 17 B13VFK | |
| Lenovo Legion Pro 5 16ARX8 (R5 7645HX, RTX 4050) | |
| Lenovo LOQ 15APH8 | |
| Lenovo LOQ 16IRH8 | |
| Lenovo LOQ 15IRH8 Core i7 | |
| Medio Intel Core i7-13620H (45092 - 62324, n=7) | |
| 7-Zip 18.03 / 7z b 4 -mmt1 | |
| Lenovo Legion Pro 5 16ARX8 (R5 7645HX, RTX 4050) | |
| Asus TUF Gaming A16 FA617XS | |
| Media de la clase Gaming (4199 - 7436, n=105, últimos 2 años) | |
| Lenovo LOQ 15APH8 | |
| Medio Intel Core i7-13620H (5648 - 6326, n=7) | |
| Lenovo LOQ 15IRH8 Core i7 | |
| Lenovo LOQ 16IRH8 | |
| Dell G15 5530 | |
| MSI Katana 17 B13VFK | |
| HP Victus 16-r0077ng | |
| Geekbench 5.5 / Multi-Core | |
| Media de la clase Gaming (6460 - 28263, n=105, últimos 2 años) | |
| Dell G15 5530 | |
| Lenovo LOQ 16IRH8 | |
| Asus TUF Gaming A16 FA617XS | |
| HP Victus 16-r0077ng | |
| Lenovo LOQ 15IRH8 Core i7 | |
| MSI Katana 17 B13VFK | |
| Medio Intel Core i7-13620H (8112 - 12223, n=7) | |
| Lenovo Legion Pro 5 16ARX8 (R5 7645HX, RTX 4050) | |
| Lenovo LOQ 15APH8 | |
| Geekbench 5.5 / Single-Core | |
| Media de la clase Gaming (986 - 2474, n=105, últimos 2 años) | |
| Asus TUF Gaming A16 FA617XS | |
| Lenovo Legion Pro 5 16ARX8 (R5 7645HX, RTX 4050) | |
| Lenovo LOQ 15IRH8 Core i7 | |
| Dell G15 5530 | |
| Lenovo LOQ 15APH8 | |
| Lenovo LOQ 16IRH8 | |
| Medio Intel Core i7-13620H (1703 - 1865, n=7) | |
| MSI Katana 17 B13VFK | |
| HP Victus 16-r0077ng | |
| HWBOT x265 Benchmark v2.2 / 4k Preset | |
| Media de la clase Gaming (11.5 - 44.4, n=105, últimos 2 años) | |
| Dell G15 5530 | |
| Asus TUF Gaming A16 FA617XS | |
| Lenovo Legion Pro 5 16ARX8 (R5 7645HX, RTX 4050) | |
| Lenovo LOQ 15APH8 | |
| MSI Katana 17 B13VFK | |
| Lenovo LOQ 16IRH8 | |
| Lenovo LOQ 15IRH8 Core i7 | |
| HP Victus 16-r0077ng | |
| Medio Intel Core i7-13620H (12.2 - 17.7, n=7) | |
| LibreOffice / 20 Documents To PDF | |
| HP Victus 16-r0077ng | |
| MSI Katana 17 B13VFK | |
| Lenovo Legion Pro 5 16ARX8 (R5 7645HX, RTX 4050) | |
| Medio Intel Core i7-13620H (41.5 - 78.9, n=7) | |
| Media de la clase Gaming (33.2 - 88.8, n=105, últimos 2 años) | |
| Dell G15 5530 | |
| Lenovo LOQ 16IRH8 | |
| Lenovo LOQ 15IRH8 Core i7 | |
| Asus TUF Gaming A16 FA617XS | |
| Lenovo LOQ 15APH8 | |
| R Benchmark 2.5 / Overall mean | |
| HP Victus 16-r0077ng | |
| Medio Intel Core i7-13620H (0.4438 - 0.4762, n=7) | |
| Lenovo LOQ 15IRH8 Core i7 | |
| Lenovo LOQ 15APH8 | |
| Lenovo LOQ 16IRH8 | |
| MSI Katana 17 B13VFK | |
| Lenovo Legion Pro 5 16ARX8 (R5 7645HX, RTX 4050) | |
| Media de la clase Gaming (0.3439 - 0.759, n=106, últimos 2 años) | |
| Dell G15 5530 | |
| Asus TUF Gaming A16 FA617XS | |
* ... más pequeño es mejor
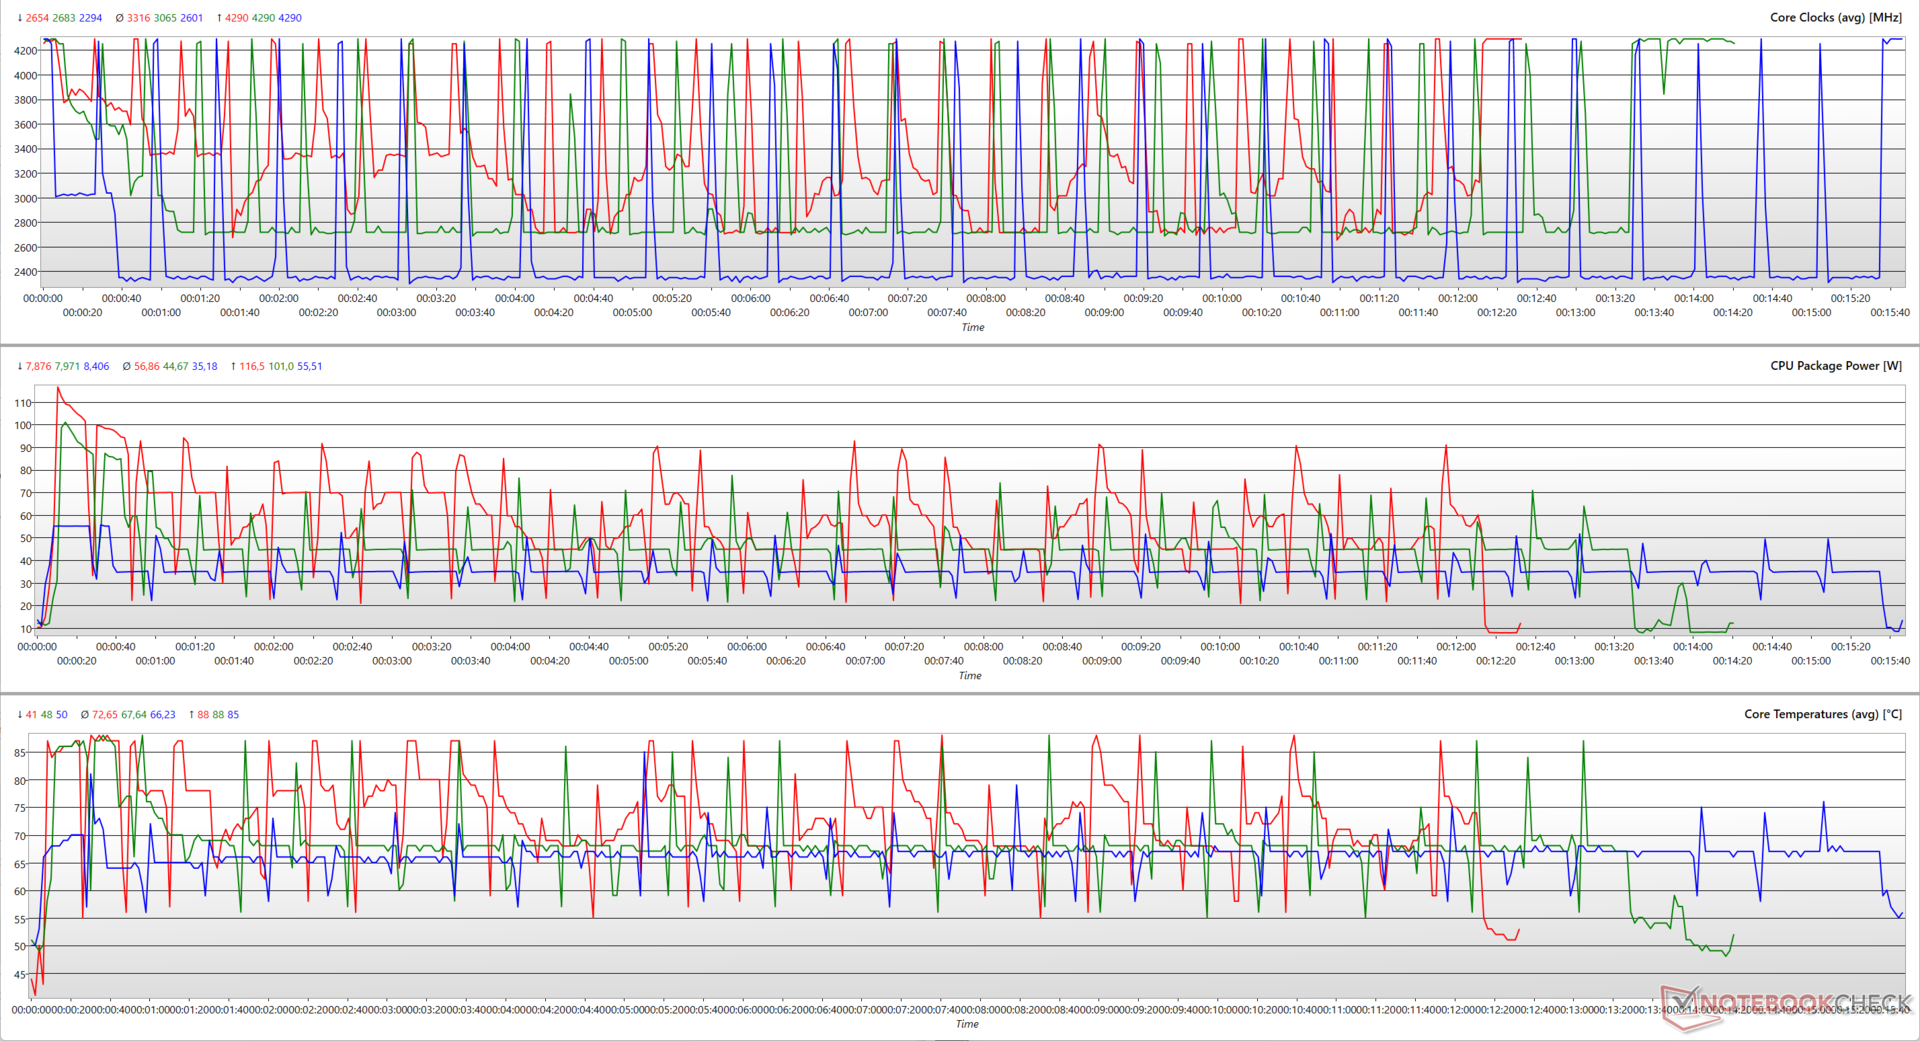
Un análisis de la prueba de bucle multinúcleo Cinebench R15 muestra cómo influyen los perfiles de potencia incorporados en varios parámetros de la CPU.
Mientras que se supone que el modo Rendimiento permite al procesador utilizar hasta 135 W PL2, vemos que sólo alcanza un máximo de 116,5 W. El modo Equilibrio también parece conformarse con una potencia del paquete inferior a la posible (101 W frente a 117 W), pero aquí vemos una ejecución más estable en comparación con el Rendimiento.
Es posible que el sistema de refrigeración del LOQ 15IRH8 esté luchando cada vez que el límite de potencia cruza los 116 W, lo que explica el rendimiento poco sostenido en este benchmark.
Las puntuaciones multinúcleo de Cinebench R20 caen un 23% con la energía de la batería, aunque el rendimiento de un solo núcleo sólo recibe un golpe menor.
AIDA64: FP32 Ray-Trace | FPU Julia | CPU SHA3 | CPU Queen | FPU SinJulia | FPU Mandel | CPU AES | CPU ZLib | FP64 Ray-Trace | CPU PhotoWorxx
| Performance rating | |
| Media de la clase Gaming | |
| Asus TUF Gaming A16 FA617XS | |
| Lenovo LOQ 15APH8 | |
| Dell G15 5530 | |
| Lenovo Legion Pro 5 16ARX8 (R5 7645HX, RTX 4050) | |
| HP Victus 16-r0077ng | |
| MSI Katana 17 B13VFK | |
| Lenovo LOQ 16IRH8 | |
| Lenovo LOQ 15IRH8 Core i7 | |
| Medio Intel Core i7-13620H | |
| AIDA64 / FP32 Ray-Trace | |
| Media de la clase Gaming (10227 - 85542, n=105, últimos 2 años) | |
| Lenovo LOQ 15APH8 | |
| Asus TUF Gaming A16 FA617XS | |
| Lenovo Legion Pro 5 16ARX8 (R5 7645HX, RTX 4050) | |
| Dell G15 5530 | |
| HP Victus 16-r0077ng | |
| MSI Katana 17 B13VFK | |
| Lenovo LOQ 16IRH8 | |
| Medio Intel Core i7-13620H (10779 - 13601, n=7) | |
| Lenovo LOQ 15IRH8 Core i7 | |
| AIDA64 / FPU Julia | |
| Media de la clase Gaming (51376 - 238426, n=105, últimos 2 años) | |
| Lenovo LOQ 15APH8 | |
| Asus TUF Gaming A16 FA617XS | |
| Lenovo Legion Pro 5 16ARX8 (R5 7645HX, RTX 4050) | |
| Dell G15 5530 | |
| HP Victus 16-r0077ng | |
| MSI Katana 17 B13VFK | |
| Lenovo LOQ 16IRH8 | |
| Lenovo LOQ 15IRH8 Core i7 | |
| Medio Intel Core i7-13620H (54287 - 67187, n=7) | |
| AIDA64 / CPU SHA3 | |
| Media de la clase Gaming (2180 - 10115, n=105, últimos 2 años) | |
| Lenovo LOQ 15APH8 | |
| Asus TUF Gaming A16 FA617XS | |
| Dell G15 5530 | |
| Lenovo Legion Pro 5 16ARX8 (R5 7645HX, RTX 4050) | |
| HP Victus 16-r0077ng | |
| MSI Katana 17 B13VFK | |
| Lenovo LOQ 16IRH8 | |
| Medio Intel Core i7-13620H (2327 - 2773, n=7) | |
| Lenovo LOQ 15IRH8 Core i7 | |
| AIDA64 / CPU Queen | |
| Asus TUF Gaming A16 FA617XS | |
| Lenovo LOQ 15APH8 | |
| Media de la clase Gaming (49785 - 173351, n=90, últimos 2 años) | |
| Dell G15 5530 | |
| Lenovo Legion Pro 5 16ARX8 (R5 7645HX, RTX 4050) | |
| HP Victus 16-r0077ng | |
| Lenovo LOQ 15IRH8 Core i7 | |
| Lenovo LOQ 16IRH8 | |
| MSI Katana 17 B13VFK | |
| Medio Intel Core i7-13620H (66885 - 78867, n=7) | |
| AIDA64 / FPU SinJulia | |
| Asus TUF Gaming A16 FA617XS | |
| Lenovo LOQ 15APH8 | |
| Media de la clase Gaming (4424 - 33636, n=105, últimos 2 años) | |
| Lenovo Legion Pro 5 16ARX8 (R5 7645HX, RTX 4050) | |
| Dell G15 5530 | |
| HP Victus 16-r0077ng | |
| MSI Katana 17 B13VFK | |
| Lenovo LOQ 16IRH8 | |
| Medio Intel Core i7-13620H (6737 - 8421, n=7) | |
| Lenovo LOQ 15IRH8 Core i7 | |
| AIDA64 / FPU Mandel | |
| Media de la clase Gaming (25115 - 128721, n=105, últimos 2 años) | |
| Lenovo LOQ 15APH8 | |
| Asus TUF Gaming A16 FA617XS | |
| Lenovo Legion Pro 5 16ARX8 (R5 7645HX, RTX 4050) | |
| Dell G15 5530 | |
| HP Victus 16-r0077ng | |
| MSI Katana 17 B13VFK | |
| Lenovo LOQ 16IRH8 | |
| Lenovo LOQ 15IRH8 Core i7 | |
| Medio Intel Core i7-13620H (27242 - 32787, n=7) | |
| AIDA64 / CPU AES | |
| Media de la clase Gaming (39258 - 247074, n=105, últimos 2 años) | |
| Asus TUF Gaming A16 FA617XS | |
| Dell G15 5530 | |
| Lenovo LOQ 15APH8 | |
| HP Victus 16-r0077ng | |
| Medio Intel Core i7-13620H (48646 - 85895, n=7) | |
| MSI Katana 17 B13VFK | |
| Lenovo LOQ 16IRH8 | |
| Lenovo Legion Pro 5 16ARX8 (R5 7645HX, RTX 4050) | |
| Lenovo LOQ 15IRH8 Core i7 | |
| AIDA64 / CPU ZLib | |
| Media de la clase Gaming (574 - 2531, n=105, últimos 2 años) | |
| Dell G15 5530 | |
| Lenovo LOQ 15APH8 | |
| Asus TUF Gaming A16 FA617XS | |
| HP Victus 16-r0077ng | |
| Lenovo Legion Pro 5 16ARX8 (R5 7645HX, RTX 4050) | |
| Lenovo LOQ 16IRH8 | |
| MSI Katana 17 B13VFK | |
| Medio Intel Core i7-13620H (688 - 835, n=7) | |
| Lenovo LOQ 15IRH8 Core i7 | |
| AIDA64 / FP64 Ray-Trace | |
| Media de la clase Gaming (5509 - 45446, n=105, últimos 2 años) | |
| Lenovo LOQ 15APH8 | |
| Asus TUF Gaming A16 FA617XS | |
| Lenovo Legion Pro 5 16ARX8 (R5 7645HX, RTX 4050) | |
| Dell G15 5530 | |
| HP Victus 16-r0077ng | |
| MSI Katana 17 B13VFK | |
| Lenovo LOQ 16IRH8 | |
| Medio Intel Core i7-13620H (5919 - 7364, n=7) | |
| Lenovo LOQ 15IRH8 Core i7 | |
| AIDA64 / CPU PhotoWorxx | |
| Media de la clase Gaming (12271 - 89891, n=105, últimos 2 años) | |
| HP Victus 16-r0077ng | |
| Dell G15 5530 | |
| MSI Katana 17 B13VFK | |
| Lenovo LOQ 15IRH8 Core i7 | |
| Lenovo LOQ 16IRH8 | |
| Asus TUF Gaming A16 FA617XS | |
| Lenovo Legion Pro 5 16ARX8 (R5 7645HX, RTX 4050) | |
| Medio Intel Core i7-13620H (19421 - 34544, n=7) | |
| Lenovo LOQ 15APH8 | |
Eche un vistazo a nuestro Intel Core i7-13620H para obtener más información y comparaciones de rendimiento.
Rendimiento del sistema
El LOQ 15IRH8 aventaja a su primo LOQ 15APH8 basado en AMD en un 19% en CrossMark general, pero estos dos dispositivos están prácticamente empatados en PCMark. No observamos ningún contratiempo en el rendimiento diario del sistema durante tareas de productividad o juegos.
CrossMark: Overall | Productivity | Creativity | Responsiveness
AIDA64: Memory Copy | Memory Read | Memory Write | Memory Latency
| PCMark 10 / Score | |
| Media de la clase Gaming (5828 - 12414, n=93, últimos 2 años) | |
| Lenovo Legion Pro 5 16ARX8 (R5 7645HX, RTX 4050) | |
| Asus TUF Gaming A16 FA617XS | |
| Lenovo LOQ 15APH8 | |
| Lenovo LOQ 15IRH8 Core i7 | |
| Medio Intel Core i7-13620H, NVIDIA GeForce RTX 4050 Laptop GPU (n=1) | |
| MSI Katana 17 B13VFK | |
| HP Victus 16-r0077ng | |
| Dell G15 5530 | |
| Lenovo LOQ 16IRH8 | |
| PCMark 10 / Essentials | |
| Lenovo Legion Pro 5 16ARX8 (R5 7645HX, RTX 4050) | |
| Dell G15 5530 | |
| Lenovo LOQ 15IRH8 Core i7 | |
| Medio Intel Core i7-13620H, NVIDIA GeForce RTX 4050 Laptop GPU (n=1) | |
| Asus TUF Gaming A16 FA617XS | |
| MSI Katana 17 B13VFK | |
| HP Victus 16-r0077ng | |
| Media de la clase Gaming (8810 - 11935, n=97, últimos 2 años) | |
| Lenovo LOQ 15APH8 | |
| Lenovo LOQ 16IRH8 | |
| PCMark 10 / Productivity | |
| Media de la clase Gaming (6845 - 25323, n=95, últimos 2 años) | |
| Lenovo Legion Pro 5 16ARX8 (R5 7645HX, RTX 4050) | |
| Asus TUF Gaming A16 FA617XS | |
| Dell G15 5530 | |
| Lenovo LOQ 15APH8 | |
| Lenovo LOQ 15IRH8 Core i7 | |
| Medio Intel Core i7-13620H, NVIDIA GeForce RTX 4050 Laptop GPU (n=1) | |
| MSI Katana 17 B13VFK | |
| HP Victus 16-r0077ng | |
| Lenovo LOQ 16IRH8 | |
| PCMark 10 / Digital Content Creation | |
| Media de la clase Gaming (7602 - 19954, n=95, últimos 2 años) | |
| Asus TUF Gaming A16 FA617XS | |
| Lenovo LOQ 15APH8 | |
| Lenovo LOQ 15IRH8 Core i7 | |
| Medio Intel Core i7-13620H, NVIDIA GeForce RTX 4050 Laptop GPU (n=1) | |
| Lenovo Legion Pro 5 16ARX8 (R5 7645HX, RTX 4050) | |
| HP Victus 16-r0077ng | |
| MSI Katana 17 B13VFK | |
| Lenovo LOQ 16IRH8 | |
| Dell G15 5530 | |
| CrossMark / Overall | |
| Media de la clase Gaming (1366 - 2409, n=94, últimos 2 años) | |
| Lenovo LOQ 16IRH8 | |
| Lenovo Legion Pro 5 16ARX8 (R5 7645HX, RTX 4050) | |
| Lenovo LOQ 15IRH8 Core i7 | |
| Medio Intel Core i7-13620H, NVIDIA GeForce RTX 4050 Laptop GPU (n=1) | |
| MSI Katana 17 B13VFK | |
| Dell G15 5530 | |
| Asus TUF Gaming A16 FA617XS | |
| Lenovo LOQ 15APH8 | |
| CrossMark / Productivity | |
| Lenovo Legion Pro 5 16ARX8 (R5 7645HX, RTX 4050) | |
| Lenovo LOQ 16IRH8 | |
| Media de la clase Gaming (1386 - 2254, n=94, últimos 2 años) | |
| Lenovo LOQ 15IRH8 Core i7 | |
| Medio Intel Core i7-13620H, NVIDIA GeForce RTX 4050 Laptop GPU (n=1) | |
| MSI Katana 17 B13VFK | |
| Dell G15 5530 | |
| Asus TUF Gaming A16 FA617XS | |
| Lenovo LOQ 15APH8 | |
| CrossMark / Creativity | |
| Media de la clase Gaming (1343 - 2786, n=94, últimos 2 años) | |
| Dell G15 5530 | |
| Lenovo LOQ 16IRH8 | |
| Lenovo Legion Pro 5 16ARX8 (R5 7645HX, RTX 4050) | |
| MSI Katana 17 B13VFK | |
| Lenovo LOQ 15IRH8 Core i7 | |
| Medio Intel Core i7-13620H, NVIDIA GeForce RTX 4050 Laptop GPU (n=1) | |
| Asus TUF Gaming A16 FA617XS | |
| Lenovo LOQ 15APH8 | |
| CrossMark / Responsiveness | |
| Lenovo LOQ 16IRH8 | |
| Lenovo Legion Pro 5 16ARX8 (R5 7645HX, RTX 4050) | |
| Lenovo LOQ 15IRH8 Core i7 | |
| Medio Intel Core i7-13620H, NVIDIA GeForce RTX 4050 Laptop GPU (n=1) | |
| MSI Katana 17 B13VFK | |
| Media de la clase Gaming (1226 - 2334, n=94, últimos 2 años) | |
| Dell G15 5530 | |
| Asus TUF Gaming A16 FA617XS | |
| Lenovo LOQ 15APH8 | |
| AIDA64 / Memory Copy | |
| Media de la clase Gaming (21750 - 129946, n=105, últimos 2 años) | |
| HP Victus 16-r0077ng | |
| Asus TUF Gaming A16 FA617XS | |
| Dell G15 5530 | |
| Lenovo LOQ 15IRH8 Core i7 | |
| Medio Intel Core i7-13620H, NVIDIA GeForce RTX 4050 Laptop GPU (n=1) | |
| Lenovo LOQ 16IRH8 | |
| MSI Katana 17 B13VFK | |
| Lenovo Legion Pro 5 16ARX8 (R5 7645HX, RTX 4050) | |
| Lenovo LOQ 15APH8 | |
| AIDA64 / Memory Read | |
| Media de la clase Gaming (22956 - 118858, n=105, últimos 2 años) | |
| HP Victus 16-r0077ng | |
| Dell G15 5530 | |
| Lenovo LOQ 16IRH8 | |
| Lenovo LOQ 15IRH8 Core i7 | |
| Medio Intel Core i7-13620H, NVIDIA GeForce RTX 4050 Laptop GPU (n=1) | |
| MSI Katana 17 B13VFK | |
| Asus TUF Gaming A16 FA617XS | |
| Lenovo Legion Pro 5 16ARX8 (R5 7645HX, RTX 4050) | |
| Lenovo LOQ 15APH8 | |
| AIDA64 / Memory Write | |
| Media de la clase Gaming (22297 - 135096, n=105, últimos 2 años) | |
| Asus TUF Gaming A16 FA617XS | |
| HP Victus 16-r0077ng | |
| Dell G15 5530 | |
| Lenovo LOQ 15IRH8 Core i7 | |
| Medio Intel Core i7-13620H, NVIDIA GeForce RTX 4050 Laptop GPU (n=1) | |
| Lenovo LOQ 16IRH8 | |
| Lenovo Legion Pro 5 16ARX8 (R5 7645HX, RTX 4050) | |
| MSI Katana 17 B13VFK | |
| Lenovo LOQ 15APH8 | |
| AIDA64 / Memory Latency | |
| Lenovo LOQ 15IRH8 Core i7 | |
| Medio Intel Core i7-13620H, NVIDIA GeForce RTX 4050 Laptop GPU (n=1) | |
| Lenovo LOQ 16IRH8 | |
| Media de la clase Gaming (75.3 - 259, n=105, últimos 2 años) | |
| MSI Katana 17 B13VFK | |
| Lenovo LOQ 15APH8 | |
| HP Victus 16-r0077ng | |
| Dell G15 5530 | |
| Asus TUF Gaming A16 FA617XS | |
| Lenovo Legion Pro 5 16ARX8 (R5 7645HX, RTX 4050) | |
* ... más pequeño es mejor
| PCMark 8 Home Score Accelerated v2 | 5795 puntos | |
| PCMark 8 Work Score Accelerated v2 | 6177 puntos | |
| PCMark 10 Score | 7656 puntos | |
ayuda | ||
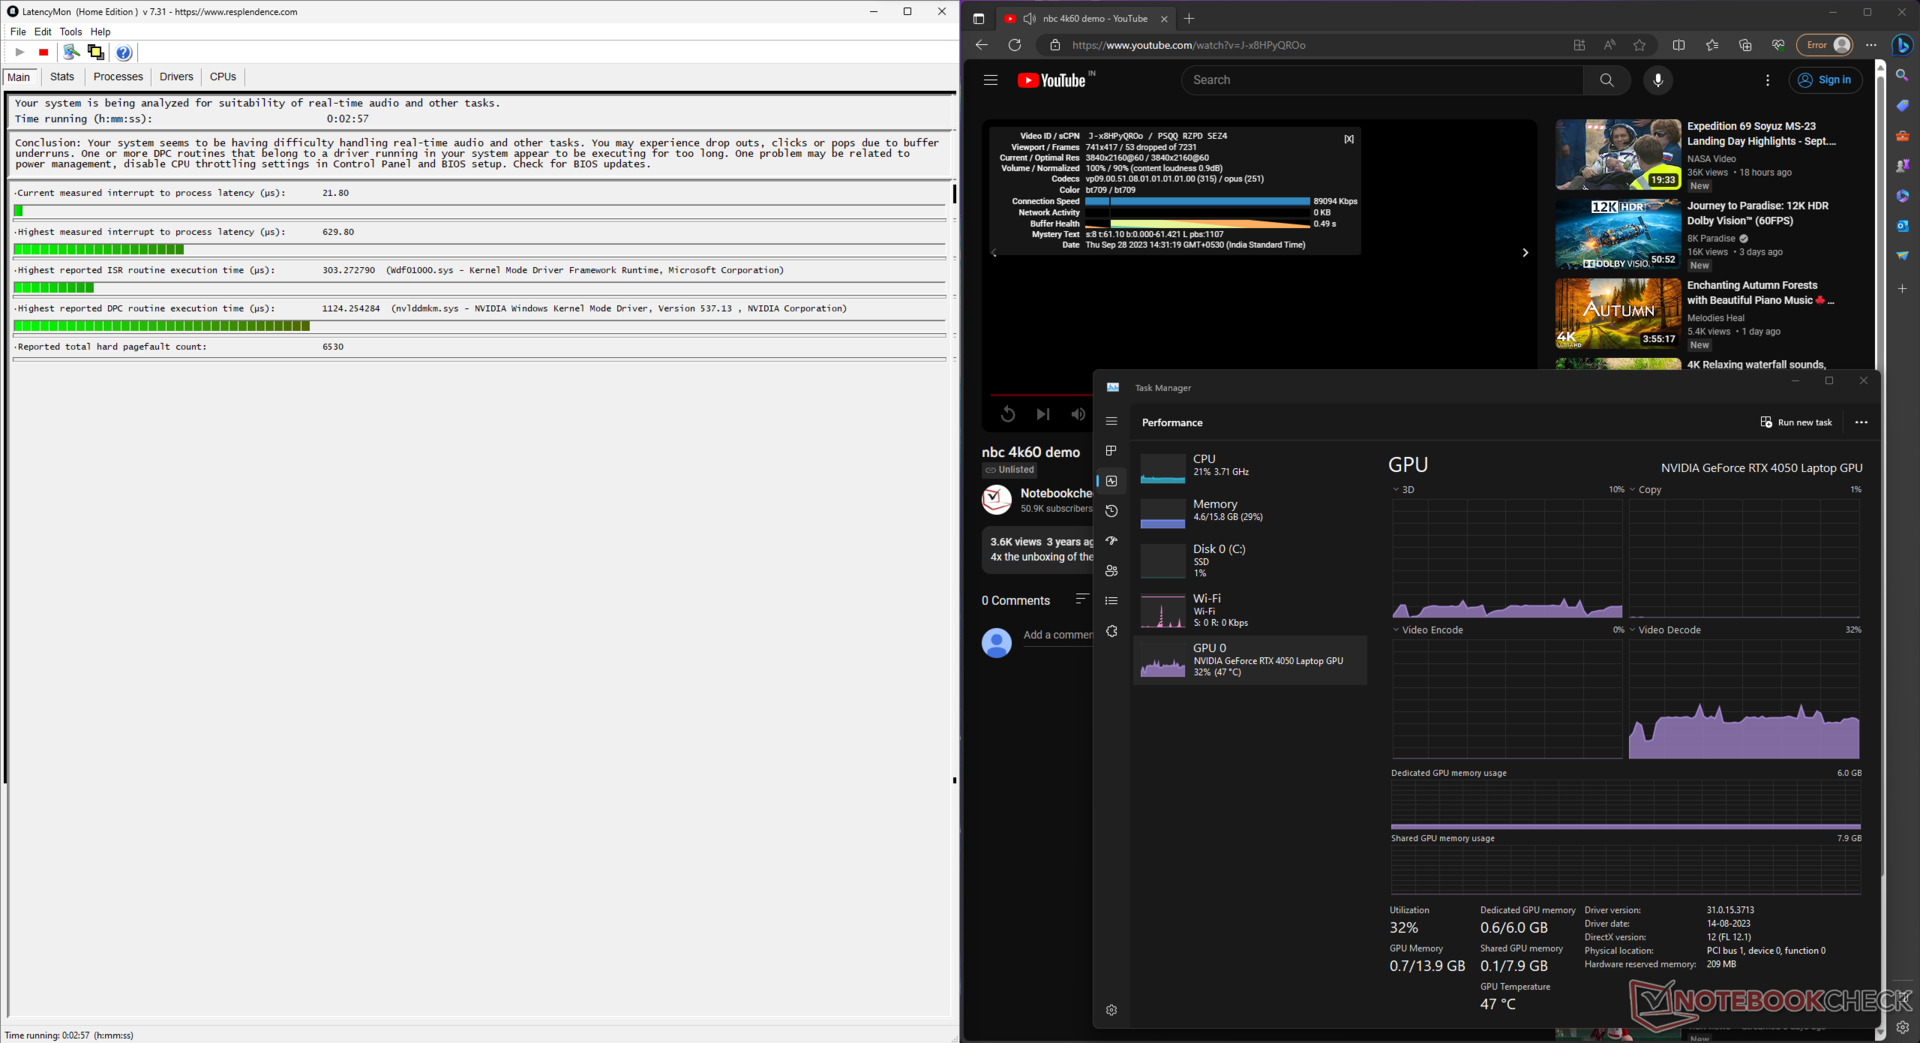
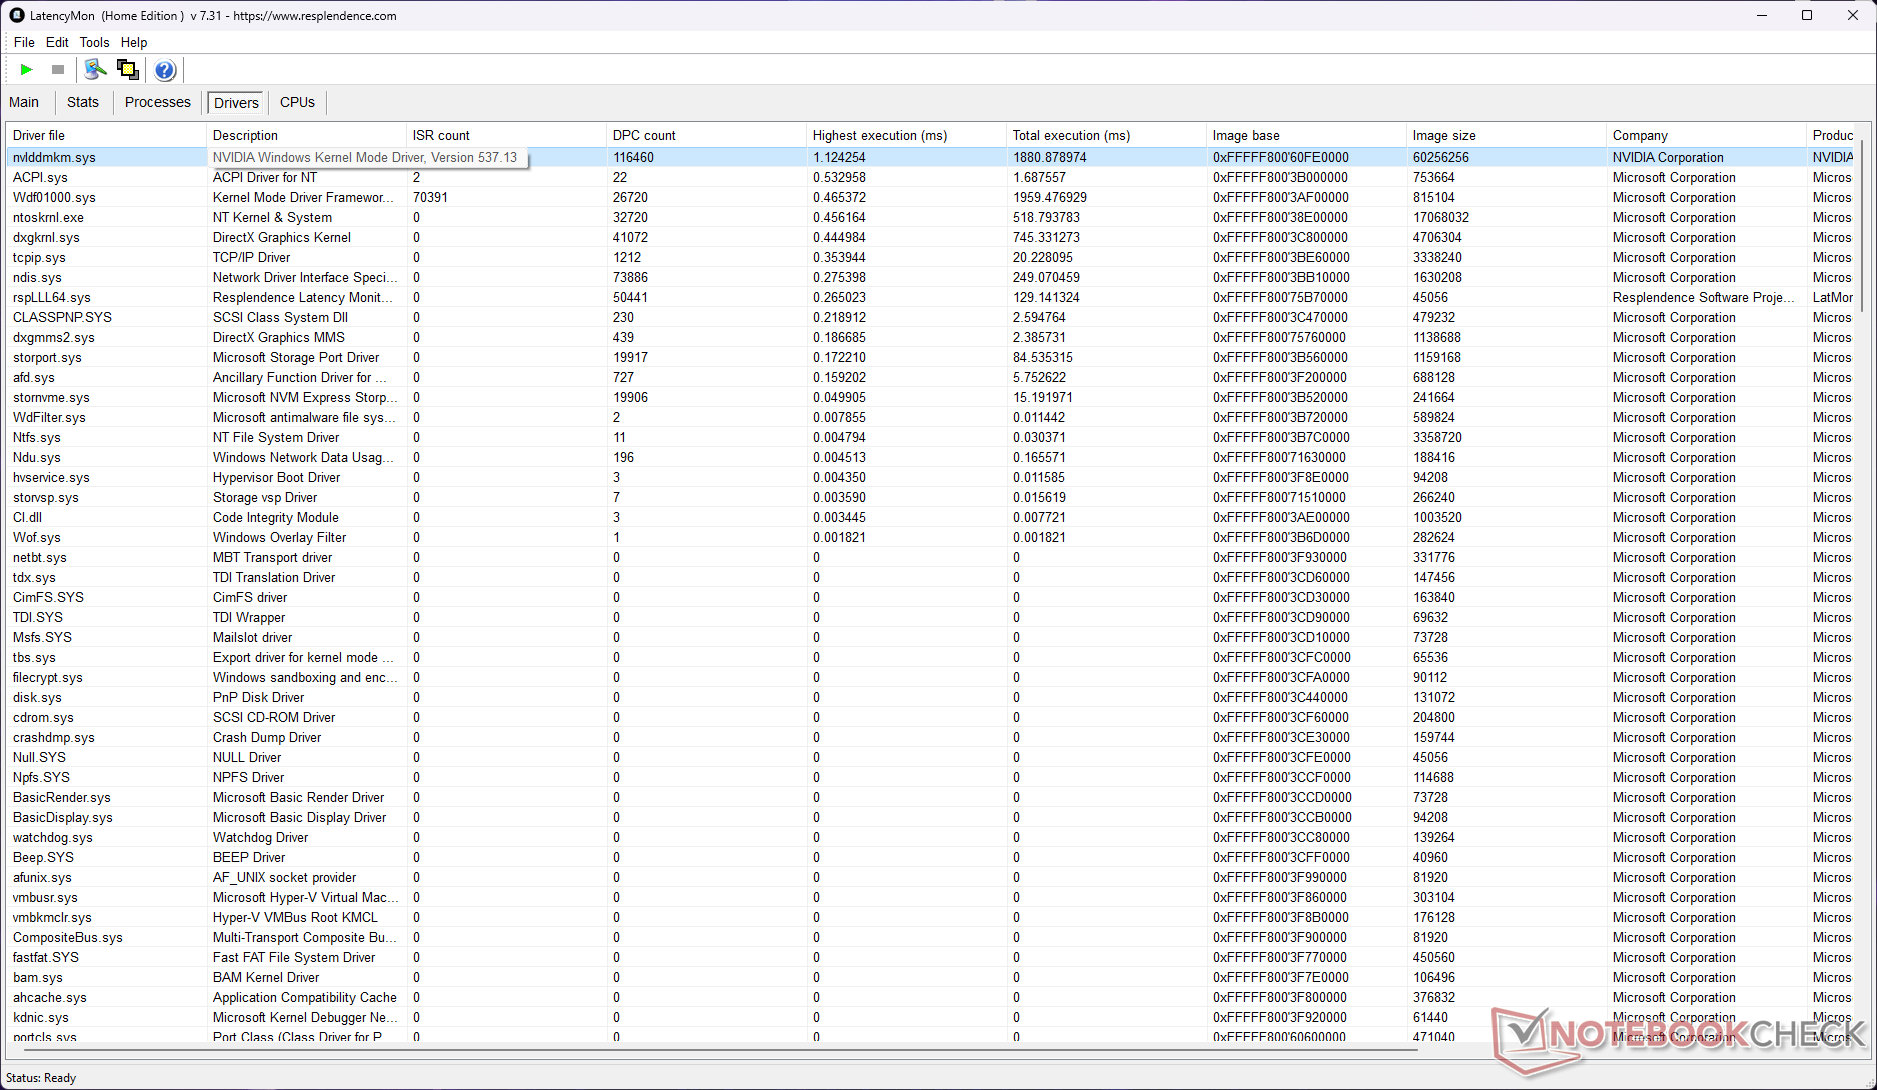
Latencia del CPD
La latencia DPC es un poco más alta, pero el LOQ 15 Core i7 se comporta mucho mejor en comparación con sus compañeros en la prueba.
| DPC Latencies / LatencyMon - interrupt to process latency (max), Web, Youtube, Prime95 | |
| Dell G15 5530 | |
| MSI Katana 17 B13VFK | |
| HP Victus 16-r0077ng | |
| Lenovo LOQ 15APH8 | |
| Lenovo LOQ 16IRH8 | |
| Asus TUF Gaming A16 FA617XS | |
| Lenovo Legion Pro 5 16ARX8 (R5 7645HX, RTX 4050) | |
| Lenovo LOQ 15IRH8 Core i7 | |
* ... más pequeño es mejor
Nuestra Clasificación de la latencia del CPD ofrece una visión general de la latencia medida en los dispositivos analizados.
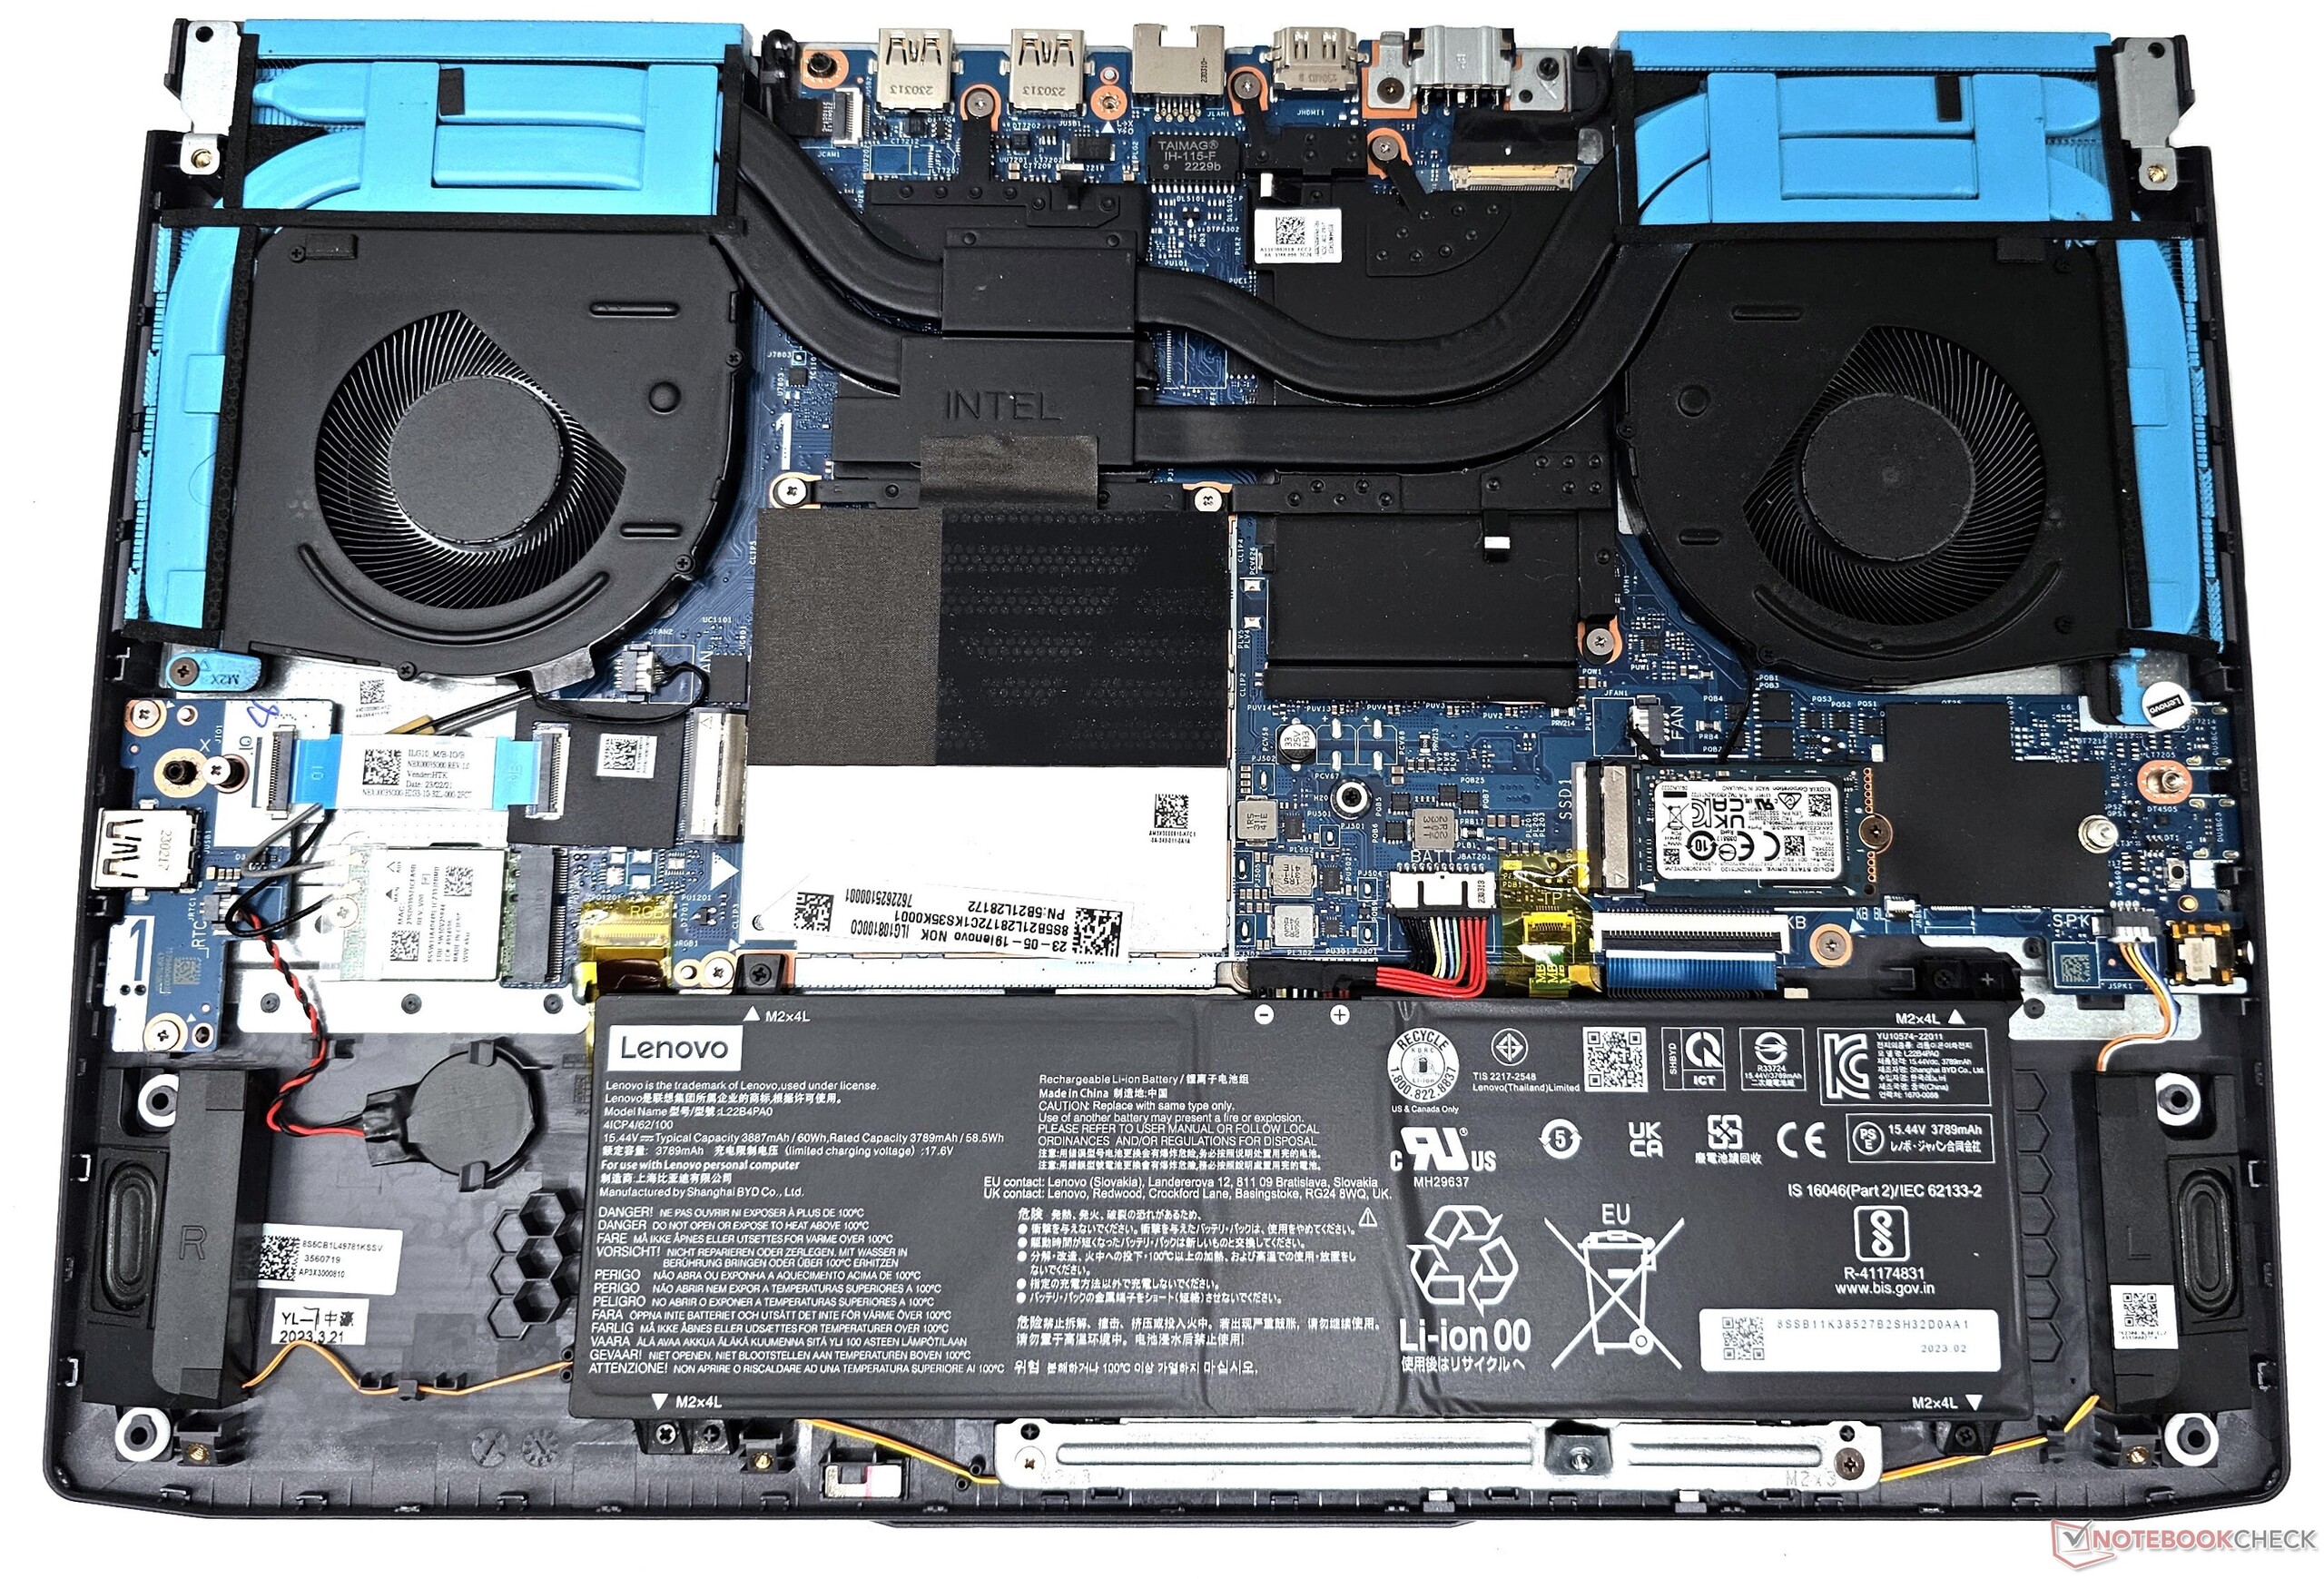
Dispositivos de almacenamiento
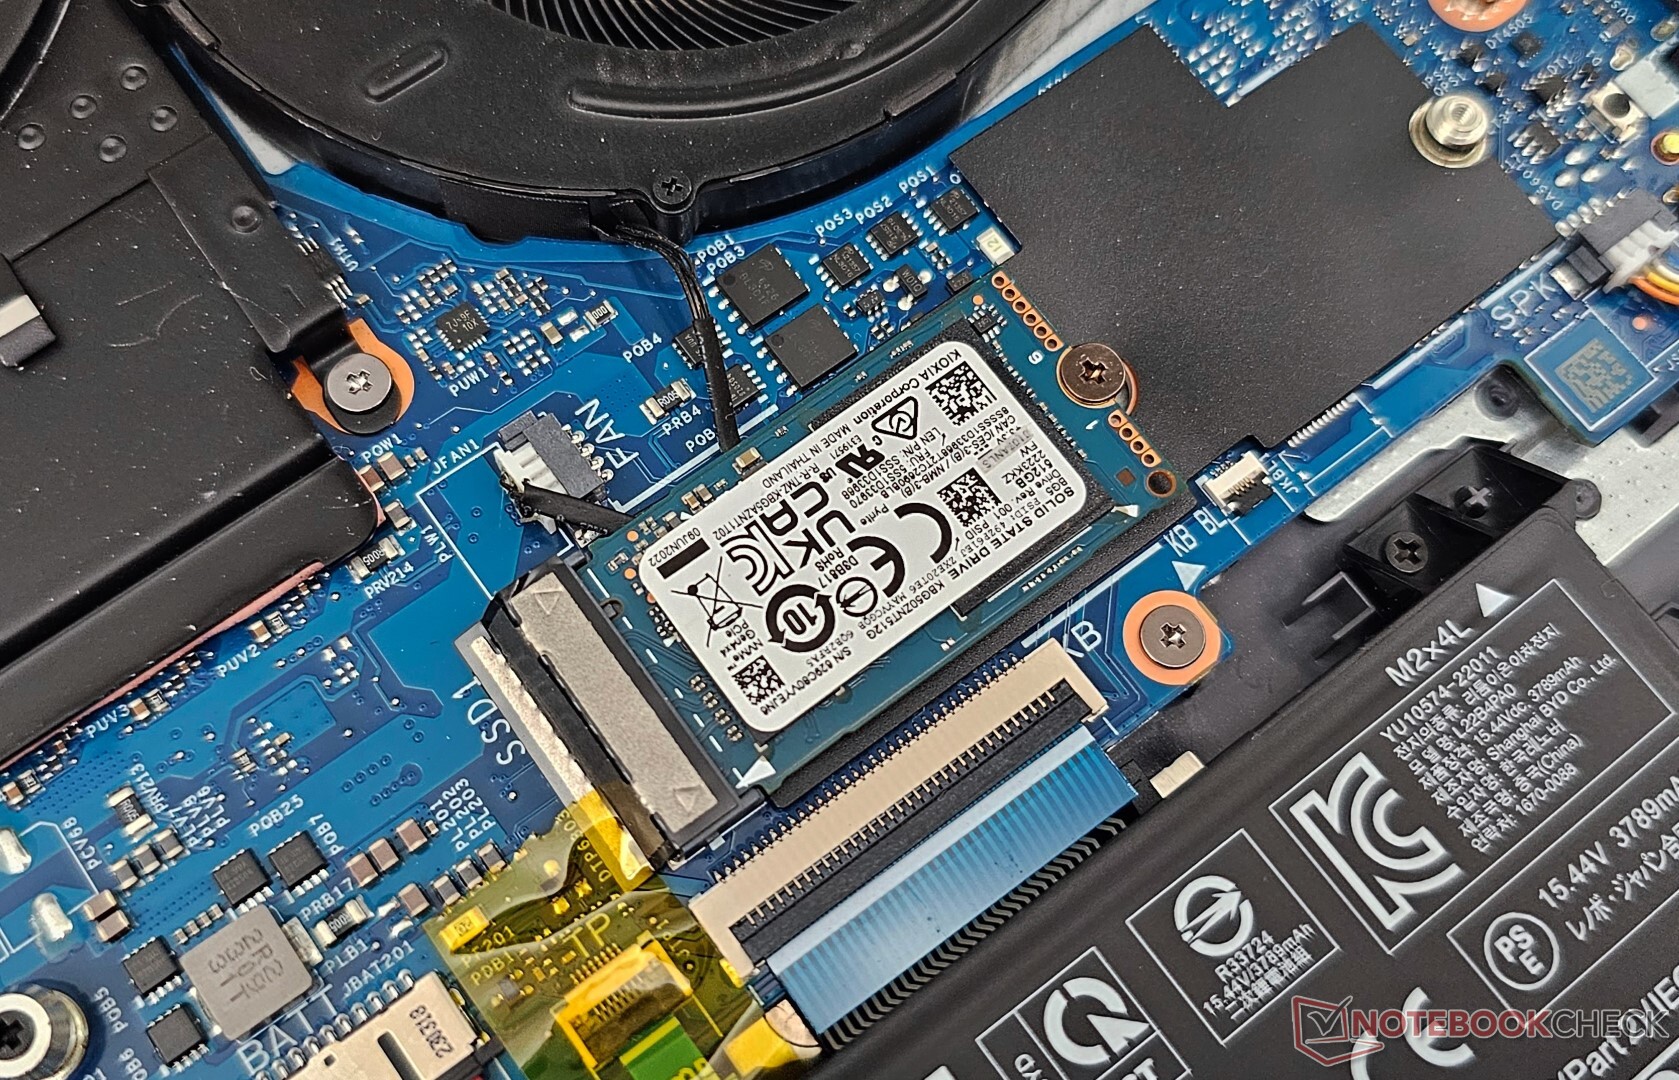
Nuestra unidad LOQ 15IRH8 venía equipada con una SSD NVMe M.2 2230 PCIe Gen4 de 512 GB de Kioxia. Puede sustituirla por una unidad M.2280 de mayor capacidad si es necesario. También hay una ranura M.2 2280 libre disponible para ampliar el almacenamiento.
El rendimiento general de la unidad queda por detrás de la unidad Kioxia de 1 TB que se encuentra en el HP Victus 16. La unidad SSD también tiene dificultades para mantener una velocidad de lectura constante, ya que observamos caídas de rendimiento después de la 25ª ejecución en nuestra prueba de bucle de lectura DiskSpd a una profundidad de cola de 8.

* ... más pequeño es mejor
Disk Throttling: DiskSpd Read Loop, Queue Depth 8
Puede obtener más información y comparaciones de rendimiento en nuestros Puntos de referencia de HDD y SSD página.
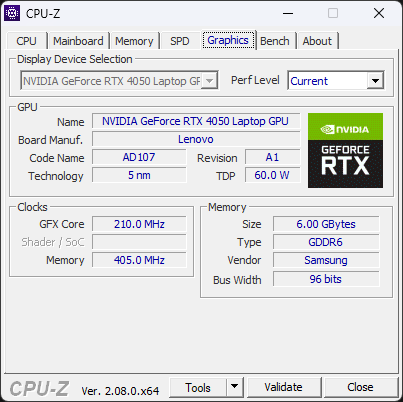
Rendimiento de la GPU
La GPU RTX 4050 para portátiles del LOQ 15IRH8 está clasificada para un TGP de 95 W, pero tiene margen para utilizar más potencia durante el estrés. Vemos que la misma GPU en el LOQ 15APH8 es aproximadamente un 6% más rápida en las pruebas 3DMark acumulativas.
Curiosamente, esta RTX 4050 de 95 W está sólo un peldaño por detrás de la variante de 140 W en el Lenovo Legion Pro 5. Sin embargo, esta última compensa este déficit en la prueba comparativa Blender CUDA.
| 3DMark 11 Performance | 27474 puntos | |
| 3DMark Ice Storm Standard Score | 229274 puntos | |
| 3DMark Cloud Gate Standard Score | 49040 puntos | |
| 3DMark Fire Strike Score | 19230 puntos | |
| 3DMark Fire Strike Extreme Score | 9873 puntos | |
| 3DMark Time Spy Score | 8701 puntos | |
ayuda | ||
| Blender / v3.3 Classroom OPTIX/RTX | |
| Medio NVIDIA GeForce RTX 4050 Laptop GPU (25 - 37, n=40) | |
| Lenovo Legion Pro 5 16ARX8 (R5 7645HX, RTX 4050) | |
| Lenovo LOQ 15IRH8 Core i7 | |
| MSI Katana 17 B13VFK | |
| Lenovo LOQ 15APH8 | |
| HP Victus 16-r0077ng | |
| Lenovo LOQ 16IRH8 | |
| Dell G15 5530 | |
| Media de la clase Gaming (9 - 32, n=106, últimos 2 años) | |
| Blender / v3.3 Classroom CUDA | |
| Medio NVIDIA GeForce RTX 4050 Laptop GPU (47 - 68, n=39) | |
| Lenovo LOQ 15IRH8 Core i7 | |
| Lenovo LOQ 15APH8 | |
| Lenovo Legion Pro 5 16ARX8 (R5 7645HX, RTX 4050) | |
| MSI Katana 17 B13VFK | |
| Lenovo LOQ 16IRH8 | |
| Dell G15 5530 | |
| HP Victus 16-r0077ng | |
| Media de la clase Gaming (15 - 228, n=106, últimos 2 años) | |
| Blender / v3.3 Classroom CPU | |
| Lenovo LOQ 15IRH8 Core i7 | |
| Medio NVIDIA GeForce RTX 4050 Laptop GPU (243 - 907, n=40) | |
| Lenovo LOQ 16IRH8 | |
| HP Victus 16-r0077ng | |
| Lenovo Legion Pro 5 16ARX8 (R5 7645HX, RTX 4050) | |
| MSI Katana 17 B13VFK | |
| Asus TUF Gaming A16 FA617XS | |
| Lenovo LOQ 15APH8 | |
| Dell G15 5530 | |
| Media de la clase Gaming (122 - 565, n=102, últimos 2 años) | |
* ... más pequeño es mejor
Rendimiento en juegos
También se observan tendencias similares en las pruebas comparativas de juegos. La RTX 4050 de 95 W del LOQ 15 y la RTX 4050 de 140 W del Legion Pro 5 ofrecieron un espectáculo casi idéntico en las pruebas acumuladas de juegos a 1080p Ultra, pero la mayor potencia de este último permite obtener ventajas perceptibles en QHD Ultra.
El LOQ 15IRH8 es esencialmente una máquina de juegos 1080p Ultra. Se pueden conseguir framerates jugables en QHD Ultra en títulos algo más antiguos. Los jugadores que deseen obtener más fotogramas en QHD o 4K tendrán que recurrir inevitablemente a tecnologías de escalado ascendente como AMD FSR, Nvidia DLSS o Intel XeSS en función del título.
| The Witcher 3 - 1920x1080 Ultra Graphics & Postprocessing (HBAO+) | |
| Media de la clase Gaming (104.7 - 240, n=7, últimos 2 años) | |
| HP Victus 16-r0077ng | |
| MSI Katana 17 B13VFK | |
| Dell G15 5530 | |
| Lenovo LOQ 16IRH8 | |
| Asus TUF Gaming A16 FA617XS | |
| Lenovo Legion Pro 5 16ARX8 (R5 7645HX, RTX 4050) | |
| Lenovo LOQ 15IRH8 Core i7 | |
| Lenovo LOQ 15APH8 | |
| The Witcher 3 - 2560x1440 Ultra Graphics & Postprocessing (HBAO+) | |
| Media de la clase Gaming (130 - 199.1, n=5, últimos 2 años) | |
| Lenovo LOQ 16IRH8 | |
| Lenovo LOQ 15IRH8 Core i7 | |
| Medio NVIDIA GeForce RTX 4050 Laptop GPU (39 - 61.3, n=8) | |
| Cyberpunk 2077 1.6 | |
| 1920x1080 Ultra Preset | |
| Dell G15 5530 | |
| MSI Katana 17 B13VFK | |
| Lenovo LOQ 15APH8 | |
| Lenovo LOQ 15IRH8 Core i7 | |
| Medio NVIDIA GeForce RTX 4050 Laptop GPU (44.4 - 79.4, n=14) | |
| 2560x1440 Ultra Preset | |
| MSI Katana 17 B13VFK | |
| Lenovo LOQ 15IRH8 Core i7 | |
| Medio NVIDIA GeForce RTX 4050 Laptop GPU (27.2 - 43.1, n=10) | |
| 1920x1080 Ray Tracing Ultra Preset (DLSS off) | |
| Dell G15 5530 | |
| Medio NVIDIA GeForce RTX 4050 Laptop GPU (15.8 - 65.6, n=5) | |
| MSI Katana 17 B13VFK | |
| Lenovo LOQ 15IRH8 Core i7 | |
| F1 22 | |
| 1920x1080 Ultra High Preset AA:T AF:16x | |
| Media de la clase Gaming (40.1 - 121.2, n=4, últimos 2 años) | |
| Dell G15 5530 | |
| MSI Katana 17 B13VFK | |
| Lenovo LOQ 15IRH8 Core i7 | |
| Asus TUF Gaming A16 FA617XS | |
| Medio NVIDIA GeForce RTX 4050 Laptop GPU (10.9 - 56.4, n=24) | |
| 2560x1440 Ultra High Preset AA:T AF:16x | |
| Media de la clase Gaming (42 - 77.8, n=3, últimos 2 años) | |
| MSI Katana 17 B13VFK | |
| Lenovo LOQ 15IRH8 Core i7 | |
| Medio NVIDIA GeForce RTX 4050 Laptop GPU (6.58 - 34, n=14) | |
| F1 23 | |
| 1920x1080 Ultra High Preset AA:T AF:16x | |
| Lenovo Legion Pro 5 16ARX8 (R5 7645HX, RTX 4050) | |
| Lenovo LOQ 15IRH8 Core i7 | |
| Medio NVIDIA GeForce RTX 4050 Laptop GPU (25.7 - 60.8, n=14) | |
| 2560x1440 Ultra High Preset AA:T AF:16x | |
| Lenovo Legion Pro 5 16ARX8 (R5 7645HX, RTX 4050) | |
| Lenovo LOQ 15IRH8 Core i7 | |
| Medio NVIDIA GeForce RTX 4050 Laptop GPU (16.7 - 40.8, n=11) | |
La tabla de FPS de Witcher 3
Aunque el rendimiento sostenido (o la falta de él) de la CPU del LOQ 15 levanta cejas, la refrigeración del portátil parece adecuada para la GPU RTX 4050 Laptop, como demuestran las velocidades de fotogramas relativamente estables en The Witcher 3 a 1080p Ultra.
| bajo | medio | alto | ultra | QHD | |
|---|---|---|---|---|---|
| GTA V (2015) | 185.9 | 179.7 | 168.9 | 93.2 | 66 |
| The Witcher 3 (2015) | 390 | 286 | 167.6 | 85.6 | 61.3 |
| Dota 2 Reborn (2015) | 196.3 | 178.3 | 171.1 | 162.2 | |
| Final Fantasy XV Benchmark (2018) | 192.9 | 121.2 | 84 | 60.9 | |
| X-Plane 11.11 (2018) | 159.9 | 139.8 | 110.2 | ||
| Far Cry 5 (2018) | 156 | 135 | 128 | 121 | 83 |
| Strange Brigade (2018) | 475 | 211 | 171.8 | 149.2 | 95.5 |
| Cyberpunk 2077 1.6 (2022) | 103.3 | 85.5 | 72.9 | 67.8 | 41 |
| F1 22 (2022) | 233 | 224 | 172.3 | 55 | 33.9 |
| F1 23 (2023) | 228 | 222 | 158.4 | 44.1 | 34.1 |
Emisiones: Altas temperaturas superficiales bajo carga
Ruido del sistema
El ruido del ventilador del LOQ 15IRH8 en reposo es en gran medida similar al que hemos visto con la variante AMD del LOQ 15, pero los ventiladores de este último son aproximadamente un 7% más ruidosos a plena carga. Lenovo ha limitado los niveles de ruido de los ventiladores por debajo de ciertos umbrales en función del perfil de potencia seleccionado, como puede verse en la tabla siguiente.
El modo Rendimiento se queda justo por debajo de la marca de 50 dB(A) bajo carga. Mientras que el modo Silencioso resulta en un golpe significativo al rendimiento de la CPU, los juegos deberían seguir siendo comparativamente amenos frente al perfil Rendimiento.
Ruido
| Ocioso |
| 29.03 / 29.03 / 29.03 dB(A) |
| Carga |
| 48.7 / 48.7 dB(A) |
 | ||
30 dB silencioso 40 dB(A) audible 50 dB(A) ruidosamente alto |
||
min: | ||
| Modo de rendimiento | Al ralentí dB(A) | Carga media dB(A) | Carga máxima dB(A) | La Witcher 3 1080p Ultra dB(A) |
|---|---|---|---|---|
| Silencio | 25,28 | 33,09 | 36,07 | 36,69 / 78 fps |
| Equilibrio | 25,28 | 40,40 | 45,15 | 45,42 / 83 fps |
| Rendimiento | 29.03 | 48.72 | 48.71 | 48.52 / 85 fps |
| Lenovo LOQ 15IRH8 Core i7 i7-13620H, GeForce RTX 4050 Laptop GPU | Lenovo LOQ 16IRH8 i7-13620H, GeForce RTX 4060 Laptop GPU | Lenovo LOQ 15APH8 R7 7840HS, GeForce RTX 4050 Laptop GPU | MSI Katana 17 B13VFK i7-13620H, GeForce RTX 4060 Laptop GPU | Lenovo Legion Pro 5 16ARX8 (R5 7645HX, RTX 4050) R5 7645HX, GeForce RTX 4050 Laptop GPU | HP Victus 16-r0077ng i7-13700H, GeForce RTX 4070 Laptop GPU | Dell G15 5530 i7-13650HX, GeForce RTX 4060 Laptop GPU | Asus TUF Gaming A16 FA617XS R9 7940HS, Radeon RX 7600S | |
|---|---|---|---|---|---|---|---|---|
| Noise | 3% | 9% | -6% | 14% | 2% | 12% | 3% | |
| apagado / medio ambiente * (dB) | 23.69 | 23 3% | 23.1 2% | 24.5 -3% | 23 3% | 25 -6% | 20.41 14% | 25 -6% |
| Idle Minimum * (dB) | 29.03 | 23 21% | 23.1 20% | 24.5 16% | 23 21% | 28 4% | 26.85 8% | 25 14% |
| Idle Average * (dB) | 29.03 | 23 21% | 23.1 20% | 24.5 16% | 23 21% | 29 -0% | 26.85 8% | 26 10% |
| Idle Maximum * (dB) | 29.03 | 27.66 5% | 25.2 13% | 40 -38% | 24.42 16% | 30 -3% | 26.85 8% | 28 4% |
| Load Average * (dB) | 48.7 | 53.62 -10% | 44.3 9% | 48.3 1% | 34.94 28% | 43 12% | 27.65 43% | 43 12% |
| Witcher 3 ultra * (dB) | 48.5 | 53.5 -10% | 45.8 6% | 56 -15% | 43.79 10% | 46 5% | 47.9 1% | 51 -5% |
| Load Maximum * (dB) | 48.7 | 53.5 -10% | 52 -7% | 59.1 -21% | 50 -3% | 48 1% | 47.86 2% | 53 -9% |
* ... más pequeño es mejor
Temperatura
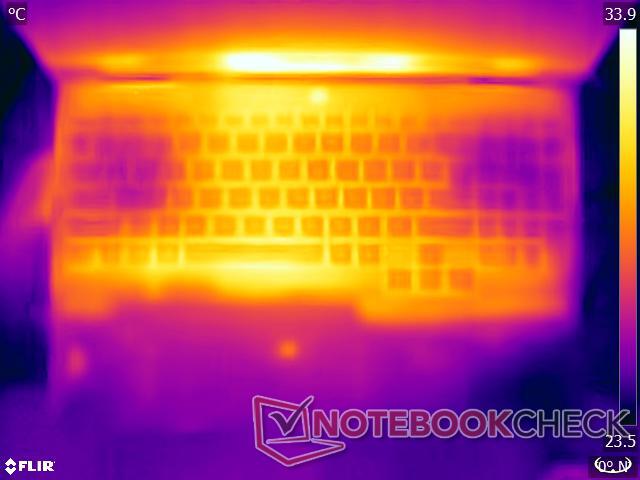
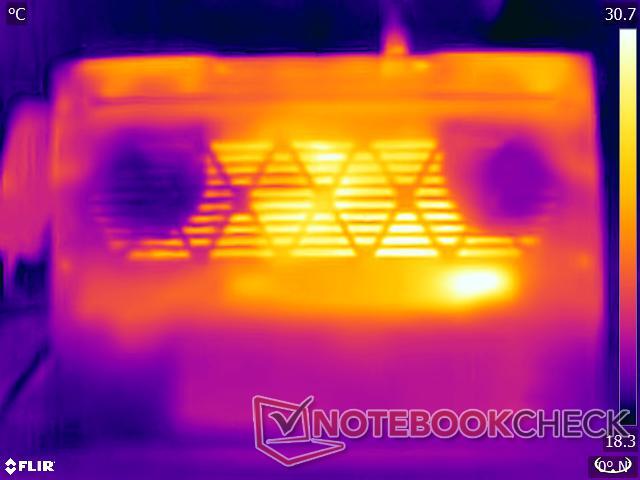
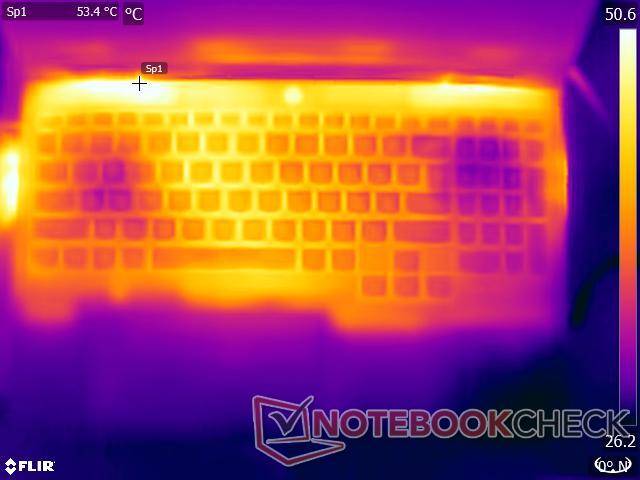
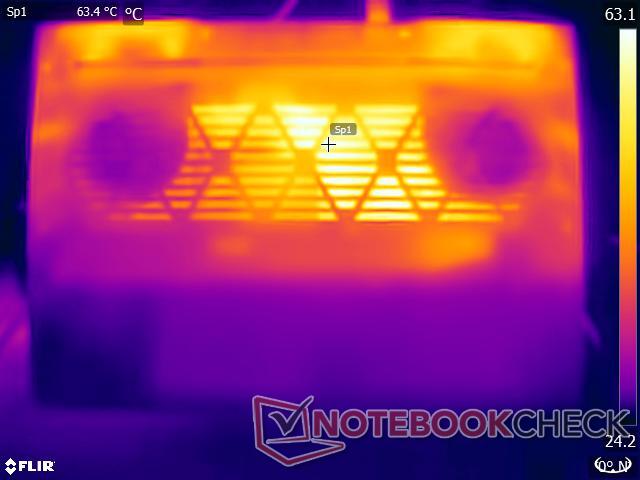
Las temperaturas de la superficie mientras se estresa en el perfil de Rendimiento pueden calentarse bastante, especialmente en la parte inferior del chasis. Aunque nuestras pruebas de estrés representan escenarios extremos, no recomendamos utilizar este dispositivo sobre el regazo para nada que no sea un uso ligero.
(-) La temperatura máxima en la parte superior es de 46.4 °C / 116 F, frente a la media de 40.4 °C / 105 F, que oscila entre 21.2 y 68.8 °C para la clase Gaming.
(-) El fondo se calienta hasta un máximo de 59.2 °C / 139 F, frente a la media de 43.2 °C / 110 F
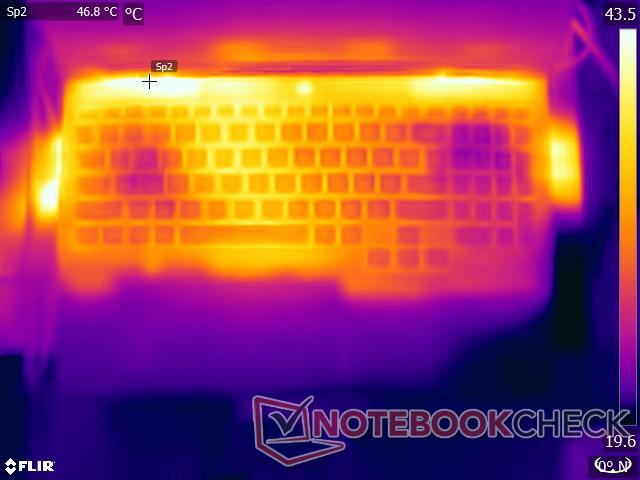
(±) En reposo, la temperatura media de la parte superior es de 32.7 °C / 91# F, frente a la media del dispositivo de 33.9 °C / 93 F.
(-) Jugando a The Witcher 3, la temperatura media de la parte superior es de 39.4 °C / 103 F, frente a la media del dispositivo de 33.9 °C / 93 F.
(+) Los reposamanos y el panel táctil alcanzan como máximo la temperatura de la piel (34 °C / 93.2 F) y, por tanto, no están calientes.
(-) La temperatura media de la zona del reposamanos de dispositivos similares fue de 28.8 °C / 83.8 F (-5.2 °C / -9.4 F).

| Lenovo LOQ 15IRH8 Core i7 Intel Core i7-13620H, NVIDIA GeForce RTX 4050 Laptop GPU | Lenovo LOQ 16IRH8 Intel Core i7-13620H, NVIDIA GeForce RTX 4060 Laptop GPU | Lenovo LOQ 15APH8 AMD Ryzen 7 7840HS, NVIDIA GeForce RTX 4050 Laptop GPU | MSI Katana 17 B13VFK Intel Core i7-13620H, NVIDIA GeForce RTX 4060 Laptop GPU | Lenovo Legion Pro 5 16ARX8 (R5 7645HX, RTX 4050) AMD Ryzen 5 7645HX, NVIDIA GeForce RTX 4050 Laptop GPU | HP Victus 16-r0077ng Intel Core i7-13700H, NVIDIA GeForce RTX 4070 Laptop GPU | Dell G15 5530 Intel Core i7-13650HX, NVIDIA GeForce RTX 4060 Laptop GPU | Asus TUF Gaming A16 FA617XS AMD Ryzen 9 7940HS, AMD Radeon RX 7600S | |
|---|---|---|---|---|---|---|---|---|
| Heat | 10% | 13% | 11% | 1% | 3% | -3% | 9% | |
| Maximum Upper Side * (°C) | 46.4 | 48 -3% | 44.4 4% | 41.6 10% | 45 3% | 51 -10% | 54 -16% | 53 -14% |
| Maximum Bottom * (°C) | 59.2 | 59 -0% | 52 12% | 43.1 27% | 54 9% | 54 9% | 62.2 -5% | 48 19% |
| Idle Upper Side * (°C) | 34.4 | 28 19% | 28 19% | 32 7% | 36 -5% | 37 -8% | 33.4 3% | 30 13% |
| Idle Bottom * (°C) | 36.2 | 28 23% | 29.6 18% | 35.8 1% | 38 -5% | 29 20% | 33.4 8% | 30 17% |
* ... más pequeño es mejor
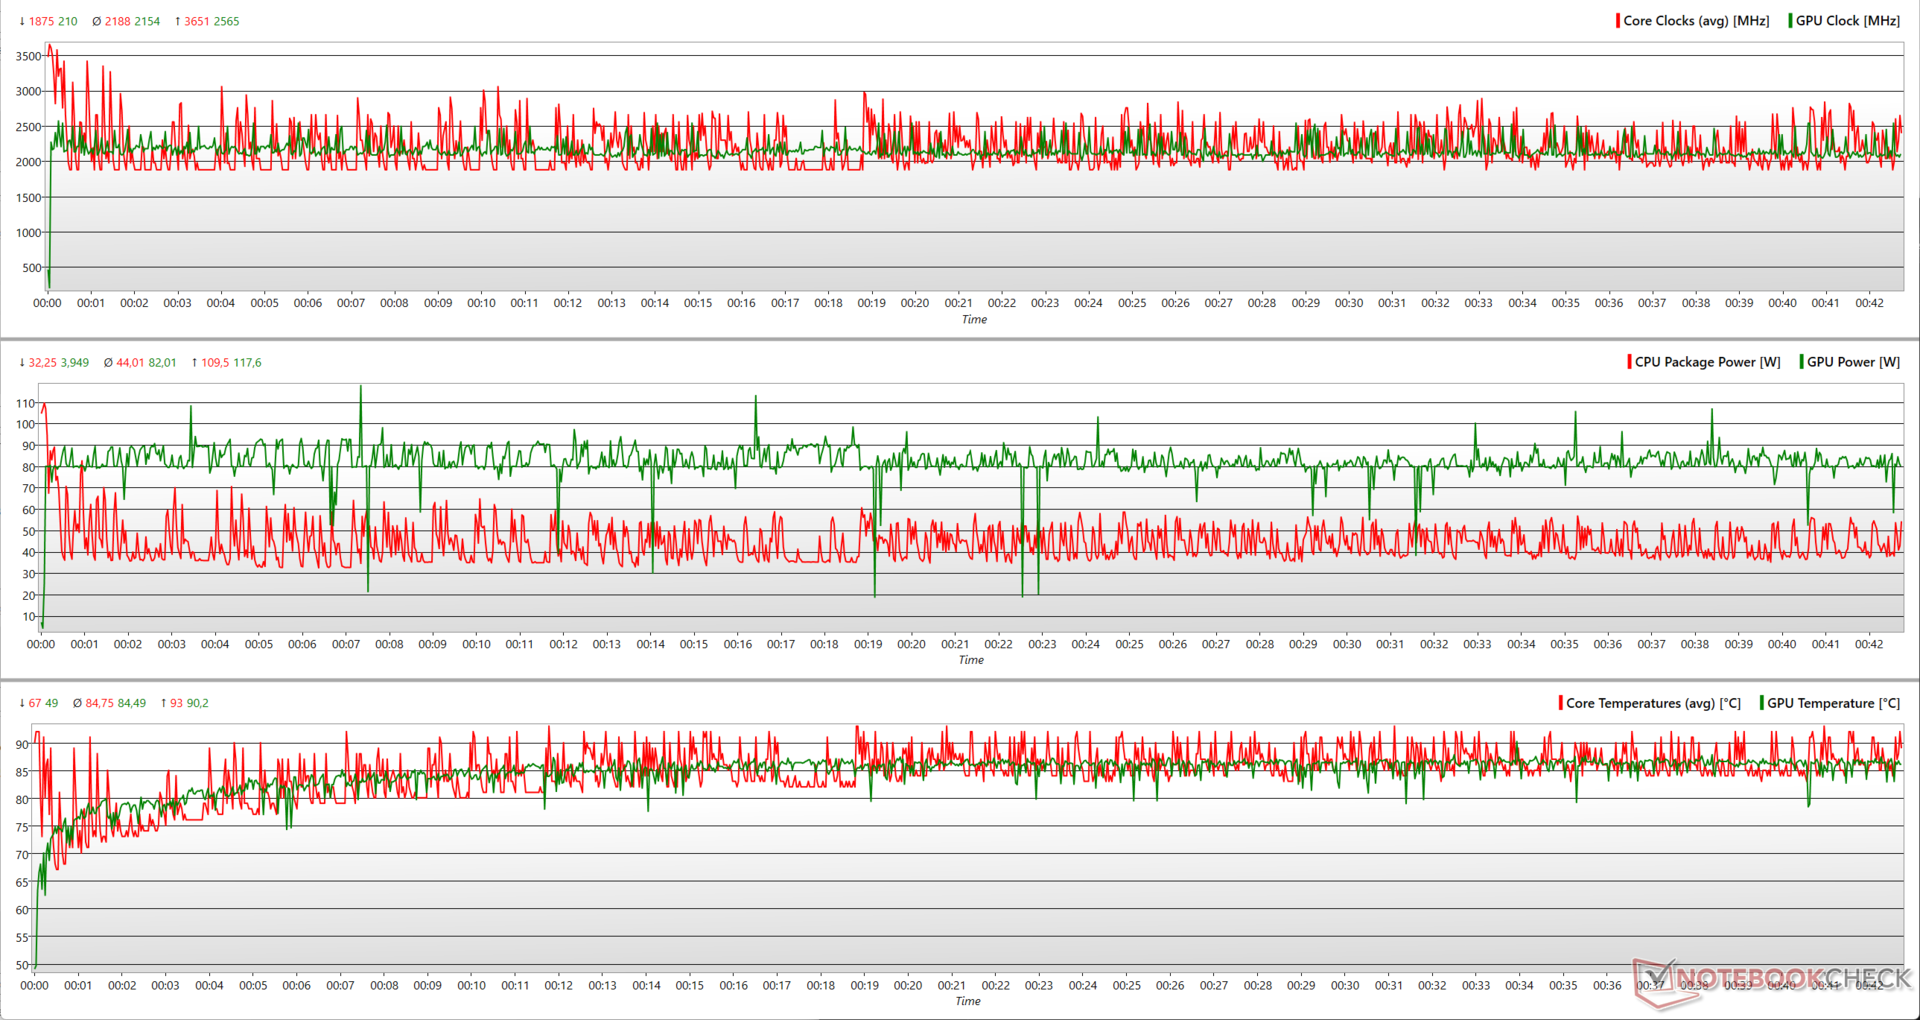
Prueba de estrés
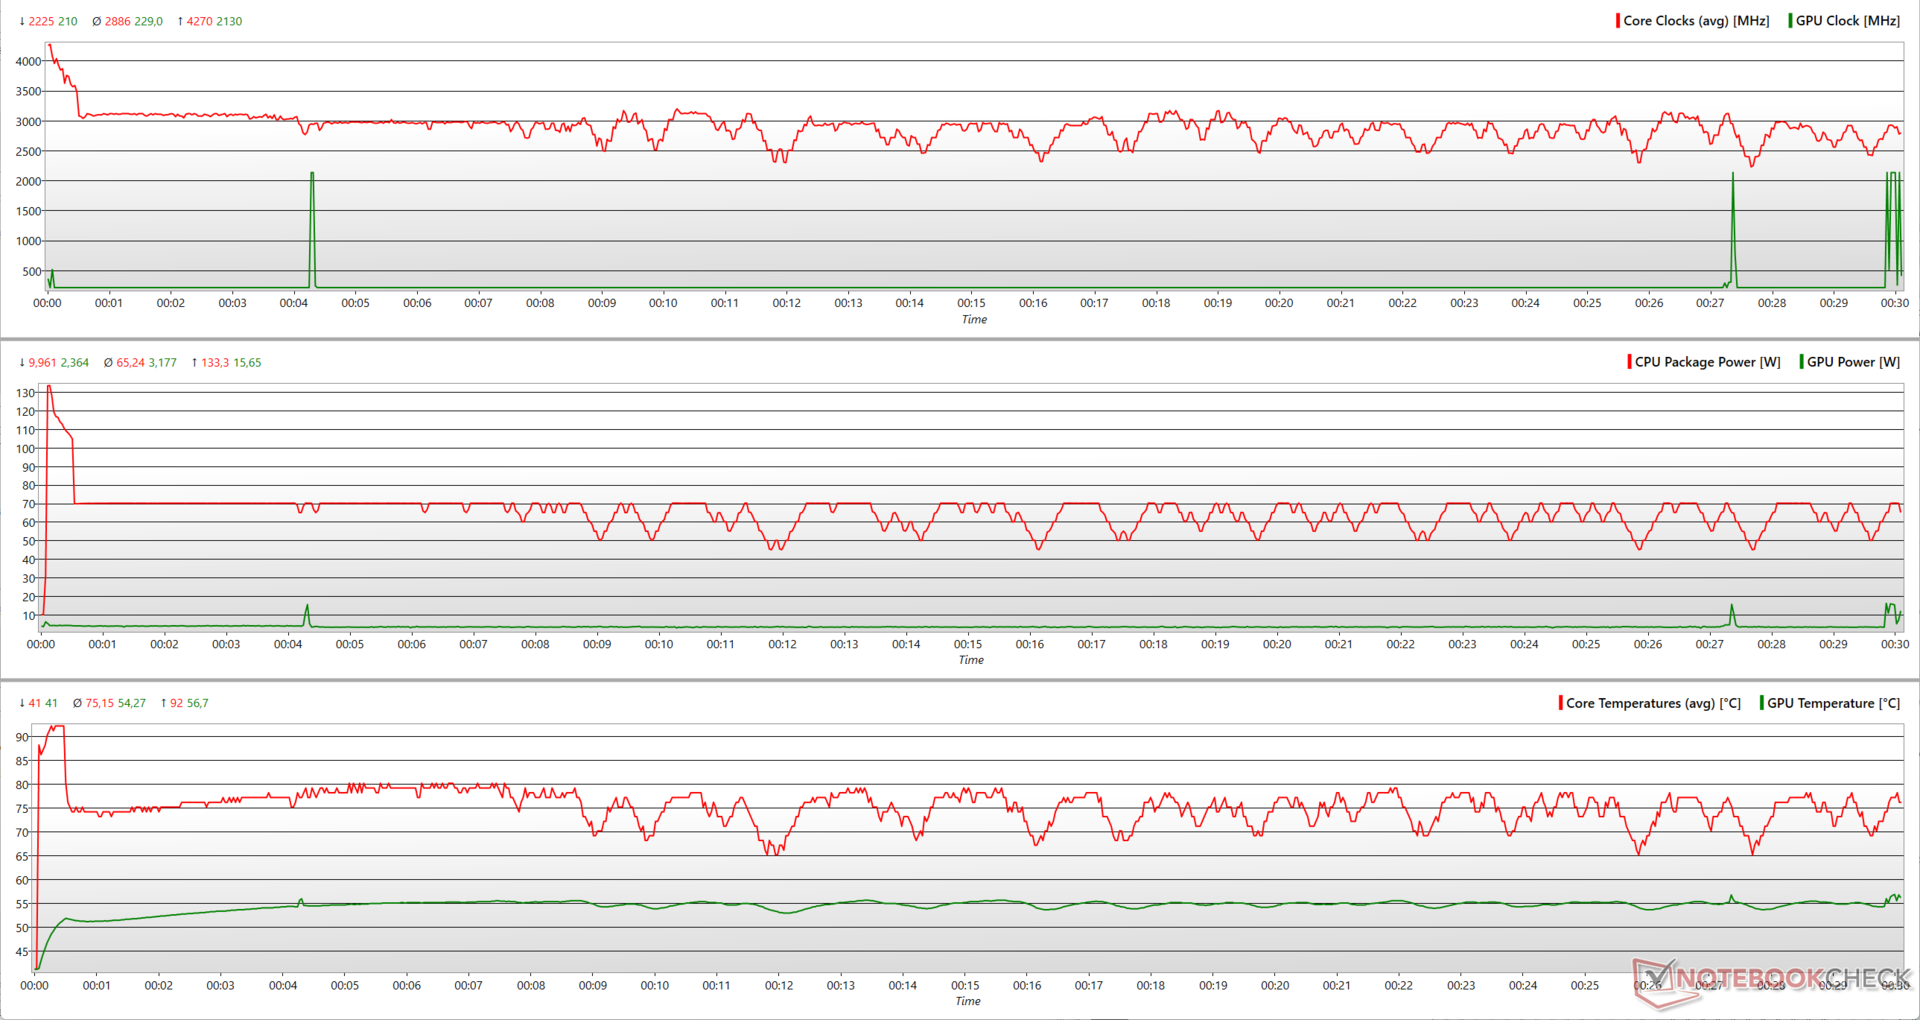
A diferencia de lo que hemos visto anteriormente con la prueba de bucle multinúcleo Cinebench R15, estresando el LOQ 15 con Prime95 en el lugar grandes FFTs ve el Core i7-13620H finalmente ser capaz de llegar a 133 W con un reloj máximo de 4,27 GHz. Sin embargo, esto es de corta duración como el procesador finalmente se asienta en una potencia media del paquete de 65 W.
Un estrés combinado de Prime95 y FurMark indica que el RTX 4050 puede utilizar hasta 117 W con un reloj máximo de 2.565 MHz. El Core i7-13620H tiene que lidiar con un pico de aceleración de 3,6 GHz, ya que tiene que compartir el margen térmico y de potencia con la RTX 4050.
| Prueba de estrés | Relojdela CPU (GHz) | Reloj de la GPU (MHz) | Temperatura media dela CPU (°C) | Temperatura media de la GPU (°C) |
| Sistema en reposo | 4,3 | 210 | 37 | 38,4 |
| Prime95 | 4,8 | 210 | 75 | 54,2 |
| Prime95+ FurMark | 3,2 | 2.220 | 77 | 79,7 |
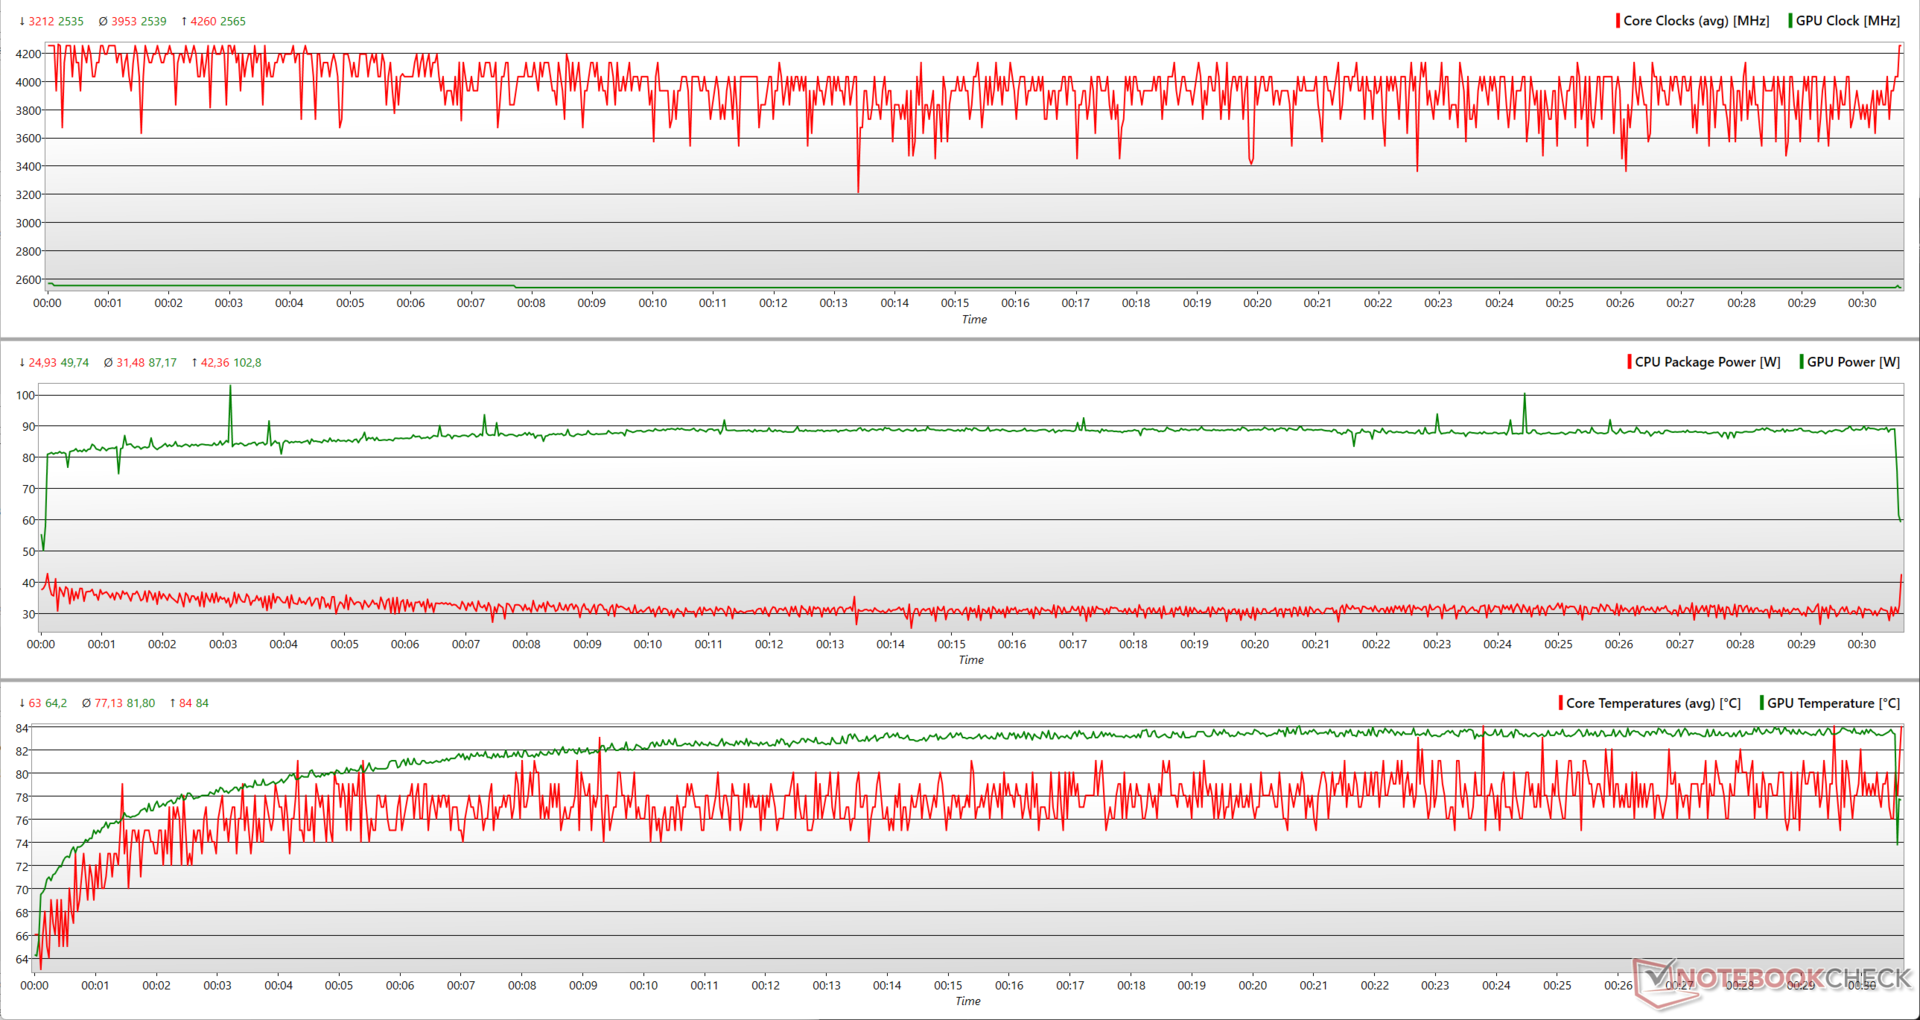
| El Witcher 3 1080p Ultra | 4,8 | 2.535 | 76 | 80,5 |
En la prueba de estrés Witcher 3 1080p Ultra, la RTX 4050 es capaz de alcanzar el mismo reloj de 2.565 MHz pero con un TGP máximo mucho más bajo de 103 W. Esto da algo de respiro al Core i7-13620H para utilizar hasta 42 W para un impulso máximo de 4,26 GHz.
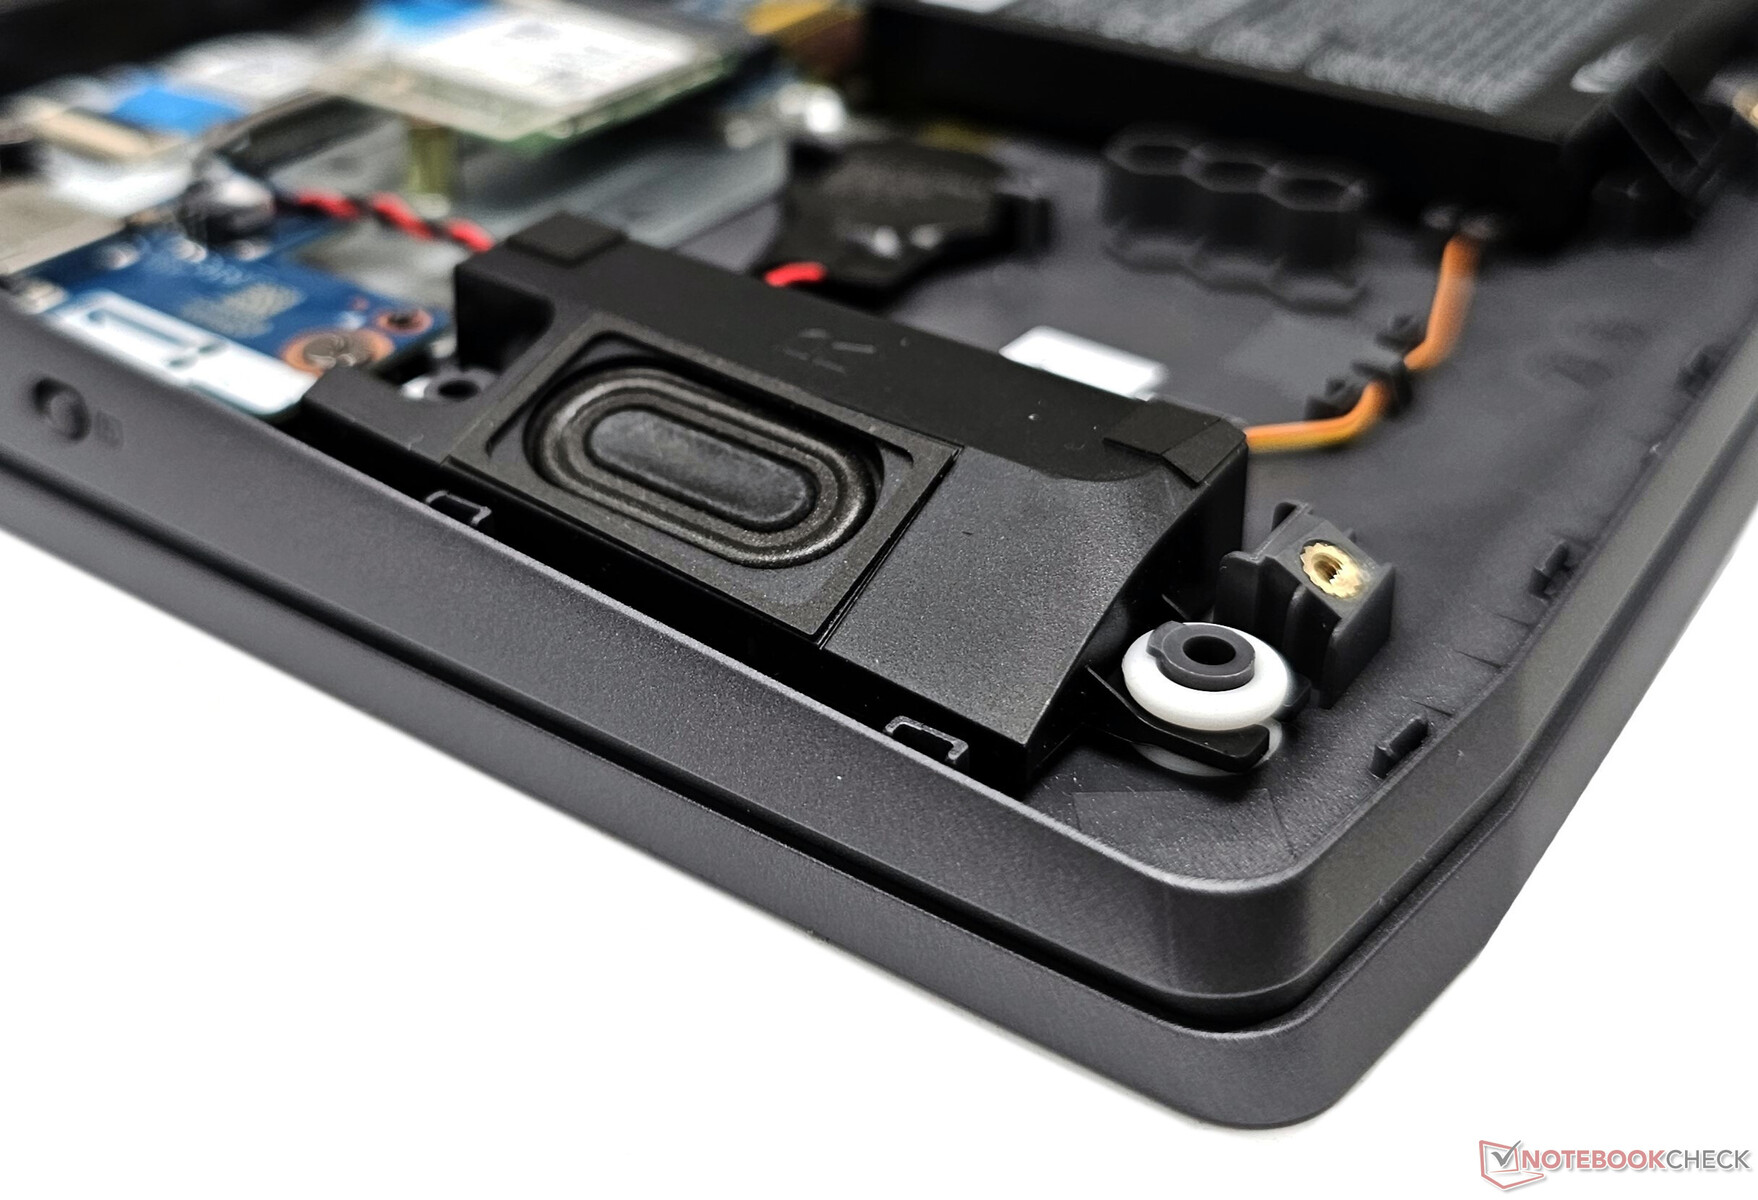
Altavoces
Los altavoces del LOQ 15IRH8 tienen una sonoridad decente. Los graves no son muy profundos, pero los medios y agudos se reproducen adecuadamente. Los usuarios pueden obtener una mejor salida de audio mediante altavoces con cable o Bluetooth 5.2.
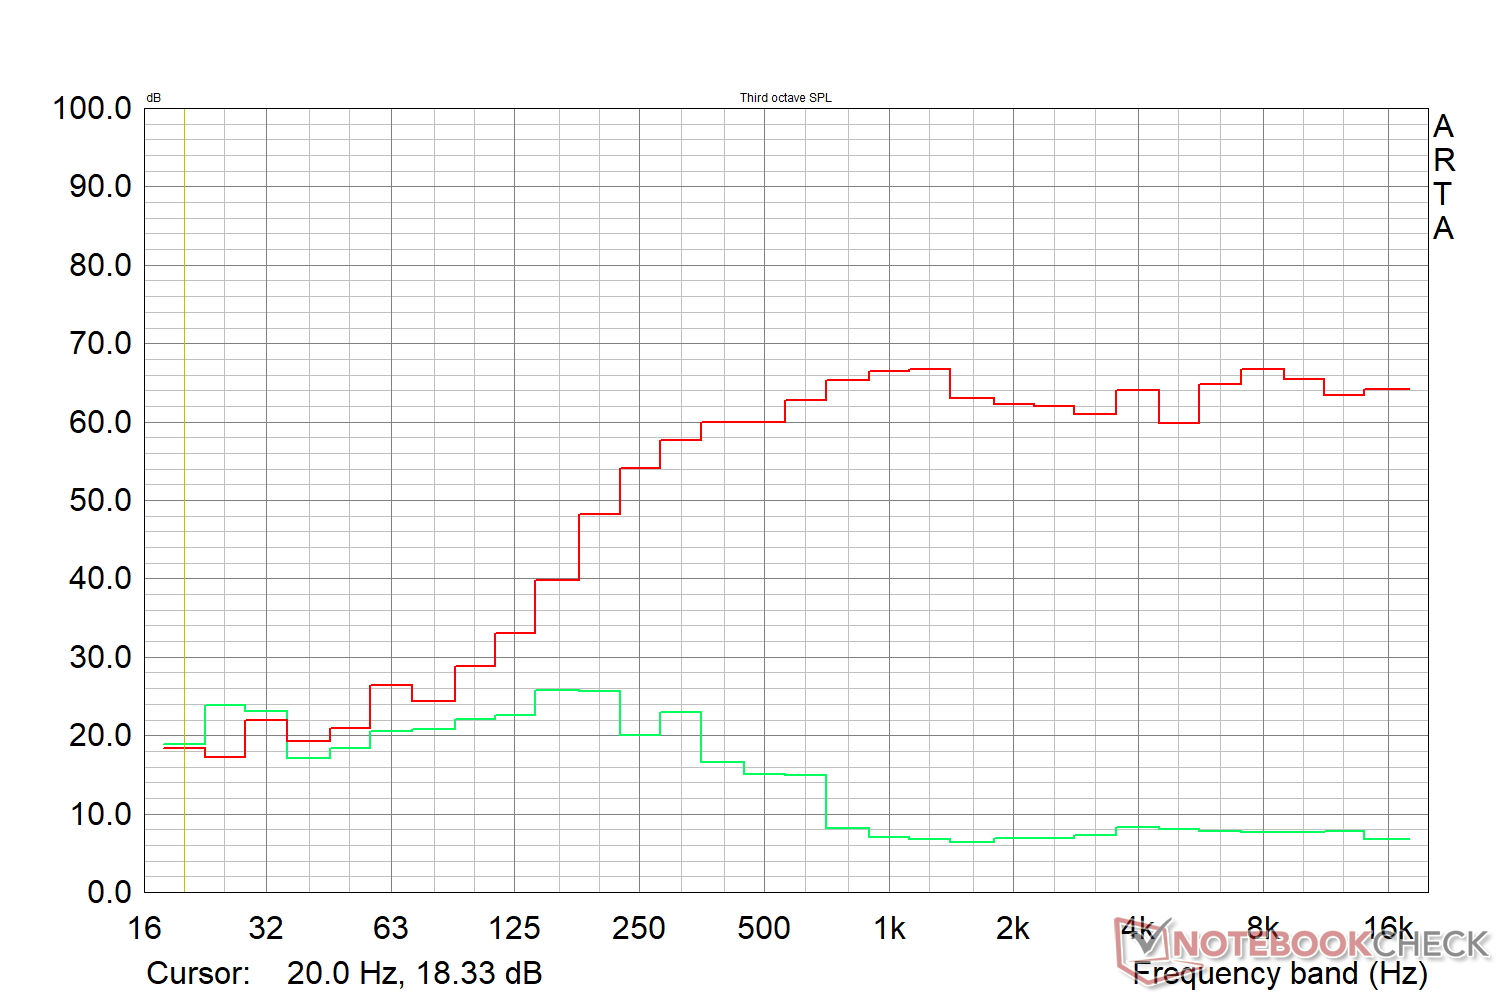
Lenovo LOQ 15IRH8 Core i7 análisis de audio
(±) | la sonoridad del altavoz es media pero buena (75.9 dB)
Graves 100 - 315 Hz
(-) | casi sin bajos - de media 18.6% inferior a la mediana
(±) | la linealidad de los graves es media (10.2% delta a frecuencia anterior)
Medios 400 - 2000 Hz
(+) | medios equilibrados - a sólo 2.2% de la mediana
(+) | los medios son lineales (3.1% delta a la frecuencia anterior)
Altos 2 - 16 kHz
(+) | máximos equilibrados - a sólo 2.3% de la mediana
(+) | los máximos son lineales (4.4% delta a la frecuencia anterior)
Total 100 - 16.000 Hz
(+) | el sonido global es lineal (13.7% de diferencia con la mediana)
En comparación con la misma clase
» 21% de todos los dispositivos probados de esta clase eran mejores, 7% similares, 72% peores
» El mejor tuvo un delta de 6%, la media fue 18%, el peor fue ###max##%
En comparación con todos los dispositivos probados
» 15% de todos los dispositivos probados eran mejores, 4% similares, 81% peores
» El mejor tuvo un delta de 4%, la media fue 23%, el peor fue ###max##%
Apple MacBook Pro 16 2021 M1 Pro análisis de audio
(+) | los altavoces pueden reproducir a un volumen relativamente alto (#84.7 dB)
Graves 100 - 315 Hz
(+) | buen bajo - sólo 3.8% lejos de la mediana
(+) | el bajo es lineal (5.2% delta a la frecuencia anterior)
Medios 400 - 2000 Hz
(+) | medios equilibrados - a sólo 1.3% de la mediana
(+) | los medios son lineales (2.1% delta a la frecuencia anterior)
Altos 2 - 16 kHz
(+) | máximos equilibrados - a sólo 1.9% de la mediana
(+) | los máximos son lineales (2.7% delta a la frecuencia anterior)
Total 100 - 16.000 Hz
(+) | el sonido global es lineal (4.6% de diferencia con la mediana)
En comparación con la misma clase
» 0% de todos los dispositivos probados de esta clase eran mejores, 0% similares, 100% peores
» El mejor tuvo un delta de 5%, la media fue 17%, el peor fue ###max##%
En comparación con todos los dispositivos probados
» 0% de todos los dispositivos probados eran mejores, 0% similares, 100% peores
» El mejor tuvo un delta de 4%, la media fue 23%, el peor fue ###max##%
Gestión de la energía: La variante AMD parece más económica
Consumo de energía
El consumo de energía bajo carga está generalmente en el lado inferior en comparación con la competencia. A pesar de las diferencias de visualización, el LOQ 15APH8 alimentado por Ryzen 7 7840HS es aproximadamente un 18% más económico en consumo de energía total que nuestra unidad LOQ 15IRH8 basada en Intel.
El todo-AMD Asus TUF Gaming A16 es el más frugal en general, pero el consumo bajo carga se sitúa en un rango comparable al del LOQ 15IRH8. El consumo de energía bajo carga máxima supera los 170 W del cargador suministrado.
| Off / Standby | |
| Ocioso | |
| Carga |
|
Clave:
min: | |
| Lenovo LOQ 15IRH8 Core i7 i7-13620H, GeForce RTX 4050 Laptop GPU, IPS, 2560x1440, 15.6" | Lenovo LOQ 16IRH8 i7-13620H, GeForce RTX 4060 Laptop GPU, IPS, 2560x1600, 16" | Lenovo LOQ 15APH8 R7 7840HS, GeForce RTX 4050 Laptop GPU, IPS, 1920x1080, 15.6" | MSI Katana 17 B13VFK i7-13620H, GeForce RTX 4060 Laptop GPU, IPS LED, 1920x1080, 17.3" | Lenovo Legion Pro 5 16ARX8 (R5 7645HX, RTX 4050) R5 7645HX, GeForce RTX 4050 Laptop GPU, IPS, 2560x1600, 16" | HP Victus 16-r0077ng i7-13700H, GeForce RTX 4070 Laptop GPU, IPS, 1920x1080, 16.1" | Dell G15 5530 i7-13650HX, GeForce RTX 4060 Laptop GPU, IPS, 1920x1080, 15.6" | Asus TUF Gaming A16 FA617XS R9 7940HS, Radeon RX 7600S, IPS, 1920x1200, 16" | Medio NVIDIA GeForce RTX 4050 Laptop GPU | Media de la clase Gaming | |
|---|---|---|---|---|---|---|---|---|---|---|
| Power Consumption | 6% | 18% | 19% | 15% | 20% | 12% | 31% | 25% | 2% | |
| Idle Minimum * (Watt) | 18.52 | 17.2 7% | 15 19% | 12.2 34% | 13 30% | 8 57% | 8.4 55% | 7 62% | 9.95 ? 46% | 13 ? 30% |
| Idle Average * (Watt) | 22.54 | 19.3 14% | 17.7 21% | 14.9 34% | 17.4 23% | 13 42% | 14.98 34% | 10 56% | 15.8 ? 30% | 19 ? 16% |
| Idle Maximum * (Watt) | 29.79 | 21.2 29% | 21.5 28% | 15.8 47% | 21.8 27% | 22 26% | 15.56 48% | 15 50% | 20.1 ? 33% | 24.6 ? 17% |
| Load Average * (Watt) | 94.5 | 90 5% | 73.5 22% | 85.22 10% | 96.4 -2% | 86 9% | 96.8 -2% | 86 9% | 88 ? 7% | 110.7 ? -17% |
| Witcher 3 ultra * (Watt) | 154.4 | 168 -9% | 138.6 10% | 151.1 2% | 125 19% | 141.8 8% | 186 -20% | 160.6 -4% | ||
| Load Maximum * (Watt) | 190.4 | 211 -11% | 176.5 7% | 212.8 -12% | 204 -7% | 233 -22% | 271.42 -43% | 172 10% | 176.3 ? 7% | 259 ? -36% |
* ... más pequeño es mejor
Power Consumption: The Witcher 3 / Stress test
Power Consumption: External Monitor
Duración de las pilas
La duración de las pilas es similar a la que hemos observado con el LOQ 16IRH8. El aumento del consumo de energía del LOQ 15APH8 se traduce en un 25% más de duración de la batería en comparación con el LOQ 15IRH8.
El adaptador de corriente de 170 W suministrado es compatible con la carga rápida Rapid Charge, que puede activarse en la aplicación Lenovo Vantage. Esto permite cargar el dispositivo de cero al 100% en aproximadamente 45 minutos.
| Lenovo LOQ 15IRH8 Core i7 i7-13620H, GeForce RTX 4050 Laptop GPU, 60 Wh | Lenovo LOQ 16IRH8 i7-13620H, GeForce RTX 4060 Laptop GPU, 80 Wh | Lenovo LOQ 15APH8 R7 7840HS, GeForce RTX 4050 Laptop GPU, 60 Wh | MSI Katana 17 B13VFK i7-13620H, GeForce RTX 4060 Laptop GPU, 53.5 Wh | Lenovo Legion Pro 5 16ARX8 (R5 7645HX, RTX 4050) R5 7645HX, GeForce RTX 4050 Laptop GPU, 80 Wh | HP Victus 16-r0077ng i7-13700H, GeForce RTX 4070 Laptop GPU, 83 Wh | Dell G15 5530 i7-13650HX, GeForce RTX 4060 Laptop GPU, 86 Wh | Asus TUF Gaming A16 FA617XS R9 7940HS, Radeon RX 7600S, 90 Wh | Media de la clase Gaming | |
|---|---|---|---|---|---|---|---|---|---|
| Duración de Batería | 6% | 25% | -51% | -8% | 20% | 11% | 107% | 29% | |
| H.264 (h) | 6.1 | 6.4 5% | 5.4 -11% | 6.8 11% | 12.4 103% | 8.32 ? 36% | |||
| WiFi v1.3 (h) | 5.9 | 6.3 7% | 7.4 25% | 2.9 -51% | 5.6 -5% | 7.1 20% | 6.5 10% | 12.4 110% | 7.11 ? 21% |
| Load (h) | 1.5 | 1.1 | 1 | 0.8 | 0.9 | 1.502 ? | |||
| Reader / Idle (h) | 9.8 | 20.3 | 8.27 ? | ||||||
| Witcher 3 ultra (h) | 0.8 | 0.8 |
Pro
Contra
Veredicto: juegos en Ultra 1080p que no rompen el banco
El LOQ 15 Core i7 cuenta con una pantalla QHD G-Sync de 165 Hz y una webcam de 1080p a pesar de su bajo coste. El panel QHD impresiona especialmente por sus colores y tiempos de respuesta significativamente mejorados respecto a la opción FHD de 144 Hz.
La calidad de construcción adolece, comprensiblemente, de abundante plástico. Un aspecto más preocupante es que el Core i7-13620H del LOQ 15IRH8 lucha por mantener su rendimiento a diferencia de lo que hemos visto con el AMD Ryzen 7 7840HS basado en el LOQ 15APH8 o incluso el LOQ 16IRH8.
Sin embargo, el rendimiento es adecuado para jugar sin problemas a 1080p, gracias al procesador Intel i7-13620H y a los gráficos RTX 4050 que pueden utilizar más de su TGP nominal.
El Lenovo LOQ 15 Core i7 comprueba la mayoría de las casillas y merece una alta consideración si usted está en la búsqueda de un portátil de juegos 1080p capaz alrededor de la marca de US$1,200 o ₹1,00,00. Sin embargo, hay que moderar las expectativas con respecto a la calidad de construcción y las emisiones de calor."
Otra área en la que el LOQ 15 basado en Intel decepciona es en términos de emisiones de calor. Por el contrario, los niveles de ruido de los ventiladores son manejables, y es posible jugar adecuadamente a 1080p incluso en perfiles de potencia más bajos.
Elegir entre las SKU LOQ 15 con tecnología Intel y AMD se reduce a las prioridades. La versión Intel ofrece mejor potencia de juego a 1080p y menor ruido del ventilador bajo carga. Pero la variante AMD tiene una ventaja en el rendimiento general de la CPU, funciona más fría, es más eficiente energéticamente y tiene mejor duración de la batería.
Dicho esto, ambas variantes del LOQ 15 presentan un gran valor en comparación con el Legion Pro 5 16. Portátiles como el HP Victus 16 y el MSI Katana 17 salen notablemente mejor parados en las tablas, pero su precio no parece ajustarse bien a la oferta de hardware en relación con el LOQ 15.
Precio y disponibilidad
El LOQ 15 Core i7 parte de ₹97.790 para la variante FHD 144 Hz y puede adquirirse directamente en Lenovo India. El sitio web no lista actualmente la disponibilidad de la variante QHD probada.
Amazon India no tiene la mayoría de las variantes del LOQ 15 en stock actualmente excepto el LOQ 16IRH8 con un Core i7-13700H y RTX 4060 que está listado en ₹2,25,766.
Lenovo EE. UU. también tiene una serie de LOQ 15 de 13ª generación de Intel con varias opciones de GPU de Nvidia. Best Buy ofrece un LOQ 15 equipado con el Core i5-13420H y gráficos RTX 3050 por 650 dólares. Amazon US tiene una variante con una RTX 4050 por 1.227 dólares. Una opción Ryzen 7 7840HS con RTX 4050 también está disponible en Best Buy por 1.240 dólares.
Lenovo LOQ 15IRH8 Core i7
- 10/13/2023 v7 (old)
Vaidyanathan Subramaniam
Transparencia
La selección de los dispositivos que se van a reseñar corre a cargo de nuestro equipo editorial. La muestra de prueba fue proporcionada al autor en calidad de préstamo por el fabricante o el minorista a los efectos de esta reseña. El prestamista no tuvo ninguna influencia en esta reseña, ni el fabricante recibió una copia de la misma antes de su publicación. No había ninguna obligación de publicar esta reseña. Como empresa de medios independiente, Notebookcheck no está sujeta a la autoridad de fabricantes, minoristas o editores.
Así es como prueba Notebookcheck
Cada año, Notebookcheck revisa de forma independiente cientos de portátiles y smartphones utilizando procedimientos estandarizados para asegurar que todos los resultados son comparables. Hemos desarrollado continuamente nuestros métodos de prueba durante unos 20 años y hemos establecido los estándares de la industria en el proceso. En nuestros laboratorios de pruebas, técnicos y editores experimentados utilizan equipos de medición de alta calidad. Estas pruebas implican un proceso de validación en varias fases. Nuestro complejo sistema de clasificación se basa en cientos de mediciones y puntos de referencia bien fundamentados, lo que mantiene la objetividad.Price comparison

