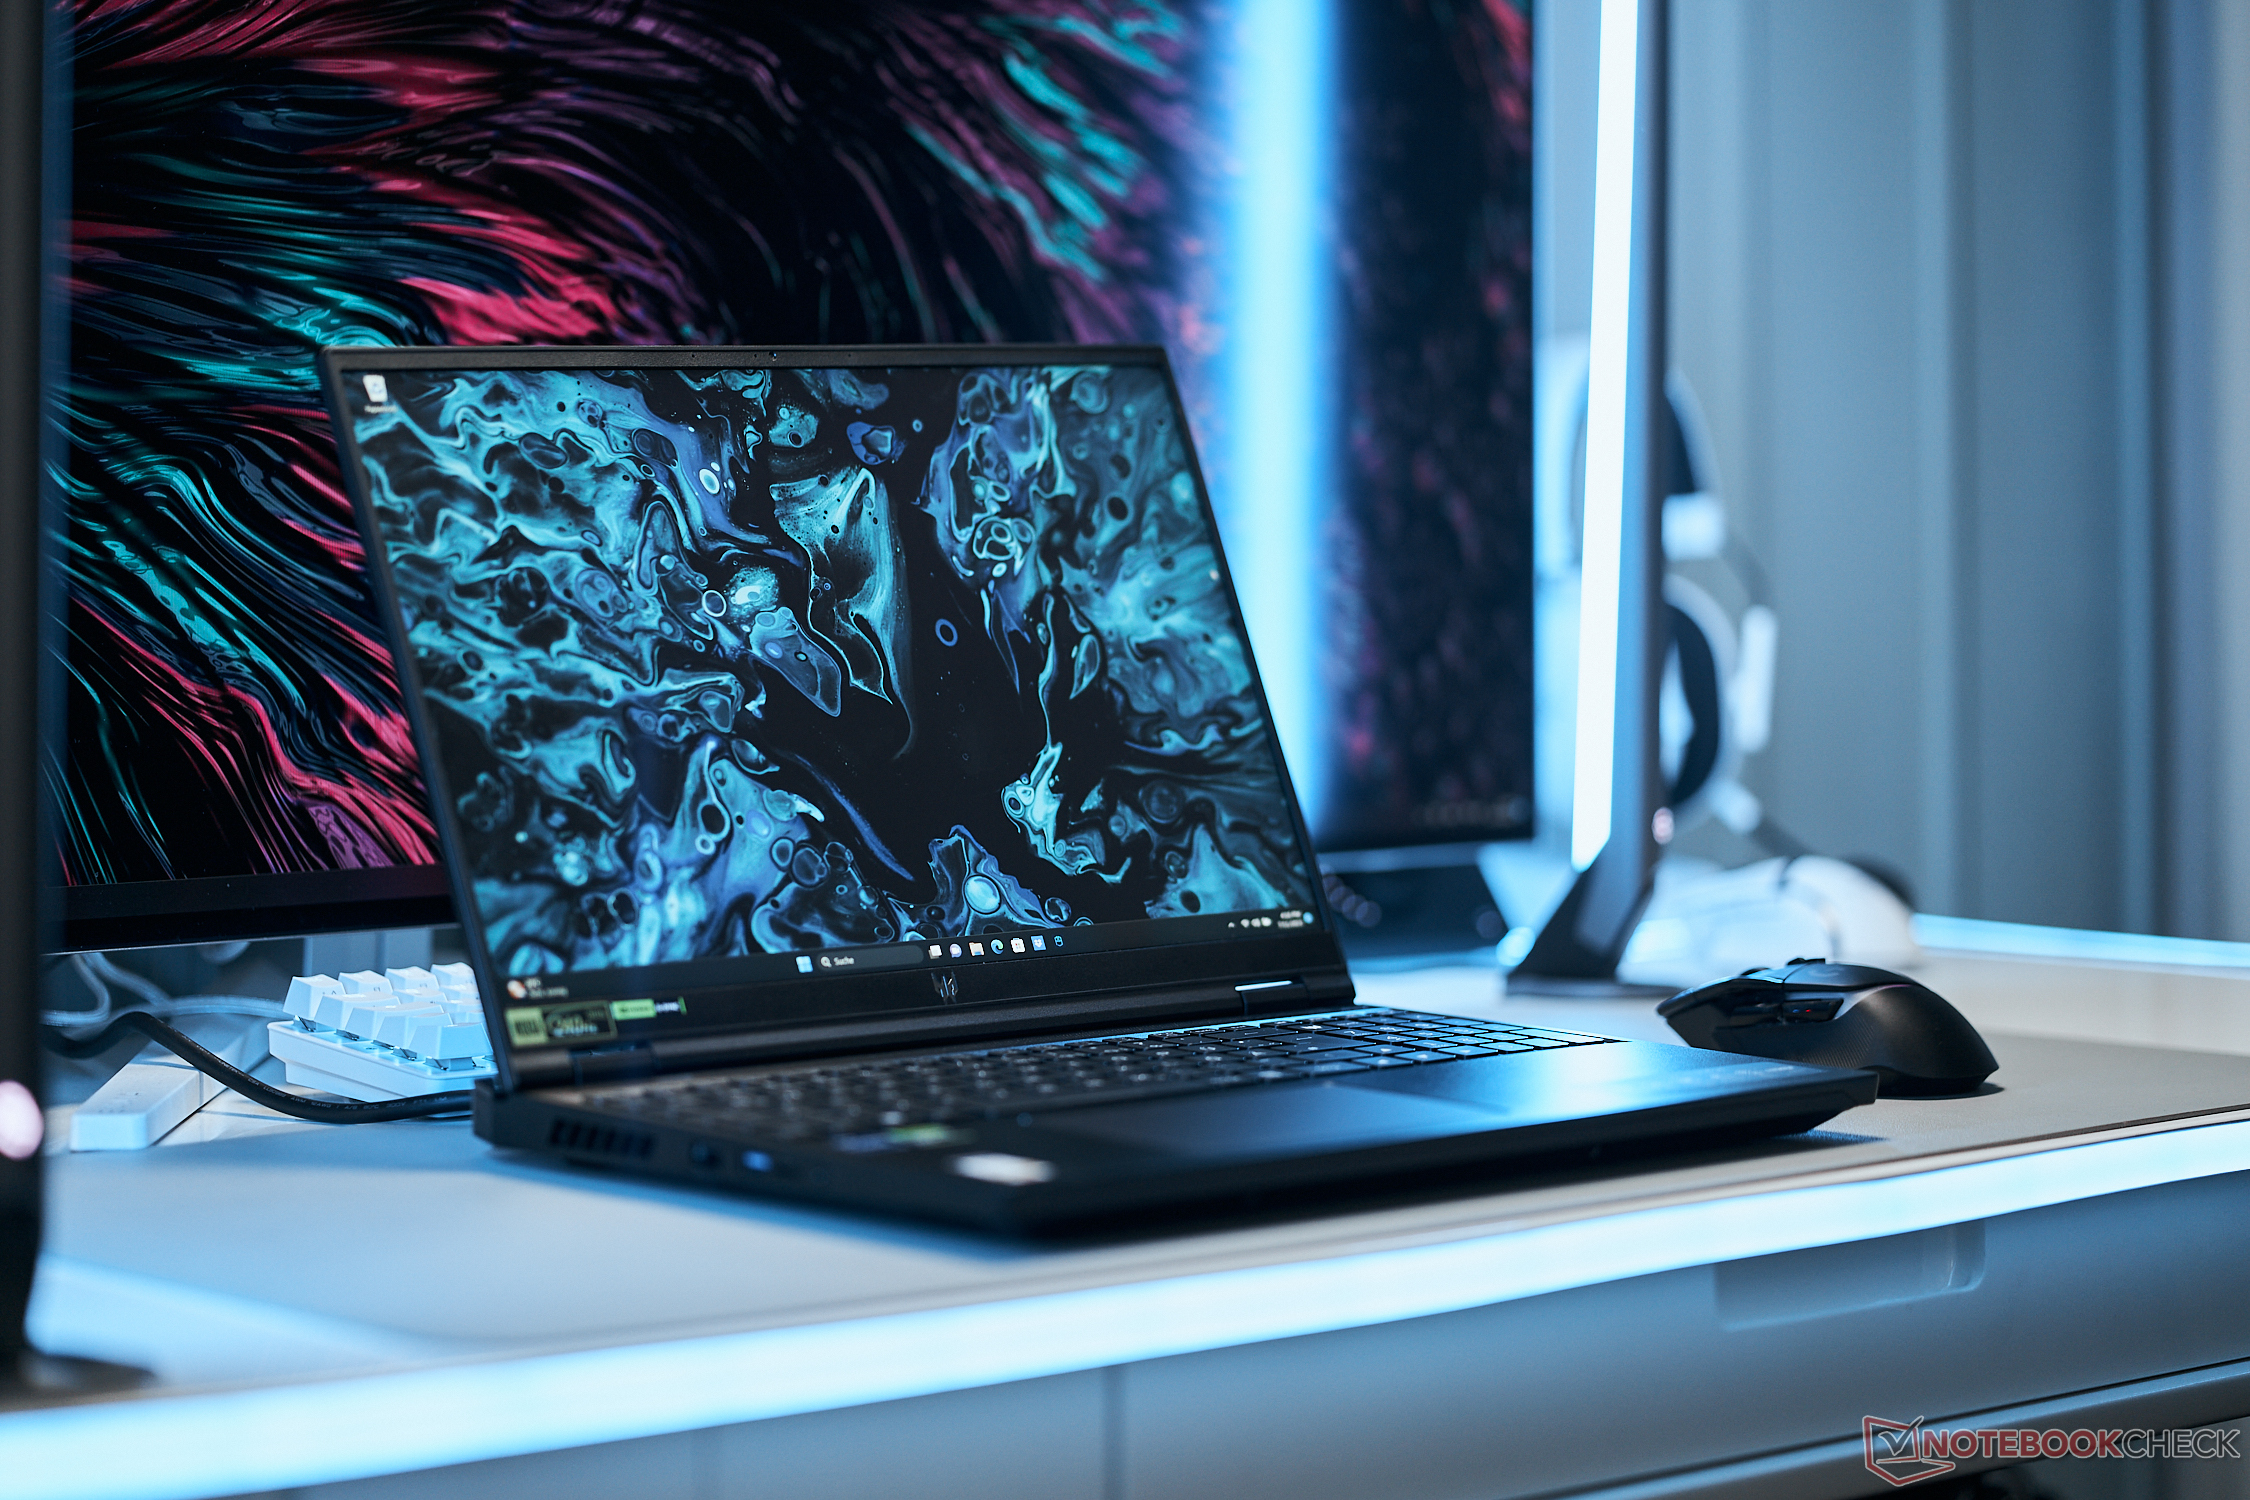
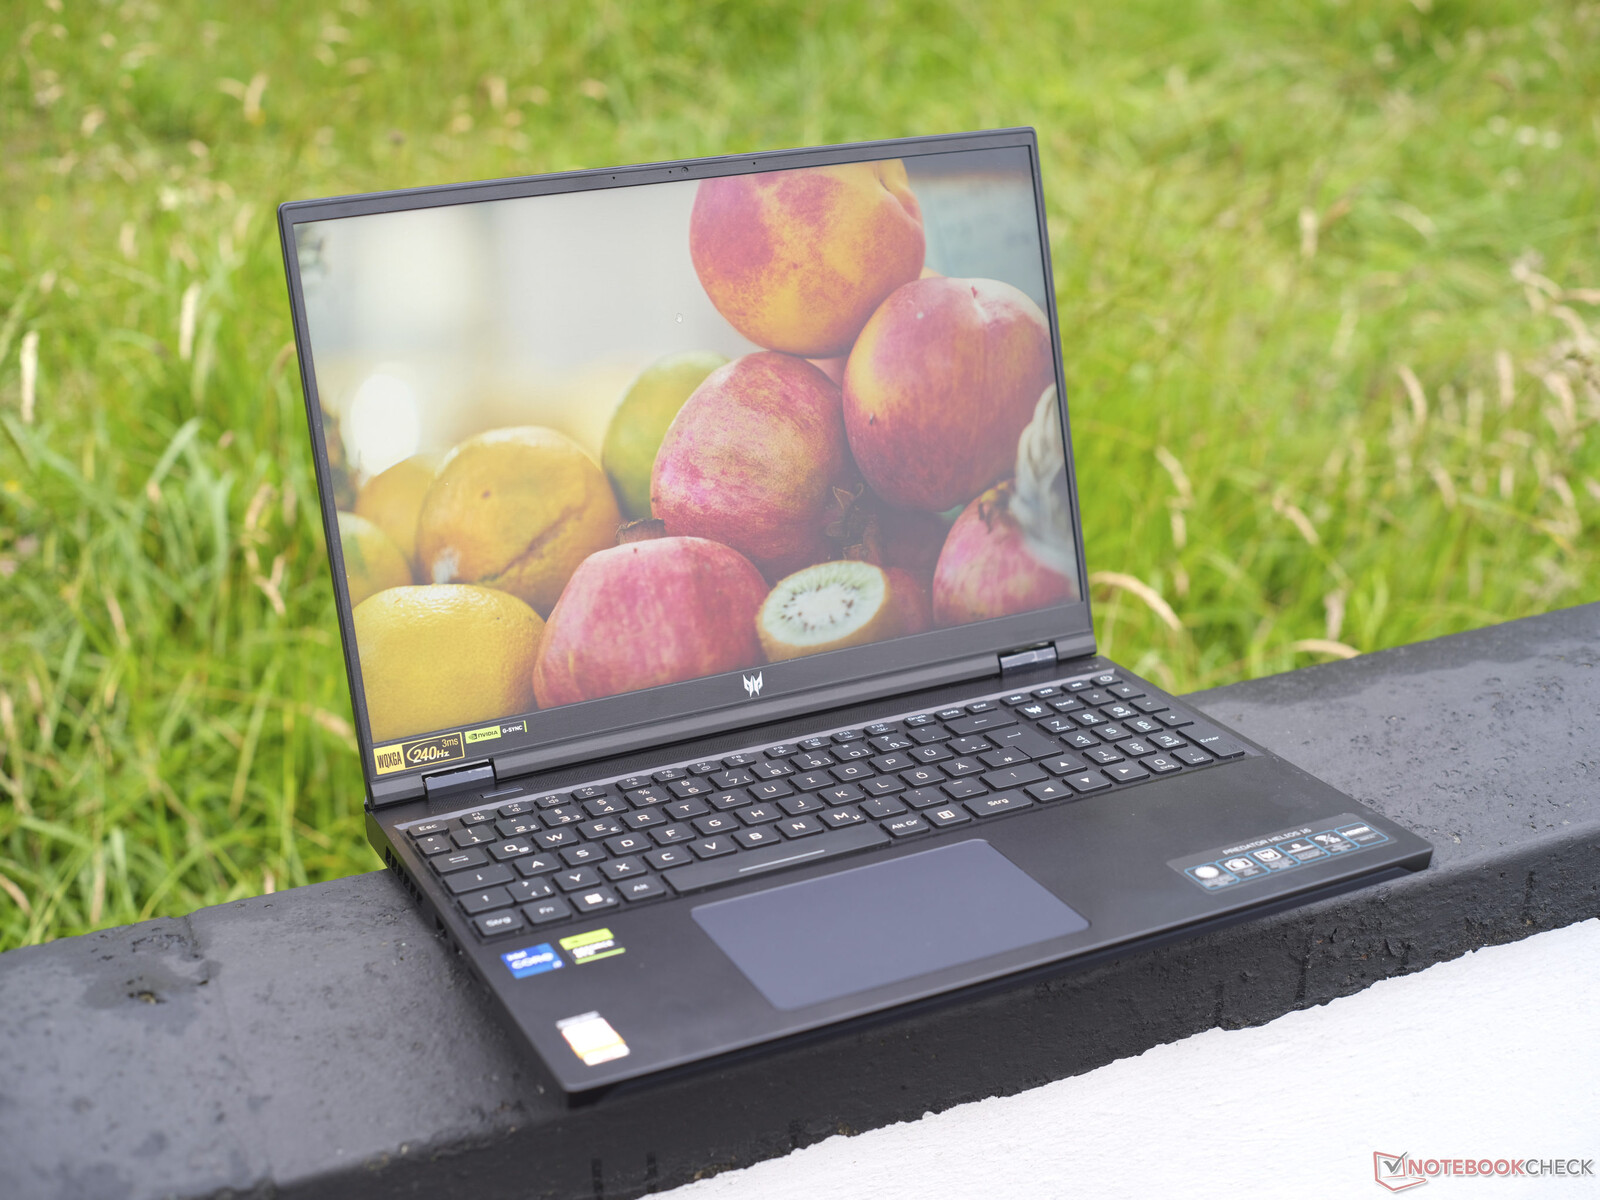
Análisis del portátil Acer Predator Helios 16: Un portátil para juegos silencioso con muchos puntos fuertes
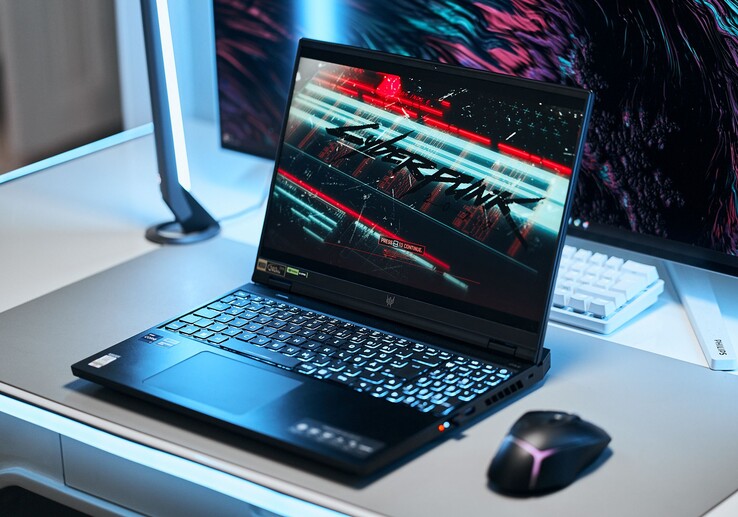
Como sucesor del Predator Helios 300el Predator Helios 16 es el último portátil para juegos de gama alta de Acer con elementos de gama media. Nuestro modelo de análisis ha optado por unaRTX 4060una GPU de gama media, y cuesta alrededor de 1.700 dólares, con SKUs de hasta unaRTX 4080también disponibles. La gama media pura de Acer está representada por elHelios Neo 16y la serieSerie Nitroque cubre el segmento básico. Por el contrario, elTriton 16es el portátil para juegos ultrafino de Acer.
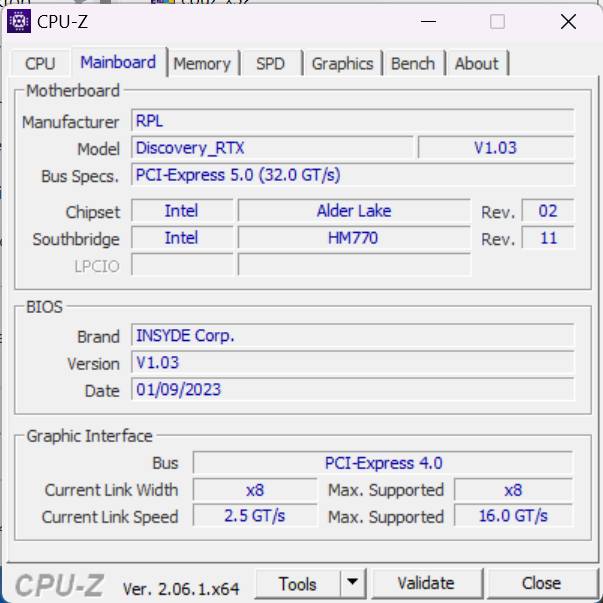
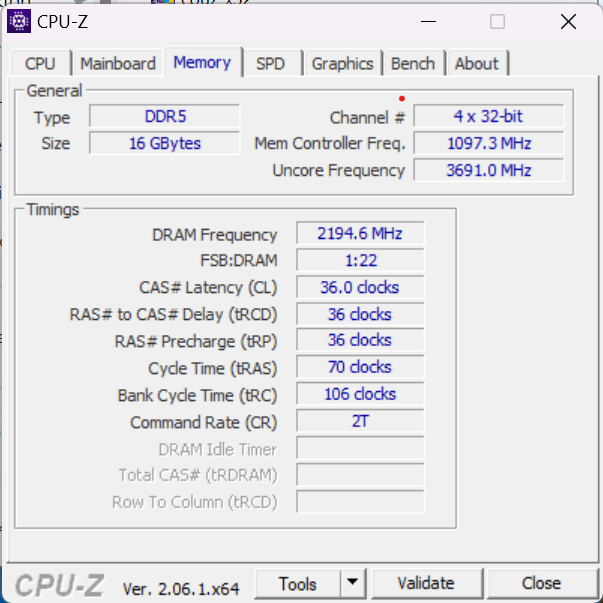
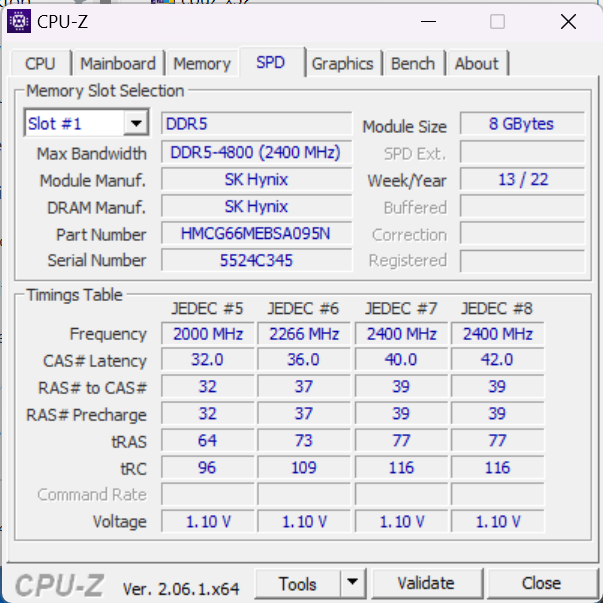
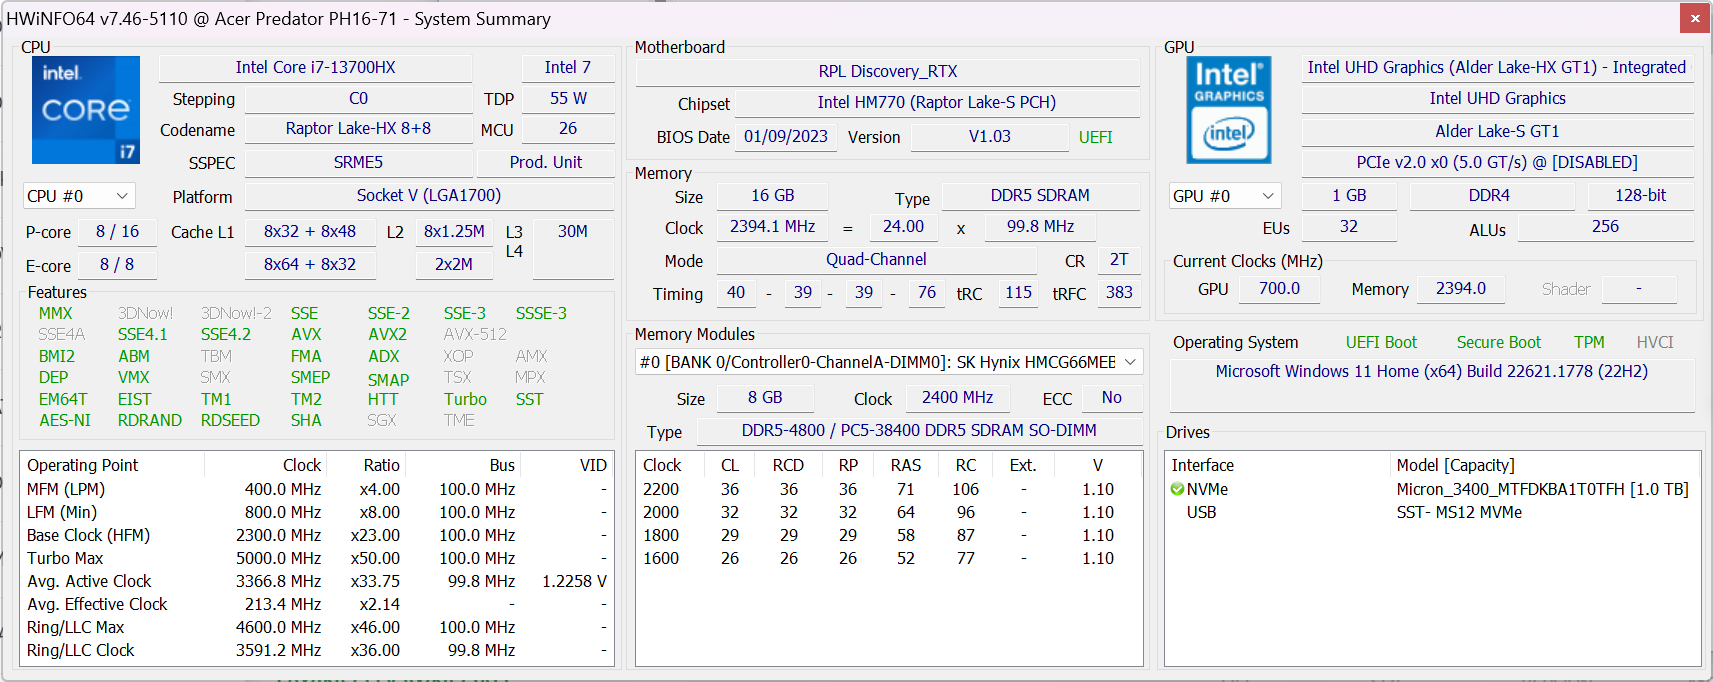
Además, un procesador Intel Core i7-13700HX (TDP de 55 vatios), 16 GB de RAM DDR5 (dos bancos de RAM) y un SSD de 1 TB (PCIe 4.0). Aunque también hay disponible una pantalla mini-LED, nuestro modelo viene con un panel IPS retroiluminado por LED normal que, inesperadamente, ha apostado por un conjunto de características de gama alta, como muestra nuestro análisis.
La competencia viene principalmente de la mano del Lenovo Legion Pro 5 de Lenovo de Lenovo, pero el Asus TUF Gaming A16de Gigabyte Aorus 15Xy el Dell G15 también se disputan el título de mejor portátil gaming de gama media.
Posibles contendientes en la comparación
Valoración | Fecha | Modelo | Peso | Altura | Tamaño | Resolución | Precio |
|---|---|---|---|---|---|---|---|
| 89.5 % v7 (old) | 07/2023 | Acer Predator Helios 16 PH16-71-731Q i7-13700HX, GeForce RTX 4060 Laptop GPU | 2.6 kg | 26.9 mm | 16.00" | 2560x1600 | |
| 88.1 % v7 (old) | 06/2023 | Acer Nitro 16 AN16-41 R7 7735HS, GeForce RTX 4070 Laptop GPU | 2.7 kg | 27.9 mm | 16.00" | 2560x1600 | |
| 87.9 % v7 (old) | 05/2023 | Lenovo Legion Pro 5 16IRX8 i7-13700HX, GeForce RTX 4060 Laptop GPU | 2.5 kg | 26.8 mm | 16.00" | 2560x1600 | |
| 86.2 % v7 (old) | 04/2023 | Aorus 15X ASF i7-13700HX, GeForce RTX 4070 Laptop GPU | 2.3 kg | 19.7 mm | 15.60" | 2560x1440 | |
| 86.2 % v7 (old) | 02/2023 | Asus TUF Gaming A16 FA617 R7 7735HS, Radeon RX 7600S | 2.2 kg | 27 mm | 16.00" | 1920x1200 | |
| 84.2 % v7 (old) | 06/2023 | Dell G15 5530 i7-13650HX, GeForce RTX 4060 Laptop GPU | 3 kg | 26.95 mm | 15.60" | 1920x1080 |
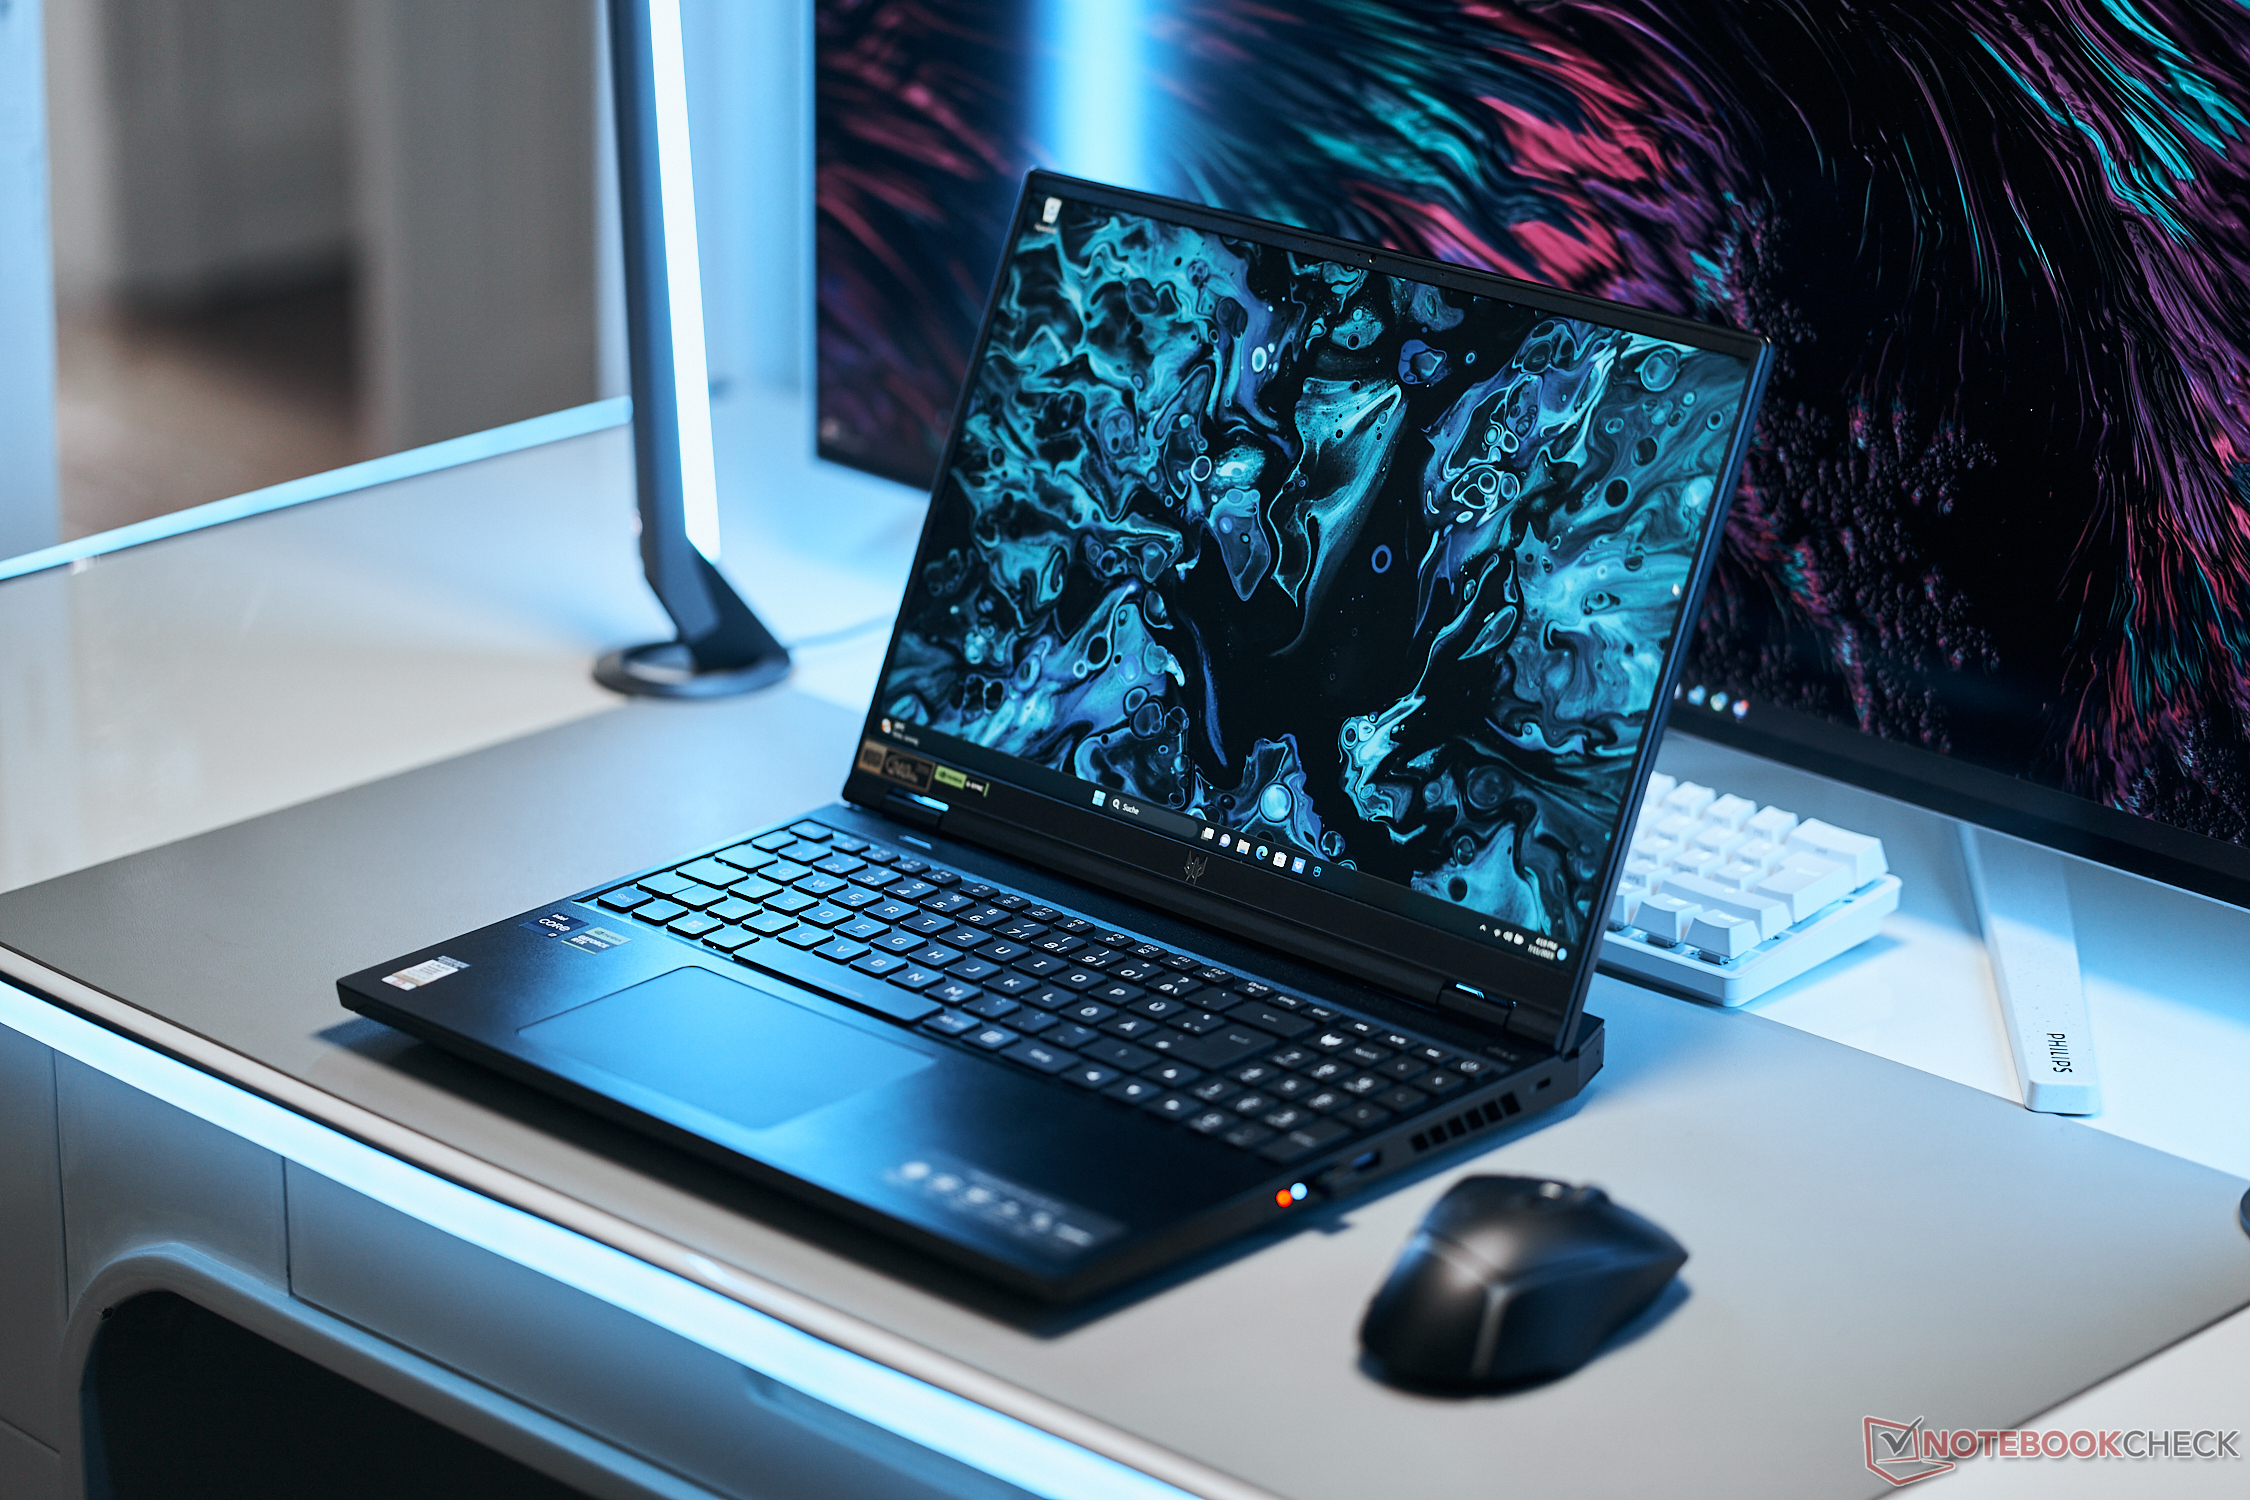
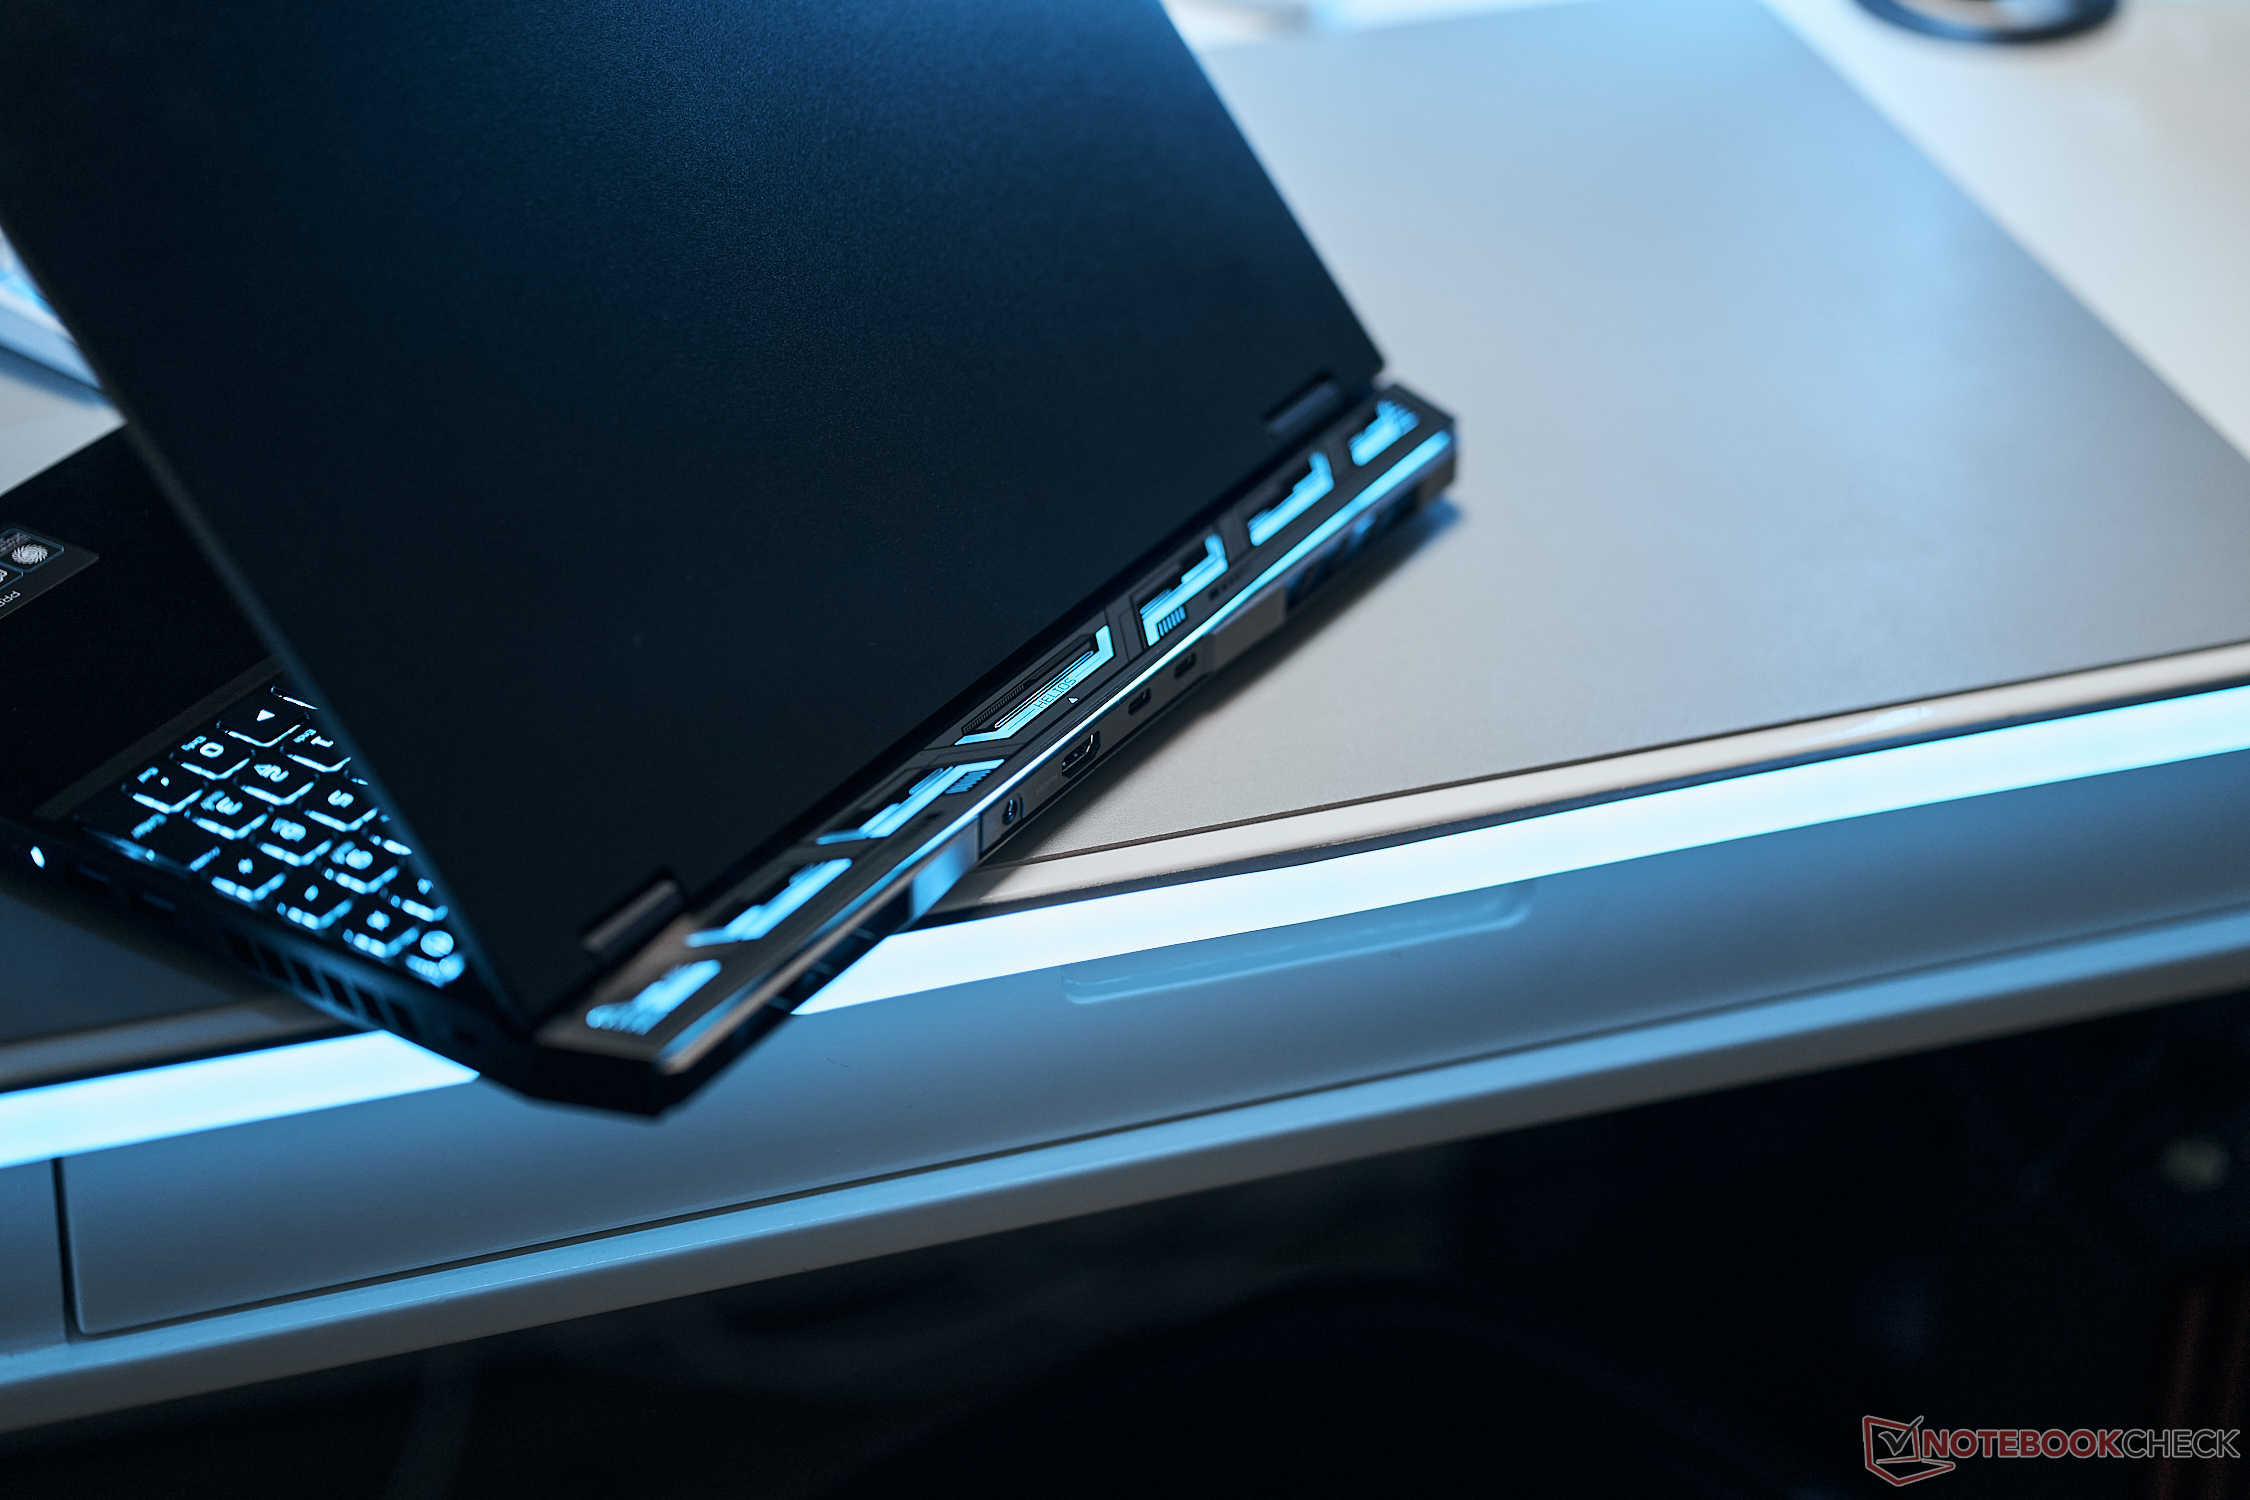
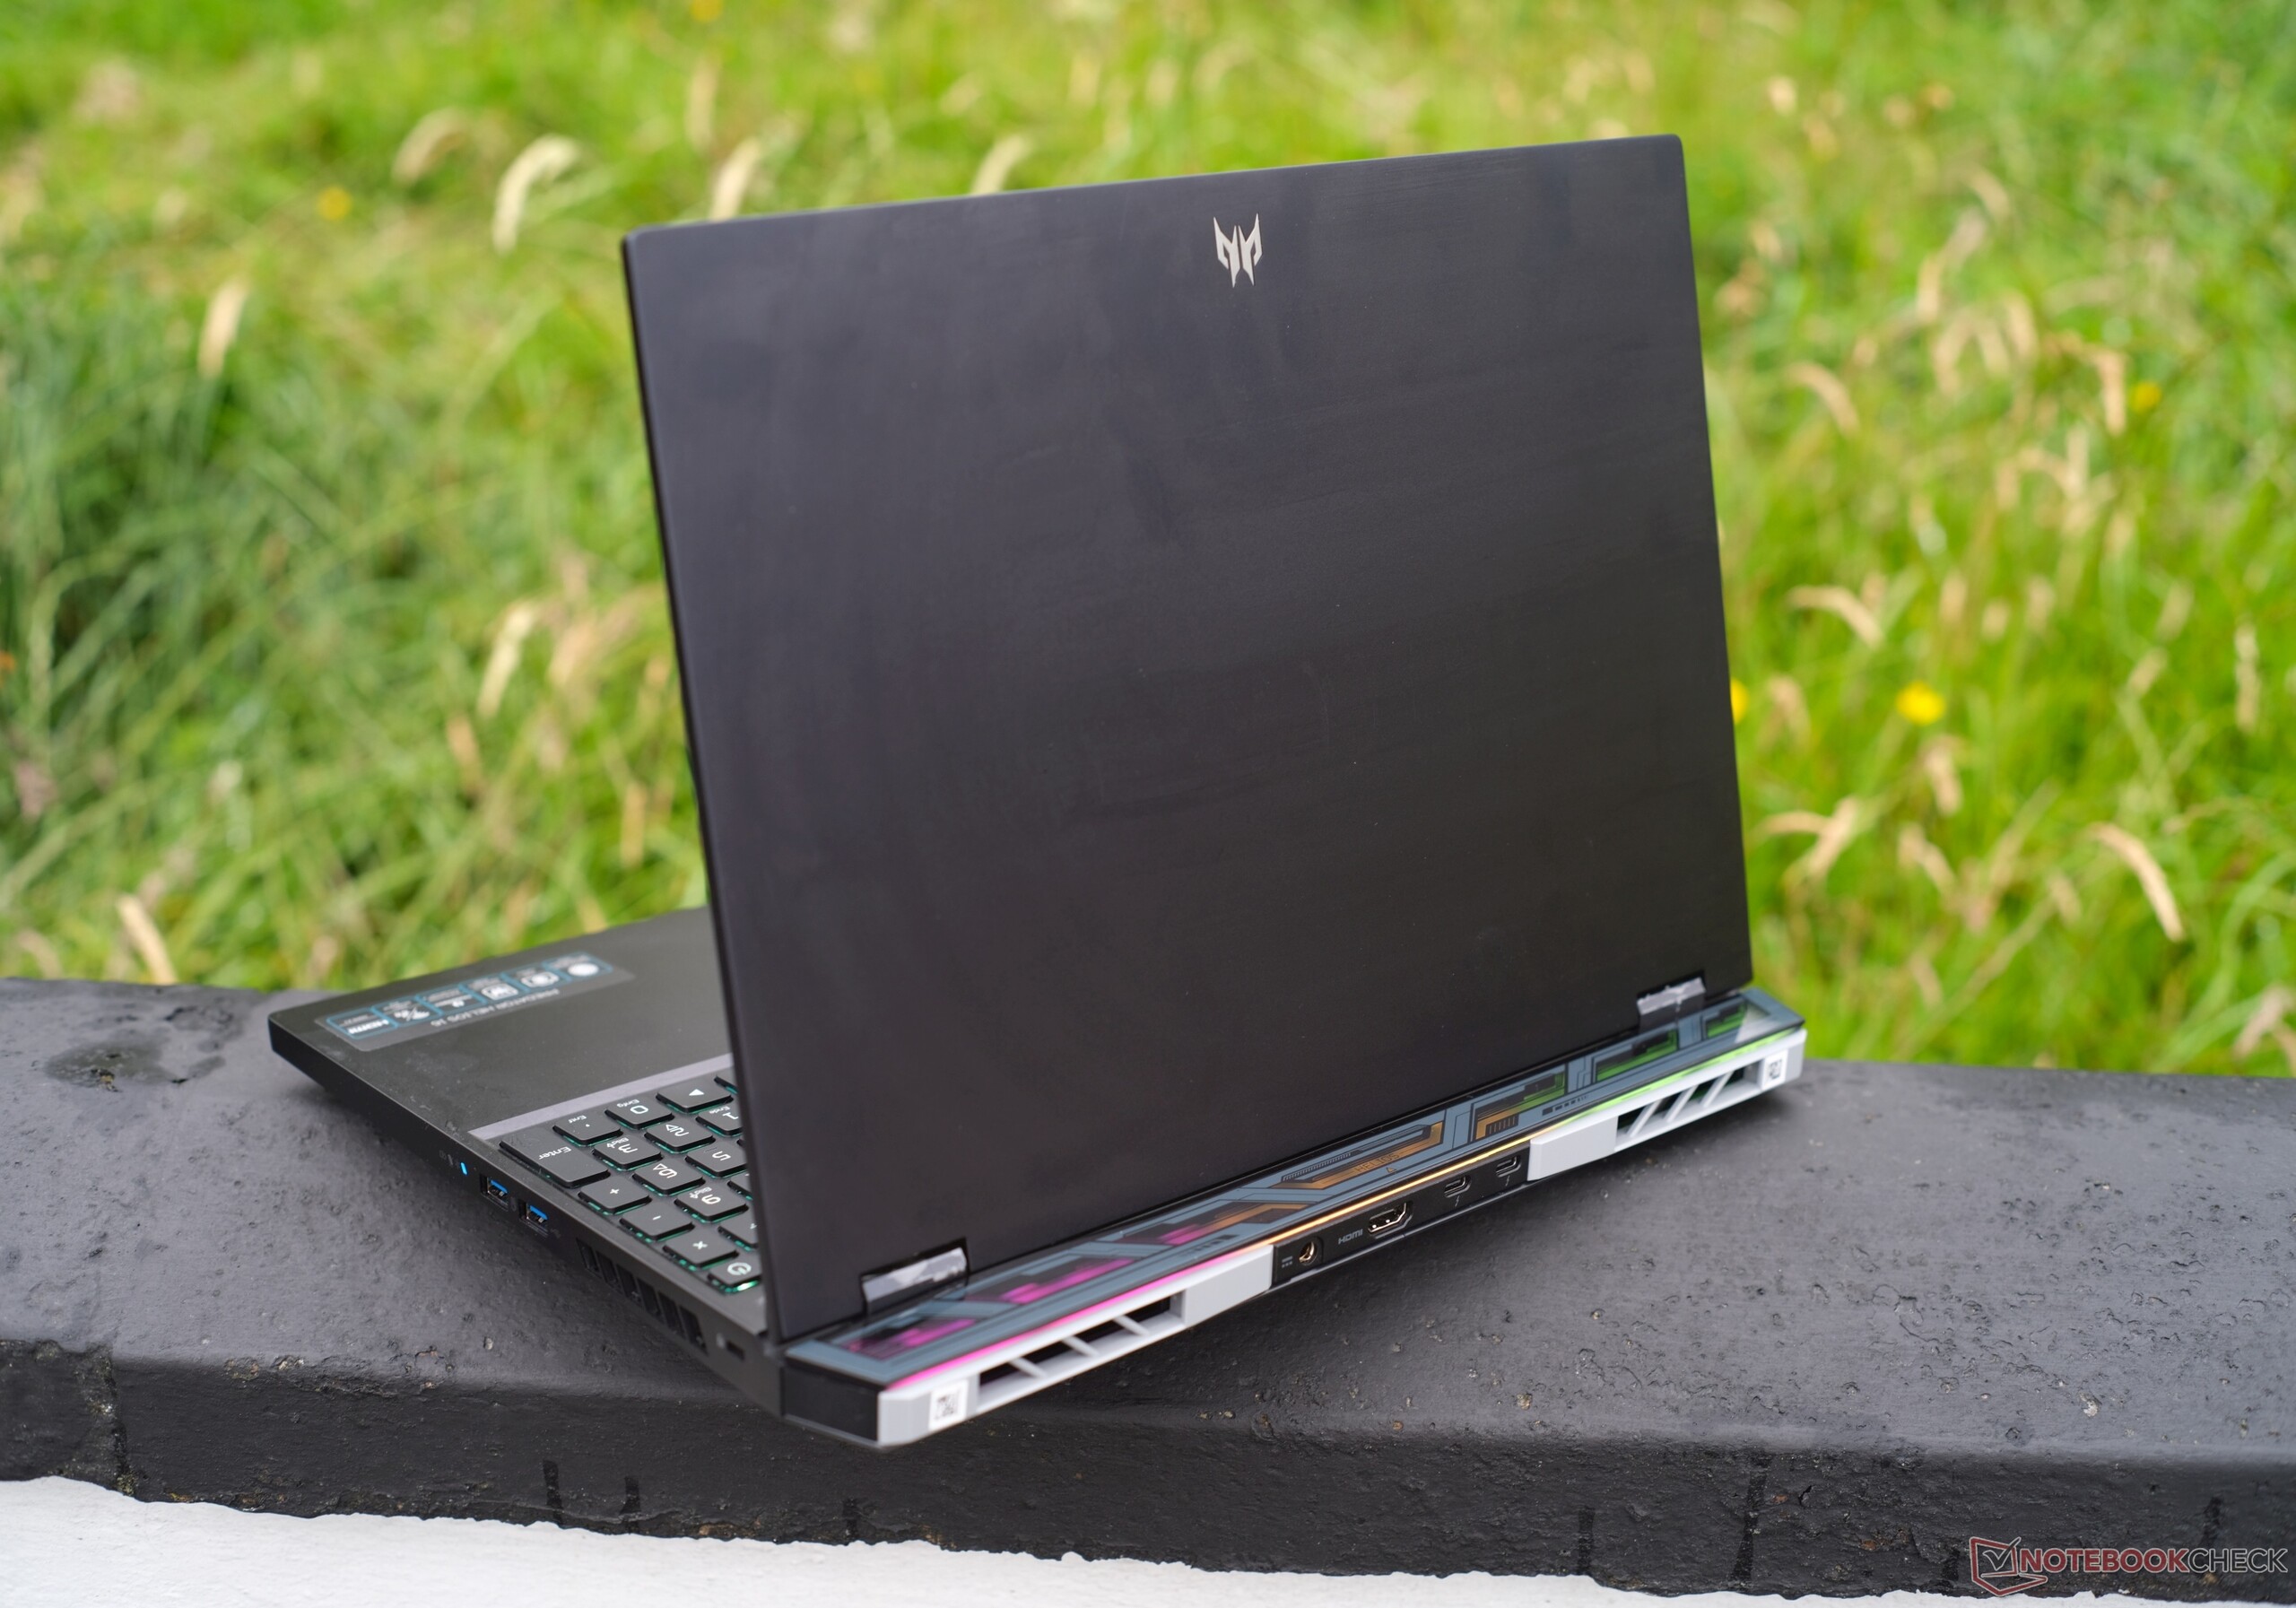
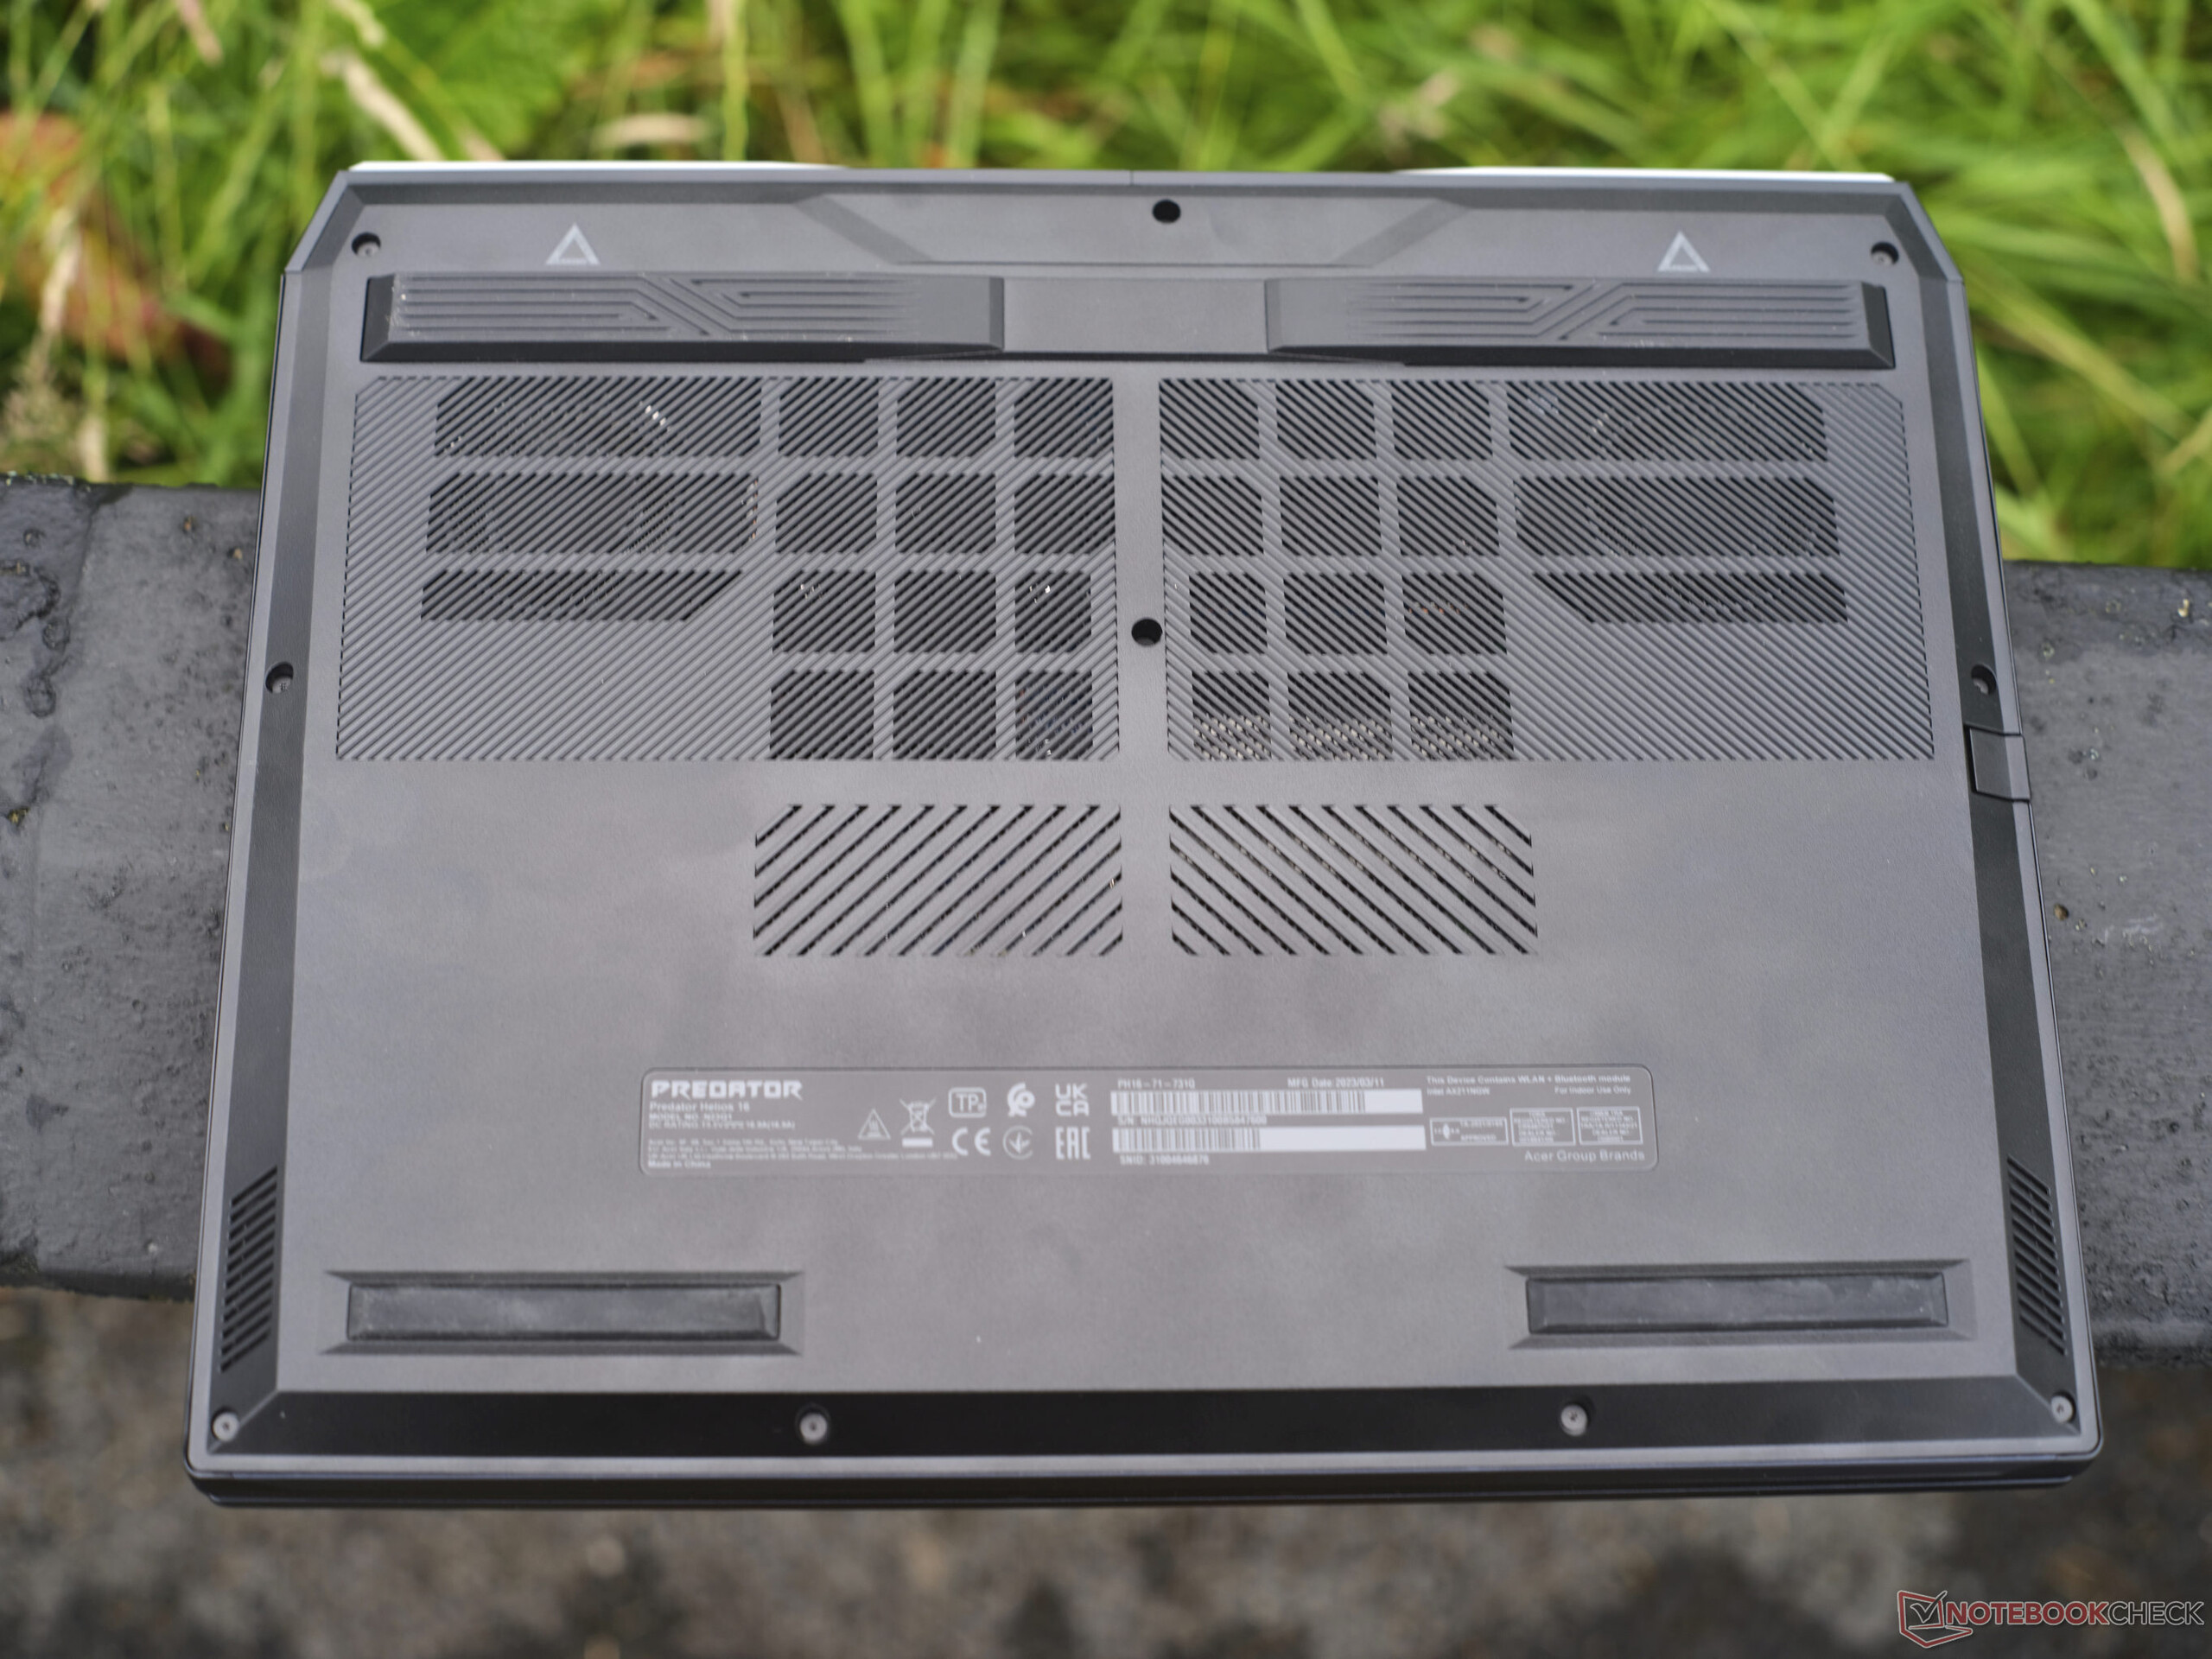
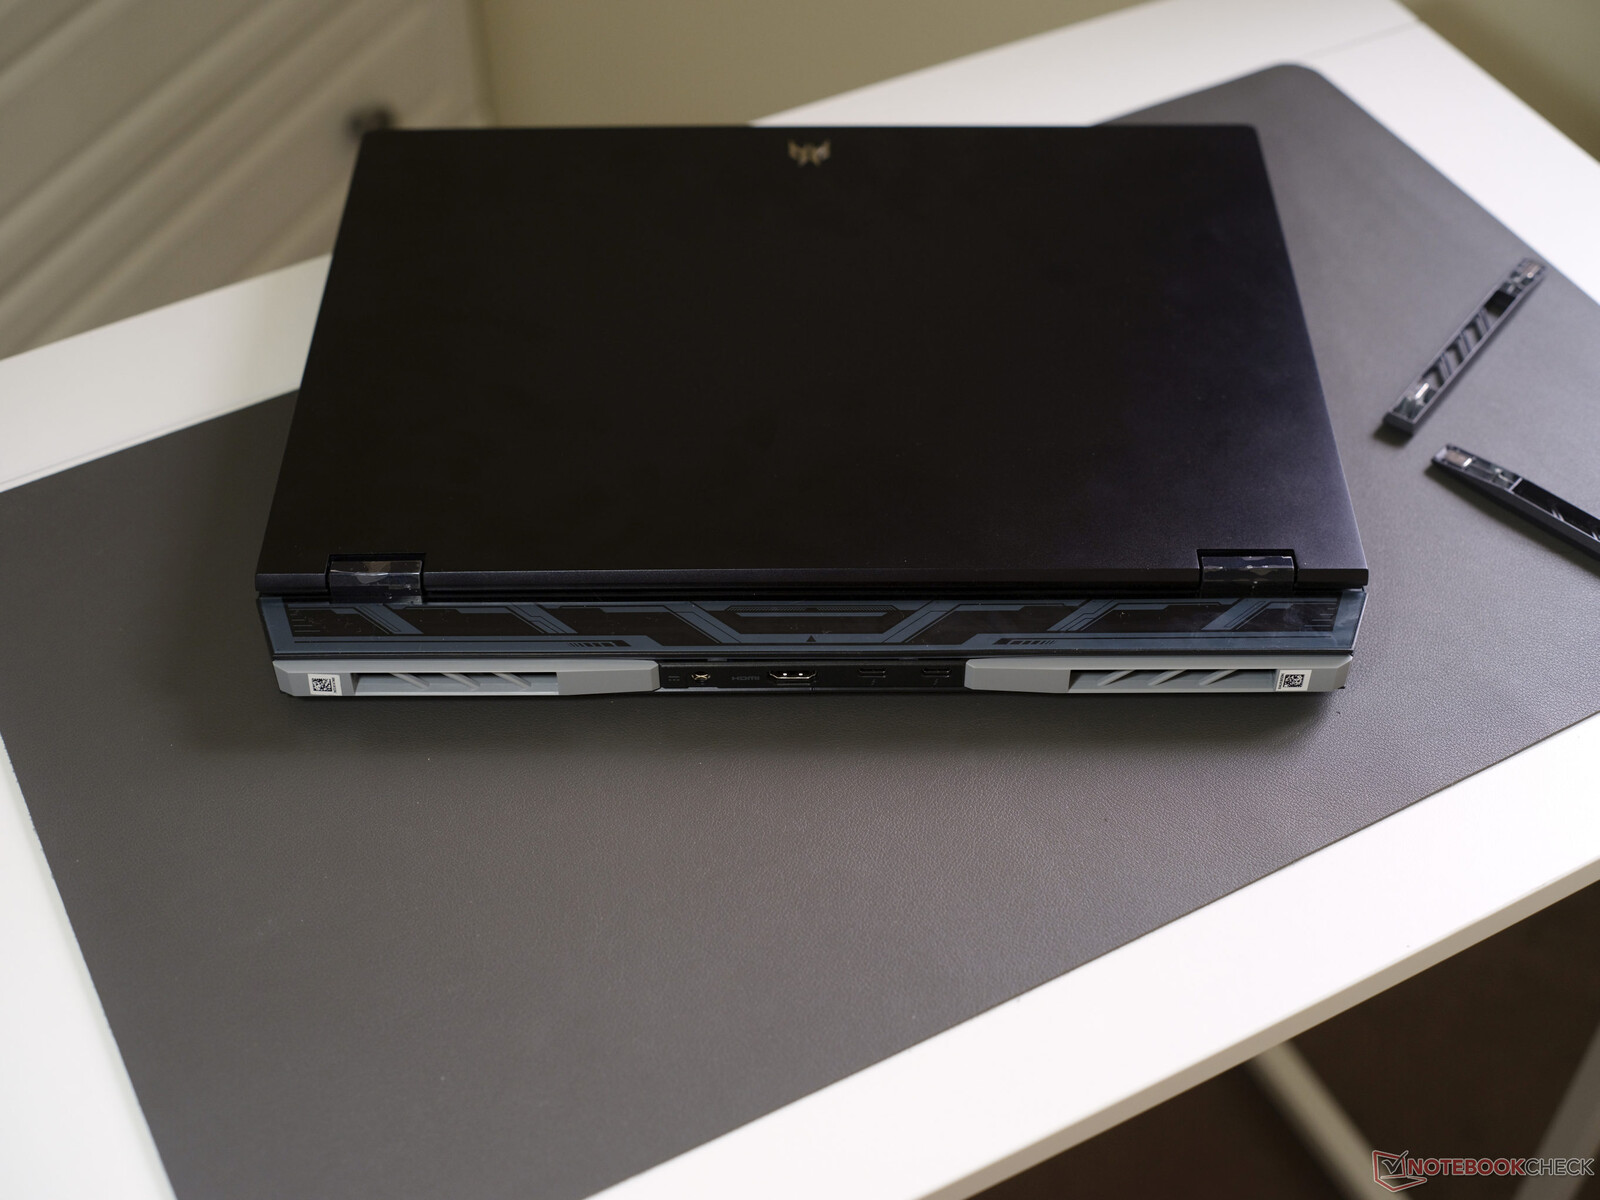
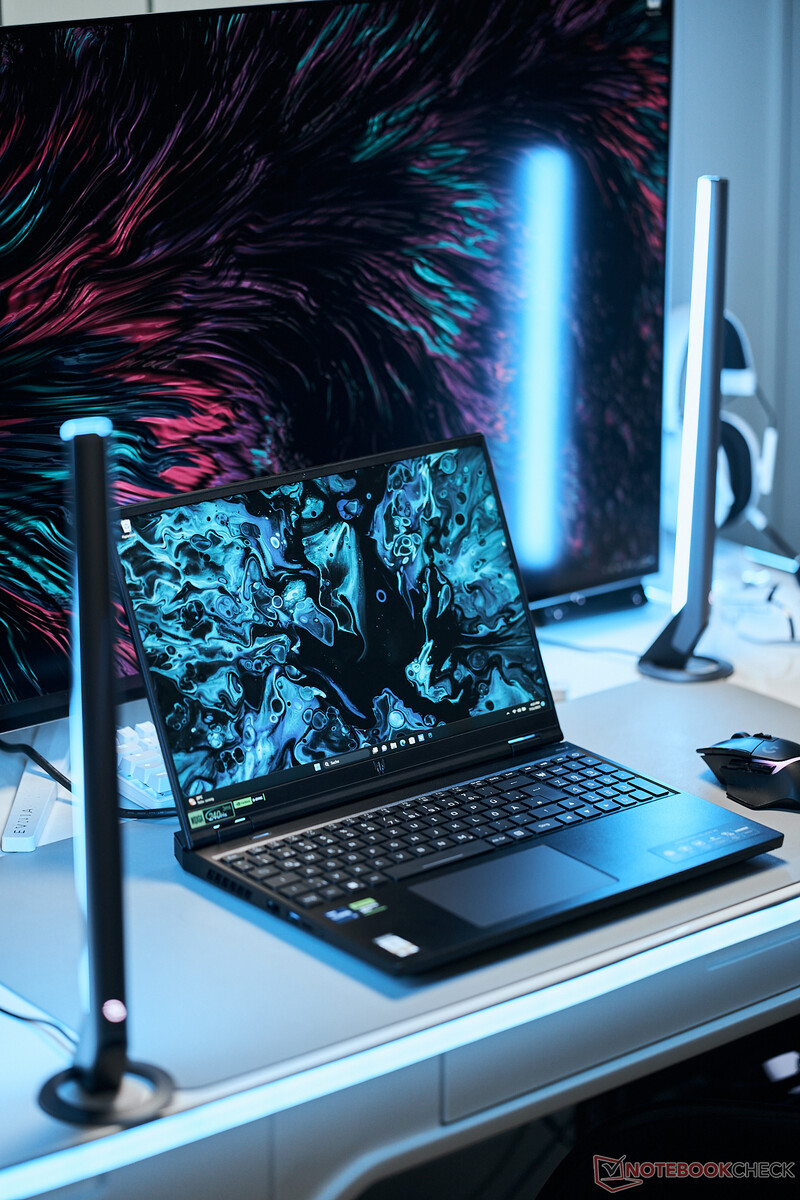
Carcasa: Un robusto y casi discreto portátil para juegos de Acer
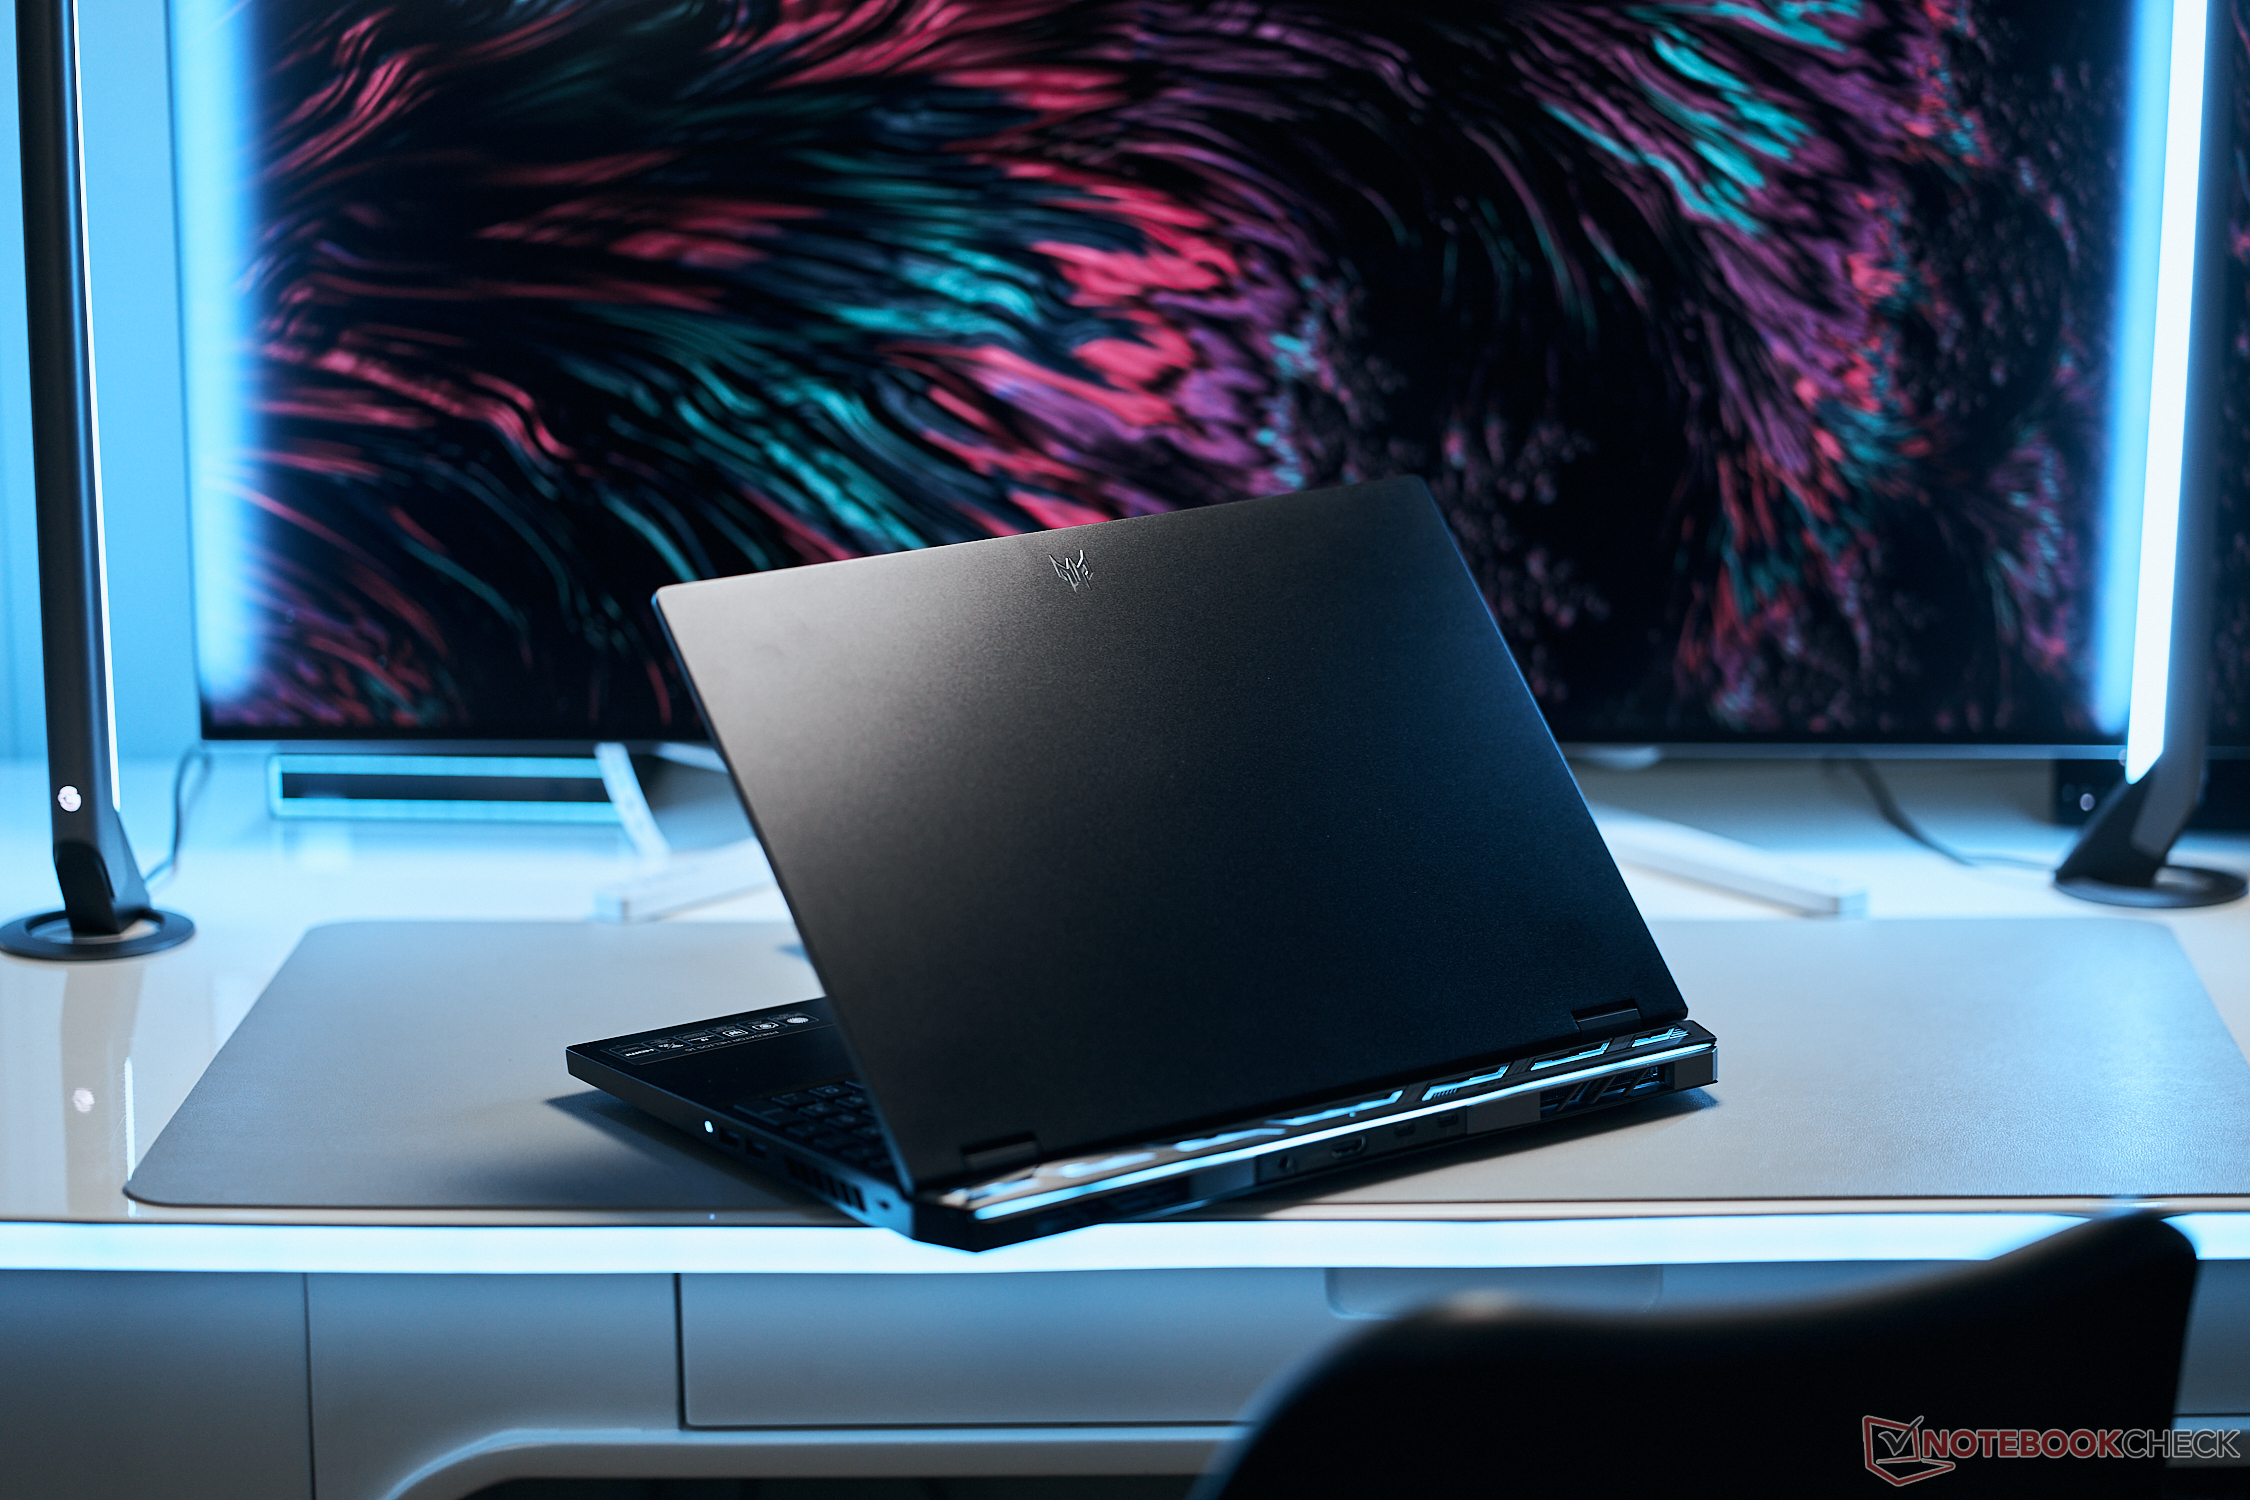
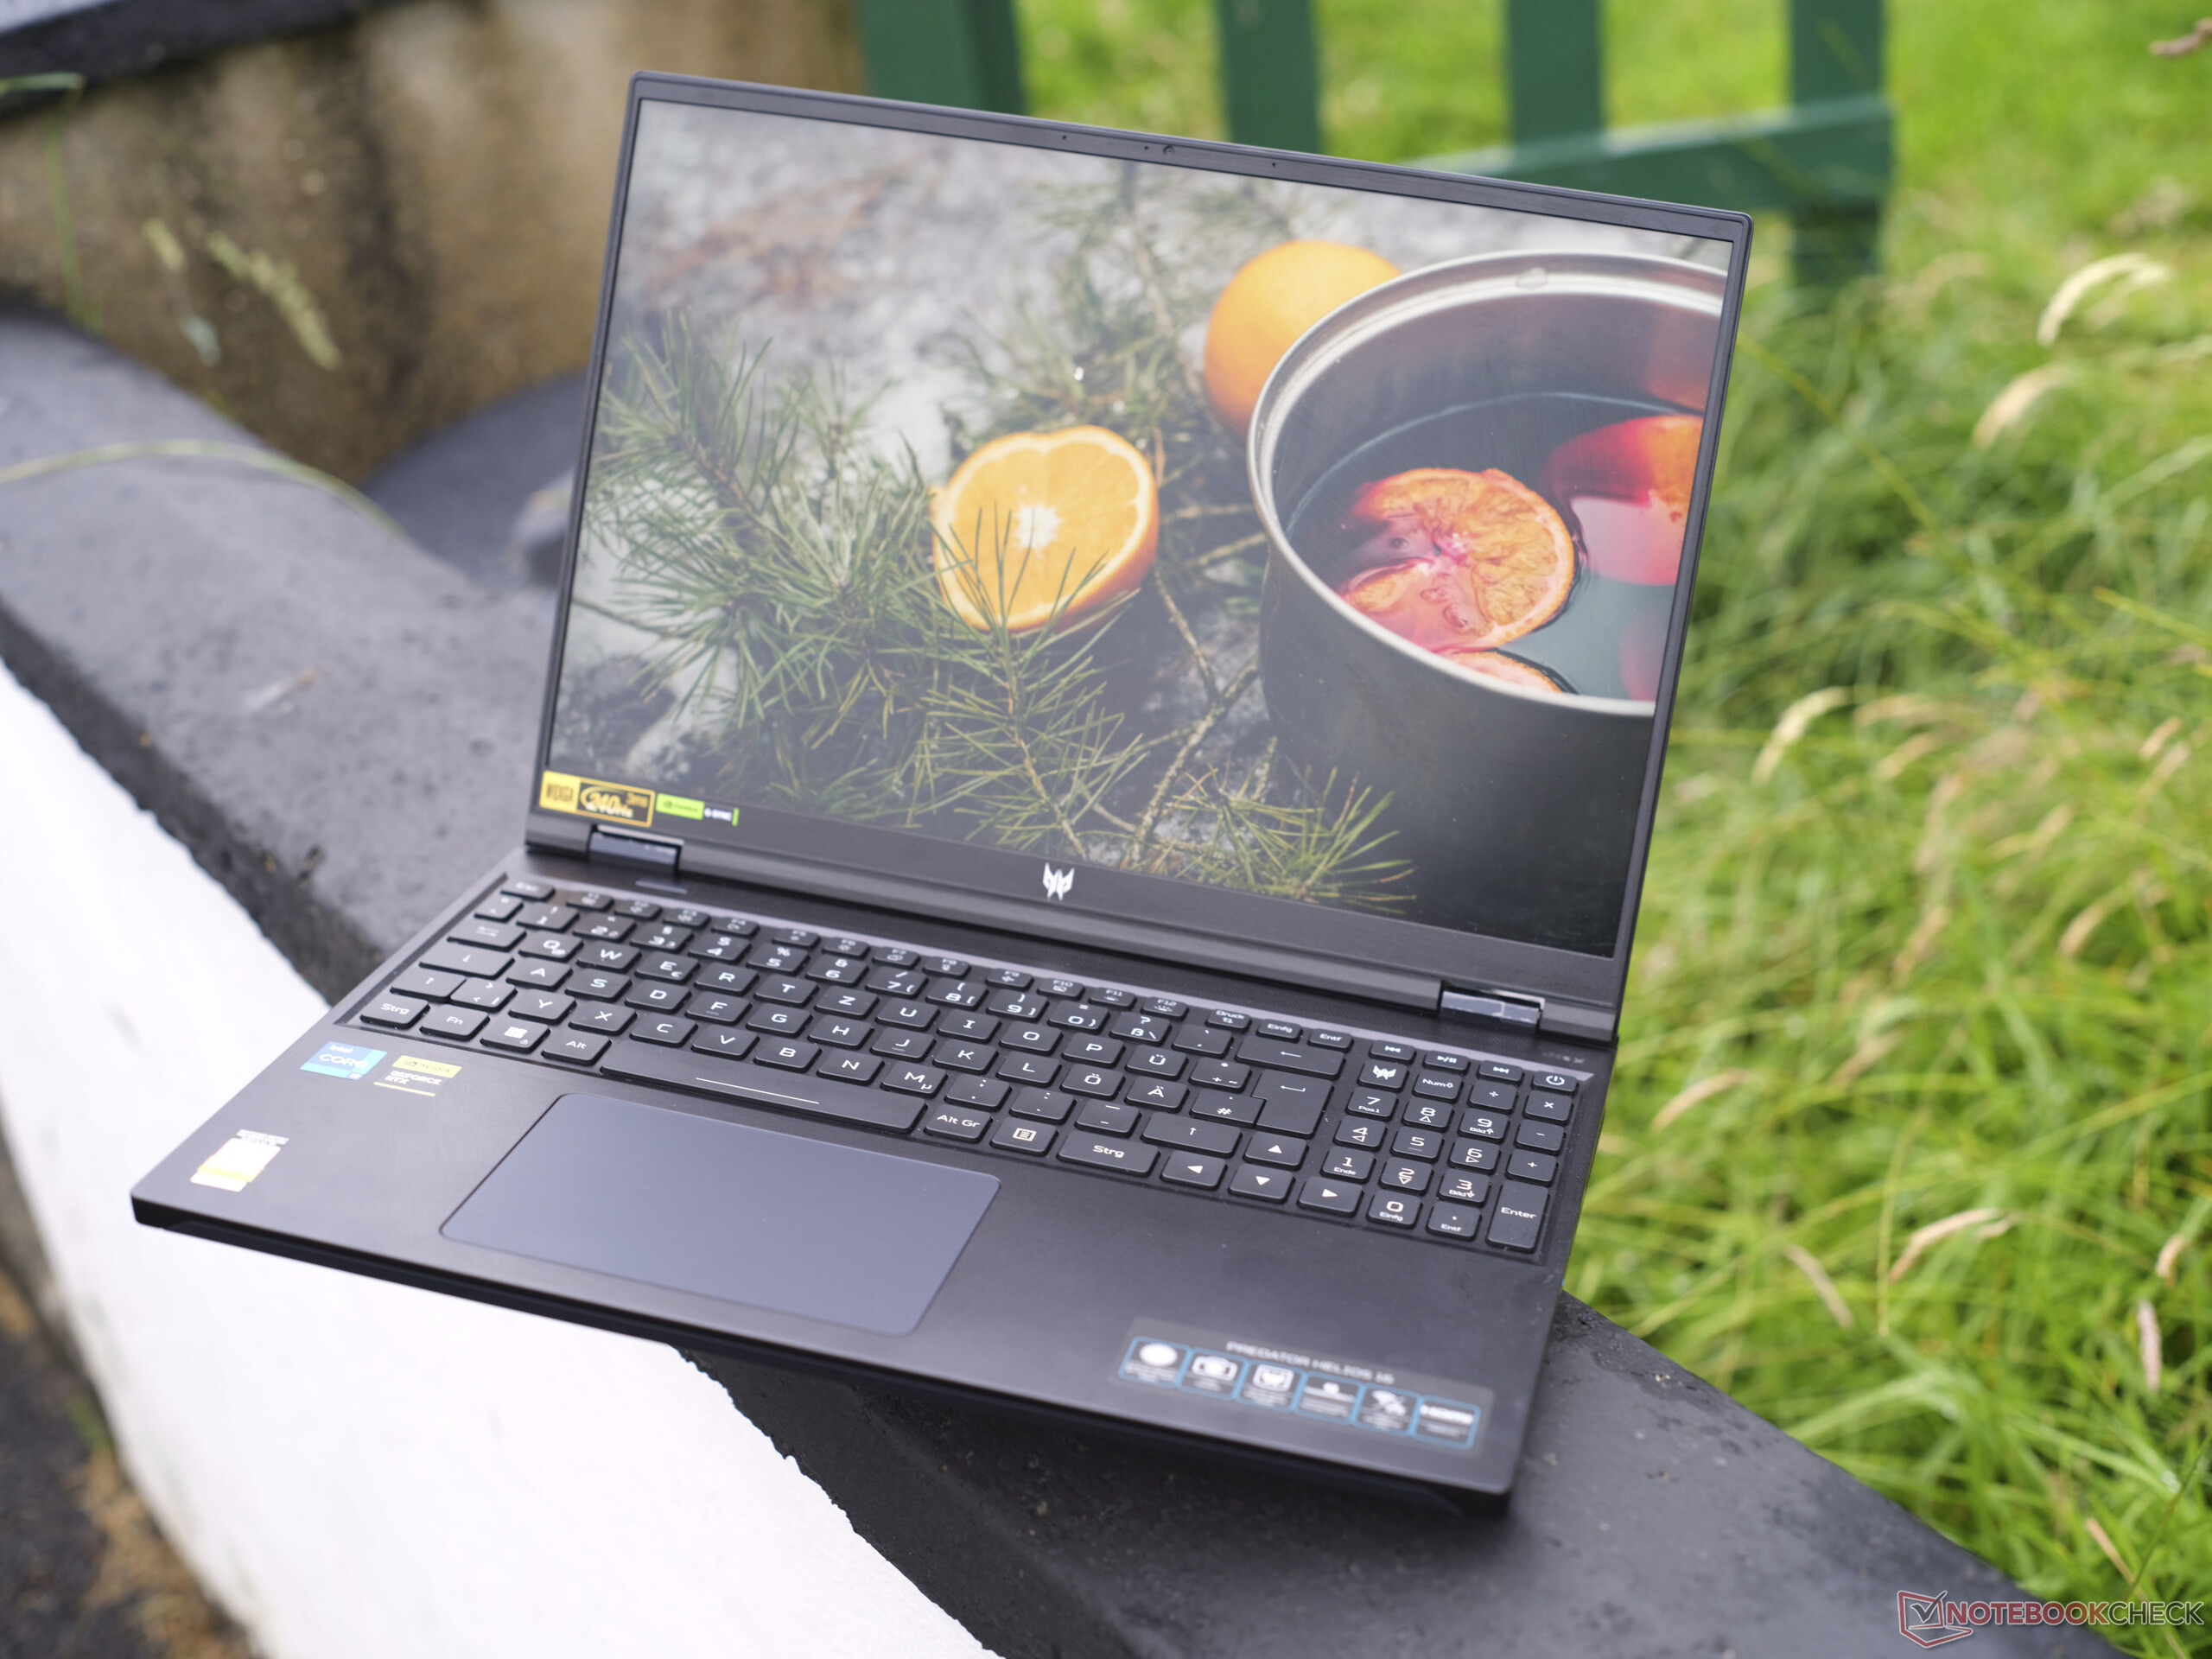
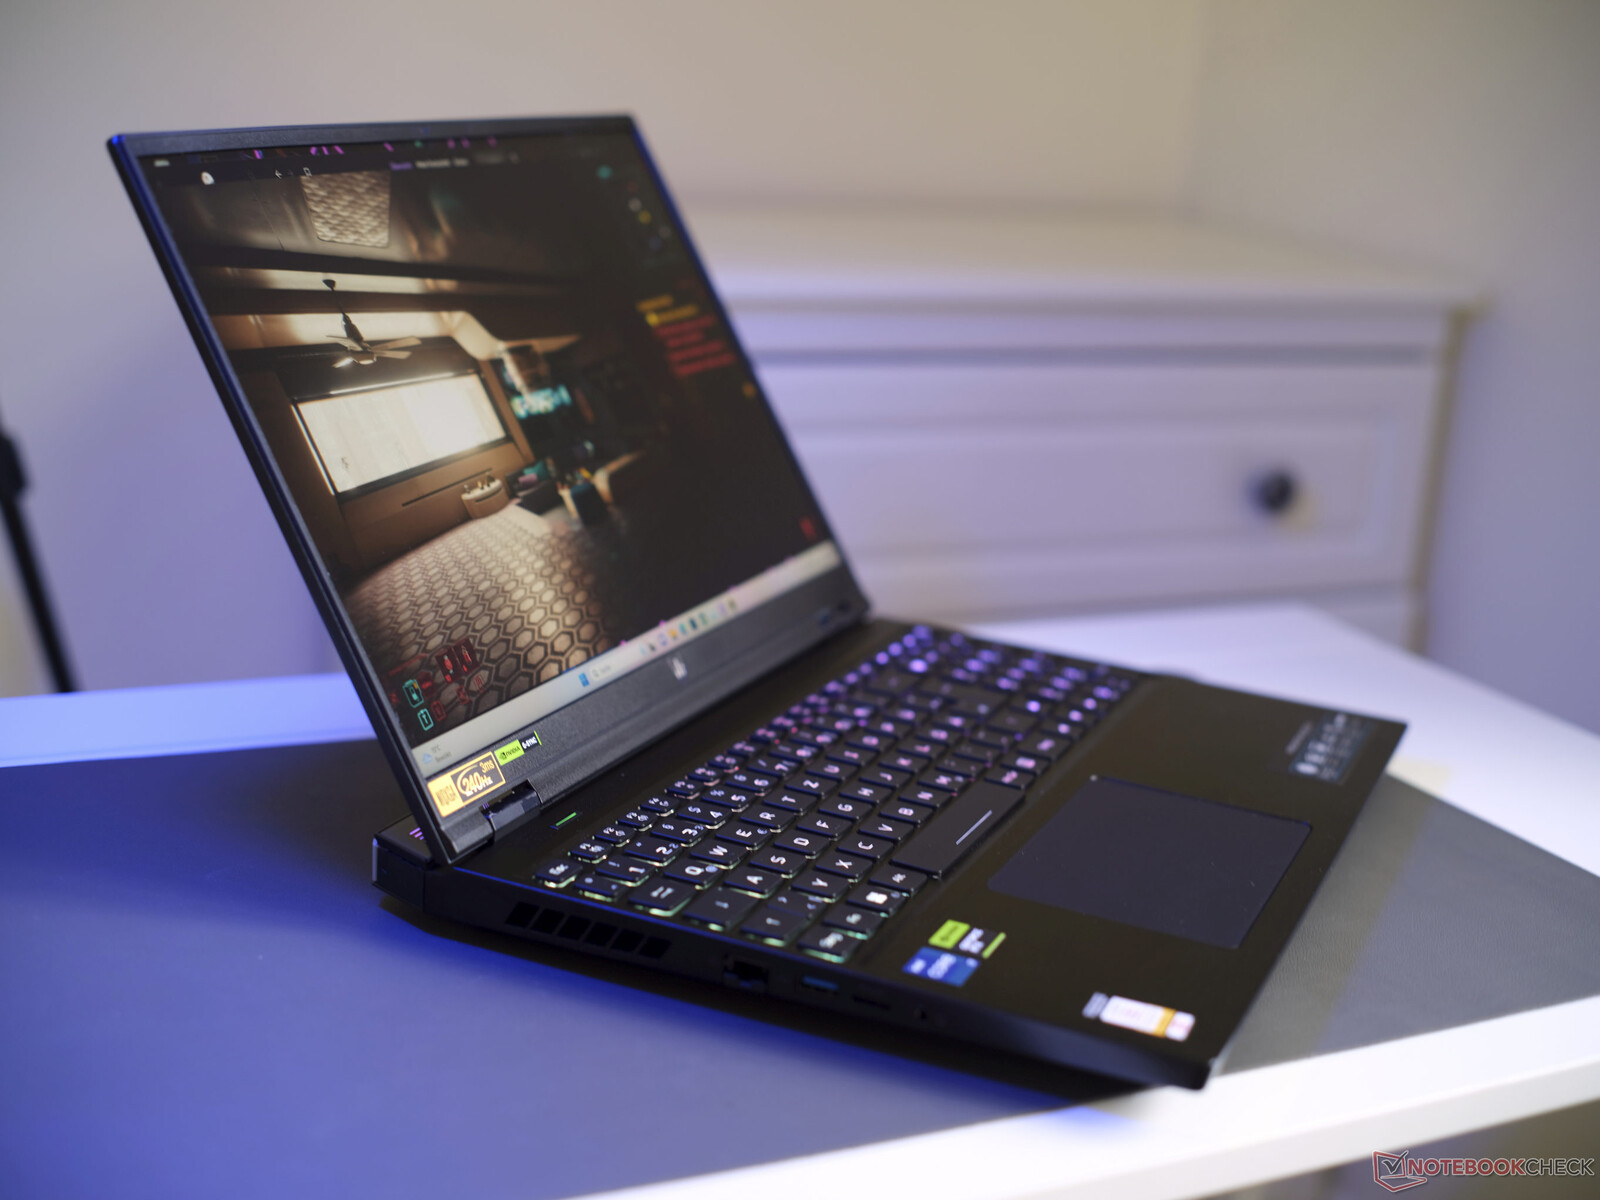
Al igual que su predecesorel Helios 16 viene en negro mate y está fabricado en su mayor parte con una aleación de aluminio cepillado, y sólo la unidad base y el borde de la pantalla son de plástico para evitar los inconvenientes asociados a los materiales conductores del calor.
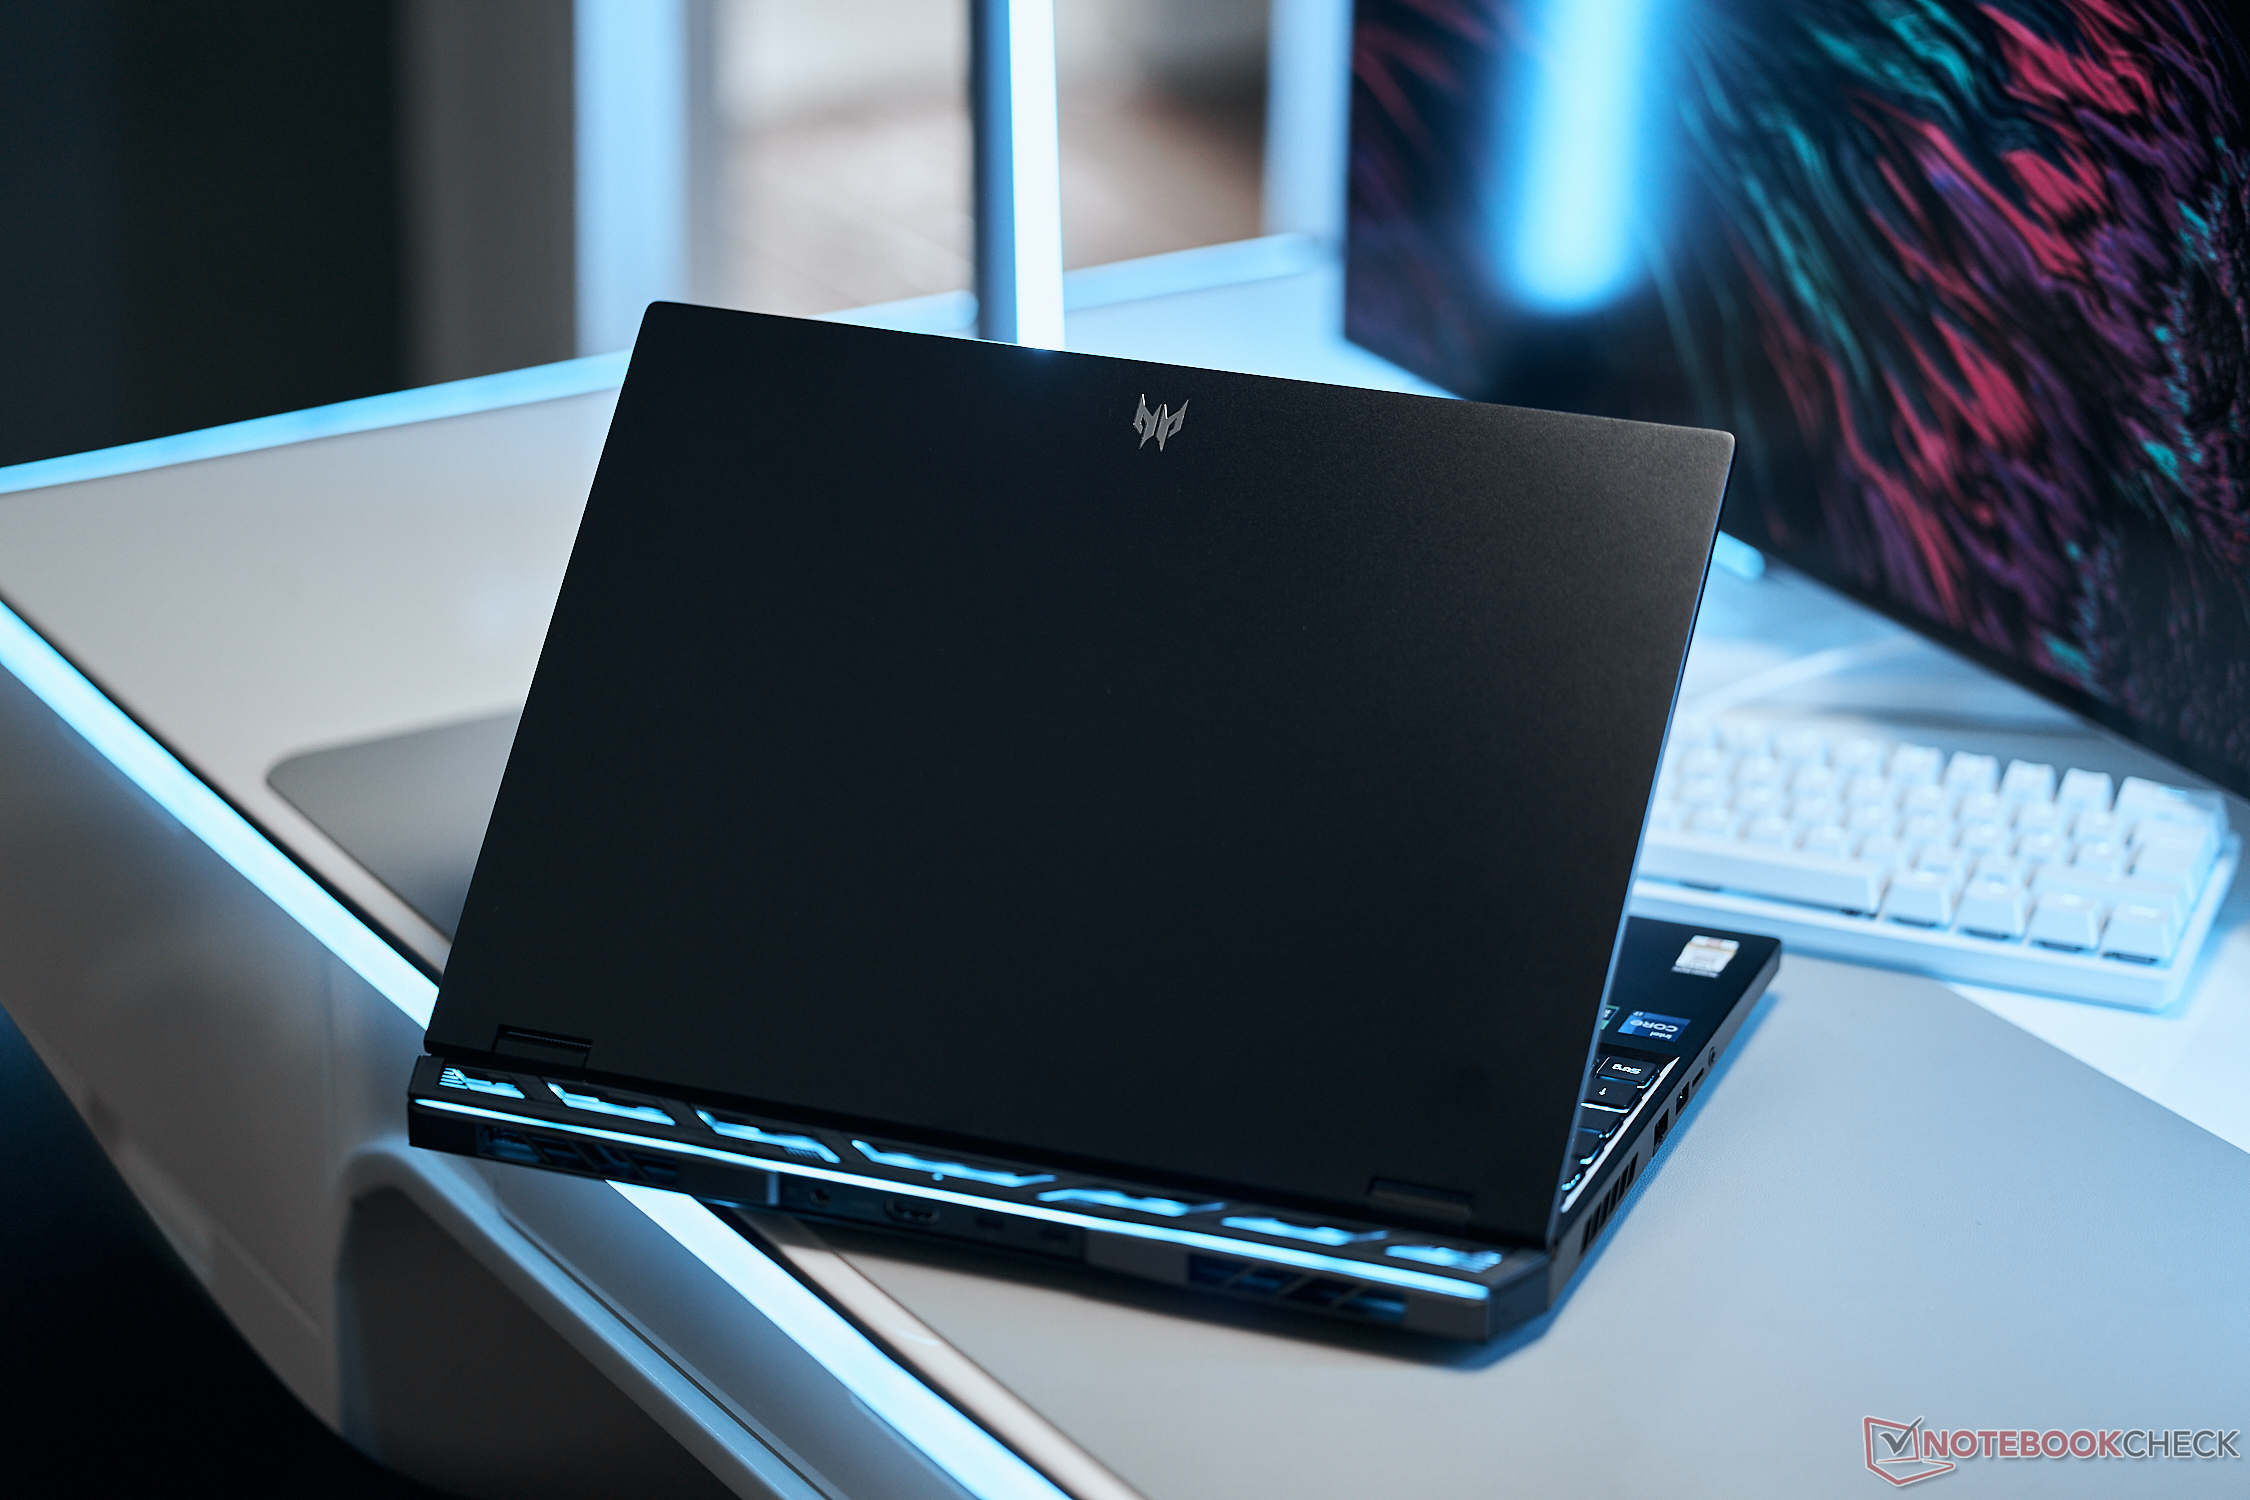
Los detalles, en un exterior de aspecto discreto, son el elegante logotipo de Predator en la tapa de la pantalla y el bisel inferior, así como un sistema de refrigeración retroiluminado con LED. Las superficies lisas atraen bien las huellas dactilares, mientras que el ajuste y el acabado son impecables, sin crujidos.
La unidad base es muy estable, mientras que la tapa se puede girar ligeramente, pero no pudimos producir distorsiones de la imagen, incluso después de aplicar una presión dirigida. Las bisagras están bien fijadas, la tapa apenas se tambalea y se puede abrir con una sola mano hasta un ángulo de ~145°. En general, el Predator Helios causa una impresión muy sólida.
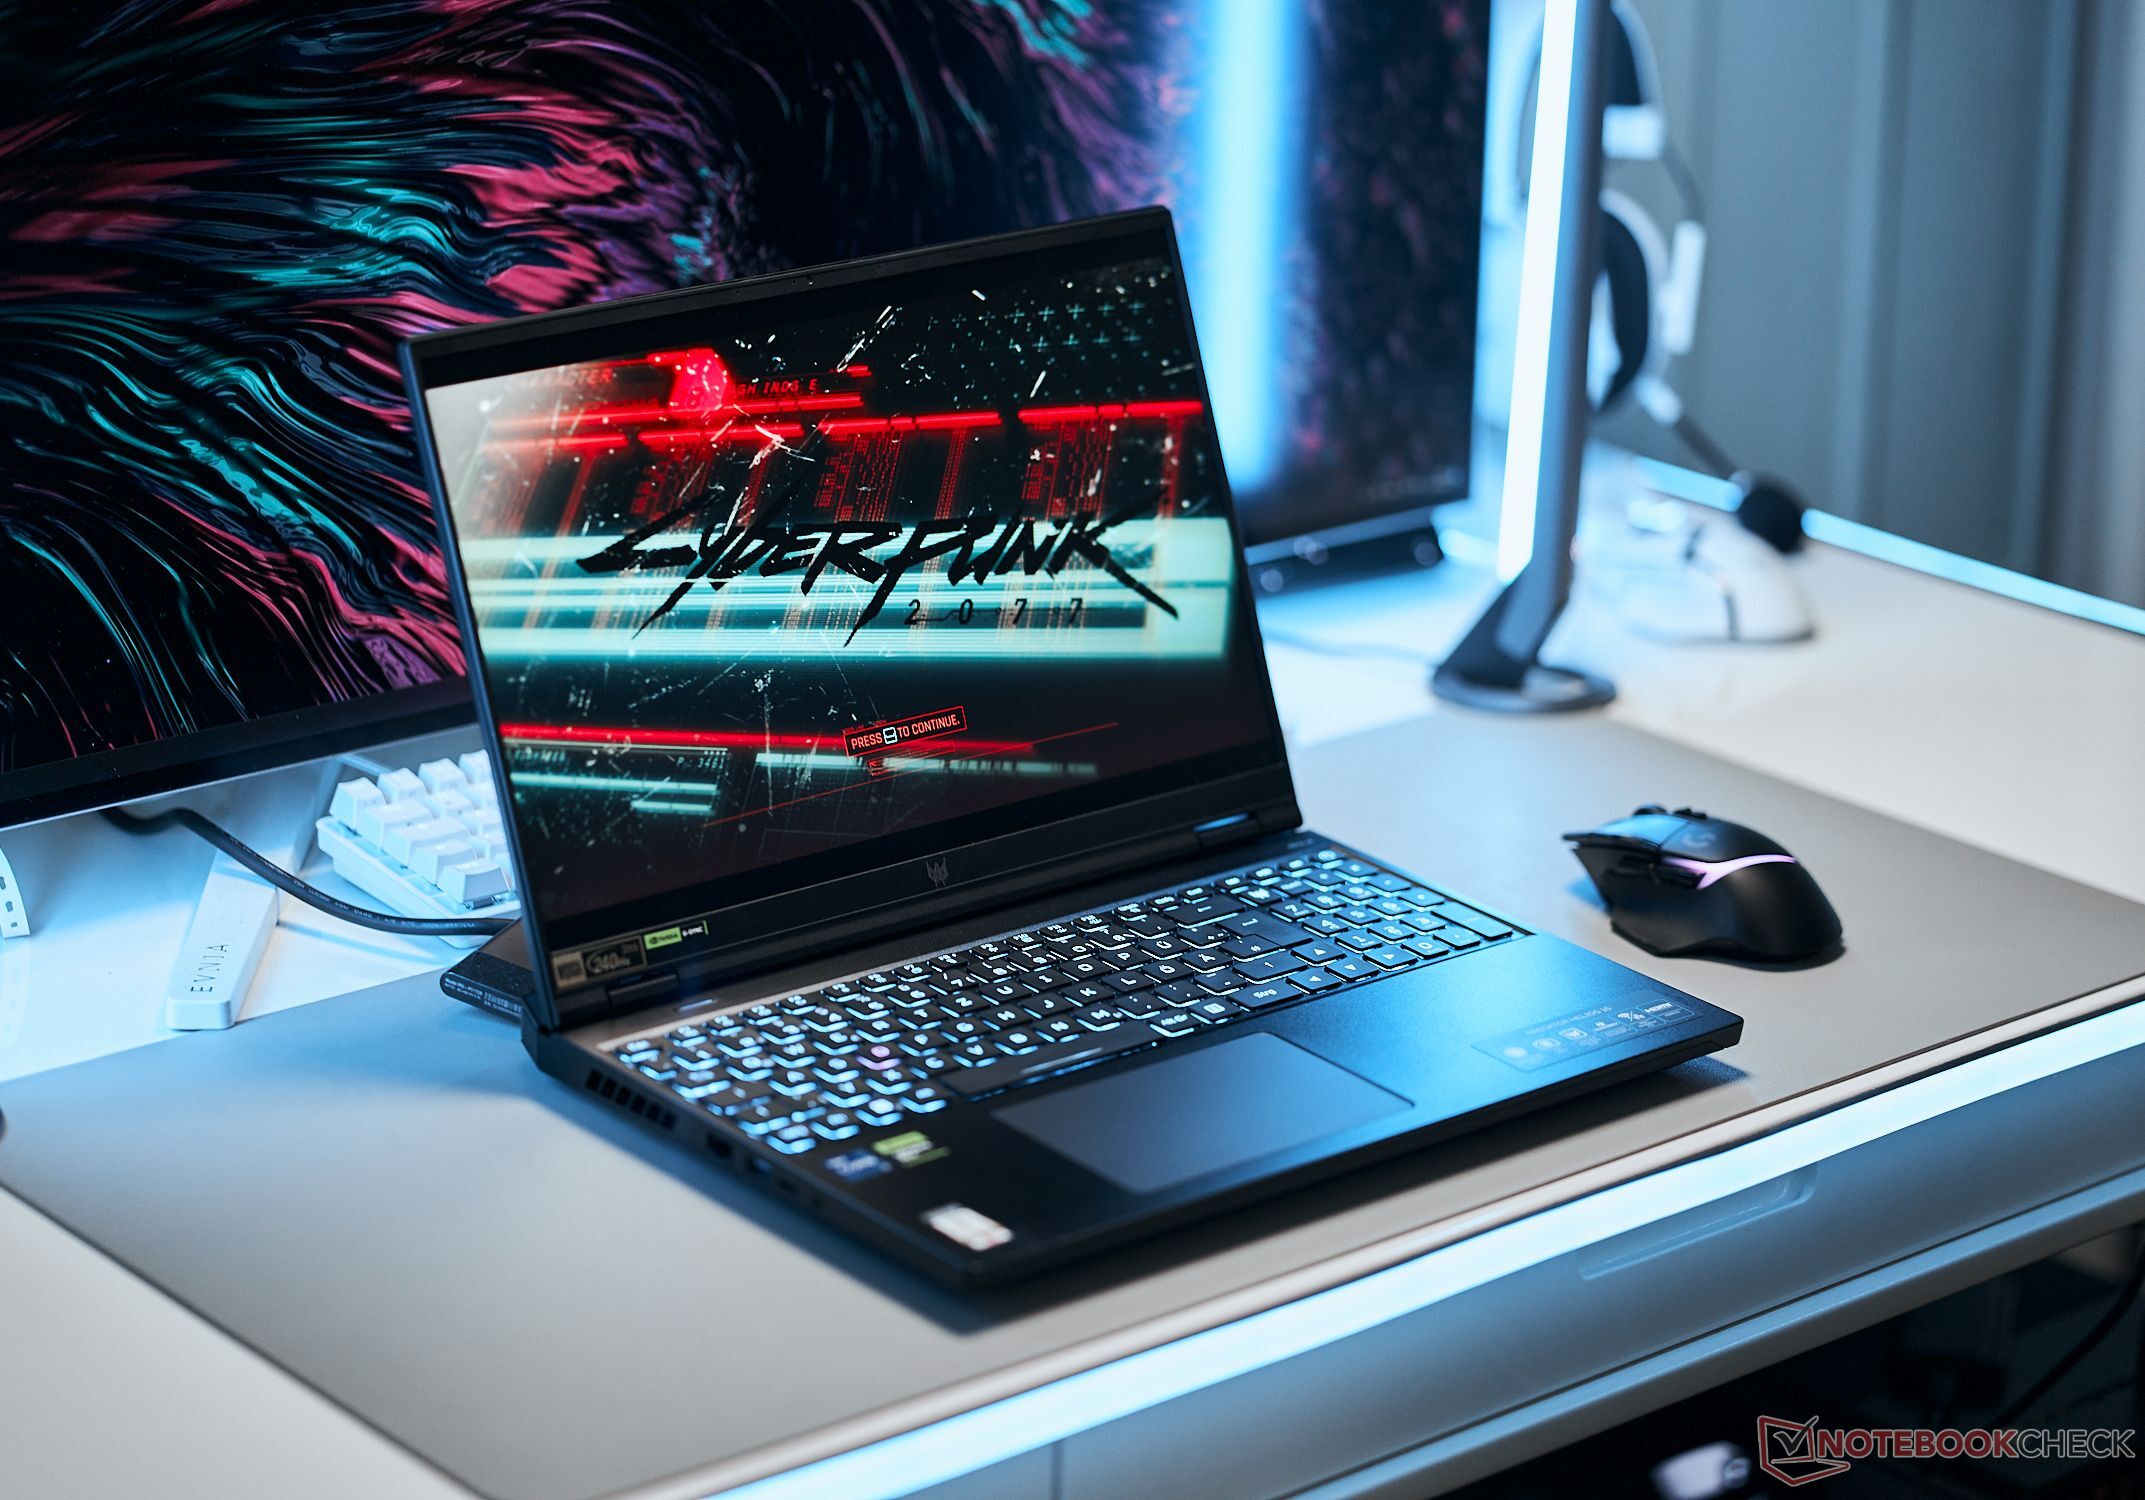

El Acer Predator Helios tiene unos 27 mm de grosor y pesa poco menos de 2,6 kg. Estas estadísticas vitales pueden considerarse medias para una máquina de juegos con un sistema de refrigeración tan potente. Sin embargo, a pesar de tener la misma altura, con 2,2 kg, elAsus TUF Gaming A16es significativamente más ligero, mientras que el GigabyteGigabyte Aorus 15Xes considerablemente más delgado a pesar de tener el mismo TGP.
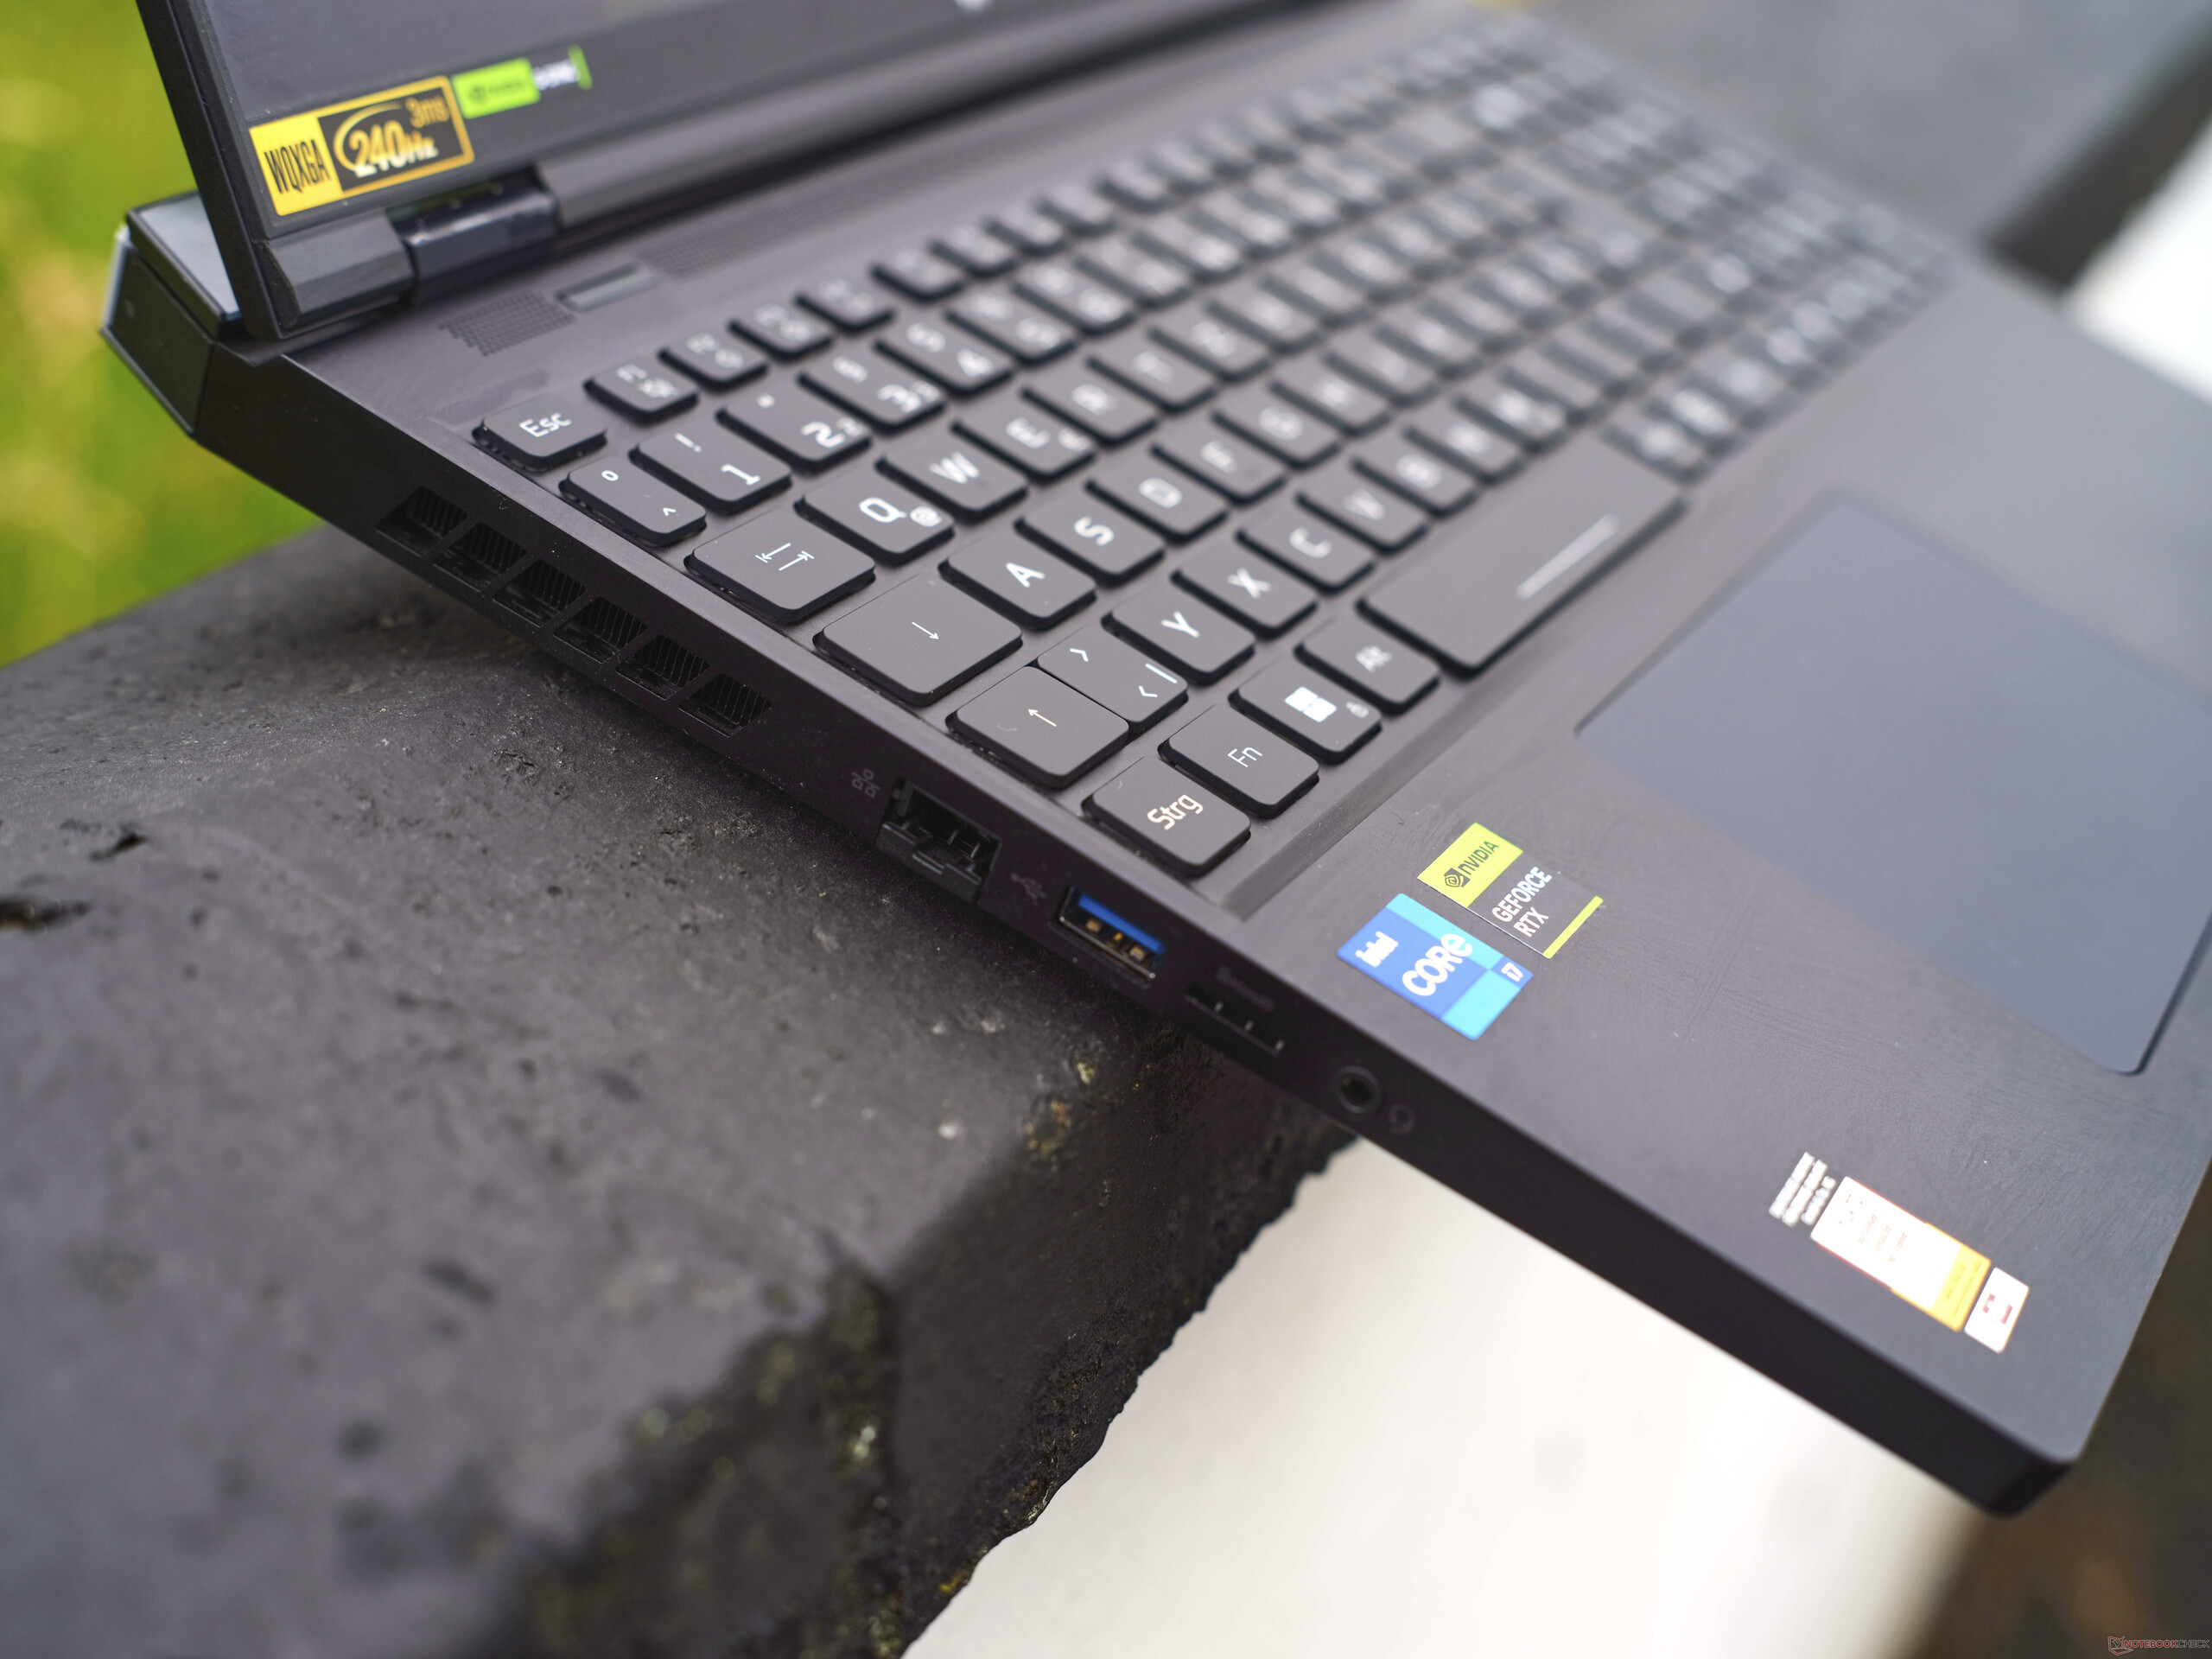
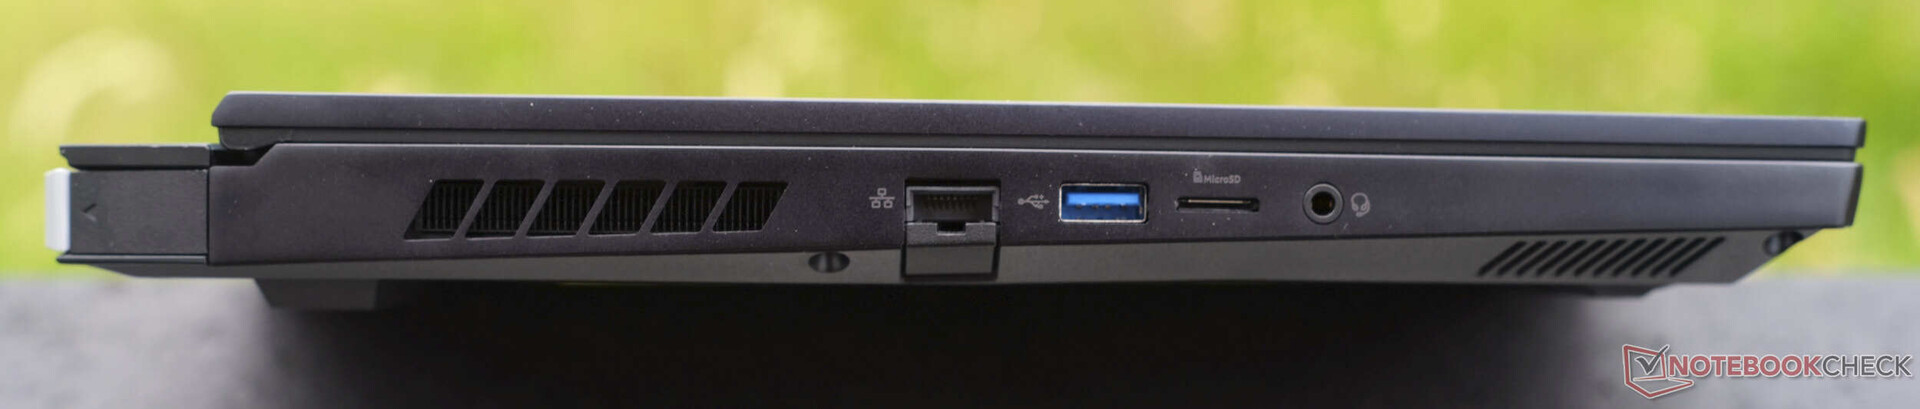
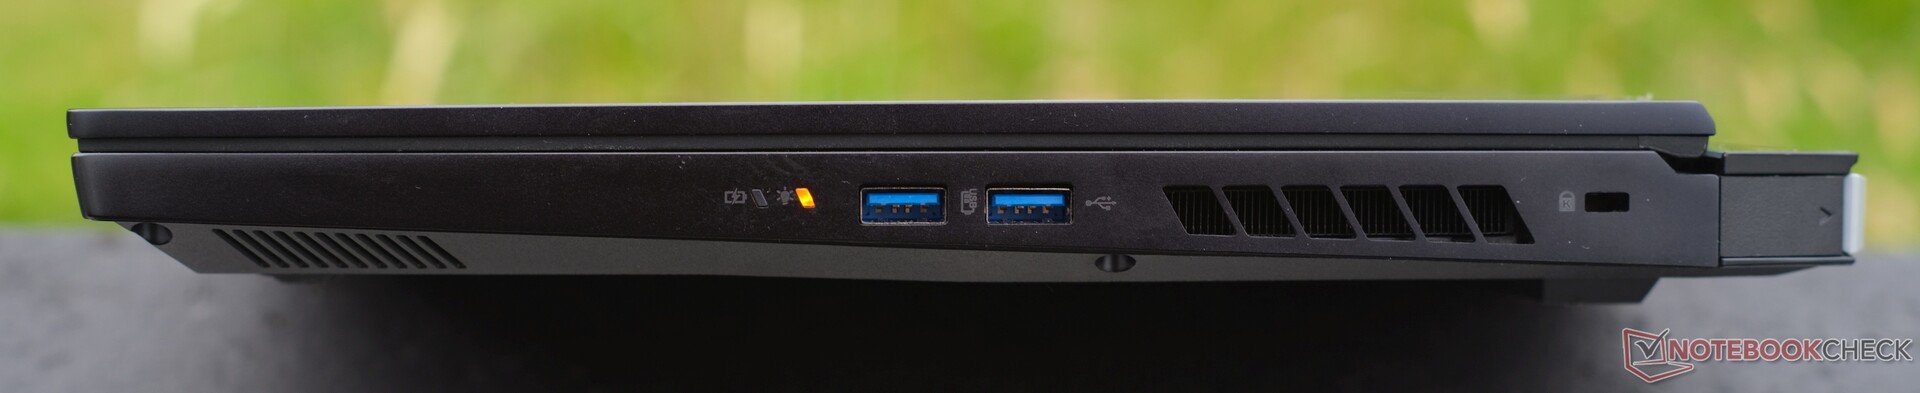
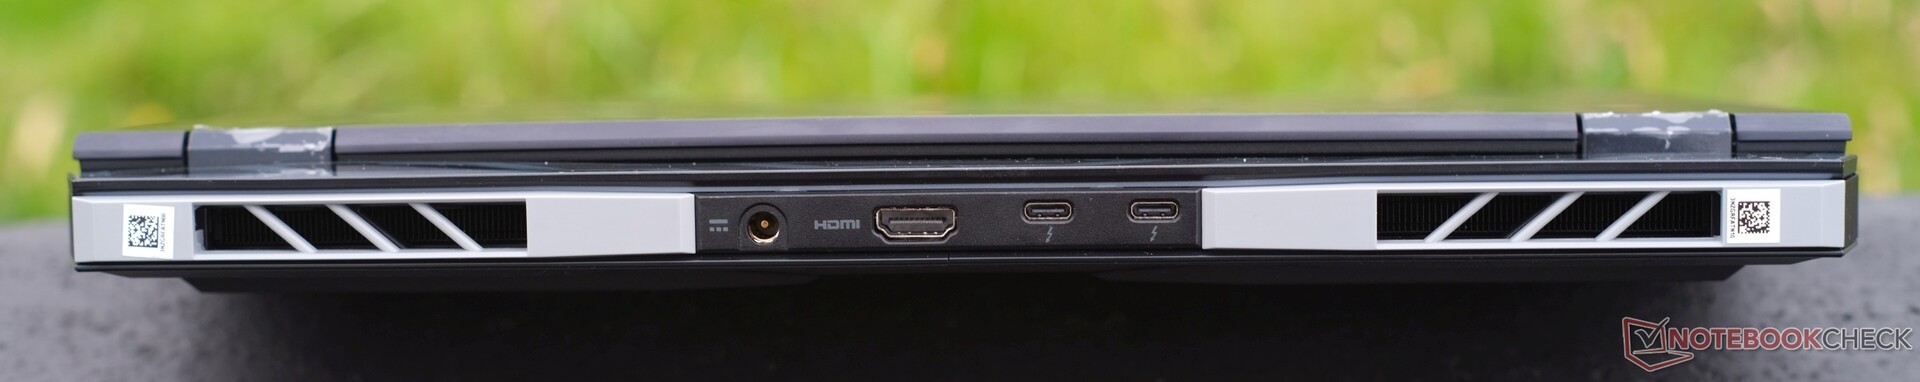
Características: El Helios 16 ofrece una generosa selección de puertos y Wi-Fi Killer rápido
El portátil gaming Acer tiene numerosos puertos incluyendo 5x USB. A la izquierda, hay 1x USB-A 3.1 (5 GBit/s), a la derecha, 2x USB-A 3.2 (10 GBit/s) así como 2x Thunderbolt 4 en la trasera que incluye DisplayPort 1.4 y Power Delivery (100 vatios). El portátil también alberga Gigabit ethernet, un lector de tarjetas microSD, una toma de audio de 3,5 mm, un cierre Kensington, HDMI 2.1 y el conector de carga.
Lector de tarjetas SD
Emparejado con nuestra tarjeta de referencia AV PRO microSD 128 GB V60, el lector de tarjetas microSD no es necesariamente lento, pero tampoco muy rápido, y es una lástima teniendo en cuenta el precio del Helios 16. Sin embargo, los dispositivos de nuestra competencia (al menos los equipados con lector de tarjetas) leen y copian los datos con una rapidez similar.
| SD Card Reader | |
| average JPG Copy Test (av. of 3 runs) | |
| Media de la clase Gaming (20.9 - 210, n=54, últimos 2 años) | |
| Lenovo Legion S7 16ARHA7 (AV PRO microSD 128 GB V60) | |
| Medion Erazer Defender P40 (AV PRO microSD 128 GB V60) | |
| Acer Nitro 16 AN16-41 (AV Pro SD microSD 128 GB V60) | |
| HP Omen 17-ck2097ng (AV PRO microSD 128 GB V60) | |
| Acer Predator Helios 16 PH16-71-731Q | |
| maximum AS SSD Seq Read Test (1GB) | |
| Media de la clase Gaming (25.5 - 261, n=51, últimos 2 años) | |
| Medion Erazer Defender P40 (AV PRO microSD 128 GB V60) | |
| Lenovo Legion S7 16ARHA7 (AV PRO microSD 128 GB V60) | |
| Acer Predator Helios 16 PH16-71-731Q | |
| Acer Nitro 16 AN16-41 (AV Pro SD microSD 128 GB V60) | |
| HP Omen 17-ck2097ng (AV PRO microSD 128 GB V60) | |
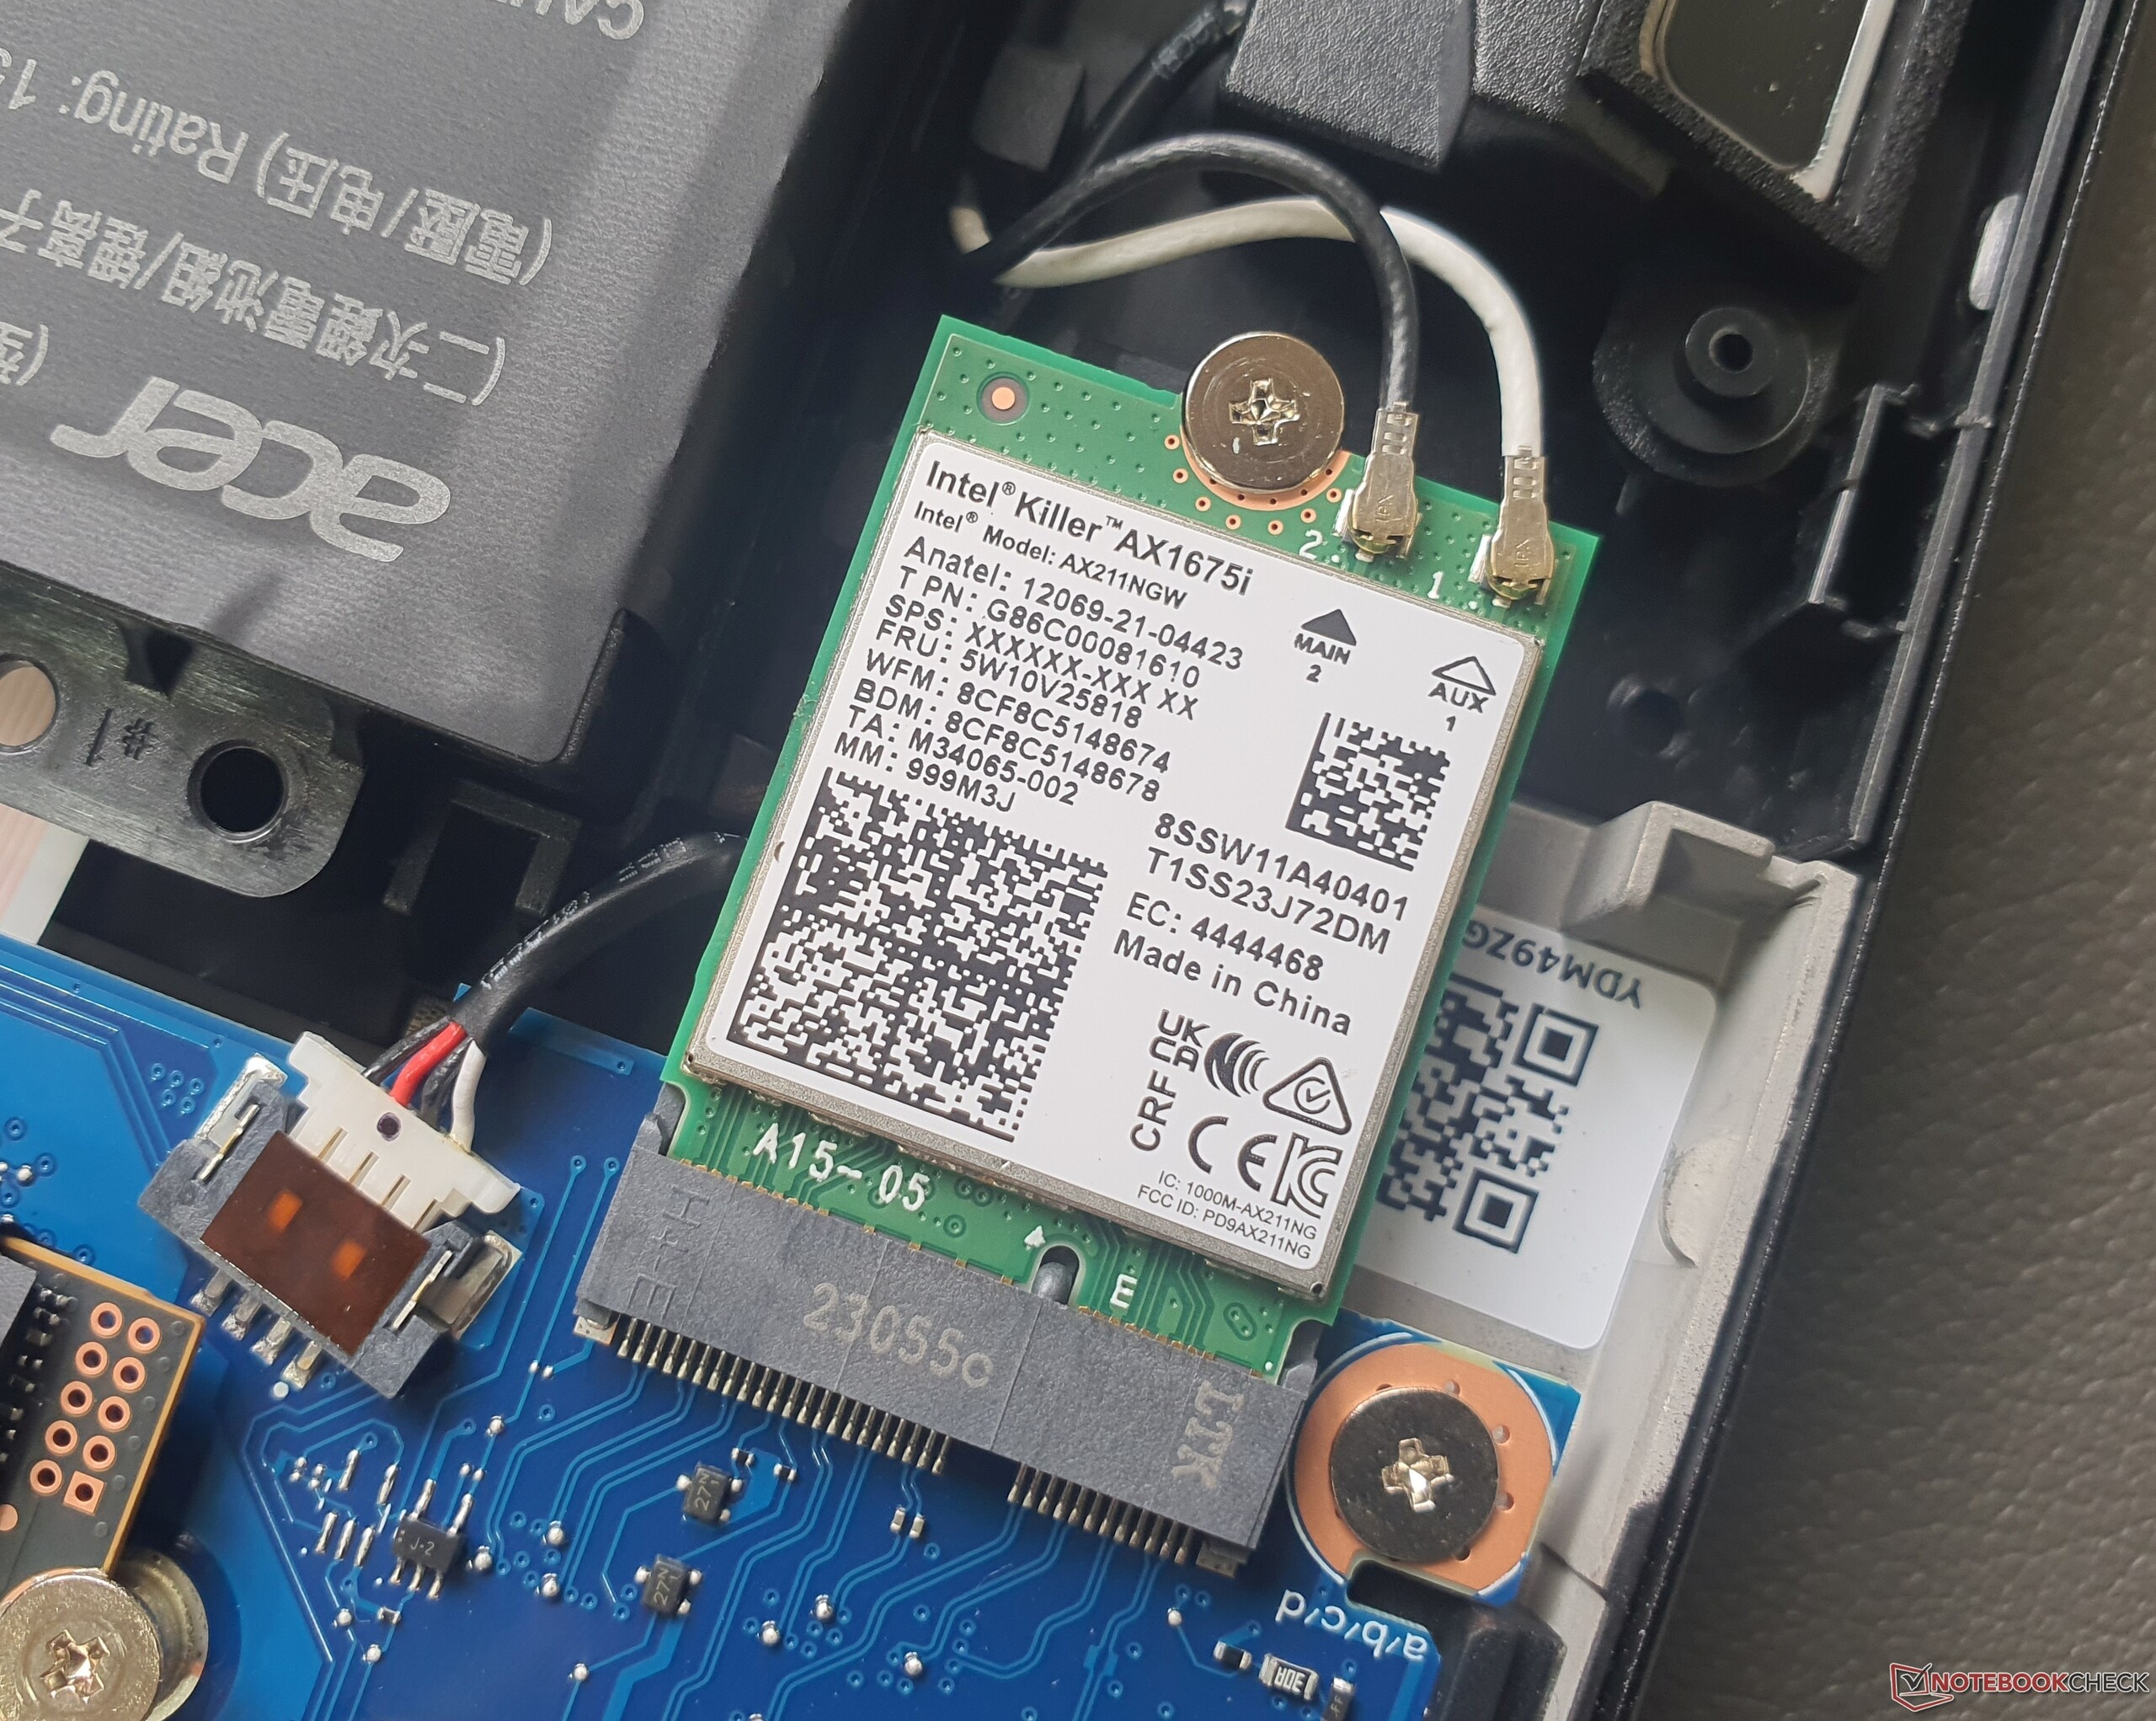
Comunicación
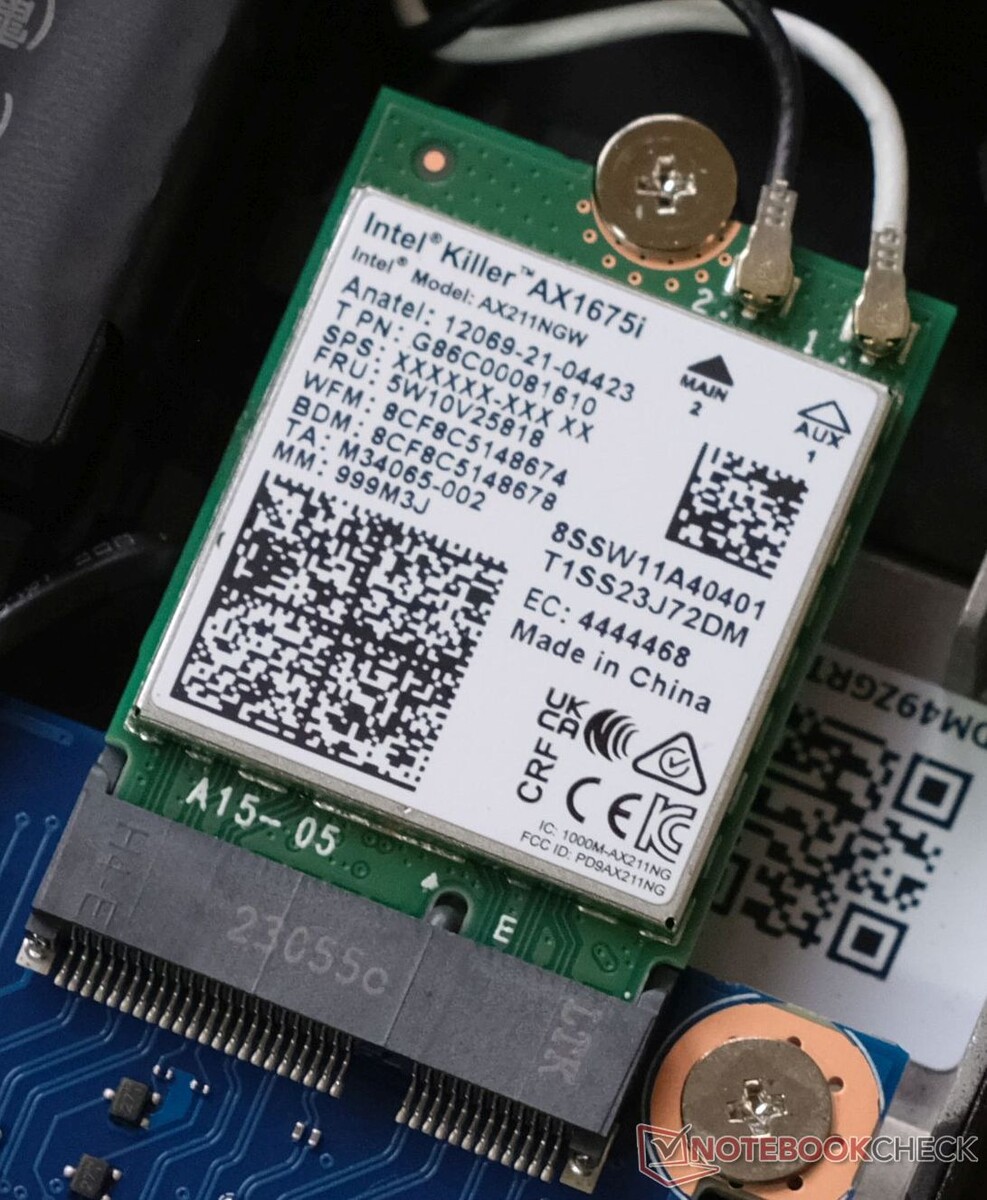
El chip Intel Killer AX1675i Wi-Fi 6E es el responsable de la transmisión inalámbrica de red, que funciona a una velocidad de primera clase de hasta 1,6 GBit/s y es más rápida de lo que permite el puerto Gigabit RJ45 instalado (Killer 2600), ya que no admite 2,5 GBit/s En particular, elLegion Pro 5 16y elTUF Gaming A16quedan a cierta distancia del Helios 16. Incorpora Bluetooth 5.2.
Cámara web
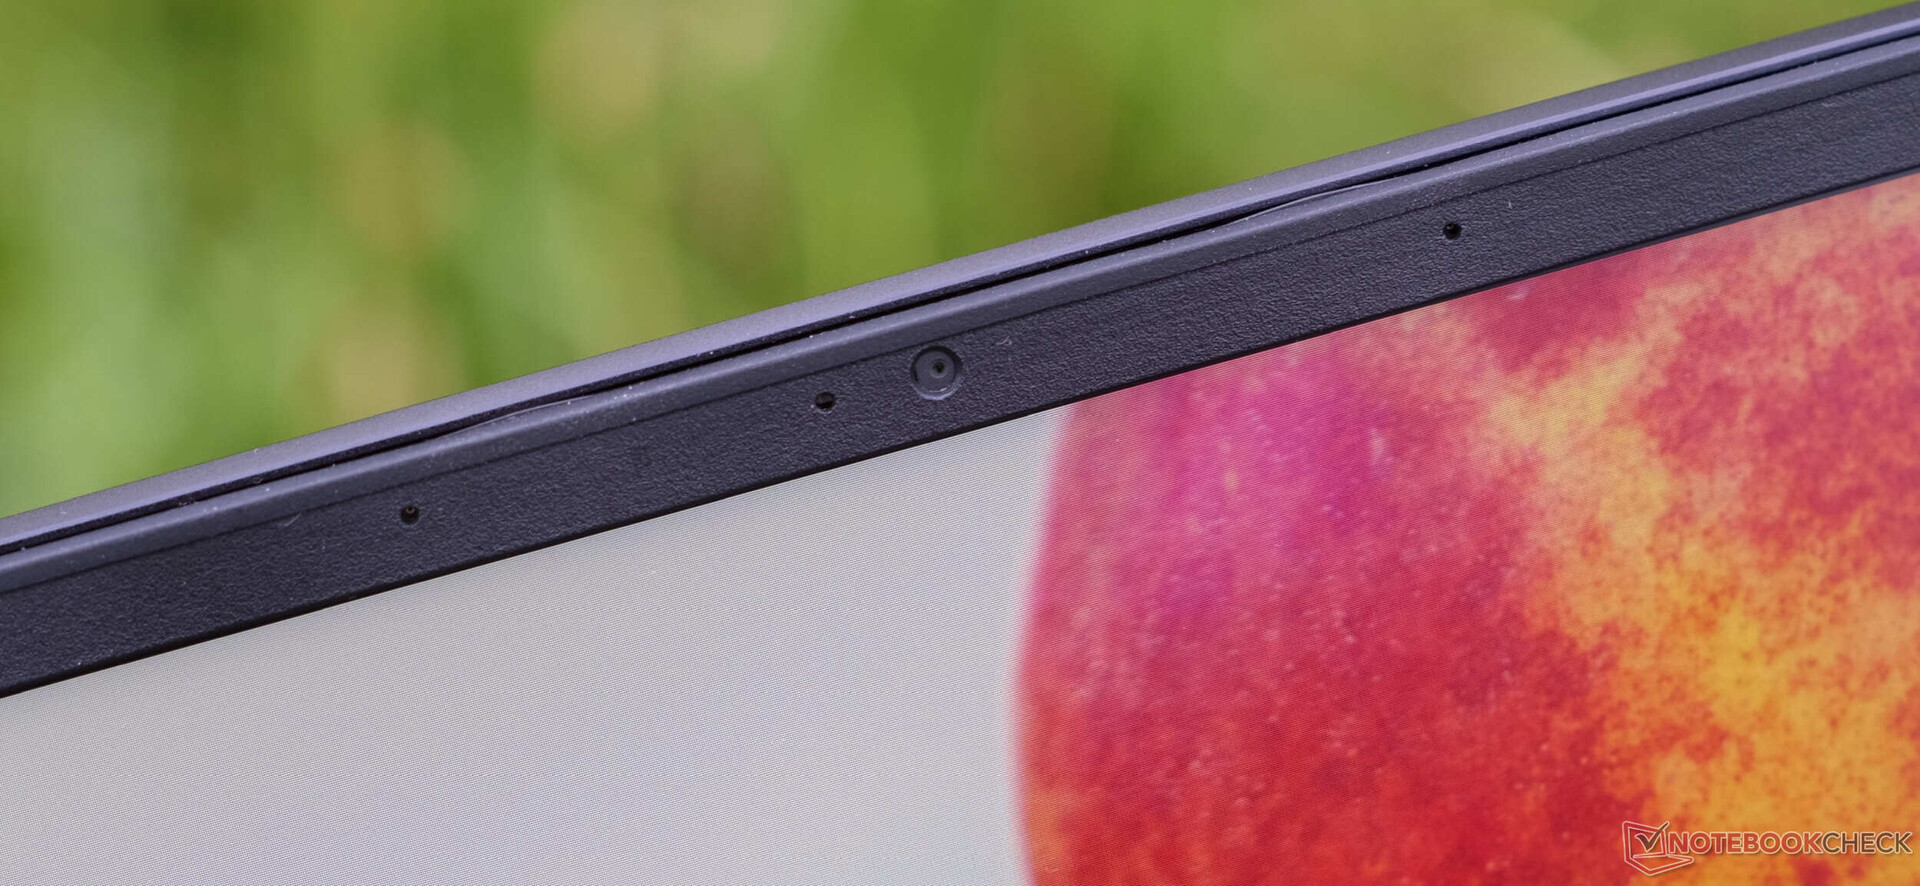
En buenas condiciones de iluminación, la webcam 1080p ofrece imágenes muy buenas. Frente a una luz de fondo (en este caso, procedente de una ventana lateral sin fuentes de luz adicionales), hay una drástica reducción de la calidad. Es compatible con Windows Hello, pero no tiene obturador físico.


Accesorios
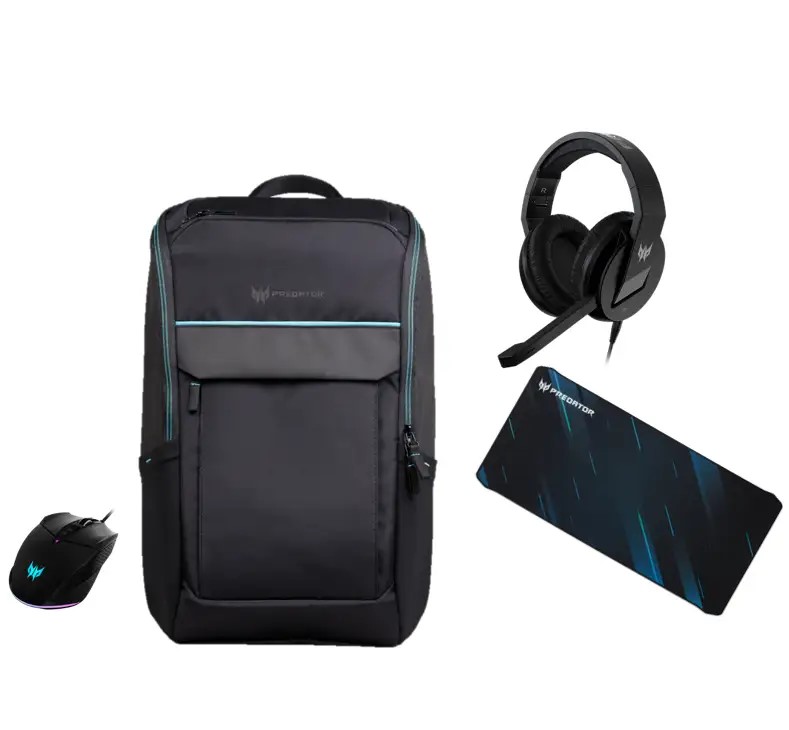
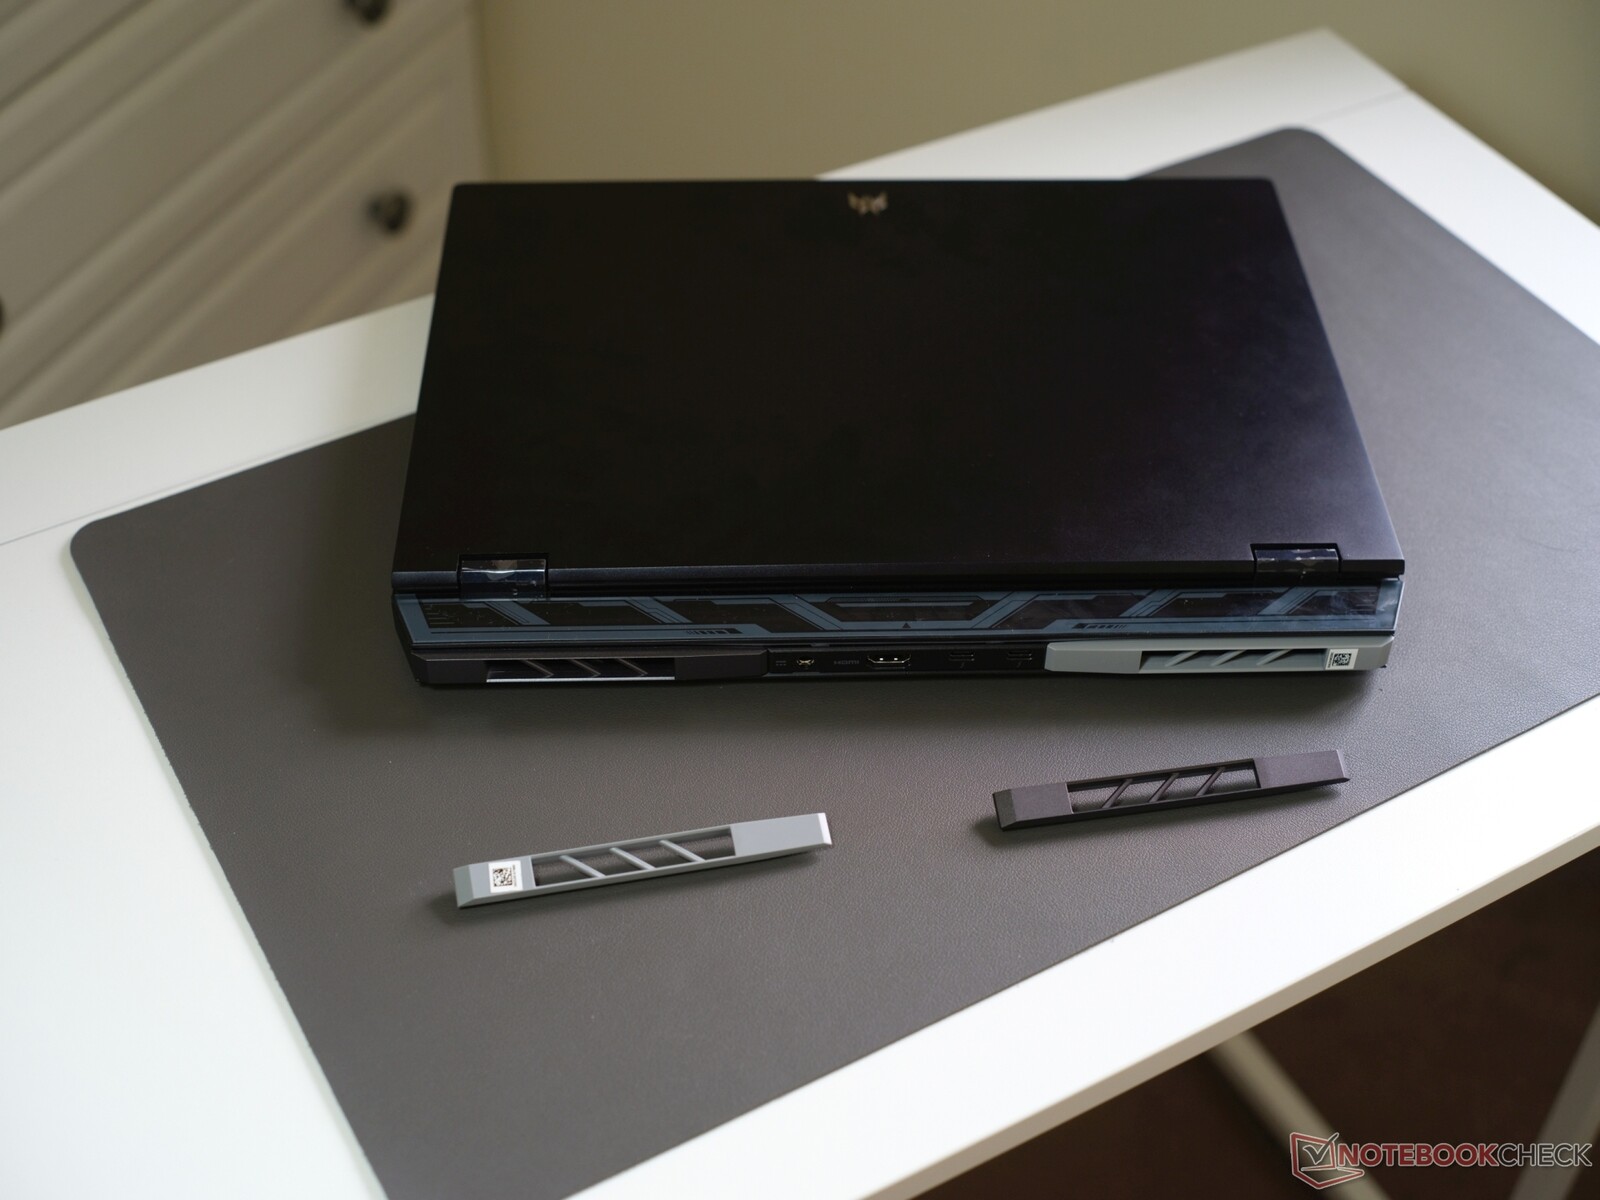
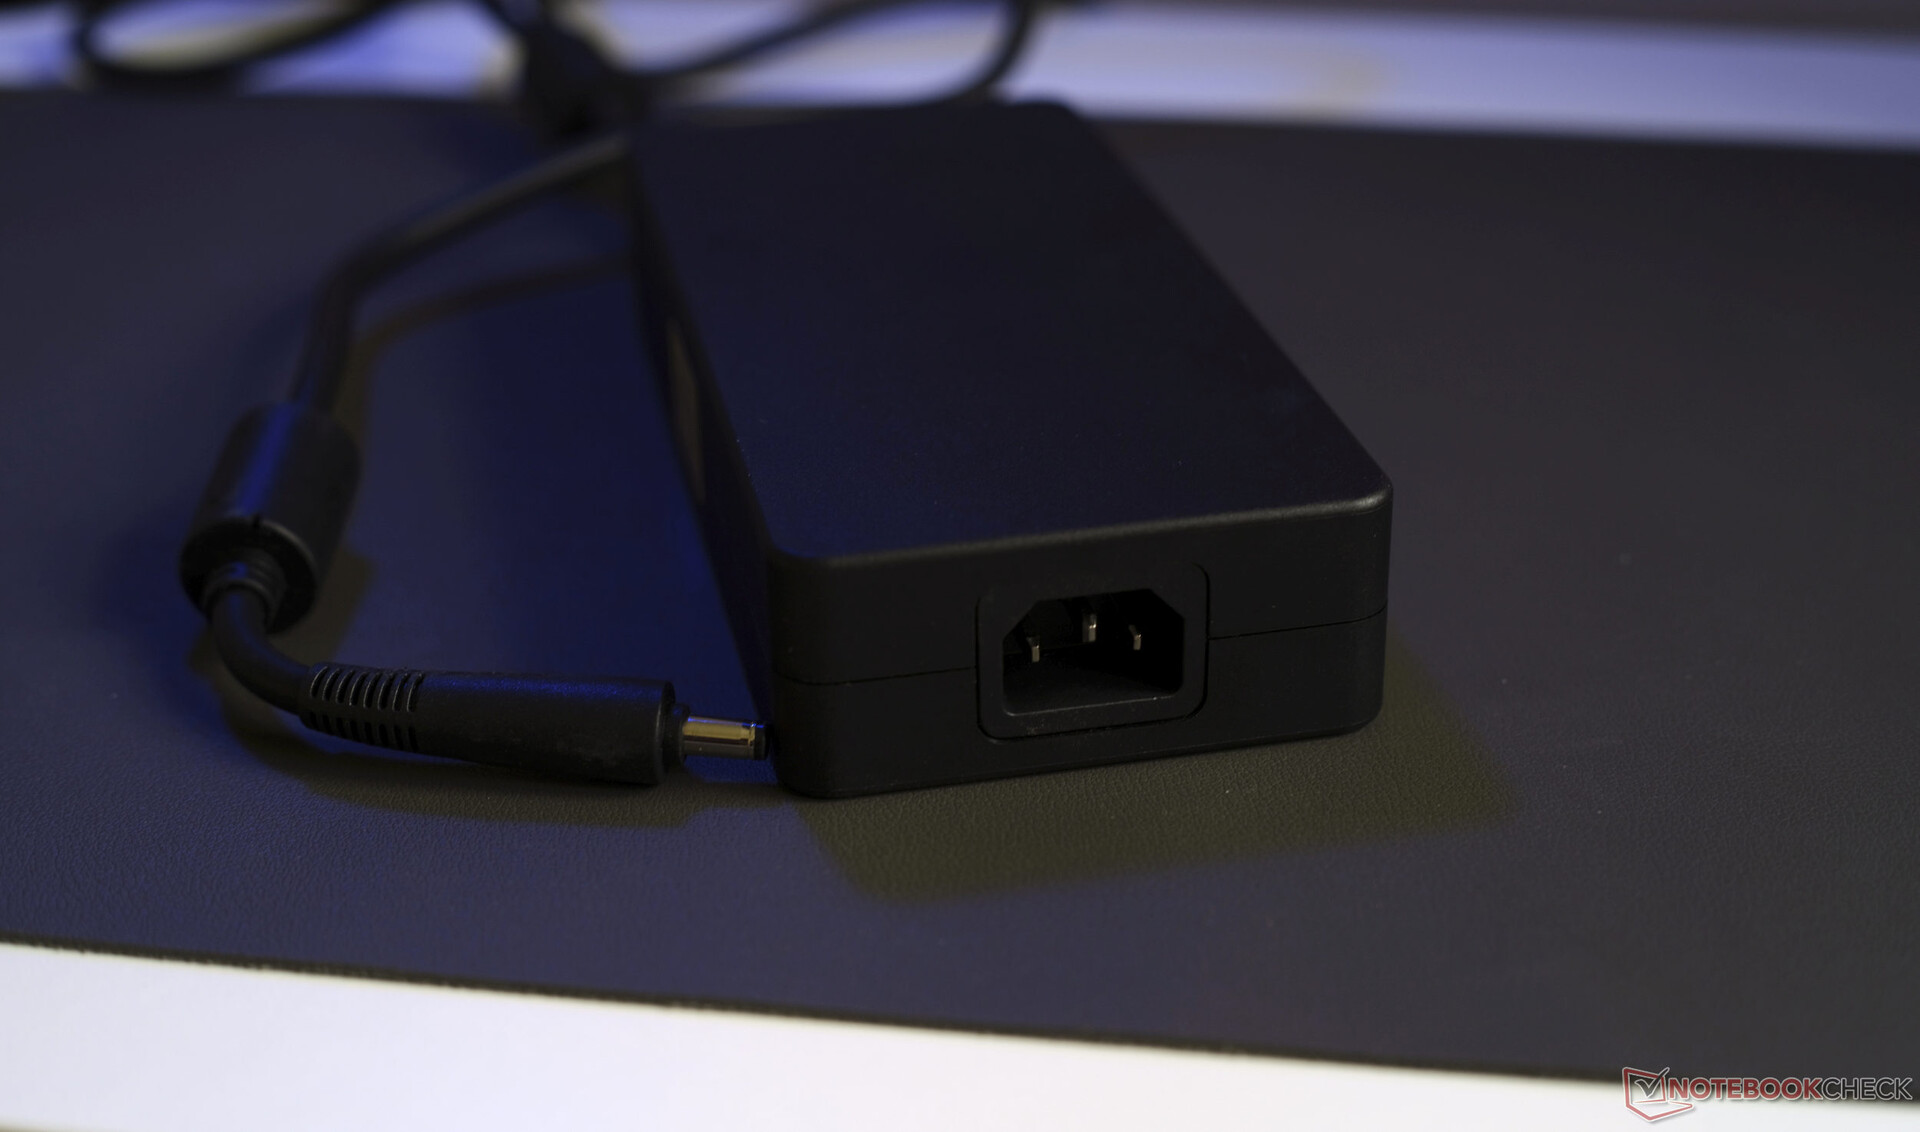
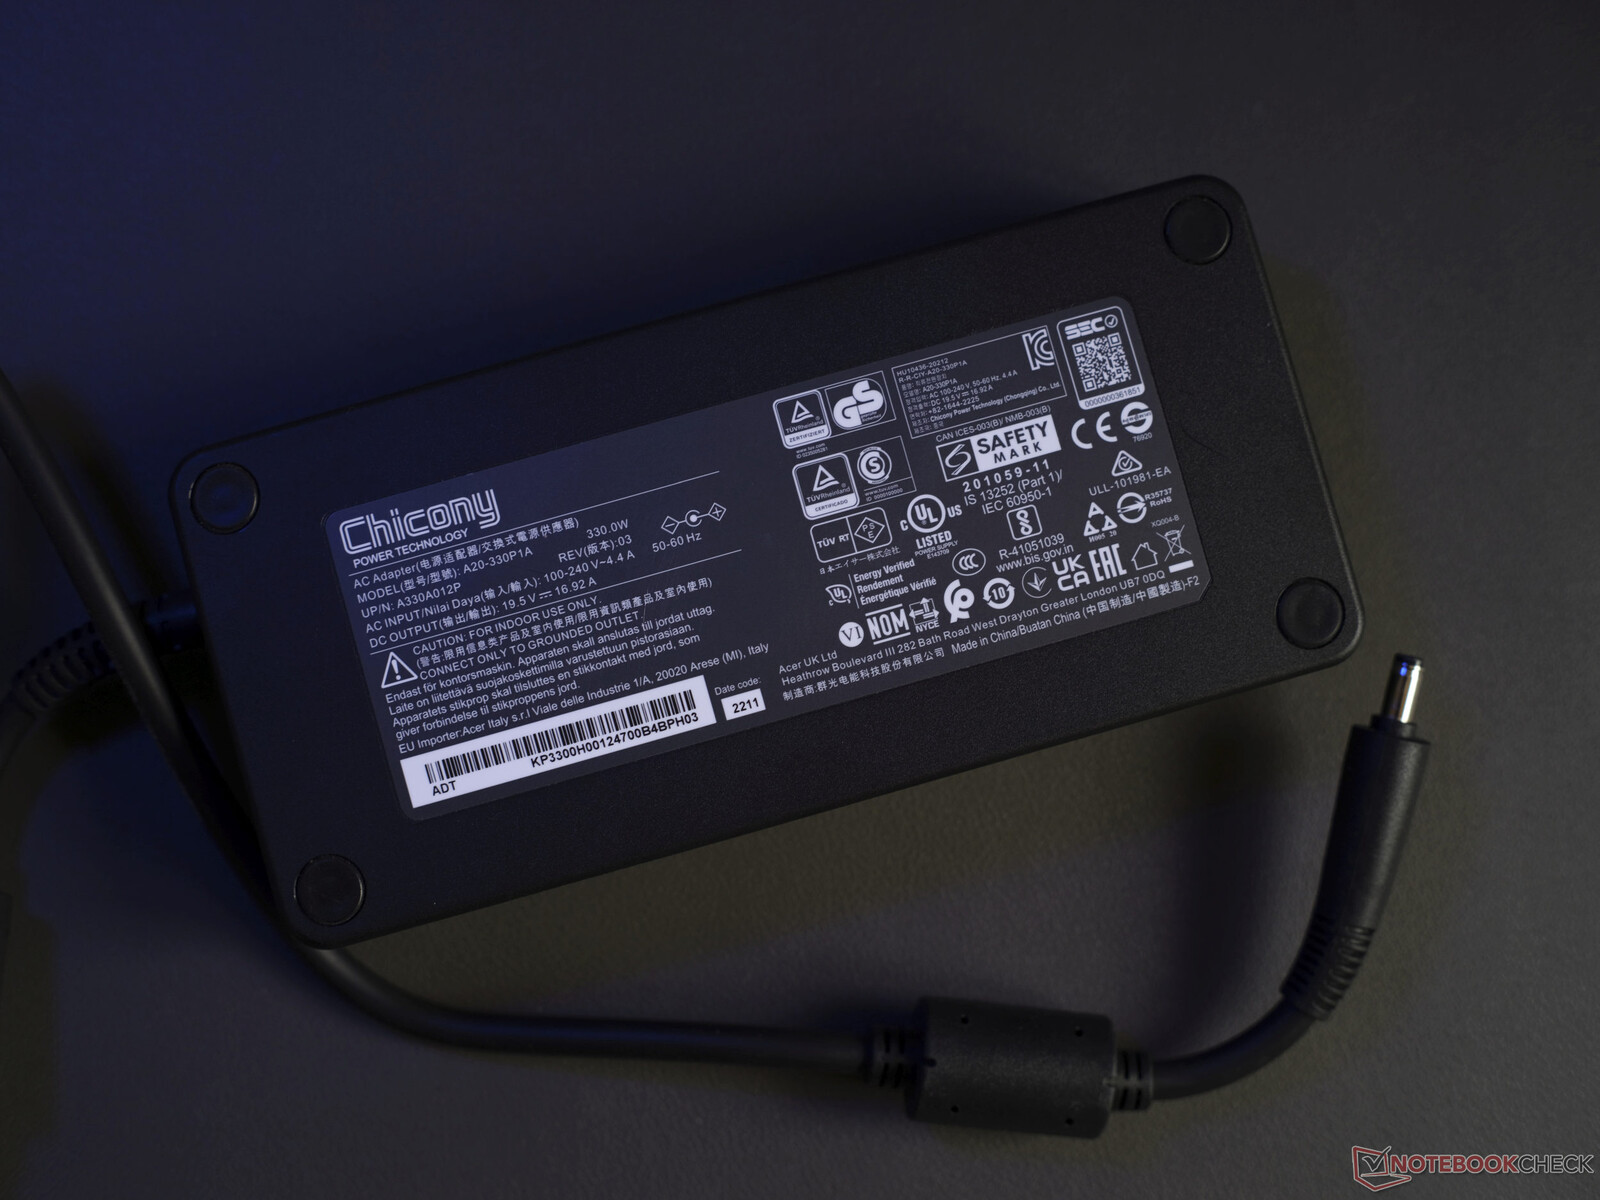
Acer ha incluido dos rejillas magnéticas de ventilador adicionales de color gris claro para reemplazar las preinstaladas de color gris oscuro. Unos acentos de color más atrevidos habrían sido divertidos. Aparte de eso, sólo está la fuente de alimentación de 330 vatios. El fabricante no ha optado por un embalaje respetuoso con el medio ambiente.
Las fotos de la derecha corresponden al paquete de juego Predator actualmente disponible en la tienda Acer alemana.
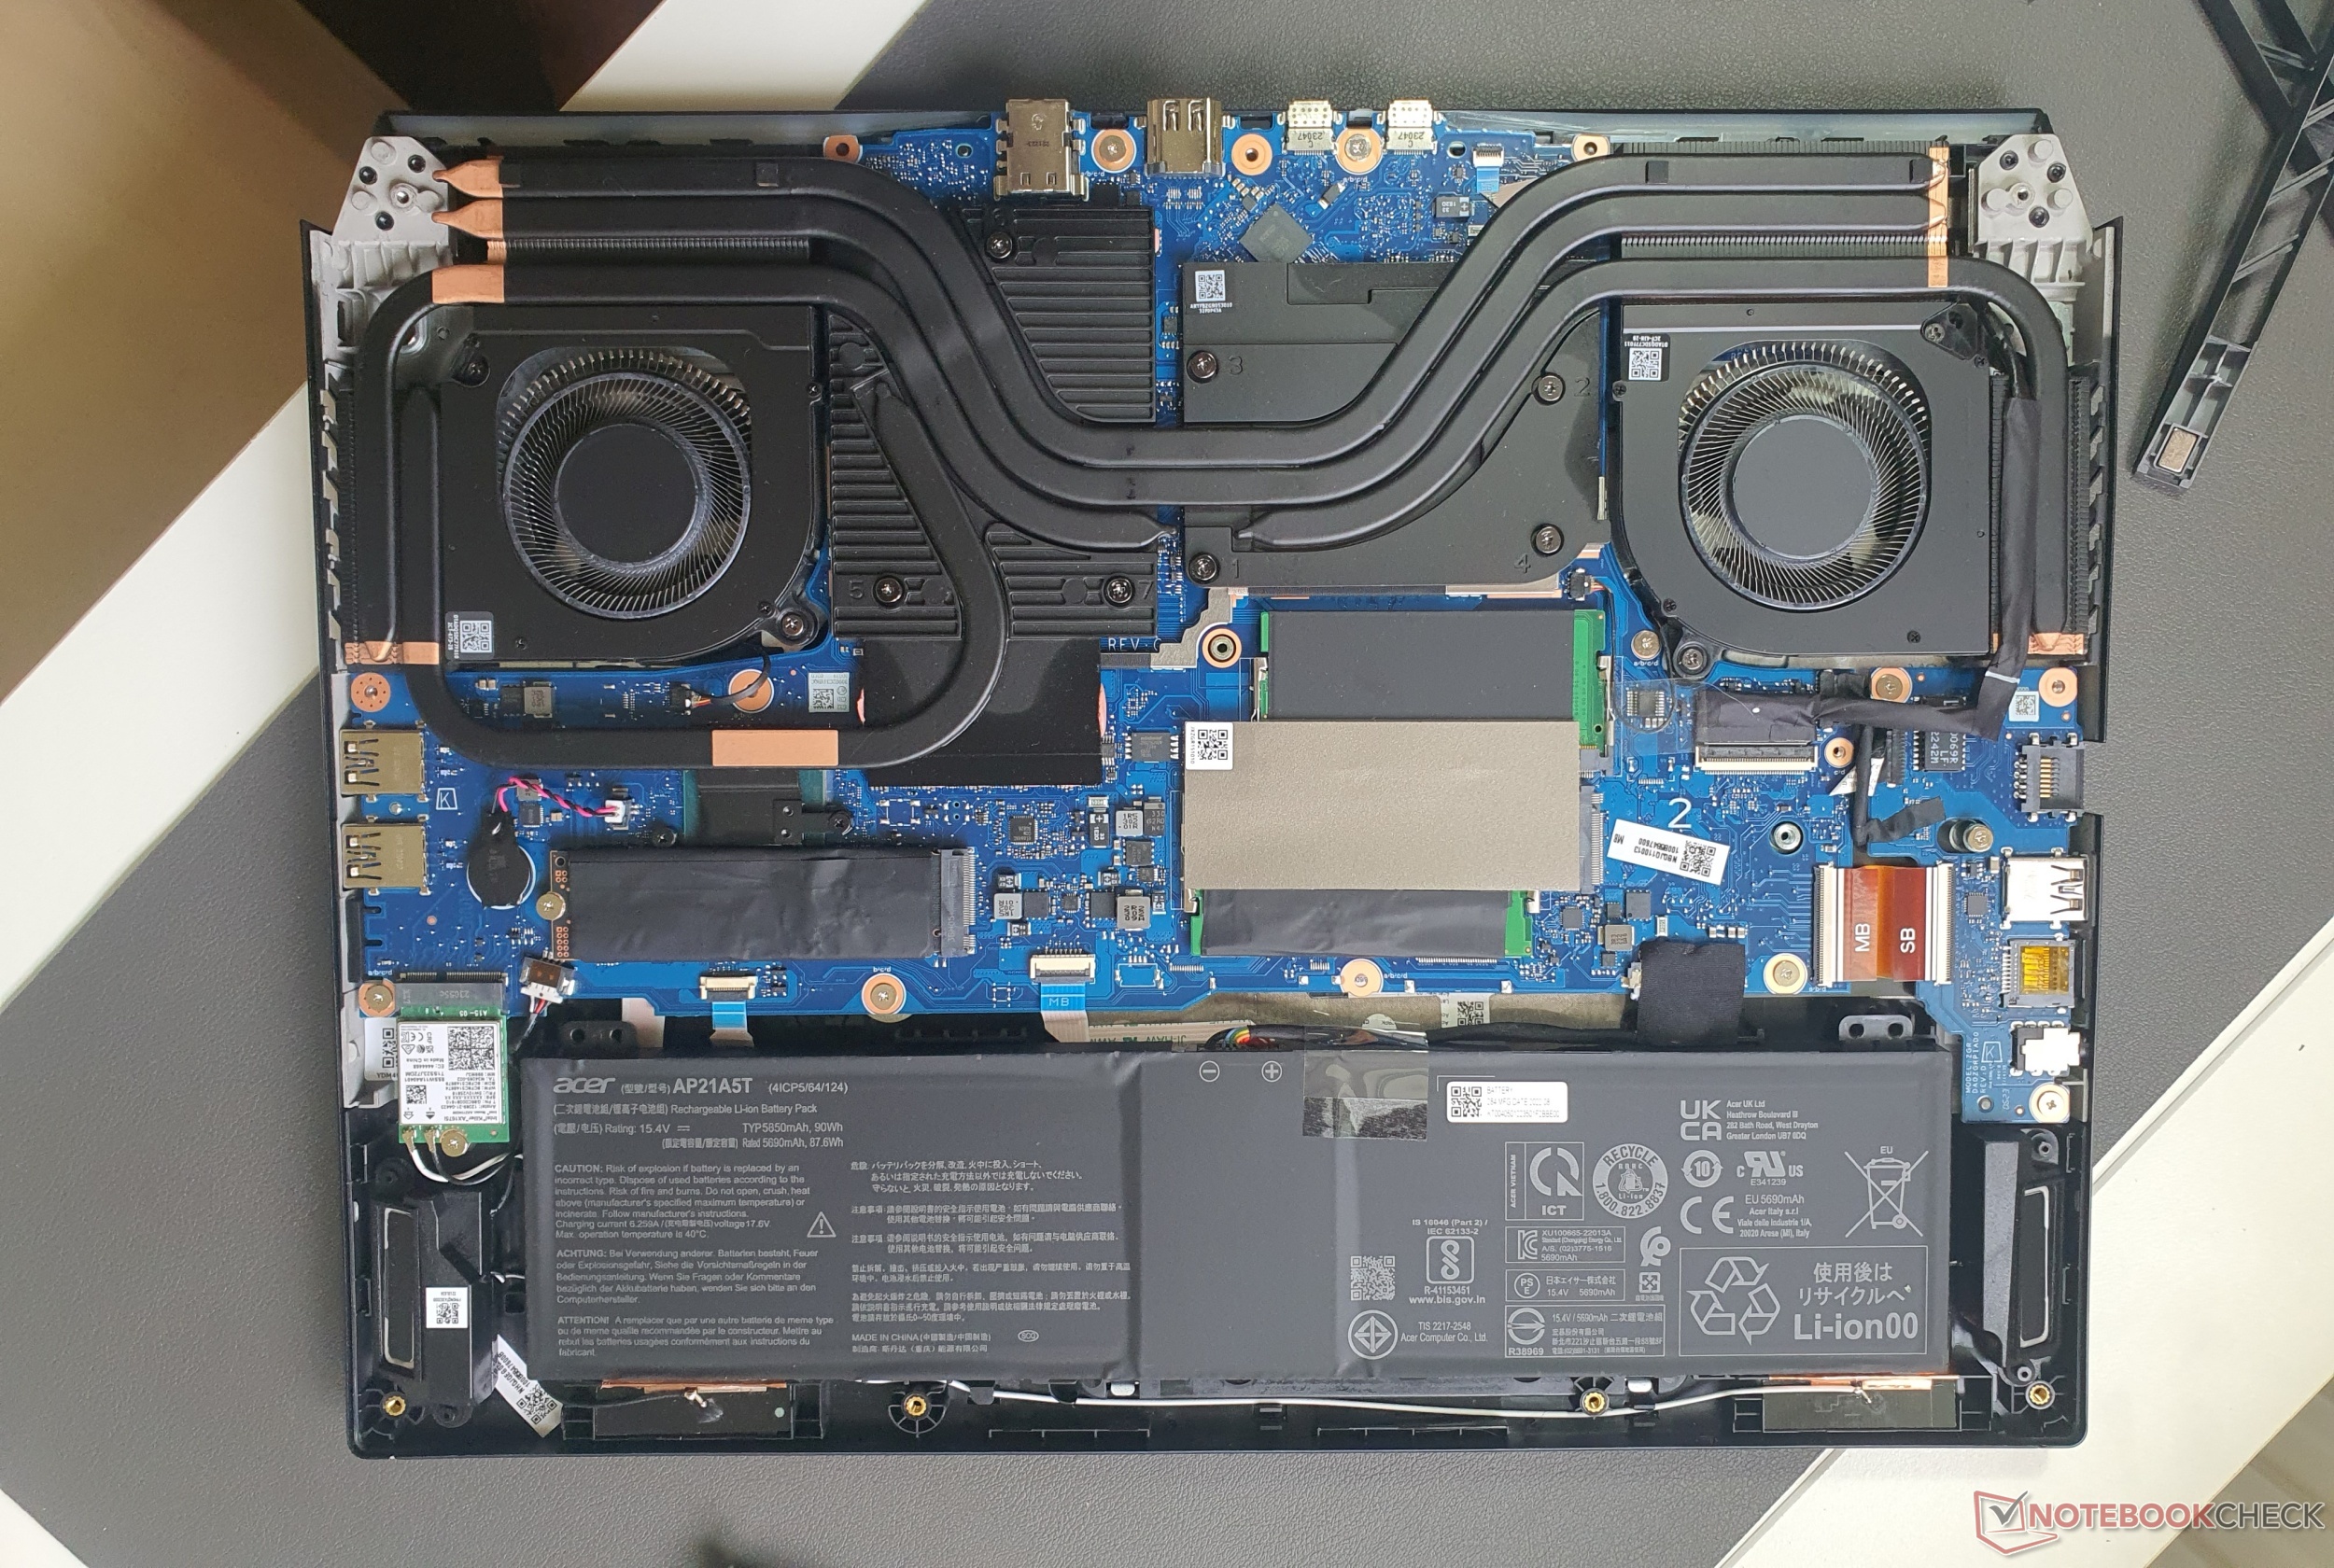
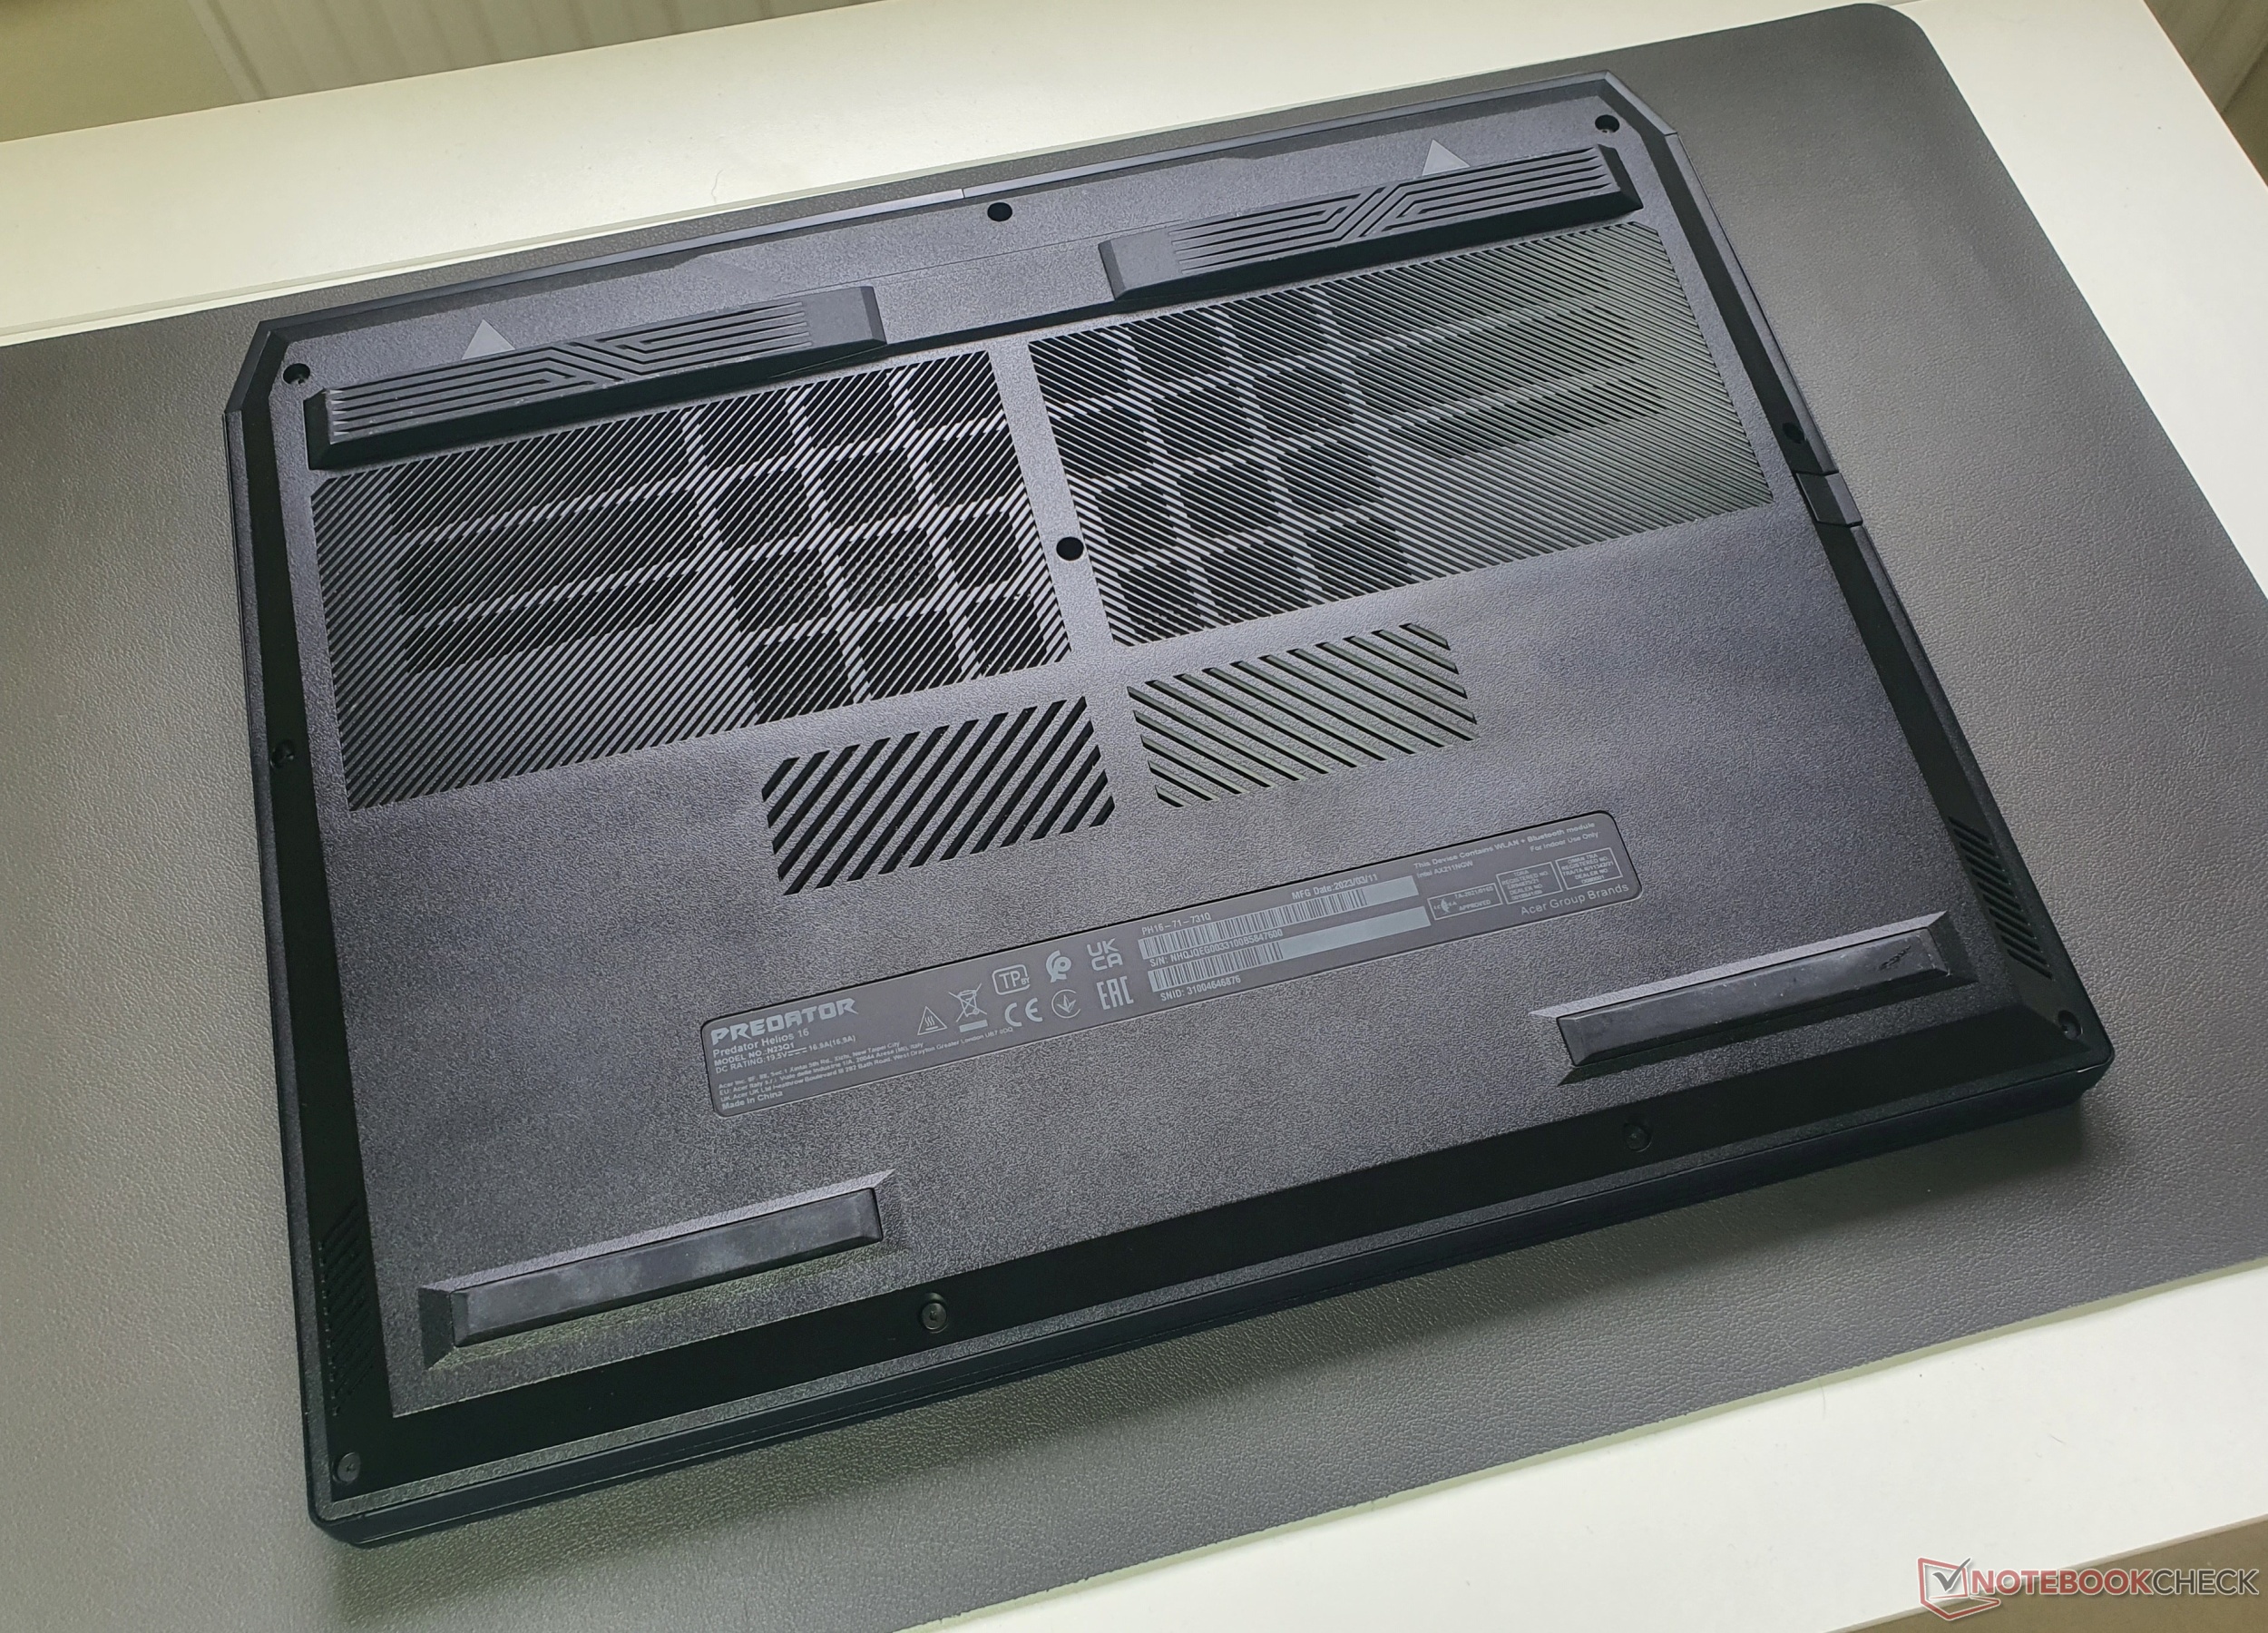
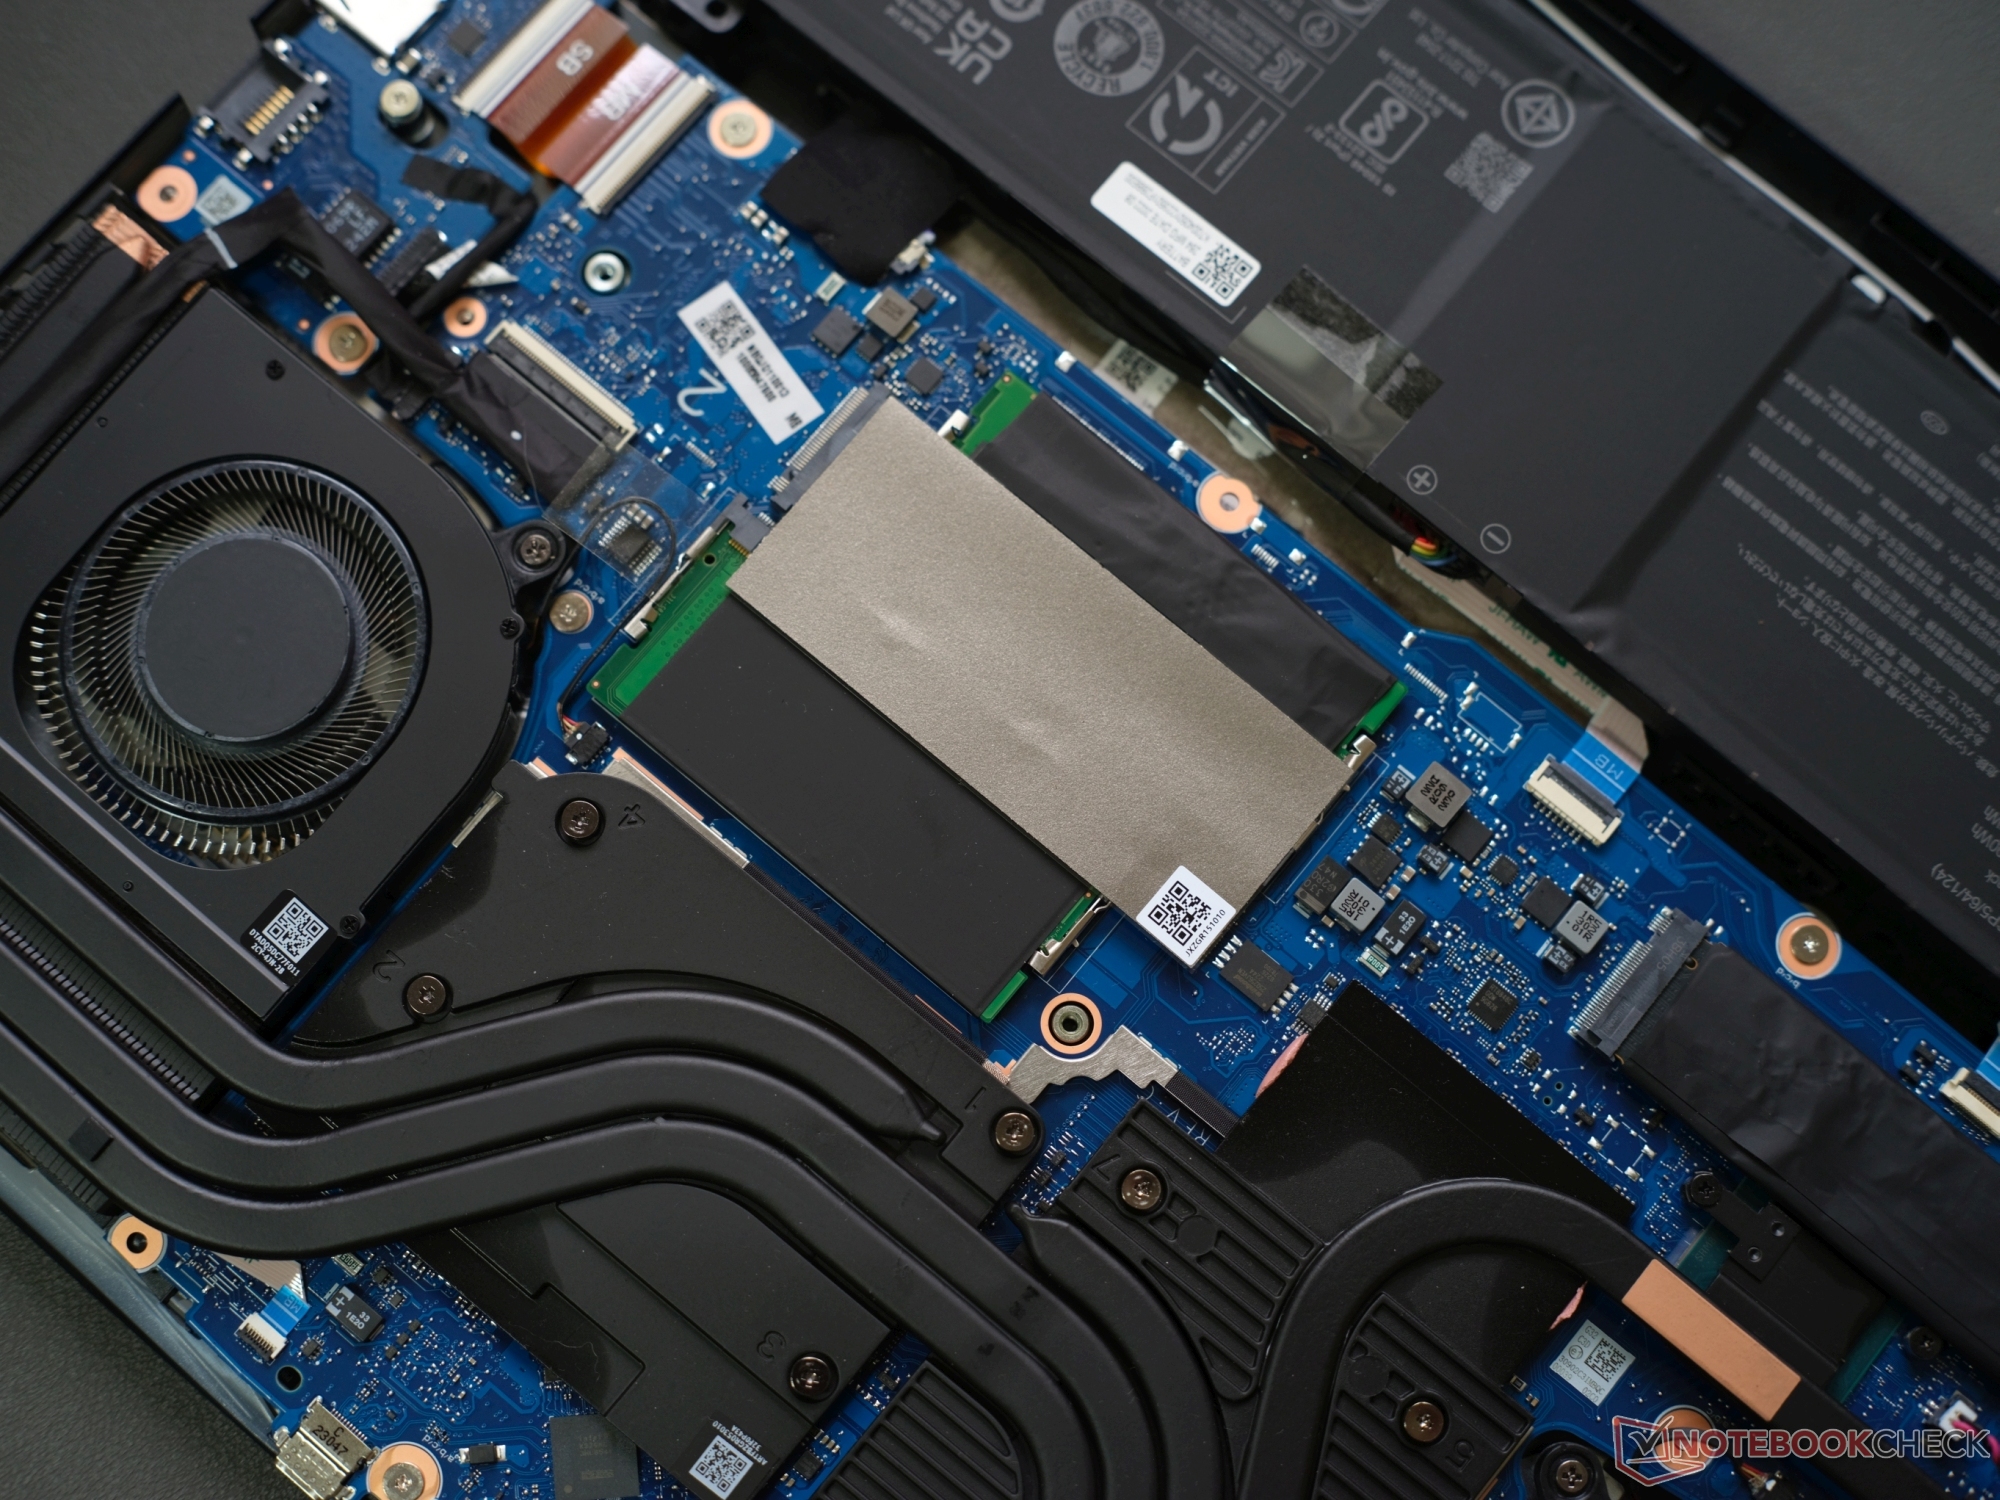
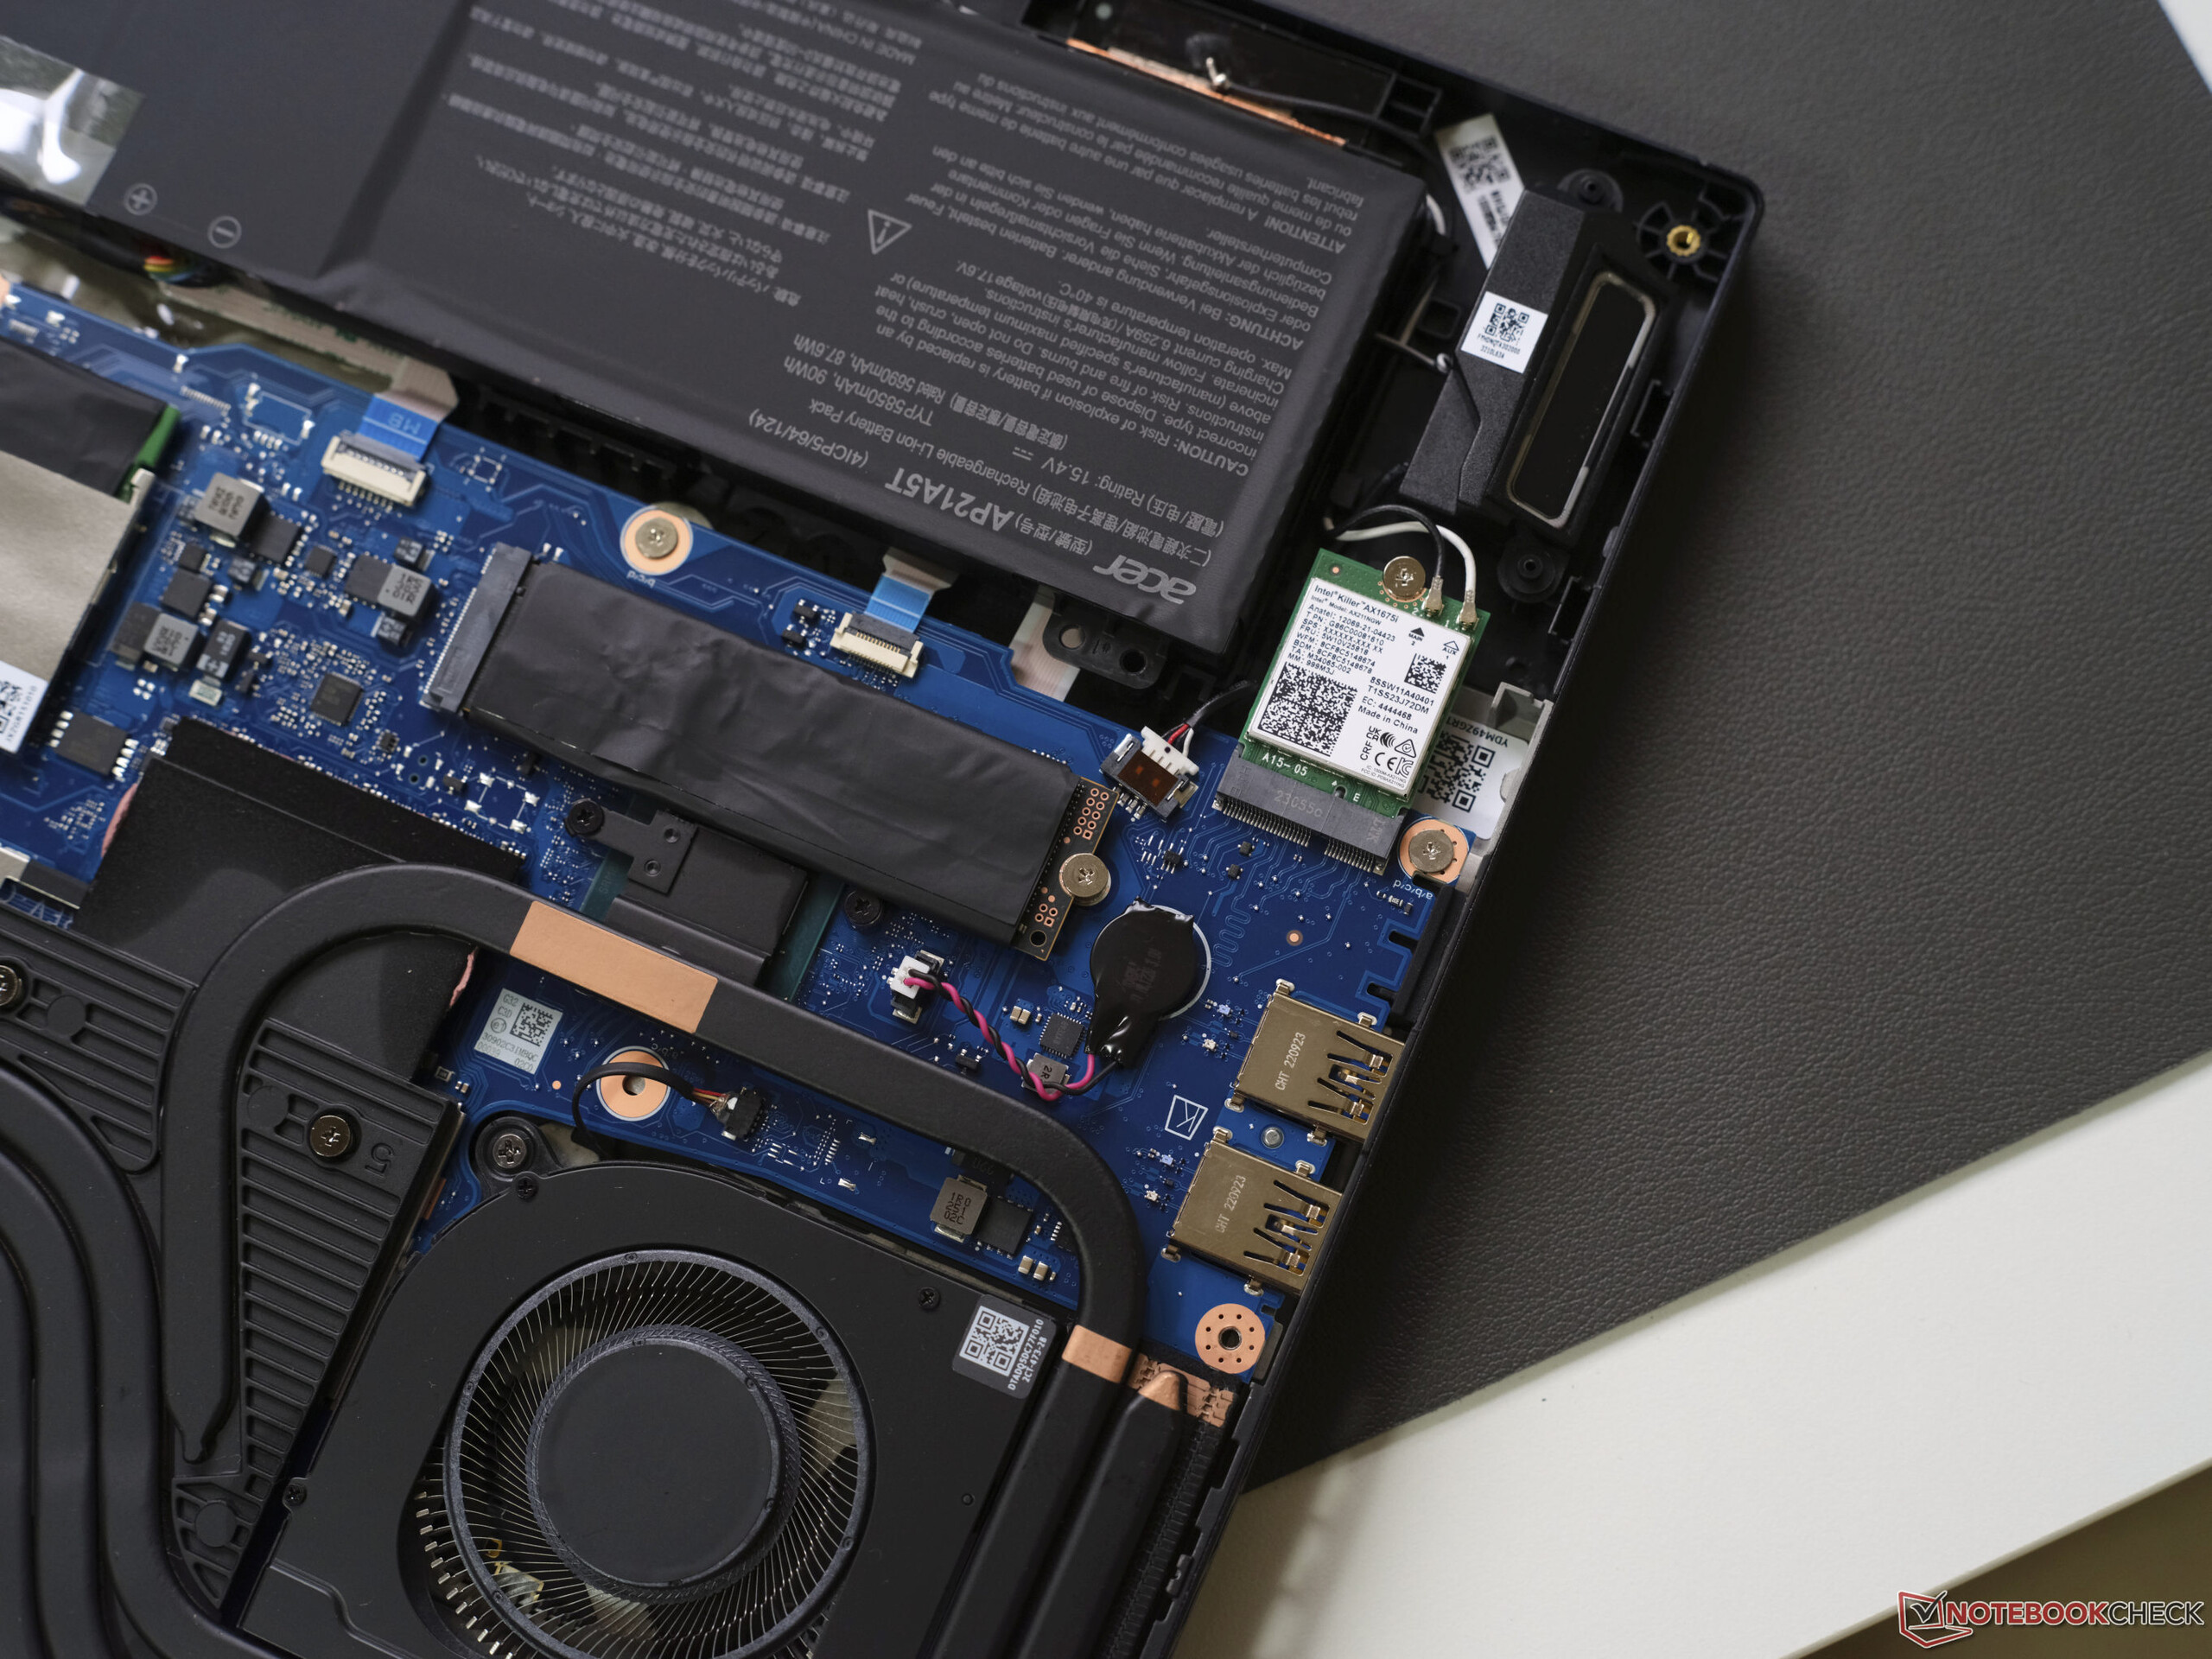
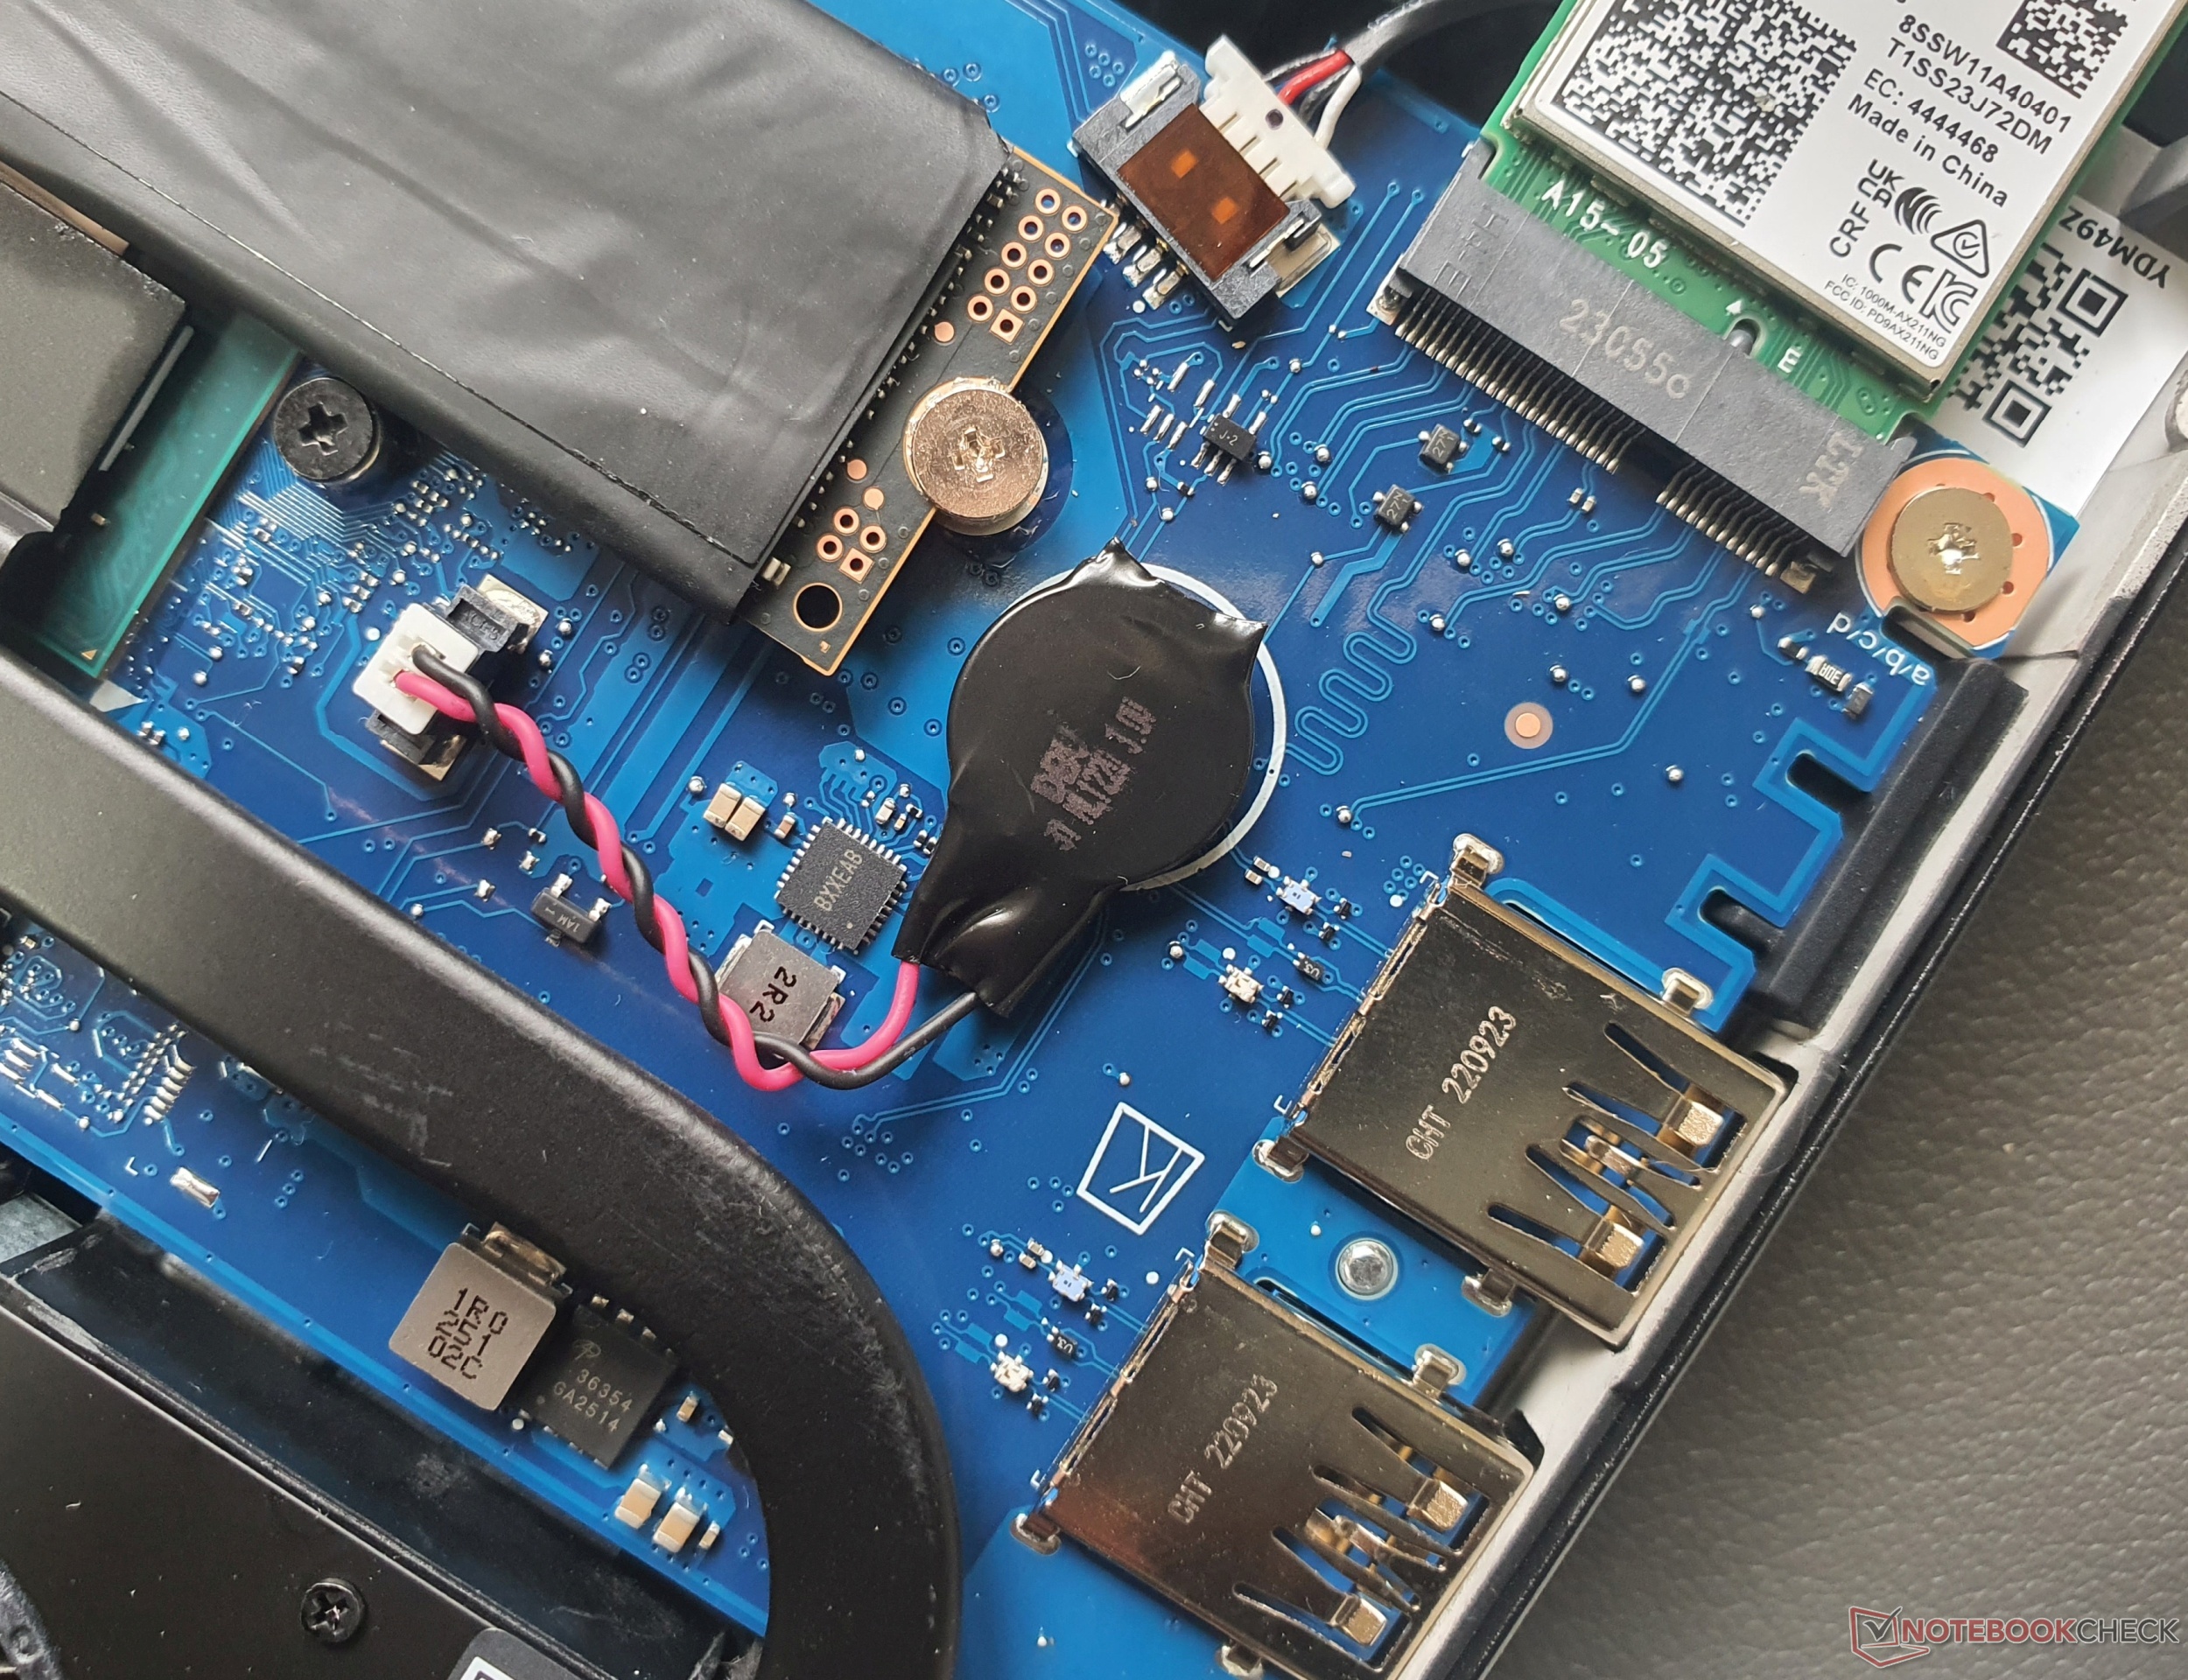
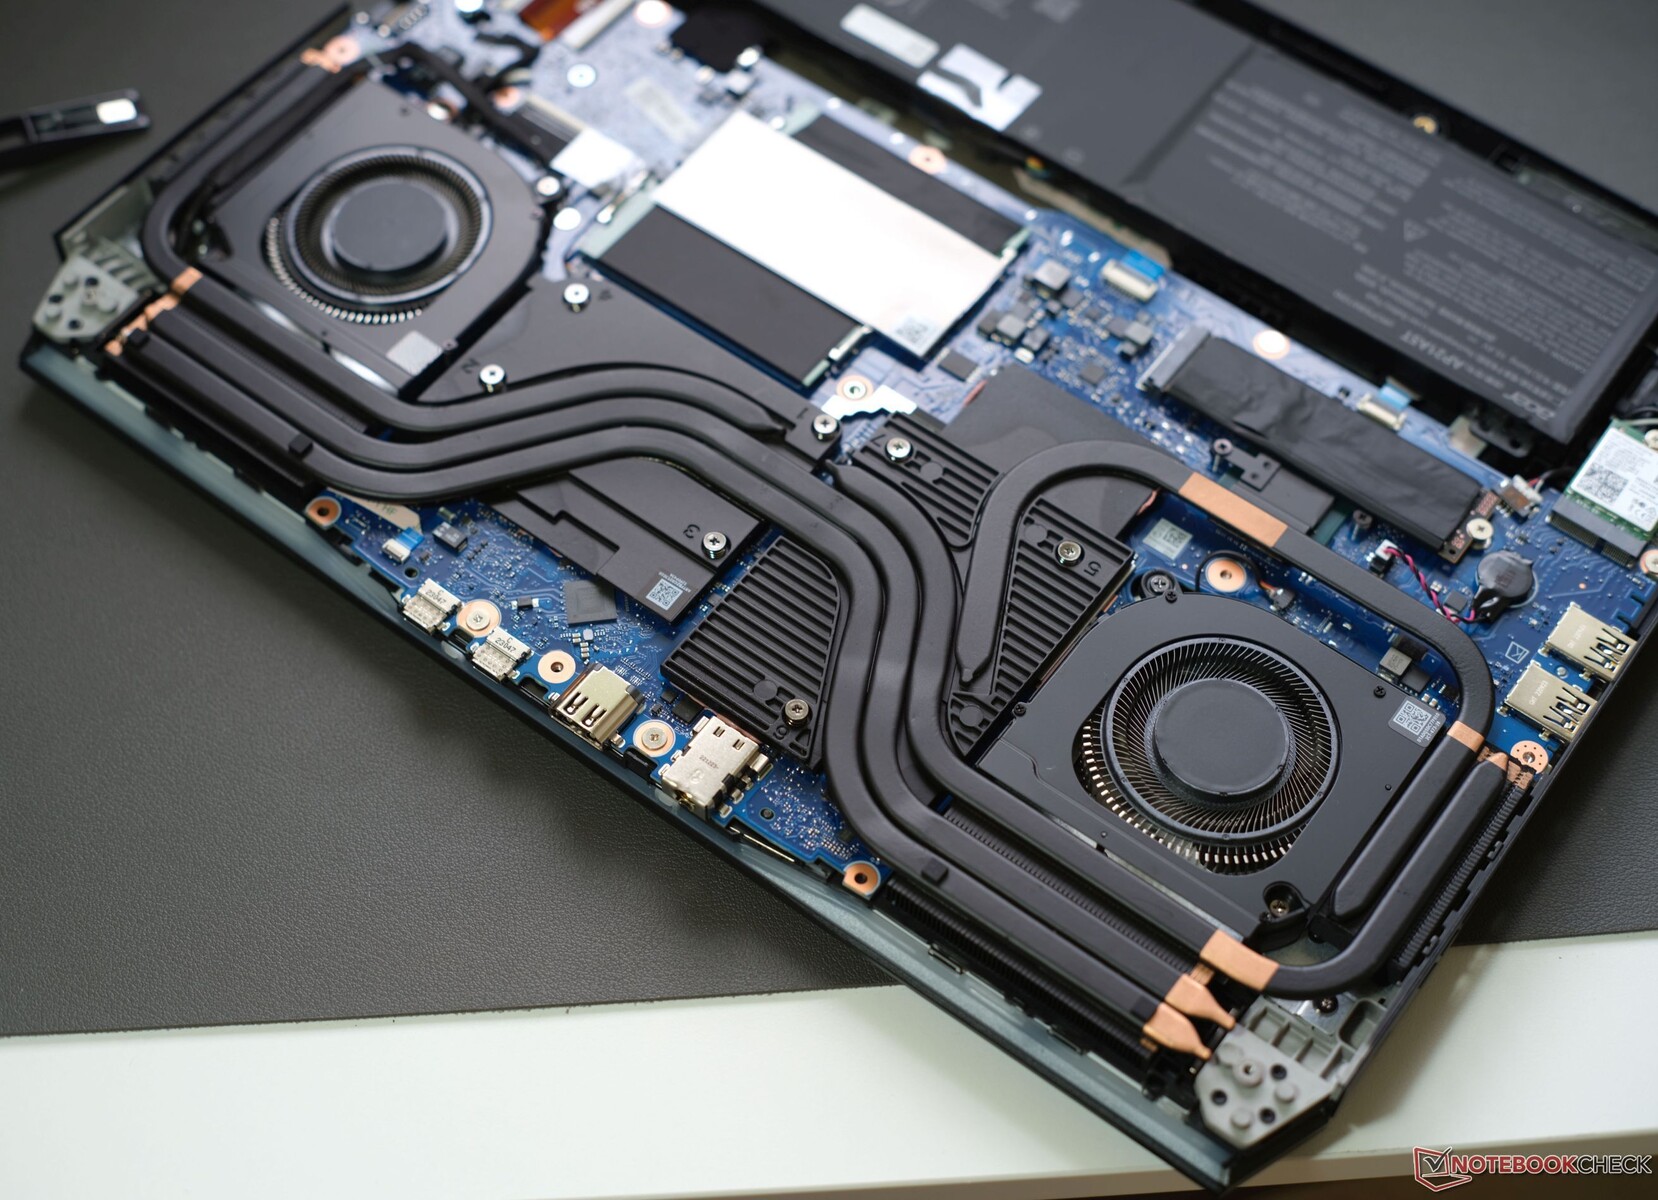
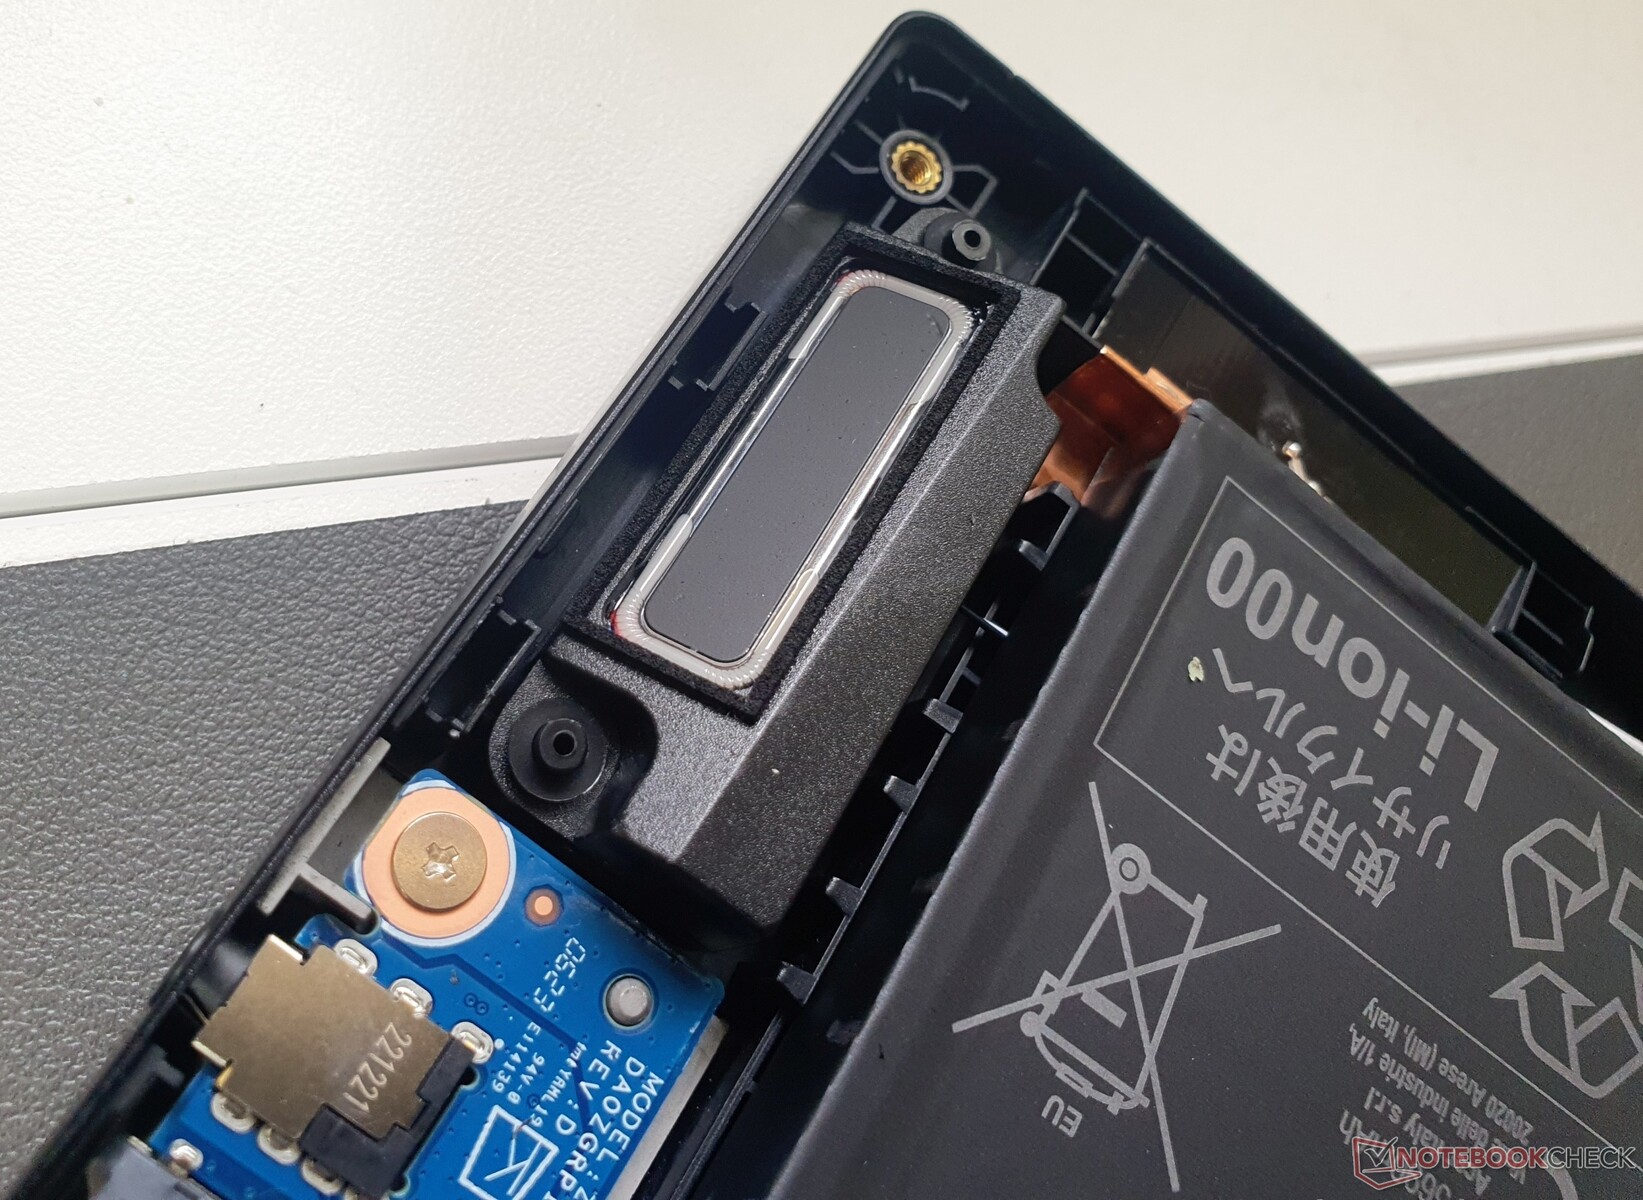
Mantenimiento
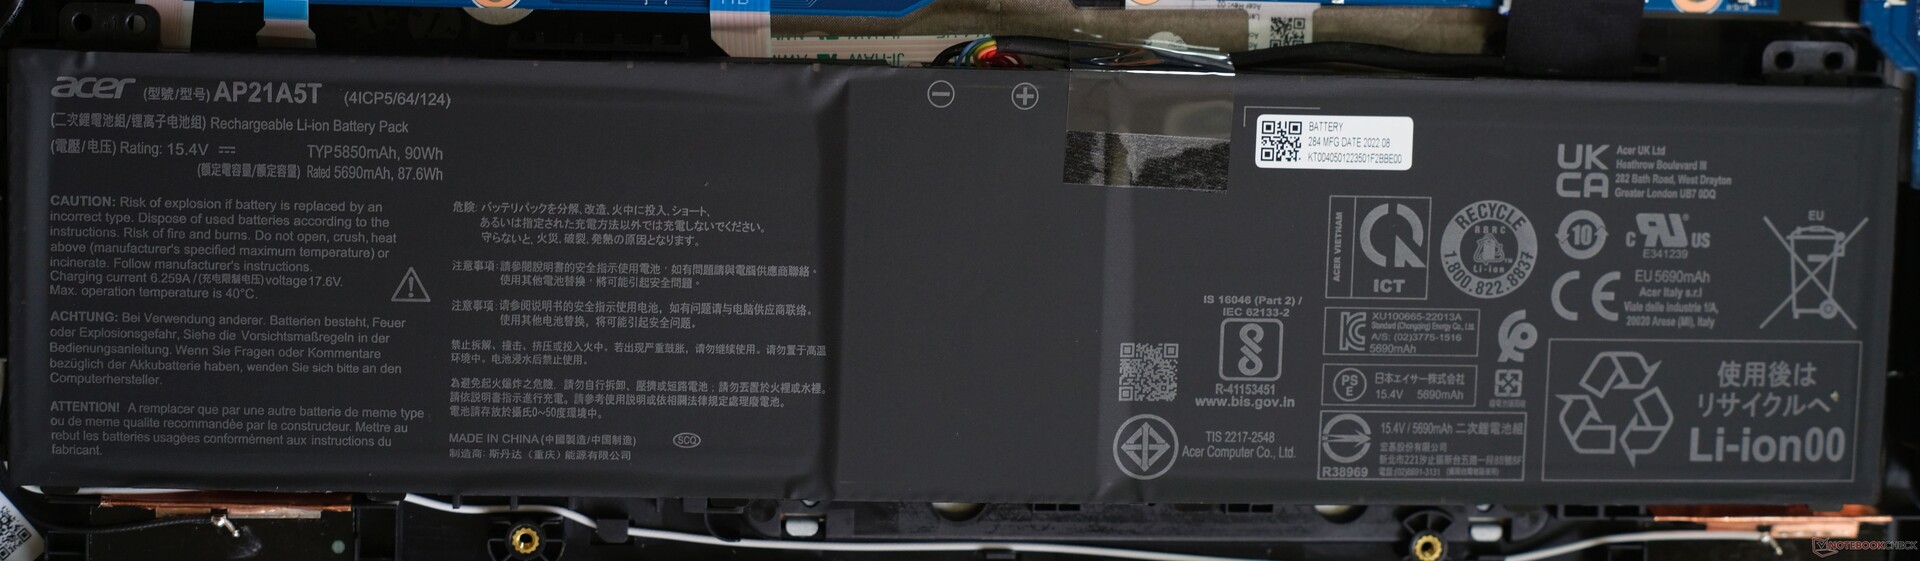
Es bastante fácil acceder a las partes internas de la carcasa tras aflojar diez tornillos Torx T5. Las partes intercambiables incluyen la RAM (dos bancos), el SSD M.2 2280 y el chip Wi-Fi. Sin embargo, la batería atornillada y la batería de la BIOS también se pueden cambiar fácilmente.

Garantía
En Alemania, Acer ofrece una garantía de 24 meses. Con Acer Care Plus, se puede ampliar hasta cinco años.
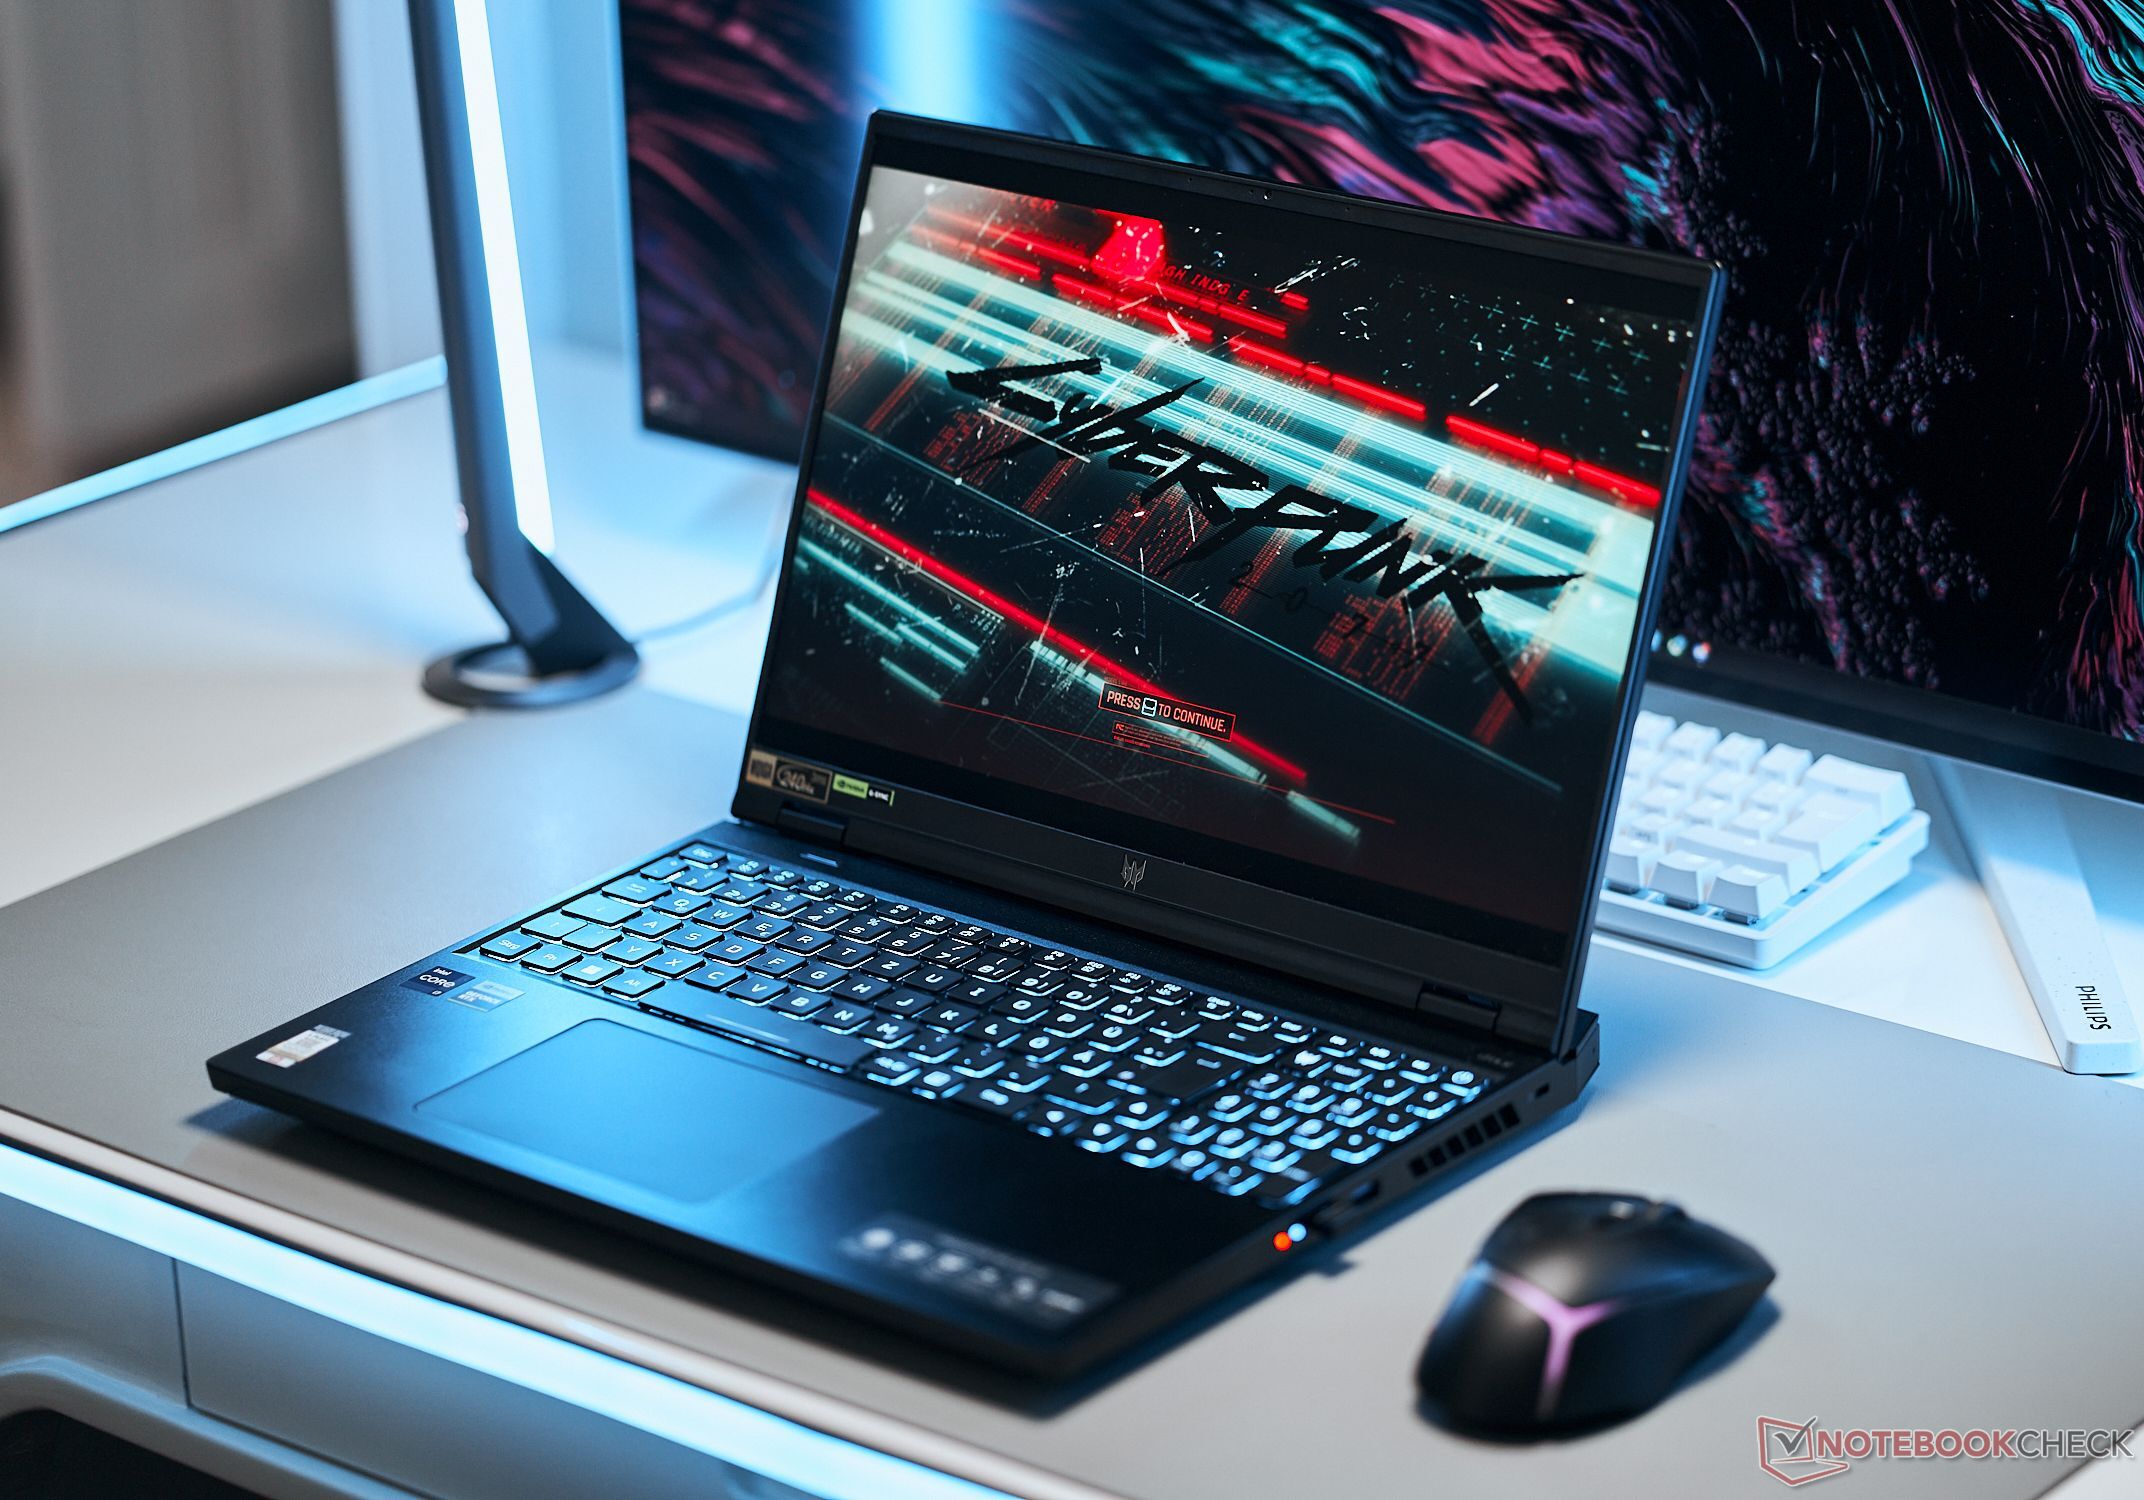
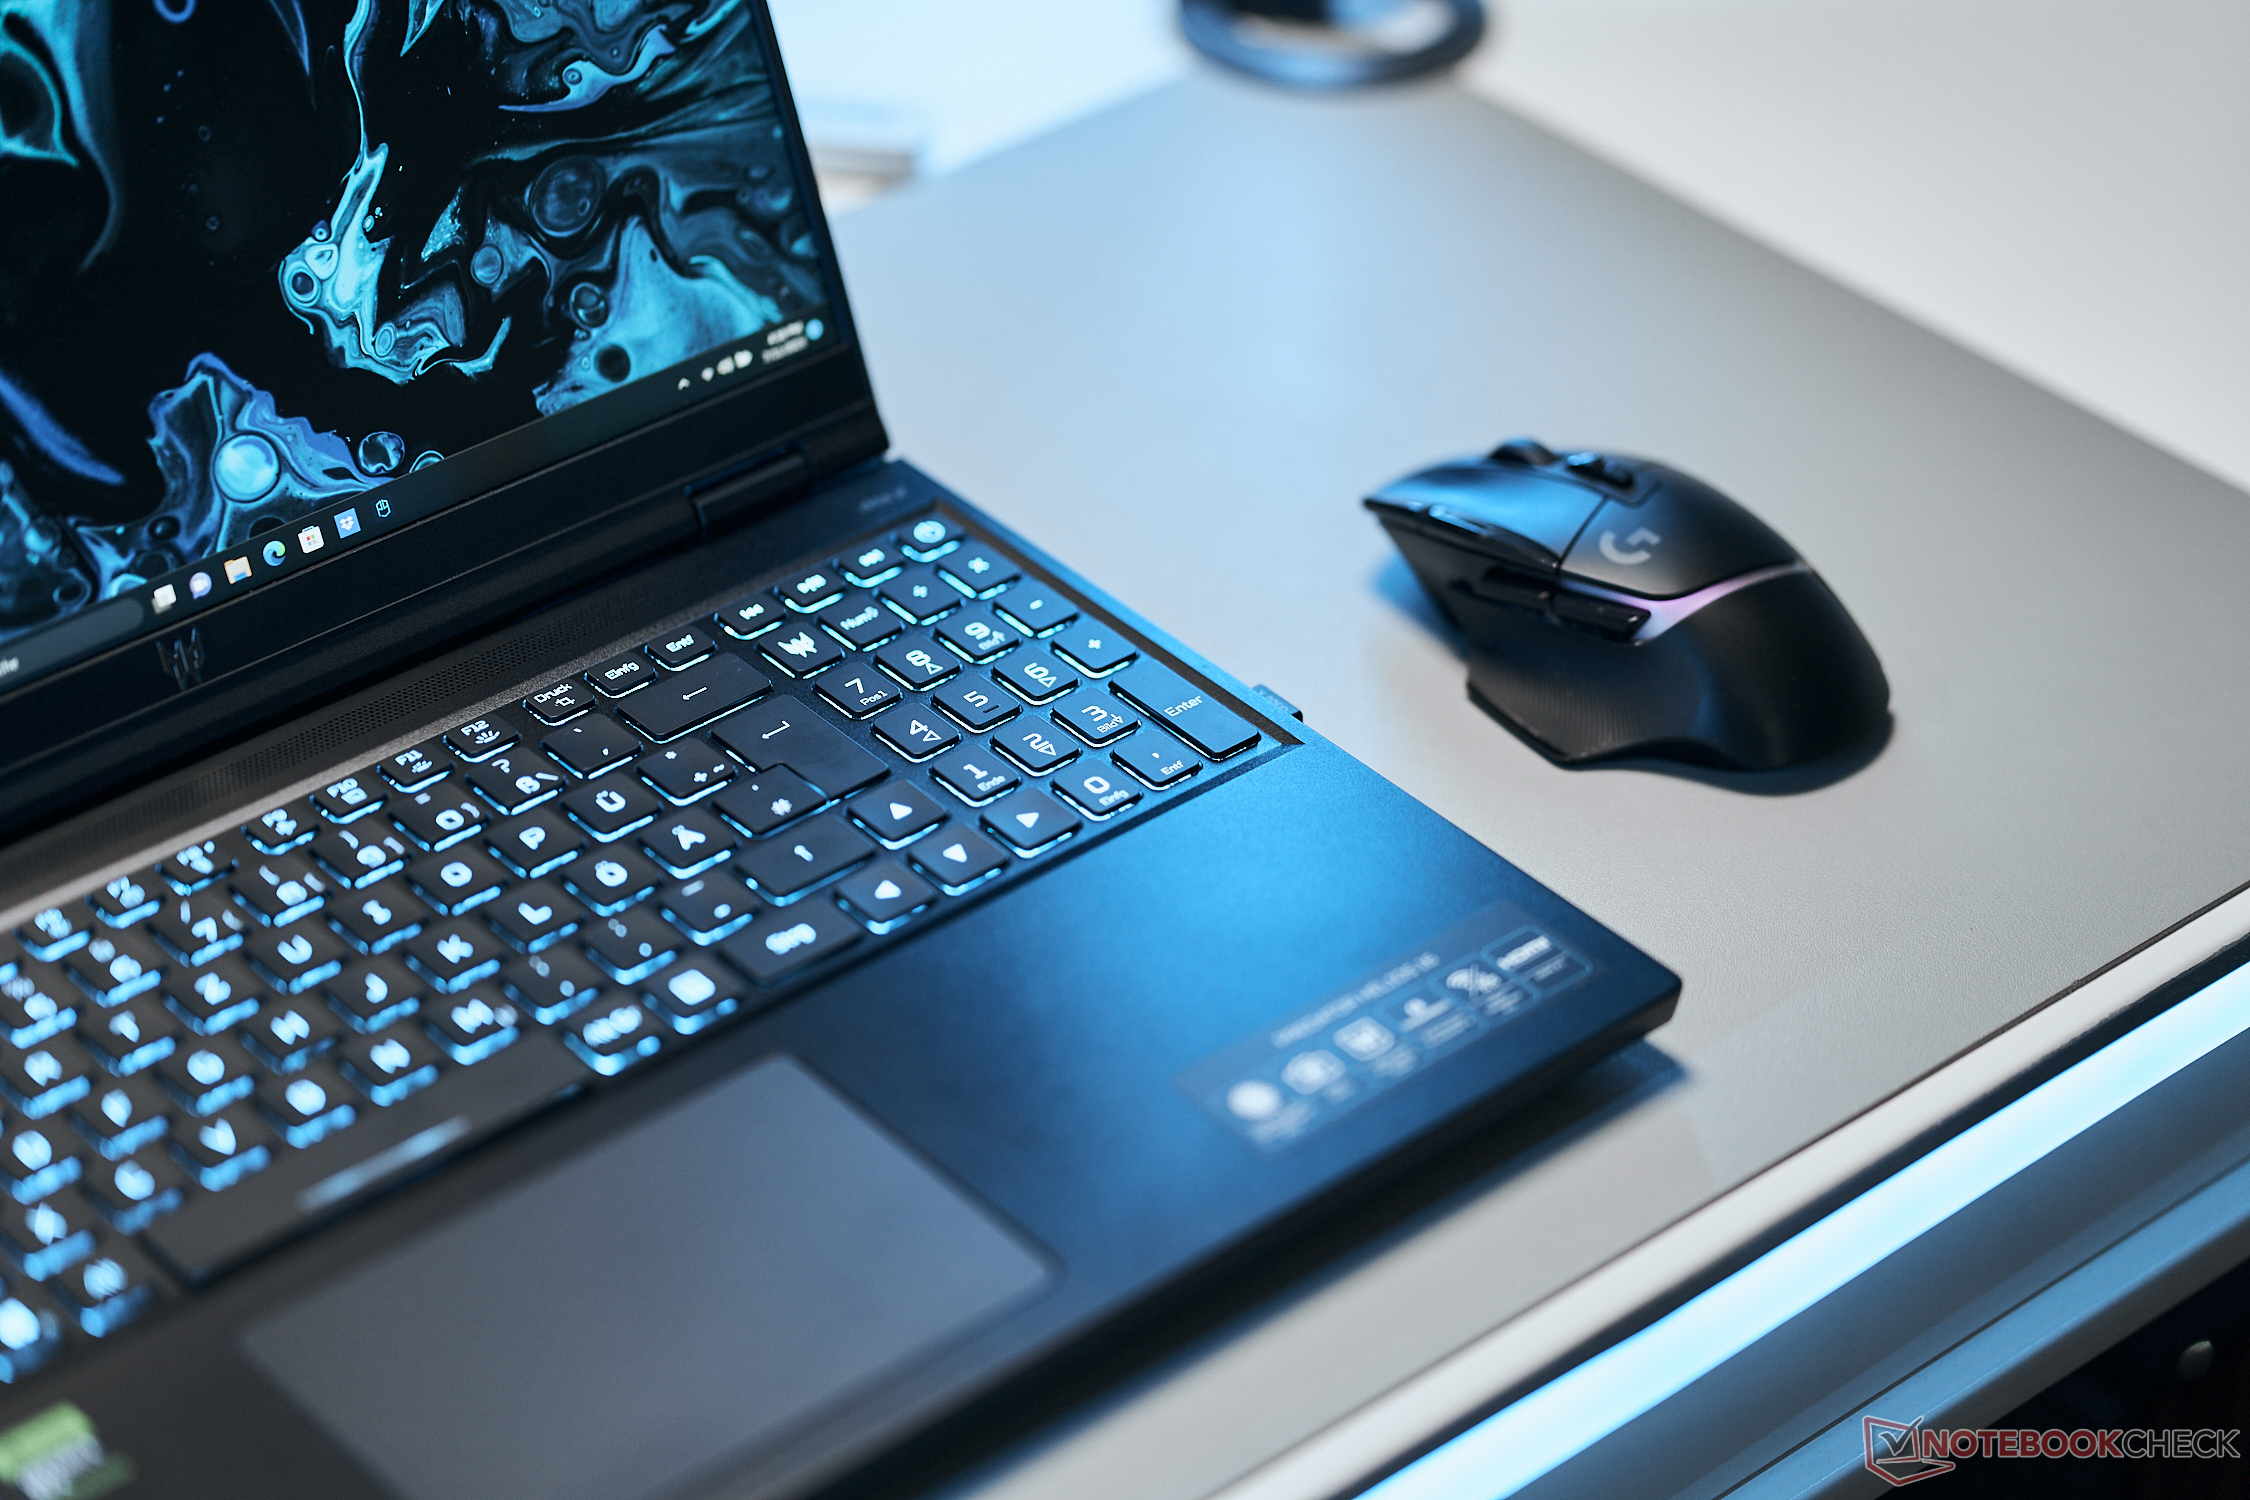
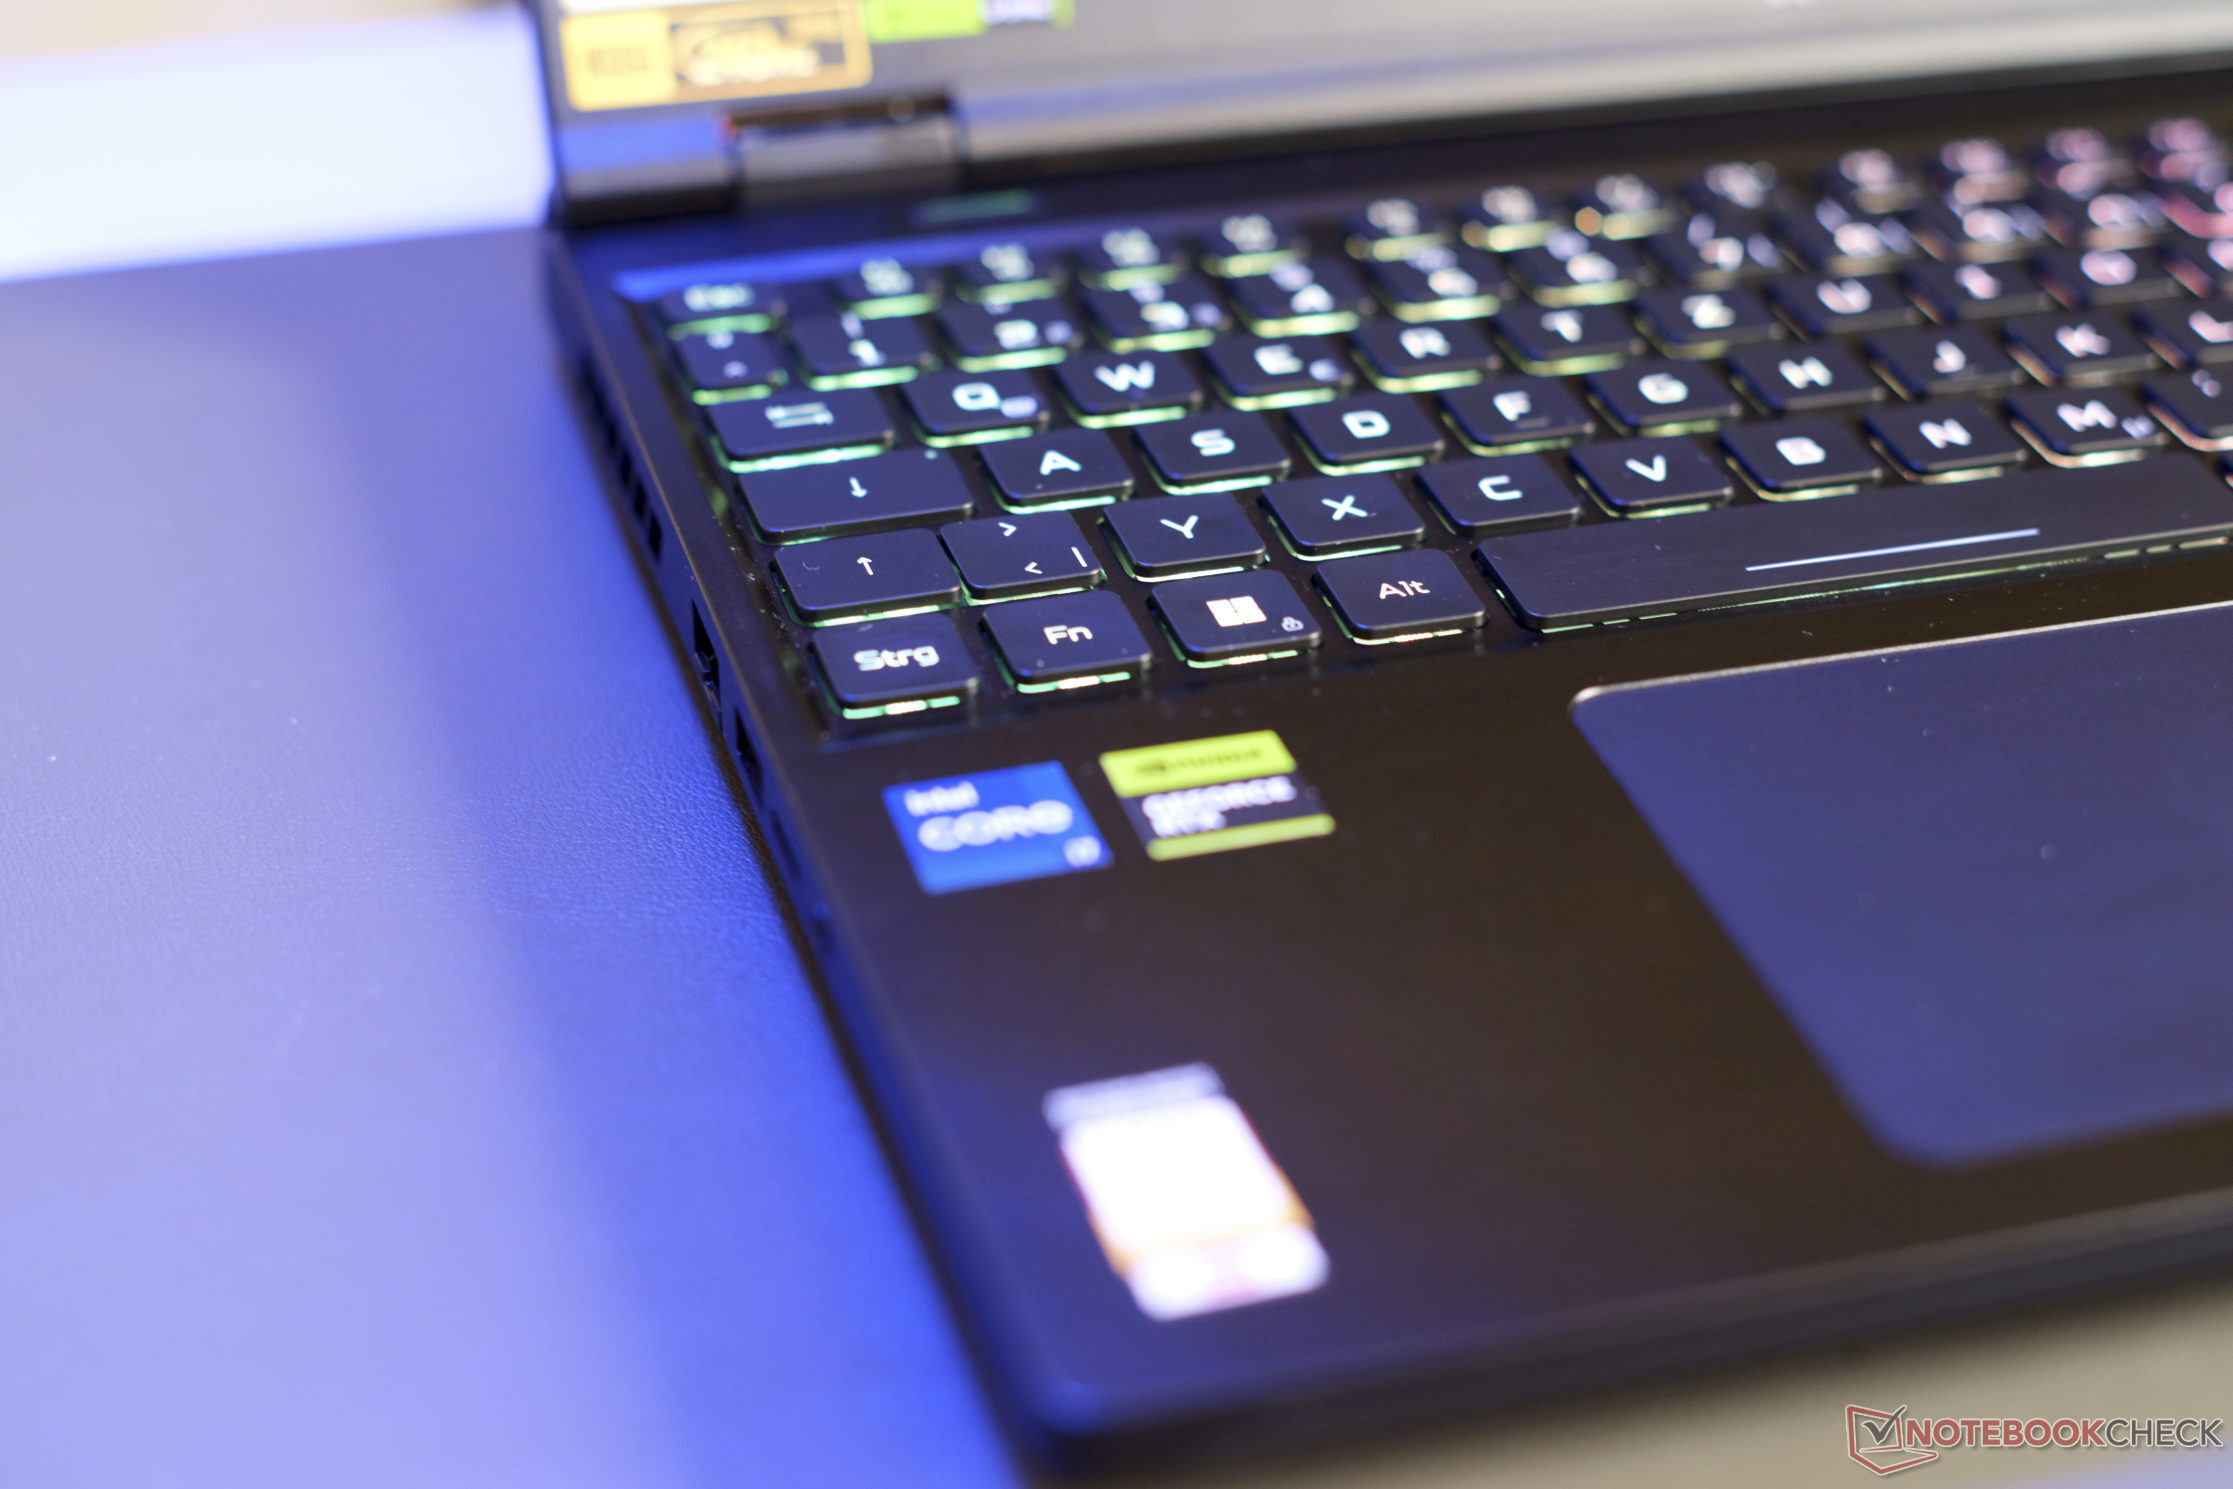
Dispositivos de entrada: El Predator Helios tiene iluminación mini-LED
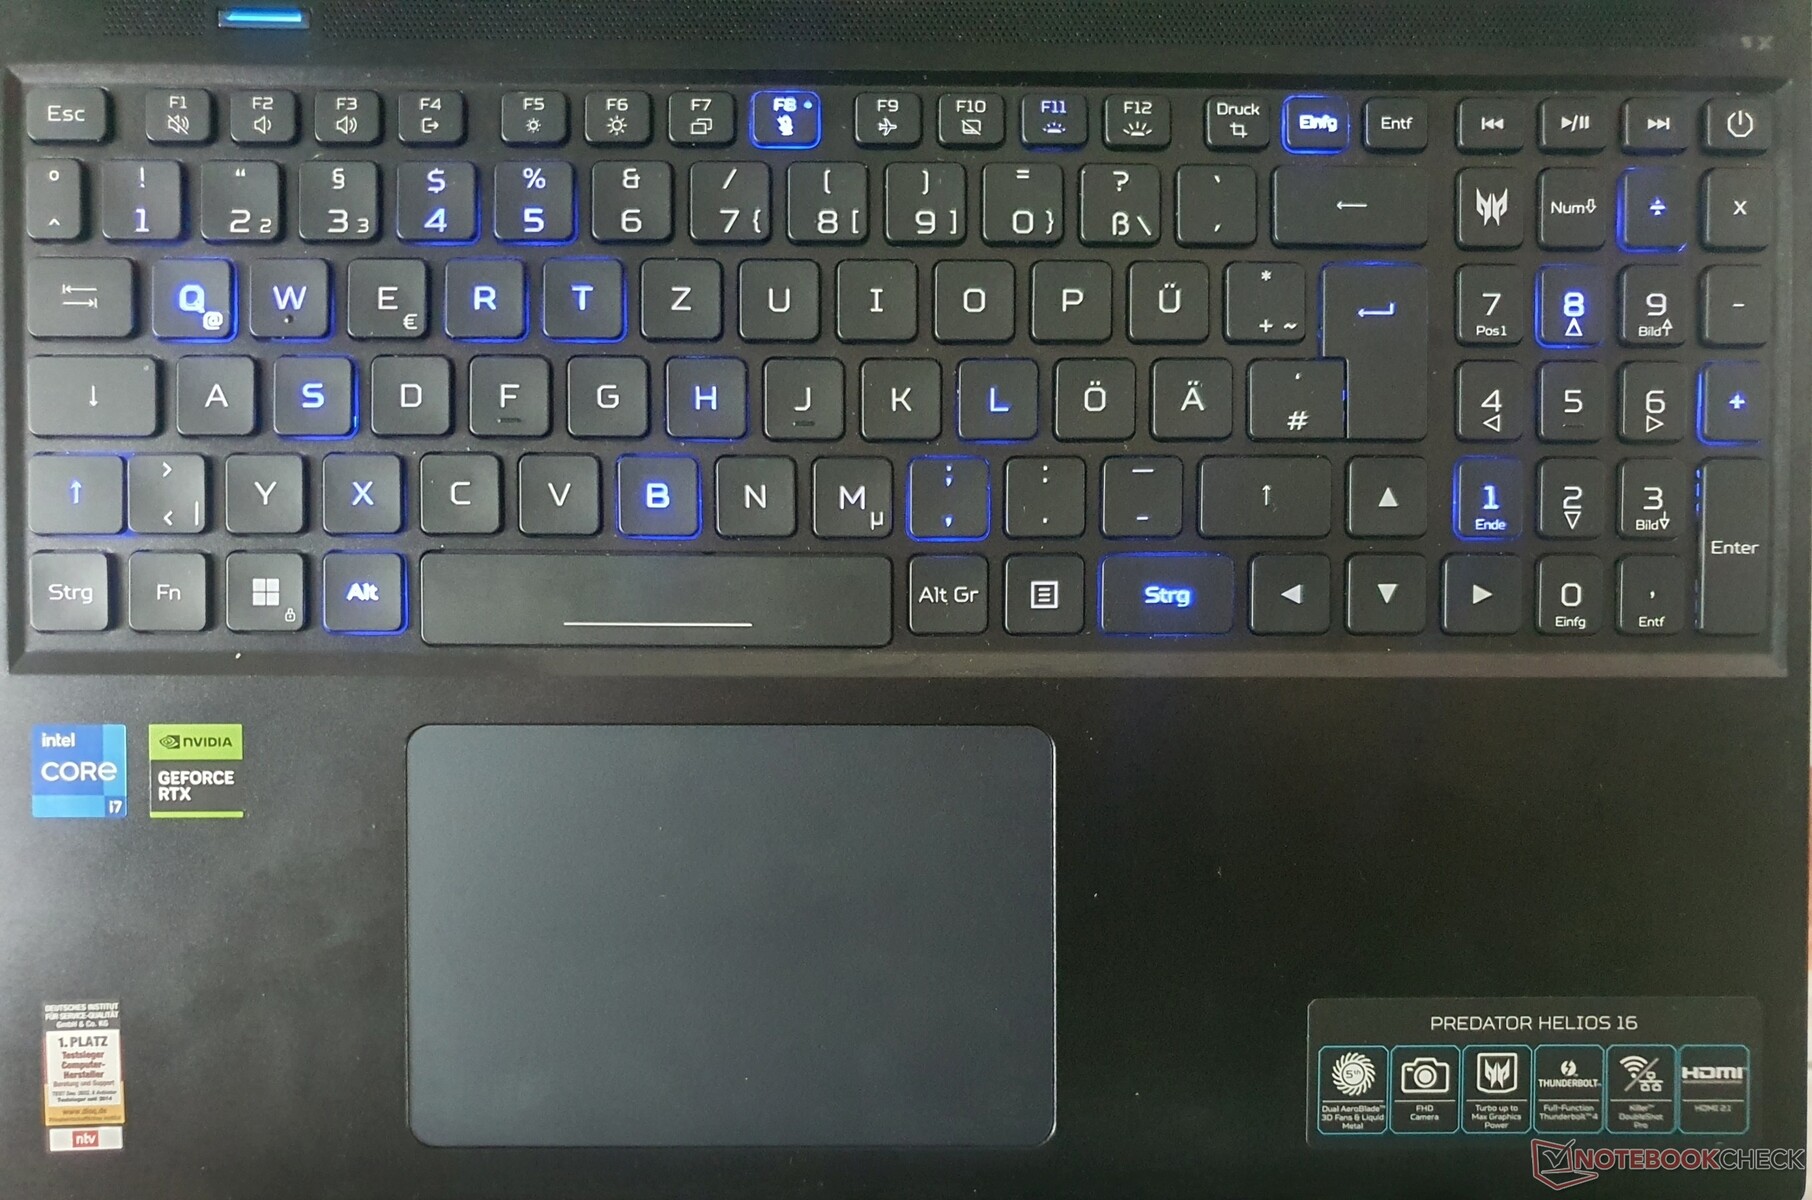
Teclado
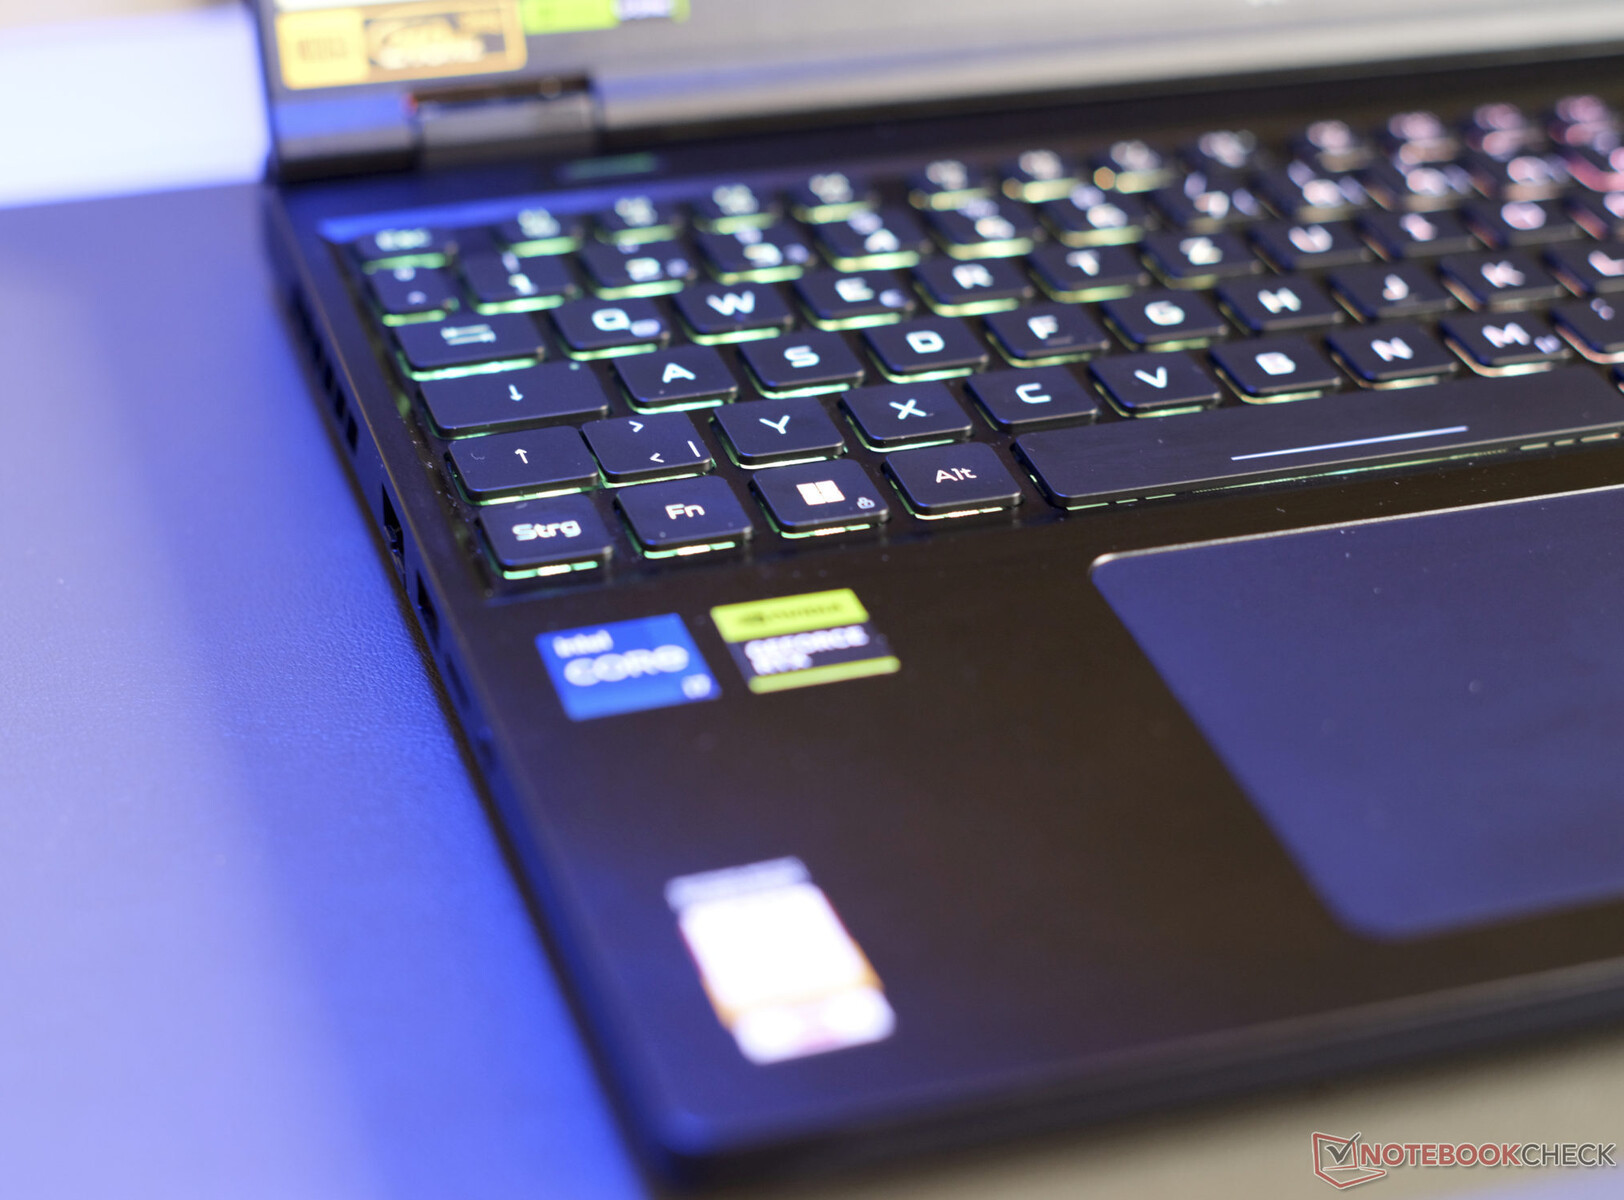
Acer lleva utilizando el mismo teclado chiclet de 6 filas con teclas de 15 x 15 mm desde el modelomodelo 2020. A pesar del generoso desplazamiento de tecla, la respuesta no alcanza su potencial: El punto de presión es tangible y podría estar un poco más definido, pero el ruido de tecleo es discreto. En el centro y en el lado derecho, el teclado se flexiona significativamente, pero no resulta molesto al escribir, siempre que no se martilleen las teclas.
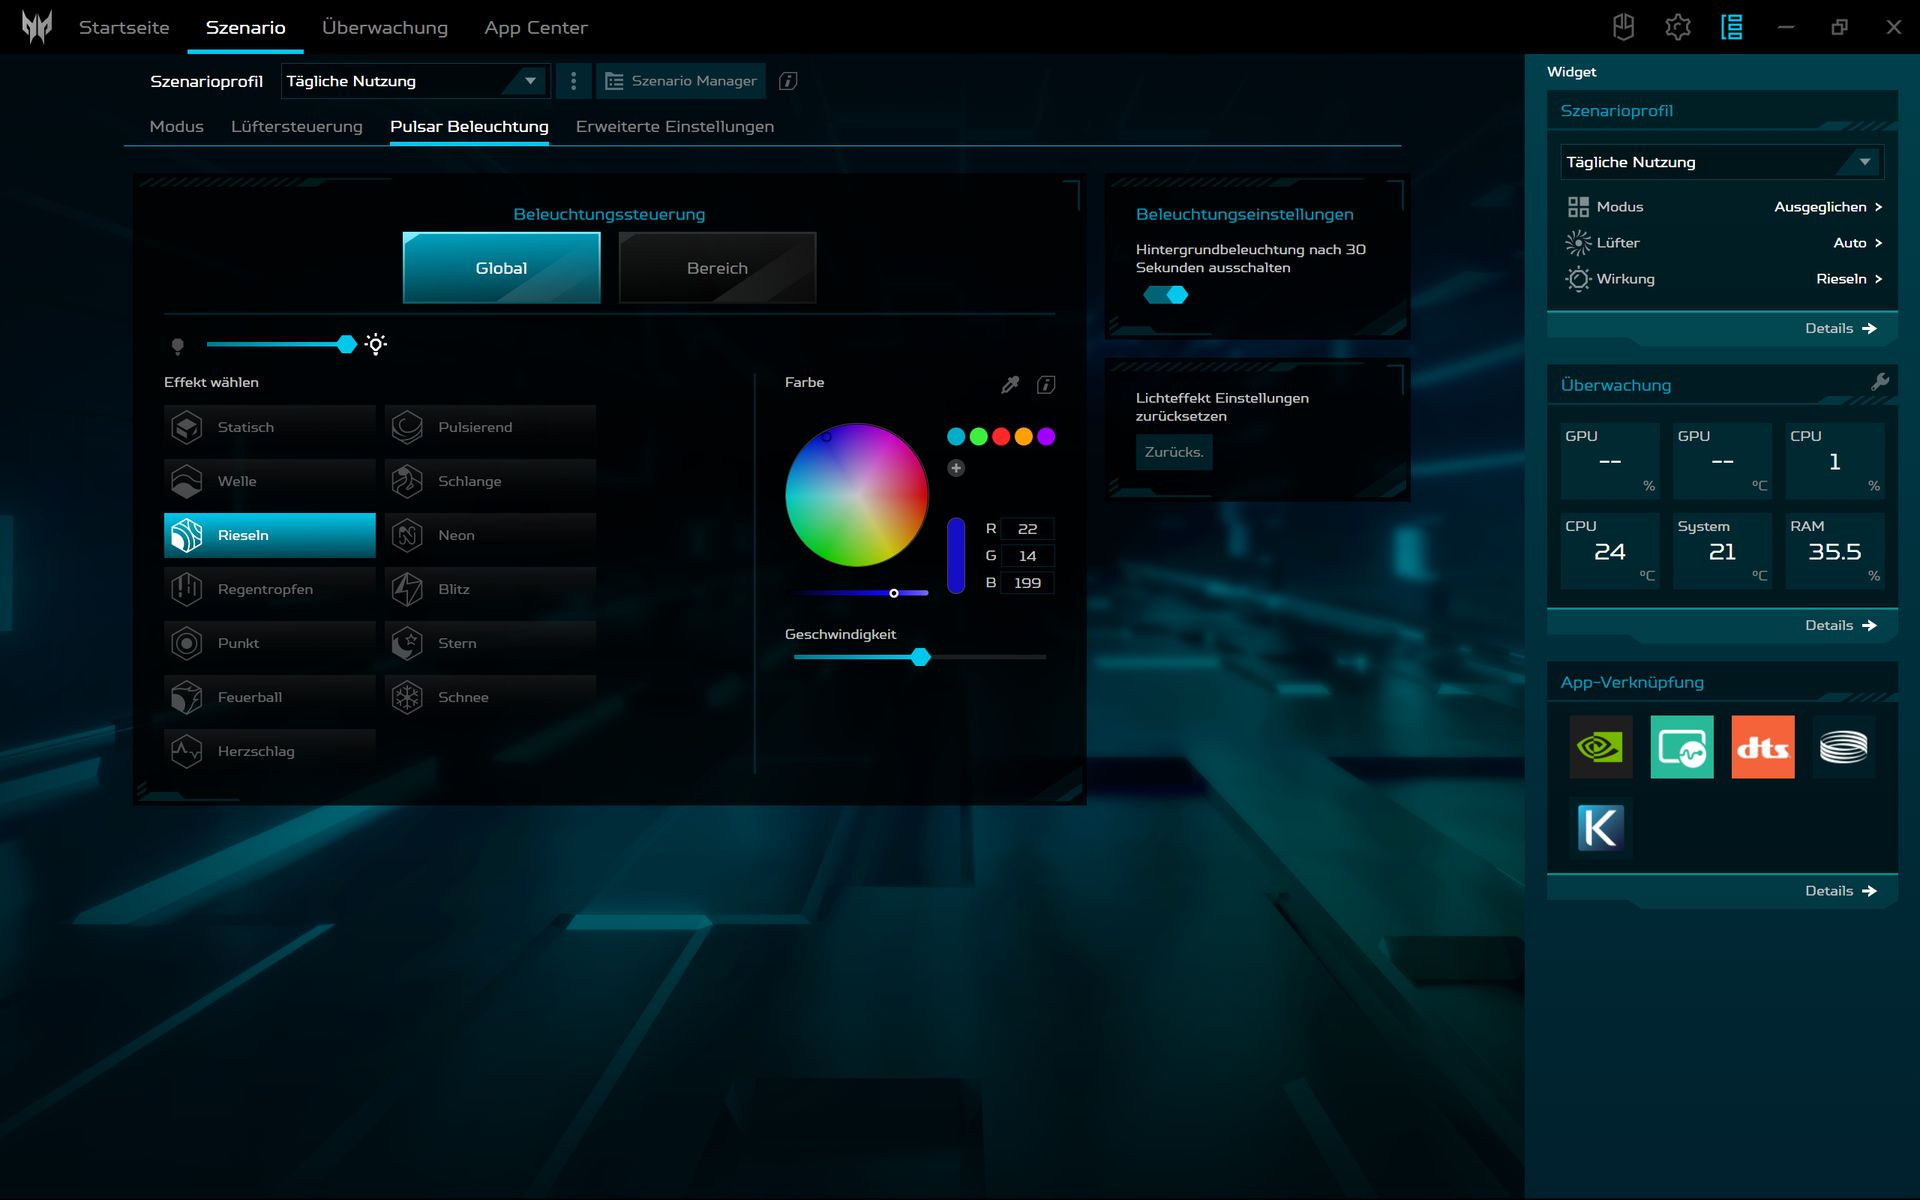
La retroiluminación mini-LED es nueva y ofrece diferentes configuraciones principales. La tecla individual RGB tiene cuatro ajustes disponibles y puede llegar a ser muy brillante. Las transiciones son particularmente suaves y limpias, mientras que los mini-LEDs son también más eficientes energéticamente.
Nos gusta la disposición y, en particular, las teclas de flecha de tamaño normal a costa de un shift más pequeño. Mientras que el botón del logotipo inicia la aplicación Predator Sense, es posible cambiar entre los modos de rendimiento mediante el botón situado a la izquierda, encima del teclado.
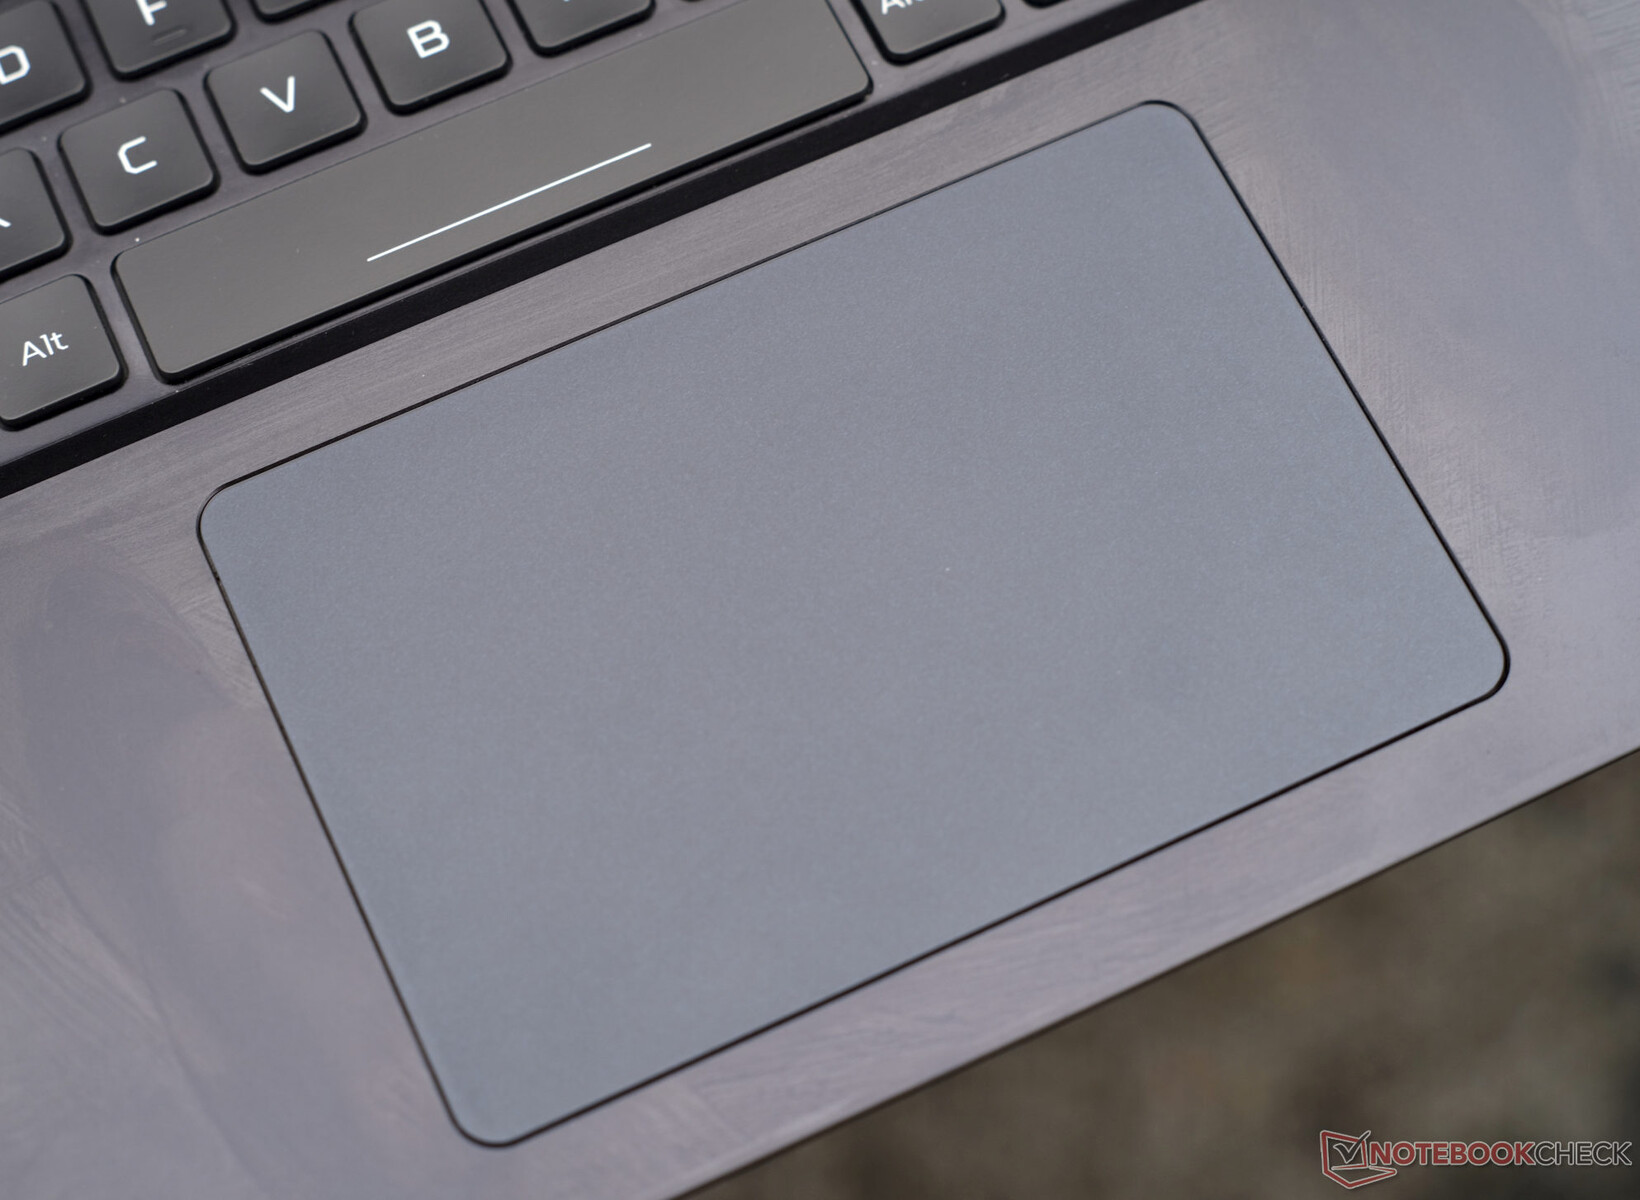
Panel táctil
Los dedos se deslizan maravillosamente y con una respuesta muy precisa sobre el touchpad de 12,6 x 8,3 mm gracias a su revestimiento Gorilla Glass. En consecuencia, los gestos multitáctiles y el desplazamiento se hacen sin esfuerzo. Los botones de clic integrados tienen un recorrido medio y una respuesta satisfactoria.
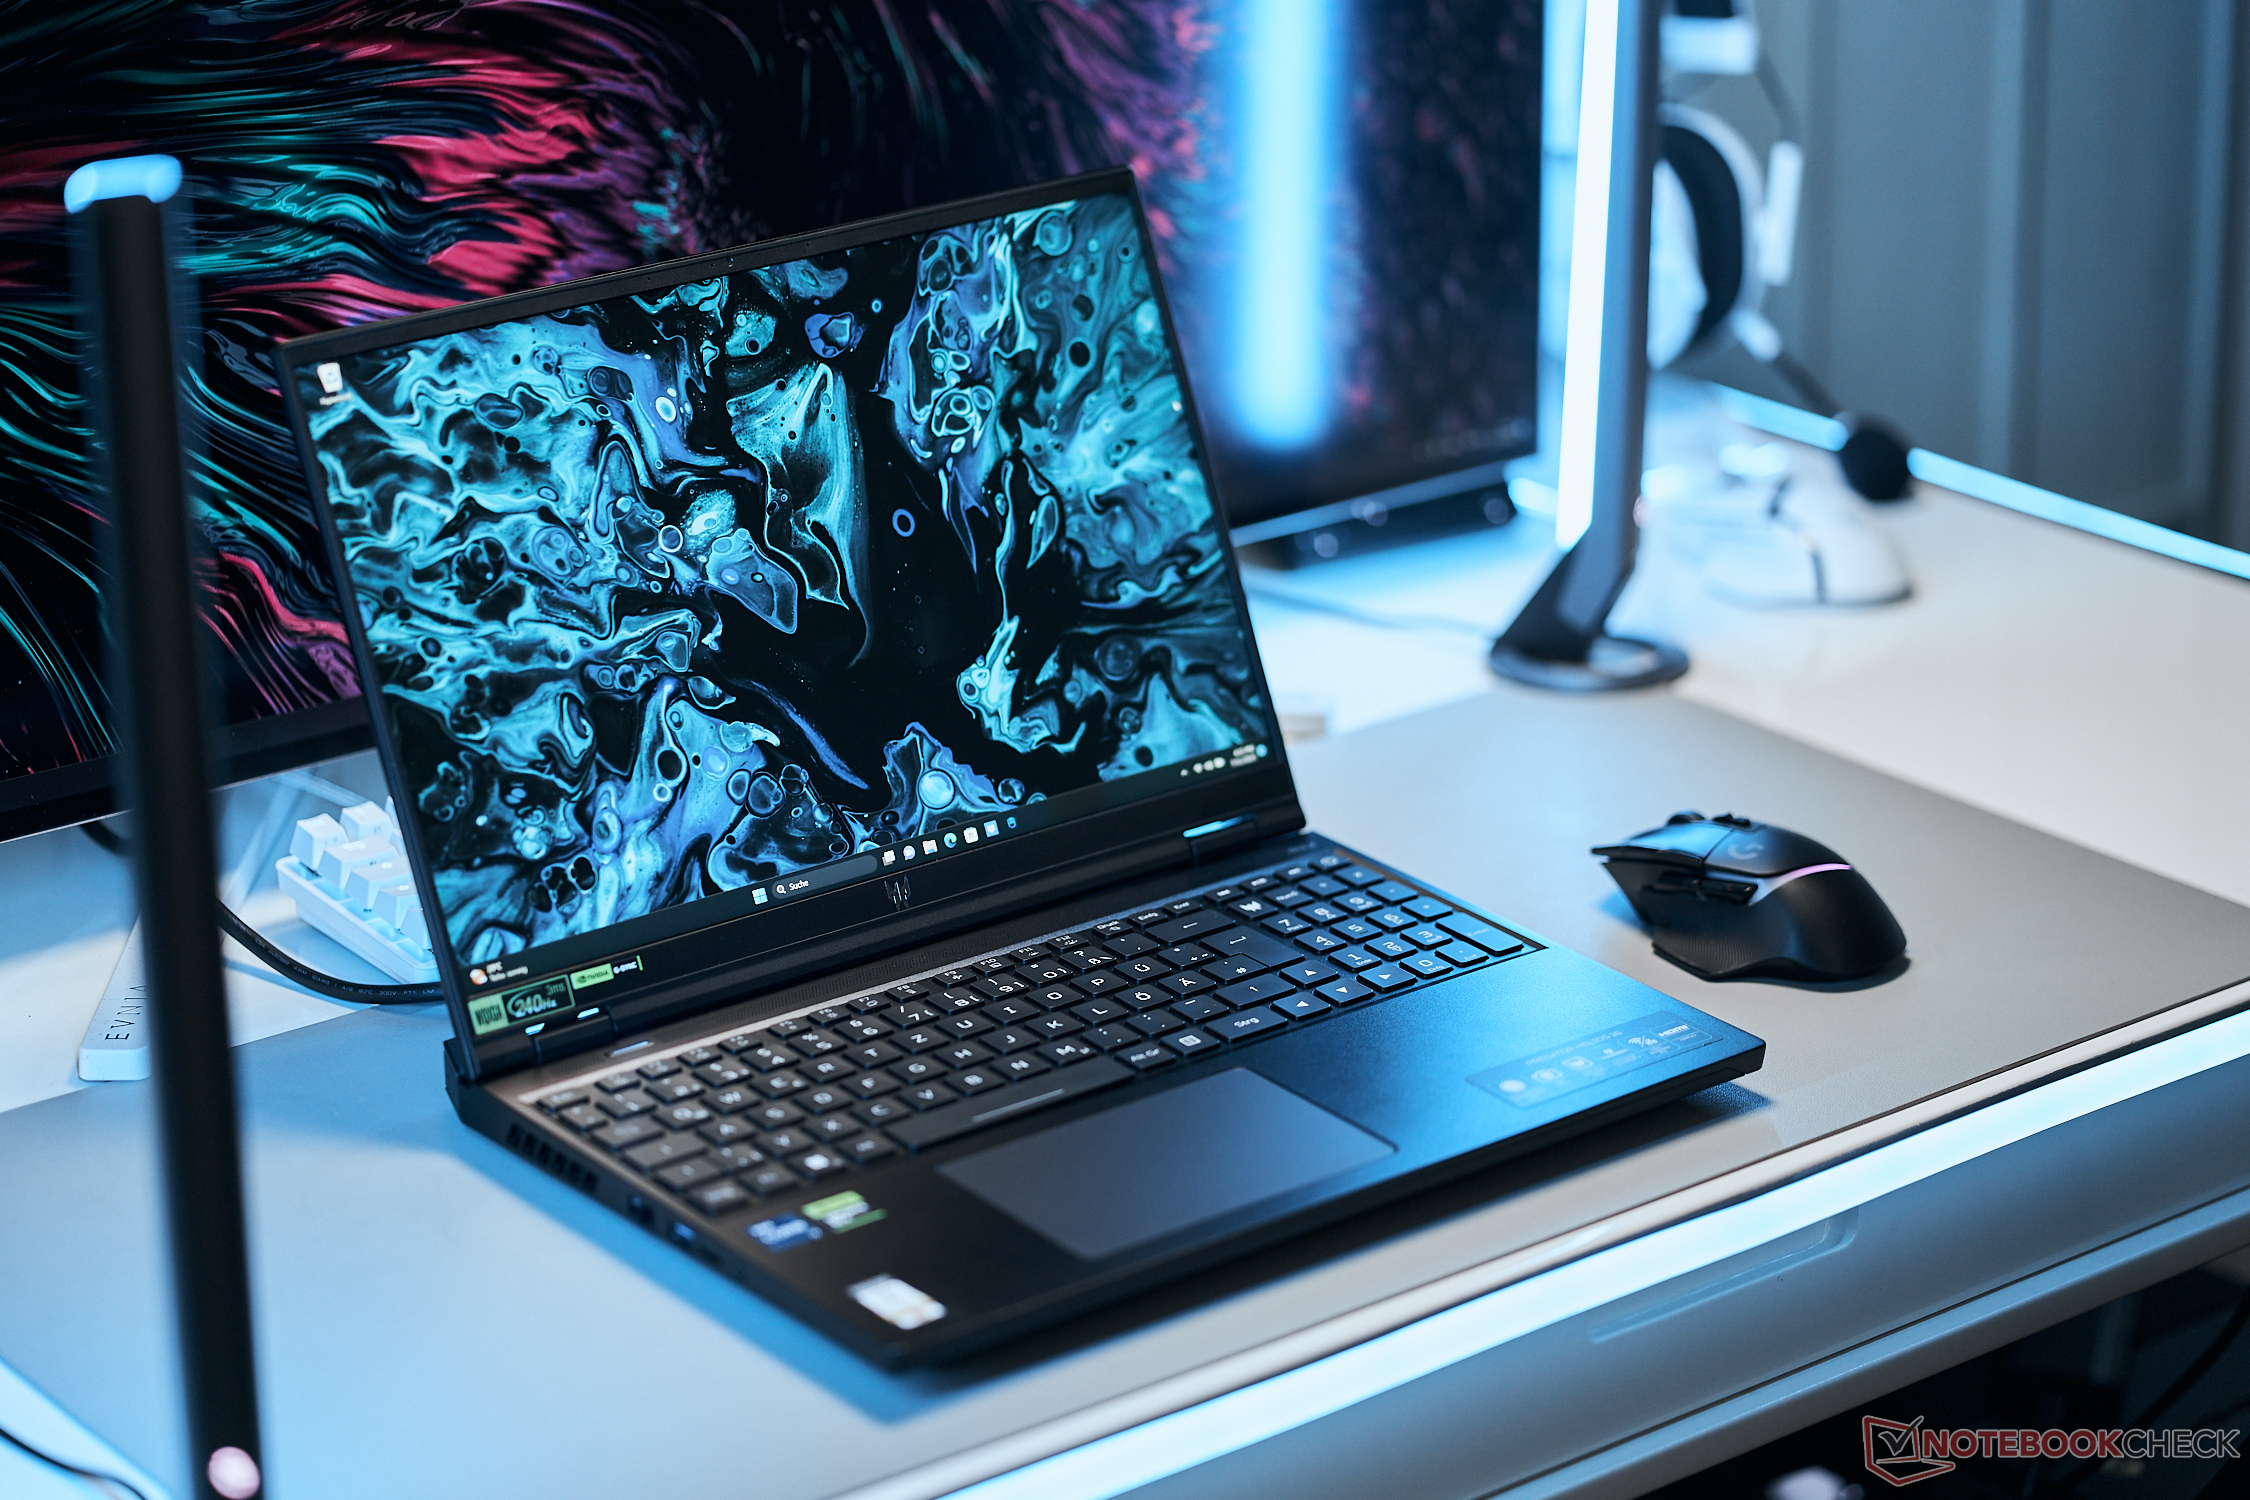
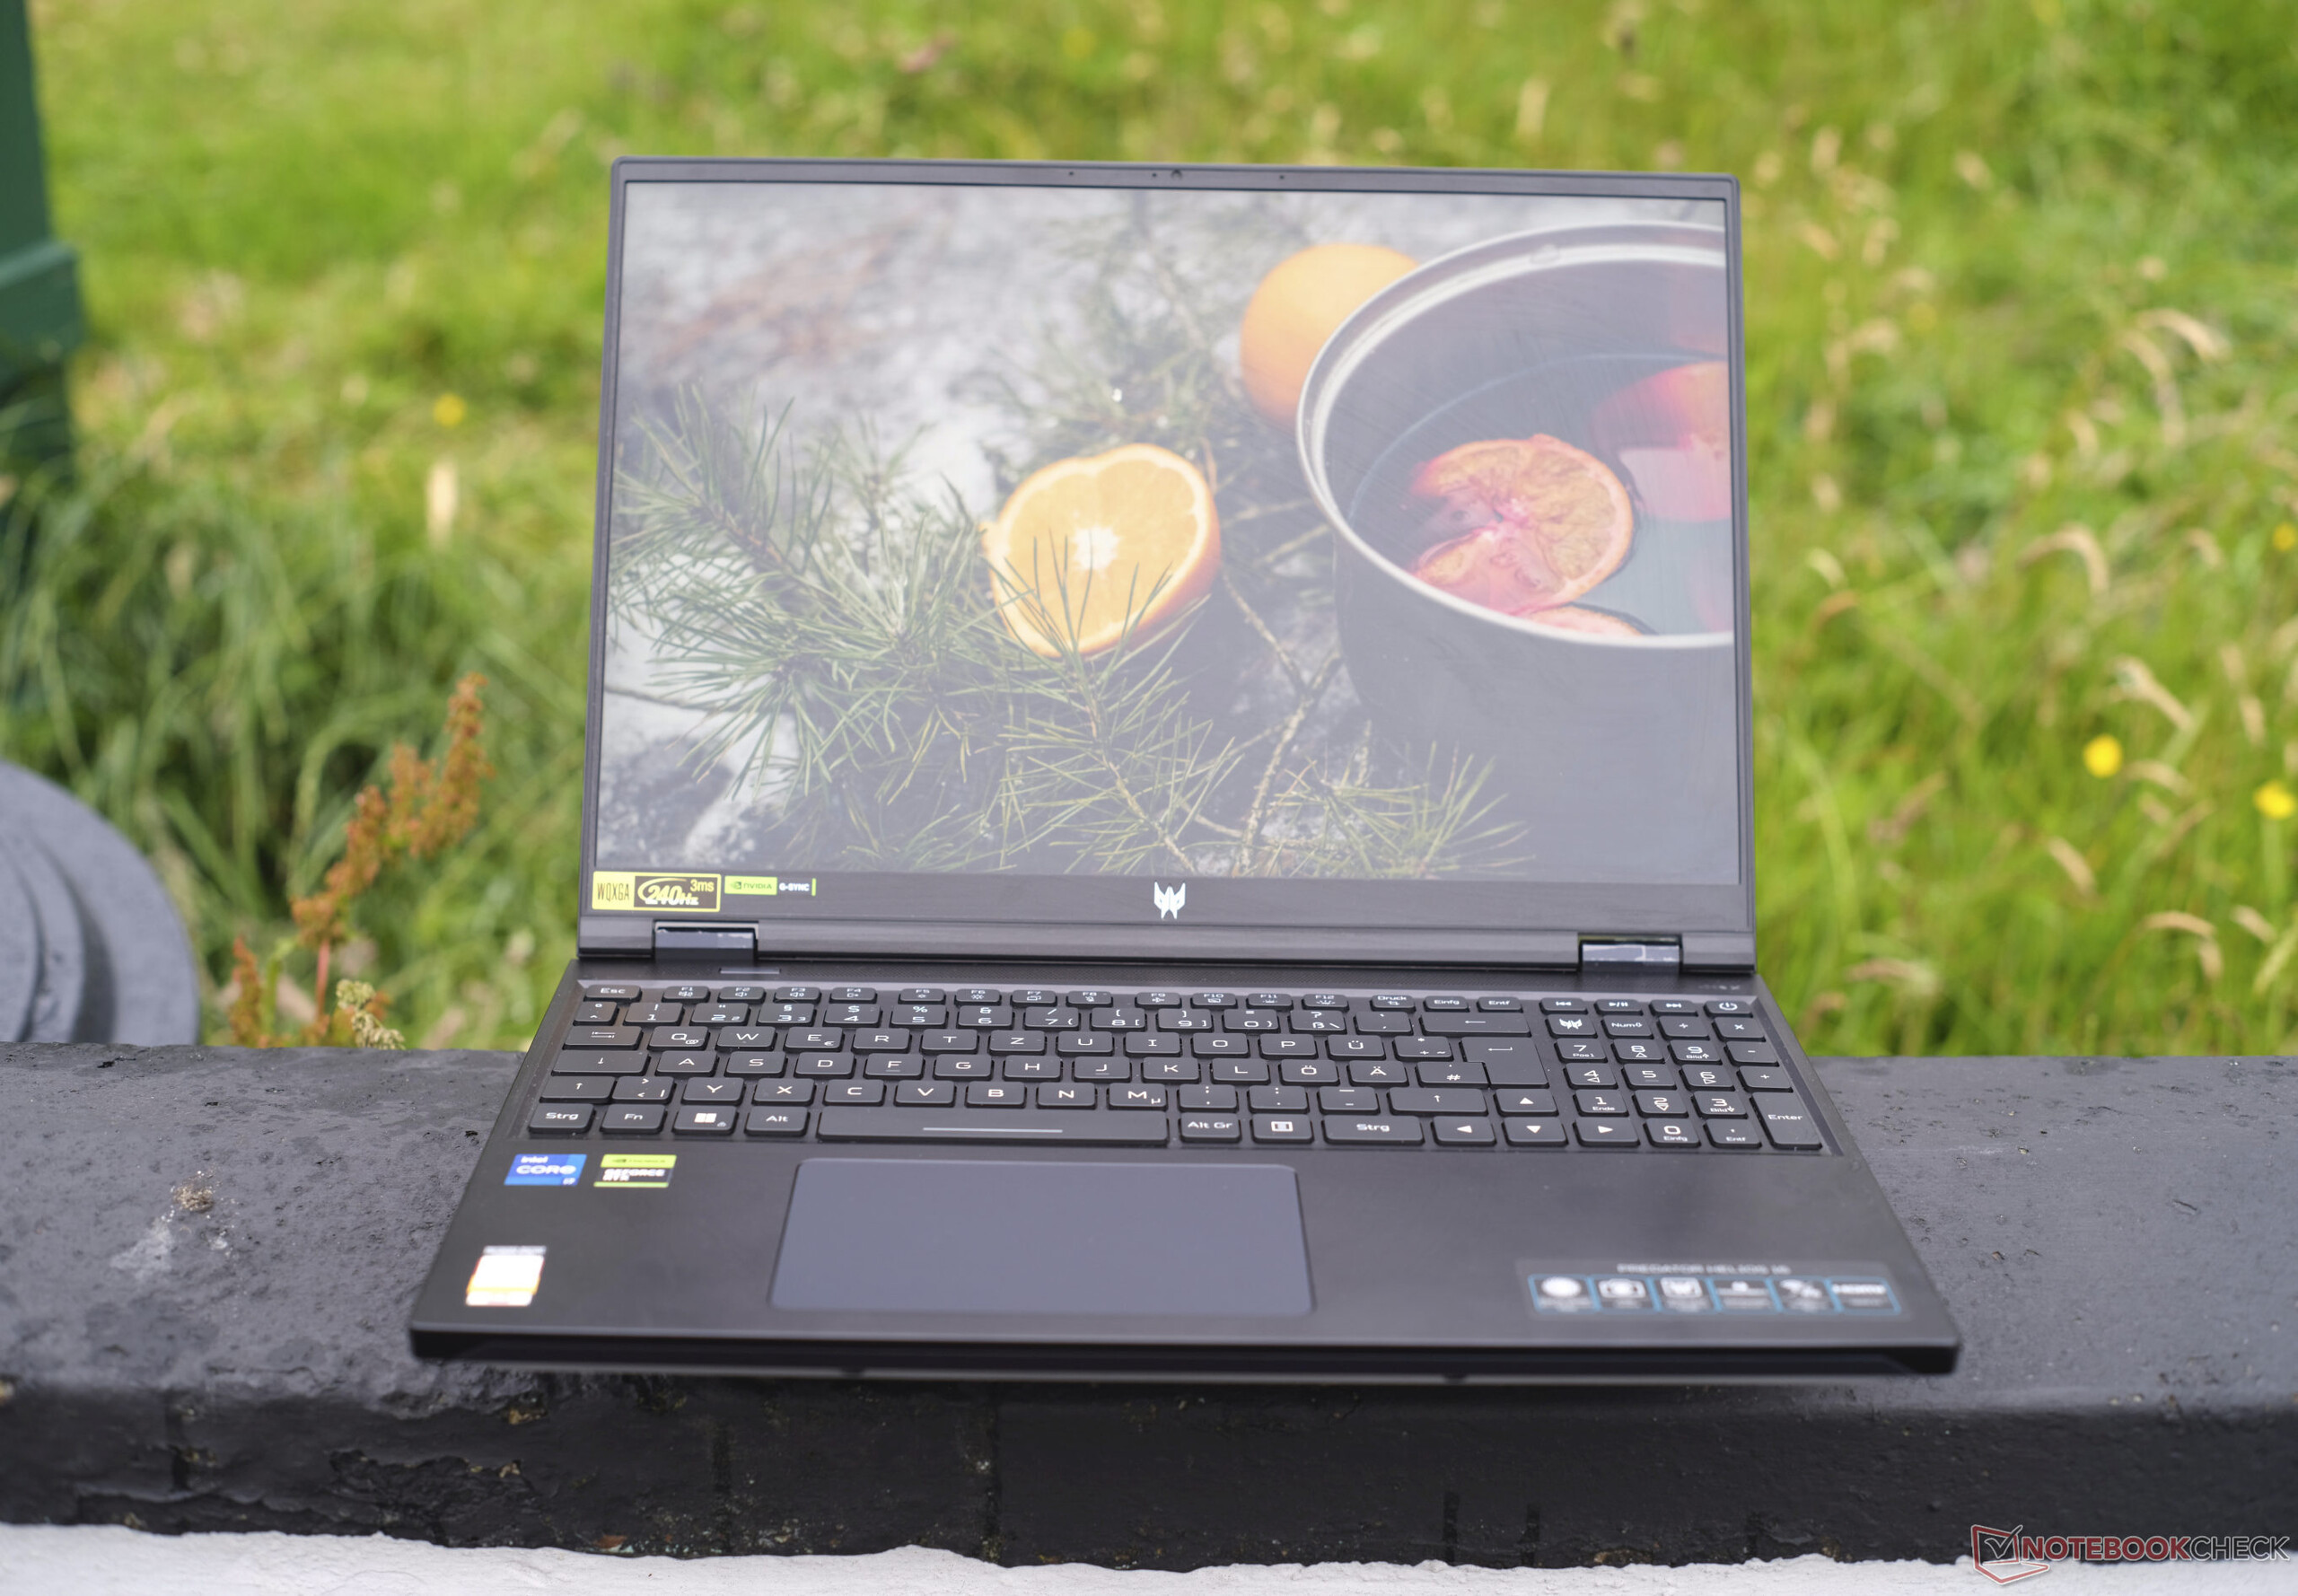
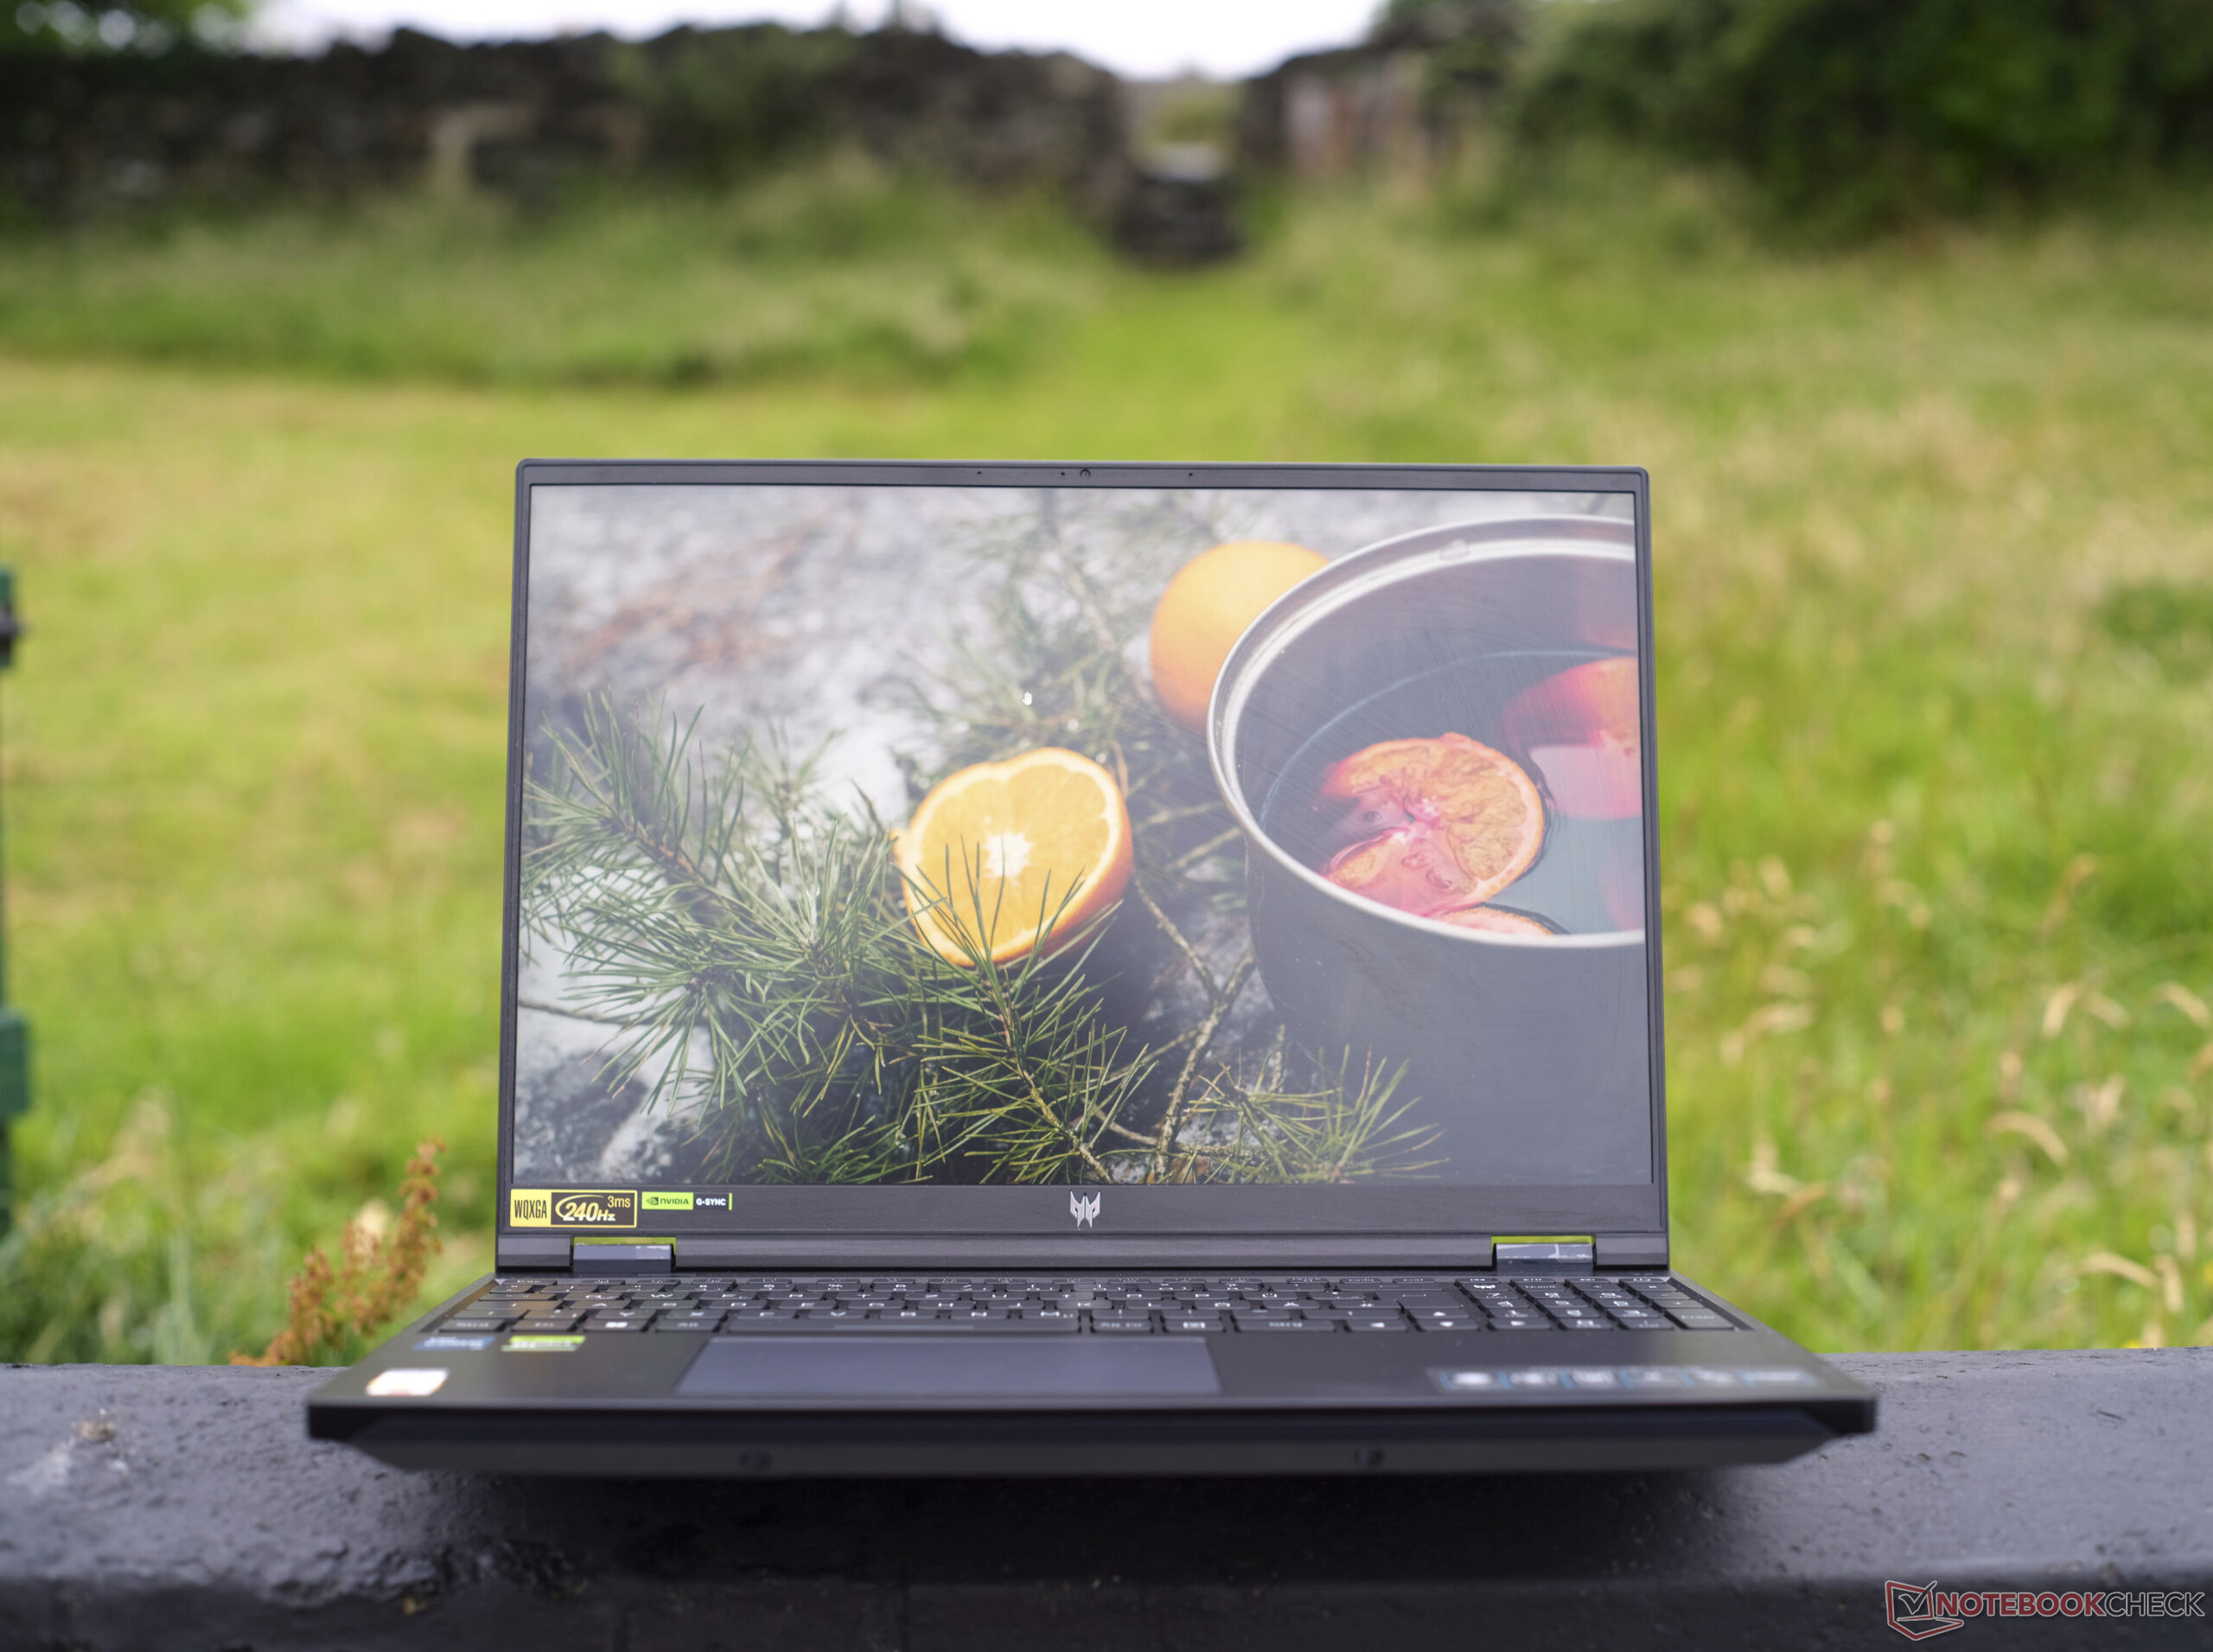
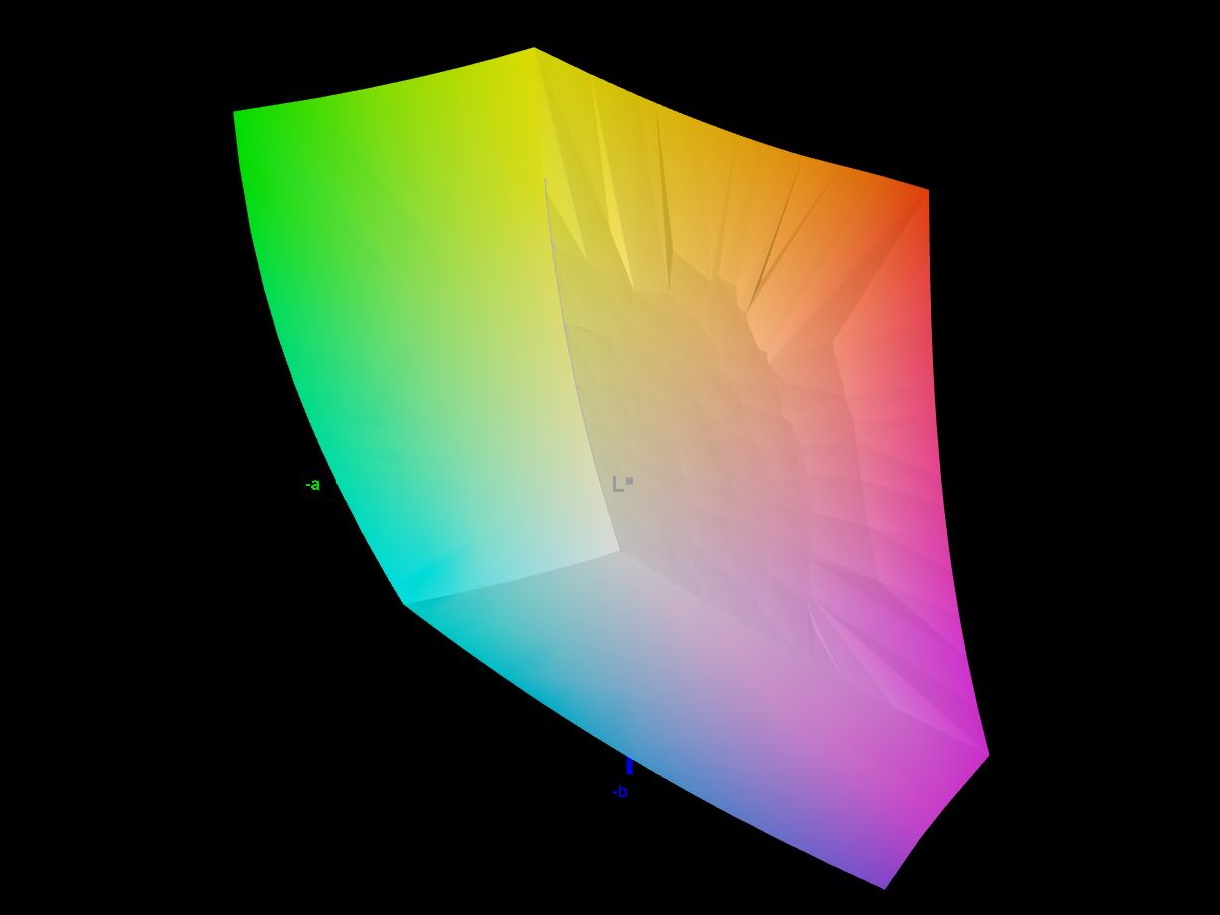
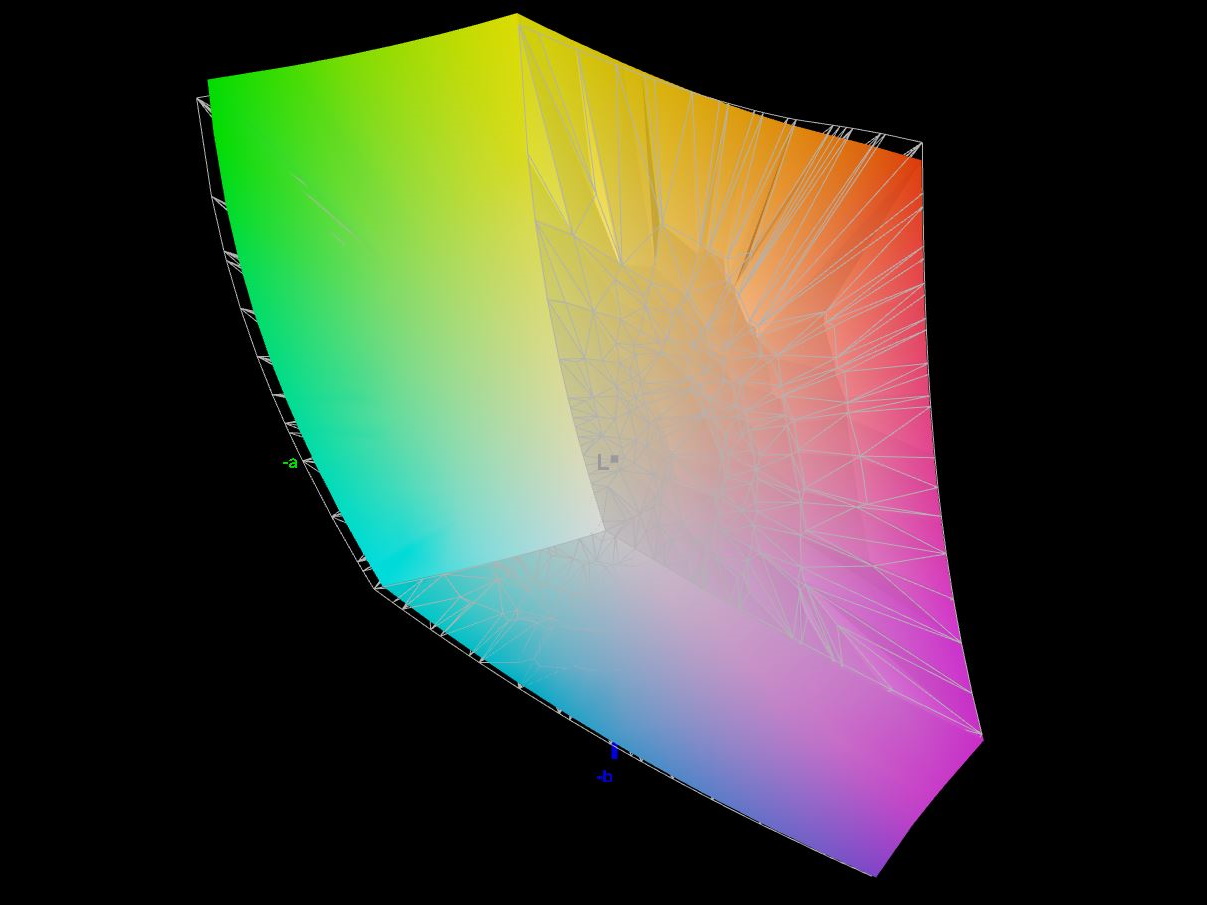
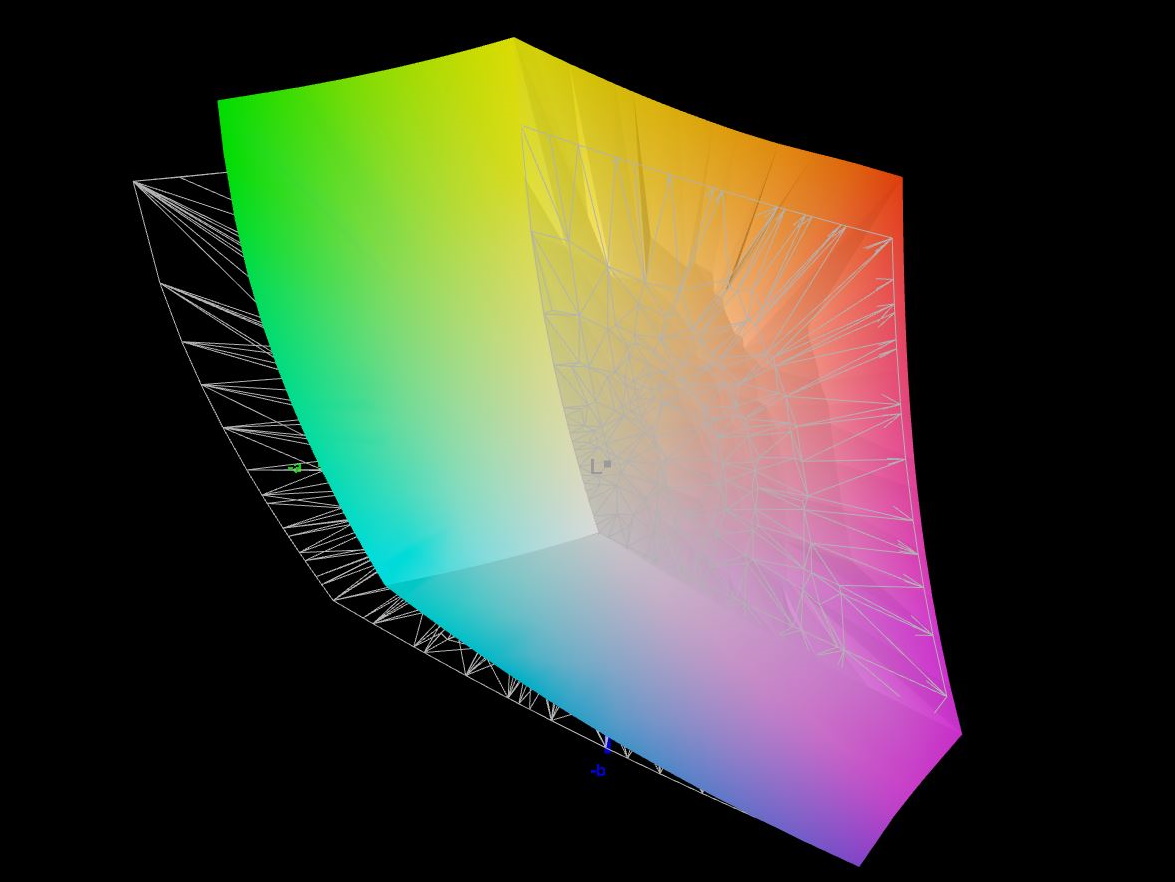
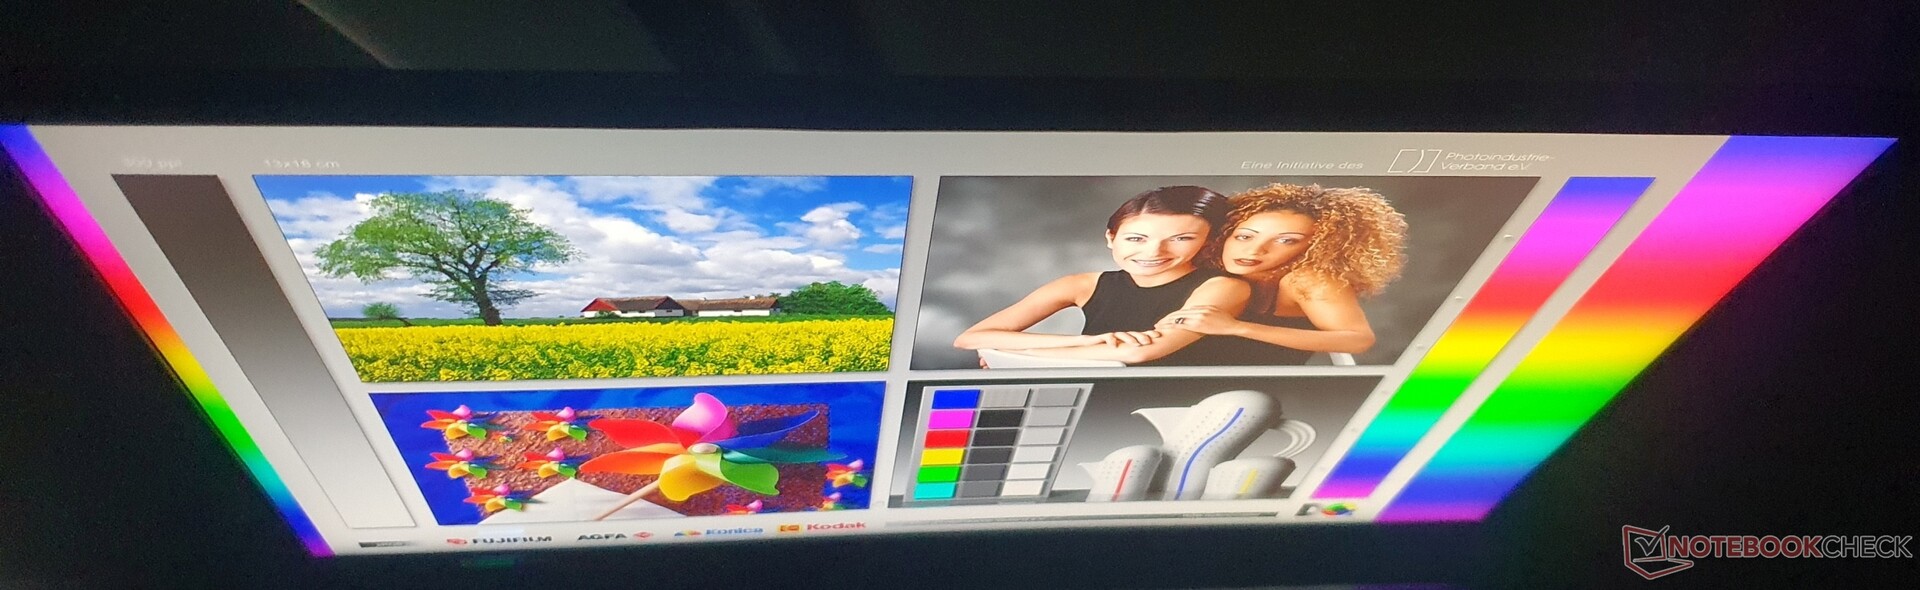
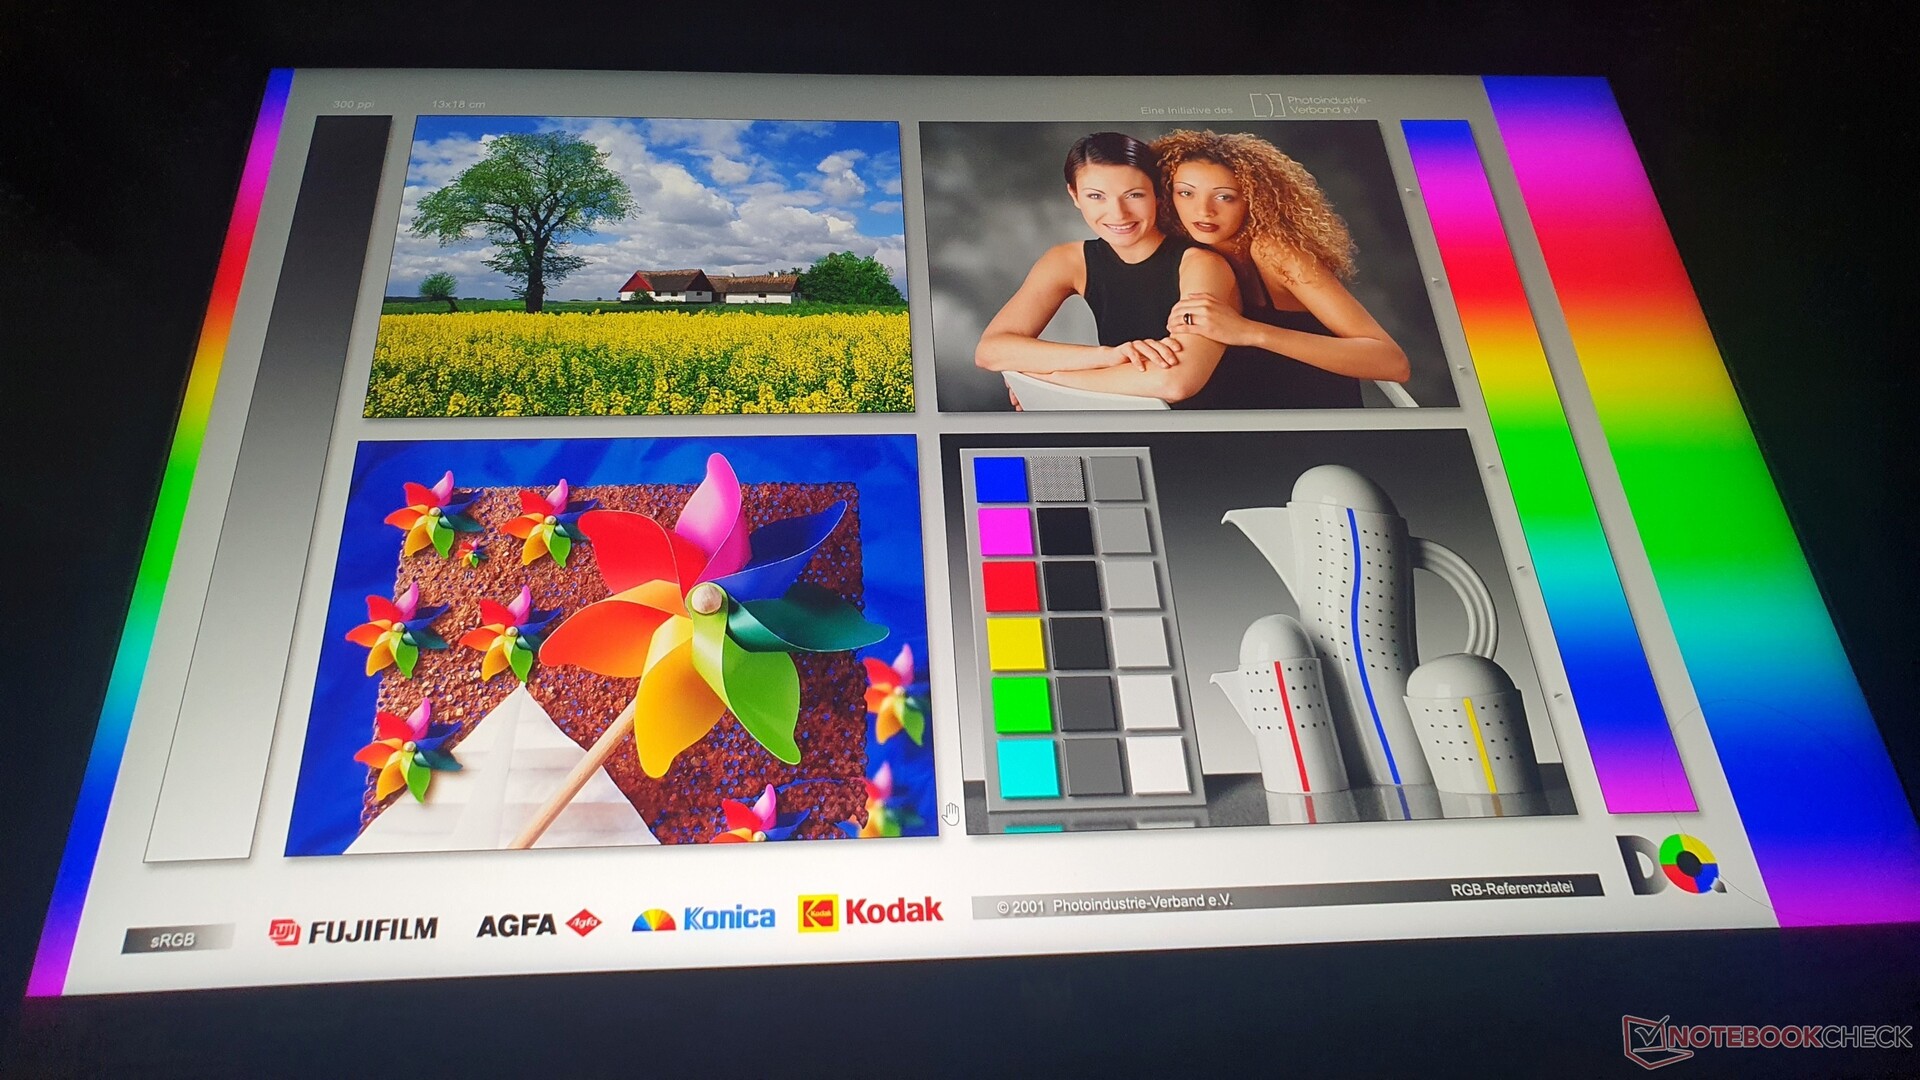
Pantalla: Una máquina de juegos con 97 % DCI P3, 500 cd/m² y 240 Hz
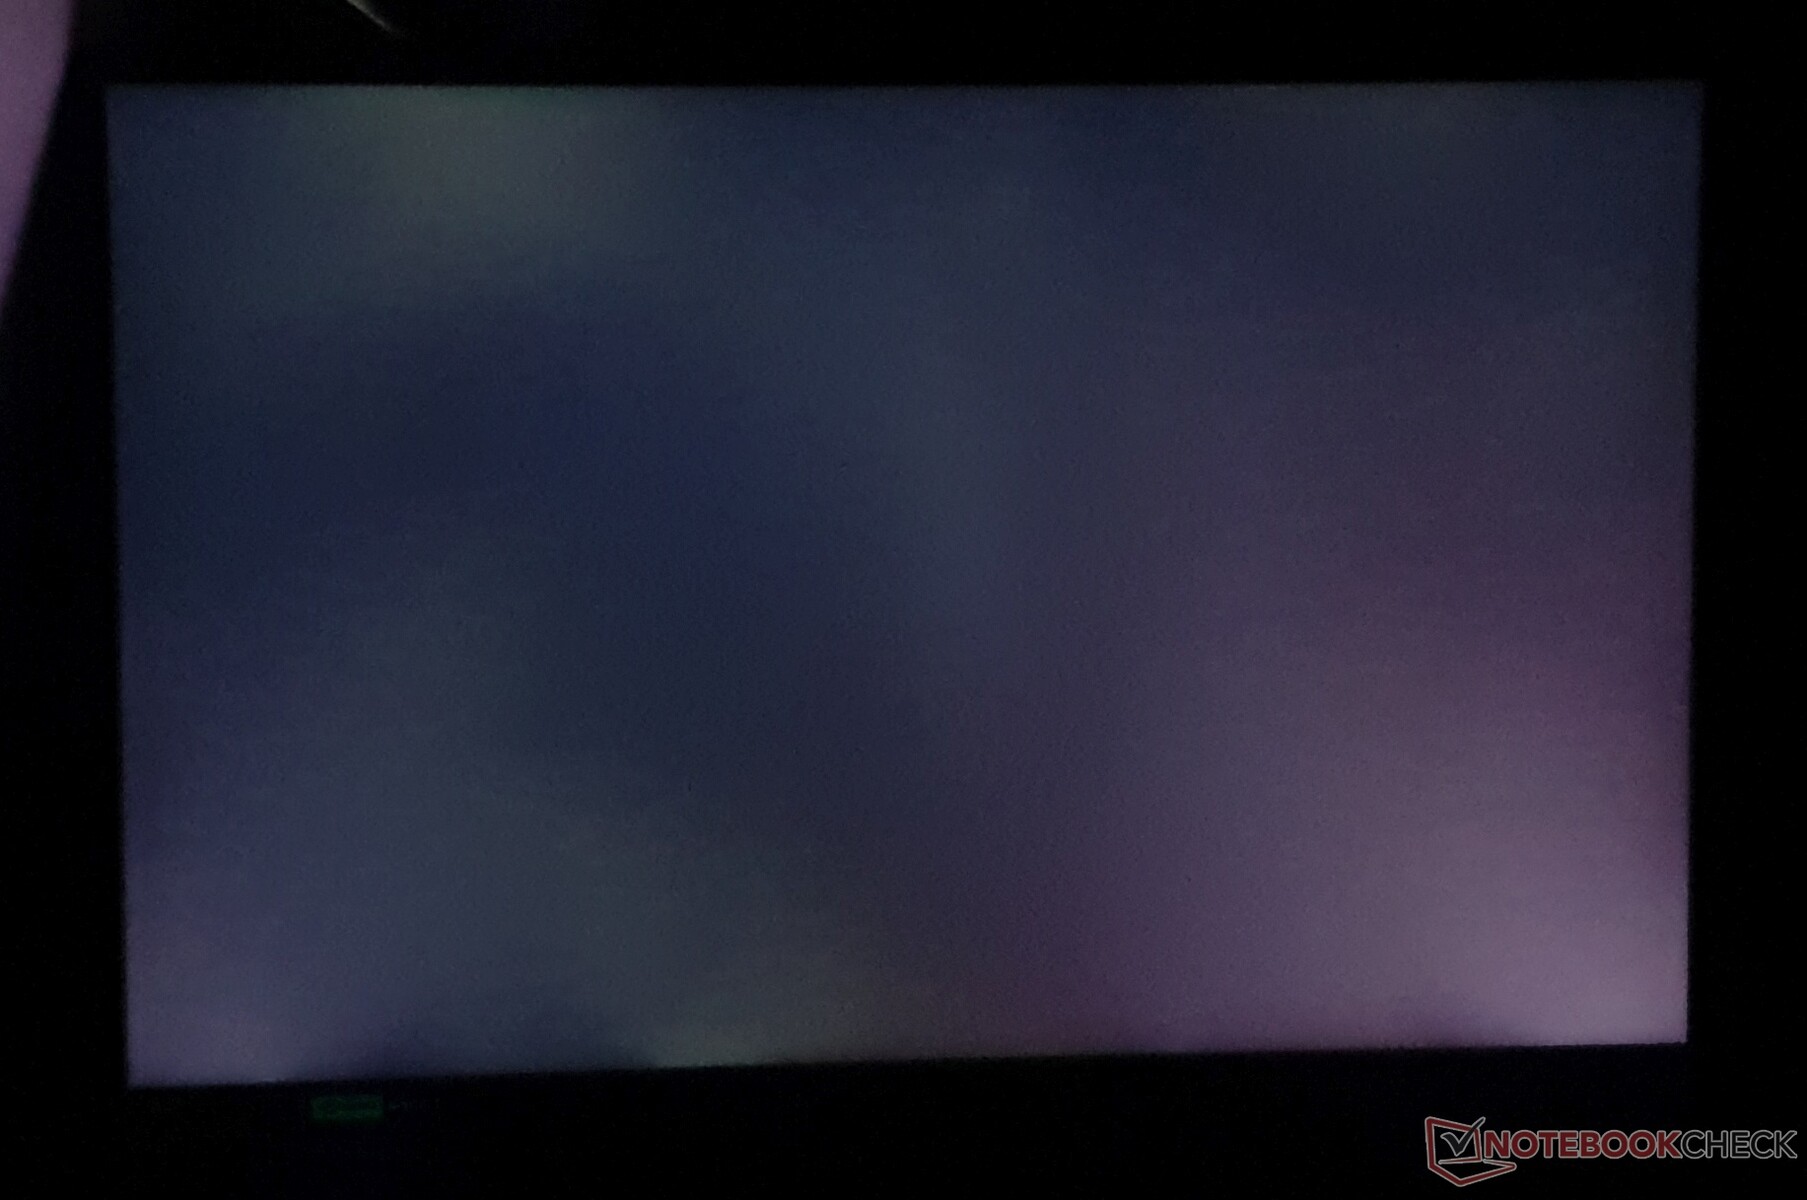
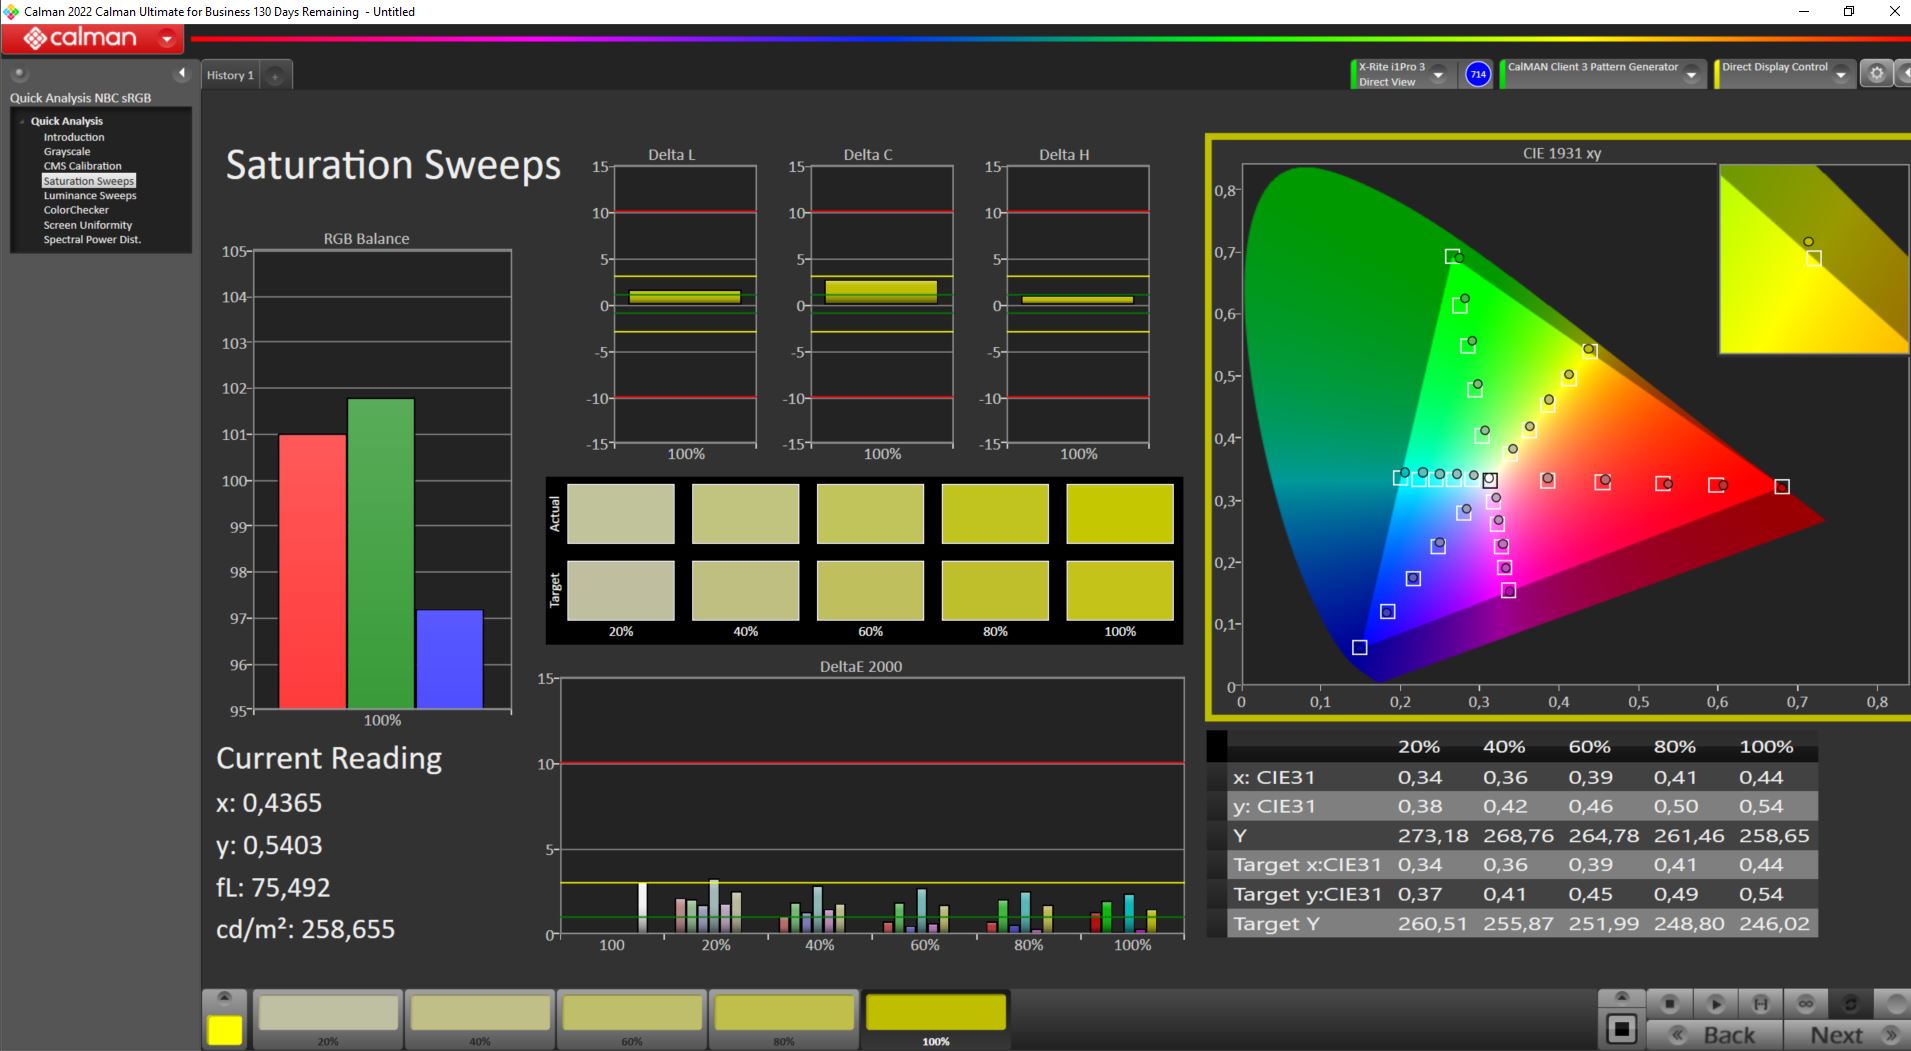
El dispositivo de pruebas con el número de modelo PH16-71-731Q no viene con la pantalla mini-LED disponible opcionalmente y sus 1.024 zonas de atenuación. No obstante, nos sorprendió que el rápido panel IPS mate de 240 Hz y 2.560 x 1.600 píxeles de resolución (16:10) cubriera con orgullo el 97% del espacio de color DCI P3. Esto significa que las imágenes, en los juegos entre otras cosas, parecen aún más vívidas.
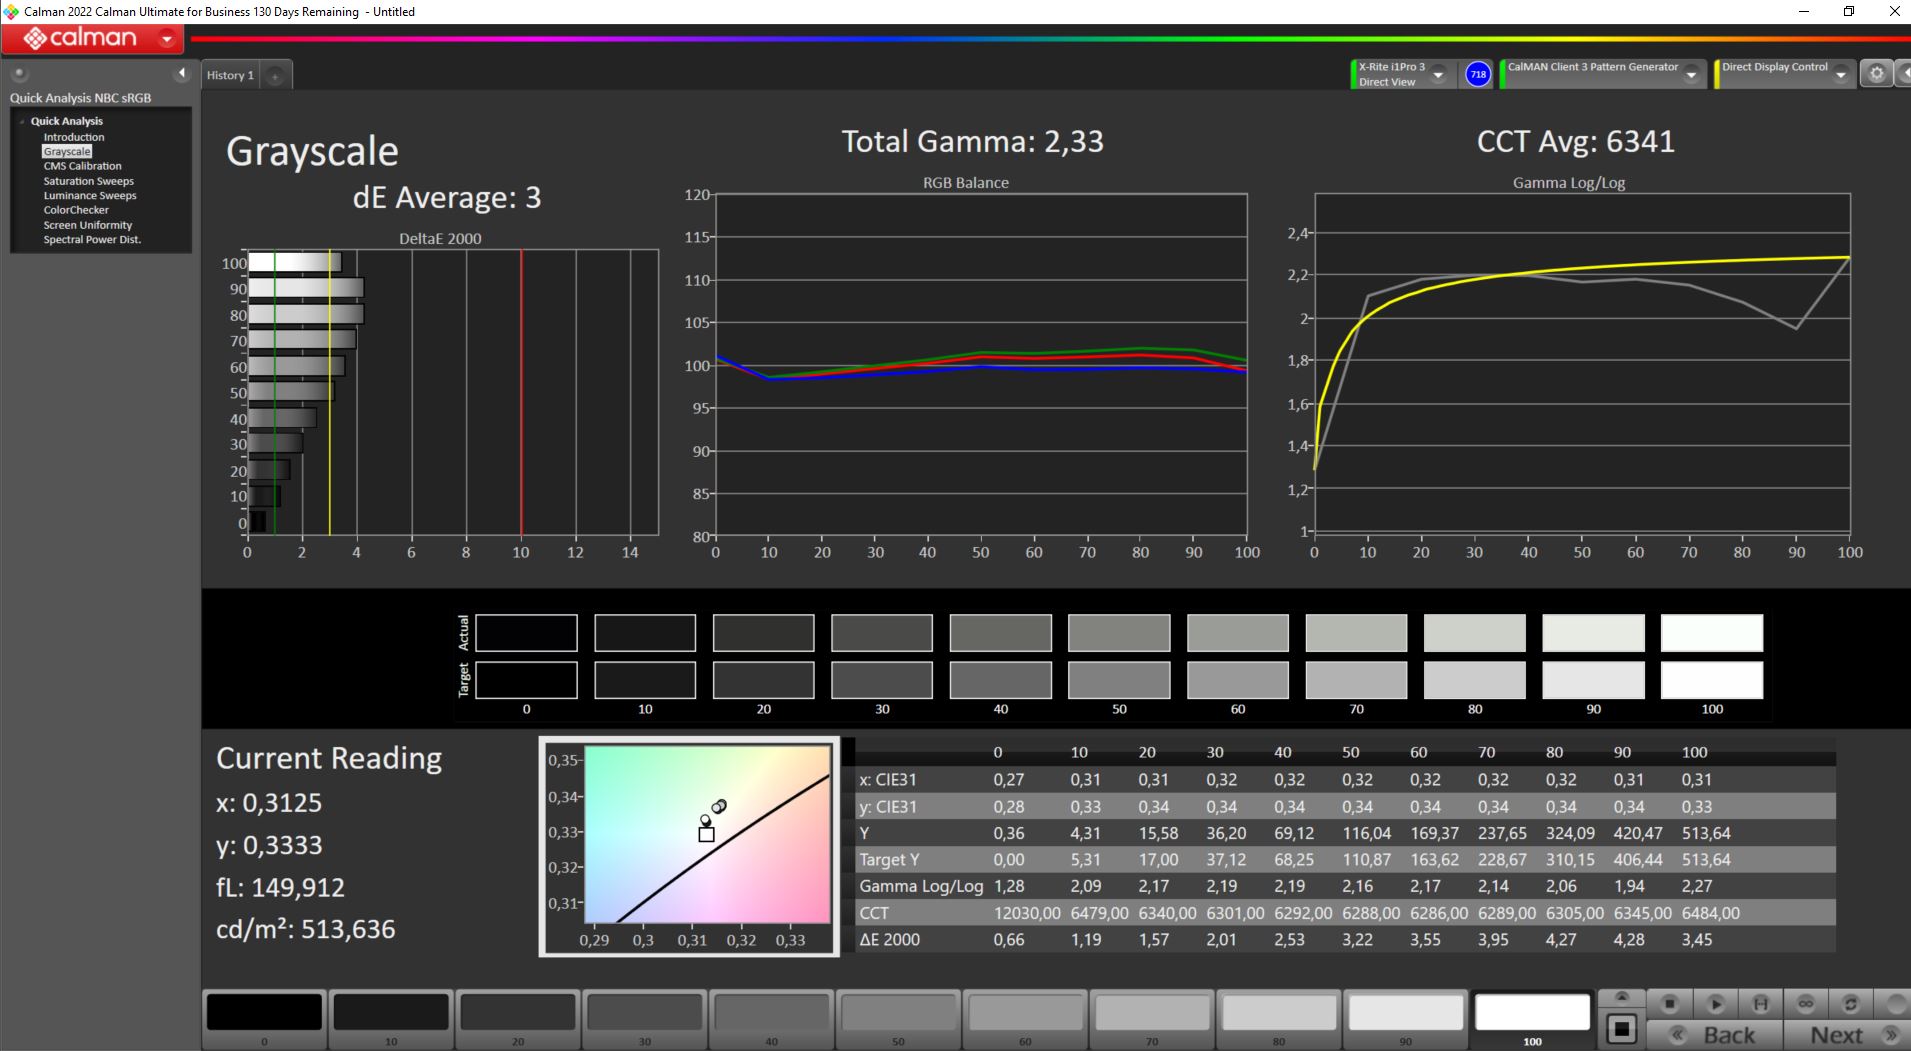
Todos los demás datos clave también tienen buen aspecto: Brillo de algo menos de 500 cd/m², alto contraste de 1:419:1 e iluminación uniforme del 94 %. Además, no se usa PWM, que puede provocar fatiga visual o dolores de cabeza, El Acer Nitro 16 es el único competidor de nuestra lista de dispositivos de la competencia que logra un brillo de bastante más de ~300 cd
/m².Los buenos tiempos de respuesta de gris a gris de 13,6 ms y de negro a blanco de 6,4 ms son similares a los de sus compañeros, por lo que el Dell G15 5530 tiene la nariz por delante con un tiempo de gris a gris de sólo 3,4 ms. Además, también soporta Nvidia G-Sync y Dolby Vision.
| |||||||||||||||||||||||||
iluminación: 94 %
Brillo con batería: 511 cd/m²
Contraste: 1419:1 (Negro: 0.36 cd/m²)
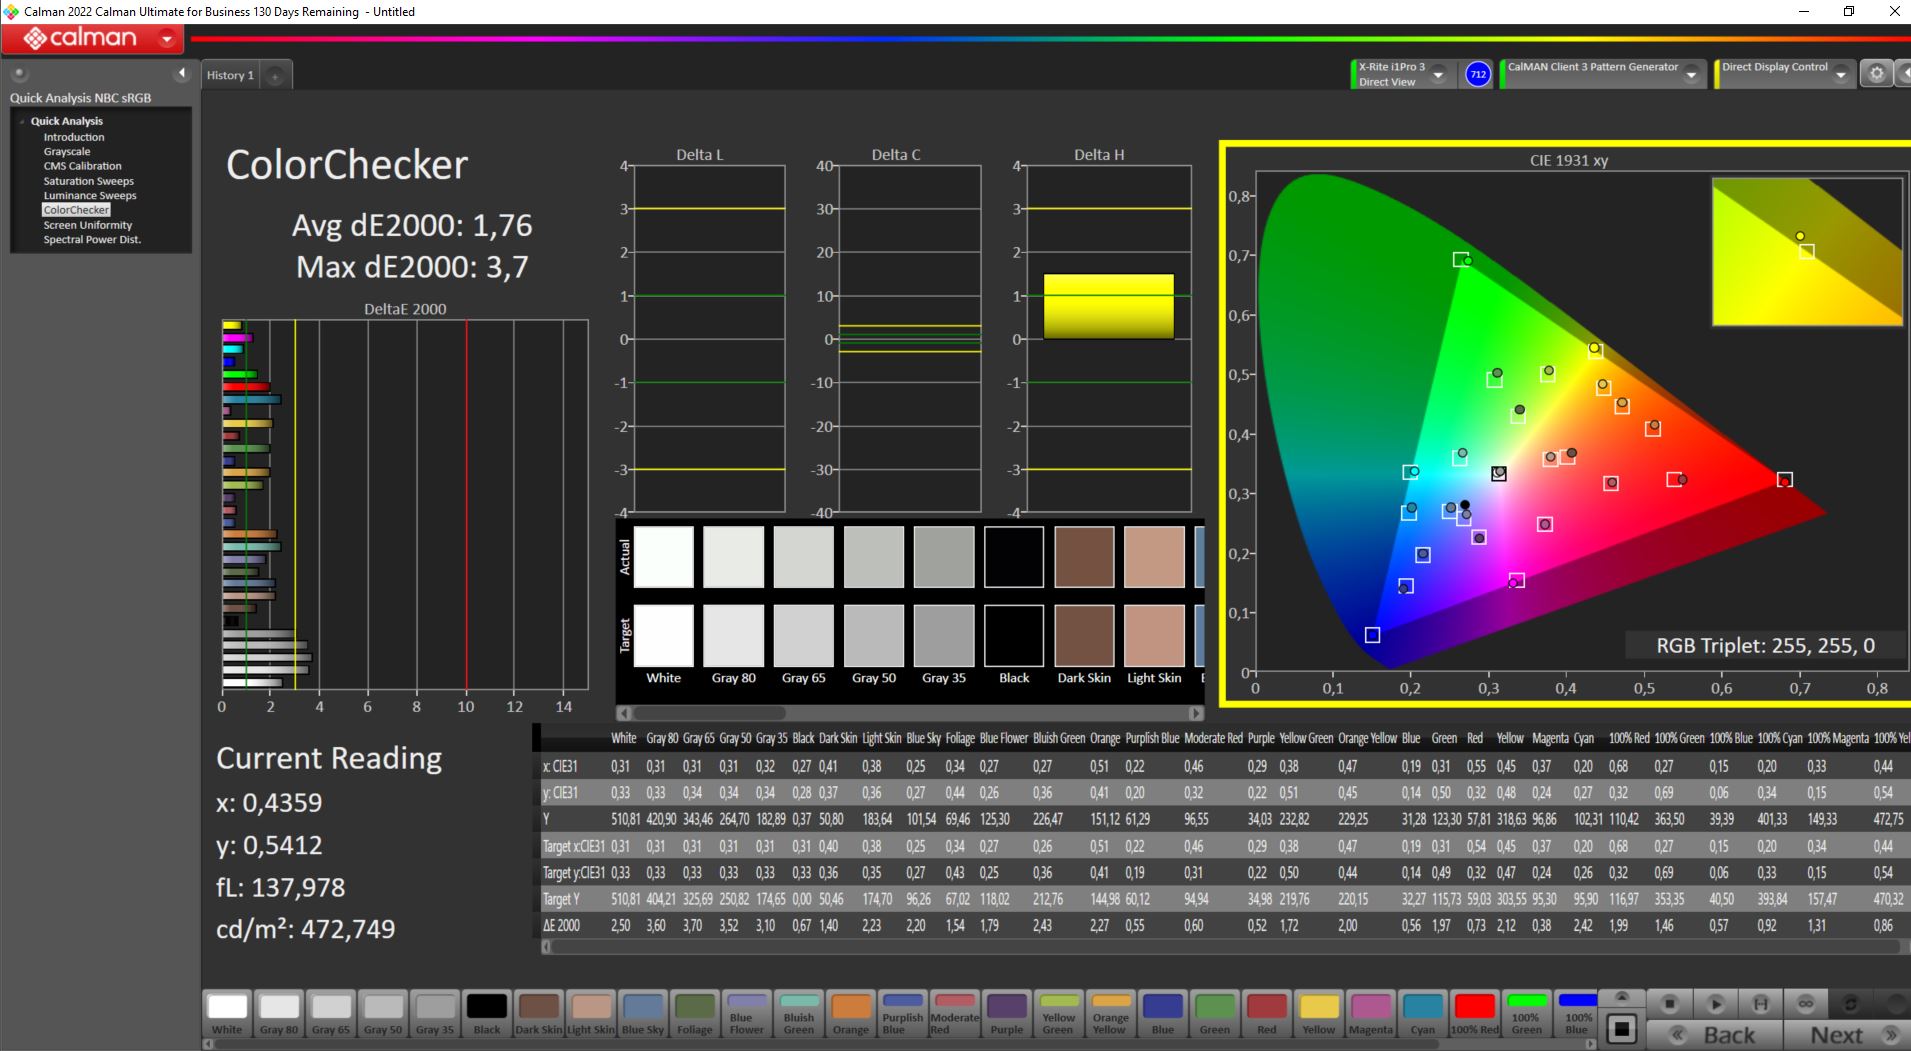
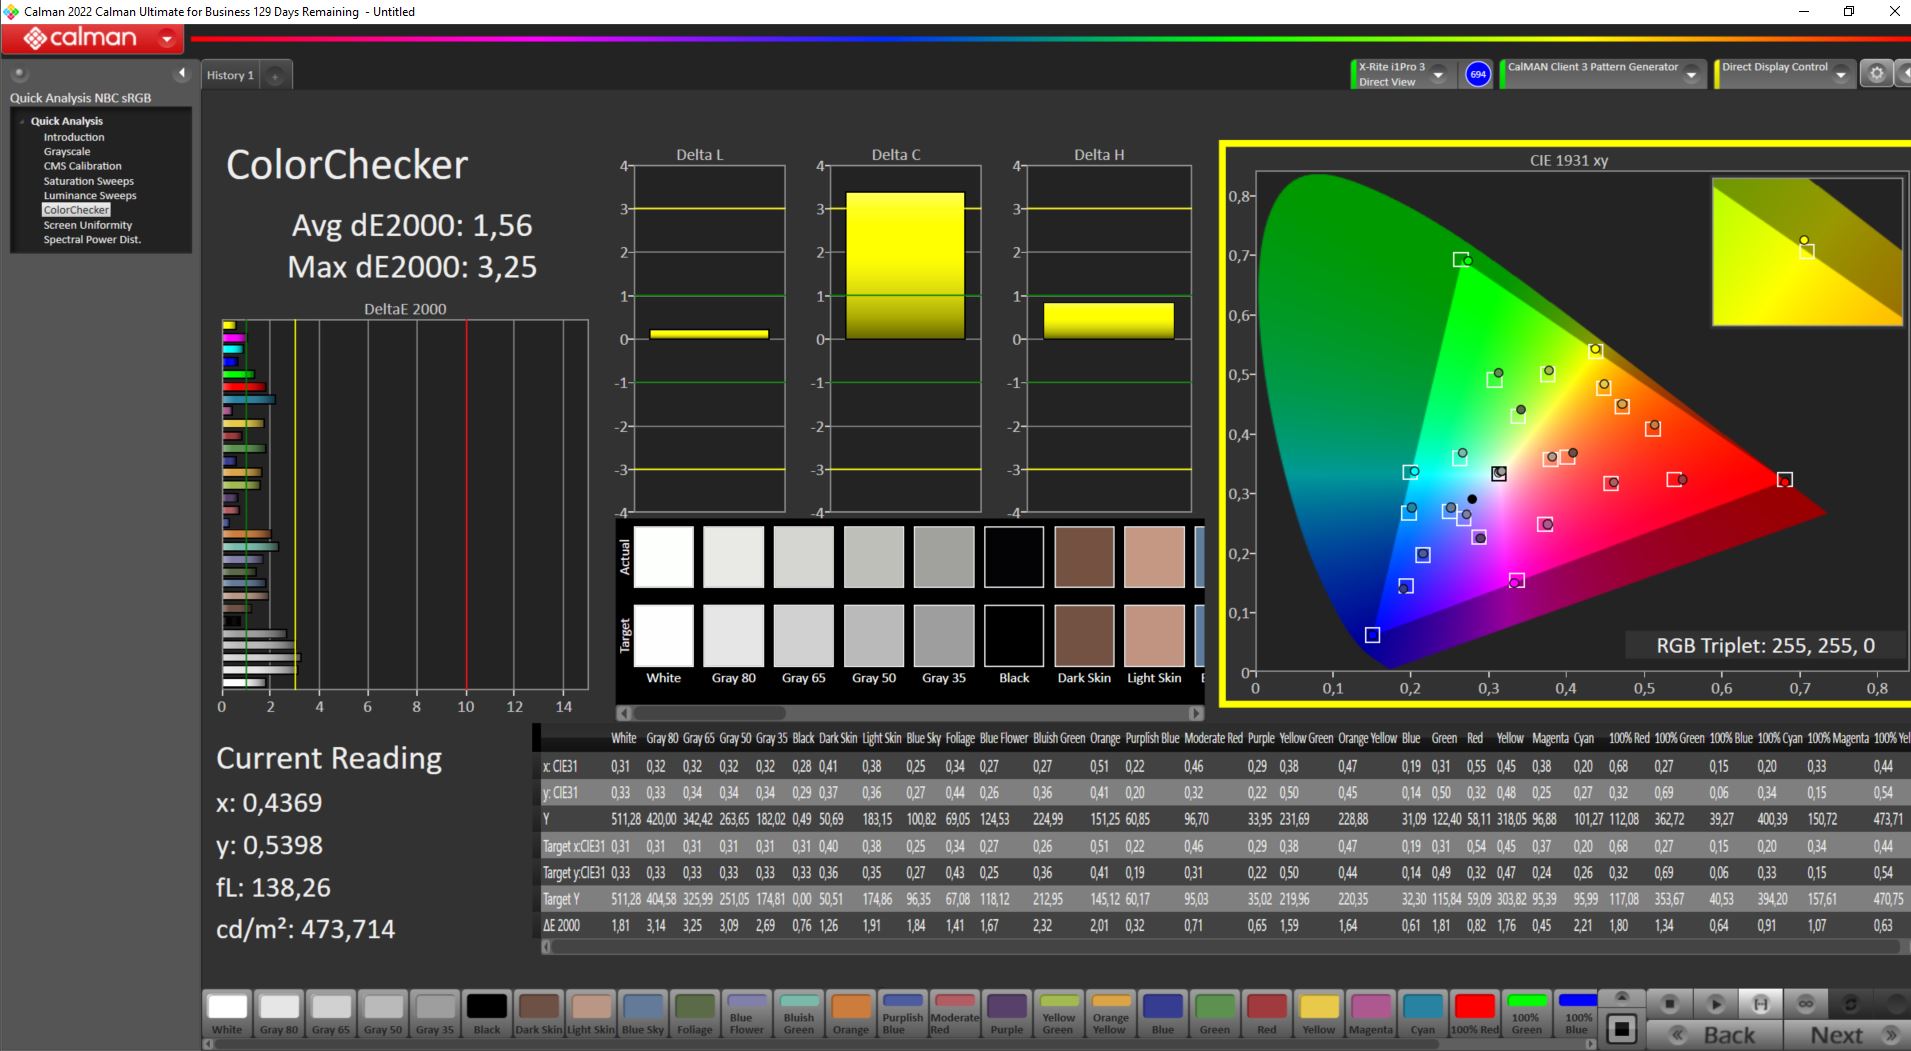
ΔE ColorChecker Calman: 1.76 | ∀{0.5-29.43 Ø4.71}
calibrated: 1.56
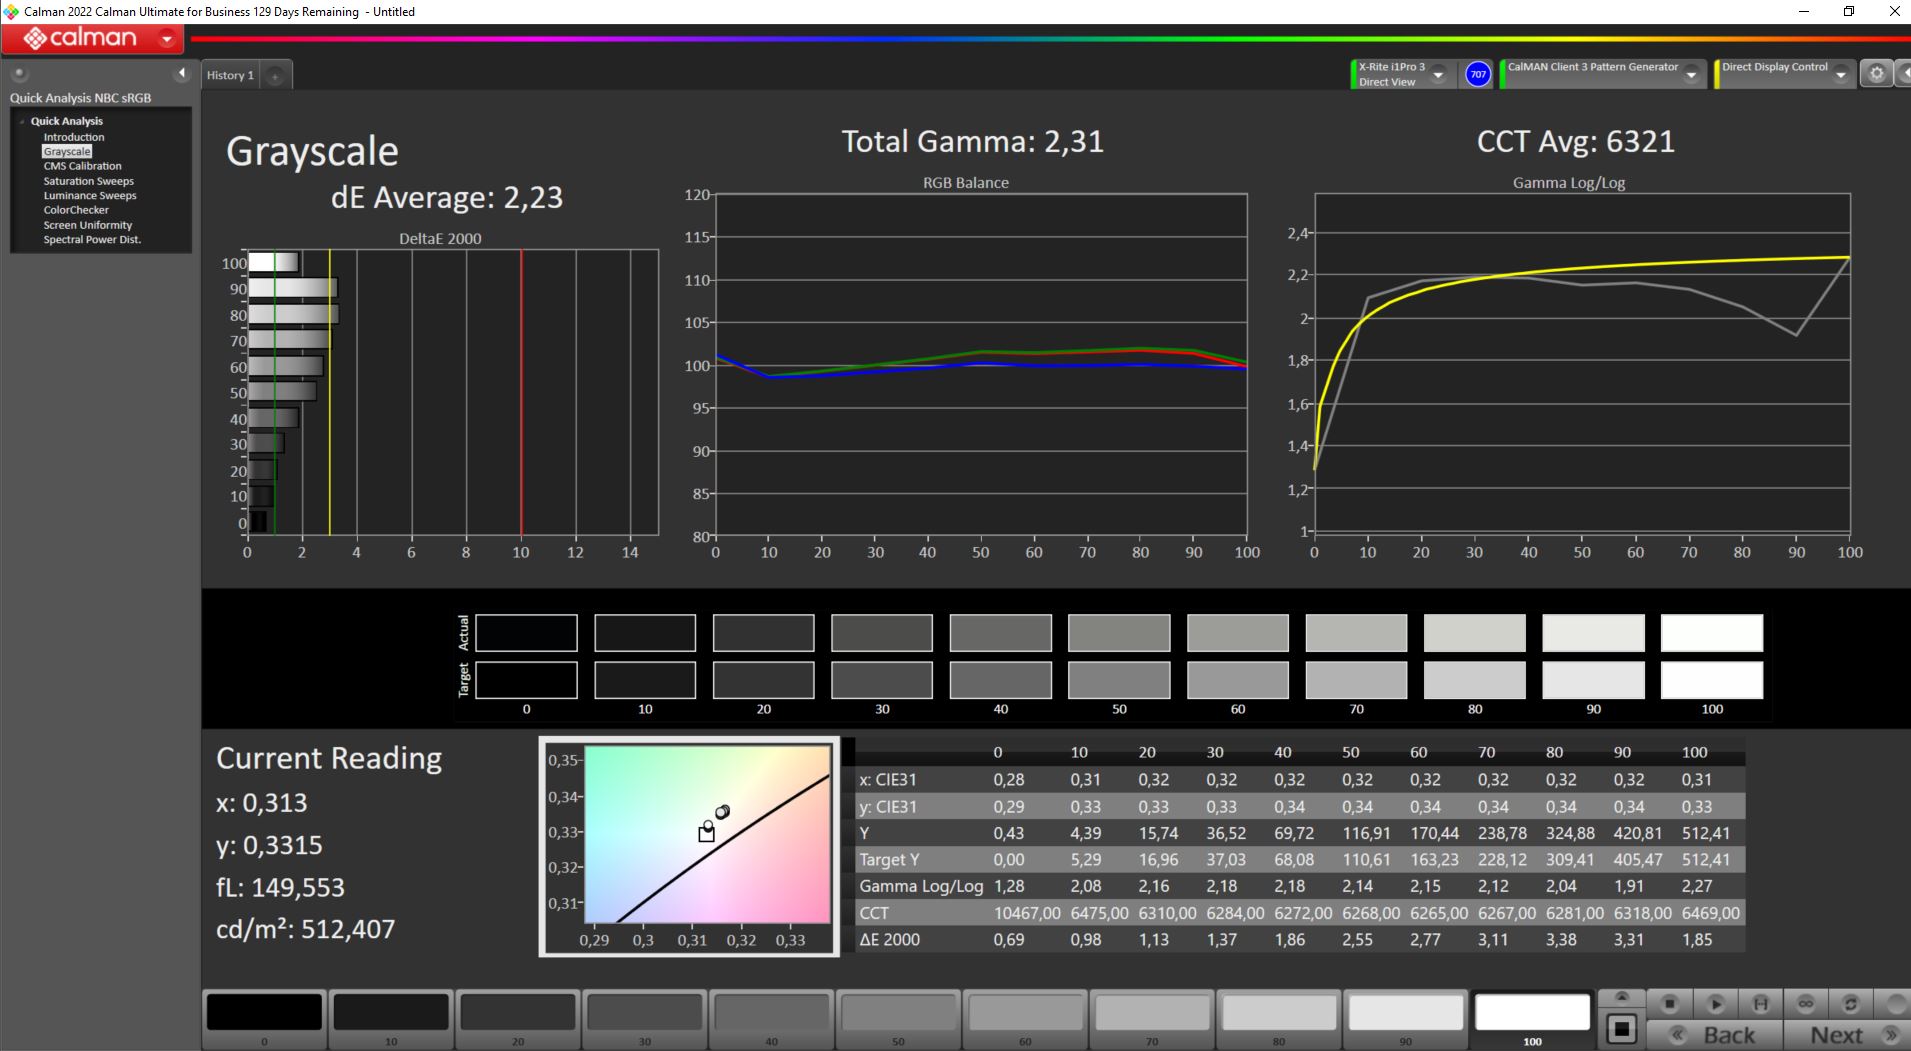
ΔE Greyscale Calman: 3 | ∀{0.09-98 Ø4.96}
84.7% AdobeRGB 1998 (Argyll 3D)
100% sRGB (Argyll 3D)
97.1% Display P3 (Argyll 3D)
Gamma: 2.33
CCT: 6341 K
| Acer Predator Helios 16 PH16-71-731Q BOE NE160QDM-NZ2, IPS-LED, 2560x1600, 16" | Acer Nitro 16 AN16-41 BOE CQ NE16QDM-NY1, IPS, 2560x1600, 16" | Lenovo Legion Pro 5 16IRX8 AU Optronics B160QAN03.1, IPS, 2560x1600, 16" | Aorus 15X ASF BOE CQ NE156QHM-NZ1, IPS, 2560x1440, 15.6" | Asus TUF Gaming A16 FA617 NE160WUM-NX2 (BOE0B33), IPS-Level, 1920x1200, 16" | Dell G15 5530 AUO B156HAN, IPS, 1920x1080, 15.6" | |
|---|---|---|---|---|---|---|
| Display | -16% | -14% | -16% | -16% | -13% | |
| Display P3 Coverage (%) | 97.1 | 67.9 -30% | 71.2 -27% | 69.3 -29% | 69.4 -29% | 73.1 -25% |
| sRGB Coverage (%) | 100 | 99.1 -1% | 98.8 -1% | 98.2 -2% | 97.8 -2% | 98.4 -2% |
| AdobeRGB 1998 Coverage (%) | 84.7 | 69.9 -17% | 73.3 -13% | 70.5 -17% | 70.9 -16% | 74.4 -12% |
| Response Times | 21% | -35% | -19% | -42% | 46% | |
| Response Time Grey 50% / Grey 80% * (ms) | 13.6 ? | 11 ? 19% | 14.5 ? -7% | 12.4 ? 9% | 17 ? -25% | 3.39 ? 75% |
| Response Time Black / White * (ms) | 6.4 ? | 5 ? 22% | 10.4 ? -63% | 9.4 ? -47% | 10.1 ? -58% | 5.35 ? 16% |
| PWM Frequency (Hz) | 21620 ? | |||||
| Screen | -3% | 4% | 5% | 5% | -50% | |
| Brightness middle (cd/m²) | 511 | 520 2% | 405.7 -21% | 316 -38% | 308 -40% | 320 -37% |
| Brightness (cd/m²) | 498 | 494 -1% | 368 -26% | 301 -40% | 293 -41% | 316 -37% |
| Brightness Distribution (%) | 94 | 91 -3% | 87 -7% | 90 -4% | 90 -4% | 94 0% |
| Black Level * (cd/m²) | 0.36 | 0.39 -8% | 0.38 -6% | 0.28 22% | 0.23 36% | 0.21 42% |
| Contrast (:1) | 1419 | 1333 -6% | 1068 -25% | 1129 -20% | 1339 -6% | 1524 7% |
| Colorchecker dE 2000 * | 1.76 | 1.94 -10% | 1.65 6% | 1.54 12% | 1.47 16% | 4.55 -159% |
| Colorchecker dE 2000 max. * | 3.7 | 5.62 -52% | 4.2 -14% | 2.46 34% | 2.98 19% | 9.83 -166% |
| Colorchecker dE 2000 calibrated * | 1.56 | 0.74 53% | 0.53 66% | 1.21 22% | 1.02 35% | 1.51 3% |
| Greyscale dE 2000 * | 3 | 2.94 2% | 1.2 60% | 1.3 57% | 2.2 27% | 6.2 -107% |
| Gamma | 2.33 94% | 2.37 93% | 2.3 96% | 2.307 95% | 2.228 99% | 2.07 106% |
| CCT | 6341 103% | 6443 101% | 6453 101% | 6456 101% | 6228 104% | 6479 100% |
| Media total (Programa/Opciones) | 1% /
-2% | -15% /
-6% | -10% /
-3% | -18% /
-6% | -6% /
-29% |
* ... más pequeño es mejor
Dado que se cubre el 100% de sRGB, el 97,1% de DCI P3 y el 84,7% de AdobeRGB, nada se interpone en el camino de la edición de fotos y vídeo, que dependen de colores precisos. Ningún portátil de juego de nuestra comparativa puede siquiera acercarse a estas cifras con la excepción del espacio de color sRGB.
De fábrica, los colores y las escalas de grises ya están calibrados y, por tanto, no superan el límite DeltaE 3, hasta el cual el ojo humano puede detectar desviaciones de color. Nuestra calibración ha conseguido mejorar aún más estos valores sin una dominante de color visible. Nuestro perfil de color calibrado puede descargarse en https://notebookcheck.com/uploads/tx_nbc2/helios16_kal.icm.

Tiempos de respuesta del display
| ↔ Tiempo de respuesta de Negro a Blanco | ||
|---|---|---|
| 6.4 ms ... subida ↗ y bajada ↘ combinada | ↗ 2.2 ms subida | 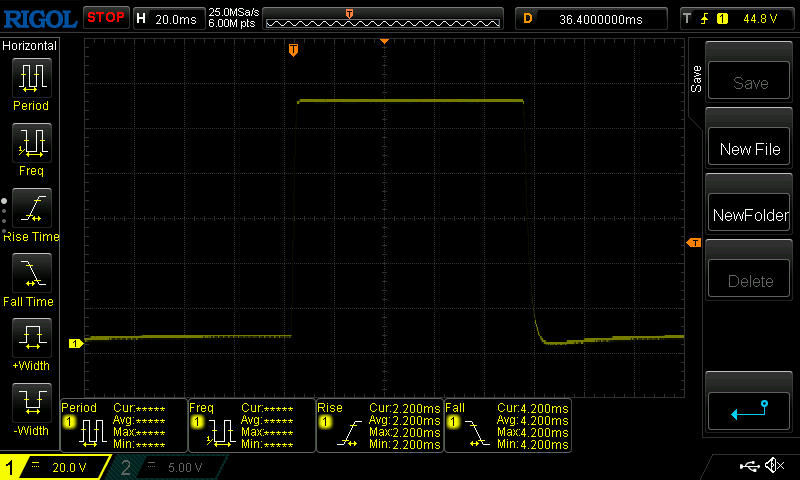 |
| ↘ 4.2 ms bajada | ||
| La pantalla mostró tiempos de respuesta muy rápidos en nuestros tests y debería ser adecuada para juegos frenéticos. En comparación, todos los dispositivos de prueba van de ##min### (mínimo) a 240 (máximo) ms. » 20 % de todos los dispositivos son mejores. Esto quiere decir que el tiempo de respuesta medido es mejor que la media (19.8 ms) de todos los dispositivos testados. | ||
| ↔ Tiempo de respuesta 50% Gris a 80% Gris | ||
| 13.6 ms ... subida ↗ y bajada ↘ combinada | ↗ 6.2 ms subida | 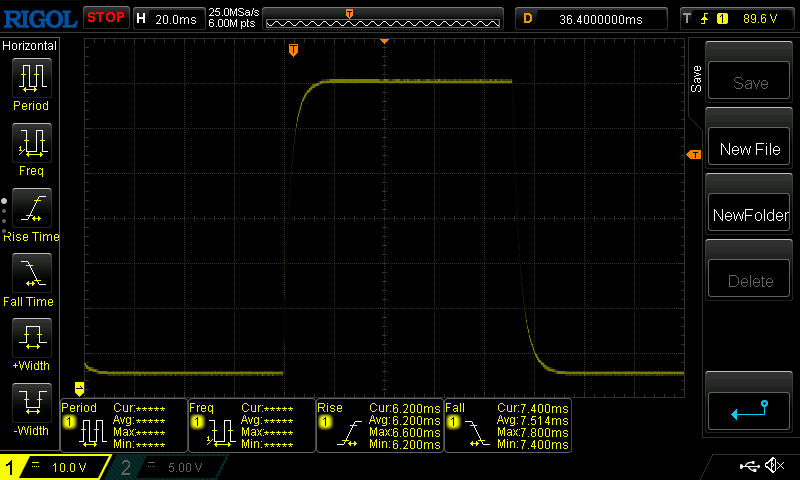 |
| ↘ 7.4 ms bajada | ||
| La pantalla mostró buenos tiempos de respuesta en nuestros tests pero podría ser demasiado lenta para los jugones competitivos. En comparación, todos los dispositivos de prueba van de ##min### (mínimo) a 636 (máximo) ms. » 27 % de todos los dispositivos son mejores. Esto quiere decir que el tiempo de respuesta medido es mejor que la media (31 ms) de todos los dispositivos testados. | ||
Parpadeo de Pantalla / PWM (Pulse-Width Modulation)
| Parpadeo de Pantalla / PWM no detectado | 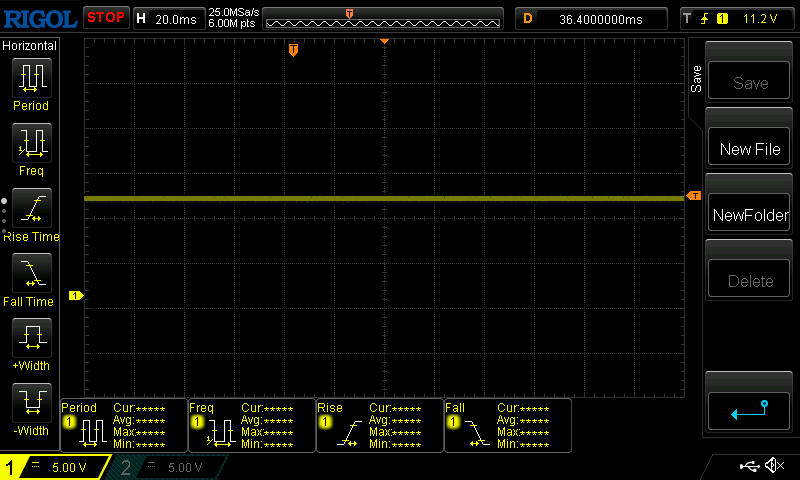 | ||
Comparación: 52 % de todos los dispositivos testados no usaron PWM para atenuar el display. Si se usó, medimos una media de 7757 (mínimo: 5 - máxmo: 343500) Hz. | |||
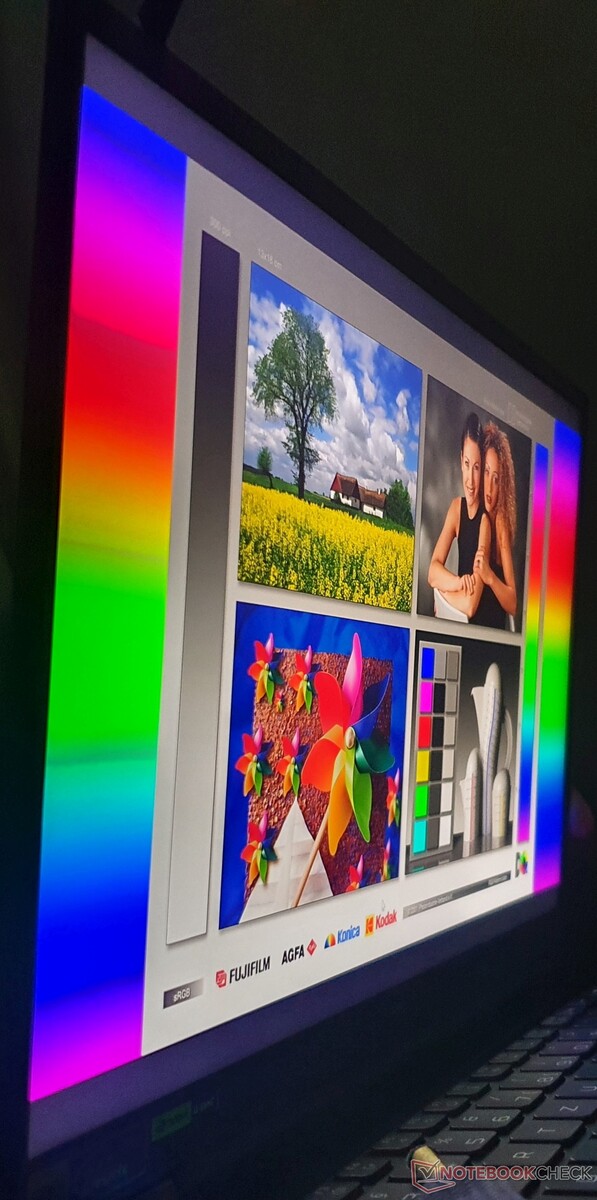
En exteriores, la pantalla es legible tanto a la sombra como en semisombra. A la luz directa del sol, ni siquiera una pantalla mate y 500 cd/m² ayudan siempre.


Típico de un panel IPS, los ángulos de visión son estables, desde arriba, desde abajo y también desde el lateral.
Rendimiento: La RTX 4060 ya alcanza su velocidad máxima de reloj a 100 vatios
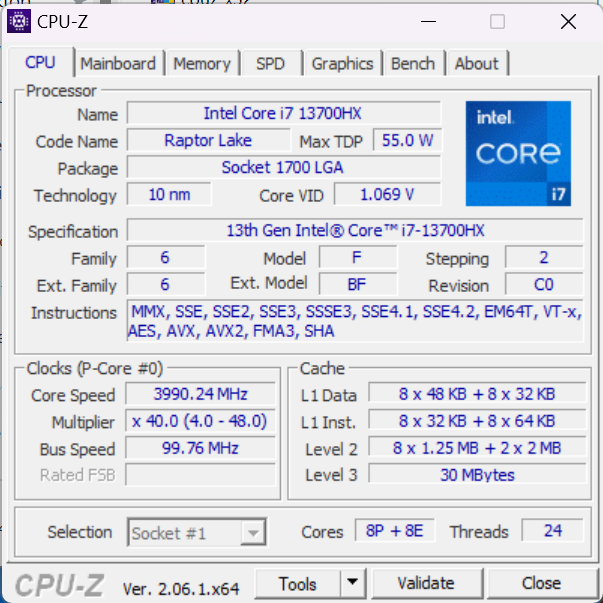
Nuestra configuración de prueba Acer Predator Helios 16 tiene un Intel Core i7-13700HX(8 núcleos P + 8 núcleos E), 16 GB de RAM DDR5 4800, una unidad SSD de 1 TB (PCIe 4.0) y una Nvidia GeForce RTX 4060con Max TGP (140 vatios). Otras SKU están disponibles con un Core i9-13900HX(8 núcleos P + 16 núcleos E), un procesadorRTX 4070 o RTX 4080.
El mercado objetivo del modelo de análisis son los jugones que no necesitan jugar a los juegos actuales ni a las tasas de frames más altas ni a la resolución QHD nativa del dispositivo. Otras aplicaciones gráficas como la edición de vídeo 4K o el renderizado 3D son fácilmente alcanzables con este modelo.
Condiciones de la prueba
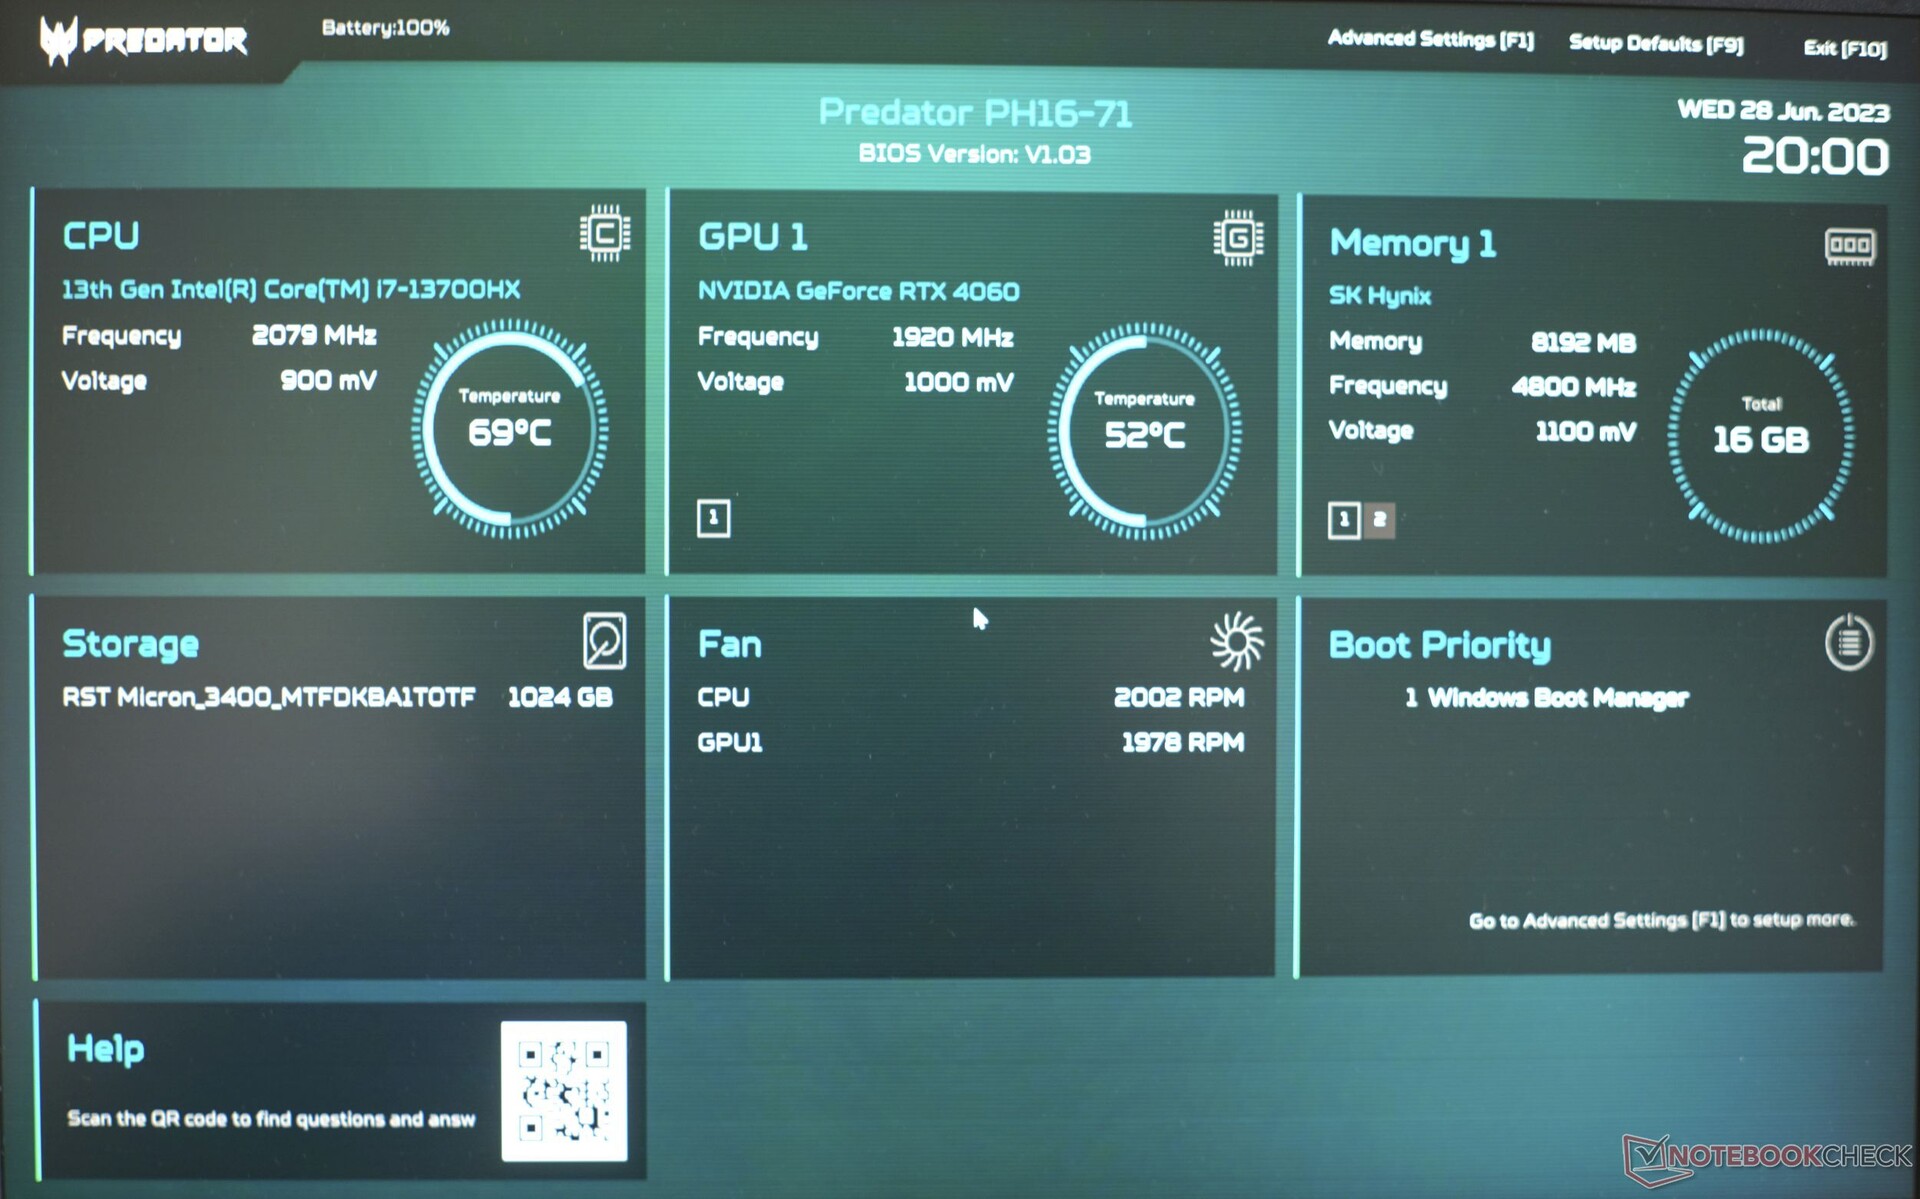
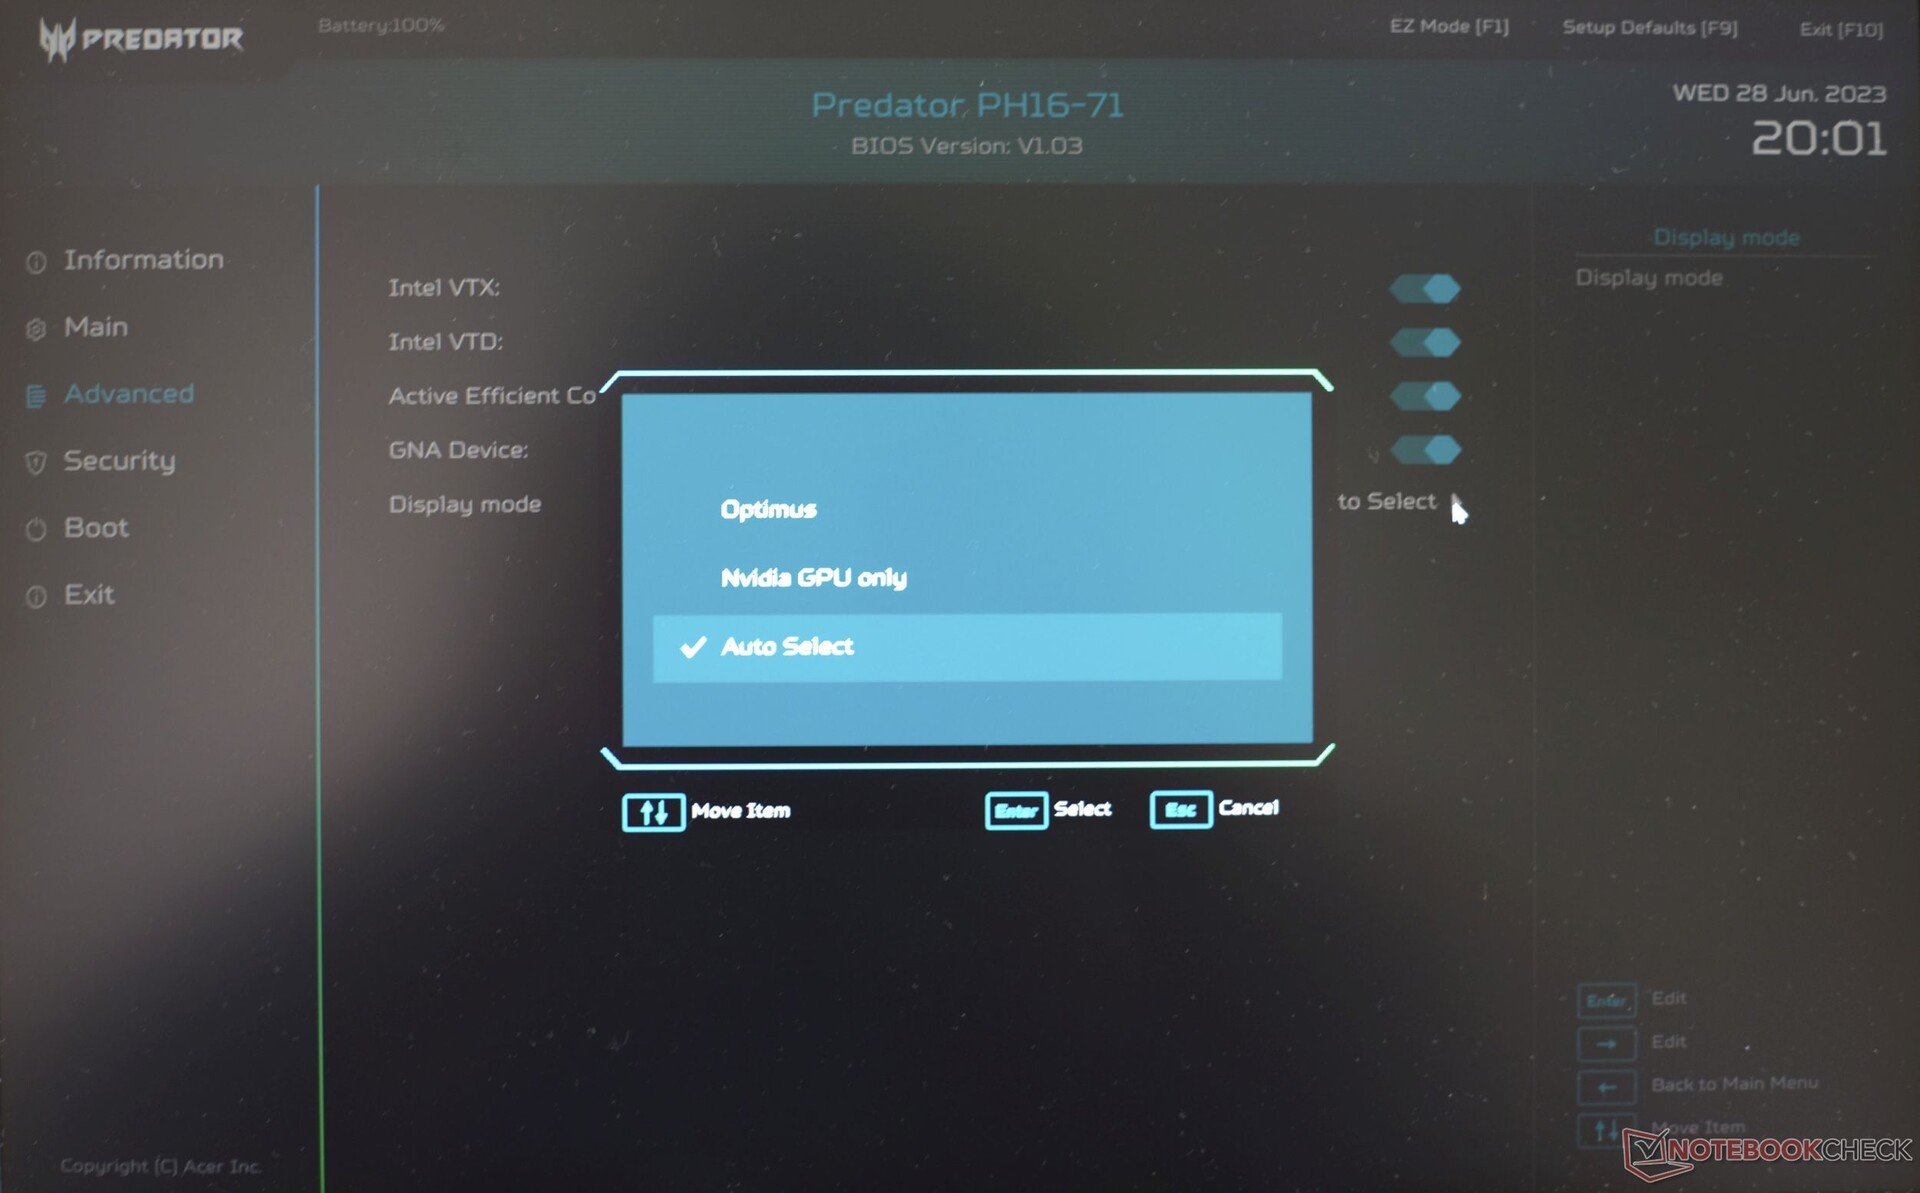
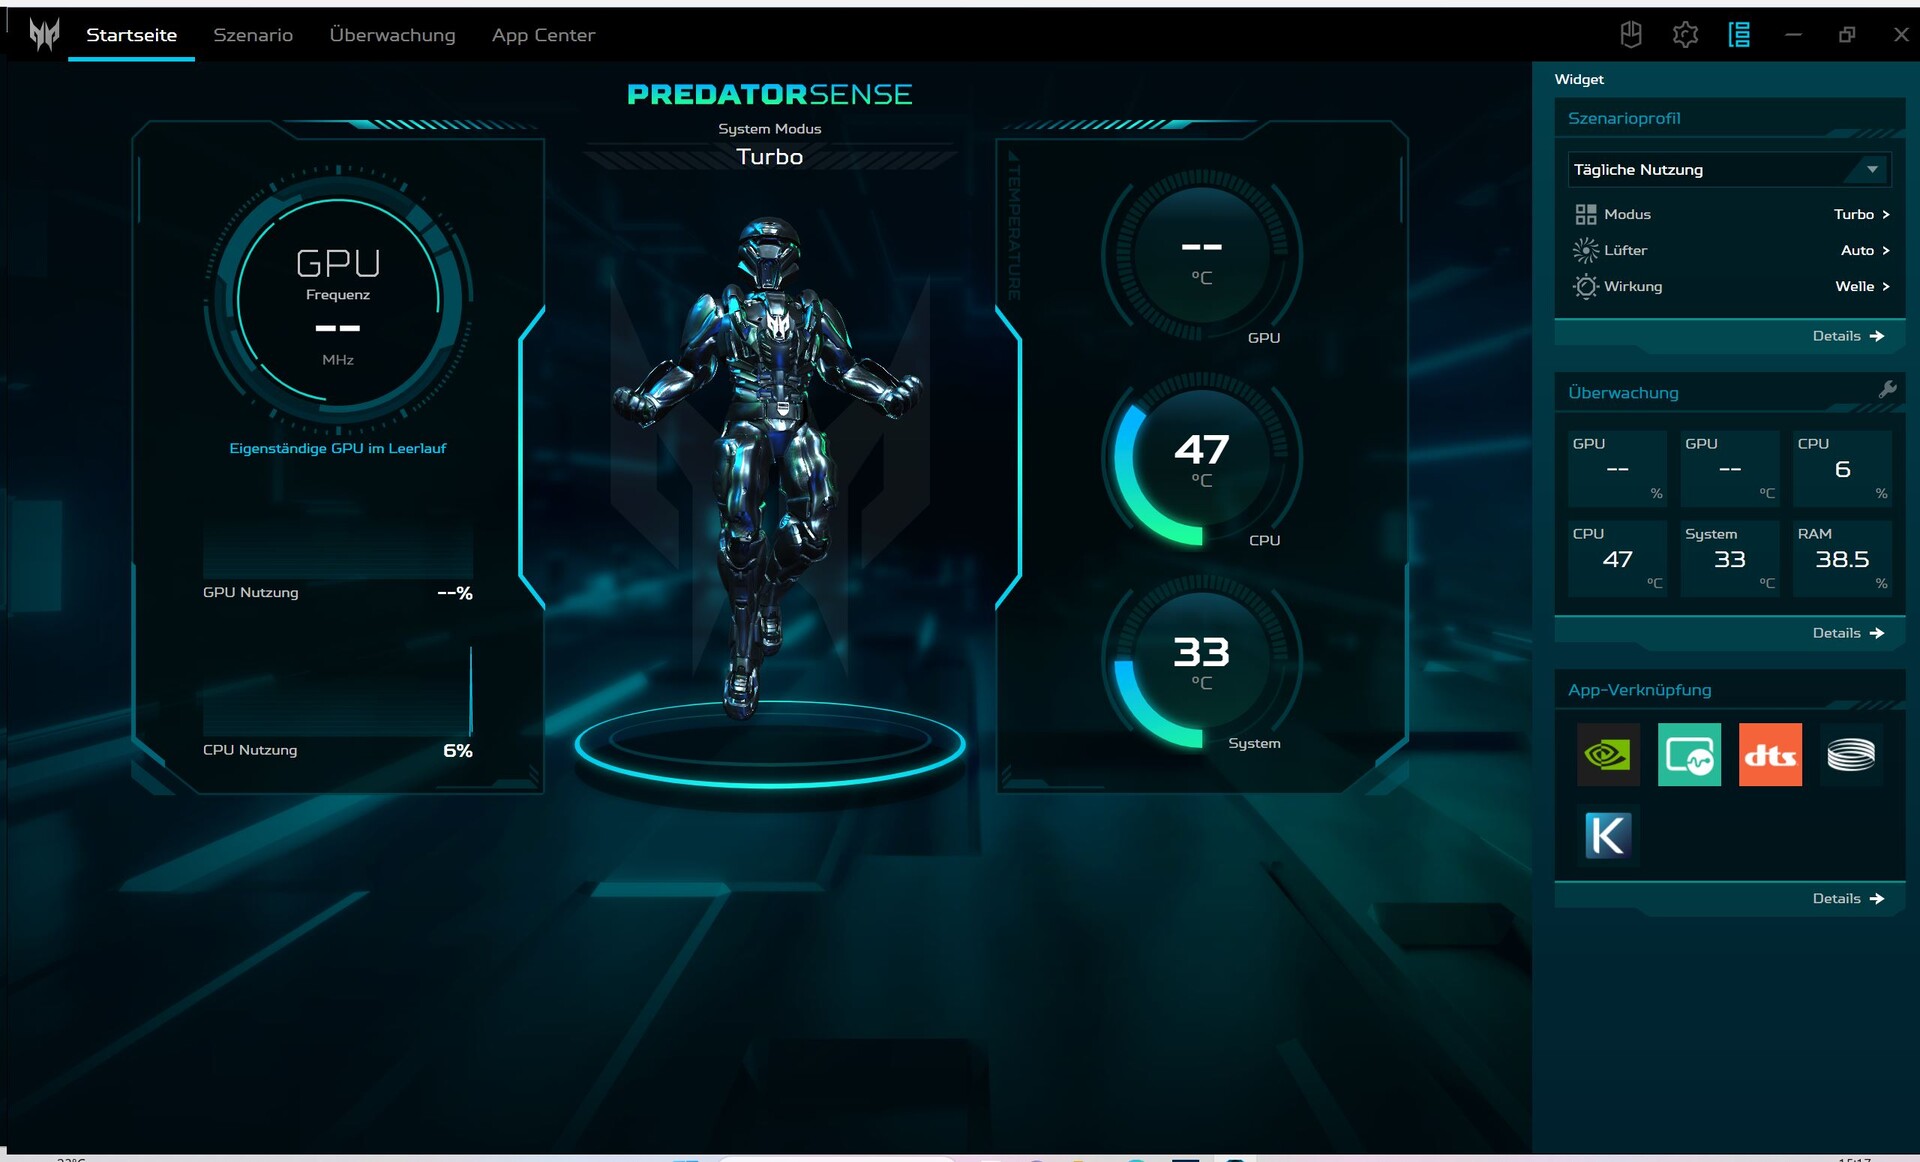
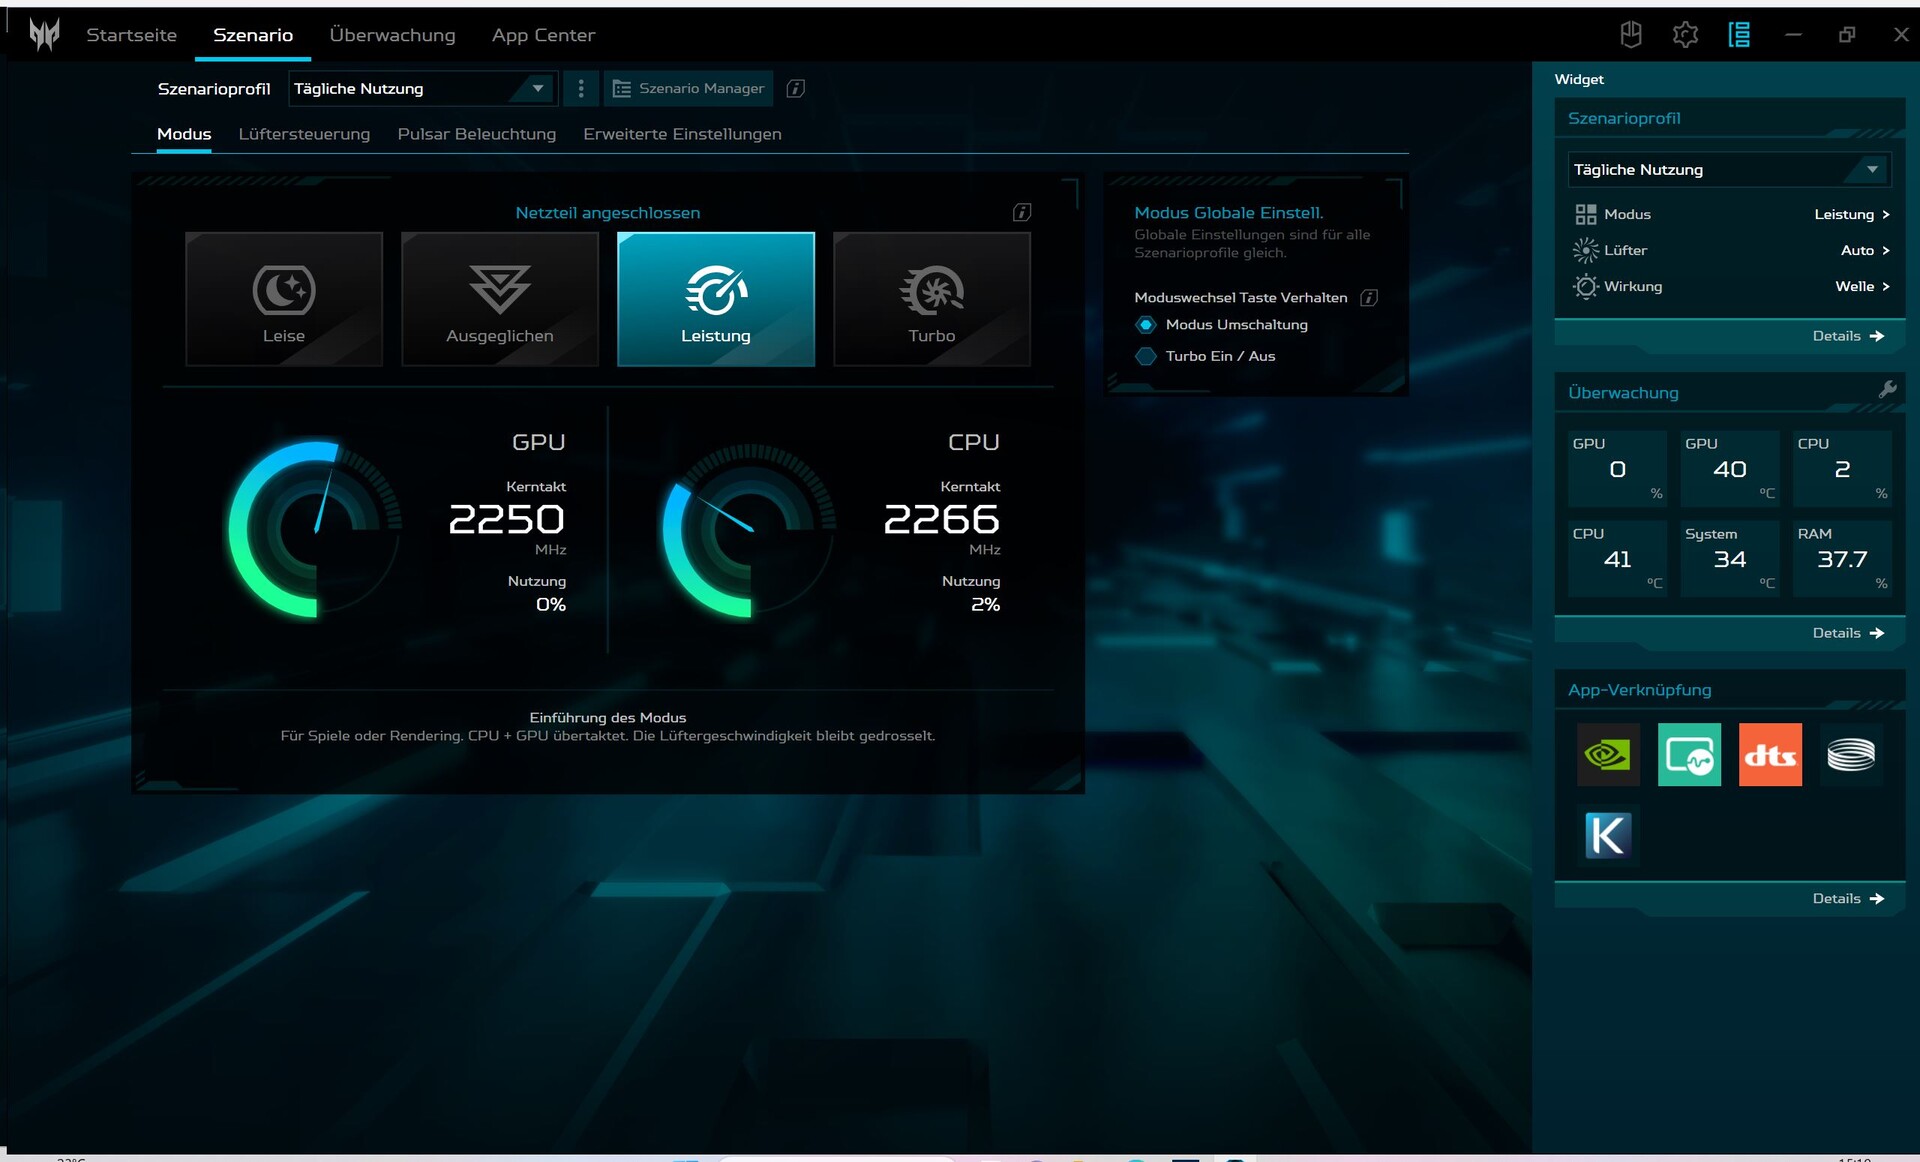
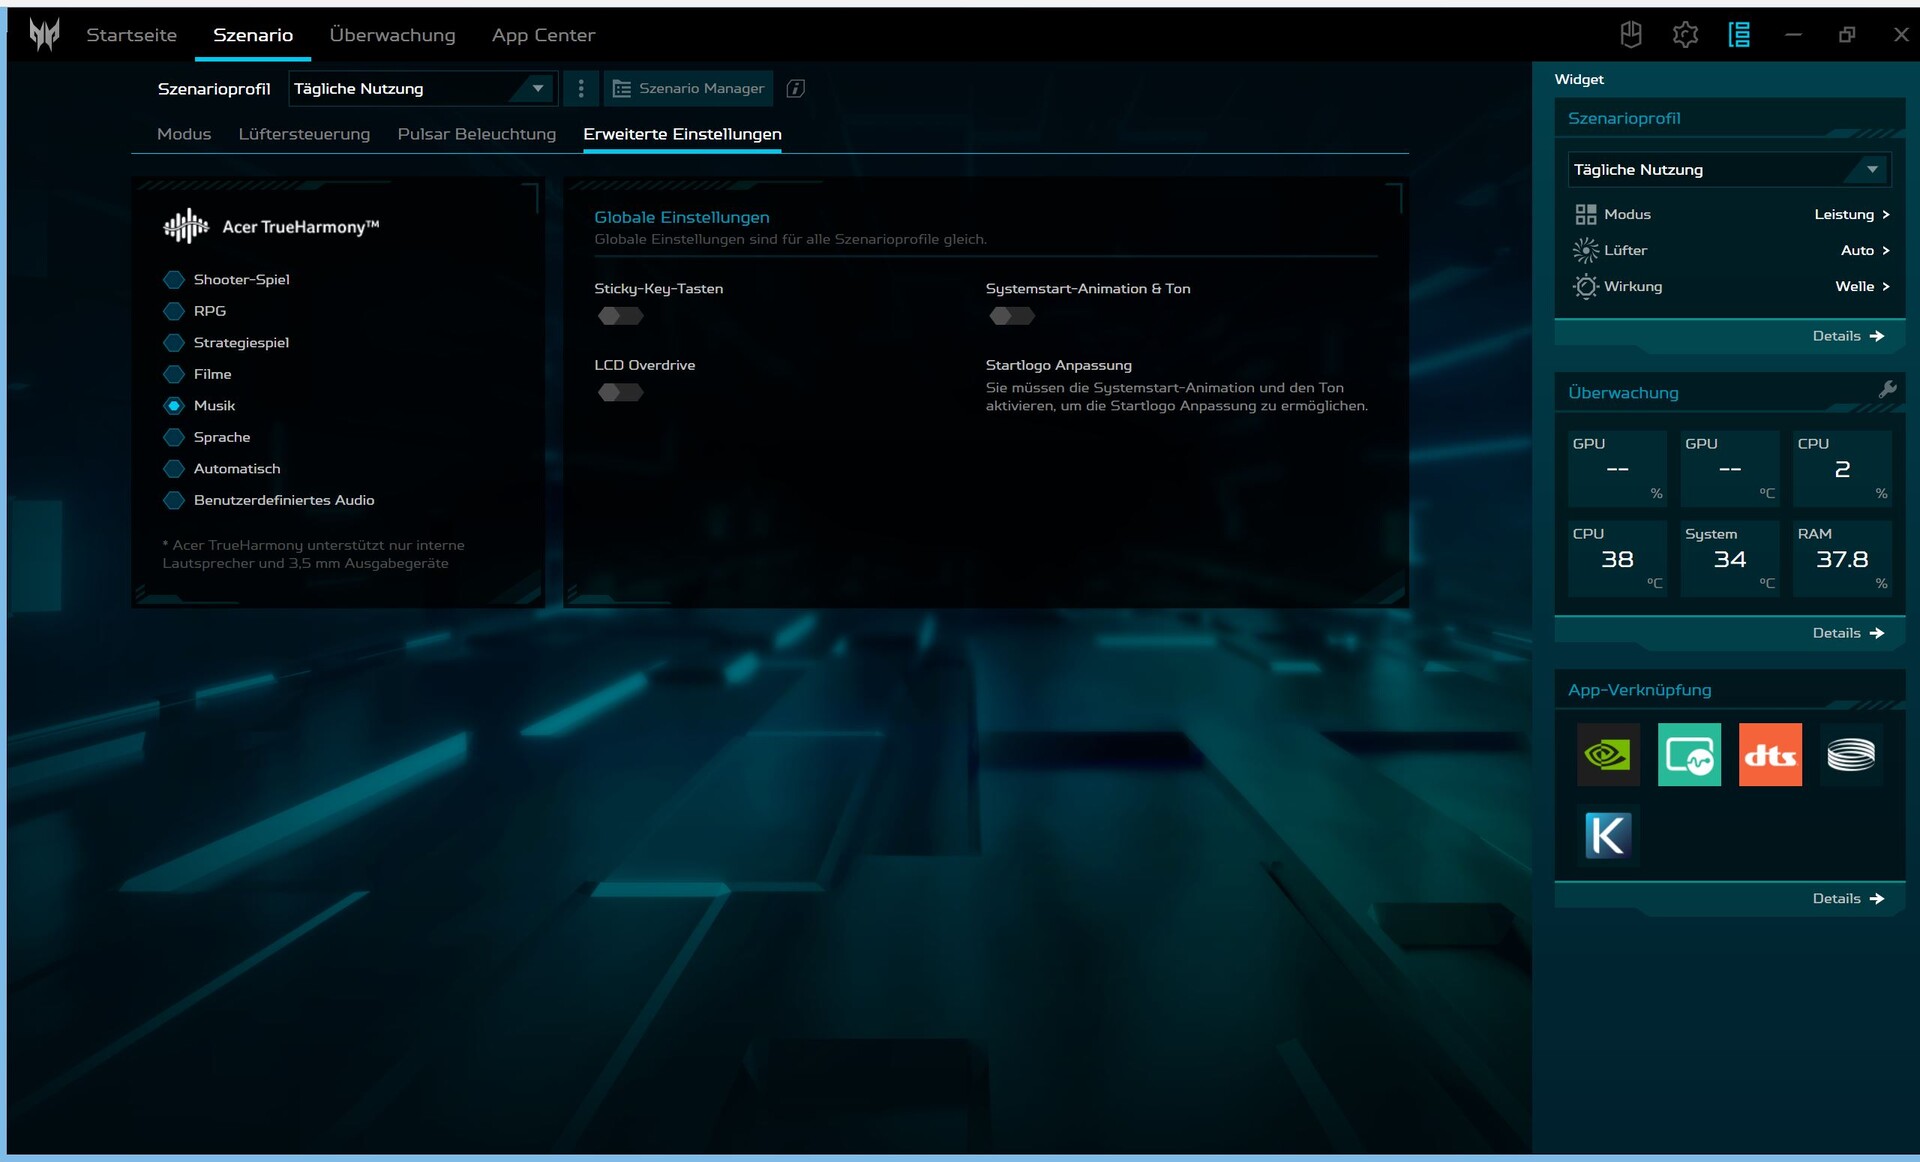
En el software del Centro de Control de Acer, "PredatorSense", hay cuatro modos de rendimiento disponibles que pueden seleccionarse alternativamente mediante el botón situado a la izquierda, encima del teclado. Realizamos nuestras pruebas de rendimiento utilizando el modo "Rendimiento". Al desenchufarlo de la corriente, se cambia automáticamente al modo "Equilibrado". El modo "Eco", que también está disponible aquí, reduce el brillo de la pantalla y se desactivan todas las formas de iluminación LED. Para poder controlar los modos de rendimiento, el Helios 16 tiene que estar cargado al 40 % como mínimo.
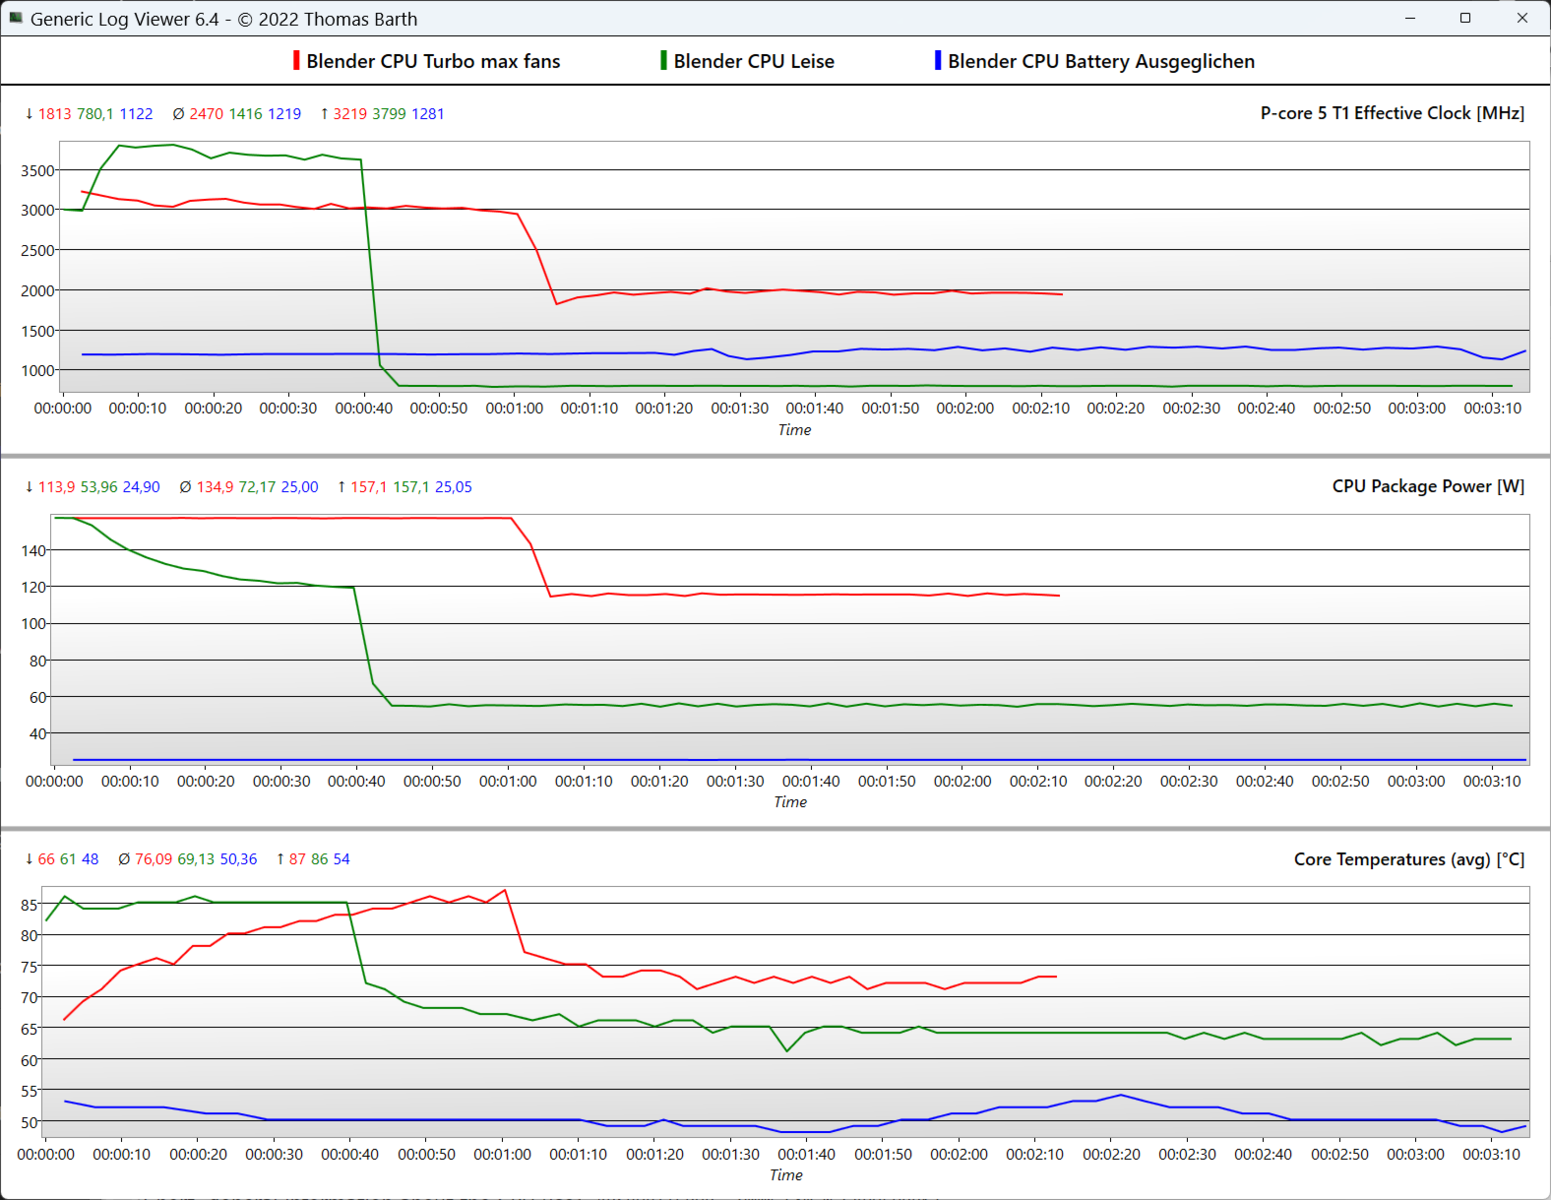
La tabla siguiente pone de relieve que se pierde muy poca potencia en el modo "Equilibrado" y que los ventiladores permanecen considerablemente más silenciosos, de hecho, casi agradablemente silenciosos. Por el contrario, el modo "Turbo" es insoportablemente ruidoso y, por tanto, sólo es útil para largas renderizaciones de vídeo o algo similar.
| Escenario | Turbo + Max ventiladores | Turbo | Rendimiento | Equilibrado | Silencioso | Batería |
|---|---|---|---|---|---|---|
| CPUPL2 | 157 W (1:05 min) | 157 W > 150 W (1 min) | 157 W > 140 W (~55 seg) | 157 W > 135 W (~55 seg) | 157 W > 120 W (~40 seg) | 25 W |
| CPU PL1 | 118 W | 115 W | 95 W | 85 W | 55 W | 25 W |
| GPU@Cyberpunk 2077 1.6 | 103 W | 100 W | 100 W | 90 W | 55 W | 37 W |
| GPU@FurMark | 138 W | 137 W | 130 W | 100 W | 60 W | 40 W |
| Rendimiento (Cyperpunk 2077 1.6 @FHD/Ultra) | 96.2fps | 95.5fps | 93.2fps | 87.4fps | 65.8fps | 30fps |
Procesador
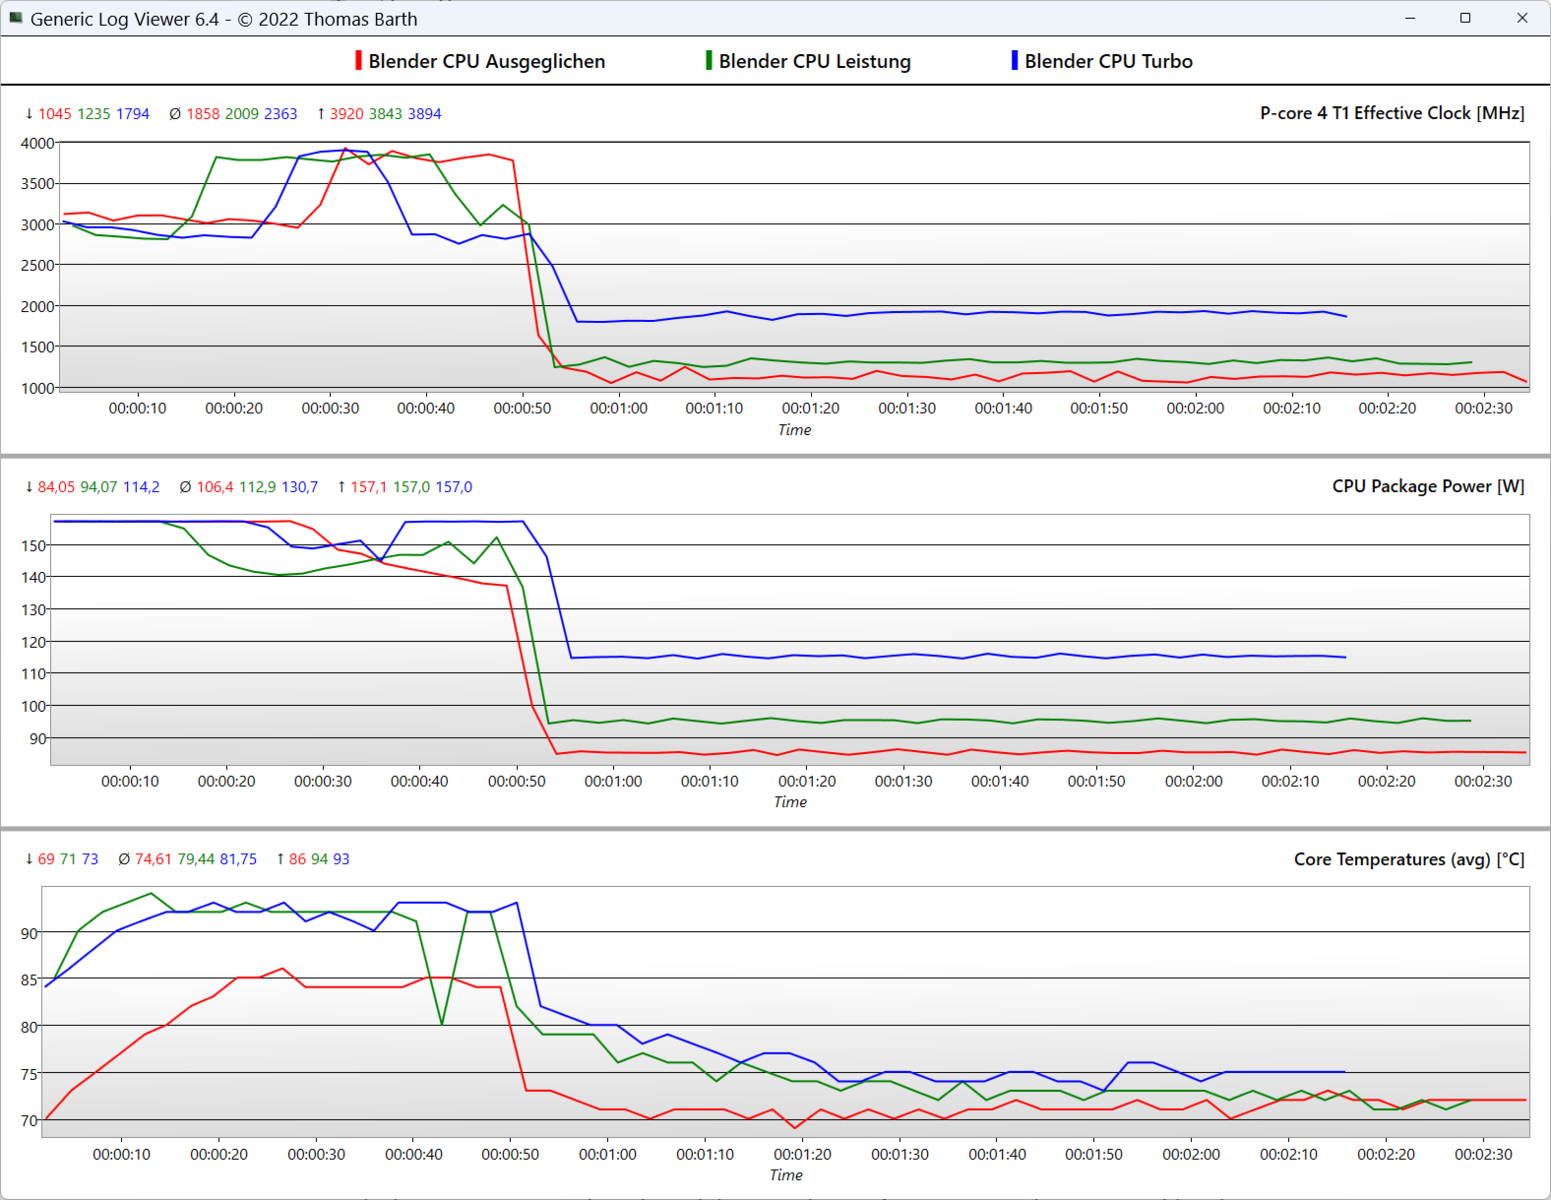
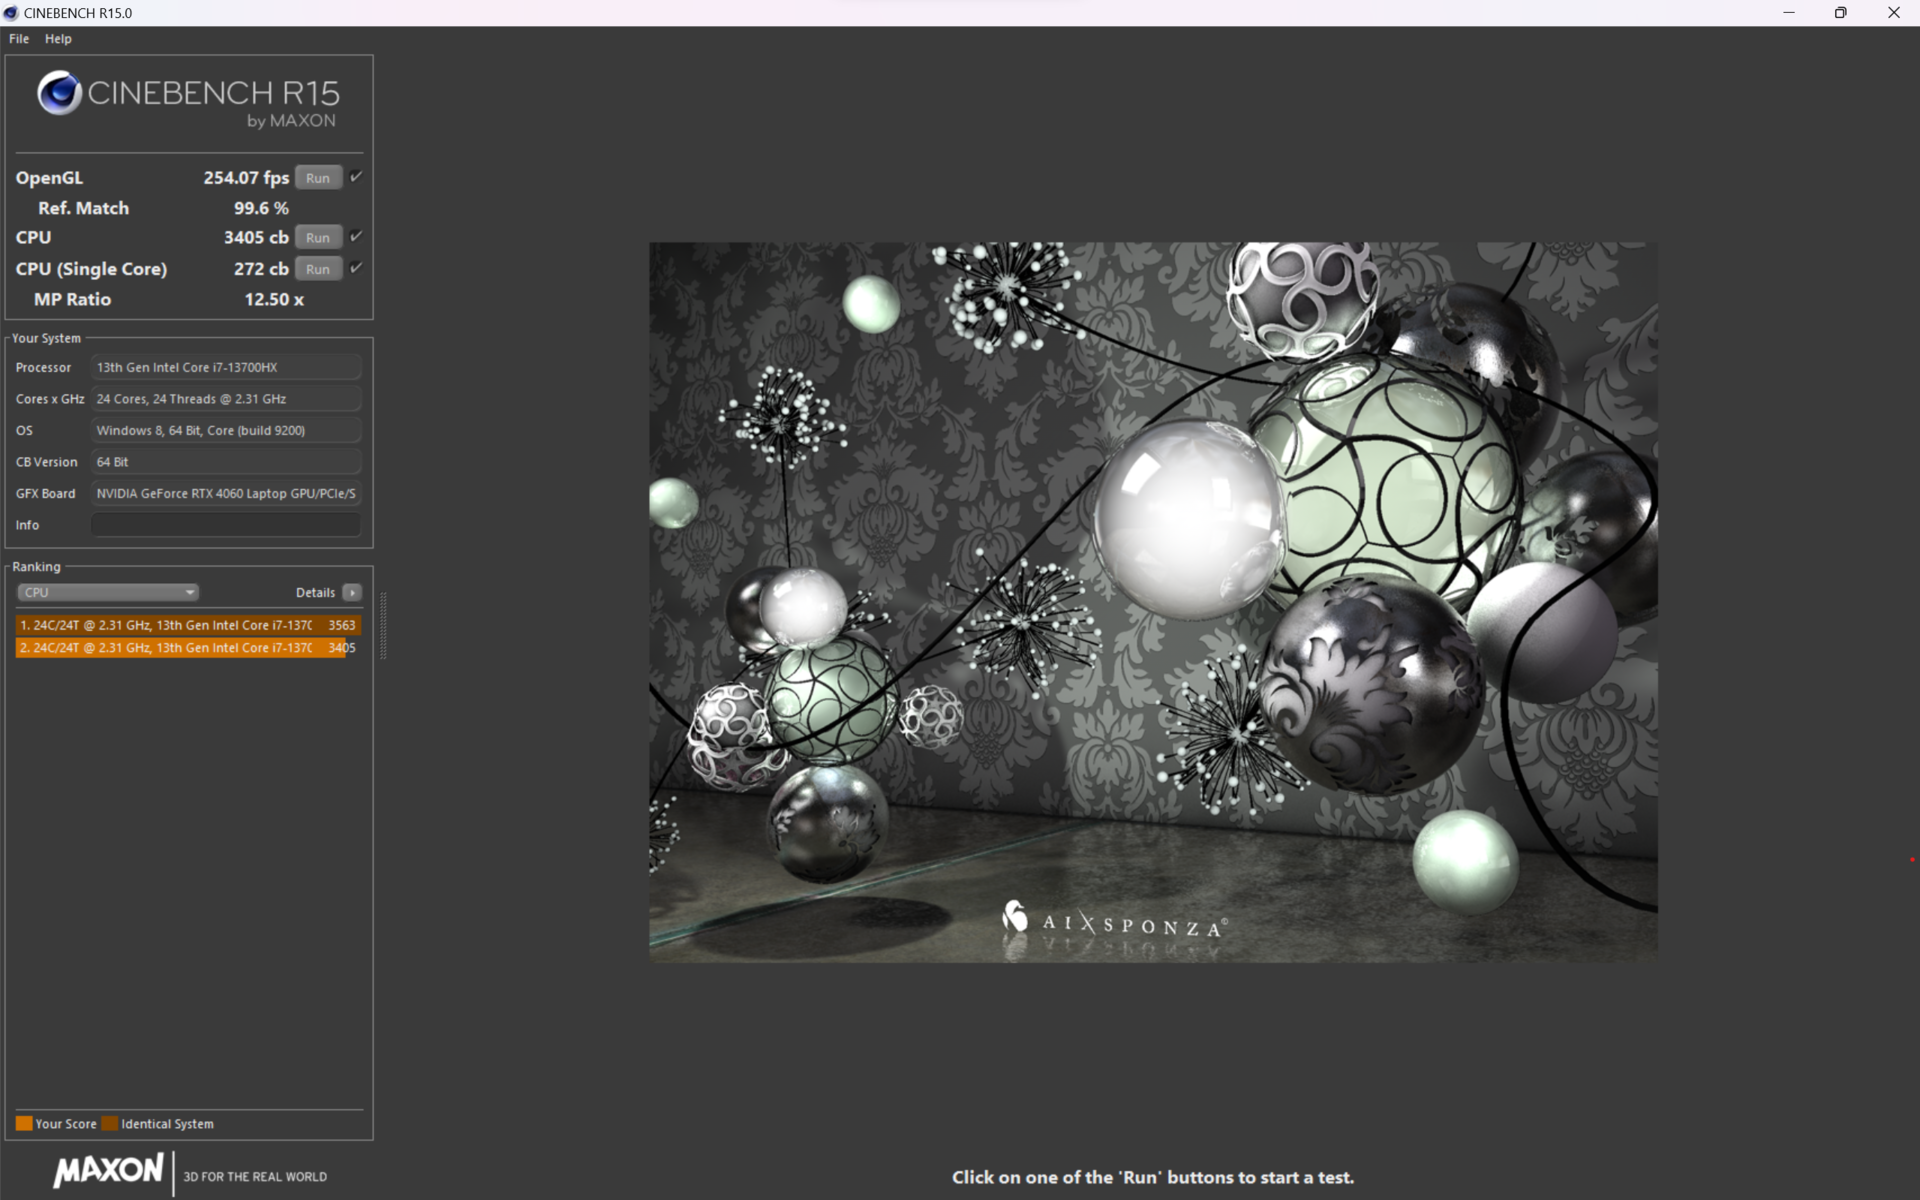
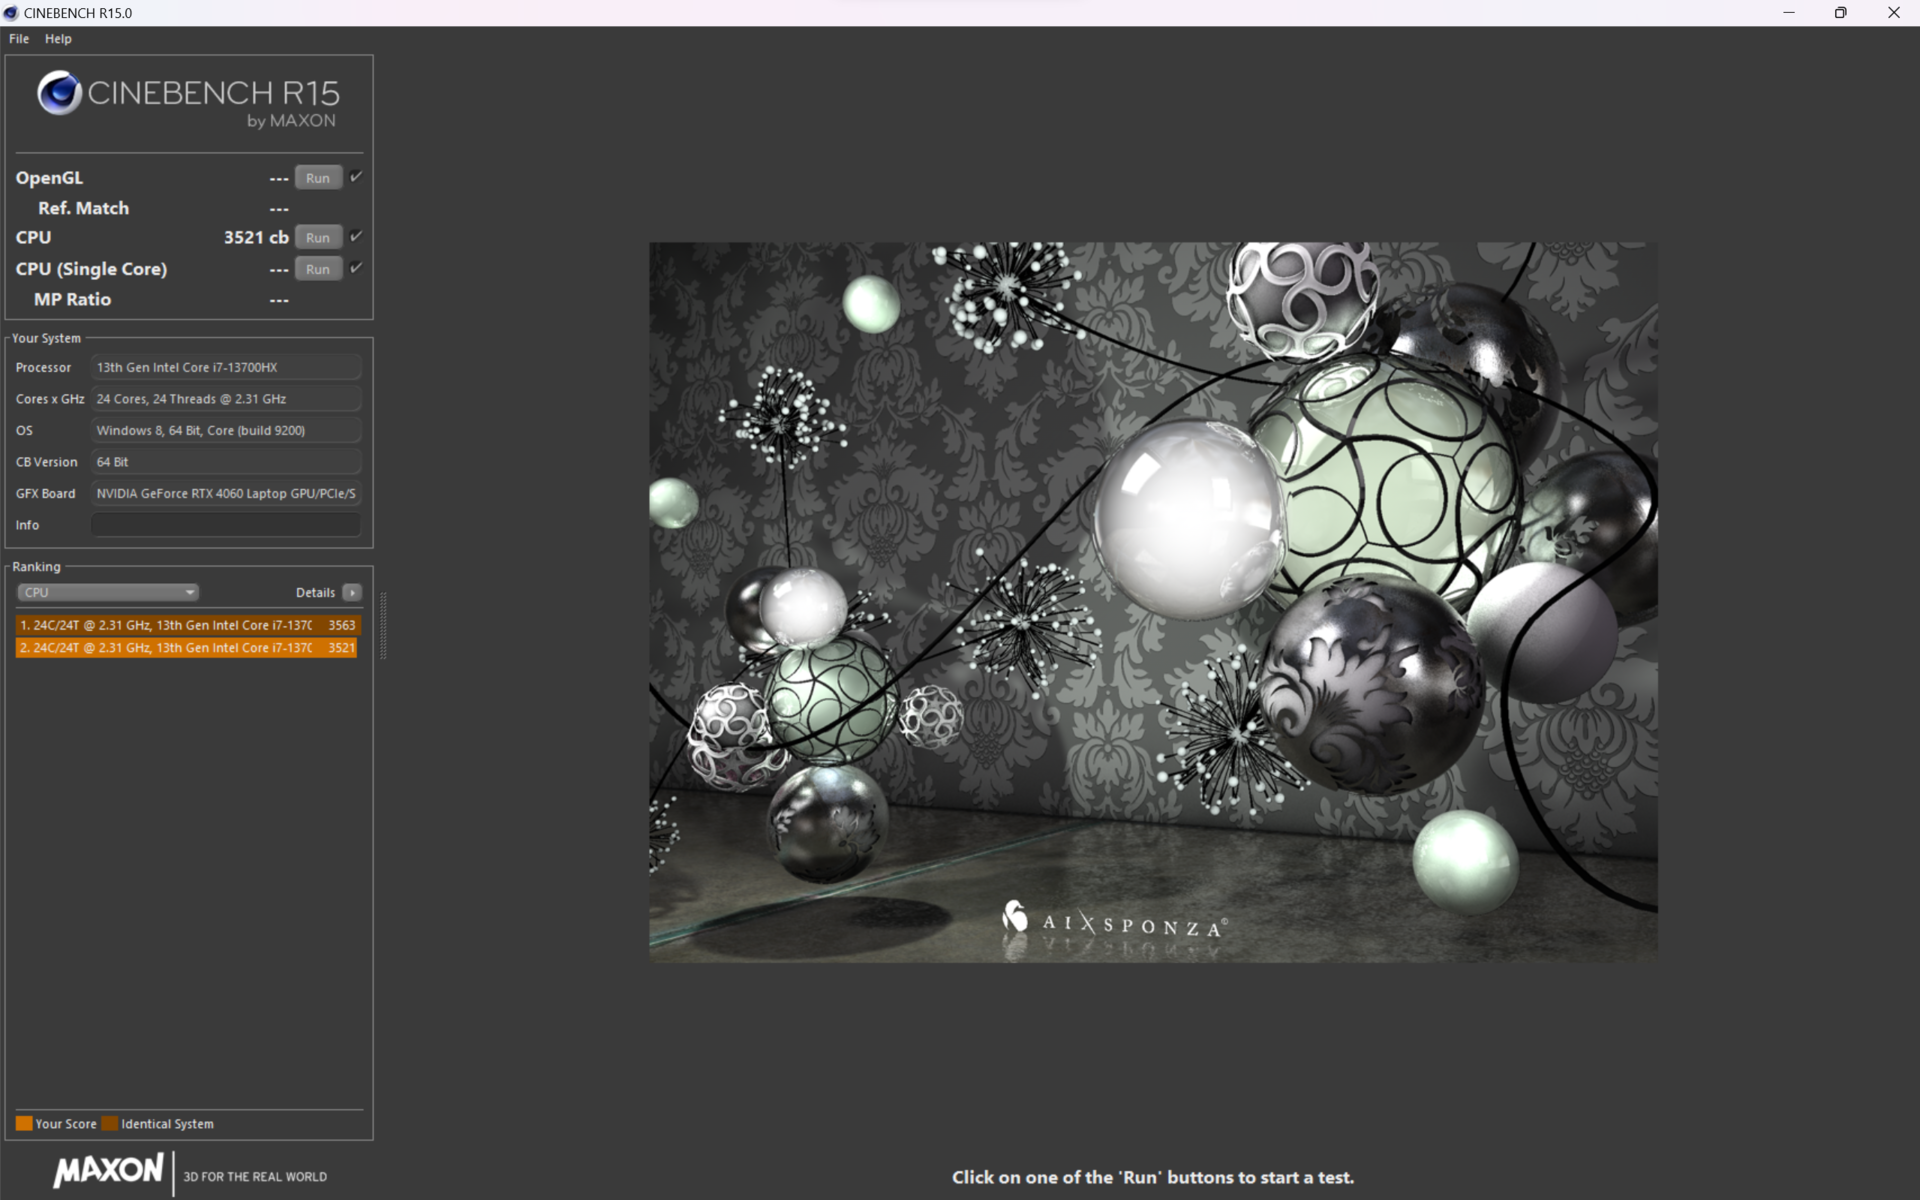
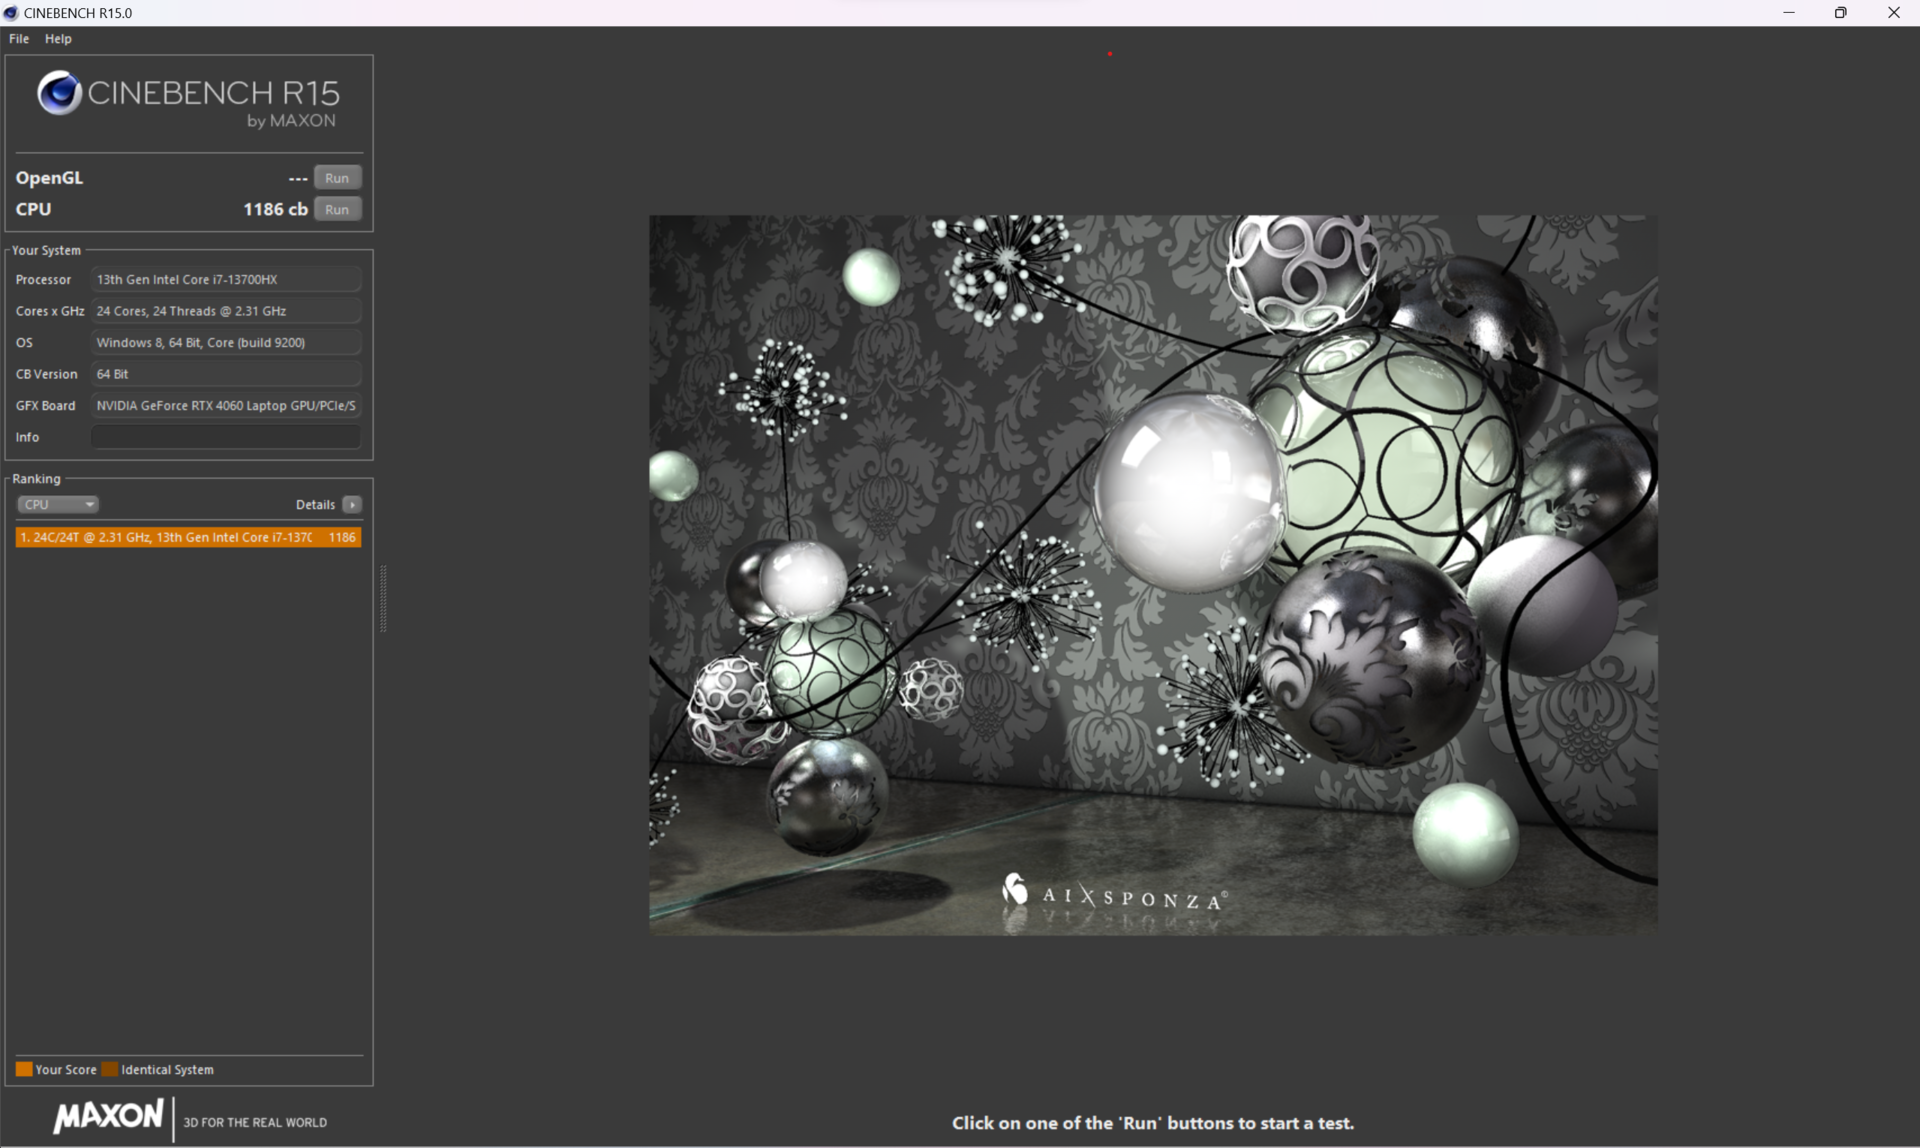
El Intel Core i7-13700HXposee 16 núcleos y 24 hilos (8 núcleos P + 8 núcleos E) así como un TDP de 55 vatios. El turbo de 4,5 GHz no se aprovecha al máximo y, en el primer minuto, los núcleos P se sitúan entre 3 GHz y 3,9 GHz para luego caer a 1,9 GHz (modo Turbo) y 1,3 GHz (modo Rendimiento), respectivamente.
El rendimiento multinúcleo corresponde al de sus competidores con la misma CPU. El 8-core AMD Ryzen 7 7735HS que se encuentra en el Acer Nitro 16 y el Asus TUF Gaming A16 queda claramente superado. A partir de la quinta ejecución de Cinebench R15, la ralentización se situó en ~15 % y pudo evitarse casi por completo activando el ruidoso modo "Turbo". El Core i9-13900HX disponible opcionalmente posee el doble de núcleos E y suele ser un ~33 % más rápido en tareas multi-core. En modo batería, las cosas pintan mal ya que el mísero límite TDP de 25w implica una caída de rendimiento de casi el 65 %.


Cinebench R15 Multi Continuous Test
Cinebench R23: Multi Core | Single Core
Cinebench R20: CPU (Multi Core) | CPU (Single Core)
Cinebench R15: CPU Multi 64Bit | CPU Single 64Bit
Blender: v2.79 BMW27 CPU
7-Zip 18.03: 7z b 4 | 7z b 4 -mmt1
Geekbench 5.5: Multi-Core | Single-Core
HWBOT x265 Benchmark v2.2: 4k Preset
LibreOffice : 20 Documents To PDF
R Benchmark 2.5: Overall mean
| CPU Performance rating | |
| Media de la clase Gaming | |
| Acer Predator Helios 16 PH16-71-731Q | |
| Asus ROG Zephyrus M16 GU604VY-NM042X | |
| Aorus 15X ASF | |
| Dell G15 5530 | |
| Medio Intel Core i7-13700HX | |
| Lenovo Legion Pro 5 16IRX8 | |
| Acer Predator Helios 300 (i7-12700H, RTX 3070 Ti) | |
| Acer Nitro 16 AN16-41 | |
| Asus TUF Gaming A16 FA617 | |
| Cinebench R23 / Multi Core | |
| Media de la clase Gaming (10488 - 42661, n=107, últimos 2 años) | |
| Acer Predator Helios 16 PH16-71-731Q | |
| Dell G15 5530 | |
| Medio Intel Core i7-13700HX (15558 - 22598, n=11) | |
| Aorus 15X ASF | |
| Lenovo Legion Pro 5 16IRX8 | |
| Asus ROG Zephyrus M16 GU604VY-NM042X | |
| Acer Predator Helios 300 (i7-12700H, RTX 3070 Ti) | |
| Acer Nitro 16 AN16-41 | |
| Asus TUF Gaming A16 FA617 | |
| Cinebench R23 / Single Core | |
| Media de la clase Gaming (1166 - 2415, n=107, últimos 2 años) | |
| Asus ROG Zephyrus M16 GU604VY-NM042X | |
| Acer Predator Helios 16 PH16-71-731Q | |
| Aorus 15X ASF | |
| Dell G15 5530 | |
| Medio Intel Core i7-13700HX (1666 - 1933, n=11) | |
| Acer Predator Helios 300 (i7-12700H, RTX 3070 Ti) | |
| Lenovo Legion Pro 5 16IRX8 | |
| Asus TUF Gaming A16 FA617 | |
| Acer Nitro 16 AN16-41 | |
| Cinebench R20 / CPU (Multi Core) | |
| Media de la clase Gaming (4029 - 16433, n=106, últimos 2 años) | |
| Acer Predator Helios 16 PH16-71-731Q | |
| Dell G15 5530 | |
| Aorus 15X ASF | |
| Medio Intel Core i7-13700HX (6160 - 8610, n=11) | |
| Asus ROG Zephyrus M16 GU604VY-NM042X | |
| Lenovo Legion Pro 5 16IRX8 | |
| Acer Predator Helios 300 (i7-12700H, RTX 3070 Ti) | |
| Acer Nitro 16 AN16-41 | |
| Asus TUF Gaming A16 FA617 | |
| Cinebench R20 / CPU (Single Core) | |
| Media de la clase Gaming (442 - 913, n=106, últimos 2 años) | |
| Asus ROG Zephyrus M16 GU604VY-NM042X | |
| Acer Predator Helios 16 PH16-71-731Q | |
| Aorus 15X ASF | |
| Dell G15 5530 | |
| Medio Intel Core i7-13700HX (644 - 740, n=11) | |
| Acer Predator Helios 300 (i7-12700H, RTX 3070 Ti) | |
| Lenovo Legion Pro 5 16IRX8 | |
| Asus TUF Gaming A16 FA617 | |
| Acer Nitro 16 AN16-41 | |
| Cinebench R15 / CPU Multi 64Bit | |
| Media de la clase Gaming (1578 - 6330, n=105, últimos 2 años) | |
| Aorus 15X ASF | |
| Acer Predator Helios 16 PH16-71-731Q | |
| Acer Predator Helios 16 PH16-71-731Q | |
| Lenovo Legion Pro 5 16IRX8 | |
| Medio Intel Core i7-13700HX (2548 - 3482, n=12) | |
| Dell G15 5530 | |
| Asus ROG Zephyrus M16 GU604VY-NM042X | |
| Acer Predator Helios 300 (i7-12700H, RTX 3070 Ti) | |
| Acer Nitro 16 AN16-41 | |
| Asus TUF Gaming A16 FA617 | |
| Cinebench R15 / CPU Single 64Bit | |
| Media de la clase Gaming (188.8 - 350, n=106, últimos 2 años) | |
| Asus ROG Zephyrus M16 GU604VY-NM042X | |
| Aorus 15X ASF | |
| Dell G15 5530 | |
| Acer Predator Helios 16 PH16-71-731Q | |
| Medio Intel Core i7-13700HX (243 - 279, n=11) | |
| Lenovo Legion Pro 5 16IRX8 | |
| Acer Predator Helios 300 (i7-12700H, RTX 3070 Ti) | |
| Asus TUF Gaming A16 FA617 | |
| Acer Nitro 16 AN16-41 | |
| Blender / v2.79 BMW27 CPU | |
| Asus TUF Gaming A16 FA617 | |
| Acer Nitro 16 AN16-41 | |
| Acer Predator Helios 300 (i7-12700H, RTX 3070 Ti) | |
| Aorus 15X ASF | |
| Asus ROG Zephyrus M16 GU604VY-NM042X | |
| Medio Intel Core i7-13700HX (138 - 207, n=10) | |
| Dell G15 5530 | |
| Acer Predator Helios 16 PH16-71-731Q | |
| Lenovo Legion Pro 5 16IRX8 | |
| Media de la clase Gaming (79 - 330, n=104, últimos 2 años) | |
| 7-Zip 18.03 / 7z b 4 | |
| Media de la clase Gaming (33491 - 148086, n=105, últimos 2 años) | |
| Acer Predator Helios 16 PH16-71-731Q | |
| Asus ROG Zephyrus M16 GU604VY-NM042X | |
| Lenovo Legion Pro 5 16IRX8 | |
| Dell G15 5530 | |
| Medio Intel Core i7-13700HX (58912 - 89294, n=11) | |
| Aorus 15X ASF | |
| Acer Predator Helios 300 (i7-12700H, RTX 3070 Ti) | |
| Asus TUF Gaming A16 FA617 | |
| Acer Nitro 16 AN16-41 | |
| 7-Zip 18.03 / 7z b 4 -mmt1 | |
| Media de la clase Gaming (4199 - 7436, n=105, últimos 2 años) | |
| Aorus 15X ASF | |
| Asus ROG Zephyrus M16 GU604VY-NM042X | |
| Acer Predator Helios 16 PH16-71-731Q | |
| Medio Intel Core i7-13700HX (5552 - 6409, n=11) | |
| Dell G15 5530 | |
| Asus TUF Gaming A16 FA617 | |
| Acer Predator Helios 300 (i7-12700H, RTX 3070 Ti) | |
| Lenovo Legion Pro 5 16IRX8 | |
| Acer Nitro 16 AN16-41 | |
| Geekbench 5.5 / Multi-Core | |
| Media de la clase Gaming (6460 - 28263, n=105, últimos 2 años) | |
| Acer Predator Helios 16 PH16-71-731Q | |
| Asus ROG Zephyrus M16 GU604VY-NM042X | |
| Aorus 15X ASF | |
| Lenovo Legion Pro 5 16IRX8 | |
| Dell G15 5530 | |
| Medio Intel Core i7-13700HX (10156 - 15850, n=12) | |
| Acer Predator Helios 300 (i7-12700H, RTX 3070 Ti) | |
| Asus TUF Gaming A16 FA617 | |
| Acer Nitro 16 AN16-41 | |
| Geekbench 5.5 / Single-Core | |
| Media de la clase Gaming (986 - 2474, n=105, últimos 2 años) | |
| Asus ROG Zephyrus M16 GU604VY-NM042X | |
| Acer Predator Helios 16 PH16-71-731Q | |
| Aorus 15X ASF | |
| Dell G15 5530 | |
| Medio Intel Core i7-13700HX (1666 - 1899, n=12) | |
| Lenovo Legion Pro 5 16IRX8 | |
| Acer Predator Helios 300 (i7-12700H, RTX 3070 Ti) | |
| Asus TUF Gaming A16 FA617 | |
| Acer Nitro 16 AN16-41 | |
| HWBOT x265 Benchmark v2.2 / 4k Preset | |
| Media de la clase Gaming (11.5 - 44.4, n=105, últimos 2 años) | |
| Lenovo Legion Pro 5 16IRX8 | |
| Acer Predator Helios 16 PH16-71-731Q | |
| Dell G15 5530 | |
| Medio Intel Core i7-13700HX (17.1 - 25.5, n=11) | |
| Asus ROG Zephyrus M16 GU604VY-NM042X | |
| Aorus 15X ASF | |
| Asus TUF Gaming A16 FA617 | |
| Acer Nitro 16 AN16-41 | |
| Acer Predator Helios 300 (i7-12700H, RTX 3070 Ti) | |
| LibreOffice / 20 Documents To PDF | |
| Acer Predator Helios 300 (i7-12700H, RTX 3070 Ti) | |
| Asus TUF Gaming A16 FA617 | |
| Acer Nitro 16 AN16-41 | |
| Asus ROG Zephyrus M16 GU604VY-NM042X | |
| Media de la clase Gaming (33.2 - 88.8, n=105, últimos 2 años) | |
| Dell G15 5530 | |
| Medio Intel Core i7-13700HX (36.5 - 52.9, n=11) | |
| Aorus 15X ASF | |
| Acer Predator Helios 16 PH16-71-731Q | |
| Lenovo Legion Pro 5 16IRX8 | |
| R Benchmark 2.5 / Overall mean | |
| Asus TUF Gaming A16 FA617 | |
| Acer Nitro 16 AN16-41 | |
| Lenovo Legion Pro 5 16IRX8 | |
| Medio Intel Core i7-13700HX (0.4274 - 0.513, n=11) | |
| Acer Predator Helios 300 (i7-12700H, RTX 3070 Ti) | |
| Aorus 15X ASF | |
| Media de la clase Gaming (0.3439 - 0.759, n=106, últimos 2 años) | |
| Acer Predator Helios 16 PH16-71-731Q | |
| Dell G15 5530 | |
| Asus ROG Zephyrus M16 GU604VY-NM042X | |
* ... más pequeño es mejor
AIDA64: FP32 Ray-Trace | FPU Julia | CPU SHA3 | CPU Queen | FPU SinJulia | FPU Mandel | CPU AES | CPU ZLib | FP64 Ray-Trace | CPU PhotoWorxx
| Performance rating | |
| Media de la clase Gaming | |
| Acer Predator Helios 16 PH16-71-731Q | |
| Lenovo Legion Pro 5 16IRX8 | |
| Medio Intel Core i7-13700HX | |
| Aorus 15X ASF | |
| Dell G15 5530 | |
| Acer Nitro 16 AN16-41 | |
| Asus TUF Gaming A16 FA617 | |
| AIDA64 / FP32 Ray-Trace | |
| Media de la clase Gaming (10227 - 85542, n=105, últimos 2 años) | |
| Lenovo Legion Pro 5 16IRX8 | |
| Acer Predator Helios 16 PH16-71-731Q | |
| Medio Intel Core i7-13700HX (14261 - 21999, n=11) | |
| Dell G15 5530 | |
| Aorus 15X ASF | |
| Acer Nitro 16 AN16-41 | |
| Asus TUF Gaming A16 FA617 | |
| AIDA64 / FPU Julia | |
| Media de la clase Gaming (51376 - 238426, n=105, últimos 2 años) | |
| Acer Nitro 16 AN16-41 | |
| Lenovo Legion Pro 5 16IRX8 | |
| Asus TUF Gaming A16 FA617 | |
| Acer Predator Helios 16 PH16-71-731Q | |
| Medio Intel Core i7-13700HX (74636 - 109364, n=11) | |
| Dell G15 5530 | |
| Aorus 15X ASF | |
| AIDA64 / CPU SHA3 | |
| Media de la clase Gaming (2180 - 10115, n=105, últimos 2 años) | |
| Lenovo Legion Pro 5 16IRX8 | |
| Acer Predator Helios 16 PH16-71-731Q | |
| Dell G15 5530 | |
| Medio Intel Core i7-13700HX (3359 - 5053, n=11) | |
| Aorus 15X ASF | |
| Asus TUF Gaming A16 FA617 | |
| Acer Nitro 16 AN16-41 | |
| AIDA64 / CPU Queen | |
| Media de la clase Gaming (49785 - 173351, n=90, últimos 2 años) | |
| Acer Predator Helios 16 PH16-71-731Q | |
| Lenovo Legion Pro 5 16IRX8 | |
| Aorus 15X ASF | |
| Medio Intel Core i7-13700HX (86532 - 114717, n=11) | |
| Acer Nitro 16 AN16-41 | |
| Dell G15 5530 | |
| Asus TUF Gaming A16 FA617 | |
| AIDA64 / FPU SinJulia | |
| Media de la clase Gaming (4424 - 33636, n=105, últimos 2 años) | |
| Lenovo Legion Pro 5 16IRX8 | |
| Acer Nitro 16 AN16-41 | |
| Acer Predator Helios 16 PH16-71-731Q | |
| Asus TUF Gaming A16 FA617 | |
| Medio Intel Core i7-13700HX (9290 - 13519, n=11) | |
| Aorus 15X ASF | |
| Dell G15 5530 | |
| AIDA64 / FPU Mandel | |
| Media de la clase Gaming (25115 - 128721, n=105, últimos 2 años) | |
| Acer Nitro 16 AN16-41 | |
| Asus TUF Gaming A16 FA617 | |
| Lenovo Legion Pro 5 16IRX8 | |
| Acer Predator Helios 16 PH16-71-731Q | |
| Medio Intel Core i7-13700HX (35751 - 53484, n=11) | |
| Dell G15 5530 | |
| Aorus 15X ASF | |
| AIDA64 / CPU AES | |
| Acer Predator Helios 16 PH16-71-731Q | |
| Aorus 15X ASF | |
| Medio Intel Core i7-13700HX (67846 - 182575, n=11) | |
| Media de la clase Gaming (39258 - 247074, n=105, últimos 2 años) | |
| Lenovo Legion Pro 5 16IRX8 | |
| Dell G15 5530 | |
| Asus TUF Gaming A16 FA617 | |
| Acer Nitro 16 AN16-41 | |
| AIDA64 / CPU ZLib | |
| Media de la clase Gaming (574 - 2531, n=105, últimos 2 años) | |
| Acer Predator Helios 16 PH16-71-731Q | |
| Lenovo Legion Pro 5 16IRX8 | |
| Dell G15 5530 | |
| Medio Intel Core i7-13700HX (981 - 1451, n=11) | |
| Aorus 15X ASF | |
| Acer Nitro 16 AN16-41 | |
| Asus TUF Gaming A16 FA617 | |
| AIDA64 / FP64 Ray-Trace | |
| Media de la clase Gaming (5509 - 45446, n=105, últimos 2 años) | |
| Lenovo Legion Pro 5 16IRX8 | |
| Acer Predator Helios 16 PH16-71-731Q | |
| Medio Intel Core i7-13700HX (7728 - 11837, n=11) | |
| Dell G15 5530 | |
| Aorus 15X ASF | |
| Acer Nitro 16 AN16-41 | |
| Asus TUF Gaming A16 FA617 | |
| AIDA64 / CPU PhotoWorxx | |
| Media de la clase Gaming (12271 - 89891, n=105, últimos 2 años) | |
| Dell G15 5530 | |
| Lenovo Legion Pro 5 16IRX8 | |
| Acer Predator Helios 16 PH16-71-731Q | |
| Aorus 15X ASF | |
| Medio Intel Core i7-13700HX (19678 - 42415, n=11) | |
| Asus TUF Gaming A16 FA617 | |
| Acer Nitro 16 AN16-41 | |
Rendimiento del sistema
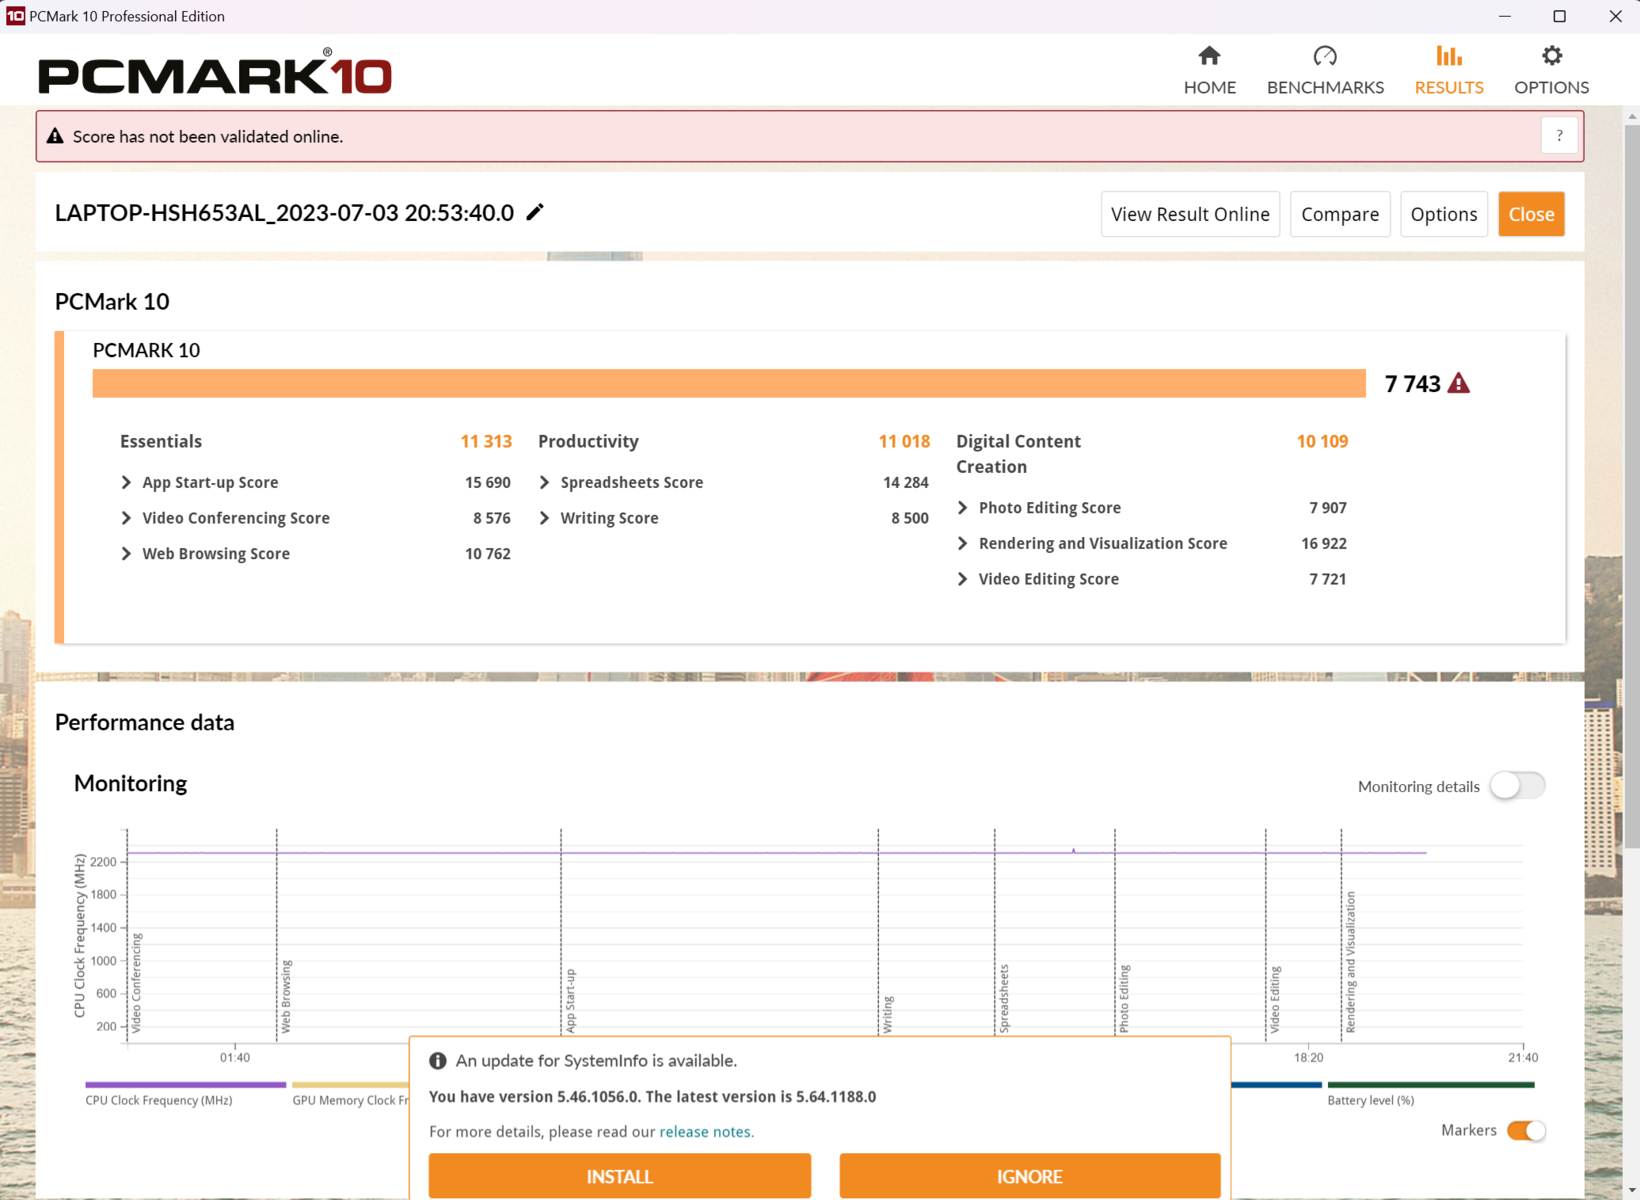
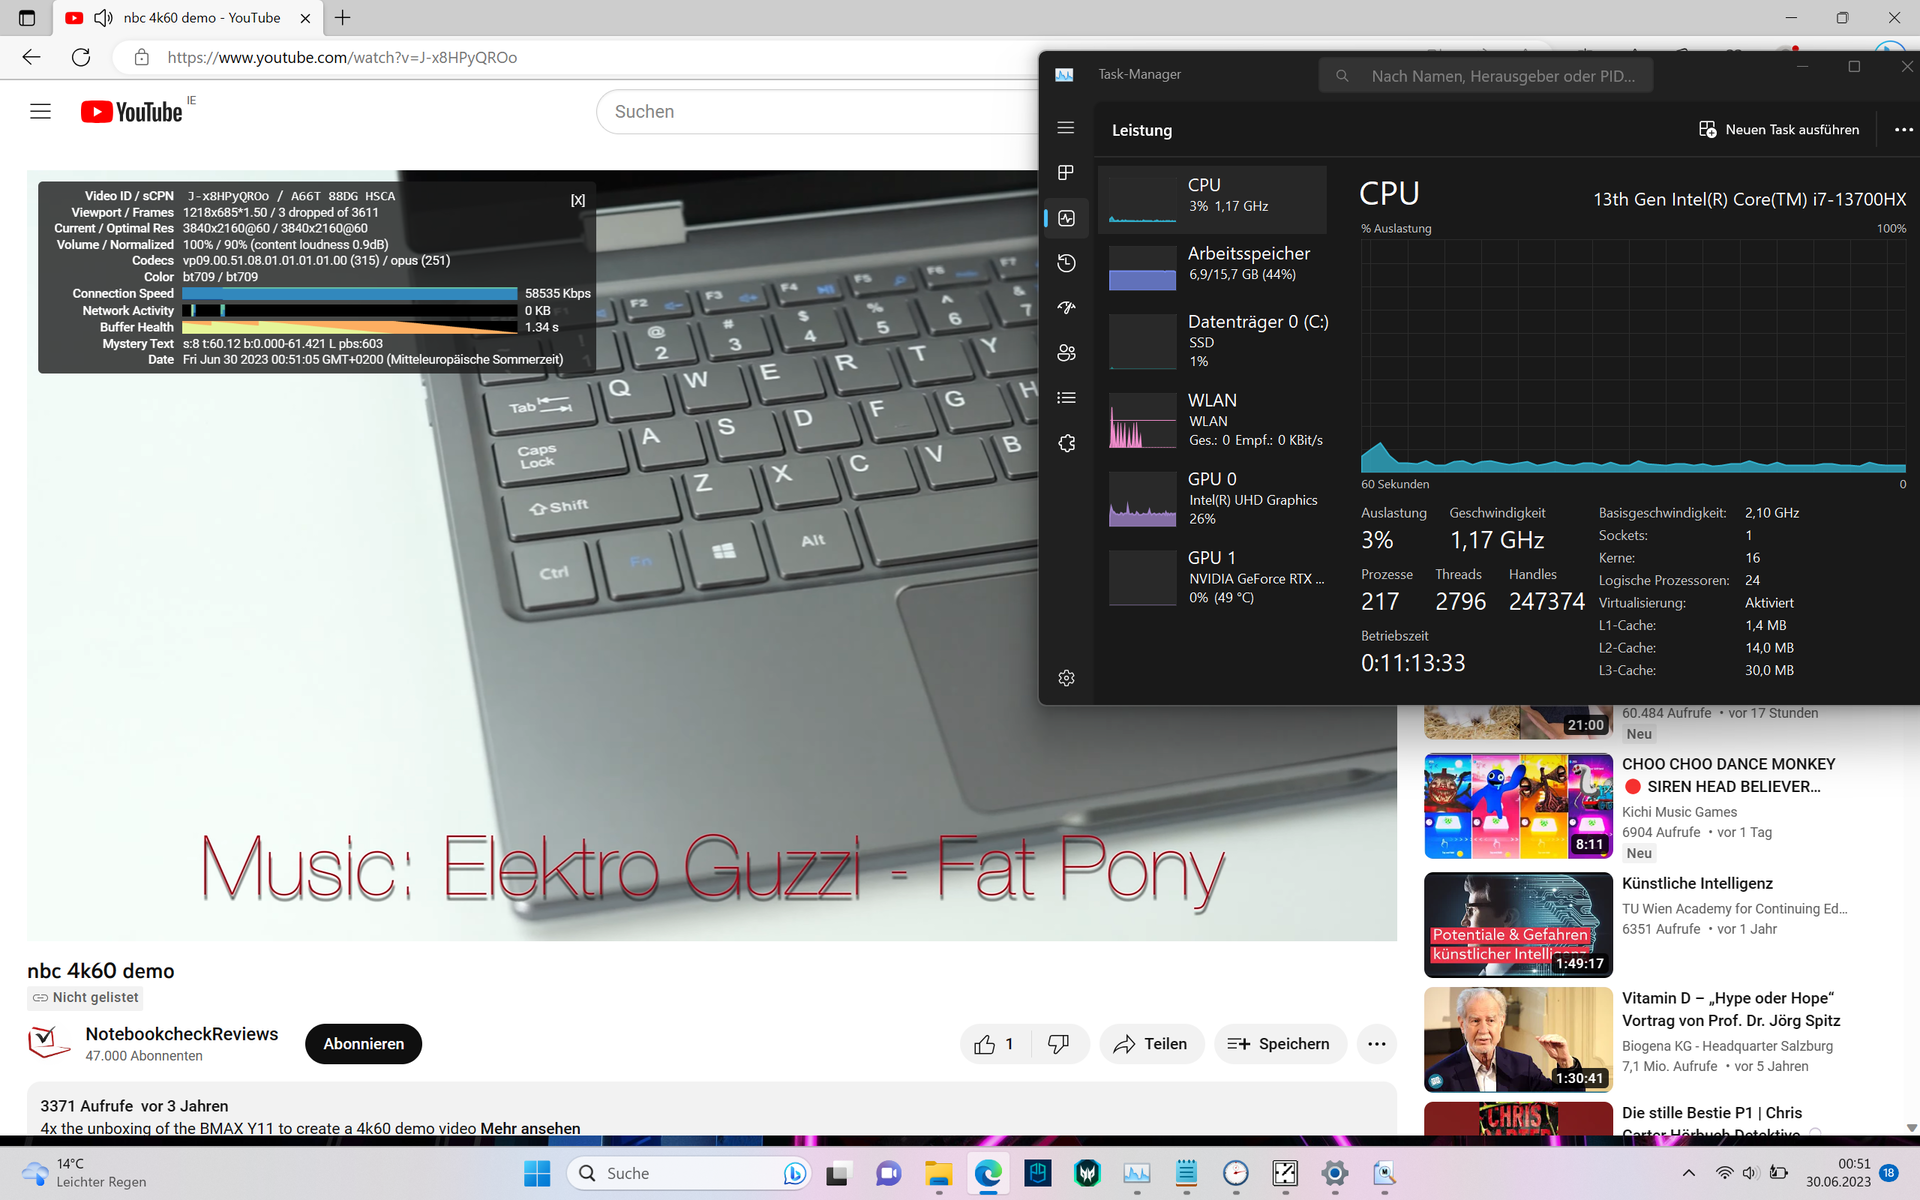
En las tareas cotidianas, el portátil Acer responde de forma excepcional. Navegar por internet mientras se reproduce un vídeo 4K de YouTube ni siquiera hace sudar al sistema Intel-HX. Esto significa que, en el benchmark PCMark 10, el Predator Helios se sitúa en primer lugar, seguido de cerca por elLenovo Legion Pro 5 16.
Asimismo, el rendimiento de navegación web, como ilustran Mozilla Kraken 1.1 y WebXPRT, también está a un nivel muy alto gracias al fuerte rendimiento de un solo núcleo.
CrossMark: Overall | Productivity | Creativity | Responsiveness
Mozilla Kraken 1.1: Total
Speedometer 2.0: Result 2.0
Octane V2: Total Score
Jetstream 2: 2.0 Total
WebXPRT 3: Overall
WebXPRT 4: Overall
| PCMark 10 / Score | |
| Media de la clase Gaming (5828 - 12414, n=93, últimos 2 años) | |
| Acer Predator Helios 16 PH16-71-731Q | |
| Lenovo Legion Pro 5 16IRX8 | |
| Medio Intel Core i7-13700HX, NVIDIA GeForce RTX 4060 Laptop GPU (6909 - 7743, n=5) | |
| Asus TUF Gaming A16 FA617 | |
| Acer Nitro 16 AN16-41 | |
| Aorus 15X ASF | |
| Dell G15 5530 | |
| PCMark 10 / Essentials | |
| Acer Predator Helios 16 PH16-71-731Q | |
| Dell G15 5530 | |
| Lenovo Legion Pro 5 16IRX8 | |
| Aorus 15X ASF | |
| Media de la clase Gaming (8810 - 11935, n=97, últimos 2 años) | |
| Medio Intel Core i7-13700HX, NVIDIA GeForce RTX 4060 Laptop GPU (9760 - 11313, n=5) | |
| Asus TUF Gaming A16 FA617 | |
| Acer Nitro 16 AN16-41 | |
| PCMark 10 / Productivity | |
| Media de la clase Gaming (6845 - 25323, n=95, últimos 2 años) | |
| Acer Predator Helios 16 PH16-71-731Q | |
| Dell G15 5530 | |
| Medio Intel Core i7-13700HX, NVIDIA GeForce RTX 4060 Laptop GPU (9131 - 11018, n=5) | |
| Aorus 15X ASF | |
| Asus TUF Gaming A16 FA617 | |
| Acer Nitro 16 AN16-41 | |
| Lenovo Legion Pro 5 16IRX8 | |
| PCMark 10 / Digital Content Creation | |
| Media de la clase Gaming (7602 - 19954, n=95, últimos 2 años) | |
| Lenovo Legion Pro 5 16IRX8 | |
| Medio Intel Core i7-13700HX, NVIDIA GeForce RTX 4060 Laptop GPU (9393 - 12434, n=5) | |
| Asus TUF Gaming A16 FA617 | |
| Acer Nitro 16 AN16-41 | |
| Acer Predator Helios 16 PH16-71-731Q | |
| Aorus 15X ASF | |
| Dell G15 5530 | |
| CrossMark / Overall | |
| Acer Predator Helios 16 PH16-71-731Q | |
| Aorus 15X ASF | |
| Media de la clase Gaming (1366 - 2409, n=94, últimos 2 años) | |
| Medio Intel Core i7-13700HX, NVIDIA GeForce RTX 4060 Laptop GPU (1663 - 2105, n=5) | |
| Dell G15 5530 | |
| Lenovo Legion Pro 5 16IRX8 | |
| Acer Nitro 16 AN16-41 | |
| CrossMark / Productivity | |
| Acer Predator Helios 16 PH16-71-731Q | |
| Aorus 15X ASF | |
| Media de la clase Gaming (1386 - 2254, n=94, últimos 2 años) | |
| Medio Intel Core i7-13700HX, NVIDIA GeForce RTX 4060 Laptop GPU (1618 - 1989, n=5) | |
| Dell G15 5530 | |
| Lenovo Legion Pro 5 16IRX8 | |
| Acer Nitro 16 AN16-41 | |
| CrossMark / Creativity | |
| Acer Predator Helios 16 PH16-71-731Q | |
| Media de la clase Gaming (1343 - 2786, n=94, últimos 2 años) | |
| Aorus 15X ASF | |
| Dell G15 5530 | |
| Medio Intel Core i7-13700HX, NVIDIA GeForce RTX 4060 Laptop GPU (1710 - 2274, n=5) | |
| Lenovo Legion Pro 5 16IRX8 | |
| Acer Nitro 16 AN16-41 | |
| CrossMark / Responsiveness | |
| Aorus 15X ASF | |
| Acer Predator Helios 16 PH16-71-731Q | |
| Media de la clase Gaming (1226 - 2334, n=94, últimos 2 años) | |
| Medio Intel Core i7-13700HX, NVIDIA GeForce RTX 4060 Laptop GPU (1269 - 1983, n=5) | |
| Lenovo Legion Pro 5 16IRX8 | |
| Dell G15 5530 | |
| Acer Nitro 16 AN16-41 | |
| Mozilla Kraken 1.1 / Total | |
| Asus TUF Gaming A16 FA617 | |
| Asus TUF Gaming A16 FA617 | |
| Acer Nitro 16 AN16-41 | |
| Lenovo Legion Pro 5 16IRX8 | |
| Medio Intel Core i7-13700HX, NVIDIA GeForce RTX 4060 Laptop GPU (495 - 538, n=5) | |
| Dell G15 5530 | |
| Acer Predator Helios 16 PH16-71-731Q | |
| Aorus 15X ASF | |
| Media de la clase Gaming (391 - 590, n=100, últimos 2 años) | |
| Speedometer 2.0 / Result 2.0 | |
| Media de la clase Gaming (29 - 736, n=27, últimos 2 años) | |
| Acer Predator Helios 16 PH16-71-731Q | |
| Medio Intel Core i7-13700HX, NVIDIA GeForce RTX 4060 Laptop GPU (300 - 343, n=3) | |
| Aorus 15X ASF | |
| Acer Nitro 16 AN16-41 | |
| Octane V2 / Total Score | |
| Media de la clase Gaming (93292 - 139447, n=27, últimos 2 años) | |
| Aorus 15X ASF | |
| Acer Predator Helios 16 PH16-71-731Q | |
| Medio Intel Core i7-13700HX, NVIDIA GeForce RTX 4060 Laptop GPU (86875 - 96413, n=3) | |
| Acer Nitro 16 AN16-41 | |
| Jetstream 2 / 2.0 Total | |
| Media de la clase Gaming (334 - 516, n=27, últimos 2 años) | |
| Lenovo Legion Pro 5 16IRX8 | |
| Acer Predator Helios 16 PH16-71-731Q | |
| Aorus 15X ASF | |
| Medio Intel Core i7-13700HX, NVIDIA GeForce RTX 4060 Laptop GPU (263 - 305, n=4) | |
| Acer Nitro 16 AN16-41 | |
| WebXPRT 3 / Overall | |
| Acer Predator Helios 16 PH16-71-731Q | |
| Aorus 15X ASF | |
| Media de la clase Gaming (220 - 532, n=98, últimos 2 años) | |
| Asus TUF Gaming A16 FA617 | |
| Asus TUF Gaming A16 FA617 | |
| Dell G15 5530 | |
| Medio Intel Core i7-13700HX, NVIDIA GeForce RTX 4060 Laptop GPU (238 - 336, n=4) | |
| Acer Nitro 16 AN16-41 | |
| Lenovo Legion Pro 5 16IRX8 | |
| WebXPRT 4 / Overall | |
| Media de la clase Gaming (165 - 354, n=98, últimos 2 años) | |
| Acer Predator Helios 16 PH16-71-731Q | |
| Dell G15 5530 | |
| Aorus 15X ASF | |
| Medio Intel Core i7-13700HX, NVIDIA GeForce RTX 4060 Laptop GPU (247 - 283, n=5) | |
| Lenovo Legion Pro 5 16IRX8 | |
| Asus TUF Gaming A16 FA617 | |
| Asus TUF Gaming A16 FA617 | |
| Acer Nitro 16 AN16-41 | |
* ... más pequeño es mejor
| PCMark 10 Score | 7743 puntos | |
ayuda | ||
| AIDA64 / Memory Copy | |
| Media de la clase Gaming (21750 - 129946, n=105, últimos 2 años) | |
| Dell G15 5530 | |
| Lenovo Legion Pro 5 16IRX8 | |
| Aorus 15X ASF | |
| Acer Predator Helios 16 PH16-71-731Q | |
| Medio Intel Core i7-13700HX (36125 - 63990, n=11) | |
| Asus TUF Gaming A16 FA617 | |
| Acer Nitro 16 AN16-41 | |
| AIDA64 / Memory Read | |
| Media de la clase Gaming (22956 - 118858, n=105, últimos 2 años) | |
| Dell G15 5530 | |
| Lenovo Legion Pro 5 16IRX8 | |
| Acer Predator Helios 16 PH16-71-731Q | |
| Aorus 15X ASF | |
| Medio Intel Core i7-13700HX (36510 - 69729, n=11) | |
| Asus TUF Gaming A16 FA617 | |
| Acer Nitro 16 AN16-41 | |
| AIDA64 / Memory Write | |
| Acer Predator Helios 16 PH16-71-731Q | |
| Media de la clase Gaming (22297 - 135096, n=105, últimos 2 años) | |
| Lenovo Legion Pro 5 16IRX8 | |
| Dell G15 5530 | |
| Medio Intel Core i7-13700HX (33598 - 85675, n=11) | |
| Aorus 15X ASF | |
| Asus TUF Gaming A16 FA617 | |
| Acer Nitro 16 AN16-41 | |
| AIDA64 / Memory Latency | |
| Media de la clase Gaming (75.3 - 259, n=105, últimos 2 años) | |
| Acer Nitro 16 AN16-41 | |
| Dell G15 5530 | |
| Medio Intel Core i7-13700HX (81.5 - 97.9, n=11) | |
| Aorus 15X ASF | |
| Acer Predator Helios 16 PH16-71-731Q | |
| Asus TUF Gaming A16 FA617 | |
| Lenovo Legion Pro 5 16IRX8 | |
* ... más pequeño es mejor
Latencias del CPD
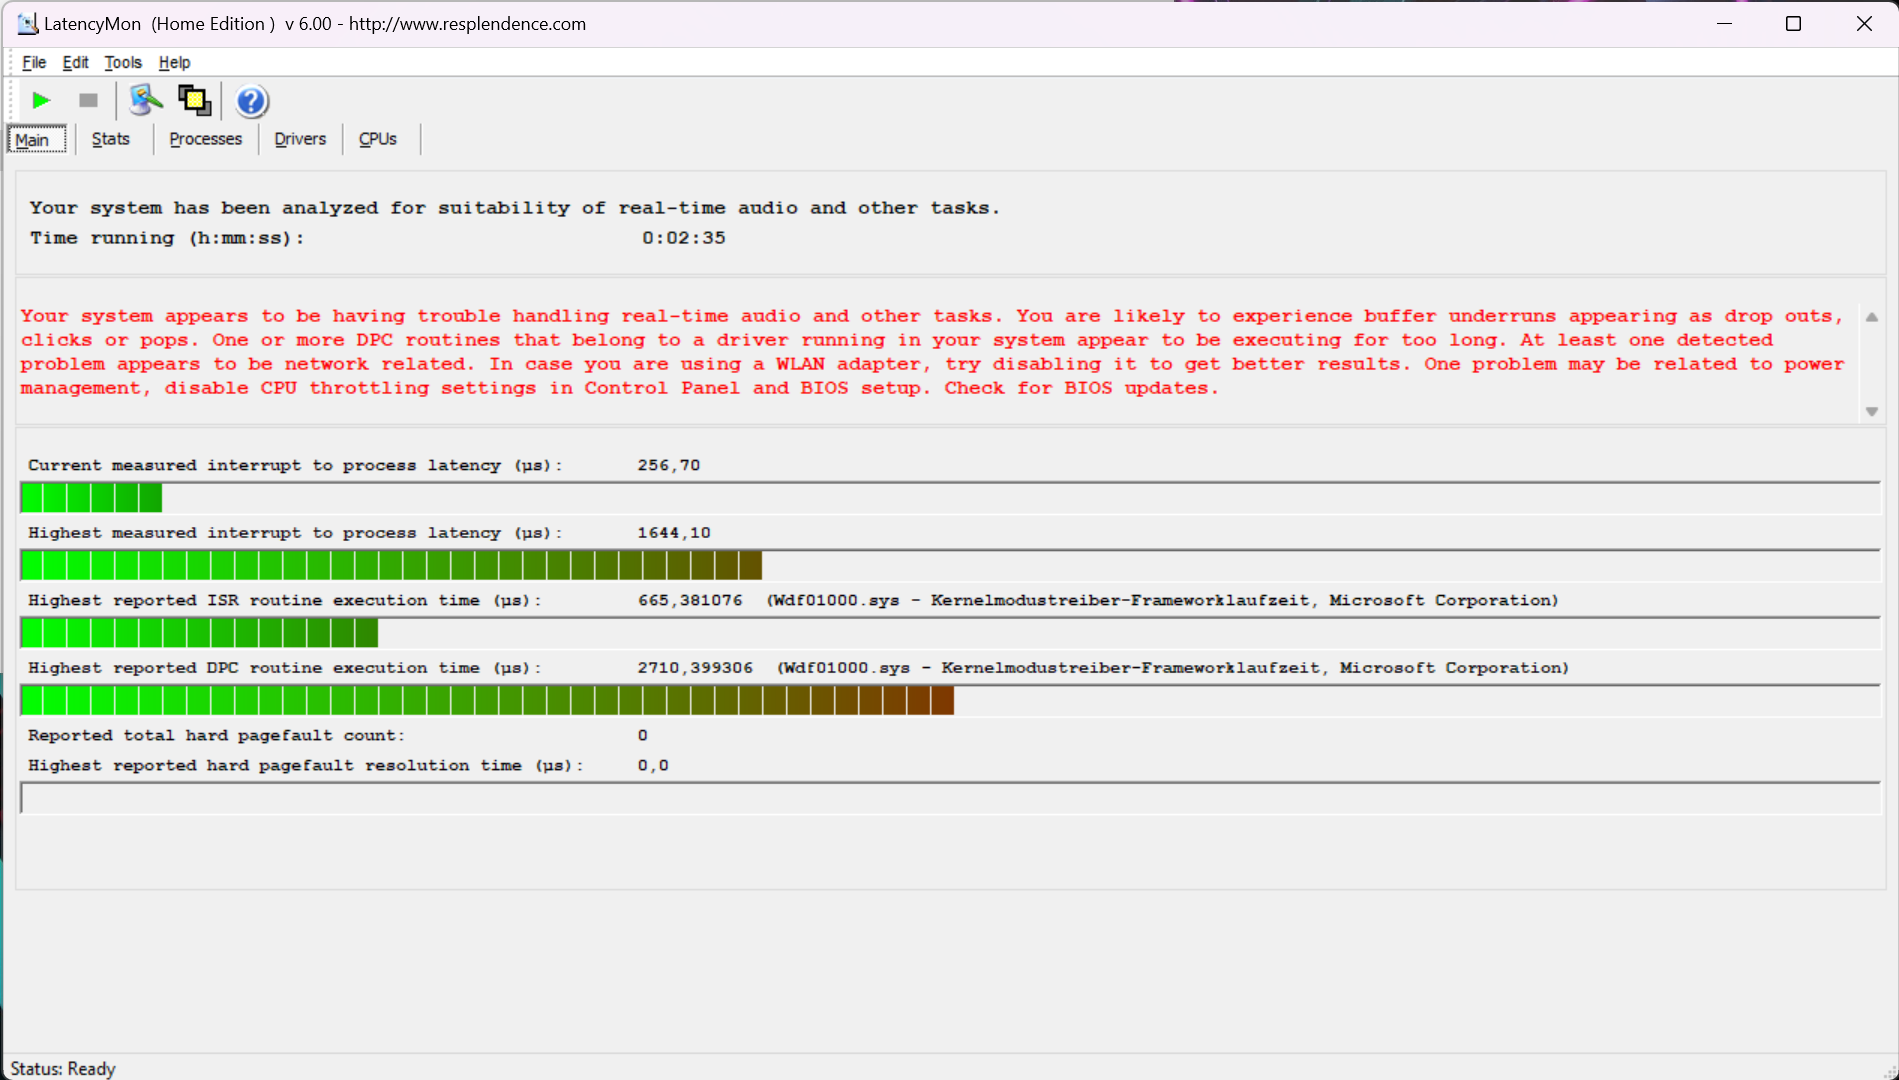
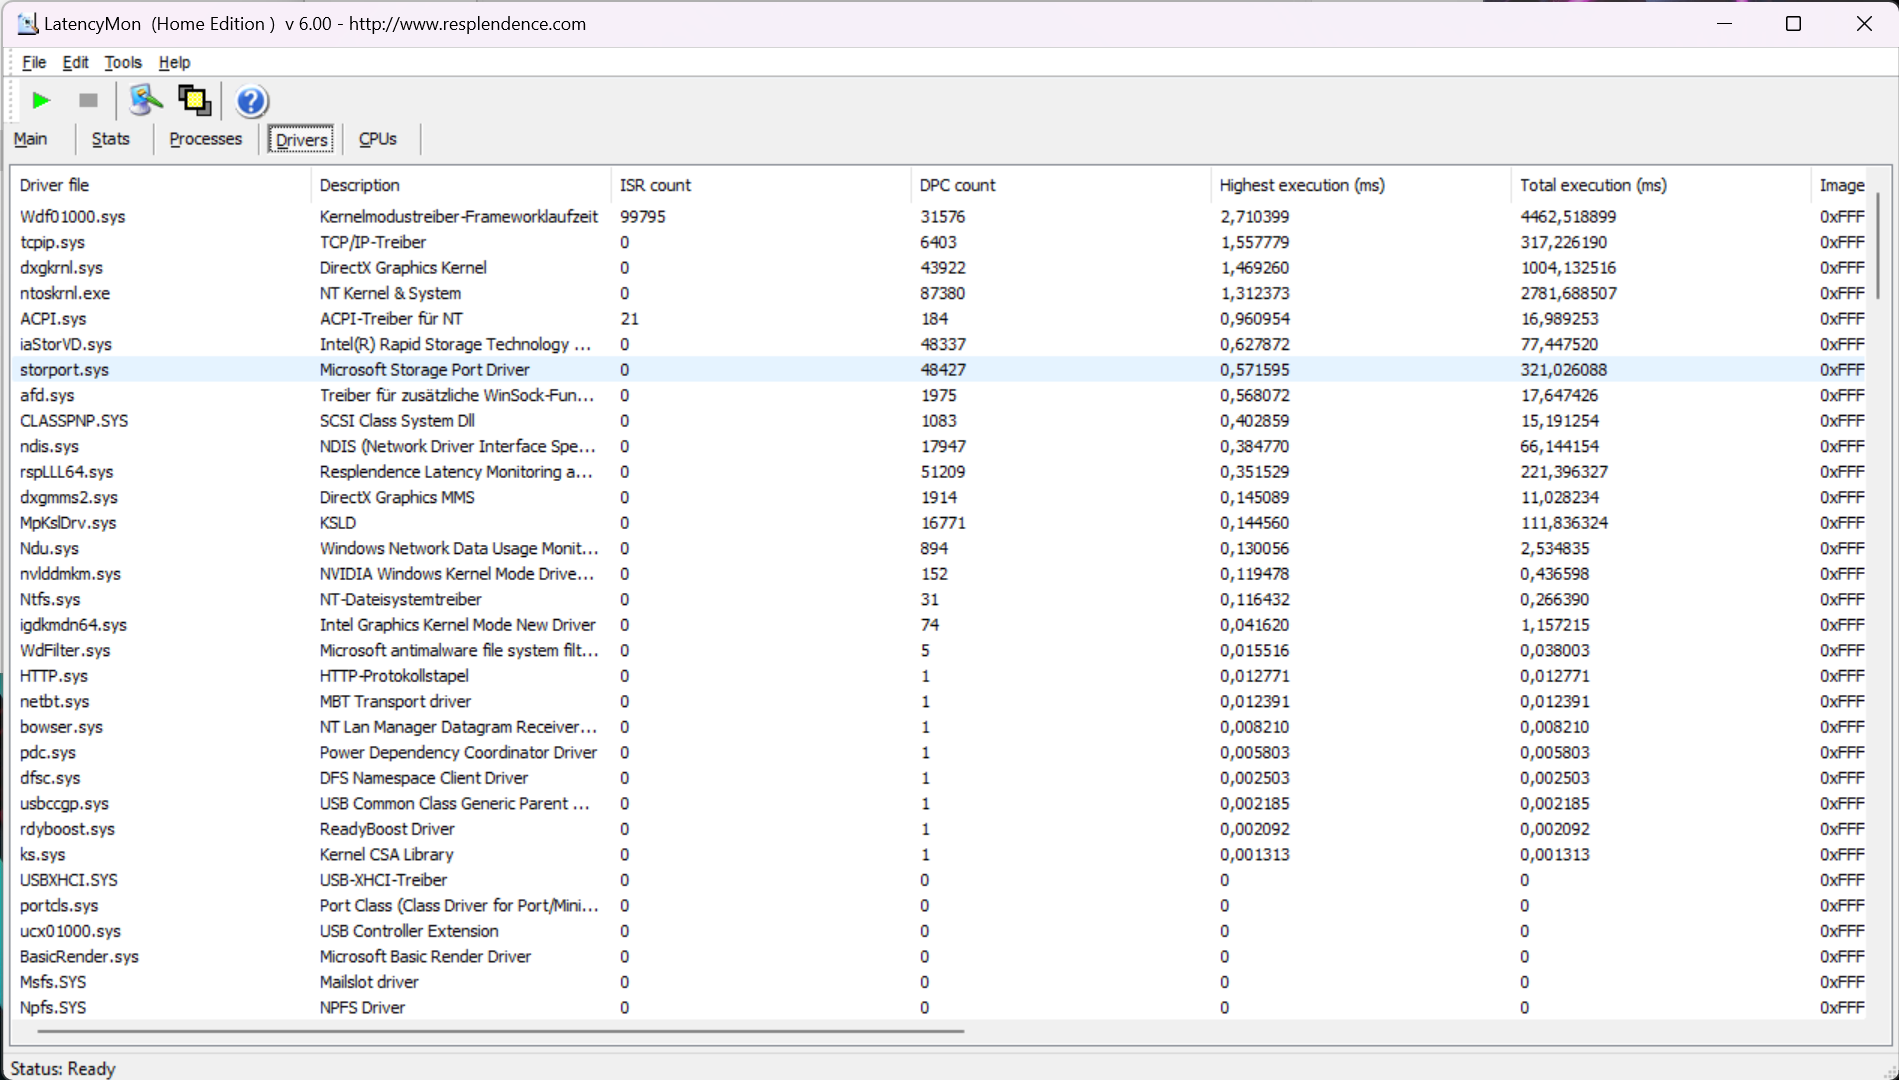
| DPC Latencies / LatencyMon - interrupt to process latency (max), Web, Youtube, Prime95 | |
| Dell G15 5530 | |
| Aorus 15X ASF | |
| Acer Predator Helios 16 PH16-71-731Q | |
| Acer Nitro 16 AN16-41 | |
| Lenovo Legion Pro 5 16IRX8 | |
| Asus TUF Gaming A16 FA617 | |
* ... más pequeño es mejor
Almacenamiento masivo
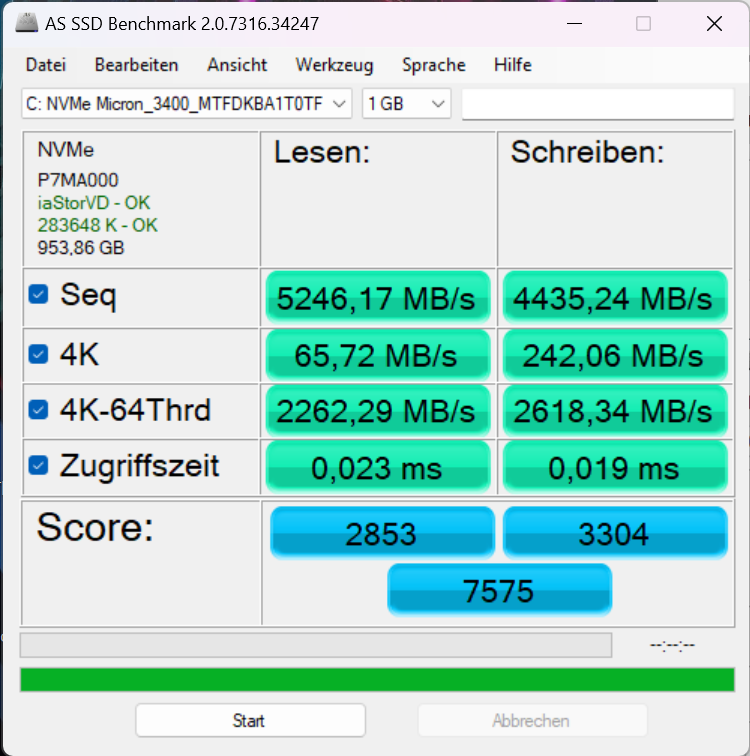
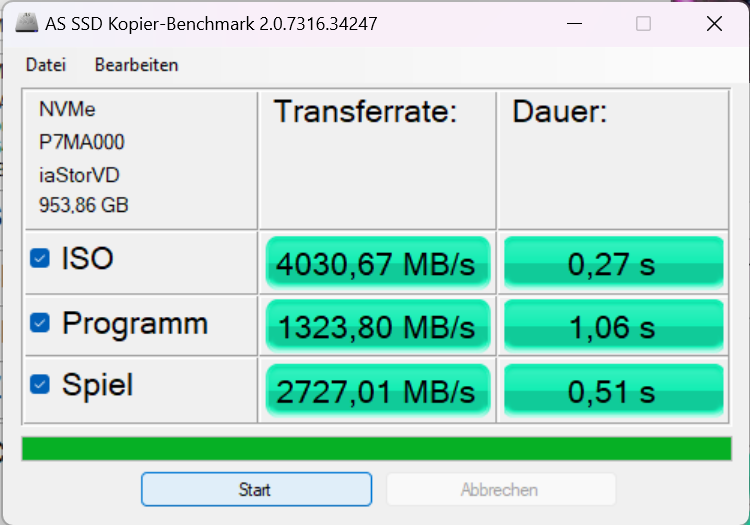
El SSD PCIe 4.0 Micron 3400 instalado tiene capacidad para 1 TB. Las tasas de transferencia de lectura secuencial de hasta 6.100 MB/s están por encima de la media. Sin embargo, tras un breve periodo de tiempo, se produce una drástica ralentización térmica que reduce la velocidad a un tercio de su capacidad. La ralentización no está presente en el Micron 3400 delAsus ROG Flow X16oLenovo Legion 7pero el mismo problema fue reportado en el HP ZBook Fury 16y ZBook Firefly 14.
El SK Hynix PC801 delLegion Pro 5 16también puede soportar transferencias de hasta ~6000 MB/s, mientras que el pequeño SSD M.2 2242 que se encuentra en elDell G15 5530está claramente en la cola del pelotón.
| Acer Predator Helios 16 PH16-71-731Q Micron 3400 1TB MTFDKBA1T0TFH | Acer Nitro 16 AN16-41 Samsung PM9A1 MZVL21T0HCLR | Lenovo Legion Pro 5 16IRX8 SK hynix PC801 HFS512GEJ9X115N | Aorus 15X ASF Gigabyte AG470S1TB-SI B10 | Asus TUF Gaming A16 FA617 Micron 2400 MTFDKBA1T0QFM | Dell G15 5530 SSTC CL4-3D512-Q11 | |
|---|---|---|---|---|---|---|
| AS SSD | -25% | -15% | -15% | -72% | -144% | |
| Seq Read (MB/s) | 5246.2 | 5185.49 -1% | 5856.12 12% | 4649.46 -11% | 3976.53 -24% | 2603.73 -50% |
| Seq Write (MB/s) | 4435.2 | 3900.46 -12% | 4750.28 7% | 3810.26 -14% | 3020.8 -32% | 494.63 -89% |
| 4K Read (MB/s) | 65.7 | 62.76 -4% | 77.12 17% | 100.75 53% | 49.25 -25% | 36.37 -45% |
| 4K Write (MB/s) | 242.1 | 137.9 -43% | 276.66 14% | 308.92 28% | 152.75 -37% | 188.64 -22% |
| 4K-64 Read (MB/s) | 2262.3 | 2593.07 15% | 2572.63 14% | 2964.13 31% | 1901.41 -16% | 932.26 -59% |
| 4K-64 Write (MB/s) | 2618.3 | 3195.33 22% | 3536.78 35% | 3103.89 19% | 1949.13 -26% | 276.64 -89% |
| Access Time Read * (ms) | 0.023 | 0.079 -243% | 0.044 -91% | 0.068 -196% | 0.05 -117% | 0.103 -348% |
| Access Time Write * (ms) | 0.019 | 0.029 -53% | 0.053 -179% | 0.012 37% | 0.105 -453% | 0.182 -858% |
| Score Read (Points) | 2853 | 3174 11% | 3235 13% | 3530 24% | 2348 -18% | 1229 -57% |
| Score Write (Points) | 3304 | 3723 13% | 4288 30% | 3794 15% | 2404 -27% | 515 -84% |
| Score Total (Points) | 7575 | 8452 12% | 9125 20% | 9097 20% | 5903 -22% | 2271 -70% |
| Copy ISO MB/s (MB/s) | 4030.7 | 3037.59 -25% | 566.62 -86% | 1039.04 -74% | 488.98 -88% | |
| Copy Program MB/s (MB/s) | 1323.8 | 968.9 -27% | 1098.38 -17% | 439.84 -67% | 296.26 -78% | |
| Copy Game MB/s (MB/s) | 2727 | 2239.37 -18% | 2670.4 -2% | 721.09 -74% | 452.22 -83% | |
| DiskSpd | -22% | -3% | 9% | -31% | -57% | |
| seq read (MB/s) | 3587 | 3520 -2% | 5346 49% | 3419 -5% | 2460 -31% | 2726 -24% |
| seq write (MB/s) | 4634 | 2220 -52% | 1495 -68% | 3270 -29% | 2991 -35% | 535 -88% |
| seq q8 t1 read (MB/s) | 6521 | 6661 2% | 7127 9% | 7018 8% | 4633 -29% | 2985 -54% |
| seq q8 t1 write (MB/s) | 4962 | 2216 -55% | 4903 -1% | 4398 -11% | 3415 -31% | 539 -89% |
| 4k q1 t1 read (MB/s) | 68.3 | 48.4 -29% | 65.9 -4% | 73.5 8% | 35.5 -48% | 34 -50% |
| 4k q1 t1 write (MB/s) | 249 | 159.6 -36% | 328 32% | 346 39% | 181.3 -27% | 224 -10% |
| 4k q32 t16 read (MB/s) | 2848 | 3311 16% | 2889 1% | 3552 25% | 2025 -29% | 1054 -63% |
| 4k q32 t16 write (MB/s) | 2670 | 2193 -18% | 1457 -45% | 3610 35% | 2291 -14% | 507 -81% |
| Media total (Programa/Opciones) | -24% /
-24% | -9% /
-11% | -3% /
-6% | -52% /
-55% | -101% /
-113% |
* ... más pequeño es mejor
* ... más pequeño es mejor
Continuous Performance Read: DiskSpd Read Loop, Queue Depth 8
Tarjeta gráfica
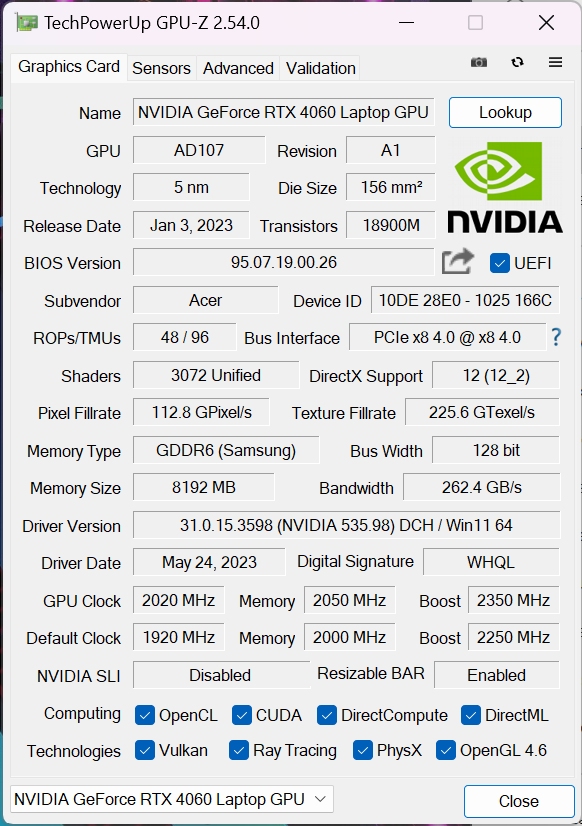
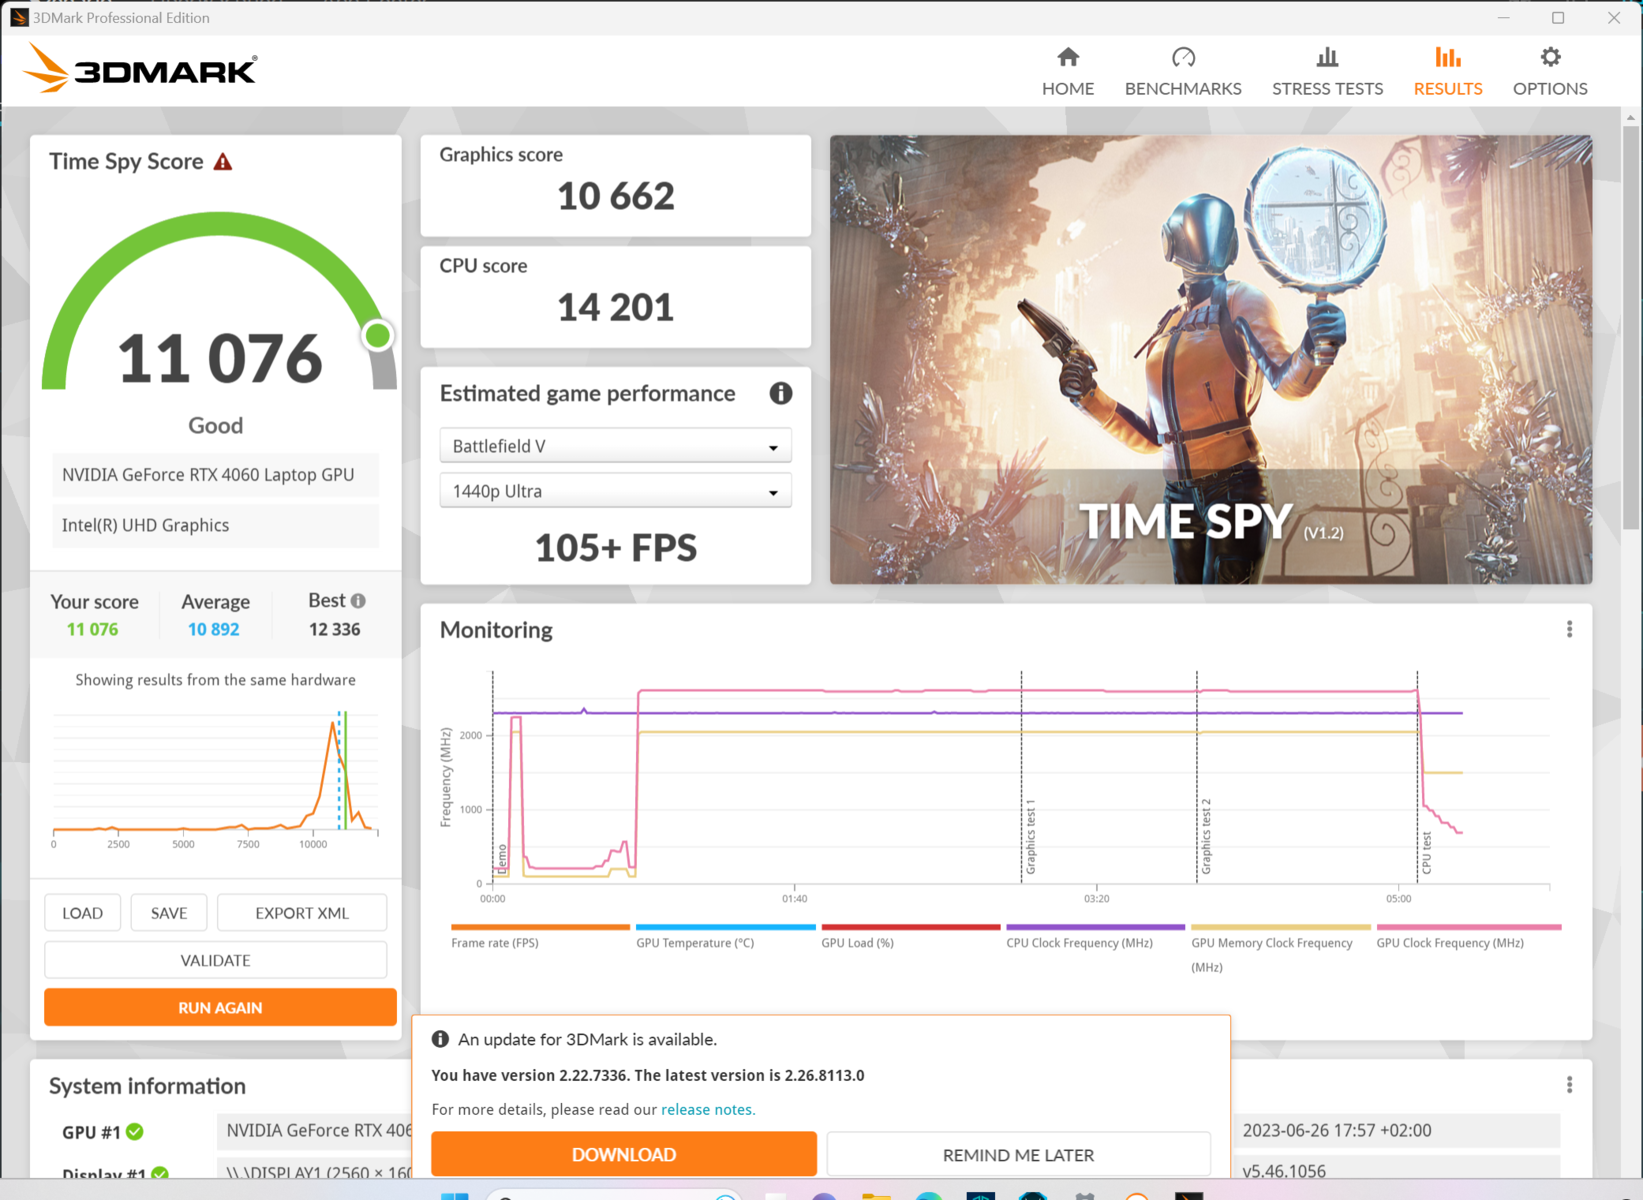
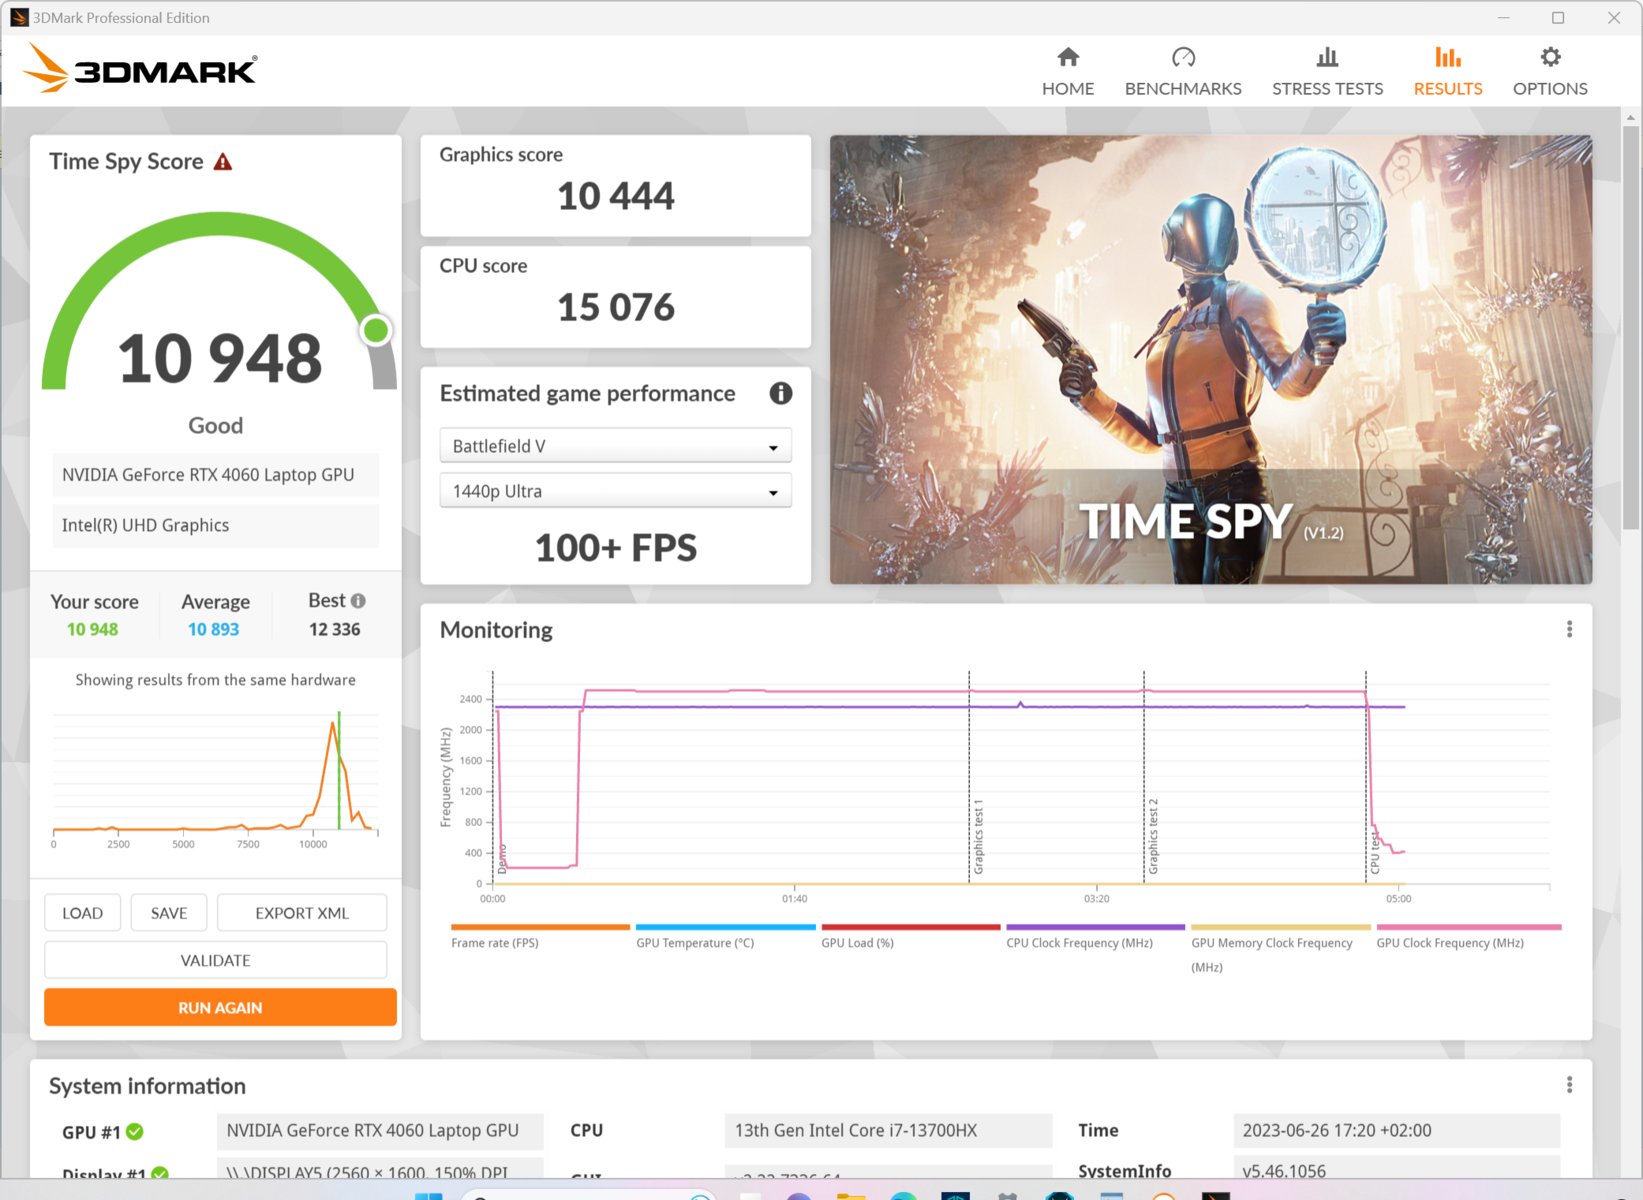
Las Nvidia GeForce RTX 4060 es un chip de gama media con 8 GB de VRAM que tiene un TGP máximo de 140 vatios (115 vatios + 25 vatios Dynamic Boost). Sin embargo, la velocidad de reloj máxima de 2.570 MHz ya se alcanza con 100 vatios. Sólo el test de estrés FurMark fue capaz de sacar ~140 vatios de la GPU. En cambio, cuando se juega, la GPU de un portátil RTX 4060 nunca consume más de ~100 W.
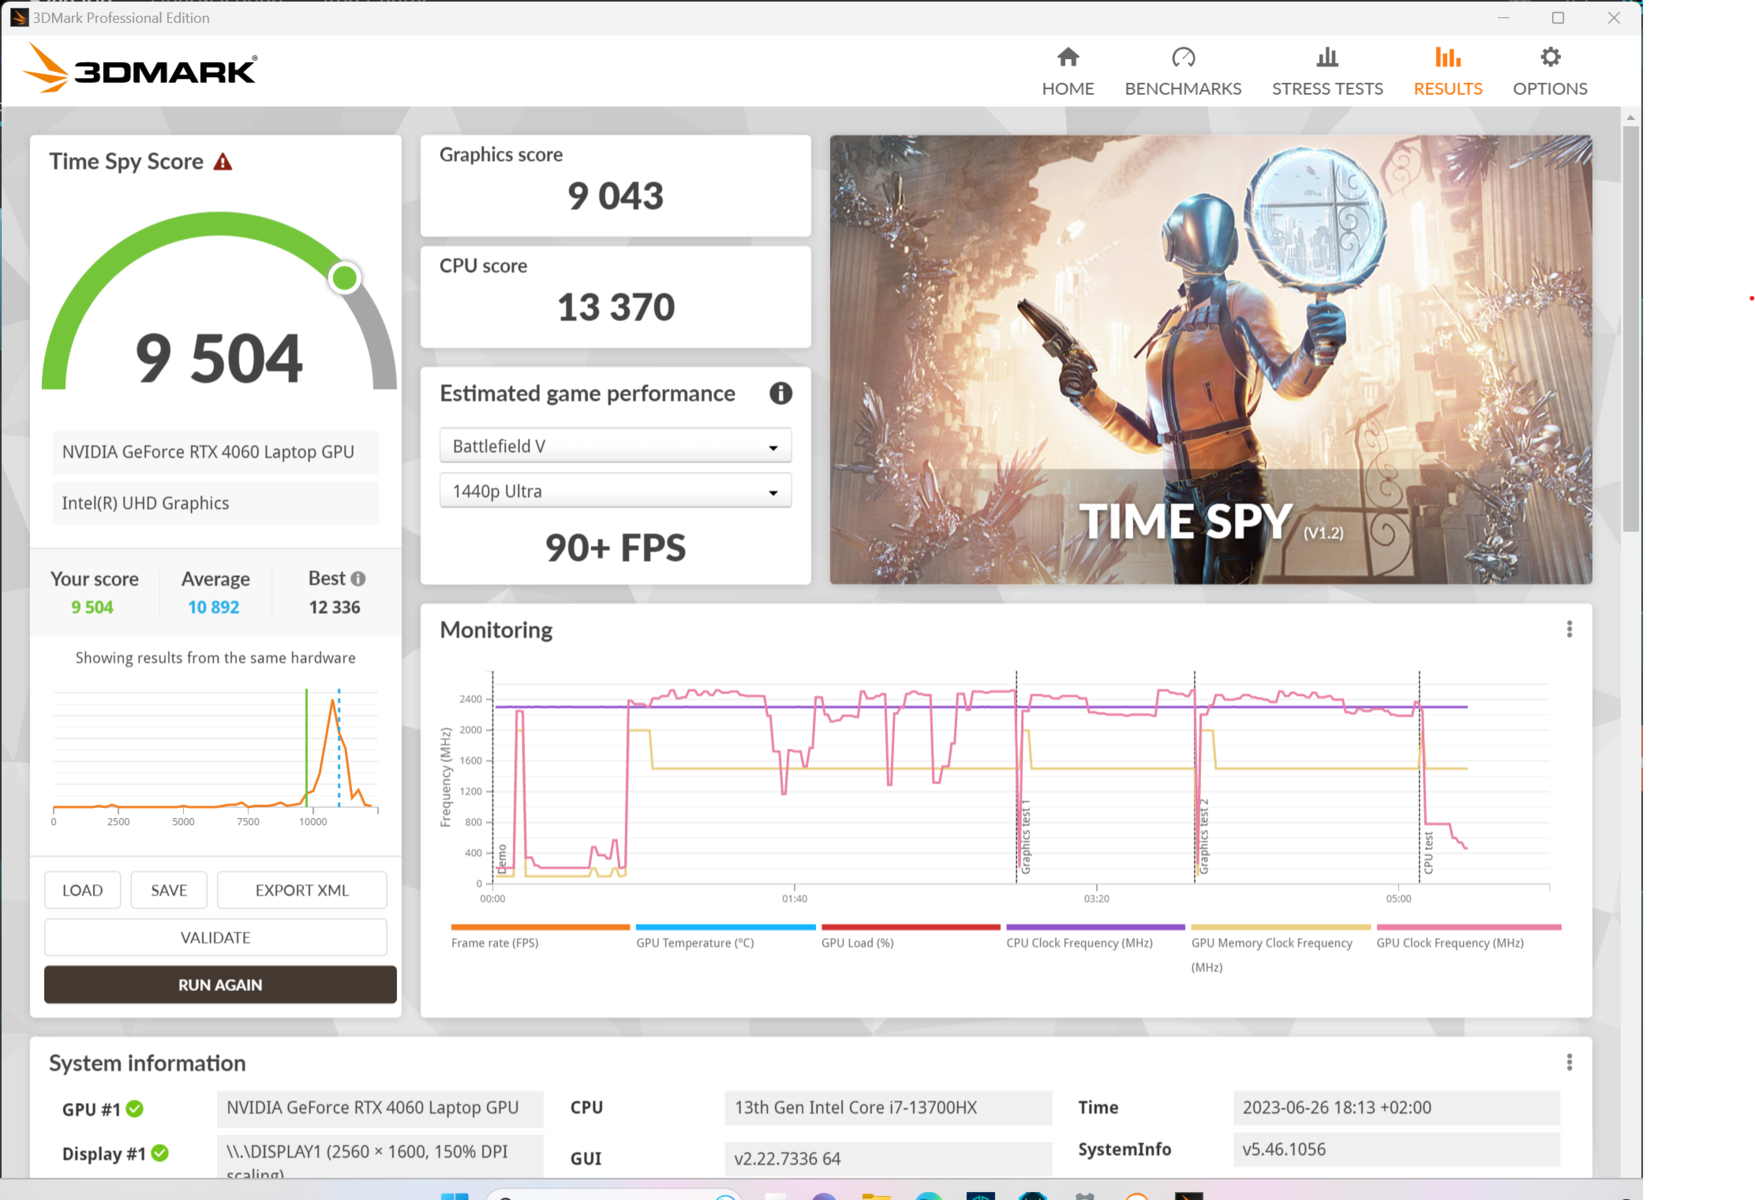
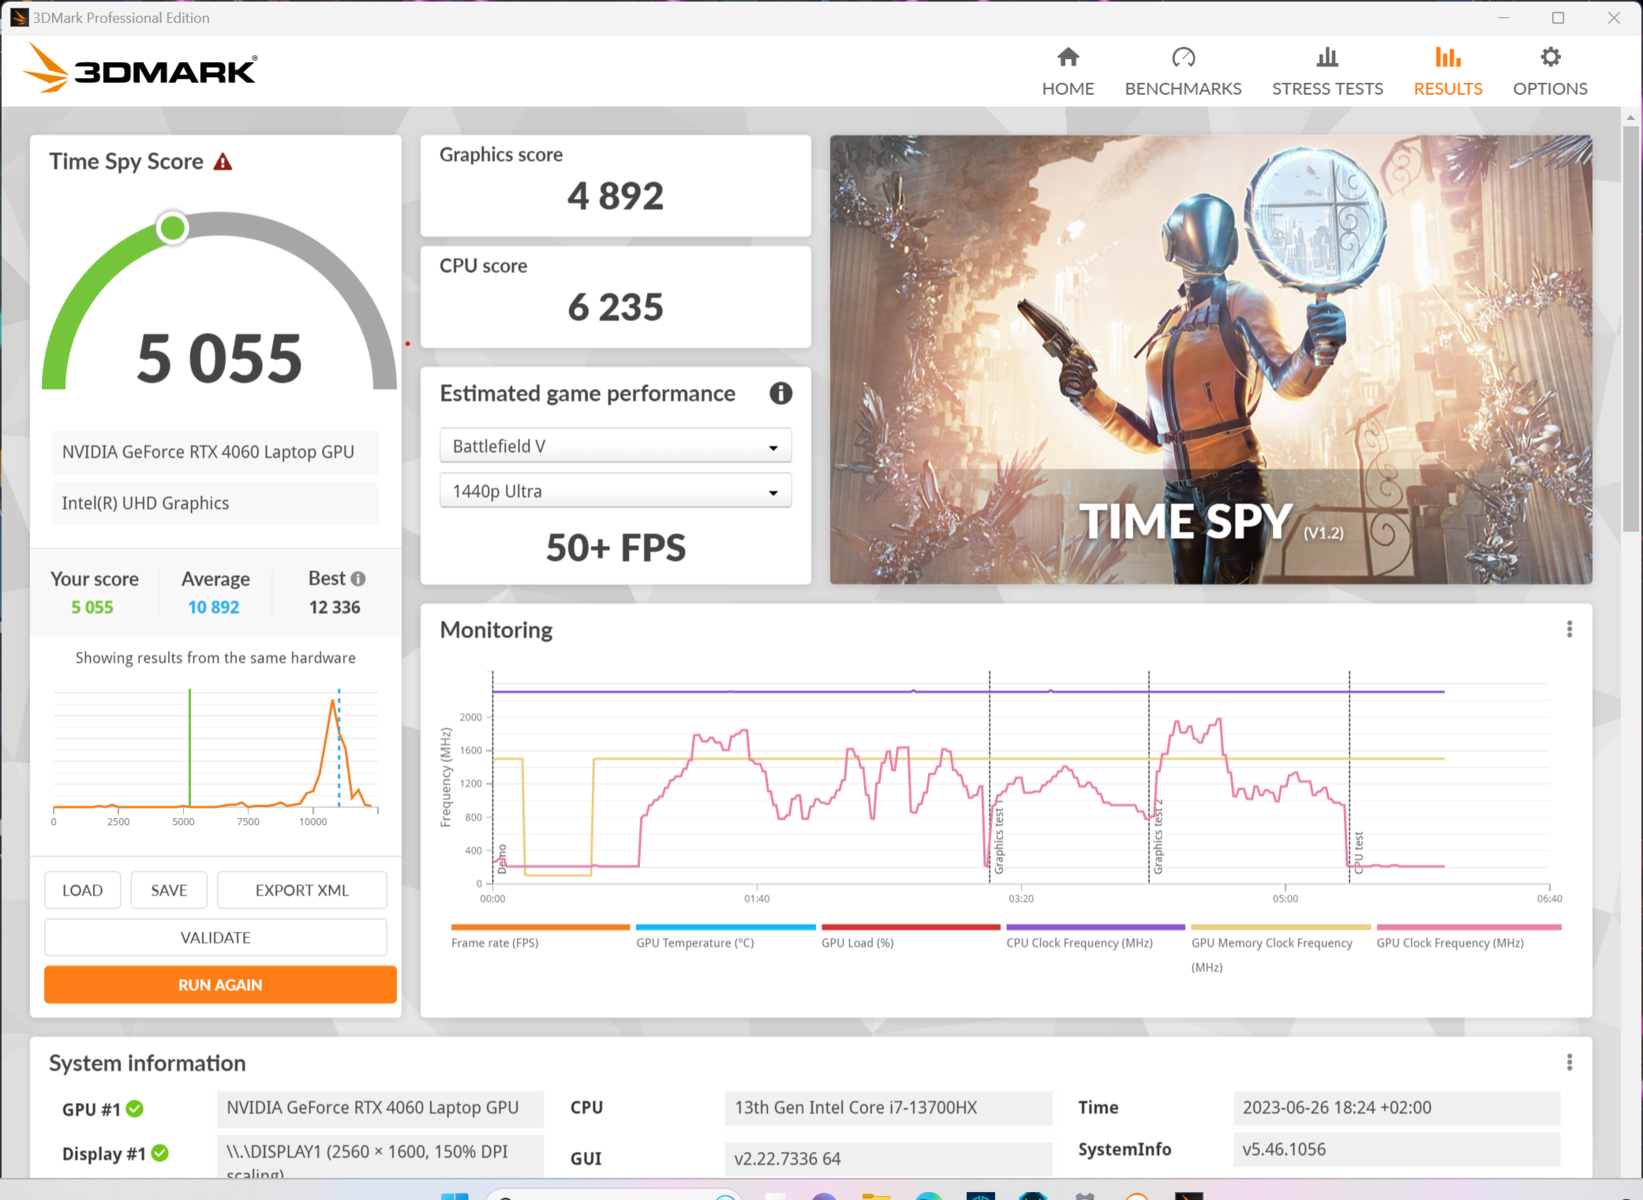
El rendimiento es similar al de otros portátiles de juego con RTX 4060 como elLegion Pro 5 16y el Dell G15 5530. El RTX 4070en elAorus 15X tampoco se queda atrás. Los resultados sintéticos se reducen a la mitad en modo batería.
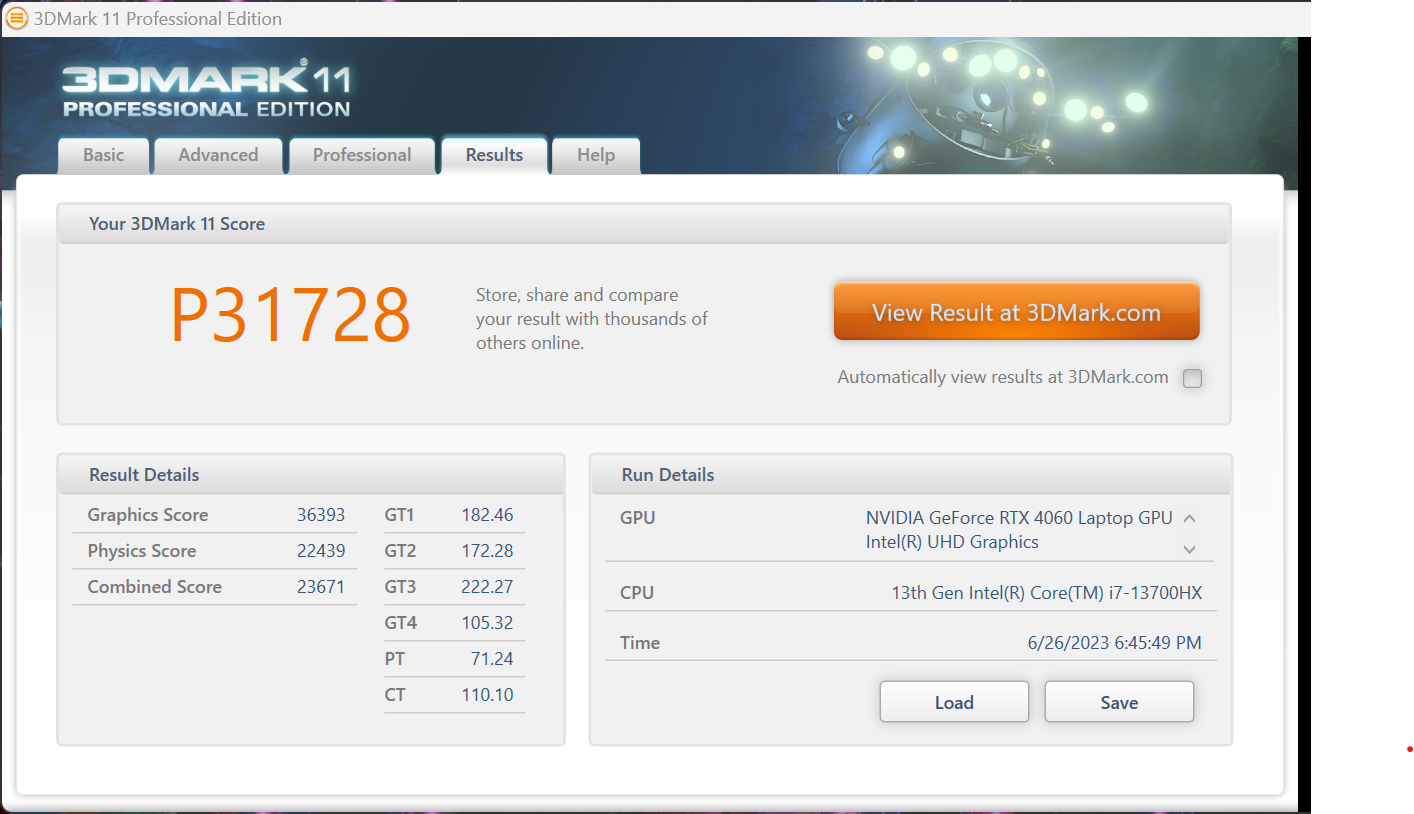

| 3DMark 11 Performance | 31728 puntos | |
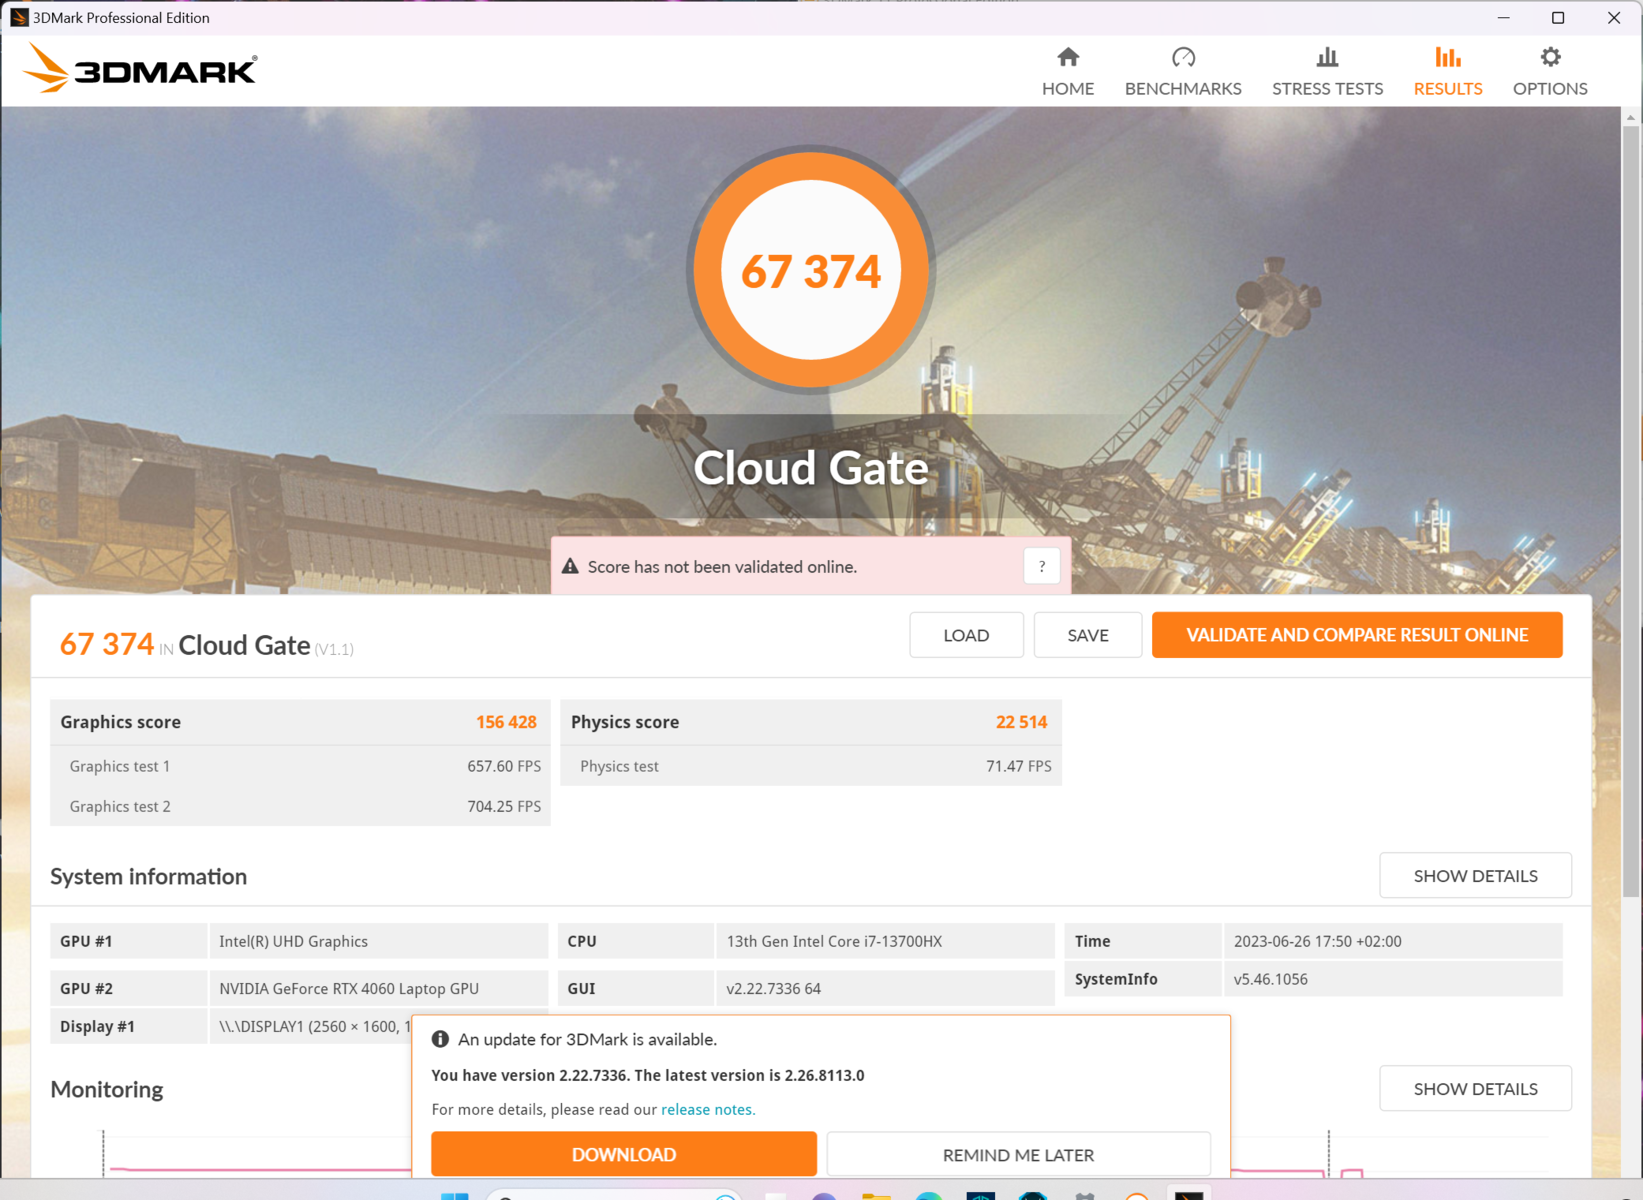
| 3DMark Cloud Gate Standard Score | 67374 puntos | |
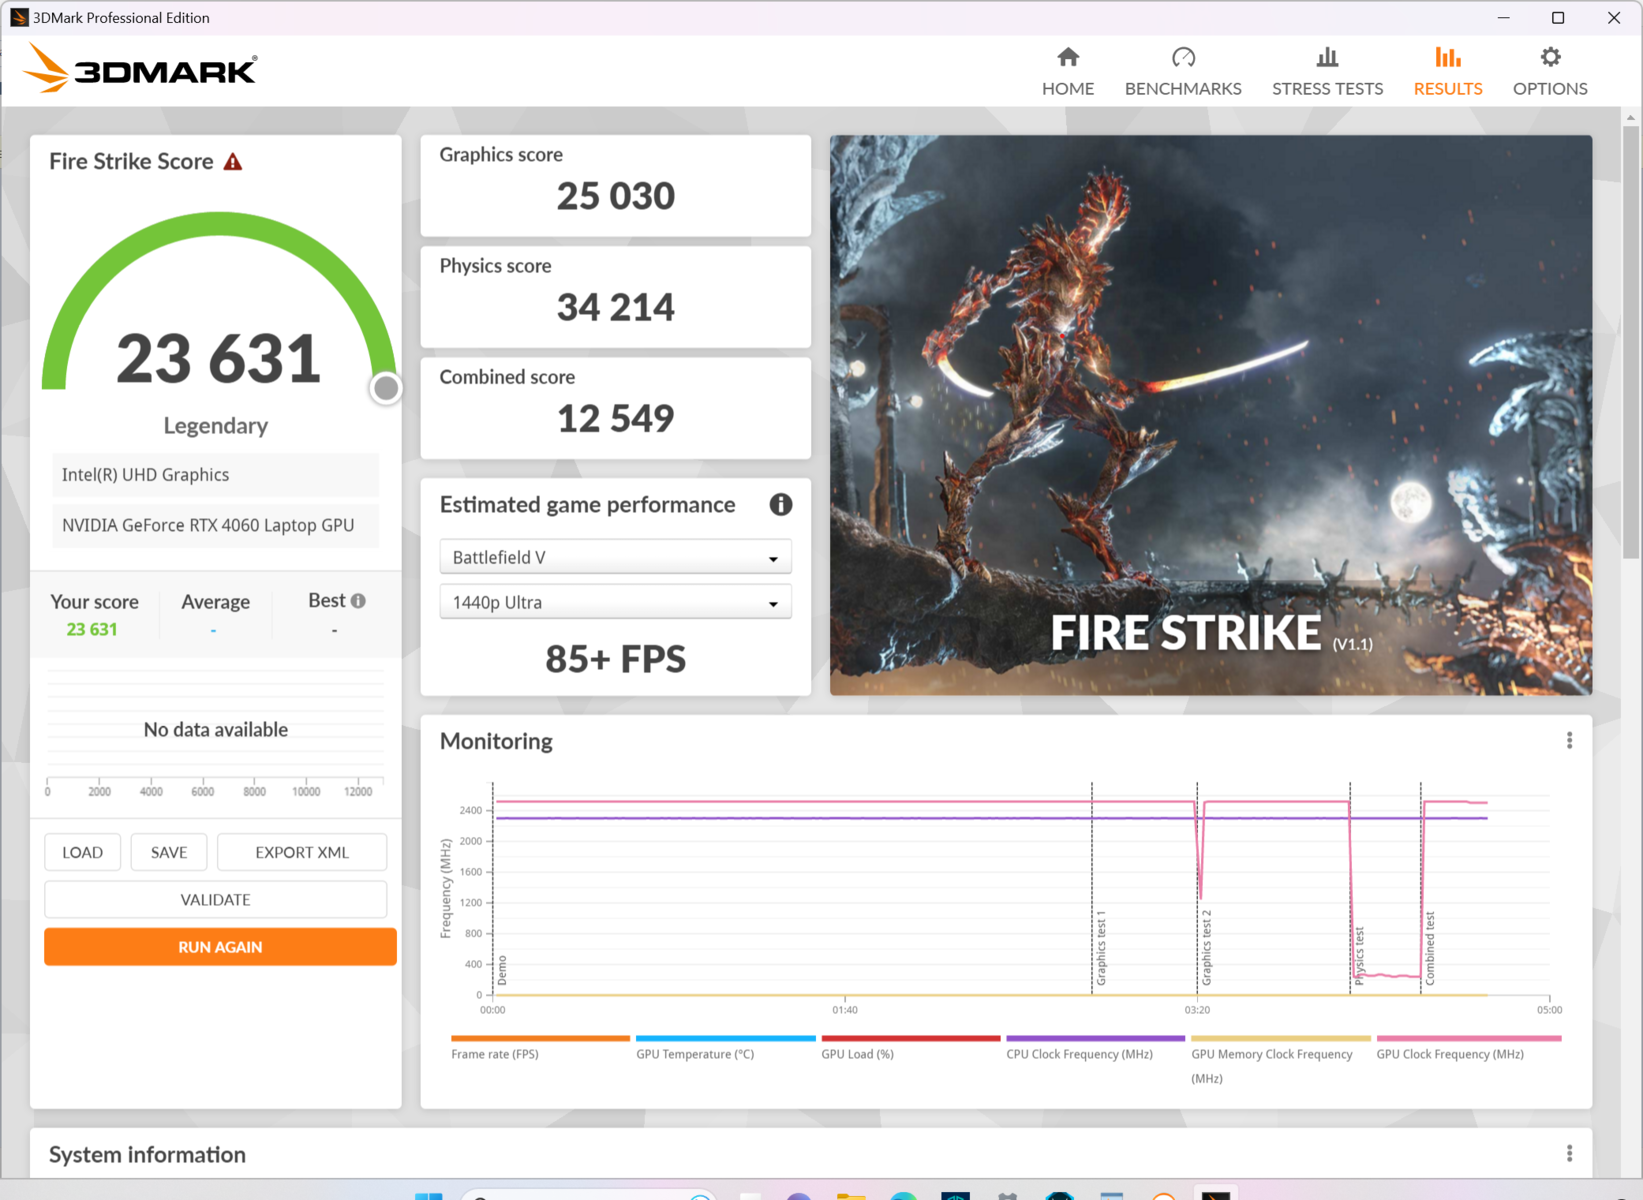
| 3DMark Fire Strike Score | 23631 puntos | |
| 3DMark Time Spy Score | 10948 puntos | |
ayuda | ||
| Geekbench 6.0 - GPU OpenCL 6.0 | |
| Aorus 15X ASF | |
| Acer Nitro 16 AN16-41 | |
| Acer Predator Helios 16 PH16-71-731Q | |
| Dell G15 5530 | |
* ... más pequeño es mejor
Rendimiento de juego
En Cyberpunk 2077 @QHD/Ultra, el Acer Predator Helios 16 fue capaz de correr al frente de nuestro campo de competidores, incluso ligeramente por delante del Legion Pro 5 16'sRTX 4070. Sin embargo, en nuestra clasificación de rendimiento, los dispositivos de la competencia están todos agrupados con la RadeonRX 7600Sque se encuentra en el TUF Gaming A16se debilita ligeramente.
Cambiando al modo dGPU-solamente resulta en una escasa ganancia de rendimiento del 3%. Si se combina con el modo turbo, aumenta hasta el 6 %. Con el trazado de rayos activado, sigues obteniendo 60fps en Cyberpunk 2077 1.6 Ultra/FHD en vez de 93.2fps. Con DLSS activado (equilibrado) - en este caso sin trazado de rayos - es de 134,2fps.
El modo de rendimiento equilibrado baja la tasa de frames a 87.4, que es más que aceptable teniendo en cuenta los ventiladores significativamente más silenciosos. En modo batería, la tasa de imágenes por segundo cae casi un 70 % hasta los 30 fps. Con "DLSS Max Performance", es posible duplicar la tasa de imágenes por segundo una vez más para que algunos juegos nuevos se reproduzcan (y se mantengan) con relativa fluidez en modo batería.
Witcher 3 FPS diagram
| bajo | medio | alto | ultra | QHD | |
|---|---|---|---|---|---|
| GTA V (2015) | 182.8 | 181.3 | 172.5 | 112.8 | 88.3 |
| The Witcher 3 (2015) | 466 | 331 | 181.3 | 102.1 | |
| Dota 2 Reborn (2015) | 189.6 | 171.8 | 159.2 | 153 | |
| Final Fantasy XV Benchmark (2018) | 226 | 150.3 | 100.1 | 72.4 | |
| X-Plane 11.11 (2018) | 136.2 | 123.2 | 95.4 | ||
| Strange Brigade (2018) | 434 | 272 | 215 | 185.2 | 123.5 |
| Shadow of the Tomb Raider (2018) | 141 | 93 | |||
| God of War (2022) | 134.4 | 112.3 | 89.4 | 64.6 | 53.3 |
| Cyberpunk 2077 1.6 (2022) | 132.5 | 126 | 114.9 | 93.2 | 58.6 |
| Tiny Tina's Wonderlands (2022) | 219 | 175.1 | 114.7 | 87.9 | 60 |
| F1 22 (2022) | 256 | 244 | 196.5 | 65.2 | 38 |
| Call of Duty Modern Warfare 2 2022 (2022) | 88 | 60 | |||
| Returnal (2023) | 84.4 | 77.9 | 72.6 | 67 | 59.4 |
Emisiones: El Acer Predator Helios 16 cuenta con un potente sistema de refrigeración
Emisiones sonoras
En reposo, cuando navega por Internet y realiza tareas sencillas de oficina, el Predator Helios 16 es casi siempre agradablemente silencioso y, ni que decir tiene, en modo silencioso o funcionamiento con batería.
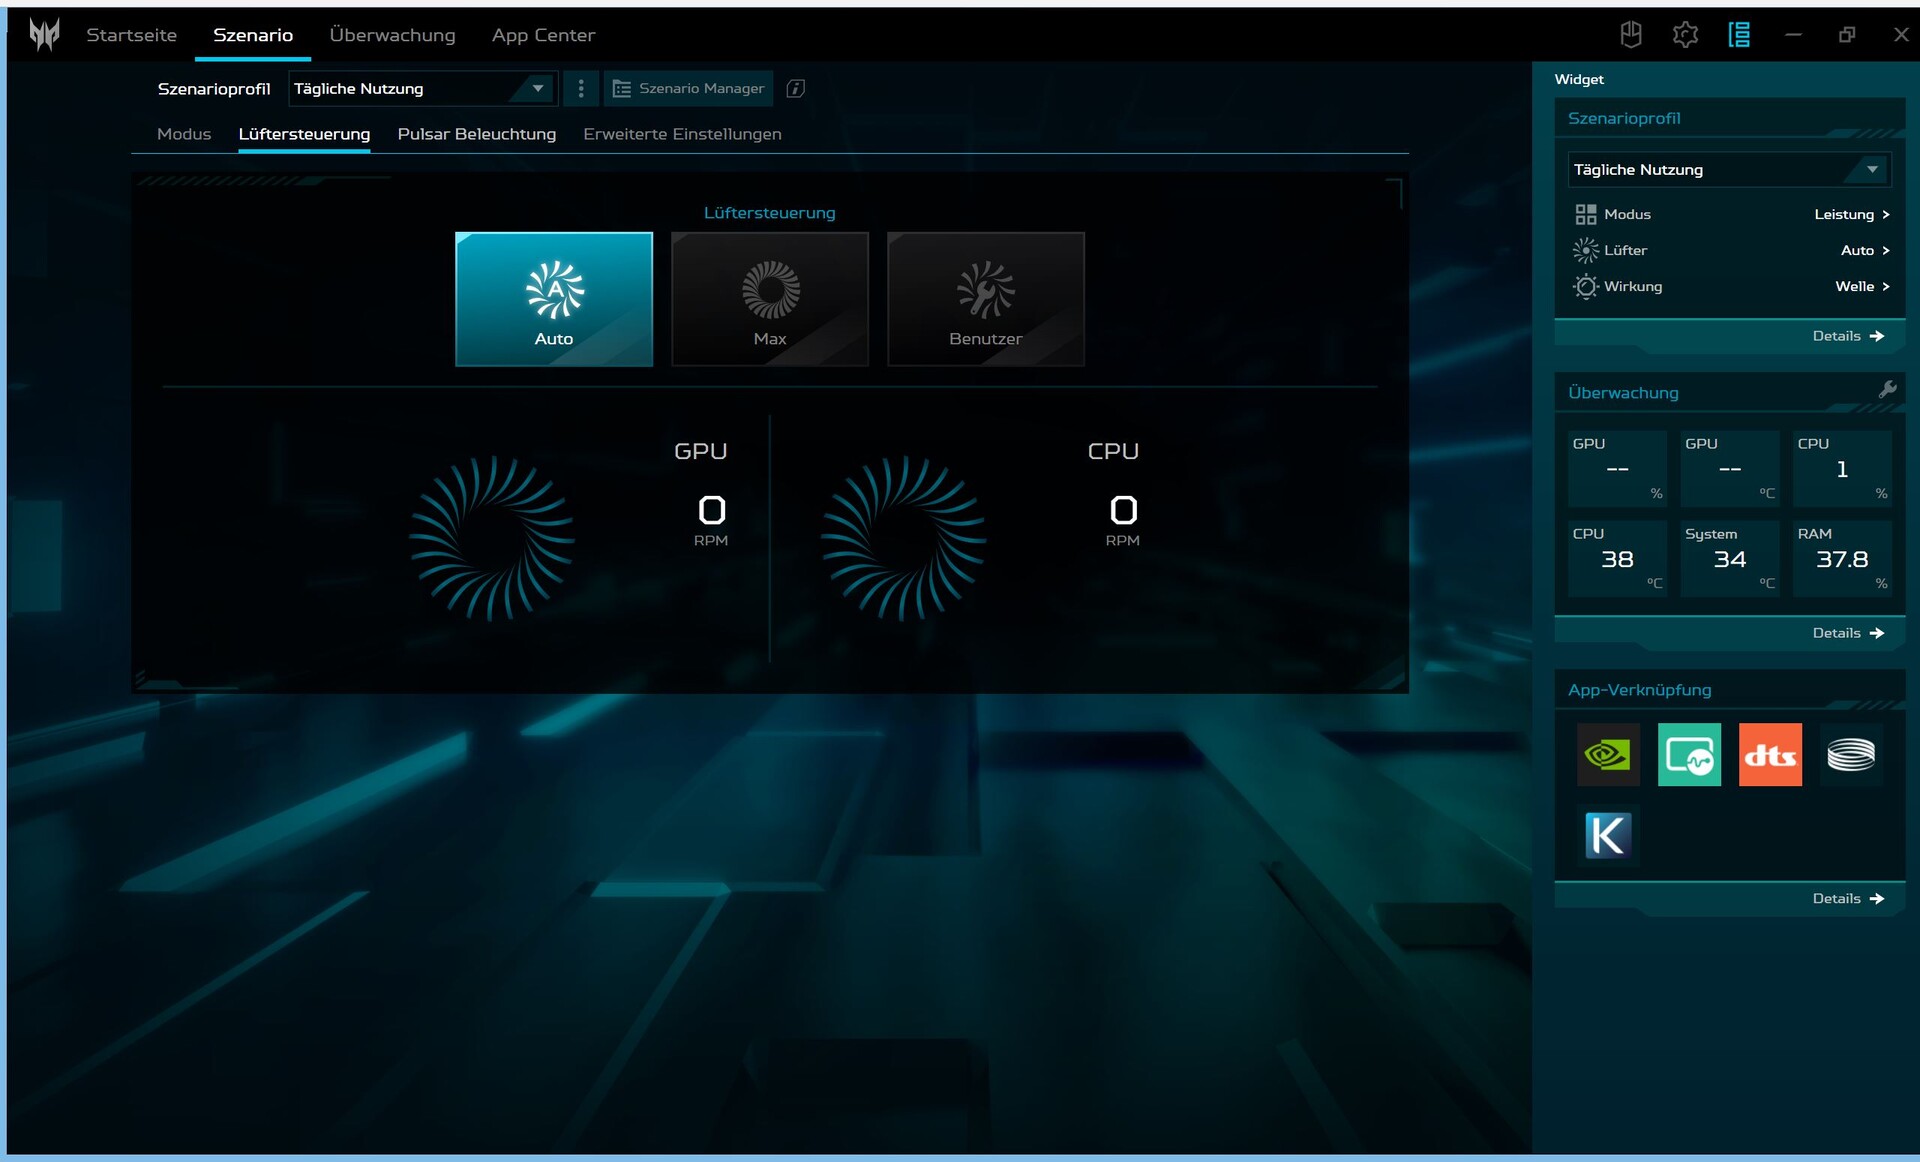
En términos de carga pura de CPU, se alcanzaron 36.6 dB(A) pero tampoco fue muy molesto. Cuando se juega, el modo de rendimiento se vuelve muy ruidoso con 49 dB(A) que es la media de los portátiles para juegos. En modo turbo, se vuelve insoportablemente ruidoso sin ningún valor añadido real. Por el contrario, el modo equilibrado consigue un ruido de fondo casi agradable mientras se pierde muy poco rendimiento. Por último, el modo silencioso es agradable al oído, con caídas de alrededor del 30 % en aplicaciones 3D.
Sin embargo, al cargar nuestro modelo de prueba se produjo un ruido de fondo claramente audible.
Ruido
| Ocioso |
| 24 / 24 / 32.32 dB(A) |
| Carga |
| 36.66 / 49.49 dB(A) |
 | ||
30 dB silencioso 40 dB(A) audible 50 dB(A) ruidosamente alto |
||
min: | ||
| Acer Predator Helios 16 PH16-71-731Q GeForce RTX 4060 Laptop GPU, i7-13700HX, Micron 3400 1TB MTFDKBA1T0TFH | Acer Nitro 16 AN16-41 GeForce RTX 4070 Laptop GPU, R7 7735HS, Samsung PM9A1 MZVL21T0HCLR | Lenovo Legion Pro 5 16IRX8 GeForce RTX 4060 Laptop GPU, i7-13700HX, SK hynix PC801 HFS512GEJ9X115N | Aorus 15X ASF GeForce RTX 4070 Laptop GPU, i7-13700HX, Gigabyte AG470S1TB-SI B10 | Asus TUF Gaming A16 FA617 Radeon RX 7600S, R7 7735HS, Micron 2400 MTFDKBA1T0QFM | Dell G15 5530 GeForce RTX 4060 Laptop GPU, i7-13650HX, SSTC CL4-3D512-Q11 | |
|---|---|---|---|---|---|---|
| Noise | -3% | 4% | -17% | -1% | 5% | |
| apagado / medio ambiente * (dB) | 24 | 25.7 -7% | 23 4% | 25 -4% | 24 -0% | 20.41 15% |
| Idle Minimum * (dB) | 24 | 25.7 -7% | 23.1 4% | 28 -17% | 24 -0% | 26.85 -12% |
| Idle Average * (dB) | 24 | 25.7 -7% | 23.1 4% | 29 -21% | 25 -4% | 26.85 -12% |
| Idle Maximum * (dB) | 32.32 | 26.3 19% | 26.6 18% | 36 -11% | 28 13% | 26.85 17% |
| Load Average * (dB) | 36.66 | 33.9 8% | 34.7 5% | 50 -36% | 42 -15% | 27.65 25% |
| Witcher 3 ultra * (dB) | 49.06 | 47.6 3% | 54 -10% | 50 -2% | 47.9 2% | |
| Load Maximum * (dB) | 49.49 | 62 -25% | 54.8 -11% | 58 -17% | 50 -1% | 47.86 3% |
* ... más pequeño es mejor
Temperatura
El portátil gaming de Acer se mantiene asombrosamente fresco y, durante las sesiones de juego, la mayoría de las superficies ni siquiera alcanzan los 40 °C. El calor sólo se concentra en el sistema de ventilación sobresaliente de la trasera, donde los puntos calientes pueden alcanzar los 55 °C al jugar. Sólo en el test de estrés combinado, medimos un punto caliente de 66 °C, aunque esto no ocurre durante el uso diario. La mayoría de usuarios nunca entrarán en contacto con la barra trasera pero, cuando se pone en el regazo, el contacto ocasional con el dispositivo será desagradable al jugar.
(±) La temperatura máxima en la parte superior es de 41 °C / 106 F, frente a la media de 40.4 °C / 105 F, que oscila entre 21.2 y 68.8 °C para la clase Gaming.
(-) El fondo se calienta hasta un máximo de 66 °C / 151 F, frente a la media de 43.2 °C / 110 F
(±) En reposo, la temperatura media de la parte superior es de 32.4 °C / 90# F, frente a la media del dispositivo de 33.9 °C / 93 F.
(±) Jugando a The Witcher 3, la temperatura media de la parte superior es de 33.1 °C / 92 F, frente a la media del dispositivo de 33.9 °C / 93 F.
(+) Los reposamanos y el panel táctil alcanzan como máximo la temperatura de la piel (32 °C / 89.6 F) y, por tanto, no están calientes.
(-) La temperatura media de la zona del reposamanos de dispositivos similares fue de 28.8 °C / 83.8 F (-3.2 °C / -5.8 F).
| Acer Predator Helios 16 PH16-71-731Q Intel Core i7-13700HX, NVIDIA GeForce RTX 4060 Laptop GPU | Acer Nitro 16 AN16-41 AMD Ryzen 7 7735HS, NVIDIA GeForce RTX 4070 Laptop GPU | Lenovo Legion Pro 5 16IRX8 Intel Core i7-13700HX, NVIDIA GeForce RTX 4060 Laptop GPU | Aorus 15X ASF Intel Core i7-13700HX, NVIDIA GeForce RTX 4070 Laptop GPU | Asus TUF Gaming A16 FA617 AMD Ryzen 7 7735HS, AMD Radeon RX 7600S | Dell G15 5530 Intel Core i7-13650HX, NVIDIA GeForce RTX 4060 Laptop GPU | |
|---|---|---|---|---|---|---|
| Heat | 10% | 12% | 19% | -6% | -2% | |
| Maximum Upper Side * (°C) | 41 | 41.5 -1% | 42.8 -4% | 42 -2% | 54 -32% | 54 -32% |
| Maximum Bottom * (°C) | 66 | 51.8 22% | 50 24% | 51 23% | 47 29% | 62.2 6% |
| Idle Upper Side * (°C) | 36 | 31.6 12% | 29.6 18% | 27 25% | 40 -11% | 33.4 7% |
| Idle Bottom * (°C) | 37 | 34.5 7% | 34 8% | 26 30% | 40 -8% | 33.4 10% |
* ... más pequeño es mejor
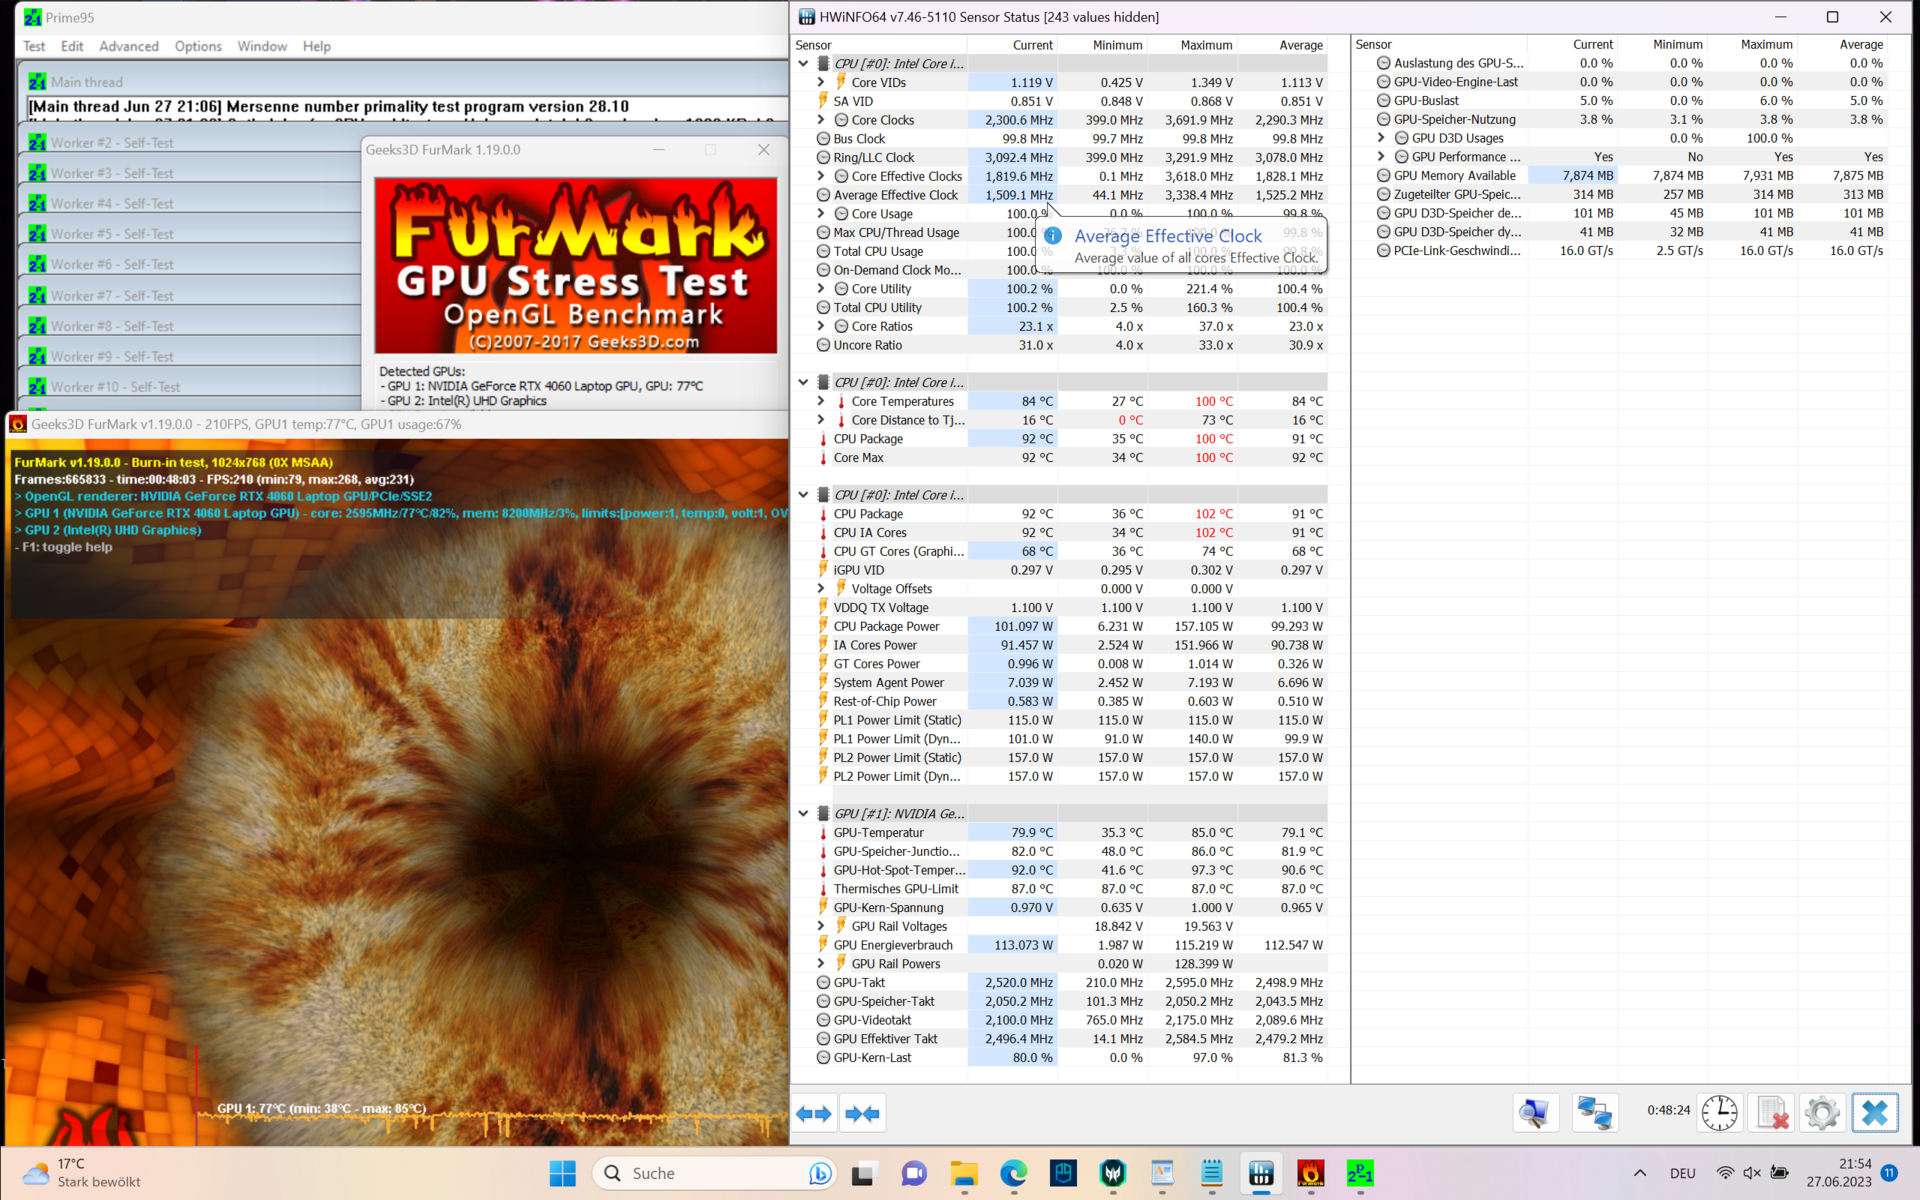
Prueba de esfuerzo
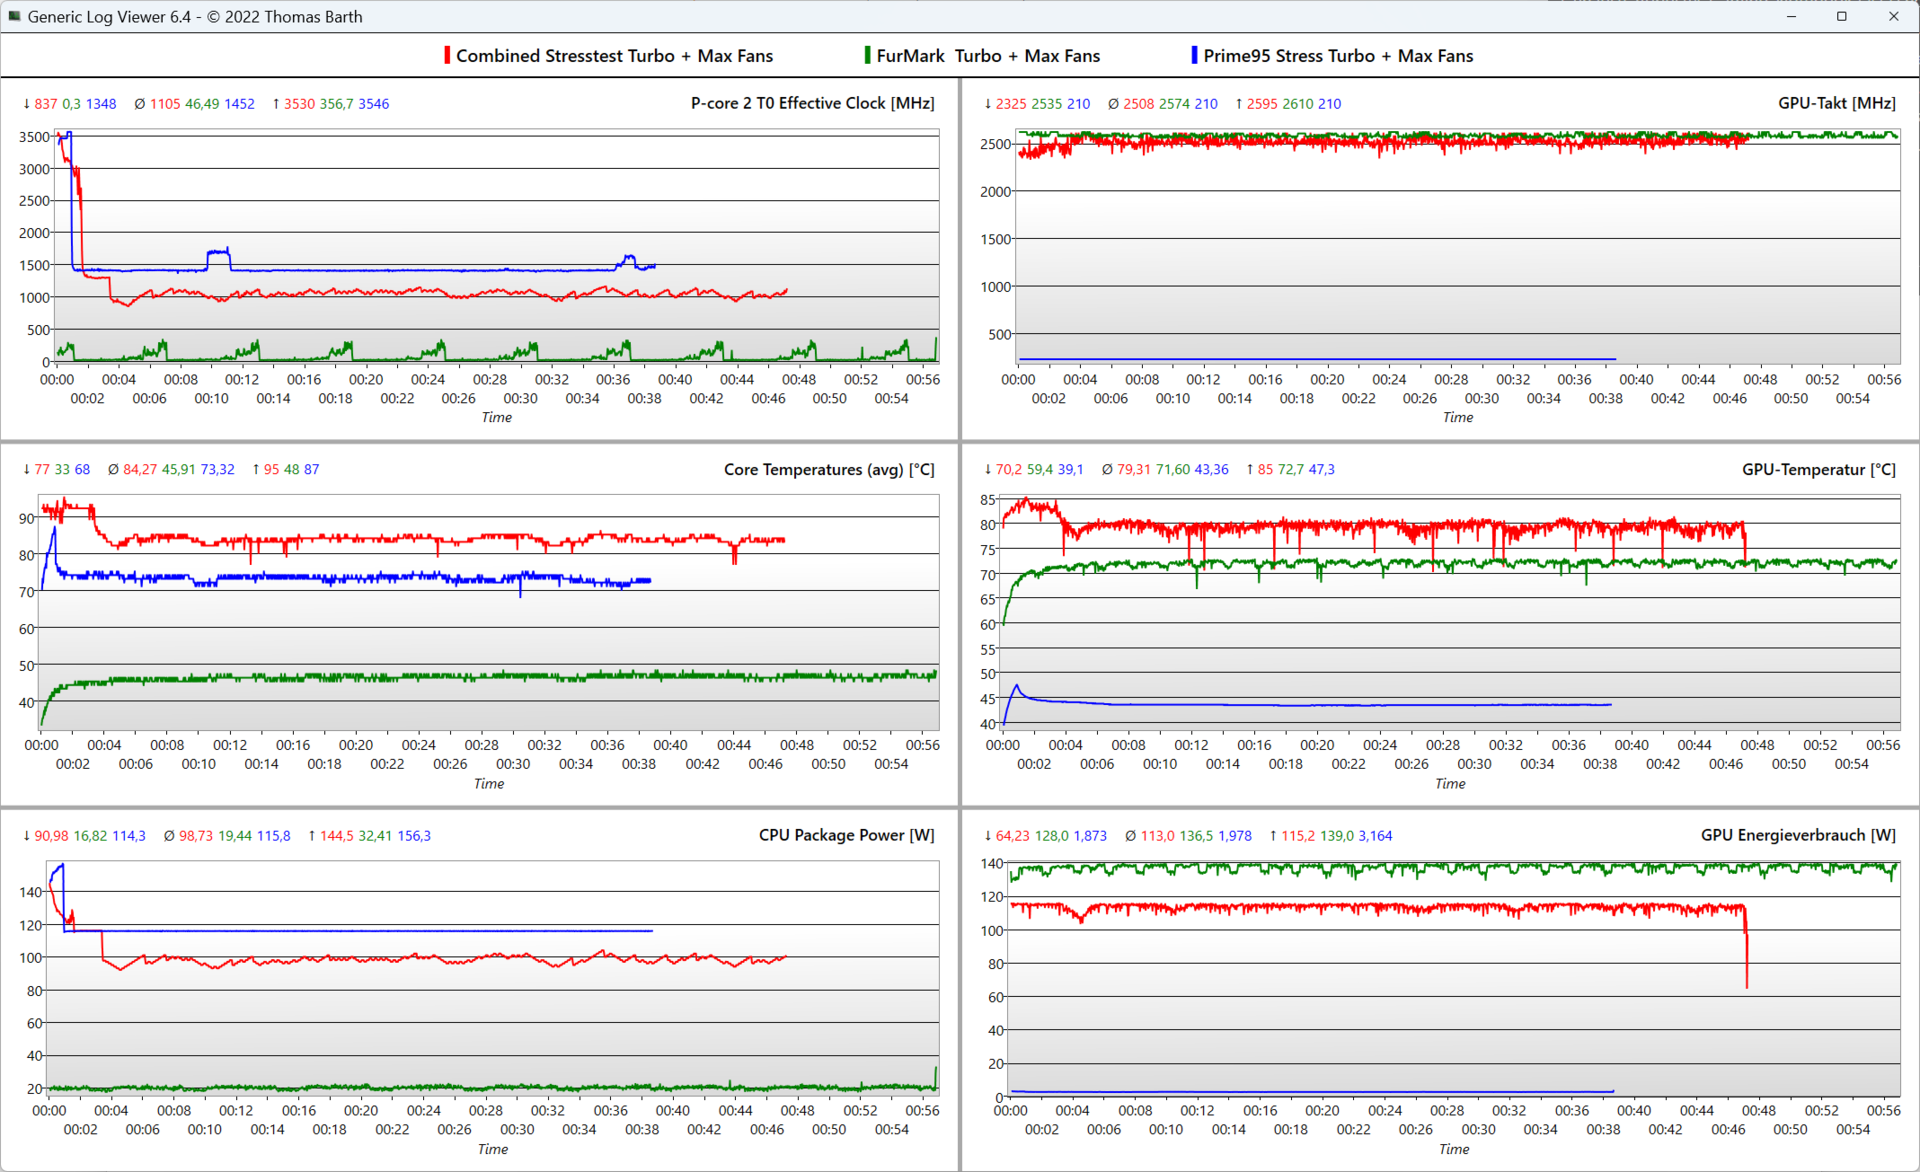
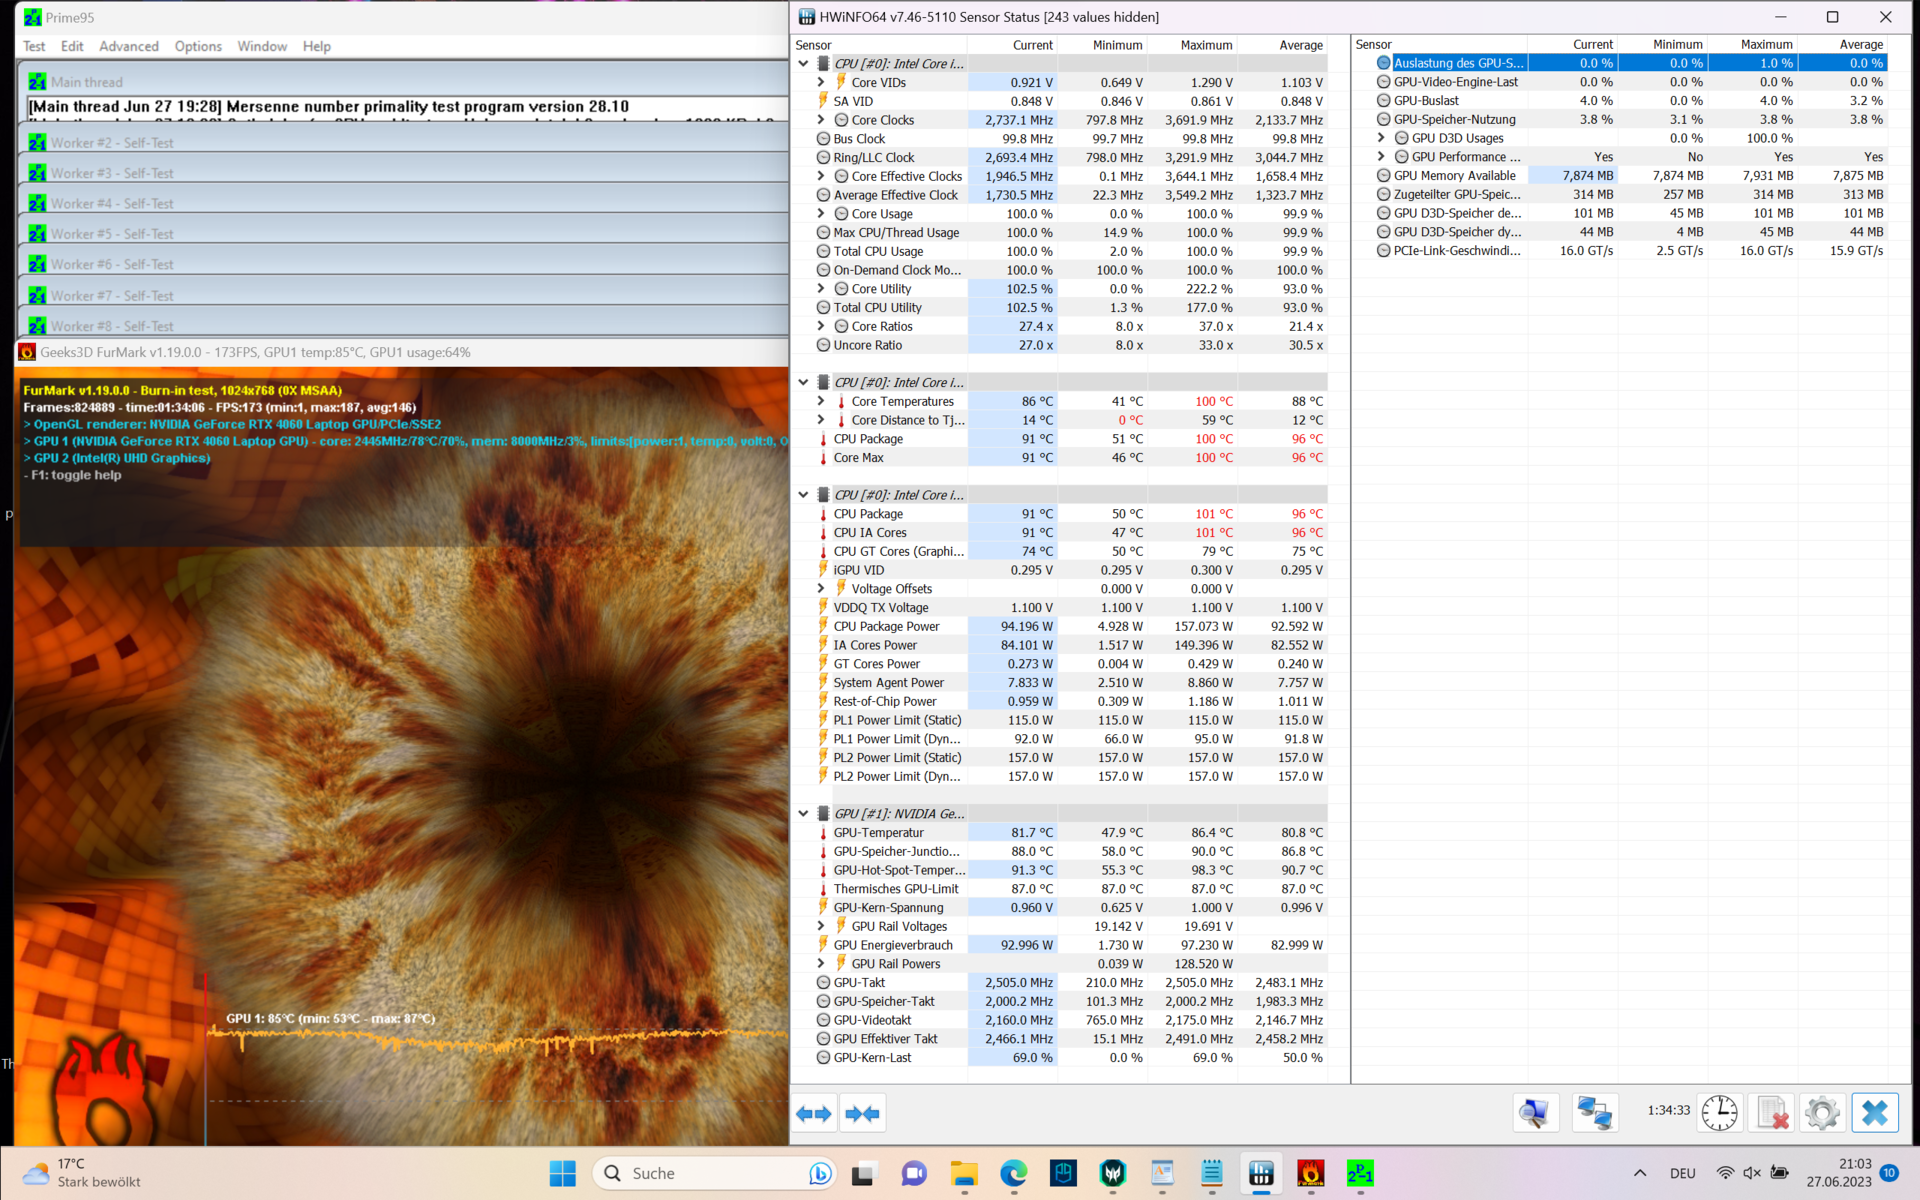
En la prueba de estrés (FurMark + Prime95), tras un minuto, la velocidad de reloj de los núcleos P cayó de 3,6 GHz a sólo 0,85 GHz, muy por debajo de la velocidad de reloj base de 2,1 GHz. Al activar el modo turbo y los "ventiladores al máximo", la velocidad de reloj no bajó hasta pasados 3 minutos (a ~1,1 GHz). La CPU se calienta hasta los 86 °C (y 83 °C, respectivamente) y consume continuamente 100 vatios.
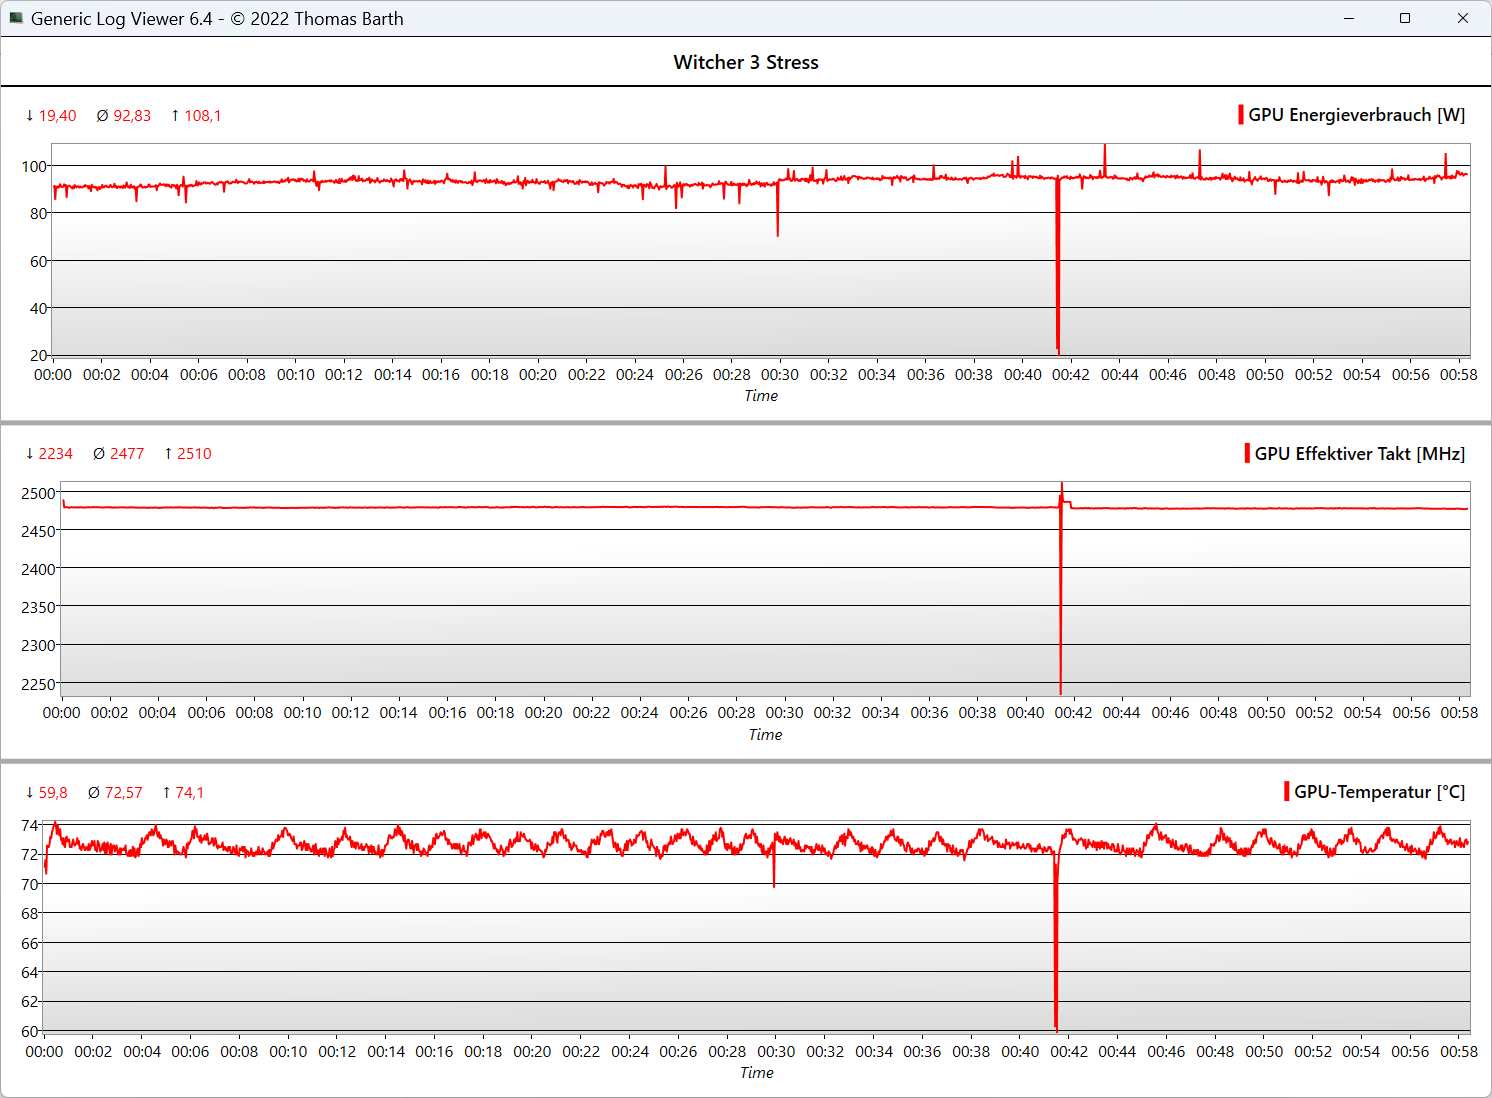
La GPU mantiene más o menos su velocidad de reloj entre 2.500 y 2.600 MHz, no se calienta demasiado (81 °C) y consume 115 vatios. En la prueba de estrés de Witcher 3 y en casi todos los juegos, laRTX 4060 sólo necesita 100 vatios para alcanzar su velocidad de reloj máxima. Sin embargo, en los modelos conRTX 4080eso debería ser diferente.
En la prueba de estrés de GPU pura (FurMark), la GPU siguió casi alcanzando la velocidad de reloj máxima de unos 2.430 MHz, consumiendo 129 vatios y calentándose hasta los 76 °C. En modo turbo + ventiladores al máximo, se alcanzan los 2.625 MHz (ligero overclocking), consumiendo 136 vatios (un pico de 139 vatios), mientras que la GPU se mantiene relativamente fresca a 71,5 °C.
Incluso durante el estrés puro de la CPU, tras un minuto, los núcleos P sólo alcanzan los 0,92 GHz, ya que está limitado a 100 vatios, aunque la CPU sólo alcanza los 70 °C. El sistema de refrigeración claramente podría manejar más. Si se activa el modo turbo + ventiladores máximos, sigue a 1.45 GHz a 115 vatios y 73 °C. La posibilidad de elegir los límites PL habría sido sensata, especialmente al elegir una SKU con un Core i9-13900HX.
| @Modo de rendimiento | Reloj de los núcleos P/ E (GHz) | Reloj de la GPU (MHz) | Temperatura mediadela CPU (°C) | Temperatura media de la GPU (°C) |
| Sistema en reposo | 0,07 / 0,07 | - | 33 | 37 |
| Prime95Stress | 0,95 / 3,5 | 10 | 71 | 49 |
| Prime95+ FurMark | 0,85 / 3,4 | 2.500 | 86 | 81 |
| FurMark Stress | 0,55 / 0,02 | 2.450 | 54 | 76 |
| Witcher 3 Stress | 1,6 / 0,02 | 2.475 | 61 | 73 |
Altavoces
Los altavoces estéreo descendentes de 2 vatios producen medios y agudos equilibrados, pero los graves están casi completamente ausentes, mientras que el volumen máximo de 76,1 dB(A) es más bien medio. Los portátiles para juegos de nuestra comparativa no lo hacen mejor.
Como alternativa, elAsus ROG Strix G16o el Lenovo Legion Pro 7ofrece mejor sonido o puedes usar unos auriculares o un sistema de sonido a través de la clavija de audio o Bluetooth.
Acer Predator Helios 16 PH16-71-731Q análisis de audio
(±) | la sonoridad del altavoz es media pero buena (76.12 dB)
Graves 100 - 315 Hz
(-) | casi sin bajos - de media 15% inferior a la mediana
(-) | los graves no son lineales (15% delta a la frecuencia anterior)
Medios 400 - 2000 Hz
(+) | medios equilibrados - a sólo 2.5% de la mediana
(+) | los medios son lineales (5.9% delta a la frecuencia anterior)
Altos 2 - 16 kHz
(+) | máximos equilibrados - a sólo 2.9% de la mediana
(±) | la linealidad de los máximos es media (8.4% delta a frecuencia anterior)
Total 100 - 16.000 Hz
(+) | el sonido global es lineal (13.6% de diferencia con la mediana)
En comparación con la misma clase
» 20% de todos los dispositivos probados de esta clase eran mejores, 7% similares, 73% peores
» El mejor tuvo un delta de 6%, la media fue 18%, el peor fue ###max##%
En comparación con todos los dispositivos probados
» 15% de todos los dispositivos probados eran mejores, 4% similares, 82% peores
» El mejor tuvo un delta de 4%, la media fue 23%, el peor fue ###max##%
Lenovo Legion Pro 5 16IRX8 análisis de audio
(±) | la sonoridad del altavoz es media pero buena (72.7 dB)
Graves 100 - 315 Hz
(-) | casi sin bajos - de media 23.7% inferior a la mediana
(±) | la linealidad de los graves es media (10.7% delta a frecuencia anterior)
Medios 400 - 2000 Hz
(+) | medios equilibrados - a sólo 3.8% de la mediana
(±) | la linealidad de los medios es media (7.1% delta respecto a la frecuencia anterior)
Altos 2 - 16 kHz
(+) | máximos equilibrados - a sólo 3.7% de la mediana
(+) | los máximos son lineales (6.7% delta a la frecuencia anterior)
Total 100 - 16.000 Hz
(±) | la linealidad del sonido global es media (21.9% de diferencia con la mediana)
En comparación con la misma clase
» 79% de todos los dispositivos probados de esta clase eran mejores, 6% similares, 16% peores
» El mejor tuvo un delta de 6%, la media fue 18%, el peor fue ###max##%
En comparación con todos los dispositivos probados
» 63% de todos los dispositivos probados eran mejores, 7% similares, 30% peores
» El mejor tuvo un delta de 4%, la media fue 23%, el peor fue ###max##%
Gestión de la energía: Alto consumo en reposo, menor duración de la batería
Consumo de energía
Con 20 vatios, el consumo en inactivo es muy alto, incluso para un sistema Intel HX mientras que los sistemas AMD HS ofrecen los mejores resultados entre los competidores de Acer.
175 vatios cuando se juega es relativamente bajo, sin embargo, casi todos los portátiles RTX 4060 registran este valor ya que la GPU alcanza su máxima velocidad de reloj a 100 vatios. sólo se alcanzan de 240 vatios a 276 vatios en la prueba de estrés diaria (y no típica), siendo fácilmente absorbida por la fuente de alimentación de 330 vatios.
| Off / Standby | |
| Ocioso | |
| Carga |
|
Clave:
min: | |
| Acer Predator Helios 16 PH16-71-731Q i7-13700HX, GeForce RTX 4060 Laptop GPU, Micron 3400 1TB MTFDKBA1T0TFH, IPS-LED, 2560x1600, 16" | Acer Nitro 16 AN16-41 R7 7735HS, GeForce RTX 4070 Laptop GPU, Samsung PM9A1 MZVL21T0HCLR, IPS, 2560x1600, 16" | Lenovo Legion Pro 5 16IRX8 i7-13700HX, GeForce RTX 4060 Laptop GPU, SK hynix PC801 HFS512GEJ9X115N, IPS, 2560x1600, 16" | Aorus 15X ASF i7-13700HX, GeForce RTX 4070 Laptop GPU, Gigabyte AG470S1TB-SI B10, IPS, 2560x1440, 15.6" | Asus TUF Gaming A16 FA617 R7 7735HS, Radeon RX 7600S, Micron 2400 MTFDKBA1T0QFM, IPS-Level, 1920x1200, 16" | Dell G15 5530 i7-13650HX, GeForce RTX 4060 Laptop GPU, SSTC CL4-3D512-Q11, IPS, 1920x1080, 15.6" | Medio NVIDIA GeForce RTX 4060 Laptop GPU | Media de la clase Gaming | |
|---|---|---|---|---|---|---|---|---|
| Power Consumption | 11% | -24% | 6% | 29% | 18% | 18% | 2% | |
| Idle Minimum * (Watt) | 15.9 | 11.6 27% | 24.5 -54% | 11 31% | 8 50% | 8.4 47% | 11.5 ? 28% | 13 ? 18% |
| Idle Average * (Watt) | 20.5 | 15.6 24% | 29.2 -42% | 16 22% | 11 46% | 14.98 27% | 16 ? 22% | 19 ? 7% |
| Idle Maximum * (Watt) | 20.9 | 16.5 21% | 34.3 -64% | 24 -15% | 16 23% | 15.56 26% | 20.3 ? 3% | 24.6 ? -18% |
| Load Average * (Watt) | 106 | 155 -46% | 98.7 7% | 104 2% | 97 8% | 96.8 9% | 92.9 ? 12% | 110.7 ? -4% |
| Witcher 3 ultra * (Watt) | 175 | 154.8 12% | 178.6 -2% | 185.4 -6% | 161.5 8% | 186 -6% | ||
| Load Maximum * (Watt) | 276 | 205 26% | 249.6 10% | 272 1% | 168 39% | 271.42 2% | 210 ? 24% | 259 ? 6% |
* ... más pequeño es mejor
Power consumption Witcher 3 / stress test
Power consumption with an external monitor
Duración de la batería
Con un brillo de 150 cd/m² mientras se navega por Internet, y una frecuencia de actualización variable de 120 a 240 Hz, la duración de la batería del Helios 16 mide algo más de 5,5 horas y se sitúa más o menos en la media de los portátiles para juegos. Los sistemas AMD, elAcer Nitro 16yAsus TUF Gaming A16tienen una autonomía mucho mayor, de 9 y 12 horas respectivamente. Con sólo 3,5 horas, elLegion Pro 5 16 se queda atrás.
Tras media hora, la batería vuelve a cargarse al 50% y el 100% tarda unas 1.15 horas. También se puede cargar el portátil por USB-C, pero es más lento.
| Acer Predator Helios 16 PH16-71-731Q i7-13700HX, GeForce RTX 4060 Laptop GPU, 90 Wh | Acer Nitro 16 AN16-41 R7 7735HS, GeForce RTX 4070 Laptop GPU, 90 Wh | Lenovo Legion Pro 5 16IRX8 i7-13700HX, GeForce RTX 4060 Laptop GPU, 80 Wh | Aorus 15X ASF i7-13700HX, GeForce RTX 4070 Laptop GPU, 99 Wh | Asus TUF Gaming A16 FA617 R7 7735HS, Radeon RX 7600S, 90 Wh | Dell G15 5530 i7-13650HX, GeForce RTX 4060 Laptop GPU, 86 Wh | Media de la clase Gaming | |
|---|---|---|---|---|---|---|---|
| Duración de Batería | 65% | -46% | 48% | 58% | -9% | 33% | |
| H.264 (h) | 4.8 | 10.2 113% | 7.9 65% | 6.8 42% | 8.32 ? 73% | ||
| WiFi v1.3 (h) | 5.6 | 9 61% | 3.4 -39% | 8.2 46% | 12.1 116% | 6.5 16% | 7.11 ? 27% |
| Witcher 3 ultra (h) | 1.5 | 0.8 -47% | |||||
| Load (h) | 1.5 | 1.8 20% | 0.7 -53% | 2 33% | 1.5 0% | 0.8 -47% | 1.502 ? 0% |
| Reader / Idle (h) | 12.2 | 6.7 | 11.3 | 20.2 | 8.27 ? |
Pro
Contra
Veredicto: El sólido portátil para juegos RTX 4060 también puede ser silencioso
El portátil de juego Acer Predator Helios 16 tiene muchos puntos fuertes, pero también algunas pequeñas concesiones. Nos sorprendió positivamente la pantalla QHD rápida, de colores vivos y 240 Hz con 97 % DCI P3 y Dolby Vision, lo que significa que nada se interpone en el camino del trabajo creativo.
Combinado con la potencia de la CPU Intel HX y una igualmente potenteRTX 4060se obtiene un portátil para juegos de gama media con muchos elementos de gama alta.
También nos impresionó la carcasa de metal a pesar de que el teclado se flexiona un poco. Las teclas en sí podrían tener más respuesta, pero, a la inversa, nos gustó la iluminación mini-LED de las teclas, de colores particularmente vivos y que ahorra energía. No obstante, la duración de la batería es mediocre y probablemente será aún menor cuando se use la pantalla mini-LED disponible opcionalmente - especialmente cuando se combina con la SKU más potente (Core i9-13900HX + RTX 4080).
Rendimiento de alto nivel, una vívida pantalla QHD de 240 Hz y paz y tranquilidad al jugar suenan como la receta ideal para un portátil de juegos y una estación de trabajo creativa. Sin embargo, tenemos que aceptar algunas concesiones.
El potente sistema de refrigeración ayuda a mantener bajas las temperaturas internas, garantizando un rendimiento silencioso y estable, especialmente en los modos equilibrado o silencioso. Lo que echamos de menos fueron los límites de potencia personalizables individualmente para llevar el sistema de refrigeración al límite. La ralentización del SSD relacionada con la temperatura parece ser una mancha en una imagen general por lo demás positiva, con una limitación de la CPU aparentemente excesiva de 25 vatios en modo batería.
Con su variante SKU de análisis, el portátil cuesta actualmente 1.900 y 1.750 $ respectivamente, pero a veces también es posible comprar un modelo más barato por unos 1.450 $ con un display de 165 Hz algo menos colorido. Sin embargo, a menudo es posible encontrar a su principal competidor, el Lenovo Legion Pro 5 16 por unos 1.400 $ con el dispositivo ofreciendo casi las mismas prestaciones. Las diferencias sólo se aprecian en los detalles, como la ausencia de Advanced Optimus, un teclado mejor y una pantalla QHD de 165 Hz que carece de cobertura DCI P3.
Además, el Asus ROG Strix G16 es una opción interesante, viene con una RTX 4060 y también cuesta unos 1.800 dólares. Con esta inversión también conseguirás mejores altavoces, mayor duración de batería, un teclado con feedback más pronunciado y tiempos de respuesta de pantalla más rápidos.
Precio y disponibilidad
El Acer Predator Helios 16 con el número de modelo PH16-71-74UU (Core i7-13700HX, RTX 4060 y una pantalla de 165 Hz) cuesta actualmente 1650 dólares en Amazon. El modelo mini-LED, combinado con un Core i9-13900HX y la RTX 4080, está actualmente agotado.
Acer Predator Helios 16 PH16-71-731Q
- 07/05/2023 v7 (old)
Marvin Gollor
Transparencia
La selección de los dispositivos que se van a reseñar corre a cargo de nuestro equipo editorial. La muestra de prueba fue proporcionada al autor en calidad de préstamo por el fabricante o el minorista a los efectos de esta reseña. El prestamista no tuvo ninguna influencia en esta reseña, ni el fabricante recibió una copia de la misma antes de su publicación. No había ninguna obligación de publicar esta reseña. Como empresa de medios independiente, Notebookcheck no está sujeta a la autoridad de fabricantes, minoristas o editores.
Así es como prueba Notebookcheck
Cada año, Notebookcheck revisa de forma independiente cientos de portátiles y smartphones utilizando procedimientos estandarizados para asegurar que todos los resultados son comparables. Hemos desarrollado continuamente nuestros métodos de prueba durante unos 20 años y hemos establecido los estándares de la industria en el proceso. En nuestros laboratorios de pruebas, técnicos y editores experimentados utilizan equipos de medición de alta calidad. Estas pruebas implican un proceso de validación en varias fases. Nuestro complejo sistema de clasificación se basa en cientos de mediciones y puntos de referencia bien fundamentados, lo que mantiene la objetividad.Price comparison

