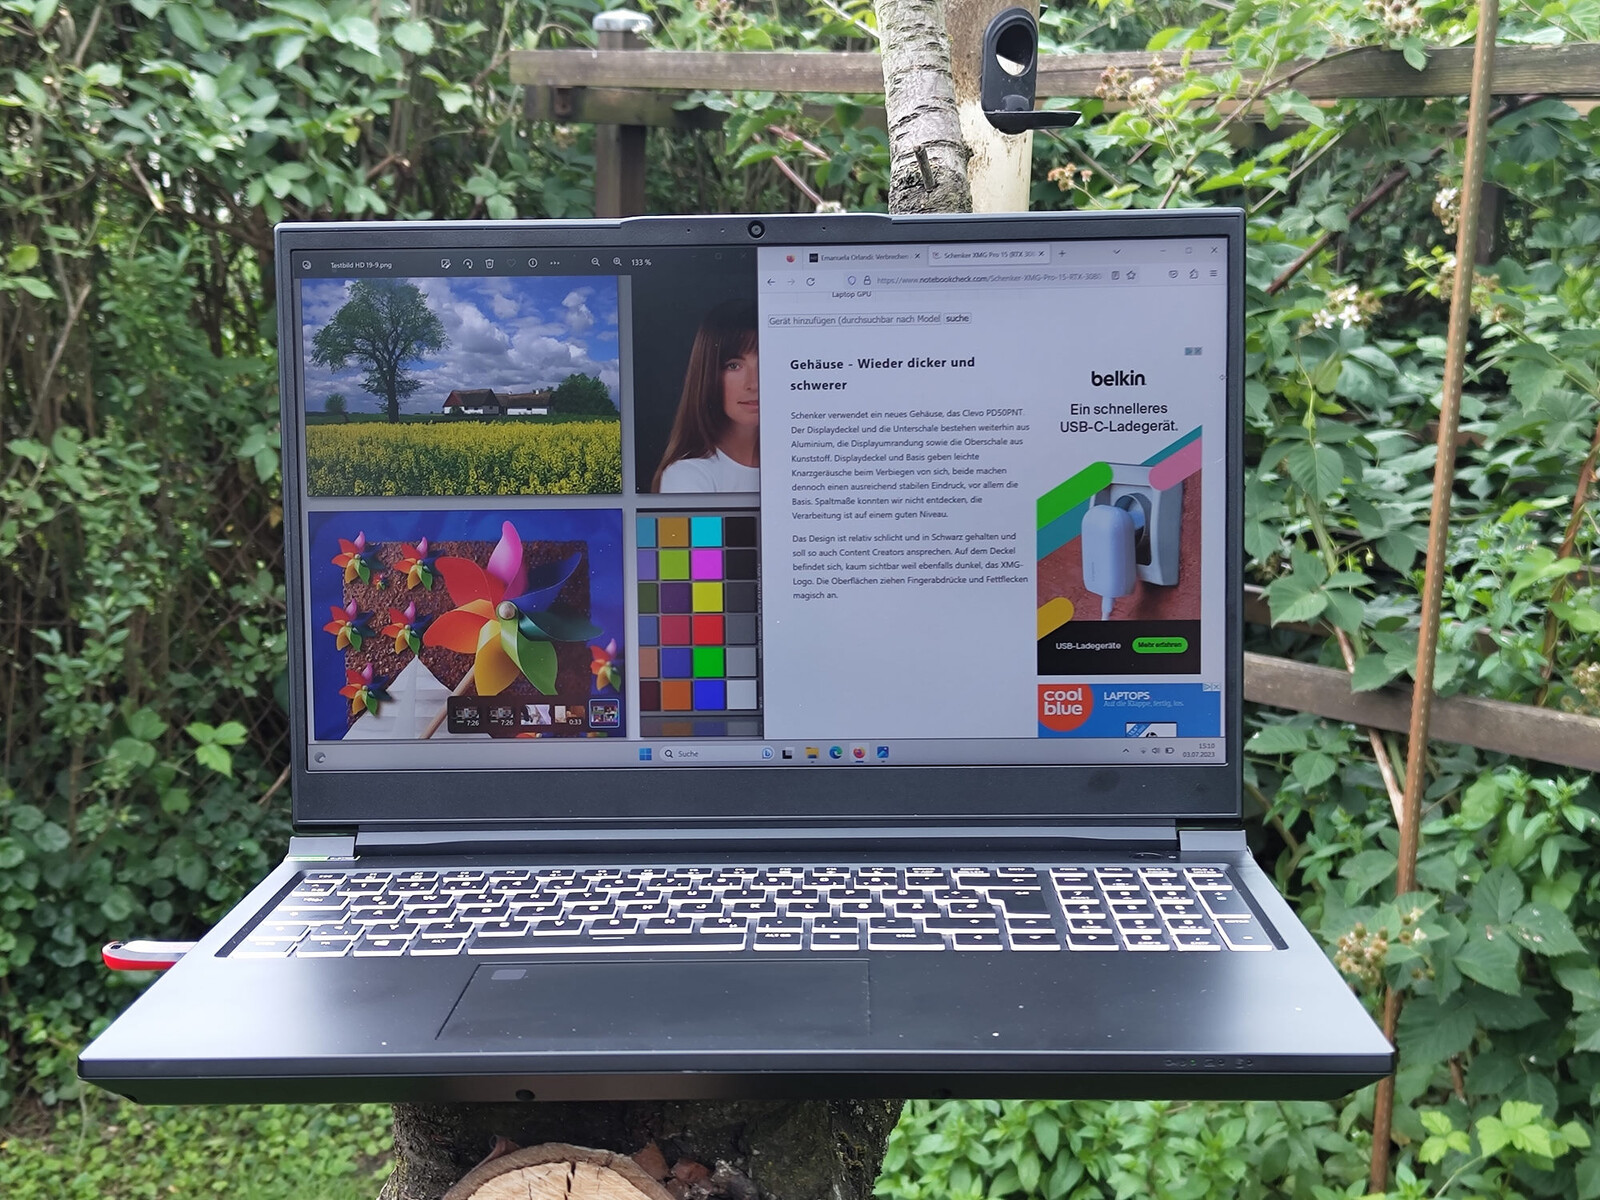
Análisis del portátil para juegos Schenker XMG Pro 15 E23 (PD50SND-G): Por el equilibrio entre trabajo y ocio
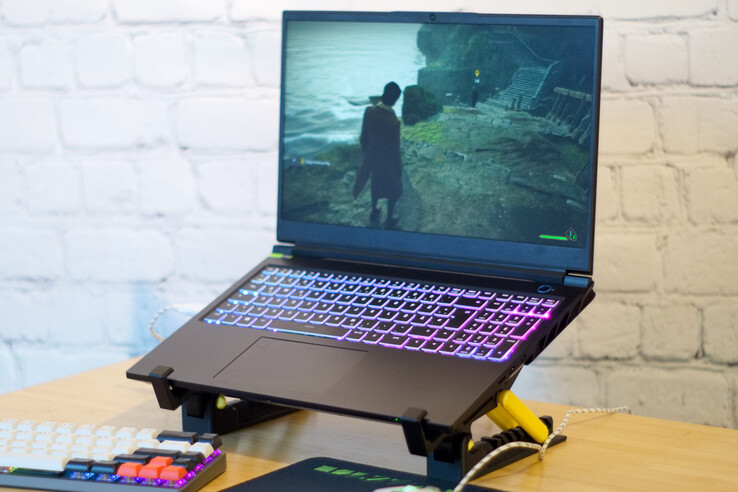
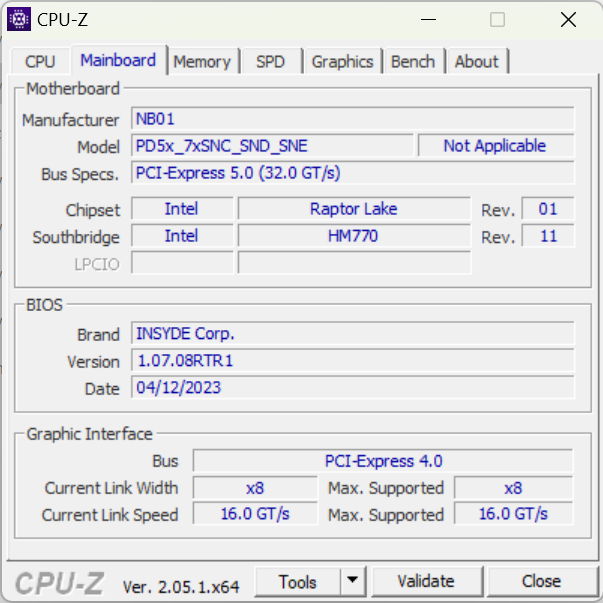
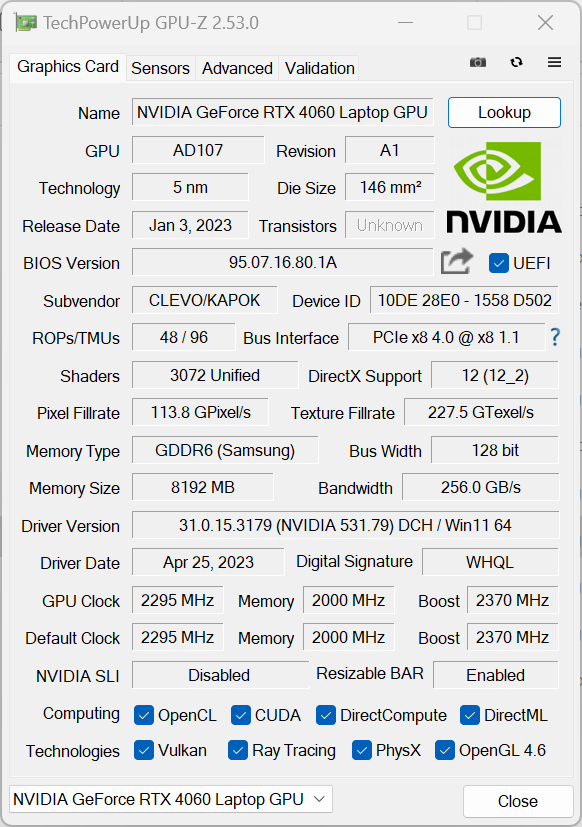
Los portátiles Schenker se actualizan con regularidad y el año pasado analizamos dos de los predecesores del XMG Pro 15. Uno conTiger Lake CPUy otro con Alder Lakey ambos con una RTX 3080. En cuanto al procesador, nuestro dispositivo de análisis está equipado con la última generación Raptor Lake y ha optado por unaNvidia GeForce RTX 4060. Pero, el portátil no sólo ha recibido ajustes internos ya que el diseño también ha recibido un ligero cambio de imagen. El dispositivo se basa ahora en el barebone Clevo PD50SND-G.
Una comparación con el predecesor es interesante porque aunque la tarjeta gráfica ahora proviene de la más reciente generación Ada Lovelace de Nvidia, su clase se ha reducido de 80 a 60. Otra opción de configuración es el modeloRTX 4070. Ambas tarjetas gráficas funcionan entre 140 y 150 vatios. El Pro 15 E23 ha logrado un rendimiento impresionante y se mantiene bien en comparación con portátiles para juegos como el Dell G15 5530 o elAorus 15X ASF. Un poco más allá de este nivel está elAsus ZenBook Pro 14 Duo. Sin embargo, el portátil multimedia también presume de altos fps en muchos títulos actuales.
Posibles contendientes en la comparación
Valoración | Fecha | Modelo | Peso | Altura | Tamaño | Resolución | Precio |
|---|---|---|---|---|---|---|---|
| 86.2 % v7 (old) | 07/2023 | Schenker XMG Pro 15 (E23) i9-13900HX, GeForce RTX 4060 Laptop GPU | 2.4 kg | 24.9 mm | 15.60" | 2560x1440 | |
| 86.9 % v7 (old) | 07/2022 | Schenker XMG Pro 15 (i7-12700H, RTX 3080 Ti) i7-12700H, GeForce RTX 3080 Ti Laptop GPU | 2.4 kg | 25 mm | 15.60" | 2560x1440 | |
| 84.2 % v7 (old) | 06/2023 | Dell G15 5530 i7-13650HX, GeForce RTX 4060 Laptop GPU | 3 kg | 26.95 mm | 15.60" | 1920x1080 | |
| 86.3 % v7 (old) | 06/2023 | Asus TUF A15 FA507 R7 7735HS, GeForce RTX 4050 Laptop GPU | 2.2 kg | 24.9 mm | 15.60" | 1920x1080 | |
| 86.2 % v7 (old) | 04/2023 | Aorus 15X ASF i7-13700HX, GeForce RTX 4070 Laptop GPU | 2.3 kg | 19.7 mm | 15.60" | 2560x1440 | |
| 87 % v7 (old) | 06/2023 | Asus ZenBook Pro 14 Duo UX8402VV-P1021W i9-13900H, GeForce RTX 4060 Laptop GPU | 1.8 kg | 21 mm | 14.50" | 2880x1800 | |
| 82.4 % v7 (old) | 04/2023 | MSI Cyborg 15 A12VF i7-12650H, GeForce RTX 4060 Laptop GPU | 2 kg | 22.9 mm | 15.60" | 1920x1080 | |
| 88.4 % v7 (old) | 06/2023 | Alienware x16 R1 i9-13900HK, GeForce RTX 4080 Laptop GPU | 2.6 kg | 18.57 mm | 16.00" | 2560x1600 |
Caja y características - Alto contenido en metal
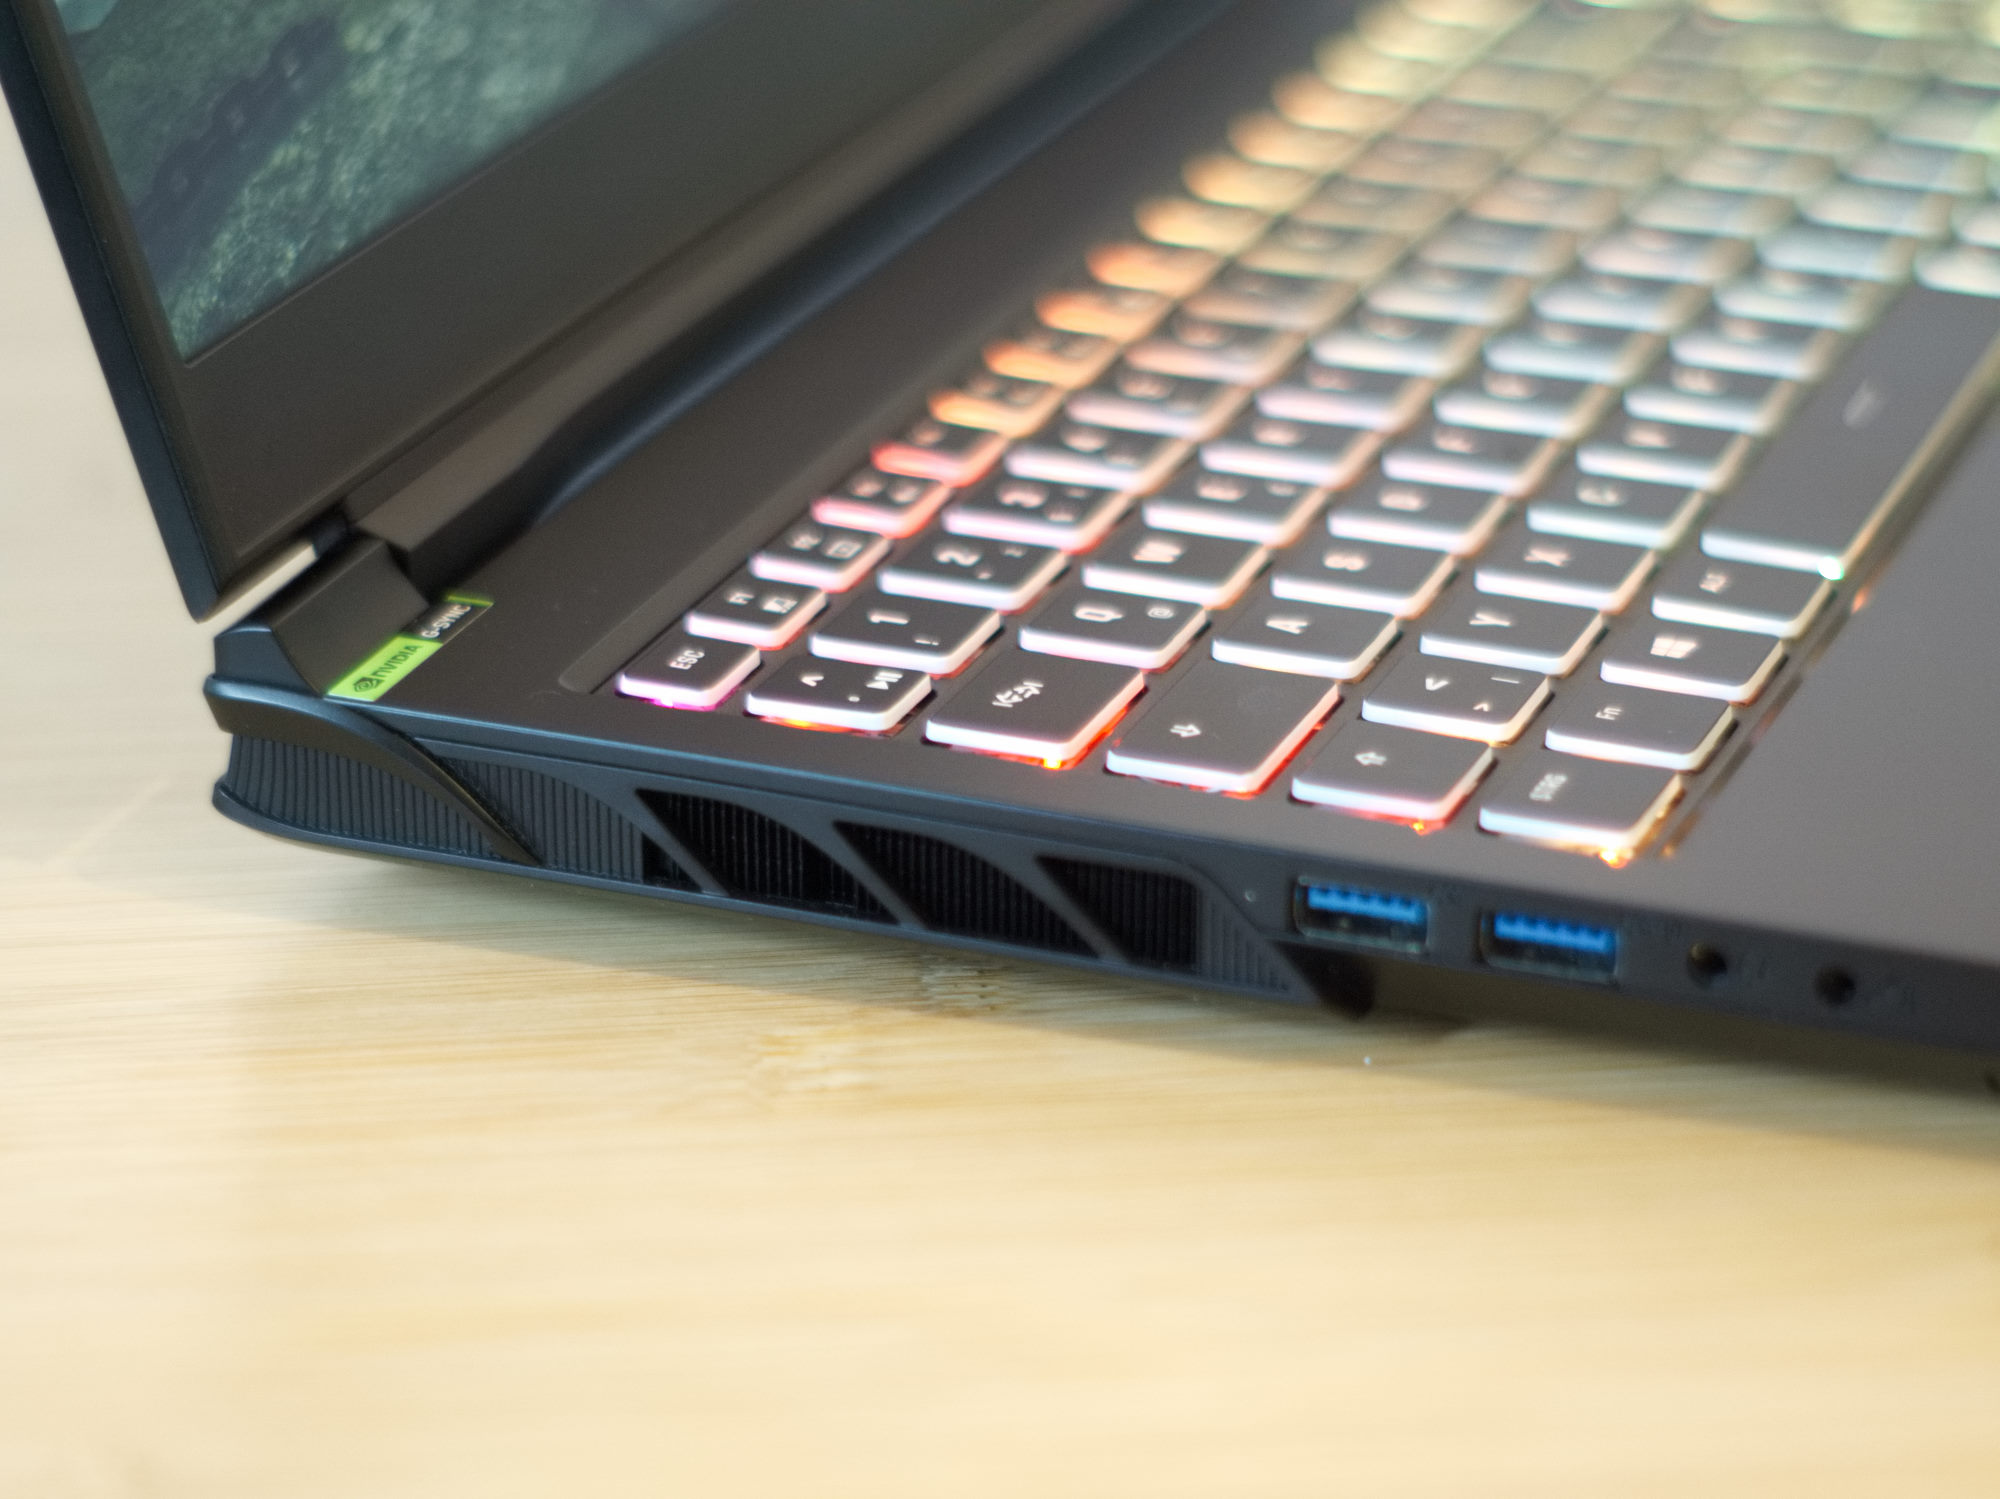
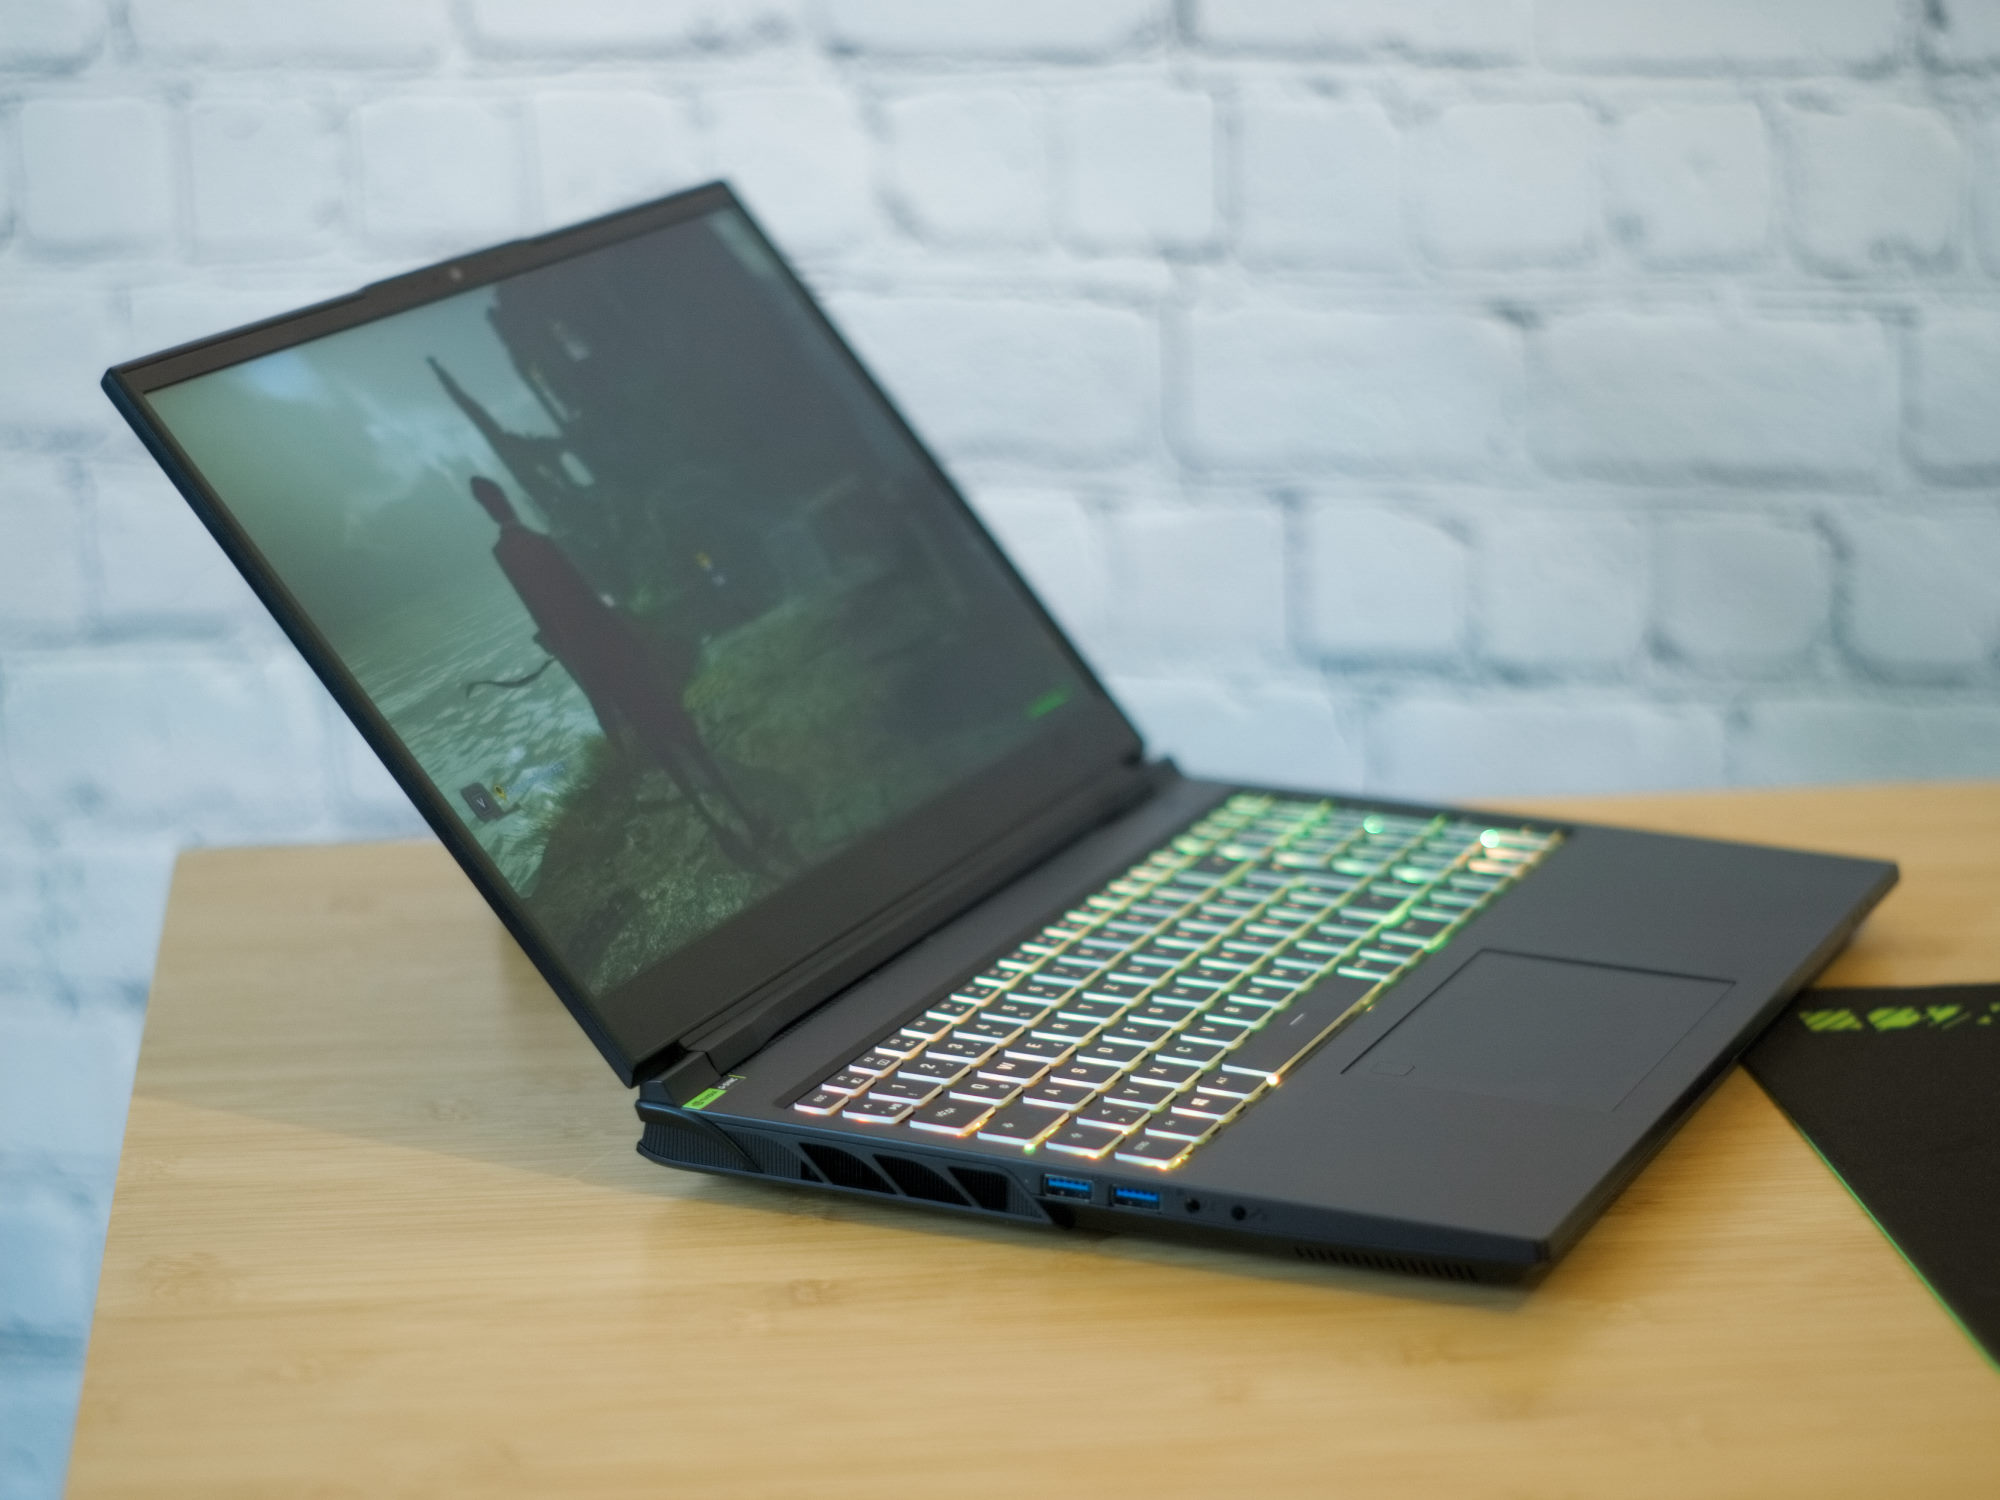
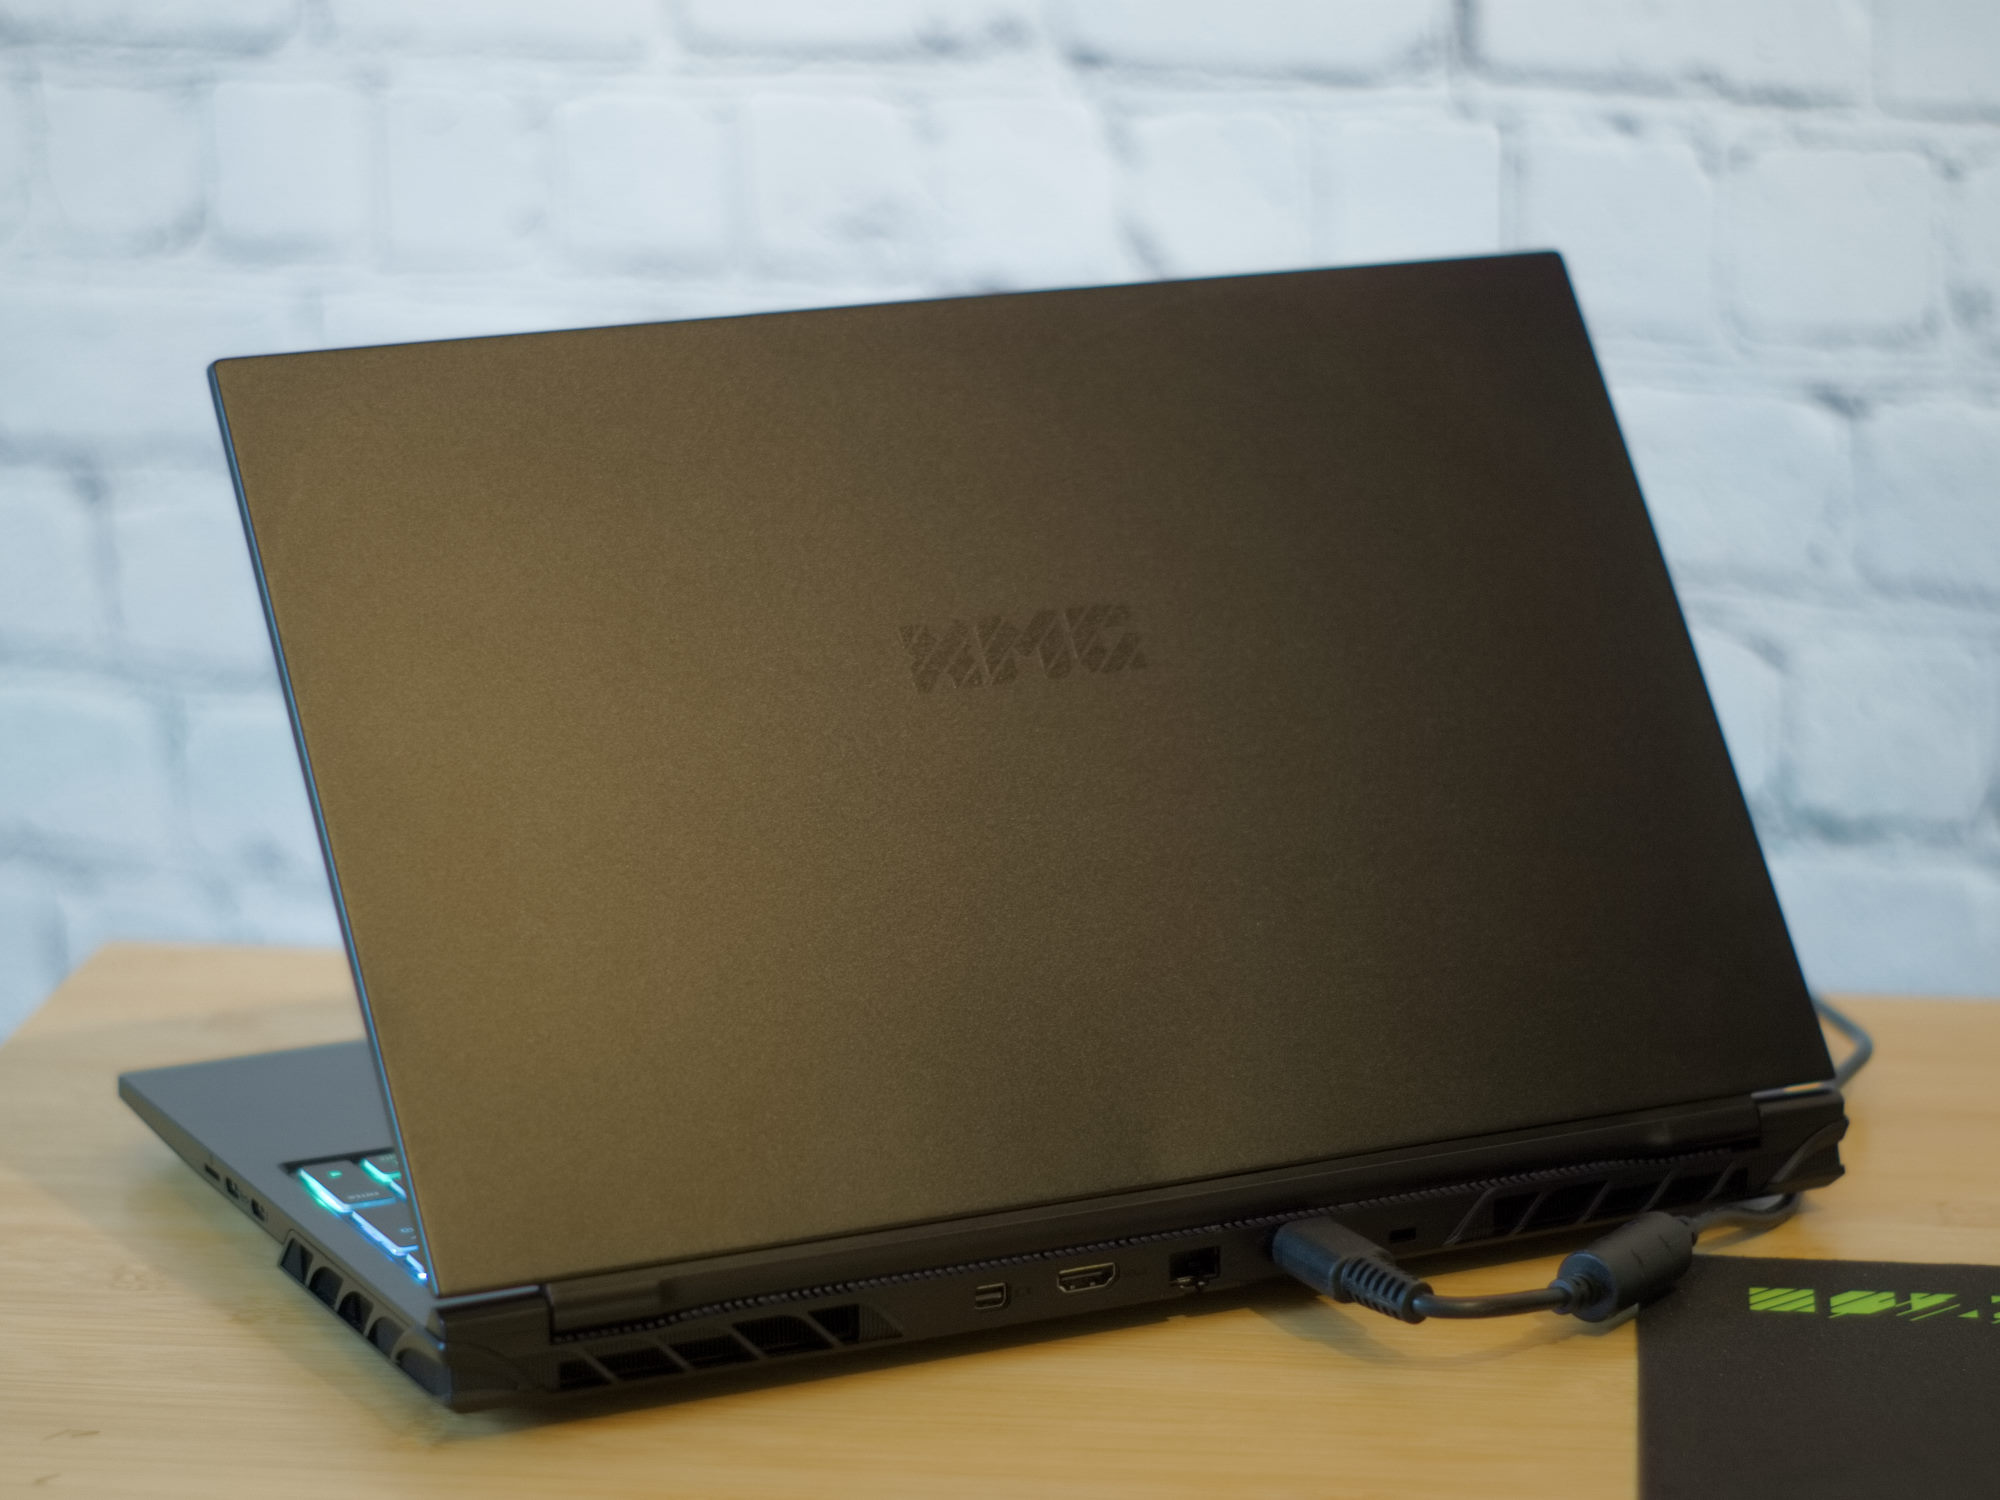
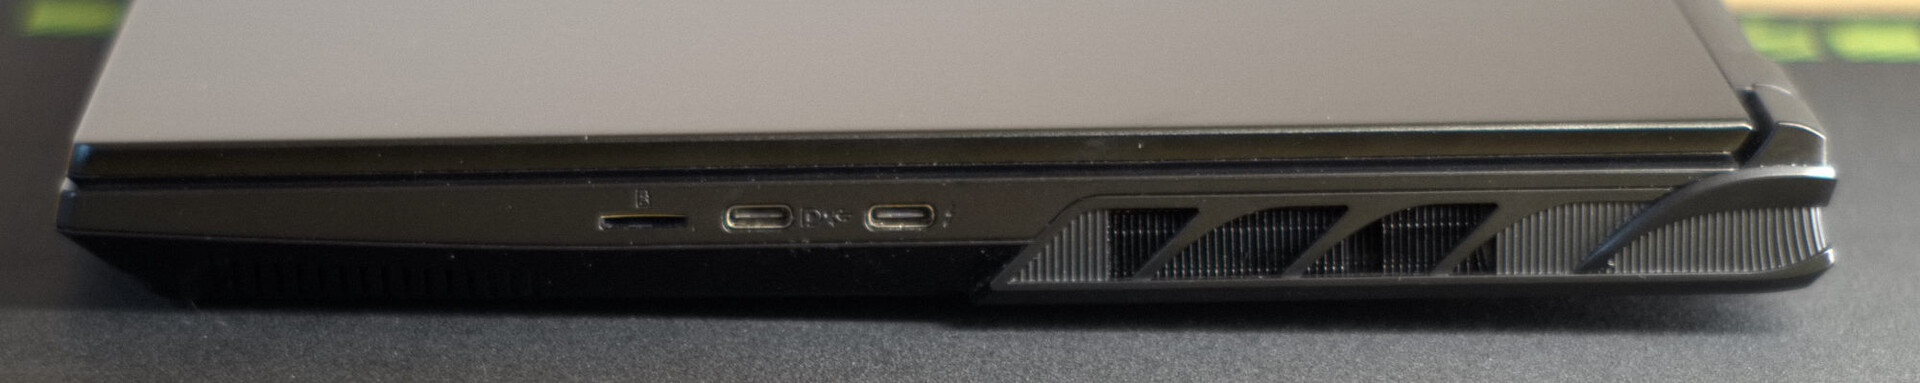
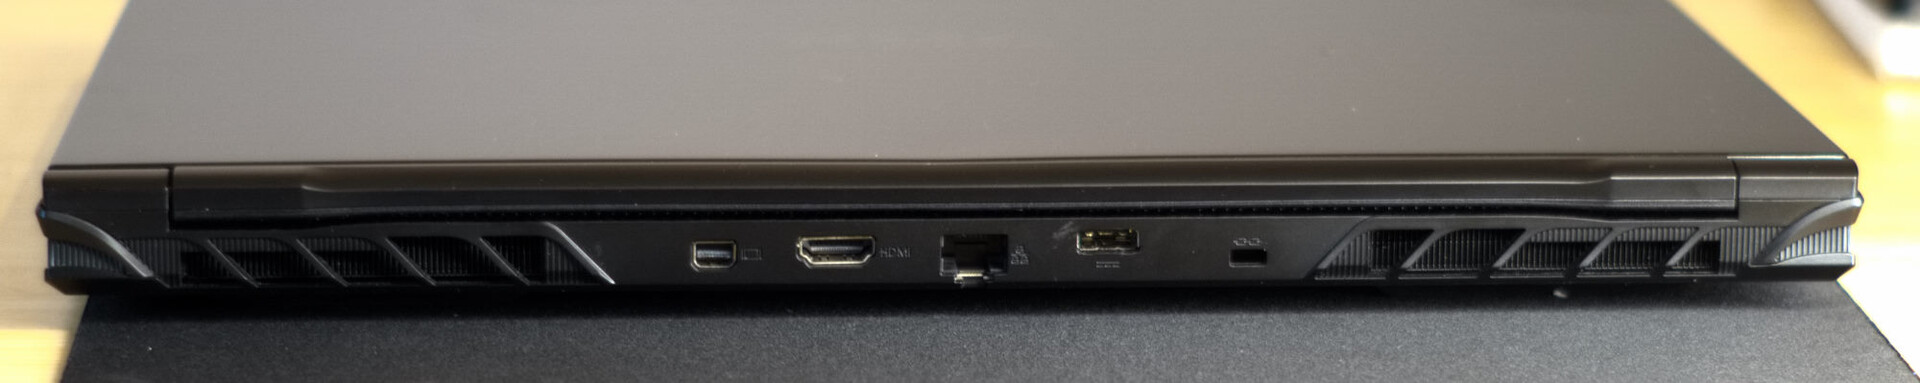
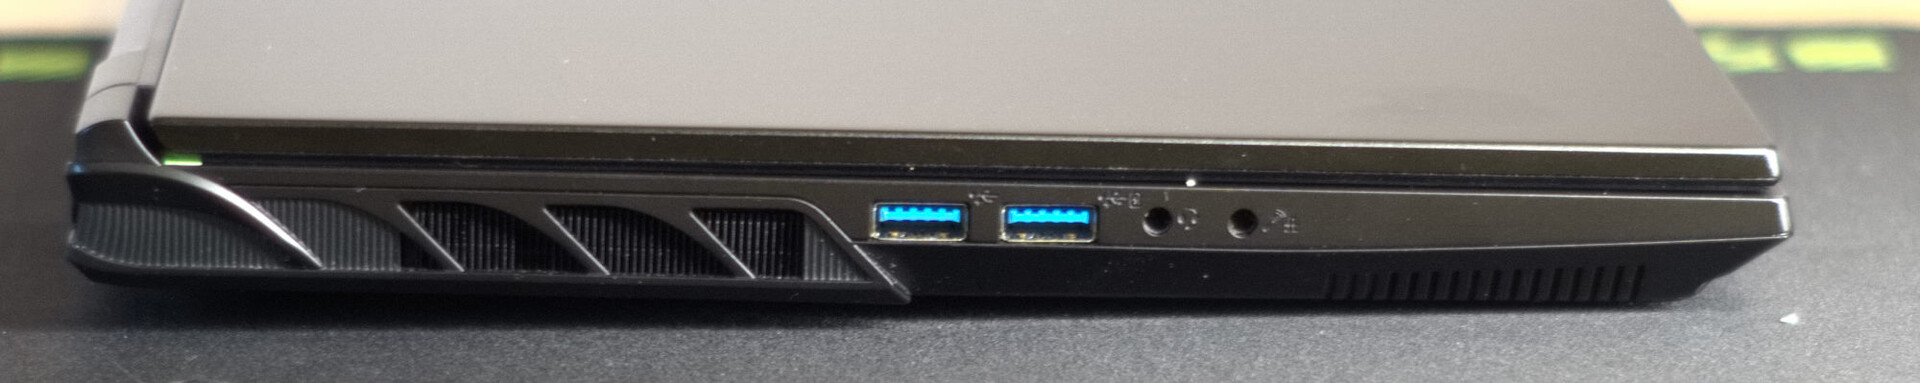
Comparado con su predecesor, el Pro 15 E23 ha recibido algunos ajustes de detalle menores. Los afectados son esencialmente las rejillas de ventilación de los laterales del portátil y un cambio de posición de la ranura RJ45 y una ranura USB-C. Ahora todos los puertos USB se encuentran en los laterales del dispositivo.
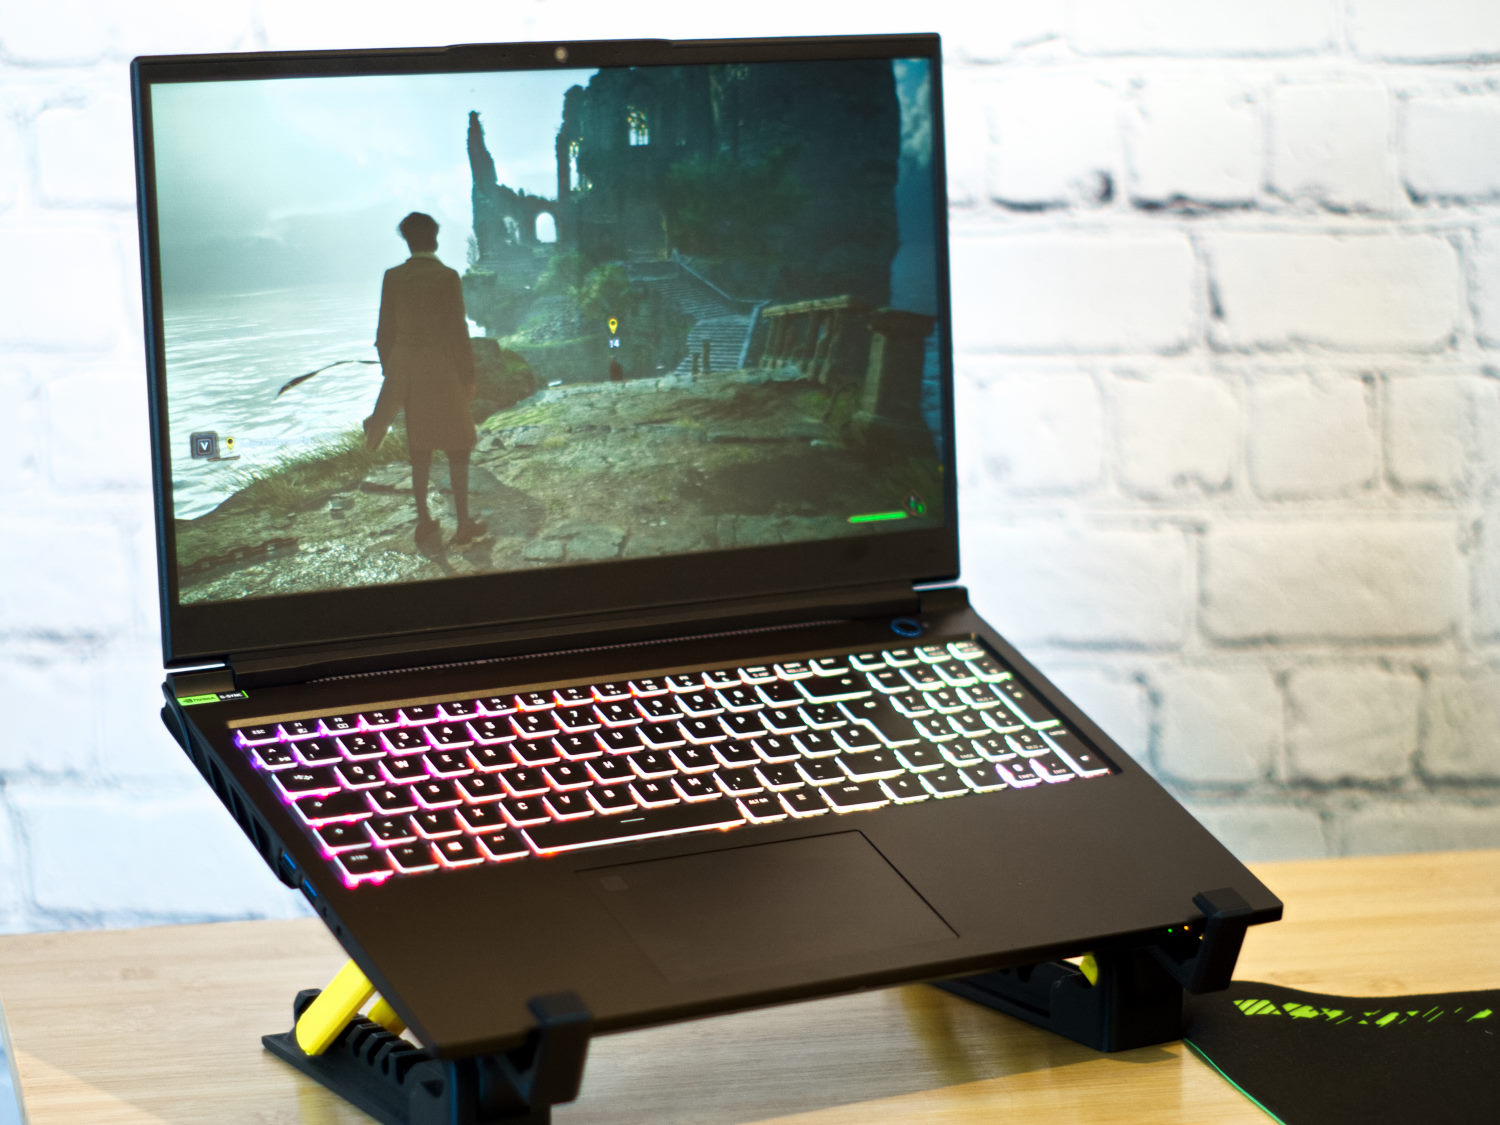
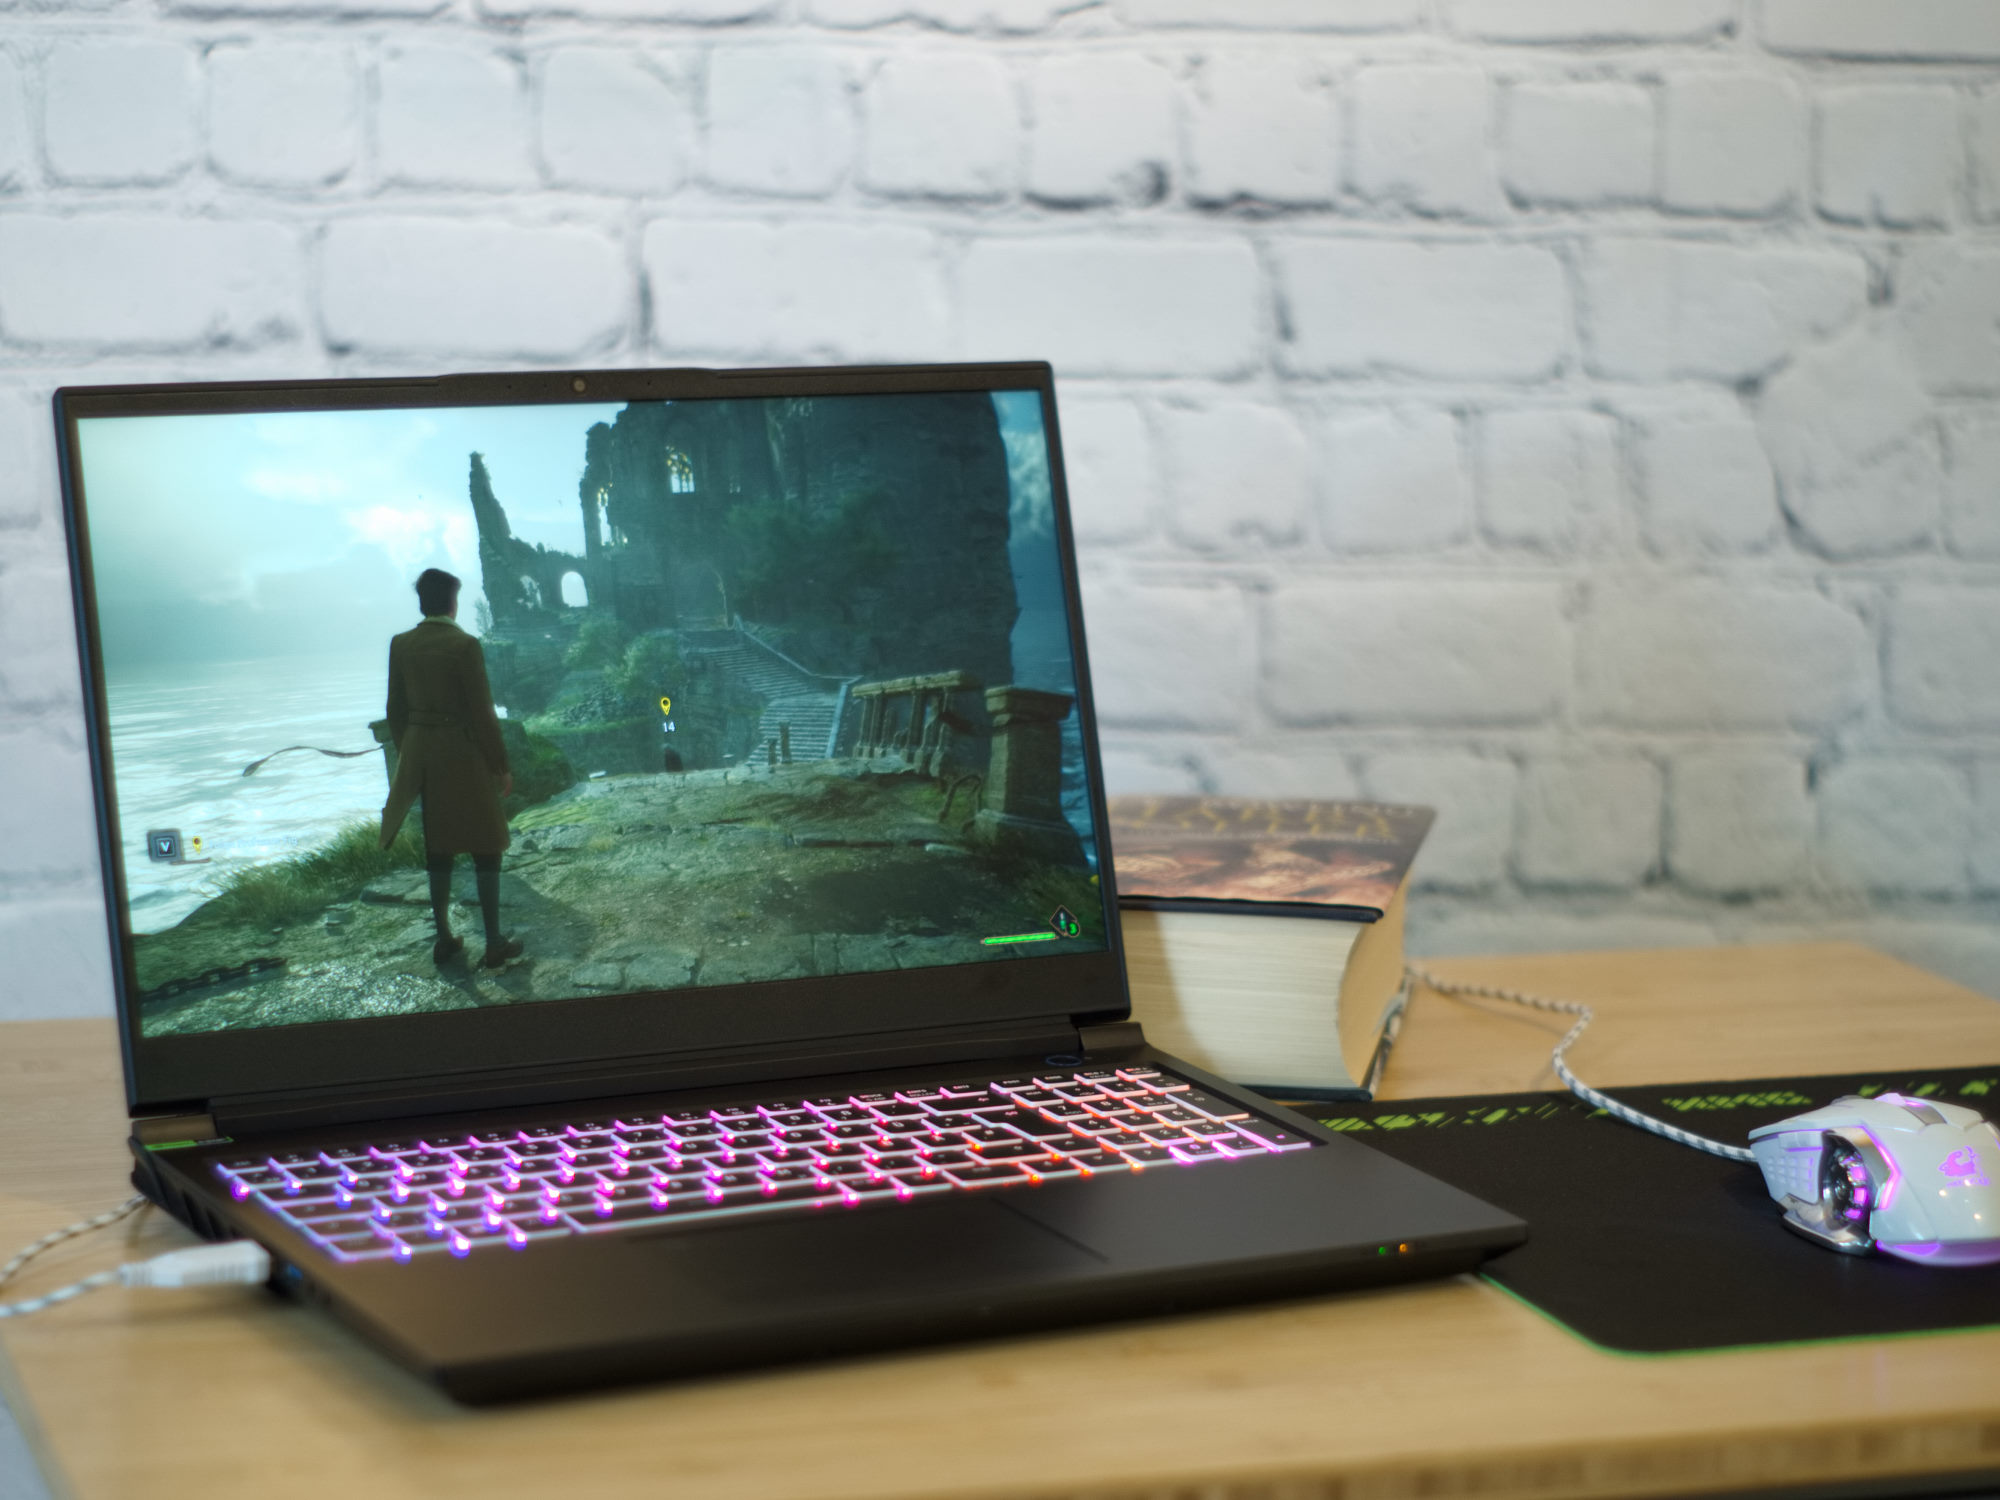
El diseño sigue siendo sobrio, negro y prácticamente sin marcas. Tanto el tamaño como el peso del portátil son casi idénticos a los de su predecesor. La tapa de la pantalla y la parte inferior de la carcasa siguen siendo de aluminio, mientras que la parte superior es de plástico. La pantalla está enmarcada por un borde de plástico de aspecto ancho que sólo tiene 5 mm de grosor en los laterales, un centímetro en la parte superior y dos centímetros en la inferior. Es posible obtener un pequeño chirrido de la pantalla y la base girándolas. Pero para conseguirlo hay que hacer un esfuerzo considerable, ya que todas las piezas del portátil están muy bien construidas y son muy sólidas. El teclado y la tapa de la pantalla sólo se flexionan un poco cuando se aplica mucha presión y las bisagras mantienen con seguridad el monitor en todas las posiciones imaginables entre 0° y 135°.

Lector de tarjetas SD, Wi-Fi y cámara web
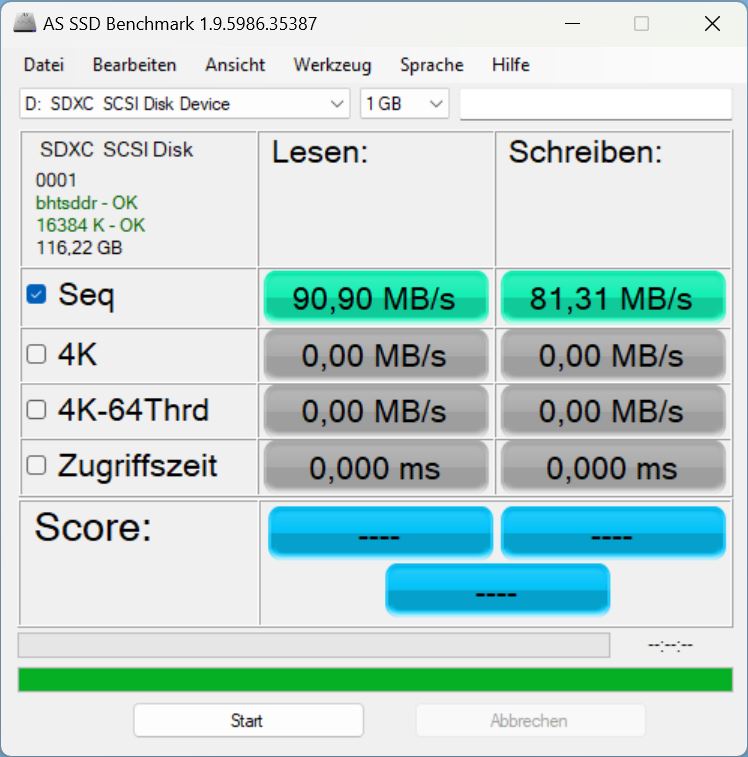
Das Pro 15 posee, al menos en comparación con muchos otros portátiles para juegos, un lector de tarjetas microSD. Combinado con nuestra microSD AV Pro (V60), registramos buenas velocidades de transferencia en el rango de 80 a 90 MB/s.
En la red de 6 GHz, el Intel Wi-Fi 6E AX211 del portátil demostró velocidades de datos en su mayoría excelentes, pero en la red de 5 GHz, arrojó cifras bastante por debajo de la media en lo que se refiere a velocidades de transferencia.
Para los streamers, la calidad de la webcam Full HD integrada es probablemente insuficiente, sobre todo en condiciones de poca luz. Sin embargo, puede utilizarse para videollamadas ocasionales.
| SD Card Reader | |
| average JPG Copy Test (av. of 3 runs) | |
| Media de la clase Gaming (20.9 - 210, n=54, últimos 2 años) | |
| Schenker XMG Pro 15 (E23) | |
| Schenker XMG Pro 15 (i7-12700H, RTX 3080 Ti) | |
| Asus ZenBook Pro 14 Duo UX8402VV-P1021W (AV Pro SD microSD 128 GB V60) | |
| Alienware x16 R1 (AV PRO microSD 128 GB V60) | |
| maximum AS SSD Seq Read Test (1GB) | |
| Alienware x16 R1 (AV PRO microSD 128 GB V60) | |
| Media de la clase Gaming (25.5 - 261, n=51, últimos 2 años) | |
| Schenker XMG Pro 15 (i7-12700H, RTX 3080 Ti) | |
| Schenker XMG Pro 15 (E23) | |
| Asus ZenBook Pro 14 Duo UX8402VV-P1021W (AV Pro SD microSD 128 GB V60) | |

 GeForce RTX 4060 Laptop GPU, i9-13900HX, Crucial P5 Plus 1TB CT1000P5PSSD8")
 GeForce RTX 4060 Laptop GPU, i9-13900HX, Crucial P5 Plus 1TB CT1000P5PSSD8")
Accesorios y mantenimiento
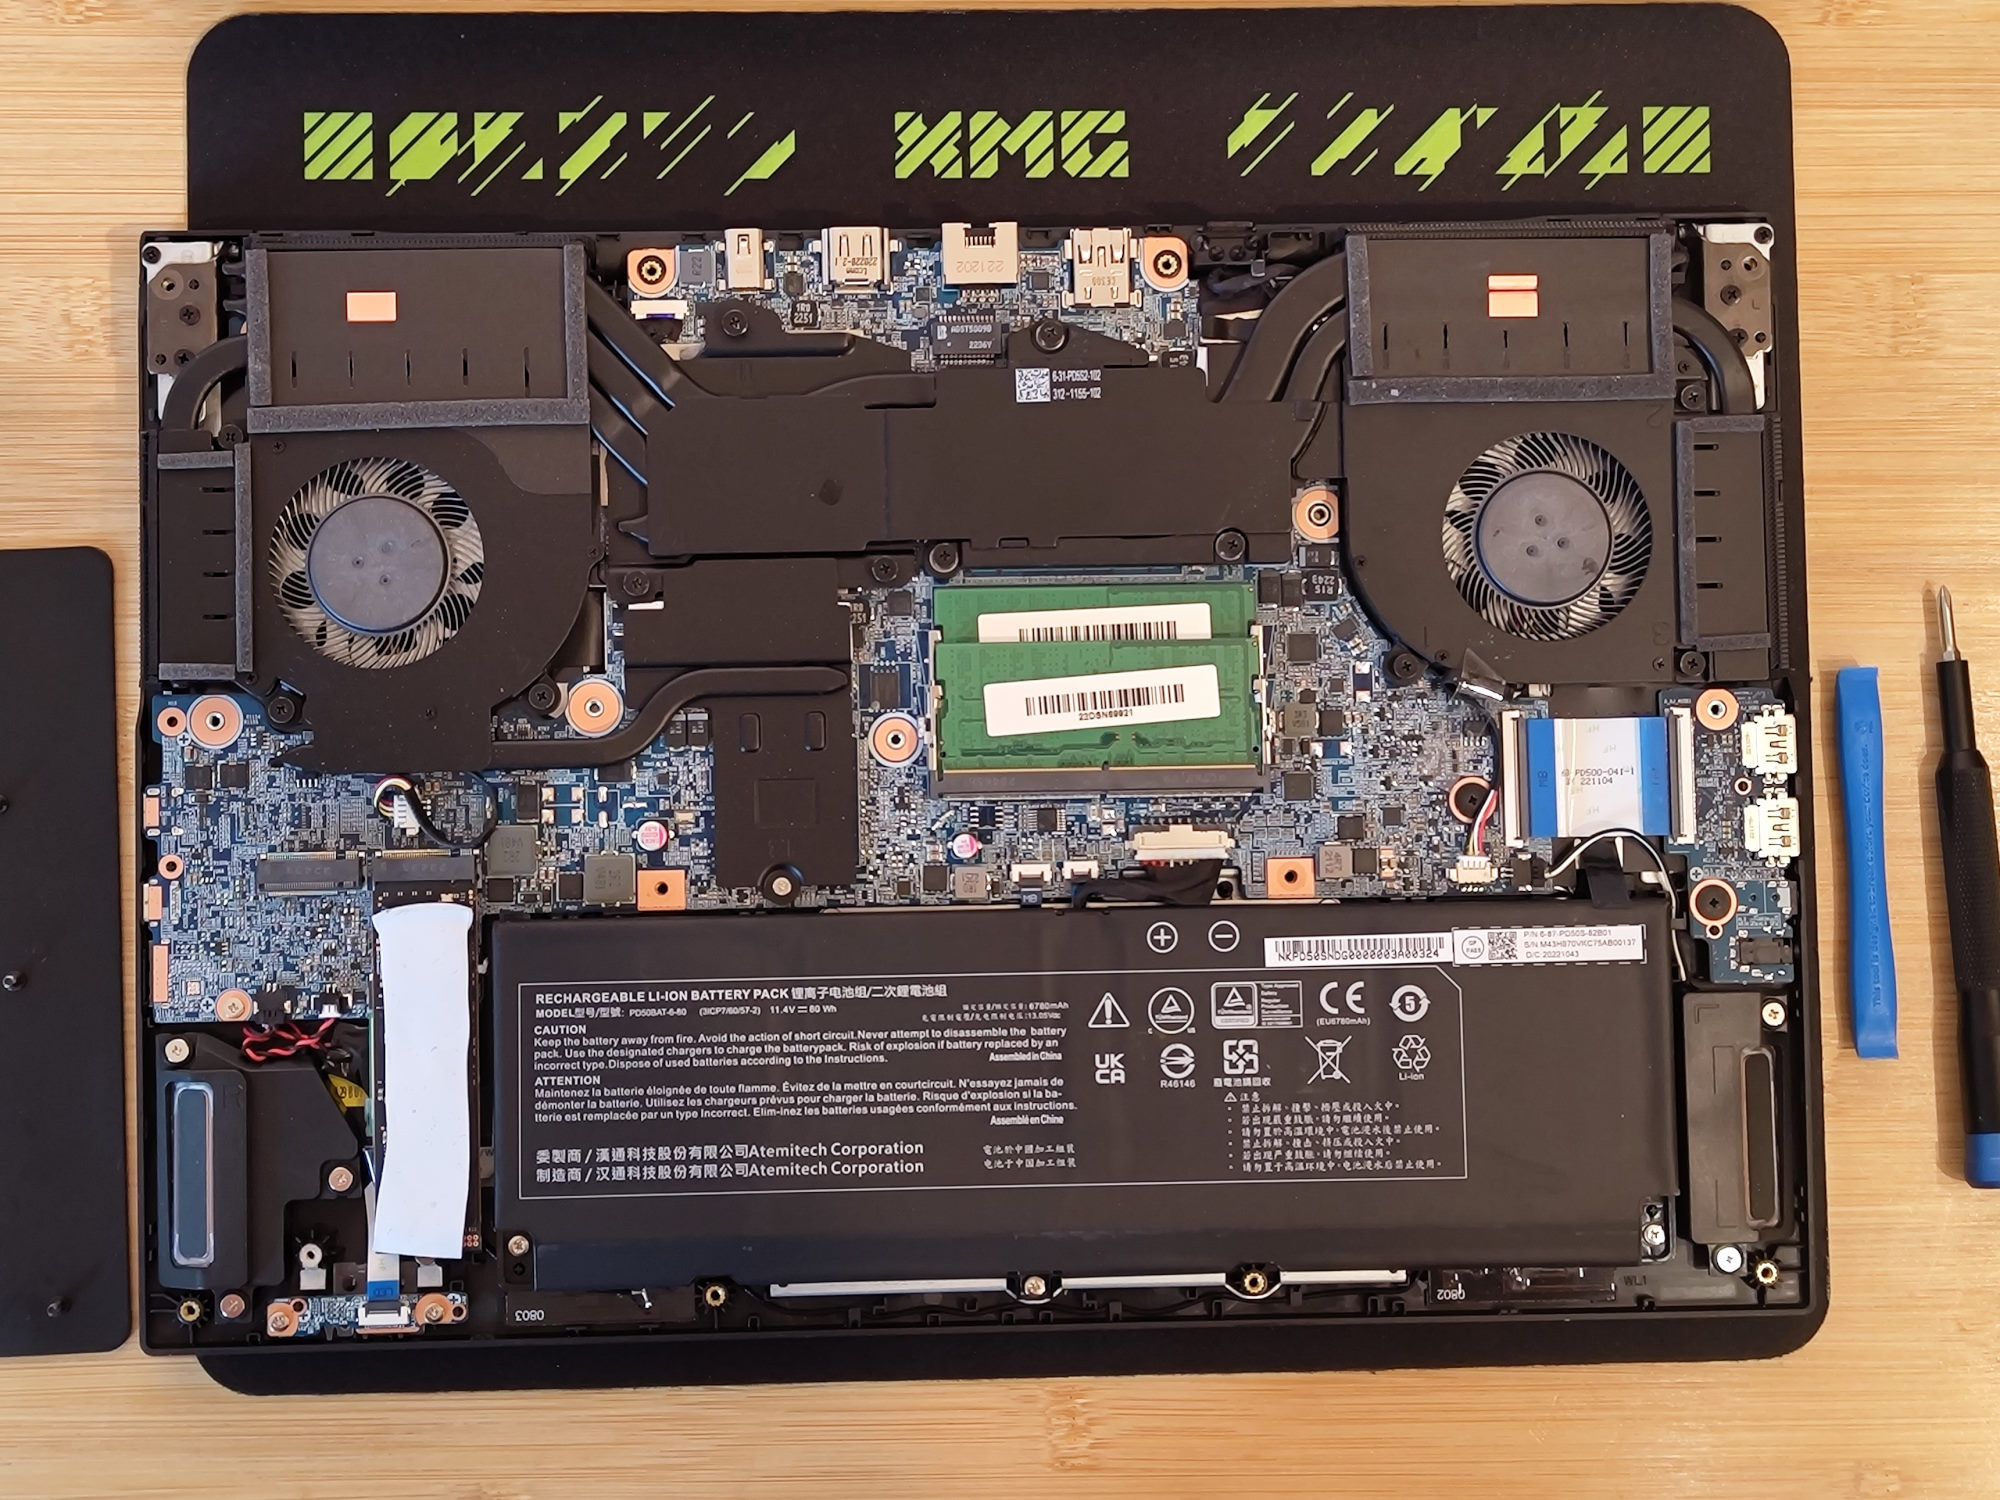
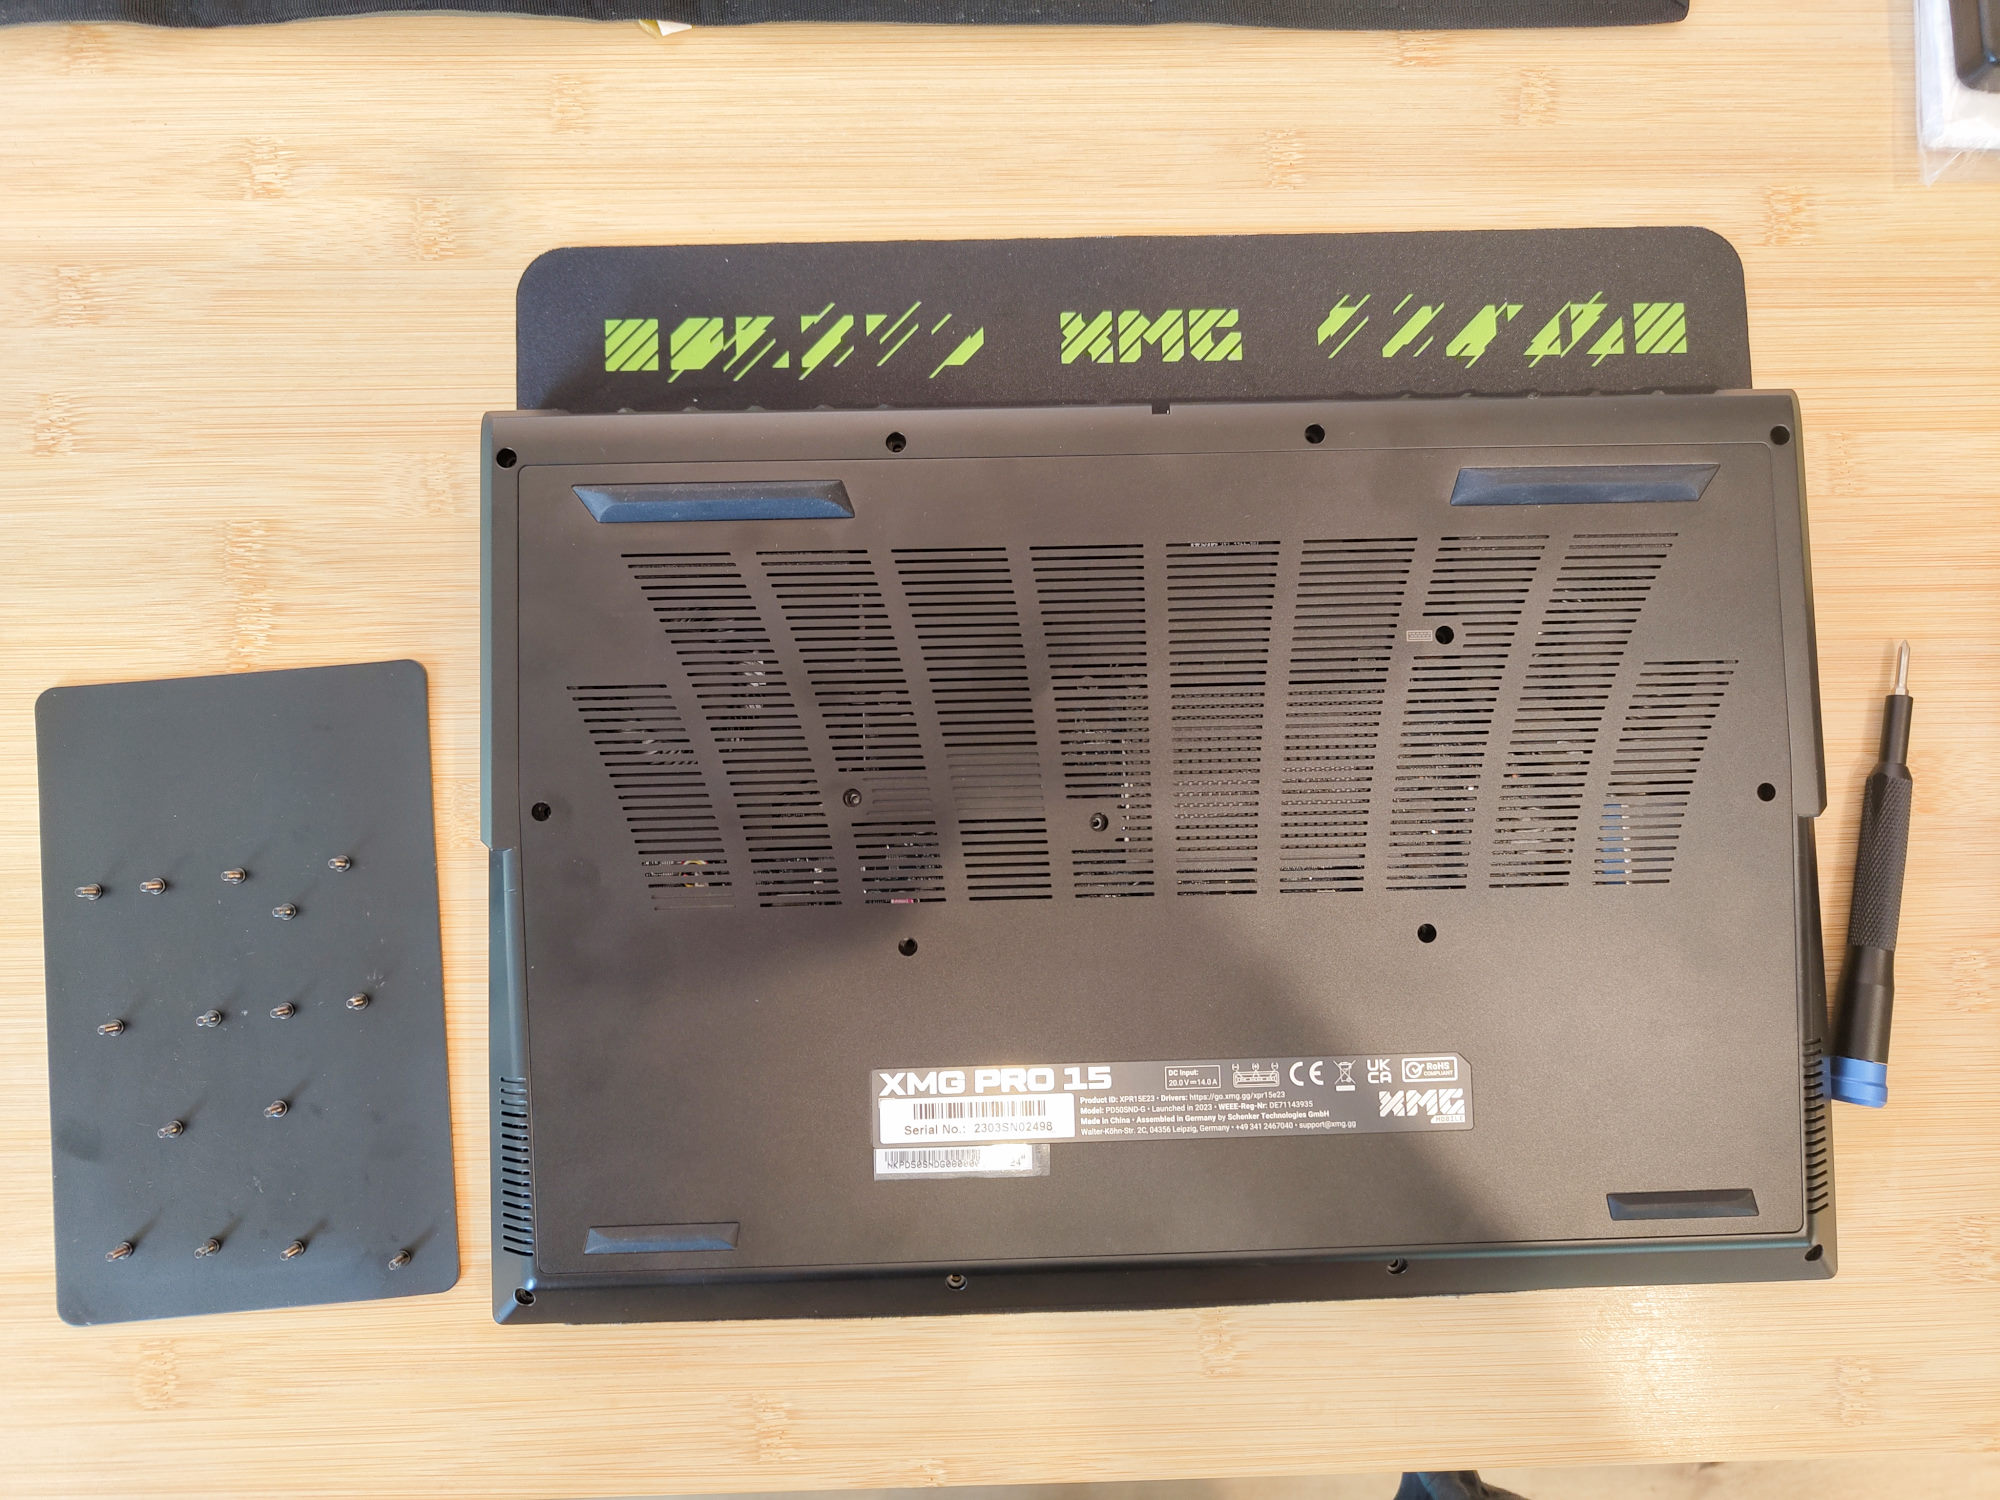
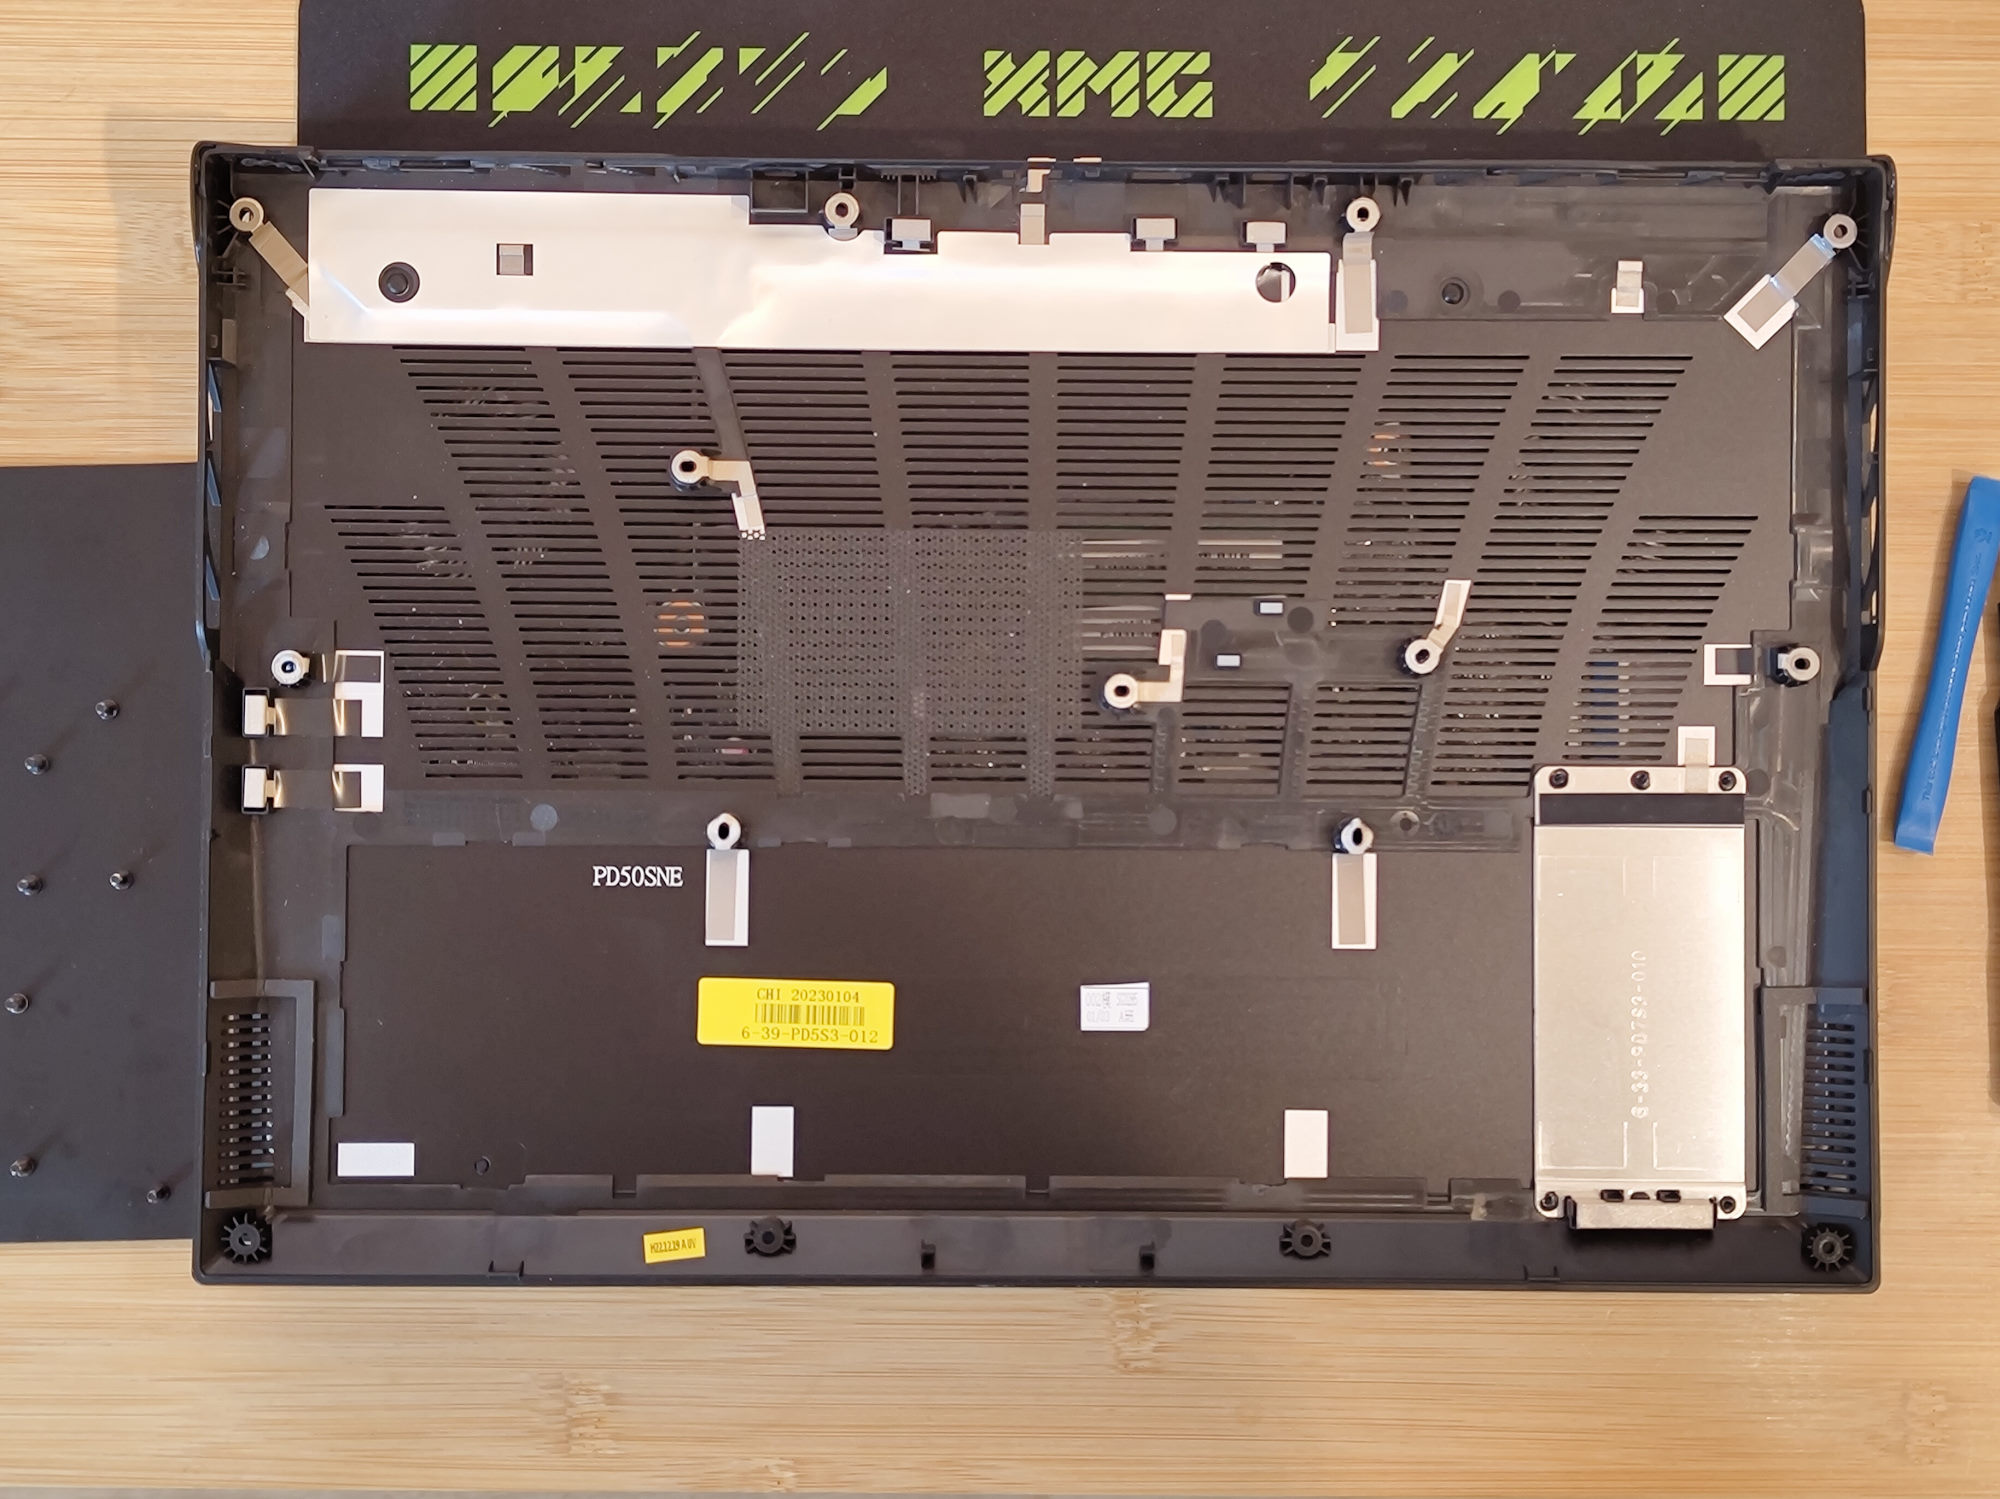
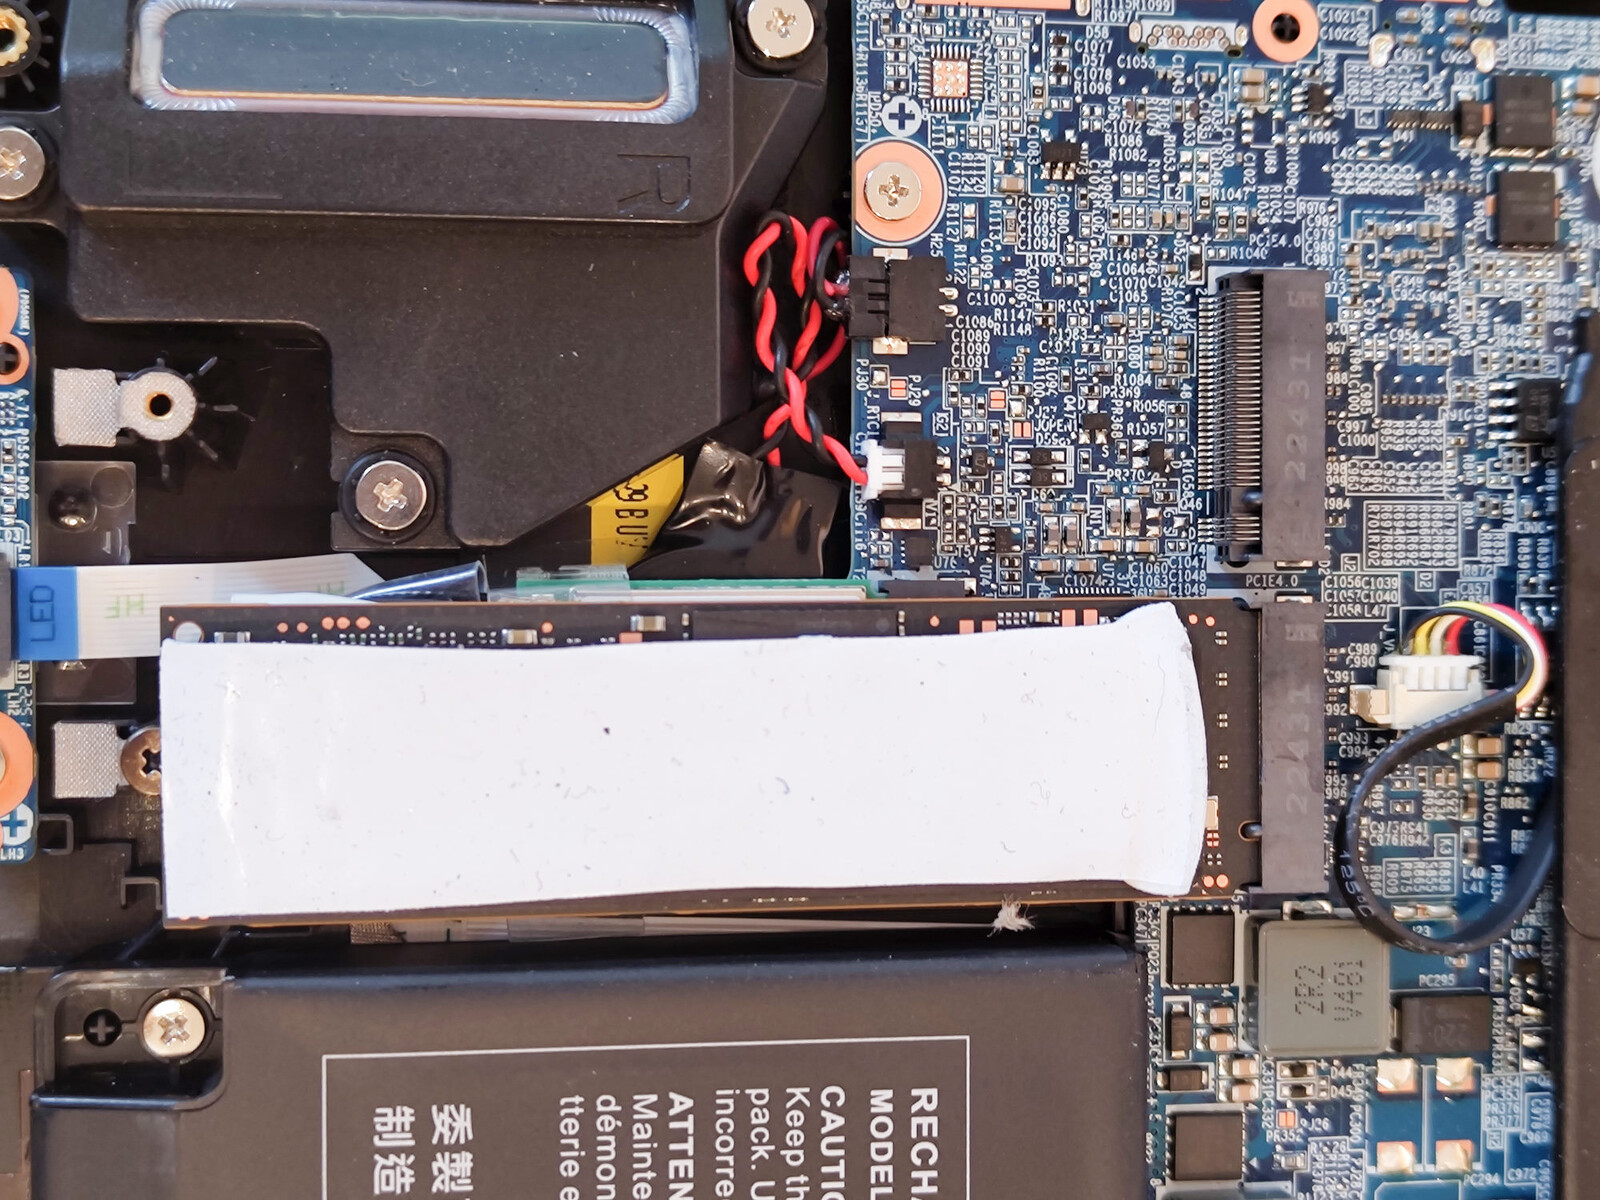
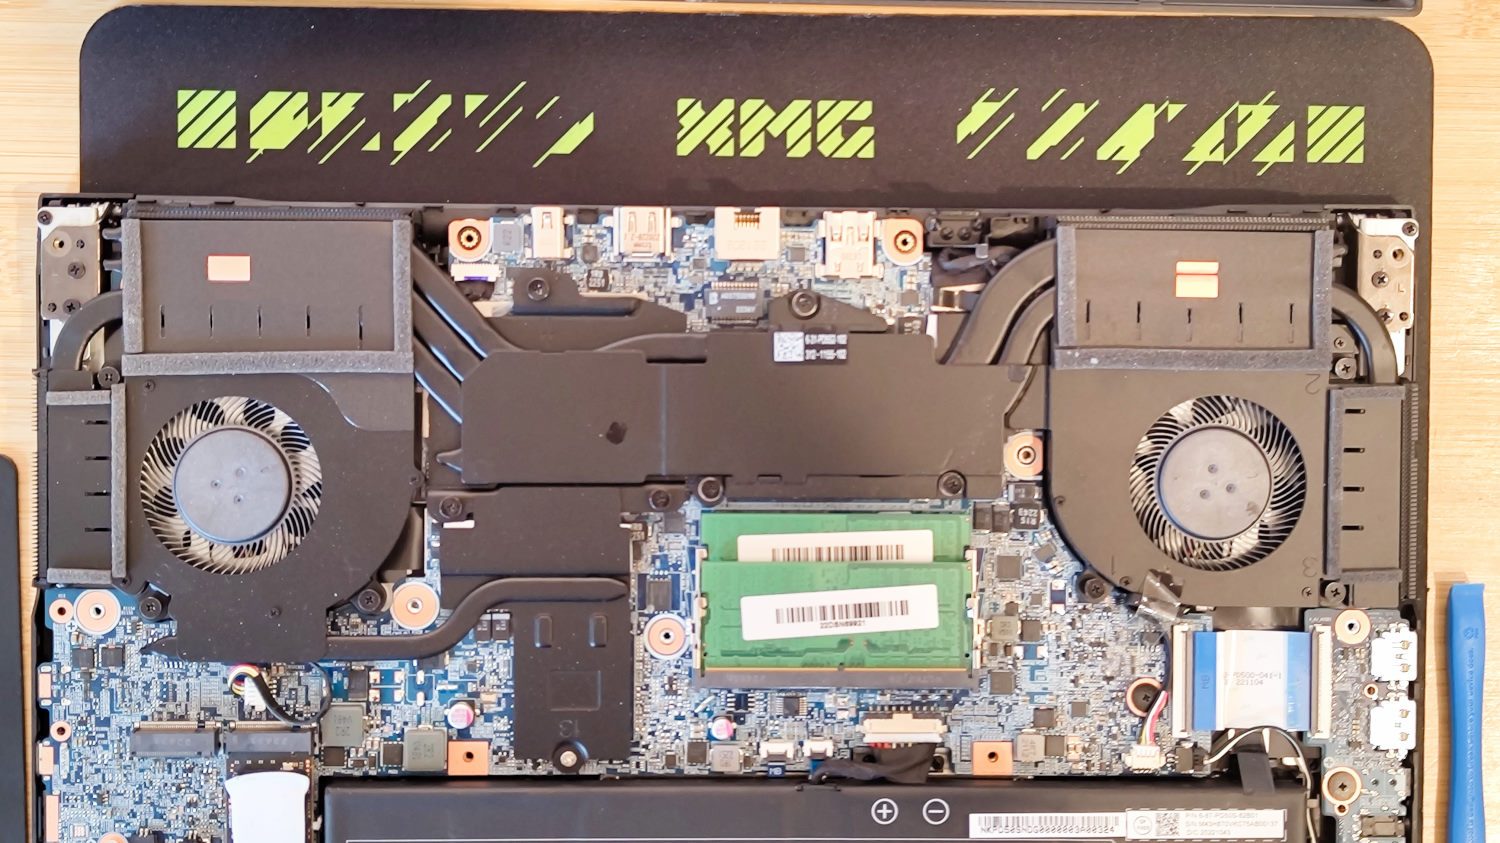
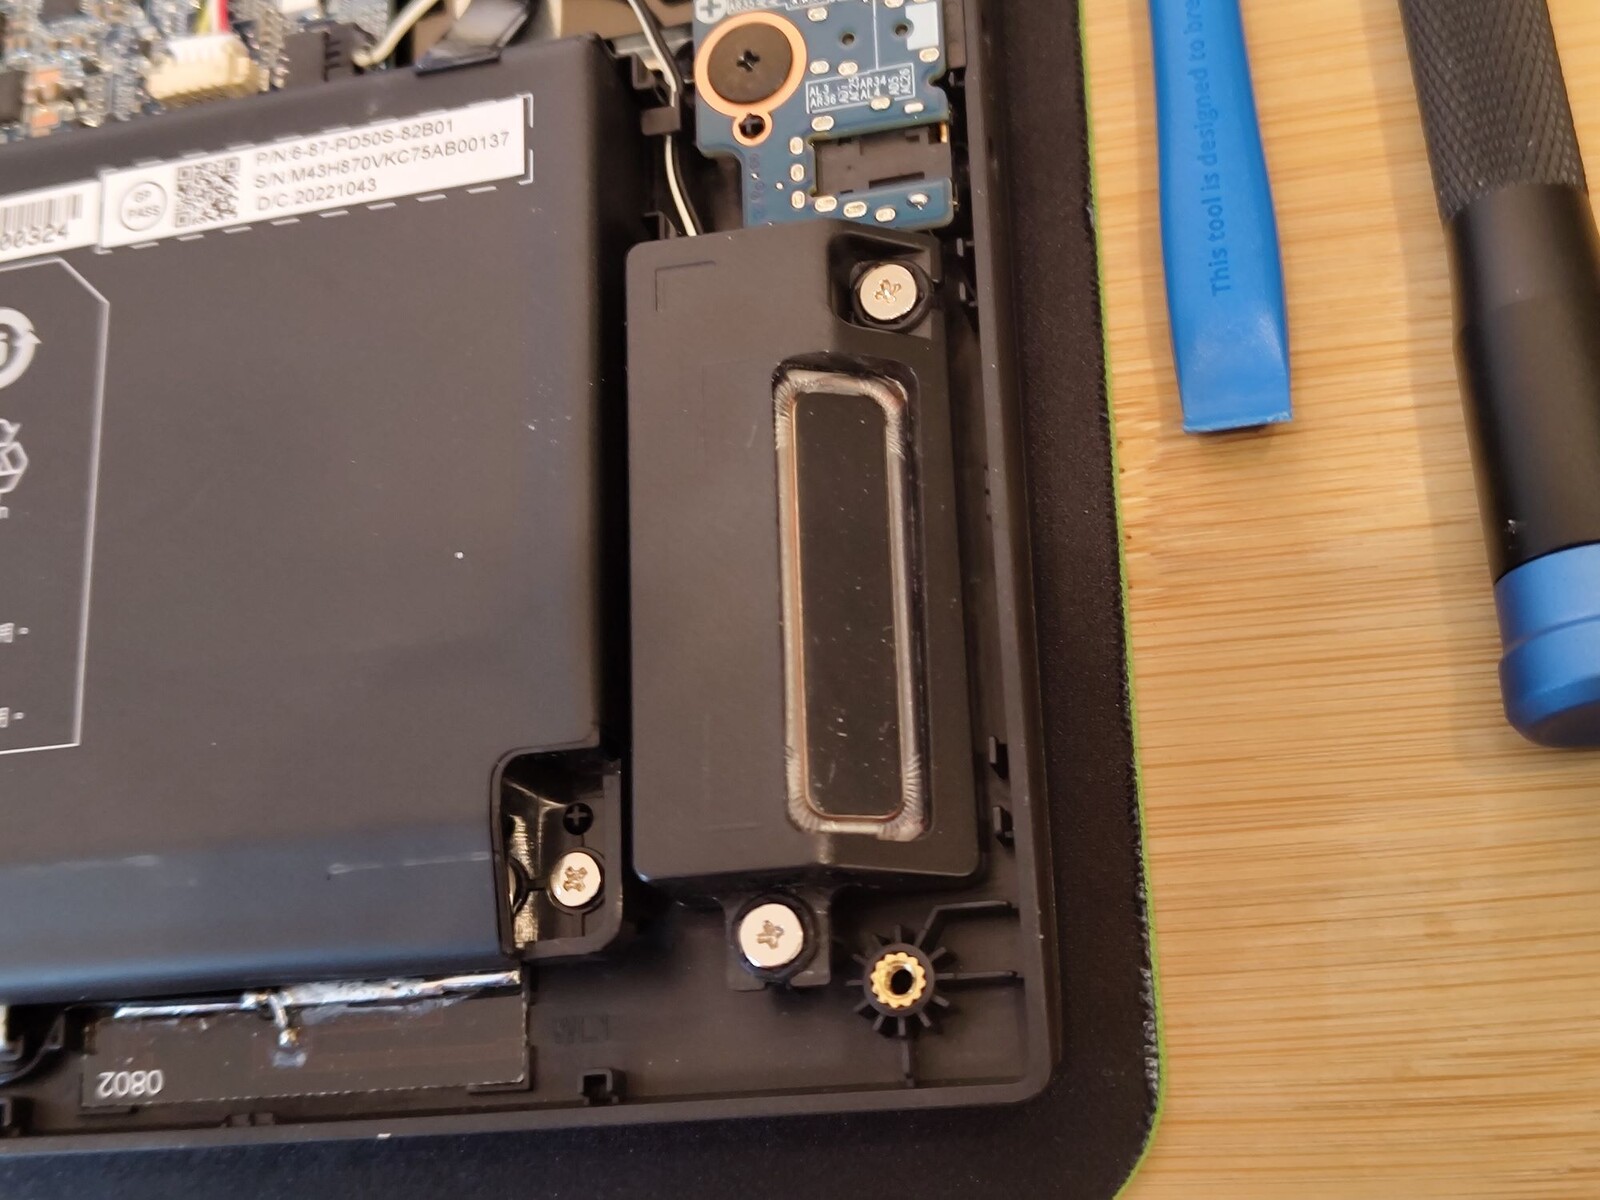
Un total de 15 tornillos fijan la tapa de la base. Al desenroscarlos, la tapa puede abrirse fácilmente desde la parte frontal con la ayuda de una herramienta de apertura de plástico. Debajo, encontrarás RAM intercambiable y una ranura M.2 libre para un SSD adicional. La almohadilla térmica adecuada se incluye con el portátil, al igual que un CD con controladores, una memoria USB con el mismo contenido, una alfombrilla de ratón grande y un abridor de botellas.
Dispositivos de entrada - Un teclado RGB de tamaño normal
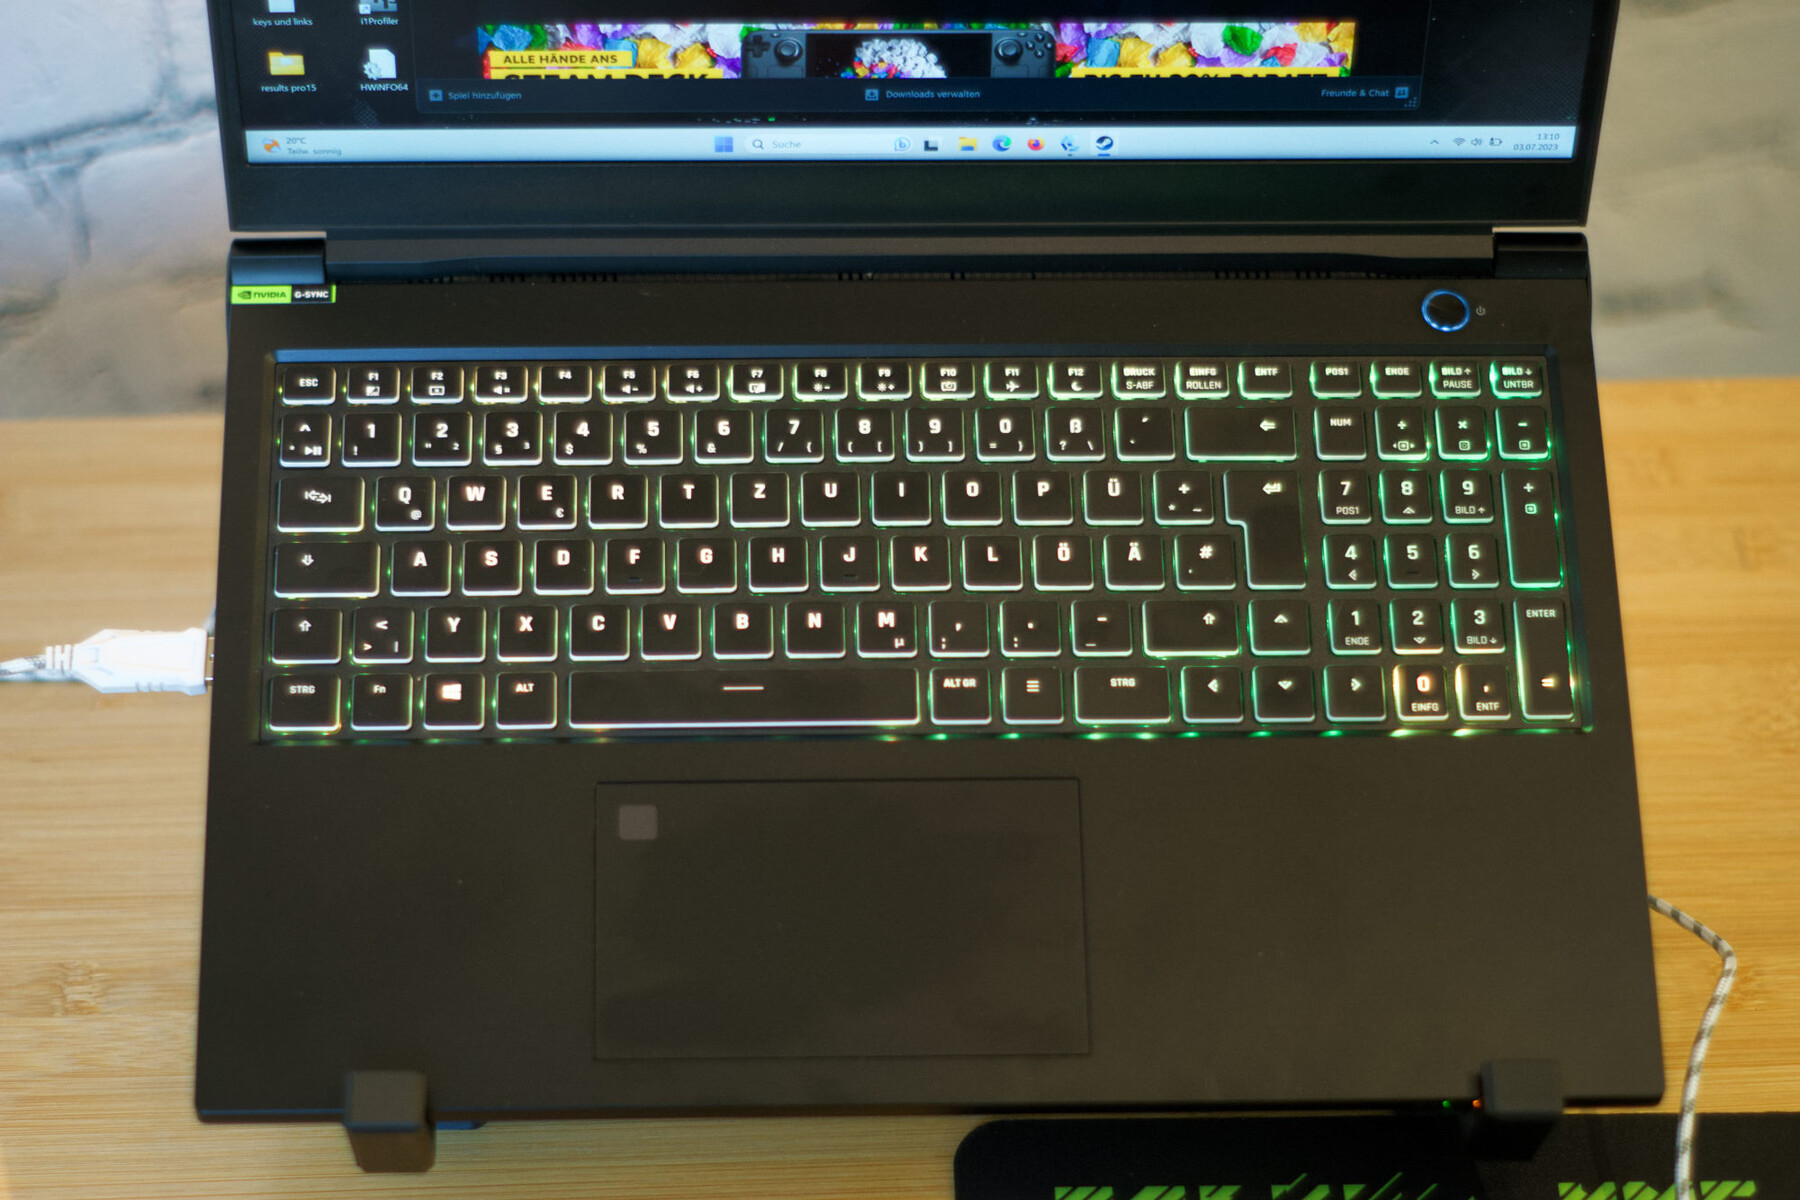
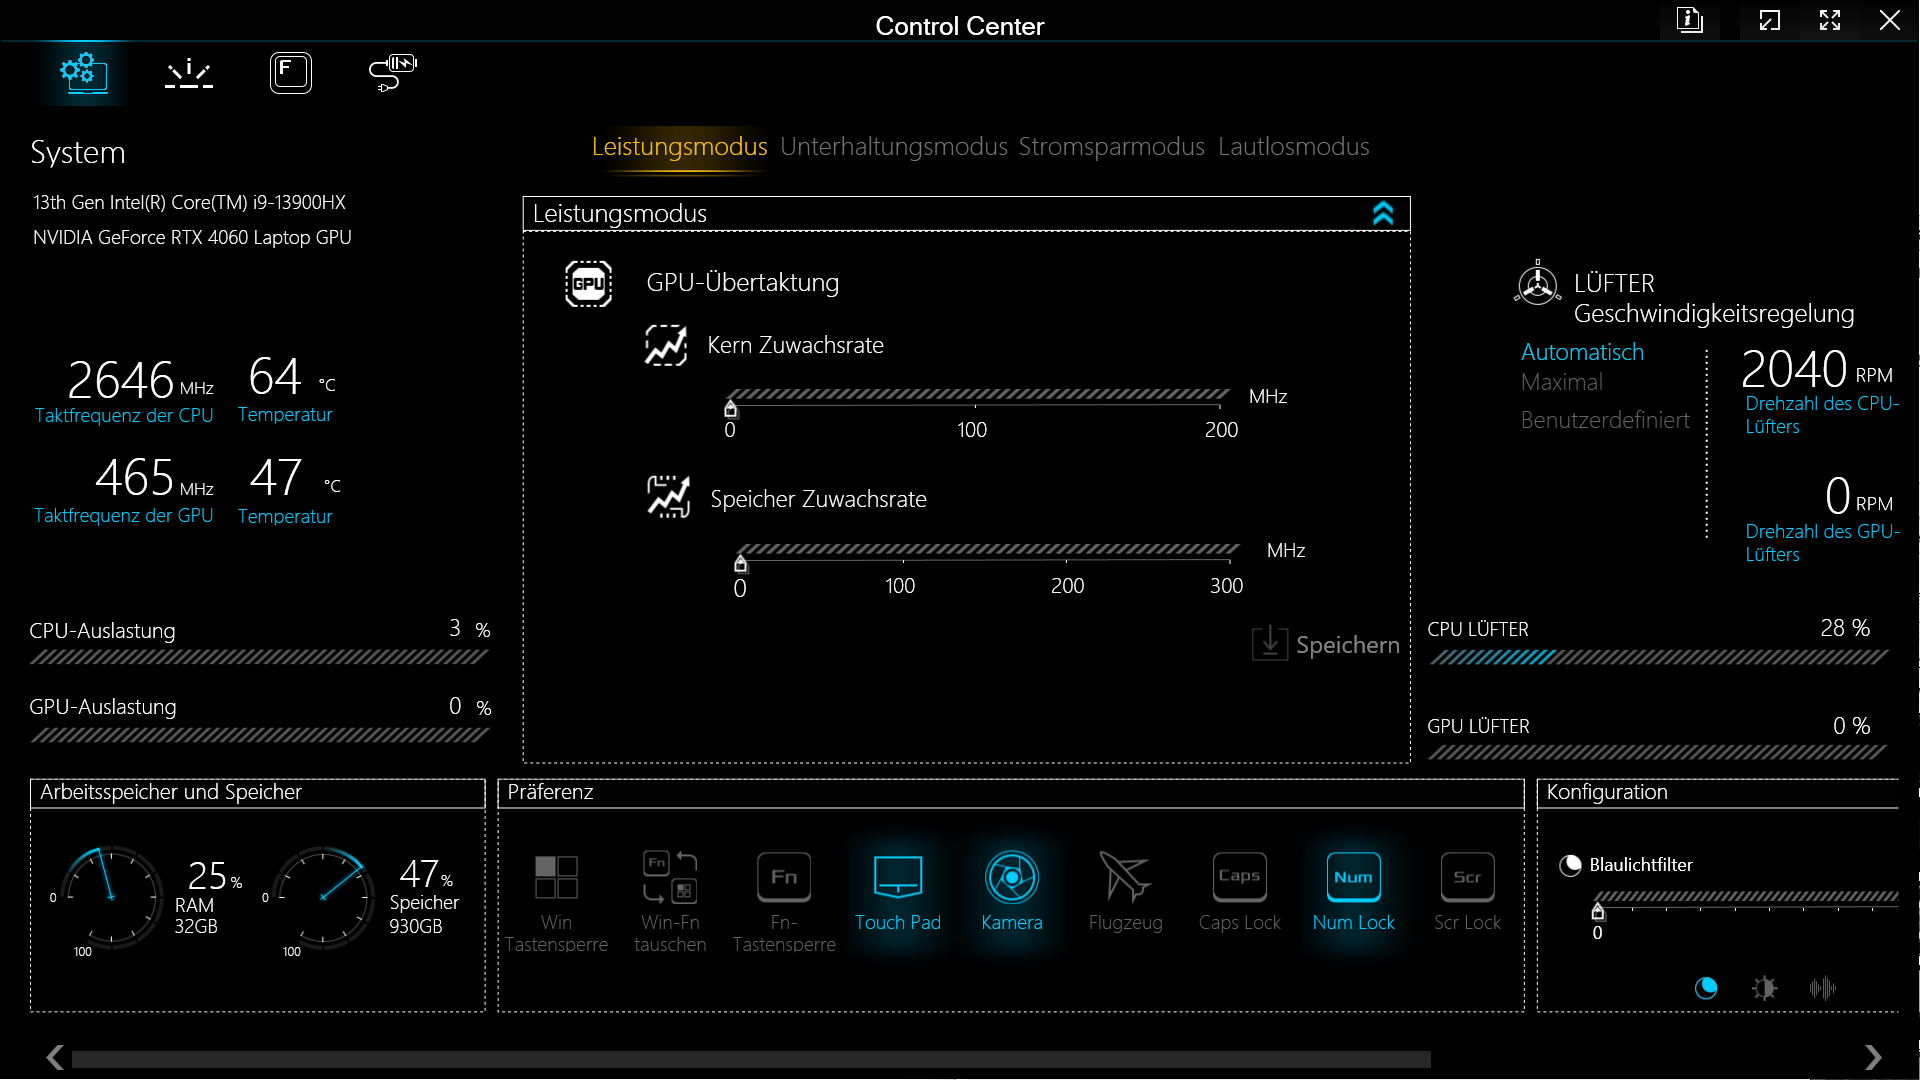
Un Clickpad de 12 × 7 cm con escáner de huellas dactilares y un teclado de tamaño completo con teclado numérico componen los dispositivos de entrada del XMG Pro 15. Ambos tienen un tacto agradable y un punto de presión tangible. En cuanto al teclado, el recorrido de las teclas es de alrededor de 1,5 mm. Todas las teclas se pueden iluminar individualmente con iluminación RGB.
Pantalla - A 240 Hz QHD y DisplayP3
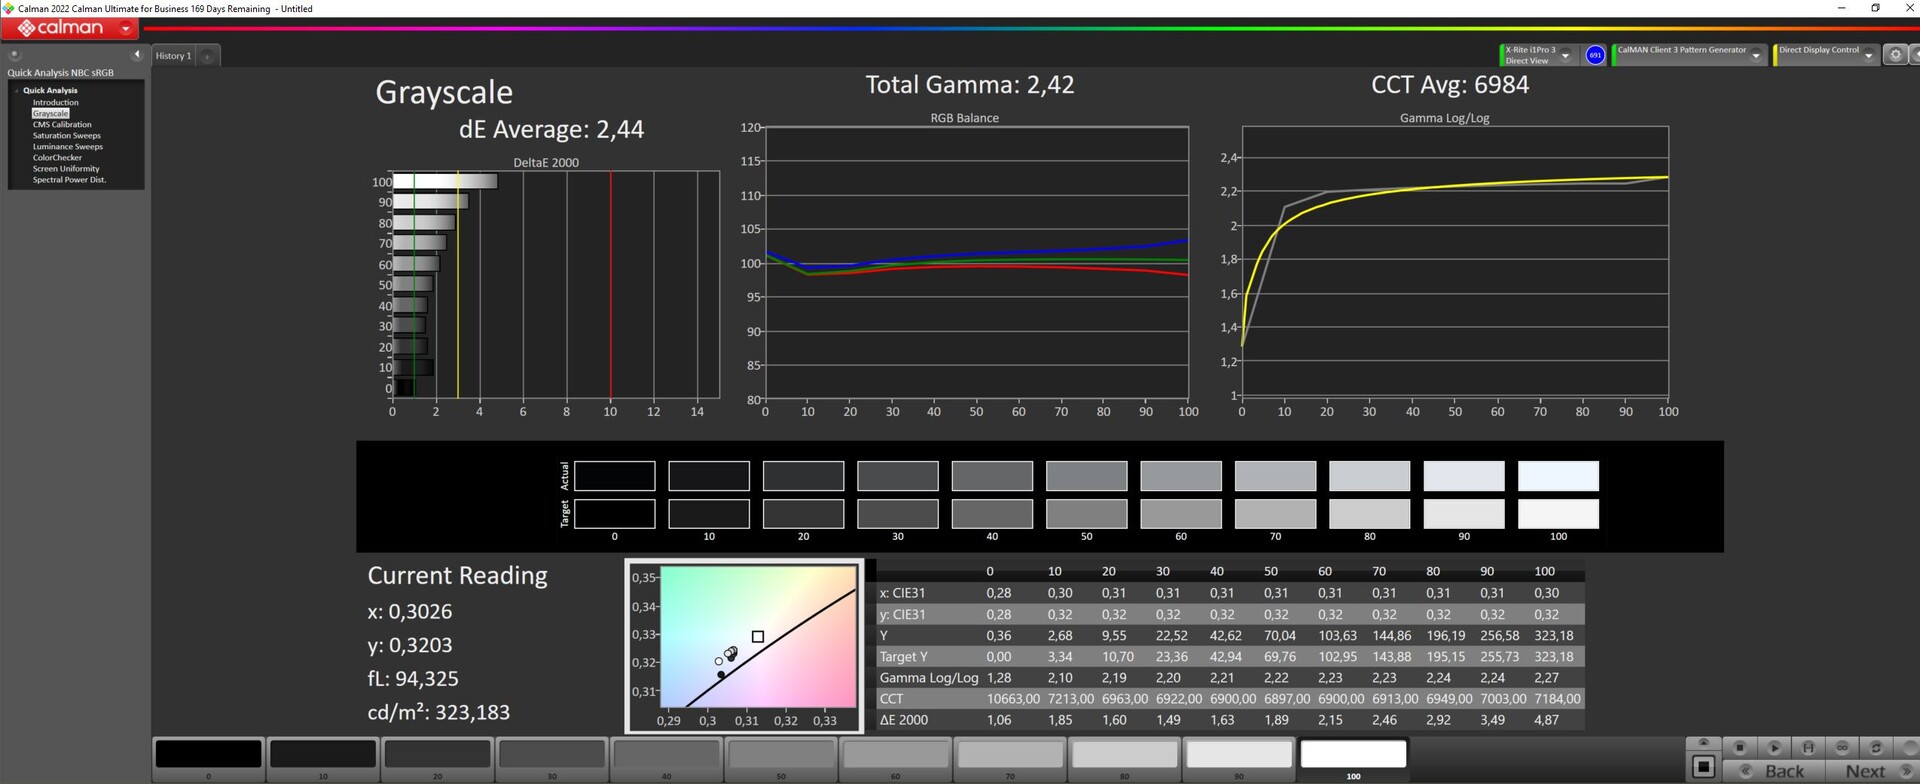
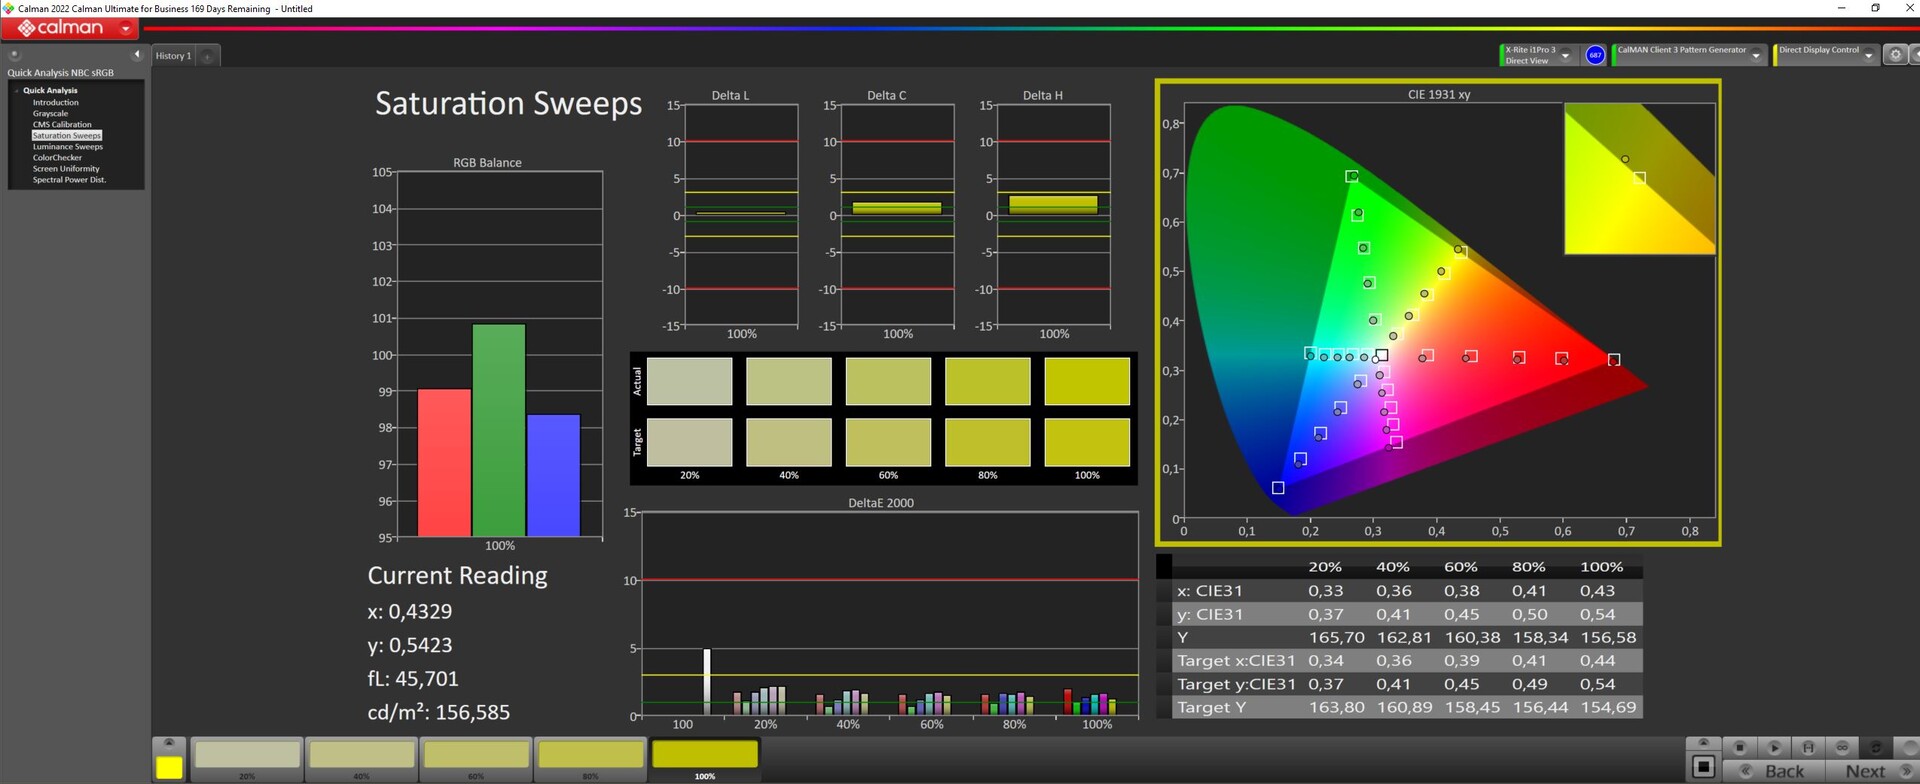
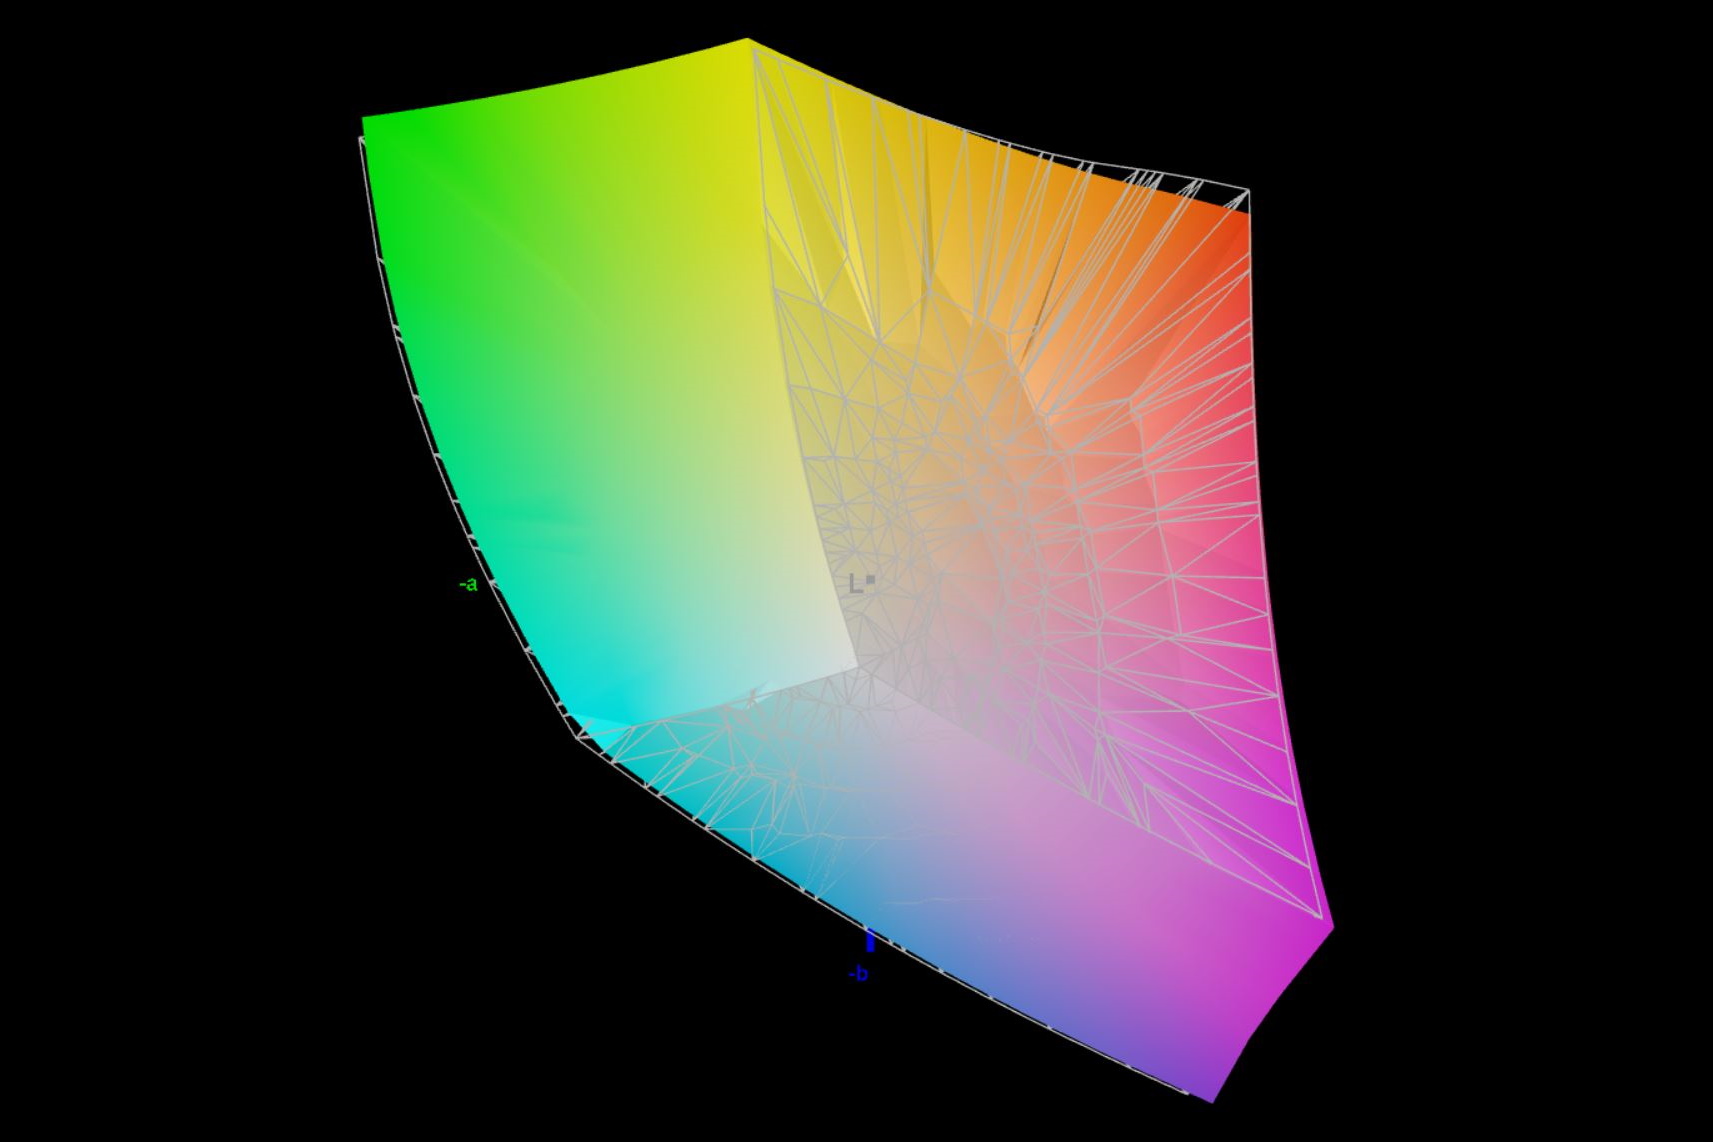
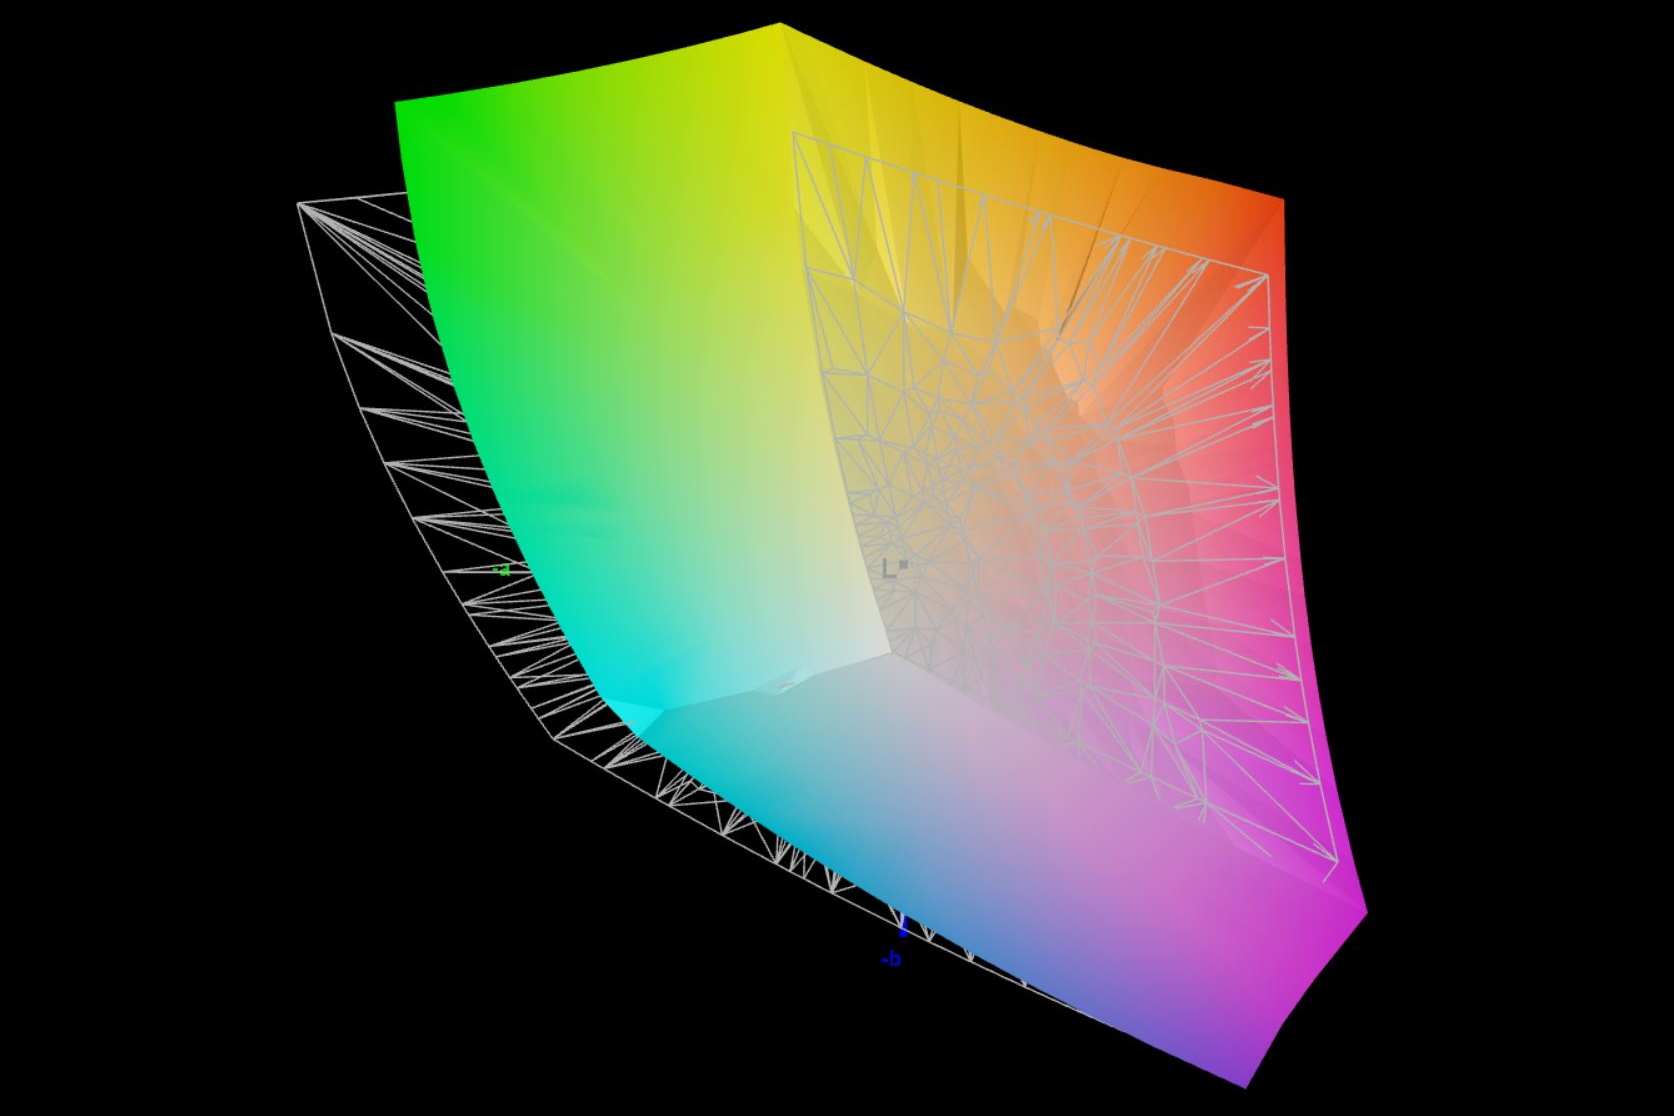
Aunque no es un OLED, el XMG Pro 15 posee una buena pantalla G-Sync, IPS. A 240 Hz y 2,560 × 1,660 pixels, los espacios de color sRGB y DisplayP3 están casi completamente cubiertos. A brillo máximo, sin embargo, se nota ligeramente que la pantalla de 300 cd/m² se ilumina notablemente más en el centro de la pantalla que en los bordes. Sin embargo, a diferencia del predecesor, esto no se manifiesta en un sangrado de pantalla claramente visible.
En comparación con el modelo de última generación, los tiempos de respuesta de la pantalla se mantienen prácticamente sin cambios. La frecuencia de imagen ha pasado de 165 Hz a 240 Hz. No detectamos ningún parpadeo de pantalla.
| |||||||||||||||||||||||||
iluminación: 85 %
Contraste: 894:1 (Negro: 0.36 cd/m²)
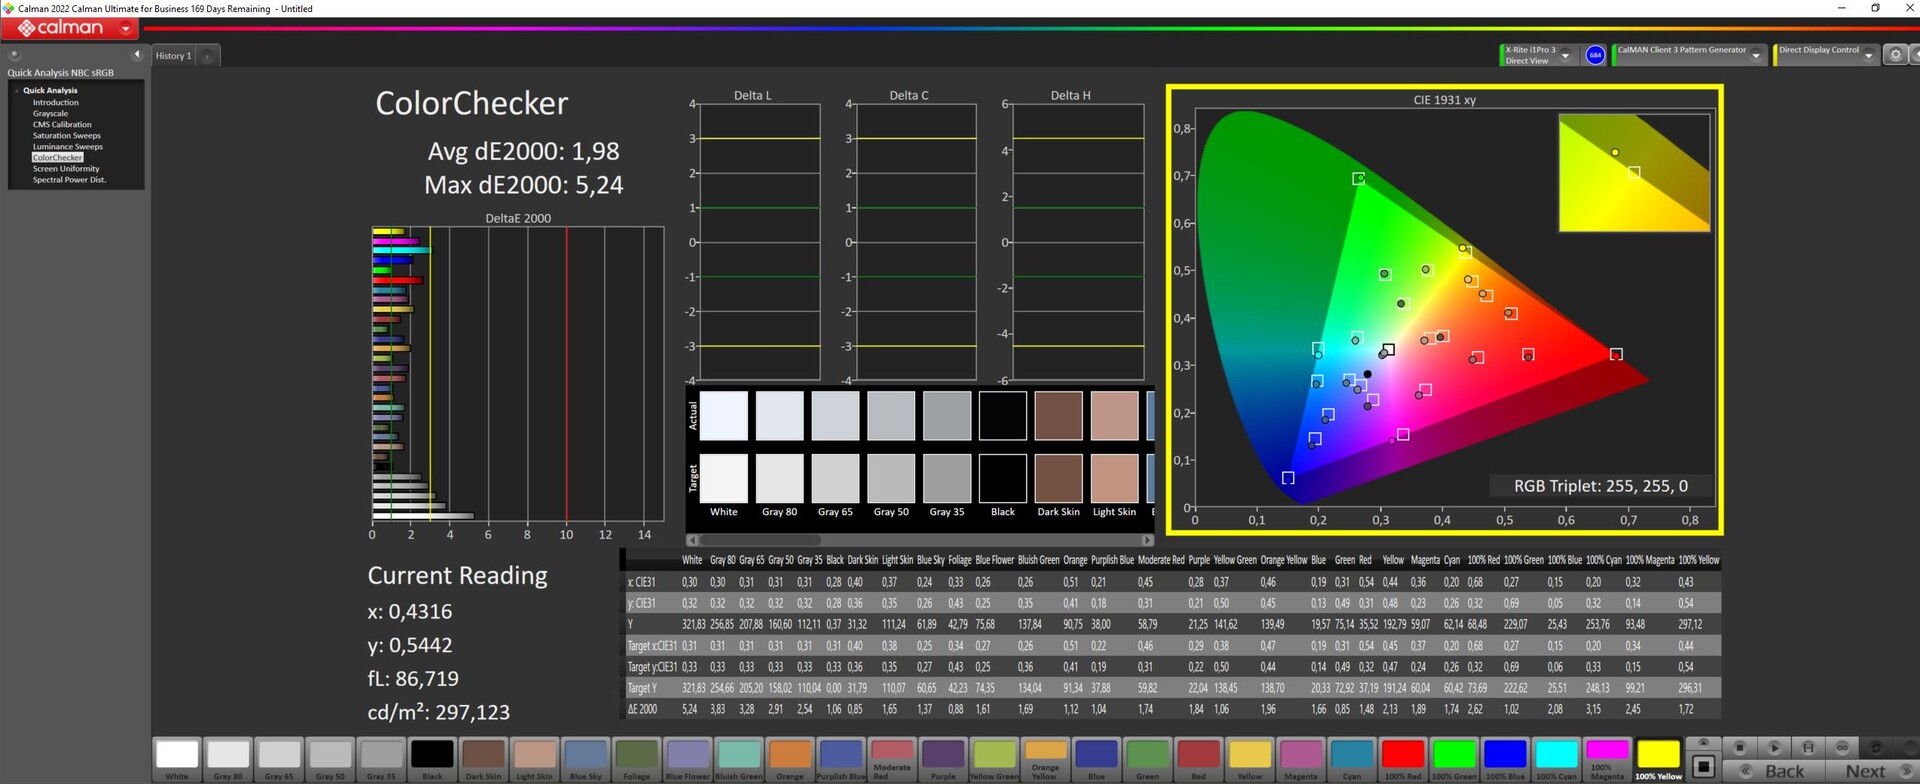
ΔE ColorChecker Calman: 1.98 | ∀{0.5-29.43 Ø4.71}
calibrated: 1.98
ΔE Greyscale Calman: 2.44 | ∀{0.09-98 Ø4.96}
85.4% AdobeRGB 1998 (Argyll 3D)
99.9% sRGB (Argyll 3D)
97.8% Display P3 (Argyll 3D)
Gamma: 2.42
CCT: 6984 K
| Schenker XMG Pro 15 (E23) BOE0AD1, IPS, 2560x1440, 15.6" | Schenker XMG Pro 15 (i7-12700H, RTX 3080 Ti) BOE09C2 (BOE CQ NE156QHM-NY1), IPS, 2560x1440, 15.6" | Dell G15 5530 AUO B156HAN, IPS, 1920x1080, 15.6" | Aorus 15X ASF BOE CQ NE156QHM-NZ1, IPS, 2560x1440, 15.6" | MSI Cyborg 15 A12VF AU Optronics B156HAN15.1, IPS, 1920x1080, 15.6" | Alienware x16 R1 BOE NE16NZ4, IPS, 2560x1600, 16" | |
|---|---|---|---|---|---|---|
| Display | 0% | -13% | -16% | -48% | 2% | |
| Display P3 Coverage (%) | 97.8 | 97.5 0% | 73.1 -25% | 69.3 -29% | 42.3 -57% | 99.2 1% |
| sRGB Coverage (%) | 99.9 | 99.9 0% | 98.4 -2% | 98.2 -2% | 62.6 -37% | 100 0% |
| AdobeRGB 1998 Coverage (%) | 85.4 | 85.2 0% | 74.4 -13% | 70.5 -17% | 43.7 -49% | 88.6 4% |
| Response Times | 7% | 60% | 7% | -52% | 29% | |
| Response Time Grey 50% / Grey 80% * (ms) | 14 ? | 13.2 ? 6% | 3.39 ? 76% | 12.4 ? 11% | 22 ? -57% | 5.1 ? 64% |
| Response Time Black / White * (ms) | 9.6 ? | 8.8 ? 8% | 5.35 ? 44% | 9.4 ? 2% | 14 ? -46% | 10.3 ? -7% |
| PWM Frequency (Hz) | 21620 ? | |||||
| Screen | -33% | -25% | 24% | -22% | 14% | |
| Brightness middle (cd/m²) | 322 | 317 -2% | 320 -1% | 316 -2% | 247 -23% | 302.2 -6% |
| Brightness (cd/m²) | 301 | 294 -2% | 316 5% | 301 0% | 234 -22% | 285 -5% |
| Brightness Distribution (%) | 85 | 83 -2% | 94 11% | 90 6% | 89 5% | 89 5% |
| Black Level * (cd/m²) | 0.36 | 0.32 11% | 0.21 42% | 0.28 22% | 0.25 31% | 0.26 28% |
| Contrast (:1) | 894 | 991 11% | 1524 70% | 1129 26% | 988 11% | 1162 30% |
| Colorchecker dE 2000 * | 1.98 | 4.22 -113% | 4.55 -130% | 1.54 22% | 3.78 -91% | 1.63 18% |
| Colorchecker dE 2000 max. * | 5.24 | 5.97 -14% | 9.83 -88% | 2.46 53% | 6.42 -23% | 4.13 21% |
| Colorchecker dE 2000 calibrated * | 1.98 | 4.09 -107% | 1.51 24% | 1.21 39% | 3.94 -99% | 1.17 41% |
| Greyscale dE 2000 * | 2.44 | 4.41 -81% | 6.2 -154% | 1.3 47% | 2.16 11% | 2.5 -2% |
| Gamma | 2.42 91% | 2.29 96% | 2.07 106% | 2.307 95% | 2.33 94% | 2.23 99% |
| CCT | 6984 93% | 6733 97% | 6479 100% | 6456 101% | 6906 94% | 6590 99% |
| Media total (Programa/Opciones) | -9% /
-20% | 7% /
-10% | 5% /
13% | -41% /
-32% | 15% /
14% |
* ... más pequeño es mejor
Con los colores y las escalas de grises en Calman ColorChecker, en ΔΕ 1,98 y ΔΕ 2,44, respectivamente, el XMG Pro 15 se sitúa claramente dentro del rango objetivo de ΔΕ < 3. Nuestro propio perfil ICC (descargar en la caja de información) debería poder reducir ligeramente el azul sobreacentuado y mejorar significativamente tanto las escalas de grises como la reproducción del color. Junto con el espacio de color DisplayP3 casi completamente cubierto, estamos ante una pantalla que parece adecuada para la edición de vídeo profesional.
Tiempos de respuesta del display
| ↔ Tiempo de respuesta de Negro a Blanco | ||
|---|---|---|
| 9.6 ms ... subida ↗ y bajada ↘ combinada | ↗ 4.2 ms subida | 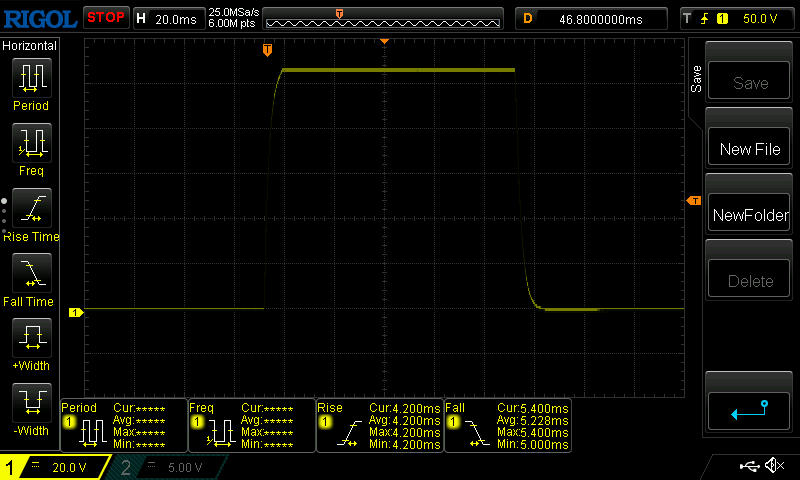 |
| ↘ 5.4 ms bajada | ||
| La pantalla mostró tiempos de respuesta rápidos en nuestros tests y debería ser adecuada para juegos. En comparación, todos los dispositivos de prueba van de ##min### (mínimo) a 240 (máximo) ms. » 26 % de todos los dispositivos son mejores. Esto quiere decir que el tiempo de respuesta medido es mejor que la media (19.8 ms) de todos los dispositivos testados. | ||
| ↔ Tiempo de respuesta 50% Gris a 80% Gris | ||
| 14 ms ... subida ↗ y bajada ↘ combinada | ↗ 6.6 ms subida | 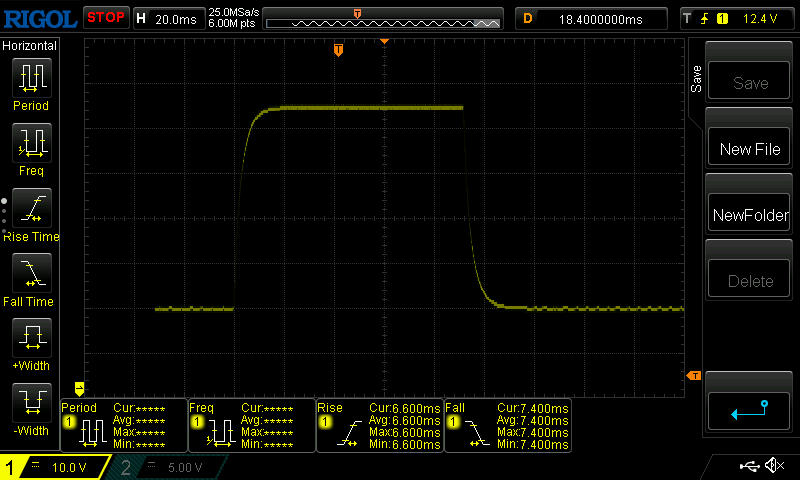 |
| ↘ 7.4 ms bajada | ||
| La pantalla mostró buenos tiempos de respuesta en nuestros tests pero podría ser demasiado lenta para los jugones competitivos. En comparación, todos los dispositivos de prueba van de ##min### (mínimo) a 636 (máximo) ms. » 28 % de todos los dispositivos son mejores. Esto quiere decir que el tiempo de respuesta medido es mejor que la media (31 ms) de todos los dispositivos testados. | ||
Parpadeo de Pantalla / PWM (Pulse-Width Modulation)
| Parpadeo de Pantalla / PWM no detectado |  | ||
Comparación: 52 % de todos los dispositivos testados no usaron PWM para atenuar el display. Si se usó, medimos una media de 7754 (mínimo: 5 - máxmo: 343500) Hz. | |||
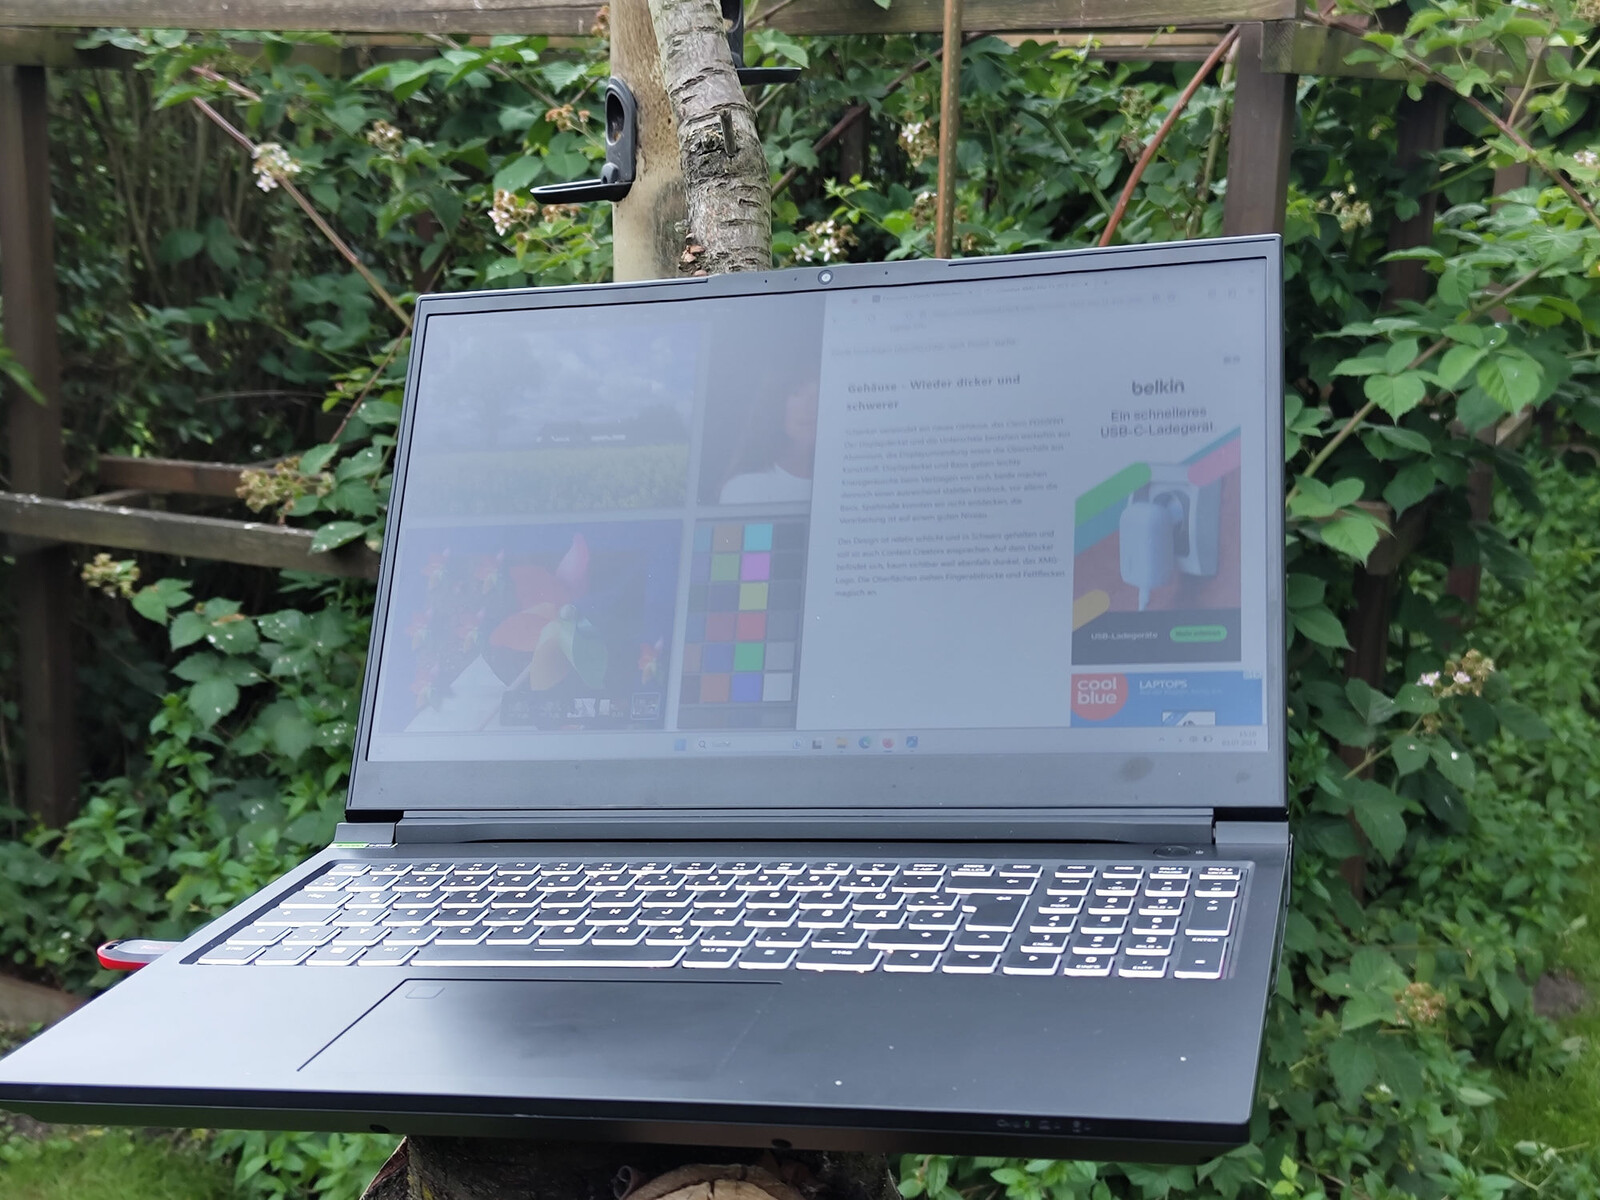
También es posible utilizar el portátil de 15 pulgadas en exteriores, gracias a la pantalla mate y relativamente brillante. Dependiendo del lugar, hay que elegir el ángulo de visión adecuado para experimentar la menor cantidad posible de reflejos. Por suerte, el panel IPS posee ángulos de visión muy estables.
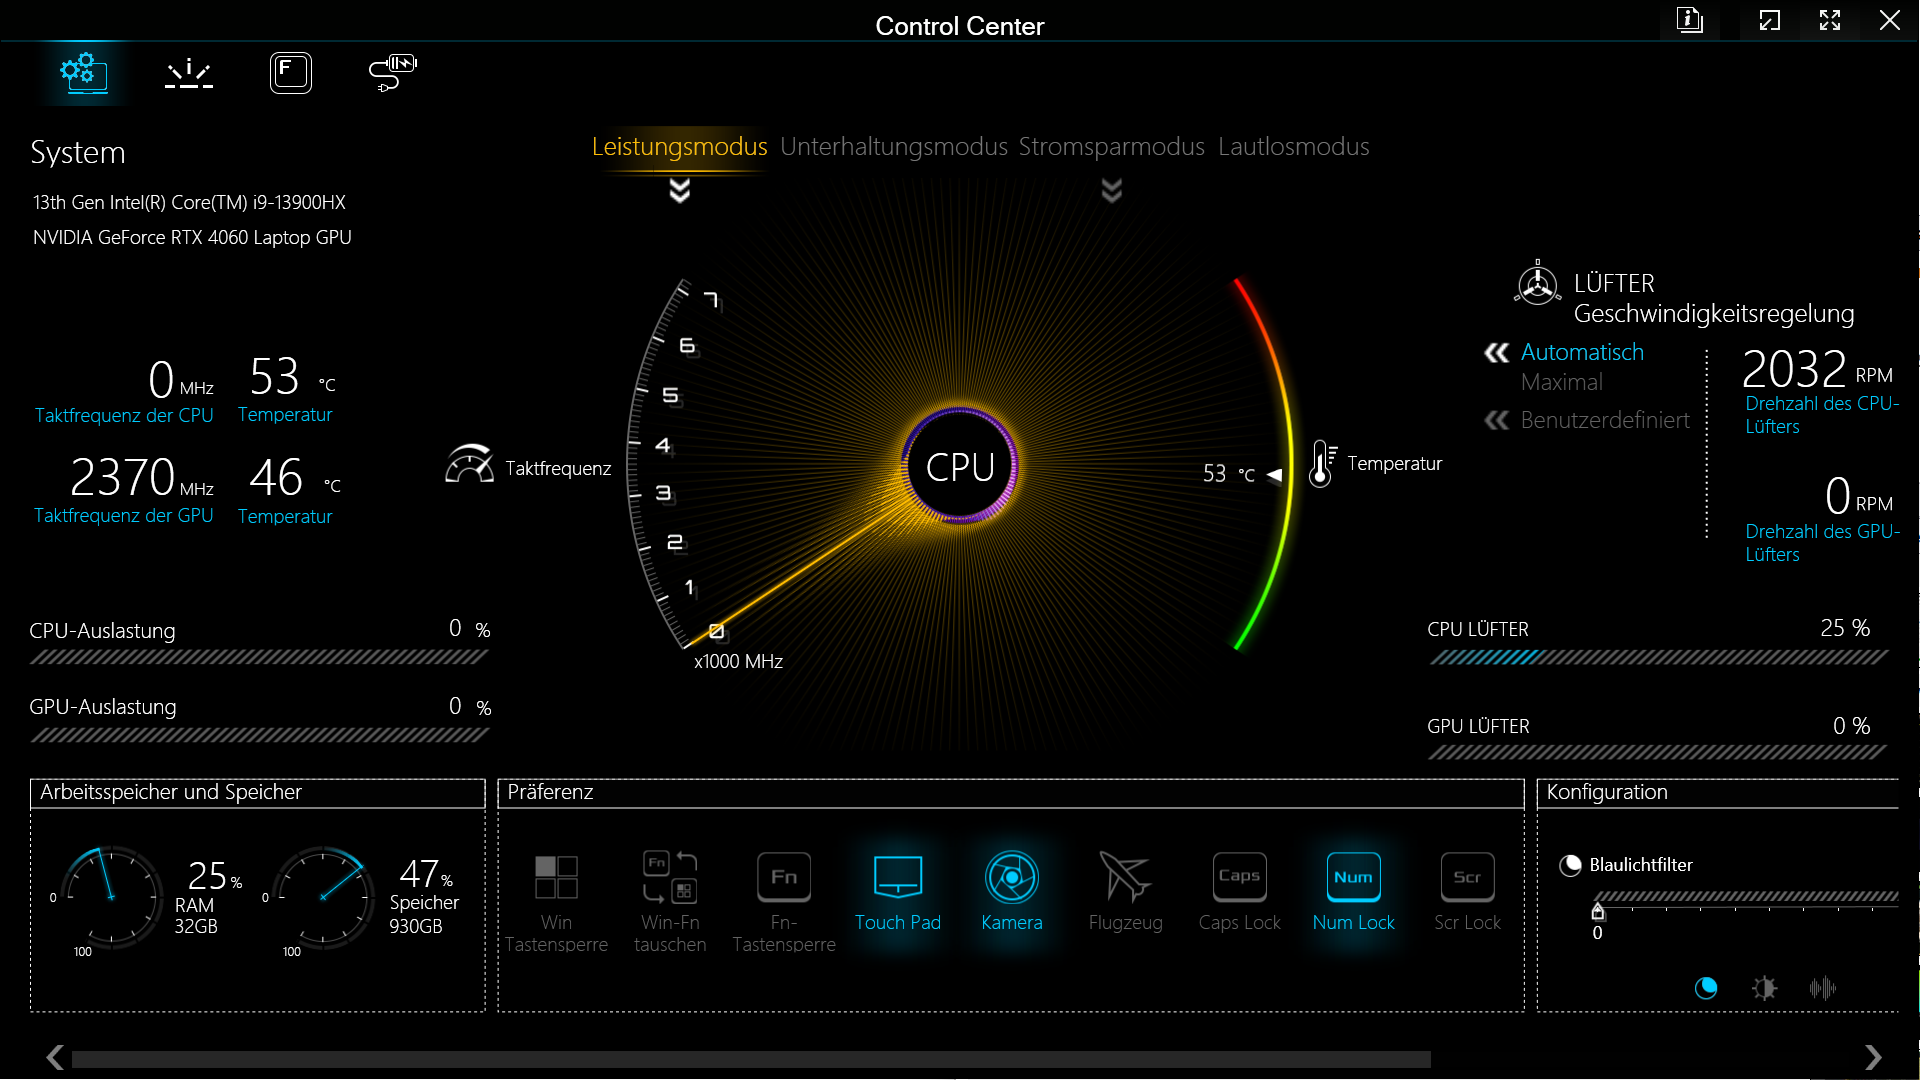
Rendimiento - El Intel Core i9 y la Nvidia GeForce RTX 4060 tienen potencia de sobra
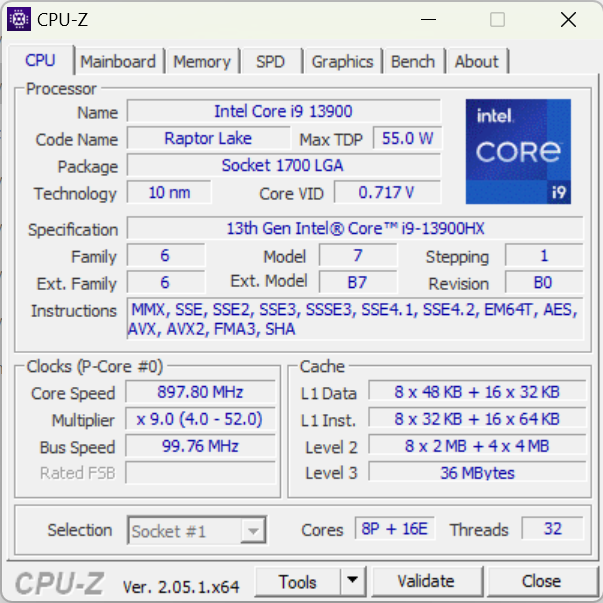
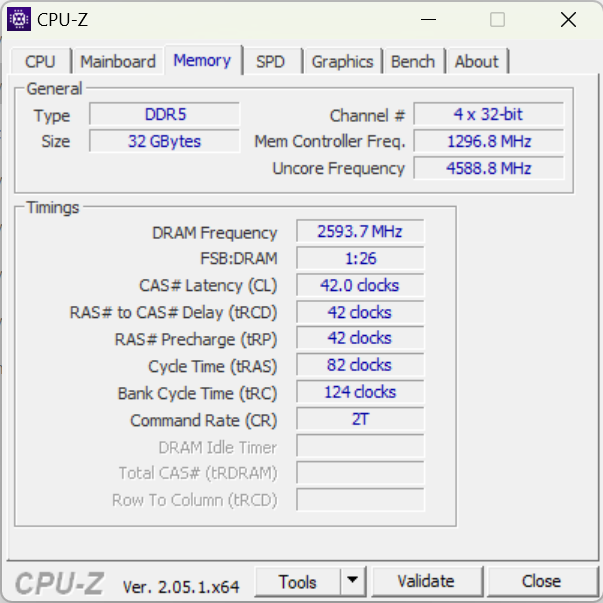
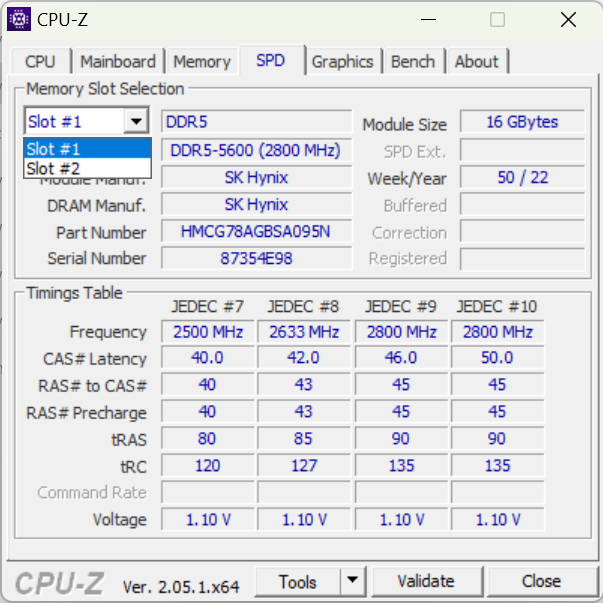
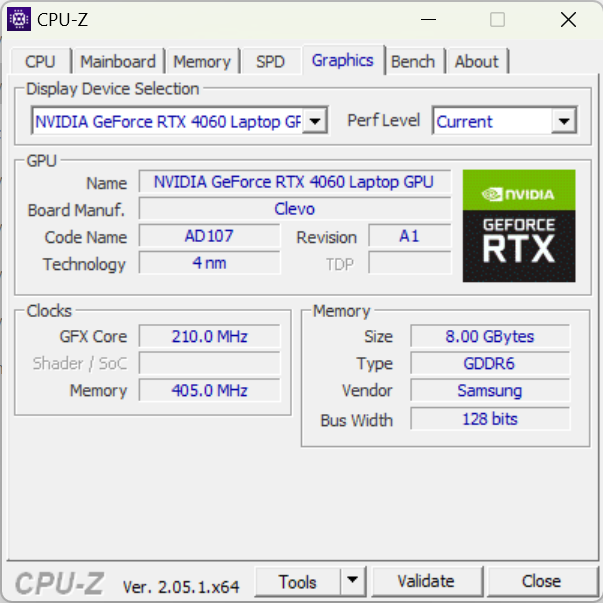
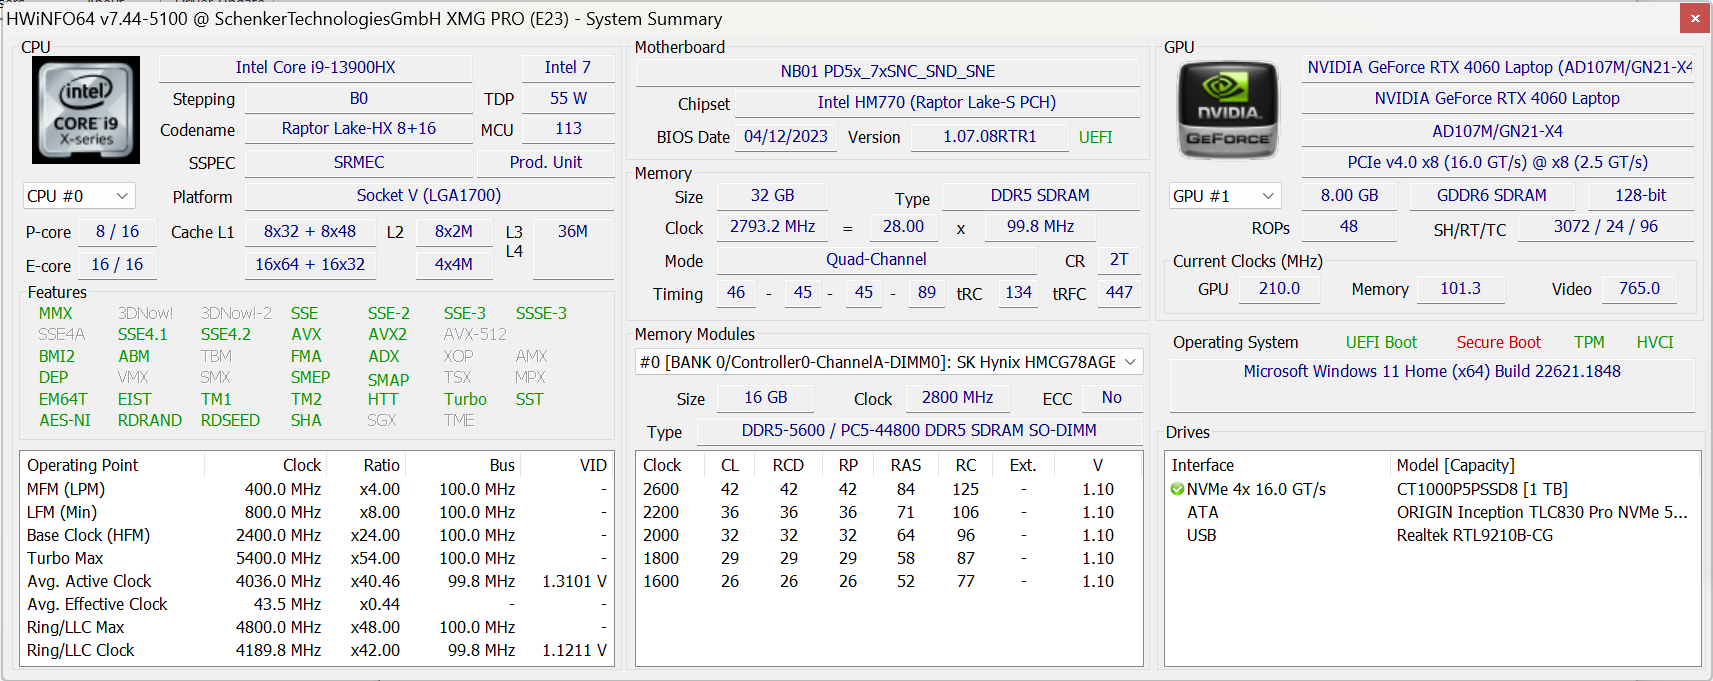
En nuestro dispositivo de prueba, un potenteIntel Core i9-13900HX y laNvidia GeForce RTX 4060 son responsables de la potencia suficiente para poder manejar juegos y la mayoría de tareas creativas. El portátil puede configurarse con 8 a 64 GB de RAM DDR5. Nuestro modelo de pruebas está equipado con 32 GB. Típico de Schenker, se puede elegir entre muchas opciones diferentes como parte del proceso de pedido de Bestware. Además de la RTX 4060, también se puede configurar una RTX 4070. En cuanto a SSDs y opciones WiFi, también hay disponible una amplia selección.
Condiciones de la prueba
Los distintos niveles de rendimiento -modo de rendimiento, modo de entretenimiento, modo de ahorro de energía y modo silencioso- se pueden seleccionar a través del Centro de Control. Además, en el modo de rendimiento, hay opciones disponibles para overclockear ligeramente la GPU y la memoria gráfica. El Intel Core i9 se alimenta con un máximo de 135 vatios y la GeForce RTX 4060 con 140 vatios, si se cambian 25 vatios del procesador a la tarjeta gráfica. En los distintos modos de ahorro de energía se aplican los siguientes valores objetivo:
| Modo: | Modo de rendimiento | Modo de entretenimiento | Modo de ahorro de energía | Modo silencioso |
|---|---|---|---|---|
| CPU PL1 | 135 W | 65 W | 55 W | 45 W |
| CPU PL2 | 162 W | 115 W | 115 W | 115 W |
| Temperatura objetivo CPU | 93 °C | 87 °C | 85 °C | 85 °C |
| GPU TGP + Dynamic Boost | 115 W + 25 W | 115 W + 0 W | 115 W + 0 W | 115 W + 0 W |
| Temperatura objetivo GPU | 87 °C | 87 °C | 87 °C | 87 °C |
Los registros que hemos recopilado muestran que el portátil para juegos puede soportar un aumento de rendimiento muy alto durante hasta 90 segundos tanto en el modo de entretenimiento como en el de rendimiento. Schenker sugiere realizar las tareas cotidianas en modo de entretenimiento. Sin embargo, decidimos realizar todas las pruebas en modo de rendimiento.
Procesador
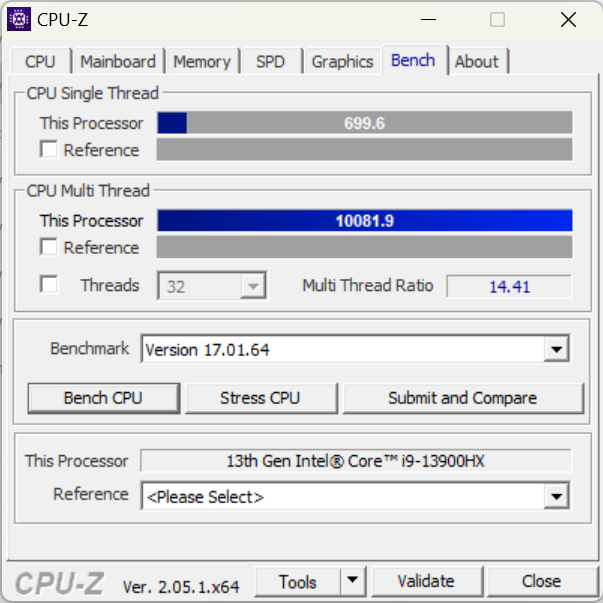
ElIntel Core i9-13900HX es el procesador para portátiles más potente de la actual generación Raptor Lake. Esta CPU es capaz de procesar simultáneamente 32 hilos distribuidos en 8 núcleos P y 16 núcleos E. Gracias a sus elevados valores PL1 y PL2, el i9 muestra realmente el potencial que posee con el XMG Pro 15 superando a todos los demás dispositivos en las pruebas de rendimiento del procesador.
Cinebench R15 Multi Continuous Test
Cinebench R23: Multi Core | Single Core
Cinebench R20: CPU (Multi Core) | CPU (Single Core)
Cinebench R15: CPU Multi 64Bit | CPU Single 64Bit
Blender: v2.79 BMW27 CPU
7-Zip 18.03: 7z b 4 | 7z b 4 -mmt1
Geekbench 5.5: Multi-Core | Single-Core
HWBOT x265 Benchmark v2.2: 4k Preset
LibreOffice : 20 Documents To PDF
R Benchmark 2.5: Overall mean
| CPU Performance rating | |
| Medio Intel Core i9-13900HX | |
| Media de la clase Gaming | |
| Schenker XMG Pro 15 (E23) | |
| Alienware x16 R1 -1! | |
| Aorus 15X ASF | |
| Dell G15 5530 | |
| Asus ZenBook Pro 14 Duo UX8402VV-P1021W | |
| Schenker XMG Pro 15 (i7-12700H, RTX 3080 Ti) | |
| MSI Cyborg 15 A12VF | |
| Asus TUF A15 FA507 | |
| Cinebench R23 / Multi Core | |
| Medio Intel Core i9-13900HX (24270 - 32623, n=23) | |
| Media de la clase Gaming (10488 - 42661, n=107, últimos 2 años) | |
| Schenker XMG Pro 15 (E23) | |
| Dell G15 5530 | |
| Aorus 15X ASF | |
| Alienware x16 R1 | |
| Asus ZenBook Pro 14 Duo UX8402VV-P1021W | |
| Schenker XMG Pro 15 (i7-12700H, RTX 3080 Ti) | |
| MSI Cyborg 15 A12VF | |
| Asus TUF A15 FA507 | |
| Cinebench R23 / Single Core | |
| Medio Intel Core i9-13900HX (1867 - 2105, n=20) | |
| Media de la clase Gaming (1166 - 2415, n=107, últimos 2 años) | |
| Asus ZenBook Pro 14 Duo UX8402VV-P1021W | |
| Alienware x16 R1 | |
| Aorus 15X ASF | |
| Schenker XMG Pro 15 (E23) | |
| Dell G15 5530 | |
| Schenker XMG Pro 15 (i7-12700H, RTX 3080 Ti) | |
| MSI Cyborg 15 A12VF | |
| Asus TUF A15 FA507 | |
| Cinebench R20 / CPU (Multi Core) | |
| Medio Intel Core i9-13900HX (9152 - 12541, n=21) | |
| Media de la clase Gaming (4029 - 16433, n=106, últimos 2 años) | |
| Schenker XMG Pro 15 (E23) | |
| Dell G15 5530 | |
| Aorus 15X ASF | |
| Alienware x16 R1 | |
| Asus ZenBook Pro 14 Duo UX8402VV-P1021W | |
| Schenker XMG Pro 15 (i7-12700H, RTX 3080 Ti) | |
| MSI Cyborg 15 A12VF | |
| Asus TUF A15 FA507 | |
| Cinebench R20 / CPU (Single Core) | |
| Medio Intel Core i9-13900HX (722 - 810, n=21) | |
| Media de la clase Gaming (442 - 913, n=106, últimos 2 años) | |
| Asus ZenBook Pro 14 Duo UX8402VV-P1021W | |
| Alienware x16 R1 | |
| Aorus 15X ASF | |
| Schenker XMG Pro 15 (E23) | |
| Dell G15 5530 | |
| Schenker XMG Pro 15 (i7-12700H, RTX 3080 Ti) | |
| MSI Cyborg 15 A12VF | |
| Asus TUF A15 FA507 | |
| Cinebench R15 / CPU Multi 64Bit | |
| Medio Intel Core i9-13900HX (3913 - 4970, n=22) | |
| Media de la clase Gaming (1578 - 6330, n=105, últimos 2 años) | |
| Schenker XMG Pro 15 (E23) | |
| Aorus 15X ASF | |
| Dell G15 5530 | |
| Alienware x16 R1 | |
| Asus ZenBook Pro 14 Duo UX8402VV-P1021W | |
| Schenker XMG Pro 15 (i7-12700H, RTX 3080 Ti) | |
| Asus TUF A15 FA507 | |
| MSI Cyborg 15 A12VF | |
| Cinebench R15 / CPU Single 64Bit | |
| Media de la clase Gaming (188.8 - 350, n=106, últimos 2 años) | |
| Medio Intel Core i9-13900HX (247 - 304, n=22) | |
| Asus ZenBook Pro 14 Duo UX8402VV-P1021W | |
| Alienware x16 R1 | |
| Aorus 15X ASF | |
| Dell G15 5530 | |
| Schenker XMG Pro 15 (i7-12700H, RTX 3080 Ti) | |
| Asus TUF A15 FA507 | |
| Schenker XMG Pro 15 (E23) | |
| MSI Cyborg 15 A12VF | |
| Blender / v2.79 BMW27 CPU | |
| MSI Cyborg 15 A12VF | |
| Asus TUF A15 FA507 | |
| Schenker XMG Pro 15 (i7-12700H, RTX 3080 Ti) | |
| Asus ZenBook Pro 14 Duo UX8402VV-P1021W | |
| Aorus 15X ASF | |
| Dell G15 5530 | |
| Media de la clase Gaming (79 - 330, n=104, últimos 2 años) | |
| Schenker XMG Pro 15 (E23) | |
| Medio Intel Core i9-13900HX (101 - 153, n=22) | |
| 7-Zip 18.03 / 7z b 4 | |
| Medio Intel Core i9-13900HX (90675 - 127283, n=21) | |
| Schenker XMG Pro 15 (E23) | |
| Media de la clase Gaming (33491 - 148086, n=105, últimos 2 años) | |
| Dell G15 5530 | |
| Alienware x16 R1 | |
| Aorus 15X ASF | |
| Asus ZenBook Pro 14 Duo UX8402VV-P1021W | |
| Schenker XMG Pro 15 (i7-12700H, RTX 3080 Ti) | |
| Asus TUF A15 FA507 | |
| MSI Cyborg 15 A12VF | |
| 7-Zip 18.03 / 7z b 4 -mmt1 | |
| Medio Intel Core i9-13900HX (6340 - 7177, n=21) | |
| Media de la clase Gaming (4199 - 7436, n=105, últimos 2 años) | |
| Aorus 15X ASF | |
| Schenker XMG Pro 15 (E23) | |
| Asus ZenBook Pro 14 Duo UX8402VV-P1021W | |
| Alienware x16 R1 | |
| Dell G15 5530 | |
| Asus TUF A15 FA507 | |
| Schenker XMG Pro 15 (i7-12700H, RTX 3080 Ti) | |
| MSI Cyborg 15 A12VF | |
| Geekbench 5.5 / Multi-Core | |
| Medio Intel Core i9-13900HX (17614 - 21075, n=22) | |
| Schenker XMG Pro 15 (E23) | |
| Media de la clase Gaming (6460 - 28263, n=105, últimos 2 años) | |
| Aorus 15X ASF | |
| Alienware x16 R1 | |
| Dell G15 5530 | |
| Asus ZenBook Pro 14 Duo UX8402VV-P1021W | |
| Schenker XMG Pro 15 (i7-12700H, RTX 3080 Ti) | |
| MSI Cyborg 15 A12VF | |
| Asus TUF A15 FA507 | |
| Geekbench 5.5 / Single-Core | |
| Media de la clase Gaming (986 - 2474, n=105, últimos 2 años) | |
| Medio Intel Core i9-13900HX (1345 - 2093, n=22) | |
| Alienware x16 R1 | |
| Asus ZenBook Pro 14 Duo UX8402VV-P1021W | |
| Aorus 15X ASF | |
| Dell G15 5530 | |
| Schenker XMG Pro 15 (E23) | |
| MSI Cyborg 15 A12VF | |
| Schenker XMG Pro 15 (i7-12700H, RTX 3080 Ti) | |
| Asus TUF A15 FA507 | |
| HWBOT x265 Benchmark v2.2 / 4k Preset | |
| Medio Intel Core i9-13900HX (23.5 - 34.4, n=22) | |
| Media de la clase Gaming (11.5 - 44.4, n=105, últimos 2 años) | |
| Schenker XMG Pro 15 (E23) | |
| Dell G15 5530 | |
| Alienware x16 R1 | |
| Aorus 15X ASF | |
| Schenker XMG Pro 15 (i7-12700H, RTX 3080 Ti) | |
| Asus ZenBook Pro 14 Duo UX8402VV-P1021W | |
| Asus TUF A15 FA507 | |
| MSI Cyborg 15 A12VF | |
| MSI Cyborg 15 A12VF | |
| LibreOffice / 20 Documents To PDF | |
| Schenker XMG Pro 15 (E23) | |
| Asus TUF A15 FA507 | |
| Media de la clase Gaming (33.2 - 88.8, n=105, últimos 2 años) | |
| Schenker XMG Pro 15 (i7-12700H, RTX 3080 Ti) | |
| Dell G15 5530 | |
| Alienware x16 R1 | |
| Aorus 15X ASF | |
| Medio Intel Core i9-13900HX (32.8 - 51.1, n=21) | |
| Asus ZenBook Pro 14 Duo UX8402VV-P1021W | |
| MSI Cyborg 15 A12VF | |
| R Benchmark 2.5 / Overall mean | |
| Asus TUF A15 FA507 | |
| MSI Cyborg 15 A12VF | |
| Schenker XMG Pro 15 (E23) | |
| Schenker XMG Pro 15 (i7-12700H, RTX 3080 Ti) | |
| Aorus 15X ASF | |
| Asus ZenBook Pro 14 Duo UX8402VV-P1021W | |
| Media de la clase Gaming (0.3439 - 0.759, n=106, últimos 2 años) | |
| Alienware x16 R1 | |
| Dell G15 5530 | |
| Medio Intel Core i9-13900HX (0.375 - 0.4564, n=22) | |
* ... más pequeño es mejor
AIDA64: FP32 Ray-Trace | FPU Julia | CPU SHA3 | CPU Queen | FPU SinJulia | FPU Mandel | CPU AES | CPU ZLib | FP64 Ray-Trace | CPU PhotoWorxx
| Performance rating | |
| Media de la clase Gaming | |
| Medio Intel Core i9-13900HX | |
| Schenker XMG Pro 15 (E23) | |
| Alienware x16 R1 | |
| Aorus 15X ASF | |
| Dell G15 5530 | |
| Asus TUF A15 FA507 | |
| Asus ZenBook Pro 14 Duo UX8402VV-P1021W | |
| MSI Cyborg 15 A12VF | |
| Schenker XMG Pro 15 (i7-12700H, RTX 3080 Ti) | |
| AIDA64 / FP32 Ray-Trace | |
| Media de la clase Gaming (10227 - 85542, n=105, últimos 2 años) | |
| Medio Intel Core i9-13900HX (17589 - 27615, n=22) | |
| Alienware x16 R1 | |
| Dell G15 5530 | |
| Schenker XMG Pro 15 (E23) | |
| Aorus 15X ASF | |
| Asus TUF A15 FA507 | |
| Asus ZenBook Pro 14 Duo UX8402VV-P1021W | |
| MSI Cyborg 15 A12VF | |
| Schenker XMG Pro 15 (i7-12700H, RTX 3080 Ti) | |
| AIDA64 / FPU Julia | |
| Media de la clase Gaming (51376 - 238426, n=105, últimos 2 años) | |
| Medio Intel Core i9-13900HX (88686 - 137015, n=22) | |
| Asus TUF A15 FA507 | |
| Schenker XMG Pro 15 (E23) | |
| Alienware x16 R1 | |
| Dell G15 5530 | |
| Aorus 15X ASF | |
| Asus ZenBook Pro 14 Duo UX8402VV-P1021W | |
| MSI Cyborg 15 A12VF | |
| Schenker XMG Pro 15 (i7-12700H, RTX 3080 Ti) | |
| AIDA64 / CPU SHA3 | |
| Media de la clase Gaming (2180 - 10115, n=105, últimos 2 años) | |
| Medio Intel Core i9-13900HX (4362 - 7029, n=22) | |
| Schenker XMG Pro 15 (E23) | |
| Dell G15 5530 | |
| Alienware x16 R1 | |
| Aorus 15X ASF | |
| Asus TUF A15 FA507 | |
| Asus ZenBook Pro 14 Duo UX8402VV-P1021W | |
| MSI Cyborg 15 A12VF | |
| Schenker XMG Pro 15 (i7-12700H, RTX 3080 Ti) | |
| AIDA64 / CPU Queen | |
| Medio Intel Core i9-13900HX (125644 - 141385, n=22) | |
| Schenker XMG Pro 15 (E23) | |
| Alienware x16 R1 | |
| Media de la clase Gaming (49785 - 173351, n=90, últimos 2 años) | |
| Aorus 15X ASF | |
| Asus ZenBook Pro 14 Duo UX8402VV-P1021W | |
| Dell G15 5530 | |
| Asus TUF A15 FA507 | |
| Schenker XMG Pro 15 (i7-12700H, RTX 3080 Ti) | |
| MSI Cyborg 15 A12VF | |
| AIDA64 / FPU SinJulia | |
| Medio Intel Core i9-13900HX (12334 - 17179, n=22) | |
| Media de la clase Gaming (4424 - 33636, n=105, últimos 2 años) | |
| Asus TUF A15 FA507 | |
| Schenker XMG Pro 15 (E23) | |
| Aorus 15X ASF | |
| Alienware x16 R1 | |
| Dell G15 5530 | |
| Schenker XMG Pro 15 (i7-12700H, RTX 3080 Ti) | |
| Asus ZenBook Pro 14 Duo UX8402VV-P1021W | |
| MSI Cyborg 15 A12VF | |
| AIDA64 / FPU Mandel | |
| Media de la clase Gaming (25115 - 128721, n=105, últimos 2 años) | |
| Medio Intel Core i9-13900HX (43850 - 69202, n=22) | |
| Asus TUF A15 FA507 | |
| Alienware x16 R1 | |
| Schenker XMG Pro 15 (E23) | |
| Dell G15 5530 | |
| Aorus 15X ASF | |
| Asus ZenBook Pro 14 Duo UX8402VV-P1021W | |
| MSI Cyborg 15 A12VF | |
| Schenker XMG Pro 15 (i7-12700H, RTX 3080 Ti) | |
| AIDA64 / CPU AES | |
| Aorus 15X ASF | |
| Medio Intel Core i9-13900HX (89413 - 237881, n=22) | |
| Media de la clase Gaming (39258 - 247074, n=105, últimos 2 años) | |
| Schenker XMG Pro 15 (E23) | |
| Dell G15 5530 | |
| Alienware x16 R1 | |
| Asus TUF A15 FA507 | |
| MSI Cyborg 15 A12VF | |
| Asus ZenBook Pro 14 Duo UX8402VV-P1021W | |
| Schenker XMG Pro 15 (i7-12700H, RTX 3080 Ti) | |
| AIDA64 / CPU ZLib | |
| Medio Intel Core i9-13900HX (1284 - 1958, n=22) | |
| Media de la clase Gaming (574 - 2531, n=105, últimos 2 años) | |
| Schenker XMG Pro 15 (E23) | |
| Dell G15 5530 | |
| Alienware x16 R1 | |
| Aorus 15X ASF | |
| Schenker XMG Pro 15 (i7-12700H, RTX 3080 Ti) | |
| MSI Cyborg 15 A12VF | |
| Asus ZenBook Pro 14 Duo UX8402VV-P1021W | |
| Asus TUF A15 FA507 | |
| AIDA64 / FP64 Ray-Trace | |
| Media de la clase Gaming (5509 - 45446, n=105, últimos 2 años) | |
| Medio Intel Core i9-13900HX (9481 - 15279, n=22) | |
| Alienware x16 R1 | |
| Dell G15 5530 | |
| Schenker XMG Pro 15 (E23) | |
| Aorus 15X ASF | |
| Asus TUF A15 FA507 | |
| Asus ZenBook Pro 14 Duo UX8402VV-P1021W | |
| MSI Cyborg 15 A12VF | |
| Schenker XMG Pro 15 (i7-12700H, RTX 3080 Ti) | |
| AIDA64 / CPU PhotoWorxx | |
| Schenker XMG Pro 15 (E23) | |
| Alienware x16 R1 | |
| Medio Intel Core i9-13900HX (42994 - 51994, n=22) | |
| Media de la clase Gaming (12271 - 89891, n=105, últimos 2 años) | |
| Asus ZenBook Pro 14 Duo UX8402VV-P1021W | |
| Dell G15 5530 | |
| MSI Cyborg 15 A12VF | |
| Aorus 15X ASF | |
| Schenker XMG Pro 15 (i7-12700H, RTX 3080 Ti) | |
| Asus TUF A15 FA507 | |
Rendimiento del sistema
En el área de rendimiento del sistema, el dispositivo de análisis también obtuvo buenas cifras e incluso superó al Aorus 15X ASFa pesar de compartir valores similares de TDP y TGP. En PCMark 10, el XMG Pro 15 queda sólo unos puntos por detrás del delgado Asus ZenBook Pro 14 Duo lo que demuestra que un portátil gaming potente no siempre tiene que ser un portátil gaming pesado.
CrossMark: Overall | Productivity | Creativity | Responsiveness
| PCMark 10 / Score | |
| Media de la clase Gaming (5828 - 12414, n=93, últimos 2 años) | |
| Alienware x16 R1 | |
| Asus ZenBook Pro 14 Duo UX8402VV-P1021W | |
| Schenker XMG Pro 15 (E23) | |
| Medio Intel Core i9-13900HX, NVIDIA GeForce RTX 4060 Laptop GPU (n=1) | |
| Asus TUF A15 FA507 | |
| Aorus 15X ASF | |
| MSI Cyborg 15 A12VF | |
| Dell G15 5530 | |
| Schenker XMG Pro 15 (i7-12700H, RTX 3080 Ti) | |
| PCMark 10 / Essentials | |
| Schenker XMG Pro 15 (E23) | |
| Medio Intel Core i9-13900HX, NVIDIA GeForce RTX 4060 Laptop GPU (n=1) | |
| Asus ZenBook Pro 14 Duo UX8402VV-P1021W | |
| Alienware x16 R1 | |
| Dell G15 5530 | |
| Schenker XMG Pro 15 (i7-12700H, RTX 3080 Ti) | |
| Aorus 15X ASF | |
| MSI Cyborg 15 A12VF | |
| Media de la clase Gaming (8810 - 11935, n=97, últimos 2 años) | |
| Asus TUF A15 FA507 | |
| PCMark 10 / Productivity | |
| Media de la clase Gaming (6845 - 25323, n=95, últimos 2 años) | |
| Schenker XMG Pro 15 (E23) | |
| Medio Intel Core i9-13900HX, NVIDIA GeForce RTX 4060 Laptop GPU (n=1) | |
| Dell G15 5530 | |
| MSI Cyborg 15 A12VF | |
| Alienware x16 R1 | |
| Asus ZenBook Pro 14 Duo UX8402VV-P1021W | |
| Aorus 15X ASF | |
| Asus TUF A15 FA507 | |
| Schenker XMG Pro 15 (i7-12700H, RTX 3080 Ti) | |
| PCMark 10 / Digital Content Creation | |
| Alienware x16 R1 | |
| Media de la clase Gaming (7602 - 19954, n=95, últimos 2 años) | |
| Asus ZenBook Pro 14 Duo UX8402VV-P1021W | |
| Asus TUF A15 FA507 | |
| Aorus 15X ASF | |
| Schenker XMG Pro 15 (E23) | |
| Medio Intel Core i9-13900HX, NVIDIA GeForce RTX 4060 Laptop GPU (n=1) | |
| MSI Cyborg 15 A12VF | |
| Schenker XMG Pro 15 (i7-12700H, RTX 3080 Ti) | |
| Dell G15 5530 | |
| CrossMark / Overall | |
| Aorus 15X ASF | |
| Media de la clase Gaming (1366 - 2409, n=94, últimos 2 años) | |
| Schenker XMG Pro 15 (E23) | |
| Medio Intel Core i9-13900HX, NVIDIA GeForce RTX 4060 Laptop GPU (n=1) | |
| Alienware x16 R1 | |
| Asus ZenBook Pro 14 Duo UX8402VV-P1021W | |
| Dell G15 5530 | |
| MSI Cyborg 15 A12VF | |
| Asus TUF A15 FA507 | |
| CrossMark / Productivity | |
| Aorus 15X ASF | |
| Media de la clase Gaming (1386 - 2254, n=94, últimos 2 años) | |
| Alienware x16 R1 | |
| Schenker XMG Pro 15 (E23) | |
| Medio Intel Core i9-13900HX, NVIDIA GeForce RTX 4060 Laptop GPU (n=1) | |
| Asus ZenBook Pro 14 Duo UX8402VV-P1021W | |
| Dell G15 5530 | |
| MSI Cyborg 15 A12VF | |
| Asus TUF A15 FA507 | |
| CrossMark / Creativity | |
| Media de la clase Gaming (1343 - 2786, n=94, últimos 2 años) | |
| Schenker XMG Pro 15 (E23) | |
| Medio Intel Core i9-13900HX, NVIDIA GeForce RTX 4060 Laptop GPU (n=1) | |
| Aorus 15X ASF | |
| Asus ZenBook Pro 14 Duo UX8402VV-P1021W | |
| Dell G15 5530 | |
| Alienware x16 R1 | |
| MSI Cyborg 15 A12VF | |
| Asus TUF A15 FA507 | |
| CrossMark / Responsiveness | |
| Aorus 15X ASF | |
| Alienware x16 R1 | |
| Schenker XMG Pro 15 (E23) | |
| Medio Intel Core i9-13900HX, NVIDIA GeForce RTX 4060 Laptop GPU (n=1) | |
| Media de la clase Gaming (1226 - 2334, n=94, últimos 2 años) | |
| MSI Cyborg 15 A12VF | |
| Asus ZenBook Pro 14 Duo UX8402VV-P1021W | |
| Dell G15 5530 | |
| Asus TUF A15 FA507 | |
| PCMark 10 Score | 7521 puntos | |
ayuda | ||
| AIDA64 / Memory Copy | |
| Schenker XMG Pro 15 (E23) | |
| Medio Intel Core i9-13900HX (67716 - 79193, n=22) | |
| Alienware x16 R1 | |
| Media de la clase Gaming (21750 - 129946, n=105, últimos 2 años) | |
| Asus ZenBook Pro 14 Duo UX8402VV-P1021W | |
| Dell G15 5530 | |
| Aorus 15X ASF | |
| MSI Cyborg 15 A12VF | |
| Asus TUF A15 FA507 | |
| Schenker XMG Pro 15 (i7-12700H, RTX 3080 Ti) | |
| AIDA64 / Memory Read | |
| Schenker XMG Pro 15 (E23) | |
| Medio Intel Core i9-13900HX (73998 - 88462, n=22) | |
| Media de la clase Gaming (22956 - 118858, n=105, últimos 2 años) | |
| Dell G15 5530 | |
| Alienware x16 R1 | |
| Aorus 15X ASF | |
| MSI Cyborg 15 A12VF | |
| Asus ZenBook Pro 14 Duo UX8402VV-P1021W | |
| Asus TUF A15 FA507 | |
| Schenker XMG Pro 15 (i7-12700H, RTX 3080 Ti) | |
| AIDA64 / Memory Write | |
| Alienware x16 R1 | |
| Media de la clase Gaming (22297 - 135096, n=105, últimos 2 años) | |
| Schenker XMG Pro 15 (E23) | |
| Medio Intel Core i9-13900HX (65472 - 77045, n=22) | |
| Asus ZenBook Pro 14 Duo UX8402VV-P1021W | |
| Dell G15 5530 | |
| MSI Cyborg 15 A12VF | |
| Aorus 15X ASF | |
| Asus TUF A15 FA507 | |
| Schenker XMG Pro 15 (i7-12700H, RTX 3080 Ti) | |
| AIDA64 / Memory Latency | |
| Media de la clase Gaming (75.3 - 259, n=105, últimos 2 años) | |
| Alienware x16 R1 | |
| Asus ZenBook Pro 14 Duo UX8402VV-P1021W | |
| MSI Cyborg 15 A12VF | |
| Dell G15 5530 | |
| Aorus 15X ASF | |
| Medio Intel Core i9-13900HX (75.3 - 91.1, n=22) | |
| Schenker XMG Pro 15 (E23) | |
| Asus TUF A15 FA507 | |
* ... más pequeño es mejor
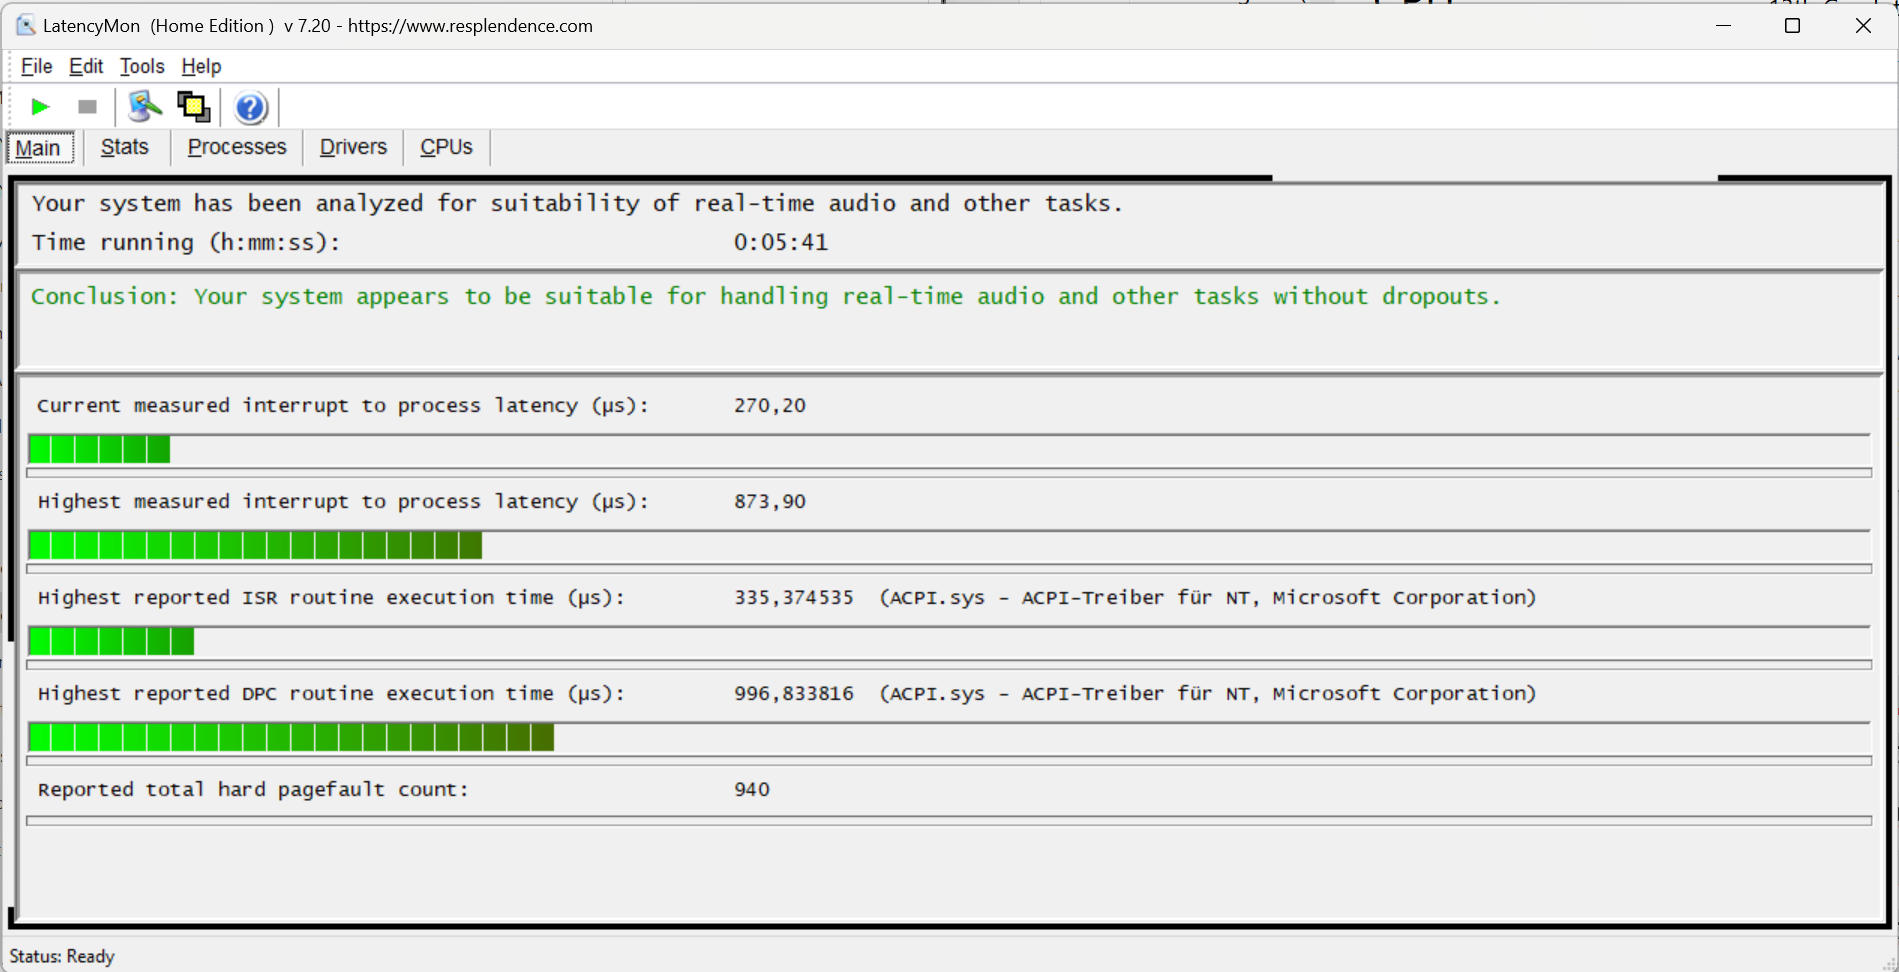
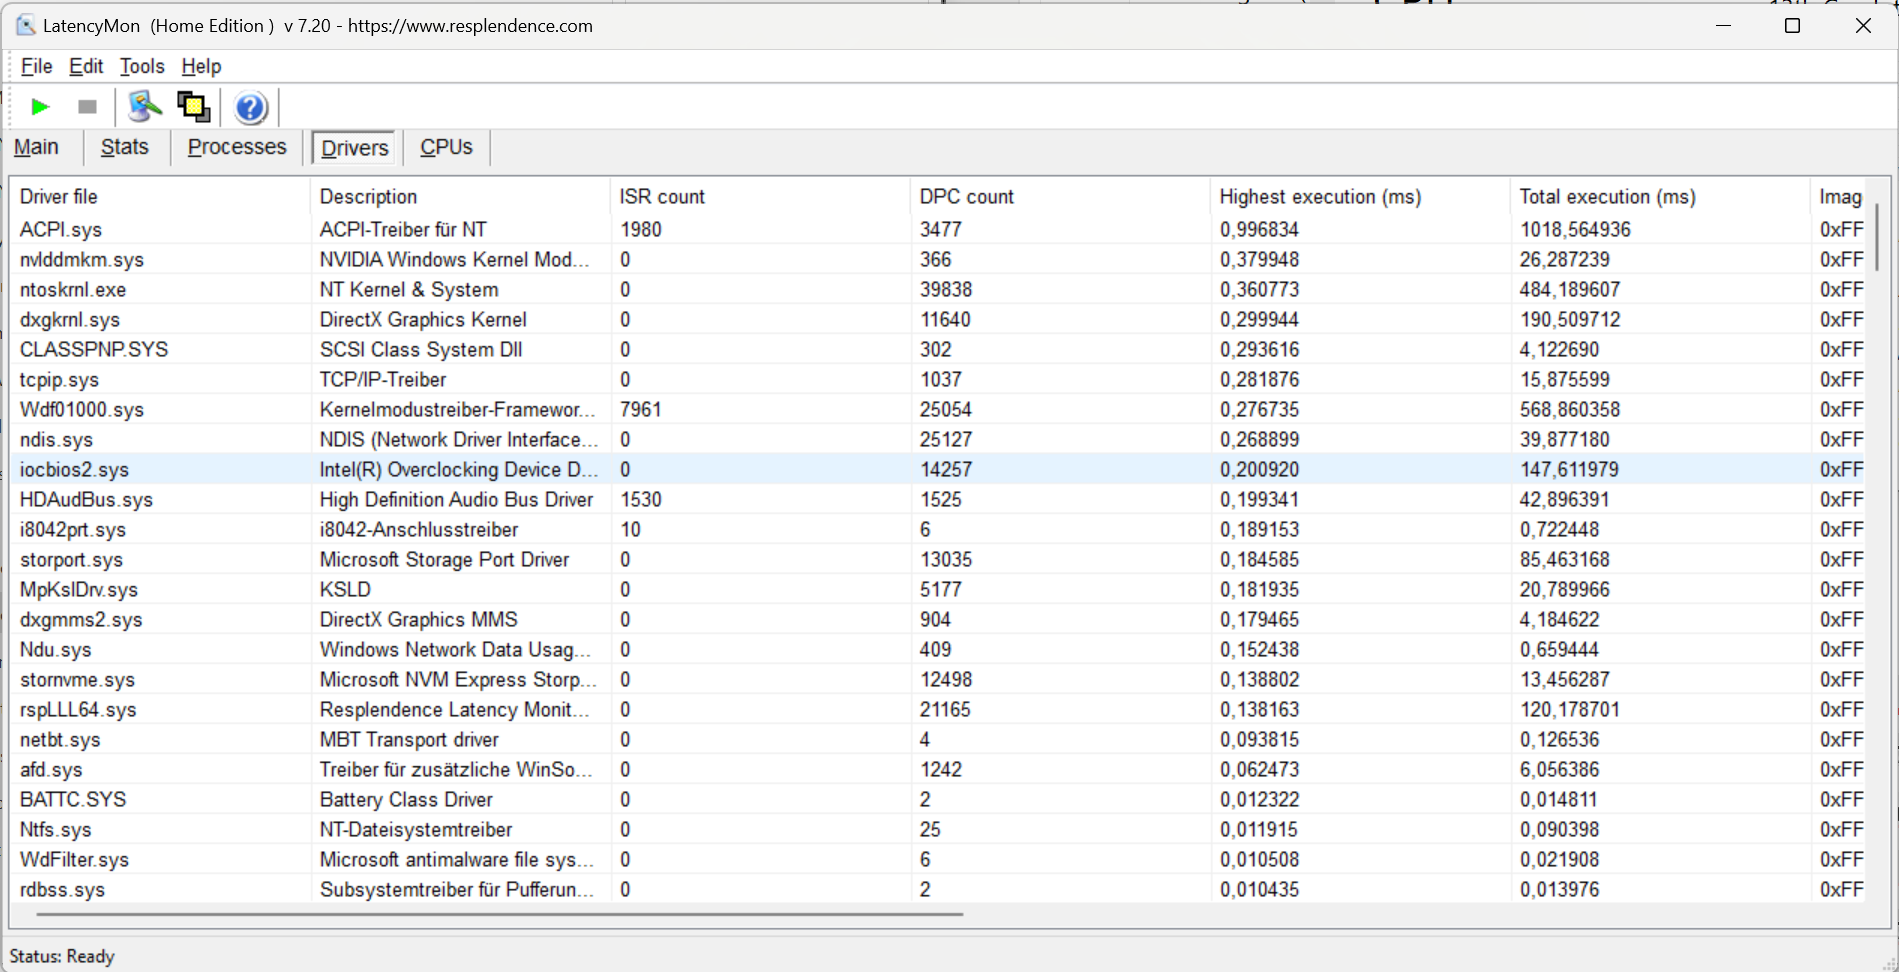
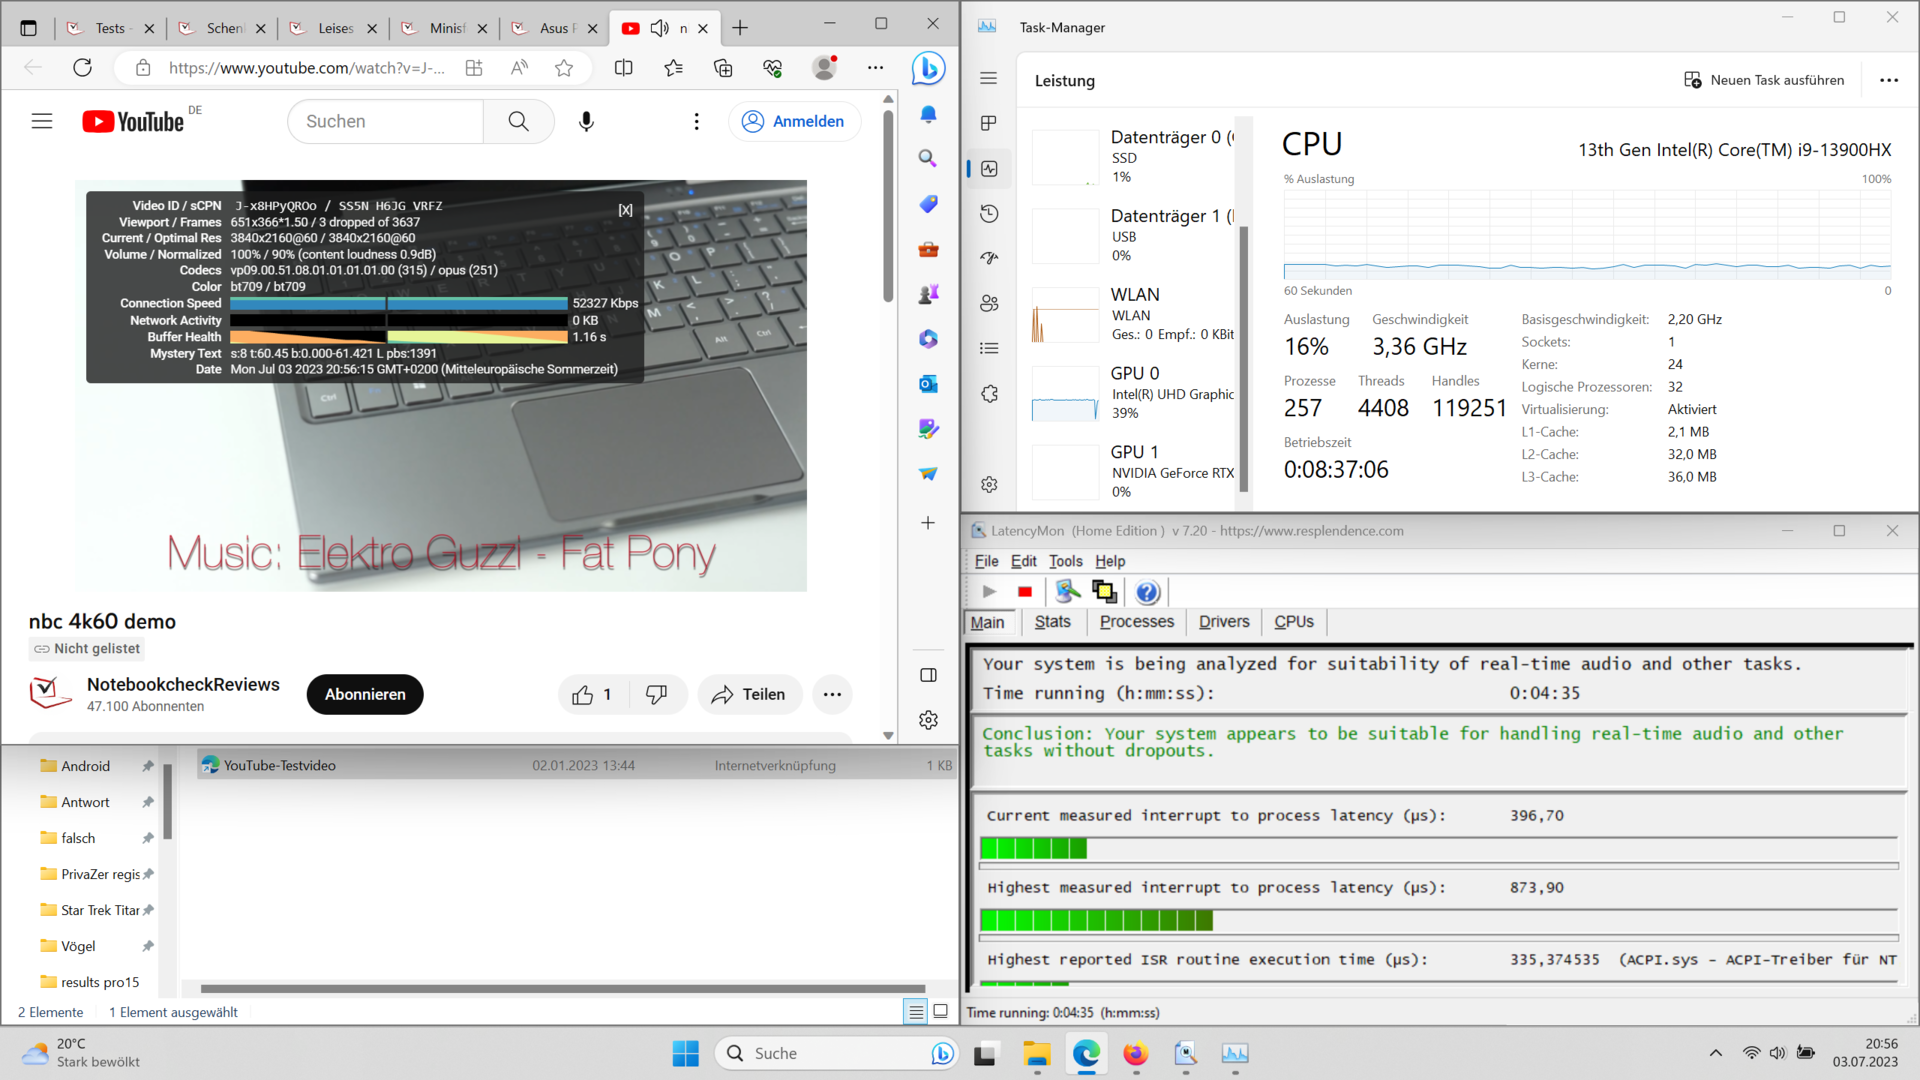
Latencias del CPD
En esta área, se nota que los problemas de interacción entre los controladores de Nvidia y otros controladores han sido, entretanto, superados. En este portátil, en el momento de las pruebas, las latencias del CPD se sitúan en un nivel bajo con los controladores y el firmware actuales.
| DPC Latencies / LatencyMon - interrupt to process latency (max), Web, Youtube, Prime95 | |
| Dell G15 5530 | |
| Aorus 15X ASF | |
| Schenker XMG Pro 15 (i7-12700H, RTX 3080 Ti) | |
| Alienware x16 R1 | |
| MSI Cyborg 15 A12VF | |
| Asus ZenBook Pro 14 Duo UX8402VV-P1021W | |
| Schenker XMG Pro 15 (E23) | |
* ... más pequeño es mejor
Almacenamiento masivo
De todos los SSDs NVMe que Schenker ofrece para el XMG Pro 15, el Crucial P5 Plus probablemente no sea la opción más rápida. Sin embargo, en las pruebas devolvió buenos valores que mantuvo durante largos periodos de tiempo. En el bucle DiskSpd, sólo observamos una ralentización mínima tras bastantes ejecuciones.

* ... más pequeño es mejor
Continuous Performance Read: DiskSpd Read Loop, Queue Depth 8
Tarjeta gráfica
Ahora llegamos a la cuestión central de nuestro análisis. ¿Puede laNvidia GeForce RTX 4060 en nuestro dispositivo de revisión mantenerse al día con el predecesor de laRTX 3080 Ti? La respuesta honesta a esta pregunta es un claro sí y no. Dependiendo del benchmark, tendrás que contar con entre un 10 % y un 20 % menos de rendimiento. A la hora de jugar, la diferencia de rendimiento entre la actual XMG Pro 15 y su predecesora depende más bien del juego. Mientras que algo como The Witcher 3 se beneficia de la mayor velocidad de reloj de la 4060 y logra mayores tasas de fotogramas, en GTA V, la Pro 15 E23 queda algo por detrás de su predecesora. Sin embargo, el XMG Pro 15 también se puede configurar con unaRTX 4070. ElAorus 15X ASFmuestra que la diferencia de rendimiento entre una RTX 3080 Ti y una RTX 4070 es muy baja - en todas las situaciones. Dado que el Aorus y el XMG Pro 15 funcionan con valores TDP y TGP casi idénticos, esto indica el posible rendimiento que cabe esperar en el XMG Pro 15 con una RTX 4070.
| 3DMark 11 Performance | 29518 puntos | |
| 3DMark Ice Storm Standard Score | 146918 puntos | |
| 3DMark Cloud Gate Standard Score | 54429 puntos | |
| 3DMark Fire Strike Score | 23131 puntos | |
| 3DMark Time Spy Score | 10776 puntos | |
ayuda | ||
* ... más pequeño es mejor
| The Witcher 3 - 1920x1080 Ultra Graphics & Postprocessing (HBAO+) | |
| Media de la clase Gaming (104.7 - 240, n=7, últimos 2 años) | |
| Alienware x16 R1 | |
| Schenker XMG Pro 15 (E23) | |
| Asus ZenBook Pro 14 Duo UX8402VV-P1021W | |
| Schenker XMG Pro 15 (i7-12700H, RTX 3080 Ti) | |
| Aorus 15X ASF | |
| Dell G15 5530 | |
| Asus TUF A15 FA507 | |
| MSI Cyborg 15 A12VF | |
| Final Fantasy XV Benchmark - 1920x1080 High Quality | |
| Alienware x16 R1 | |
| Media de la clase Gaming (41 - 215, n=95, últimos 2 años) | |
| Aorus 15X ASF | |
| Schenker XMG Pro 15 (i7-12700H, RTX 3080 Ti) | |
| Dell G15 5530 | |
| Asus ZenBook Pro 14 Duo UX8402VV-P1021W | |
| Asus TUF A15 FA507 | |
| MSI Cyborg 15 A12VF | |
| Hogwarts Legacy | |
| 2560x1440 Ultra Preset AA:High T | |
| Media de la clase Gaming (n=1últimos 2 años) | |
| Schenker XMG Pro 15 (E23) | |
| Medio NVIDIA GeForce RTX 4060 Laptop GPU (42.8 - 45, n=4) | |
| 1920x1080 Ultra Preset AA:High T | |
| Media de la clase Gaming (n=1últimos 2 años) | |
| Medio NVIDIA GeForce RTX 4060 Laptop GPU (61.9 - 91.9, n=6) | |
| Schenker XMG Pro 15 (E23) | |
| MSI Cyborg 15 A12VF | |
| Asus TUF A15 FA507 | |
| 1920x1080 High Preset AA:High T | |
| Asus TUF A15 FA507 | |
| Medio NVIDIA GeForce RTX 4060 Laptop GPU (70.8 - 107.7, n=6) | |
| MSI Cyborg 15 A12VF | |
| Schenker XMG Pro 15 (E23) | |
| bajo | medio | alto | ultra | QHD | 4K | |
|---|---|---|---|---|---|---|
| GTA V (2015) | 184.5 | 178.9 | 170.6 | 107.2 | 87 | |
| The Witcher 3 (2015) | 112 | 159.7 | ||||
| Dota 2 Reborn (2015) | 210 | 182.9 | 176.1 | 154.3 | 126.4 | |
| X-Plane 11.11 (2018) | 154.9 | 135.9 | 111 | 102 | ||
| Strange Brigade (2018) | 377 | 267 | 213 | 183.3 | 127.5 | |
| Shadow of the Tomb Raider (2018) | 142 | 94 | ||||
| Cyberpunk 2077 1.6 (2022) | 80.6 | 48.56 | ||||
| Tiny Tina's Wonderlands (2022) | 89.29 | 60.01 | ||||
| F1 22 (2022) | 245 | 235 | 179.8 | 66.4 | 43 | |
| Call of Duty Modern Warfare 2 2022 (2022) | 91 | 66 | ||||
| Hogwarts Legacy (2023) | 90.4 | 70.8 | 64 | 44.4 |
Emisiones y energía: altavoces silenciosos y ventiladores ruidosos
Emisiones sonoras
Por desgracia, en las pruebas, el XMG Pro 15 demostró ser muy ruidoso. Usando el modo de rendimiento activado a plena carga y a una distancia de 15 centímetros, medimos nada menos que 53 dB(A) en Prime95 y Furmark. Sin embargo, los ventiladores tienen otros trucos bajo la manga. Nuestra experiencia demuestra que el modo de entretenimiento también ofrece rendimiento suficiente para muchos juegos. Esto reduce significativamente el nivel de ruido emitido por el portátil. En uso normal sin aplicaciones 3D, puedes incluso esperar un funcionamiento entre muy silencioso y silencioso. Esto, al menos, le ayuda a tener la nariz un poco delante en comparación con el predecesor.
Ruido
| Ocioso |
| 24 / 24 / 24 dB(A) |
| Carga |
| 53.65 / 53.65 dB(A) |
 | ||
30 dB silencioso 40 dB(A) audible 50 dB(A) ruidosamente alto |
||
min: | ||
| Schenker XMG Pro 15 (E23) GeForce RTX 4060 Laptop GPU, i9-13900HX, Crucial P5 Plus 1TB CT1000P5PSSD8 | Schenker XMG Pro 15 (i7-12700H, RTX 3080 Ti) GeForce RTX 3080 Ti Laptop GPU, i7-12700H, Samsung SSD 980 Pro 1TB MZ-V8P1T0BW | Dell G15 5530 GeForce RTX 4060 Laptop GPU, i7-13650HX, SSTC CL4-3D512-Q11 | Asus TUF A15 FA507 GeForce RTX 4050 Laptop GPU, R7 7735HS, Micron 2400 MTFDKBA512QFM | Aorus 15X ASF GeForce RTX 4070 Laptop GPU, i7-13700HX, Gigabyte AG470S1TB-SI B10 | Asus ZenBook Pro 14 Duo UX8402VV-P1021W GeForce RTX 4060 Laptop GPU, i9-13900H, Samsung PM9A1 MZVL22T0HBLB | MSI Cyborg 15 A12VF GeForce RTX 4060 Laptop GPU, i7-12650H, Samsung PM9B1 1024GB MZVL41T0HBLB | Alienware x16 R1 GeForce RTX 4080 Laptop GPU, i9-13900HK, SK hynix PC801 HFS001TEJ9X101N | |
|---|---|---|---|---|---|---|---|---|
| Noise | -11% | 7% | 14% | -13% | -13% | -25% | 4% | |
| apagado / medio ambiente * (dB) | 24 | 23 4% | 20.41 15% | 23.3 3% | 25 -4% | 25.2 -5% | 27 -13% | 22.7 5% |
| Idle Minimum * (dB) | 24 | 23 4% | 26.85 -12% | 23.3 3% | 28 -17% | 25.2 -5% | 27 -13% | 23.1 4% |
| Idle Average * (dB) | 24 | 31.22 -30% | 26.85 -12% | 23.3 3% | 29 -21% | 25.2 -5% | 37.5 -56% | 25.8 -8% |
| Idle Maximum * (dB) | 24 | 33.09 -38% | 26.85 -12% | 23.3 3% | 36 -50% | 32.5 -35% | 38 -58% | 25.8 -8% |
| Load Average * (dB) | 53.65 | 56.35 -5% | 27.65 48% | 29.6 45% | 50 7% | 59.7 -11% | 56.3 -5% | 39.3 27% |
| Witcher 3 ultra * (dB) | 53.53 | 56.89 -6% | 47.9 11% | 43 20% | 54 -1% | 49.9 7% | ||
| Load Maximum * (dB) | 53.65 | 56.89 -6% | 47.86 11% | 43 20% | 58 -8% | 60.9 -14% | 56.3 -5% | 54.8 -2% |
* ... más pequeño es mejor
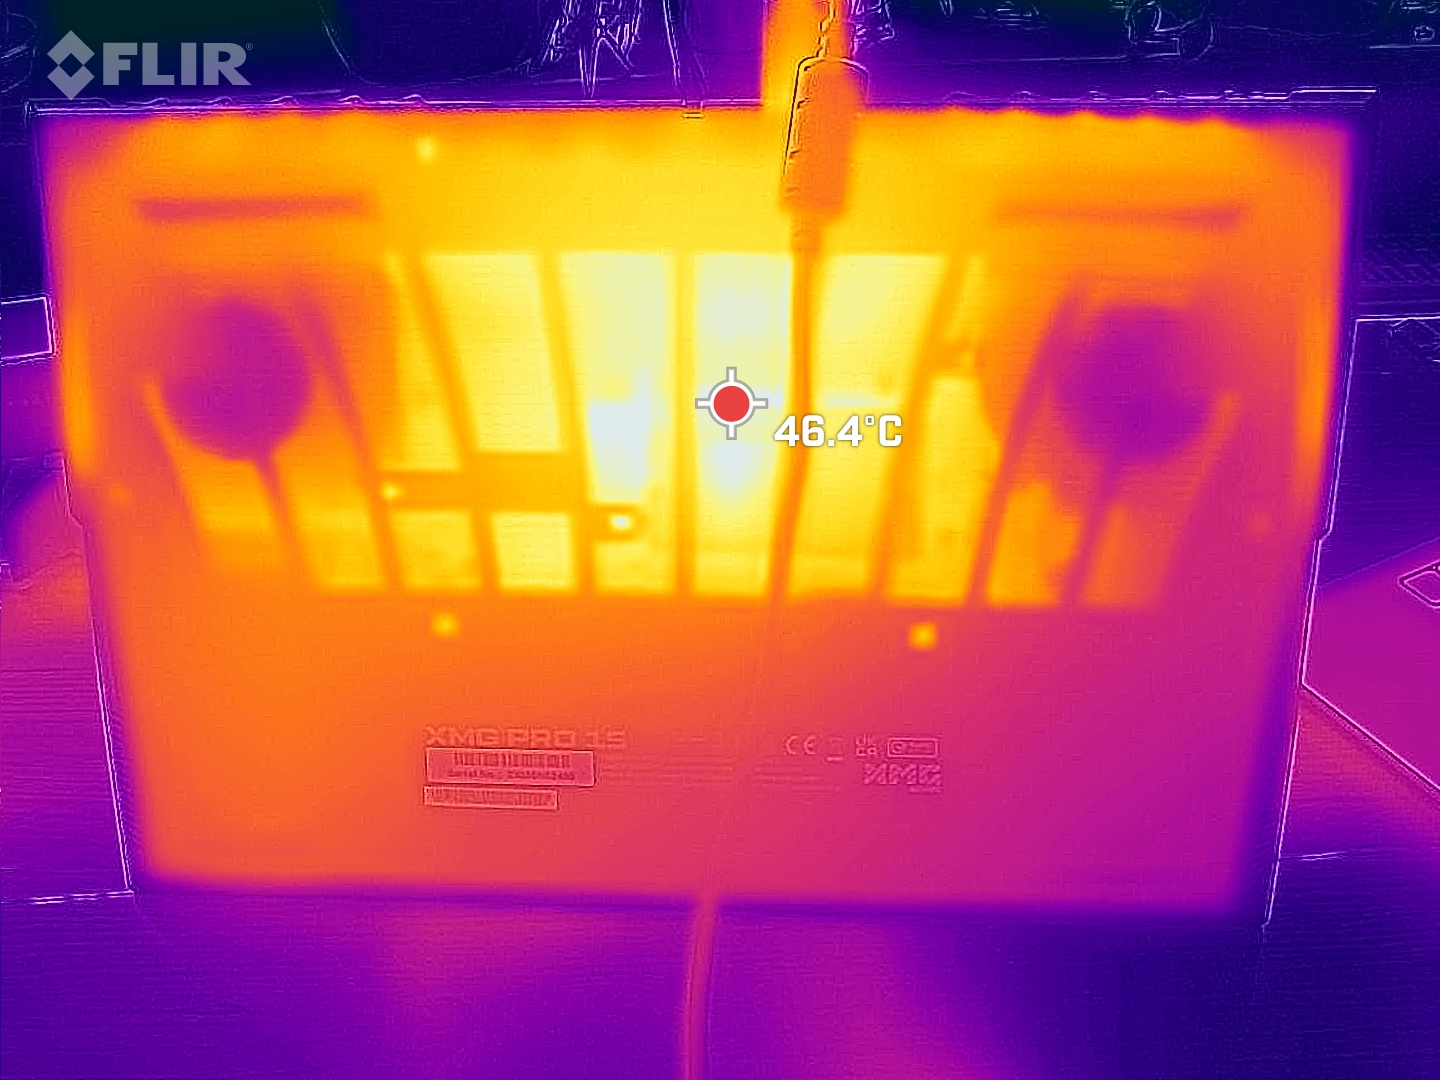
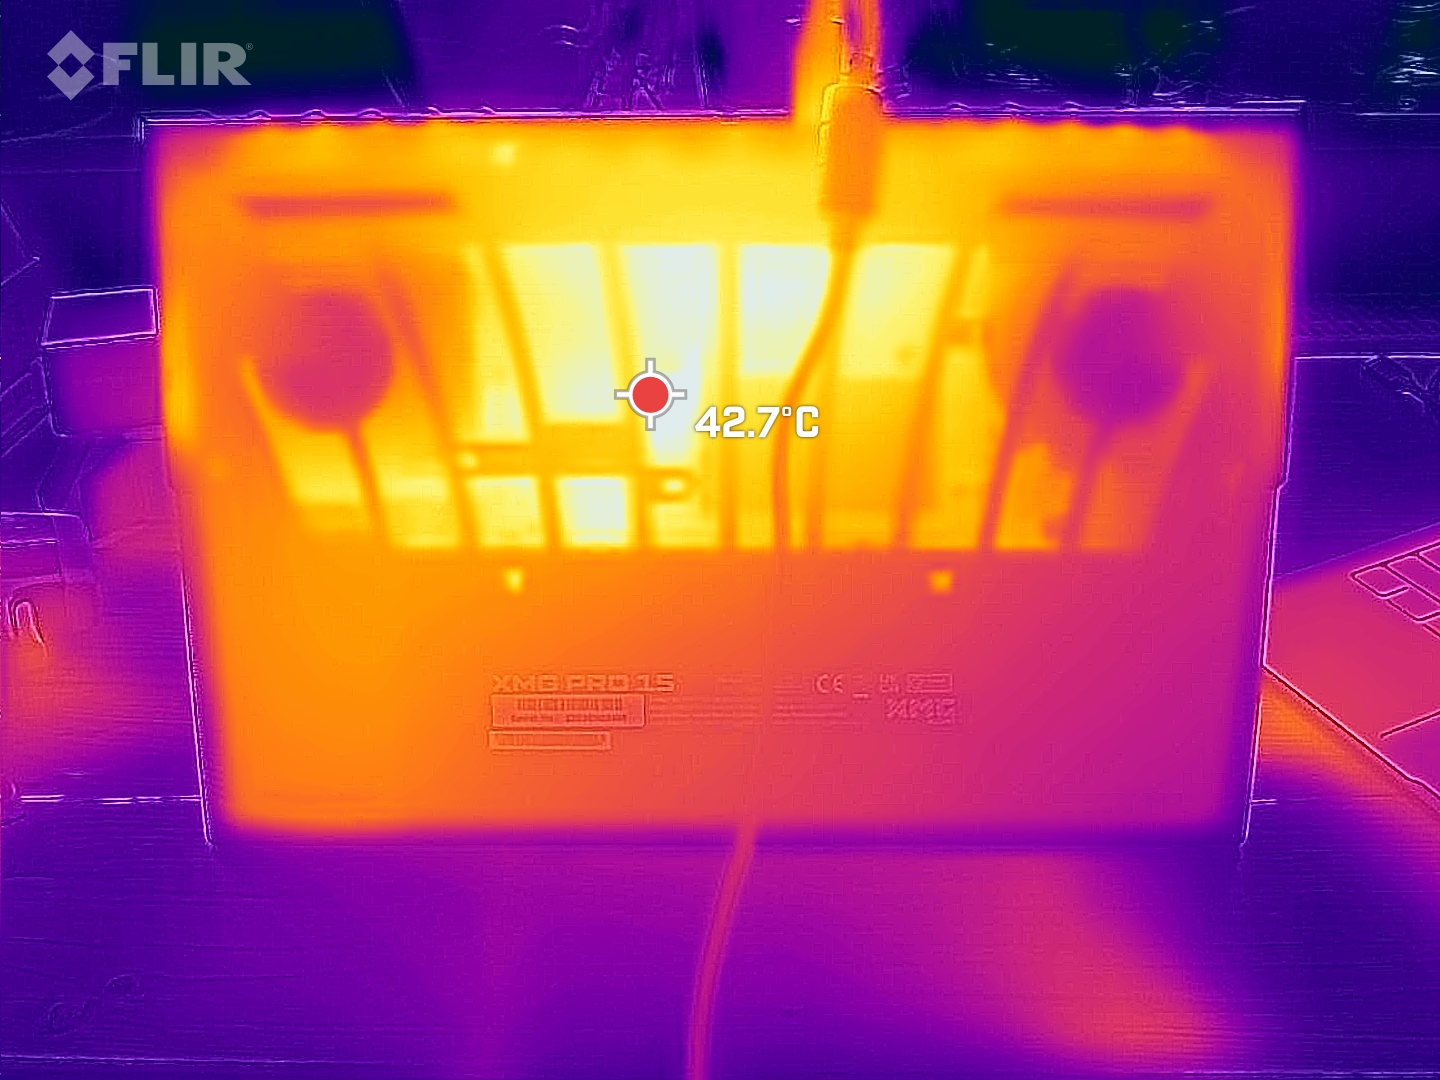
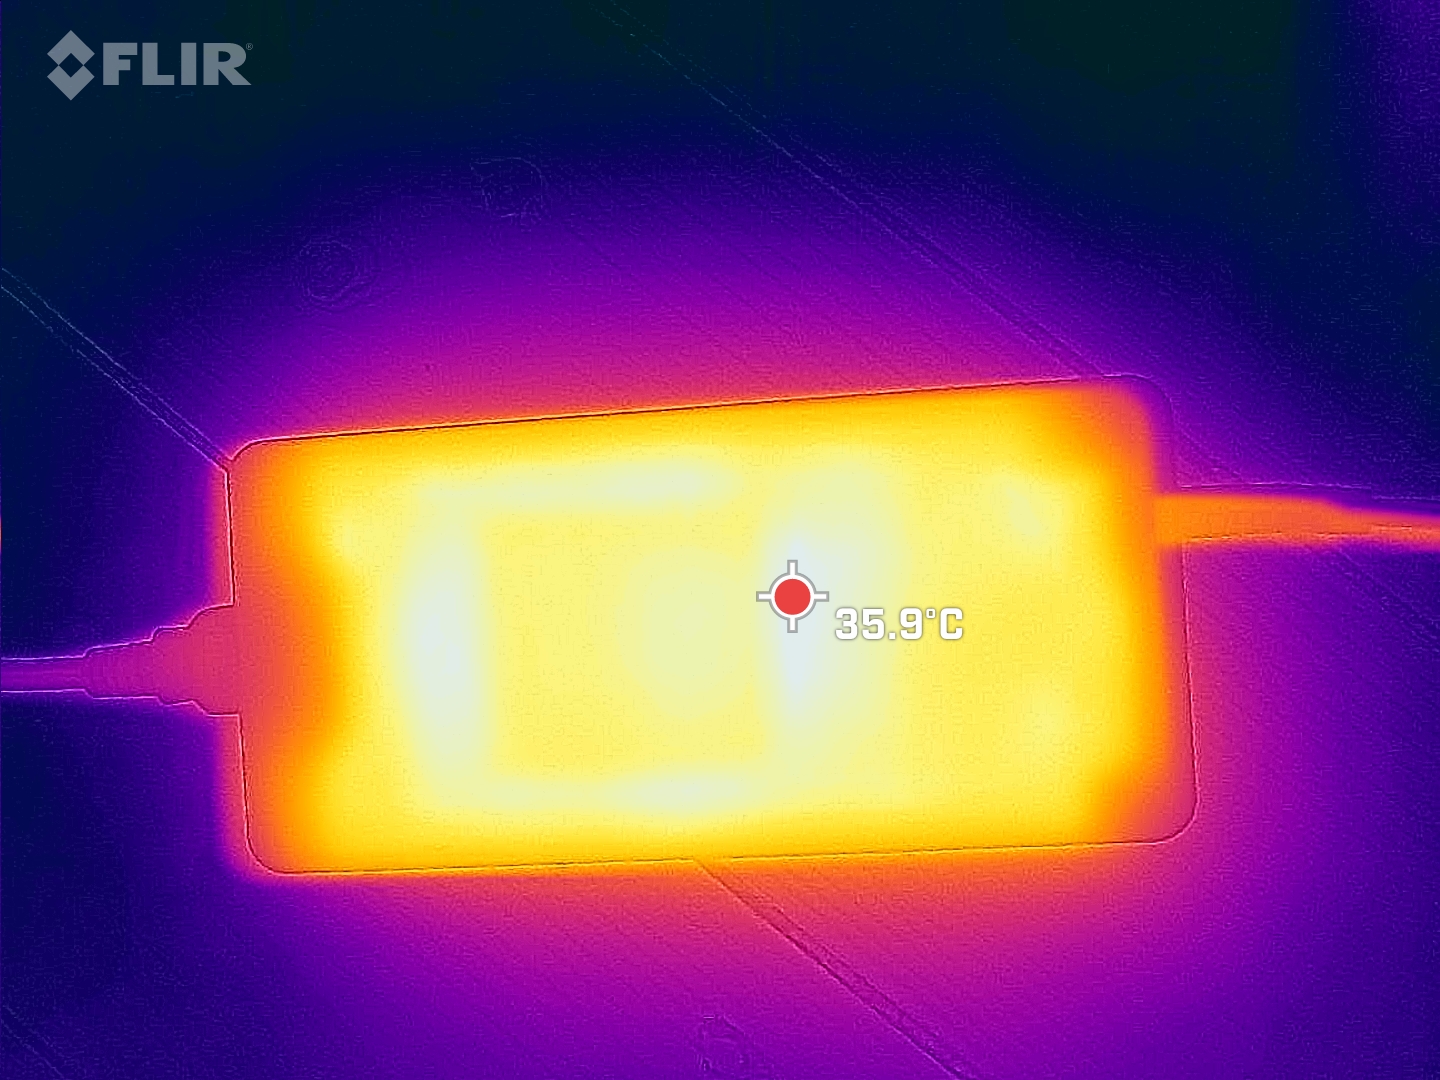
Temperatura
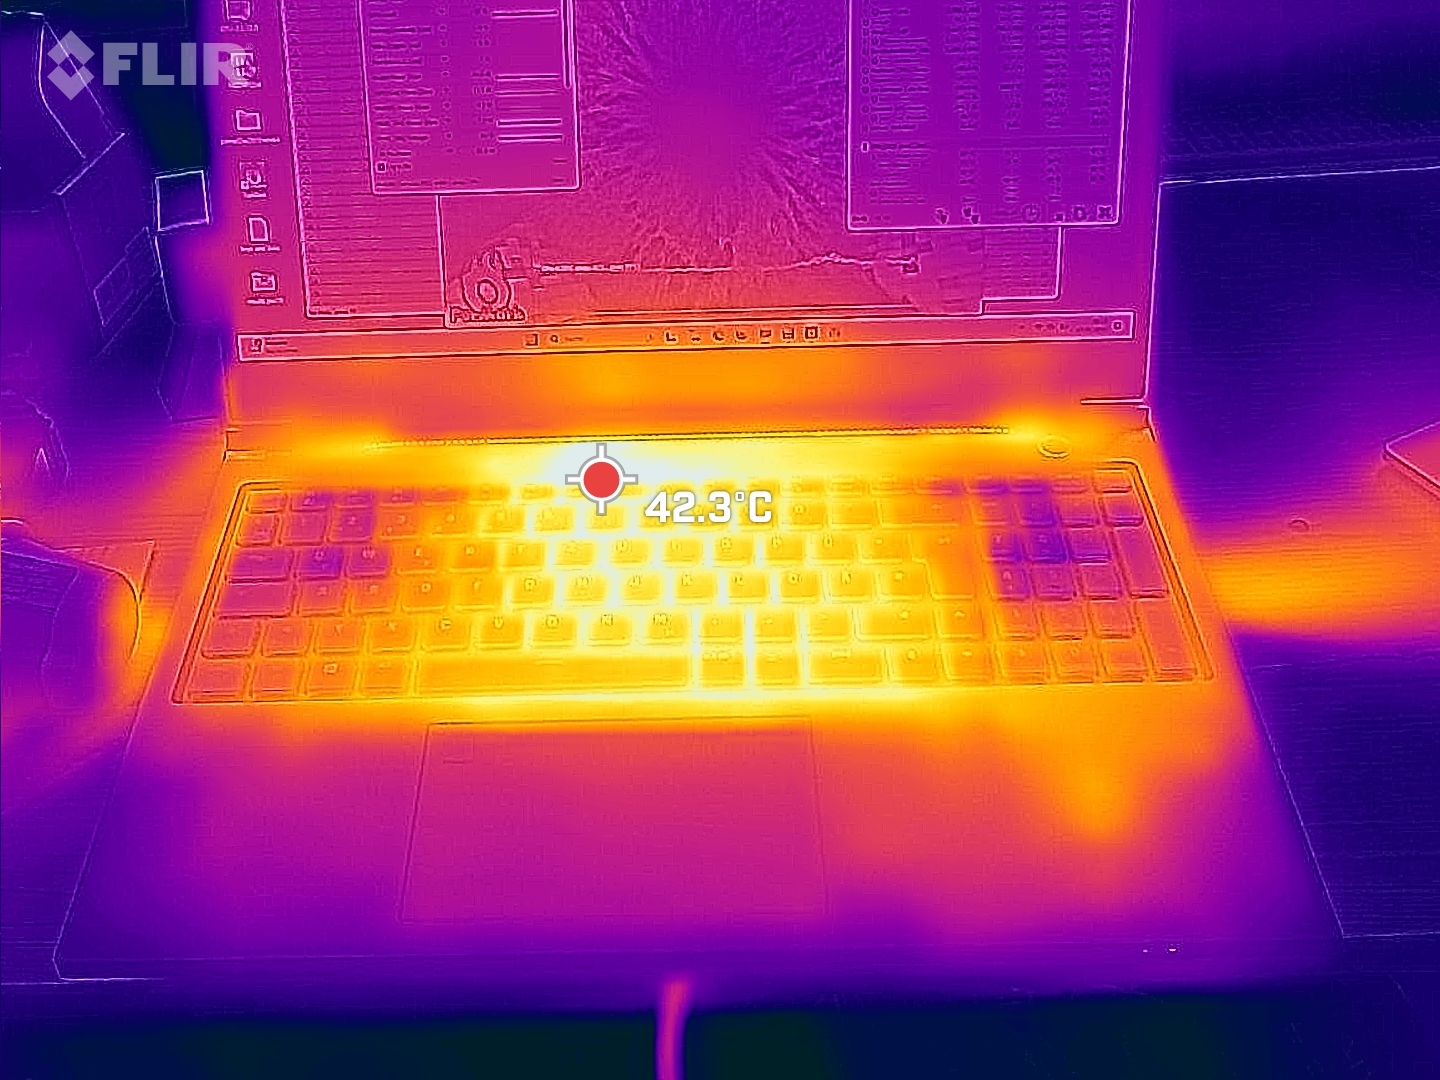
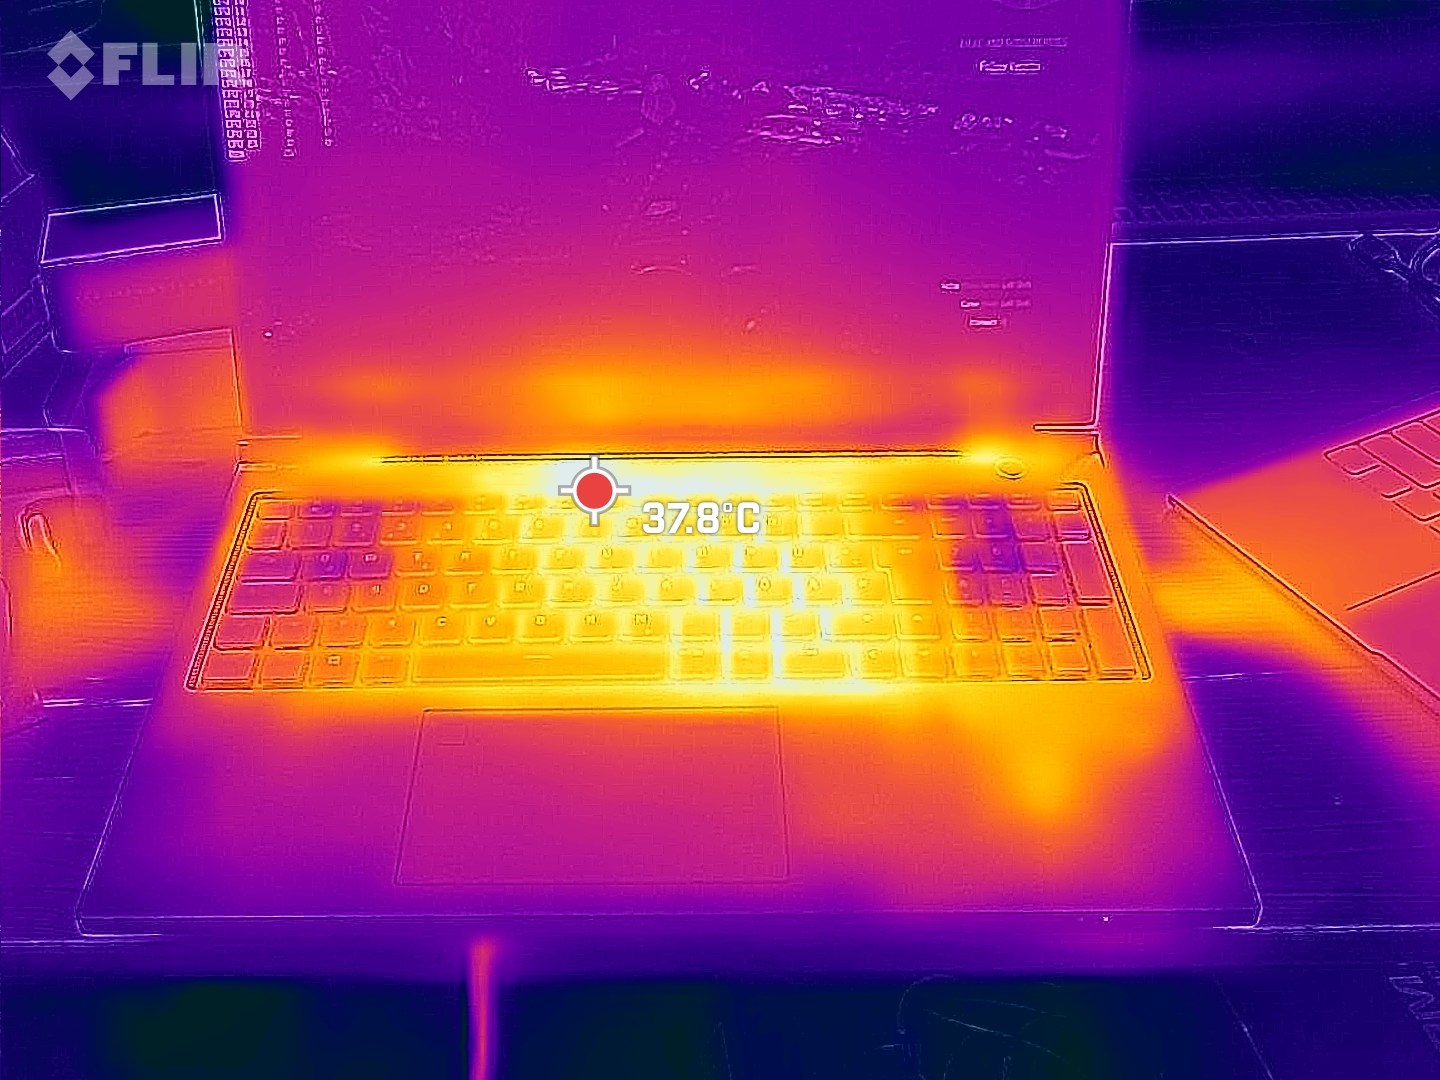
Con temperaturas superficiales de hasta 50 °C en la prueba de estrés, el XMG Pro 15 es considerablemente más cálido que muchos de sus competidores. Sin embargo, por un lado, sólo hablamos de puntos calientes relativamente pequeños, y por otro, la superficie de la unidad base es de plástico. Al contacto, esto hace que las altas temperaturas parezcan significativamente menores. Cuando se juega, no sería correcto describir el teclado como frío, pero no se siente desagradablemente caliente. El rendimiento del portátil tampoco se ralentiza con el tiempo.
(-) La temperatura máxima en la parte superior es de 50 °C / 122 F, frente a la media de 40.4 °C / 105 F, que oscila entre 21.2 y 68.8 °C para la clase Gaming.
(-) El fondo se calienta hasta un máximo de 50 °C / 122 F, frente a la media de 43.2 °C / 110 F
(+) En reposo, la temperatura media de la parte superior es de 28.7 °C / 84# F, frente a la media del dispositivo de 33.9 °C / 93 F.
(±) Jugando a The Witcher 3, la temperatura media de la parte superior es de 35.6 °C / 96 F, frente a la media del dispositivo de 33.9 °C / 93 F.
(+) Los reposamanos y el panel táctil alcanzan como máximo la temperatura de la piel (34 °C / 93.2 F) y, por tanto, no están calientes.
(-) La temperatura media de la zona del reposamanos de dispositivos similares fue de 28.8 °C / 83.8 F (-5.2 °C / -9.4 F).
| Schenker XMG Pro 15 (E23) Intel Core i9-13900HX, NVIDIA GeForce RTX 4060 Laptop GPU | Schenker XMG Pro 15 (i7-12700H, RTX 3080 Ti) Intel Core i7-12700H, NVIDIA GeForce RTX 3080 Ti Laptop GPU | Dell G15 5530 Intel Core i7-13650HX, NVIDIA GeForce RTX 4060 Laptop GPU | Asus TUF A15 FA507 AMD Ryzen 7 7735HS, NVIDIA GeForce RTX 4050 Laptop GPU | Aorus 15X ASF Intel Core i7-13700HX, NVIDIA GeForce RTX 4070 Laptop GPU | Asus ZenBook Pro 14 Duo UX8402VV-P1021W Intel Core i9-13900H, NVIDIA GeForce RTX 4060 Laptop GPU | MSI Cyborg 15 A12VF Intel Core i7-12650H, NVIDIA GeForce RTX 4060 Laptop GPU | Alienware x16 R1 Intel Core i9-13900HK, NVIDIA GeForce RTX 4080 Laptop GPU | |
|---|---|---|---|---|---|---|---|---|
| Heat | -5% | -9% | 11% | 13% | 9% | 15% | -4% | |
| Maximum Upper Side * (°C) | 50 | 57 -14% | 54 -8% | 48.9 2% | 42 16% | 37.1 26% | 47.5 5% | 47.2 6% |
| Maximum Bottom * (°C) | 50 | 52 -4% | 62.2 -24% | 44.6 11% | 51 -2% | 49.4 1% | 35.5 29% | 47.8 4% |
| Idle Upper Side * (°C) | 33 | 32 3% | 33.4 -1% | 27.1 18% | 27 18% | 30 9% | 27.7 16% | 36.8 -12% |
| Idle Bottom * (°C) | 32 | 34 -6% | 33.4 -4% | 27.5 14% | 26 19% | 32.4 -1% | 29.5 8% | 35.8 -12% |
* ... más pequeño es mejor
Altavoces
El volumen medio percibido de los dos altavoces del XMG Pro 15 se sitúa en sólo 72,5 dB(A). Muchos rangos de frecuencia están significativamente por debajo del volumen del ventilador bajo carga. Como resultado, cuando se juega, unos auriculares o altavoces externos son imprescindibles. Éstos pueden conectarse a través de la toma de auriculares de 3,5 mm, Bluetooth o S/PDIF óptico a través del conector de 3,5 mm. Con este método, también es posible conectar un sistema de sonido Surround directamente al ordenador.
Schenker XMG Pro 15 (E23) análisis de audio
(±) | la sonoridad del altavoz es media pero buena (72.52 dB)
Graves 100 - 315 Hz
(±) | lubina reducida - en promedio 12.9% inferior a la mediana
(±) | la linealidad de los graves es media (7.2% delta a frecuencia anterior)
Medios 400 - 2000 Hz
(±) | medias más altas - de media 6.2% más altas que la mediana
(±) | la linealidad de los medios es media (7.8% delta respecto a la frecuencia anterior)
Altos 2 - 16 kHz
(+) | máximos equilibrados - a sólo 2.5% de la mediana
(+) | los máximos son lineales (4.6% delta a la frecuencia anterior)
Total 100 - 16.000 Hz
(±) | la linealidad del sonido global es media (18% de diferencia con la mediana)
En comparación con la misma clase
» 56% de todos los dispositivos probados de esta clase eran mejores, 9% similares, 36% peores
» El mejor tuvo un delta de 6%, la media fue 18%, el peor fue ###max##%
En comparación con todos los dispositivos probados
» 38% de todos los dispositivos probados eran mejores, 8% similares, 54% peores
» El mejor tuvo un delta de 4%, la media fue 23%, el peor fue ###max##%
Asus ZenBook Pro 14 Duo UX8402VV-P1021W análisis de audio
(+) | los altavoces pueden reproducir a un volumen relativamente alto (#83.7 dB)
Graves 100 - 315 Hz
(-) | casi sin bajos - de media 19.9% inferior a la mediana
(±) | la linealidad de los graves es media (11.9% delta a frecuencia anterior)
Medios 400 - 2000 Hz
(+) | medios equilibrados - a sólo 1.2% de la mediana
(+) | los medios son lineales (4.7% delta a la frecuencia anterior)
Altos 2 - 16 kHz
(±) | máximos más altos - de media 5.5% más altos que la mediana
(+) | los máximos son lineales (5.9% delta a la frecuencia anterior)
Total 100 - 16.000 Hz
(±) | la linealidad del sonido global es media (16.1% de diferencia con la mediana)
En comparación con la misma clase
» 41% de todos los dispositivos probados de esta clase eran mejores, 6% similares, 53% peores
» El mejor tuvo un delta de 5%, la media fue 17%, el peor fue ###max##%
En comparación con todos los dispositivos probados
» 26% de todos los dispositivos probados eran mejores, 5% similares, 69% peores
» El mejor tuvo un delta de 4%, la media fue 23%, el peor fue ###max##%
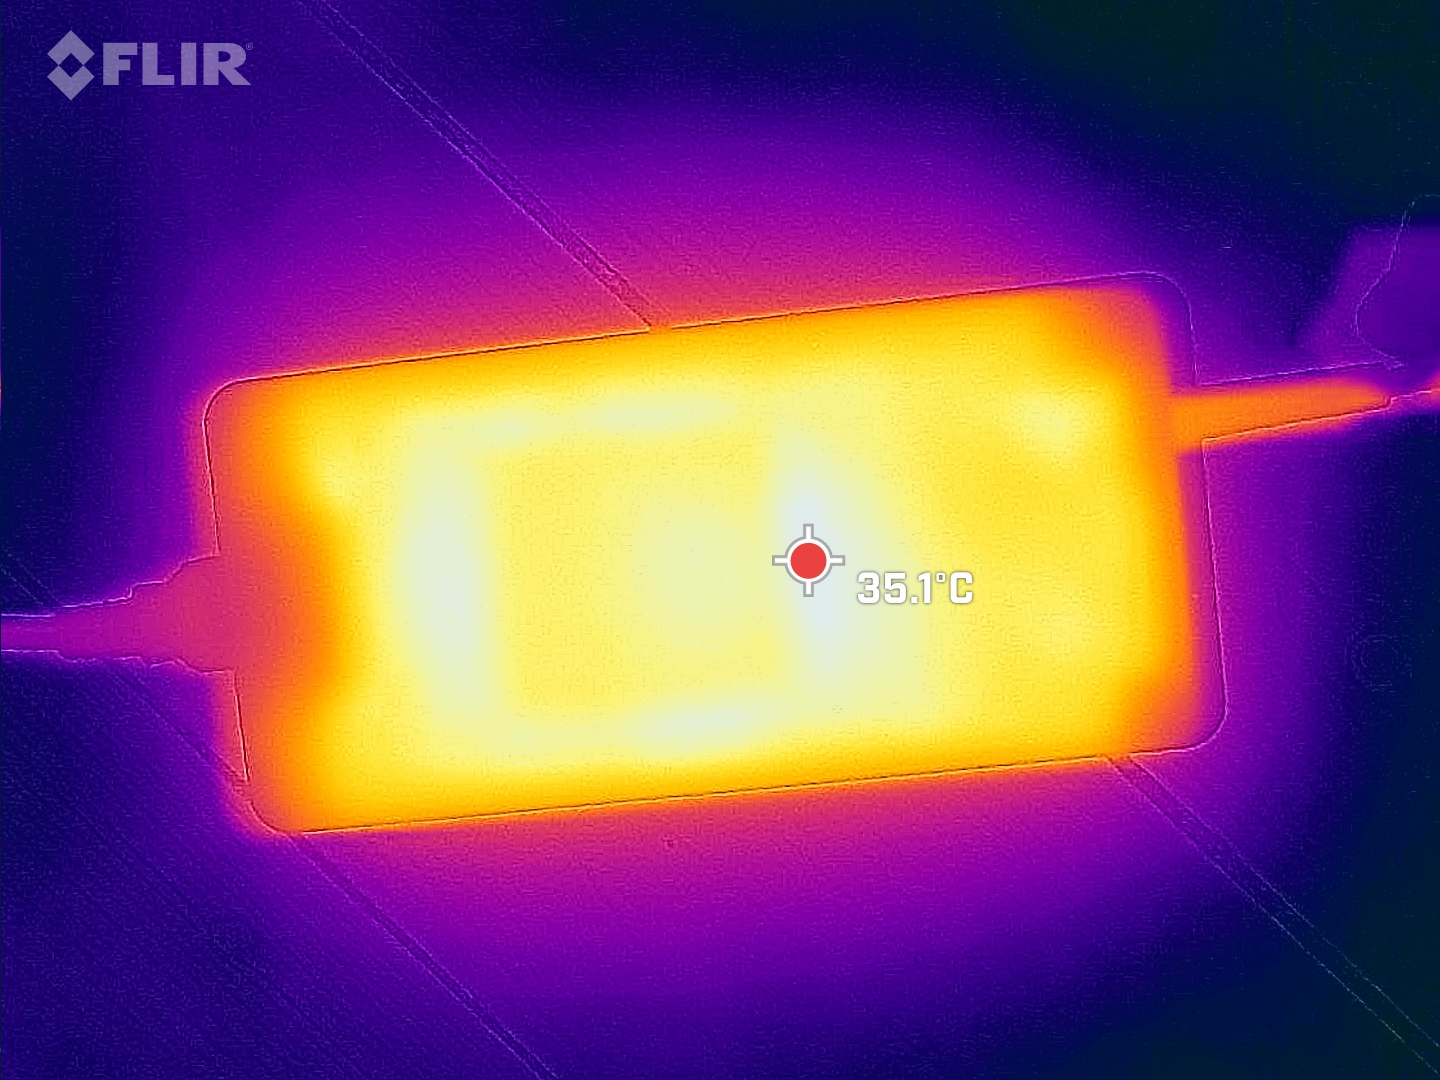
Consumo de energía
De acuerdo con su categoría, el Schenker XMG Pro 15 no es un milagro del ahorro de energía. Incluye un gran alimentador que puede suministrar hasta 280 vatios. Cuando se usa con el portátil de juegos eso significa que aún le queda un poco de reserva. En el test de estrés Prime95 y Furmark consumió un máximo de 269 vatios, pero la media fue de 215 vatios.
| Off / Standby | |
| Ocioso | |
| Carga |
|
Clave:
min: | |
Power consumption Witcher 3 / stress test
Power consumption with an external monitor
Duración de la batería
En nuestra prueba de navegación por Internet Wi-Fi, el XMG Pro 15 E23 no pudo aguantar más de seis horas. Sin embargo, no se puede esperar mucho más de una batería de 80 Wh. Dicho esto, el dispositivo de pruebas tiene un pequeño problema con el modo inactivo de la dGPU. No siempre se activa con fiabilidad, pero Schenker es consciente del problema y está trabajando en una solución.
| Schenker XMG Pro 15 (E23) i9-13900HX, GeForce RTX 4060 Laptop GPU, 80 Wh | Schenker XMG Pro 15 (i7-12700H, RTX 3080 Ti) i7-12700H, GeForce RTX 3080 Ti Laptop GPU, 80 Wh | Dell G15 5530 i7-13650HX, GeForce RTX 4060 Laptop GPU, 86 Wh | Asus TUF A15 FA507 R7 7735HS, GeForce RTX 4050 Laptop GPU, 90 Wh | Aorus 15X ASF i7-13700HX, GeForce RTX 4070 Laptop GPU, 99 Wh | Asus ZenBook Pro 14 Duo UX8402VV-P1021W i9-13900H, GeForce RTX 4060 Laptop GPU, 76 Wh | MSI Cyborg 15 A12VF i7-12650H, GeForce RTX 4060 Laptop GPU, 53.5 Wh | Alienware x16 R1 i9-13900HK, GeForce RTX 4080 Laptop GPU, 90 Wh | Media de la clase Gaming | |
|---|---|---|---|---|---|---|---|---|---|
| Duración de Batería | -2% | -22% | 29% | 25% | 71% | 27% | -60% | 2% | |
| WiFi v1.3 (h) | 5.7 | 5.8 2% | 6.5 14% | 11.7 105% | 8.2 44% | 9 58% | 7.5 32% | 2.5 -56% | 7.11 ? 25% |
| Load (h) | 1.9 | 1.8 -5% | 0.8 -58% | 1 -47% | 2 5% | 3.5 84% | 2.3 21% | 0.7 -63% | 1.502 ? -21% |
| H.264 (h) | 5.3 | 6.8 | 12.5 | 7.9 | 8 | 8.32 ? | |||
| Witcher 3 ultra (h) | 0.8 | ||||||||
| Reader / Idle (h) | 11.3 | 13.6 | 7.3 | 8.27 ? |
Pro
Contra
Veredicto: perfecto para conciliar trabajo y ocio
El XMG Pro 15 E23 se anuncia como una estación de trabajo para juegos. En nuestro análisis, cumple todos los requisitos de un buen portátil de gama media para juegos, pero también muchos aspectos que lo convierten en un portátil decente para trabajar con vídeo y películas. Su diseño discreto no refleja en absoluto el atronador rendimiento del dispositivo de 15,6 pulgadas. Al sacarlo de la caja, Schenker ha refinado un sólido barebone que viene con buenos dispositivos de entrada y una sólida selección de puertos, así como componentes de primera calidad.
Algunas de las desventajas del predecesor se han reducido significativamente o se han eliminado por completo. Ahora el SSD funciona de forma estable a altas velocidades, la pantalla es más brillante y el volumen se ha ajustado ligeramente. Puede que el portátil de juegos siga sin ser silencioso, pero ahora sabe en qué momentos comportarse correctamente.
Algunos de los bordes dentados del XMG Pro 15 E23 se han suavizado, lo que significa que el portátil de juego ahora sólo tiene algunas molestias menores.
No hay puntos negativos claros que sobresalgan. La falta de un puerto USB trasero es bastante desafortunada, lo que significa que sólo una configuración inalámbrica de ratón y teclado dará lugar a un escritorio sin cables. Cualquiera que no desee llevar permanentemente el portátil a sus límites de rendimiento disfrutará usando el silencioso modo de entretenimiento. La mayoría de los juegos también funcionan bien. Sólo los lentos tiempos de respuesta de la pantalla QHD de 240 Hz nos molestan. Mientras tanto, la diferencia con competidores como elAorus 15X ASF o MSI Cyborg 15 sólo puede encontrarse en los detalles. Cualquiera que busque un portátil para juegos más emocionante debería echar un vistazo alAlienware x16 R1 o elAsus ROG Strix G16- pero no será recompensado con mucha más potencia.
Precio y disponibilidad
El XMG Pro 15 puede configurarse en Bestware. Sin Windows, un SSD y la cantidad mínima de RAM, el portátil sale por 1.893 euros. Nuestro dispositivo de prueba sin Windows 11 cuesta 2.150 euros. Por un Windows 11 Home activado, Bestware pide 100 euros más. Está claro que Schenker no sigue la espiral de precios al alza. El año pasado, el Pro 15 E22con una RTX 3070 Ti, 32 GB de RAM y un SSD de 1 TB costaba 2.510 euros. Para el E23 con una RTX 4070, 32 GB de RAM y un SSD de 1 TB, Bestware pide 2.400 euros.
Schenker XMG Pro 15 (E23)
- 07/04/2023 v7 (old)
Marc Herter
Transparencia
La selección de los dispositivos que se van a reseñar corre a cargo de nuestro equipo editorial. La muestra de prueba fue proporcionada al autor en calidad de préstamo por el fabricante o el minorista a los efectos de esta reseña. El prestamista no tuvo ninguna influencia en esta reseña, ni el fabricante recibió una copia de la misma antes de su publicación. No había ninguna obligación de publicar esta reseña. Como empresa de medios independiente, Notebookcheck no está sujeta a la autoridad de fabricantes, minoristas o editores.
Así es como prueba Notebookcheck
Cada año, Notebookcheck revisa de forma independiente cientos de portátiles y smartphones utilizando procedimientos estandarizados para asegurar que todos los resultados son comparables. Hemos desarrollado continuamente nuestros métodos de prueba durante unos 20 años y hemos establecido los estándares de la industria en el proceso. En nuestros laboratorios de pruebas, técnicos y editores experimentados utilizan equipos de medición de alta calidad. Estas pruebas implican un proceso de validación en varias fases. Nuestro complejo sistema de clasificación se basa en cientos de mediciones y puntos de referencia bien fundamentados, lo que mantiene la objetividad.Price comparison

