Análisis del Asus ROG Zephyrus G16 2024 - El portátil para juegos ahora con OLED G-Sync e Intel Meteor Lake
Republic of Gamers es sinónimo de portátiles para juegos en Asus. Sin embargo, cuando se trata del nuevo ROG Zephyrus G16 (y también del más pequeño G14), el fabricante ha modificado ligeramente su enfoque, con el objetivo de dirigirse a otros tipos de clientes. Para ello, utiliza un diseño de carcasa más plano y elegante, pero esto limita los componentes que se pueden instalar. El resultado es un portátil híbrido de gama alta para juegos/multimedia que también podría resultar interesante para los creadores de contenidos o, en general, para los usuarios a la caza de un dispositivo elegante y potente. De hecho, el nuevo Zephyrus G16 es también el único portátil gaming 2024 de Asus hasta la fecha que utiliza un nuevo procesador Meteor Lake de Intel. El más pequeño ROG Zephyrus G14 (el análisis se publicará en breve), por otro lado, utiliza los nuevos procesadores Ryzen 8000 de AMD.
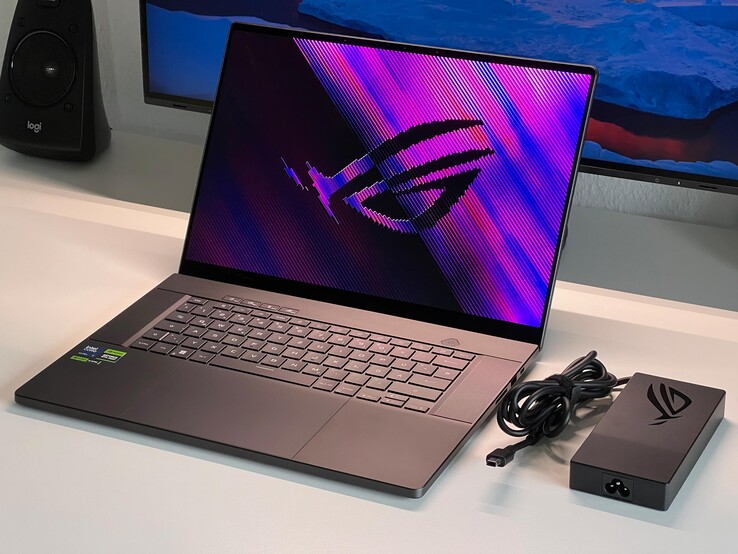
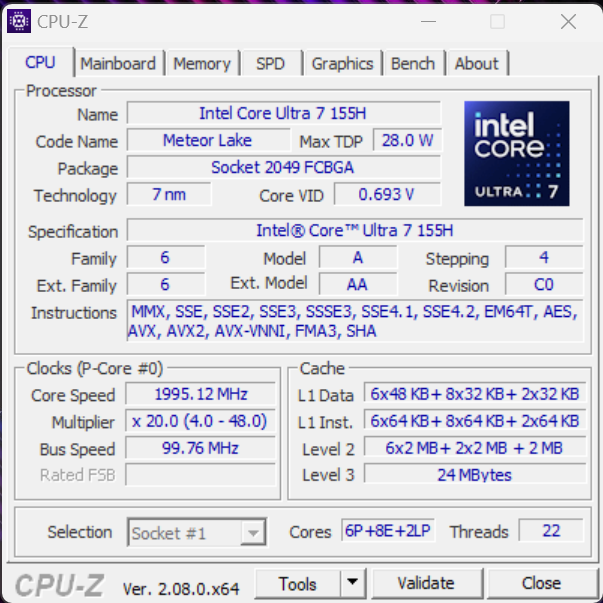
Nuestra versión de prueba del ROG Zephyrus G16 GU605M no es la variante de gama alta, ya que aparte de su nuevo Core Ultra 7 155Hestá equipado con la GeForce Portátil RTX 4070. Además, ahora cuenta con una pantalla OLED de Samsung que tiene una frecuencia de actualización de 240 Hz y soporta G-Sync por primera vez. Además, el portátil tiene 16 GB de RAM y una unidad SSD de 1 TB instalada. El nuevo G16 estará disponible para su compra a partir del 15 de febrero con precios que parten de los 2.899,99 dólares; aún no podemos nombrar un MRSP para nuestra configuración de prueba.
Posibles contendientes en la comparación
Valoración | Fecha | Modelo | Peso | Altura | Tamaño | Resolución | Precio |
|---|---|---|---|---|---|---|---|
| 92.3 % v7 (old) | 02/2024 | Asus ROG Zephyrus G16 2024 GU605M Ultra 7 155H, GeForce RTX 4070 Laptop GPU | 1.8 kg | 16.4 mm | 16.00" | 2560x1600 | |
| 88.4 % v7 (old) | 08/2023 | Lenovo Yoga Pro 9 16-IRP G8 i7-13705H, GeForce RTX 4060 Laptop GPU | 2.2 kg | 18.2 mm | 16.00" | 3200x2000 | |
| 91.2 % v7 (old) | 02/2023 | Razer Blade 16 Early 2023 i9-13950HX, GeForce RTX 4080 Laptop GPU | 2.4 kg | 21.99 mm | 16.00" | 2560x1600 | |
| 86.2 % v7 (old) | 03/2023 | Gigabyte AERO 16 OLED BSF i9-13900H, GeForce RTX 4070 Laptop GPU | 2.1 kg | 18 mm | 16.00" | 3840x2400 | |
| 88.6 % v7 (old) | 07/2023 | Schenker VISION 16 Pro (M23) i7-13700H, GeForce RTX 4070 Laptop GPU | 1.6 kg | 17.1 mm | 16.00" | 2560x1600 | |
| 88.8 % v7 (old) | 07/2023 | MSI Stealth 16 Studio A13VG i7-13700H, GeForce RTX 4070 Laptop GPU | 2 kg | 19.95 mm | 16.00" | 2560x1600 | |
| 93.2 % v7 (old) | 11/2023 | Apple MacBook Pro 16 2023 M3 Max Apple M3 Max 16-Core, M3 Max 40-Core GPU | 2.1 kg | 16.9 mm | 16.00" | 3456x2234 |
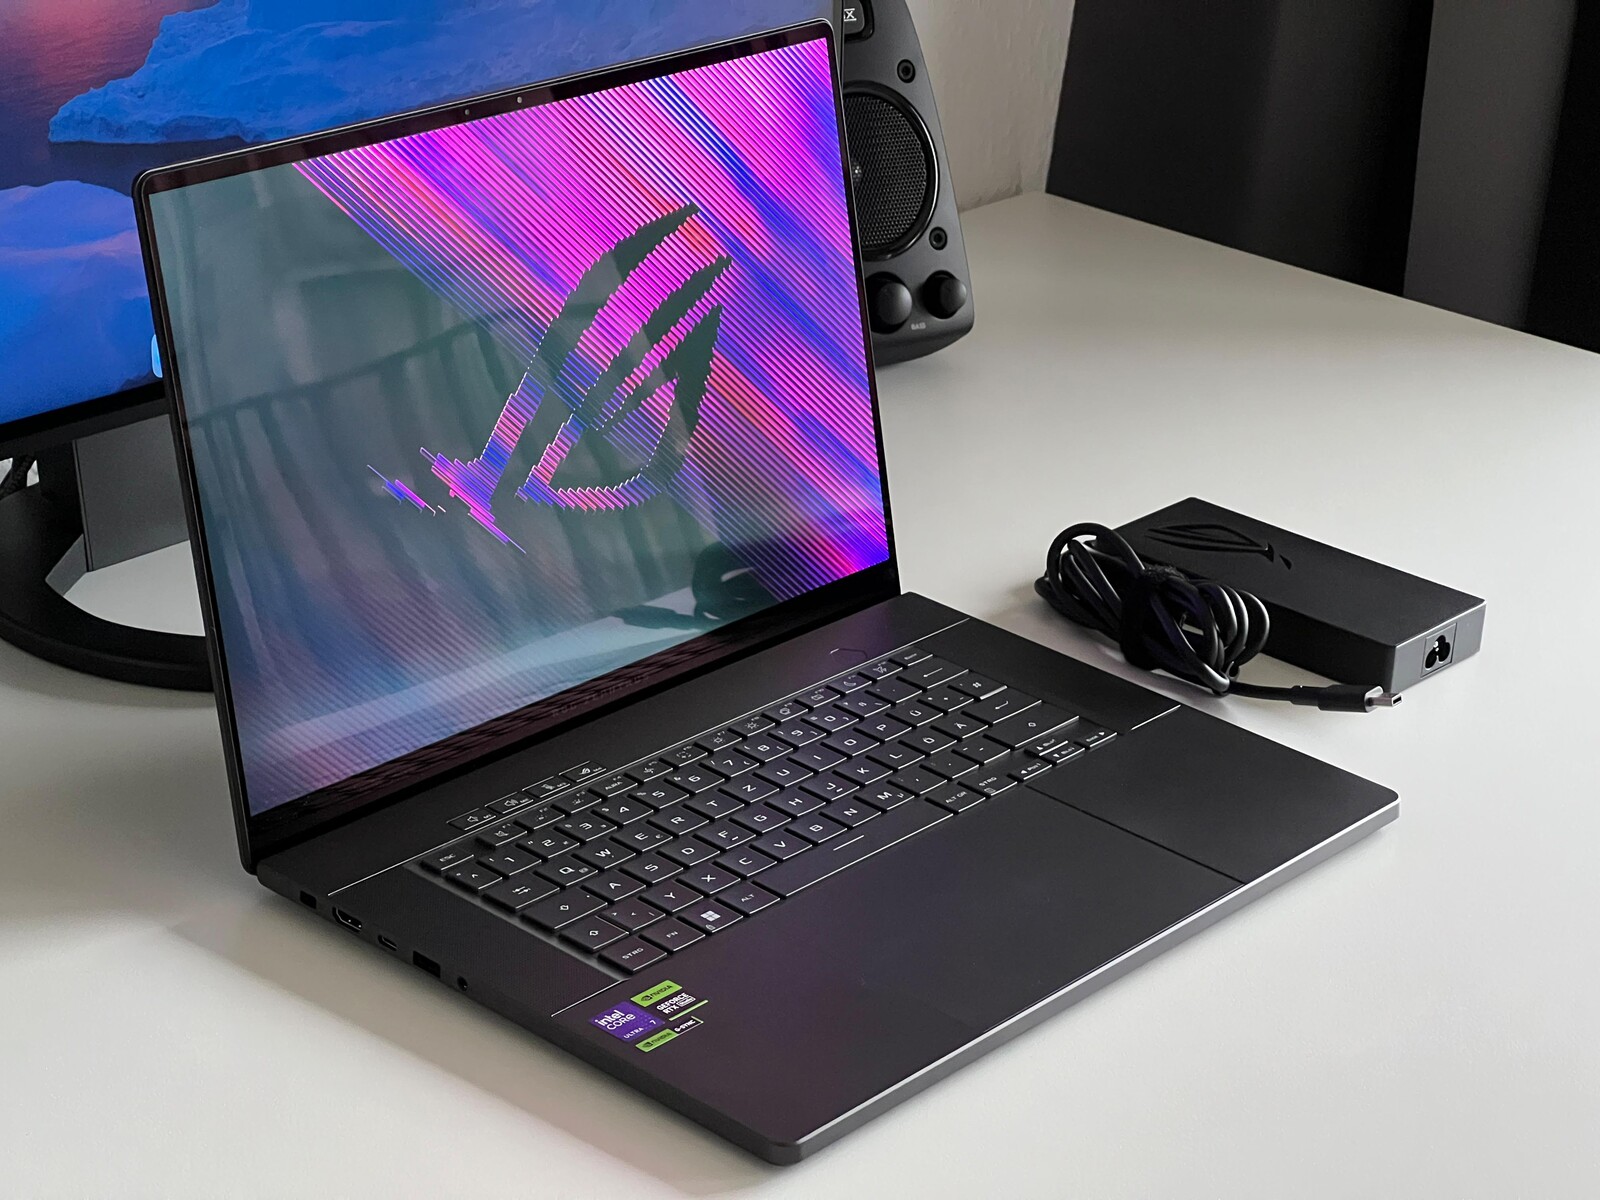
Caja - La Zephyrus ahora de aluminio
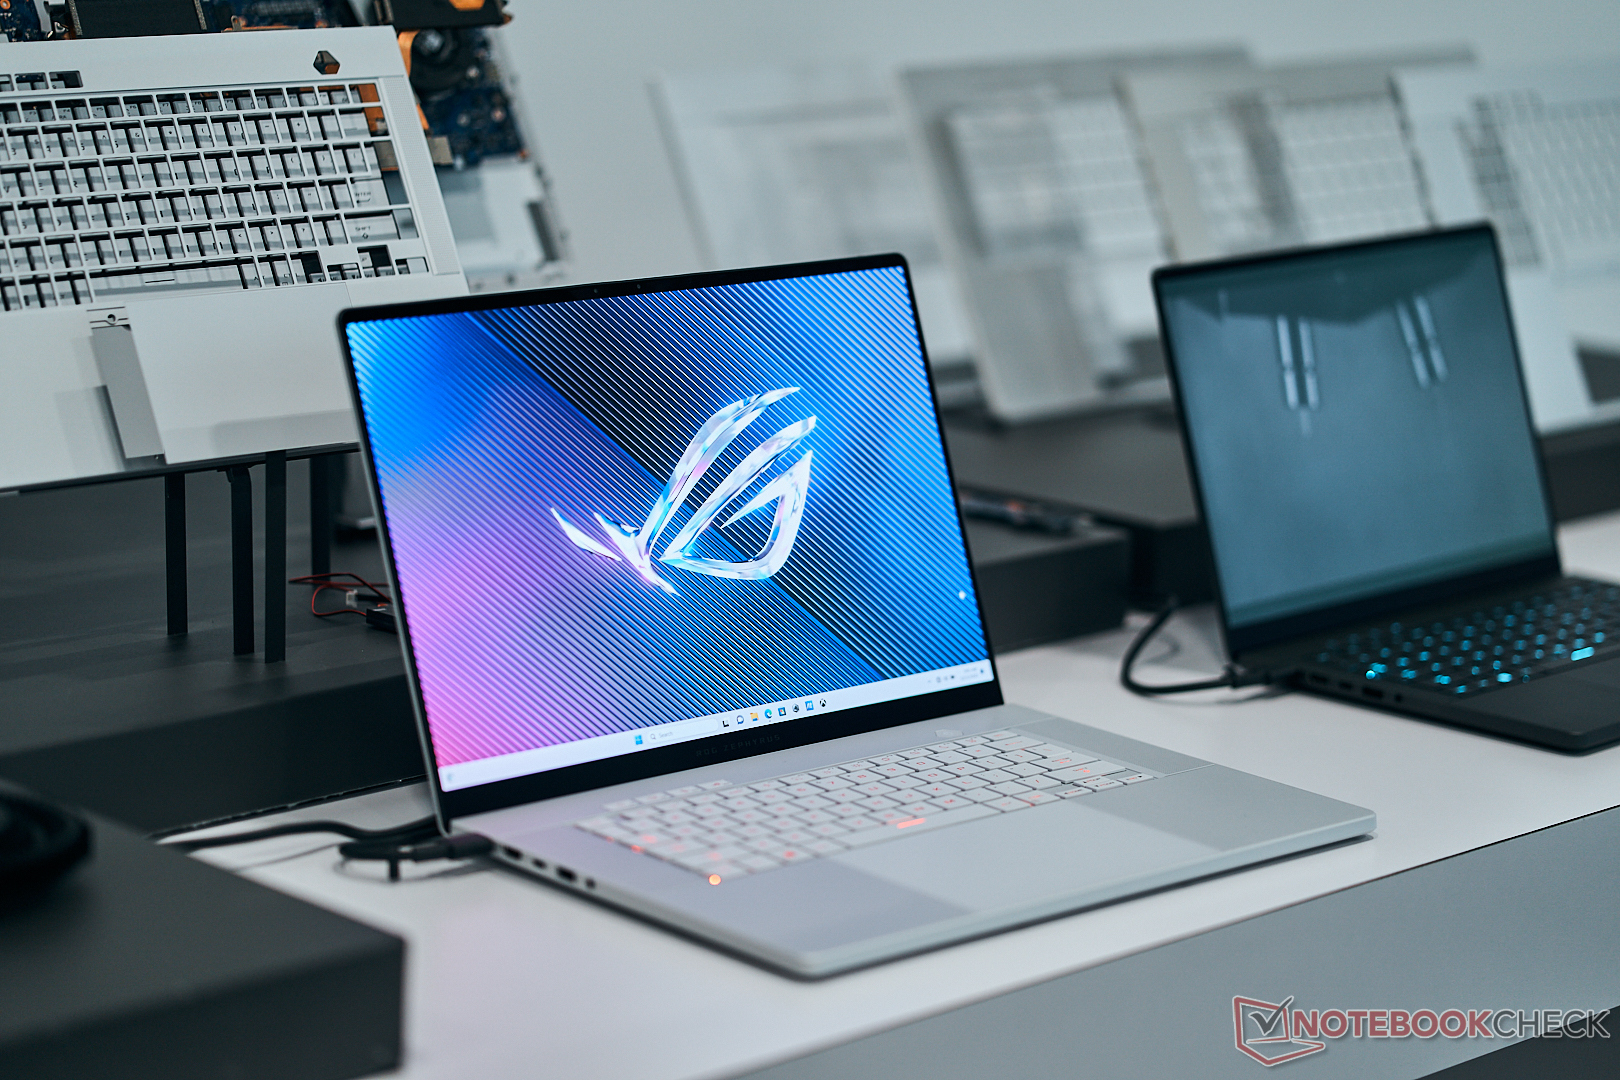
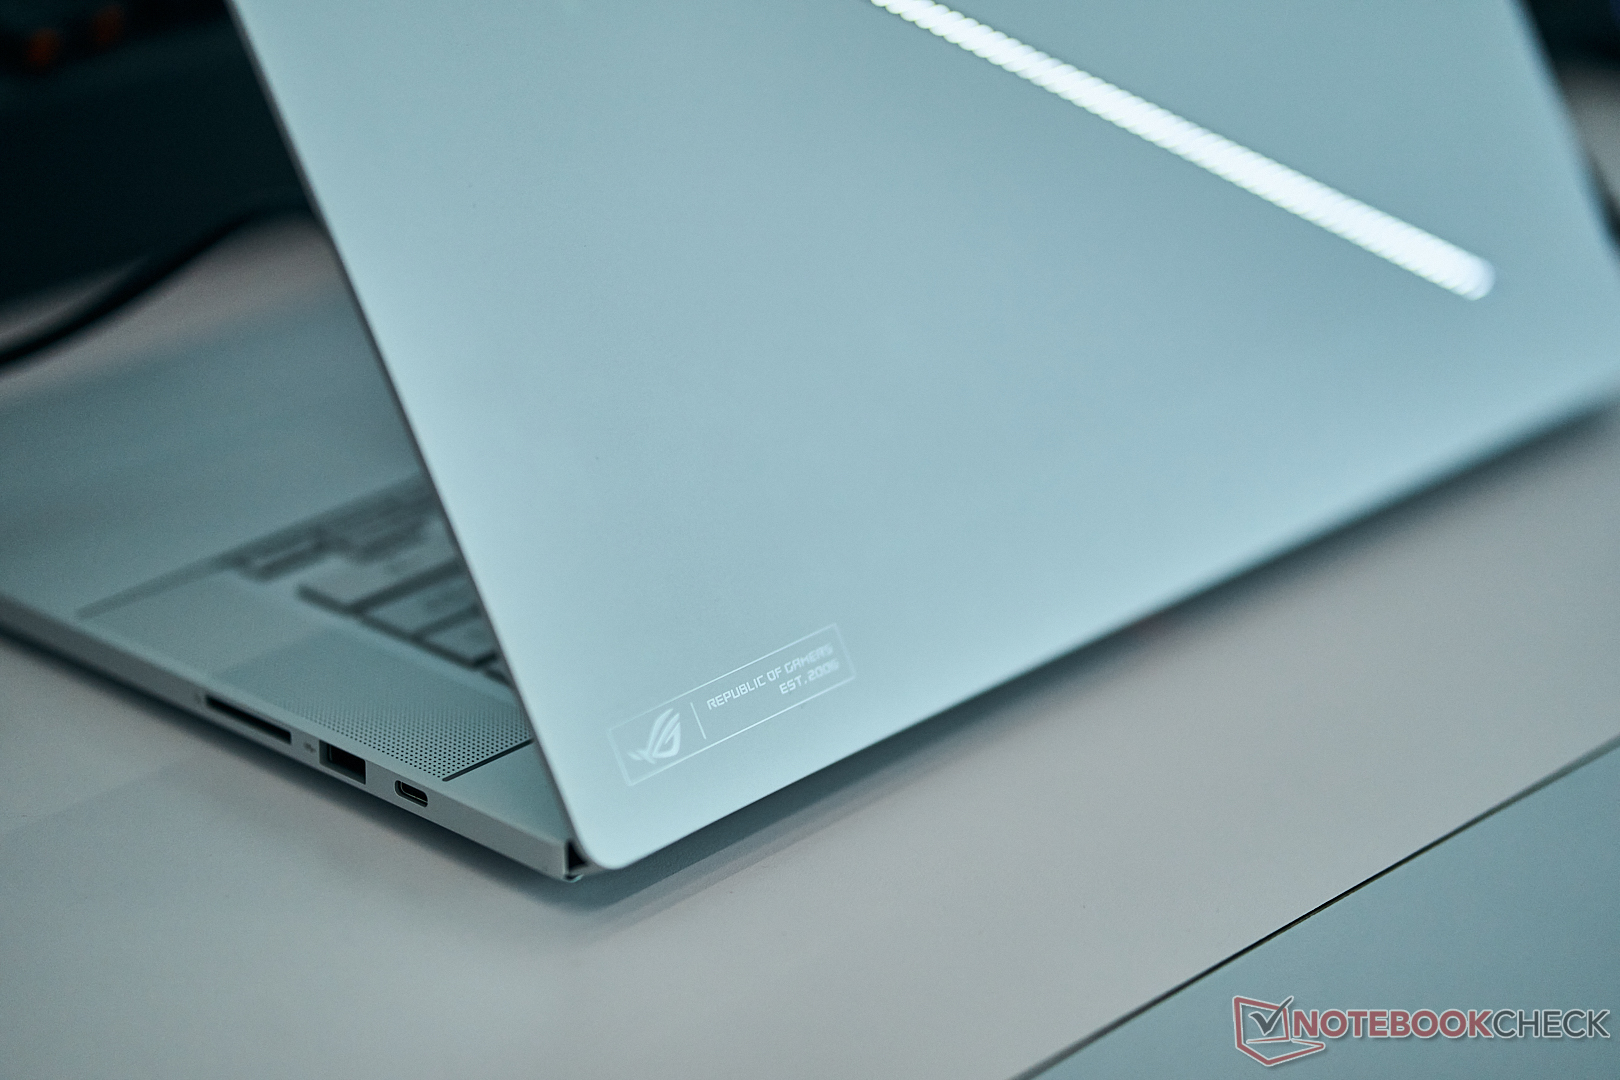
El nuevo Zephyrus G16 de Asus presenta una elegante carcasa unibody de aluminio y, a primera vista, recuerda inmediatamente a dispositivos como el Razer Blade 16 o el Apple MacBook Pro 16. Al manejar el portátil, no cabe duda de que se trata de un auténtico dispositivo premium. Nuestro dispositivo de prueba es la versión gris oscuro (Eclipse Gray) y durante el evento de presentación previa a finales del año pasado, también tuvimos la oportunidad de echar un vistazo a la variante blanca (Platinum White). El modelo blanco es un poco menos imán de huellas dactilares pero, a su vez, el modelo gris oscuro es un poco más discreto. También incluimos algunas imágenes de la variante blanca en nuestra galería de fotos.
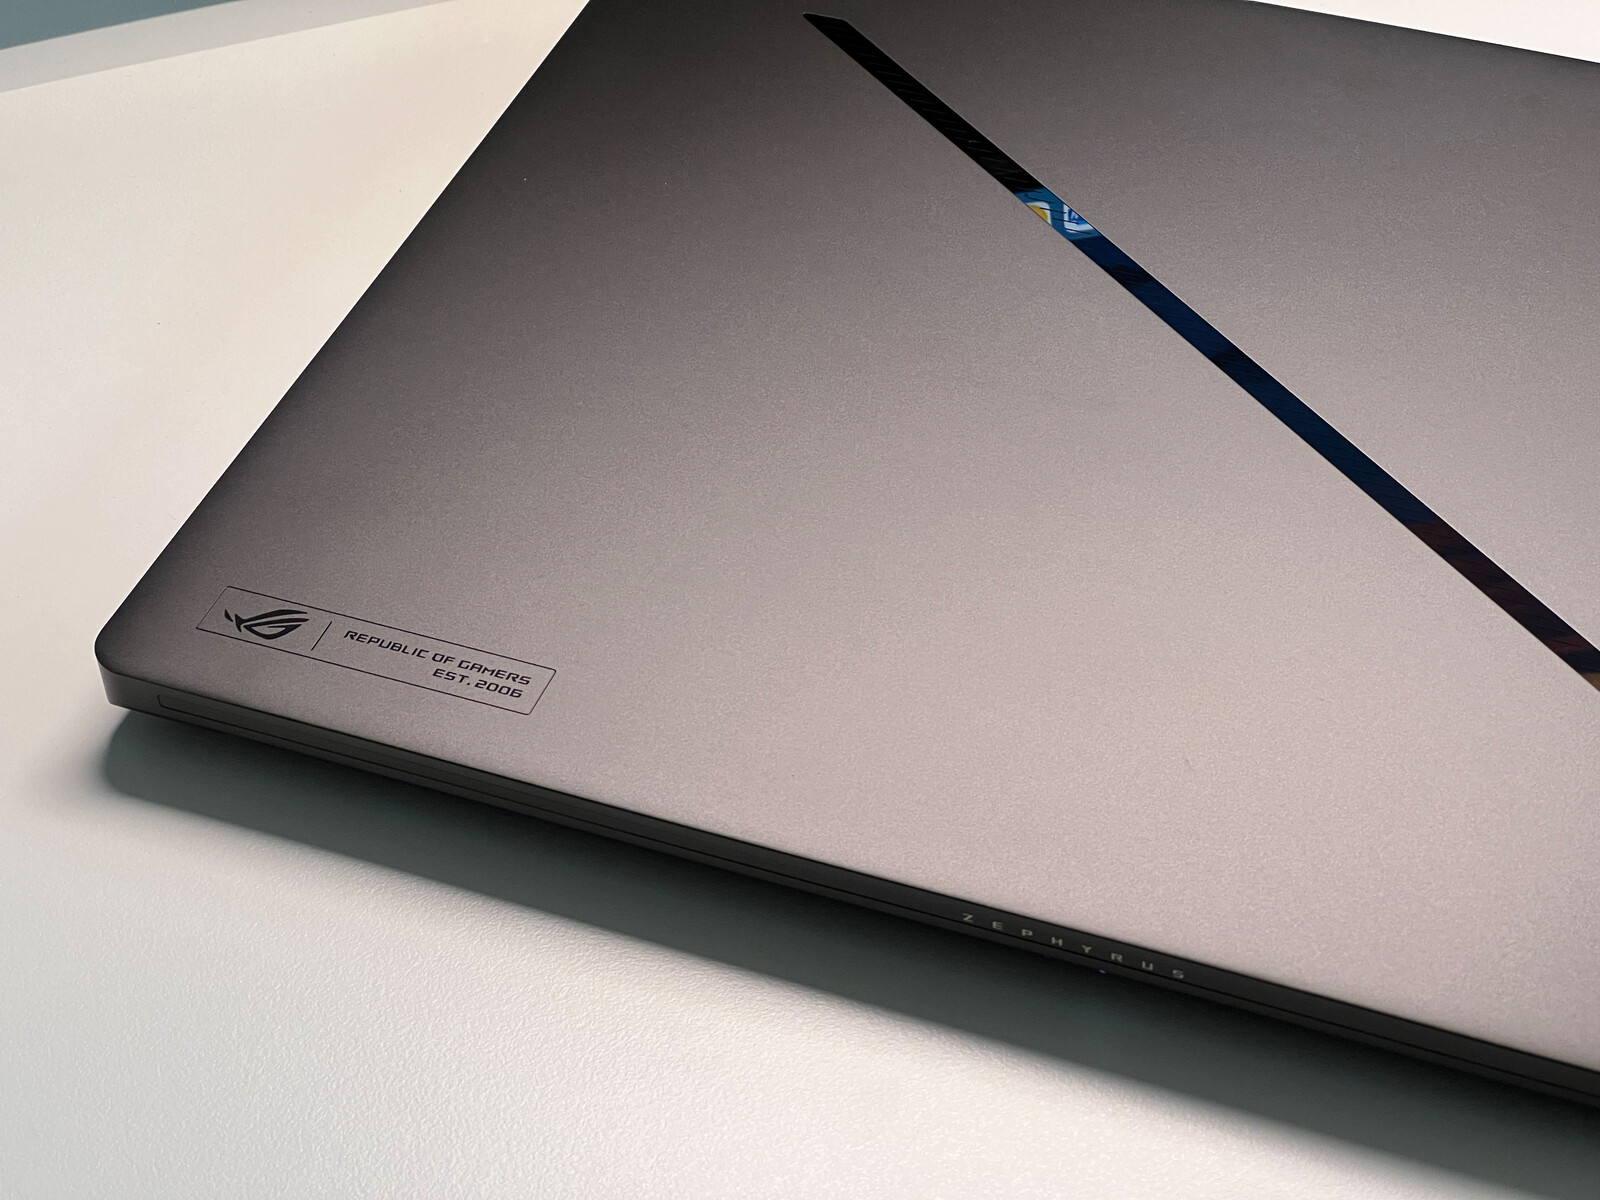
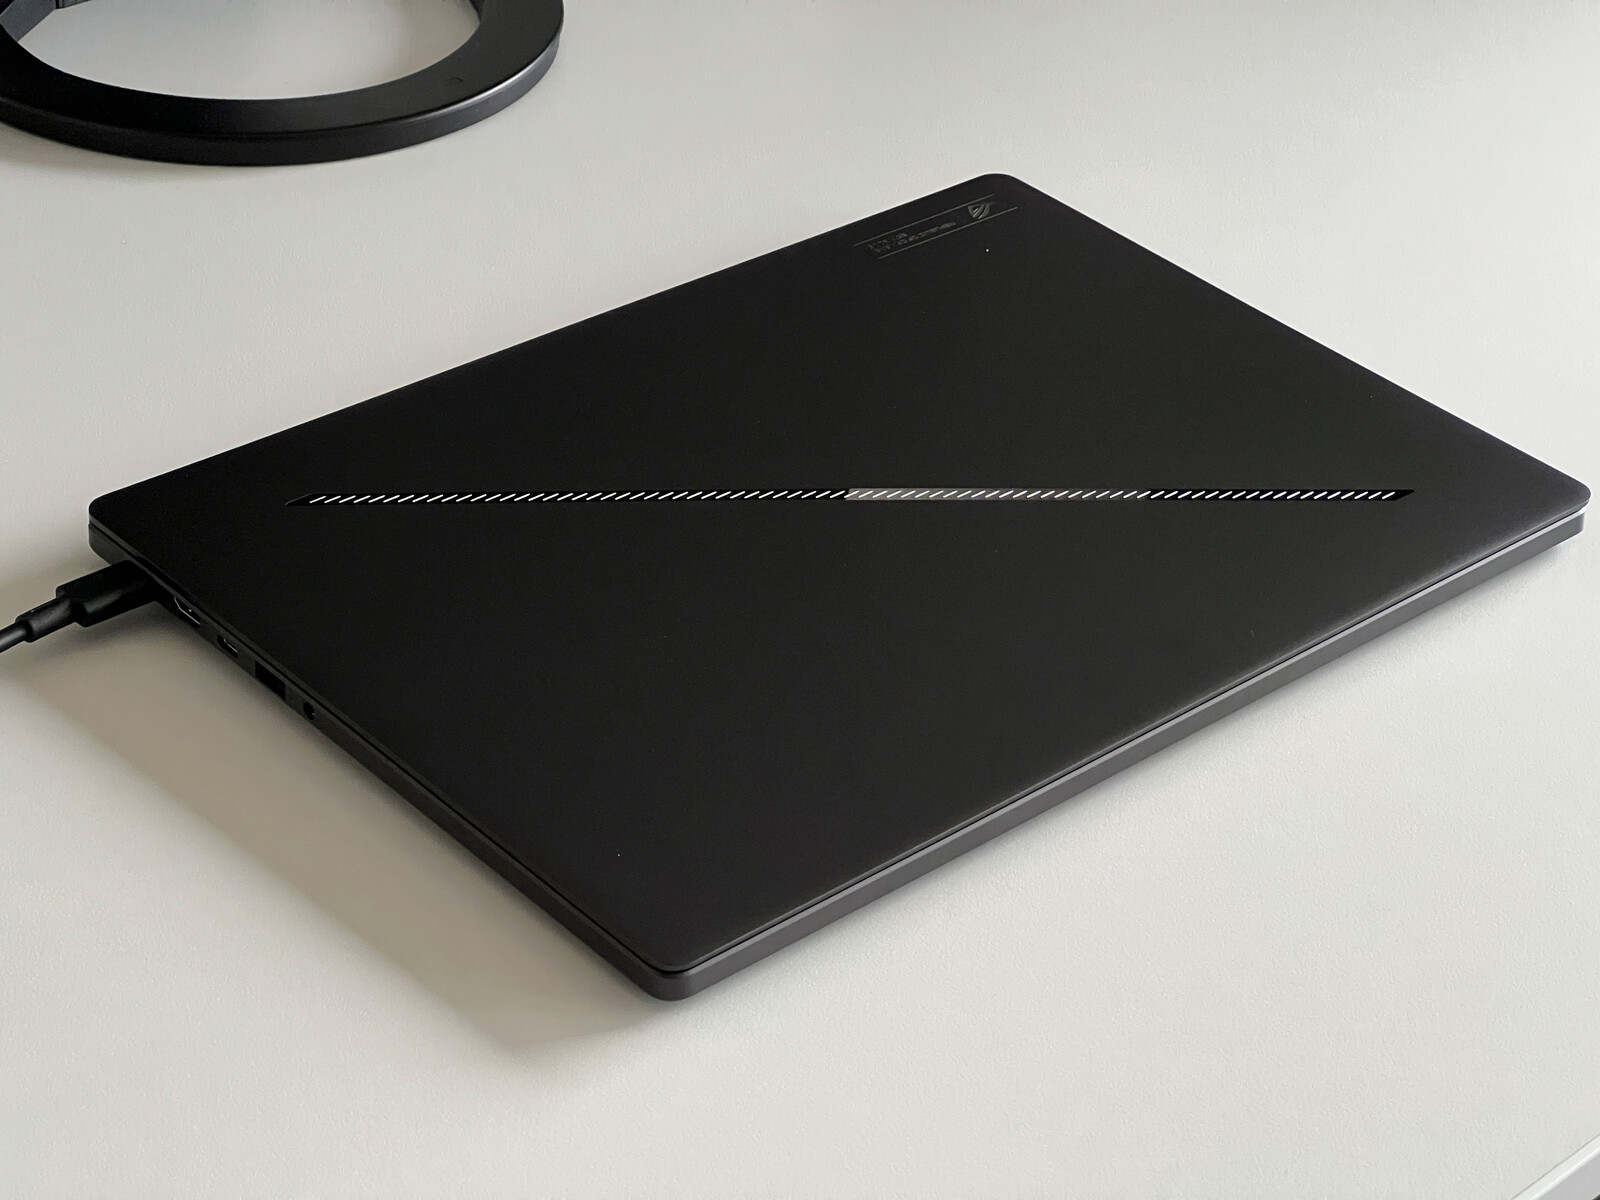
Asus ha renunciado a la extensa pantalla matricial en la tapa del nuevo modelo y, a cambio, incorpora una fina tira diagonal de luz blanca (Slash Lighting) compuesta por 28 mini LED y 7 zonas diferentes. Puede programarse (por ejemplo, como luz de notificación) o, alternativamente, puede desactivarse por completo si no desea llamar demasiado la atención sobre el dispositivo. Aparte del teclado, no hay más elementos iluminados.
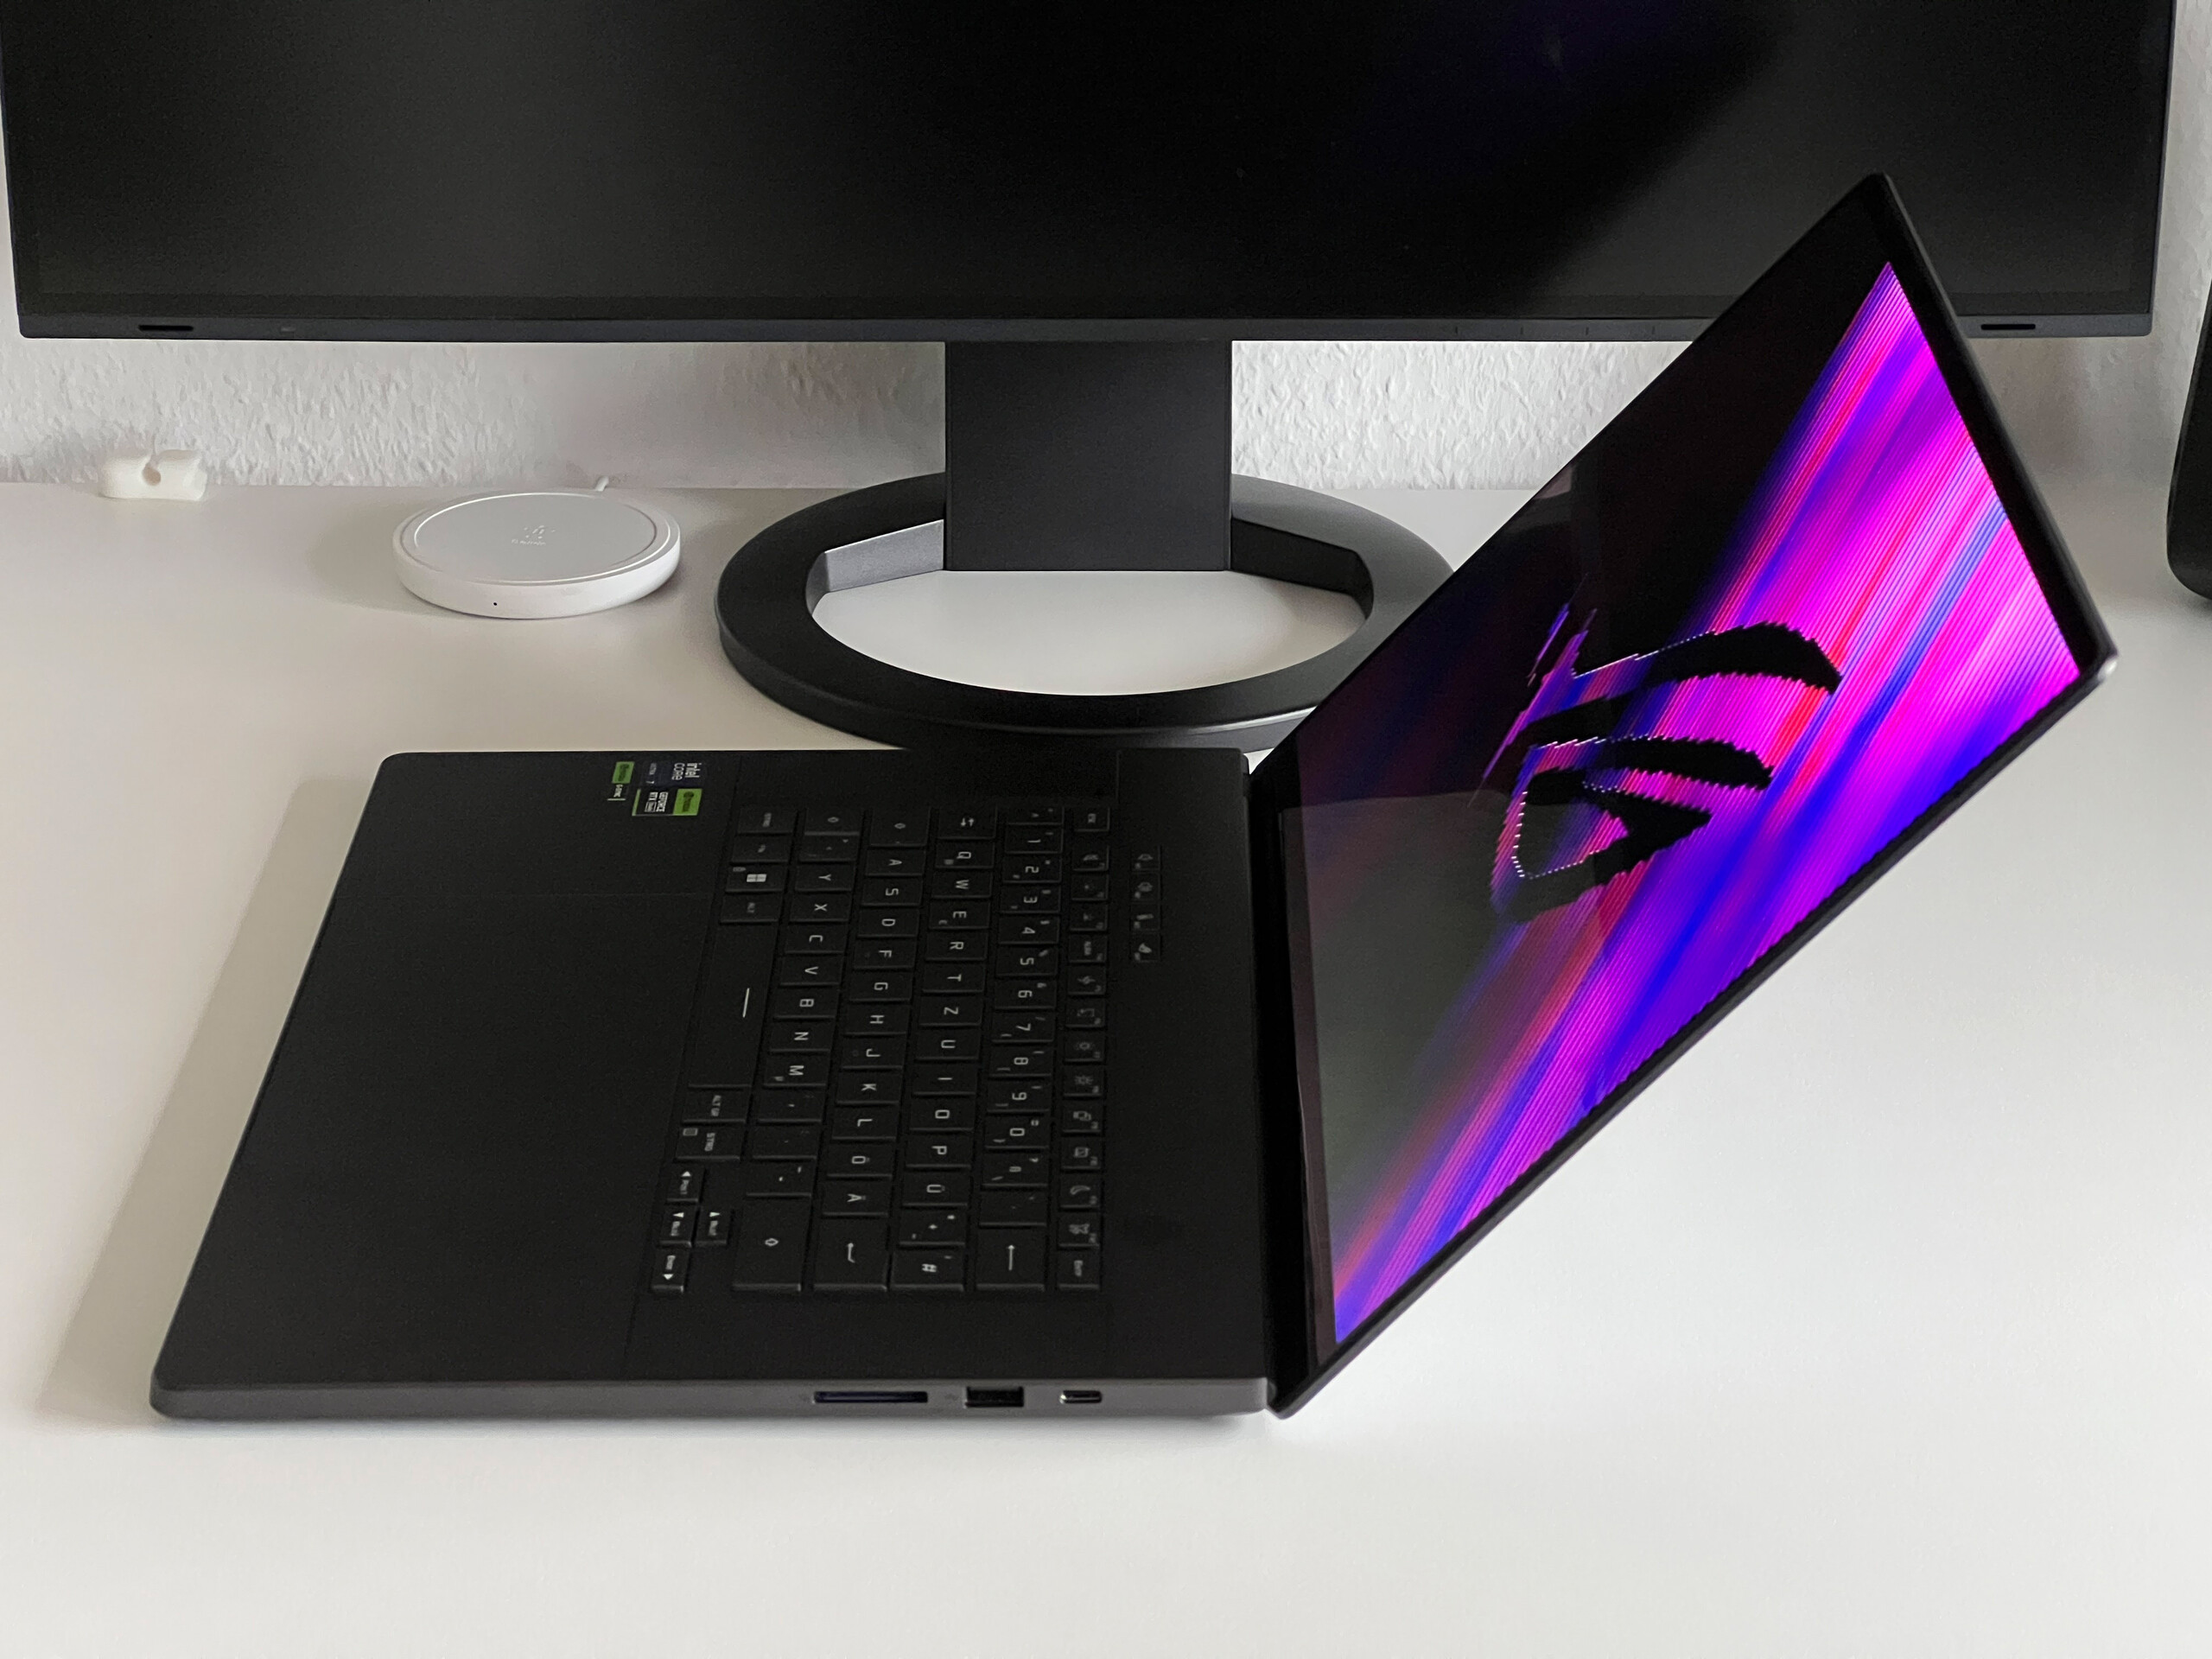
La construcción y la estabilidad del dispositivo son asombrosas y el teclado prácticamente no se puede presionar en absoluto, incluso ejerciendo mucha presión. Los crujidos también son ajenos al Zephyrus. La delgada tapa de la pantalla es un poco más flexible, pero tampoco notamos problemas aquí. Sin embargo, el nuevo diseño de la bisagra limita el ángulo máximo de apertura del portátil a 135 grados. La tapa puede abrirse fácilmente con una mano pero, para nuestro gusto, la bisagra podría ajustarse un poco más, ya que se tambalea bastante al ajustar el ángulo.
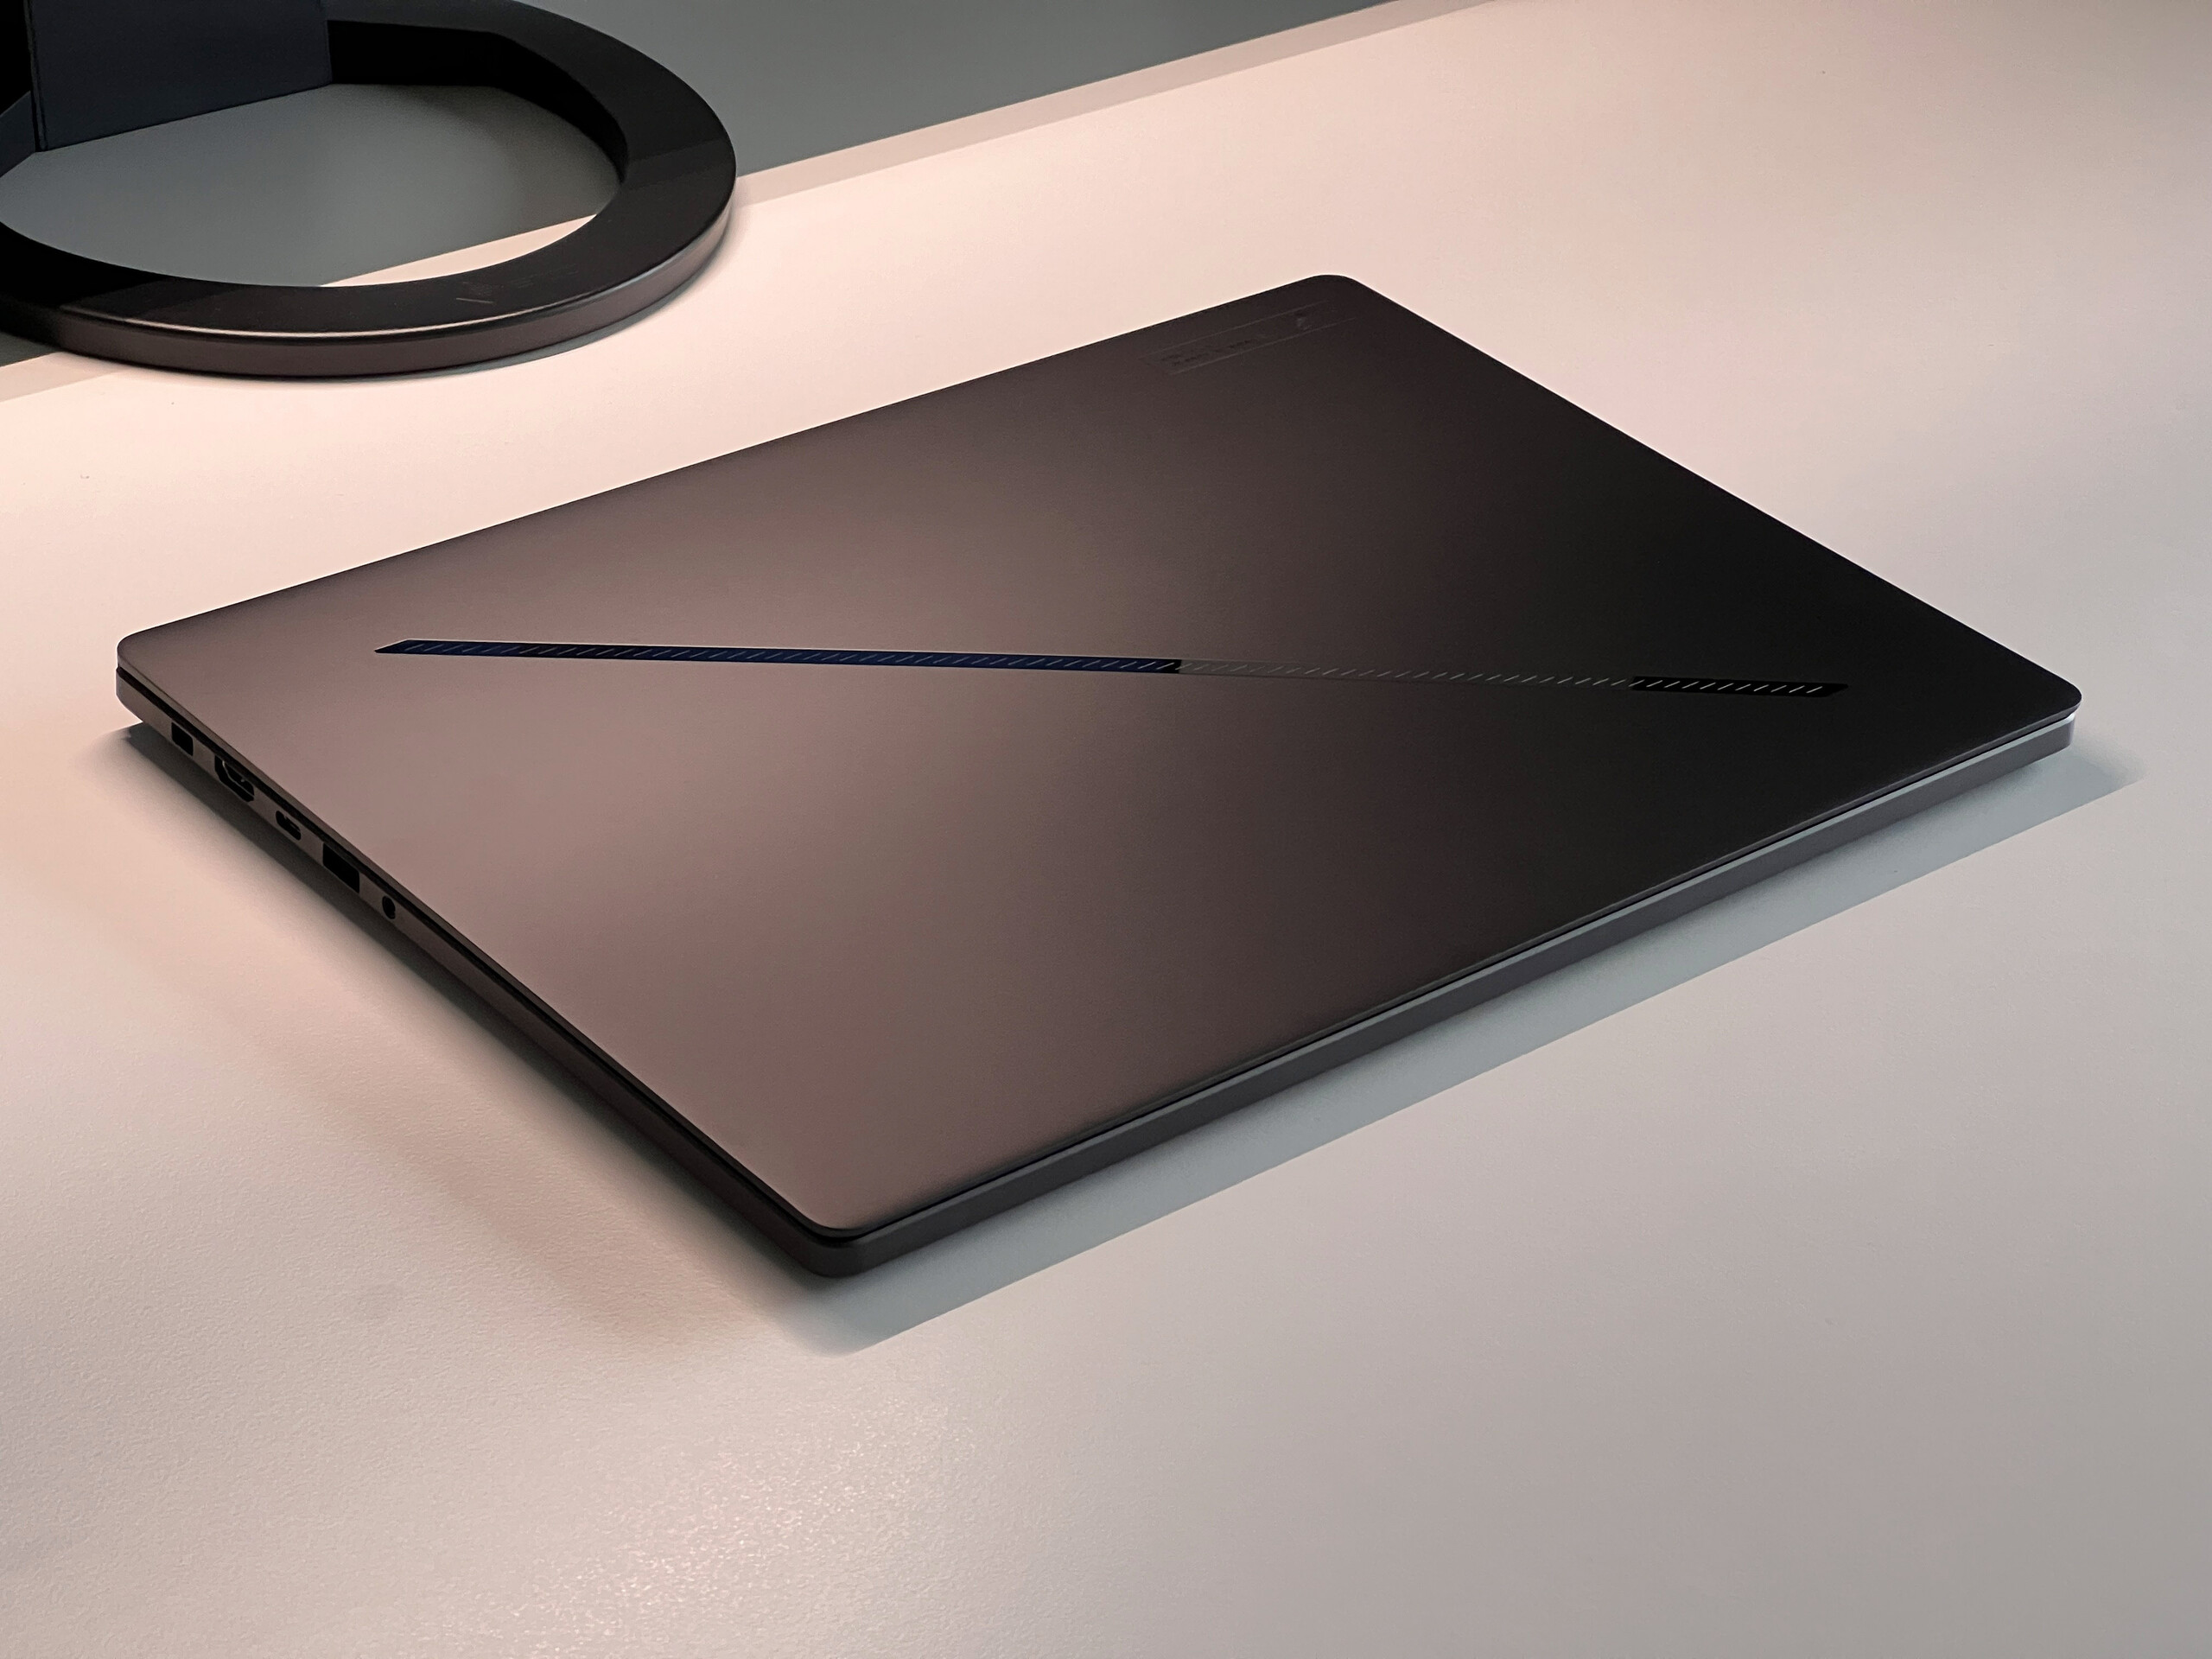
El nuevo ROG Zephyrus G16 es uno de los modelos más compactos de nuestra comparativa y junto con el Vision 16 Pro y el MacBook Prosus 16,4 mm lo convierten también en uno de los modelos más delgados. Sin embargo, también hay que señalar que nuestro dispositivo de prueba es la versión más delgada de la gama, ya que los modelos TFT y Vapor-Chamber son un poco más gruesos. También es ligero, ya que pesa 1,8 kg; la fuente de alimentación de 200 vatios añade 583 gramos adicionales a la balanza.
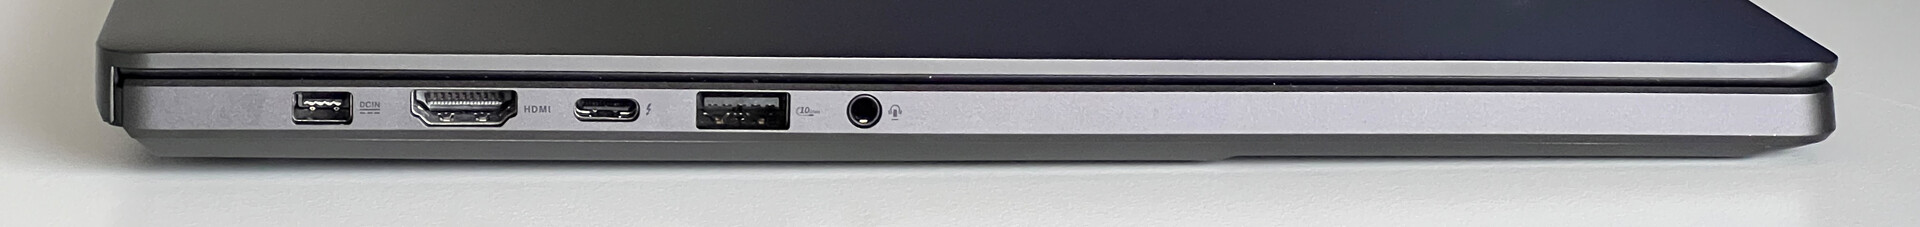
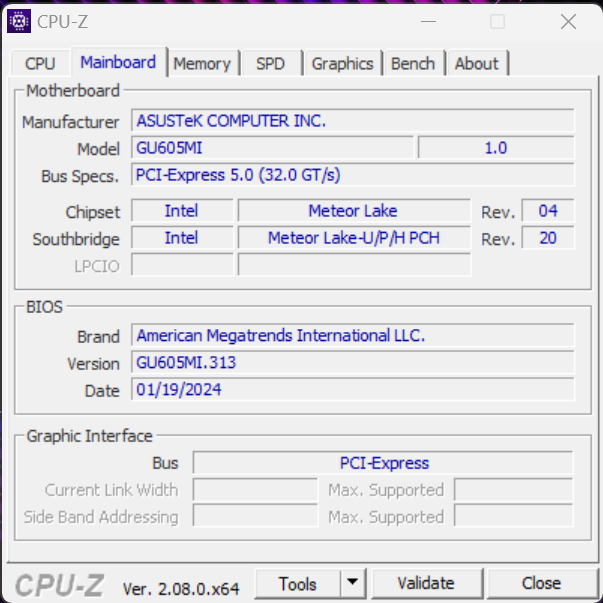
Conectividad - Thunderbolt y WLAN rápida
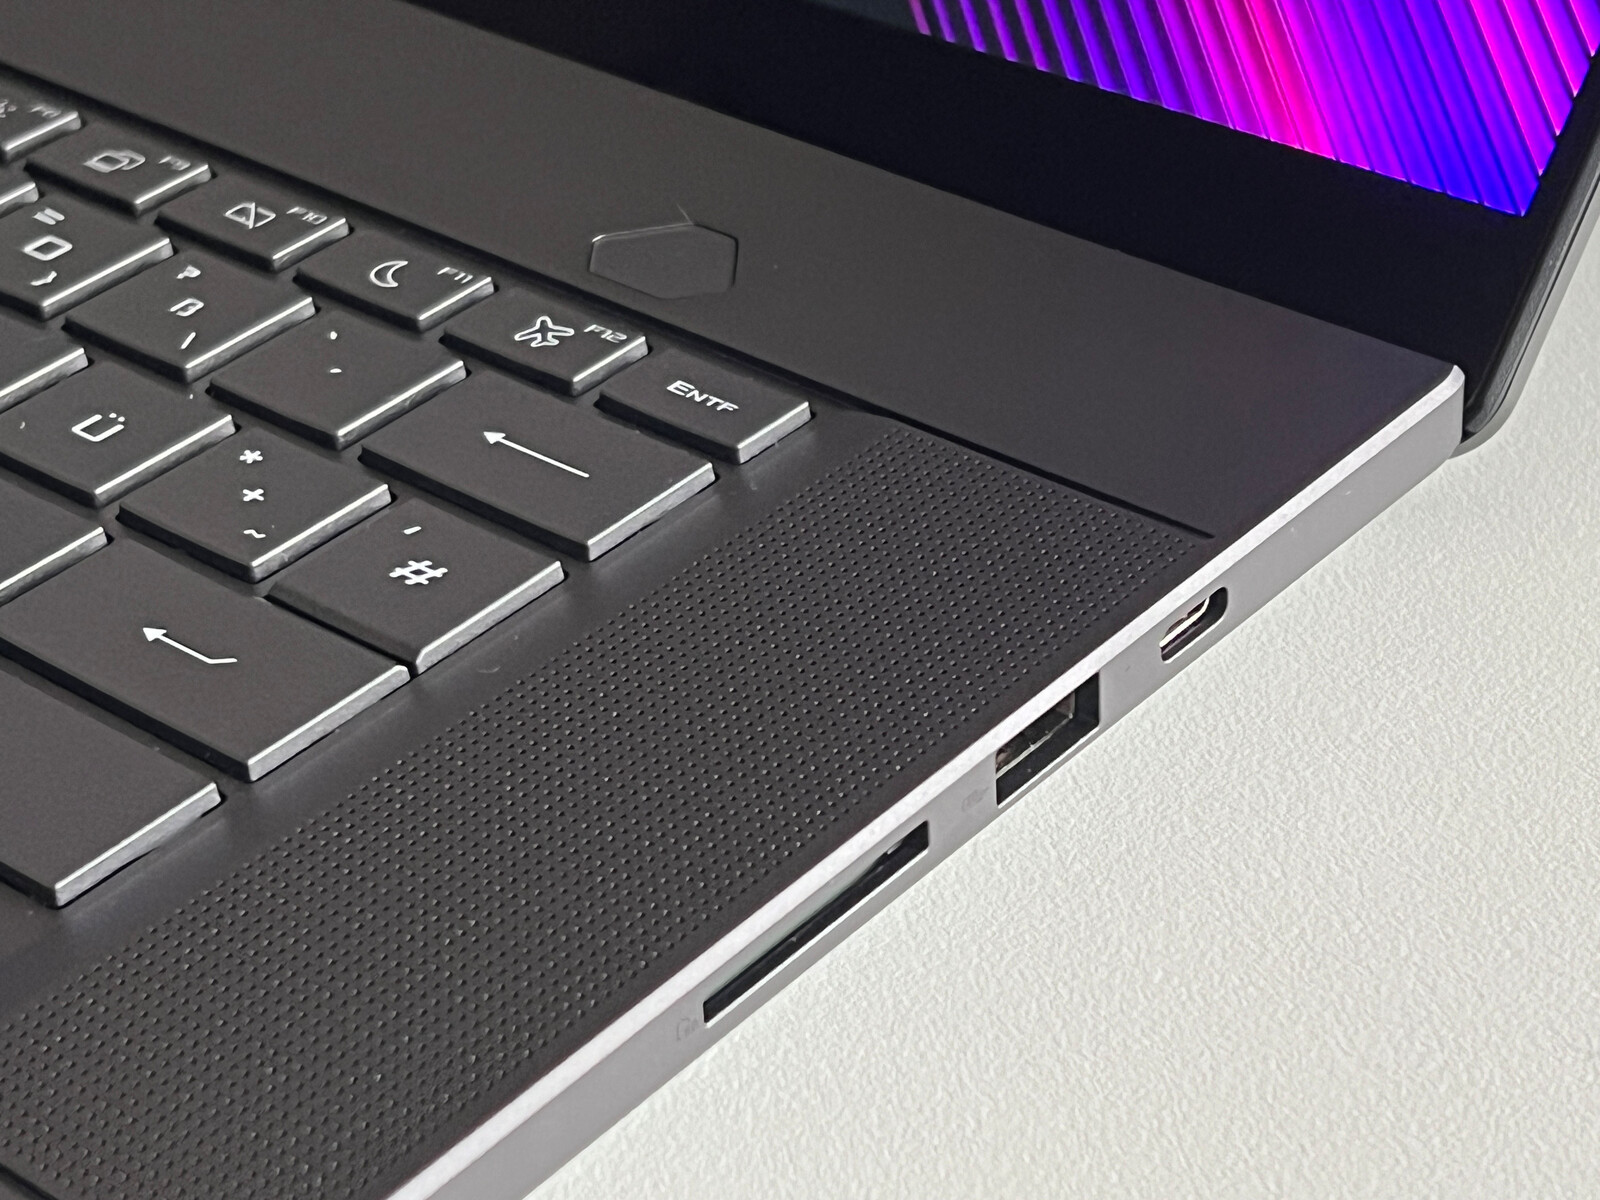
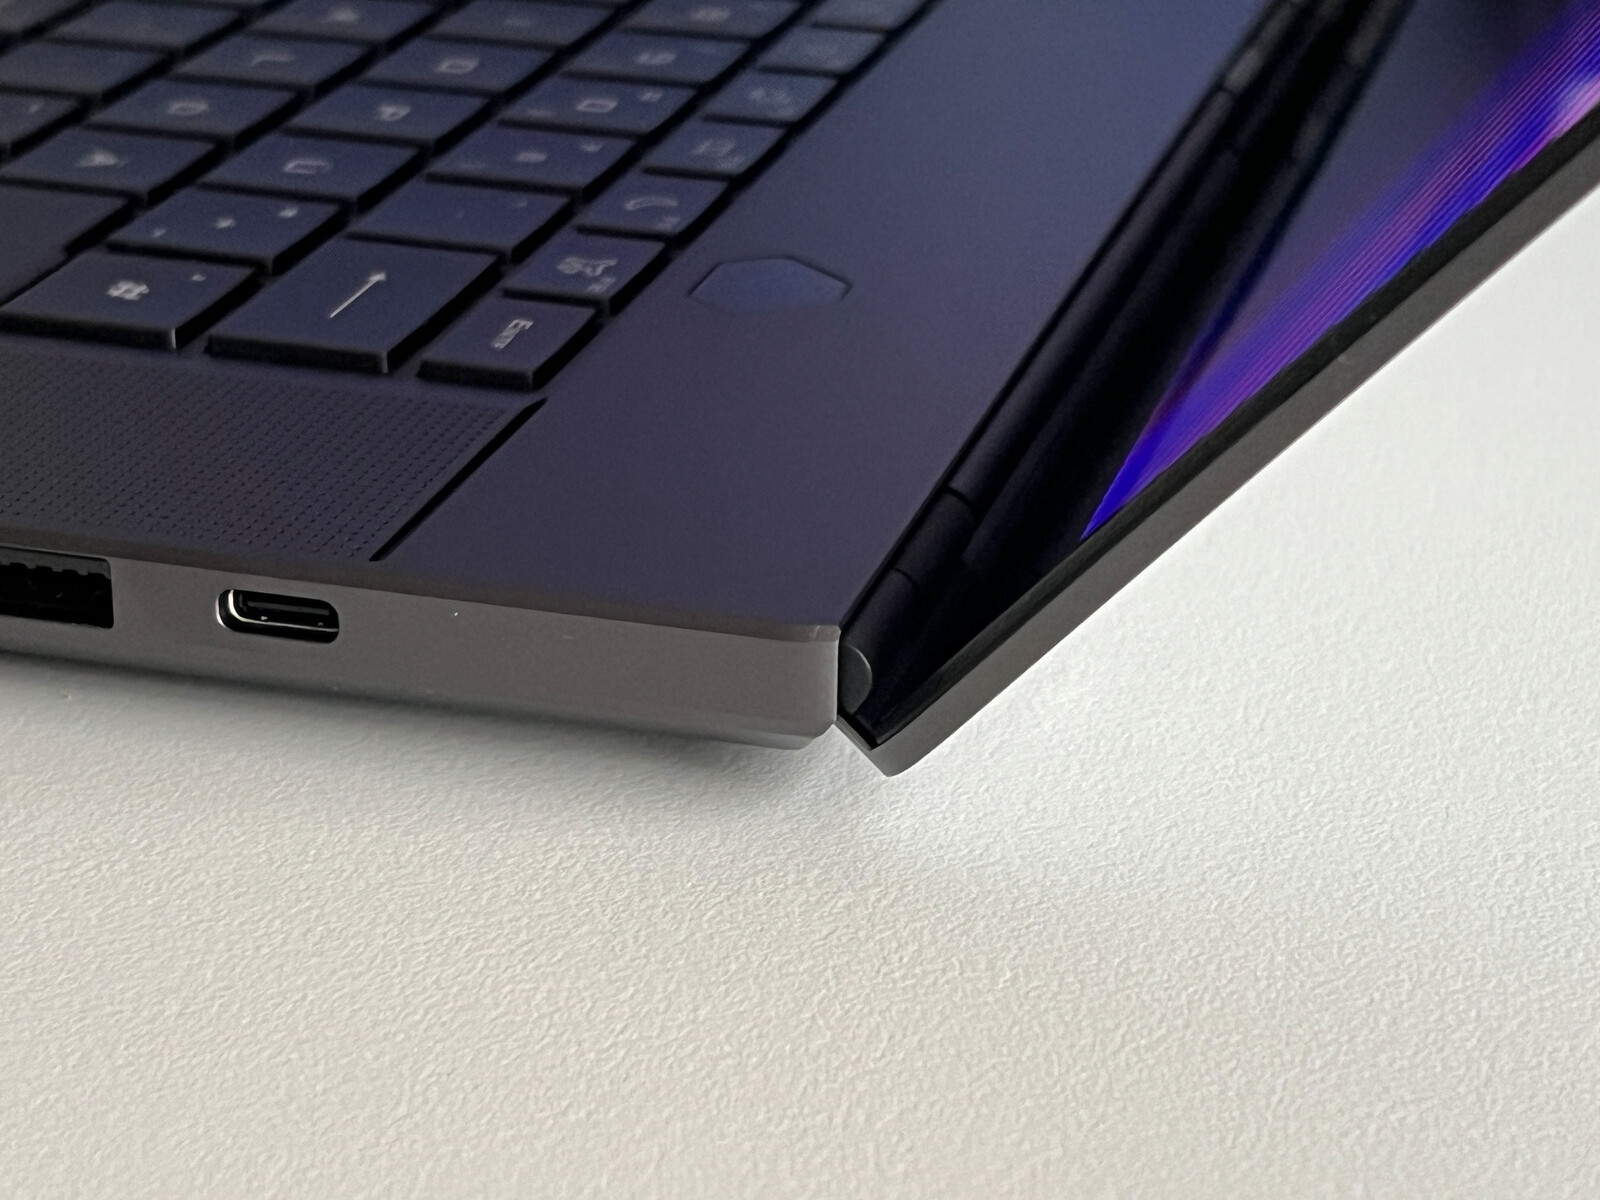
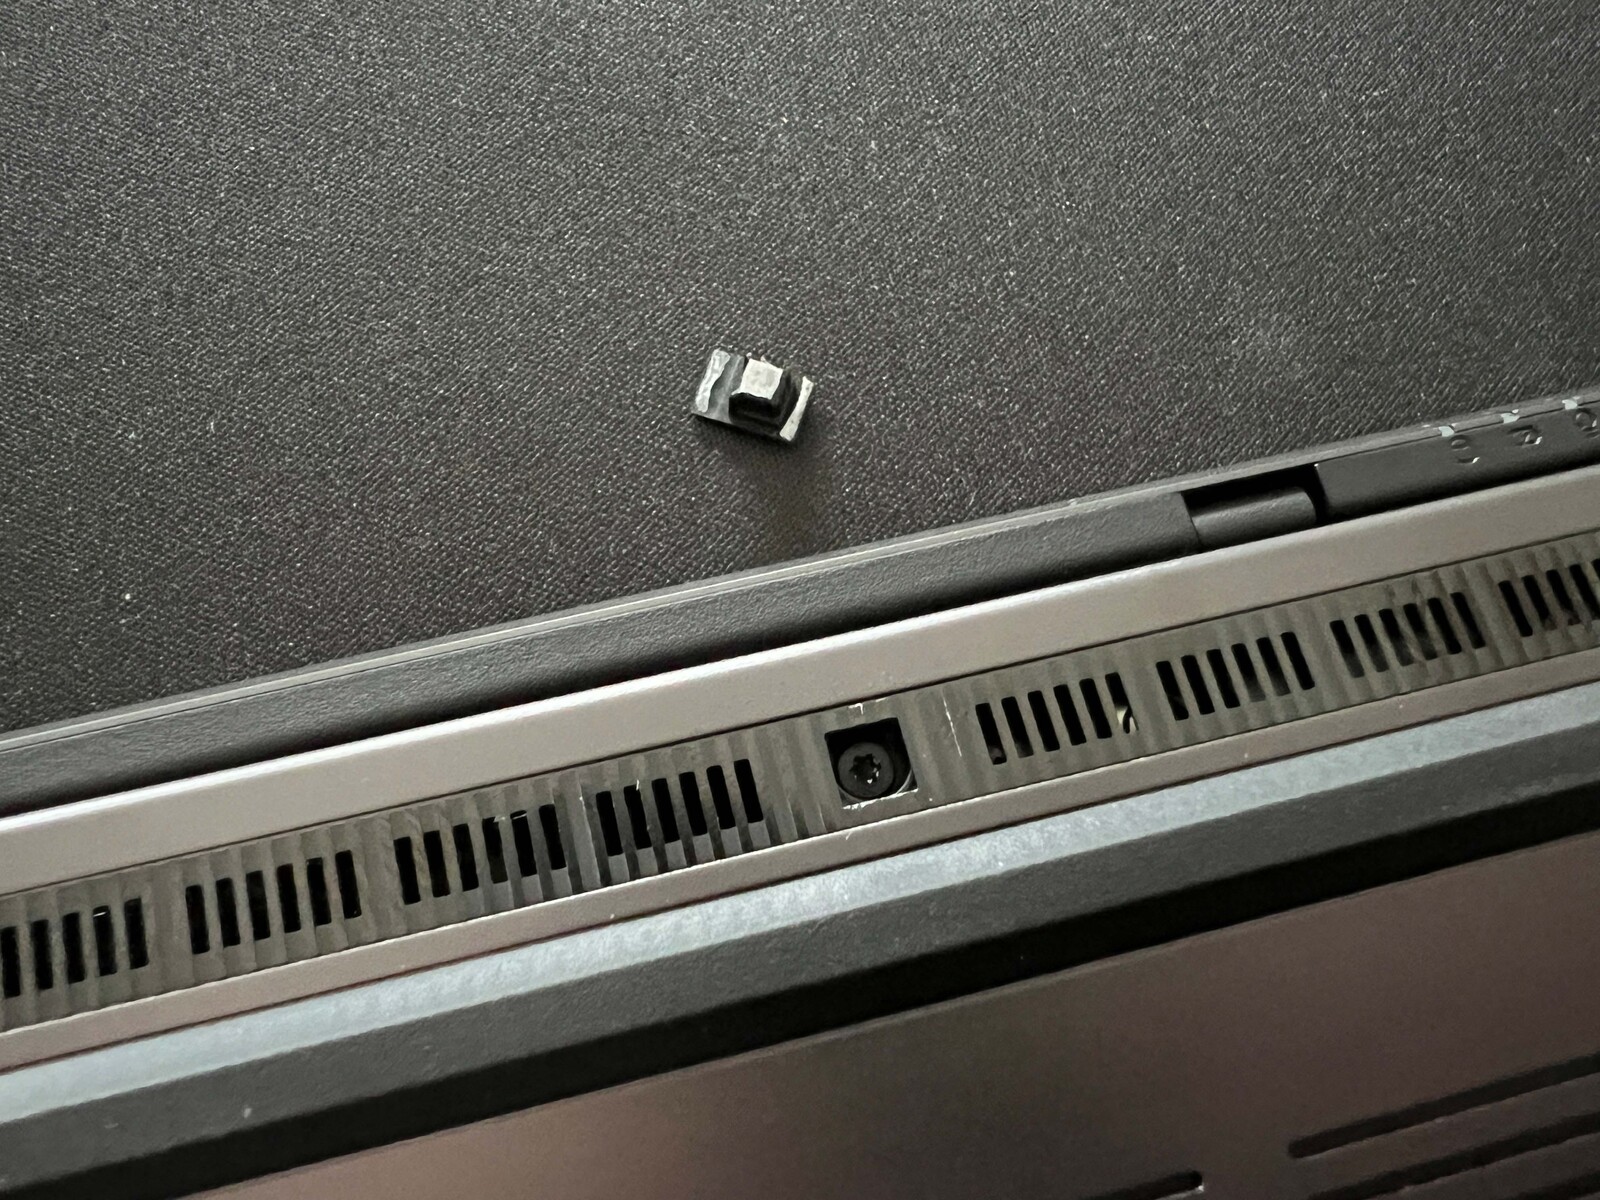
La parte trasera está completamente ocupada por la refrigeración, por lo que los puertos están repartidos entre ambos lados del portátil. Asus utiliza ahora un nuevo conector de alimentación rectangular que se ha colocado en la parte posterior izquierda de la carcasa. El dispositivo cuenta con todas las conexiones importantes, ya que además de USB-C, también dispone de USB-A, una salida HDMI completa y un lector de tarjetas. Ambos puertos USB-C admiten Power Delivery de hasta 100 vatios y el de la izquierda es compatible con Thunderbolt 4. Sólo carece de conexión Ethernet; si la necesita, tendrá que utilizar un adaptador USB.
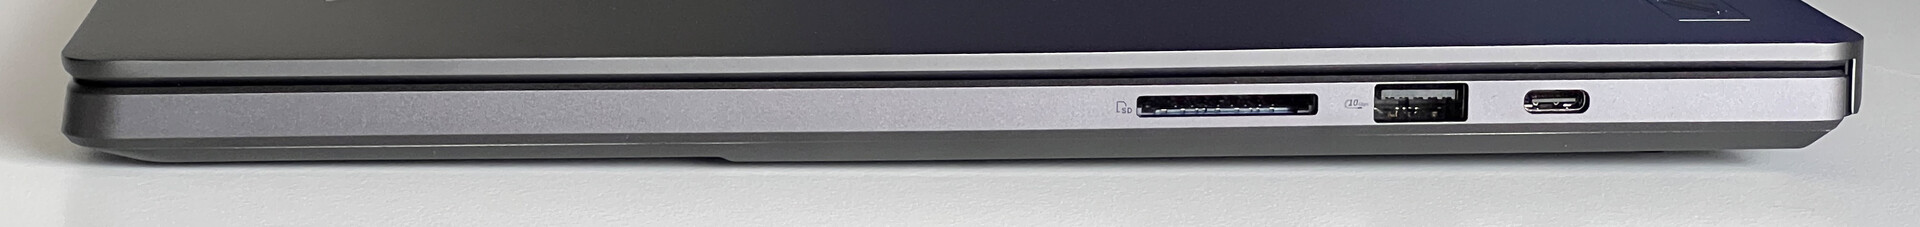
Lector de tarjetas SD
La G16 dispone de un lector de tarjetas completo en el lado derecho, por el que las tarjetas insertadas sobresalen unos 1,2 cm. En combinación con nuestra tarjeta de referencia (Angelbird AV Pro V60), alcanzó unas tasas de transferencia de unos 80-90 MB/s, lo que significa que el dispositivo de prueba quedó cerca del final.
| SD Card Reader | |
| average JPG Copy Test (av. of 3 runs) | |
| Gigabyte AERO 16 OLED BSF | |
| Apple MacBook Pro 16 2023 M3 Max (Angelbird AV Pro V60) | |
| MSI Stealth 16 Studio A13VG | |
| Media de la clase Gaming (20.9 - 210, n=55, últimos 2 años) | |
| Razer Blade 16 Early 2023 (AV PRO microSD 128 GB V60) | |
| Asus ROG Zephyrus G16 2024 GU605M | |
| Lenovo Yoga Pro 9 16-IRP G8 (Angelibird AV Pro V60) | |
| Schenker VISION 16 Pro (M23) (Angelbird AV Pro V60) | |
| maximum AS SSD Seq Read Test (1GB) | |
| Apple MacBook Pro 16 2023 M3 Max (Angelbird AV Pro V60) | |
| Razer Blade 16 Early 2023 (AV PRO microSD 128 GB V60) | |
| Gigabyte AERO 16 OLED BSF | |
| MSI Stealth 16 Studio A13VG | |
| Media de la clase Gaming (25.5 - 261, n=52, últimos 2 años) | |
| Asus ROG Zephyrus G16 2024 GU605M | |
| Lenovo Yoga Pro 9 16-IRP G8 (Angelibird AV Pro V60) | |
| Schenker VISION 16 Pro (M23) (Angelbird AV Pro V60) | |
Comunicación
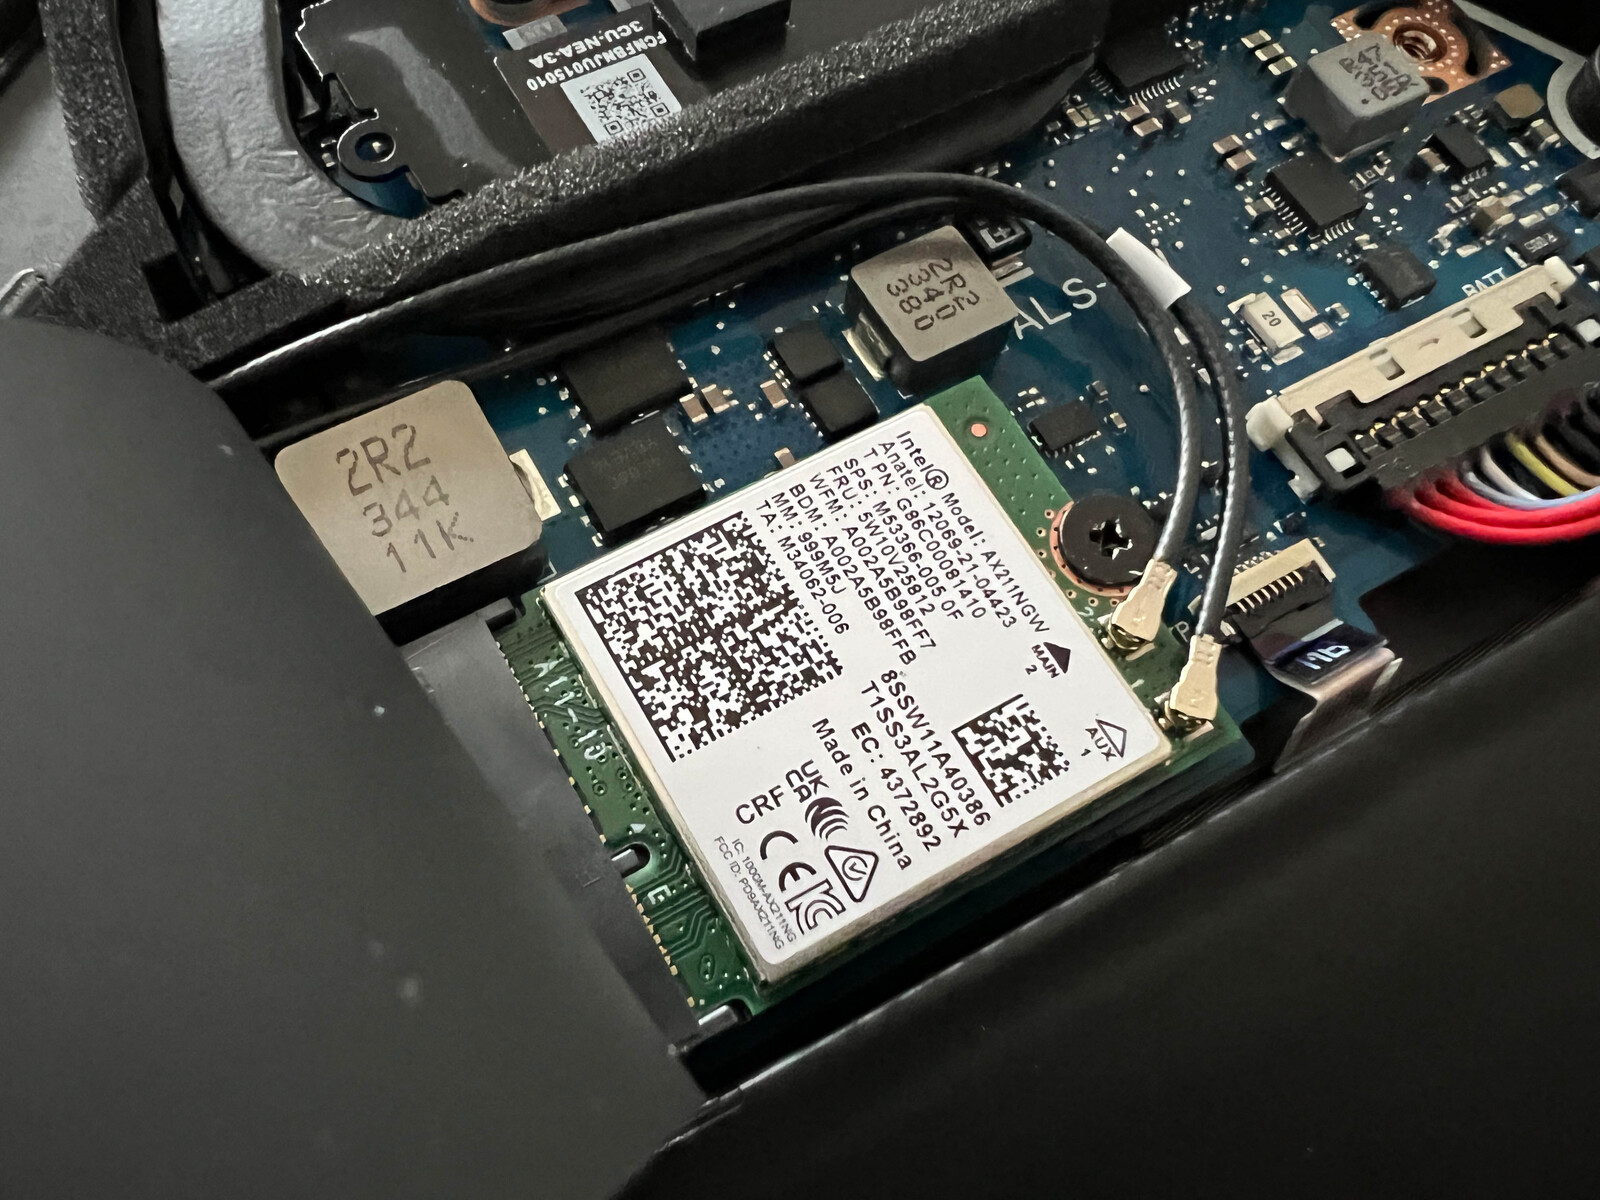
Asus ha renunciado a Wi-Fi 7 pero, aun así, el módulo AX211 de Intel sigue siendo un adaptador WLAN actualizado que admite Bluetooth 5.3 así como Wi-Fi 6E. Junto con nuestro router de referencia de Asus, sus velocidades de transferencia fueron muy buenas y estables y, durante nuestro periodo de pruebas, no tuvimos ningún problema en torno a la calidad de la señal.
| Networking | |
| Asus ROG Zephyrus G16 2024 GU605M | |
| iperf3 transmit AXE11000 | |
| iperf3 receive AXE11000 | |
| Lenovo Yoga Pro 9 16-IRP G8 | |
| iperf3 transmit AXE11000 | |
| iperf3 receive AXE11000 | |
| Razer Blade 16 Early 2023 | |
| iperf3 transmit AXE11000 | |
| iperf3 receive AXE11000 | |
| iperf3 transmit AXE11000 6GHz | |
| iperf3 receive AXE11000 6GHz | |
| Gigabyte AERO 16 OLED BSF | |
| iperf3 transmit AXE11000 6GHz | |
| iperf3 receive AXE11000 6GHz | |
| Schenker VISION 16 Pro (M23) | |
| iperf3 transmit AXE11000 | |
| iperf3 receive AXE11000 | |
| MSI Stealth 16 Studio A13VG | |
| iperf3 transmit AXE11000 | |
| iperf3 receive AXE11000 | |
| iperf3 transmit AXE11000 6GHz | |
| iperf3 receive AXE11000 6GHz | |
| Apple MacBook Pro 16 2023 M3 Max | |
| iperf3 transmit AXE11000 | |
| iperf3 receive AXE11000 | |
Cámara web
La cámara web de 1080p instalada en el marco superior de la pantalla toma fotos decentes en buenas condiciones de iluminación y también admite funciones como el seguimiento facial y el enfoque suave. Cuenta con una cámara IR adicional para el reconocimiento facial a través de Windows Hello.


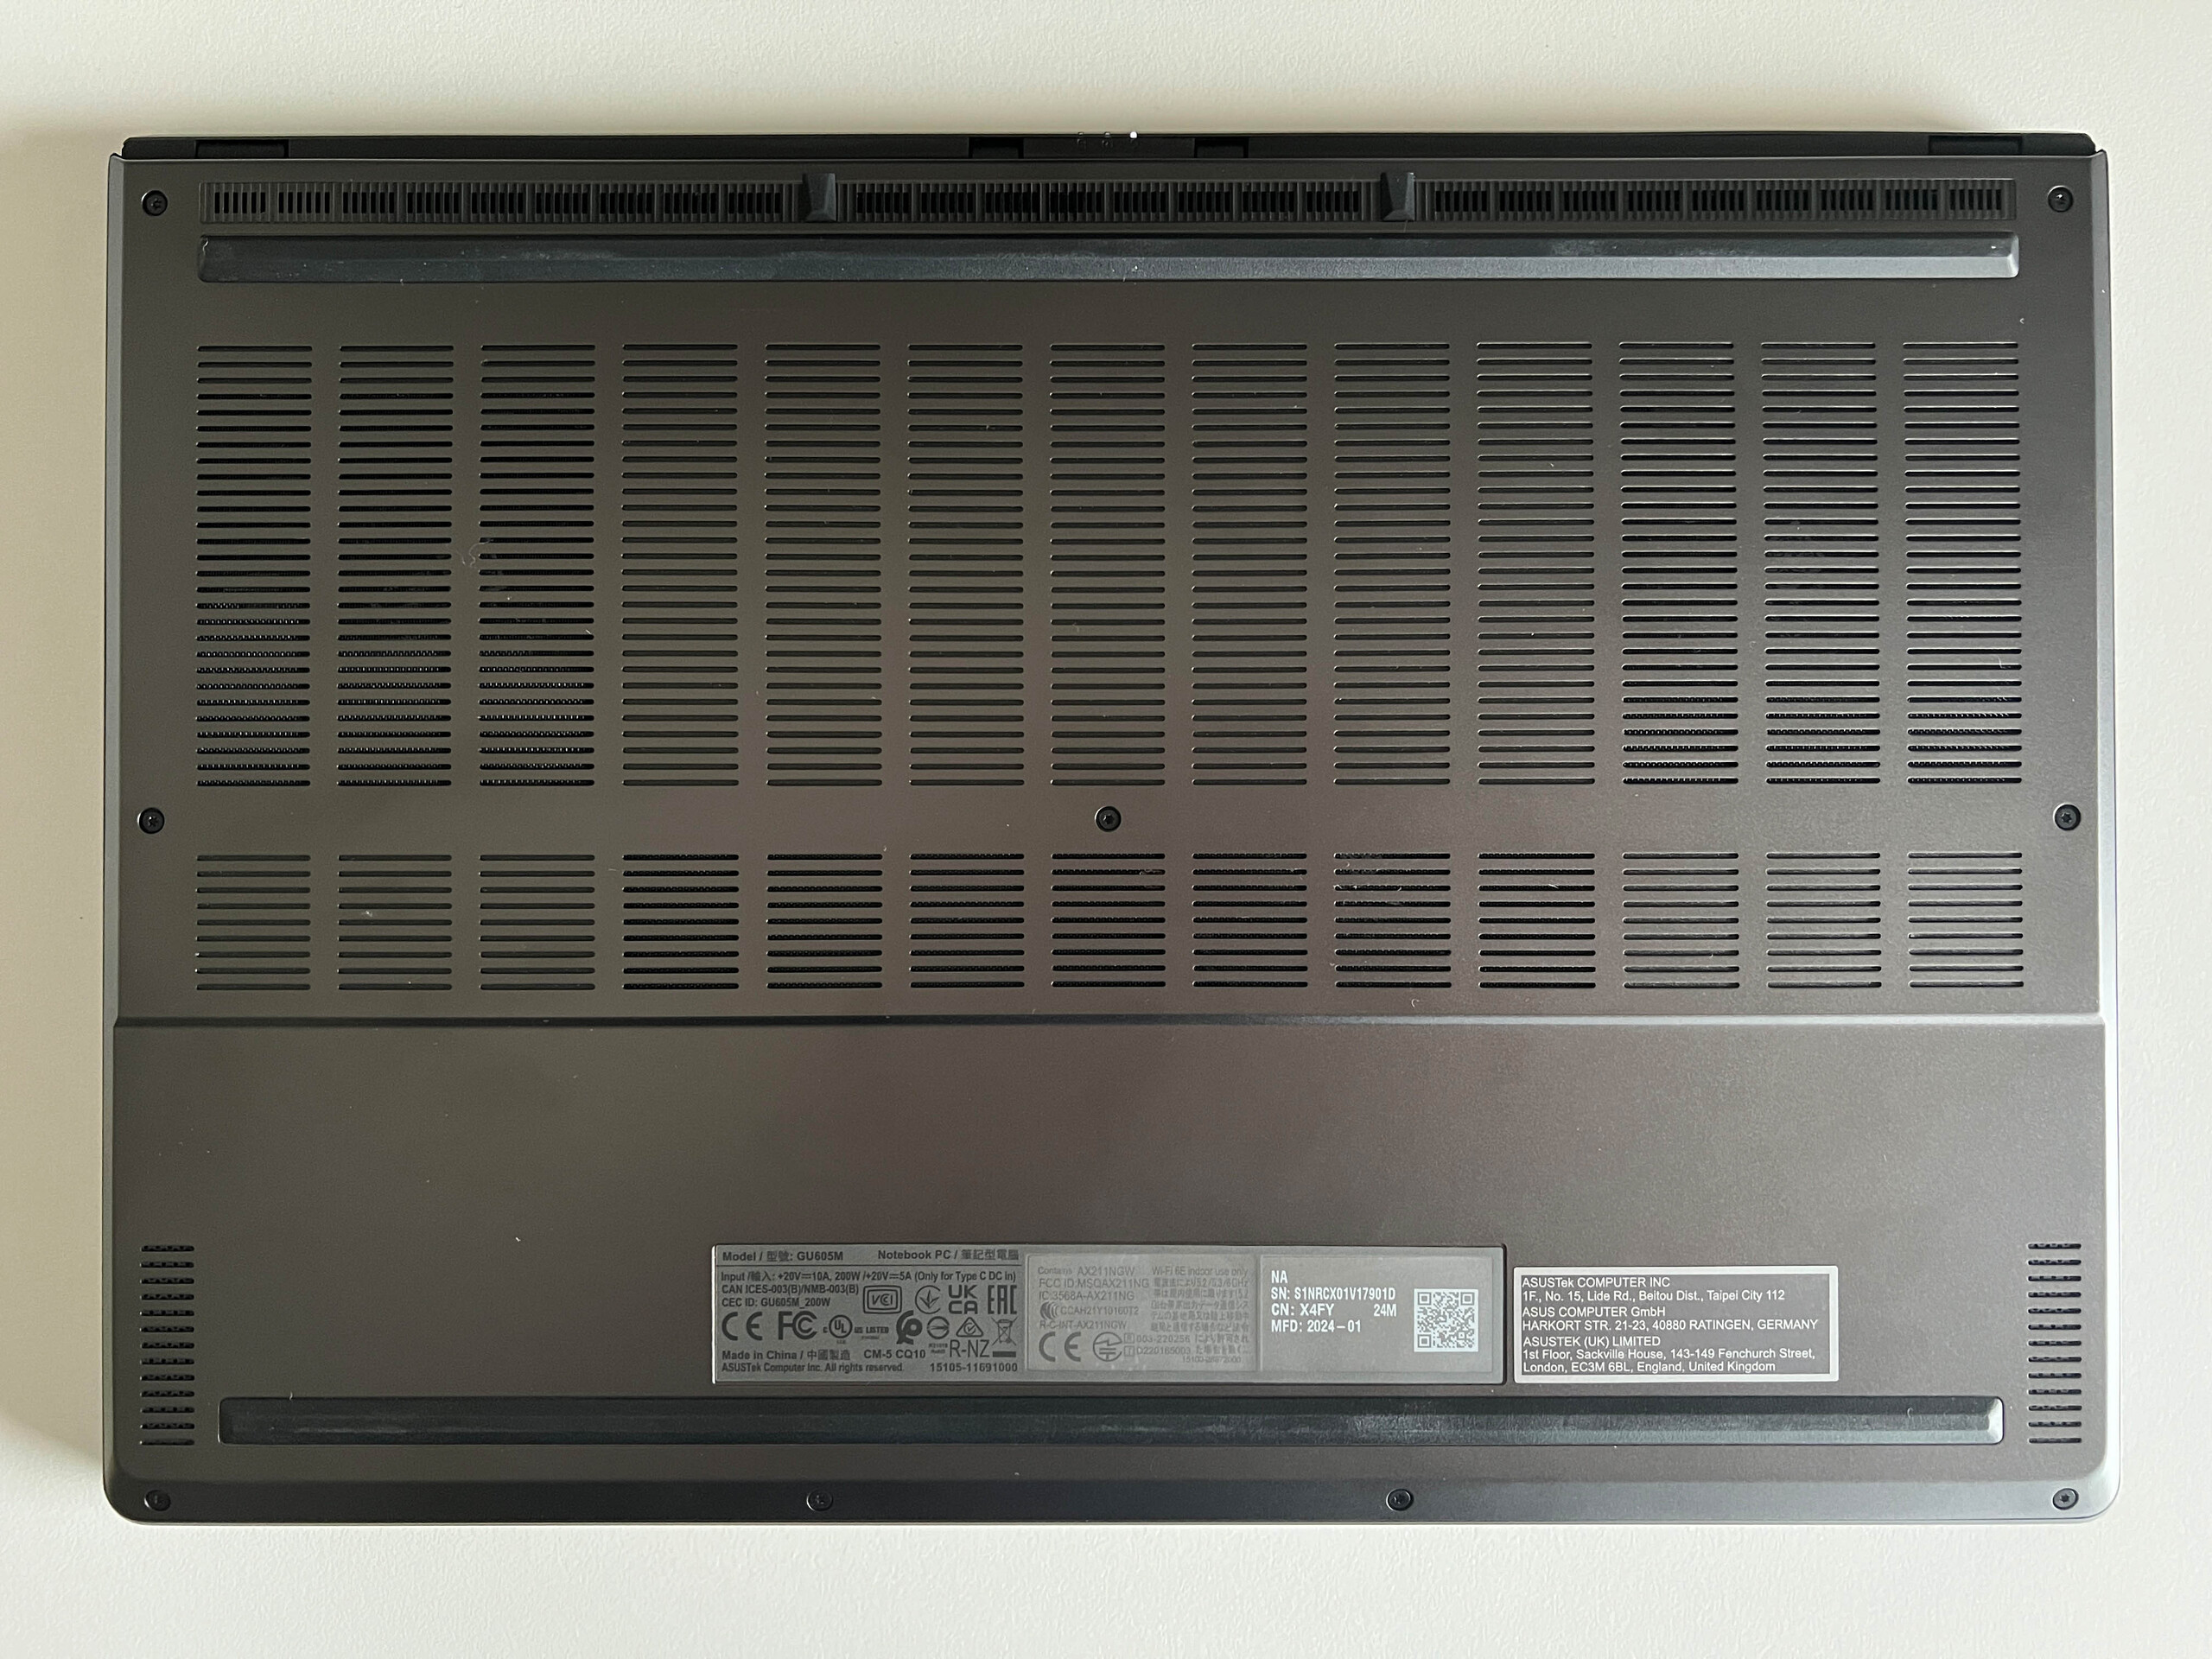
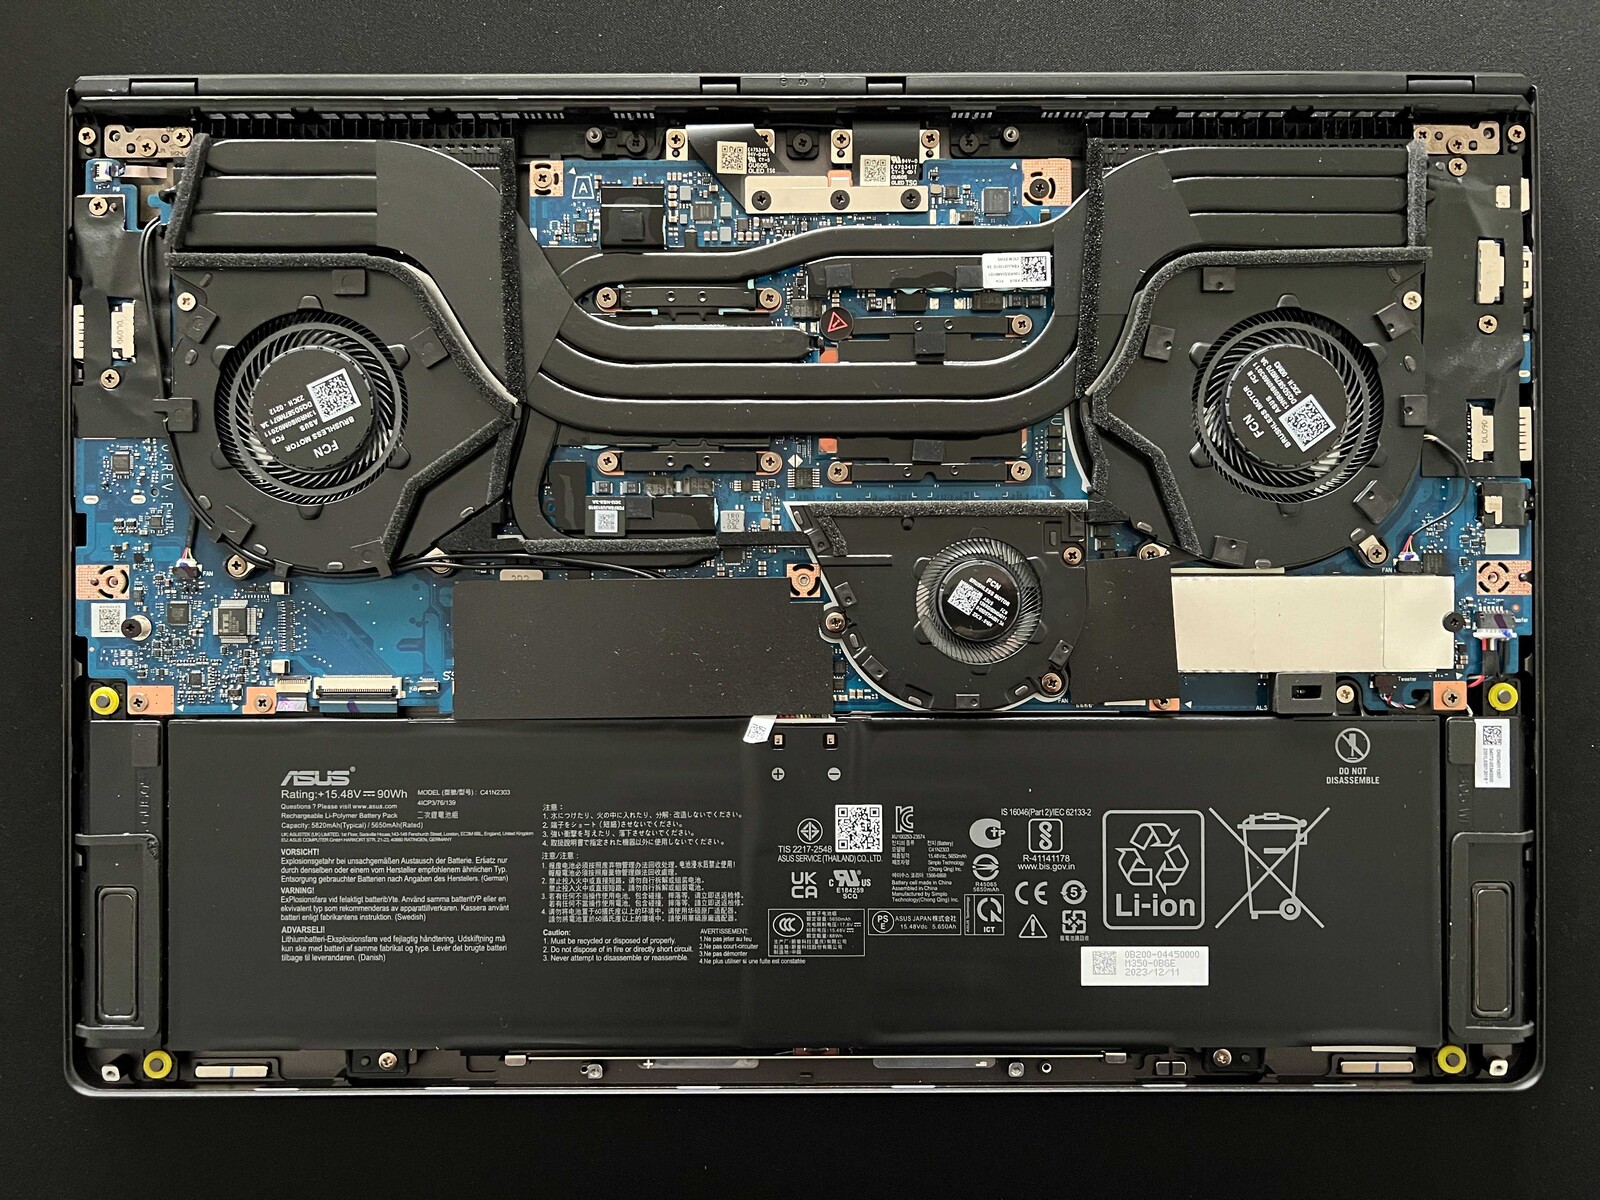
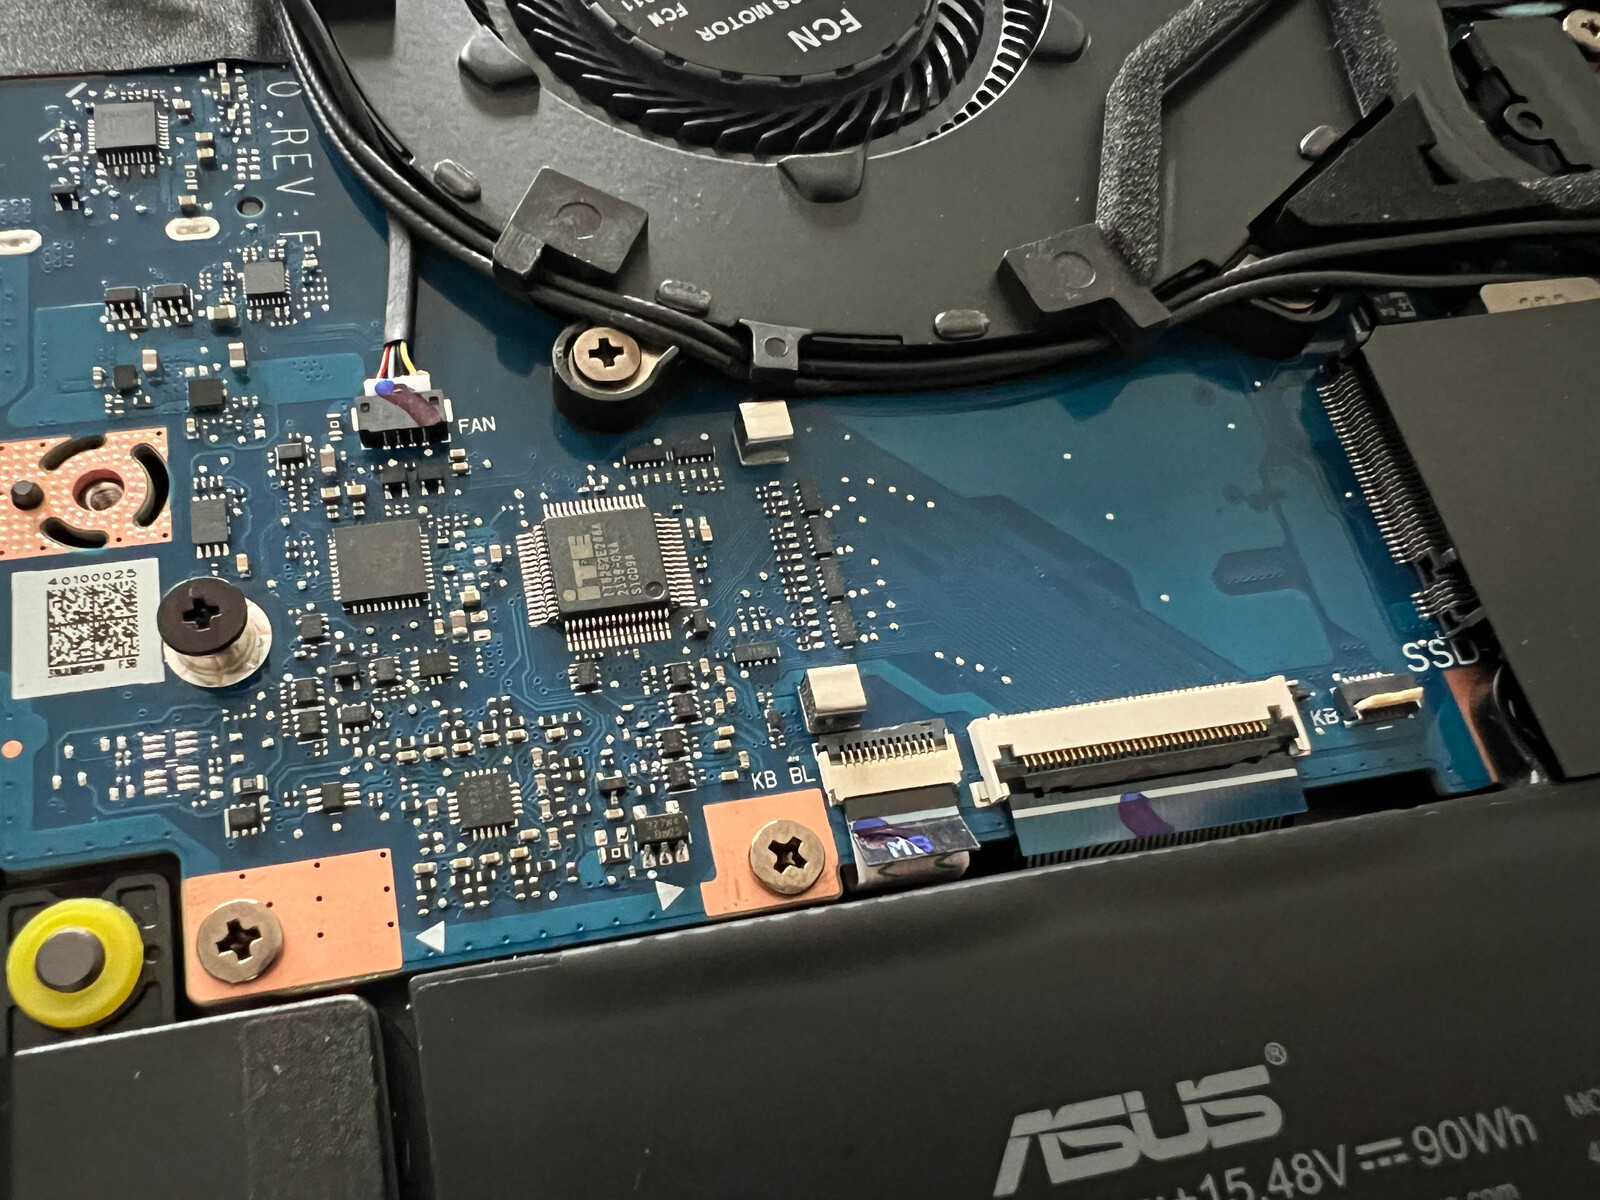
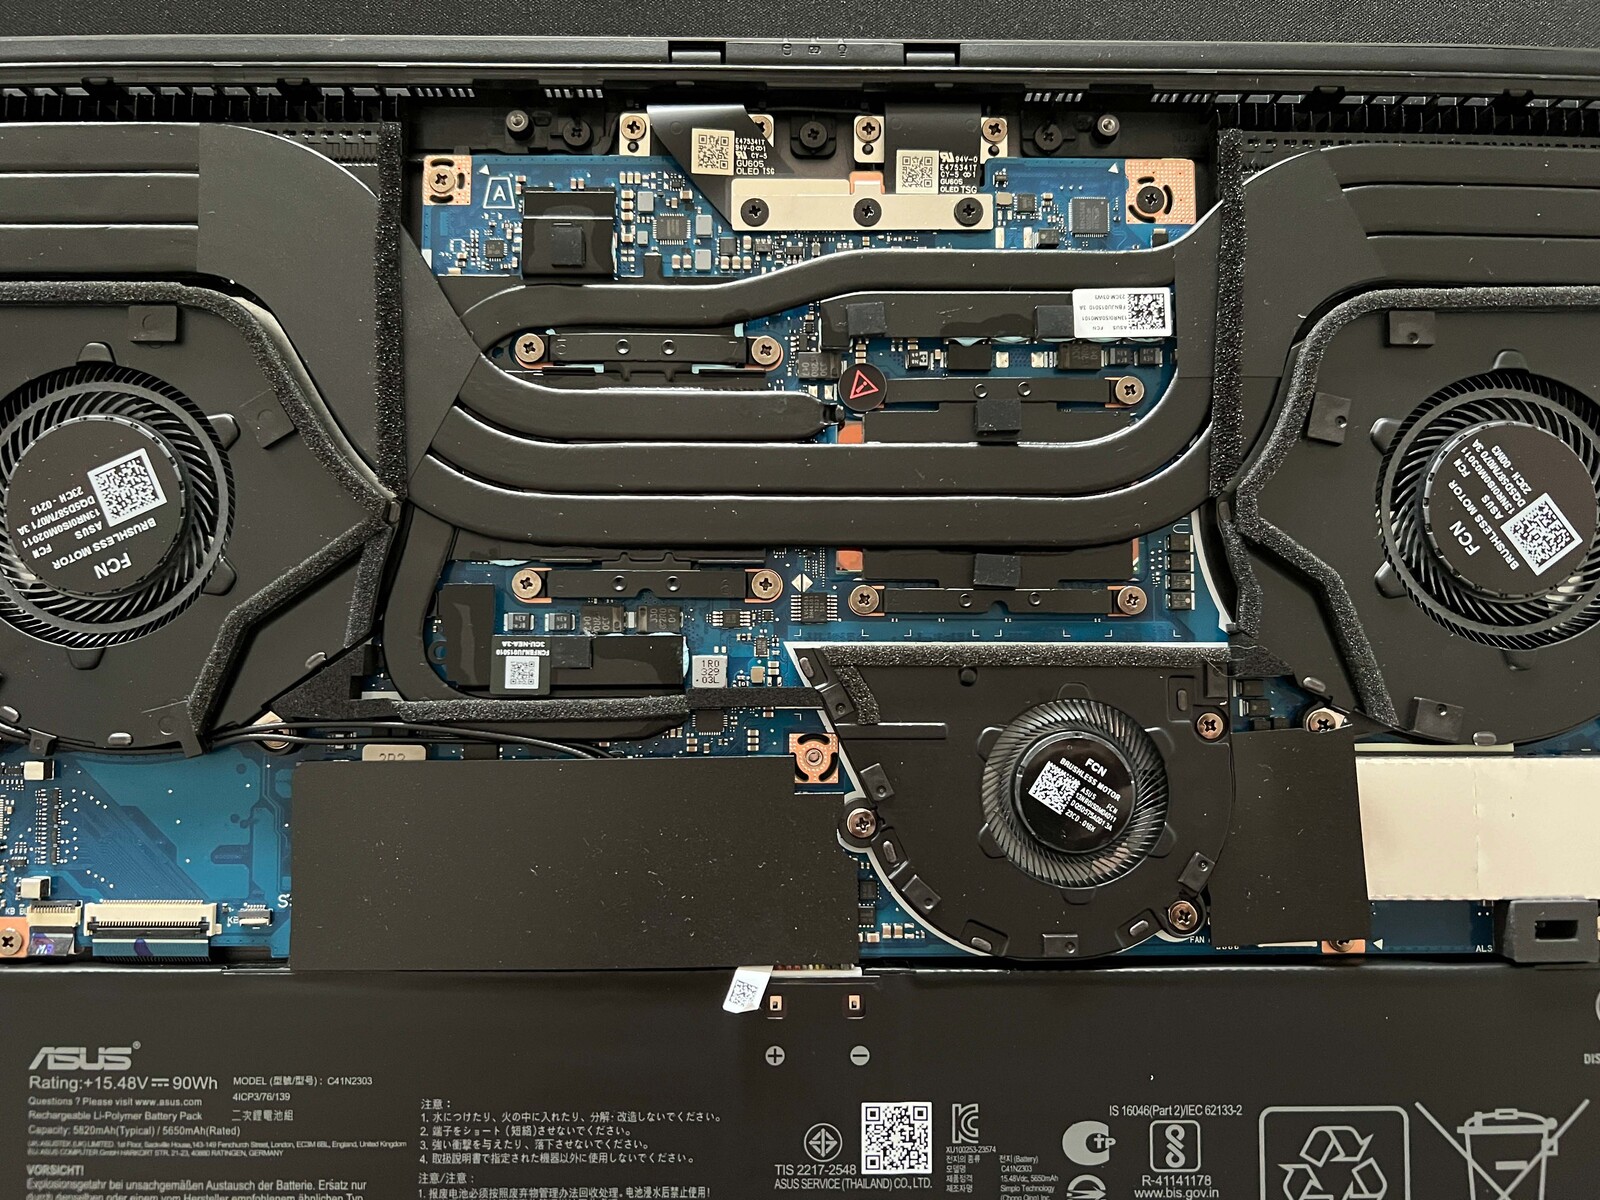
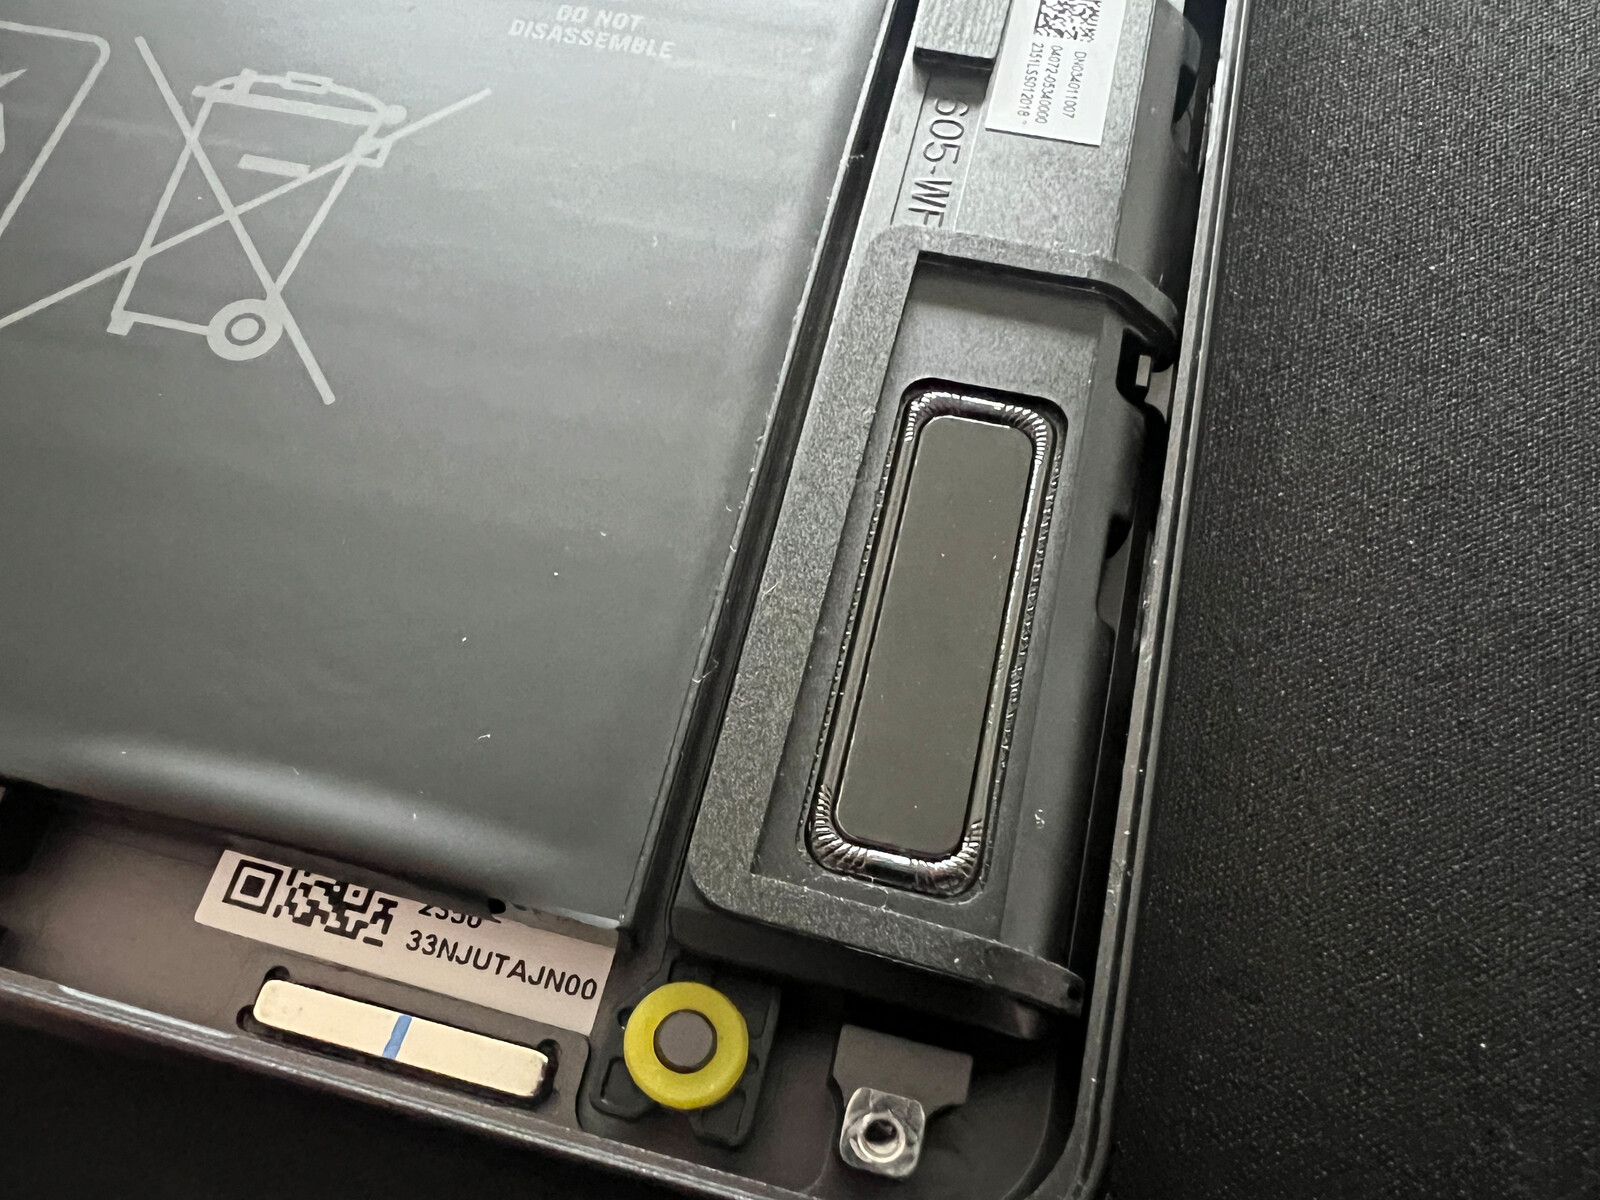
Mantenimiento
Aparte de los tornillos visibles, hay otros dos ocultos bajo cubiertas de goma pegadas. Esto dificulta innecesariamente el acceso a los componentes. De todos modos, no se puede acceder a mucho en el interior, ya que la RAM está soldada. Por otro lado, hay dos ranuras para unidades SSD y, si lo desea, puede intercambiar el módulo WLAN y la batería. También puede acceder a los ventiladores para limpiarlos.
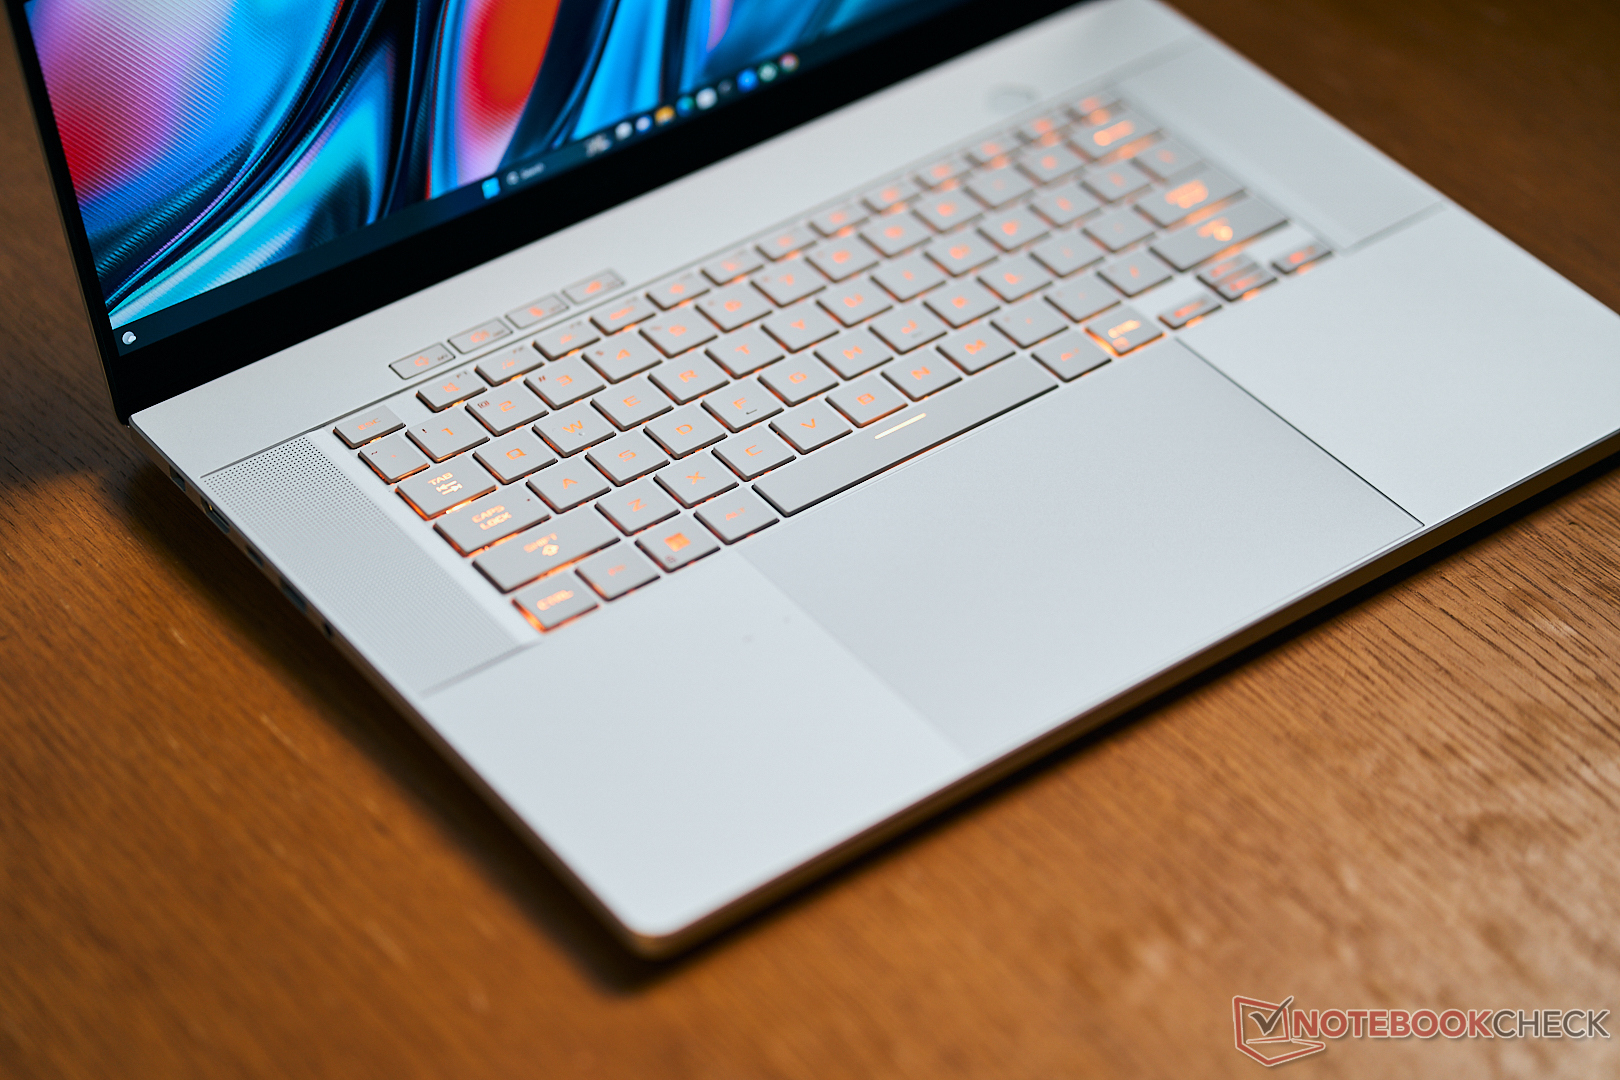
Dispositivos de entrada - Cómodo teclado y enorme touchpad
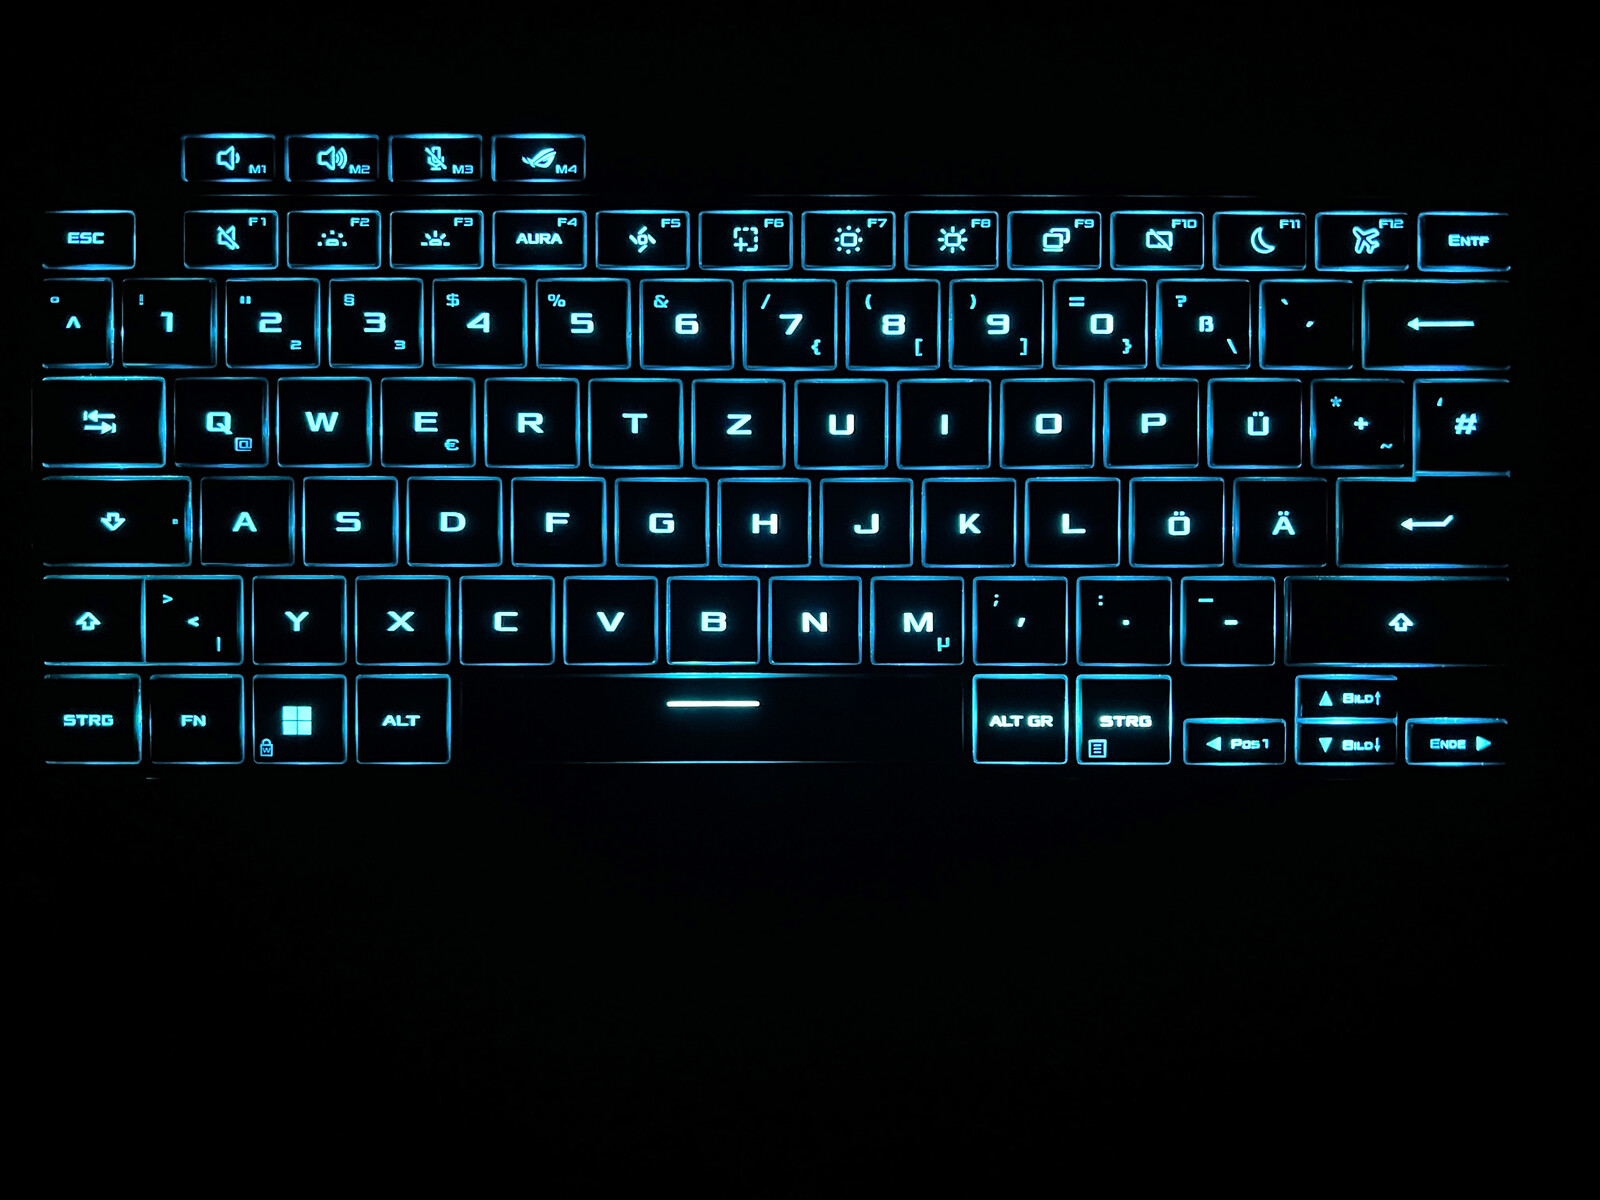
El G16 incorpora un teclado retroiluminado (una zona RGB, 3 niveles de intensidad) sin teclado numérico dedicado. La disposición no es nada fuera de lo común, pero hay que acostumbrarse a la tecla Intro de una sola línea, así como a las pequeñas teclas de flecha, lo que no es ideal para un portátil de juegos. El teclado en sí es, sin embargo, extremadamente cómodo y sus teclas tienen una generosa elevación de 1,7 mm. Es bastante silencioso en el uso diario y puede utilizarlo fácilmente para escribir textos más largos.
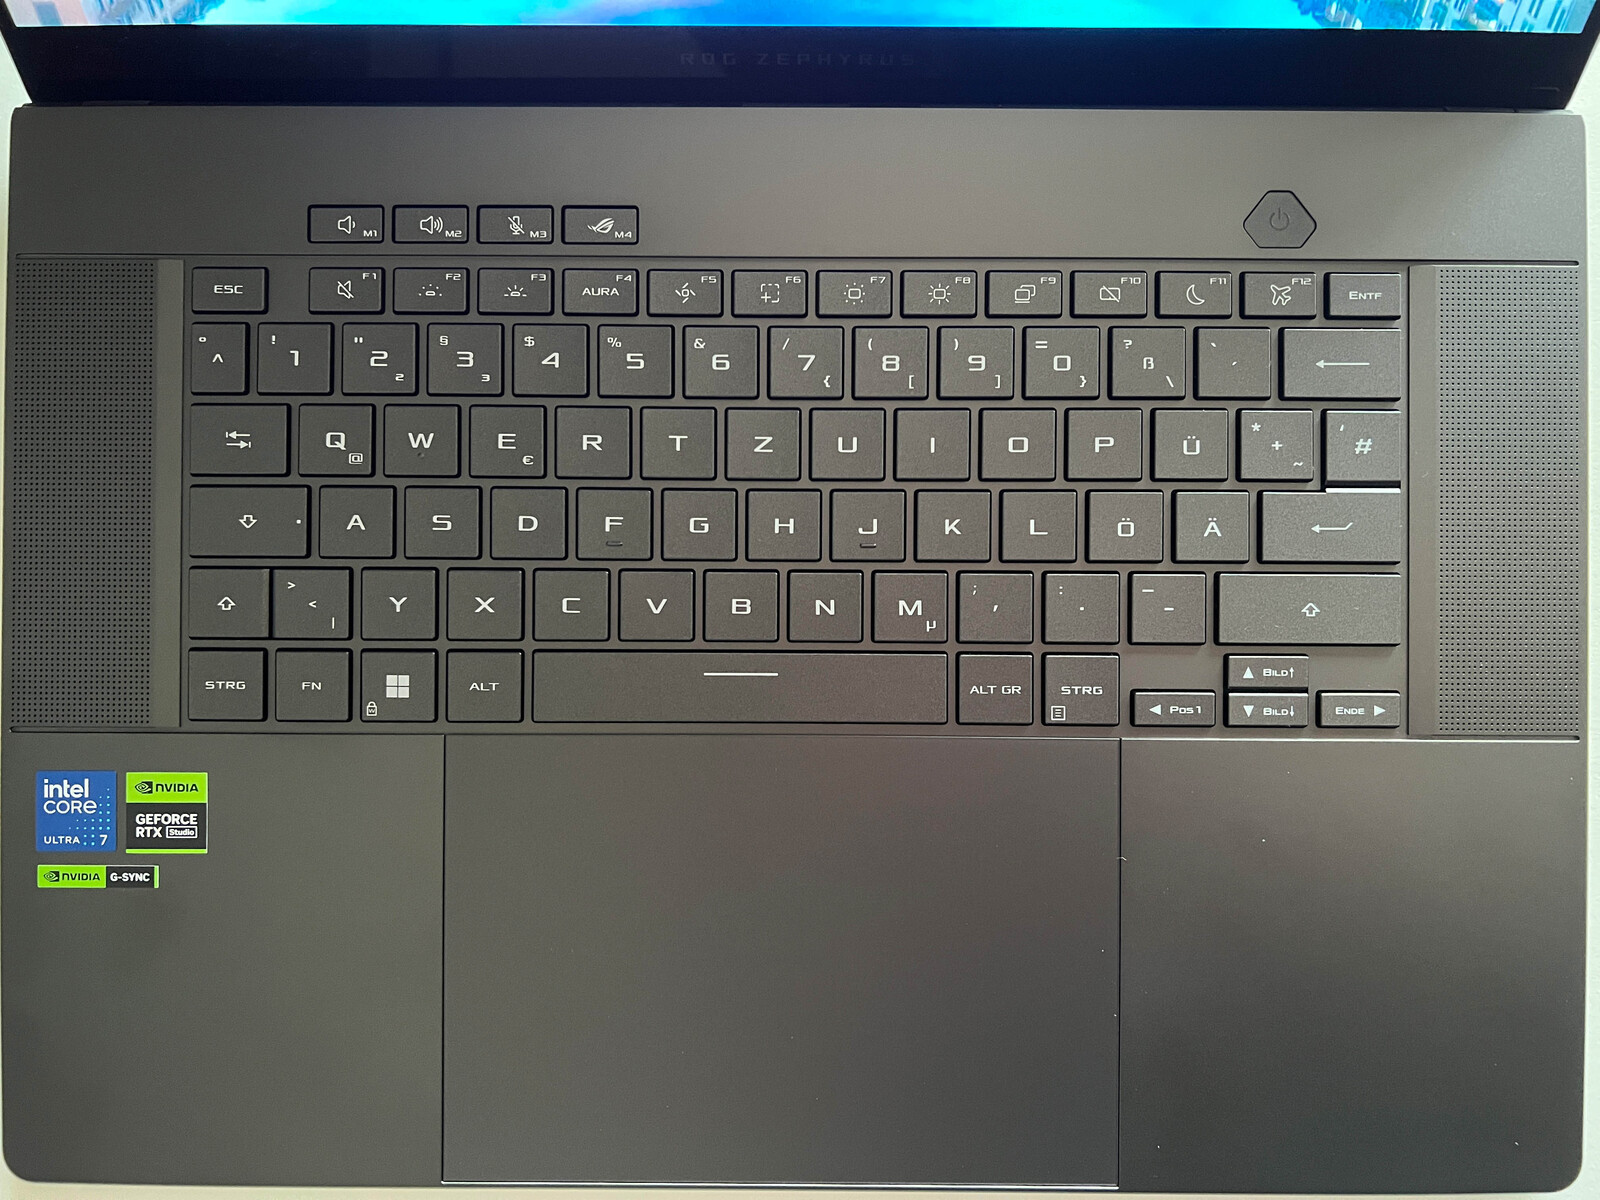
El nuevo panel táctil del portátil es extremadamente grande, mide 15 x 9,9 cm (un 37 % más que antes) y tiene una relación de 16:10. Se maneja muy bien gracias a su superficie lisa, y su ruido de clic es agradable y amortiguado, lo que le da una sensación de alta calidad.
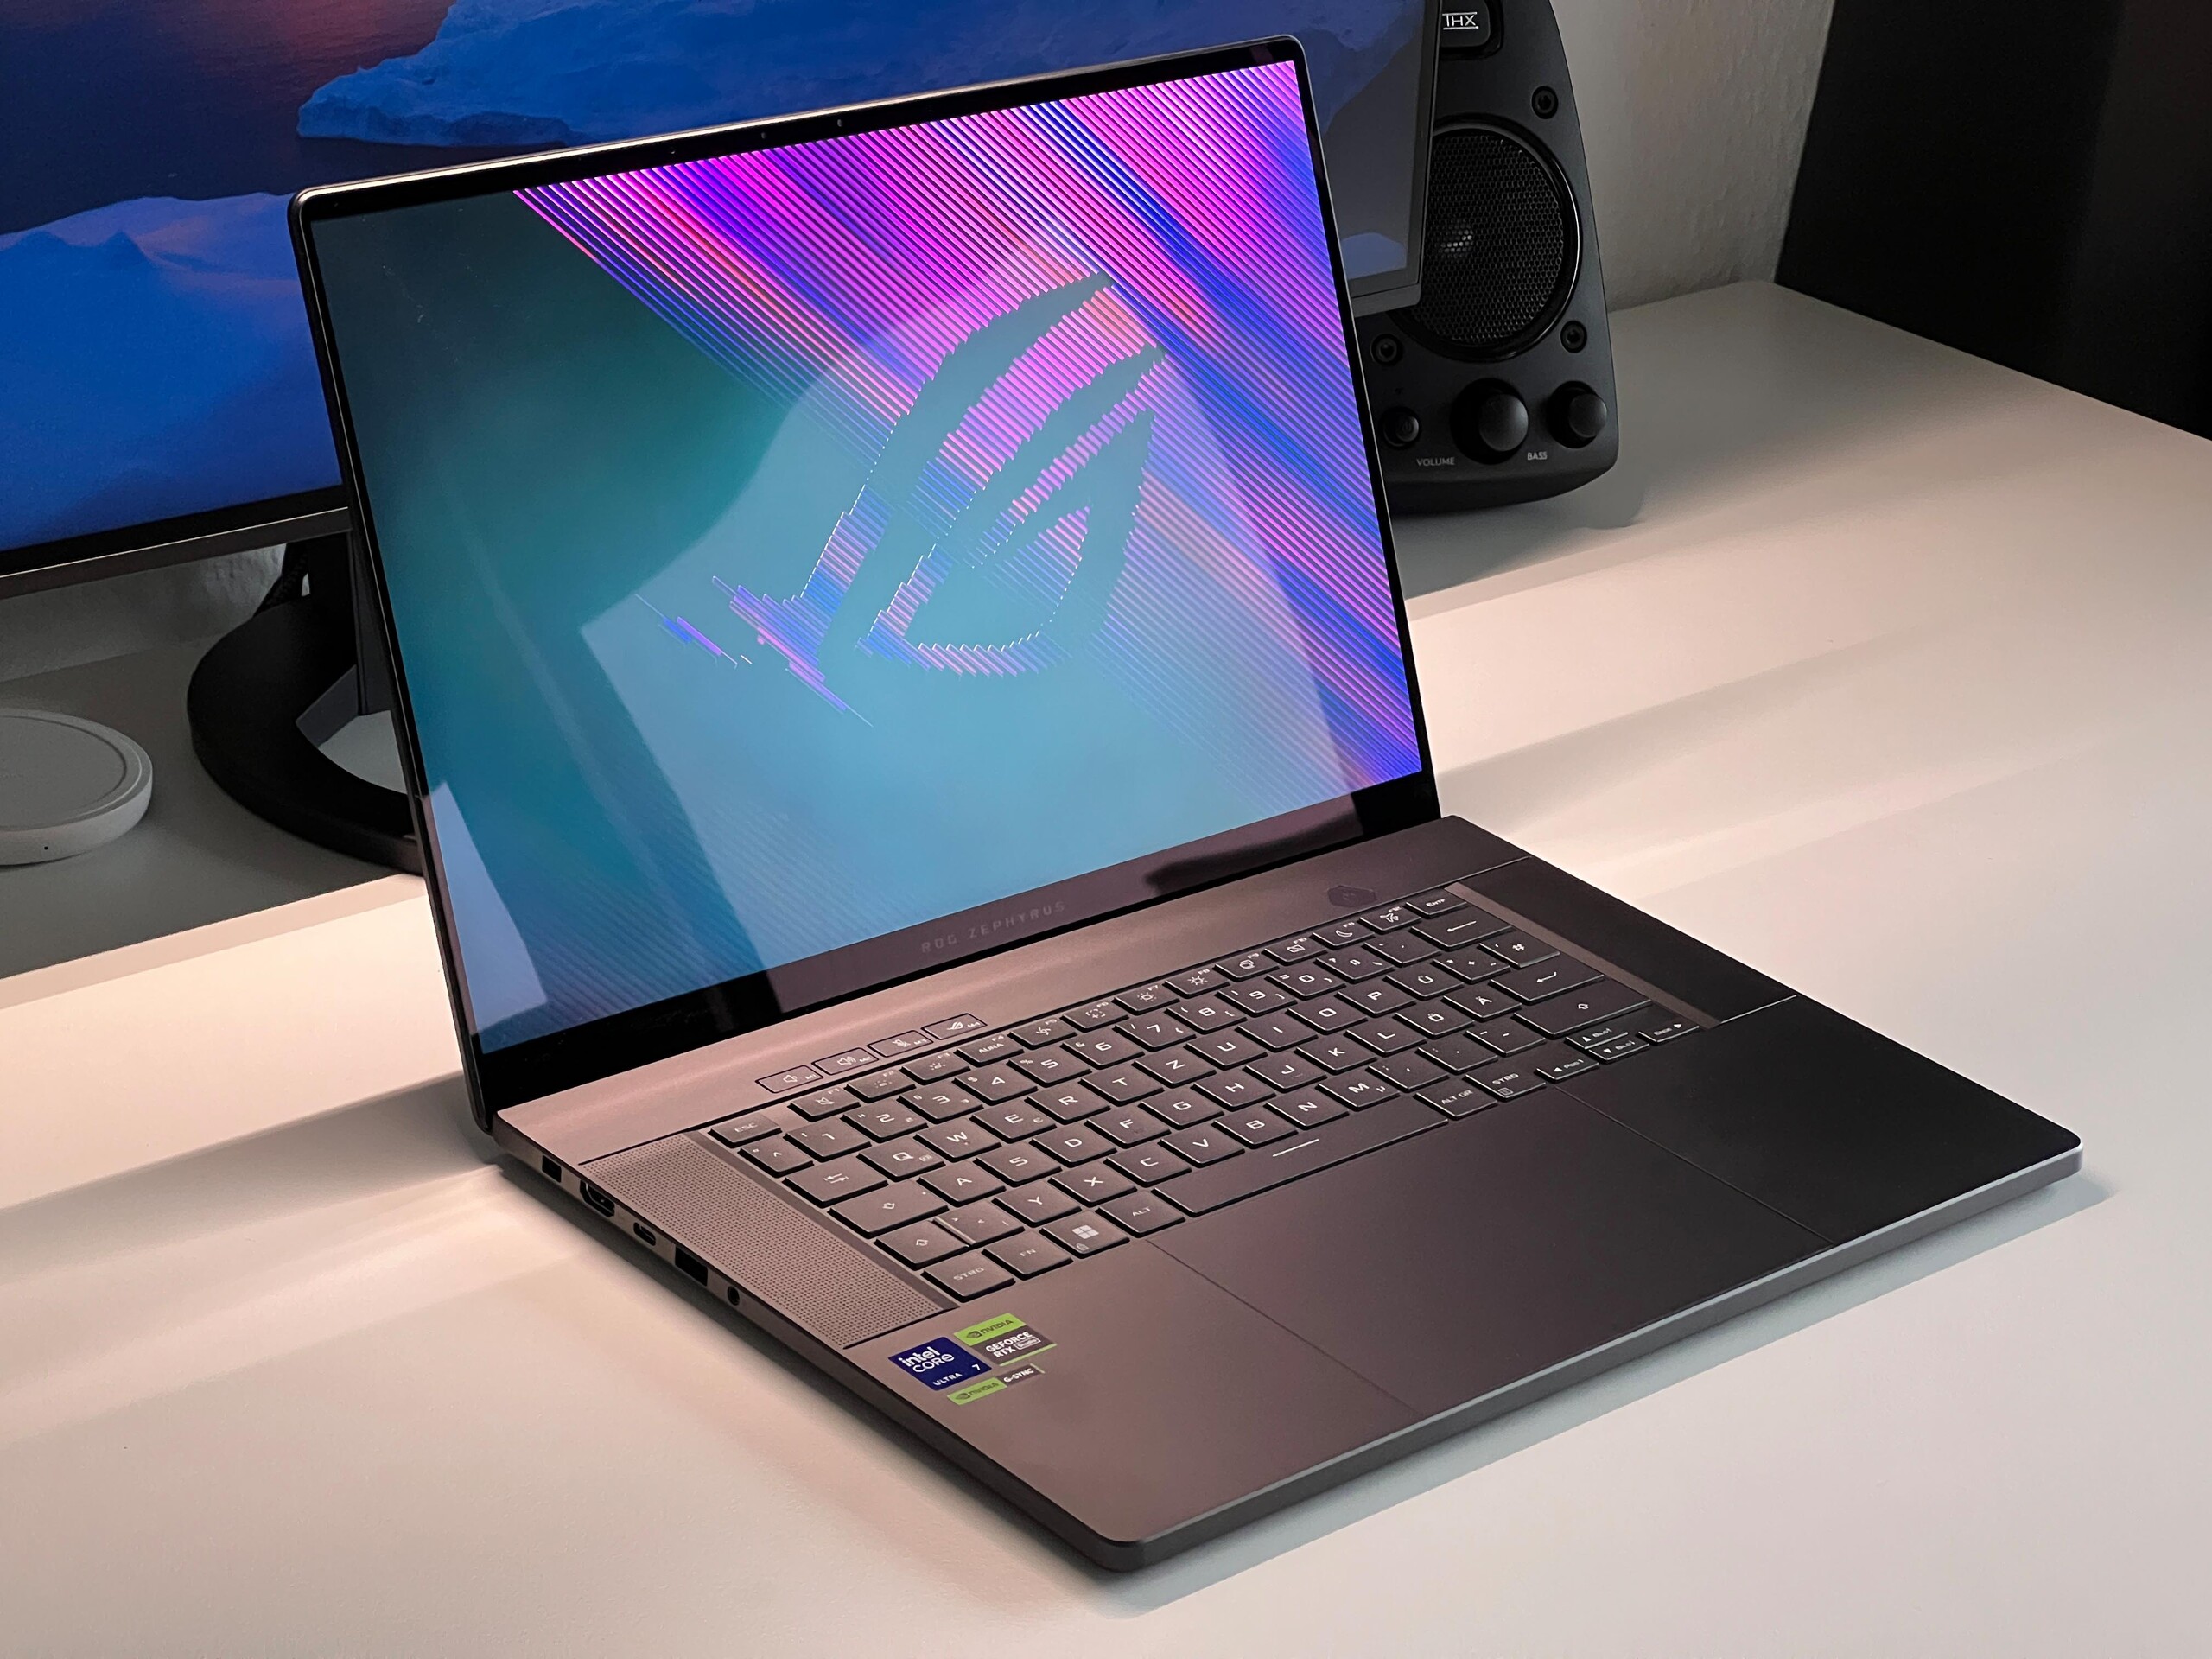
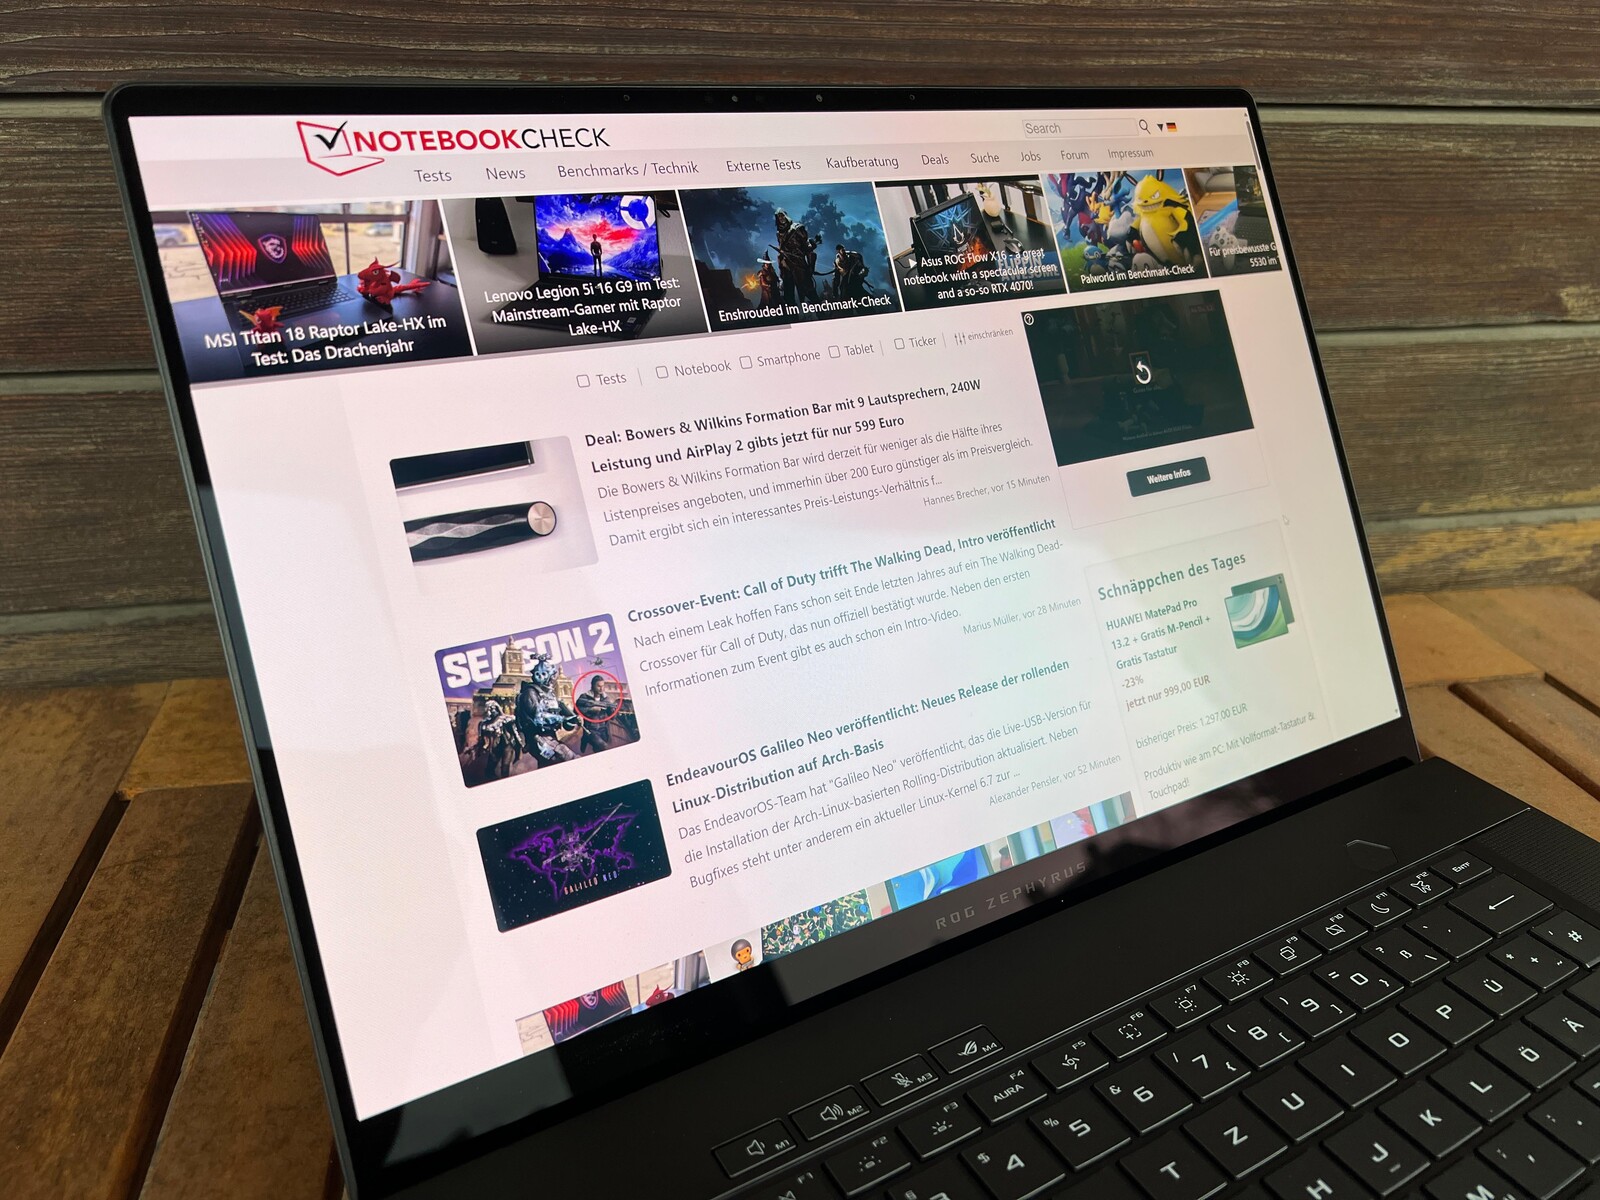
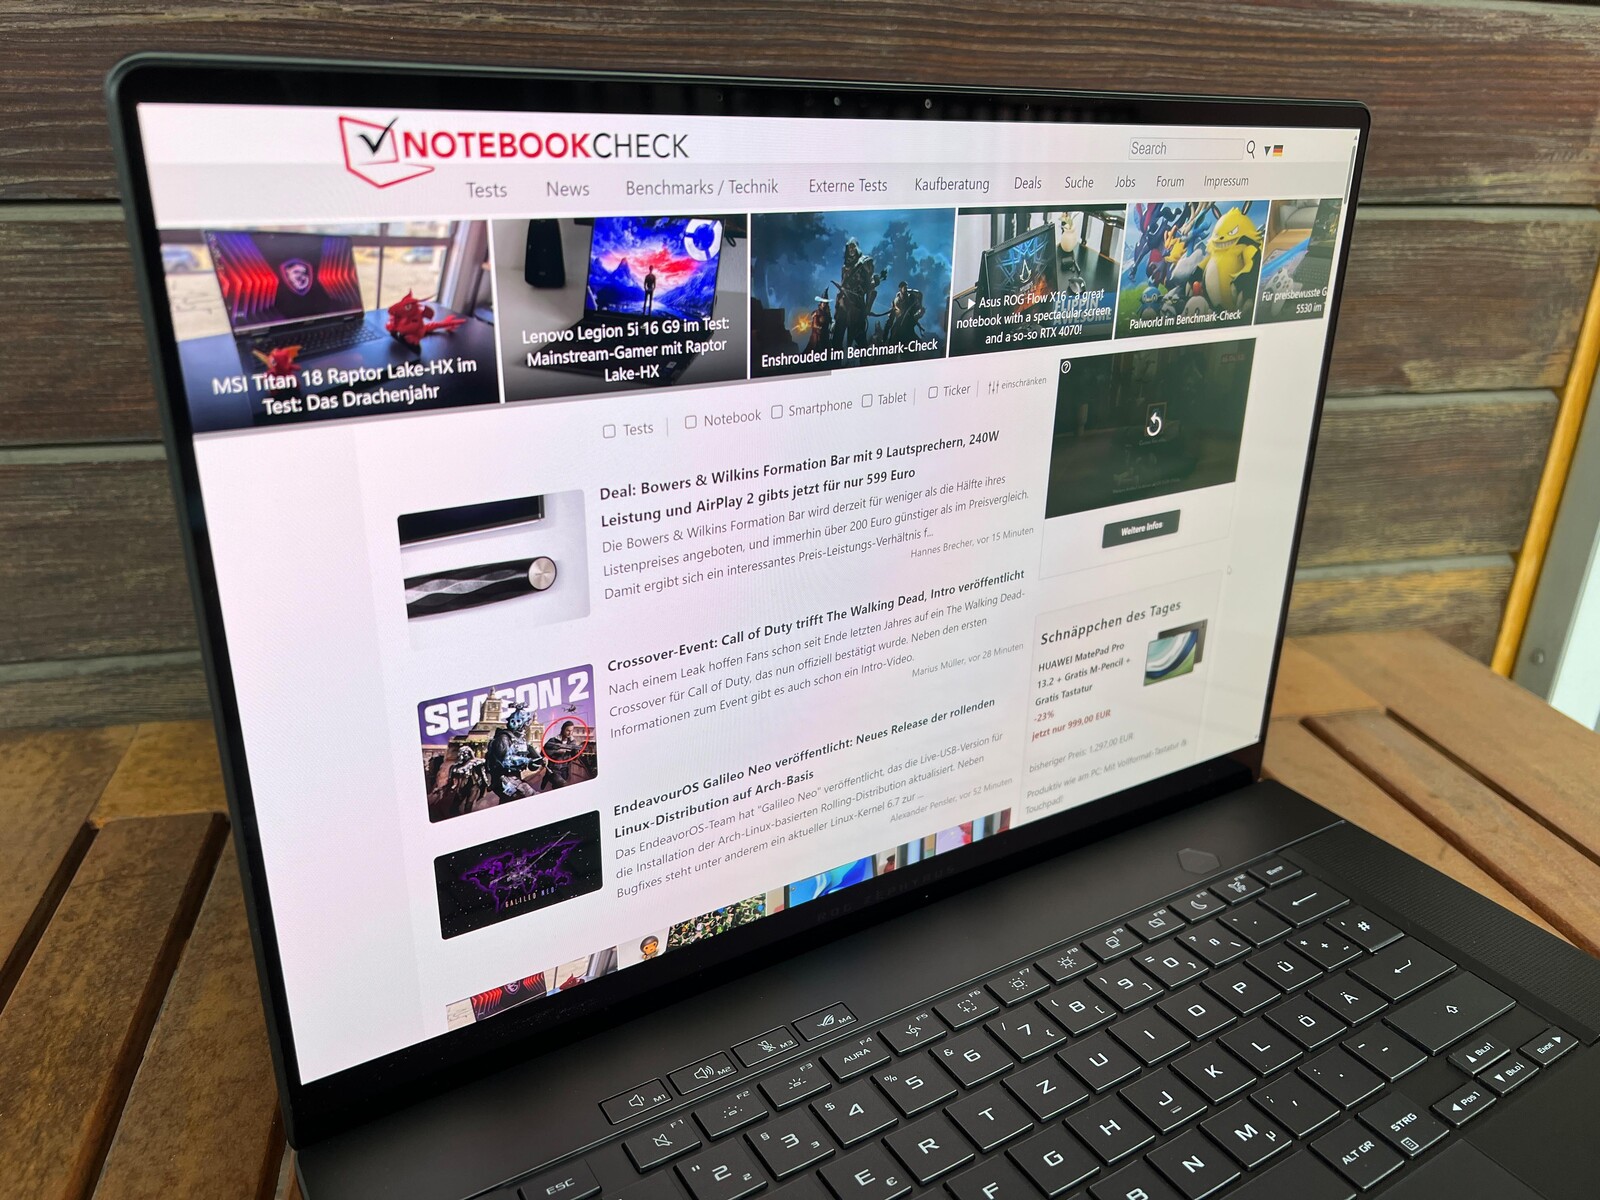
Pantalla - La primera OLED de 240 Hz de Asus con G-Sync

El nuevo ROG Zephyrus G16 es el primer portátil con un panel OLED de 16 pulgadas compatible con G-Sync. Además, su frecuencia de refresco es de 240 Hz y, subjetivamente, la calidad de imagen del panel Samsung reflectante es simplemente asombrosa: El contenido es nítido y los colores se ven súper vivos. Gracias a sus rápidos tiempos de respuesta, el OLED también es perfecto para jugar. Asus no ha instalado un sensor de brillo.
En modo SDR, tiene un brillo medio de 420 cd/m², lo que es un buen resultado. Como es típico en OLED, tiene un valor de negro de 0, lo que da lugar a una relación de contraste extremadamente alta. Asus ha declarado un brillo HDR máximo de 500 cd/m², mientras que nosotros hemos medido un pico de 455 cd/m². En este aspecto, el panel Samsung no está a la altura de otros monitores OLED y, en especial, del mini panel LED instalado en Apple's MacBook Pro 16 (máx. 1.600 cd/m²). Además, tenemos que seguir criticando la implementación HDR de Windows, ya que tiene que activarse manualmente y, posteriormente, los perfiles de color ya no funcionan correctamente. Esto afecta actualmente a todos los dispositivos Windows. Gracias a la construcción del panel OLED, no sufre ningún efecto de halo.
| |||||||||||||||||||||||||
iluminación: 96 %
Brillo con batería: 416 cd/m²
Contraste: ∞:1 (Negro: 0 cd/m²)
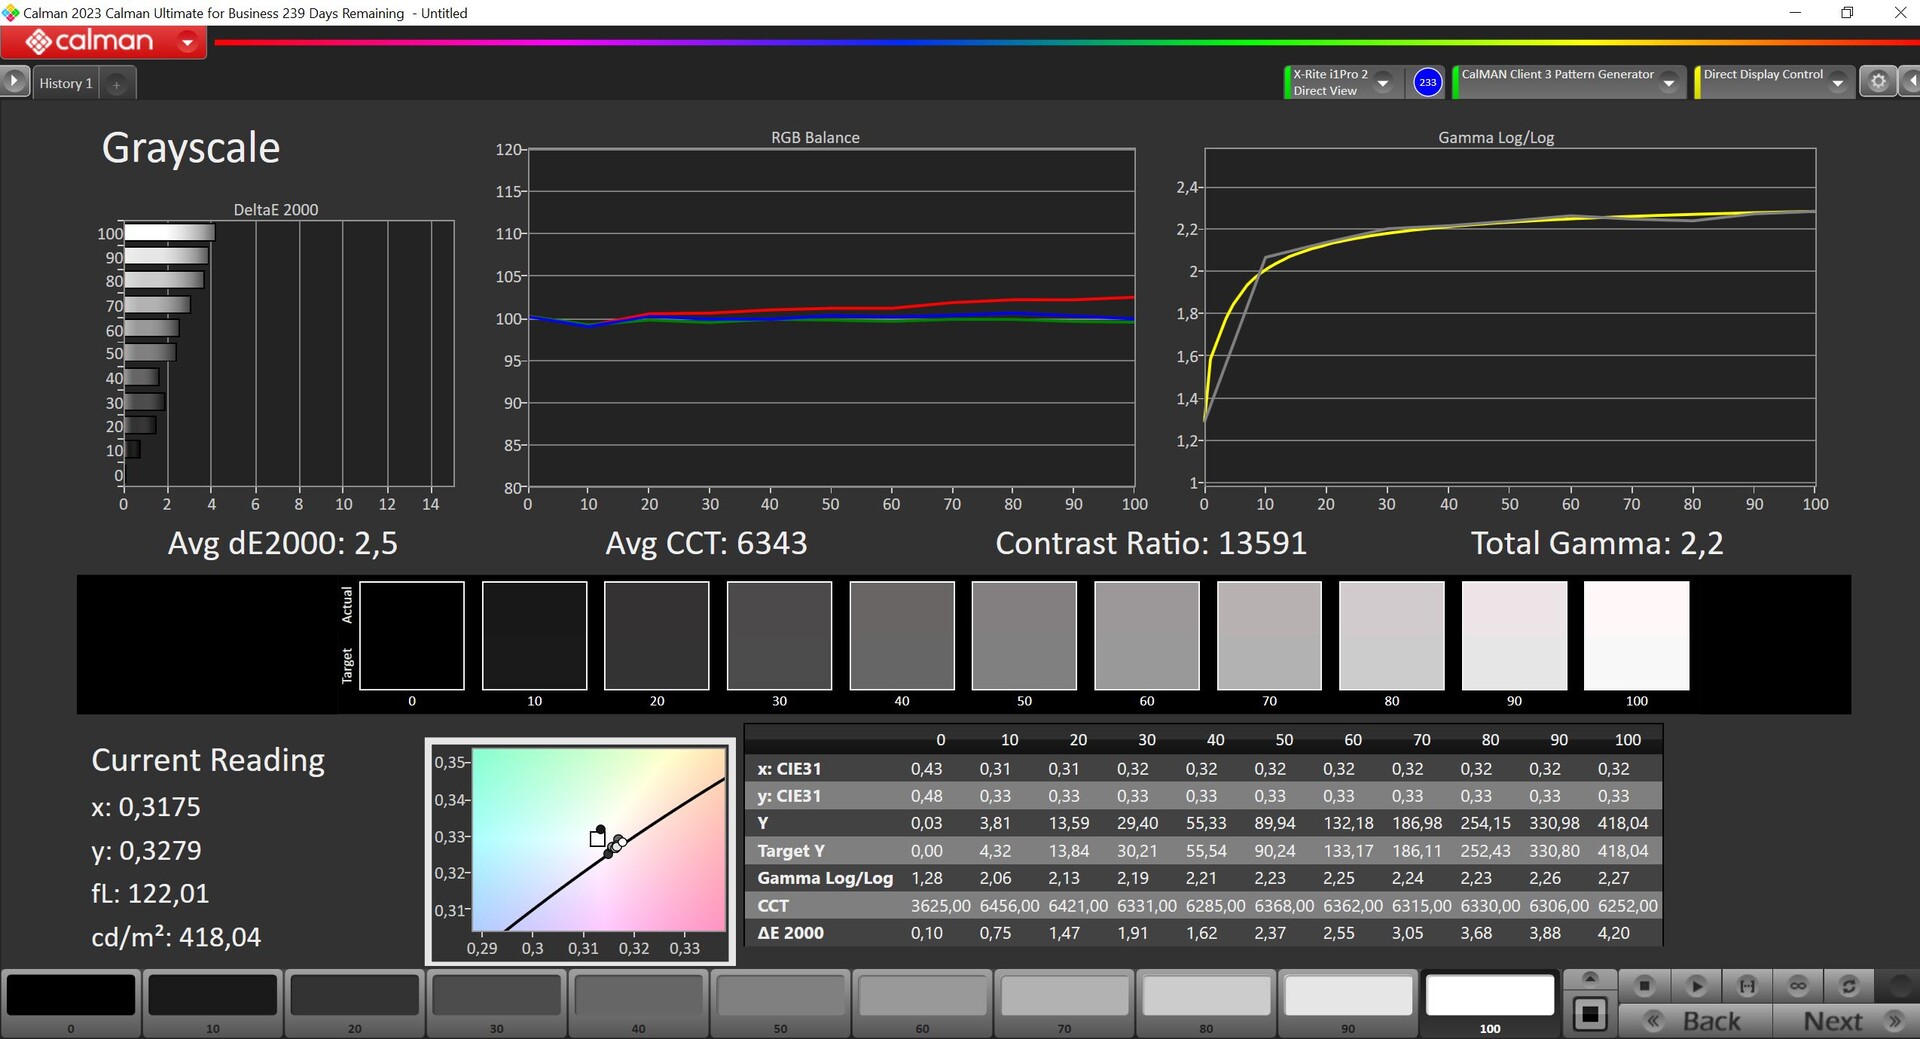
ΔE ColorChecker Calman: 1.6 | ∀{0.5-29.43 Ø4.71}
ΔE Greyscale Calman: 2.7 | ∀{0.09-98 Ø4.96}
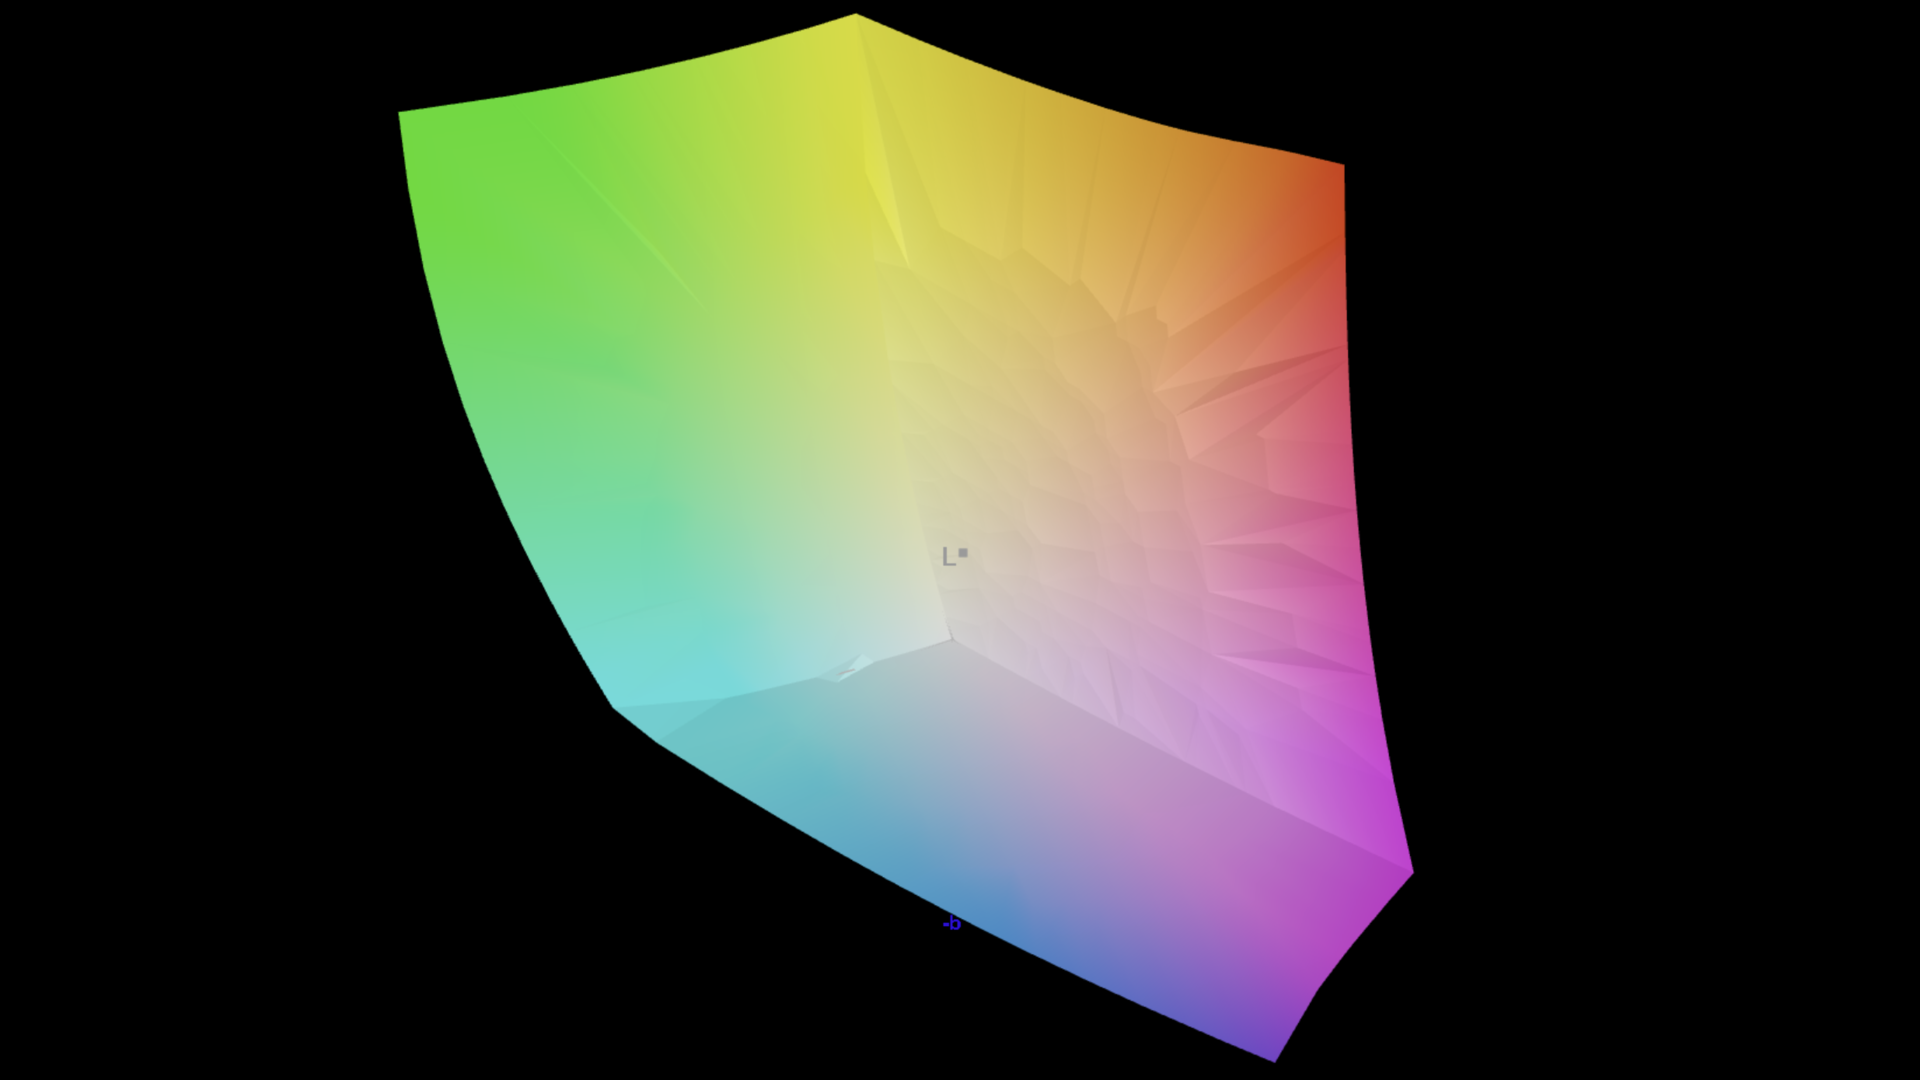
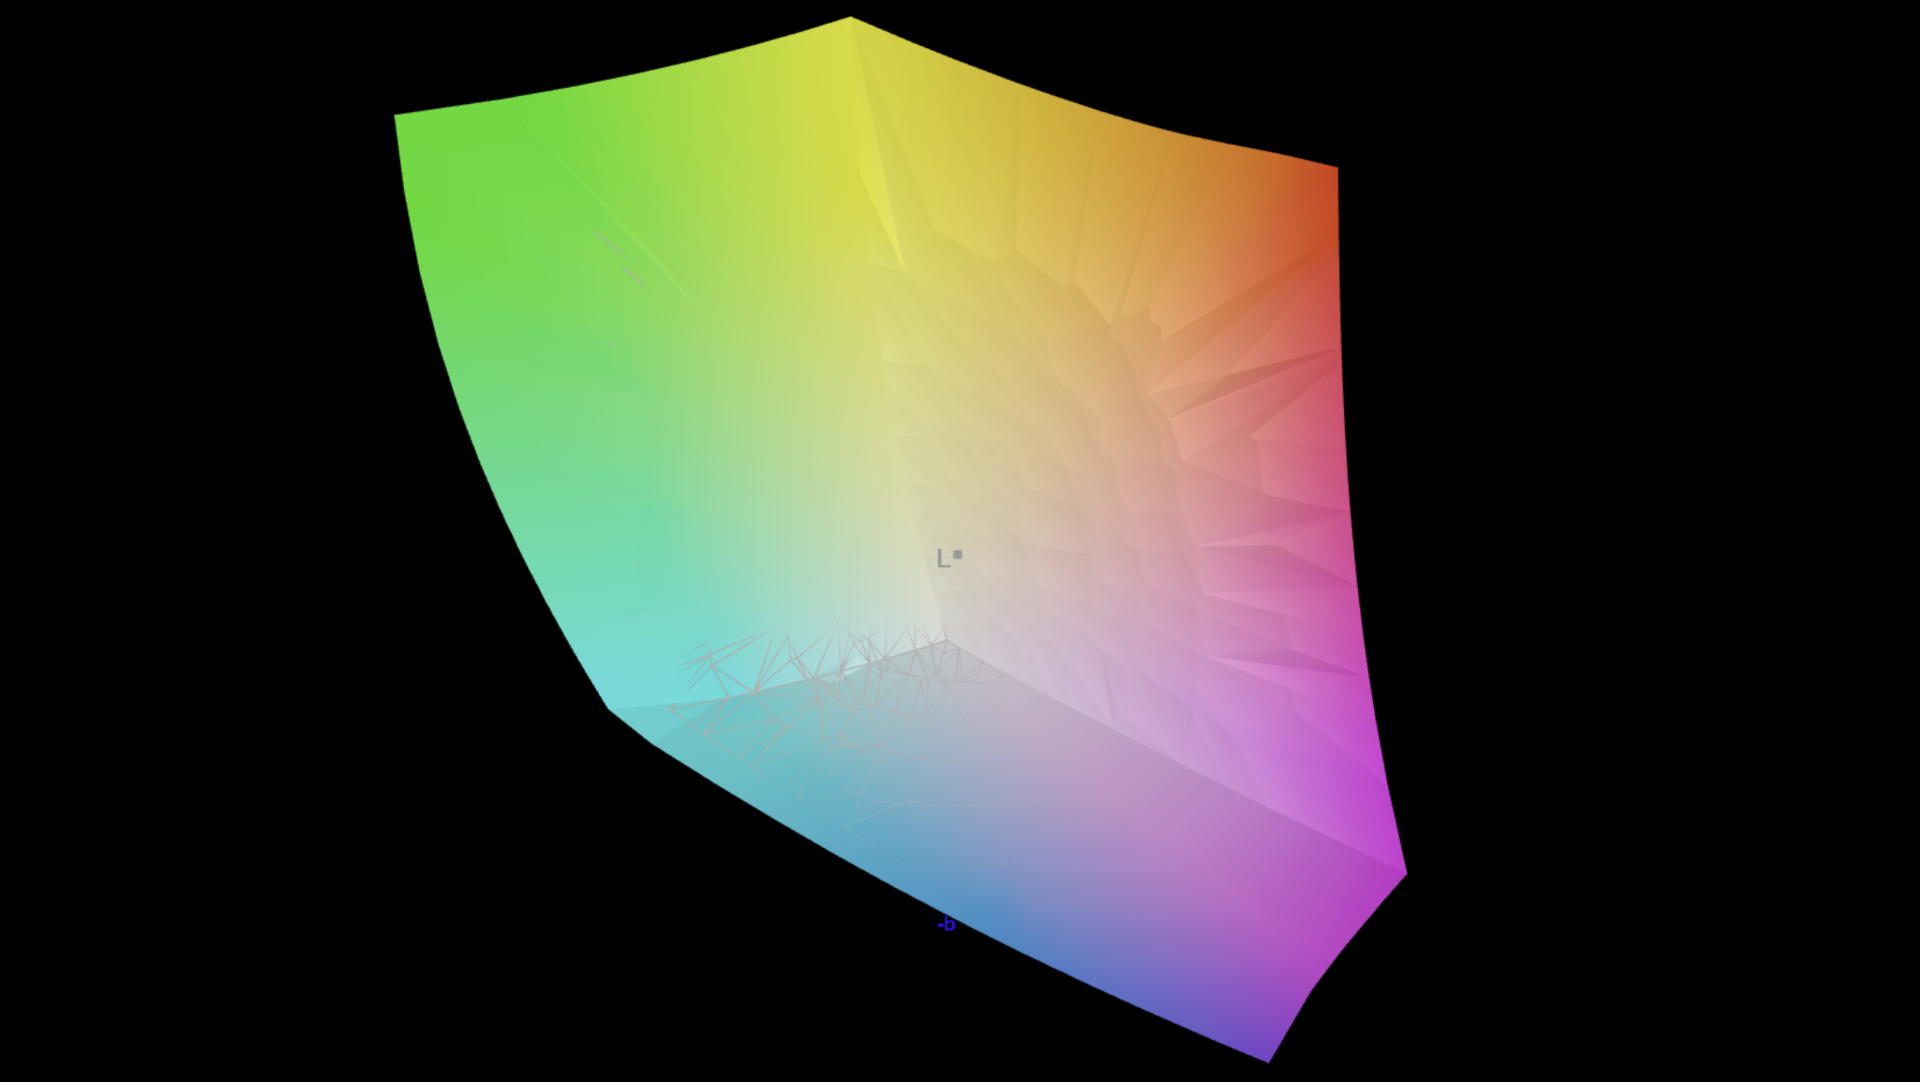
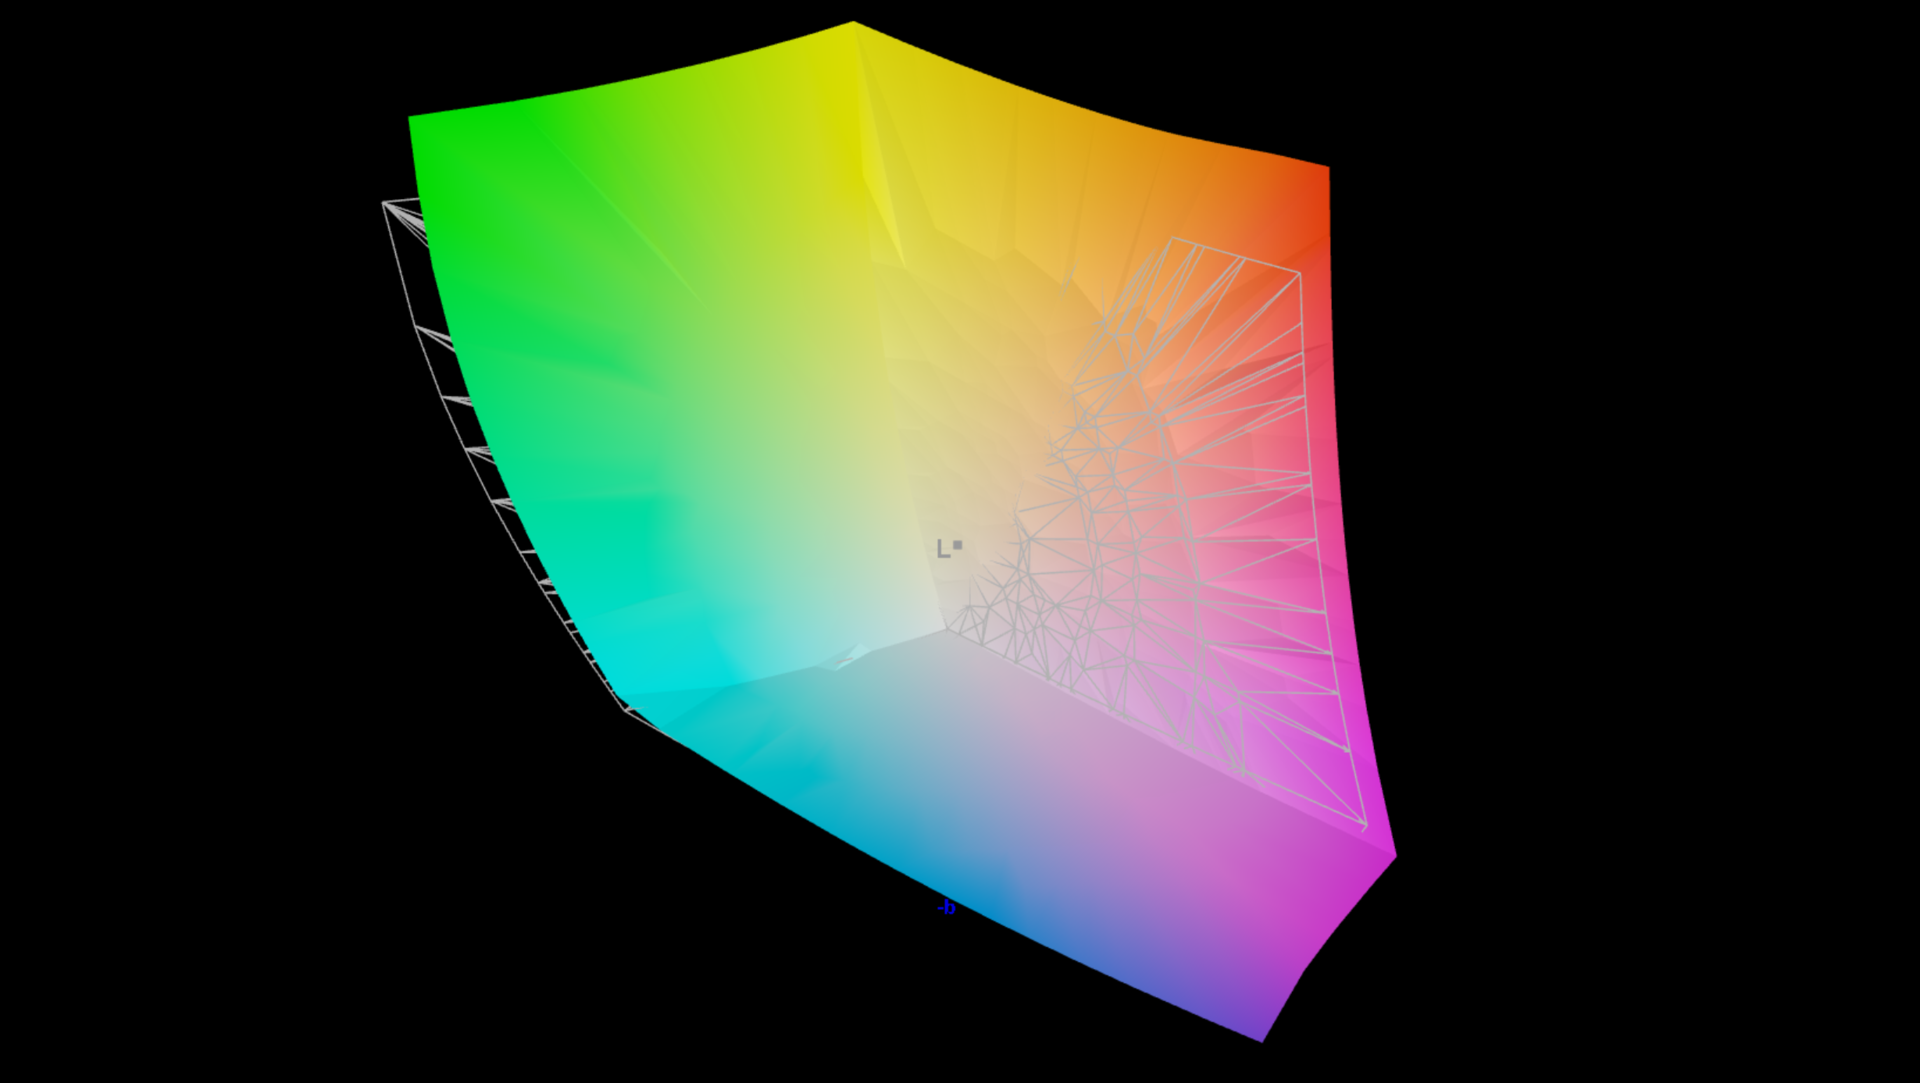
96.9% AdobeRGB 1998 (Argyll 3D)
100% sRGB (Argyll 3D)
99.9% Display P3 (Argyll 3D)
Gamma: 2.16
CCT: 6331 K
| Asus ROG Zephyrus G16 2024 GU605M ATNA60DL01-0, OLED, 2560x1600, 16" | Lenovo Yoga Pro 9 16-IRP G8 LEN160-3.2K, Mini-LED, 3200x2000, 16" | Razer Blade 16 Early 2023 CSOT T3 MNG007DA4-1, IPS, 2560x1600, 16" | Gigabyte AERO 16 OLED BSF Samsung SDC4191 (ATNA60YV09-0, OLED, 3840x2400, 16" | Schenker VISION 16 Pro (M23) NE160QDM-NZ1, IPS, 2560x1600, 16" | MSI Stealth 16 Studio A13VG AUO26A9, IPS, 2560x1600, 16" | Apple MacBook Pro 16 2023 M3 Max Mini-LED, 3456x2234, 16" | |
|---|---|---|---|---|---|---|---|
| Display | -2% | -3% | -0% | -20% | -5% | -1% | |
| Display P3 Coverage (%) | 99.9 | 97 -3% | 98.5 -1% | 99.9 0% | 68.8 -31% | 96.4 -4% | 99.2 -1% |
| sRGB Coverage (%) | 100 | 99.8 0% | 100 0% | 100 0% | 98.8 -1% | 99.7 0% | |
| AdobeRGB 1998 Coverage (%) | 96.9 | 95.1 -2% | 89.7 -7% | 96.4 -1% | 70 -28% | 84.8 -12% | |
| Response Times | -4922% | -3800% | -751% | -4634% | -2020% | -23825% | |
| Response Time Grey 50% / Grey 80% * (ms) | 0.22 ? | 14 ? -6264% | 6.6 ? -2900% | 2 ? -809% | 13.7 ? -6127% | 4.4 ? -1900% | 66.9 ? -30309% |
| Response Time Black / White * (ms) | 0.25 ? | 9.2 ? -3580% | 12 ? -4700% | 1.98 ? -692% | 8.1 ? -3140% | 5.6 ? -2140% | 43.6 ? -17340% |
| PWM Frequency (Hz) | 960 ? | 5800 ? | 60 | 14877 | |||
| Screen | 16% | -55% | -19% | -84% | -69% | 19% | |
| Brightness middle (cd/m²) | 416 | 539 30% | 456.8 10% | 389.97 -6% | 384 -8% | 424 2% | 630 51% |
| Brightness (cd/m²) | 418 | 546 31% | 437 5% | 395 -6% | 371 -11% | 411 -2% | 604 44% |
| Brightness Distribution (%) | 96 | 96 0% | 83 -14% | 97 1% | 88 -8% | 88 -8% | 94 -2% |
| Black Level * (cd/m²) | 0.18 | 0.35 | 0.03 | 0.3 | 0.37 | ||
| Colorchecker dE 2000 * | 1.6 | 1.4 13% | 3.7 -131% | 2 -25% | 3.4 -113% | 3.04 -90% | 1.2 25% |
| Colorchecker dE 2000 max. * | 2.1 | 2.1 -0% | 6.42 -206% | 4.1 -95% | 9.2 -338% | 7.5 -257% | 2.8 -33% |
| Greyscale dE 2000 * | 2.7 | 2.2 19% | 2.6 4% | 2.23 17% | 3.4 -26% | 4.34 -61% | 1.9 30% |
| Gamma | 2.16 102% | 2.19 100% | 2.3 96% | 2.41 91% | 2.16 102% | 2.32 95% | 2.29 96% |
| CCT | 6331 103% | 6479 100% | 6108 106% | 6323 103% | 7462 87% | 6952 93% | 6812 95% |
| Contrast (:1) | 2994 | 1305 | 12999 | 1280 | 1146 | ||
| Colorchecker dE 2000 calibrated * | 0.66 | 1.68 | 1.3 | 3.04 | |||
| Media total (Programa/Opciones) | -1636% /
-887% | -1286% /
-722% | -257% /
-147% | -1579% /
-894% | -698% /
-407% | -7936% /
-5282% |
* ... más pequeño es mejor
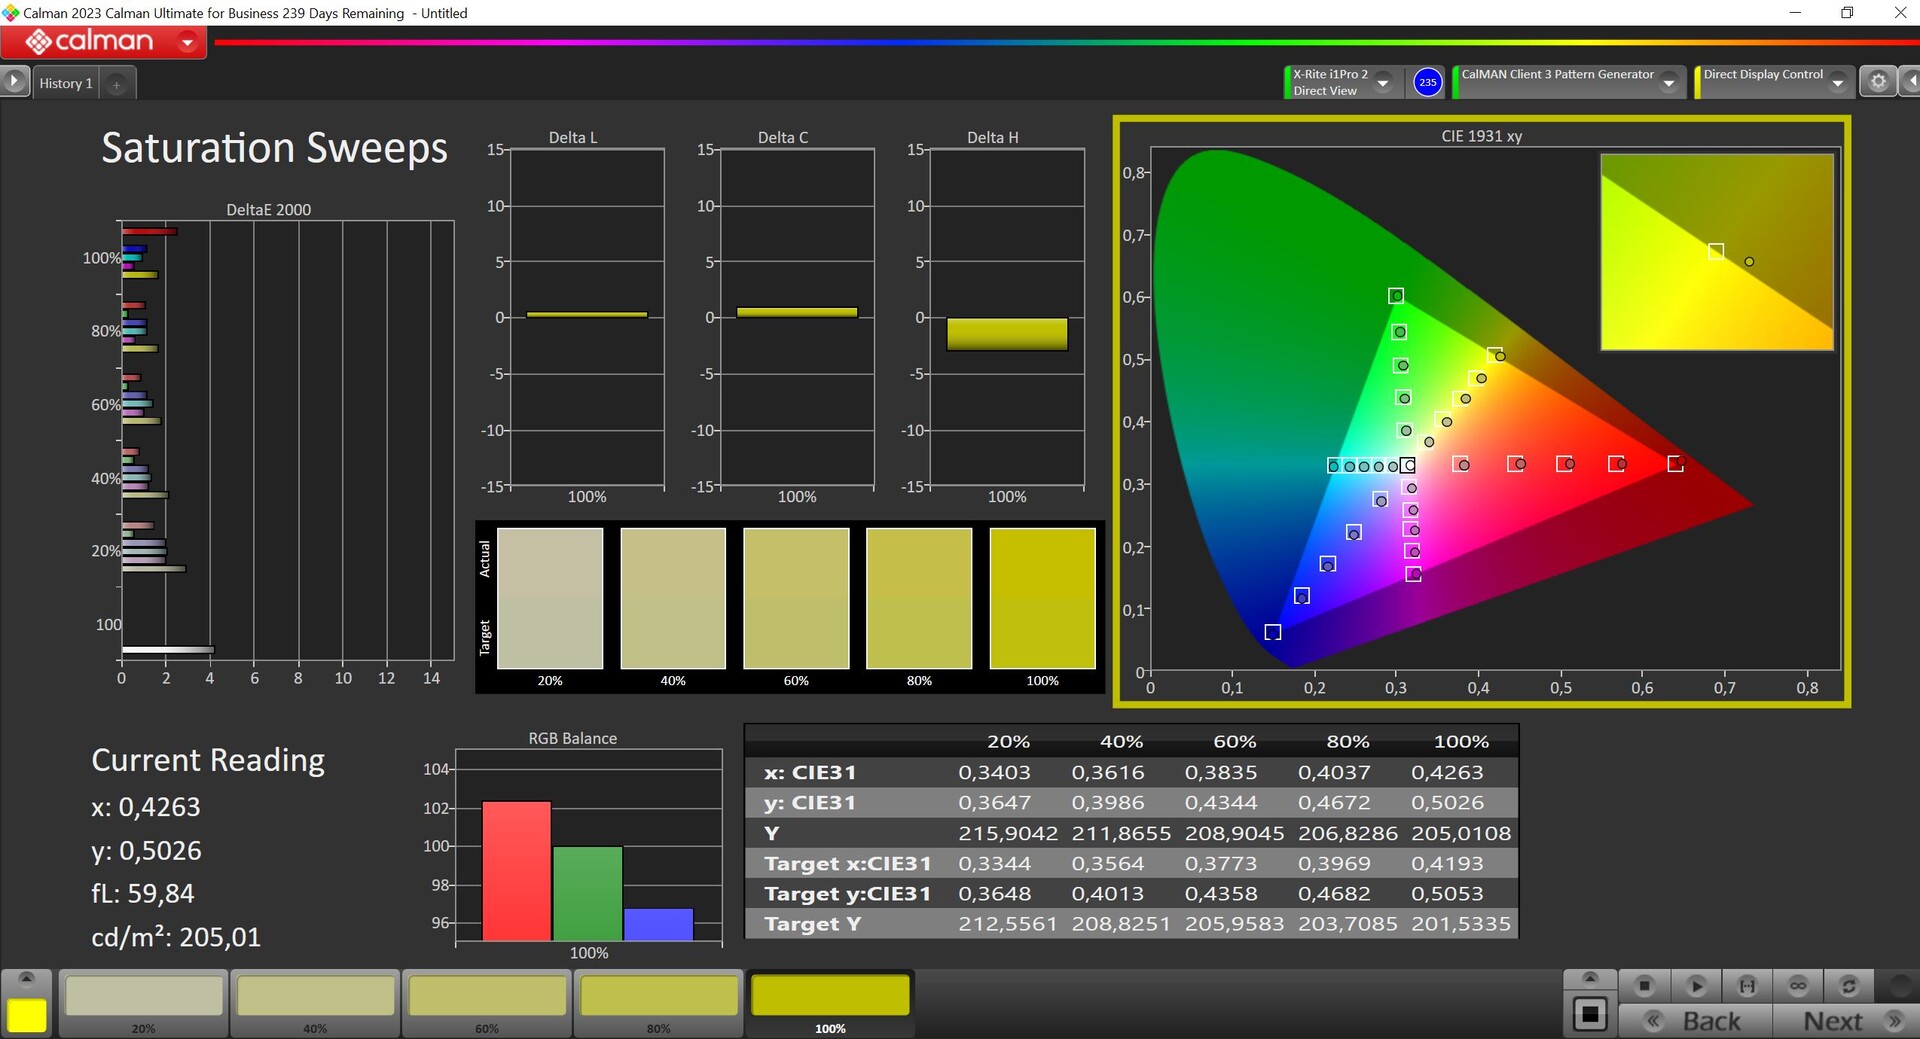
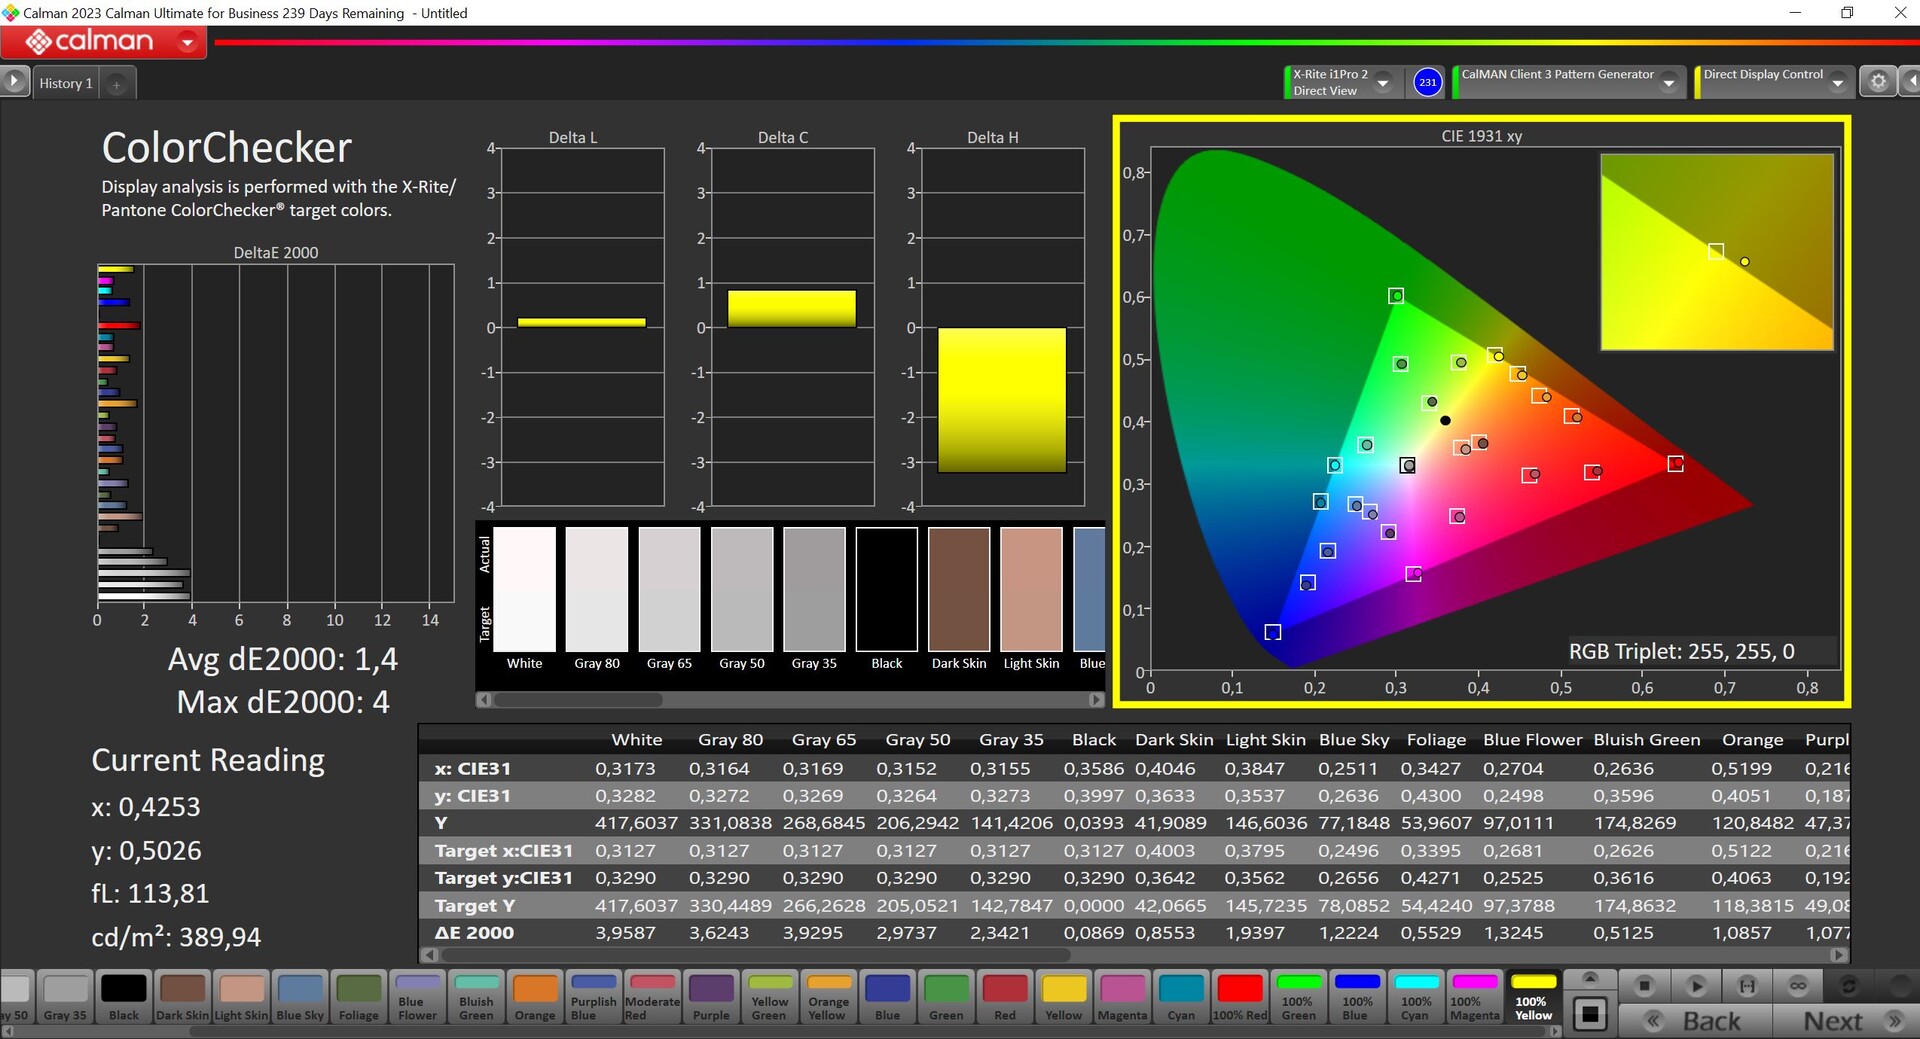
El software Armoury-Crate le ofrece diferentes perfiles de color para seleccionar, que analizamos utilizando el software profesional CalMAN (X-Rite i1 Pro2). El perfil preseleccionado Native es estupendo para el uso diario, pero los colores están un poco demasiado sobresaturados. Para garantizar la mejor precisión cromática, debería optar por el perfil Pantalla P3. Los tonos grises aún pueden mostrar algunas desviaciones (pero sin tinte de color), sin embargo, su precisión cromática en comparación con la referencia P3 ya es excelente y todos los colores muestran desviaciones por debajo del importante valor de 3.
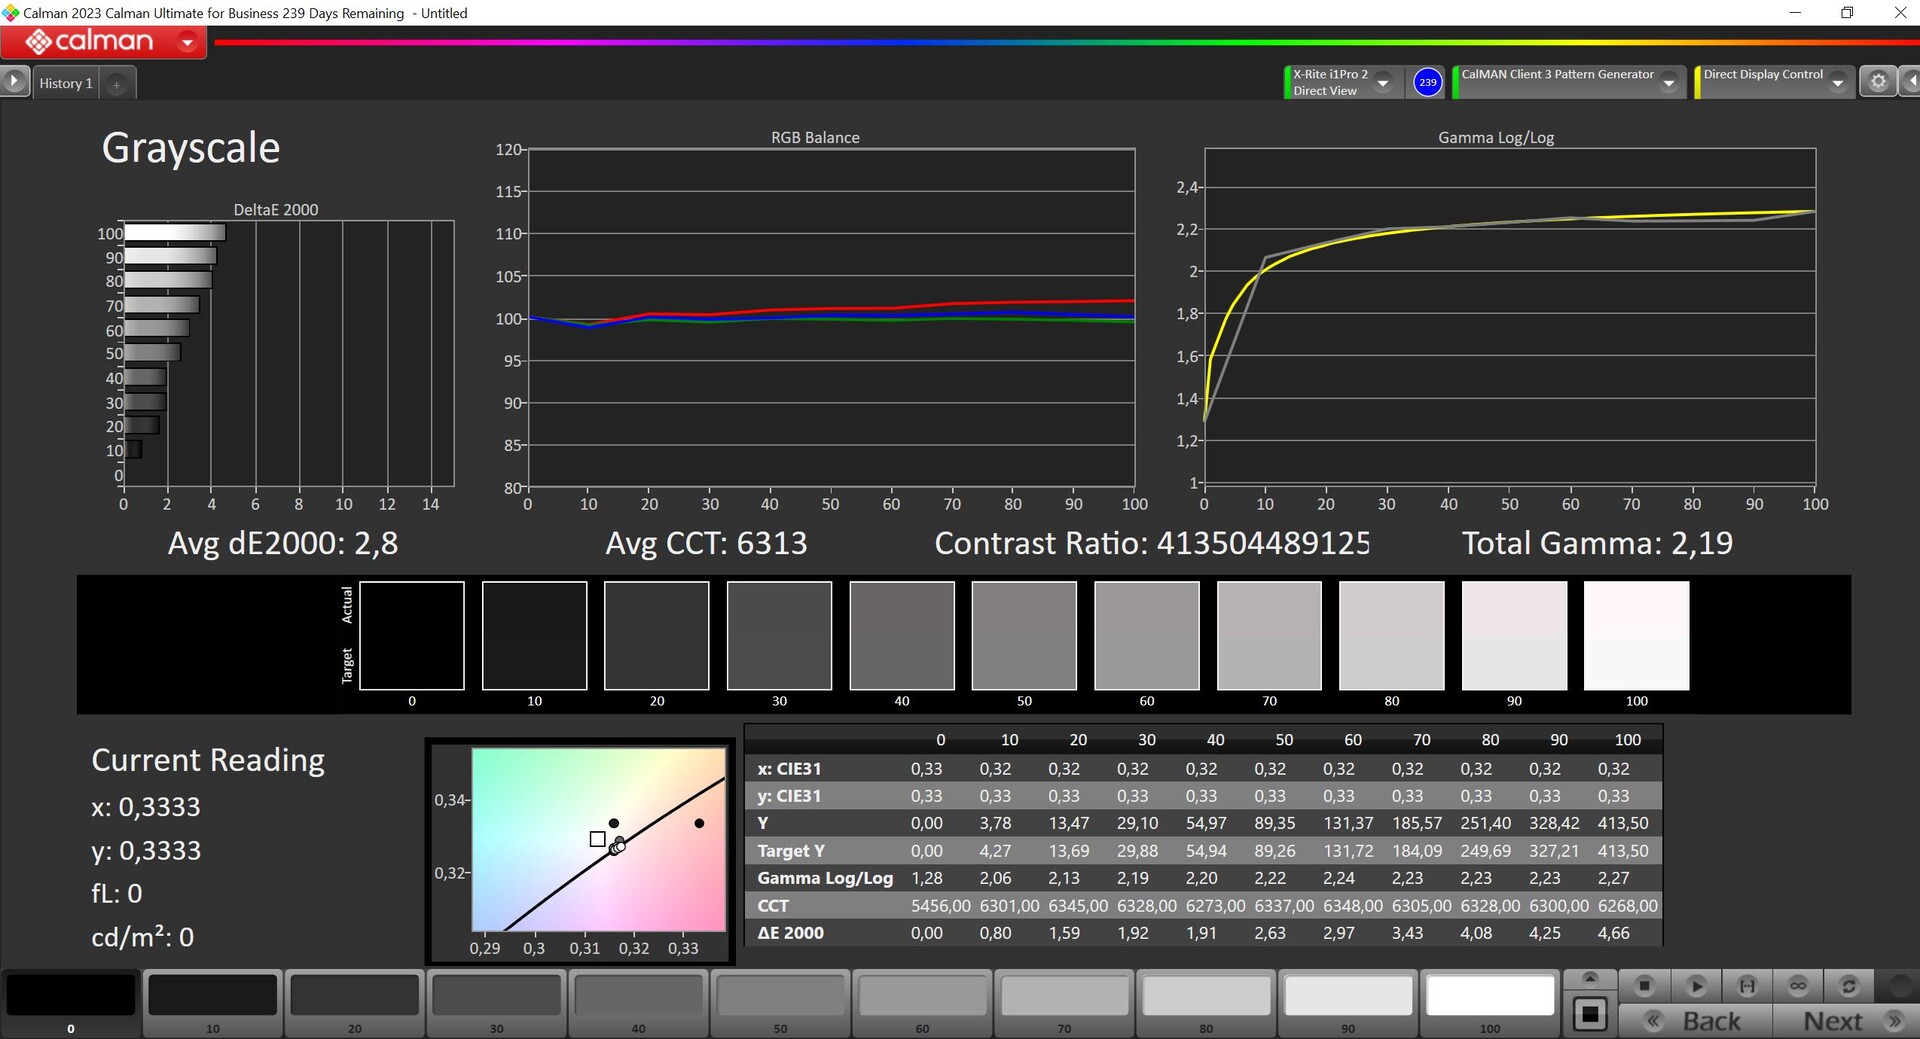
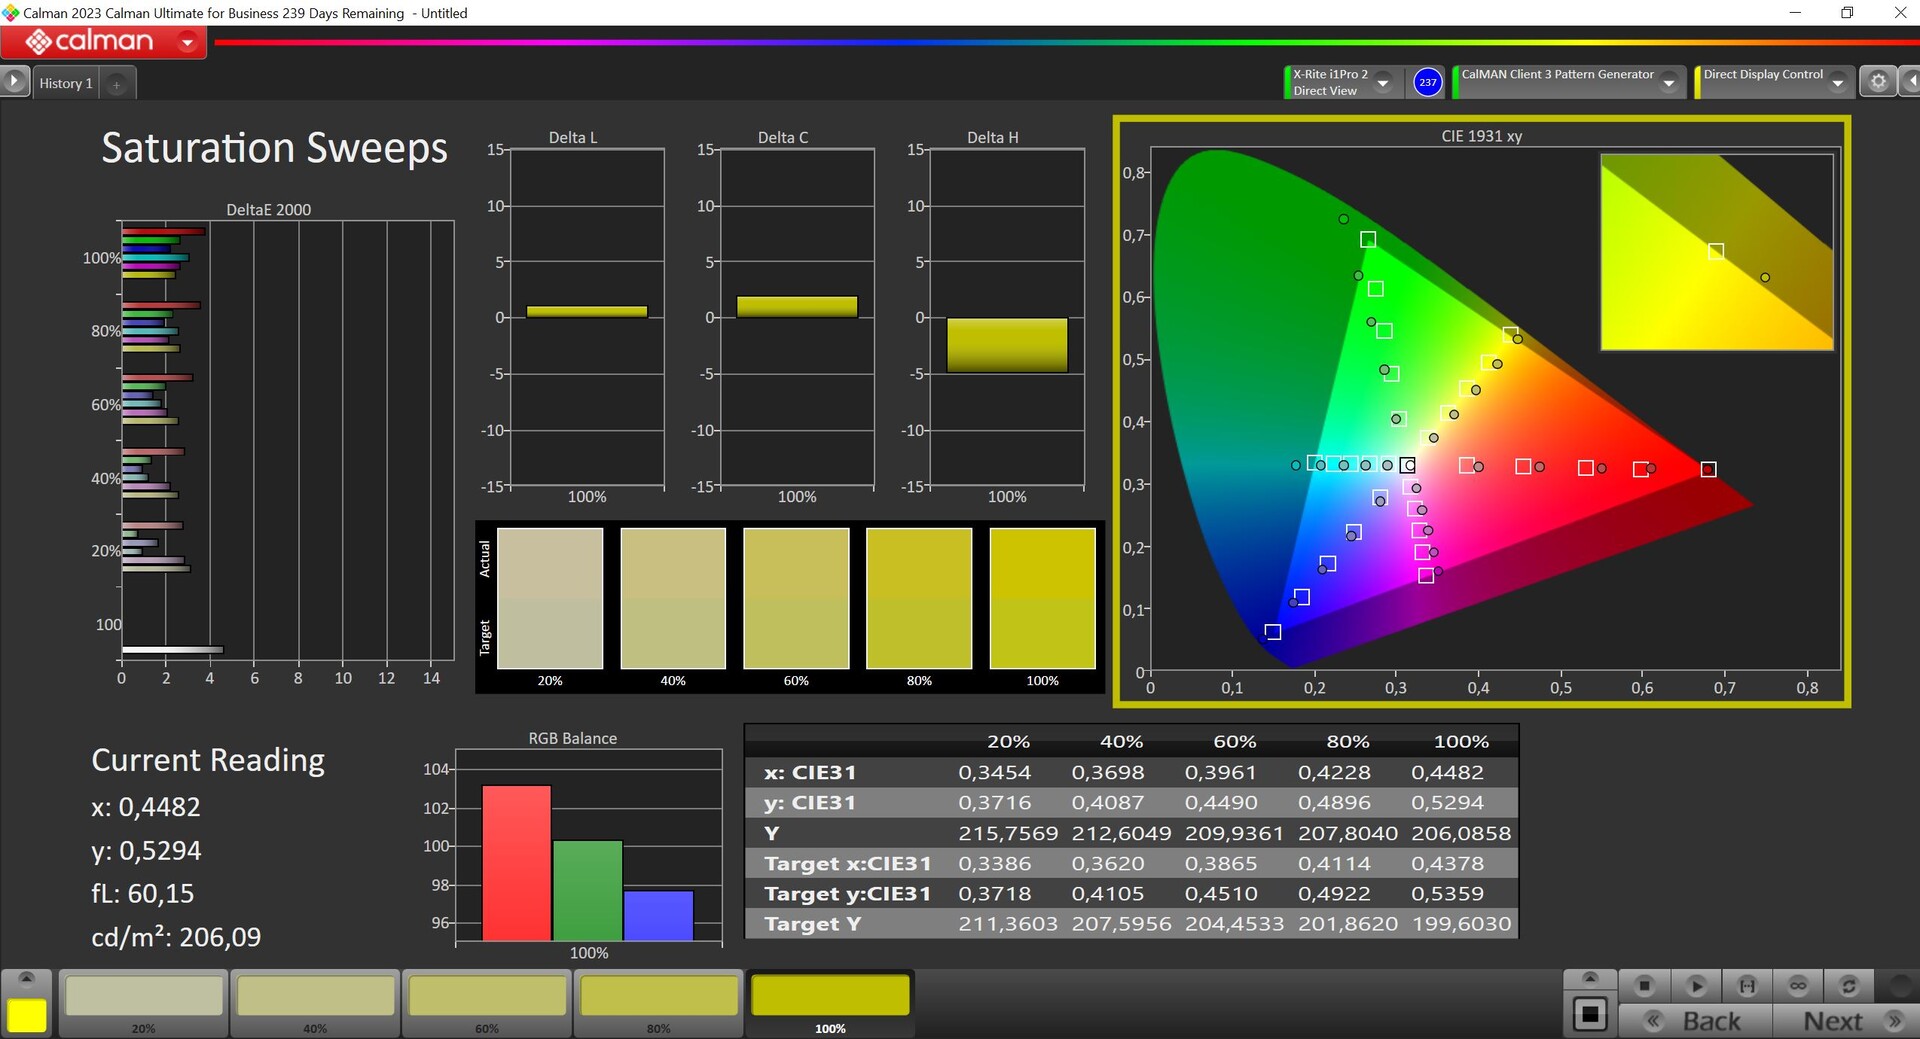
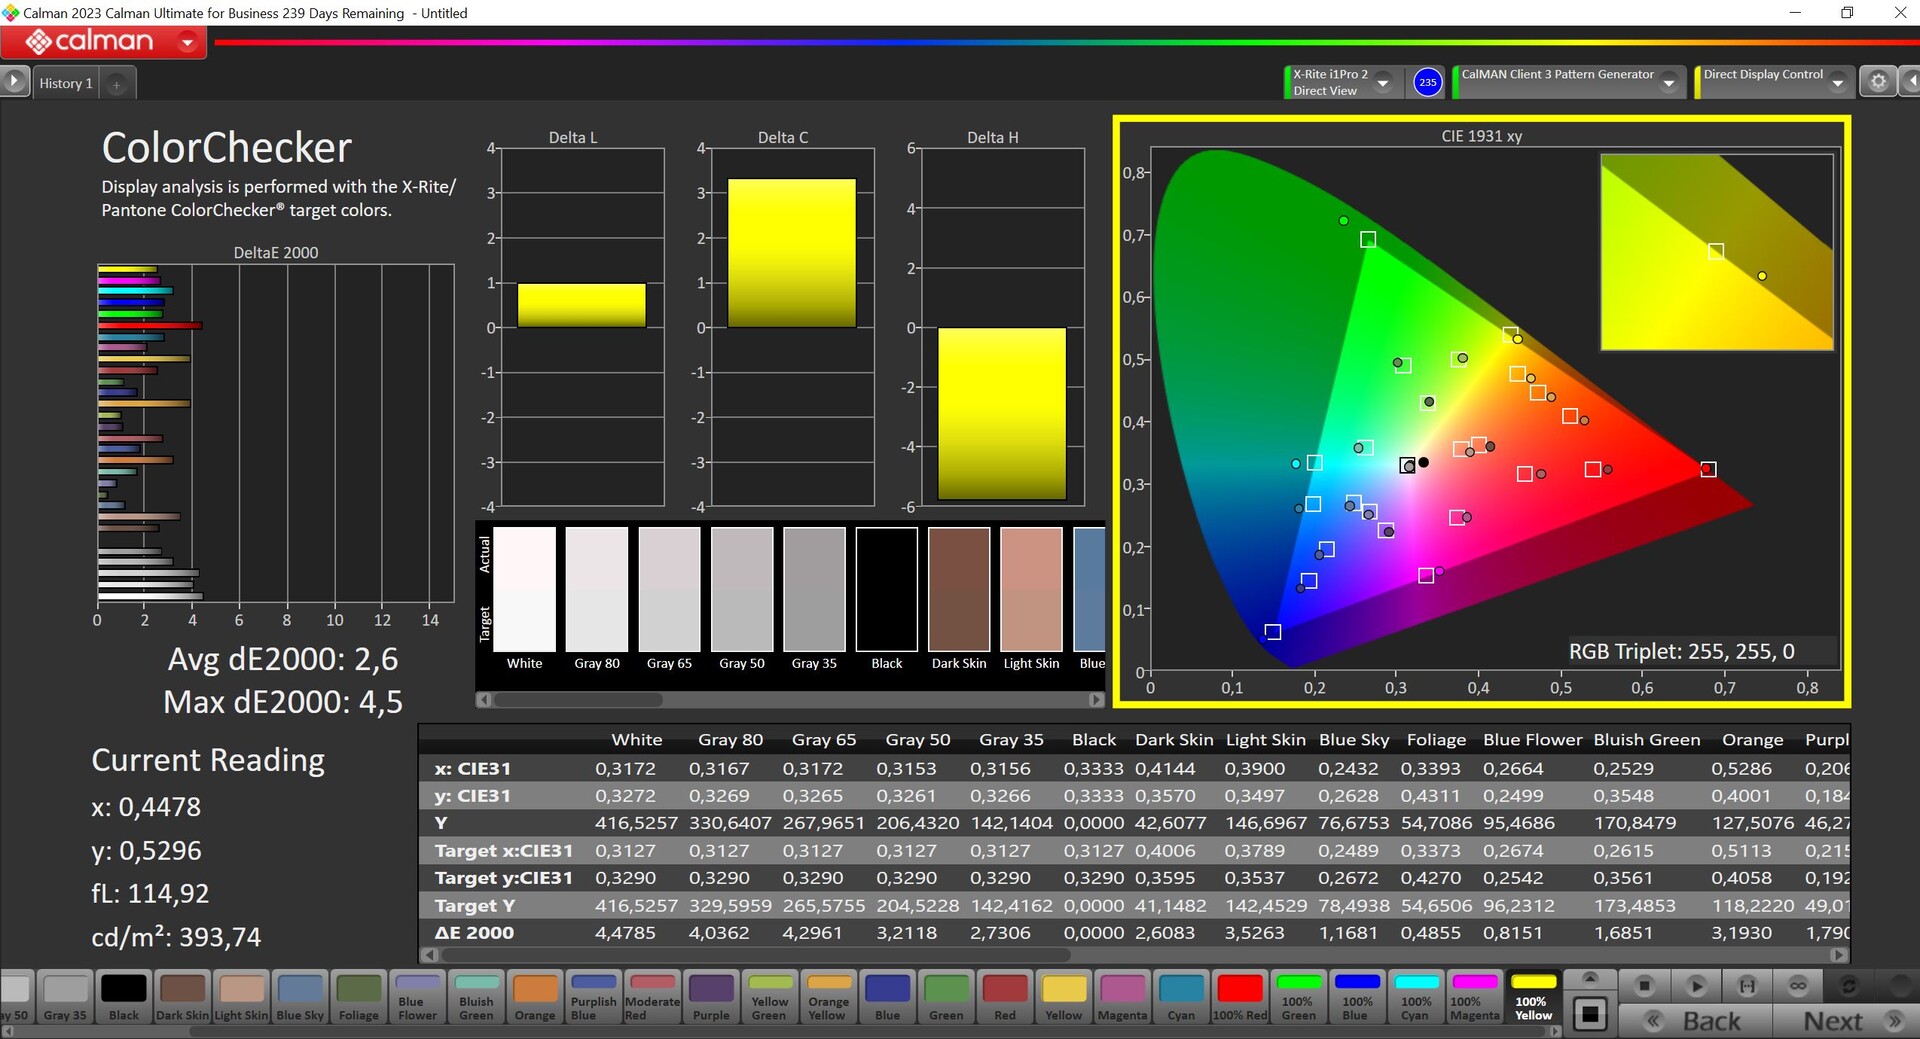


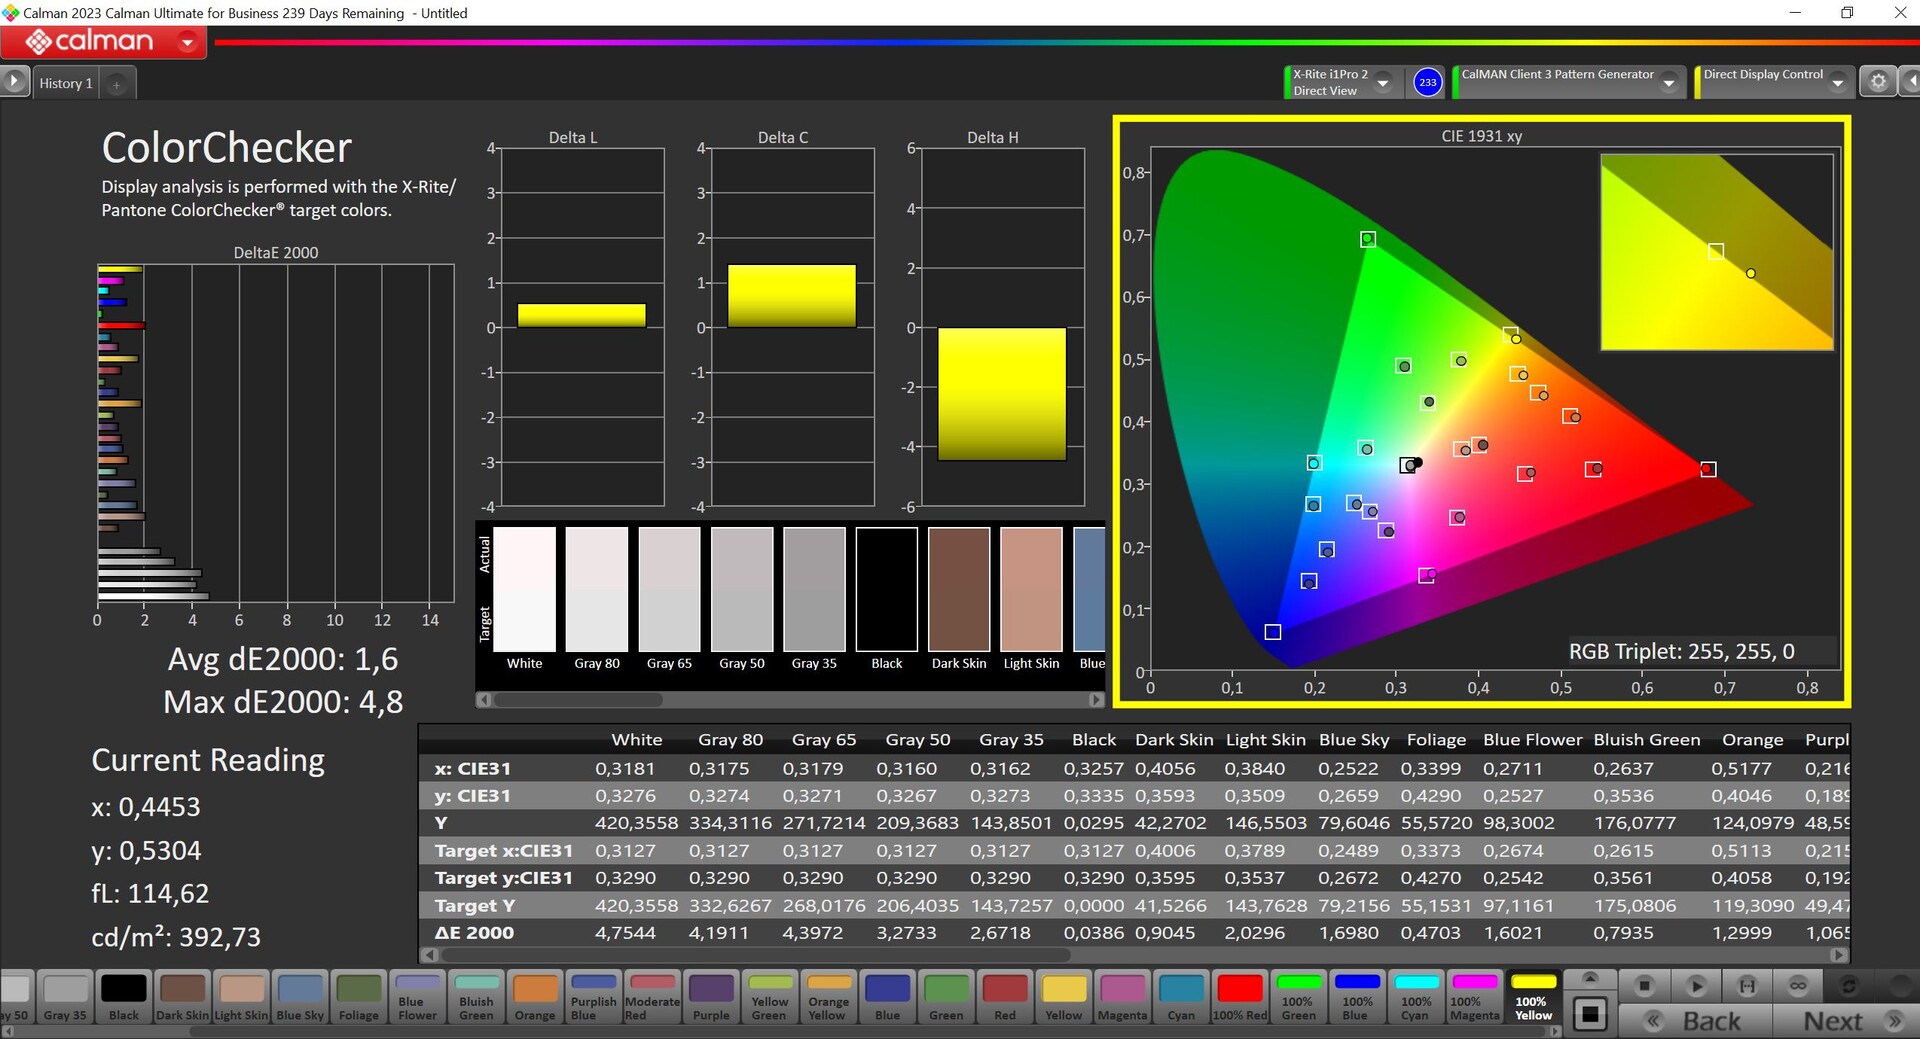
Además, calibramos la pantalla nosotros mismos, con resultados desiguales. Aunque pudimos mejorar ligeramente las desviaciones de la escala de grises, esto se tradujo en mayores desviaciones de color y, en conjunto, no mejoró realmente la situación. Por eso no ponemos a su disposición el perfil correspondiente para su descarga. La pantalla cubre el espacio de color P3 en su totalidad, pero también cuenta con un modo sRGB muy preciso, por si desea editar fotos o vídeos en el espacio de color más pequeño.
Tiempos de respuesta del display
| ↔ Tiempo de respuesta de Negro a Blanco | ||
|---|---|---|
| 0.25 ms ... subida ↗ y bajada ↘ combinada | ↗ 0.13 ms subida | 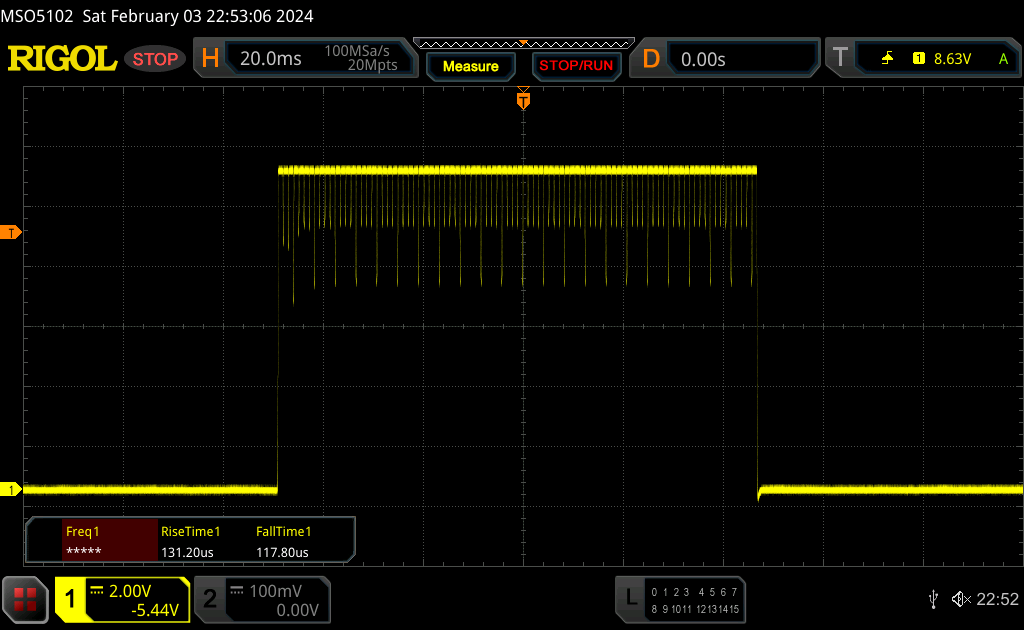 |
| ↘ 0.12 ms bajada | ||
| La pantalla mostró tiempos de respuesta muy rápidos en nuestros tests y debería ser adecuada para juegos frenéticos. En comparación, todos los dispositivos de prueba van de ##min### (mínimo) a 240 (máximo) ms. » 0 % de todos los dispositivos son mejores. Esto quiere decir que el tiempo de respuesta medido es mejor que la media (19.8 ms) de todos los dispositivos testados. | ||
| ↔ Tiempo de respuesta 50% Gris a 80% Gris | ||
| 0.22 ms ... subida ↗ y bajada ↘ combinada | ↗ 0.11 ms subida | 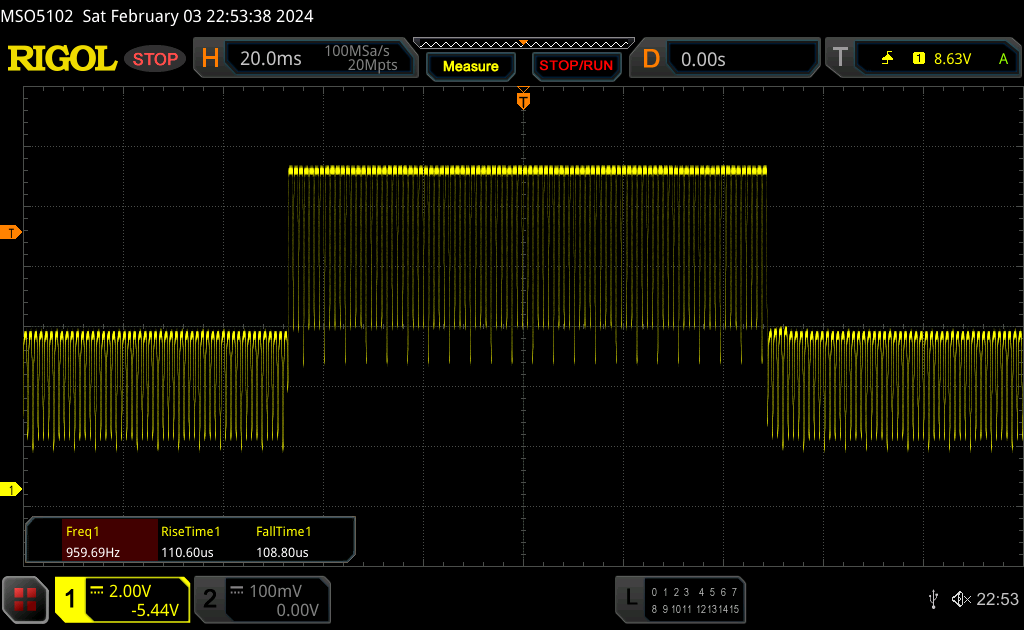 |
| ↘ 0.11 ms bajada | ||
| La pantalla mostró tiempos de respuesta muy rápidos en nuestros tests y debería ser adecuada para juegos frenéticos. En comparación, todos los dispositivos de prueba van de ##min### (mínimo) a 636 (máximo) ms. » 0 % de todos los dispositivos son mejores. Esto quiere decir que el tiempo de respuesta medido es mejor que la media (30.9 ms) de todos los dispositivos testados. | ||
Parpadeo de Pantalla / PWM (Pulse-Width Modulation)
| Parpadeo de Pantalla / PWM detectado | 960 Hz | ≤ 60 % de brillo | 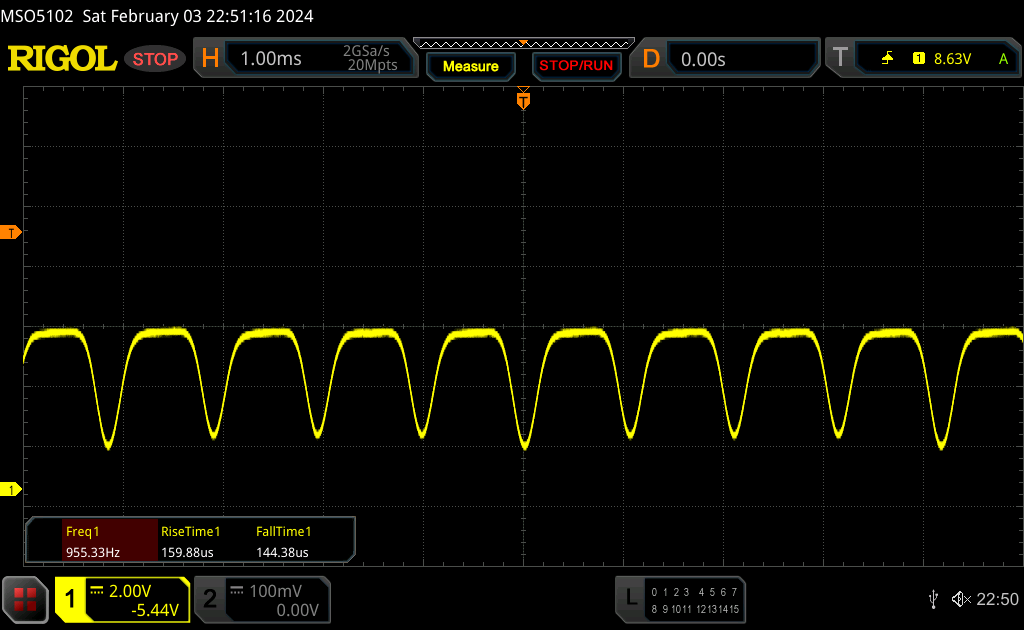 |
La retroiluminación del display parpadea a 960 Hz (seguramente usa PWM - Pulse-Width Modulation) a un brillo del 60 % e inferior. Sobre este nivel de brillo no debería darse parpadeo / PWM. La frecuencia de 960 Hz es bastante alta, por lo que la mayoría de gente sensible al parpadeo no debería ver parpadeo o tener fatiga visual. Comparación: 52 % de todos los dispositivos testados no usaron PWM para atenuar el display. Si se usó, medimos una media de 7748 (mínimo: 5 - máxmo: 343500) Hz. | |||
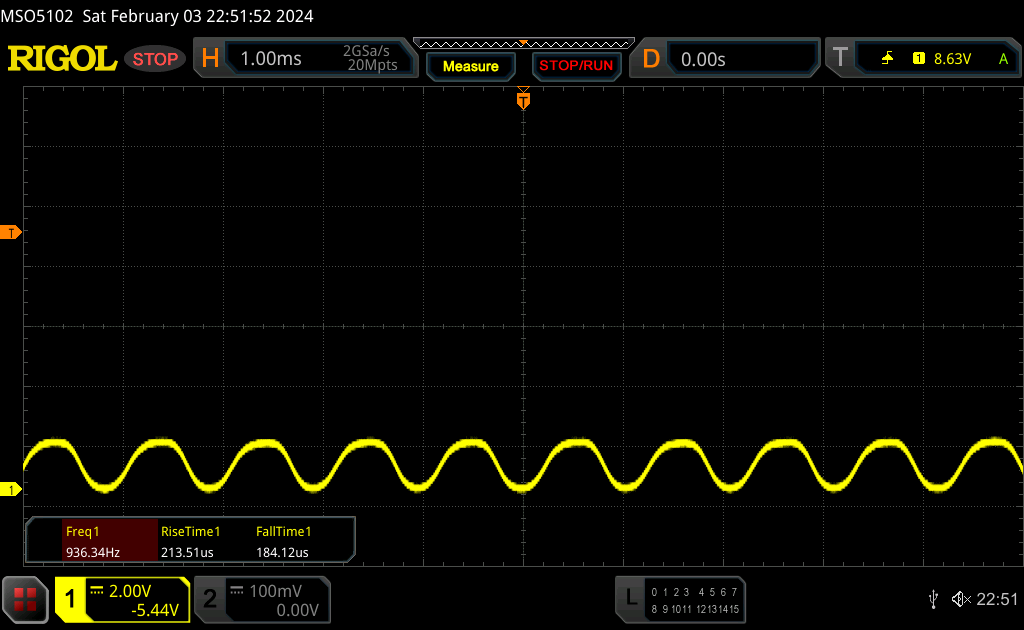
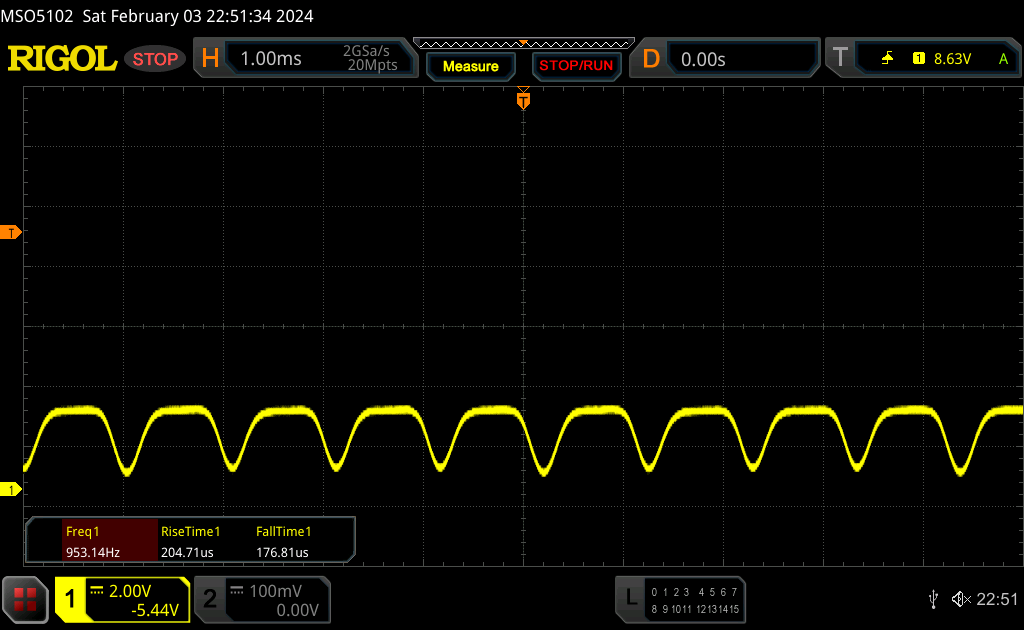
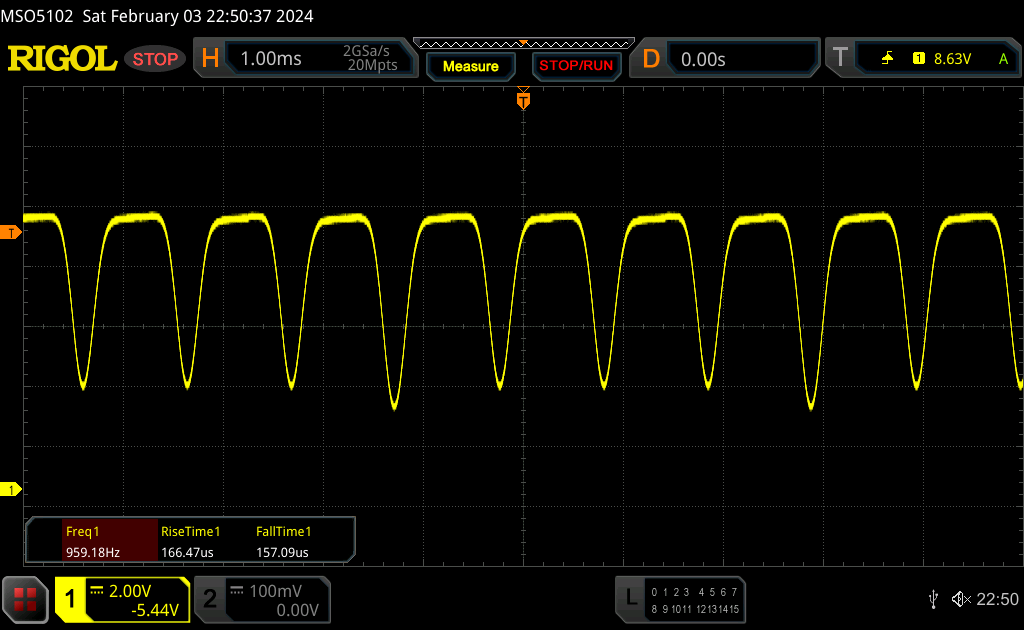
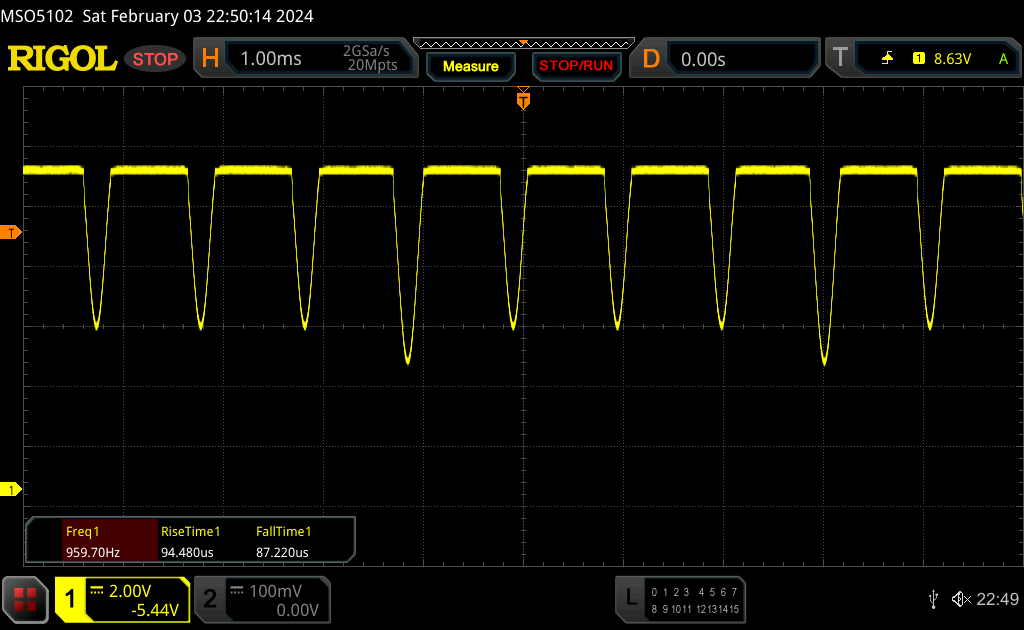
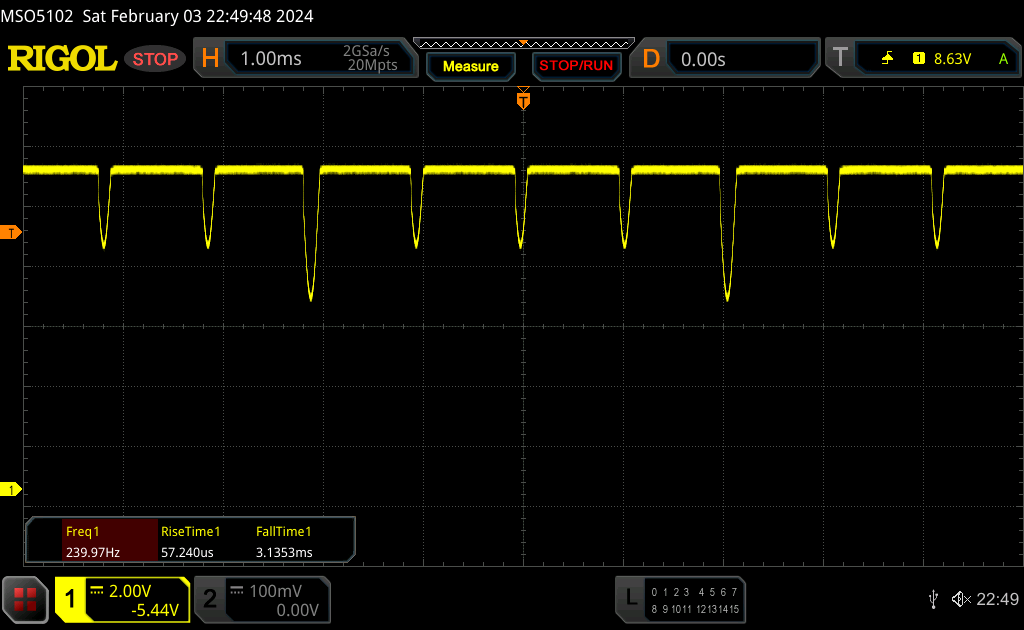
En general, el nuevo panel OLED funciona mediante PWM a una frecuencia de 960 Hz, pero a niveles de brillo superiores al 60 %, hace uso de la menos dañina atenuación DC (a 240 Hz). En cuanto el brillo cae por debajo de este nivel, aparece una advertencia indicando que la atenuación DC ya no está disponible. Como ya ocurría en otros portátiles OLED de Asus, tiene la posibilidad de atenuar la pantalla mediante un software que le permite seguir utilizando la atenuación DC. Sólo nos gustaría que este control se combinara con el control de brillo habitual para maximizar la comodidad.

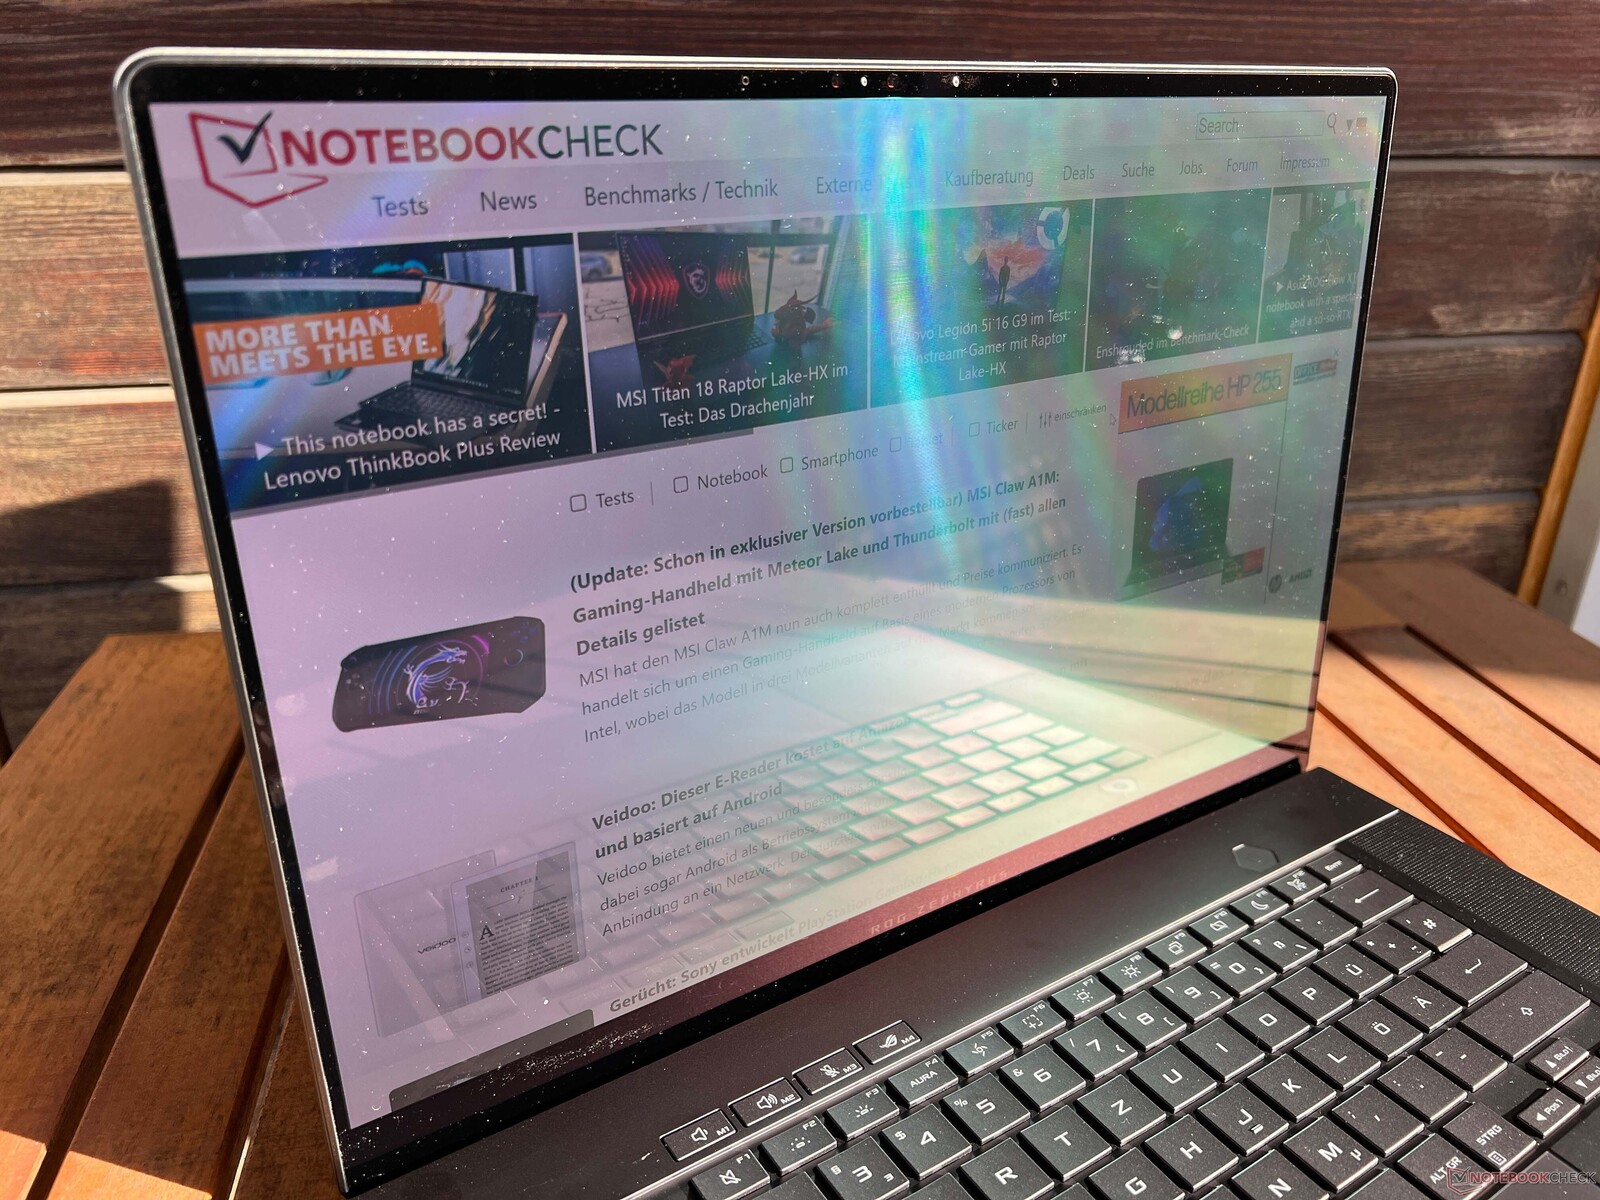
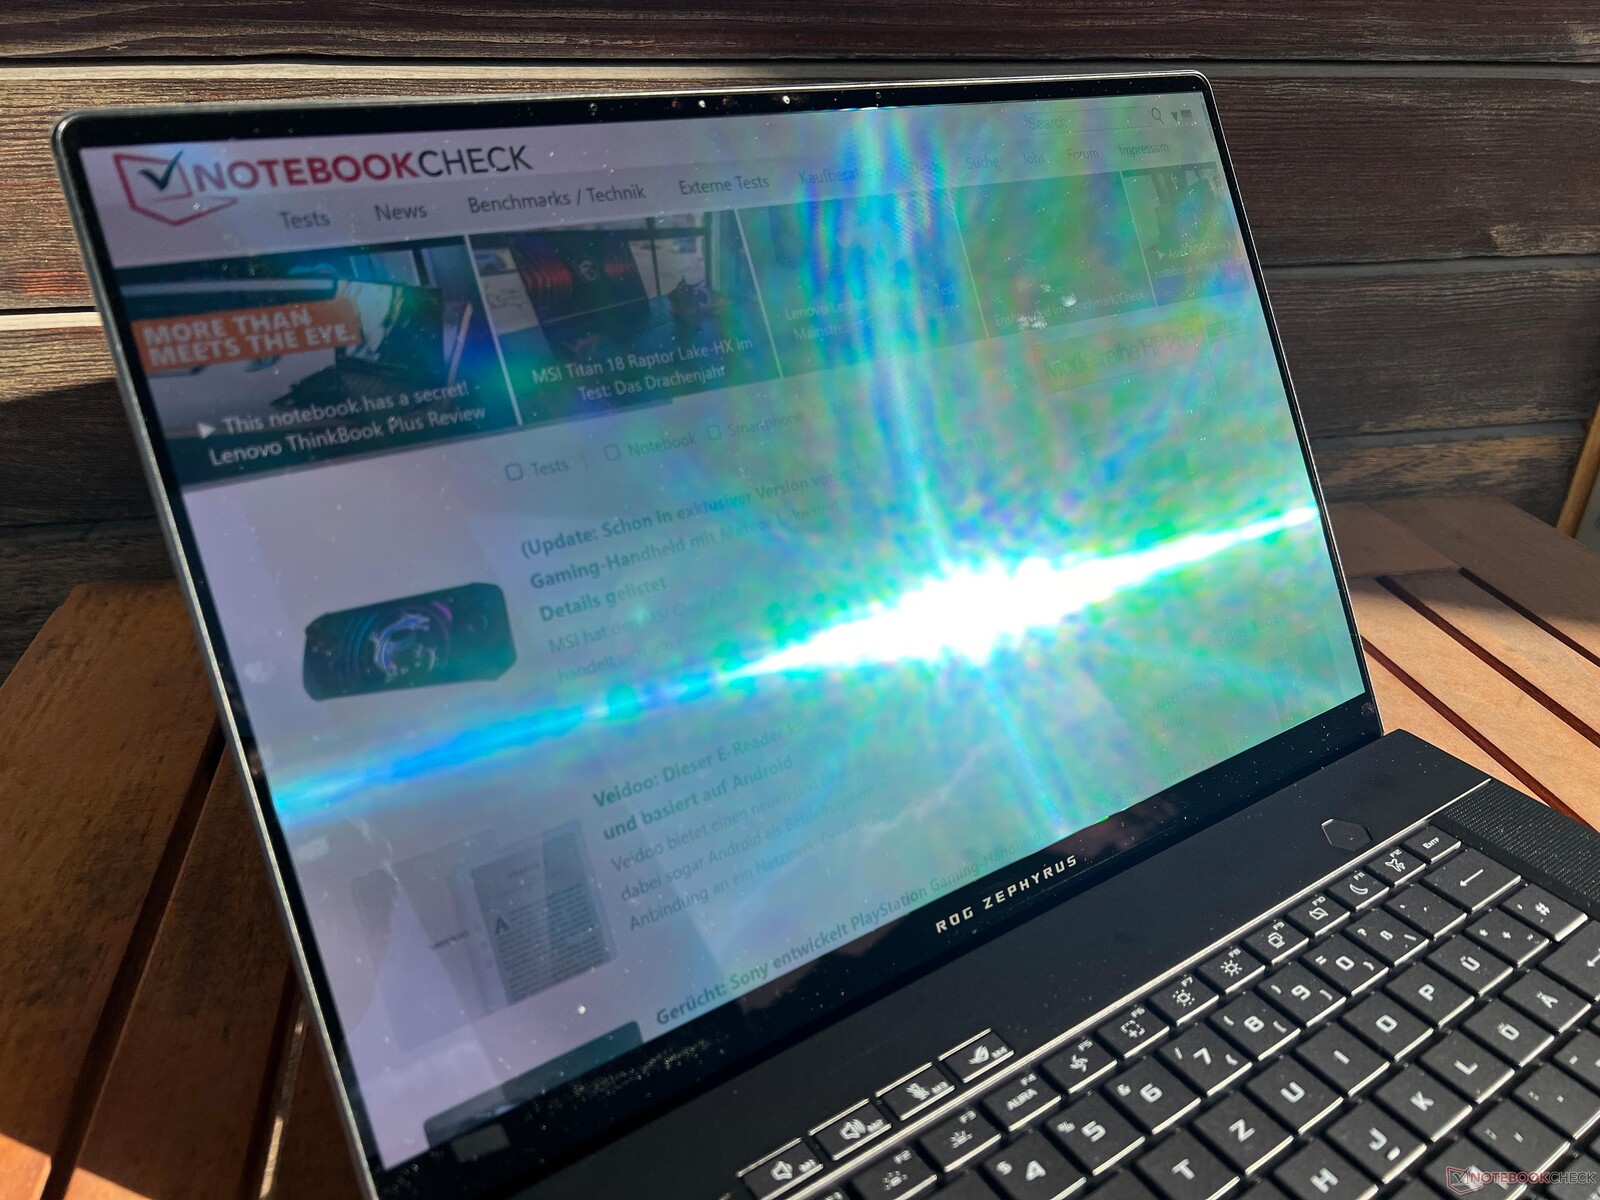
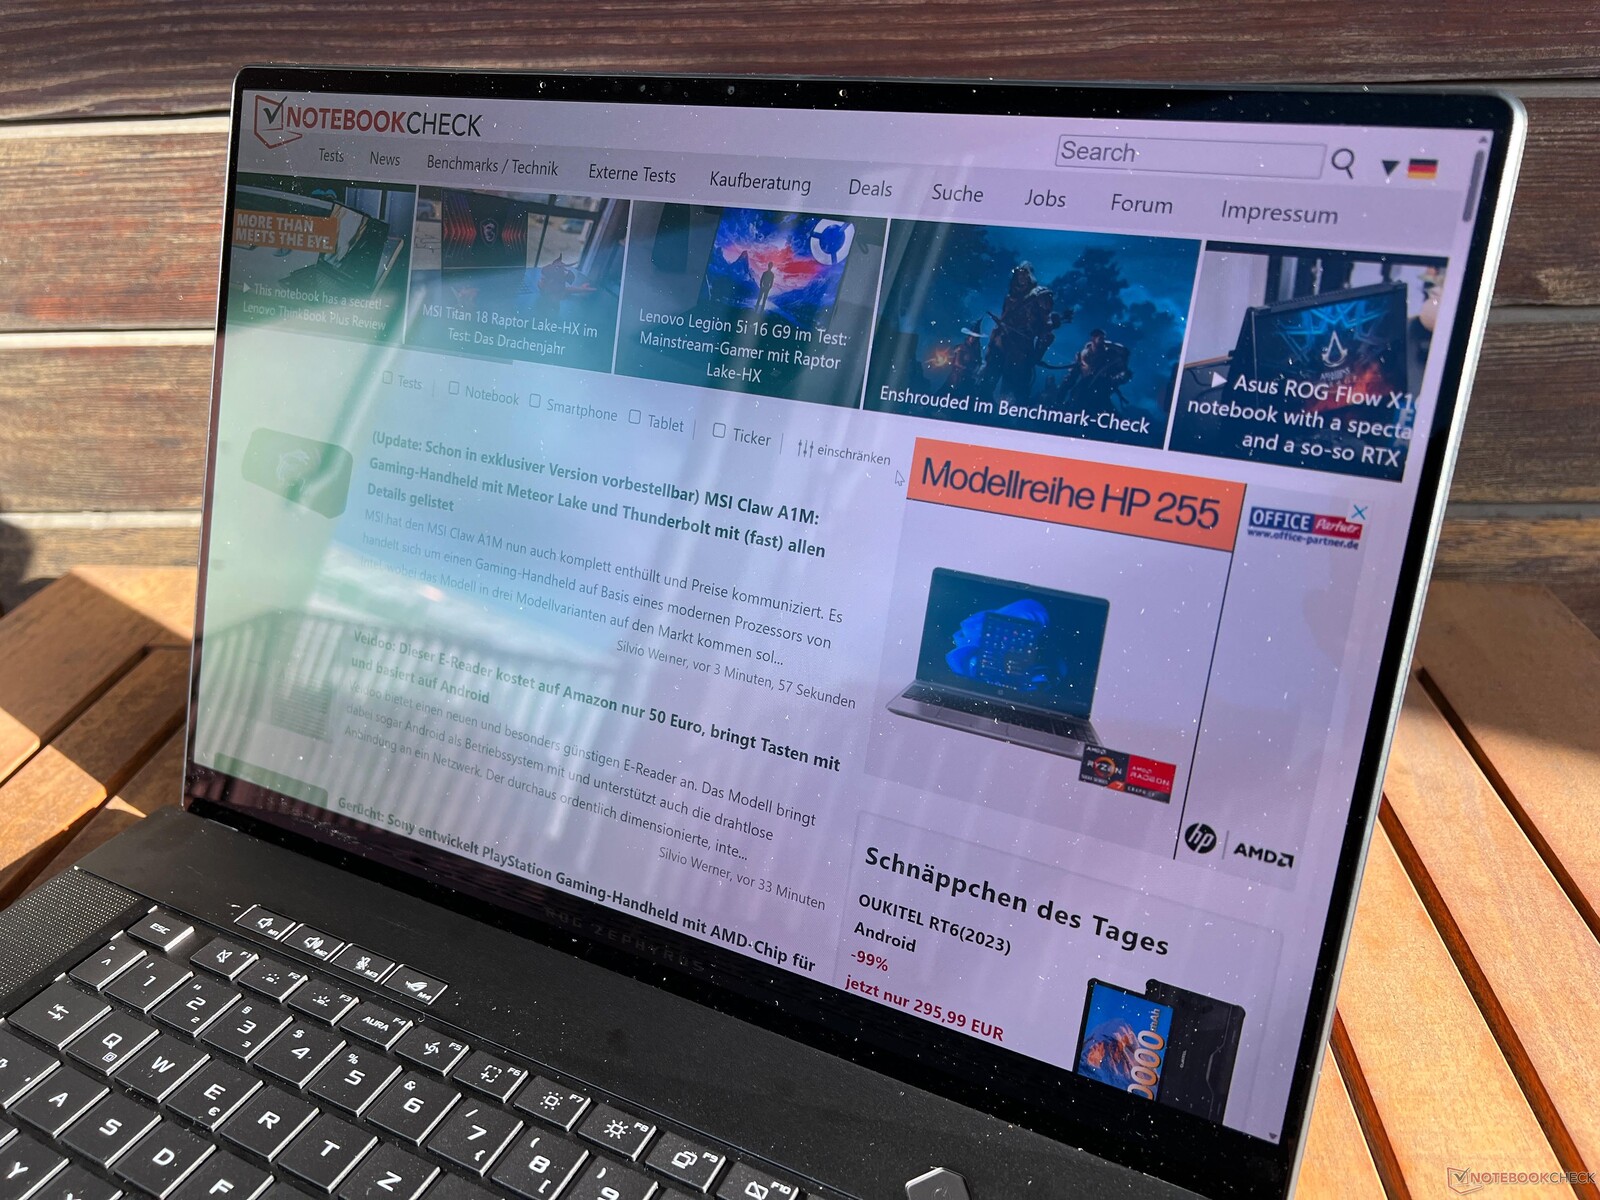
El Zephyrus G16 se comporta realmente bien en exteriores e incluso en días soleados se puede utilizar bien siempre que se mantenga alejado de la luz solar directa. Su estabilidad del ángulo de visión es estupenda y sólo las grandes desviaciones del centro hacen que se note un ligero brillo azul, pero esto es típico de los paneles OLED.

Rendimiento - El Zephyrus ahora con Meteor Lake
Condiciones de prueba
Dentro de su software Armoury-Crate, Asus ofrece diversos perfiles de energía, así como un modo manual que permite configurar individualmente el rendimiento de la GPU/CPU. Hemos reunido los valores de los perfiles de energía en la siguiente tabla. No obstante, debe tenerse en cuenta que estos valores sólo se refieren a las configuraciones con el portátil 4070/4060/4050, que están equipadas con tubos de calor convencionales y tres ventiladores. En cambio, los modelos más potentes con la RTX 4080/4090 Laptop disponen de un sistema de refrigeración Vapor-Chamber con dos ventiladores, por lo que el procesador y la GPU consumen más energía (en todos los perfiles).
| Perfil energético | Carga de la CPU | CB R23 Multi | Carga de la GPU | Time Spy gráficos | Cyberpunk 2077 QHD Ultra | emisiones máx. del ventilador |
|---|---|---|---|---|---|---|
| Silencioso | 60->45 vatios | 15.869 puntos | 65 vatios | 9.042 puntos | 32,6 fps | 41,5 dB(A) |
| Rendimiento | 70->50 vatios | 17.133 puntos | 80 vatios | 10.989 puntos | 43,7 fps | 46,4 dB(A) |
| Turbo | 95->70 vatios | 18.372 puntos | 105 vatios | 12.312 puntos | 48,7 fps | 52,4 dB(A) |
Tras varias pruebas, decidimos ejecutar los siguientes puntos de referencia y mediciones utilizando el modo de rendimiento. Aunque no obtenga el máximo rendimiento, los ventiladores siguen siendo soportables al jugar, ya que las emisiones de ruido de unos 48 dB(A) son difíciles de tolerar. Gracias a sus excelentes altavoces, puede incluso salirse con la suya jugando sin auriculares con el modo de rendimiento seleccionado. Aun así, si necesita el máximo rendimiento posible, puede cambiar fácilmente de modo con sólo pulsar un botón (sin embargo, el modo turbo sólo está disponible cuando está conectado a la red eléctrica). Durante las tareas sencillas, debe seleccionar el modo silencioso, ya que, de lo contrario, casi siempre se oirán los ventiladores.
Procesador - Core Ultra 7 155H
Ya echamos un vistazo al nuevo Meteor-Lake-gen Core Ultra 7 155H en nuestro artículo de análisis. Con límites de potencia de 70/50 vatios, el procesador lo hace bien, pero no hay una diferencia real con los antiguos chips Raptor-Lake como el Core i7-13700H y esto tampoco cambia cuando se selecciona el modo turbo. Sin embargo, su rendimiento mononúcleo es ligeramente más débil y ya estamos deseando ver cómo se comporta Meteor Lake frente a las nuevas CPU Ryzen-8000. En conjunto, su rendimiento multinúcleo se mantiene muy constante en total. En el uso en batería, el rendimiento de la CPU se mantiene constante. Puede encontrar más pruebas de rendimiento de la CPU aquí.
Cinebench R15 Multi continuous test
Cinebench R20: CPU (Multi Core) | CPU (Single Core)
Cinebench R15: CPU Multi 64Bit | CPU Single 64Bit
Blender: v2.79 BMW27 CPU
7-Zip 18.03: 7z b 4 | 7z b 4 -mmt1
Geekbench 6.7: Multi-Core | Single-Core
Geekbench 5.5: Multi-Core | Single-Core
HWBOT x265 Benchmark v2.2: 4k Preset
LibreOffice : 20 Documents To PDF
R Benchmark 2.5: Overall mean
| Cinebench R20 / CPU (Multi Core) | |
| Media de la clase Gaming (4029 - 16433, n=107, últimos 2 años) | |
| Razer Blade 16 Early 2023 | |
| MSI Stealth 16 Studio A13VG | |
| Lenovo Yoga Pro 9 16-IRP G8 | |
| Gigabyte AERO 16 OLED BSF | |
| Asus ROG Zephyrus G16 2024 GU605M | |
| Apple MacBook Pro 16 2023 M3 Max | |
| Schenker VISION 16 Pro (M23) | |
| Cinebench R20 / CPU (Single Core) | |
| Media de la clase Gaming (442 - 913, n=107, últimos 2 años) | |
| Razer Blade 16 Early 2023 | |
| Lenovo Yoga Pro 9 16-IRP G8 | |
| Schenker VISION 16 Pro (M23) | |
| MSI Stealth 16 Studio A13VG | |
| Asus ROG Zephyrus G16 2024 GU605M | |
| Gigabyte AERO 16 OLED BSF | |
| Apple MacBook Pro 16 2023 M3 Max | |
| Cinebench R15 / CPU Multi 64Bit | |
| Razer Blade 16 Early 2023 | |
| Media de la clase Gaming (1578 - 6330, n=106, últimos 2 años) | |
| Apple MacBook Pro 16 2023 M3 Max | |
| Lenovo Yoga Pro 9 16-IRP G8 | |
| Gigabyte AERO 16 OLED BSF | |
| MSI Stealth 16 Studio A13VG | |
| Asus ROG Zephyrus G16 2024 GU605M | |
| Schenker VISION 16 Pro (M23) | |
| Cinebench R15 / CPU Single 64Bit | |
| Media de la clase Gaming (188.8 - 350, n=107, últimos 2 años) | |
| Schenker VISION 16 Pro (M23) | |
| Razer Blade 16 Early 2023 | |
| Lenovo Yoga Pro 9 16-IRP G8 | |
| MSI Stealth 16 Studio A13VG | |
| Apple MacBook Pro 16 2023 M3 Max | |
| Asus ROG Zephyrus G16 2024 GU605M | |
| Gigabyte AERO 16 OLED BSF | |
| 7-Zip 18.03 / 7z b 4 -mmt1 | |
| Razer Blade 16 Early 2023 | |
| Media de la clase Gaming (4199 - 7436, n=106, últimos 2 años) | |
| Schenker VISION 16 Pro (M23) | |
| MSI Stealth 16 Studio A13VG | |
| Lenovo Yoga Pro 9 16-IRP G8 | |
| Gigabyte AERO 16 OLED BSF | |
| Asus ROG Zephyrus G16 2024 GU605M | |
| Geekbench 6.7 / Multi-Core | |
| Apple MacBook Pro 16 2023 M3 Max | |
| Razer Blade 16 Early 2023 | |
| Razer Blade 16 Early 2023 | |
| Razer Blade 16 Early 2023 | |
| Media de la clase Gaming (6625 - 22850, n=107, últimos 2 años) | |
| Lenovo Yoga Pro 9 16-IRP G8 | |
| Asus ROG Zephyrus G16 2024 GU605M | |
| Geekbench 6.7 / Single-Core | |
| Apple MacBook Pro 16 2023 M3 Max | |
| Razer Blade 16 Early 2023 | |
| Razer Blade 16 Early 2023 | |
| Razer Blade 16 Early 2023 | |
| Media de la clase Gaming (1490 - 3259, n=107, últimos 2 años) | |
| Lenovo Yoga Pro 9 16-IRP G8 | |
| Asus ROG Zephyrus G16 2024 GU605M | |
| HWBOT x265 Benchmark v2.2 / 4k Preset | |
| Media de la clase Gaming (11.5 - 44.4, n=106, últimos 2 años) | |
| Razer Blade 16 Early 2023 | |
| Lenovo Yoga Pro 9 16-IRP G8 | |
| Gigabyte AERO 16 OLED BSF | |
| Asus ROG Zephyrus G16 2024 GU605M | |
| MSI Stealth 16 Studio A13VG | |
| Schenker VISION 16 Pro (M23) | |
| LibreOffice / 20 Documents To PDF | |
| Gigabyte AERO 16 OLED BSF | |
| MSI Stealth 16 Studio A13VG | |
| Media de la clase Gaming (33.2 - 88.8, n=106, últimos 2 años) | |
| Asus ROG Zephyrus G16 2024 GU605M | |
| Lenovo Yoga Pro 9 16-IRP G8 | |
| Schenker VISION 16 Pro (M23) | |
| Razer Blade 16 Early 2023 | |
| R Benchmark 2.5 / Overall mean | |
| Gigabyte AERO 16 OLED BSF | |
| Asus ROG Zephyrus G16 2024 GU605M | |
| Lenovo Yoga Pro 9 16-IRP G8 | |
| MSI Stealth 16 Studio A13VG | |
| Schenker VISION 16 Pro (M23) | |
| Media de la clase Gaming (0.3439 - 0.759, n=107, últimos 2 años) | |
| Razer Blade 16 Early 2023 | |
* ... más pequeño es mejor
AIDA64: FP32 Ray-Trace | FPU Julia | CPU SHA3 | CPU Queen | FPU SinJulia | FPU Mandel | CPU AES | CPU ZLib | FP64 Ray-Trace | CPU PhotoWorxx
| Performance rating | |
| Media de la clase Gaming | |
| Razer Blade 16 Early 2023 | |
| Gigabyte AERO 16 OLED BSF | |
| Lenovo Yoga Pro 9 16-IRP G8 | |
| MSI Stealth 16 Studio A13VG | |
| Asus ROG Zephyrus G16 2024 GU605M | |
| Schenker VISION 16 Pro (M23) | |
| Medio Intel Core Ultra 7 155H | |
| AIDA64 / FP32 Ray-Trace | |
| Media de la clase Gaming (10227 - 85542, n=106, últimos 2 años) | |
| Razer Blade 16 Early 2023 | |
| Razer Blade 16 Early 2023 | |
| Razer Blade 16 Early 2023 | |
| Gigabyte AERO 16 OLED BSF | |
| MSI Stealth 16 Studio A13VG | |
| Lenovo Yoga Pro 9 16-IRP G8 | |
| Asus ROG Zephyrus G16 2024 GU605M | |
| Schenker VISION 16 Pro (M23) | |
| Medio Intel Core Ultra 7 155H (6670 - 18470, n=50) | |
| AIDA64 / FPU Julia | |
| Media de la clase Gaming (51376 - 372155, n=106, últimos 2 años) | |
| Razer Blade 16 Early 2023 | |
| Razer Blade 16 Early 2023 | |
| Razer Blade 16 Early 2023 | |
| Lenovo Yoga Pro 9 16-IRP G8 | |
| Gigabyte AERO 16 OLED BSF | |
| Asus ROG Zephyrus G16 2024 GU605M | |
| MSI Stealth 16 Studio A13VG | |
| Schenker VISION 16 Pro (M23) | |
| Medio Intel Core Ultra 7 155H (40905 - 93181, n=50) | |
| AIDA64 / CPU SHA3 | |
| Media de la clase Gaming (2180 - 10115, n=106, últimos 2 años) | |
| Razer Blade 16 Early 2023 | |
| Razer Blade 16 Early 2023 | |
| Razer Blade 16 Early 2023 | |
| Lenovo Yoga Pro 9 16-IRP G8 | |
| Gigabyte AERO 16 OLED BSF | |
| MSI Stealth 16 Studio A13VG | |
| Asus ROG Zephyrus G16 2024 GU605M | |
| Medio Intel Core Ultra 7 155H (1940 - 4436, n=50) | |
| Schenker VISION 16 Pro (M23) | |
| AIDA64 / CPU Queen | |
| Razer Blade 16 Early 2023 | |
| Razer Blade 16 Early 2023 | |
| Media de la clase Gaming (49785 - 173351, n=90, últimos 2 años) | |
| Lenovo Yoga Pro 9 16-IRP G8 | |
| MSI Stealth 16 Studio A13VG | |
| Schenker VISION 16 Pro (M23) | |
| Gigabyte AERO 16 OLED BSF | |
| Asus ROG Zephyrus G16 2024 GU605M | |
| Medio Intel Core Ultra 7 155H (64698 - 94181, n=50) | |
| AIDA64 / FPU SinJulia | |
| Razer Blade 16 Early 2023 | |
| Razer Blade 16 Early 2023 | |
| Razer Blade 16 Early 2023 | |
| Media de la clase Gaming (4424 - 33636, n=106, últimos 2 años) | |
| Lenovo Yoga Pro 9 16-IRP G8 | |
| MSI Stealth 16 Studio A13VG | |
| Asus ROG Zephyrus G16 2024 GU605M | |
| Gigabyte AERO 16 OLED BSF | |
| Medio Intel Core Ultra 7 155H (5639 - 10647, n=50) | |
| Schenker VISION 16 Pro (M23) | |
| AIDA64 / FPU Mandel | |
| Media de la clase Gaming (25115 - 196829, n=106, últimos 2 años) | |
| Razer Blade 16 Early 2023 | |
| Razer Blade 16 Early 2023 | |
| Razer Blade 16 Early 2023 | |
| Gigabyte AERO 16 OLED BSF | |
| MSI Stealth 16 Studio A13VG | |
| Lenovo Yoga Pro 9 16-IRP G8 | |
| Asus ROG Zephyrus G16 2024 GU605M | |
| Medio Intel Core Ultra 7 155H (18236 - 47685, n=50) | |
| Schenker VISION 16 Pro (M23) | |
| AIDA64 / CPU AES | |
| Razer Blade 16 Early 2023 | |
| Razer Blade 16 Early 2023 | |
| Razer Blade 16 Early 2023 | |
| Gigabyte AERO 16 OLED BSF | |
| Media de la clase Gaming (39258 - 247074, n=106, últimos 2 años) | |
| Lenovo Yoga Pro 9 16-IRP G8 | |
| MSI Stealth 16 Studio A13VG | |
| Asus ROG Zephyrus G16 2024 GU605M | |
| Medio Intel Core Ultra 7 155H (45713 - 152179, n=50) | |
| Schenker VISION 16 Pro (M23) | |
| AIDA64 / CPU ZLib | |
| Razer Blade 16 Early 2023 | |
| Razer Blade 16 Early 2023 | |
| Razer Blade 16 Early 2023 | |
| Media de la clase Gaming (574 - 2531, n=106, últimos 2 años) | |
| Lenovo Yoga Pro 9 16-IRP G8 | |
| Gigabyte AERO 16 OLED BSF | |
| Asus ROG Zephyrus G16 2024 GU605M | |
| MSI Stealth 16 Studio A13VG | |
| Medio Intel Core Ultra 7 155H (557 - 1250, n=50) | |
| Schenker VISION 16 Pro (M23) | |
| AIDA64 / FP64 Ray-Trace | |
| Media de la clase Gaming (5509 - 45446, n=106, últimos 2 años) | |
| Razer Blade 16 Early 2023 | |
| Razer Blade 16 Early 2023 | |
| Razer Blade 16 Early 2023 | |
| Gigabyte AERO 16 OLED BSF | |
| MSI Stealth 16 Studio A13VG | |
| Lenovo Yoga Pro 9 16-IRP G8 | |
| Asus ROG Zephyrus G16 2024 GU605M | |
| Schenker VISION 16 Pro (M23) | |
| Medio Intel Core Ultra 7 155H (3569 - 9802, n=50) | |
| AIDA64 / CPU PhotoWorxx | |
| Lenovo Yoga Pro 9 16-IRP G8 | |
| Razer Blade 16 Early 2023 | |
| Razer Blade 16 Early 2023 | |
| Razer Blade 16 Early 2023 | |
| Asus ROG Zephyrus G16 2024 GU605M | |
| Medio Intel Core Ultra 7 155H (32719 - 54223, n=50) | |
| MSI Stealth 16 Studio A13VG | |
| Media de la clase Gaming (12271 - 89891, n=106, últimos 2 años) | |
| Gigabyte AERO 16 OLED BSF | |
| Schenker VISION 16 Pro (M23) | |
Rendimiento del sistema
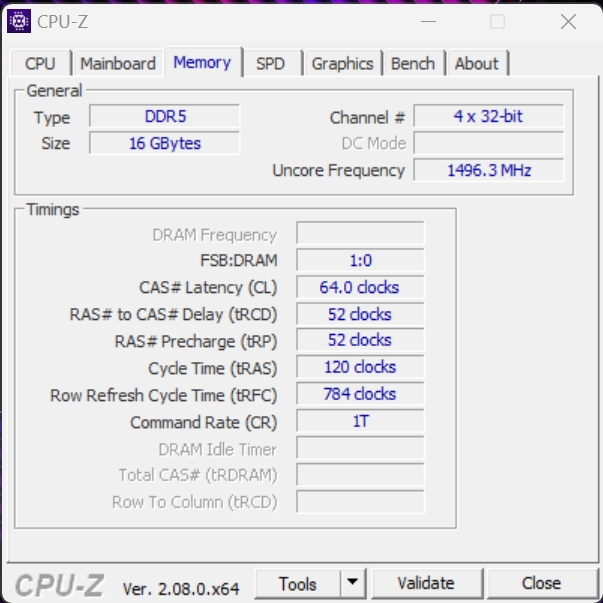
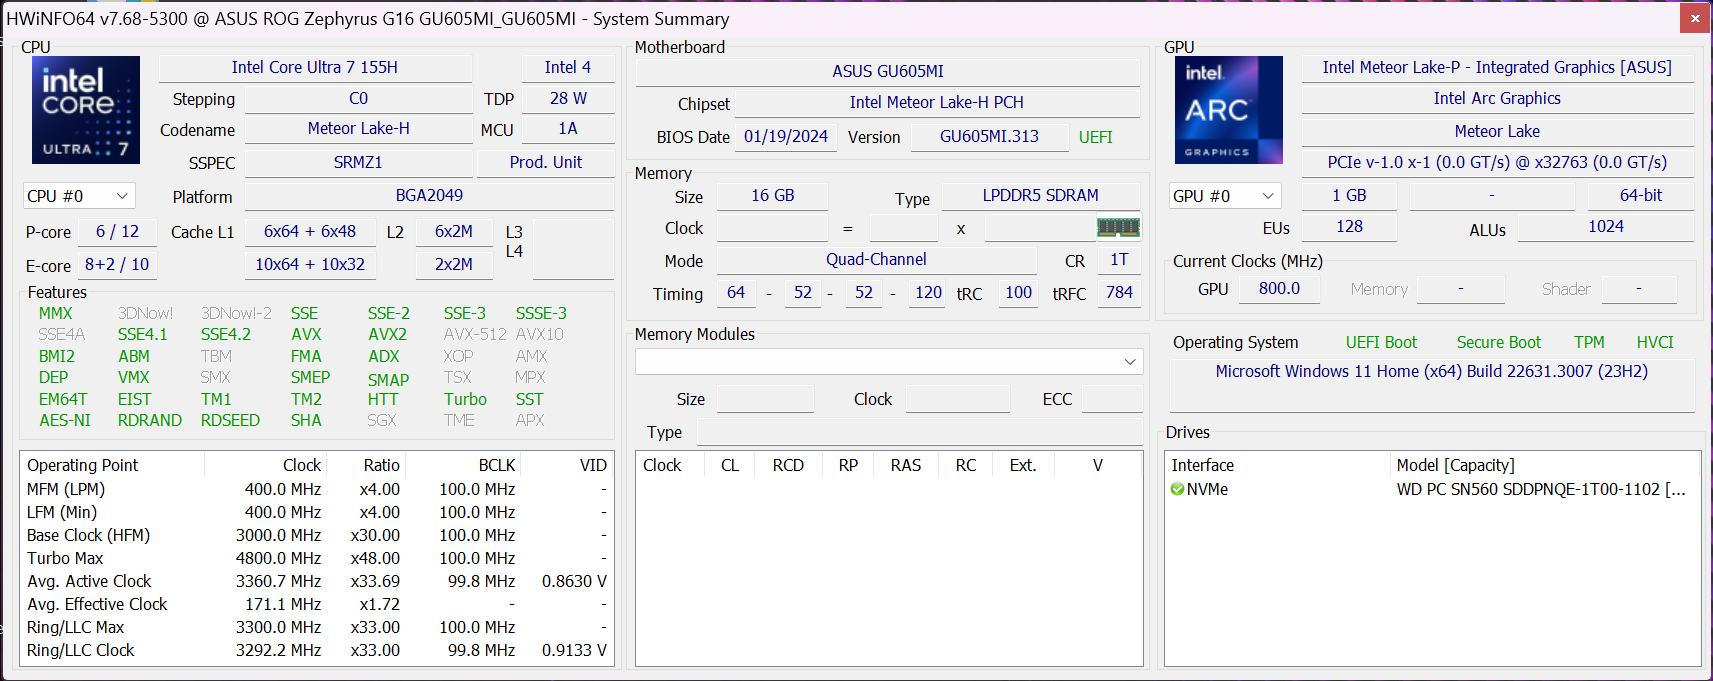
Subjetivamente, el portátil rinde bien sólo durante el cambio de gráficos (por ejemplo, al arrancar juegos) se cuelga ligeramente durante el cambio MUX, pero esto es completamente normal. Consiguió más puntos en las pruebas sintéticas, sin embargo, es probable que no note la diferencia en el uso diario. Sus resultados en las pruebas comparativas de memoria fueron excelentes, pero su RAM no se puede ampliar y 16 GB en un dispositivo de gama alta simplemente no son suficientes. Todos los modelos deberían tener 32 GB de serie.
CrossMark: Overall | Productivity | Creativity | Responsiveness
WebXPRT 3: Overall
WebXPRT 4: Overall
Mozilla Kraken 1.1: Total
| PCMark 10 / Score | |
| Media de la clase Gaming (5828 - 12414, n=94, últimos 2 años) | |
| Gigabyte AERO 16 OLED BSF | |
| Razer Blade 16 Early 2023 | |
| Medio Intel Core Ultra 7 155H, NVIDIA GeForce RTX 4070 Laptop GPU (7084 - 7761, n=4) | |
| Schenker VISION 16 Pro (M23) | |
| MSI Stealth 16 Studio A13VG | |
| Lenovo Yoga Pro 9 16-IRP G8 | |
| Asus ROG Zephyrus G16 2024 GU605M | |
| PCMark 10 / Essentials | |
| Gigabyte AERO 16 OLED BSF | |
| Razer Blade 16 Early 2023 | |
| Lenovo Yoga Pro 9 16-IRP G8 | |
| Schenker VISION 16 Pro (M23) | |
| Media de la clase Gaming (8810 - 11935, n=98, últimos 2 años) | |
| MSI Stealth 16 Studio A13VG | |
| Medio Intel Core Ultra 7 155H, NVIDIA GeForce RTX 4070 Laptop GPU (10038 - 10393, n=4) | |
| Asus ROG Zephyrus G16 2024 GU605M | |
| PCMark 10 / Productivity | |
| Media de la clase Gaming (6845 - 25323, n=96, últimos 2 años) | |
| Schenker VISION 16 Pro (M23) | |
| MSI Stealth 16 Studio A13VG | |
| Medio Intel Core Ultra 7 155H, NVIDIA GeForce RTX 4070 Laptop GPU (9192 - 9518, n=4) | |
| Gigabyte AERO 16 OLED BSF | |
| Asus ROG Zephyrus G16 2024 GU605M | |
| Lenovo Yoga Pro 9 16-IRP G8 | |
| Razer Blade 16 Early 2023 | |
| PCMark 10 / Digital Content Creation | |
| Razer Blade 16 Early 2023 | |
| Media de la clase Gaming (7602 - 19954, n=96, últimos 2 años) | |
| Gigabyte AERO 16 OLED BSF | |
| Medio Intel Core Ultra 7 155H, NVIDIA GeForce RTX 4070 Laptop GPU (10100 - 13035, n=4) | |
| MSI Stealth 16 Studio A13VG | |
| Lenovo Yoga Pro 9 16-IRP G8 | |
| Schenker VISION 16 Pro (M23) | |
| Asus ROG Zephyrus G16 2024 GU605M | |
| CrossMark / Overall | |
| Apple MacBook Pro 16 2023 M3 Max | |
| Media de la clase Gaming (1366 - 2409, n=95, últimos 2 años) | |
| Schenker VISION 16 Pro (M23) | |
| Gigabyte AERO 16 OLED BSF | |
| Lenovo Yoga Pro 9 16-IRP G8 | |
| MSI Stealth 16 Studio A13VG | |
| Medio Intel Core Ultra 7 155H, NVIDIA GeForce RTX 4070 Laptop GPU (1687 - 1848, n=4) | |
| Asus ROG Zephyrus G16 2024 GU605M | |
| Razer Blade 16 Early 2023 | |
| CrossMark / Productivity | |
| Media de la clase Gaming (1386 - 2254, n=95, últimos 2 años) | |
| Apple MacBook Pro 16 2023 M3 Max | |
| Schenker VISION 16 Pro (M23) | |
| Gigabyte AERO 16 OLED BSF | |
| MSI Stealth 16 Studio A13VG | |
| Lenovo Yoga Pro 9 16-IRP G8 | |
| Medio Intel Core Ultra 7 155H, NVIDIA GeForce RTX 4070 Laptop GPU (1589 - 1750, n=4) | |
| Asus ROG Zephyrus G16 2024 GU605M | |
| Razer Blade 16 Early 2023 | |
| CrossMark / Creativity | |
| Apple MacBook Pro 16 2023 M3 Max | |
| Media de la clase Gaming (1343 - 2786, n=95, últimos 2 años) | |
| Lenovo Yoga Pro 9 16-IRP G8 | |
| Schenker VISION 16 Pro (M23) | |
| Gigabyte AERO 16 OLED BSF | |
| Asus ROG Zephyrus G16 2024 GU605M | |
| MSI Stealth 16 Studio A13VG | |
| Medio Intel Core Ultra 7 155H, NVIDIA GeForce RTX 4070 Laptop GPU (1860 - 2014, n=4) | |
| Razer Blade 16 Early 2023 | |
| CrossMark / Responsiveness | |
| Gigabyte AERO 16 OLED BSF | |
| Schenker VISION 16 Pro (M23) | |
| Media de la clase Gaming (1226 - 2334, n=95, últimos 2 años) | |
| MSI Stealth 16 Studio A13VG | |
| Medio Intel Core Ultra 7 155H, NVIDIA GeForce RTX 4070 Laptop GPU (1424 - 1683, n=4) | |
| Lenovo Yoga Pro 9 16-IRP G8 | |
| Apple MacBook Pro 16 2023 M3 Max | |
| Asus ROG Zephyrus G16 2024 GU605M | |
| Razer Blade 16 Early 2023 | |
| WebXPRT 3 / Overall | |
| Apple MacBook Pro 16 2023 M3 Max | |
| Media de la clase Gaming (220 - 532, n=99, últimos 2 años) | |
| Schenker VISION 16 Pro (M23) | |
| Lenovo Yoga Pro 9 16-IRP G8 | |
| MSI Stealth 16 Studio A13VG | |
| Asus ROG Zephyrus G16 2024 GU605M | |
| Medio Intel Core Ultra 7 155H, NVIDIA GeForce RTX 4070 Laptop GPU (264 - 294, n=4) | |
| Razer Blade 16 Early 2023 | |
| Gigabyte AERO 16 OLED BSF | |
| WebXPRT 4 / Overall | |
| Media de la clase Gaming (165 - 354, n=99, últimos 2 años) | |
| Razer Blade 16 Early 2023 | |
| Schenker VISION 16 Pro (M23) | |
| MSI Stealth 16 Studio A13VG | |
| Lenovo Yoga Pro 9 16-IRP G8 | |
| Asus ROG Zephyrus G16 2024 GU605M | |
| Medio Intel Core Ultra 7 155H, NVIDIA GeForce RTX 4070 Laptop GPU (247 - 257, n=4) | |
| Gigabyte AERO 16 OLED BSF | |
| Mozilla Kraken 1.1 / Total | |
| Gigabyte AERO 16 OLED BSF | |
| Medio Intel Core Ultra 7 155H, NVIDIA GeForce RTX 4070 Laptop GPU (546 - 568, n=3) | |
| Asus ROG Zephyrus G16 2024 GU605M | |
| MSI Stealth 16 Studio A13VG | |
| Lenovo Yoga Pro 9 16-IRP G8 | |
| Schenker VISION 16 Pro (M23) | |
| Razer Blade 16 Early 2023 | |
| Media de la clase Gaming (391 - 590, n=101, últimos 2 años) | |
| Apple MacBook Pro 16 2023 M3 Max | |
* ... más pequeño es mejor
| PCMark 10 Score | 7123 puntos | |
ayuda | ||
| AIDA64 / Memory Copy | |
| Asus ROG Zephyrus G16 2024 GU605M | |
| Medio Intel Core Ultra 7 155H (62397 - 96791, n=50) | |
| Razer Blade 16 Early 2023 | |
| Razer Blade 16 Early 2023 | |
| Razer Blade 16 Early 2023 | |
| Lenovo Yoga Pro 9 16-IRP G8 | |
| Media de la clase Gaming (21750 - 129946, n=106, últimos 2 años) | |
| MSI Stealth 16 Studio A13VG | |
| Gigabyte AERO 16 OLED BSF | |
| Schenker VISION 16 Pro (M23) | |
| AIDA64 / Memory Read | |
| Razer Blade 16 Early 2023 | |
| Razer Blade 16 Early 2023 | |
| Razer Blade 16 Early 2023 | |
| Asus ROG Zephyrus G16 2024 GU605M | |
| Medio Intel Core Ultra 7 155H (60544 - 90647, n=50) | |
| Lenovo Yoga Pro 9 16-IRP G8 | |
| Media de la clase Gaming (22956 - 118858, n=106, últimos 2 años) | |
| MSI Stealth 16 Studio A13VG | |
| Schenker VISION 16 Pro (M23) | |
| Gigabyte AERO 16 OLED BSF | |
| AIDA64 / Memory Write | |
| Lenovo Yoga Pro 9 16-IRP G8 | |
| Razer Blade 16 Early 2023 | |
| Razer Blade 16 Early 2023 | |
| Razer Blade 16 Early 2023 | |
| Media de la clase Gaming (22297 - 135096, n=106, últimos 2 años) | |
| Asus ROG Zephyrus G16 2024 GU605M | |
| Medio Intel Core Ultra 7 155H (58692 - 93451, n=50) | |
| MSI Stealth 16 Studio A13VG | |
| Gigabyte AERO 16 OLED BSF | |
| Schenker VISION 16 Pro (M23) | |
| AIDA64 / Memory Latency | |
| Medio Intel Core Ultra 7 155H (116.2 - 233, n=50) | |
| Asus ROG Zephyrus G16 2024 GU605M | |
| Lenovo Yoga Pro 9 16-IRP G8 | |
| Media de la clase Gaming (75.3 - 259, n=106, últimos 2 años) | |
| Razer Blade 16 Early 2023 | |
| Razer Blade 16 Early 2023 | |
| Razer Blade 16 Early 2023 | |
| Gigabyte AERO 16 OLED BSF | |
| MSI Stealth 16 Studio A13VG | |
| Schenker VISION 16 Pro (M23) | |
* ... más pequeño es mejor
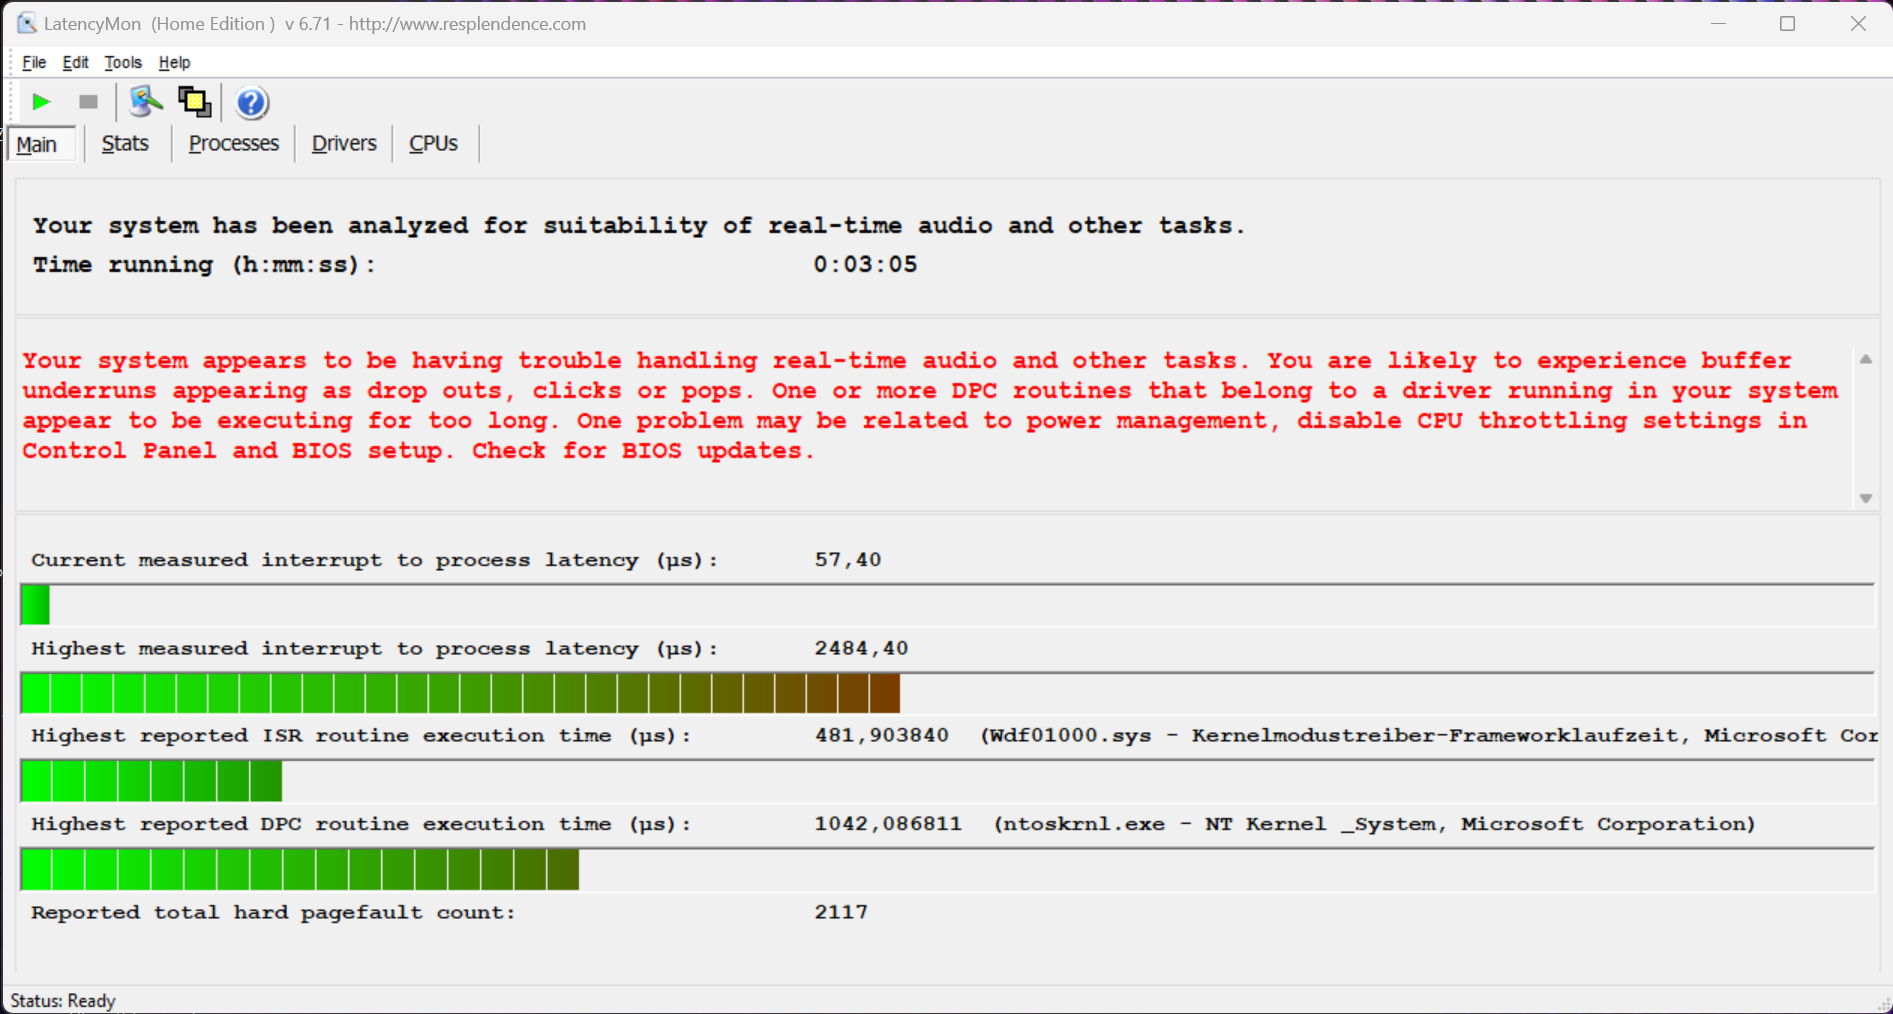
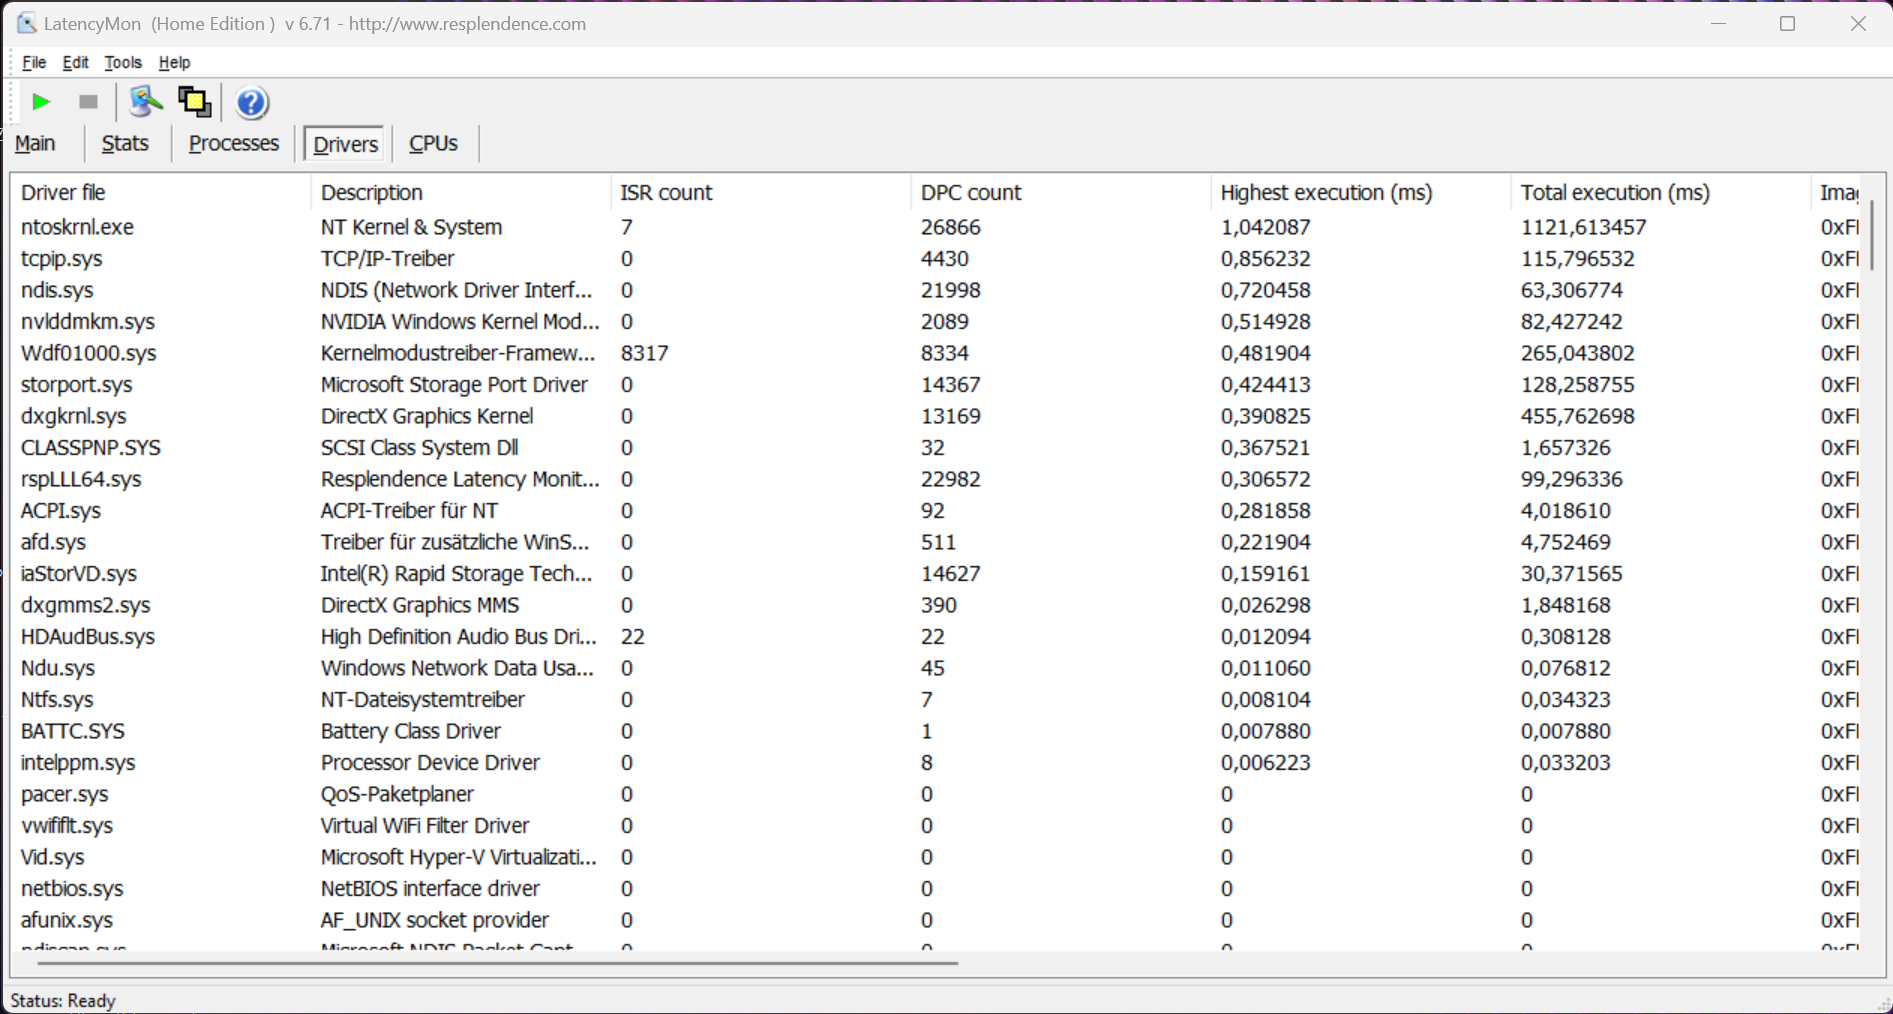
Latencia del CPD
En nuestra prueba de latencia estandarizada (navegación por Internet, reproducción 4K de YouTube, carga de la CPU), el dispositivo de prueba con la versión actual de la BIOS mostró ligeras limitaciones al utilizar aplicaciones de audio en tiempo real.
| DPC Latencies / LatencyMon - interrupt to process latency (max), Web, Youtube, Prime95 | |
| MSI Stealth 16 Studio A13VG | |
| Lenovo Yoga Pro 9 16-IRP G8 | |
| Asus ROG Zephyrus G16 2024 GU605M | |
| Razer Blade 16 Early 2023 | |
| Gigabyte AERO 16 OLED BSF | |
| Schenker VISION 16 Pro (M23) | |
* ... más pequeño es mejor
Dispositivos de almacenamiento
El nuevo G16 dispone de dos ranuras M.2-2280 que se conectan a través de PCIe 4.0. La versión de 1 TB del Western Digital SN560 está instalada en nuestro dispositivo de pruebas y, aunque ofrece buenas tasas de transferencia de hasta 5 GB/s, no es una de las unidades más rápidas del mercado. Al menos, su rendimiento se mantiene constante incluso bajo carga permanente. Ex fábrica, los usuarios disponen de 855 GB libres para su uso. Puede encontrar más pruebas comparativas de SSD aquí.

* ... más pequeño es mejor
Reading continuous performance: DiskSpd Read Loop, Queue Depth 8
Tarjeta gráfica
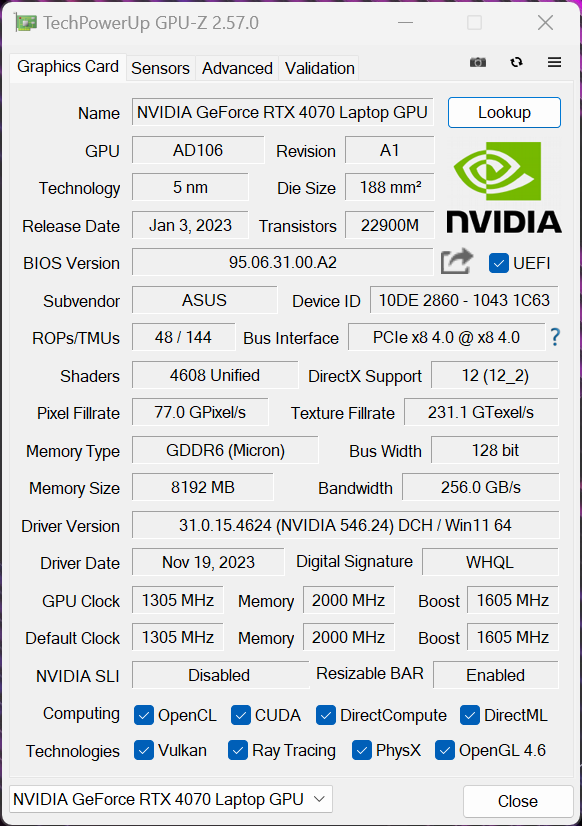
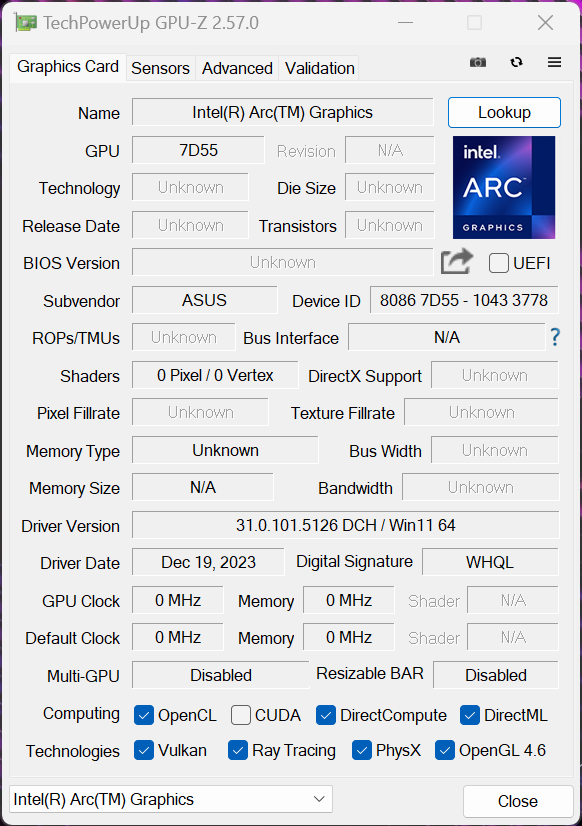
El GeForce Portátil RTX 4070 tiene 8 GB de RAM y, en modo de rendimiento, funciona a un máximo de 80 vatios. Para acceder a su pleno rendimiento de hasta 105 vatios, hay que seleccionar el modo turbo. El Zephyrus G16 incorpora un conmutador MUX con Advanced Optimus, por lo que cambiar a la dGPU no requiere reiniciar el sistema. La iGPU Arc de los nuevos procesadores Meteor-Lake muestra un rendimiento considerablemente mejorado en comparación con la antigua Iris Xe Graphics G7, pero como la G16 tiene una GPU Nvidia dedicada, esto no es demasiado importante.
Sus resultados en los bancos de pruebas fueron correctos y se podría conseguir un rendimiento un poco mejor utilizando el modo turbo (esto también reduciría la diferencia con los dispositivos de comparación). Bajo carga permanente, la GPU sólo puede consumir 42 vatios, por lo que el rendimiento de la GPU acaba siendo un 27 % inferior. Encontrará más pruebas comparativas de la GPU en .
| 3DMark 11 Performance | 31273 puntos | |
| 3DMark Fire Strike Score | 23302 puntos | |
| 3DMark Time Spy Score | 10850 puntos | |
ayuda | ||
| Blender / v3.3 Classroom OPTIX/RTX | |
| Lenovo Yoga Pro 9 16-IRP G8 | |
| MSI Stealth 16 Studio A13VG | |
| Schenker VISION 16 Pro (M23) | |
| Asus ROG Zephyrus G16 2024 GU605M | |
| Medio NVIDIA GeForce RTX 4070 Laptop GPU (18 - 30, n=68) | |
| Gigabyte AERO 16 OLED BSF | |
| Media de la clase Gaming (9 - 32, n=107, últimos 2 años) | |
| Razer Blade 16 Early 2023 | |
| Blender / v3.3 Classroom CUDA | |
| Lenovo Yoga Pro 9 16-IRP G8 | |
| MSI Stealth 16 Studio A13VG | |
| Schenker VISION 16 Pro (M23) | |
| Medio NVIDIA GeForce RTX 4070 Laptop GPU (32 - 50, n=67) | |
| Gigabyte AERO 16 OLED BSF | |
| Asus ROG Zephyrus G16 2024 GU605M | |
| Media de la clase Gaming (15 - 228, n=107, últimos 2 años) | |
| Razer Blade 16 Early 2023 | |
| Blender / v3.3 Classroom CPU | |
| Schenker VISION 16 Pro (M23) | |
| Asus ROG Zephyrus G16 2024 GU605M | |
| Lenovo Yoga Pro 9 16-IRP G8 | |
| Gigabyte AERO 16 OLED BSF | |
| MSI Stealth 16 Studio A13VG | |
| Medio NVIDIA GeForce RTX 4070 Laptop GPU (158 - 440, n=67) | |
| Media de la clase Gaming (122 - 565, n=103, últimos 2 años) | |
| Razer Blade 16 Early 2023 | |
| Apple MacBook Pro 16 2023 M3 Max | |
| Blender / v3.3 Classroom METAL | |
| Apple MacBook Pro 16 2023 M3 Max | |
* ... más pequeño es mejor
Rendimiento en juegos
Aunque el nuevo ROG Zephyrus G16 ya no es un portátil para juegos hardcore, su rendimiento en juegos sigue siendo naturalmente un aspecto muy importante-y el nuevo modelo ciertamente no decepcionó. El Portátil RTX 4070junto con el del procesador Meteor-Lake, es más que suficiente para ejecutar los juegos actuales sin problemas. En combinación con el gran panel OLED, este portátil ofrece una experiencia de juego extraordinaria. Sólo los juegos extremadamente exigentes o el trazado de rayos podrían requerir el uso de tecnologías de reescalado, si el juego las admite. Además, su rendimiento en juegos se mantiene completamente estable incluso durante las sesiones más largas.
| The Witcher 3 - 1920x1080 Ultra Graphics & Postprocessing (HBAO+) | |
| Media de la clase Gaming (104.7 - 240, n=7, últimos 2 años) | |
| Razer Blade 16 Early 2023 | |
| MSI Stealth 16 Studio A13VG | |
| Gigabyte AERO 16 OLED BSF | |
| Schenker VISION 16 Pro (M23) | |
| Asus ROG Zephyrus G16 2024 GU605M | |
| Lenovo Yoga Pro 9 16-IRP G8 | |
| Final Fantasy XV Benchmark - 1920x1080 High Quality | |
| Razer Blade 16 Early 2023 | |
| Media de la clase Gaming (41 - 215, n=95, últimos 2 años) | |
| Gigabyte AERO 16 OLED BSF | |
| MSI Stealth 16 Studio A13VG | |
| Schenker VISION 16 Pro (M23) | |
| Asus ROG Zephyrus G16 2024 GU605M | |
| Lenovo Yoga Pro 9 16-IRP G8 | |
| Call of Duty Modern Warfare 3 2023 | |
| 1920x1080 Extreme Preset | |
| Medio NVIDIA GeForce RTX 4070 Laptop GPU (92 - 120, n=7) | |
| Asus ROG Zephyrus G16 2024 GU605M | |
| Media de la clase Gaming (27 - 95, n=2, últimos 2 años) | |
| 2560x1440 Extreme Preset | |
| Medio NVIDIA GeForce RTX 4070 Laptop GPU (64 - 83, n=6) | |
| Media de la clase Gaming (n=1últimos 2 años) | |
| Asus ROG Zephyrus G16 2024 GU605M | |
| Avatar Frontiers of Pandora | |
| 1920x1080 Ultra Preset AA:T | |
| Media de la clase Gaming (n=1últimos 2 años) | |
| Medio NVIDIA GeForce RTX 4070 Laptop GPU (49 - 62, n=9) | |
| Asus ROG Zephyrus G16 2024 GU605M | |
| 2560x1440 Ultra Preset AA:T | |
| Media de la clase Gaming (n=1últimos 2 años) | |
| Medio NVIDIA GeForce RTX 4070 Laptop GPU (32 - 42, n=9) | |
| Asus ROG Zephyrus G16 2024 GU605M | |
También hemos observado el impacto que tienen los distintos modos de energía en varios juegos con resolución QHD y detalles máximos. Como puede ver, hay algunas diferencias, pero no son en absoluto enormes. Incluso en el modo silencioso, normalmente puede ejecutarlos bastante bien (sobre todo si baja ligeramente la resolución o utiliza DLSS); en la práctica, sólo tiene que probar muchos ajustes diferentes.
| Perfil energético | Far Cry 5 | Witcher 3 | Cyberpunk 2077 | Modern Warfare 3 | Avatar | Star Wars Jedi Survivor |
|---|---|---|---|---|---|---|
| Silencio | 87 fps | 68,5 fps | 32,6 fps | 49 fps | 23 fps | 29,8 fps |
| Rendimiento | 94 fps | 82,4 fps | 43,7 fps | 64 fps | 32 fps | 39,5 fps |
| Turbo | 105 fps | 83,9 fps | 48,7 fps | 66 fps | 34 fps | 42,5 fps |
Witcher 3 FPS diagram
| bajo | medio | alto | ultra | QHD | |
|---|---|---|---|---|---|
| GTA V (2015) | 166.5 | 98.8 | 79.6 | ||
| The Witcher 3 (2015) | 221 | 98.6 | 82.4 | ||
| Dota 2 Reborn (2015) | 162.3 | 146.8 | 140.7 | 131.6 | |
| Final Fantasy XV Benchmark (2018) | 131.8 | 100.8 | 76.3 | ||
| X-Plane 11.11 (2018) | 119.9 | 106.3 | 81.2 | ||
| Far Cry 5 (2018) | 147 | 126 | 121 | 112 | 94 |
| Strange Brigade (2018) | 211 | 129.3 | 123.4 | ||
| F1 2021 (2021) | 294 | 270 | 220 | 123.1 | 95.2 |
| F1 22 (2022) | 192.9 | 199.7 | 168.1 | 65.6 | 44.3 |
| Star Wars Jedi Survivor (2023) | 78.7 | 69.9 | 65.1 | 61.5 | 39.5 |
| F1 23 (2023) | 195.2 | 193.8 | 165.4 | 55.8 | 36 |
| Cyberpunk 2077 (2023) | 96.4 | 90 | 77 | 69 | 43.7 |
| Call of Duty Modern Warfare 3 2023 (2023) | 143 | 130 | 101 | 94 | 64 |
| Avatar Frontiers of Pandora (2023) | 81 | 75 | 66 | 49 | 32 |
Emisiones - El ROG G16 con un tercer ventilador
Emisiones sonoras
Como ya se ha mencionado, los modelos con el portátil RTX 4050/4060/4070 utilizan una unidad de refrigeración por tubo de calor convencional con un tercer ventilador en la carcasa. Este ventilador aspira aire fresco por la parte inferior y lo dirige hacia la GPU. El problema es, sin embargo, que este pequeño ventilador funciona muy rápido con una alta velocidad de rotación, lo que hace que se note bastante. En general, el nuevo Zephyrus G16 no es en absoluto un portátil silencioso, ni siquiera durante las tareas cotidianas, ya que los ventiladores entran en acción muy rápidamente. Esto ocurre incluso cuando se utiliza el modo silencioso. Bajo carga, alcanza muy rápidamente unos 46 dB(A) con el modo de rendimiento en uso, lo que es claramente audible pero aún así tolerable. A su vez, a partir de unos 48 dB(A), las emisiones sonoras de los ventiladores se vuelven bastante incómodas ya que hay un zumbido adicional presente, lo que hace que no podamos recomendar el uso del modo turbo (máx. 52,4 dB(A)). La siguiente tabla muestra un resumen de las emisiones de ruido utilizando los diferentes perfiles de energía. No observamos ningún ruido electrónico adicional procedente de nuestro dispositivo de prueba. Estos resultados de las pruebas no son representativos de los modelos con el portátil RTX 4080/4090 que utilizan dos ventiladores, incluida una cámara de vapor. Intentaremos probar uno de estos modelos lo antes posible.
| Perfil energético | 3DMark 06 | Witcher 3 | Cyberpunk 2077 Phantom Liberty | Prueba de estrés |
|---|---|---|---|---|
| Silencioso | 30,4 dB(A) | 38 dB(A) | 41,5 dB(A) | 41,5 dB(A) |
| Rendimiento | 34,2 dB(A) | 46,4 dB(A) | 46,4 dB(A) | 46,4 dB(A) |
| Turbo | 41,5 dB(A) | 52,4 dB(A) | 52,4 dB(A) | 52,4 dB(A) |
Ruido
| Ocioso |
| 23.9 / 27.8 / 30.1 dB(A) |
| Carga |
| 34.2 / 46.4 dB(A) |
 | ||
30 dB silencioso 40 dB(A) audible 50 dB(A) ruidosamente alto |
||
min: | ||
| Asus ROG Zephyrus G16 2024 GU605M GeForce RTX 4070 Laptop GPU, Ultra 7 155H, WD PC SN560 SDDPNQE-1T00 | Lenovo Yoga Pro 9 16-IRP G8 GeForce RTX 4060 Laptop GPU, i7-13705H, Samsung PM9A1 MZVL21T0HCLR | Razer Blade 16 Early 2023 GeForce RTX 4080 Laptop GPU, i9-13950HX, SSSTC CA6-8D1024 | Gigabyte AERO 16 OLED BSF GeForce RTX 4070 Laptop GPU, i9-13900H, Gigabyte AG470S1TB-SI B10 | Schenker VISION 16 Pro (M23) GeForce RTX 4070 Laptop GPU, i7-13700H, Samsung 990 Pro 1 TB | MSI Stealth 16 Studio A13VG GeForce RTX 4070 Laptop GPU, i7-13700H, Micron 3400 2TB MTFDKBA2T0TFH | Apple MacBook Pro 16 2023 M3 Max M3 Max 40-Core GPU, Apple M3 Max 16-Core, Apple SSD AP8192Z | |
|---|---|---|---|---|---|---|---|
| Noise | -5% | 2% | -11% | -12% | 4% | 5% | |
| apagado / medio ambiente * (dB) | 23.9 | 24.7 -3% | 23 4% | 23 4% | 25.9 -8% | 24 -0% | 23.7 1% |
| Idle Minimum * (dB) | 23.9 | 24.7 -3% | 23 4% | 23 4% | 25.9 -8% | 24 -0% | 23.7 1% |
| Idle Average * (dB) | 27.8 | 26.2 6% | 23 17% | 23 17% | 25.9 7% | 24 14% | 23.7 15% |
| Idle Maximum * (dB) | 30.1 | 26.2 13% | 23.6 22% | 33.64 -12% | 32 -6% | 24 20% | 23.7 21% |
| Load Average * (dB) | 34.2 | 39.7 -16% | 39 -14% | 51.49 -51% | 47.2 -38% | 34.81 -2% | 40.8 -19% |
| Witcher 3 ultra * (dB) | 46.4 | 53.2 -15% | 51.6 -11% | 55.27 -19% | 53.1 -14% | 44.05 5% | 42.8 8% |
| Load Maximum * (dB) | 46.4 | 53.2 -15% | 51.3 -11% | 55.24 -19% | 53.1 -14% | 51.57 -11% | 42.8 8% |
* ... más pequeño es mejor
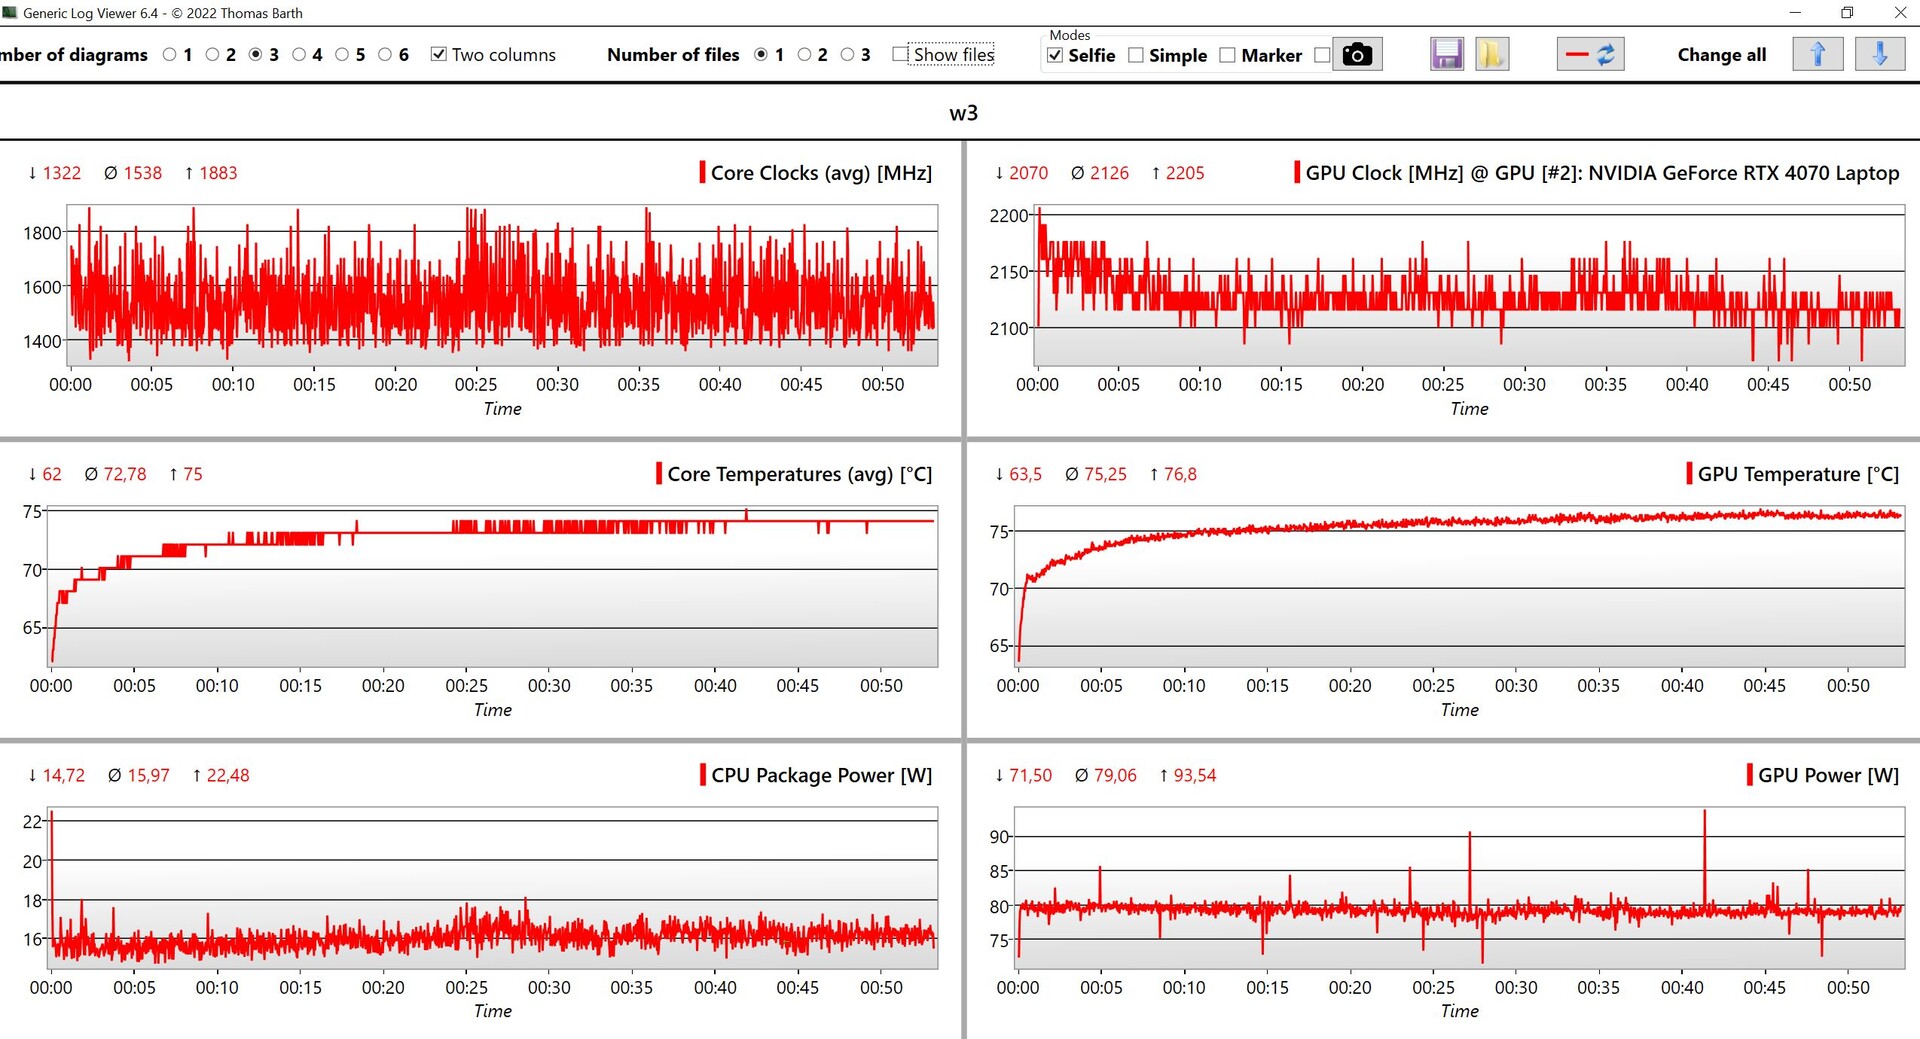
Temperatura
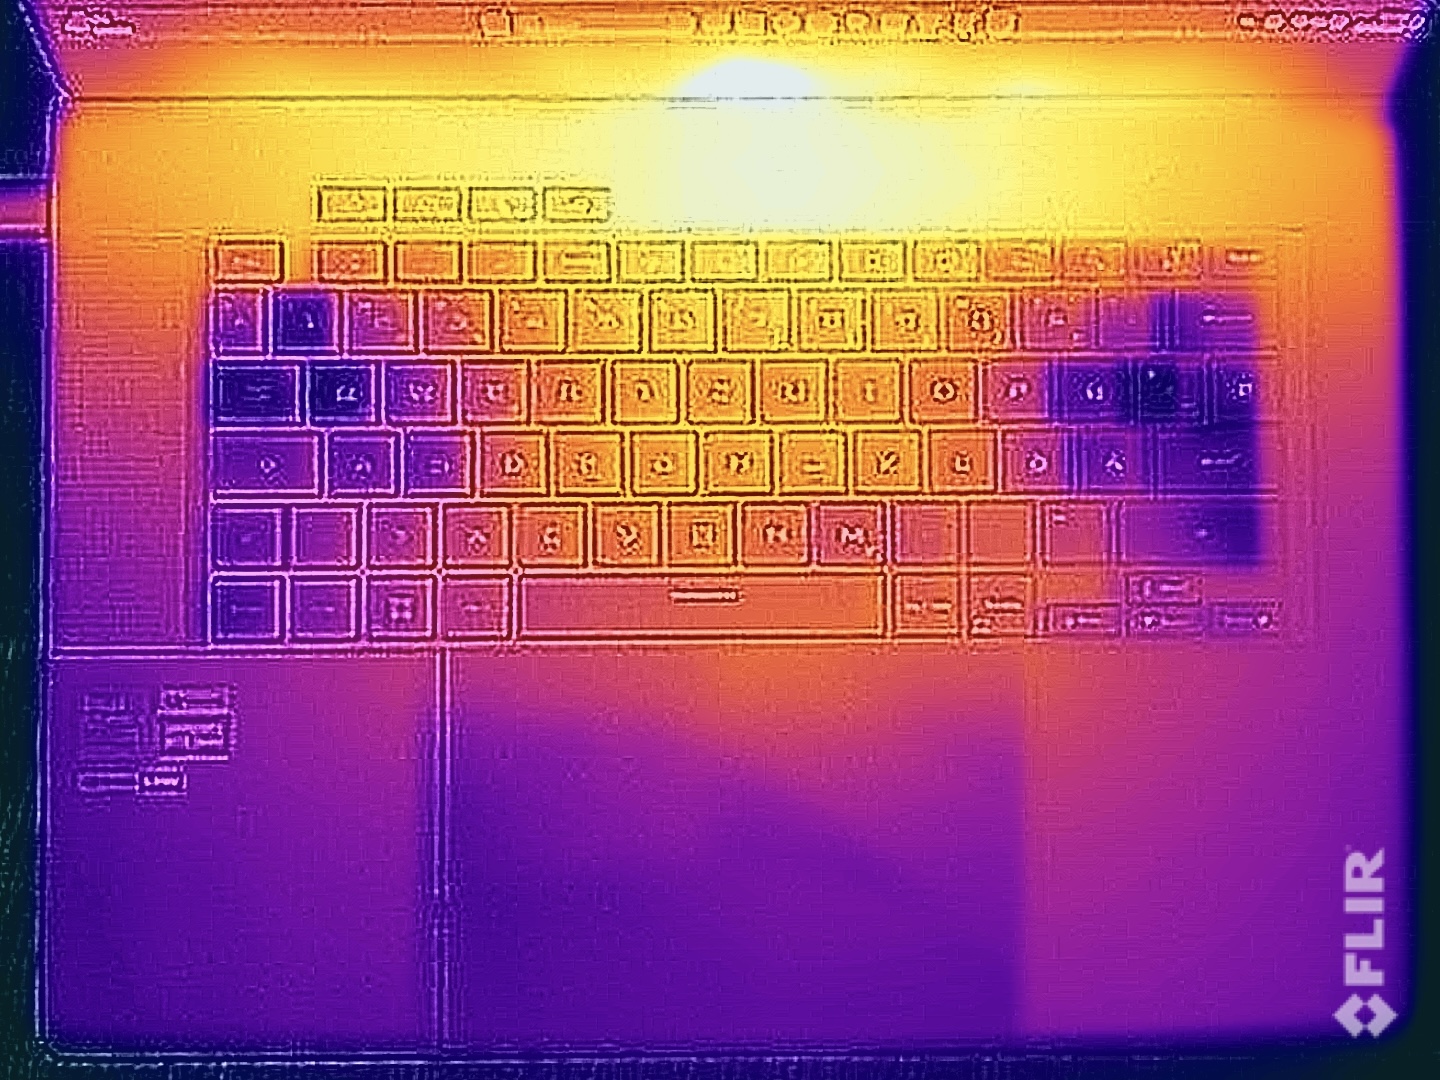
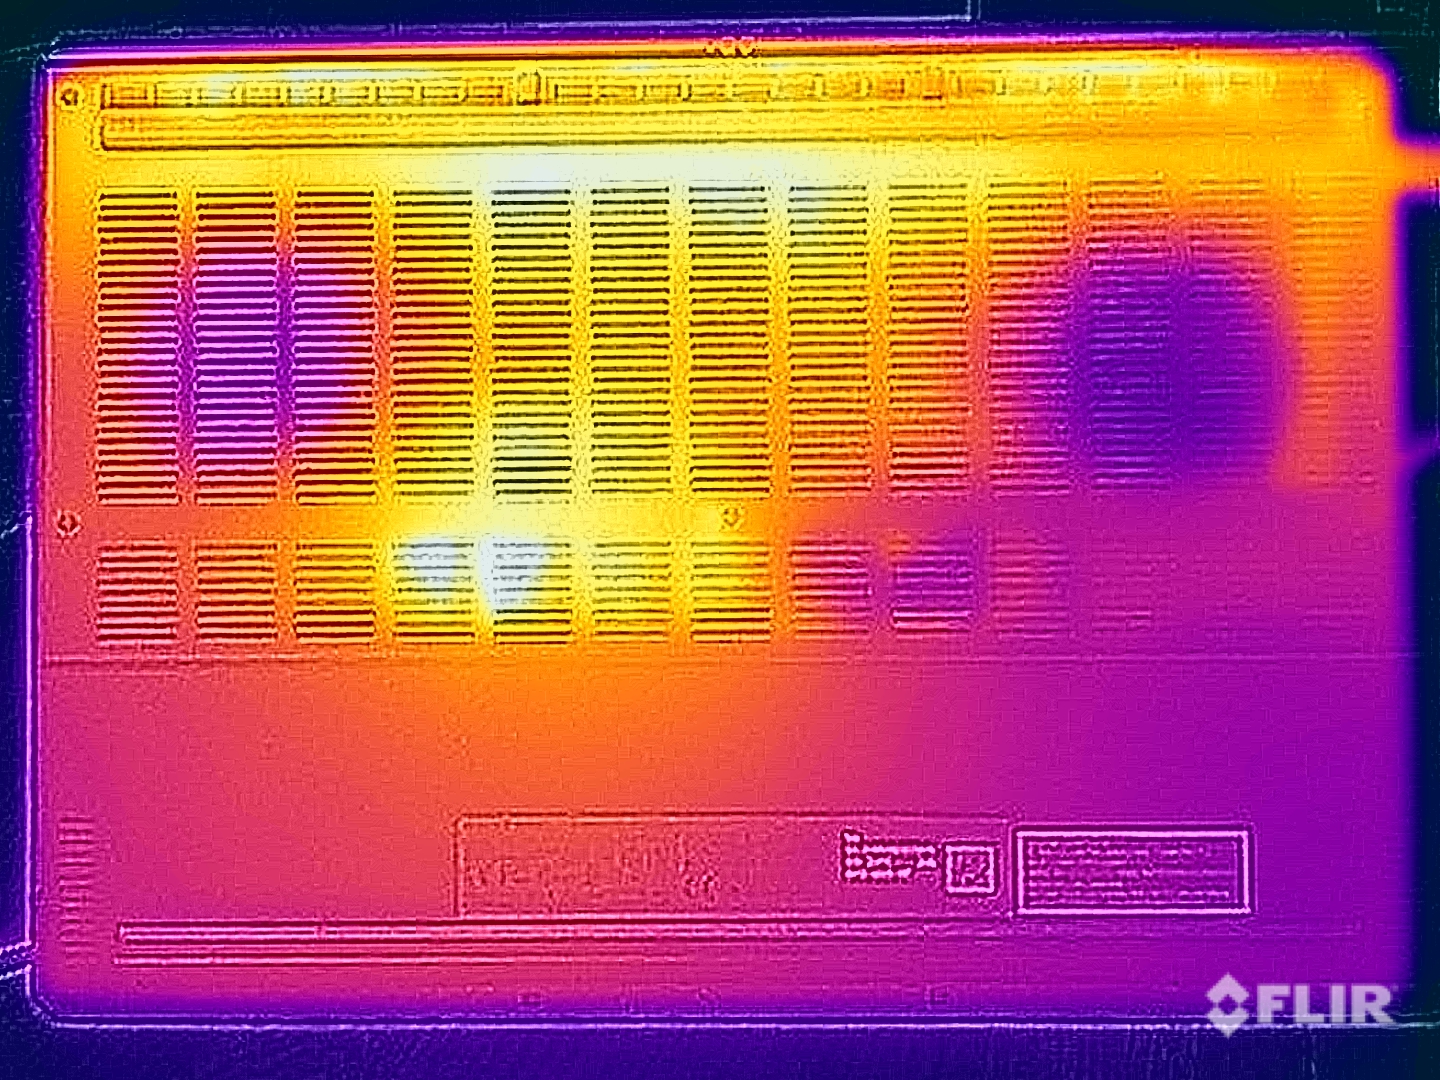
A pesar de su delgada carcasa, los resultados de temperatura del Zephyrus G16 son buenos. Durante tareas sencillas, el dispositivo apenas se calienta. Bajo carga, medimos hasta 50 °C en la parte superior de la unidad base, pero sólo en la zona por encima del teclado. El teclado en sí se mantiene mucho más fresco y no supone ninguna limitación a la hora de manejar el portátil. En la parte inferior, medimos temperaturas entre ~45-48 °C, por lo que no debería colocarlo sobre sus muslos en este caso.
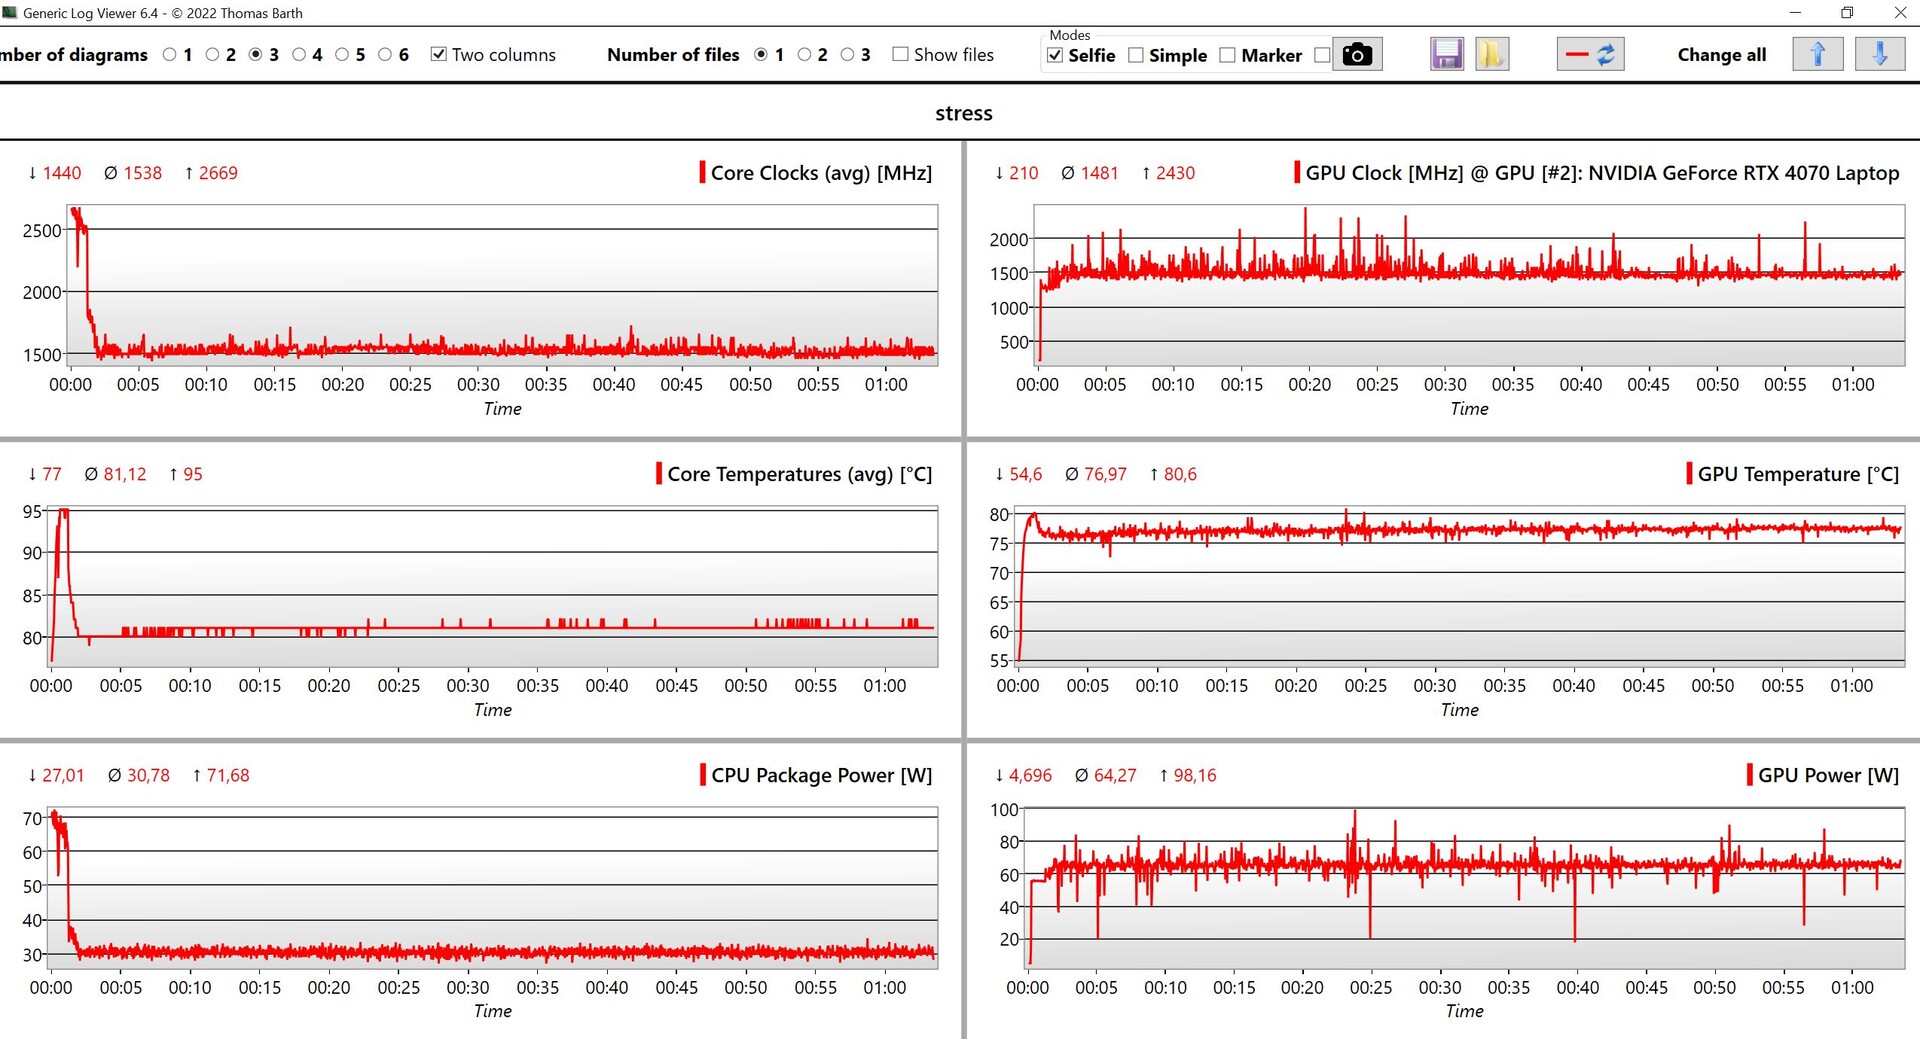
Durante la prueba de estrés, la CPU se equilibró a 30 vatios y la GPU a 65 vatios, que es exactamente lo que indica Asus en cuanto al rendimiento del perfil. En modo silencioso, anotamos 30/45 vatios y en modo turbo, medimos 35+85 vatios.
(-) La temperatura máxima en la parte superior es de 50.3 °C / 123 F, frente a la media de 40.4 °C / 105 F, que oscila entre 21.2 y 68.8 °C para la clase Gaming.
(-) El fondo se calienta hasta un máximo de 48 °C / 118 F, frente a la media de 43.2 °C / 110 F
(+) En reposo, la temperatura media de la parte superior es de 26.6 °C / 80# F, frente a la media del dispositivo de 33.9 °C / 93 F.
(±) Jugando a The Witcher 3, la temperatura media de la parte superior es de 38 °C / 100 F, frente a la media del dispositivo de 33.9 °C / 93 F.
(+) Los reposamanos y el panel táctil alcanzan como máximo la temperatura de la piel (32.4 °C / 90.3 F) y, por tanto, no están calientes.
(-) La temperatura media de la zona del reposamanos de dispositivos similares fue de 28.8 °C / 83.8 F (-3.6 °C / -6.5 F).
| Asus ROG Zephyrus G16 2024 GU605M Intel Core Ultra 7 155H, NVIDIA GeForce RTX 4070 Laptop GPU | Lenovo Yoga Pro 9 16-IRP G8 Intel Core i7-13705H, NVIDIA GeForce RTX 4060 Laptop GPU | Razer Blade 16 Early 2023 Intel Core i9-13950HX, NVIDIA GeForce RTX 4080 Laptop GPU | Gigabyte AERO 16 OLED BSF Intel Core i9-13900H, NVIDIA GeForce RTX 4070 Laptop GPU | Schenker VISION 16 Pro (M23) Intel Core i7-13700H, NVIDIA GeForce RTX 4070 Laptop GPU | MSI Stealth 16 Studio A13VG Intel Core i7-13700H, NVIDIA GeForce RTX 4070 Laptop GPU | Apple MacBook Pro 16 2023 M3 Max Apple M3 Max 16-Core, Apple M3 Max 40-Core GPU | |
|---|---|---|---|---|---|---|---|
| Heat | 7% | 6% | 16% | 3% | -27% | 18% | |
| Maximum Upper Side * (°C) | 50.3 | 41.6 17% | 40 20% | 41 18% | 46.7 7% | 60 -19% | 42.3 16% |
| Maximum Bottom * (°C) | 48 | 50 -4% | 37.6 22% | 47 2% | 54.1 -13% | 61 -27% | 42 12% |
| Idle Upper Side * (°C) | 28.8 | 26.8 7% | 32.4 -13% | 23 20% | 26.5 8% | 38.2 -33% | 22.5 22% |
| Idle Bottom * (°C) | 29.8 | 27.9 6% | 31.4 -5% | 23 23% | 26.8 10% | 37.7 -27% | 22.9 23% |
* ... más pequeño es mejor
Altavoces
Asus ha instalado un sistema de sonido con 6 módulos (4x woofers a 2 vatios cada uno + 2x tweeters a 2 vatios cada uno) en el ROG Zephyrus G16. Los resultados son magníficos y están más o menos al mismo nivel que el MacBook Pro 16 que actualmente sigue siendo el rival a batir. Competidores multimedia como el excelente Lenovo Yoga Pro 9 16 también pueden ser superados por Asus en este aspecto. El sonido es muy potente y espacial, y los módulos pueden llegar a ser muy altos sin distorsionar demasiado. Esto significa que incluso utilizando el modo de rendimiento, puede seguir reproduciendo sonido fácilmente a través de los altavoces. En conjunto, un rendimiento sobresaliente.
Asus ROG Zephyrus G16 2024 GU605M análisis de audio
(+) | los altavoces pueden reproducir a un volumen relativamente alto (#83.3 dB)
Graves 100 - 315 Hz
(+) | buen bajo - sólo 3.8% lejos de la mediana
(±) | la linealidad de los graves es media (8.1% delta a frecuencia anterior)
Medios 400 - 2000 Hz
(+) | medios equilibrados - a sólo 3.5% de la mediana
(+) | los medios son lineales (2.4% delta a la frecuencia anterior)
Altos 2 - 16 kHz
(+) | máximos equilibrados - a sólo 2.2% de la mediana
(+) | los máximos son lineales (3.7% delta a la frecuencia anterior)
Total 100 - 16.000 Hz
(+) | el sonido global es lineal (7.3% de diferencia con la mediana)
En comparación con la misma clase
» 1% de todos los dispositivos probados de esta clase eran mejores, 0% similares, 99% peores
» El mejor tuvo un delta de 6%, la media fue 18%, el peor fue ###max##%
En comparación con todos los dispositivos probados
» 1% de todos los dispositivos probados eran mejores, 0% similares, 99% peores
» El mejor tuvo un delta de 4%, la media fue 23%, el peor fue ###max##%
Lenovo Yoga Pro 9 16-IRP G8 análisis de audio
(±) | la sonoridad del altavoz es media pero buena (80.5 dB)
Graves 100 - 315 Hz
(+) | buen bajo - sólo 4.9% lejos de la mediana
(±) | la linealidad de los graves es media (9.1% delta a frecuencia anterior)
Medios 400 - 2000 Hz
(+) | medios equilibrados - a sólo 3.2% de la mediana
(+) | los medios son lineales (6.5% delta a la frecuencia anterior)
Altos 2 - 16 kHz
(+) | máximos equilibrados - a sólo 2.9% de la mediana
(+) | los máximos son lineales (3% delta a la frecuencia anterior)
Total 100 - 16.000 Hz
(+) | el sonido global es lineal (8.4% de diferencia con la mediana)
En comparación con la misma clase
» 9% de todos los dispositivos probados de esta clase eran mejores, 2% similares, 89% peores
» El mejor tuvo un delta de 5%, la media fue 17%, el peor fue ###max##%
En comparación con todos los dispositivos probados
» 2% de todos los dispositivos probados eran mejores, 1% similares, 97% peores
» El mejor tuvo un delta de 4%, la media fue 23%, el peor fue ###max##%
Apple MacBook Pro 16 2023 M3 Max análisis de audio
(+) | los altavoces pueden reproducir a un volumen relativamente alto (#84.3 dB)
Graves 100 - 315 Hz
(±) | lubina reducida - en promedio 5% inferior a la mediana
(+) | el bajo es lineal (5.6% delta a la frecuencia anterior)
Medios 400 - 2000 Hz
(+) | medios equilibrados - a sólo 1.2% de la mediana
(+) | los medios son lineales (3.1% delta a la frecuencia anterior)
Altos 2 - 16 kHz
(+) | máximos equilibrados - a sólo 2.4% de la mediana
(+) | los máximos son lineales (2.4% delta a la frecuencia anterior)
Total 100 - 16.000 Hz
(+) | el sonido global es lineal (5.3% de diferencia con la mediana)
En comparación con la misma clase
» 1% de todos los dispositivos probados de esta clase eran mejores, 1% similares, 98% peores
» El mejor tuvo un delta de 5%, la media fue 17%, el peor fue ###max##%
En comparación con todos los dispositivos probados
» 0% de todos los dispositivos probados eran mejores, 0% similares, 100% peores
» El mejor tuvo un delta de 4%, la media fue 23%, el peor fue ###max##%
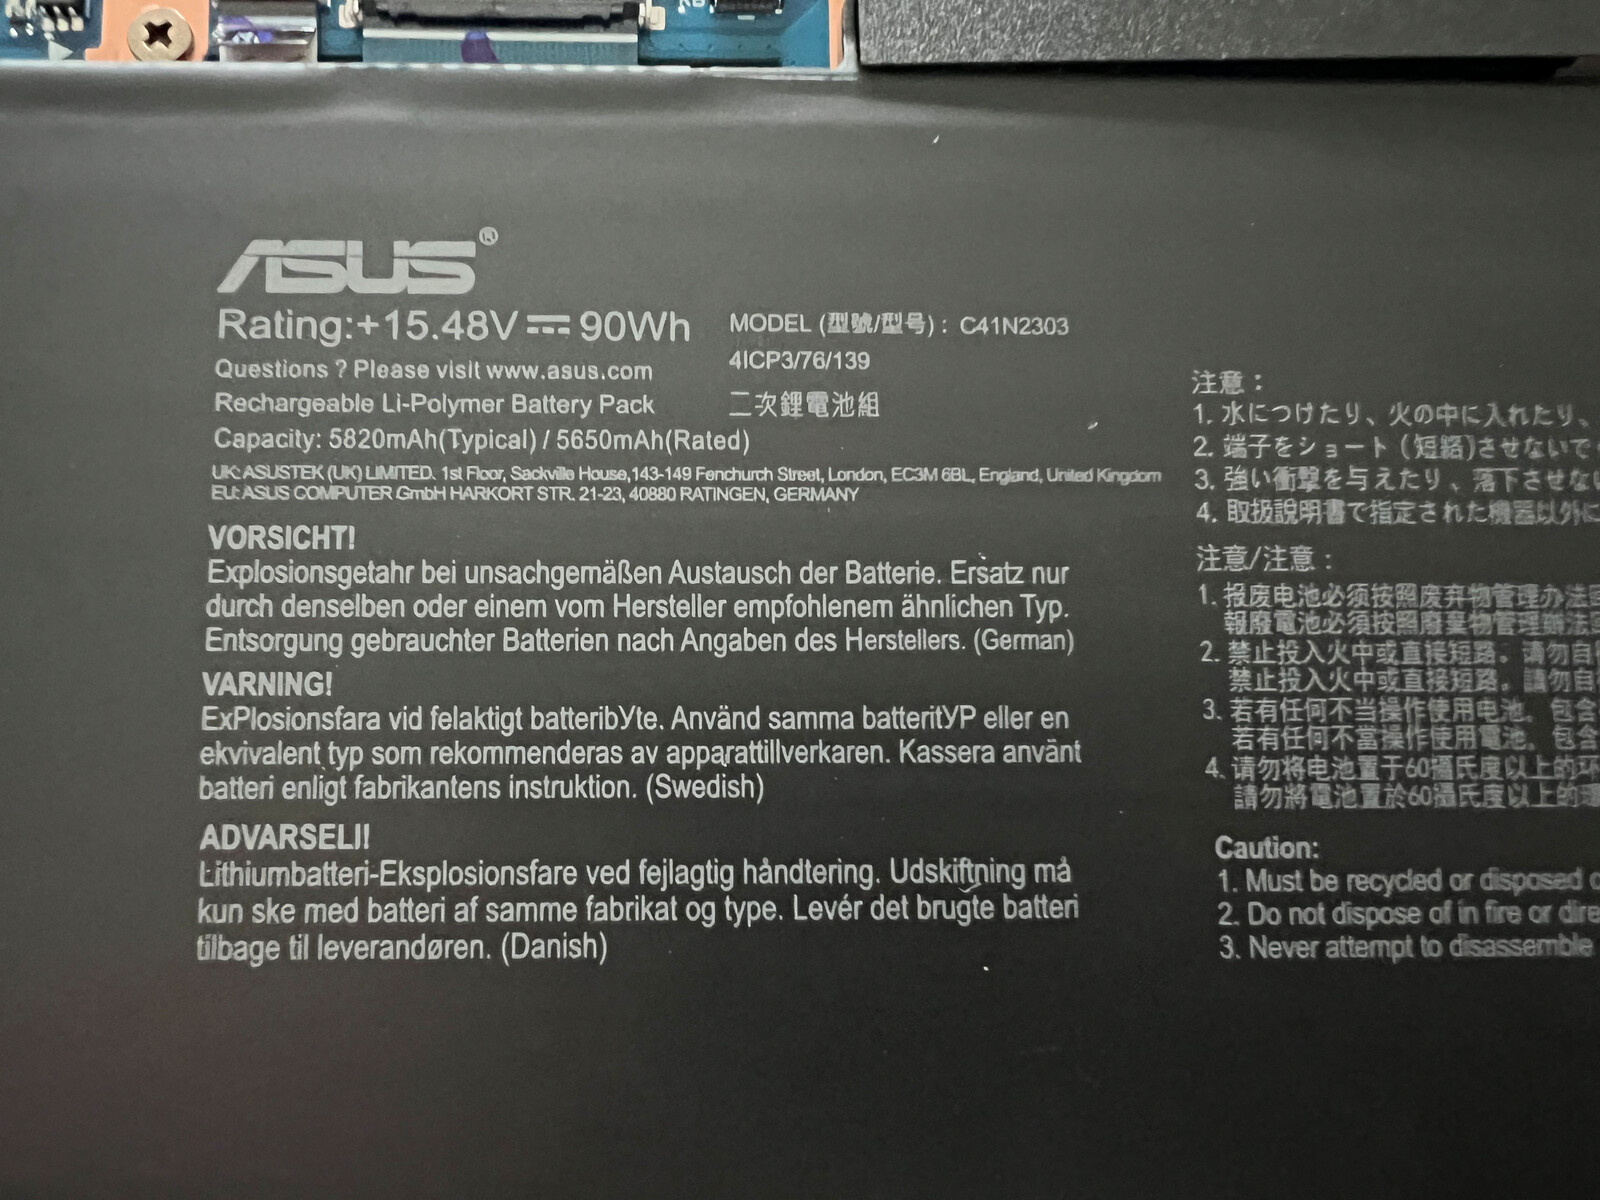
Gestión de la energía - Una batería de 90 Wh permite una autonomía decente
Consumo de energía
Las mediciones de consumo de energía del portátil son menos sorprendentes, aunque el dispositivo de prueba se benefició enormemente de su fondo de pantalla estándar oscuro durante las mediciones en reposo en particular. Como es típico en las pantallas OLED, el consumo varía en función del contenido que se represente, siendo las imágenes claras las que consumen más energía. Mientras jugábamos, notamos 120 vatios y durante la prueba de estrés, alcanzó los 170 vatios durante un breve periodo de tiempo -luego se equilibró rápidamente en 165 vatios. Como resultado, podemos afirmar con seguridad que la fuente de alimentación de 200 vatios es más que suficiente; las configuraciones con el portátil RTX 4080/4090 se entregan con una fuente de alimentación más potente de 240 vatios.
| Off / Standby | |
| Ocioso | |
| Carga |
|
Clave:
min: | |
| Asus ROG Zephyrus G16 2024 GU605M Ultra 7 155H, GeForce RTX 4070 Laptop GPU, WD PC SN560 SDDPNQE-1T00, OLED, 2560x1600, 16" | Lenovo Yoga Pro 9 16-IRP G8 i7-13705H, GeForce RTX 4060 Laptop GPU, Samsung PM9A1 MZVL21T0HCLR, Mini-LED, 3200x2000, 16" | Razer Blade 16 Early 2023 i9-13950HX, GeForce RTX 4080 Laptop GPU, SSSTC CA6-8D1024, IPS, 2560x1600, 16" | Gigabyte AERO 16 OLED BSF i9-13900H, GeForce RTX 4070 Laptop GPU, Gigabyte AG470S1TB-SI B10, OLED, 3840x2400, 16" | Schenker VISION 16 Pro (M23) i7-13700H, GeForce RTX 4070 Laptop GPU, Samsung 990 Pro 1 TB, IPS, 2560x1600, 16" | MSI Stealth 16 Studio A13VG i7-13700H, GeForce RTX 4070 Laptop GPU, Micron 3400 2TB MTFDKBA2T0TFH, IPS, 2560x1600, 16" | Apple MacBook Pro 16 2023 M3 Max Apple M3 Max 16-Core, M3 Max 40-Core GPU, Apple SSD AP8192Z, Mini-LED, 3456x2234, 16" | Medio NVIDIA GeForce RTX 4070 Laptop GPU | Media de la clase Gaming | |
|---|---|---|---|---|---|---|---|---|---|
| Power Consumption | -41% | -113% | -31% | -5% | -32% | -5% | -53% | -62% | |
| Idle Minimum * (Watt) | 8.3 | 10.9 -31% | 15.2 -83% | 11.8 -42% | 8.6 -4% | 11 -33% | 5.2 37% | 13.2 ? -59% | 13 ? -57% |
| Idle Average * (Watt) | 12.5 | 22.6 -81% | 22.8 -82% | 16.1 -29% | 12 4% | 18 -44% | 16.9 -35% | 18.2 ? -46% | 19 ? -52% |
| Idle Maximum * (Watt) | 12.8 | 23.5 -84% | 49.8 -289% | 17 -33% | 12.4 3% | 19 -48% | 17.2 -34% | 24.6 ? -92% | 24.5 ? -91% |
| Load Average * (Watt) | 71.3 | 84.6 -19% | 121.2 -70% | 100.6 -41% | 80 -12% | 91 -28% | 90.5 -27% | 97 ? -36% | 111.1 ? -56% |
| Witcher 3 ultra * (Watt) | 127.5 | 159.5 -25% | 242 -90% | 158 -24% | 147.7 -16% | 130 -2% | 109 15% | ||
| Load Maximum * (Watt) | 169.1 | 177.3 -5% | 273.7 -62% | 192 -14% | 173.1 -2% | 228 -35% | 145.2 14% | 221 ? -31% | 260 ? -54% |
* ... más pequeño es mejor
Power consumption Witcher 3 / stress test
Power consumption with external monitor
Tiempos de ejecución
El portátil Asus está equipado con una gran batería de 90 Wh y sus tiempos de ejecución son excelentes en total en comparación con los dispositivos de comparación de Windows-sólo el MacBook Pro 16 queda muy por delante. Dentro del software Armoury Crate, está configurado que la frecuencia de actualización se reduzca a 60 Hz en modo batería, por lo que utilizamos estos valores para la comparación (en breve añadiremos los valores a 240 Hz). Durante la prueba WLAN -que a menudo no es óptima para los paneles OLED debido a la gran cantidad de páginas web brillantes- observamos tiempos de ejecución de 07:15 horas a 150 cd/m² (57 % de su brillo máximo) y 05:45 horas a brillo máximo. Durante la prueba de vídeo a 150 cd/m², sus resultados de algo más de 11 horas fueron mucho mejores. Parece que la nueva iGPU Arc (o su decodificador de vídeo) funciona de forma muy eficiente en este aspecto, ya que los buenos tiempos de ejecución de los otros dispositivos de prueba Meteor-Lake también destacan ampliamente en la prueba de vídeo (por ejemplo, el Zenbook 14 OLED o el Spectre x360 14-reviews próximamente). Si reproduce un vídeo HDR con el brillo al máximo, su autonomía es de unas 7,5 horas, pero naturalmente esto también tiene que ver con su limitado brillo HDR. Una carga completa tarda 112 minutos con el dispositivo encendido, por lo que el 60 % de su capacidad está disponible tras unos 35 minutos y el 80 % tras 50 minutos.
| Asus ROG Zephyrus G16 2024 GU605M Ultra 7 155H, GeForce RTX 4070 Laptop GPU, 90 Wh | Lenovo Yoga Pro 9 16-IRP G8 i7-13705H, GeForce RTX 4060 Laptop GPU, 75 Wh | Razer Blade 16 Early 2023 i9-13950HX, GeForce RTX 4080 Laptop GPU, 95.2 Wh | Gigabyte AERO 16 OLED BSF i9-13900H, GeForce RTX 4070 Laptop GPU, 88 Wh | Schenker VISION 16 Pro (M23) i7-13700H, GeForce RTX 4070 Laptop GPU, 80 Wh | MSI Stealth 16 Studio A13VG i7-13700H, GeForce RTX 4070 Laptop GPU, 99.9 Wh | Apple MacBook Pro 16 2023 M3 Max Apple M3 Max 16-Core, M3 Max 40-Core GPU, 99.6 Wh | Media de la clase Gaming | |
|---|---|---|---|---|---|---|---|---|
| Duración de Batería | -29% | 1% | 15% | -5% | 25% | 70% | -1% | |
| H.264 (h) | 11.2 | 7.5 -33% | 7.4 -34% | 7.8 -30% | 7.7 -31% | 20.4 82% | 8.32 ? -26% | |
| WiFi v1.3 (h) | 7.3 | 6.4 -12% | 6.1 -16% | 7.5 3% | 7.8 7% | 7.8 7% | 16.7 129% | 7.11 ? -3% |
| Load (h) | 1.2 | 0.7 -42% | 1.4 17% | 2.1 75% | 1.3 8% | 2.4 100% | 1.2 0% | 1.502 ? 25% |
Pro
Contra
Veredicto - El nuevo ROG Zephyrus G16 es un híbrido gaming/multimedia sobresaliente
Asus ha retocado su concepto en torno al nuevo ROG Zephyrus G16, ahora con el objetivo de atraer a un público más amplio. A nuestros ojos, esto ha sido un éxito por parte del fabricante, ya que su nuevo modelo 2024 es un portátil de 16 pulgadas de gran calidad, compacto y ligero, con una carcasa de aluminio, unos altavoces impresionantes, unos dispositivos de entrada estupendos y un maravilloso panel OLED. Este último no puede estar a la altura de la competencia en lo que se refiere a sus capacidades HDR, ya que su brillo máximo es limitado. Aun así, las películas y los juegos se ven muy bien en la pantalla OLED de 240 Hz y los jugadores estarán encantados con sus rápidos tiempos de respuesta y su compatibilidad con G-Sync. Además, Asus sigue siendo uno de los únicos fabricantes que ofrece una solución de software que atenúa la pantalla sin llegar a zonas PWM potencialmente dañinas.
El rendimiento de sus componentes también es bueno, aunque el nuevo procesador Meteor-Lake no ofrece realmente un mayor rendimiento en comparación con su antiguo homólogo Raptor-Lake; además, su rendimiento en un solo núcleo es en realidad incluso peor. El verdadero punto fuerte de los nuevos procesadores móviles -la nueva iGPU Arc- no aporta gran cosa en este caso, ya que el dispositivo lleva instalada una GPU Nvidia dedicada.
Una carcasa de aluminio ligera y de alta calidad, una gran pantalla OLED y unos altavoces excelentes: Gracias a su potente hardware, el nuevo ROG Zephyrus G16 puede, por supuesto, seguir representando juegos actuales, pero el modelo 2024 de Asus se orienta más en la dirección multimedia de gama alta. Así que, aunque no tenga ambiciones de juego en absoluto, merece la pena echar un vistazo al nuevo Zephyrus G16.
Nuestro mayor problema radica en la refrigeración del portátil, ya que el G16 sólo permanece realmente silencioso en los casos más raros, además, su ventilador de sistema adicional tiene por desgracia una velocidad de rotación muy alta. También es una pena que sólo las dos versiones con el portátil RTX 4080/4090 se beneficien de una refrigeración Vapor-Chamber más potente, lo que conduce a un comportamiento del ventilador completamente diferente y a que la CPU pueda beneficiarse de límites de potencia más elevados. La memoria RAM soldada del dispositivo es otra desventaja, sobre todo si se tiene en cuenta que nuestra muestra de prueba sólo tiene 16 GB instalados. Por un precio de partida de casi 3.000 dólares, Asus realmente debería instalar 32 GB de RAM de serie.
El mayor competidor del nuevo ROG Zephyrus G16 es seguramente el Razer Blade 16 y nuestro análisis de la nueva variante 2024 (que también cuenta con una OLED de Samsung) se publicará en breve. Cuando se trata de dispositivos multimedia, el Lenovo Yoga Pro 9i 16 o el Apple MacBook Pro 16 son sus mayores rivales, aunque, estos dispositivos sólo ofrecen capacidades limitadas para juegos.
Precio y disponibilidad
El nuevo ROG Zephyrus G16 estará disponible a partir del 15/02/2024 y las configuraciones individuales ya están listadas. Los precios empiezan en US$2,899.99.
Asus ROG Zephyrus G16 2024 GU605M
- 02/04/2024 v7 (old)
Andreas Osthoff
Transparencia
La selección de los dispositivos que se van a reseñar corre a cargo de nuestro equipo editorial. La muestra de prueba fue proporcionada al autor en calidad de préstamo por el fabricante o el minorista a los efectos de esta reseña. El prestamista no tuvo ninguna influencia en esta reseña, ni el fabricante recibió una copia de la misma antes de su publicación. No había ninguna obligación de publicar esta reseña. Como empresa de medios independiente, Notebookcheck no está sujeta a la autoridad de fabricantes, minoristas o editores.
Así es como prueba Notebookcheck
Cada año, Notebookcheck revisa de forma independiente cientos de portátiles y smartphones utilizando procedimientos estandarizados para asegurar que todos los resultados son comparables. Hemos desarrollado continuamente nuestros métodos de prueba durante unos 20 años y hemos establecido los estándares de la industria en el proceso. En nuestros laboratorios de pruebas, técnicos y editores experimentados utilizan equipos de medición de alta calidad. Estas pruebas implican un proceso de validación en varias fases. Nuestro complejo sistema de clasificación se basa en cientos de mediciones y puntos de referencia bien fundamentados, lo que mantiene la objetividad.Price comparison

