Debut del portátil GeForce RTX 4080: Análisis del portátil Razer Blade 16 Early 2023
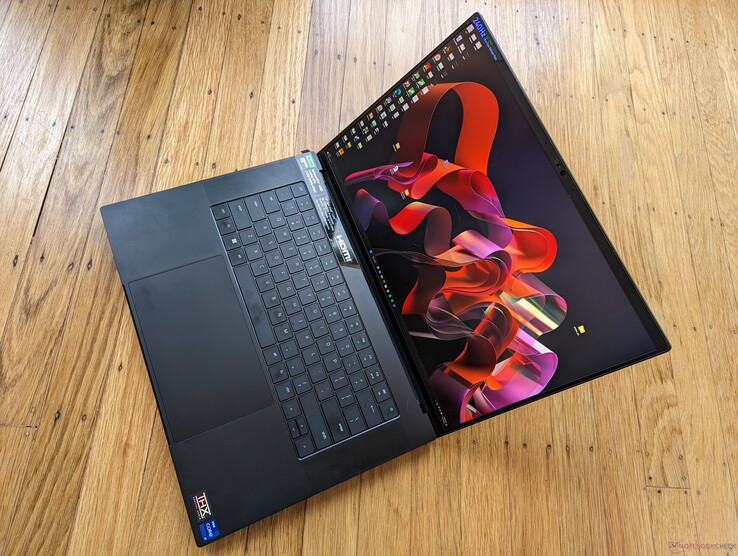
El 2023 Blade 16 es el primer modelo de 16 pulgadas de la serie Blade. Su lanzamiento coincide con el de las CPU móviles Intel Raptor Lake de 13ª generación y las GPU móviles Nvidia GeForce RTX 40 Ada Lovelace. Como máquina de juegos de gama alta, al igual que el resto de los modelos Blade, el Blade 16 ocupa el cada vez más popular espacio de 16:10 pulgadas entre el Blade 15 de 15,6 pulgadas y el Blade 17 de 17,3 pulgadas.
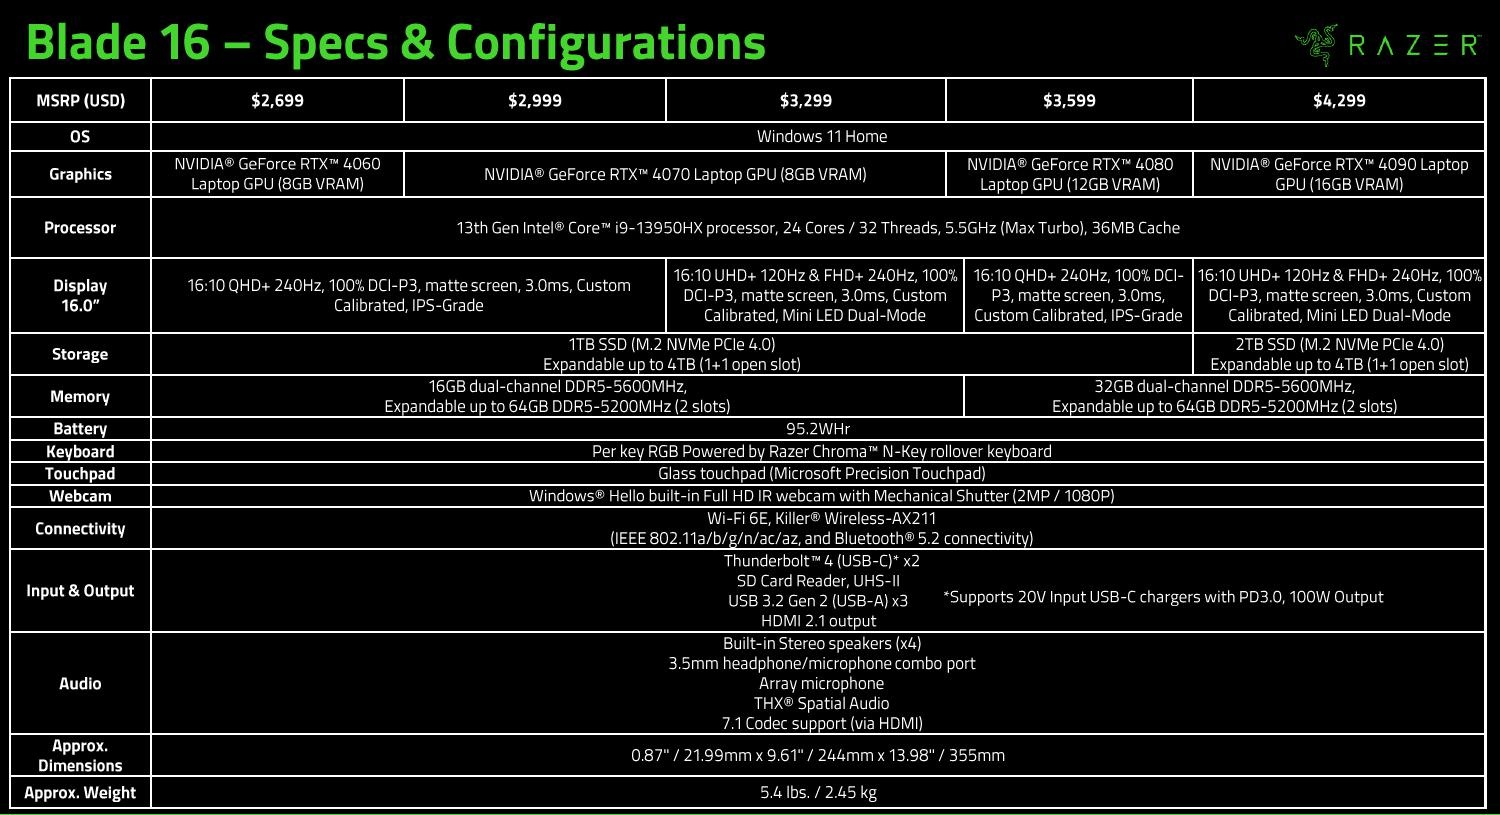
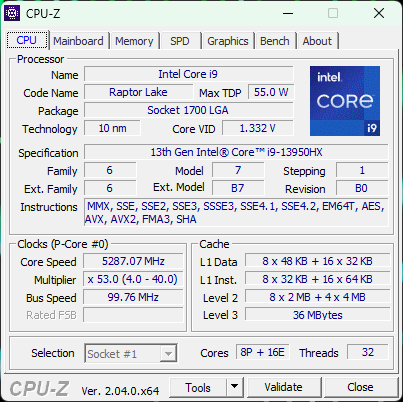
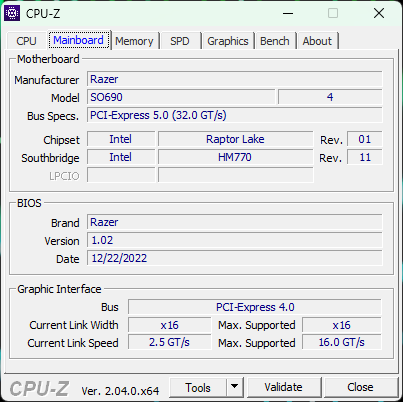
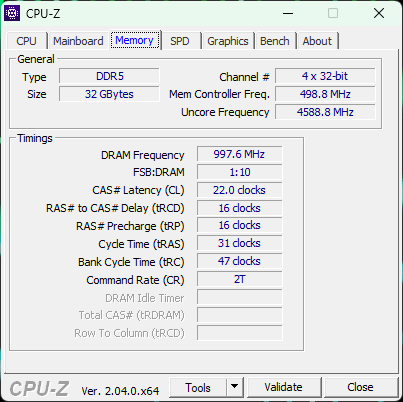
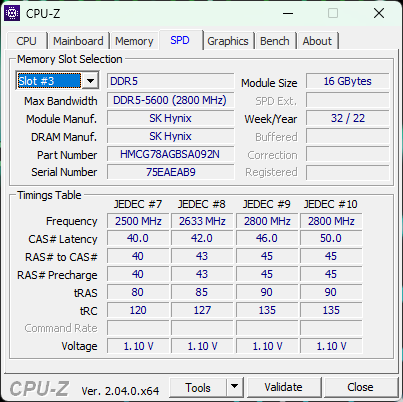
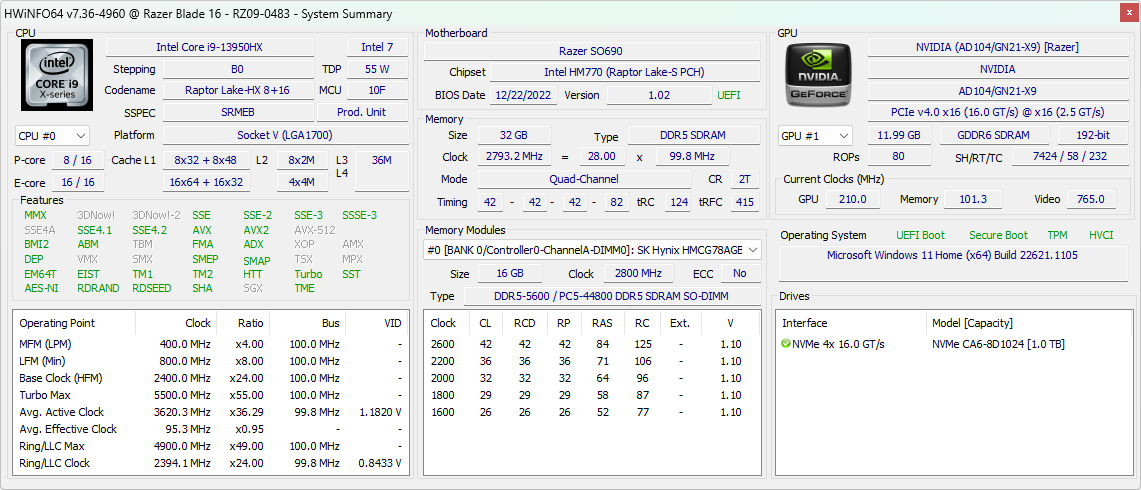
Nuestra unidad de análisis es una SKU de gama alta con el Core i9-13950HX CPU, GeForce GPU RTX 4080 32 GB de RAM DDR5-5600, y pantalla QHD+ de 240 Hz por unos $3600 USD. Hay disponible un modelo de gama aún más alta con la misma CPU pero una pantalla mini-LED 4K UHD+ más sofisticada y una GPU RTX 4090 por 4300 dólares. Otras opciones estarán disponibles en el futuro, como se detalla en la siguiente tabla.
Las alternativas a la Blade 16 incluyen la de 16 pulgadas Lenovo Legion S7 16ARHA7dell Alienware x16 Asus ROG Zephyrus Duo 16y el HP Omen 16. MSI aún no ha anunciado un portátil para juegos de 16 pulgadas en el momento de escribir este artículo.
Más análisis de Razer:
Potential Competitors in Comparison
Valoración | Fecha | Modelo | Peso | Altura | Tamaño | Resolución | Precio |
|---|---|---|---|---|---|---|---|
| 91.2 % v7 (old) | 02/2023 | Razer Blade 16 Early 2023 i9-13950HX, GeForce RTX 4080 Laptop GPU | 2.4 kg | 21.99 mm | 16.00" | 2560x1600 | |
| 88.3 % v7 (old) | 05/2022 | Razer Blade 15 Advanced Model Early 2022 i7-12800H, GeForce RTX 3080 Ti Laptop GPU | 2.1 kg | 16.99 mm | 15.60" | 1920x1080 | |
| 89.3 % v7 (old) | 01/2023 | Lenovo Legion S7 16ARHA7 R9 6900HX, Radeon RX 6800S | 2.2 kg | 16.9 mm | 16.00" | 2560x1600 | |
| 86.1 % v7 (old) | 10/2022 | Dell G16 7620 i7-12700H, GeForce RTX 3060 Laptop GPU | 2.6 kg | 26.9 mm | 16.00" | 2560x1600 | |
| 88.2 % v7 (old) | 05/2022 | Asus ROG Zephyrus Duo 16 GX650RX R9 6900HX, GeForce RTX 3080 Ti Laptop GPU | 2.6 kg | 20.5 mm | 16.00" | 3840x2400 | |
| 86.4 % v7 (old) | 12/2022 | HP Omen 16-n0033dx R7 6800H, Radeon RX 6650M | 2.4 kg | 22.6 mm | 16.10" | 1920x1080 |
Maletín - Blade 13, 14, 15, 17, 18 y ahora 16
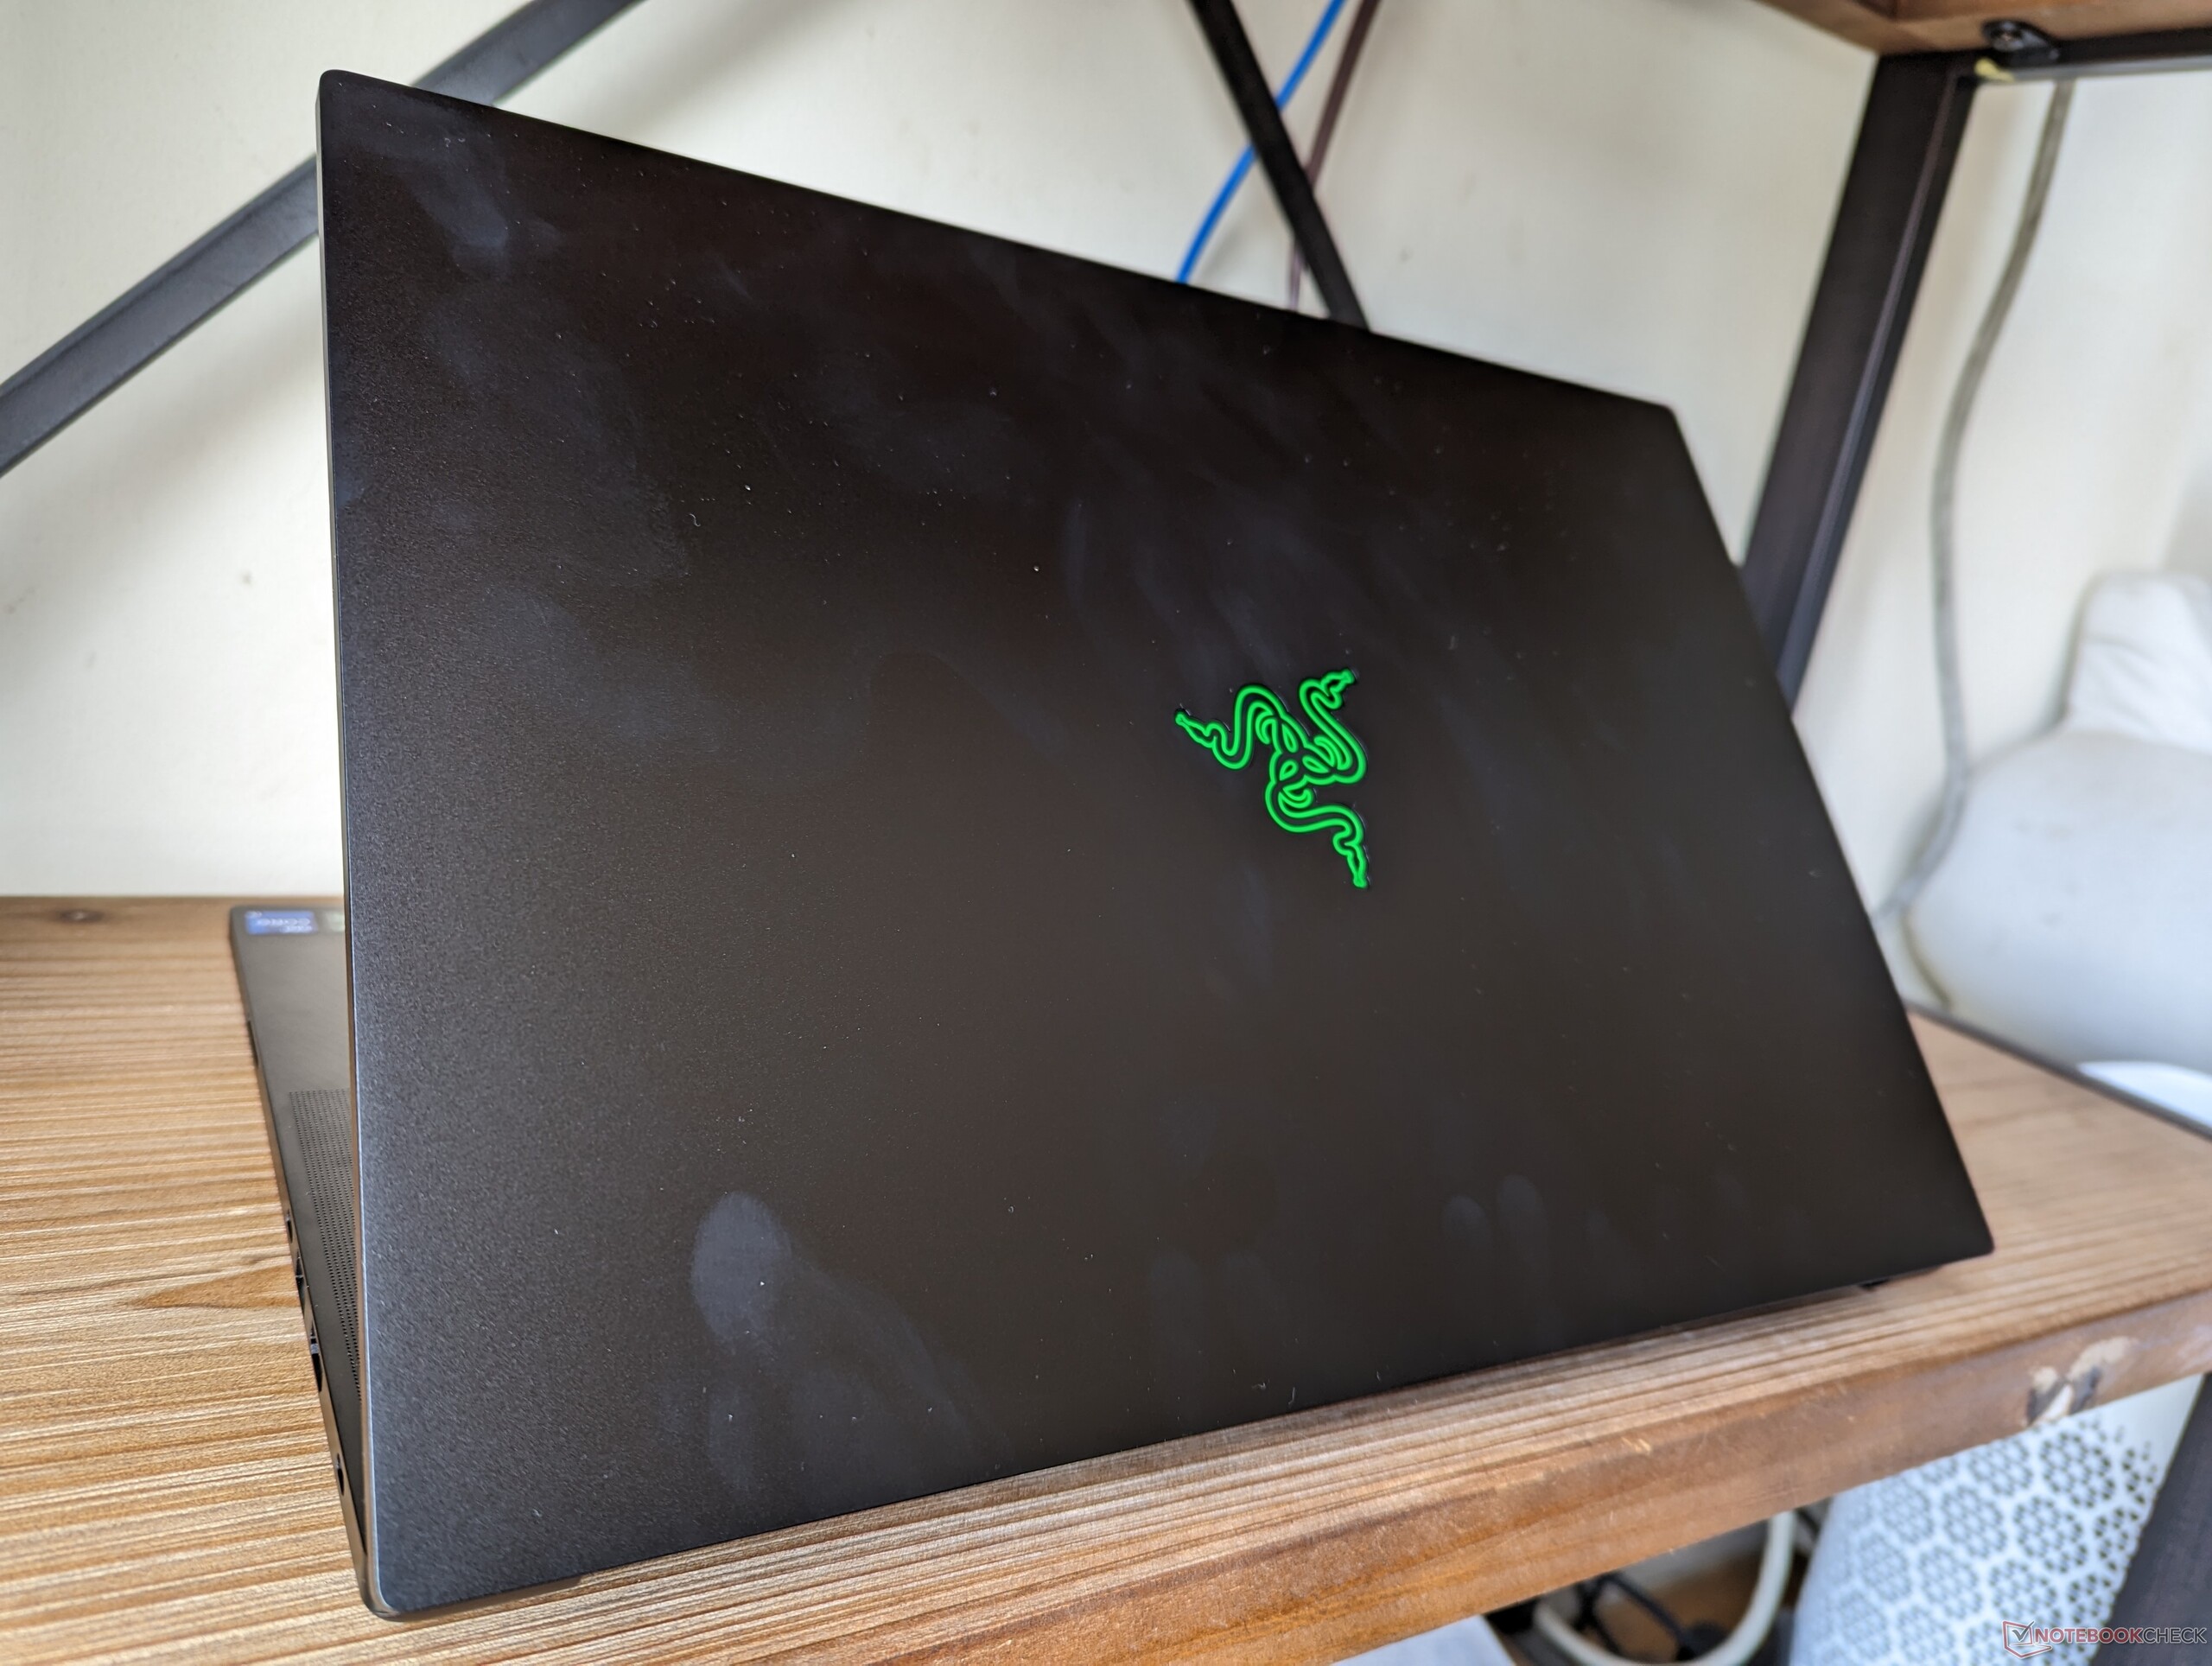
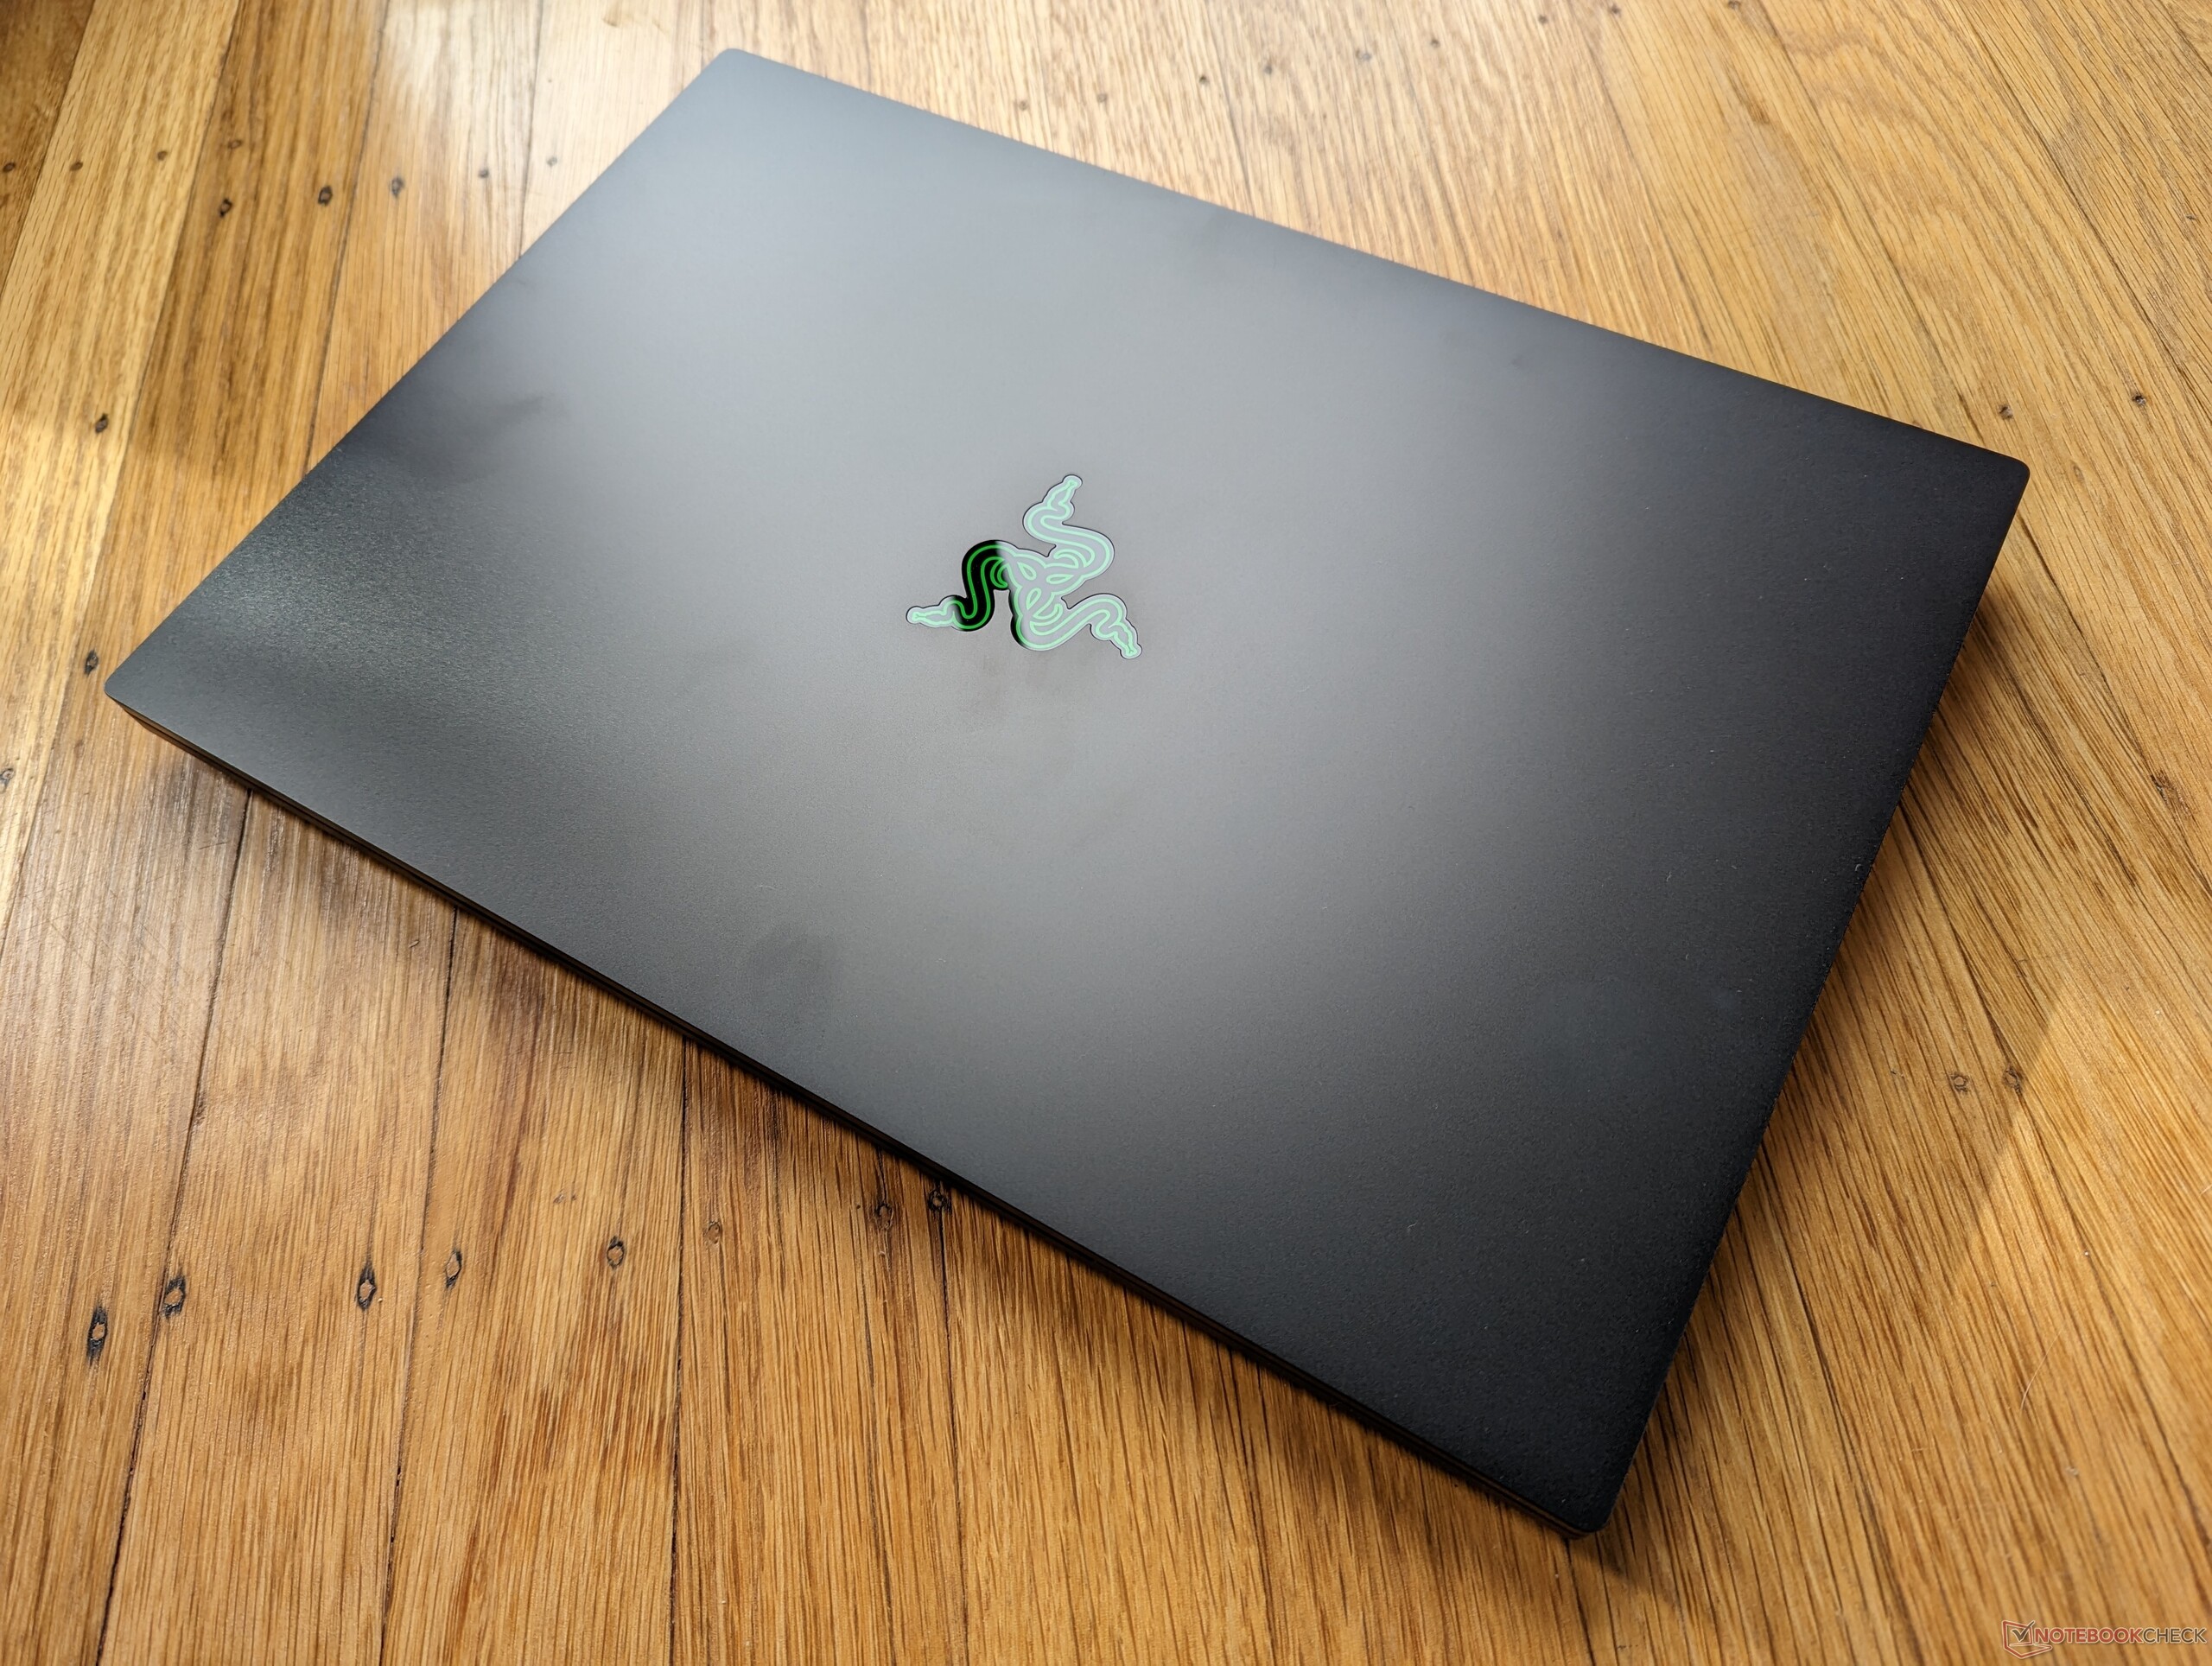
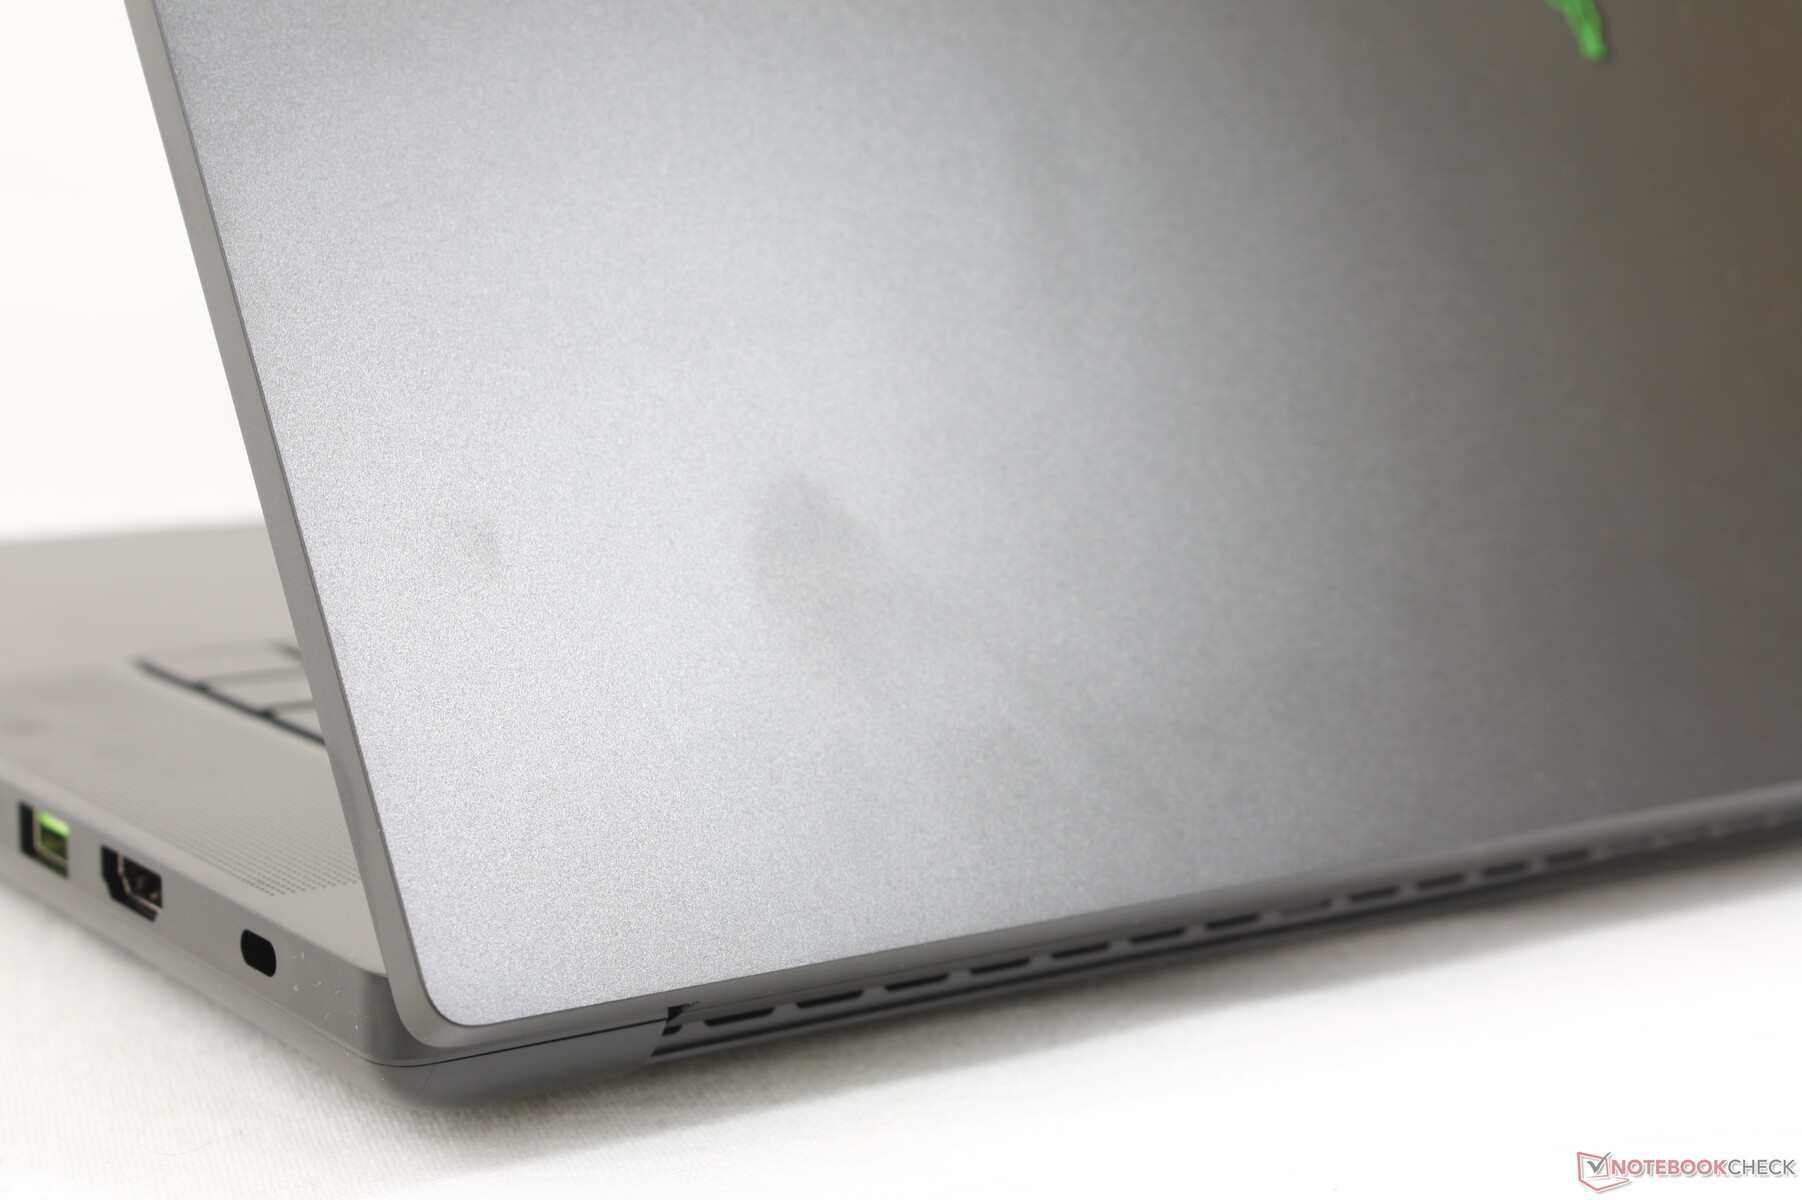
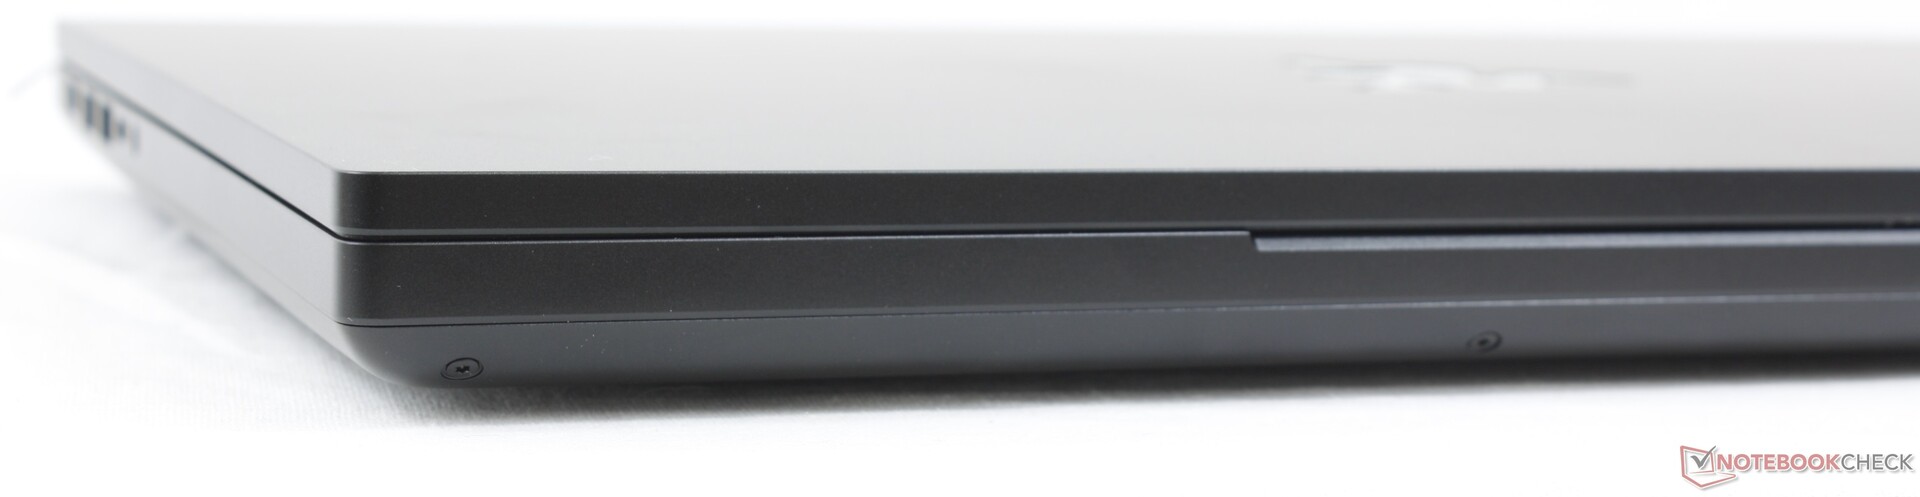
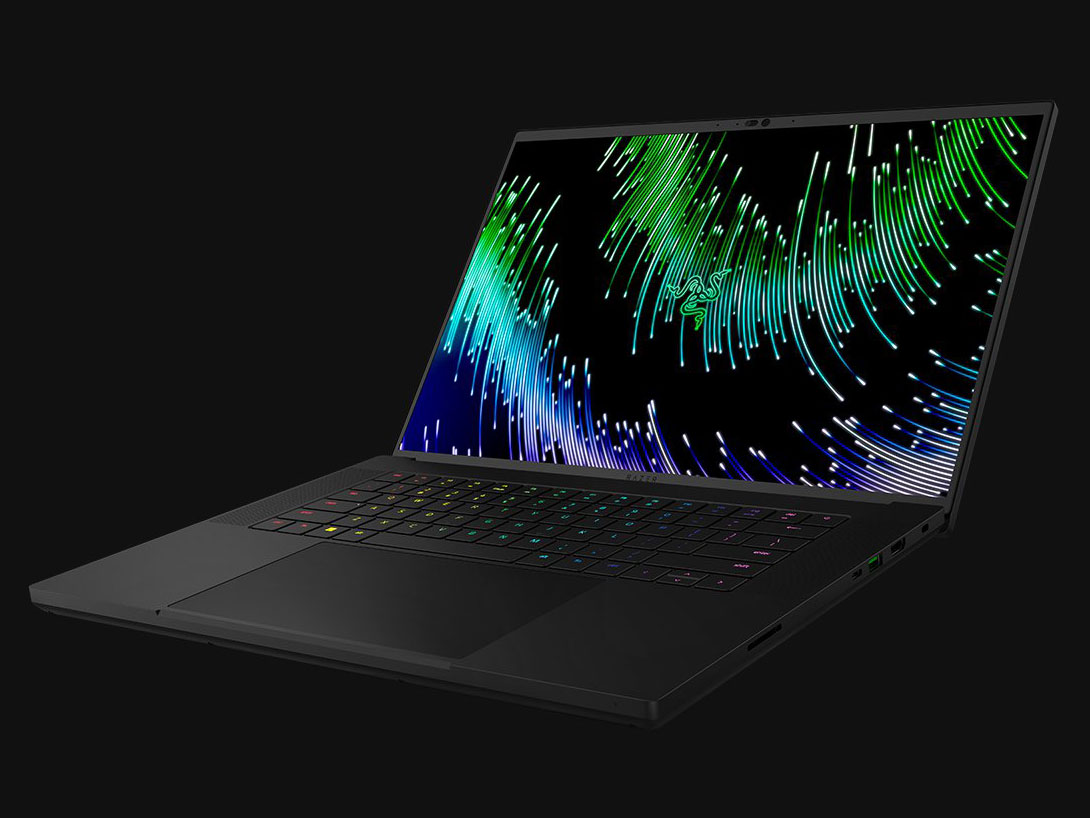
Razer se desvía muy poco del reconocible diseño Blade y el Blade 16 no es diferente. Si alguna vez has manejado un Blade Stealth 13, Blade 14, Blade 15 o Blade 17 de 2019 o más recientes, entonces ya tendrás una muy buena idea de cómo se ve y se siente el Blade 16. Sigue siendo uno de los diseños más sólidos en términos de rigidez y minimalismo y el más "parecido a un MacBook" de todos los portátiles Windows hasta la fecha.
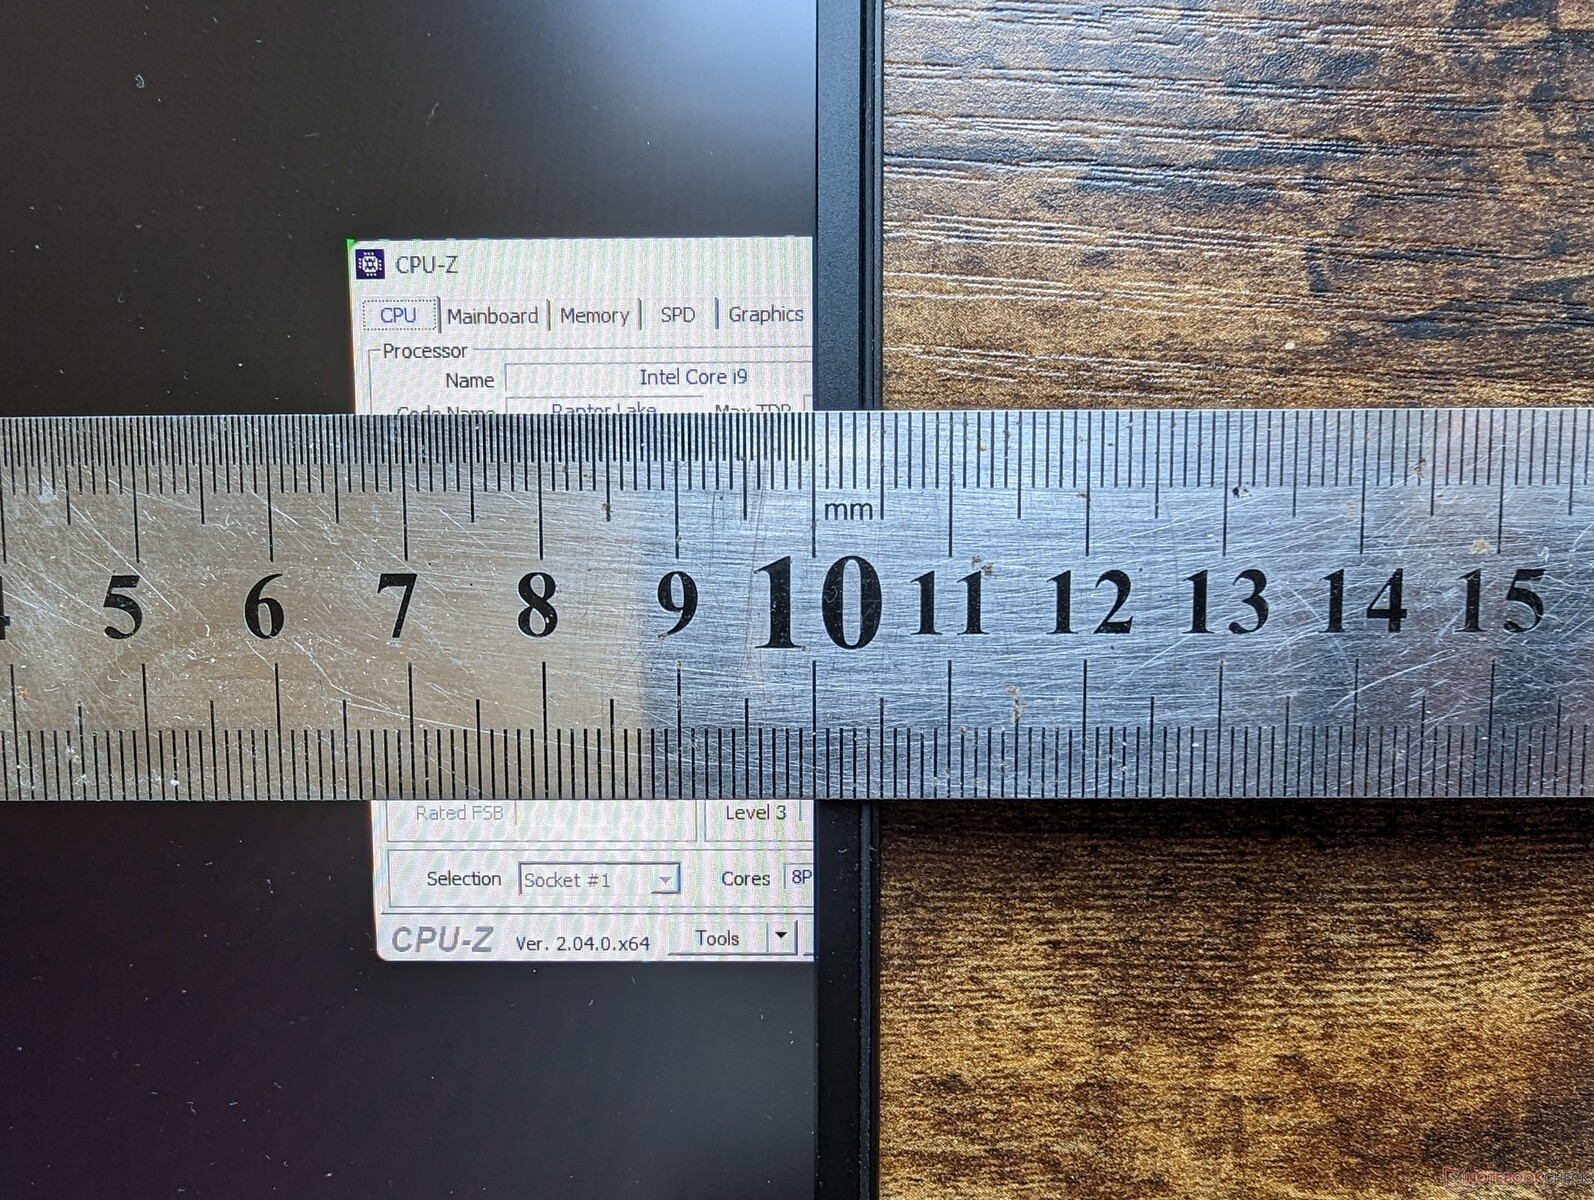
Sin embargo, hay una actualización digna de mención en el chasis que aún no se encuentra en ningún otro modelo Blade y que tiene que ver con el bisel de la barbilla significativamente más delgado a lo largo de la parte inferior de la pantalla. El Blade 14 y el Blade 15, por ejemplo, tienen biseles de barbilla visiblemente más gruesos que en el Blade 16. Por lo tanto, la relación pantalla-cuerpo es mayor en el Blade 16 que en el Blade 14. La relación pantalla-cuerpo es, por tanto, mayor en el Blade 16, con un 89%, y su tamaño es relativamente pequeño para un formato de 16 pulgadas. Aparte de eso, el diseño conserva el espíritu Blade y la familiaridad que los fans de Razer admiran.
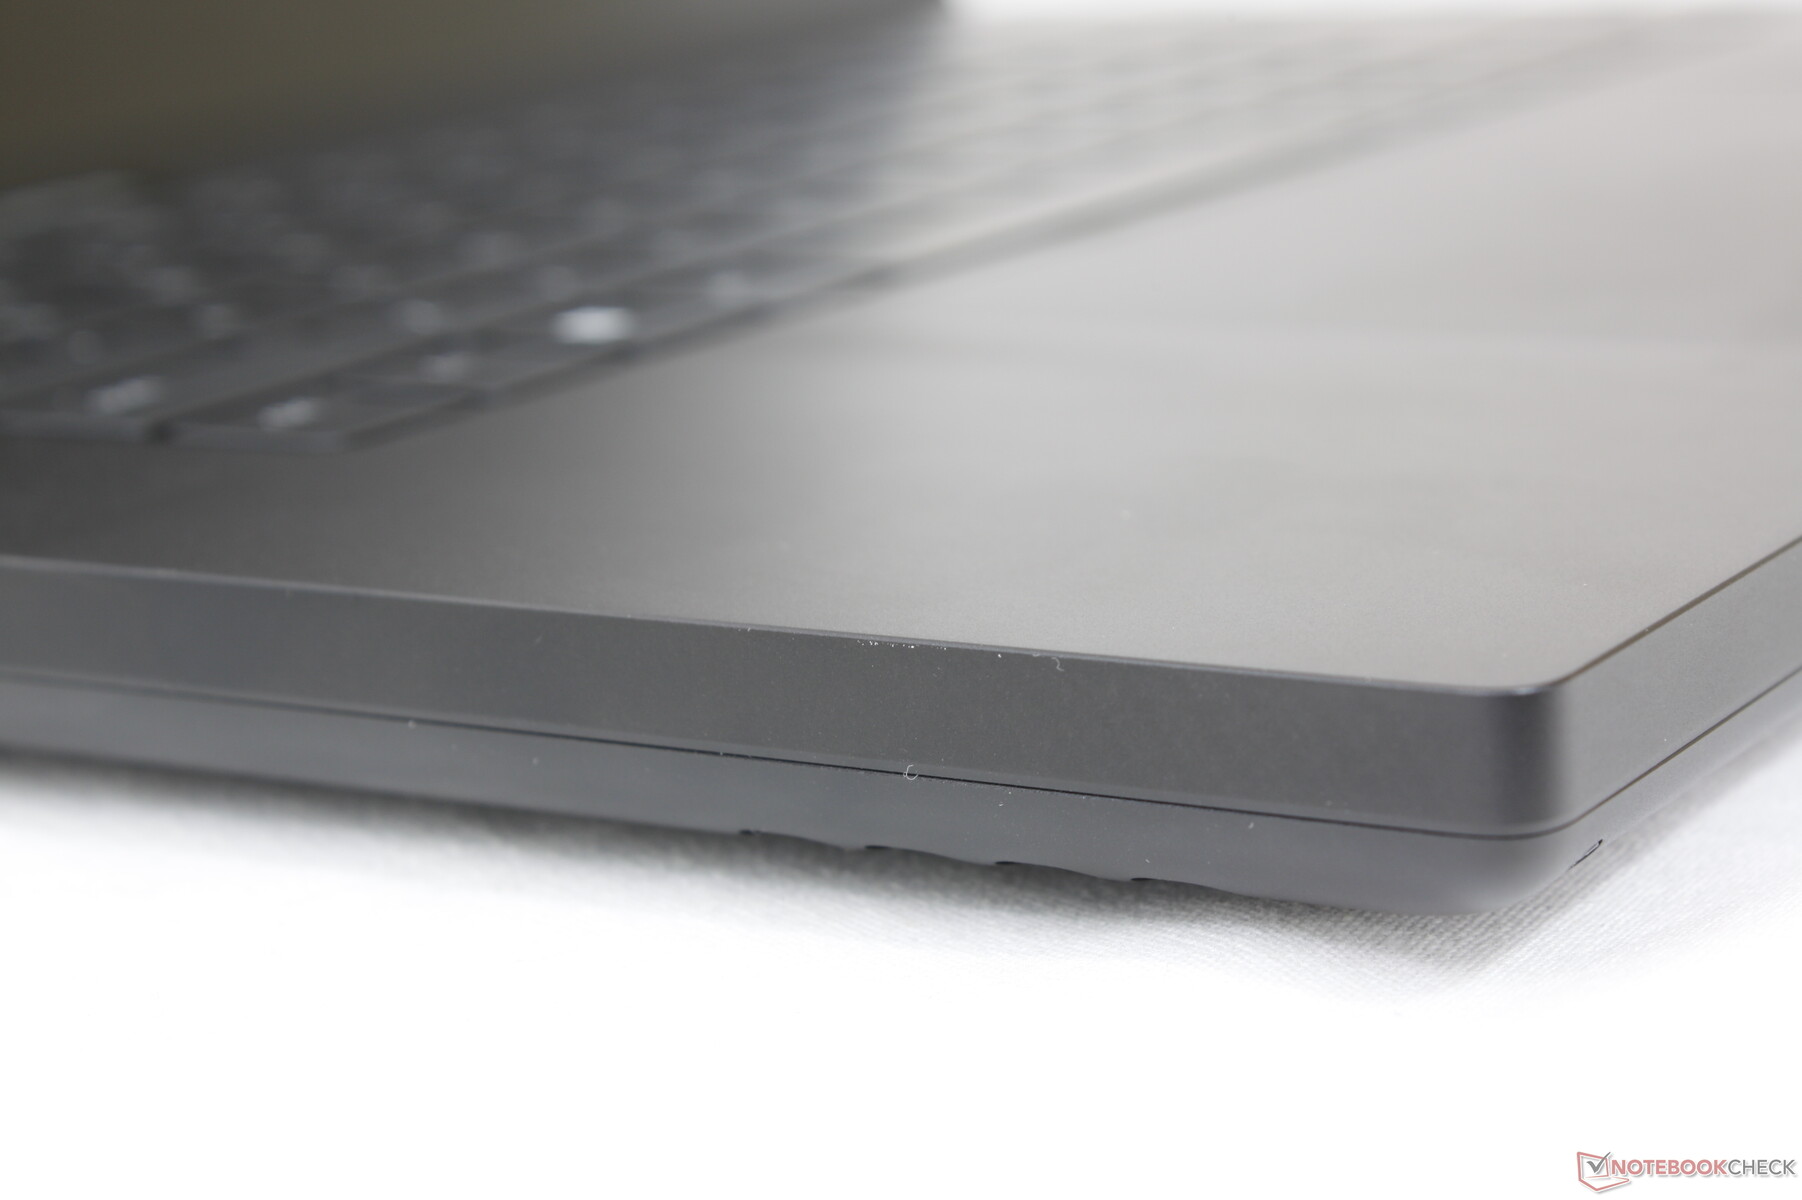
Afortunadamente, el Blade 16 es mucho más parecido en tamaño y peso al Blade 15 que al Blade 17 como muestra nuestra tabla comparativa de abajo. Aun así, es notablemente más grande que la Blade 15. El grosor y el peso han aumentado en 5 mm y 300 gramos, respectivamente, para ser aún más grueso que el Blade 17. Sigue siendo más pequeño que el competidorHP Omen 16 oLenovo Legion S7 16 gracias a la ya mencionada elevada relación pantalla/cuerpo.
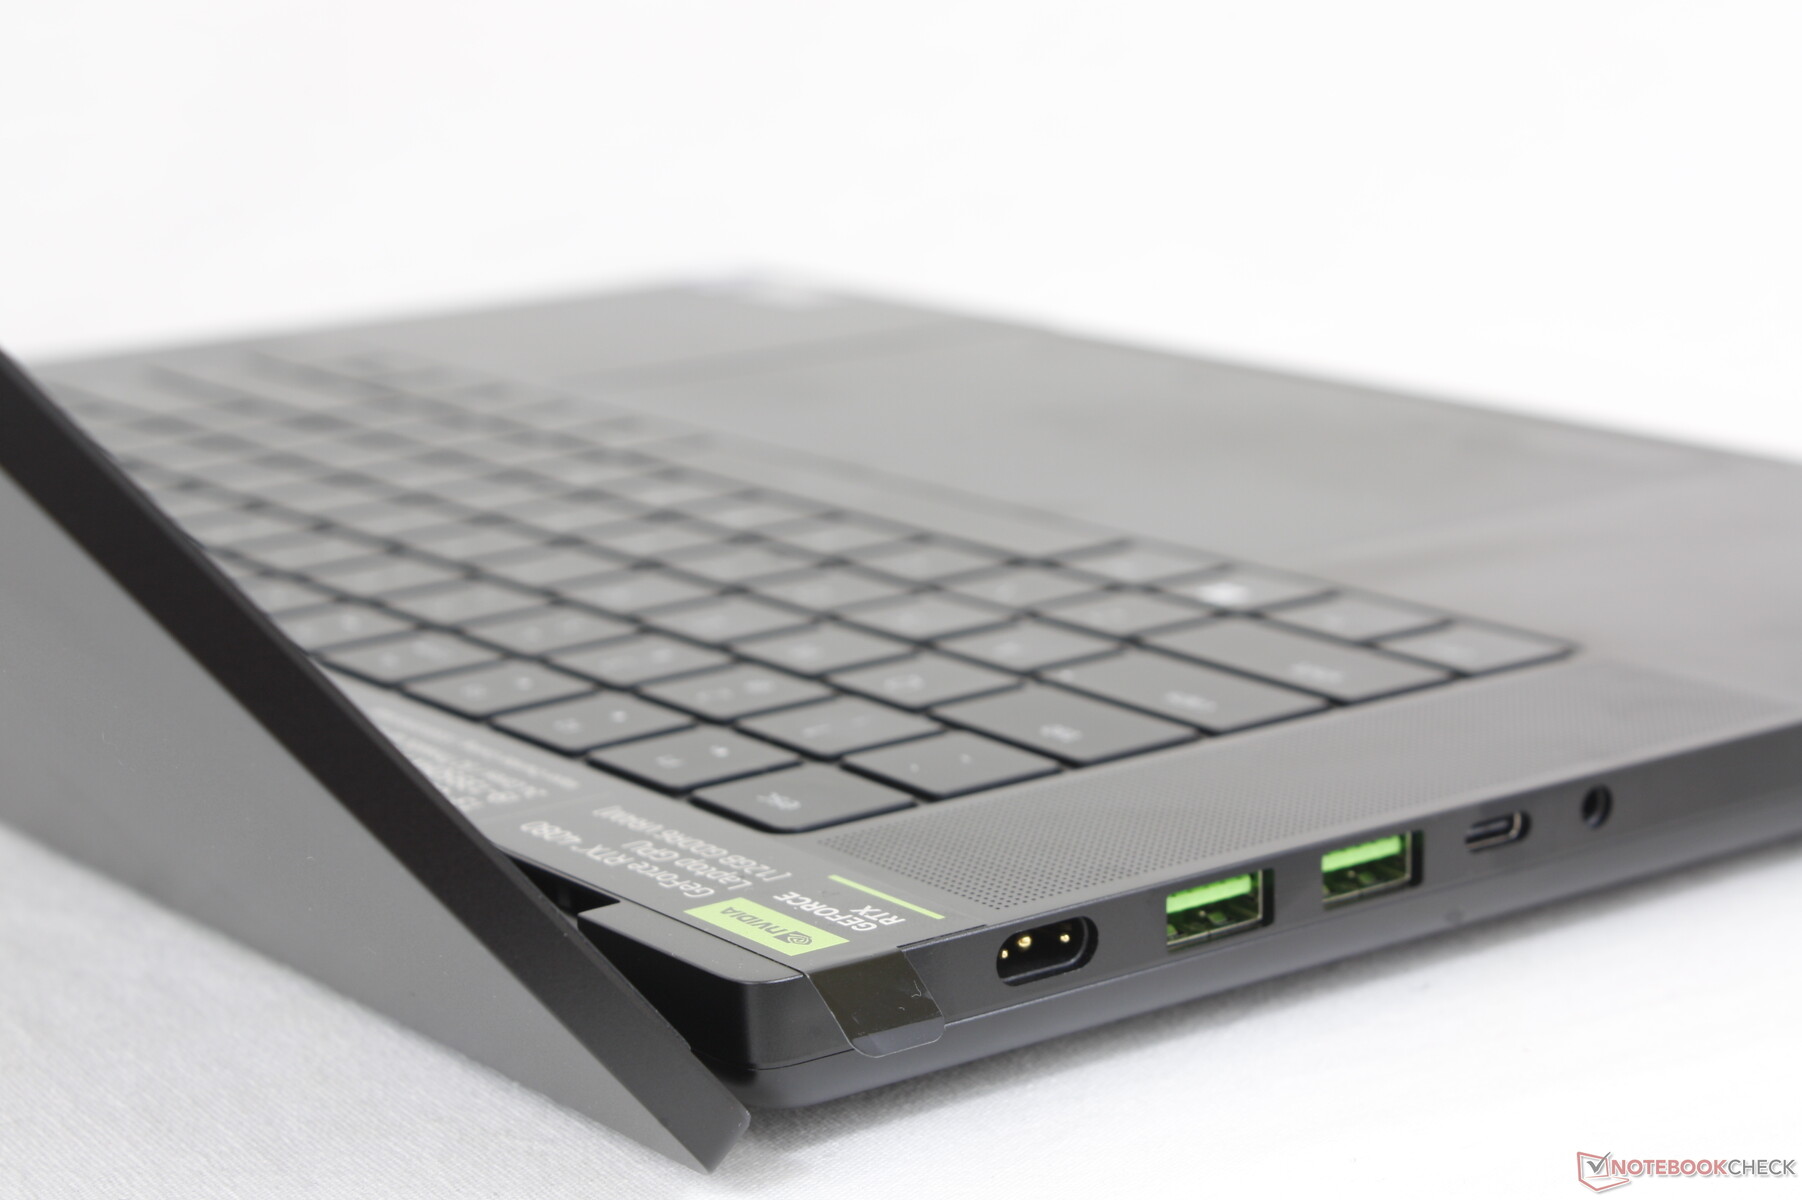
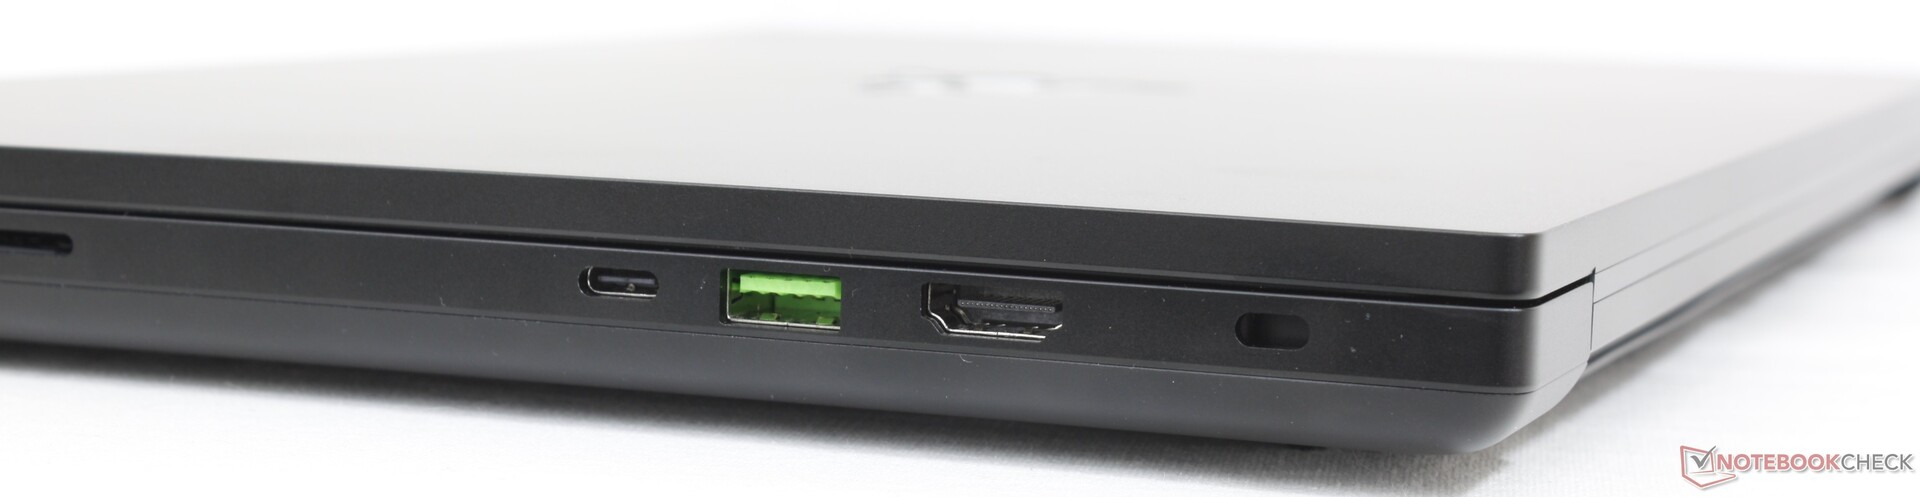
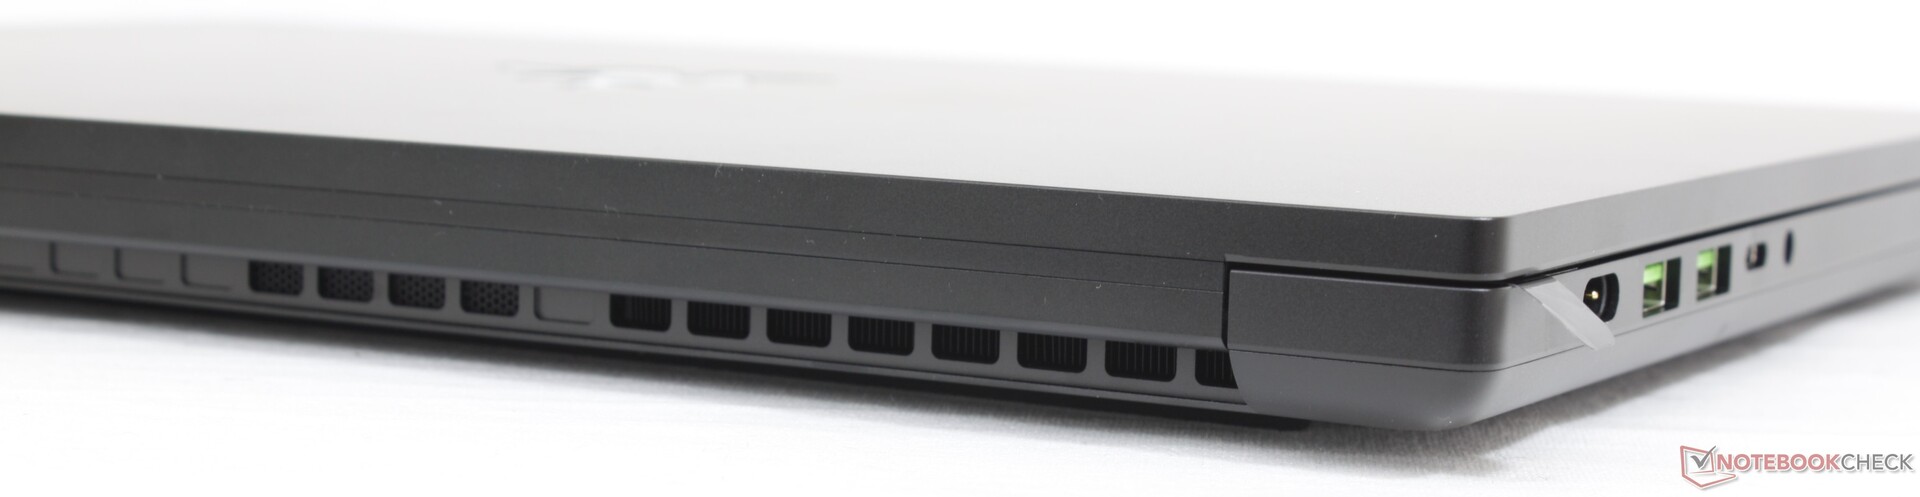
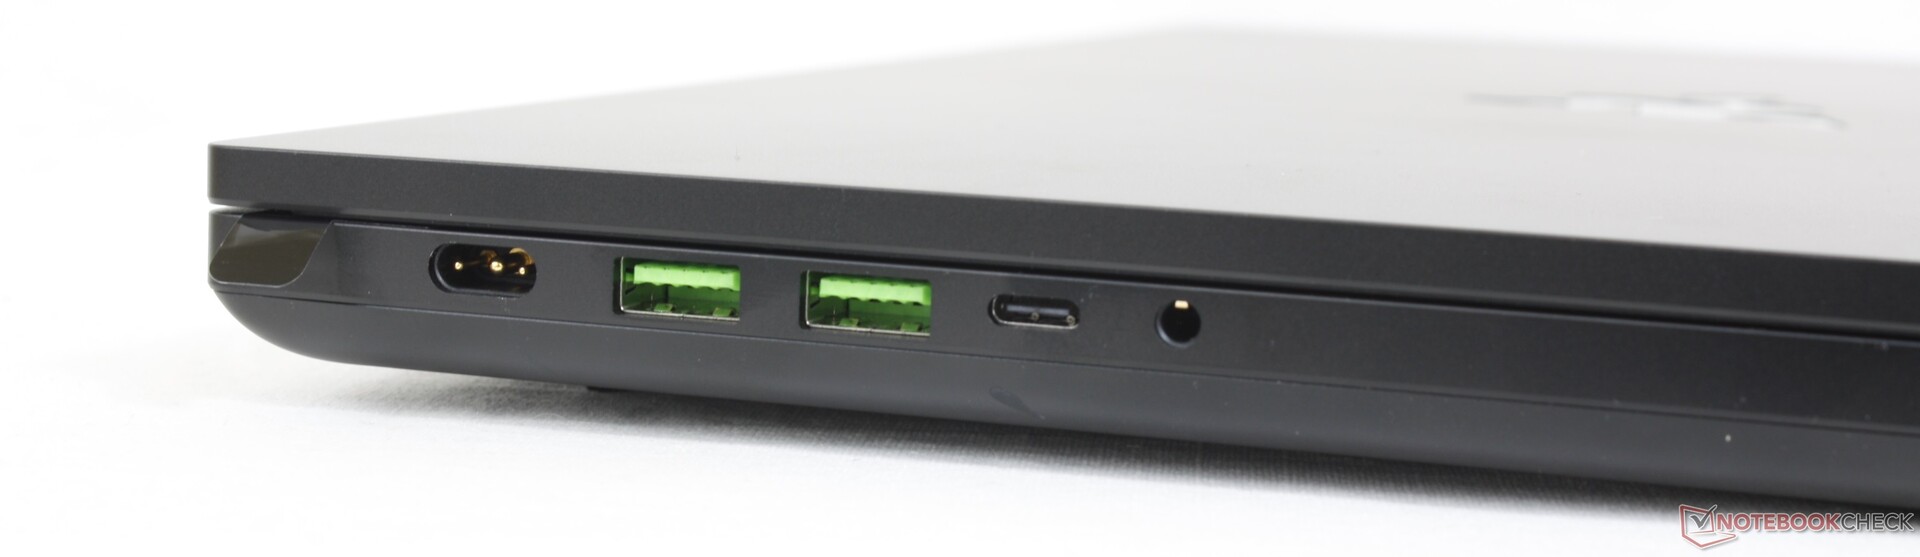
Conectividad: compatibilidad con Thunderbolt 4
Todos los puertos del modelo Blade 15 Advanced han vuelto al Blade 16. Los usuarios que esperen un puerto RJ-45 dedicado tendrán que actualizarse al modelo Blade 17 más grande o considerar un modelo base Blade 15 más antiguo Blade 15 Modelo Base. Hay que tener en cuenta que los dispositivos Thunderbolt sólo son compatibles con el puerto USB-C del borde derecho y no con el izquierdo.
Razer ha confirmado que el Blade 16 es compatible con los adaptadores de CA Blade 15 y Blade 17 del año pasado, pero el rendimiento y / o la carga pueden ser más lentos debido a las mayores demandas de energía del Blade 16.
Lector de tarjetas SD
Razer ha mantenido el lector de tarjetas SD integrado de las series Blade 15 y Blade 17. Las tasas de transferencia son aproximadamente el doble de rápidas que las de los lectores de tarjetas del Lenovo Legion S7 16, HP Omen 16, e incluso el MSI GE67 HX.
| SD Card Reader | |
| average JPG Copy Test (av. of 3 runs) | |
| Razer Blade 15 Advanced Model Early 2022 (AV PRO microSD 128 GB V60) | |
| Asus ROG Zephyrus Duo 16 GX650RX (AV PRO microSD 128 GB V60) | |
| Razer Blade 17 (i7-12800H, RTX 3070 Ti) | |
| Razer Blade 16 Early 2023 (AV PRO microSD 128 GB V60) | |
| Lenovo Legion S7 16ARHA7 (AV PRO microSD 128 GB V60) | |
| MSI GE67 HX 12UGS (Toshiba Exceria Pro SDXC 64 GB UHS-II) | |
| HP Omen 16-n0033dx (AV PRO microSD 128 GB V60) | |
| maximum AS SSD Seq Read Test (1GB) | |
| Razer Blade 16 Early 2023 (AV PRO microSD 128 GB V60) | |
| Razer Blade 17 (i7-12800H, RTX 3070 Ti) | |
| Asus ROG Zephyrus Duo 16 GX650RX (AV PRO microSD 128 GB V60) | |
| Lenovo Legion S7 16ARHA7 (AV PRO microSD 128 GB V60) | |
| HP Omen 16-n0033dx (AV PRO microSD 128 GB V60) | |
| MSI GE67 HX 12UGS (Toshiba Exceria Pro SDXC 64 GB UHS-II) | |
Comunicación
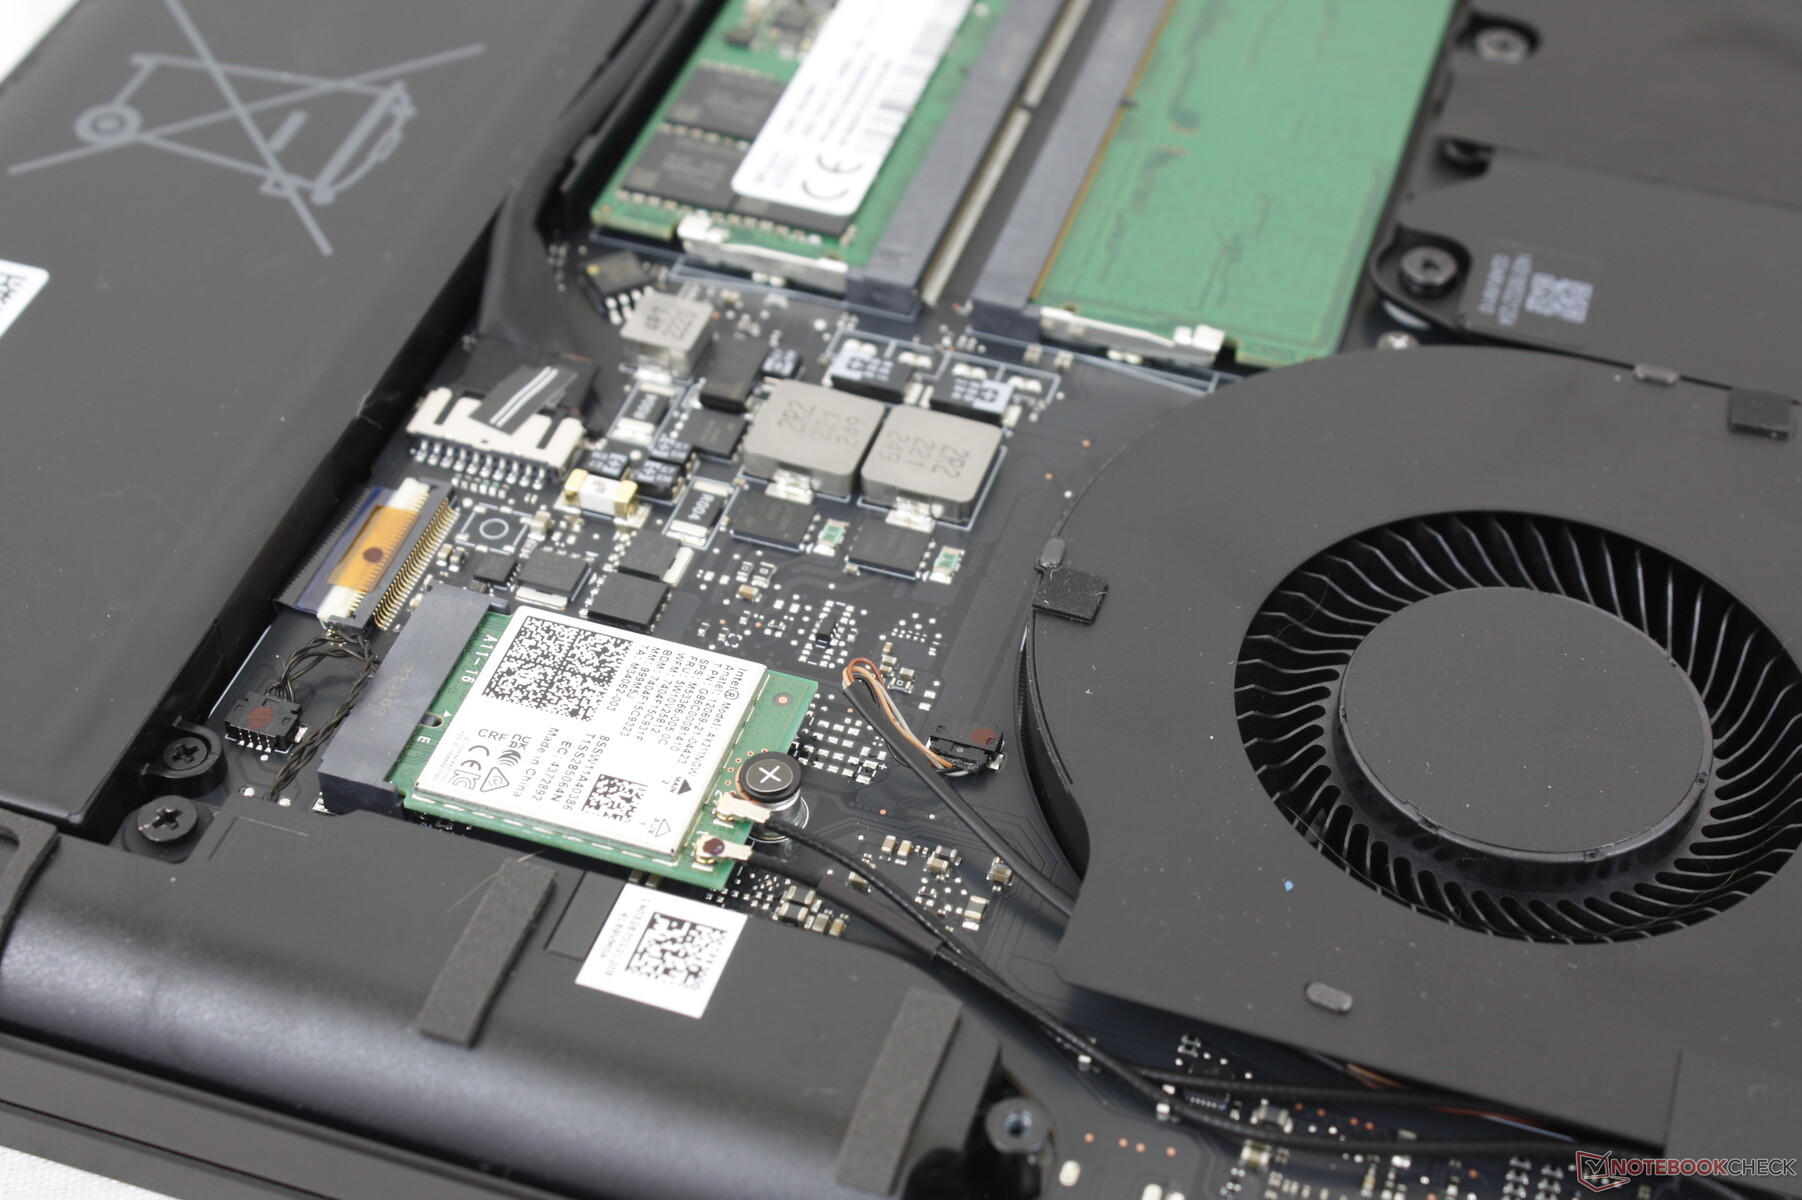
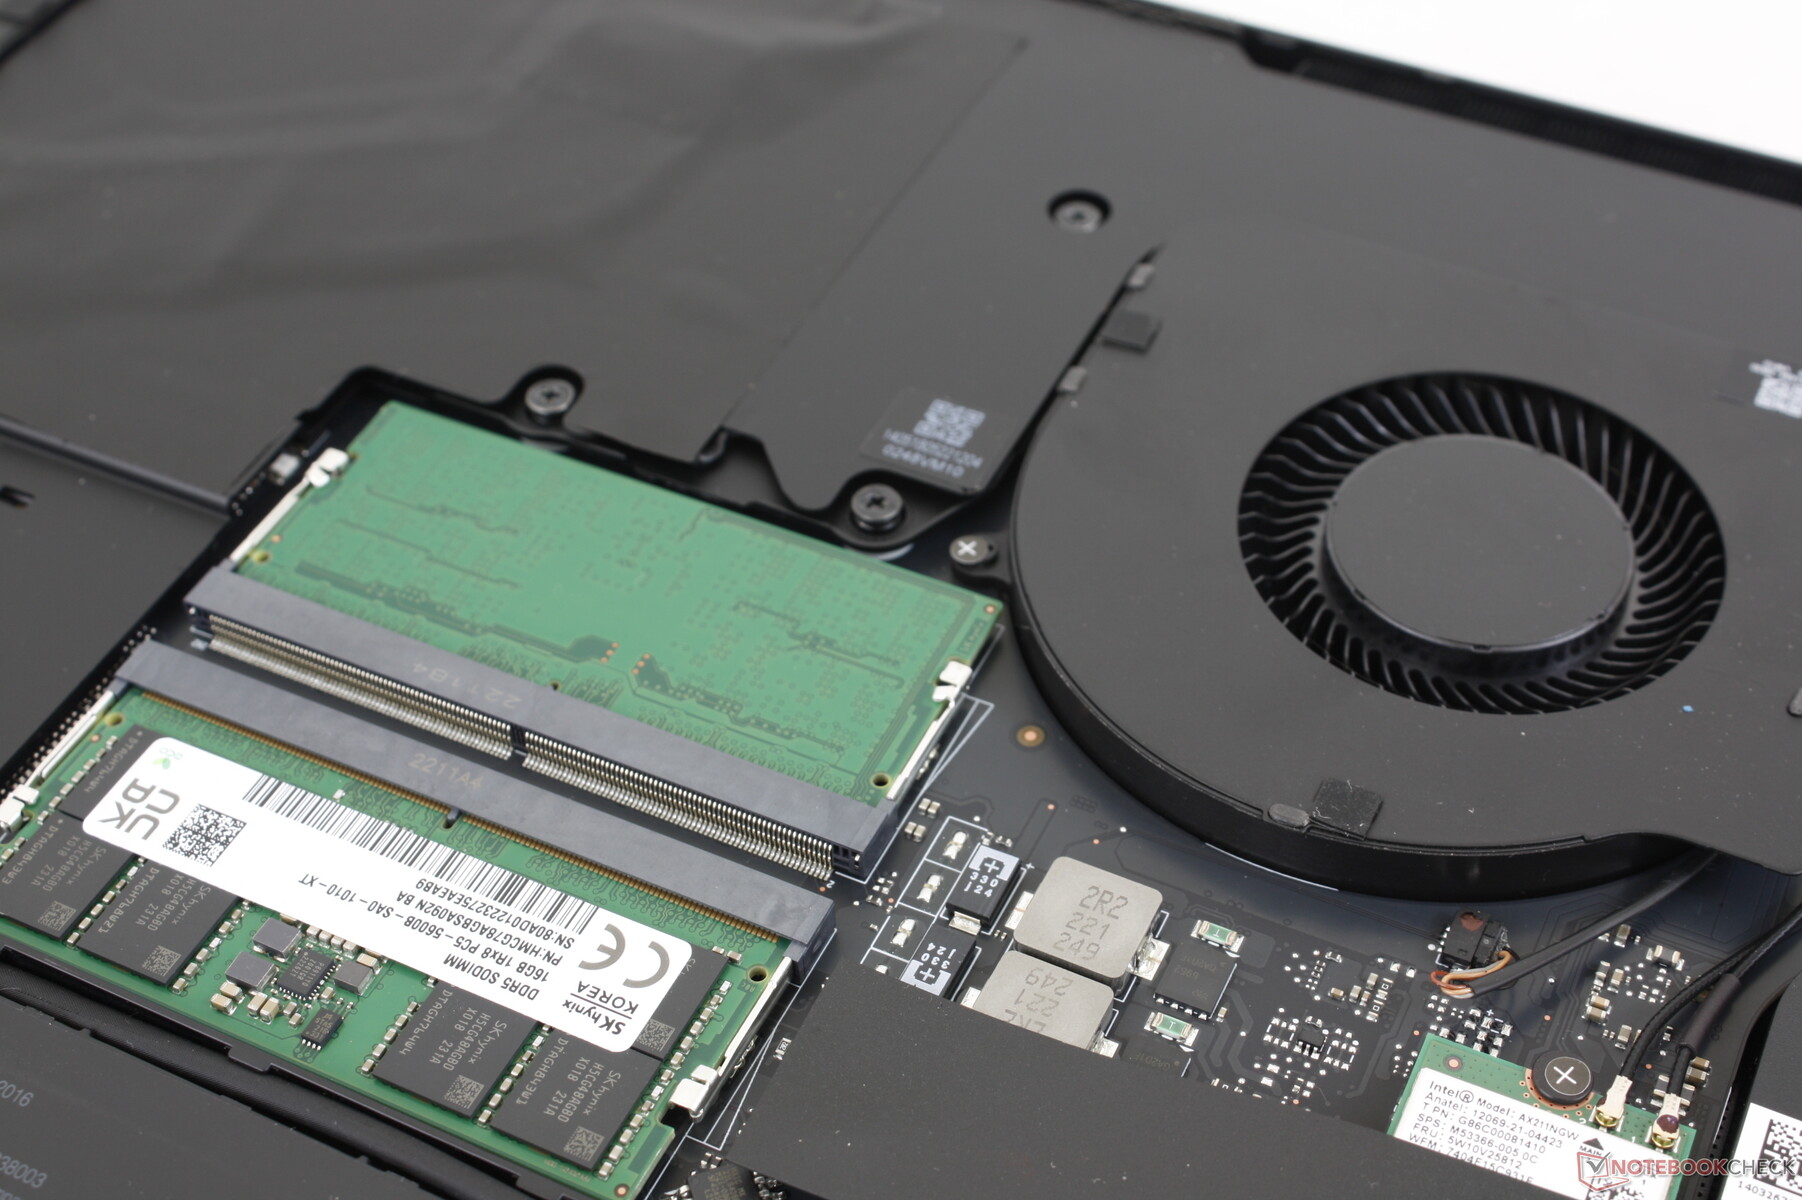
Un Intel AX211 viene de serie para la conectividad Wi-Fi 6E a 6 GHz y Bluetooth 5.2. No experimentamos problemas de rendimiento cuando lo emparejamos con nuestro router Asus AXE11000.
| Networking | |
| iperf3 receive AXE11000 6GHz | |
| Razer Blade 16 Early 2023 | |
| Lenovo Legion S7 16ARHA7 | |
| HP Omen 16-n0033dx | |
| iperf3 receive AXE11000 | |
| Razer Blade 15 Advanced Model Early 2022 | |
| Asus ROG Zephyrus Duo 16 GX650RX | |
| HP Omen 16-n0033dx | |
| Razer Blade 16 Early 2023 | |
| Dell G16 7620 | |
| iperf3 transmit AXE11000 | |
| Asus ROG Zephyrus Duo 16 GX650RX | |
| Razer Blade 15 Advanced Model Early 2022 | |
| HP Omen 16-n0033dx | |
| Razer Blade 16 Early 2023 | |
| Dell G16 7620 | |
| iperf3 transmit AXE11000 6GHz | |
| Lenovo Legion S7 16ARHA7 | |
| HP Omen 16-n0033dx | |
| Razer Blade 16 Early 2023 | |
Cámara web
La webcam parece ser el mismo sensor de 2 MP que se encuentra en el Blade 17. Aunque no esperamos mucho de la webcam de un portátil de juego, sigue siendo decepcionante no ver un obturador o un interruptor de apagado por cuestiones de privacidad. Los modelos de juego de MSI ofrecen un interruptor de un solo toque para desactivar eléctricamente la cámara en comparación. Al menos hay un sensor IR para el soporte de Hello.


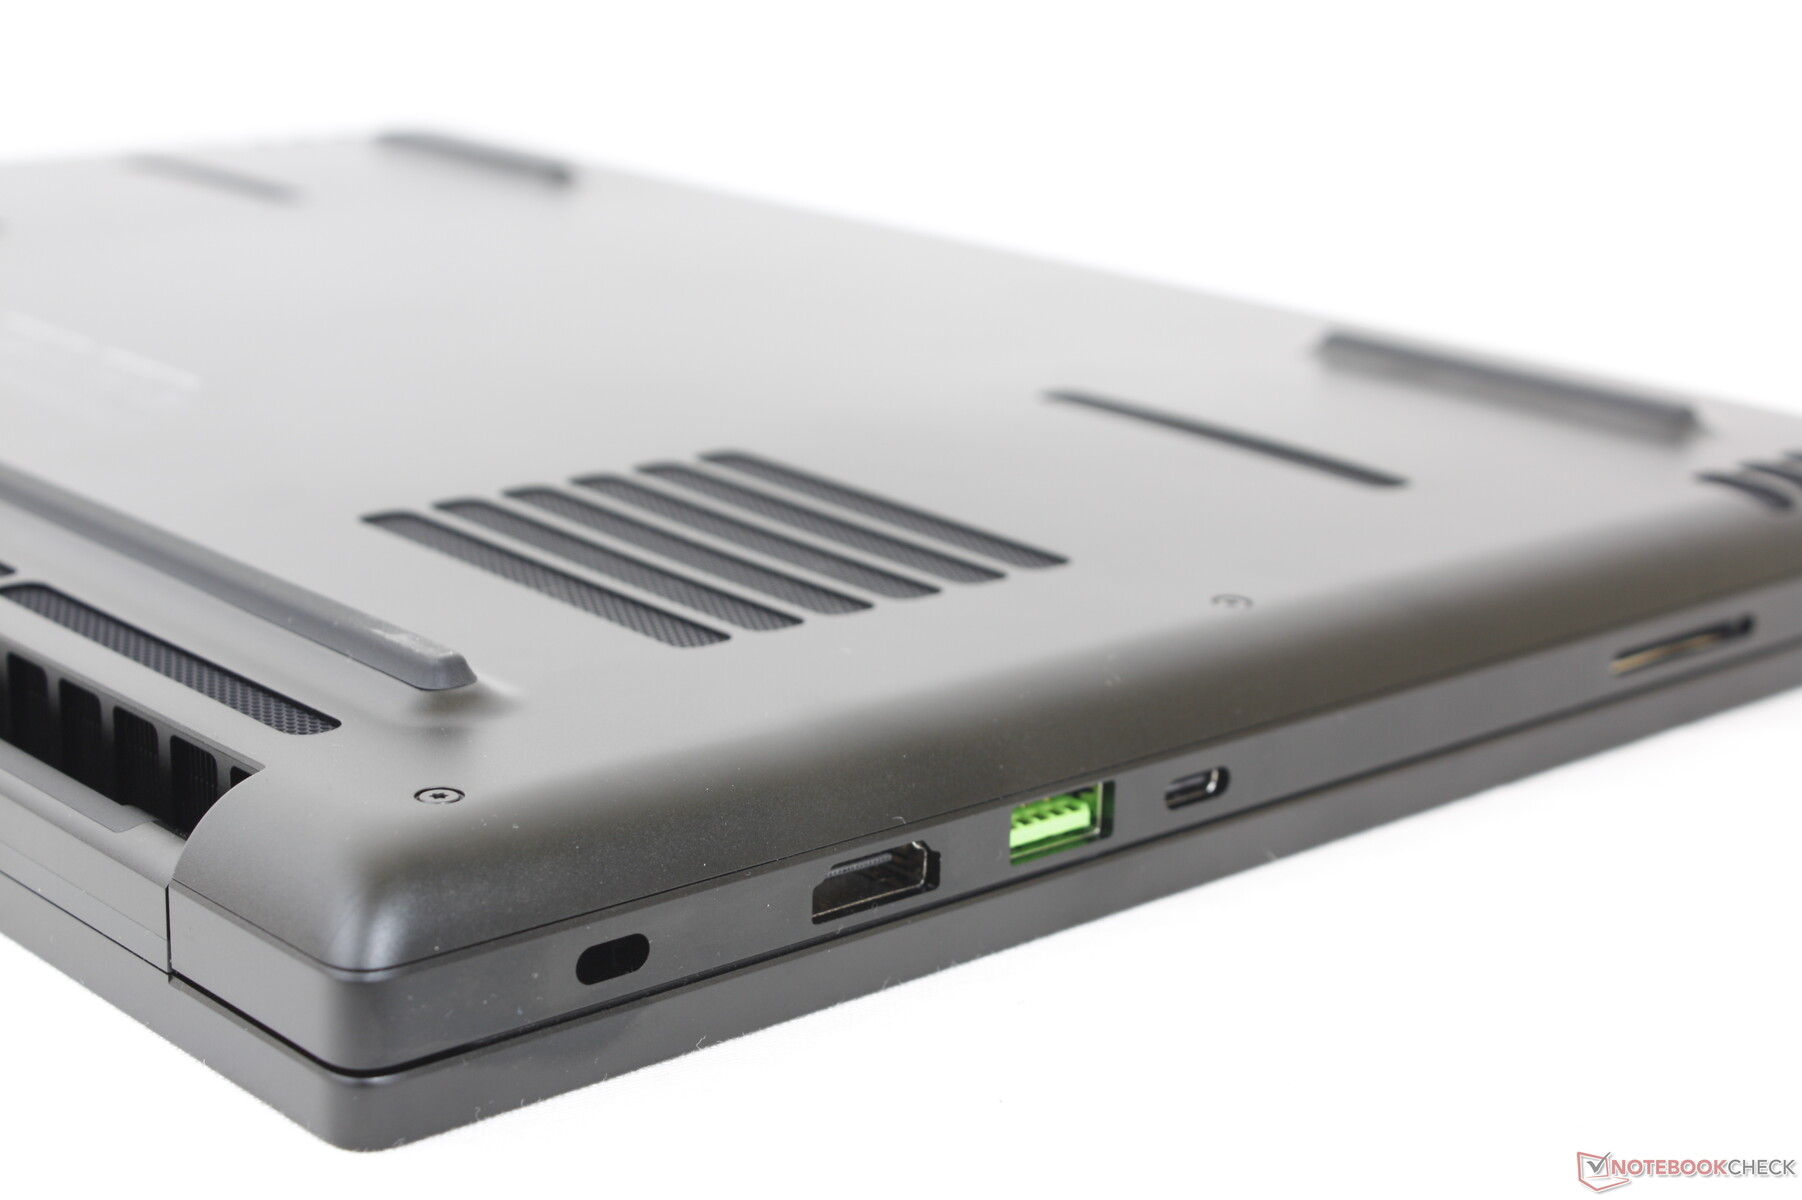
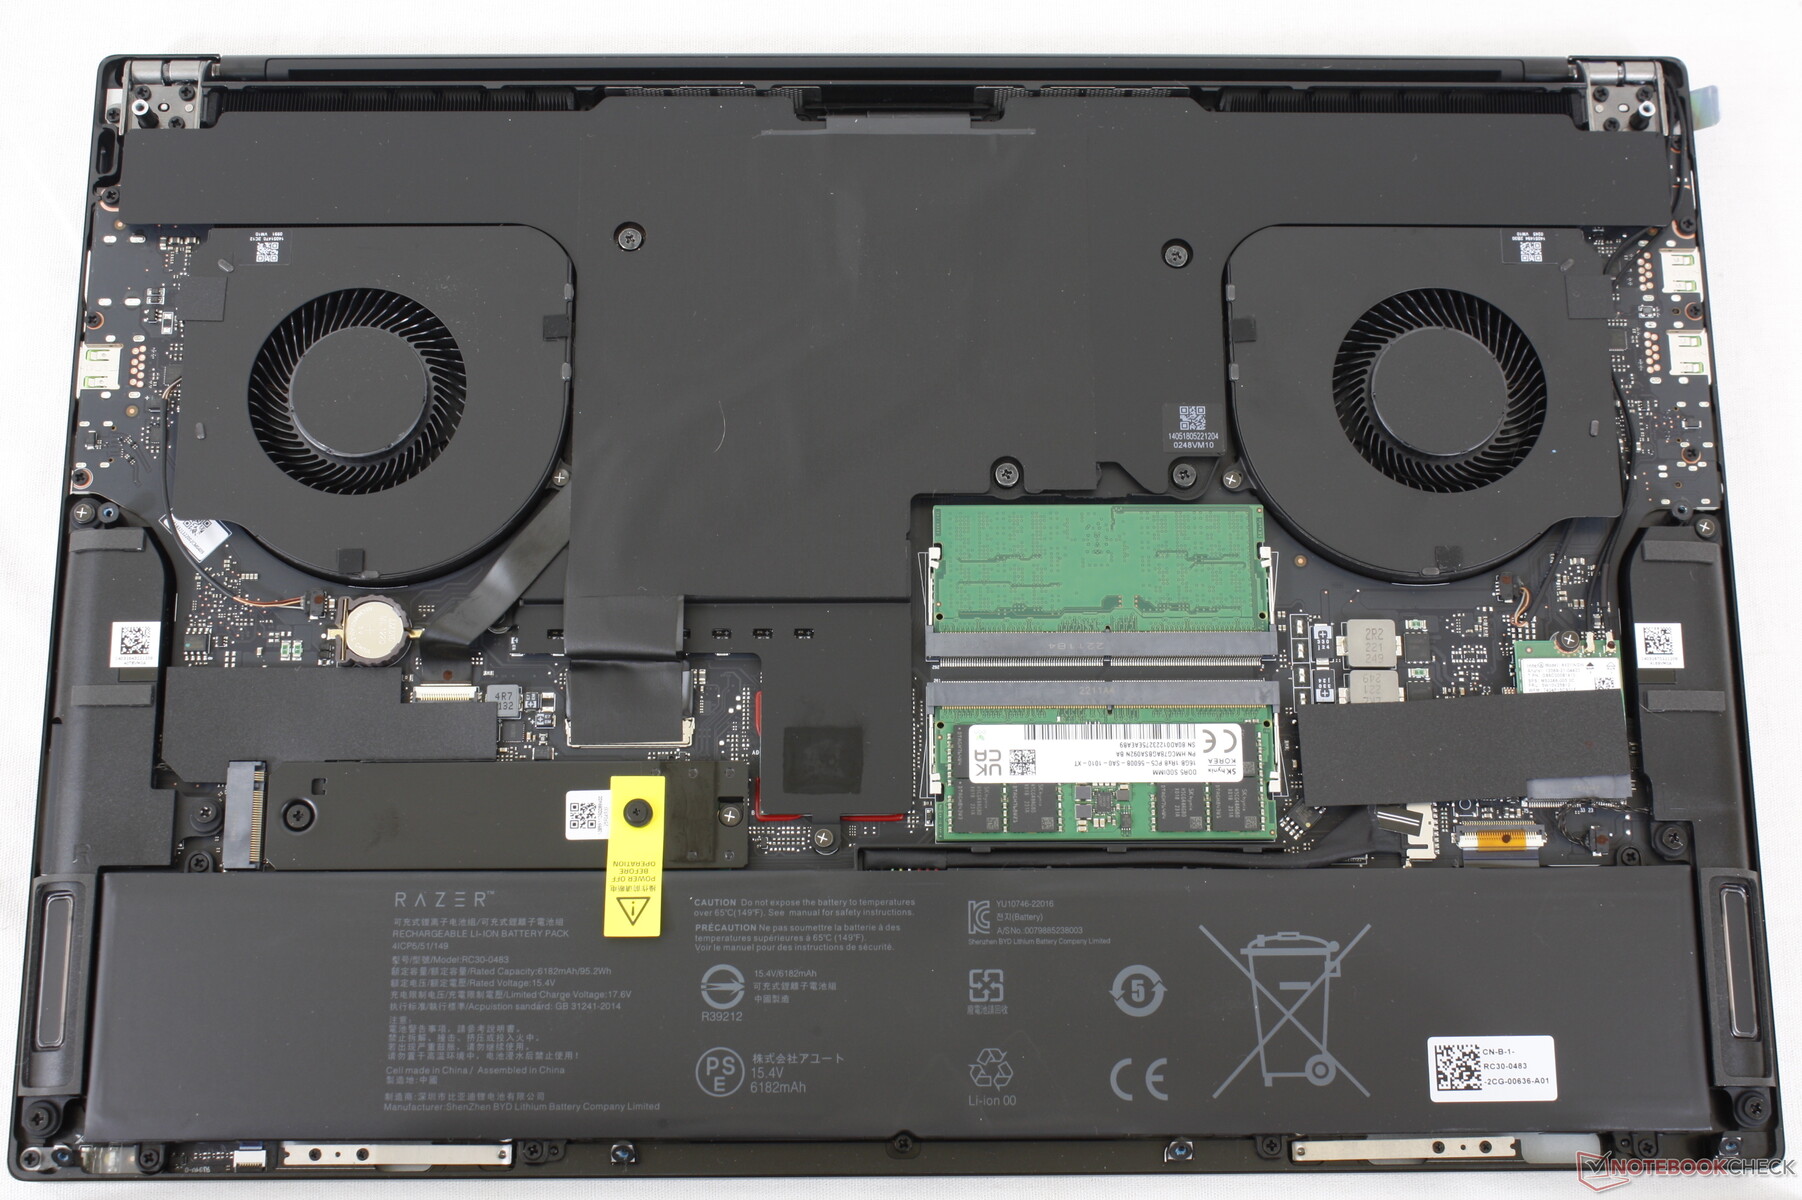
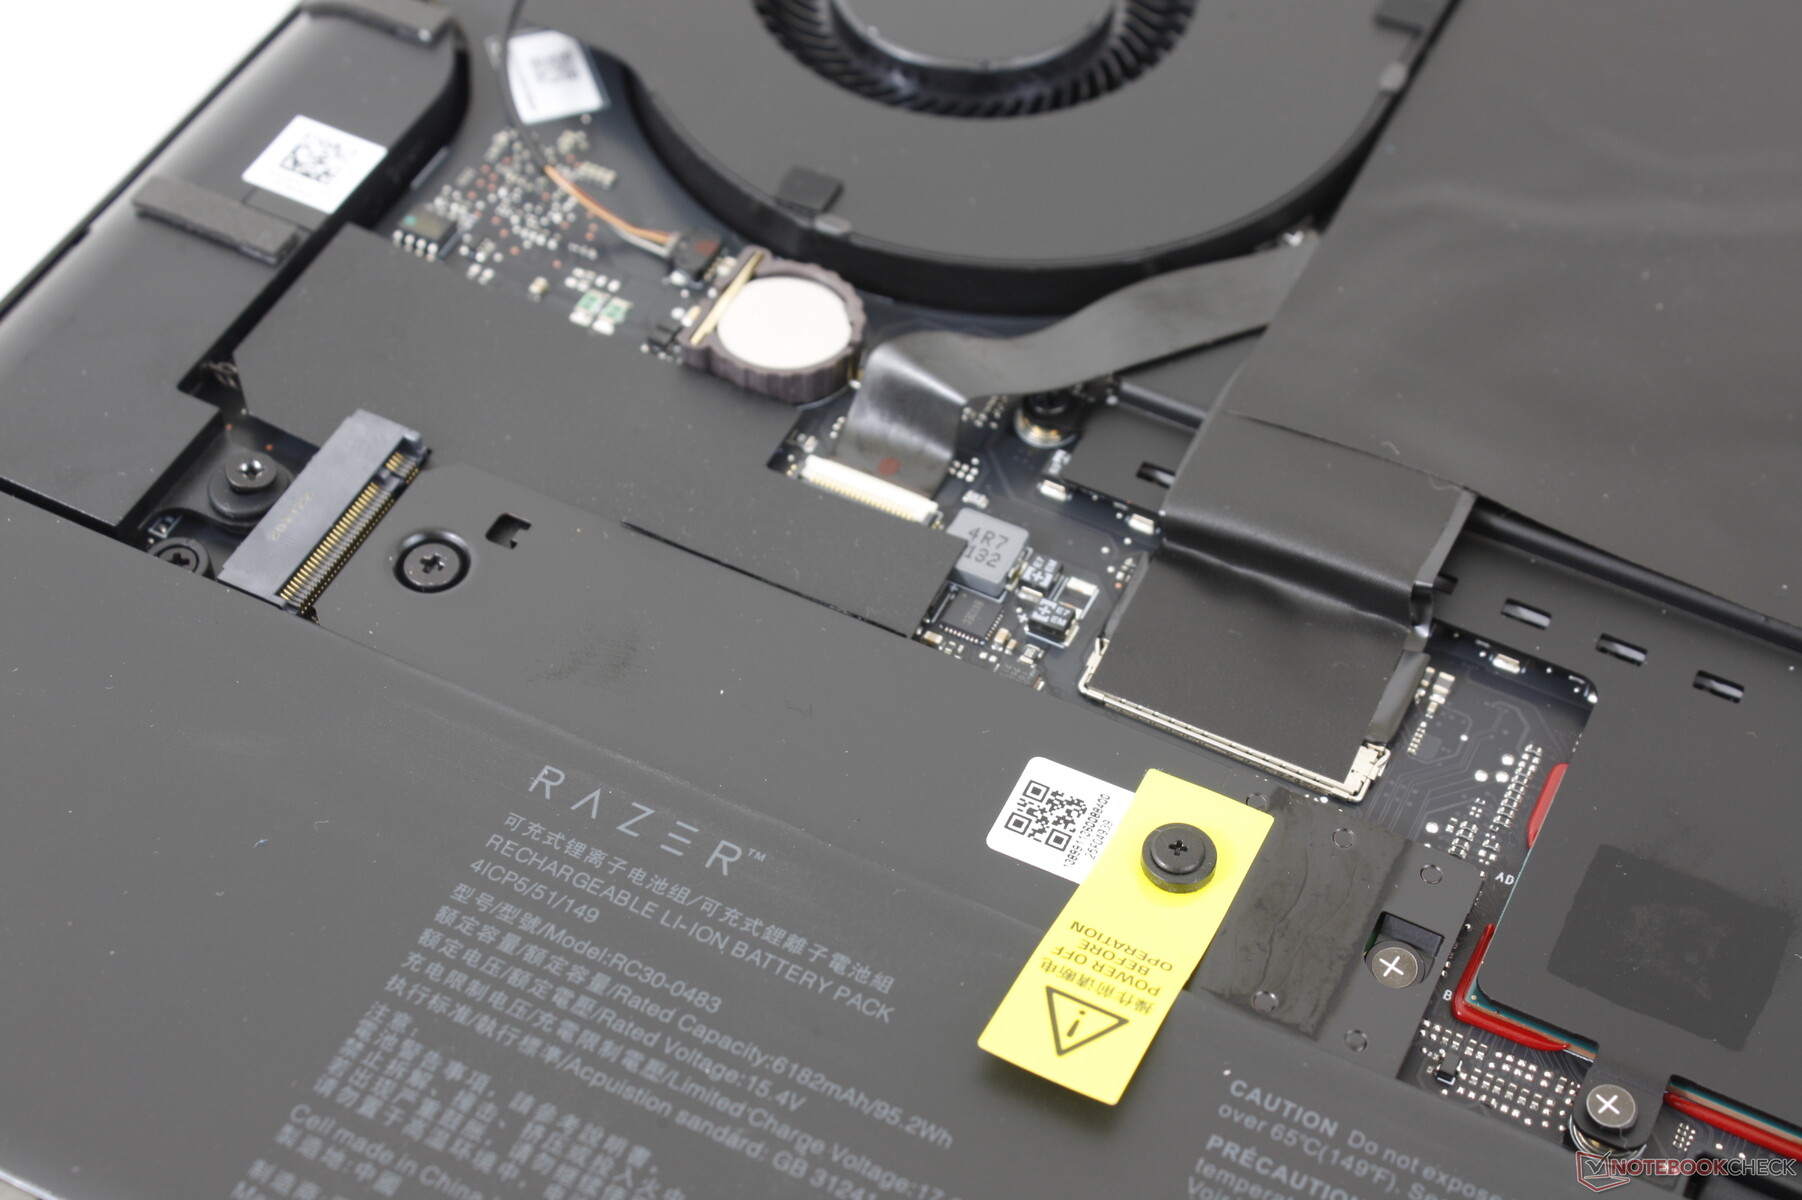
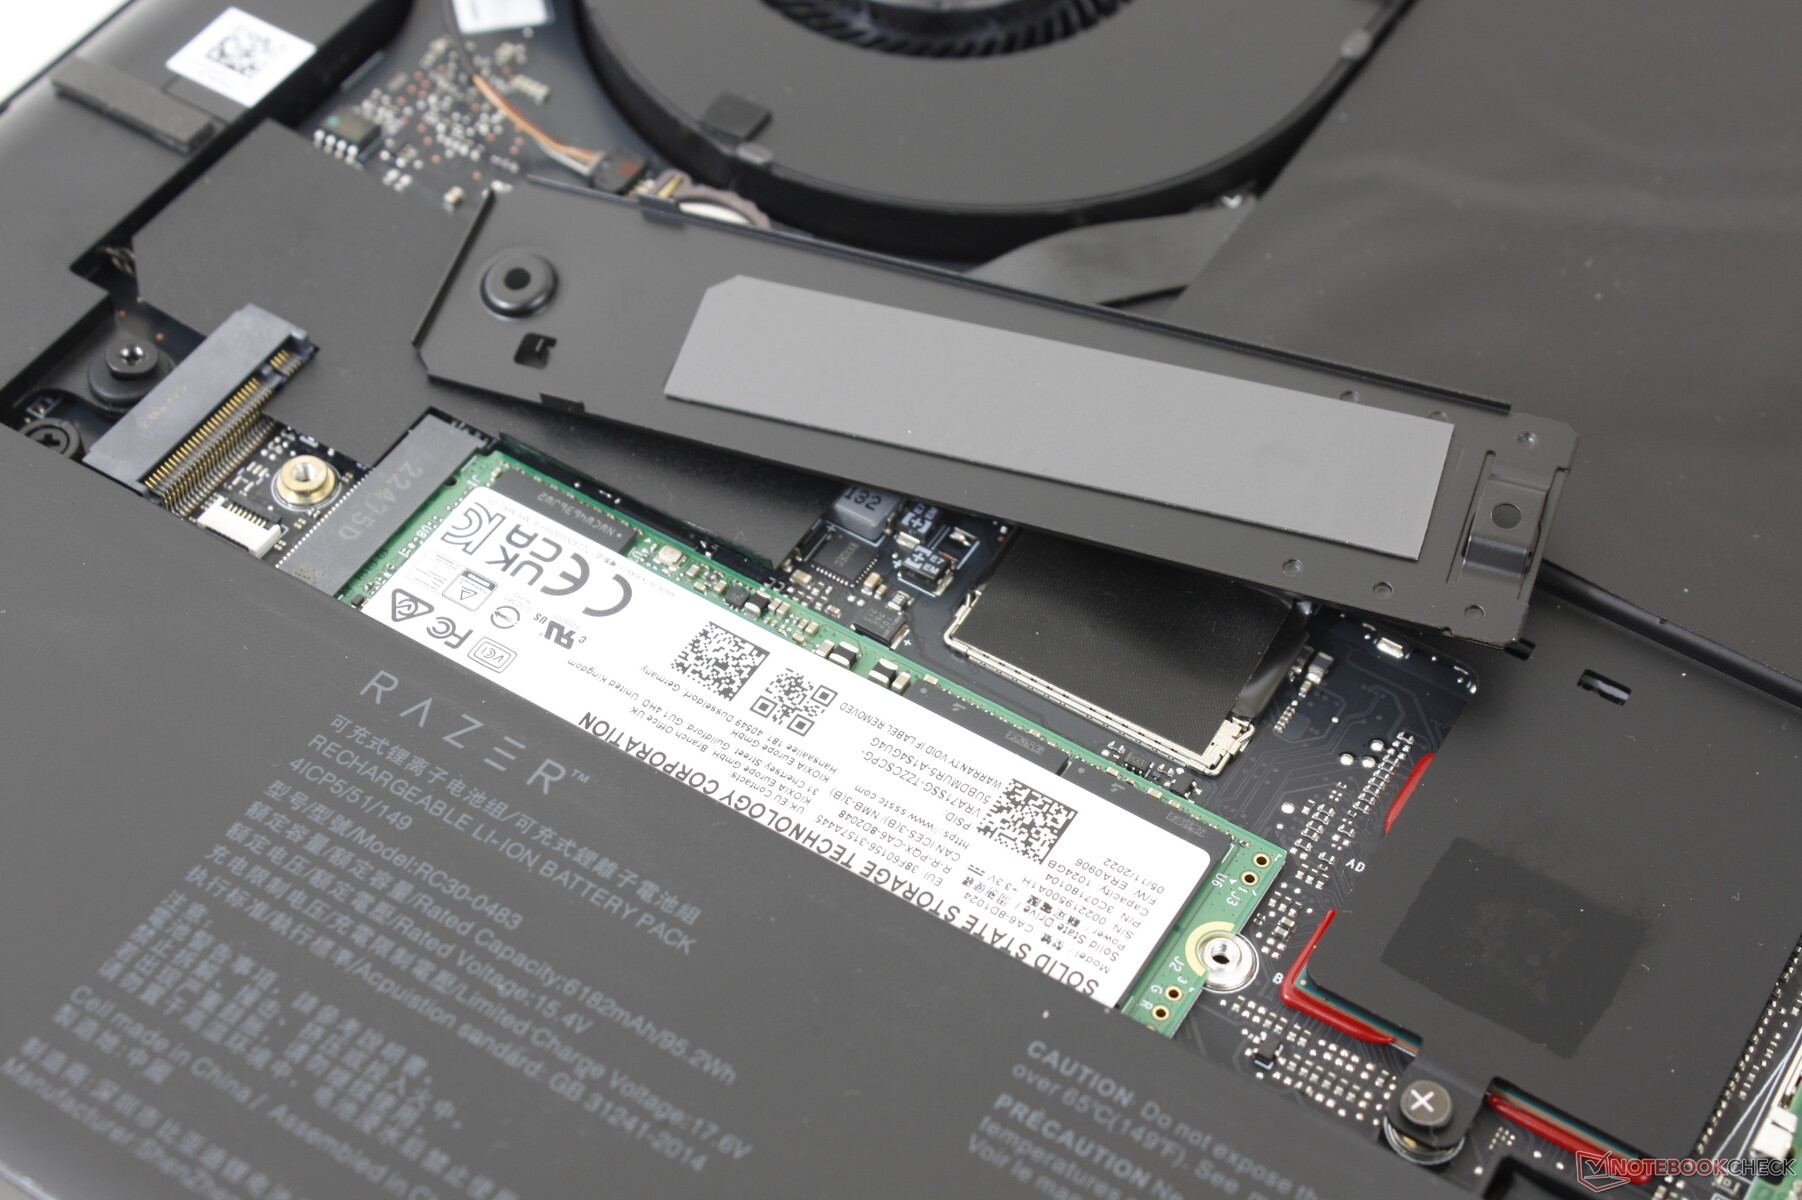
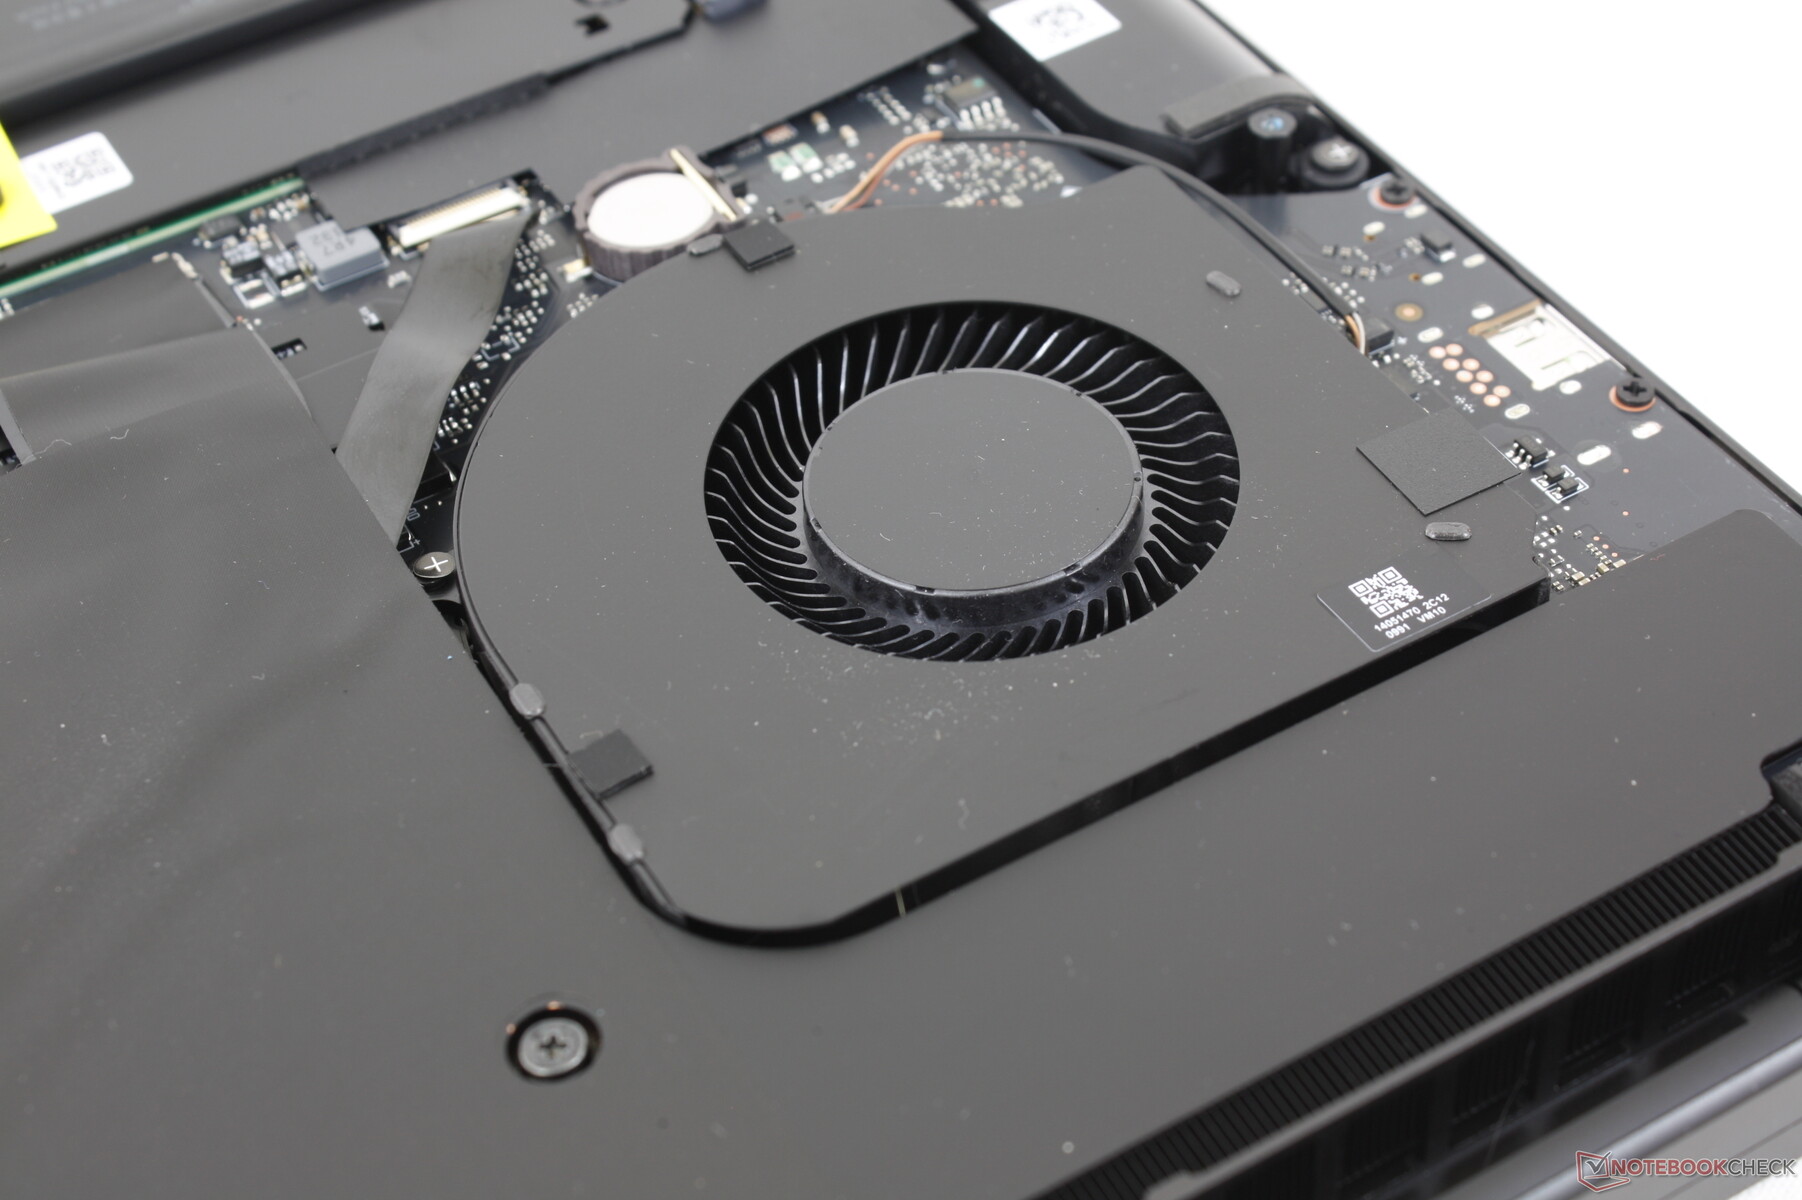
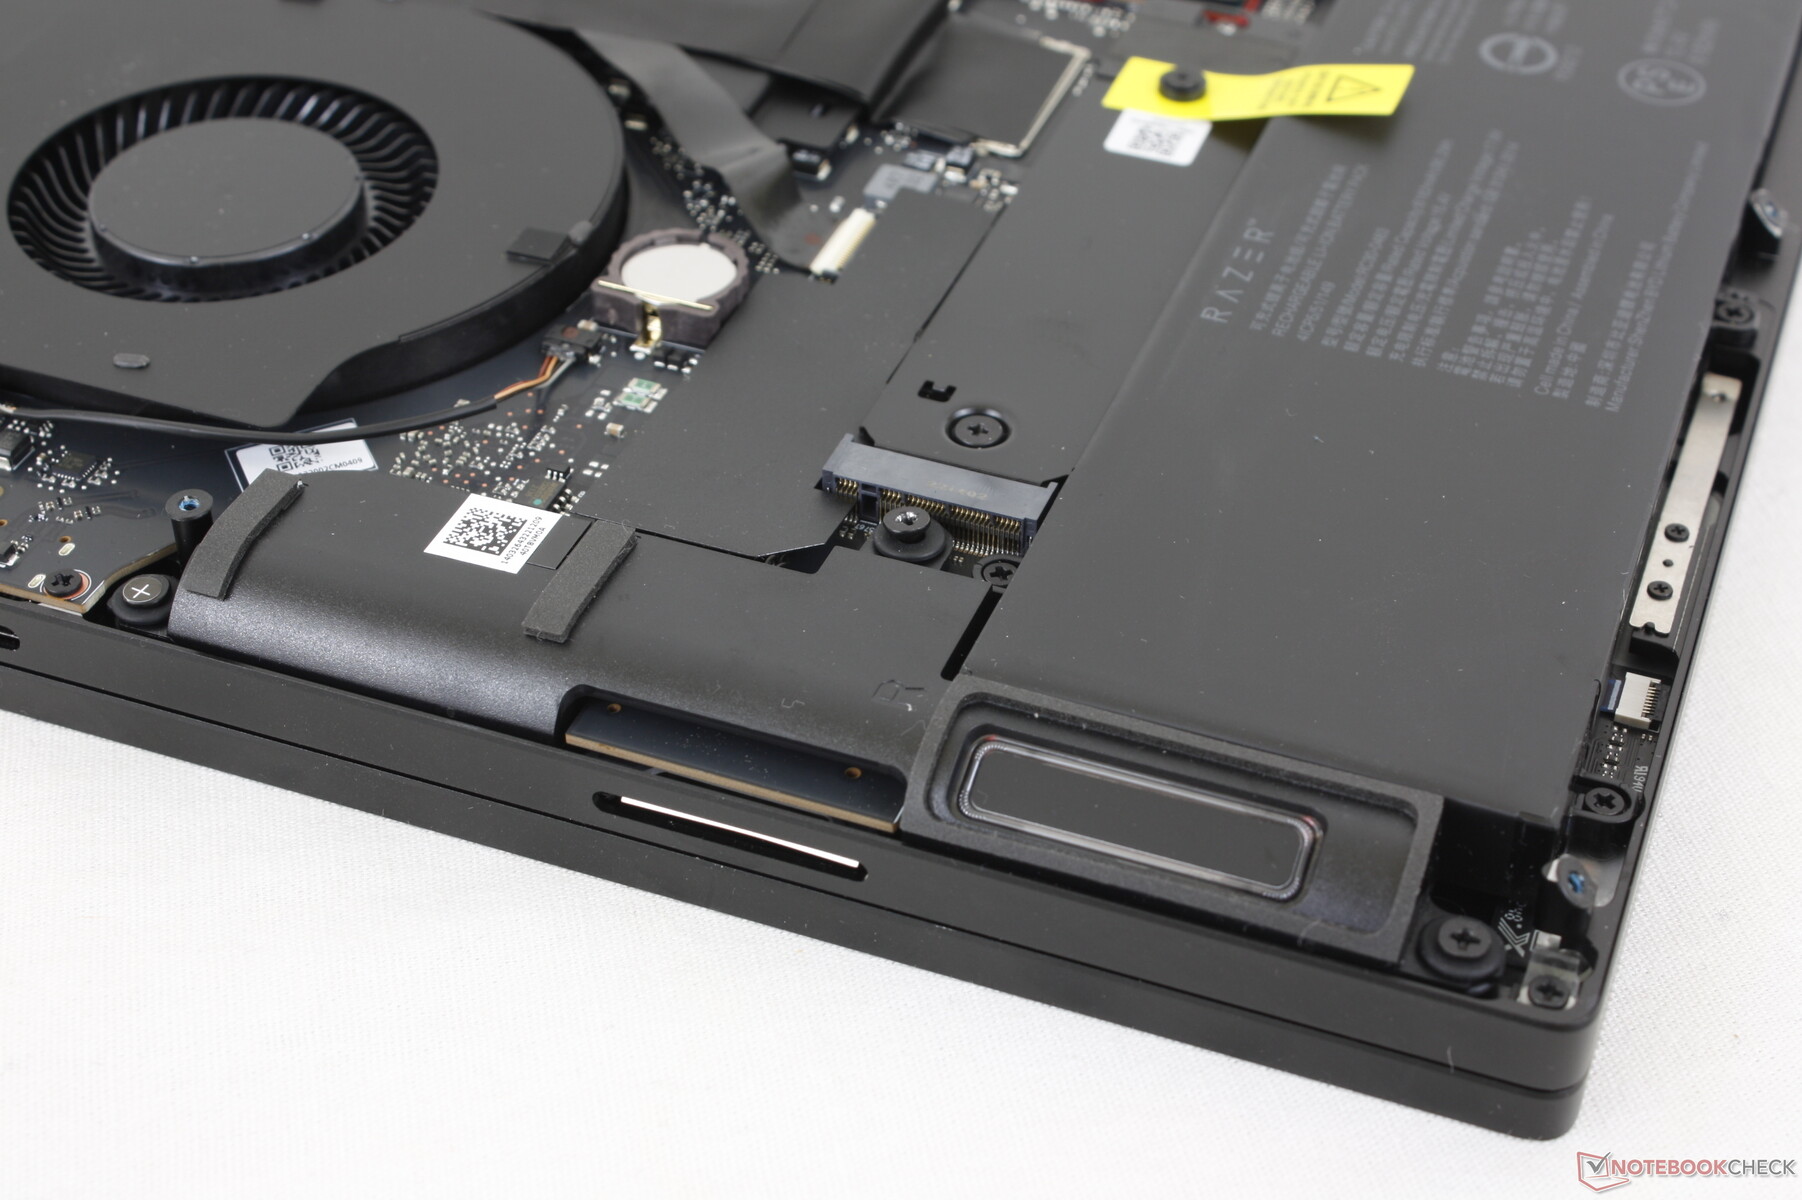
Mantenimiento
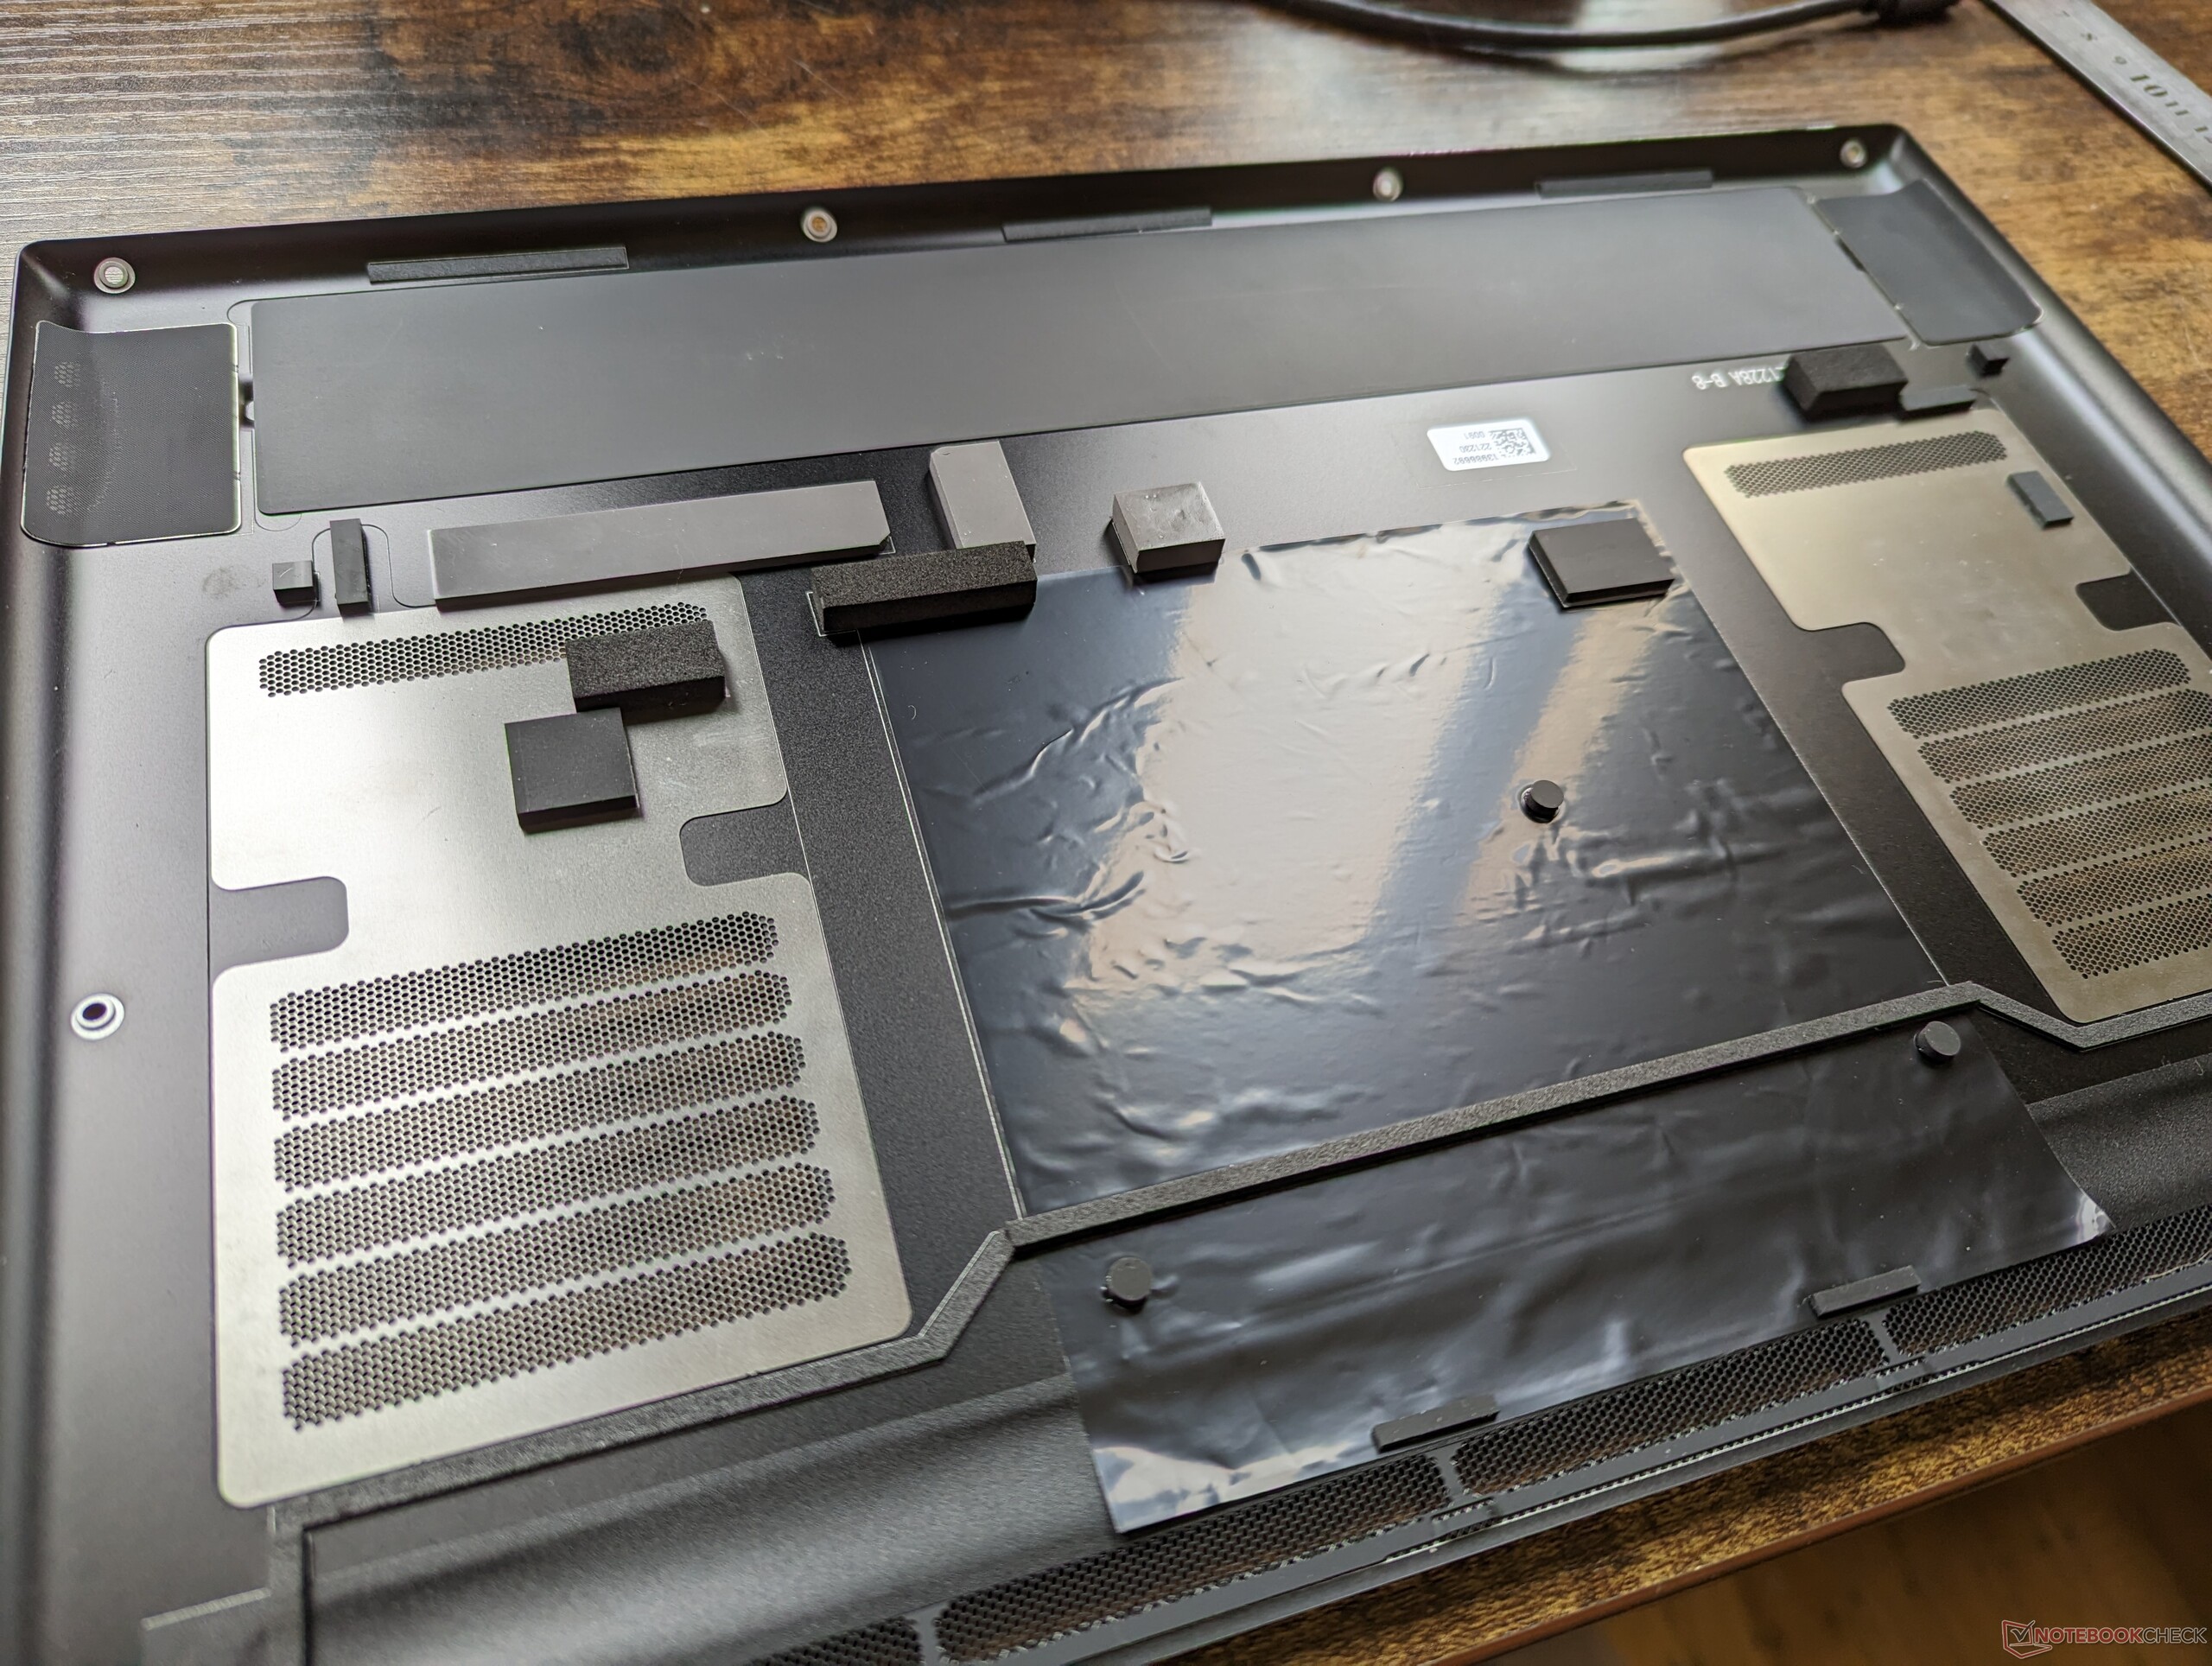
El panel inferior está asegurado por ocho tornillos Torx T5 para facilitar el mantenimiento. Los usuarios tienen acceso directo a 2x ranuras SODIMM DDR5, 2x ranuras SSD M.2 2280, ambas baterías, y el módulo WLAN. Se pueden instalar hasta 64 GB de RAM, pero el rendimiento de la RAM se limitará a 5200 MHz en comparación con 5600 MHz si se instala con 32 GB o menos. El límite de rendimiento se debe a las limitaciones de la interfaz SODIMM.
Accesorios y garantía
La caja no incluye más accesorios que el adaptador de CA o la documentación, ni siquiera un paño de terciopelo. Si se adquiere en EE.UU., el fabricante aplica una garantía limitada de un año.
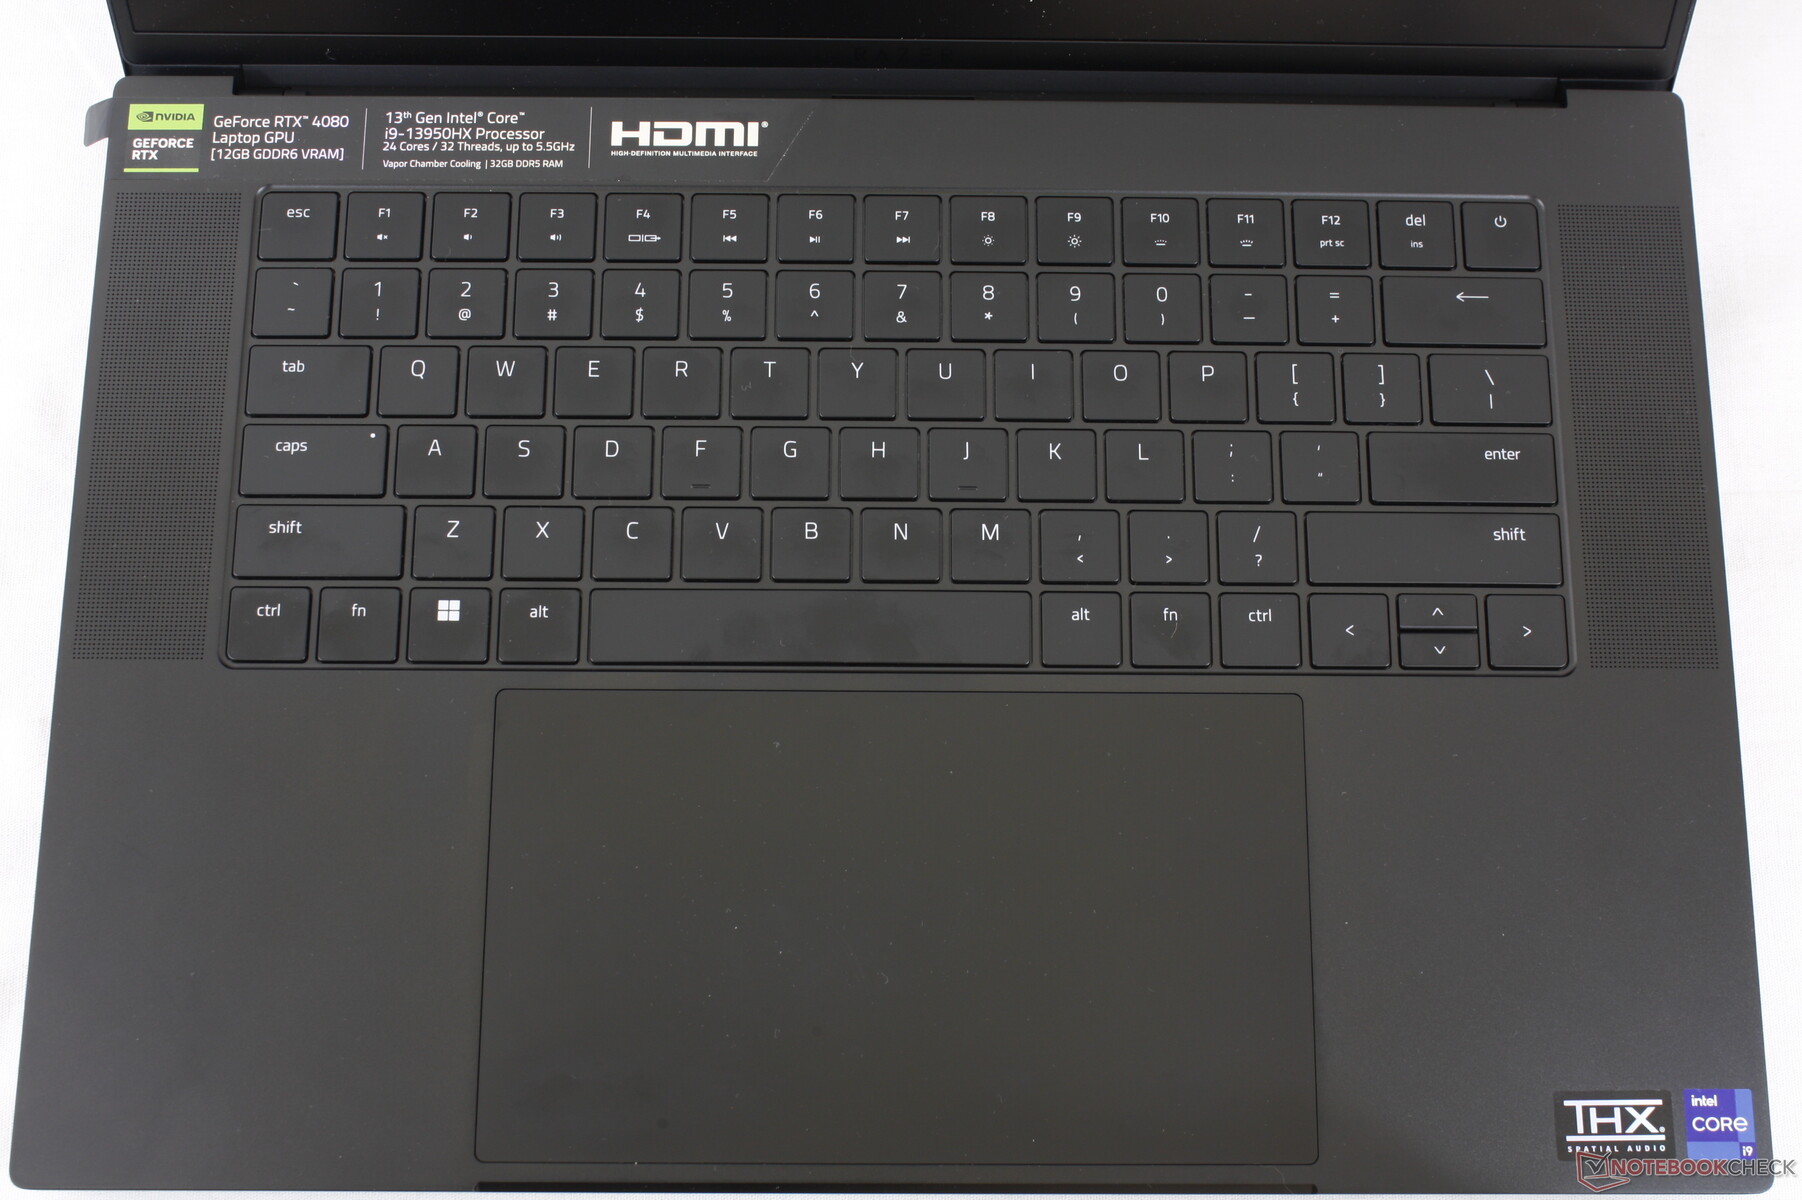
Dispositivos de entrada - Clickpad mucho más grande
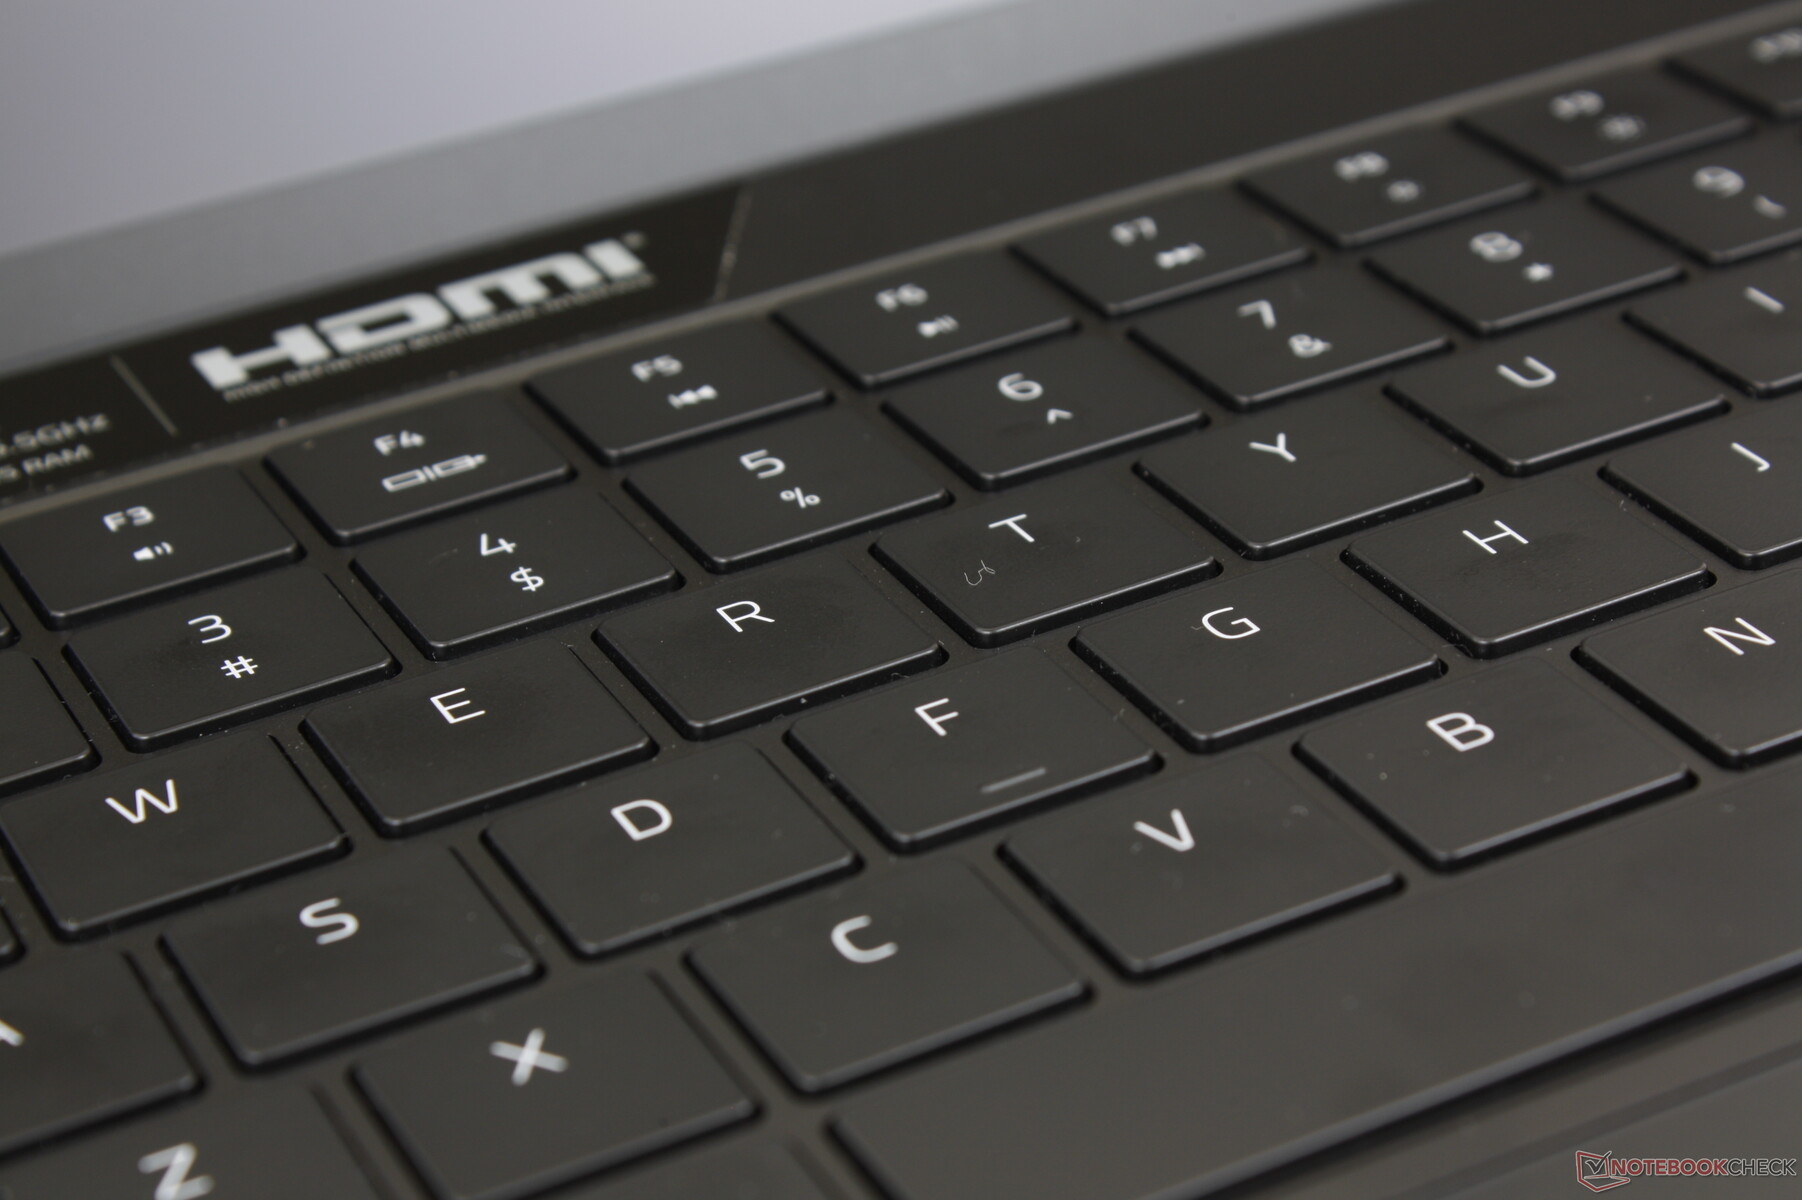
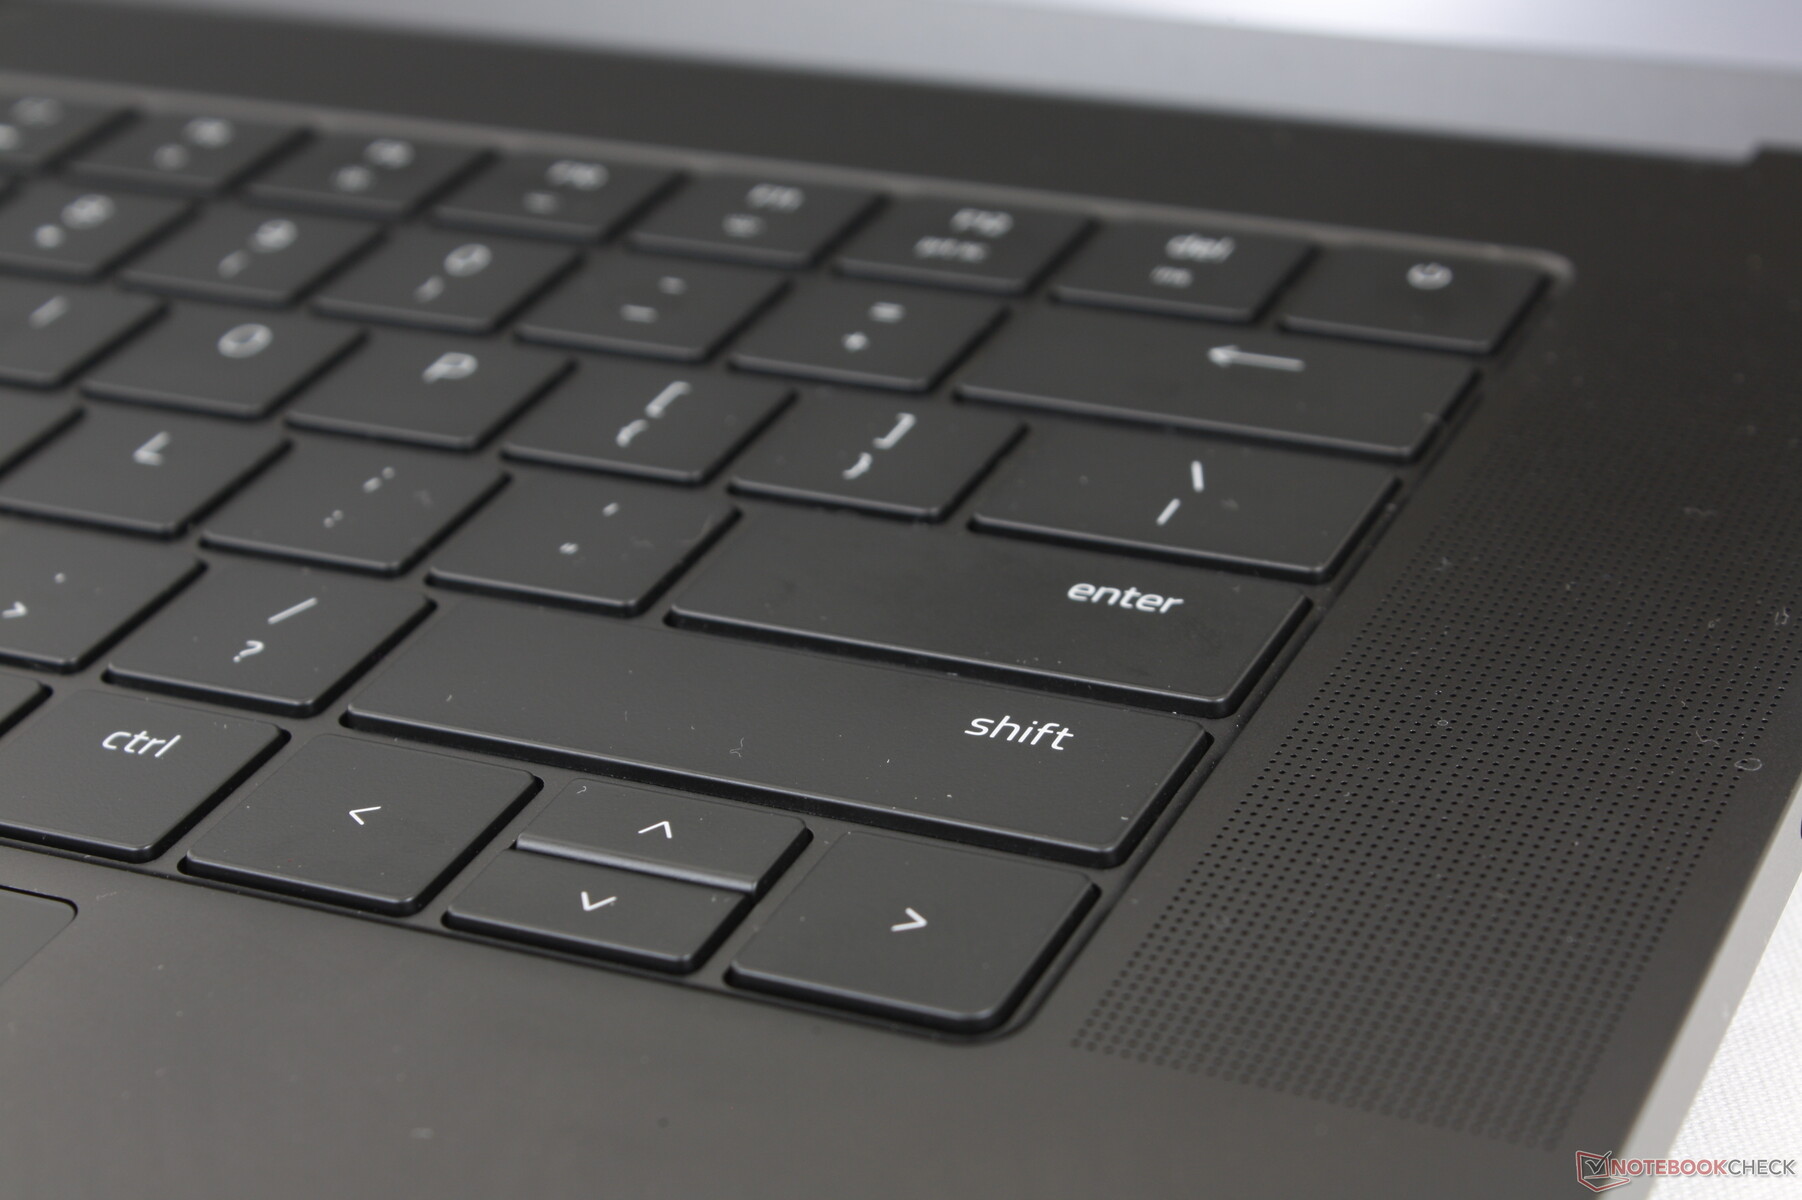
Teclado
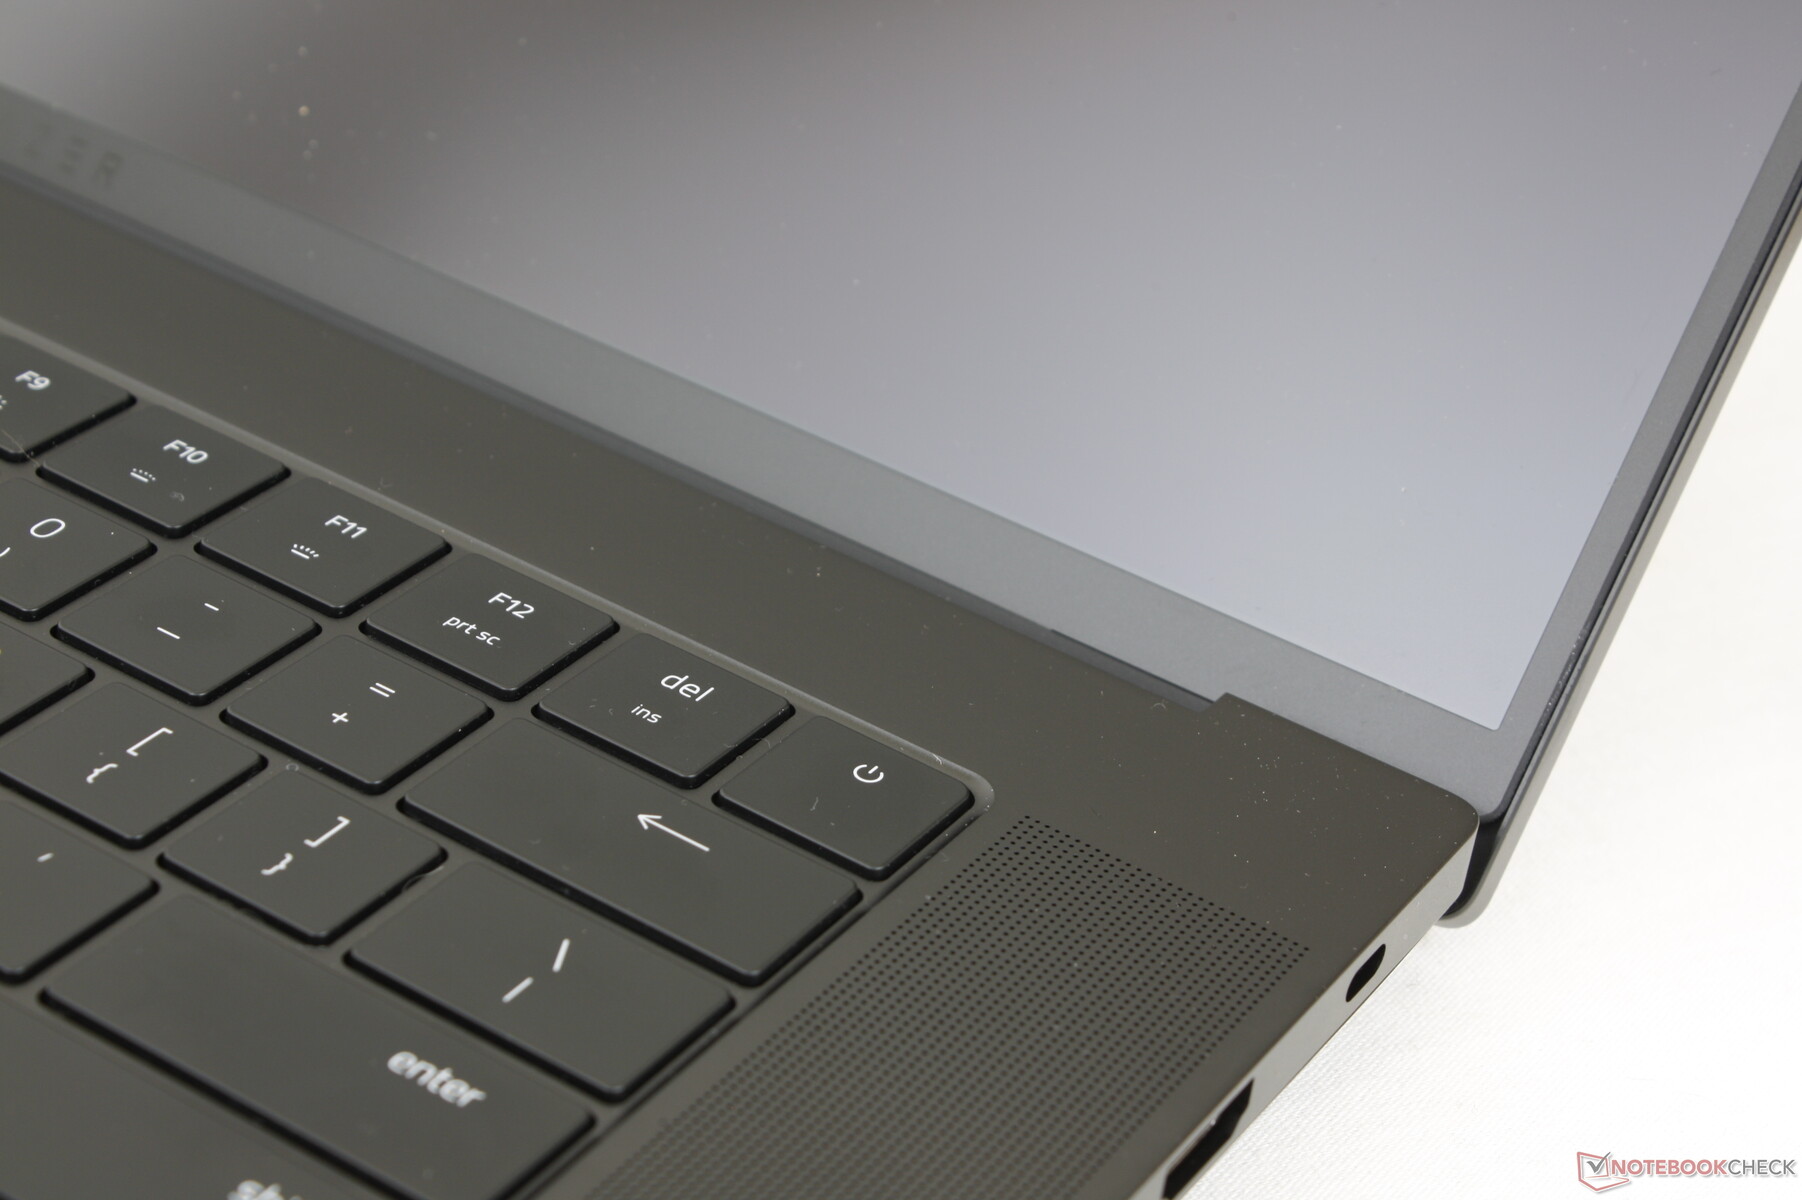
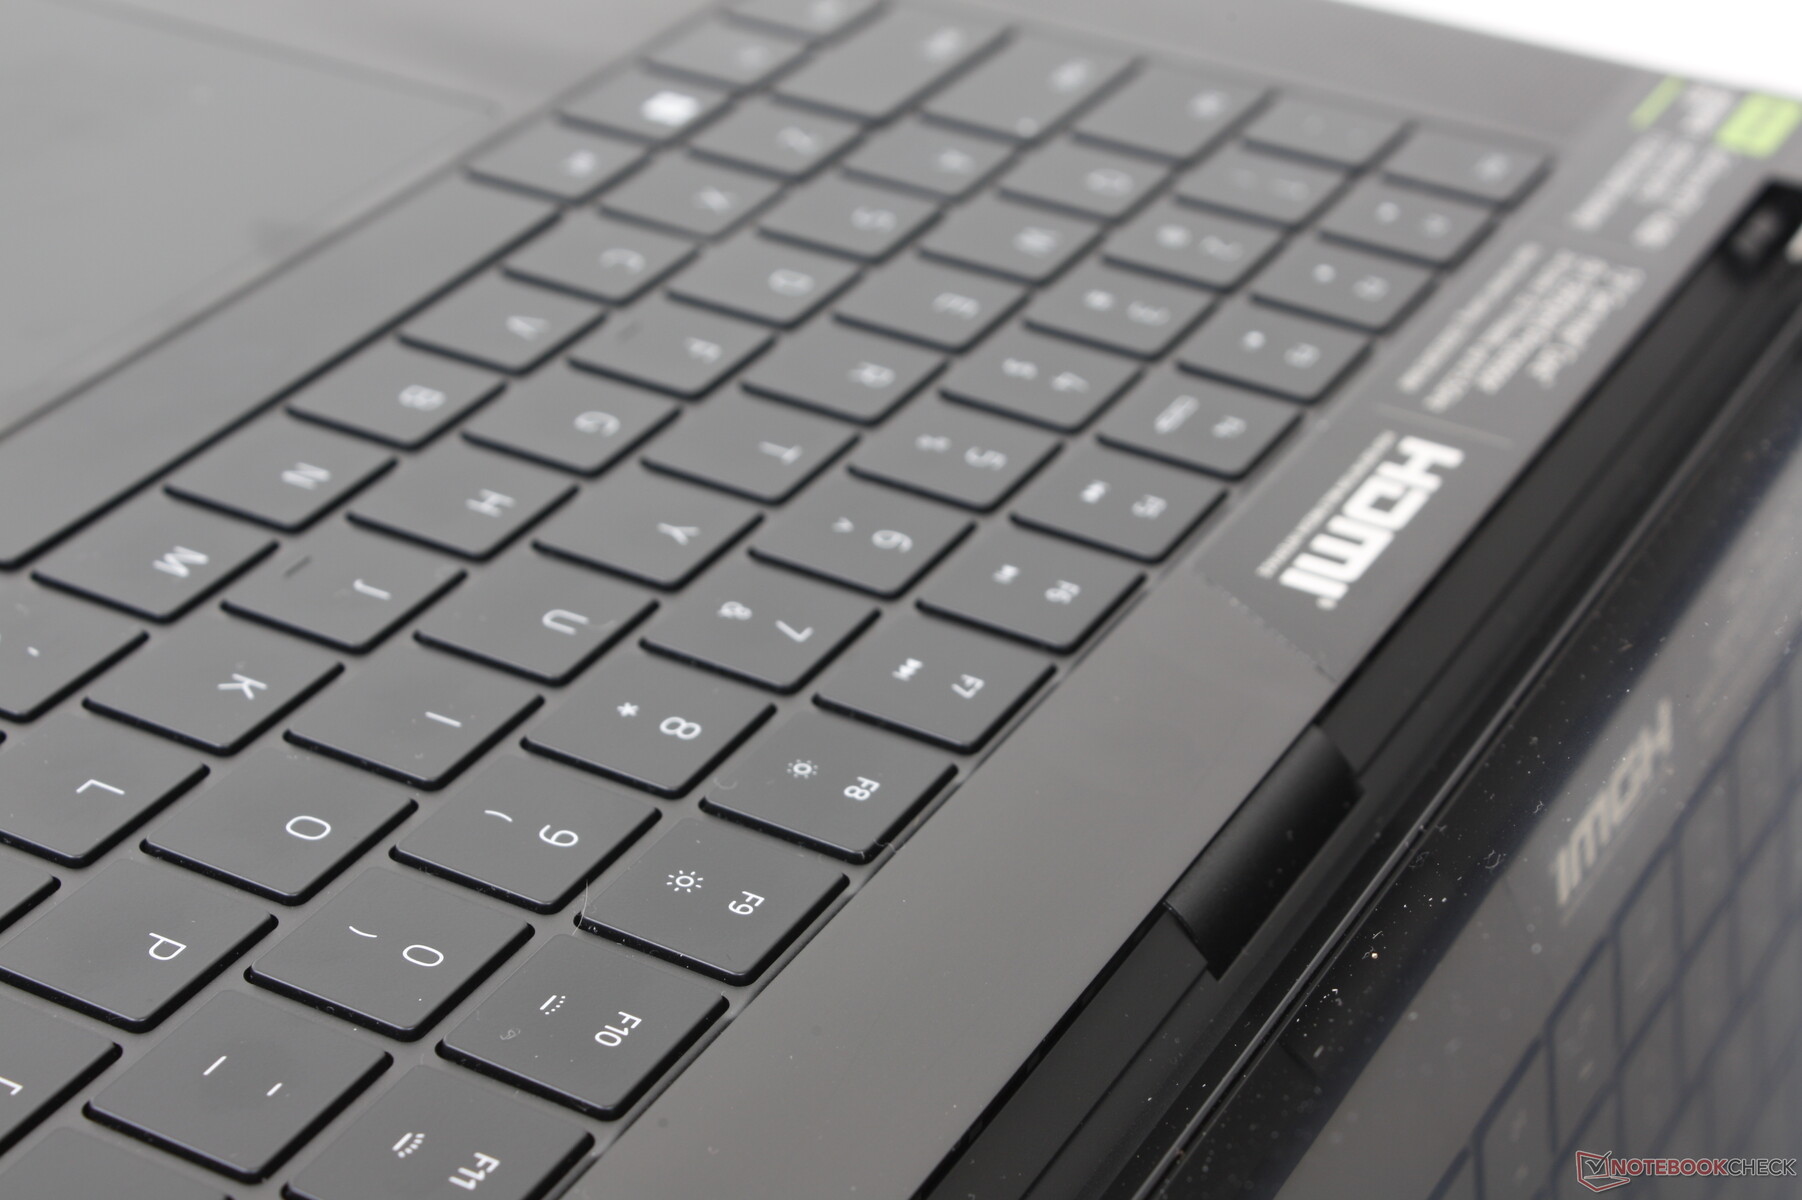
El teclado sigue siendo idéntico al del 2022 Blade 15 hasta el tamaño de las teclas, el recorrido, la fuente y la iluminación RGB por tecla. Razer ya alargó las teclas Shift entre los modelos Blade 15 2021 y 2022, por lo que el Blade 16 ha heredado este cambio. Sin embargo, habría estado bien ver un botón de encendido con huella dactilar.
Los modelos Blade 15 más antiguos incorporaban interruptores ópticos, pero esta característica ha desaparecido en los últimos modelos Blade.
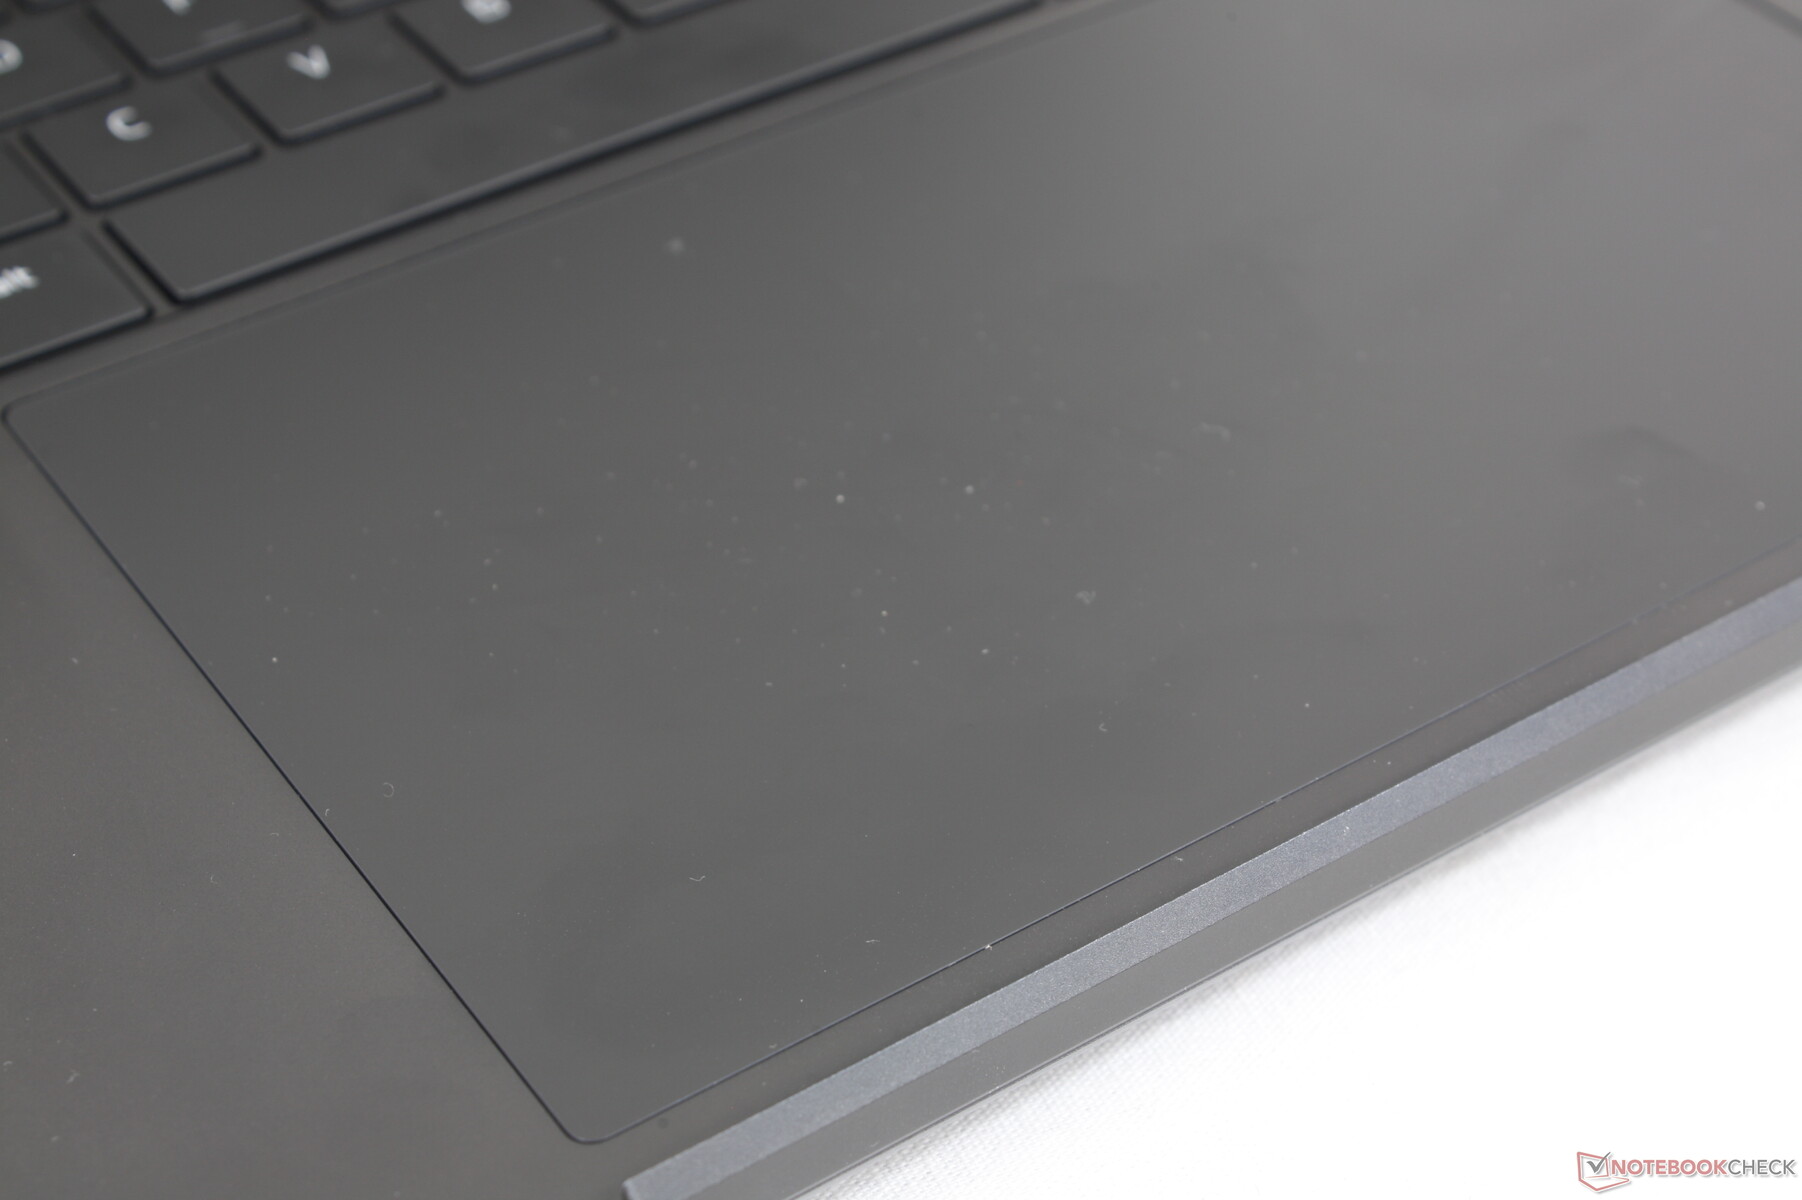
Panel táctil
Cuando Razer presentó el modelo más grande de 17,3 pulgadas Blade Pro o Blade 17, nos sorprendió ver que su teclado era exactamente del mismo tamaño que el del Blade 15 de 15,6 pulgadas. Para el Blade 16, el fabricante ha aumentado finalmente la superficie de 13 x 8 cm del Blade 15/17 a unos superespaciosos 17 x 9,7 cm. Los controles del cursor y las entradas multitáctiles son por tanto más fáciles, pero la respuesta al pulsar sigue siendo esponjosa, similar a los modelos Blade existentes o al Dell XPS 15/17. Si encuentras la respuesta del clickpad en el Blade 15 o 17 demasiado suave, entonces el clickpad del Blade 16 no te parecerá diferente.
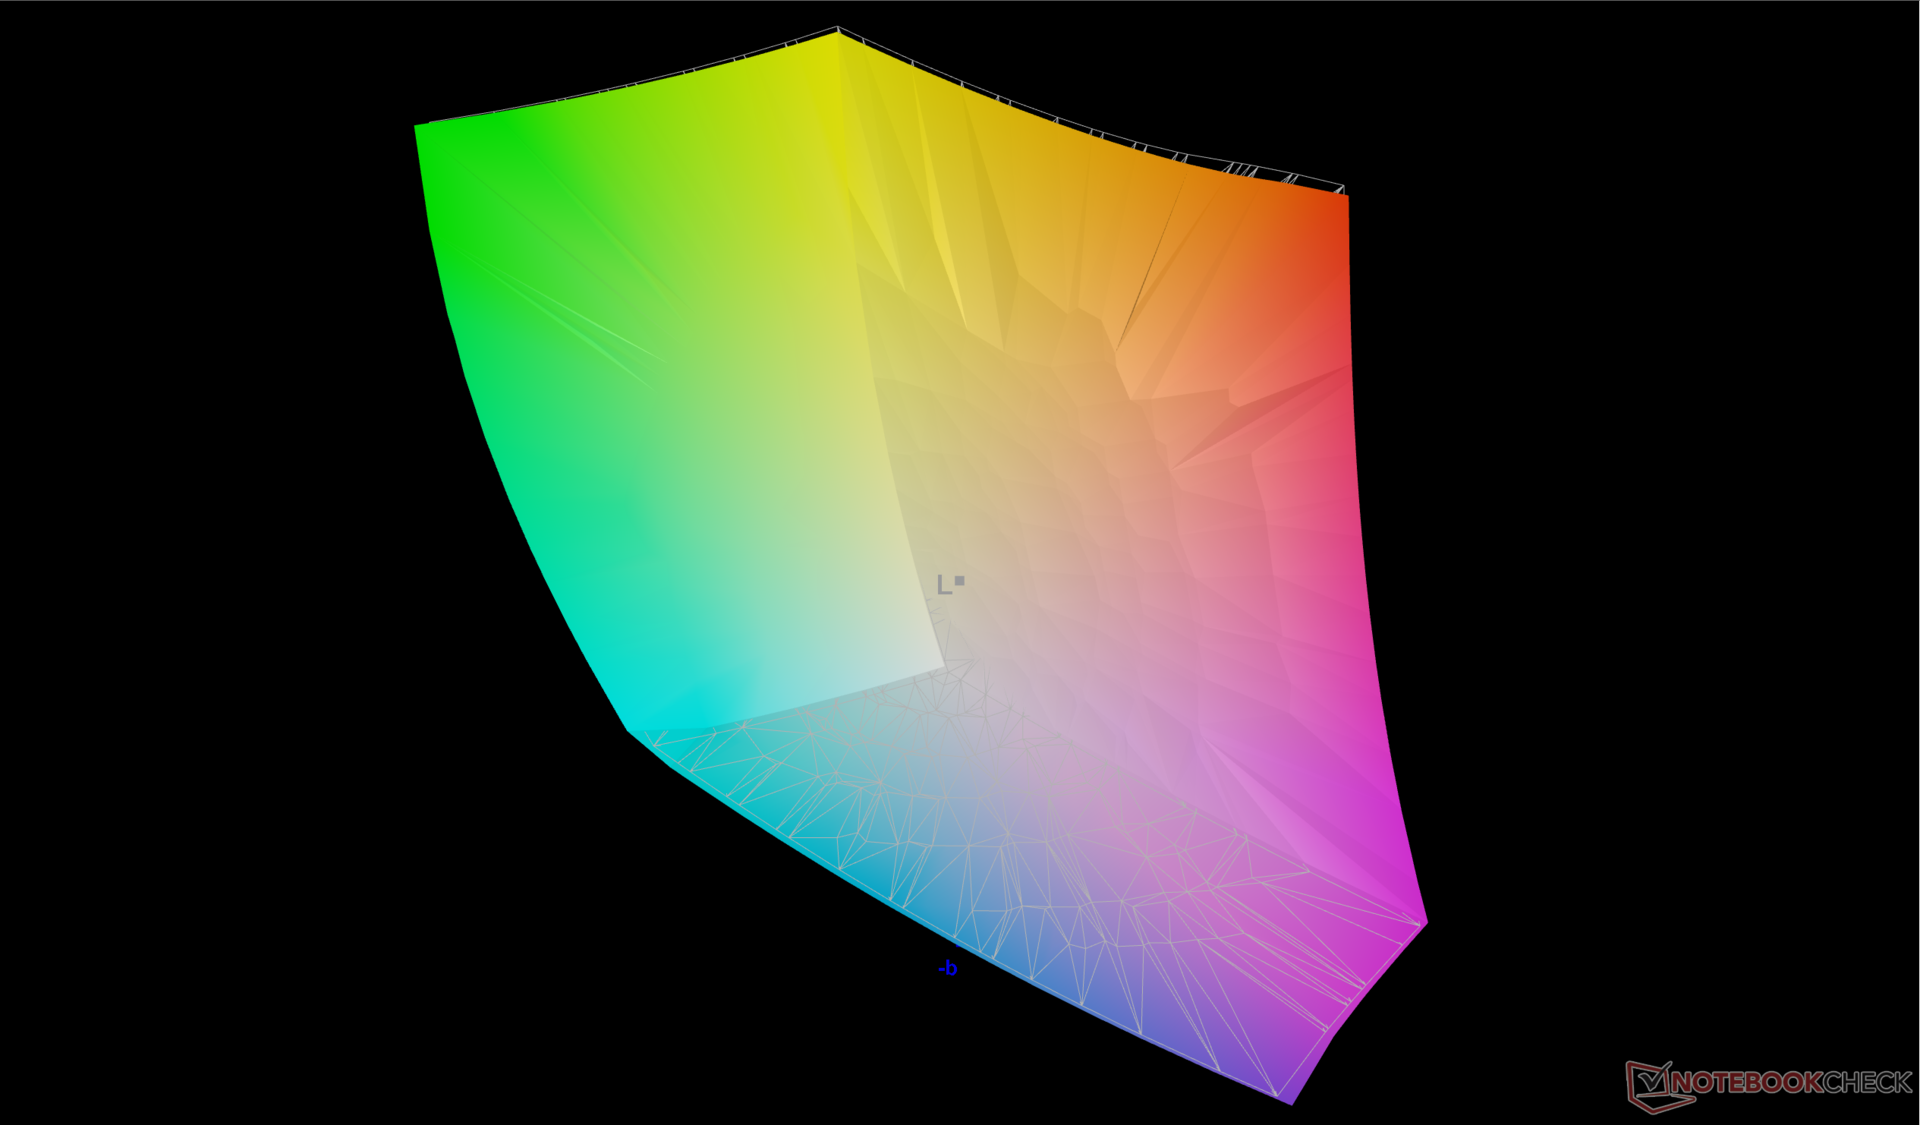
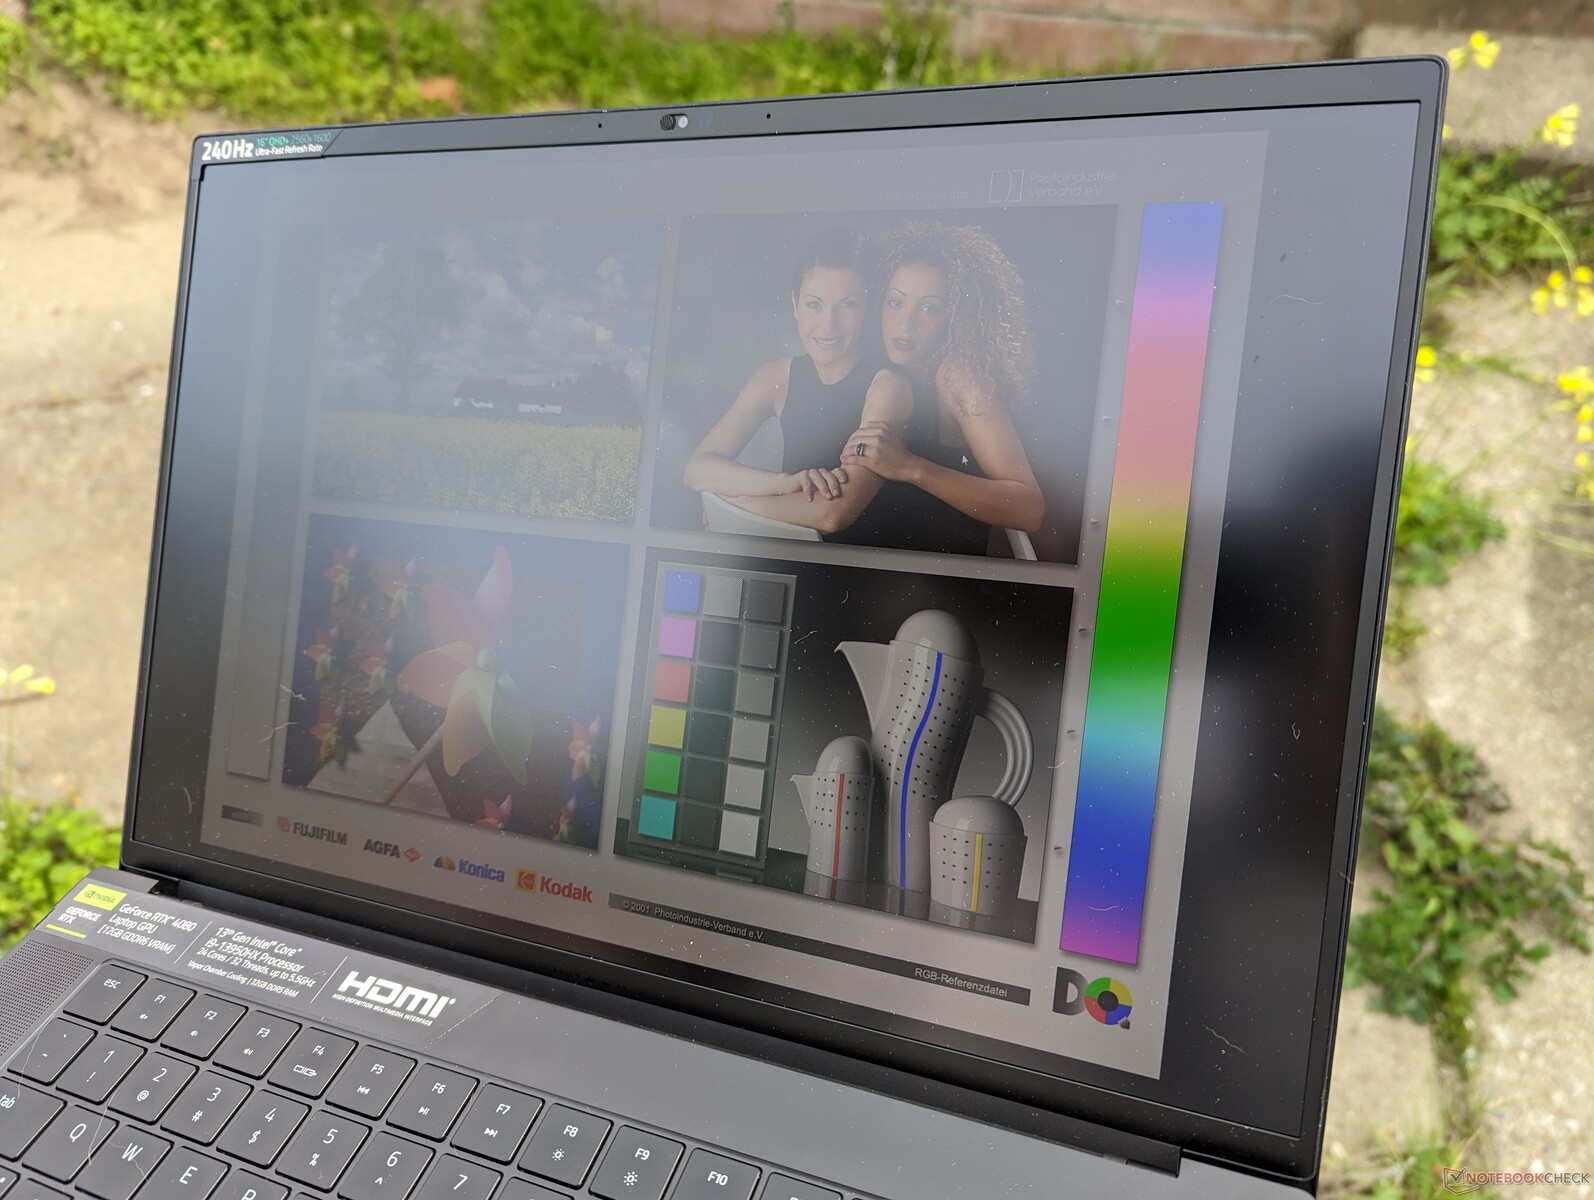
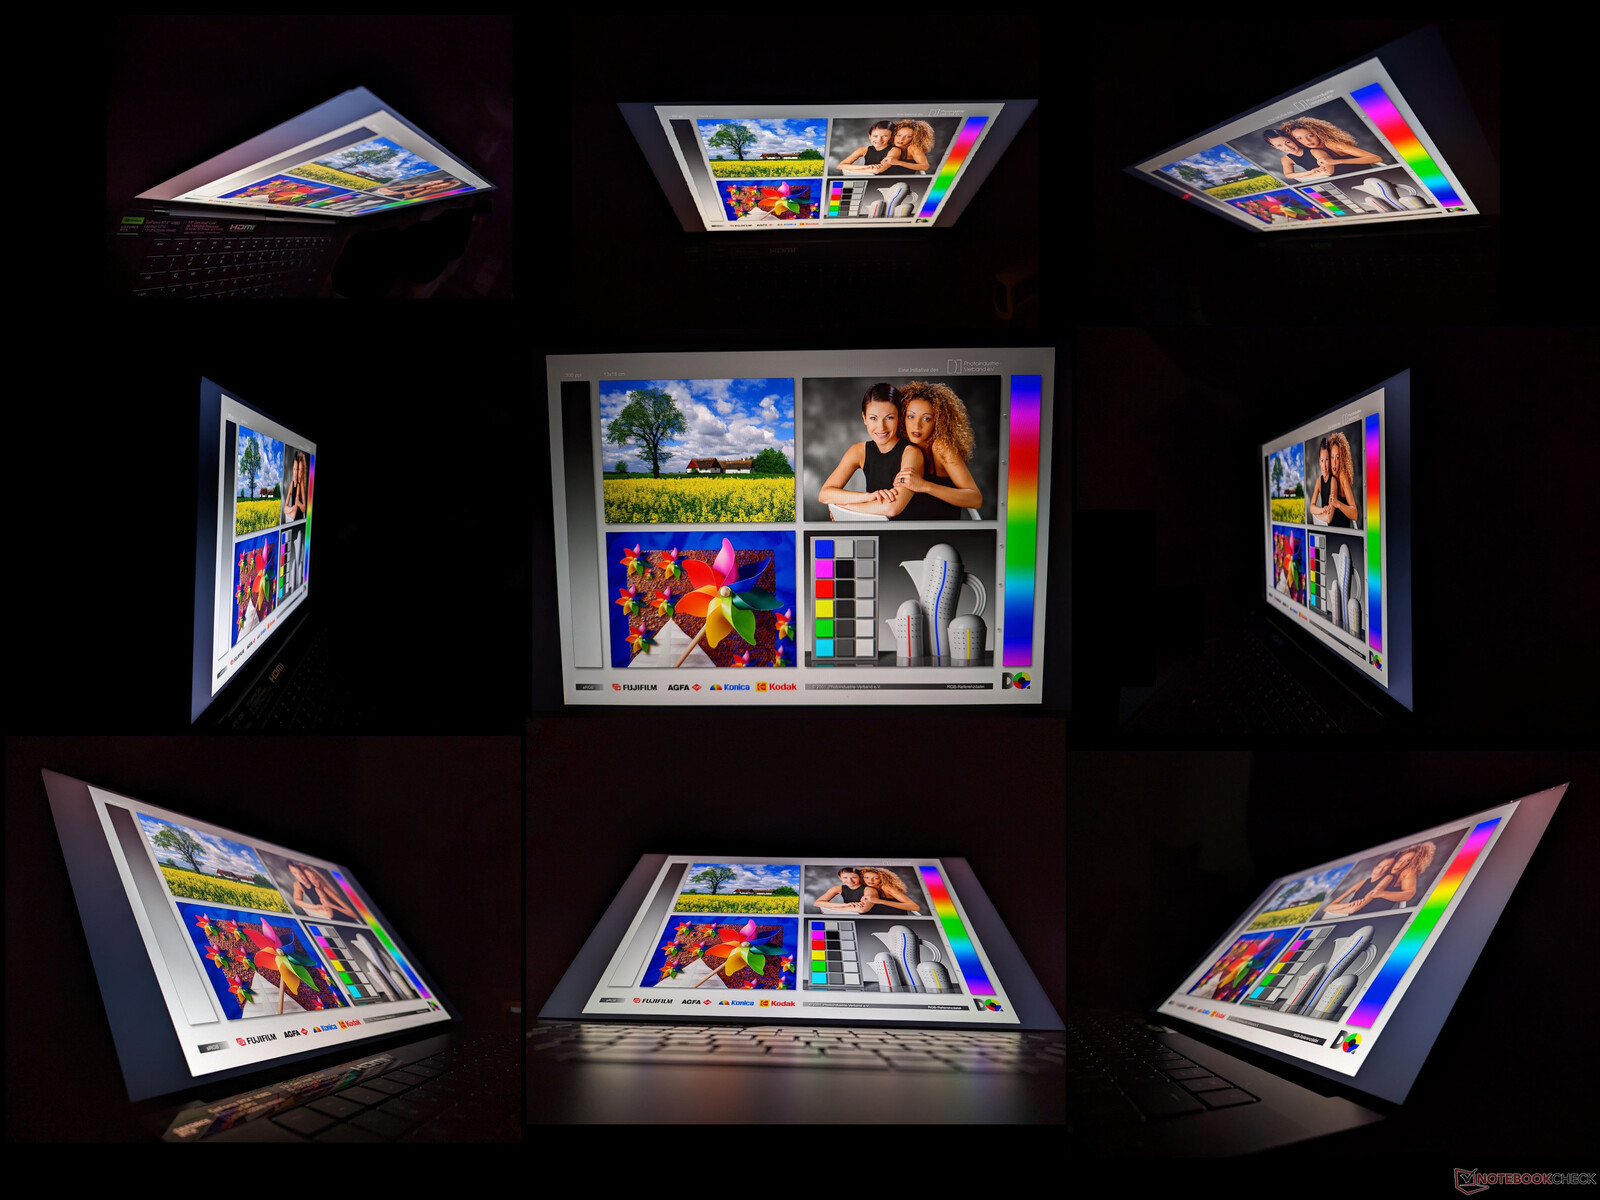
Pantalla - IPS, 240 Hz, QHD+, 16:10, AdobeRGB completo
Hay dos opciones disponibles, ambas mates y calibradas en fábrica:
- QHD+, 240 Hz, 100% DCI-P3, IPS
- Modo dual (UHD+@120 Hz o FHD+@240 Hz), 100% DCI-P3, mini-LED
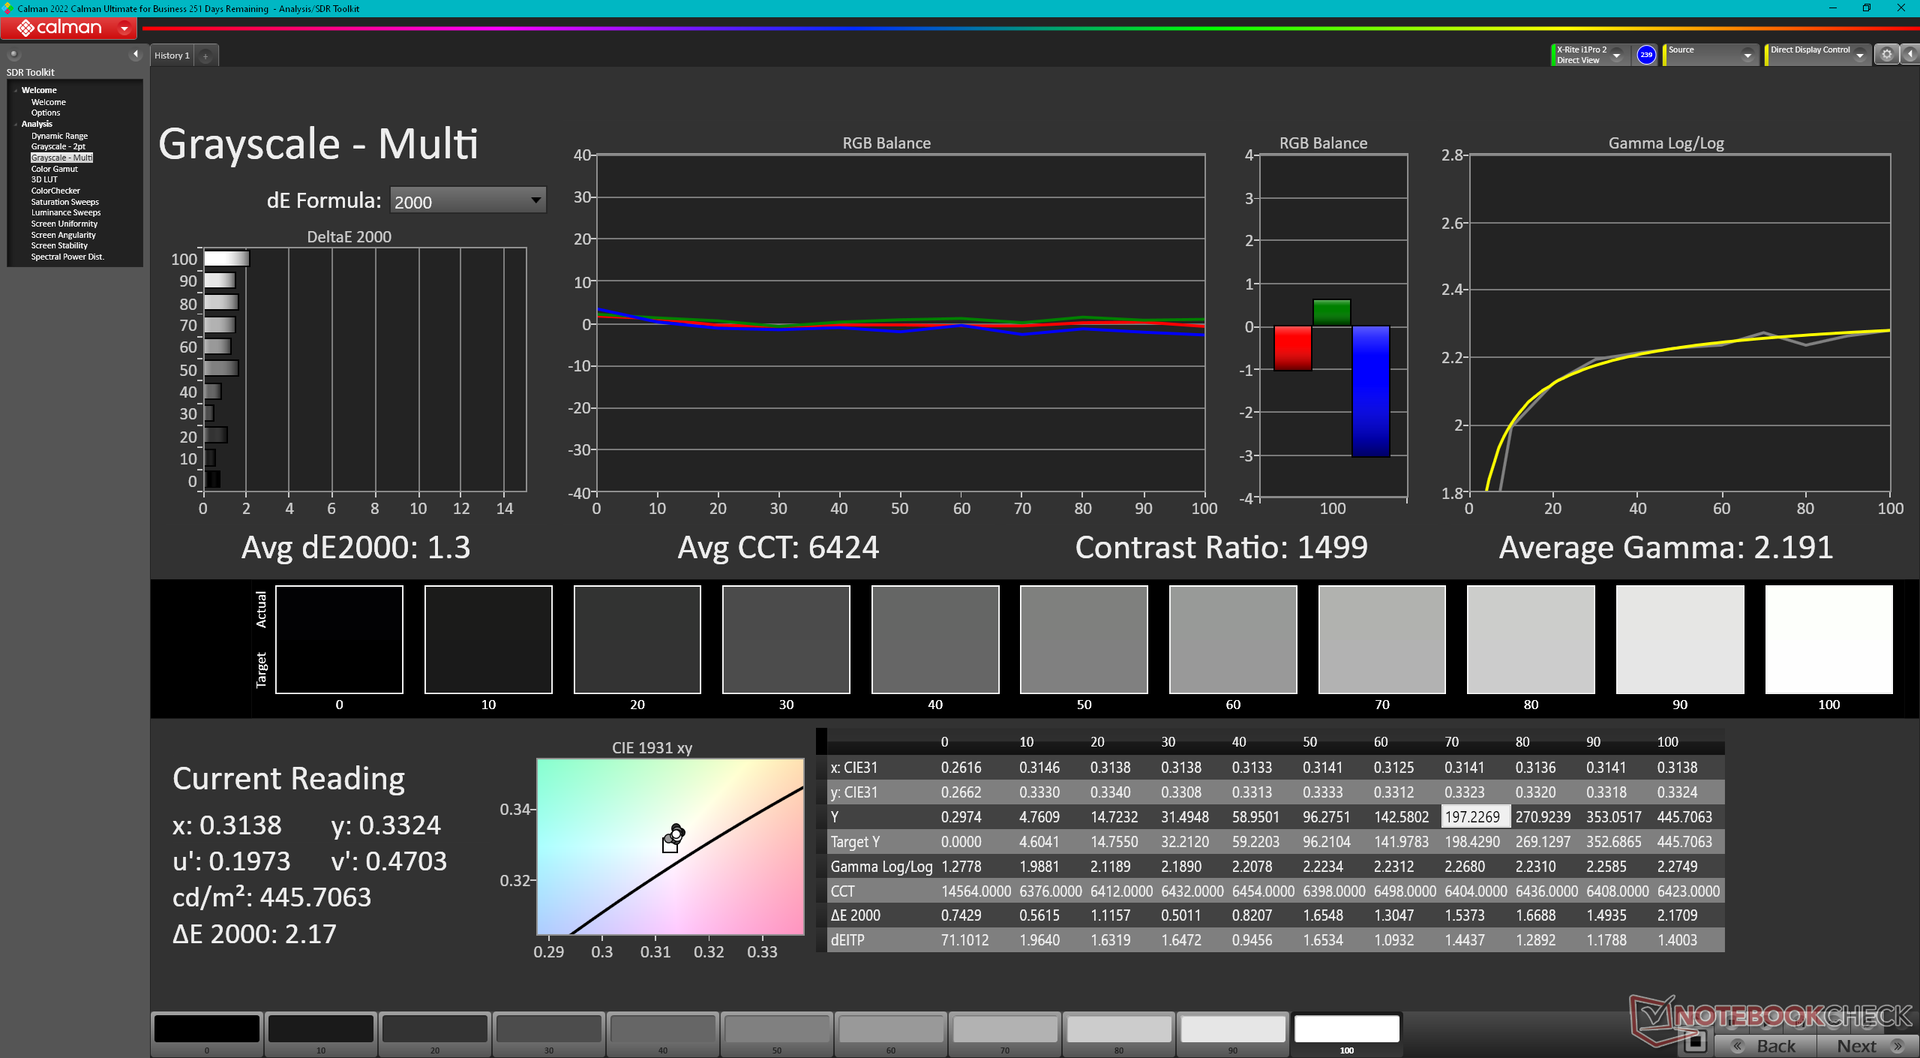
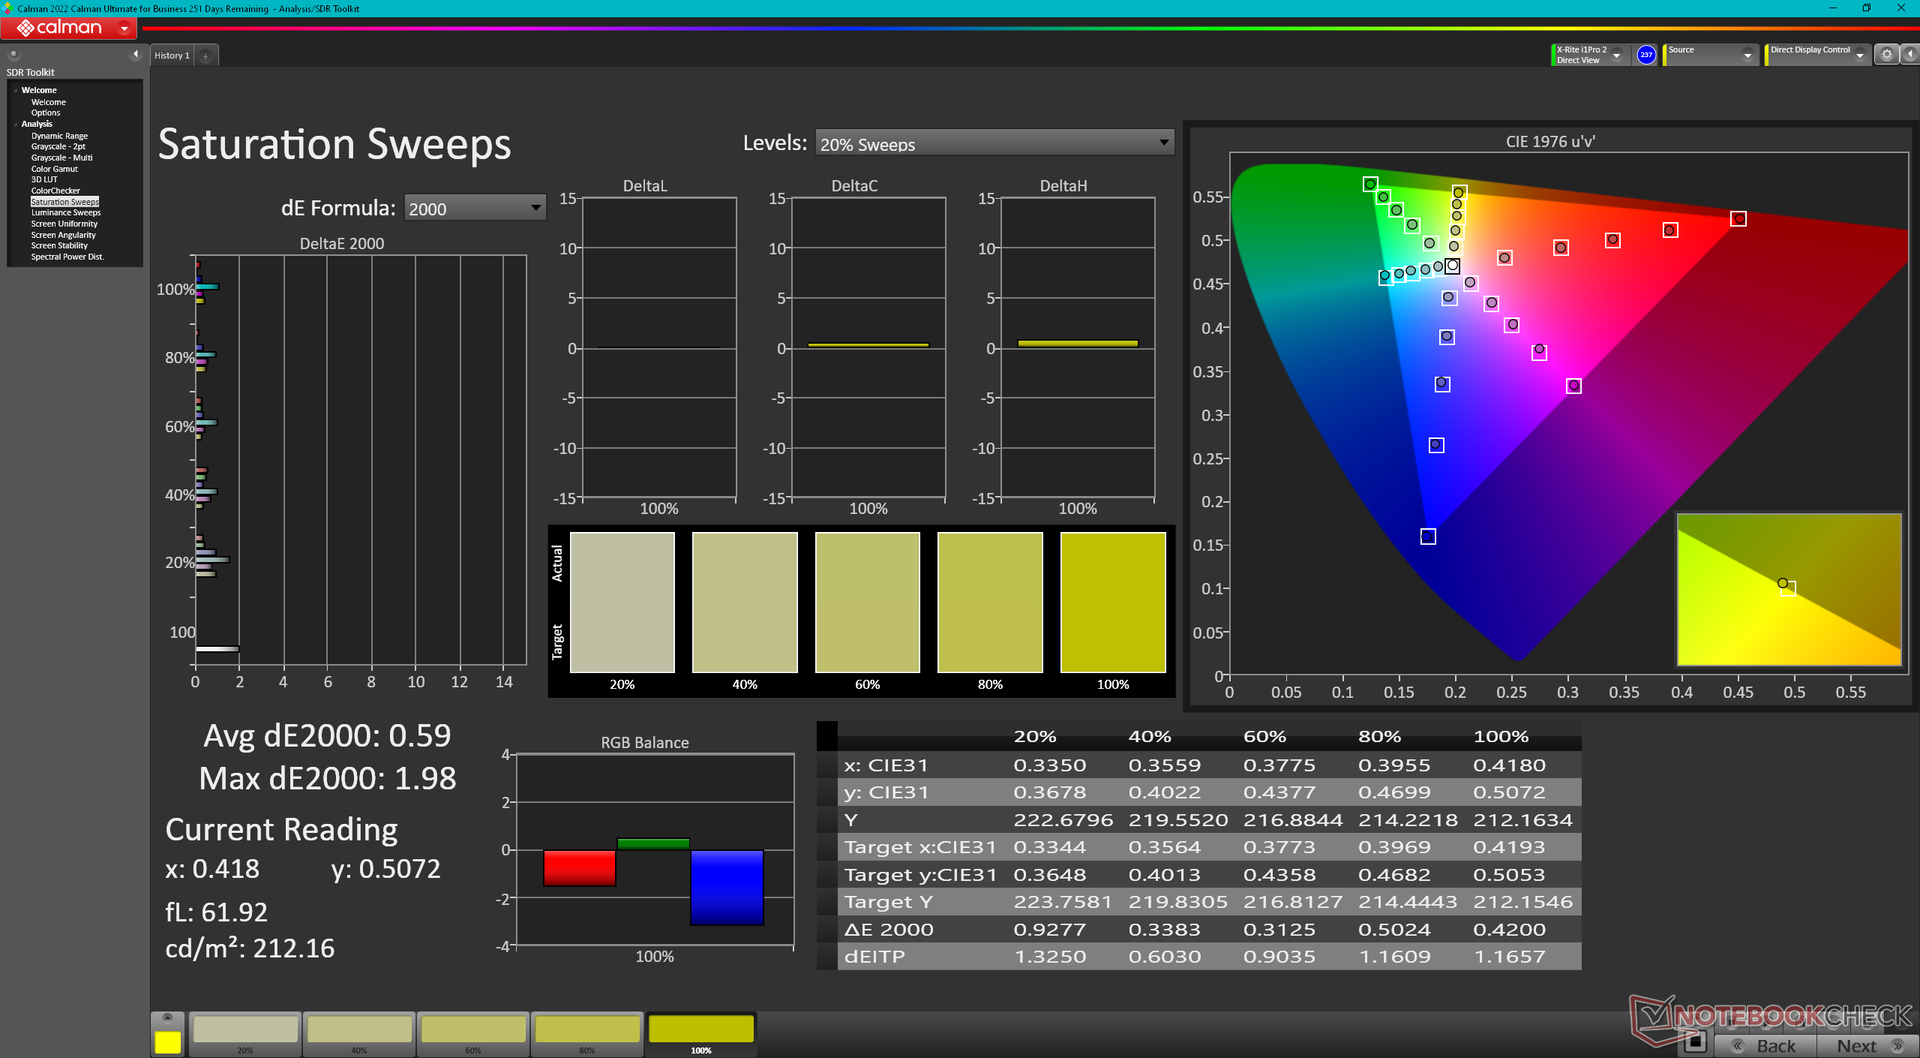
Nuestras mediciones reflejan únicamente la opción en negrita. El Blade 16 es el primer portátil de 16 pulgadas que se comercializa con una pantalla IPS QHD+ de 240 Hz que ofrece tanto colores DCI-P3 completos como rápidos tiempos de respuesta en blanco y negro. Existen otros paneles de 16 pulgadas con colores P3 completos, pero todos son UHD+ u OLED con frecuencias de actualización nativas más lentas. Este panel en particular es excelente tanto para juegos como para edición de gráficos y esperamos verlo en más portátiles tipo Creator o Studio en un futuro próximo.
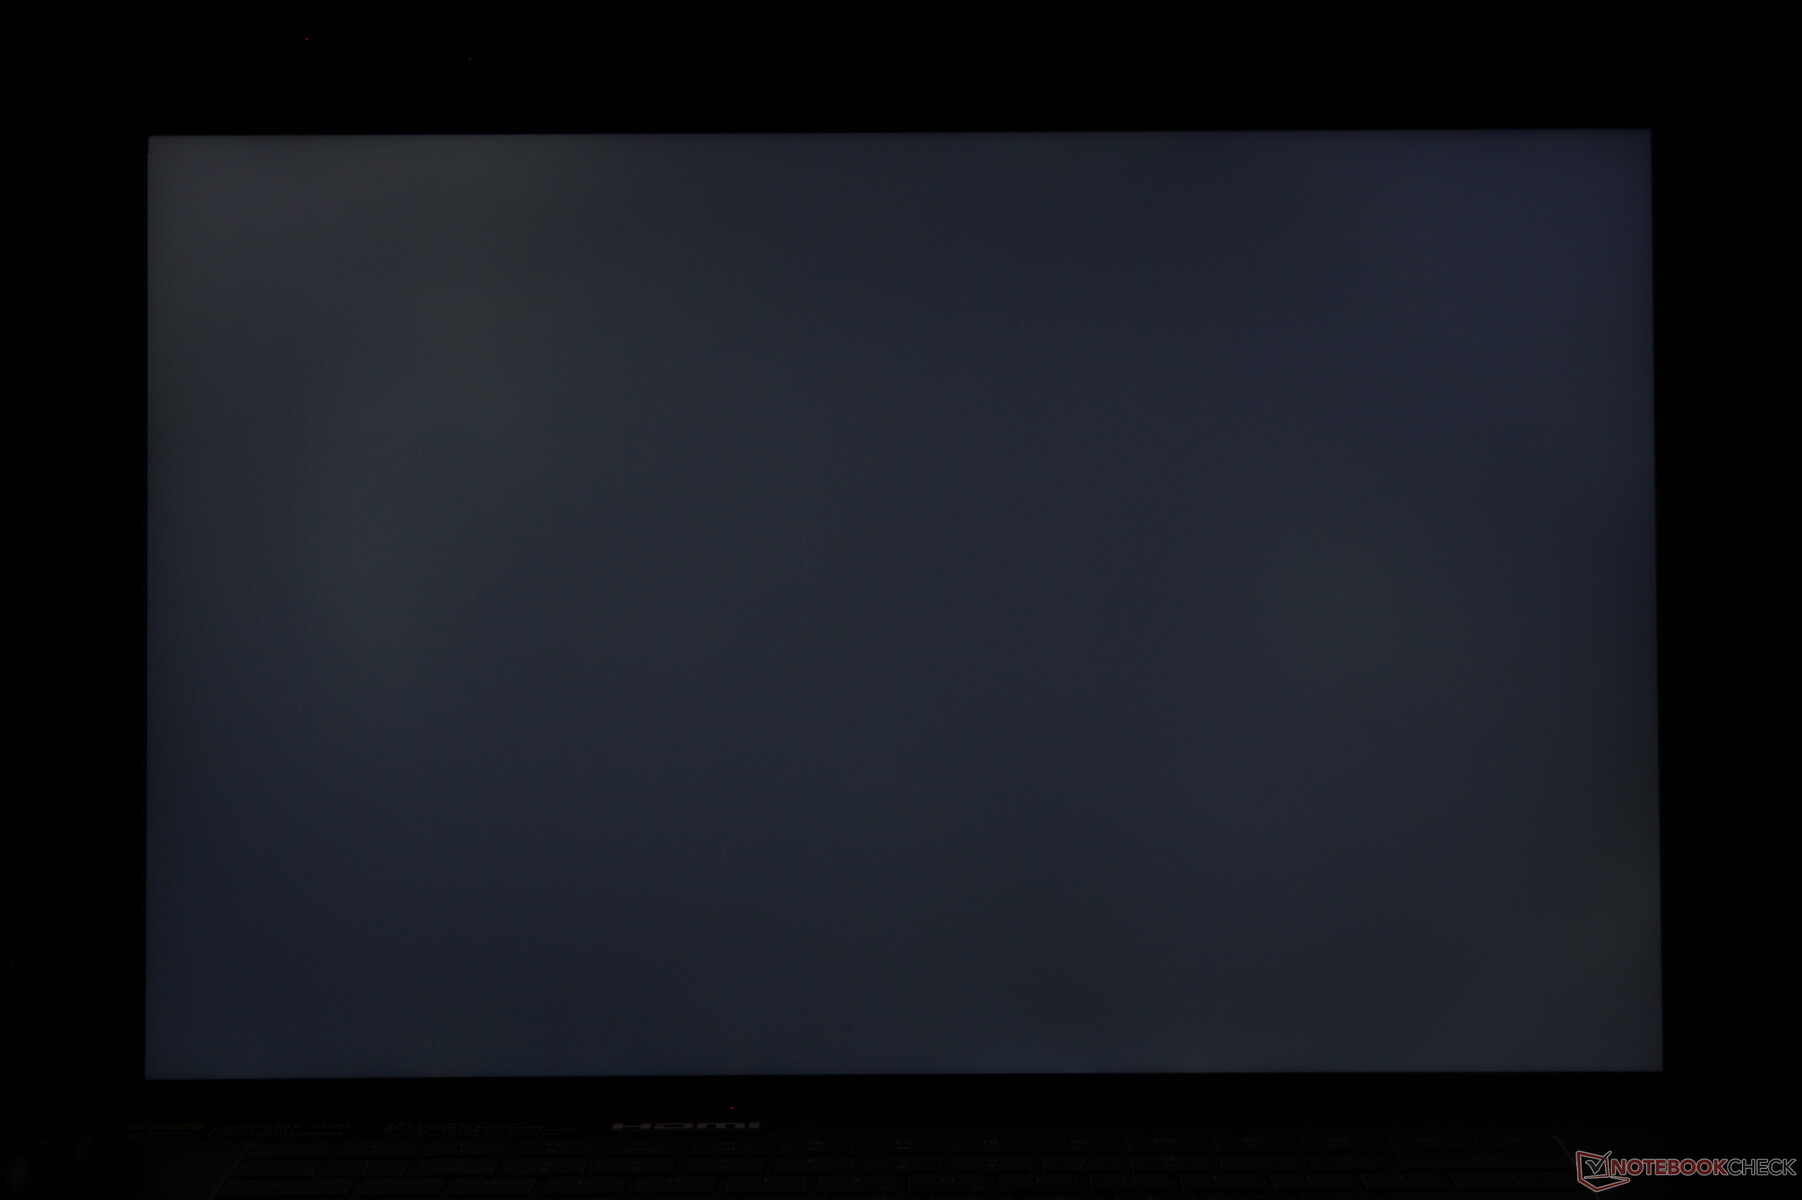
La distribución del brillo podría ser mejor en nuestra unidad teniendo en cuenta el elevado precio de venta. La mitad inferior de la pantalla es más tenue que la superior, con una distribución del brillo de sólo el 83%. La actualización a la SKU mini-LED probablemente resolverá este pequeño problema, pero el Blade 16 ya es caro de por sí.

| |||||||||||||||||||||||||
iluminación: 83 %
Brillo con batería: 456.8 cd/m²
Contraste: 1305:1 (Negro: 0.35 cd/m²)
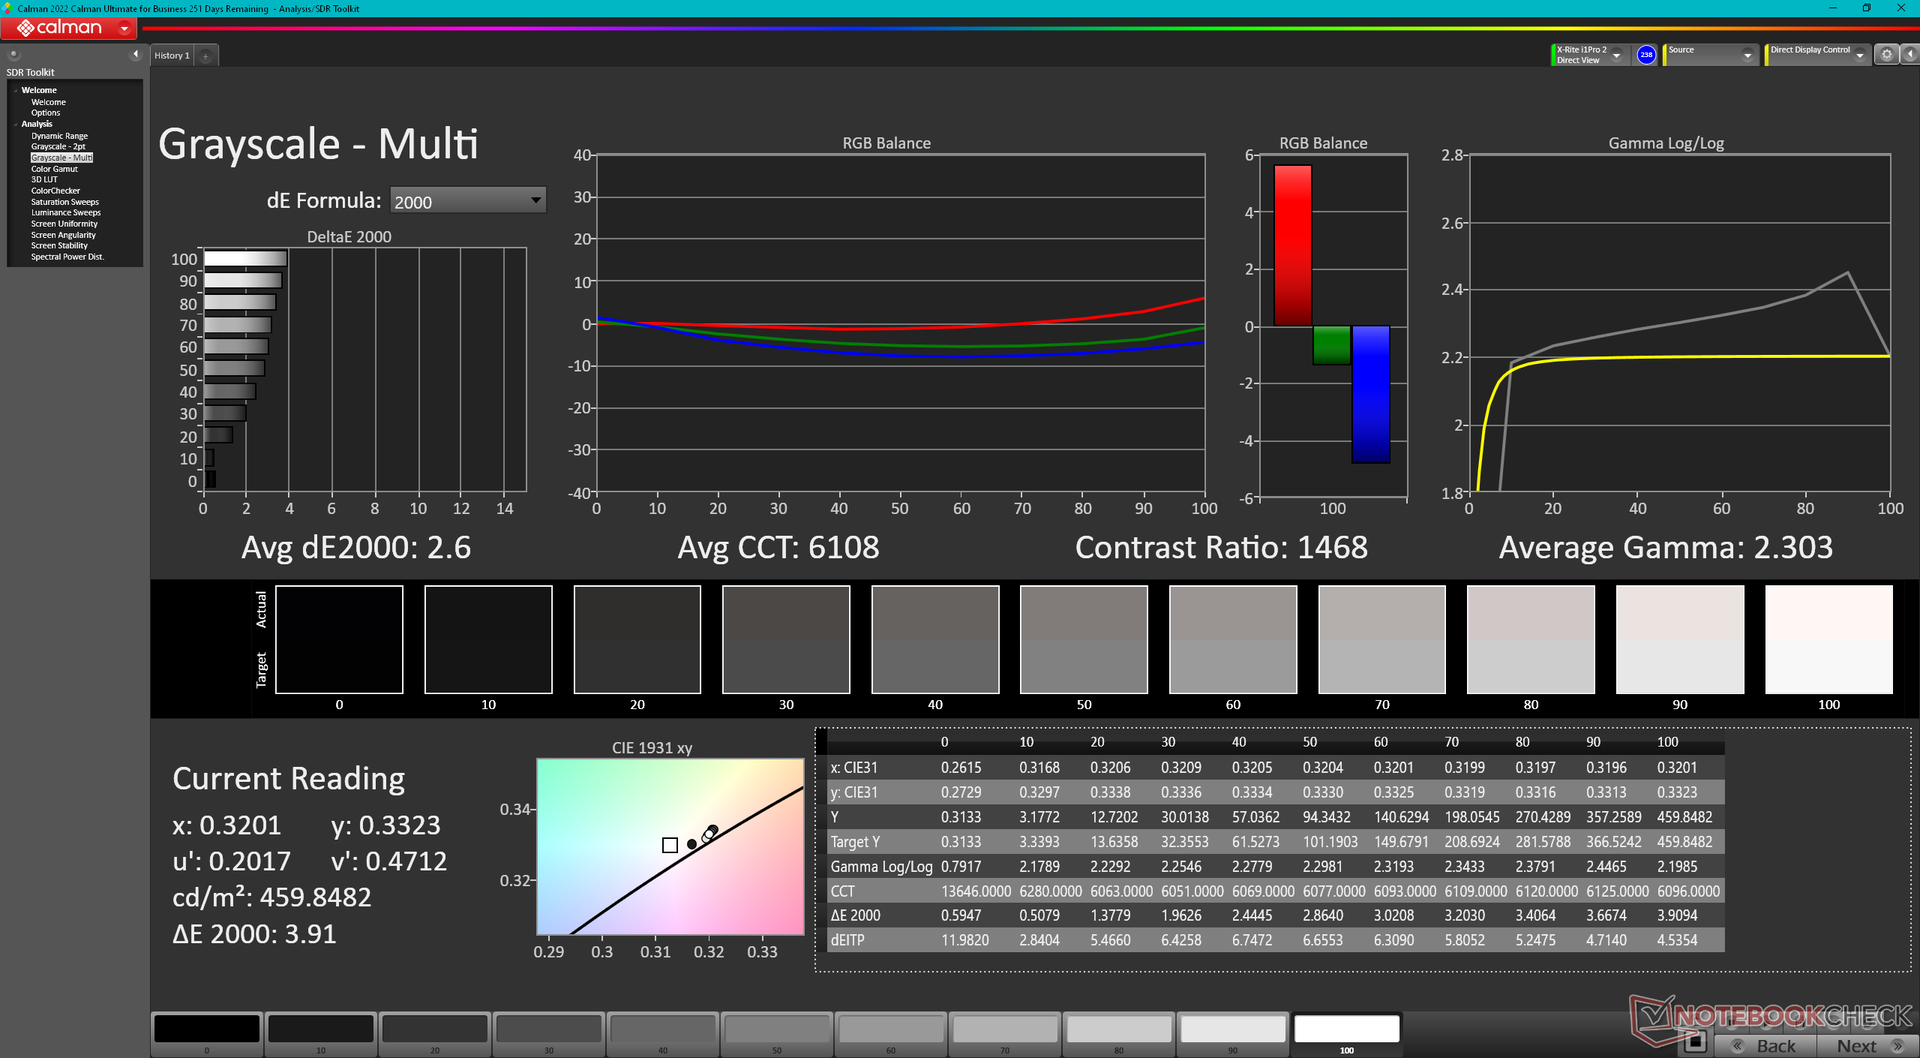
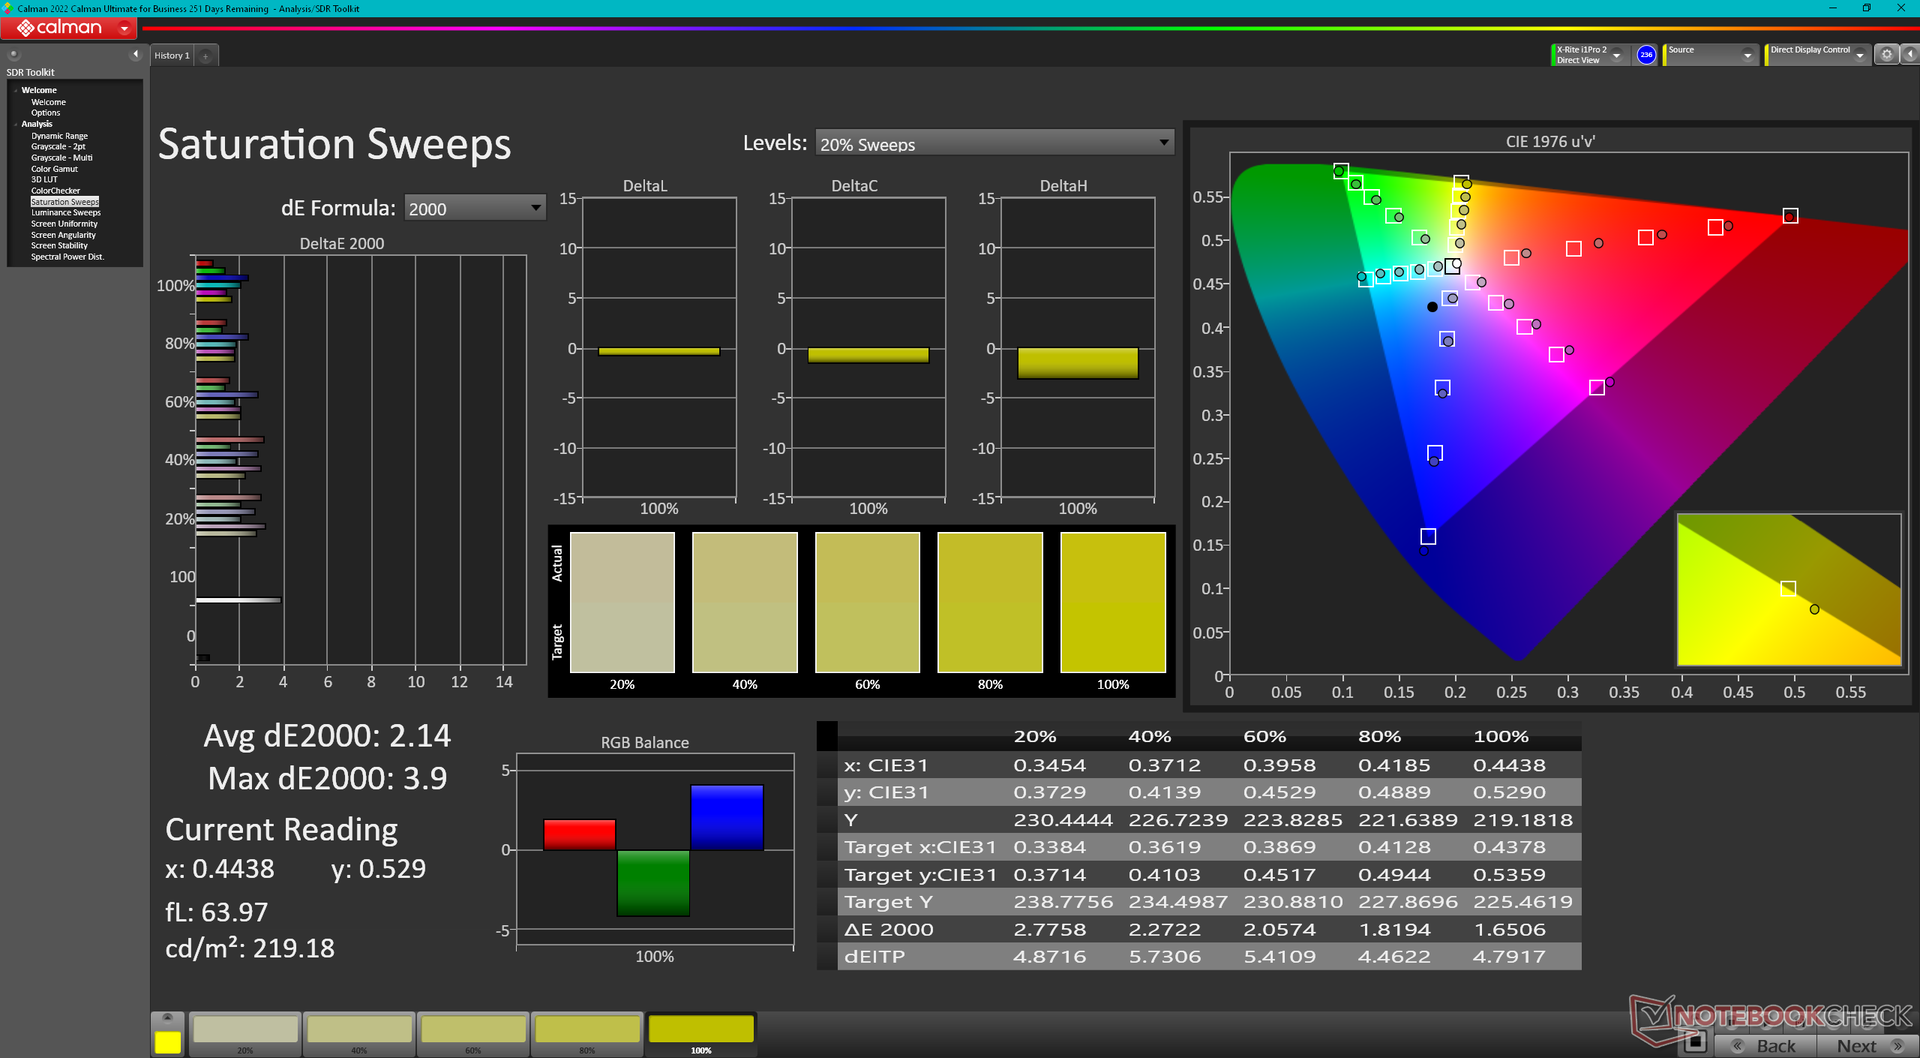
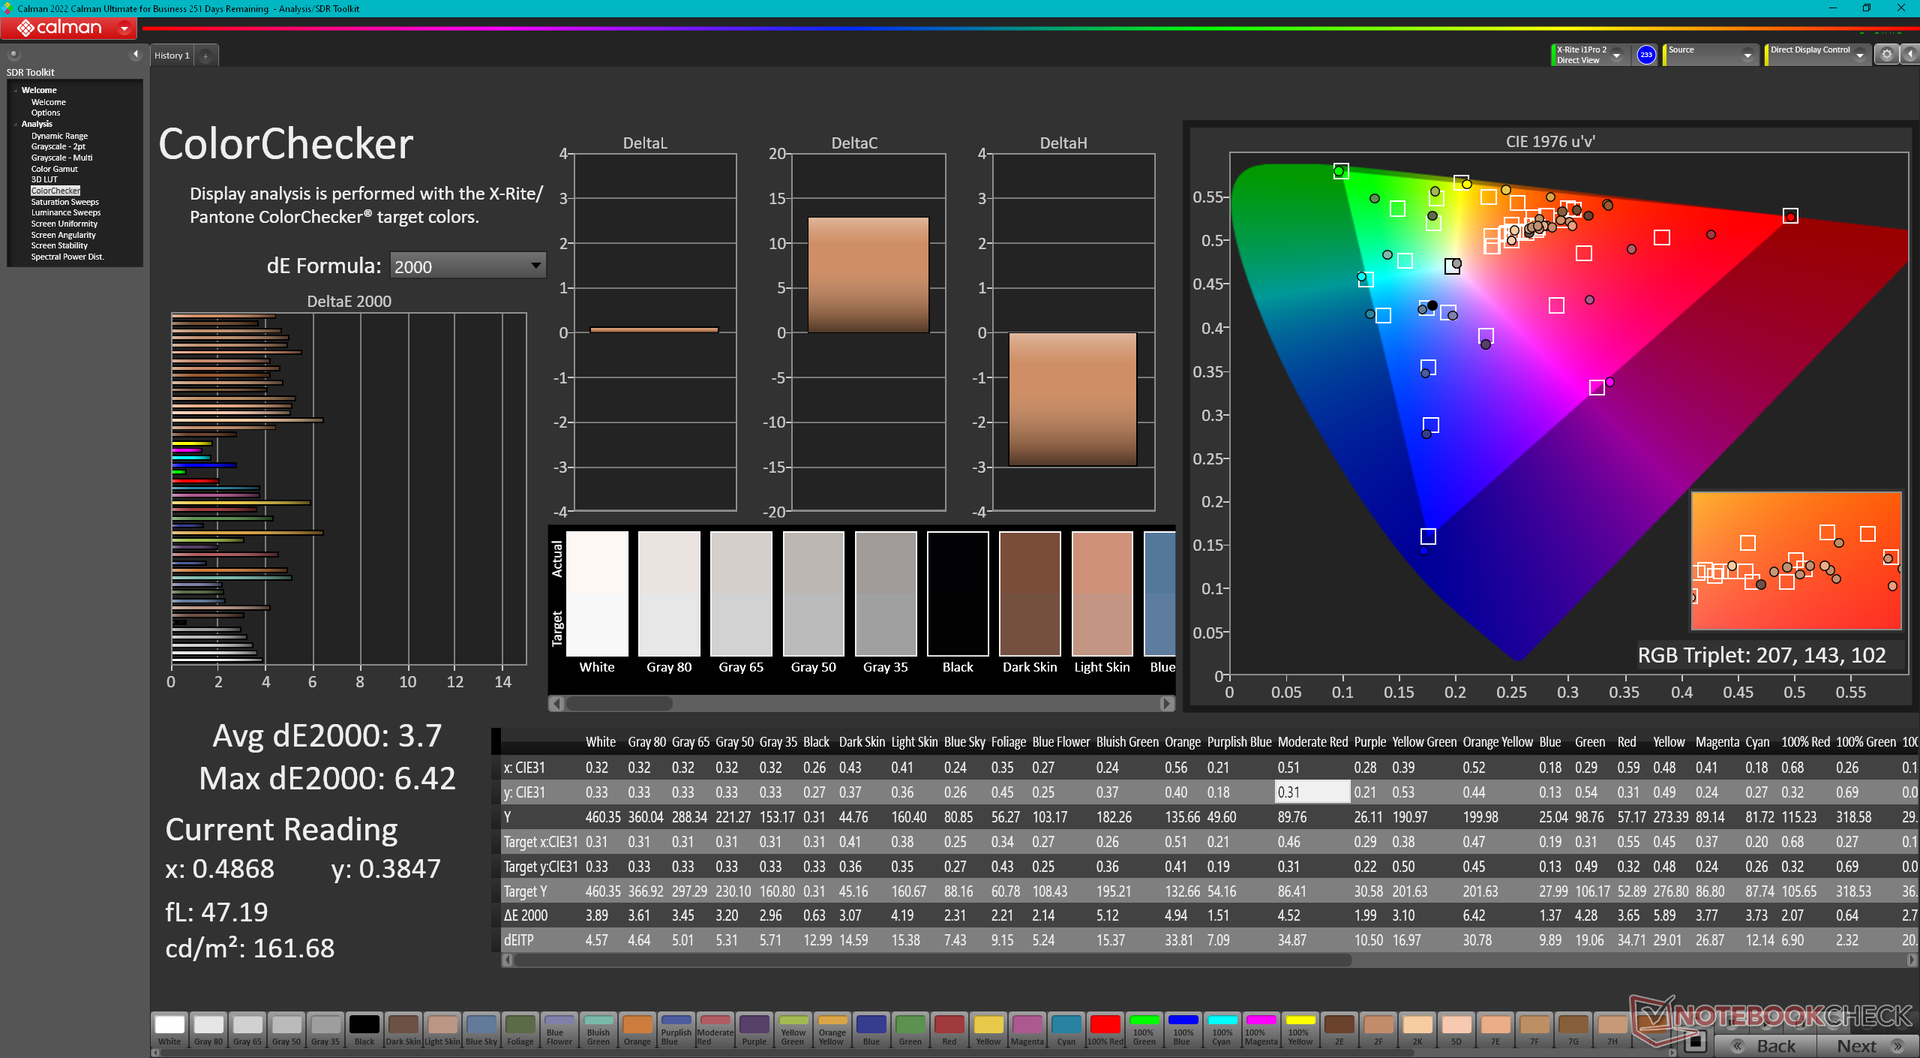
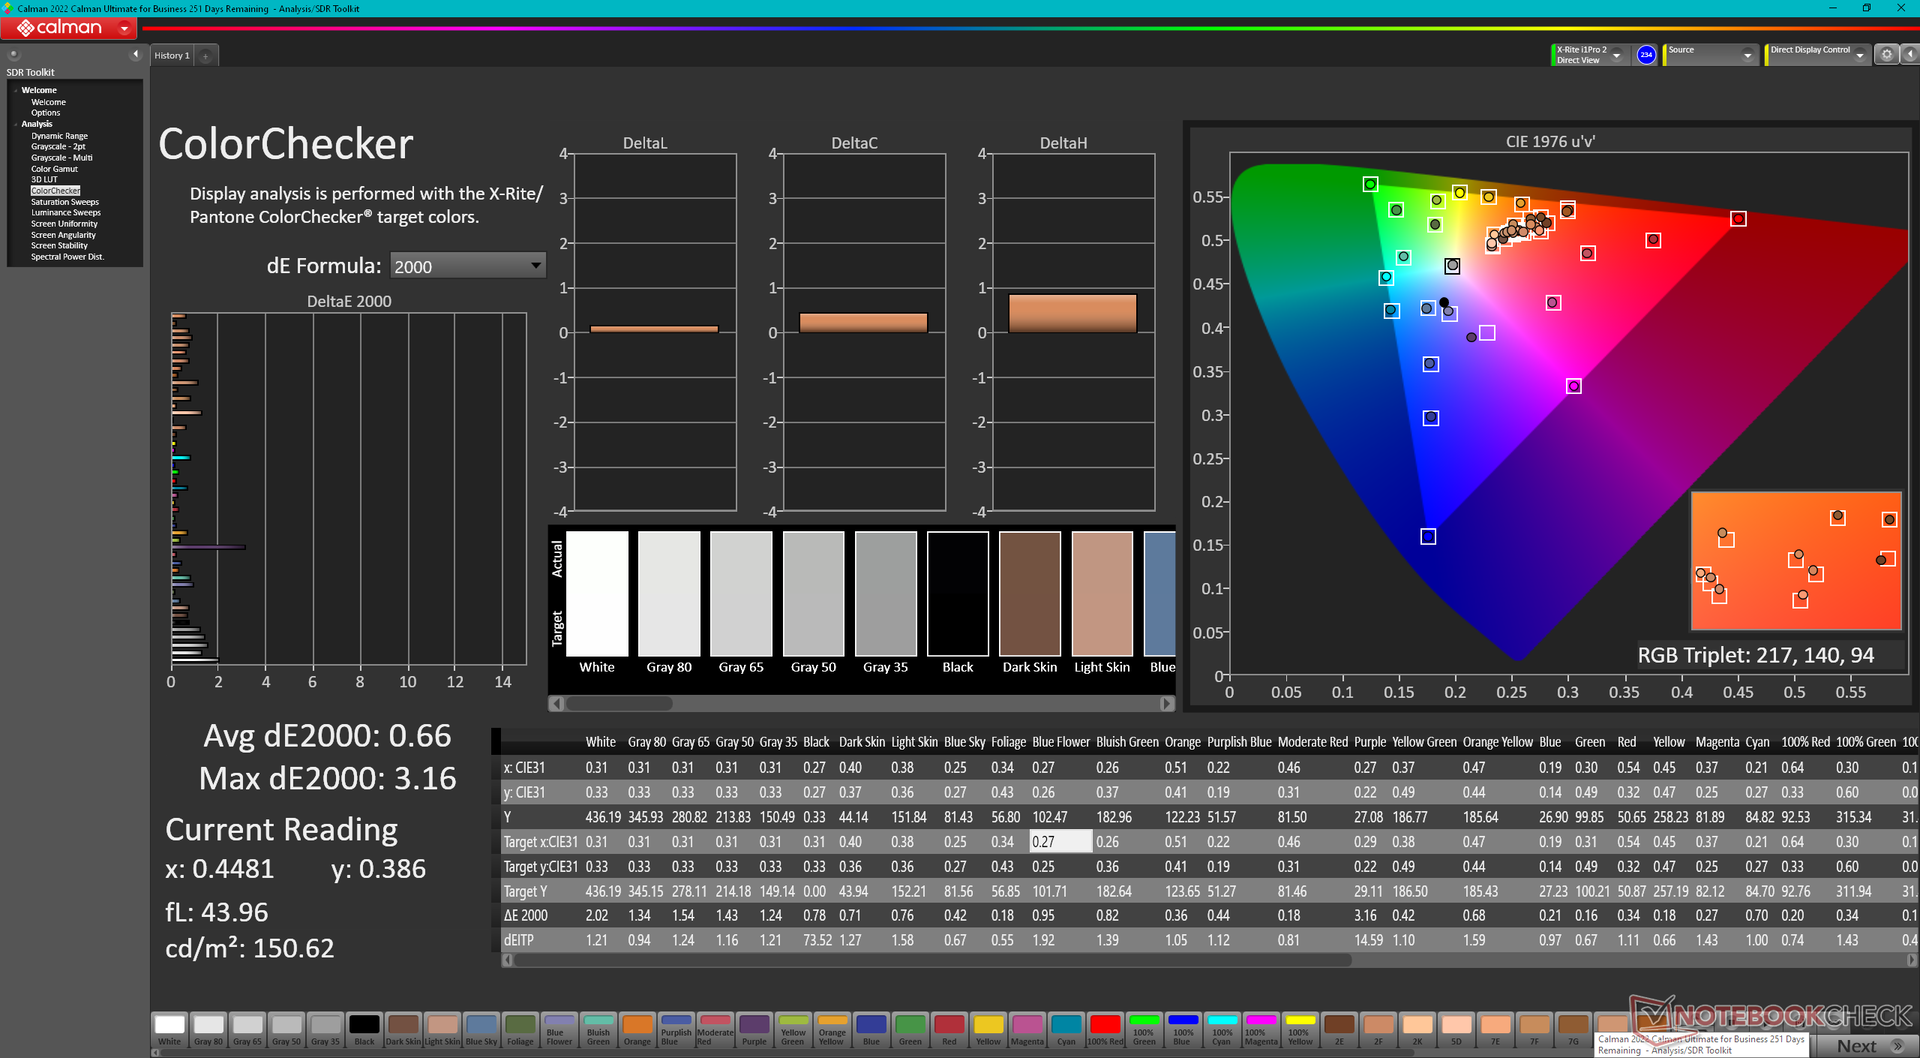
ΔE ColorChecker Argyll: 1.6 (Display P3) Calman: 3.7 | ∀{0.5-29.43 Ø4.71}
calibrated: 0.66
ΔE Greyscale Calman: 2.6 | ∀{0.09-98 Ø4.96}
89.7% AdobeRGB 1998 (Argyll 3D)
100% sRGB (Argyll 3D)
98.5% Display P3 (Argyll 3D)
Gamma: 2.3, Argyll: 98.5
CCT: 6108 K, Argyll: 6626 K
| Razer Blade 16 Early 2023 CSOT T3 MNG007DA4-1, IPS, 2560x1600, 16" | Razer Blade 15 Advanced Model Early 2022 TL156VDXP02-0, IPS, 1920x1080, 15.6" | Lenovo Legion S7 16ARHA7 BOE CQ NE160QDM-NY1, IPS, 2560x1600, 16" | Dell G16 7620 BOE NE16QDM, IPS, 2560x1600, 16" | Asus ROG Zephyrus Duo 16 GX650RX BOE NE160QAM-NX1, IPS-Level, 3840x2400, 16" | HP Omen 16-n0033dx BOE0AAE, IPS, 1920x1080, 16.1" | |
|---|---|---|---|---|---|---|
| Display | -25% | -17% | -18% | -2% | -14% | |
| Display P3 Coverage (%) | 98.5 | 65.3 -34% | 69.8 -29% | 68.3 -31% | 98 -1% | 74.4 -24% |
| sRGB Coverage (%) | 100 | 85.1 -15% | 98.1 -2% | 98 -2% | 99.9 0% | 99.2 -1% |
| AdobeRGB 1998 Coverage (%) | 89.7 | 67.4 -25% | 71.9 -20% | 70.5 -21% | 86.3 -4% | 73.4 -18% |
| Response Times | 24% | -30% | -9% | -34% | -80% | |
| Response Time Grey 50% / Grey 80% * (ms) | 6.6 ? | 4.3 ? 35% | 10 ? -52% | 8.6 ? -30% | 14.6 ? -121% | 17.6 ? -167% |
| Response Time Black / White * (ms) | 12 ? | 10.5 ? 12% | 12.8 ? -7% | 10.4 ? 13% | 5.6 ? 53% | 11.2 ? 7% |
| PWM Frequency (Hz) | ||||||
| Screen | 16% | 9% | -7% | -21% | -28% | |
| Brightness middle (cd/m²) | 456.8 | 330 -28% | 492.4 8% | 369.4 -19% | 459 0% | 373.3 -18% |
| Brightness (cd/m²) | 437 | 315 -28% | 471 8% | 348 -20% | 434 -1% | 361 -17% |
| Brightness Distribution (%) | 83 | 89 7% | 90 8% | 83 0% | 88 6% | 79 -5% |
| Black Level * (cd/m²) | 0.35 | 0.24 31% | 0.4 -14% | 0.32 9% | 0.44 -26% | 0.44 -26% |
| Contrast (:1) | 1305 | 1375 5% | 1231 -6% | 1154 -12% | 1043 -20% | 848 -35% |
| Colorchecker dE 2000 * | 3.7 | 1.47 60% | 1.9 49% | 1.78 52% | 2.97 20% | 2.12 43% |
| Colorchecker dE 2000 max. * | 6.42 | 2.73 57% | 3.81 41% | 4.41 31% | 8.13 -27% | 5.62 12% |
| Colorchecker dE 2000 calibrated * | 0.66 | 0.63 5% | 0.99 -50% | 1.22 -85% | 1.03 -56% | 2.06 -212% |
| Greyscale dE 2000 * | 2.6 | 1.8 31% | 1.7 35% | 3.2 -23% | 4.9 -88% | 2.5 4% |
| Gamma | 2.3 96% | 2.282 96% | 2.36 93% | 2.2 100% | 2.235 98% | 2.3 96% |
| CCT | 6108 106% | 6499 100% | 6497 100% | 6750 96% | 6775 96% | 6408 101% |
| Media total (Programa/Opciones) | 5% /
8% | -13% /
-2% | -11% /
-10% | -19% /
-19% | -41% /
-33% |
* ... más pequeño es mejor
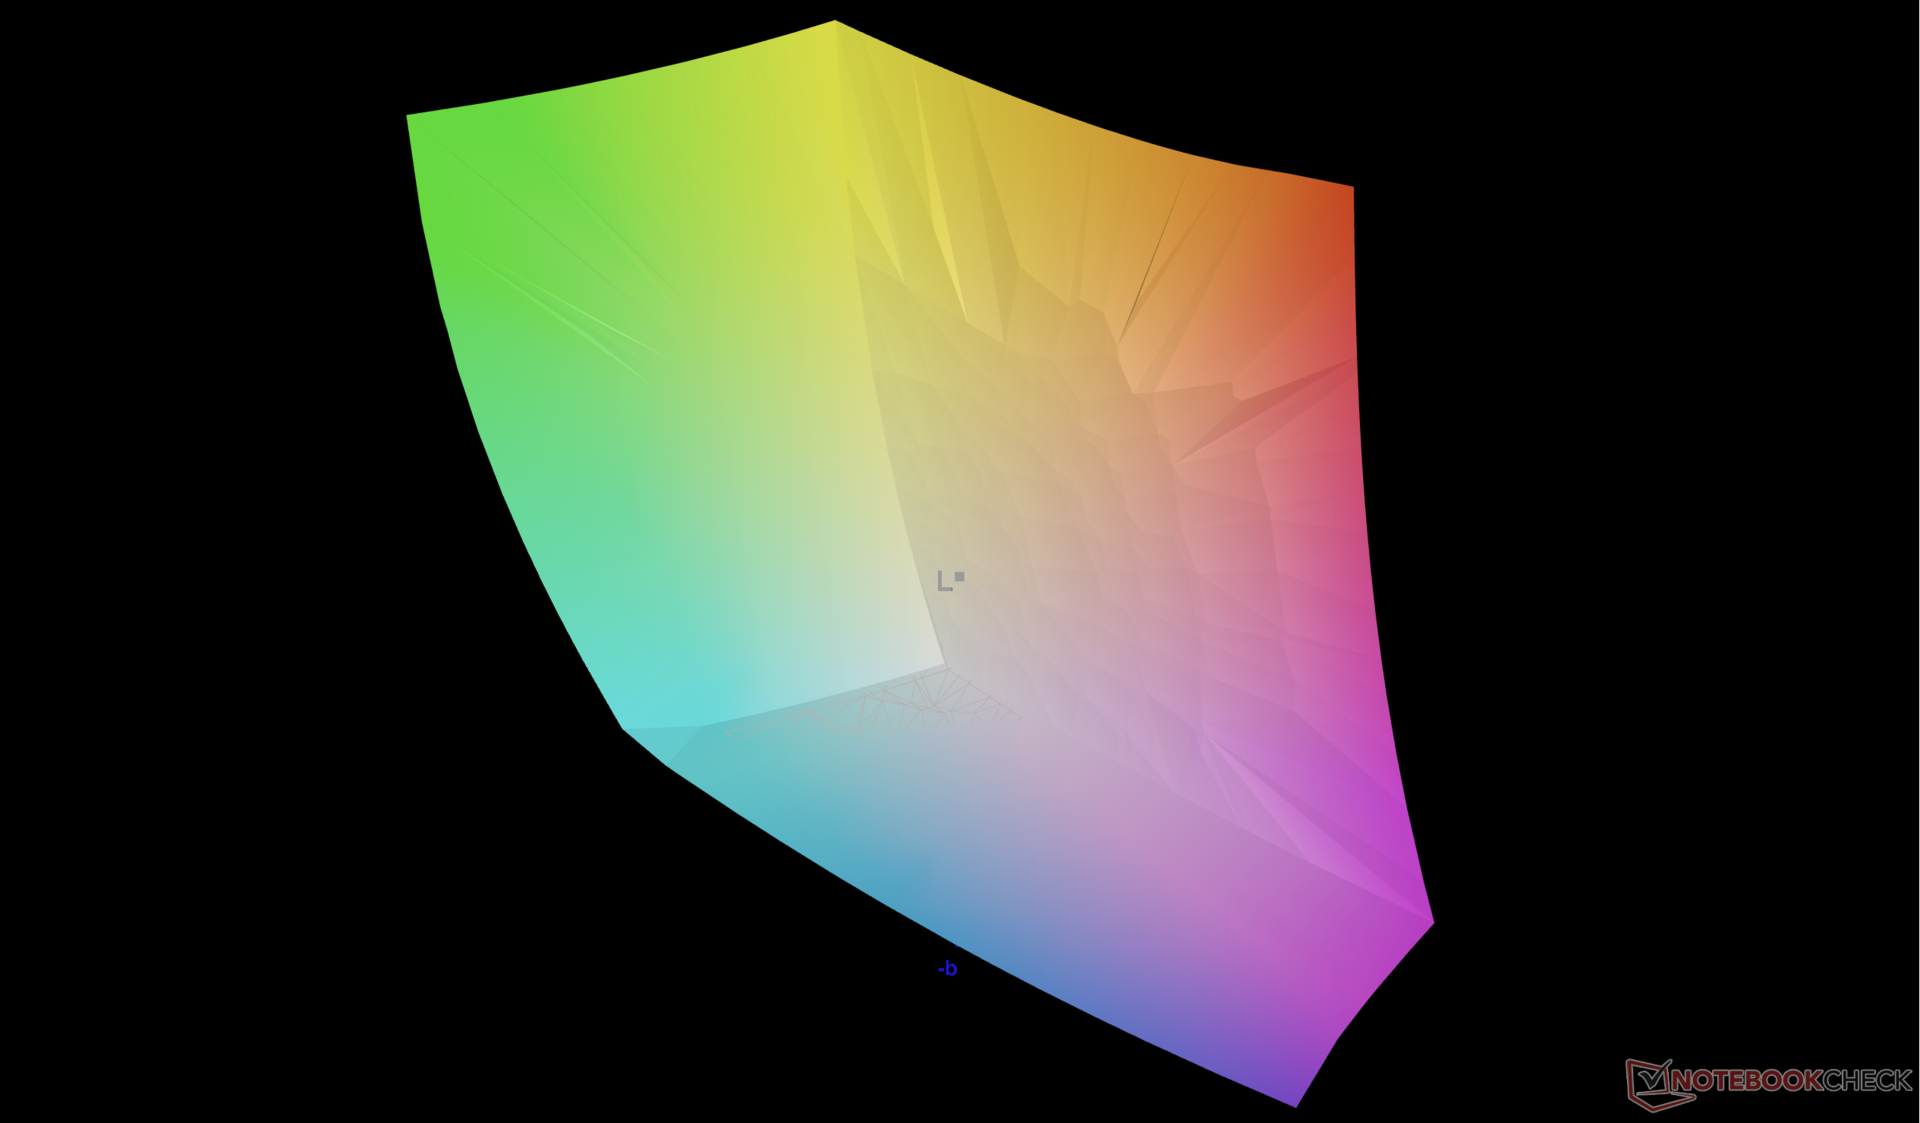
Nuestro colorímetro X-Rite puede confirmar los colores DCI-P3 completos, pero el brillo máximo de 466 nits se queda corto respecto a los 500 nits anunciados por el fabricante. No obstante, los valores medios de escala de grises y deltaE de color son bajos, de sólo 2,6 y 3,7, respectivamente, antes de cualquier calibración por parte del usuario final.
Tiempos de respuesta del display
| ↔ Tiempo de respuesta de Negro a Blanco | ||
|---|---|---|
| 12 ms ... subida ↗ y bajada ↘ combinada | ↗ 6.8 ms subida | 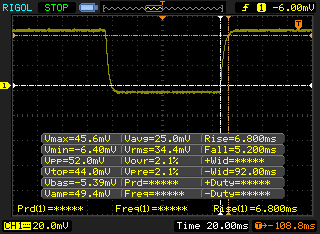 |
| ↘ 5.2 ms bajada | ||
| La pantalla mostró buenos tiempos de respuesta en nuestros tests pero podría ser demasiado lenta para los jugones competitivos. En comparación, todos los dispositivos de prueba van de ##min### (mínimo) a 240 (máximo) ms. » 32 % de todos los dispositivos son mejores. Esto quiere decir que el tiempo de respuesta medido es mejor que la media (19.8 ms) de todos los dispositivos testados. | ||
| ↔ Tiempo de respuesta 50% Gris a 80% Gris | ||
| 6.6 ms ... subida ↗ y bajada ↘ combinada | ↗ 3.4 ms subida | 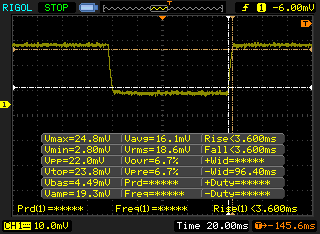 |
| ↘ 3.2 ms bajada | ||
| La pantalla mostró tiempos de respuesta muy rápidos en nuestros tests y debería ser adecuada para juegos frenéticos. En comparación, todos los dispositivos de prueba van de ##min### (mínimo) a 636 (máximo) ms. » 20 % de todos los dispositivos son mejores. Esto quiere decir que el tiempo de respuesta medido es mejor que la media (31 ms) de todos los dispositivos testados. | ||
Parpadeo de Pantalla / PWM (Pulse-Width Modulation)
| Parpadeo de Pantalla / PWM no detectado | 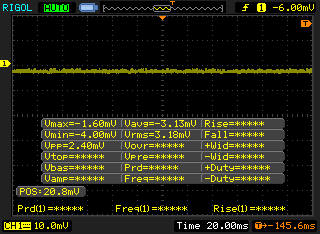 | ||
Comparación: 52 % de todos los dispositivos testados no usaron PWM para atenuar el display. Si se usó, medimos una media de 7754 (mínimo: 5 - máxmo: 343500) Hz. | |||
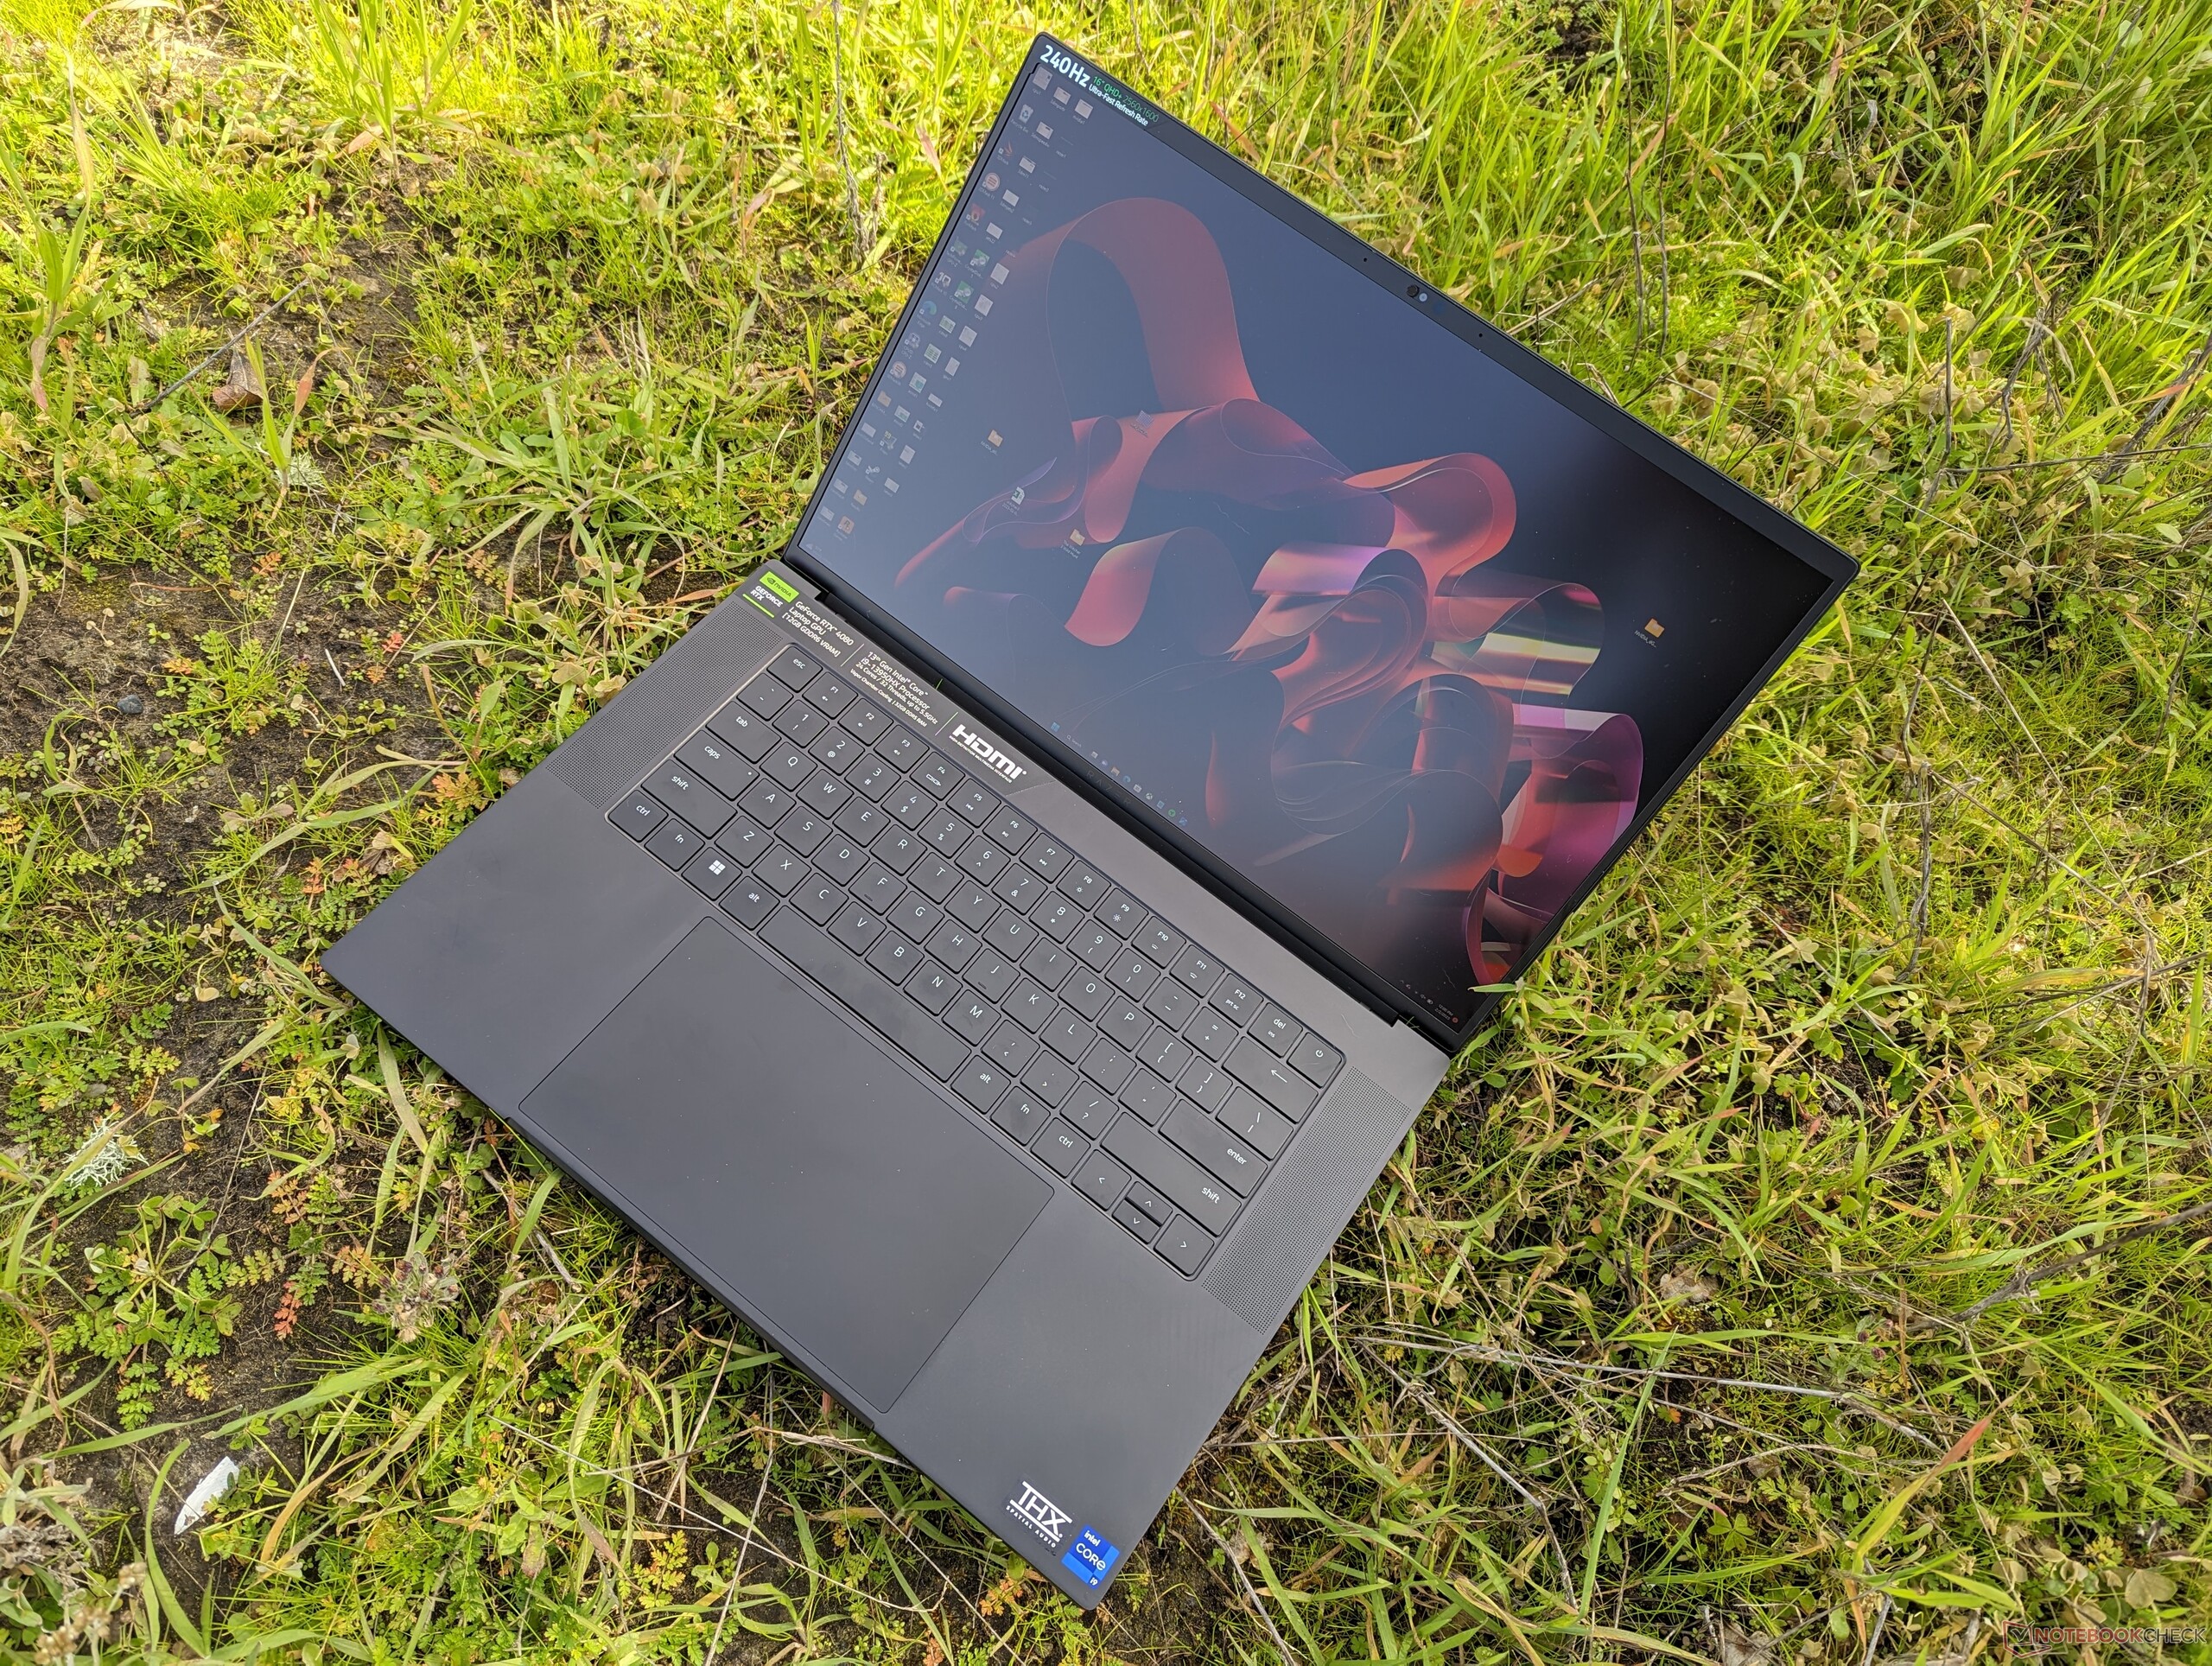
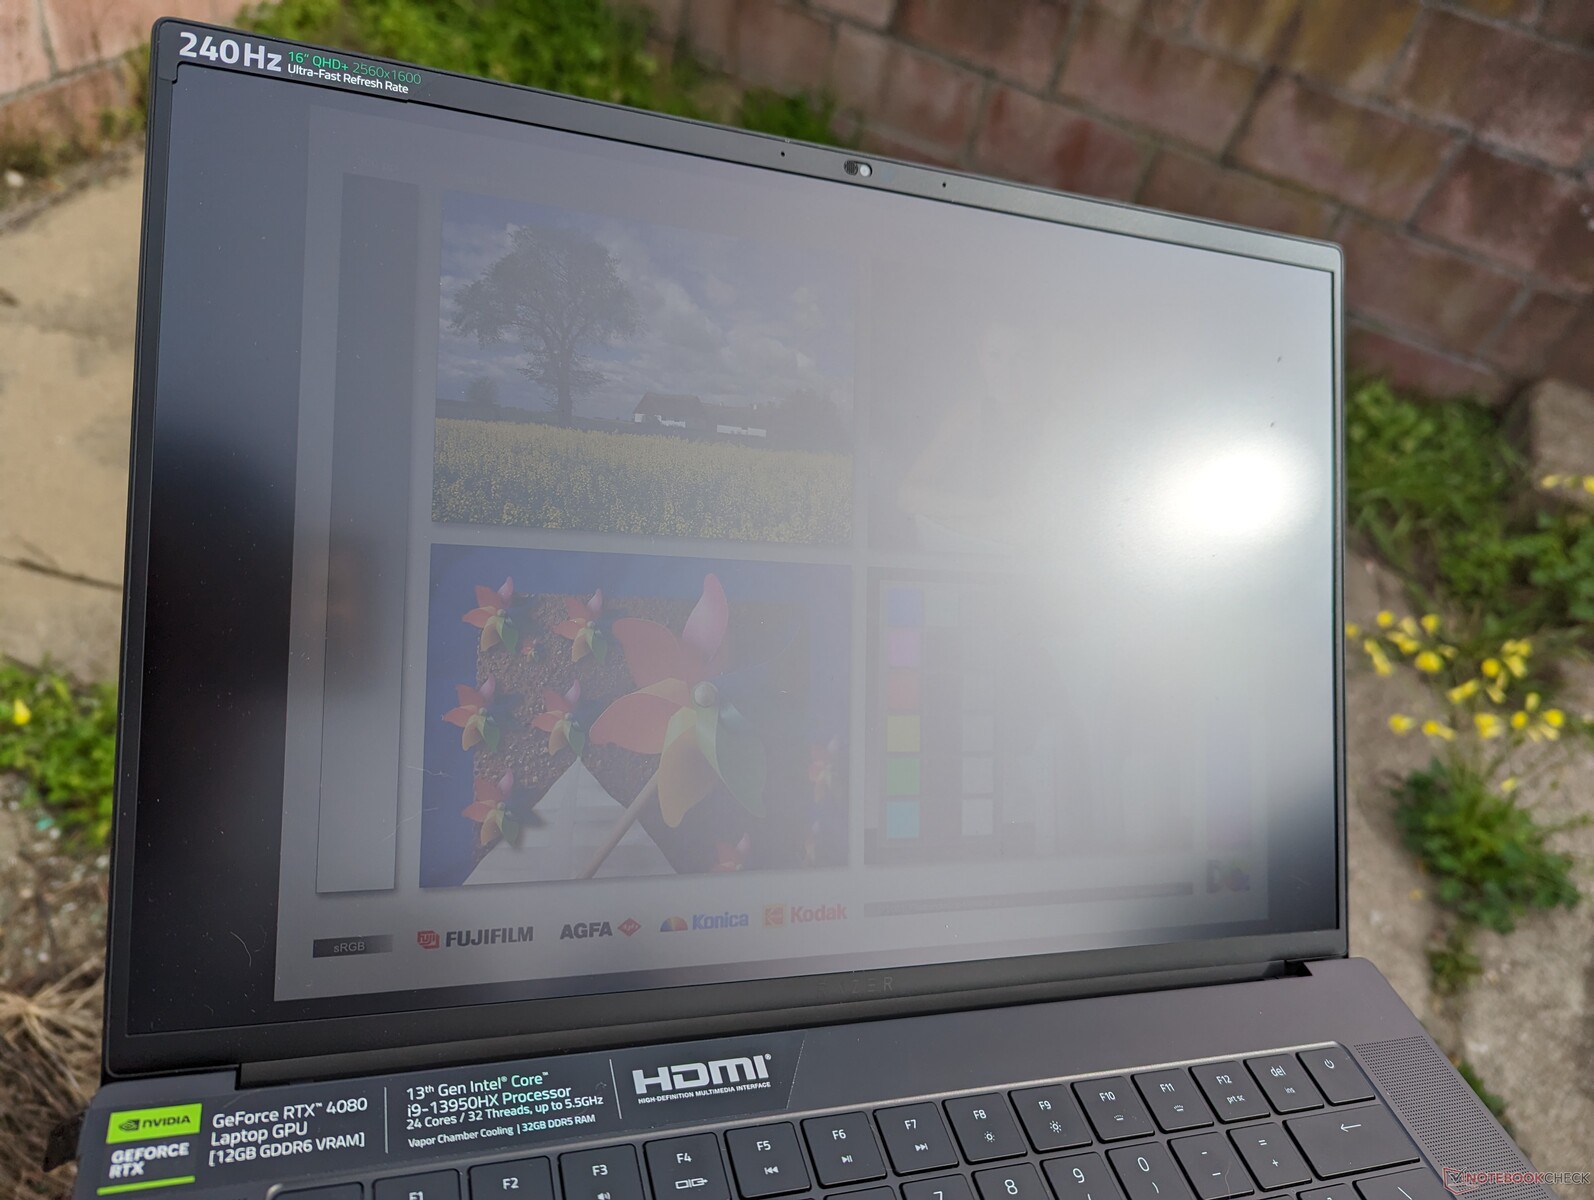
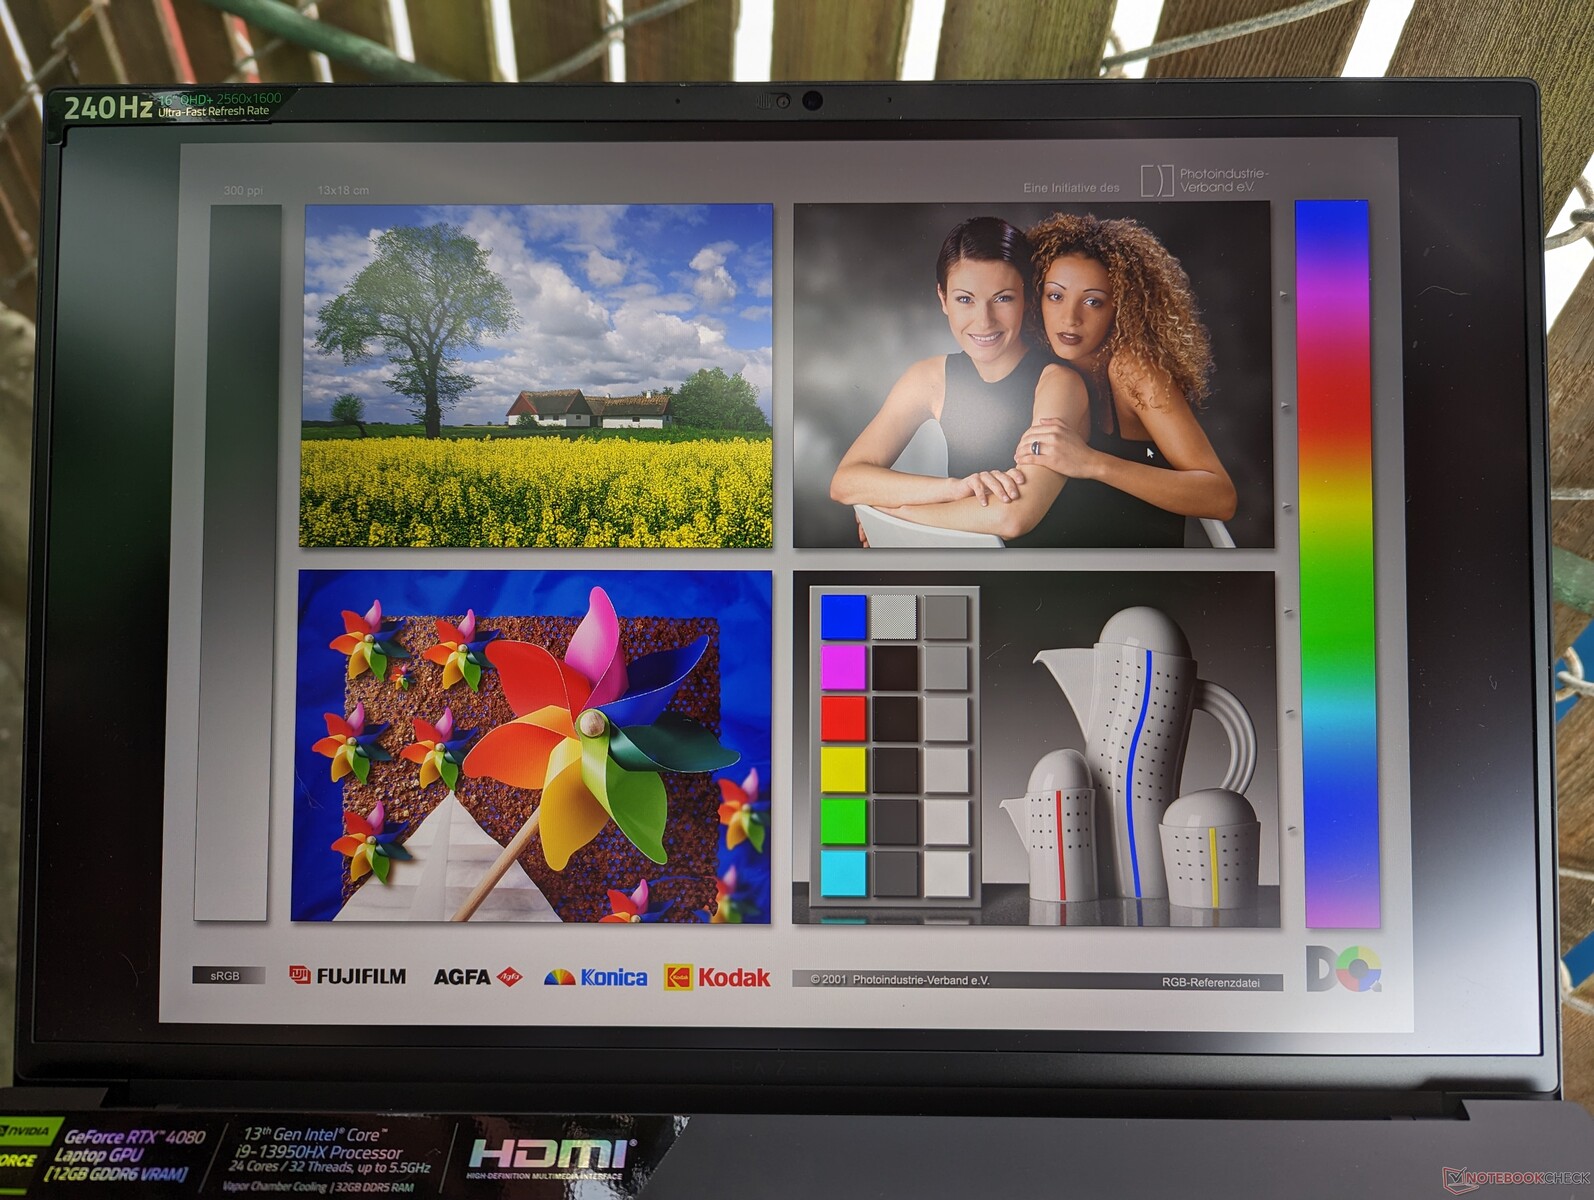
La visibilidad en exteriores es decente si se está a la sombra, ya que en condiciones más brillantes la pantalla se verá deslucida. La pantalla de ~450 nits es más brillante que los paneles 1080p del Blade 15 o el Omen 16 y está a la par con las pantallas UHD+ y QHD+ del Zephyrus Duo 16 y el Lenovo Legion S7 16, respectivamente. En comparación, los portátiles de juego más baratos suelen rondar los 300 nits en el mejor de los casos.
Rendimiento - 13ª generación Intel + Nvidia Ada Lovelace
Condiciones de ensayo
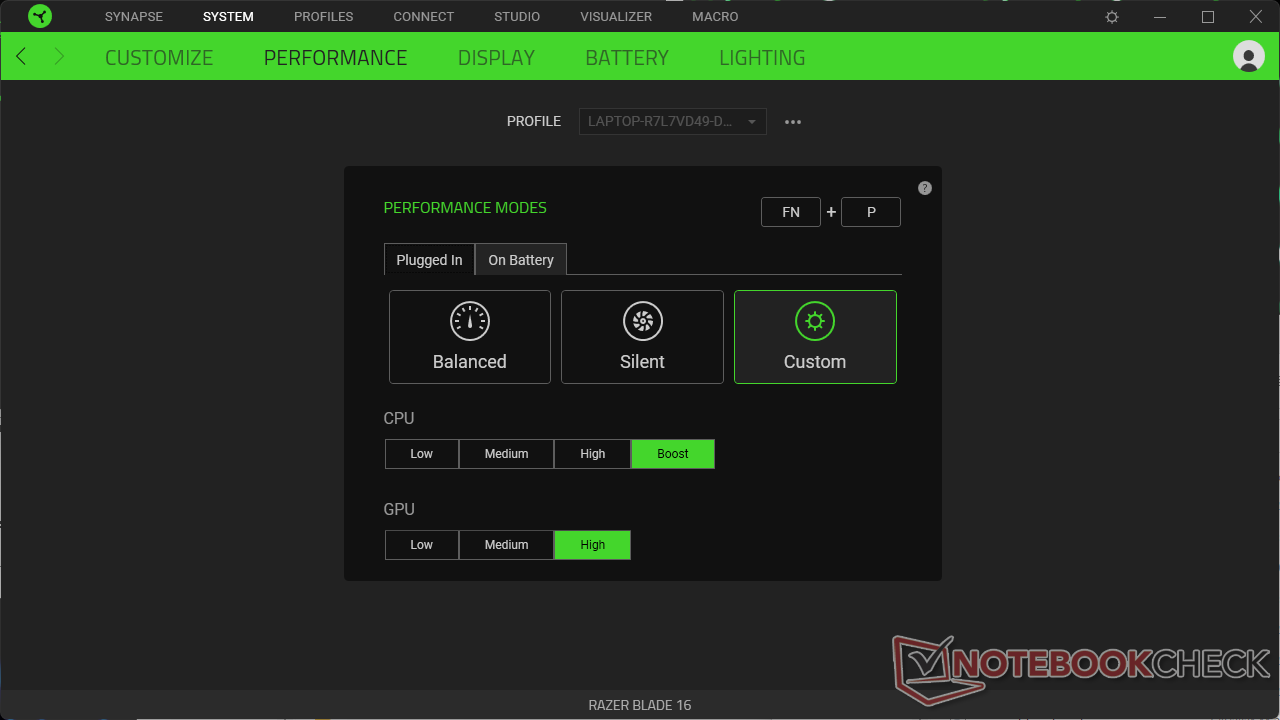
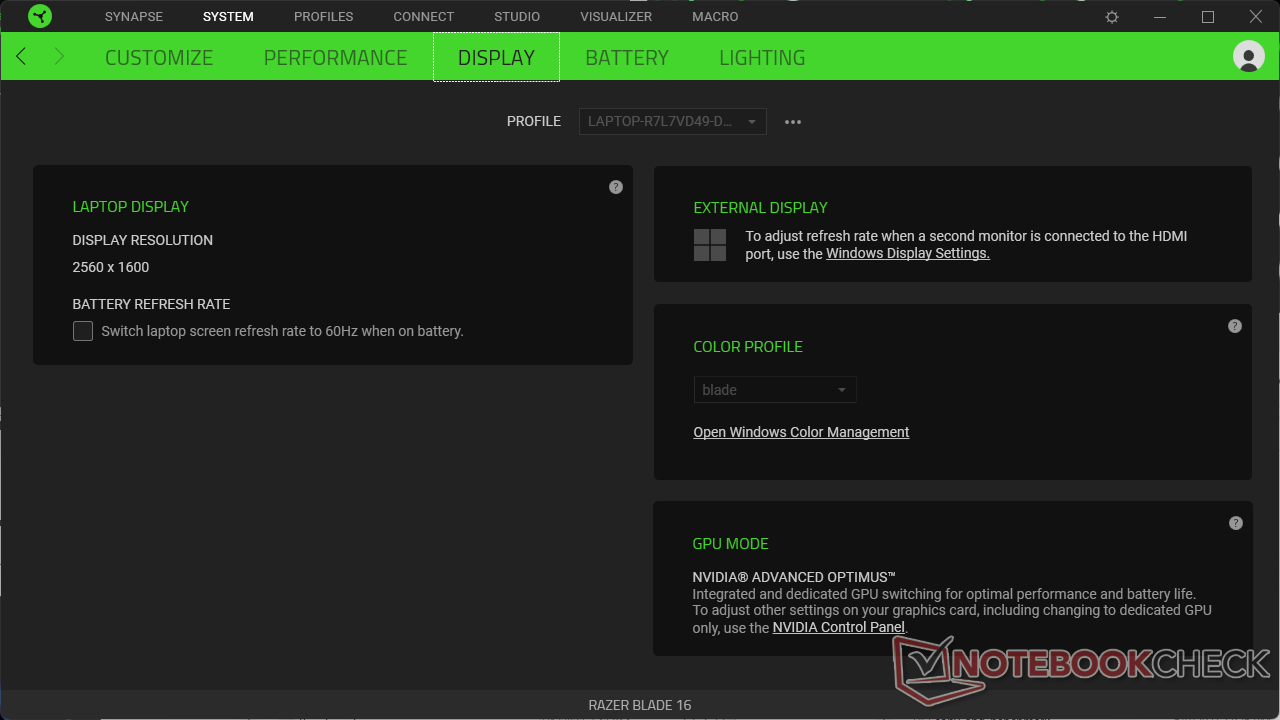
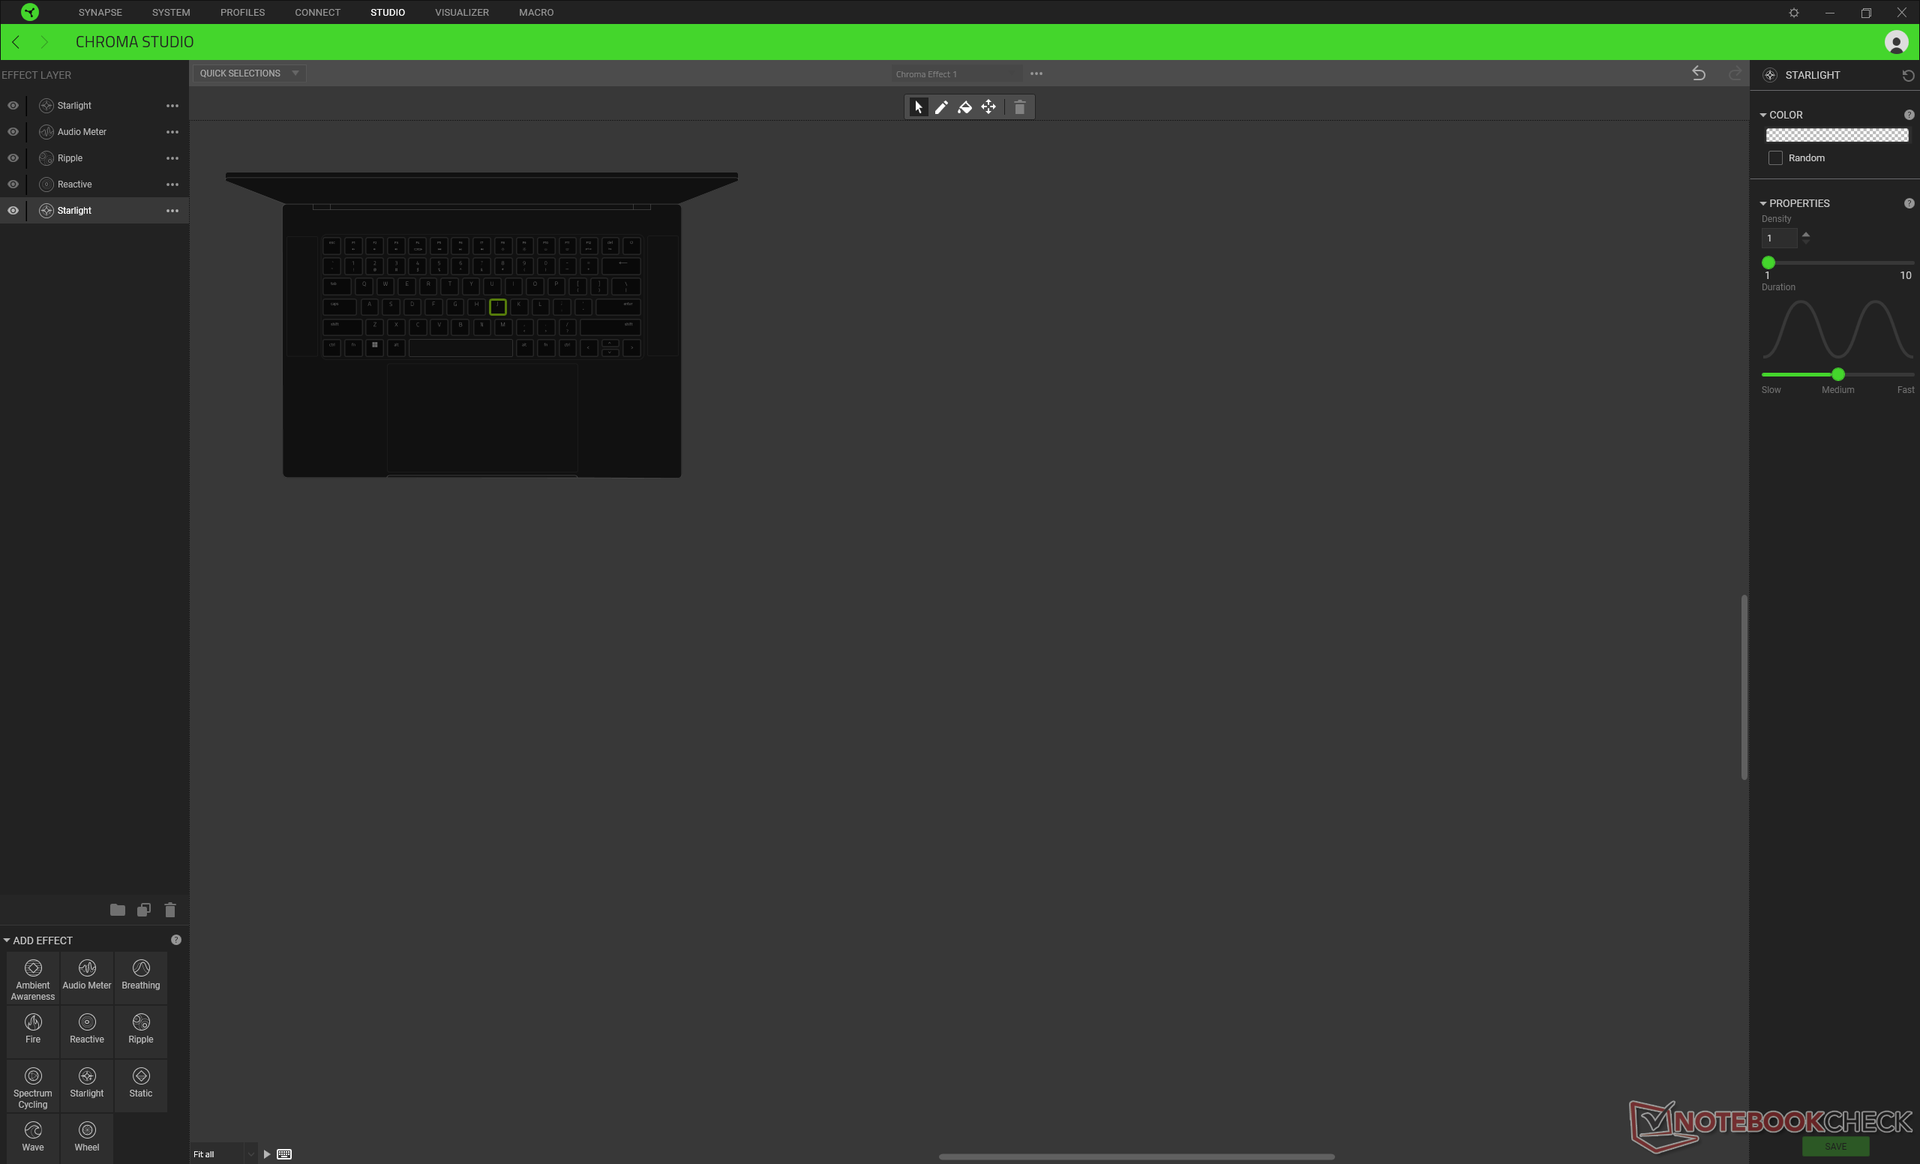
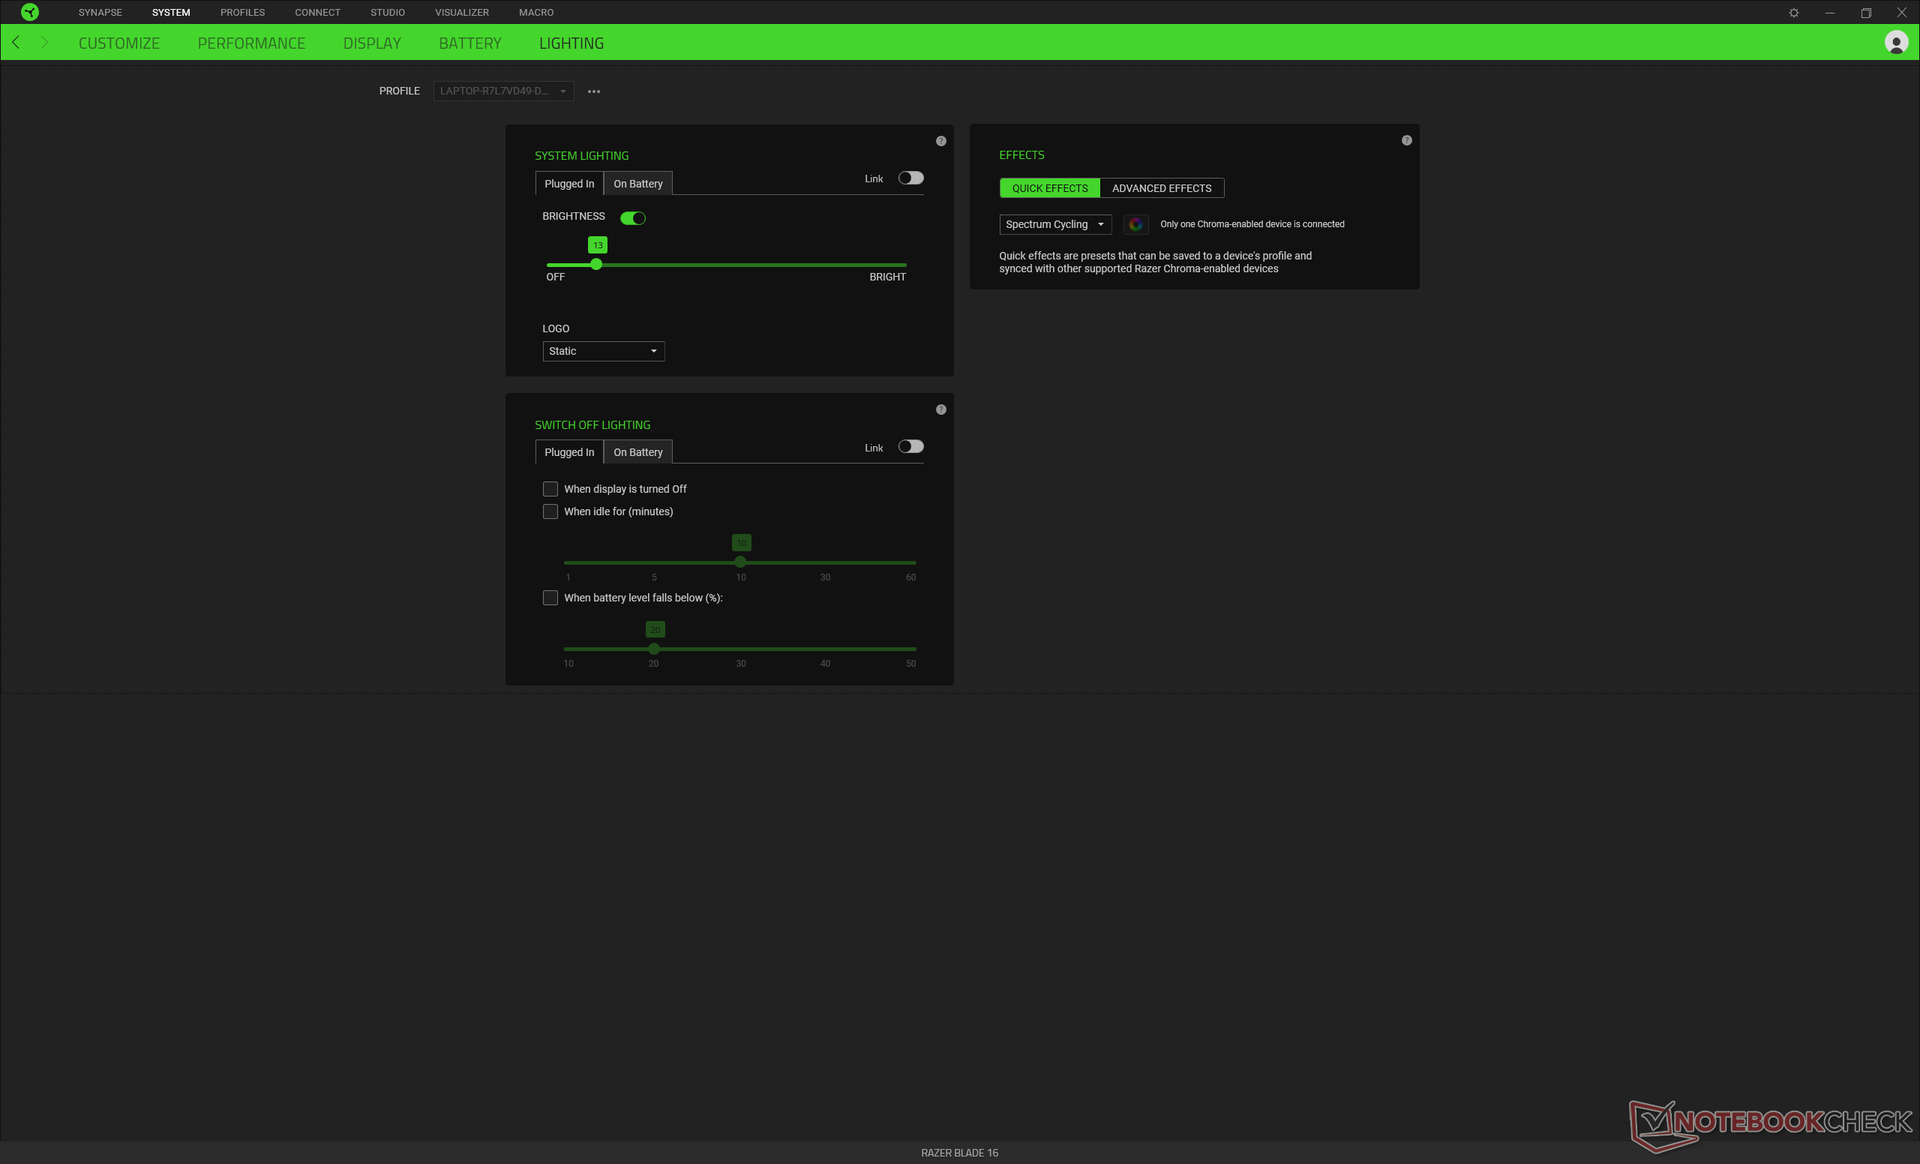
Pusimos la unidad en modo Rendimiento a través de Windows y en modo dGPU a través del Panel de control de Nvidia antes de ejecutar las pruebas. También nos aseguramos de configurar el perfil Razer Synapse en Personalizado con la CPU y la GPU en Boost y Alto, respectivamente, que deberían ser las configuraciones más rápidas disponibles. Se recomienda a los usuarios que se familiaricen con Synapse, ya que es el eje central de los ajustes de Razer, como muestran algunas capturas de pantalla.
Advanced Optimus viene de serie, lo que significa que los usuarios pueden cambiar entre Optimus y gráficos discretos sobre la marcha a través del panel de control de Nvidia sin necesidad de reiniciar el sistema. G-Sync es compatible, aunque sólo en el modo dGPU. Ten en cuenta que el modo Optimus debe estar activado en todo momento si hay monitores externos conectados.
Procesador
Nuestra 13ª generación Core i9-13950HX es un 30% más rápido que la generación anterior, el Core i9-12900HX. La sostenibilidad del rendimiento es excelente también cuando se ejecuta CineBench R15 xT en un bucle como se muestra en nuestro gráfico de comparación a continuación. Los resultados son significativamente más rápidos que cualquier Blade 15 o Blade 17 de 2022 o anteriores, especialmente porque el Blade 15 de 2022 tenía un Core i7-12800H.
Por otro lado, el rendimiento de un solo subproceso se ha mantenido plano de generación en generación. Tus aplicaciones tendrán que explotar tantos núcleos e hilos como sea posible para sacar el máximo partido de la CPU de 13ª generación.
La CPU móvil más rápida de AMD, la Zen 3+ Ryzen 9 6900HX, es casi dos veces más lenta que nuestro Core i9-13950HX en aplicaciones multihilo. Todas las miradas estarán puestas en Zen 4 móvil cuando se lance a finales de este año, ya que competirá directamente con la serie Raptor Lake móvil.
Cinebench R15 Multi Loop
Cinebench R23: Multi Core | Single Core
Cinebench R20: CPU (Multi Core) | CPU (Single Core)
Cinebench R15: CPU Multi 64Bit | CPU Single 64Bit
Blender: v2.79 BMW27 CPU
7-Zip 18.03: 7z b 4 | 7z b 4 -mmt1
Geekbench 5.5: Multi-Core | Single-Core
HWBOT x265 Benchmark v2.2: 4k Preset
LibreOffice : 20 Documents To PDF
R Benchmark 2.5: Overall mean
* ... más pequeño es mejor
AIDA64: FP32 Ray-Trace | FPU Julia | CPU SHA3 | CPU Queen | FPU SinJulia | FPU Mandel | CPU AES | CPU ZLib | FP64 Ray-Trace | CPU PhotoWorxx
Rendimiento del sistema
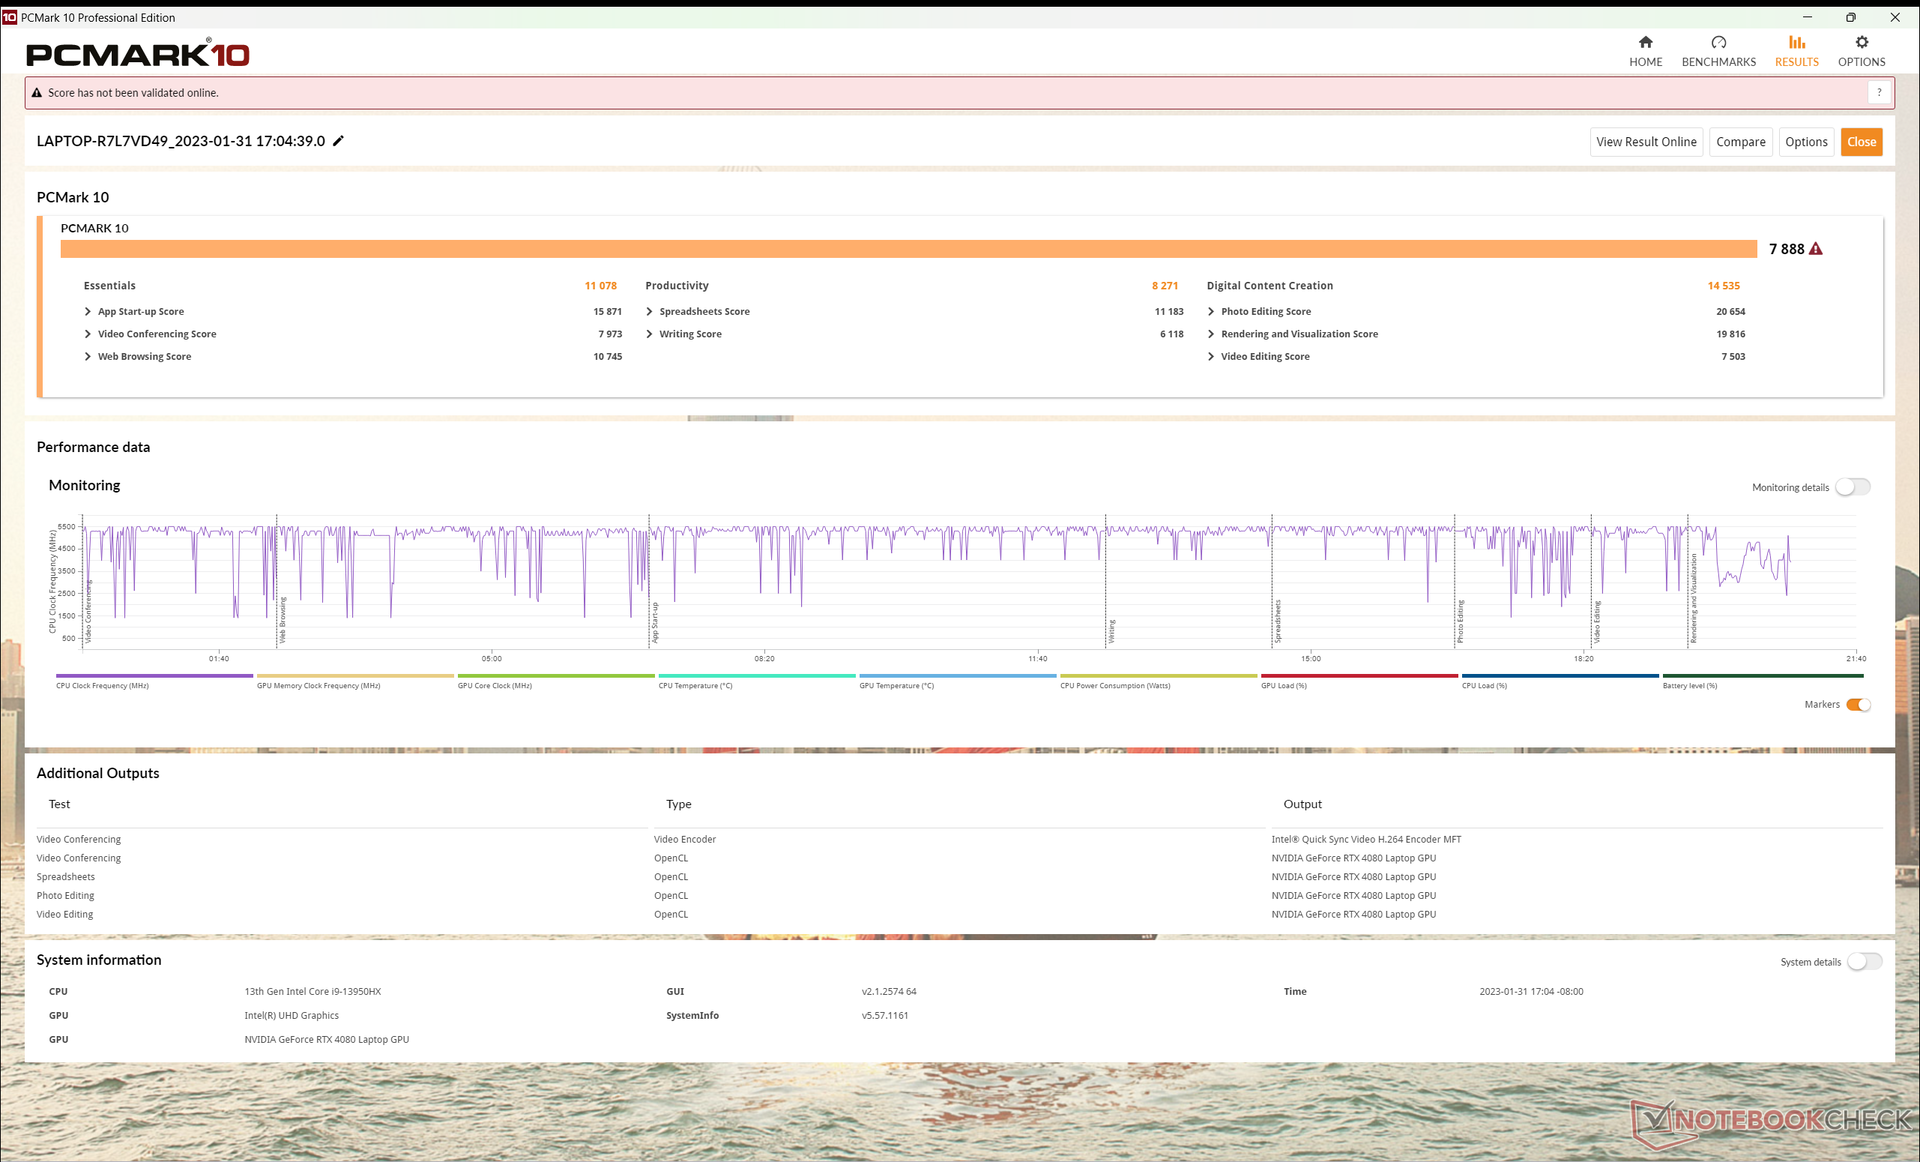
Las puntuaciones PCMark 10 son superiores a las de los modelos Blade de la generación anterior de media aunque las diferencias sean mínimas. Los portátiles de juego con el Samsung PM9A1 más rápido como el MSI GE67 HX aún pueden tener ventaja particularmente en la subprueba de Productividad.
CrossMark: Overall | Productivity | Creativity | Responsiveness
| PCMark 10 Score | 7888 puntos | |
ayuda | ||
| AIDA64 / Memory Write | |
| Razer Blade 16 Early 2023 | |
| Razer Blade 16 Early 2023 | |
| Razer Blade 16 Early 2023 | |
| Media de la clase Gaming (22297 - 135096, n=105, últimos 2 años) | |
| Medio Intel Core i9-13950HX (59501 - 80441, n=9) | |
| Razer Blade 15 Advanced Model Early 2022 | |
| MSI GE67 HX 12UGS | |
| Asus ROG Zephyrus Duo 16 GX650RX | |
| Dell G16 7620 | |
| Lenovo Legion S7 16ARHA7 | |
| HP Omen 16-n0033dx | |
| Razer Blade 17 (i7-12800H, RTX 3070 Ti) | |
| AIDA64 / Memory Latency | |
| Media de la clase Gaming (75.3 - 259, n=105, últimos 2 años) | |
| Dell G16 7620 | |
| Razer Blade 16 Early 2023 | |
| Razer Blade 16 Early 2023 | |
| Razer Blade 16 Early 2023 | |
| MSI GE67 HX 12UGS | |
| Razer Blade 15 Advanced Model Early 2022 | |
| Asus ROG Zephyrus Duo 16 GX650RX | |
| Medio Intel Core i9-13950HX (84.4 - 99.5, n=9) | |
| HP Omen 16-n0033dx | |
| Lenovo Legion S7 16ARHA7 | |
| Razer Blade 17 (i7-12800H, RTX 3070 Ti) | |
* ... más pequeño es mejor
Latencia del CPD
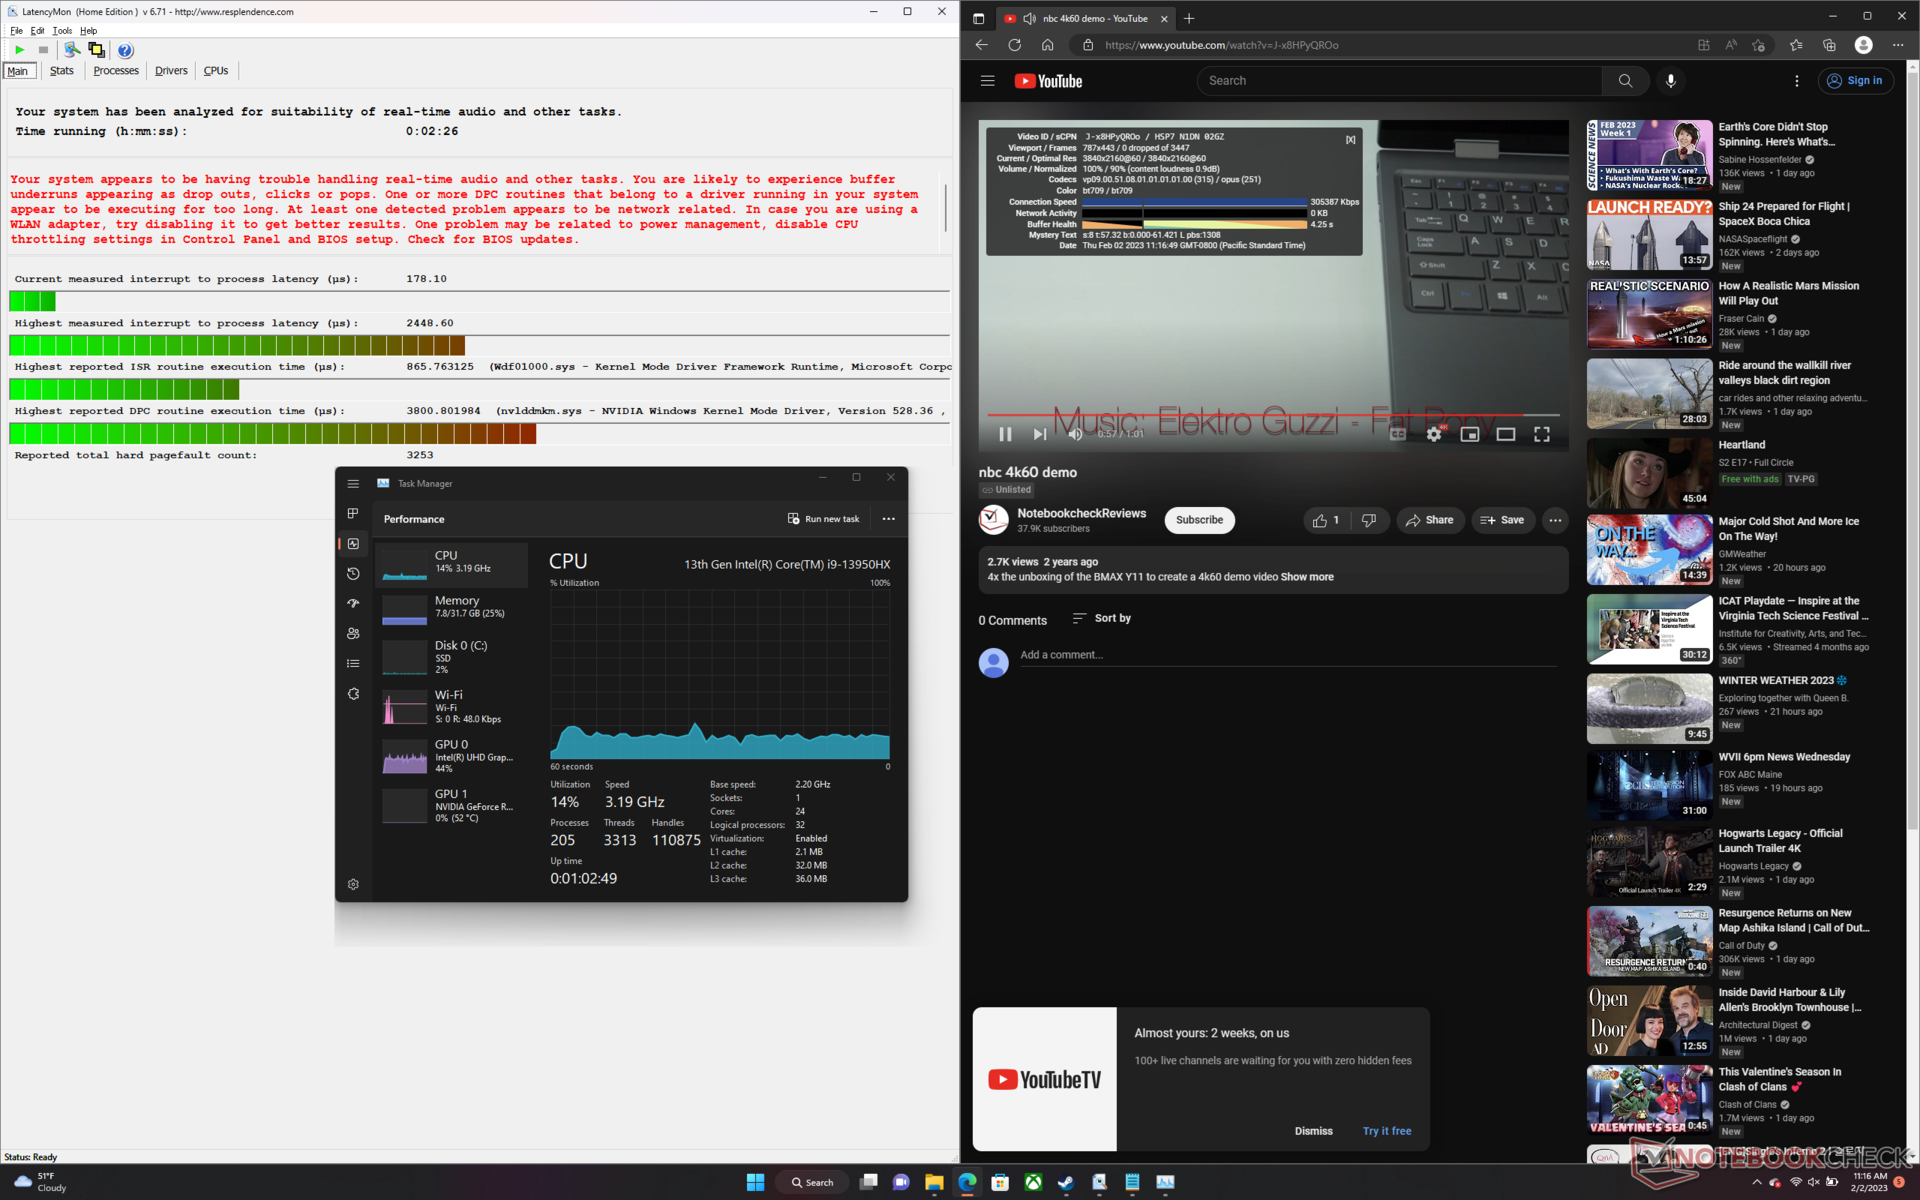
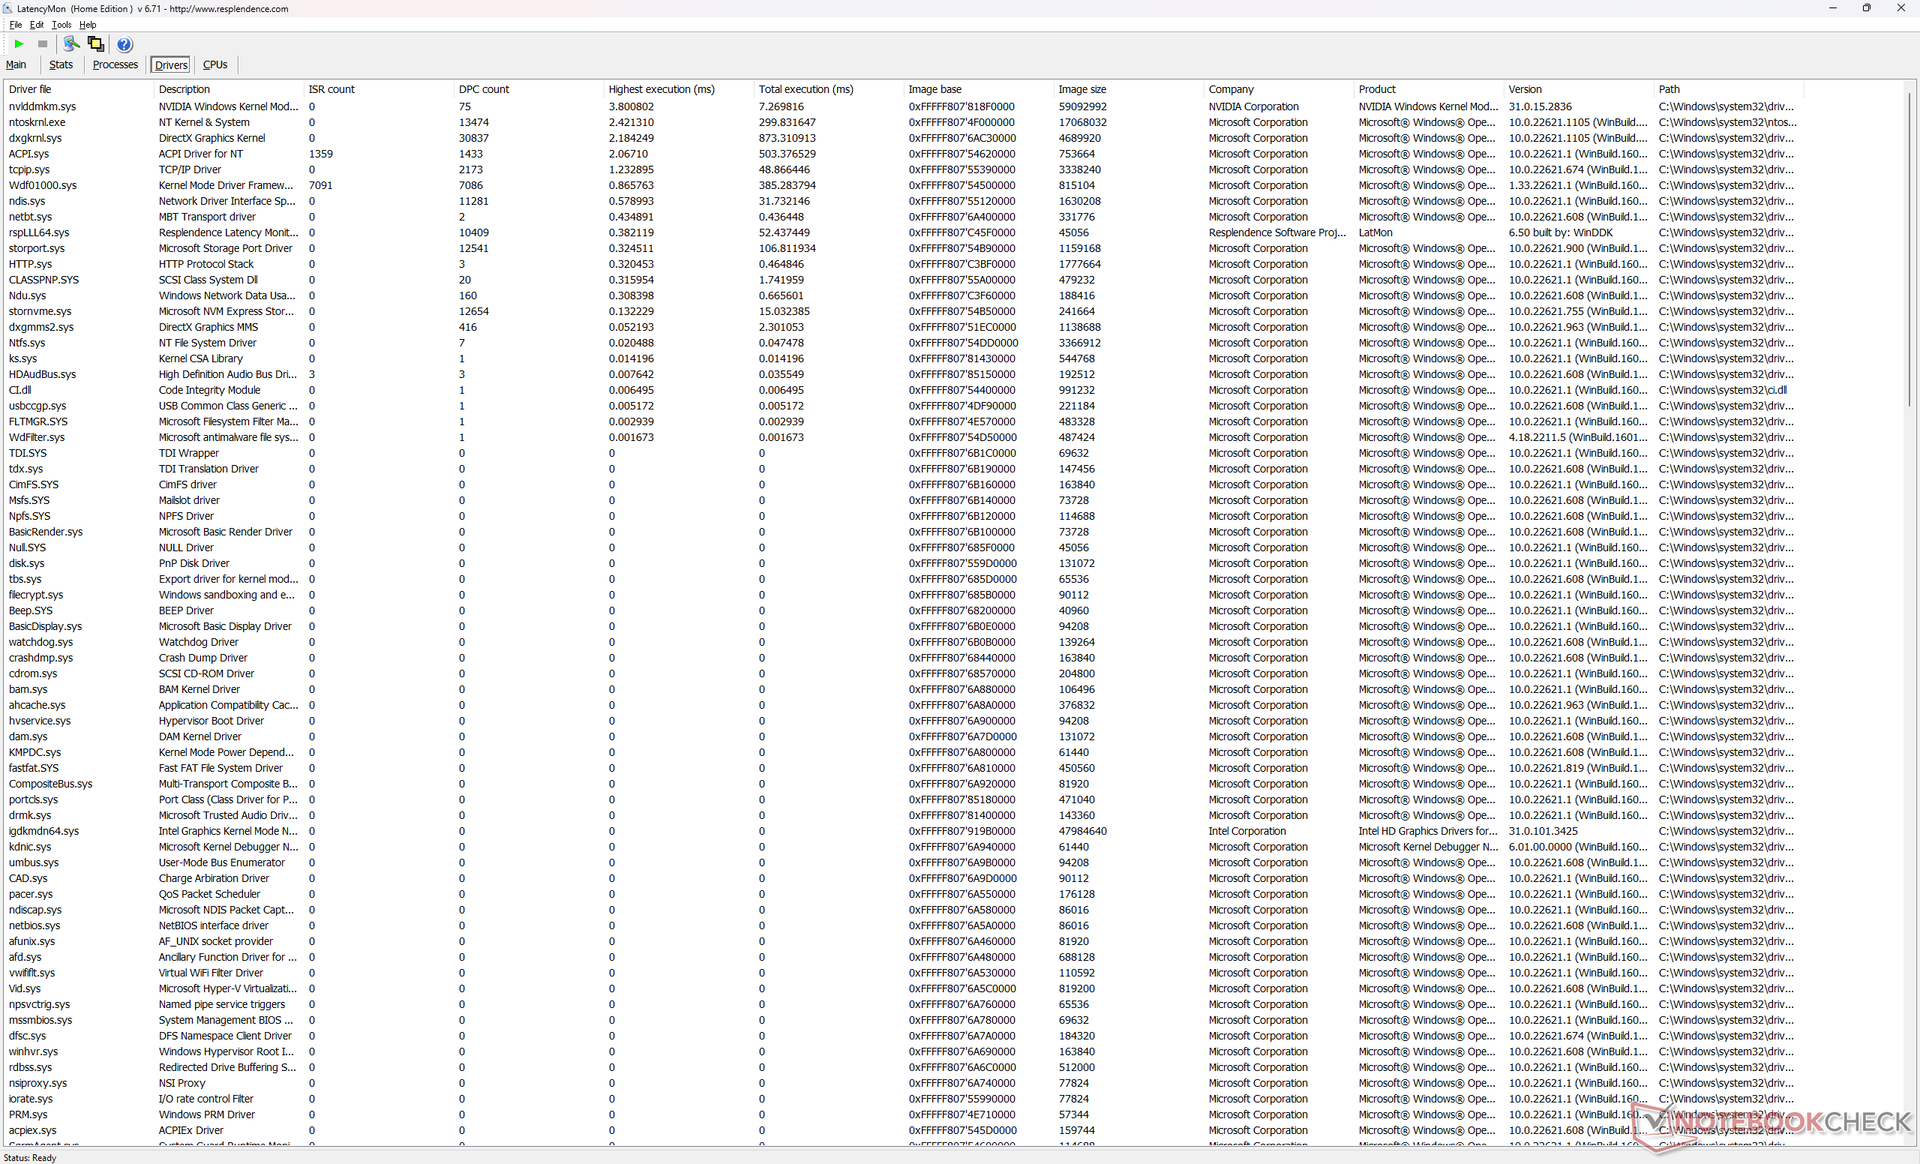
LatencyMon revela problemas de CPD al abrir varias pestañas del navegador en nuestra página de inicio. por lo demás, la reproducción de vídeo 4K a 60 FPS es fluida y sin caídas de fotogramas.
| DPC Latencies / LatencyMon - interrupt to process latency (max), Web, Youtube, Prime95 | |
| Razer Blade 15 Advanced Model Early 2022 | |
| Razer Blade 16 Early 2023 | |
| MSI GE67 HX 12UGS | |
| HP Omen 16-n0033dx | |
| Lenovo Legion S7 16ARHA7 | |
| Dell G16 7620 | |
| Razer Blade 17 (i7-12800H, RTX 3070 Ti) | |
| Asus ROG Zephyrus Duo 16 GX650RX | |
* ... más pequeño es mejor
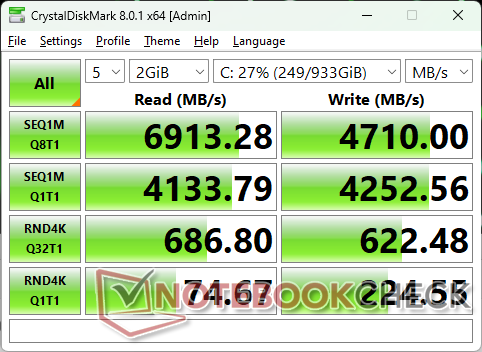
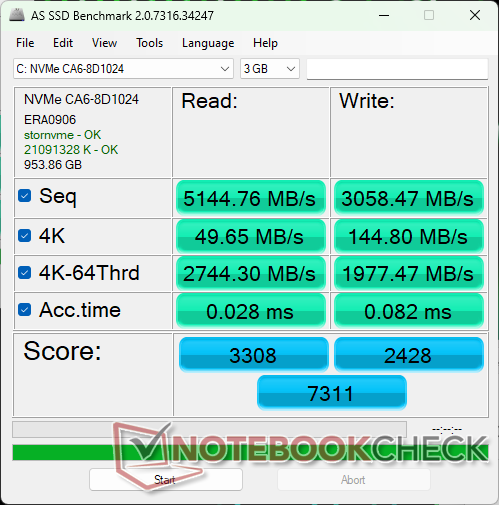
Dispositivos de almacenamiento: admite hasta 2 unidades SSD PCIe4
Nuestra unidad Blade 16 se entrega con la misma unidad de 1 TB SSSTC CA6-8D1024 que se encuentra en los modelos 2021 y 2022 Blade 15 2022. Aunque las tasas de transferencia secuencial siguen siendo muy buenas con hasta 6900 MB/s en nuestras pruebas, sus tasas de lectura y escritura de cargas de trabajo SEQ Q8 T1 más pequeñas quedan por detrás de la Samsung PM9A1 de la competencia. Razer sigue enviando unidades Blade 17 con la unidad Samsung, por lo que es probable que los envíos actuales de Blade 16 lleven SSD de ambos fabricantes.
Se admiten hasta dos unidades SSD M.2 internas, al igual que en los modelos Blade 15 y Blade 17. En el Blade 16, sin embargo, Razer ha apilado las dos unidades una encima de otra para preservar el espacio de la placa base para otros componentes como la batería de mayor capacidad y la solución de refrigeración.

* ... más pequeño es mejor
Disk Throttling: DiskSpd Read Loop, Queue Depth 8
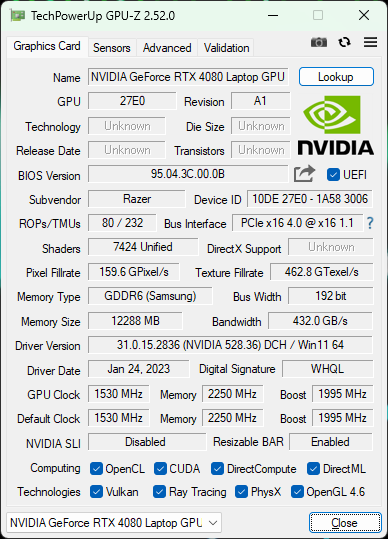
Rendimiento de la GPU - 175 W TGP GeForce RTX 4080
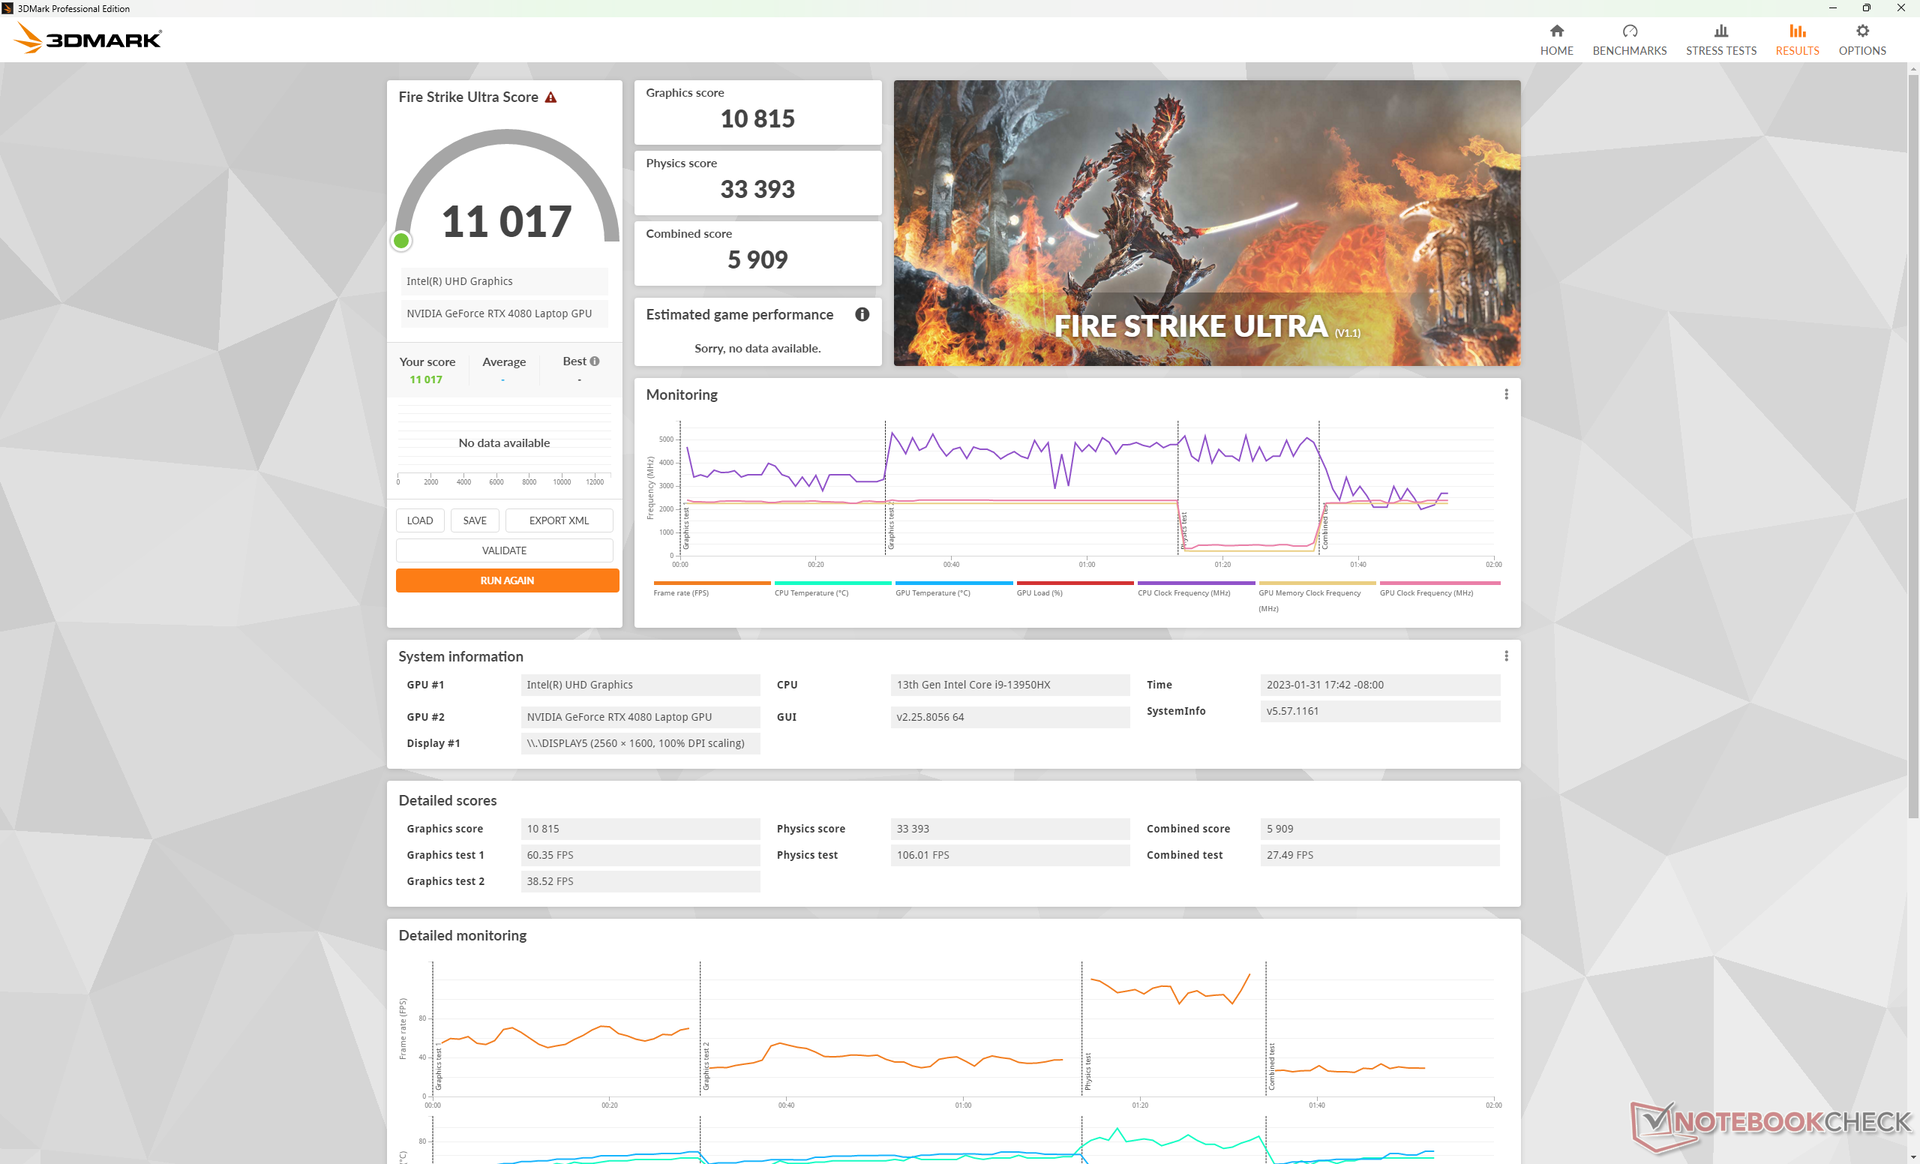
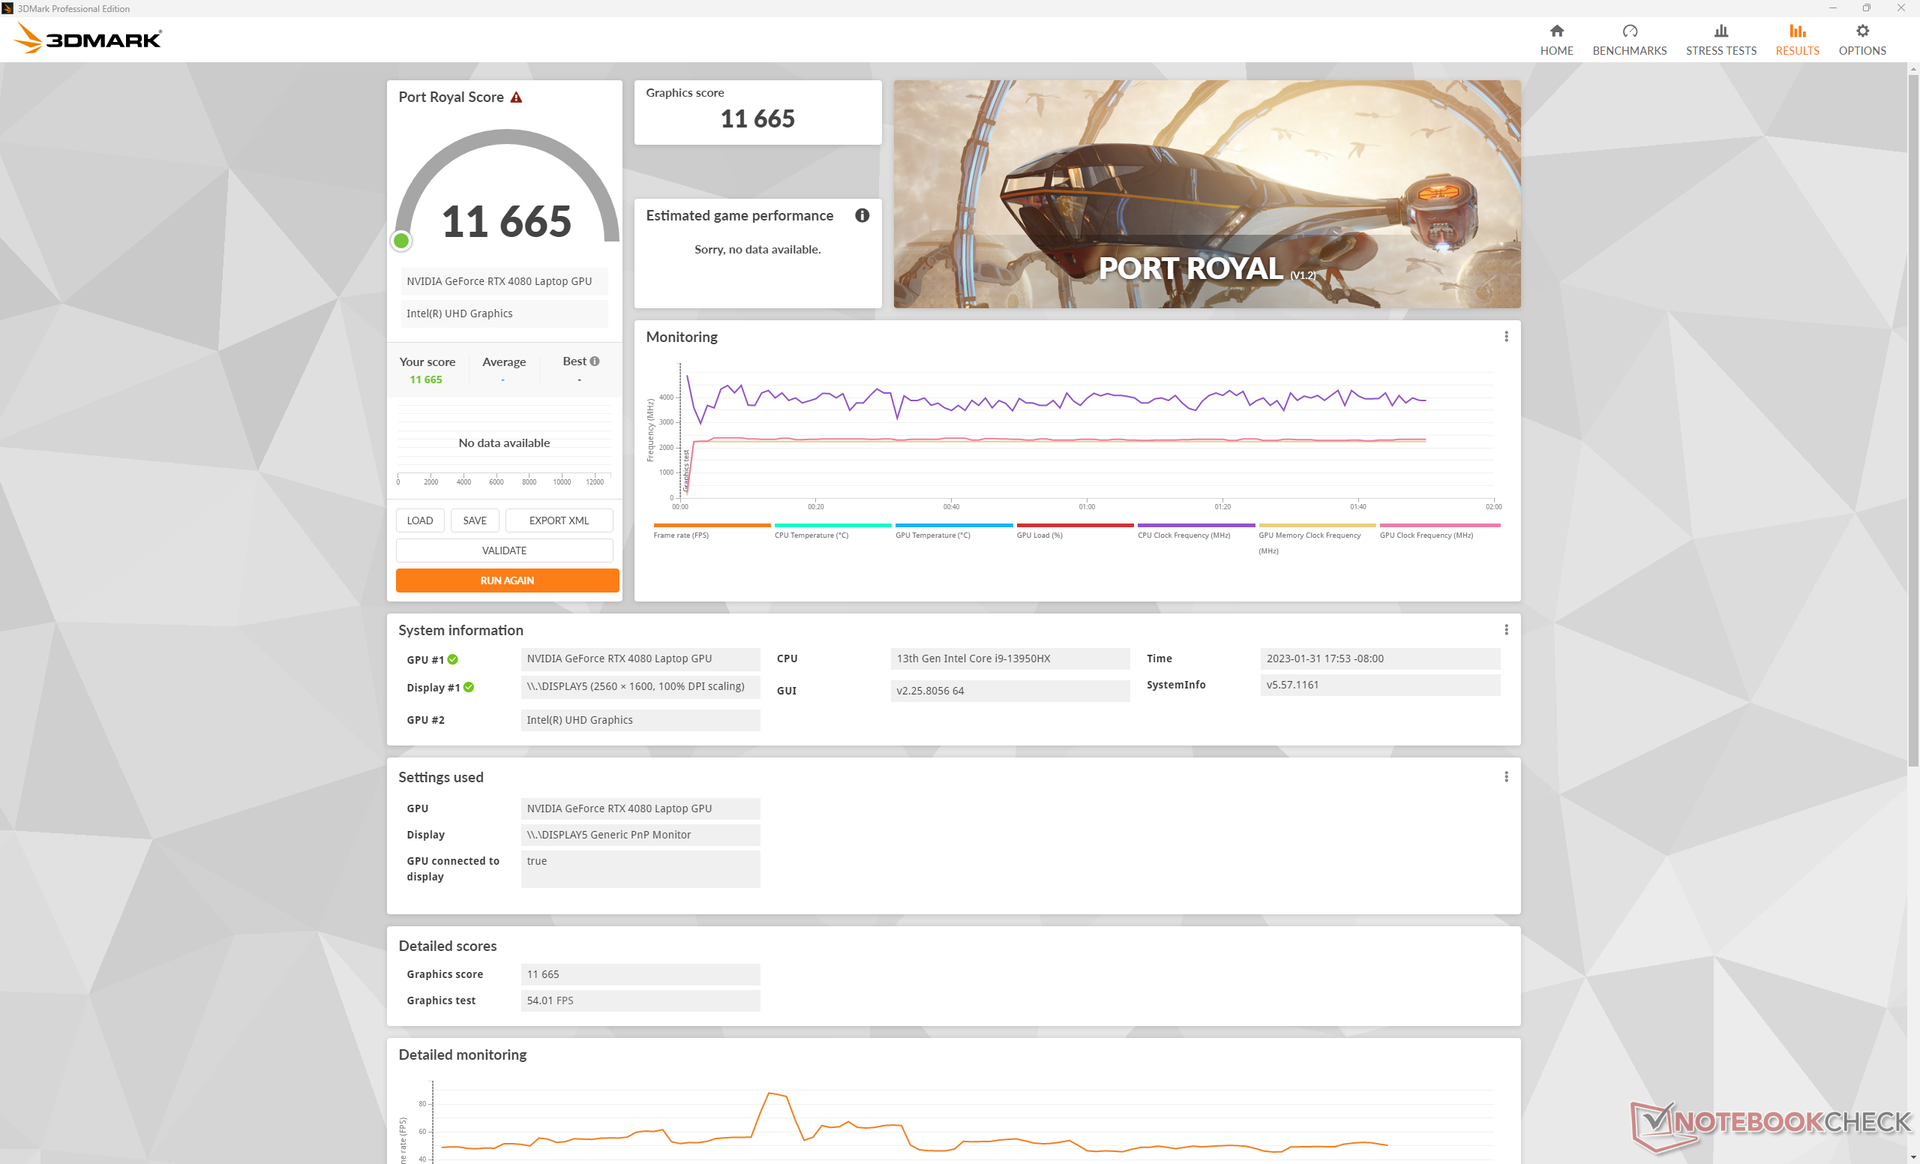
El rendimiento gráfico bruto es entre un 30 y un 50 por ciento más rápido que el de la última generación rTX 3080 Ti para portátiles lo que concuerda con la afirmación de Nvidia de una mejora del 40% entre generaciones. Las ventajas de rendimiento incluyen también el potencial de trazado de rayos, con una puntuación Port Royal entre 1,5 y 2,5 veces más rápida que la mayoría de portátiles de juego basados en Ampere. La GeForce RTX 4080 móvil es realmente un salto generacional tras dos años de opciones GeForce 30 móviles.
El rendimiento es incluso más rápido, entre 2 y 3 veces, si los títulos son compatibles con DLSS 3.0. Los títulos que probamos a continuación se ejecutaron sin DLSS para que la comparación entre generaciones fuera más justa, pero se recomienda encarecidamente activar DLSS 3.0, ya que los pequeños artefactos o la latencia de entrada que introduce quedan eclipsados por el aumento de la velocidad de fotogramas. Consulta nuestras páginas dedicadas a las GeForce RTX 4080 para móviles y 4090 para más pruebas e información sobre la serie GeForce 40. En las próximas semanas iremos añadiendo más juegos. Por desgracia, muchos juegos populares no son compatibles con DLSS 3.0, como Fortnite y Elden Ring.
Aunque la RTX 4080 para móviles es impresionante, sigue estando por detrás de nuestra referencia GeForce RTX 4080 de sobremesa entre un 35 % y un 40 %. Por lo tanto, los usuarios pueden esperar que la RTX 4080 móvil rinda más como una rTX 3080 de sobremesa cuando DLSS 3.0 está desactivado.
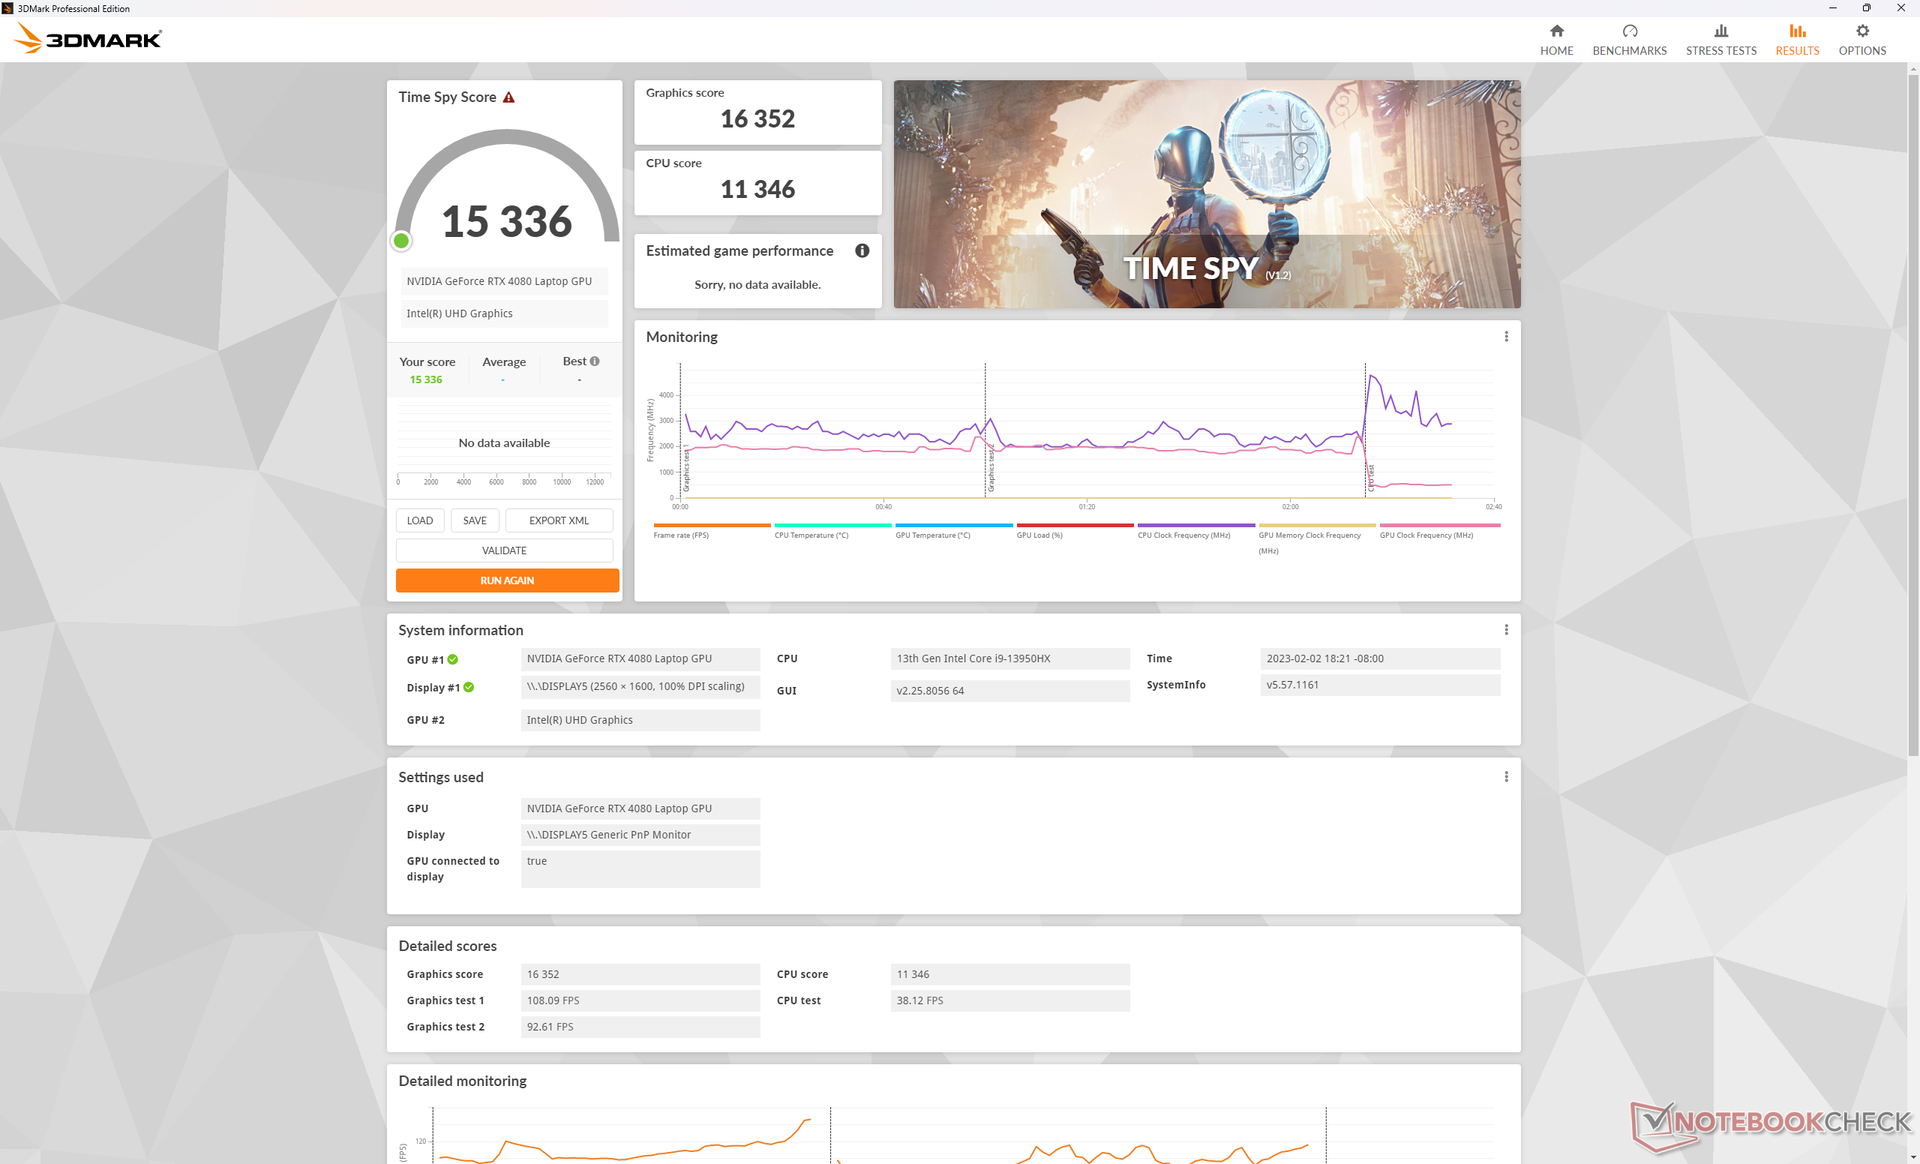
Ejecutar la Blade 16 en modo equilibrado en lugar de en modo de rendimiento afectará al rendimiento gráfico en un 10 por ciento, según Time Spy.
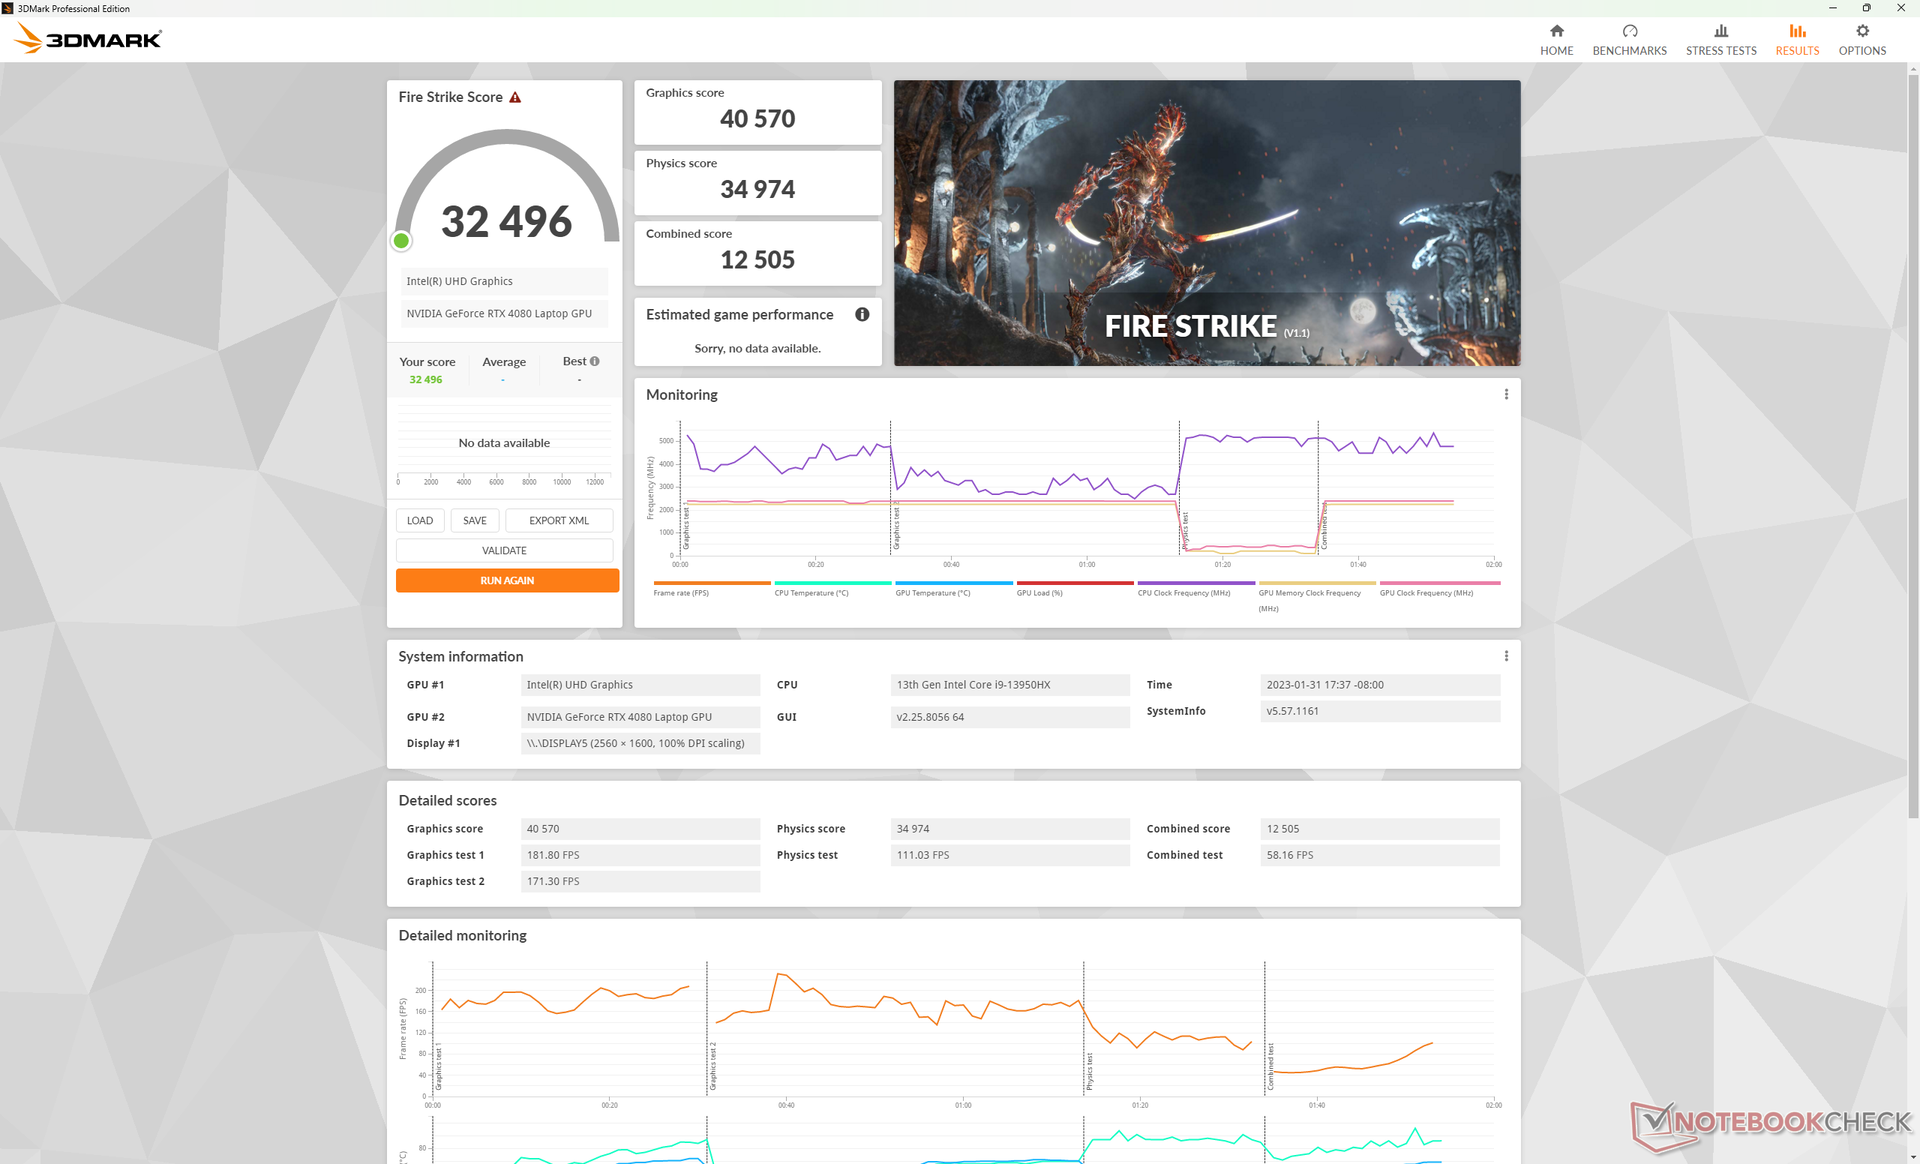

| 3DMark 11 Performance | 41542 puntos | |
| 3DMark Fire Strike Score | 32496 puntos | |
| 3DMark Time Spy Score | 17601 puntos | |
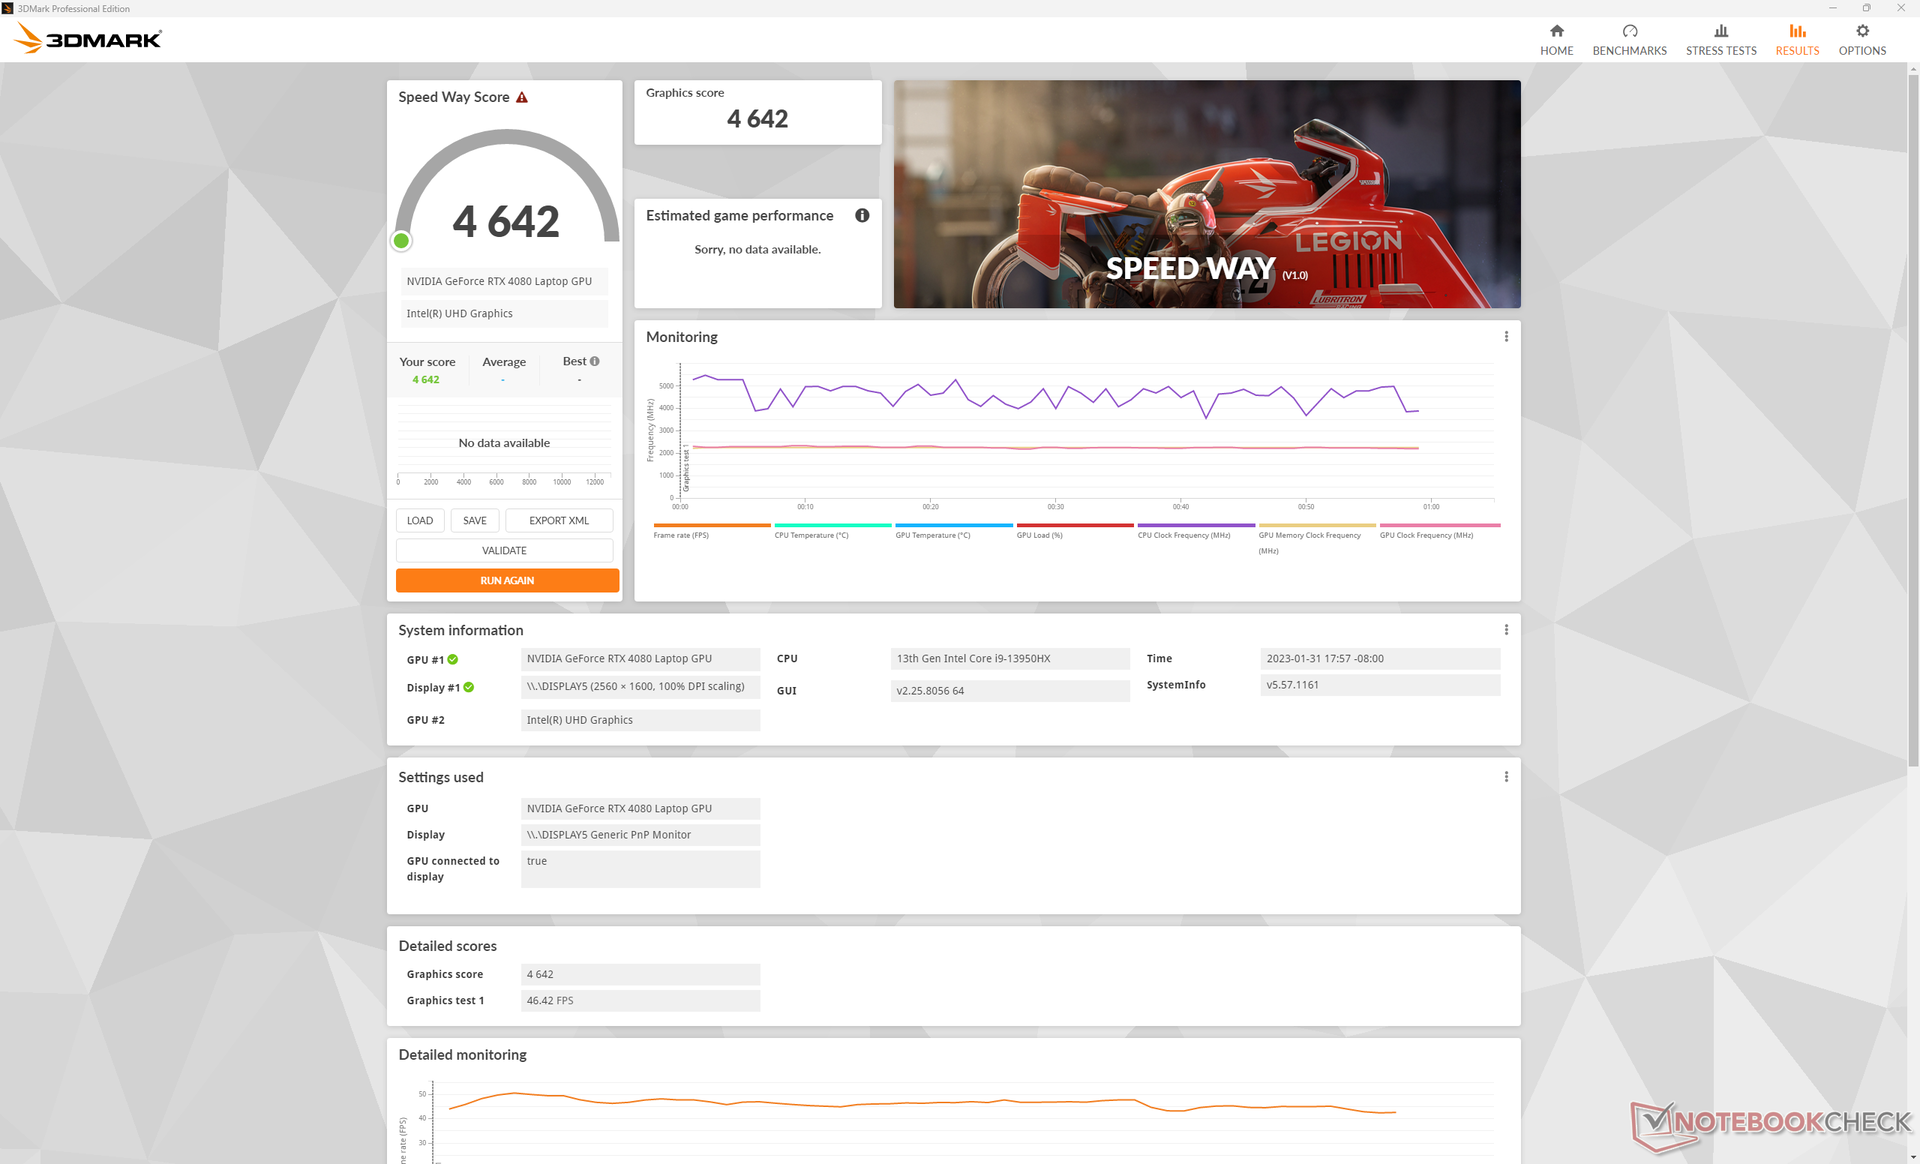
| 3DMark Steel Nomad Score | 4021 puntos | |
| 3DMark Steel Nomad Light Score | 16652 puntos | |
ayuda | ||
* ... más pequeño es mejor
El ralentí en Witcher 3 1080p Ultra no muestra caídas significativas del rendimiento ni ralentización con el tiempo. Una prueba de estrés en Time Spy arrojaría una puntuación final del 98,5%.
Witcher 3 FPS Chart
| bajo | medio | alto | ultra | QHD DLSS | QHD FSR | QHD | 4K DLSS | 4K FSR | 4K | |
|---|---|---|---|---|---|---|---|---|---|---|
| GTA V (2015) | 186.6 | 185.2 | 183.4 | 140.7 | 125.2 | 143.7 | ||||
| The Witcher 3 (2015) | 609.6 | 462.7 | 353.5 | 176.8 | 120.6 | |||||
| Dota 2 Reborn (2015) | 218 | 204 | 196 | 194.7 | 176.7 | |||||
| Final Fantasy XV Benchmark (2018) | 195.8 | 184.1 | 157.8 | 120.1 | 74.1 | |||||
| X-Plane 11.11 (2018) | 201 | 177.7 | 137 | 117.5 | ||||||
| Strange Brigade (2018) | 438 | 365 | 351 | 323 | 237 | 122.3 | ||||
| Shadow of the Tomb Raider (2018) | 228 | 201 | 196 | 176 | 154 | 84 | ||||
| Metro Exodus (2019) | 197 | 170.4 | 145 | 121.7 | 102 | 67 | ||||
| Control (2019) | 239.1 | 204.7 | 157 | 102 | 50.1 | |||||
| Borderlands 3 (2019) | 207.7 | 176.6 | 158.1 | 133.5 | 108.7 | 59.8 | ||||
| Valorant (2020) | 336 | |||||||||
| Horizon Zero Dawn (2020) | 128 | 112 | ||||||||
| Mafia Definitive Edition (2020) | 280.3 | 184 | 171.3 | 121.6 | 70.4 | |||||
| Watch Dogs Legion (2020) | 140 | 129 | 121 | 110 | 93 | 56 | ||||
| Far Cry 6 (2021) | 181 | 149 | 134 | 125 | 115 | 71 | ||||
| Dying Light 2 (2022) | 184.1 | 160.4 | 140.9 | 97.8 | 48.6 | |||||
| Cyberpunk 2077 1.6 (2022) | 121.1 | 118.1 | 113.8 | 106.2 | 81.2 | 40 | ||||
| Ghostwire Tokyo (2022) | 198.7 | 159.6 | 154 | 145 | 135.9 | 73.1 | ||||
| The Callisto Protocol (2022) | 177.8 | 159.8 | 119.9 | 120.4 | 93.1 | 55.3 | ||||
| Baldur's Gate 3 (2023) | 168.3 | 160 | 121.9 | 120.5 | 66.7 | |||||
| Cyberpunk 2077 (2023) | 110 | 93.6 | 80.6 | 44.4 | 36.2 | 35 | ||||
| Alan Wake 2 (2023) | 66.9 | 37 | ||||||||
| Skull & Bones (2024) | 50 | |||||||||
| Horizon Forbidden West (2024) | 56.1 | 54.8 | 39.5 | |||||||
| F1 24 (2024) | 226 | 236 | 251 | 117.7 | 118.8 | 92.5 | 76.3 | 65 | 38.8 | |
| Black Myth: Wukong (2024) | 110 | 89 | 71 | 42 | 47 | 31 | 33 | 18 | ||
| Star Wars Outlaws (2024) | 84.3 | 81.5 | 74.1 | 64.4 | 59.1 | 47.7 | 35.8 | 20.5 | ||
| Call of Duty Black Ops 6 (2024) | 107 | 100 | 65 | 62 | ||||||
| Stalker 2 (2024) | 63.1 | 50.3 | 30.9 | |||||||
| Marvel Rivals (2024) | 145 | 120 | 88 | 74 | 56 | |||||
| Indiana Jones and the Great Circle (2024) | 96.4 | 80.3 | 51 | |||||||
| Kingdom Come Deliverance 2 (2025) | 92.3 | 92.3 | 71.2 | |||||||
| Monster Hunter Wilds (2025) | 63.3 | 62 | 54.8 | 48 | 34.4 | |||||
| Civilization 7 (2025) | 155.1 | 117.3 | 105.8 | 50.2 | ||||||
| Assassin's Creed Shadows (2025) | 69 | 50 | 52 | 44 | 41 | 32 | ||||
| Doom: The Dark Ages (2025) | 112.5 | 102.8 | 94.6 | 93.8 | 86.6 | 65.4 | 51.9 | 53.1 | 34.7 | |
| F1 25 (2025) | 172.5 | 171.9 | 44.2 | 46.1 | 26.5 | 24.2 | 12.2 | |||
| Borderlands 4 (2025) | 58.5 | 30.5 | 46.1 | 26.2 | ||||||
| Battlefield 6 (2025) | 128.9 | 121.9 | 115.1 | 103.8 | 113.8 | 75.5 | 70.1 | 53.7 | ||
| The Outer Worlds 2 (2025) | 83.7 | 79.7 | 73.6 | 61.1 | 31.1 | 43.4 | ||||
| ARC Raiders (2025) | 88.4 | 89.4 | 68.1 | |||||||
| Anno 117: Pax Romana (2025) | 79.8 | 48.2 | 35.2 | |||||||
| Call of Duty Black Ops 7 (2025) | 58 | 56 | 38 | |||||||
| Resident Evil Requiem (2026) | 66.6 | 46.1 | 21.6 | |||||||
| Death Stranding 2 (2026) | 72.1 | 80 | 60.3 | 37.9 | ||||||
| Crimson Desert (2026) | 104.2 | 88.7 | 76.2 | 69 | 68.1 | 59.3 | 48 | 35.9 | ||
| Pragmata (2026) | 114 | 97.9 | 81 | 64.8 | 44.2 | |||||
| War Thunder (2026) | 304 | 127 | 88.6 | 37.9 | ||||||
| Forza Horizon 6 (2026) | 91 | 78 | 59 | 58 | 44 | 37 | 27 | |||
| 007 First Light (2026) | 78.6 | 69.6 | 55.9 | 51.8 | 28.3 |
Emisiones - Siguen siendo bastante ruidosas
Ruido del sistema
El ruido del ventilador depende del perfil de potencia de Synapse. Cuando se juega en modo equilibrado, por ejemplo, el ruido del ventilador alcanza un máximo de 42 dB(A) frente a 51,6 dB(A) si se juega en modo rendimiento. Por tanto, los usuarios pueden considerar jugar en modo Equilibrado en lugar de Rendimiento, aunque esto suponga un ligero impacto en el rendimiento gráfico, como ya se ha mencionado.
El ruido general del ventilador es más similar al del Blade 17 que al Blade 15, lo que es desafortunado ya que el Blade 15 es la máquina más silenciosa. ElMSI GE67 HX es incluso más ruidoso que el Blade 16 en condiciones similares.
Se recomienda usar el modo silencioso o de ahorro de energía cuando se navega por internet o se hace streaming para que los ventiladores internos permanezcan más silenciosos durante más tiempo. Si no, tienden a pulsar pronto y fuerte si se pone en modo Equilibrado o superior. Al ejecutar 3DMark 06 en modo Equilibrado, por ejemplo, el ruido del ventilador aumentaría de forma constante a 39 dB(A) mucho antes en el benchmark comparado con los 31 dB(A) del Lenovo S7.Lenovo Legion S7 16.
Ruido
| Ocioso |
| 23 / 23 / 23.6 dB(A) |
| Carga |
| 39 / 51.3 dB(A) |
 | ||
30 dB silencioso 40 dB(A) audible 50 dB(A) ruidosamente alto |
||
min: | ||
| Razer Blade 16 Early 2023 GeForce RTX 4080 Laptop GPU, i9-13950HX, SSSTC CA6-8D1024 | Razer Blade 15 Advanced Model Early 2022 GeForce RTX 3080 Ti Laptop GPU, i7-12800H, Samsung PM9A1 MZVL21T0HCLR | Lenovo Legion S7 16ARHA7 Radeon RX 6800S, R9 6900HX, SK Hynix HFS001TEJ9X115N | Dell G16 7620 GeForce RTX 3060 Laptop GPU, i7-12700H, WDC PC SN810 512GB | Asus ROG Zephyrus Duo 16 GX650RX GeForce RTX 3080 Ti Laptop GPU, R9 6900HX, 2x Samsung SSD 980 Pro 2TB MZ-V8P2T0 (RAID 0) | HP Omen 16-n0033dx Radeon RX 6650M, R7 6800H, Samsung PM9A1 MZVL21T0HCLR | MSI GE67 HX 12UGS GeForce RTX 3070 Ti Laptop GPU, i7-12800HX, Samsung PM9A1 MZVL21T0HCLR | Razer Blade 17 (i7-12800H, RTX 3070 Ti) GeForce RTX 3070 Ti Laptop GPU, i7-12800H, Samsung PM9A1 MZVL21T0HCLR | |
|---|---|---|---|---|---|---|---|---|
| Noise | -5% | 3% | -6% | -9% | -9% | -4% | 2% | |
| apagado / medio ambiente * (dB) | 23 | 26 -13% | 23.1 -0% | 23.2 -1% | 26 -13% | 24.2 -5% | 22.7 1% | 23 -0% |
| Idle Minimum * (dB) | 23 | 26 -13% | 23.1 -0% | 28.3 -23% | 26 -13% | 27.4 -19% | 22.9 -0% | 23 -0% |
| Idle Average * (dB) | 23 | 27 -17% | 23.1 -0% | 28.8 -25% | 27 -17% | 27.4 -19% | 22.9 -0% | 23 -0% |
| Idle Maximum * (dB) | 23.6 | 29 -23% | 23.1 2% | 28.9 -22% | 29 -23% | 28.9 -22% | 22.9 3% | 23 3% |
| Load Average * (dB) | 39 | 37 5% | 31.4 19% | 32.4 17% | 41 -5% | 32.3 17% | 44.4 -14% | 36.92 5% |
| Witcher 3 ultra * (dB) | 51.6 | 44 15% | 51.4 -0% | 48.3 6% | 48 7% | 54.1 -5% | 55.7 -8% | 50 3% |
| Load Maximum * (dB) | 51.3 | 45 12% | 51.2 -0% | 48.1 6% | 50 3% | 57.6 -12% | 57.4 -12% | 50 3% |
* ... más pequeño es mejor
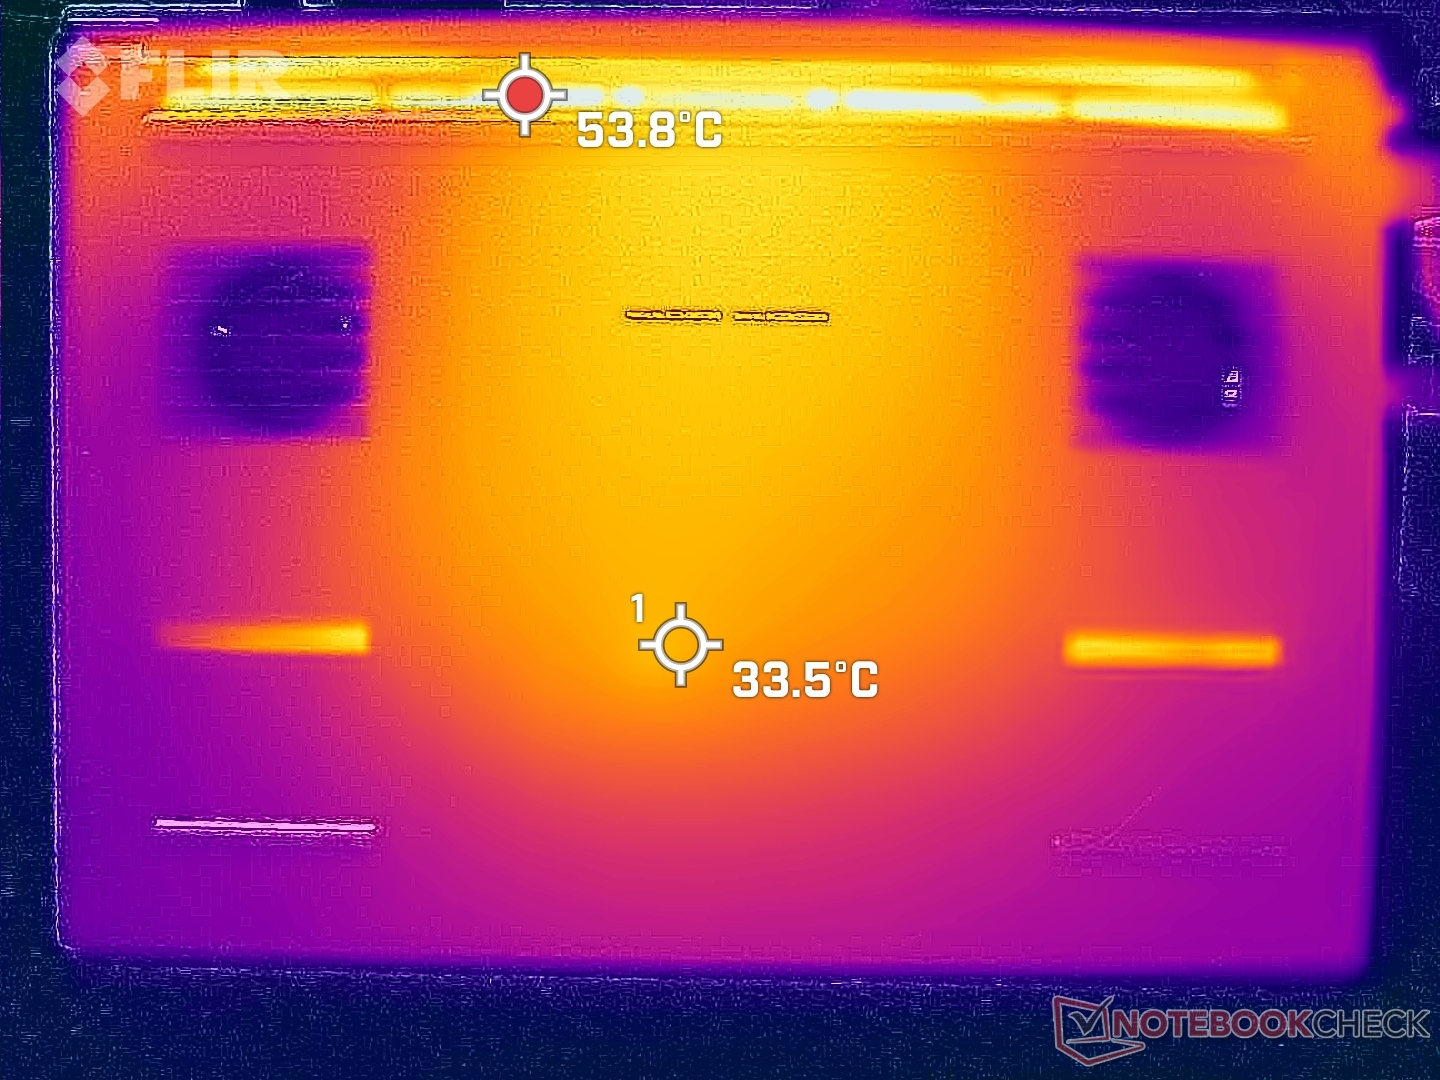
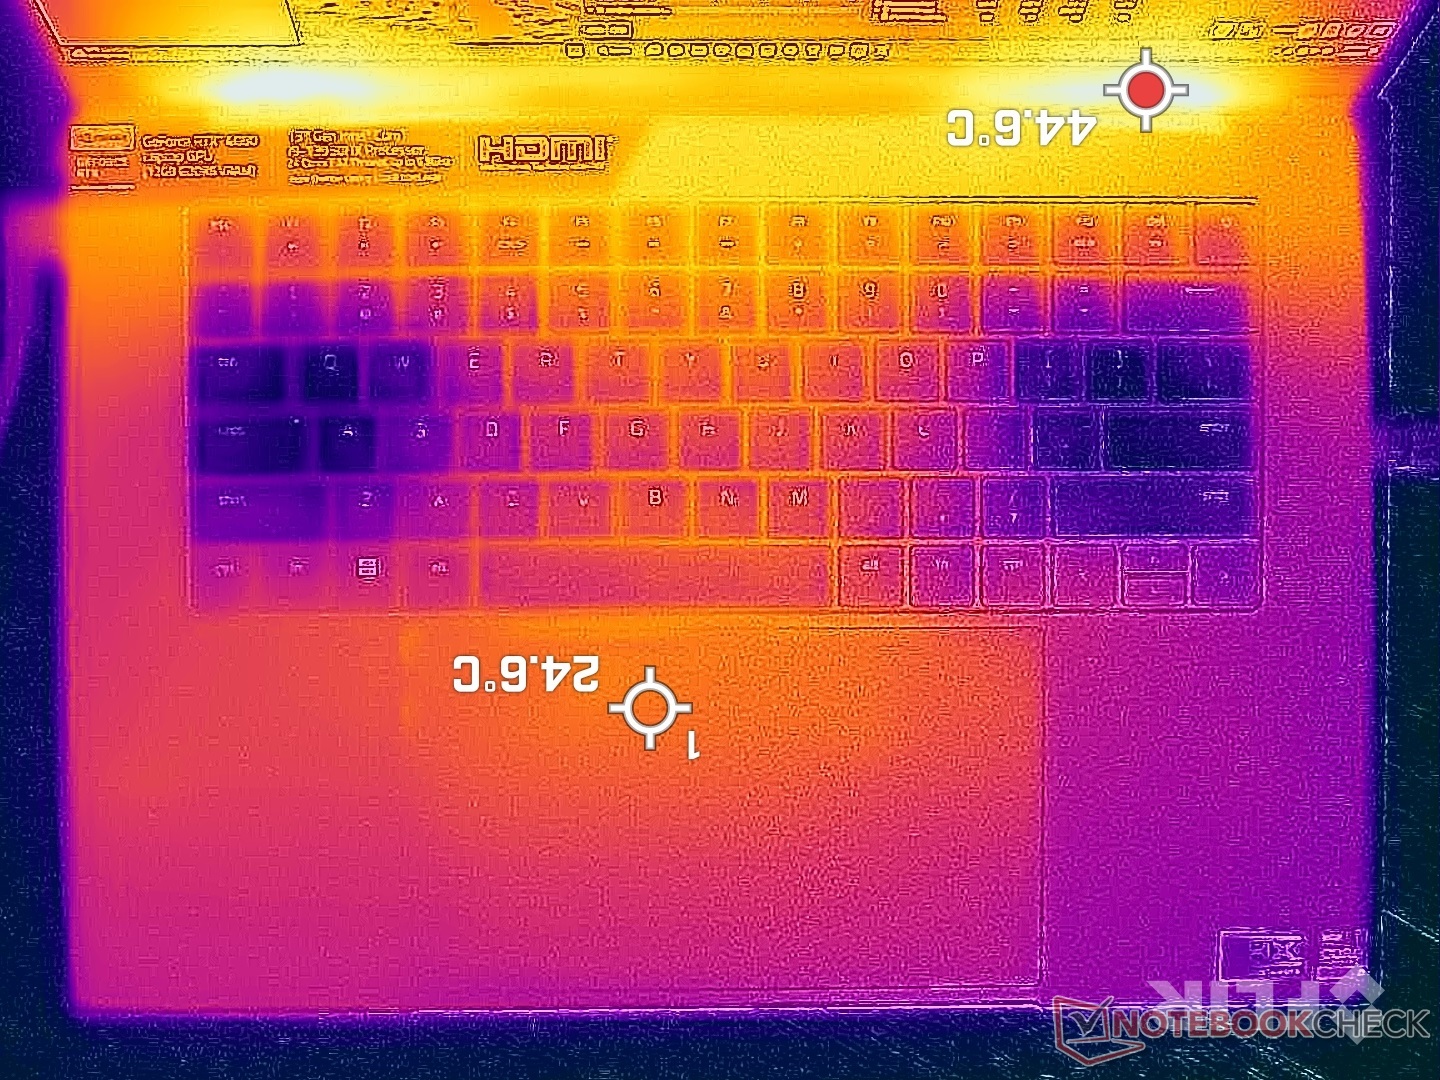
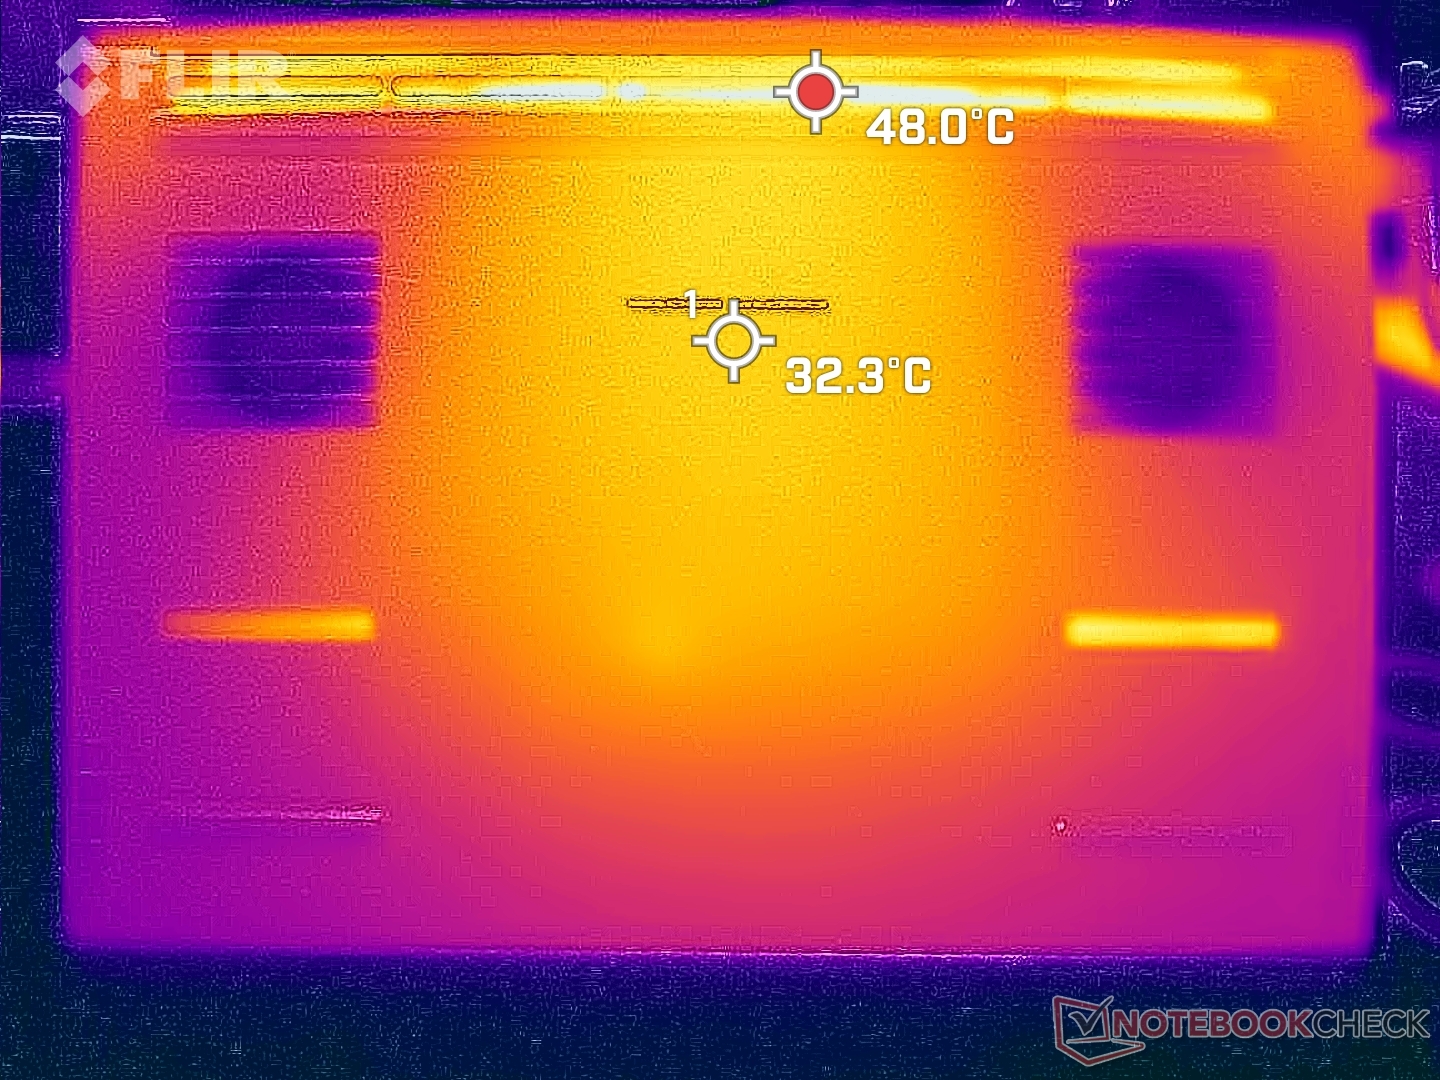
Temperatura
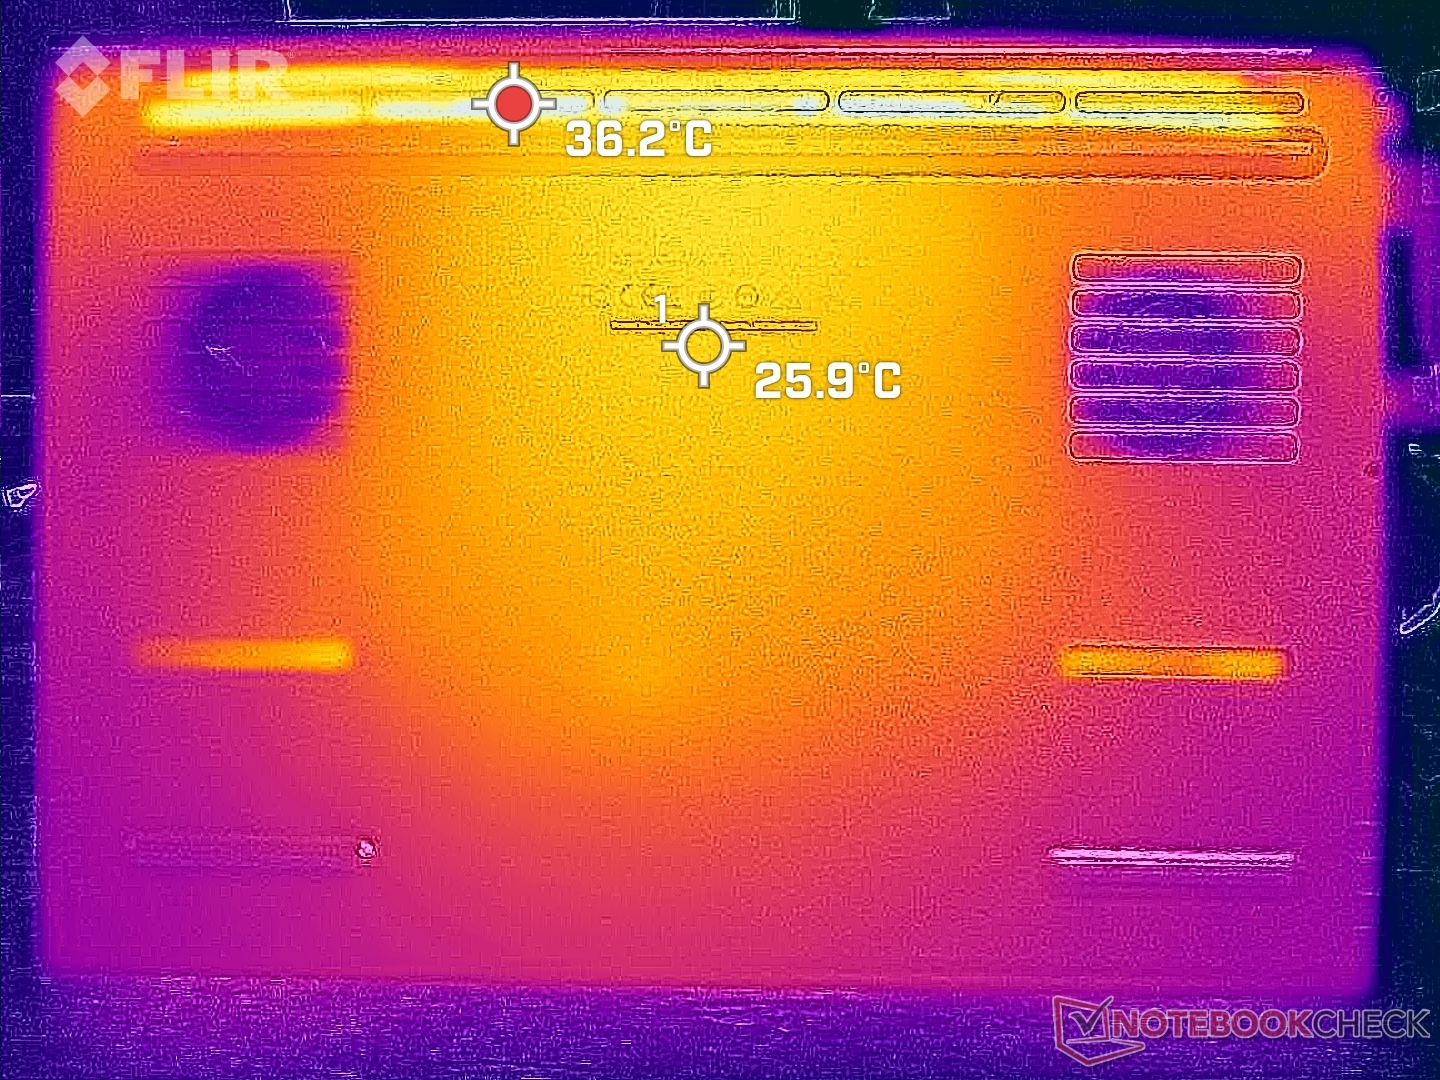
Las temperaturas superficiales son más cálidas de lo esperado en ralentí o con cargas poco exigentes y más frías de lo esperado al jugar. Los puntos calientes en reposo en el escritorio, por ejemplo, pueden llegar a los 32 C tanto en la parte superior como en la inferior, en comparación con los 21 C a 24 C de la parte inferior Lenovo Legion Slim 7 16. Esto puede atribuirse en parte a que los ventiladores inertes del Blade 16 provocan temperaturas superficiales más altas.
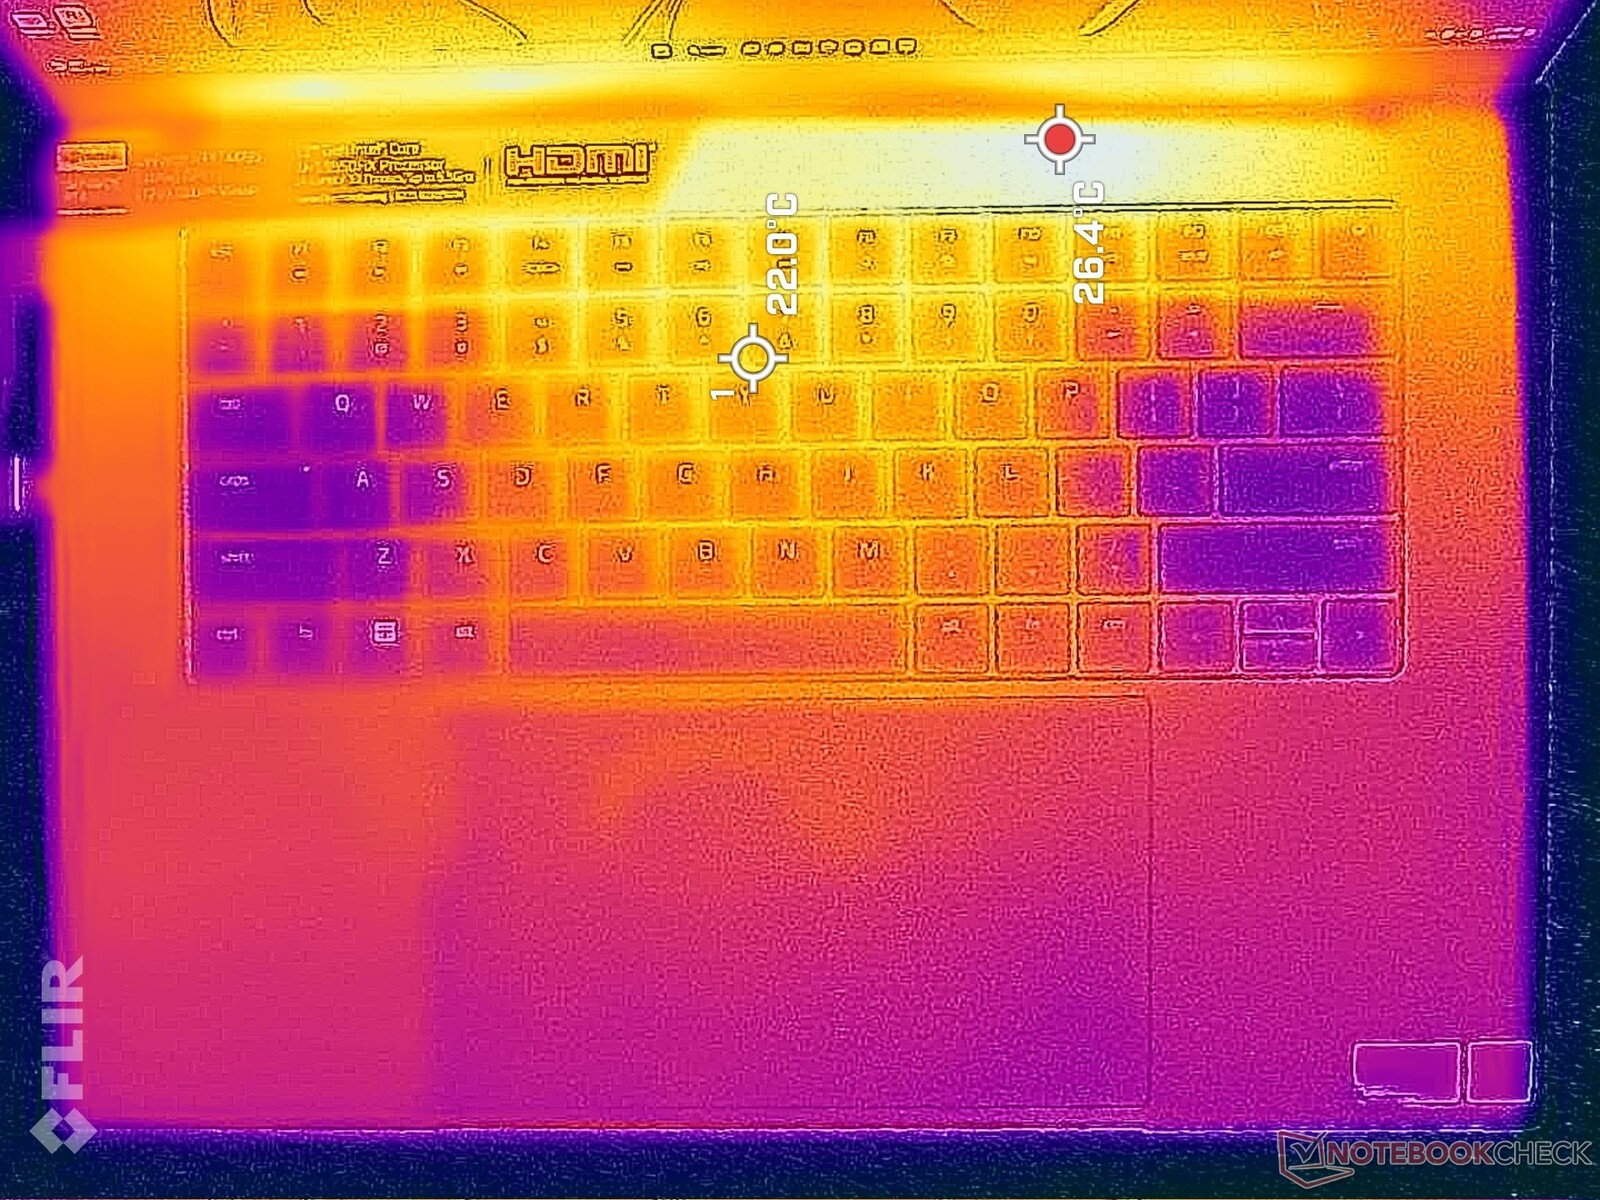
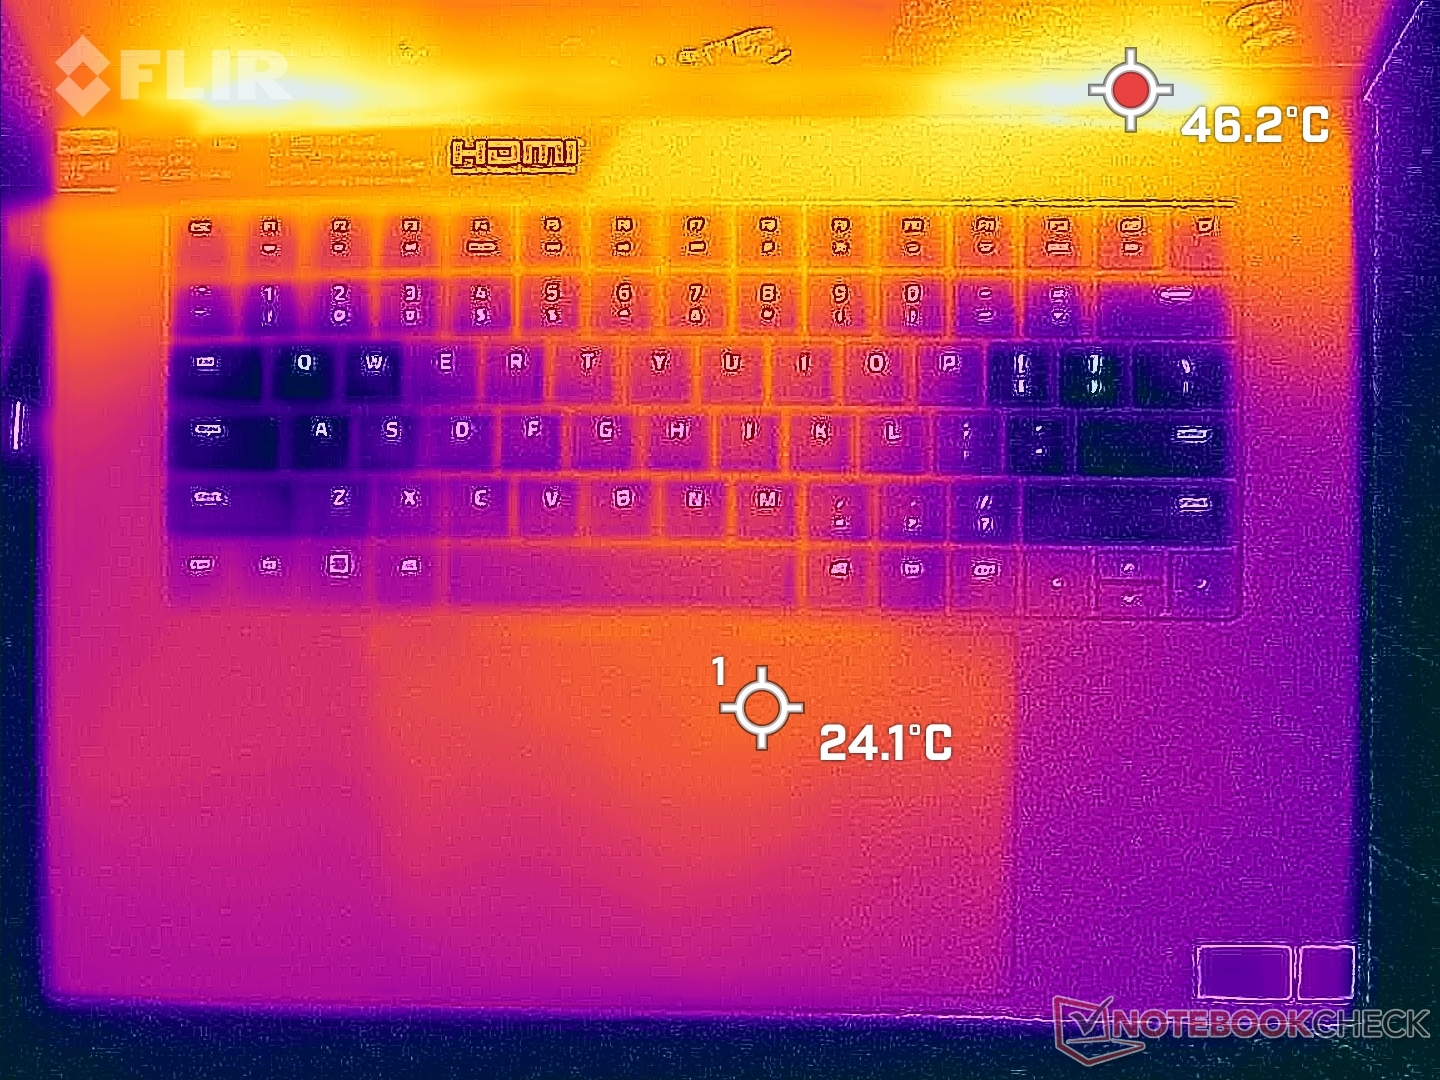
Cuando se juega, las temperaturas superficiales son relativamente frías, especialmente en la cubierta del teclado, teniendo en cuenta el delgado chasis totalmente metálico y el alto rendimiento. El centro del teclado alcanza sólo 31 C cuando funciona Witcher 3 durante largos periodos comparado con los 39 C del Lenovo antes mencionado. Nuestras manos o dedos nunca se sentirían incómodamente calientes sin importar la carga en pantalla.
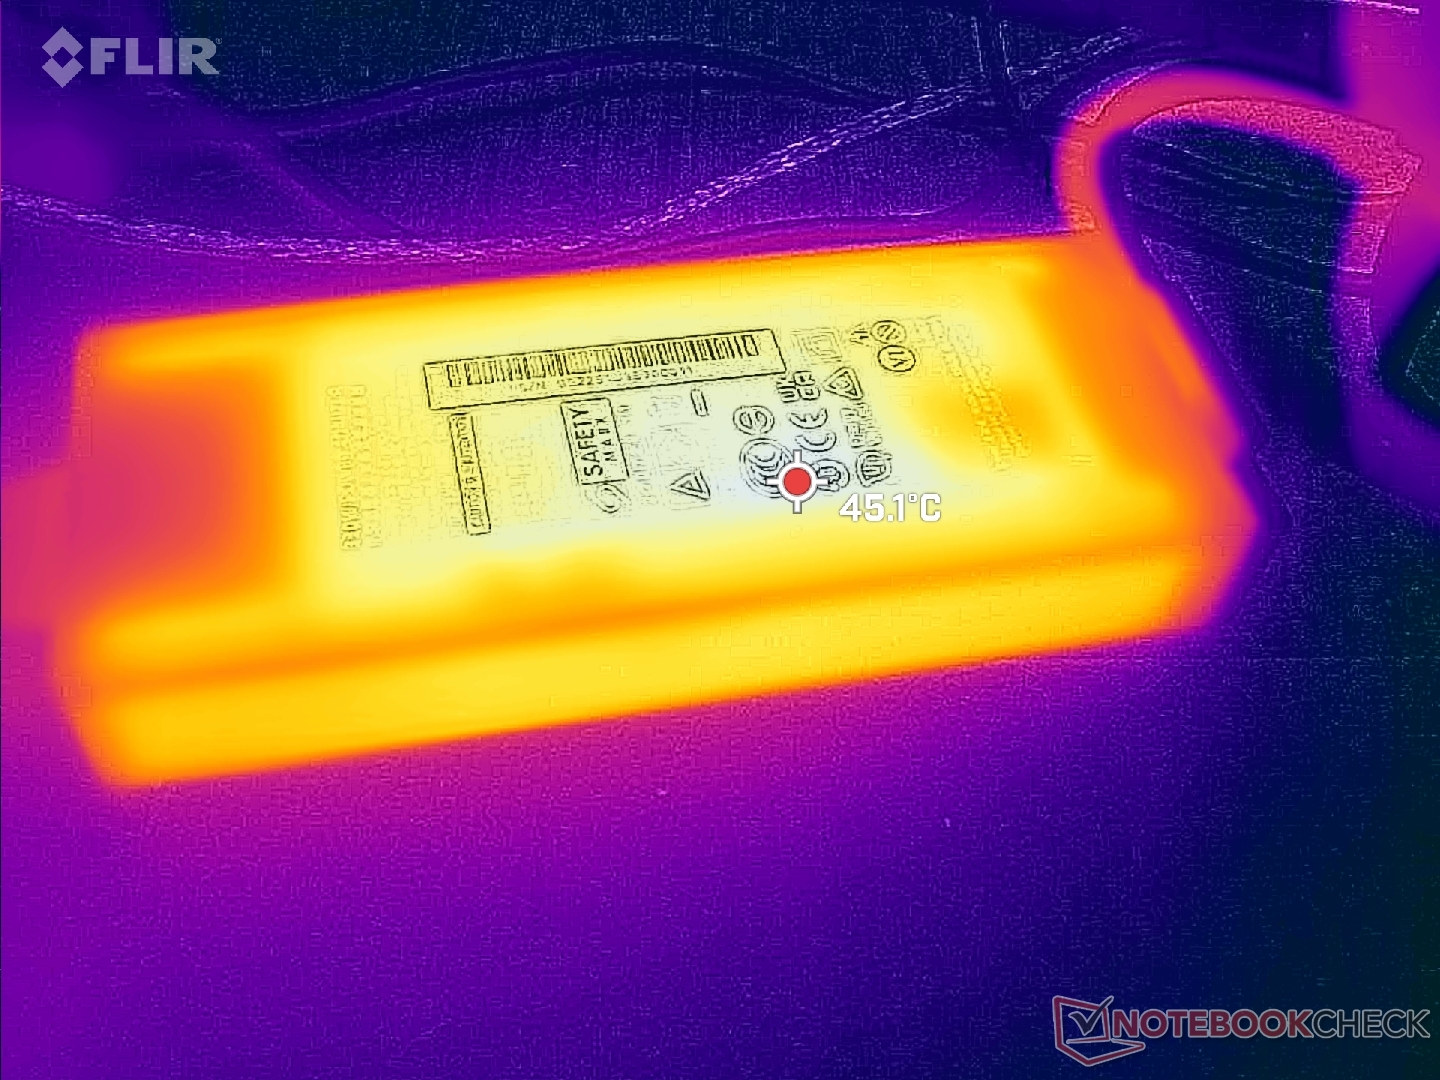
También vale la pena mencionar que el nuevo adaptador GaN funciona mucho más frío que los antiguos adaptadores Blade AC donde 60 C o más eran comunes bajo carga.
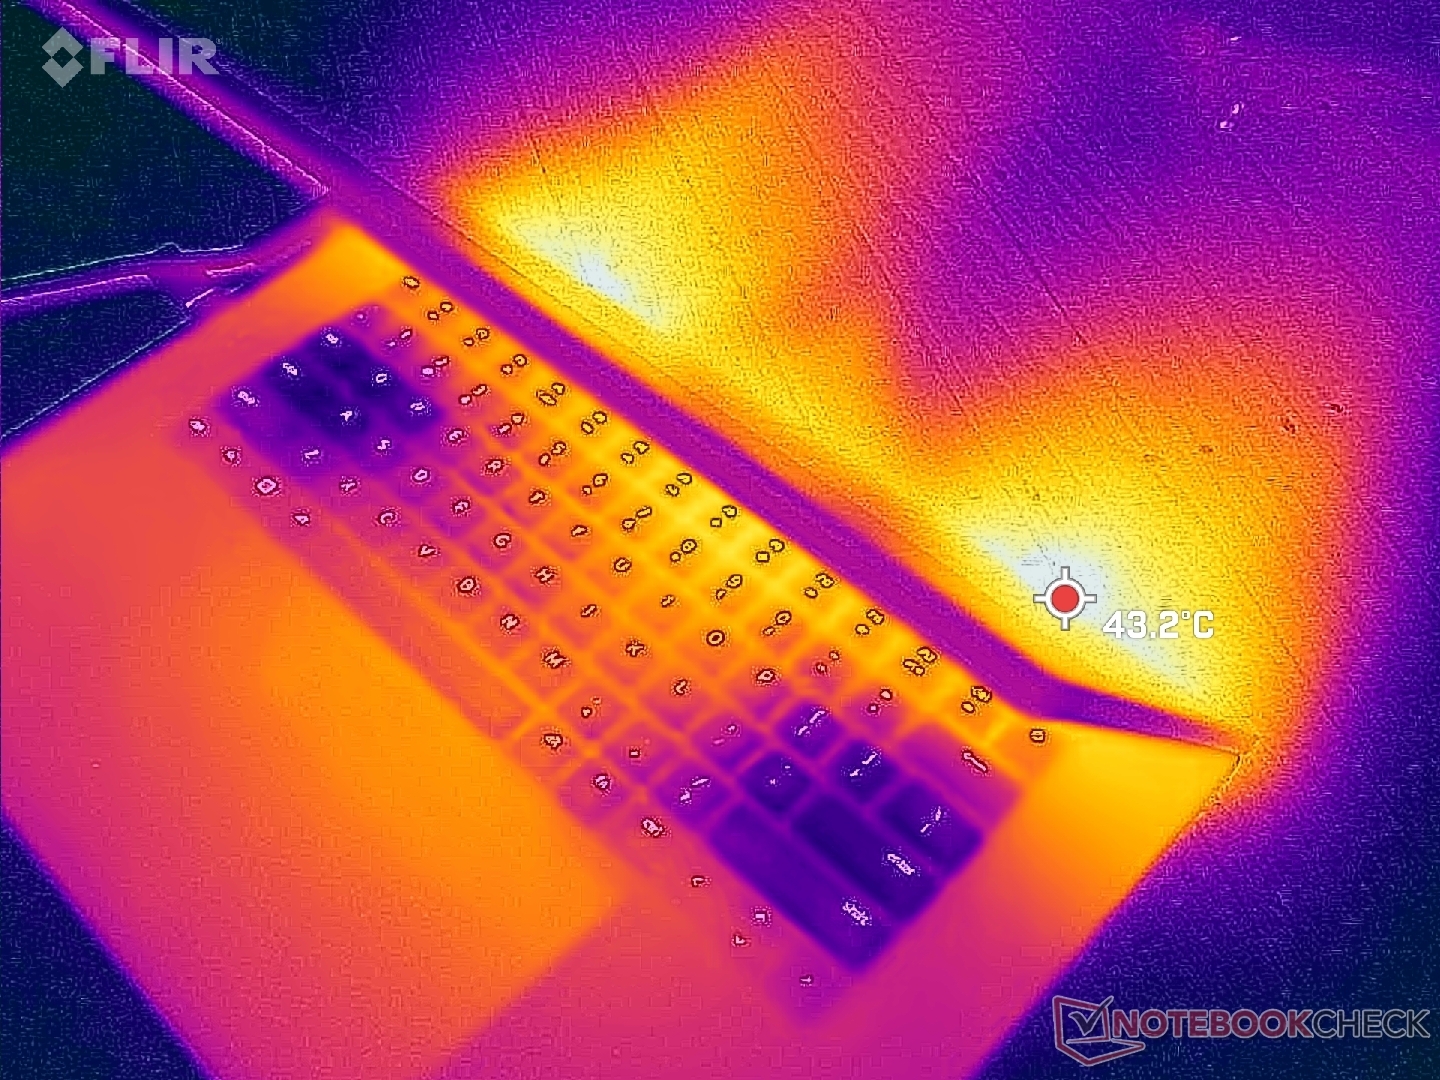
(±) La temperatura máxima en la parte superior es de 40 °C / 104 F, frente a la media de 40.4 °C / 105 F, que oscila entre 21.2 y 68.8 °C para la clase Gaming.
(+) El fondo se calienta hasta un máximo de 37.6 °C / 100 F, frente a la media de 43.2 °C / 110 F
(+) En reposo, la temperatura media de la parte superior es de 27.3 °C / 81# F, frente a la media del dispositivo de 33.9 °C / 93 F.
(+) Jugando a The Witcher 3, la temperatura media de la parte superior es de 31.8 °C / 89 F, frente a la media del dispositivo de 33.9 °C / 93 F.
(+) El reposamanos y el panel táctil están a una temperatura inferior a la de la piel, con un máximo de 30 °C / 86 F y, por tanto, son fríos al tacto.
(±) La temperatura media de la zona del reposamanos de dispositivos similares fue de 28.8 °C / 83.8 F (-1.2 °C / -2.2 F).
| Razer Blade 16 Early 2023 Intel Core i9-13950HX, NVIDIA GeForce RTX 4080 Laptop GPU | Razer Blade 15 Advanced Model Early 2022 Intel Core i7-12800H, NVIDIA GeForce RTX 3080 Ti Laptop GPU | Lenovo Legion S7 16ARHA7 AMD Ryzen 9 6900HX, AMD Radeon RX 6800S | Dell G16 7620 Intel Core i7-12700H, NVIDIA GeForce RTX 3060 Laptop GPU | Asus ROG Zephyrus Duo 16 GX650RX AMD Ryzen 9 6900HX, NVIDIA GeForce RTX 3080 Ti Laptop GPU | HP Omen 16-n0033dx AMD Ryzen 7 6800H, AMD Radeon RX 6650M | MSI GE67 HX 12UGS Intel Core i7-12800HX, NVIDIA GeForce RTX 3070 Ti Laptop GPU | |
|---|---|---|---|---|---|---|---|
| Heat | -27% | -5% | -3% | -13% | -4% | 6% | |
| Maximum Upper Side * (°C) | 40 | 53 -33% | 46.6 -17% | 47.6 -19% | 45 -13% | 41.2 -3% | 34.4 14% |
| Maximum Bottom * (°C) | 37.6 | 53 -41% | 50.8 -35% | 54 -44% | 50 -33% | 53.2 -41% | 42 -12% |
| Idle Upper Side * (°C) | 32.4 | 36 -11% | 26.4 19% | 23 29% | 33 -2% | 26.4 19% | 24 26% |
| Idle Bottom * (°C) | 31.4 | 38 -21% | 27.2 13% | 24.6 22% | 33 -5% | 27.8 11% | 33.2 -6% |
* ... más pequeño es mejor
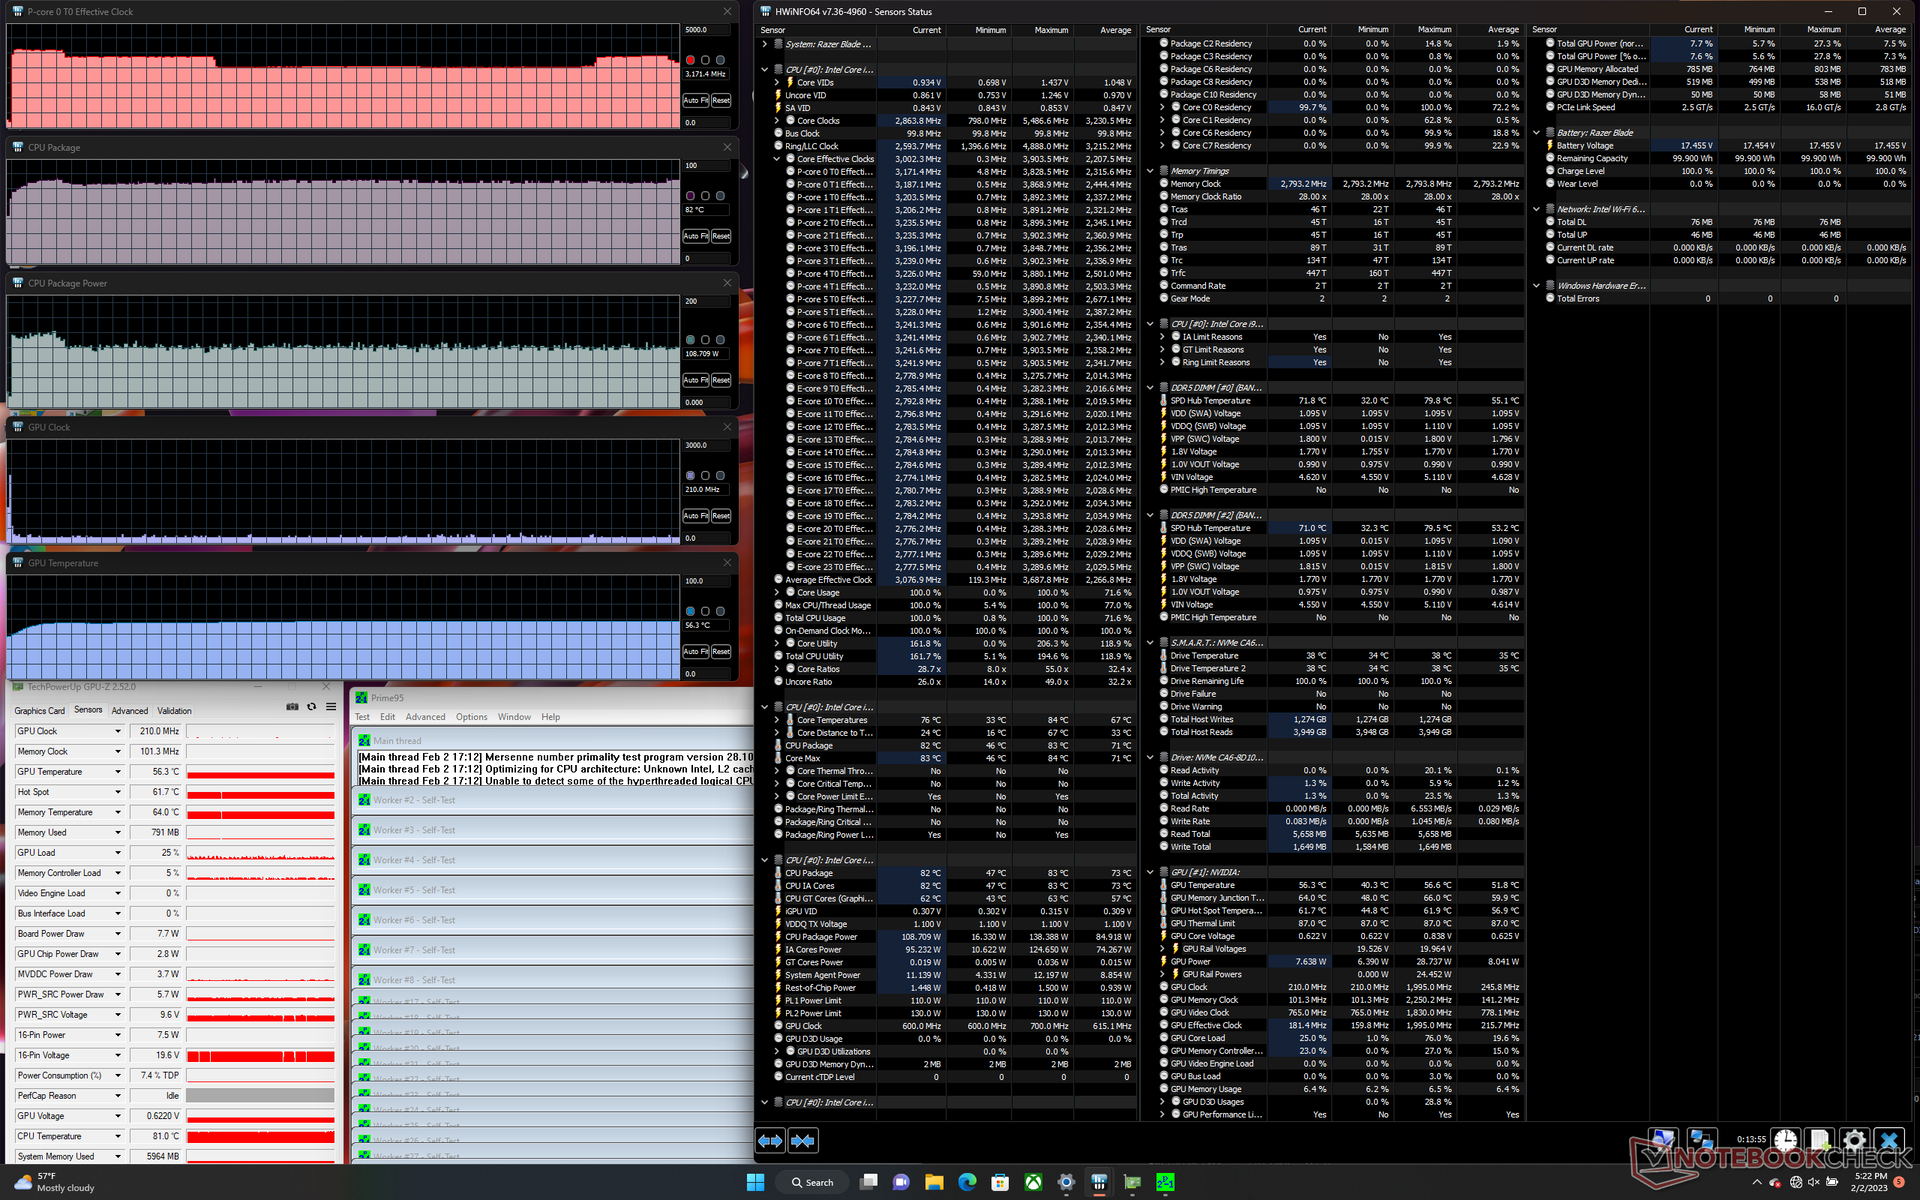
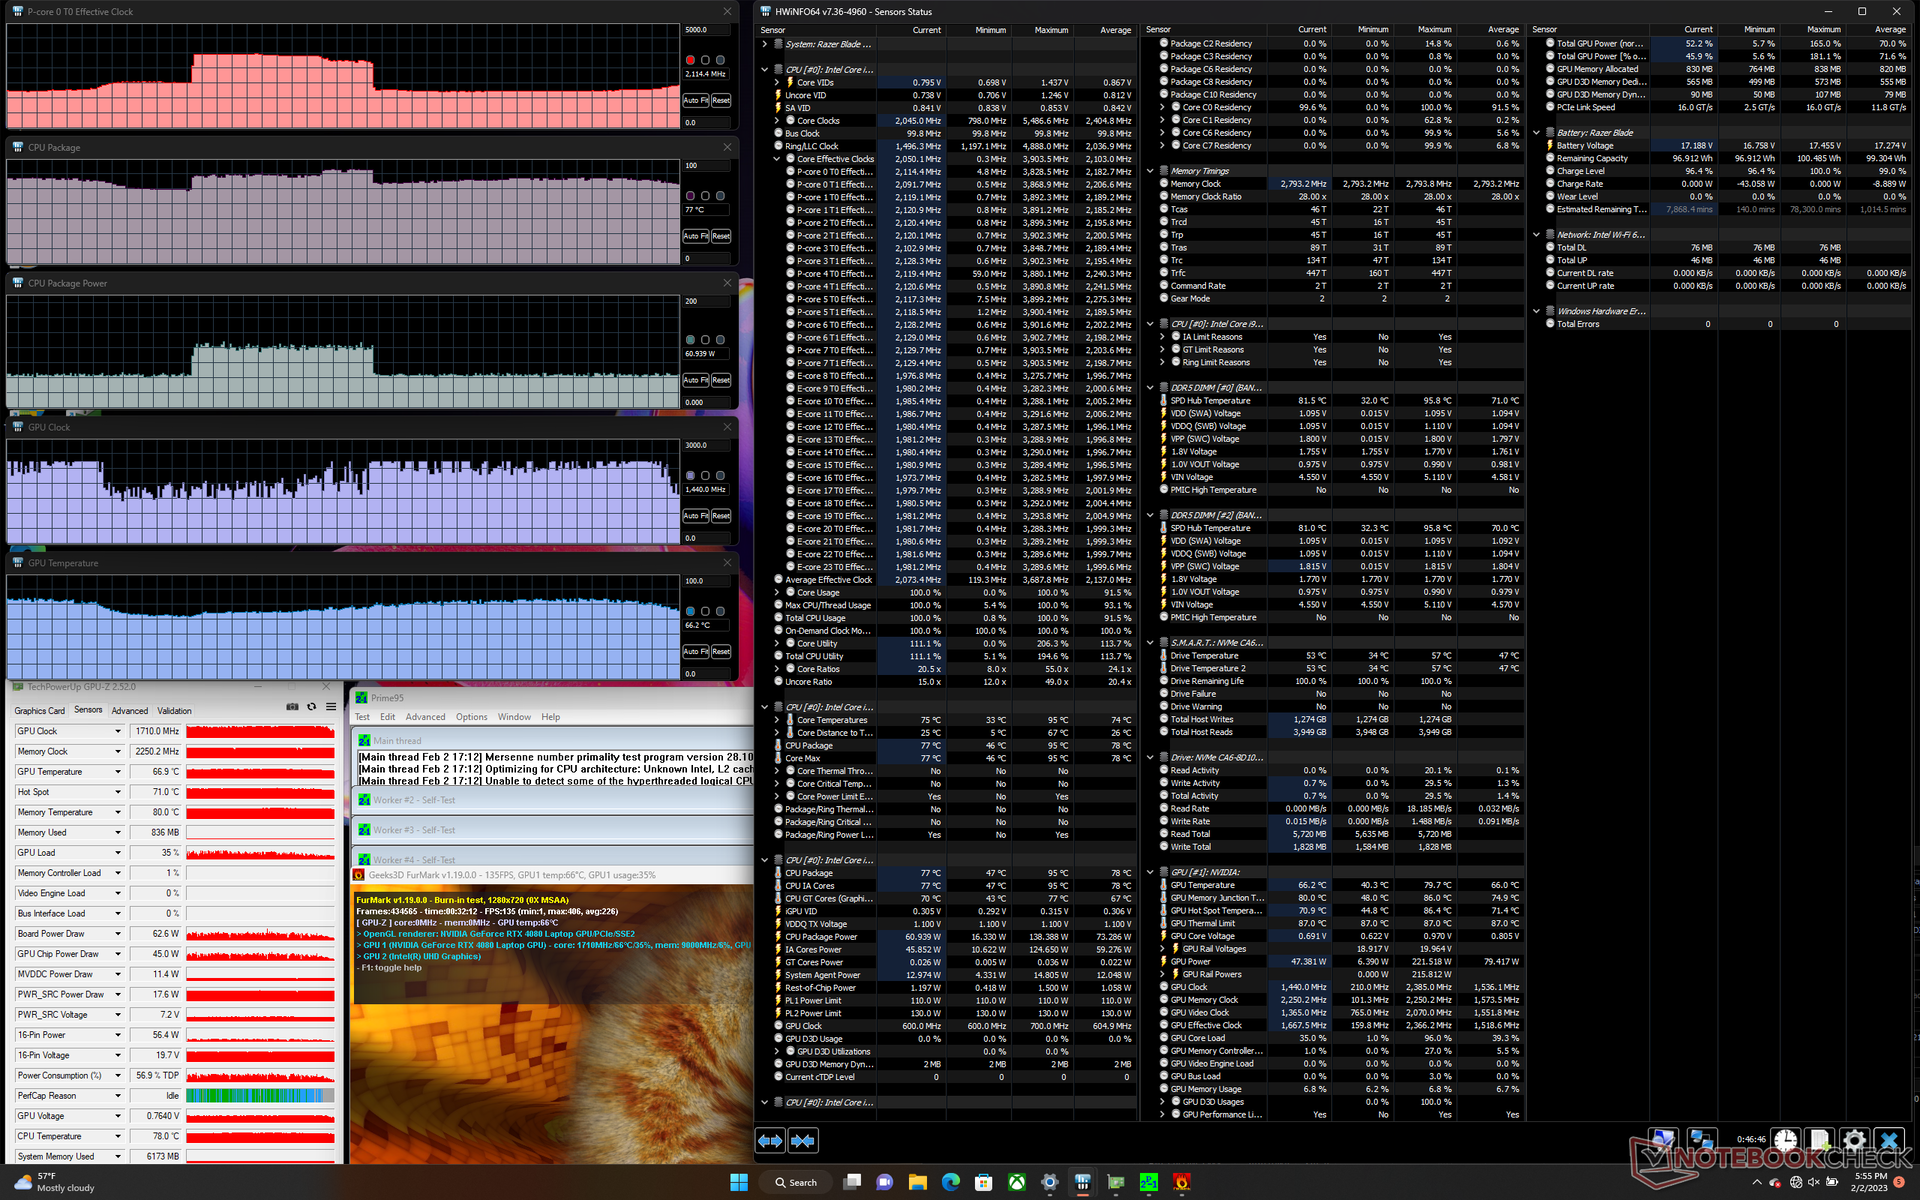
Prueba de resistencia
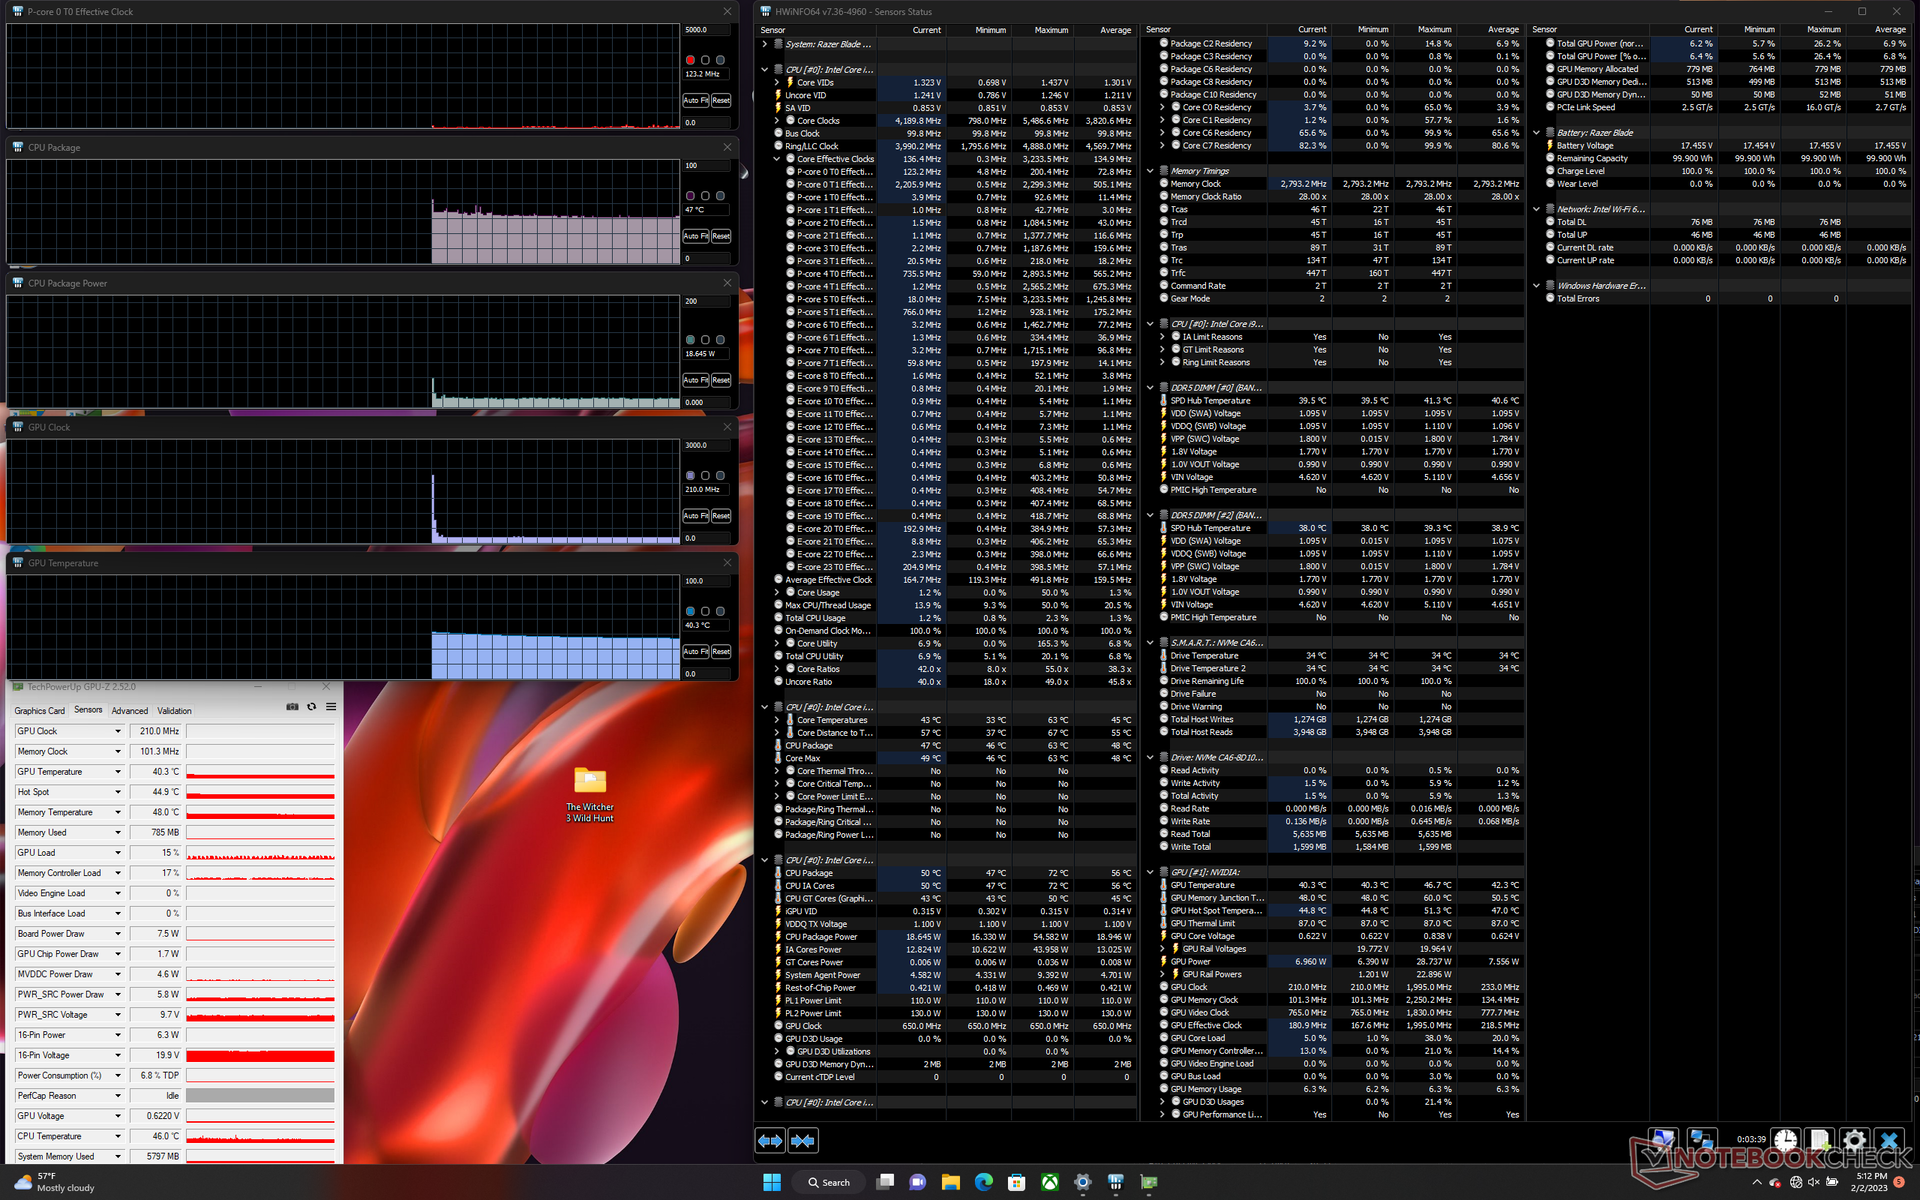
Cuando se estresó con Prime95, la CPU subió a 3,8 GHz y 138 W durante unos 50 segundos antes de caer y estabilizarse en ~3,1 GHz, 108 W y 82 C. El Turbo Boost máximo es, por tanto, sólo temporal incluso con los ajustes de Rendimiento más altos. Repitiendo esta prueba en el Core i7-12800HX potenciado por el MSI GE67 HX resultaría en frecuencias más altas y una temperatura de núcleo más cálida de ~3.6 GHz y 87 C, respectivamente.
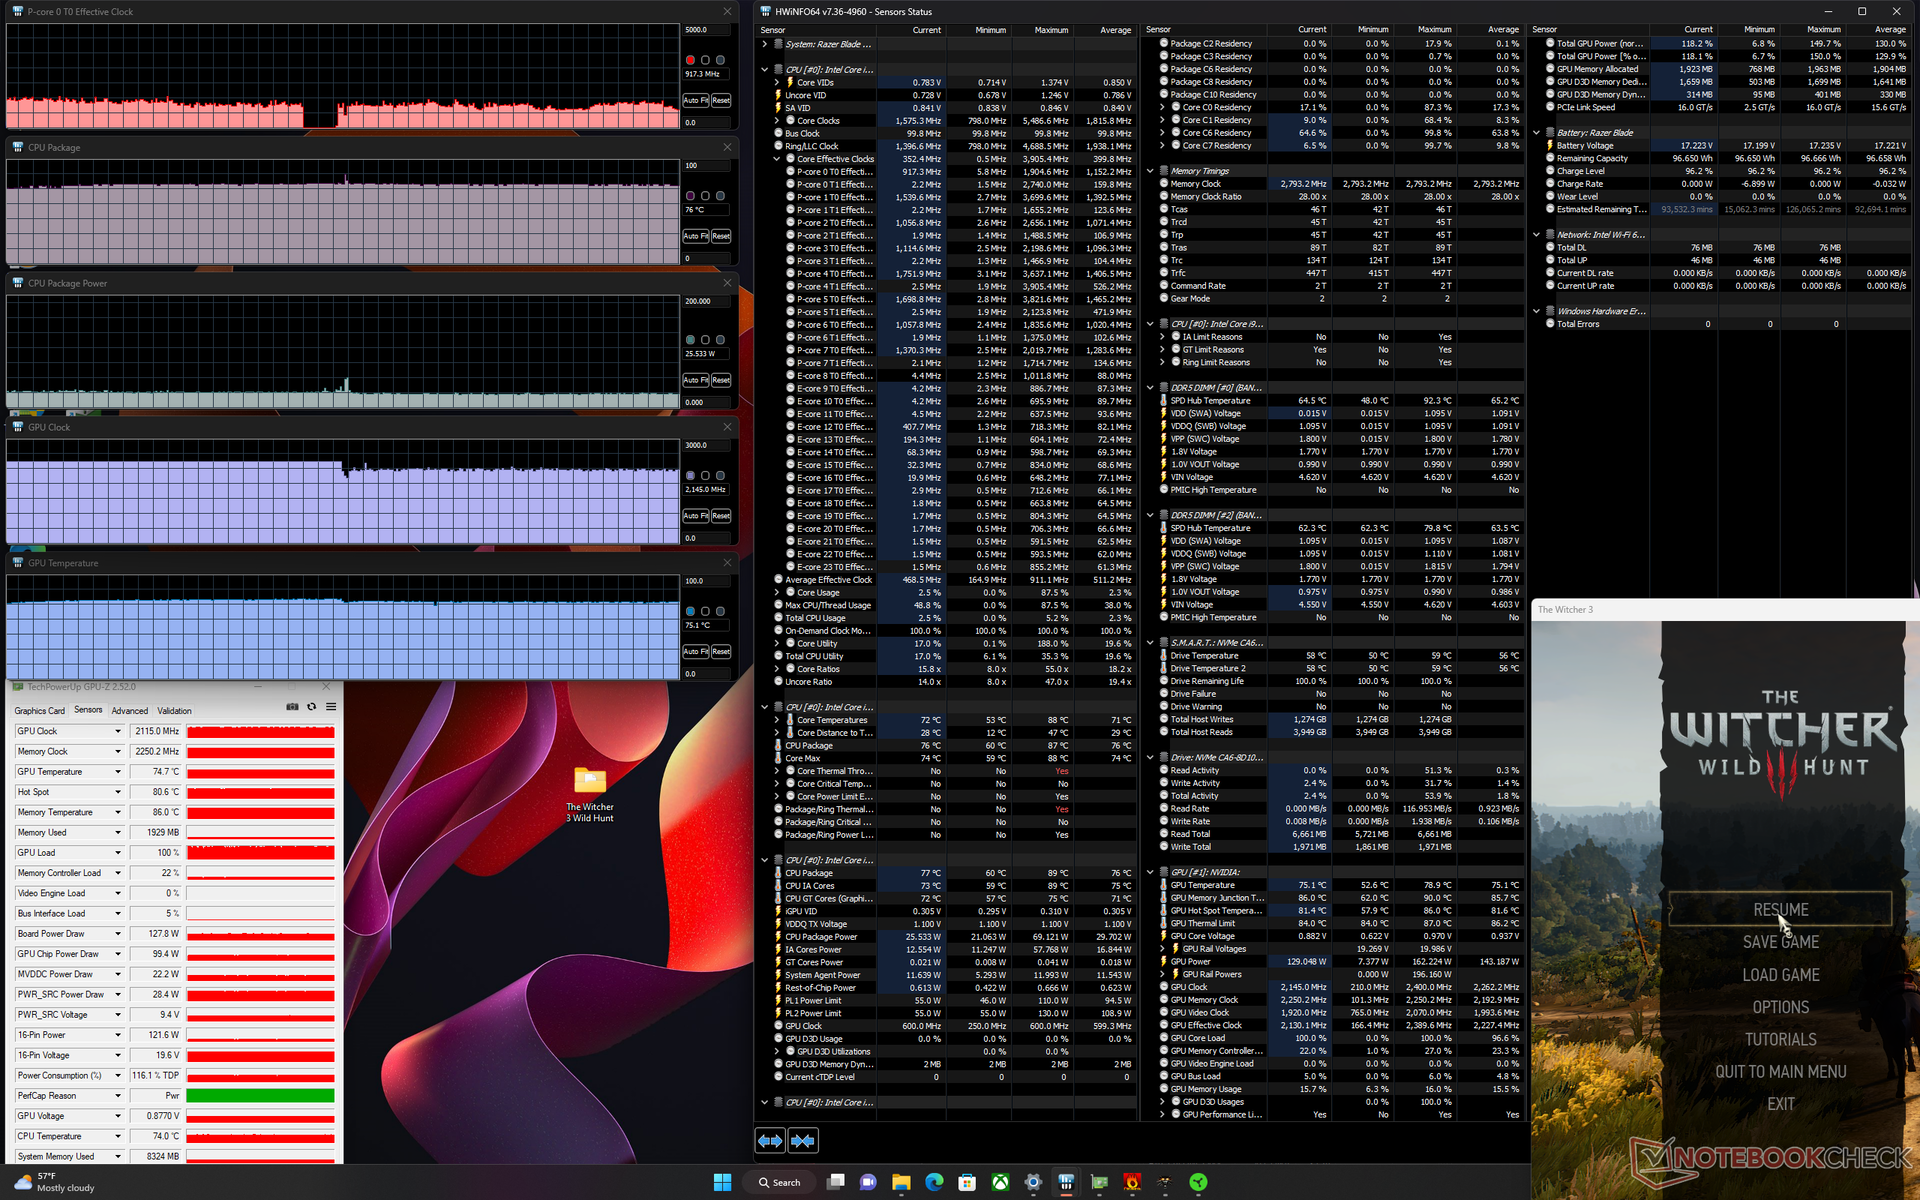
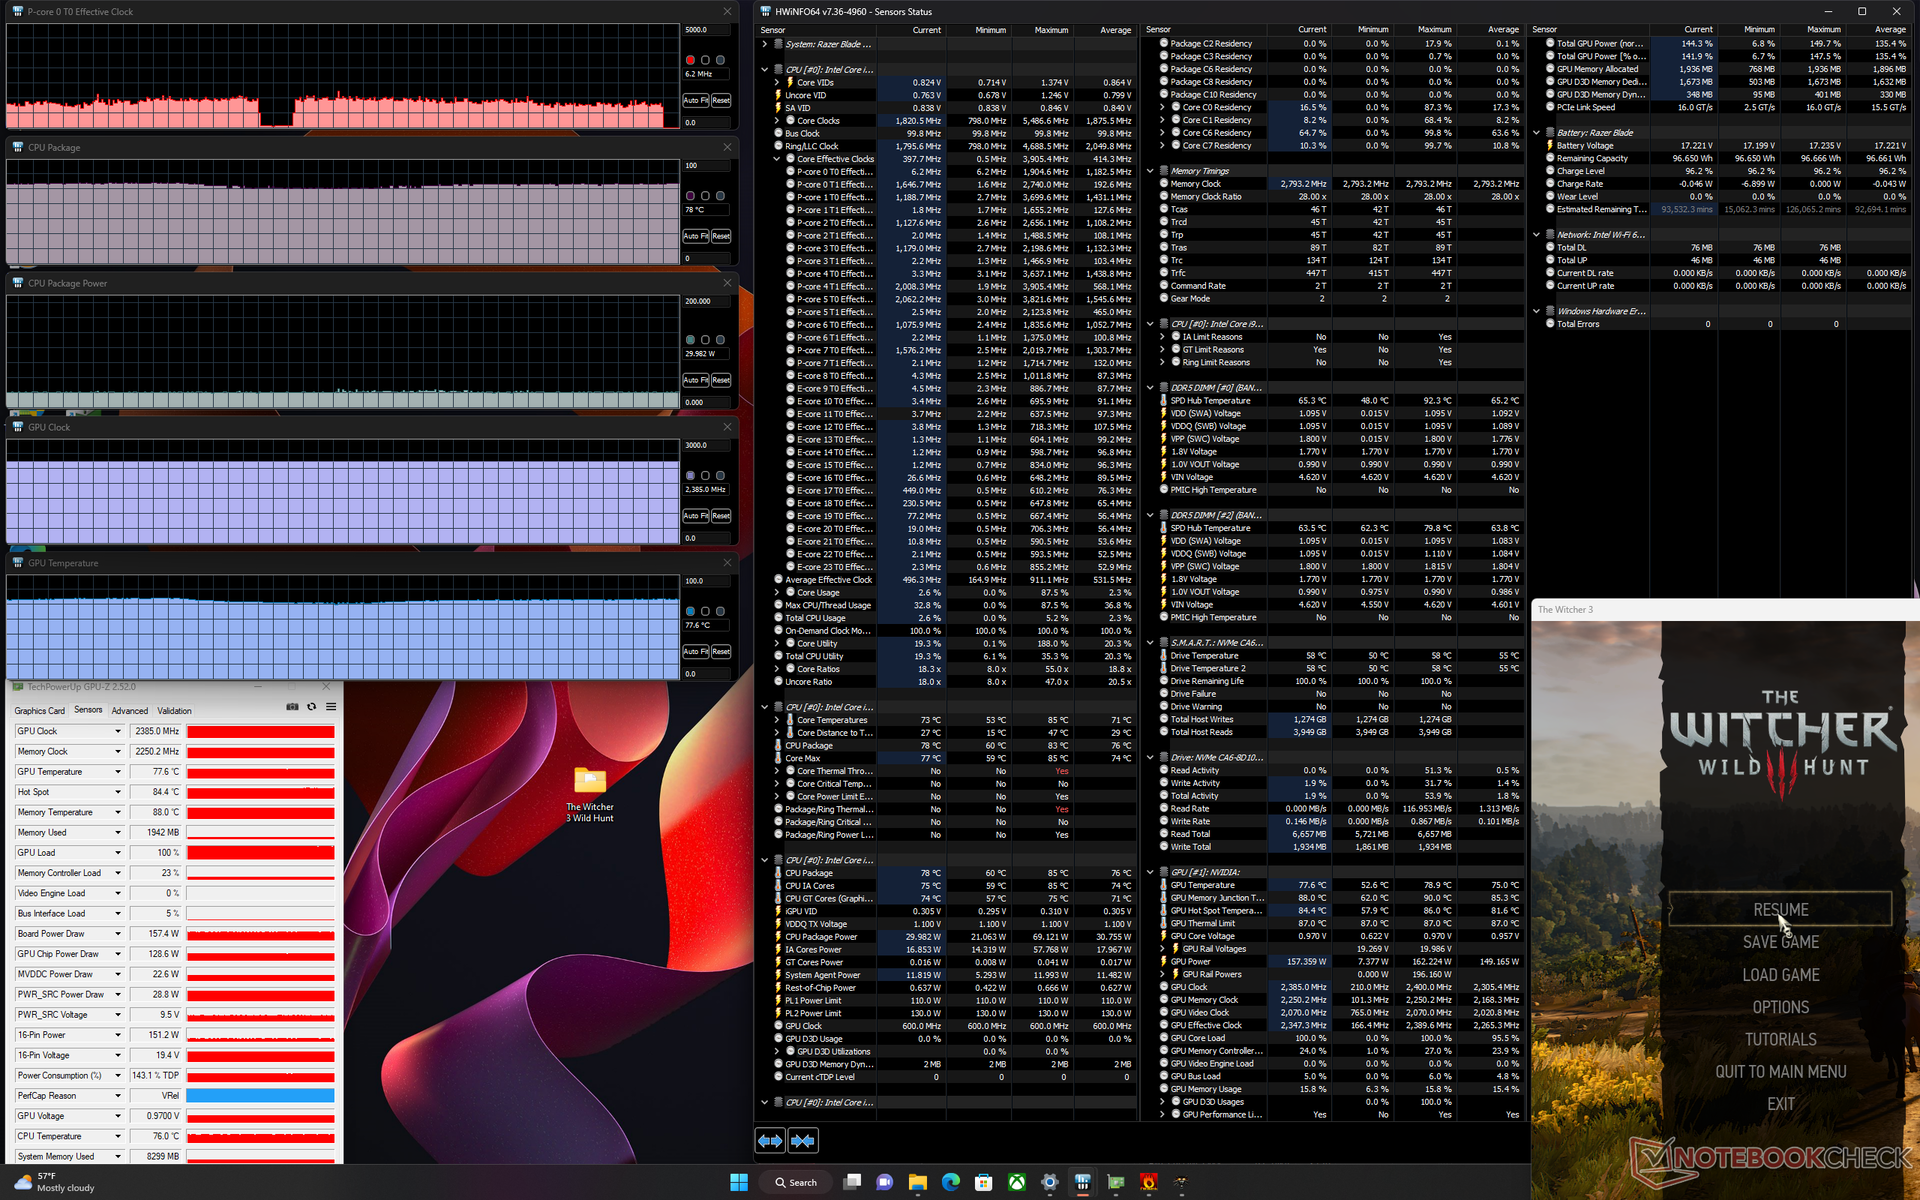
Si se ejecuta Witcher 3 en modo Rendimiento daría como resultado una velocidad de reloj de la GPU, un reloj de memoria, un consumo de energía de la placa y una temperatura del núcleo estables de 2385 MHz, 2250 MHz, 157 W y 78 C, respectivamente, mientras que el modo Equilibrado reduciría la velocidad de reloj de la GPU, el consumo de energía de la placa y la temperatura del núcleo a 2115 MHz, 128 W y 75 C, respectivamente. Por tanto, los usuarios deben acordarse de activar el modo de rendimiento Personalizado a través de Synapse y soportar el límite máximo de ruido del ventilador si desean hacer funcionar la GPU al máximo de su potencial. Estas diferencias de rendimiento entre perfiles de potencia coinciden con nuestras observaciones anteriores sobre el rendimiento de la GPU.
Repitiendo la prueba Witcher 3 en el 2022 Blade 15 con la RTX 3080 Ti de 110 W resultaría en frecuencias de reloj de GPU más lentas y una temperatura del núcleo más fría de 1455 MHz y 67 C, respectivamente. El Blade 16 puede ser más rápido, pero ciertamente es más cálido y exigente en el proceso.
Aunque Razer anuncia un TGP máximo de 175 W, sólo pudimos registrar un rango máximo estable entre 157 W y 162 W al ejecutar juegos exigentes. Será interesante ver cómo se comparan los futuros portátiles GeForce RTX 4080 en este aspecto, ya que el Blade 16 es solo el primero.
Funcionar con batería limita el rendimiento. Un test Time Spy con batería arrojaría unas puntuaciones de Física y Gráficos de 8611 y 8085 puntos, respectivamente, frente a los 13991 y 18441 puntos de la red eléctrica.
| RelojCPU (GHz) | Reloj GPU (MHz) | Temperatura mediaCPU (°C) | Temperatura media GPU (°C) | |
| Sistema en reposo | -- | -- | 47 | 40 |
| Prime95 Stress | 3.0 - 3.5 | -- | 82 | 56 |
| Tensión Prime95+ FurMark | ~2,1 | ~1440 - 2357 | 77 - 95 | 62 - 80 |
| Witcher 3 Estrés(perfil equilibrado) | ~1,0 | 2115 | 76 | 75 |
| Witcher 3 (Perfil de rendimiento) | ~1,3 | 2385 | 78 | 78 |
Altavoces
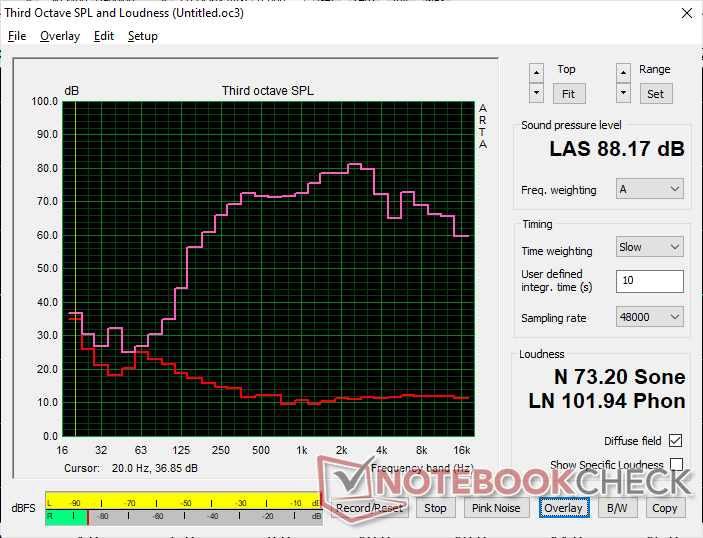
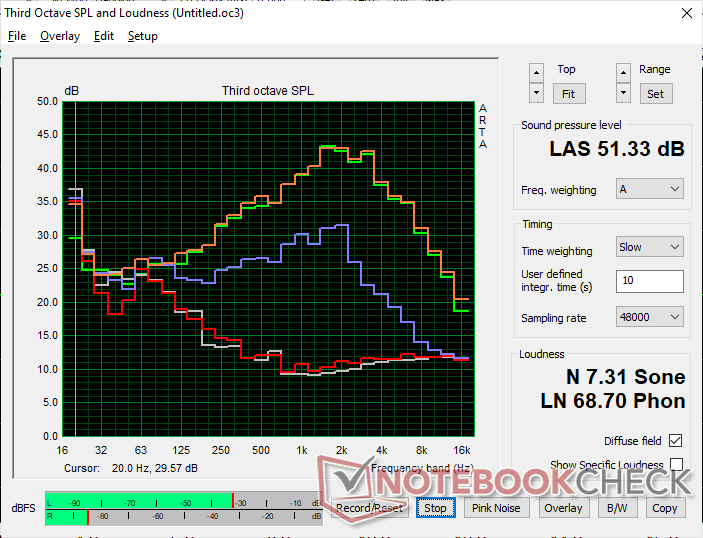
Razer Blade 16 Early 2023 análisis de audio
(+) | los altavoces pueden reproducir a un volumen relativamente alto (#88.2 dB)
Graves 100 - 315 Hz
(-) | casi sin bajos - de media 16.4% inferior a la mediana
(±) | la linealidad de los graves es media (10.8% delta a frecuencia anterior)
Medios 400 - 2000 Hz
(+) | medios equilibrados - a sólo 2.5% de la mediana
(+) | los medios son lineales (2.4% delta a la frecuencia anterior)
Altos 2 - 16 kHz
(+) | máximos equilibrados - a sólo 4.9% de la mediana
(±) | la linealidad de los máximos es media (7.9% delta a frecuencia anterior)
Total 100 - 16.000 Hz
(+) | el sonido global es lineal (12.6% de diferencia con la mediana)
En comparación con la misma clase
» 16% de todos los dispositivos probados de esta clase eran mejores, 4% similares, 81% peores
» El mejor tuvo un delta de 6%, la media fue 18%, el peor fue ###max##%
En comparación con todos los dispositivos probados
» 11% de todos los dispositivos probados eran mejores, 3% similares, 86% peores
» El mejor tuvo un delta de 4%, la media fue 23%, el peor fue ###max##%
Apple MacBook Pro 16 2021 M1 Pro análisis de audio
(+) | los altavoces pueden reproducir a un volumen relativamente alto (#84.7 dB)
Graves 100 - 315 Hz
(+) | buen bajo - sólo 3.8% lejos de la mediana
(+) | el bajo es lineal (5.2% delta a la frecuencia anterior)
Medios 400 - 2000 Hz
(+) | medios equilibrados - a sólo 1.3% de la mediana
(+) | los medios son lineales (2.1% delta a la frecuencia anterior)
Altos 2 - 16 kHz
(+) | máximos equilibrados - a sólo 1.9% de la mediana
(+) | los máximos son lineales (2.7% delta a la frecuencia anterior)
Total 100 - 16.000 Hz
(+) | el sonido global es lineal (4.6% de diferencia con la mediana)
En comparación con la misma clase
» 0% de todos los dispositivos probados de esta clase eran mejores, 0% similares, 100% peores
» El mejor tuvo un delta de 5%, la media fue 17%, el peor fue ###max##%
En comparación con todos los dispositivos probados
» 0% de todos los dispositivos probados eran mejores, 0% similares, 100% peores
» El mejor tuvo un delta de 4%, la media fue 23%, el peor fue ###max##%
Gestión energética: más exigente que nunca
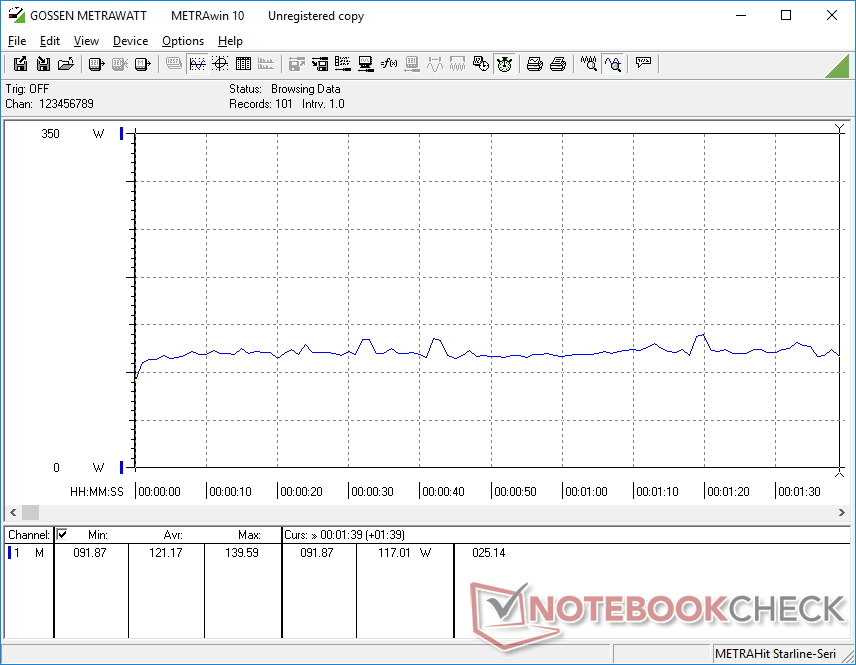
Consumo de energía
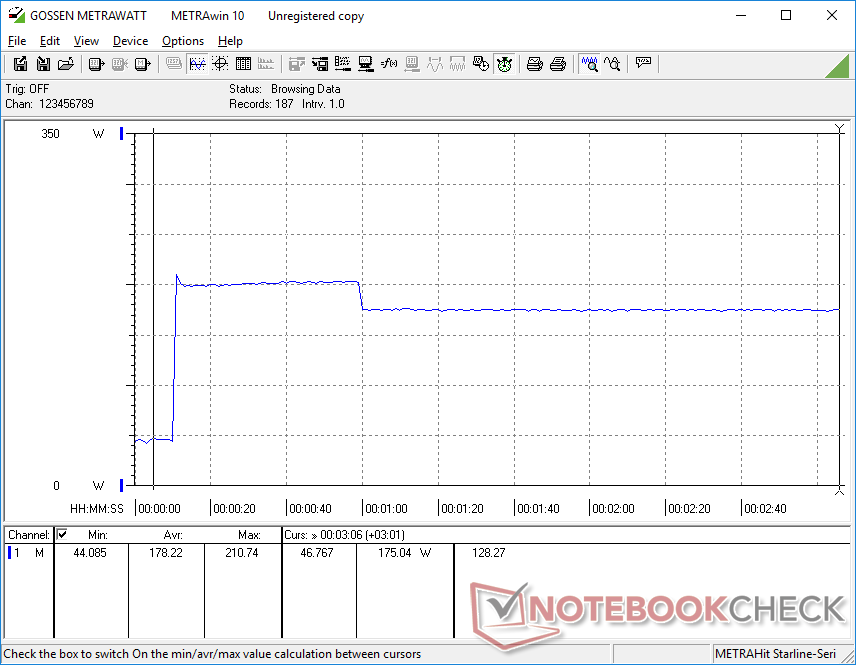
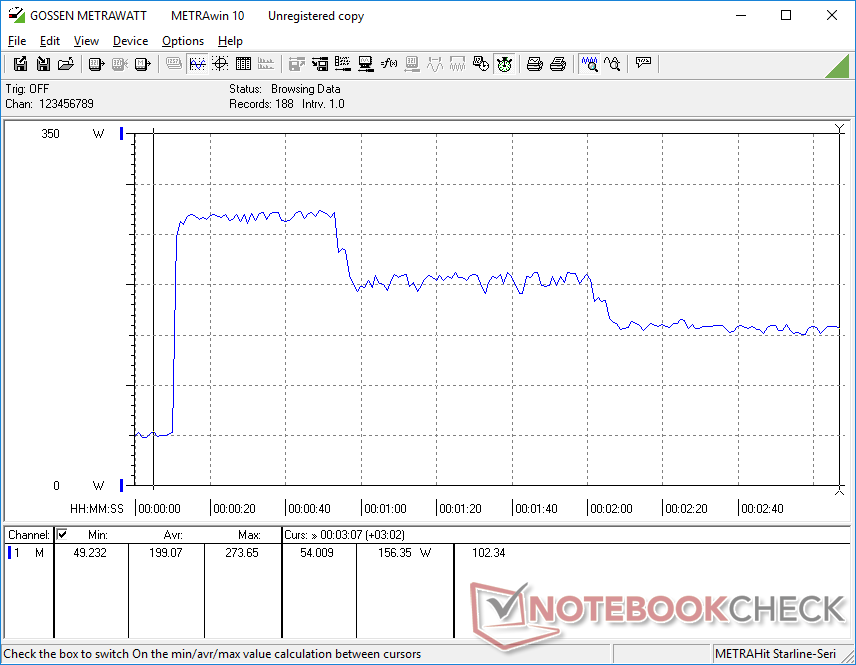
Todo ese rendimiento extra no sale gratis, ya que el consumo de energía es de los más altos de cualquier modelo Blade. Por ejemplo, en modo Rendimiento dGPU y con el brillo al máximo, el sistema consumiría casi 50 W en reposo, comparado con la mitad del Blade 15 del año pasado. Bajar el sistema al modo Optimus es muy recomendable si se ejecutan cargas poco exigentes, ya que reduciría el consumo de energía en reposo a sólo 15 W a 23 W.
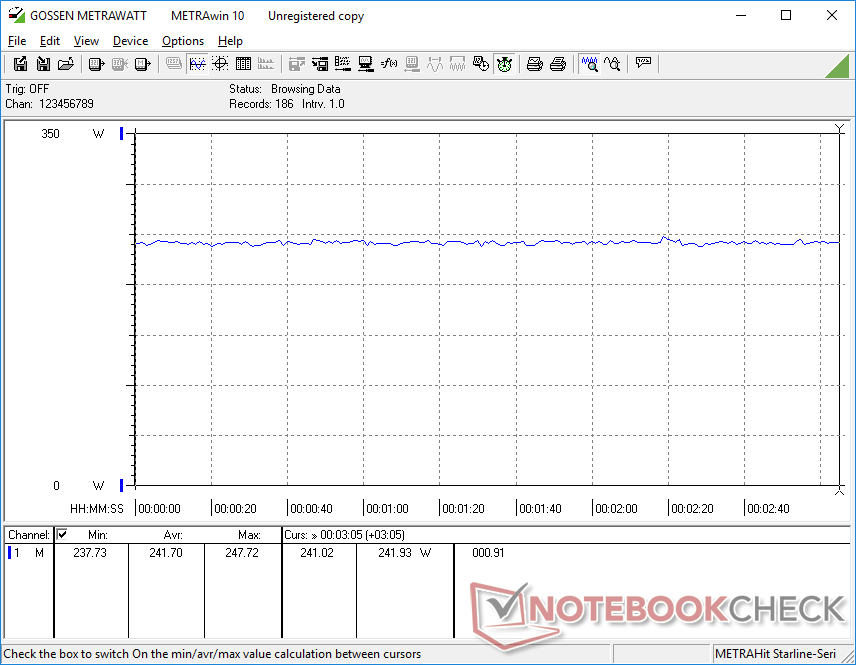
Cuando se ejecuta Witcher 3 para representar cargas típicas de juego, el consumo de energía sería aproximadamente un 5 por ciento mayor que en el Blade 17 2022 con RTX 3080 Ti y Core i9-12900H de 12ª generación. Afortunadamente, el aumento del 40% en la potencia gráfica bruta de generación a generación compensa con creces el ligero aumento en el consumo de energía. No obstante, el Blade 16 sigue siendo notablemente más exigente que la mayoría de portátiles de juego basados en Ampere, incluyendo el Asus ROG Zephyrus Duo 16 o 2022 Razer Blade 15 por márgenes de hasta el 60 por ciento.
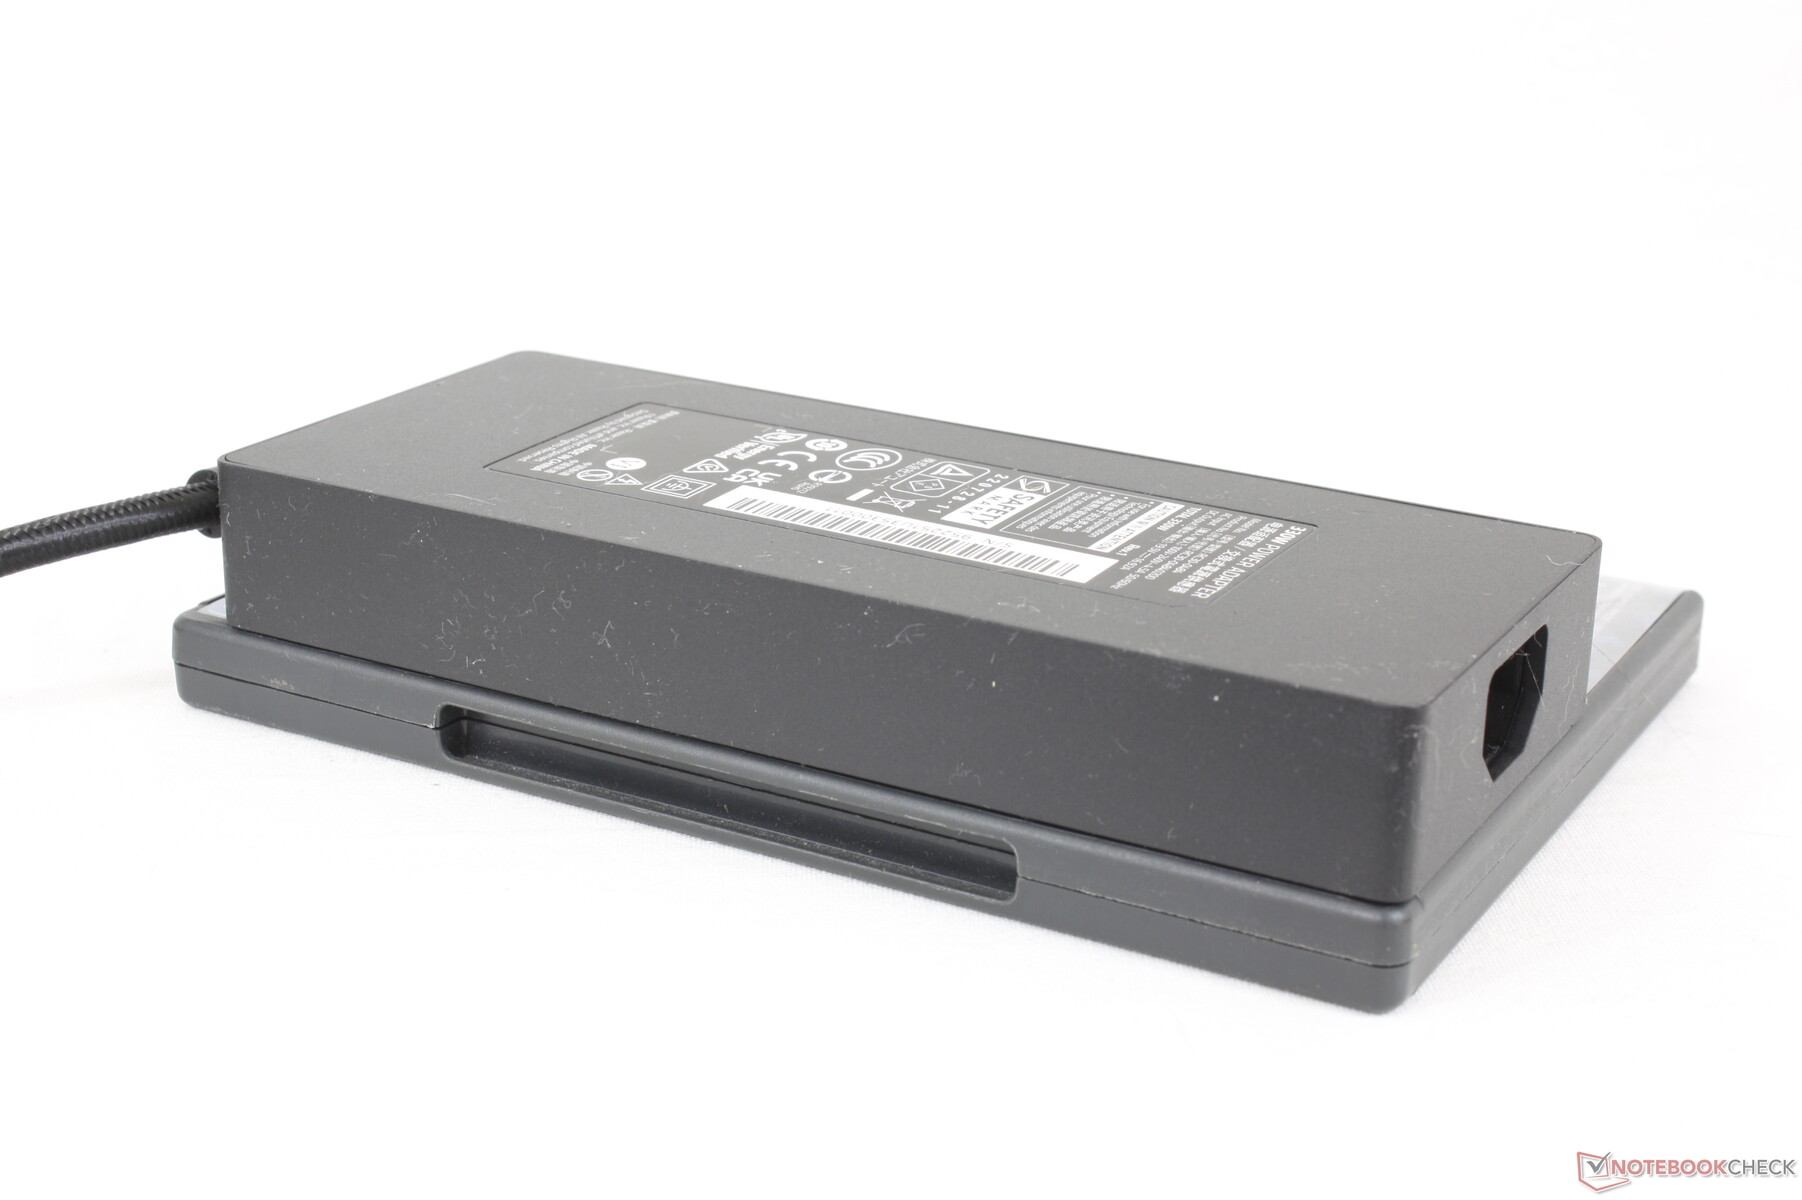
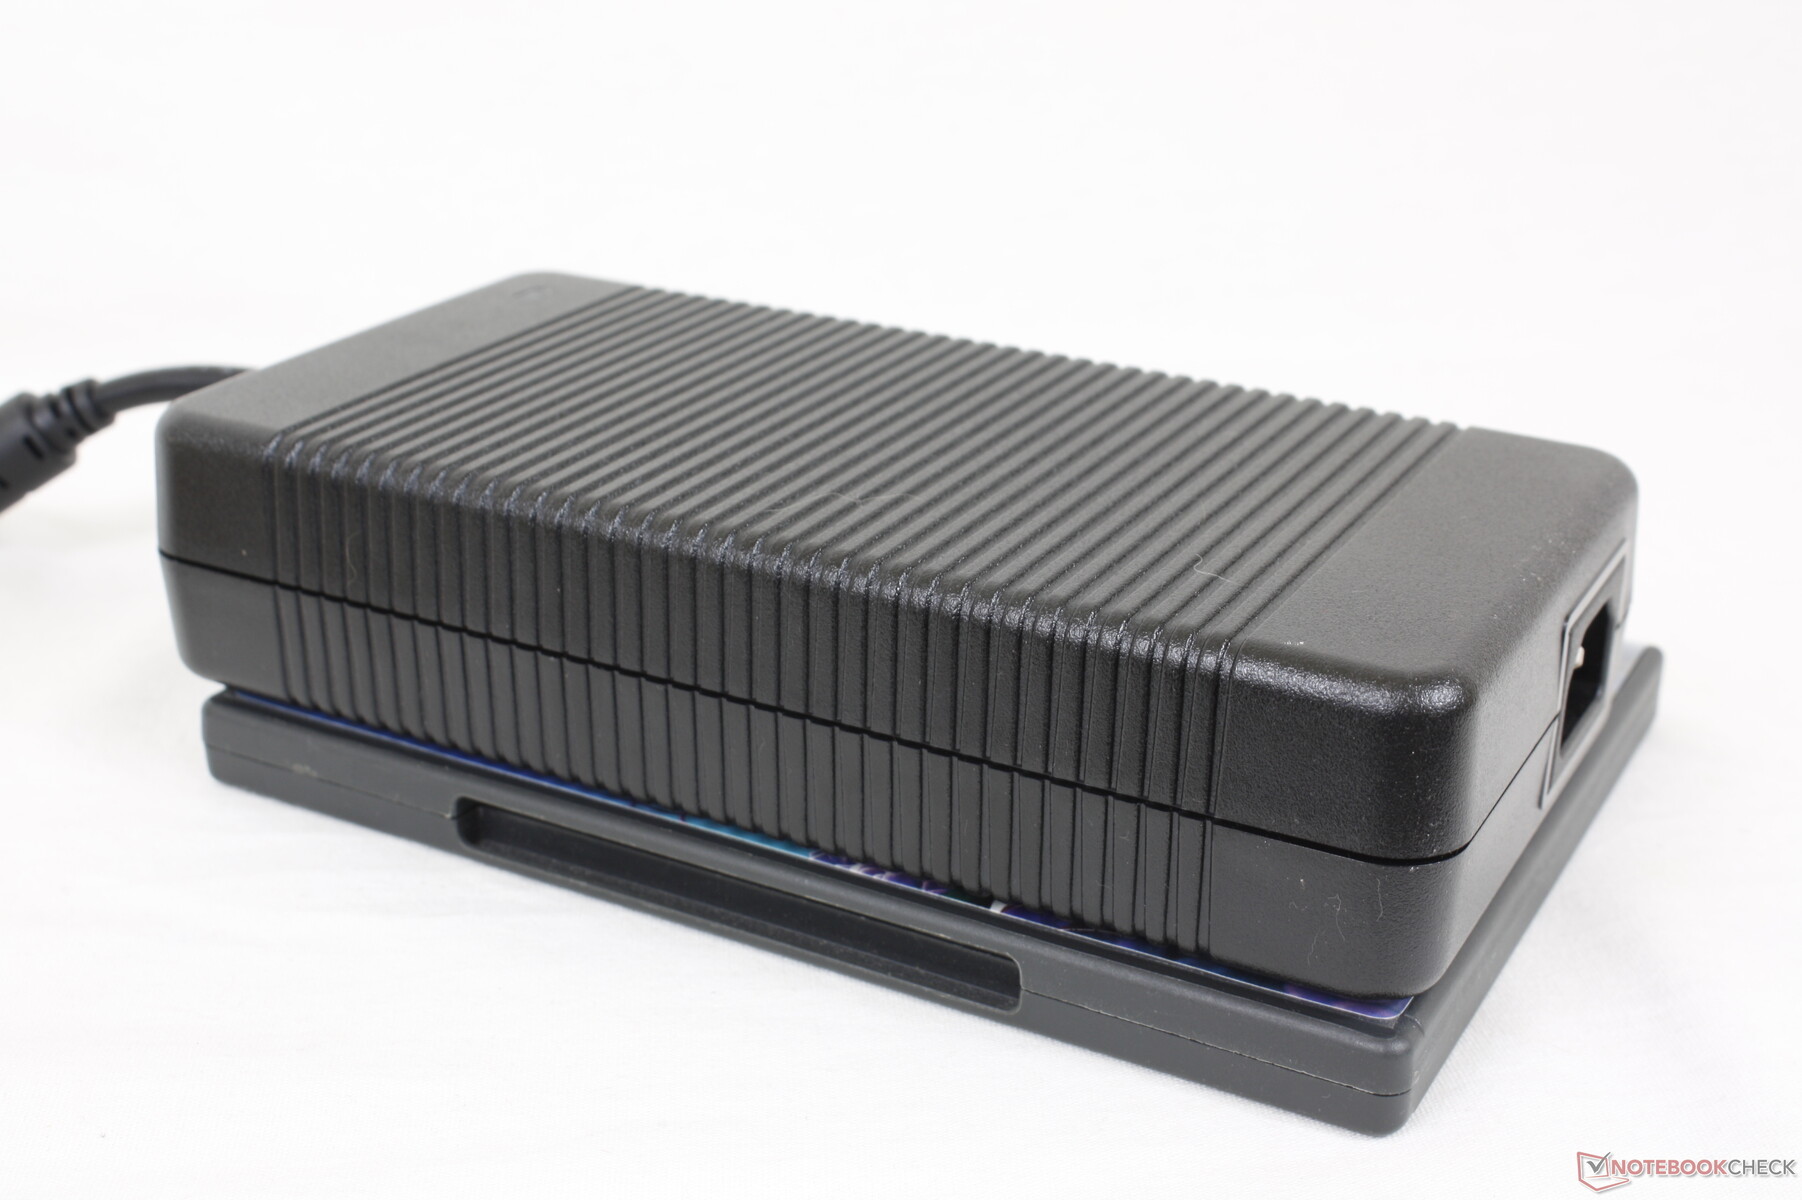
Registramos un consumo máximo temporal de 274 W al iniciar Prime95 y FurMark simultáneamente. El adaptador de CA GaN de 330 W incluido (18 x 7,5 x 2,5 cm) es ligeramente más grande que los anteriores de 230 W y 280 W, pero es más compacto en comparación con otros adaptadores de CA de 330 W. El adaptador de 330 W que viene con el MSI GE67 HX, por ejemplo, es mucho más voluminoso con 20 x 9,8 x 4,3 cm.
| Off / Standby | |
| Ocioso | |
| Carga |
|
Clave:
min: | |
| Razer Blade 16 Early 2023 i9-13950HX, GeForce RTX 4080 Laptop GPU, SSSTC CA6-8D1024, IPS, 2560x1600, 16" | Razer Blade 15 Advanced Model Early 2022 i7-12800H, GeForce RTX 3080 Ti Laptop GPU, Samsung PM9A1 MZVL21T0HCLR, IPS, 1920x1080, 15.6" | Lenovo Legion S7 16ARHA7 R9 6900HX, Radeon RX 6800S, SK Hynix HFS001TEJ9X115N, IPS, 2560x1600, 16" | Dell G16 7620 i7-12700H, GeForce RTX 3060 Laptop GPU, WDC PC SN810 512GB, IPS, 2560x1600, 16" | Asus ROG Zephyrus Duo 16 GX650RX R9 6900HX, GeForce RTX 3080 Ti Laptop GPU, 2x Samsung SSD 980 Pro 2TB MZ-V8P2T0 (RAID 0), IPS-Level, 3840x2400, 16" | HP Omen 16-n0033dx R7 6800H, Radeon RX 6650M, Samsung PM9A1 MZVL21T0HCLR, IPS, 1920x1080, 16.1" | MSI GE67 HX 12UGS i7-12800HX, GeForce RTX 3070 Ti Laptop GPU, Samsung PM9A1 MZVL21T0HCLR, OLED, 1920x1080, 15.6" | |
|---|---|---|---|---|---|---|---|
| Power Consumption | 23% | 36% | 20% | 9% | 36% | 11% | |
| Idle Minimum * (Watt) | 15.2 | 17 -12% | 8.8 42% | 14.4 5% | 19 -25% | 7.9 48% | 16.1 -6% |
| Idle Average * (Watt) | 22.8 | 19 17% | 14.7 36% | 17.8 22% | 24 -5% | 11.5 50% | 17.1 25% |
| Idle Maximum * (Watt) | 49.8 | 25 50% | 19.8 60% | 31.5 37% | 31 38% | 18.3 63% | 26.6 47% |
| Load Average * (Watt) | 121.2 | 108 11% | 85.3 30% | 101.2 17% | 104 14% | 88.1 27% | 116.3 4% |
| Witcher 3 ultra * (Watt) | 242 | 150 38% | 167.5 31% | 176.9 27% | 186.5 23% | 206 15% | 237 2% |
| Load Maximum * (Watt) | 273.7 | 179 35% | 230.7 16% | 242.9 11% | 256 6% | 246.4 10% | 291.1 -6% |
* ... más pequeño es mejor
Power Consumption Witcher 3 / Stresstest
Power Consumption external Monitor
Duración de la batería
Con 95 Wh, la batería del Blade 16 es mayor que la del Blade 15 (80 Wh) e incluso que la del Blade 17 (82 Wh). Se espera que la autonomía WLAN sea de 1 a 2 horas más para un total de unas 6 horas.
La carga desde vacío a plena capacidad con el adaptador de CA incluido tarda aproximadamente una hora y 45 minutos. El sistema también puede recargarse con adaptadores USB-C, aunque a un ritmo mucho más lento.
| Razer Blade 16 Early 2023 i9-13950HX, GeForce RTX 4080 Laptop GPU, 95.2 Wh | Razer Blade 15 Advanced Model Early 2022 i7-12800H, GeForce RTX 3080 Ti Laptop GPU, 80 Wh | Lenovo Legion S7 16ARHA7 R9 6900HX, Radeon RX 6800S, 71 Wh | Dell G16 7620 i7-12700H, GeForce RTX 3060 Laptop GPU, 84 Wh | Asus ROG Zephyrus Duo 16 GX650RX R9 6900HX, GeForce RTX 3080 Ti Laptop GPU, 90 Wh | HP Omen 16-n0033dx R7 6800H, Radeon RX 6650M, 68 Wh | MSI GE67 HX 12UGS i7-12800HX, GeForce RTX 3070 Ti Laptop GPU, 99.9 Wh | |
|---|---|---|---|---|---|---|---|
| Duración de Batería | 5% | 2% | -29% | 13% | 2% | 12% | |
| Reader / Idle (h) | 8.9 | 8.1 -9% | 7.1 -20% | 12.5 40% | 10 12% | 8.4 -6% | |
| WiFi v1.3 (h) | 6.1 | 4.9 -20% | 6.2 2% | 5 -18% | 7.8 28% | 7 15% | 5.6 -8% |
| Load (h) | 1.4 | 2 43% | 0.7 -50% | 1 -29% | 1.1 -21% | 2.1 50% | |
| H.264 (h) | 5.9 | 9.3 |
Pro
Contra
Veredicto - Una cuchilla mejor, pero más grande
Como primer Blade de 16 pulgadas de Razer, el Blade 16 cumple todos los requisitos, incluido el rendimiento de la CPU, el rendimiento de la GPU y el inconfundible diseño de Razer. La GPU de 175 W es particularmente impresionante, ya que las alternativas del año pasado como el Legion Slim 7 16 o el Omen 16 tienen GPU de ~100 W menos potentes en comparación. No obstante, los modelos de los fabricantes de la competencia deberían ir mejor una vez que se actualicen adecuadamente con CPUs Intel de 13ª generación similares y opciones de GPU GeForce 40. El próximo Alienware x16 es el contendiente más prometedor del nuevo Blade hasta el momento.
El nuevo adaptador de CA GaN de 330 W también es digno de elogio, ya que los adaptadores de CA de otros fabricantes siguen siendo mucho más grandes. Los viajeros frecuentes apreciarán sin duda esta ventaja de Razer.
El Blade 16 y su delgado adaptador de CA equilibran el rendimiento y la portabilidad mejor que cualquier otro portátil de juegos de 16 pulgadas hasta la fecha. Sin embargo, su diseño más grueso puede animar a algunos usuarios a esperar a la actualización del Blade 15.
Tal vez los compromisos más notables para las ganancias de rendimiento de generación a generación son el mayor consumo de energía y el perfil más grueso. El Blade 16 consume notablemente más energía que la mayoría de portátiles de 12ª generación + RTX 3080 cuando se juega, por lo que es necesario el adaptador de CA de 330 W de mayor capacidad. Las mayores demandas de refrigeración resultantes han convertido al Blade 16 en el modelo más grueso de la serie hasta la fecha, incluido incluso el Blade 17. Sigue siendo un diseño elegante teniendo en cuenta el factor de forma de 16 pulgadas, pero ciertamente no es tan compacto o portátil como un Blade 15.
Otros inconvenientes son relativamente menores, como el esponjoso clickpad, los ruidosos ventiladores y la falta de obturador de la webcam, ya que son habituales en muchos portátiles para juegos.
En cuanto al portátil GeForce RTX 4080, puede ser impresionante o decepcionante según se mire. Desde el punto de vista de un portátil, es un salto respetable con respecto a la RTX 3080 móvil, especialmente con DLSS 3.0 activado. Sin embargo, desde el punto de vista de un ordenador de sobremesa, es mucho más lenta que la RTX 4080, con márgenes más amplios que incluso la RTX 3080 para portátiles y la RTX 3080 para ordenadores de sobremesa. Es posible que Nvidia quiera considerar la reintroducción del sufijo "M" para su serie GeForce para portátiles debido a esta creciente diferencia de rendimiento entre las tarjetas gráficas para portátiles y las de sobremesa.
Precio y disponibilidad
Razer Blade 16 Early 2023
- 02/06/2023 v7 (old)
Allen Ngo
Transparencia
La selección de los dispositivos que se van a reseñar corre a cargo de nuestro equipo editorial. La muestra de prueba fue proporcionada al autor en calidad de préstamo por el fabricante o el minorista a los efectos de esta reseña. El prestamista no tuvo ninguna influencia en esta reseña, ni el fabricante recibió una copia de la misma antes de su publicación. No había ninguna obligación de publicar esta reseña. Como empresa de medios independiente, Notebookcheck no está sujeta a la autoridad de fabricantes, minoristas o editores.
Así es como prueba Notebookcheck
Cada año, Notebookcheck revisa de forma independiente cientos de portátiles y smartphones utilizando procedimientos estandarizados para asegurar que todos los resultados son comparables. Hemos desarrollado continuamente nuestros métodos de prueba durante unos 20 años y hemos establecido los estándares de la industria en el proceso. En nuestros laboratorios de pruebas, técnicos y editores experimentados utilizan equipos de medición de alta calidad. Estas pruebas implican un proceso de validación en varias fases. Nuestro complejo sistema de clasificación se basa en cientos de mediciones y puntos de referencia bien fundamentados, lo que mantiene la objetividad.Price comparison

