Análisis del portátil Lenovo Yoga Pro 9i 16: Gran panel mini-LED, pero medidas de ahorro innecesarias
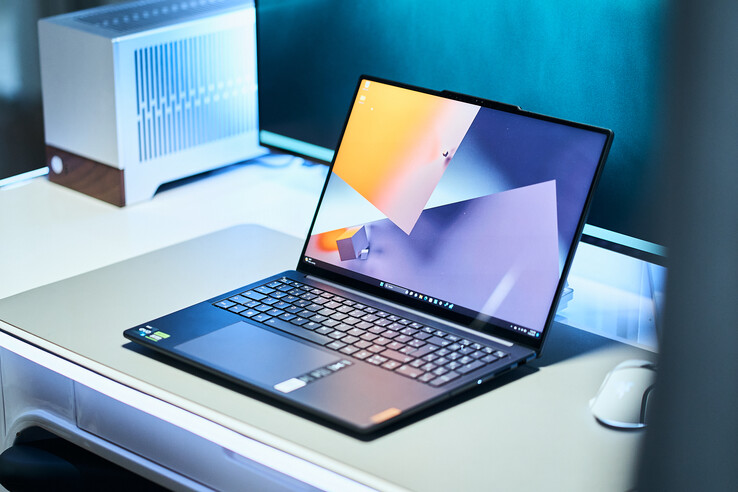
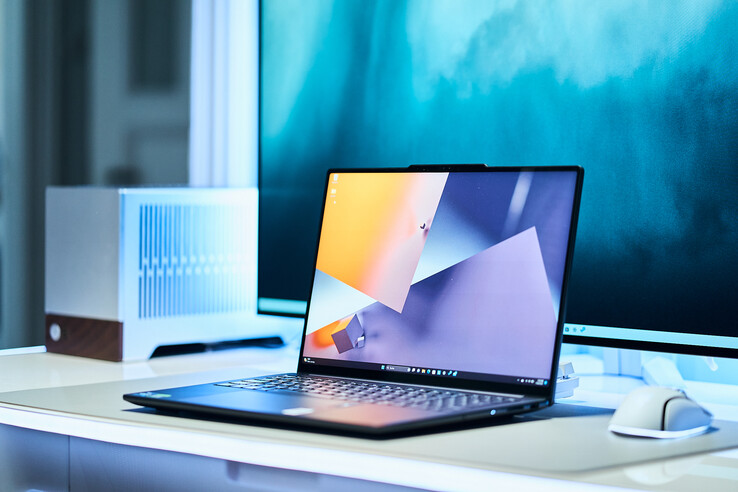
Tras haber analizado detenidamente la versión de 14 pulgadas del nuevo Lenovo Yoga Pro 9i, ahora echamos un vistazo a la versión de 16 pulgadas. Las especificaciones técnicas (aparte del tamaño) son fundamentalmente idénticas, ya que aquí también se usa una pantalla táctil mini-LED de 3,2K con 165 Hz y cobertura AdobeRGB. Bajo el capó se encuentran las últimas CPU Raptor Lake H de Intel y GPU Nvidia que van desde la RTX 4050 a la RTX 4070. En detalle, sin embargo, hay algunas diferencias a las que también echamos un vistazo.
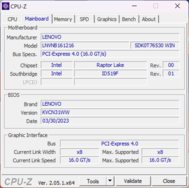
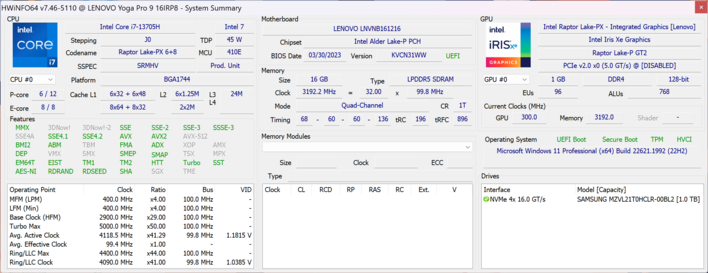
Nuestro dispositivo de pruebas es el modelo 83BY0016GE y tiene un precio de 2.399 euros(Nota del traductor: los modelos de EE.UU. son bastante más baratos - ver "Precio y disponibilidad" al final de este análisis) con un mini panel LED 3.2K (165 Hz), un procesador Core i7, una GPUGeForce RTX 406016 GB de RAM LPDDR5X 6400 y un SSD PCIe 4.0 de 1 TB. También pudimos ejecutar algunas pruebas en una configuración más potente (Core i9, RTX 4070 portátil, 64 GB de RAM).
Posibles contendientes en la comparación
Valoración | Fecha | Modelo | Peso | Altura | Tamaño | Resolución | Precio |
|---|---|---|---|---|---|---|---|
| 88.4 % v7 (old) | 08/2023 | Lenovo Yoga Pro 9 16-IRP G8 i7-13705H, GeForce RTX 4060 Laptop GPU | 2.2 kg | 18.2 mm | 16.00" | 3200x2000 | |
| 88.6 % v7 (old) | 07/2023 | Schenker VISION 16 Pro (M23) i7-13700H, GeForce RTX 4070 Laptop GPU | 1.6 kg | 17.1 mm | 16.00" | 2560x1600 | |
| 86.2 % v7 (old) | 07/2023 | Asus Vivobook Pro 16X K6604JV-MX016W i9-13980HX, GeForce RTX 4060 Laptop GPU | 2.1 kg | 22.8 mm | 16.00" | 3200x2000 | |
| 86.1 % v7 (old) | 06/2023 | Asus ProArt Studiobook 16 OLED H7604 i9-13980HX, GeForce RTX 4070 Laptop GPU | 2.4 kg | 23.9 mm | 16.00" | 3200x2000 | |
| 88.8 % v7 (old) | 07/2023 | MSI Stealth 16 Studio A13VG i7-13700H, GeForce RTX 4070 Laptop GPU | 2 kg | 19.95 mm | 16.00" | 2560x1600 | |
| 93.7 % v7 (old) | 03/2023 | Apple MacBook Pro 16 2023 M2 Max M2 Max, M2 Max 38-Core GPU | 2.2 kg | 16.8 mm | 16.20" | 3456x2234 |
Carcasa - Carcasa de aluminio con una chirriante placa base
El diseño de la carcasa es el mismo que el del Yoga Pro 9i 14es decir, se usa una construcción de aluminio. Sin embargo, el modelo de 16 pulgadas tiene un punto débil: la placa base es muy delgada y emite crujidos desagradables al manipularla, lo que no encaja en absoluto con un dispositivo premium. El problema también estaba presente (aunque menos pronunciado) en el segundo dispositivo de prueba, por lo que puede tratarse de un problema general. Es una lástima, porque por lo demás no hay defectos de fabricación ni de estabilidad. La unidad base sólo se puede presionar mínimamente en la zona central, pero prácticamente no se puede girar en absoluto. La tapa es un poco más flexible que la del modelo más pequeño de 14 pulgadas, pero tampoco aquí surgen problemas. Las dos bisagras están bien ajustadas (sólo se tambalean mínimamente) y mantienen la pantalla firmemente en su sitio, incluso en pequeños ángulos de apertura. Al mismo tiempo, es posible abrir la pantalla con una sola mano y el ángulo máximo de apertura es de 180 grados.
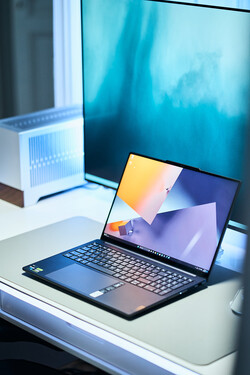
Nuestra unidad de prueba es la variante Strom Grey , que es muy discreta y encaja perfectamente en la oficina sin llamar la atención. Los que lo prefieran más colorido pueden optar por la variante de color Tidal Teal (verde turquesa). En general, el diseño parece muy moderno y los bordes de la pantalla son bastante estrechos, pero la joroba de la cámara resulta algo molesta porque queda un poco más hundida que el resto de la tapa de la pantalla.
Top 10 Análisis
» Top 10 Portátiles Multimedia
» Top 10 Portátiles de Juego
» Top 10 Portátiles de Juego ligeros
» Top 10 Portátiles Asequibles de Oficina/Empresa
» Top 10 Portátiles de Juego Ligeros
» Top 10 Portátiles de Oficina/Empresa Premium
» Top 10 Estaciones de Trabajo
» Top 10 Subportátiles
» Top 10 Ultrabooks
» Top 10 Convertibles
» Top 10 Tablets
» Top 10 Tablets Windows
» Top 10 Tablets de menos de 250 Euros
» Top 10 Phablets (>5.5")
» Top 10 Smartphones
» Top 10 Smartphones (≤5")
» Top 10 Smartphones de menos de 300 Euros
» Top 10 Smartphones de menos de 120 Euros
» Top 10 Portátiles de menos de 1000 Euros
» Top 10 Portátiles de menos de 500 Euros
» Top 10 Portátiles de menos de 300 Euros
» Los Mejores Displays de Portátiles Analizados por Notebookcheck
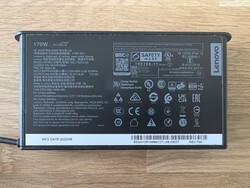
Junto con el Schenker Vision 16 Pro y elApple MacBook Pro 16el Yoga Pro 9i 16 es el que ocupa menos espacio de la comparativa, pero también es uno de los modelos más pesados con algo más de 2,2 kg, aunque las diferencias no son enormes. La única excepción es el Vision 16 Pro con sólo 1,6 kg. El adaptador de corriente de 170 vatios incluido pesa unos 570 gramos.
Equipo - Yoga Pro de 16 pulgadas sólo con HDMI 1.4b
Las diferencias con el modelo más pequeño se encuentran en los puertos. Sólo hay un puerto USB-C, que al menos también soporta Thunderbolt 4 y puede usarse para cargar si hace falta (funcionó sin problemas con una fuente de 65w). Dado que hay una fuente de alimentación dedicada (SlimTip), la falta de un segundo puerto USB puede pasarse por alto, pero no entendemos por qué la salida HMDI de la versión de 16" sólo soporta el estándar 1.4b, que es la razón por la que el 4K sólo puede salir a 30 Hz.
Lector de tarjetas SD
El lector de tarjetas de la derecha admite tarjetas SD normales, que sobresalen unos 2 cm del dispositivo. Las velocidades de transferencia junto con nuestra tarjeta de referencia Angelbird AV Pro V60 rondan los 80 MB/s. Se trata de un valor medio claramente superado por algunos competidores.
| SD Card Reader | |
| average JPG Copy Test (av. of 3 runs) | |
| Apple MacBook Pro 16 2023 M2 Max (Angelbird AV Pro V60) | |
| MSI Stealth 16 Studio A13VG | |
| Asus Vivobook Pro 16X K6604JV-MX016W | |
| Media de la clase Multimedia (21.1 - 531, n=46, últimos 2 años) | |
| Lenovo Yoga Pro 9 16-IRP G8 (Angelibird AV Pro V60) | |
| Asus ProArt Studiobook 16 OLED H7604 (Angelibird AV Pro V60) | |
| Schenker VISION 16 Pro (M23) (Angelbird AV Pro V60) | |
| maximum AS SSD Seq Read Test (1GB) | |
| Apple MacBook Pro 16 2023 M2 Max (Angelbird AV Pro V60) | |
| MSI Stealth 16 Studio A13VG | |
| Media de la clase Multimedia (27.4 - 1455, n=46, últimos 2 años) | |
| Asus Vivobook Pro 16X K6604JV-MX016W | |
| Asus ProArt Studiobook 16 OLED H7604 (Angelibird AV Pro V60) | |
| Lenovo Yoga Pro 9 16-IRP G8 (Angelibird AV Pro V60) | |
| Schenker VISION 16 Pro (M23) (Angelbird AV Pro V60) | |
Comunicación
No dispone de un puerto para conexiones de red por cable, pero puede implementarse mediante un adaptador USB opcional. El módulo AX211 de Intel, que también soporta el actual estándar Wi-Fi 6E, se encarga de las conexiones inalámbricas. Medimos tasas de transferencia altas y estables con nuestro router de referencia Asus. Tampoco surgieron problemas en la práctica, ni en grandes transferencias de datos ni en descargas.
| Networking | |
| Lenovo Yoga Pro 9 16-IRP G8 | |
| iperf3 transmit AXE11000 | |
| iperf3 receive AXE11000 | |
| Schenker VISION 16 Pro (M23) | |
| iperf3 transmit AXE11000 | |
| iperf3 receive AXE11000 | |
| Asus Vivobook Pro 16X K6604JV-MX016W | |
| iperf3 transmit AXE11000 | |
| iperf3 receive AXE11000 | |
| iperf3 transmit AXE11000 6GHz | |
| iperf3 receive AXE11000 6GHz | |
| Asus ProArt Studiobook 16 OLED H7604 | |
| iperf3 transmit AXE11000 | |
| iperf3 receive AXE11000 | |
| MSI Stealth 16 Studio A13VG | |
| iperf3 transmit AXE11000 | |
| iperf3 receive AXE11000 | |
| iperf3 transmit AXE11000 6GHz | |
| iperf3 receive AXE11000 6GHz | |
| Apple MacBook Pro 16 2023 M2 Max | |
| iperf3 transmit AXE11000 6GHz | |
| iperf3 receive AXE11000 6GHz | |
Cámara web
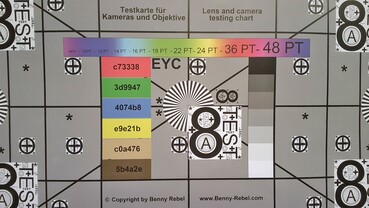
La joroba de la cámara, ligeramente más gruesa, alberga una cámara de 5 MP que ofrece una buena calidad de imagen, tanto para fotos como para vídeos. Esto elimina la necesidad de una webcam externa, especialmente para videoconferencias. También lleva instalado un sensor de infrarrojos que permite el reconocimiento facial a través de Windows Hello. La cámara se puede desactivar mediante un pequeño control deslizante en el lado derecho de la carcasa (e-shutter).
Mantenimiento
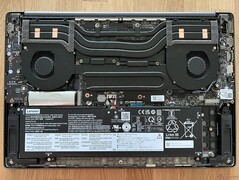
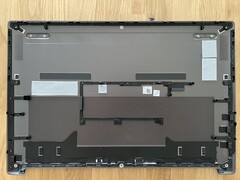
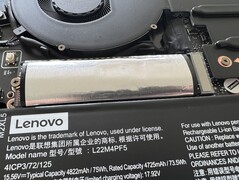
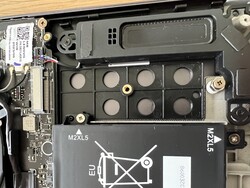
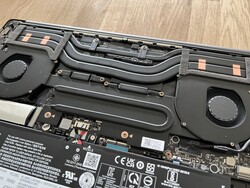
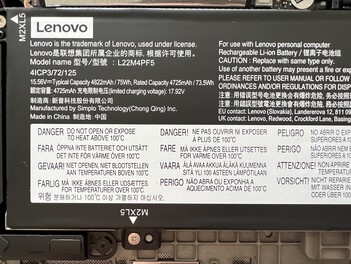
La placa base se fija con unos tornillos Torx (T5) y se quita fácilmente. Entonces tienes acceso a los dos ventiladores, la batería y las dos ranuras para los SSDs M.2-2280. Sin embargo, la RAM y el módulo WLAN están soldados.
Dispositivos de entrada - Lenovo instala un buen teclado con teclado numérico
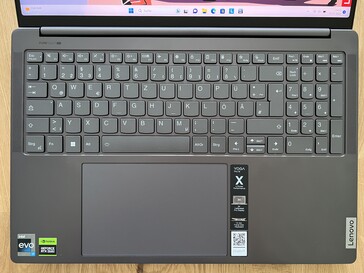
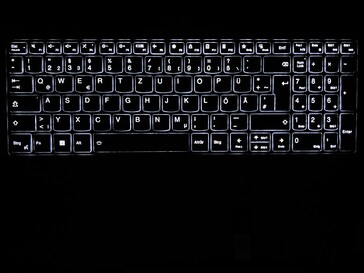
Lenovo no deja sin usar el ancho extra de la carcasa y añade un teclado numérico dedicado al teclado. Como en el pequeño Yoga Pro 9i 14el fabricante instala un teclado cómodo y preciso que también ofrece suficiente recorrido de tecla de 1.5 mm. Los textos largos también se pueden teclear sin esfuerzo. Una retroiluminación blanca de dos niveles que puede activarse automáticamente mediante un sensor ayuda en entornos oscuros.
El touchpad del Yoga de 16 pulgadas es aún mayor y, con 15 x 9.5 cm, ofrece mucho espacio para el control del puntero y gestos de hasta cuatro dedos, que también funcionan muy bien y fiablemente gracias a las buenas propiedades de deslizado. La mitad inferior también se puede pulsar, lo que se caracteriza por un chasquido muy fuerte y barato. Recomendamos simplemente tocar el pad para introducir datos. A diferencia del modelo más pequeño de 14 pulgadas, el touchpad no está en el centro de la carcasa, sino ligeramente desplazado a la izquierda.
Pantalla - Mini LED a 165 Hz
Las especificaciones del display sólo difieren de su hermano pequeño en la diagonal de pantalla, ya que el Yoga Pro 9i 16 también usa una mini pantalla LED con una resolución de 3.200 x 2.000 (16:10) y una frecuencia de 165 Hz. El lustroso panel también soporta entrada táctil. La impresión subjetiva de la imagen es excelente, especialmente con contenidos HDR. Además de la pantalla mini-LED, Lenovo también ofrece un panel IPS normal (3200 x 2000 pixels, 165 Hz, sRGB).
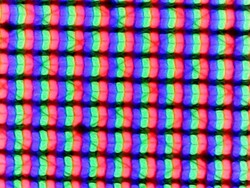
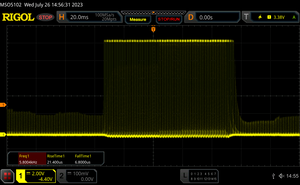
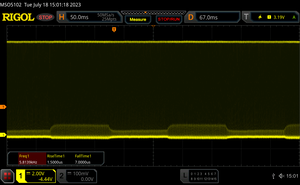
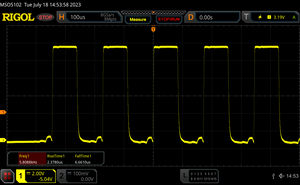
De nuevo hay una gran diferencia entre los modos SDR y HDR: en modo SDR normal la retroiluminación mini-LED no está activa y el panel se comporta como un modelo IPS normal. Por tanto, el contenido negro no es completamente negro y también se ven ligeros halos. Sin embargo, a diferencia del modelo de 14 pulgadas, el control PWM es diferente, por lo que no pudimos determinar con exactitud los tiempos de respuesta. El parpadeo a 5,8 kHz se da en todos los niveles de brillo, pero no debería ser un problema para la gran mayoría de usuarios.
En modo SDR, la minipantalla LED de 16 pulgadas alcanza un brillo inferior de apenas 550 cd/m² (~700 cd/m² para el panel de 14 pulgadas), que está más o menos a la par con elMacBook Pro de 16 pulgadasel valor de negro es de 0.18 cd/m² en modo SDR, por lo que el ratio de contraste es de "sólo" ~3,000:1. Es bajo comparado con otros paneles mini-LED u OLED, pero sigue siendo muy bueno comparado con las pantallas IPS normales.
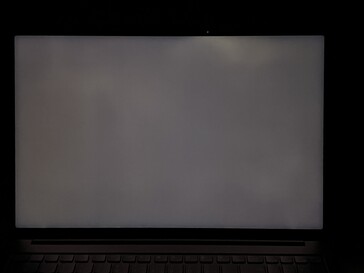
El valor de negro es sólo 0 en el modo HDR, por lo que la relación de contraste también es extremadamente alta. El contenido negro es realmente negro aquí y puedes ver la diferencia muy claramente en las dos imágenes comparativas de arriba. Con contenido HDR, el brillo máximo es de poco menos de 1.100 cd/m², que es significativamente inferior al del Yoga de 14 pulgadas y también inferior a la especificación del fabricante de 1.200 cd/m². El modo HDR también resulta en un visible blooming debido a las zonas mini-LED, aunque el efecto no es particularmente pronunciado aquí.
Por desgracia, la implementación HDR de Windows sigue dejando mucho que desear porque el modo HDR tiene que activarse manualmente primero. Esto a su vez significa que Windows ya no ofrece ningún perfil de color y el modo HDR está efectivamente limitado al espacio de color sRGB.
| |||||||||||||||||||||||||
iluminación: 96 %
Brillo con batería: 545 cd/m²
Contraste: 2994:1 (Negro: 0.18 cd/m²)
ΔE ColorChecker Calman: 1.4 | ∀{0.5-29.43 Ø4.76}
ΔE Greyscale Calman: 2.2 | ∀{0.09-98 Ø5}
95.1% AdobeRGB 1998 (Argyll 3D)
99.8% sRGB (Argyll 3D)
97% Display P3 (Argyll 3D)
Gamma: 2.19
CCT: 6479 K
| Lenovo Yoga Pro 9 16-IRP G8 LEN160-3.2K, Mini-LED, 3200x2000, 16" | Schenker VISION 16 Pro (M23) NE160QDM-NZ1, IPS, 2560x1600, 16" | Asus Vivobook Pro 16X K6604JV-MX016W Samsung SDC4178 ATNA60BX01-1, OLED, 3200x2000, 16" | Asus ProArt Studiobook 16 OLED H7604 ATNA60BX01-1, OLED, 3200x2000, 16" | MSI Stealth 16 Studio A13VG AUO26A9, IPS, 2560x1600, 16" | Apple MacBook Pro 16 2023 M2 Max Mini-LED, 3456x2234, 16.2" | |
|---|---|---|---|---|---|---|
| Display | -19% | 1% | -1% | -4% | -2% | |
| Display P3 Coverage (%) | 97 | 68.8 -29% | 98.4 1% | 99.6 3% | 96.4 -1% | 99 2% |
| sRGB Coverage (%) | 99.8 | 98.8 -1% | 99.7 0% | 100 0% | 99.7 0% | 100 0% |
| AdobeRGB 1998 Coverage (%) | 95.1 | 70 -26% | 95.8 1% | 89.4 -6% | 84.8 -11% | 88.5 -7% |
| Response Times | 7% | 87% | 94% | 54% | -444% | |
| Response Time Grey 50% / Grey 80% * (ms) | 14 ? | 13.7 ? 2% | 1.6 ? 89% | 0.59 ? 96% | 4.4 ? 69% | 80.5 ? -475% |
| Response Time Black / White * (ms) | 9.2 ? | 8.1 ? 12% | 1.4 ? 85% | 0.79 ? 91% | 5.6 ? 39% | 47.2 ? -413% |
| PWM Frequency (Hz) | 5800 ? | 120 ? | 240 ? | 14880 ? | ||
| Screen | -91% | 4% | 42% | -87% | 2094% | |
| Brightness middle (cd/m²) | 539 | 384 -29% | 347 -36% | 349 -35% | 424 -21% | 504 -6% |
| Brightness (cd/m²) | 546 | 371 -32% | 346 -37% | 350 -36% | 411 -25% | 487 -11% |
| Brightness Distribution (%) | 96 | 88 -8% | 97 1% | 95 -1% | 88 -8% | 94 -2% |
| Black Level * (cd/m²) | 0.18 | 0.3 -67% | 0.06 67% | 0.02 89% | 0.37 -106% | 0.001 99% |
| Contrast (:1) | 2994 | 1280 -57% | 5783 93% | 17450 483% | 1146 -62% | 504000 16734% |
| Colorchecker dE 2000 * | 1.4 | 3.4 -143% | 1.89 -35% | 2.1 -50% | 3.04 -117% | 1.5 -7% |
| Colorchecker dE 2000 max. * | 2.1 | 9.2 -338% | 3.26 -55% | 5.5 -162% | 7.5 -257% | 3.3 -57% |
| Greyscale dE 2000 * | 2.2 | 3.4 -55% | 1.55 30% | 1.2 45% | 4.34 -97% | 2.1 5% |
| Gamma | 2.19 100% | 2.16 102% | 2.39 92% | 2.19 100% | 2.32 95% | 2.25 98% |
| CCT | 6479 100% | 7462 87% | 6458 101% | 6545 99% | 6952 93% | 6882 94% |
| Colorchecker dE 2000 calibrated * | 1.3 | 1.97 | 2.1 | 3.04 | ||
| Media total (Programa/Opciones) | -34% /
-59% | 31% /
16% | 45% /
40% | -12% /
-46% | 549% /
1220% |
* ... más pequeño es mejor
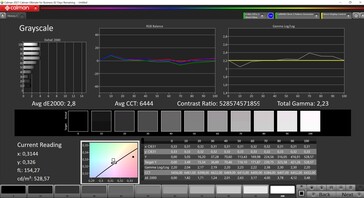
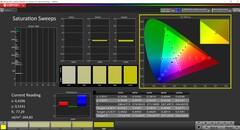
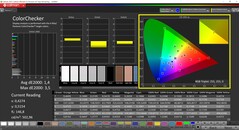
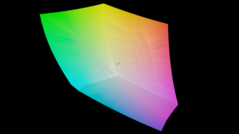
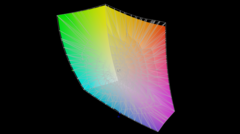
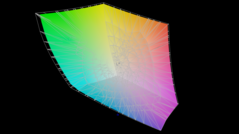
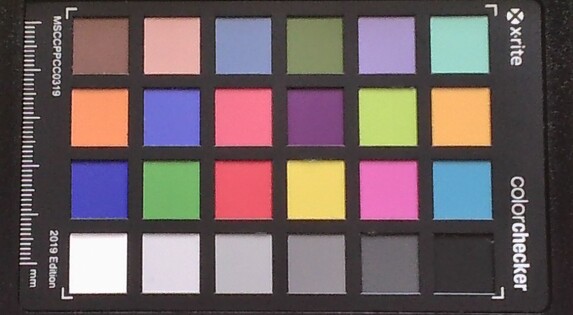
Medimos el panel con el software profesional CalMAN. En el software preinstalado Lenovo Vantage, puedes elegir entre los perfiles de color sRGB, Display P3 y AdobeRGB. Como Lenovo anuncia una cobertura completa de AdobeRGB, también usamos este perfil para nuestras mediciones.
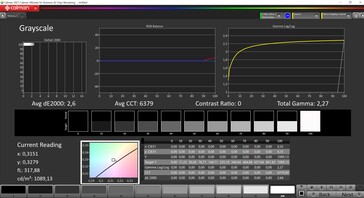
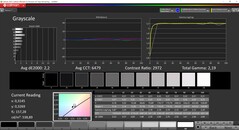
El calibrado estándar del panel resulta mucho mejor que el del modelo de 14 pulgadas y la desviación DeltaE-2000 media ya está por debajo de 3, tanto para la escala de grises como para los colores (aquí tampoco hay valores atípicos). No pudimos confirmar el valor DeltaE anunciado de <1, pero una calibración posterior no es realmente necesaria aquí y no pudimos mejorar el display con nuestra propia calibración, por lo que no ofrecemos un perfil de color para descargar en este punto. El panel cubre casi por completo los espacios de color P3 y AdobeRGB.
Tiempos de respuesta del display
| ↔ Tiempo de respuesta de Negro a Blanco | ||
|---|---|---|
| 9.2 ms ... subida ↗ y bajada ↘ combinada | ↗ 2.2 ms subida | |
| ↘ 7 ms bajada | ||
| La pantalla mostró tiempos de respuesta rápidos en nuestros tests y debería ser adecuada para juegos. En comparación, todos los dispositivos de prueba van de ##min### (mínimo) a 240 (máximo) ms. » 25 % de todos los dispositivos son mejores. Esto quiere decir que el tiempo de respuesta medido es mejor que la media (20.1 ms) de todos los dispositivos testados. | ||
| ↔ Tiempo de respuesta 50% Gris a 80% Gris | ||
| 14 ms ... subida ↗ y bajada ↘ combinada | ↗ 7.5 ms subida | |
| ↘ 6.5 ms bajada | ||
| La pantalla mostró buenos tiempos de respuesta en nuestros tests pero podría ser demasiado lenta para los jugones competitivos. En comparación, todos los dispositivos de prueba van de ##min### (mínimo) a 636 (máximo) ms. » 27 % de todos los dispositivos son mejores. Esto quiere decir que el tiempo de respuesta medido es mejor que la media (31.5 ms) de todos los dispositivos testados. | ||
Parpadeo de Pantalla / PWM (Pulse-Width Modulation)
| Parpadeo de Pantalla / PWM detectado | 5800 Hz | ≤ 100 % de brillo | |
La retroiluminación del display parpadea a 5800 Hz (seguramente usa PWM - Pulse-Width Modulation) a un brillo del 100 % e inferior. Sobre este nivel de brillo no debería darse parpadeo / PWM. La frecuencia de 5800 Hz es bastante alta, por lo que la mayoría de gente sensible al parpadeo no debería ver parpadeo o tener fatiga visual. Comparación: 53 % de todos los dispositivos testados no usaron PWM para atenuar el display. Si se usó, medimos una media de 8023 (mínimo: 5 - máxmo: 343500) Hz. | |||
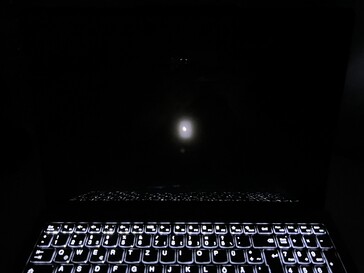
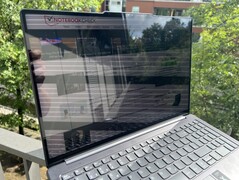
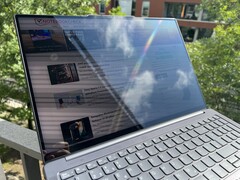
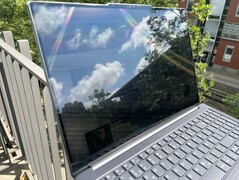
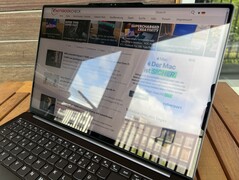
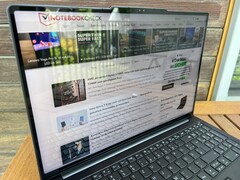
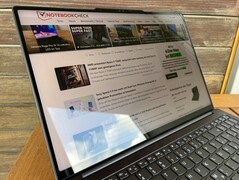
La pantalla táctil es muy reflectante y se producen molestos reflejos incluso en interiores. En días soleados, encontrar una posición adecuada para poder reconocer correctamente el contenido de la pantalla no es fácil. La estabilidad del ángulo de visión es muy buena.
Rendimiento - RTX 4060 con 100 vatios
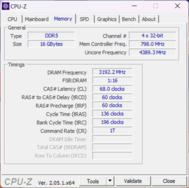
Como se mencionó anteriormente, el Yoga Pro 9i 16 viene con un procesador Core i7 o Core i9, así como la GeForce RTX 4050,RTX 4060 o RTX 4070 (100 vatios TGP en cada caso). La memoria de trabajo consiste en una RAM LPDDR5X-6400 más rápida, pero está soldada y no se puede ampliar.
Condiciones de ensayo
La app Lenovo Vantage preinstalada ofrece tres perfiles de rendimiento diferentes que pueden cambiarse cómodamente con la combinación de teclas Fn+Q en cualquier momento. Hemos listado los respectivos valores TDP/TGP en la siguiente tabla. Usamos el modo de Alto Rendimiento por defecto para nuestras pruebas y mediciones.
| Modo | Carga de la CPU | Carga de la GPU | Prueba de estrés | Volumen máx. del ventilador |
|---|---|---|---|---|
| Batería | 40 -> 25 vatios | 22 vatios | CPU: 25 vatios GPU: 22 vatios |
31,4 dB(A) |
| Refrigeración inteligente | 75 -> 65 vatios | 55 vatios | CPU: 30 vatios GPU: 45 vatios |
44,5 dB(A) |
| Alto rendimiento | 125 -> 80 vatios | 100 vatios | CPU: 30 vatios GPU: 100 vatios |
53,2 dB(A) |
Procesador
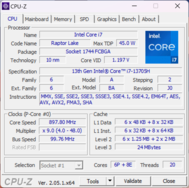
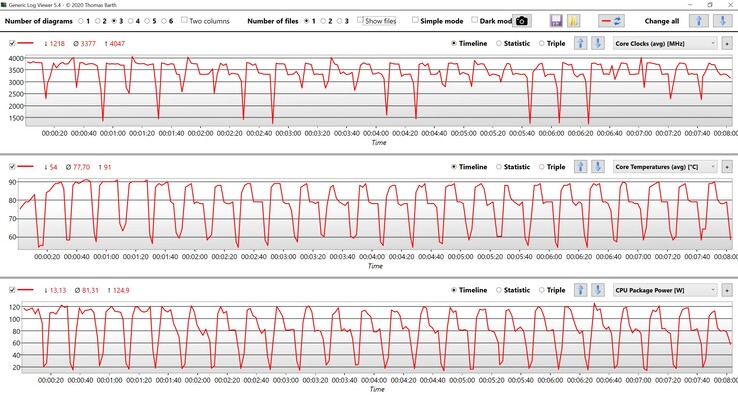
El modelo de 16 pulgadas del Yoga Pro 9i también utiliza el Core i7-13705Hque es el mismo que el Core i7-13700H en modo Alto Rendimiento, el procesador es capaz de consumir hasta 125w durante periodos cortos de tiempo y 80w permanentemente, lo que da muy buenos resultados. Curiosamente, el Core i9-13905H opcional rinde ligeramente peor, por lo que la mejora no merece la pena. Dentro de nuestro grupo de comparación, el Yoga sólo tiene que admitir la derrota ante competidores con procesadores HX bastante más rápidos.
El procesador puede consumir un máximo de 85 vatios en modo batería, lo que lleva a una reducción de rendimiento de alrededor del 20% en las pruebas multi-core. Encontrará más pruebas de CPU en nuestra sección de tecnología.
Cinebench R15 Multi Sustained Load
Cinebench R23: Multi Core | Single Core
Cinebench R20: CPU (Multi Core) | CPU (Single Core)
Cinebench R15: CPU Multi 64Bit | CPU Single 64Bit
Blender: v2.79 BMW27 CPU
7-Zip 18.03: 7z b 4 | 7z b 4 -mmt1
Geekbench 5.5: Multi-Core | Single-Core
HWBOT x265 Benchmark v2.2: 4k Preset
LibreOffice : 20 Documents To PDF
R Benchmark 2.5: Overall mean
| CPU Performance rating | |
| Asus ProArt Studiobook 16 OLED H7604 | |
| Asus Vivobook Pro 16X K6604JV-MX016W | |
| Apple MacBook Pro 16 2023 M2 Max -6! | |
| Lenovo Yoga Pro 9 16-IRP G8 | |
| Medio Intel Core i7-13705H | |
| MSI Stealth 16 Studio A13VG | |
| Schenker VISION 16 Pro (M23) | |
| Media de la clase Multimedia | |
| Cinebench R23 / Multi Core | |
| Asus ProArt Studiobook 16 OLED H7604 | |
| Asus Vivobook Pro 16X K6604JV-MX016W | |
| MSI Stealth 16 Studio A13VG | |
| Lenovo Yoga Pro 9 16-IRP G8 | |
| Medio Intel Core i7-13705H (17855 - 19675, n=2) | |
| Media de la clase Multimedia (4861 - 33362, n=80, últimos 2 años) | |
| Apple MacBook Pro 16 2023 M2 Max | |
| Schenker VISION 16 Pro (M23) | |
| Cinebench R23 / Single Core | |
| Asus ProArt Studiobook 16 OLED H7604 | |
| Schenker VISION 16 Pro (M23) | |
| Lenovo Yoga Pro 9 16-IRP G8 | |
| Medio Intel Core i7-13705H (1869 - 1879, n=2) | |
| Media de la clase Multimedia (1128 - 2459, n=72, últimos 2 años) | |
| MSI Stealth 16 Studio A13VG | |
| Asus Vivobook Pro 16X K6604JV-MX016W | |
| Apple MacBook Pro 16 2023 M2 Max | |
| Cinebench R20 / CPU (Multi Core) | |
| Asus ProArt Studiobook 16 OLED H7604 | |
| Asus Vivobook Pro 16X K6604JV-MX016W | |
| MSI Stealth 16 Studio A13VG | |
| Lenovo Yoga Pro 9 16-IRP G8 | |
| Medio Intel Core i7-13705H (6868 - 7529, n=2) | |
| Media de la clase Multimedia (1887 - 12912, n=63, últimos 2 años) | |
| Schenker VISION 16 Pro (M23) | |
| Apple MacBook Pro 16 2023 M2 Max | |
| Cinebench R20 / CPU (Single Core) | |
| Asus ProArt Studiobook 16 OLED H7604 | |
| Lenovo Yoga Pro 9 16-IRP G8 | |
| Schenker VISION 16 Pro (M23) | |
| Medio Intel Core i7-13705H (723 - 732, n=2) | |
| MSI Stealth 16 Studio A13VG | |
| Asus Vivobook Pro 16X K6604JV-MX016W | |
| Media de la clase Multimedia (420 - 853, n=63, últimos 2 años) | |
| Apple MacBook Pro 16 2023 M2 Max | |
| Cinebench R15 / CPU Multi 64Bit | |
| Asus Vivobook Pro 16X K6604JV-MX016W | |
| Asus ProArt Studiobook 16 OLED H7604 | |
| Lenovo Yoga Pro 9 16-IRP G8 | |
| Medio Intel Core i7-13705H (2750 - 2987, n=2) | |
| MSI Stealth 16 Studio A13VG | |
| Media de la clase Multimedia (856 - 5224, n=68, últimos 2 años) | |
| Schenker VISION 16 Pro (M23) | |
| Apple MacBook Pro 16 2023 M2 Max | |
| Cinebench R15 / CPU Single 64Bit | |
| Asus ProArt Studiobook 16 OLED H7604 | |
| Asus Vivobook Pro 16X K6604JV-MX016W | |
| Schenker VISION 16 Pro (M23) | |
| Lenovo Yoga Pro 9 16-IRP G8 | |
| Medio Intel Core i7-13705H (273 - 274, n=2) | |
| MSI Stealth 16 Studio A13VG | |
| Media de la clase Multimedia (99.6 - 326, n=66, últimos 2 años) | |
| Apple MacBook Pro 16 2023 M2 Max | |
| Blender / v2.79 BMW27 CPU | |
| Media de la clase Multimedia (100 - 557, n=64, últimos 2 años) | |
| Schenker VISION 16 Pro (M23) | |
| Medio Intel Core i7-13705H (172 - 190, n=2) | |
| Lenovo Yoga Pro 9 16-IRP G8 | |
| MSI Stealth 16 Studio A13VG | |
| Asus Vivobook Pro 16X K6604JV-MX016W | |
| Asus ProArt Studiobook 16 OLED H7604 | |
| 7-Zip 18.03 / 7z b 4 | |
| Asus ProArt Studiobook 16 OLED H7604 | |
| Asus Vivobook Pro 16X K6604JV-MX016W | |
| Lenovo Yoga Pro 9 16-IRP G8 | |
| MSI Stealth 16 Studio A13VG | |
| Medio Intel Core i7-13705H (71884 - 78446, n=2) | |
| Schenker VISION 16 Pro (M23) | |
| Media de la clase Multimedia (29095 - 130368, n=62, últimos 2 años) | |
| 7-Zip 18.03 / 7z b 4 -mmt1 | |
| Asus ProArt Studiobook 16 OLED H7604 | |
| Asus Vivobook Pro 16X K6604JV-MX016W | |
| Schenker VISION 16 Pro (M23) | |
| MSI Stealth 16 Studio A13VG | |
| Medio Intel Core i7-13705H (5924 - 6075, n=2) | |
| Lenovo Yoga Pro 9 16-IRP G8 | |
| Media de la clase Multimedia (3666 - 7545, n=62, últimos 2 años) | |
| Geekbench 5.5 / Multi-Core | |
| Asus ProArt Studiobook 16 OLED H7604 | |
| Asus Vivobook Pro 16X K6604JV-MX016W | |
| Apple MacBook Pro 16 2023 M2 Max | |
| Lenovo Yoga Pro 9 16-IRP G8 | |
| Medio Intel Core i7-13705H (14124 - 14521, n=2) | |
| MSI Stealth 16 Studio A13VG | |
| Media de la clase Multimedia (4652 - 20422, n=63, últimos 2 años) | |
| Schenker VISION 16 Pro (M23) | |
| Geekbench 5.5 / Single-Core | |
| Asus ProArt Studiobook 16 OLED H7604 | |
| Asus Vivobook Pro 16X K6604JV-MX016W | |
| Apple MacBook Pro 16 2023 M2 Max | |
| Media de la clase Multimedia (805 - 2974, n=63, últimos 2 años) | |
| Schenker VISION 16 Pro (M23) | |
| Medio Intel Core i7-13705H (1791 - 1891, n=2) | |
| MSI Stealth 16 Studio A13VG | |
| Lenovo Yoga Pro 9 16-IRP G8 | |
| HWBOT x265 Benchmark v2.2 / 4k Preset | |
| Asus ProArt Studiobook 16 OLED H7604 | |
| Asus Vivobook Pro 16X K6604JV-MX016W | |
| Lenovo Yoga Pro 9 16-IRP G8 | |
| Medio Intel Core i7-13705H (18.9 - 21.3, n=2) | |
| MSI Stealth 16 Studio A13VG | |
| Media de la clase Multimedia (5.26 - 36.1, n=62, últimos 2 años) | |
| Schenker VISION 16 Pro (M23) | |
| LibreOffice / 20 Documents To PDF | |
| MSI Stealth 16 Studio A13VG | |
| Asus Vivobook Pro 16X K6604JV-MX016W | |
| Media de la clase Multimedia (23.9 - 146.7, n=63, últimos 2 años) | |
| Lenovo Yoga Pro 9 16-IRP G8 | |
| Schenker VISION 16 Pro (M23) | |
| Medio Intel Core i7-13705H (47.4 - 47.7, n=2) | |
| Asus ProArt Studiobook 16 OLED H7604 | |
| R Benchmark 2.5 / Overall mean | |
| Media de la clase Multimedia (0.3604 - 0.947, n=62, últimos 2 años) | |
| Lenovo Yoga Pro 9 16-IRP G8 | |
| MSI Stealth 16 Studio A13VG | |
| Medio Intel Core i7-13705H (0.4305 - 0.4571, n=2) | |
| Schenker VISION 16 Pro (M23) | |
| Asus Vivobook Pro 16X K6604JV-MX016W | |
| Asus ProArt Studiobook 16 OLED H7604 | |
* ... más pequeño es mejor
AIDA64: FP32 Ray-Trace | FPU Julia | CPU SHA3 | CPU Queen | FPU SinJulia | FPU Mandel | CPU AES | CPU ZLib | FP64 Ray-Trace | CPU PhotoWorxx
| Performance rating | |
| Asus ProArt Studiobook 16 OLED H7604 | |
| Asus Vivobook Pro 16X K6604JV-MX016W | |
| Lenovo Yoga Pro 9 16-IRP G8 | |
| Medio Intel Core i7-13705H | |
| MSI Stealth 16 Studio A13VG | |
| Media de la clase Multimedia | |
| Schenker VISION 16 Pro (M23) | |
| AIDA64 / FP32 Ray-Trace | |
| Asus ProArt Studiobook 16 OLED H7604 | |
| Asus Vivobook Pro 16X K6604JV-MX016W | |
| MSI Stealth 16 Studio A13VG | |
| Lenovo Yoga Pro 9 16-IRP G8 | |
| Media de la clase Multimedia (2214 - 50388, n=59, últimos 2 años) | |
| Medio Intel Core i7-13705H (16297 - 17568, n=2) | |
| Schenker VISION 16 Pro (M23) | |
| AIDA64 / FPU Julia | |
| Asus ProArt Studiobook 16 OLED H7604 | |
| Asus Vivobook Pro 16X K6604JV-MX016W | |
| Lenovo Yoga Pro 9 16-IRP G8 | |
| Medio Intel Core i7-13705H (80950 - 92250, n=2) | |
| MSI Stealth 16 Studio A13VG | |
| Media de la clase Multimedia (12867 - 201874, n=60, últimos 2 años) | |
| Schenker VISION 16 Pro (M23) | |
| AIDA64 / CPU SHA3 | |
| Asus ProArt Studiobook 16 OLED H7604 | |
| Asus Vivobook Pro 16X K6604JV-MX016W | |
| Lenovo Yoga Pro 9 16-IRP G8 | |
| MSI Stealth 16 Studio A13VG | |
| Medio Intel Core i7-13705H (3673 - 4189, n=2) | |
| Media de la clase Multimedia (653 - 8623, n=60, últimos 2 años) | |
| Schenker VISION 16 Pro (M23) | |
| AIDA64 / CPU Queen | |
| Asus ProArt Studiobook 16 OLED H7604 | |
| Asus Vivobook Pro 16X K6604JV-MX016W | |
| Lenovo Yoga Pro 9 16-IRP G8 | |
| Medio Intel Core i7-13705H (106151 - 106736, n=2) | |
| MSI Stealth 16 Studio A13VG | |
| Schenker VISION 16 Pro (M23) | |
| Media de la clase Multimedia (13483 - 181505, n=60, últimos 2 años) | |
| AIDA64 / FPU SinJulia | |
| Asus ProArt Studiobook 16 OLED H7604 | |
| Asus Vivobook Pro 16X K6604JV-MX016W | |
| Lenovo Yoga Pro 9 16-IRP G8 | |
| MSI Stealth 16 Studio A13VG | |
| Medio Intel Core i7-13705H (10635 - 11077, n=2) | |
| Media de la clase Multimedia (1240 - 28794, n=60, últimos 2 años) | |
| Schenker VISION 16 Pro (M23) | |
| AIDA64 / FPU Mandel | |
| Asus ProArt Studiobook 16 OLED H7604 | |
| Asus Vivobook Pro 16X K6604JV-MX016W | |
| MSI Stealth 16 Studio A13VG | |
| Lenovo Yoga Pro 9 16-IRP G8 | |
| Medio Intel Core i7-13705H (40508 - 42686, n=2) | |
| Media de la clase Multimedia (6395 - 105740, n=59, últimos 2 años) | |
| Schenker VISION 16 Pro (M23) | |
| AIDA64 / CPU AES | |
| Asus ProArt Studiobook 16 OLED H7604 | |
| Asus Vivobook Pro 16X K6604JV-MX016W | |
| Lenovo Yoga Pro 9 16-IRP G8 | |
| MSI Stealth 16 Studio A13VG | |
| Medio Intel Core i7-13705H (75651 - 85118, n=2) | |
| Media de la clase Multimedia (2609 - 126790, n=60, últimos 2 años) | |
| Schenker VISION 16 Pro (M23) | |
| AIDA64 / CPU ZLib | |
| Asus ProArt Studiobook 16 OLED H7604 | |
| Asus Vivobook Pro 16X K6604JV-MX016W | |
| Lenovo Yoga Pro 9 16-IRP G8 | |
| Medio Intel Core i7-13705H (1126 - 1226, n=2) | |
| MSI Stealth 16 Studio A13VG | |
| Media de la clase Multimedia (167.2 - 2022, n=60, últimos 2 años) | |
| Schenker VISION 16 Pro (M23) | |
| AIDA64 / FP64 Ray-Trace | |
| Asus ProArt Studiobook 16 OLED H7604 | |
| Asus Vivobook Pro 16X K6604JV-MX016W | |
| MSI Stealth 16 Studio A13VG | |
| Media de la clase Multimedia (1014 - 26875, n=60, últimos 2 años) | |
| Lenovo Yoga Pro 9 16-IRP G8 | |
| Medio Intel Core i7-13705H (8846 - 9166, n=2) | |
| Schenker VISION 16 Pro (M23) | |
| AIDA64 / CPU PhotoWorxx | |
| Lenovo Yoga Pro 9 16-IRP G8 | |
| Medio Intel Core i7-13705H (51796 - 52257, n=2) | |
| Asus ProArt Studiobook 16 OLED H7604 | |
| MSI Stealth 16 Studio A13VG | |
| Schenker VISION 16 Pro (M23) | |
| Media de la clase Multimedia (12860 - 65787, n=60, últimos 2 años) | |
| Asus Vivobook Pro 16X K6604JV-MX016W | |
Rendimiento del sistema
Los valores de rendimiento en los benchmarks sintéticos son muy buenos, aunque los portátiles de la competencia también están a un nivel muy similar en general. En el uso diario, el portátil siempre es fluido y sensible. Tampoco surgió ningún problema durante las pruebas.
CrossMark: Overall | Productivity | Creativity | Responsiveness
| PCMark 10 / Score | |
| Asus ProArt Studiobook 16 OLED H7604 | |
| Schenker VISION 16 Pro (M23) | |
| MSI Stealth 16 Studio A13VG | |
| Lenovo Yoga Pro 9 16-IRP G8 | |
| Medio Intel Core i7-13705H, NVIDIA GeForce RTX 4060 Laptop GPU (n=1) | |
| Media de la clase Multimedia (4325 - 10386, n=56, últimos 2 años) | |
| Asus Vivobook Pro 16X K6604JV-MX016W | |
| PCMark 10 / Essentials | |
| Lenovo Yoga Pro 9 16-IRP G8 | |
| Medio Intel Core i7-13705H, NVIDIA GeForce RTX 4060 Laptop GPU (n=1) | |
| Asus ProArt Studiobook 16 OLED H7604 | |
| Schenker VISION 16 Pro (M23) | |
| Asus Vivobook Pro 16X K6604JV-MX016W | |
| MSI Stealth 16 Studio A13VG | |
| Media de la clase Multimedia (8025 - 11664, n=56, últimos 2 años) | |
| PCMark 10 / Productivity | |
| Media de la clase Multimedia (7323 - 18233, n=56, últimos 2 años) | |
| Asus ProArt Studiobook 16 OLED H7604 | |
| Schenker VISION 16 Pro (M23) | |
| MSI Stealth 16 Studio A13VG | |
| Asus Vivobook Pro 16X K6604JV-MX016W | |
| Lenovo Yoga Pro 9 16-IRP G8 | |
| Medio Intel Core i7-13705H, NVIDIA GeForce RTX 4060 Laptop GPU (n=1) | |
| PCMark 10 / Digital Content Creation | |
| MSI Stealth 16 Studio A13VG | |
| Lenovo Yoga Pro 9 16-IRP G8 | |
| Medio Intel Core i7-13705H, NVIDIA GeForce RTX 4060 Laptop GPU (n=1) | |
| Schenker VISION 16 Pro (M23) | |
| Asus ProArt Studiobook 16 OLED H7604 | |
| Media de la clase Multimedia (3651 - 16240, n=56, últimos 2 años) | |
| Asus Vivobook Pro 16X K6604JV-MX016W | |
| CrossMark / Overall | |
| Asus ProArt Studiobook 16 OLED H7604 | |
| Asus Vivobook Pro 16X K6604JV-MX016W | |
| Apple MacBook Pro 16 2023 M2 Max | |
| Schenker VISION 16 Pro (M23) | |
| Lenovo Yoga Pro 9 16-IRP G8 | |
| Medio Intel Core i7-13705H, NVIDIA GeForce RTX 4060 Laptop GPU (n=1) | |
| MSI Stealth 16 Studio A13VG | |
| Media de la clase Multimedia (866 - 2426, n=64, últimos 2 años) | |
| CrossMark / Productivity | |
| Asus ProArt Studiobook 16 OLED H7604 | |
| Asus Vivobook Pro 16X K6604JV-MX016W | |
| Schenker VISION 16 Pro (M23) | |
| MSI Stealth 16 Studio A13VG | |
| Lenovo Yoga Pro 9 16-IRP G8 | |
| Medio Intel Core i7-13705H, NVIDIA GeForce RTX 4060 Laptop GPU (n=1) | |
| Media de la clase Multimedia (913 - 2344, n=64, últimos 2 años) | |
| Apple MacBook Pro 16 2023 M2 Max | |
| CrossMark / Creativity | |
| Apple MacBook Pro 16 2023 M2 Max | |
| Asus ProArt Studiobook 16 OLED H7604 | |
| Asus Vivobook Pro 16X K6604JV-MX016W | |
| Lenovo Yoga Pro 9 16-IRP G8 | |
| Medio Intel Core i7-13705H, NVIDIA GeForce RTX 4060 Laptop GPU (n=1) | |
| Schenker VISION 16 Pro (M23) | |
| Media de la clase Multimedia (907 - 2820, n=64, últimos 2 años) | |
| MSI Stealth 16 Studio A13VG | |
| CrossMark / Responsiveness | |
| Asus ProArt Studiobook 16 OLED H7604 | |
| Schenker VISION 16 Pro (M23) | |
| Asus Vivobook Pro 16X K6604JV-MX016W | |
| MSI Stealth 16 Studio A13VG | |
| Lenovo Yoga Pro 9 16-IRP G8 | |
| Medio Intel Core i7-13705H, NVIDIA GeForce RTX 4060 Laptop GPU (n=1) | |
| Media de la clase Multimedia (605 - 2024, n=64, últimos 2 años) | |
| Apple MacBook Pro 16 2023 M2 Max | |
| PCMark 10 Score | 7301 puntos | |
ayuda | ||
| AIDA64 / Memory Copy | |
| Medio Intel Core i7-13705H (78047 - 79495, n=2) | |
| Media de la clase Multimedia (21158 - 109252, n=59, últimos 2 años) | |
| Lenovo Yoga Pro 9 16-IRP G8 | |
| Asus ProArt Studiobook 16 OLED H7604 | |
| MSI Stealth 16 Studio A13VG | |
| Asus Vivobook Pro 16X K6604JV-MX016W | |
| Schenker VISION 16 Pro (M23) | |
| AIDA64 / Memory Read | |
| Media de la clase Multimedia (19699 - 132641, n=60, últimos 2 años) | |
| Lenovo Yoga Pro 9 16-IRP G8 | |
| Asus ProArt Studiobook 16 OLED H7604 | |
| Asus Vivobook Pro 16X K6604JV-MX016W | |
| Medio Intel Core i7-13705H (72741 - 77976, n=2) | |
| MSI Stealth 16 Studio A13VG | |
| Schenker VISION 16 Pro (M23) | |
| AIDA64 / Memory Write | |
| Lenovo Yoga Pro 9 16-IRP G8 | |
| Medio Intel Core i7-13705H (90999 - 95196, n=2) | |
| Media de la clase Multimedia (17733 - 134966, n=60, últimos 2 años) | |
| Asus ProArt Studiobook 16 OLED H7604 | |
| MSI Stealth 16 Studio A13VG | |
| Asus Vivobook Pro 16X K6604JV-MX016W | |
| Schenker VISION 16 Pro (M23) | |
| AIDA64 / Memory Latency | |
| Media de la clase Multimedia (0 - 535, n=60, últimos 2 años) | |
| Lenovo Yoga Pro 9 16-IRP G8 | |
| Medio Intel Core i7-13705H (93.9 - 115, n=2) | |
| Asus Vivobook Pro 16X K6604JV-MX016W | |
| MSI Stealth 16 Studio A13VG | |
| Asus ProArt Studiobook 16 OLED H7604 | |
| Schenker VISION 16 Pro (M23) | |
* ... más pequeño es mejor
Latencia del CPD
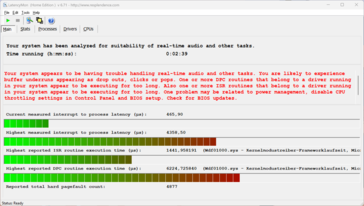
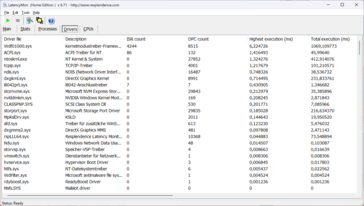
Nuestra unidad de pruebas reveló restricciones significativas en nuestra prueba de latencia estandarizada (navegación web, reproducción 4K de YouTube, carga de la CPU) con la versión actual de la BIOS y, por tanto, no es apta para aplicaciones de audio en tiempo real.
| DPC Latencies / LatencyMon - interrupt to process latency (max), Web, Youtube, Prime95 | |
| MSI Stealth 16 Studio A13VG | |
| Lenovo Yoga Pro 9 16-IRP G8 | |
| Asus Vivobook Pro 16X K6604JV-MX016W | |
| Asus ProArt Studiobook 16 OLED H7604 | |
| Schenker VISION 16 Pro (M23) | |
* ... más pequeño es mejor
Dispositivos de almacenamiento
Lenovo usa el espacio extra del chasis de 16" para una segunda ranura M.2, que sin embargo sólo soporta PCIe 3.0 x4. La ranura primaria está conectada por PCIe-4.0, y la versión de 1 TB del Samsung PM9A1 (versión OEM del 980 Pro) está instalada en nuestro dispositivo de pruebas. Tras el primer arranque, el usuario dispone de 891 GB. Las tasas de transferencia son muy buenas en general y el rendimiento se mantiene estable bajo carga prolongada, lo que no siempre está garantizado con las unidades modernas. Sin embargo, el sucesor del 990 Pro (véaseSchenker Vision 16 Pro) vuelve a ofrecer ventajas significativas en los accesos aleatorios. Más pruebas de rendimiento de SSD aquí.
* ... más pequeño es mejor
Sustained Read Performance: DiskSpd Read Loop, Queue Depth 8
Tarjeta gráfica
El procesador integradoIris Xe Graphics G7se encarga del procesamiento gráfico para tareas sencillas, y la GPU dedicada GeForce sólo toma el relevo en tareas más exigentes (por ejemplo, juegos). A diferencia del Yoga Pro 9i 14lenovo prescinde de Advanced Optimus aquí y no hay interruptor MUX para evitar la iGPU por completo. Esto no es inusual para un portátil multimedia, pero nos sorprende la diferencia comparado con su hermano menor, que está mejor equipado en este aspecto.
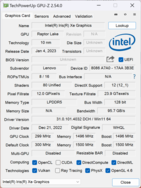
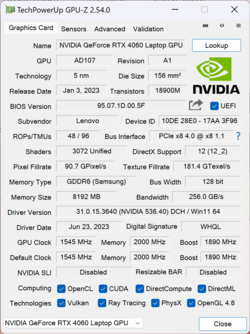
Nuestra unidad de pruebas está equipada con laGeForce RTX 4060que es la versión de 100 vatios. Teóricamente, hay modelos mucho más rápidos, pero hay que tener cuidado aquí porque según nuestra prueba, la 4060 sólo consume un máximo de ~105 vatios durante el juego de todos modos. Sólo en pruebas sintéticas como Furmark el consumo es mayor. Por tanto, una RTX 4060 con un TGP de 140 vatios no aporta realmente ninguna ventaja sobre la versión de 100 vatios del Yoga Pro 9i a la hora de jugar, por ejemplo, ni tampoco la opcional RTX 4070.
En general, los resultados son muy buenos y el Yoga también queda justo por delante de los resultados medios de la RTX 4060 en nuestra base de datos. La GPU puede incluso overclockearse en la app Vantage. Los que opten por el Yoga con la RTX 4070 pueden esperar un aumento de rendimiento de entre el 15 y el 20%. Bajo carga sostenida, el rendimiento de la GPU se mantiene estable. Desenchufado (TGP de 68 vatios como máximo), el rendimiento es un 18% inferior. Más pruebas de rendimiento de la GPU aquí.
| Geekbench 6.5 - GPU OpenCL | |
| Medio NVIDIA GeForce RTX 4060 Laptop GPU (76525 - 100831, n=39) | |
| Lenovo Yoga Pro 9 16-IRP G8 | |
| Media de la clase Multimedia (9994 - 187922, n=70, últimos 2 años) | |
| 3DMark 11 Performance | 30821 puntos | |
| 3DMark Fire Strike Score | 23225 puntos | |
| 3DMark Time Spy Score | 10393 puntos | |
ayuda | ||
| Blender / v3.3 Classroom OPTIX/RTX | |
| Media de la clase Multimedia (12 - 105, n=28, últimos 2 años) | |
| Asus Vivobook Pro 16X K6604JV-MX016W | |
| Lenovo Yoga Pro 9 16-IRP G8 | |
| MSI Stealth 16 Studio A13VG | |
| Schenker VISION 16 Pro (M23) | |
| Medio NVIDIA GeForce RTX 4060 Laptop GPU (19 - 28, n=53) | |
| Asus ProArt Studiobook 16 OLED H7604 | |
| Lenovo Yoga Pro 9i RTX4070 | |
| Blender / v3.3 Classroom CUDA | |
| Media de la clase Multimedia (20 - 186, n=28, últimos 2 años) | |
| Asus Vivobook Pro 16X K6604JV-MX016W | |
| Lenovo Yoga Pro 9 16-IRP G8 | |
| Medio NVIDIA GeForce RTX 4060 Laptop GPU (39 - 53, n=53) | |
| MSI Stealth 16 Studio A13VG | |
| Asus ProArt Studiobook 16 OLED H7604 | |
| Schenker VISION 16 Pro (M23) | |
| Blender / v3.3 Classroom METAL | |
| Apple MacBook Pro 16 2023 M2 Max | |
| Media de la clase Multimedia (17.8 - 68, n=3, últimos 2 años) | |
| Blender / v3.3 Classroom CPU | |
| Media de la clase Multimedia (160 - 1042, n=65, últimos 2 años) | |
| Schenker VISION 16 Pro (M23) | |
| Apple MacBook Pro 16 2023 M2 Max | |
| Medio NVIDIA GeForce RTX 4060 Laptop GPU (189 - 452, n=53) | |
| Lenovo Yoga Pro 9 16-IRP G8 | |
| Lenovo Yoga Pro 9i RTX4070 | |
| MSI Stealth 16 Studio A13VG | |
| Asus Vivobook Pro 16X K6604JV-MX016W | |
| Asus ProArt Studiobook 16 OLED H7604 | |
* ... más pequeño es mejor
Rendimiento en juegos
El rendimiento gaming está bastante en línea con nuestras expectativas, por lo que el Yoga Pro 9i 16 es capaz de ejecutar títulos modernos muy bien y normalmente puedes elegir la resolución QHD al máximo detalle. Sólo títulos muy exigentes como Star Wars Jedi Survivor o F1 2023 (dónde el trazado de rayos ya está activo) hacen que el portátil tenga problemas. Aquí tienes que reducir los detalles o usar el upsampling (ej. DLSS) para aumentar la tasa de frames. El rendimiento permanece completamente estable durante largas sesiones de juego.
| The Witcher 3 - 1920x1080 Ultra Graphics & Postprocessing (HBAO+) | |
| Lenovo Yoga Pro 9i RTX4070 | |
| MSI Stealth 16 Studio A13VG | |
| Asus ProArt Studiobook 16 OLED H7604 | |
| Schenker VISION 16 Pro (M23) | |
| Asus Vivobook Pro 16X K6604JV-MX016W | |
| Lenovo Yoga Pro 9 16-IRP G8 | |
| Media de la clase Multimedia (11 - 121, n=24, últimos 2 años) | |
Witcher 3 FPS chart
| bajo | medio | alto | ultra | QHD | |
|---|---|---|---|---|---|
| GTA V (2015) | 175.9 | 169.4 | 107.4 | 84.1 | |
| The Witcher 3 (2015) | 203 | 90.8 | |||
| Dota 2 Reborn (2015) | 170.8 | 156.4 | 148.5 | 142.3 | |
| Final Fantasy XV Benchmark (2018) | 186 | 134.6 | 95.7 | 70.6 | |
| X-Plane 11.11 (2018) | 145.9 | 127.4 | 98.3 | ||
| Far Cry 5 (2018) | 166 | 146 | 136 | 127 | 97 |
| Strange Brigade (2018) | 265 | 214 | 184.1 | 123.7 | |
| F1 2021 (2021) | 274 | 221 | 123.2 | 92.4 | |
| Cyberpunk 2077 1.6 (2022) | 114 | 94 | 82 | 75 | 54 |
| F1 22 (2022) | 220 | 218 | 160 | 62.7 | 40 |
| Star Wars Jedi Survivor (2023) | 75 | 68 | 62 | 60 | 38 |
| F1 23 (2023) | 227 | 225 | 172.7 | 54.1 | 34.2 |
Emisiones - Excelentes altavoces en el Yoga Pro 9i 16
Ruido
El volumen de los dos ventiladores depende en gran medida del modo de rendimiento elegido. Siempre recomendamos usar el modo de ahorro de batería para las tareas cotidianas, ya que los ventiladores suelen desactivarse aquí. Los ventiladores arrancan muy rápido, especialmente en el modo de alto rendimiento, lo que puede resultar molesto en el uso diario. También se vuelve ruidoso rápidamente bajo carga y medimos entre 44.5 dB(A) (Smart Cooling) y 53.2 dB(A) (Alto Rendimiento) durante los juegos, lo que es muy claramente audible. En ambos modos los auriculares son ciertamente la opción preferible, aunque otros competidores Windows tampoco lo hacen mejor aquí. Al menos los ventiladores no pulsan innecesariamente y no se detectaron otros ruidos electrónicos.
| Escenario | Batería | Refrigeración inteligente | Alto rendimiento |
|---|---|---|---|
| 3DMark 06 | 31,4 dB(A) | 35,4 dB(A) | 39,7 dB(A) |
| Witcher 3 | 31.4dB(A) | 44,5dB(A) | 53,2dB(A) |
| Prueba de esfuerzo | 31,4 dB(A) | 35,4 dB(A) | 53,2 dB(A) |
Ruido
| Ocioso |
| 24.7 / 26.2 / 26.2 dB(A) |
| Carga |
| 39.7 / 53.2 dB(A) |
 | ||
30 dB silencioso 40 dB(A) audible 50 dB(A) ruidosamente alto |
||
min: | ||
| Lenovo Yoga Pro 9 16-IRP G8 GeForce RTX 4060 Laptop GPU, i7-13705H, Samsung PM9A1 MZVL21T0HCLR | Schenker VISION 16 Pro (M23) GeForce RTX 4070 Laptop GPU, i7-13700H, Samsung 990 Pro 1 TB | Asus Vivobook Pro 16X K6604JV-MX016W GeForce RTX 4060 Laptop GPU, i9-13980HX, Solidigm P41 Plus SSDPFKNU010TZ | Asus ProArt Studiobook 16 OLED H7604 GeForce RTX 4070 Laptop GPU, i9-13980HX, Phison EM2804TBMTCB47 | MSI Stealth 16 Studio A13VG GeForce RTX 4070 Laptop GPU, i7-13700H, Micron 3400 2TB MTFDKBA2T0TFH | Apple MacBook Pro 16 2023 M2 Max M2 Max 38-Core GPU, M2 Max, Apple SSD AP2048Z | |
|---|---|---|---|---|---|---|
| Noise | -7% | -11% | -3% | 8% | 12% | |
| apagado / medio ambiente * (dB) | 24.7 | 25.9 -5% | 25.2 -2% | 24.5 1% | 24 3% | 23.9 3% |
| Idle Minimum * (dB) | 24.7 | 25.9 -5% | 26.6 -8% | 24.5 1% | 24 3% | 23.9 3% |
| Idle Average * (dB) | 26.2 | 25.9 1% | 26.6 -2% | 24.5 6% | 24 8% | 23.9 9% |
| Idle Maximum * (dB) | 26.2 | 32 -22% | 29.2 -11% | 24.5 6% | 24 8% | 23.9 9% |
| Load Average * (dB) | 39.7 | 47.2 -19% | 53.4 -35% | 47.6 -20% | 34.81 12% | 36.6 8% |
| Witcher 3 ultra * (dB) | 53.2 | 53.1 -0% | 55.9 -5% | 44.05 17% | 35.1 34% | |
| Load Maximum * (dB) | 53.2 | 53.1 -0% | 56.9 -7% | 56.7 -7% | 51.57 3% | 43.2 19% |
* ... más pequeño es mejor
Temperatura
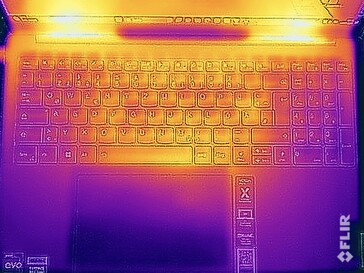
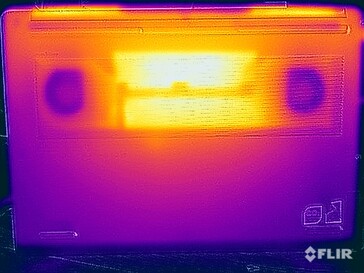
No hay ningún problema con las temperaturas superficiales en el uso diario, pero no deberías poner el dispositivo sobre el regazo bajo carga o mientras juegas. Medimos hasta 50 °C en la parte inferior, lo que puede ser desagradable si entra en contacto con la piel. Sin embargo, los resultados no son en absoluto críticos y en general el modelo de 16 pulgadas rinde mejor aquí que el más pequeño Yoga Pro 9i 14 y la mayoría de competidores Windows. El teclado incluso se mantiene bastante más fresco a 35-40 °C, por lo que no hay restricciones de uso aquí.
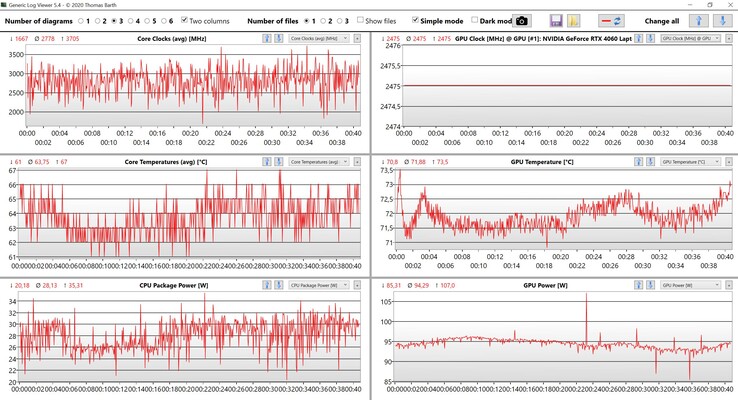
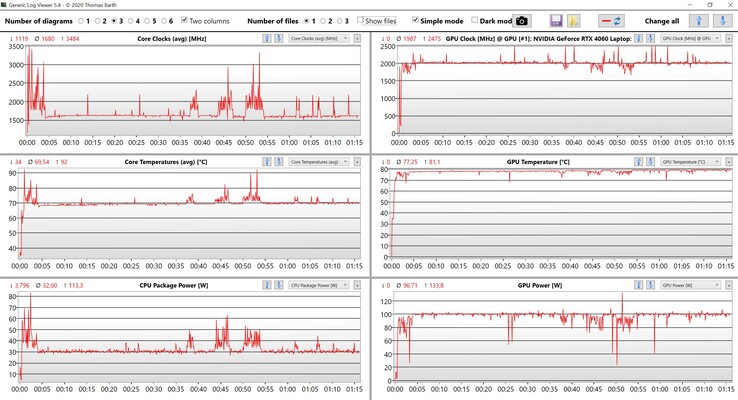
En el test de estrés, la GPU es claramente priorizada por el sistema y funciona consistentemente a los 100w mientras que el procesador se nivela rápidamente a 30w.
(±) La temperatura máxima en la parte superior es de 41.6 °C / 107 F, frente a la media de 36.9 °C / 98 F, que oscila entre 21.1 y 71 °C para la clase Multimedia.
(-) El fondo se calienta hasta un máximo de 50 °C / 122 F, frente a la media de 39.1 °C / 102 F
(+) En reposo, la temperatura media de la parte superior es de 26.4 °C / 80# F, frente a la media del dispositivo de 31.3 °C / 88 F.
(±) Jugando a The Witcher 3, la temperatura media de la parte superior es de 35.6 °C / 96 F, frente a la media del dispositivo de 31.3 °C / 88 F.
(+) Los reposamanos y el panel táctil alcanzan como máximo la temperatura de la piel (34.9 °C / 94.8 F) y, por tanto, no están calientes.
(-) La temperatura media de la zona del reposamanos de dispositivos similares fue de 28.7 °C / 83.7 F (-6.2 °C / -11.1 F).
| Lenovo Yoga Pro 9 16-IRP G8 Intel Core i7-13705H, NVIDIA GeForce RTX 4060 Laptop GPU | Schenker VISION 16 Pro (M23) Intel Core i7-13700H, NVIDIA GeForce RTX 4070 Laptop GPU | Asus Vivobook Pro 16X K6604JV-MX016W Intel Core i9-13980HX, NVIDIA GeForce RTX 4060 Laptop GPU | Asus ProArt Studiobook 16 OLED H7604 Intel Core i9-13980HX, NVIDIA GeForce RTX 4070 Laptop GPU | MSI Stealth 16 Studio A13VG Intel Core i7-13700H, NVIDIA GeForce RTX 4070 Laptop GPU | Apple MacBook Pro 16 2023 M2 Max Apple M2 Max, Apple M2 Max 38-Core GPU | |
|---|---|---|---|---|---|---|
| Heat | -4% | -14% | -12% | -36% | 11% | |
| Maximum Upper Side * (°C) | 41.6 | 46.7 -12% | 39.7 5% | 44.1 -6% | 60 -44% | 44.2 -6% |
| Maximum Bottom * (°C) | 50 | 54.1 -8% | 60 -20% | 48 4% | 61 -22% | 42.9 14% |
| Idle Upper Side * (°C) | 26.8 | 26.5 1% | 30.9 -15% | 32.7 -22% | 38.2 -43% | 22.4 16% |
| Idle Bottom * (°C) | 27.9 | 26.8 4% | 34.7 -24% | 34.9 -25% | 37.7 -35% | 22.3 20% |
* ... más pequeño es mejor
Altavoces
La variante de 16 pulgadas del Yoga Pro 9i está equipada con seis altavoces (4 woofers + 2 tweeters, 6 vatios cada uno) y es capaz de mejorar el ya sólido rendimiento del modelo de 14 pulgadas, aunque el volumen máximo sea algo inferior. El sonido es en general muy bueno y la diferencia con elApple MacBook Pro 16(también con 6 altavoces) tampoco es grande. En definitiva, los altavoces hacen muy bien su trabajo.
Lenovo Yoga Pro 9 16-IRP G8 análisis de audio
(±) | la sonoridad del altavoz es media pero buena (80.5 dB)
Graves 100 - 315 Hz
(+) | buen bajo - sólo 4.9% lejos de la mediana
(±) | la linealidad de los graves es media (9.1% delta a frecuencia anterior)
Medios 400 - 2000 Hz
(+) | medios equilibrados - a sólo 3.2% de la mediana
(+) | los medios son lineales (6.5% delta a la frecuencia anterior)
Altos 2 - 16 kHz
(+) | máximos equilibrados - a sólo 2.9% de la mediana
(+) | los máximos son lineales (3% delta a la frecuencia anterior)
Total 100 - 16.000 Hz
(+) | el sonido global es lineal (8.4% de diferencia con la mediana)
En comparación con la misma clase
» 8% de todos los dispositivos probados de esta clase eran mejores, 2% similares, 90% peores
» El mejor tuvo un delta de 5%, la media fue 17%, el peor fue ###max##%
En comparación con todos los dispositivos probados
» 2% de todos los dispositivos probados eran mejores, 1% similares, 97% peores
» El mejor tuvo un delta de 4%, la media fue 24%, el peor fue ###max##%
Apple MacBook Pro 16 2023 M2 Max análisis de audio
(+) | los altavoces pueden reproducir a un volumen relativamente alto (#86.1 dB)
Graves 100 - 315 Hz
(+) | buen bajo - sólo 3.9% lejos de la mediana
(+) | el bajo es lineal (5.7% delta a la frecuencia anterior)
Medios 400 - 2000 Hz
(+) | medios equilibrados - a sólo 1.2% de la mediana
(+) | los medios son lineales (1.5% delta a la frecuencia anterior)
Altos 2 - 16 kHz
(+) | máximos equilibrados - a sólo 2.5% de la mediana
(+) | los máximos son lineales (1.7% delta a la frecuencia anterior)
Total 100 - 16.000 Hz
(+) | el sonido global es lineal (4.9% de diferencia con la mediana)
En comparación con la misma clase
» 0% de todos los dispositivos probados de esta clase eran mejores, 0% similares, 99% peores
» El mejor tuvo un delta de 5%, la media fue 17%, el peor fue ###max##%
En comparación con todos los dispositivos probados
» 0% de todos los dispositivos probados eran mejores, 0% similares, 100% peores
» El mejor tuvo un delta de 4%, la media fue 24%, el peor fue ###max##%
Gestión de la energía - Batería de corta duración
Consumo de energía
La gran pantalla de 16 pulgadas es en gran parte responsable del consumo de energía en el uso diario y medimos hasta 24 vatios en reposo con el máximo brillo SDR. En comparación, el modelo más pequeño de 14 pulgadas consume 20 vatios a pesar del mayor brillo. En modo HDR, hasta 40 vatios es posible. Bajo carga, vemos brevemente unos 177 vatios, pero se estabiliza rápidamente en unos 170 vatios (~160-170 vatios durante los juegos). Así que el adaptador de corriente de 170 vatios es suficiente, pero no hay espacio para cargar la batería en tales situaciones. Un modelo de 200 o 230 vatios habría sido la mejor opción en este caso.
| Off / Standby | |
| Ocioso | |
| Carga |
|
Clave:
min: | |
| Lenovo Yoga Pro 9 16-IRP G8 i7-13705H, GeForce RTX 4060 Laptop GPU, Samsung PM9A1 MZVL21T0HCLR, Mini-LED, 3200x2000, 16" | Schenker VISION 16 Pro (M23) i7-13700H, GeForce RTX 4070 Laptop GPU, Samsung 990 Pro 1 TB, IPS, 2560x1600, 16" | Asus Vivobook Pro 16X K6604JV-MX016W i9-13980HX, GeForce RTX 4060 Laptop GPU, Solidigm P41 Plus SSDPFKNU010TZ, OLED, 3200x2000, 16" | Asus ProArt Studiobook 16 OLED H7604 i9-13980HX, GeForce RTX 4070 Laptop GPU, Phison EM2804TBMTCB47, OLED, 3200x2000, 16" | MSI Stealth 16 Studio A13VG i7-13700H, GeForce RTX 4070 Laptop GPU, Micron 3400 2TB MTFDKBA2T0TFH, IPS, 2560x1600, 16" | Apple MacBook Pro 16 2023 M2 Max M2 Max, M2 Max 38-Core GPU, Apple SSD AP2048Z, Mini-LED, 3456x2234, 16.2" | Medio NVIDIA GeForce RTX 4060 Laptop GPU | Media de la clase Multimedia | |
|---|---|---|---|---|---|---|---|---|
| Power Consumption | 22% | -14% | -18% | 3% | 22% | 2% | 41% | |
| Idle Minimum * (Watt) | 10.9 | 8.6 21% | 13.8 -27% | 12.8 -17% | 11 -1% | 5.2 52% | 11.5 ? -6% | 5.96 ? 45% |
| Idle Average * (Watt) | 22.6 | 12 47% | 16 29% | 19.9 12% | 18 20% | 16.5 27% | 16 ? 29% | 10.3 ? 54% |
| Idle Maximum * (Watt) | 23.5 | 12.4 47% | 19 19% | 20.3 14% | 19 19% | 16.8 29% | 20.3 ? 14% | 12.3 ? 48% |
| Load Average * (Watt) | 84.6 | 80 5% | 147 -74% | 131.4 -55% | 91 -8% | 113 -34% | 92.9 ? -10% | 67.4 ? 20% |
| Witcher 3 ultra * (Watt) | 159.5 | 147.7 7% | 147.8 7% | 196.5 -23% | 130 18% | 92 42% | ||
| Load Maximum * (Watt) | 177.3 | 173.1 2% | 244 -38% | 246.8 -39% | 228 -29% | 145 18% | 210 ? -18% | 113.2 ? 36% |
* ... más pequeño es mejor
Power consumption Witcher 3 / Stress test
Power consumption with an external monitor
Duración de la batería
Lenovo también equipa al Yoga Pro 9i 16 con una batería de 75 Wh. A la vista de las mayores tasas de consumo, uno puede ser perdonado por asumir ya que la duración de la batería está destinada a ser aún peor que en el modelo de 14 pulgadas. A 150 cd/m² (correspondiente al 50% del brillo SDR máximo) y 60 Hz, los resultados siguen siendo buenos con 6,5 horas en el test WLAN (165 Hz: ~5,5 horas) y 7,5 horas en el test de vídeo. Pero en cuanto se usa el brillo alto y/o la frecuencia más alta de 165 Hz, la cosa se vuelve problemática. A pleno brillo SDR, nuestro test Wi-Fi sólo dura algo más de 3.5 horas a 60 Hz y 15 minutos menos a 165 Hz. Un vídeo HDR con brillo máximo agota la batería por completo en sólo 133 minutos.
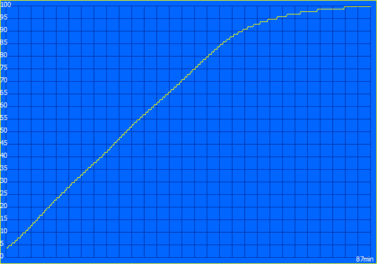
A la vista de estos resultados, Lenovo debería haber instalado una batería mayor en vez de la segunda ranura M.2 o al menos dar al cliente la elección. El proceso de carga es muy lineal hasta el 80% y tarda 48 minutos en llegar ahí. El proceso de carga completo tarda 87 minutos cuando el dispositivo está encendido.
| Lenovo Yoga Pro 9 16-IRP G8 i7-13705H, GeForce RTX 4060 Laptop GPU, 75 Wh | Schenker VISION 16 Pro (M23) i7-13700H, GeForce RTX 4070 Laptop GPU, 80 Wh | Asus Vivobook Pro 16X K6604JV-MX016W i9-13980HX, GeForce RTX 4060 Laptop GPU, 90 Wh | Asus ProArt Studiobook 16 OLED H7604 i9-13980HX, GeForce RTX 4070 Laptop GPU, 90 Wh | MSI Stealth 16 Studio A13VG i7-13700H, GeForce RTX 4070 Laptop GPU, 99.9 Wh | Apple MacBook Pro 16 2023 M2 Max M2 Max, M2 Max 38-Core GPU, 99.6 Wh | Media de la clase Multimedia | |
|---|---|---|---|---|---|---|---|
| Duración de Batería | 37% | 29% | 8% | 89% | 112% | 112% | |
| H.264 (h) | 7.5 | 7.8 4% | 5.3 -29% | 6 -20% | 7.7 3% | 18.7 149% | 16.1 ? 115% |
| WiFi v1.3 (h) | 6.4 | 7.8 22% | 6.5 2% | 5.6 -13% | 7.8 22% | 14.8 131% | 11.4 ? 78% |
| Load (h) | 0.7 | 1.3 86% | 1.5 114% | 1.1 57% | 2.4 243% | 1.1 57% | 1.692 ? 142% |
Pro
Contra
Veredicto - El Yoga Pro 9i tiene problemas sobre todo con la duración de la batería
Se supone que el Yoga Pro 9i 16 es el portátil multimedia más potente y mejor de Lenovo. Comparado con el más pequeño Yoga Pro 9i 14sin embargo, uno tiene la impresión de que el fabricante ha hecho recortes en varias áreas en el modelo de 16 pulgadas. Pero en primer lugar, el rendimiento es en general muy bueno y los dos componentes principales, es decir, la CPU y la GPU, son más rápidos que en el modelo de 14 pulgadas. Por eso nos preguntamos por qué el Yoga Pro 9i 16 no ofrece Advanced Optimus y por qué el puerto HDMI sólo soporta el estándar 1.4b. En consecuencia, las pantallas 4K sólo pueden funcionar a 30 Hz, lo que no se ajusta al nivel actual de la tecnología ni al elevado precio. También es problemática la decisión de hacer soldar la RAM. Sobre el tema de la carcasa, otra cosa que nos molesta es la chirriante placa base.
El brillante panel mini-LED tiene un aspecto fantástico, especialmente con contenido HDR, y también ofrece una reproducción precisa del color además de una cobertura AdobeRGB completa. Por desgracia, las medidas son peores aquí que en el modelo de 14 pulgadas; el fabricante parece haberse esforzado menos aquí, ya que el modelo grande de 16 pulgadas parpadea en todos los niveles de brillo. La gran pantalla también tiene altos índices de consumo de energía, por lo que no podemos entender por qué Lenovo no ha instalado una batería más grande.
El Lenovo Yoga Pro 9i 16, en sus propios términos, es un muy buen portátil multimedia con un gran panel mini-LED, alto rendimiento, buen teclado y fantásticos altavoces. Sin embargo, Lenovo ha recortado en varias áreas y hay ciertos inconvenientes en comparación con el modelo más pequeño de 14 pulgadas, lo que es incomprensible.
Por supuesto, hay muchos aspectos positivos. Ya hemos mencionado los sólidos valores de rendimiento junto con el buen teclado, el teclado numérico y los excelentes altavoces. Excluyendo el chirriante panel de la base, la carcasa es muy buena y la calidad de construcción muy estable. Por último, el modelo de 16 pulgadas también ofrece una segunda ranura SSD.
La duración de la batería es muy pobre en general y sin duda un punto débil. El Apple MacBook Pro 16 tiene aquí una enorme ventaja a pesar de su excelente y brillante panel mini-LED. Los rivales equipados con Windows y pantallas OLED, como el Asus Vivobook Pro 16X o Asus Studiobook 16 OLED no lo hacen mejor aquí y están claramente por detrás en lo que respecta al brillo de la pantalla. Rivales IPS Schenker Vision 16 Pro y el MSI Stealth 16 Studio tienen ventajas como las pantallas mate y la ausencia de parpadeo PWN, pero no soportan HDR.
Precio y disponibilidad
En la tienda de Lenovo en EE. UU., una variante con el Core i9-13905H, RTX 4060 y 32 GB de RAM está disponible actualmente por 2.199,99 dólares.
Los precios son a fecha de 02.08.2023 y están sujetos a cambios.
Lenovo Yoga Pro 9 16-IRP G8
- 07/31/2023 v7 (old)
Andreas Osthoff
Transparencia
La selección de los dispositivos que se van a reseñar corre a cargo de nuestro equipo editorial. La muestra de prueba fue proporcionada al autor en calidad de préstamo por el fabricante o el minorista a los efectos de esta reseña. El prestamista no tuvo ninguna influencia en esta reseña, ni el fabricante recibió una copia de la misma antes de su publicación. No había ninguna obligación de publicar esta reseña. Como empresa de medios independiente, Notebookcheck no está sujeta a la autoridad de fabricantes, minoristas o editores.
Así es como prueba Notebookcheck
Cada año, Notebookcheck revisa de forma independiente cientos de portátiles y smartphones utilizando procedimientos estandarizados para asegurar que todos los resultados son comparables. Hemos desarrollado continuamente nuestros métodos de prueba durante unos 20 años y hemos establecido los estándares de la industria en el proceso. En nuestros laboratorios de pruebas, técnicos y editores experimentados utilizan equipos de medición de alta calidad. Estas pruebas implican un proceso de validación en varias fases. Nuestro complejo sistema de clasificación se basa en cientos de mediciones y puntos de referencia bien fundamentados, lo que mantiene la objetividad.

