Estreno del Intel Core i7-12800H: Análisis del portátil Razer Blade 15
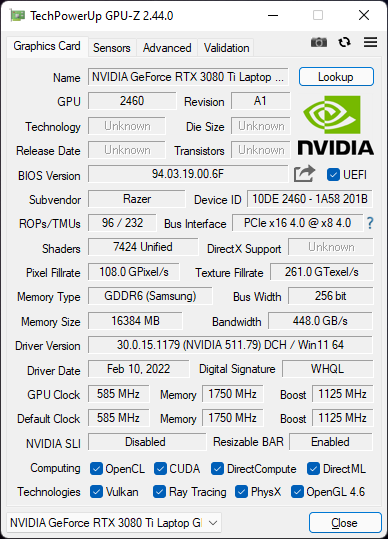
Razer ha renovado su serie Blade 15 este año para incluir las últimas CPUs de Intel y GPUs de Nvidia. En este caso, el modelo recibe las CPUs Core i7-12800H y Core i9-12900H de 12ª generación junto con las GeForce RTX 3070 Ti y 3080 Ti (110 W TGP) para sustituir a las antiguas opciones Core i7-11800H, Core i9-11900H, RTX 3070 y RTX 3080 (105 W TGP) de 11ª generación. Este análisis se centrará en las diferencias de rendimiento que los usuarios pueden esperar al actualizar de un Razer Blade 15 antiguo a la última configuración de 2022 en el análisis.
Entre las alternativas al Blade 15 se encuentran otros portátiles de juego ultradelgados de 15,6 pulgadas como el Eurocom RX315, MSI GS66, ADATA XPG Xenia 15o el Serie Asus Zephyrus S
Más reseñas de Razer:
Posibles contendientes en la comparación
Valoración | Fecha | Modelo | Peso | Altura | Tamaño | Resolución | Precio |
|---|---|---|---|---|---|---|---|
| 89.1 % v7 (old) | 03/2022 | Razer Blade 15 2022 i7-12800H, GeForce RTX 3080 Ti Laptop GPU | 2.1 kg | 16.99 mm | 15.60" | 2560x1440 | |
| 87.5 % v7 (old) | 05/2021 | Razer Blade 15 Advanced Model Early 2021 i7-10875H, GeForce RTX 3080 Laptop GPU | 2 kg | 16.99 mm | 15.60" | 1920x1080 | |
| 85.9 % v7 (old) | 08/2020 | Razer Blade 15 RTX 2080 Super Max-Q i7-10875H, GeForce RTX 2080 Super Max-Q | 2.2 kg | 17.8 mm | 15.60" | 1920x1080 | |
v (old) | 03/2022 | Schenker XMG Neo 15 E22 (Early 2022, RTX 3080 Ti) i7-12700H, GeForce RTX 3080 Ti Laptop GPU | 2.2 kg | 26.6 mm | 15.60" | 2560x1440 | |
| 87.3 % v7 (old) | 10/2021 | ADATA XPG Xenia 15 i7-11800H, GeForce RTX 3070 Laptop GPU | 1.9 kg | 20.5 mm | 15.60" | 2560x1440 | |
| 83 % v7 (old) | 01/2022 | Eurocom Nightsky ARX315 R9 5900X, GeForce RTX 3070 Laptop GPU | 2.6 kg | 32.5 mm | 15.60" | 1920x1080 |
Caso
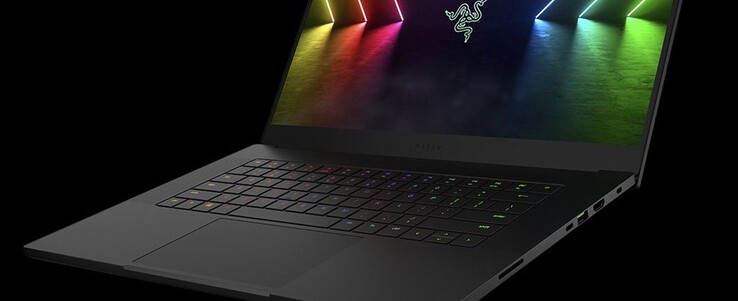
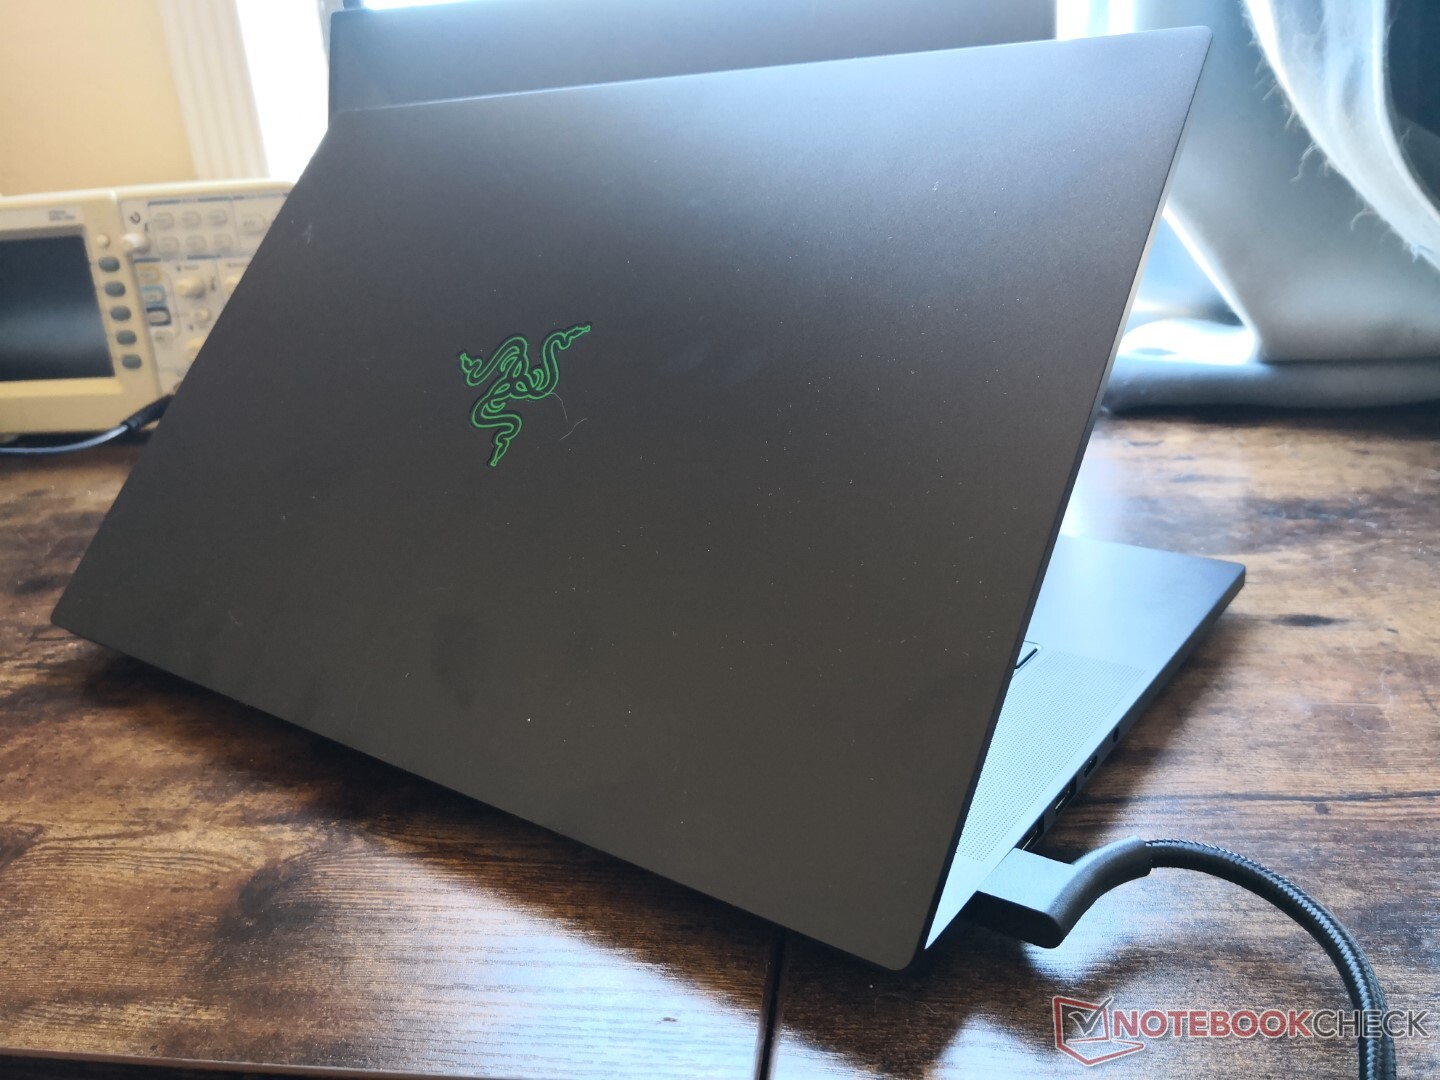
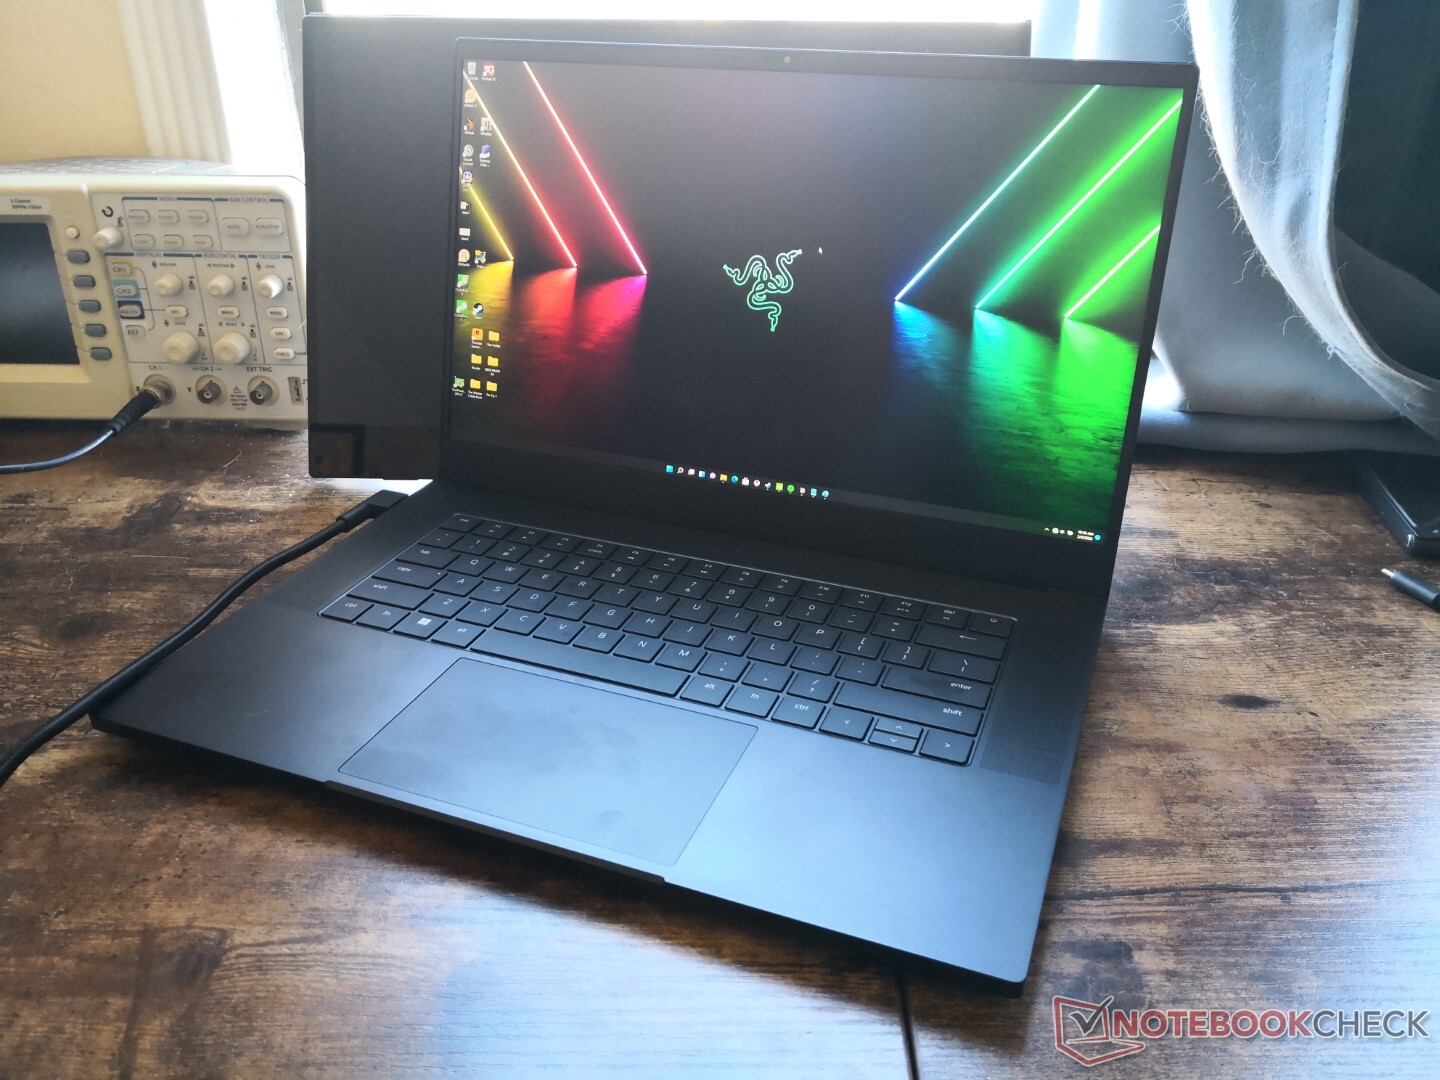
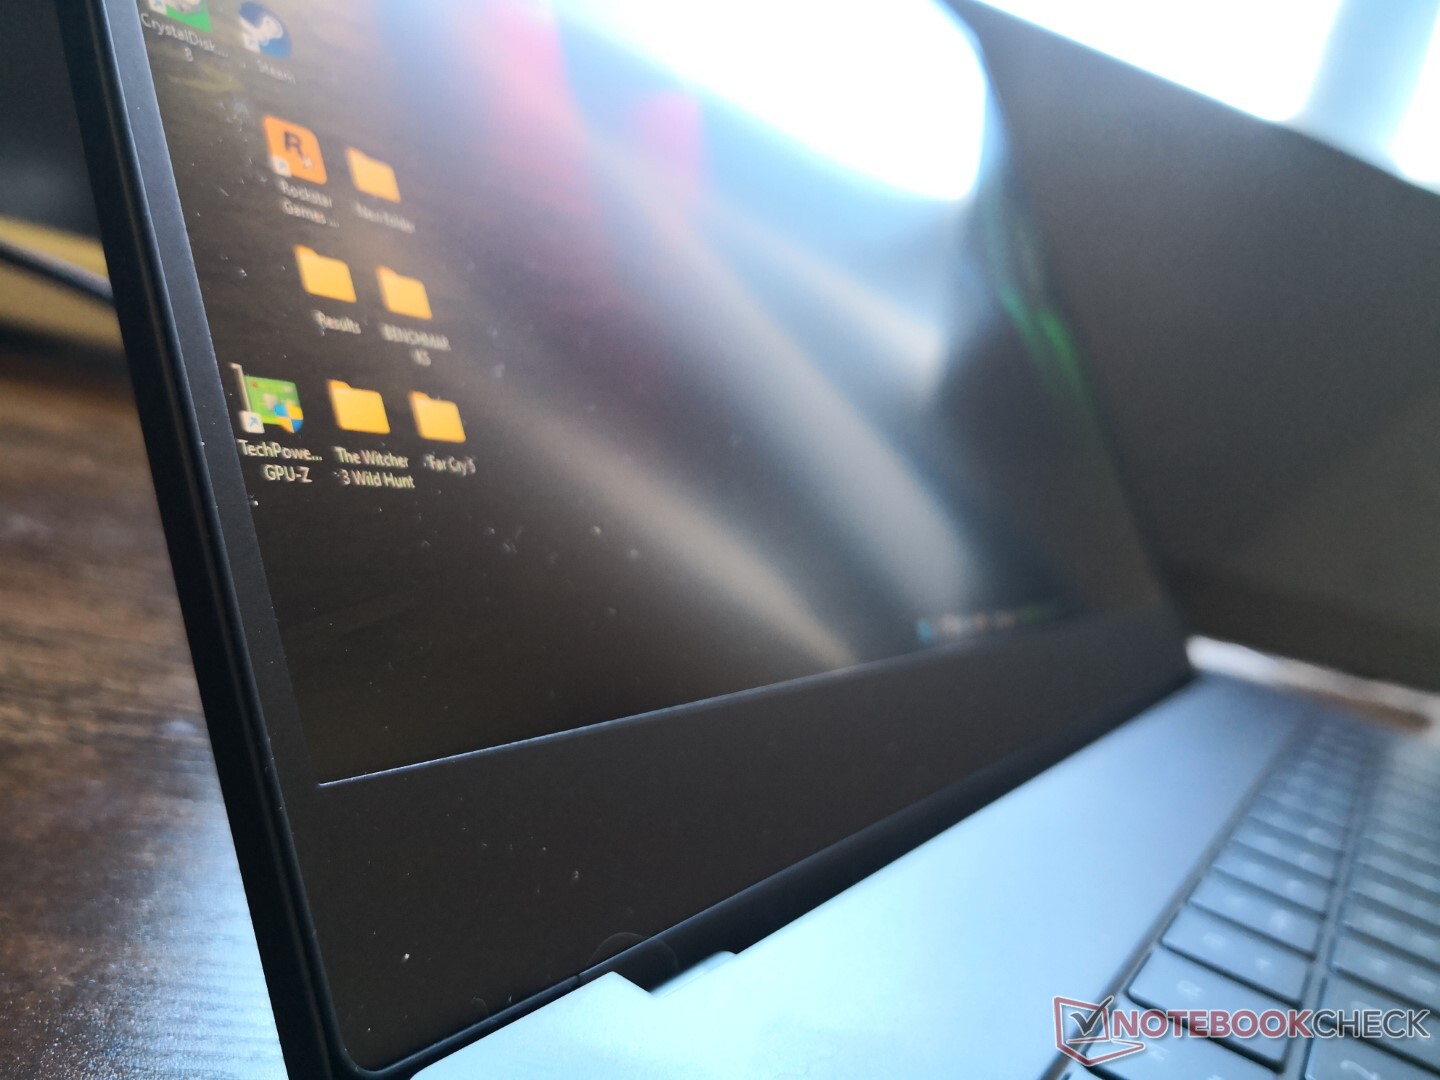
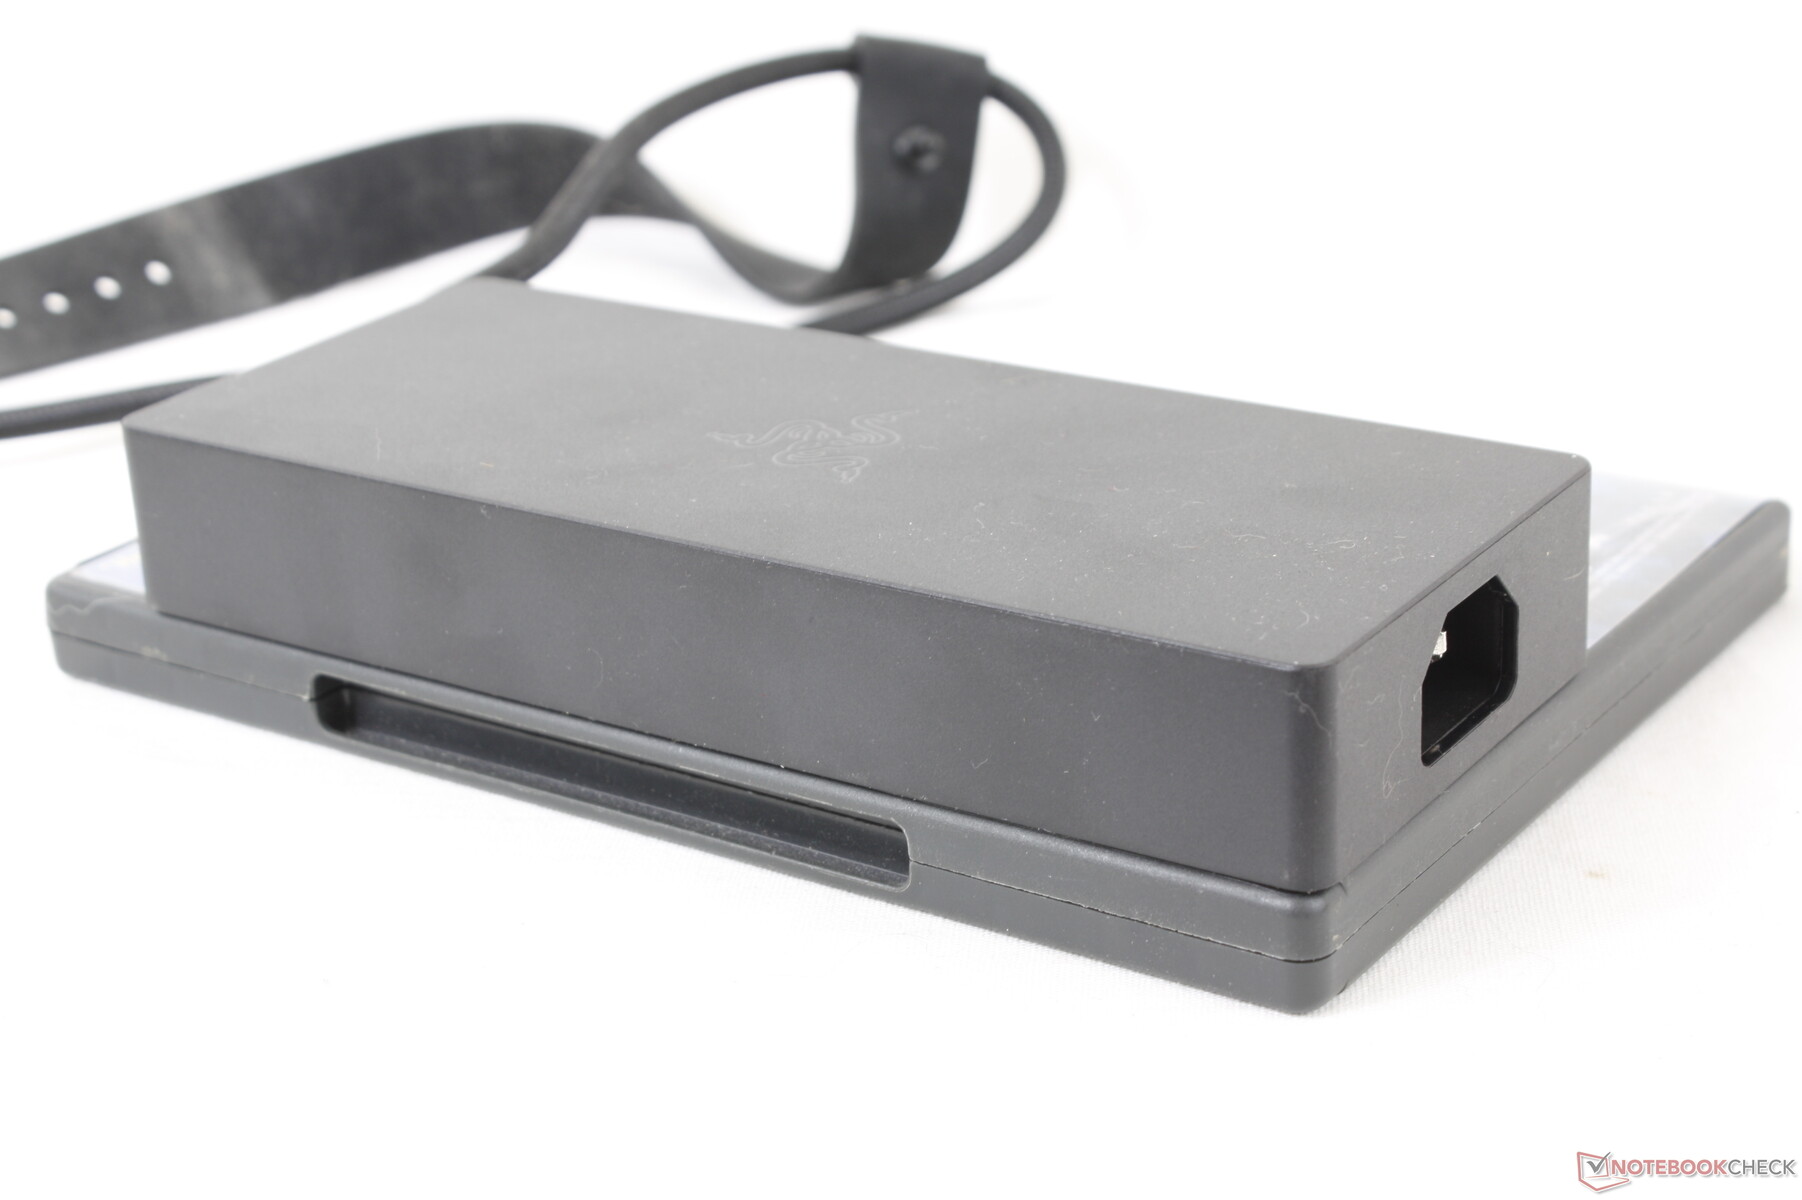
El chasis sigue siendo prácticamente idéntico al del modelo avanzado del año pasado, por lo que no hay cambios en las dimensiones ni en la sensación del sistema. Si ha manejado un Blade Stealth, Blade 14, Blade 15o Blade Pro 17 en el pasado, entonces esta última 2022 le resultará familiar.
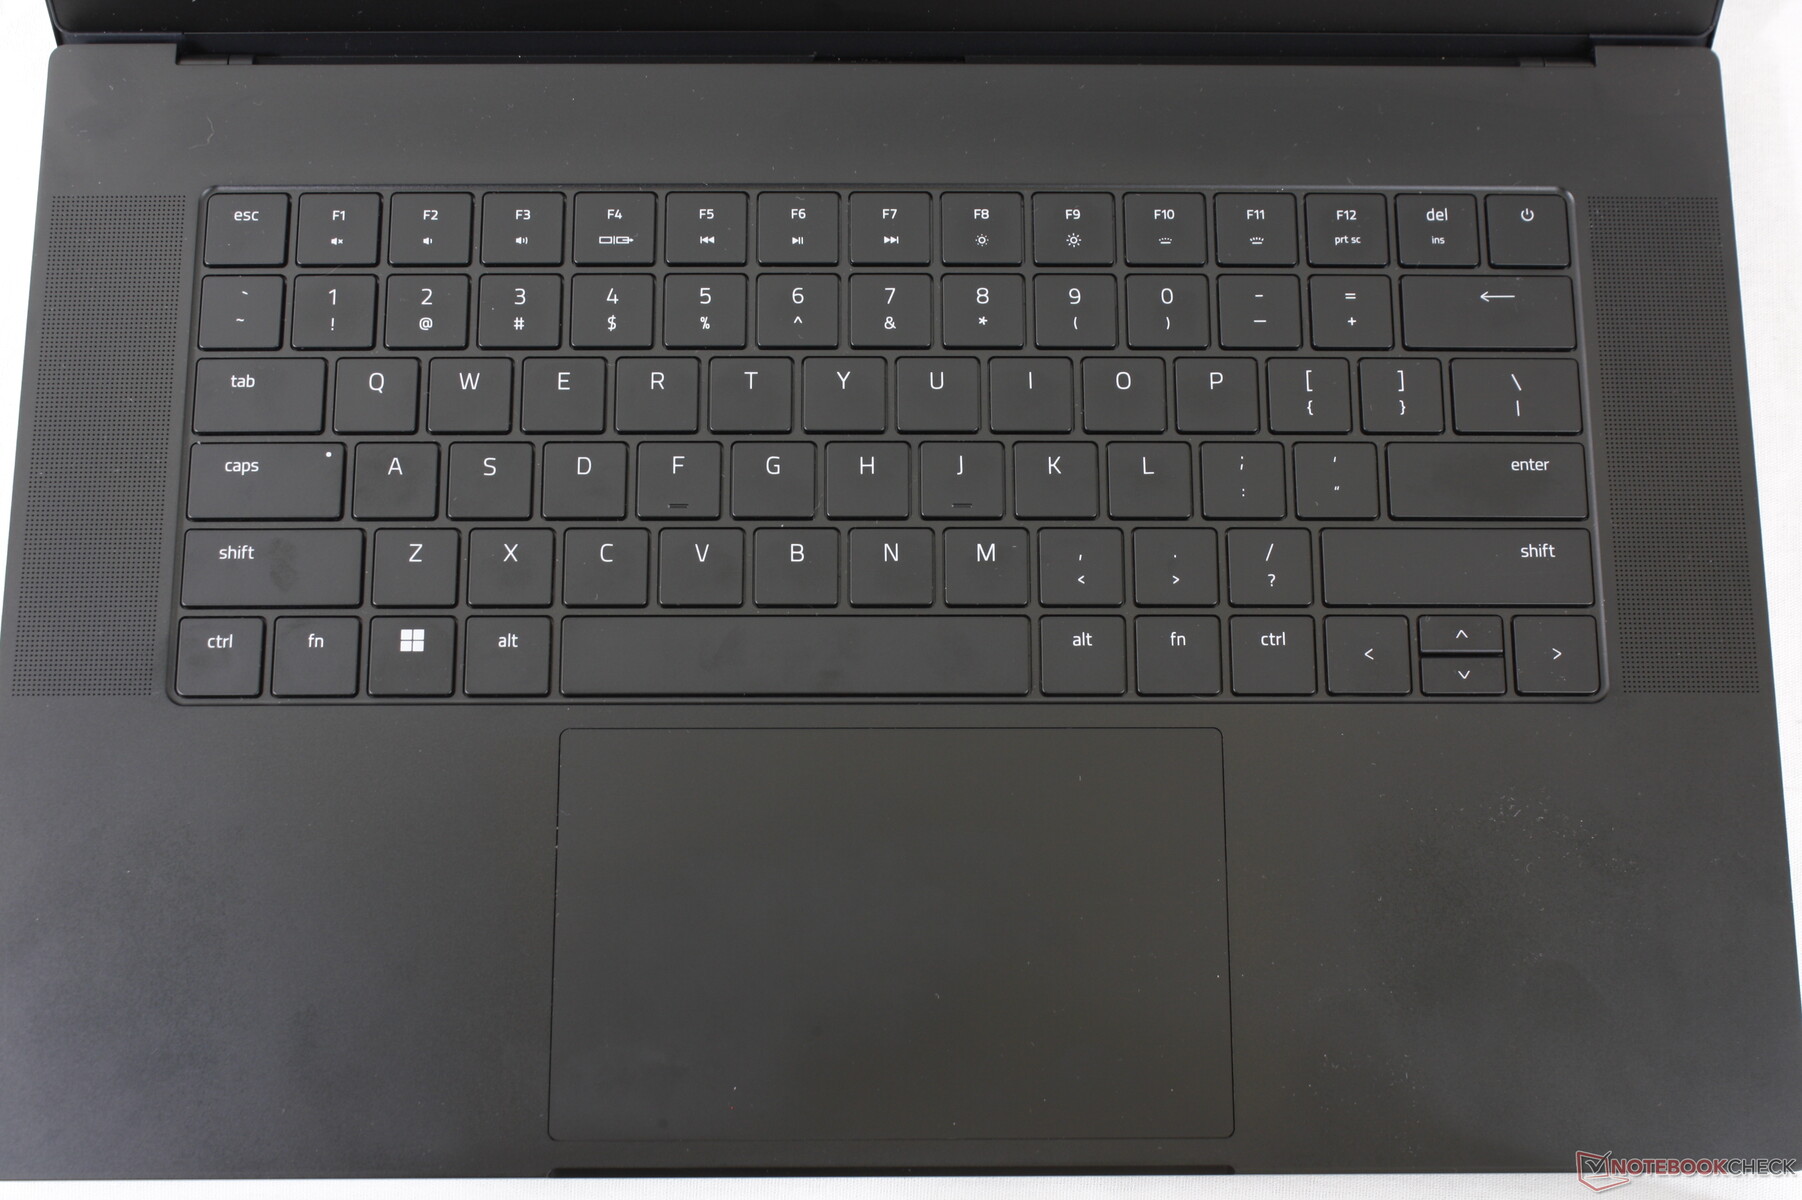
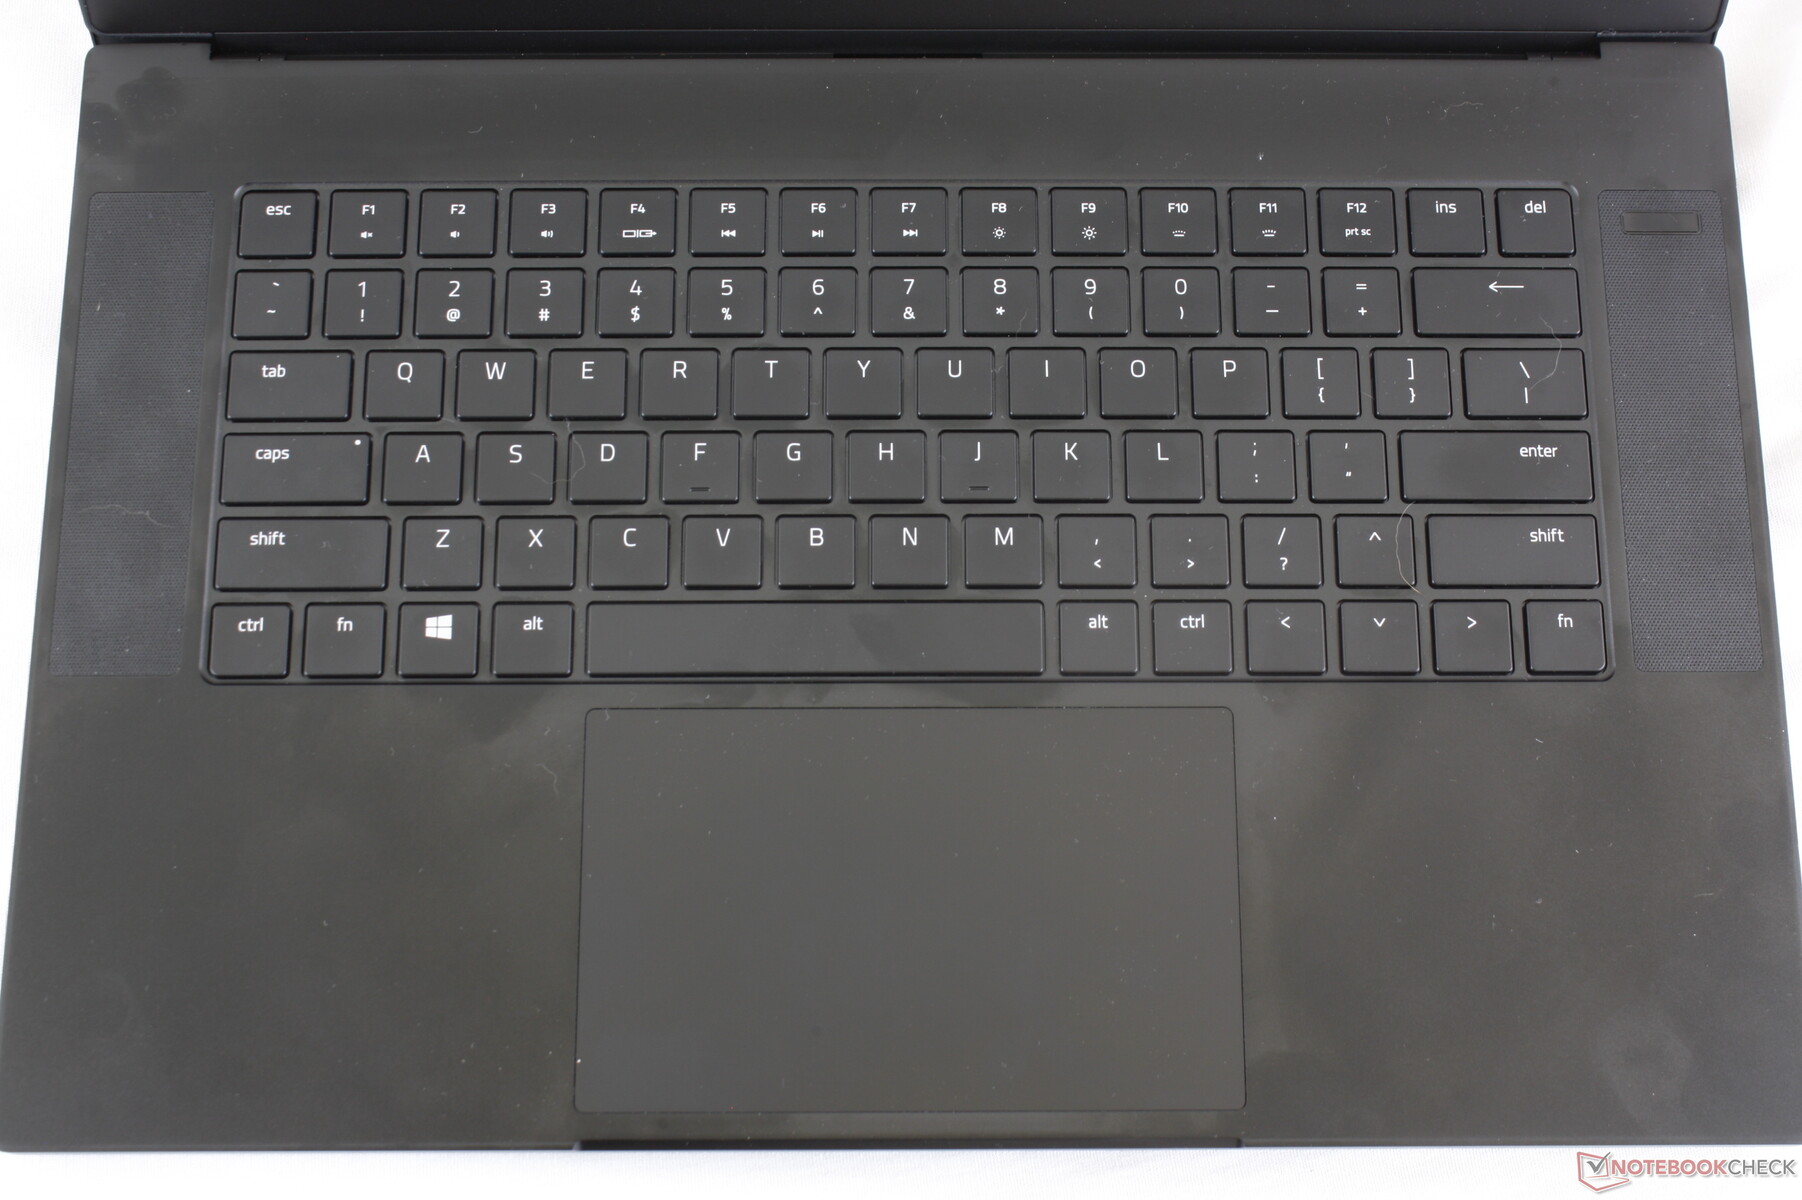
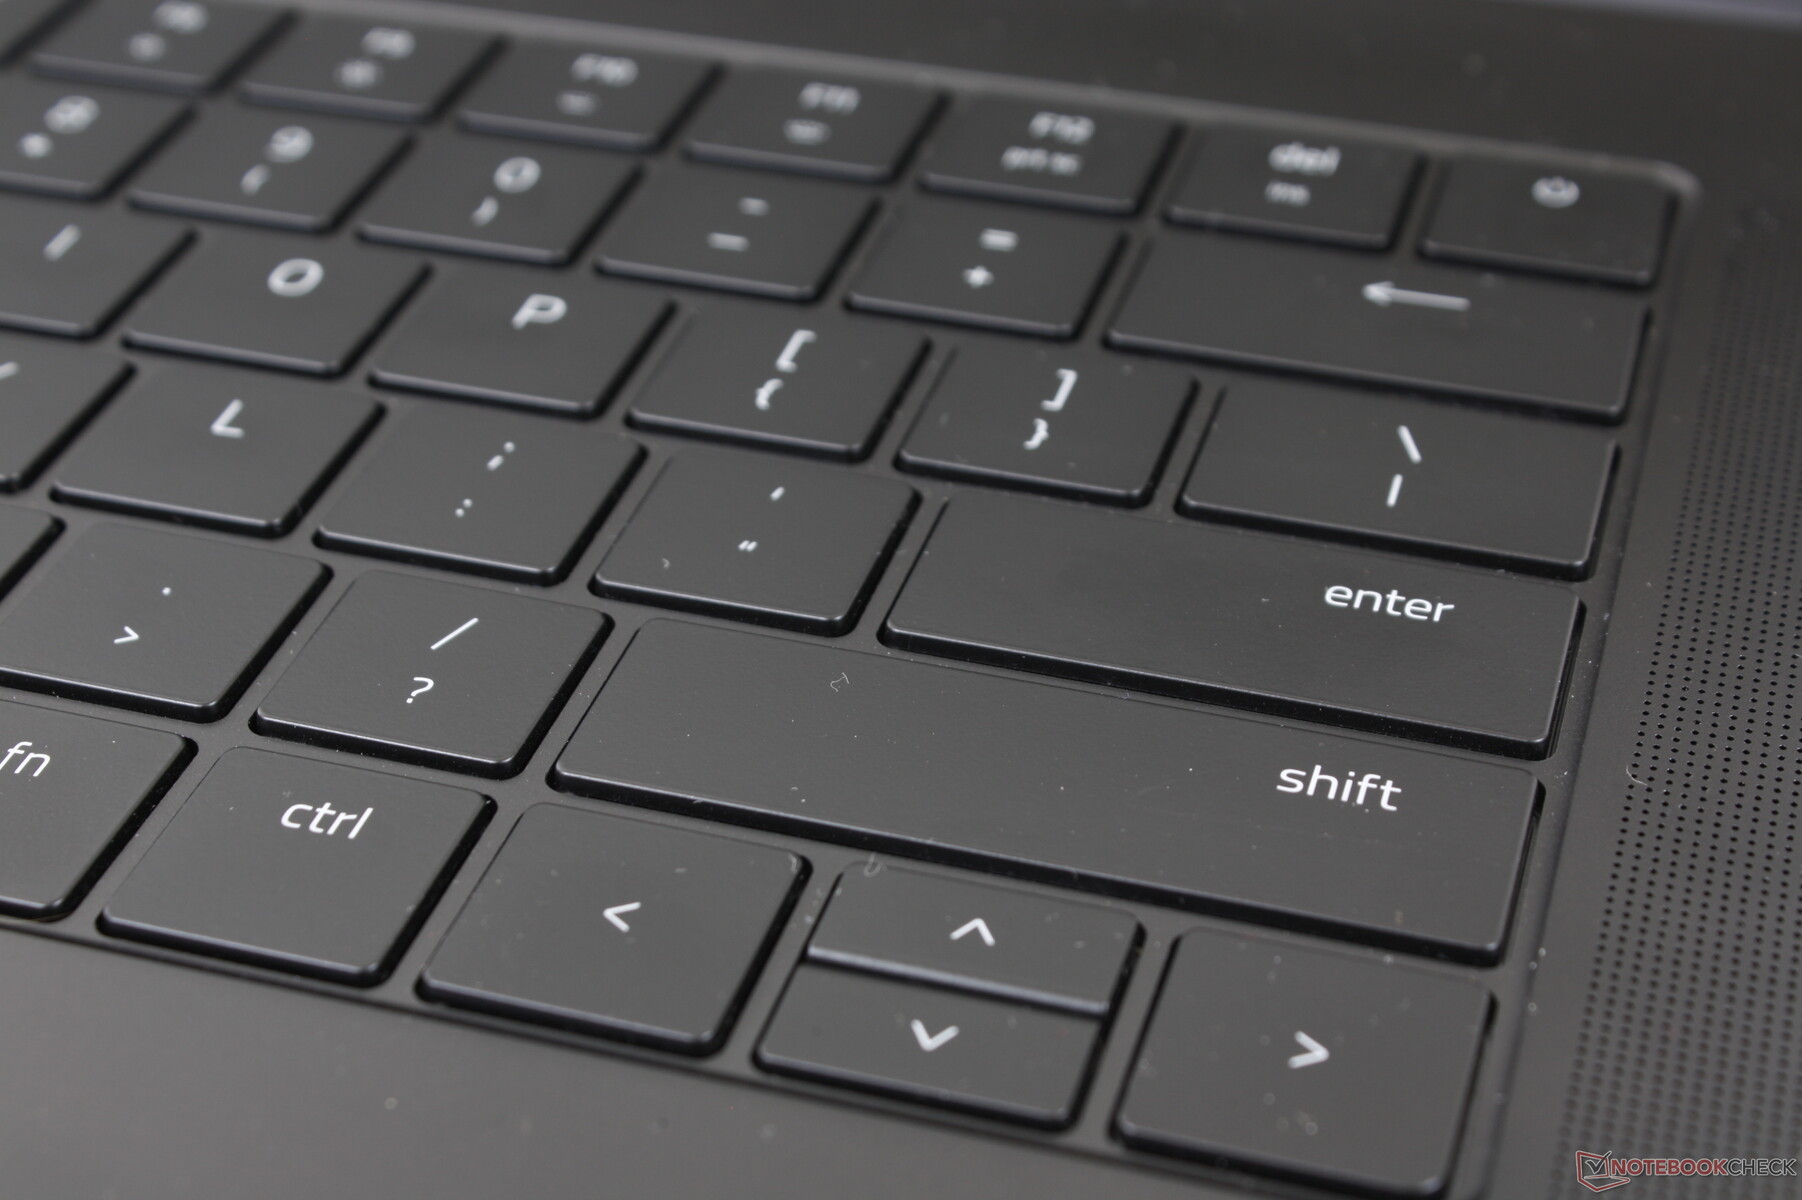
El único cambio físico importante de este año es el de las tapas del teclado, que ahora son ligeramente más grandes que antes. El botón de encendido también ha sido reubicado, lo que sirve para distinguir visualmente el modelo 2022 de los anteriores.
Lector de tarjetas SD
| SD Card Reader | |
| average JPG Copy Test (av. of 3 runs) | |
| Razer Blade 15 Advanced Model Early 2021 (AV PRO microSD 128 GB V60) | |
| Razer Blade 15 RTX 2080 Super Max-Q (Toshiba Exceria Pro SDXC 64 GB UHS-II) | |
| Razer Blade 15 2022 (Toshiba Exceria Pro SDXC 64 GB UHS-II) | |
| ADATA XPG Xenia 15 (AV Pro V60) | |
| Schenker XMG Neo 15 E22 (Early 2022, RTX 3080 Ti) | |
| Eurocom Nightsky ARX315 (AV Pro V60) | |
| maximum AS SSD Seq Read Test (1GB) | |
| Razer Blade 15 RTX 2080 Super Max-Q (Toshiba Exceria Pro SDXC 64 GB UHS-II) | |
| Razer Blade 15 Advanced Model Early 2021 (AV PRO microSD 128 GB V60) | |
| Razer Blade 15 2022 (Toshiba Exceria Pro SDXC 64 GB UHS-II) | |
| ADATA XPG Xenia 15 (AV Pro V60) | |
| Eurocom Nightsky ARX315 (AV Pro V60) | |
| Schenker XMG Neo 15 E22 (Early 2022, RTX 3080 Ti) | |
Comunicación
El módulo WLAN se ha actualizado al Killer AX1690i, que es esencialmente la versión para juegos del actual Intel Wi-Fi 6E AX210.
Cámara web


Mantenimiento
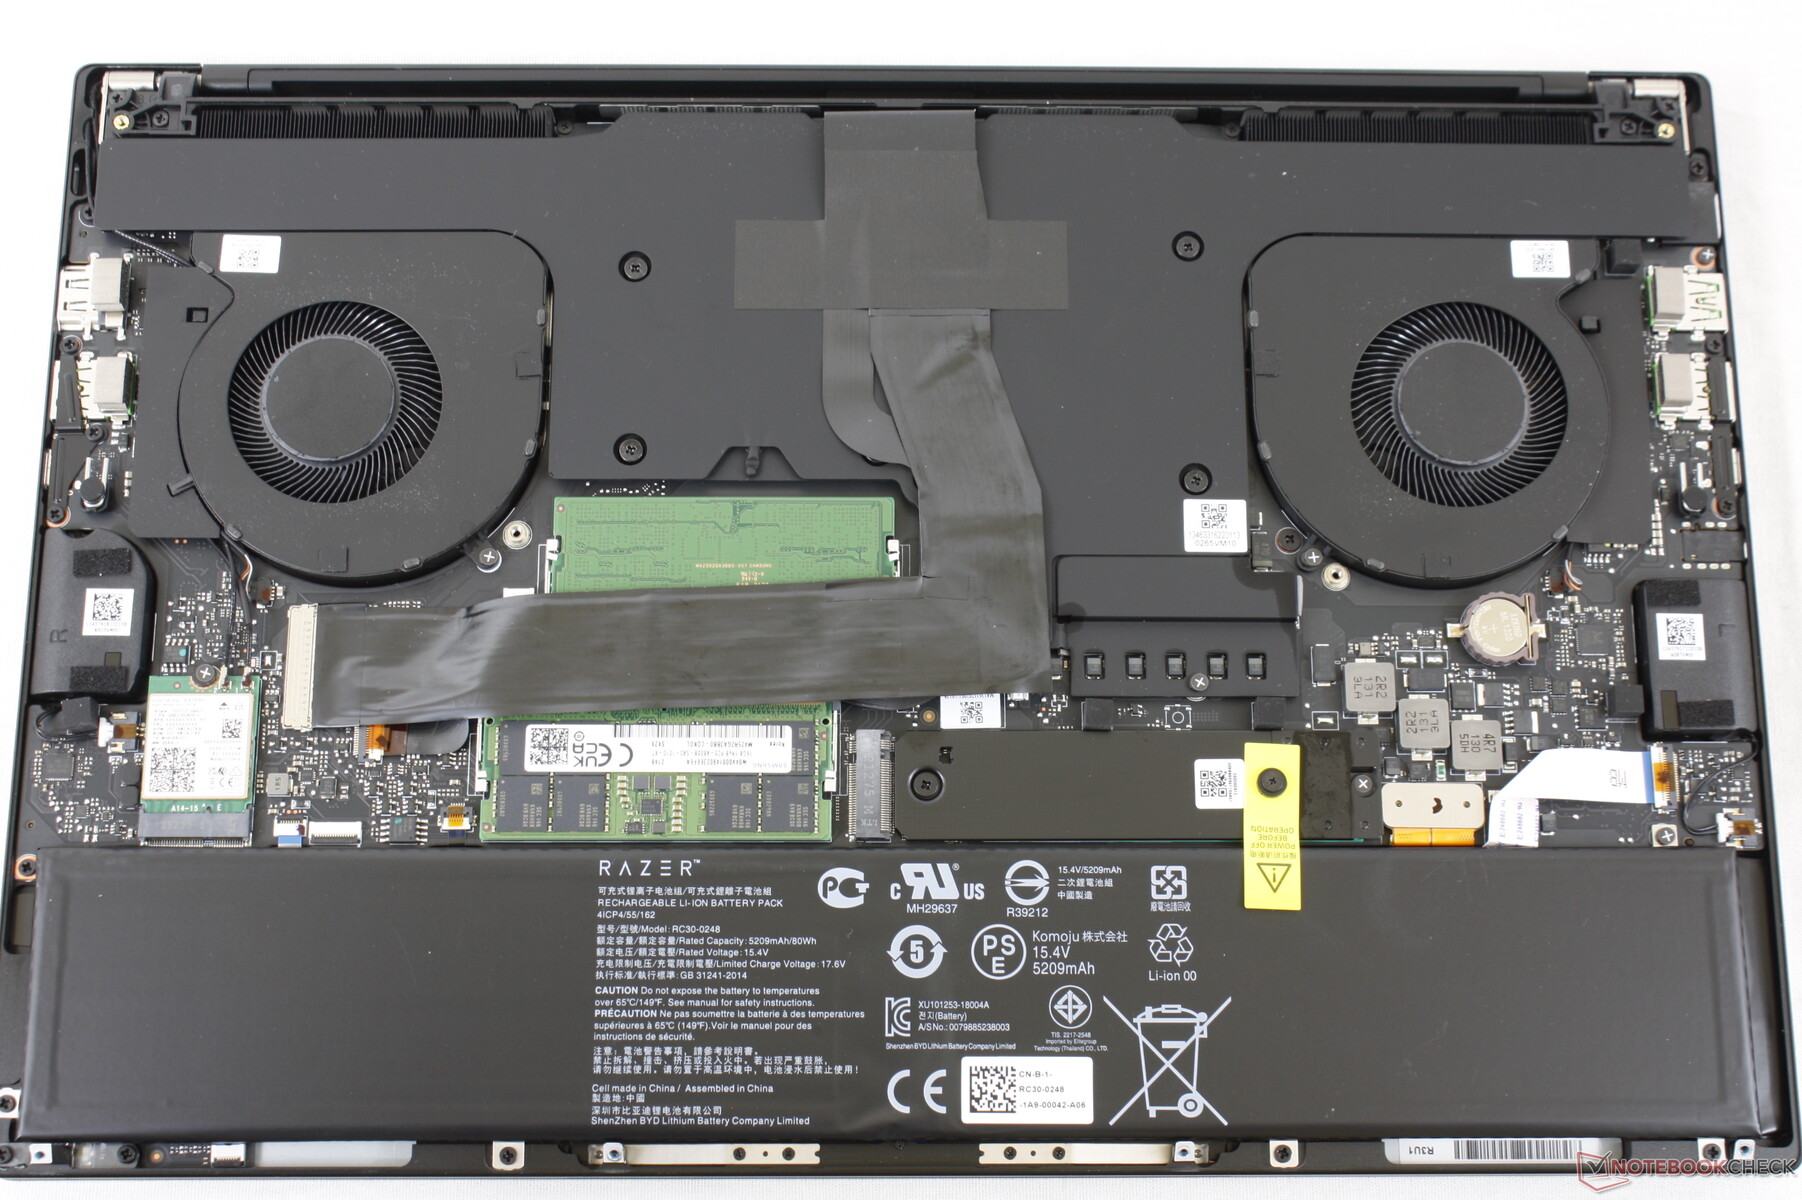
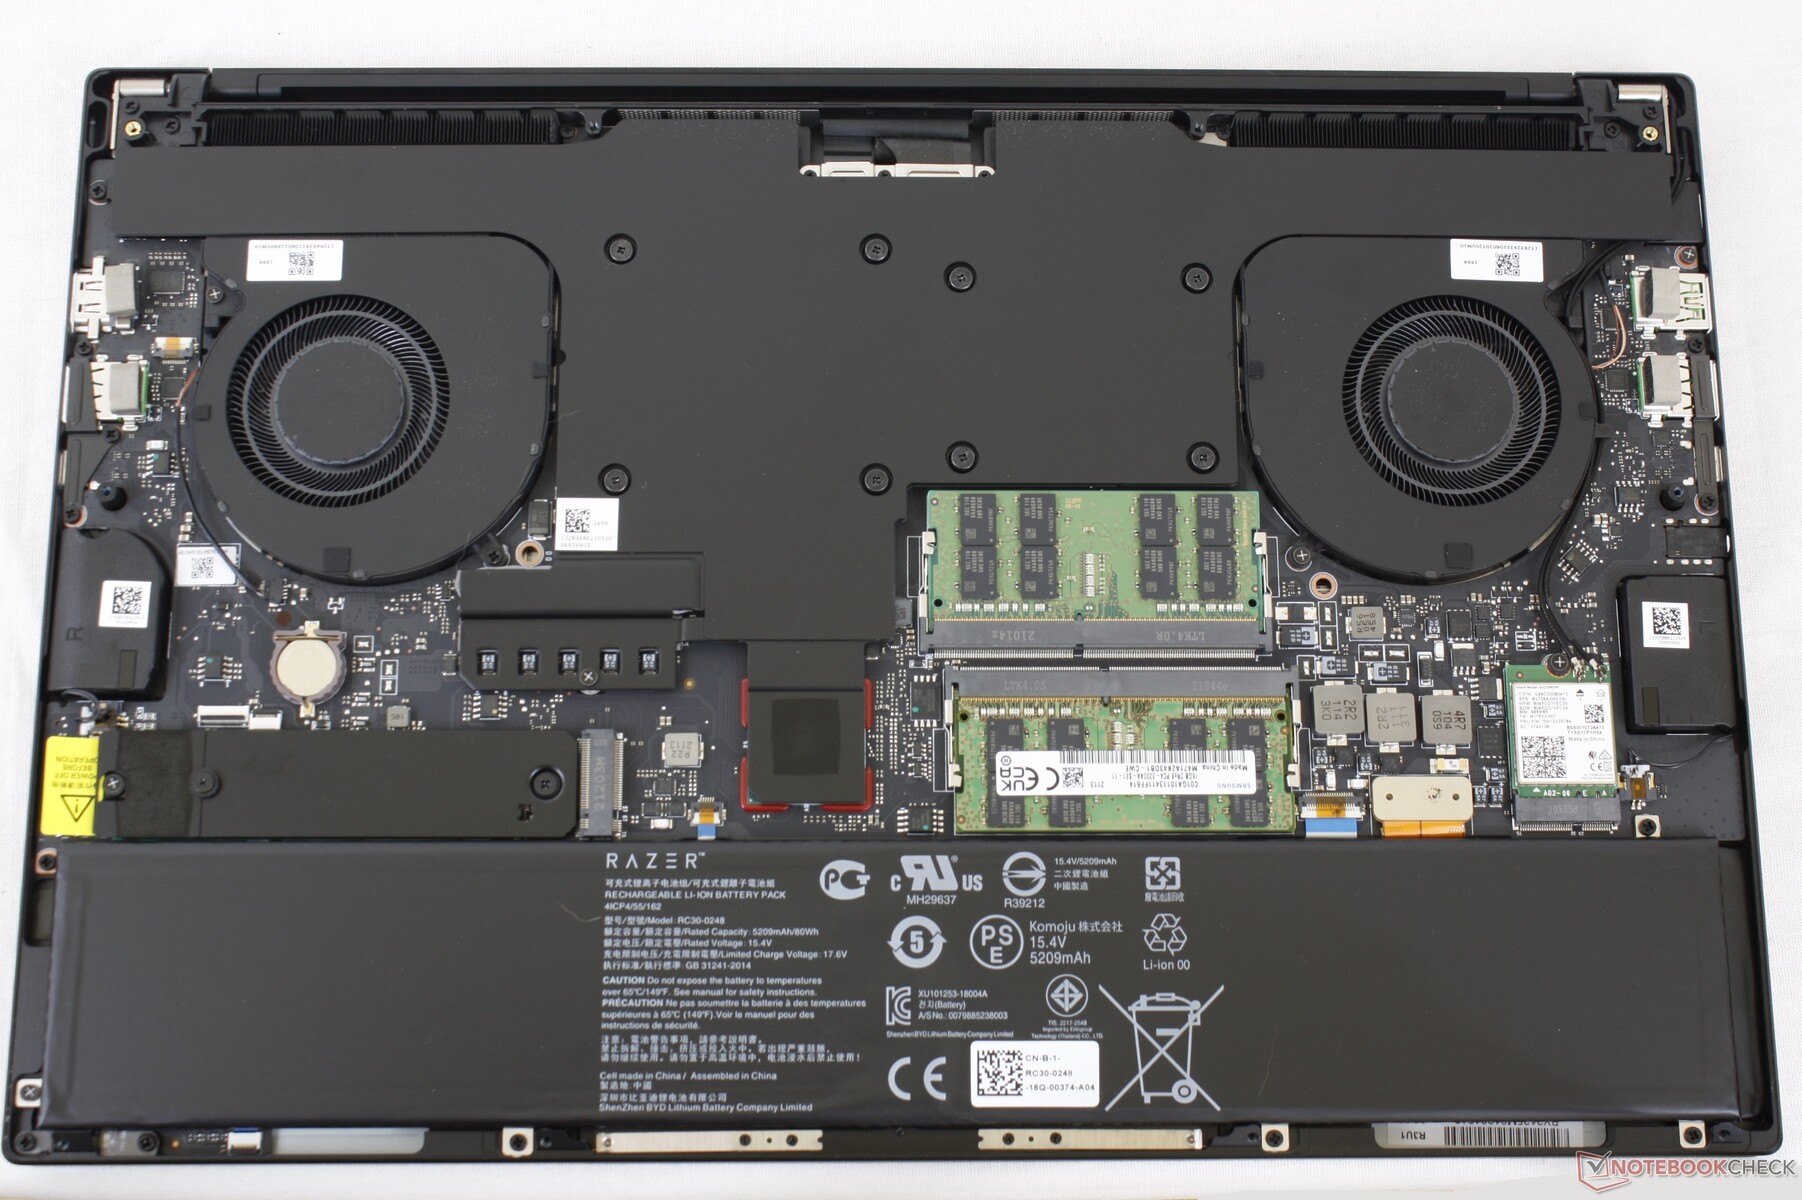
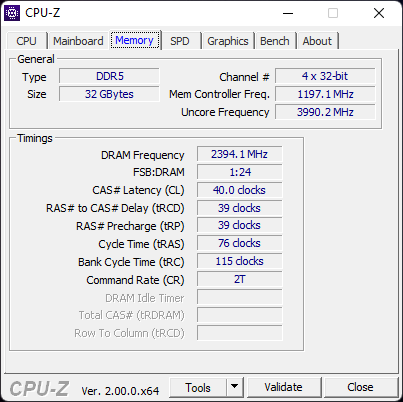
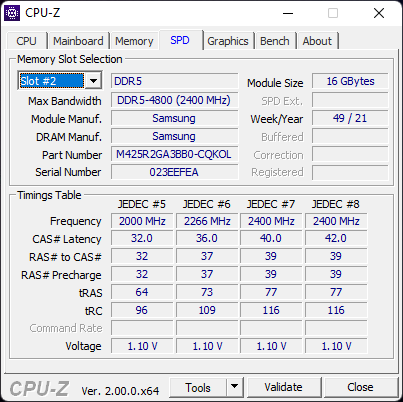
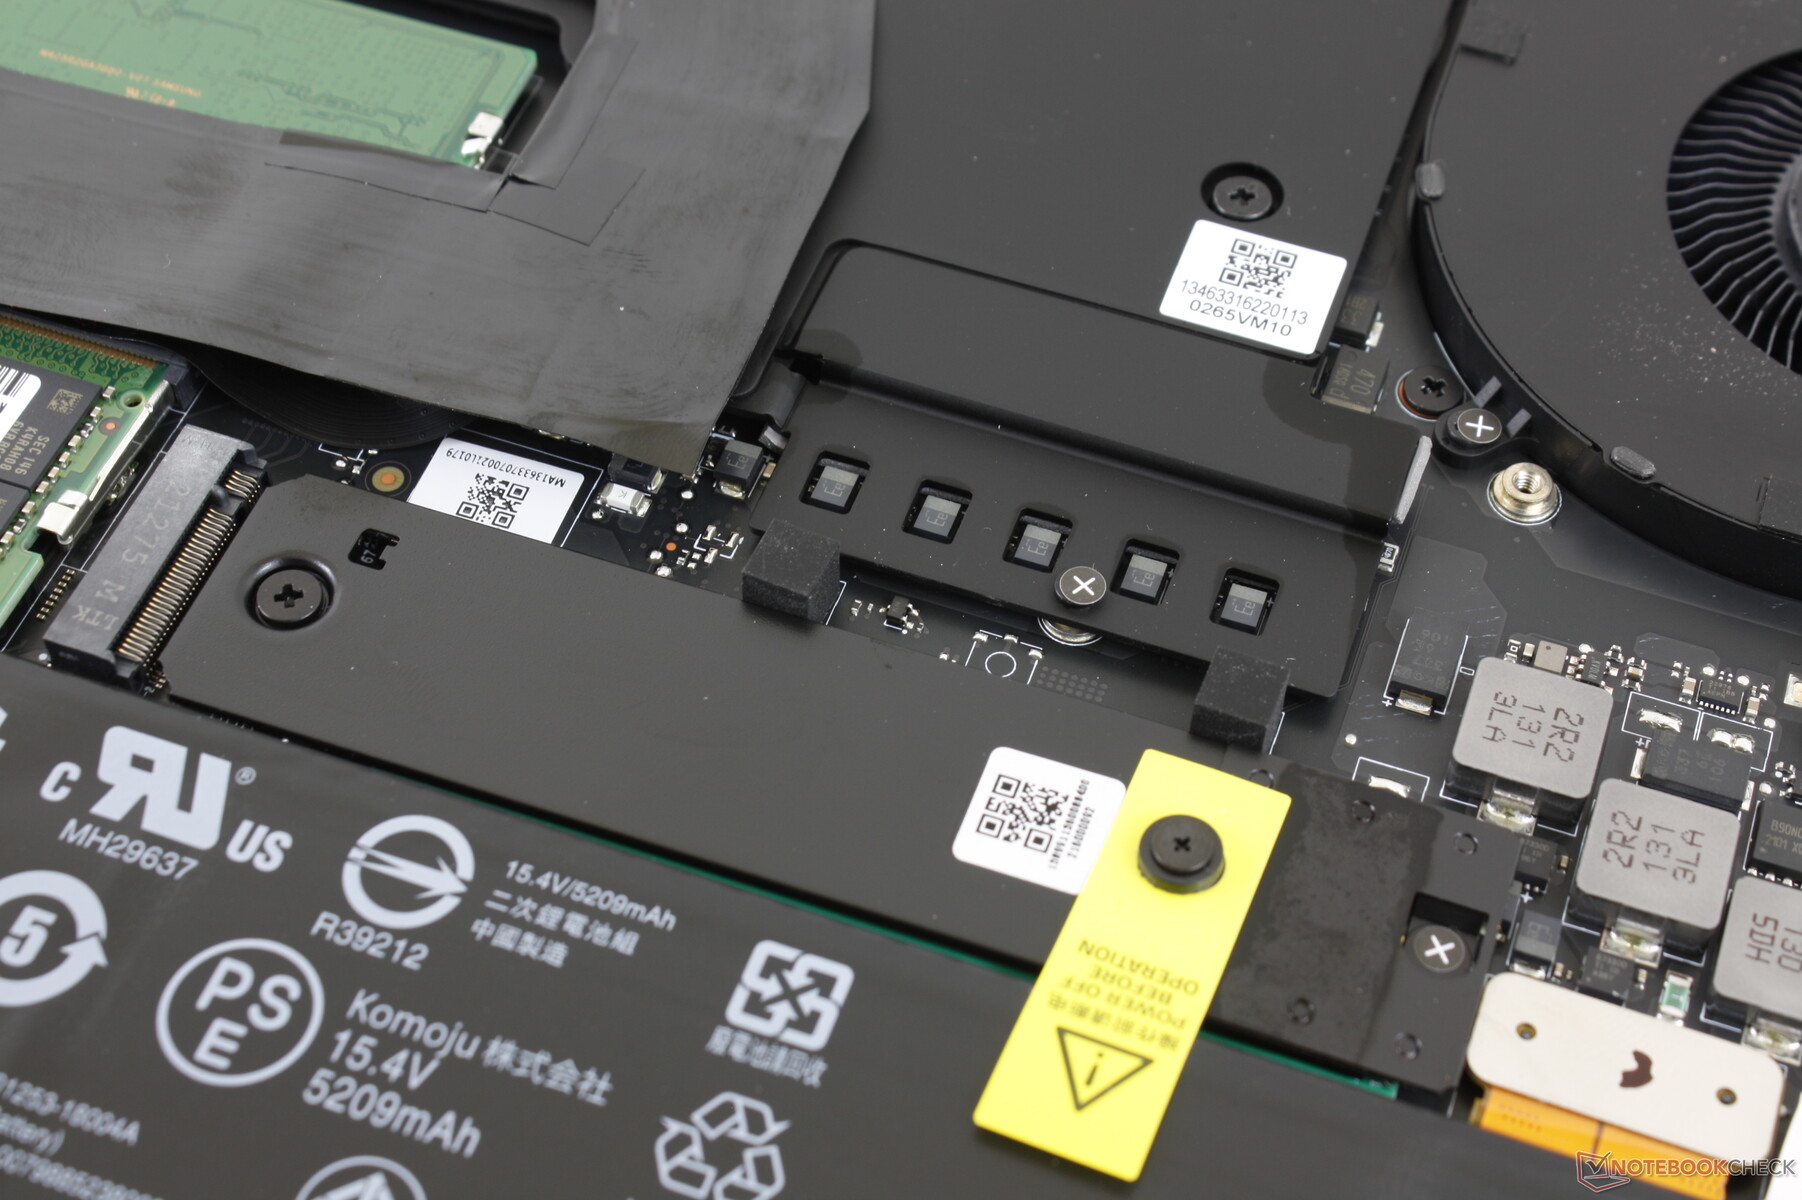
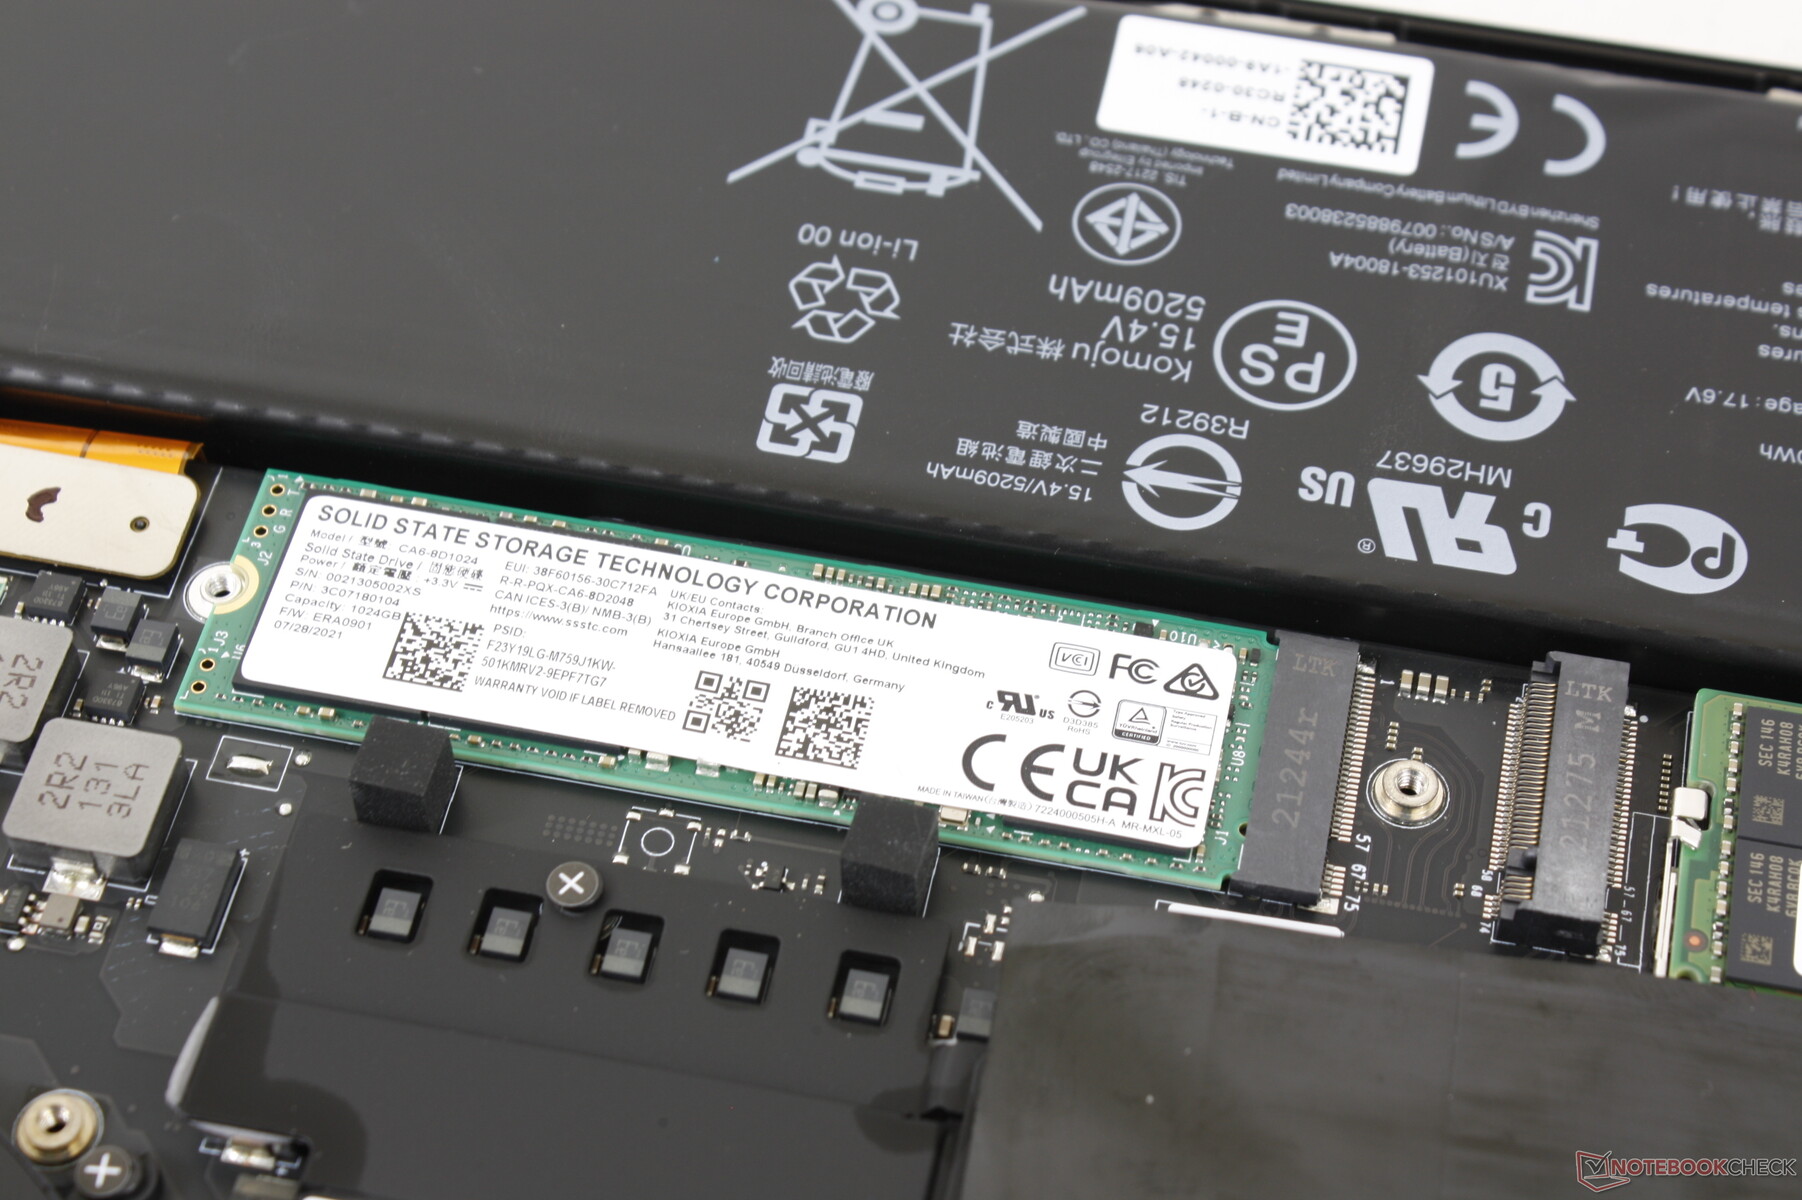
Hay cambios menores en las partes internas y los ventiladores en comparación con el modelo del año pasado, como se muestra a continuación. Se mantienen las 2 ranuras M.2 2280 PCIe4, las 2 ranuras SODIMM y el módulo WLAN extraíble.
Accesorios y garantía
No hay más extras en la caja que el adaptador de CA y la documentación.
La garantía básica de un año y la garantía de dos años de la batería se incluyen con cada nueva compra de un modelo Blade de 12ª generación. Sin embargo, hay que tener en cuenta que la garantía de dos años de la batería no se aplica actualmente a los modelos Blade más antiguos.
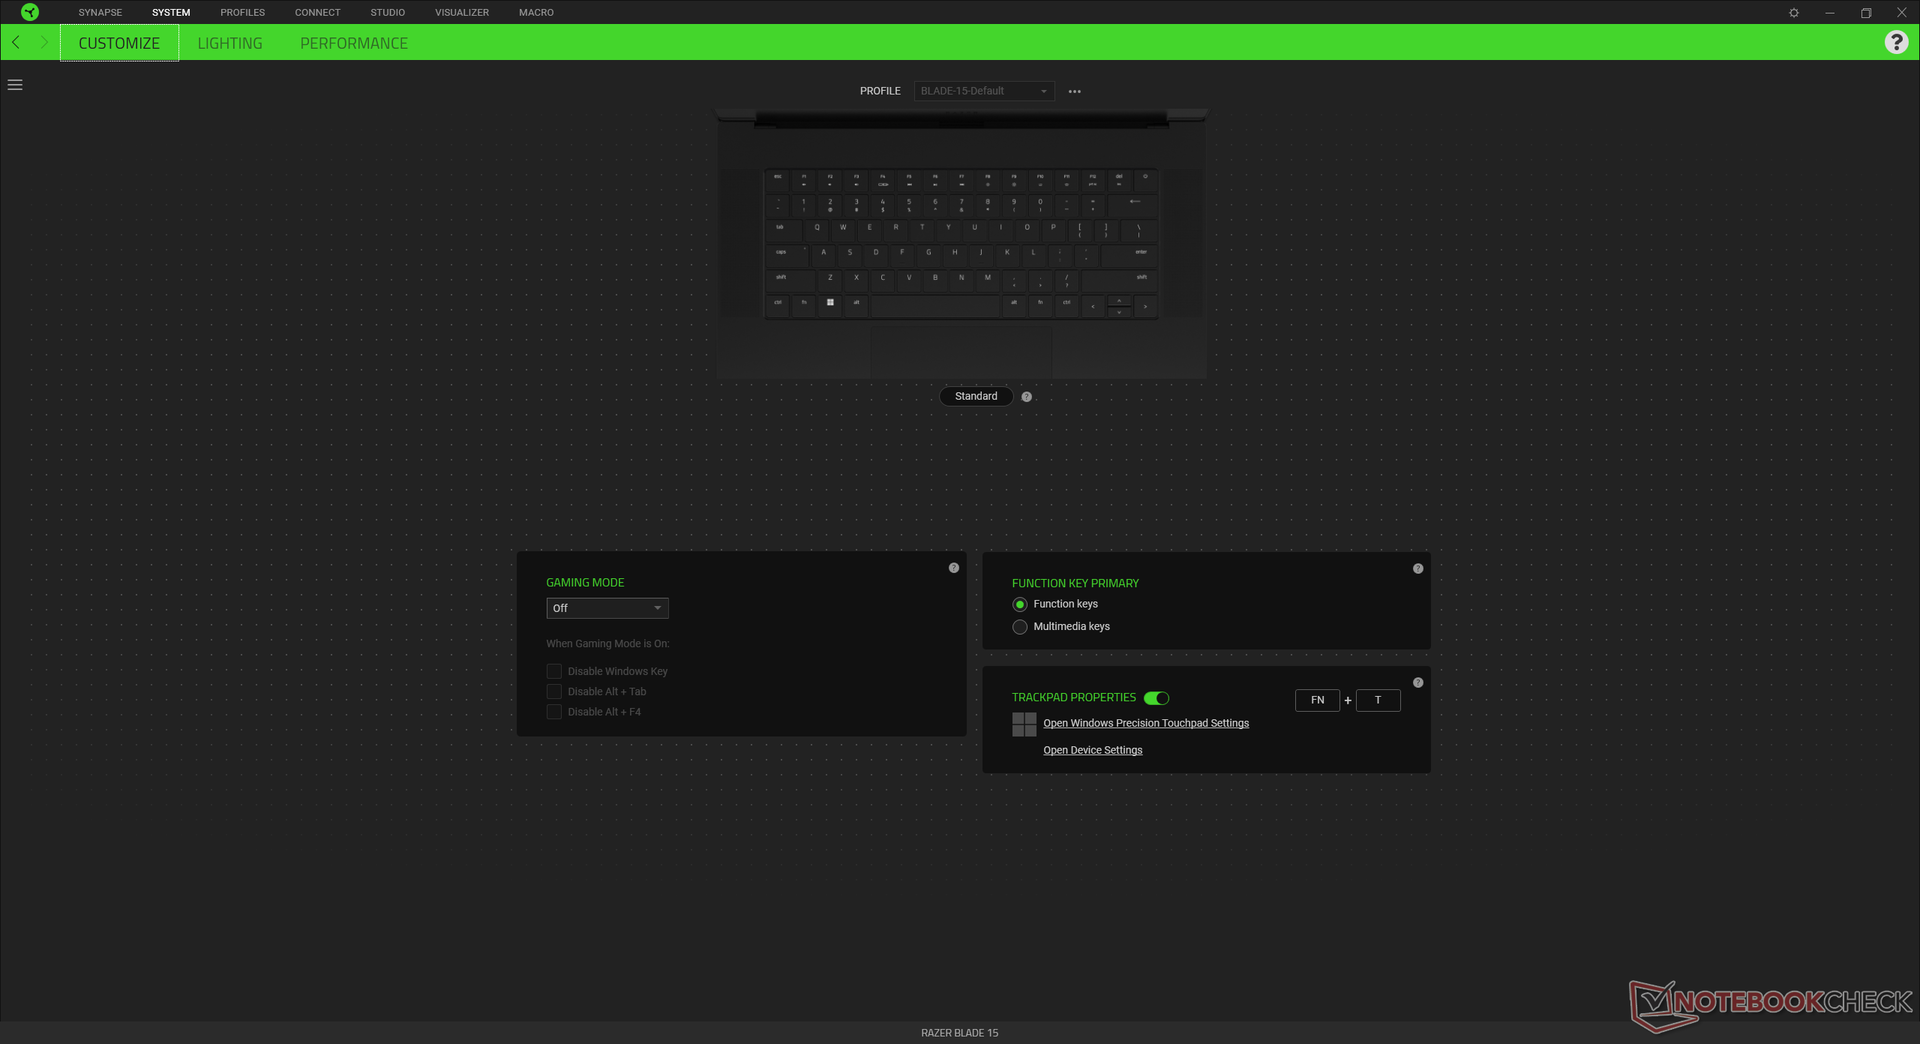
Dispositivos de entrada
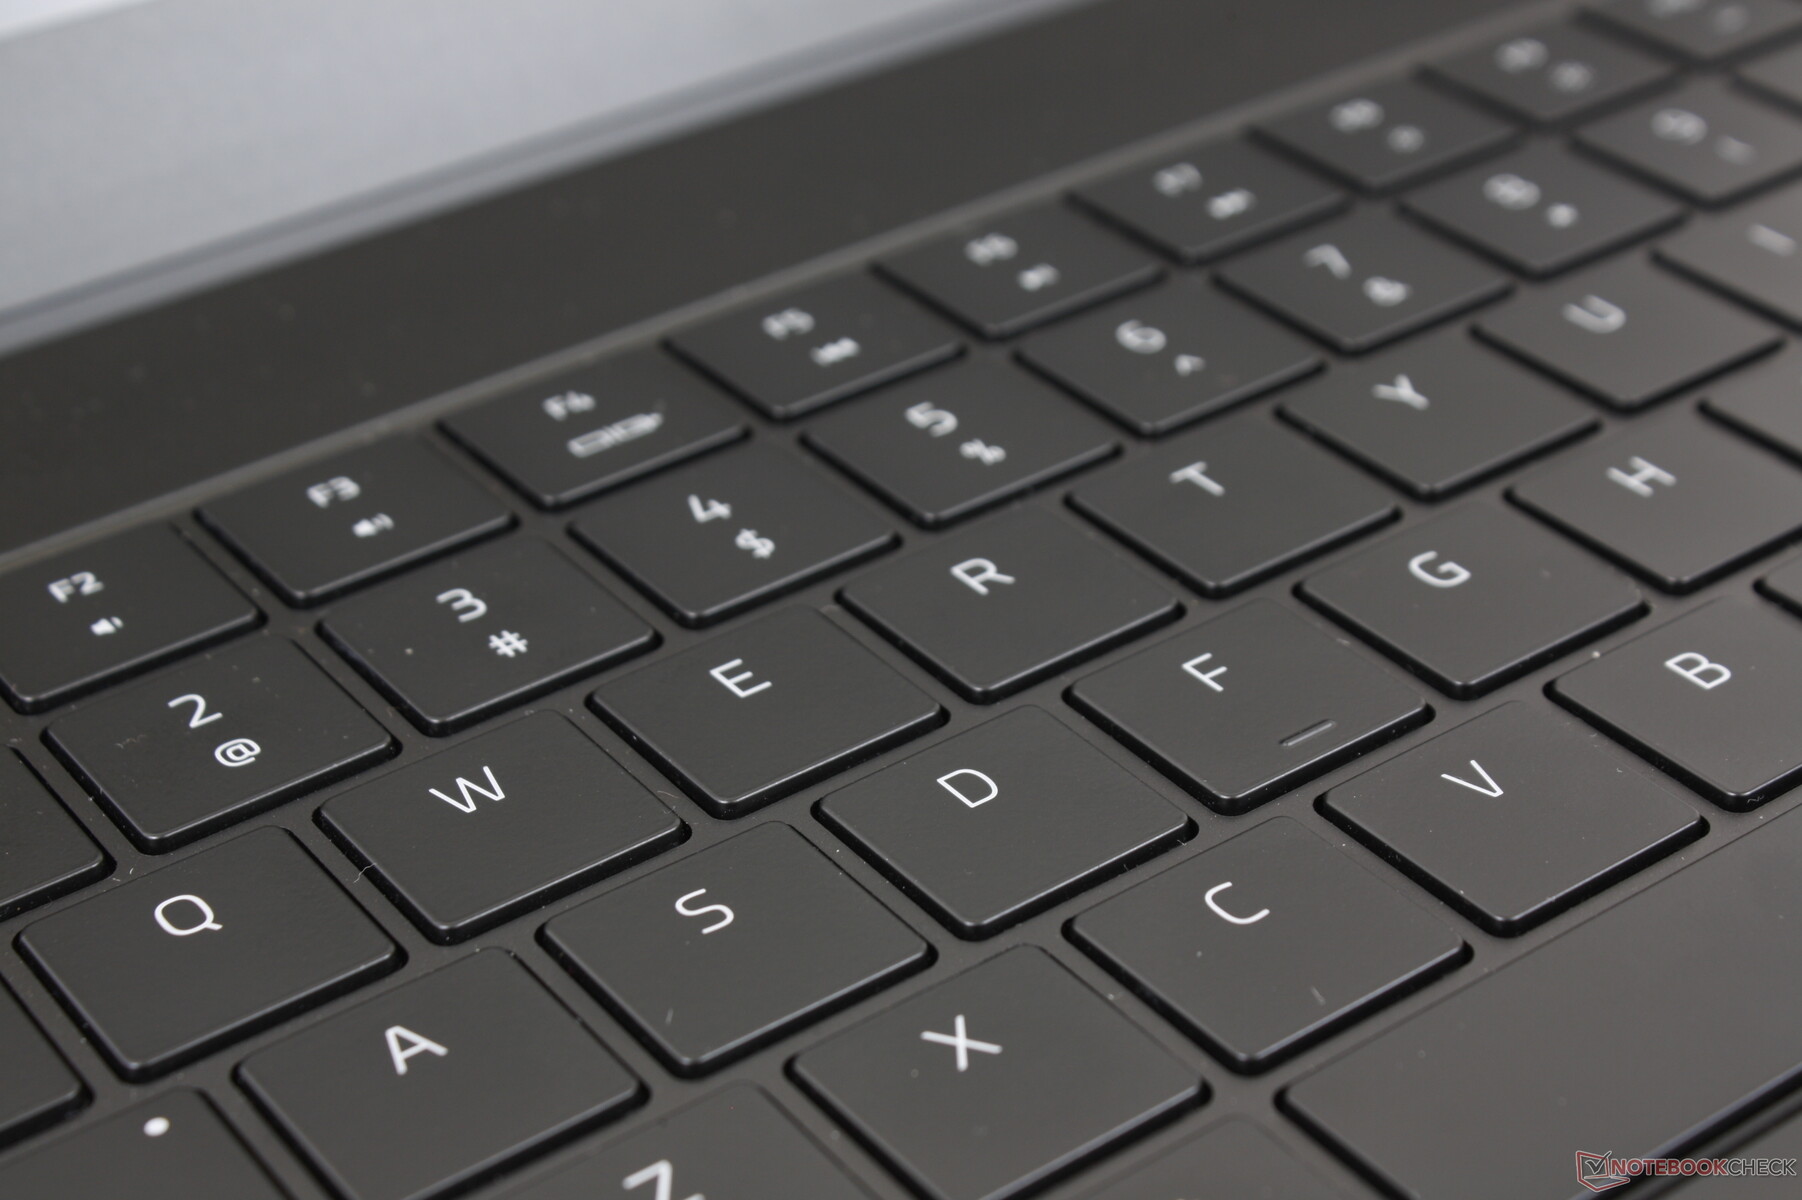
Aunque el gran clickpad sigue siendo el mismo, Razer ha mejorado el teclado del Blade 15 2022 con teclas ligeramente más grandes que en los modelos de la generación anterior para reducir los errores de escritura. En consecuencia, se ha reducido el espacio entre cada tecla. Por lo demás, el desplazamiento y la respuesta son idénticos de un año a otro.
Mostrar
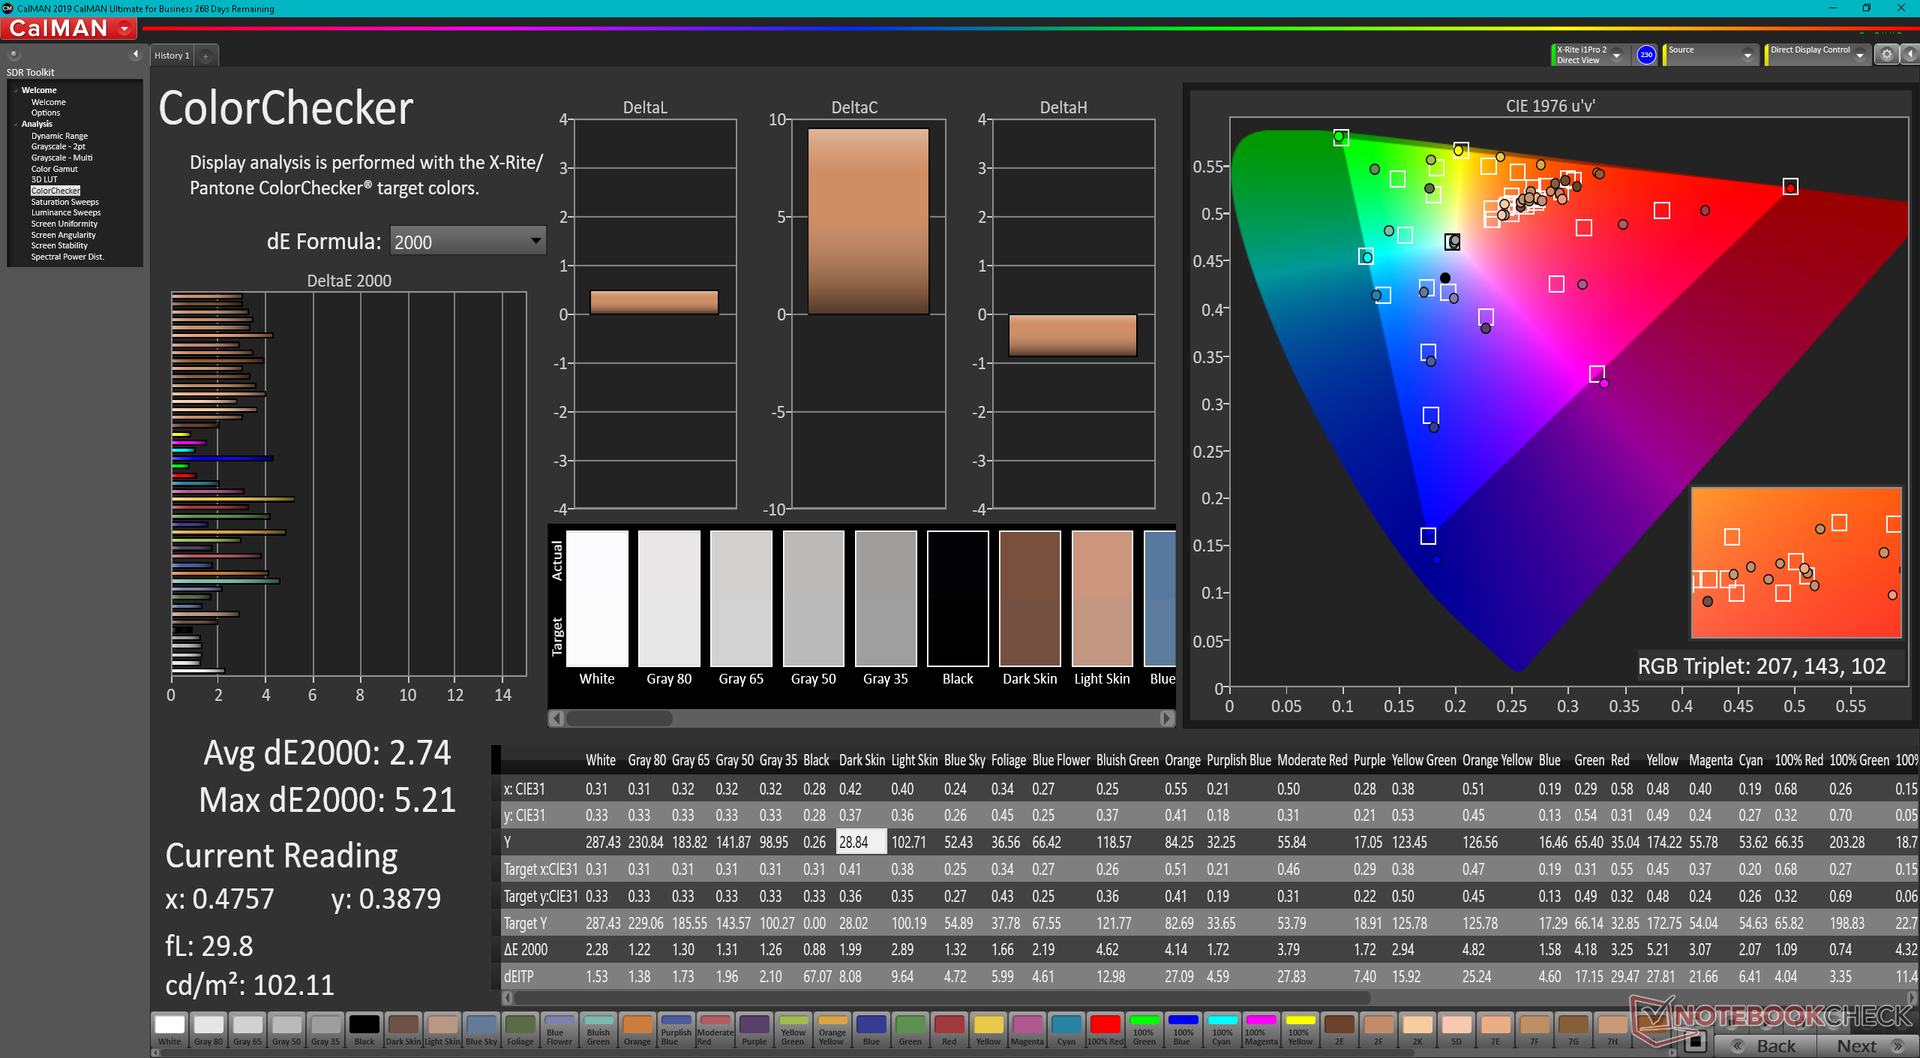
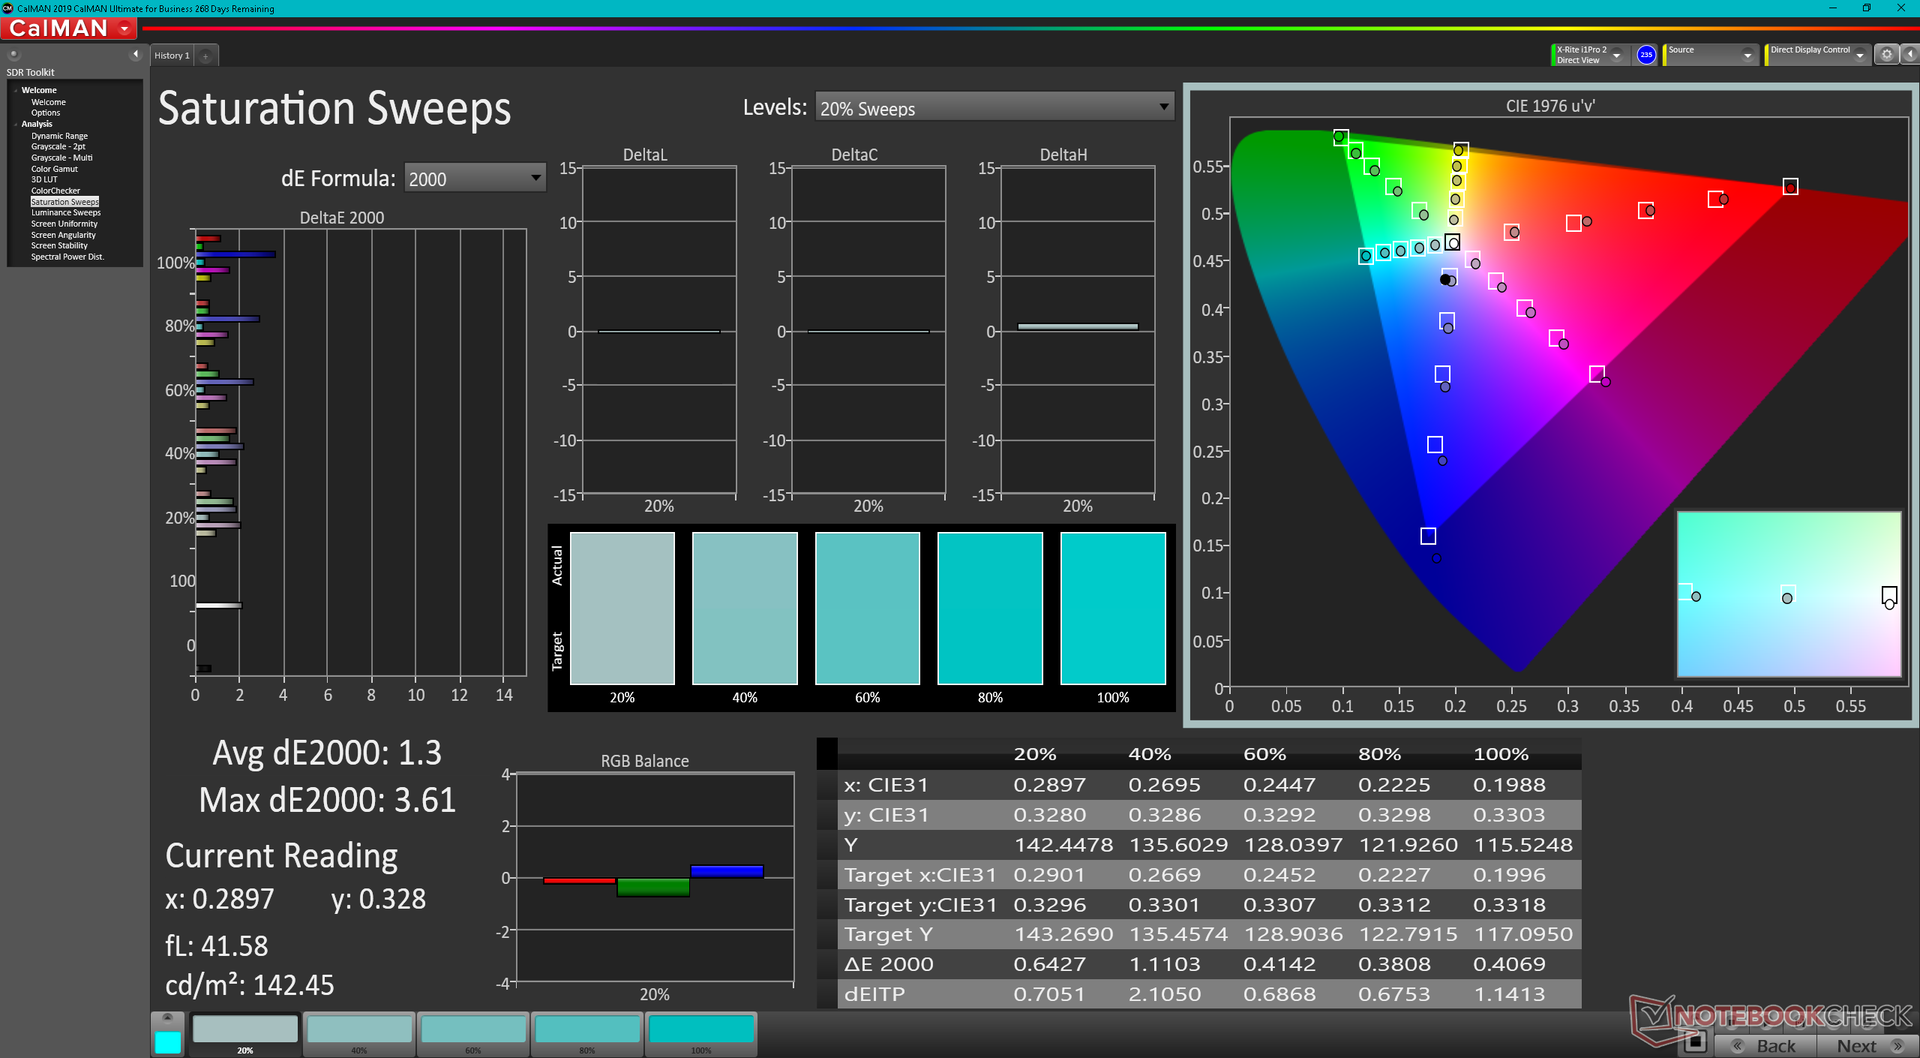
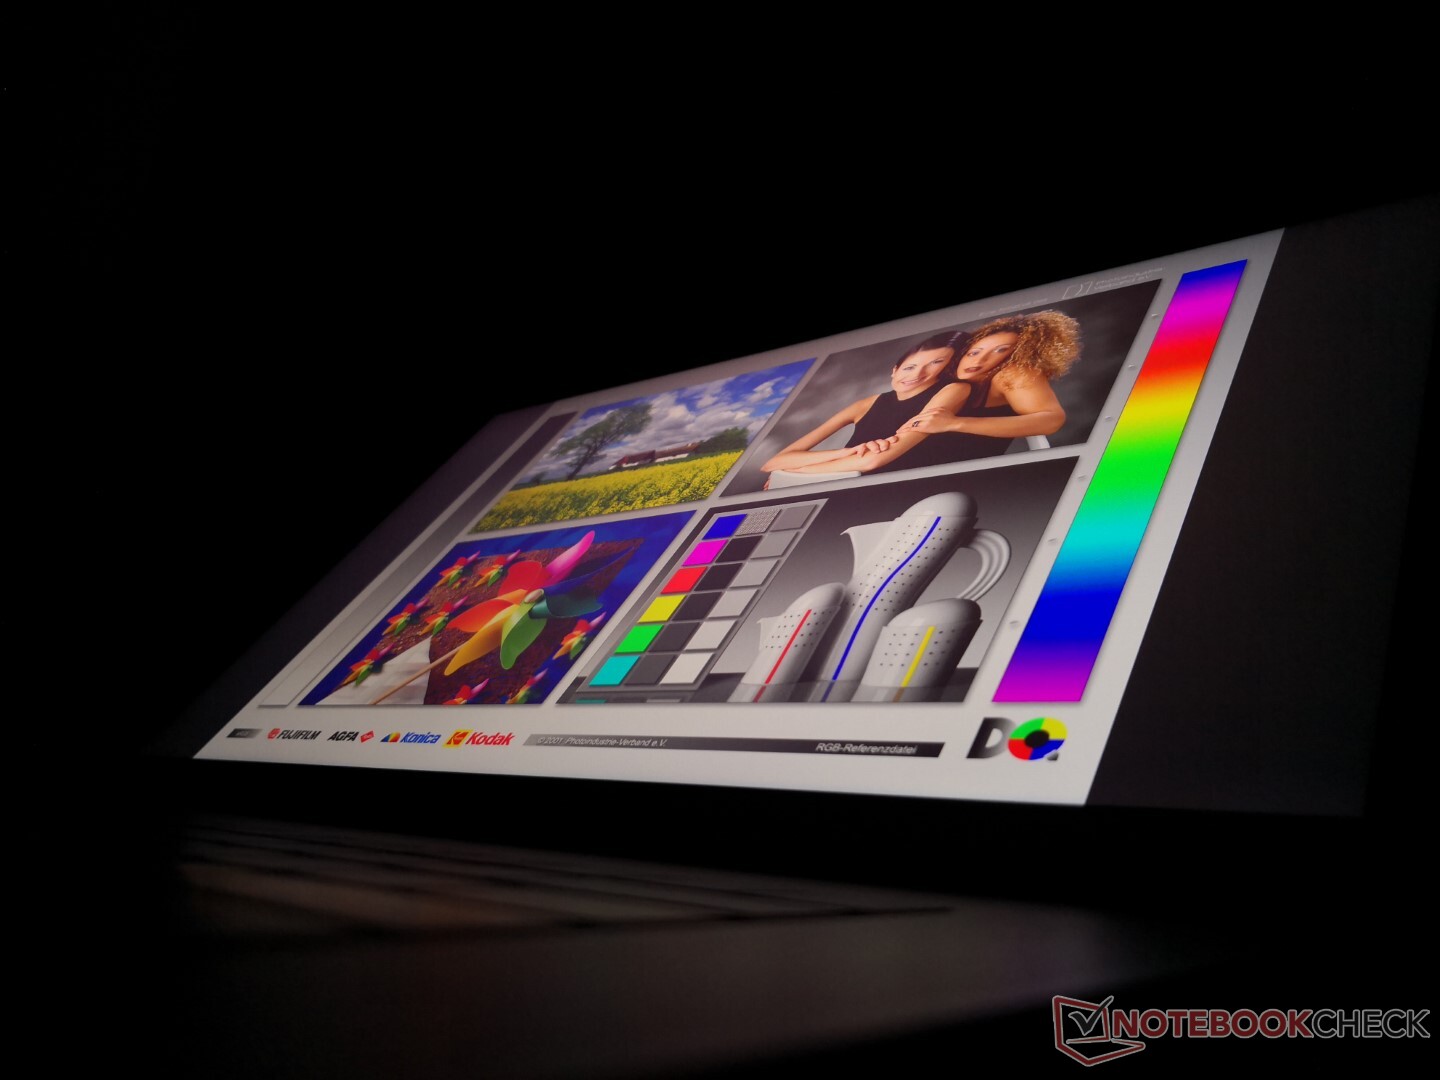
El Blade 15 es uno de los pocos portátiles de 15,6 pulgadas que viene con un panel de 240 Hz 1440p que cubre todo el estándar DCI-P3. El panel de 165 Hz 1440p del Xenia 15por ejemplo, cubre todo el sRGB pero sólo el 68% del P3. Los tiempos de respuesta en blanco y negro y gris también son muy buenos, lo que significa que este panel puede utilizarse tanto para juegos como para edición digital. En años anteriores, los propietarios del Blade 15 habrían tenido que conformarse con las opciones 4K UHD para obtener la cobertura DCI-P3 completa.

| |||||||||||||||||||||||||
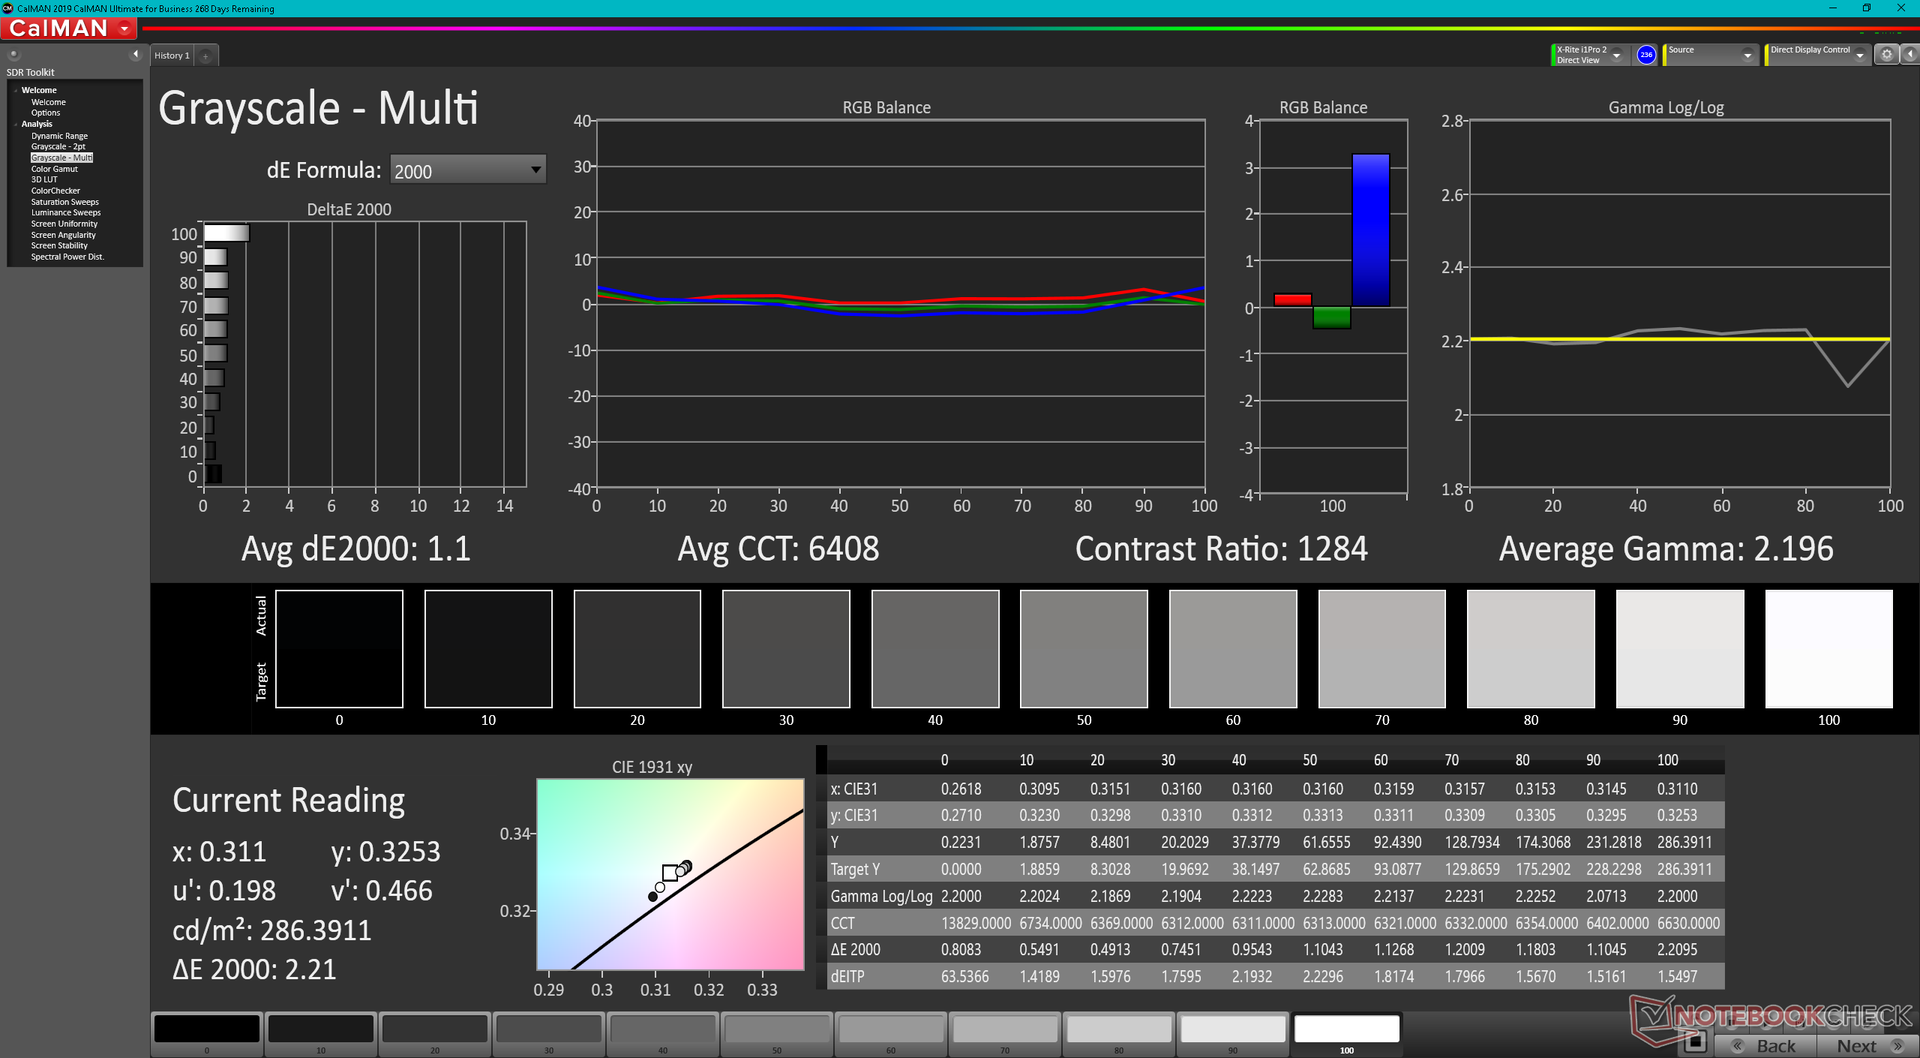
iluminación: 89 %
Brillo con batería: 286 cd/m²
Contraste: 1144:1 (Negro: 0.25 cd/m²)
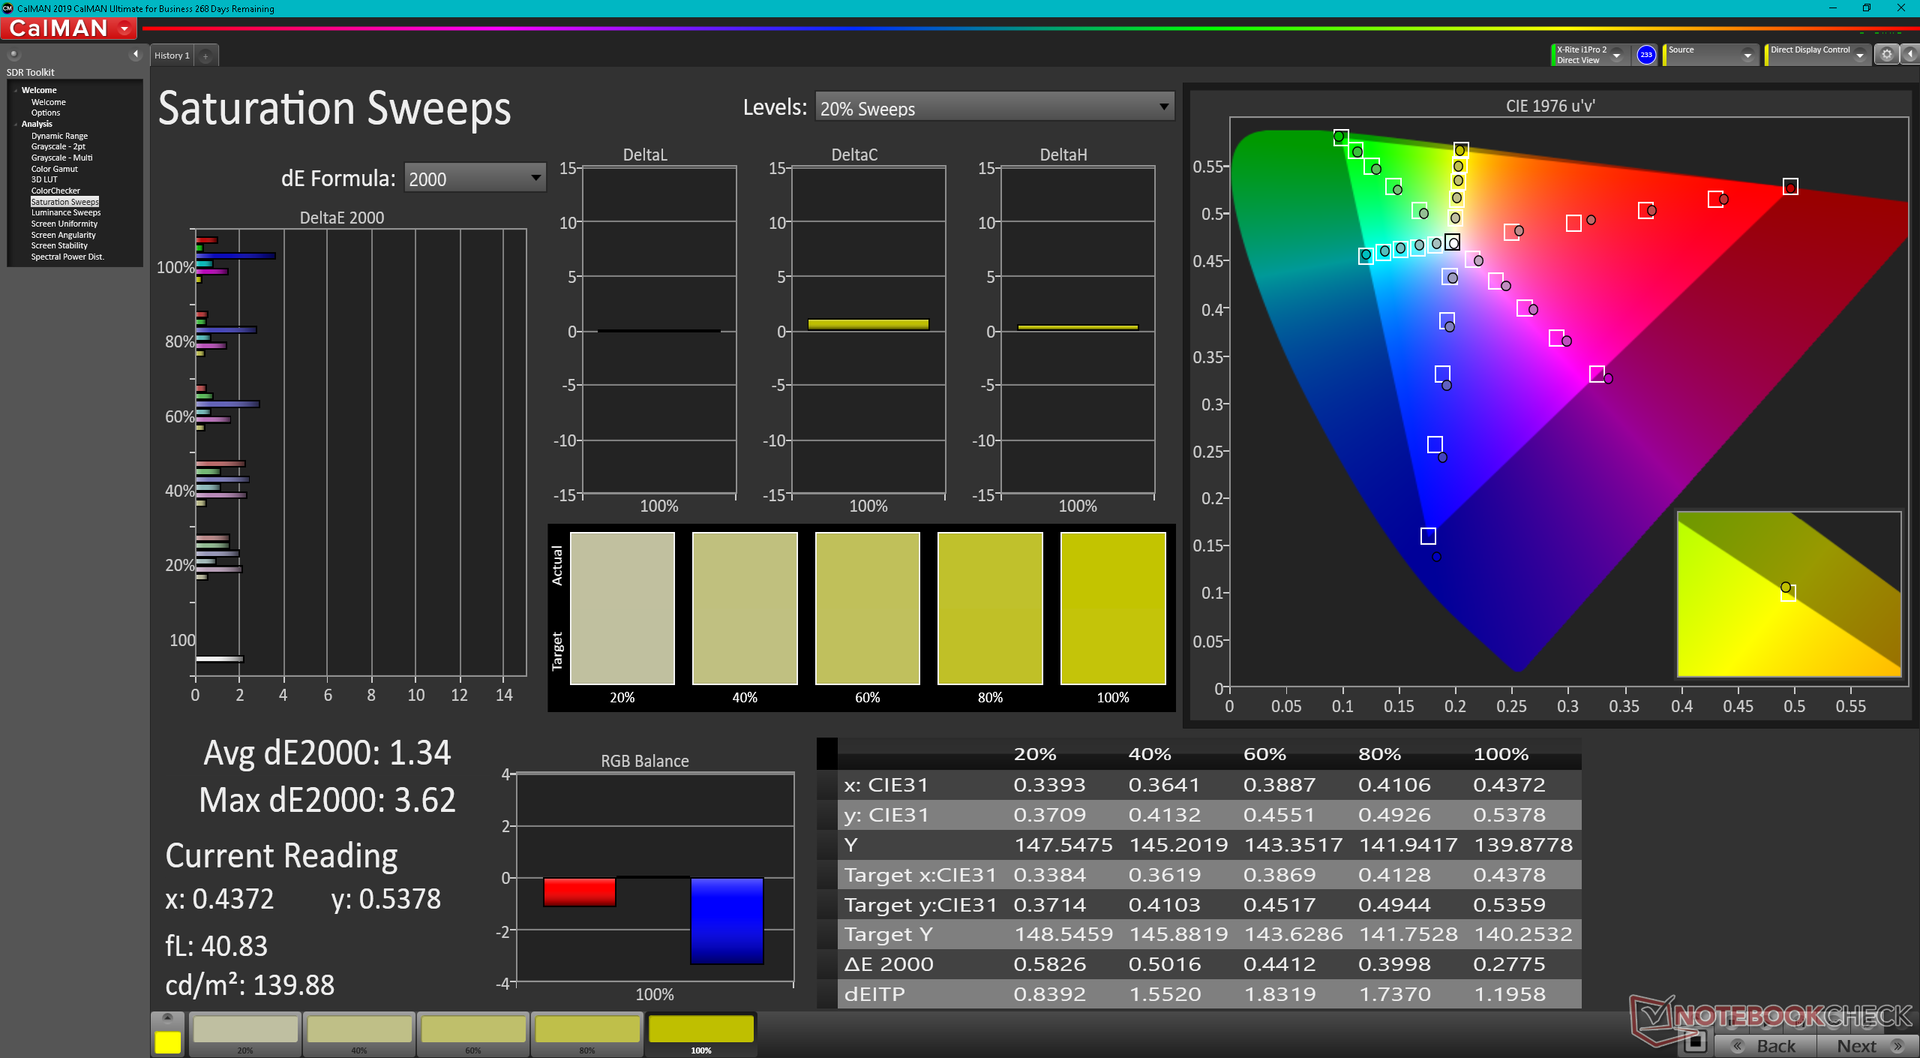
ΔE ColorChecker Calman: 2.74 | ∀{0.5-29.43 Ø4.71}
calibrated: 2.52
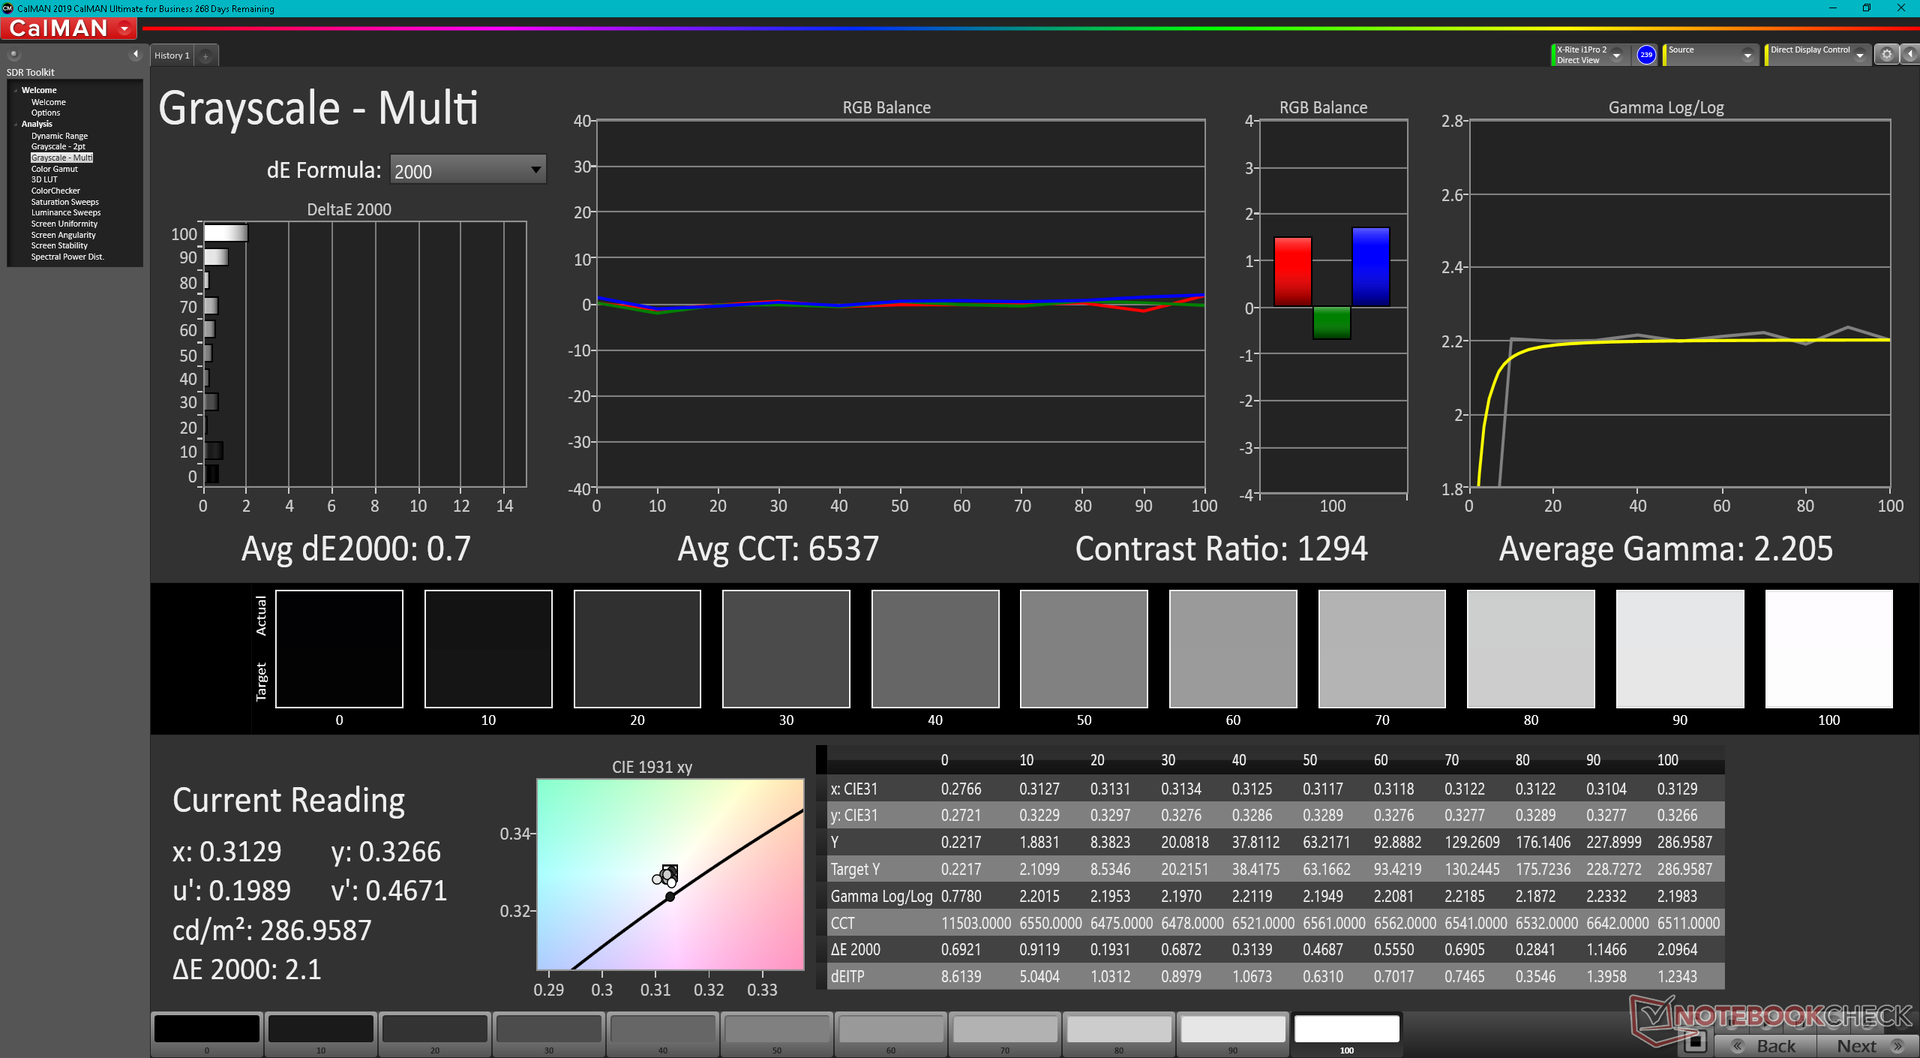
ΔE Greyscale Calman: 1.1 | ∀{0.09-98 Ø4.96}
86.8% AdobeRGB 1998 (Argyll 3D)
99.9% sRGB (Argyll 3D)
99.1% Display P3 (Argyll 3D)
Gamma: 2.2
CCT: 6408 K
| Razer Blade 15 2022 Sharp LQ156T1JW03, IPS, 2560x1440, 15.6" | Razer Blade 15 Advanced Model Early 2021 TL156VDXP02-0, IPS, 1920x1080, 15.6" | Razer Blade 15 RTX 2080 Super Max-Q AU Optronics B156HAN12.0, IPS, 1920x1080, 15.6" | Schenker XMG Neo 15 E22 (Early 2022, RTX 3080 Ti) BOE0A67 (BOE CQ NE156QHM-NZ1), IPS, 2560x1440, 15.6" | ADATA XPG Xenia 15 BOE CQ NE156QHM-NY2, IPS, 2560x1440, 15.6" | Eurocom Nightsky ARX315 Sharp LQ156M1JW03, IPS, 1920x1080, 15.6" | |
|---|---|---|---|---|---|---|
| Display | -20% | -16% | -18% | -15% | ||
| Display P3 Coverage (%) | 99.1 | 65.9 -34% | 70.2 -29% | 68.2 -31% | 67.9 -31% | |
| sRGB Coverage (%) | 99.9 | 96.4 -4% | 99 -1% | 98.1 -2% | 99.7 0% | |
| AdobeRGB 1998 Coverage (%) | 86.8 | 68 -22% | 71.4 -18% | 69.1 -20% | 73.7 -15% | |
| Response Times | -1% | 40% | 4% | 2% | -2% | |
| Response Time Grey 50% / Grey 80% * (ms) | 14.4 ? | 16 ? -11% | 6 ? 58% | 14.4 ? -0% | 13.6 ? 6% | 15.2 ? -6% |
| Response Time Black / White * (ms) | 11.6 ? | 10.4 ? 10% | 9 ? 22% | 10.8 ? 7% | 12 ? -3% | 11.2 ? 3% |
| PWM Frequency (Hz) | 23150 ? | |||||
| Screen | 20% | -6% | -28% | -62% | -38% | |
| Brightness middle (cd/m²) | 286 | 338 18% | 347 21% | 295 3% | 321.1 12% | 312.8 9% |
| Brightness (cd/m²) | 271 | 334 23% | 328 21% | 277 2% | 308 14% | 294 8% |
| Brightness Distribution (%) | 89 | 94 6% | 89 0% | 62 -30% | 82 -8% | 90 1% |
| Black Level * (cd/m²) | 0.25 | 0.24 4% | 0.285 -14% | 0.28 -12% | 0.38 -52% | 0.28 -12% |
| Contrast (:1) | 1144 | 1408 23% | 1218 6% | 1054 -8% | 845 -26% | 1117 -2% |
| Colorchecker dE 2000 * | 2.74 | 1.39 49% | 2.35 14% | 2.36 14% | 3.21 -17% | 2.96 -8% |
| Colorchecker dE 2000 max. * | 5.21 | 3.31 36% | 4.15 20% | 4.24 19% | 10.56 -103% | 6.23 -20% |
| Colorchecker dE 2000 calibrated * | 2.52 | 0.97 62% | 1.16 54% | 1.53 39% | ||
| Greyscale dE 2000 * | 1.1 | 1.6 -45% | 3.04 -176% | 3.43 -212% | 5.7 -418% | 4.2 -282% |
| Gamma | 2.2 100% | 2.291 96% | 2.35 94% | 2.44 90% | 2.09 105% | 2.32 95% |
| CCT | 6408 101% | 6626 98% | 6658 98% | 6266 104% | 7194 90% | 7145 91% |
| Color Space (Percent of AdobeRGB 1998) (%) | 68 | 65 | ||||
| Color Space (Percent of sRGB) (%) | 89 | 99 | ||||
| Media total (Programa/Opciones) | -0% /
8% | 6% /
-2% | -12% /
-22% | -26% /
-44% | -18% /
-27% |
* ... más pequeño es mejor
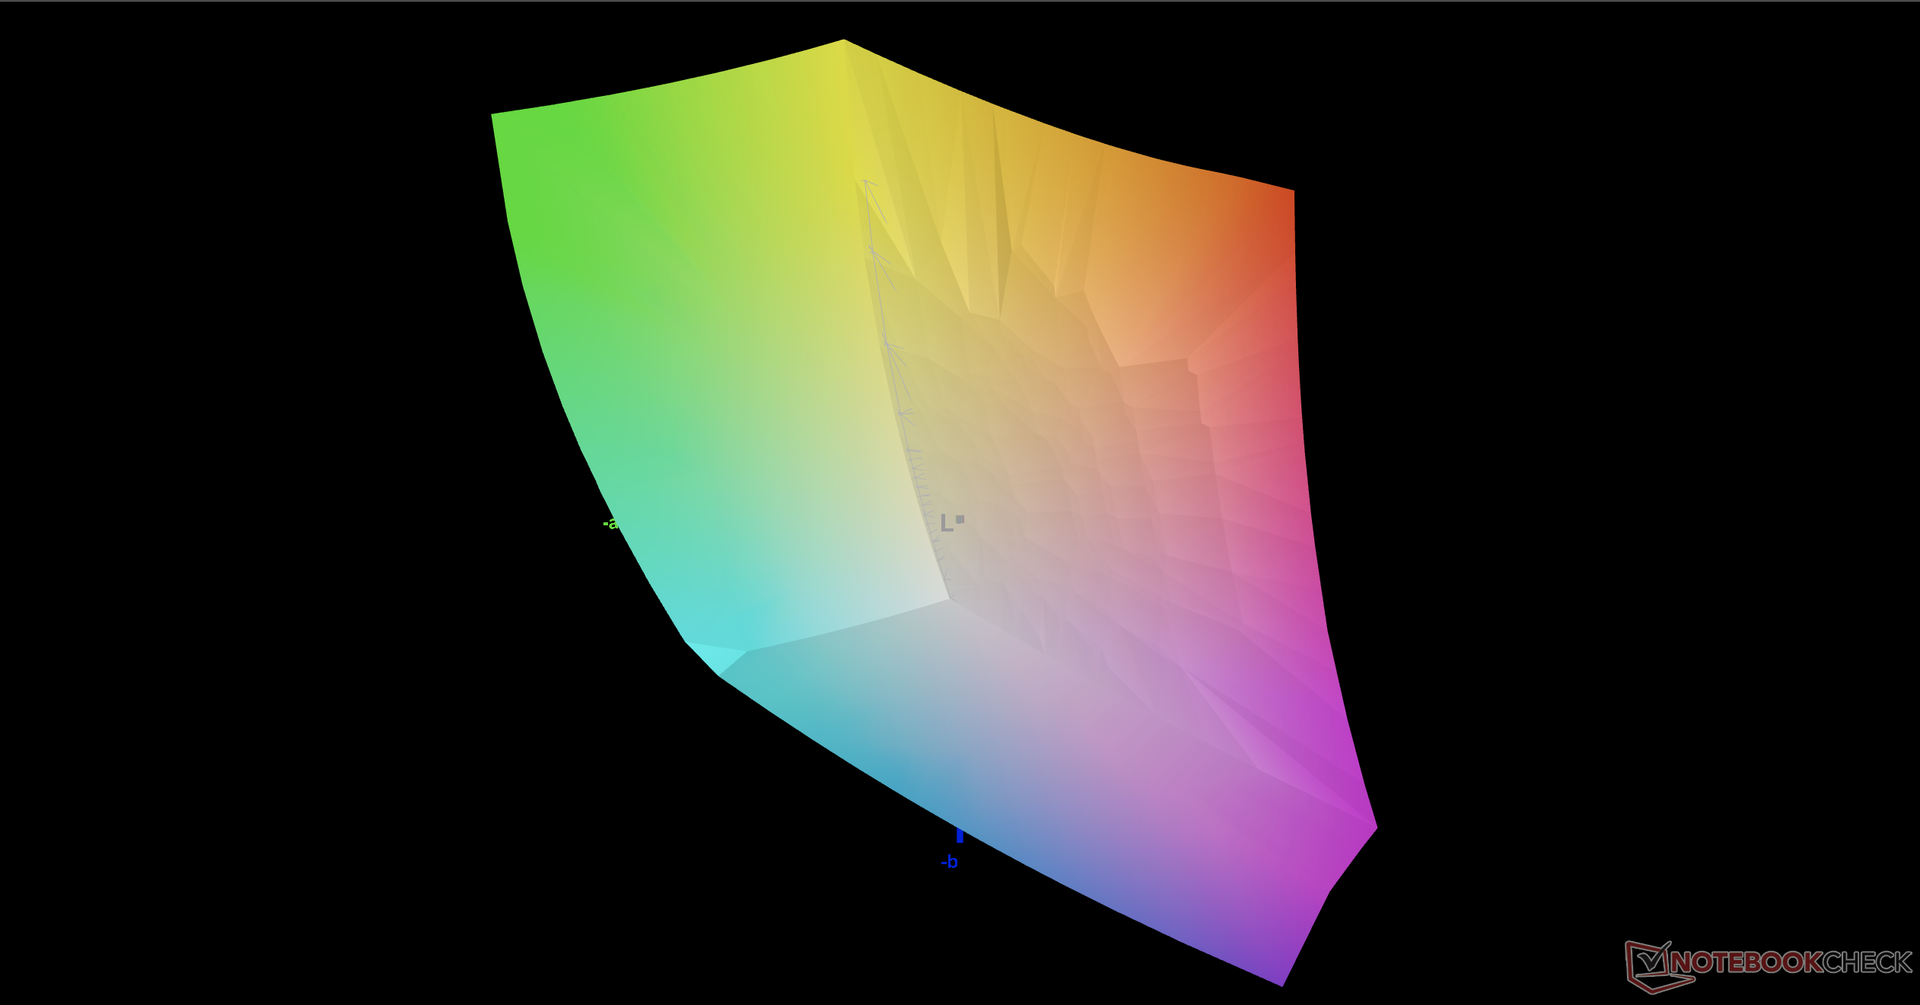
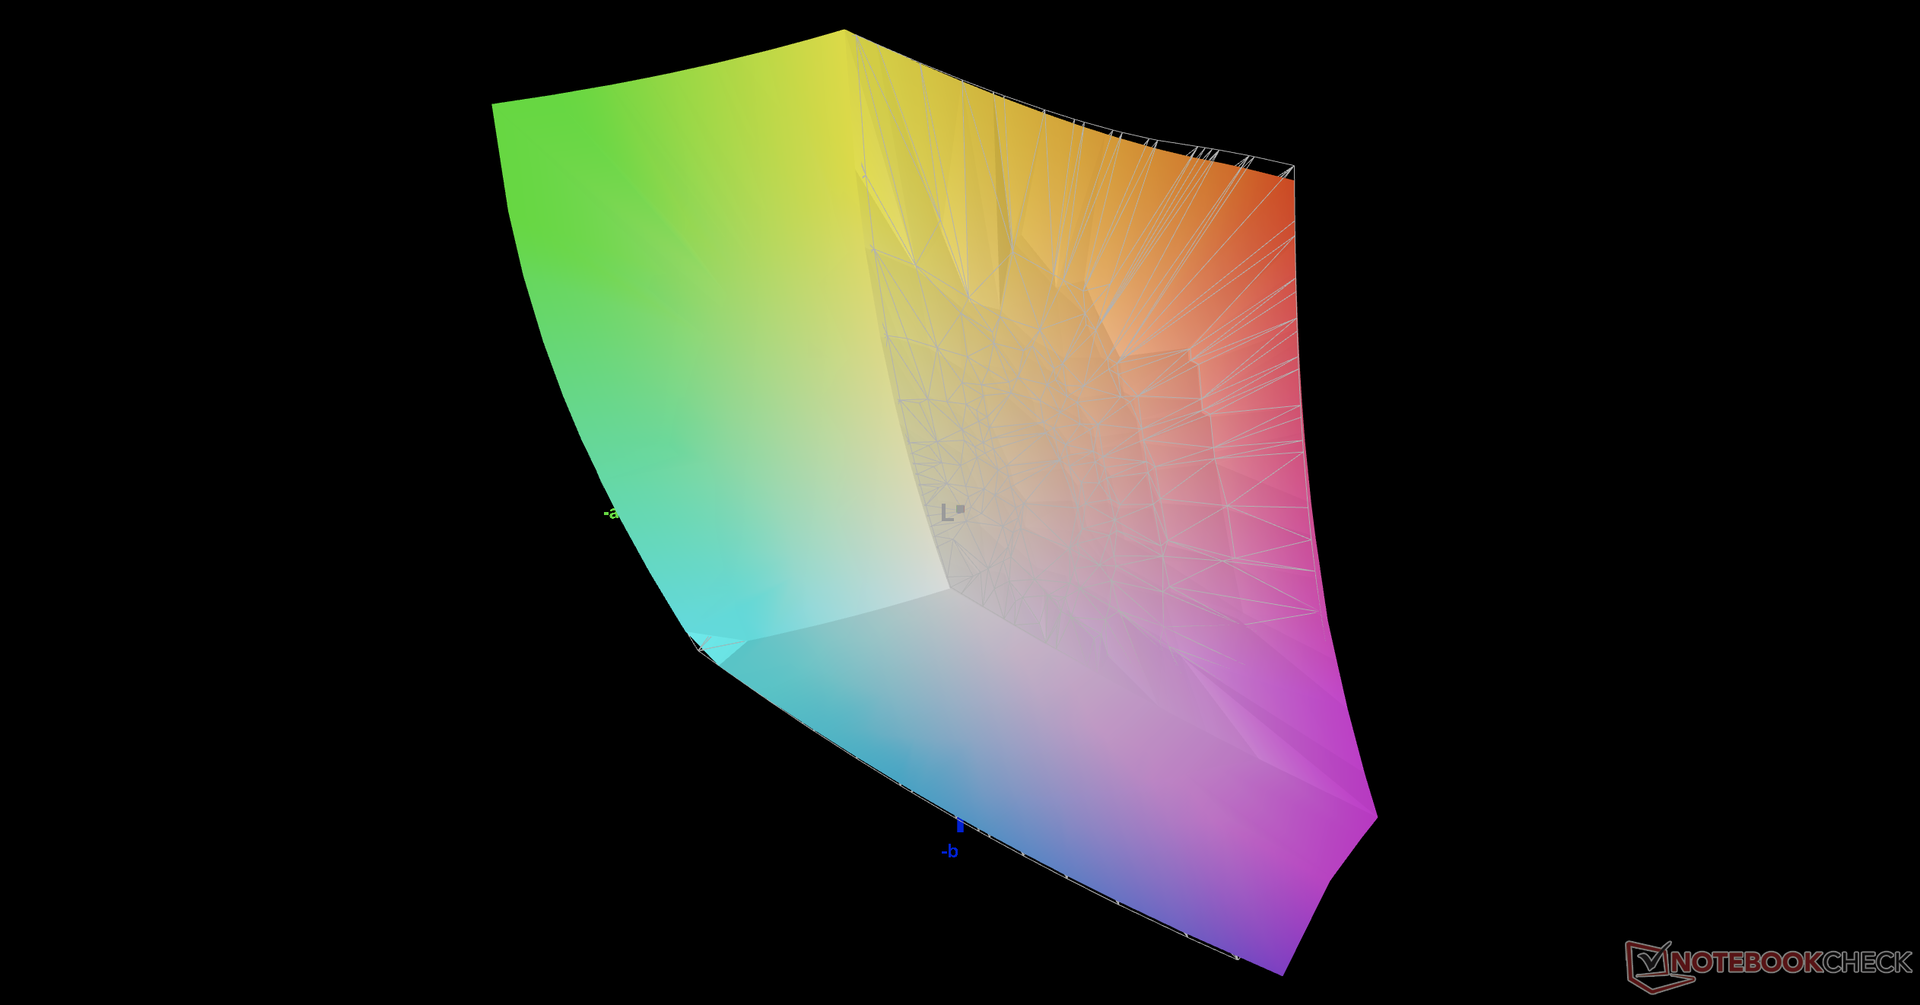
La pantalla está bien calibrada desde el primer momento, con unos valores medios de escala de grises y color DeltaE de tan solo 1,1 y 2,74, respectivamente, según el estándar DCI-P3. Razer dice que calibra individualmente cada panel en la fábrica y nuestras mediciones independientes con un colorímetro X-Rite pueden confirmar la precisión de los colores y la escala de grises.

Tiempos de respuesta del display
| ↔ Tiempo de respuesta de Negro a Blanco | ||
|---|---|---|
| 11.6 ms ... subida ↗ y bajada ↘ combinada | ↗ 5.6 ms subida | 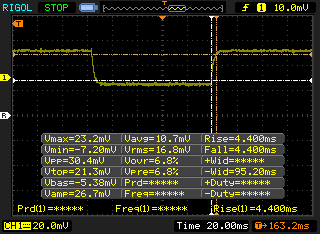 |
| ↘ 6 ms bajada | ||
| La pantalla mostró buenos tiempos de respuesta en nuestros tests pero podría ser demasiado lenta para los jugones competitivos. En comparación, todos los dispositivos de prueba van de ##min### (mínimo) a 240 (máximo) ms. » 31 % de todos los dispositivos son mejores. Esto quiere decir que el tiempo de respuesta medido es mejor que la media (19.8 ms) de todos los dispositivos testados. | ||
| ↔ Tiempo de respuesta 50% Gris a 80% Gris | ||
| 14.4 ms ... subida ↗ y bajada ↘ combinada | ↗ 6.8 ms subida | 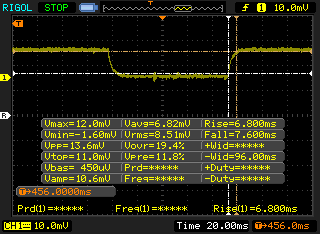 |
| ↘ 7.6 ms bajada | ||
| La pantalla mostró buenos tiempos de respuesta en nuestros tests pero podría ser demasiado lenta para los jugones competitivos. En comparación, todos los dispositivos de prueba van de ##min### (mínimo) a 636 (máximo) ms. » 28 % de todos los dispositivos son mejores. Esto quiere decir que el tiempo de respuesta medido es mejor que la media (31 ms) de todos los dispositivos testados. | ||
Parpadeo de Pantalla / PWM (Pulse-Width Modulation)
| Parpadeo de Pantalla / PWM no detectado | 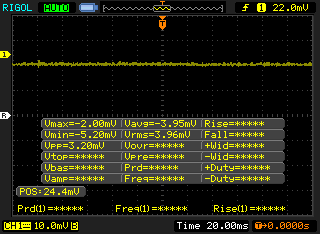 | ||
Comparación: 52 % de todos los dispositivos testados no usaron PWM para atenuar el display. Si se usó, medimos una media de 7757 (mínimo: 5 - máxmo: 343500) Hz. | |||
Rendimiento
Condiciones de la prueba
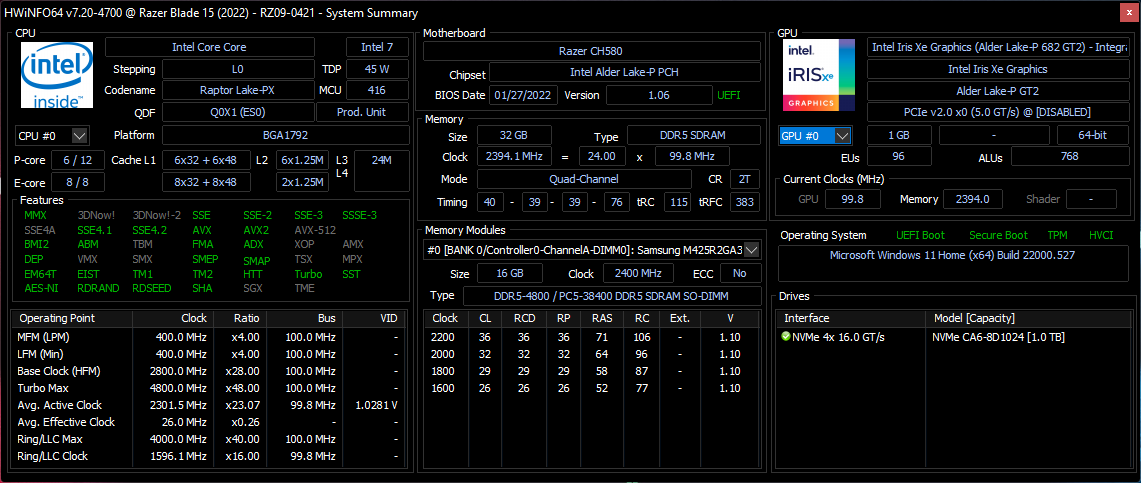
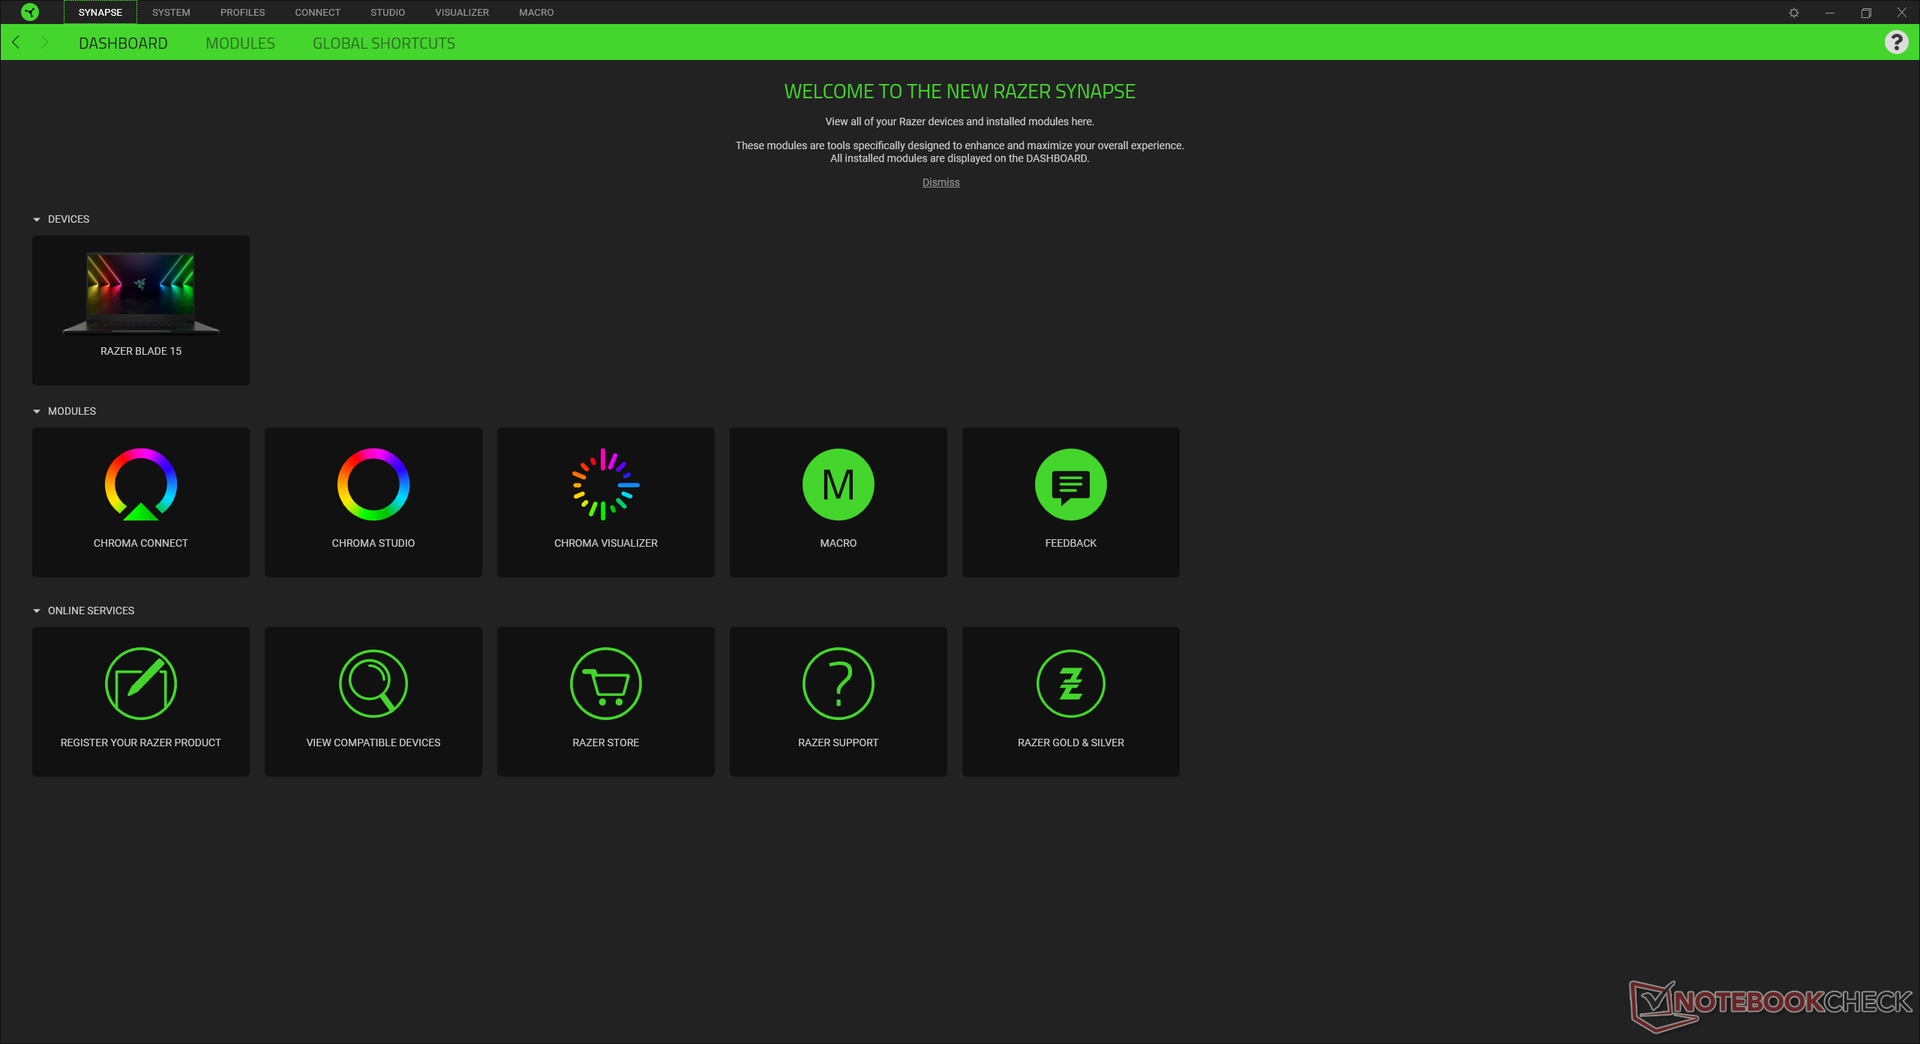
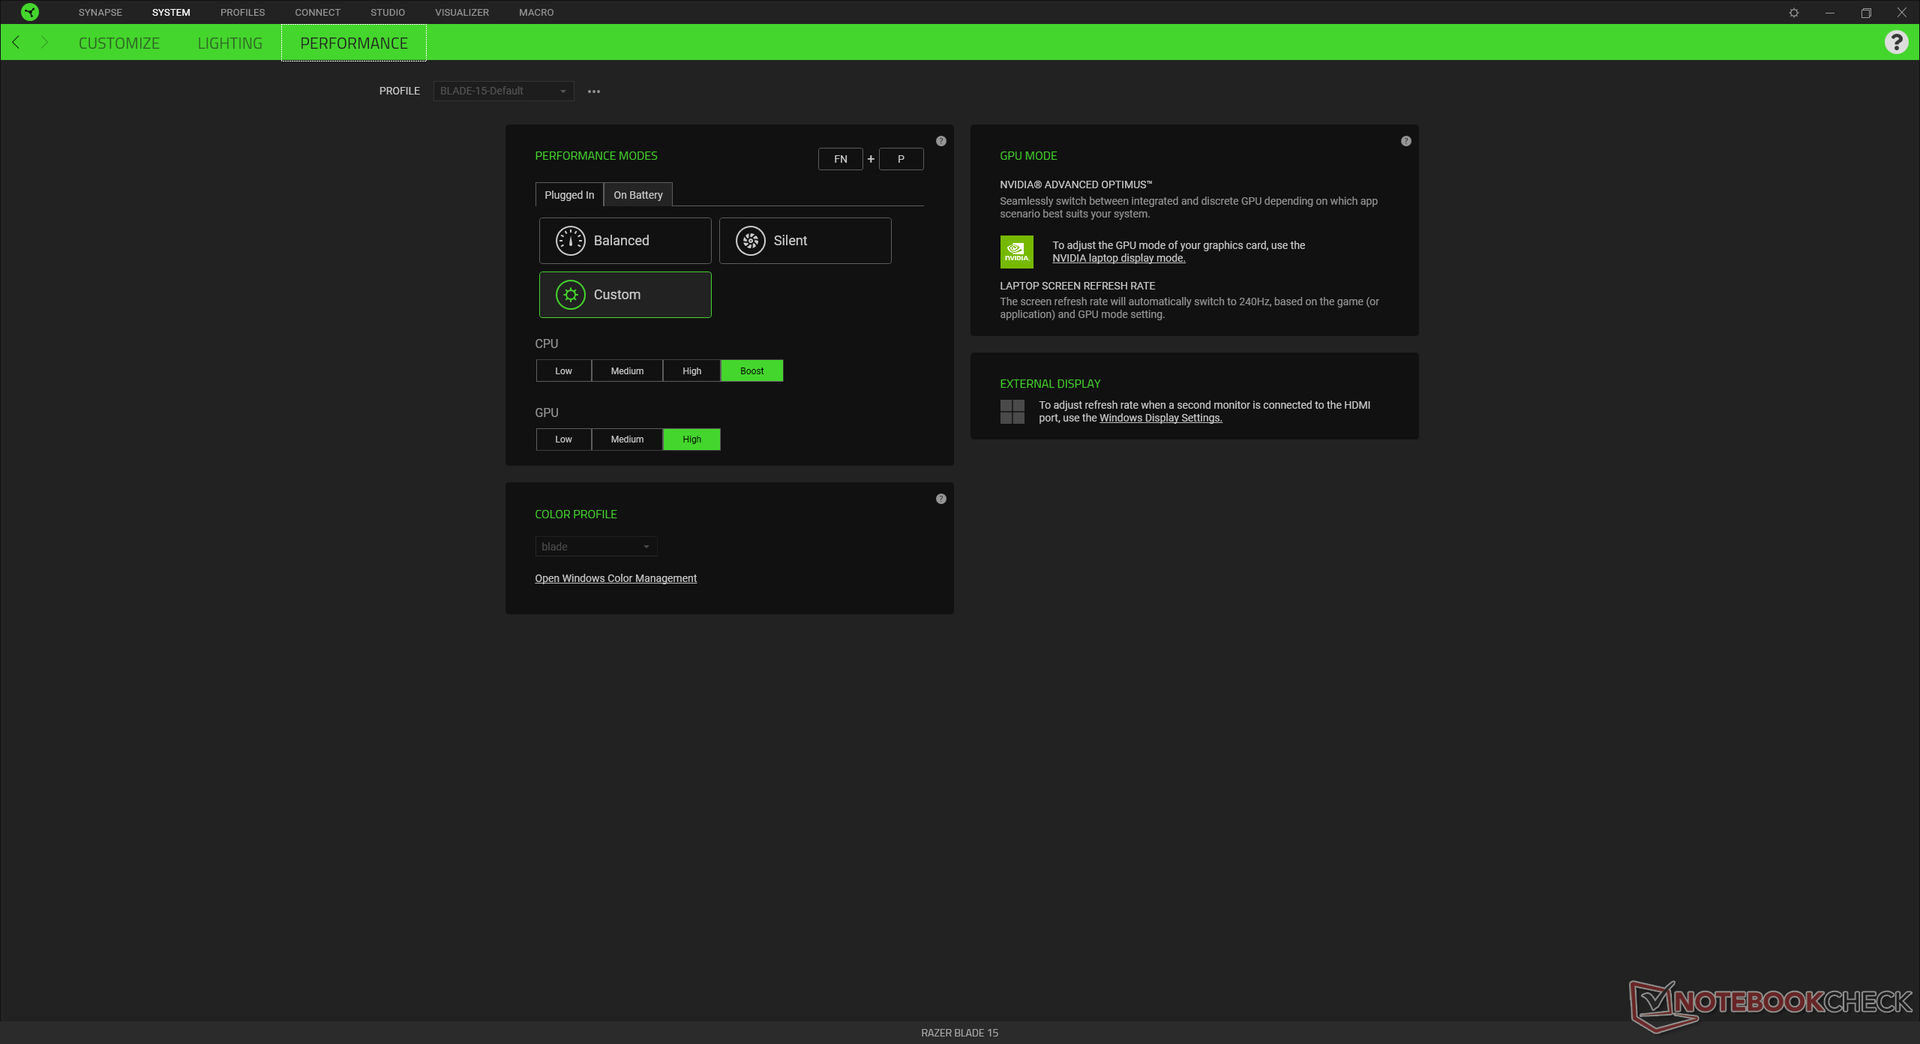
Nuestra unidad se configuró en el modo de rendimiento personalizado con la CPU en Boost y la GPU en High a través del software Razer Synapse antes de ejecutar cualquier prueba de rendimiento para obtener las puntuaciones más altas posibles. También activamos la dGPU desactivando Optimus. Es muy recomendable familiarizarse con Razer Synapse, ya que es el centro del software para controlar el rendimiento y las funciones.
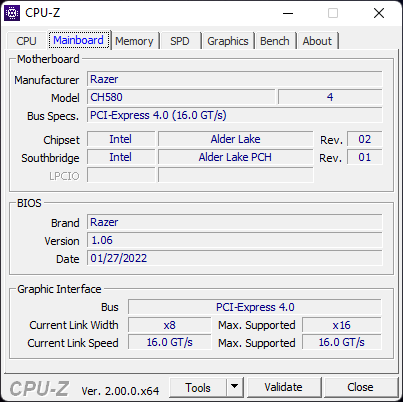
Los usuarios pueden cambiar entre sólo dGPU o Nvidia Optimus (MUX) sin necesidad de reiniciar el sistema, ya que el Blade 15 es uno de los pocos portátiles para juegos que soporta Advanced Optimus u Optimus 2.0. Hay que tener en cuenta que G-Sync para la pantalla interna sólo funcionará cuando no esté en modo Optimus. Además, el soporte de Thunderbolt 4 sólo se activará cuando esté en modo Optimus, como en otros portátiles con CPUs Alder Lake-H de 12ª generación.
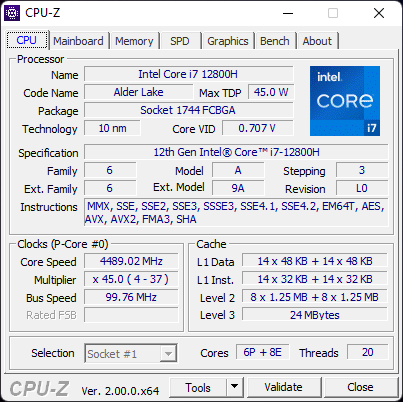
Procesador
El Core i7-12800H ofrece un 20% más de rendimiento en un solo hilo y en varios hilos que la última generación de Core i7-11800H al que sustituye directamente. La actualización al Core i9-12900H Se espera que aumente el rendimiento de la CPU entre un 5 y un 15 por ciento más, según nuestra experiencia con el MSI Vector GP66.
Cinebench R15 Multi Loop
Cinebench R23: Multi Core | Single Core
Cinebench R15: CPU Multi 64Bit | CPU Single 64Bit
Blender: v2.79 BMW27 CPU
7-Zip 18.03: 7z b 4 | 7z b 4 -mmt1
Geekbench 5.5: Multi-Core | Single-Core
HWBOT x265 Benchmark v2.2: 4k Preset
LibreOffice : 20 Documents To PDF
R Benchmark 2.5: Overall mean
| Geekbench 5.5 / Single-Core | |
| MSI Vector GP66 12UGS | |
| Medio Intel Core i7-12800H (1739 - 1842, n=5) | |
| Razer Blade 15 2022 | |
| Asus ROG Zephyrus M16 GU603H | |
| MSI Alpha 15 B5EEK-008 | |
| Lenovo Legion C7 15IMH05 82EH0030GE | |
| Razer Blade 15 Advanced Model Early 2021 | |
| Aorus 15P XC | |
| Asus ROG Zephyrus G15 GA502IU-ES76 | |
* ... más pequeño es mejor
AIDA64: FP32 Ray-Trace | FPU Julia | CPU SHA3 | CPU Queen | FPU SinJulia | FPU Mandel | CPU AES | CPU ZLib | FP64 Ray-Trace | CPU PhotoWorxx
| Performance rating | |
| Eurocom Nightsky ARX315 | |
| Schenker XMG Neo 15 E22 (Early 2022, RTX 3080 Ti) | |
| Medio Intel Core i7-12800H | |
| Razer Blade 15 2022 | |
| Razer Blade 15 RTX 2080 Super Max-Q | |
| Razer Blade 15 Advanced Model Early 2021 | |
| ADATA XPG Xenia 15 -9! | |
| AIDA64 / FP32 Ray-Trace | |
| Eurocom Nightsky ARX315 | |
| Schenker XMG Neo 15 E22 (Early 2022, RTX 3080 Ti) | |
| Razer Blade 15 RTX 2080 Super Max-Q | |
| Medio Intel Core i7-12800H (5839 - 15206, n=5) | |
| Razer Blade 15 Advanced Model Early 2021 | |
| Razer Blade 15 2022 | |
| AIDA64 / FPU Julia | |
| Eurocom Nightsky ARX315 | |
| Razer Blade 15 RTX 2080 Super Max-Q | |
| Razer Blade 15 Advanced Model Early 2021 | |
| Medio Intel Core i7-12800H (27801 - 80002, n=5) | |
| Schenker XMG Neo 15 E22 (Early 2022, RTX 3080 Ti) | |
| Razer Blade 15 2022 | |
| AIDA64 / CPU SHA3 | |
| Schenker XMG Neo 15 E22 (Early 2022, RTX 3080 Ti) | |
| Eurocom Nightsky ARX315 | |
| Medio Intel Core i7-12800H (2013 - 3684, n=5) | |
| Razer Blade 15 2022 | |
| Razer Blade 15 RTX 2080 Super Max-Q | |
| Razer Blade 15 Advanced Model Early 2021 | |
| AIDA64 / CPU Queen | |
| Eurocom Nightsky ARX315 | |
| Schenker XMG Neo 15 E22 (Early 2022, RTX 3080 Ti) | |
| Medio Intel Core i7-12800H (85965 - 108084, n=5) | |
| Razer Blade 15 2022 | |
| Razer Blade 15 RTX 2080 Super Max-Q | |
| Razer Blade 15 Advanced Model Early 2021 | |
| AIDA64 / FPU SinJulia | |
| Eurocom Nightsky ARX315 | |
| Schenker XMG Neo 15 E22 (Early 2022, RTX 3080 Ti) | |
| Razer Blade 15 2022 | |
| Medio Intel Core i7-12800H (7027 - 9658, n=5) | |
| Razer Blade 15 RTX 2080 Super Max-Q | |
| Razer Blade 15 Advanced Model Early 2021 | |
| AIDA64 / FPU Mandel | |
| Eurocom Nightsky ARX315 | |
| Schenker XMG Neo 15 E22 (Early 2022, RTX 3080 Ti) | |
| Razer Blade 15 RTX 2080 Super Max-Q | |
| Medio Intel Core i7-12800H (15765 - 38179, n=5) | |
| Razer Blade 15 Advanced Model Early 2021 | |
| Razer Blade 15 2022 | |
| AIDA64 / CPU AES | |
| Eurocom Nightsky ARX315 | |
| Schenker XMG Neo 15 E22 (Early 2022, RTX 3080 Ti) | |
| Medio Intel Core i7-12800H (55371 - 73928, n=5) | |
| Razer Blade 15 2022 | |
| Razer Blade 15 RTX 2080 Super Max-Q | |
| Razer Blade 15 Advanced Model Early 2021 | |
| AIDA64 / FP64 Ray-Trace | |
| Eurocom Nightsky ARX315 | |
| Schenker XMG Neo 15 E22 (Early 2022, RTX 3080 Ti) | |
| Razer Blade 15 RTX 2080 Super Max-Q | |
| Medio Intel Core i7-12800H (3257 - 8559, n=5) | |
| Razer Blade 15 Advanced Model Early 2021 | |
| Razer Blade 15 2022 | |
| AIDA64 / CPU PhotoWorxx | |
| Razer Blade 15 2022 | |
| Schenker XMG Neo 15 E22 (Early 2022, RTX 3080 Ti) | |
| Medio Intel Core i7-12800H (31329 - 40992, n=5) | |
| Razer Blade 15 Advanced Model Early 2021 | |
| Eurocom Nightsky ARX315 | |
| Razer Blade 15 RTX 2080 Super Max-Q | |
Rendimiento del sistema
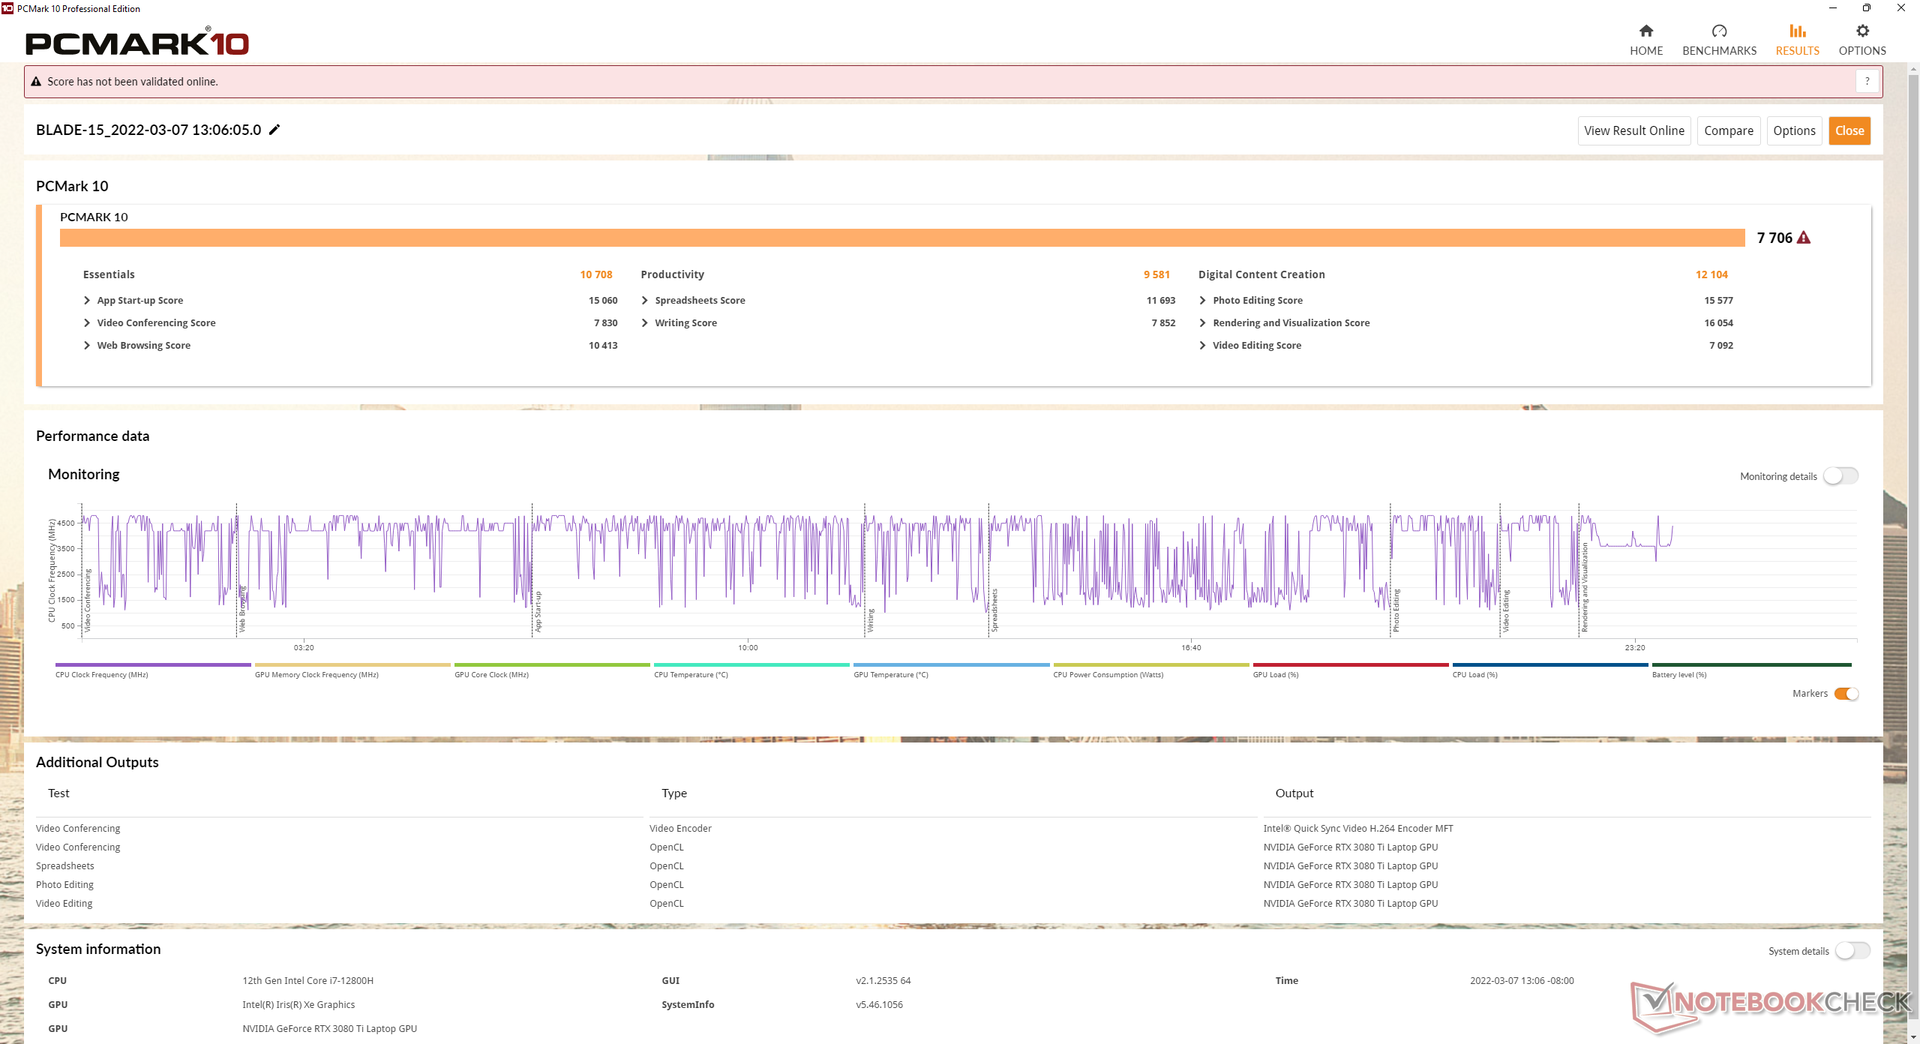
| PCMark 10 / Score | |
| Razer Blade 15 2022 | |
| Medio Intel Core i7-12800H, NVIDIA GeForce RTX 3080 Ti Laptop GPU (7313 - 7744, n=3) | |
| Razer Blade 15 Advanced (Mid 2021) | |
| Razer Blade 17 RTX 3070 | |
| Razer Blade 14 Ryzen 9 RTX 3070 | |
| Razer Blade 15 RTX 2070 Super Max-Q | |
| Razer Blade Pro 17 2021 (QHD Touch) | |
| Razer Blade 15 Base Edition 2021, i7-10750H RTX 3060 | |
| Razer Blade 15 Advanced Model Early 2021 | |
| PCMark 10 / Essentials | |
| Razer Blade 15 Advanced (Mid 2021) | |
| Razer Blade 17 RTX 3070 | |
| Razer Blade 15 2022 | |
| Medio Intel Core i7-12800H, NVIDIA GeForce RTX 3080 Ti Laptop GPU (10597 - 10814, n=3) | |
| Razer Blade 14 Ryzen 9 RTX 3070 | |
| Razer Blade 15 RTX 2070 Super Max-Q | |
| Razer Blade 15 Base Edition 2021, i7-10750H RTX 3060 | |
| Razer Blade Pro 17 2021 (QHD Touch) | |
| Razer Blade 15 Advanced Model Early 2021 | |
| PCMark 10 / Productivity | |
| Razer Blade 15 2022 | |
| Medio Intel Core i7-12800H, NVIDIA GeForce RTX 3080 Ti Laptop GPU (9470 - 9675, n=3) | |
| Razer Blade 14 Ryzen 9 RTX 3070 | |
| Razer Blade 17 RTX 3070 | |
| Razer Blade 15 Advanced (Mid 2021) | |
| Razer Blade 15 RTX 2070 Super Max-Q | |
| Razer Blade Pro 17 2021 (QHD Touch) | |
| Razer Blade 15 Advanced Model Early 2021 | |
| Razer Blade 15 Base Edition 2021, i7-10750H RTX 3060 | |
| PCMark 10 / Digital Content Creation | |
| Razer Blade 15 2022 | |
| Medio Intel Core i7-12800H, NVIDIA GeForce RTX 3080 Ti Laptop GPU (10351 - 12306, n=3) | |
| Razer Blade 15 Advanced (Mid 2021) | |
| Razer Blade 17 RTX 3070 | |
| Razer Blade 15 RTX 2070 Super Max-Q | |
| Razer Blade 14 Ryzen 9 RTX 3070 | |
| Razer Blade Pro 17 2021 (QHD Touch) | |
| Razer Blade 15 Base Edition 2021, i7-10750H RTX 3060 | |
| Razer Blade 15 Advanced Model Early 2021 | |
| PCMark 10 Score | 7706 puntos | |
ayuda | ||
| AIDA64 / Memory Copy | |
| Schenker XMG Neo 15 E22 (Early 2022, RTX 3080 Ti) | |
| Razer Blade 15 2022 | |
| Medio Intel Core i7-12800H (48643 - 62522, n=5) | |
| Eurocom Nightsky ARX315 | |
| Razer Blade 15 Advanced Model Early 2021 | |
| Razer Blade 15 RTX 2080 Super Max-Q | |
| AIDA64 / Memory Read | |
| Schenker XMG Neo 15 E22 (Early 2022, RTX 3080 Ti) | |
| Razer Blade 15 2022 | |
| Medio Intel Core i7-12800H (56629 - 66199, n=5) | |
| Eurocom Nightsky ARX315 | |
| Razer Blade 15 Advanced Model Early 2021 | |
| Razer Blade 15 RTX 2080 Super Max-Q | |
| AIDA64 / Memory Write | |
| Razer Blade 15 2022 | |
| Schenker XMG Neo 15 E22 (Early 2022, RTX 3080 Ti) | |
| Medio Intel Core i7-12800H (50923 - 66074, n=5) | |
| Eurocom Nightsky ARX315 | |
| Razer Blade 15 Advanced Model Early 2021 | |
| Razer Blade 15 RTX 2080 Super Max-Q | |
| AIDA64 / Memory Latency | |
| Eurocom Nightsky ARX315 | |
| Razer Blade 15 Advanced Model Early 2021 | |
| Razer Blade 15 RTX 2080 Super Max-Q | |
| Medio Intel Core i7-12800H (89.3 - 95.2, n=5) | |
| ADATA XPG Xenia 15 | |
| Schenker XMG Neo 15 E22 (Early 2022, RTX 3080 Ti) | |
| Razer Blade 15 2022 | |
* ... más pequeño es mejor
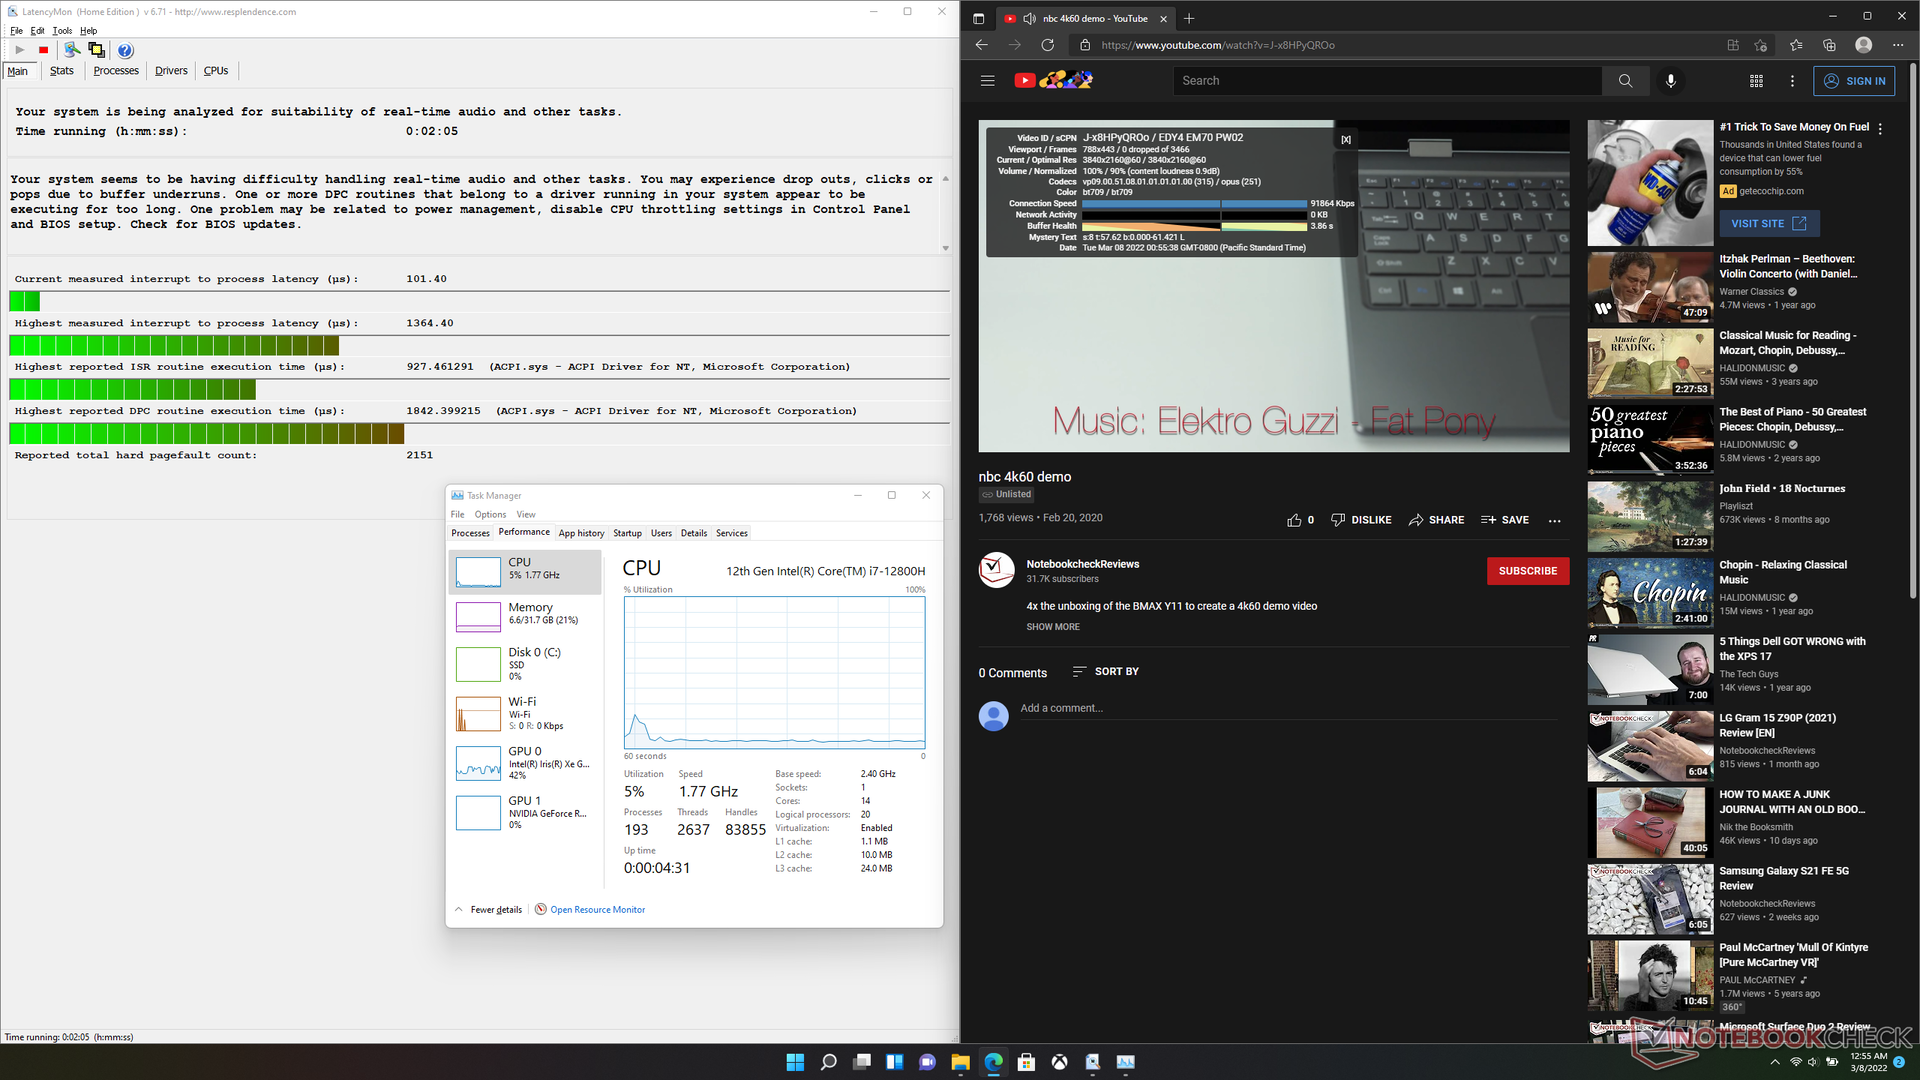
Latencia del CPD
LatencyMon muestra problemas de CPD al abrir varias pestañas del navegador en nuestra página web. la reproducción de vídeo 4K a 60 FPS es, por lo demás, fluida y sin caídas de fotogramas cuando está en modo Optimus.
| DPC Latencies / LatencyMon - interrupt to process latency (max), Web, Youtube, Prime95 | |
| ADATA XPG Xenia 15 | |
| Razer Blade 15 2022 | |
| Schenker XMG Neo 15 E22 (Early 2022, RTX 3080 Ti) | |
| Razer Blade 15 RTX 2080 Super Max-Q | |
| Razer Blade 15 Advanced Model Early 2021 | |
| Eurocom Nightsky ARX315 | |
* ... más pequeño es mejor
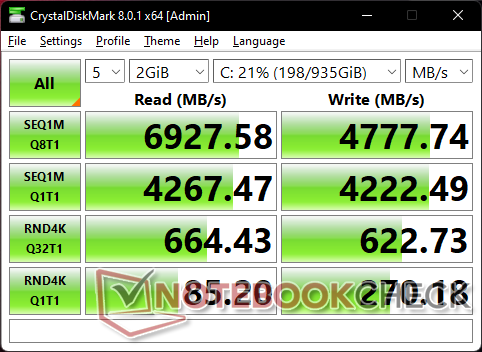
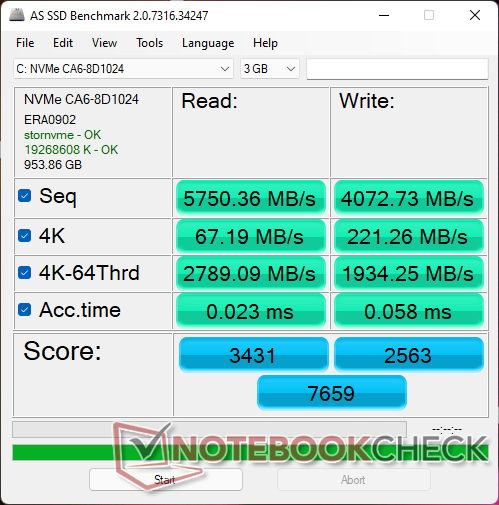
Dispositivos de almacenamiento
Casi todos los portátiles Razer Blade utilizan unidades SSD Lite-On o Samsung y el último Blade 15 no es una excepción. Nuestra unidad de prueba viene equipada con el lite-On CA6-8D1024 de 1 TB PCIe4 x4 NVMe SSD para velocidades de lectura y escritura secuenciales de hasta 6800 MB/s y 4800 MB/s, respectivamente. Nuestra prueba DiskSpd Read Loop muestra que la unidad no tiene problemas para mantener sus niveles máximos de rendimiento durante periodos prolongados.

* ... más pequeño es mejor
Disk Throttling: DiskSpd Read Loop, Queue Depth 8
Rendimiento de la GPU
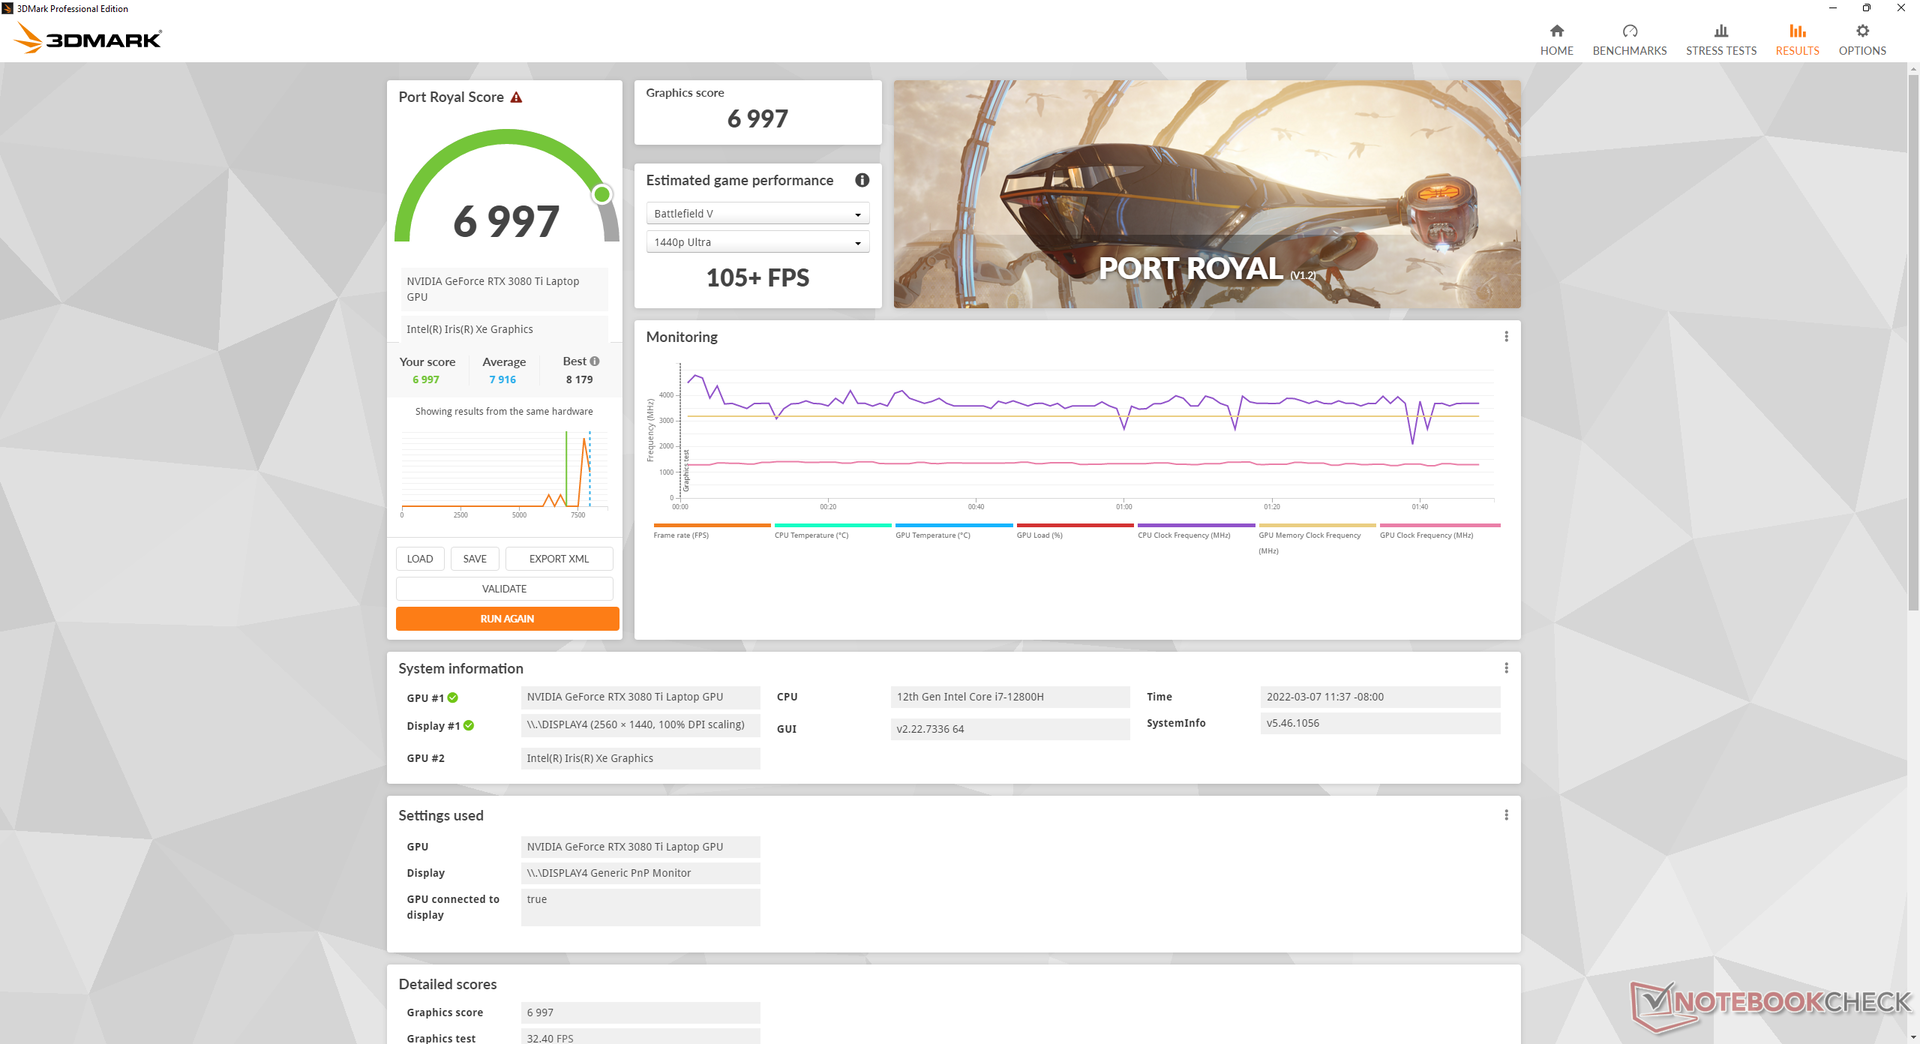
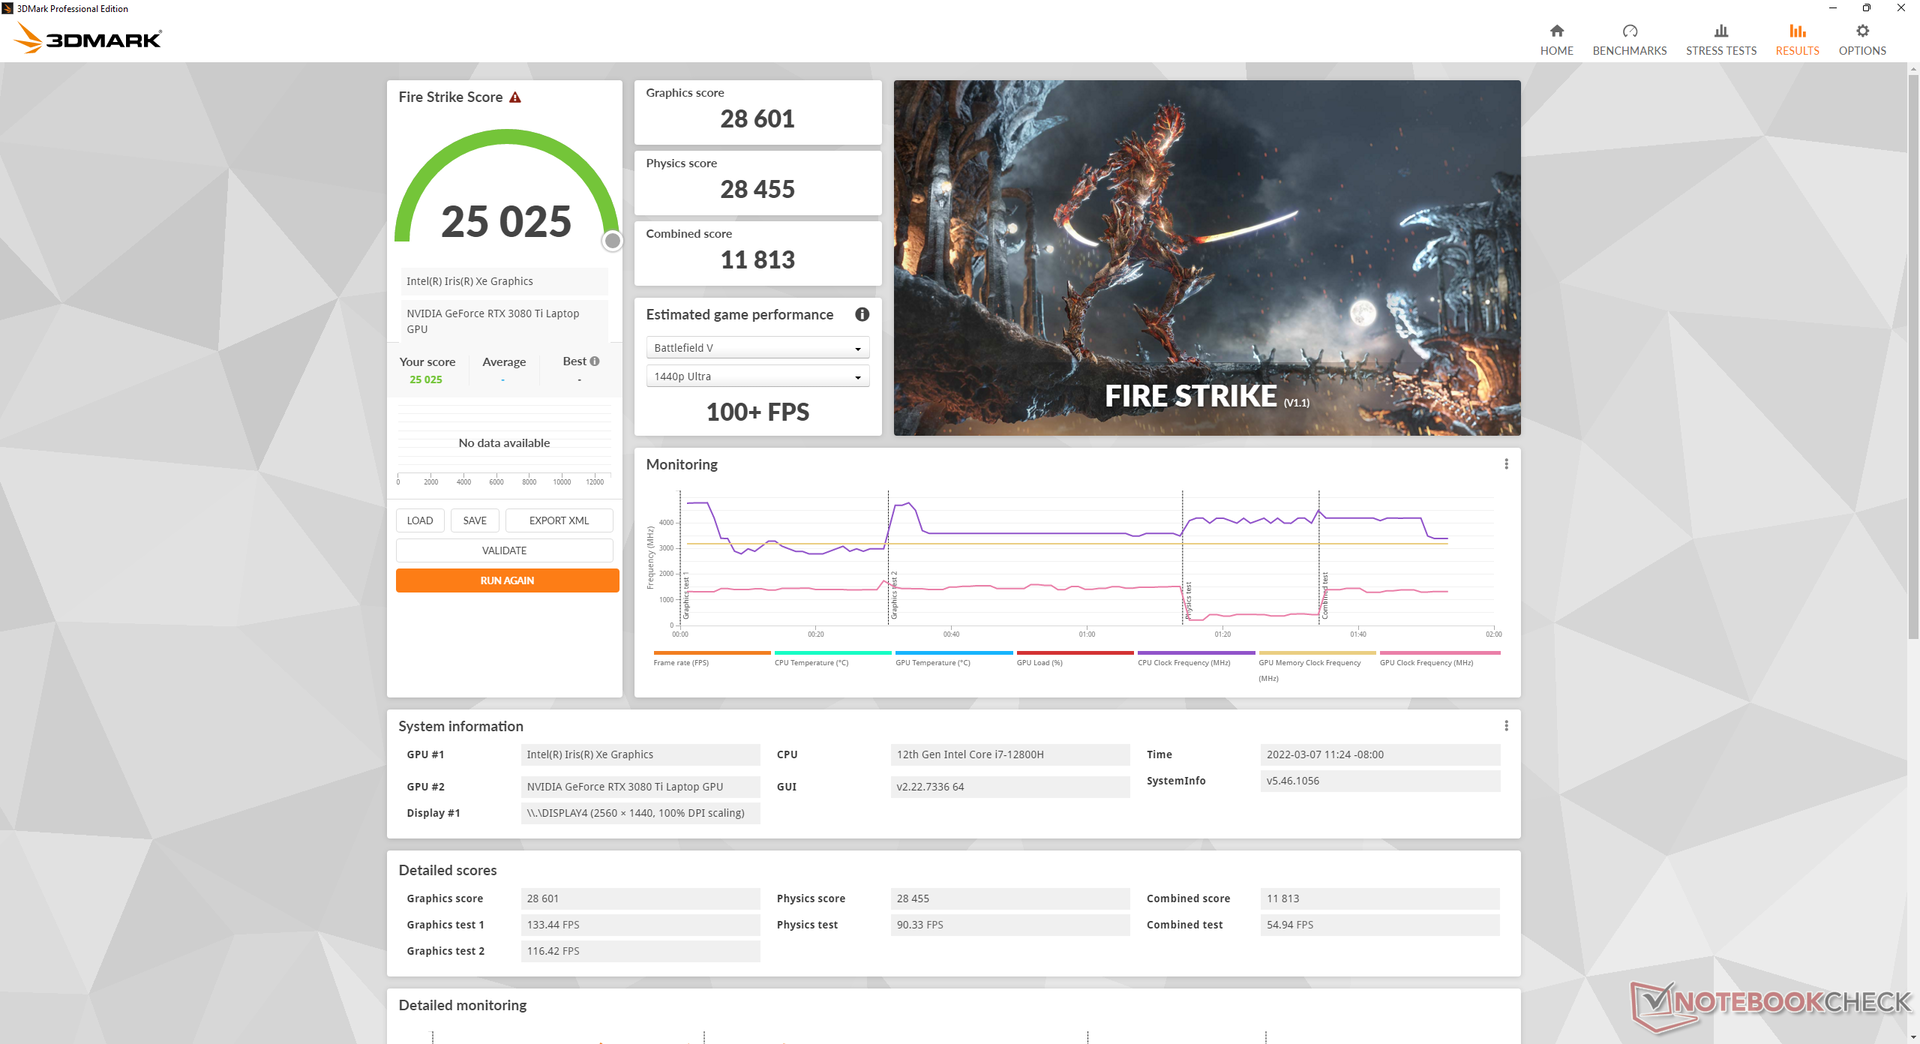
El rendimiento gráfico es entre un 15 y un 25 por ciento superior al del Blade 15 RTX 3080 o entre un 30 y un 45 por ciento más rápido que el Blade 15 RTX 2080 Max-Q. Algunas alternativas como el Schenker XMG Neo 15 E22 oSchenker Uniwill Technology GM7AG8P vienen con versiones de mayor potencia de 150+ W de la misma GPU GeForce RTX 3080 Ti para un aumento de rendimiento del 10 al 15 por ciento sobre nuestra Blade 15 RTX 3080 Ti.
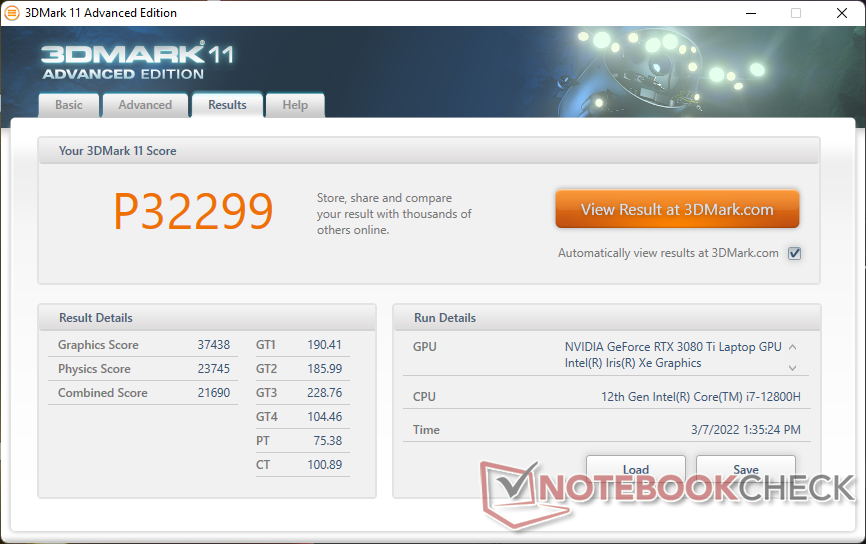
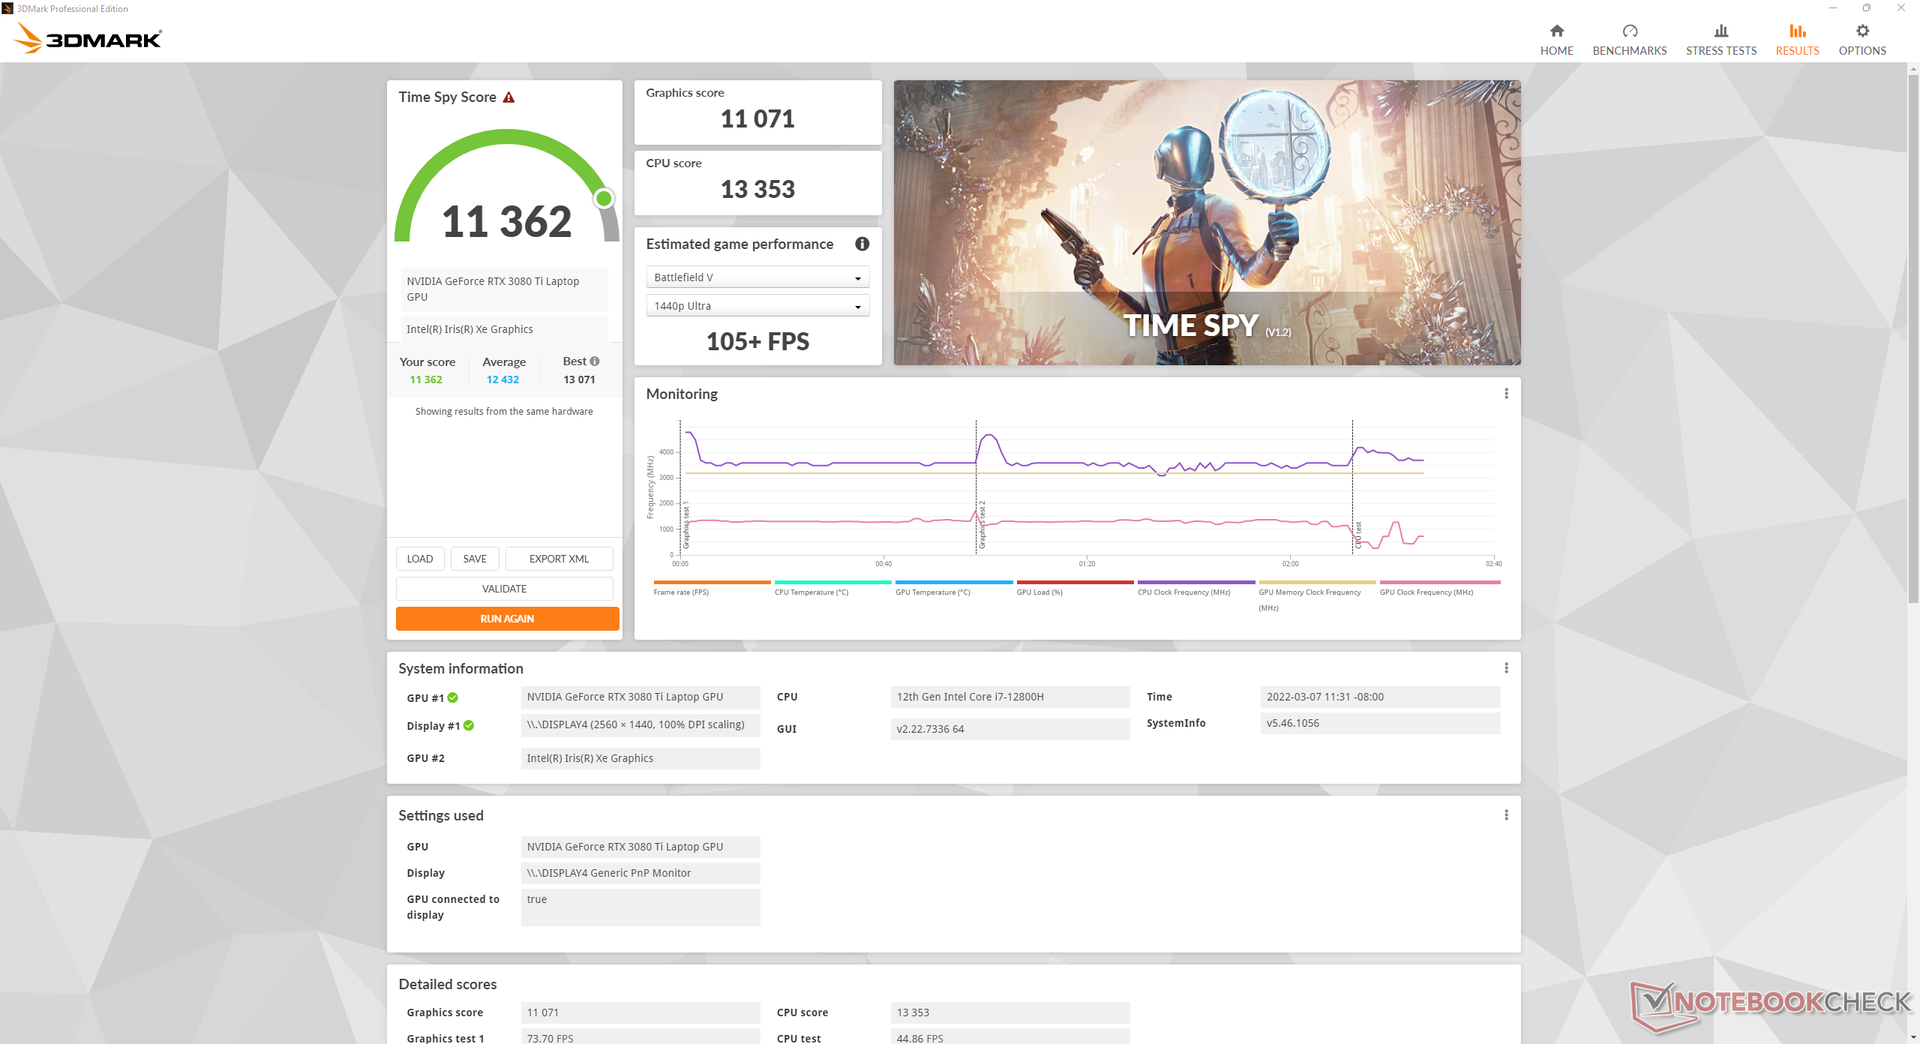
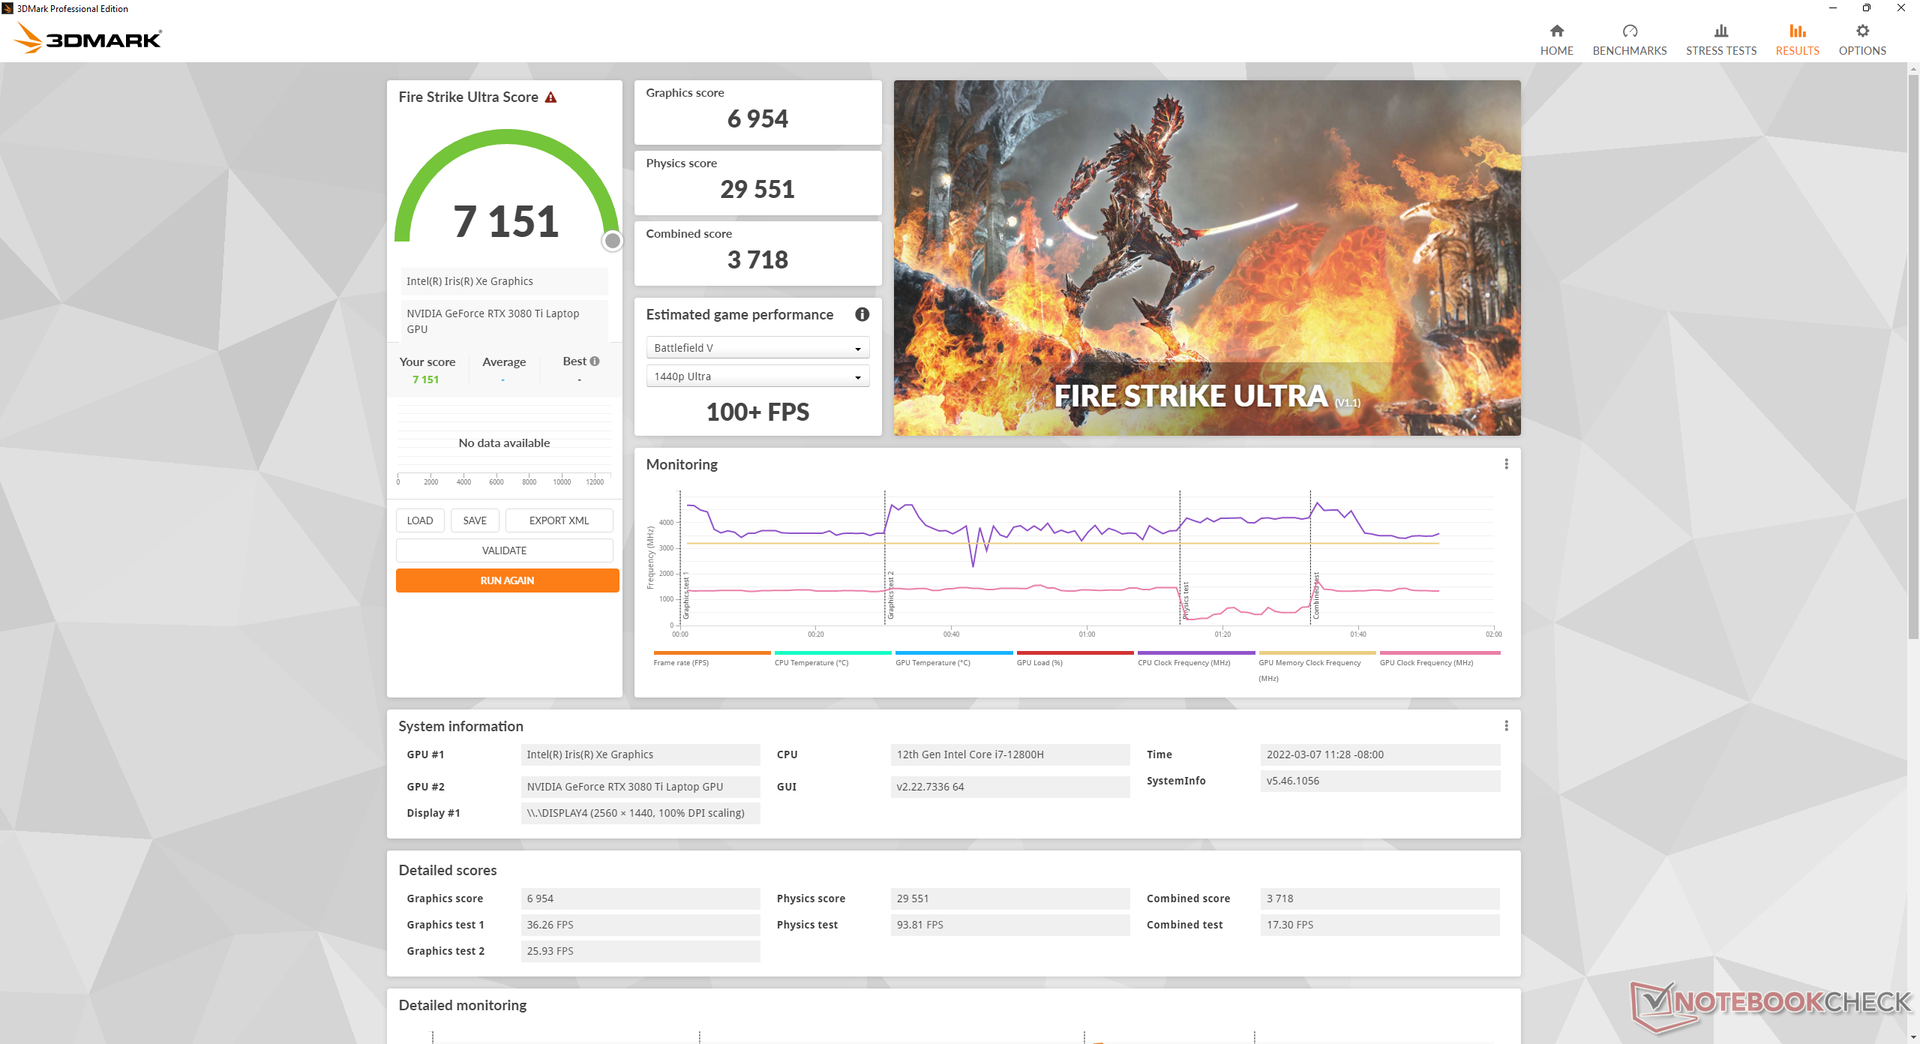
| 3DMark 11 Performance | 32299 puntos | |
| 3DMark Cloud Gate Standard Score | 60579 puntos | |
| 3DMark Fire Strike Score | 25025 puntos | |
| 3DMark Time Spy Score | 11362 puntos | |
ayuda | ||
Witcher 3 FPS Chart
| bajo | medio | alto | ultra | QHD | |
|---|---|---|---|---|---|
| GTA V (2015) | 186 | 181 | 177 | 118 | 97.8 |
| The Witcher 3 (2015) | 457.4 | 320.9 | 213.7 | 107.2 | |
| Dota 2 Reborn (2015) | 181 | 169 | 164 | 156 | |
| Final Fantasy XV Benchmark (2018) | 178 | 141 | 106 | 82.9 | |
| X-Plane 11.11 (2018) | 158 | 140 | 110 | ||
| Far Cry 5 (2018) | 179 | 151 | 144 | 135 | 107 |
| Strange Brigade (2018) | 442 | 252 | 205 | 184 | 132 |
Emisiones
Ruido del sistema
El ruido del ventilador depende del perfil de energía de Synapse. Recomendamos usar el sistema en modo silencioso cuando se navega por la web o se hace streaming de vídeo, ya que los ventiladores pulsarán con más frecuencia si están en los modos equilibrado o de alto rendimiento. La desventaja del modo silencioso es que los reposamanos y la parte inferior del portátil se calentarán notablemente, ya que los ventiladores funcionan mucho más lentamente.
El ruido del ventilador cuando se ejecuta Witcher 3 en el modo de alto rendimiento es similar al que registramos en los antiguos modelos Blade 15, con unos 45 dB(A), lo que sigue siendo mucho más silencioso que en el XPG Xenia 15 de la competencia o elEurocom Nightsky ARX315. Sin embargo, esto puede aumentar al rango de 49 a 52 dB(A) si la CPU se estresa mucho más.
Ruido
| Ocioso |
| 26.2 / 26.2 / 28.4 dB(A) |
| Carga |
| 44.7 / 51.9 dB(A) |
 | ||
30 dB silencioso 40 dB(A) audible 50 dB(A) ruidosamente alto |
||
min: | ||
| Razer Blade 15 2022 GeForce RTX 3080 Ti Laptop GPU, i7-12800H, SSSTC CA6-8D1024 | Razer Blade 15 Advanced Model Early 2021 GeForce RTX 3080 Laptop GPU, i7-10875H, Samsung PM981a MZVLB1T0HBLR | Razer Blade 15 RTX 2080 Super Max-Q GeForce RTX 2080 Super Max-Q, i7-10875H, Samsung PM981a MZVLB1T0HBLR | Schenker XMG Neo 15 E22 (Early 2022, RTX 3080 Ti) GeForce RTX 3080 Ti Laptop GPU, i7-12700H, Samsung SSD 980 Pro 250GB MZ-V8P250BW | ADATA XPG Xenia 15 GeForce RTX 3070 Laptop GPU, i7-11800H, ADATA XPG Gammix S70 1TB | Eurocom Nightsky ARX315 GeForce RTX 3070 Laptop GPU, R9 5900X, Samsung SSD 980 Pro 1TB MZ-V8P1T0BW | |
|---|---|---|---|---|---|---|
| Noise | -4% | -8% | 2% | 5% | -15% | |
| apagado / medio ambiente * (dB) | 25.4 | 24 6% | 30.1 -19% | 24 6% | 24.8 2% | 25.3 -0% |
| Idle Minimum * (dB) | 26.2 | 26 1% | 30.1 -15% | 24 8% | 24.9 5% | 25.9 1% |
| Idle Average * (dB) | 26.2 | 28 -7% | 30.1 -15% | 24 8% | 24.9 5% | 27.9 -6% |
| Idle Maximum * (dB) | 28.4 | 40 -41% | 30.1 -6% | 27.76 2% | 24.9 12% | 40.8 -44% |
| Load Average * (dB) | 44.7 | 45 -1% | 46.8 -5% | 38.81 13% | 28.8 36% | 55.2 -23% |
| Witcher 3 ultra * (dB) | 44.7 | 43 4% | 48.4 -8% | 54.2 -21% | 52.7 -18% | 52.4 -17% |
| Load Maximum * (dB) | 51.9 | 45 13% | 46 11% | 54.18 -4% | 54.9 -6% | 60.3 -16% |
* ... más pequeño es mejor
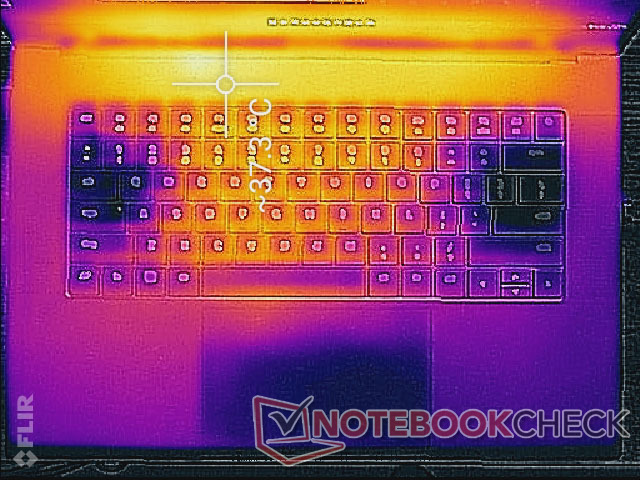
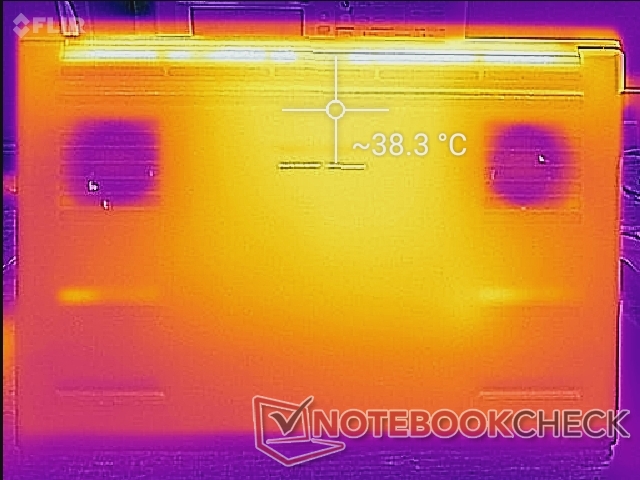
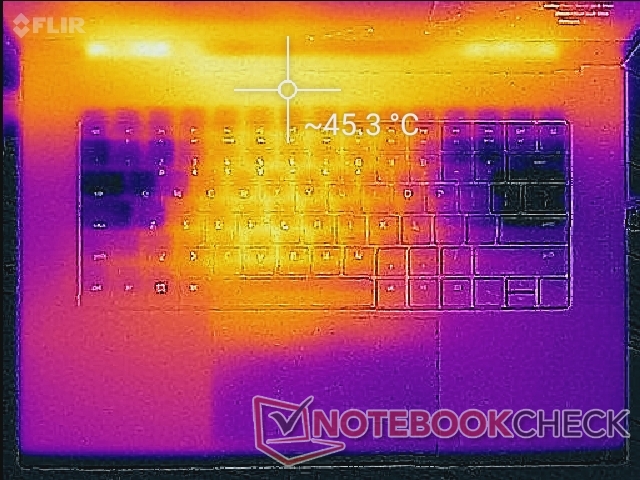
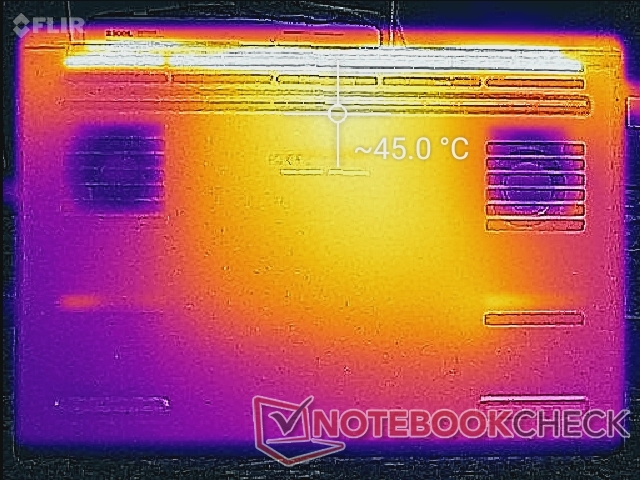
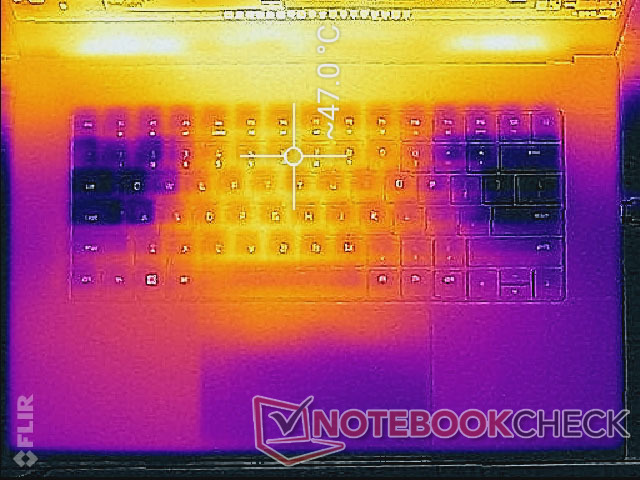
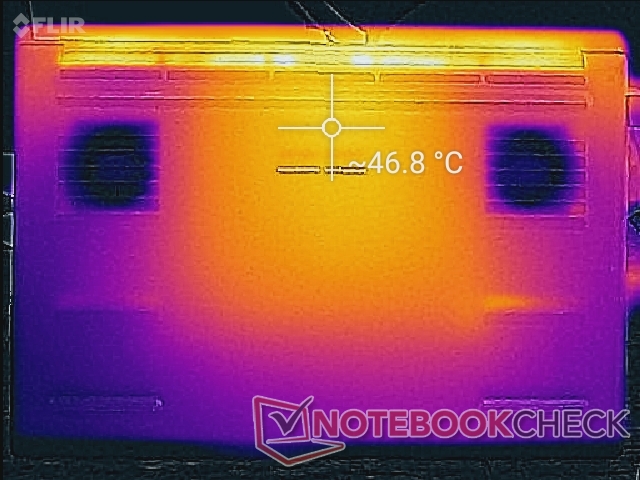
Temperatura
Las temperaturas de la superficie son cálidas incluso cuando está en reposo en el escritorio. Los puntos calientes pueden alcanzar más de 37 C en la parte superior e inferior, cifras comparables a las del ultrafino XPG Xenia 15 o MSI Vector GP66 en condiciones similares. El centro del teclado puede alcanzar los 48 C cuando se juega.
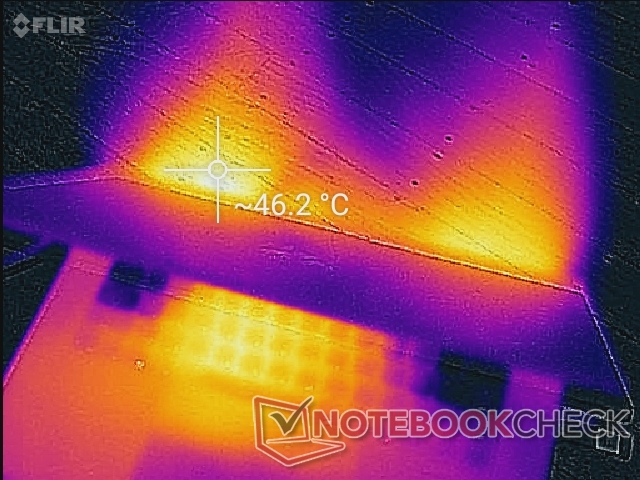
(-) La temperatura máxima en la parte superior es de 50 °C / 122 F, frente a la media de 40.4 °C / 105 F, que oscila entre 21.2 y 68.8 °C para la clase Gaming.
(-) El fondo se calienta hasta un máximo de 47 °C / 117 F, frente a la media de 43.2 °C / 110 F
(±) En reposo, la temperatura media de la parte superior es de 32.4 °C / 90# F, frente a la media del dispositivo de 33.9 °C / 93 F.
(±) Jugando a The Witcher 3, la temperatura media de la parte superior es de 36 °C / 97 F, frente a la media del dispositivo de 33.9 °C / 93 F.
(+) Los reposamanos y el panel táctil alcanzan como máximo la temperatura de la piel (34 °C / 93.2 F) y, por tanto, no están calientes.
(-) La temperatura media de la zona del reposamanos de dispositivos similares fue de 28.8 °C / 83.8 F (-5.2 °C / -9.4 F).
| Razer Blade 15 2022 Intel Core i7-12800H, NVIDIA GeForce RTX 3080 Ti Laptop GPU | Razer Blade 15 Advanced Model Early 2021 Intel Core i7-10875H, NVIDIA GeForce RTX 3080 Laptop GPU | Razer Blade 15 RTX 2080 Super Max-Q Intel Core i7-10875H, NVIDIA GeForce RTX 2080 Super Max-Q | Schenker XMG Neo 15 E22 (Early 2022, RTX 3080 Ti) Intel Core i7-12700H, NVIDIA GeForce RTX 3080 Ti Laptop GPU | ADATA XPG Xenia 15 Intel Core i7-11800H, NVIDIA GeForce RTX 3070 Laptop GPU | Eurocom Nightsky ARX315 AMD Ryzen 9 5900X, NVIDIA GeForce RTX 3070 Laptop GPU | |
|---|---|---|---|---|---|---|
| Heat | 6% | 7% | -7% | -12% | 6% | |
| Maximum Upper Side * (°C) | 50 | 49 2% | 52 -4% | 52 -4% | 49 2% | 36.2 28% |
| Maximum Bottom * (°C) | 47 | 54 -15% | 53 -13% | 68 -45% | 64.2 -37% | 49.6 -6% |
| Idle Upper Side * (°C) | 37.4 | 30 20% | 29.3 22% | 32 14% | 37.6 -1% | 32.6 13% |
| Idle Bottom * (°C) | 38.4 | 32 17% | 30.2 21% | 36 6% | 42.2 -10% | 43.2 -13% |
* ... más pequeño es mejor
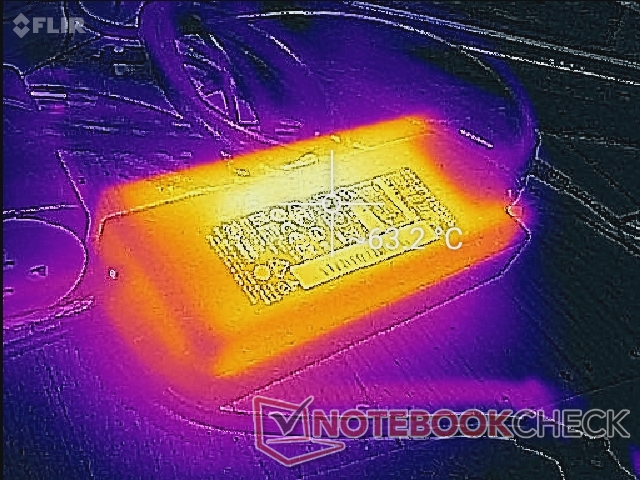
Prueba de esfuerzo
Cuando se estresa con Prime95, la CPU sube a 3,1 GHz durante los primeros segundos hasta alcanzar una temperatura del núcleo de 80 C. A partir de entonces, la velocidad de reloj y la temperatura se estabilizan en torno a 2,2 GHz y 66 C, respectivamente. El consumo del paquete de la CPU también caería desde el pico inicial de 90 W hasta un nivel más estable de 55 W.
Si se ejecuta Witcher 3 haría que la CPU y la GPU se estabilizaran a 74 C y 67 C, respectivamente, comparado con los 73 C y 71 C del modelo Blade 15 RTX 3080 del año pasado (o 67 C y 75 C del modelo Blade 15 Base). Las temperaturas de los núcleos no son, por tanto, muy diferentes de un año a otro a pesar de los aumentos de rendimiento de la CPU y la GPU.
El funcionamiento con baterías limitará el rendimiento. Una prueba de Fire Strike con baterías arrojaría unas puntuaciones de Física y Gráficos de 10560 y 8439 puntos, respectivamente, en comparación con los 28455 y 28601 puntos de la red eléctrica.
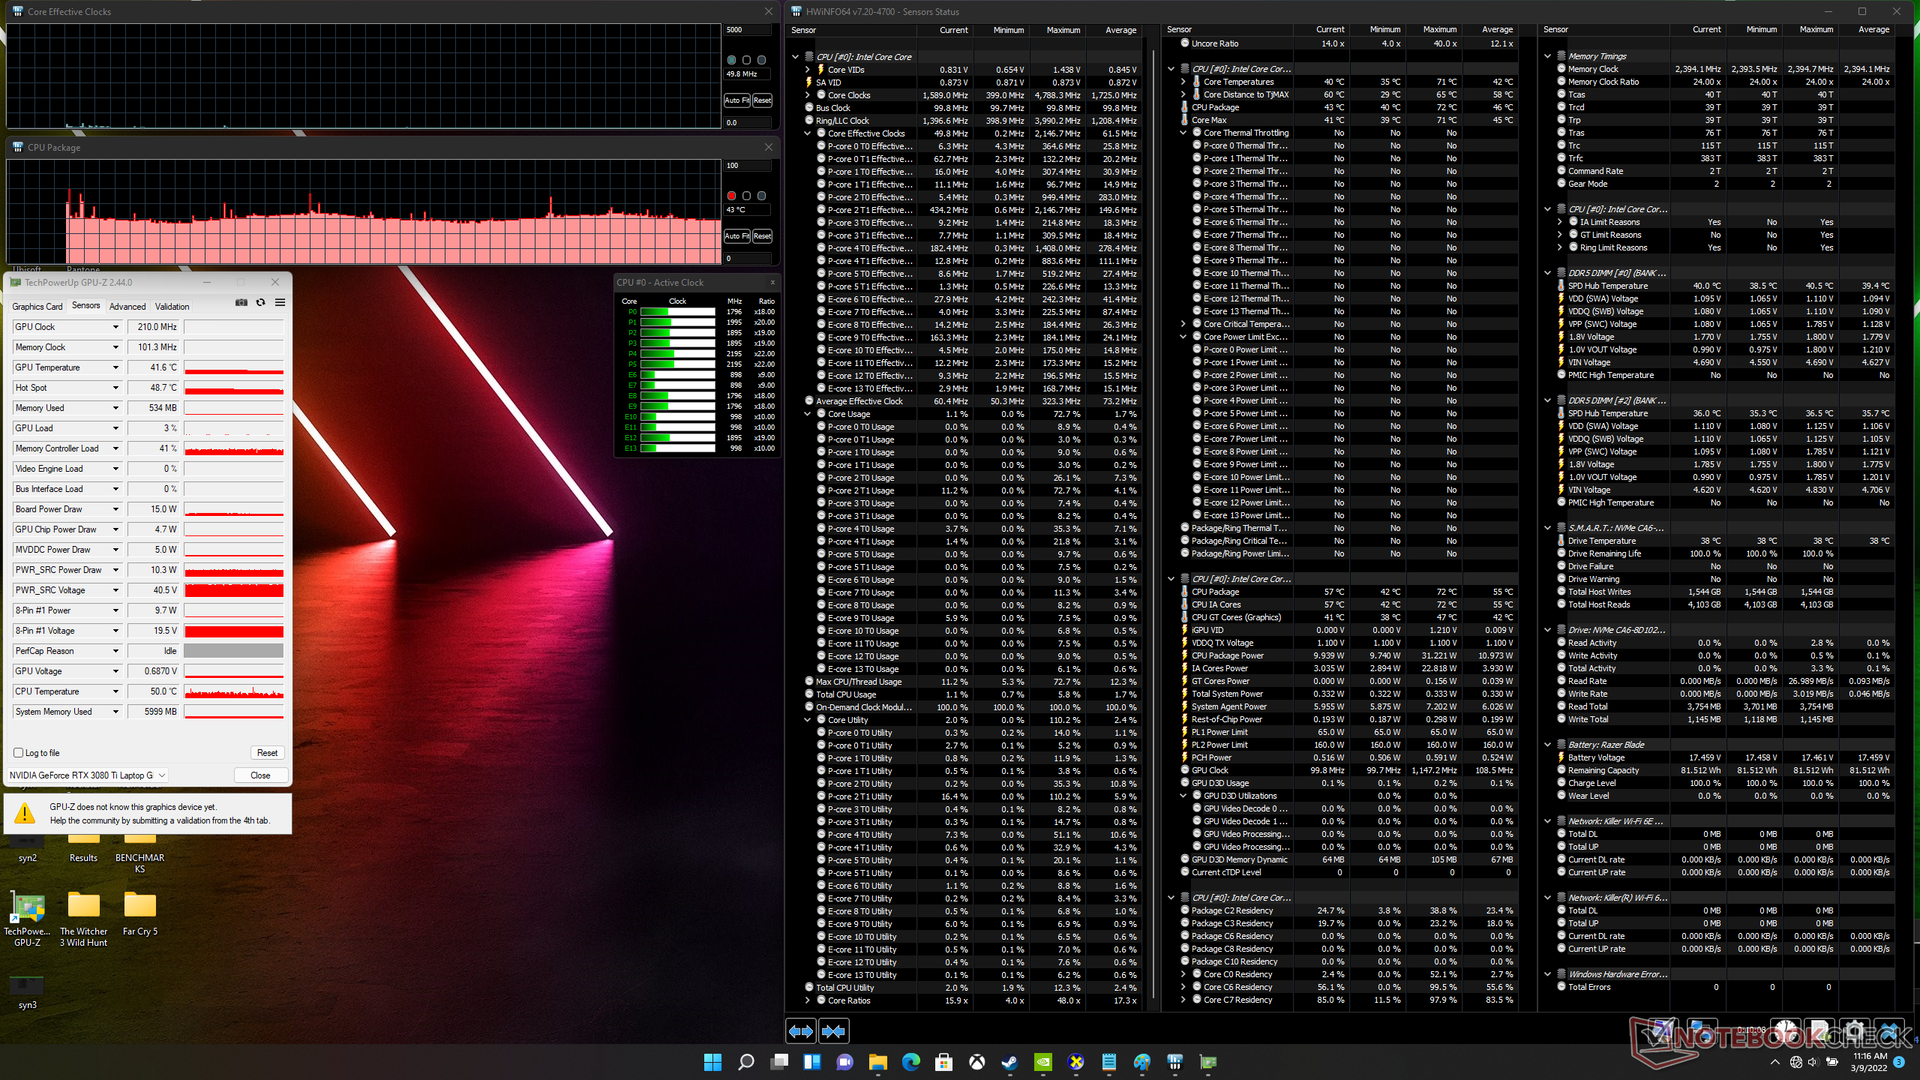
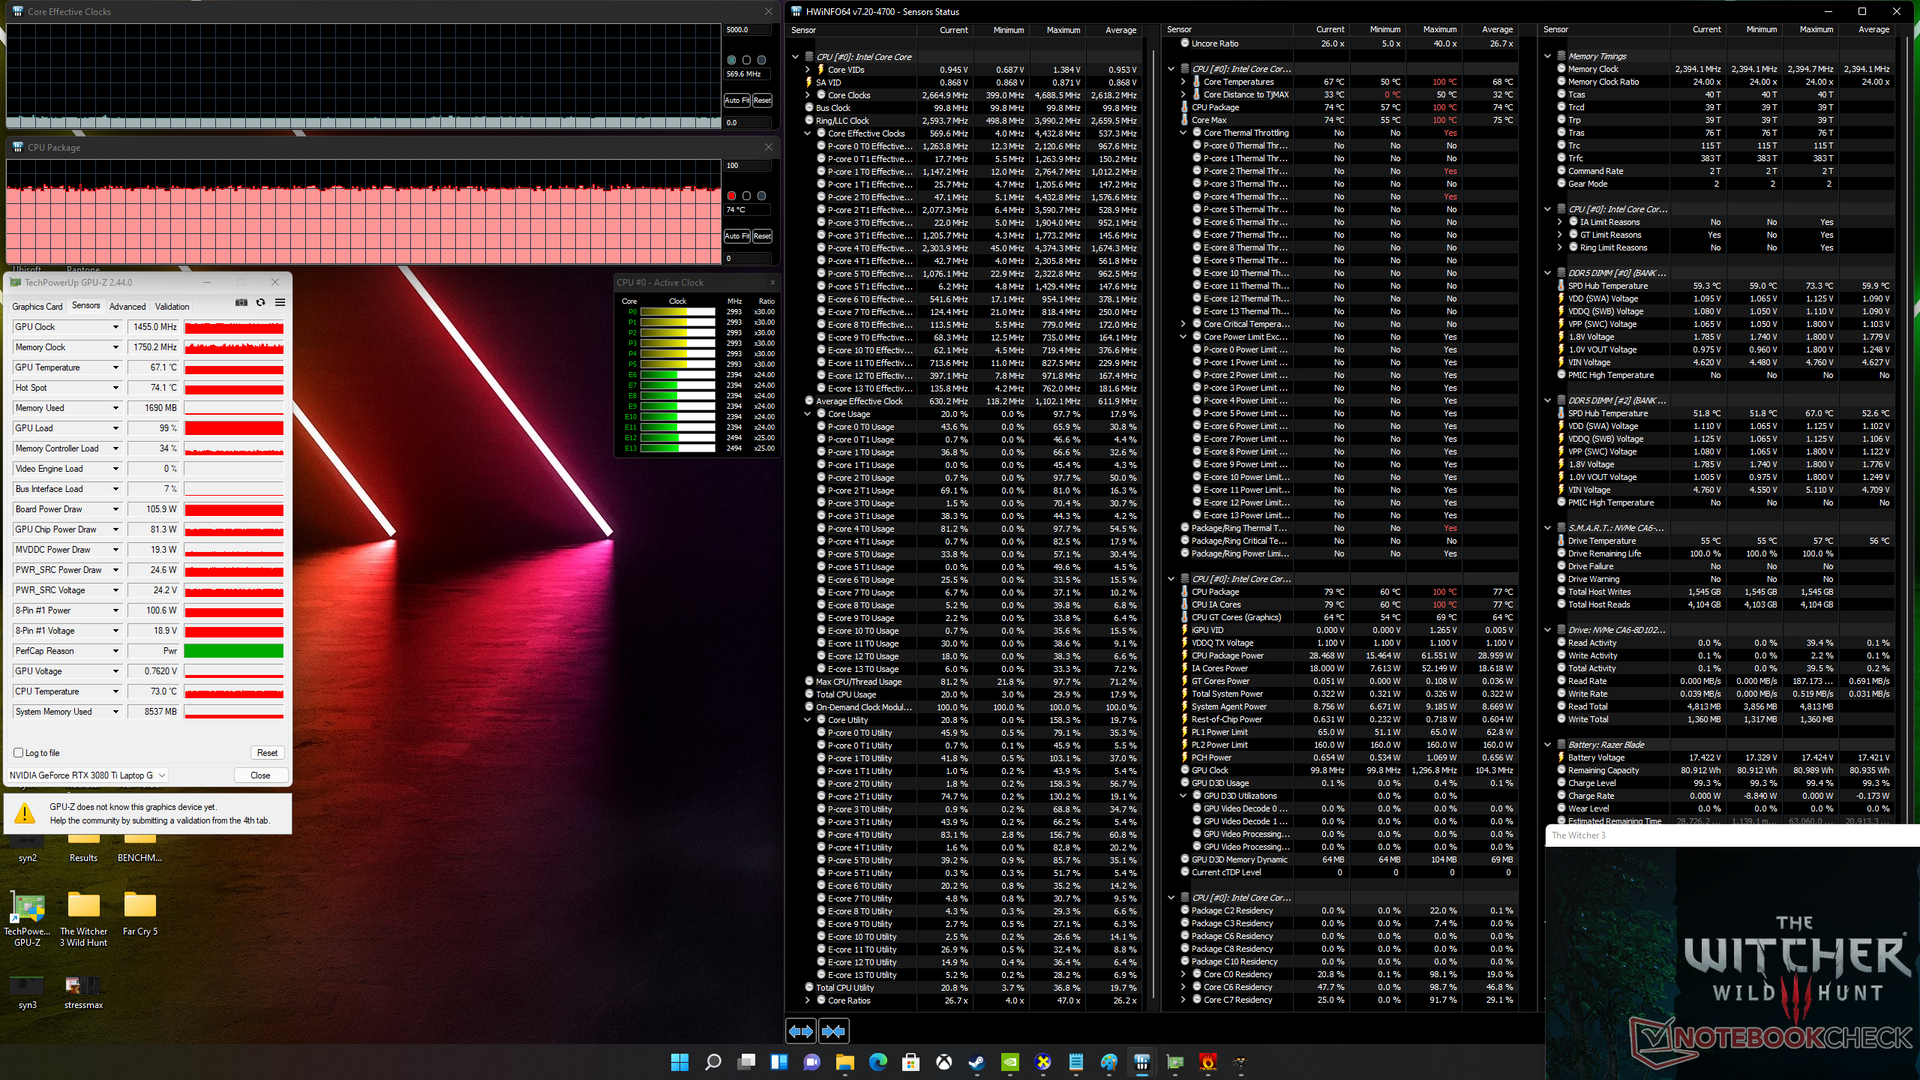
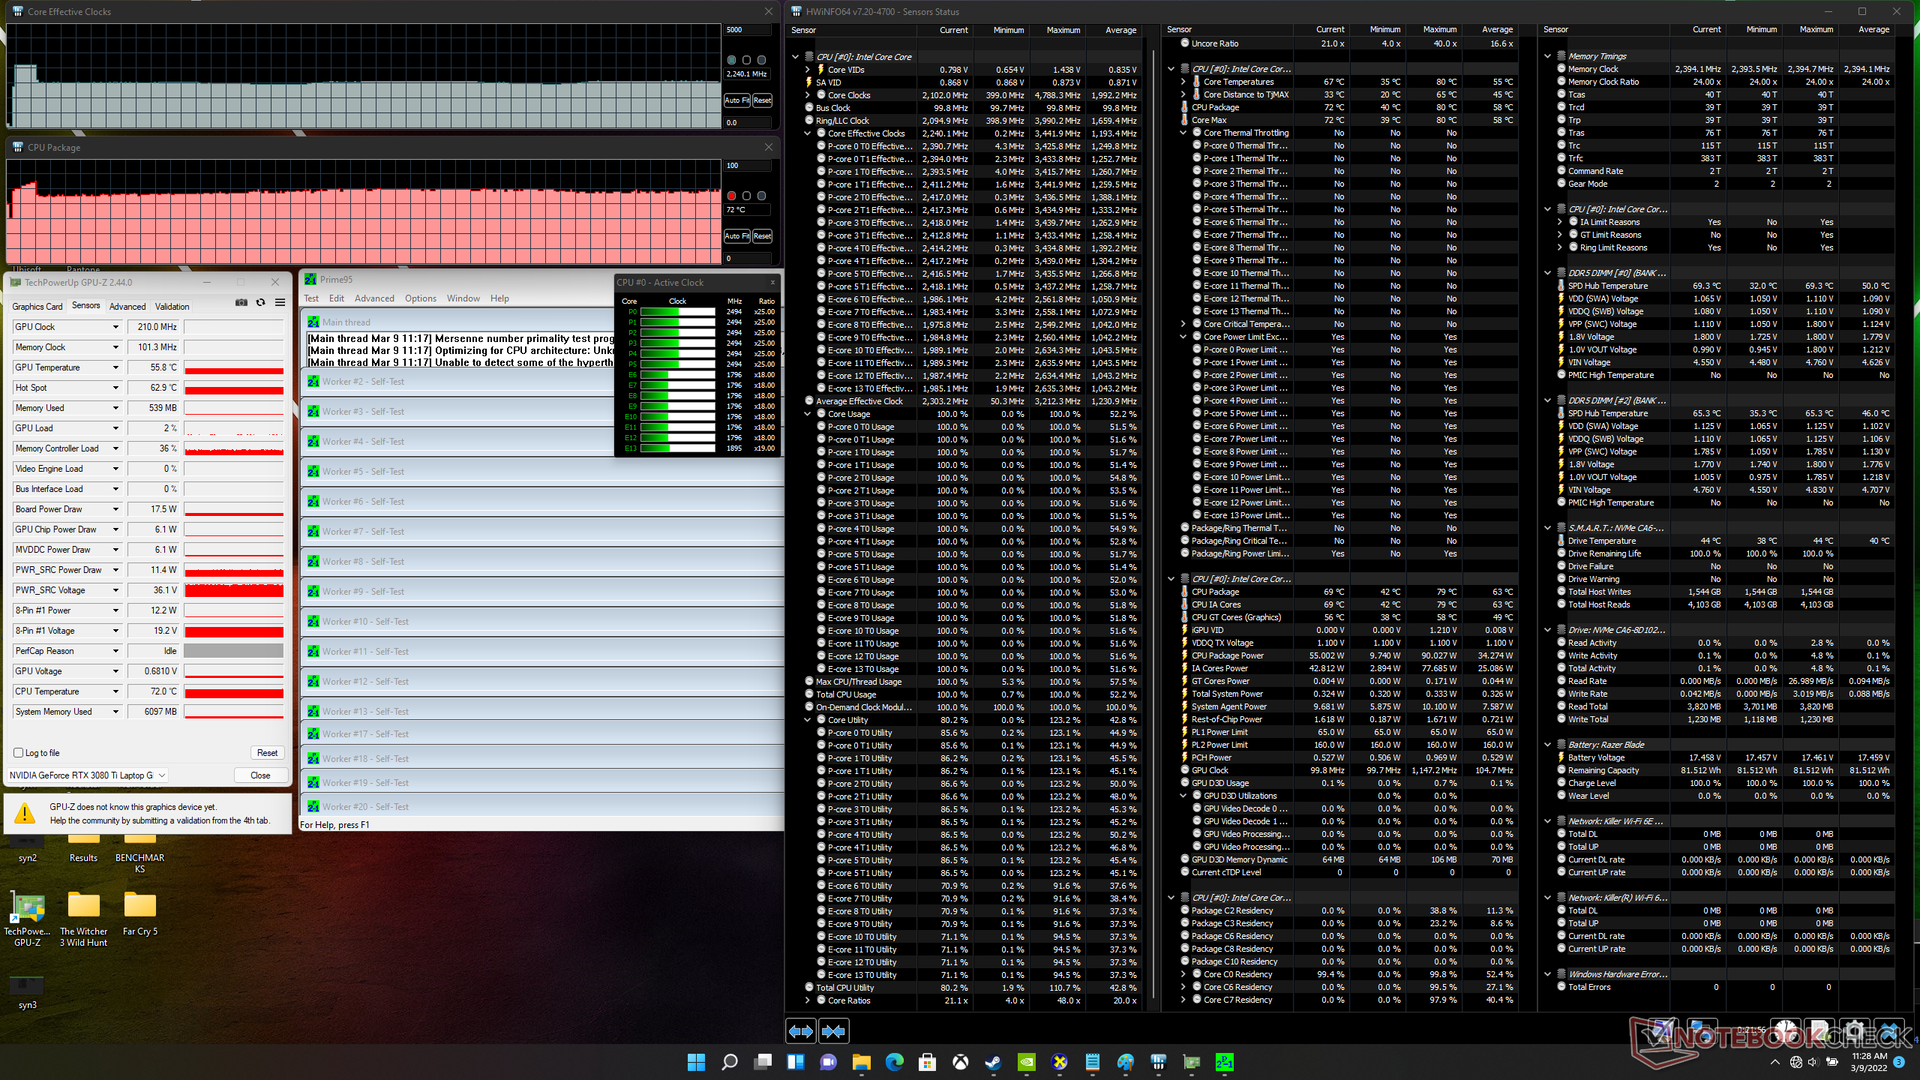
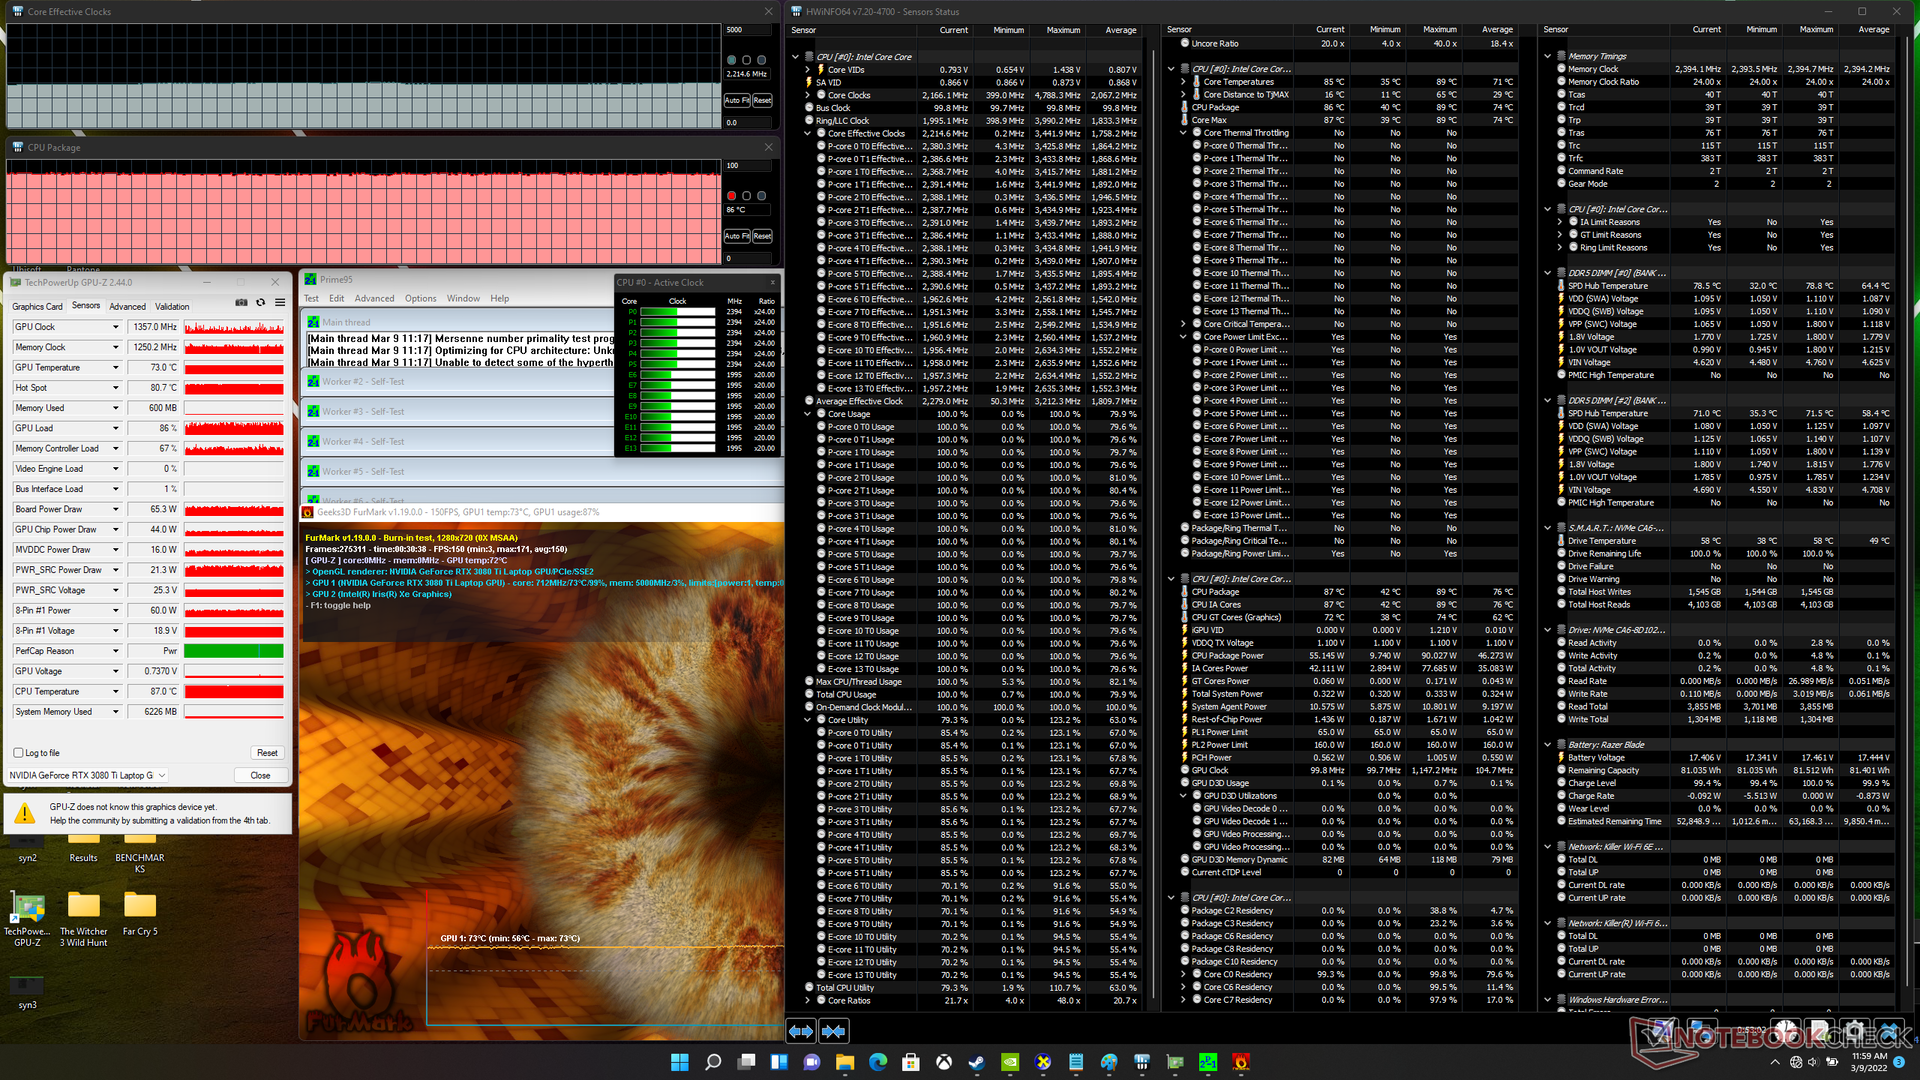
| Reloj dela CPU (GHz) | Reloj de la GPU (MHz) | Temperatura media dela CPU (°C) | Temperatura media de la GPU (°C) | |
| Sistema en reposo | -- | -- | 43 | 42 |
| Prime95Stress | 2.2 | -- | 72 | 56 |
| Prime95+ FurMarkStress | 2,2 | ~1357 | 86 | 73 |
| Witcher 3 Stress | 0,6 | 1455 | 74 | 67 |
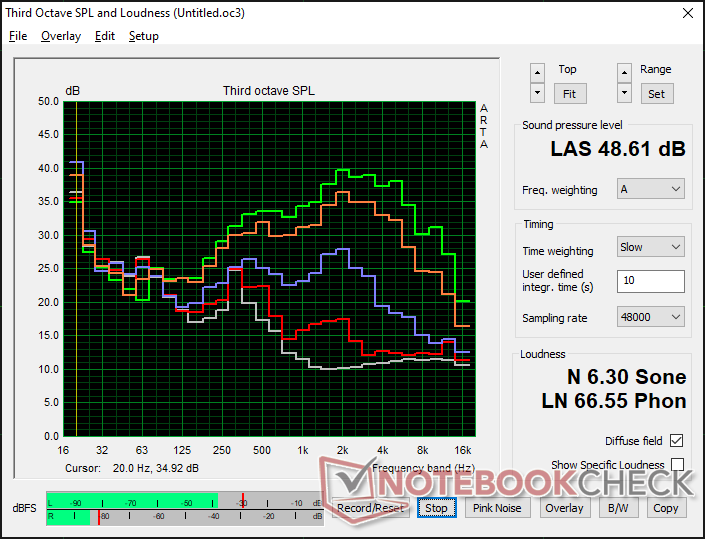
Altavoces
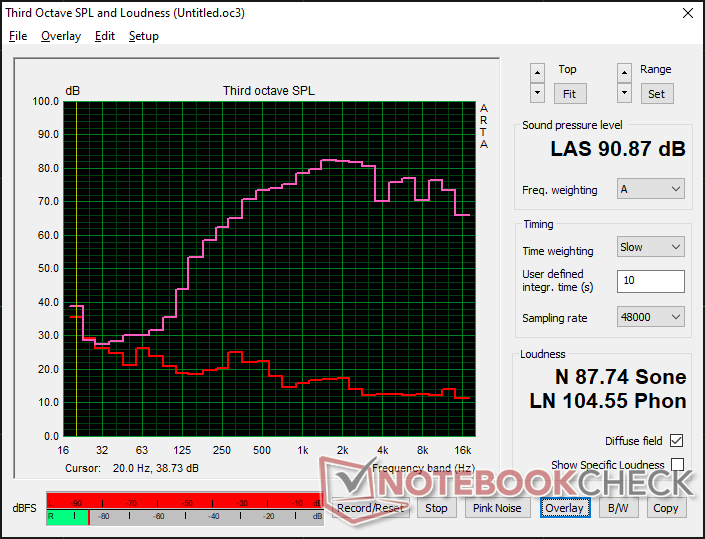
Razer Blade 15 2022 análisis de audio
(+) | los altavoces pueden reproducir a un volumen relativamente alto (#90.9 dB)
Graves 100 - 315 Hz
(-) | casi sin bajos - de media 21% inferior a la mediana
(±) | la linealidad de los graves es media (9.7% delta a frecuencia anterior)
Medios 400 - 2000 Hz
(+) | medios equilibrados - a sólo 3.9% de la mediana
(+) | los medios son lineales (3.9% delta a la frecuencia anterior)
Altos 2 - 16 kHz
(+) | máximos equilibrados - a sólo 4.2% de la mediana
(±) | la linealidad de los máximos es media (7.8% delta a frecuencia anterior)
Total 100 - 16.000 Hz
(±) | la linealidad del sonido global es media (15.7% de diferencia con la mediana)
En comparación con la misma clase
» 37% de todos los dispositivos probados de esta clase eran mejores, 7% similares, 57% peores
» El mejor tuvo un delta de 6%, la media fue 18%, el peor fue ###max##%
En comparación con todos los dispositivos probados
» 24% de todos los dispositivos probados eran mejores, 5% similares, 71% peores
» El mejor tuvo un delta de 4%, la media fue 23%, el peor fue ###max##%
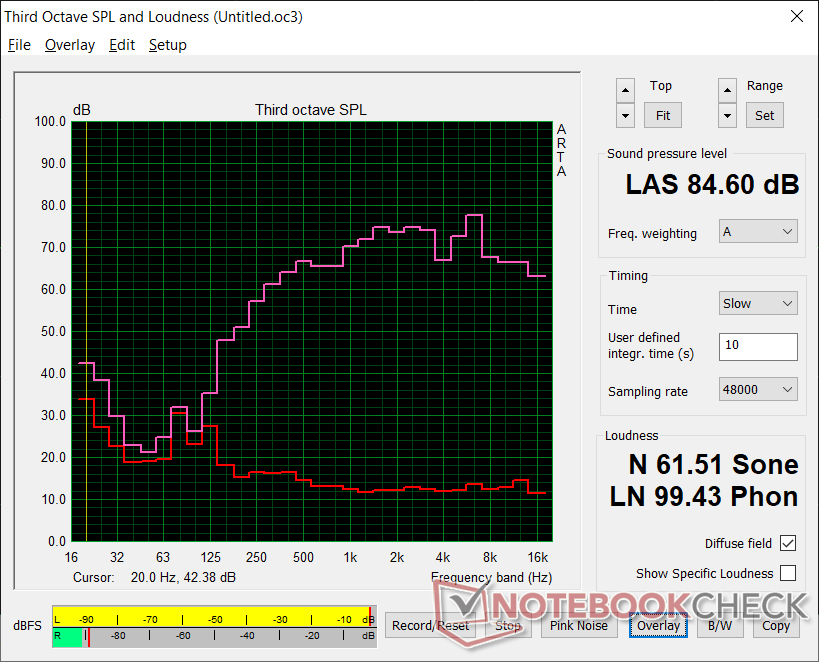
Apple MacBook Pro 16 2021 M1 Pro análisis de audio
(+) | los altavoces pueden reproducir a un volumen relativamente alto (#84.7 dB)
Graves 100 - 315 Hz
(+) | buen bajo - sólo 3.8% lejos de la mediana
(+) | el bajo es lineal (5.2% delta a la frecuencia anterior)
Medios 400 - 2000 Hz
(+) | medios equilibrados - a sólo 1.3% de la mediana
(+) | los medios son lineales (2.1% delta a la frecuencia anterior)
Altos 2 - 16 kHz
(+) | máximos equilibrados - a sólo 1.9% de la mediana
(+) | los máximos son lineales (2.7% delta a la frecuencia anterior)
Total 100 - 16.000 Hz
(+) | el sonido global es lineal (4.6% de diferencia con la mediana)
En comparación con la misma clase
» 0% de todos los dispositivos probados de esta clase eran mejores, 0% similares, 100% peores
» El mejor tuvo un delta de 5%, la media fue 17%, el peor fue ###max##%
En comparación con todos los dispositivos probados
» 0% de todos los dispositivos probados eran mejores, 0% similares, 100% peores
» El mejor tuvo un delta de 4%, la media fue 23%, el peor fue ###max##%
Gestión de la energía
Consumo de energía
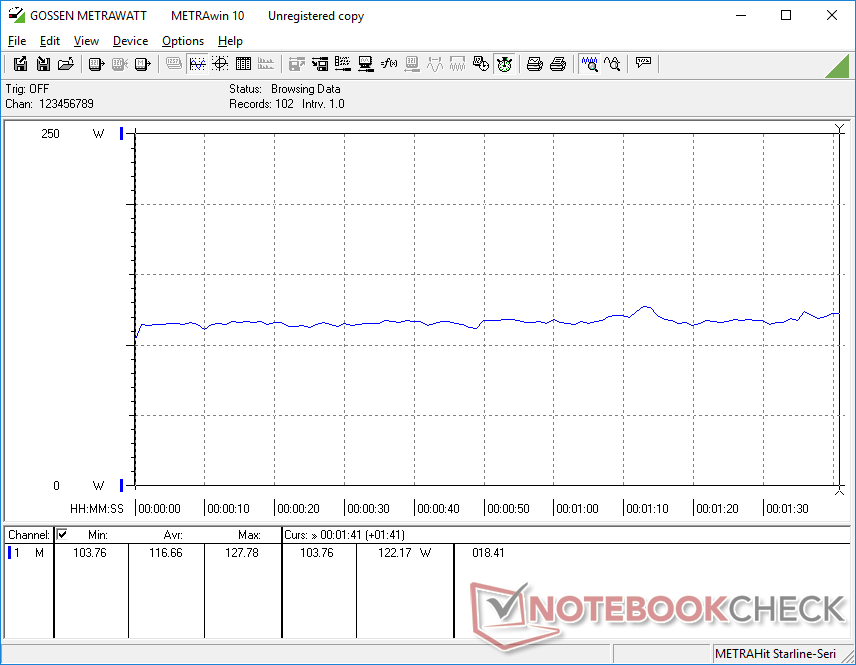
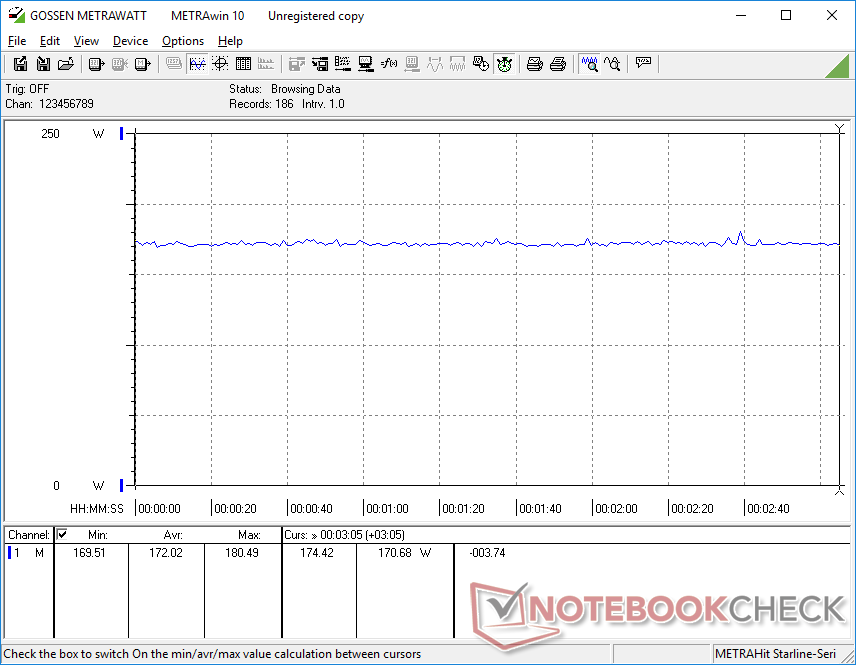
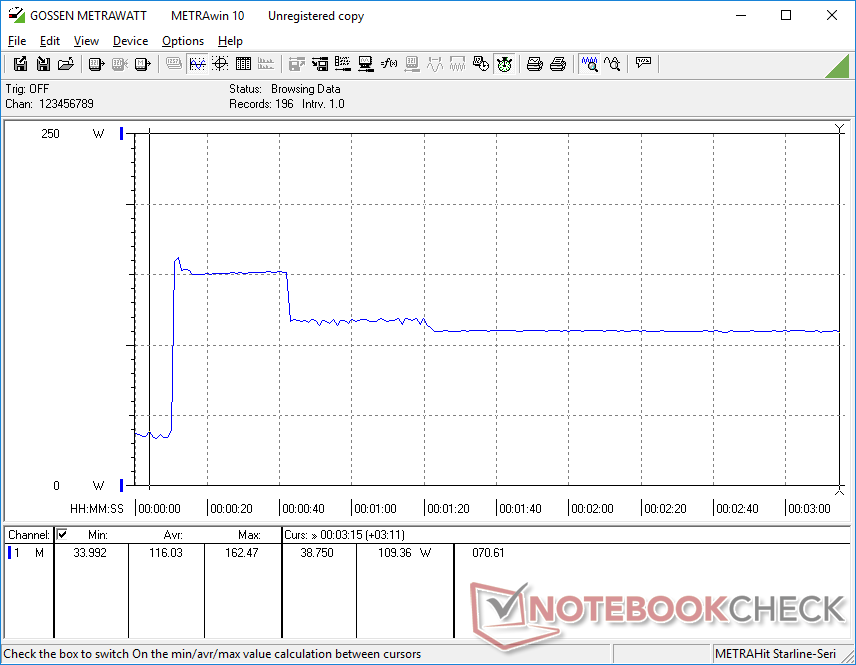
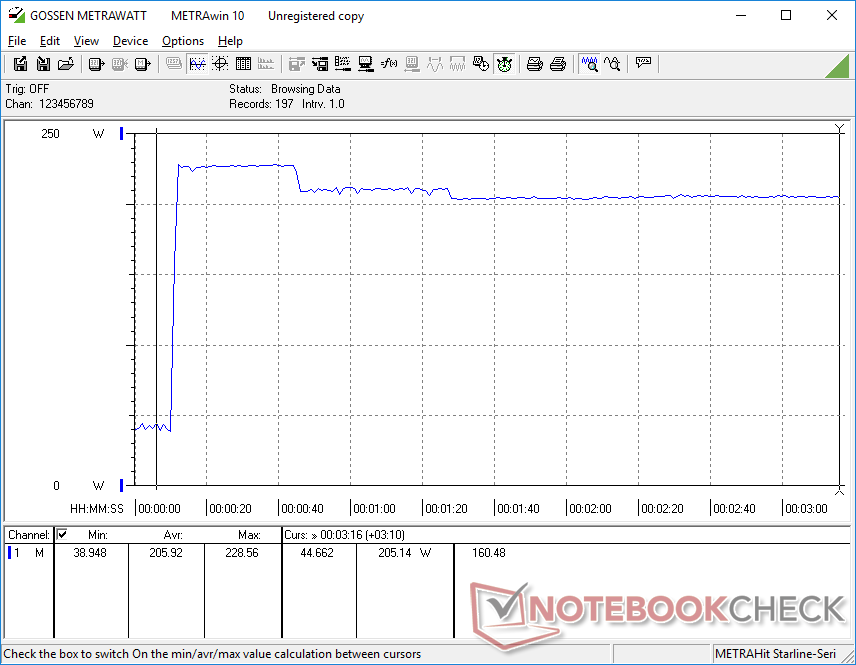
Los usuarios obtienen más del doble de rendimiento multihilo de la CPU y un aumento de los gráficos de entre el 15 y el 25 por ciento en comparación con el Blade 15 de principios de 2021. El consumo de energía es posteriormente más alto en nuestro último modelo Blade 15, hasta 60 W cuando está completamente estresado o unos 30 W cuando ejecuta juegos. El Schenker XMG Neo 15 E22 con su RTX 3080 Ti de 175 W consumirá incluso más energía que nuestro Blade 15 y su RTX 3080 Ti de 110 W
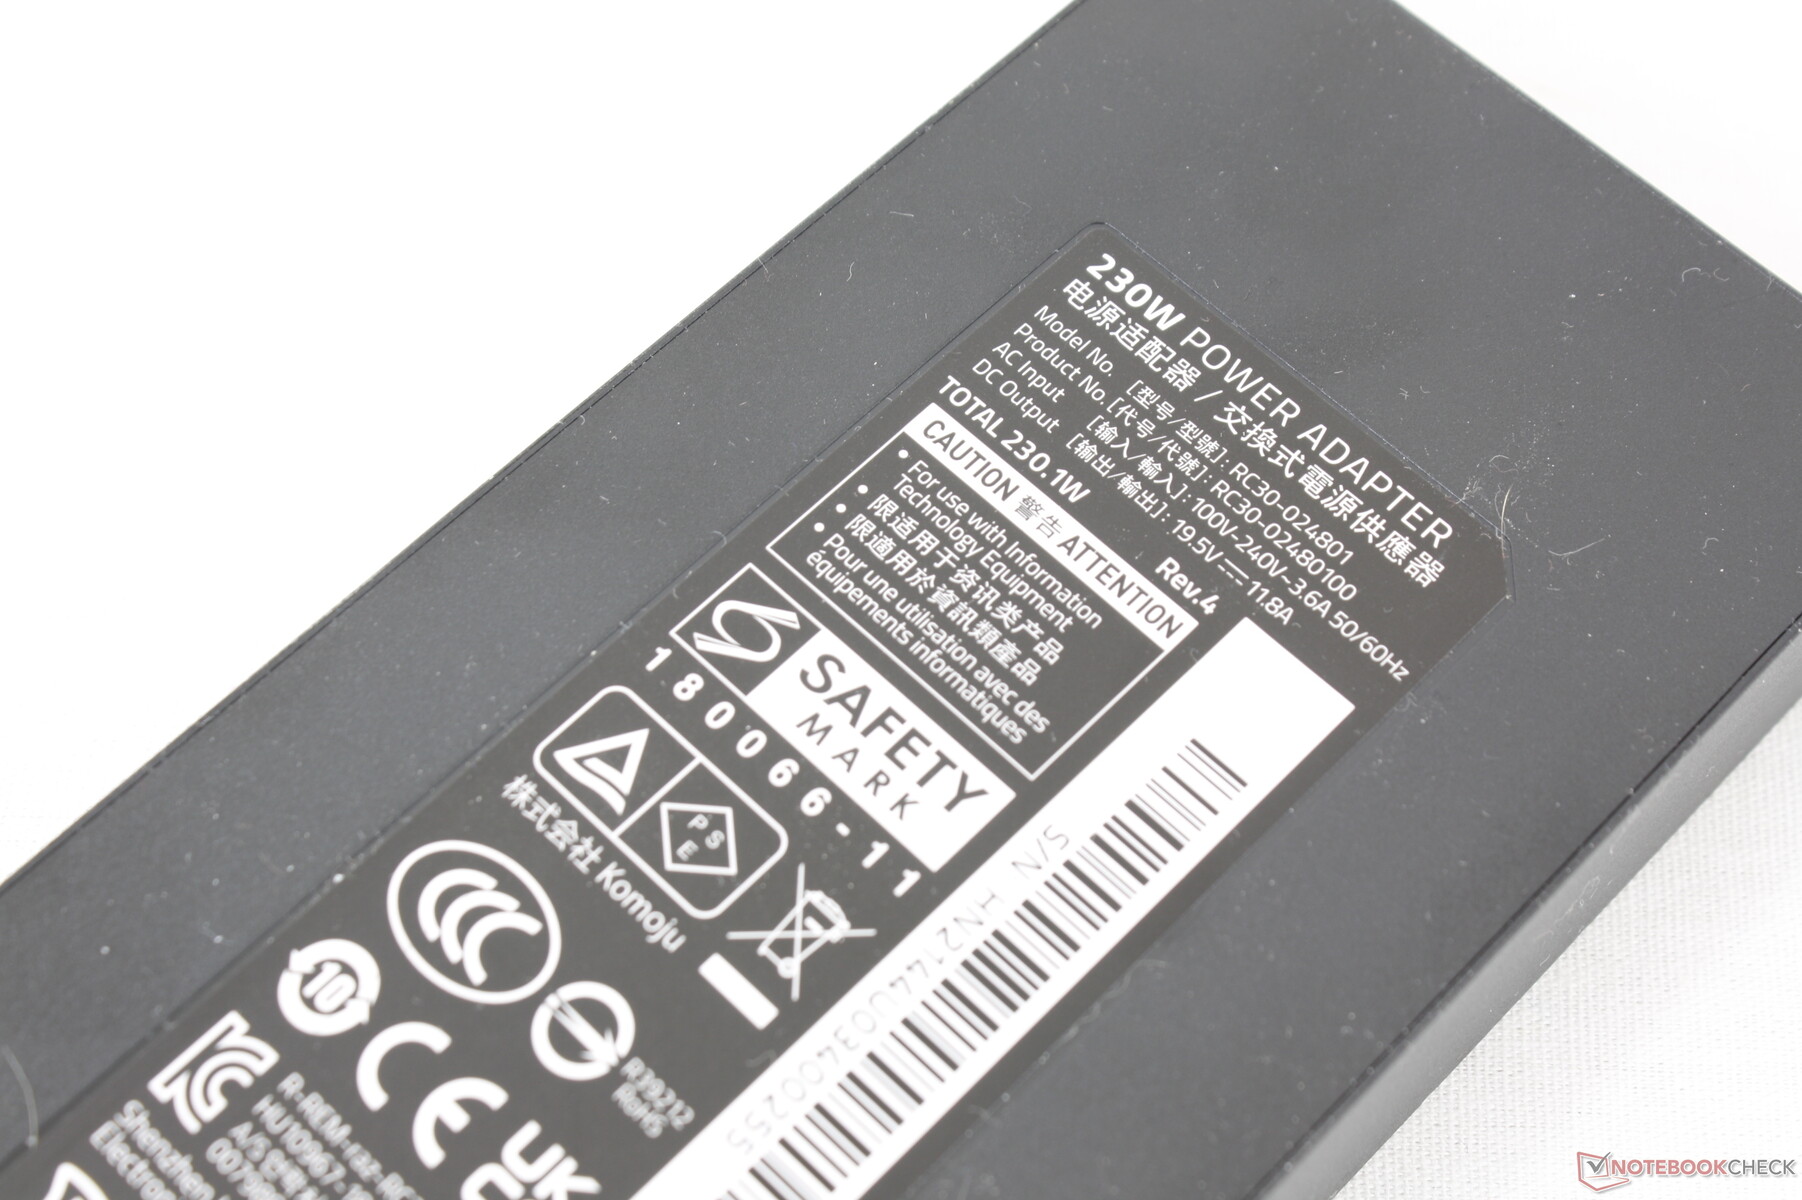
El adaptador de CA de 230 W es relativamente pequeño (~17 x 7 x 2,5 cm) en comparación con la mayoría de adaptadores de potencia equivalente para facilitar su transporte. Podemos registrar un consumo máximo temporal de 228 W cuando tanto la CPU como la GPU están al 100% de utilización.
| Off / Standby | |
| Ocioso | |
| Carga |
|
Clave:
min: | |
| Razer Blade 15 2022 i7-12800H, GeForce RTX 3080 Ti Laptop GPU, SSSTC CA6-8D1024, IPS, 2560x1440, 15.6" | Razer Blade 15 Advanced Model Early 2021 i7-10875H, GeForce RTX 3080 Laptop GPU, Samsung PM981a MZVLB1T0HBLR, IPS, 1920x1080, 15.6" | Razer Blade 15 RTX 2080 Super Max-Q i7-10875H, GeForce RTX 2080 Super Max-Q, Samsung PM981a MZVLB1T0HBLR, IPS, 1920x1080, 15.6" | Schenker XMG Neo 15 E22 (Early 2022, RTX 3080 Ti) i7-12700H, GeForce RTX 3080 Ti Laptop GPU, Samsung SSD 980 Pro 250GB MZ-V8P250BW, IPS, 2560x1440, 15.6" | ADATA XPG Xenia 15 i7-11800H, GeForce RTX 3070 Laptop GPU, ADATA XPG Gammix S70 1TB, IPS, 2560x1440, 15.6" | Eurocom Nightsky ARX315 R9 5900X, GeForce RTX 3070 Laptop GPU, Samsung SSD 980 Pro 1TB MZ-V8P1T0BW, IPS, 1920x1080, 15.6" | |
|---|---|---|---|---|---|---|
| Power Consumption | 39% | 37% | 15% | 27% | -54% | |
| Idle Minimum * (Watt) | 33.2 | 13 61% | 10.6 68% | 14 58% | 8.9 73% | 55 -66% |
| Idle Average * (Watt) | 36.4 | 15 59% | 13.1 64% | 18 51% | 14.4 60% | 68.2 -87% |
| Idle Maximum * (Watt) | 37.6 | 22 41% | 15.8 58% | 19 49% | 31.1 17% | 72.5 -93% |
| Load Average * (Watt) | 116.7 | 98 16% | 131 -12% | 115 1% | 97 17% | 149.2 -28% |
| Witcher 3 ultra * (Watt) | 172 | 126 27% | 146 15% | 228 -33% | 188 -9% | 233 -35% |
| Load Maximum * (Watt) | 228.6 | 165 28% | 169 26% | 307 -34% | 222.2 3% | 255.8 -12% |
* ... más pequeño es mejor
Power Consumption Witcher 3 / Stresstest
Power Consumption external Monitor
Duración de la batería
La duración de la WLAN es menor que en los modelos de la generación anterior, probablemente debido en parte al panel 1440p 240 Hz más exigente. Pudimos exprimir casi 5 horas de uso WLAN en el mundo real con el perfil de energía equilibrado con Nvidia Optimus en la iGPU y la pantalla a 150 nits. En comparación, somos capaces de exprimir 6 horas o más en el 2021 Blade 15 bajo condiciones de prueba similares
La carga desde el vacío hasta la capacidad total con el adaptador de CA incluido tarda menos de 90 minutos. El sistema también puede cargarse con adaptadores USB-C de terceros.
| Razer Blade 15 2022 i7-12800H, GeForce RTX 3080 Ti Laptop GPU, 80 Wh | Razer Blade 15 Advanced Model Early 2021 i7-10875H, GeForce RTX 3080 Laptop GPU, 80 Wh | Razer Blade 15 RTX 2080 Super Max-Q i7-10875H, GeForce RTX 2080 Super Max-Q, 80 Wh | Schenker XMG Neo 15 E22 (Early 2022, RTX 3080 Ti) i7-12700H, GeForce RTX 3080 Ti Laptop GPU, 93 Wh | ADATA XPG Xenia 15 i7-11800H, GeForce RTX 3070 Laptop GPU, 94 Wh | Eurocom Nightsky ARX315 R9 5900X, GeForce RTX 3070 Laptop GPU, 62 Wh | |
|---|---|---|---|---|---|---|
| Duración de Batería | 84% | 24% | 37% | 78% | -80% | |
| WiFi v1.3 (h) | 4.9 | 9 84% | 6.1 24% | 6.7 37% | 8.7 78% | 1 -80% |
| Reader / Idle (h) | 14.4 | 8.7 | 14 | |||
| H.264 (h) | 8.9 | 7.3 | 6.9 | |||
| Load (h) | 2 | 1.9 | 3.8 | 1.5 |
Pro
Contra
Veredicto
El 2022 Blade 15 ofrece entre un 15 y un 25 por ciento más de rendimiento gráfico y un 20 por ciento más de rendimiento de la CPU con respecto al modelo Core i7-11800H y RTX 3080 del año pasado. Afortunadamente, el sistema no necesita funcionar notablemente más fuerte o más caliente para lograr resultados más rápidos, pero tanto el consumo de energía como la duración de la batería sufren un golpe. El mayor consumo, en particular, parece ser una tendencia entre muchos portátiles Core de 12ª generación, incluyendo el Schenker Uniwill Technology GM7AG8P o MSI Vector GP66 en comparación con sus homólogos de la generación anterior. También nos alegramos de no ver un rendimiento de la CPU por debajo de la media, como era el caso del modelo Core i7-10875H de 10ª generación.
El Blade 15 con la 12ª generación de Intel incluye aún más rendimiento bajo un diseño familiar sin necesidad de comprometer el ruido o el calor. Sin embargo, no esperes que la duración de la batería sea mayor.
Teniendo esto en cuenta, el nuevo Blade 15 es la actualización anual iterativa de un chasis ya excelente. Las tapas de las teclas tradicionales más grandes son bienvenidas, especialmente para aquellos que no eran fans del "experimento" del teclado óptico de Razer en el Blade 15 de 2019, mientras que el adaptador de CA relativamente pequeño merece cierto reconocimiento por ser más portátil que la mayoría de los demás. Tal vez el modelo del próximo año pueda finalmente agregar un obturador de cámara web que muchos portátiles más baratos vienen hoy en día.
Precio y disponibilidad
Razer ya está enviando el Blade 15 y el Blade 17 de 2022. Nuestra configuración específica está disponible por $3700 USD.
Razer Blade 15 2022
- 03/12/2022 v7 (old)
Allen Ngo
Price comparison

