Análisis del Schenker XMG Pro 15 (Clevo PC50HS-D): Portátil de juegos 4K fino y ligero

El Schenker XMG Pro 15 de finales de 2021 es un portátil para juegos ligero y compacto de 15,6 pulgadas. Se basa en el barebone Clevo (PC50HS-D) y está alimentado por unCore-i7-11800Hy una CPU móvilGeForce RTX 3080gPU. Compite directamente con dispositivos como elLenovo Legion S7 15ACH6, MSI Delta 15, Alienware x15y elRazer Blade 15 Advanced (mediados de 2021).
Potential competitors in comparison
Valoración | Fecha | Modelo | Peso | Altura | Tamaño | Resolución | Precio |
|---|---|---|---|---|---|---|---|
| 84.6 % v7 (old) | 01/2022 | Schenker XMG Pro 15 (Late 2021) i7-11800H, GeForce RTX 3080 Laptop GPU | 2 kg | 19.8 mm | 15.60" | 3840x2160 | |
| 87.9 % v7 (old) | 11/2021 | Lenovo Legion S7 15ACH6 82K80030GE R9 5900HX, GeForce RTX 3060 Laptop GPU | 2 kg | 18.9 mm | 15.60" | 3840x2160 | |
| 87.2 % v7 (old) | 09/2021 | Alienware x15 RTX 3070 P111F i7-11800H, GeForce RTX 3070 Laptop GPU | 2.4 kg | 15.9 mm | 15.60" | 2560x1440 | |
| 88.9 % v7 (old) | 07/2021 | Razer Blade 15 Advanced (Mid 2021) i7-11800H, GeForce RTX 3080 Laptop GPU | 2 kg | 16.99 mm | 15.60" | 1920x1080 |
Maletín - Portátil Schenker con chasis metálico
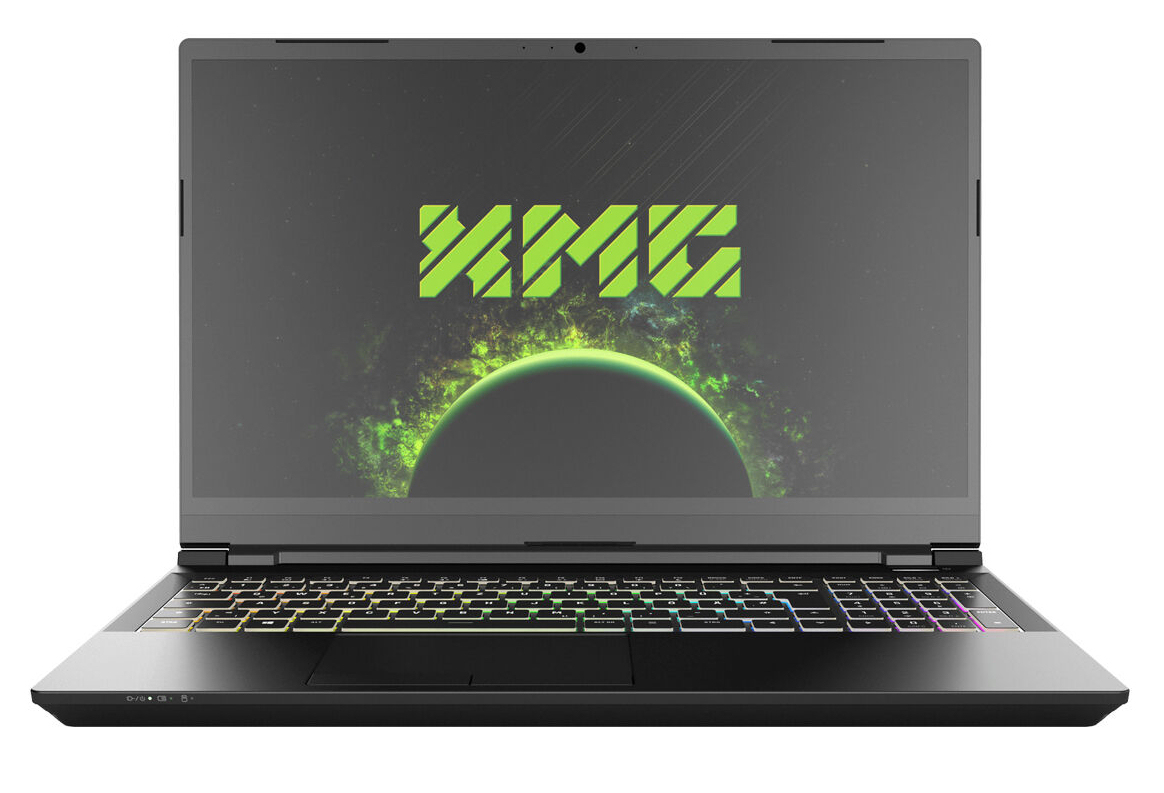
Para el XMG Pro, Schenker utiliza un delgado chasis metálico en negro mate. El chasis, sencillo y elegante a la vez, carece de acentos visuales llamativos, por lo que es adecuado para entornos profesionales. En comparación con el modeloModelo XMG Pro 15 de principios de 2021sólo hay algunas diferencias menores. No hay escotilla de mantenimiento y la batería es fija.
La construcción no merece críticas. Las distancias son uniformes y no hay salientes de material no deseados. Aunque la tapa y la unidad de base ceden ligeramente cuando se tuercen en las esquinas, la rigidez sigue siendo sólida en general. Las bisagras mantienen la tapa firmemente en su sitio, aunque permiten un cierto tambaleo. La pantalla puede abrirse hasta 130 grados. Es posible abrir el portátil con una sola mano.
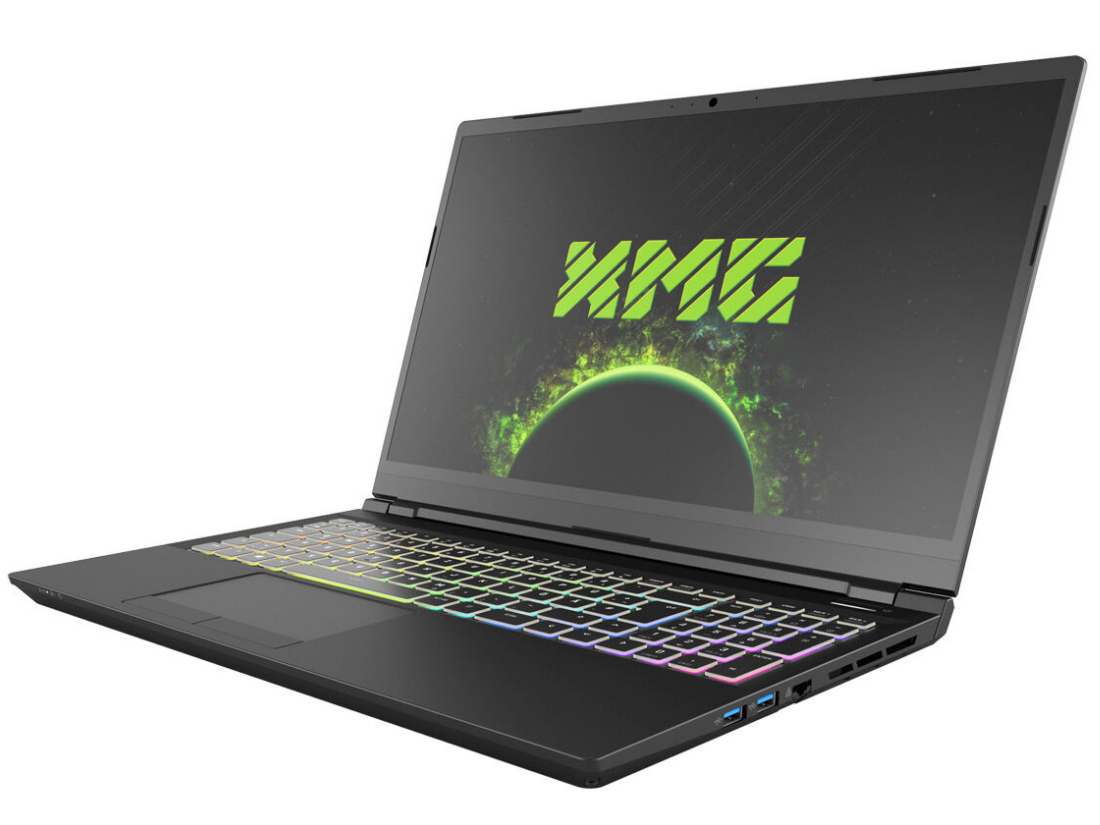
El XMG Pro es uno de los dispositivos más compactos de nuestra comparación y sólo es ligeramente más grande que el Blade 15. En su mayor parte, todos los portátiles de nuestra comparación están igualados en cuanto a su peso. Sólo elAlienware x15se desvía de esto y pesa unos 400 g más.
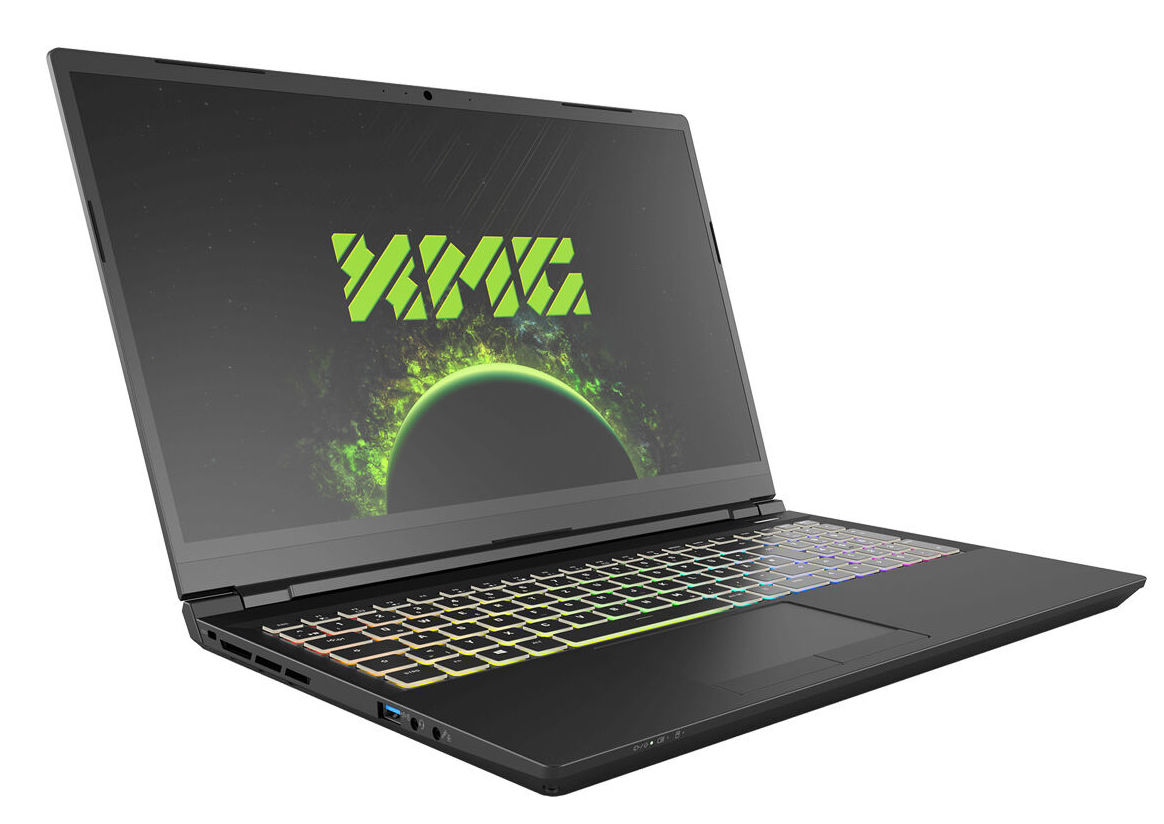
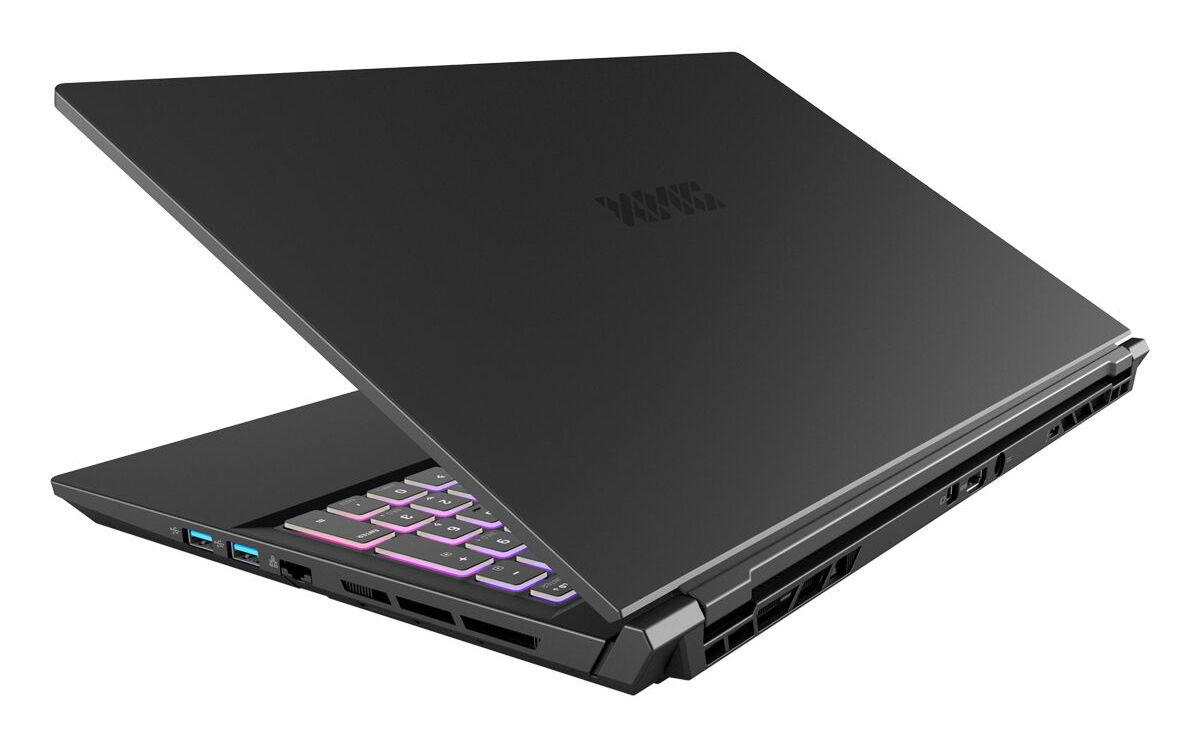
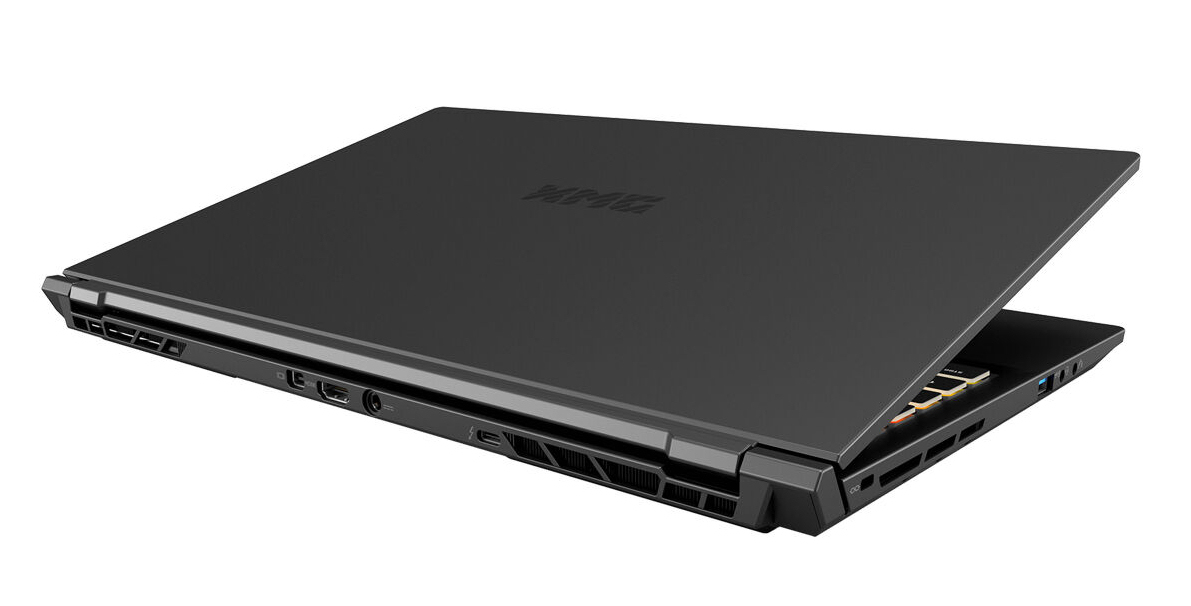
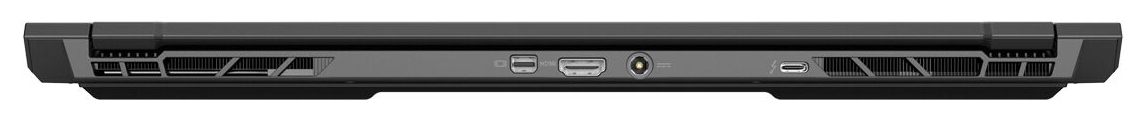
Conectividad - Schenker XMG con Thunderbolt 4
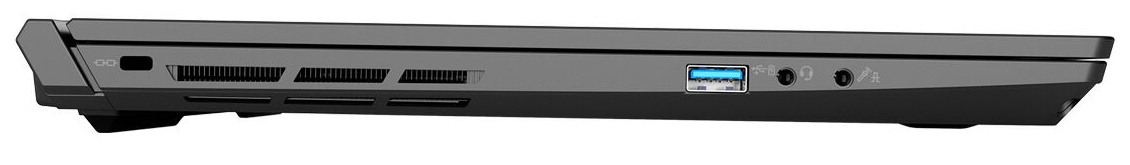
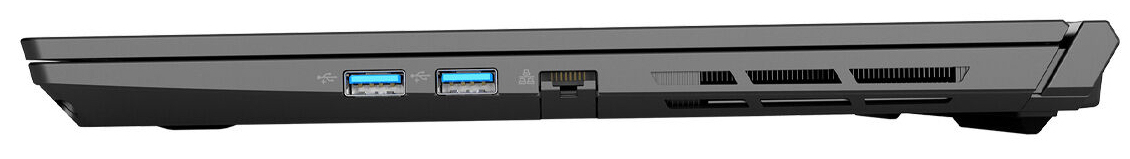
El XMG Pro integra tres puertos USB tipo A (USB 3.2 Gen 1) y un puerto USB tipo C (Thunderbolt 4). Este último puede conectarse a una estación de acoplamiento con muchas funciones o a una GPU externa. Además, el puerto admite DisplayPort a través de USB-C. Combinado con el Mini DisplayPort y el puerto HDMI, hay tres salidas de vídeo en total. Las tres salidas de vídeo admiten G-Sync. Para el puerto USB tipo-C, hay que habilitarlo manualmente desde la BIOS. No hay lector de tarjetas integrado
Los puertos están distribuidos en tres lados del portátil. Las tres salidas de vídeo se encuentran en la parte trasera del dispositivo. Como resultado, los cables conectados pasan por la parte trasera y no estorban
Comunicación
El módulo Wi-Fi está basado en un chip Intel (AX201) y soporta los estándares 802.11a/b/g/n/ac/ax. En condiciones óptimas (sin otros dispositivos Wi-Fi en las cercanías, el portátil y el servidor muy cerca), observamos excelentes tasas de transferencia. Un controlador Gigabit Ethernet de Realtek se encarga de la red por cable. No encontramos ningún problema con él durante nuestras pruebas
Cámara web
La cámara web (0,9 MP) captura imágenes con una resolución máxima de 1280 x 720 píxeles. La precisión del color es mediocre: Los colores se desvían significativamente de sus valores ideales

 GeForce RTX 3080 Laptop GPU, i7-11800H, Samsung SSD 980 Pro 1TB MZ-V8P1T0BW")
 GeForce RTX 3080 Laptop GPU, i7-11800H, Samsung SSD 980 Pro 1TB MZ-V8P1T0BW")
Accesorios
Además de la información sobre la garantía y el manual, el paquete incluye un DVD de recuperación, un paño de limpieza, una unidad USB y un tornillo M.2
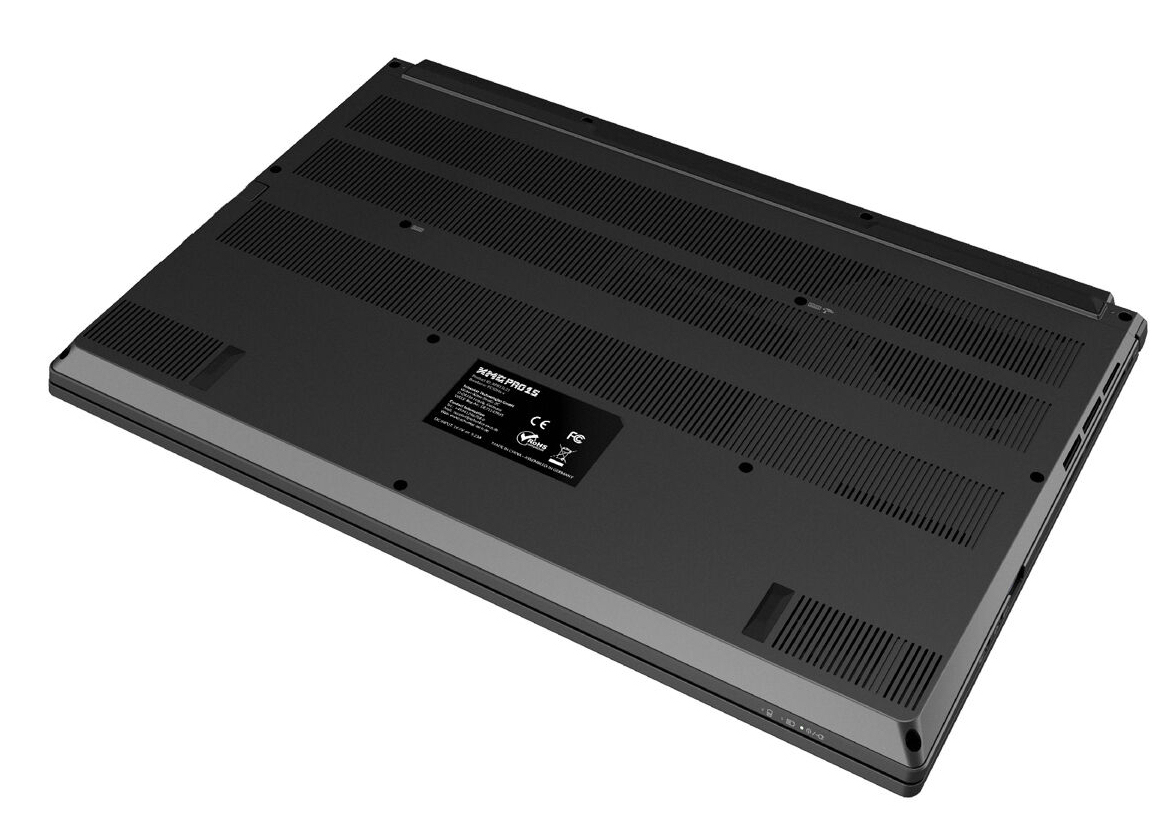
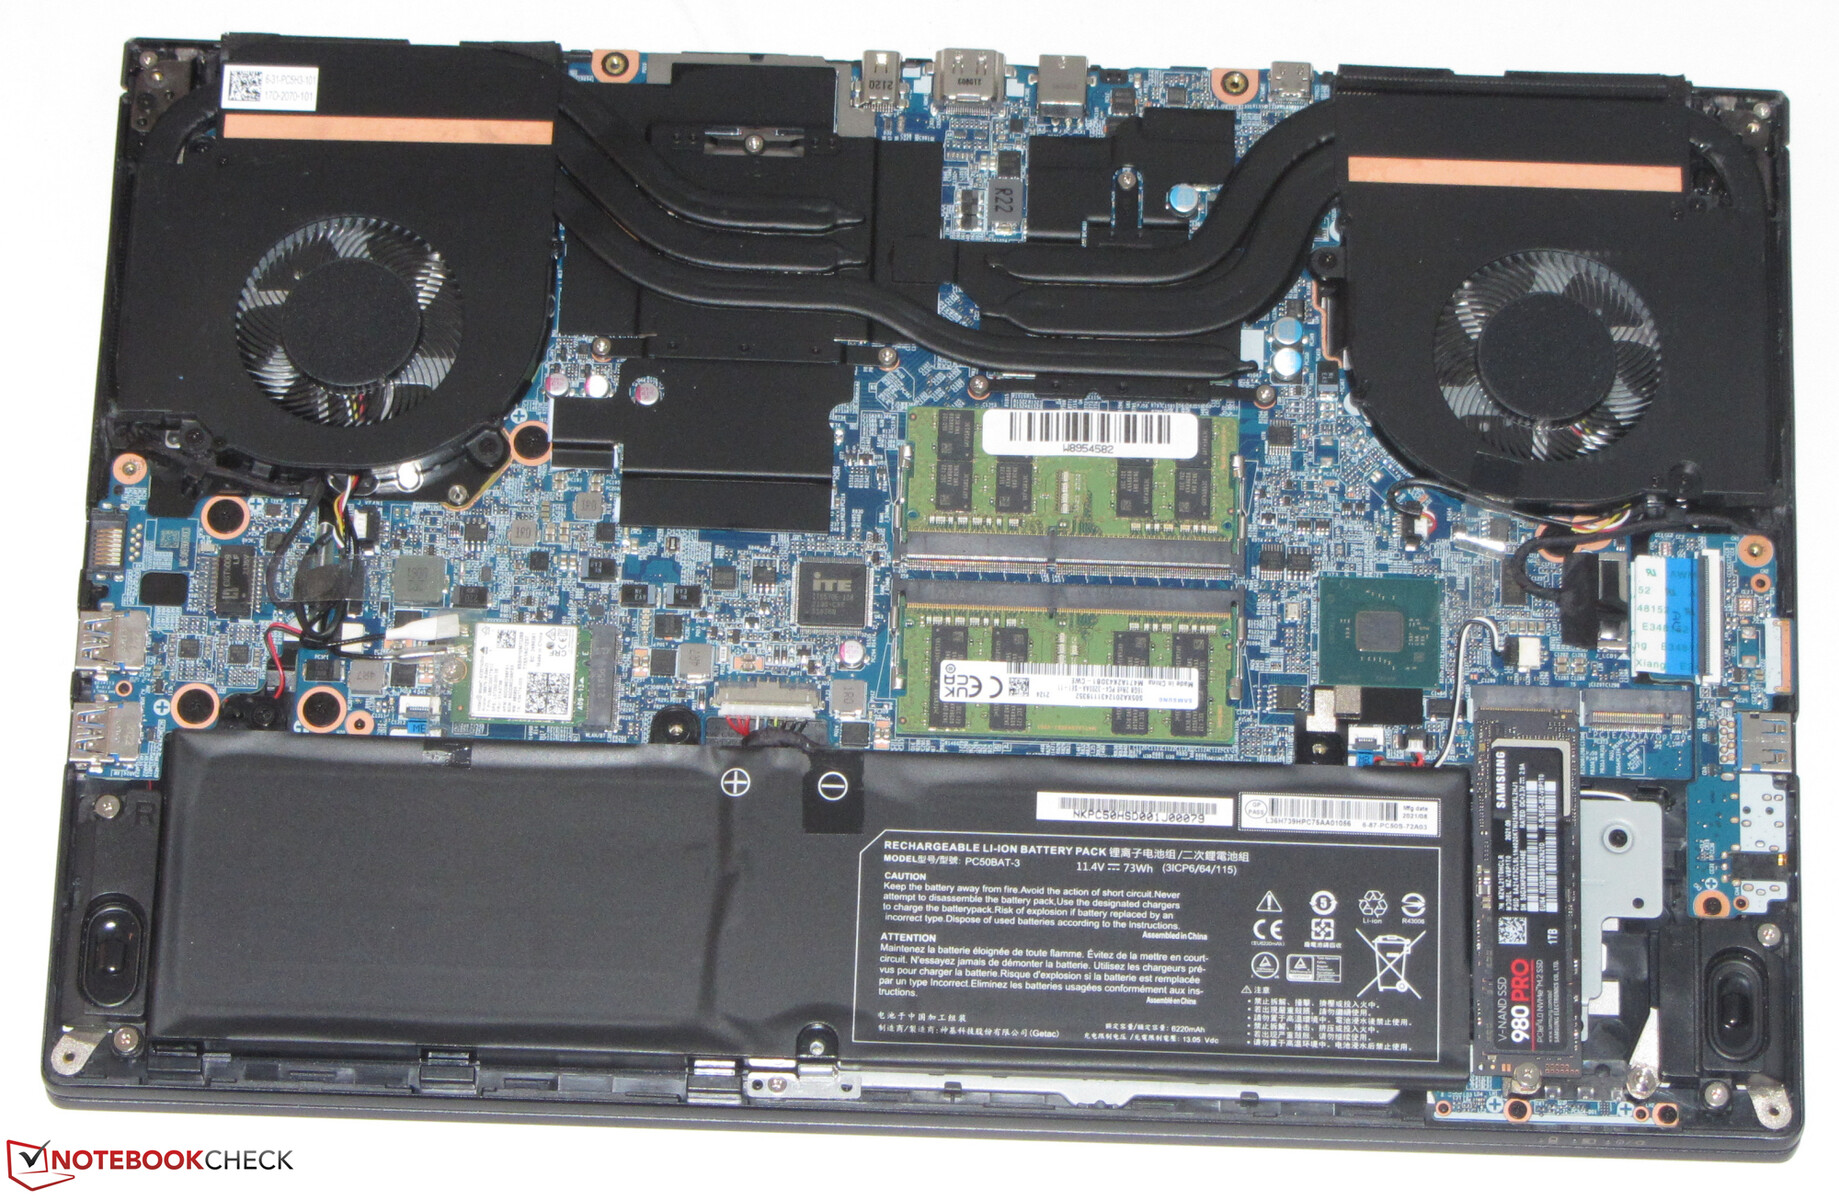
Mantenimiento
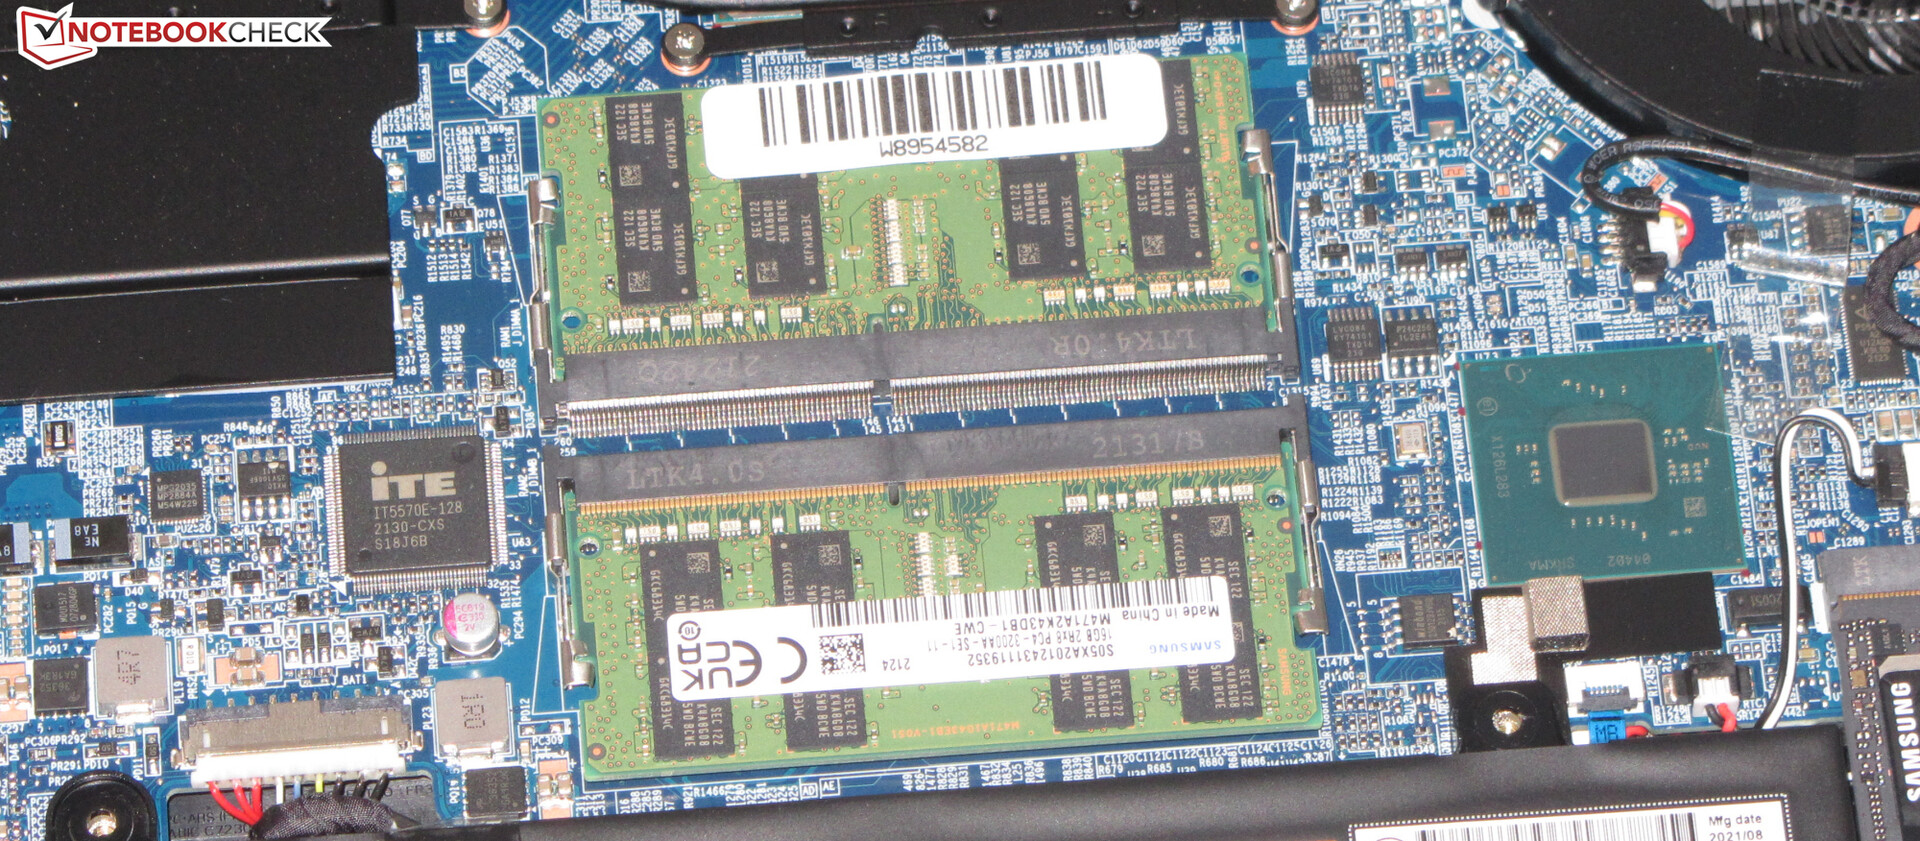
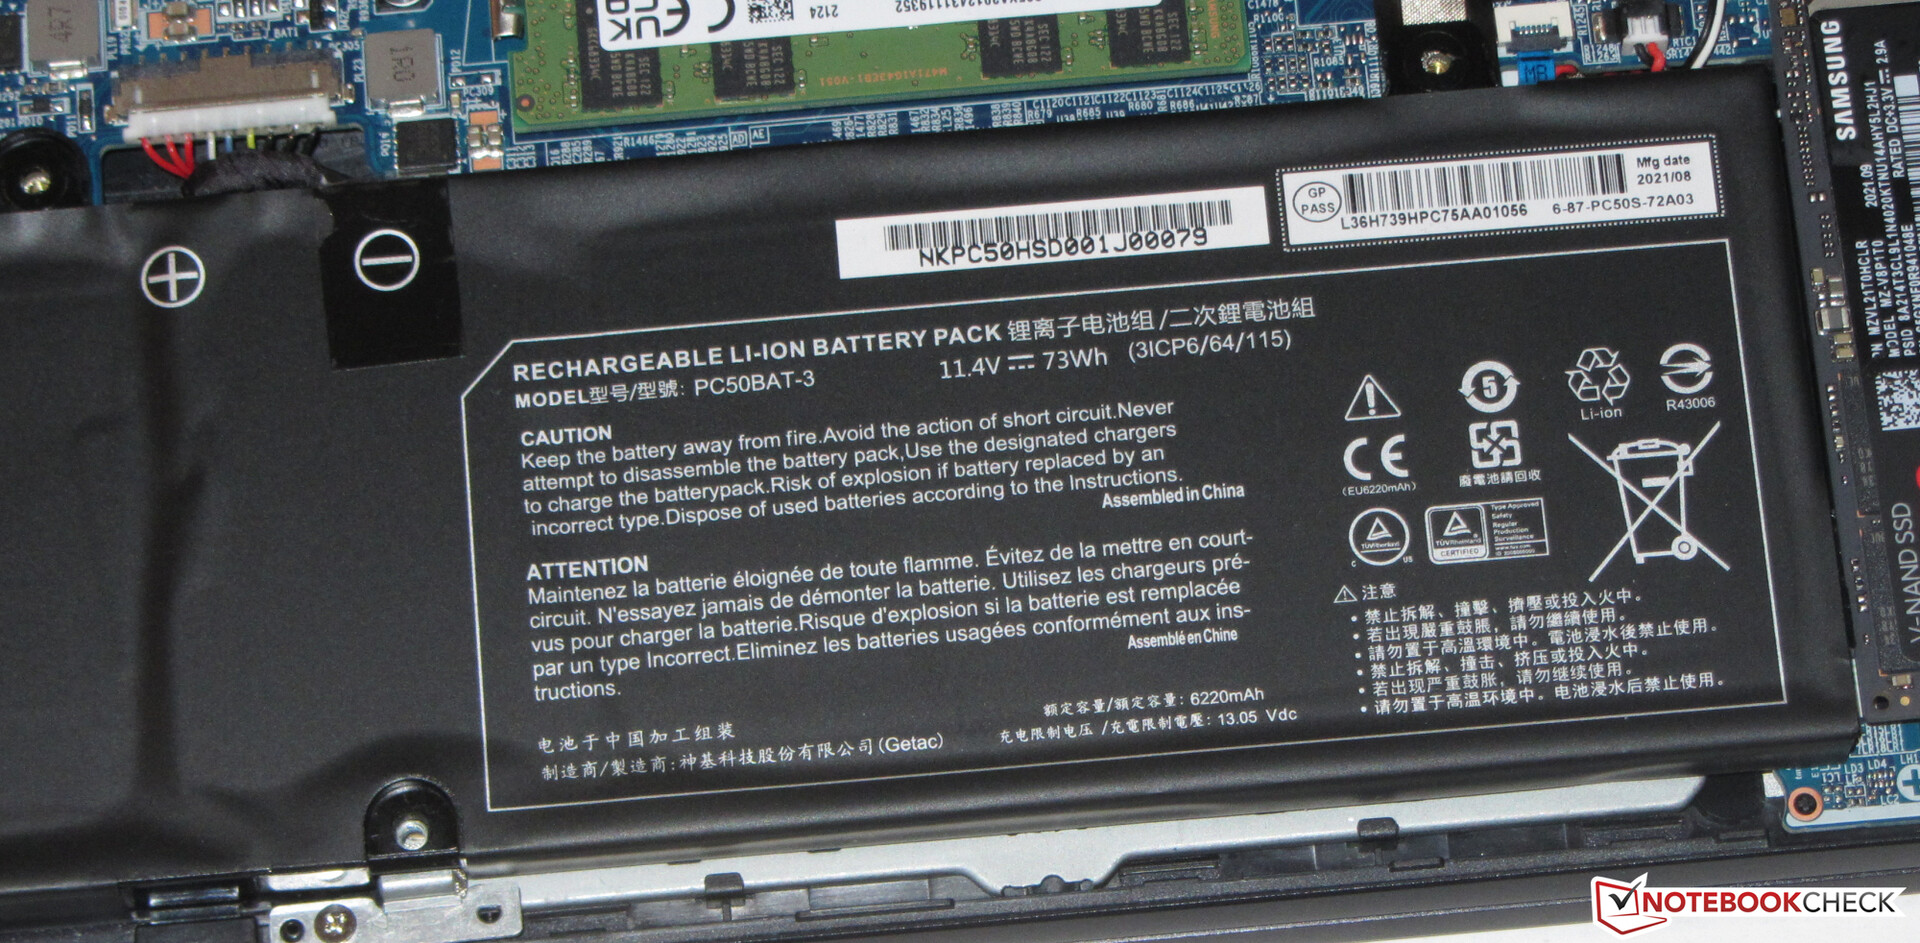
Realizar el mantenimiento y la actualización del sistema es sencillo. Tras aflojar todos los tornillos de la parte inferior del dispositivo, se puede retirar la placa inferior con la ayuda de un objeto con un borde afilado. Posteriormente, los usuarios pueden acceder al SSD, la ranura M.2 secundaria, el módulo Wi-Fi, la batería, la RAM y los ventiladores
Garantía
El fabricante ofrece una garantía básica de dos años con servicio de recogida y devolución en algunos países europeos, así como un servicio de reparación rápida de 6 meses (reparación en 48 horas). La ampliación de la garantía a 36 meses puede costar entre 100 y 149 euros (entre 110 y 170 dólares), dependiendo del periodo de reparación rápida
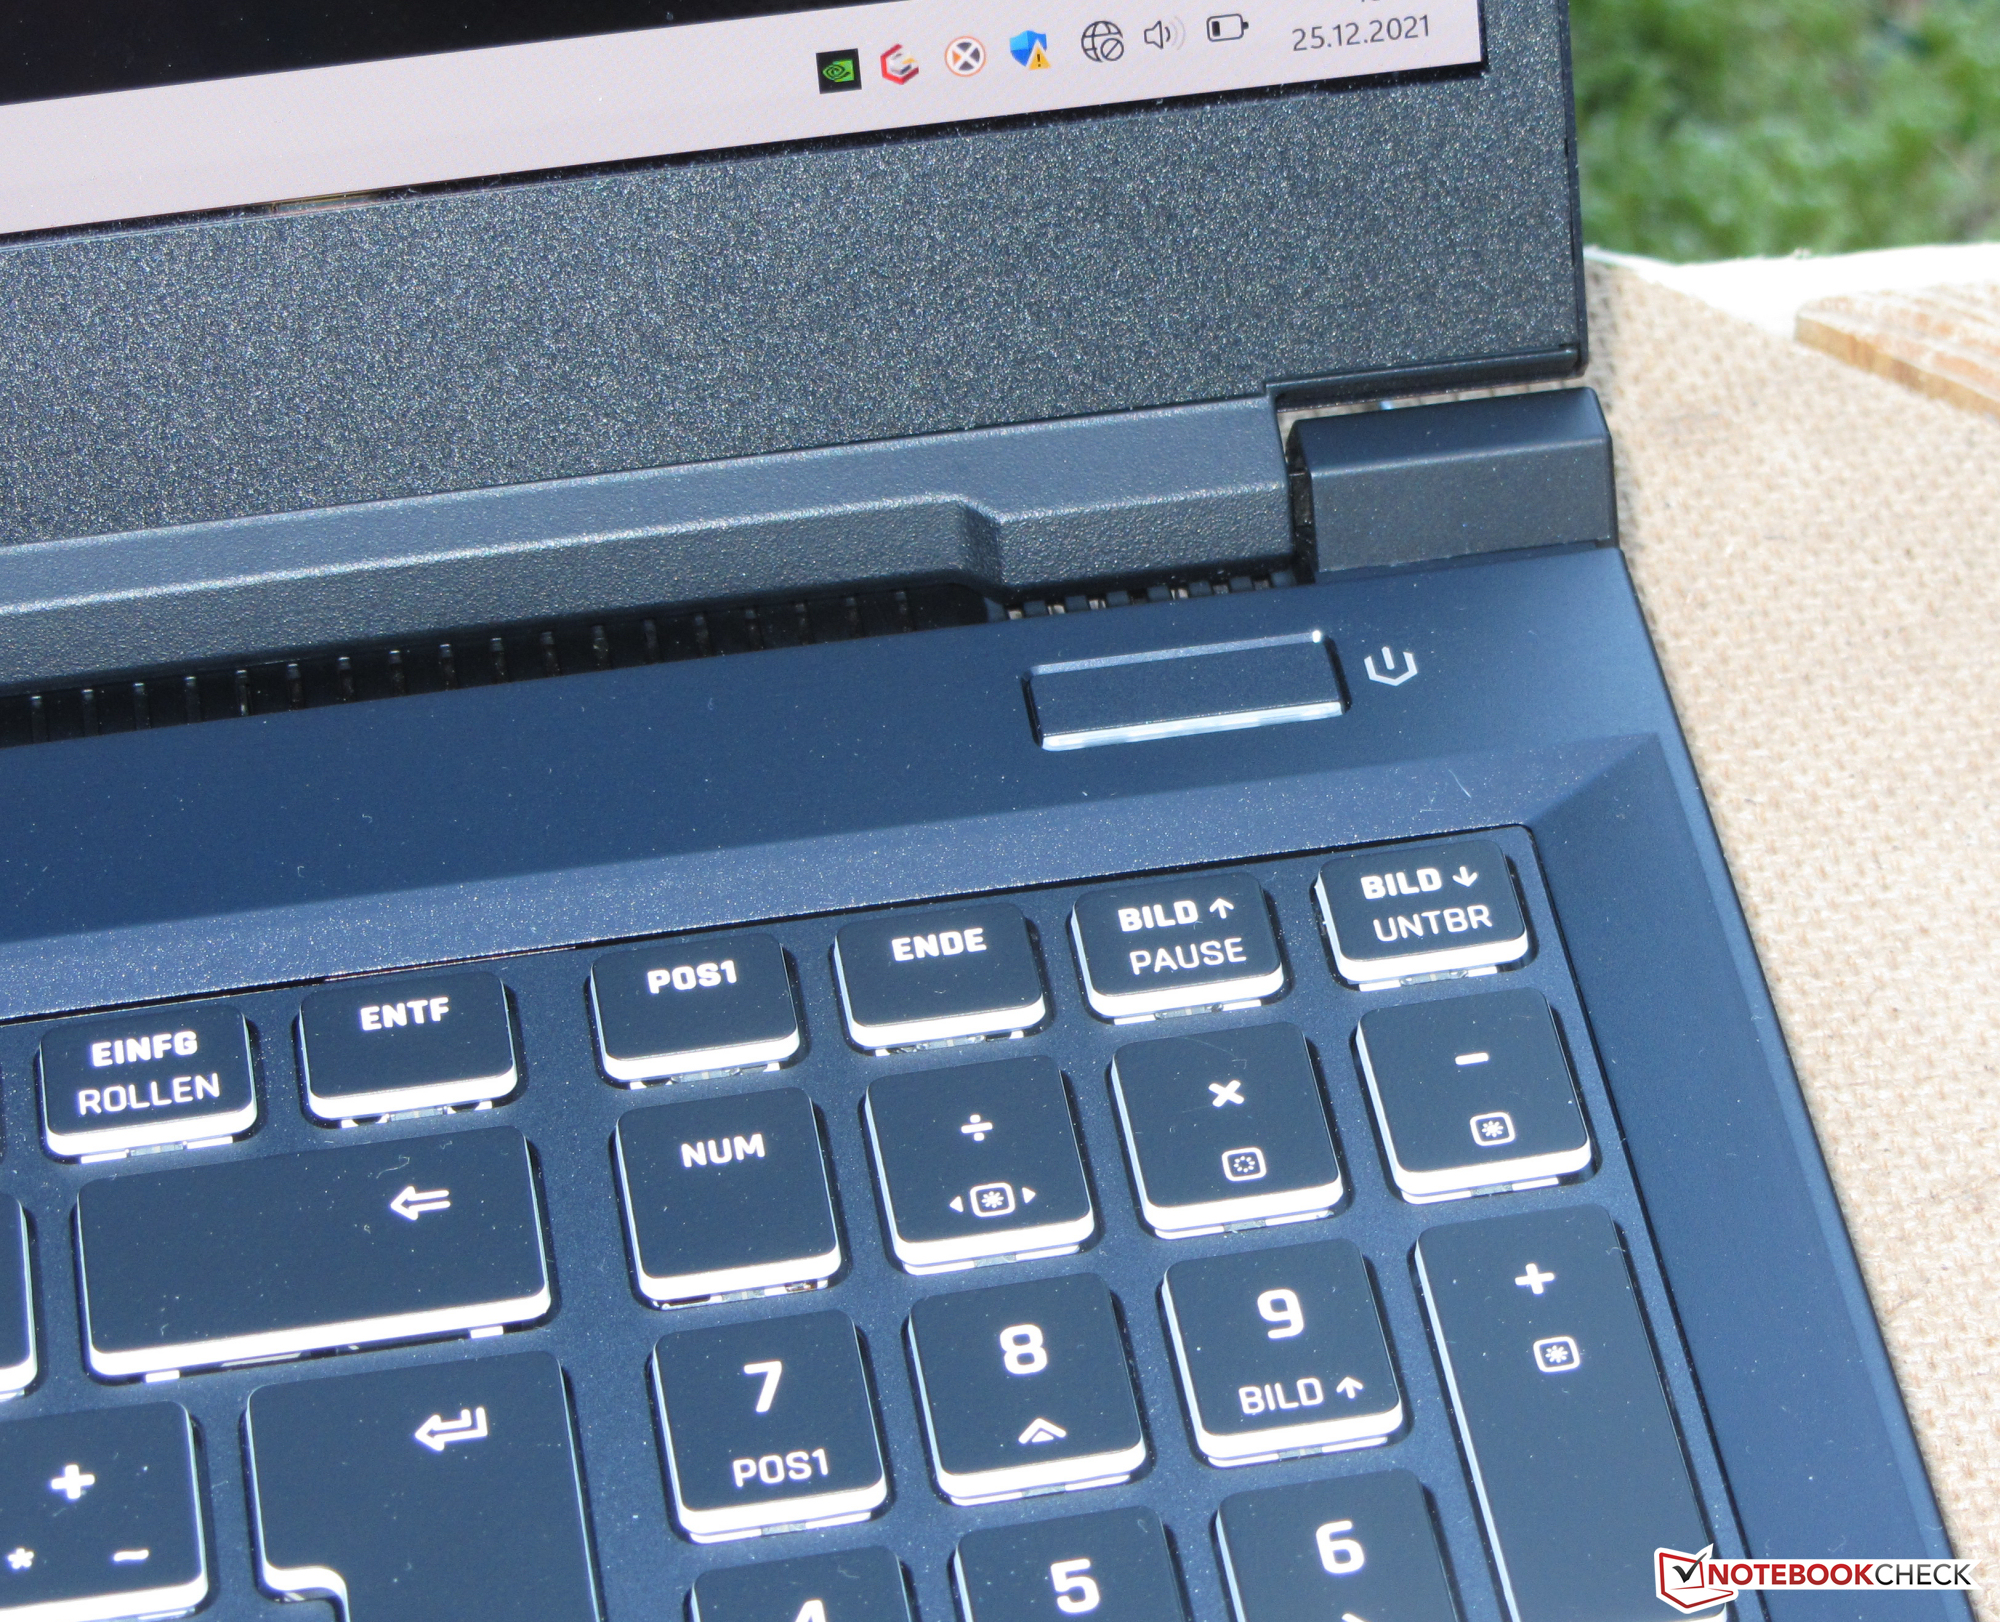
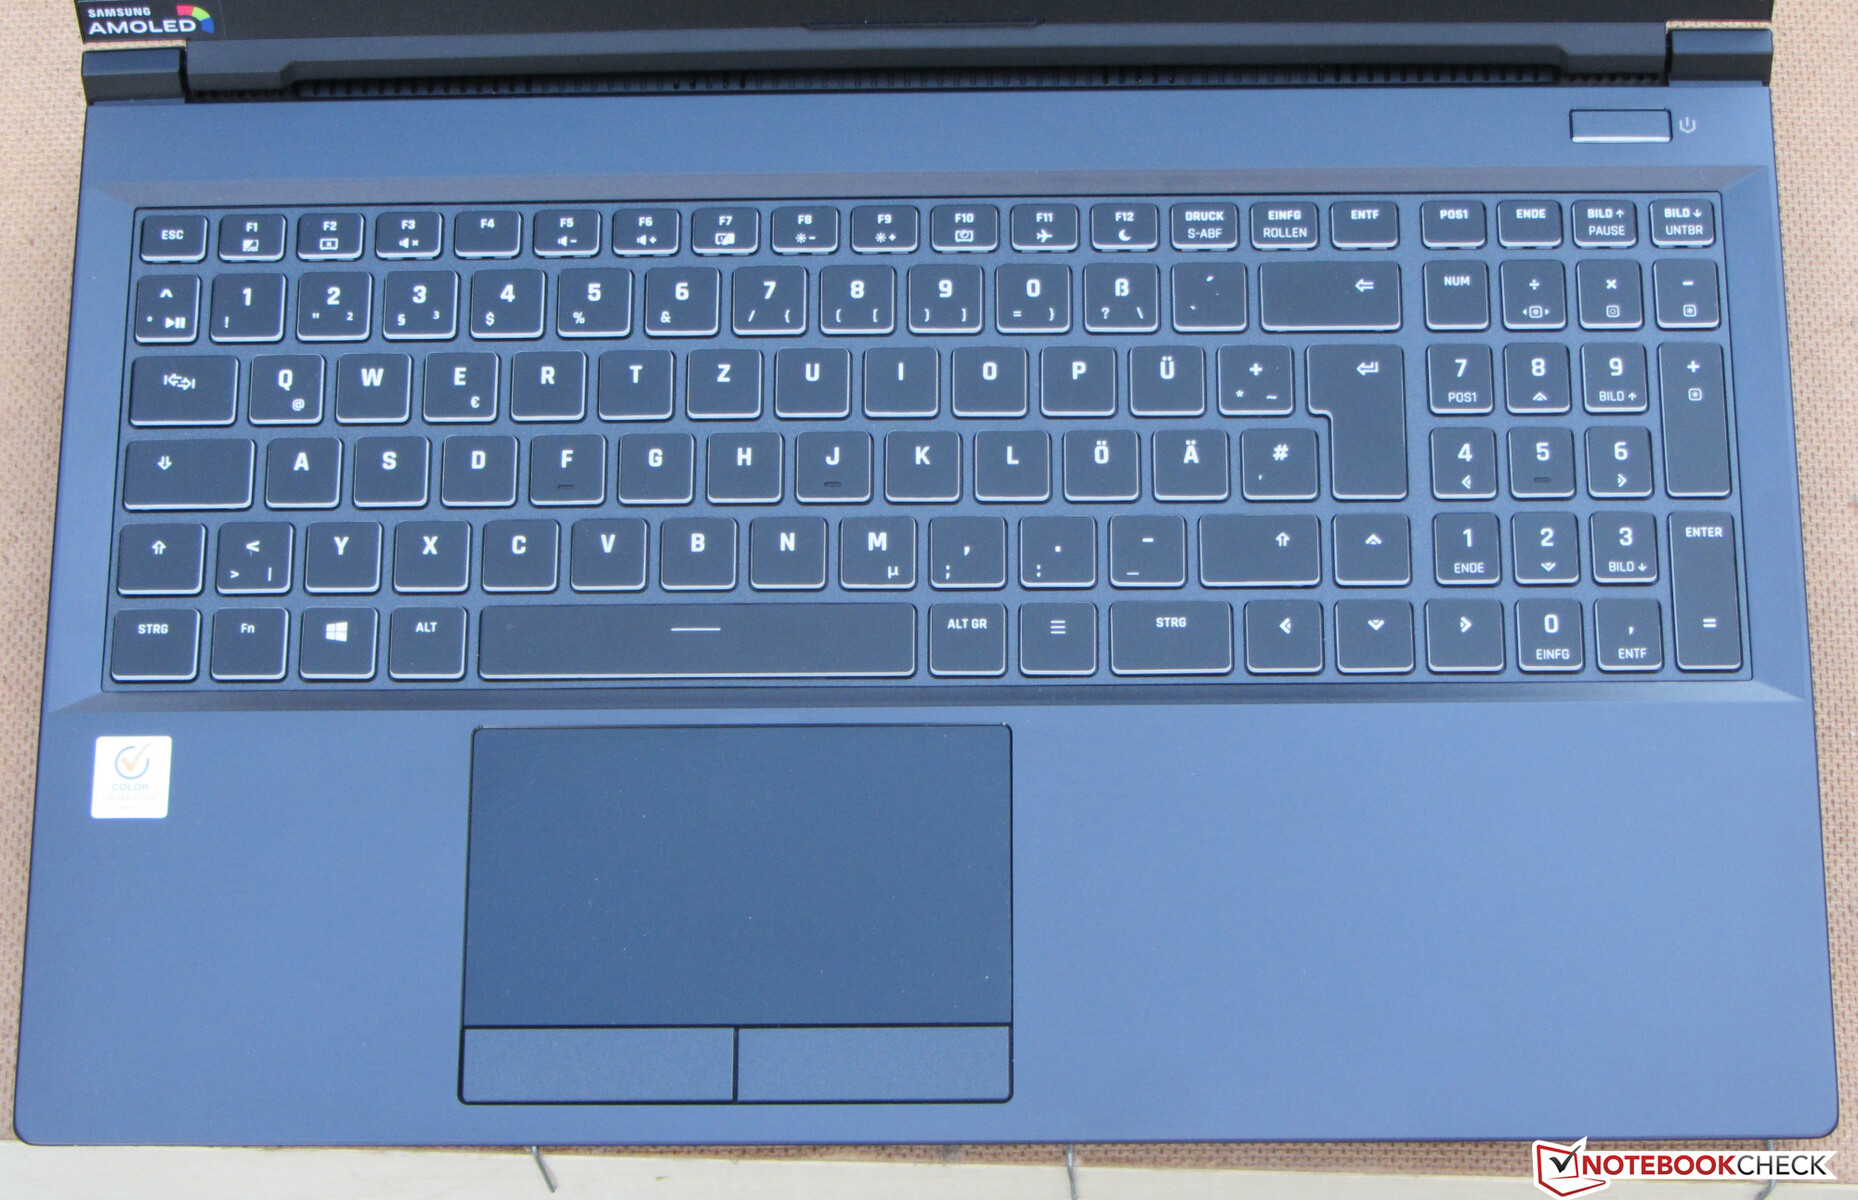
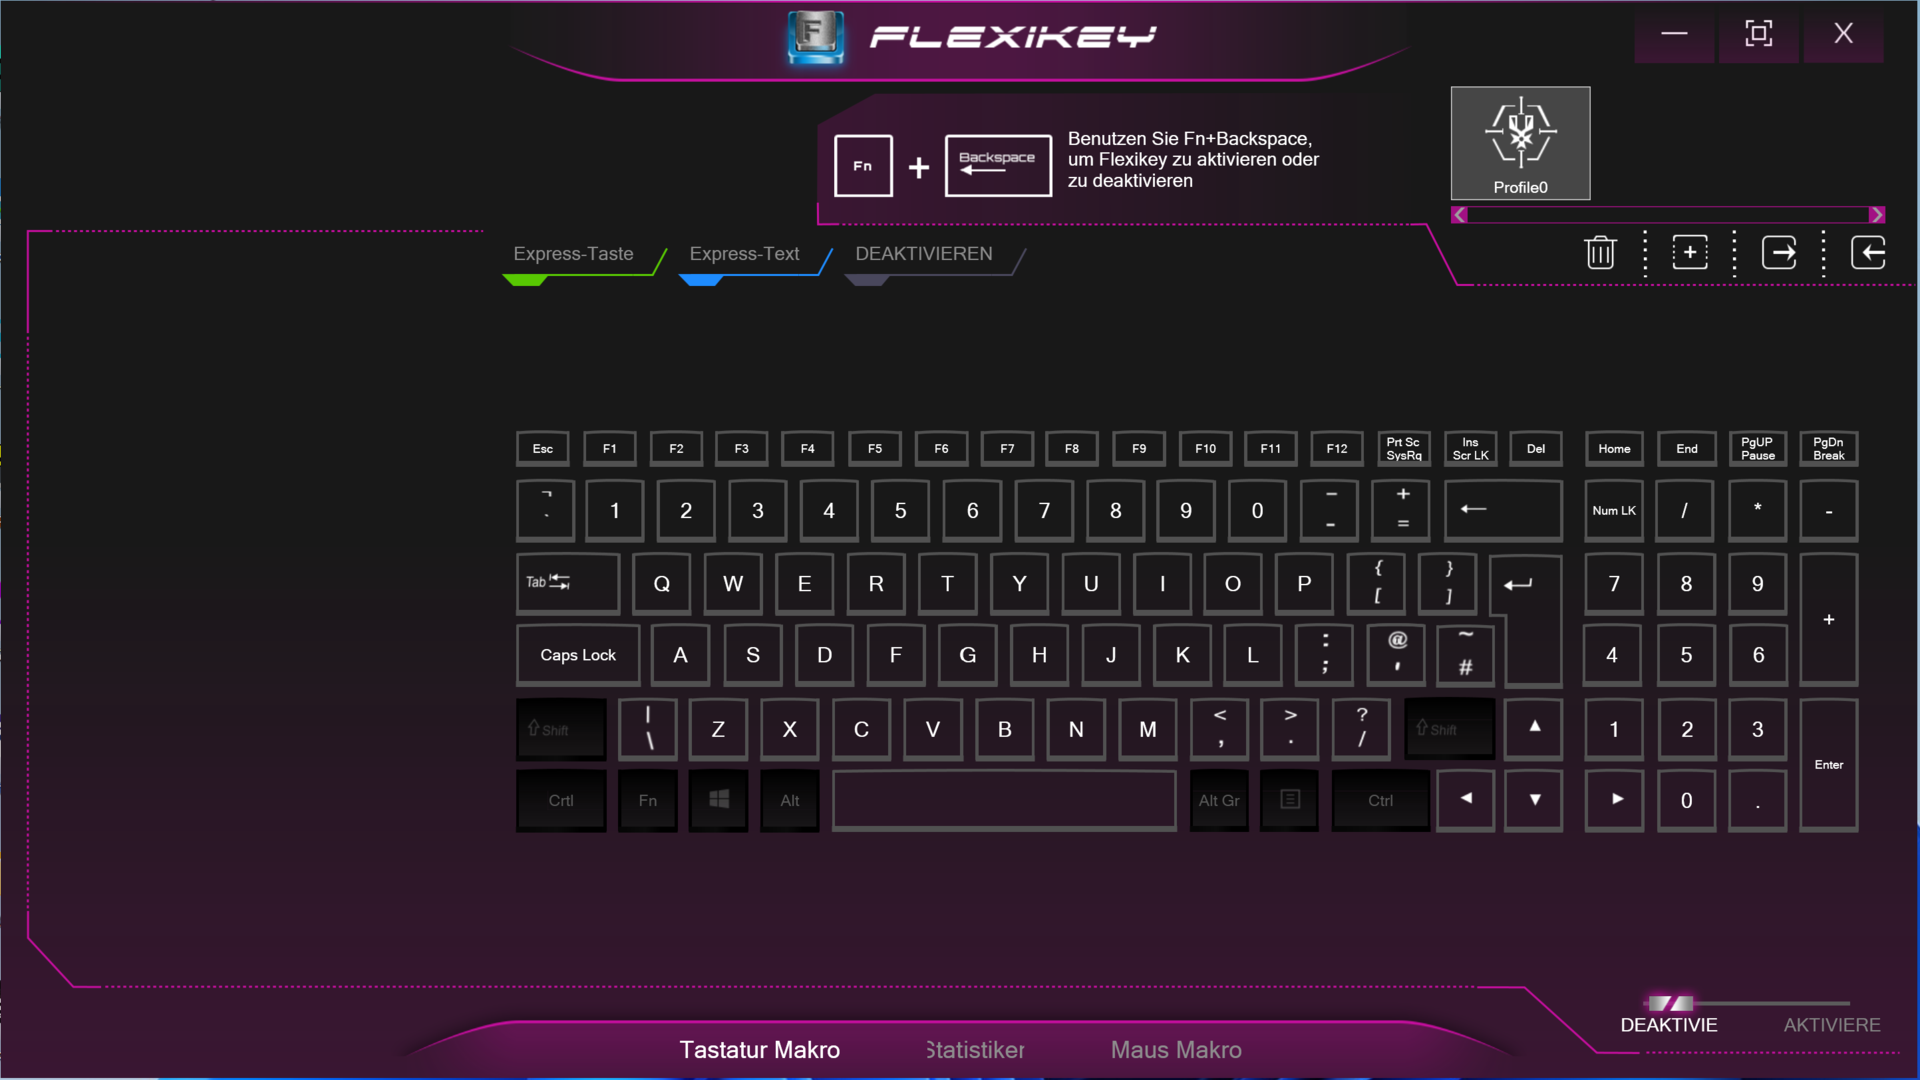
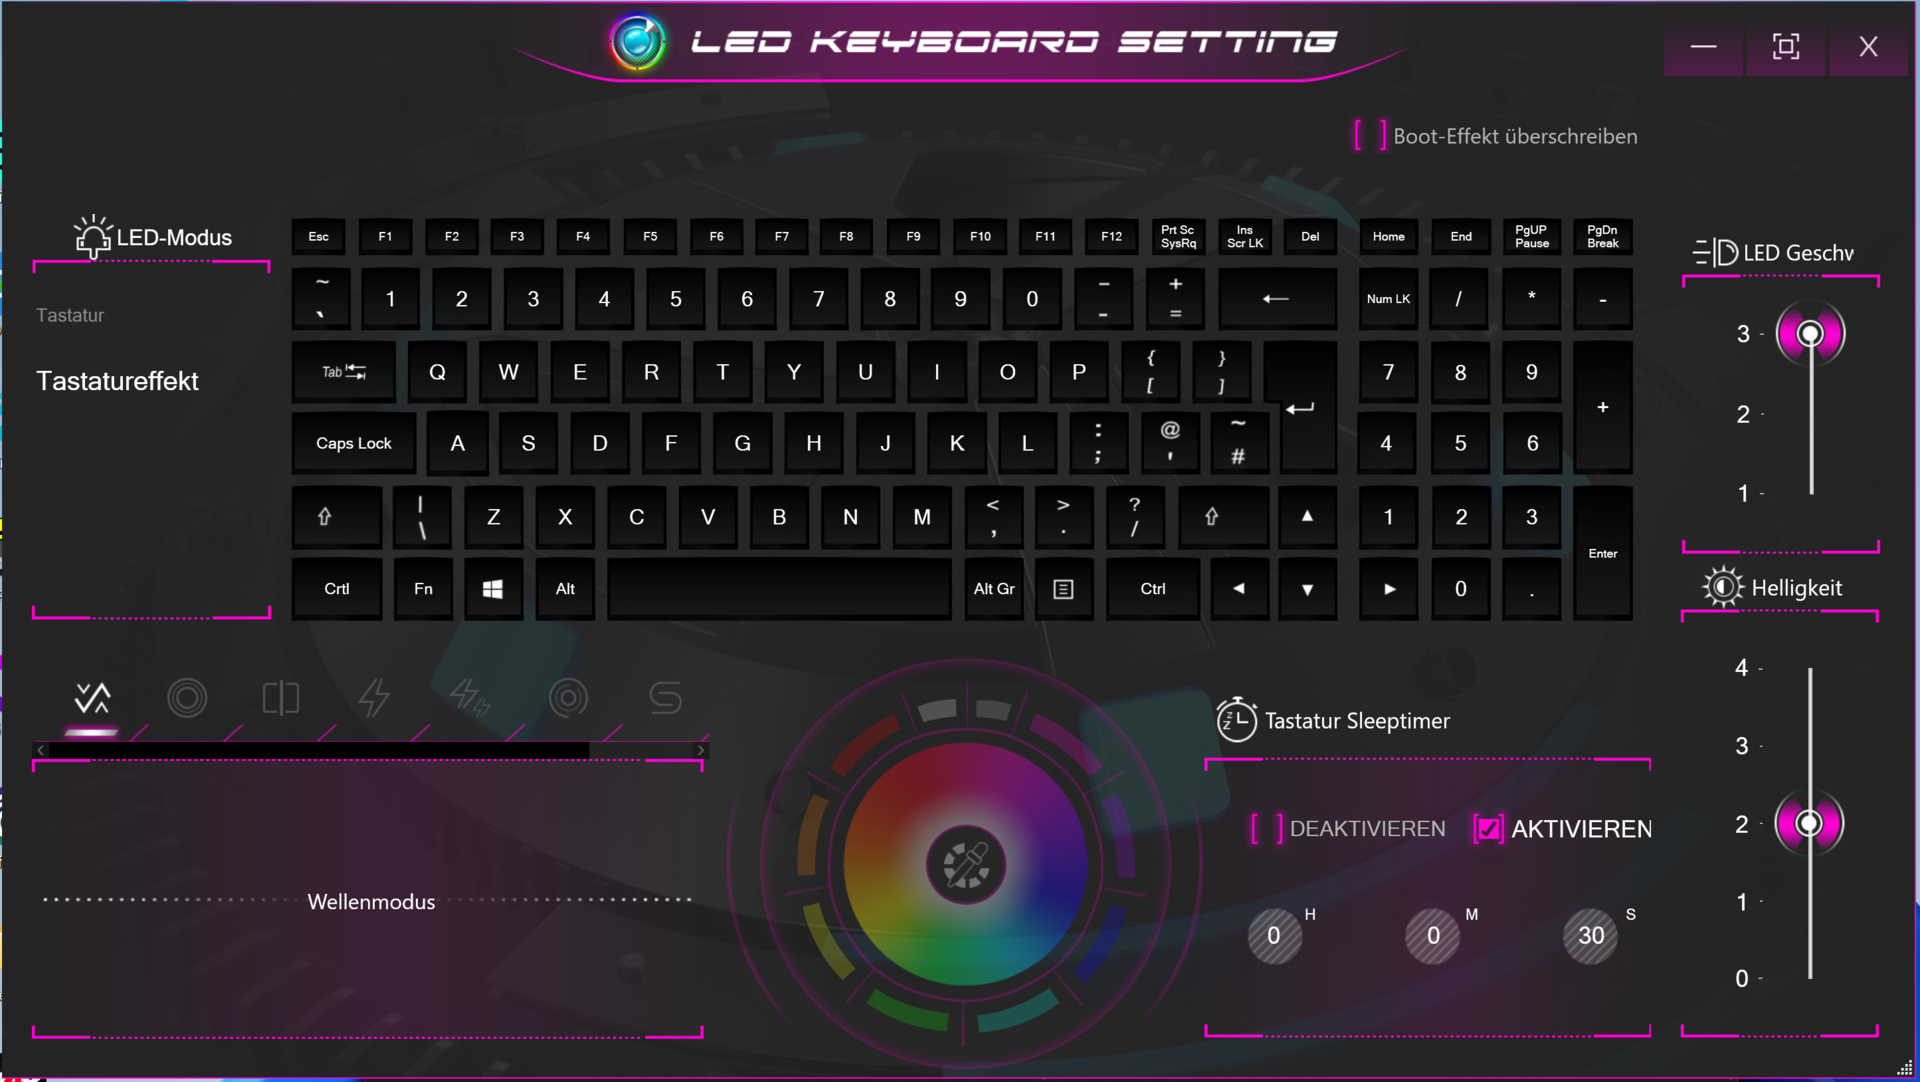
Dispositivos de entrada - Teclado con retroiluminación RGB
Teclado
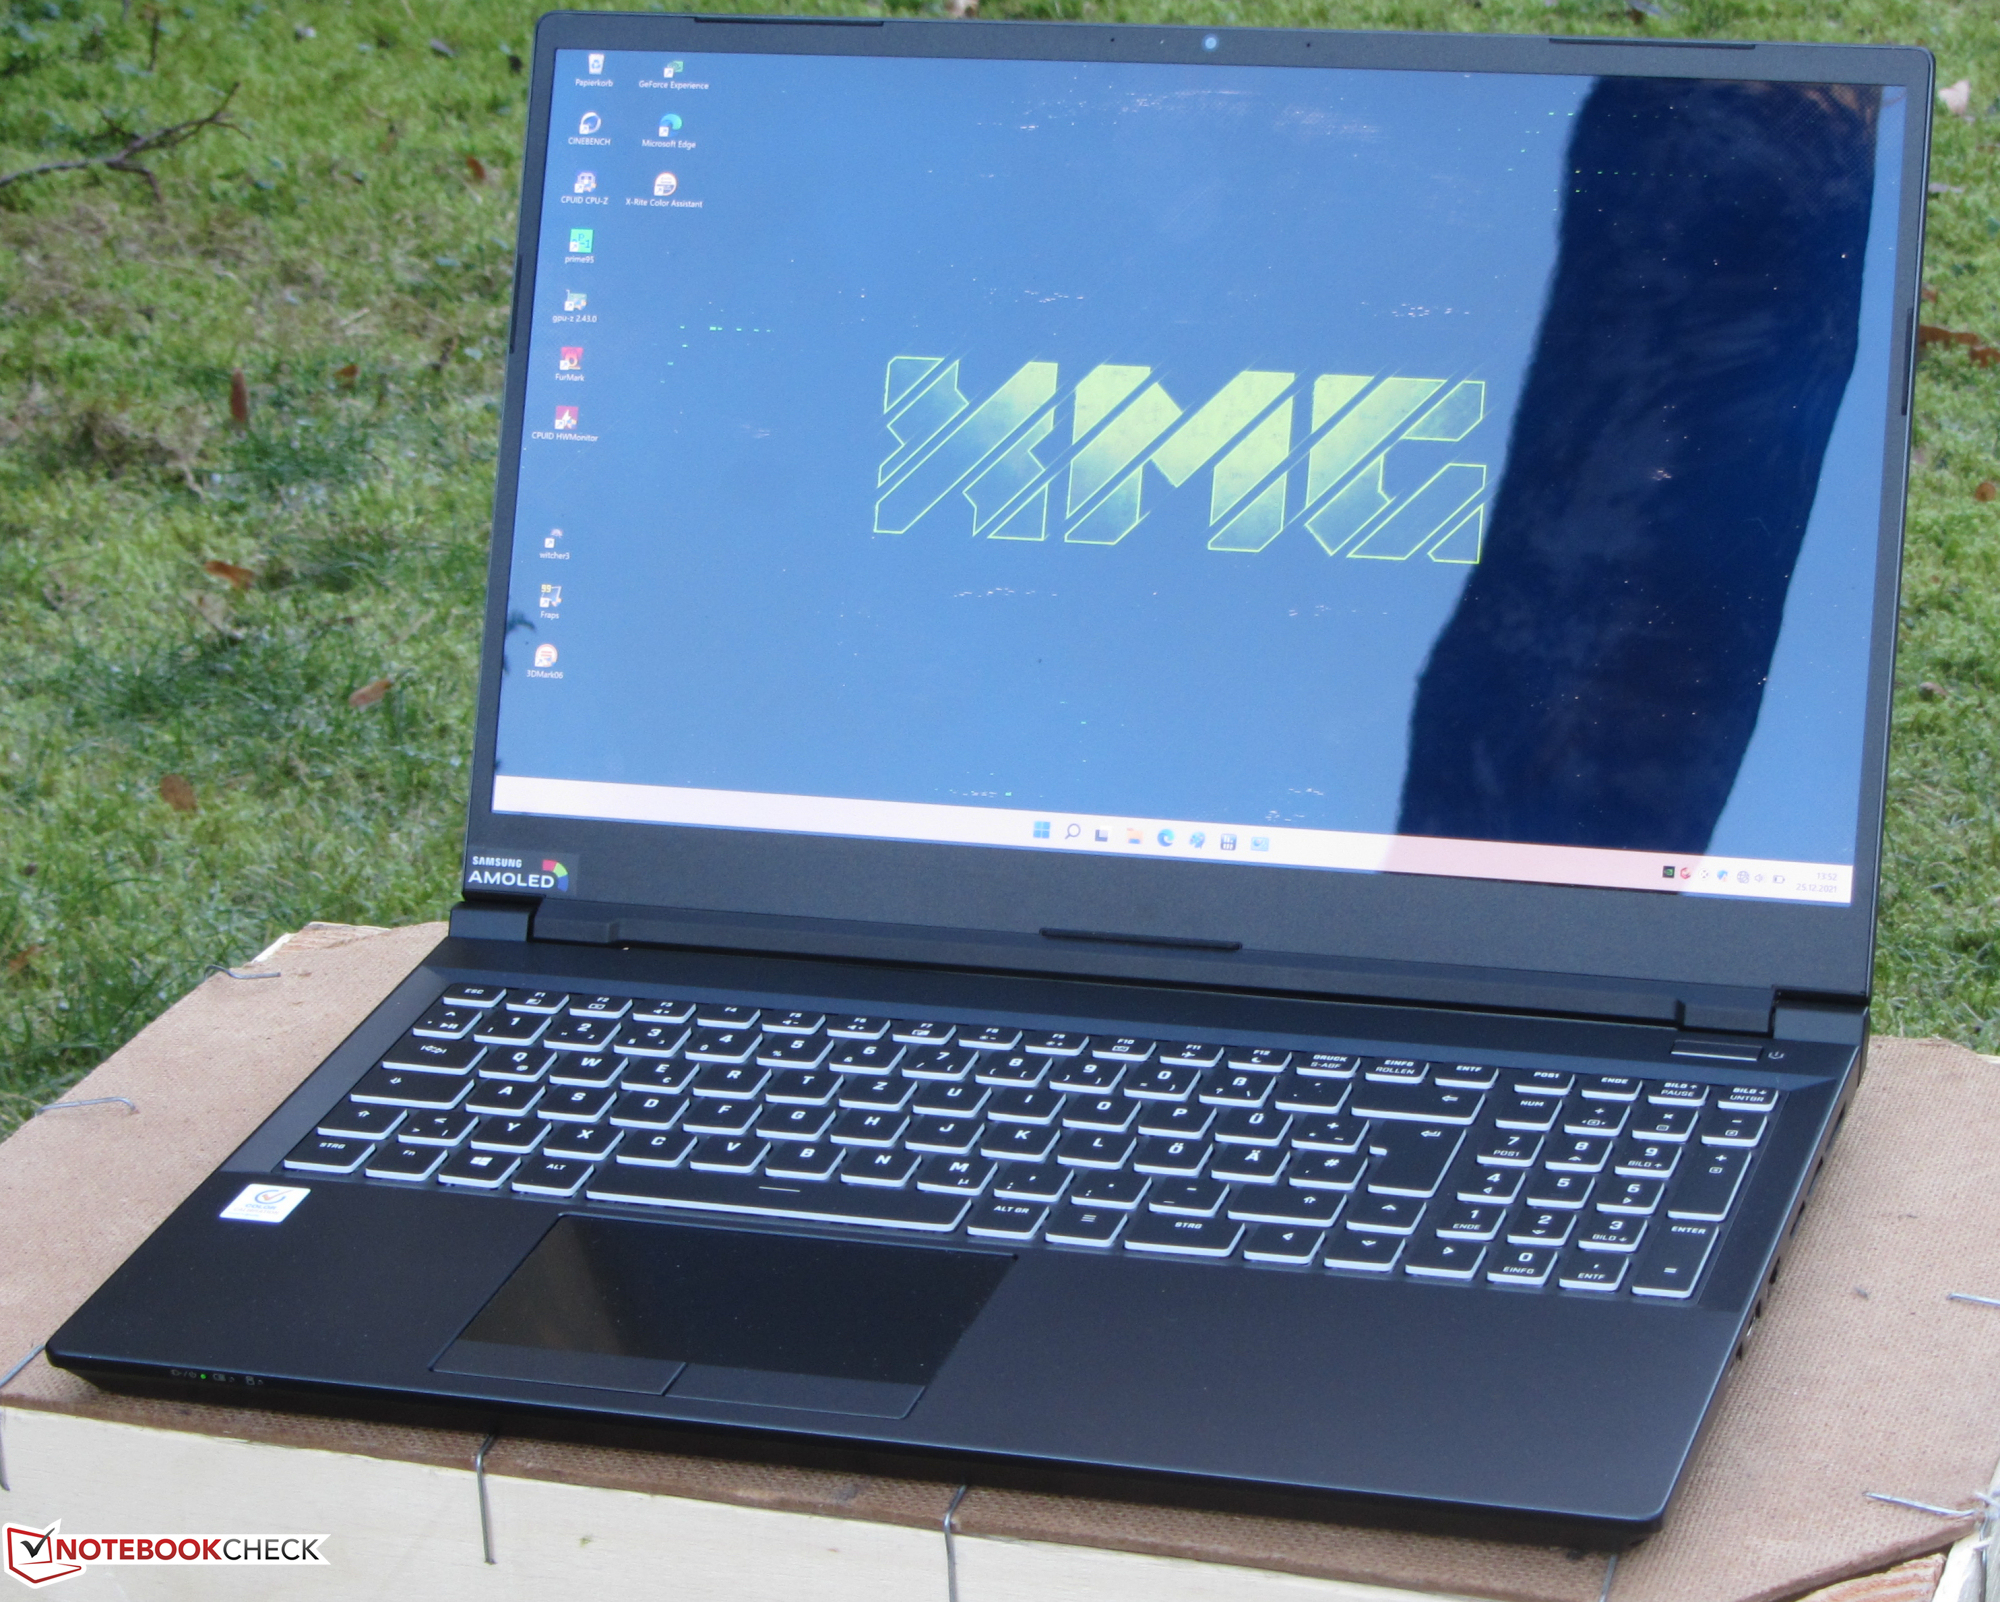
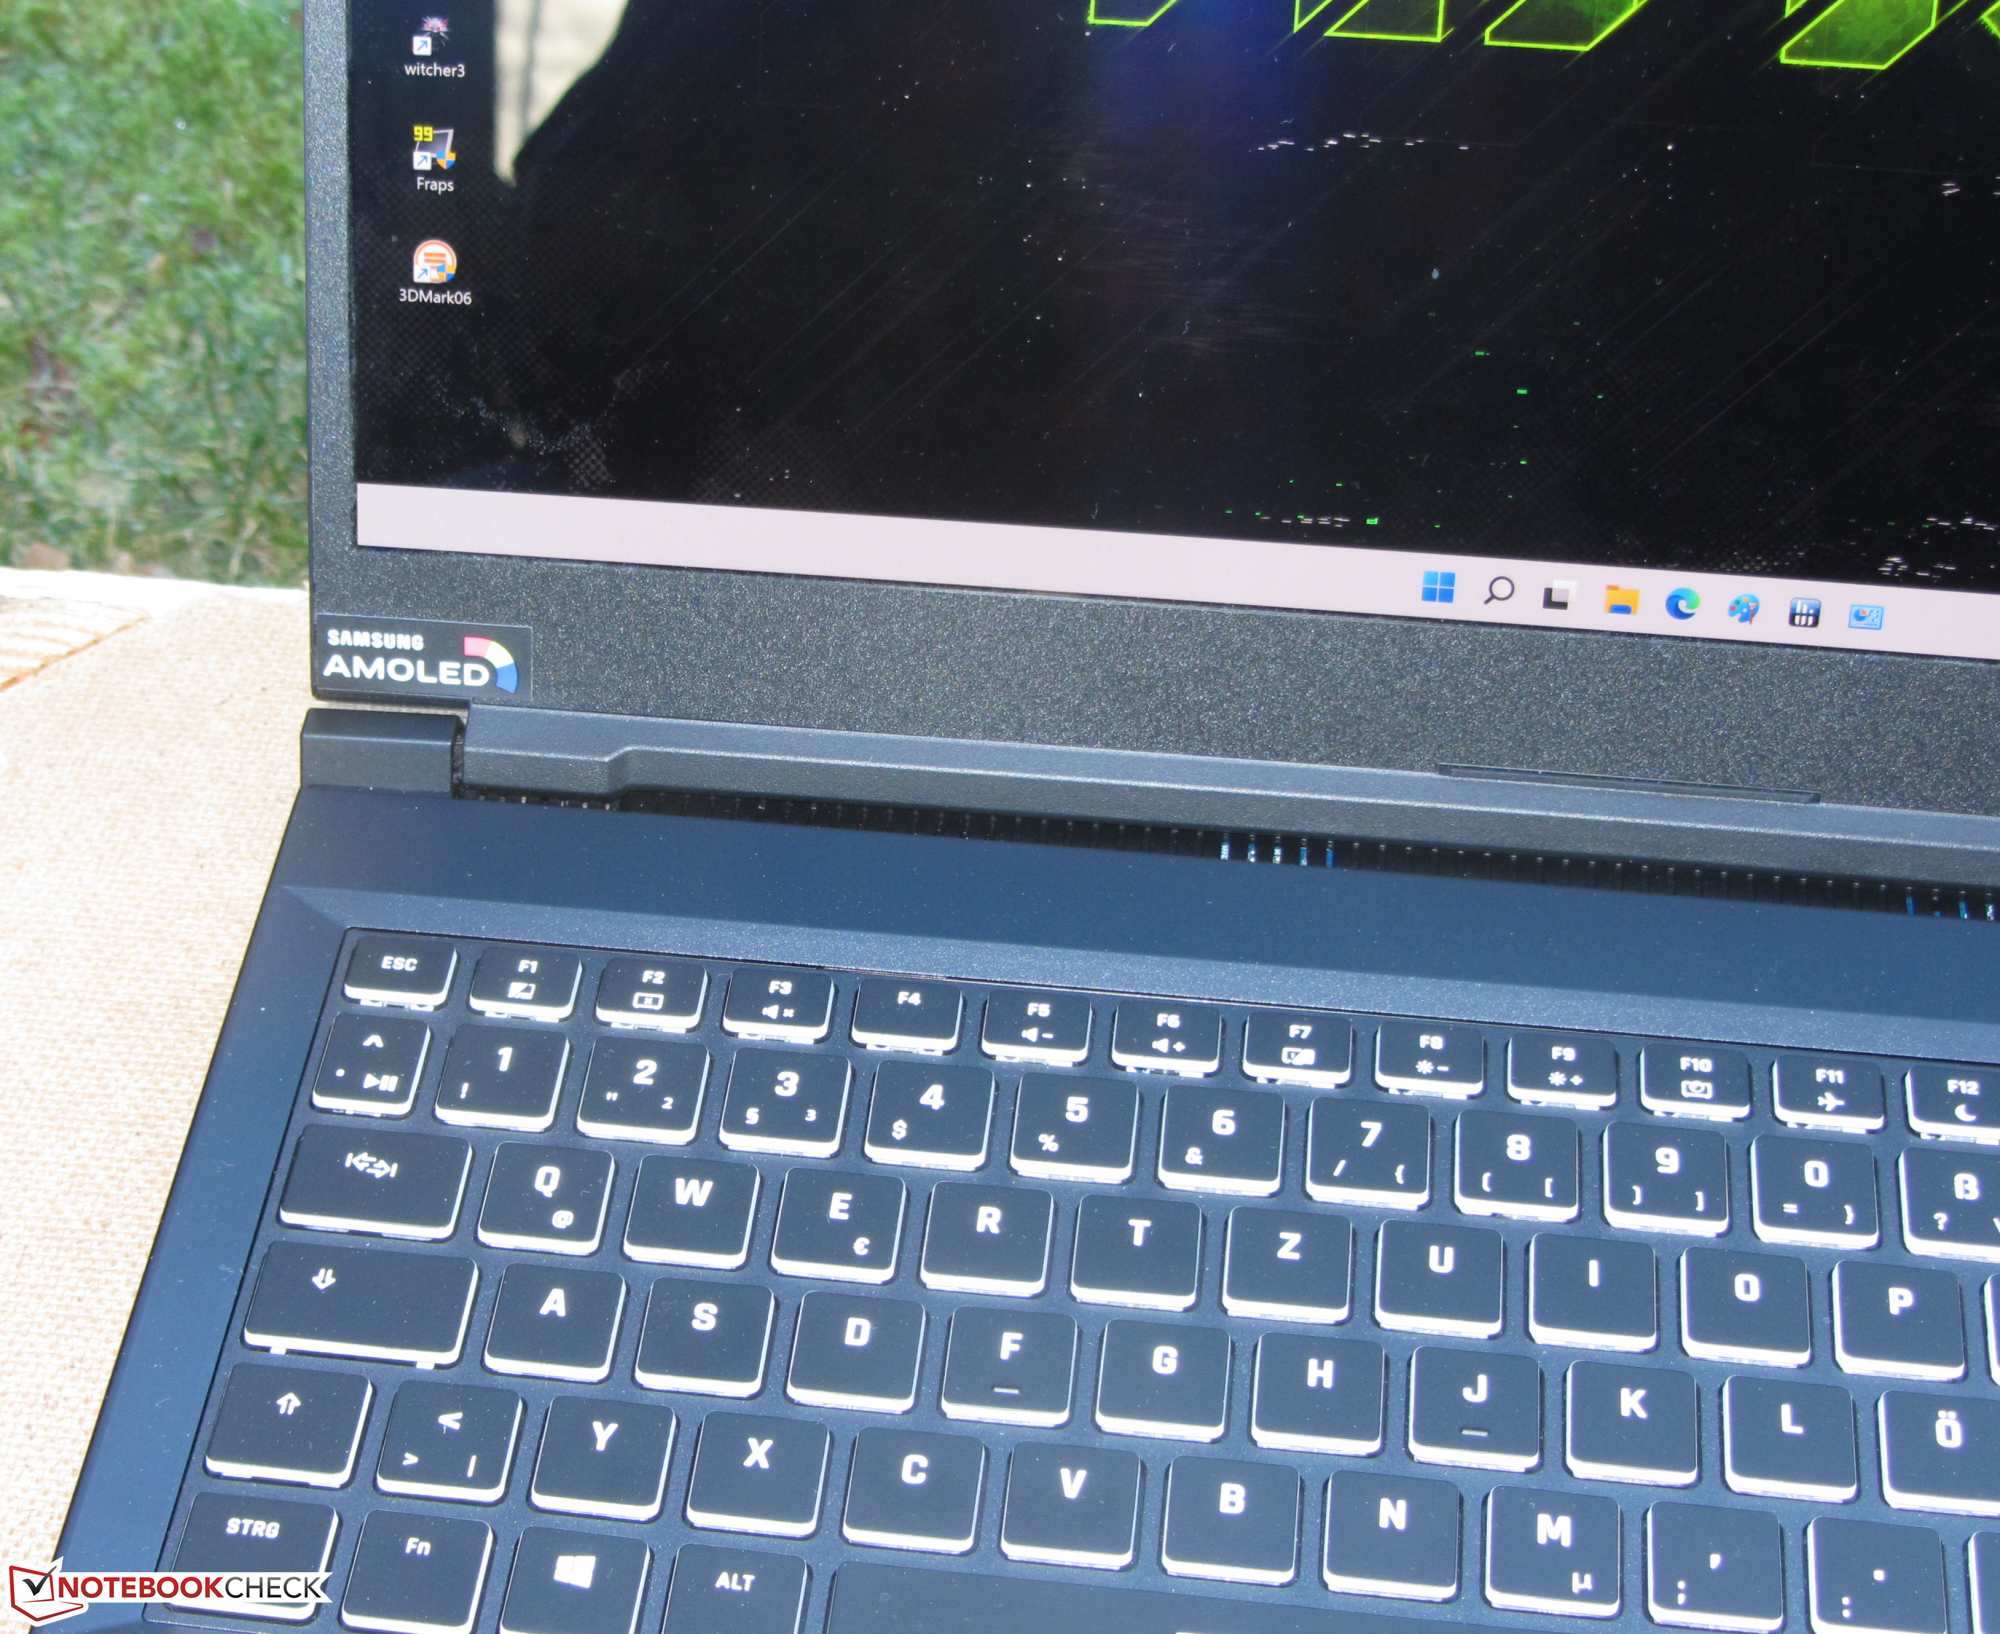
El portátil Schenker está equipado con un teclado chiclet RGB retroiluminado que incluye un teclado numérico. Las teclas planas y suaves ofrecen un recorrido medio y un punto de accionamiento claro. Estamos satisfechos con la respuesta de las teclas. El área del teclado cede ligeramente al escribir. Esto no fue un problema durante nuestras pruebas. La retroiluminación del teclado tiene tres ajustes de brillo, que se pueden controlar a través de dos teclas de función. En general, el teclado es adecuado para el uso diario
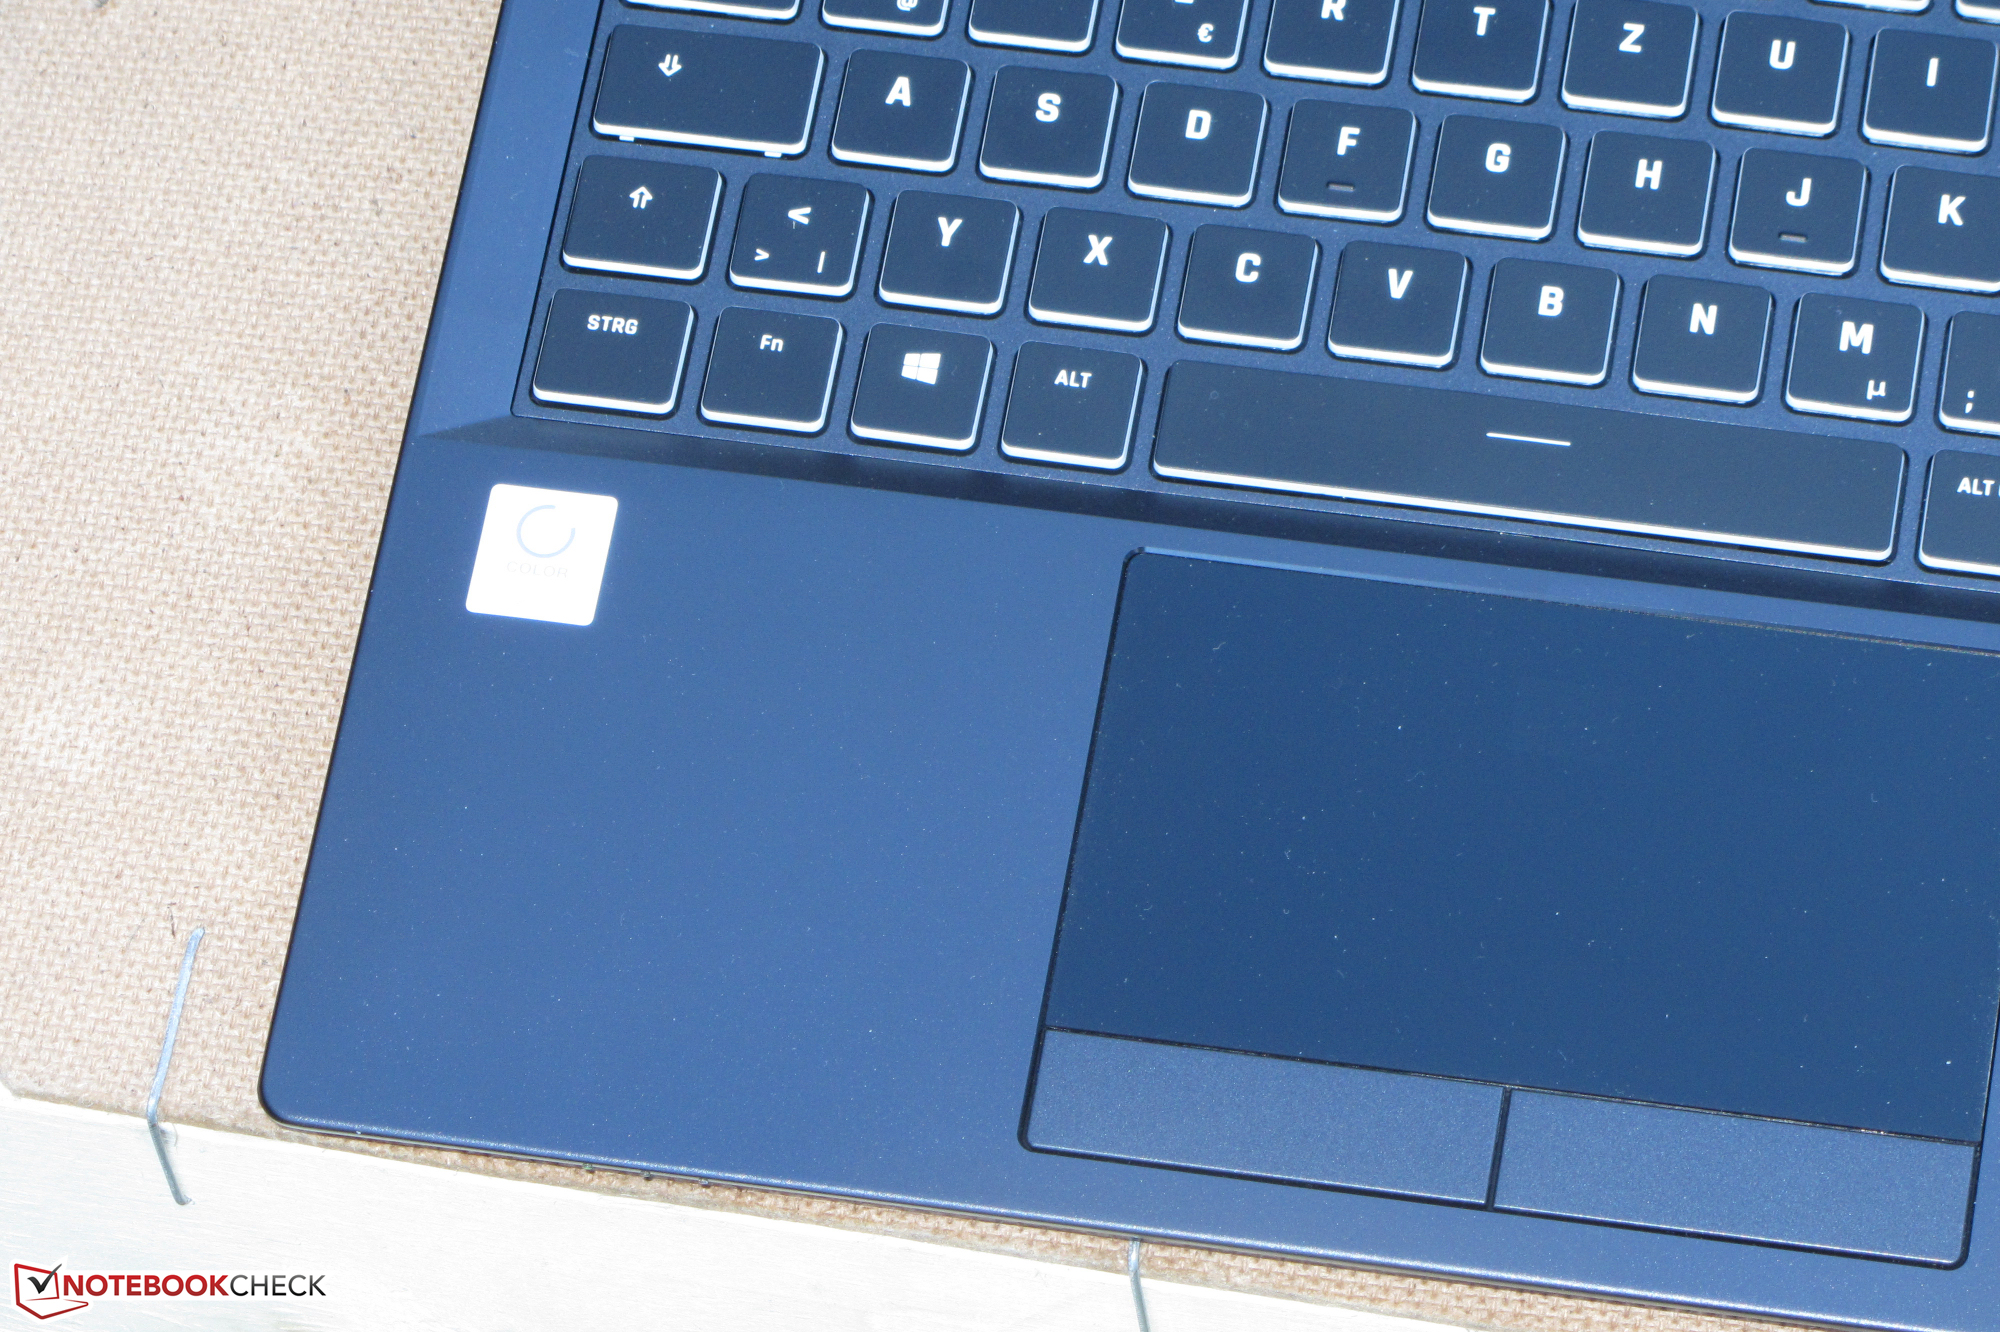
Panel táctil
La superficie lisa (~10,8x6,1 cm) del touchpad soporta gestos multitáctiles y tiene buenas propiedades de deslizamiento. Responde bien a las entradas hasta las esquinas. Los dos botones dedicados del ratón ofrecen un recorrido medio y un punto de actuación distinto
Pantalla: portátil para juegos con un panel OLED 4K
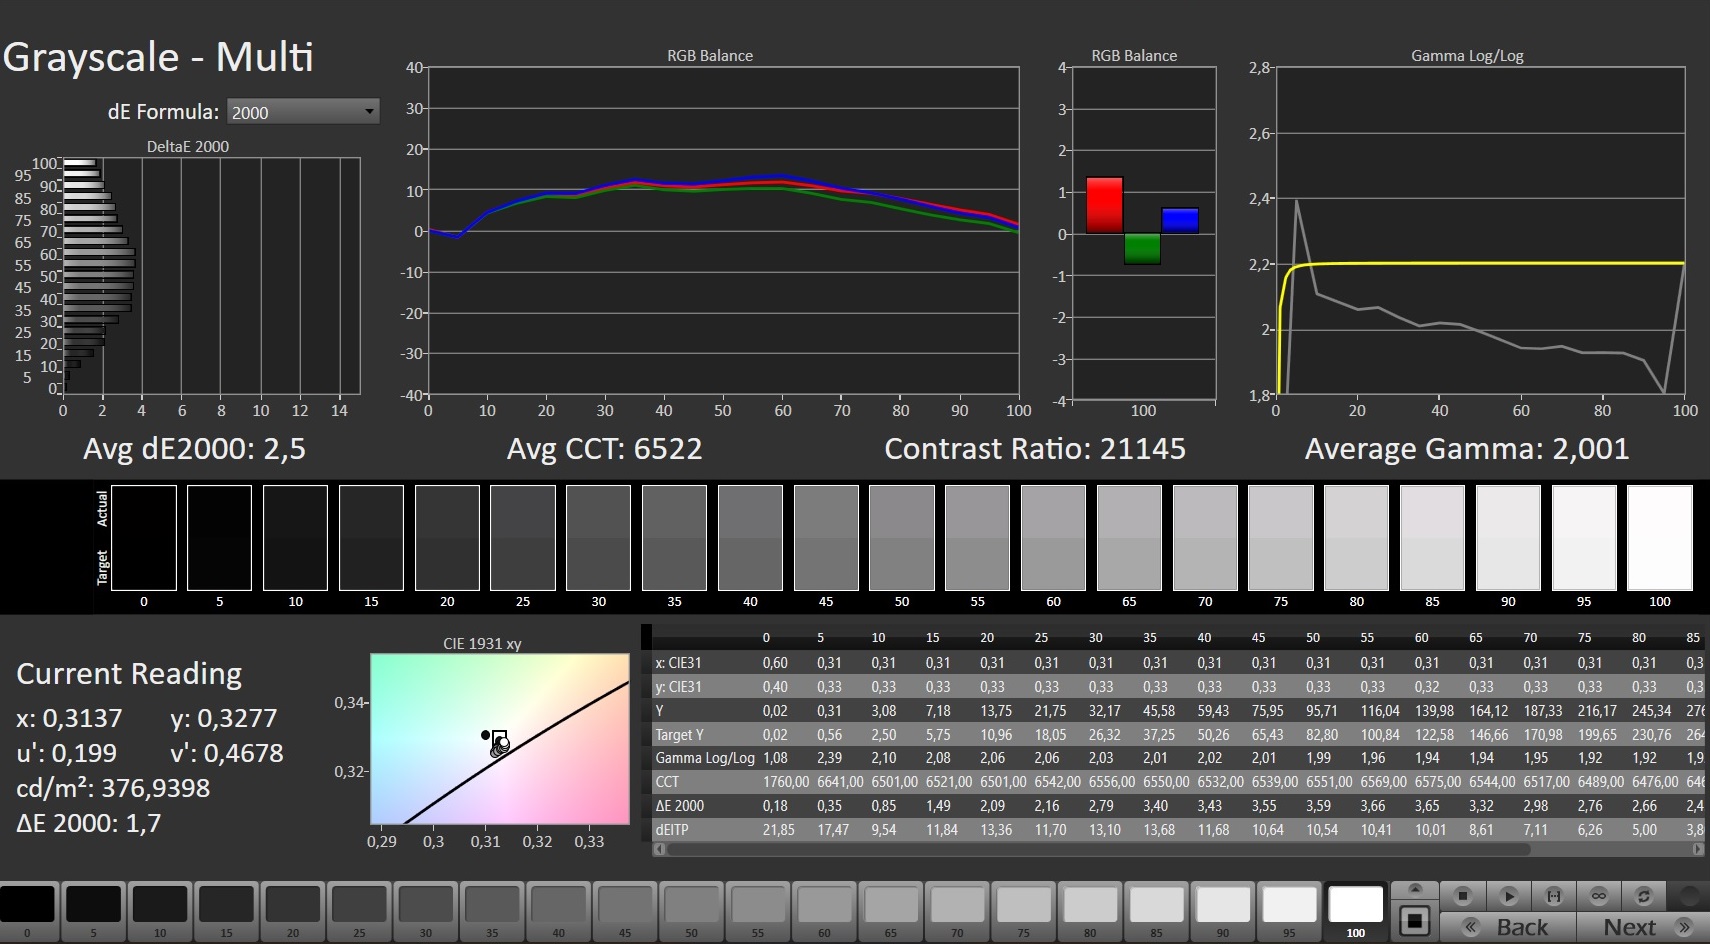
La pantalla OLED reflectante (3840 x 2160 píxeles) ofrece una excelente relación de contraste (22150:1), así como un valor de negro (0,02) y tiempos de respuesta cortos. El brillo (433.7 nits) también es agradablemente alto. Con niveles de brillo del 81 % o inferiores, nuestros dispositivos de medición detectan parpadeos con una frecuencia de 60 a 240 Hz. Debido a la baja frecuencia, los usuarios sensibles pueden sufrir dolores de cabeza o fatiga visual. Como alternativa al panel OLED, Schenker también ofrece una pantalla FHD mate (IPS, 300 Hz). El mismo panel puede encontrarse en el Modelo de principios de 2021 del XMG Proque también analizamos
| |||||||||||||||||||||||||
iluminación: 94 %
Brillo con batería: 443 cd/m²
Contraste: 22150:1 (Negro: 0.02 cd/m²)
ΔE ColorChecker Calman: 3.73 | ∀{0.5-29.43 Ø4.71}
ΔE Greyscale Calman: 2.5 | ∀{0.09-98 Ø4.96}
89.1% AdobeRGB 1998 (Argyll 3D)
97.7% sRGB (Argyll 3D)
81.2% Display P3 (Argyll 3D)
Gamma: 2.001
CCT: 6522 K
| Schenker XMG Pro 15 (Late 2021) Samsung ATNA56WR14-0, OLED, 3840x2160, 15.6" | Lenovo Legion S7 15ACH6 82K80030GE CSOT T3 MNF601EA1-6, IPS, 3840x2160, 15.6" | Alienware x15 RTX 3070 P111F LG Philips 156QHG, IPS, 2560x1440, 15.6" | Razer Blade 15 Advanced (Mid 2021) TL156VDXP02-0, IPS, 1920x1080, 15.6" | Schenker XMG Pro 15 (Early 2021, RTX 3080) AU Optronics AUO7A8C (B156HAN12.0), IPS, 1920x1080, 15.6" | MSI Delta 15 A5EFK LQ156M1JW03 (SHP155D), IPS-Level, 1920x1080, 15.6" | |
|---|---|---|---|---|---|---|
| Display | 5% | 11% | -14% | -11% | -14% | |
| Display P3 Coverage (%) | 81.2 | 85.2 5% | 97.8 20% | 66.9 -18% | 69.2 -15% | 66.5 -18% |
| sRGB Coverage (%) | 97.7 | 98.8 1% | 99.9 2% | 97.1 -1% | 99.7 2% | 97.8 0% |
| AdobeRGB 1998 Coverage (%) | 89.1 | 98.2 10% | 69 -23% | 70.8 -21% | 67.6 -24% | |
| Response Times | -894% | -413% | -278% | -269% | -425% | |
| Response Time Grey 50% / Grey 80% * (ms) | 3.2 ? | 31.6 ? -888% | 12 ? -275% | 4.2 ? -31% | 3.6 ? -13% | 12.8 ? -300% |
| Response Time Black / White * (ms) | 1.6 ? | 16 ? -900% | 10.4 ? -550% | 10 ? -525% | 10 ? -525% | 10.4 ? -550% |
| PWM Frequency (Hz) | 60 ? | 23580 ? | ||||
| Screen | -222% | -305% | -194% | -133% | -240% | |
| Brightness middle (cd/m²) | 443 | 607 37% | 409.5 -8% | 353.4 -20% | 327 -26% | 291 -34% |
| Brightness (cd/m²) | 434 | 605 39% | 390 -10% | 340 -22% | 335 -23% | 266 -39% |
| Brightness Distribution (%) | 94 | 93 -1% | 88 -6% | 92 -2% | 89 -5% | 88 -6% |
| Black Level * (cd/m²) | 0.02 | 0.41 -1950% | 0.47 -2250% | 0.31 -1450% | 0.22 -1000% | 0.36 -1700% |
| Contrast (:1) | 22150 | 1480 -93% | 871 -96% | 1140 -95% | 1486 -93% | 808 -96% |
| Colorchecker dE 2000 * | 3.73 | 0.84 77% | 3.48 7% | 2.17 42% | 2.18 42% | 2.98 20% |
| Colorchecker dE 2000 max. * | 8.12 | 3.02 63% | 6.31 22% | 5.69 30% | 4.24 48% | 7.59 7% |
| Greyscale dE 2000 * | 2.5 | 1.1 56% | 5 -100% | 3.4 -36% | 2.6 -4% | 4.2 -68% |
| Gamma | 2.001 110% | 2.131 103% | 2.16 102% | 2.2 100% | 2.123 104% | 2.293 96% |
| CCT | 6522 100% | 6648 98% | 6591 99% | 6830 95% | 6815 95% | 7624 85% |
| Colorchecker dE 2000 calibrated * | 0.69 | 0.89 | 1.05 | 1 | 0.91 | |
| Color Space (Percent of AdobeRGB 1998) (%) | 71 | |||||
| Color Space (Percent of sRGB) (%) | 93 | |||||
| Media total (Programa/Opciones) | -370% /
-273% | -236% /
-270% | -162% /
-165% | -138% /
-126% | -226% /
-216% |
* ... más pequeño es mejor
La certificación X-Rite de la pantalla garantiza una representación natural del color. Incluso de fábrica, la desviación del color es muy baja e imposible de notar a simple vista. La pantalla no sufre de un tinte azul. La cobertura del espacio de color es amplia: La pantalla puede mostrar el 98 % y el 89 % de los espacios de color sRGB y AdobeRGB, respectivamente (es posible que volvamos a probarlo, ya que Schenker alcanza el 100 % en sus propias pruebas)
Tiempos de respuesta del display
| ↔ Tiempo de respuesta de Negro a Blanco | ||
|---|---|---|
| 1.6 ms ... subida ↗ y bajada ↘ combinada | ↗ 1 ms subida | 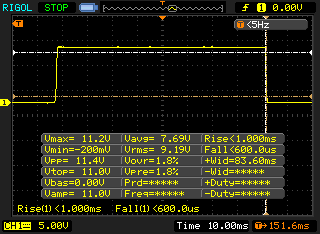 |
| ↘ 0.6 ms bajada | ||
| La pantalla mostró tiempos de respuesta muy rápidos en nuestros tests y debería ser adecuada para juegos frenéticos. En comparación, todos los dispositivos de prueba van de ##min### (mínimo) a 240 (máximo) ms. » 10 % de todos los dispositivos son mejores. Esto quiere decir que el tiempo de respuesta medido es mejor que la media (19.8 ms) de todos los dispositivos testados. | ||
| ↔ Tiempo de respuesta 50% Gris a 80% Gris | ||
| 3.2 ms ... subida ↗ y bajada ↘ combinada | ↗ 1.2 ms subida | 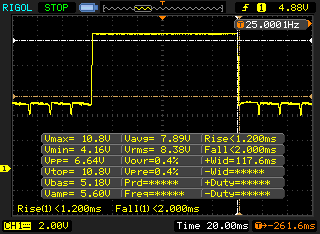 |
| ↘ 2 ms bajada | ||
| La pantalla mostró tiempos de respuesta muy rápidos en nuestros tests y debería ser adecuada para juegos frenéticos. En comparación, todos los dispositivos de prueba van de ##min### (mínimo) a 636 (máximo) ms. » 13 % de todos los dispositivos son mejores. Esto quiere decir que el tiempo de respuesta medido es mejor que la media (30.9 ms) de todos los dispositivos testados. | ||
Parpadeo de Pantalla / PWM (Pulse-Width Modulation)
| Parpadeo de Pantalla / PWM detectado | 60 Hz | ≤ 81 % de brillo |  |
La retroiluminación del display parpadea a 60 Hz (seguramente usa PWM - Pulse-Width Modulation) a un brillo del 81 % e inferior. Sobre este nivel de brillo no debería darse parpadeo / PWM. La frecuencia de 60 Hz es bajísima, por lo que el parpadeo puede causar fatiga visual y cefaleas cuando se usa mucho tiempo. Comparación: 52 % de todos los dispositivos testados no usaron PWM para atenuar el display. Si se usó, medimos una media de 7744 (mínimo: 5 - máxmo: 343500) Hz. | |||
Como el panel tiene buenos ángulos de visión, se puede leer desde cualquier posición. En exteriores, la lectura del contenido de la pantalla puede ser complicada debido a su naturaleza reflectante

Rendimiento - Suficiente para los próximos años
Con el XMG Pro 15, Schenker ha creado un portátil para juegos delgado y compacto de 15,6 pulgadas con suficientes reservas de rendimiento para ejecutar todos los juegos actuales sin problemas

Condiciones de la prueba
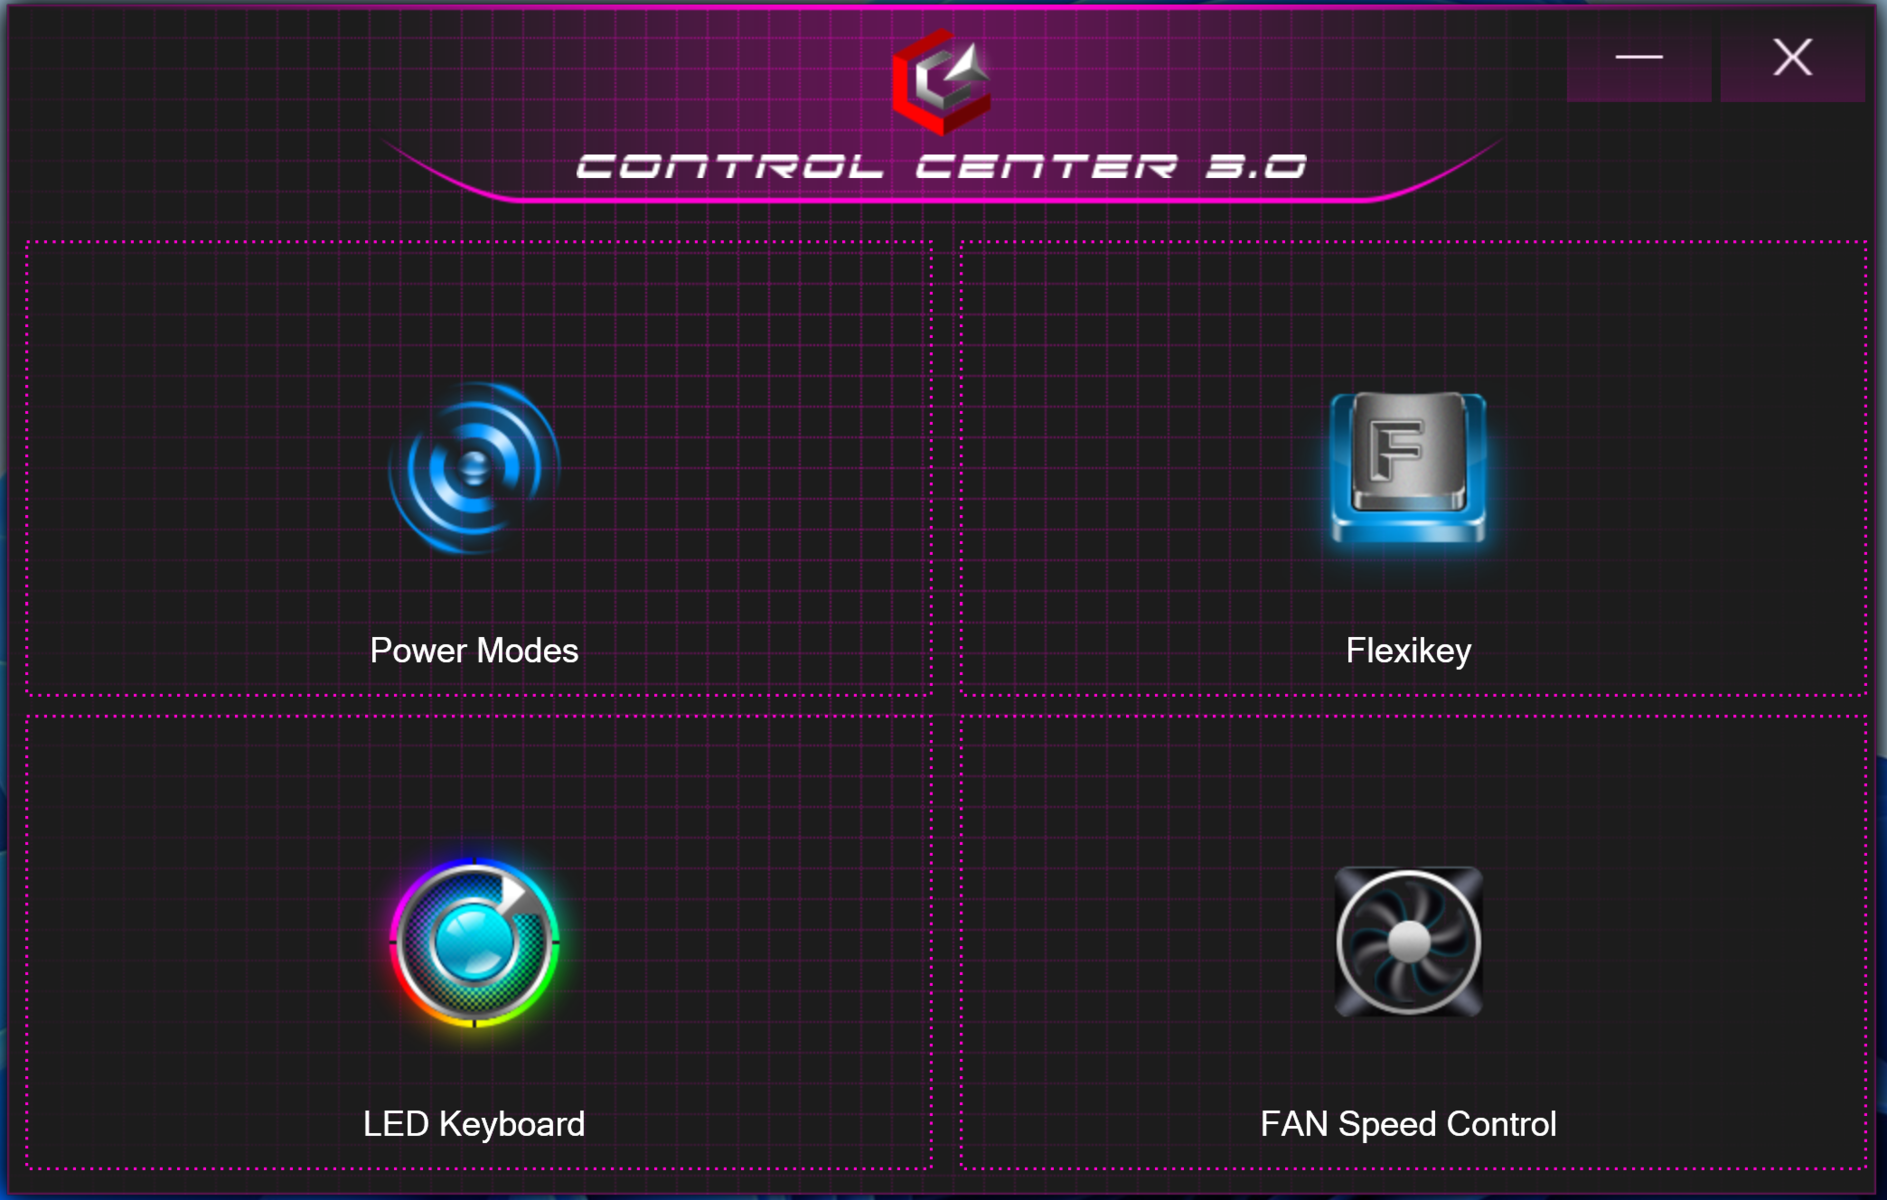
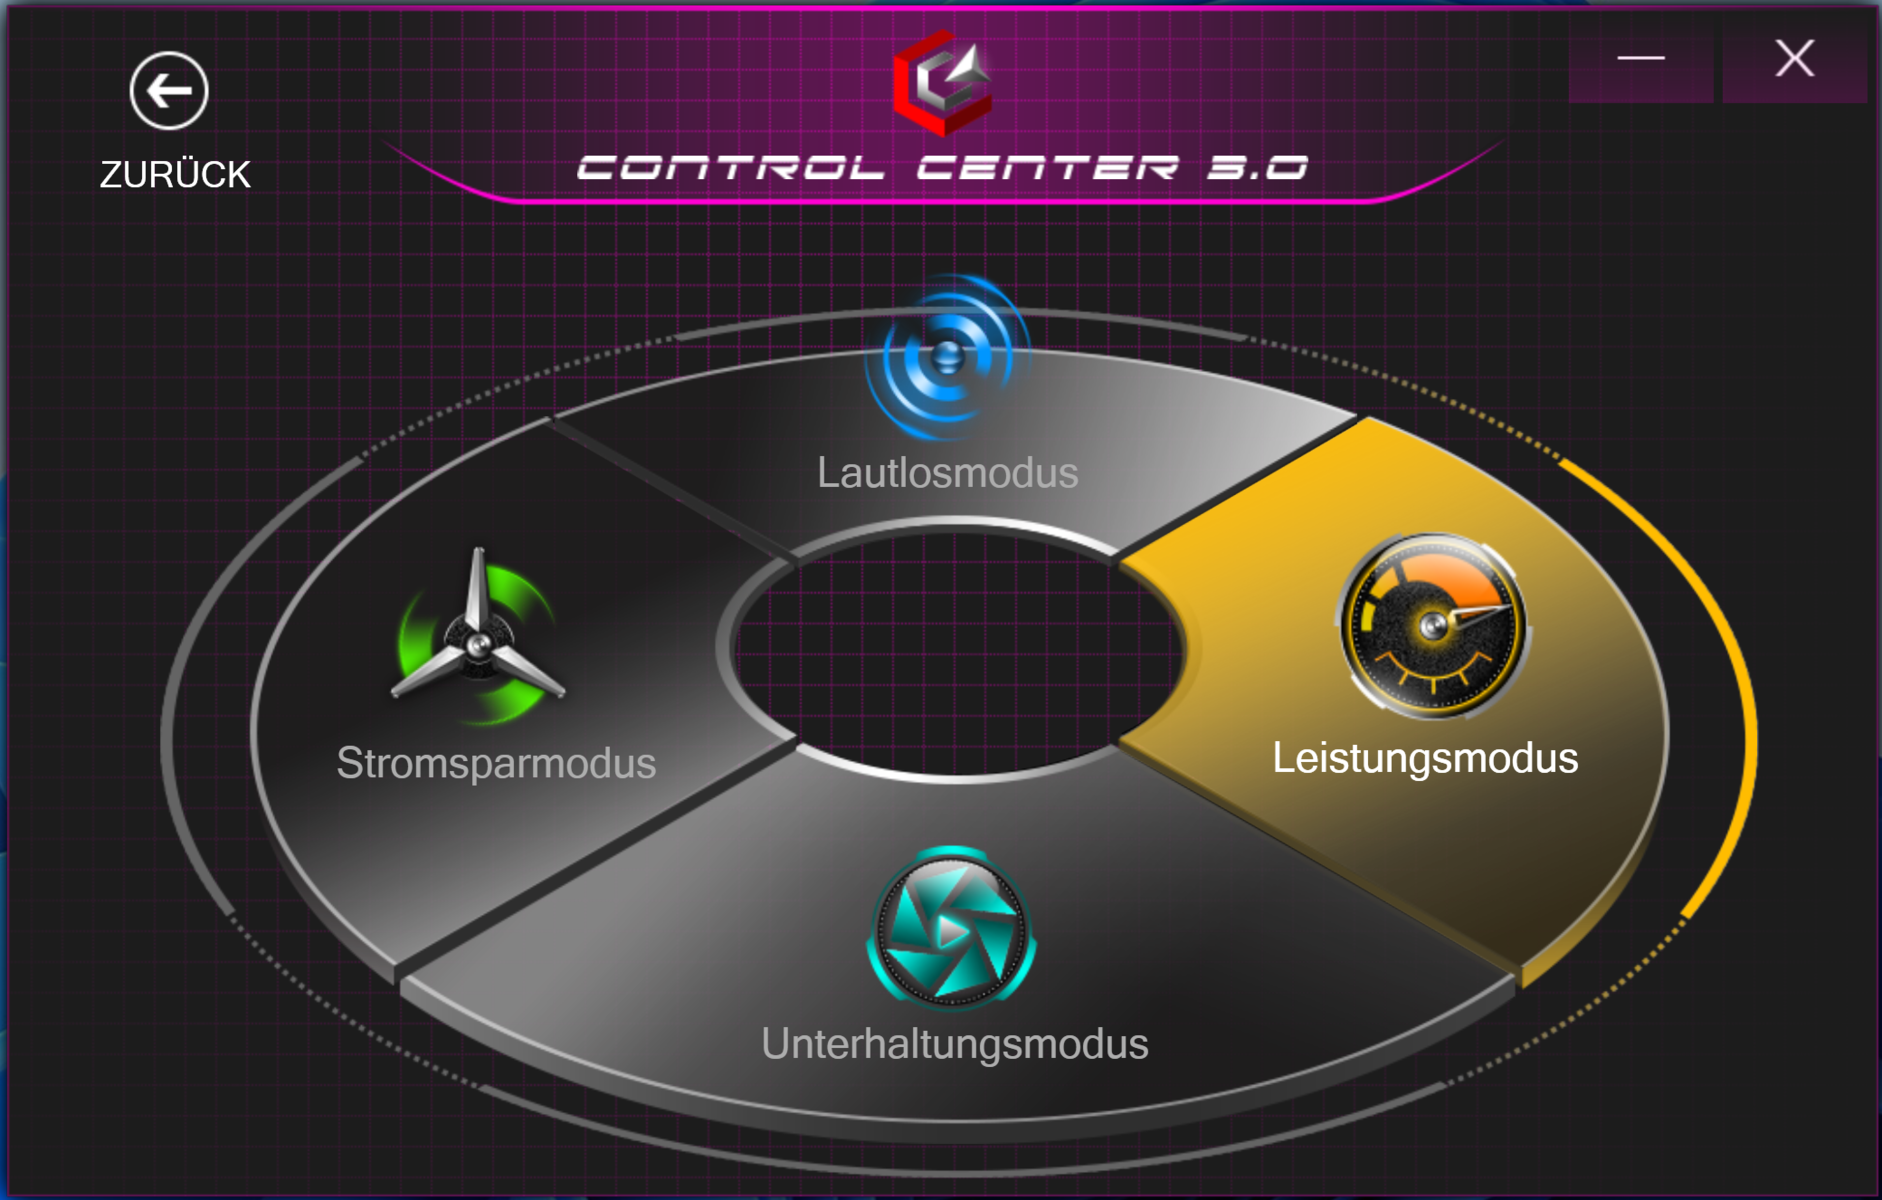
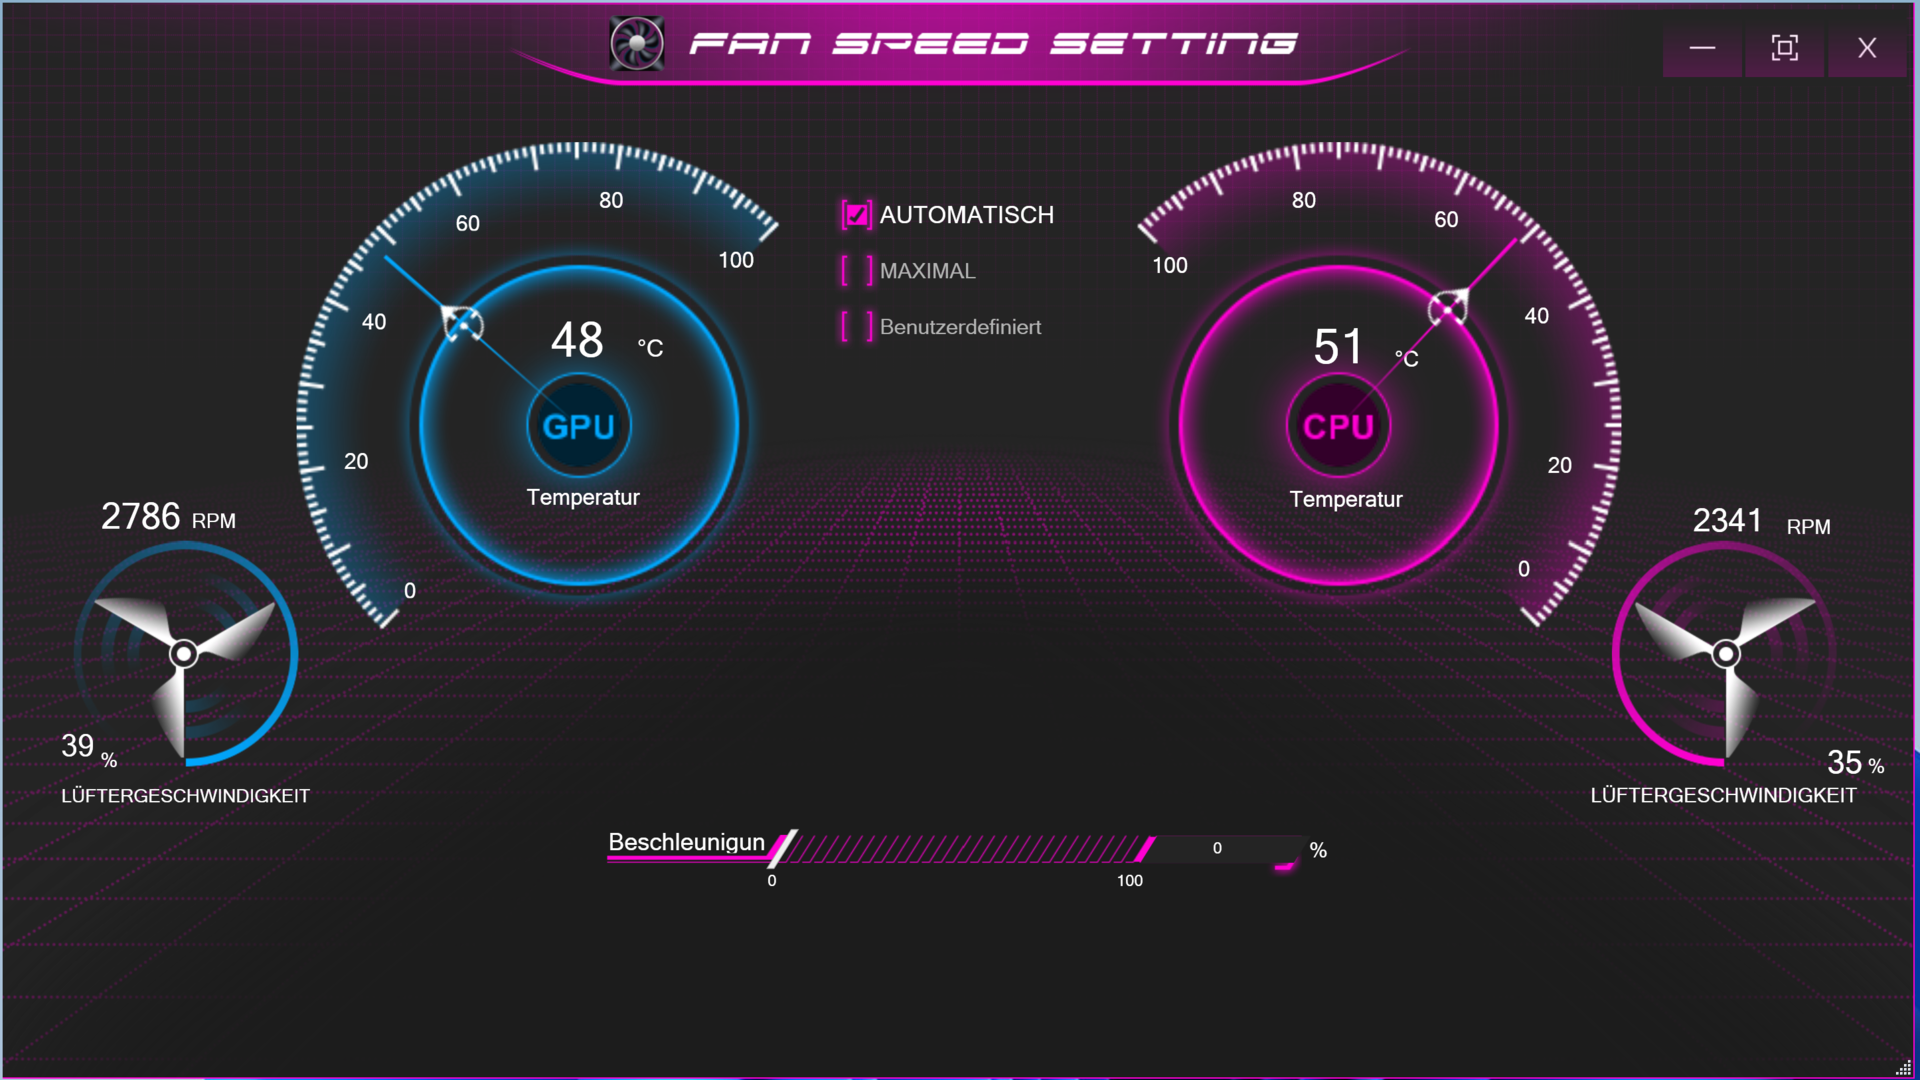
El software preinstalado del Centro de Control permite a los usuarios seleccionar un perfil de energía (ver tabla), entre otras cosas. El perfil de rendimiento con control automático del ventilador se seleccionó antes de ejecutar cualquier prueba de rendimiento. También se ejecutaron varias pruebas de rendimiento utilizando los otros tres perfiles. Los resultados se pueden encontrar en las tablas de comparación. Las pruebas de duración de la batería se realizaron con el "modo de entretenimiento"
| Modo de rendimiento | Modo de entretenimiento | Modo de ahorro de energía | Modo silencioso | |
|---|---|---|---|---|
| Límite de potencia 1 | 55 vatios | 45 vatios | 20 vatios | 15 vatios |
| Límite de potencia 2 | 135 vatios | 90 vatios | 90 vatios | 90 vatios |
| máx. TGP | 105 vatios | 90 vatios | 80 vatios | 80 vatios |
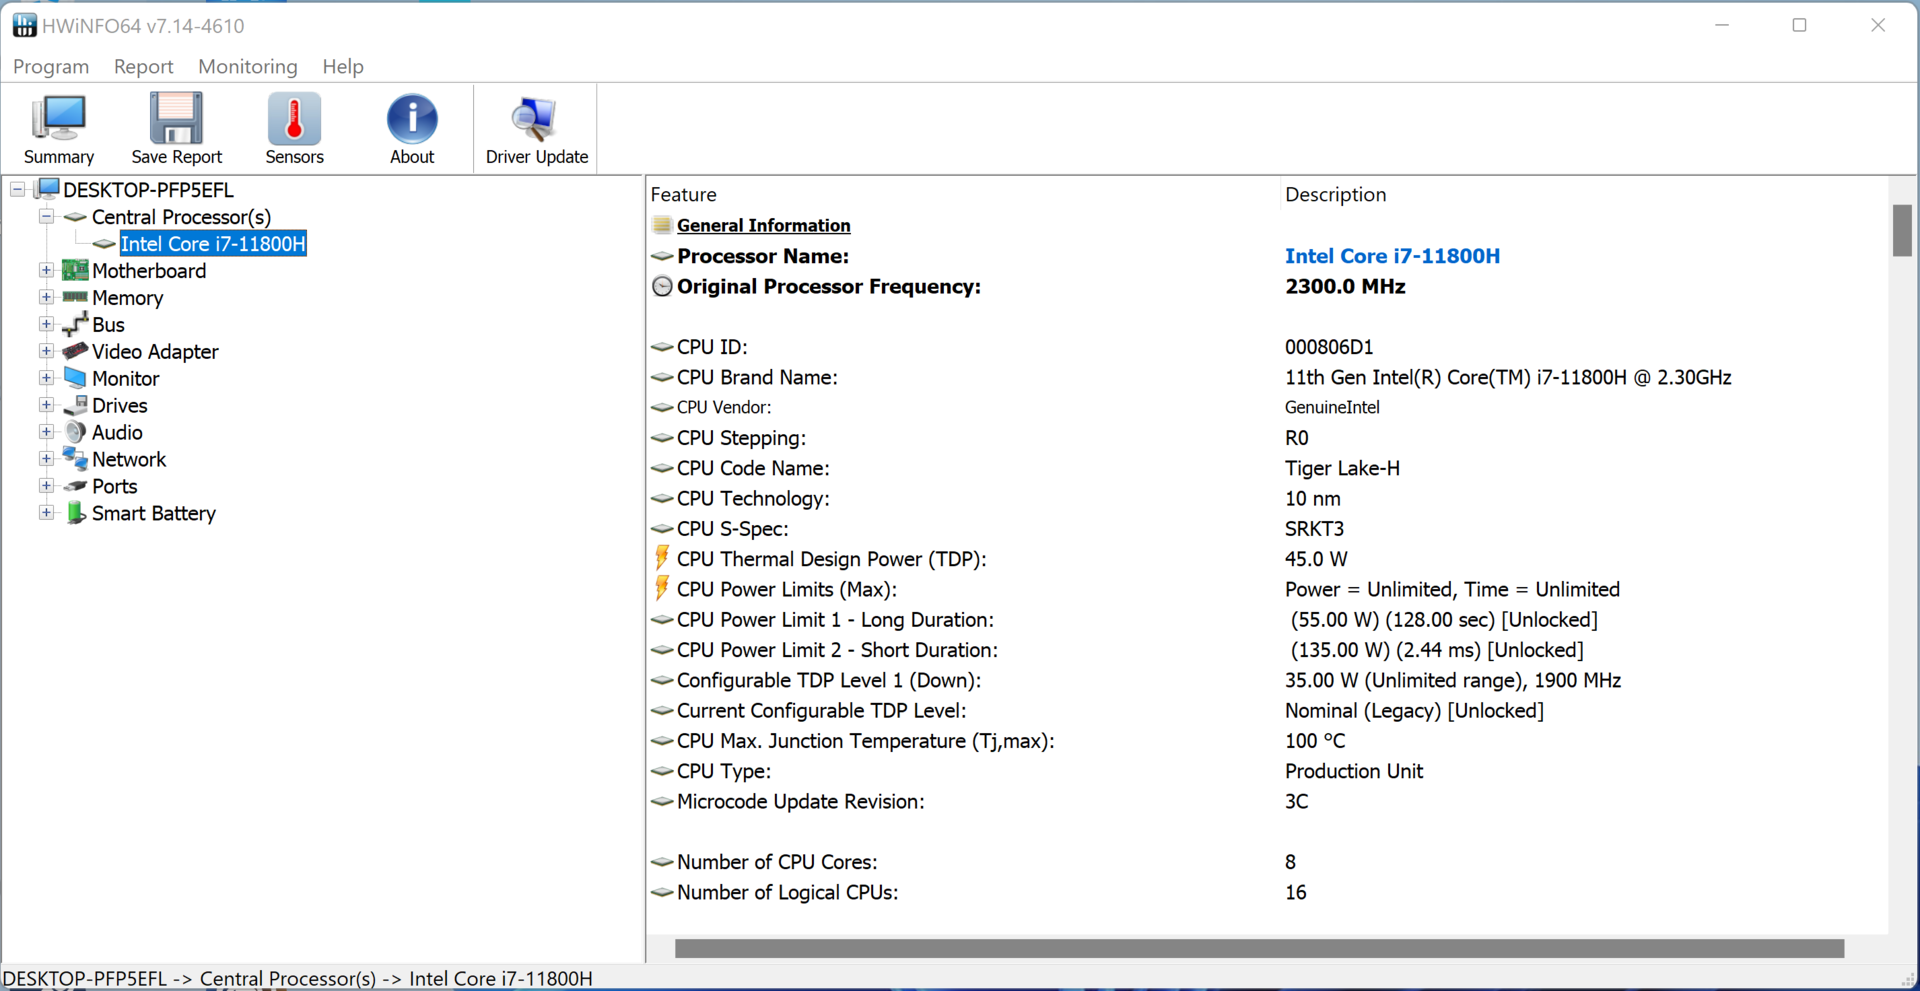
Procesador
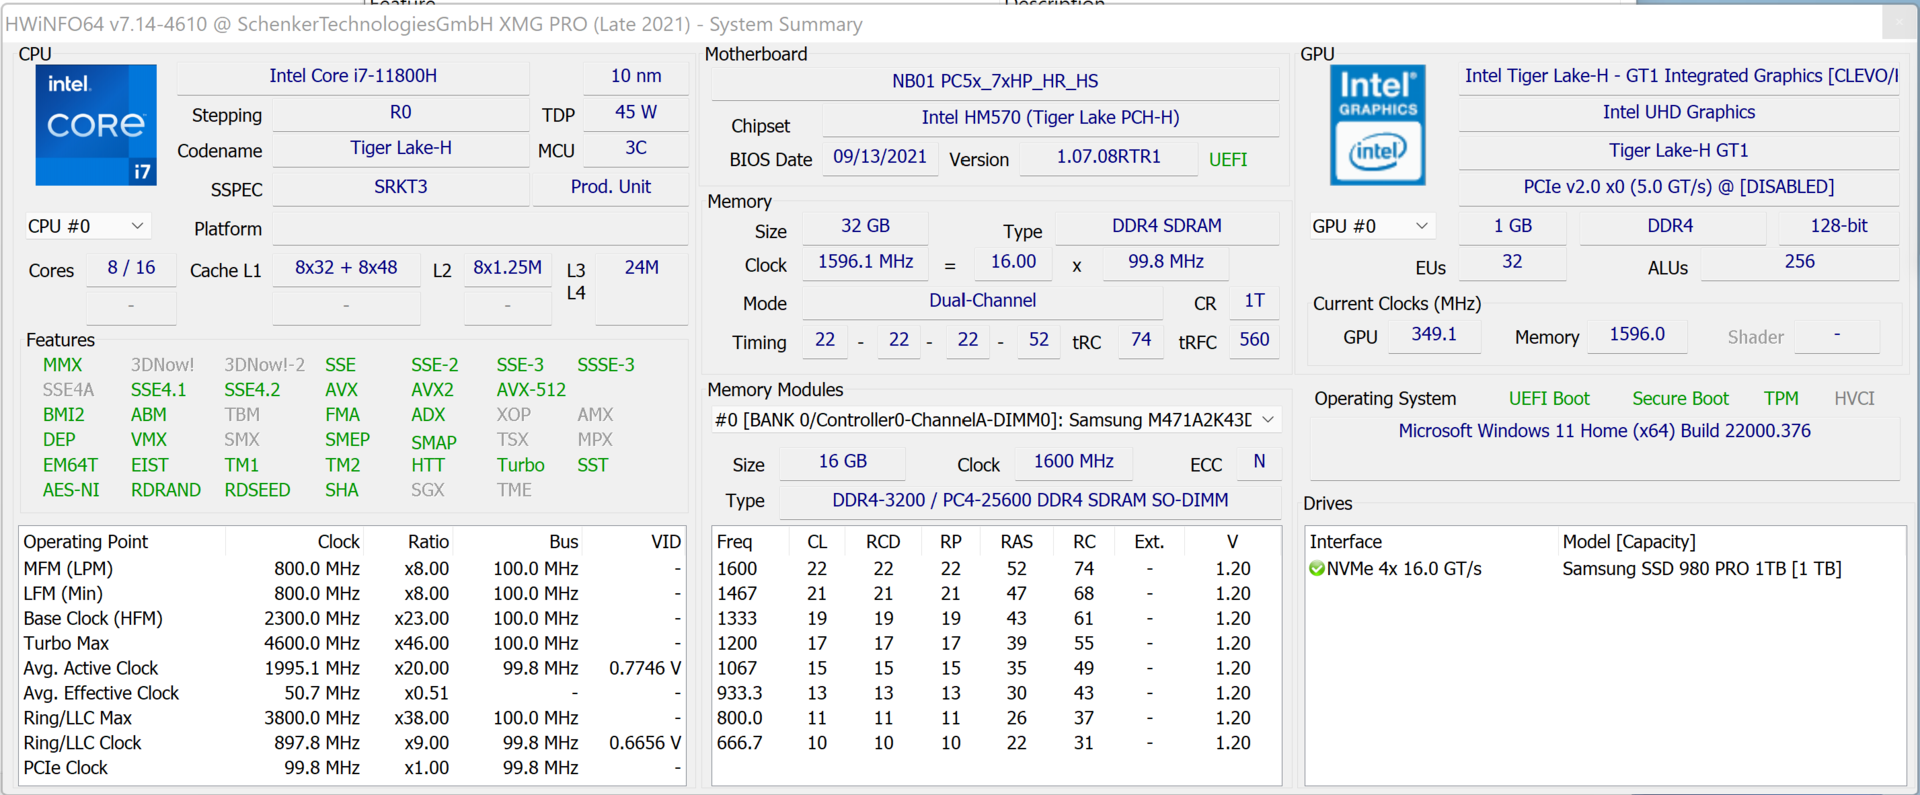
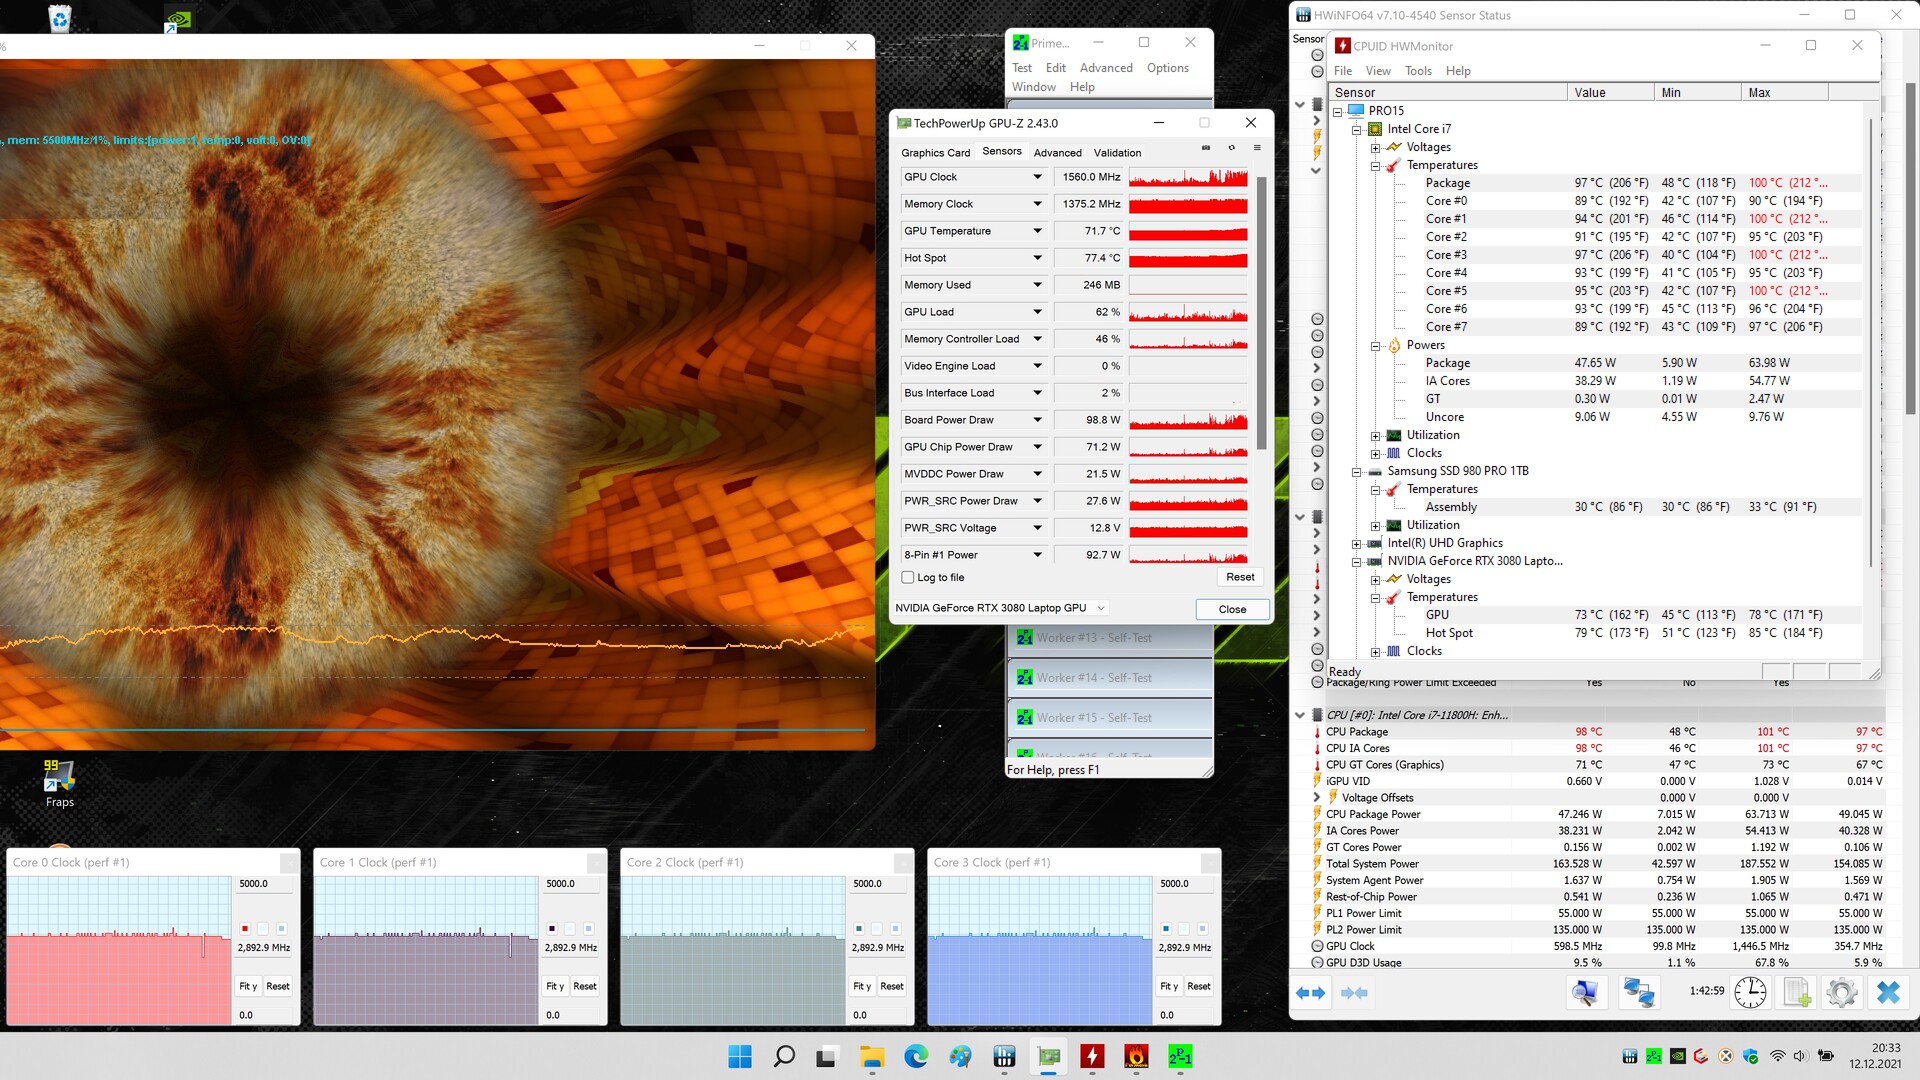
El procesador octa-core Core i7-11800H (Tiger Lake) funciona a un reloj base de 2,3 GHz. Con Turbo, aumenta hasta 4,2 GHz (ocho núcleos) o 4,6 GHz (un solo núcleo). Soporta Hyper-Threading (dos hilos por núcleo).
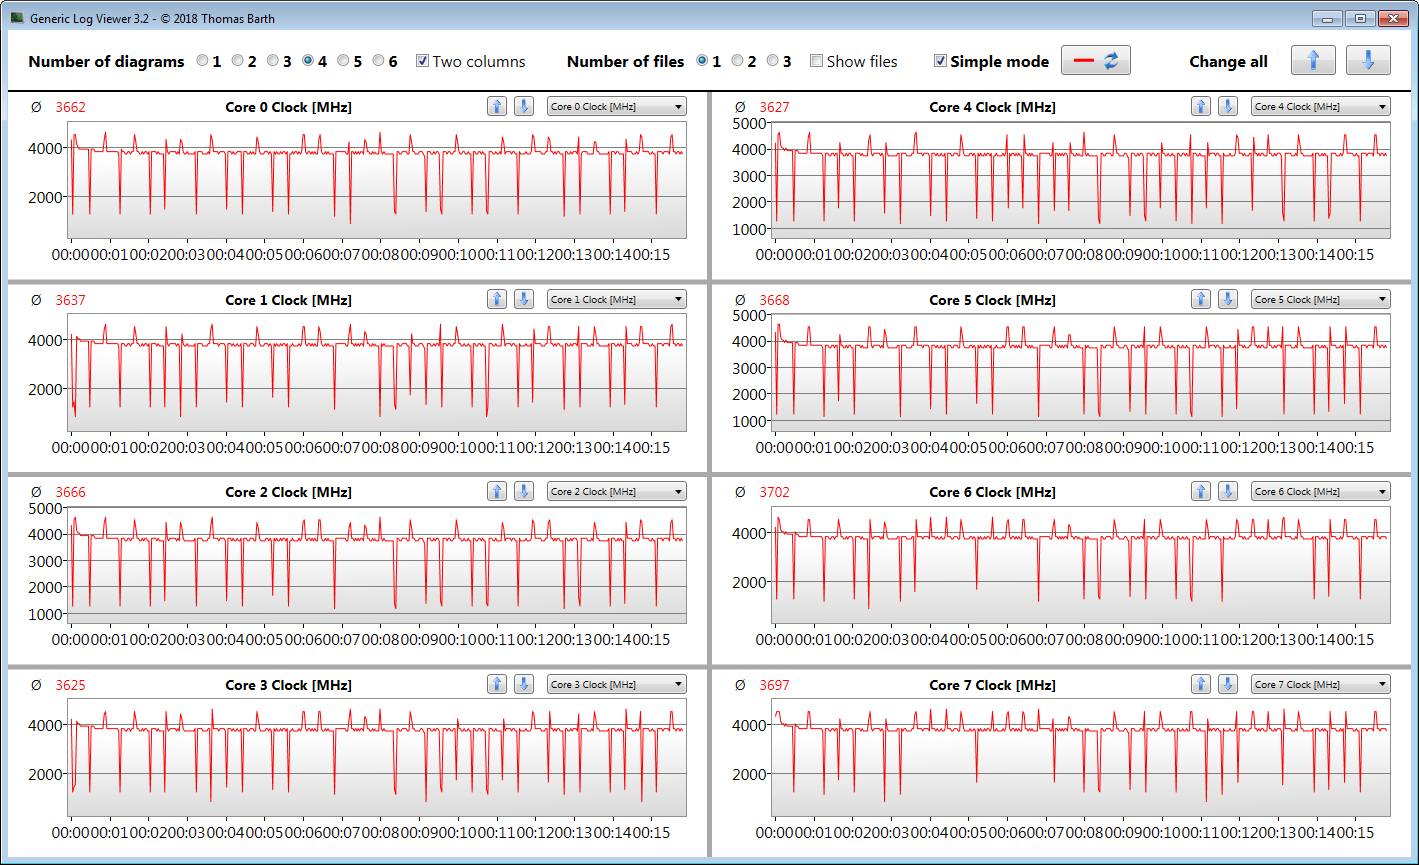
Durante el benchmark Cinebench R15 Multi, la CPU funciona de 4 a 4,1 GHz (en red) o de 1 a 4,1 GHz (en modo batería). Durante el benchmark single-thread, la CPU funciona a 1,6 a 4,6 GHz en ambos casos
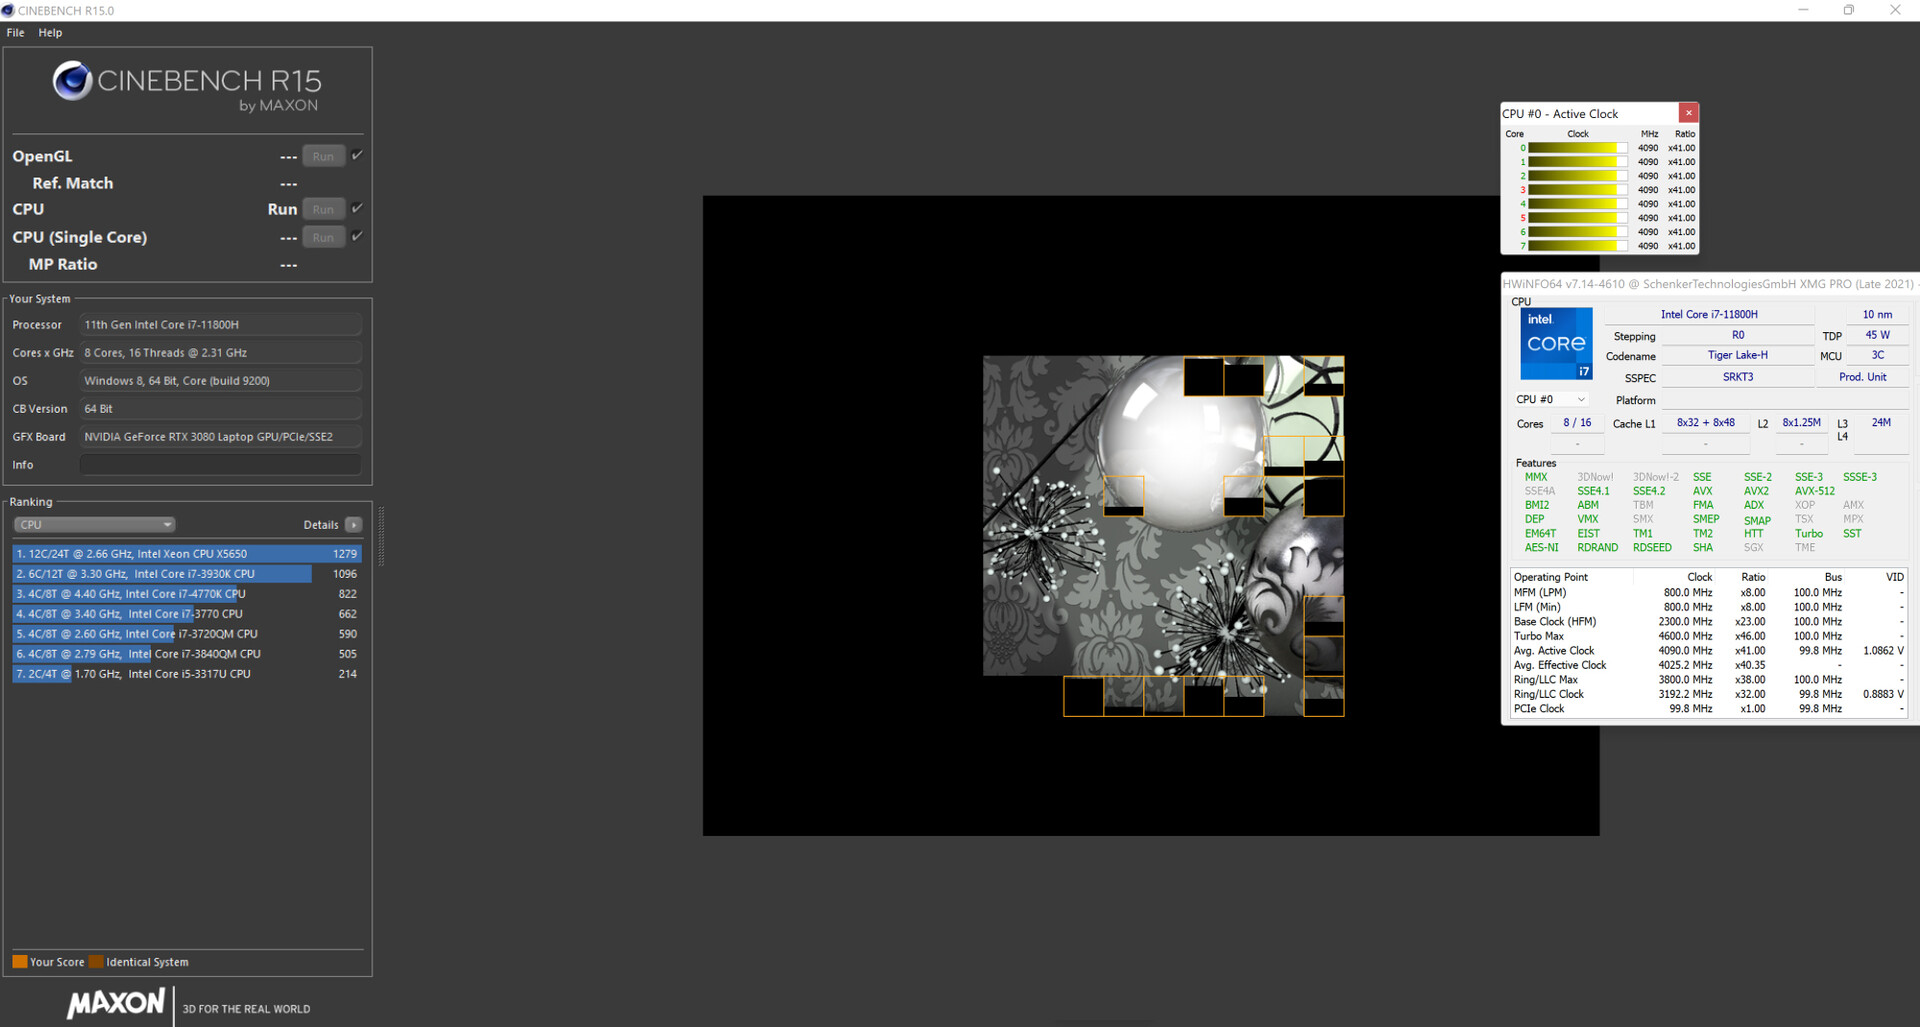
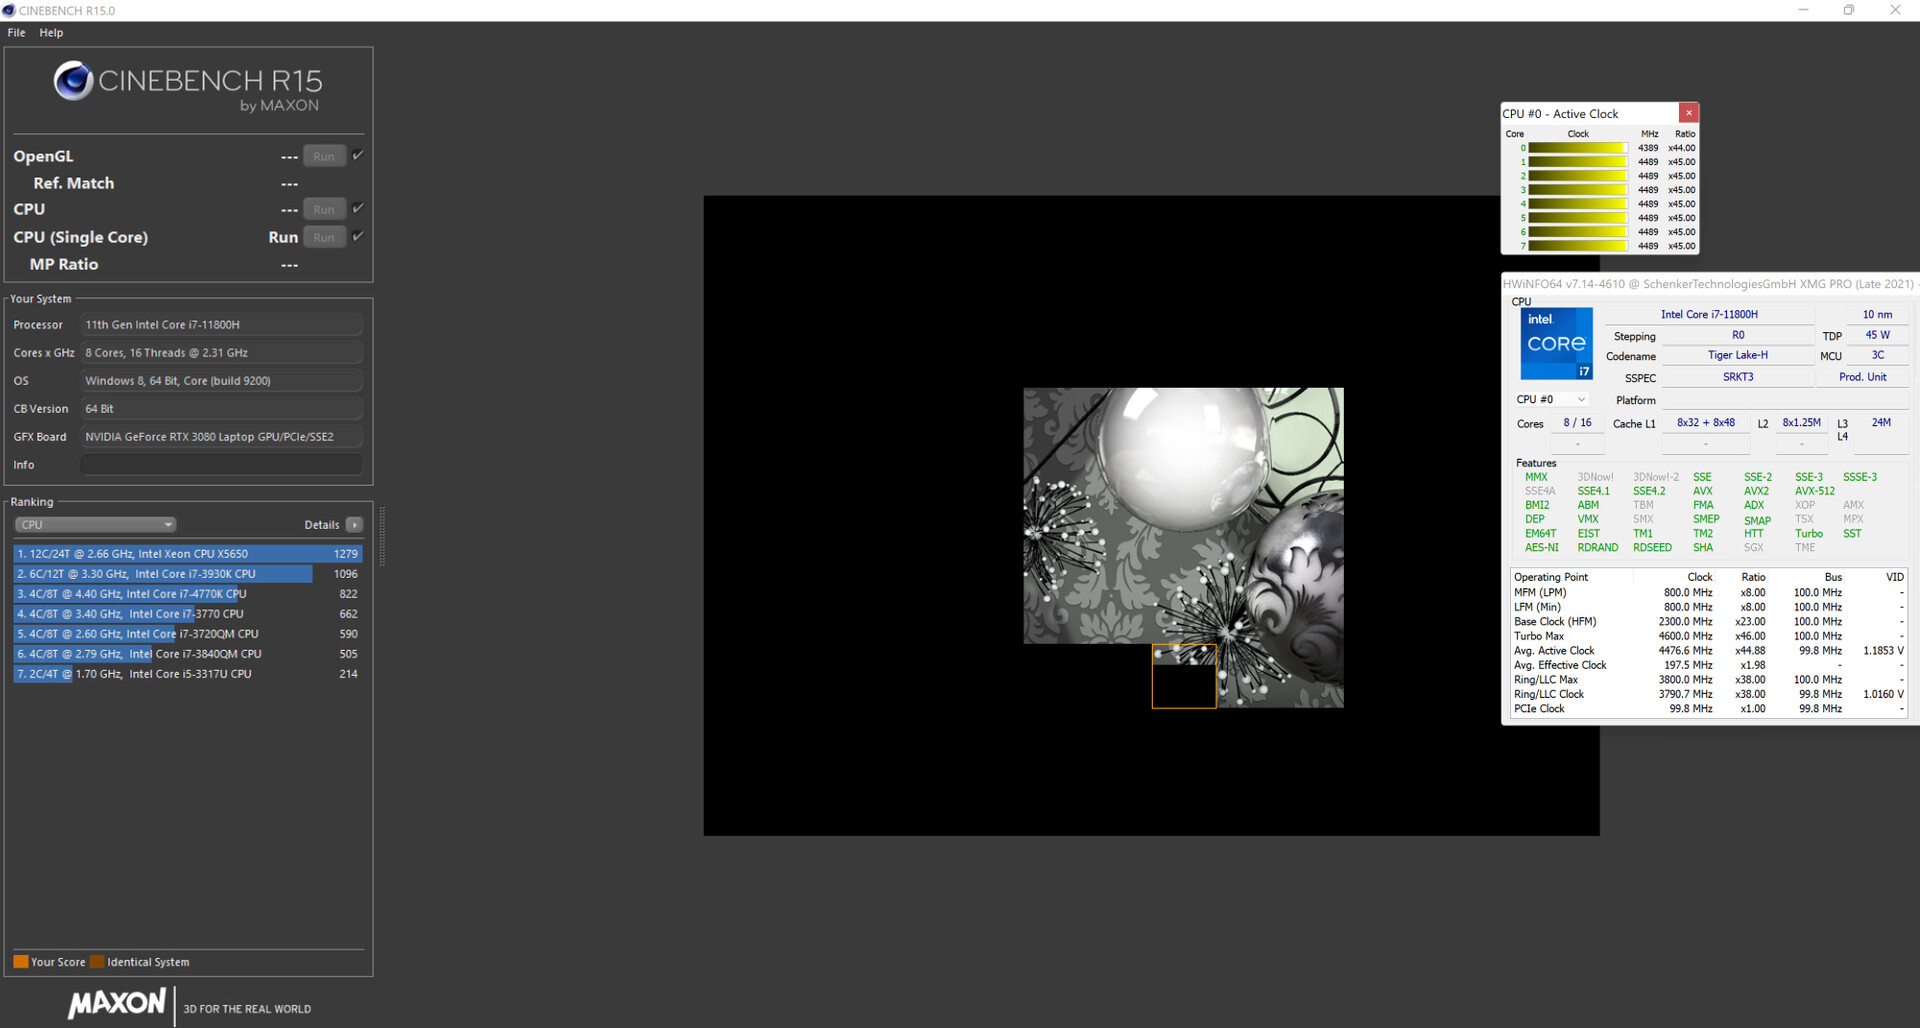
Ejecutando el benchmark Cinebench R15 multihilo en bucle durante al menos 30 minutos, determinamos si el Turbo Boost de la CPU está constantemente activo. Resulta ser el caso y el Turbo funciona a altas velocidades de reloj.
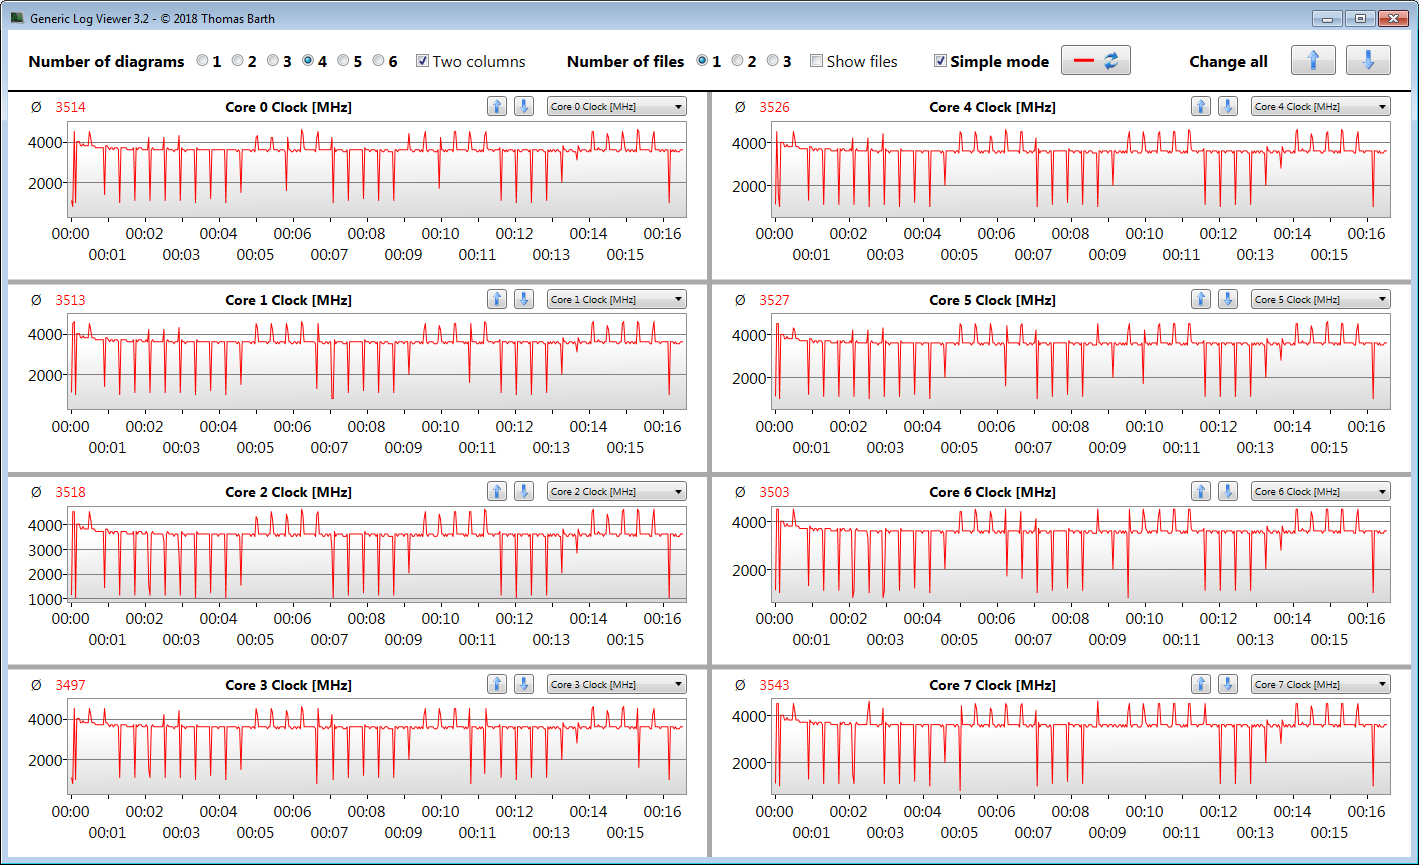
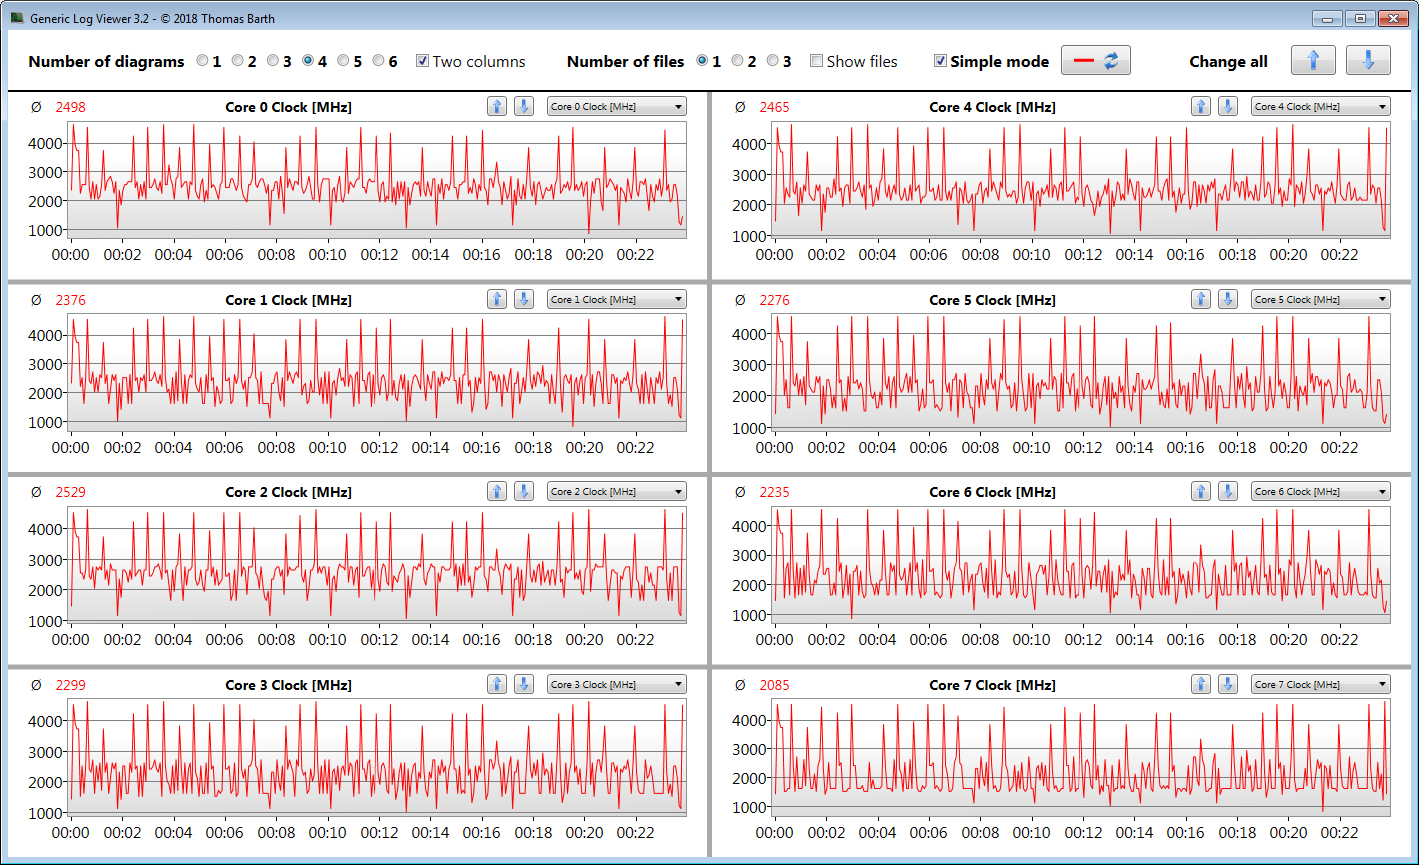
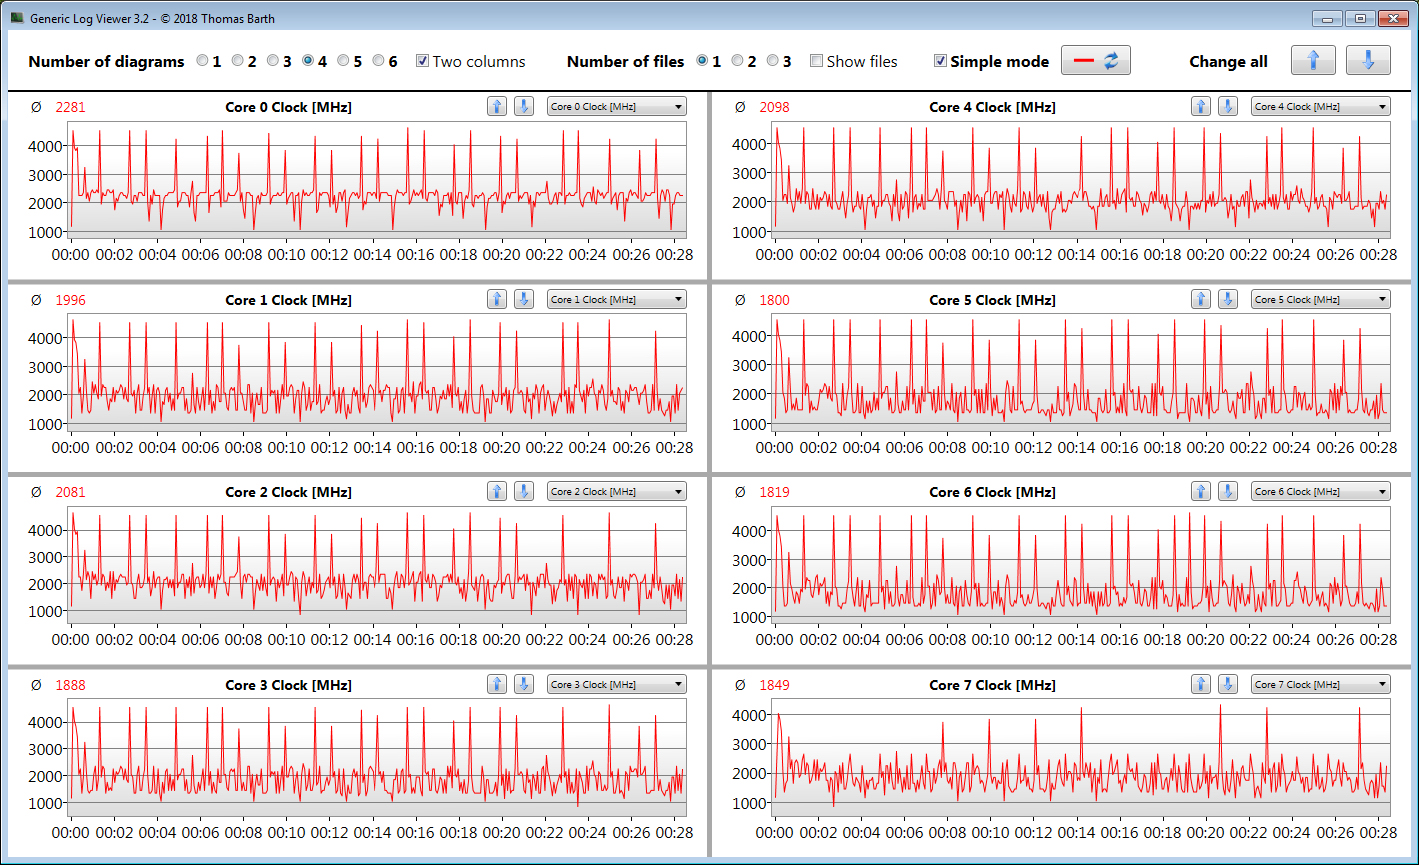
Con el perfil de potencia silencioso, el rendimiento cae significativamente. Las altas frecuencias del Turbo Boost sólo se alcanzan de forma intermitente. A pesar de ello, el rendimiento reducido es más que suficiente para cargas de trabajo de oficina y navegación web e incluso para juegos ligeros
Cinebench R15 Multi Loop
| CPU Performance rating - Percent | |
| Media de la clase Gaming | |
| MSI Delta 15 A5EFK | |
| Schenker XMG Pro 15 (Late 2021) | |
| Alienware x15 RTX 3070 P111F -2! | |
| Lenovo Legion S7 15ACH6 82K80030GE | |
| Schenker XMG Pro 15 (Late 2021) | |
| Razer Blade 15 Advanced (Mid 2021) -2! | |
| Medio Intel Core i7-11800H | |
| Schenker XMG Pro 15 (Late 2021) | |
| Schenker XMG Pro 15 (Early 2021, RTX 3080) | |
| Schenker XMG Pro 15 (Late 2021) | |
| Cinebench R23 | |
| Multi Core | |
| Media de la clase Gaming (10488 - 42661, n=104, últimos 2 años) | |
| Alienware x15 RTX 3070 P111F | |
| Lenovo Legion S7 15ACH6 82K80030GE | |
| Schenker XMG Pro 15 (Late 2021) | |
| Schenker XMG Pro 15 (Late 2021) (Unterhaltungsmodus) | |
| Razer Blade 15 Advanced (Mid 2021) | |
| MSI Delta 15 A5EFK | |
| Medio Intel Core i7-11800H (6508 - 14088, n=48) | |
| Schenker XMG Pro 15 (Early 2021, RTX 3080) | |
| Schenker XMG Pro 15 (Late 2021) (Stromsparmodus) | |
| Schenker XMG Pro 15 (Late 2021) (Lautlosmodus) | |
| Single Core | |
| Media de la clase Gaming (1601 - 2415, n=104, últimos 2 años) | |
| Razer Blade 15 Advanced (Mid 2021) | |
| Schenker XMG Pro 15 (Late 2021) | |
| Alienware x15 RTX 3070 P111F | |
| Schenker XMG Pro 15 (Late 2021) (Unterhaltungsmodus) | |
| Schenker XMG Pro 15 (Late 2021) (Stromsparmodus) | |
| Schenker XMG Pro 15 (Late 2021) (Lautlosmodus) | |
| Medio Intel Core i7-11800H (1386 - 1522, n=45) | |
| Lenovo Legion S7 15ACH6 82K80030GE | |
| MSI Delta 15 A5EFK | |
| Schenker XMG Pro 15 (Early 2021, RTX 3080) | |
| Cinebench R20 | |
| CPU (Multi Core) | |
| Media de la clase Gaming (4029 - 16433, n=103, últimos 2 años) | |
| Alienware x15 RTX 3070 P111F | |
| Lenovo Legion S7 15ACH6 82K80030GE | |
| Schenker XMG Pro 15 (Late 2021) | |
| Razer Blade 15 Advanced (Mid 2021) | |
| Schenker XMG Pro 15 (Late 2021) (Unterhaltungsmodus) | |
| MSI Delta 15 A5EFK | |
| Medio Intel Core i7-11800H (2498 - 5408, n=50) | |
| Schenker XMG Pro 15 (Early 2021, RTX 3080) | |
| Schenker XMG Pro 15 (Late 2021) (Stromsparmodus) | |
| Schenker XMG Pro 15 (Late 2021) (Lautlosmodus) | |
| CPU (Single Core) | |
| Media de la clase Gaming (622 - 913, n=103, últimos 2 años) | |
| Schenker XMG Pro 15 (Late 2021) | |
| Razer Blade 15 Advanced (Mid 2021) | |
| Schenker XMG Pro 15 (Late 2021) (Unterhaltungsmodus) | |
| Schenker XMG Pro 15 (Late 2021) (Stromsparmodus) | |
| Alienware x15 RTX 3070 P111F | |
| Schenker XMG Pro 15 (Late 2021) (Lautlosmodus) | |
| Lenovo Legion S7 15ACH6 82K80030GE | |
| MSI Delta 15 A5EFK | |
| Medio Intel Core i7-11800H (520 - 586, n=47) | |
| Schenker XMG Pro 15 (Early 2021, RTX 3080) | |
| Cinebench R15 | |
| CPU Multi 64Bit | |
| Media de la clase Gaming (1578 - 6330, n=102, últimos 2 años) | |
| Lenovo Legion S7 15ACH6 82K80030GE | |
| Alienware x15 RTX 3070 P111F | |
| MSI Delta 15 A5EFK | |
| Schenker XMG Pro 15 (Late 2021) | |
| Schenker XMG Pro 15 (Late 2021) (Unterhaltungsmodus) | |
| Medio Intel Core i7-11800H (1342 - 2173, n=50) | |
| Razer Blade 15 Advanced (Mid 2021) | |
| Schenker XMG Pro 15 (Early 2021, RTX 3080) | |
| Schenker XMG Pro 15 (Late 2021) (Stromsparmodus) | |
| Schenker XMG Pro 15 (Late 2021) (Lautlosmodus) | |
| CPU Single 64Bit | |
| Media de la clase Gaming (188.8 - 350, n=103, últimos 2 años) | |
| MSI Delta 15 A5EFK | |
| Lenovo Legion S7 15ACH6 82K80030GE | |
| Schenker XMG Pro 15 (Late 2021) (Stromsparmodus) | |
| Schenker XMG Pro 15 (Late 2021) (Lautlosmodus) | |
| Schenker XMG Pro 15 (Late 2021) (Unterhaltungsmodus) | |
| Razer Blade 15 Advanced (Mid 2021) | |
| Alienware x15 RTX 3070 P111F | |
| Schenker XMG Pro 15 (Late 2021) | |
| Medio Intel Core i7-11800H (201 - 231, n=46) | |
| Schenker XMG Pro 15 (Early 2021, RTX 3080) | |
| Blender - v2.79 BMW27 CPU | |
| Schenker XMG Pro 15 (Late 2021) (Lautlosmodus) | |
| Schenker XMG Pro 15 (Late 2021) (Stromsparmodus) | |
| Schenker XMG Pro 15 (Early 2021, RTX 3080) | |
| Medio Intel Core i7-11800H (217 - 454, n=46) | |
| Razer Blade 15 Advanced (Mid 2021) | |
| Schenker XMG Pro 15 (Late 2021) (Unterhaltungsmodus) | |
| Schenker XMG Pro 15 (Late 2021) | |
| MSI Delta 15 A5EFK | |
| Lenovo Legion S7 15ACH6 82K80030GE | |
| Alienware x15 RTX 3070 P111F | |
| Media de la clase Gaming (79 - 330, n=101, últimos 2 años) | |
| 7-Zip 18.03 | |
| 7z b 4 | |
| Media de la clase Gaming (33491 - 148086, n=102, últimos 2 años) | |
| Lenovo Legion S7 15ACH6 82K80030GE | |
| MSI Delta 15 A5EFK | |
| Schenker XMG Pro 15 (Late 2021) | |
| Razer Blade 15 Advanced (Mid 2021) | |
| Schenker XMG Pro 15 (Late 2021) (Unterhaltungsmodus) | |
| Alienware x15 RTX 3070 P111F | |
| Medio Intel Core i7-11800H (33718 - 56758, n=46) | |
| Schenker XMG Pro 15 (Early 2021, RTX 3080) | |
| Schenker XMG Pro 15 (Late 2021) (Stromsparmodus) | |
| Schenker XMG Pro 15 (Late 2021) (Lautlosmodus) | |
| 7z b 4 -mmt1 | |
| Media de la clase Gaming (4824 - 7436, n=102, últimos 2 años) | |
| Lenovo Legion S7 15ACH6 82K80030GE | |
| MSI Delta 15 A5EFK | |
| Schenker XMG Pro 15 (Late 2021) (Lautlosmodus) | |
| Schenker XMG Pro 15 (Late 2021) | |
| Schenker XMG Pro 15 (Late 2021) (Stromsparmodus) | |
| Medio Intel Core i7-11800H (5138 - 5732, n=46) | |
| Schenker XMG Pro 15 (Late 2021) (Unterhaltungsmodus) | |
| Razer Blade 15 Advanced (Mid 2021) | |
| Alienware x15 RTX 3070 P111F | |
| Schenker XMG Pro 15 (Early 2021, RTX 3080) | |
| Geekbench 5.5 | |
| Multi-Core | |
| Media de la clase Gaming (6460 - 28263, n=102, últimos 2 años) | |
| Schenker XMG Pro 15 (Late 2021) | |
| Schenker XMG Pro 15 (Late 2021) (Unterhaltungsmodus) | |
| Schenker XMG Pro 15 (Late 2021) (Stromsparmodus) | |
| MSI Delta 15 A5EFK | |
| Lenovo Legion S7 15ACH6 82K80030GE | |
| Medio Intel Core i7-11800H (4655 - 9851, n=40) | |
| Schenker XMG Pro 15 (Early 2021, RTX 3080) | |
| Schenker XMG Pro 15 (Late 2021) (Lautlosmodus) | |
| Single-Core | |
| Media de la clase Gaming (1403 - 2474, n=102, últimos 2 años) | |
| Schenker XMG Pro 15 (Late 2021) | |
| Schenker XMG Pro 15 (Late 2021) (Stromsparmodus) | |
| MSI Delta 15 A5EFK | |
| Medio Intel Core i7-11800H (1429 - 1625, n=40) | |
| Schenker XMG Pro 15 (Late 2021) (Unterhaltungsmodus) | |
| Lenovo Legion S7 15ACH6 82K80030GE | |
| Schenker XMG Pro 15 (Late 2021) (Lautlosmodus) | |
| Schenker XMG Pro 15 (Early 2021, RTX 3080) | |
| HWBOT x265 Benchmark v2.2 - 4k Preset | |
| Media de la clase Gaming (11.5 - 44.4, n=102, últimos 2 años) | |
| Alienware x15 RTX 3070 P111F | |
| Lenovo Legion S7 15ACH6 82K80030GE | |
| Schenker XMG Pro 15 (Late 2021) | |
| MSI Delta 15 A5EFK | |
| Razer Blade 15 Advanced (Mid 2021) | |
| Schenker XMG Pro 15 (Late 2021) (Unterhaltungsmodus) | |
| Medio Intel Core i7-11800H (7.38 - 17.4, n=46) | |
| Schenker XMG Pro 15 (Early 2021, RTX 3080) | |
| Schenker XMG Pro 15 (Late 2021) (Stromsparmodus) | |
| Schenker XMG Pro 15 (Late 2021) (Lautlosmodus) | |
| LibreOffice - 20 Documents To PDF | |
| Lenovo Legion S7 15ACH6 82K80030GE | |
| Schenker XMG Pro 15 (Early 2021, RTX 3080) | |
| Schenker XMG Pro 15 (Late 2021) (Unterhaltungsmodus) | |
| MSI Delta 15 A5EFK | |
| Media de la clase Gaming (33.2 - 88.8, n=102, últimos 2 años) | |
| Alienware x15 RTX 3070 P111F | |
| Schenker XMG Pro 15 (Late 2021) | |
| Medio Intel Core i7-11800H (38.6 - 59.9, n=45) | |
| Razer Blade 15 Advanced (Mid 2021) | |
| Schenker XMG Pro 15 (Late 2021) (Lautlosmodus) | |
| Schenker XMG Pro 15 (Late 2021) (Stromsparmodus) | |
| R Benchmark 2.5 - Overall mean | |
| Schenker XMG Pro 15 (Early 2021, RTX 3080) | |
| Schenker XMG Pro 15 (Late 2021) (Lautlosmodus) | |
| Schenker XMG Pro 15 (Late 2021) (Stromsparmodus) | |
| Alienware x15 RTX 3070 P111F | |
| Medio Intel Core i7-11800H (0.548 - 0.615, n=46) | |
| Schenker XMG Pro 15 (Late 2021) (Unterhaltungsmodus) | |
| Razer Blade 15 Advanced (Mid 2021) | |
| Schenker XMG Pro 15 (Late 2021) | |
| MSI Delta 15 A5EFK | |
| Lenovo Legion S7 15ACH6 82K80030GE | |
| Media de la clase Gaming (0.3439 - 0.59, n=102, últimos 2 años) | |
* ... más pequeño es mejor
AIDA64: FP32 Ray-Trace | FPU Julia | CPU SHA3 | CPU Queen | FPU SinJulia | FPU Mandel | CPU AES | CPU ZLib | FP64 Ray-Trace | CPU PhotoWorxx
| Performance rating | |
| Media de la clase Gaming | |
| Lenovo Legion S7 15ACH6 82K80030GE | |
| MSI Delta 15 A5EFK | |
| Schenker XMG Pro 15 (Late 2021) | |
| Medio Intel Core i7-11800H | |
| Schenker XMG Pro 15 (Late 2021) | |
| Schenker XMG Pro 15 (Early 2021, RTX 3080) | |
| Schenker XMG Pro 15 (Late 2021) | |
| Alienware x15 RTX 3070 P111F -9! | |
| Razer Blade 15 Advanced (Mid 2021) -9! | |
| AIDA64 / FP32 Ray-Trace | |
| Media de la clase Gaming (10227 - 85542, n=102, últimos 2 años) | |
| Lenovo Legion S7 15ACH6 82K80030GE (v6.33.5700) | |
| Schenker XMG Pro 15 (Late 2021) (v6.50.5800) | |
| MSI Delta 15 A5EFK (v6.33.5700) | |
| Medio Intel Core i7-11800H (8772 - 15961, n=20) | |
| Schenker XMG Pro 15 (Early 2021, RTX 3080) (v6.32.5600) | |
| Schenker XMG Pro 15 (Late 2021) (v6.50.5800, Stromsparmodus) | |
| Schenker XMG Pro 15 (Late 2021) (v6.50.5800, Lautlosmodus) | |
| AIDA64 / FPU Julia | |
| Media de la clase Gaming (51376 - 372155, n=102, últimos 2 años) | |
| Lenovo Legion S7 15ACH6 82K80030GE (v6.33.5700) | |
| MSI Delta 15 A5EFK (v6.33.5700) | |
| Schenker XMG Pro 15 (Late 2021) (v6.50.5800) | |
| Schenker XMG Pro 15 (Early 2021, RTX 3080) (v6.32.5600) | |
| Medio Intel Core i7-11800H (39404 - 65636, n=20) | |
| Schenker XMG Pro 15 (Late 2021) (v6.50.5800, Stromsparmodus) | |
| Schenker XMG Pro 15 (Late 2021) (v6.50.5800, Lautlosmodus) | |
| AIDA64 / CPU SHA3 | |
| Media de la clase Gaming (2180 - 10115, n=102, últimos 2 años) | |
| Schenker XMG Pro 15 (Late 2021) (v6.50.5800) | |
| Medio Intel Core i7-11800H (2599 - 4439, n=20) | |
| Lenovo Legion S7 15ACH6 82K80030GE (v6.33.5700) | |
| Schenker XMG Pro 15 (Early 2021, RTX 3080) (v6.32.5600) | |
| MSI Delta 15 A5EFK (v6.33.5700) | |
| Schenker XMG Pro 15 (Late 2021) (v6.50.5800, Stromsparmodus) | |
| Schenker XMG Pro 15 (Late 2021) (v6.50.5800, Lautlosmodus) | |
| AIDA64 / CPU Queen | |
| Media de la clase Gaming (49785 - 173351, n=86, últimos 2 años) | |
| MSI Delta 15 A5EFK (v6.33.5700) | |
| Lenovo Legion S7 15ACH6 82K80030GE (v6.33.5700) | |
| Schenker XMG Pro 15 (Late 2021) (v6.50.5800) | |
| Schenker XMG Pro 15 (Late 2021) (v6.50.5800, Lautlosmodus) | |
| Schenker XMG Pro 15 (Late 2021) (v6.50.5800, Stromsparmodus) | |
| Medio Intel Core i7-11800H (85233 - 91941, n=20) | |
| Schenker XMG Pro 15 (Early 2021, RTX 3080) (v6.32.5600) | |
| AIDA64 / FPU SinJulia | |
| Media de la clase Gaming (4424 - 33636, n=102, últimos 2 años) | |
| MSI Delta 15 A5EFK (v6.33.5700) | |
| Lenovo Legion S7 15ACH6 82K80030GE (v6.33.5700) | |
| Schenker XMG Pro 15 (Late 2021) (v6.50.5800) | |
| Schenker XMG Pro 15 (Early 2021, RTX 3080) (v6.32.5600) | |
| Medio Intel Core i7-11800H (6420 - 9792, n=20) | |
| Schenker XMG Pro 15 (Late 2021) (v6.50.5800, Stromsparmodus) | |
| Schenker XMG Pro 15 (Late 2021) (v6.50.5800, Lautlosmodus) | |
| AIDA64 / FPU Mandel | |
| Media de la clase Gaming (25115 - 196829, n=102, últimos 2 años) | |
| Lenovo Legion S7 15ACH6 82K80030GE (v6.33.5700) | |
| MSI Delta 15 A5EFK (v6.33.5700) | |
| Schenker XMG Pro 15 (Late 2021) (v6.50.5800) | |
| Medio Intel Core i7-11800H (23365 - 39464, n=20) | |
| Schenker XMG Pro 15 (Early 2021, RTX 3080) (v6.32.5600) | |
| Schenker XMG Pro 15 (Late 2021) (v6.50.5800, Stromsparmodus) | |
| Schenker XMG Pro 15 (Late 2021) (v6.50.5800, Lautlosmodus) | |
| AIDA64 / CPU AES | |
| Schenker XMG Pro 15 (Late 2021) (v6.50.5800) | |
| Lenovo Legion S7 15ACH6 82K80030GE (v6.33.5700) | |
| MSI Delta 15 A5EFK (v6.33.5700) | |
| Medio Intel Core i7-11800H (74617 - 149388, n=20) | |
| Media de la clase Gaming (39258 - 247074, n=102, últimos 2 años) | |
| Schenker XMG Pro 15 (Late 2021) (v6.50.5800, Stromsparmodus) | |
| Schenker XMG Pro 15 (Late 2021) (v6.50.5800, Lautlosmodus) | |
| Schenker XMG Pro 15 (Early 2021, RTX 3080) (v6.32.5600) | |
| AIDA64 / CPU ZLib | |
| Media de la clase Gaming (574 - 2531, n=102, últimos 2 años) | |
| Lenovo Legion S7 15ACH6 82K80030GE (v6.33.5700) | |
| MSI Delta 15 A5EFK (v6.33.5700) | |
| Schenker XMG Pro 15 (Late 2021) (v6.50.5800) | |
| Schenker XMG Pro 15 (Early 2021, RTX 3080) (v6.32.5600) | |
| Schenker XMG Pro 15 (Late 2021) (v6.50.5800, Stromsparmodus) | |
| Schenker XMG Pro 15 (Late 2021) (v6.50.5800, Lautlosmodus) | |
| Medio Intel Core i7-11800H (461 - 830, n=43) | |
| Razer Blade 15 Advanced (Mid 2021) (v6.33.5700) | |
| Alienware x15 RTX 3070 P111F (v6.33.5700) | |
| AIDA64 / FP64 Ray-Trace | |
| Media de la clase Gaming (5509 - 45446, n=102, últimos 2 años) | |
| Schenker XMG Pro 15 (Late 2021) (v6.50.5800) | |
| Lenovo Legion S7 15ACH6 82K80030GE (v6.33.5700) | |
| MSI Delta 15 A5EFK (v6.33.5700) | |
| Medio Intel Core i7-11800H (4545 - 8717, n=21) | |
| Schenker XMG Pro 15 (Early 2021, RTX 3080) (v6.32.5600) | |
| Schenker XMG Pro 15 (Late 2021) (v6.50.5800, Stromsparmodus) | |
| Schenker XMG Pro 15 (Late 2021) (v6.50.5800, Lautlosmodus) | |
| AIDA64 / CPU PhotoWorxx | |
| Media de la clase Gaming (12271 - 89891, n=102, últimos 2 años) | |
| Schenker XMG Pro 15 (Late 2021) (v6.50.5800) | |
| Schenker XMG Pro 15 (Late 2021) (v6.50.5800, Stromsparmodus) | |
| Schenker XMG Pro 15 (Late 2021) (v6.50.5800, Lautlosmodus) | |
| Medio Intel Core i7-11800H (11898 - 26757, n=21) | |
| MSI Delta 15 A5EFK (v6.33.5700) | |
| Schenker XMG Pro 15 (Early 2021, RTX 3080) (v6.32.5600) | |
| Lenovo Legion S7 15ACH6 82K80030GE (v6.33.5700) | |
Rendimiento del sistema
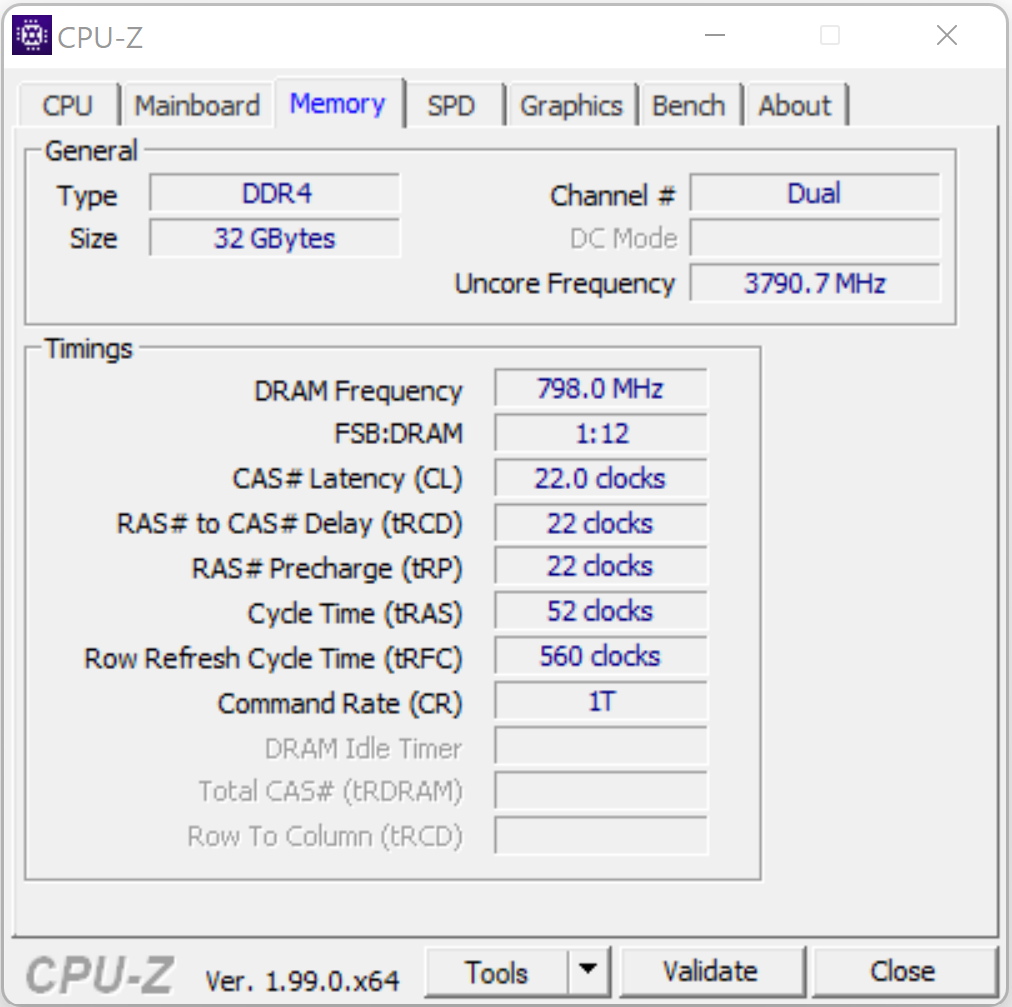
El sistema se siente suave y sensible. Los componentes son más que suficientes para cargas de trabajo exigentes como los juegos y la edición de vídeo y fotos. Las tasas de transferencia de la RAM están a la altura de nuestras expectativas para una RAM DDR4-3200. Por último, los resultados de PCMark son excelentes
| PCMark 8 Home Score Accelerated v2 | 3941 puntos | |
| PCMark 8 Creative Score Accelerated v2 | 6411 puntos | |
| PCMark 8 Work Score Accelerated v2 | 4756 puntos | |
| PCMark 10 Score | 6673 puntos | |
ayuda | ||
| PCMark 10 / Score | |
| Media de la clase Gaming (5828 - 12414, n=93, últimos 2 años) | |
| Razer Blade 15 Advanced (Mid 2021) | |
| MSI Delta 15 A5EFK | |
| Alienware x15 RTX 3070 P111F | |
| Medio Intel Core i7-11800H, NVIDIA GeForce RTX 3080 Laptop GPU (6673 - 7470, n=11) | |
| Schenker XMG Pro 15 (Late 2021) | |
| Lenovo Legion S7 15ACH6 82K80030GE | |
| Schenker XMG Pro 15 (Early 2021, RTX 3080) | |
| PCMark 10 / Essentials | |
| Razer Blade 15 Advanced (Mid 2021) | |
| Media de la clase Gaming (8810 - 11935, n=97, últimos 2 años) | |
| MSI Delta 15 A5EFK | |
| Alienware x15 RTX 3070 P111F | |
| Medio Intel Core i7-11800H, NVIDIA GeForce RTX 3080 Laptop GPU (9862 - 11064, n=11) | |
| Schenker XMG Pro 15 (Late 2021) | |
| Lenovo Legion S7 15ACH6 82K80030GE | |
| Schenker XMG Pro 15 (Early 2021, RTX 3080) | |
| PCMark 10 / Productivity | |
| Media de la clase Gaming (6845 - 25323, n=95, últimos 2 años) | |
| MSI Delta 15 A5EFK | |
| Medio Intel Core i7-11800H, NVIDIA GeForce RTX 3080 Laptop GPU (8278 - 9803, n=11) | |
| Alienware x15 RTX 3070 P111F | |
| Razer Blade 15 Advanced (Mid 2021) | |
| Lenovo Legion S7 15ACH6 82K80030GE | |
| Schenker XMG Pro 15 (Early 2021, RTX 3080) | |
| Schenker XMG Pro 15 (Late 2021) | |
| PCMark 10 / Digital Content Creation | |
| Media de la clase Gaming (7602 - 19954, n=95, últimos 2 años) | |
| Alienware x15 RTX 3070 P111F | |
| Razer Blade 15 Advanced (Mid 2021) | |
| MSI Delta 15 A5EFK | |
| Medio Intel Core i7-11800H, NVIDIA GeForce RTX 3080 Laptop GPU (9881 - 11323, n=11) | |
| Schenker XMG Pro 15 (Late 2021) | |
| Schenker XMG Pro 15 (Early 2021, RTX 3080) | |
| Lenovo Legion S7 15ACH6 82K80030GE | |
| AIDA64 / Memory Copy | |
| Media de la clase Gaming (21750 - 129946, n=102, últimos 2 años) | |
| Schenker XMG Pro 15 (Late 2021) | |
| Medio Intel Core i7-11800H (24508 - 48144, n=21) | |
| MSI Delta 15 A5EFK | |
| Lenovo Legion S7 15ACH6 82K80030GE | |
| Schenker XMG Pro 15 (Early 2021, RTX 3080) | |
| AIDA64 / Memory Read | |
| Media de la clase Gaming (22956 - 118858, n=102, últimos 2 años) | |
| Schenker XMG Pro 15 (Late 2021) | |
| MSI Delta 15 A5EFK | |
| Lenovo Legion S7 15ACH6 82K80030GE | |
| Medio Intel Core i7-11800H (25882 - 50365, n=20) | |
| Schenker XMG Pro 15 (Early 2021, RTX 3080) | |
| AIDA64 / Memory Write | |
| Media de la clase Gaming (22297 - 135096, n=102, últimos 2 años) | |
| Schenker XMG Pro 15 (Late 2021) | |
| MSI Delta 15 A5EFK | |
| Medio Intel Core i7-11800H (22240 - 46214, n=20) | |
| Lenovo Legion S7 15ACH6 82K80030GE | |
| Schenker XMG Pro 15 (Early 2021, RTX 3080) | |
| AIDA64 / Memory Latency | |
| Media de la clase Gaming (75.3 - 165.4, n=102, últimos 2 años) | |
| Schenker XMG Pro 15 (Late 2021) | |
| Lenovo Legion S7 15ACH6 82K80030GE | |
| MSI Delta 15 A5EFK | |
| Schenker XMG Pro 15 (Early 2021, RTX 3080) | |
| Medio Intel Core i7-11800H (71.9 - 104.1, n=44) | |
| Razer Blade 15 Advanced (Mid 2021) | |
| Alienware x15 RTX 3070 P111F | |
* ... más pequeño es mejor
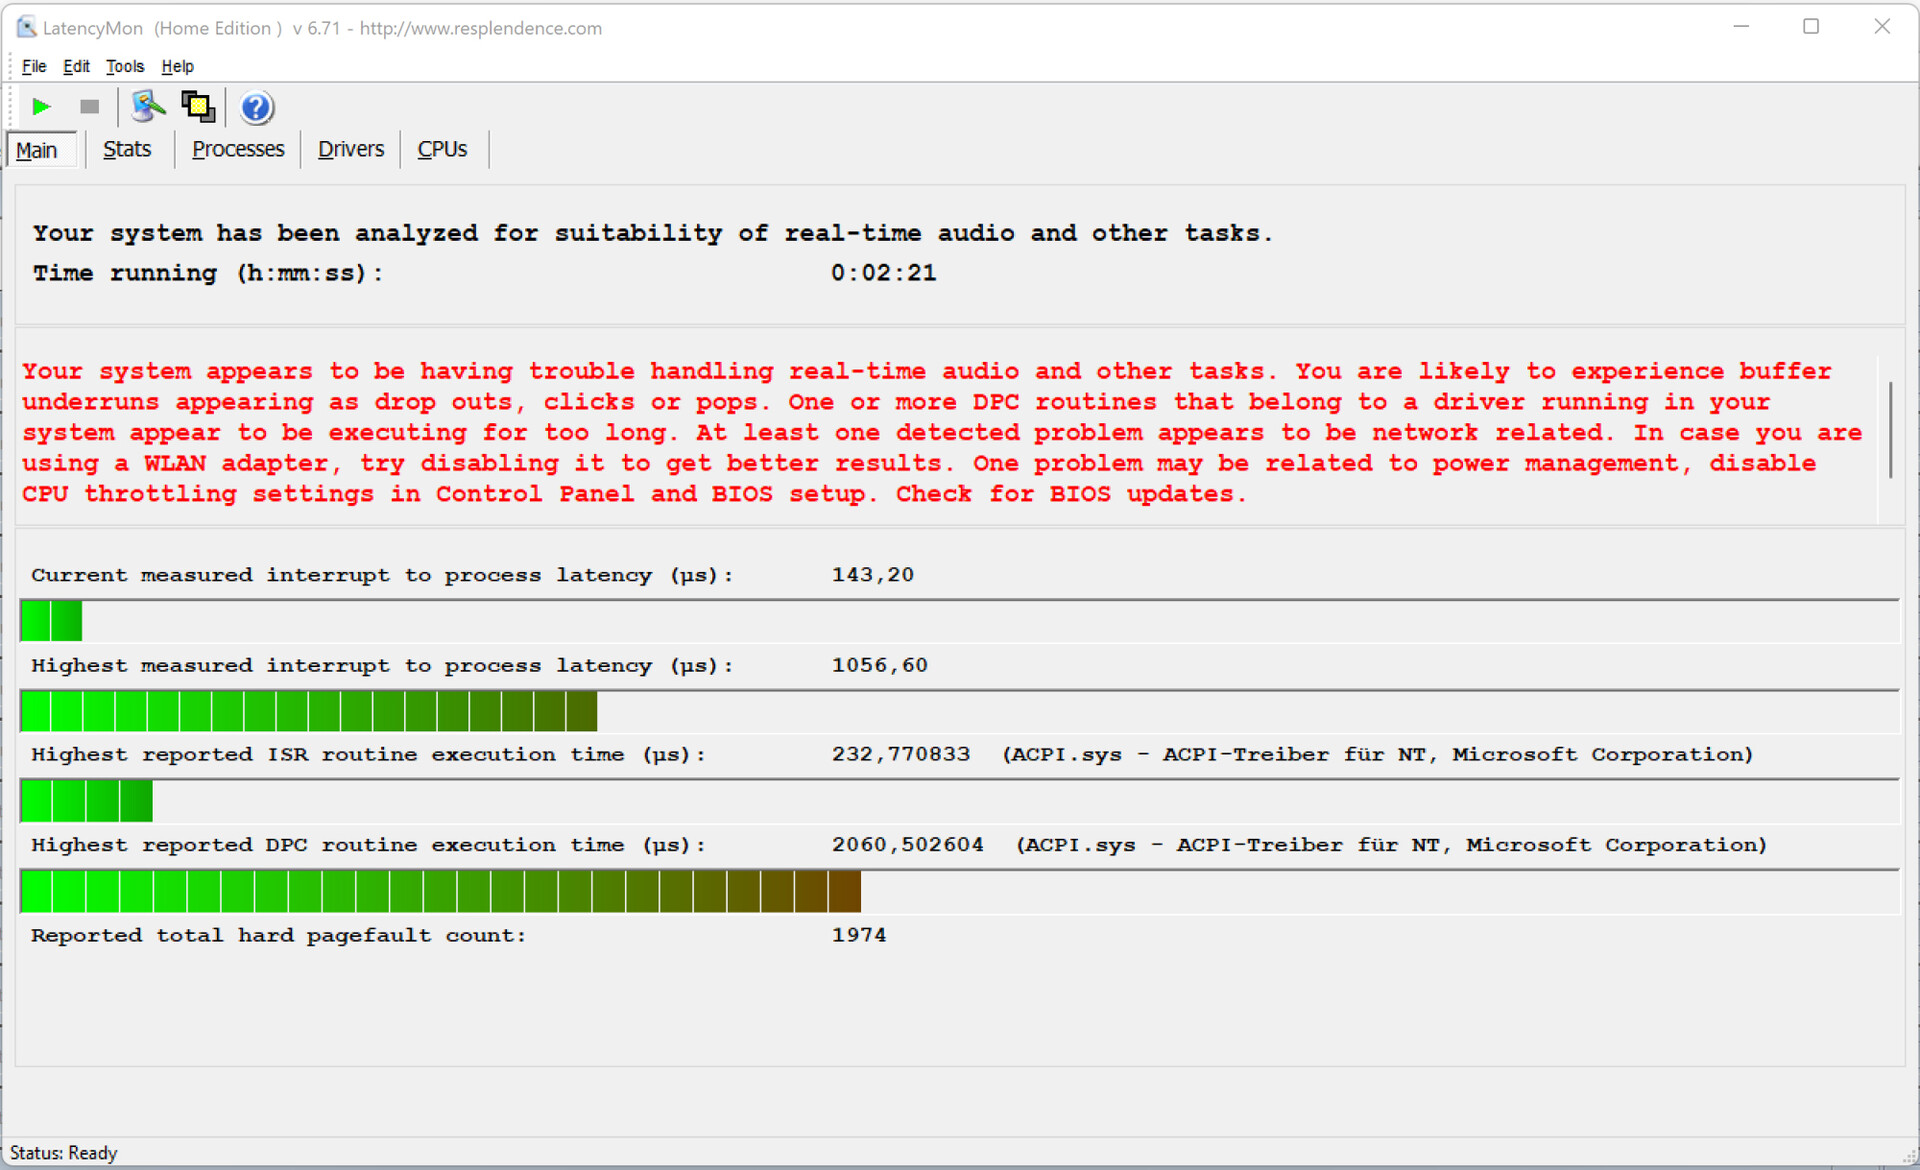
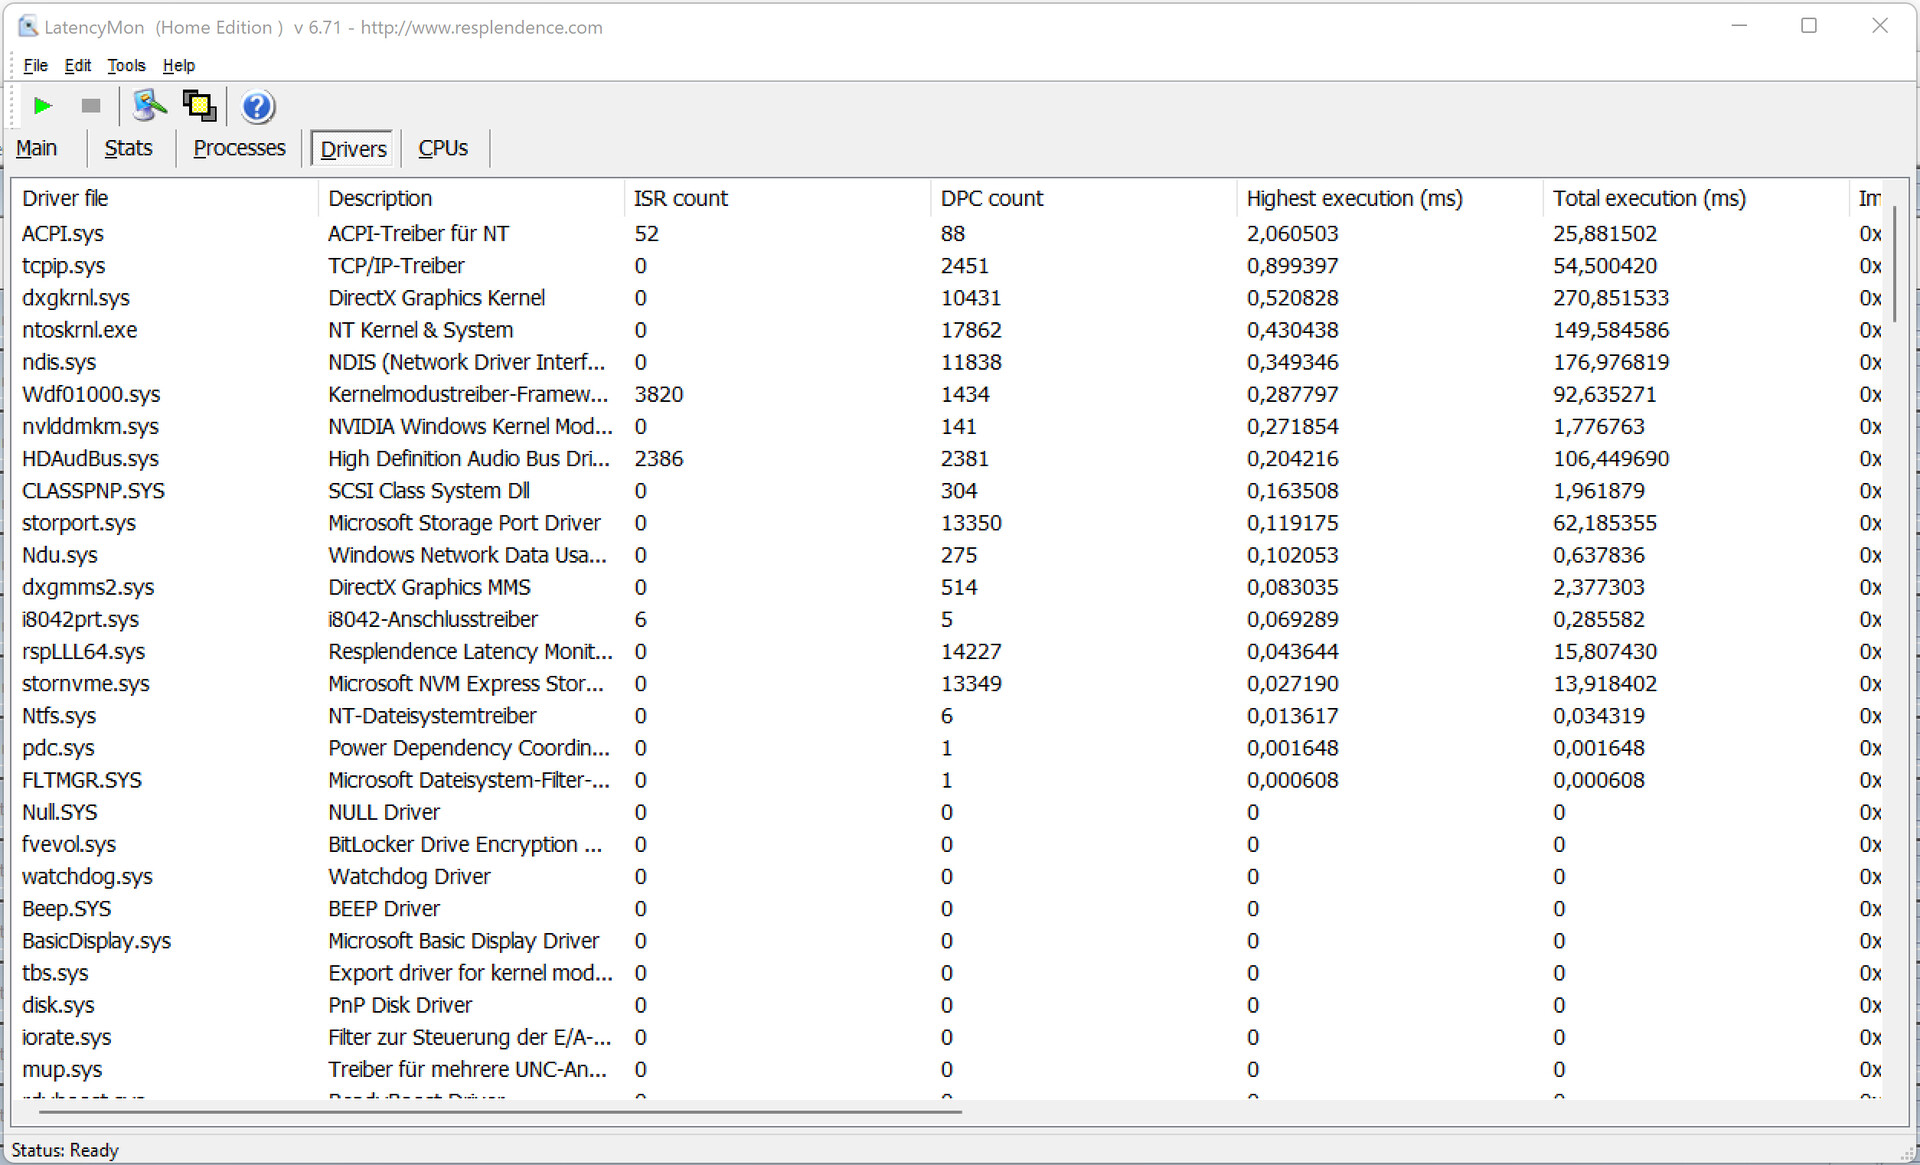
Latencias del CPD
Nuestra prueba estandarizada LatencyMon (navegación web, reproducción de vídeo 4K, Prime95 de alta carga) reveló latencias DPC potencialmente problemáticas. El sistema no parece ser adecuado para la edición de vídeo y audio en tiempo real. Las futuras actualizaciones de software pueden mejorar o agravar el problema
| DPC Latencies / LatencyMon - interrupt to process latency (max), Web, Youtube, Prime95 | |
| Razer Blade 15 Advanced (Mid 2021) | |
| MSI Delta 15 A5EFK | |
| Alienware x15 RTX 3070 P111F | |
| Schenker XMG Pro 15 (Late 2021) | |
| Schenker XMG Pro 15 (Early 2021, RTX 3080) | |
| Lenovo Legion S7 15ACH6 82K80030GE | |
* ... más pequeño es mejor
Solución de almacenamiento
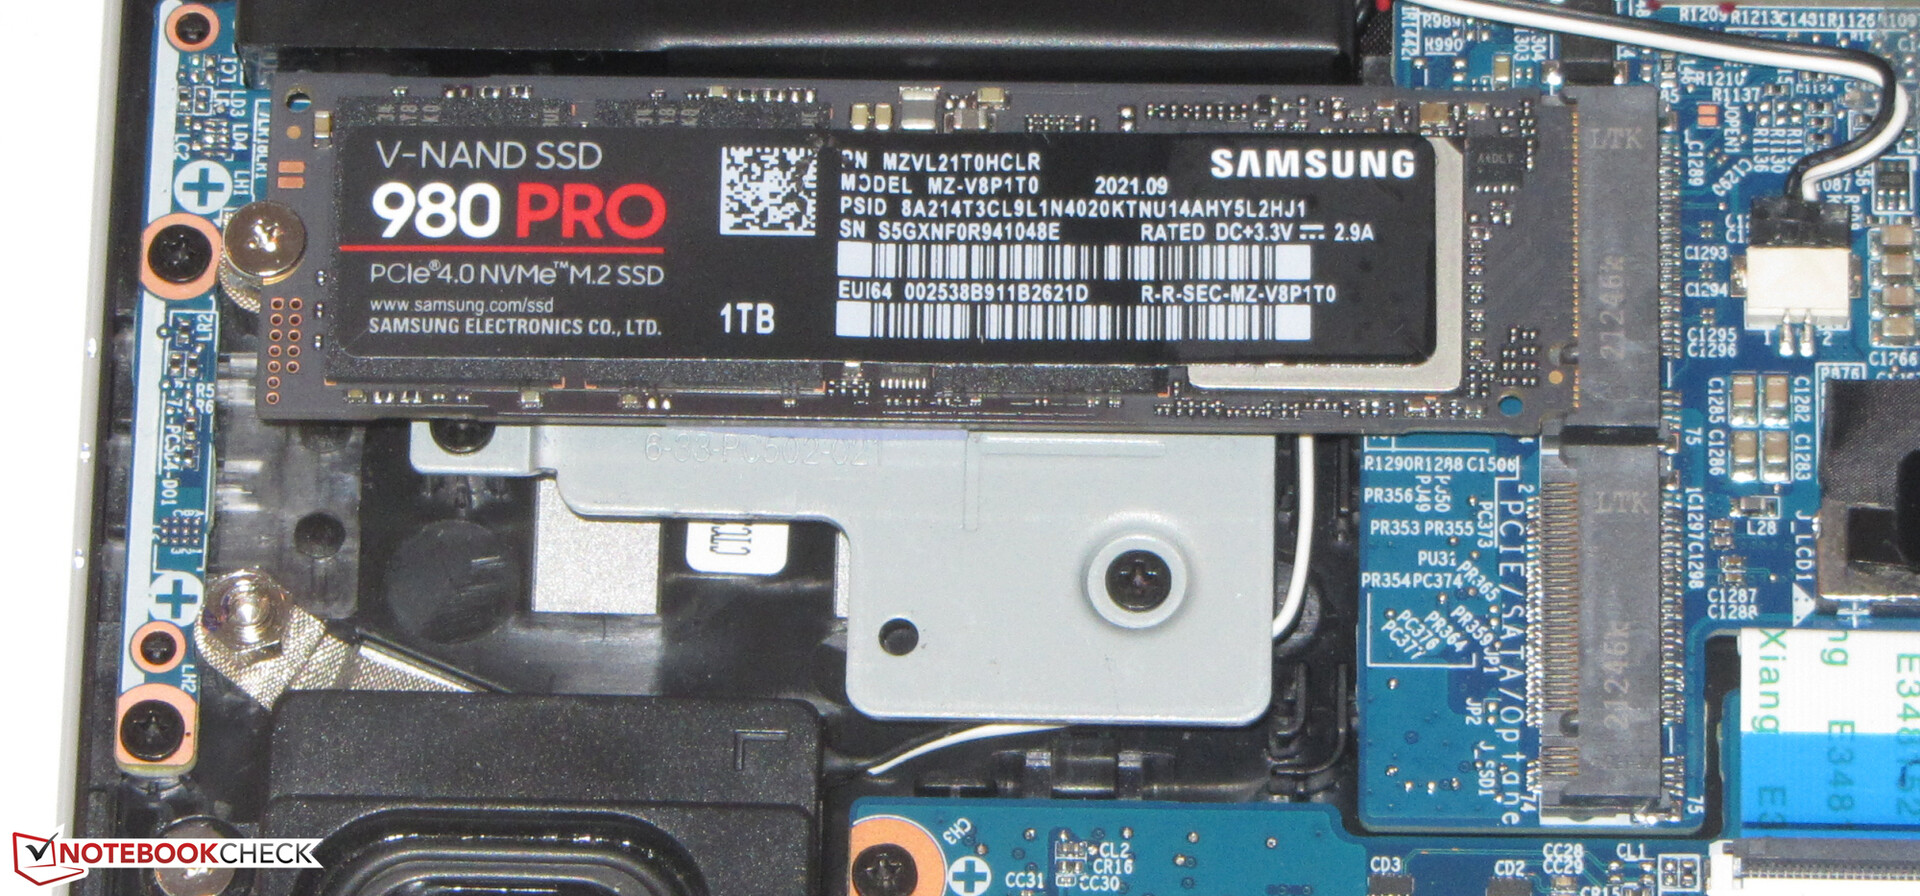
Un SSD Samsung de 1 TB (NVMe, M.2-2280) sirve como unidad del sistema y logra excelentes tasas de transferencia gracias a su interfaz PCIe 4. El portátil admite hasta dos SSD M.2-2280 (1x PCIe 4.0, 1x PCIe 3.0/SATA) en total. También admite RAID 0/1

* ... más pequeño es mejor
Disk Throttling: DiskSpd Read Loop, Queue Depth 8
Rendimiento de la GPU
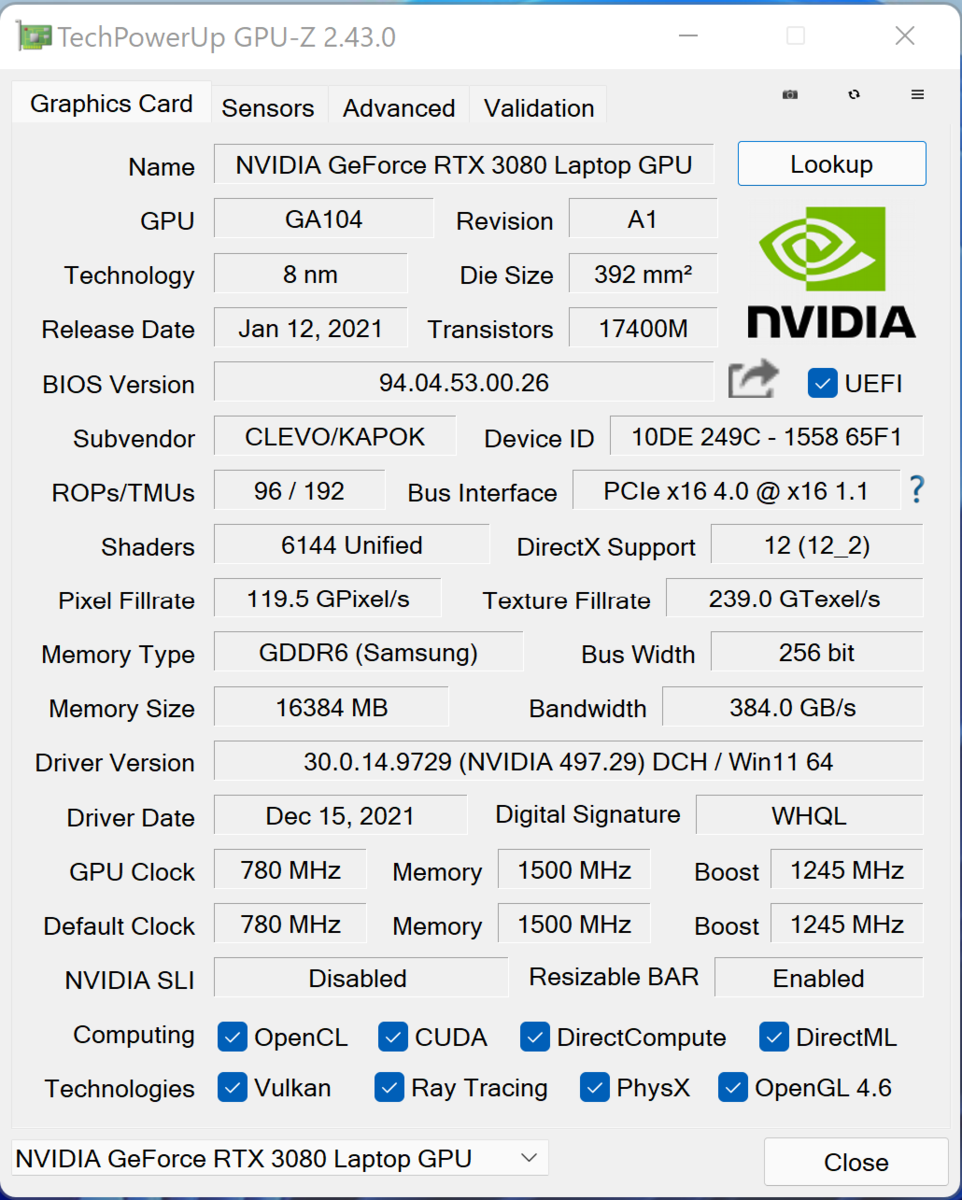
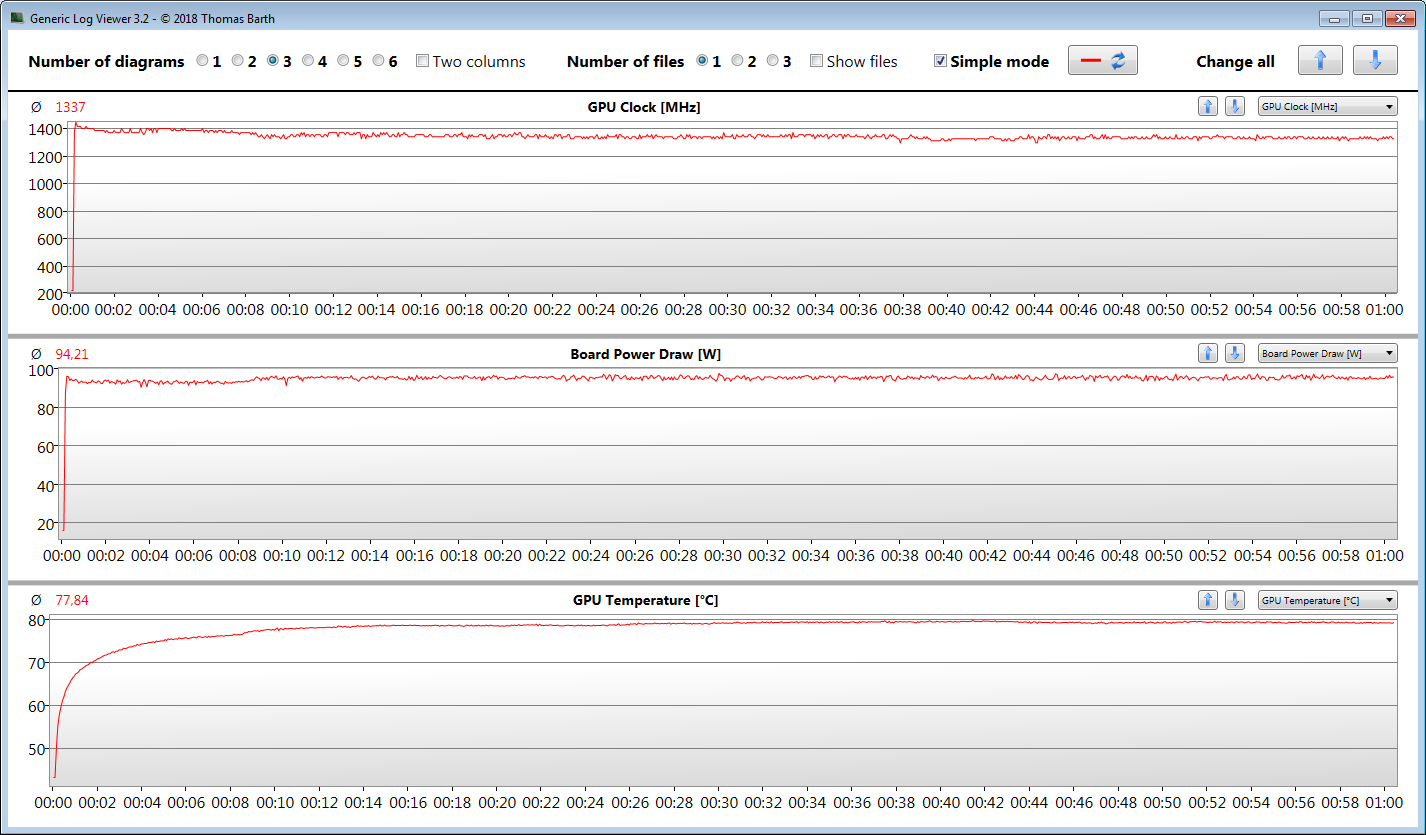
El rendimiento real de una GPU RTX 3000 depende de numerosos factores: La solución de refrigeración, la configuración de la memoria y el TGP máximo, que el fabricante puede fijar en un valor dentro de un rango predefinido por Nvidia. Schenker fijó el TGP máximo de la GeForce RTX 3080 GPU (resumen de todos los portátiles RTX 3080 y sus TGP) a 105 vatios (90 vatios + 15 vatios de Dynamic Boost)
Los resultados de 3DMark son más bajos comparados con nuestra media anterior para la RTX 3080. Aquí, el TGP relativamente bajo se hace evidente. Las puntuaciones del Razer Blade 15 Advancedque es el competidor directo de nuestro dispositivo de pruebas, son comparables. Nuestra prueba Witcher 3 benchmark muestra que el TGP máximo puede mantenerse durante un periodo prolongado de tiempo
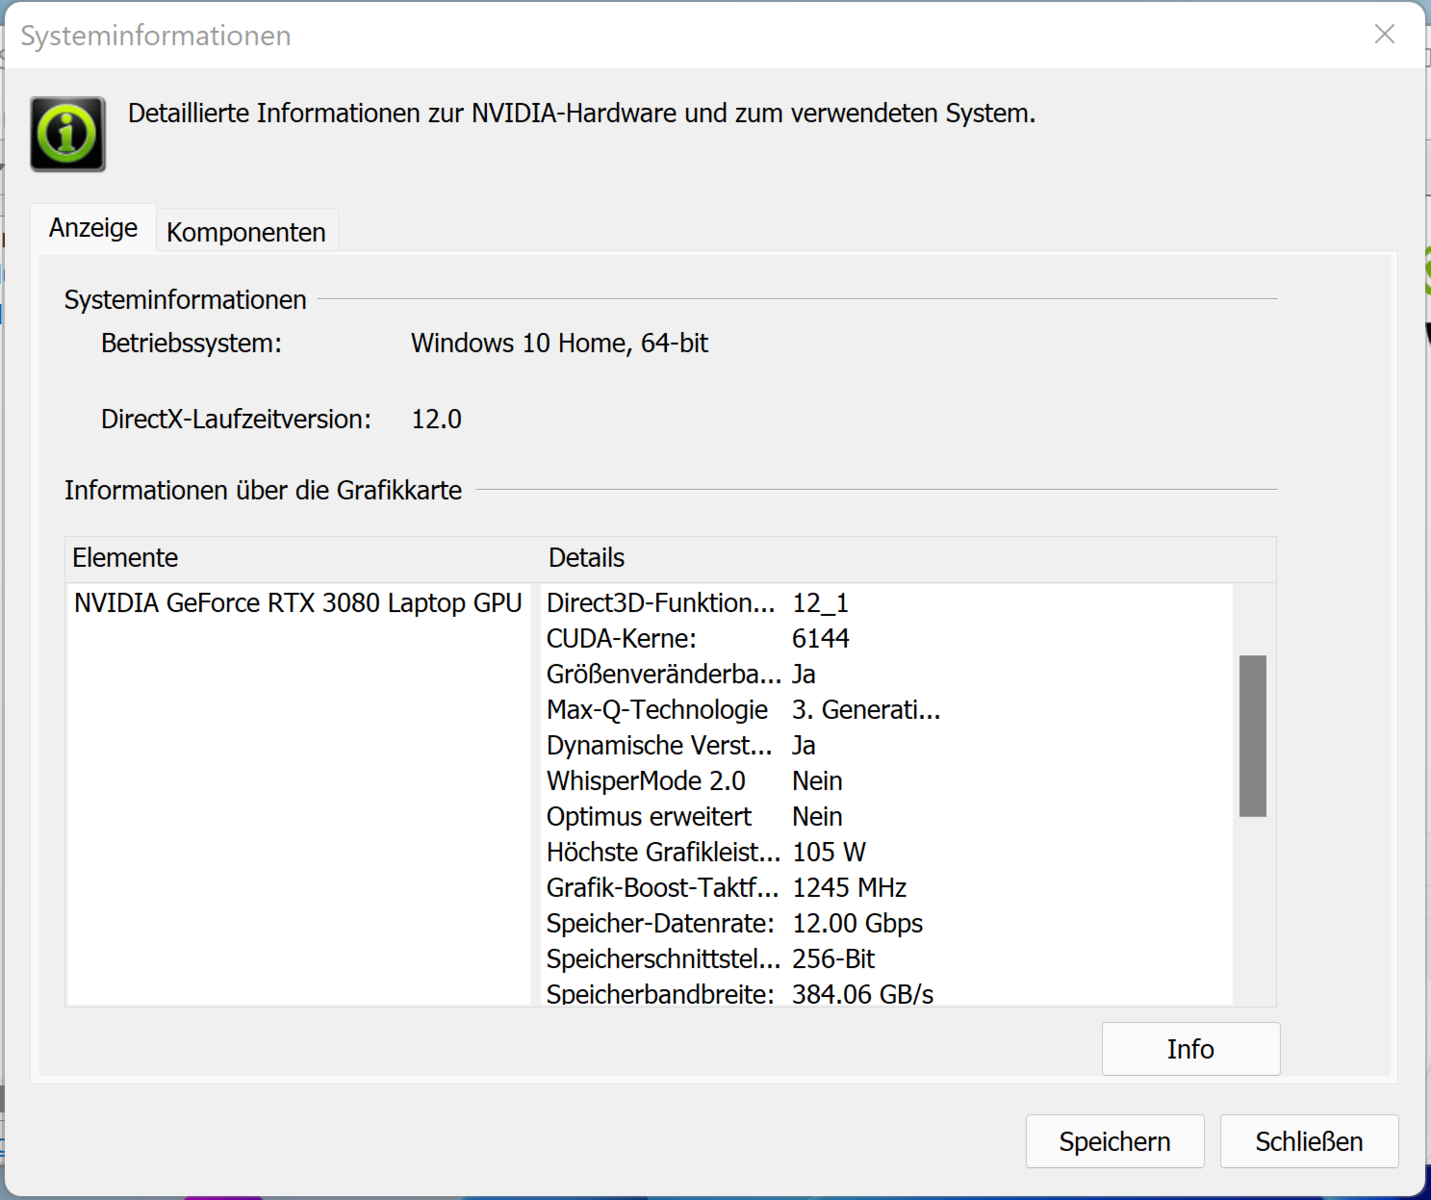
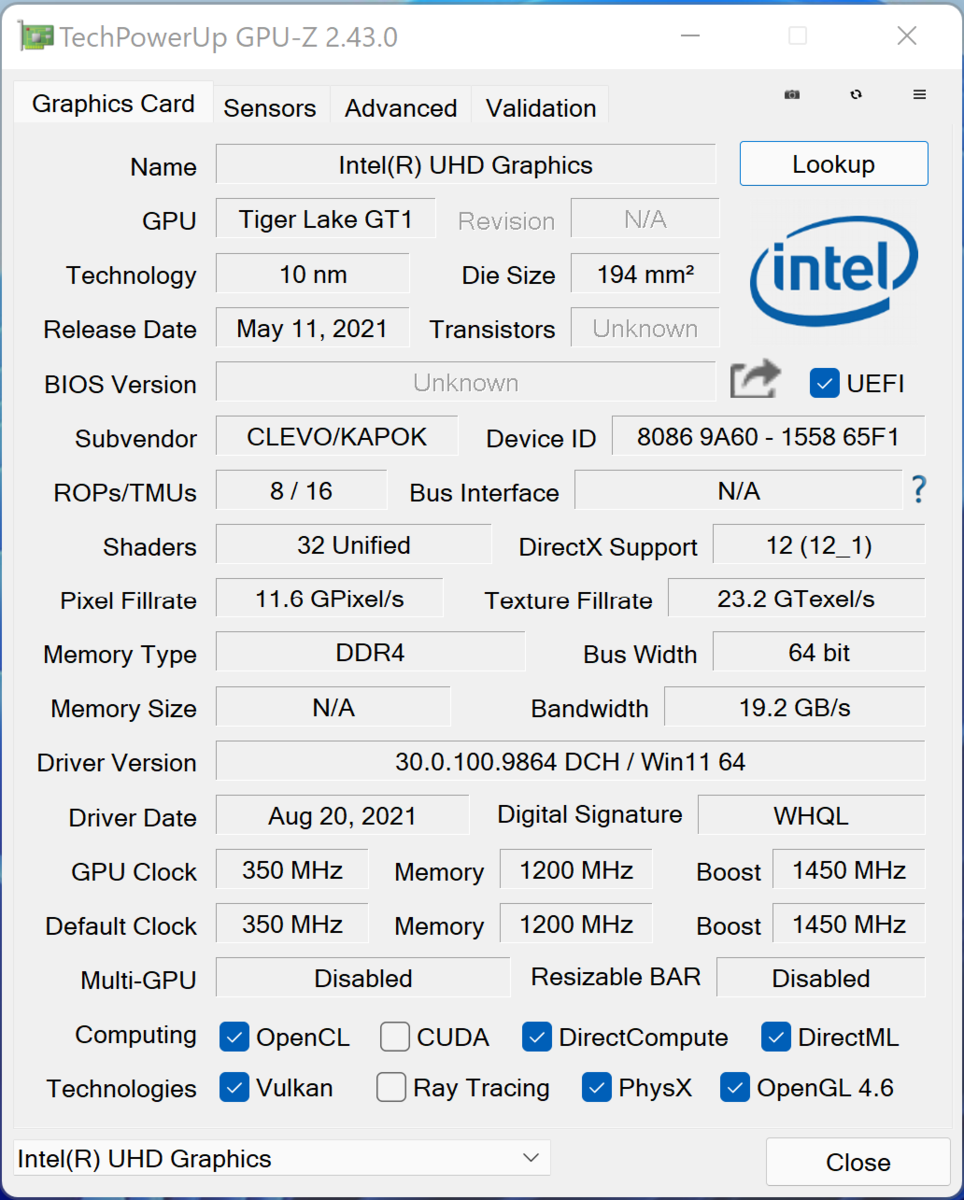
La GPU viene con una rápida memoria de vídeo GDDR6 (16384 MB). El sistema integrado UHD Graphics Xe Integrada está habilitada y el portátil utiliza la tecnología de conmutación de gráficos Nvidia Optimus


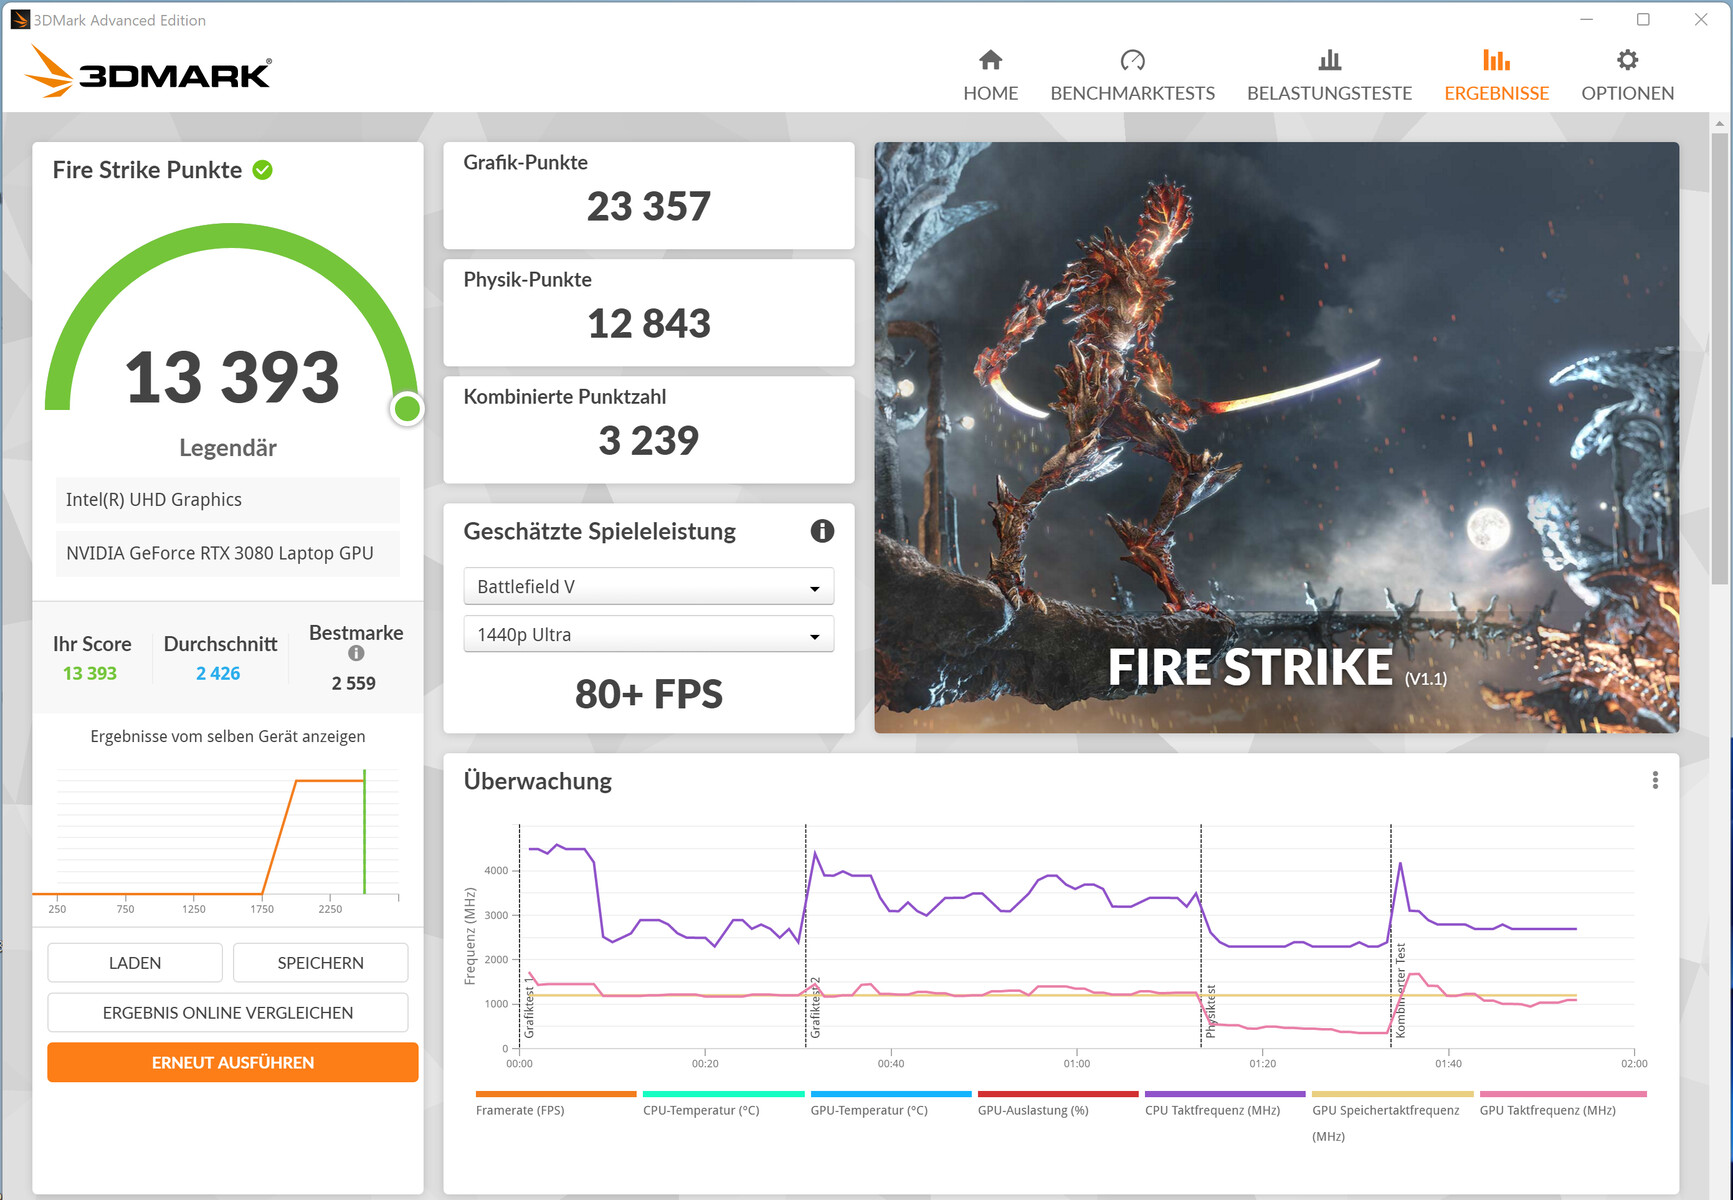
| 3DMark 11 Performance | 29001 puntos | |
| 3DMark Fire Strike Score | 19449 puntos | |
| 3DMark Time Spy Score | 9882 puntos | |
ayuda | ||
| 3DMark Performance rating - Percent | |
| Media de la clase Gaming | |
| Medio NVIDIA GeForce RTX 3080 Laptop GPU | |
| Razer Blade 15 Advanced (Mid 2021) | |
| Schenker XMG Pro 15 (Late 2021) | |
| Schenker XMG Pro 15 (Early 2021, RTX 3080) | |
| MSI Delta 15 A5EFK | |
| Alienware x15 RTX 3070 P111F | |
| Schenker XMG Pro 15 (Late 2021) -1! | |
| Schenker XMG Pro 15 (Late 2021) -1! | |
| Lenovo Legion S7 15ACH6 82K80030GE | |
| Schenker XMG Pro 15 (Late 2021) -1! | |
| 3DMark | |
| 1920x1080 Fire Strike Graphics | |
| Media de la clase Gaming (18629 - 62849, n=112, últimos 2 años) | |
| MSI Delta 15 A5EFK | |
| Medio NVIDIA GeForce RTX 3080 Laptop GPU (16455 - 32366, n=46) | |
| Razer Blade 15 Advanced (Mid 2021) | |
| Schenker XMG Pro 15 (Early 2021, RTX 3080) | |
| Schenker XMG Pro 15 (Late 2021) | |
| Schenker XMG Pro 15 (Late 2021) (Unterhaltungsmodus) | |
| Alienware x15 RTX 3070 P111F | |
| Schenker XMG Pro 15 (Late 2021) (Lautlosmodus) | |
| Lenovo Legion S7 15ACH6 82K80030GE | |
| Schenker XMG Pro 15 (Late 2021) (Stromsparmodus) | |
| 2560x1440 Time Spy Graphics | |
| Media de la clase Gaming (6387 - 26212, n=112, últimos 2 años) | |
| Medio NVIDIA GeForce RTX 3080 Laptop GPU (6407 - 13210, n=45) | |
| Razer Blade 15 Advanced (Mid 2021) | |
| Schenker XMG Pro 15 (Early 2021, RTX 3080) | |
| Schenker XMG Pro 15 (Late 2021) | |
| Alienware x15 RTX 3070 P111F | |
| Schenker XMG Pro 15 (Late 2021) (Unterhaltungsmodus) | |
| MSI Delta 15 A5EFK | |
| Schenker XMG Pro 15 (Late 2021) (Lautlosmodus) | |
| Lenovo Legion S7 15ACH6 82K80030GE | |
| Schenker XMG Pro 15 (Late 2021) (Stromsparmodus) | |
Rendimiento de los juegos
Con la resolución FHD y los ajustes de máxima calidad, el hardware muestra sin esfuerzo todos los juegos actuales con fluidez. También es posible elegir resoluciones más altas, aunque con ajustes de detalle reducidos. Las tasas de frames rondan la media de la RTX 3080 - a veces la Pro 15 la supera, otras veces se queda ligeramente atrás
| The Witcher 3 - 1920x1080 Ultra Graphics & Postprocessing (HBAO+) | |
| Media de la clase Gaming (104.7 - 240, n=7, últimos 2 años) | |
| Medio NVIDIA GeForce RTX 3080 Laptop GPU (85.1 - 123, n=40) | |
| Razer Blade 15 Advanced (Mid 2021) | |
| Alienware x15 RTX 3070 P111F | |
| Schenker XMG Pro 15 (Late 2021) | |
| Schenker XMG Pro 15 (Early 2021, RTX 3080) | |
| MSI Delta 15 A5EFK | |
| Schenker XMG Pro 15 (Late 2021) (Lautlosmodus) | |
| Lenovo Legion S7 15ACH6 82K80030GE | |
| Dota 2 Reborn | |
| 1920x1080 ultra (3/3) best looking | |
| Media de la clase Gaming (84.8 - 252, n=104, últimos 2 años) | |
| Razer Blade 15 Advanced (Mid 2021) | |
| Schenker XMG Pro 15 (Late 2021) | |
| Alienware x15 RTX 3070 P111F | |
| Medio NVIDIA GeForce RTX 3080 Laptop GPU (98 - 156, n=45) | |
| Schenker XMG Pro 15 (Late 2021) (Unterhaltungsmodus) | |
| Lenovo Legion S7 15ACH6 82K80030GE | |
| Schenker XMG Pro 15 (Early 2021, RTX 3080) | |
| Schenker XMG Pro 15 (Late 2021) (Stromsparmodus) | |
| MSI Delta 15 A5EFK | |
| Schenker XMG Pro 15 (Late 2021) (Lautlosmodus) | |
| 3840x2160 ultra (3/3) best looking | |
| Media de la clase Gaming (114.9 - 199.2, n=32, últimos 2 años) | |
| Schenker XMG Pro 15 (Late 2021) | |
| Schenker XMG Pro 15 (Late 2021) (Unterhaltungsmodus) | |
| Medio NVIDIA GeForce RTX 3080 Laptop GPU (55.2 - 128, n=17) | |
| Lenovo Legion S7 15ACH6 82K80030GE | |
| Schenker XMG Pro 15 (Late 2021) (Lautlosmodus) | |
| Schenker XMG Pro 15 (Late 2021) (Stromsparmodus) | |
| X-Plane 11.11 | |
| 1920x1080 high (fps_test=3) | |
| Media de la clase Gaming (55.5 - 148.5, n=106, últimos 2 años) | |
| Razer Blade 15 Advanced (Mid 2021) | |
| Alienware x15 RTX 3070 P111F | |
| Schenker XMG Pro 15 (Late 2021) | |
| Schenker XMG Pro 15 (Late 2021) (Unterhaltungsmodus) | |
| Medio NVIDIA GeForce RTX 3080 Laptop GPU (65.6 - 113, n=44) | |
| Schenker XMG Pro 15 (Early 2021, RTX 3080) | |
| Schenker XMG Pro 15 (Late 2021) (Stromsparmodus) | |
| Lenovo Legion S7 15ACH6 82K80030GE | |
| Schenker XMG Pro 15 (Late 2021) (Lautlosmodus) | |
| 3840x2160 high (fps_test=3) | |
| Media de la clase Gaming (60 - 124.1, n=32, últimos 2 años) | |
| Schenker XMG Pro 15 (Late 2021) | |
| Medio NVIDIA GeForce RTX 3080 Laptop GPU (39.9 - 88.6, n=17) | |
| Schenker XMG Pro 15 (Late 2021) (Unterhaltungsmodus) | |
| Schenker XMG Pro 15 (Late 2021) (Stromsparmodus) | |
| Lenovo Legion S7 15ACH6 82K80030GE | |
| Schenker XMG Pro 15 (Late 2021) (Lautlosmodus) | |
| Strange Brigade | |
| 1920x1080 ultra AA:ultra AF:16 | |
| Media de la clase Gaming (113.6 - 458, n=83, últimos 2 años) | |
| Medio NVIDIA GeForce RTX 3080 Laptop GPU (117 - 219, n=34) | |
| Razer Blade 15 Advanced (Mid 2021) (1.47.22.14 D3D12) | |
| Alienware x15 RTX 3070 P111F (1.47.22.14 D3D12) | |
| Schenker XMG Pro 15 (Late 2021) (1.47.22.14 D3D12) | |
| MSI Delta 15 A5EFK (1.47.22.14 D3D12) | |
| Schenker XMG Pro 15 (Late 2021) (1.47.22.14 D3D12, Unterhaltungsmodus) | |
| Schenker XMG Pro 15 (Late 2021) (1.47.22.14 D3D12, Lautlosmodus) | |
| Lenovo Legion S7 15ACH6 82K80030GE (1.47.22.14 D3D12) | |
| Schenker XMG Pro 15 (Late 2021) (1.47.22.14 D3D12, Stromsparmodus) | |
| 2560x1440 ultra AA:ultra AF:16 | |
| Media de la clase Gaming (103.8 - 354, n=72, últimos 2 años) | |
| Medio NVIDIA GeForce RTX 3080 Laptop GPU (123 - 165, n=14) | |
| Alienware x15 RTX 3070 P111F (1.47.22.14 D3D12) | |
| Schenker XMG Pro 15 (Late 2021) (1.47.22.14 D3D12) | |
| Lenovo Legion S7 15ACH6 82K80030GE (1.47.22.14 D3D12) | |
| 3840x2160 ultra AA:ultra AF:16 | |
| Media de la clase Gaming (83 - 187.2, n=34, últimos 2 años) | |
| Medio NVIDIA GeForce RTX 3080 Laptop GPU (55.9 - 91.7, n=12) | |
| Schenker XMG Pro 15 (Late 2021) (1.47.22.14 D3D12) | |
| Schenker XMG Pro 15 (Late 2021) (1.47.22.14 D3D12, Unterhaltungsmodus) | |
| Schenker XMG Pro 15 (Late 2021) (1.47.22.14 D3D12, Lautlosmodus) | |
| Lenovo Legion S7 15ACH6 82K80030GE (1.47.22.14 D3D12) | |
| Schenker XMG Pro 15 (Late 2021) (1.47.22.14 D3D12, Stromsparmodus) | |
| F1 2021 | |
| 1920x1080 Ultra High Preset + Raytracing AA:T AF:16x | |
| Schenker XMG Pro 15 (Late 2021) (831795) | |
| Schenker XMG Pro 15 (Late 2021) (831795, Unterhaltungsmodus) | |
| Medio NVIDIA GeForce RTX 3080 Laptop GPU (74.9 - 123.7, n=9) | |
| MSI Delta 15 A5EFK | |
| Schenker XMG Pro 15 (Late 2021) (831795, Lautlosmodus) | |
| Lenovo Legion S7 15ACH6 82K80030GE (815237) | |
| Schenker XMG Pro 15 (Late 2021) (831795, Stromsparmodus) | |
| 2560x1440 Ultra High Preset + Raytracing AA:T AF:16x | |
| Medio NVIDIA GeForce RTX 3080 Laptop GPU (84 - 90.4, n=4) | |
| Schenker XMG Pro 15 (Late 2021) (831795) | |
| Lenovo Legion S7 15ACH6 82K80030GE (815237) | |
| 3840x2160 Ultra High Preset + Raytracing AA:T AF:16x | |
| Schenker XMG Pro 15 (Late 2021) (831795) | |
| Schenker XMG Pro 15 (Late 2021) (831795, Unterhaltungsmodus) | |
| Medio NVIDIA GeForce RTX 3080 Laptop GPU (32.5 - 51.5, n=7) | |
| Schenker XMG Pro 15 (Late 2021) (831795, Lautlosmodus) | |
| Lenovo Legion S7 15ACH6 82K80030GE (815237) | |
| Schenker XMG Pro 15 (Late 2021) (831795, Stromsparmodus) | |
| Far Cry 6 | |
| 1920x1080 Ultra Graphics Quality + HD Textures AA:T | |
| Media de la clase Gaming (n=1últimos 2 años) | |
| Lenovo Legion S7 15ACH6 82K80030GE | |
| Medio NVIDIA GeForce RTX 3080 Laptop GPU (55 - 104.4, n=5) | |
| MSI Delta 15 A5EFK | |
| Schenker XMG Pro 15 (Late 2021) | |
| 3840x2160 Ultra Graphics Quality + HD Textures AA:T | |
| Medio NVIDIA GeForce RTX 3080 Laptop GPU (40 - 50, n=4) | |
| Schenker XMG Pro 15 (Late 2021) | |
| 1920x1080 Ultra Graphics Quality + HD Textures + DXR AA:T | |
| Media de la clase Gaming (n=1últimos 2 años) | |
| Medio NVIDIA GeForce RTX 3080 Laptop GPU (59 - 84.7, n=4) | |
| Lenovo Legion S7 15ACH6 82K80030GE | |
| Schenker XMG Pro 15 (Late 2021) | |
| MSI Delta 15 A5EFK | |
| Guardians of the Galaxy | |
| 1920x1080 Ultra Preset | |
| Medio NVIDIA GeForce RTX 3080 Laptop GPU (122 - 145, n=4) | |
| Schenker XMG Pro 15 (Late 2021) | |
| Lenovo Legion S7 15ACH6 82K80030GE | |
| 3840x2160 Ultra Preset | |
| Medio NVIDIA GeForce RTX 3080 Laptop GPU (55 - 60, n=4) | |
| Schenker XMG Pro 15 (Late 2021) | |
| Lenovo Legion S7 15ACH6 82K80030GE | |
| 1920x1080 Ultra Preset + Ultra Ray-Tracing | |
| Medio NVIDIA GeForce RTX 3080 Laptop GPU (75 - 85, n=4) | |
| Schenker XMG Pro 15 (Late 2021) | |
| Lenovo Legion S7 15ACH6 82K80030GE | |
| Riders Republic | |
| 1920x1080 Ultra Preset | |
| Medio NVIDIA GeForce RTX 3080 Laptop GPU (104 - 115, n=2) | |
| Schenker XMG Pro 15 (Late 2021) | |
| Lenovo Legion S7 15ACH6 82K80030GE | |
| 3840x2160 Ultra Preset | |
| Medio NVIDIA GeForce RTX 3080 Laptop GPU (41 - 47, n=2) | |
| Schenker XMG Pro 15 (Late 2021) | |
| Lenovo Legion S7 15ACH6 82K80030GE | |
| Forza Horizon 5 | |
| 1920x1080 Extreme Preset | |
| Medio NVIDIA GeForce RTX 3080 Laptop GPU (81 - 84, n=4) | |
| Schenker XMG Pro 15 (Late 2021) | |
| 3840x2160 Extreme Preset | |
| Medio NVIDIA GeForce RTX 3080 Laptop GPU (48 - 55, n=4) | |
| Schenker XMG Pro 15 (Late 2021) | |
| Battlefield 2042 | |
| 1920x1080 Ultra Preset | |
| Medio NVIDIA GeForce RTX 3080 Laptop GPU (88.7 - 104, n=2) | |
| Schenker XMG Pro 15 (Late 2021) | |
| 3840x2160 Ultra Preset | |
| Medio NVIDIA GeForce RTX 3080 Laptop GPU (43 - 50.2, n=2) | |
| Schenker XMG Pro 15 (Late 2021) | |
| 1920x1080 Ultra Preset + Ray Tracing | |
| Medio NVIDIA GeForce RTX 3080 Laptop GPU (68 - 84.2, n=2) | |
| Schenker XMG Pro 15 (Late 2021) | |
| Halo Infinite | |
| 1920x1080 Ultra Preset | |
| Medio NVIDIA GeForce RTX 3080 Laptop GPU (96.1 - 106, n=2) | |
| Schenker XMG Pro 15 (Late 2021) | |
| 3840x2160 Ultra Preset | |
| Medio NVIDIA GeForce RTX 3080 Laptop GPU (40.2 - 46.2, n=2) | |
| Schenker XMG Pro 15 (Late 2021) | |
| Alan Wake Remastered | |
| 1920x1080 High Preset | |
| Schenker XMG Pro 15 (Late 2021) | |
| Medio NVIDIA GeForce RTX 3080 Laptop GPU (95 - 111, n=2) | |
| Lenovo Legion S7 15ACH6 82K80030GE | |
| 3840x2160 High Preset | |
| Medio NVIDIA GeForce RTX 3080 Laptop GPU (64.6 - 73.9, n=2) | |
| Schenker XMG Pro 15 (Late 2021) | |
| Lenovo Legion S7 15ACH6 82K80030GE | |
Para determinar si las velocidades de fotogramas se mantienen constantes durante un periodo prolongado, nos pusimos en reposo en The Witcher 3 durante unos 60 minutos a resolución FHD y detalles máximos. El personaje no se movió durante todo el tiempo. Con el modo de rendimiento seleccionado, no observamos ninguna caída de fotogramas
Witcher 3 FPS Diagram
| bajo | medio | alto | ultra | QHD | 4K | |
|---|---|---|---|---|---|---|
| GTA V (2015) | 184 | 180 | 166 | 102 | 85.7 | 93 |
| The Witcher 3 (2015) | 399 | 285 | 176 | 100 | 69.6 | |
| Dota 2 Reborn (2015) | 164 | 146 | 137 | 132 | 116 | |
| Final Fantasy XV Benchmark (2018) | 187 | 129 | 97.5 | 74.6 | 44.1 | |
| X-Plane 11.11 (2018) | 128 | 109 | 88.5 | 67.9 | ||
| Far Cry 5 (2018) | 163 | 130 | 123 | 115 | 95 | 54 |
| Strange Brigade (2018) | 465 | 244 | 201 | 176 | 130 | 76 |
| F1 2021 (2021) | 314 | 219 | 190 | 117 | 87.4 | 49.6 |
| Alan Wake Remastered (2021) | 121 | 111 | 108 | 64.6 | ||
| Far Cry 6 (2021) | 101 | 82 | 75 | 70 | 62 | 40 |
| Guardians of the Galaxy (2021) | 130 | 122 | 124 | 122 | 95 | 55 |
| Riders Republic (2021) | 155 | 137 | 113 | 104 | 74 | 41 |
| Forza Horizon 5 (2021) | 214 | 131 | 122 | 81 | 67 | 48 |
| Battlefield 2042 (2021) | 133 | 110 | 99.8 | 88.7 | 69.9 | 43 |
| Halo Infinite (2021) | 118 | 101 | 96.1 | 70.4 | 40.2 |
Emisiones - El portátil Schenker hace mucho ruido
Ruido del sistema
Durante el uso diario (oficina, navegación por internet), los dos ventiladores tienden a ser reservados y silenciosos. Sin embargo, notamos que los ventiladores aumentan de vez en cuando innecesariamente - esto aumenta el nivel de ruido hasta 41 dB(A). Bajo carga, las cosas pueden volverse muy ruidosas con valores máximos de 58 dB(A) (test de estrés) y 53 dB(A) (Witcher 3 prueba). El Razer Blade 15 produce sistemáticamente menos ruido independientemente de la carga del sistema
Los niveles de ruido bajo carga pueden reducirse seleccionando el perfil de potencia silenciosa. Los ventiladores giran entonces de forma muy silenciosa. Mientras tanto, las velocidades de reloj de la CPU y la GPU están muy limitadas. Aunque todavía es posible jugar en este modo, es probable que haya que reducir los ajustes de calidad o la resolución.
Ruido
| Ocioso |
| 31 / 37 / 41 dB(A) |
| Carga |
| 56 / 58 dB(A) |
 | ||
30 dB silencioso 40 dB(A) audible 50 dB(A) ruidosamente alto |
||
min: | ||
| Schenker XMG Pro 15 (Late 2021) i7-11800H, GeForce RTX 3080 Laptop GPU | Lenovo Legion S7 15ACH6 82K80030GE R9 5900HX, GeForce RTX 3060 Laptop GPU | Alienware x15 RTX 3070 P111F i7-11800H, GeForce RTX 3070 Laptop GPU | Razer Blade 15 Advanced (Mid 2021) i7-11800H, GeForce RTX 3080 Laptop GPU | Schenker XMG Pro 15 (Early 2021, RTX 3080) i7-10870H, GeForce RTX 3080 Laptop GPU | MSI Delta 15 A5EFK R9 5900HX, Radeon RX 6700M | |
|---|---|---|---|---|---|---|
| Noise | 11% | 19% | 19% | 4% | 10% | |
| apagado / medio ambiente * (dB) | 24 | 25 -4% | 24.1 -0% | 25.1 -5% | 25 -4% | 25 -4% |
| Idle Minimum * (dB) | 31 | 25 19% | 26.6 14% | 25.3 18% | 33 -6% | 25 19% |
| Idle Average * (dB) | 37 | 30 19% | 26.6 28% | 25.3 32% | 34 8% | 30 19% |
| Idle Maximum * (dB) | 41 | 36 12% | 26.6 35% | 25.3 38% | 35 15% | 40 2% |
| Load Average * (dB) | 56 | 42 25% | 30.9 45% | 42 25% | 51 9% | 47 16% |
| Witcher 3 ultra * (dB) | 53 | 53 -0% | 49.9 6% | 45.6 14% | 52 2% | 48 9% |
| Load Maximum * (dB) | 58 | 54 7% | 53.5 8% | 51.6 11% | 57 2% | 51 12% |
* ... más pequeño es mejor
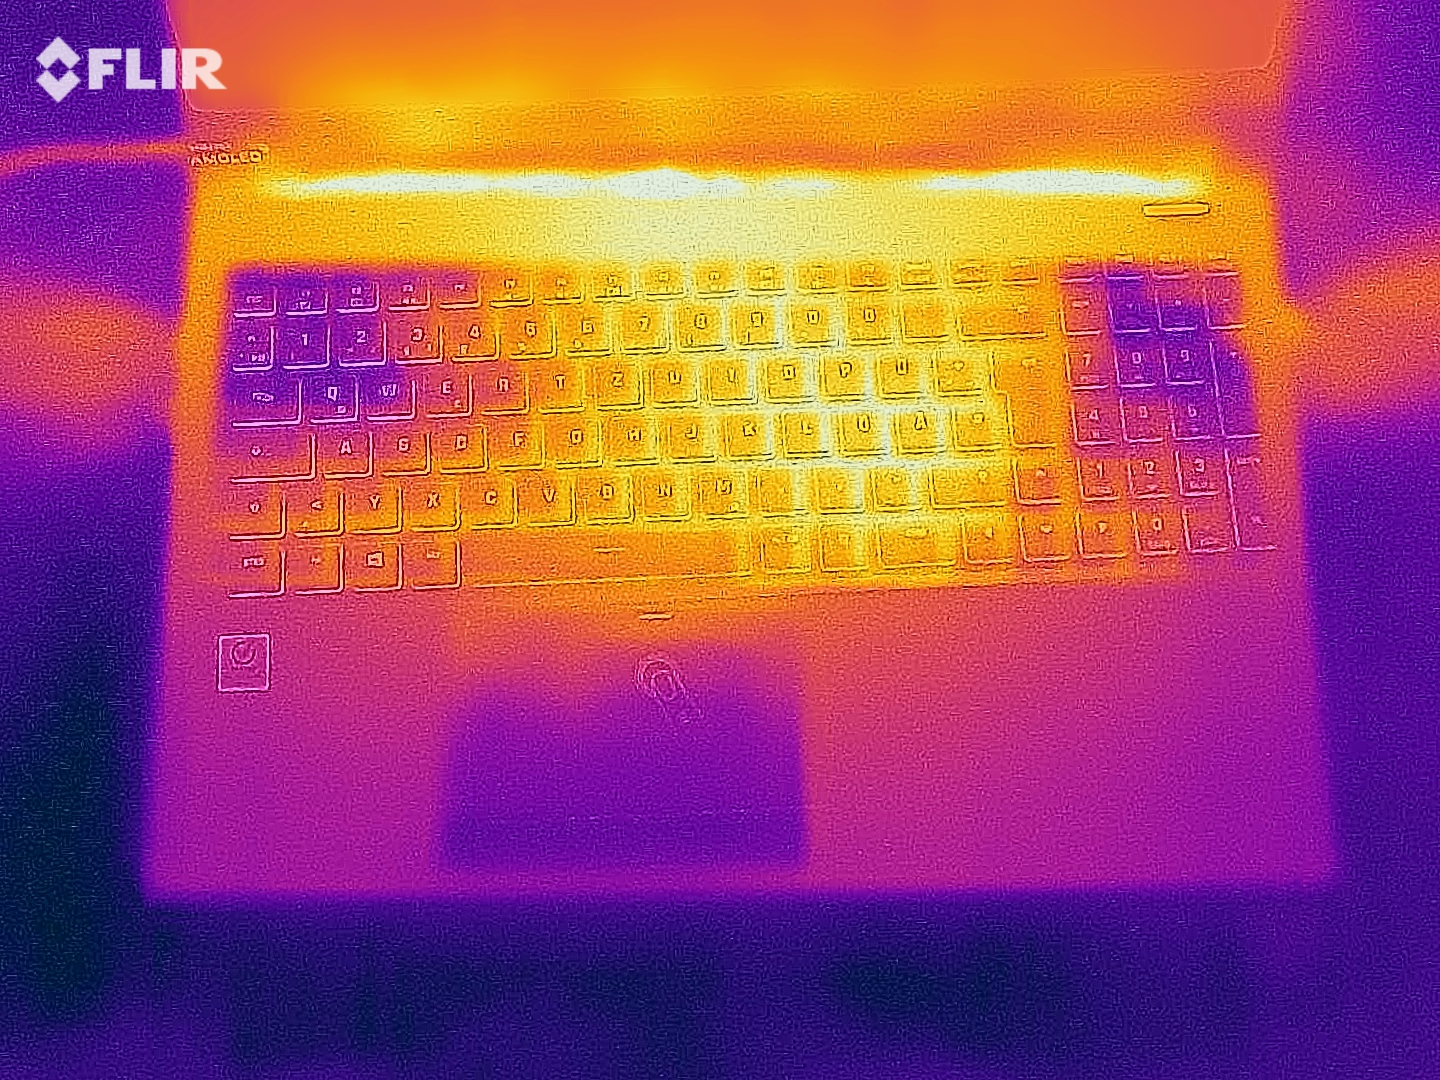
Temperatura
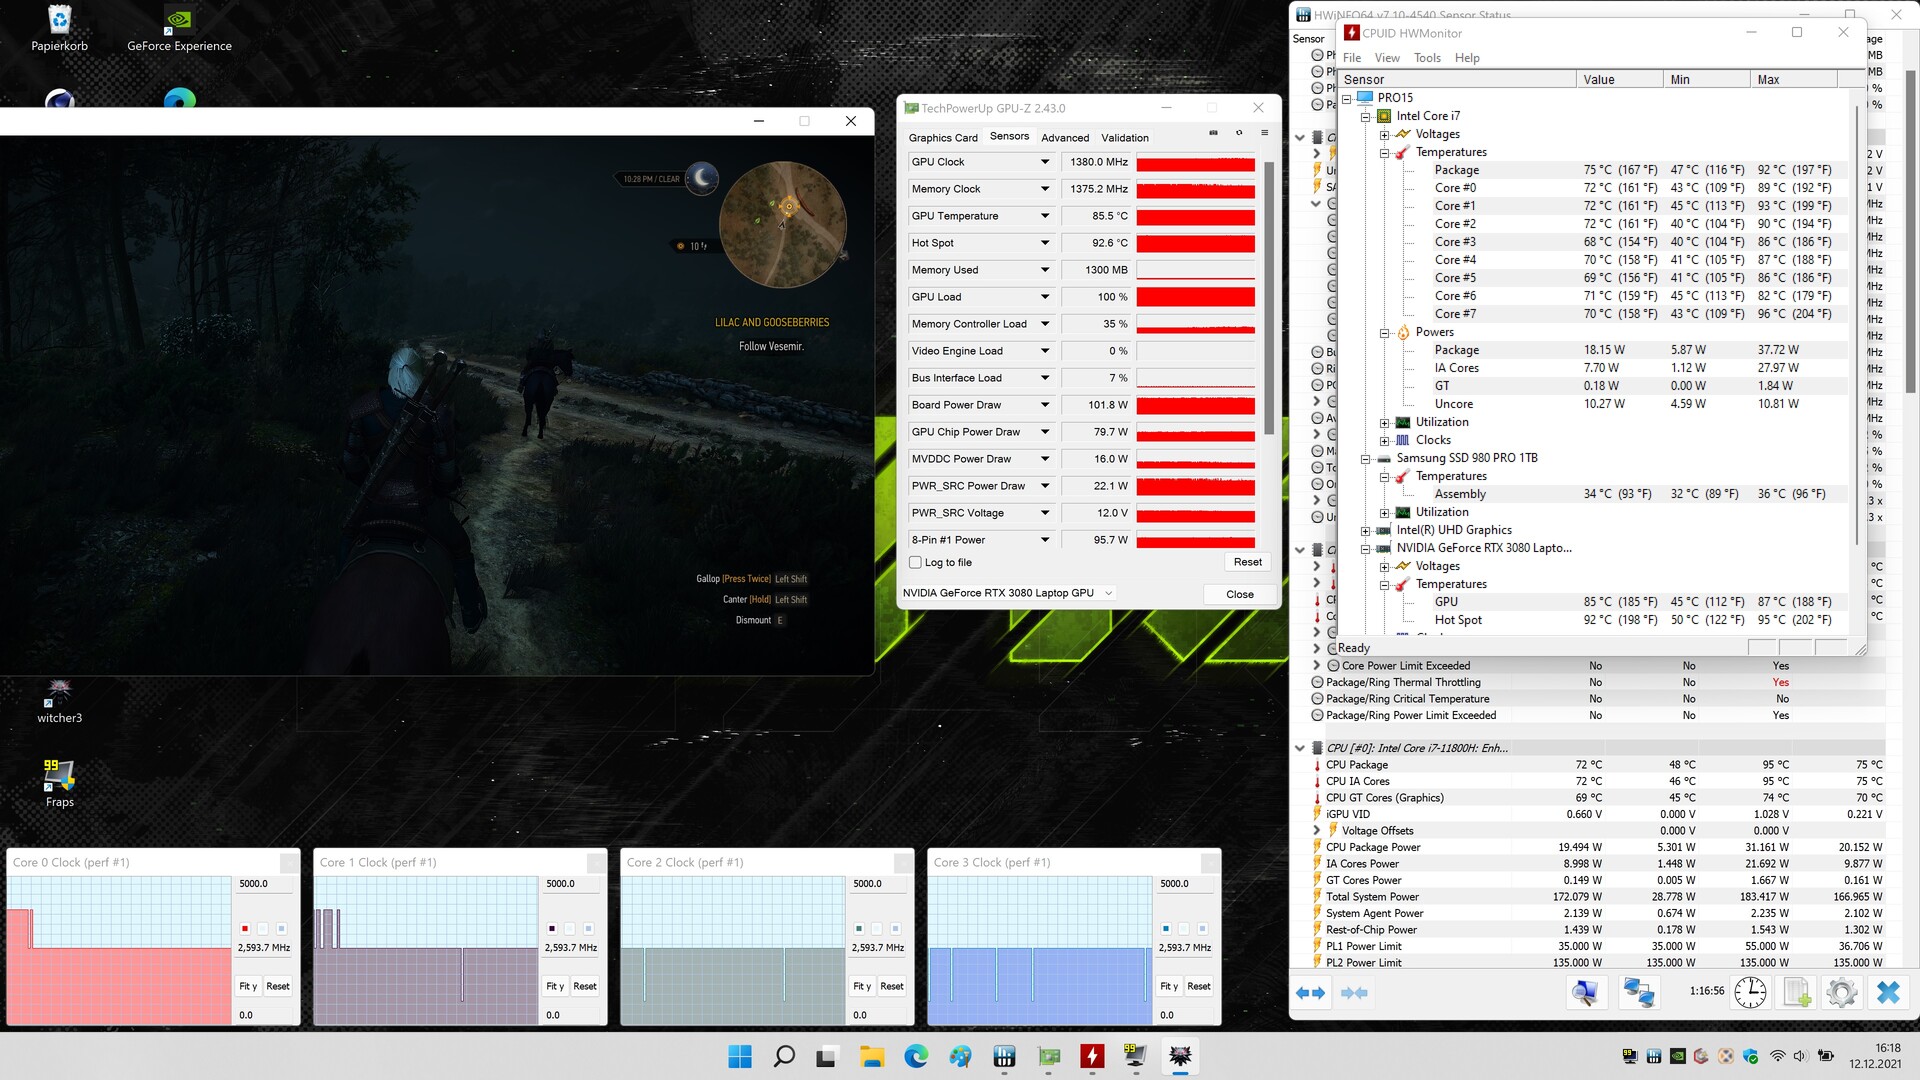
Durante el uso diario (oficina, navegación por Internet), las temperaturas de la superficie se mantienen bajas. Bajo carga (prueba de estrés, Witcher 3), el portátil se calienta mucho. En algunos puntos, medimos temperaturas superiores a los 60 °C (140 °F). Al principio de la prueba, la CPU alcanza una temperatura de 100 °C (212 °F) y, por tanto, la máxima especificada por Intel. Posteriormente, la temperatura se estabiliza entre 90 y 100 °C (194-212 °F)
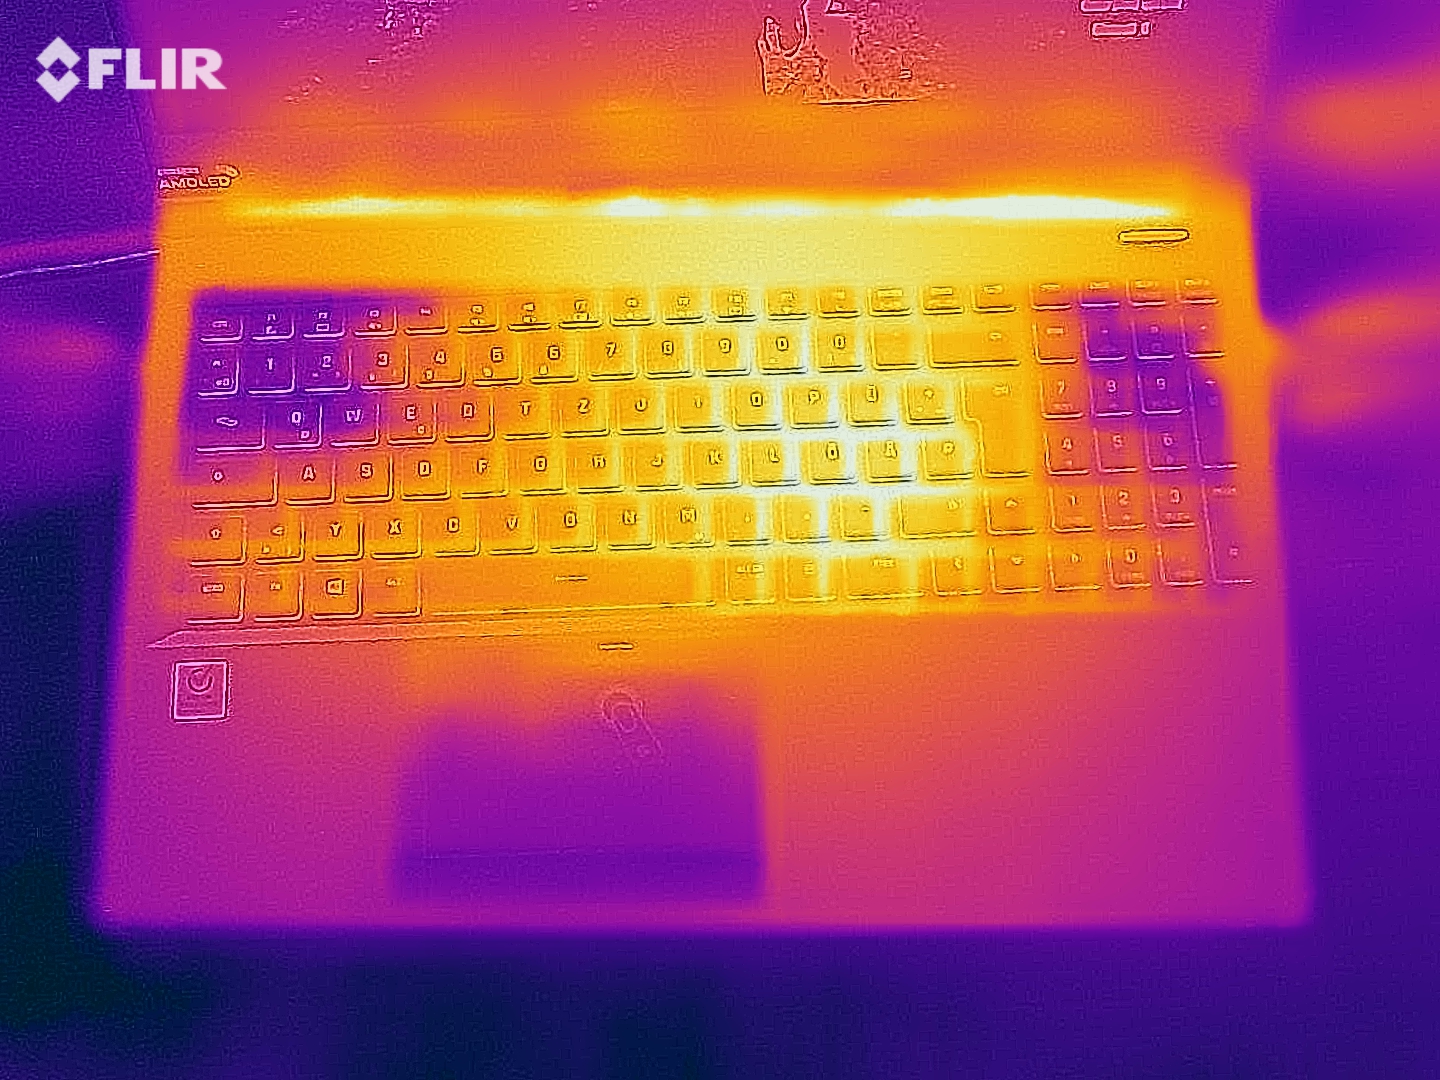
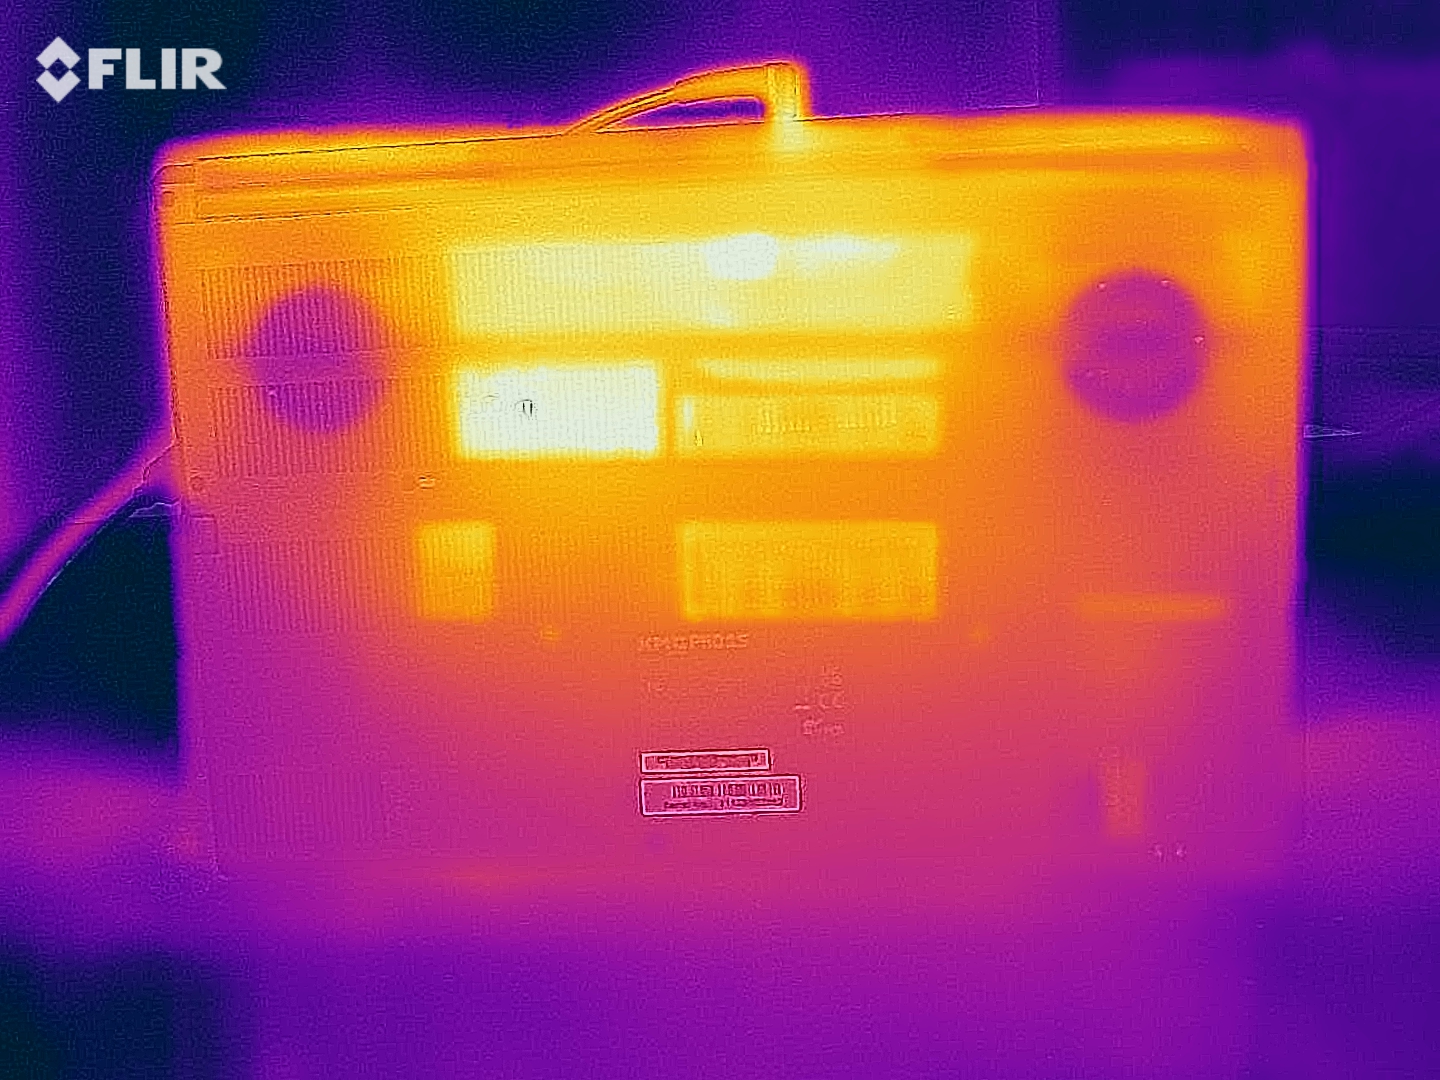
(±) La temperatura máxima en la parte superior es de 44 °C / 111 F, frente a la media de 40.4 °C / 105 F, que oscila entre 21.2 y 68.8 °C para la clase Gaming.
(-) El fondo se calienta hasta un máximo de 60 °C / 140 F, frente a la media de 43.2 °C / 110 F
(+) En reposo, la temperatura media de la parte superior es de 27.8 °C / 82# F, frente a la media del dispositivo de 33.9 °C / 93 F.
(-) Jugando a The Witcher 3, la temperatura media de la parte superior es de 44.2 °C / 112 F, frente a la media del dispositivo de 33.9 °C / 93 F.
(±) El reposamanos y el touchpad pueden calentarse mucho al tacto con un máximo de 38 °C / 100.4 F.
(-) La temperatura media de la zona del reposamanos de dispositivos similares fue de 28.8 °C / 83.8 F (-9.2 °C / -16.6 F).
| Schenker XMG Pro 15 (Late 2021) Intel Core i7-11800H, NVIDIA GeForce RTX 3080 Laptop GPU | Lenovo Legion S7 15ACH6 82K80030GE AMD Ryzen 9 5900HX, NVIDIA GeForce RTX 3060 Laptop GPU | Alienware x15 RTX 3070 P111F Intel Core i7-11800H, NVIDIA GeForce RTX 3070 Laptop GPU | Razer Blade 15 Advanced (Mid 2021) Intel Core i7-11800H, NVIDIA GeForce RTX 3080 Laptop GPU | Schenker XMG Pro 15 (Early 2021, RTX 3080) Intel Core i7-10870H, NVIDIA GeForce RTX 3080 Laptop GPU | MSI Delta 15 A5EFK AMD Ryzen 9 5900HX, AMD Radeon RX 6700M | |
|---|---|---|---|---|---|---|
| Heat | 5% | -3% | -8% | -7% | 1% | |
| Maximum Upper Side * (°C) | 44 | 49 -11% | 59.2 -35% | 51 -16% | 51 -16% | 50 -14% |
| Maximum Bottom * (°C) | 60 | 50 17% | 58 3% | 52 13% | 66 -10% | 55 8% |
| Idle Upper Side * (°C) | 30 | 29 3% | 28.4 5% | 35.2 -17% | 32 -7% | 31 -3% |
| Idle Bottom * (°C) | 34 | 30 12% | 29 15% | 37.8 -11% | 32 6% | 30 12% |
* ... más pequeño es mejor
Prueba de esfuerzo
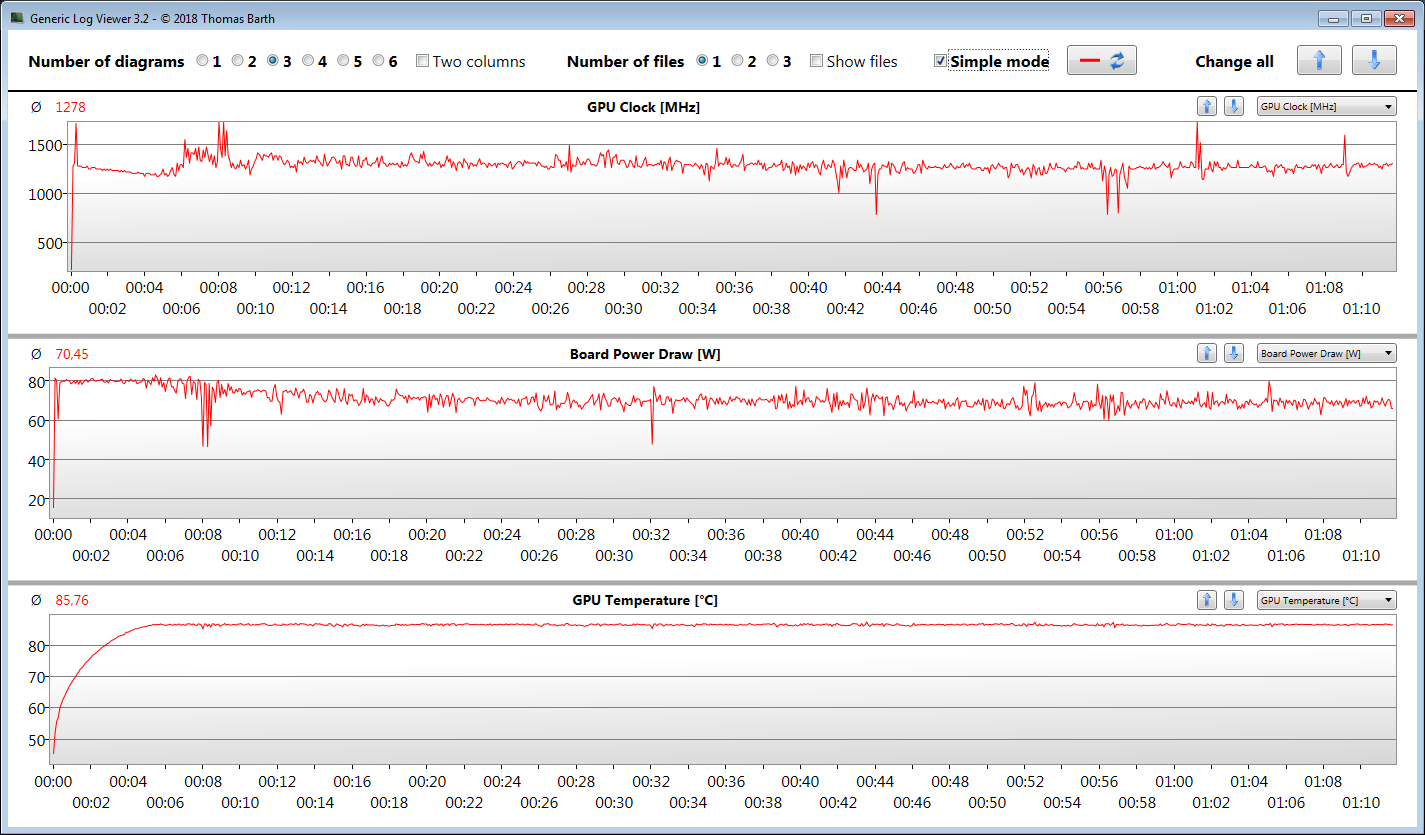
Al principio de nuestra prueba de estrés (ejecutando Prime95 y FurMark durante al menos una hora) la CPU (3,8 a 4,1 GHz) y la GPU (1300 a 1600 MHz) funcionan a velocidades de reloj bastante altas. Después de unos minutos, las velocidades de reloj caen a 2,9 GHz y 500 a 1600 MHz, respectivamente, donde permanecen. Esta prueba de estrés representa un escenario extremo. Utilizamos esta prueba para determinar si el sistema se mantiene estable incluso bajo carga máxima
Altavoces
Los altavoces estéreo producen un sonido mediocre que carece de graves. El nivel de volumen máximo es relativamente alto. Recomendamos auriculares o altavoces externos para una mejor experiencia de sonido
Schenker XMG Pro 15 (Late 2021) análisis de audio
(+) | los altavoces pueden reproducir a un volumen relativamente alto (#89 dB)
Graves 100 - 315 Hz
(-) | casi sin bajos - de media 26% inferior a la mediana
(±) | la linealidad de los graves es media (10.4% delta a frecuencia anterior)
Medios 400 - 2000 Hz
(±) | medias más altas - de media 10.2% más altas que la mediana
(±) | la linealidad de los medios es media (8% delta respecto a la frecuencia anterior)
Altos 2 - 16 kHz
(±) | máximos más altos - de media 5.1% más altos que la mediana
(+) | los máximos son lineales (5.5% delta a la frecuencia anterior)
Total 100 - 16.000 Hz
(±) | la linealidad del sonido global es media (22.5% de diferencia con la mediana)
En comparación con la misma clase
» 81% de todos los dispositivos probados de esta clase eran mejores, 5% similares, 14% peores
» El mejor tuvo un delta de 6%, la media fue 18%, el peor fue ###max##%
En comparación con todos los dispositivos probados
» 66% de todos los dispositivos probados eran mejores, 6% similares, 28% peores
» El mejor tuvo un delta de 4%, la media fue 23%, el peor fue ###max##%
Razer Blade 15 Advanced (Mid 2021) análisis de audio
(+) | los altavoces pueden reproducir a un volumen relativamente alto (#84.6 dB)
Graves 100 - 315 Hz
(-) | casi sin bajos - de media 20.1% inferior a la mediana
(±) | la linealidad de los graves es media (12.8% delta a frecuencia anterior)
Medios 400 - 2000 Hz
(+) | medios equilibrados - a sólo 3.6% de la mediana
(+) | los medios son lineales (4.1% delta a la frecuencia anterior)
Altos 2 - 16 kHz
(+) | máximos equilibrados - a sólo 4.9% de la mediana
(±) | la linealidad de los máximos es media (8.3% delta a frecuencia anterior)
Total 100 - 16.000 Hz
(±) | la linealidad del sonido global es media (15.8% de diferencia con la mediana)
En comparación con la misma clase
» 37% de todos los dispositivos probados de esta clase eran mejores, 7% similares, 56% peores
» El mejor tuvo un delta de 6%, la media fue 18%, el peor fue ###max##%
En comparación con todos los dispositivos probados
» 24% de todos los dispositivos probados eran mejores, 5% similares, 70% peores
» El mejor tuvo un delta de 4%, la media fue 23%, el peor fue ###max##%
Gestión de la energía - Schenker 15 con una duración decente de la batería
Consumo de energía
El consumo de energía del modelo Schenker no es nada fuera de lo común. Coincide con nuestras expectativas para el hardware instalado. Al principio de nuestra prueba de estrés, el consumo de energía alcanza los 218 vatios y luego baja rápidamente a unos 165 vatios. Durante nuestra Witcher 3 prueba observamos un consumo medio de 186 vatios. Dado que no encontramos agotamiento de la batería durante esto, el cargador incluido parece ser suficiente (con capacidad para 180 vatios)
| Off / Standby | |
| Ocioso | |
| Carga |
|
Clave:
min: | |
| Schenker XMG Pro 15 (Late 2021) i7-11800H, GeForce RTX 3080 Laptop GPU | Lenovo Legion S7 15ACH6 82K80030GE R9 5900HX, GeForce RTX 3060 Laptop GPU | Alienware x15 RTX 3070 P111F i7-11800H, GeForce RTX 3070 Laptop GPU | Razer Blade 15 Advanced (Mid 2021) i7-11800H, GeForce RTX 3080 Laptop GPU | Schenker XMG Pro 15 (Early 2021, RTX 3080) i7-10870H, GeForce RTX 3080 Laptop GPU | MSI Delta 15 A5EFK R9 5900HX, Radeon RX 6700M | Medio NVIDIA GeForce RTX 3080 Laptop GPU | Media de la clase Gaming | |
|---|---|---|---|---|---|---|---|---|
| Power Consumption | 18% | -0% | -8% | 21% | 12% | -10% | 5% | |
| Idle Minimum * (Watt) | 20 | 13 35% | 15.7 22% | 19.5 2% | 8 60% | 10 50% | 19.8 ? 1% | 13.1 ? 34% |
| Idle Average * (Watt) | 22 | 16 27% | 20.3 8% | 23.3 -6% | 13 41% | 18 18% | 24.3 ? -10% | 19 ? 14% |
| Idle Maximum * (Watt) | 26 | 23 12% | 43 -65% | 40.1 -54% | 22 15% | 25 4% | 33.3 ? -28% | 24.6 ? 5% |
| Load Average * (Watt) | 103 | 95 8% | 94.4 8% | 98.9 4% | 97 6% | 101 2% | 108.1 ? -5% | 111.3 ? -8% |
| Witcher 3 ultra * (Watt) | 186 | 156 16% | 167 10% | 174 6% | 179 4% | 187 -1% | ||
| Load Maximum * (Watt) | 218 | 191 12% | 183.4 16% | 214 2% | 225 -3% | 217 -0% | 230 ? -6% | 260 ? -19% |
* ... más pequeño es mejor
Energy Consumption Witcher 3 / Stress Test
Energy Consumption external Monitor
Duración de la batería
El portátil de 15,6 pulgadas alcanza tiempos de ejecución de 5:14 h y 6:32 h en nuestras pruebas de Wi-Fi (acceso a páginas web periódicamente a través de un script) y de vídeo (cortometraje Big Buck Bunny en bucle, códec H.264, FHD). Para ambas pruebas, desactivamos todos los mecanismos de ahorro de energía del portátil y ajustamos el brillo de la pantalla a unos 150 cd/m². Para la prueba de vídeo, también desactivamos los módulos inalámbricos
Pro
Contra
| Schenker XMG Pro 15 (Late 2021) i7-11800H, GeForce RTX 3080 Laptop GPU, 73 Wh | Lenovo Legion S7 15ACH6 82K80030GE R9 5900HX, GeForce RTX 3060 Laptop GPU, 71 Wh | Alienware x15 RTX 3070 P111F i7-11800H, GeForce RTX 3070 Laptop GPU, 87 Wh | Razer Blade 15 Advanced (Mid 2021) i7-11800H, GeForce RTX 3080 Laptop GPU, 80 Wh | Schenker XMG Pro 15 (Early 2021, RTX 3080) i7-10870H, GeForce RTX 3080 Laptop GPU, 73 Wh | MSI Delta 15 A5EFK R9 5900HX, Radeon RX 6700M, 82 Wh | Media de la clase Gaming | |
|---|---|---|---|---|---|---|---|
| Duración de Batería | 19% | -7% | 13% | 6% | 27% | 13% | |
| Reader / Idle (h) | 10.6 | 14 32% | 9.7 -8% | 8.4 -21% | 11.1 5% | 7.84 ? -26% | |
| H.264 (h) | 6.5 | 7.5 15% | 5.5 -15% | 8.27 ? 27% | |||
| WiFi v1.3 (h) | 5.2 | 7 35% | 6.1 17% | 5.9 13% | 7.2 38% | 7.9 52% | 7.08 ? 36% |
| Load (h) | 1.3 | 1.2 -8% | 0.9 -31% | 1.6 23% | 1.6 23% | 1.496 ? 15% |
Veredicto - El Schenker XMG Pro 15 es un portátil para juegos compacto y bien construido
El rendimiento en juegos de este delgado portátil coincide con la media de un dispositivo RTX 3080. Aquí, el relativamente bajo TGP de 105 vatios se hace evidente. Mientras que en FHD, la mayoría de juegos pueden jugarse con los ajustes de máxima calidad, ejecutarlos a la resolución nativa de la pantalla (4K) suele requerir bajar los ajustes de calidad
PCIe 4, Thunderbolt 4, OLED - El Schenker XMG Pro 15 (finales de 2021) viene con las últimas tecnologías
El Core i7-11800H Y la GPU móvil GeForce RTX 3080 tienen un buen rendimiento. Bajo carga, el portátil se calienta considerablemente y genera mucho ruido. El perfil de alimentación silencioso reduce el nivel de ruido a costa de algo de rendimiento.
Hay espacio para dos SSD M.2-2280 (1x PCIe 4.0, 1x PCIe 3.0/SATA) y soporte RAID 0/1. Nuestro dispositivo de pruebas está equipado con un veloz SSD PCIe-4 (1 TB). Si bien su autonomía Wi-Fi real de entre 5 y 7 horas no es nada del otro mundo, no sería razonable esperar mucho más de un portátil de juegos con pantalla 4K. Por desgracia, la batería no puede recargarse a través del puerto Thunderbolt 4 integrado.
La pantalla OLED (3840 x 2160 píxeles) es la característica más destacada del Pro 15. Ofrece un alto brillo máximo, excelente contraste, grandes ángulos de visión, cortos tiempos de respuesta, buena precisión de color y una amplia gama de colores. Por desgracia, la pantalla es reflectante. Además, observamos parpadeo PWM.
Una alternativa al XMG Pro es el Razer Blade 15 Advanced. Es aún más compacto y ofrece dos puertos Thunderbolt 4. Aunque su capacidad de batería es mayor y "sólo" viene con un panel FHD, su duración de batería no supera significativamente la de nuestro portátil Schenker. Mientras tanto, el Lenovo Legion S7 15ACH6 (2000 euros o ~2250 dólares). Aunque su rendimiento 3D es significativamente más lento, brilla con una pantalla IPS 4K mate más brillante, mejor duración de la batería y una garantía de tres años. La mayor debilidad es su único módulo de RAM soldado
Precio y disponibilidad
El Schenker XMG Pro 15 (finales de 2021) se puede configurar a través de la tienda online Schenker. Nuestra configuración puede adquirirse por unos 3000 euros (~3400 dólares). El modelo base parte de unos 2200 euros (~2500 dólares)
Schenker XMG Pro 15 (Late 2021)
- 01/19/2022 v7 (old)
Sascha Mölck
Price comparison

