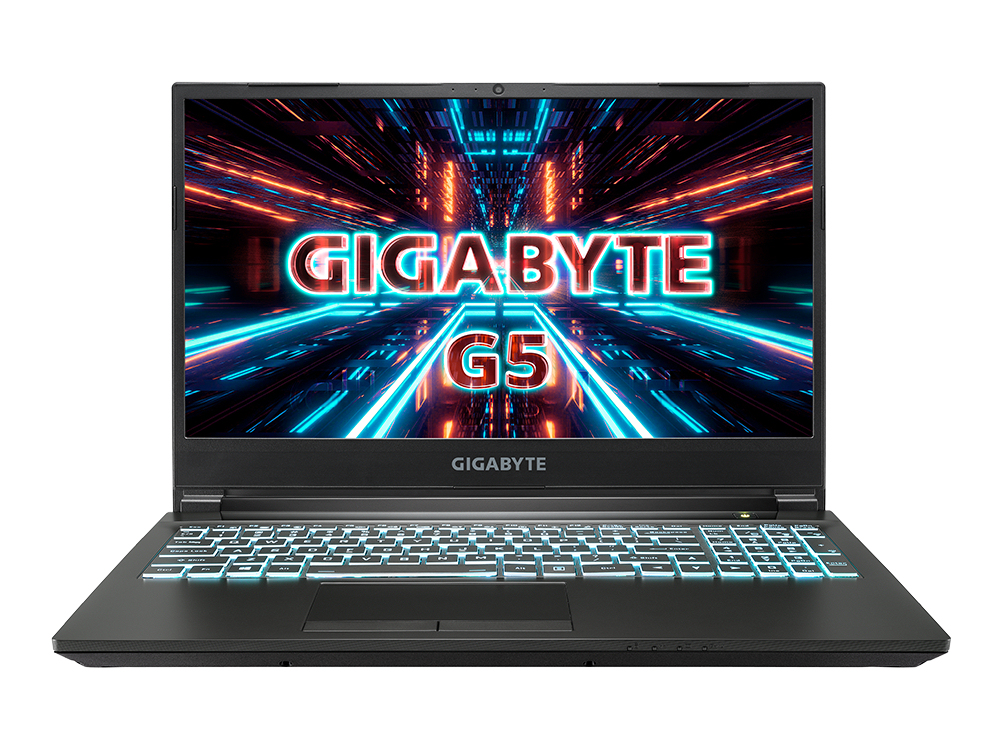
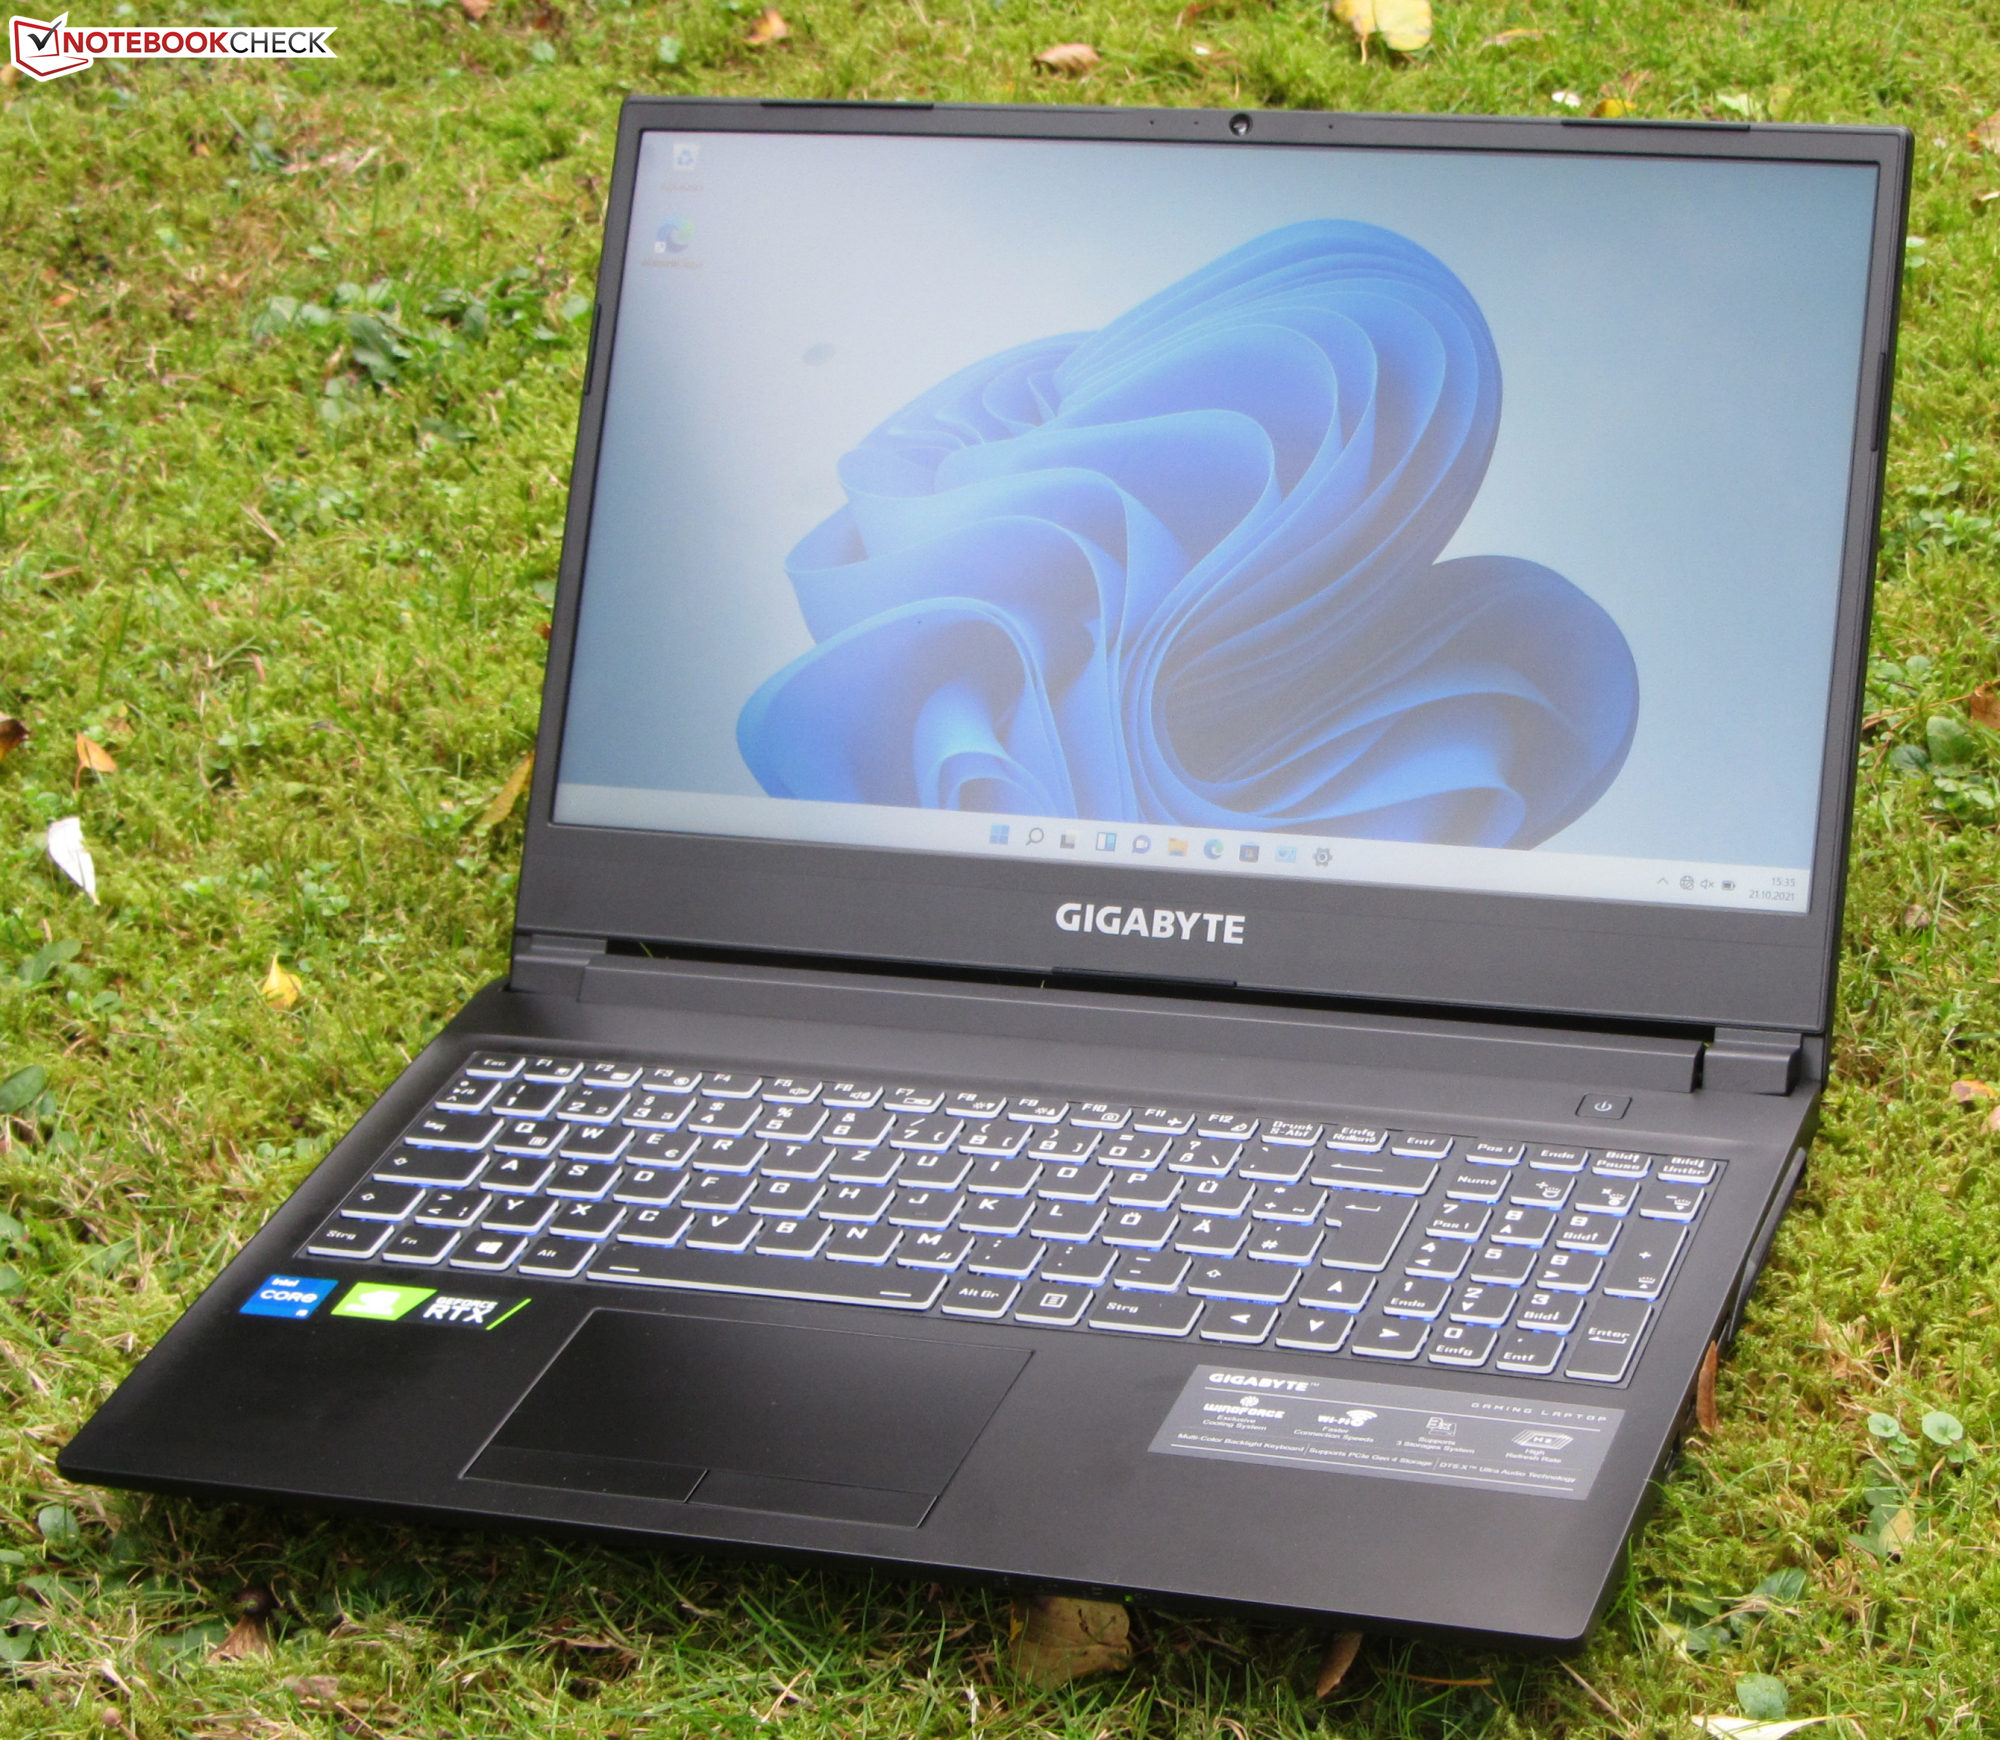
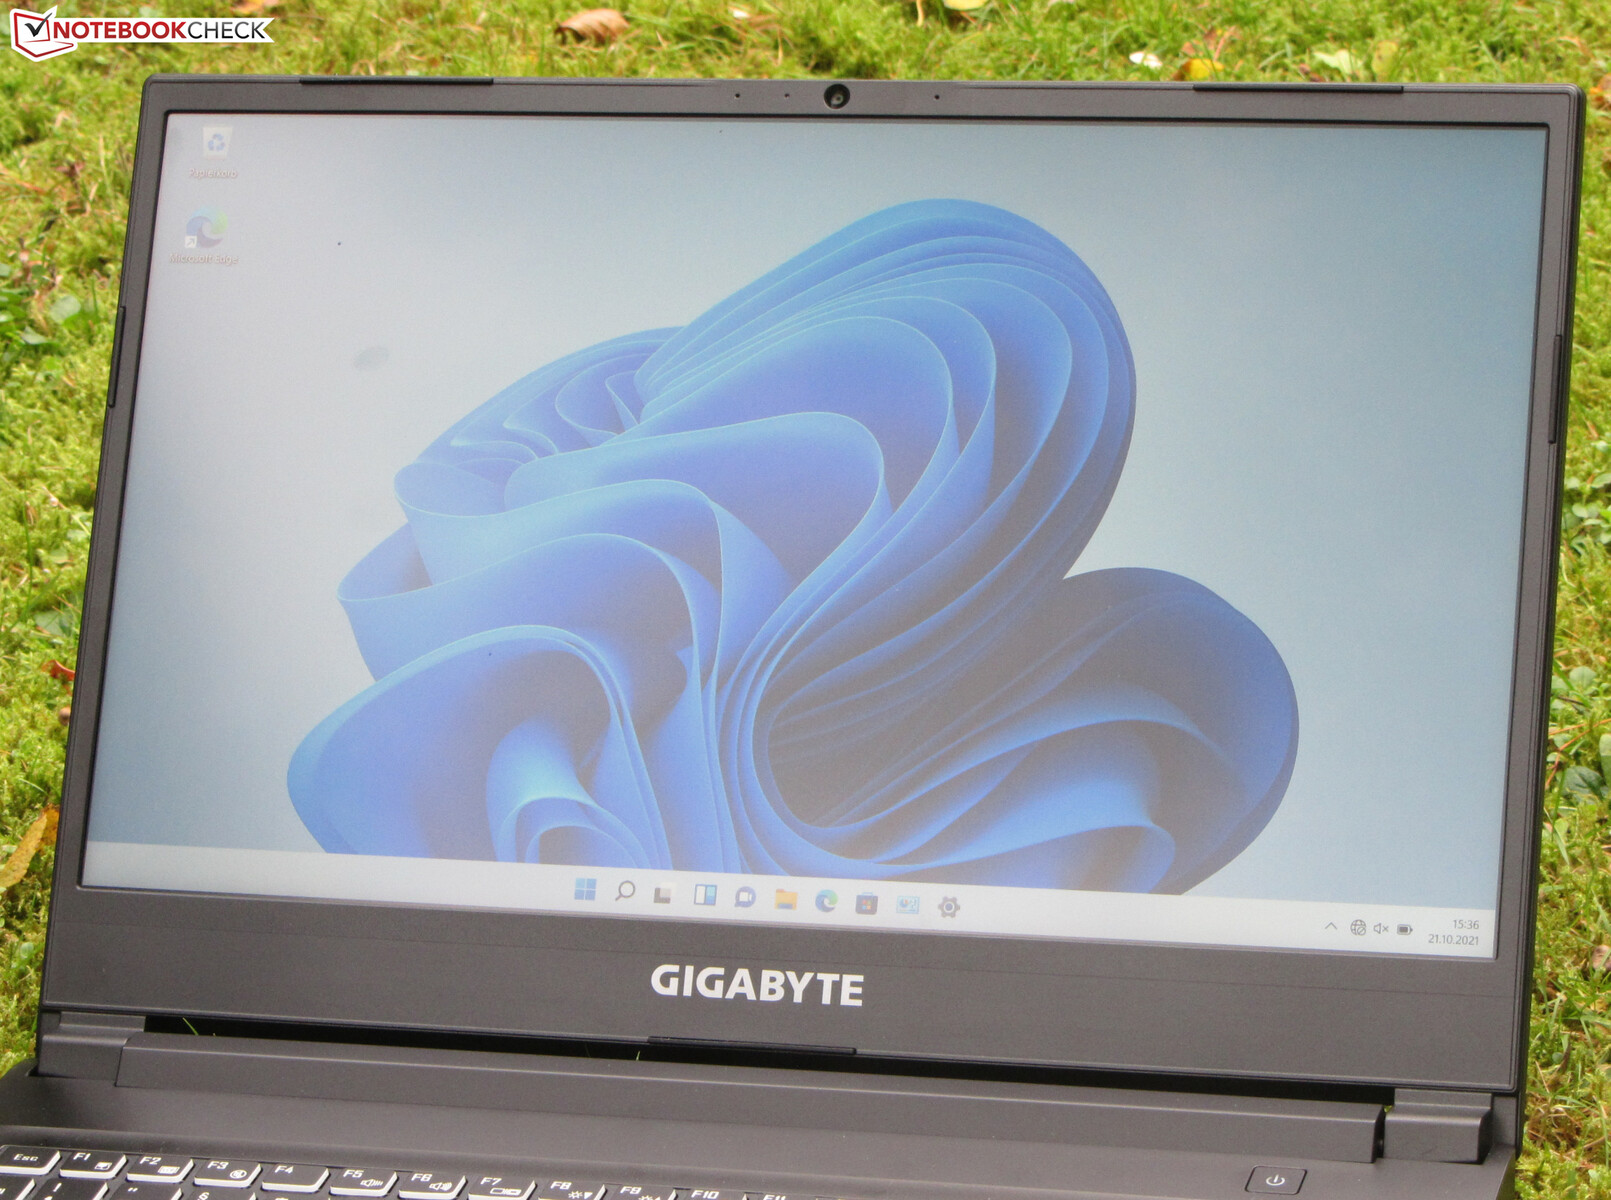
Análisis del Gigabyte G5 GD: Un portátil para juegos asequible sin Windows

Su configuración (Core i5-11400H,GeForce RTX 3050) y su precio (alrededor de 750 euros) posicionan al Gigabyte G5 GD como un portátil para juegos de nivel básico. La competencia incluye dispositivos como el Lenovo Legion 5 15ACHy elMSI GF65 Thin 10UEy el Dell G15 5515.
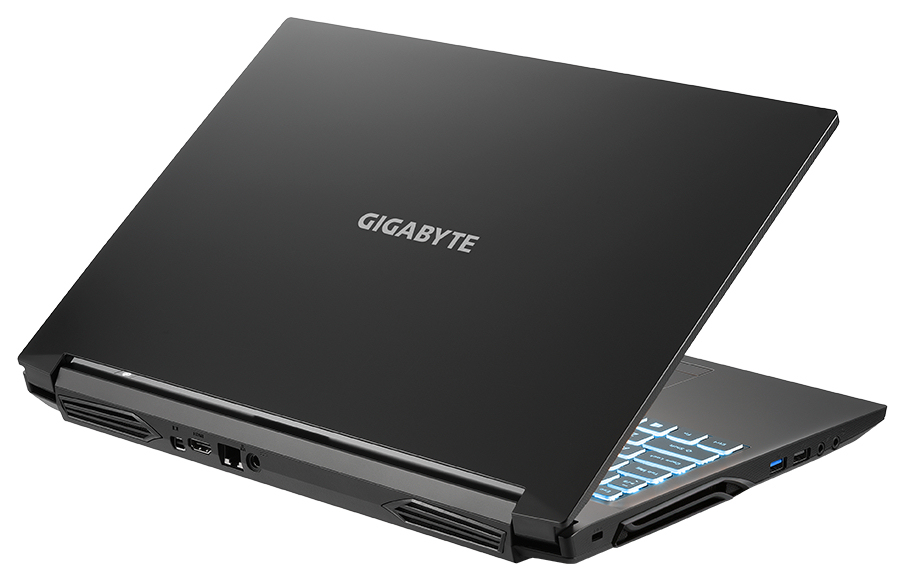
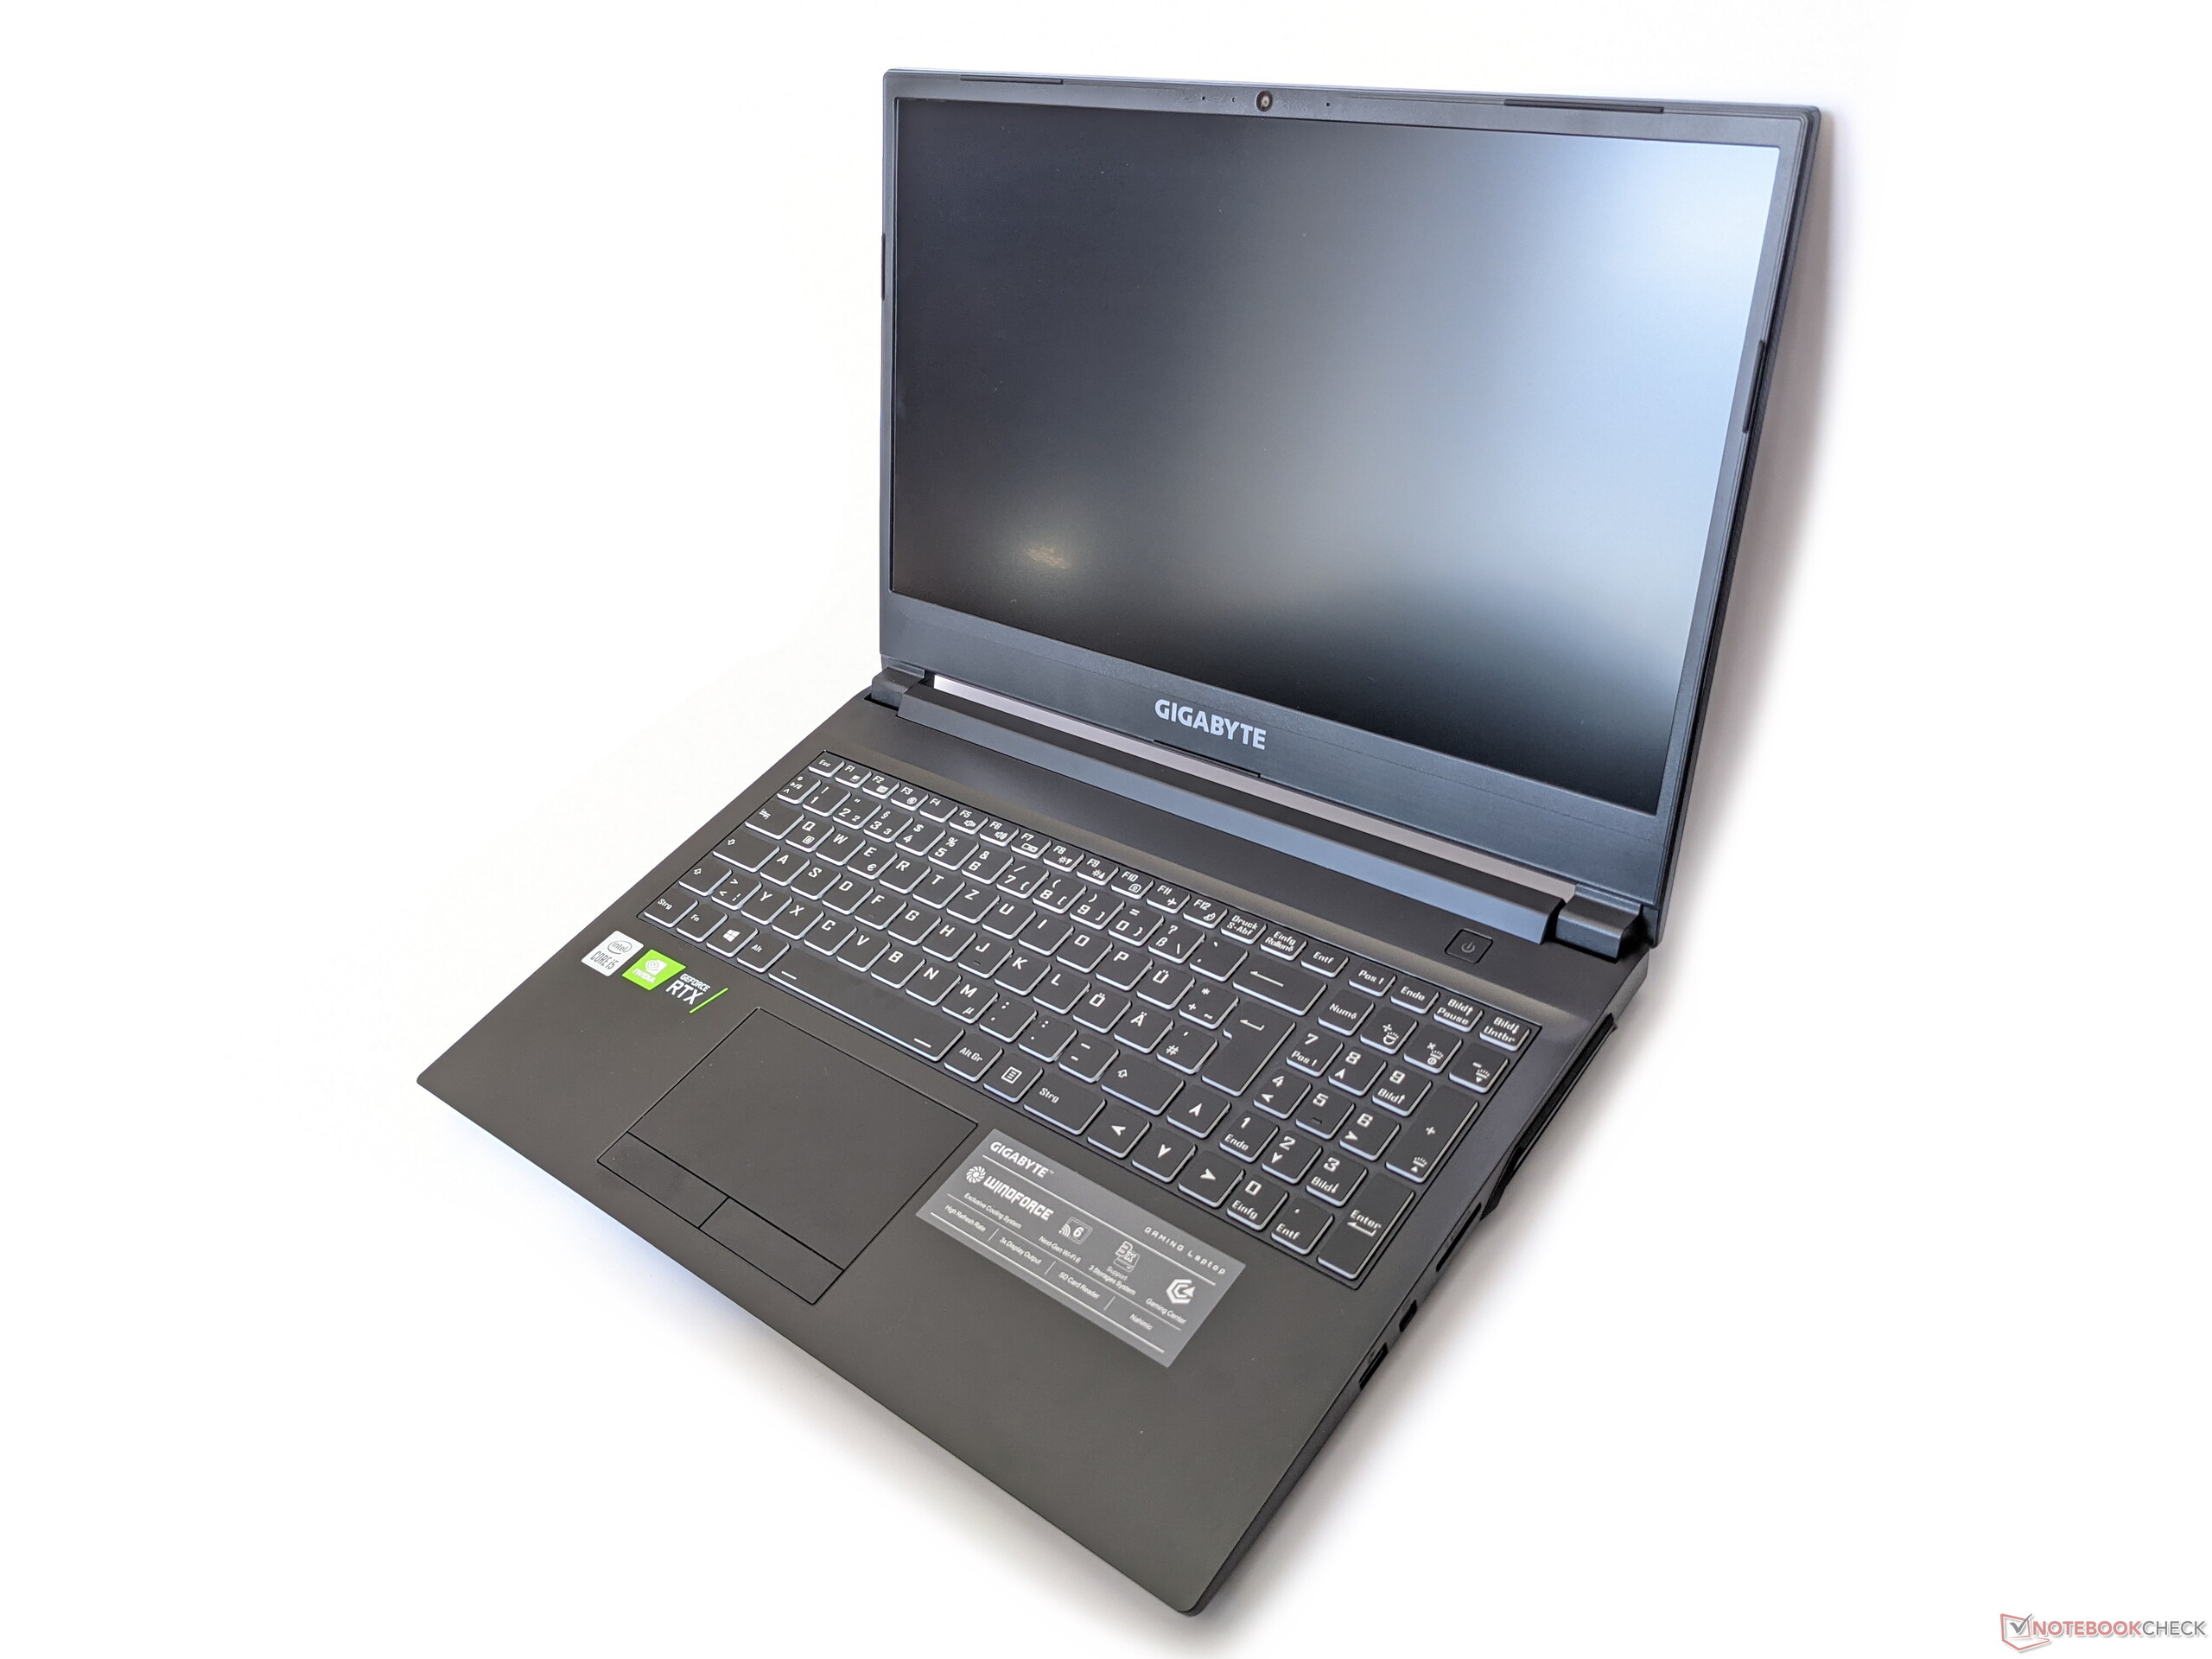
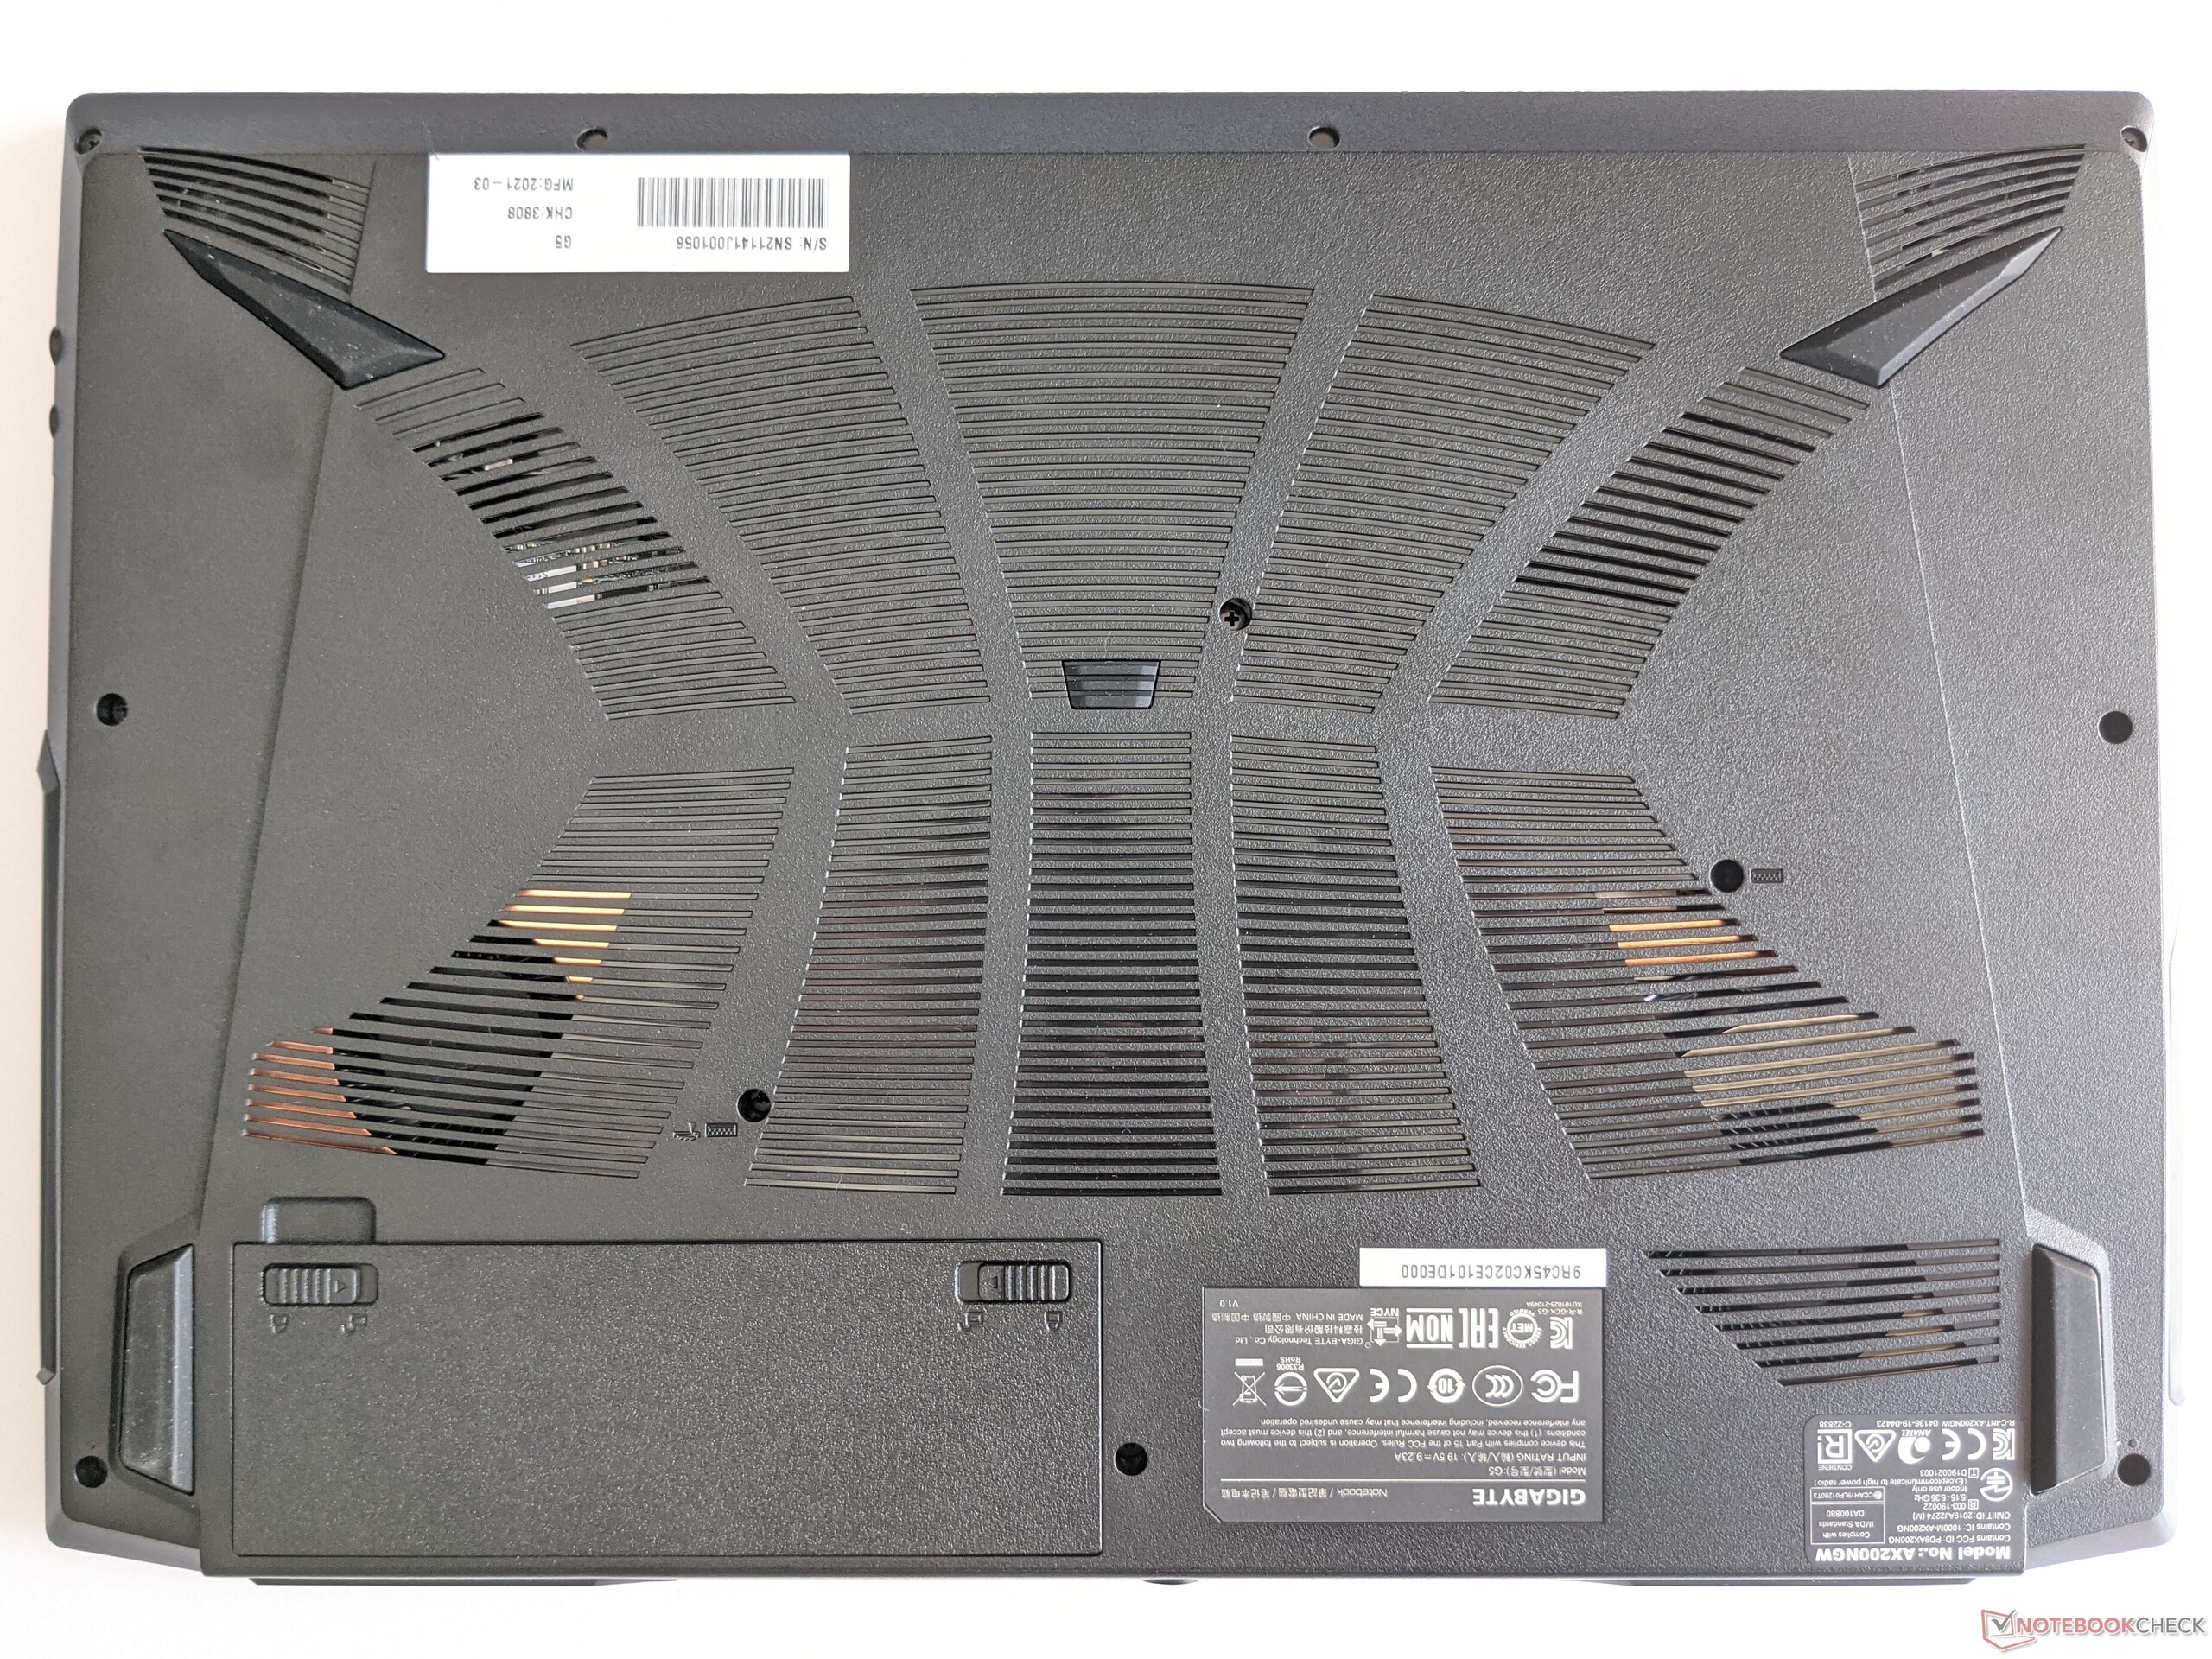
No entraremos en más detalles sobre la carcasa, la conectividad, los dispositivos de entrada y los altavoces en este análisis. La información correspondiente se puede encontrar en el análisis del Gigabyte G5 KC de idéntica construcción.
Possible contenders in comparison
Valoración | Fecha | Modelo | Peso | Altura | Tamaño | Resolución | Precio |
|---|---|---|---|---|---|---|---|
| 81.7 % v7 (old) | 11/2021 | Gigabyte G5 GD i5-11400H, GeForce RTX 3050 4GB Laptop GPU | 2.1 kg | 31.6 mm | 15.60" | 1920x1080 | |
| 82.7 % v7 (old) | 10/2021 | Dell G15 5515 R7 5800H, GeForce RTX 3050 Ti Laptop GPU | 2.4 kg | 24.9 mm | 15.60" | 1920x1080 | |
| 83.4 % v7 (old) | 09/2021 | Lenovo Legion 5 15ACH-82JU00C6GE-FL R7 5800H, GeForce RTX 3060 Laptop GPU | 2.5 kg | 26 mm | 15.60" | 1920x1080 | |
| 80.4 % v7 (old) | 03/2021 | MSI GF65 Thin 10UE i7-10750H, GeForce RTX 3060 Laptop GPU | 1.9 kg | 21.7 mm | 15.60" | 1920x1080 |


| SD Card Reader | |
| average JPG Copy Test (av. of 3 runs) | |
| Media de la clase Gaming (20.9 - 210, n=55, últimos 2 años) | |
| Gigabyte G5 GD (AV PRO microSD 128 GB V60) | |
| Gigabyte G5 KC (AV PRO microSD 128 GB V60) | |
| maximum AS SSD Seq Read Test (1GB) | |
| Media de la clase Gaming (25.5 - 261, n=52, últimos 2 años) | |
| Gigabyte G5 GD (AV PRO microSD 128 GB V60) | |
| Gigabyte G5 KC (AV PRO microSD 128 GB V60) | |


Pantalla - 144 Hz IPS
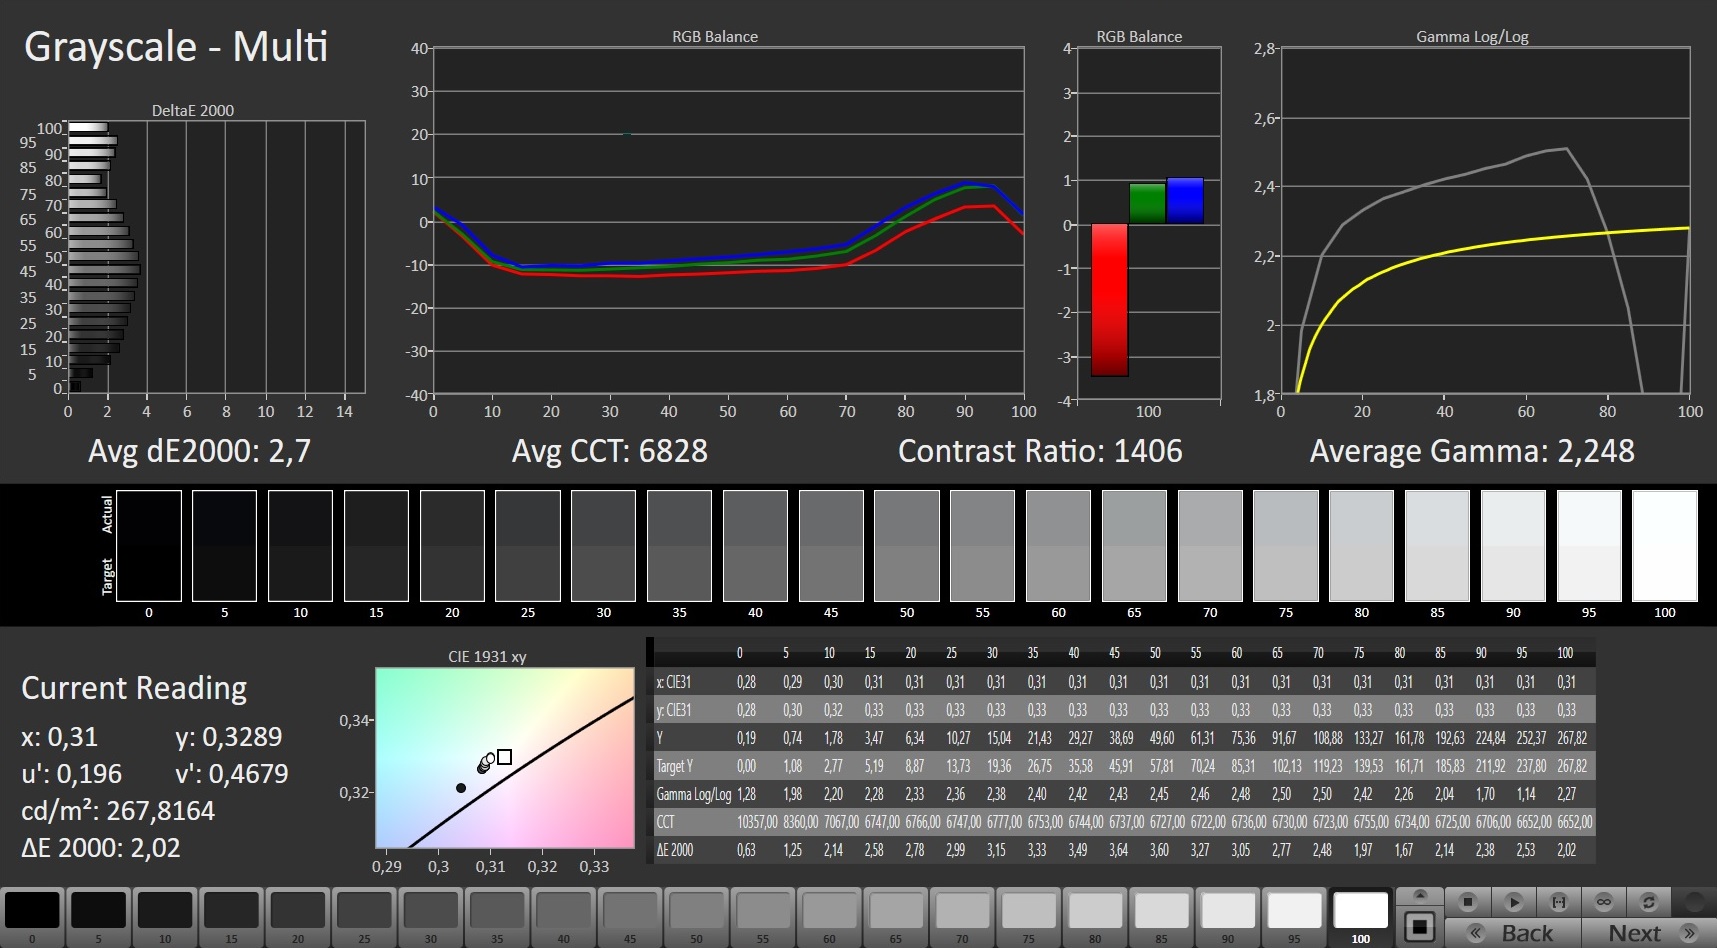
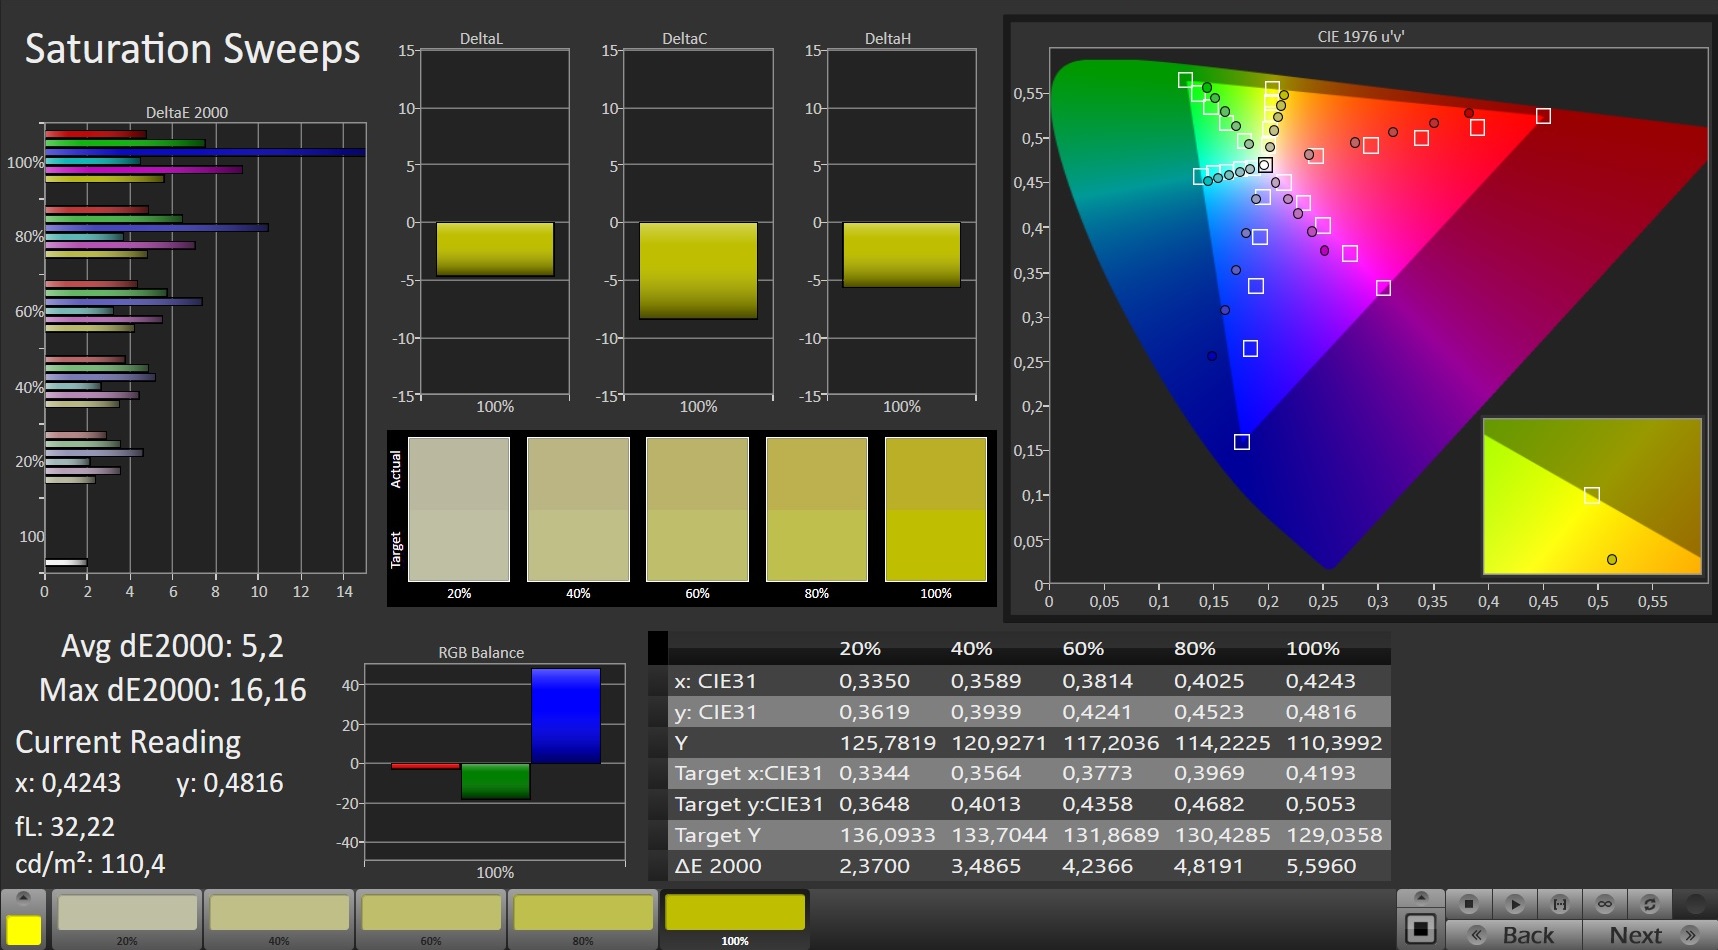
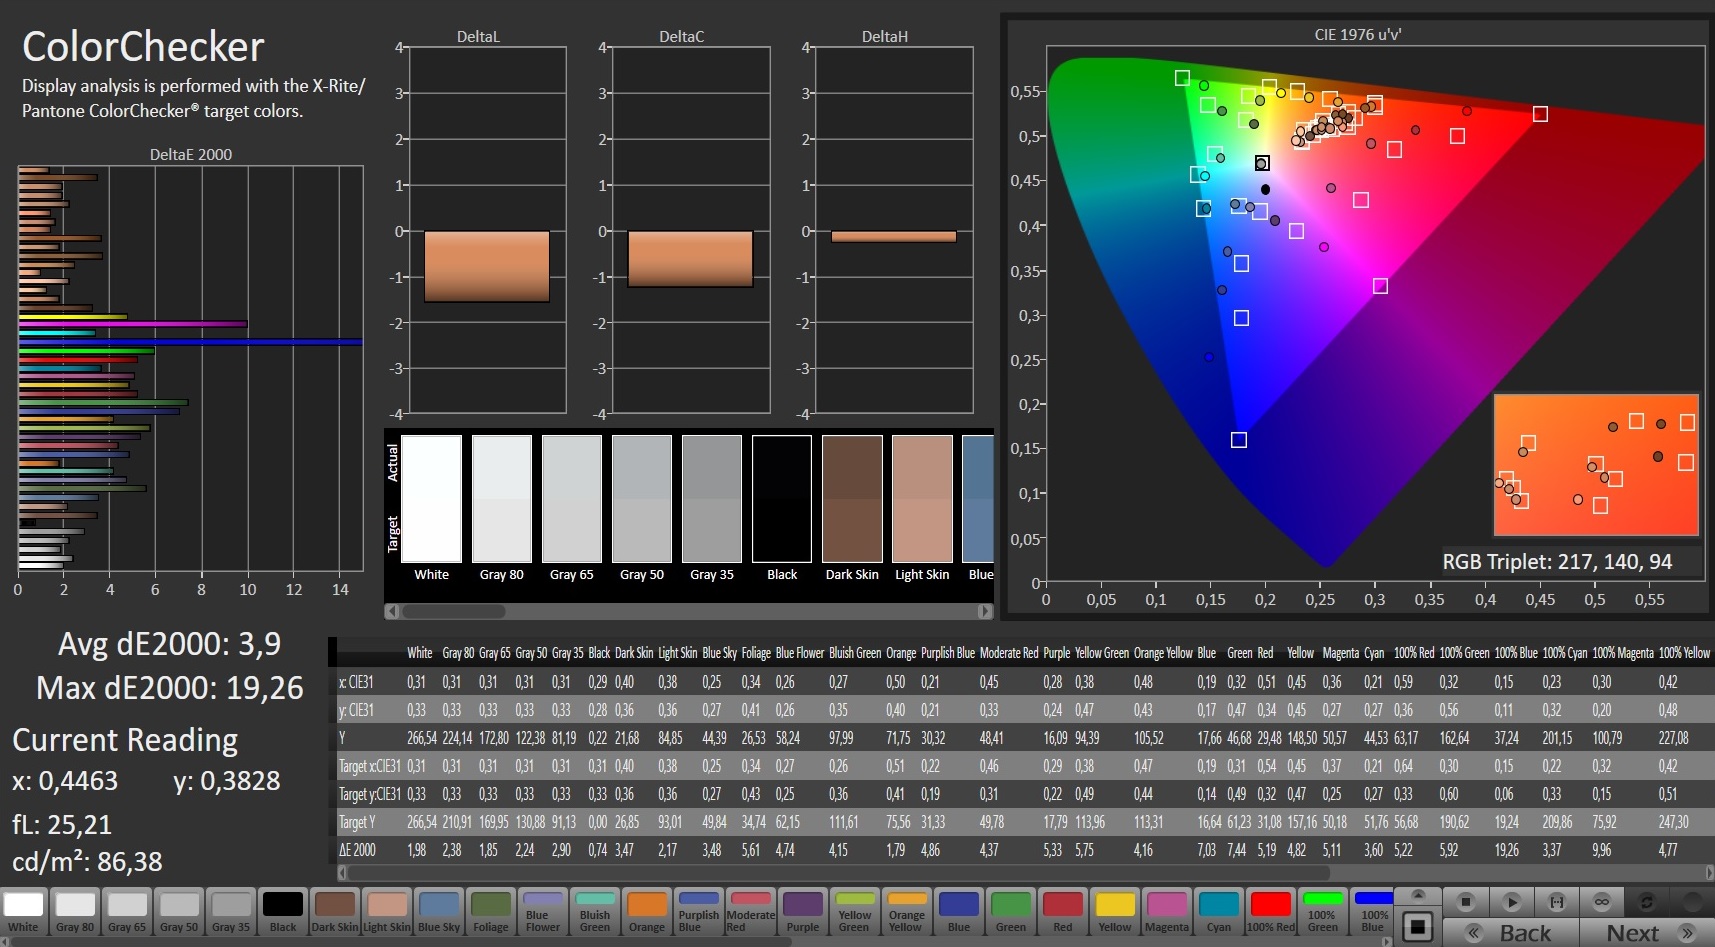
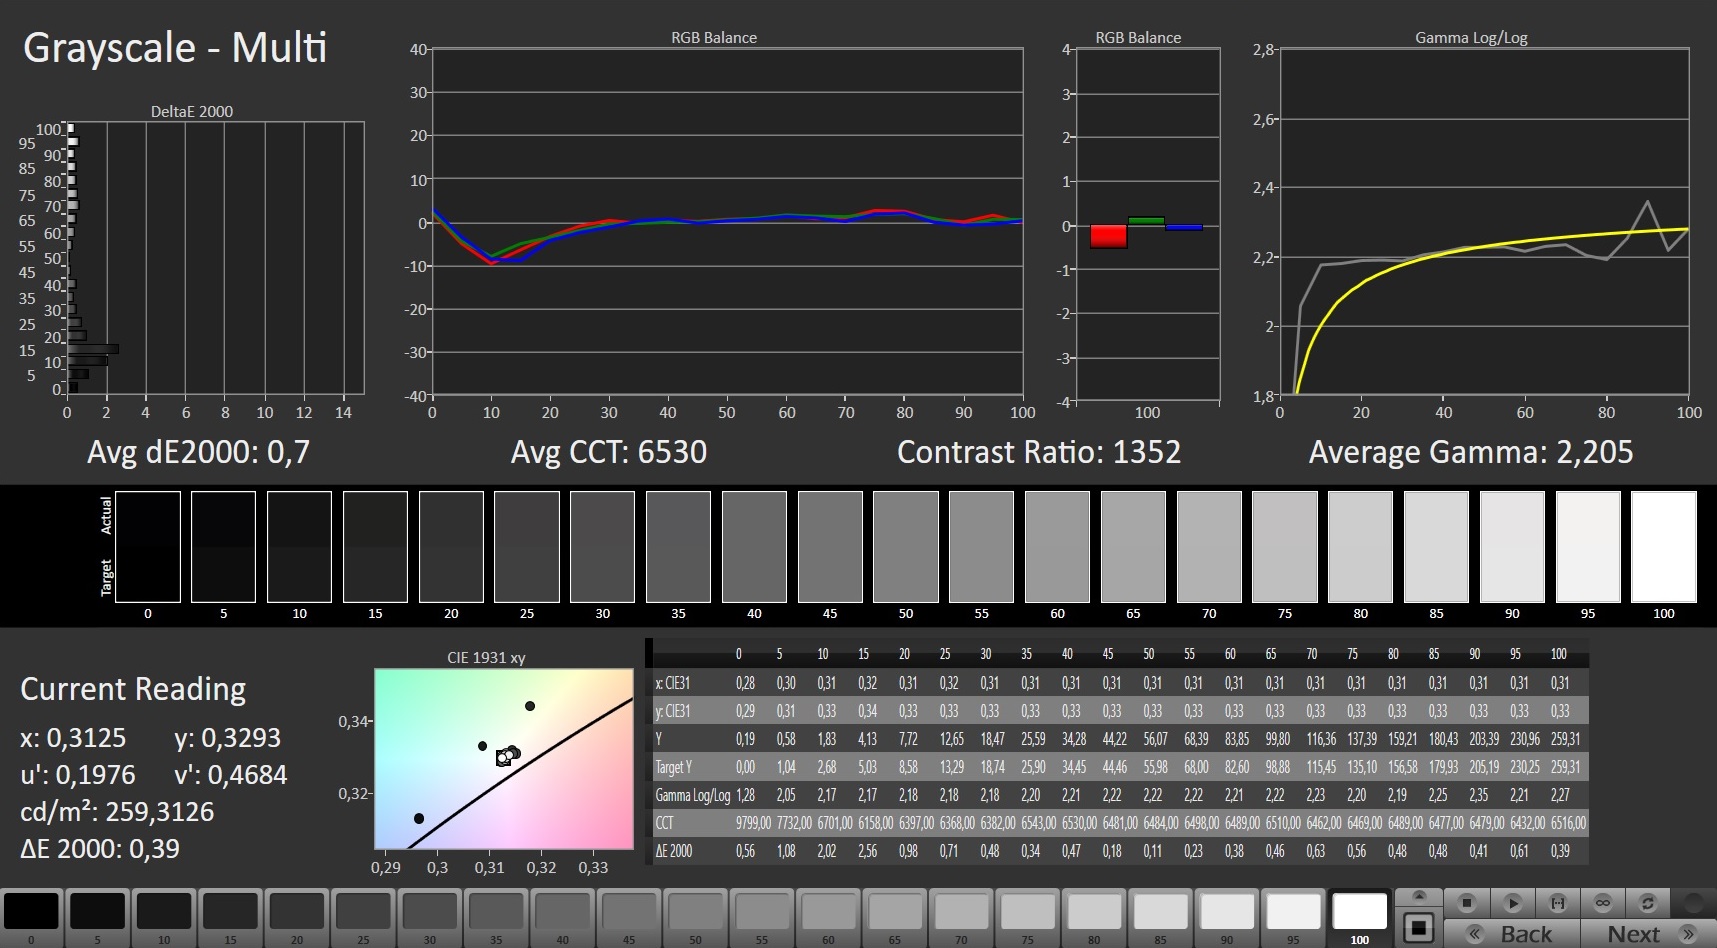
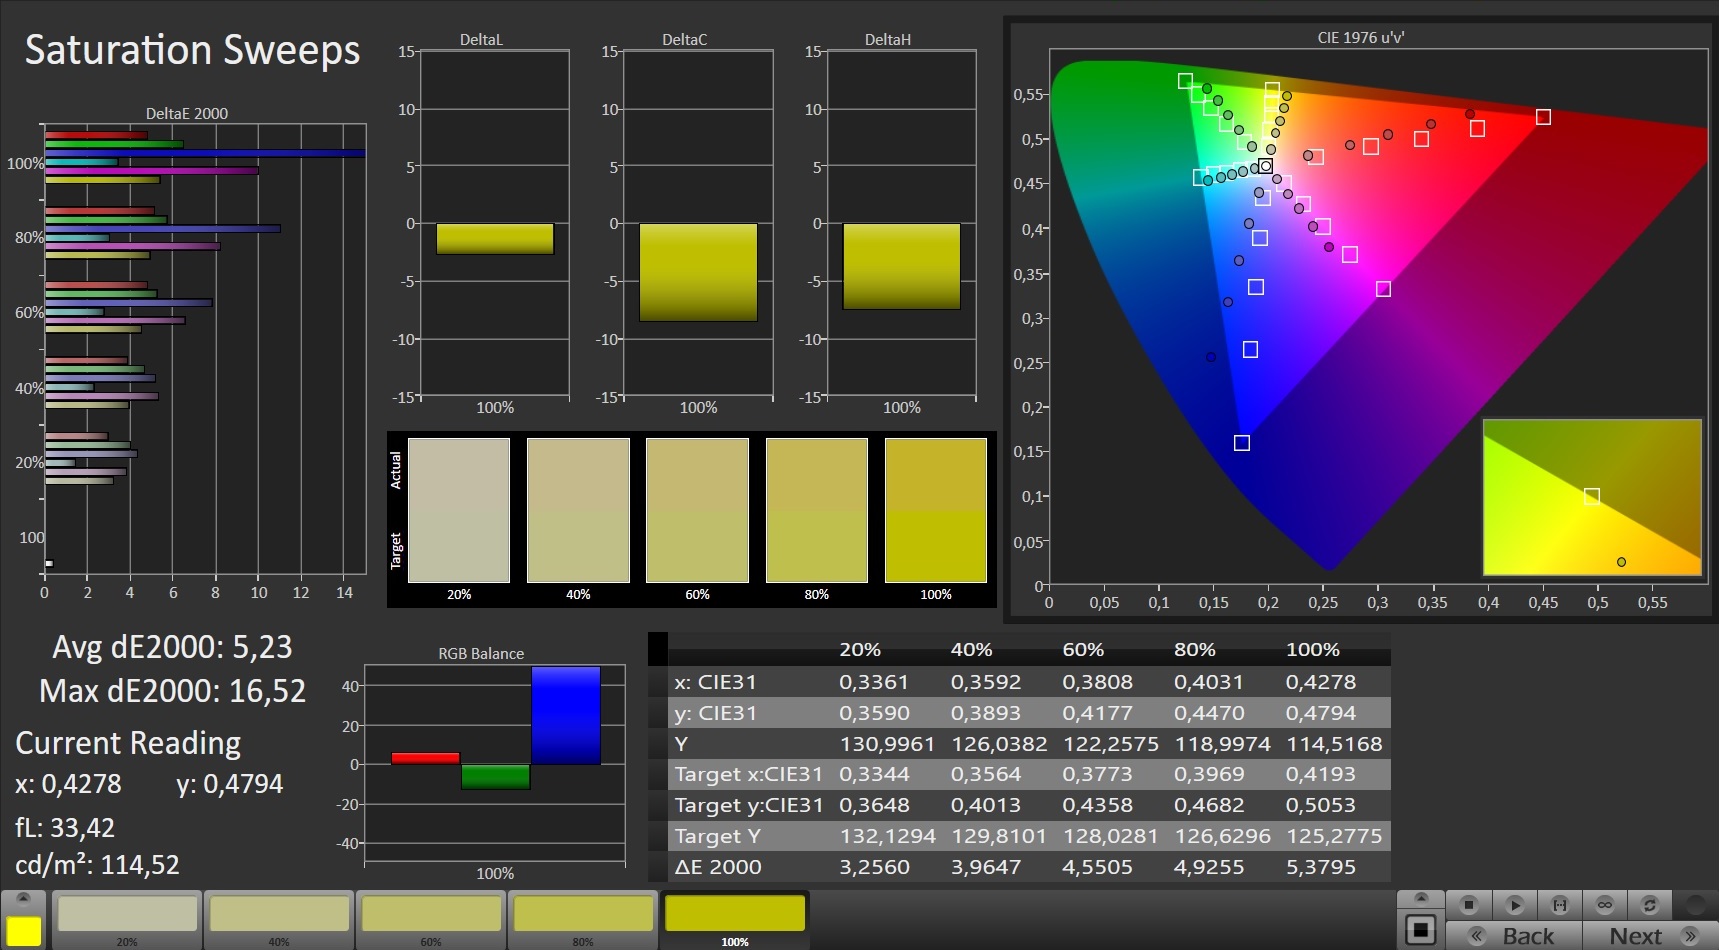
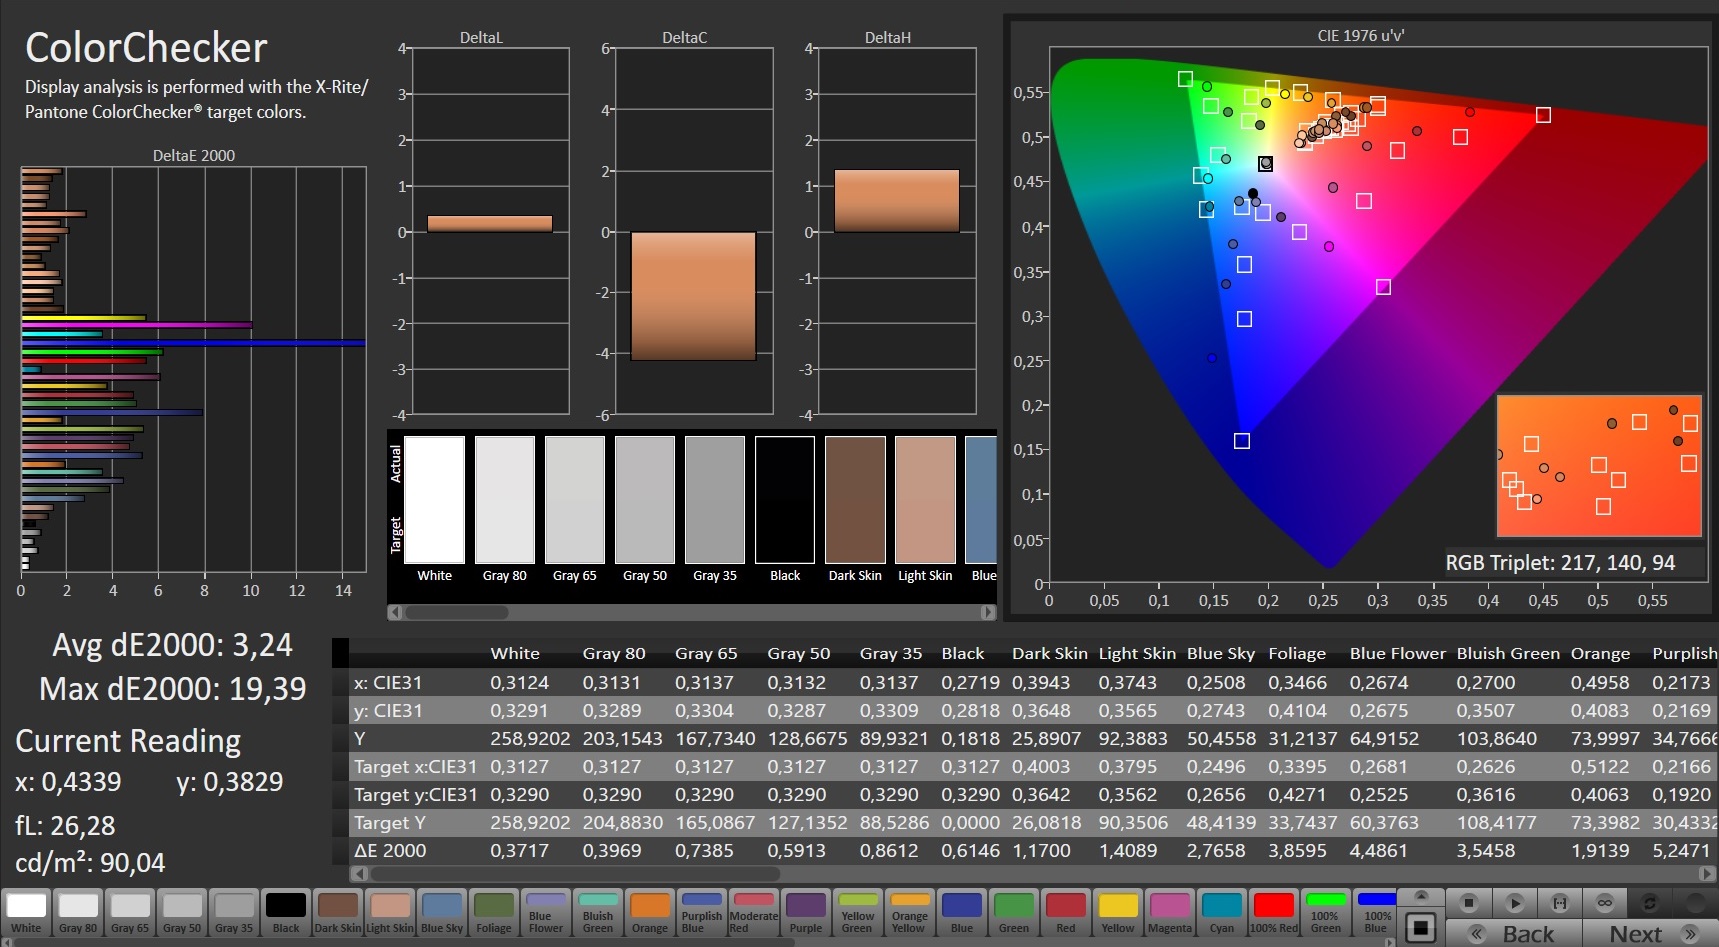
Mientras que el contraste (1.374:1) de la pantalla mate de 15,6 pulgadas (1920x1080 píxeles) cumple el objetivo (> 1.000:1), el brillo medio (245,7 cd/m²) es demasiado bajo. Consideramos que los valores superiores a 300 cd/m² son buenos. El panel de 144 Hz tiene tiempos de respuesta pobres. No se observó parpadeo PWM
| |||||||||||||||||||||||||
iluminación: 87 %
Brillo con batería: 261 cd/m²
Contraste: 1374:1 (Negro: 0.19 cd/m²)
ΔE ColorChecker Calman: 3.9 | ∀{0.5-29.43 Ø4.73}
calibrated: 3.24
ΔE Greyscale Calman: 2.7 | ∀{0.09-98 Ø4.97}
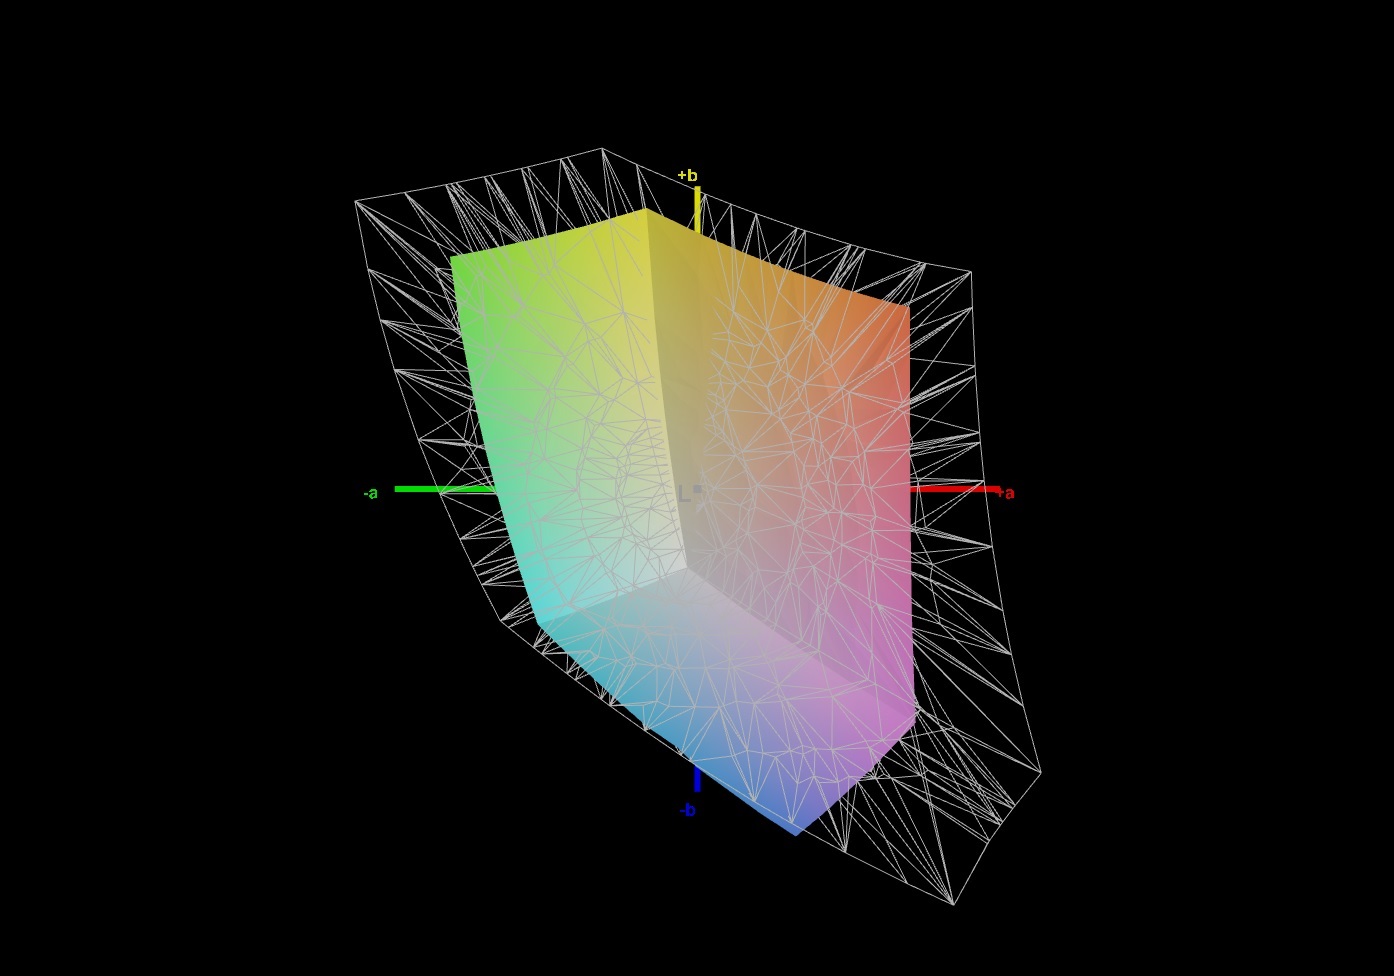
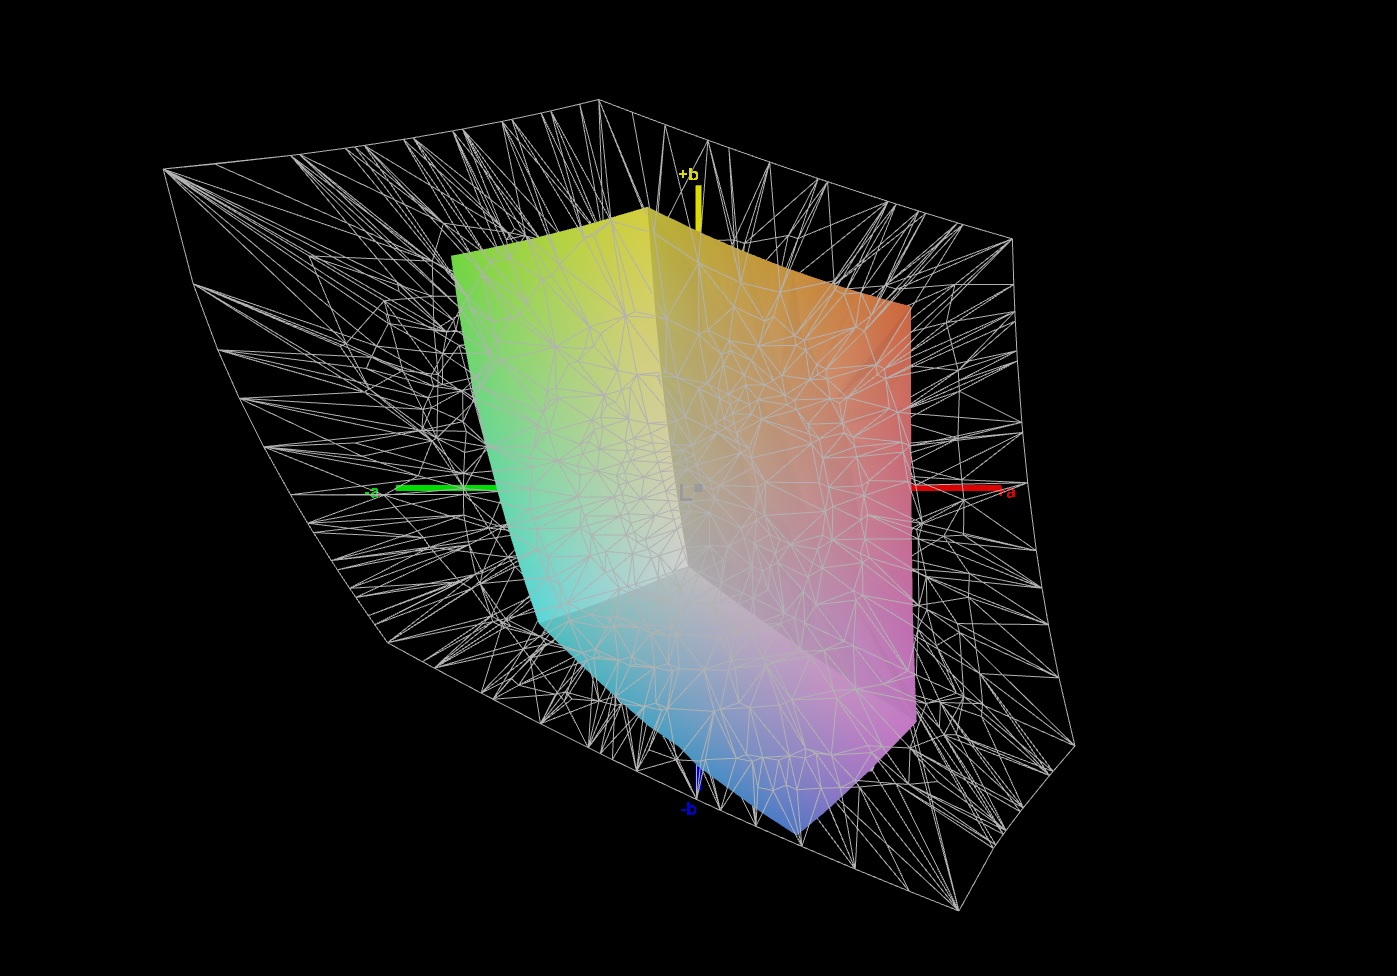
43.2% AdobeRGB 1998 (Argyll 3D)
62.3% sRGB (Argyll 3D)
41.8% Display P3 (Argyll 3D)
Gamma: 2.248
CCT: 6828 K
| Gigabyte G5 GD Chi Mei N156HRA-EA1, IPS, 1920x1080, 15.6" | Dell G15 5515 BOE092A, IPS, 1920x1080, 15.6" | Lenovo Legion 5 15ACH-82JU00C6GE-FL B156HAN12.H, , 1920x1080, 15.6" | MSI GF65 Thin 10UE AU Optronics B156HAN08.4, IPS, 1920x1080, 15.6" | Gigabyte G5 KC LM156LF-1F02, IPS, 1920x1080, 15.6" | |
|---|---|---|---|---|---|
| Display | -7% | 56% | -10% | 60% | |
| Display P3 Coverage (%) | 41.8 | 39.1 -6% | 65.4 56% | 37.65 -10% | 68.2 63% |
| sRGB Coverage (%) | 62.3 | 56.9 -9% | 96.3 55% | 56.3 -10% | 96.7 55% |
| AdobeRGB 1998 Coverage (%) | 43.2 | 40.4 -6% | 67.5 56% | 38.9 -10% | 69.6 61% |
| Response Times | 28% | 60% | -22% | 63% | |
| Response Time Grey 50% / Grey 80% * (ms) | 34.4 ? | 25.2 ? 27% | 13.6 ? 60% | 36.8 ? -7% | 10 ? 71% |
| Response Time Black / White * (ms) | 23.2 ? | 16.8 ? 28% | 9.2 ? 60% | 31.6 ? -36% | 10.4 ? 55% |
| PWM Frequency (Hz) | 200 ? | ||||
| Screen | -26% | 2% | -12% | -24% | |
| Brightness middle (cd/m²) | 261 | 278 7% | 350 34% | 266.5 2% | 295 13% |
| Brightness (cd/m²) | 246 | 262 7% | 350 42% | 262 7% | 275 12% |
| Brightness Distribution (%) | 87 | 83 -5% | 96 10% | 91 5% | 86 -1% |
| Black Level * (cd/m²) | 0.19 | 0.36 -89% | 0.3 -58% | 0.18 5% | 0.23 -21% |
| Contrast (:1) | 1374 | 772 -44% | 1167 -15% | 1481 8% | 1283 -7% |
| Colorchecker dE 2000 * | 3.9 | 5.74 -47% | 3.9 -0% | 5.33 -37% | 5.21 -34% |
| Colorchecker dE 2000 max. * | 19.26 | 19.63 -2% | 8.2 57% | 18.28 5% | 14.03 27% |
| Colorchecker dE 2000 calibrated * | 3.24 | 4.7 -45% | 1.6 51% | 4.36 -35% | 1.73 47% |
| Greyscale dE 2000 * | 2.7 | 3.1 -15% | 5.5 -104% | 4.5 -67% | 9.4 -248% |
| Gamma | 2.248 98% | 2.011 109% | 2.15 102% | 2.35 94% | 2.046 108% |
| CCT | 6828 95% | 6207 105% | 7414 88% | 6289 103% | 8002 81% |
| Color Space (Percent of AdobeRGB 1998) (%) | 35.6 | ||||
| Color Space (Percent of sRGB) (%) | 55.8 | ||||
| Media total (Programa/Opciones) | -2% /
-14% | 39% /
22% | -15% /
-13% | 33% /
7% |
* ... más pequeño es mejor
Al sacarlo de la caja, la reproducción del color se desvía ligeramente del objetivo. Sin embargo, esto no es perceptible. La calibración sólo aporta pequeñas mejoras. Además, el panel no sufre de un tinte azul. La pantalla no puede representar los espacios de color AdobeRGB (43%), sRGB (62%) y DCI-P3 (42%)
Tiempos de respuesta del display
| ↔ Tiempo de respuesta de Negro a Blanco | ||
|---|---|---|
| 23.2 ms ... subida ↗ y bajada ↘ combinada | ↗ 13.2 ms subida | 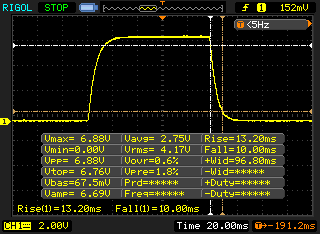 |
| ↘ 10 ms bajada | ||
| La pantalla mostró buenos tiempos de respuesta en nuestros tests pero podría ser demasiado lenta para los jugones competitivos. En comparación, todos los dispositivos de prueba van de ##min### (mínimo) a 240 (máximo) ms. » 53 % de todos los dispositivos son mejores. Eso quiere decir que el tiempo de respuesta es peor que la media (19.9 ms) de todos los dispositivos testados. | ||
| ↔ Tiempo de respuesta 50% Gris a 80% Gris | ||
| 34.4 ms ... subida ↗ y bajada ↘ combinada | ↗ 16.4 ms subida | 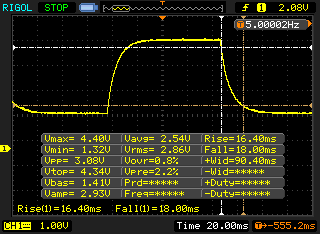 |
| ↘ 18 ms bajada | ||
| La pantalla mostró tiempos de respuesta lentos en nuestros tests y podría ser demasiado lenta para los jugones. En comparación, todos los dispositivos de prueba van de ##min### (mínimo) a 636 (máximo) ms. » 48 % de todos los dispositivos son mejores. Eso quiere decir que el tiempo de respuesta es peor que la media (31.1 ms) de todos los dispositivos testados. | ||
Parpadeo de Pantalla / PWM (Pulse-Width Modulation)
| Parpadeo de Pantalla / PWM no detectado | 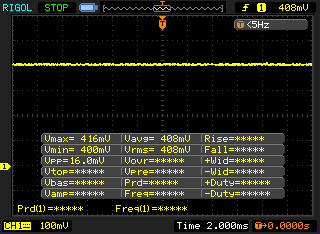 | ||
Comparación: 52 % de todos los dispositivos testados no usaron PWM para atenuar el display. Si se usó, medimos una media de 7798 (mínimo: 5 - máxmo: 343500) Hz. | |||
El panel IPS de ángulo de visión estable se puede leer desde cualquier posición. La lectura en exteriores es posible cuando el sol no brilla demasiado

Rendimiento - Portátil Gigabyte con todo el rendimiento de la RTX 3050
El Gigabyte G5 GD es un portátil para juegos de 15,6 pulgadas que lleva todos los juegos modernos a la pantalla sin problemas
Condiciones de la prueba
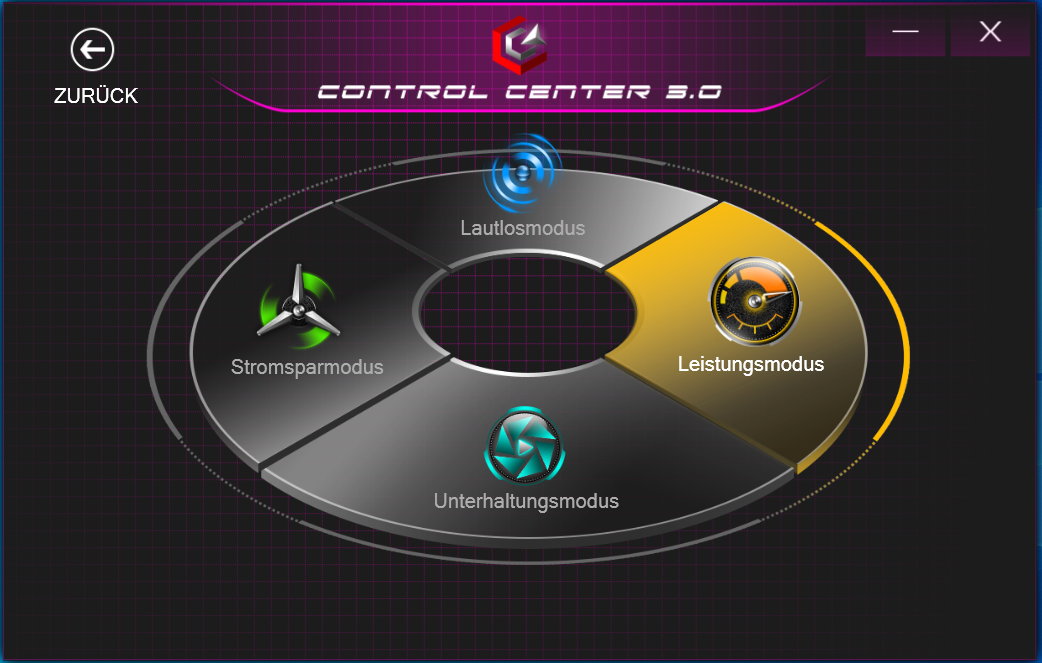
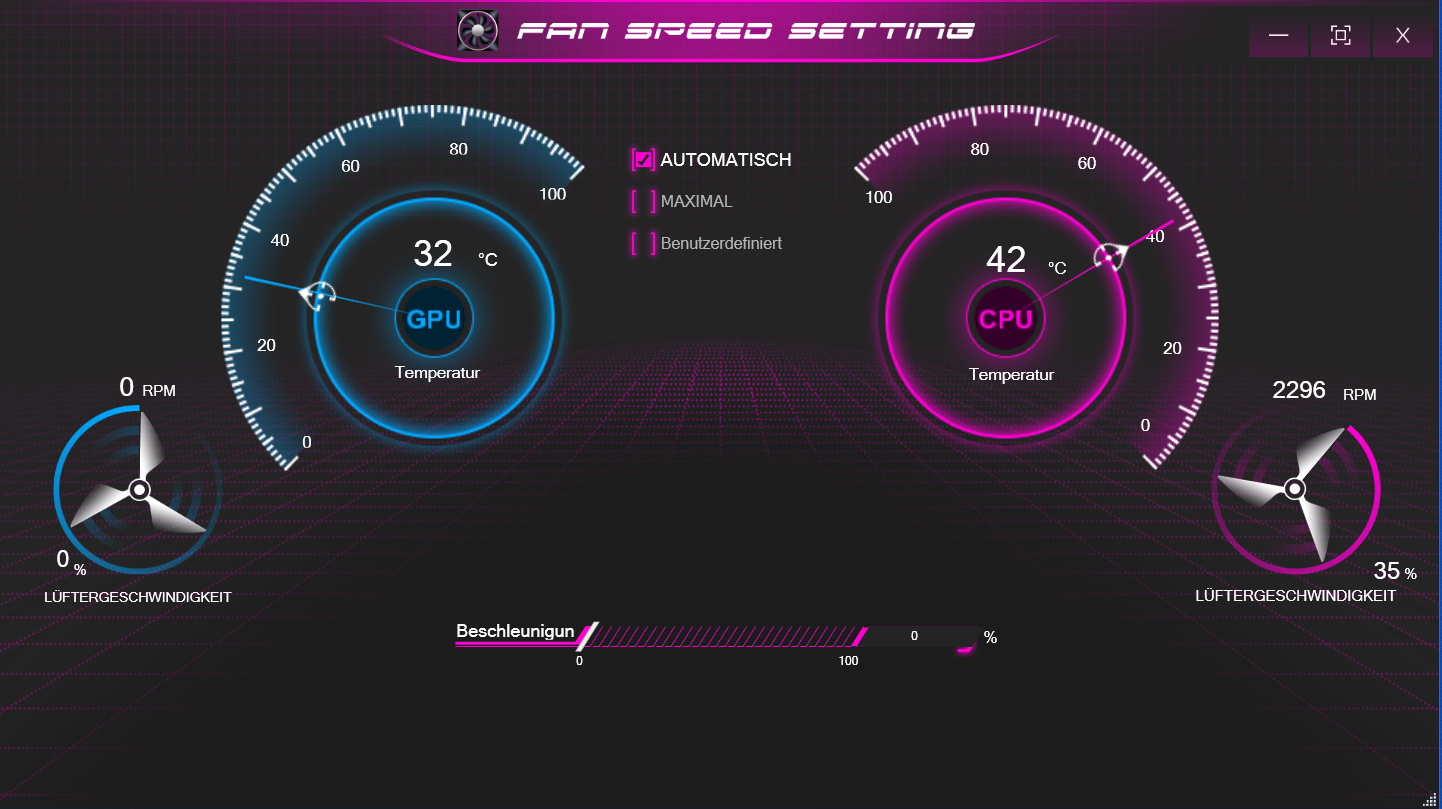
El Centro de Control preinstalado permite elegir un perfil de rendimiento (ver tabla), entre otras cosas. Usamos el perfil "Modo de entretenimiento", que incluye el control automático del ventilador. También realizamos algunas pruebas bajo los perfiles "Modo de rendimiento" y "Modo de ahorro de energía". Los resultados se pueden encontrar en las tablas de comparación.
| Modo de rendimiento | Modo de entretenimiento | Modo de ahorro de energía | Modo silencioso | |
|---|---|---|---|---|
| Límite de potencia 1 | 60 vatios | 45 vatios | 30 vatios | 15 vatios |
| Límite de potencia 2 | 135 vatios | 109 vatios | 30 vatios | 30 vatios |
Consejos de autoayuda: Problemas de BIOS con el G5 GD
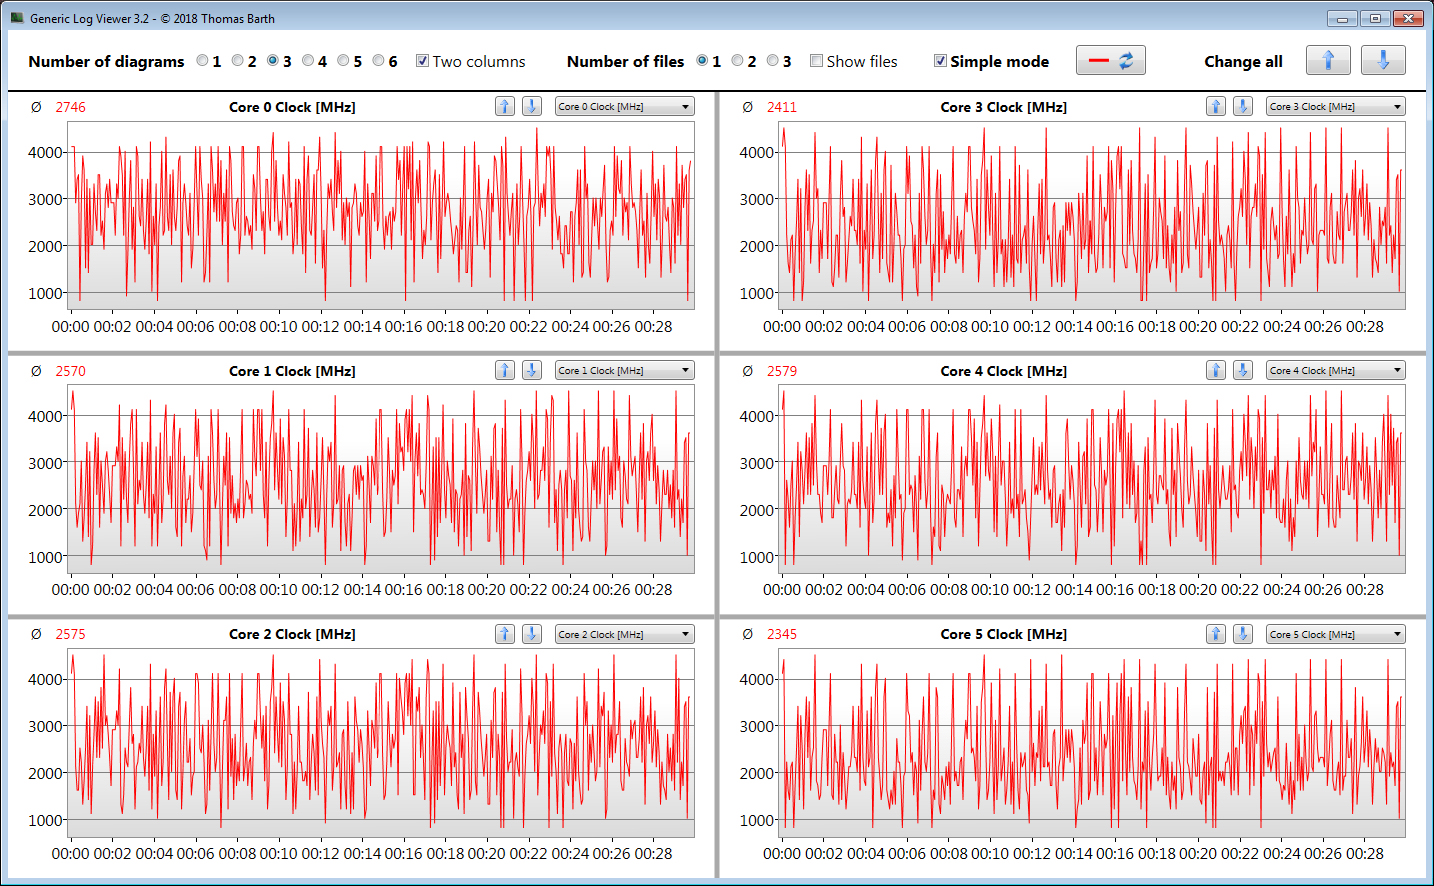
El dispositivo de prueba que se nos proporcionó presentaba un problema: la ralentización de la CPU al ejecutar aplicaciones 3D. Esto se reflejaba en juegos entrecortados, a veces en mayor o menor medida. Fue posible rastrear el problema hasta la BIOS: De las siete versiones de la BIOS lanzadas hasta ahora, sólo las tres primeras (FB01 a FB03) funcionan sin problemas - nuestro dispositivo de prueba venía con la versión FB07 de la BIOS. Por lo tanto, finalmente optamos por instalar la versión FB03 de la BIOS para llevar a cabo nuestras pruebas
Windows 10 o Windows 11 - Depende de la versión del BIOS
El G5 sólo es compatible con Windows 11 a partir de la versión FB06 del BIOS. Las versiones anteriores hacen que el portátil se congele incluso antes del arranque real de un SO Windows 11 previamente instalado. Windows 10 funciona con todas las versiones de BIOS.
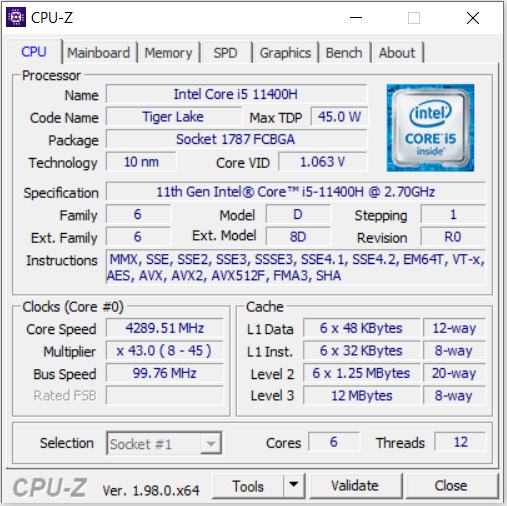
Procesador
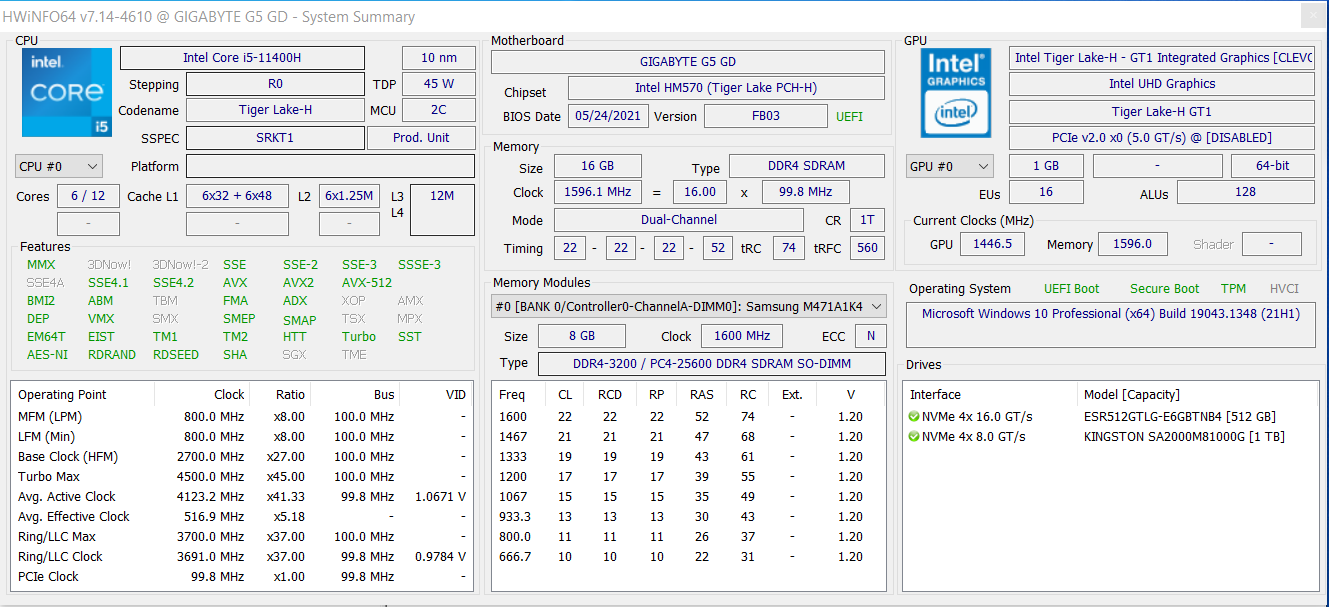
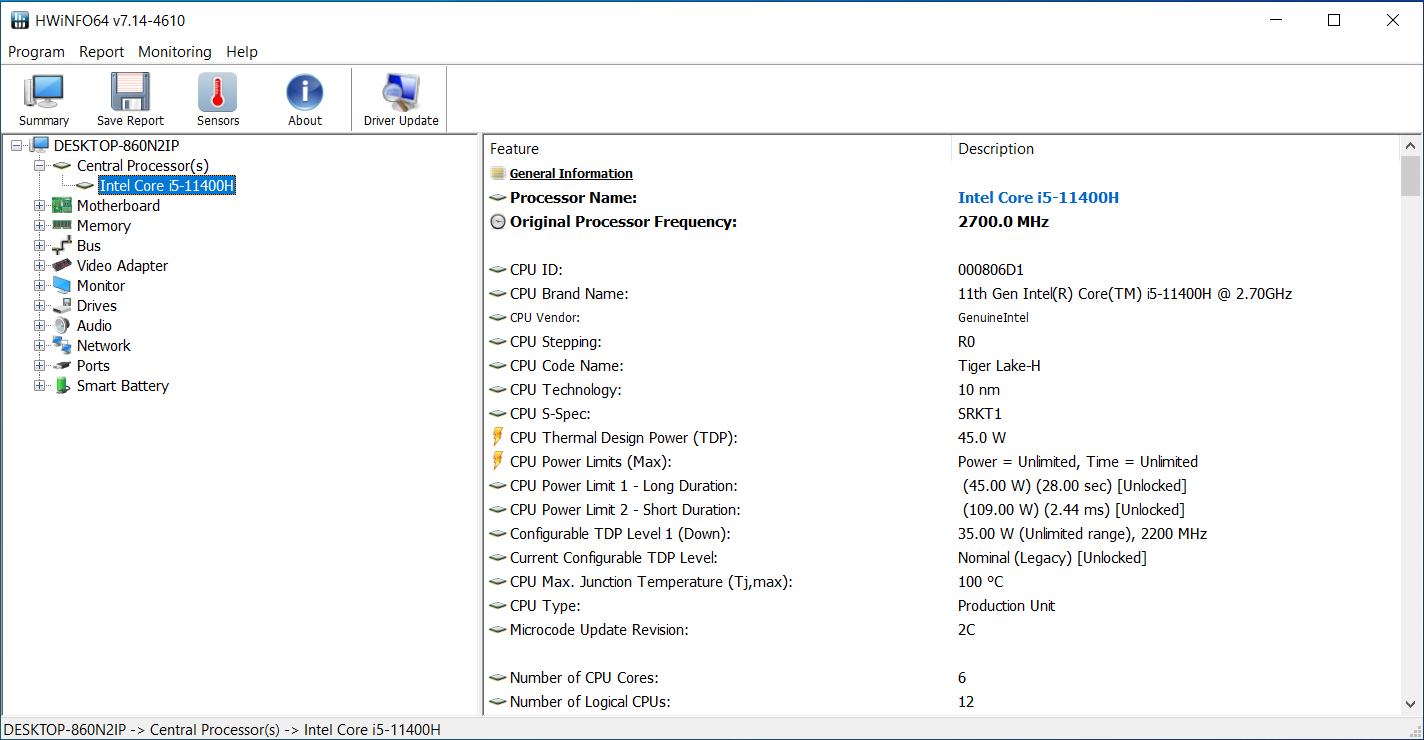
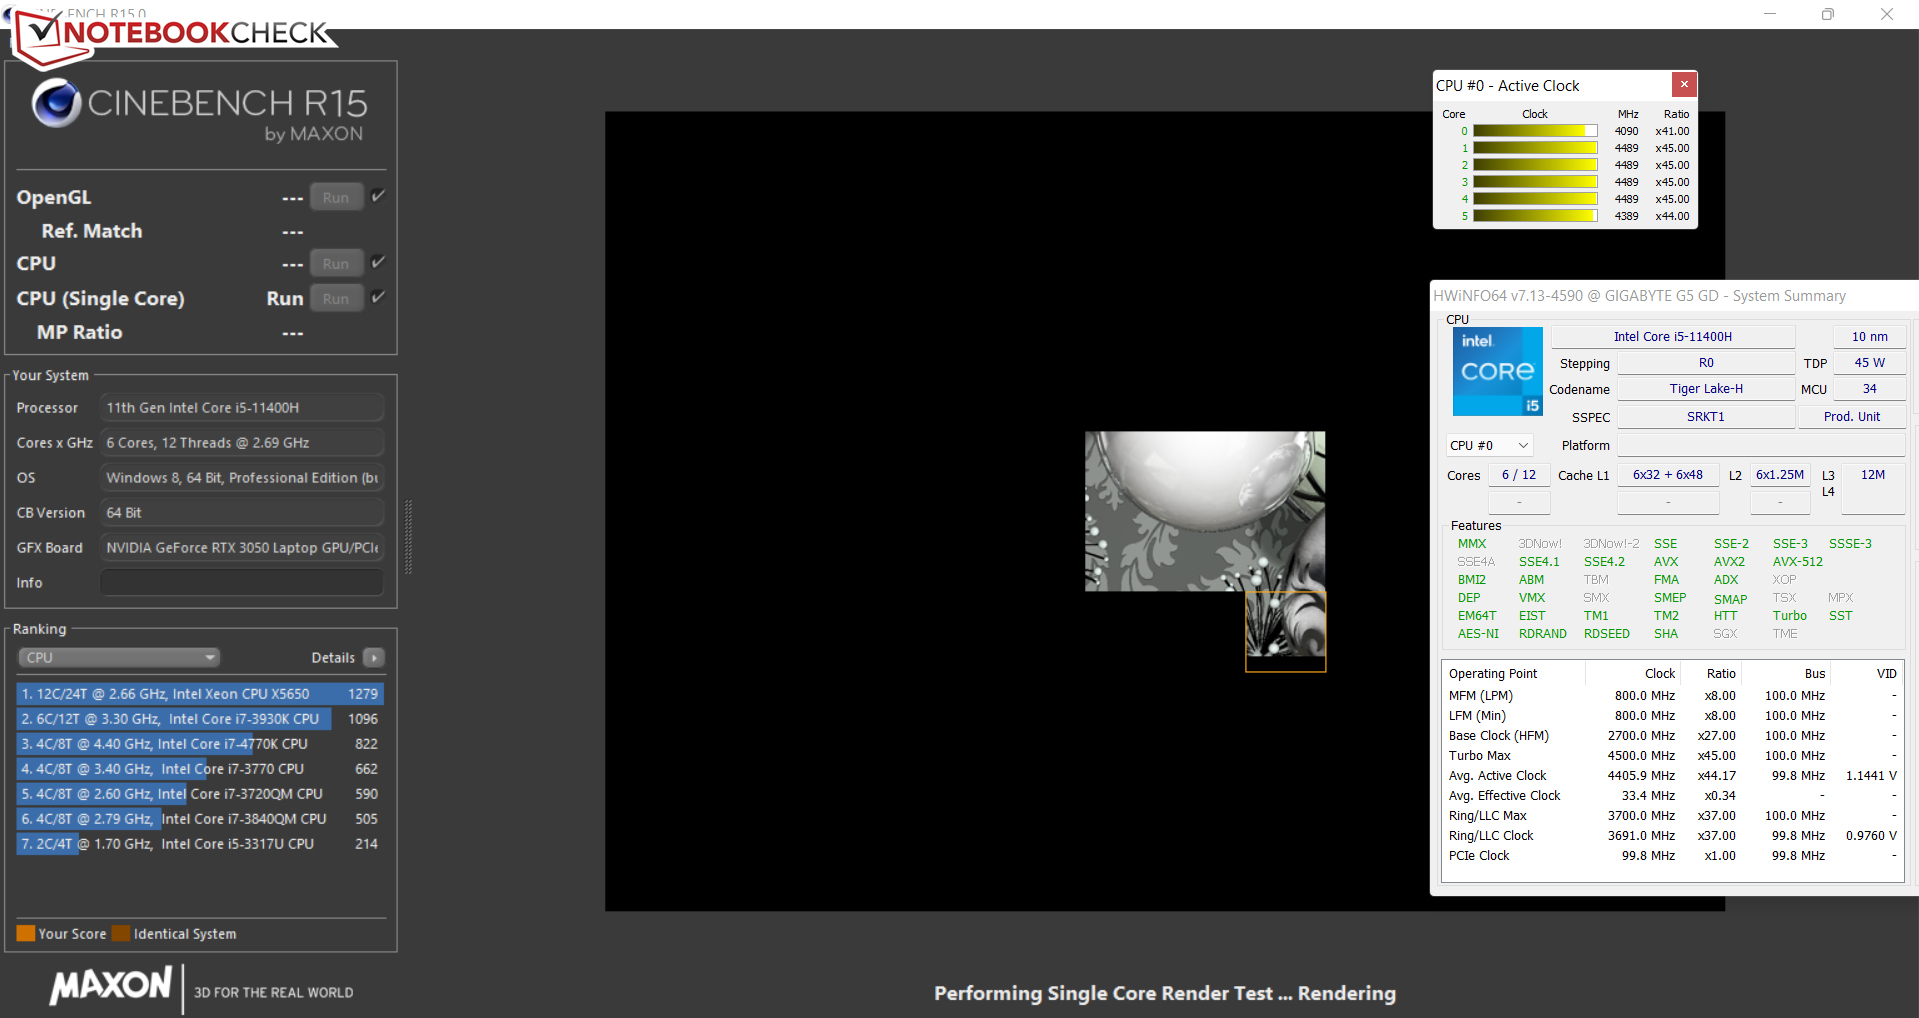
El procesador Core i7-11400H hexa-core (Tiger Lake) alcanza velocidades de reloj de 4,1 GHz (seis núcleos) a 4,5 GHz (un núcleo). Soporta Hyper-Threading (dos hilos por núcleo). Las pruebas de CPU del benchmark CB R15 se realizan a 4,1 GHz (multi) y de 4,1 a 4,5 GHz (simple). Las velocidades de reloj son de 1,9 a 2 GHz (multi) y de 3,1 a 4,5 GHz (simple), respectivamente, en batería
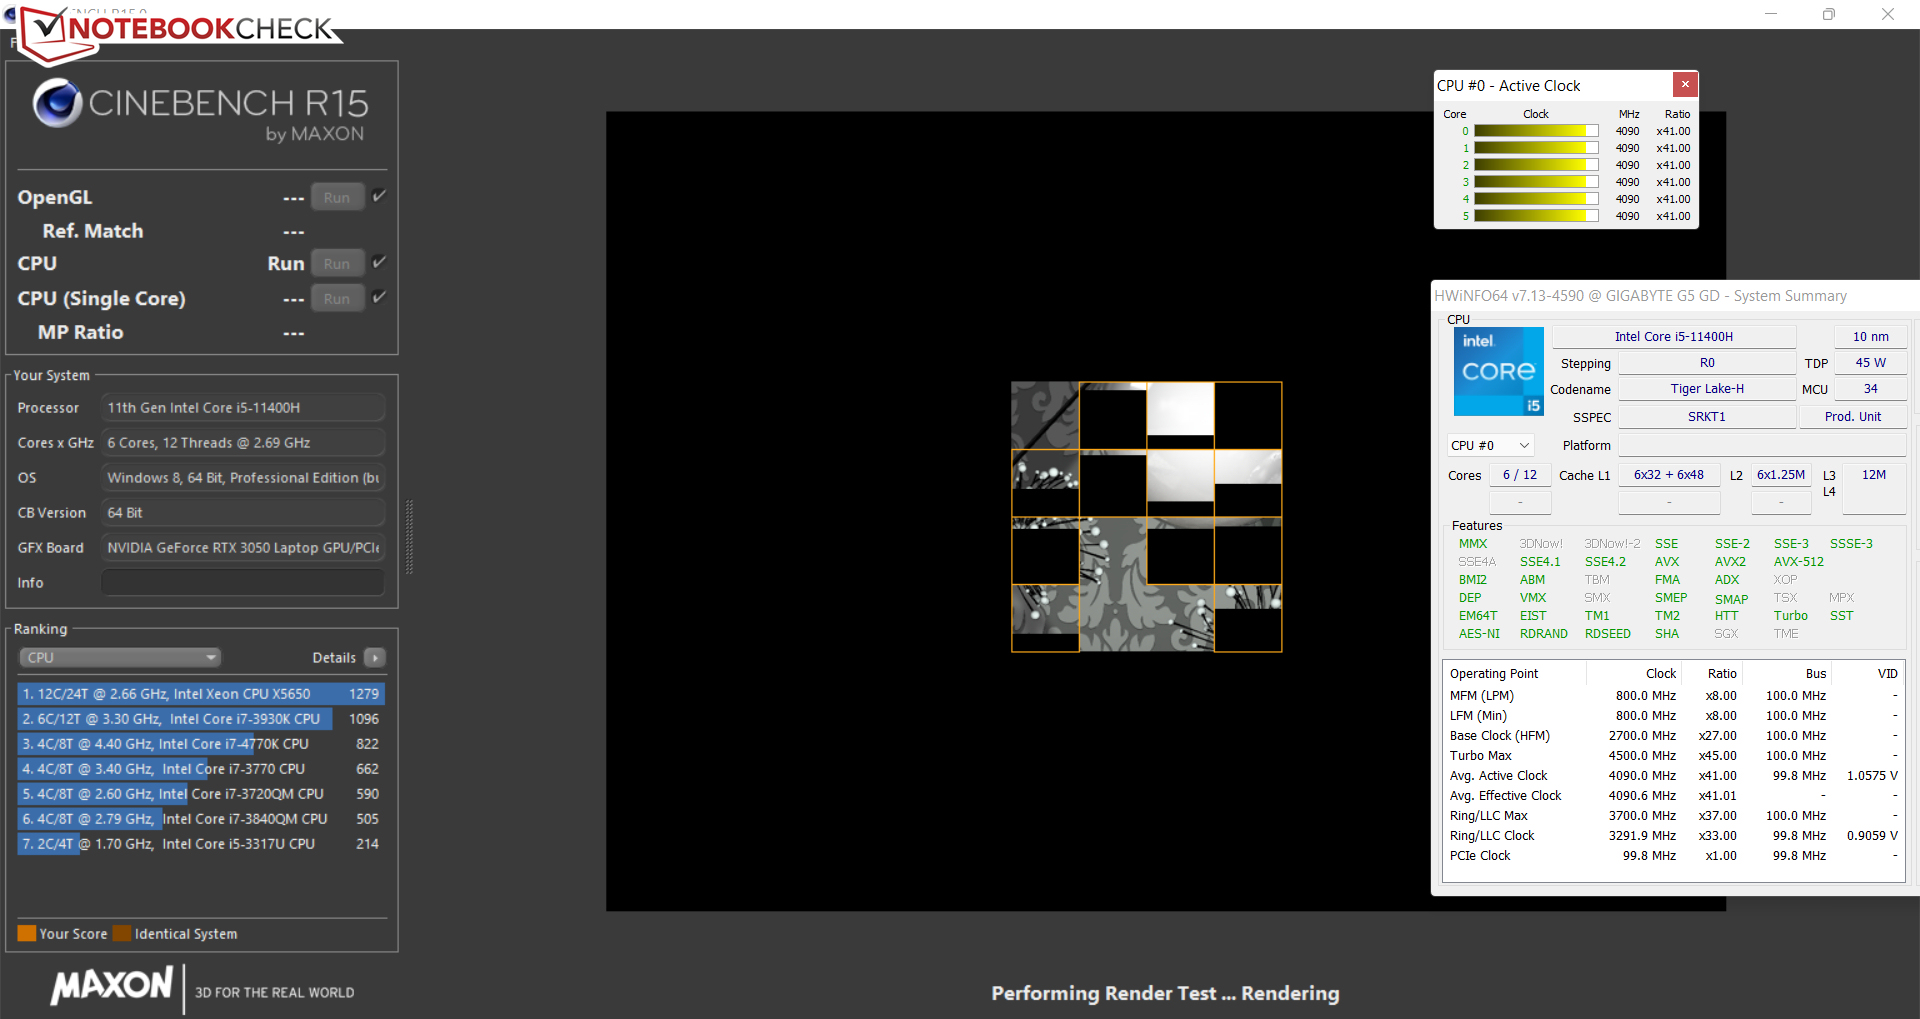
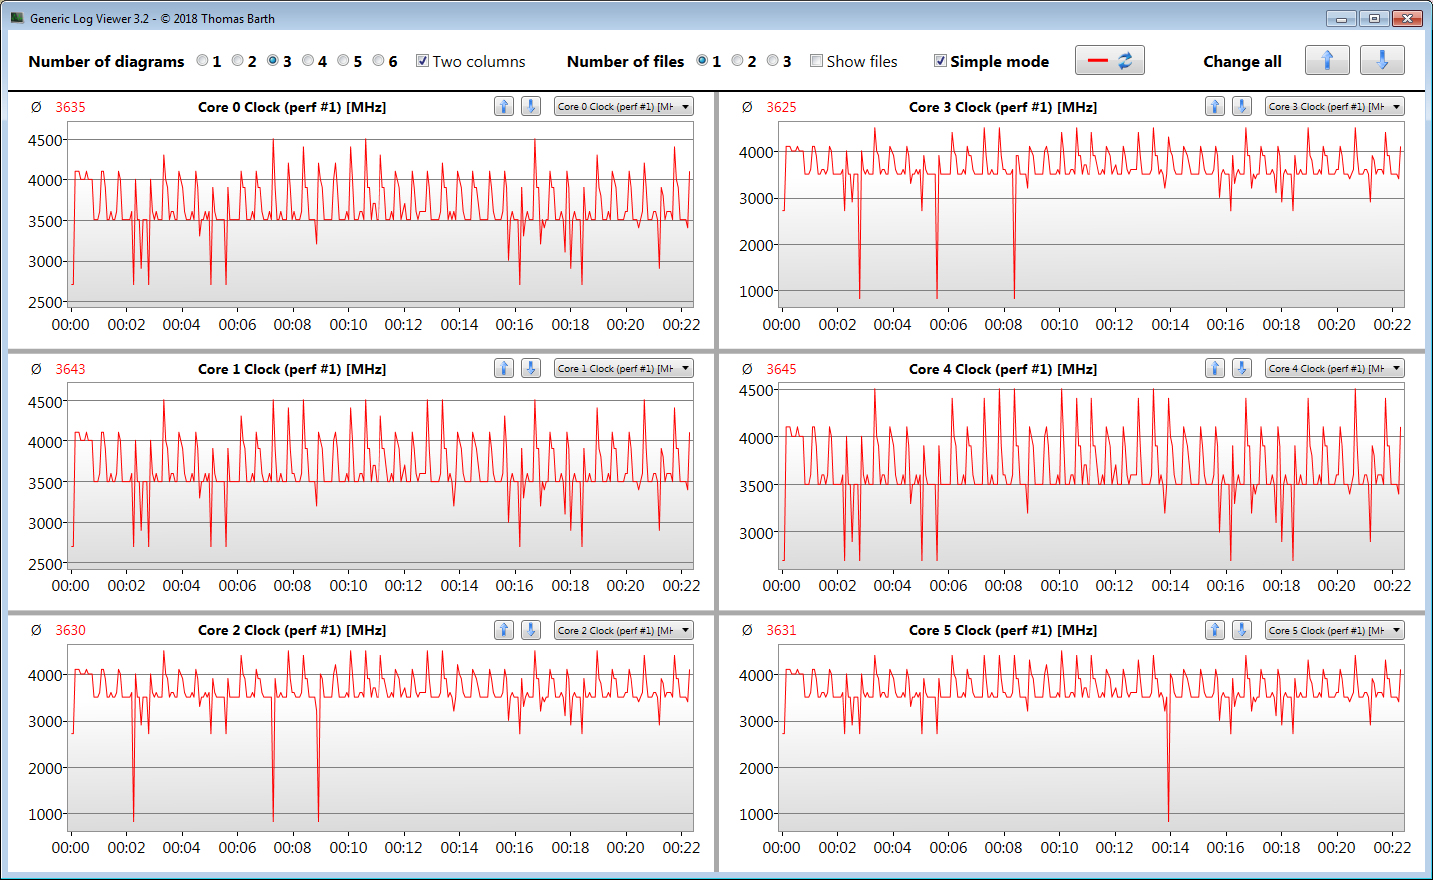
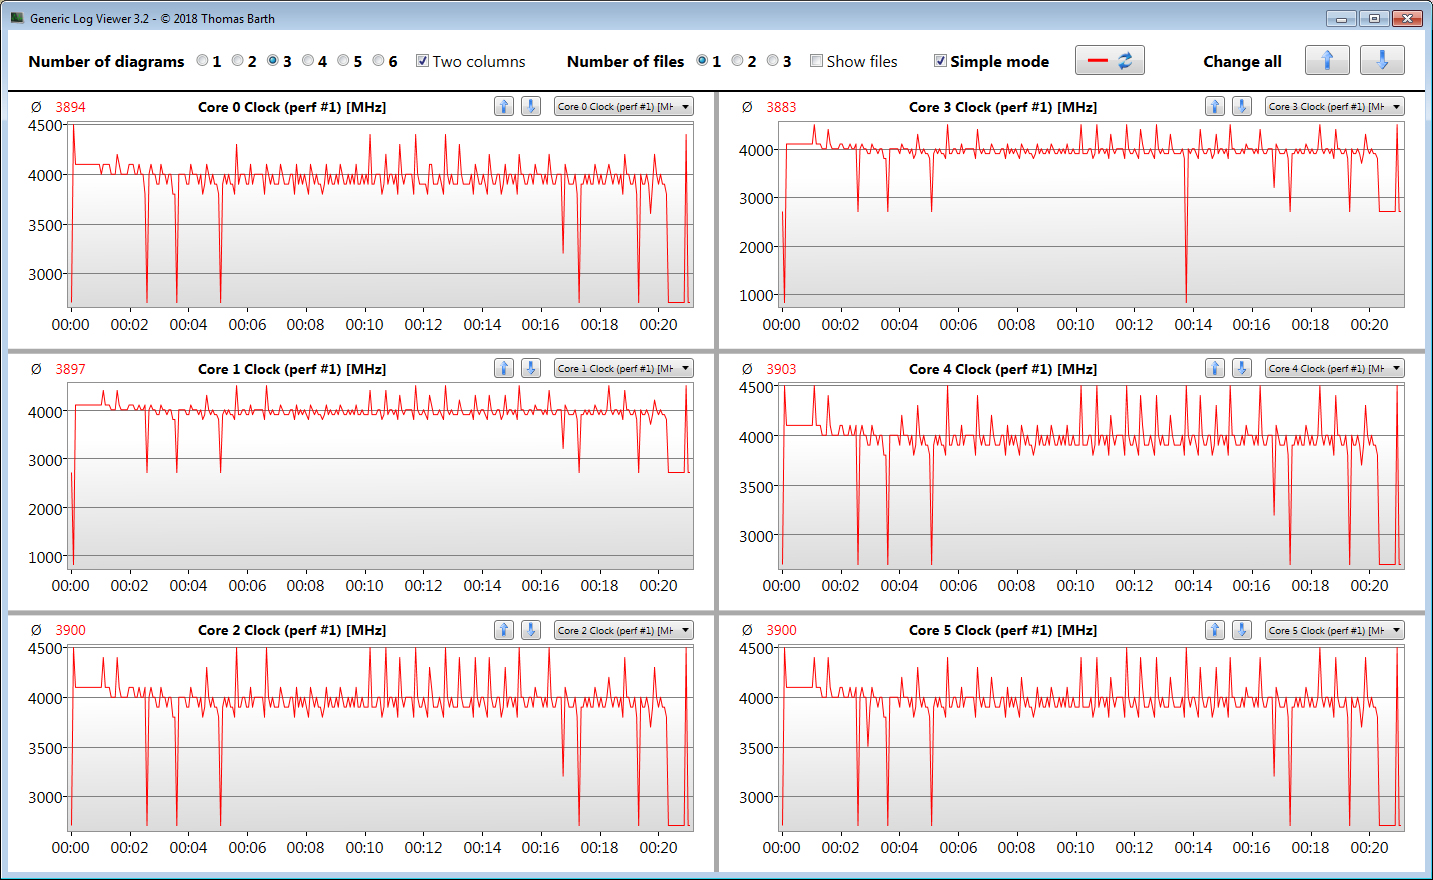
El test de resistencia múltiple Cinebench R15 (min. 30 minutos) muestra que el Turbo de la CPU se utiliza continuamente - a un nivel medio. Un ligero aumento de la velocidad de reloj del Turbo se consigue seleccionando el perfil "Modo Rendimiento".
Extraño: Mientras que el perfil "Modo de Rendimiento" aumenta un poco el rendimiento de los multihilos, el rendimiento de los hilos individuales cae al mismo tiempo. Esto podría estar relacionado con la versión anticuada de la BIOS que tuvimos que instalar.
Cinebench R15 Multi endurance test
| CPU Performance rating - Percent | |
| Media de la clase Gaming | |
| Lenovo Legion 5 15ACH-82JU00C6GE-FL | |
| Dell G15 5515 | |
| Gigabyte G5 GD | |
| Gigabyte G5 GD | |
| Medio Intel Core i5-11400H | |
| Gigabyte G5 GD | |
| MSI GF65 Thin 10UE | |
| Gigabyte G5 KC | |
| Cinebench R23 | |
| Multi Core | |
| Media de la clase Gaming (10488 - 40970, n=113, últimos 2 años) | |
| Lenovo Legion 5 15ACH-82JU00C6GE-FL | |
| Dell G15 5515 | |
| Gigabyte G5 GD (Leistungsmodus) | |
| Gigabyte G5 GD | |
| Medio Intel Core i5-11400H (6674 - 9406, n=7) | |
| MSI GF65 Thin 10UE | |
| Gigabyte G5 KC | |
| Gigabyte G5 GD (Stromsparmodus) | |
| Single Core | |
| Media de la clase Gaming (1166 - 2356, n=113, últimos 2 años) | |
| Gigabyte G5 GD | |
| Gigabyte G5 GD (Stromsparmodus) | |
| Medio Intel Core i5-11400H (1349 - 1472, n=6) | |
| Dell G15 5515 | |
| Lenovo Legion 5 15ACH-82JU00C6GE-FL | |
| Gigabyte G5 GD (Leistungsmodus) | |
| MSI GF65 Thin 10UE | |
| Gigabyte G5 KC | |
| Cinebench R20 | |
| CPU (Multi Core) | |
| Media de la clase Gaming (4029 - 16108, n=112, últimos 2 años) | |
| Lenovo Legion 5 15ACH-82JU00C6GE-FL | |
| Dell G15 5515 | |
| Gigabyte G5 GD (Leistungsmodus) | |
| Gigabyte G5 GD | |
| Medio Intel Core i5-11400H (2550 - 3740, n=7) | |
| Gigabyte G5 KC | |
| MSI GF65 Thin 10UE | |
| Gigabyte G5 GD (Stromsparmodus) | |
| CPU (Single Core) | |
| Media de la clase Gaming (442 - 895, n=112, últimos 2 años) | |
| Gigabyte G5 GD | |
| Gigabyte G5 GD (Stromsparmodus) | |
| Medio Intel Core i5-11400H (522 - 569, n=6) | |
| Dell G15 5515 | |
| Lenovo Legion 5 15ACH-82JU00C6GE-FL | |
| Gigabyte G5 GD (Leistungsmodus) | |
| MSI GF65 Thin 10UE | |
| Gigabyte G5 KC | |
| Cinebench R15 | |
| CPU Multi 64Bit | |
| Media de la clase Gaming (1578 - 6271, n=113, últimos 2 años) | |
| Lenovo Legion 5 15ACH-82JU00C6GE-FL | |
| Dell G15 5515 | |
| Gigabyte G5 GD (Leistungsmodus) | |
| Gigabyte G5 GD | |
| Medio Intel Core i5-11400H (1014 - 1532, n=7) | |
| Gigabyte G5 KC | |
| MSI GF65 Thin 10UE | |
| Gigabyte G5 GD (Stromsparmodus) | |
| CPU Single 64Bit | |
| Media de la clase Gaming (188.8 - 343, n=112, últimos 2 años) | |
| Dell G15 5515 | |
| Lenovo Legion 5 15ACH-82JU00C6GE-FL | |
| Gigabyte G5 GD (Stromsparmodus) | |
| Gigabyte G5 GD | |
| Medio Intel Core i5-11400H (202 - 219, n=6) | |
| MSI GF65 Thin 10UE | |
| Gigabyte G5 GD (Leistungsmodus) | |
| Gigabyte G5 KC | |
| Blender - v2.79 BMW27 CPU | |
| Gigabyte G5 GD (Stromsparmodus) | |
| MSI GF65 Thin 10UE | |
| Medio Intel Core i5-11400H (340 - 483, n=6) | |
| Gigabyte G5 KC | |
| Gigabyte G5 GD | |
| Gigabyte G5 GD (Leistungsmodus) | |
| Dell G15 5515 | |
| Lenovo Legion 5 15ACH-82JU00C6GE-FL | |
| Media de la clase Gaming (80 - 330, n=110, últimos 2 años) | |
| 7-Zip 18.03 | |
| 7z b 4 | |
| Media de la clase Gaming (33491 - 148086, n=111, últimos 2 años) | |
| Dell G15 5515 | |
| Lenovo Legion 5 15ACH-82JU00C6GE-FL | |
| Gigabyte G5 GD (Leistungsmodus) | |
| Gigabyte G5 GD | |
| Medio Intel Core i5-11400H (27615 - 40268, n=6) | |
| MSI GF65 Thin 10UE | |
| Gigabyte G5 KC | |
| Gigabyte G5 GD (Stromsparmodus) | |
| 7z b 4 -mmt1 | |
| Media de la clase Gaming (4199 - 7436, n=111, últimos 2 años) | |
| Dell G15 5515 | |
| Lenovo Legion 5 15ACH-82JU00C6GE-FL | |
| MSI GF65 Thin 10UE | |
| Gigabyte G5 GD | |
| Gigabyte G5 GD (Stromsparmodus) | |
| Medio Intel Core i5-11400H (4802 - 5343, n=6) | |
| Gigabyte G5 KC | |
| Gigabyte G5 GD (Leistungsmodus) | |
| Geekbench 5.5 | |
| Multi-Core | |
| Media de la clase Gaming (6460 - 27010, n=111, últimos 2 años) | |
| Lenovo Legion 5 15ACH-82JU00C6GE-FL | |
| Dell G15 5515 | |
| Gigabyte G5 GD (Leistungsmodus) | |
| Gigabyte G5 GD | |
| MSI GF65 Thin 10UE | |
| Gigabyte G5 KC | |
| Gigabyte G5 KC | |
| Medio Intel Core i5-11400H (4679 - 7018, n=7) | |
| Gigabyte G5 GD (Stromsparmodus) | |
| Single-Core | |
| Media de la clase Gaming (986 - 2474, n=111, últimos 2 años) | |
| Gigabyte G5 GD (Stromsparmodus) | |
| Gigabyte G5 GD | |
| Medio Intel Core i5-11400H (1396 - 1528, n=7) | |
| Lenovo Legion 5 15ACH-82JU00C6GE-FL | |
| Dell G15 5515 | |
| Gigabyte G5 GD (Leistungsmodus) | |
| MSI GF65 Thin 10UE | |
| Gigabyte G5 KC | |
| Gigabyte G5 KC | |
| HWBOT x265 Benchmark v2.2 - 4k Preset | |
| Media de la clase Gaming (11.5 - 44.3, n=111, últimos 2 años) | |
| Lenovo Legion 5 15ACH-82JU00C6GE-FL | |
| Dell G15 5515 | |
| Gigabyte G5 GD (Leistungsmodus) | |
| Gigabyte G5 GD | |
| Medio Intel Core i5-11400H (8.19 - 11.3, n=6) | |
| MSI GF65 Thin 10UE | |
| Gigabyte G5 KC | |
| Gigabyte G5 GD (Stromsparmodus) | |
| LibreOffice - 20 Documents To PDF | |
| Lenovo Legion 5 15ACH-82JU00C6GE-FL | |
| Dell G15 5515 | |
| Gigabyte G5 KC | |
| Media de la clase Gaming (19 - 88.8, n=111, últimos 2 años) | |
| Medio Intel Core i5-11400H (41.4 - 53, n=6) | |
| MSI GF65 Thin 10UE | |
| Gigabyte G5 GD (Leistungsmodus) | |
| Gigabyte G5 GD | |
| Gigabyte G5 GD (Stromsparmodus) | |
| R Benchmark 2.5 - Overall mean | |
| Gigabyte G5 KC | |
| Gigabyte G5 GD (Leistungsmodus) | |
| Medio Intel Core i5-11400H (0.581 - 0.644, n=6) | |
| MSI GF65 Thin 10UE | |
| Gigabyte G5 GD | |
| Gigabyte G5 GD (Stromsparmodus) | |
| Lenovo Legion 5 15ACH-82JU00C6GE-FL | |
| Dell G15 5515 | |
| Media de la clase Gaming (0.3439 - 0.759, n=112, últimos 2 años) | |
* ... más pequeño es mejor
| Performance rating - Percent | |
| Media de la clase Gaming | |
| Lenovo Legion 5 15ACH-82JU00C6GE-FL | |
| Dell G15 5515 | |
| Gigabyte G5 GD | |
| Gigabyte G5 GD | |
| Medio Intel Core i5-11400H | |
| Gigabyte G5 KC | |
Rendimiento del sistema
El sistema, rápido y fluido, ofrece suficiente potencia de cálculo para todas las tareas habituales: los juegos, la edición de vídeo y el procesamiento de imágenes no son grandes retos para el portátil. Esto va acompañado de buenos resultados en PCMark

| PCMark 8 Home Score Accelerated v2 | 4312 puntos | |
| PCMark 8 Creative Score Accelerated v2 | 5850 puntos | |
| PCMark 8 Work Score Accelerated v2 | 6010 puntos | |
| PCMark 10 Score | 5895 puntos | |
ayuda | ||
| PCMark 10 / Score | |
| Media de la clase Gaming (5828 - 11574, n=96, últimos 2 años) | |
| Lenovo Legion 5 15ACH-82JU00C6GE-FL | |
| Dell G15 5515 | |
| Gigabyte G5 KC | |
| Gigabyte G5 GD | |
| Medio Intel Core i5-11400H, NVIDIA GeForce RTX 3050 4GB Laptop GPU (5136 - 5895, n=2) | |
| MSI GF65 Thin 10UE | |
| PCMark 10 / Essentials | |
| Media de la clase Gaming (8810 - 12600, n=100, últimos 2 años) | |
| Lenovo Legion 5 15ACH-82JU00C6GE-FL | |
| Dell G15 5515 | |
| Gigabyte G5 GD | |
| MSI GF65 Thin 10UE | |
| Gigabyte G5 KC | |
| Medio Intel Core i5-11400H, NVIDIA GeForce RTX 3050 4GB Laptop GPU (8610 - 9155, n=2) | |
| PCMark 10 / Productivity | |
| Media de la clase Gaming (6845 - 18766, n=98, últimos 2 años) | |
| Lenovo Legion 5 15ACH-82JU00C6GE-FL | |
| Dell G15 5515 | |
| Gigabyte G5 GD | |
| Medio Intel Core i5-11400H, NVIDIA GeForce RTX 3050 4GB Laptop GPU (8149 - 8506, n=2) | |
| Gigabyte G5 KC | |
| MSI GF65 Thin 10UE | |
| PCMark 10 / Digital Content Creation | |
| Media de la clase Gaming (7602 - 19657, n=98, últimos 2 años) | |
| Gigabyte G5 KC | |
| Lenovo Legion 5 15ACH-82JU00C6GE-FL | |
| Dell G15 5515 | |
| Gigabyte G5 GD | |
| Medio Intel Core i5-11400H, NVIDIA GeForce RTX 3050 4GB Laptop GPU (5242 - 7140, n=2) | |
| MSI GF65 Thin 10UE | |
| AIDA64 / Memory Copy | |
| Media de la clase Gaming (21750 - 129946, n=110, últimos 2 años) | |
| Gigabyte G5 GD | |
| Dell G15 5515 | |
| Lenovo Legion 5 15ACH-82JU00C6GE-FL | |
| Gigabyte G5 KC | |
| Medio Intel Core i5-11400H (20513 - 42471, n=4) | |
| AIDA64 / Memory Read | |
| Media de la clase Gaming (22956 - 118858, n=110, últimos 2 años) | |
| Gigabyte G5 GD | |
| Dell G15 5515 | |
| Lenovo Legion 5 15ACH-82JU00C6GE-FL | |
| Gigabyte G5 KC | |
| Medio Intel Core i5-11400H (23172 - 48221, n=4) | |
| AIDA64 / Memory Write | |
| Media de la clase Gaming (22297 - 135096, n=110, últimos 2 años) | |
| Gigabyte G5 GD | |
| Gigabyte G5 KC | |
| Dell G15 5515 | |
| Medio Intel Core i5-11400H (21862 - 45893, n=4) | |
| Lenovo Legion 5 15ACH-82JU00C6GE-FL | |
| AIDA64 / Memory Latency | |
| Media de la clase Gaming (75.3 - 259, n=110, últimos 2 años) | |
| Gigabyte G5 GD | |
| Lenovo Legion 5 15ACH-82JU00C6GE-FL | |
| Dell G15 5515 | |
| Medio Intel Core i5-11400H (73.3 - 95.9, n=5) | |
| Gigabyte G5 KC | |
* ... más pequeño es mejor
Latencias del CPD
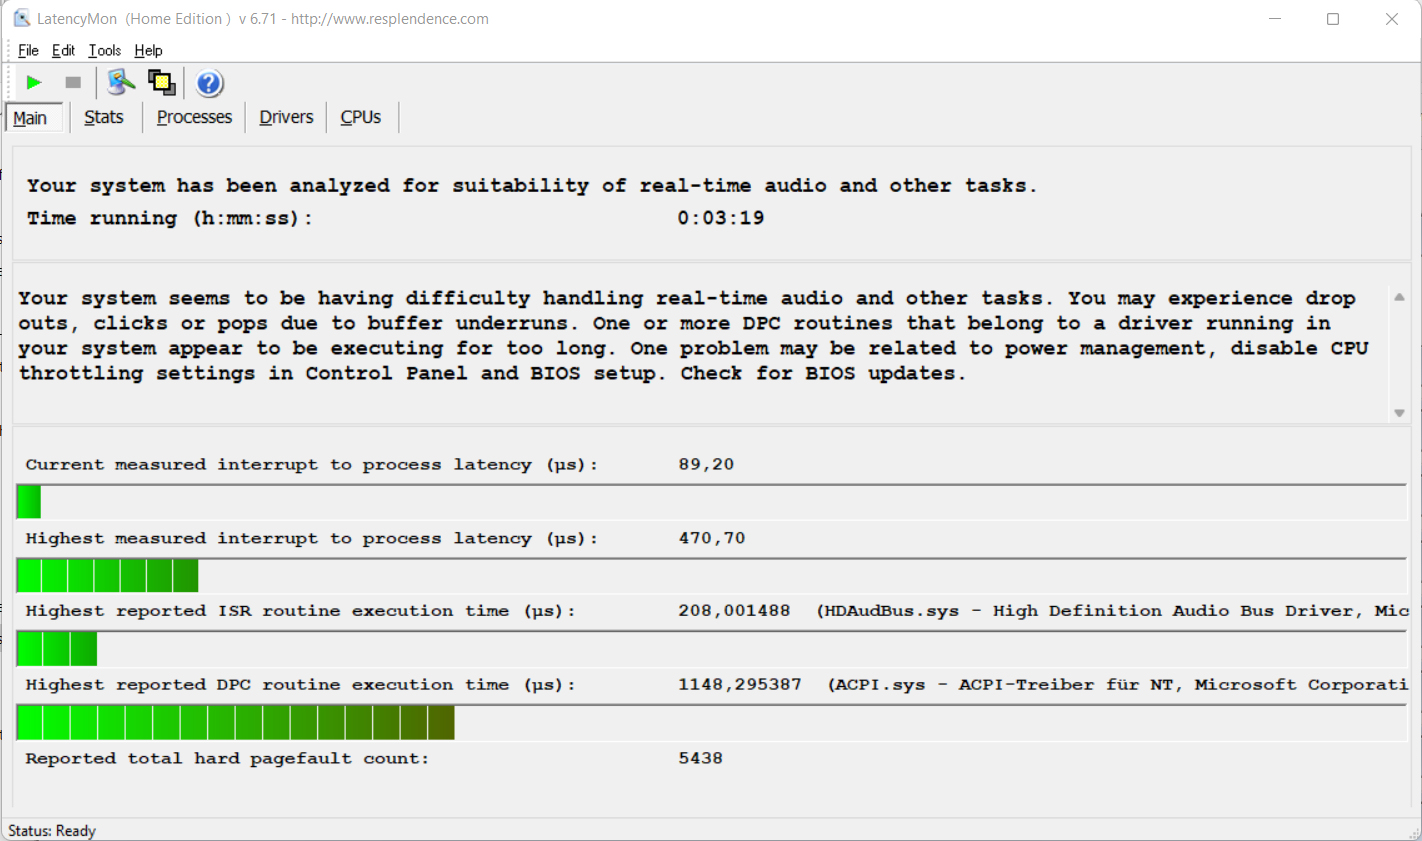
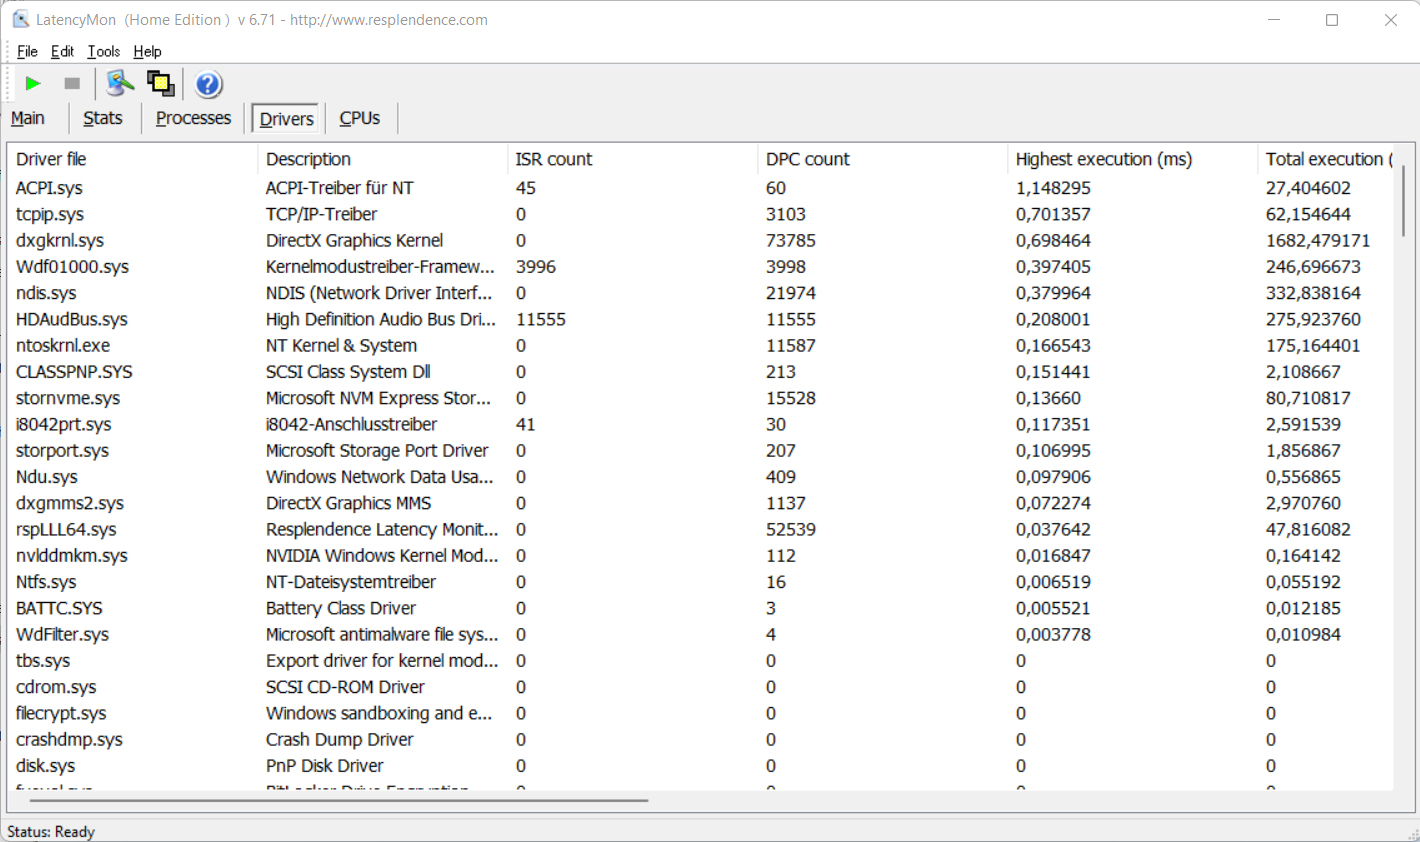
Nuestra prueba de monitorización de latencia estandarizada (navegación web, reproducción de vídeo 4K, Prime95 de alta carga) reveló irregularidades con las latencias del CPD. El sistema no parece adecuado para la edición de vídeo y audio en tiempo real. Las futuras actualizaciones de software podrían llevar a mejoras o incluso a un peor rendimiento
| DPC Latencies / LatencyMon - interrupt to process latency (max), Web, Youtube, Prime95 | |
| MSI GF65 Thin 10UE | |
| Lenovo Legion 5 15ACH-82JU00C6GE-FL | |
| Dell G15 5515 | |
| Gigabyte G5 KC | |
| Gigabyte G5 GD | |
* ... más pequeño es mejor
Almacenamiento
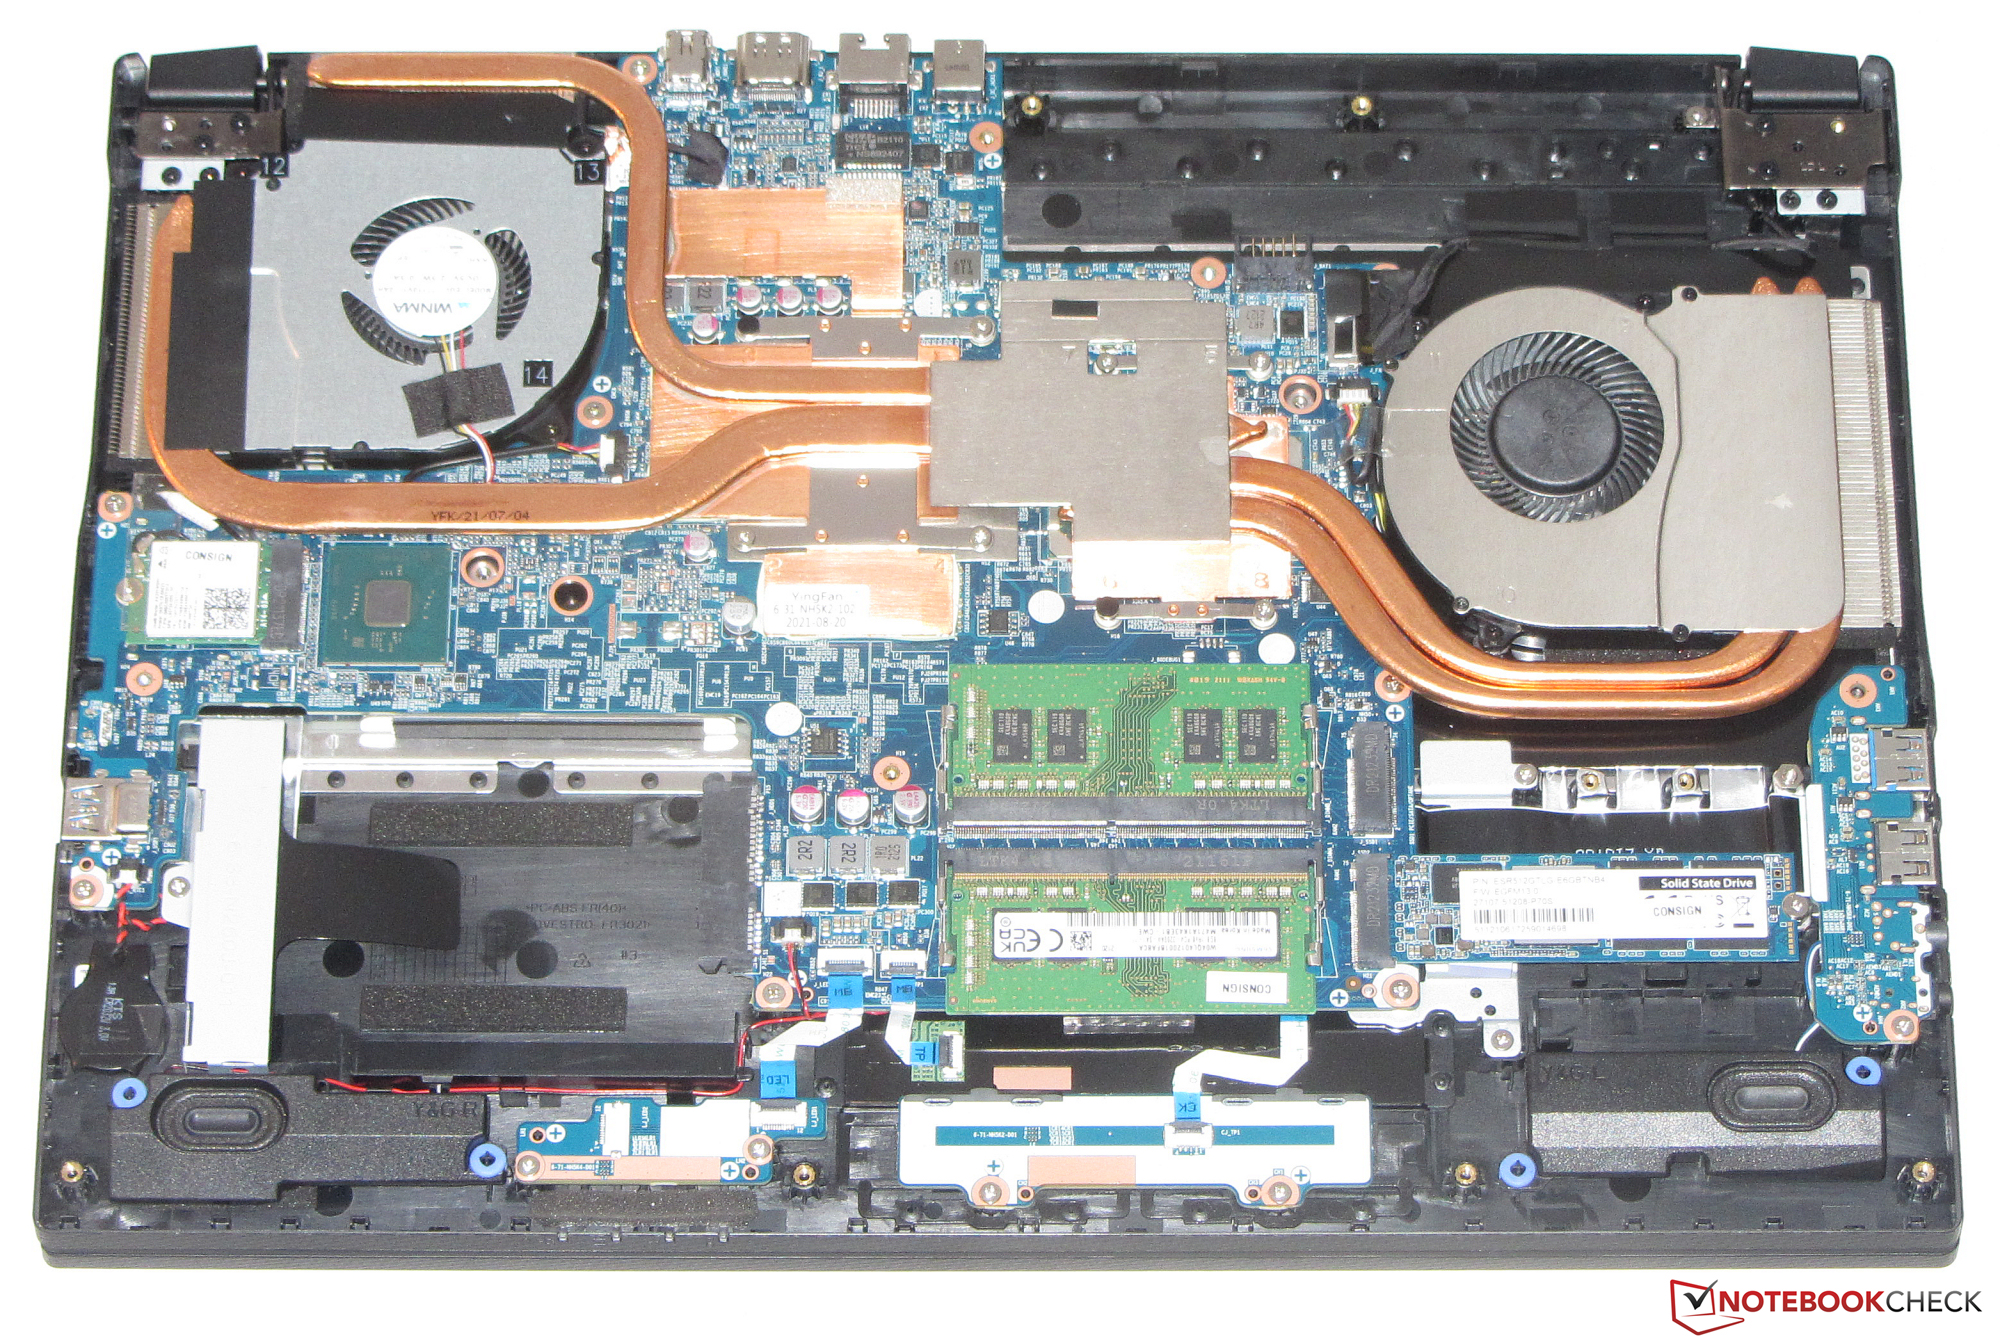
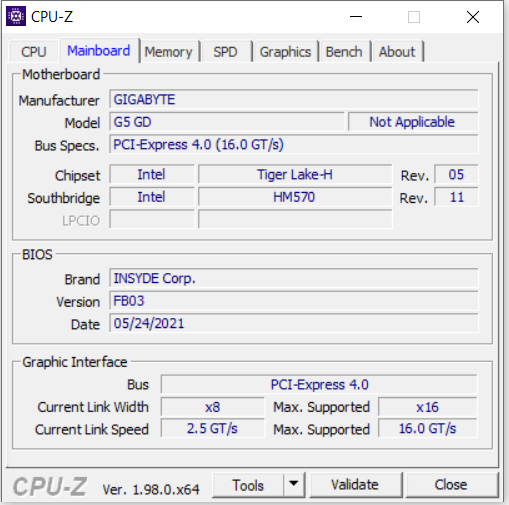
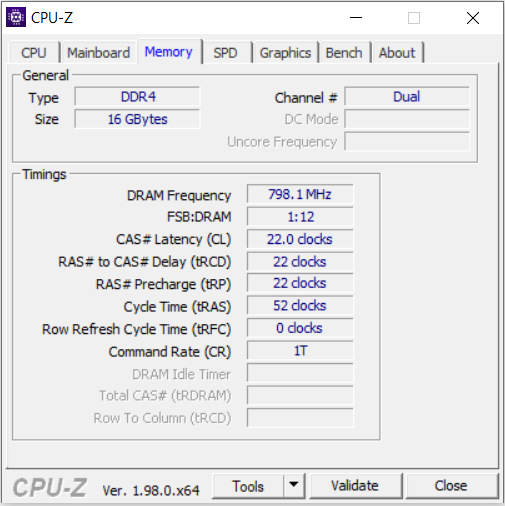
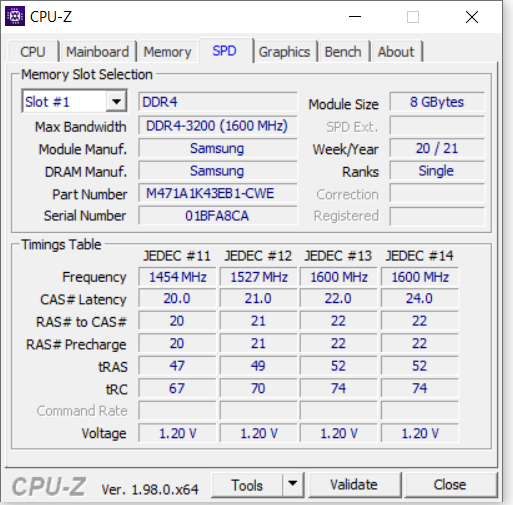
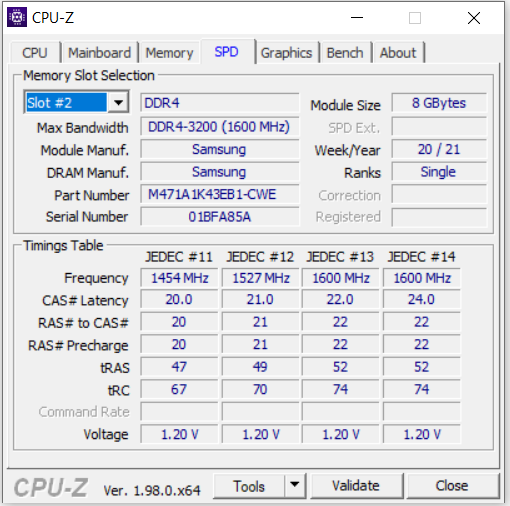
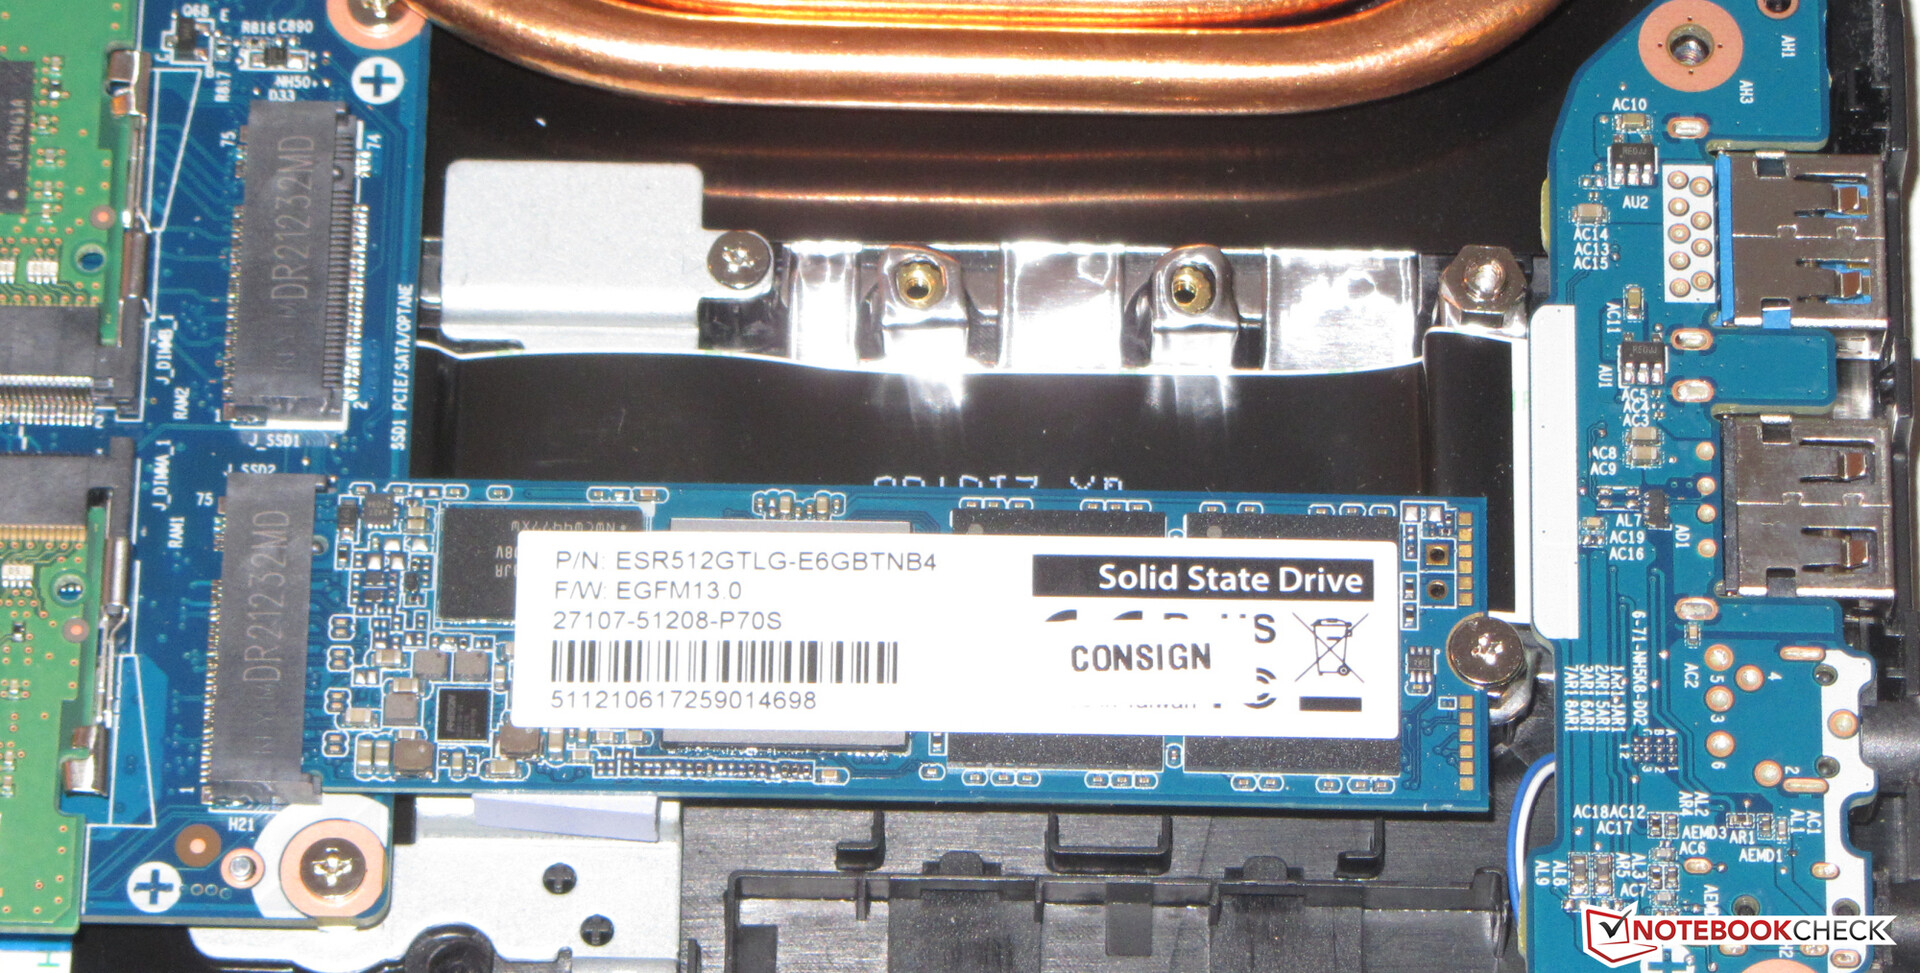
Un SSD NVMe de 512 GB (M.2 2280) de Phison sirve como unidad de sistema. La conexión a través de PCIe 4 permite unas tasas de transferencia muy buenas. El espacio de almacenamiento puede ampliarse con un segundo SSD M.2 (PCIe 3/SATA) y una unidad de almacenamiento de 2.5 pulgadas. Ambas ranuras M.2 pueden alojar SSD de los formatos 2242, 2260 y 2280

| Drive Performance rating - Percent | |
| Media de la clase Gaming | |
| Gigabyte G5 GD | |
| Gigabyte G5 KC | |
| Medio ESR512GTLG-E6GBTNB4 | |
| MSI GF65 Thin 10UE | |
| Lenovo Legion 5 15ACH-82JU00C6GE-FL | |
| Dell G15 5515 | |
* ... más pequeño es mejor
Continuous load read: DiskSpd Read Loop, Queue Depth 8
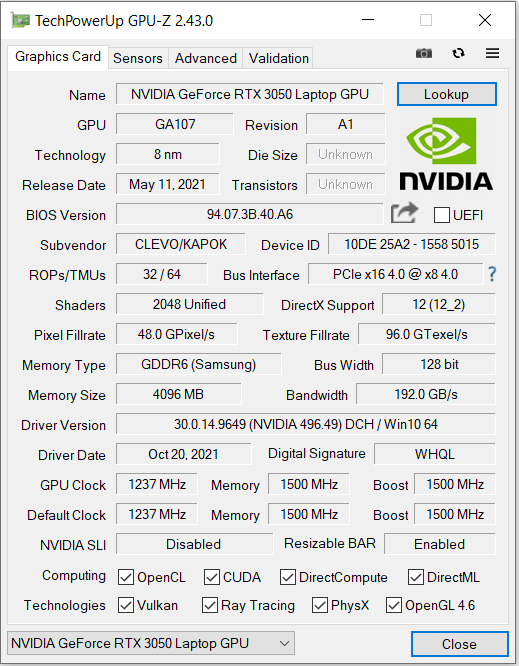
Rendimiento de la GPU
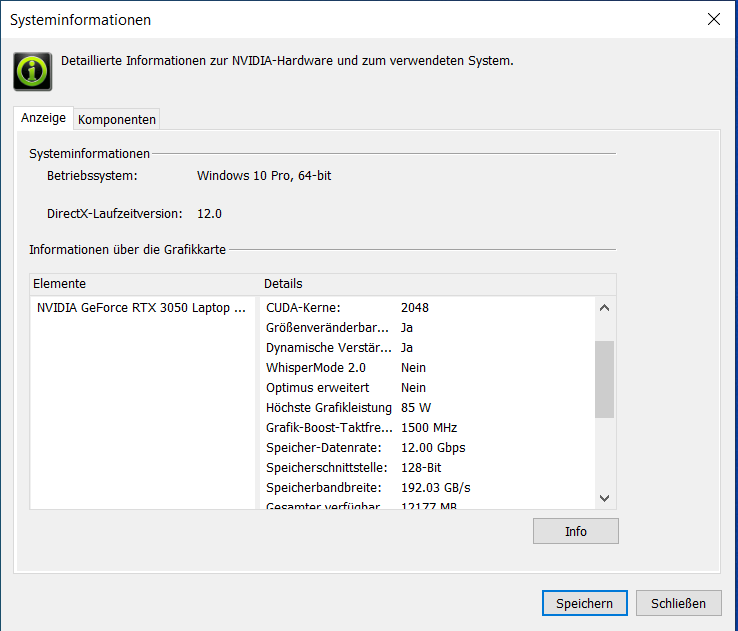
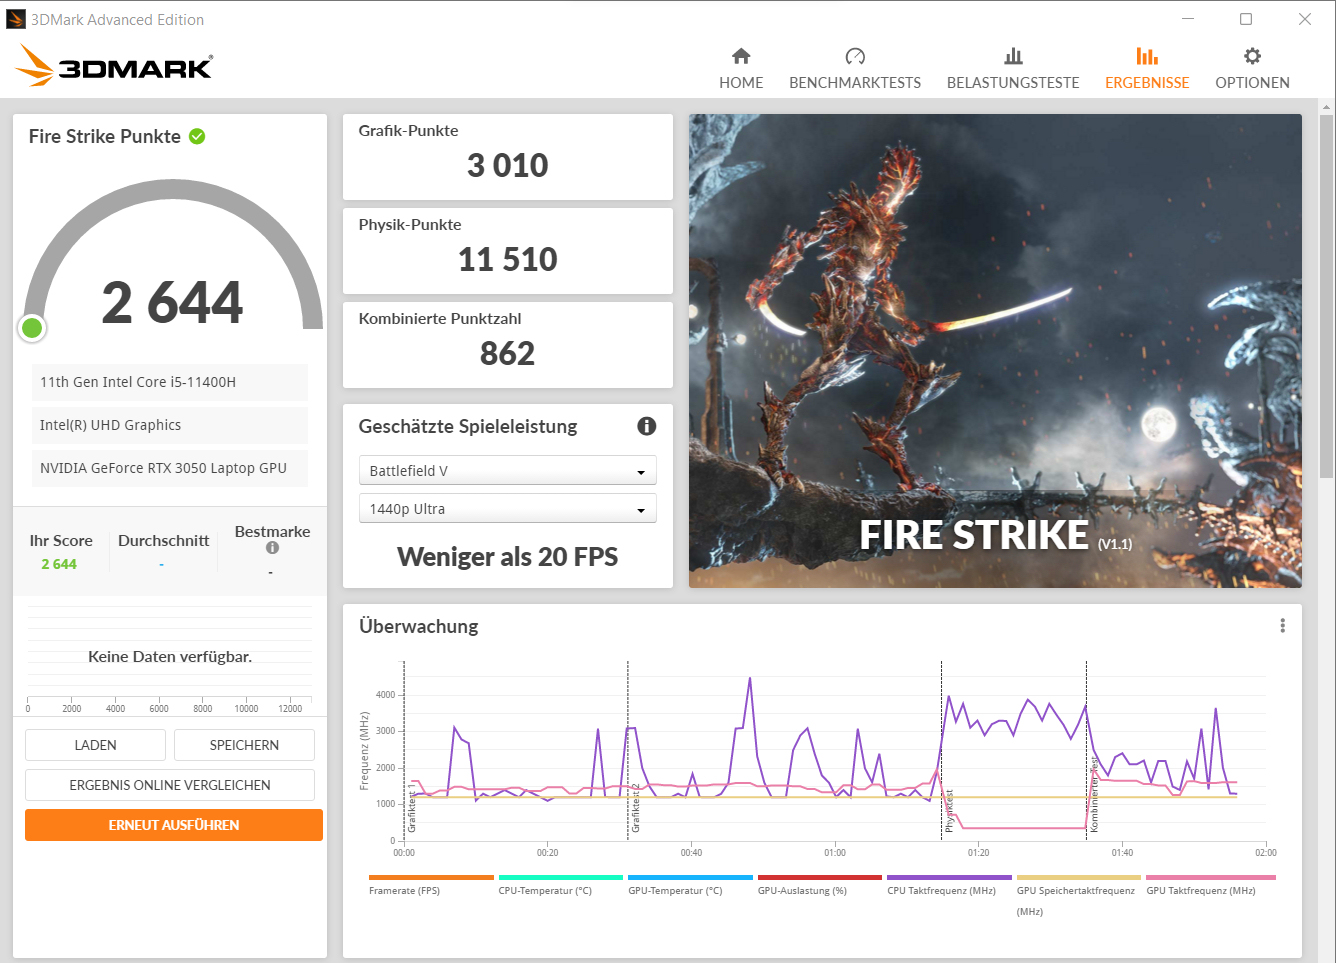
Gigabyte concede elGeForce RTX 3050 portátil GPU (resumen de todos los portátiles RTX 3050 incluyendo sus TGPs) un TGP máximo de 85 vatios. En consecuencia, ofrece los mejores resultados 3DMark que hemos podido determinar con la RTX 3050 hasta ahora. El perfil "Modo Rendimiento" conlleva un ligero aumento del rendimiento gráfico.
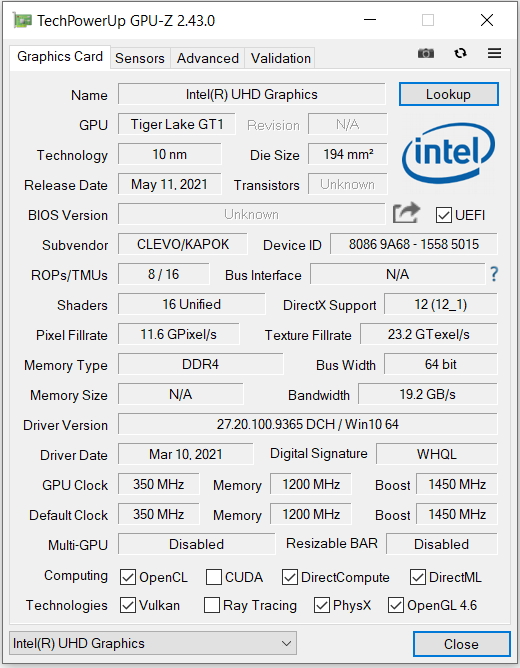
La RTX 3050 puede acceder a la rápida memoria gráfica GDDR6 (4.096 MB). La página webUHD Graphics Xe 16EUs núcleo gráfico integrado en el procesador está activo, y el portátil funciona con la solución de conmutación gráfica Optimus de Nvidia.
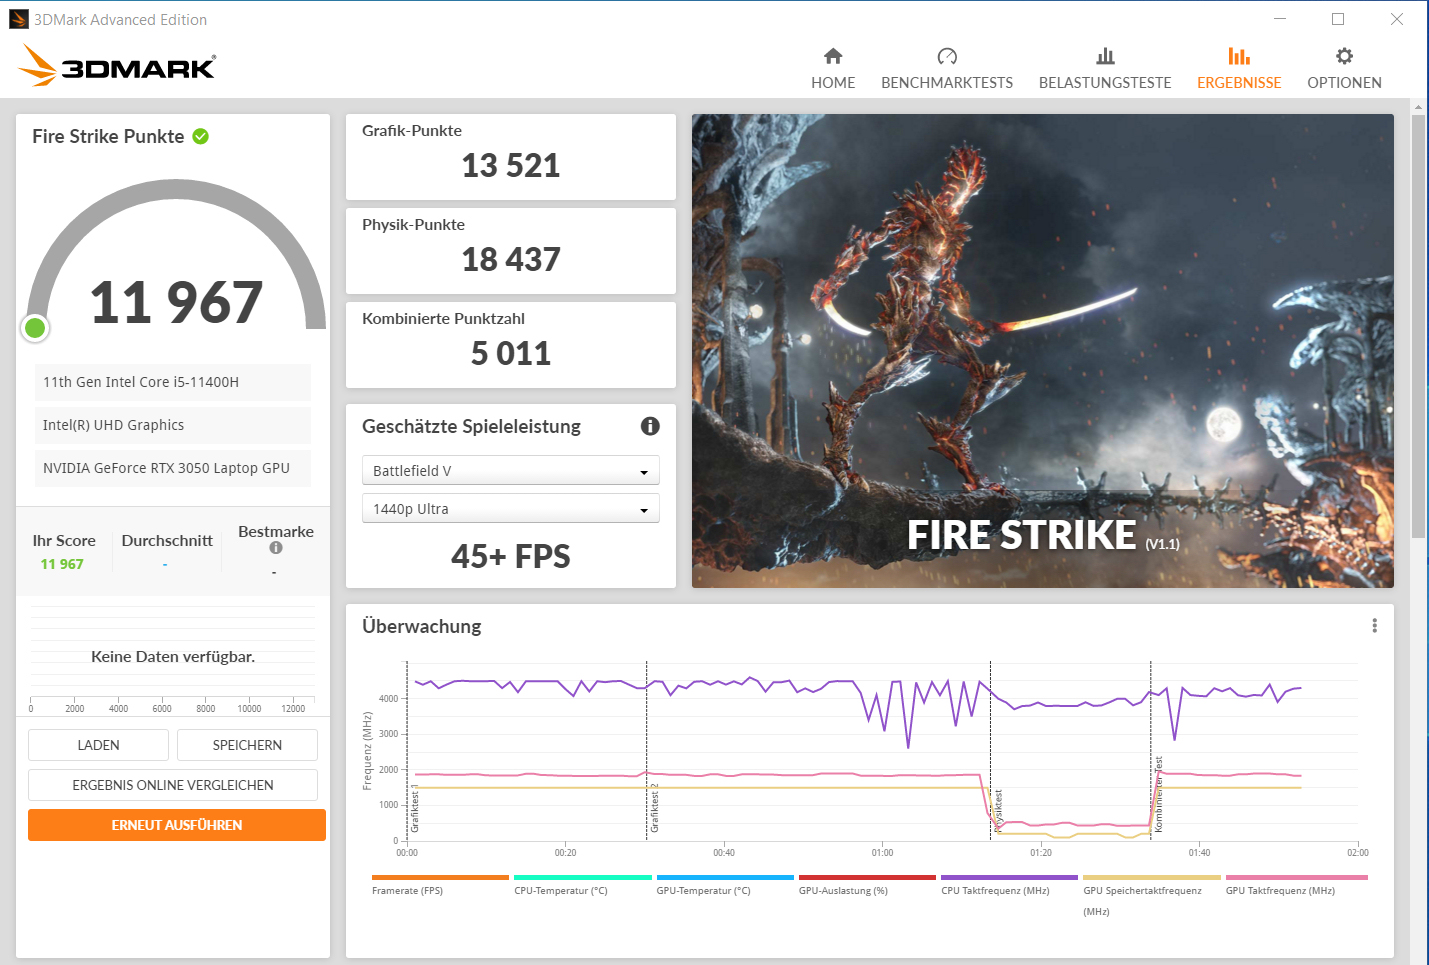
| 3DMark 06 Standard Score | 42599 puntos | |
| 3DMark 11 Performance | 16190 puntos | |
| 3DMark Cloud Gate Standard Score | 37239 puntos | |
| 3DMark Fire Strike Score | 11967 puntos | |
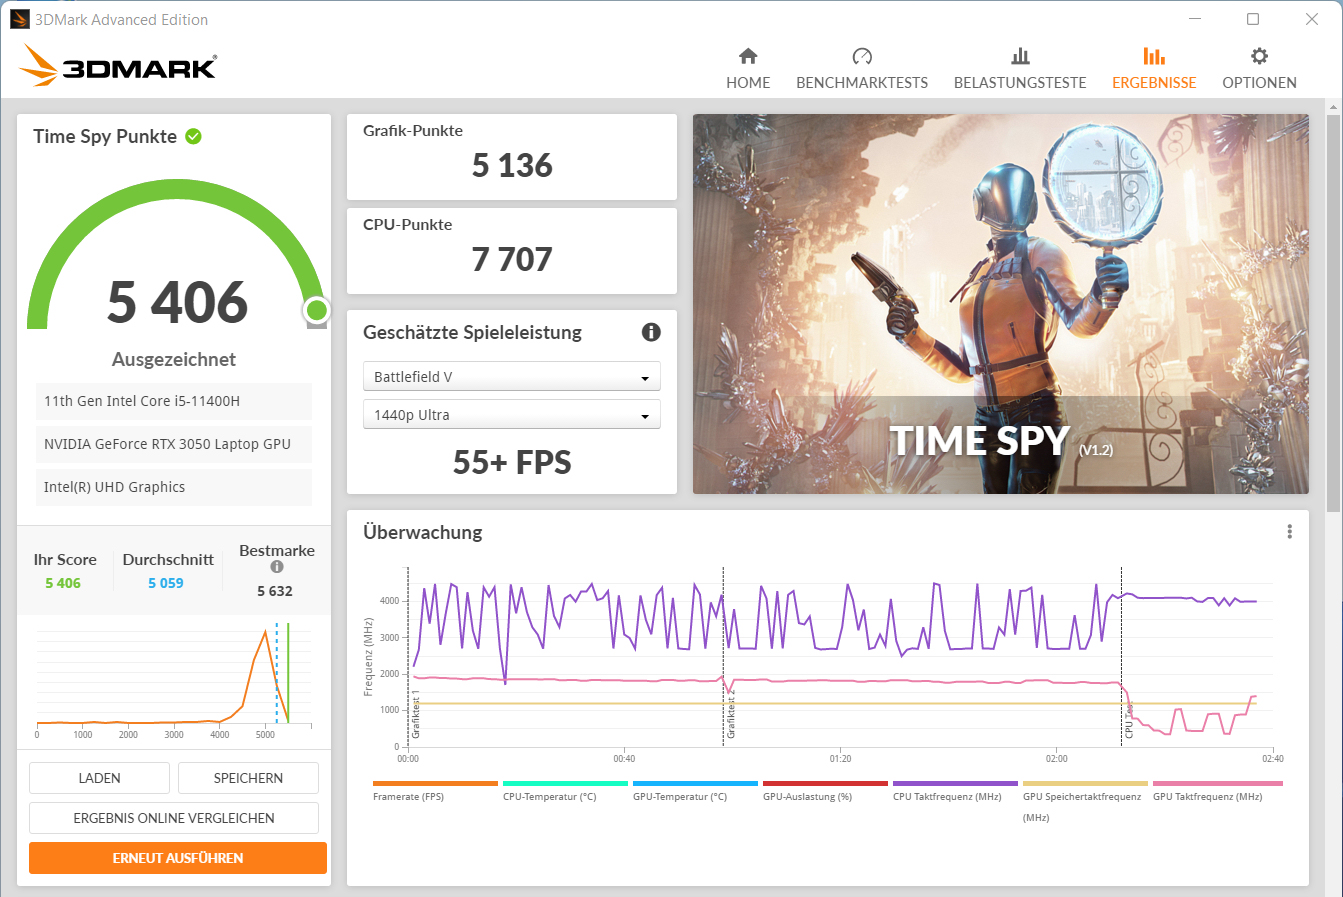
| 3DMark Time Spy Score | 5406 puntos | |
ayuda | ||
| 3DMark Performance rating - Percent | |
| Media de la clase Gaming | |
| Lenovo Legion 5 15ACH-82JU00C6GE-FL | |
| Gigabyte G5 KC | |
| MSI GF65 Thin 10UE | |
| Dell G15 5515 | |
| Gigabyte G5 GD | |
| Gigabyte G5 GD -1! | |
| Medio NVIDIA GeForce RTX 3050 4GB Laptop GPU | |
| Acer Nitro 5 AN517-53-54DQ | |
| Gigabyte G5 GD -1! | |
| 3DMark 11 - 1280x720 Performance GPU | |
| Media de la clase Gaming (21841 - 80022, n=109, últimos 2 años) | |
| Lenovo Legion 5 15ACH-82JU00C6GE-FL | |
| Gigabyte G5 KC | |
| MSI GF65 Thin 10UE | |
| Dell G15 5515 | |
| Gigabyte G5 GD (Leistungsmodus) | |
| Gigabyte G5 GD | |
| Acer Nitro 5 AN517-53-54DQ | |
| Medio NVIDIA GeForce RTX 3050 4GB Laptop GPU (11980 - 18557, n=23) | |
| Gigabyte G5 GD (Stromsparmodus) | |
| 3DMark | |
| 1280x720 Cloud Gate Standard Graphics | |
| Media de la clase Gaming (86886 - 223650, n=61, últimos 2 años) | |
| Lenovo Legion 5 15ACH-82JU00C6GE-FL | |
| Gigabyte G5 KC | |
| MSI GF65 Thin 10UE | |
| Gigabyte G5 GD | |
| Dell G15 5515 | |
| Medio NVIDIA GeForce RTX 3050 4GB Laptop GPU (33426 - 87403, n=18) | |
| Acer Nitro 5 AN517-53-54DQ | |
| 1920x1080 Fire Strike Graphics | |
| Media de la clase Gaming (12242 - 62849, n=121, últimos 2 años) | |
| Lenovo Legion 5 15ACH-82JU00C6GE-FL | |
| Gigabyte G5 KC | |
| MSI GF65 Thin 10UE | |
| Dell G15 5515 | |
| Gigabyte G5 GD (Leistungsmodus) | |
| Gigabyte G5 GD | |
| Acer Nitro 5 AN517-53-54DQ | |
| Medio NVIDIA GeForce RTX 3050 4GB Laptop GPU (9138 - 14157, n=22) | |
| Gigabyte G5 GD (Stromsparmodus) | |
| 2560x1440 Time Spy Graphics | |
| Media de la clase Gaming (5012 - 26212, n=120, últimos 2 años) | |
| Lenovo Legion 5 15ACH-82JU00C6GE-FL | |
| Gigabyte G5 KC | |
| MSI GF65 Thin 10UE | |
| Dell G15 5515 | |
| Gigabyte G5 GD (Leistungsmodus) | |
| Gigabyte G5 GD | |
| Acer Nitro 5 AN517-53-54DQ | |
| Medio NVIDIA GeForce RTX 3050 4GB Laptop GPU (3281 - 5295, n=23) | |
| Gigabyte G5 GD (Stromsparmodus) | |
Rendimiento de los juegos
El portátil lleva todos los juegos más recientes sin problemas a la pantalla. Por lo general, se puede seleccionar la resolución Full HD y los ajustes de calidad de alta a máxima. Algunos títulos que exigen mucho rendimiento - Cyberpunk 2077, por ejemplo - requerirán compromisos en términos de niveles de calidad. El G5 GD ofrece las mejores velocidades de fotogramas que hemos podido registrar con elRTX 3050 para portátiles Hasta ahora. La diferencia con laRTX 3050 Ti para portátilesGPU en elDell G15 5515 no es tan grande
| The Witcher 3 - 1920x1080 Ultra Graphics & Postprocessing (HBAO+) | |
| Media de la clase Gaming (95 - 240, n=8, últimos 2 años) | |
| Gigabyte G5 KC | |
| Lenovo Legion 5 15ACH-82JU00C6GE-FL (Ultra Performance) | |
| Lenovo Legion 5 15ACH-82JU00C6GE-FL (Auto) | |
| Lenovo Legion 5 15ACH-82JU00C6GE-FL (Eco) | |
| MSI GF65 Thin 10UE | |
| Dell G15 5515 | |
| Gigabyte G5 GD (Leistungsmodus) | |
| Gigabyte G5 GD | |
| Medio NVIDIA GeForce RTX 3050 4GB Laptop GPU (31.5 - 55.8, n=21) | |
| Gigabyte G5 GD (Stromsparmodus) | |
| Dota 2 Reborn - 1920x1080 ultra (3/3) best looking | |
| Media de la clase Gaming (84.8 - 248, n=113, últimos 2 años) | |
| Gigabyte G5 GD (Leistungsmodus) | |
| Gigabyte G5 GD | |
| Gigabyte G5 KC | |
| Gigabyte G5 GD (Stromsparmodus) | |
| Medio NVIDIA GeForce RTX 3050 4GB Laptop GPU (82.8 - 147.7, n=22) | |
| Dell G15 5515 | |
| Lenovo Legion 5 15ACH-82JU00C6GE-FL | |
| MSI GF65 Thin 10UE | |
| X-Plane 11.11 - 1920x1080 high (fps_test=3) | |
| Media de la clase Gaming (52.1 - 143.5, n=116, últimos 2 años) | |
| Gigabyte G5 GD (Leistungsmodus) | |
| Gigabyte G5 KC | |
| Gigabyte G5 GD | |
| Gigabyte G5 GD (Stromsparmodus) | |
| Medio NVIDIA GeForce RTX 3050 4GB Laptop GPU (51.6 - 103.1, n=22) | |
| Dell G15 5515 | |
| Lenovo Legion 5 15ACH-82JU00C6GE-FL | |
| MSI GF65 Thin 10UE | |
| Final Fantasy XV Benchmark - 1920x1080 High Quality | |
| Media de la clase Gaming (41 - 215, n=104, últimos 2 años) | |
| Lenovo Legion 5 15ACH-82JU00C6GE-FL (1.3) | |
| Gigabyte G5 KC (1.3) | |
| MSI GF65 Thin 10UE (1.3) | |
| Dell G15 5515 (1.3) | |
| Gigabyte G5 GD (1.3, Leistungsmodus) | |
| Gigabyte G5 GD (1.3) | |
| Medio NVIDIA GeForce RTX 3050 4GB Laptop GPU (35.9 - 53.5, n=21) | |
| Gigabyte G5 GD (1.3, Stromsparmodus) | |
| GTA V - 1920x1080 Highest AA:4xMSAA + FX AF:16x | |
| Media de la clase Gaming (48.3 - 186.9, n=103, últimos 2 años) | |
| Gigabyte G5 KC | |
| Lenovo Legion 5 15ACH-82JU00C6GE-FL | |
| Dell G15 5515 | |
| Gigabyte G5 GD | |
| MSI GF65 Thin 10UE | |
| Gigabyte G5 GD (Leistungsmodus) | |
| Medio NVIDIA GeForce RTX 3050 4GB Laptop GPU (48 - 72.5, n=21) | |
| Gigabyte G5 GD (Stromsparmodus) | |
| Strange Brigade - 1920x1080 ultra AA:ultra AF:16 | |
| Media de la clase Gaming (76.3 - 456, n=94, últimos 2 años) | |
| Gigabyte G5 KC (1.47.22.14 D3D12) | |
| MSI GF65 Thin 10UE (1.47.22.14 D3D12) | |
| Dell G15 5515 (1.47.22.14 D3D12) | |
| Gigabyte G5 GD (1.47.22.14 D3D12, Leistungsmodus) | |
| Gigabyte G5 GD (1.47.22.14 D3D12) | |
| Medio NVIDIA GeForce RTX 3050 4GB Laptop GPU (57.9 - 95.1, n=21) | |
| Gigabyte G5 GD (1.47.22.14 D3D12, Stromsparmodus) | |
| F1 2021 - 1920x1080 Ultra High Preset + Raytracing AA:T AF:16x | |
| Gigabyte G5 KC (803111) | |
| Lenovo Legion 5 15ACH-82JU00C6GE-FL | |
| Dell G15 5515 (807588) | |
| Gigabyte G5 GD (824817) | |
| Medio NVIDIA GeForce RTX 3050 4GB Laptop GPU (44.1 - 62, n=8) | |
| Gigabyte G5 GD (824817, Stromsparmodus) | |
| Deathloop - 1920x1080 High Preset | |
| Gigabyte G5 GD | |
| Medio NVIDIA GeForce RTX 3050 4GB Laptop GPU (n=1) | |
| New World - 1920x1080 Very High Video Quality | |
| Dell G15 5515 | |
| Gigabyte G5 GD | |
| Medio NVIDIA GeForce RTX 3050 4GB Laptop GPU (n=1) | |
| Alan Wake Remastered - 1920x1080 High Preset | |
| Gigabyte G5 GD | |
| Medio NVIDIA GeForce RTX 3050 4GB Laptop GPU (n=1) | |
| Far Cry 6 - 1920x1080 Ultra Graphics Quality + HD Textures AA:T | |
| Media de la clase Gaming (96.3 - 135.7, n=3, últimos 2 años) | |
| Gigabyte G5 GD | |
| Dell G15 5515 | |
| Medio NVIDIA GeForce RTX 3050 4GB Laptop GPU (45 - 59, n=3) | |
| Back 4 Blood - 1920x1080 Epic Preset (DX12) AA:T | |
| Gigabyte G5 GD | |
| Medio NVIDIA GeForce RTX 3050 4GB Laptop GPU (n=1) | |
| Guardians of the Galaxy - 1920x1080 High Preset | |
| Gigabyte G5 GD | |
| Medio NVIDIA GeForce RTX 3050 4GB Laptop GPU (n=1) | |
| Riders Republic - 1920x1080 Ultra Preset | |
| Gigabyte G5 GD | |
| Medio NVIDIA GeForce RTX 3050 4GB Laptop GPU (n=1) | |
| Forza Horizon 5 - 1920x1080 High Preset | |
| Gigabyte G5 GD | |
| Medio NVIDIA GeForce RTX 3050 4GB Laptop GPU (n=1) | |
Para comprobar si la velocidad de fotogramas se mantiene prácticamente constante durante un periodo de tiempo prolongado, dejamos que el juego The Witcher 3 funcionara durante unos 60 minutos a resolución Full HD y con los ajustes de máxima calidad. El personaje no se mueve. No se encontró una caída de la tasa de imágenes por segundo
The Witcher 3 FPS diagram
| bajo | medio | alto | ultra | |
|---|---|---|---|---|
| GTA V (2015) | 178 | 171 | 138 | 70.8 |
| The Witcher 3 (2015) | 258 | 166 | 93.6 | 51.7 |
| Dota 2 Reborn (2015) | 146 | 137 | 131 | 123 |
| Final Fantasy XV Benchmark (2018) | 136 | 73.1 | 51.1 | |
| X-Plane 11.11 (2018) | 112 | 95.7 | 77.3 | |
| Far Cry 5 (2018) | 131 | 84 | 79 | 75 |
| Strange Brigade (2018) | 287 | 130 | 105 | 91.3 |
| F1 2021 (2021) | 235 | 150 | 126 | 59.4 |
| Deathloop (2021) | 109 | 63.4 | 51.7 | 38.1 |
| New World (2021) | 95 | 65.2 | 60.2 | 49.2 |
| Alan Wake Remastered (2021) | 91.9 | 70.6 | 64.2 | |
| Far Cry 6 (2021) | 110 | 77 | 67 | 59 |
| Back 4 Blood (2021) | 247 | 138 | 112 | 103 |
| Guardians of the Galaxy (2021) | 96 | 74 | 73 | 32 |
| Riders Republic (2021) | 144 | 80 | 61 | 55 |
| Forza Horizon 5 (2021) | 154 | 87 | 77 | 28 |
Emisiones - El G5 produce mucho ruido bajo carga
Ruido del ventilador
En el uso diario (oficina, Internet), los dos ventiladores funcionan a baja velocidad y son apenas audibles. De vez en cuando, se quedan quietos. Sin embargo, se vuelve bastante ruidoso bajo carga con niveles máximos de presión sonora de 54 dB(A) (prueba de estrés) y 52 dB(A) (nuestra prueba The Witcher 3 ), respectivamente. El nivel de ruido bajo carga puede reducirse considerablemente utilizando los perfiles "Modo de ahorro de energía" y "Modo silencioso", con una disminución del rendimiento informático. En general, elDell G15 5515 produce menos ruido
| Gigabyte G5 GD GeForce RTX 3050 4GB Laptop GPU, i5-11400H | Dell G15 5515 GeForce RTX 3050 Ti Laptop GPU, R7 5800H | Lenovo Legion 5 15ACH-82JU00C6GE-FL GeForce RTX 3060 Laptop GPU, R7 5800H | MSI GF65 Thin 10UE GeForce RTX 3060 Laptop GPU, i7-10750H | Gigabyte G5 KC GeForce RTX 3060 Laptop GPU, i5-10500H | |
|---|---|---|---|---|---|
| Noise | 11% | 1% | 0% | -16% | |
| apagado / medio ambiente * (dB) | 24 | 24 -0% | 24.2 -1% | 24.7 -3% | 27 -13% |
| Idle Minimum * (dB) | 29 | 25 14% | 29 -0% | 33.1 -14% | 31 -7% |
| Idle Average * (dB) | 30 | 26 13% | 29 3% | 33.1 -10% | 32 -7% |
| Idle Maximum * (dB) | 32 | 30 6% | 29 9% | 33.1 -3% | 51 -59% |
| Load Average * (dB) | 53 | 44 17% | 53.5 -1% | 42.7 19% | 57 -8% |
| Witcher 3 ultra * (dB) | 52 | 44 15% | 53.5 -3% | 40.6 22% | 56 -8% |
| Load Maximum * (dB) | 54 | 48 11% | 53.5 1% | 59.4 -10% | 58 -7% |
* ... más pequeño es mejor
Ruido
| Ocioso |
| 29 / 30 / 32 dB(A) |
| Carga |
| 53 / 54 dB(A) |
 | ||
30 dB silencioso 40 dB(A) audible 50 dB(A) ruidosamente alto |
||
min: | ||
Temperatura
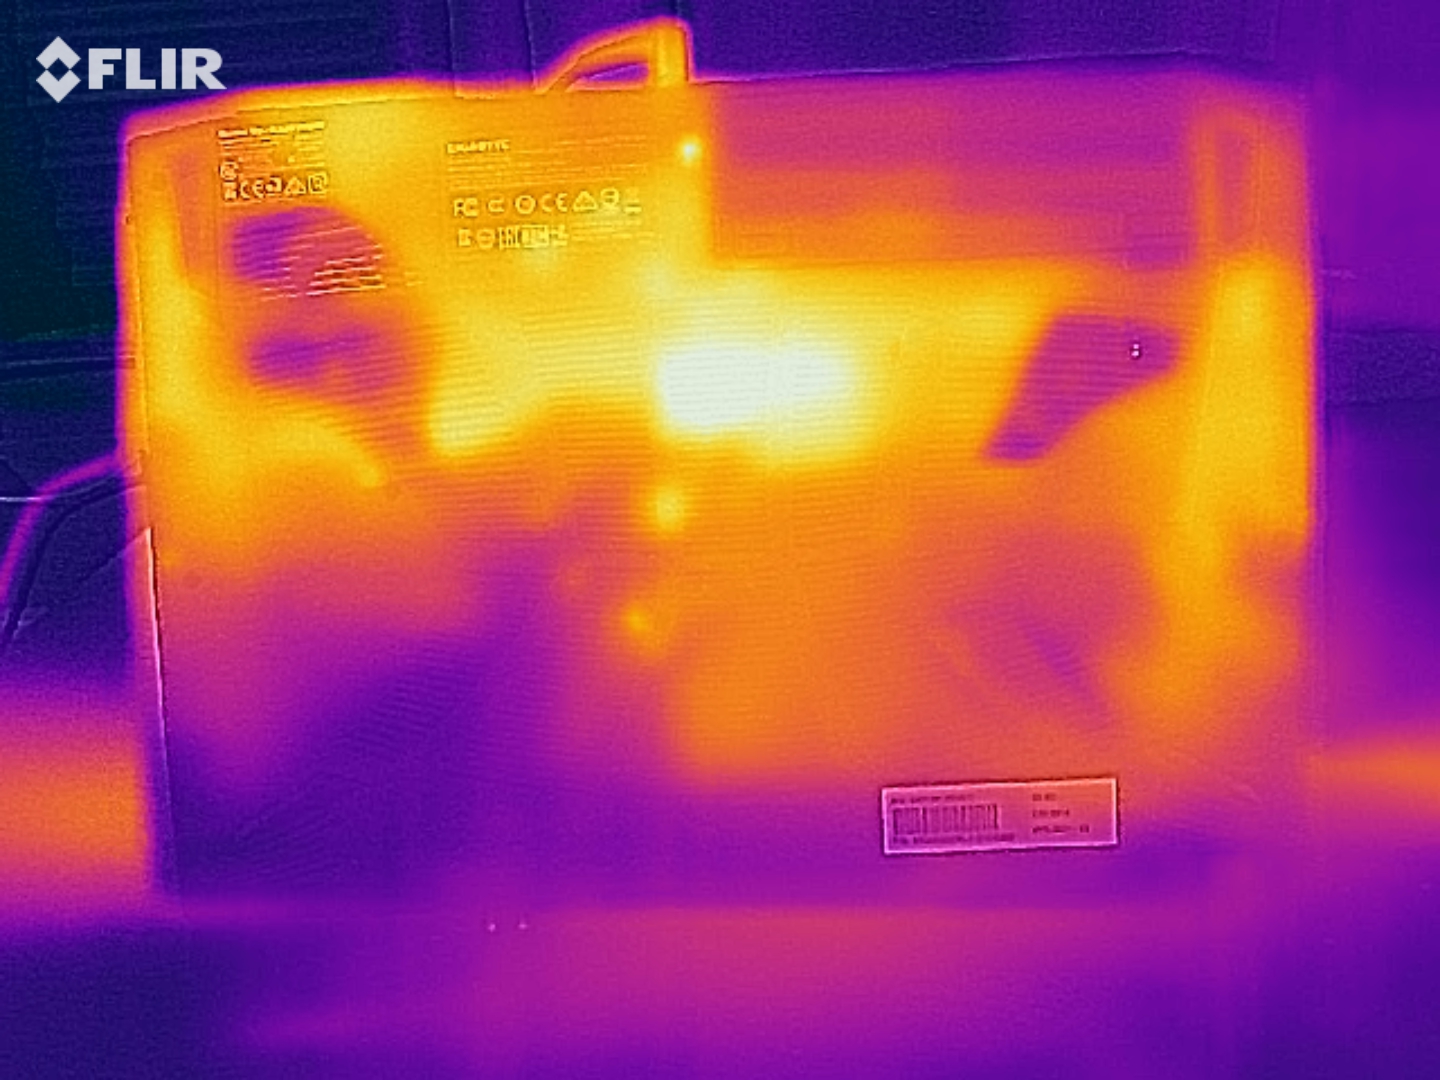
Las temperaturas de la carcasa del G5 se mantienen dentro del rango verde en el uso diario (oficina, Internet). Bajo carga (test de estrés, nuestra prueba The Witcher 3 ), las temperaturas son más altas en ciertas áreas, pero siguen siendo moderadas en general. En general, la competencia está a la par. Las temperaturas de la CPU tampoco son motivo de preocupación
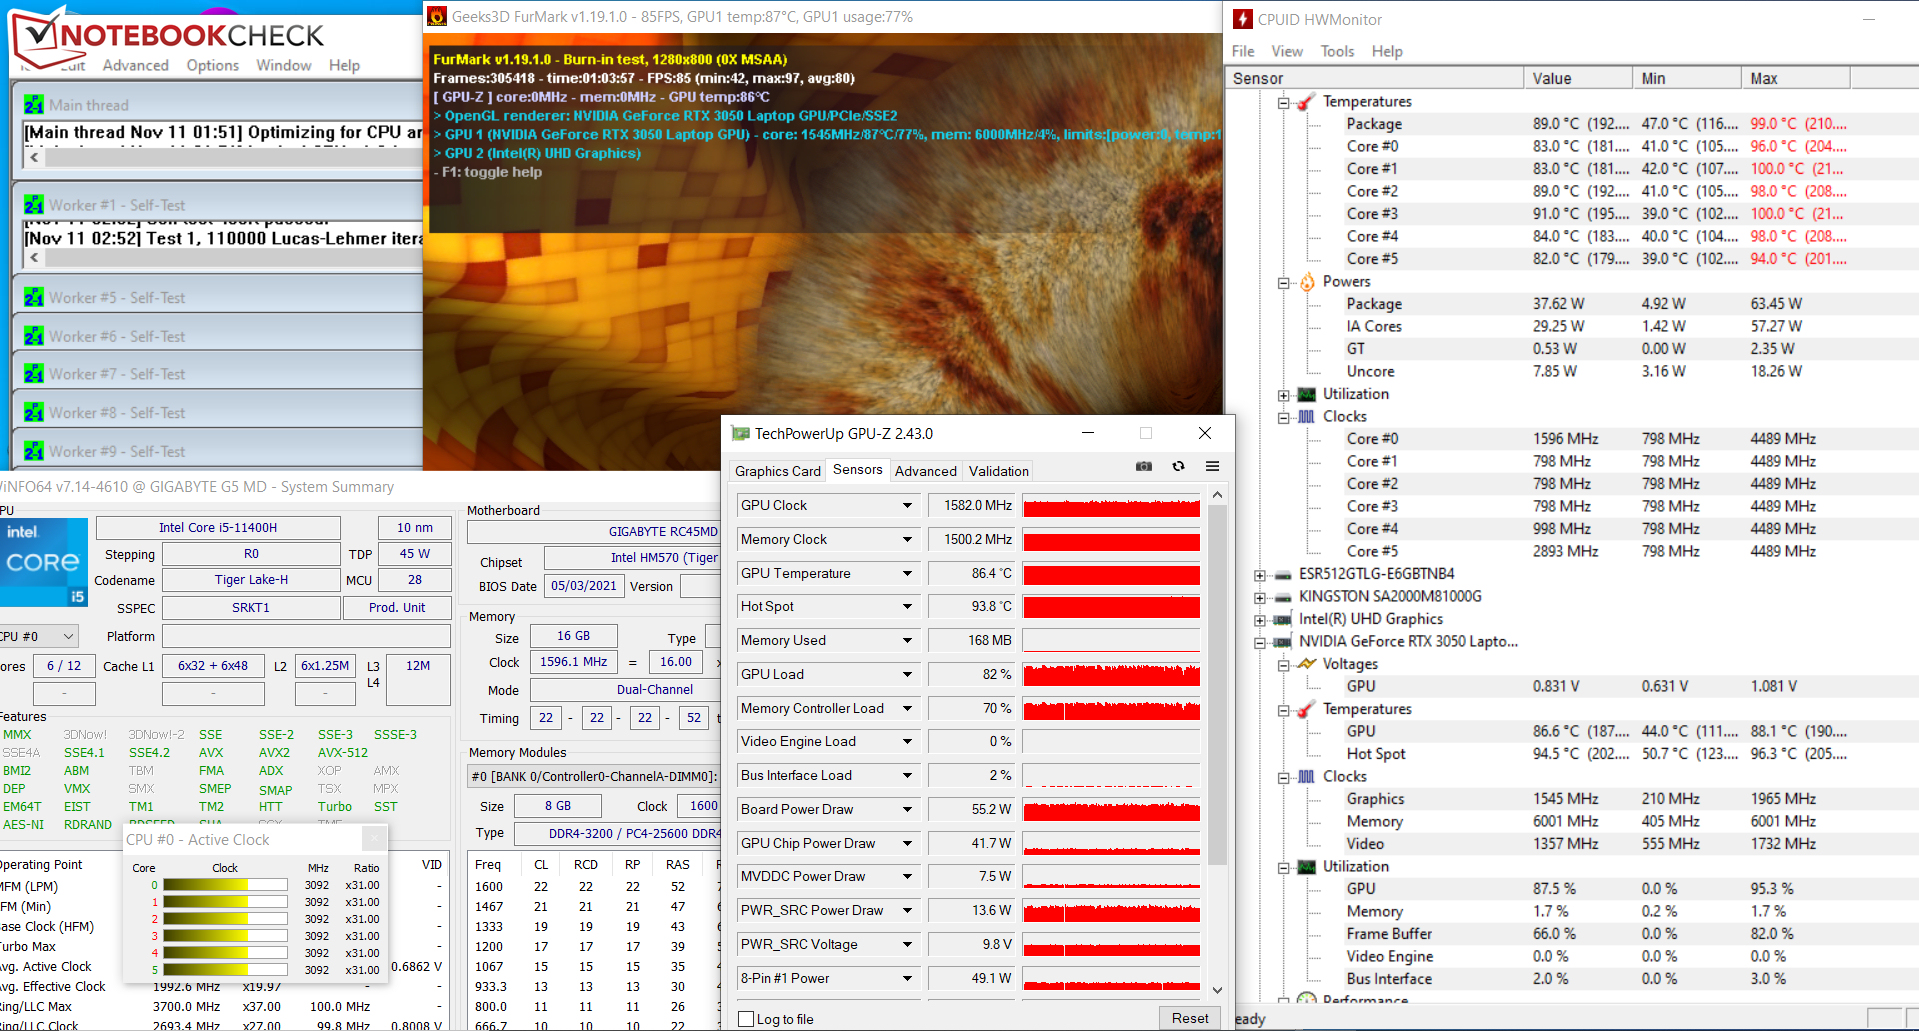
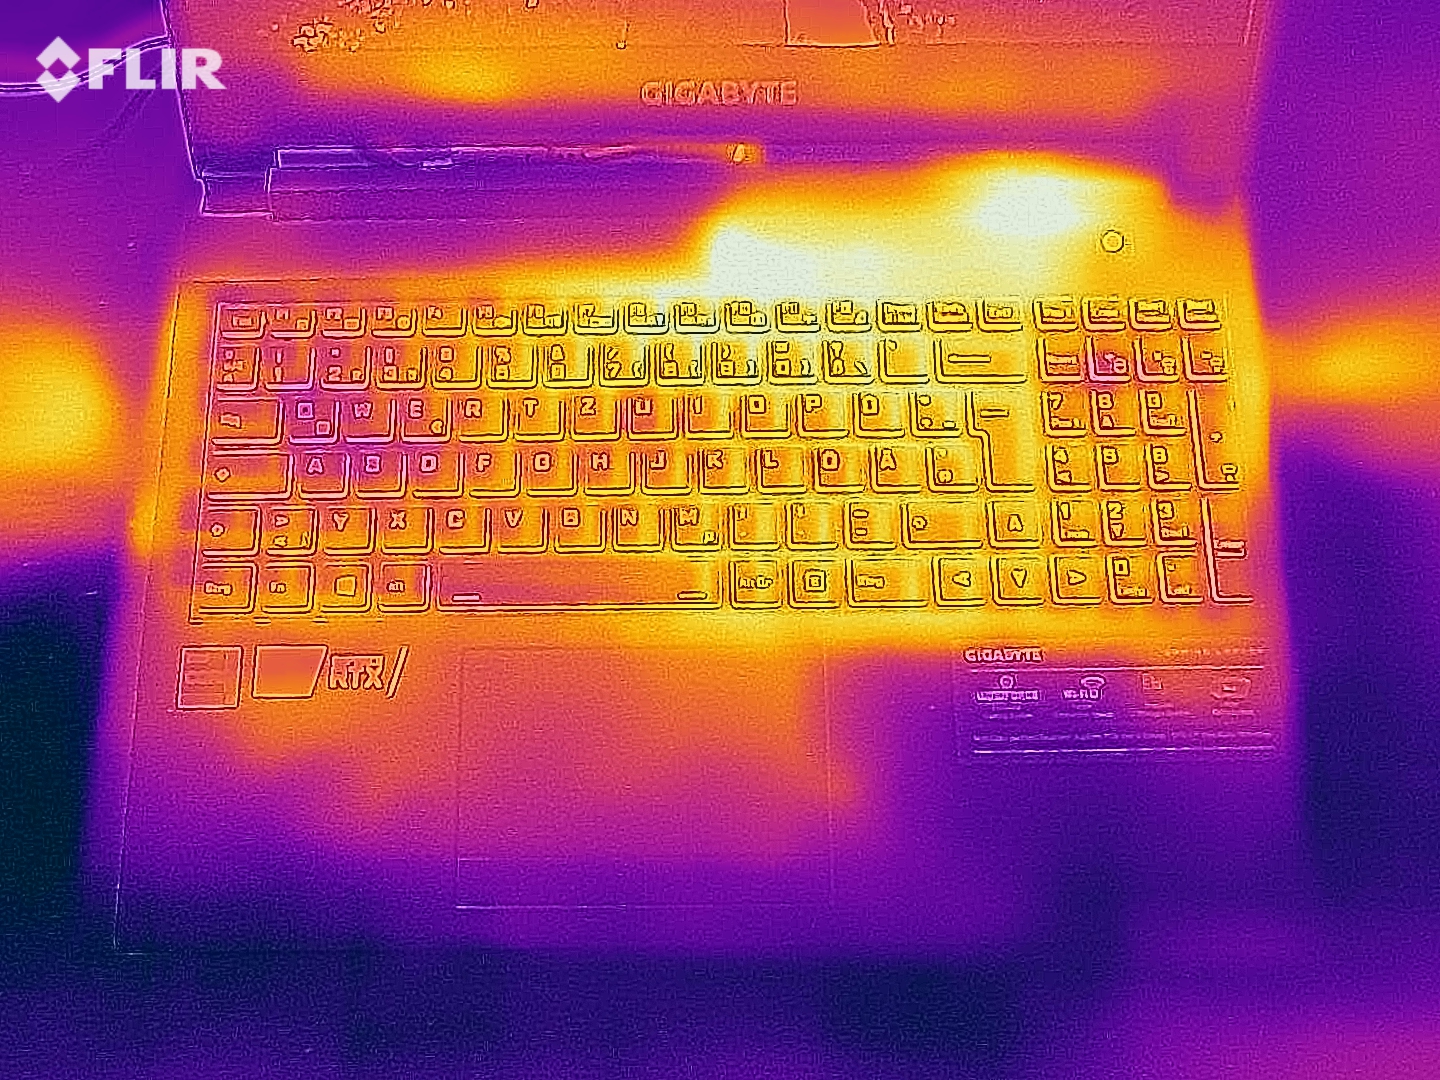
Prueba de esfuerzo
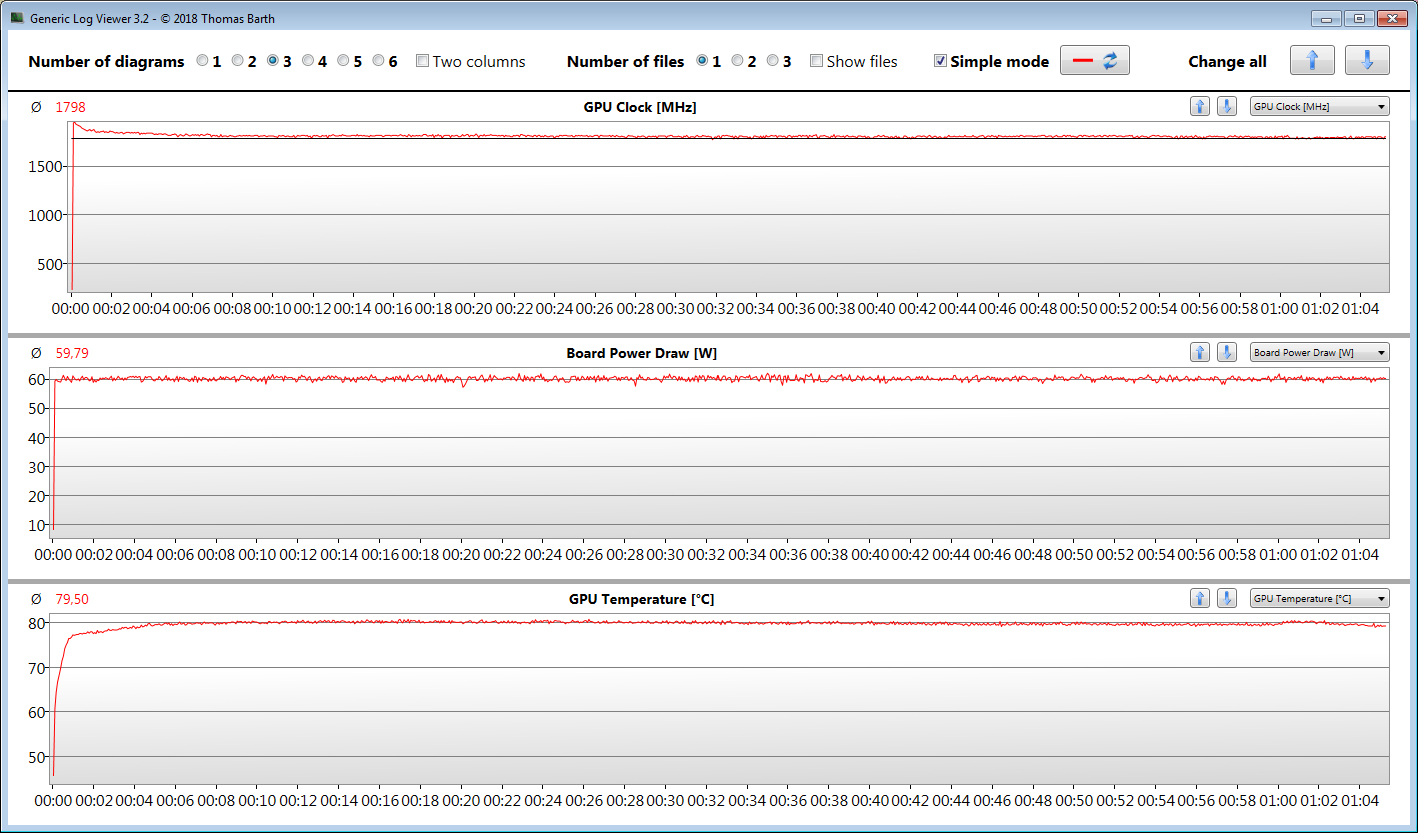
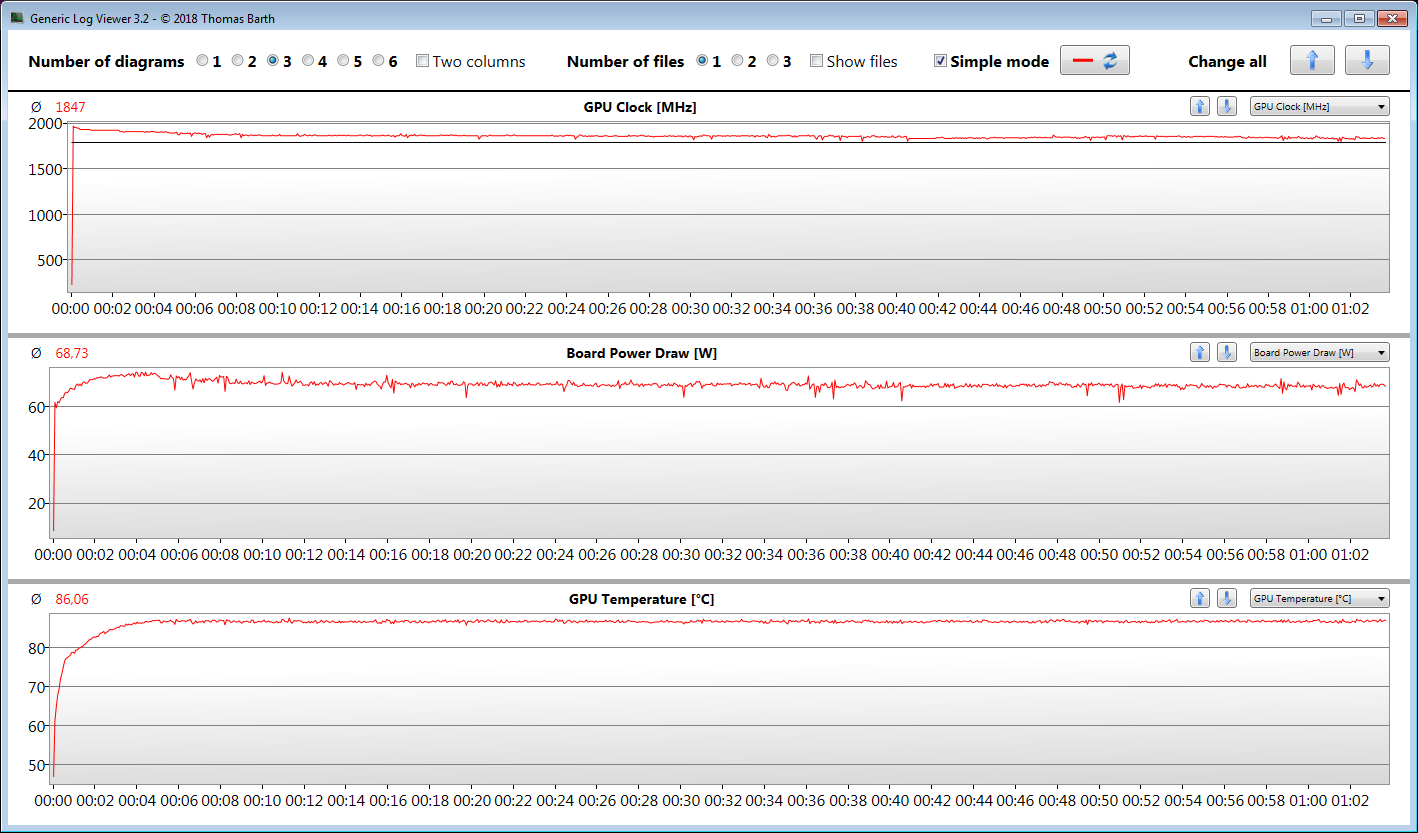
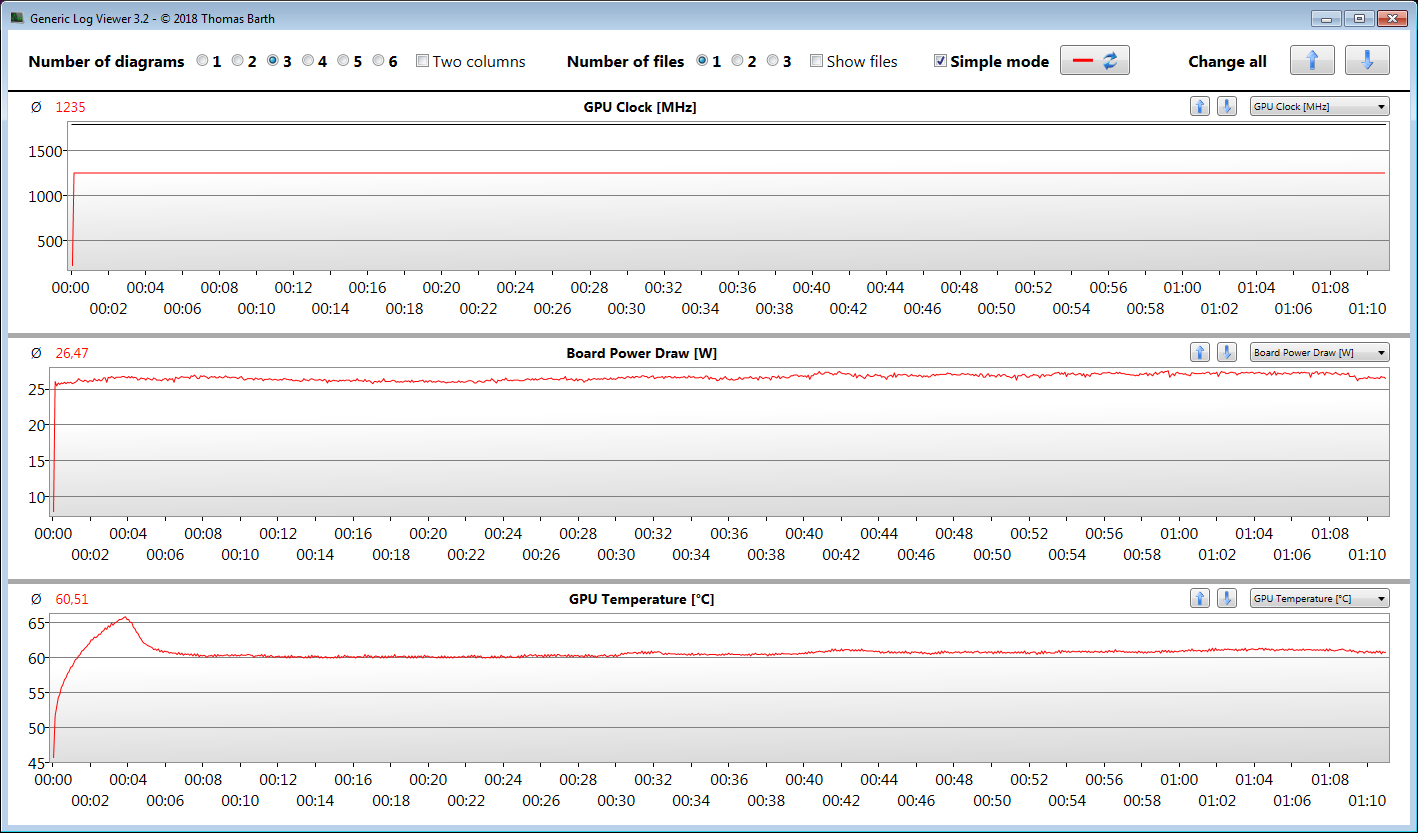
La CPU y la GPU procesan la prueba de estrés (Prime95 y FurMark se ejecutan durante al menos una hora) a una velocidad de entre 2,6 y 3,1 GHz y unos 1.600 MHz, respectivamente. La prueba representa un escenario extremo que utilizamos para comprobar si el sistema se mantiene estable a plena carga
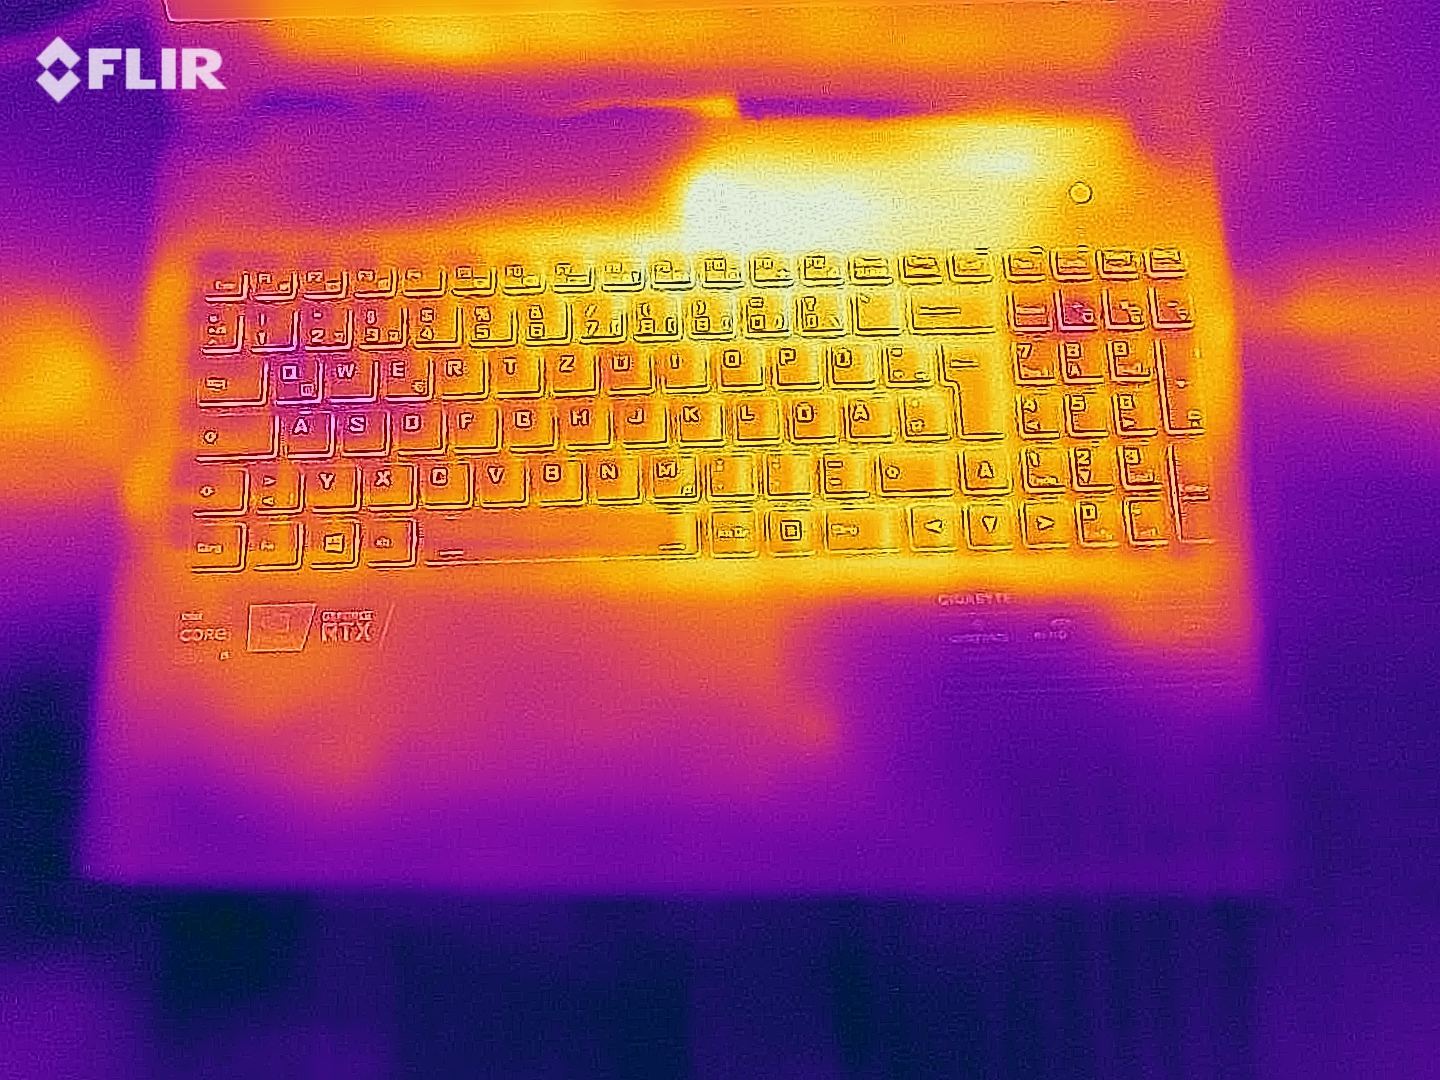
(±) La temperatura máxima en la parte superior es de 45 °C / 113 F, frente a la media de 40.4 °C / 105 F, que oscila entre 21.2 y 68.8 °C para la clase Gaming.
(-) El fondo se calienta hasta un máximo de 50 °C / 122 F, frente a la media de 43.2 °C / 110 F
(+) En reposo, la temperatura media de la parte superior es de 26.7 °C / 80# F, frente a la media del dispositivo de 33.9 °C / 93 F.
(±) Jugando a The Witcher 3, la temperatura media de la parte superior es de 36.3 °C / 97 F, frente a la media del dispositivo de 33.9 °C / 93 F.
(+) Los reposamanos y el panel táctil alcanzan como máximo la temperatura de la piel (33 °C / 91.4 F) y, por tanto, no están calientes.
(-) La temperatura media de la zona del reposamanos de dispositivos similares fue de 28.8 °C / 83.8 F (-4.2 °C / -7.6 F).
| Gigabyte G5 GD GeForce RTX 3050 4GB Laptop GPU, i5-11400H | Dell G15 5515 GeForce RTX 3050 Ti Laptop GPU, R7 5800H | Lenovo Legion 5 15ACH-82JU00C6GE-FL GeForce RTX 3060 Laptop GPU, R7 5800H | MSI GF65 Thin 10UE GeForce RTX 3060 Laptop GPU, i7-10750H | Gigabyte G5 KC GeForce RTX 3060 Laptop GPU, i5-10500H | |
|---|---|---|---|---|---|
| Heat | 4% | 8% | 5% | -9% | |
| Maximum Upper Side * (°C) | 45 | 50 -11% | 42.6 5% | 43.4 4% | 50 -11% |
| Maximum Bottom * (°C) | 50 | 49 2% | 52.2 -4% | 41.8 16% | 49 2% |
| Idle Upper Side * (°C) | 28 | 26 7% | 24.9 11% | 30.2 -8% | 33 -18% |
| Idle Bottom * (°C) | 31 | 26 16% | 25.3 18% | 28.4 8% | 34 -10% |
* ... más pequeño es mejor
Altavoces
Gigabyte G5 GD análisis de audio
(±) | la sonoridad del altavoz es media pero buena (80 dB)
Graves 100 - 315 Hz
(-) | casi sin bajos - de media 25.4% inferior a la mediana
(-) | los graves no son lineales (16.2% delta a la frecuencia anterior)
Medios 400 - 2000 Hz
(+) | medios equilibrados - a sólo 3.2% de la mediana
(+) | los medios son lineales (4.6% delta a la frecuencia anterior)
Altos 2 - 16 kHz
(+) | máximos equilibrados - a sólo 3.9% de la mediana
(±) | la linealidad de los máximos es media (10.1% delta a frecuencia anterior)
Total 100 - 16.000 Hz
(±) | la linealidad del sonido global es media (19.1% de diferencia con la mediana)
En comparación con la misma clase
» 64% de todos los dispositivos probados de esta clase eran mejores, 7% similares, 28% peores
» El mejor tuvo un delta de 6%, la media fue 18%, el peor fue ###max##%
En comparación con todos los dispositivos probados
» 46% de todos los dispositivos probados eran mejores, 7% similares, 47% peores
» El mejor tuvo un delta de 4%, la media fue 24%, el peor fue ###max##%
Dell G15 5515 análisis de audio
(±) | la sonoridad del altavoz es media pero buena (76 dB)
Graves 100 - 315 Hz
(-) | casi sin bajos - de media 22% inferior a la mediana
(±) | la linealidad de los graves es media (14.9% delta a frecuencia anterior)
Medios 400 - 2000 Hz
(+) | medios equilibrados - a sólo 2.8% de la mediana
(+) | los medios son lineales (3% delta a la frecuencia anterior)
Altos 2 - 16 kHz
(+) | máximos equilibrados - a sólo 1.4% de la mediana
(+) | los máximos son lineales (3.7% delta a la frecuencia anterior)
Total 100 - 16.000 Hz
(±) | la linealidad del sonido global es media (16.8% de diferencia con la mediana)
En comparación con la misma clase
» 44% de todos los dispositivos probados de esta clase eran mejores, 11% similares, 46% peores
» El mejor tuvo un delta de 6%, la media fue 18%, el peor fue ###max##%
En comparación con todos los dispositivos probados
» 29% de todos los dispositivos probados eran mejores, 8% similares, 63% peores
» El mejor tuvo un delta de 4%, la media fue 24%, el peor fue ###max##%
Consumo de energía - El portátil Gigabyte sólo ofrece una corta duración de la batería
El G5 consume una cantidad relativamente alta de energía en el uso en reposo y bajo baja carga. La competencia hace un mejor trabajo aquí. La demanda es normal para el hardware instalado aquí cuando el dispositivo está bajo carga media o alta. El siguiente diagrama ilustra el consumo de energía constante del portátil durante nuestra prueba en Witcher 3. El adaptador de corriente parece tener una capacidad adecuada con una salida nominal de 150 vatios. La batería no se agota cuando el hardware del portátil está bajo carga completa
| Off / Standby | |
| Ocioso | |
| Carga |
|
Clave:
min: | |
Energy consumption during The Witcher 3
| Gigabyte G5 GD i5-11400H, GeForce RTX 3050 4GB Laptop GPU | Dell G15 5515 R7 5800H, GeForce RTX 3050 Ti Laptop GPU | Lenovo Legion 5 15ACH-82JU00C6GE-FL R7 5800H, GeForce RTX 3060 Laptop GPU | MSI GF65 Thin 10UE i7-10750H, GeForce RTX 3060 Laptop GPU | Gigabyte G5 KC i5-10500H, GeForce RTX 3060 Laptop GPU | Media de la clase Gaming | |
|---|---|---|---|---|---|---|
| Power Consumption | 16% | -1% | 13% | -7% | -26% | |
| Idle Minimum * (Watt) | 13 | 5 62% | 7.3 44% | 5.4 58% | 8 38% | 13.3 ? -2% |
| Idle Average * (Watt) | 15 | 9 40% | 10.5 30% | 12.8 15% | 13 13% | 19 ? -27% |
| Idle Maximum * (Watt) | 20 | 20 -0% | 15.7 22% | 19.5 2% | 20 -0% | 24.5 ? -23% |
| Load Average * (Watt) | 102 | 94 8% | 108 -6% | 86.6 15% | 98 4% | 108.1 ? -6% |
| Witcher 3 ultra * (Watt) | 124 | 123 1% | 175 -41% | 115.7 7% | 166 -34% | |
| Load Maximum * (Watt) | 148 | 172 -16% | 228 -54% | 175.2 -18% | 242 -64% | 254 ? -72% |
* ... más pequeño es mejor
Duración de la batería
El portátil de 15,6 pulgadas logra duraciones de 3:06 horas y 3:34 horas en el test Wi-Fi (acceso a webs a través de un script) y en el test de vídeo (cortometraje Big Buck Bunny
(codificación H.264, Full HD) ejecutado en bucle), respectivamente. Las funciones de ahorro de energía están deshabilitadas aquí, y el brillo de la pantalla está ajustado a unos 150 cd/m². Además, los módulos inalámbricos están desactivados para la prueba de vídeo.El uso de los perfiles de energía "Modo de ahorro de energía" y "Modo silencioso" no conlleva ninguna mejora en la duración de la batería.
| Gigabyte G5 GD i5-11400H, GeForce RTX 3050 4GB Laptop GPU, 41 Wh | Dell G15 5515 R7 5800H, GeForce RTX 3050 Ti Laptop GPU, 56 Wh | Lenovo Legion 5 15ACH-82JU00C6GE-FL R7 5800H, GeForce RTX 3060 Laptop GPU, 80 Wh | MSI GF65 Thin 10UE i7-10750H, GeForce RTX 3060 Laptop GPU, 51 Wh | Gigabyte G5 KC i5-10500H, GeForce RTX 3060 Laptop GPU, 48.96 Wh | Media de la clase Gaming | |
|---|---|---|---|---|---|---|
| Duración de Batería | 119% | 46% | 48% | 2% | 86% | |
| Reader / Idle (h) | 5.7 | 13.5 137% | 11.1 95% | 5.2 -9% | 8.71 ? 53% | |
| H.264 (h) | 3.6 | 8.8 144% | 4.3 19% | 8.26 ? 129% | ||
| WiFi v1.3 (h) | 3.1 | 8 158% | 4.8 55% | 4.6 48% | 3.6 16% | 7.01 ? 126% |
| Load (h) | 1.1 | 1.5 36% | 1.8 64% | 1.1 0% | 1.1 0% | 1.47 ? 34% |
Pro
Contra
Veredicto - Sólido portátil para juegos a bajo precio
El G5 GD dejó una buena impresión general, a pesar de algunos defectos. Por un precio bajo, puedes conseguir un portátil de juegos Full HD que lleva todos los juegos más recientes con fluidez a la pantalla (aunque no siempre con los máximos detalles)
ElCore i5-11400H y la tarjeta de memoriaGeForce RTX 3050 portátil GPU pueden trabajar a velocidades de reloj constantes - si se instala una versión de BIOS que funcione. Gracias a un TGP de 85 vatios, la GPU ofrece los mejores resultados generales que hemos podido determinar para la RTX 3050 hasta ahora
Gigabyte ofrece un portátil gaming básico muy completo con el G5 GD, que está disponible por algo menos de 750 Euros.
El portátil se calienta notablemente bajo carga, pero no en exceso. El desarrollo del ruido está un poco por encima de la media. Sin embargo, el portátil funciona silenciosamente cuando realiza tareas cotidianas. Para ello se recomienda el perfil de energía "Modo de Ahorro de Energía". La reducida potencia de cálculo resultante sigue siendo más que suficiente para las aplicaciones de oficina e Internet, así como para los juegos en alta definición
La escasa capacidad de almacenamiento (512 GB, PCIe 4) puede ampliarse: Hay espacio para un segundo SSD M.2 (PCIe 3 o SATA) y una unidad de almacenamiento de 2,5 pulgadas. La pantalla mate (Full HD, IPS, 144 Hz) ofrece ángulos de visión estables, buen contraste y una decente reproducción del color. Hay margen de mejora en términos de brillo, cobertura del espacio de color y tiempos de respuesta. Además, la duración de la batería no es nada especial
El nivel de precio relativamente bajo de 750 euros (~848 dólares) se debe, entre otras cosas, a que no se incluye ningún sistema operativo Windows. Como resultado, Linux sería la primera opción obvia para un sistema operativo, pero la instalación y configuración del sistema probablemente sería una molestia demasiado grande para varios usuarios. Al final, es probable que se reduzca a Windows 10 en la mayoría de los casos. Por el momento, Windows 11 solo es compatible con las versiones más recientes de BIOS, lo que causa problemas en cuanto al rendimiento de los juegos. Los usuarios tendrán que esperar a futuras actualizaciones de la BIOS en este caso
Una alternativa al G5 GD sería el Dell G15 5515. Está equipado con componentes más potentes y, al mismo tiempo, ofrece una duración de batería mucho mejor que la del portátil Gigabyte.
Precio y disponibilidad
Gigabyte G5 GD
- 11/21/2021 v7 (old)
Sascha Mölck
Price comparison

