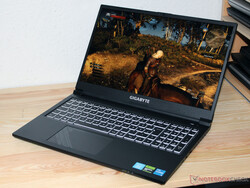
Análisis del Gigabyte G5 KF: Portátil gaming con RTX 4060 por 969 euros
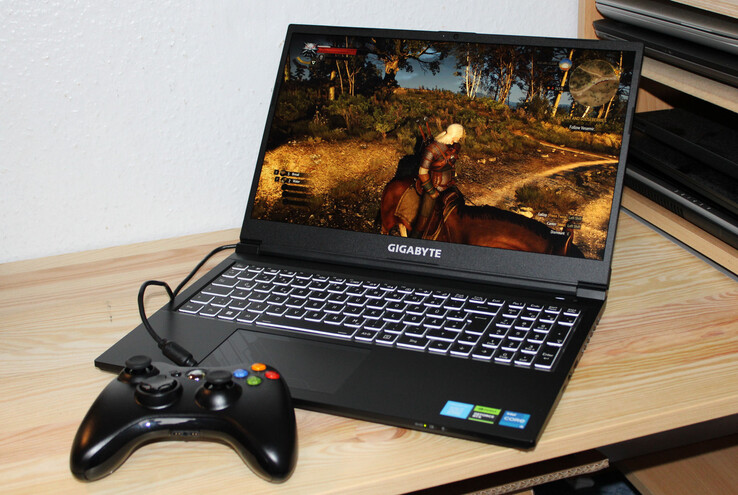
El G5 KF es un portátil para juegos en el segmento de precio más bajo: el dispositivo de 15,6 pulgadas le costará unos 969 euros (1.026 dólares). Aunque la licencia de Windows no está incluida en el precio. El portátil de Gigabyte compite con modelos de la talla del MSI Cyborg 15 A12VF, Intel NUC X15, Lenovo Legion Slim 5 16APH8yAsus TUF A15 FA507.
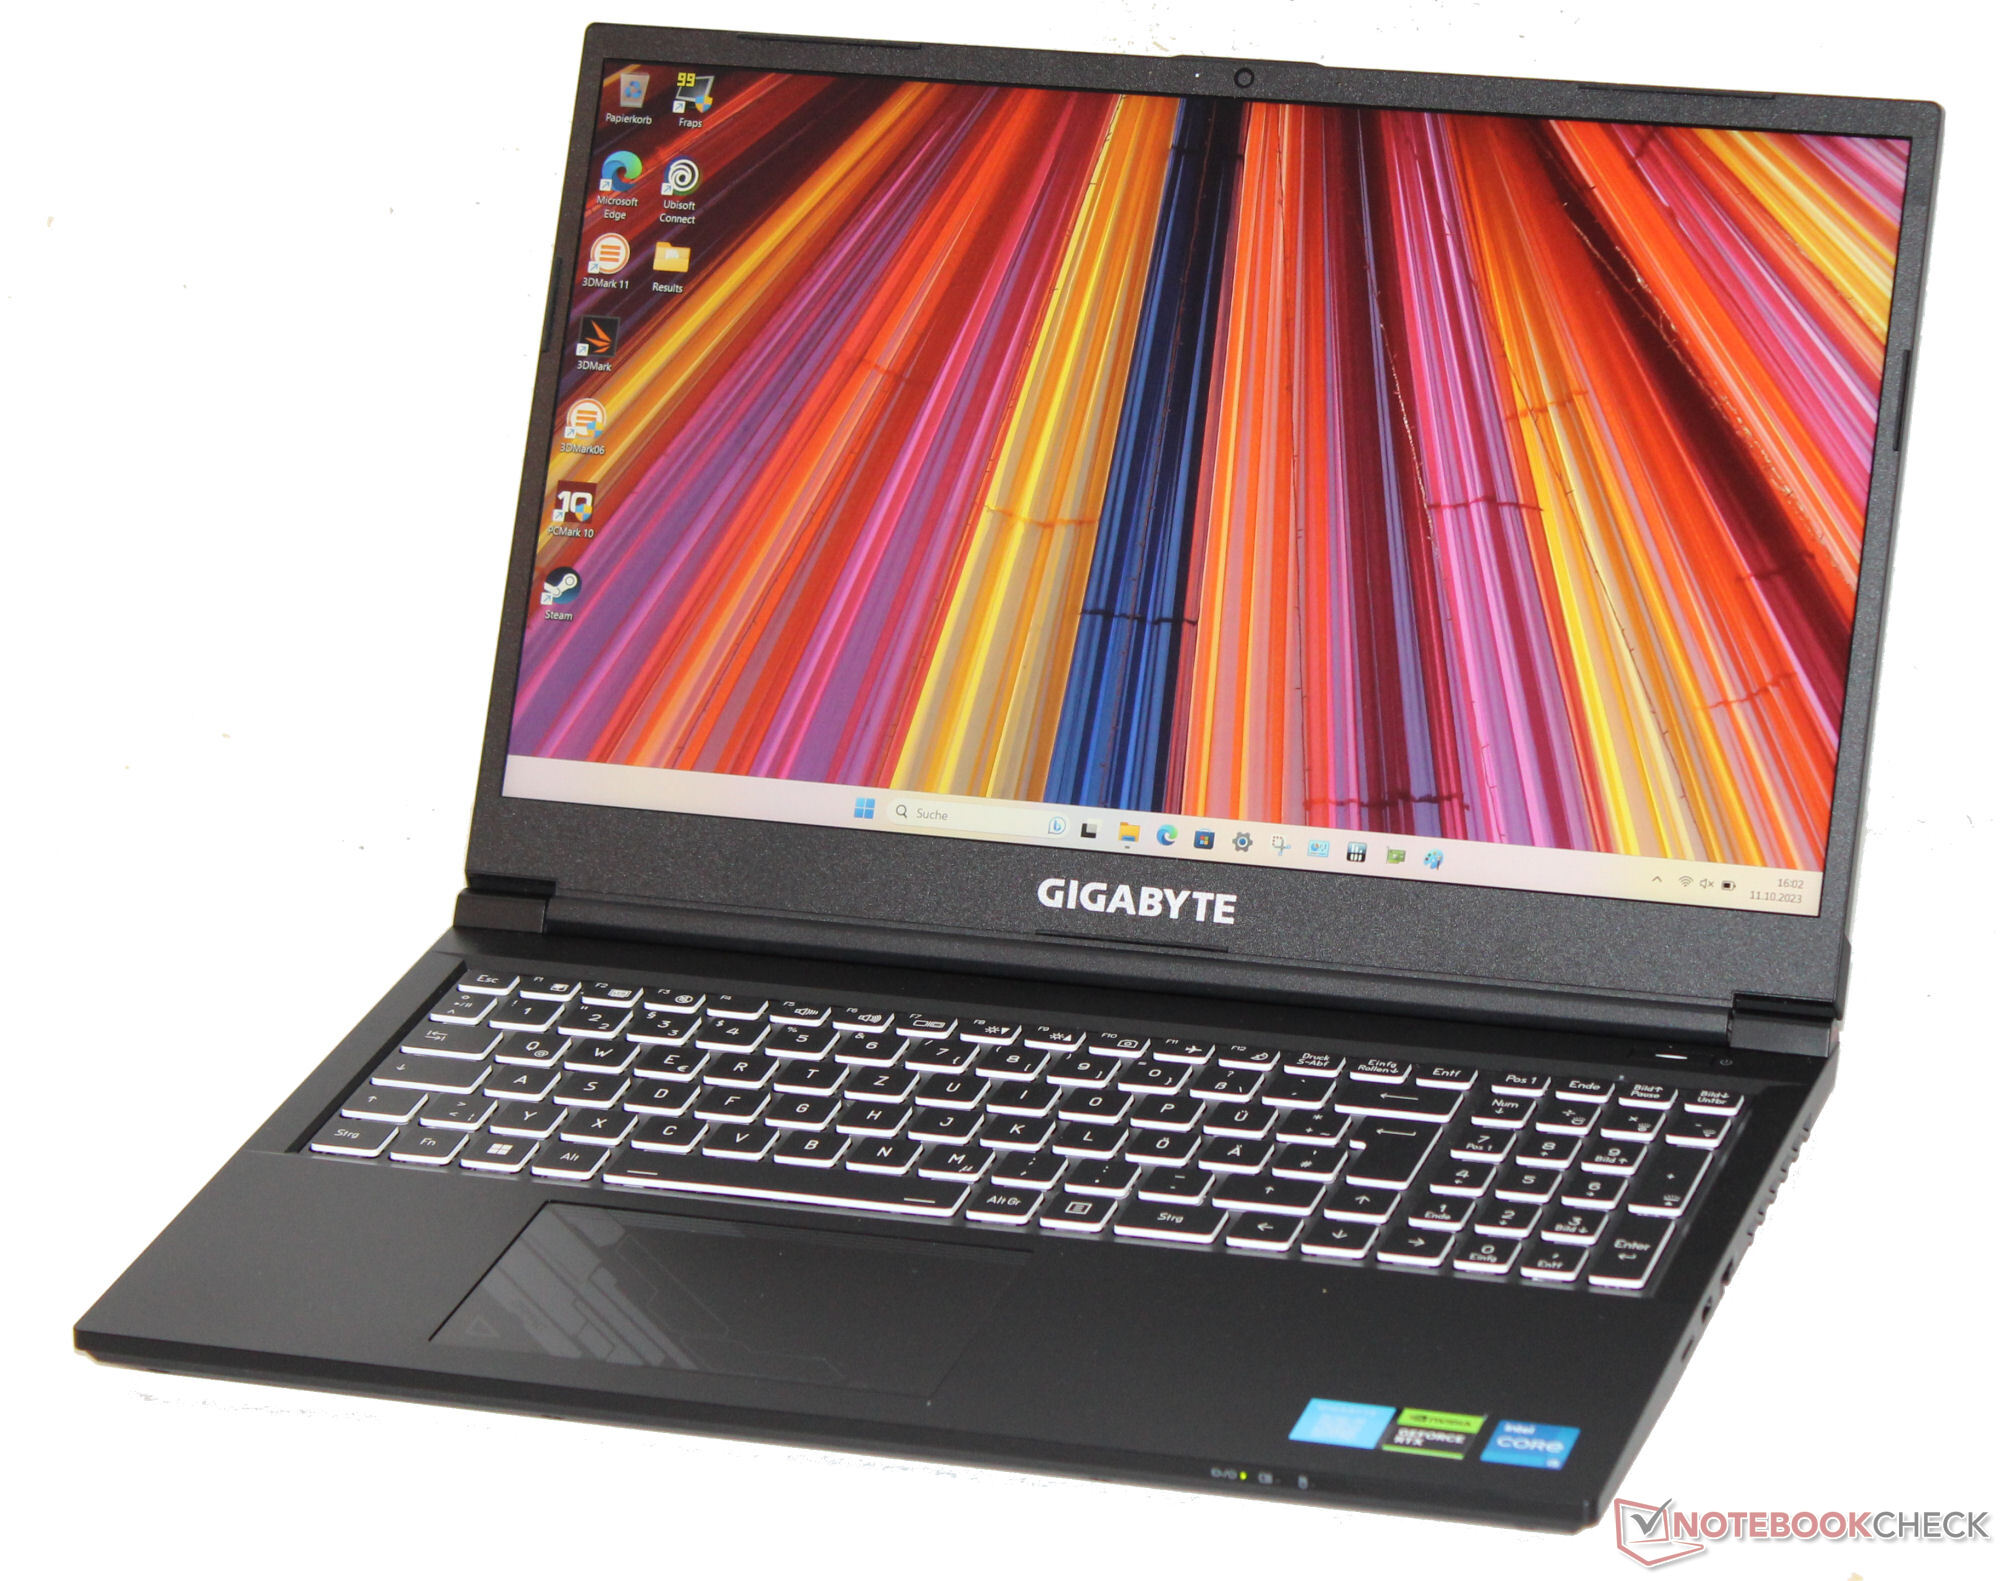
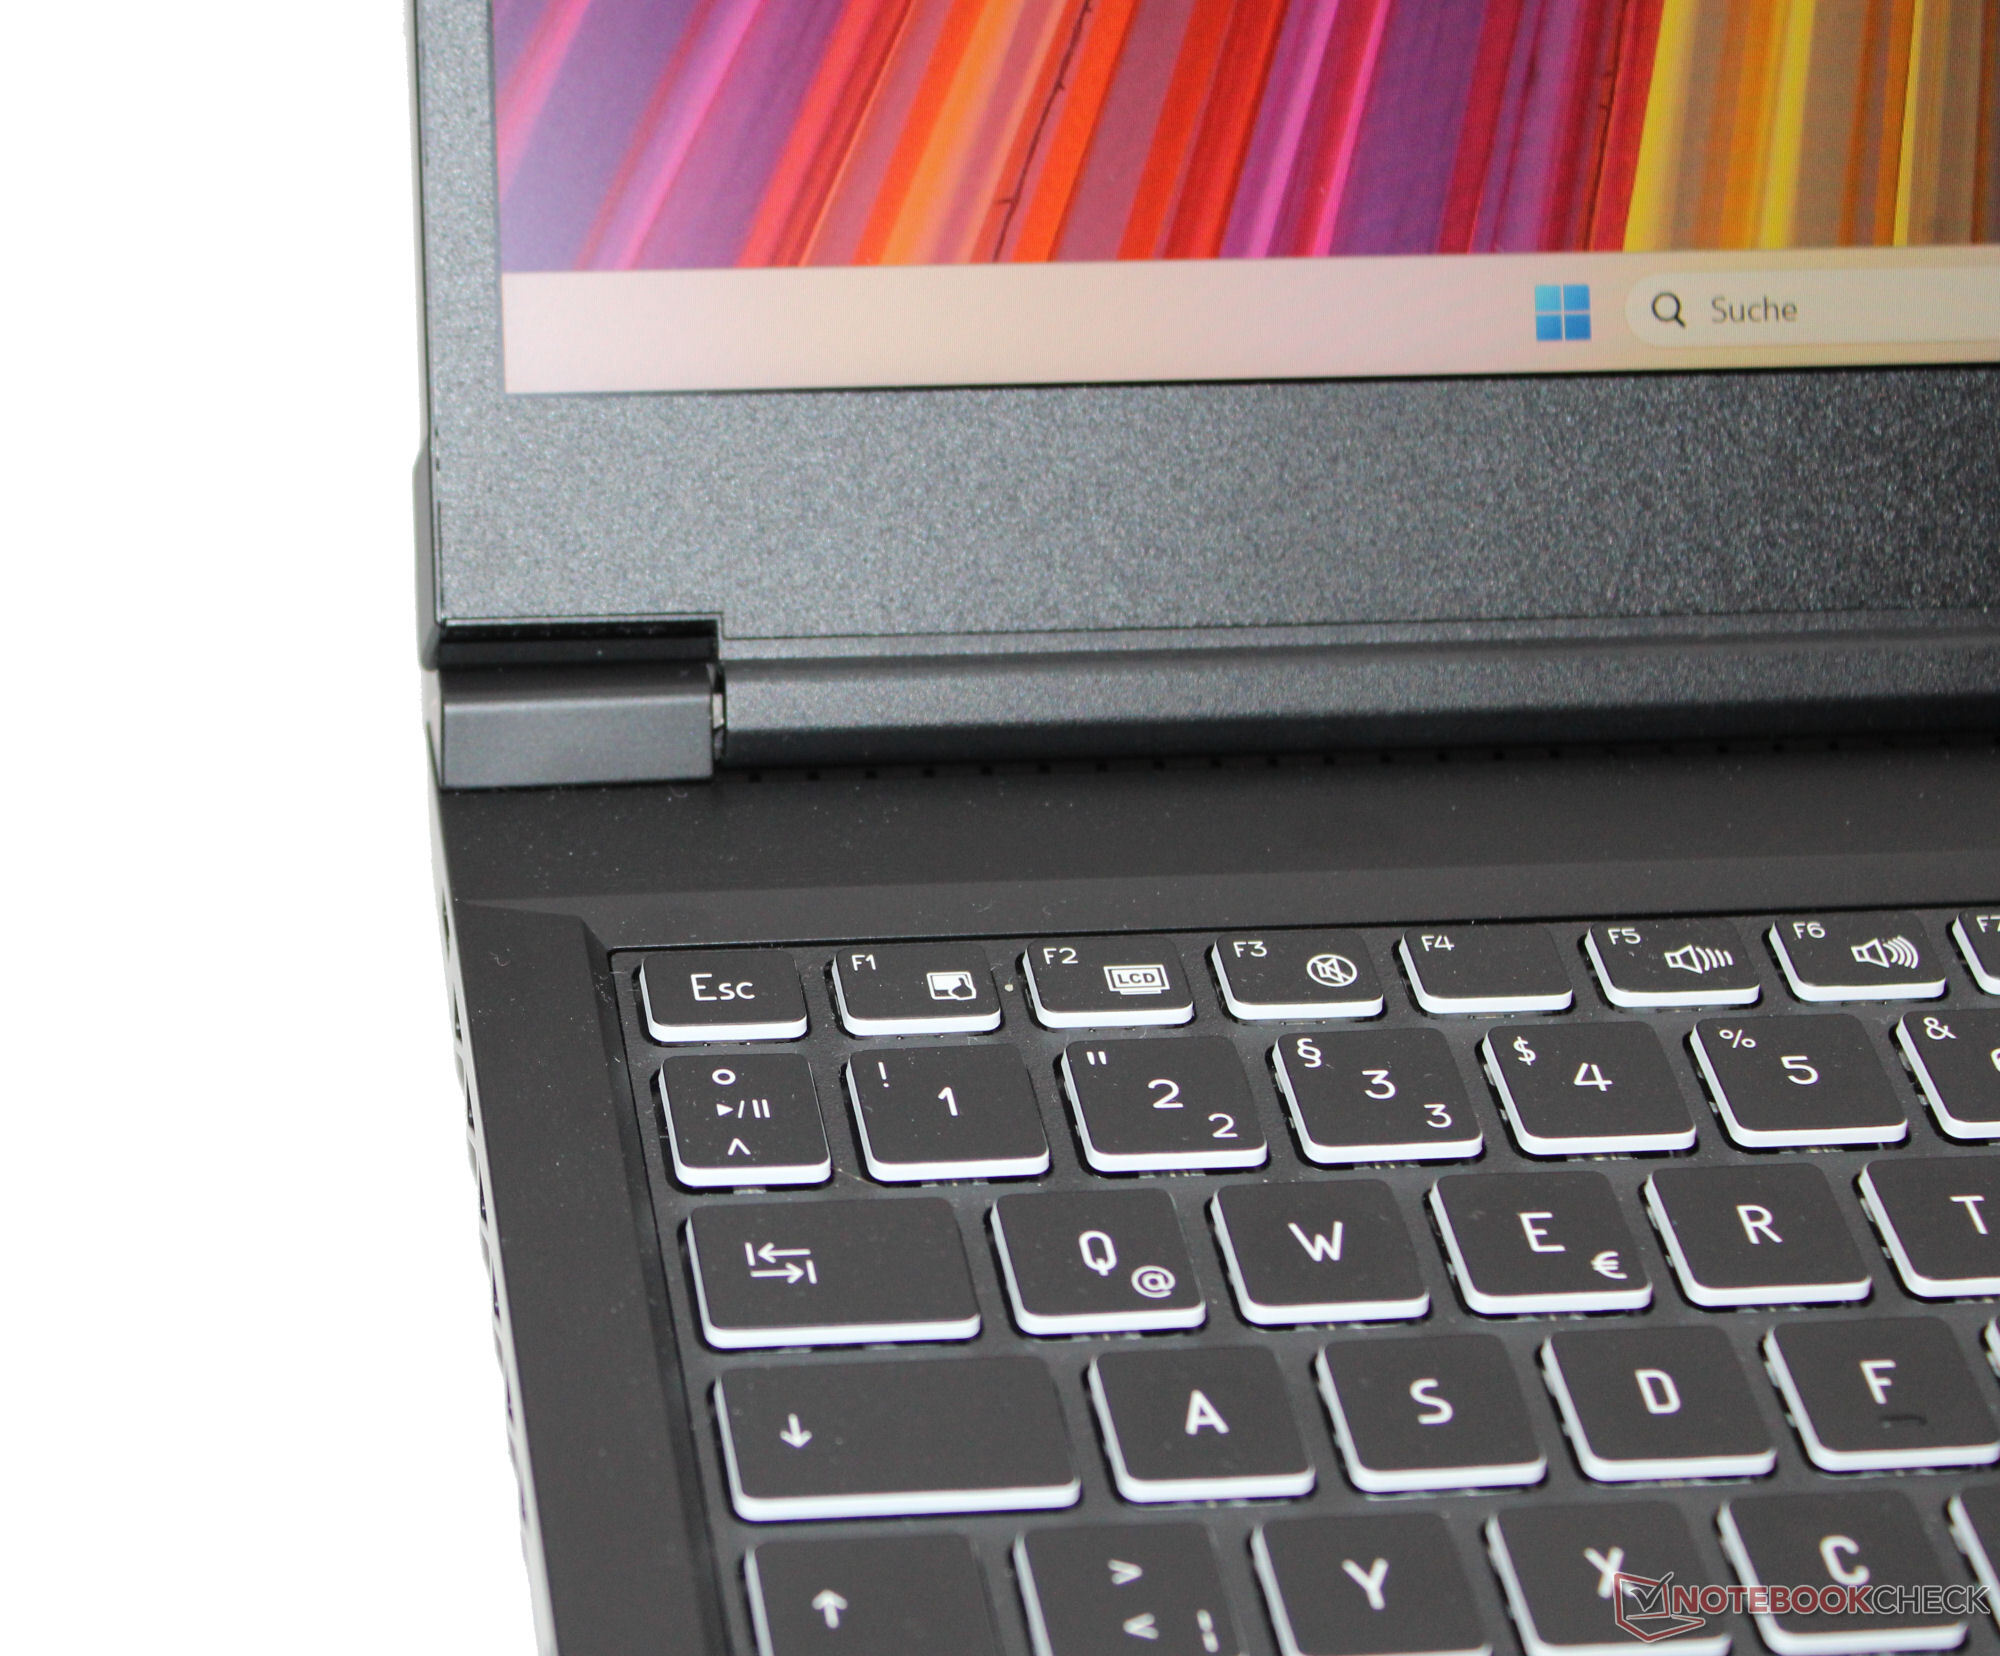
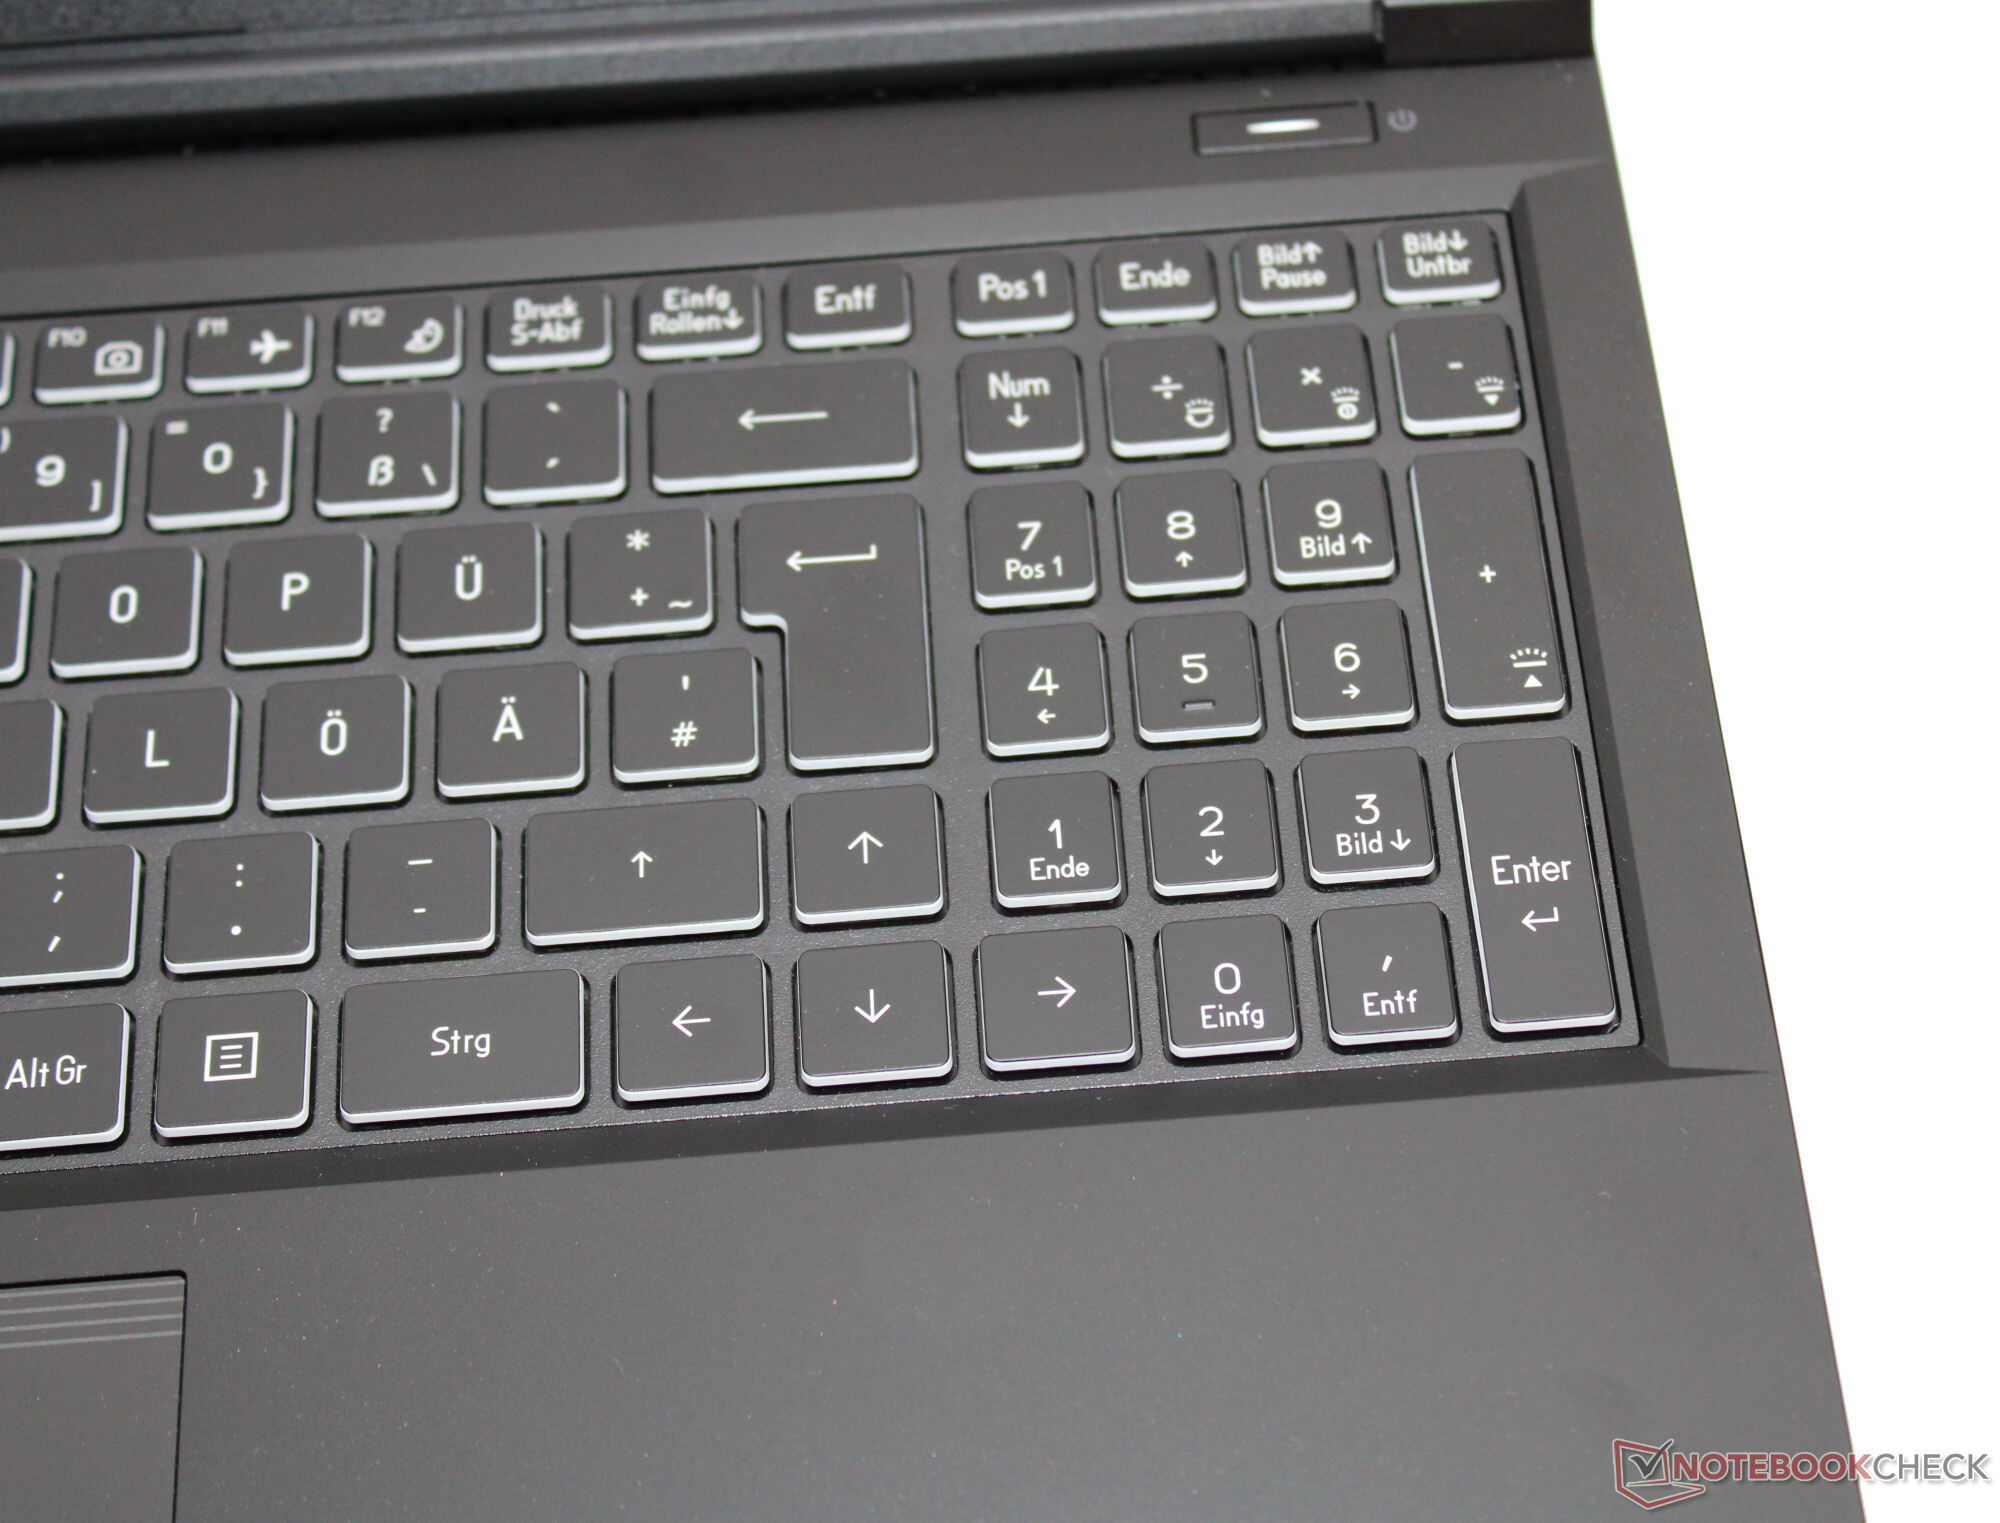
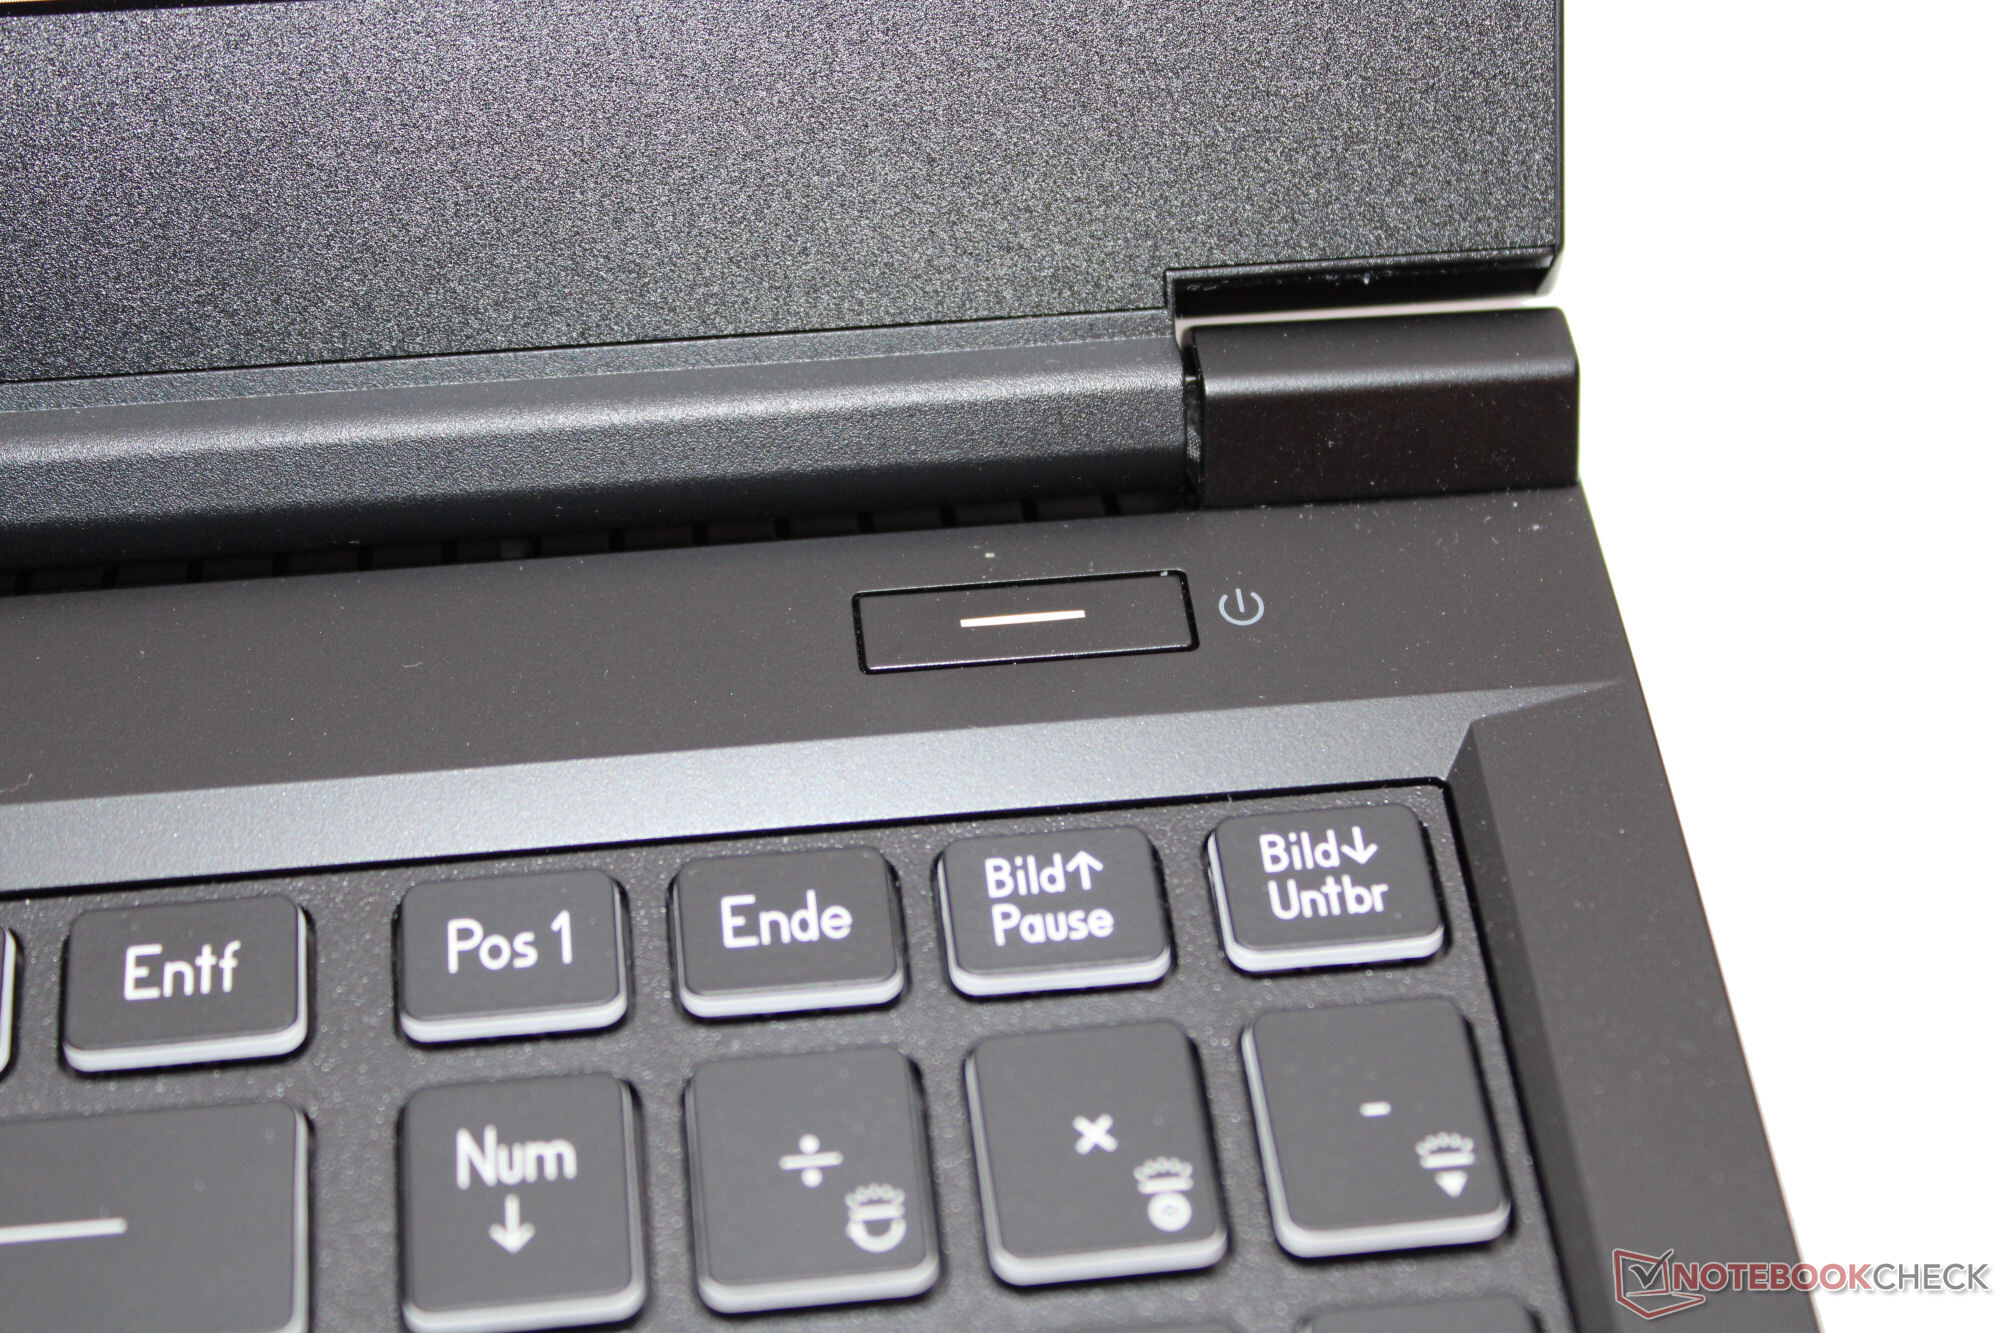
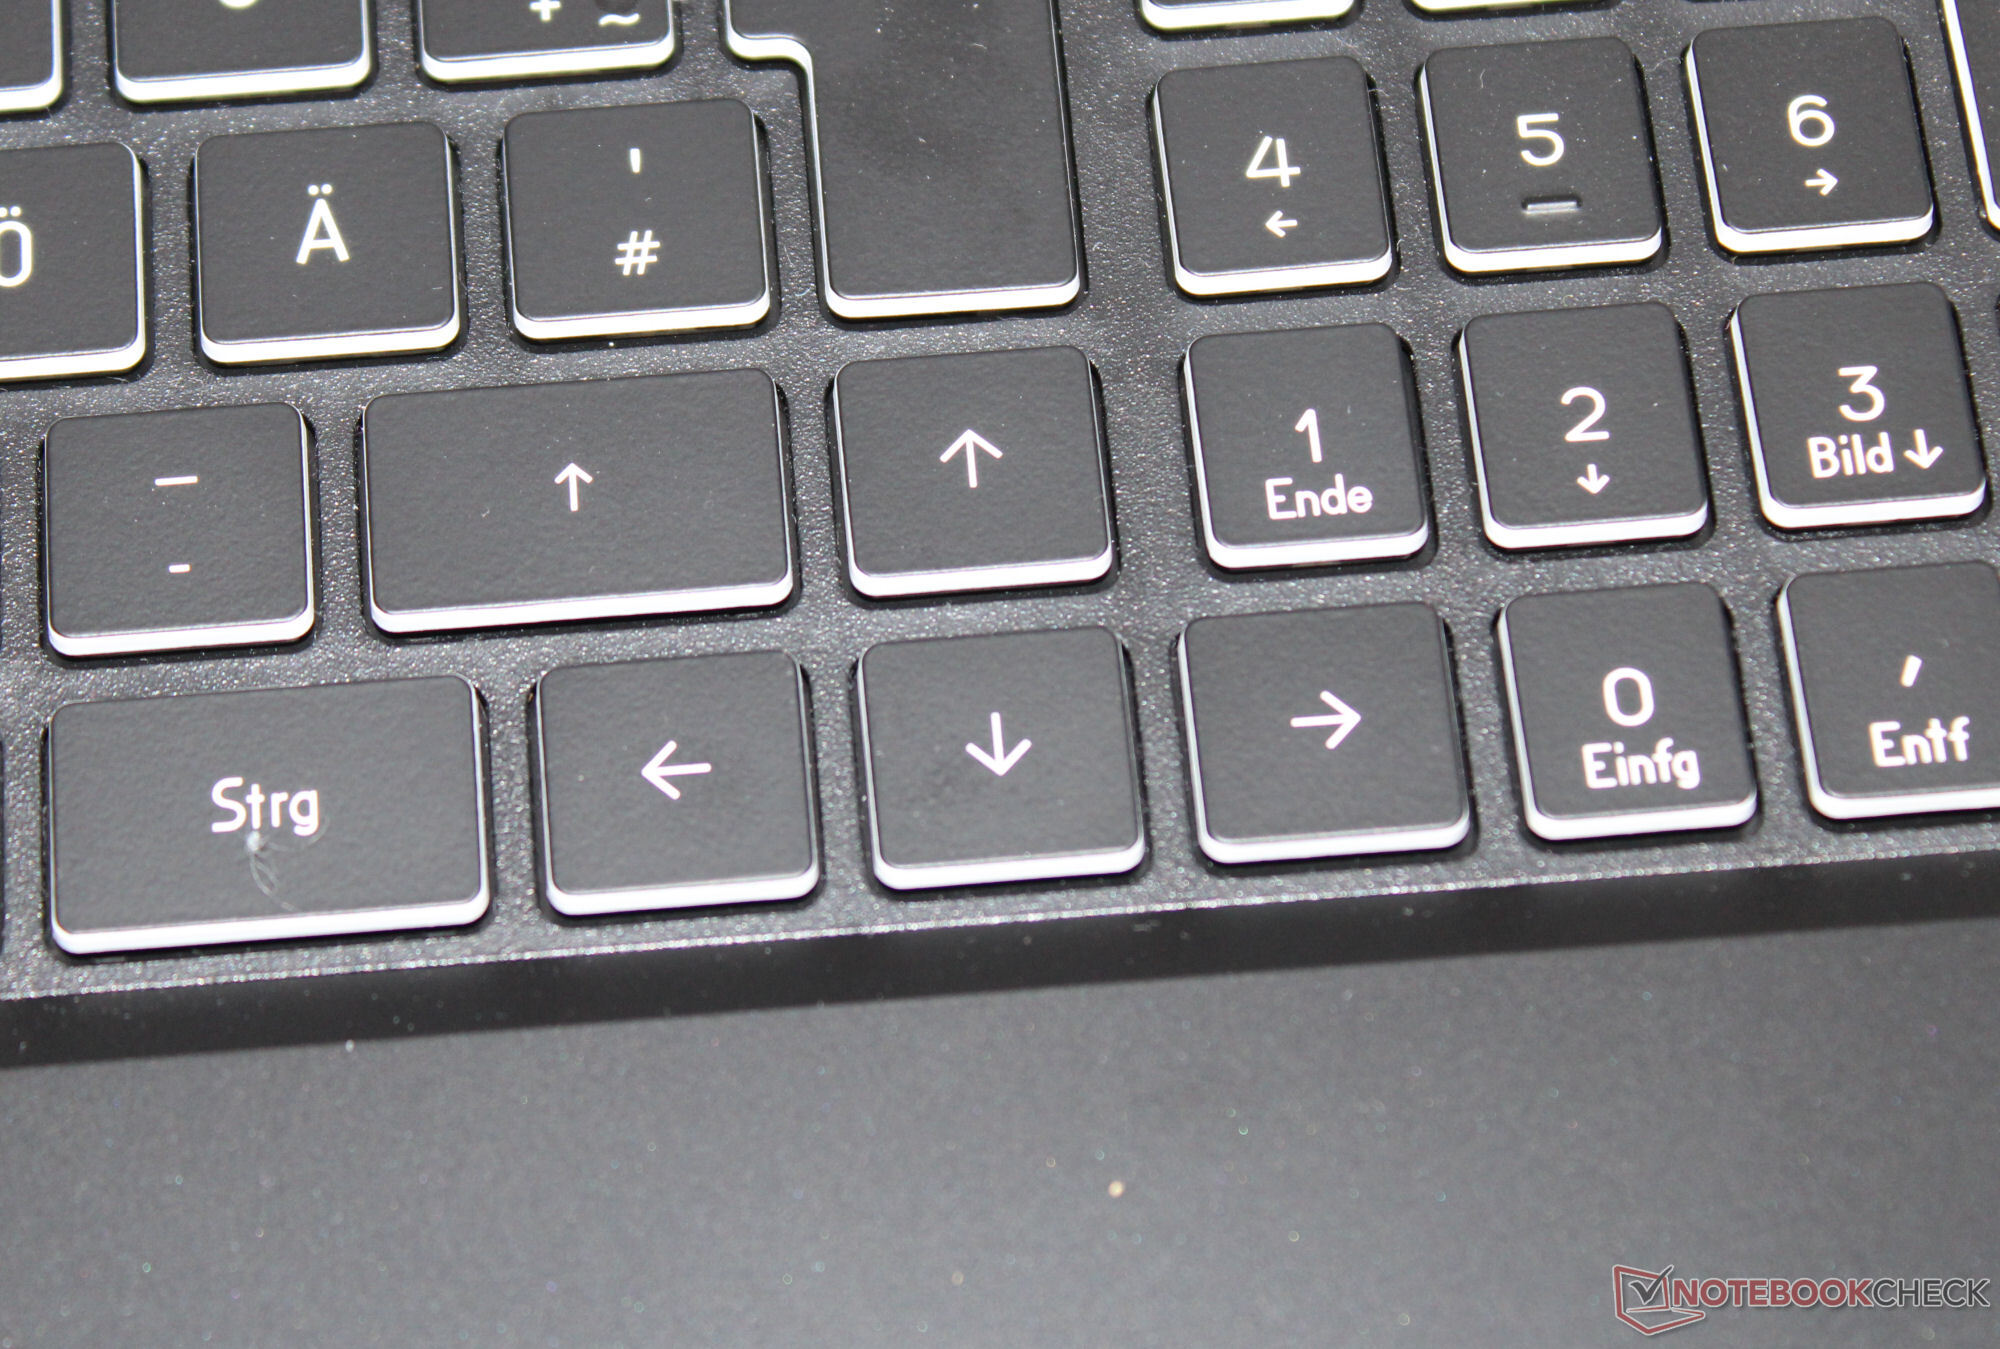
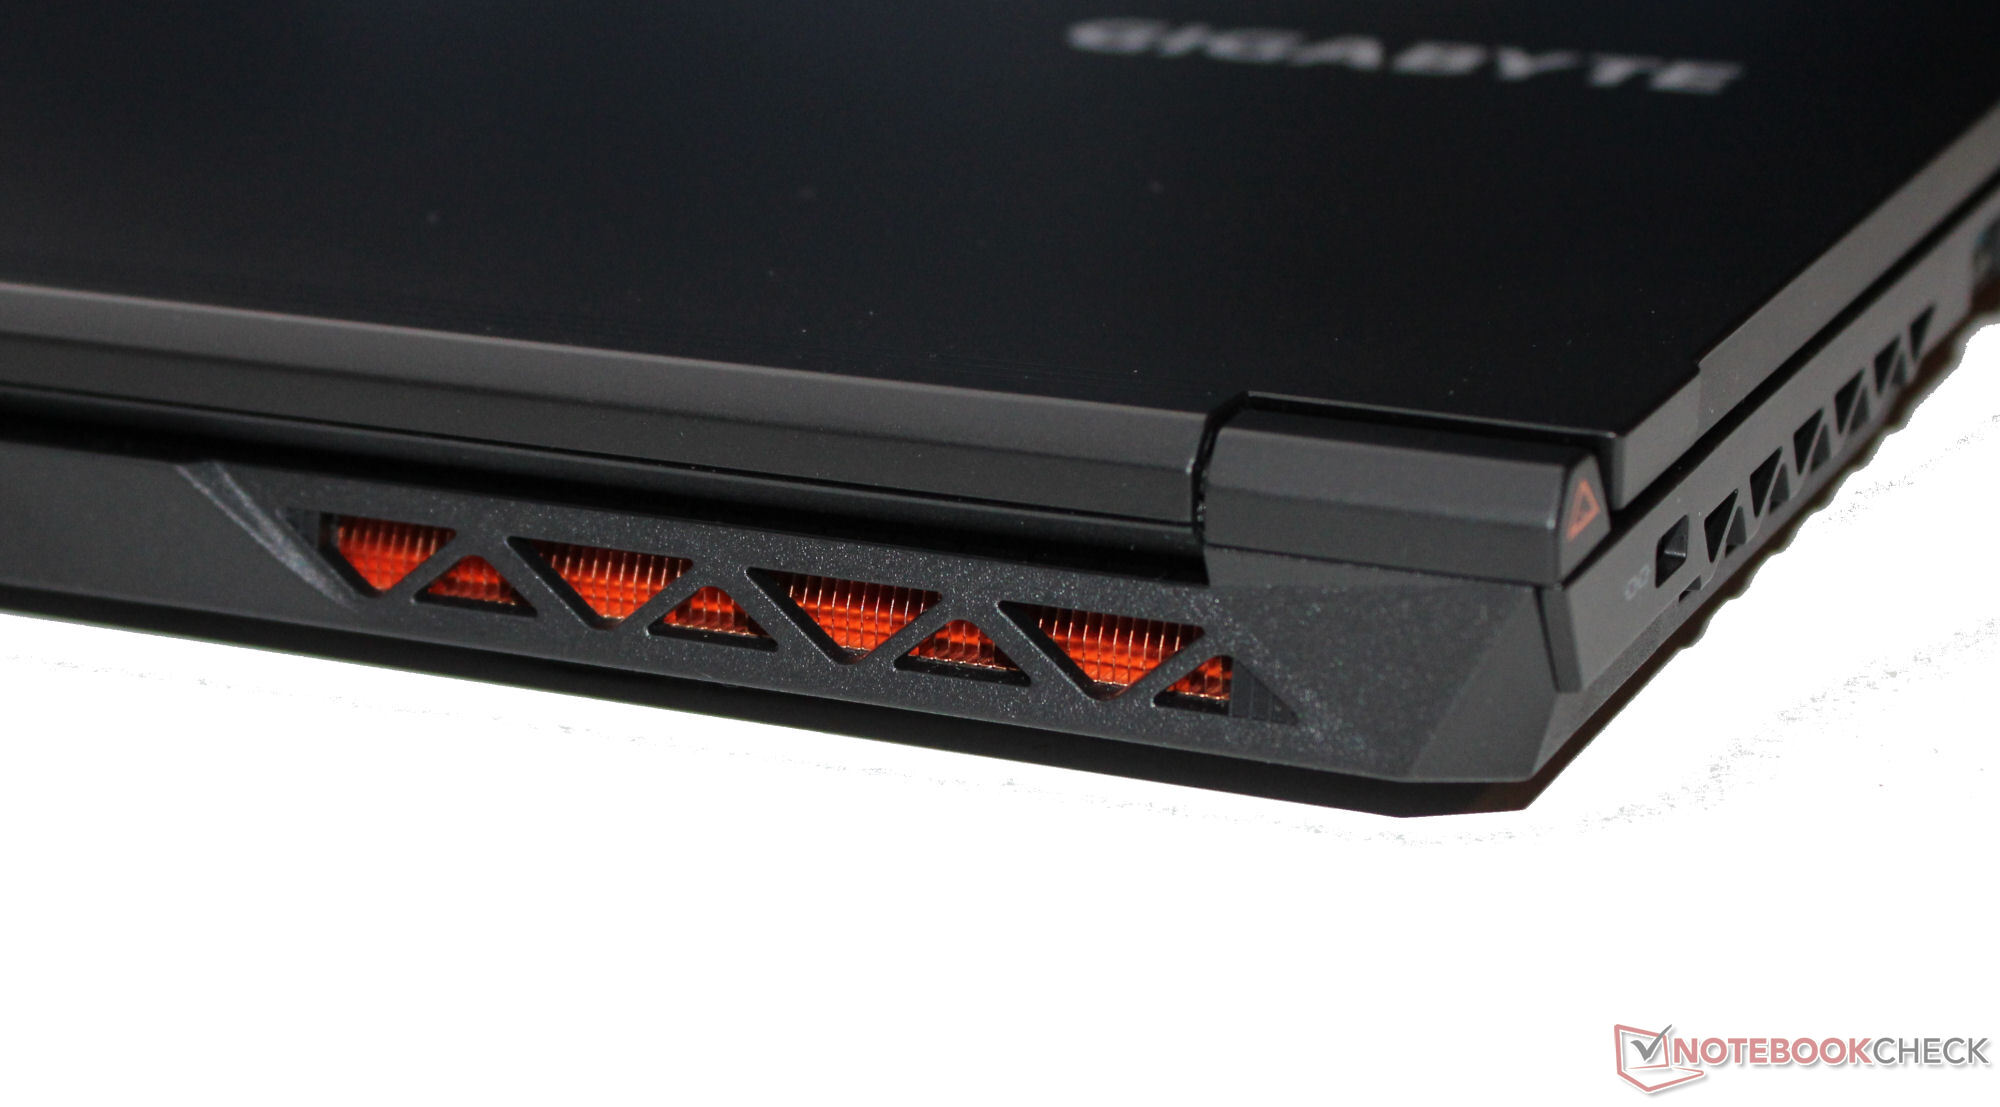
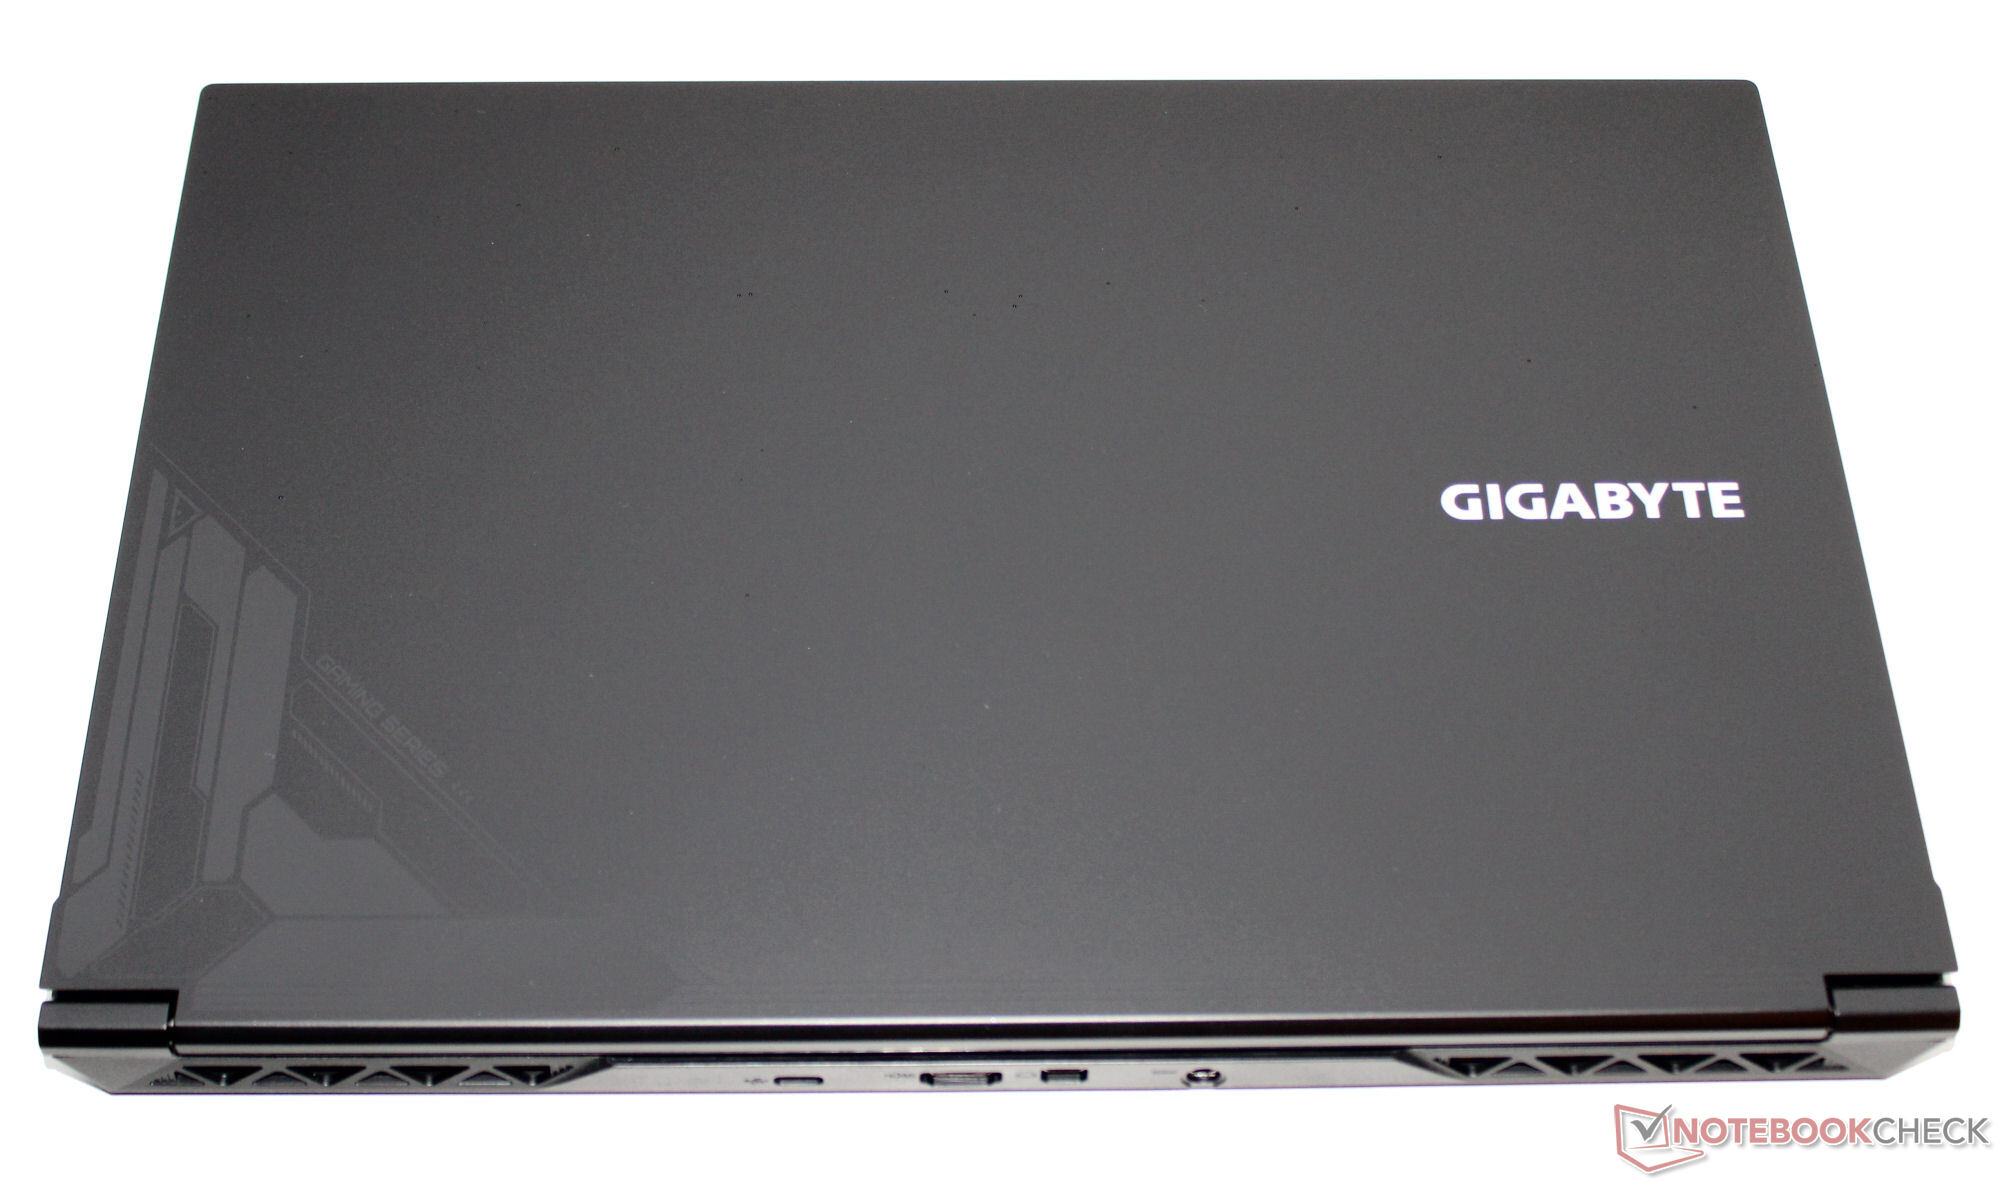
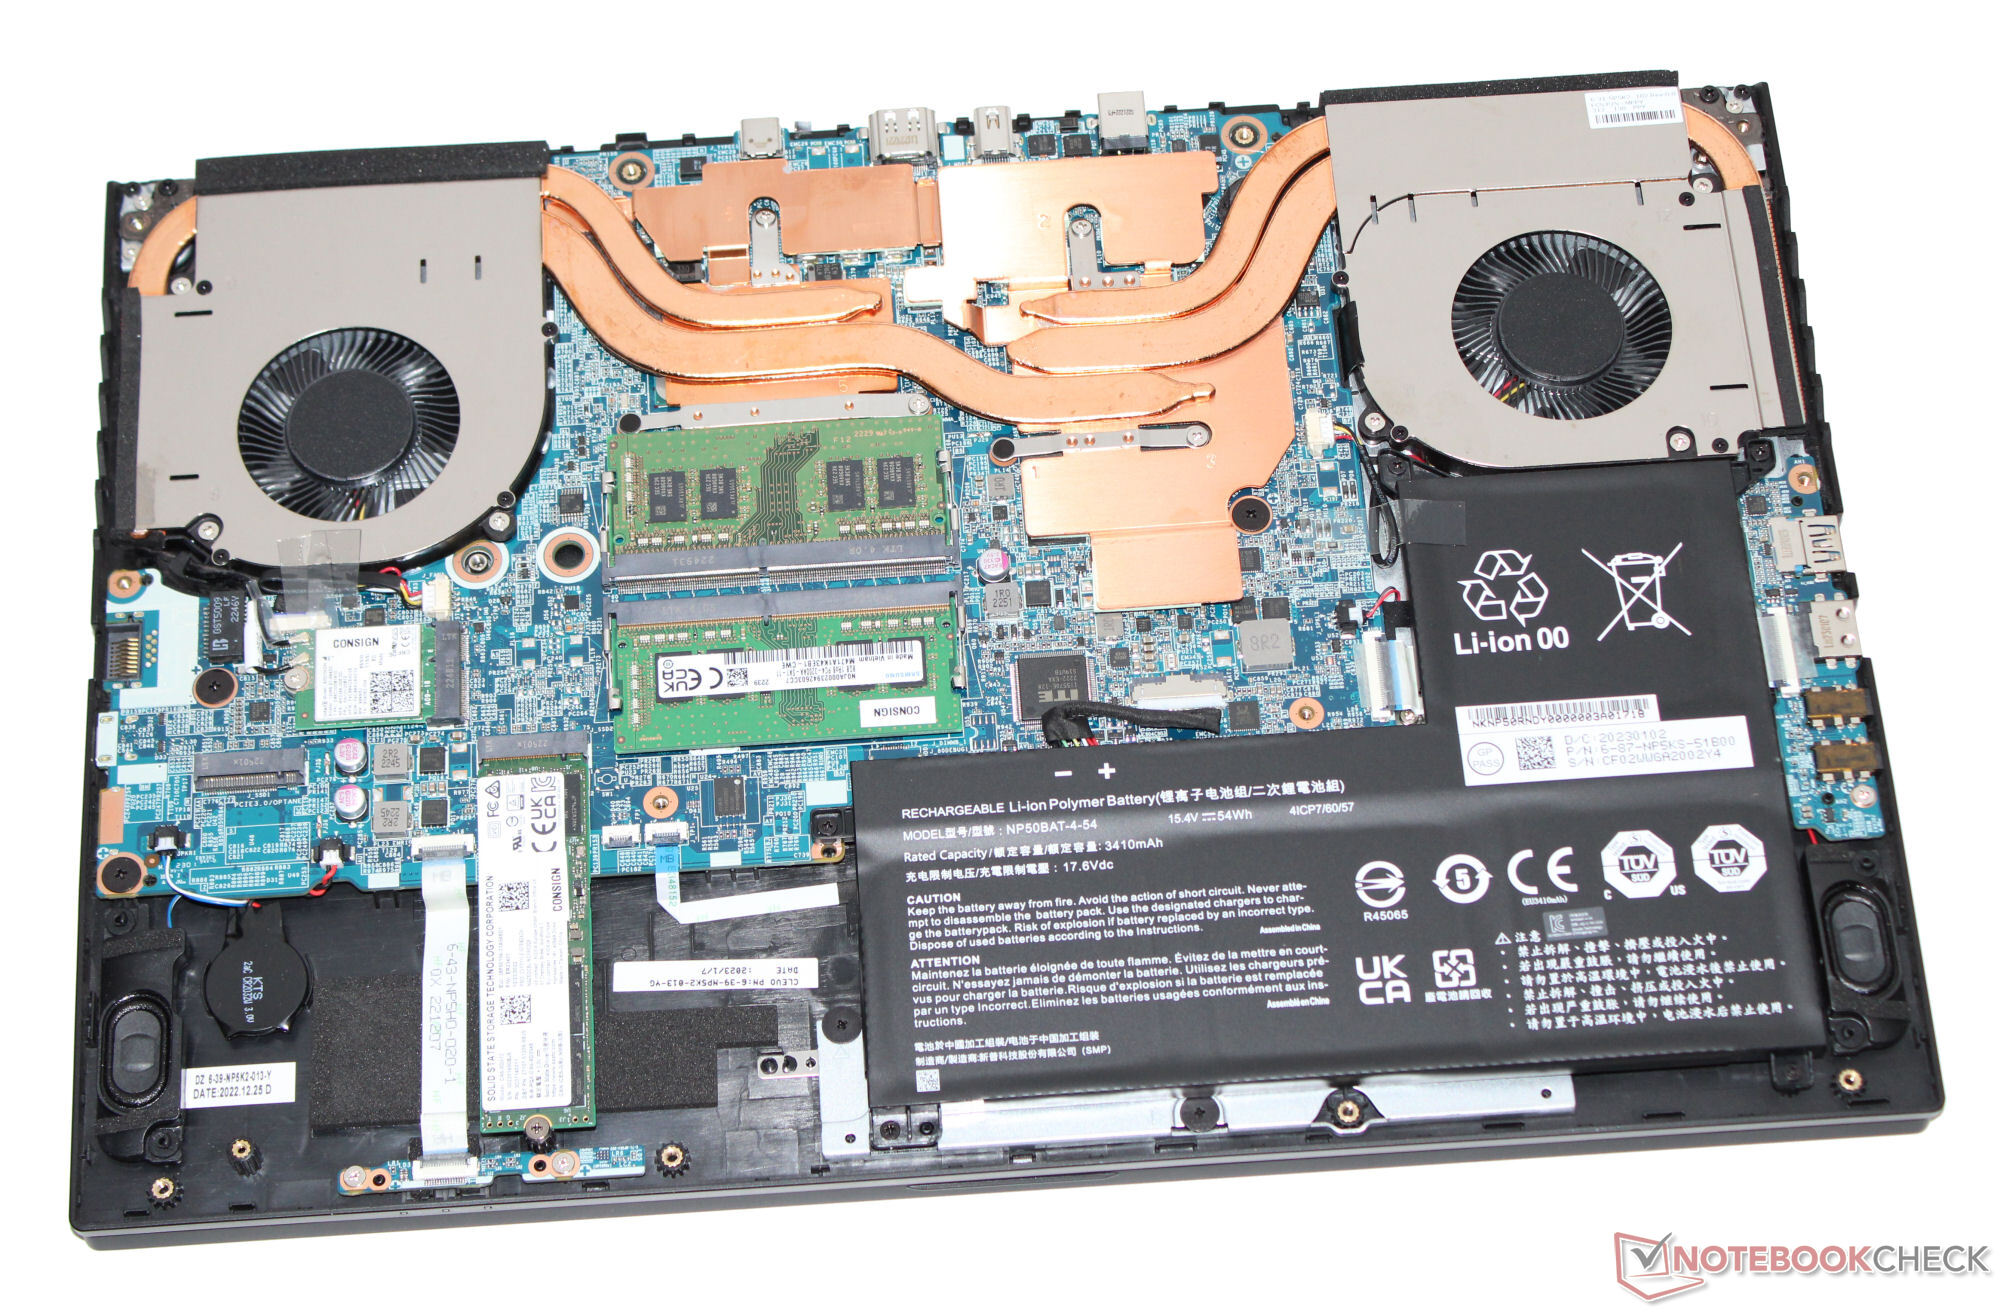
El G5 KF es la continuación del G5 KE y comparte el mismo diseño físico. Por lo tanto, puede consultar nuestro análisis del G5 KE para obtener más información sobre el chasis, las características, los dispositivos de entrada y la pantalla.
Posibles contendientes en la comparación
Valoración | Fecha | Modelo | Peso | Altura | Tamaño | Resolución | Precio |
|---|---|---|---|---|---|---|---|
| 81.8 % v7 (old) | 10/2023 | Gigabyte G5 KF i5-12500H, GeForce RTX 4060 Laptop GPU | 1.9 kg | 22.7 mm | 15.60" | 1920x1080 | |
| 82.4 % v7 (old) | 04/2023 | MSI Cyborg 15 A12VF i7-12650H, GeForce RTX 4060 Laptop GPU | 2 kg | 22.9 mm | 15.60" | 1920x1080 | |
| 84.4 % v7 (old) | 10/2023 | Intel NUC X15 LAPAC71H i7-12700H, A730M | 2.2 kg | 26.7 mm | 15.60" | 1920x1080 | |
| 86.3 % v7 (old) | 06/2023 | Asus TUF A15 FA507 R7 7735HS, GeForce RTX 4050 Laptop GPU | 2.2 kg | 24.9 mm | 15.60" | 1920x1080 | |
| 87.7 % v7 (old) | 08/2023 | Lenovo Legion Slim 5 16APH8 R7 7840HS, GeForce RTX 4060 Laptop GPU | 2.4 kg | 25.2 mm | 16.00" | 2560x1600 |
| SD Card Reader | |
| average JPG Copy Test (av. of 3 runs) | |
| Media de la clase Gaming (20.9 - 210, n=55, últimos 2 años) | |
| Gigabyte G5 KE (AV PRO microSD 128 GB V60) | |
| Gigabyte G5 KF | |
| Lenovo Legion Slim 5 16APH8 (PNY EliteX-Pro60 V60 256 GB) | |
| maximum AS SSD Seq Read Test (1GB) | |
| Media de la clase Gaming (25.5 - 261, n=52, últimos 2 años) | |
| Gigabyte G5 KE (AV PRO microSD 128 GB V60) | |
| Gigabyte G5 KF | |
| Lenovo Legion Slim 5 16APH8 (PNY EliteX-Pro60 V60 256 GB) | |


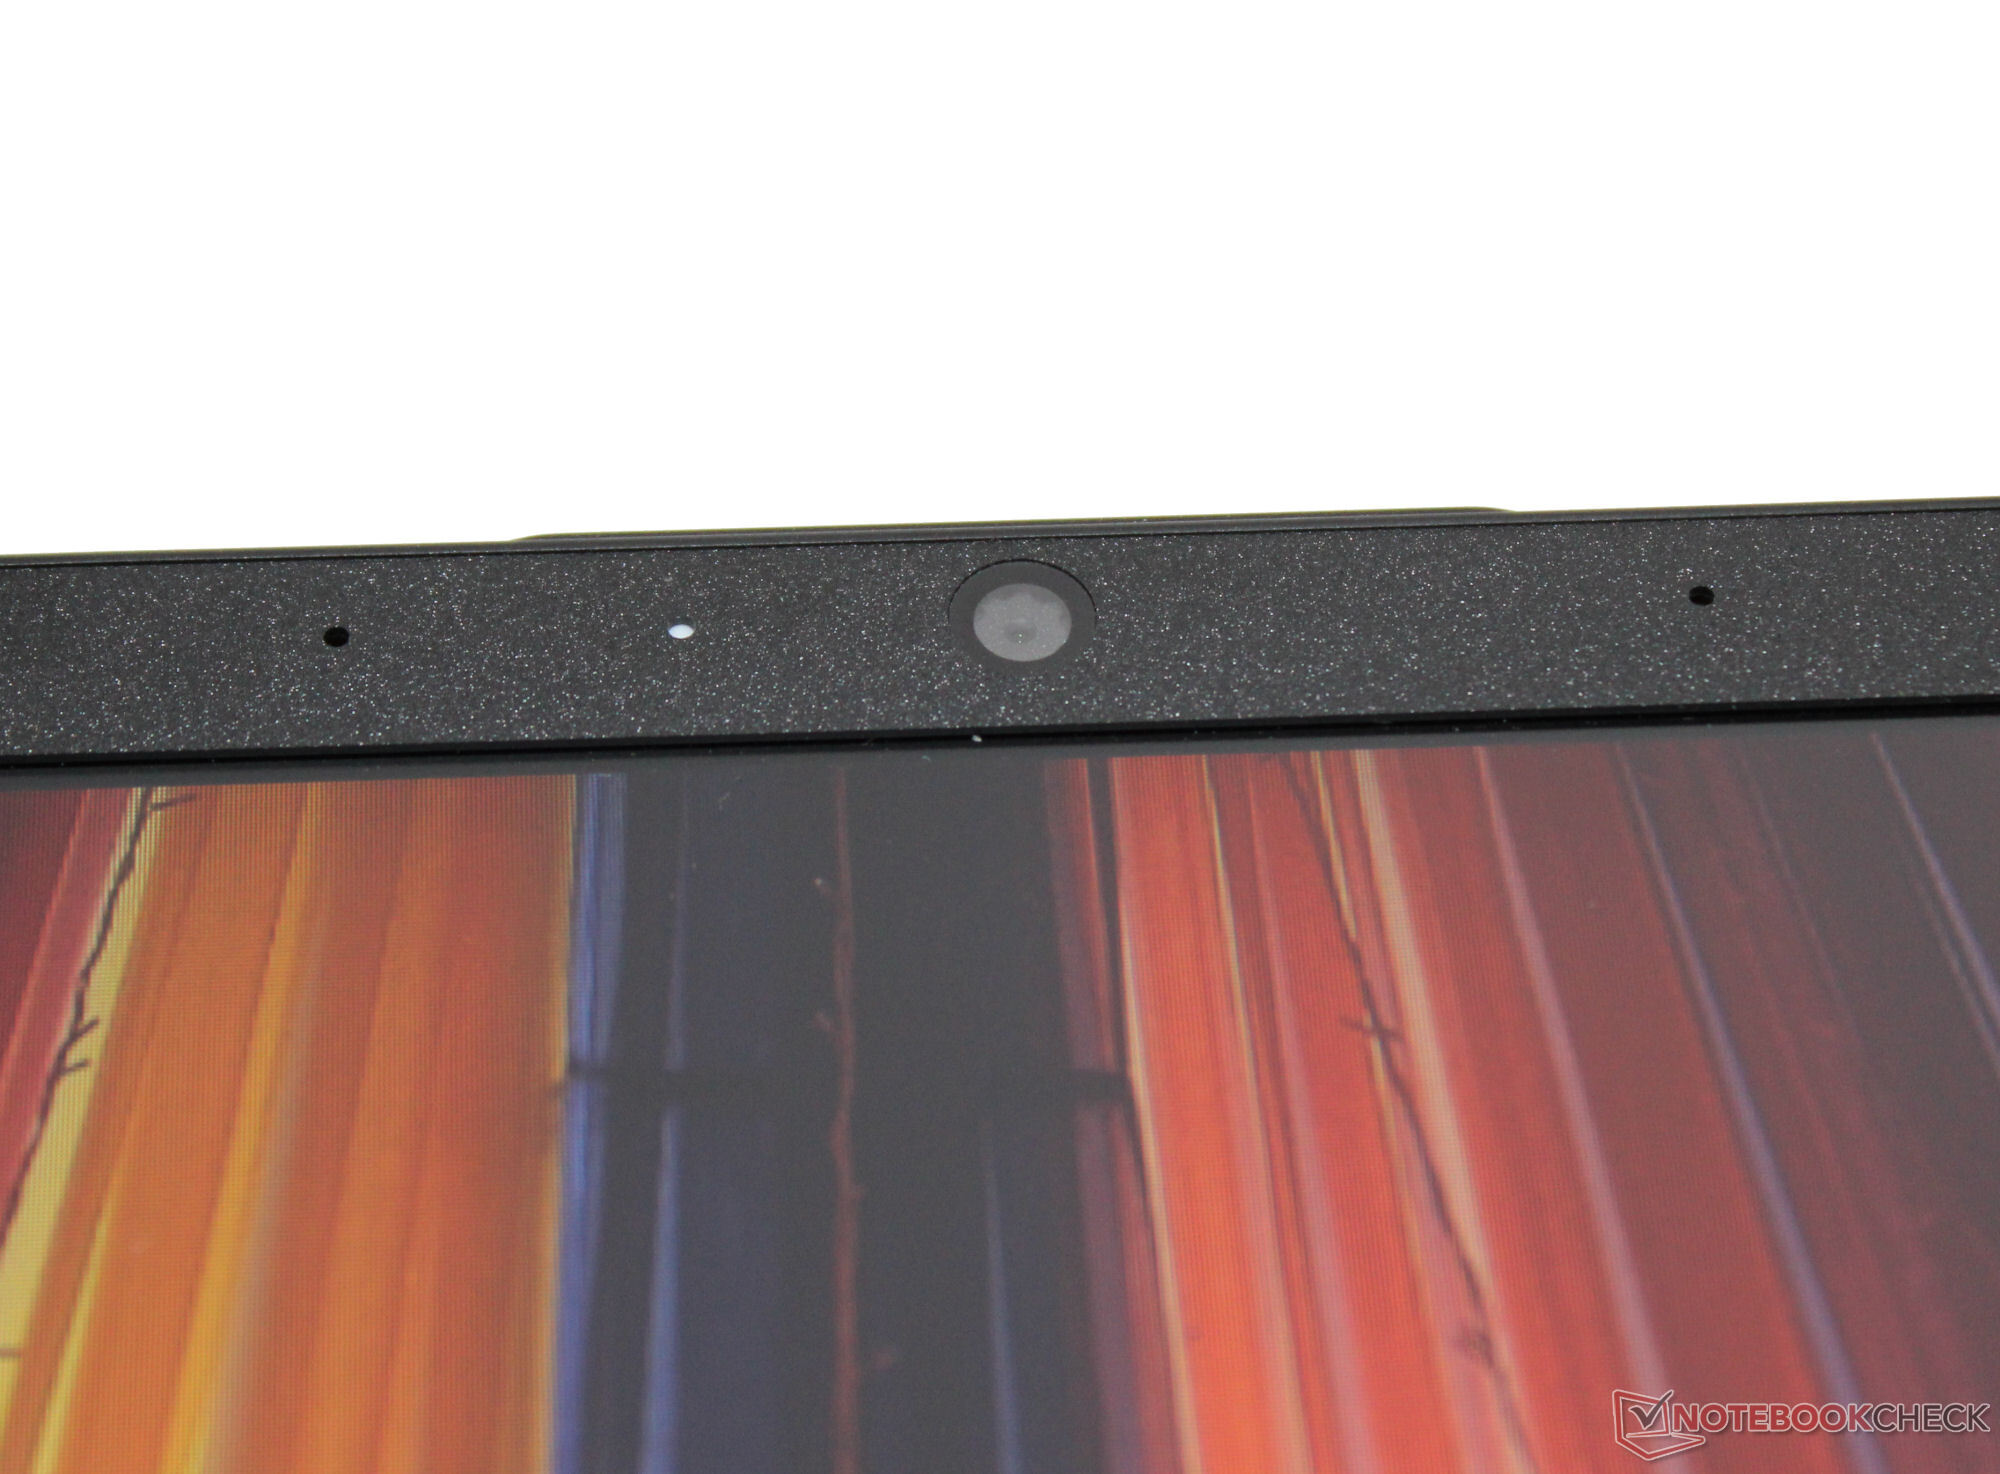
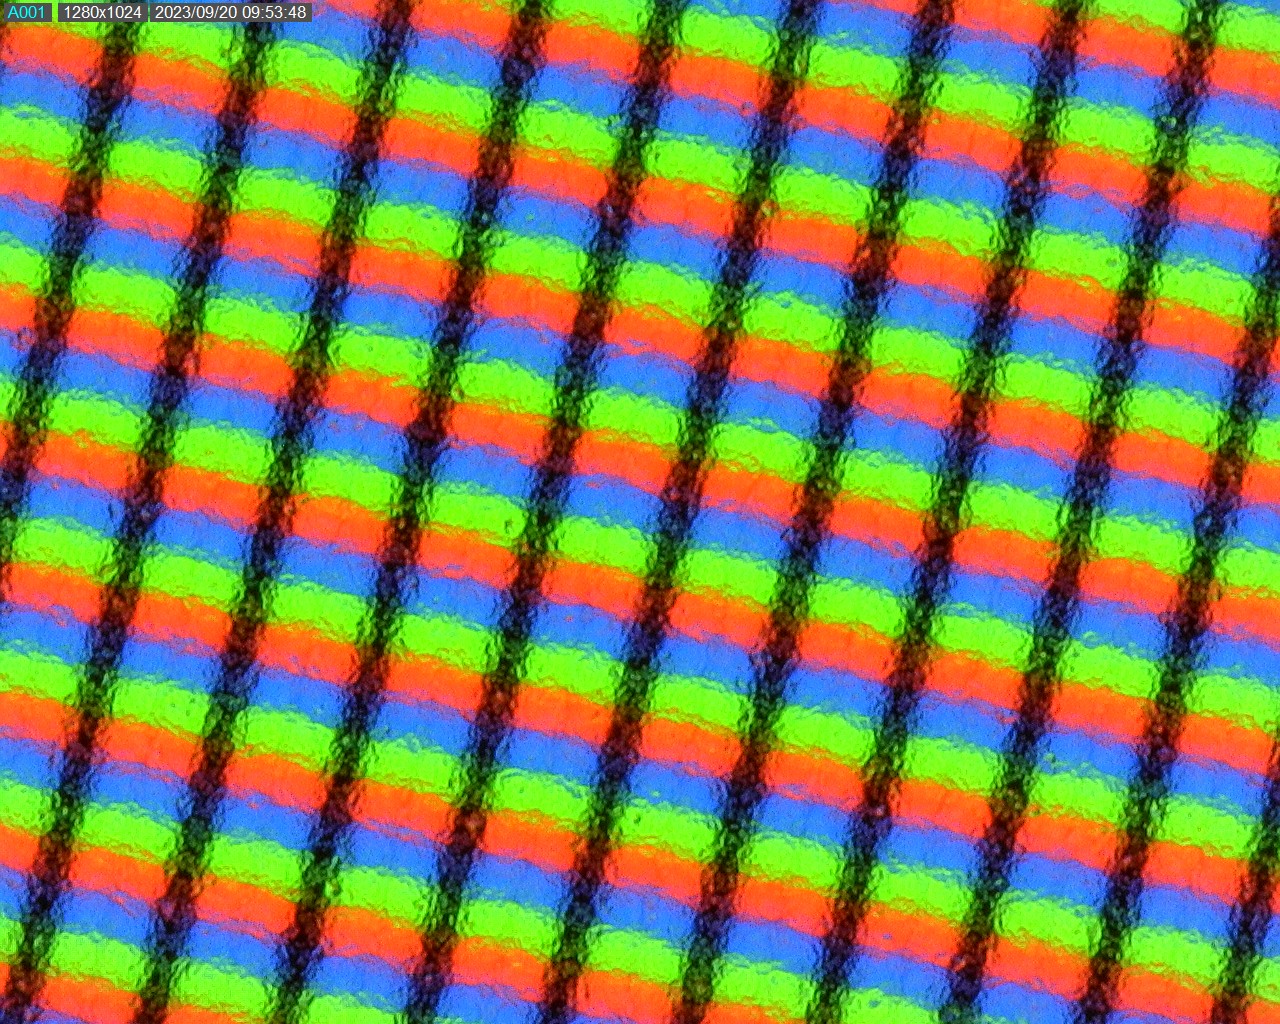
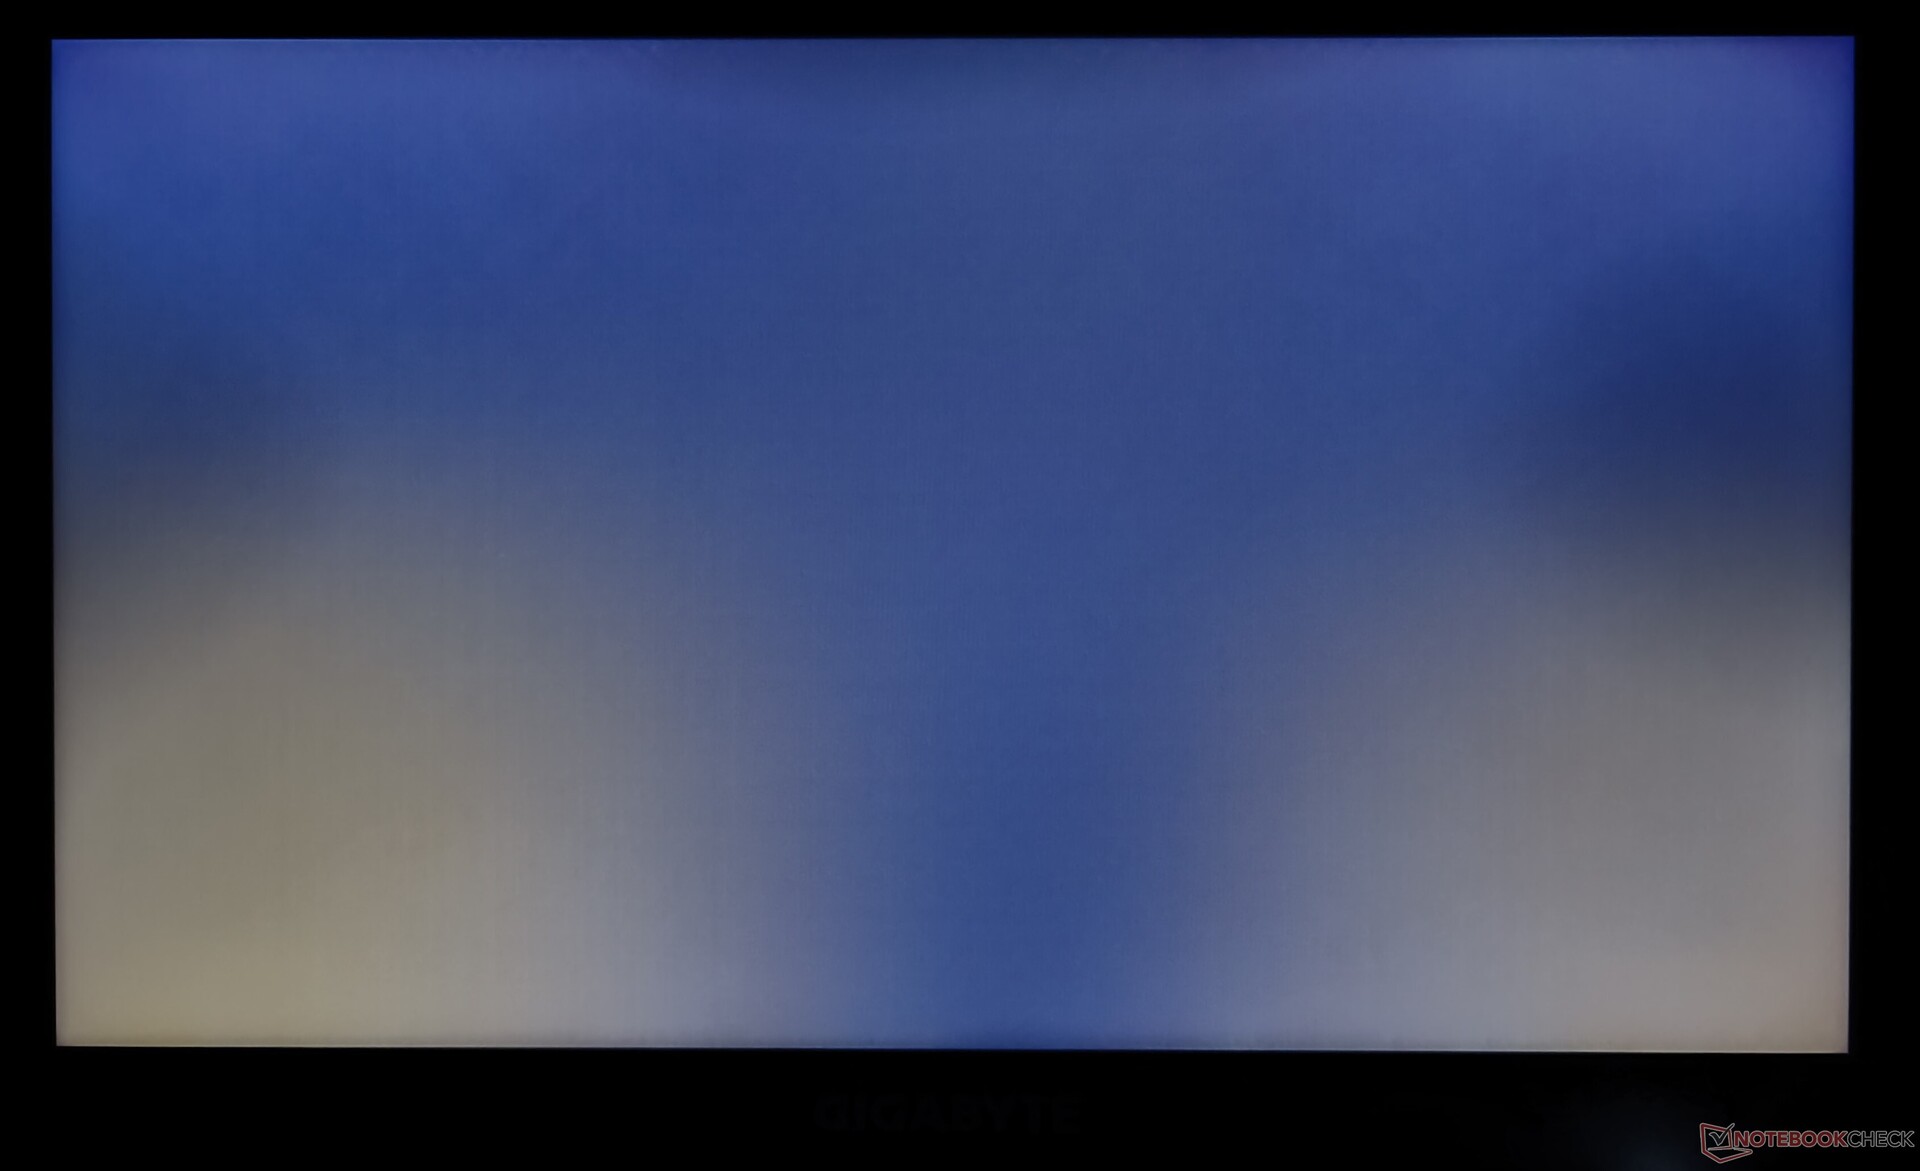
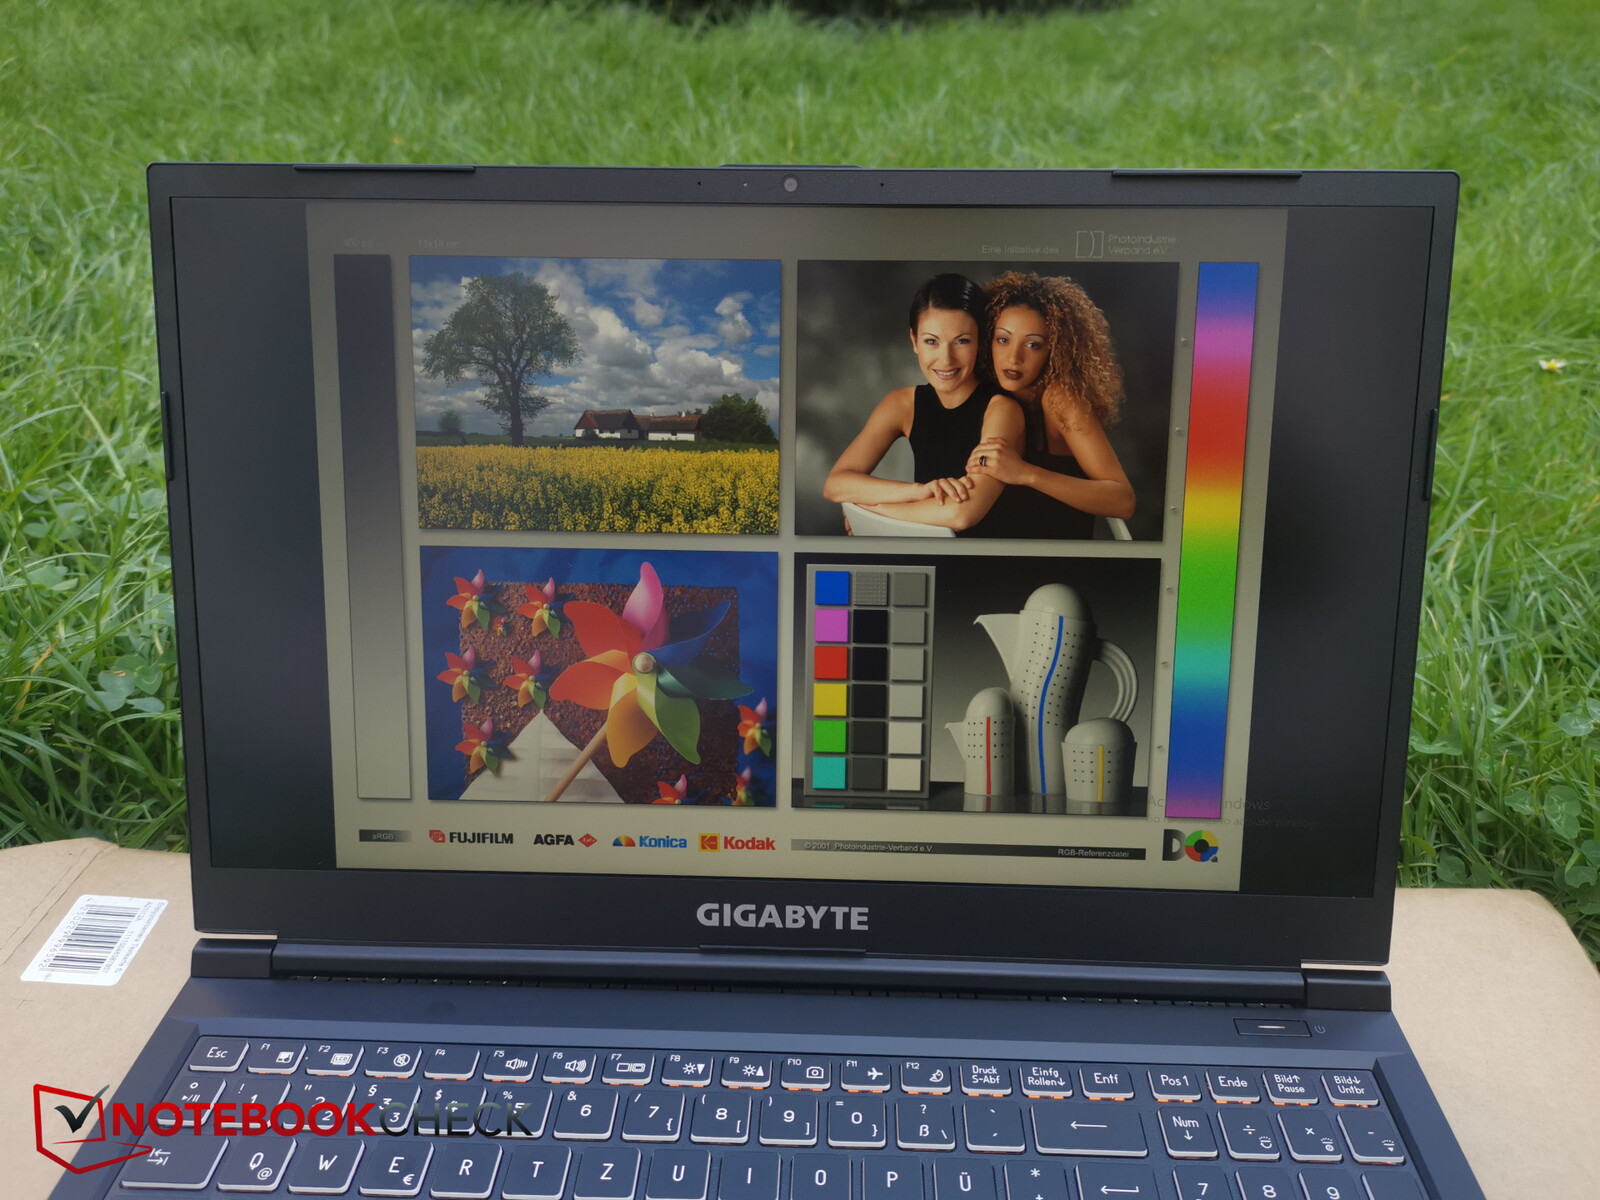
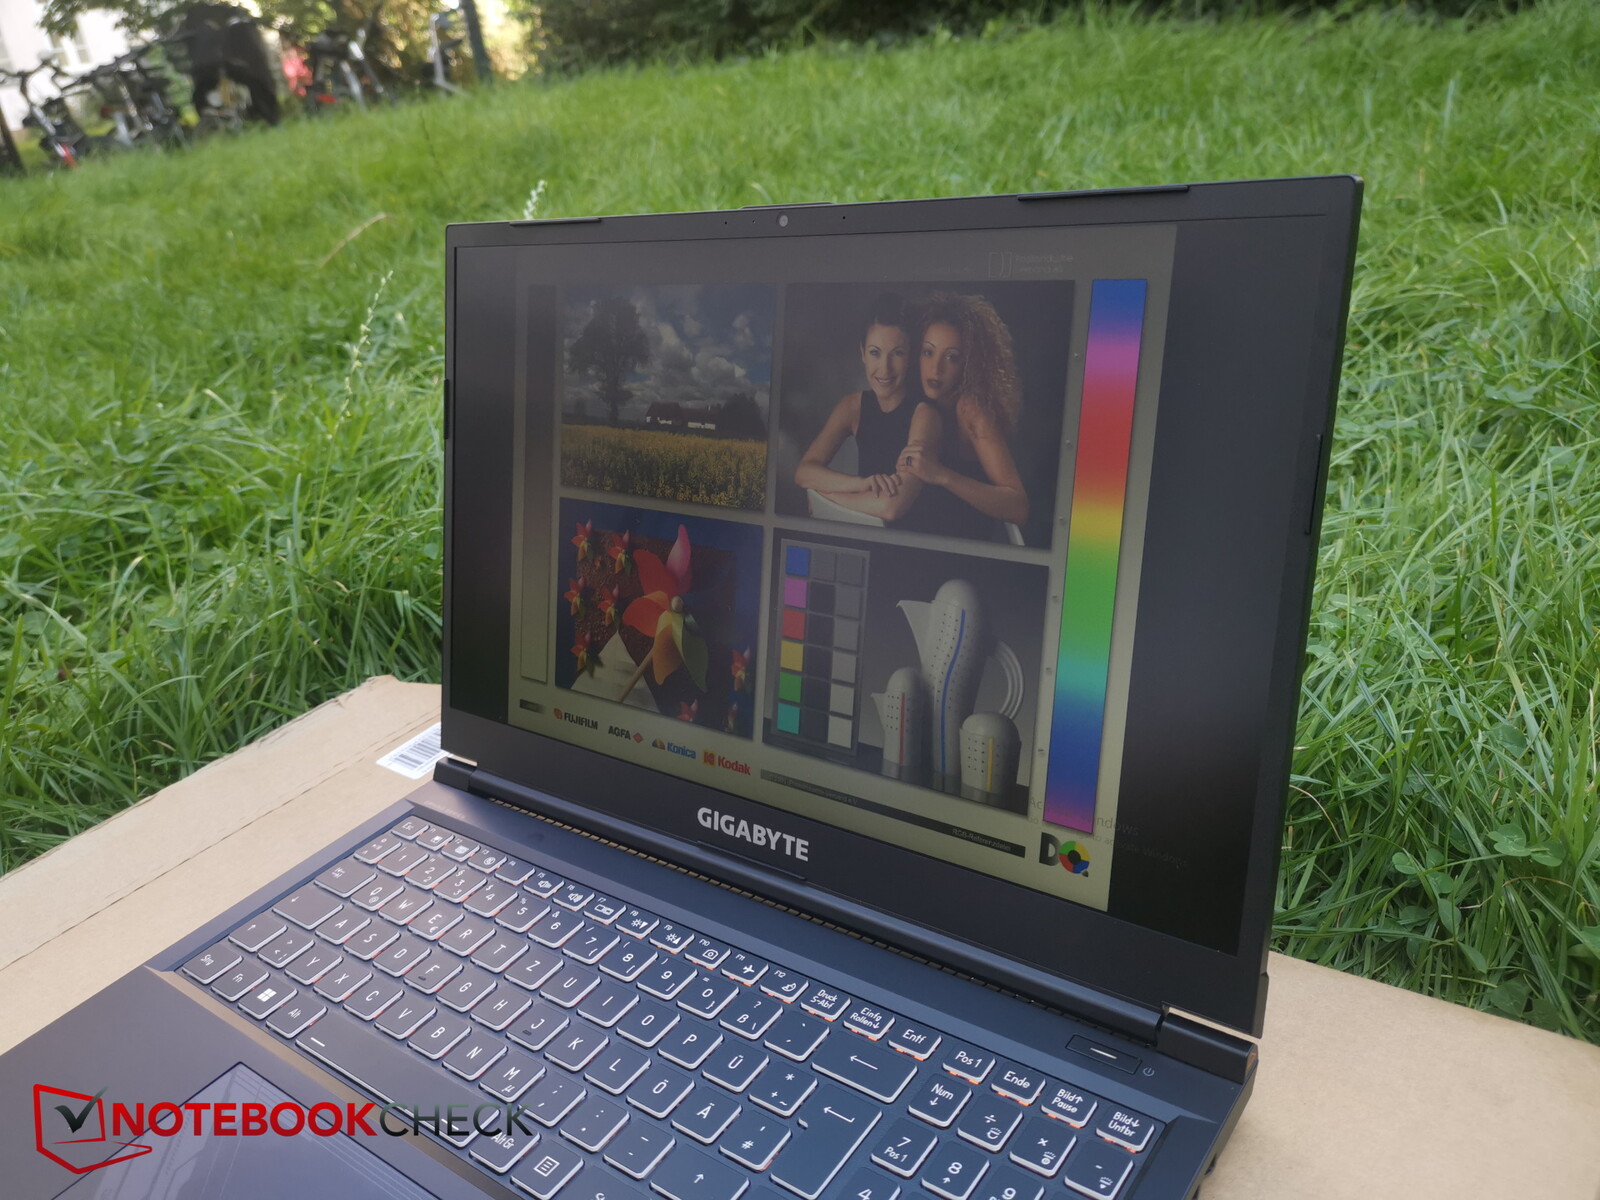
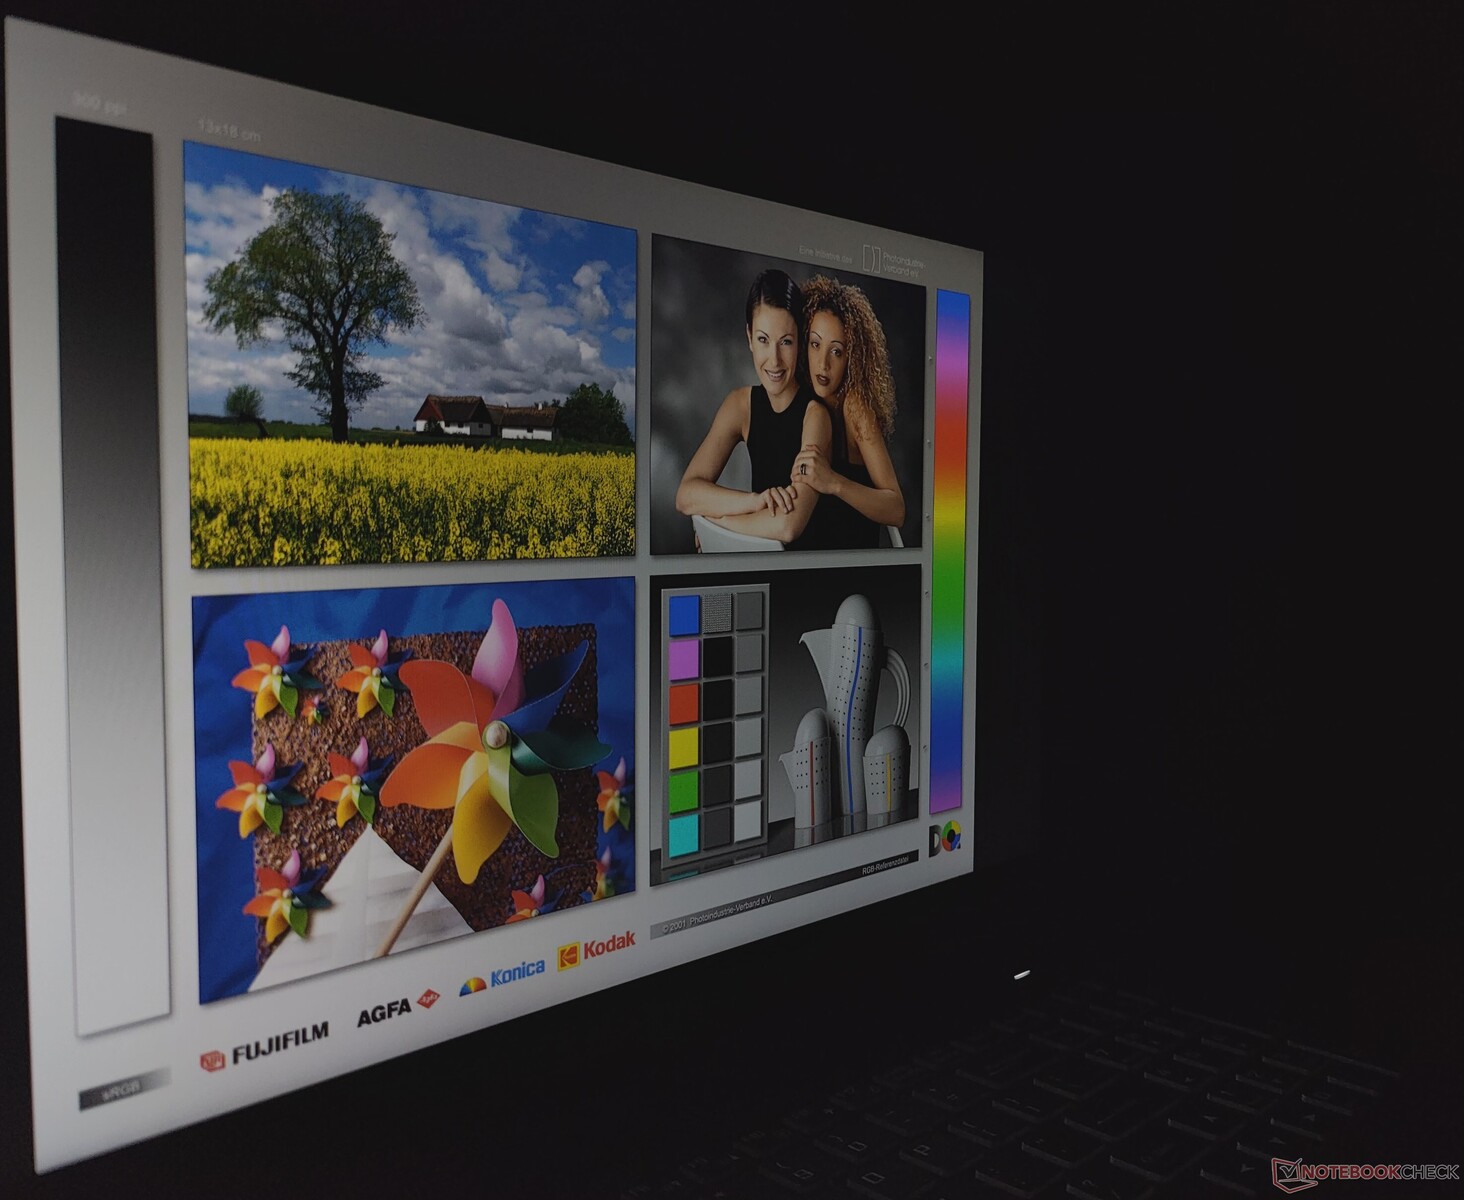
Pantalla - Panel FHD de 144 Hz
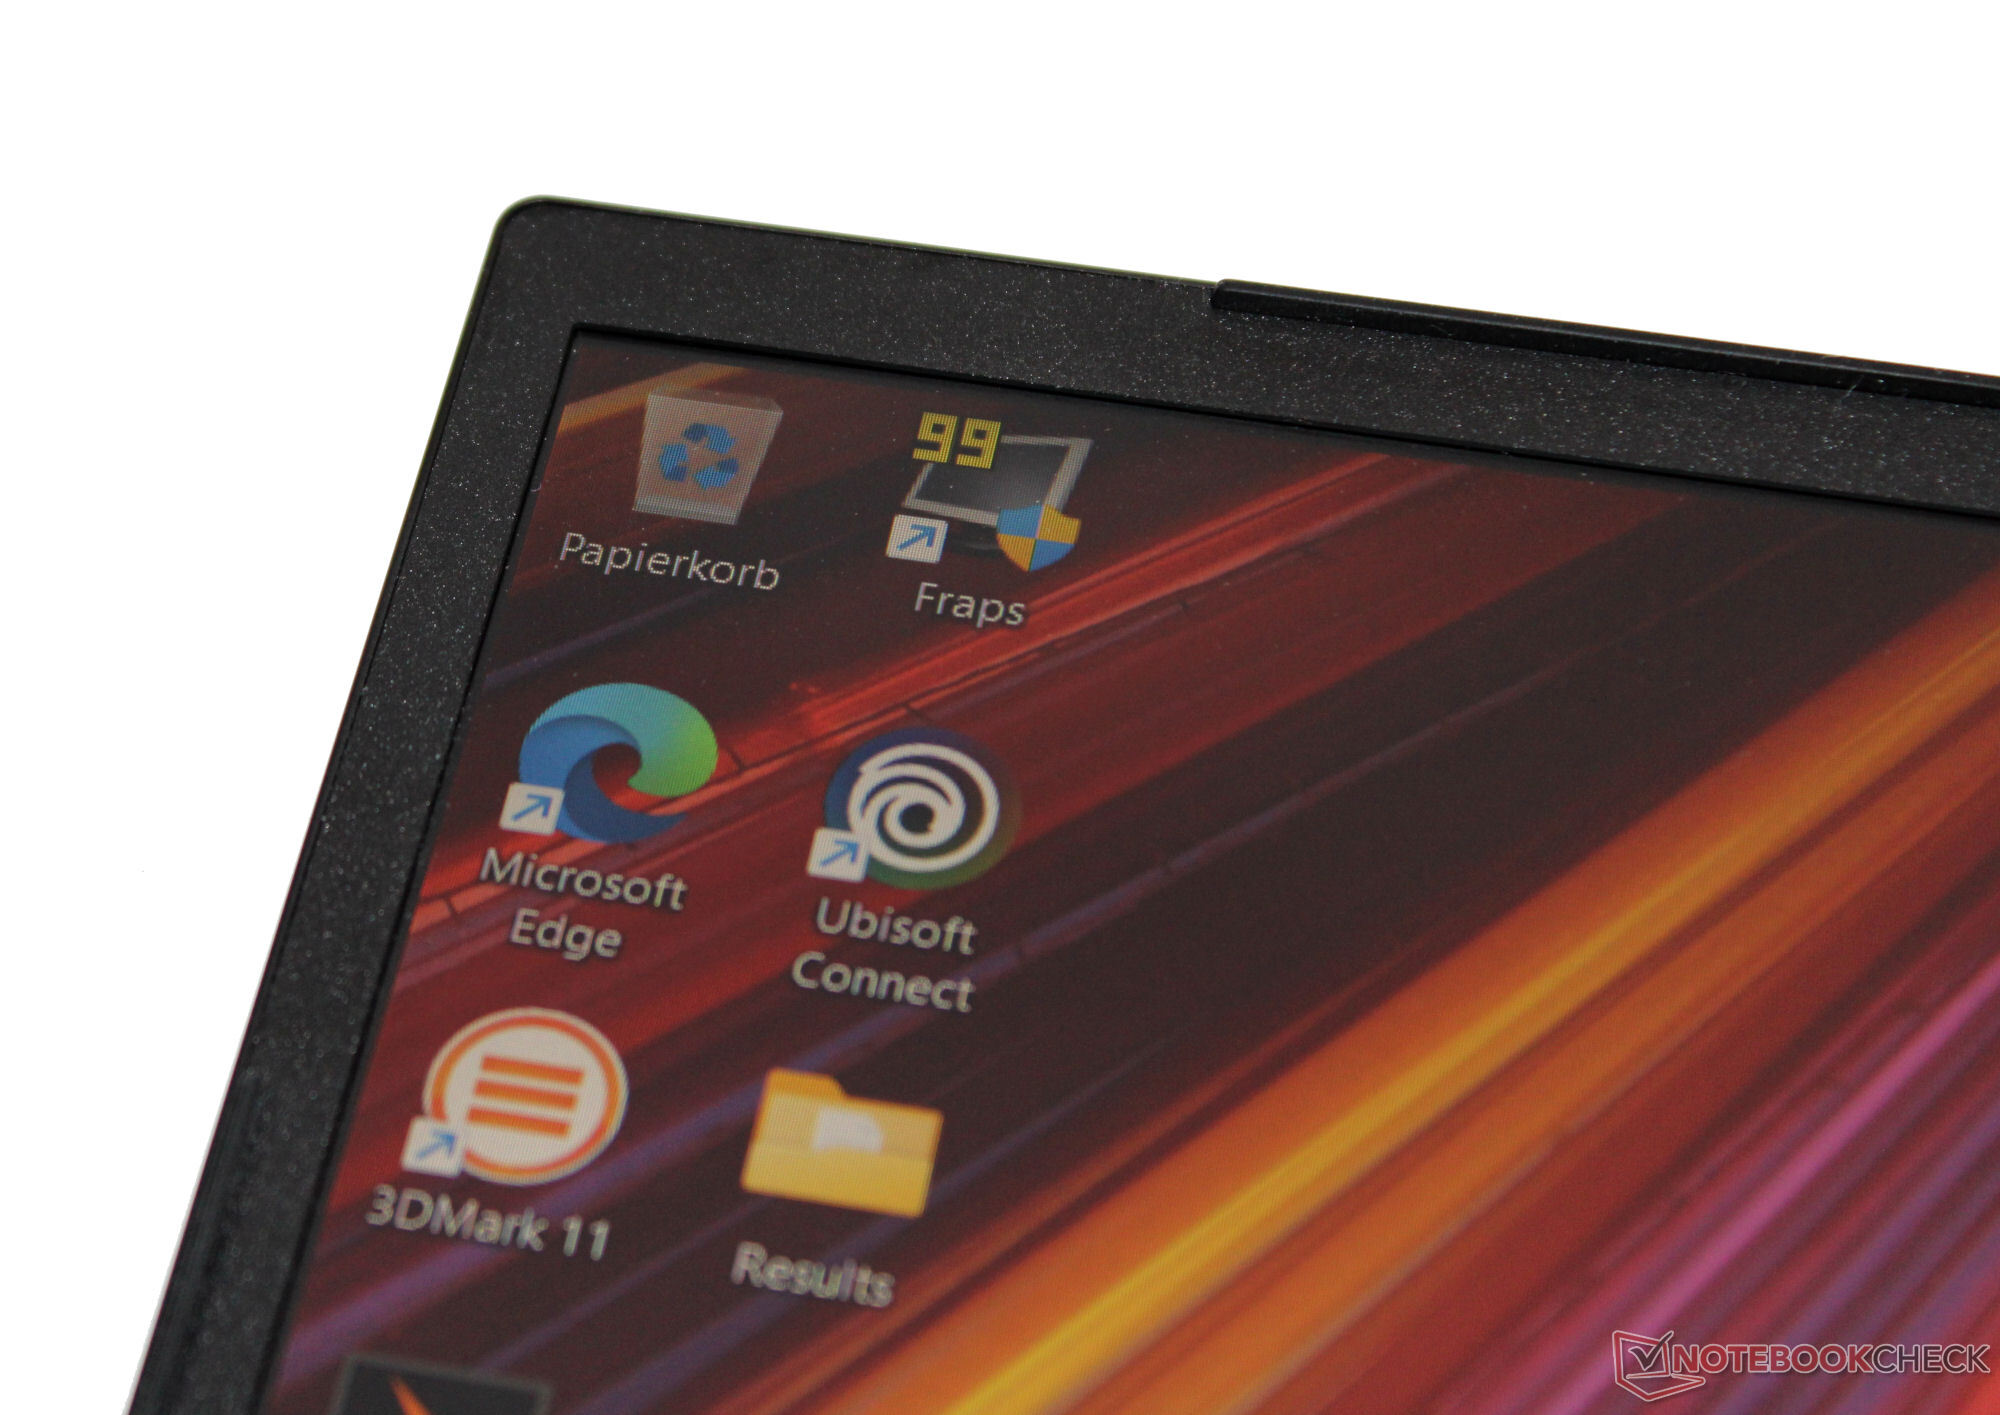
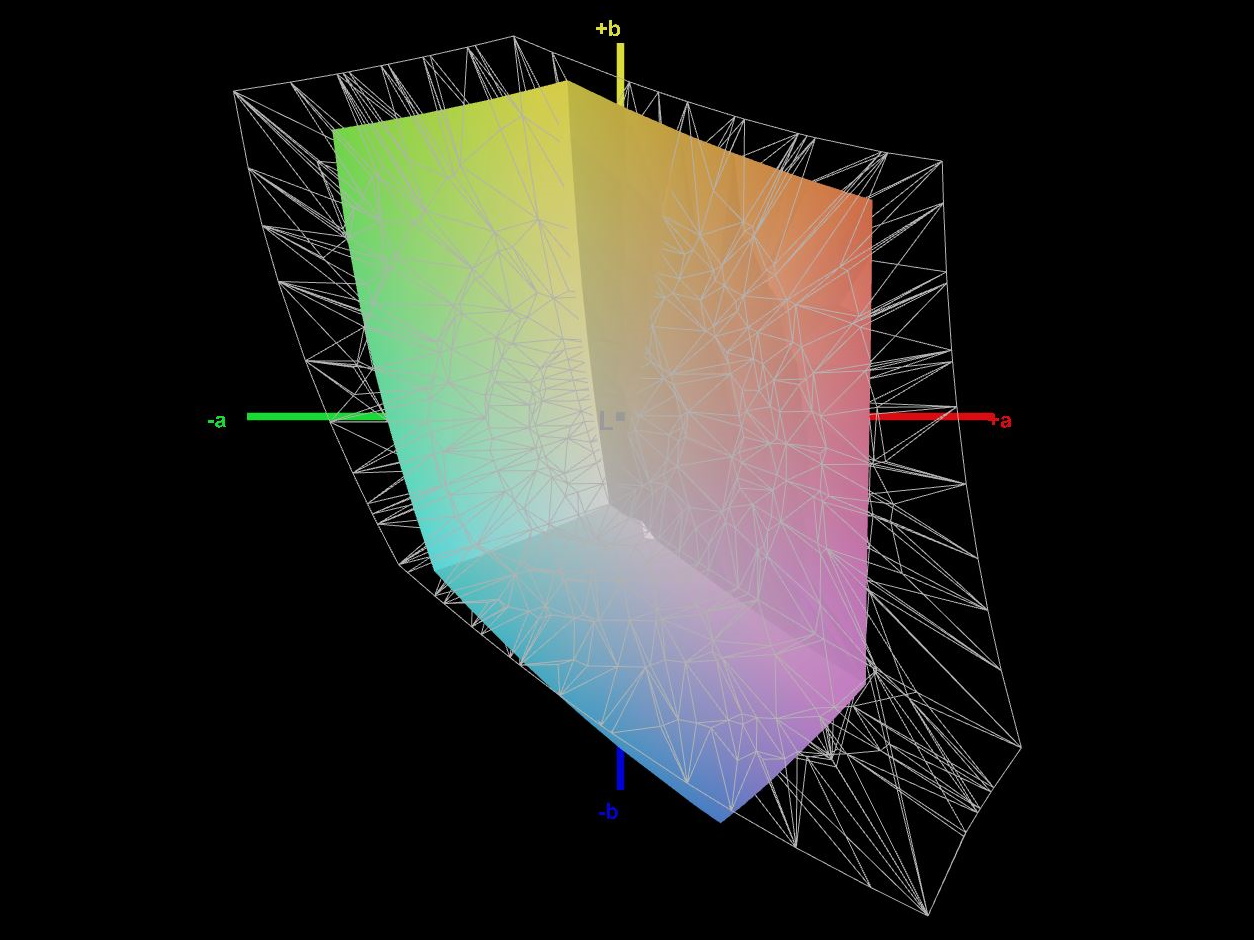
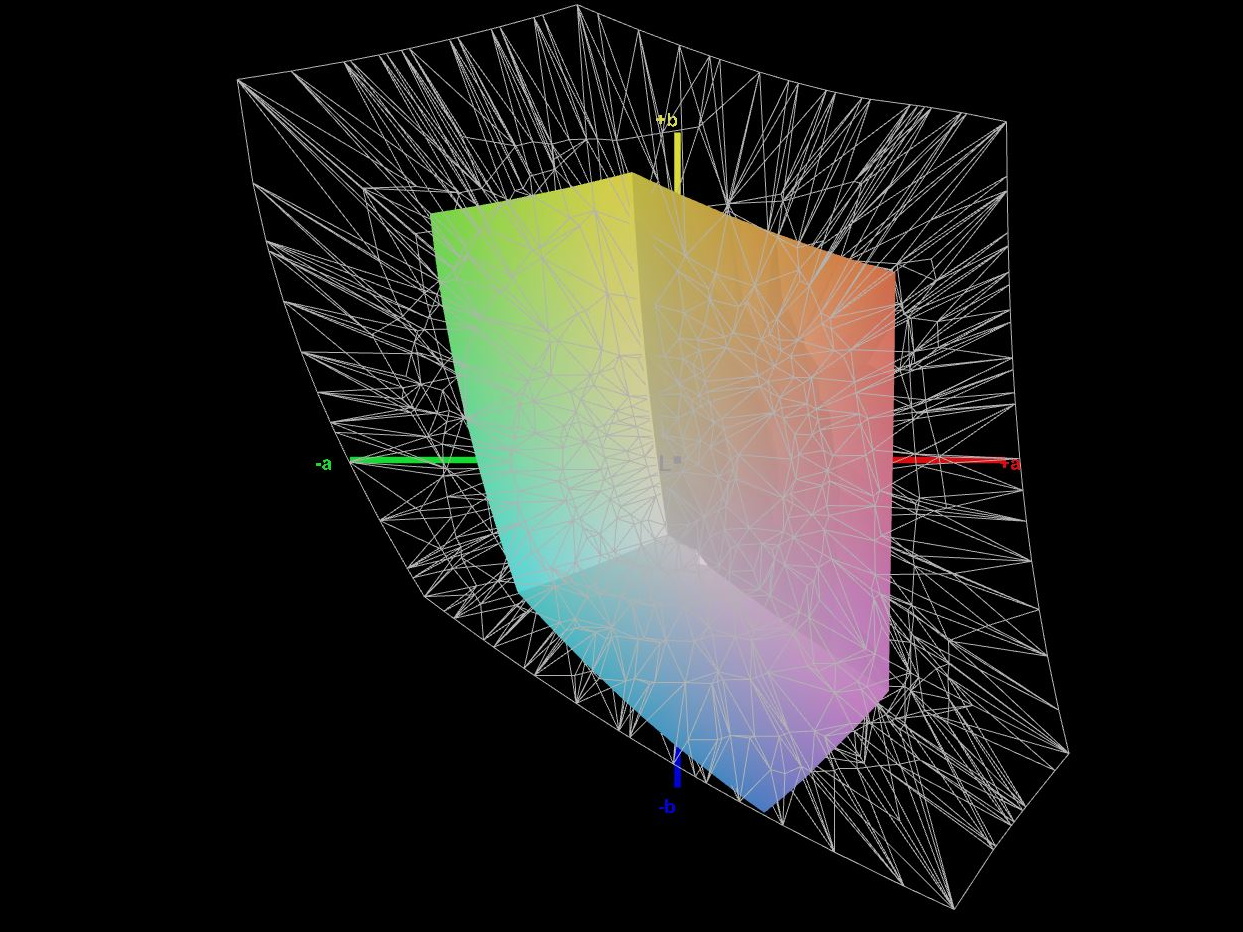
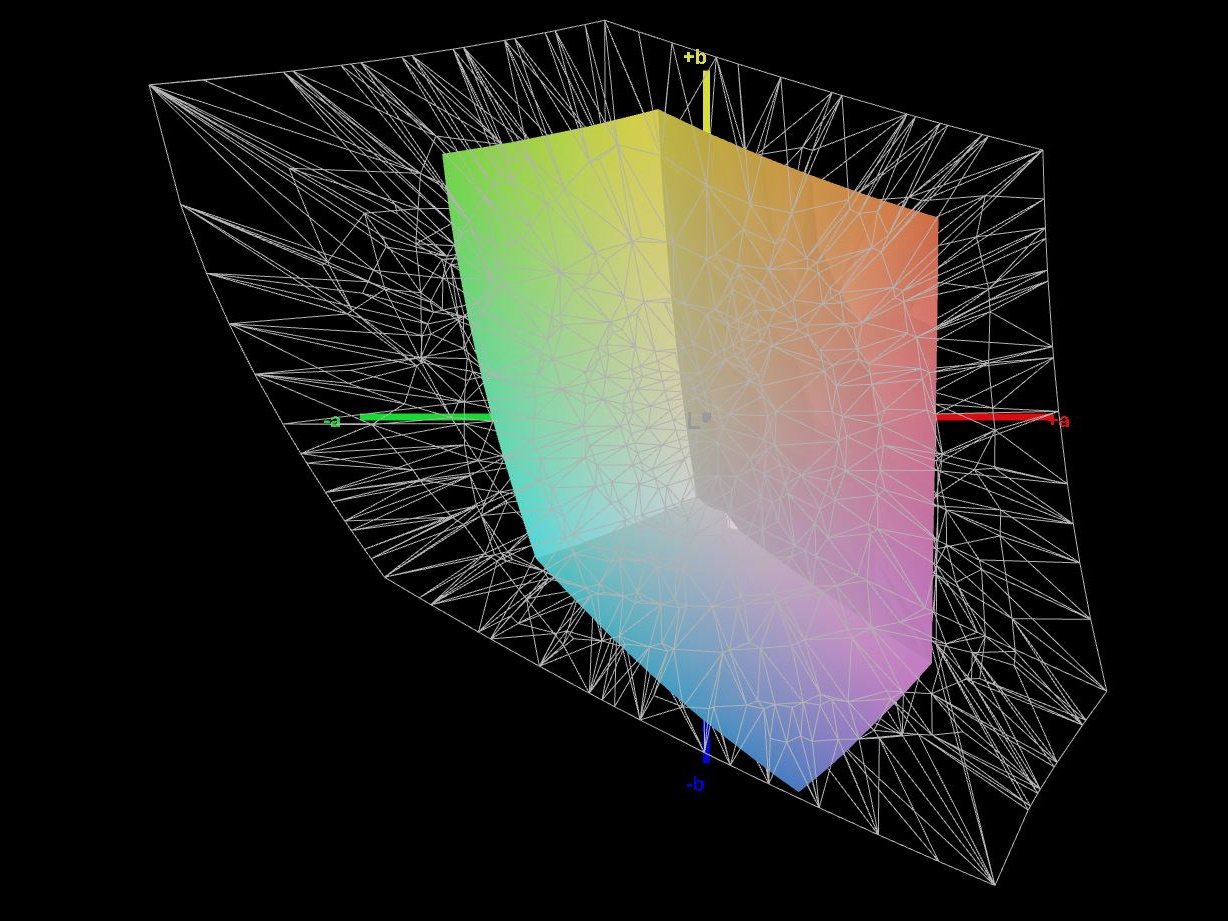
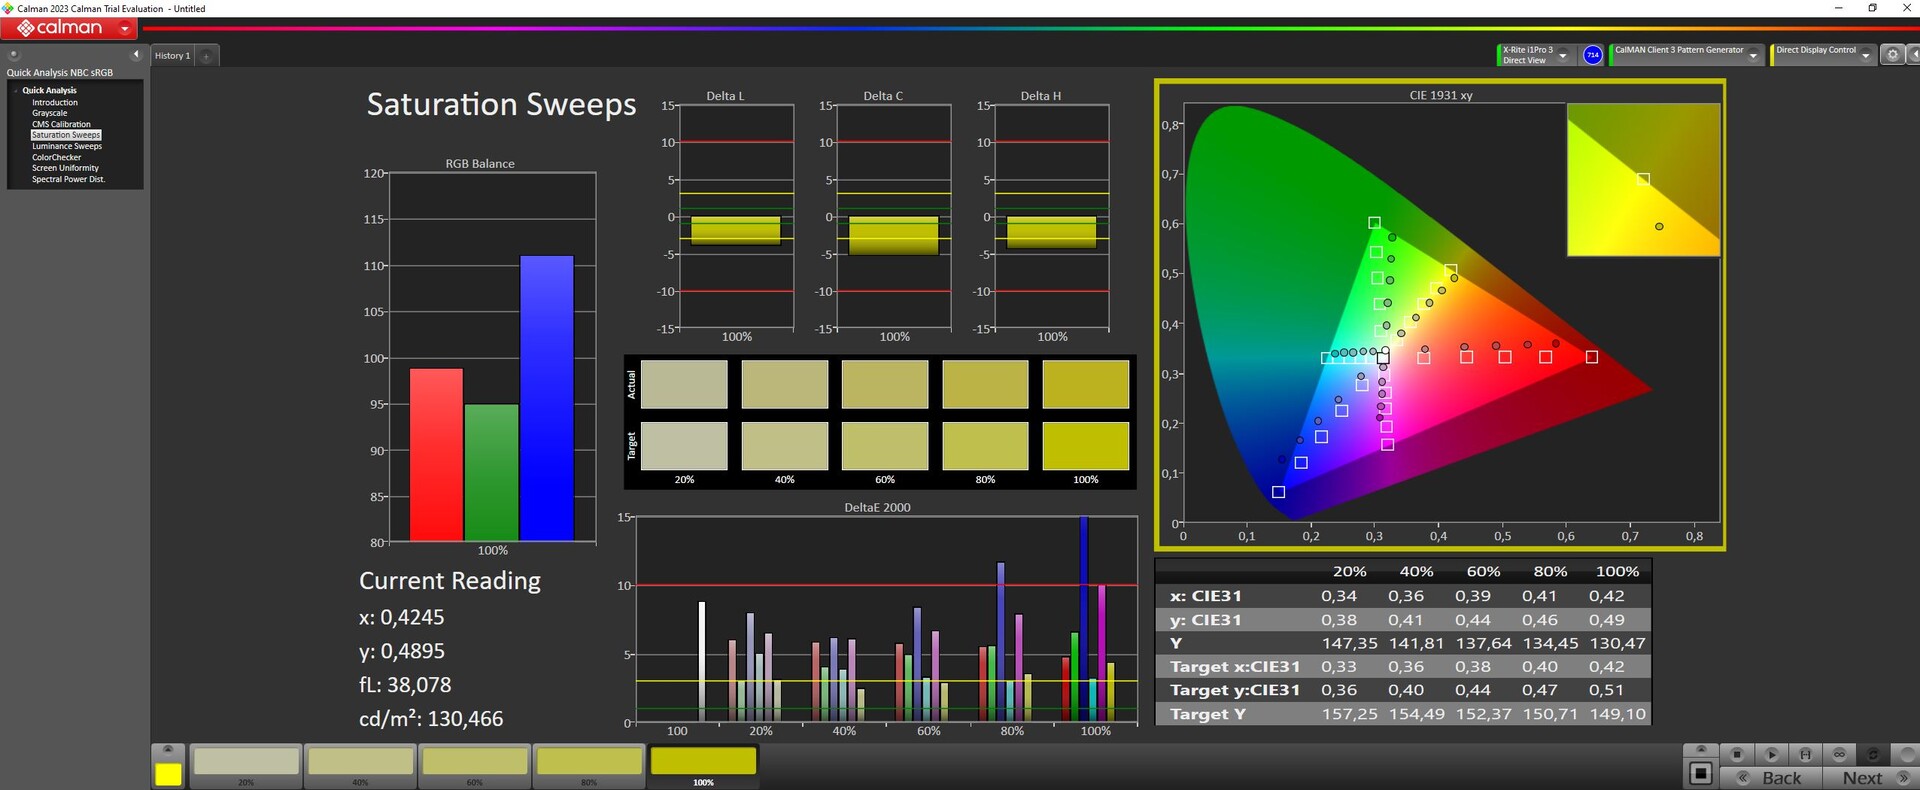
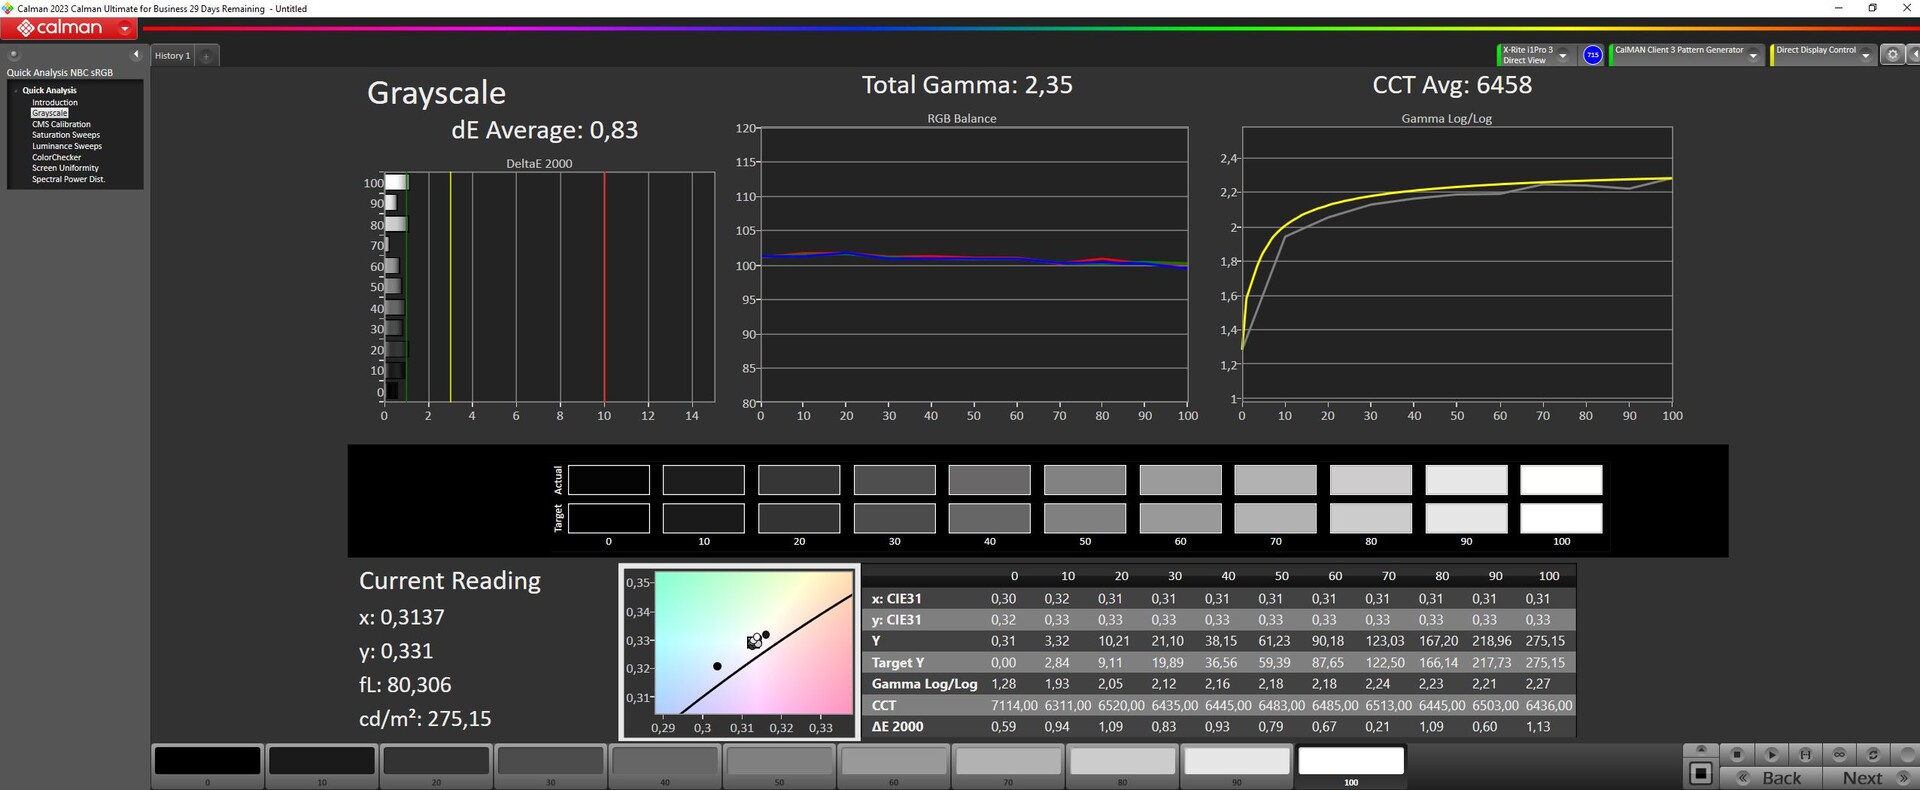
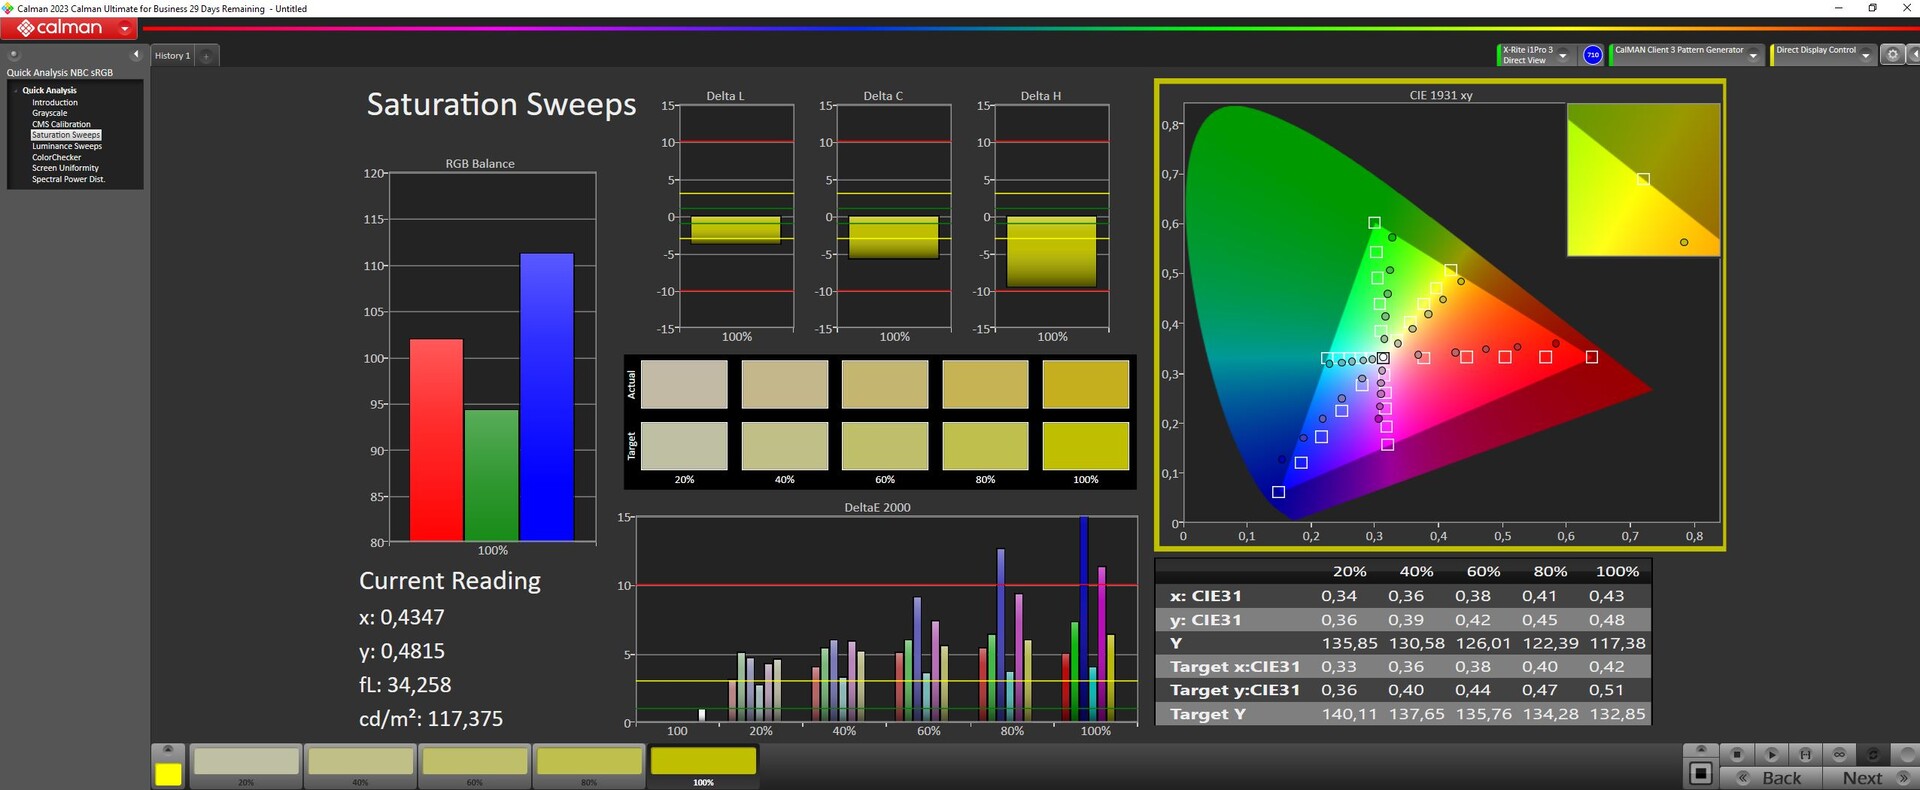
La pantalla FHD mate (fabricada por Chi Mei) se ha mantenido desde el G5 KE. Aunque tiene un buen ángulo de visión, el panel IPS de 144 Hz no está a la altura en cuanto a brillo y contraste. La pantalla no es capaz de reproducir los espacios de color habituales (sRGB, AdobeRG y DCI-P3). Pero al menos no muestra parpadeo PWM en ningún nivel de brillo. No hay otras opciones de panel disponibles. El Asus TUF A15, Intel NUC X15 y Lenovo Slim 5 16APH8 están todos equipados con mejores pantallas.
| |||||||||||||||||||||||||
iluminación: 85 %
Brillo con batería: 297 cd/m²
Contraste: 874:1 (Negro: 0.34 cd/m²)
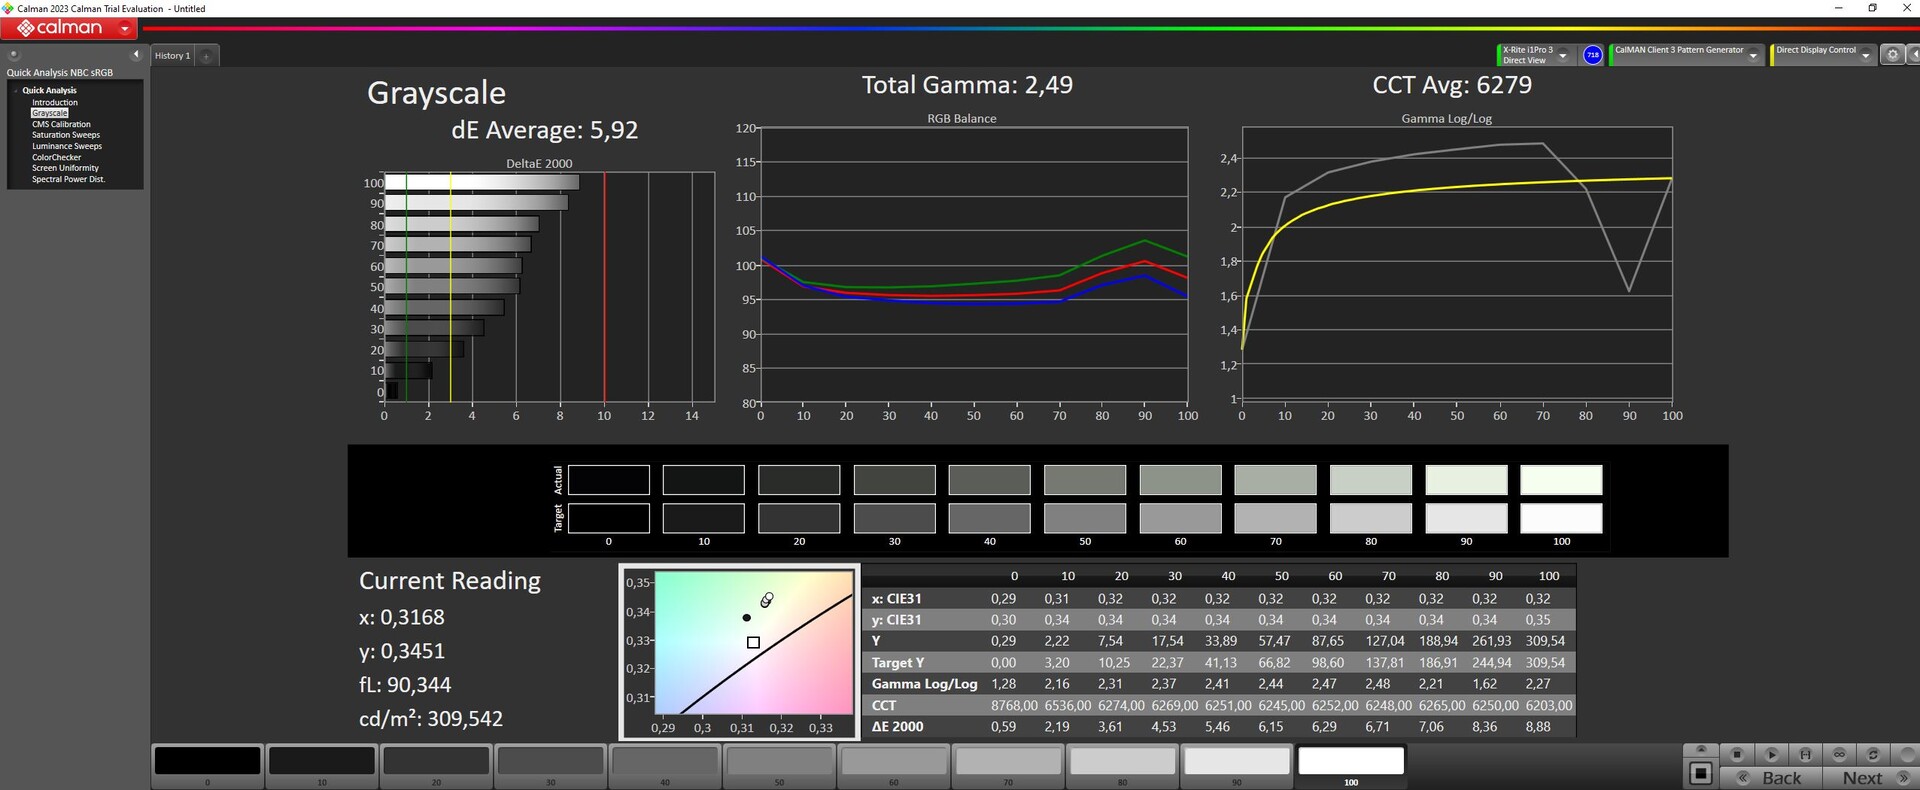
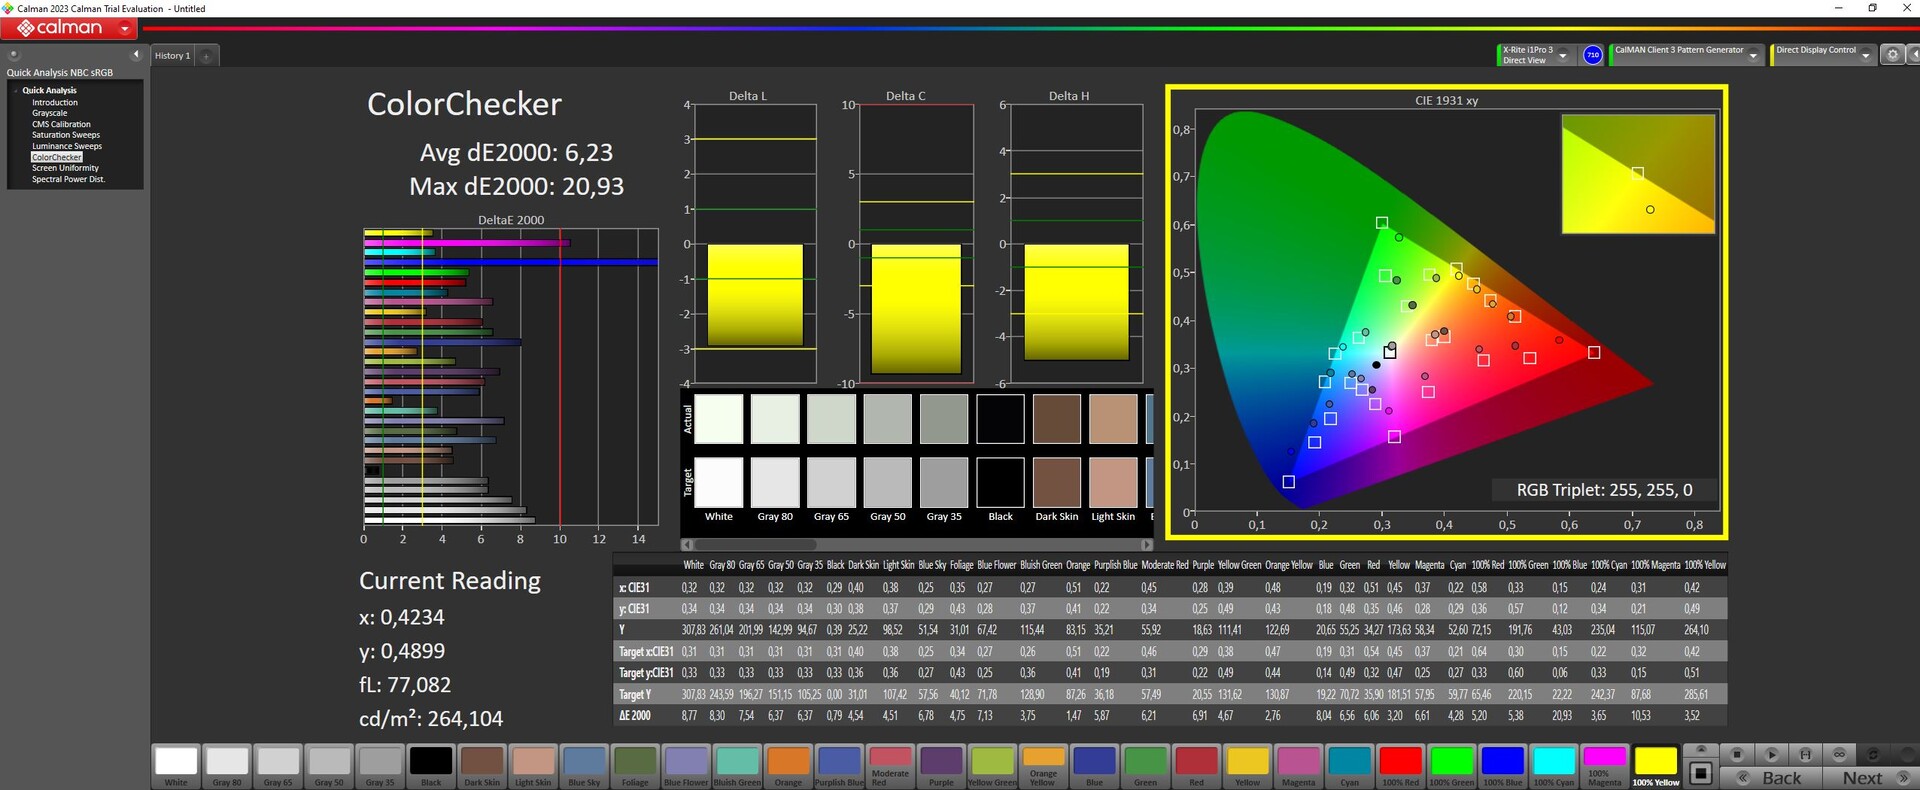
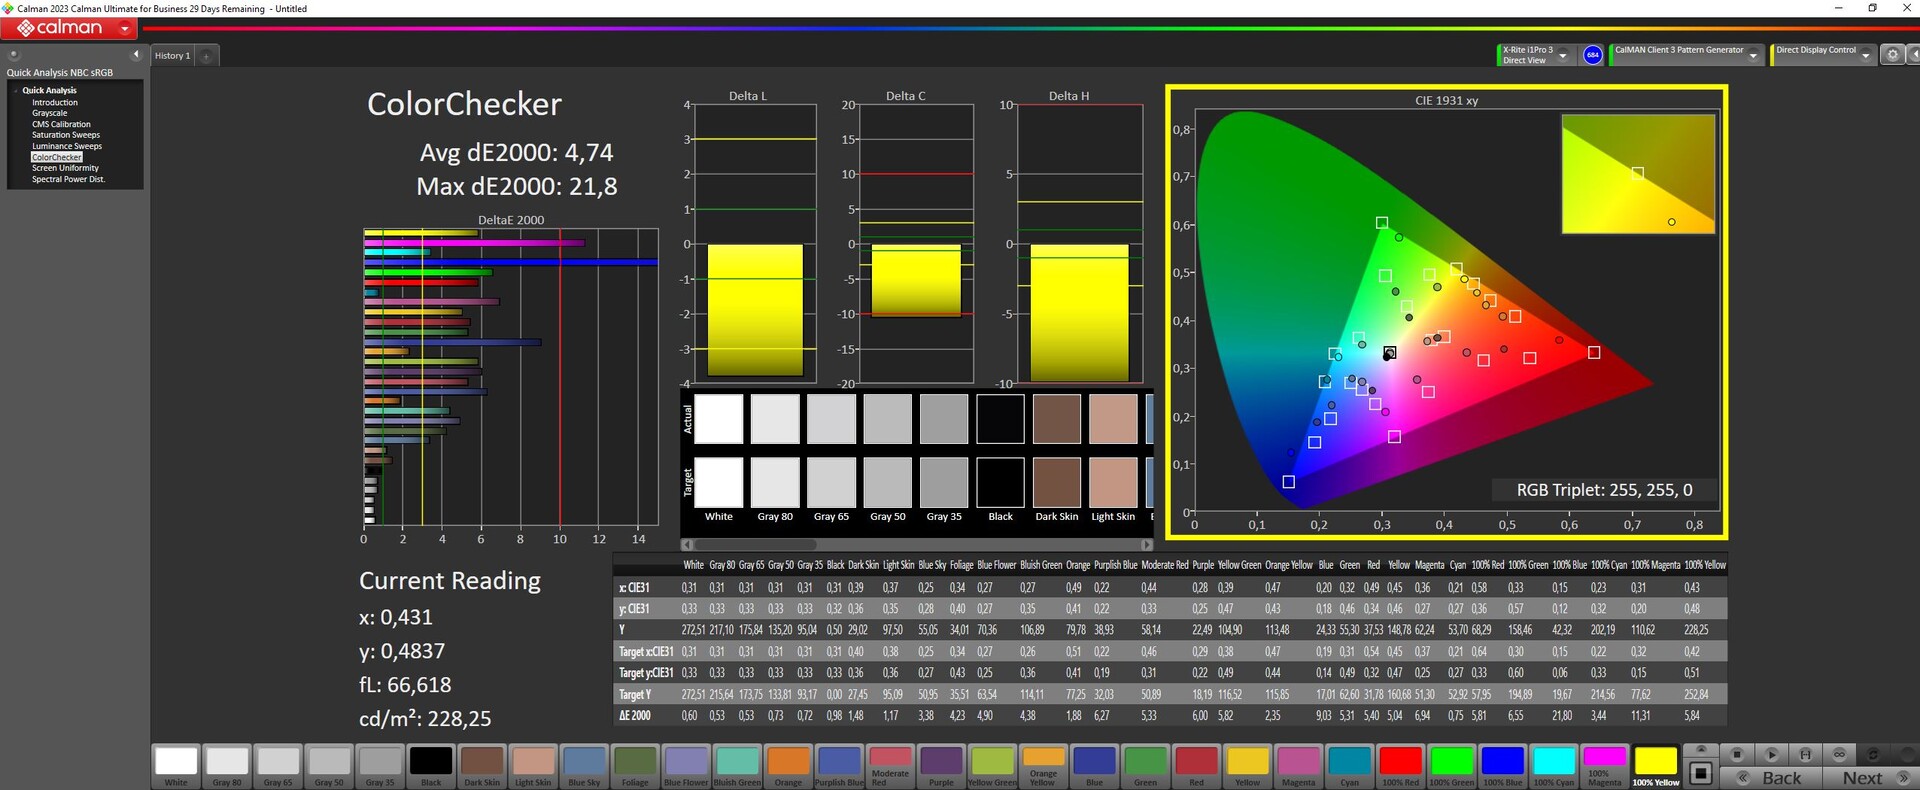
ΔE ColorChecker Calman: 6.23 | ∀{0.5-29.43 Ø4.71}
calibrated: 4.74
ΔE Greyscale Calman: 5.92 | ∀{0.09-98 Ø4.96}
44.7% AdobeRGB 1998 (Argyll 3D)
64.3% sRGB (Argyll 3D)
43.2% Display P3 (Argyll 3D)
Gamma: 2.49
CCT: 6279 K
| Gigabyte G5 KF Chi Mei N156HRA-EA1, IPS, 1920x1080, 15.6" | MSI Cyborg 15 A12VF AU Optronics B156HAN15.1, IPS, 1920x1080, 15.6" | Intel NUC X15 LAPAC71H BOE HF NV156FHM-N4G, IPS, 1920x1080, 15.6" | Asus TUF A15 FA507 N156HMA-GA1, IPS, 1920x1080, 15.6" | Lenovo Legion Slim 5 16APH8 BOE NJ NE160QDM-NYC, IPS, 2560x1600, 16" | Gigabyte G5 KE Chi Mei N156HRA-EA1, IPS, 1920x1080, 15.6" | |
|---|---|---|---|---|---|---|
| Display | -2% | 47% | 50% | 58% | -6% | |
| Display P3 Coverage (%) | 43.2 | 42.3 -2% | 64.9 50% | 64.9 50% | 69.3 60% | 40.7 -6% |
| sRGB Coverage (%) | 64.3 | 62.6 -3% | 92.6 44% | 96.5 50% | 100 56% | 61 -5% |
| AdobeRGB 1998 Coverage (%) | 44.7 | 43.7 -2% | 66.3 48% | 66.6 49% | 70 57% | 42.1 -6% |
| Response Times | -9% | 51% | -57% | 43% | -40% | |
| Response Time Grey 50% / Grey 80% * (ms) | 25.1 ? | 22 ? 12% | 7.8 ? 69% | 30.4 ? -21% | 10.7 ? 57% | 26.64 ? -6% |
| Response Time Black / White * (ms) | 10.8 ? | 14 ? -30% | 7.3 ? 32% | 20.8 ? -93% | 7.8 ? 28% | 18.65 ? -73% |
| PWM Frequency (Hz) | ||||||
| Screen | 22% | 51% | 48% | 39% | 1% | |
| Brightness middle (cd/m²) | 297 | 247 -17% | 365 23% | 288 -3% | 371.6 25% | 269 -9% |
| Brightness (cd/m²) | 275 | 234 -15% | 356 29% | 271 -1% | 343 25% | 248 -10% |
| Brightness Distribution (%) | 85 | 89 5% | 86 1% | 91 7% | 84 -1% | 85 0% |
| Black Level * (cd/m²) | 0.34 | 0.25 26% | 0.17 50% | 0.17 50% | 0.44 -29% | 0.5 -47% |
| Contrast (:1) | 874 | 988 13% | 2147 146% | 1694 94% | 845 -3% | 538 -38% |
| Colorchecker dE 2000 * | 6.23 | 3.78 39% | 3.51 44% | 1.9 70% | 1.52 76% | 4.54 27% |
| Colorchecker dE 2000 max. * | 20.93 | 6.42 69% | 6.37 70% | 3.3 84% | 2.68 87% | 17.28 17% |
| Colorchecker dE 2000 calibrated * | 4.74 | 3.94 17% | 1.88 60% | 0.9 81% | 0.33 93% | 3.34 30% |
| Greyscale dE 2000 * | 5.92 | 2.16 64% | 3.83 35% | 2.7 54% | 1.2 80% | 3.8 36% |
| Gamma | 2.49 88% | 2.33 94% | 2.47 89% | 2.32 95% | 2.1 105% | 2.17 101% |
| CCT | 6279 104% | 6906 94% | 7362 88% | 6535 99% | 6503 100% | 7408 88% |
| Media total (Programa/Opciones) | 4% /
13% | 50% /
50% | 14% /
34% | 47% /
44% | -15% /
-6% |
* ... más pequeño es mejor
Tiempos de respuesta del display
| ↔ Tiempo de respuesta de Negro a Blanco | ||
|---|---|---|
| 10.8 ms ... subida ↗ y bajada ↘ combinada | ↗ 9.9 ms subida | 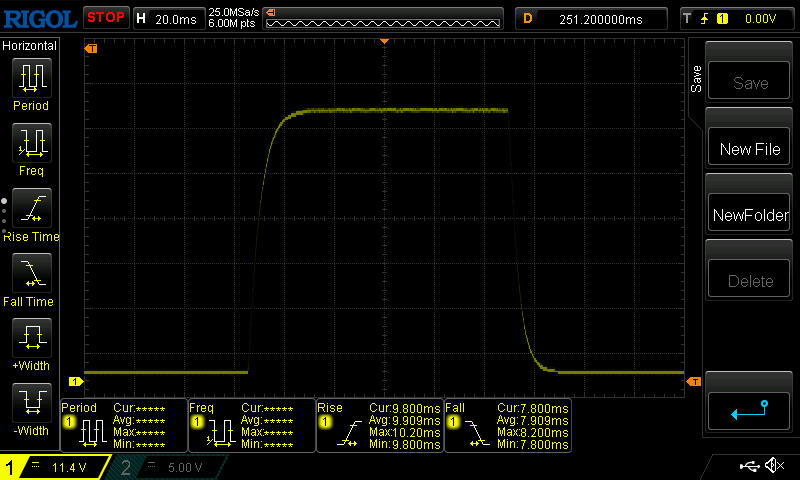 |
| ↘ 7.9 ms bajada | ||
| La pantalla mostró buenos tiempos de respuesta en nuestros tests pero podría ser demasiado lenta para los jugones competitivos. En comparación, todos los dispositivos de prueba van de ##min### (mínimo) a 240 (máximo) ms. » 29 % de todos los dispositivos son mejores. Esto quiere decir que el tiempo de respuesta medido es mejor que la media (19.8 ms) de todos los dispositivos testados. | ||
| ↔ Tiempo de respuesta 50% Gris a 80% Gris | ||
| 25.1 ms ... subida ↗ y bajada ↘ combinada | ↗ 11.7 ms subida | 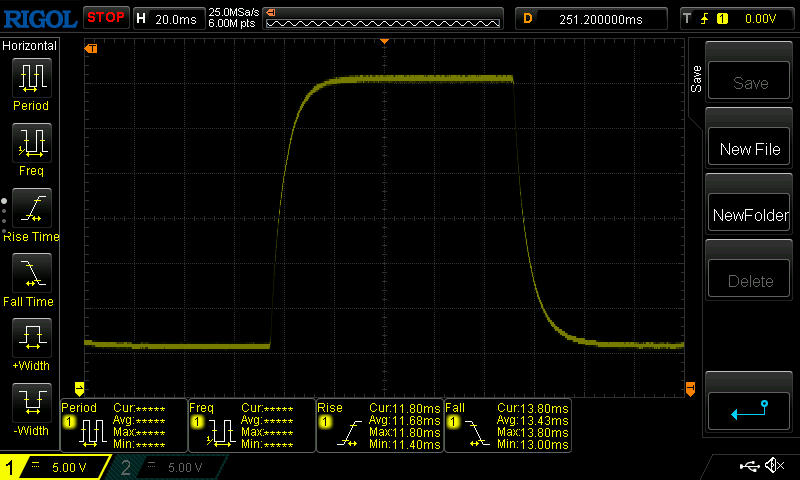 |
| ↘ 13.4 ms bajada | ||
| La pantalla mostró tiempos de respuesta relativamente lentos en nuestros tests pero podría ser demasiado lenta para los jugones. En comparación, todos los dispositivos de prueba van de ##min### (mínimo) a 636 (máximo) ms. » 36 % de todos los dispositivos son mejores. Esto quiere decir que el tiempo de respuesta medido es mejor que la media (30.9 ms) de todos los dispositivos testados. | ||
Parpadeo de Pantalla / PWM (Pulse-Width Modulation)
| Parpadeo de Pantalla / PWM no detectado | 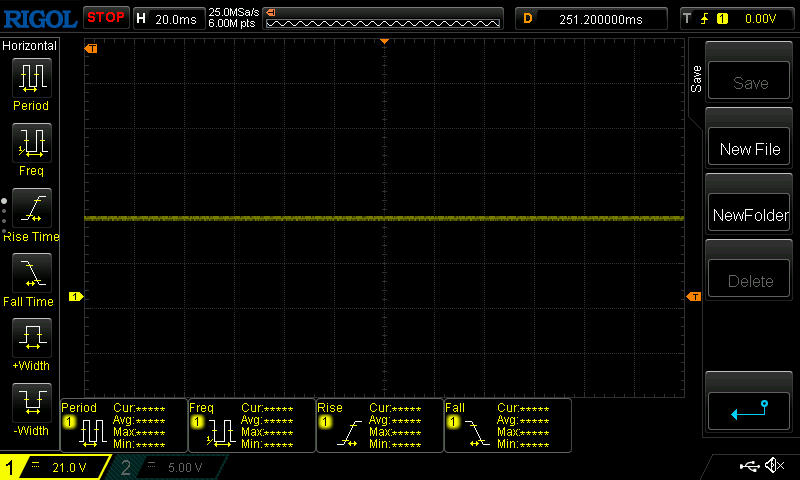 | ||
Comparación: 52 % de todos los dispositivos testados no usaron PWM para atenuar el display. Si se usó, medimos una media de 7748 (mínimo: 5 - máxmo: 343500) Hz. | |||

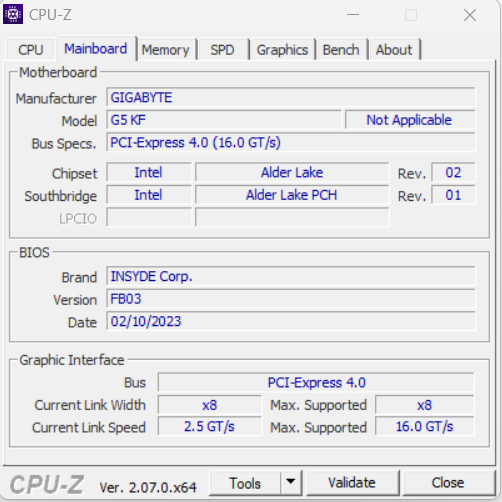
Actuación - Alder Lake conoce a Ada Lovelace
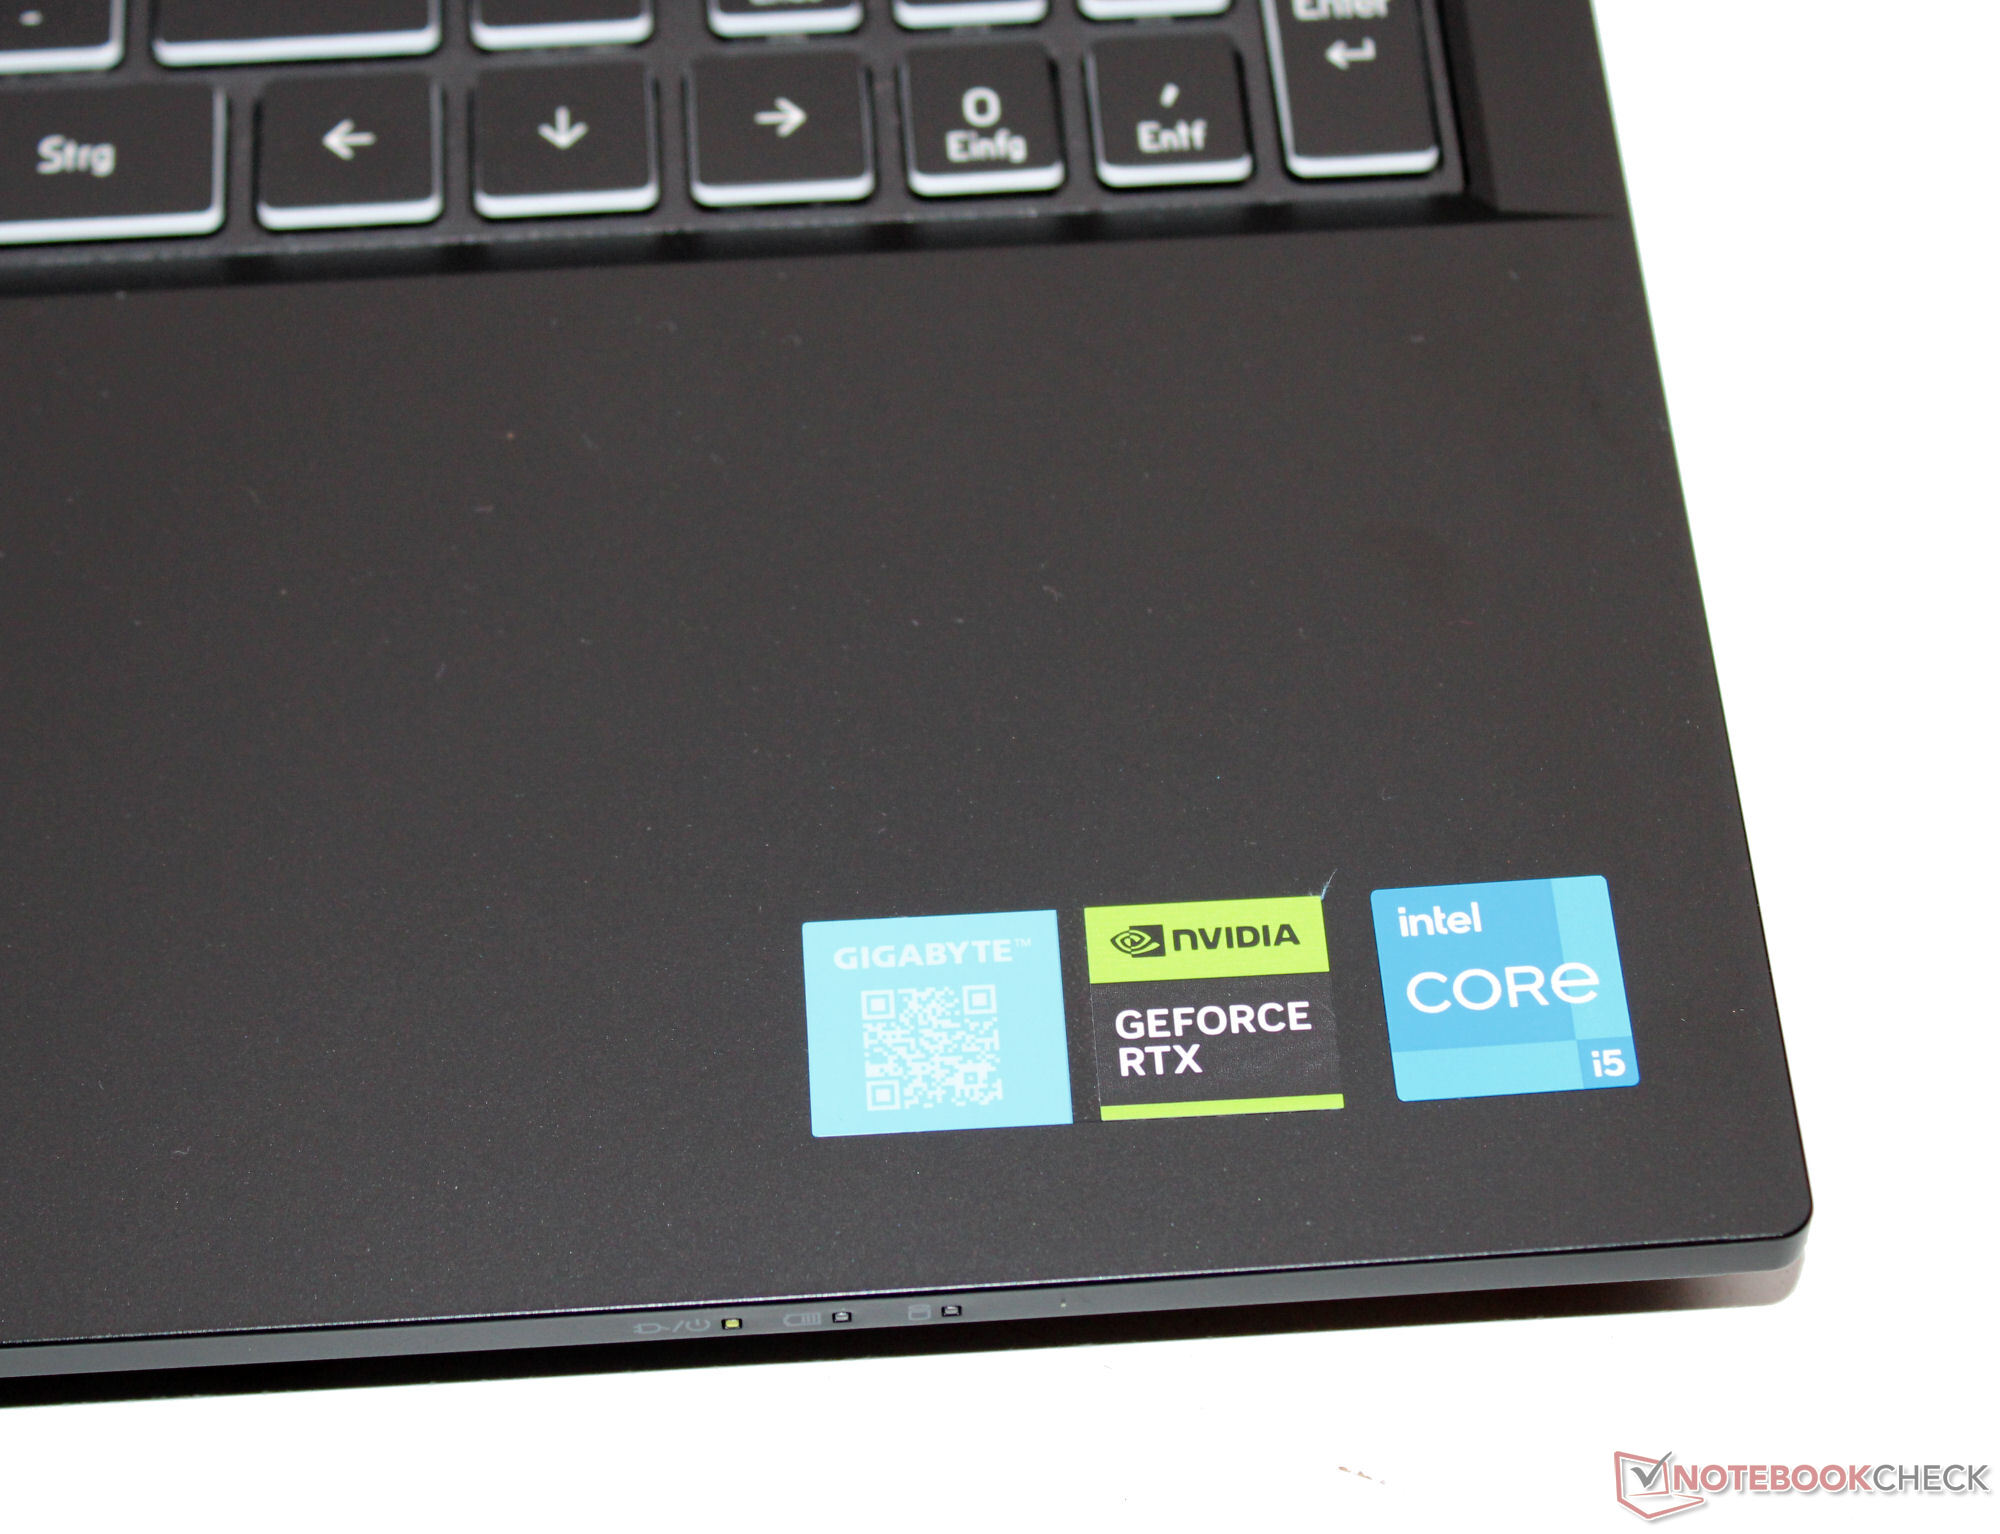
Con el G5 KF, Gigabyte tiene un portátil para juegos FHD relativamente asequible en su línea de productos. El portátil cuenta con un Core i5-12500H y GeForce RTX 4060y se puede conseguir por algo menos de 1.000 euros (1.059 dólares). La compañía también ofrece modelos menos caros con la RTX 4050 (G5 MF) o la RTX 3050 (G5 GE).
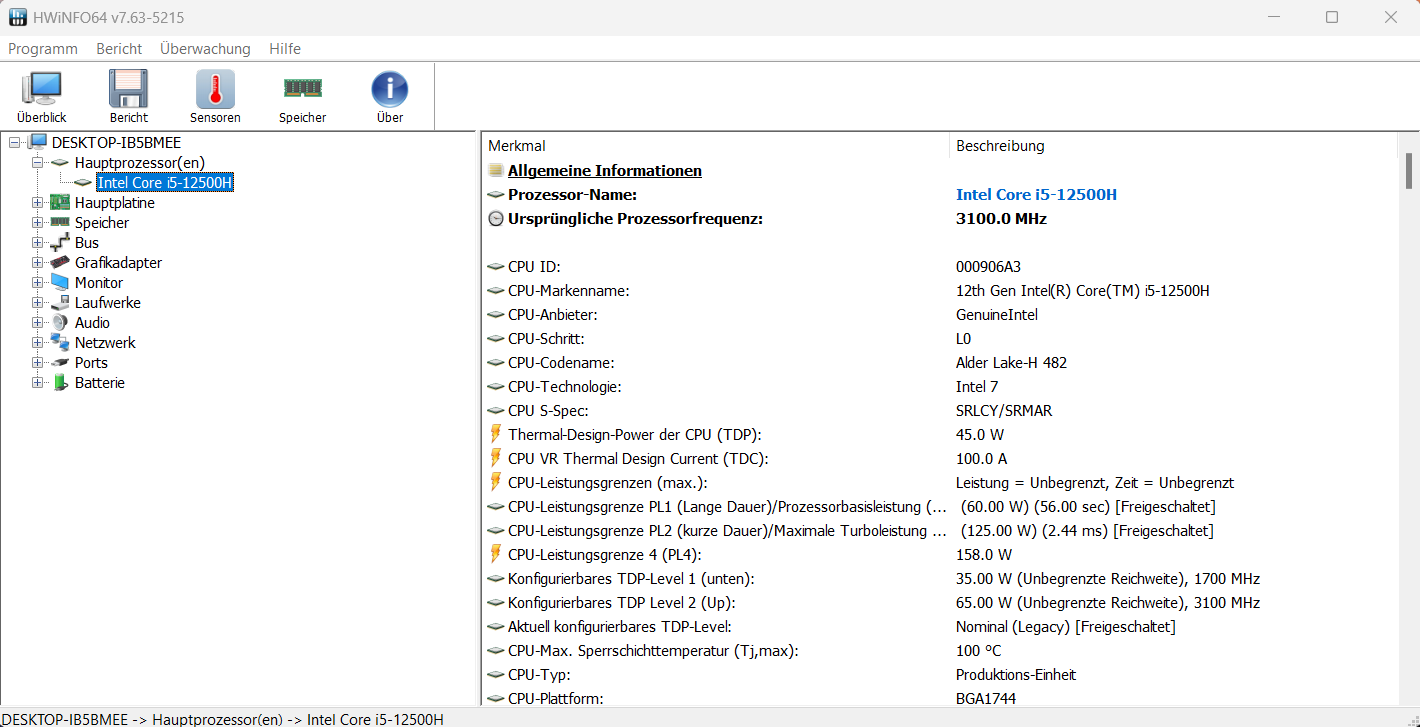
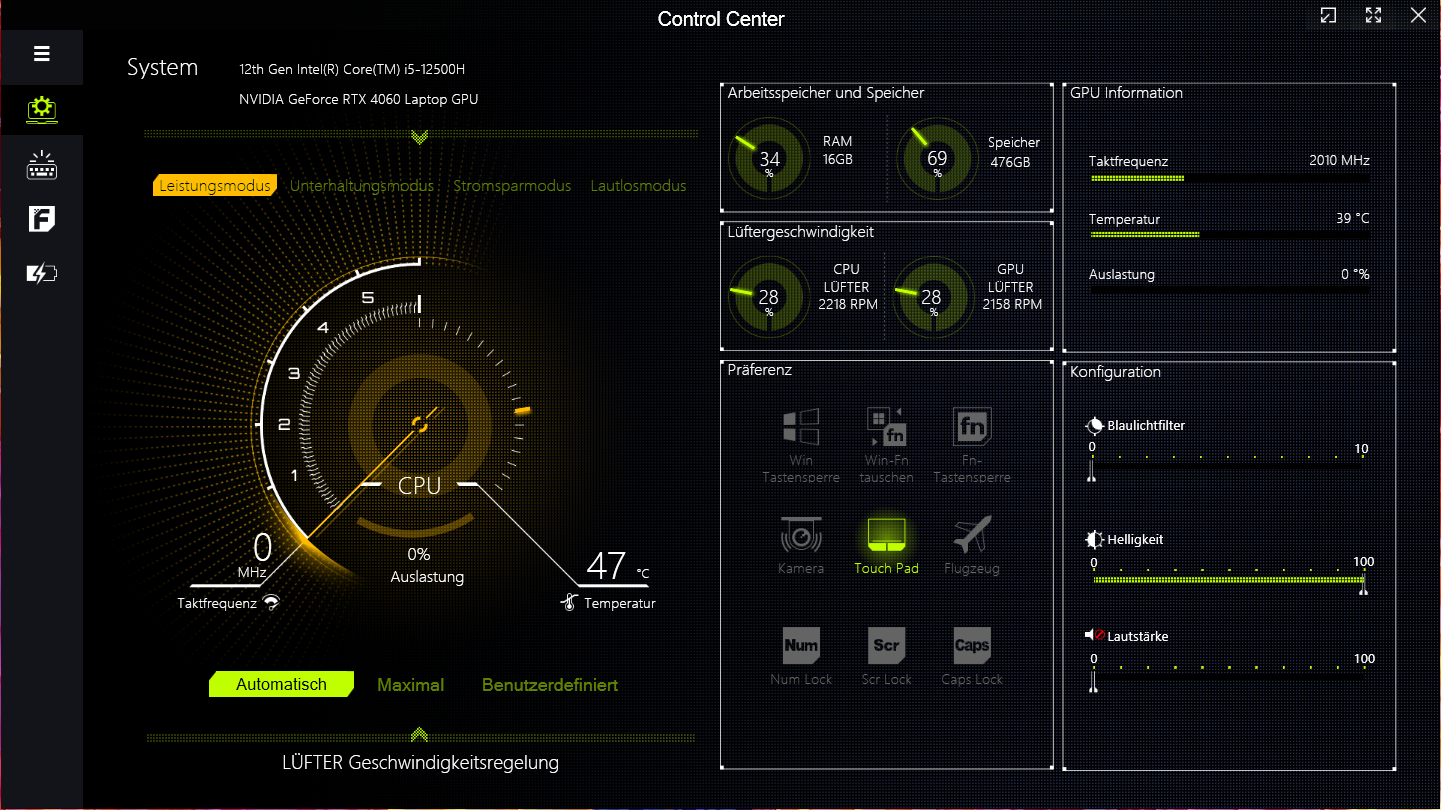
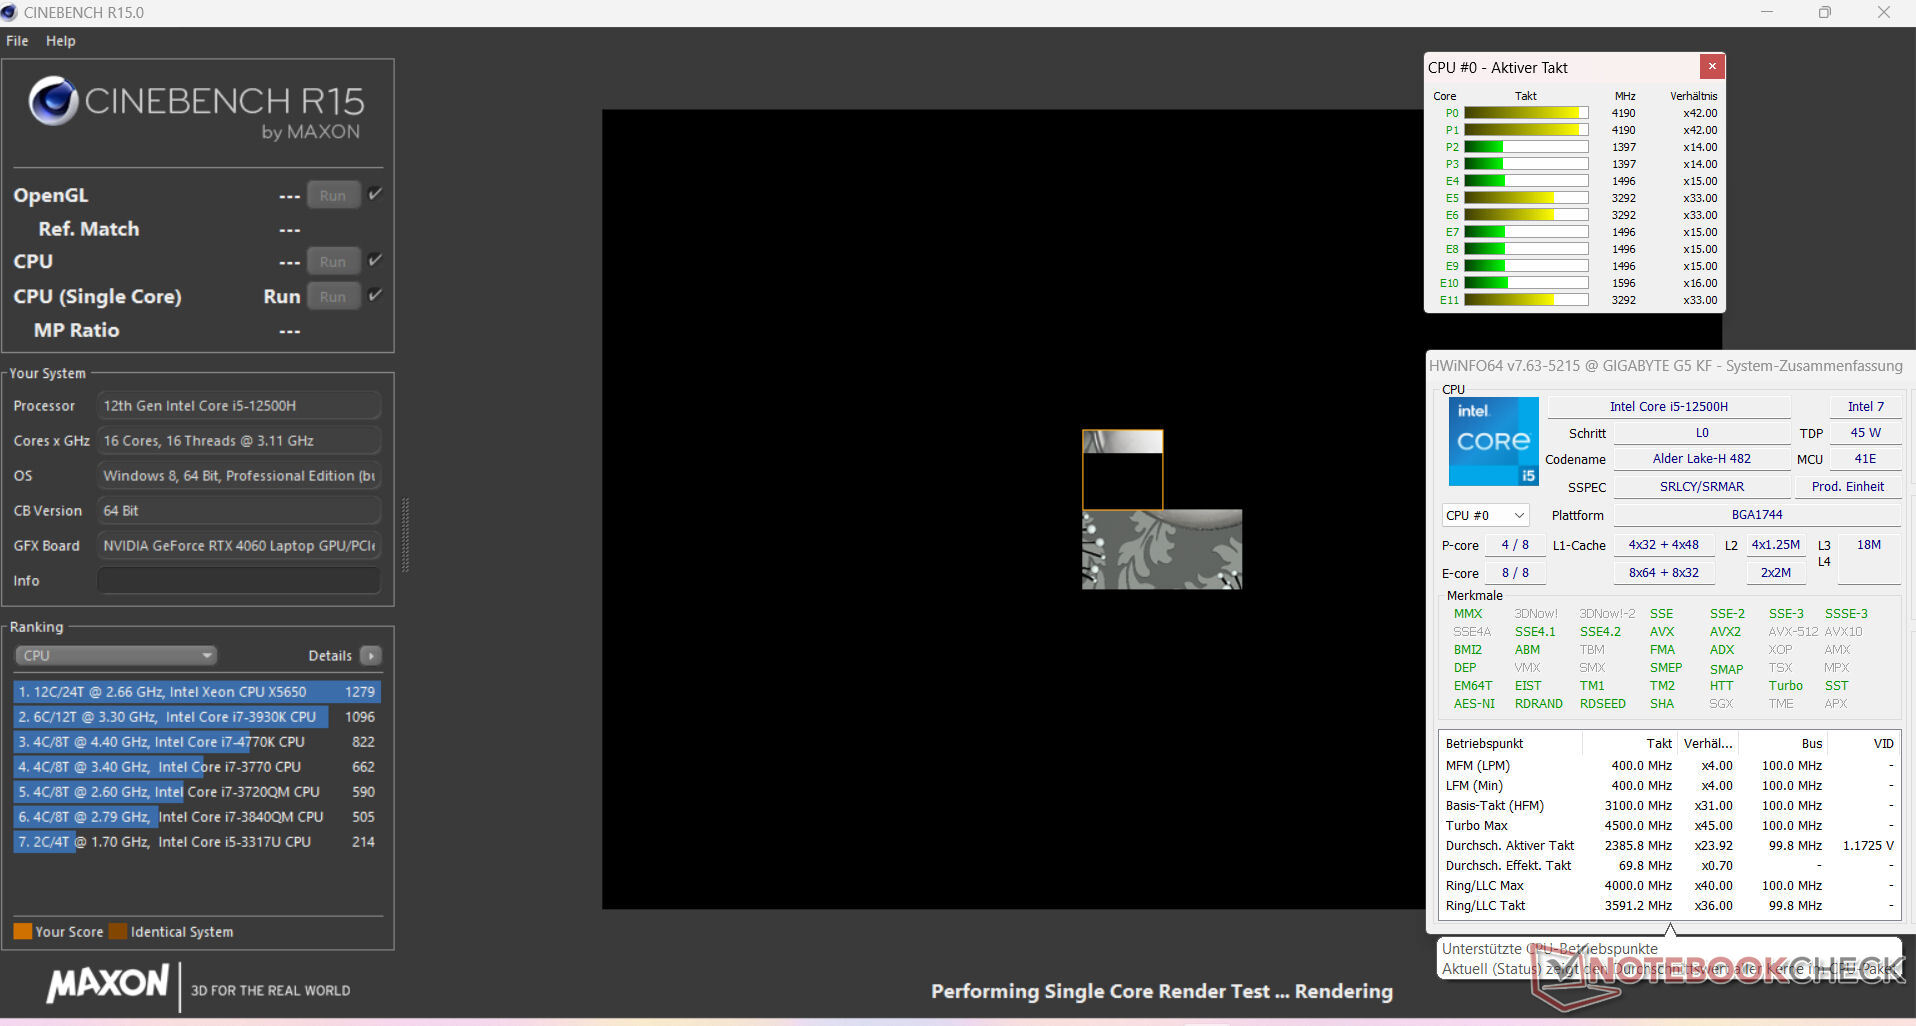
Condiciones de la prueba
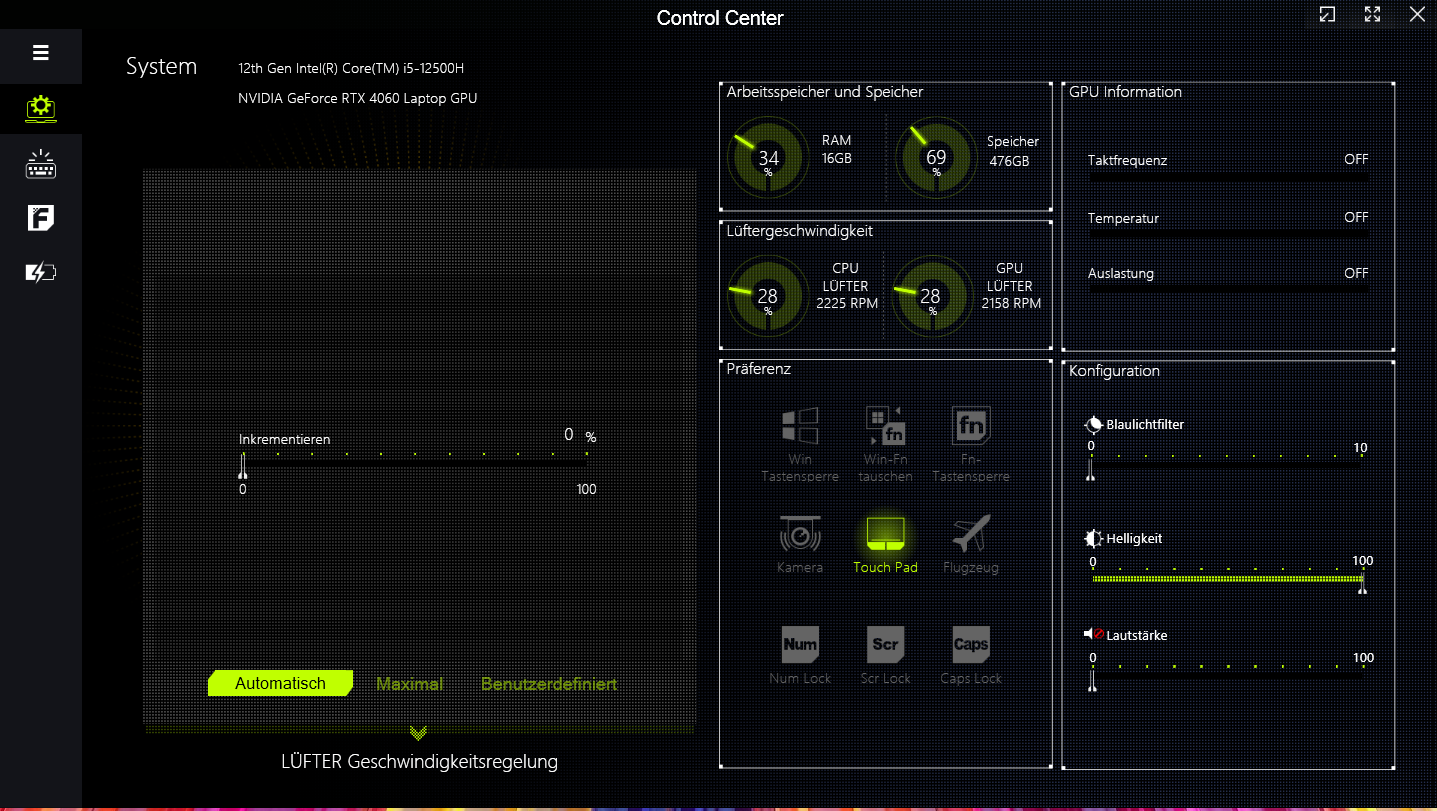
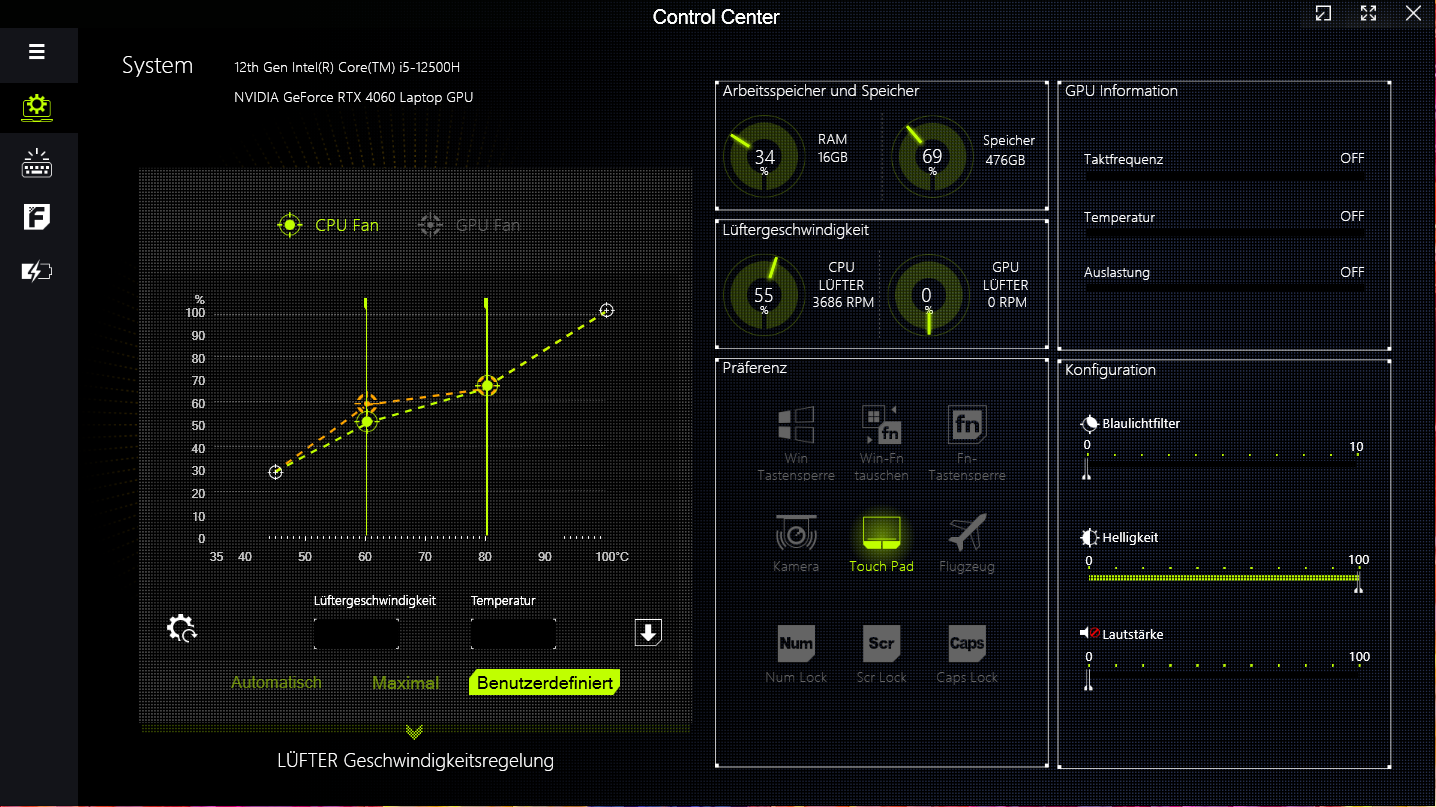
El G5 ofrece cuatro modos de funcionamiento especificados por el fabricante (véase la tabla). Puede cambiar entre ellos utilizando el software del Centro de Control. Nosotros utilizamos el "modo de rendimiento" para nuestros puntos de referencia y el "modo de ahorro de energía" para las pruebas de duración de la batería.
| Modo de rendimiento | Modo de entretenimiento | Modo de ahorro de energía | Modo silencioso | |
|---|---|---|---|---|
| Límite de potencia 1 (HWInfo) | 60 vatios | 50 vatios | 45 vatios | 15 vatios |
| Límite de potencia 2 (HWInfo) | 125 vatios | 115 vatios | 30 vatios | 30 vatios |
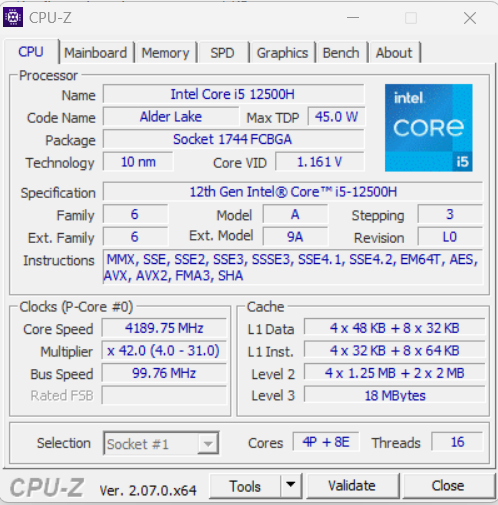
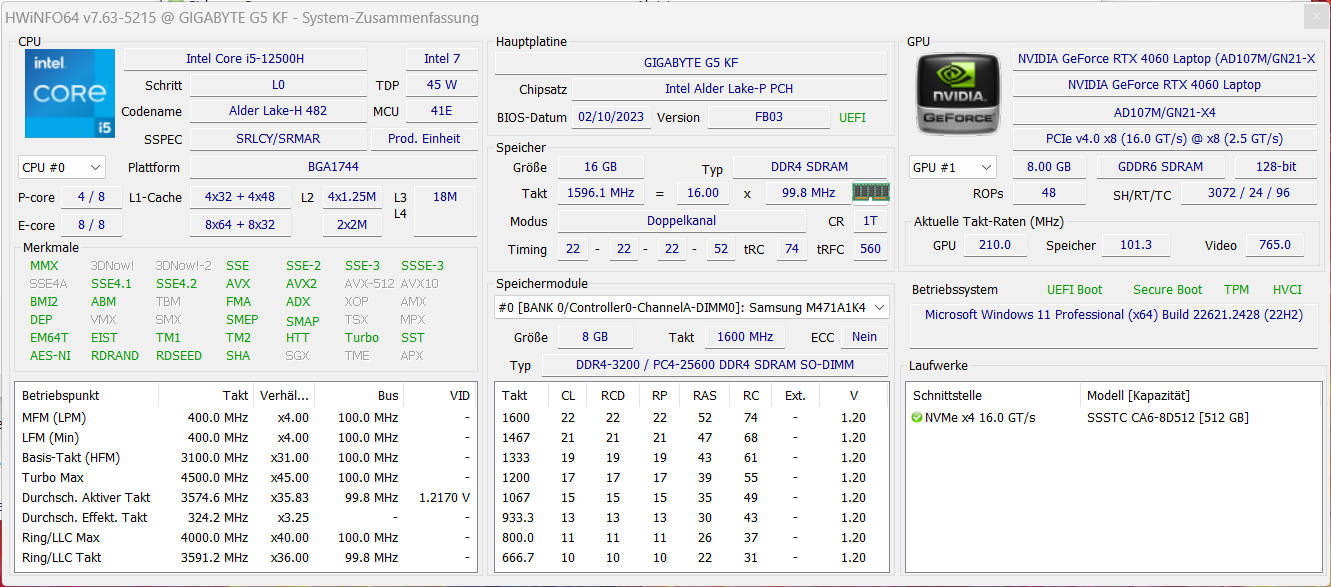
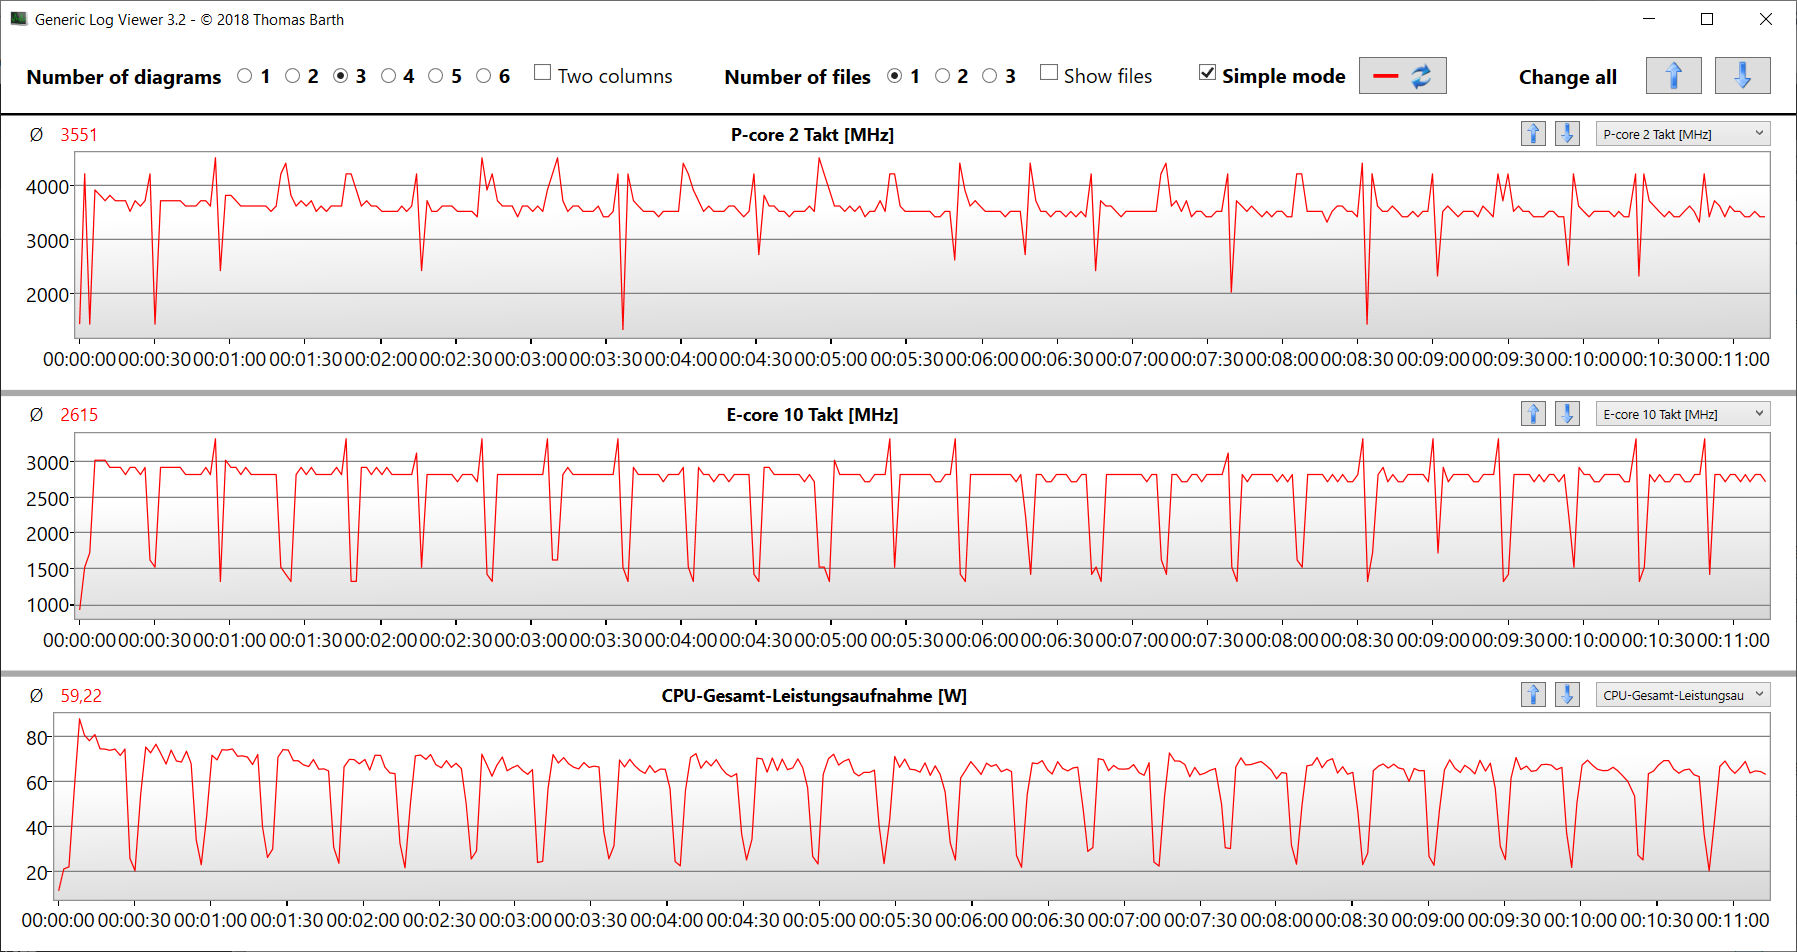
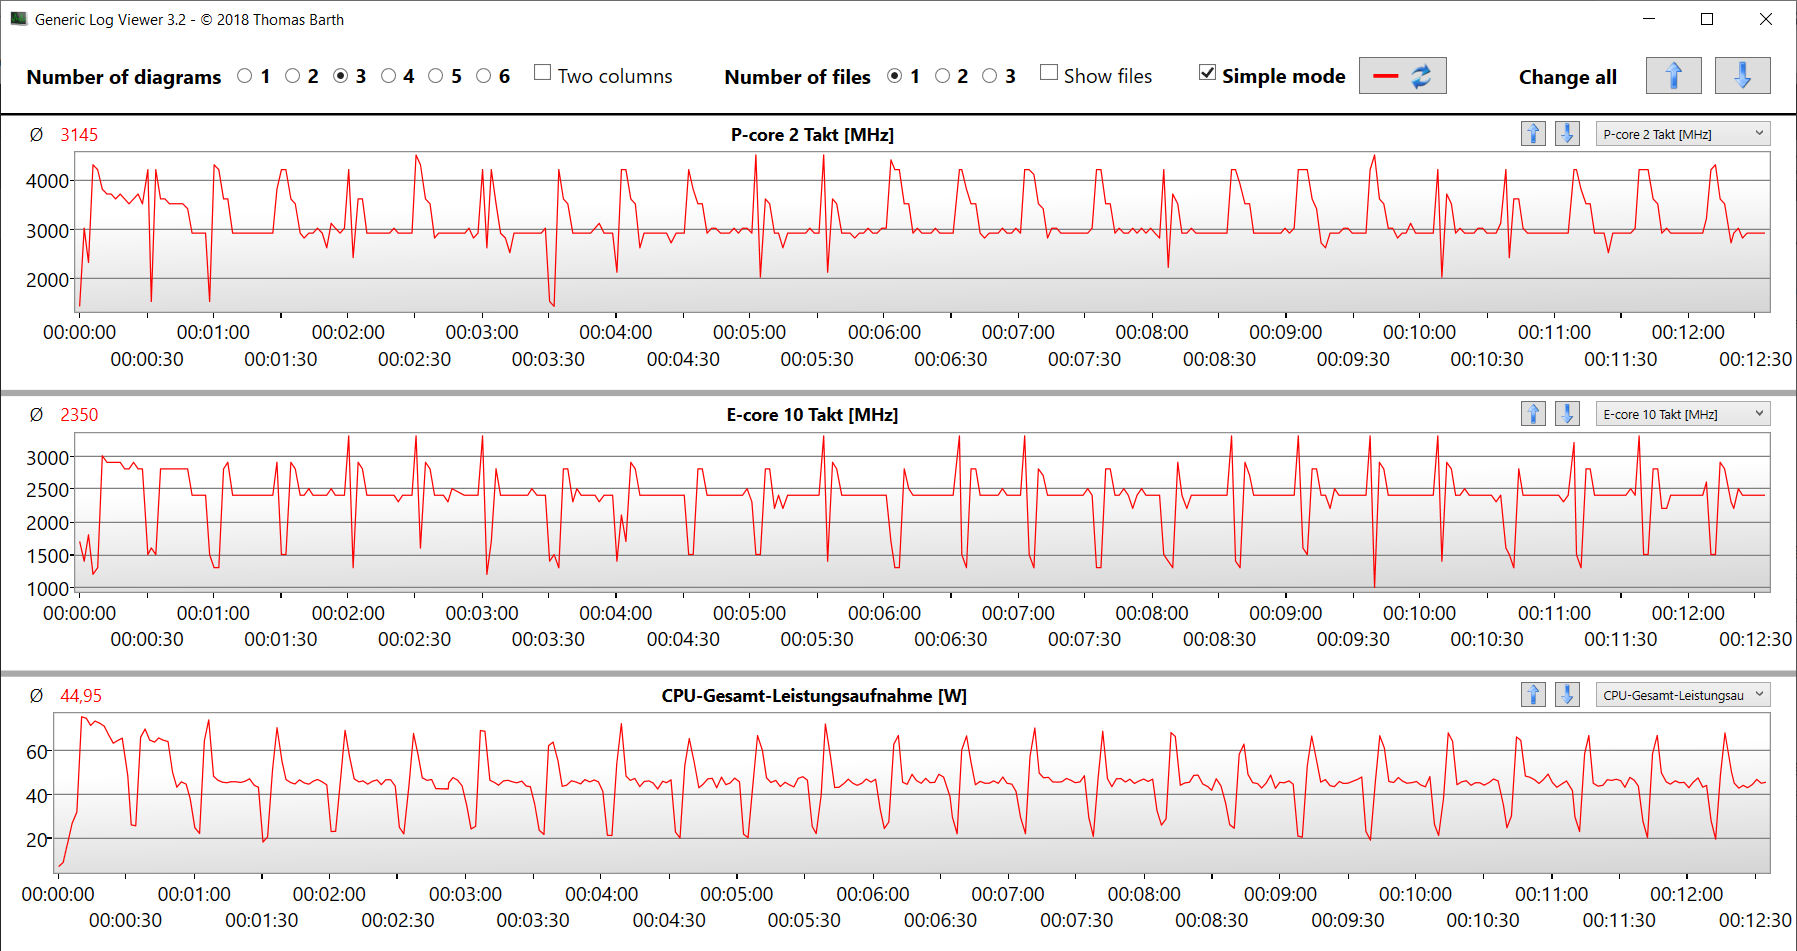
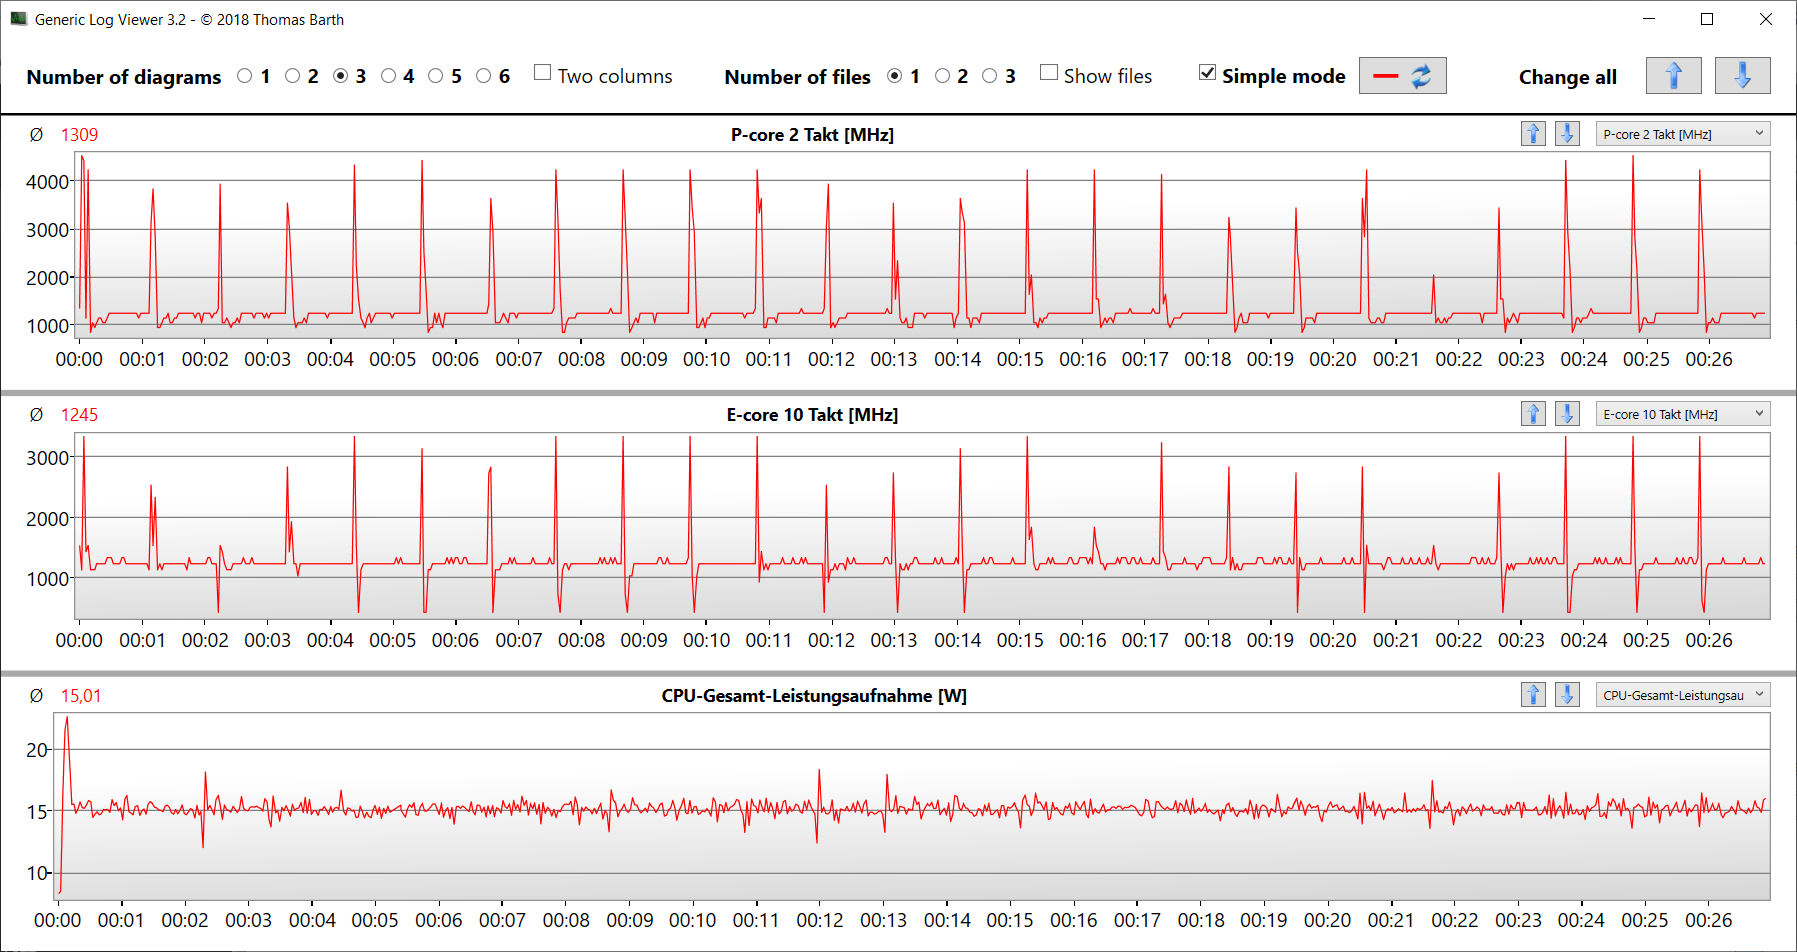
Procesador
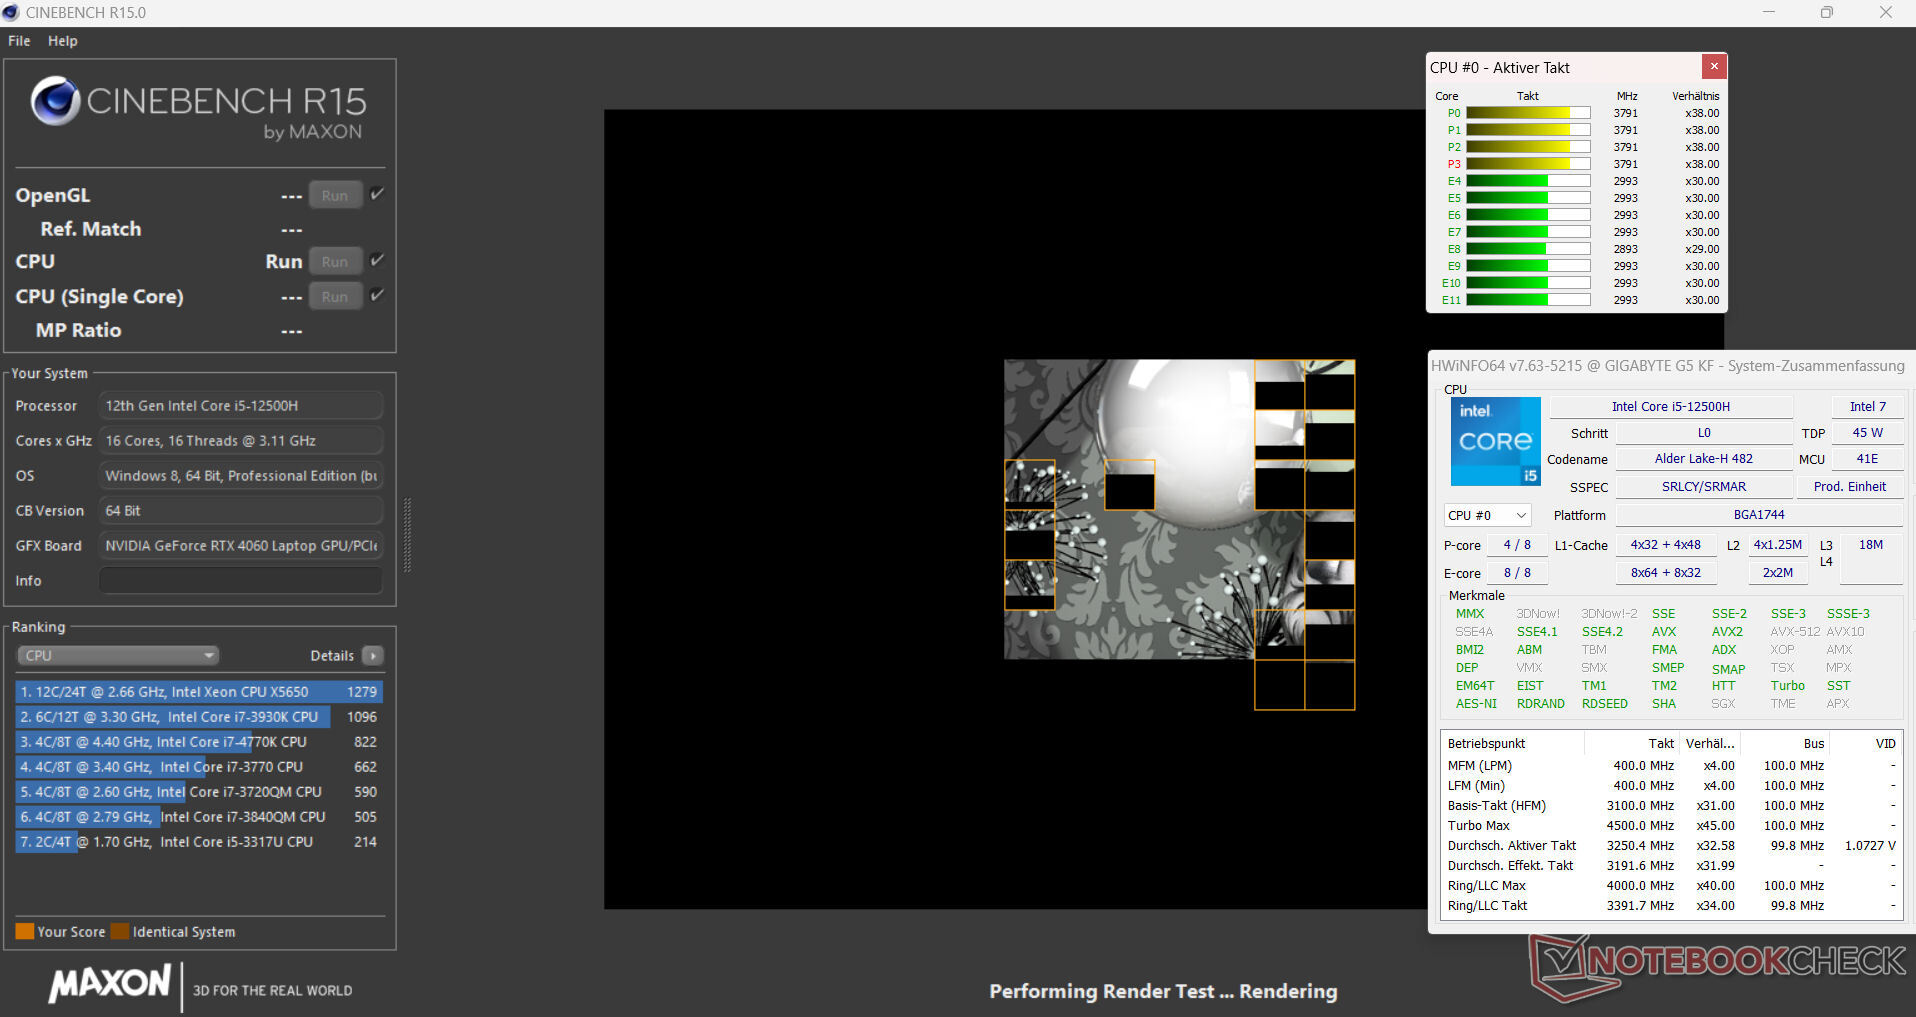
Los 12 núcleos de CPU del Core i5-12500H (4 núcleos P, 8 núcleos E) pueden alcanzar frecuencias máximas de 4,5 GHz (P) y 3,3 GHz (E). Bajo carga multihilo sostenida (es decir, CB15 en bucle), la velocidad de reloj cayó ligeramente entre la primera y la segunda ejecución y se mantuvo a un nivel relativamente constante después de eso.
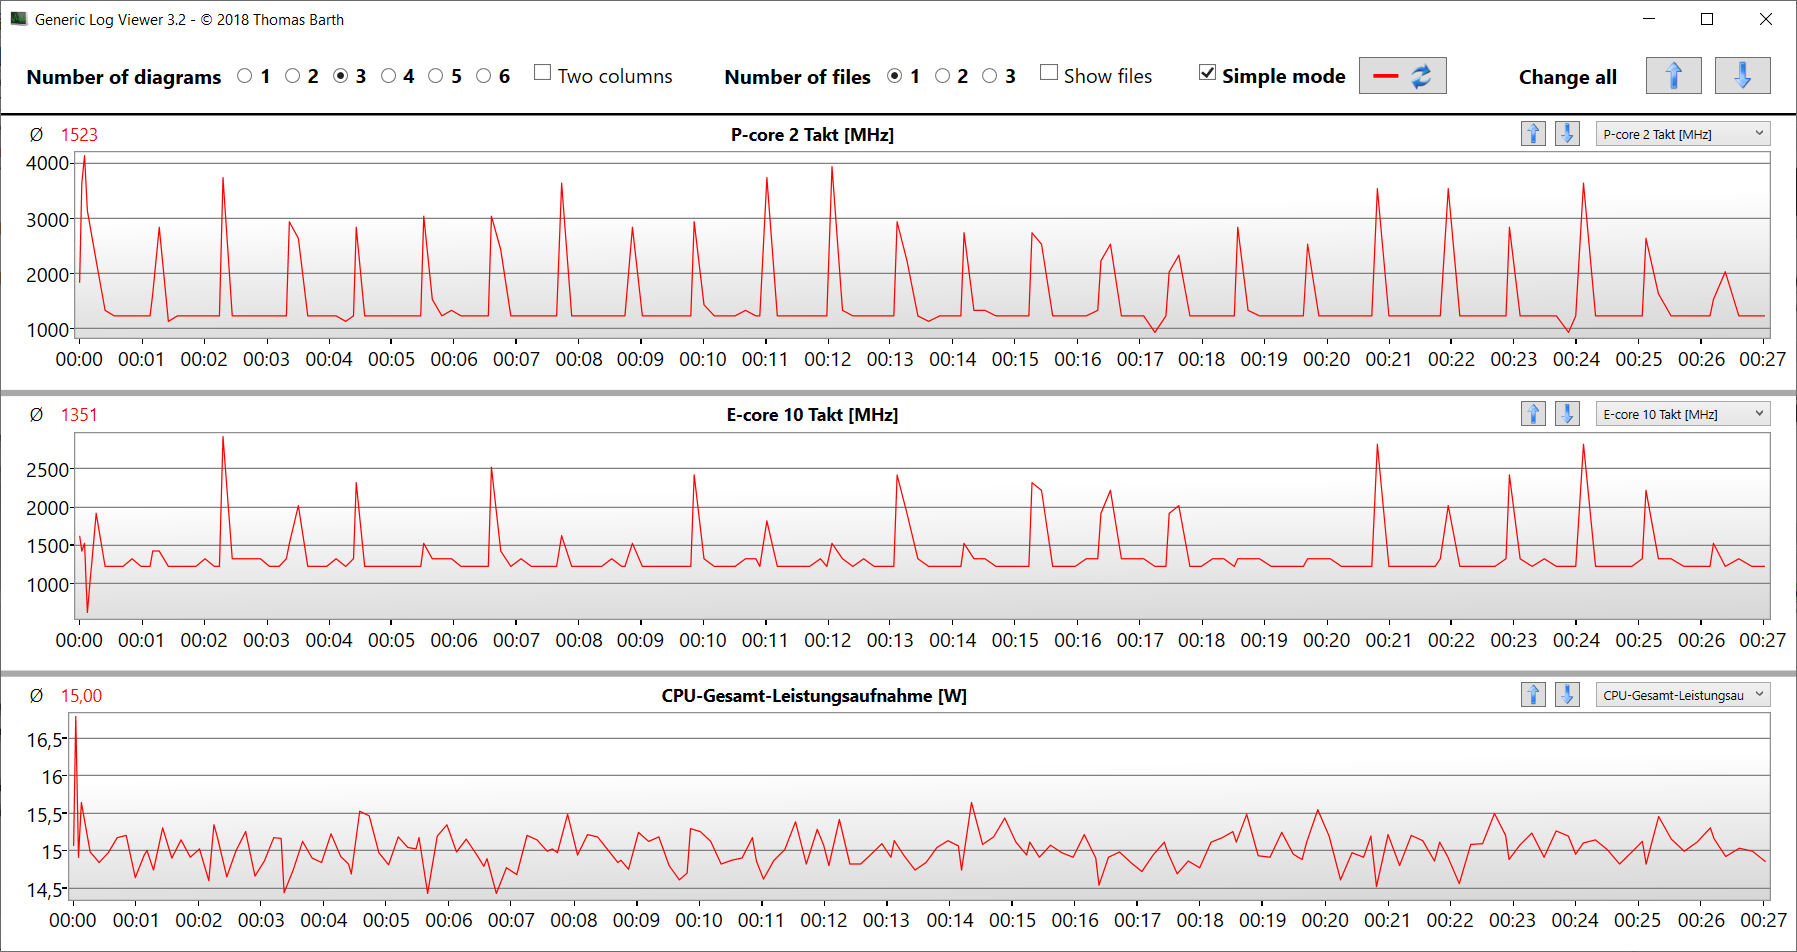
Los resultados del benchmark están a la par con lo que hemos visto de la CPU en promedio (cuando está enchufada). En cuanto a la energía de la batería, la puntuación más relevante de un solo subproceso en CB15 (159 puntos) experimentó un descenso menor que la puntuación multihilo (741 puntos).
Cinebench R15 Multi Sustained load
| CPU Performance rating - Percent | |
| Media de la clase Gaming | |
| Lenovo Legion Slim 5 16APH8 | |
| Intel NUC X15 LAPAC71H | |
| MSI Cyborg 15 A12VF | |
| Asus TUF A15 FA507 | |
| Gigabyte G5 KE | |
| Medio Intel Core i5-12500H | |
| Gigabyte G5 KF | |
* ... más pequeño es mejor
AIDA64: FP32 Ray-Trace | FPU Julia | CPU SHA3 | CPU Queen | FPU SinJulia | FPU Mandel | CPU AES | CPU ZLib | FP64 Ray-Trace | CPU PhotoWorxx
| Performance rating | |
| Media de la clase Gaming | |
| Lenovo Legion Slim 5 16APH8 | |
| Asus TUF A15 FA507 | |
| Intel NUC X15 LAPAC71H | |
| Gigabyte G5 KE | |
| MSI Cyborg 15 A12VF | |
| Gigabyte G5 KF | |
| Medio Intel Core i5-12500H | |
| AIDA64 / FP32 Ray-Trace | |
| Media de la clase Gaming (10227 - 85542, n=106, últimos 2 años) | |
| Lenovo Legion Slim 5 16APH8 | |
| Asus TUF A15 FA507 | |
| Intel NUC X15 LAPAC71H | |
| MSI Cyborg 15 A12VF | |
| Gigabyte G5 KE | |
| Medio Intel Core i5-12500H (6851 - 13947, n=9) | |
| Gigabyte G5 KF | |
| AIDA64 / FPU Julia | |
| Media de la clase Gaming (51376 - 372155, n=106, últimos 2 años) | |
| Lenovo Legion Slim 5 16APH8 | |
| Asus TUF A15 FA507 | |
| MSI Cyborg 15 A12VF | |
| Gigabyte G5 KE | |
| Intel NUC X15 LAPAC71H | |
| Gigabyte G5 KF | |
| Medio Intel Core i5-12500H (29874 - 68178, n=9) | |
| AIDA64 / CPU SHA3 | |
| Media de la clase Gaming (2180 - 10115, n=106, últimos 2 años) | |
| Lenovo Legion Slim 5 16APH8 | |
| Asus TUF A15 FA507 | |
| Gigabyte G5 KE | |
| Intel NUC X15 LAPAC71H | |
| MSI Cyborg 15 A12VF | |
| Gigabyte G5 KF | |
| Medio Intel Core i5-12500H (2287 - 3337, n=9) | |
| AIDA64 / CPU Queen | |
| Lenovo Legion Slim 5 16APH8 | |
| Media de la clase Gaming (49785 - 173351, n=90, últimos 2 años) | |
| Asus TUF A15 FA507 | |
| Intel NUC X15 LAPAC71H | |
| MSI Cyborg 15 A12VF | |
| Gigabyte G5 KE | |
| Gigabyte G5 KF | |
| Medio Intel Core i5-12500H (77935 - 80703, n=9) | |
| AIDA64 / FPU SinJulia | |
| Lenovo Legion Slim 5 16APH8 | |
| Media de la clase Gaming (4424 - 33636, n=106, últimos 2 años) | |
| Asus TUF A15 FA507 | |
| MSI Cyborg 15 A12VF | |
| Intel NUC X15 LAPAC71H | |
| Gigabyte G5 KE | |
| Gigabyte G5 KF | |
| Medio Intel Core i5-12500H (6590 - 7431, n=9) | |
| AIDA64 / FPU Mandel | |
| Media de la clase Gaming (25115 - 196829, n=106, últimos 2 años) | |
| Lenovo Legion Slim 5 16APH8 | |
| Asus TUF A15 FA507 | |
| Gigabyte G5 KE | |
| Intel NUC X15 LAPAC71H | |
| MSI Cyborg 15 A12VF | |
| Medio Intel Core i5-12500H (18252 - 34041, n=9) | |
| Gigabyte G5 KF | |
| AIDA64 / CPU AES | |
| Intel NUC X15 LAPAC71H | |
| Gigabyte G5 KE | |
| Media de la clase Gaming (39258 - 247074, n=106, últimos 2 años) | |
| Gigabyte G5 KF | |
| Medio Intel Core i5-12500H (50298 - 111567, n=9) | |
| Lenovo Legion Slim 5 16APH8 | |
| Asus TUF A15 FA507 | |
| MSI Cyborg 15 A12VF | |
| AIDA64 / CPU ZLib | |
| Media de la clase Gaming (574 - 2531, n=106, últimos 2 años) | |
| Lenovo Legion Slim 5 16APH8 | |
| Gigabyte G5 KE | |
| MSI Cyborg 15 A12VF | |
| Medio Intel Core i5-12500H (746 - 924, n=9) | |
| Gigabyte G5 KF | |
| Intel NUC X15 LAPAC71H | |
| Asus TUF A15 FA507 | |
| AIDA64 / FP64 Ray-Trace | |
| Media de la clase Gaming (5509 - 45446, n=106, últimos 2 años) | |
| Lenovo Legion Slim 5 16APH8 | |
| Asus TUF A15 FA507 | |
| Gigabyte G5 KE | |
| Intel NUC X15 LAPAC71H | |
| MSI Cyborg 15 A12VF | |
| Medio Intel Core i5-12500H (3848 - 7405, n=9) | |
| Gigabyte G5 KF | |
| AIDA64 / CPU PhotoWorxx | |
| Media de la clase Gaming (12271 - 89891, n=106, últimos 2 años) | |
| Intel NUC X15 LAPAC71H | |
| MSI Cyborg 15 A12VF | |
| Lenovo Legion Slim 5 16APH8 | |
| Medio Intel Core i5-12500H (13686 - 43813, n=9) | |
| Gigabyte G5 KE | |
| Asus TUF A15 FA507 | |
| Gigabyte G5 KF | |
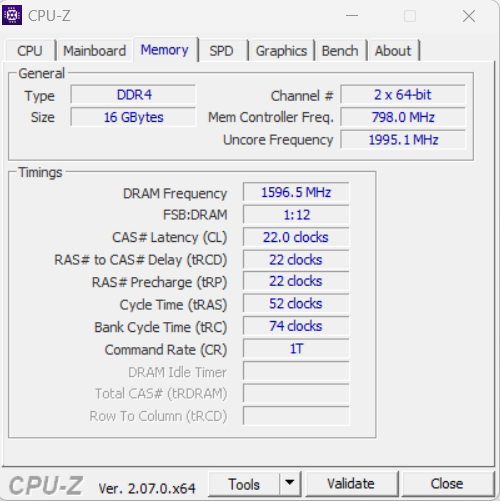
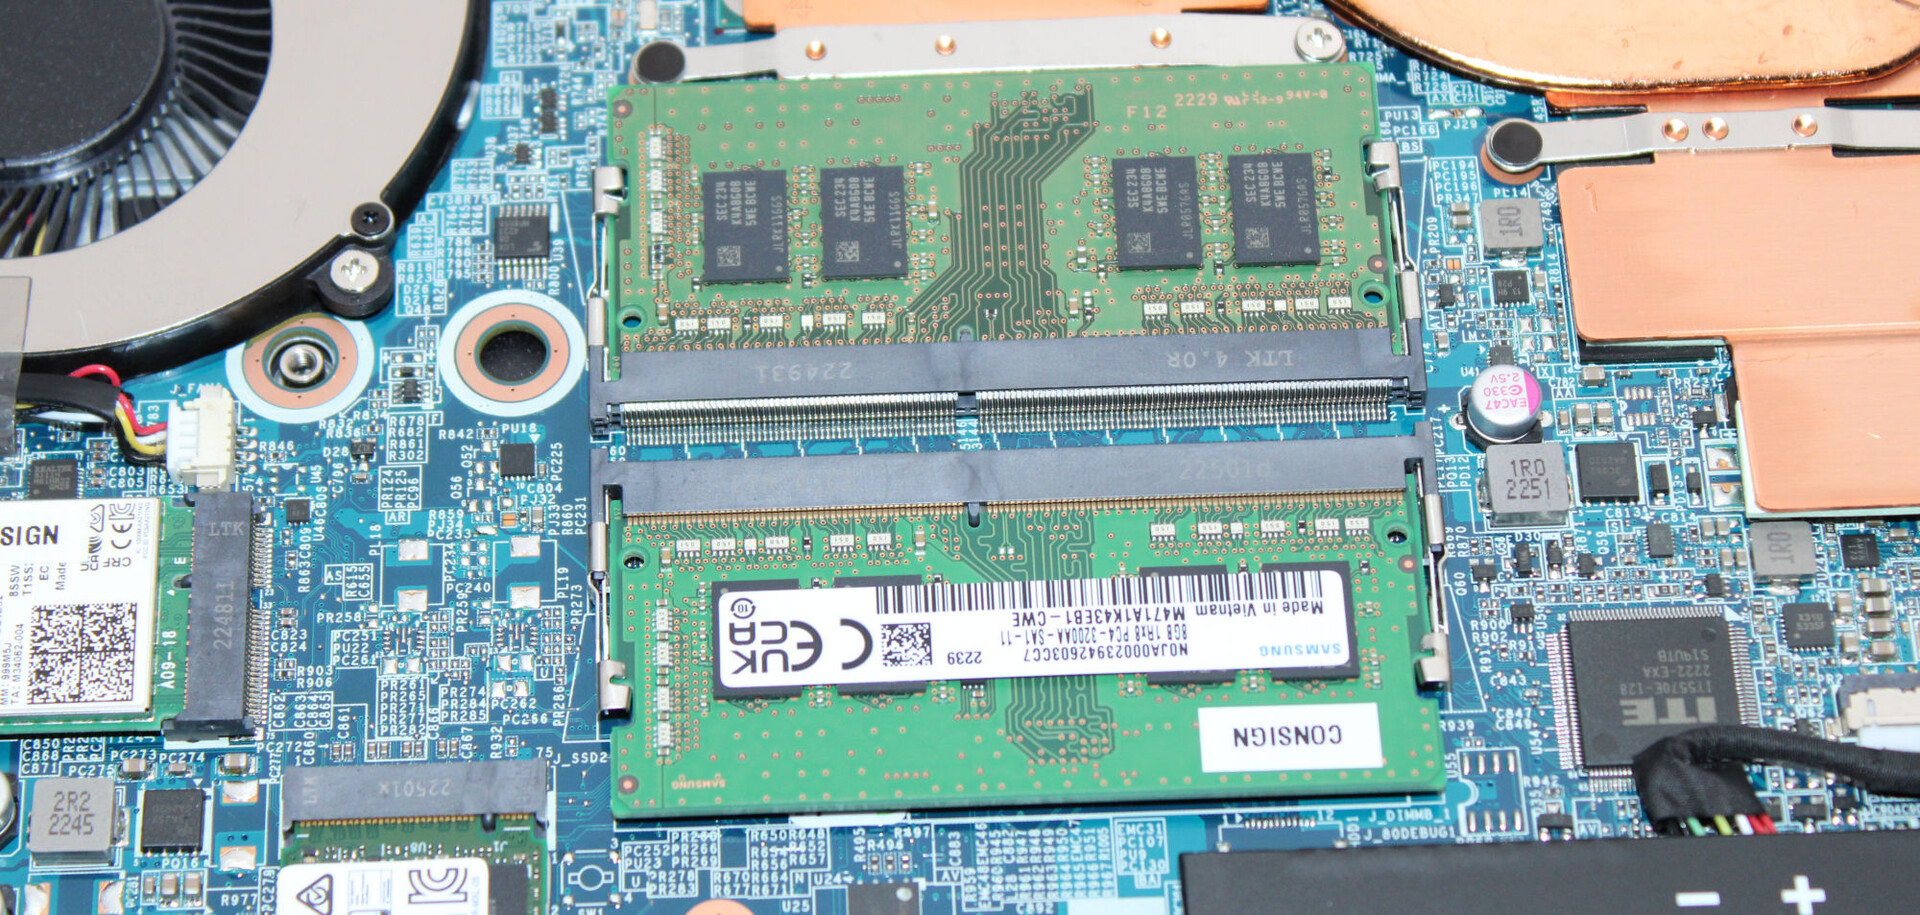
Rendimiento del sistema
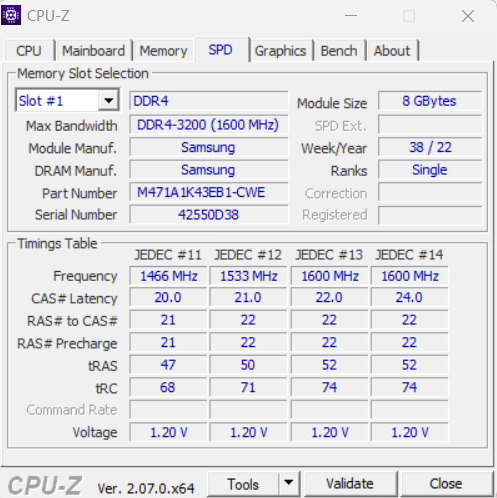
El sistema funciona sin problemas y tiene potencia suficiente para manejar aplicaciones exigentes, como el renderizado y los juegos. Las tasas de transferencia de la memoria son bastante típicas para una RAM DDR4-3200.
CrossMark: Overall | Productivity | Creativity | Responsiveness
| PCMark 10 / Score | |
| Media de la clase Gaming (5828 - 12414, n=94, últimos 2 años) | |
| Lenovo Legion Slim 5 16APH8 | |
| Asus TUF A15 FA507 | |
| Gigabyte G5 KE | |
| MSI Cyborg 15 A12VF | |
| Intel NUC X15 LAPAC71H | |
| Gigabyte G5 KF | |
| Medio Intel Core i5-12500H, NVIDIA GeForce RTX 4060 Laptop GPU (n=1) | |
| PCMark 10 / Essentials | |
| Lenovo Legion Slim 5 16APH8 | |
| Gigabyte G5 KE | |
| MSI Cyborg 15 A12VF | |
| Media de la clase Gaming (8810 - 11935, n=98, últimos 2 años) | |
| Asus TUF A15 FA507 | |
| Intel NUC X15 LAPAC71H | |
| Gigabyte G5 KF | |
| Medio Intel Core i5-12500H, NVIDIA GeForce RTX 4060 Laptop GPU (n=1) | |
| PCMark 10 / Productivity | |
| Media de la clase Gaming (6845 - 25323, n=96, últimos 2 años) | |
| Lenovo Legion Slim 5 16APH8 | |
| MSI Cyborg 15 A12VF | |
| Gigabyte G5 KF | |
| Medio Intel Core i5-12500H, NVIDIA GeForce RTX 4060 Laptop GPU (n=1) | |
| Gigabyte G5 KE | |
| Asus TUF A15 FA507 | |
| Intel NUC X15 LAPAC71H | |
| PCMark 10 / Digital Content Creation | |
| Media de la clase Gaming (7602 - 19954, n=96, últimos 2 años) | |
| Lenovo Legion Slim 5 16APH8 | |
| Intel NUC X15 LAPAC71H | |
| Asus TUF A15 FA507 | |
| Gigabyte G5 KE | |
| MSI Cyborg 15 A12VF | |
| Gigabyte G5 KF | |
| Medio Intel Core i5-12500H, NVIDIA GeForce RTX 4060 Laptop GPU (n=1) | |
| CrossMark / Overall | |
| Media de la clase Gaming (1366 - 2409, n=95, últimos 2 años) | |
| Intel NUC X15 LAPAC71H | |
| Lenovo Legion Slim 5 16APH8 | |
| MSI Cyborg 15 A12VF | |
| Gigabyte G5 KE | |
| Gigabyte G5 KF | |
| Medio Intel Core i5-12500H, NVIDIA GeForce RTX 4060 Laptop GPU (n=1) | |
| Asus TUF A15 FA507 | |
| CrossMark / Productivity | |
| Media de la clase Gaming (1386 - 2254, n=95, últimos 2 años) | |
| Intel NUC X15 LAPAC71H | |
| Lenovo Legion Slim 5 16APH8 | |
| Gigabyte G5 KE | |
| MSI Cyborg 15 A12VF | |
| Gigabyte G5 KF | |
| Medio Intel Core i5-12500H, NVIDIA GeForce RTX 4060 Laptop GPU (n=1) | |
| Asus TUF A15 FA507 | |
| CrossMark / Creativity | |
| Media de la clase Gaming (1343 - 2786, n=95, últimos 2 años) | |
| Lenovo Legion Slim 5 16APH8 | |
| Intel NUC X15 LAPAC71H | |
| MSI Cyborg 15 A12VF | |
| Gigabyte G5 KE | |
| Gigabyte G5 KF | |
| Medio Intel Core i5-12500H, NVIDIA GeForce RTX 4060 Laptop GPU (n=1) | |
| Asus TUF A15 FA507 | |
| CrossMark / Responsiveness | |
| Intel NUC X15 LAPAC71H | |
| Gigabyte G5 KF | |
| Medio Intel Core i5-12500H, NVIDIA GeForce RTX 4060 Laptop GPU (n=1) | |
| Gigabyte G5 KE | |
| Media de la clase Gaming (1226 - 2334, n=95, últimos 2 años) | |
| MSI Cyborg 15 A12VF | |
| Lenovo Legion Slim 5 16APH8 | |
| Asus TUF A15 FA507 | |
| PCMark 10 Score | 6318 puntos | |
ayuda | ||
| AIDA64 / Memory Copy | |
| Media de la clase Gaming (21750 - 129946, n=106, últimos 2 años) | |
| Intel NUC X15 LAPAC71H | |
| Lenovo Legion Slim 5 16APH8 | |
| MSI Cyborg 15 A12VF | |
| Asus TUF A15 FA507 | |
| Medio Intel Core i5-12500H (23850 - 66598, n=9) | |
| Gigabyte G5 KE | |
| Gigabyte G5 KF | |
| AIDA64 / Memory Read | |
| Media de la clase Gaming (22956 - 118858, n=106, últimos 2 años) | |
| Intel NUC X15 LAPAC71H | |
| MSI Cyborg 15 A12VF | |
| Lenovo Legion Slim 5 16APH8 | |
| Medio Intel Core i5-12500H (24879 - 68013, n=9) | |
| Asus TUF A15 FA507 | |
| Gigabyte G5 KE | |
| Gigabyte G5 KF | |
| AIDA64 / Memory Write | |
| Lenovo Legion Slim 5 16APH8 | |
| Media de la clase Gaming (22297 - 135096, n=106, últimos 2 años) | |
| Intel NUC X15 LAPAC71H | |
| MSI Cyborg 15 A12VF | |
| Asus TUF A15 FA507 | |
| Medio Intel Core i5-12500H (23543 - 58797, n=9) | |
| Gigabyte G5 KE | |
| Gigabyte G5 KF | |
| AIDA64 / Memory Latency | |
| Media de la clase Gaming (75.3 - 259, n=106, últimos 2 años) | |
| Medio Intel Core i5-12500H (83.8 - 114.7, n=9) | |
| Gigabyte G5 KE | |
| Lenovo Legion Slim 5 16APH8 | |
| MSI Cyborg 15 A12VF | |
| Intel NUC X15 LAPAC71H | |
| Gigabyte G5 KF | |
| Asus TUF A15 FA507 | |
* ... más pequeño es mejor
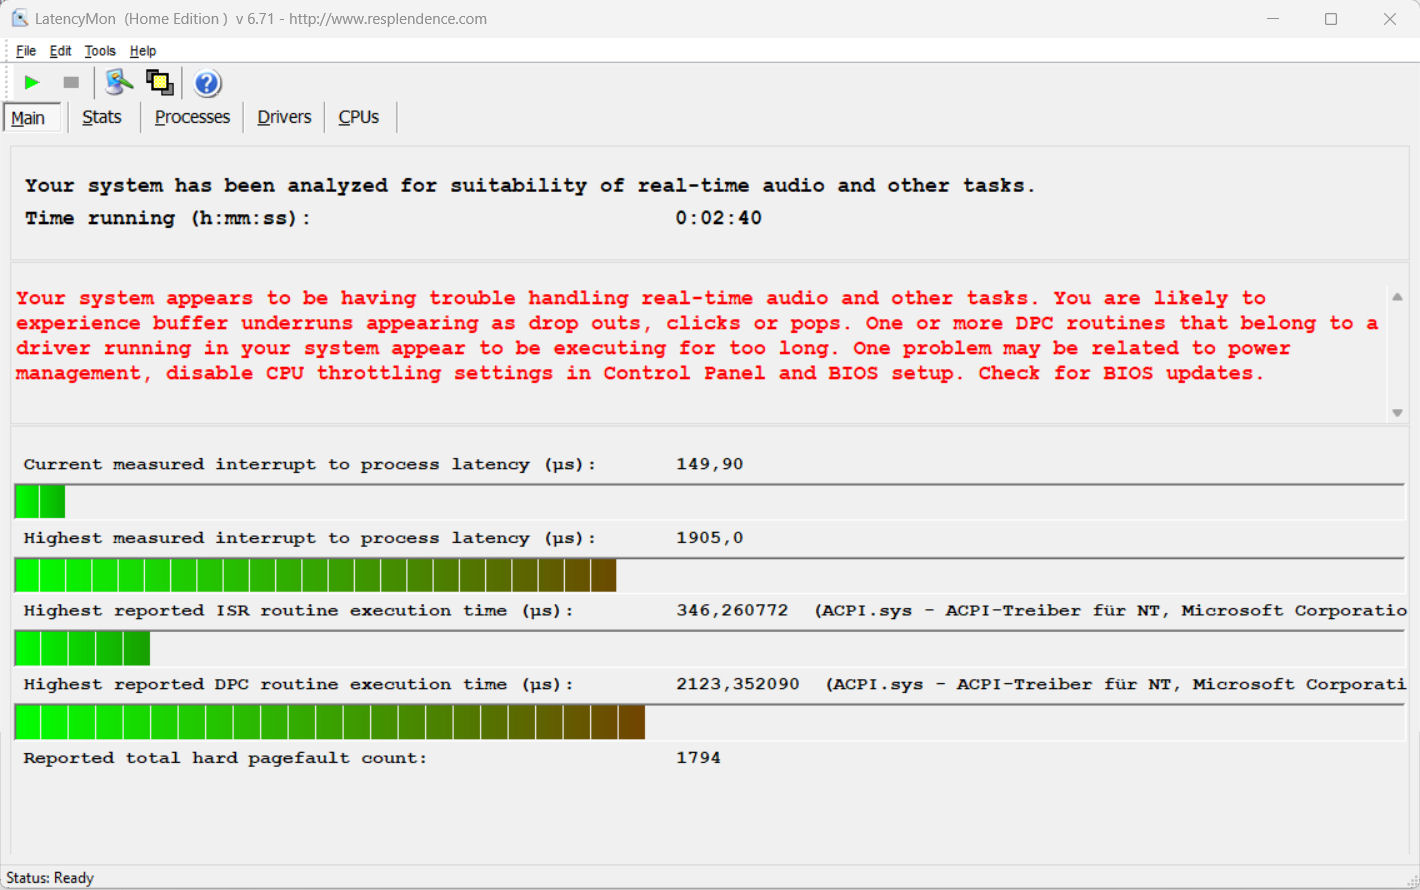
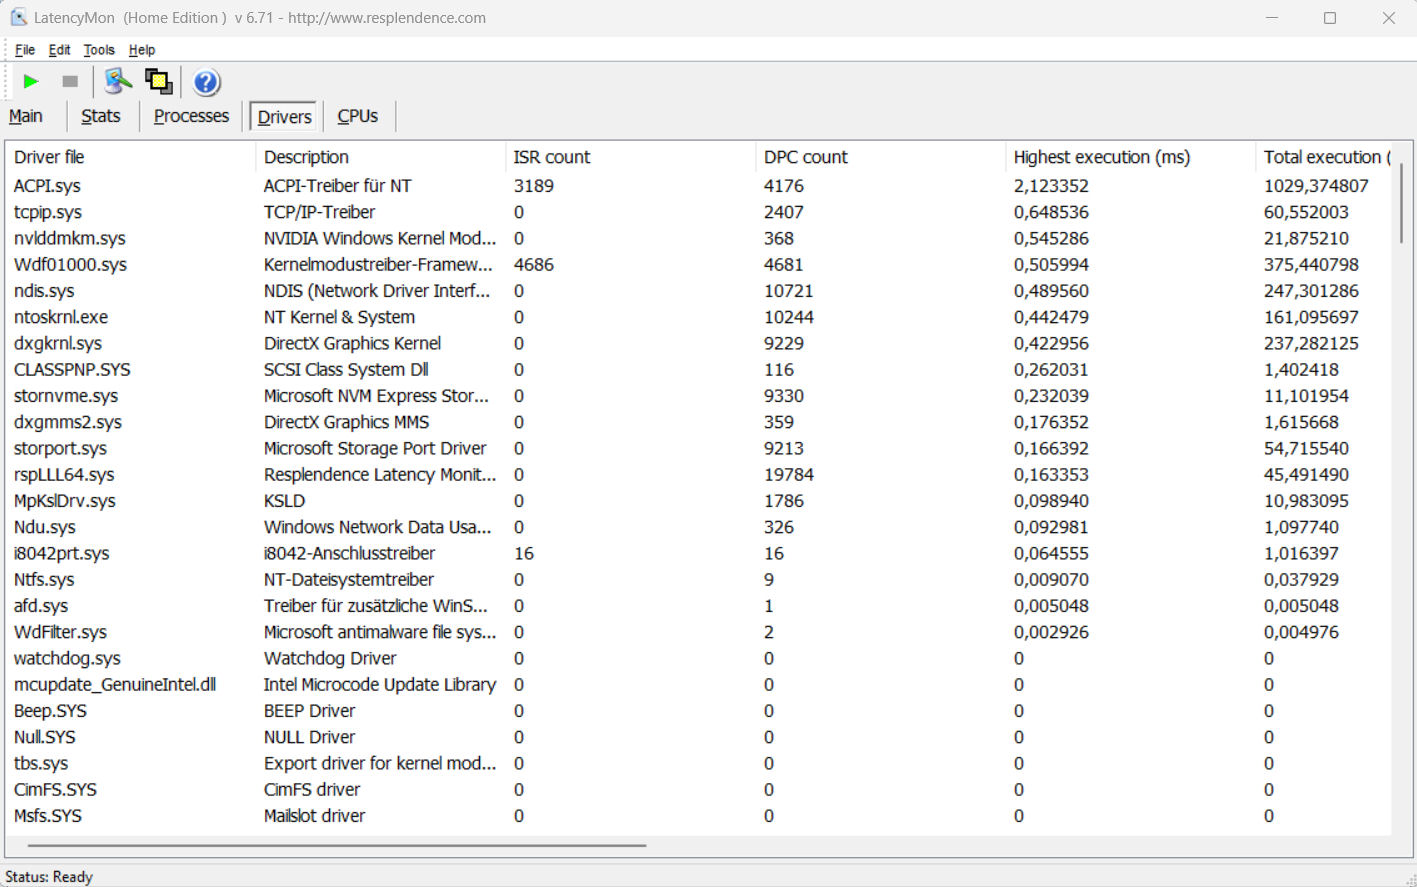
Latencia del CPD
Nuestra prueba de monitorización de latencia estandarizada (navegación web, reproducción de vídeo 4K y carga alta de Prime95) reveló algunos problemas. El sistema no parece adecuado para el procesamiento de vídeo y audio en tiempo real. Esperemos que esto pueda mejorarse con futuras actualizaciones de software.
| DPC Latencies / LatencyMon - interrupt to process latency (max), Web, Youtube, Prime95 | |
| Gigabyte G5 KF | |
| MSI Cyborg 15 A12VF | |
| Lenovo Legion Slim 5 16APH8 | |
| Gigabyte G5 KE | |
| Intel NUC X15 LAPAC71H | |
* ... más pequeño es mejor
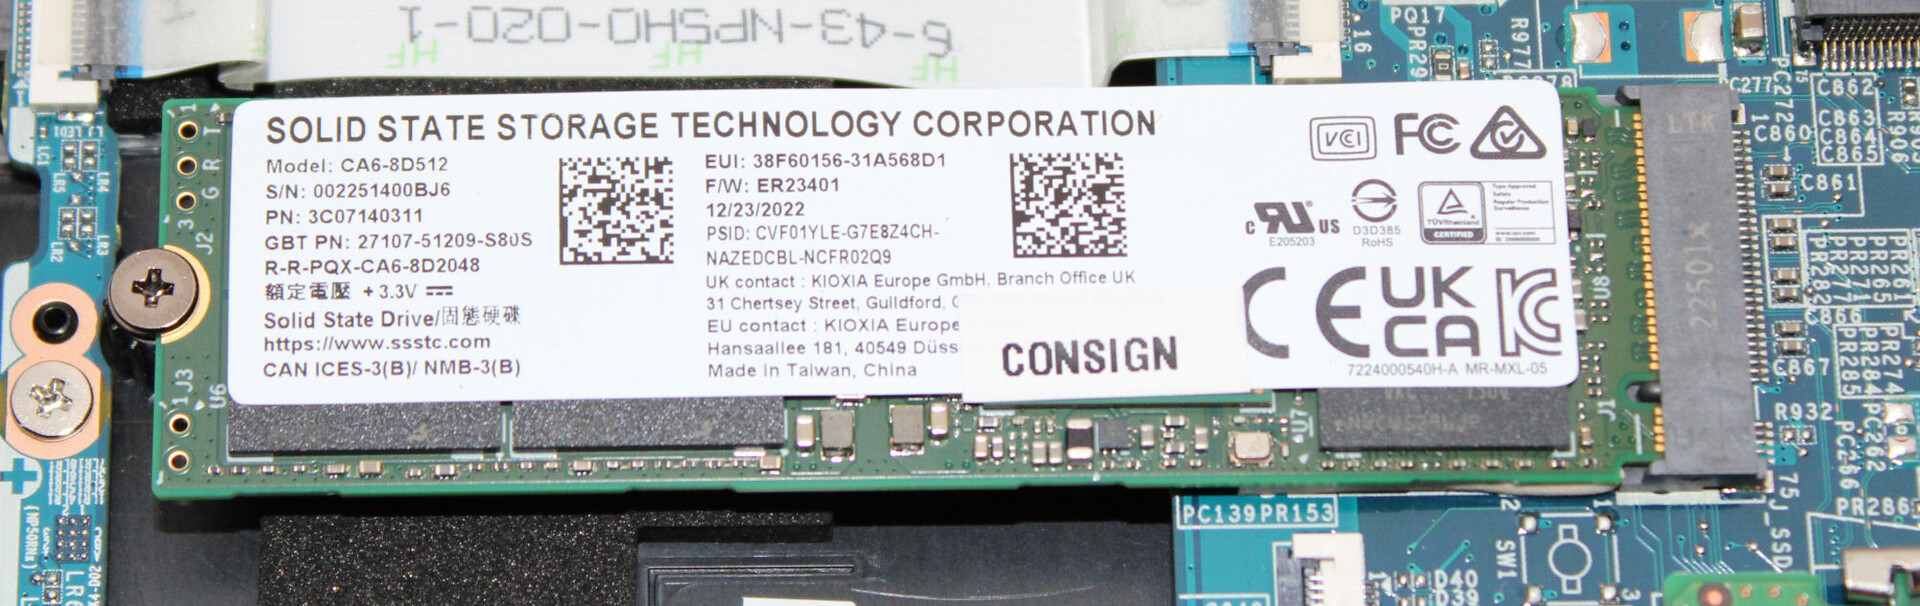
Almacenamiento masivo
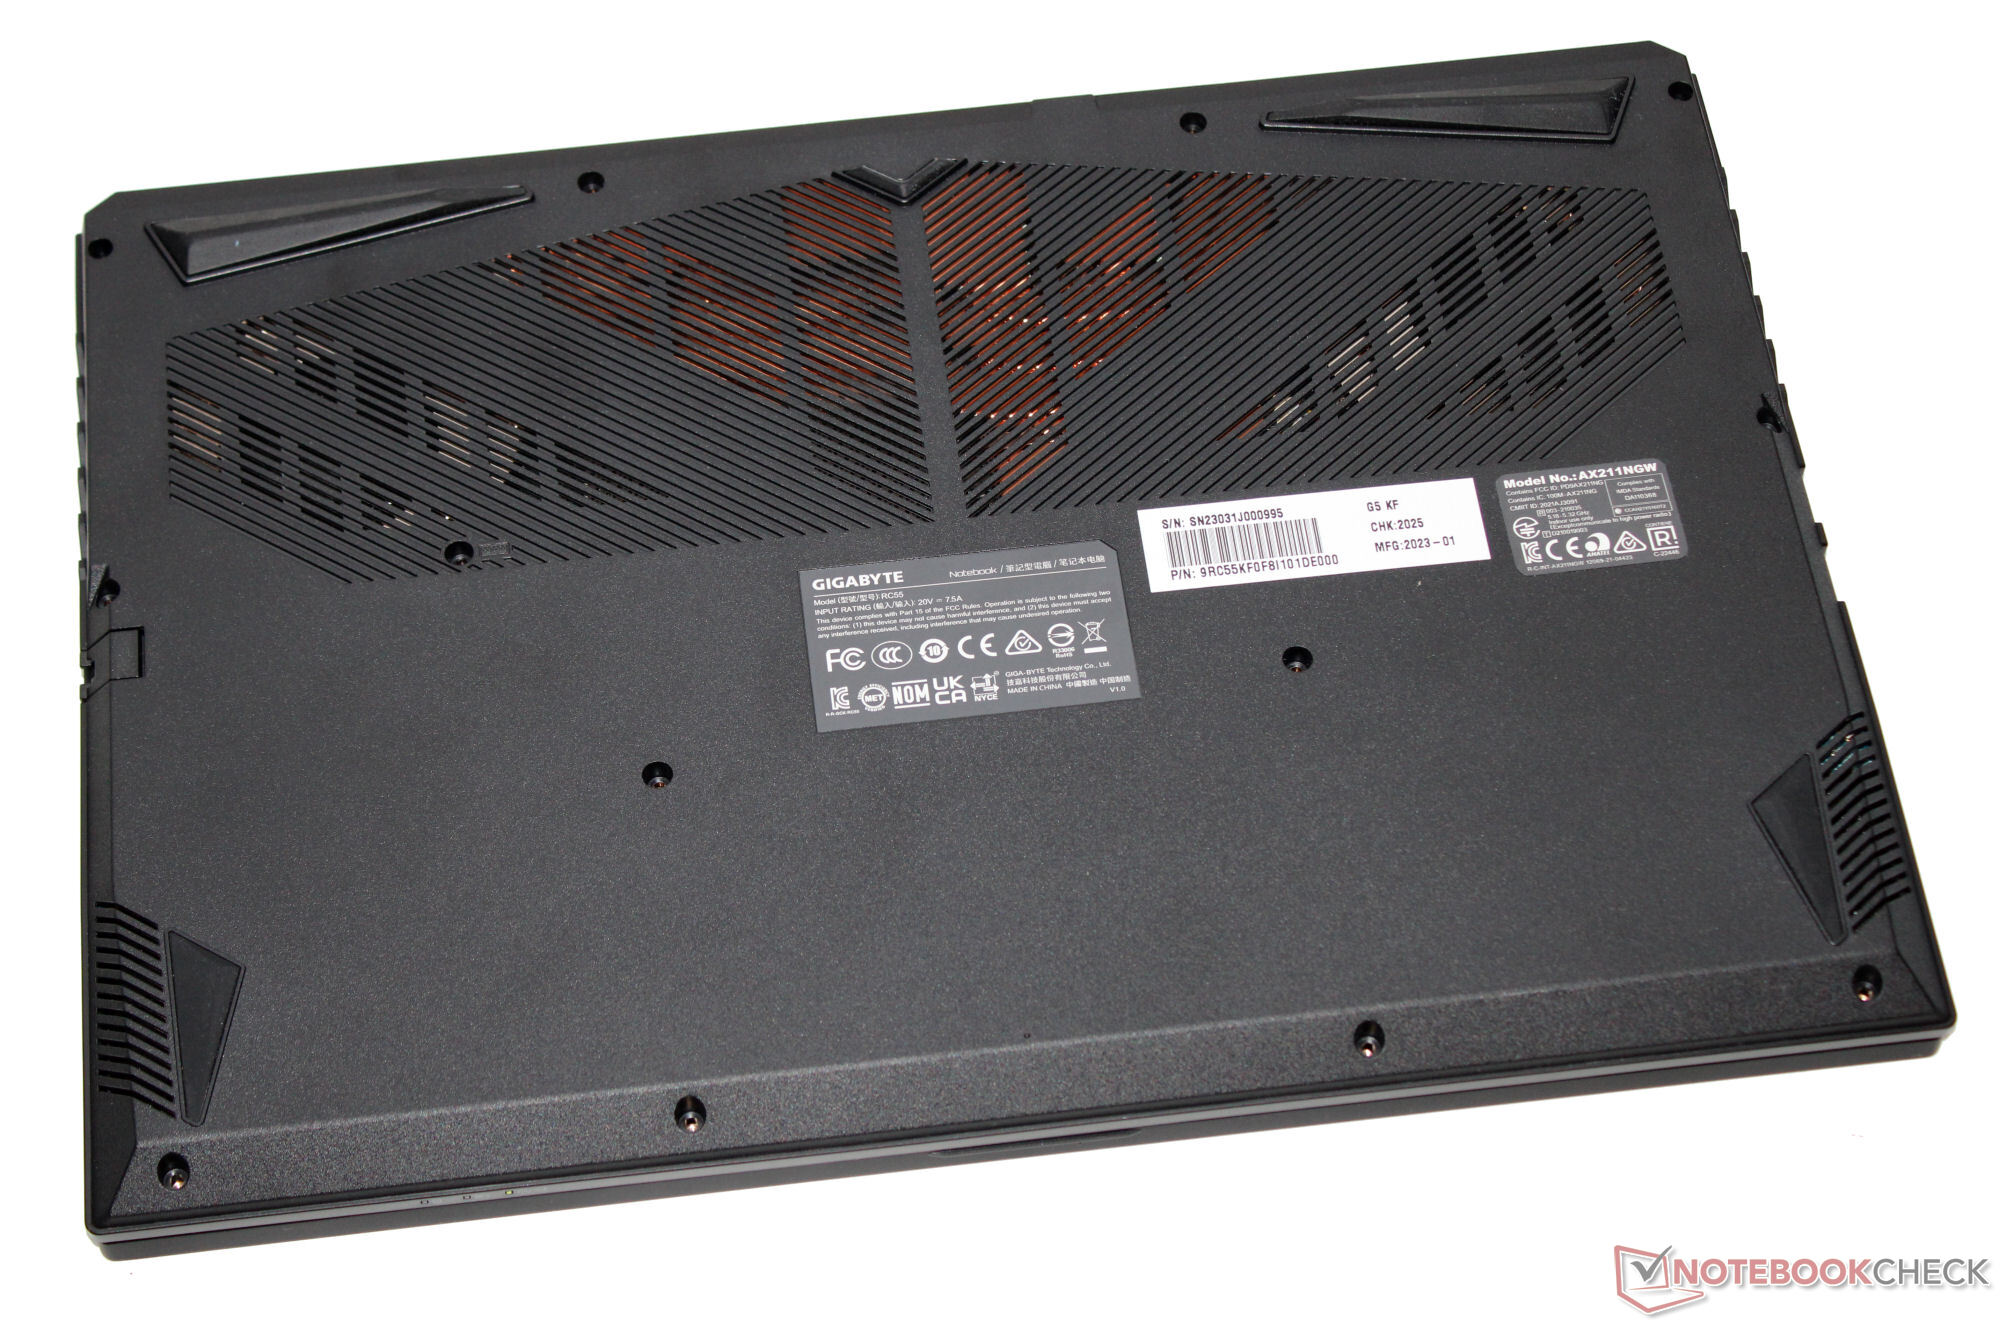
Gigabyte ha equipado el G5 con una unidad SSD de 512 GB (PCIe 4.0, M2. 2280) de SSSTC que ofrece grandes velocidades de transferencia de datos. Dicho esto, es propenso a las caídas de rendimiento causadas por el estrangulamiento térmico. El portátil también dispone de una ranura PCIe 3.0 para alojar una segunda SSD M.2 2280.

| Drive Performance rating - Percent | |
| Intel NUC X15 LAPAC71H | |
| Gigabyte G5 KF | |
| Medio SSSTC CA6-8D512 | |
| Media de la clase Gaming | |
| Lenovo Legion Slim 5 16APH8 | |
| Gigabyte G5 KE | |
| MSI Cyborg 15 A12VF | |
| Asus TUF A15 FA507 | |
* ... más pequeño es mejor
Dauerleistung Lesen: DiskSpd Read Loop, Queue Depth 8
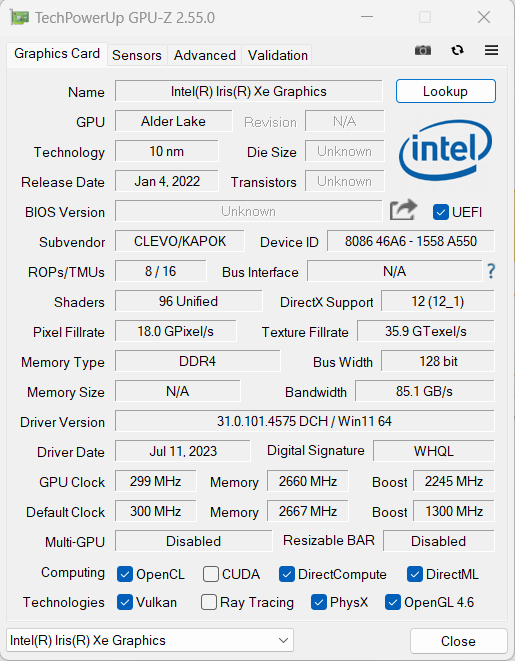
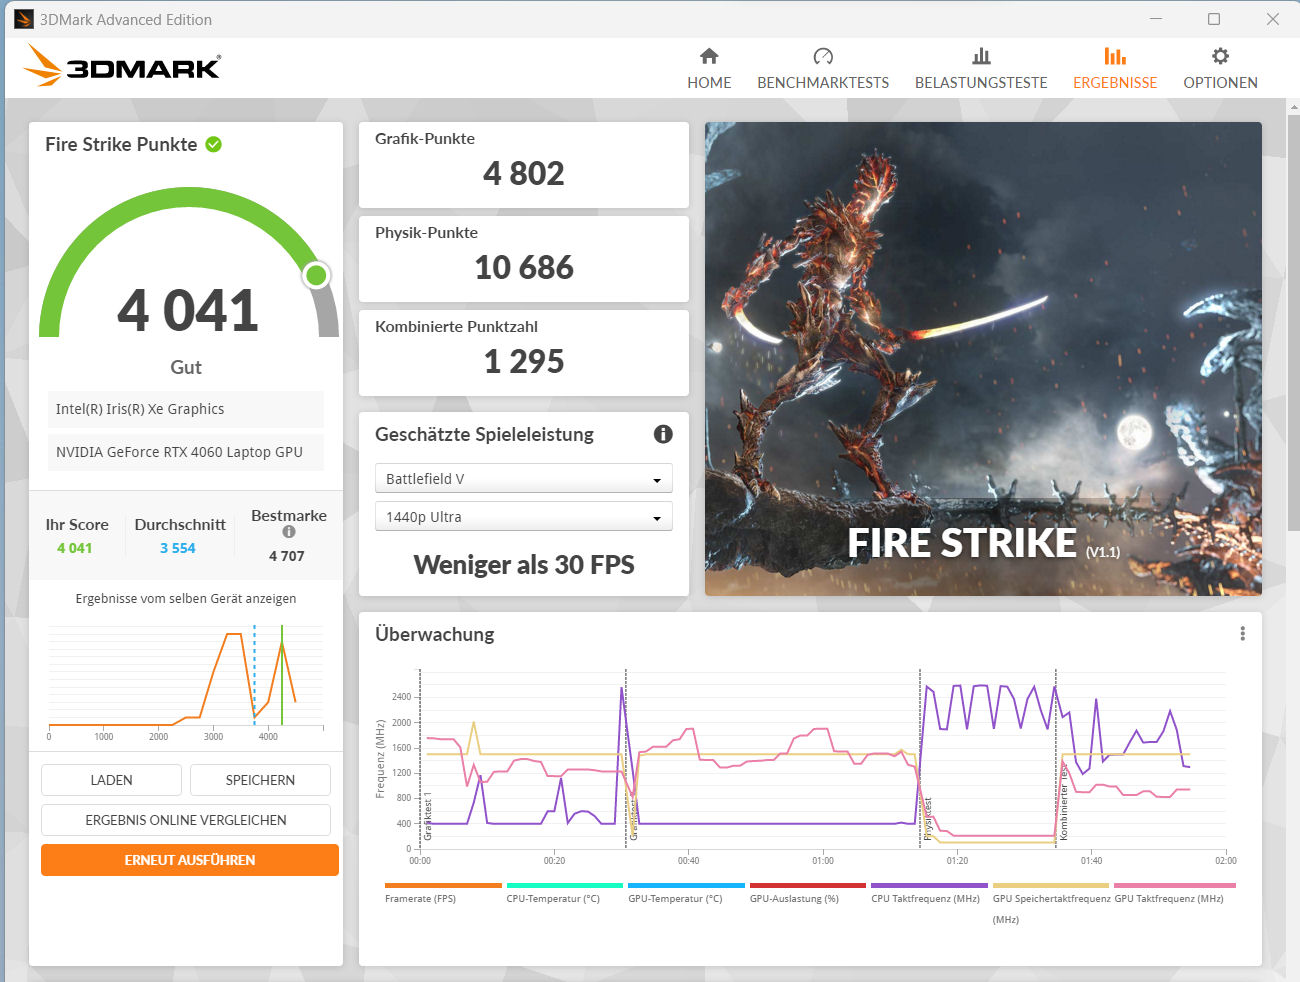
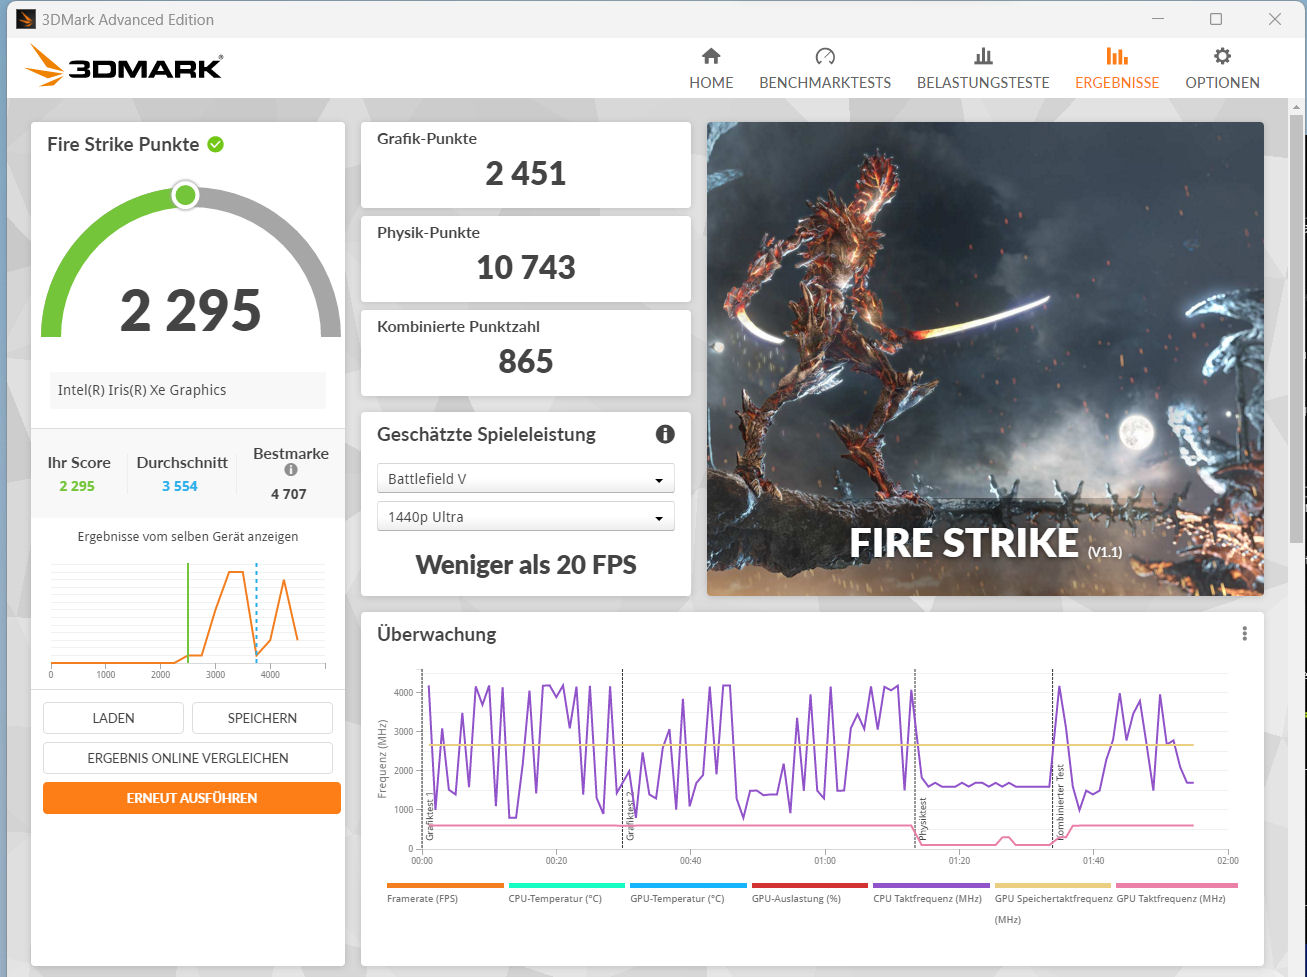
Tarjeta gráfica
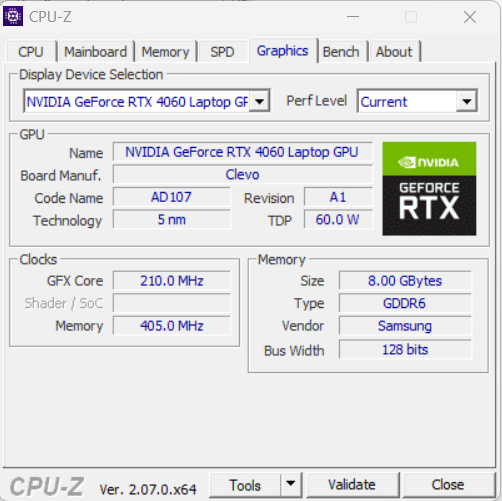
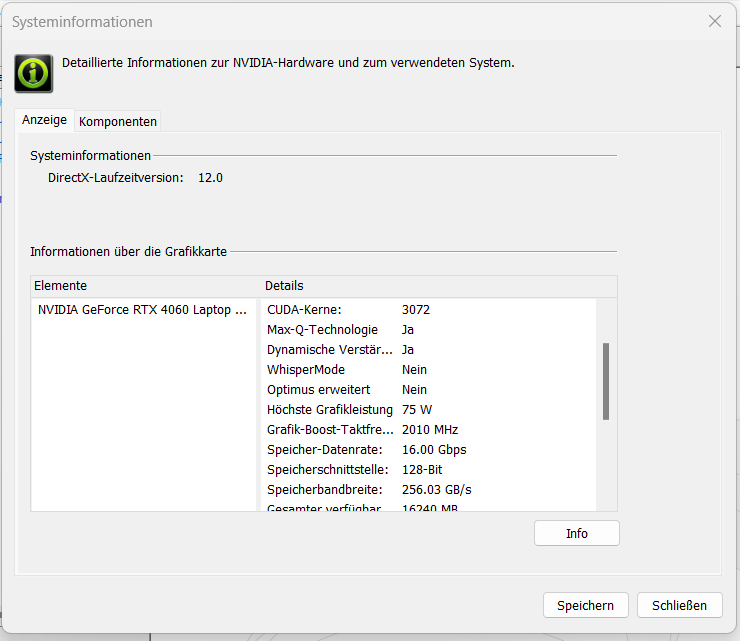
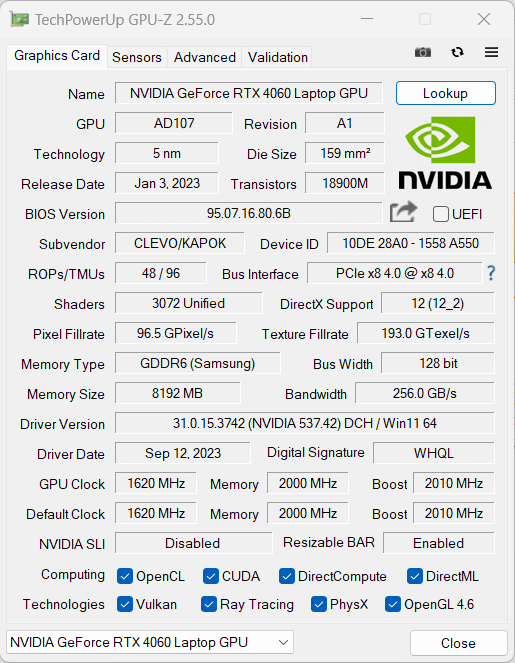
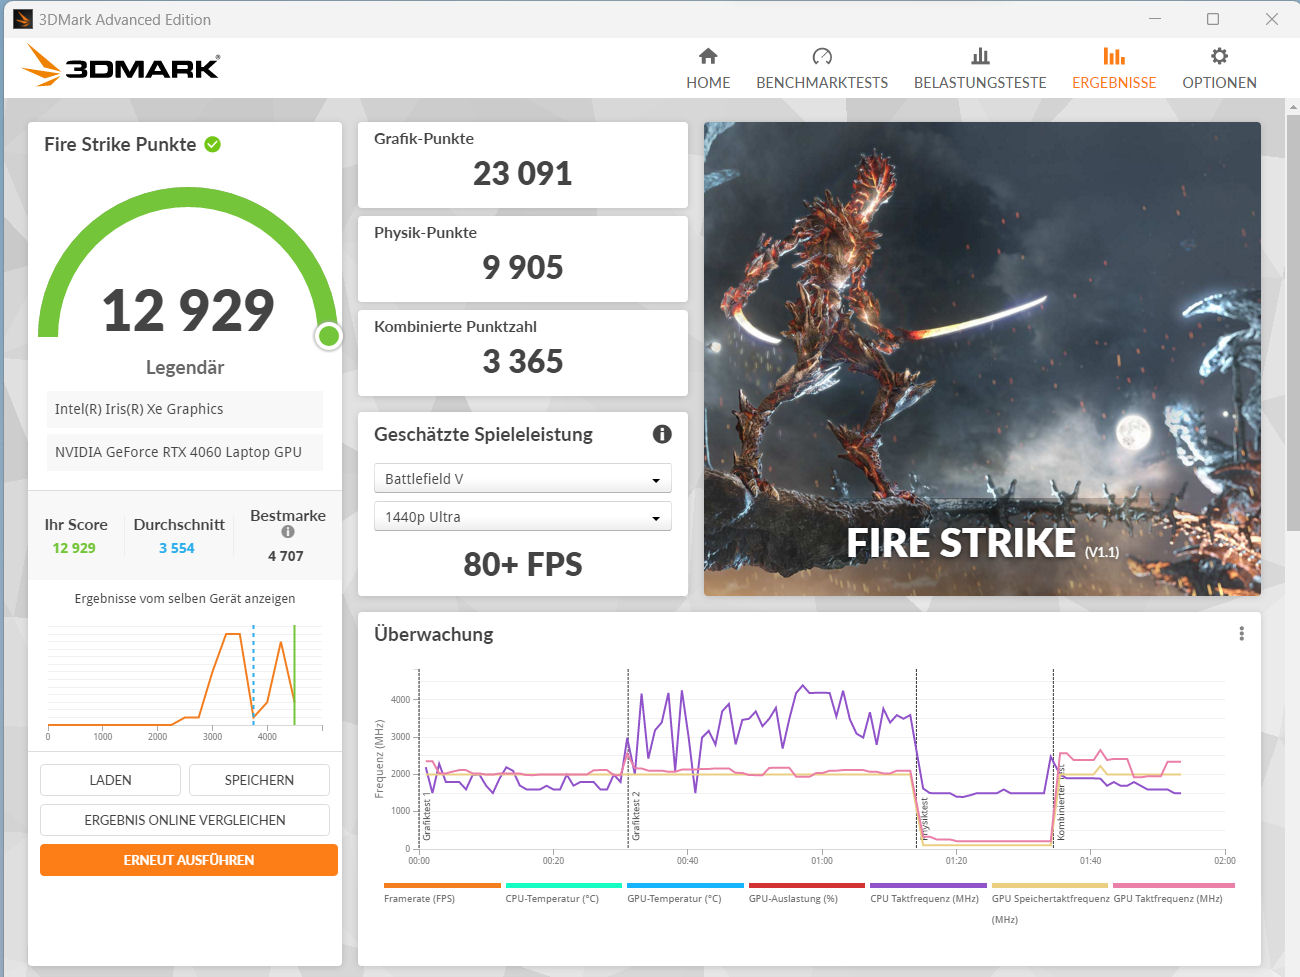
La GeForce RTX 4060 cuenta con 3.072 unidades de sombreado, un bus de memoria de 128 bits y 8.192 MB de ágil memoria de vídeo GDDR6. Gigabyte ha especificado un TGP máximo de 75 W, que está en el extremo inferior de la gama media. El TGP se utilizó plenamente durante nuestra prueba Witcher 3.
Los resultados del benchmark se sitúan dentro de la media de lo que hemos visto de la RTX 4060 hasta ahora. A pesar de su menor TGP, la RTX 4060 rinde mejor que la RTX 3060 en el G5 KE. Esto se debe a que la arquitectura Ada Lovelace es más eficiente. El G5 KF no tiene un modo dGPU.


| 3DMark Performance rating - Percent | |
| Media de la clase Gaming | |
| Medio NVIDIA GeForce RTX 4060 Laptop GPU | |
| Gigabyte G5 KF | |
| Gigabyte G5 KE | |
| MSI Cyborg 15 A12VF | |
| Lenovo Legion Slim 5 16APH8 -1! | |
| Asus TUF A15 FA507 -1! | |
| Intel NUC X15 LAPAC71H | |
| 3DMark 06 Standard Score | 45111 puntos | |
| 3DMark 11 Performance | 28012 puntos | |
| 3DMark Cloud Gate Standard Score | 51746 puntos | |
| 3DMark Fire Strike Score | 20367 puntos | |
| 3DMark Time Spy Score | 9269 puntos | |
ayuda | ||
* ... más pequeño es mejor
Rendimiento en juegos
El portátil Gigabyte está diseñado para ejecutar juegos en FHD, así como con ajustes altos o máximos. Es posible utilizar resoluciones más altas conectando el portátil a un monitor que las admita, aunque es posible que tenga que bajar algunos ajustes. En nuestras pruebas, las velocidades de fotogramas estuvieron por debajo de lo que la RTX 4060 puede hacer en promedio y más o menos a la par con el G5 KE.
| The Witcher 3 - 1920x1080 Ultra Graphics & Postprocessing (HBAO+) | |
| Media de la clase Gaming (104.7 - 240, n=7, últimos 2 años) | |
| Medio NVIDIA GeForce RTX 4060 Laptop GPU (77 - 159.7, n=42) | |
| Lenovo Legion Slim 5 16APH8 | |
| Gigabyte G5 KF | |
| Gigabyte G5 KE | |
| Asus TUF A15 FA507 | |
| MSI Cyborg 15 A12VF | |
| Intel NUC X15 LAPAC71H | |
| Final Fantasy XV Benchmark - 1920x1080 High Quality | |
| Media de la clase Gaming (41 - 215, n=95, últimos 2 años) | |
| Medio NVIDIA GeForce RTX 4060 Laptop GPU (75.1 - 109.8, n=51) | |
| Lenovo Legion Slim 5 16APH8 | |
| Gigabyte G5 KF | |
| Gigabyte G5 KE | |
| Asus TUF A15 FA507 | |
| MSI Cyborg 15 A12VF | |
| Intel NUC X15 LAPAC71H | |
| Dota 2 Reborn - 1920x1080 ultra (3/3) best looking | |
| Media de la clase Gaming (84.8 - 252, n=108, últimos 2 años) | |
| Medio NVIDIA GeForce RTX 4060 Laptop GPU (115 - 183.8, n=53) | |
| Gigabyte G5 KE | |
| Lenovo Legion Slim 5 16APH8 | |
| MSI Cyborg 15 A12VF | |
| Gigabyte G5 KF | |
| Asus TUF A15 FA507 | |
| Intel NUC X15 LAPAC71H | |
| Starfield - 1920x1080 Ultra Preset | |
| Media de la clase Gaming (n=1últimos 2 años) | |
| XMG Pro 15 E23 | |
| Medio NVIDIA GeForce RTX 4060 Laptop GPU (39.7 - 41, n=3) | |
| Gigabyte G5 KF | |
| Intel NUC X15 LAPAC71H | |
| Lies of P - 1920x1080 Best Preset | |
| XMG Pro 15 E23 | |
| Medio NVIDIA GeForce RTX 4060 Laptop GPU (106.2 - 126.6, n=3) | |
| Gigabyte G5 KF | |
| Intel NUC X15 LAPAC71H | |
| EA Sports FC 24 - 1920x1080 Ultra Preset | |
| Gigabyte G5 KF | |
| XMG Pro 15 E23 | |
| Medio NVIDIA GeForce RTX 4060 Laptop GPU (136.9 - 138, n=3) | |
| Intel NUC X15 LAPAC71H | |
| Media de la clase Gaming (n=1últimos 2 años) | |
| Assassin's Creed Mirage - 1920x1080 Ultra High Preset (Adaptive Quality Off) | |
| XMG Pro 15 E23 | |
| Medio NVIDIA GeForce RTX 4060 Laptop GPU (65 - 93, n=6) | |
| Gigabyte G5 KF | |
| Intel NUC X15 LAPAC71H | |
| The Crew Motorfest - 1920x1080 Ultra Preset | |
| XMG Pro 15 E23 | |
| Gigabyte G5 KF | |
| Medio NVIDIA GeForce RTX 4060 Laptop GPU (60 - 60, n=3) | |
| Intel NUC X15 LAPAC71H | |
| F1 23 - 1920x1080 Ultra High Preset AA:T AF:16x | |
| Medio NVIDIA GeForce RTX 4060 Laptop GPU (43.8 - 119.9, n=13) | |
| XMG Pro 15 E23 | |
| Gigabyte G5 KF | |
| Intel NUC X15 LAPAC71H | |
| Baldur's Gate 3 - 1920x1080 Ultra Preset AA:T | |
| Media de la clase Gaming (59.4 - 246, n=104, últimos 2 años) | |
| XMG Pro 15 E23 | |
| Medio NVIDIA GeForce RTX 4060 Laptop GPU (66.5 - 105.5, n=19) | |
| Gigabyte G5 KF | |
| Intel NUC X15 LAPAC71H | |
| Diablo 4 - 3840x2160 Ultra Preset | |
| XMG Pro 15 E23 | |
| Medio NVIDIA GeForce RTX 4060 Laptop GPU (n=1) | |
| Lords of the Fallen - 1920x1080 Ultra Preset | |
| XMG Pro 15 E23 | |
| Intel NUC X15 LAPAC71H | |
| Medio NVIDIA GeForce RTX 4060 Laptop GPU (32.8 - 38.1, n=3) | |
| Gigabyte G5 KF | |
Para comprobar si el portátil puede mantener ampliamente su rendimiento durante un periodo de tiempo más largo, ejecutamos "The Witcher 3" durante unos 60 minutos en Full HD y ajustes máximos. El personaje del jugador no se movió en absoluto durante este tiempo. Las velocidades de fotogramas se mantuvieron estables en su mayor parte, pero observamos algunas pequeñas caídas ocasionales (aprox. 10 FPS) en la última fase de esta prueba.
Witcher 3 FPS chart
| bajo | medio | alto | ultra | |
|---|---|---|---|---|
| GTA V (2015) | 183.5 | 178.3 | 171.5 | 107.6 |
| The Witcher 3 (2015) | 314.3 | 251.1 | 172.8 | 92.5 |
| Dota 2 Reborn (2015) | 158.6 | 146.6 | 137.55 | 131.2 |
| Final Fantasy XV Benchmark (2018) | 186.5 | 126 | 91.9 | |
| X-Plane 11.11 (2018) | 120.4 | 108 | 87.1 | |
| Far Cry 5 (2018) | 151 | 125 | 119 | 110 |
| Strange Brigade (2018) | 379 | 253 | 197.9 | 172.1 |
| Gears Tactics (2020) | 303.9 | 225.6 | 156.5 | 112.2 |
| Cyberpunk 2077 1.6 (2022) | 105.4 | 86.7 | 74.5 | 68.7 |
| Diablo 4 (2023) | 227 | 204 | 180.4 | 151 |
| F1 23 (2023) | 213 | 211 | 157.4 | 51.8 |
| Starfield (2023) | 71.2 | 61.4 | 47 | 39.8 |
| The Crew Motorfest (2023) | 60 | 60 | 60 | 60 |
| Lies of P (2023) | 159.4 | 138.5 | 126.9 | 106.2 |
| Baldur's Gate 3 (2023) | 113.1 | 93.2 | 78 | 75.1 |
| Cyberpunk 2077 (2023) | 105.9 | 91.1 | 78 | 70.5 |
| EA Sports FC 24 (2023) | 198.3 | 172.9 | 142.9 | 138 |
| Assassin's Creed Mirage (2023) | 120 | 115 | 106 | 83 |
| Lords of the Fallen (2023) | 80 | 64.7 | 46.7 | 32.8 |
Emisiones - El portátil puede llegar a ser bastante ruidoso
Emisiones sonoras
Mientras juega, el nivel de ruido puede alcanzar los 55,5 dB(A) en el "modo Rendimiento". Puede reducir la cantidad de ruido cambiando al "modo Entretenimiento" o, mejor aún, al "modo Silencio". En el uso cotidiano (por ejemplo, aplicaciones ofimáticas y navegación por Internet), los dos ventiladores suelen girar a baja velocidad y, en ocasiones, pueden permanecer completamente inmóviles.
Ruido
| Ocioso |
| 23 / 23 / 28 dB(A) |
| Carga |
| 29.94 / 55.5 dB(A) |
 | ||
30 dB silencioso 40 dB(A) audible 50 dB(A) ruidosamente alto |
||
min: | ||
| Gigabyte G5 KF GeForce RTX 4060 Laptop GPU, i5-12500H, SSSTC CA6-8D512 | MSI Cyborg 15 A12VF GeForce RTX 4060 Laptop GPU, i7-12650H, Samsung PM9B1 1024GB MZVL41T0HBLB | Intel NUC X15 LAPAC71H A730M, i7-12700H, Samsung 990 Pro 1 TB | Asus TUF A15 FA507 GeForce RTX 4050 Laptop GPU, R7 7735HS, Micron 2400 MTFDKBA512QFM | Lenovo Legion Slim 5 16APH8 GeForce RTX 4060 Laptop GPU, R7 7840HS, SK hynix PC801 HFS512GEJ9X115N | Gigabyte G5 KE GeForce RTX 3060 Laptop GPU, i5-12500H, Gigabyte AG4512G-SI B10 | |
|---|---|---|---|---|---|---|
| Noise | -37% | -6% | 9% | -1% | -22% | |
| apagado / medio ambiente * (dB) | 23 | 27 -17% | 23 -0% | 23.3 -1% | 22.9 -0% | 19.52 15% |
| Idle Minimum * (dB) | 23 | 27 -17% | 23 -0% | 23.3 -1% | 23.1 -0% | 31.05 -35% |
| Idle Average * (dB) | 23 | 37.5 -63% | 24 -4% | 23.3 -1% | 23.1 -0% | 31.05 -35% |
| Idle Maximum * (dB) | 28 | 38 -36% | 24 14% | 23.3 17% | 27.7 1% | 31.05 -11% |
| Load Average * (dB) | 29.94 | 56.3 -88% | 50.61 -69% | 29.6 1% | 33.3 -11% | 55.66 -86% |
| Witcher 3 ultra * (dB) | 55.05 | 50.65 8% | 43 22% | 54 2% | 55.7 -1% | |
| Load Maximum * (dB) | 55.5 | 56.3 -1% | 50.89 8% | 43 23% | 54 3% | 55.51 -0% |
* ... más pequeño es mejor
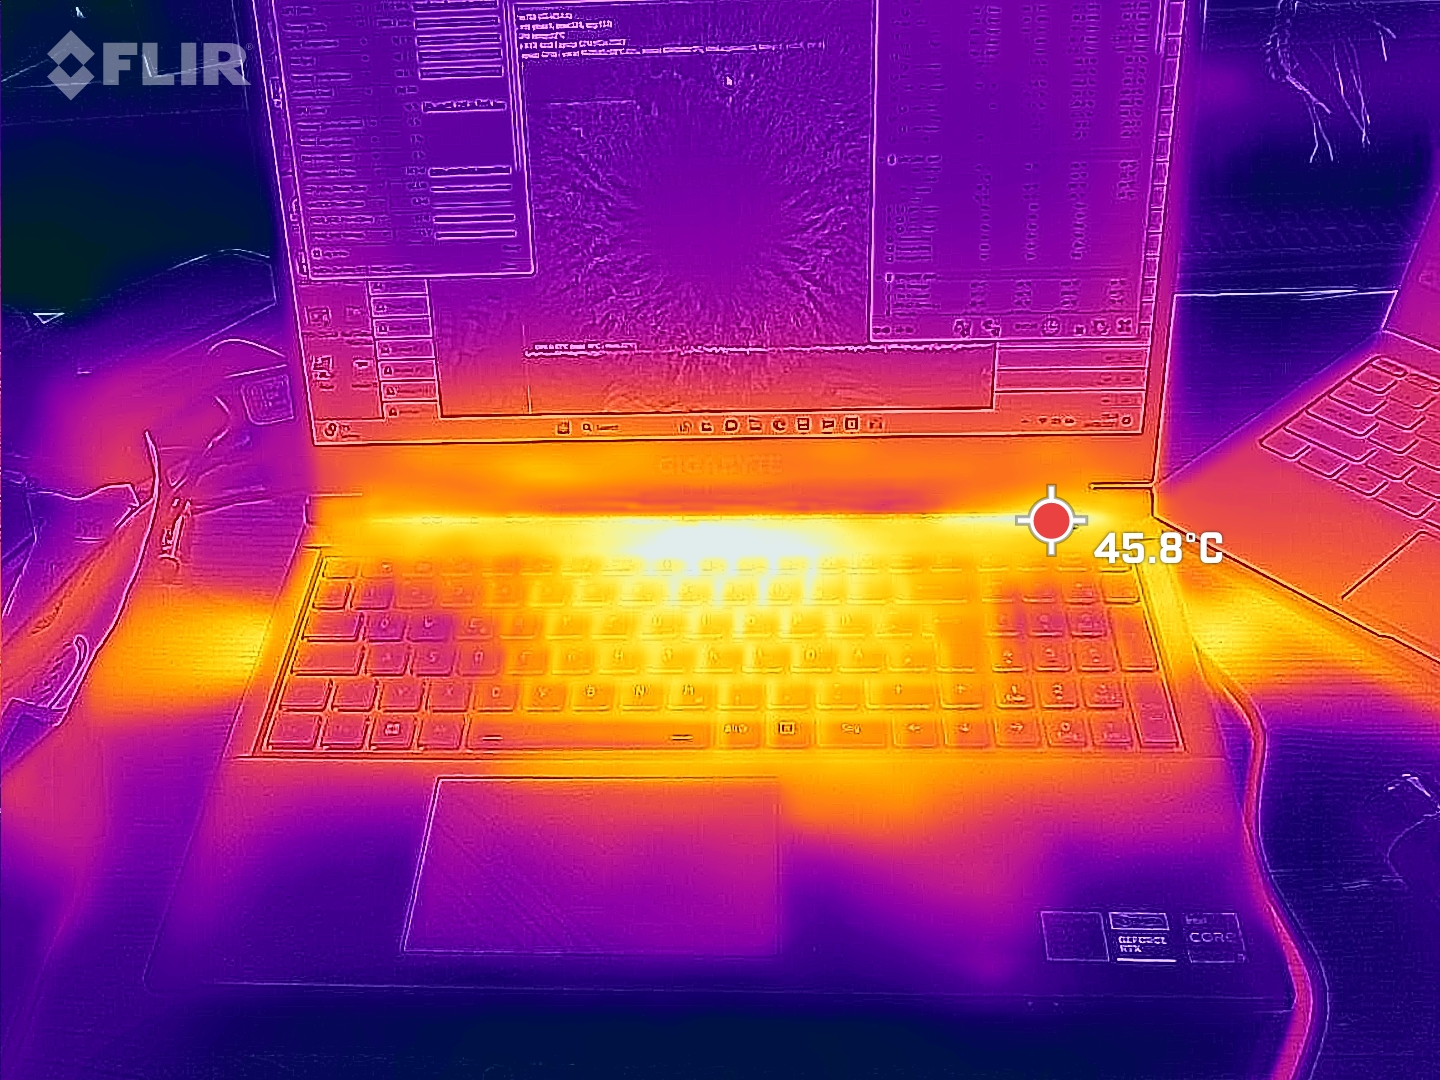
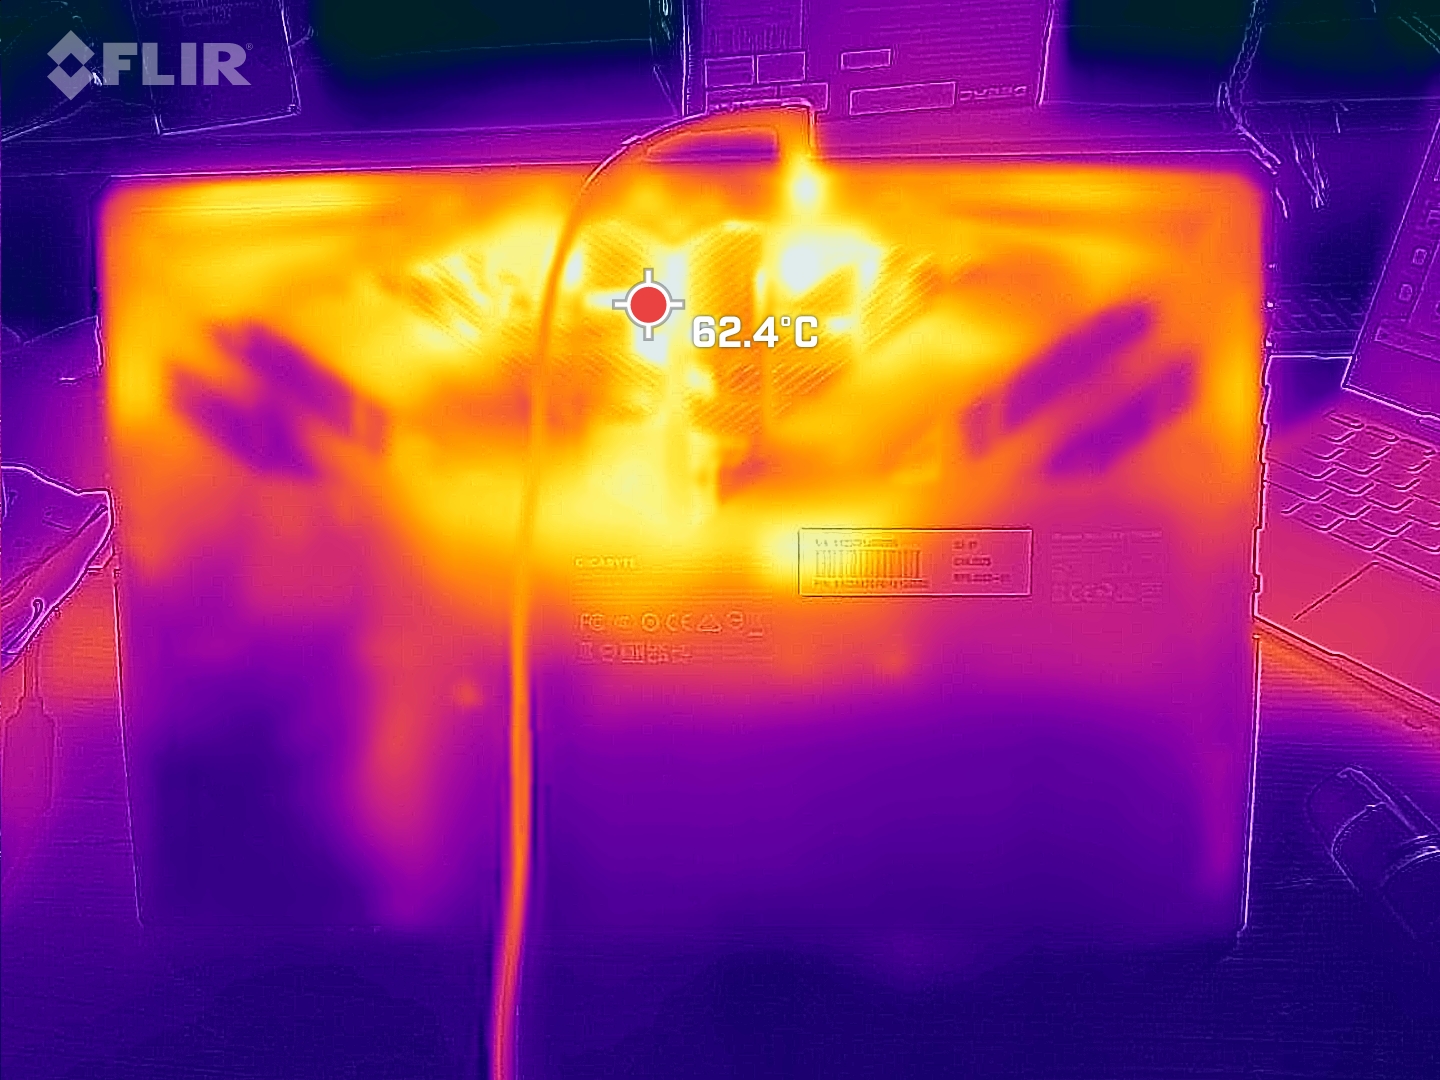
Temperatura
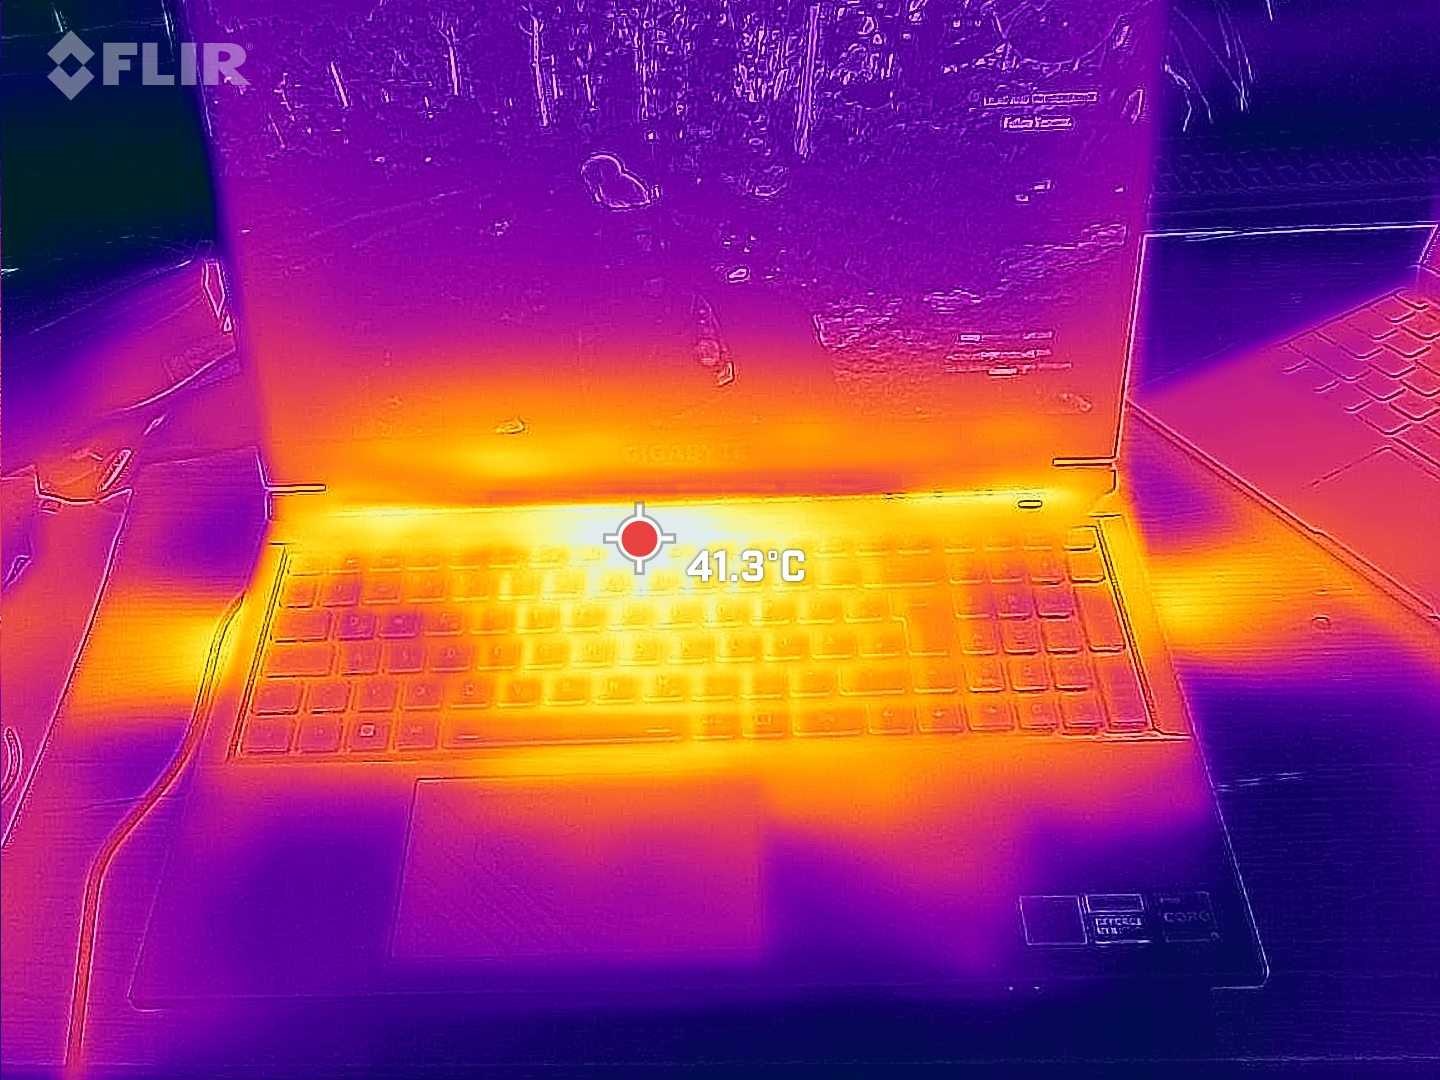
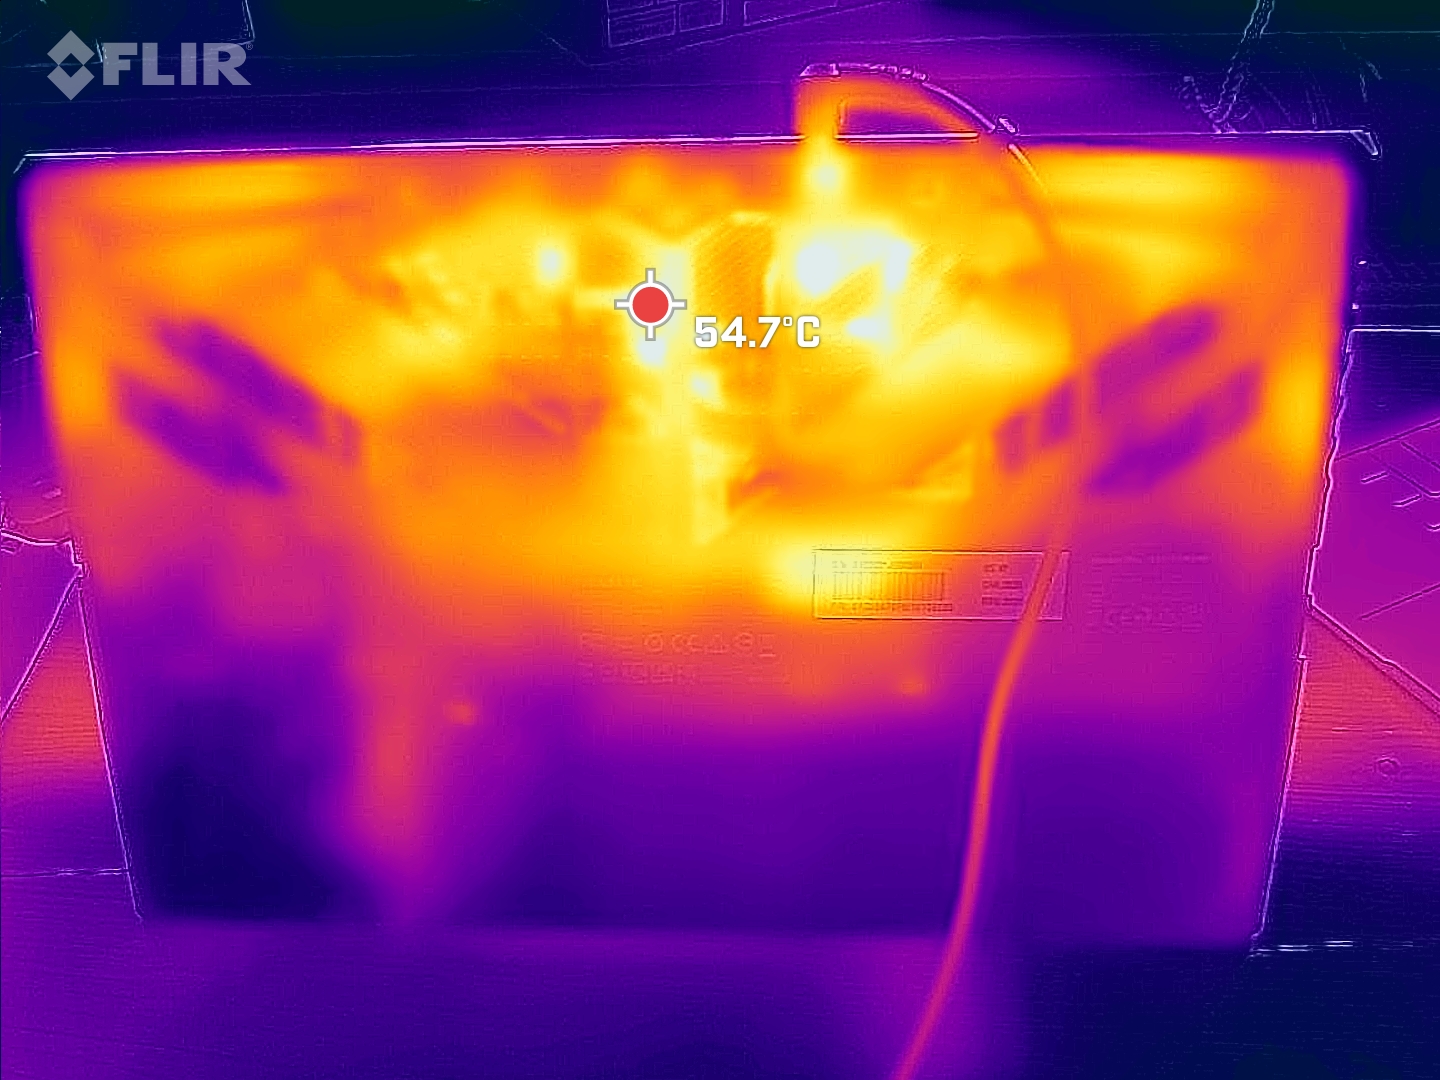
Algunos puntos de la superficie del portátil se calientan notablemente bajo carga pesada (por ejemplo, la prueba de estrés, la prueba Witcher 3 ). Por el contrario, las temperaturas del chasis son más moderadas en los dispositivos de la competencia. Dicho esto, las temperaturas de la superficie del G5 KF se mantienen dentro de un rango aceptable en el uso diario (por ejemplo, aplicaciones ofimáticas, navegación por Internet).
(-) La temperatura máxima en la parte superior es de 54 °C / 129 F, frente a la media de 40.4 °C / 105 F, que oscila entre 21.2 y 68.8 °C para la clase Gaming.
(-) El fondo se calienta hasta un máximo de 61 °C / 142 F, frente a la media de 43.2 °C / 110 F
(+) En reposo, la temperatura media de la parte superior es de 30.7 °C / 87# F, frente a la media del dispositivo de 33.9 °C / 93 F.
(±) Jugando a The Witcher 3, la temperatura media de la parte superior es de 37.3 °C / 99 F, frente a la media del dispositivo de 33.9 °C / 93 F.
(+) Los reposamanos y el panel táctil alcanzan como máximo la temperatura de la piel (34 °C / 93.2 F) y, por tanto, no están calientes.
(-) La temperatura media de la zona del reposamanos de dispositivos similares fue de 28.8 °C / 83.8 F (-5.2 °C / -9.4 F).
| Gigabyte G5 KF Intel Core i5-12500H, NVIDIA GeForce RTX 4060 Laptop GPU | MSI Cyborg 15 A12VF Intel Core i7-12650H, NVIDIA GeForce RTX 4060 Laptop GPU | Intel NUC X15 LAPAC71H Intel Core i7-12700H, Intel Arc A730M | Asus TUF A15 FA507 AMD Ryzen 7 7735HS, NVIDIA GeForce RTX 4050 Laptop GPU | Lenovo Legion Slim 5 16APH8 AMD Ryzen 7 7840HS, NVIDIA GeForce RTX 4060 Laptop GPU | Gigabyte G5 KE Intel Core i5-12500H, NVIDIA GeForce RTX 3060 Laptop GPU | |
|---|---|---|---|---|---|---|
| Heat | 23% | 11% | 20% | 25% | 1% | |
| Maximum Upper Side * (°C) | 54 | 47.5 12% | 59 -9% | 48.9 9% | 40.6 25% | 52.6 3% |
| Maximum Bottom * (°C) | 61 | 35.5 42% | 51 16% | 44.6 27% | 42 31% | 62.4 -2% |
| Idle Upper Side * (°C) | 34 | 27.7 19% | 28 18% | 27.1 20% | 27.8 18% | 33.6 1% |
| Idle Bottom * (°C) | 36 | 29.5 18% | 30 17% | 27.5 24% | 26.6 26% | 34.8 3% |
* ... más pequeño es mejor
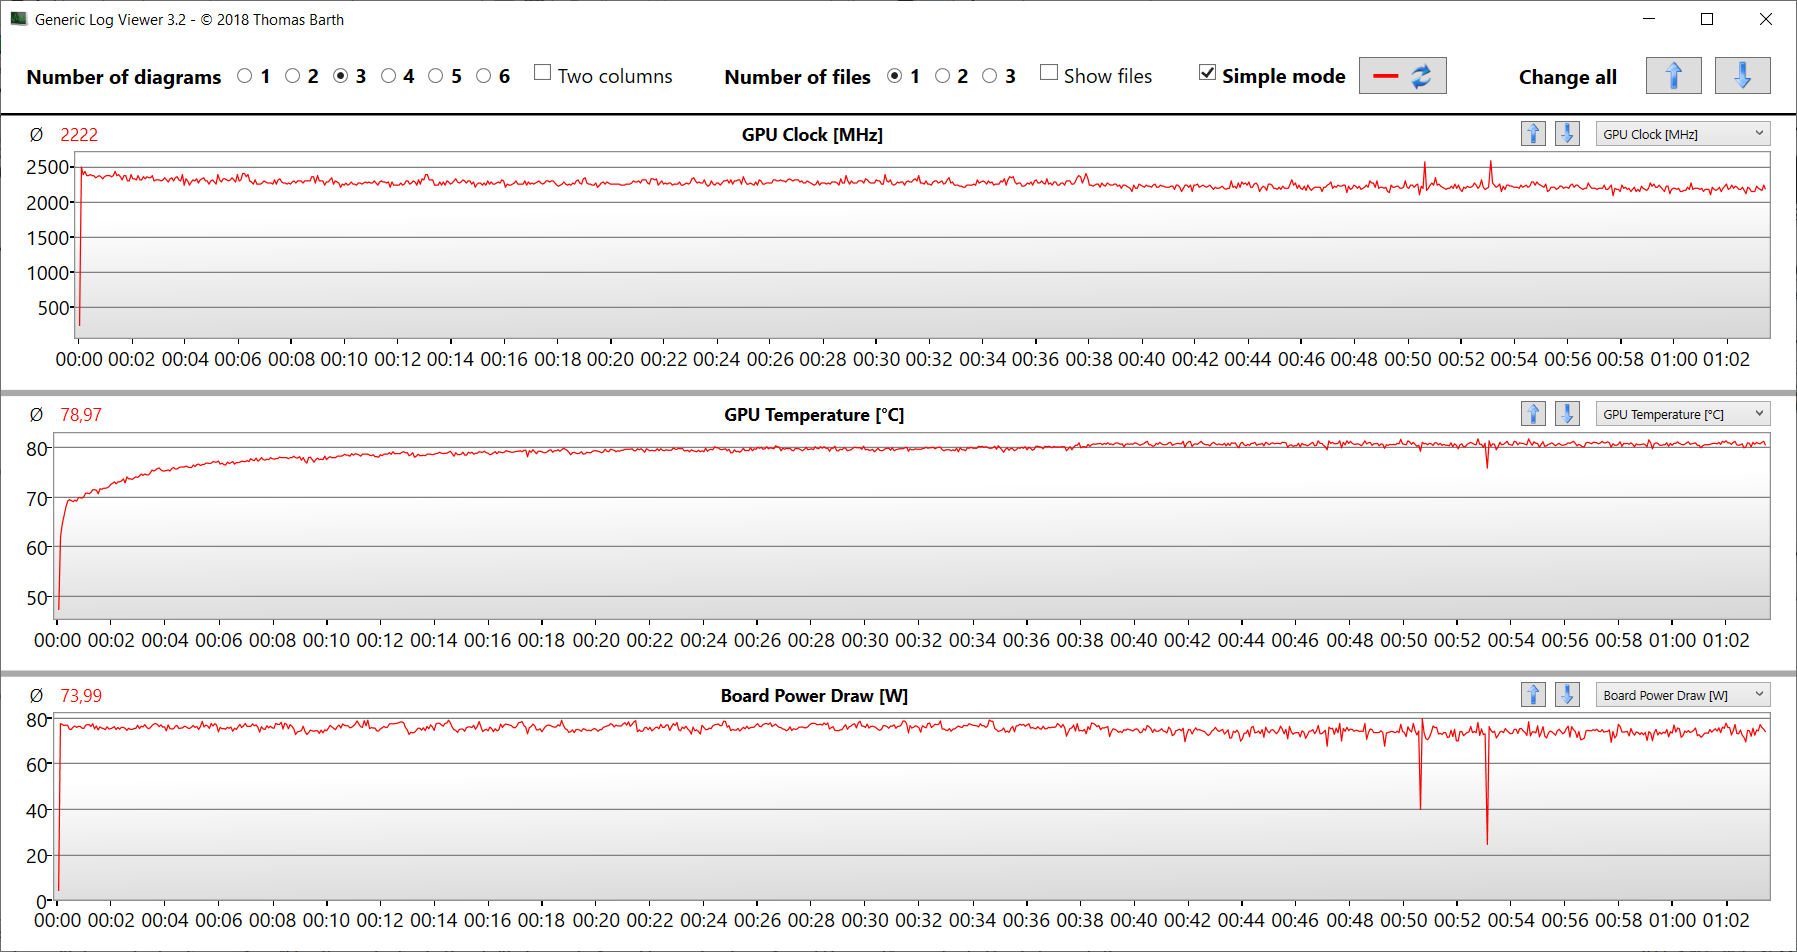
Prueba de esfuerzo
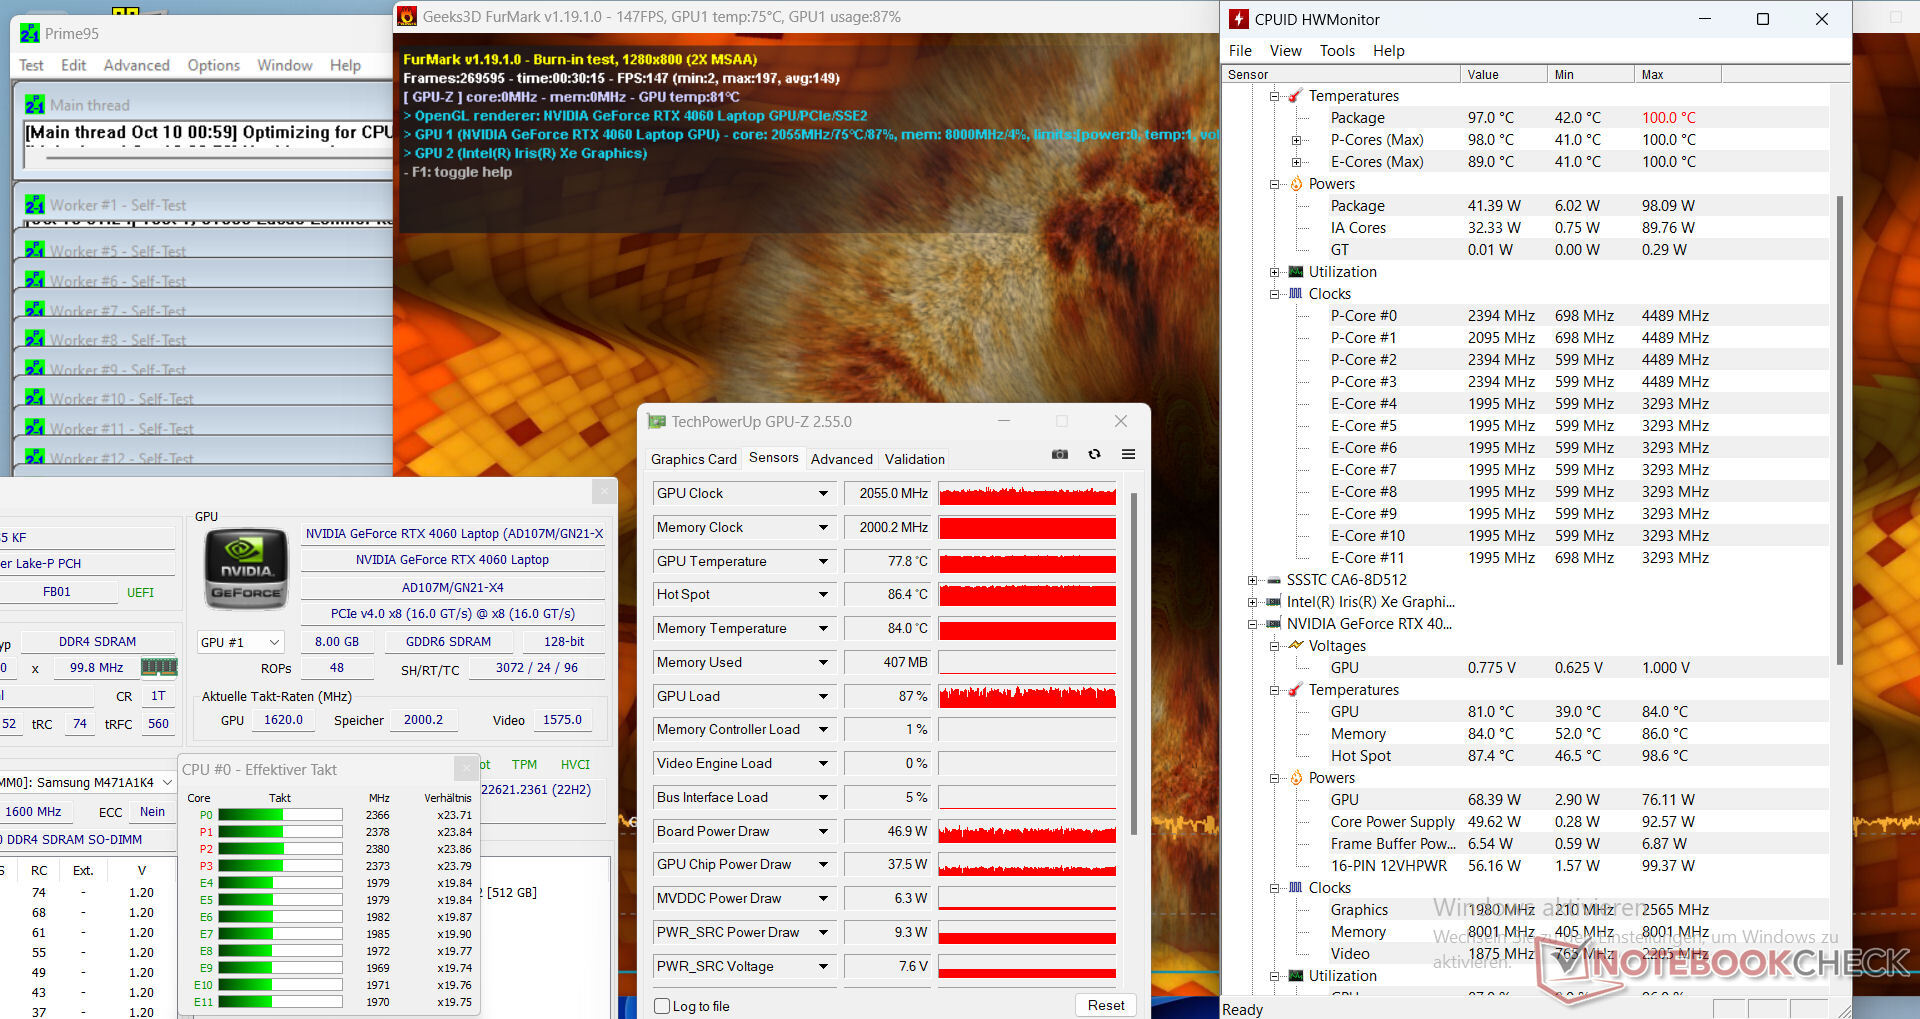
Nuestra prueba de estrés (ejecutar Prime95 y FurMark durante un periodo prolongado) representa un escenario extremo diseñado para determinar la estabilidad del sistema a plena carga. Tras comenzar a altas velocidades de reloj, la CPU y la GPU comenzaron a ralentizarse a medida que avanzaba la prueba. A los 30 minutos, la CPU funcionaba aproximadamente a su reloj base, mientras que la GPU rondaba los 2 GHz.
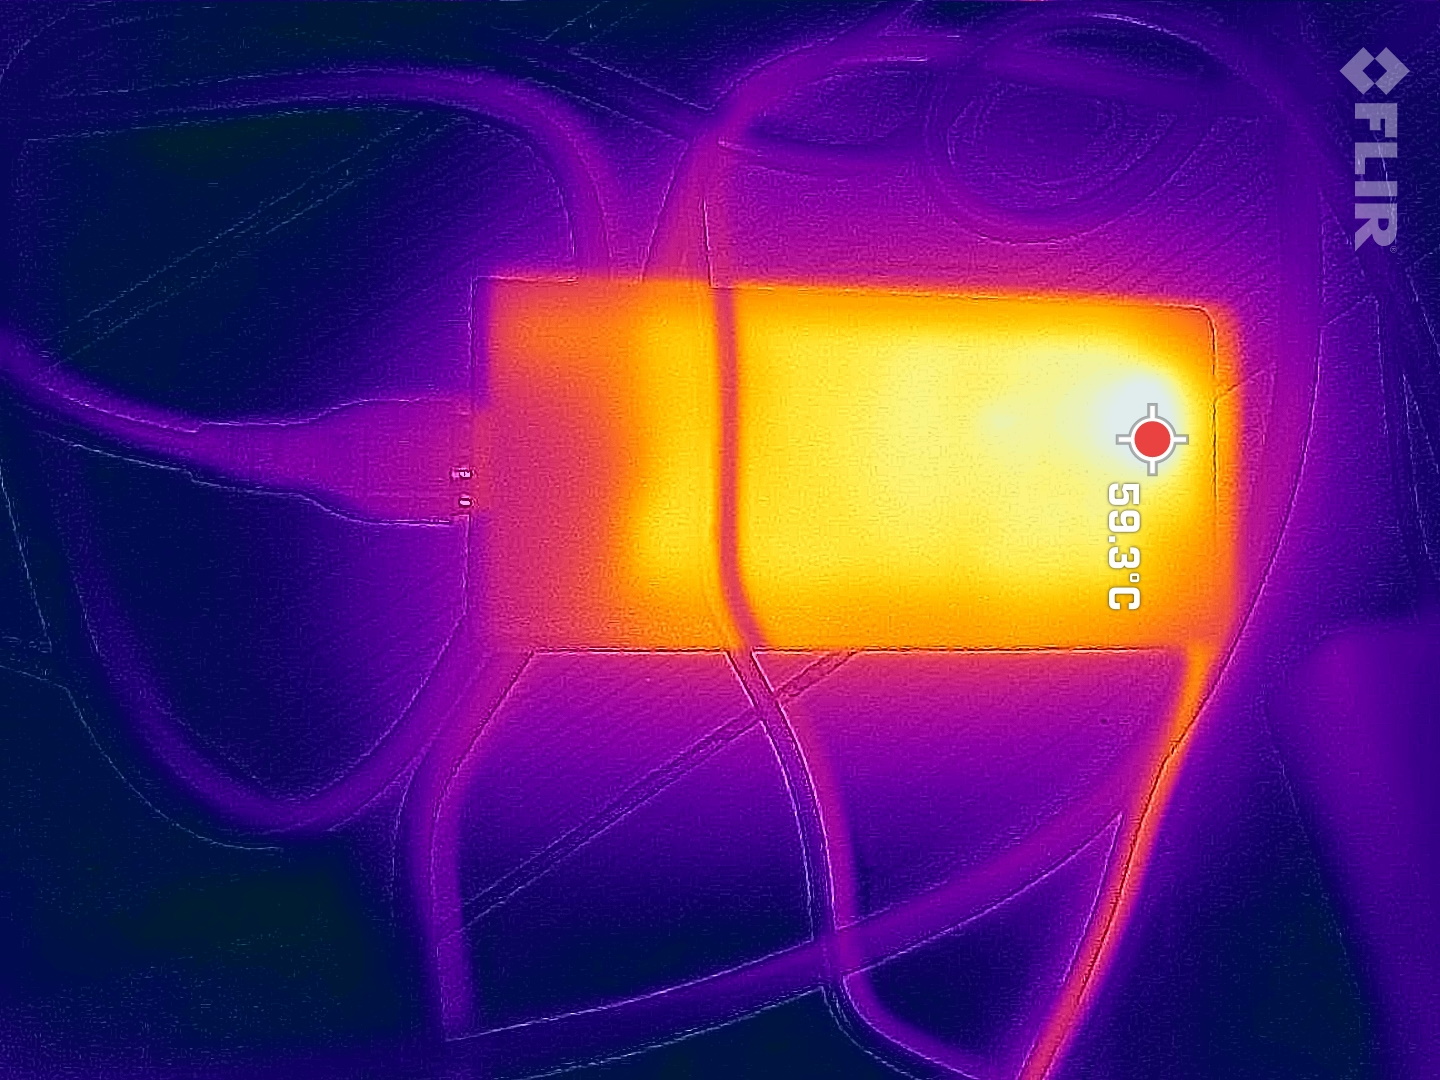
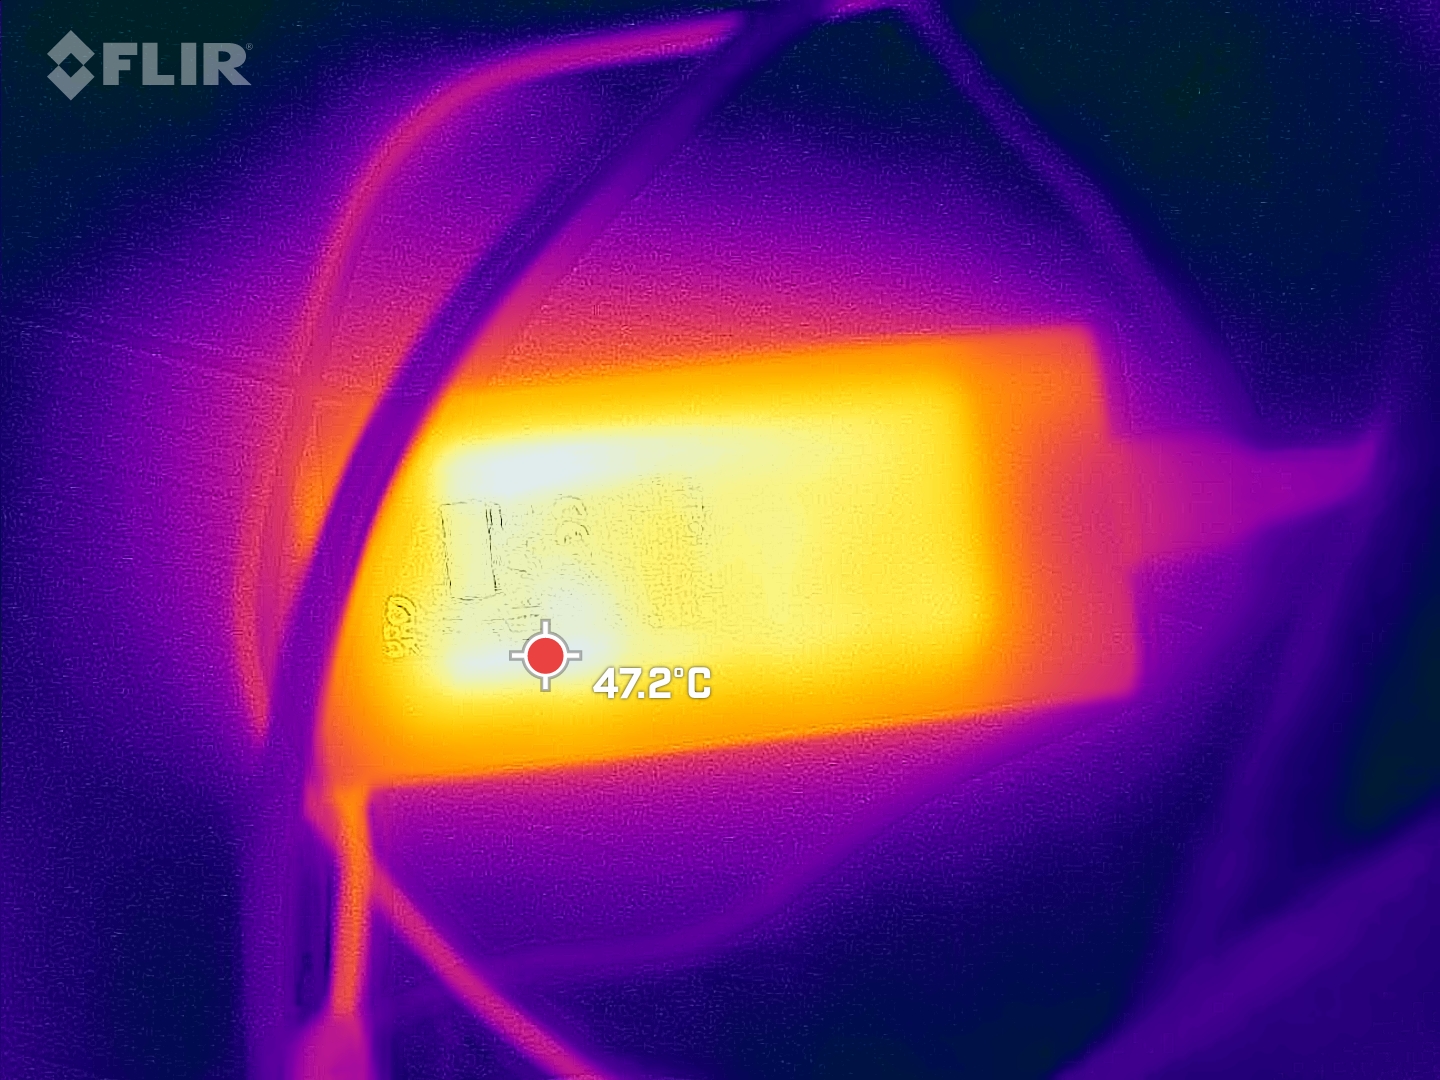
El adaptador de corriente se apagó a los 49 minutos de la prueba de estrés, y su temperatura superficial aumentó hasta los 68 °C. Durante un periodo prolongado, la cantidad de energía requerida por el hardware parece superar lo que el adaptador de 150 vatios puede suministrar. Sin embargo, en casos de uso "típicos" (por ejemplo, juegos o aplicaciones ofimáticas), no esperamos que la fuente de alimentación se apague por sí sola. La prueba de estrés simula una situación que rara vez se da en la vida real (es decir, la CPU y la GPU funcionando simultáneamente al máximo de su capacidad).
Altavoces
Los altavoces estéreo suenan decentemente pero apenas tienen graves.
Gigabyte G5 KF análisis de audio
(±) | la sonoridad del altavoz es media pero buena (78.6 dB)
Graves 100 - 315 Hz
(-) | casi sin bajos - de media 15.6% inferior a la mediana
(+) | el bajo es lineal (1.7% delta a la frecuencia anterior)
Medios 400 - 2000 Hz
(±) | medias más altas - de media 9.7% más altas que la mediana
(±) | la linealidad de los medios es media (10.4% delta respecto a la frecuencia anterior)
Altos 2 - 16 kHz
(+) | máximos equilibrados - a sólo 3.2% de la mediana
(+) | los máximos son lineales (6.9% delta a la frecuencia anterior)
Total 100 - 16.000 Hz
(±) | la linealidad del sonido global es media (22.7% de diferencia con la mediana)
En comparación con la misma clase
» 82% de todos los dispositivos probados de esta clase eran mejores, 5% similares, 13% peores
» El mejor tuvo un delta de 6%, la media fue 18%, el peor fue ###max##%
En comparación con todos los dispositivos probados
» 67% de todos los dispositivos probados eran mejores, 6% similares, 27% peores
» El mejor tuvo un delta de 4%, la media fue 23%, el peor fue ###max##%
Asus TUF A15 FA507 análisis de audio
(±) | la sonoridad del altavoz es media pero buena (79.3 dB)
Graves 100 - 315 Hz
(±) | lubina reducida - en promedio 13.7% inferior a la mediana
(+) | el bajo es lineal (6.2% delta a la frecuencia anterior)
Medios 400 - 2000 Hz
(±) | medias más altas - de media 7.6% más altas que la mediana
(±) | la linealidad de los medios es media (7.3% delta respecto a la frecuencia anterior)
Altos 2 - 16 kHz
(+) | máximos equilibrados - a sólo 2.1% de la mediana
(±) | la linealidad de los máximos es media (7.5% delta a frecuencia anterior)
Total 100 - 16.000 Hz
(±) | la linealidad del sonido global es media (17.2% de diferencia con la mediana)
En comparación con la misma clase
» 47% de todos los dispositivos probados de esta clase eran mejores, 11% similares, 42% peores
» El mejor tuvo un delta de 6%, la media fue 18%, el peor fue ###max##%
En comparación con todos los dispositivos probados
» 32% de todos los dispositivos probados eran mejores, 8% similares, 60% peores
» El mejor tuvo un delta de 4%, la media fue 23%, el peor fue ###max##%
Gestión de la energía - El G5 no le sorprenderá por su resistencia
Consumo de energía
A lo largo de nuestra prueba Witcher 3, el uso de energía del portátil se mantuvo en un nivel estable, tan alto como cabía esperar. Sin embargo, el requerimiento de energía fluctuó durante la prueba de estrés; el G5 KF consumió constantemente más energía de la que el cargador está clasificado para (150 vatios). Como resultado, el adaptador se apagó solo después de unos 50 minutos. La fuente de alimentación no parece tener mucho margen de maniobra. El modelo de 180 vatios suministrado con el G5 KE habría sido una mejor opción en este caso.
| Off / Standby | |
| Ocioso | |
| Carga |
|
Clave:
min: | |
| Gigabyte G5 KF i5-12500H, GeForce RTX 4060 Laptop GPU, SSSTC CA6-8D512, IPS, 1920x1080, 15.6" | MSI Cyborg 15 A12VF i7-12650H, GeForce RTX 4060 Laptop GPU, Samsung PM9B1 1024GB MZVL41T0HBLB, IPS, 1920x1080, 15.6" | Intel NUC X15 LAPAC71H i7-12700H, A730M, Samsung 990 Pro 1 TB, IPS, 1920x1080, 15.6" | Asus TUF A15 FA507 R7 7735HS, GeForce RTX 4050 Laptop GPU, Micron 2400 MTFDKBA512QFM, IPS, 1920x1080, 15.6" | Lenovo Legion Slim 5 16APH8 R7 7840HS, GeForce RTX 4060 Laptop GPU, SK hynix PC801 HFS512GEJ9X115N, IPS, 2560x1600, 16" | Gigabyte G5 KE i5-12500H, GeForce RTX 3060 Laptop GPU, Gigabyte AG4512G-SI B10, IPS, 1920x1080, 15.6" | Medio NVIDIA GeForce RTX 4060 Laptop GPU | Media de la clase Gaming | |
|---|---|---|---|---|---|---|---|---|
| Power Consumption | 13% | -30% | -7% | -27% | -27% | -44% | -71% | |
| Idle Minimum * (Watt) | 7 | 6 14% | 7.5 -7% | 8 -14% | 9.4 -34% | 7.66 -9% | 11.5 ? -64% | 13 ? -86% |
| Idle Average * (Watt) | 10.2 | 8.8 14% | 11.9 -17% | 12.1 -19% | 15.5 -52% | 10.3 -1% | 16 ? -57% | 19 ? -86% |
| Idle Maximum * (Watt) | 16.1 | 11.9 26% | 13.9 14% | 12.5 22% | 24.4 -52% | 16.05 -0% | 20.3 ? -26% | 24.5 ? -52% |
| Load Average * (Watt) | 59.3 | 89 -50% | 137 -131% | 74.9 -26% | 74.1 -25% | 115.8 -95% | 92.9 ? -57% | 111.1 ? -87% |
| Witcher 3 ultra * (Watt) | 129 | 90.3 30% | 166 -29% | 136.6 -6% | 112.9 12% | 168.7 -31% | ||
| Load Maximum * (Watt) | 183 | 99 46% | 203 -11% | 185 -1% | 206.5 -13% | 234.6 -28% | 210 ? -15% | 260 ? -42% |
* ... más pequeño es mejor
Energieaufnahme Witcher 3 / Stresstest
Power consumption with external monitor
Duración de las pilas
El dispositivo de 15,6 pulgadas duró 5h 16min y 4h 28min respectivamente en nuestra prueba Wi-Fi (accediendo a sitios web mediante un script) y en la prueba de vídeo (reproduciendo en bucle el cortometraje Big Buck Bunny, en FHD y codificado en formato H.264). Durante las pruebas, el brillo de la pantalla se ajustó a unos 150 cd/m² y los módulos inalámbricos se desactivaron.
En cuanto a la duración de la batería, el G5 no tuvo una buena actuación en comparación directa con un competidor como el MSI Cyborg. El portátil MSI puede durar bastante más que el G5 a pesar de que tienen especificaciones de hardware comparables y una capacidad de batería casi idéntica.
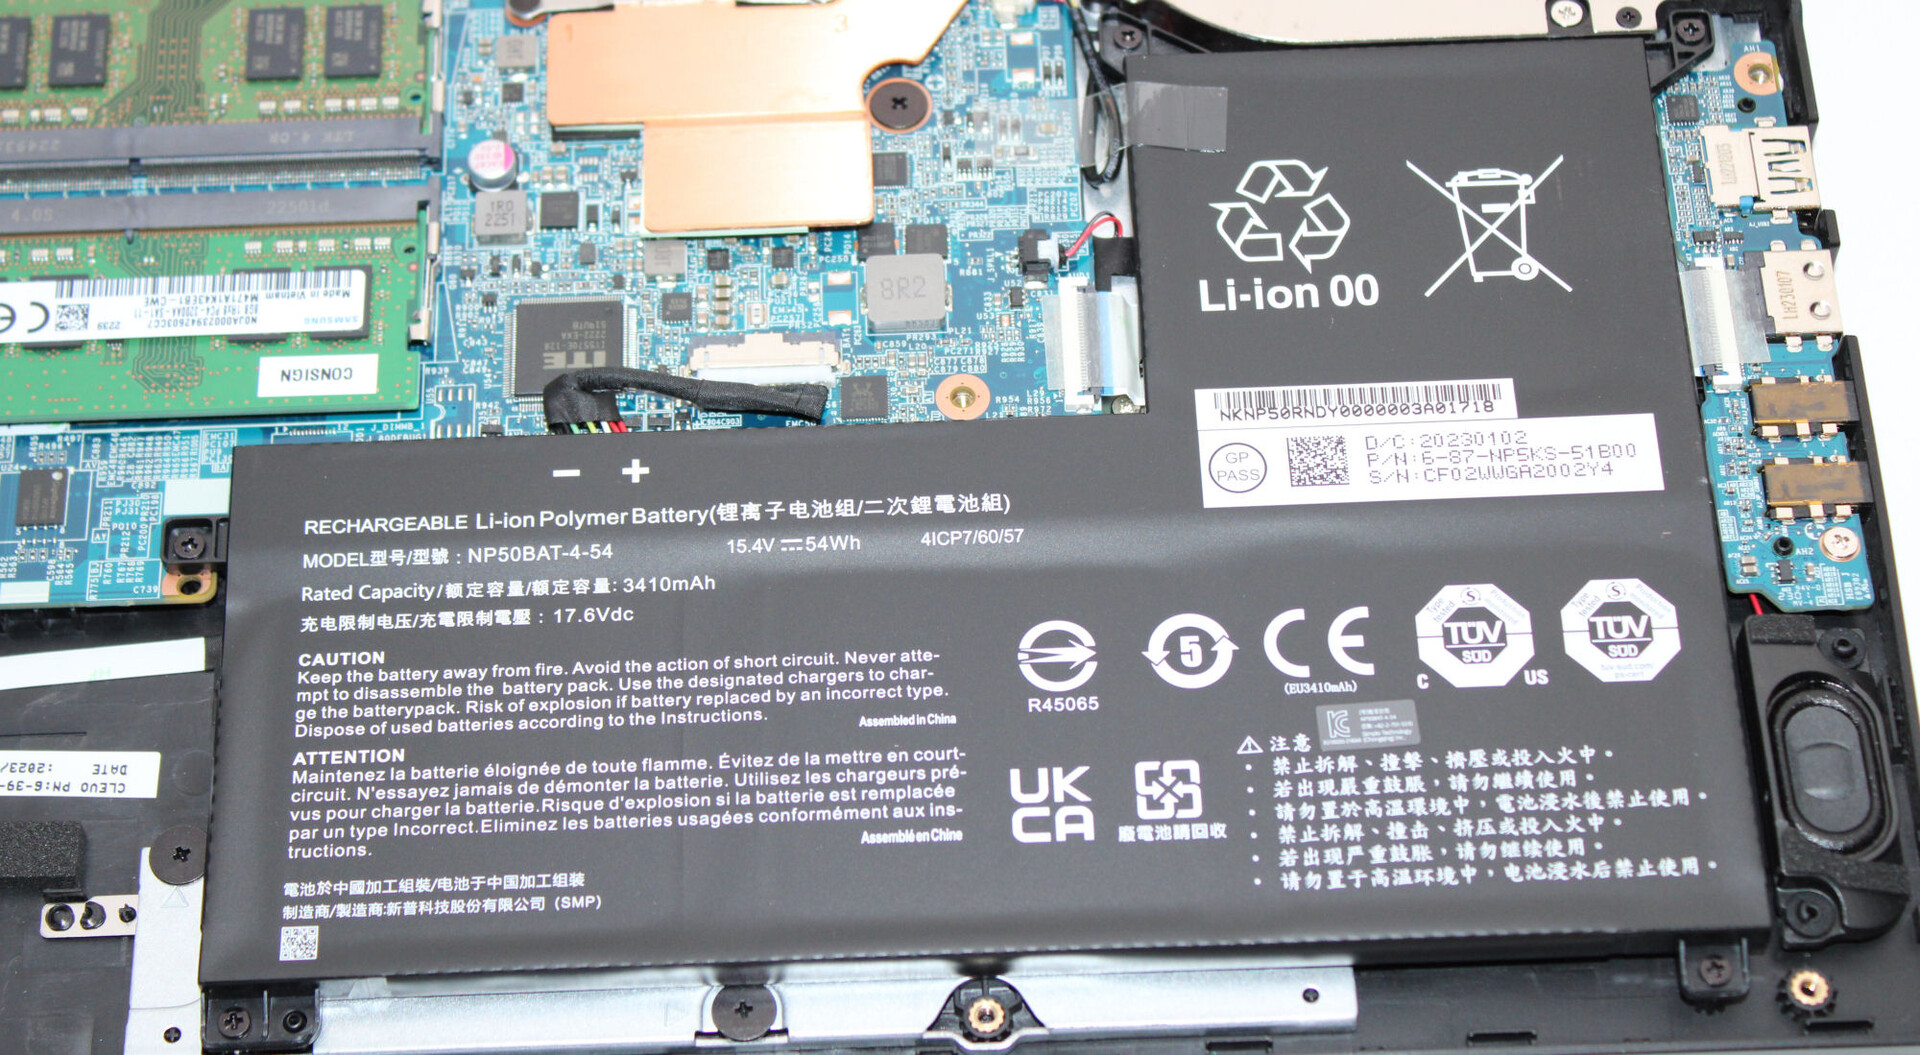
| Gigabyte G5 KF i5-12500H, GeForce RTX 4060 Laptop GPU, 54 Wh | MSI Cyborg 15 A12VF i7-12650H, GeForce RTX 4060 Laptop GPU, 53.5 Wh | Intel NUC X15 LAPAC71H i7-12700H, A730M, 62.3 Wh | Asus TUF A15 FA507 R7 7735HS, GeForce RTX 4050 Laptop GPU, 90 Wh | Lenovo Legion Slim 5 16APH8 R7 7840HS, GeForce RTX 4060 Laptop GPU, 80 Wh | Gigabyte G5 KE i5-12500H, GeForce RTX 3060 Laptop GPU, 54 Wh | Media de la clase Gaming | |
|---|---|---|---|---|---|---|---|
| Duración de Batería | 56% | 8% | 87% | 15% | -27% | 27% | |
| Reader / Idle (h) | 8.6 | 13.6 58% | 11.7 36% | 8.27 ? -4% | |||
| H.264 (h) | 4.5 | 8 78% | 12.5 178% | 2.2 -51% | 8.32 ? 85% | ||
| WiFi v1.3 (h) | 5.3 | 7.5 42% | 5.7 8% | 11.7 121% | 7.1 34% | 5.7 8% | 7.11 ? 34% |
| Load (h) | 1.6 | 2.3 44% | 1 -37% | 1.2 -25% | 1 -37% | 1.502 ? -6% | |
| Witcher 3 ultra (h) | 1.3 |
Pro
Contra
Veredicto - Oferta sólida con mucho potencial de optimización

A pesar de contar con una GPU más potente en teoría, el G5 KF "sólo" es capaz de ofrecer aproximadamente el mismo rendimiento de juego que su predecesoraunque consume mucha menos energía. La más eficiente RTX 4060 (75 W) funciona a un TGP inferior que la RTX 3060 (115 W) en el G5 KE. Al mismo TGP, el G5 KF rinde mejor que el KE.
Gigabyte ha entregado un portátil de juegos FHD económico con el G5 KF. Pero los usuarios tendrán que enfrentarse a una serie de defectos.
El portátil se calienta notablemente bajo carga en algunas zonas y también produce bastante ruido. Puede mitigar el problema del ruido utilizando los perfiles de rendimiento proporcionados, pero el rendimiento se va a resentir. Desafortunadamente, el adaptador de corriente reducido (150 vatios en lugar de 180 vatios) no es lo suficientemente capaz para manejar todo tipo de situaciones de carga (por ejemplo, pruebas de estrés).
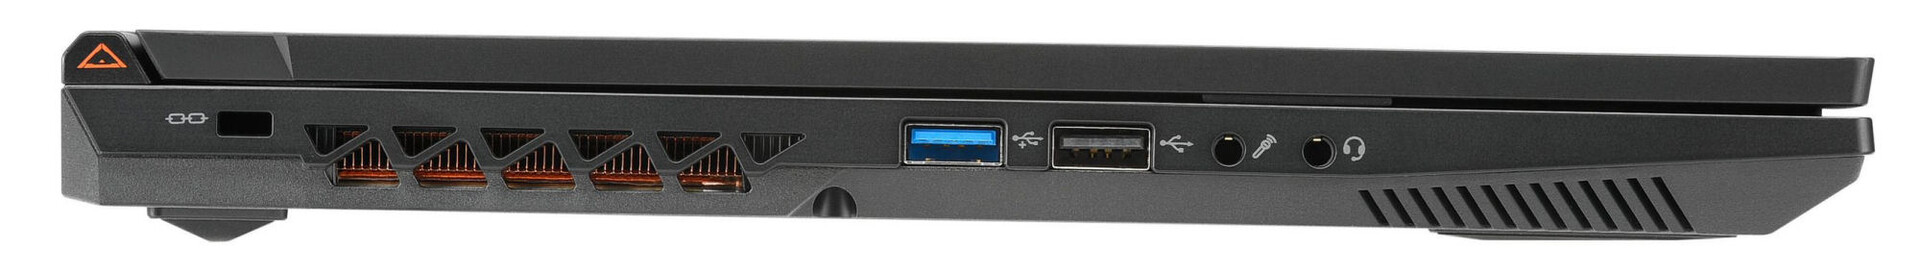
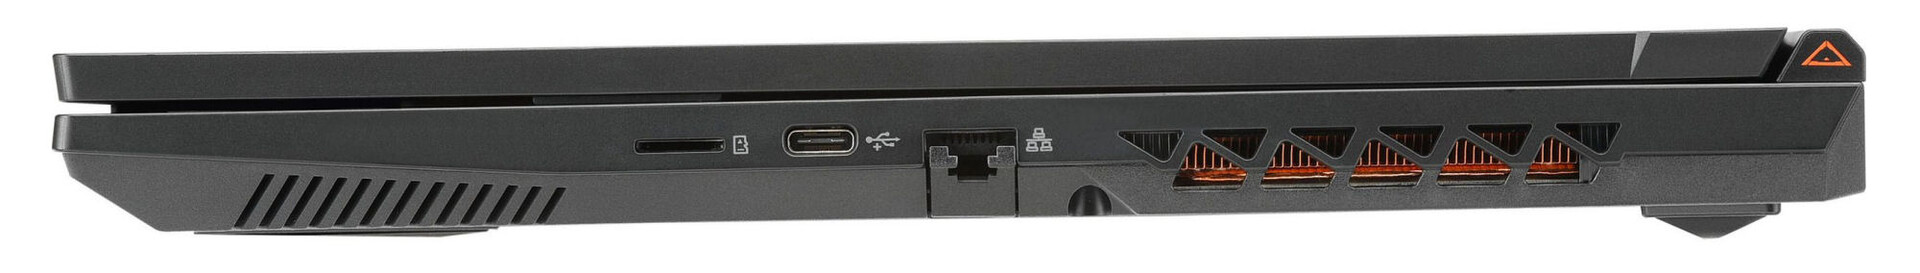
La cantidad de almacenamiento integrado (512 GB) parece mísera para un portátil de juegos. Siendo realistas, el sistema puede durar entre 4 y 5,5 horas con una sola carga, lo que no va a sorprender a nadie. Además, el puerto Thunderbolt 4 del G5 KE ha dejado paso a un puerto USB 3.2 Gen 2. La pantalla Full HD mate (15,6 pulgadas, IPS, 144 Hz) tampoco ganará ningún premio: su cobertura de color, brillo y contraste no están a la altura. El precio relativamente bajo del portátil también se debe a que no se incluye una licencia de Windows con el sistema.
El Asus TUF A15 FA507 es una alternativa al G5 KF. A pesar de tener una GPU más débil sobre el papel, sólo tiene un rendimiento gráfico ligeramente inferior al del G5. El A15 también ofrece un mejor rendimiento de la CPU, una duración de la batería significativamente mayor y un puerto USB4. El TUF A15 se puede conseguir ahora mismo por 1.099 euros (unos 1.165 dólares) con Windows 11 incluido.
Precio y disponibilidad
El Gigabyte G5 KF le costará unos 984 euros (950 dólares) en Amazon.de o Amazon.com. Tenga en cuenta que el modelo en Amazon de EE.UU. sólo tiene 8 GB de RAM pero viene con Windows 11. Los precios también pueden variar con el tiempo. Para aquellos con un presupuesto ajustado, puede considerar los modelos de especificaciones inferiores G5 MF (RTX 4050, 8 GB de RAM) y el G5 GE (RTX 3050, 8 GB de RAM), ambos con el mismo diseño físico.
Gigabyte G5 KF
- 10/18/2023 v7 (old)
Sascha Mölck
Transparencia
La selección de los dispositivos que se van a reseñar corre a cargo de nuestro equipo editorial. La muestra de prueba fue proporcionada al autor en calidad de préstamo por el fabricante o el minorista a los efectos de esta reseña. El prestamista no tuvo ninguna influencia en esta reseña, ni el fabricante recibió una copia de la misma antes de su publicación. No había ninguna obligación de publicar esta reseña. Como empresa de medios independiente, Notebookcheck no está sujeta a la autoridad de fabricantes, minoristas o editores.
Así es como prueba Notebookcheck
Cada año, Notebookcheck revisa de forma independiente cientos de portátiles y smartphones utilizando procedimientos estandarizados para asegurar que todos los resultados son comparables. Hemos desarrollado continuamente nuestros métodos de prueba durante unos 20 años y hemos establecido los estándares de la industria en el proceso. En nuestros laboratorios de pruebas, técnicos y editores experimentados utilizan equipos de medición de alta calidad. Estas pruebas implican un proceso de validación en varias fases. Nuestro complejo sistema de clasificación se basa en cientos de mediciones y puntos de referencia bien fundamentados, lo que mantiene la objetividad.Price comparison

