Análisis del Lenovo ThinkPad T14 G3: el portátil para empresas es peor con Intel y Nvidia
Ya hemos probado la versiónThinkPad T14 G3 con AMD Ryzen 7 Proincluyendo la veloz iGPU Radeon 680M ampliamente, pero Lenovo también sigue ofreciendo el portátil business de 14 pulgadas con procesadores Intel y GPU opcional Nvidia GeForce. Con el modelo 21AJS00400, ahora tenemos un representante de este tipo que combina el Alder Lake Core i7-1260Pcon el procesador GeForce MX550 en nuestro banco de pruebas. Podemos pasar por alto el hecho de que aún no se use un procesador Raptor Lake, ya que el aumento de rendimiento sería pequeño, como ya pudimos ver ya pudimos ver.
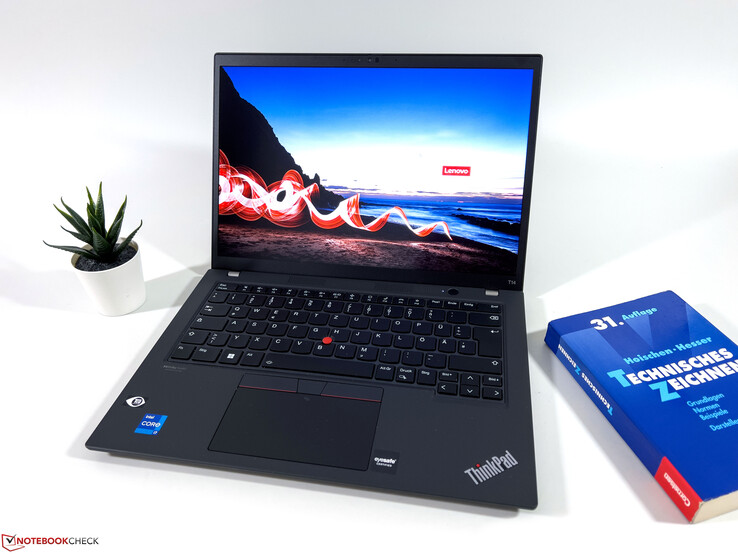
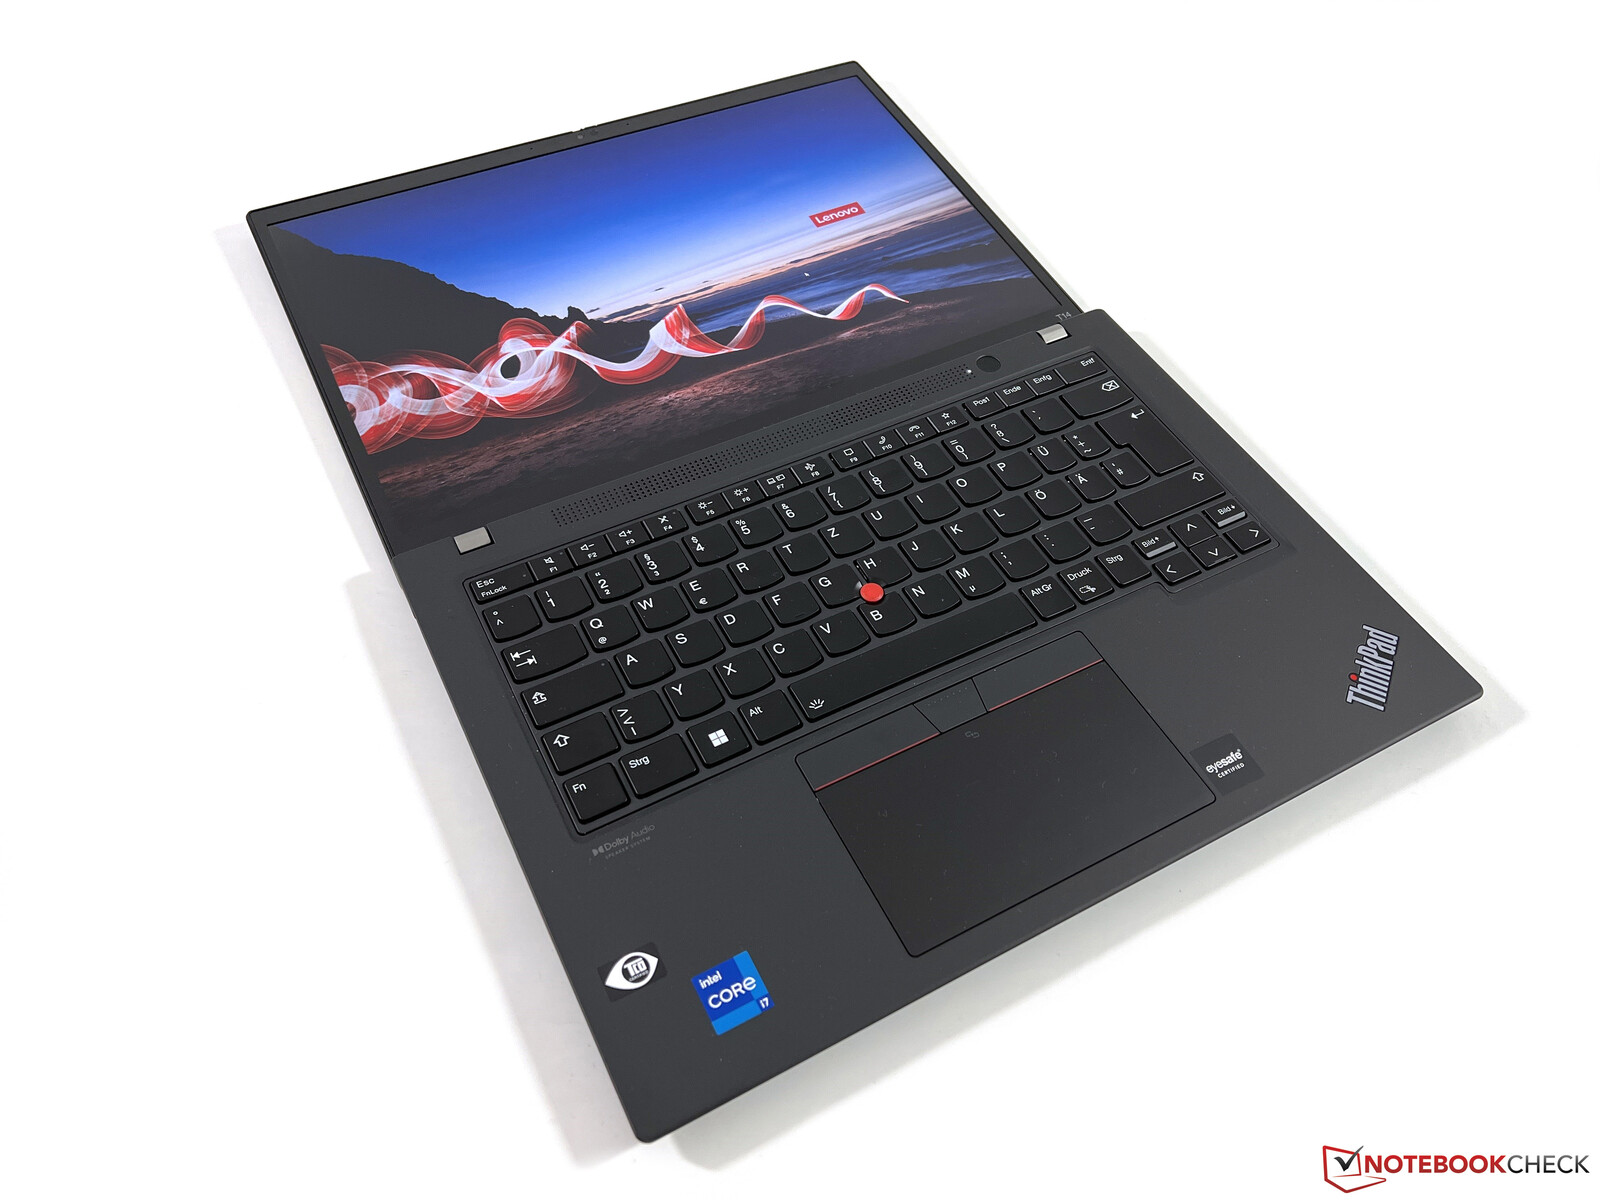
Básicamente, el modelo AMD y el Intel comparten la misma carcasa y dispositivos de entrada, webcam y altavoces. En la siguiente prueba, por lo tanto, nos concentraremos principalmente en la cuestión de qué versión es mejor y si la tarjeta gráfica adicional realmente sigue valiendo la pena.
Posibles contendientes en la comparación
Valoración | Fecha | Modelo | Peso | Altura | Tamaño | Resolución | Precio |
|---|---|---|---|---|---|---|---|
| 86.4 % v7 (old) | 03/2023 | Lenovo ThinkPad T14 G3-21AJS00400 i7-1260P, GeForce MX550 | 1.5 kg | 17.9 mm | 14.00" | 1920x1200 | |
| 88.8 % v7 (old) | 09/2022 | Lenovo ThinkPad T14 G3-21CF004NGE R7 PRO 6850U, Radeon 680M | 1.4 kg | 17.9 mm | 14.00" | 1920x1200 | |
| 88.7 % v7 (old) | 12/2022 | HP EliteBook 840 G9 i7-1280P, Iris Xe G7 96EUs | 1.5 kg | 19 mm | 14.00" | 1920x1200 | |
| 88.8 % v7 (old) | 10/2022 | Schenker Vision 14 2022 RTX 3050 Ti i7-12700H, GeForce RTX 3050 Ti Laptop GPU | 1.3 kg | 16.6 mm | 14.00" | 2880x1800 | |
| 90.3 % v7 (old) | 09/2022 | Huawei MateBook X Pro 2022 i7-1260P, Iris Xe G7 96EUs | 1.3 kg | 15.6 mm | 14.20" | 3120x2080 |
Diferencias con el ThinkPad T14 G3 AMD
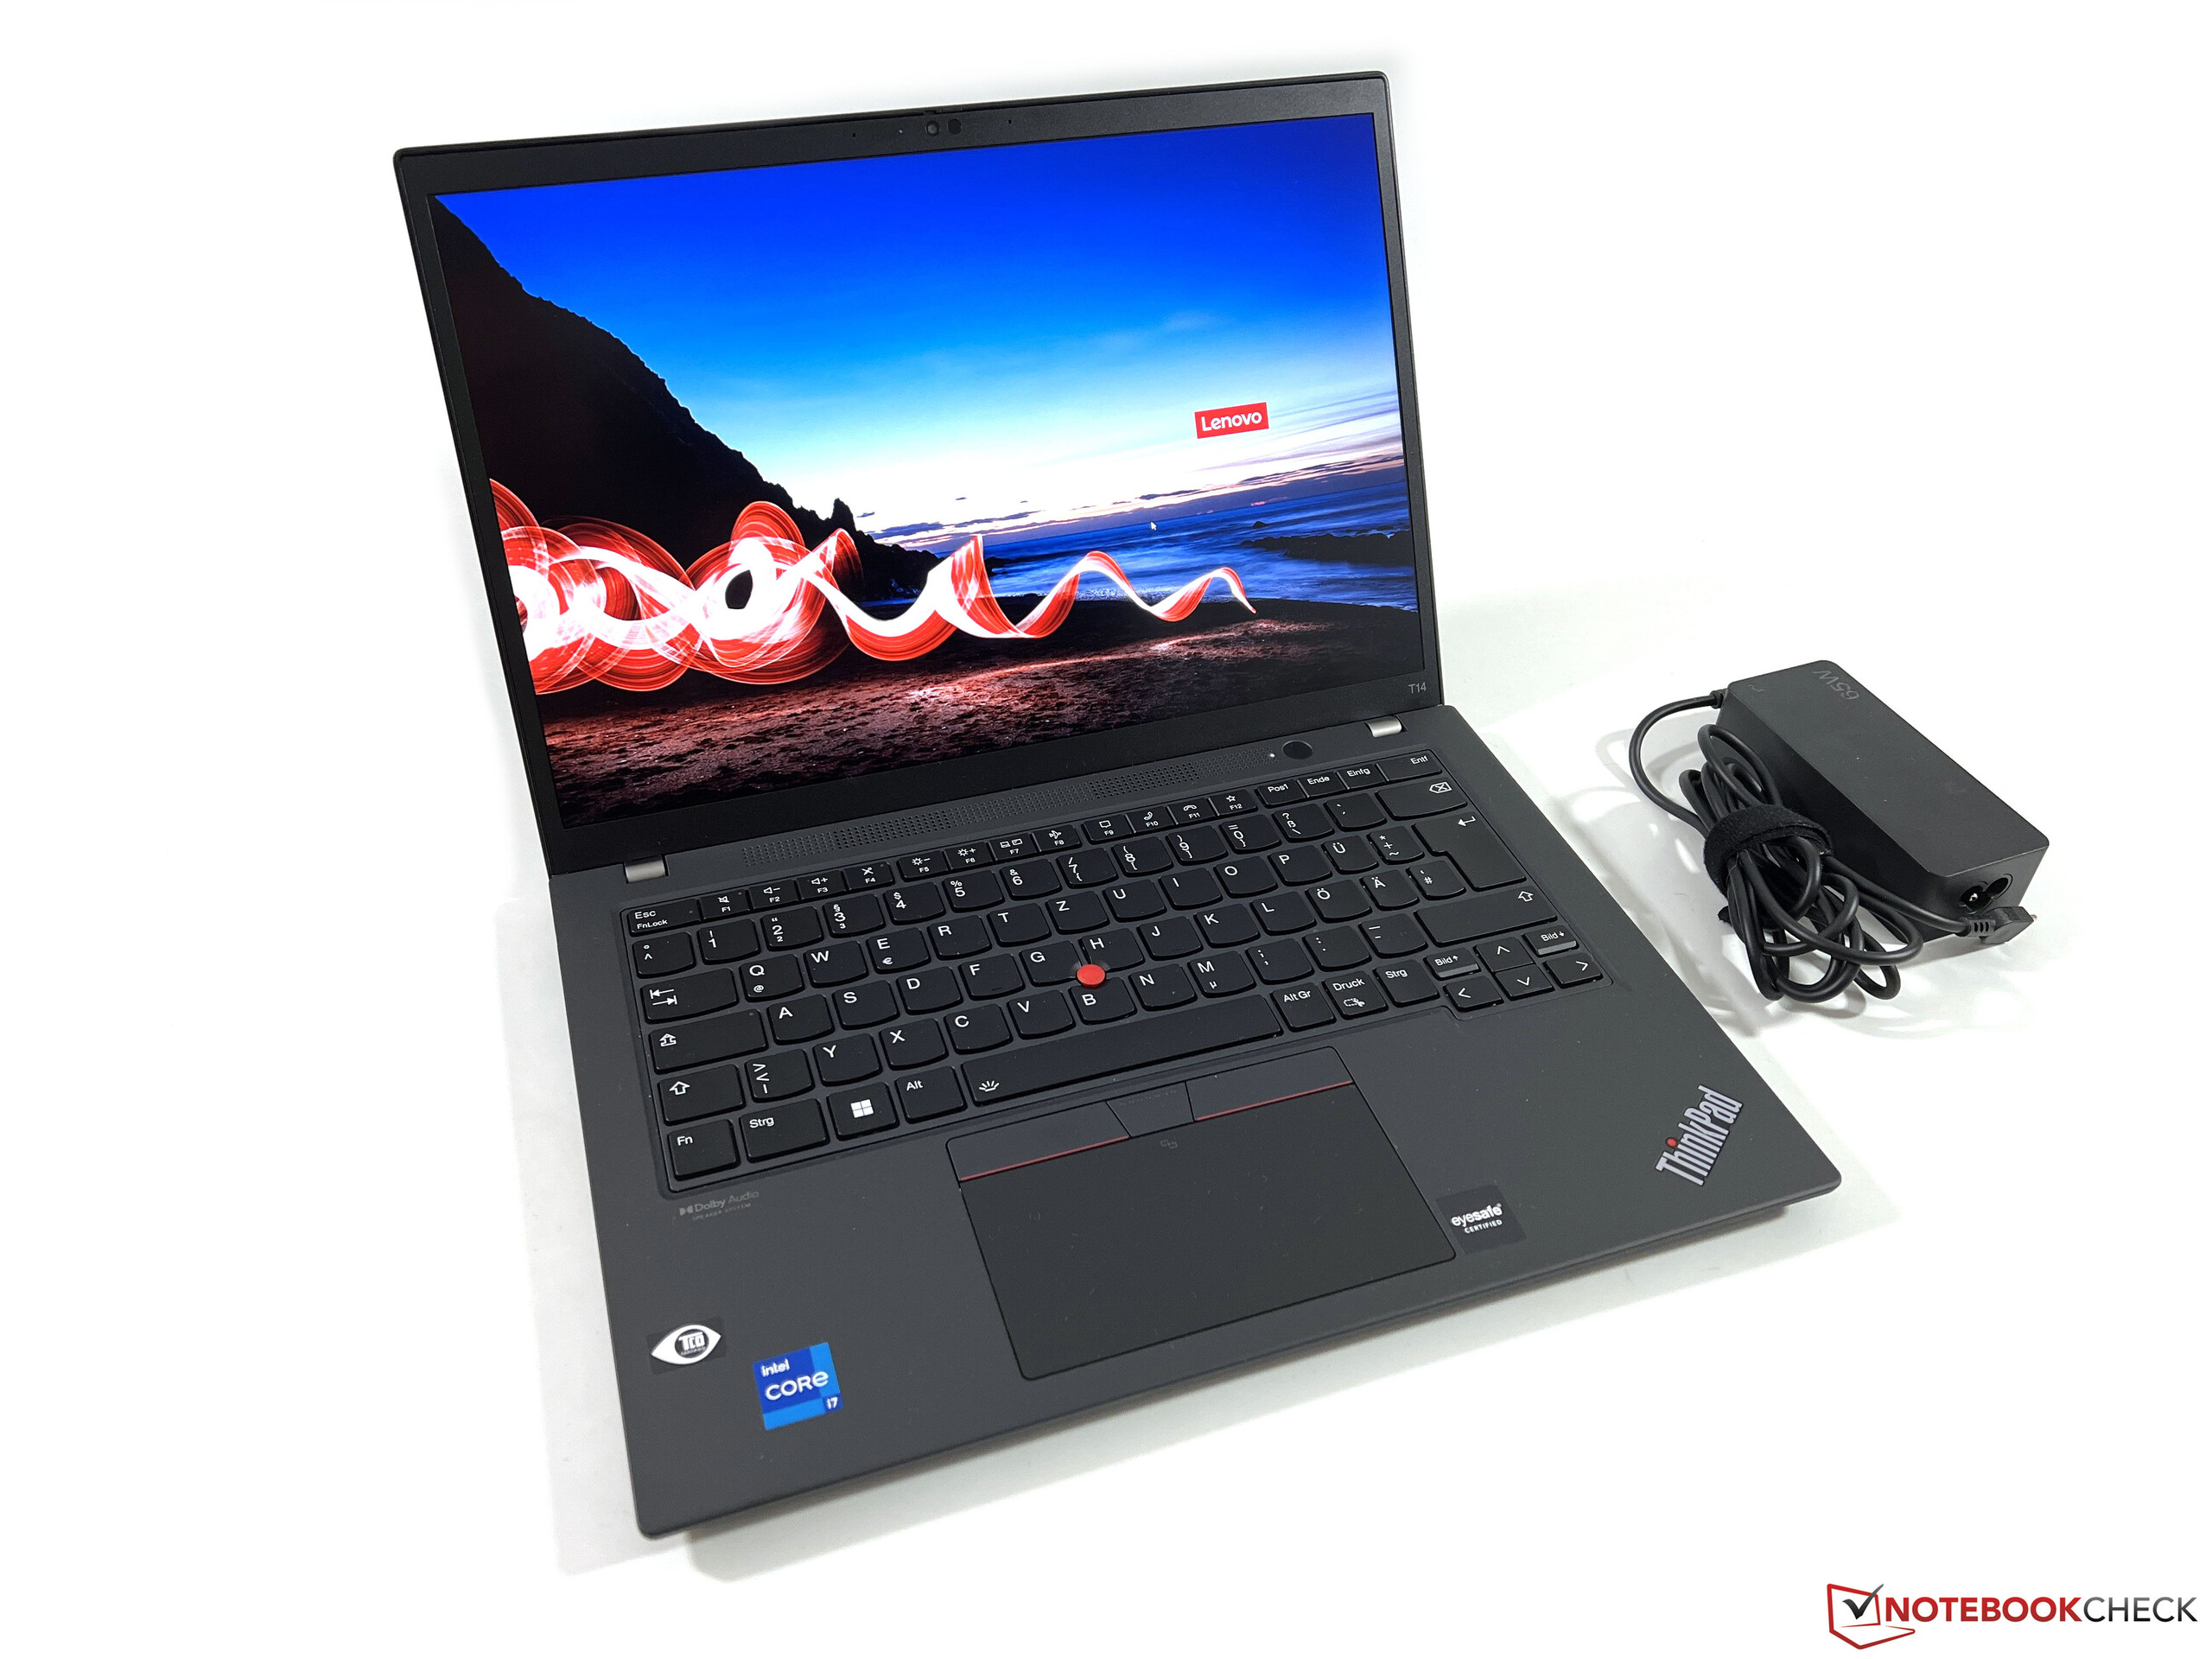
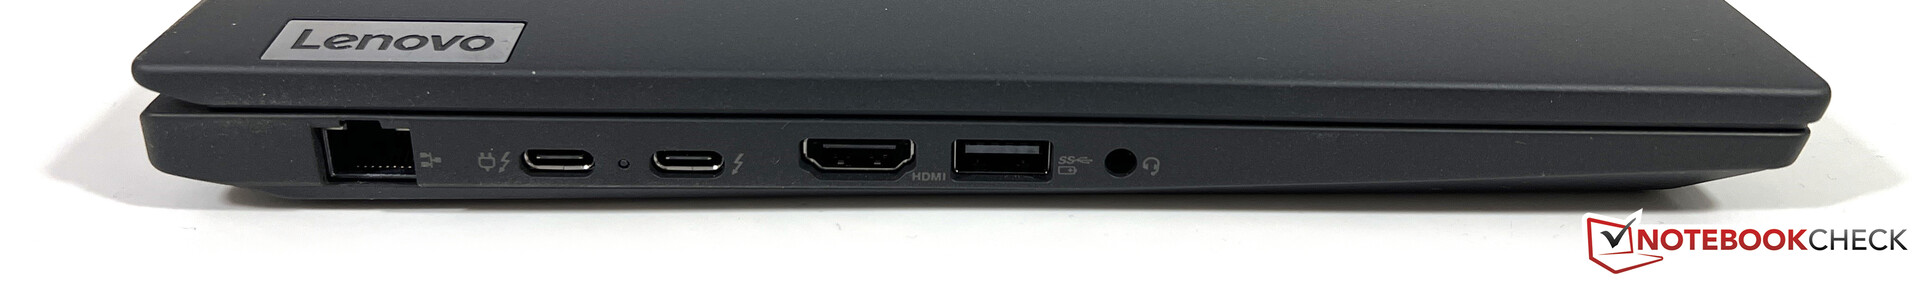
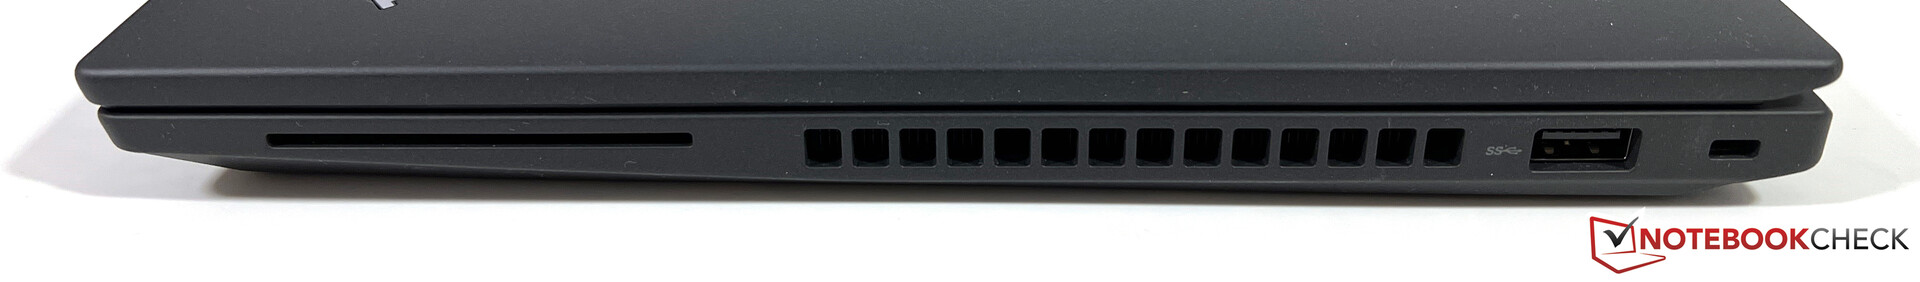
Aparte de las diferentes pegatinas en el reposamanos, no hay diferencias en el exterior de las dos versiones del ThinkPad T14, por lo que os remitimos a nuestro prueba exhaustiva del modelo AMDal respecto. Las conexiones básicas también son las mismas, pero mientras que Lenovo renuncia al USB 4.0 en el modelo AMD, la versión Intel trae dos conexiones USB-C compatibles con Thunderbolt 4.
Con la tarjeta WLAN AX211, el modelo Intel también soporta la moderna red de 6-GHz, pero no pudimos conectarnos a la red correspondiente usando nuestro router de red de referencia durante la prueba. Sin embargo, el rendimiento en la red 5G normal también fue muy bueno. Nuestra unidad de pruebas está preparada para WWAN, y la ranura Nano-SIM de la trasera así como las antenas necesarias para el módulo LTE ya están colocadas.

| Networking | |
| Lenovo ThinkPad T14 G3-21AJS00400 | |
| iperf3 receive AXE11000 | |
| iperf3 transmit AXE11000 | |
| Lenovo ThinkPad T14 G3-21CF004NGE | |
| iperf3 receive AXE11000 6GHz | |
| iperf3 transmit AXE11000 6GHz | |
| HP EliteBook 840 G9 | |
| iperf3 receive AXE11000 6GHz | |
| iperf3 receive AXE11000 | |
| iperf3 transmit AXE11000 6GHz | |
| iperf3 transmit AXE11000 | |
| Schenker Vision 14 2022 RTX 3050 Ti | |
| iperf3 receive AXE11000 | |
| iperf3 transmit AXE11000 | |
| Huawei MateBook X Pro 2022 | |
| iperf3 receive AXE11000 6GHz | |
| iperf3 transmit AXE11000 6GHz | |


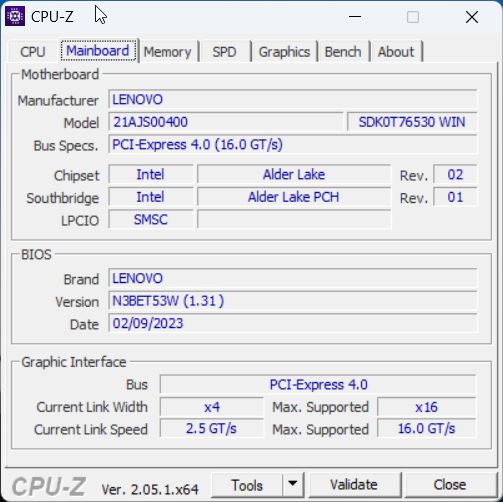
Mantenimiento
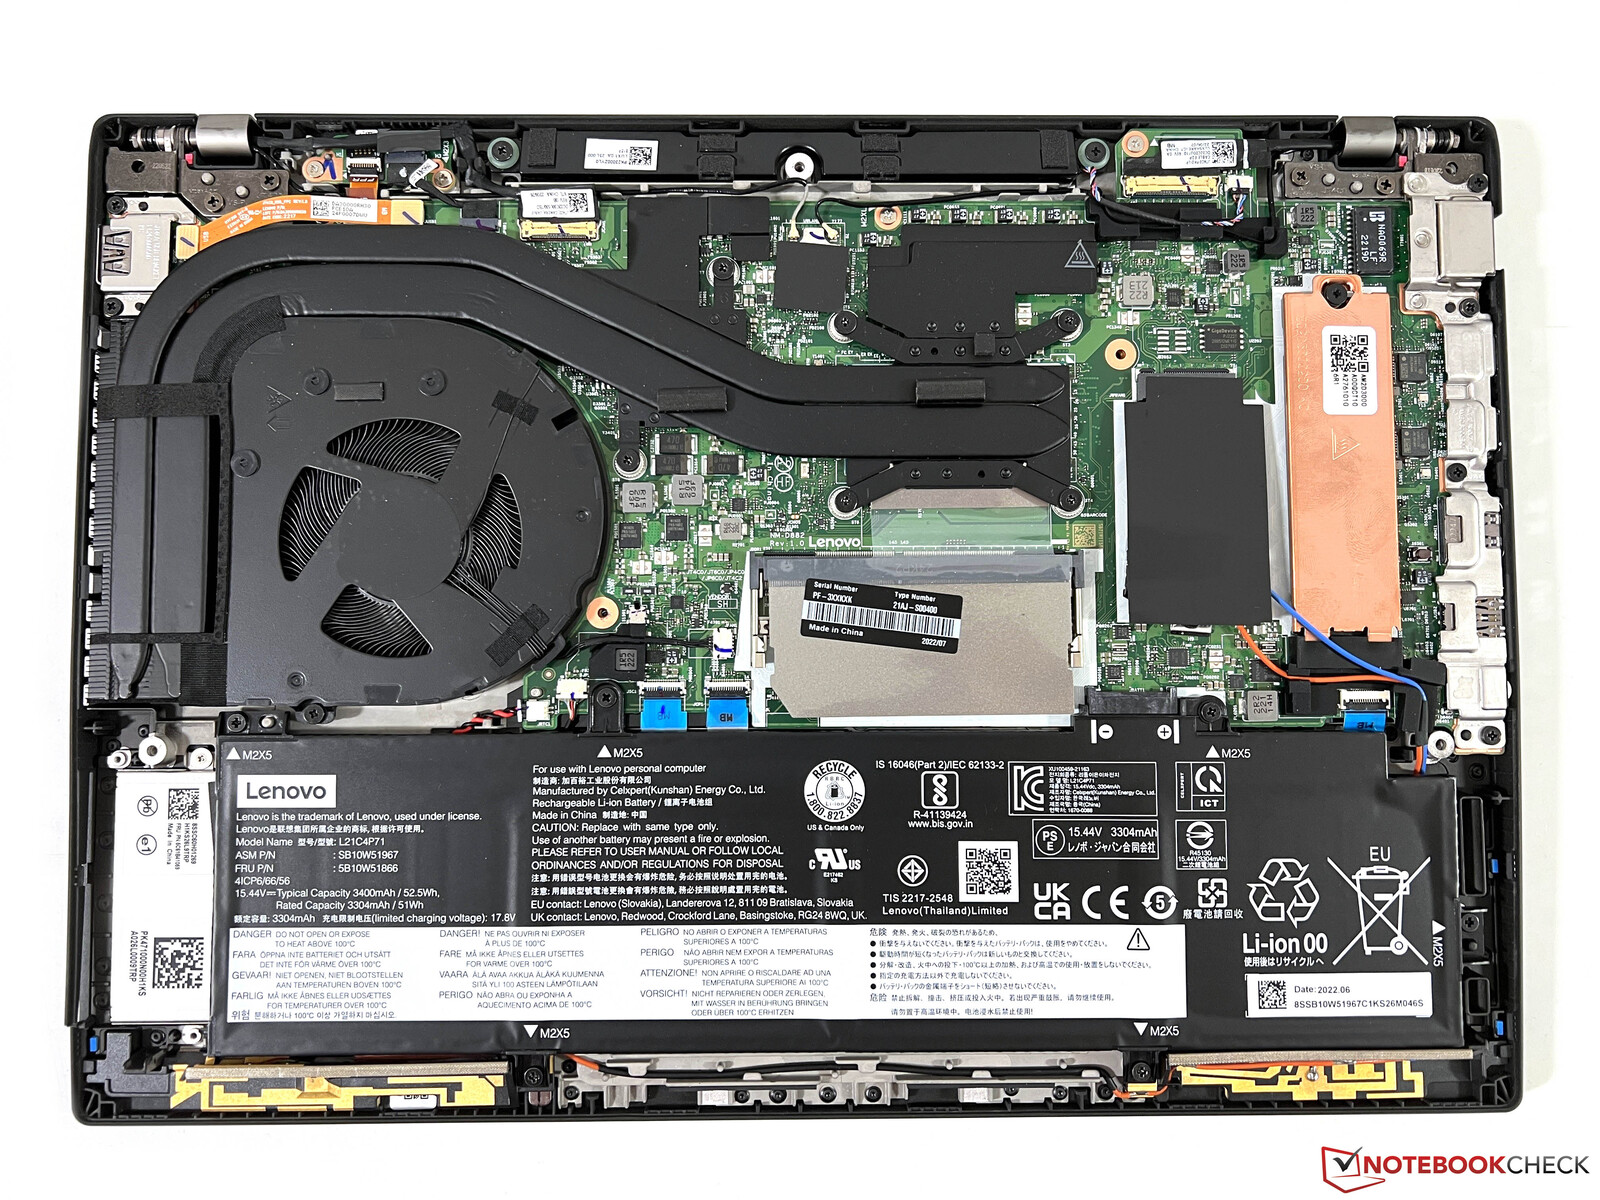
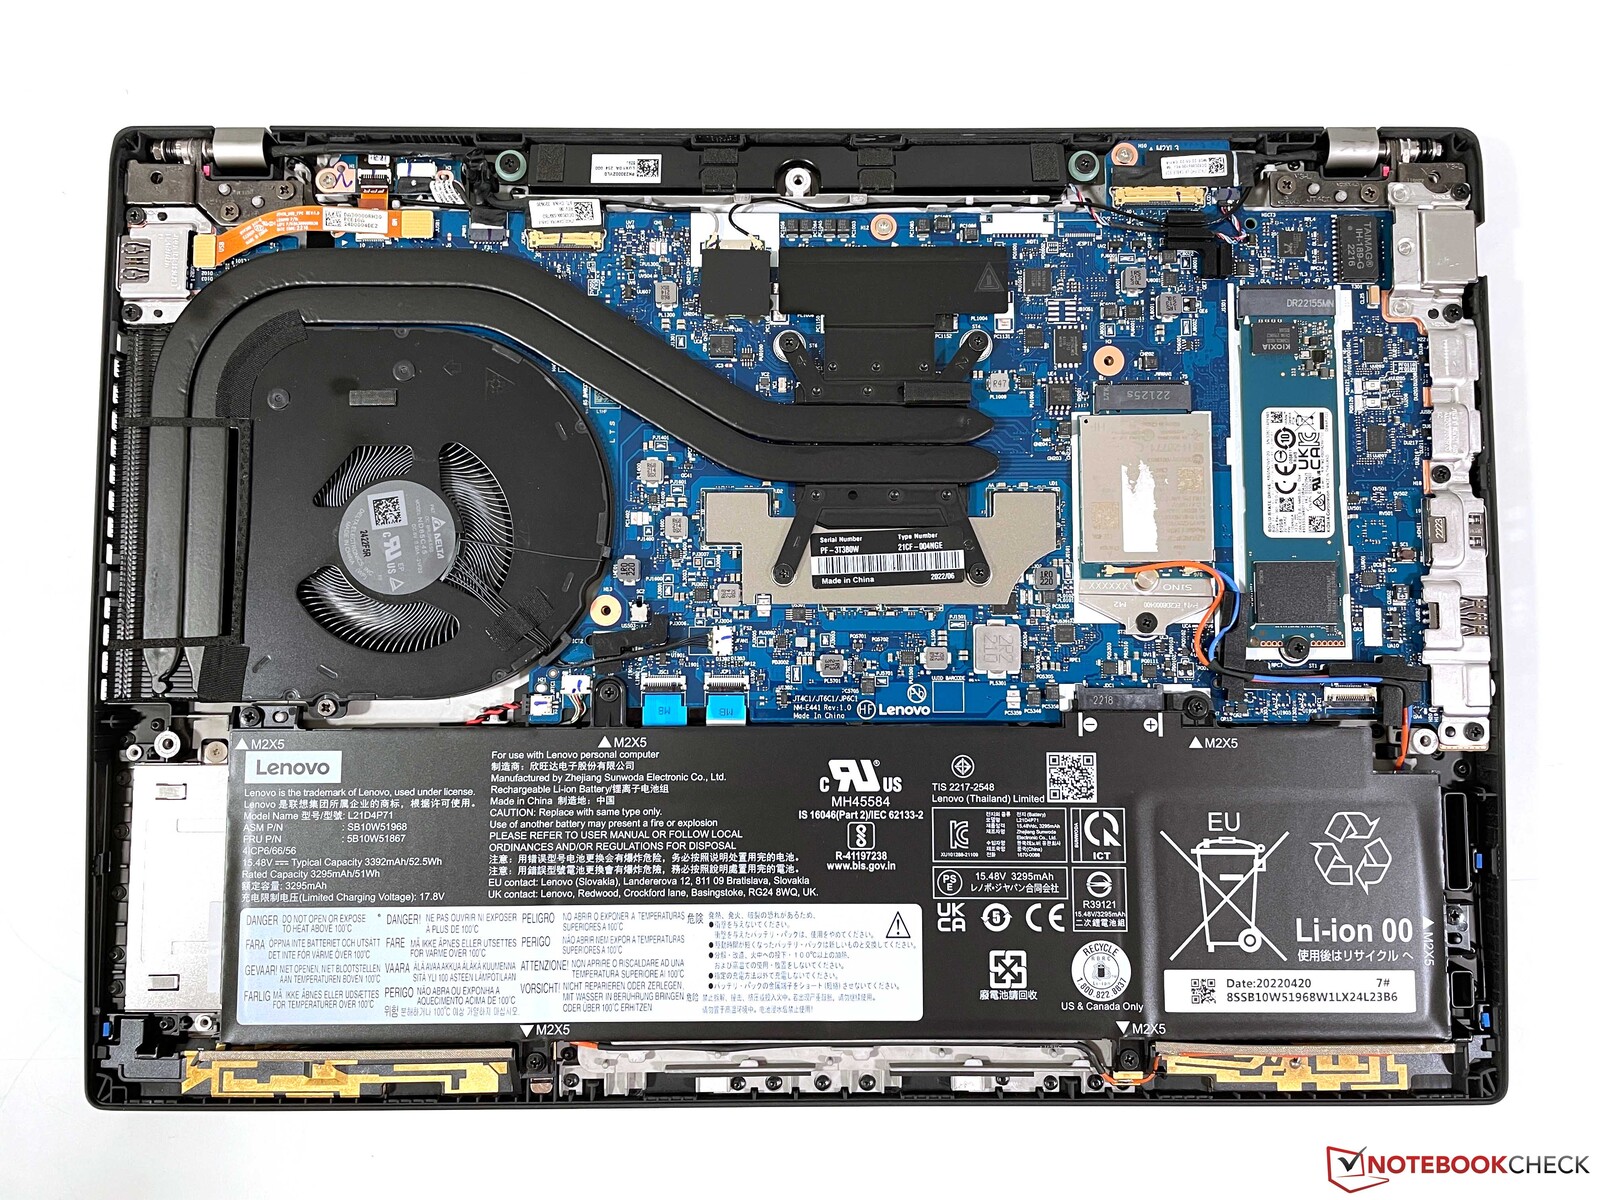
También hay diferencias en la distribución interna. Mientras que Lenovo ofrece el modelo Modelo AMDexclusivamente con RAM soldada sin ofrecer ninguna capacidad de expansión al usuario, la situación es diferente para el modelo Intel. Además de un módulo soldado (16 GB en nuestro caso), también hay una ranura SO-DIMM libre, lo que eleva la cantidad total posible de RAM hasta 48 GB.
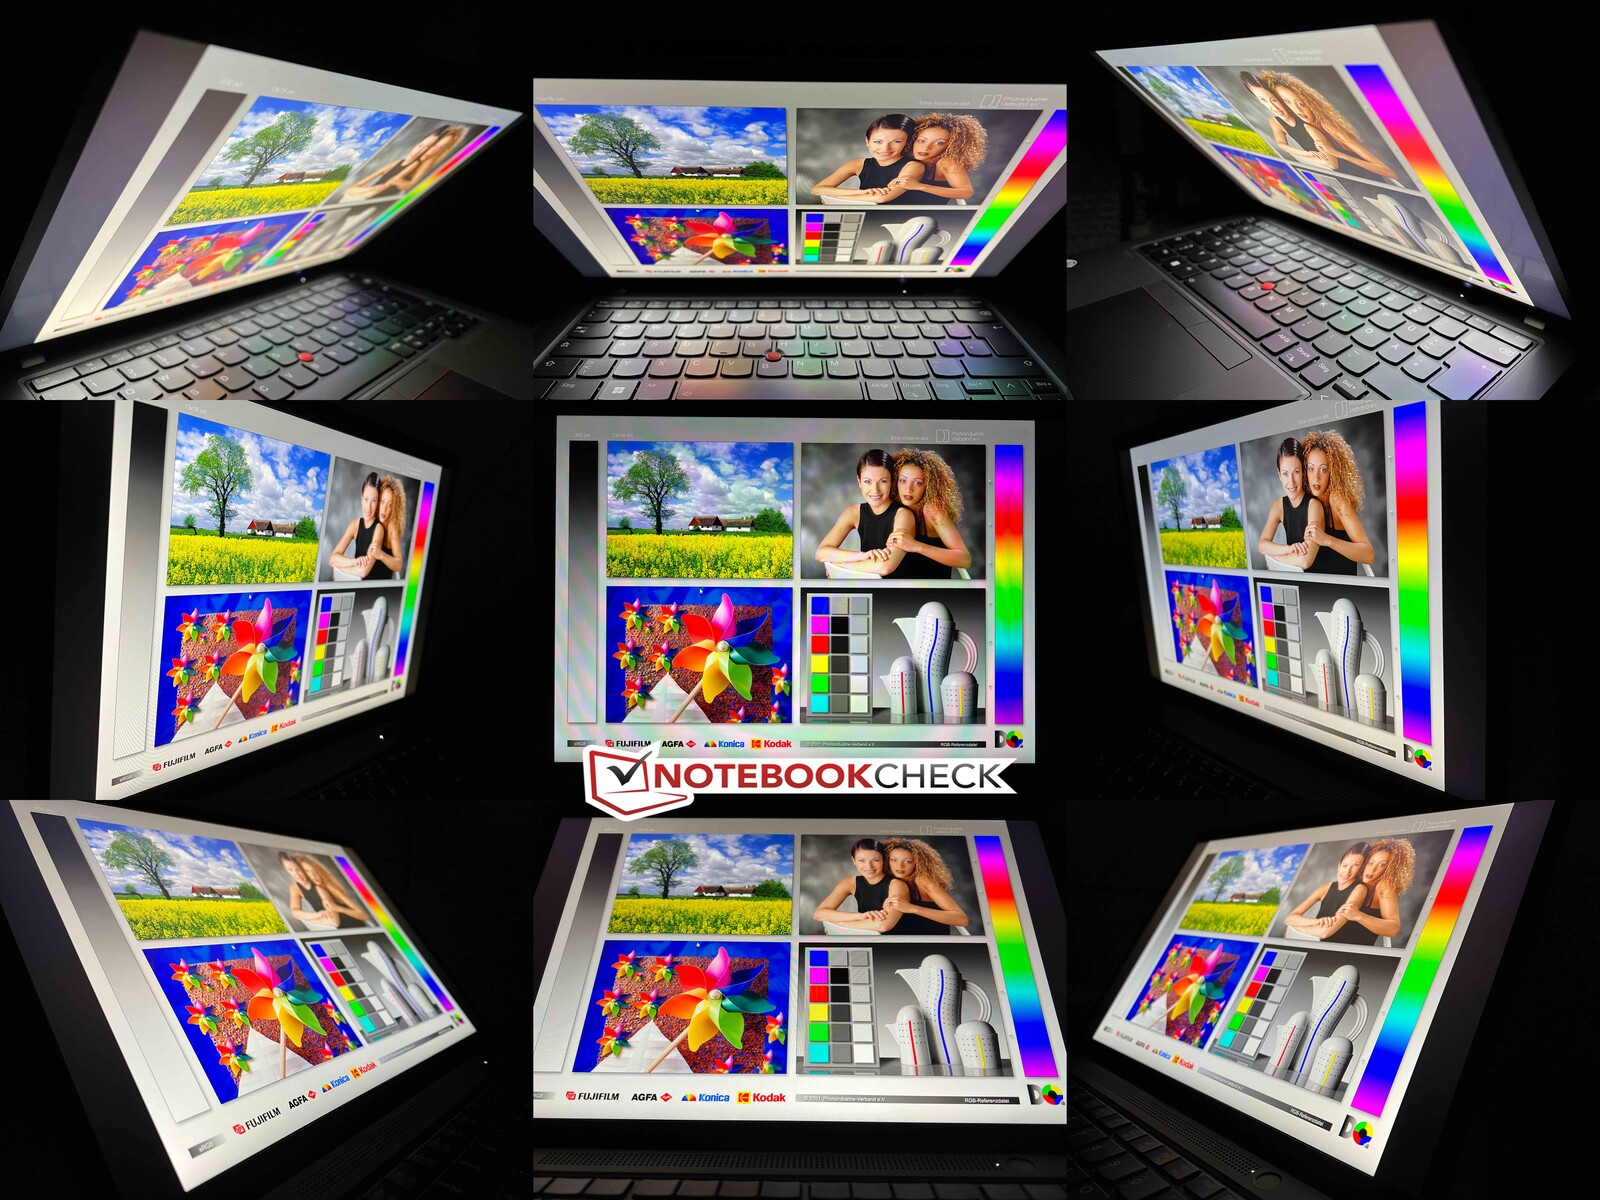
Pantalla - La lotería del panel continúa
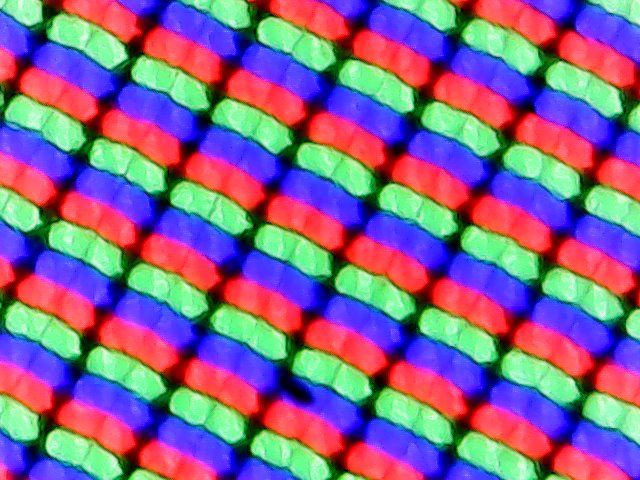
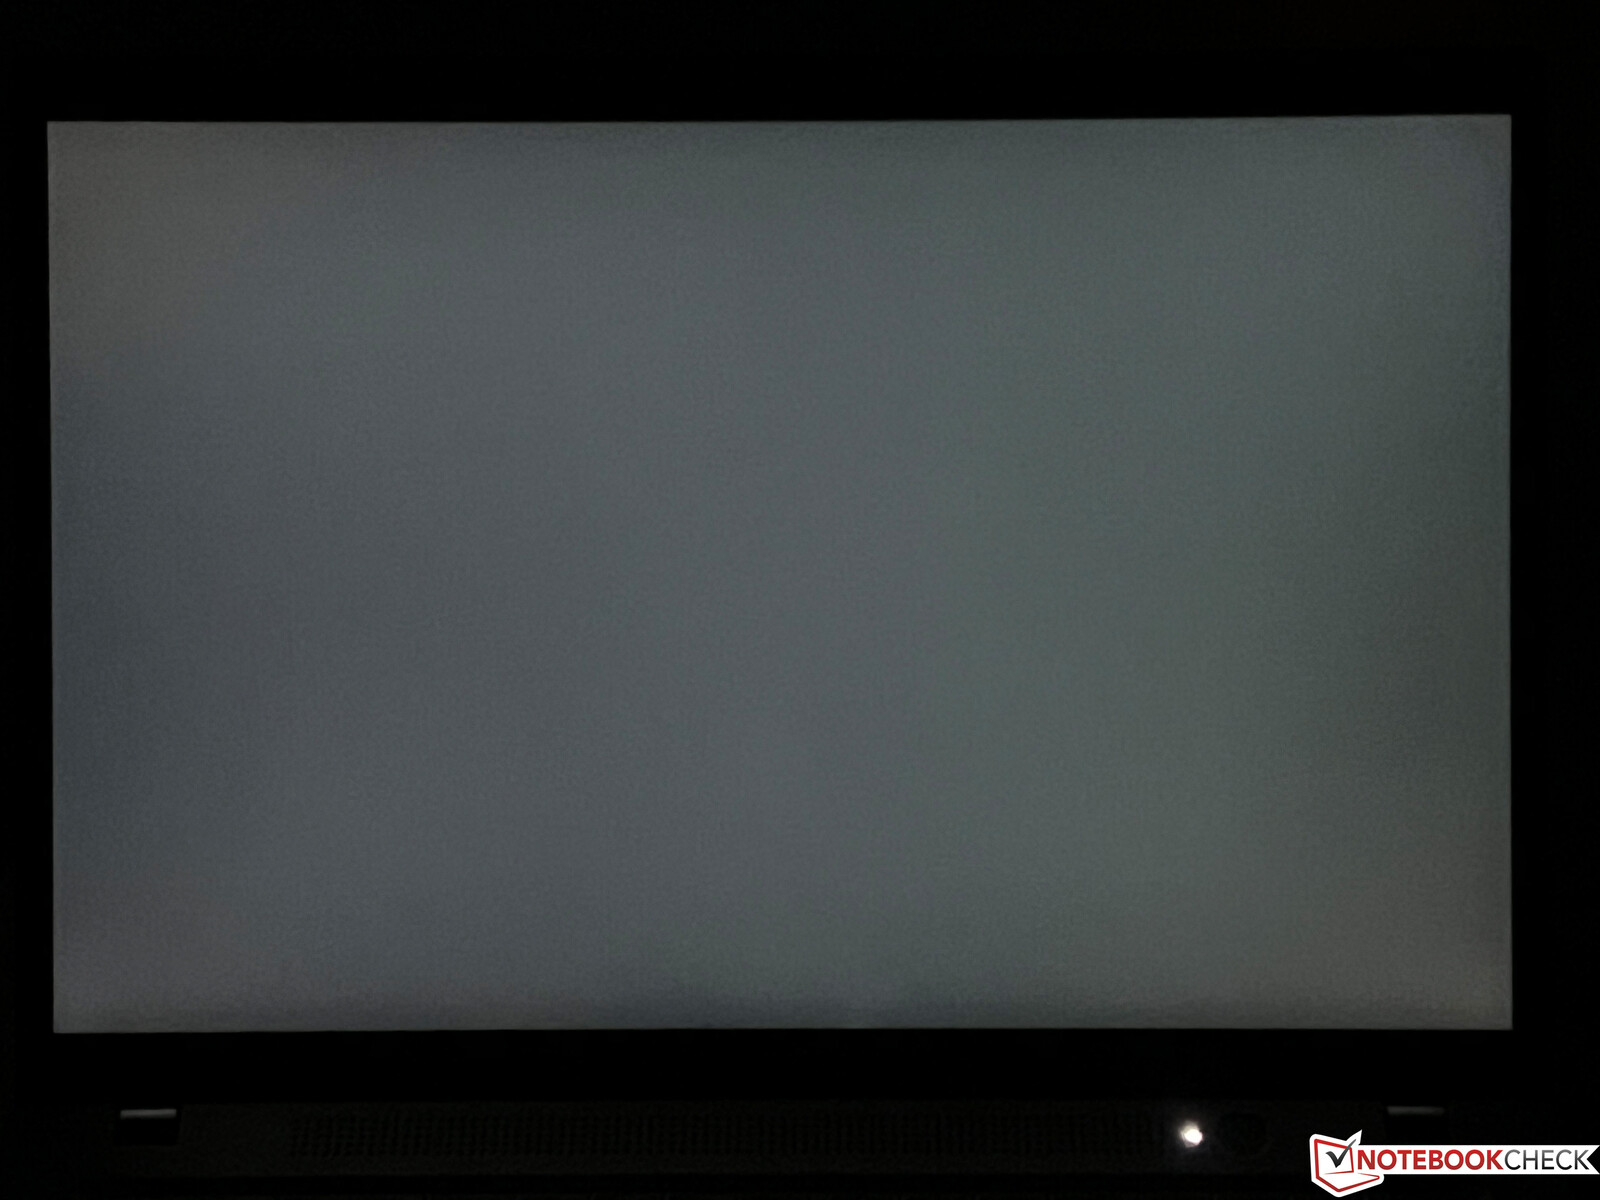
Como en anteriores modelos ThinkPad, Lenovo también usa varios fabricantes de paneles para los modelos actuales. Aunque nuestras dos unidades de pruebas están equipadas con el panel Full-HD LowPower de 14 pulgadas, hay diferencias aquí, aunque se mantengan las especificaciones técnicas básicas de ambas versiones (o incluso más, ya que hubo hasta 4 versiones en el pasado). A diferencia del panelPanel LG de nuestra anterior unidad de pruebas AMDnuestra unidad de pruebas Intel actual usa un panel de AUO, que subjetivamente no convence del todo, ya que las áreas brillantes parecen ligeramente granuladas. Los tiempos de respuesta también son significativamente más lentos aquí, y hay algunos efectos fantasma visibles, por ejemplo al mover el puntero del ratón. Sin embargo, aquí tampoco se usa PWM.
Lo mismo cabe decir del brillo, que resulta inferior al del modelo LG. Sin embargo, sigue alcanzando los 400 cd/m² anunciados. Gracias al bajo valor de negro, la relación de contraste no ofrece motivos de queja. Nuestra unidad de pruebas no tiene problemas de clouding o sangrado de pantalla, ni siquiera con el nivel de brillo más alto.
| |||||||||||||||||||||||||
iluminación: 91 %
Brillo con batería: 399 cd/m²
Contraste: 2105:1 (Negro: 0.19 cd/m²)
ΔE ColorChecker Calman: 3.5 | ∀{0.5-29.43 Ø4.71}
calibrated: 1.6
ΔE Greyscale Calman: 4.8 | ∀{0.09-98 Ø4.96}
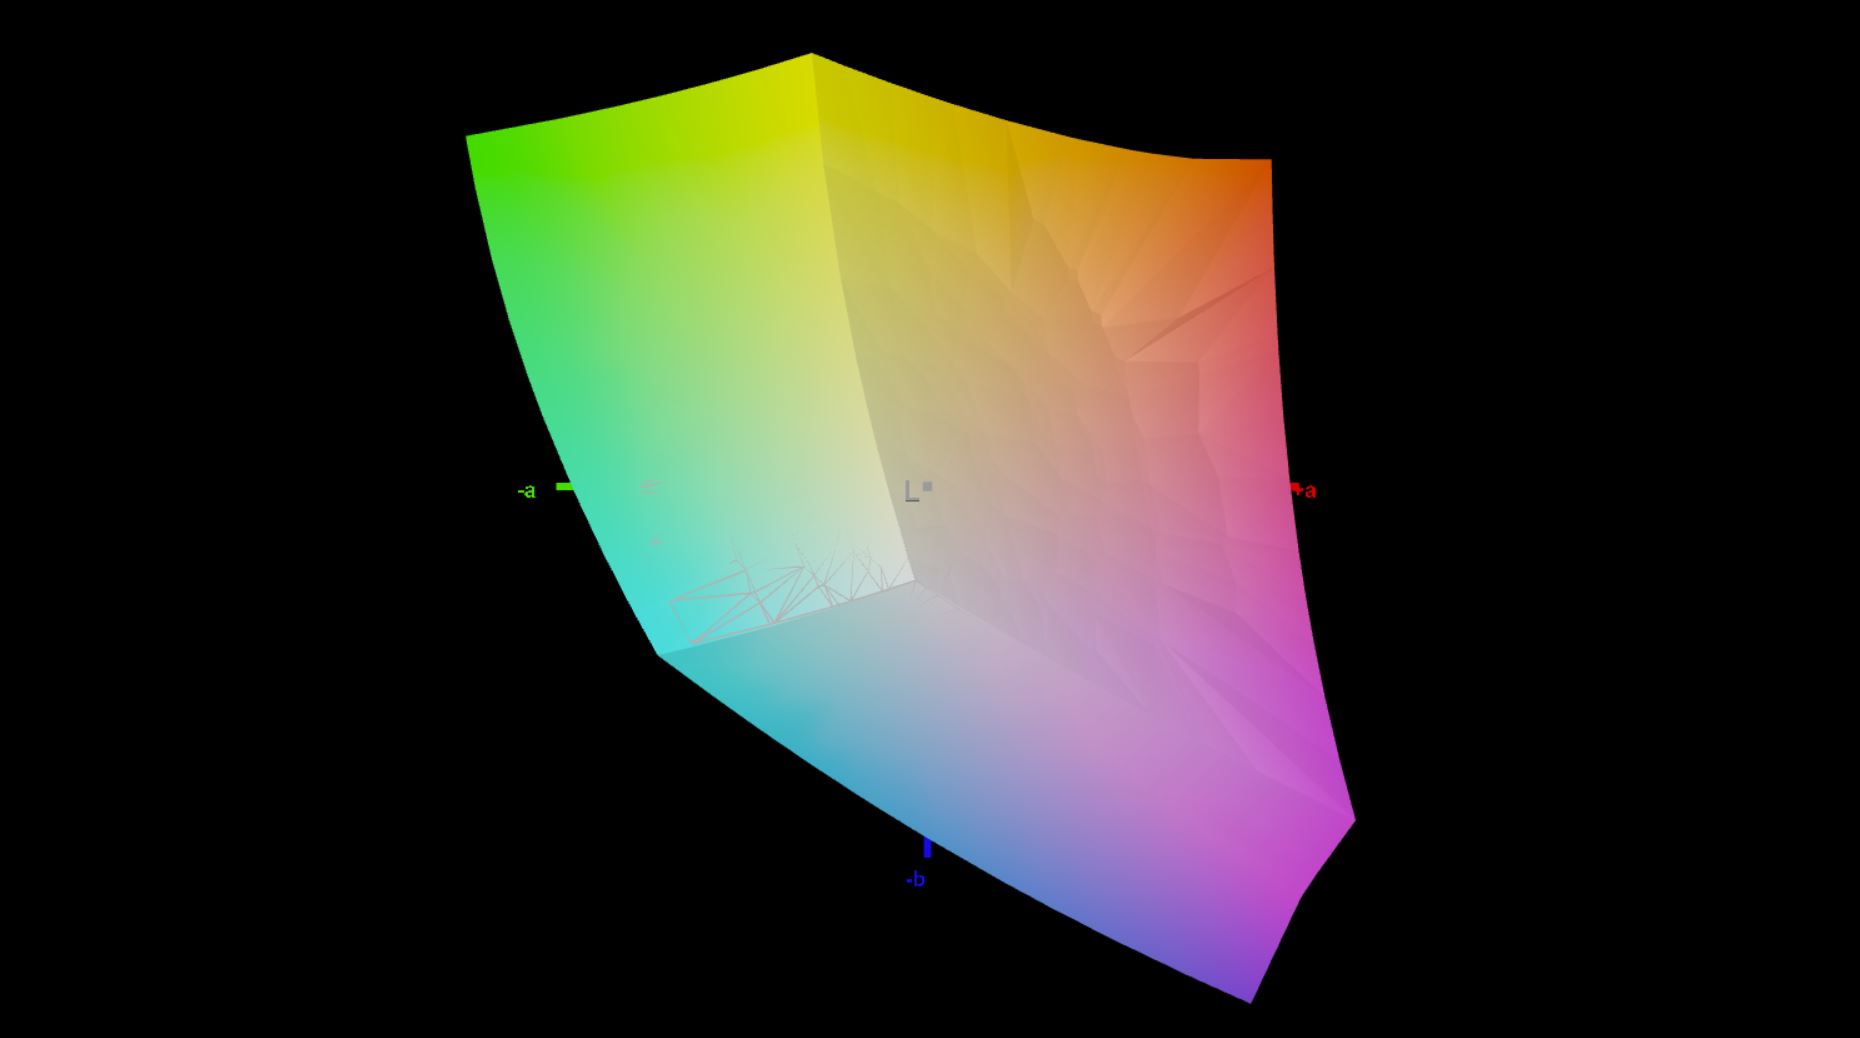
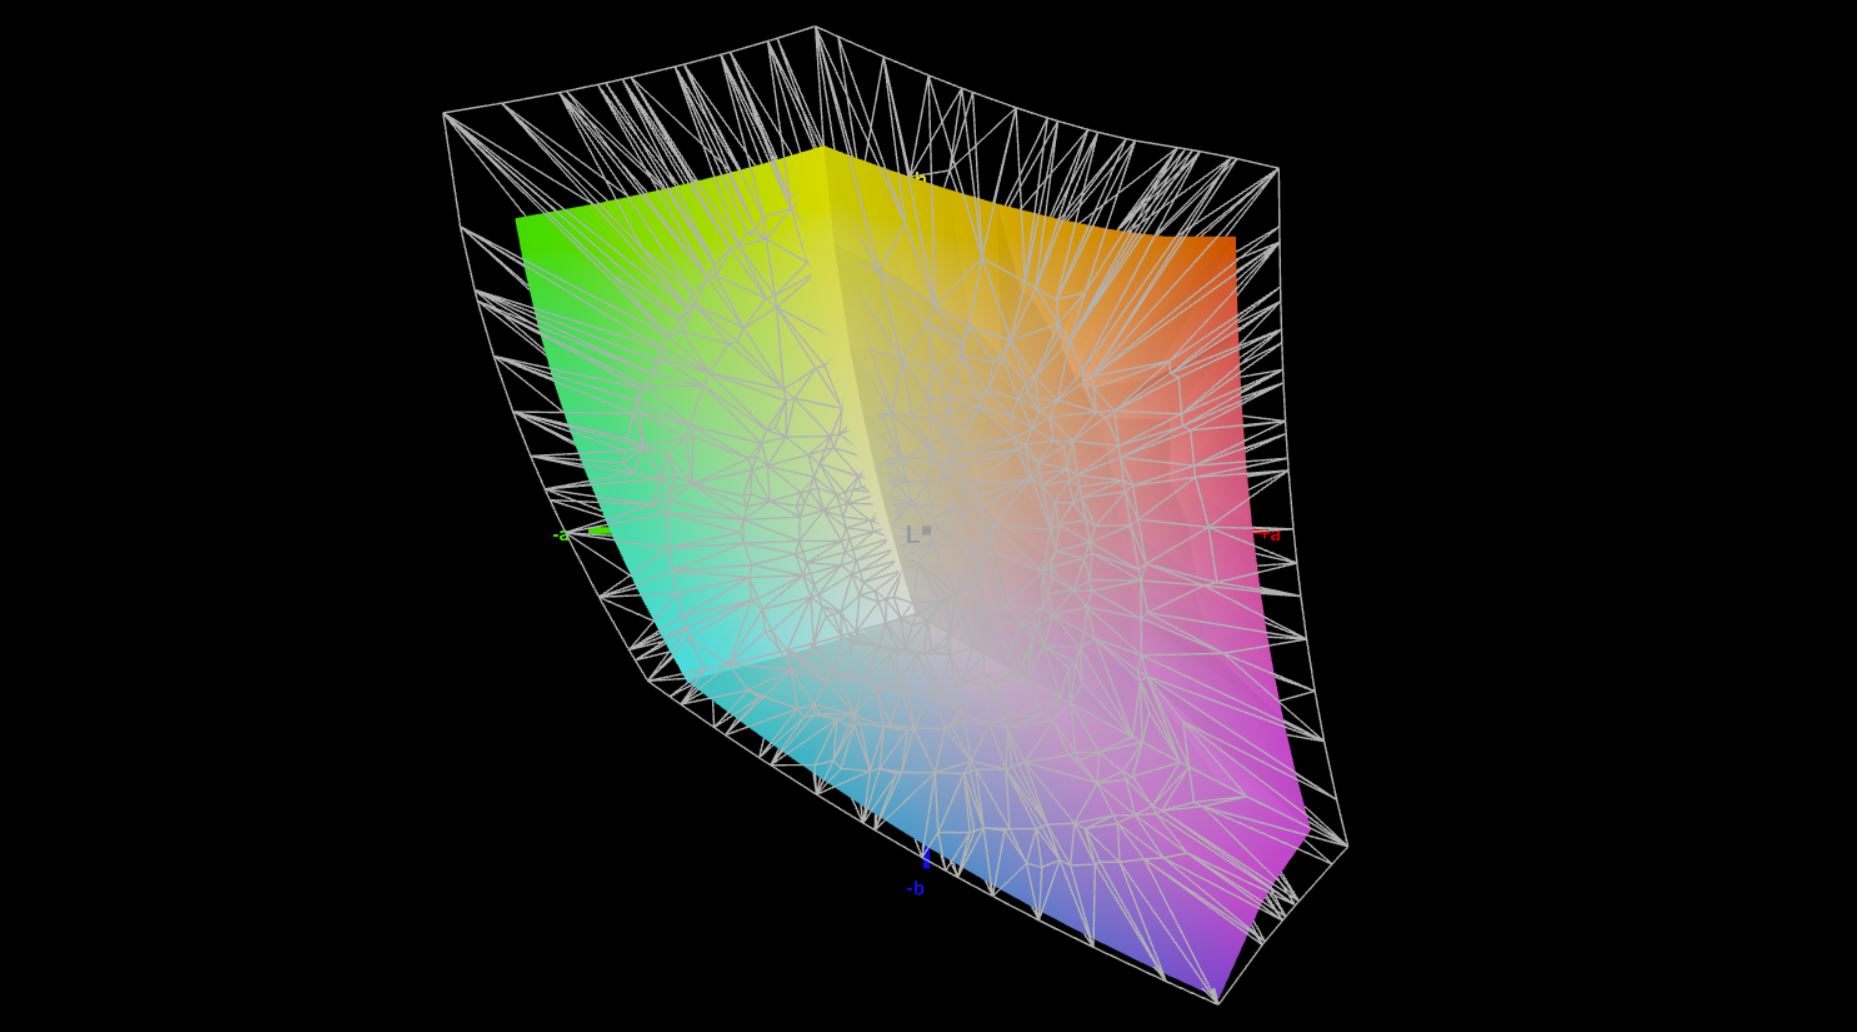
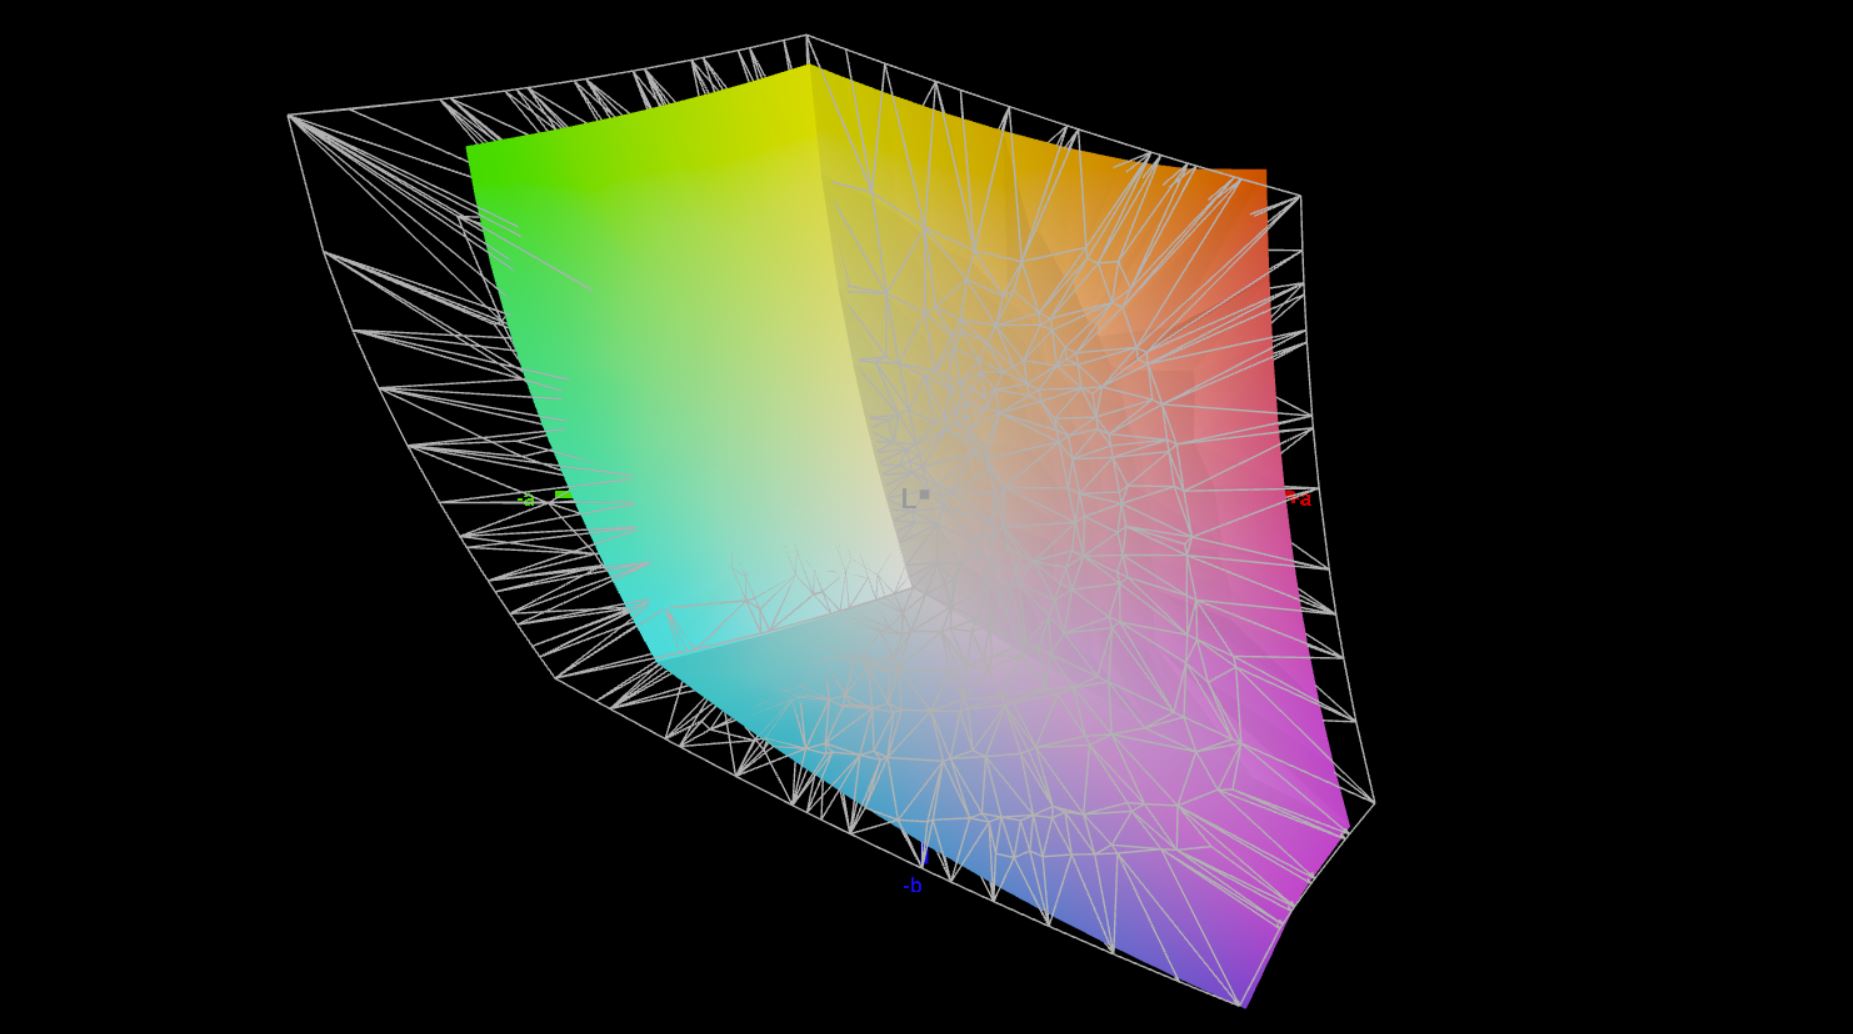
77.9% AdobeRGB 1998 (Argyll 3D)
100% sRGB (Argyll 3D)
76.3% Display P3 (Argyll 3D)
Gamma: 2.11
CCT: 6662 K
| Lenovo ThinkPad T14 G3-21AJS00400 B140UAN02.1, IPS, 1920x1200, 14" | Lenovo ThinkPad T14 G3-21CF004NGE LP140WU1-SPB2, IPS, 1920x1200, 14" | HP EliteBook 840 G9 Chi Mei CMN1435, IPS, 1920x1200, 14" | Schenker Vision 14 2022 RTX 3050 Ti MNE007ZA1-1, IPS, 2880x1800, 14" | Huawei MateBook X Pro 2022 TMX1422, IPS, 3120x2080, 14.2" | |
|---|---|---|---|---|---|
| Display | -7% | -8% | -3% | 12% | |
| Display P3 Coverage (%) | 76.3 | 69.2 -9% | 67.6 -11% | 74.1 -3% | 94.6 24% |
| sRGB Coverage (%) | 100 | 97.4 -3% | 98.7 -1% | 97.4 -3% | 99.5 0% |
| AdobeRGB 1998 Coverage (%) | 77.9 | 71.5 -8% | 69.7 -11% | 75.3 -3% | 86.5 11% |
| Response Times | 40% | -19% | 54% | 55% | |
| Response Time Grey 50% / Grey 80% * (ms) | 62.6 ? | 41.4 ? 34% | 66 ? -5% | 31.5 ? 50% | 25.4 ? 59% |
| Response Time Black / White * (ms) | 34.9 ? | 19.2 ? 45% | 46.4 ? -33% | 14.5 ? 58% | 17.1 ? 51% |
| PWM Frequency (Hz) | |||||
| Screen | 16% | 14% | -6% | 22% | |
| Brightness middle (cd/m²) | 400 | 451 13% | 391.3 -2% | 421 5% | 603 51% |
| Brightness (cd/m²) | 395 | 435 10% | 368 -7% | 416 5% | 586 48% |
| Brightness Distribution (%) | 91 | 94 3% | 86 -5% | 89 -2% | 91 0% |
| Black Level * (cd/m²) | 0.19 | 0.21 -11% | 0.32 -68% | 0.28 -47% | 0.39 -105% |
| Contrast (:1) | 2105 | 2148 2% | 1223 -42% | 1504 -29% | 1546 -27% |
| Colorchecker dE 2000 * | 3.5 | 2.4 31% | 1.49 57% | 3.2 9% | 1.1 69% |
| Colorchecker dE 2000 max. * | 7.2 | 4.1 43% | 3.29 54% | 5.5 24% | 2.2 69% |
| Colorchecker dE 2000 calibrated * | 1.6 | 1.3 19% | 0.44 73% | 2 -25% | 1.2 25% |
| Greyscale dE 2000 * | 4.8 | 3.3 31% | 1.7 65% | 4.4 8% | 1.5 69% |
| Gamma | 2.11 104% | 2.13 103% | 2.12 104% | 2.22 99% | 2.17 101% |
| CCT | 6662 98% | 6848 95% | 6488 100% | 6384 102% | 6549 99% |
| Media total (Programa/Opciones) | 16% /
14% | -4% /
5% | 15% /
3% | 30% /
25% |
* ... más pequeño es mejor
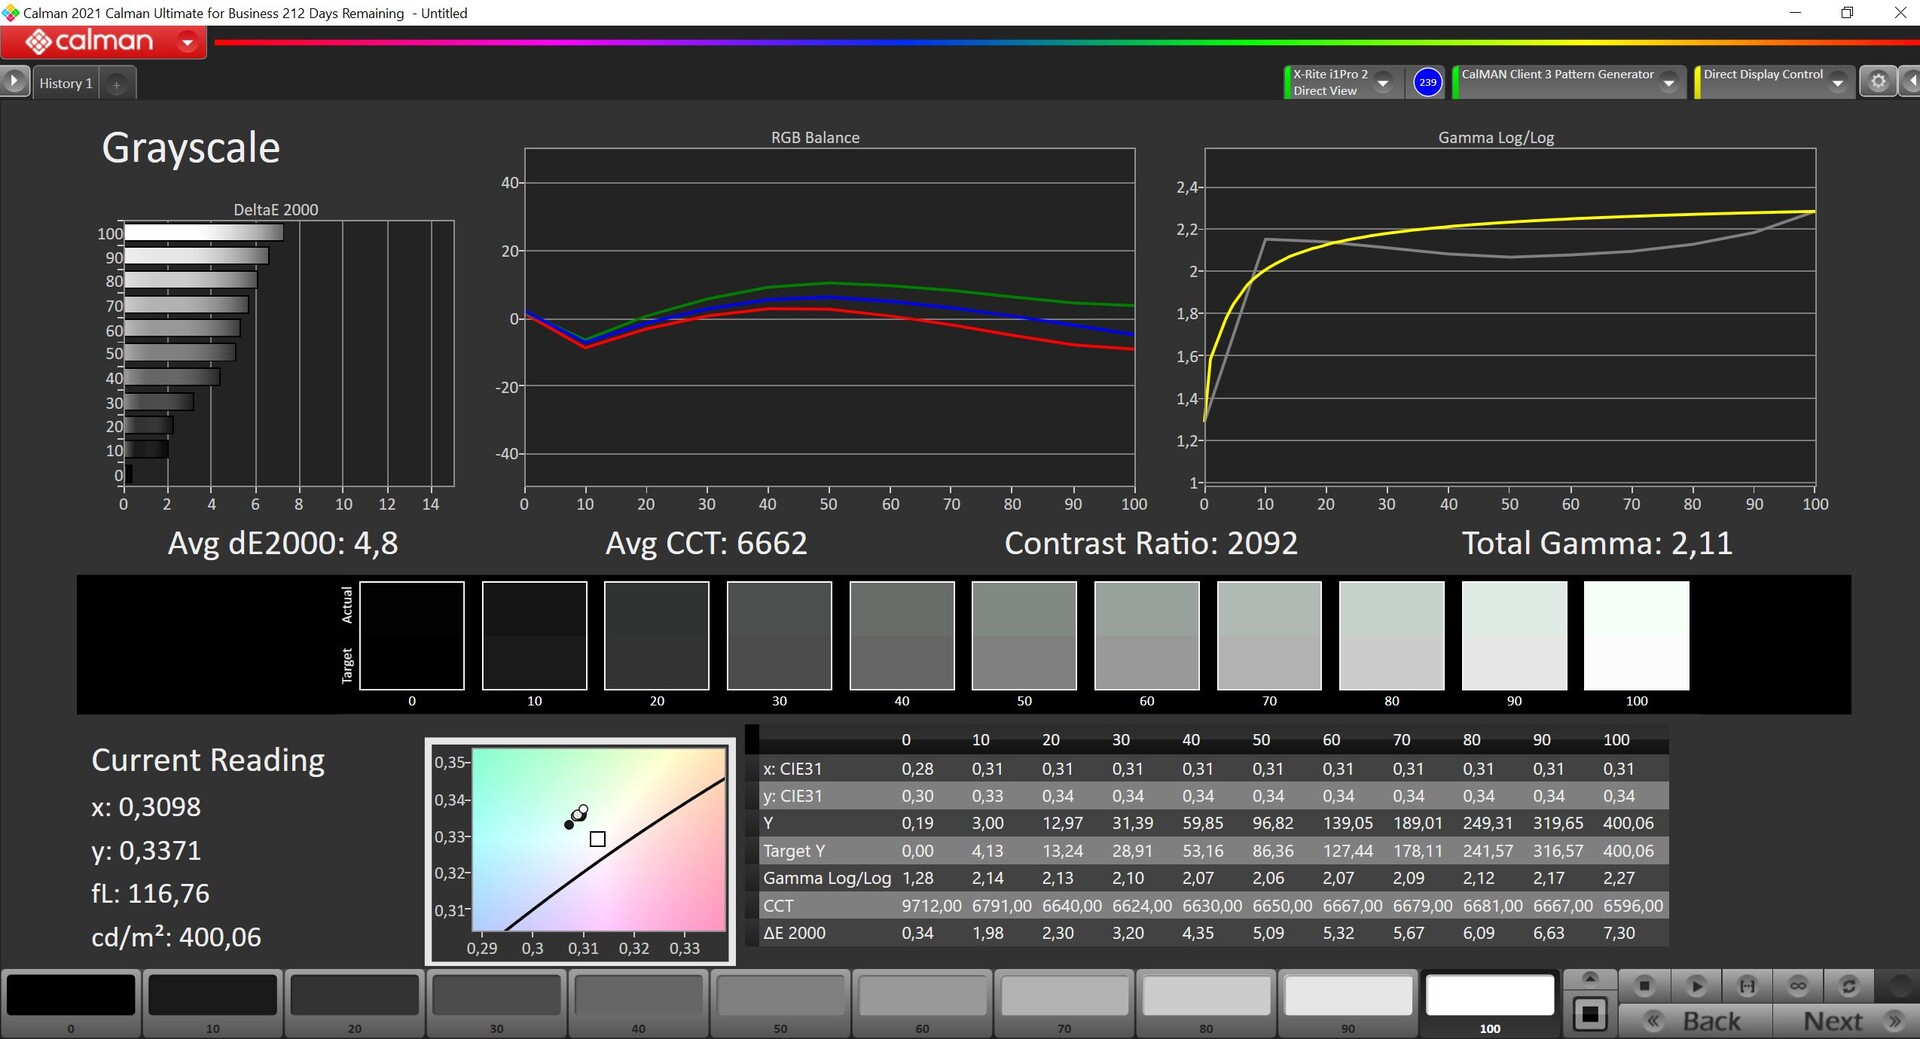
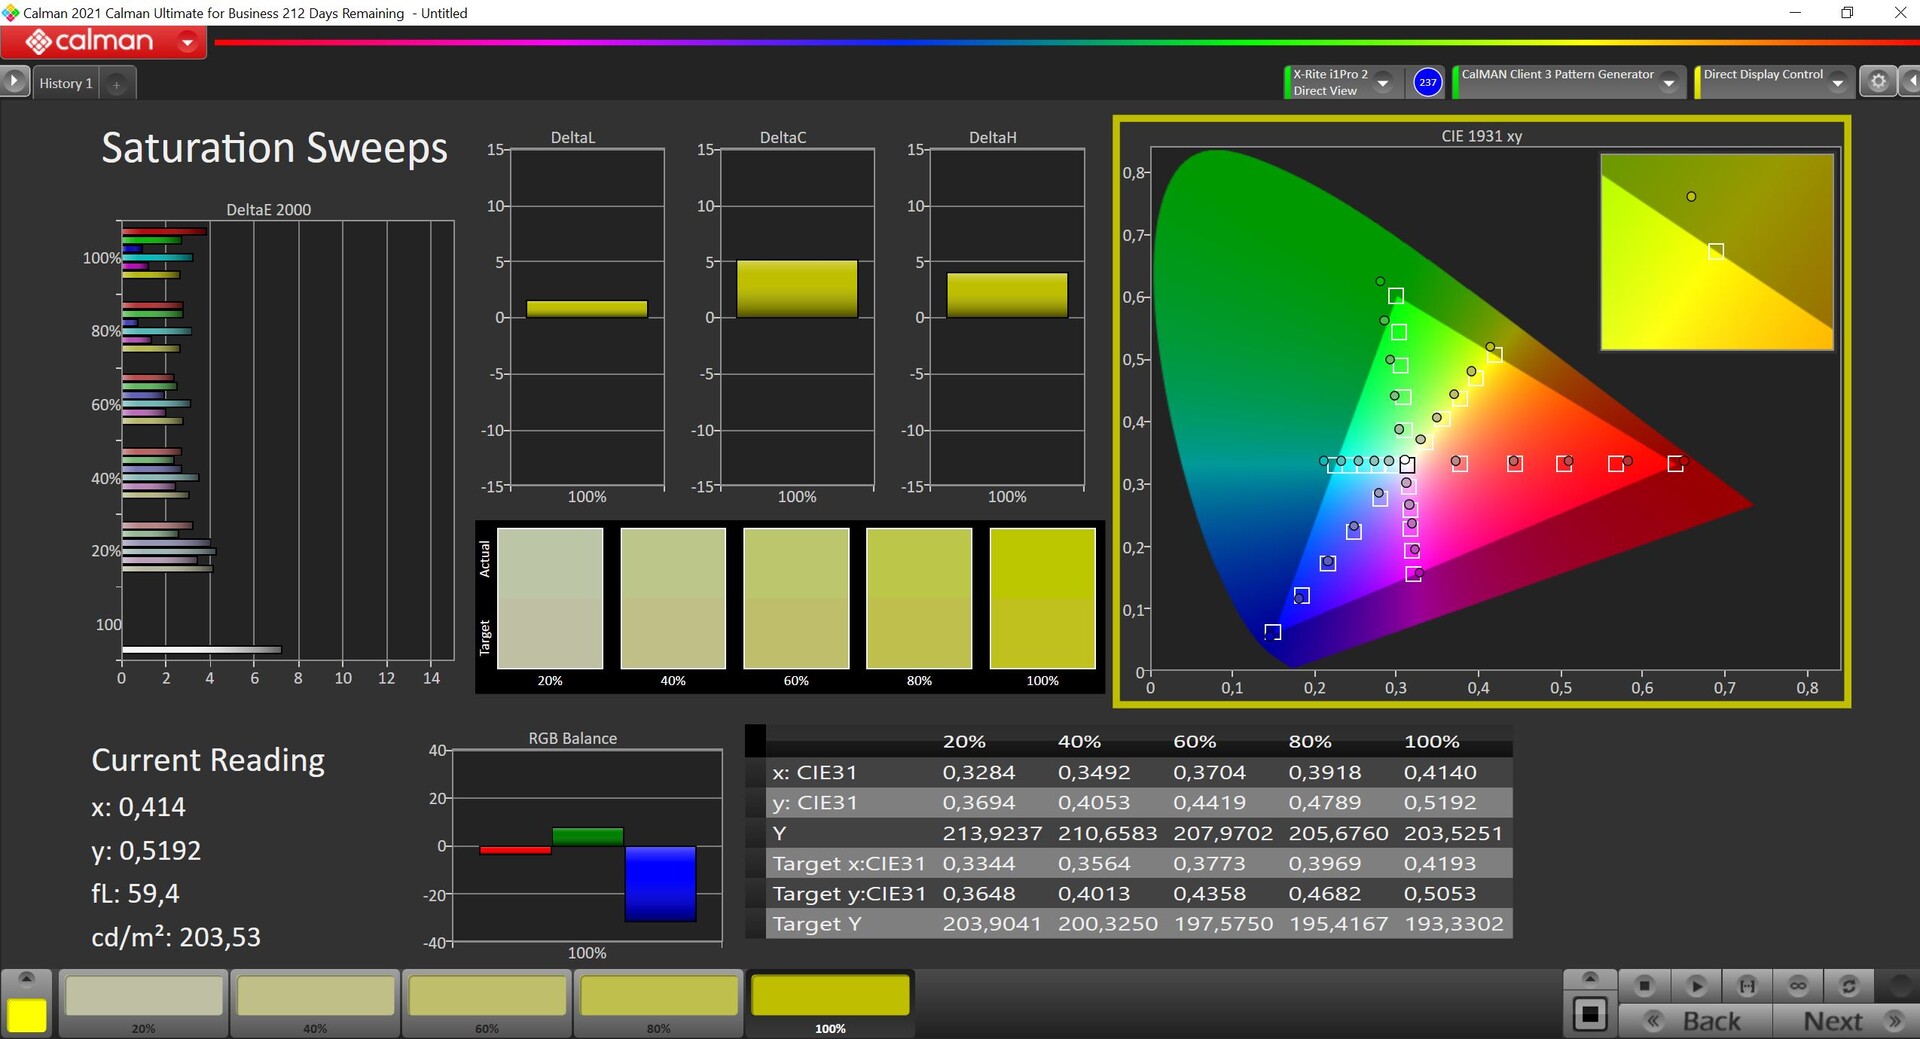
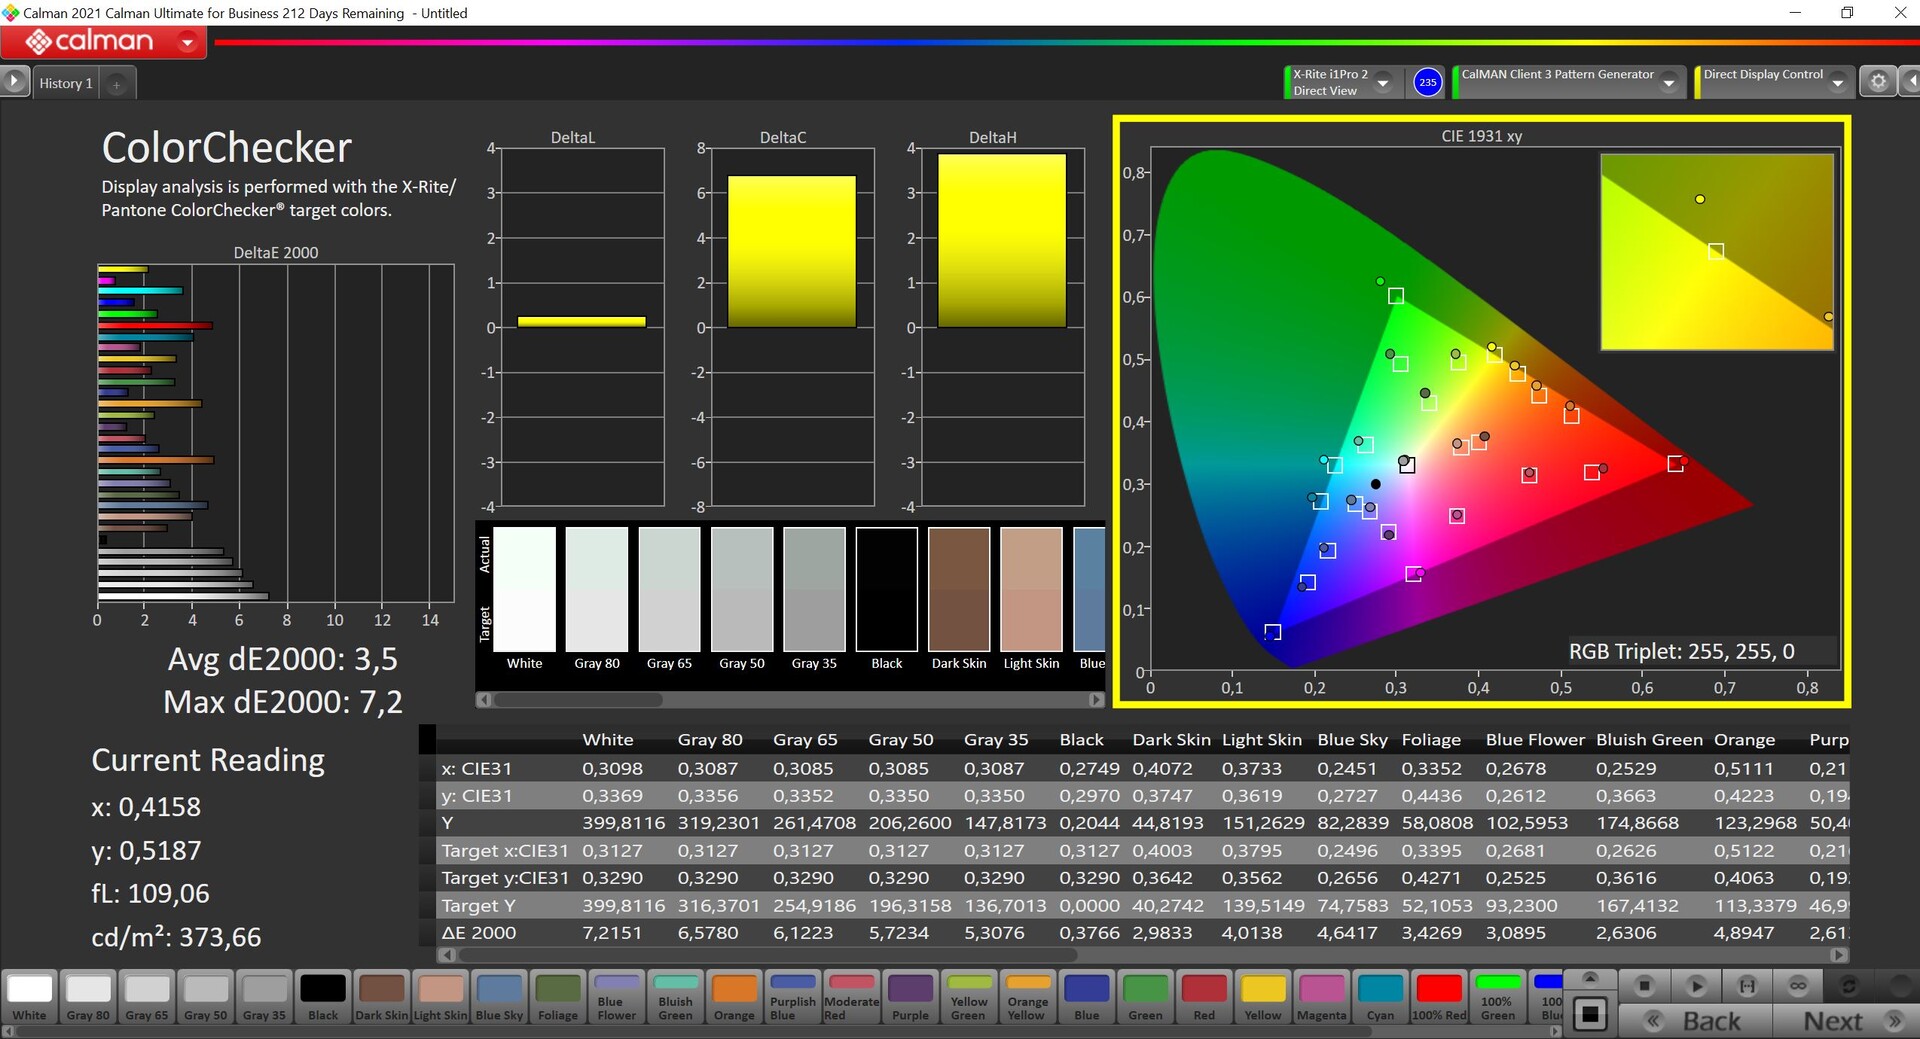
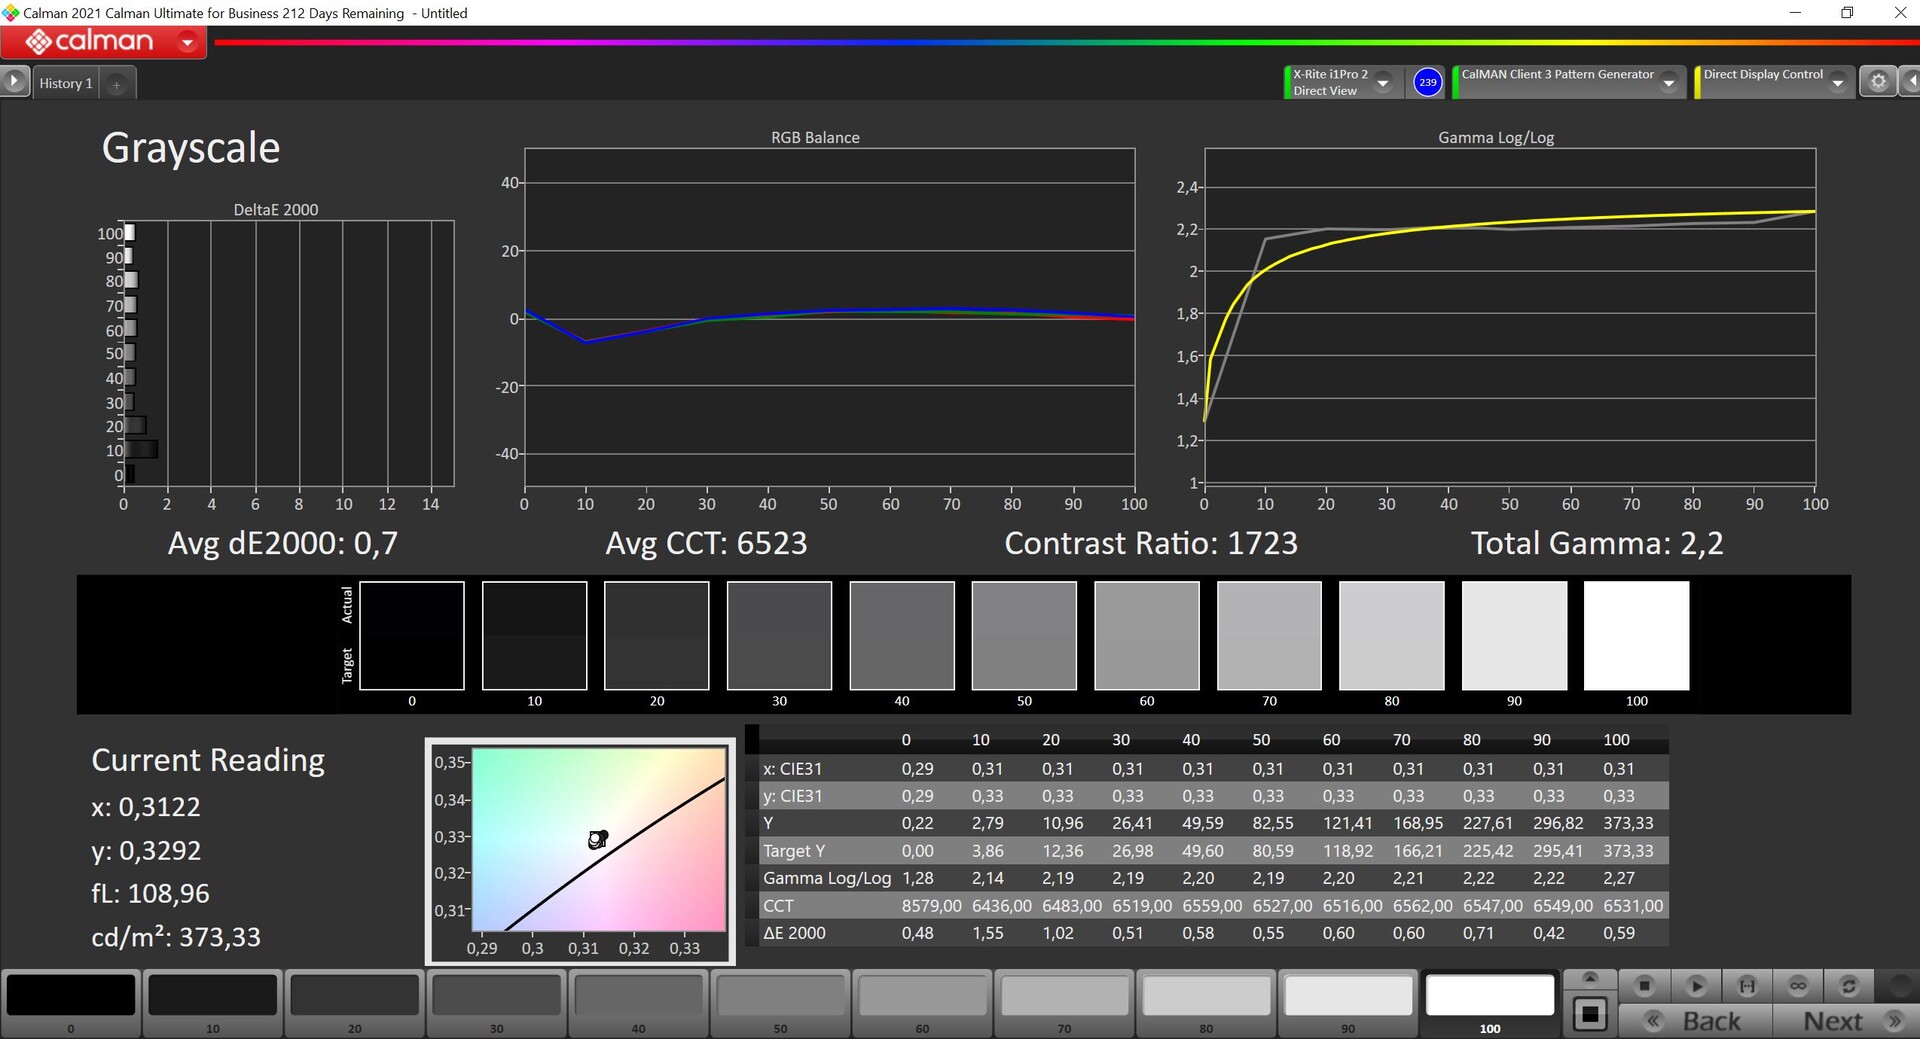
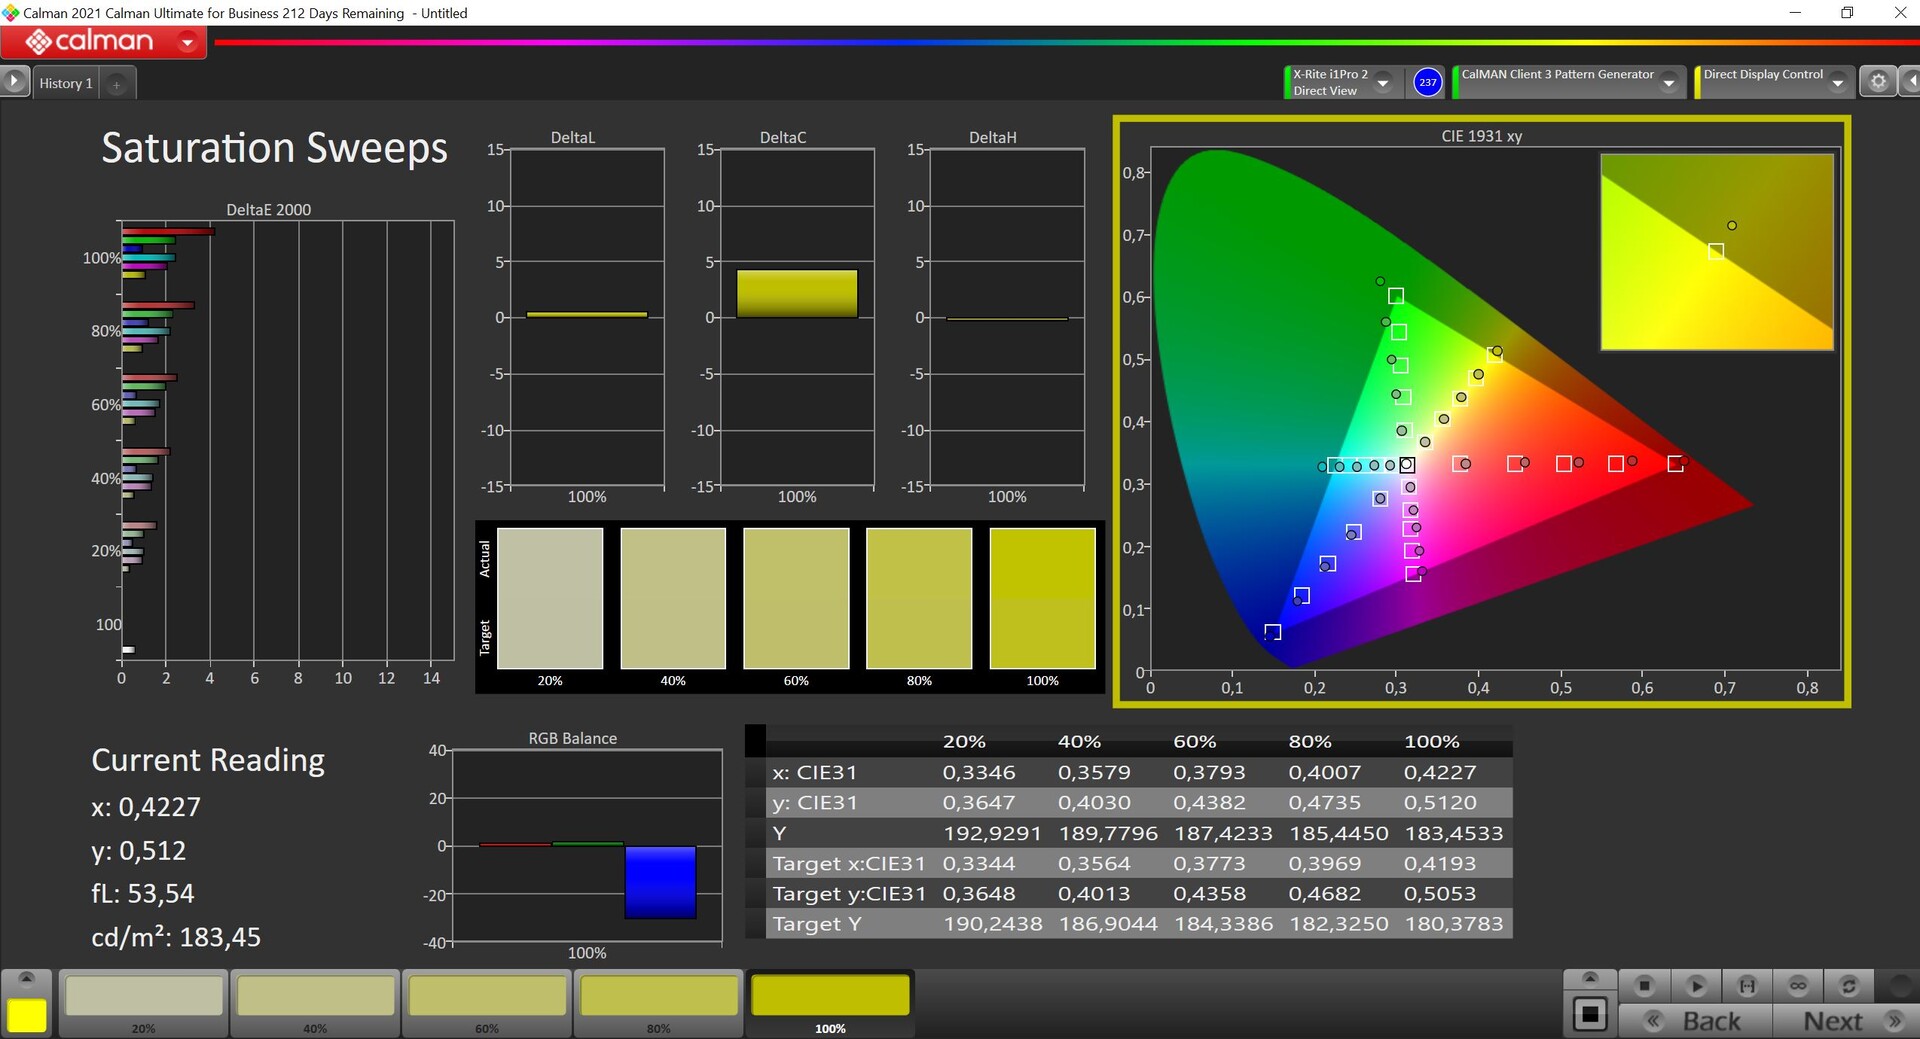
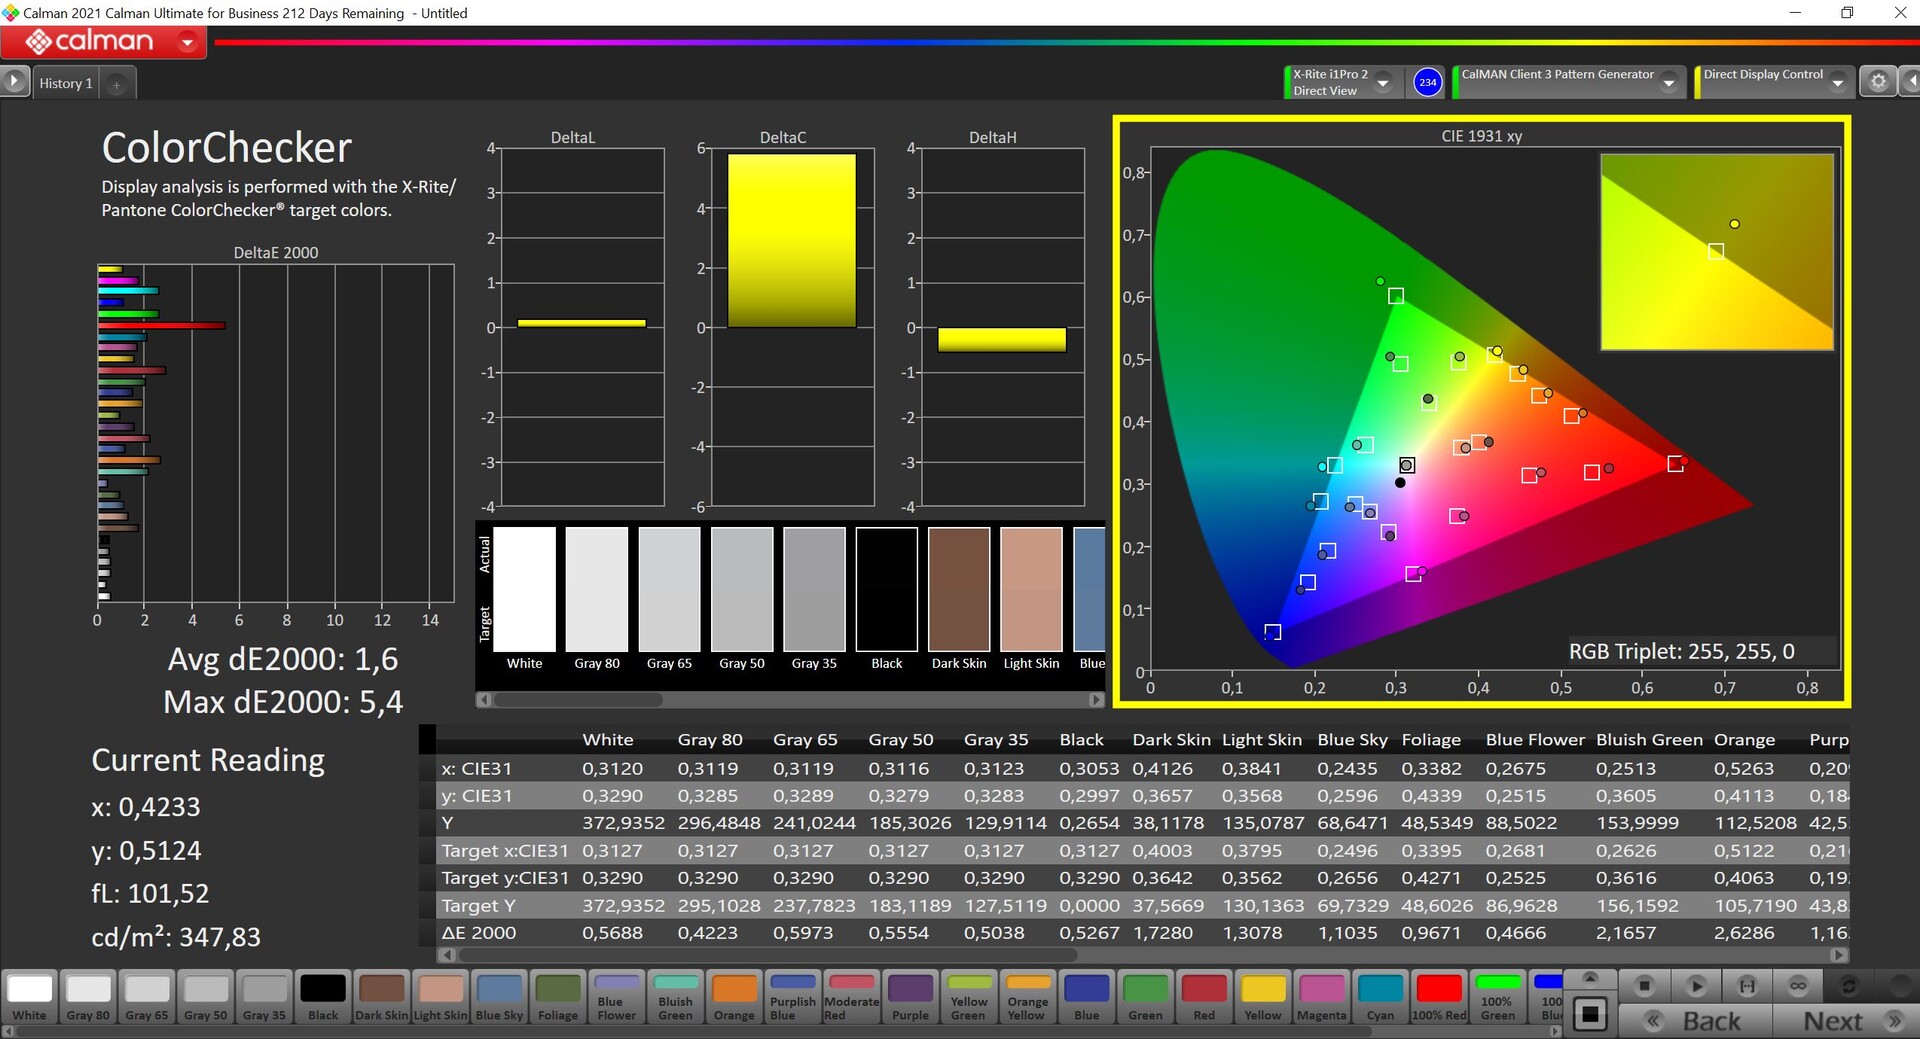
Medimos el panel con el software profesional CalMAN (X-Rite i1 Pro 2). Aunque hay un ligero tinte de color hacia el verde/azul en el estado de entrega, no es muy aparente en el funcionamiento diario, y los resultados ya son decentes para un portátil de empresa. Con nuestro propio calibrado (perfil de color disponible para descarga gratuita en el enlace anterior), podemos mejorar aún más la reproducción del color. En combinación con la cobertura completa del espacio de color sRGB, el panel es bastante adecuado para tareas ocasionales de procesado de imagen o vídeo.
Tiempos de respuesta del display
| ↔ Tiempo de respuesta de Negro a Blanco | ||
|---|---|---|
| 34.9 ms ... subida ↗ y bajada ↘ combinada | ↗ 16.5 ms subida | 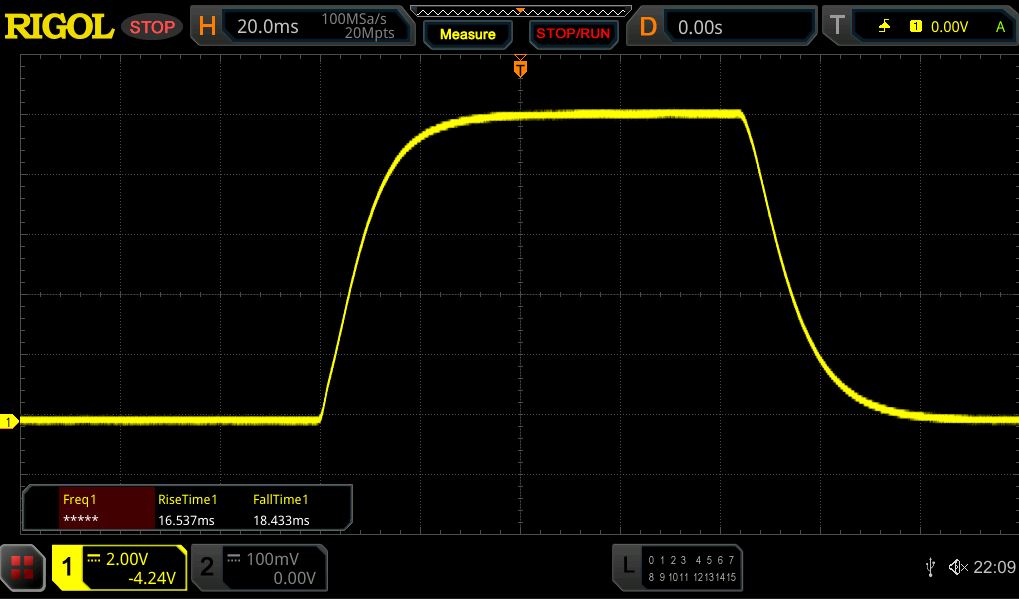 |
| ↘ 18.4 ms bajada | ||
| La pantalla mostró tiempos de respuesta lentos en nuestros tests y podría ser demasiado lenta para los jugones. En comparación, todos los dispositivos de prueba van de ##min### (mínimo) a 240 (máximo) ms. » 92 % de todos los dispositivos son mejores. Eso quiere decir que el tiempo de respuesta es peor que la media (19.8 ms) de todos los dispositivos testados. | ||
| ↔ Tiempo de respuesta 50% Gris a 80% Gris | ||
| 62.6 ms ... subida ↗ y bajada ↘ combinada | ↗ 28.2 ms subida | 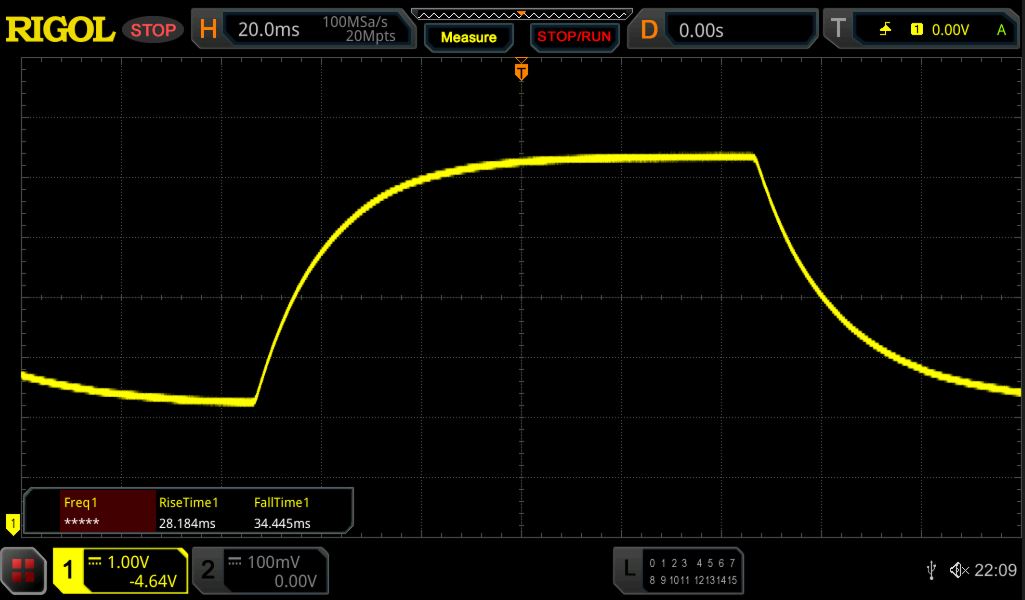 |
| ↘ 34.4 ms bajada | ||
| La pantalla mostró tiempos de respuesta lentos en nuestros tests y podría ser demasiado lenta para los jugones. En comparación, todos los dispositivos de prueba van de ##min### (mínimo) a 636 (máximo) ms. » 97 % de todos los dispositivos son mejores. Eso quiere decir que el tiempo de respuesta es peor que la media (31 ms) de todos los dispositivos testados. | ||
Parpadeo de Pantalla / PWM (Pulse-Width Modulation)
| Parpadeo de Pantalla / PWM no detectado |  | ||
Comparación: 52 % de todos los dispositivos testados no usaron PWM para atenuar el display. Si se usó, medimos una media de 7754 (mínimo: 5 - máxmo: 343500) Hz. | |||
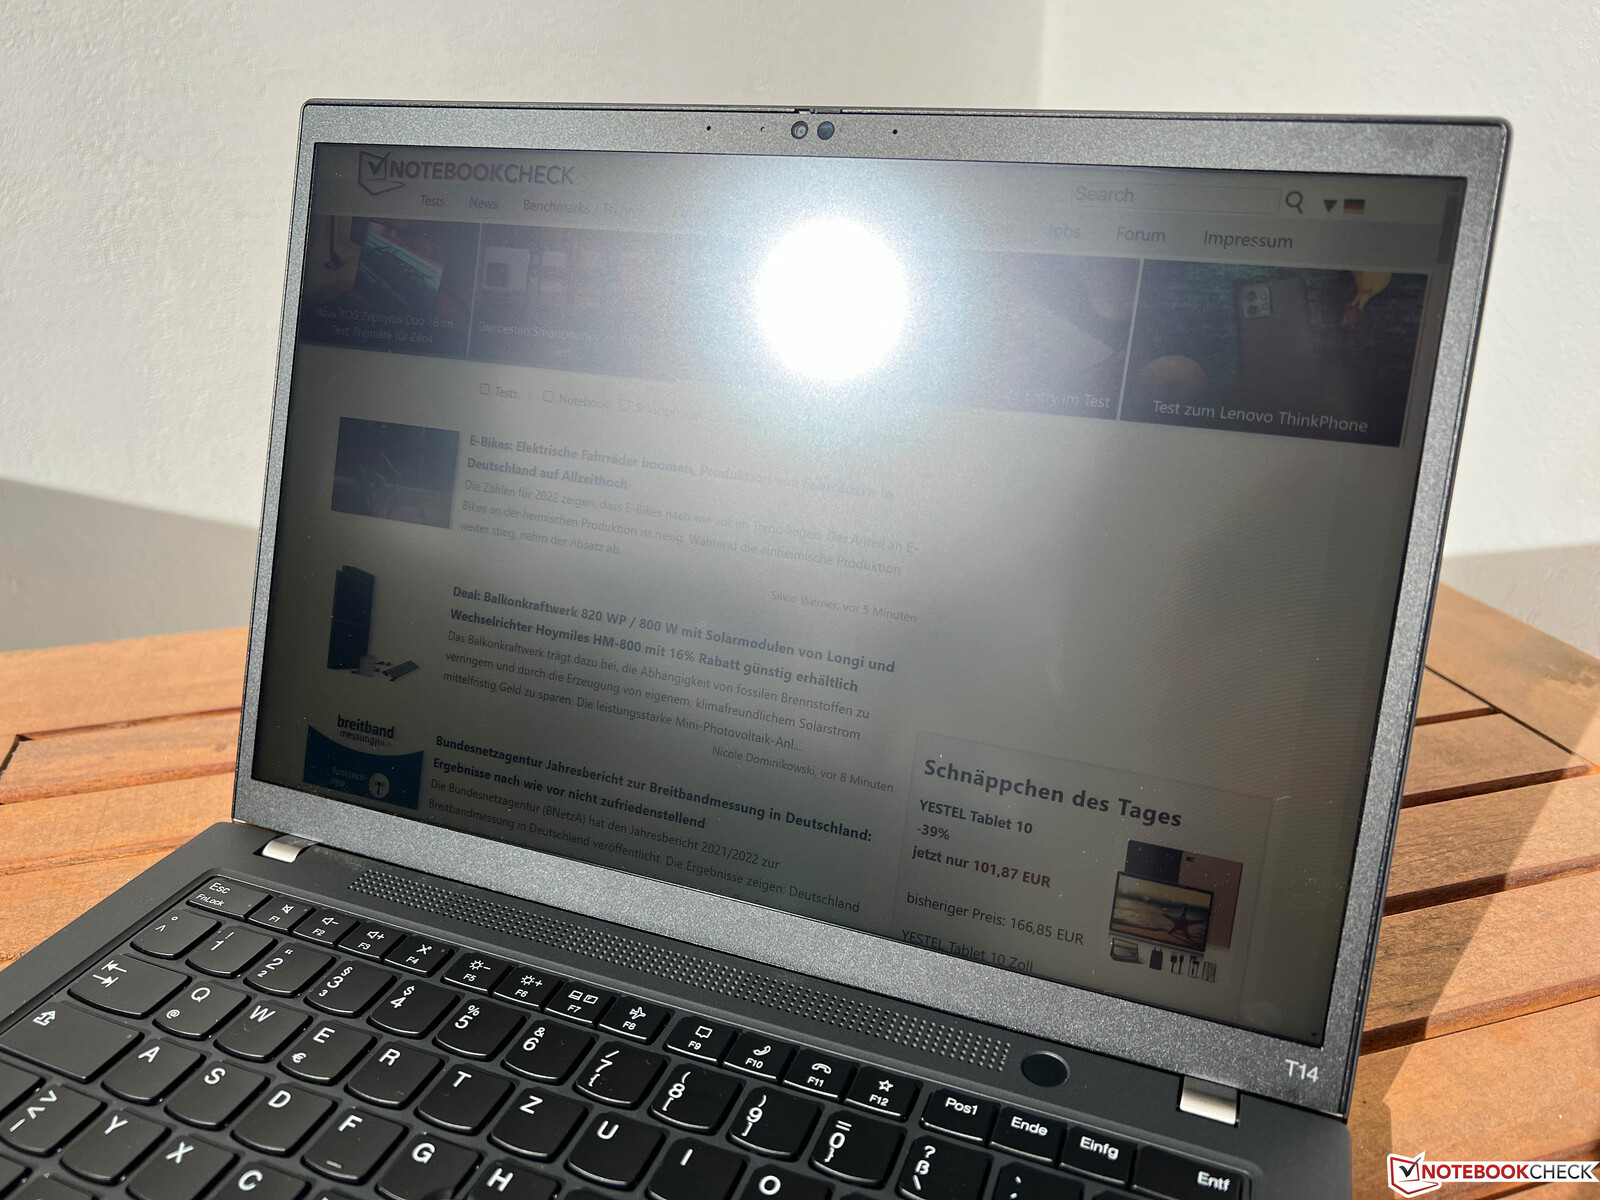
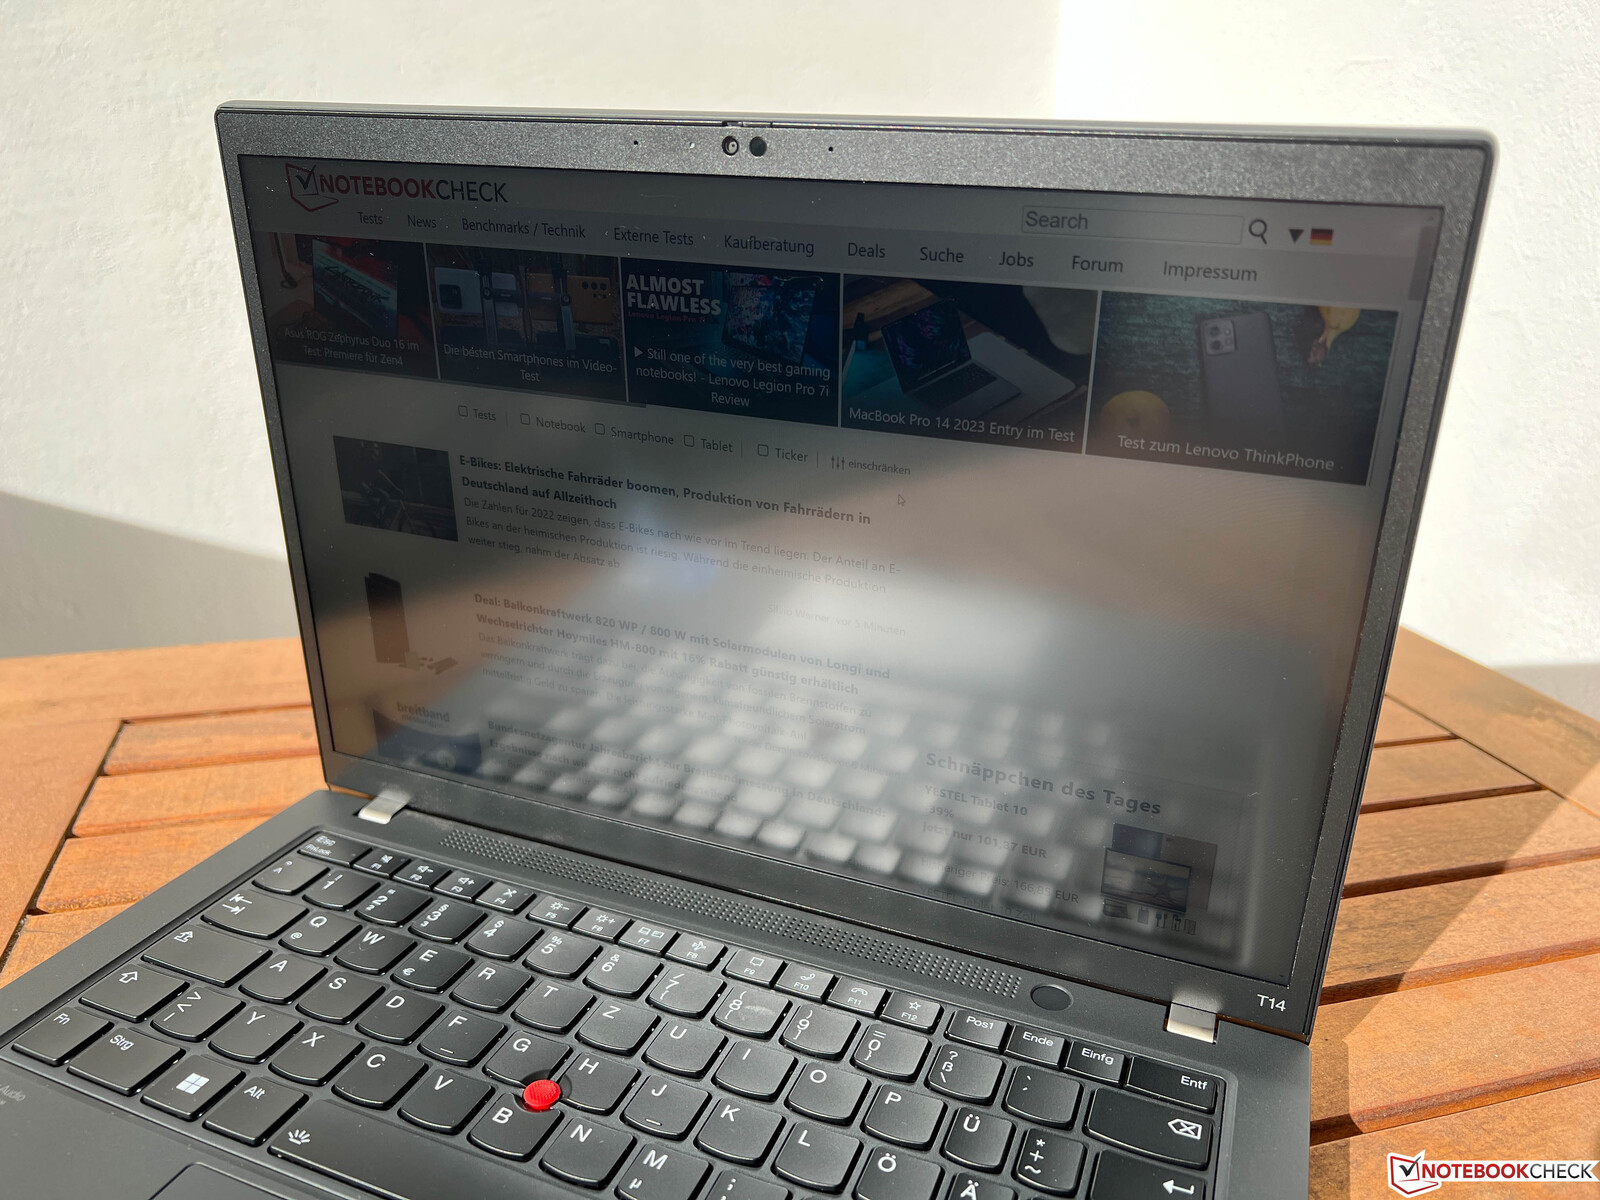
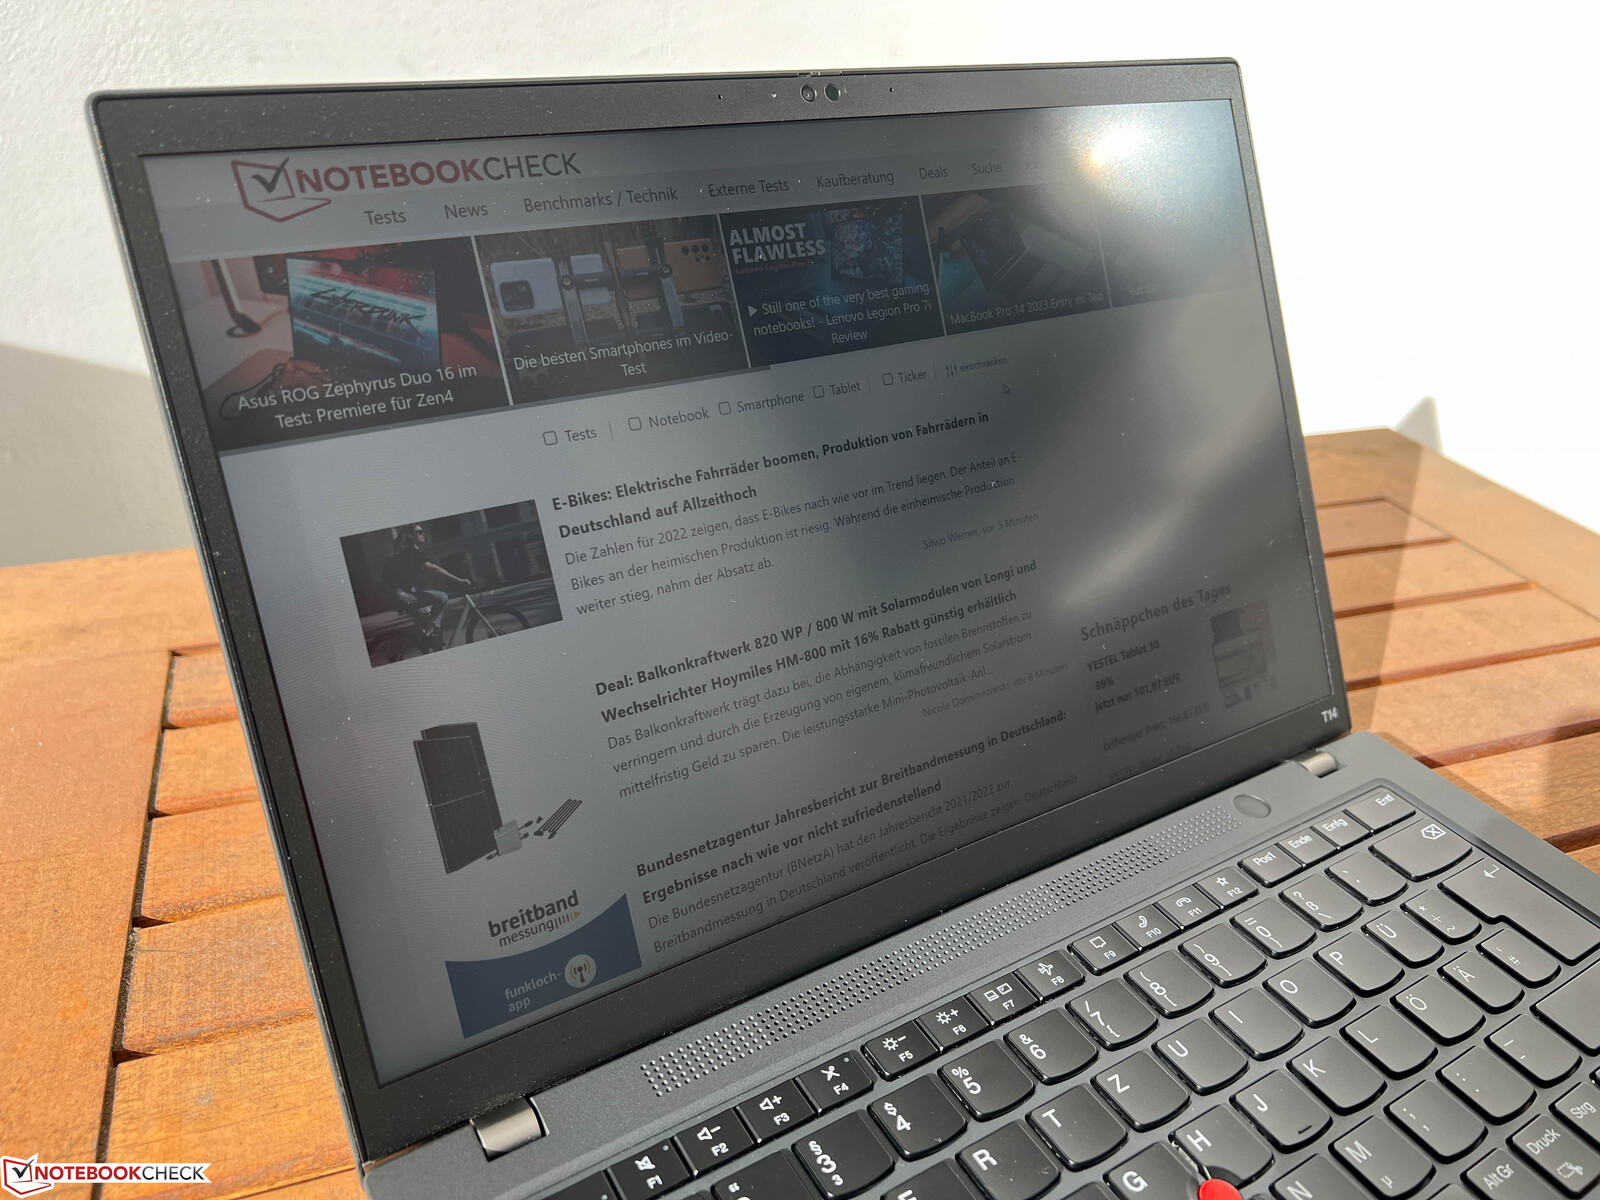
El panel rinde bien en exteriores, pero hay que evitar los reflejos de fuentes de luz directa. La estabilidad del ángulo de visión del panel IPS es muy buena.
Rendimiento - Alder Lake y GeForce MX550
Condiciones de la prueba
La Lenovo Vantage App ofrece un modo de "Refrigeración Inteligente", pero en nuestro test tuvo un efecto negativo en el rendimiento tras poco tiempo. Por tanto, desactivamos este modo para nuestras pruebas y mediciones (ya sea via app o usando la combinación de teclas Fn+T).
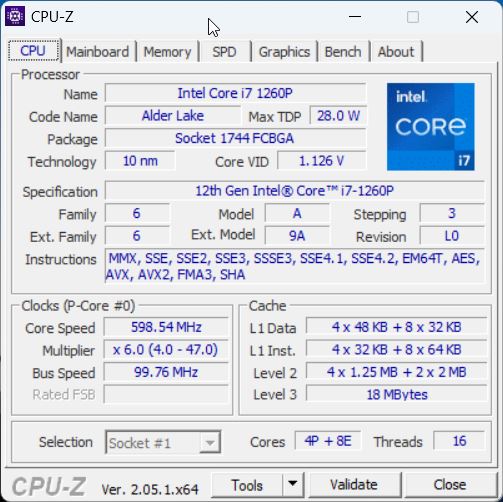
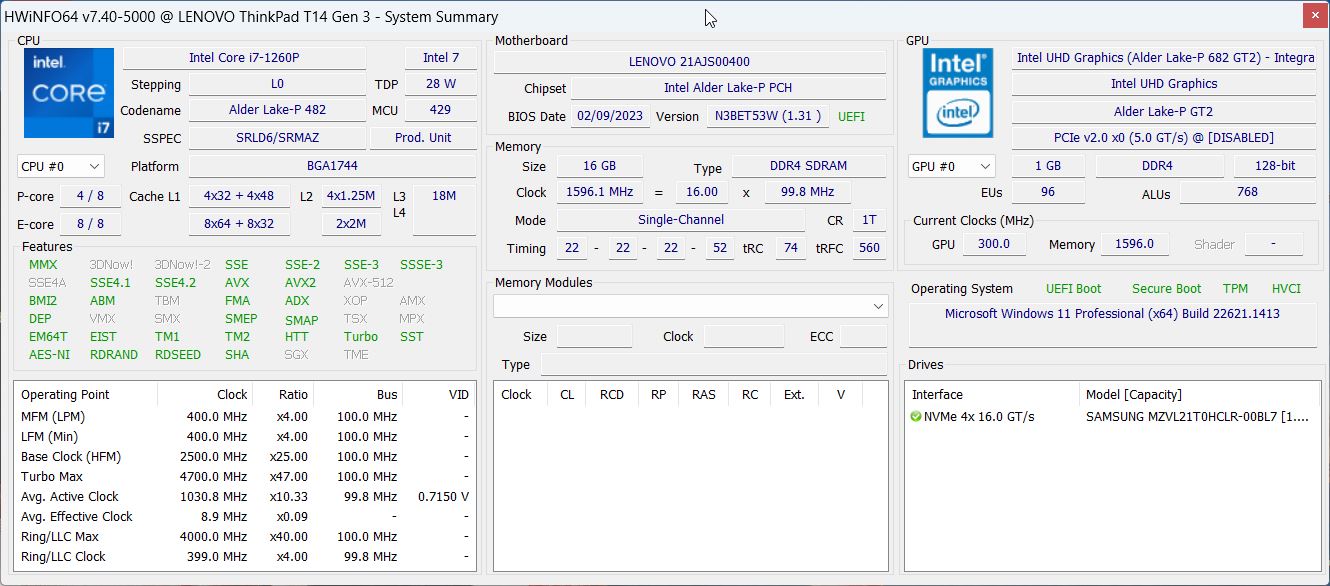
Procesador - Core i7-1260P
Ya conocemos elCore i7-1260Pde la generación Alder Lake, y con sus 4 núcleos de rendimiento rápido y 8 núcleos de eficiencia, el rendimiento es muy bueno, pero el procesador Intel también consume mucha energía con esto. En el ThinkPad T14 G3, el procesador puede consumir un máximo de hasta 58 vatios y 42 vatios constantes. El rendimiento mononúcleo es mejor que el del modelo AMD, mientras que el rendimiento multinúcleo es comparable.
Cinebench R15 Multi Constant Load Test
El rendimiento general se mantiene relativamente estable en el bucle Cinebench. Lo que también es interesante aquí es la comparación con el nuevo Raptor Lake Core i7-1360Pque tiene ventaja en la primera ejecución pero luego cae al nivel de los procesadores Alder Lake más antiguos. Sólo el rendimiento mononúcleo sigue siendo ligeramente mejor, pero en general, también puedes elegir el Core i7-1260P sin preocupaciones.
En batería, el procesador puede consumir un máximo de 32 vatios, lo que lleva a una reducción de rendimiento del ~30% en las pruebas multinúcleo. Puedes encontrar más pruebas en nuestra sección técnica.
Cinebench R23: Multi Core | Single Core
Cinebench R20: CPU (Multi Core) | CPU (Single Core)
Cinebench R15: CPU Multi 64Bit | CPU Single 64Bit
Blender: v2.79 BMW27 CPU
7-Zip 18.03: 7z b 4 | 7z b 4 -mmt1
Geekbench 5.5: Multi-Core | Single-Core
HWBOT x265 Benchmark v2.2: 4k Preset
LibreOffice : 20 Documents To PDF
R Benchmark 2.5: Overall mean
| CPU Performance rating | |
| Schenker Vision 14 2022 RTX 3050 Ti | |
| Lenovo Yoga 9 14IRP G8 | |
| HP EliteBook 840 G9 | |
| Lenovo ThinkPad T14 G3-21AJS00400 | |
| Media de la clase Office | |
| Huawei MateBook X Pro 2022 | |
| Lenovo ThinkPad T14 G3-21CF004NGE | |
| Medio Intel Core i7-1260P | |
| Cinebench R23 / Multi Core | |
| Schenker Vision 14 2022 RTX 3050 Ti | |
| Lenovo ThinkPad T14 G3-21AJS00400 | |
| Lenovo Yoga 9 14IRP G8 | |
| Media de la clase Office (1673 - 22808, n=76, últimos 2 años) | |
| Lenovo ThinkPad T14 G3-21CF004NGE | |
| HP EliteBook 840 G9 | |
| Medio Intel Core i7-1260P (3173 - 12150, n=27) | |
| Huawei MateBook X Pro 2022 | |
| Cinebench R23 / Single Core | |
| Lenovo Yoga 9 14IRP G8 | |
| Lenovo ThinkPad T14 G3-21AJS00400 | |
| HP EliteBook 840 G9 | |
| Media de la clase Office (708 - 2130, n=76, últimos 2 años) | |
| Schenker Vision 14 2022 RTX 3050 Ti | |
| Medio Intel Core i7-1260P (1155 - 1812, n=25) | |
| Huawei MateBook X Pro 2022 | |
| Lenovo ThinkPad T14 G3-21CF004NGE | |
| Cinebench R20 / CPU (Multi Core) | |
| Schenker Vision 14 2022 RTX 3050 Ti | |
| Lenovo ThinkPad T14 G3-21AJS00400 | |
| Media de la clase Office (648 - 8840, n=75, últimos 2 años) | |
| Lenovo Yoga 9 14IRP G8 | |
| HP EliteBook 840 G9 | |
| Lenovo ThinkPad T14 G3-21CF004NGE | |
| Huawei MateBook X Pro 2022 | |
| Medio Intel Core i7-1260P (1234 - 4748, n=25) | |
| Cinebench R20 / CPU (Single Core) | |
| Lenovo Yoga 9 14IRP G8 | |
| Schenker Vision 14 2022 RTX 3050 Ti | |
| Lenovo ThinkPad T14 G3-21AJS00400 | |
| Huawei MateBook X Pro 2022 | |
| Media de la clase Office (345 - 816, n=75, últimos 2 años) | |
| Medio Intel Core i7-1260P (448 - 698, n=25) | |
| HP EliteBook 840 G9 | |
| Lenovo ThinkPad T14 G3-21CF004NGE | |
| Cinebench R15 / CPU Multi 64Bit | |
| Schenker Vision 14 2022 RTX 3050 Ti | |
| Lenovo Yoga 9 14IRP G8 | |
| HP EliteBook 840 G9 | |
| Huawei MateBook X Pro 2022 | |
| Huawei MateBook X Pro 2022 | |
| Lenovo ThinkPad T14 G3-21AJS00400 | |
| Media de la clase Office (250 - 3380, n=77, últimos 2 años) | |
| Lenovo ThinkPad T14 G3-21CF004NGE | |
| Medio Intel Core i7-1260P (549 - 2034, n=29) | |
| Cinebench R15 / CPU Single 64Bit | |
| Lenovo Yoga 9 14IRP G8 | |
| Schenker Vision 14 2022 RTX 3050 Ti | |
| HP EliteBook 840 G9 | |
| Media de la clase Office (99.5 - 316, n=77, últimos 2 años) | |
| Huawei MateBook X Pro 2022 | |
| Lenovo ThinkPad T14 G3-21AJS00400 | |
| Lenovo ThinkPad T14 G3-21CF004NGE | |
| Medio Intel Core i7-1260P (165.4 - 260, n=27) | |
| Blender / v2.79 BMW27 CPU | |
| Medio Intel Core i7-1260P (264 - 906, n=26) | |
| Media de la clase Office (158 - 1940, n=76, últimos 2 años) | |
| Huawei MateBook X Pro 2022 | |
| Lenovo ThinkPad T14 G3-21AJS00400 | |
| Lenovo ThinkPad T14 G3-21CF004NGE | |
| Lenovo Yoga 9 14IRP G8 | |
| HP EliteBook 840 G9 | |
| Schenker Vision 14 2022 RTX 3050 Ti | |
| 7-Zip 18.03 / 7z b 4 | |
| Schenker Vision 14 2022 RTX 3050 Ti | |
| Lenovo ThinkPad T14 G3-21CF004NGE | |
| HP EliteBook 840 G9 | |
| Lenovo Yoga 9 14IRP G8 | |
| Media de la clase Office (7098 - 76886, n=77, últimos 2 años) | |
| Huawei MateBook X Pro 2022 | |
| Lenovo ThinkPad T14 G3-21AJS00400 | |
| Medio Intel Core i7-1260P (16146 - 47064, n=25) | |
| 7-Zip 18.03 / 7z b 4 -mmt1 | |
| HP EliteBook 840 G9 | |
| Lenovo Yoga 9 14IRP G8 | |
| Schenker Vision 14 2022 RTX 3050 Ti | |
| Lenovo ThinkPad T14 G3-21AJS00400 | |
| Media de la clase Office (3387 - 6469, n=77, últimos 2 años) | |
| Huawei MateBook X Pro 2022 | |
| Lenovo ThinkPad T14 G3-21CF004NGE | |
| Medio Intel Core i7-1260P (4064 - 5791, n=25) | |
| Geekbench 5.5 / Multi-Core | |
| HP EliteBook 840 G9 | |
| Schenker Vision 14 2022 RTX 3050 Ti | |
| Lenovo Yoga 9 14IRP G8 | |
| Huawei MateBook X Pro 2022 | |
| Media de la clase Office (1483 - 16999, n=73, últimos 2 años) | |
| Medio Intel Core i7-1260P (3866 - 10570, n=25) | |
| Lenovo ThinkPad T14 G3-21CF004NGE | |
| Lenovo ThinkPad T14 G3-21AJS00400 | |
| Geekbench 5.5 / Single-Core | |
| Media de la clase Office (811 - 2175, n=73, últimos 2 años) | |
| Lenovo Yoga 9 14IRP G8 | |
| Schenker Vision 14 2022 RTX 3050 Ti | |
| HP EliteBook 840 G9 | |
| Huawei MateBook X Pro 2022 | |
| Medio Intel Core i7-1260P (1436 - 1786, n=25) | |
| Lenovo ThinkPad T14 G3-21AJS00400 | |
| Lenovo ThinkPad T14 G3-21CF004NGE | |
| HWBOT x265 Benchmark v2.2 / 4k Preset | |
| Schenker Vision 14 2022 RTX 3050 Ti | |
| Lenovo ThinkPad T14 G3-21AJS00400 | |
| Media de la clase Office (2.21 - 26, n=76, últimos 2 años) | |
| Lenovo ThinkPad T14 G3-21CF004NGE | |
| Lenovo Yoga 9 14IRP G8 | |
| HP EliteBook 840 G9 | |
| Huawei MateBook X Pro 2022 | |
| Medio Intel Core i7-1260P (3.45 - 13.6, n=26) | |
| LibreOffice / 20 Documents To PDF | |
| Media de la clase Office (39.9 - 102.3, n=76, últimos 2 años) | |
| Lenovo ThinkPad T14 G3-21CF004NGE | |
| Medio Intel Core i7-1260P (40.2 - 65.7, n=25) | |
| Lenovo Yoga 9 14IRP G8 | |
| HP EliteBook 840 G9 | |
| Schenker Vision 14 2022 RTX 3050 Ti | |
| Lenovo ThinkPad T14 G3-21AJS00400 | |
| Huawei MateBook X Pro 2022 | |
| R Benchmark 2.5 / Overall mean | |
| Lenovo ThinkPad T14 G3-21CF004NGE | |
| Media de la clase Office (0.393 - 0.888, n=76, últimos 2 años) | |
| Medio Intel Core i7-1260P (0.4559 - 0.727, n=25) | |
| Huawei MateBook X Pro 2022 | |
| Lenovo ThinkPad T14 G3-21AJS00400 | |
| HP EliteBook 840 G9 | |
| Lenovo Yoga 9 14IRP G8 | |
| Schenker Vision 14 2022 RTX 3050 Ti | |
* ... más pequeño es mejor
AIDA64: FP32 Ray-Trace | FPU Julia | CPU SHA3 | CPU Queen | FPU SinJulia | FPU Mandel | CPU AES | CPU ZLib | FP64 Ray-Trace | CPU PhotoWorxx
| Performance rating | |
| Schenker Vision 14 2022 RTX 3050 Ti | |
| Lenovo ThinkPad T14 G3-21CF004NGE | |
| Media de la clase Office | |
| HP EliteBook 840 G9 | |
| Lenovo ThinkPad T14 G3-21AJS00400 | |
| Huawei MateBook X Pro 2022 | |
| Medio Intel Core i7-1260P | |
| AIDA64 / FP32 Ray-Trace | |
| Media de la clase Office (2083 - 31245, n=83, últimos 2 años) | |
| Schenker Vision 14 2022 RTX 3050 Ti | |
| Lenovo ThinkPad T14 G3-21CF004NGE | |
| Lenovo ThinkPad T14 G3-21AJS00400 | |
| HP EliteBook 840 G9 | |
| Medio Intel Core i7-1260P (2176 - 10898, n=26) | |
| Huawei MateBook X Pro 2022 | |
| AIDA64 / FPU Julia | |
| Lenovo ThinkPad T14 G3-21CF004NGE | |
| Media de la clase Office (8191 - 125394, n=83, últimos 2 años) | |
| Schenker Vision 14 2022 RTX 3050 Ti | |
| Lenovo ThinkPad T14 G3-21AJS00400 | |
| HP EliteBook 840 G9 | |
| Medio Intel Core i7-1260P (11015 - 56906, n=26) | |
| Huawei MateBook X Pro 2022 | |
| AIDA64 / CPU SHA3 | |
| Media de la clase Office (433 - 5755, n=83, últimos 2 años) | |
| Schenker Vision 14 2022 RTX 3050 Ti | |
| Lenovo ThinkPad T14 G3-21AJS00400 | |
| Lenovo ThinkPad T14 G3-21CF004NGE | |
| HP EliteBook 840 G9 | |
| Medio Intel Core i7-1260P (669 - 2709, n=26) | |
| Huawei MateBook X Pro 2022 | |
| AIDA64 / CPU Queen | |
| HP EliteBook 840 G9 | |
| Schenker Vision 14 2022 RTX 3050 Ti | |
| Lenovo ThinkPad T14 G3-21CF004NGE | |
| Lenovo ThinkPad T14 G3-21AJS00400 | |
| Huawei MateBook X Pro 2022 | |
| Medio Intel Core i7-1260P (42571 - 82493, n=26) | |
| Media de la clase Office (22784 - 115197, n=67, últimos 2 años) | |
| AIDA64 / FPU SinJulia | |
| Lenovo ThinkPad T14 G3-21CF004NGE | |
| Schenker Vision 14 2022 RTX 3050 Ti | |
| Media de la clase Office (1378 - 18321, n=83, últimos 2 años) | |
| HP EliteBook 840 G9 | |
| Lenovo ThinkPad T14 G3-21AJS00400 | |
| Huawei MateBook X Pro 2022 | |
| Medio Intel Core i7-1260P (2901 - 6975, n=26) | |
| AIDA64 / FPU Mandel | |
| Lenovo ThinkPad T14 G3-21CF004NGE | |
| Media de la clase Office (4601 - 66922, n=83, últimos 2 años) | |
| Schenker Vision 14 2022 RTX 3050 Ti | |
| Lenovo ThinkPad T14 G3-21AJS00400 | |
| HP EliteBook 840 G9 | |
| Medio Intel Core i7-1260P (5950 - 26376, n=26) | |
| Huawei MateBook X Pro 2022 | |
| AIDA64 / CPU AES | |
| Schenker Vision 14 2022 RTX 3050 Ti | |
| Huawei MateBook X Pro 2022 | |
| Lenovo ThinkPad T14 G3-21AJS00400 | |
| Media de la clase Office (4854 - 155900, n=83, últimos 2 años) | |
| HP EliteBook 840 G9 | |
| Lenovo ThinkPad T14 G3-21CF004NGE | |
| Medio Intel Core i7-1260P (16041 - 92356, n=26) | |
| AIDA64 / CPU ZLib | |
| Schenker Vision 14 2022 RTX 3050 Ti | |
| Lenovo ThinkPad T14 G3-21AJS00400 | |
| Media de la clase Office (114.6 - 1366, n=83, últimos 2 años) | |
| HP EliteBook 840 G9 | |
| Lenovo ThinkPad T14 G3-21CF004NGE | |
| Huawei MateBook X Pro 2022 | |
| Medio Intel Core i7-1260P (259 - 771, n=26) | |
| AIDA64 / FP64 Ray-Trace | |
| Media de la clase Office (1109 - 17834, n=83, últimos 2 años) | |
| Schenker Vision 14 2022 RTX 3050 Ti | |
| Lenovo ThinkPad T14 G3-21CF004NGE | |
| Lenovo ThinkPad T14 G3-21AJS00400 | |
| HP EliteBook 840 G9 | |
| Medio Intel Core i7-1260P (1237 - 5858, n=26) | |
| Huawei MateBook X Pro 2022 | |
| AIDA64 / CPU PhotoWorxx | |
| Media de la clase Office (11090 - 65229, n=83, últimos 2 años) | |
| Huawei MateBook X Pro 2022 | |
| HP EliteBook 840 G9 | |
| Medio Intel Core i7-1260P (13261 - 43652, n=26) | |
| Schenker Vision 14 2022 RTX 3050 Ti | |
| Lenovo ThinkPad T14 G3-21CF004NGE | |
| Lenovo ThinkPad T14 G3-21AJS00400 | |
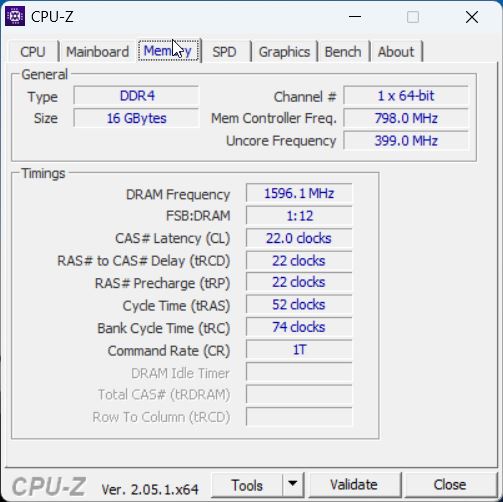
Rendimiento del sistema
En la práctica, la versión Intel del ThinkPad T14 G3 también es un portátil muy sensible, y no pudimos notar ningún problema. Sin embargo, nuestra unidad de pruebas sólo muestra un rendimiento medio en las pruebas sintéticas. Esto se debe principalmente al mal rendimiento del almacenamiento, ya que la memoria de trabajo sólo funciona en configuración monocanal.
CrossMark: Overall | Productivity | Creativity | Responsiveness
| PCMark 10 / Score | |
| Media de la clase Office (2601 - 9298, n=68, últimos 2 años) | |
| Schenker Vision 14 2022 RTX 3050 Ti | |
| Huawei MateBook X Pro 2022 | |
| Lenovo ThinkPad T14 G3-21CF004NGE | |
| Medio Intel Core i7-1260P, NVIDIA GeForce MX550 (5870 - 6235, n=2) | |
| HP EliteBook 840 G9 | |
| Lenovo ThinkPad T14 G3-21AJS00400 | |
| PCMark 10 / Essentials | |
| HP EliteBook 840 G9 | |
| Huawei MateBook X Pro 2022 | |
| Schenker Vision 14 2022 RTX 3050 Ti | |
| Media de la clase Office (3245 - 11594, n=68, últimos 2 años) | |
| Medio Intel Core i7-1260P, NVIDIA GeForce MX550 (9729 - 10132, n=2) | |
| Lenovo ThinkPad T14 G3-21CF004NGE | |
| Lenovo ThinkPad T14 G3-21AJS00400 | |
| PCMark 10 / Productivity | |
| Media de la clase Office (5336 - 17243, n=68, últimos 2 años) | |
| Medio Intel Core i7-1260P, NVIDIA GeForce MX550 (8189 - 9245, n=2) | |
| Huawei MateBook X Pro 2022 | |
| Schenker Vision 14 2022 RTX 3050 Ti | |
| Lenovo ThinkPad T14 G3-21CF004NGE | |
| Lenovo ThinkPad T14 G3-21AJS00400 | |
| HP EliteBook 840 G9 | |
| PCMark 10 / Digital Content Creation | |
| Schenker Vision 14 2022 RTX 3050 Ti | |
| Media de la clase Office (2049 - 13541, n=68, últimos 2 años) | |
| Lenovo ThinkPad T14 G3-21CF004NGE | |
| HP EliteBook 840 G9 | |
| Medio Intel Core i7-1260P, NVIDIA GeForce MX550 (6891 - 7021, n=2) | |
| Lenovo ThinkPad T14 G3-21AJS00400 | |
| Huawei MateBook X Pro 2022 | |
| CrossMark / Overall | |
| Huawei MateBook X Pro 2022 | |
| HP EliteBook 840 G9 | |
| Schenker Vision 14 2022 RTX 3050 Ti | |
| Media de la clase Office (381 - 2010, n=75, últimos 2 años) | |
| Lenovo ThinkPad T14 G3-21AJS00400 | |
| Medio Intel Core i7-1260P, NVIDIA GeForce MX550 (n=1) | |
| Lenovo ThinkPad T14 G3-21CF004NGE | |
| CrossMark / Productivity | |
| Huawei MateBook X Pro 2022 | |
| HP EliteBook 840 G9 | |
| Schenker Vision 14 2022 RTX 3050 Ti | |
| Lenovo ThinkPad T14 G3-21AJS00400 | |
| Medio Intel Core i7-1260P, NVIDIA GeForce MX550 (n=1) | |
| Media de la clase Office (464 - 1880, n=75, últimos 2 años) | |
| Lenovo ThinkPad T14 G3-21CF004NGE | |
| CrossMark / Creativity | |
| Huawei MateBook X Pro 2022 | |
| HP EliteBook 840 G9 | |
| Schenker Vision 14 2022 RTX 3050 Ti | |
| Media de la clase Office (319 - 2361, n=75, últimos 2 años) | |
| Lenovo ThinkPad T14 G3-21AJS00400 | |
| Medio Intel Core i7-1260P, NVIDIA GeForce MX550 (n=1) | |
| Lenovo ThinkPad T14 G3-21CF004NGE | |
| CrossMark / Responsiveness | |
| Huawei MateBook X Pro 2022 | |
| HP EliteBook 840 G9 | |
| Schenker Vision 14 2022 RTX 3050 Ti | |
| Lenovo ThinkPad T14 G3-21AJS00400 | |
| Medio Intel Core i7-1260P, NVIDIA GeForce MX550 (n=1) | |
| Media de la clase Office (360 - 1820, n=75, últimos 2 años) | |
| Lenovo ThinkPad T14 G3-21CF004NGE | |
| PCMark 10 Score | 5870 puntos | |
ayuda | ||
| AIDA64 / Memory Copy | |
| Media de la clase Office (20075 - 110930, n=80, últimos 2 años) | |
| Huawei MateBook X Pro 2022 | |
| HP EliteBook 840 G9 | |
| Medio Intel Core i7-1260P (25125 - 71544, n=25) | |
| Lenovo ThinkPad T14 G3-21CF004NGE | |
| Schenker Vision 14 2022 RTX 3050 Ti | |
| Lenovo ThinkPad T14 G3-21AJS00400 | |
| AIDA64 / Memory Read | |
| Huawei MateBook X Pro 2022 | |
| Media de la clase Office (10084 - 128030, n=81, últimos 2 años) | |
| HP EliteBook 840 G9 | |
| Medio Intel Core i7-1260P (24983 - 72065, n=25) | |
| Lenovo ThinkPad T14 G3-21CF004NGE | |
| Schenker Vision 14 2022 RTX 3050 Ti | |
| Lenovo ThinkPad T14 G3-21AJS00400 | |
| AIDA64 / Memory Write | |
| Media de la clase Office (20073 - 119858, n=81, últimos 2 años) | |
| Huawei MateBook X Pro 2022 | |
| HP EliteBook 840 G9 | |
| Medio Intel Core i7-1260P (23512 - 66799, n=25) | |
| Lenovo ThinkPad T14 G3-21CF004NGE | |
| Schenker Vision 14 2022 RTX 3050 Ti | |
| Lenovo ThinkPad T14 G3-21AJS00400 | |
| AIDA64 / Memory Latency | |
| Lenovo ThinkPad T14 G3-21CF004NGE | |
| Huawei MateBook X Pro 2022 | |
| Media de la clase Office (7.6 - 162.9, n=76, últimos 2 años) | |
| HP EliteBook 840 G9 | |
| Lenovo ThinkPad T14 G3-21AJS00400 | |
| Schenker Vision 14 2022 RTX 3050 Ti | |
| Medio Intel Core i7-1260P (77.9 - 118.4, n=21) | |
* ... más pequeño es mejor
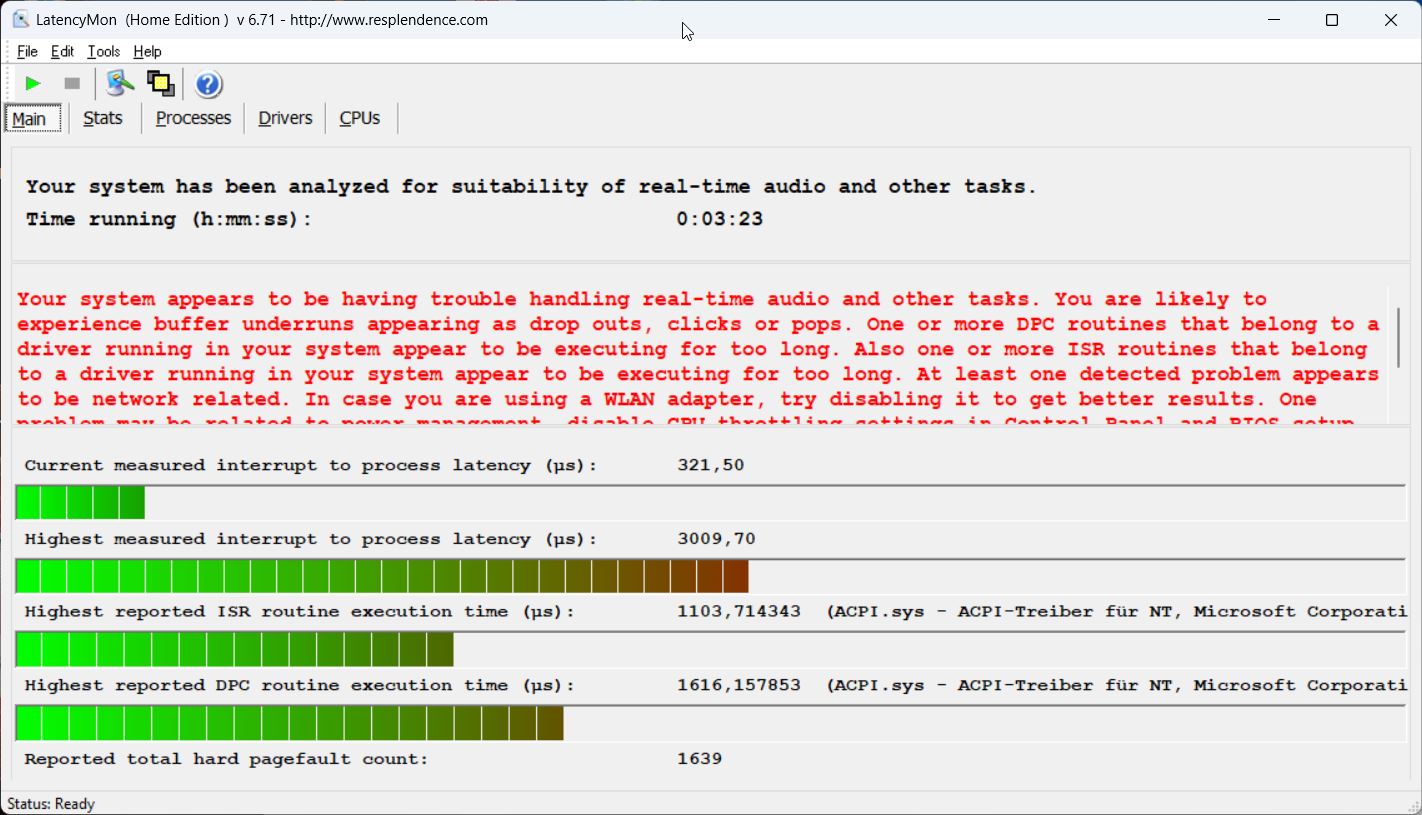
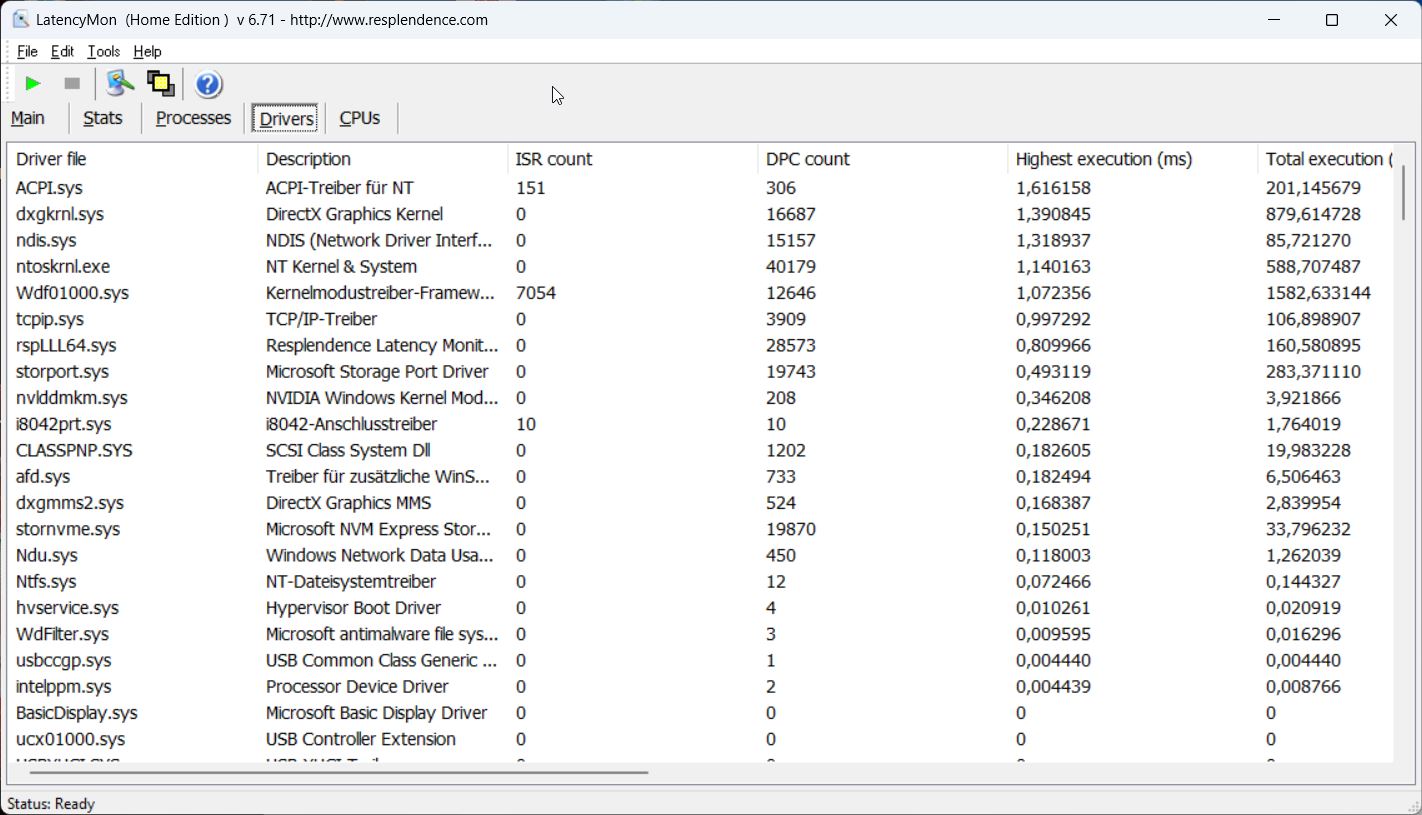
Latencias del CPD
En nuestra prueba de latencia estandarizada (navegación por internet, reproducción de vídeo 4K de YouTube y carga de CPU), la unidad de pruebas con su versión actual de BIOS muestra algunas limitaciones significativas para el uso en aplicaciones de audio en tiempo real. Pero también podría haber algunas limitaciones creadas por el driver de Nvidia, ya que ha habido problemas en este sentido para varias versiones del driver. El Modelo AMD del T14 G3no tuvo ningún problema en este sentido.
| DPC Latencies / LatencyMon - interrupt to process latency (max), Web, Youtube, Prime95 | |
| HP EliteBook 840 G9 | |
| Lenovo ThinkPad T14 G3-21AJS00400 | |
| Huawei MateBook X Pro 2022 | |
| Schenker Vision 14 2022 RTX 3050 Ti | |
| Lenovo ThinkPad T14 G3-21CF004NGE | |
* ... más pequeño es mejor
Solución de almacenamiento
Nuestra unidad de pruebas usa la versión de 1 TB del Samsung PM9A1, que es la variante OEM del 980 Pro. Aunque el SSD PCIe 4.0 ofrece muy buenas tasas de transferencia, las tasas caen tras un tiempo bajo carga constante. Sin embargo, esto no tiene impacto en el funcionamiento diario de la empresa. Tras el primer arranque, hay 904 GB de espacio de almacenamiento disponible para el usuario. Puedes encontrar más pruebas de SSD aquí.

* ... más pequeño es mejor
Disk Throttling: DiskSpd Read Loop, Queue Depth 8
Tarjeta gráfica
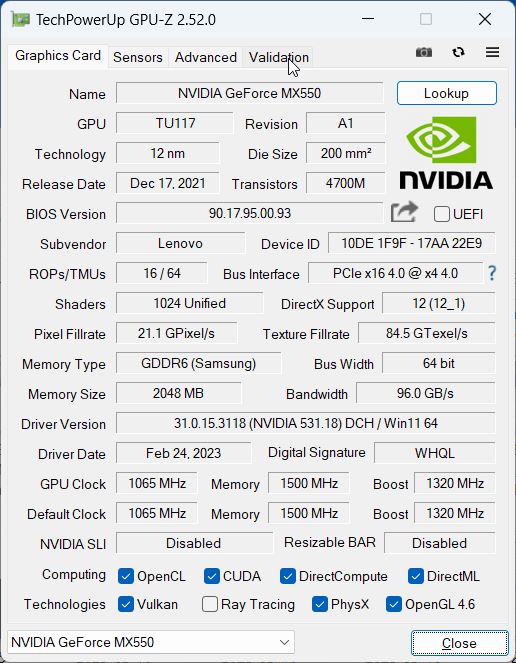
Además de los Gráficos Iris Xe G7del procesador, Lenovo también equipó nuestra configuración de prueba con una tarjeta gráfica dedicada GeForce MX550de Nvidia con 2 GB de VRAM. La tarjeta gráfica puede consumir un máximo de 30 vatios y también ofrece una ventaja notable en las pruebas comparada con la iGPU ligeramente anticuada de Intel. Sin embargo, la integrada Radeon 680M integrada en el modelo AMD rinde al mismo nivel, al menos en las pruebas sintéticas. Así que ya debemos hacernos la pregunta, por qué necesitarías la tarjeta gráfica adicional aquí.
Por otro lado, la GPU GeForce tiene una ligera ventaja en comparación con la Radeon 680M integrada en las pruebas de juego reales, pero esta ventaja no es realmente enorme. Aquellos a los que les gusta jugar una ronda de juegos en su portátil de trabajo después de terminar el trabajo están significativamente mejor servidos por el Schenker Vision 14y la der RTX 3050 Tipor ejemplo.
Bajo carga constante y en batería, el rendimiento gráfico permanece estable. Puedes encontrar más pruebas de rendimiento de GPU en nuestra sección técnica.
| 3DMark 11 Performance | 10068 puntos | |
| 3DMark Fire Strike Score | 5764 puntos | |
| 3DMark Time Spy Score | 2695 puntos | |
ayuda | ||
| Blender / v3.3 Classroom OPTIX/RTX | |
| Lenovo ThinkPad T14 G3-21AJS00400 | |
| Medio NVIDIA GeForce MX550 (n=1) | |
| Media de la clase Office (29 - 242, n=2, últimos 2 años) | |
| Schenker Vision 14 2022 RTX 3050 Ti | |
| Blender / v3.3 Classroom CUDA | |
| Lenovo ThinkPad T14 G3-21AJS00400 | |
| Medio NVIDIA GeForce MX550 (n=1) | |
| Media de la clase Office (53 - 214, n=3, últimos 2 años) | |
| Schenker Vision 14 2022 RTX 3050 Ti | |
| Blender / v3.3 Classroom CPU | |
| HP EliteBook 840 G9 | |
| Lenovo ThinkPad T14 G3-21AJS00400 | |
| Medio NVIDIA GeForce MX550 (n=1) | |
| Huawei MateBook X Pro 2022 | |
| Media de la clase Office (245 - 3219, n=75, últimos 2 años) | |
| Lenovo ThinkPad T14 G3-21CF004NGE | |
| Schenker Vision 14 2022 RTX 3050 Ti | |
| Blender / v3.3 Classroom HIP/AMD | |
| Media de la clase Office (296 - 507, n=5, últimos 2 años) | |
| Lenovo ThinkPad T14 G3-21CF004NGE | |
* ... más pequeño es mejor
| Performance rating - Percent | |
| Schenker Vision 14 2022 RTX 3050 Ti | |
| Lenovo ThinkPad T14 G3-21AJS00400 | |
| Lenovo ThinkPad T14 G3-21CF004NGE | |
| Media de la clase Office | |
| HP EliteBook 840 G9 | |
| Huawei MateBook X Pro 2022 | |
| The Witcher 3 - 1920x1080 Ultra Graphics & Postprocessing (HBAO+) | |
| Schenker Vision 14 2022 RTX 3050 Ti | |
| Lenovo ThinkPad T14 G3-21AJS00400 | |
| Lenovo ThinkPad T14 G3-21CF004NGE | |
| Media de la clase Office (14.8 - 28.1, n=3, últimos 2 años) | |
| HP EliteBook 840 G9 | |
| Huawei MateBook X Pro 2022 | |
| GTA V - 1920x1080 Highest AA:4xMSAA + FX AF:16x | |
| Schenker Vision 14 2022 RTX 3050 Ti | |
| Lenovo ThinkPad T14 G3-21AJS00400 | |
| Lenovo ThinkPad T14 G3-21CF004NGE | |
| Media de la clase Office (5.77 - 45.3, n=69, últimos 2 años) | |
| Huawei MateBook X Pro 2022 | |
| HP EliteBook 840 G9 | |
| Final Fantasy XV Benchmark - 1920x1080 High Quality | |
| Schenker Vision 14 2022 RTX 3050 Ti | |
| Lenovo ThinkPad T14 G3-21CF004NGE | |
| Media de la clase Office (8.09 - 79.5, n=71, últimos 2 años) | |
| Lenovo ThinkPad T14 G3-21AJS00400 | |
| Huawei MateBook X Pro 2022 | |
| HP EliteBook 840 G9 | |
| Strange Brigade - 1920x1080 ultra AA:ultra AF:16 | |
| Schenker Vision 14 2022 RTX 3050 Ti | |
| Lenovo ThinkPad T14 G3-21AJS00400 | |
| Lenovo ThinkPad T14 G3-21CF004NGE | |
| Media de la clase Office (12.9 - 142.1, n=53, últimos 2 años) | |
| Huawei MateBook X Pro 2022 | |
| HP EliteBook 840 G9 | |
| Dota 2 Reborn - 1920x1080 ultra (3/3) best looking | |
| Schenker Vision 14 2022 RTX 3050 Ti | |
| Lenovo ThinkPad T14 G3-21AJS00400 | |
| Lenovo ThinkPad T14 G3-21CF004NGE | |
| HP EliteBook 840 G9 | |
| Huawei MateBook X Pro 2022 | |
| Media de la clase Office (14.6 - 135, n=77, últimos 2 años) | |
The Witcher 3 FPS Chart
| bajo | medio | alto | ultra | 4K | |
|---|---|---|---|---|---|
| GTA V (2015) | 159.9 | 152.3 | 73.4 | 33.7 | |
| The Witcher 3 (2015) | 149 | 89 | 48 | 24 | |
| Dota 2 Reborn (2015) | 142.1 | 127 | 110.4 | 101.1 | |
| Final Fantasy XV Benchmark (2018) | 69.2 | 34.3 | 20.8 | ||
| X-Plane 11.11 (2018) | 109.9 | 95.2 | 73.4 | ||
| Far Cry 5 (2018) | 95 | 40 | 32 | 30 | |
| Strange Brigade (2018) | 147 | 59 | 51 | 45 | |
| F1 2021 (2021) | 152.7 | 53.5 | 47.4 | 25.7 | |
| F1 22 (2022) | 59.4 | 51.3 | 41.2 | 28.1 |
Gestión de emisiones y energía
Niveles de ruido
El modelo Intel del ThinkPad T14 G3 es un compañero muy silencioso bajo carga baja, pero las revoluciones a alta velocidad del ventilador son un poco molestas. Aunque la velocidad se reduce rápidamente, el ventilador se revoluciona inicialmente de forma muy notable. Bajo carga más pesada, el dispositivo también se vuelve ligeramente más ruidoso en general que la versión AMD, y medimos un máximo de casi 40 dB(A) mientras jugamos y durante el test de estrés. Nuestra unidad de pruebas no produce ningún otro ruido electrónico.
Ruido
| Ocioso |
| 23.6 / 23.6 / 23.6 dB(A) |
| Carga |
| 35.1 / 39.6 dB(A) |
 | ||
30 dB silencioso 40 dB(A) audible 50 dB(A) ruidosamente alto |
||
min: | ||
| Lenovo ThinkPad T14 G3-21AJS00400 GeForce MX550, i7-1260P, Samsung PM9A1 MZVL21T0HCLR | Lenovo ThinkPad T14 G3-21CF004NGE Radeon 680M, R7 PRO 6850U, Kioxia BG5 KBG5AZNV512G | HP EliteBook 840 G9 Iris Xe G7 96EUs, i7-1280P, SK hynix PC801 HFS512GEJ9X101N BF | Schenker Vision 14 2022 RTX 3050 Ti GeForce RTX 3050 Ti Laptop GPU, i7-12700H, Samsung SSD 980 Pro 1TB MZ-V8P1T0BW | Huawei MateBook X Pro 2022 Iris Xe G7 96EUs, i7-1260P, Silicon Motion PCIe-8 SSD 1TB | |
|---|---|---|---|---|---|
| Noise | 1% | -3% | -14% | 0% | |
| apagado / medio ambiente * (dB) | 23.6 | 24.2 -3% | 24.3 -3% | 24.4 -3% | 23.5 -0% |
| Idle Minimum * (dB) | 23.6 | 24.2 -3% | 24.5 -4% | 24.4 -3% | 23.5 -0% |
| Idle Average * (dB) | 23.6 | 24.2 -3% | 24.5 -4% | 24.4 -3% | 23.5 -0% |
| Idle Maximum * (dB) | 23.6 | 25.8 -9% | 26 -10% | 27.8 -18% | 25.9 -10% |
| Load Average * (dB) | 35.1 | 32.2 8% | 32.3 8% | 43.3 -23% | 33.8 4% |
| Witcher 3 ultra * (dB) | 39.6 | 34.1 14% | 39 2% | 48.2 -22% | 35.4 11% |
| Load Maximum * (dB) | 39.6 | 38.8 2% | 44.7 -13% | 48.8 -23% | 40.6 -3% |
* ... más pequeño es mejor
Temperaturas
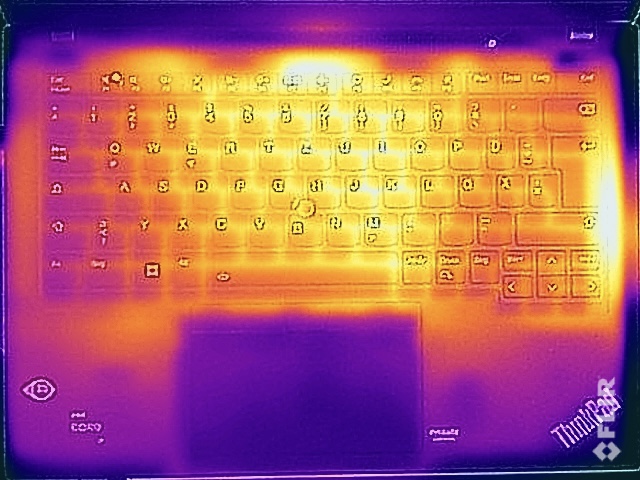
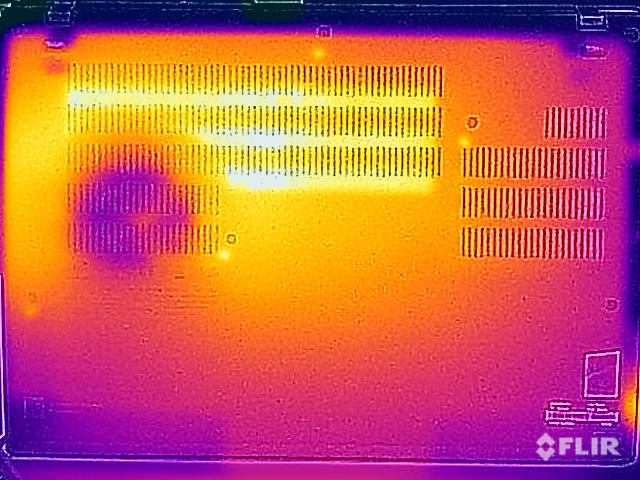
Lenovo tiene un buen control de las temperaturas superficiales del ThinkPad T14 G3 en general, pero bajo carga baja, el dispositivo por desgracia ya se calienta ligeramente más que el modelo AMD. Bajo carga más pesada, medimos una temperatura máxima ligeramente superior a los 40 °C, por lo que esto no resulta en ninguna limitación aquí, y puedes seguir tecleando cómodamente y también mantener el dispositivo en tu regazo.
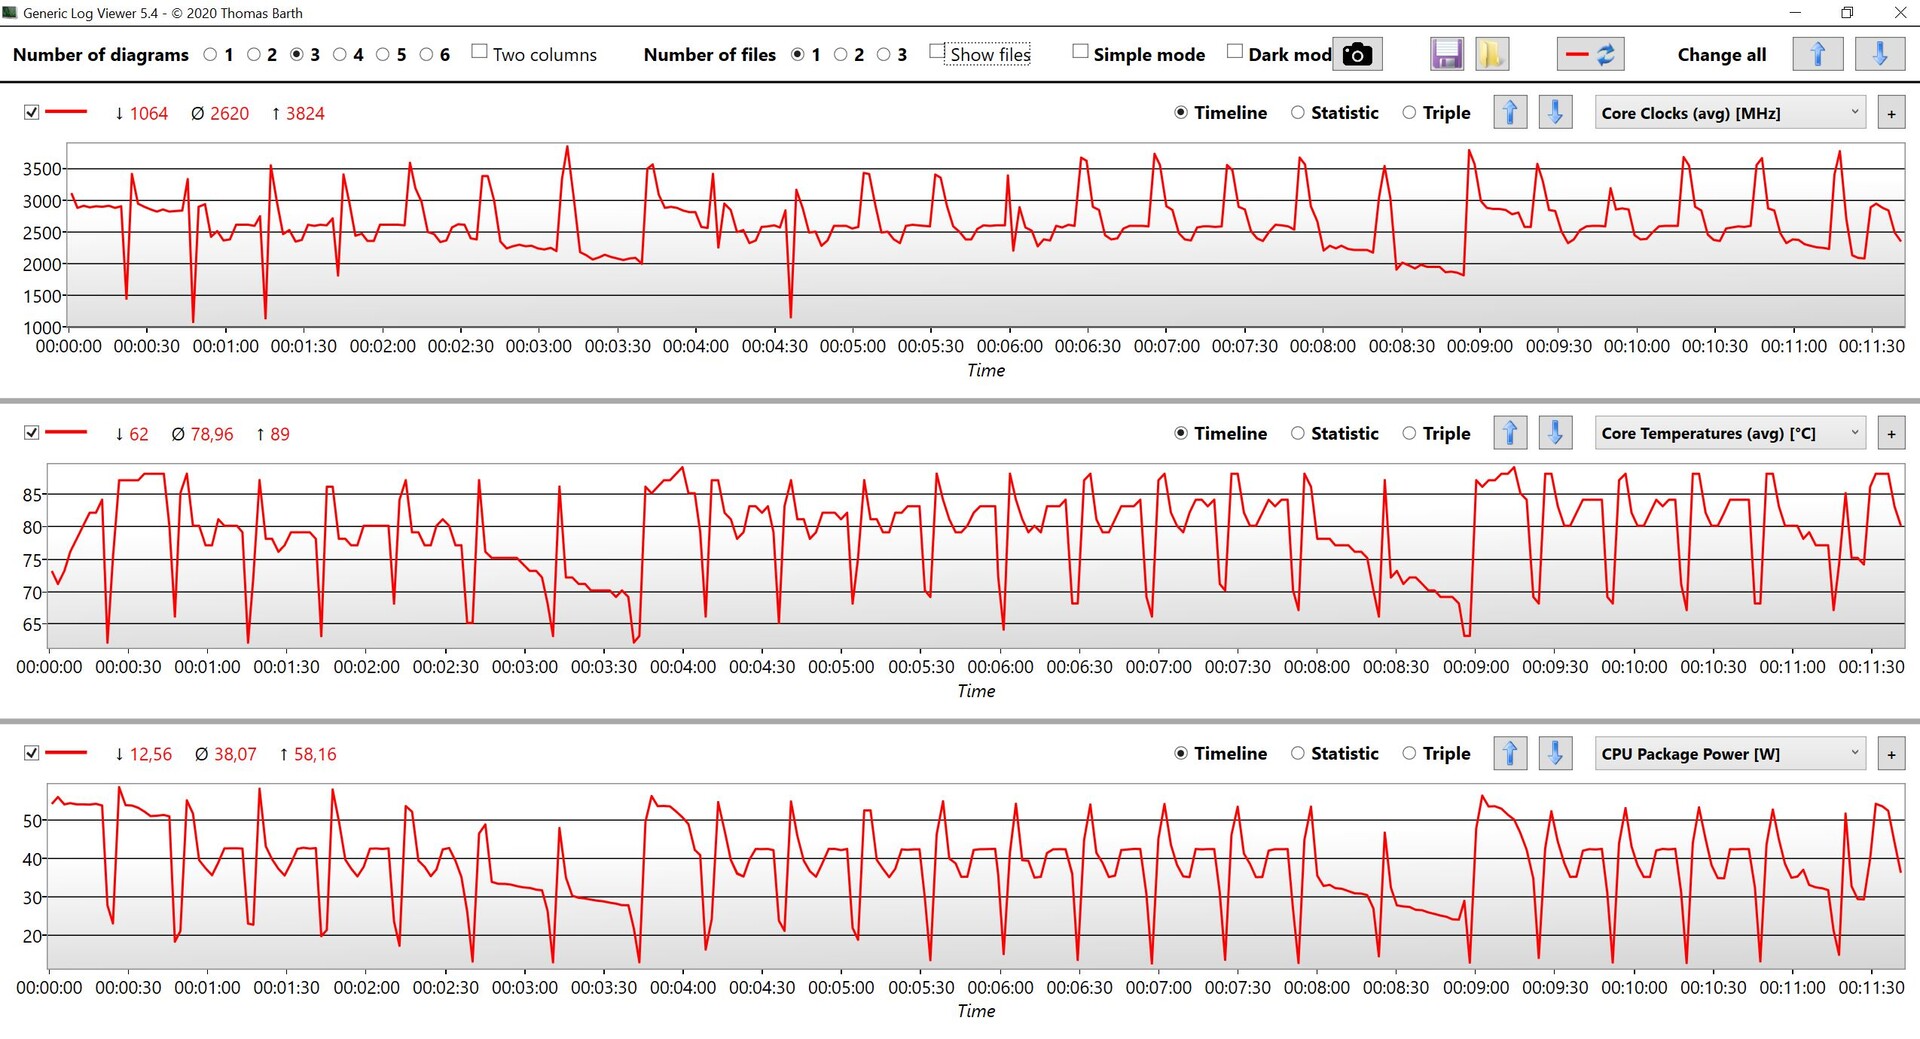
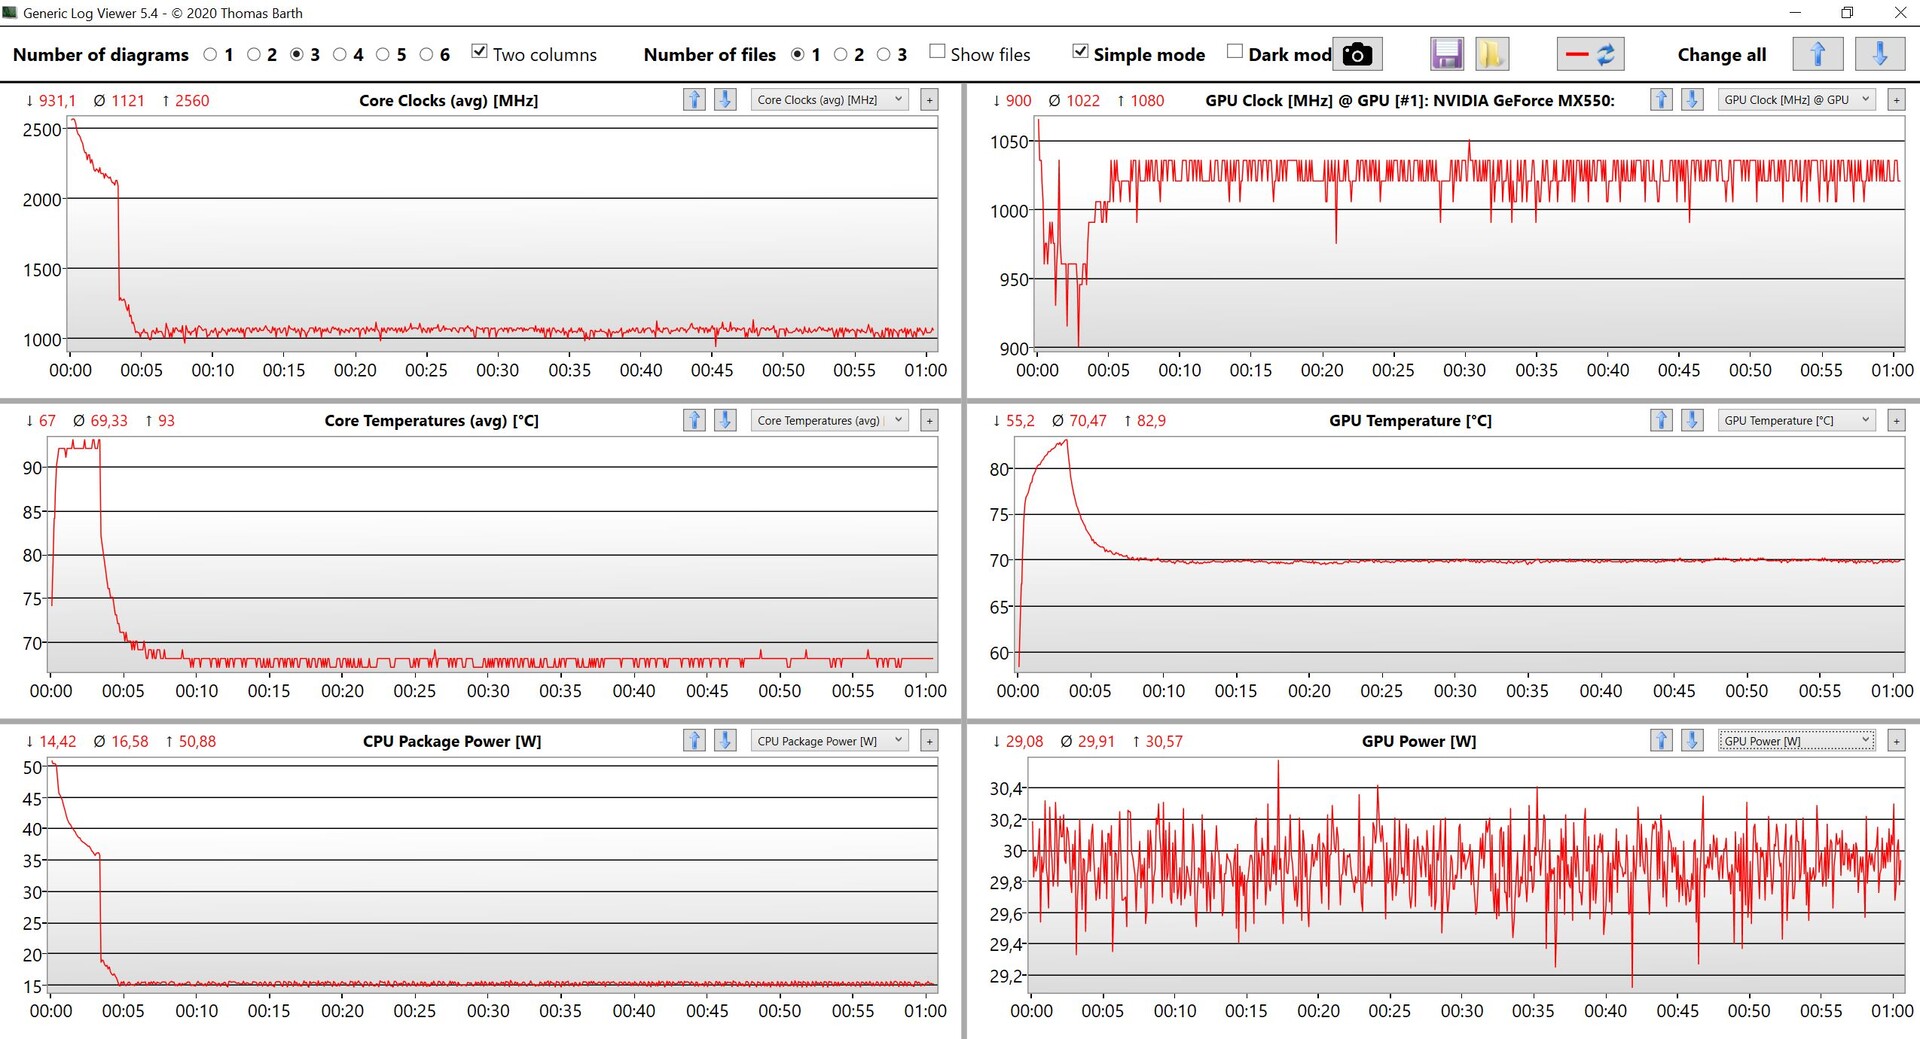
Durante la prueba de estrés, el rendimiento de la GPU se mantiene estable en torno a los 30 vatios, pero el procesador tiene que reducir su rendimiento de forma masiva tras unos minutos, bajando de un máximo de 50 vatios a sólo 15 vatios. Si te fijas en el consumo, también puedes ver inmediatamente que la fuente de alimentación de 65 vatios nunca será capaz de proporcionar suficiente potencia aquí, pero hablaremos de ello más adelante.
(-) La temperatura máxima en la parte superior es de 46.4 °C / 116 F, frente a la media de 34.3 °C / 94 F, que oscila entre 21.2 y 62.5 °C para la clase Office.
(±) El fondo se calienta hasta un máximo de 43.1 °C / 110 F, frente a la media de 36.8 °C / 98 F
(+) En reposo, la temperatura media de la parte superior es de 29.9 °C / 86# F, frente a la media del dispositivo de 29.5 °C / 85 F.
(±) Jugando a The Witcher 3, la temperatura media de la parte superior es de 37.5 °C / 100 F, frente a la media del dispositivo de 29.5 °C / 85 F.
(+) Los reposamanos y el panel táctil alcanzan como máximo la temperatura de la piel (34.5 °C / 94.1 F) y, por tanto, no están calientes.
(-) La temperatura media de la zona del reposamanos de dispositivos similares fue de 27.5 °C / 81.5 F (-7 °C / -12.6 F).
| Lenovo ThinkPad T14 G3-21AJS00400 Intel Core i7-1260P, NVIDIA GeForce MX550 | Lenovo ThinkPad T14 G3-21CF004NGE AMD Ryzen 7 PRO 6850U, AMD Radeon 680M | HP EliteBook 840 G9 Intel Core i7-1280P, Intel Iris Xe Graphics G7 96EUs | Schenker Vision 14 2022 RTX 3050 Ti Intel Core i7-12700H, NVIDIA GeForce RTX 3050 Ti Laptop GPU | Huawei MateBook X Pro 2022 Intel Core i7-1260P, Intel Iris Xe Graphics G7 96EUs | |
|---|---|---|---|---|---|
| Heat | 6% | 27% | -3% | 7% | |
| Maximum Upper Side * (°C) | 46.4 | 48.2 -4% | 32.8 29% | 48.4 -4% | 43.1 7% |
| Maximum Bottom * (°C) | 43.1 | 52.8 -23% | 36.6 15% | 57.1 -32% | 42 3% |
| Idle Upper Side * (°C) | 33.9 | 24.4 28% | 21.6 36% | 28.1 17% | 29.4 13% |
| Idle Bottom * (°C) | 31.4 | 24.5 22% | 22.2 29% | 29 8% | 29.4 6% |
* ... más pequeño es mejor
Altavoces
Lenovo ThinkPad T14 G3-21AJS00400 análisis de audio
(±) | la sonoridad del altavoz es media pero buena (77.8 dB)
Graves 100 - 315 Hz
(-) | casi sin bajos - de media 24.9% inferior a la mediana
(±) | la linealidad de los graves es media (11.7% delta a frecuencia anterior)
Medios 400 - 2000 Hz
(+) | medios equilibrados - a sólo 2.4% de la mediana
(+) | los medios son lineales (4% delta a la frecuencia anterior)
Altos 2 - 16 kHz
(+) | máximos equilibrados - a sólo 2.5% de la mediana
(+) | los máximos son lineales (3.8% delta a la frecuencia anterior)
Total 100 - 16.000 Hz
(±) | la linealidad del sonido global es media (18% de diferencia con la mediana)
En comparación con la misma clase
» 30% de todos los dispositivos probados de esta clase eran mejores, 7% similares, 62% peores
» El mejor tuvo un delta de 7%, la media fue 21%, el peor fue ###max##%
En comparación con todos los dispositivos probados
» 38% de todos los dispositivos probados eran mejores, 8% similares, 54% peores
» El mejor tuvo un delta de 4%, la media fue 23%, el peor fue ###max##%
Huawei MateBook X Pro 2022 análisis de audio
(+) | los altavoces pueden reproducir a un volumen relativamente alto (#85.5 dB)
Graves 100 - 315 Hz
(±) | lubina reducida - en promedio 5% inferior a la mediana
(+) | el bajo es lineal (5.3% delta a la frecuencia anterior)
Medios 400 - 2000 Hz
(+) | medios equilibrados - a sólo 1.5% de la mediana
(+) | los medios son lineales (2.5% delta a la frecuencia anterior)
Altos 2 - 16 kHz
(+) | máximos equilibrados - a sólo 2.1% de la mediana
(+) | los máximos son lineales (5.3% delta a la frecuencia anterior)
Total 100 - 16.000 Hz
(+) | el sonido global es lineal (5% de diferencia con la mediana)
En comparación con la misma clase
» 0% de todos los dispositivos probados de esta clase eran mejores, 0% similares, 100% peores
» El mejor tuvo un delta de 5%, la media fue 18%, el peor fue ###max##%
En comparación con todos los dispositivos probados
» 0% de todos los dispositivos probados eran mejores, 0% similares, 100% peores
» El mejor tuvo un delta de 4%, la media fue 23%, el peor fue ###max##%
Consumo de energía

El modelo Intel consume más energía que la Versión AMDen todos los escenarios, incluso en inactivo (pero el diferente panel también podría tener algo que ver). Además, la fuente de alimentación de 65W no está suficientemente dimensionada bajo carga, ya que el dispositivo tiene que sacar energía de la batería en los primeros tres minutos, con la capacidad de la batería cayendo al ~95%. Sólo después de que el procesador se nivele a 15 vatios (ver arriba) es capaz la fuente de alimentación de proporcionar suficiente energía durante la prueba de estrés.
Tenemos que decir que Lenovo limita claramente el rendimiento en este escenario. Usando una fuente de alimentación de 100W, pudimos medir un consumo máximo de 101W al principio del test de estrés, antes de nivelarse en ~85W. Con esto, el rendimiento de la CPU también sería mejor, pero por otro lado, eso también tendría un efecto en el ruido del ventilador y las temperaturas superficiales.
| Off / Standby | |
| Ocioso | |
| Carga |
|
Clave:
min: | |
| Lenovo ThinkPad T14 G3-21AJS00400 GeForce MX550, i7-1260P, Samsung PM9A1 MZVL21T0HCLR | Lenovo ThinkPad T14 G3-21CF004NGE Radeon 680M, R7 PRO 6850U, Kioxia BG5 KBG5AZNV512G | HP EliteBook 840 G9 Iris Xe G7 96EUs, i7-1280P, SK hynix PC801 HFS512GEJ9X101N BF | Schenker Vision 14 2022 RTX 3050 Ti GeForce RTX 3050 Ti Laptop GPU, i7-12700H, Samsung SSD 980 Pro 1TB MZ-V8P1T0BW | Huawei MateBook X Pro 2022 Iris Xe G7 96EUs, i7-1260P, Silicon Motion PCIe-8 SSD 1TB | |
|---|---|---|---|---|---|
| Power Consumption | 26% | 10% | -63% | -55% | |
| Idle Minimum * (Watt) | 4.3 | 2.4 44% | 2.2 49% | 7.5 -74% | 6.5 -51% |
| Idle Average * (Watt) | 6.2 | 5.3 15% | 5.3 15% | 10.4 -68% | 13.7 -121% |
| Idle Maximum * (Watt) | 7 | 5.6 20% | 8.5 -21% | 11.4 -63% | 14.4 -106% |
| Load Average * (Watt) | 63.5 | 39.7 37% | 54.3 14% | 83.3 -31% | 64.6 -2% |
| Witcher 3 ultra * (Watt) | 52.5 | 42.8 18% | 51 3% | 92.7 -77% | 57.2 -9% |
| Load Maximum * (Watt) | 66.1 | 50.6 23% | 67.3 -2% | 110.3 -67% | 90.9 -38% |
* ... más pequeño es mejor
Power Consumption The Witcher 3 / Stress Test
Power Consumption with External Monitor
Duración de la batería
El mismo comportamiento continúa en los tests de batería, y el modelo Intel queda claramente superado por la versión AMD en nuestros dos tests WLAN (una vez a brillo máximo y luego a 150 cd/m²). Medimos entre 7-8 horas navegando, mientras que el modelo AMD duró ~9.5-13 horas.
Pro
Contra
Veredicto - El ThinkPad T14 G3 es mejor con AMD
Mirando al ThinkPad T14 G3 por sí mismo, es un buen portátil de negocios también con la combinación Intel/Nvidia con un rendimiento gráfico ligeramente superior a la iGPU antigua de Intel. En comparación con la Versión AMDhay un par de ventajas, como el mayor rendimiento mononúcleo del procesador Intel y el rendimiento ligeramente mejor en juegos de la GeForce MX550 dedicada. Además, el modelo Intel también ofrece Thunderbolt 4 y hay una ranura SO-DIMM, lo que permite ampliar la memoria de trabajo.
Por otro lado, también hay desventajas como el consumo de energía significativamente mayor bajo carga, con la fuente de alimentación de 65 vatios incluida siendo demasiado débil, lo que resulta en una ralentización artificial del rendimiento bajo carga combinada CPU/GPU. El ventilador también se vuelve más ruidoso, y la duración de la batería resulta más corta. Al mismo tiempo, el procesador AMD rinde al mismo nivel en las pruebas multinúcleo, consumiendo menos energía.
Debido a la tarjeta gráfica adicional, el ThinkPad T14 G3 también consume más energía, mientras que el rendimiento adicional comparado con la versión AMD es muy pequeño. Por tanto, el módulo adicional apenas merece la pena, y los que puedan arreglárselas sin Thunderbolt 4 se llevarán el mejor portátil business con una mayor duración de batería si eligen la versión AMD del ThinkPad T14 G3.
Otro problema es la situación del panel, pero eso también va para todos los modelos del ThinkPad T14 G3. Por ejemplo, el panel LG dejó una mejor impresión en la prueba que el modelo de AU Optronics, incluso aunque fuera la pantalla LowPower de 14 pulgadas en ambos casos. Ya vimos esta lotería de paneles en modelos anteriores, y por desgracia nunca se sabe de antemano qué panel se usa.
Aunque el T14 G3 ya lleva algún tiempo en el mercado, las nuevas CPU móviles Raptor Lake de Intel son una actualización bastante decepcionante en general, y en este momento, no sabemos cuándo llegarán los nuevos modelos de AMD. Al menos, no esperamos una actualización en los próximos meses.
Precio y disponibilidad
La versión Intel del Lenovo ThinkPad T14 G3 está disponible en Lenovo a partir de 1012,32 dólares, mientras que la configuración Nvidia parte de los 1067,52 dólares.
Lenovo ThinkPad T14 G3-21AJS00400
- 03/21/2023 v7 (old)
Andreas Osthoff
Transparencia
La selección de los dispositivos que se van a reseñar corre a cargo de nuestro equipo editorial. La muestra de prueba fue proporcionada al autor en calidad de préstamo por el fabricante o el minorista a los efectos de esta reseña. El prestamista no tuvo ninguna influencia en esta reseña, ni el fabricante recibió una copia de la misma antes de su publicación. No había ninguna obligación de publicar esta reseña. Como empresa de medios independiente, Notebookcheck no está sujeta a la autoridad de fabricantes, minoristas o editores.
Así es como prueba Notebookcheck
Cada año, Notebookcheck revisa de forma independiente cientos de portátiles y smartphones utilizando procedimientos estandarizados para asegurar que todos los resultados son comparables. Hemos desarrollado continuamente nuestros métodos de prueba durante unos 20 años y hemos establecido los estándares de la industria en el proceso. En nuestros laboratorios de pruebas, técnicos y editores experimentados utilizan equipos de medición de alta calidad. Estas pruebas implican un proceso de validación en varias fases. Nuestro complejo sistema de clasificación se basa en cientos de mediciones y puntos de referencia bien fundamentados, lo que mantiene la objetividad.Price comparison

