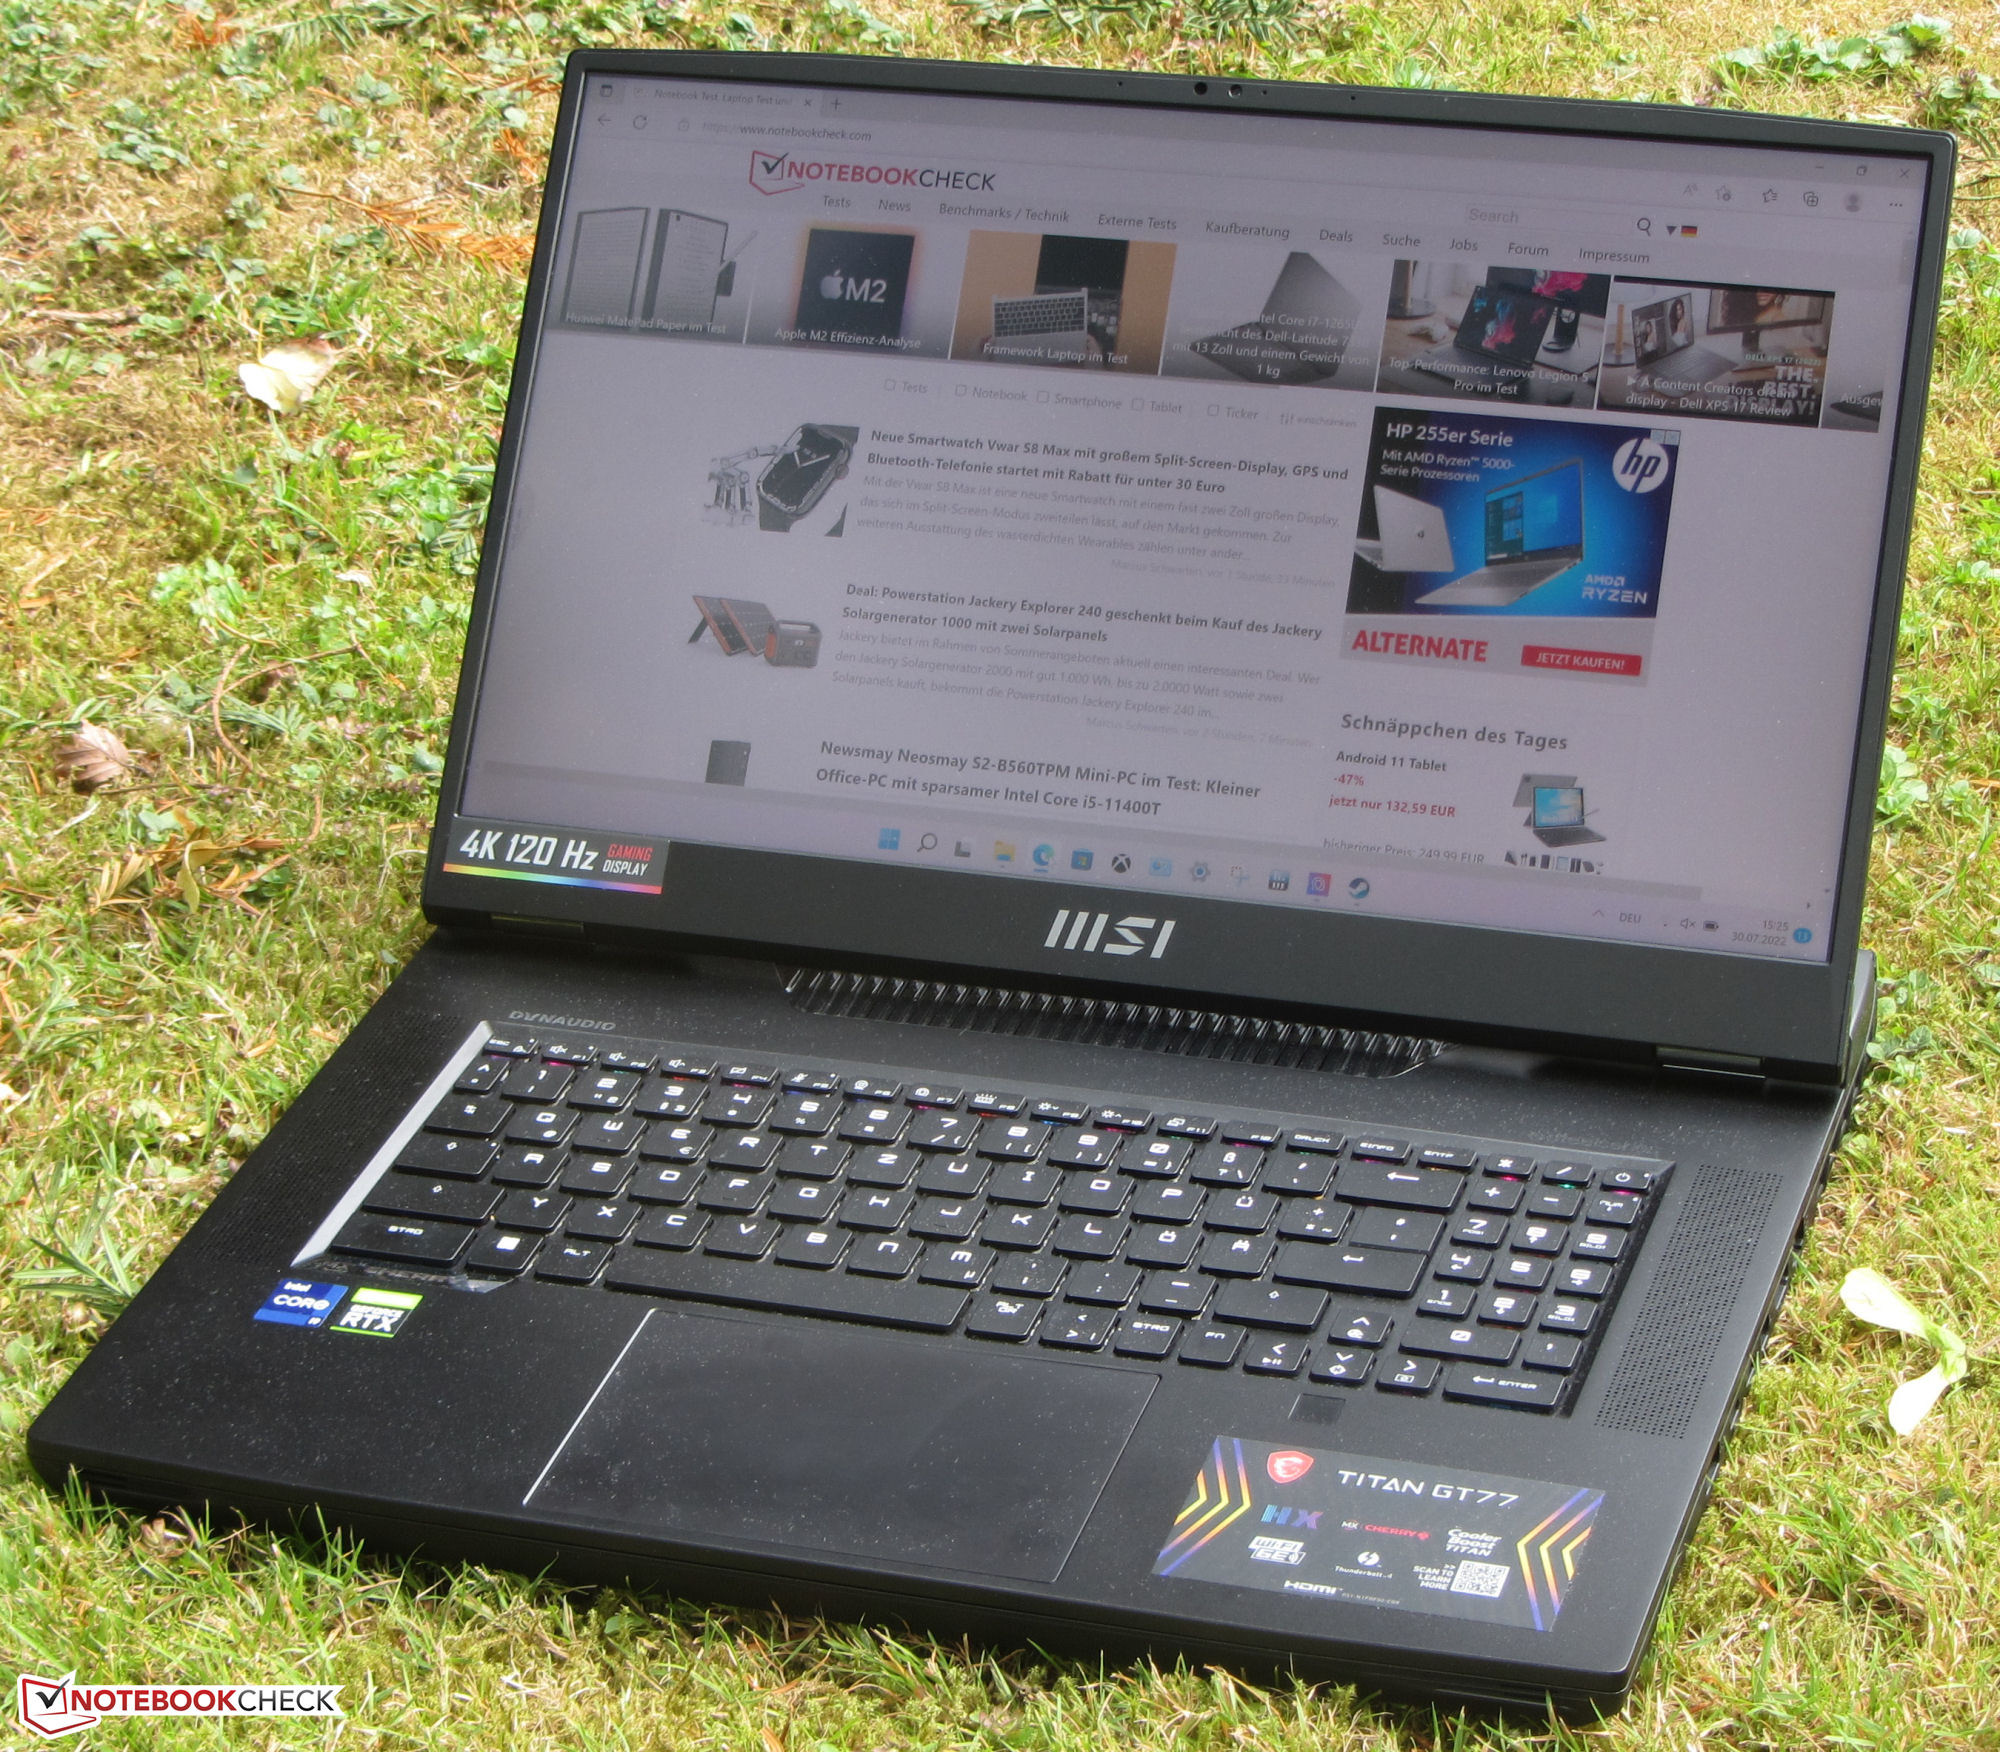
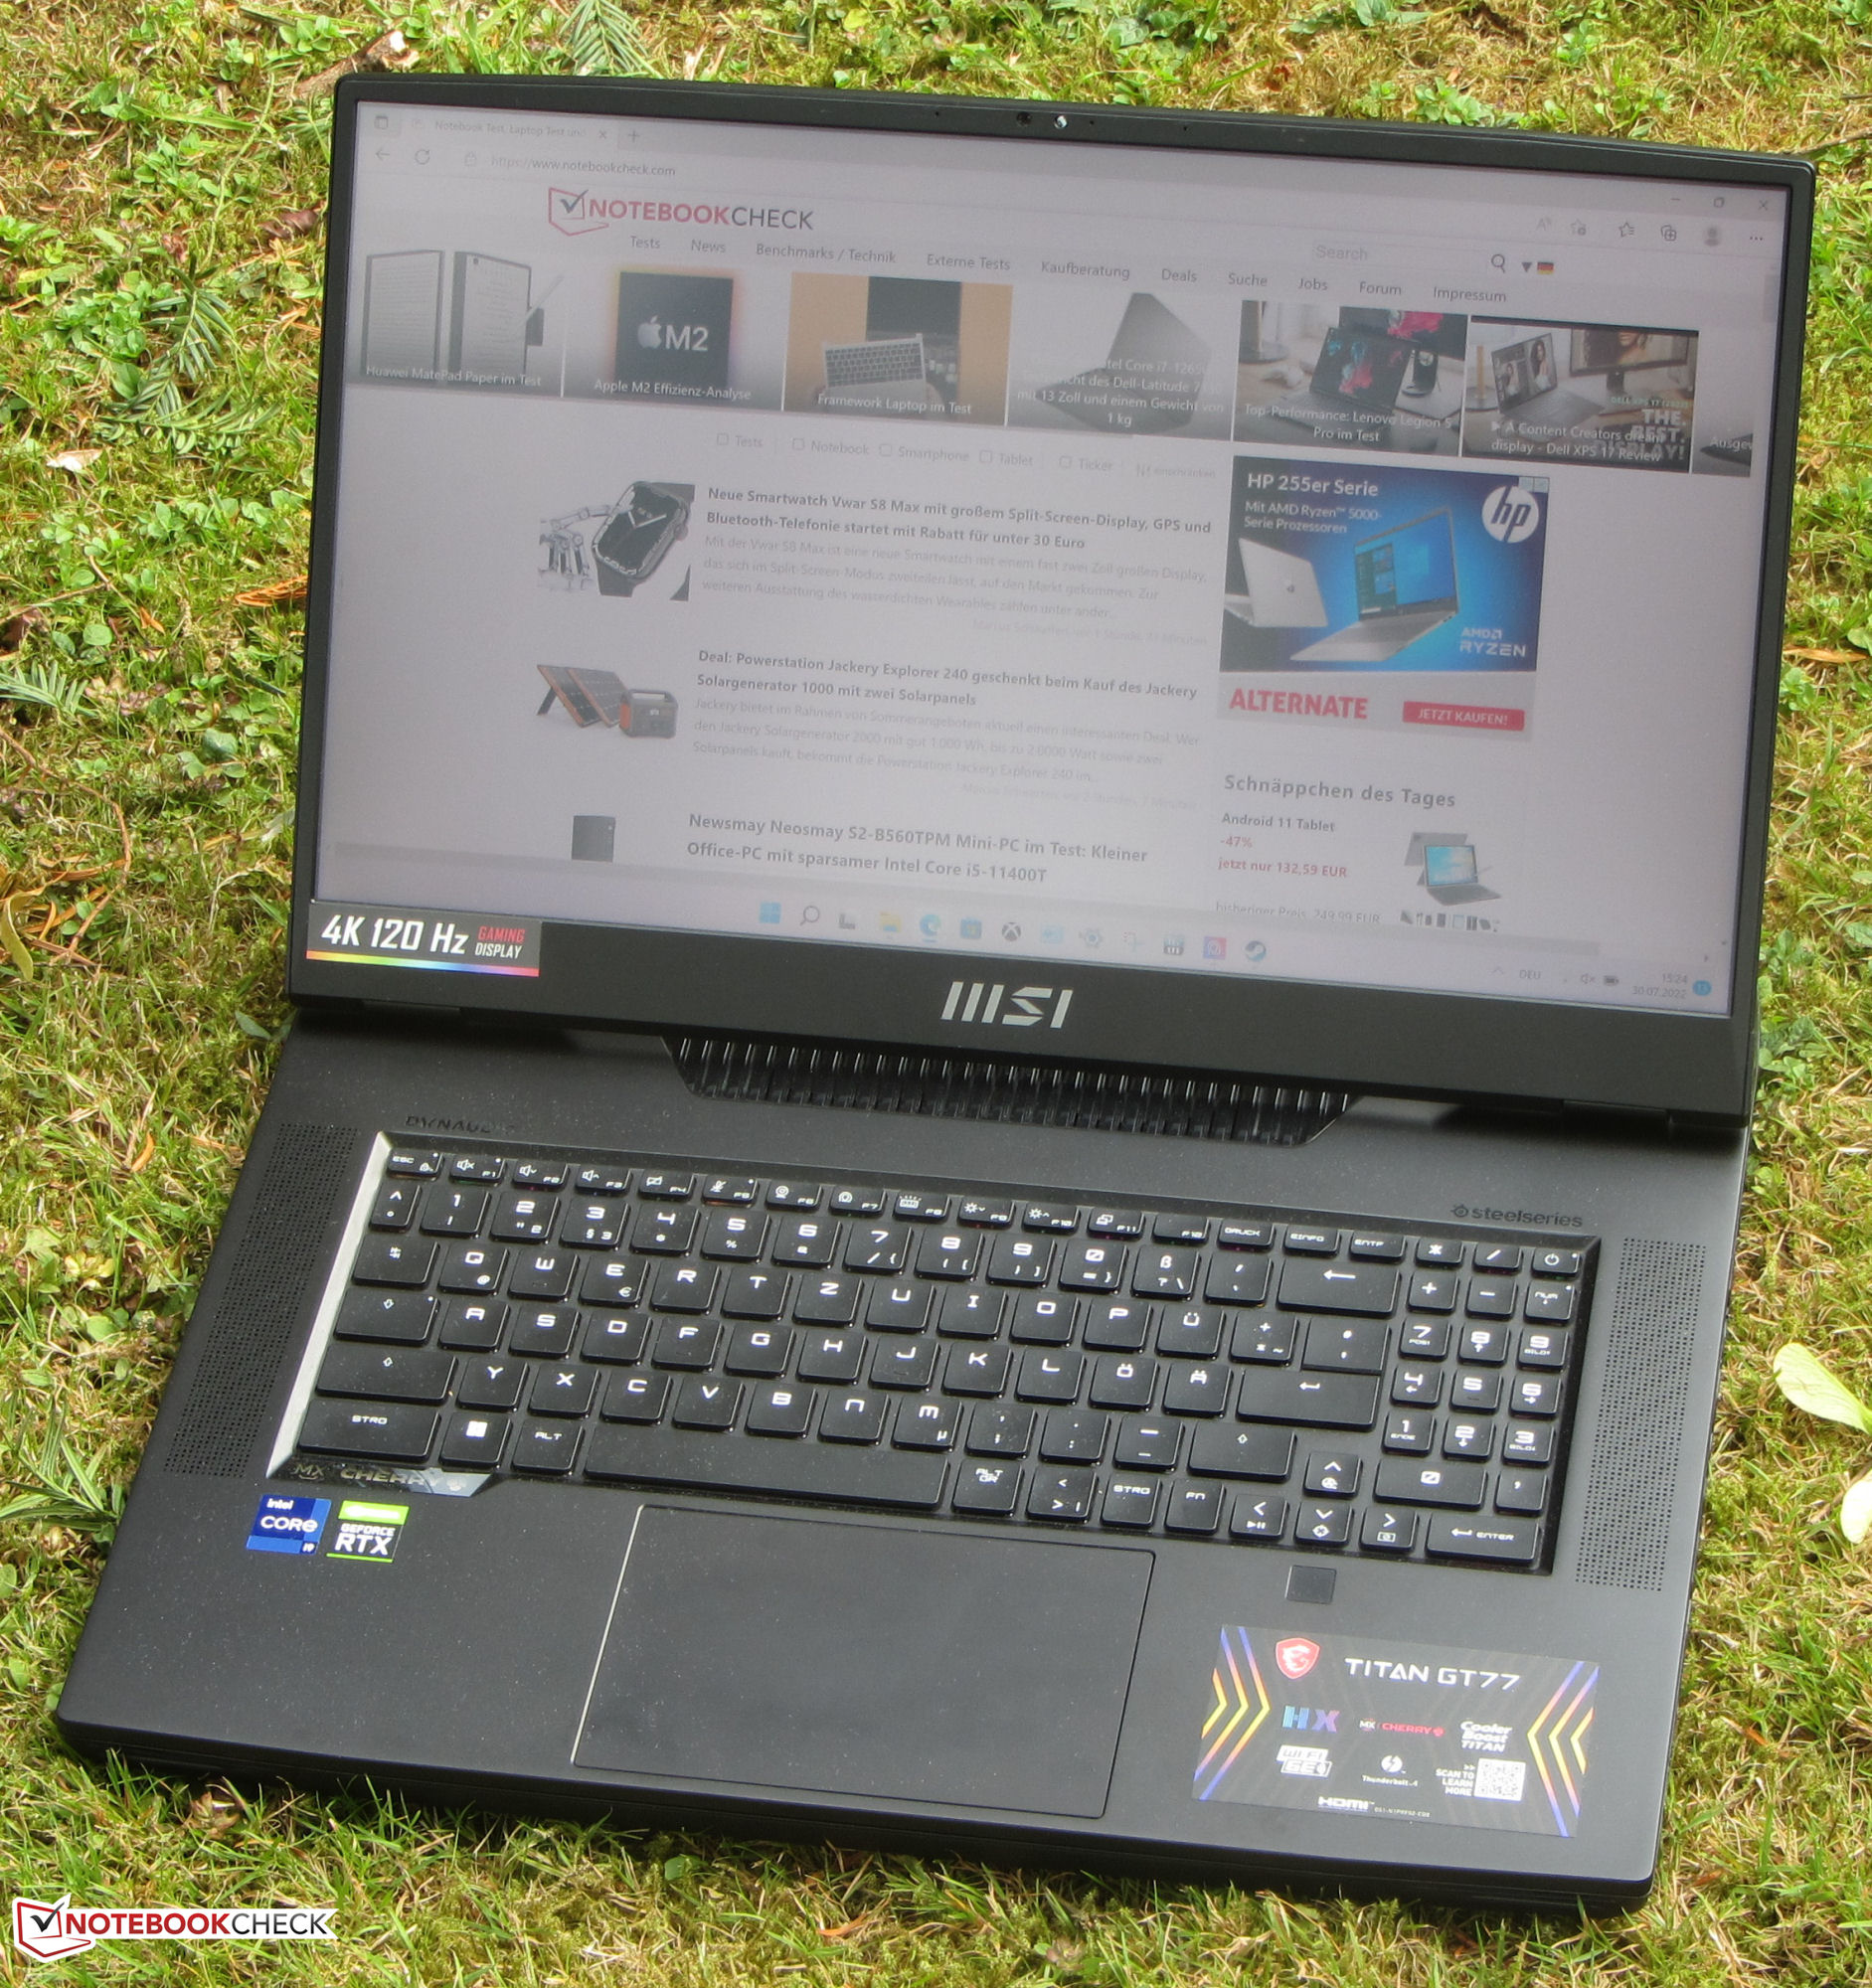
Análisis del MSI Titan GT77 12UHS 4K: La élite entre los portátiles UHD DTR
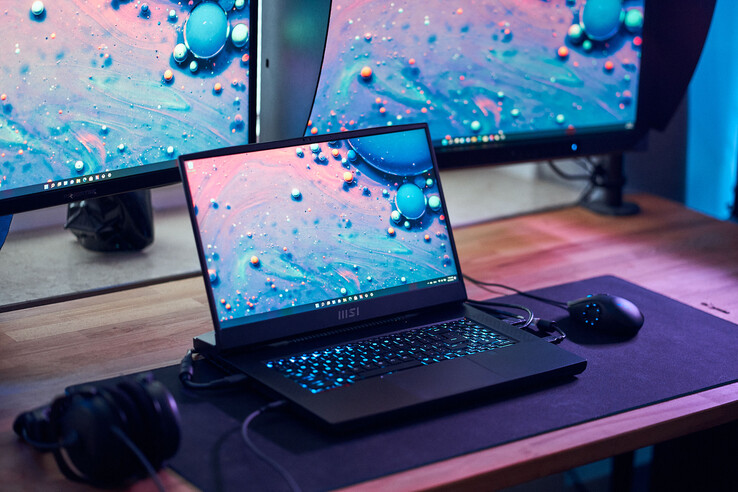
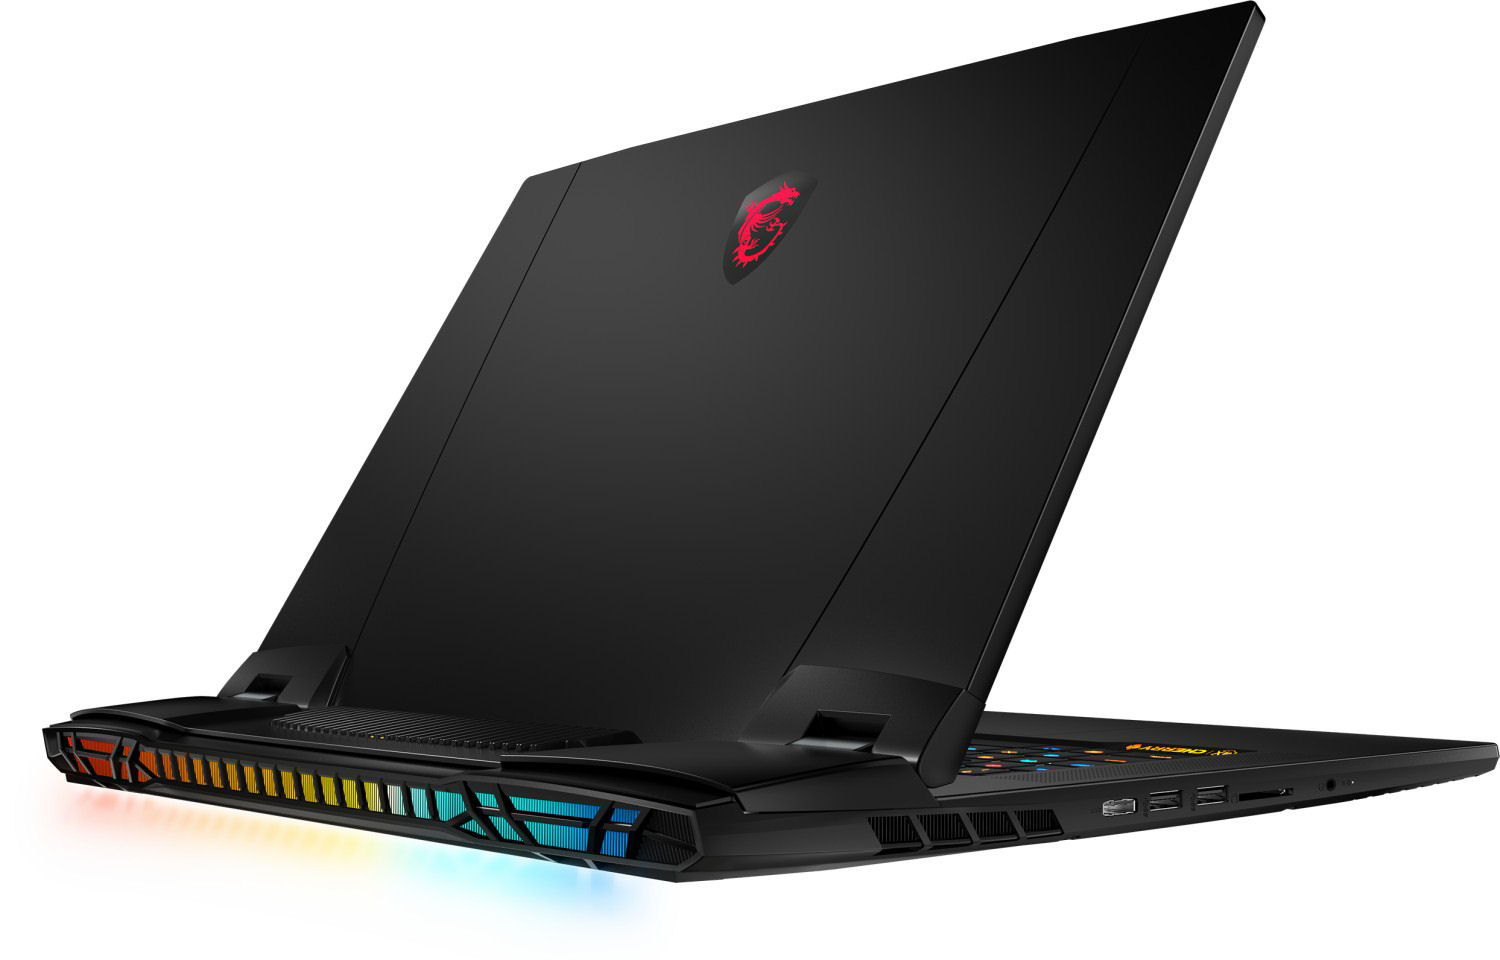
Tanto los jugadores como los creativos forman parte del público objetivo del MSI Titan GT77 12UHS, un portátil de sustitución de escritorio (DTR). Las especificaciones de gama alta (Core i9-12900HX, GeForce RTX 3080 Ti Laptop y 64 GB de RAM) elevan el precio del portátil a unos 5.600 euros (5.980 dólares). La pantalla es la principal diferencia entre este dispositivo y su Modelo hermano FHDque analizamos recientemente: la unidad de análisis actual tiene un panel 4K a bordo. Algunos de sus competidores son el Schenker XMG Ultra 17y el Razer Blade 17 y el Alienware x17 R2.
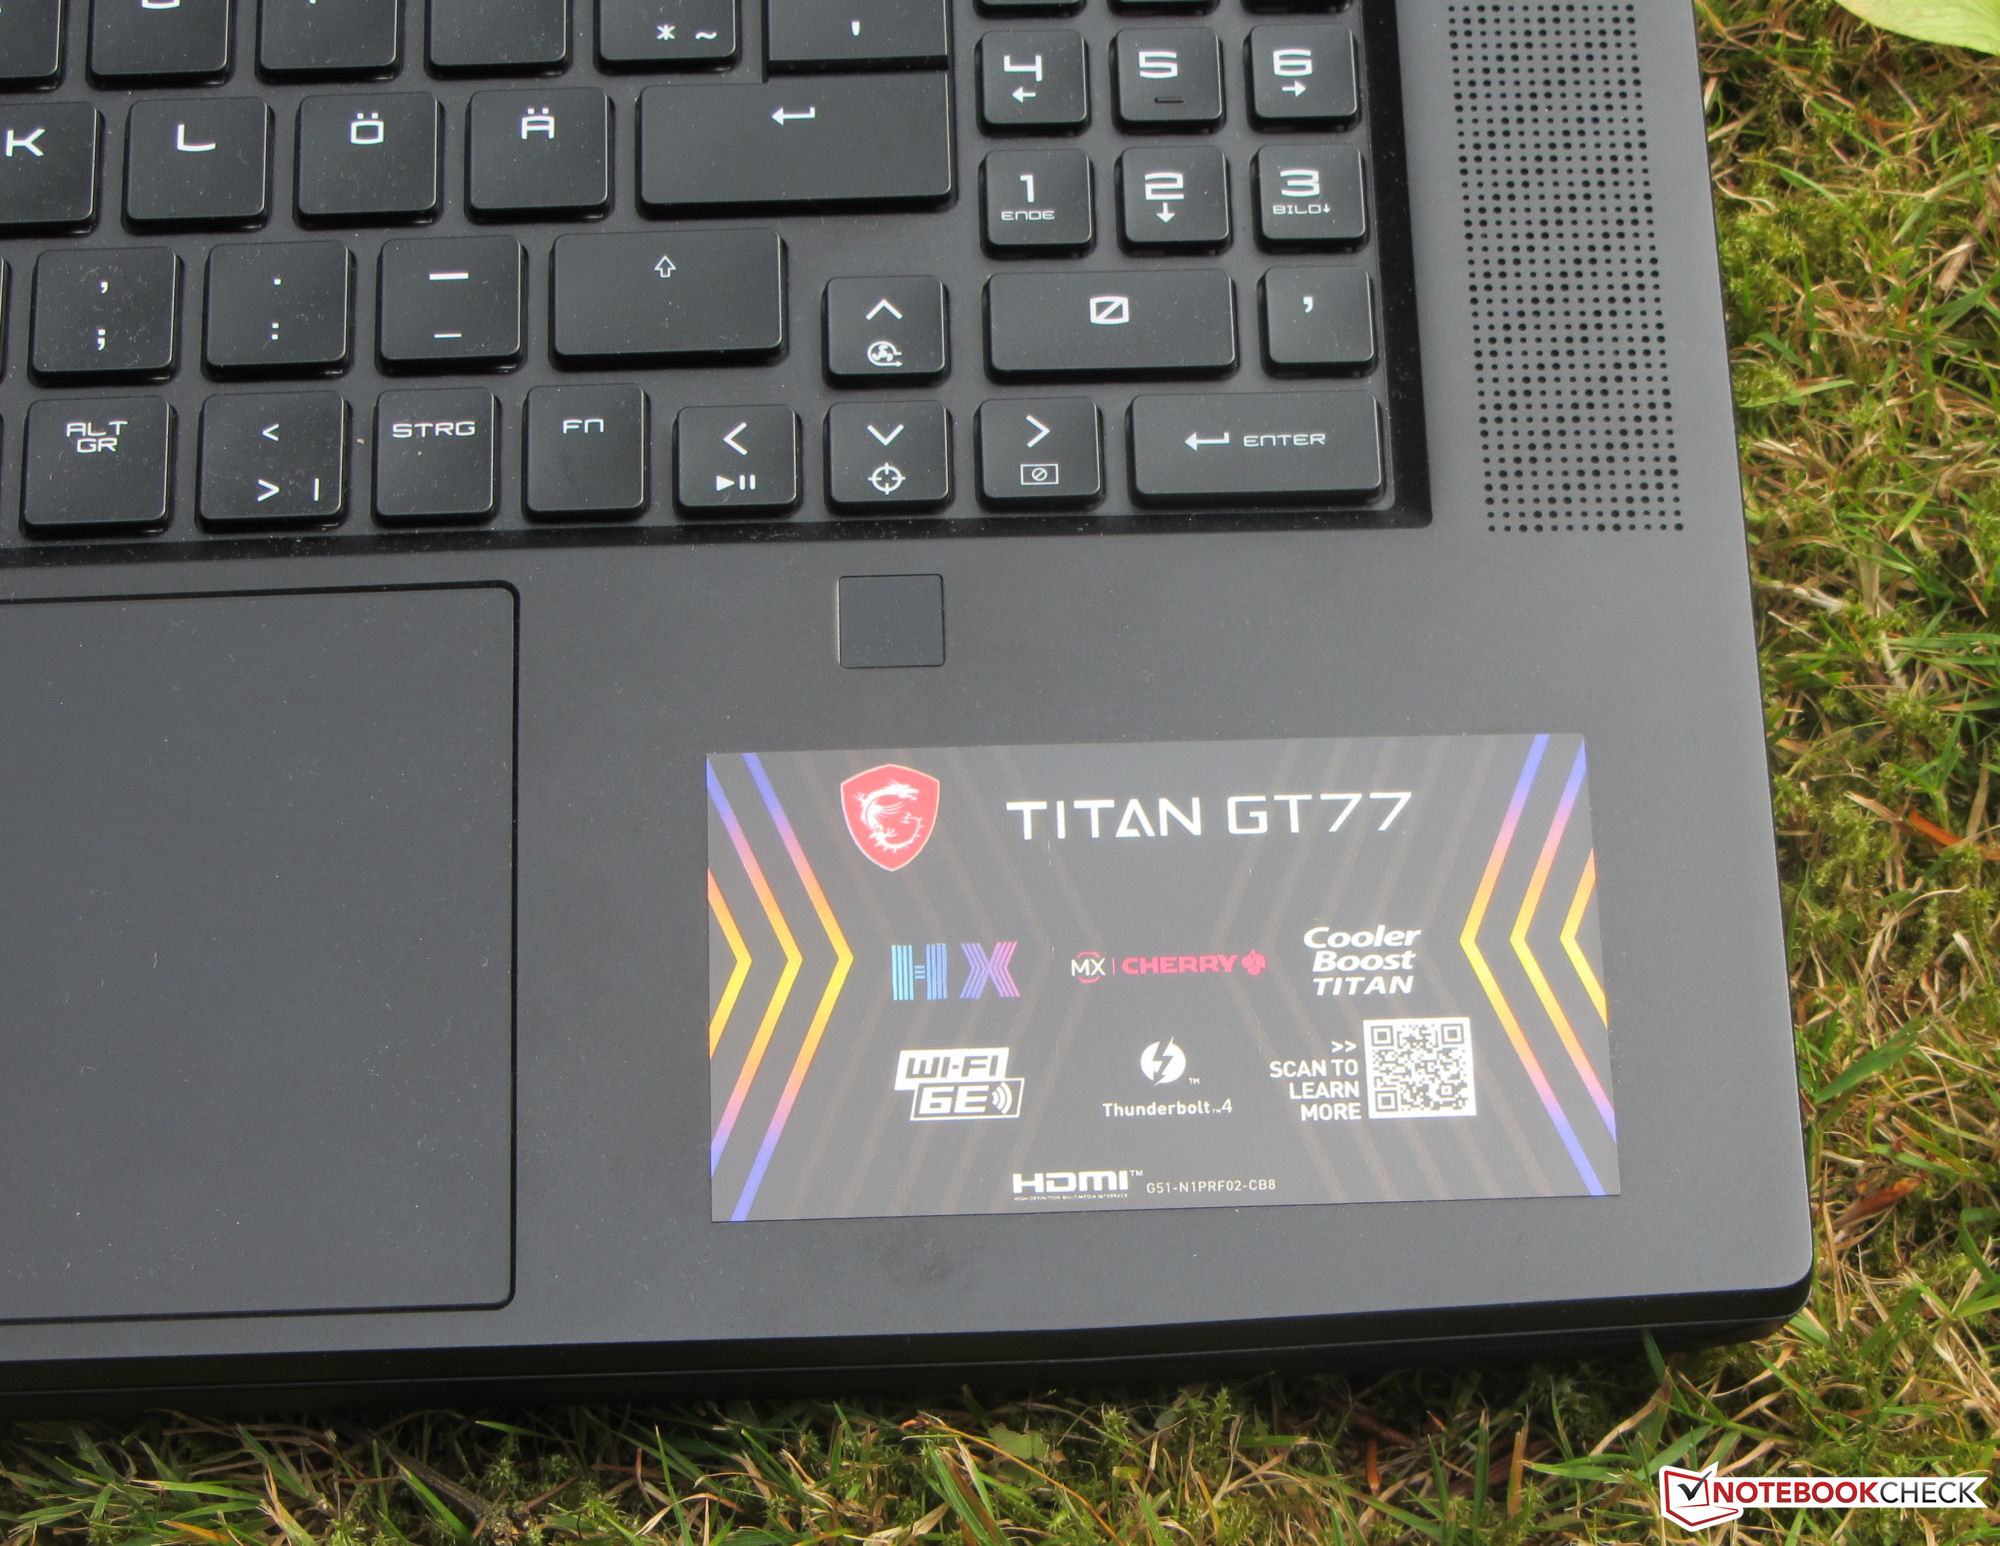
Como este dispositivo y su homólogo FHD están construidos de forma idéntica, puedes leer nuestro análisis del MSI Titan GT77 12UHS (Core i9, FHD)para más información sobre el chasis, los dispositivos de entrada y los altavoces.
Comparaison avec les concurrents potentiels
Valoración | Fecha | Modelo | Peso | Altura | Tamaño | Resolución | Precio |
|---|---|---|---|---|---|---|---|
| 87.8 % v7 (old) | 09/2022 | MSI Titan GT77 12UHS i9-12900HX, GeForce RTX 3080 Ti Laptop GPU | 3.4 kg | 23 mm | 17.30" | 3840x2160 | |
| 89.9 % v7 (old) | 07/2022 | Razer Blade 17 Early 2022 i9-12900H, GeForce RTX 3080 Ti Laptop GPU | 2.8 kg | 19.9 mm | 17.30" | 3840x2160 | |
| 89.2 % v7 (old) | 05/2022 | Alienware x17 R2 P48E i9-12900HK, GeForce RTX 3080 Ti Laptop GPU | 3.1 kg | 20.9 mm | 17.30" | 1920x1080 | |
| 84.9 % v7 (old) | 04/2021 | Schenker XMG Ultra 17 Rocket Lake i9-11900K, GeForce RTX 3080 Laptop GPU | 4.7 kg | 43.5 mm | 17.30" | 1920x1080 |

| SD Card Reader - average JPG Copy Test (av. of 3 runs) | |
| Schenker XMG Ultra 17 Rocket Lake | |
| Alienware x17 R2 P48E (AV Pro V60) | |
| Razer Blade 17 Early 2022 (AV PRO microSD 128 GB V60) | |
| Media de la clase Gaming (20.9 - 210, n=55, últimos 2 años) | |
| MSI Titan GT77 12UHS (AV PRO microSD 128 GB V60) | |
| MSI Titan GT77 12UHS 4k (AV PRO microSD 128 GB V60) | |


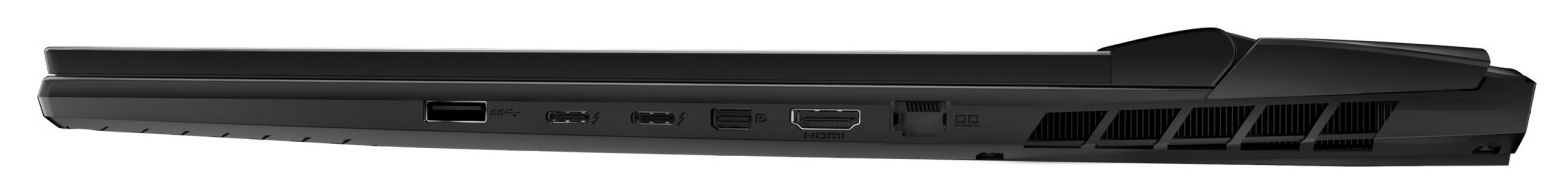
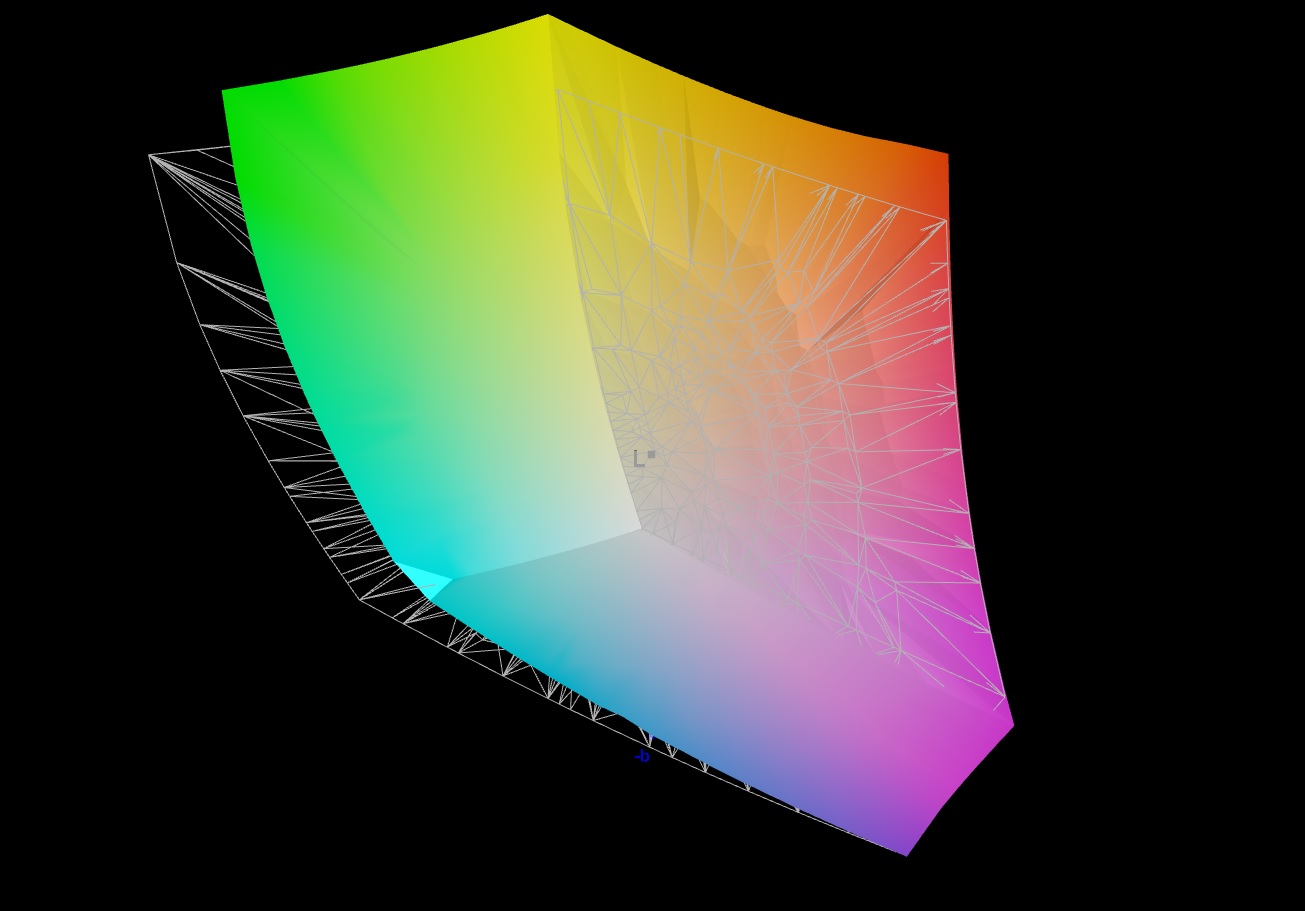
Pantalla - Panel brillante con alta cobertura DCI-P3
El panel 4K mate (3.840 x 2.160 píxeles) de la unidad de evaluación actual ofrece un brillo máximo significativamente mayor que la pantalla FHD de su modelo hermano su modelo hermano (401 cd/m² frente a 275.1 cd/m²).
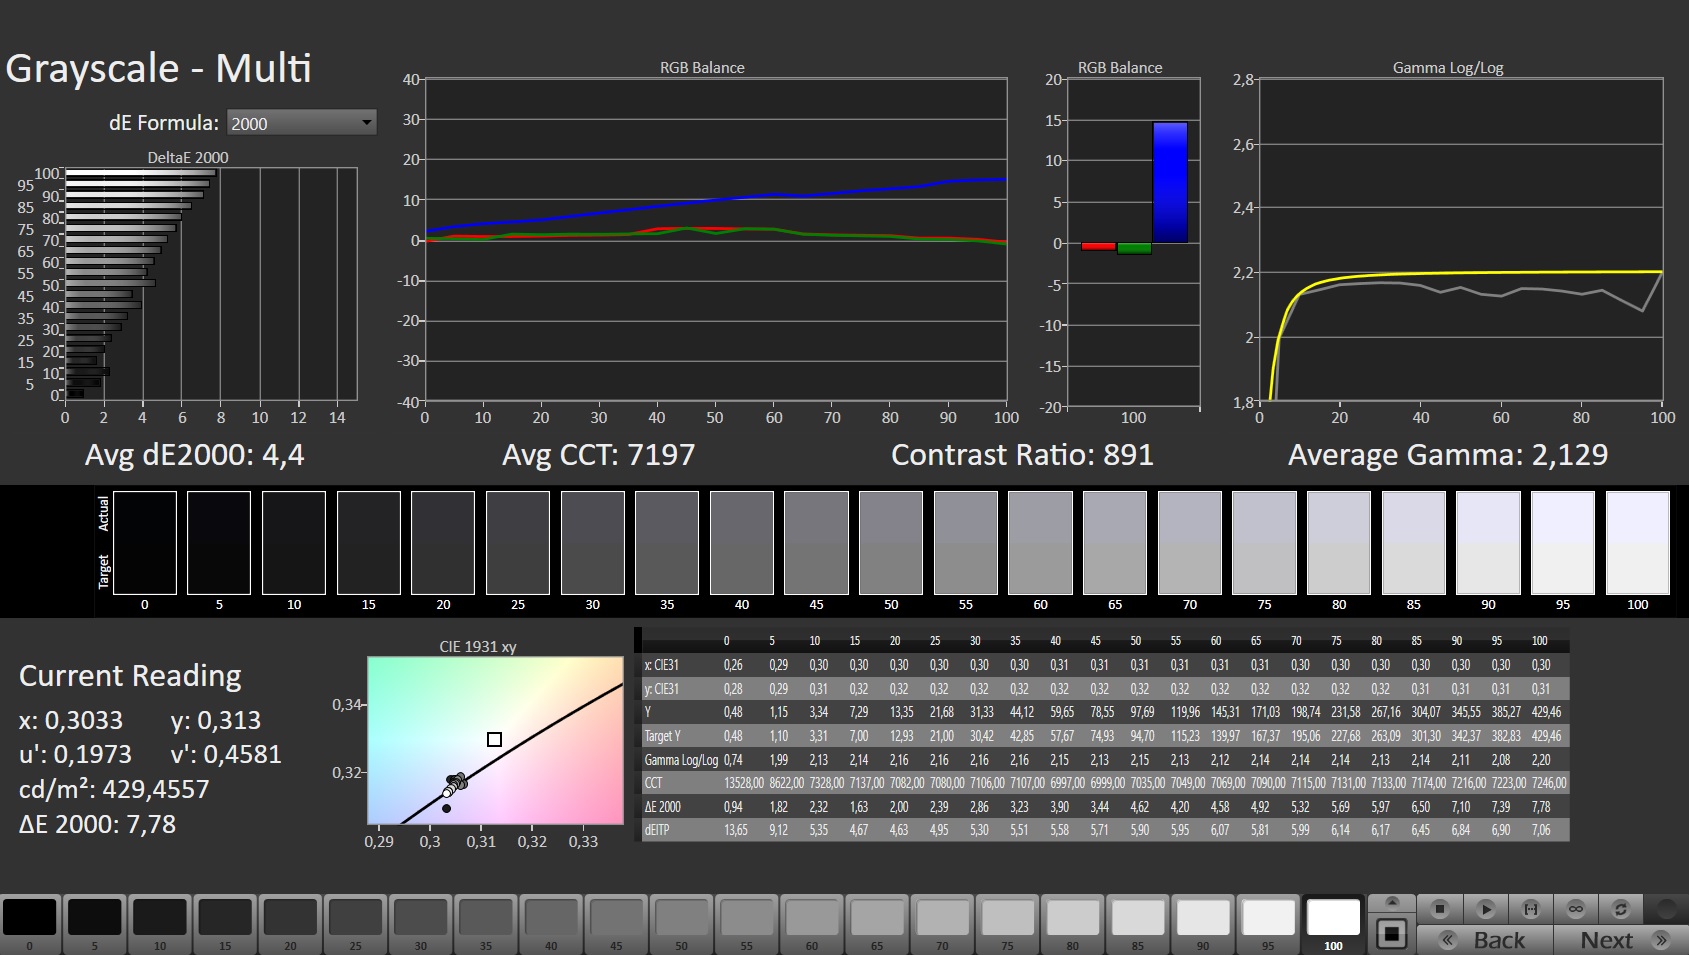
Sin embargo, todavía hay margen de mejora en términos de contraste (871:1 vs. 700:1): ambas pantallas se quedan por debajo de lo que consideramos buenos valores (> 1.000:1). Aunque los dos paneles tienen una gran capacidad de respuesta, el modelo FHD ofrece una tasa de refresco considerablemente mayor (120 Hz frente a 360 Hz). No observamos ningún parpadeo PWM durante nuestras mediciones.
| |||||||||||||||||||||||||
iluminación: 91 %
Brillo con batería: 418 cd/m²
Contraste: 871:1 (Negro: 0.48 cd/m²)
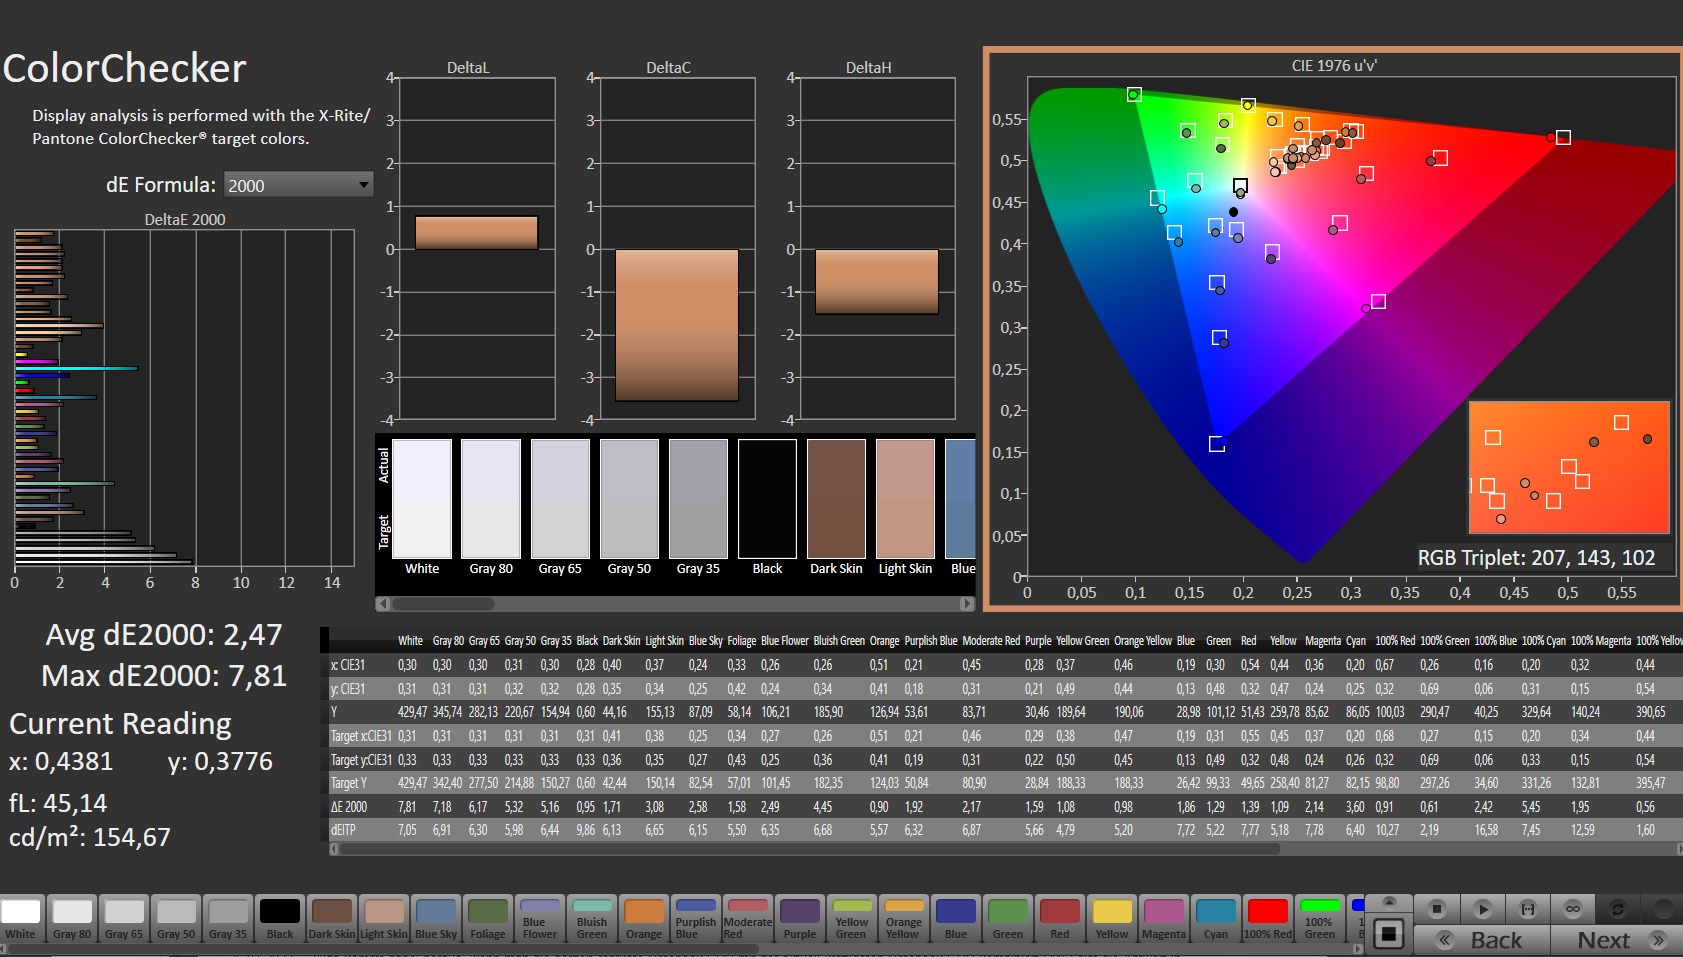
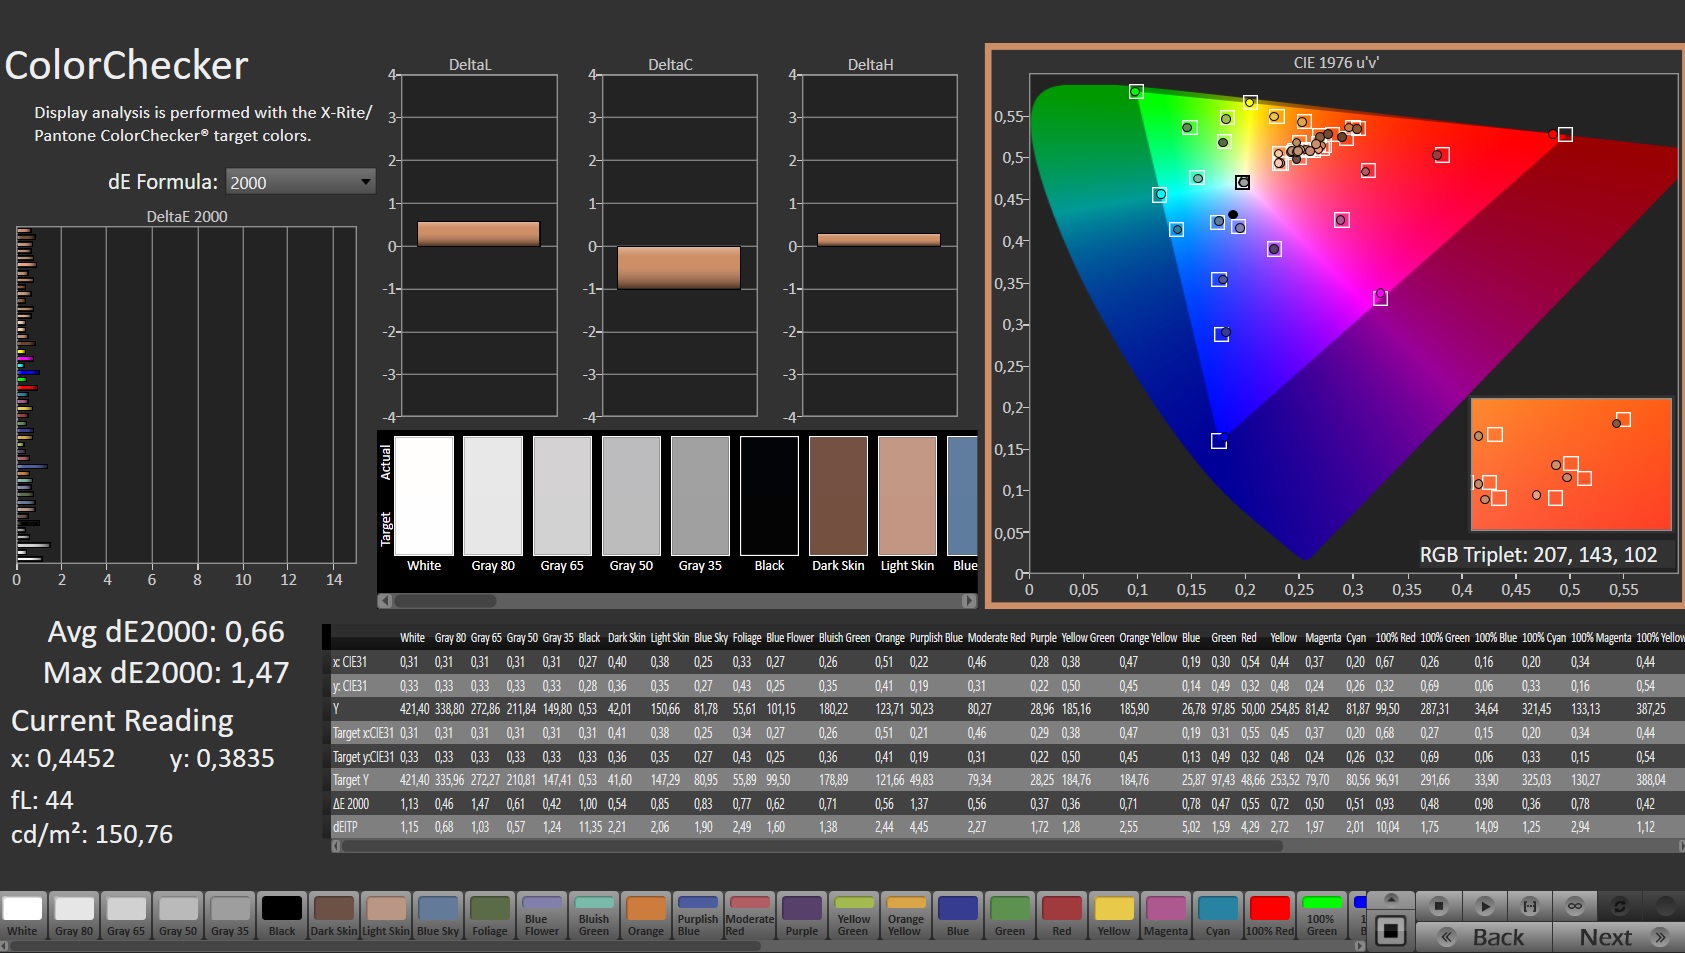
ΔE ColorChecker Calman: 2.47 | ∀{0.5-29.43 Ø4.71}
calibrated: 0.66
ΔE Greyscale Calman: 4.4 | ∀{0.09-98 Ø4.96}
86.2% AdobeRGB 1998 (Argyll 3D)
99.8% sRGB (Argyll 3D)
97% Display P3 (Argyll 3D)
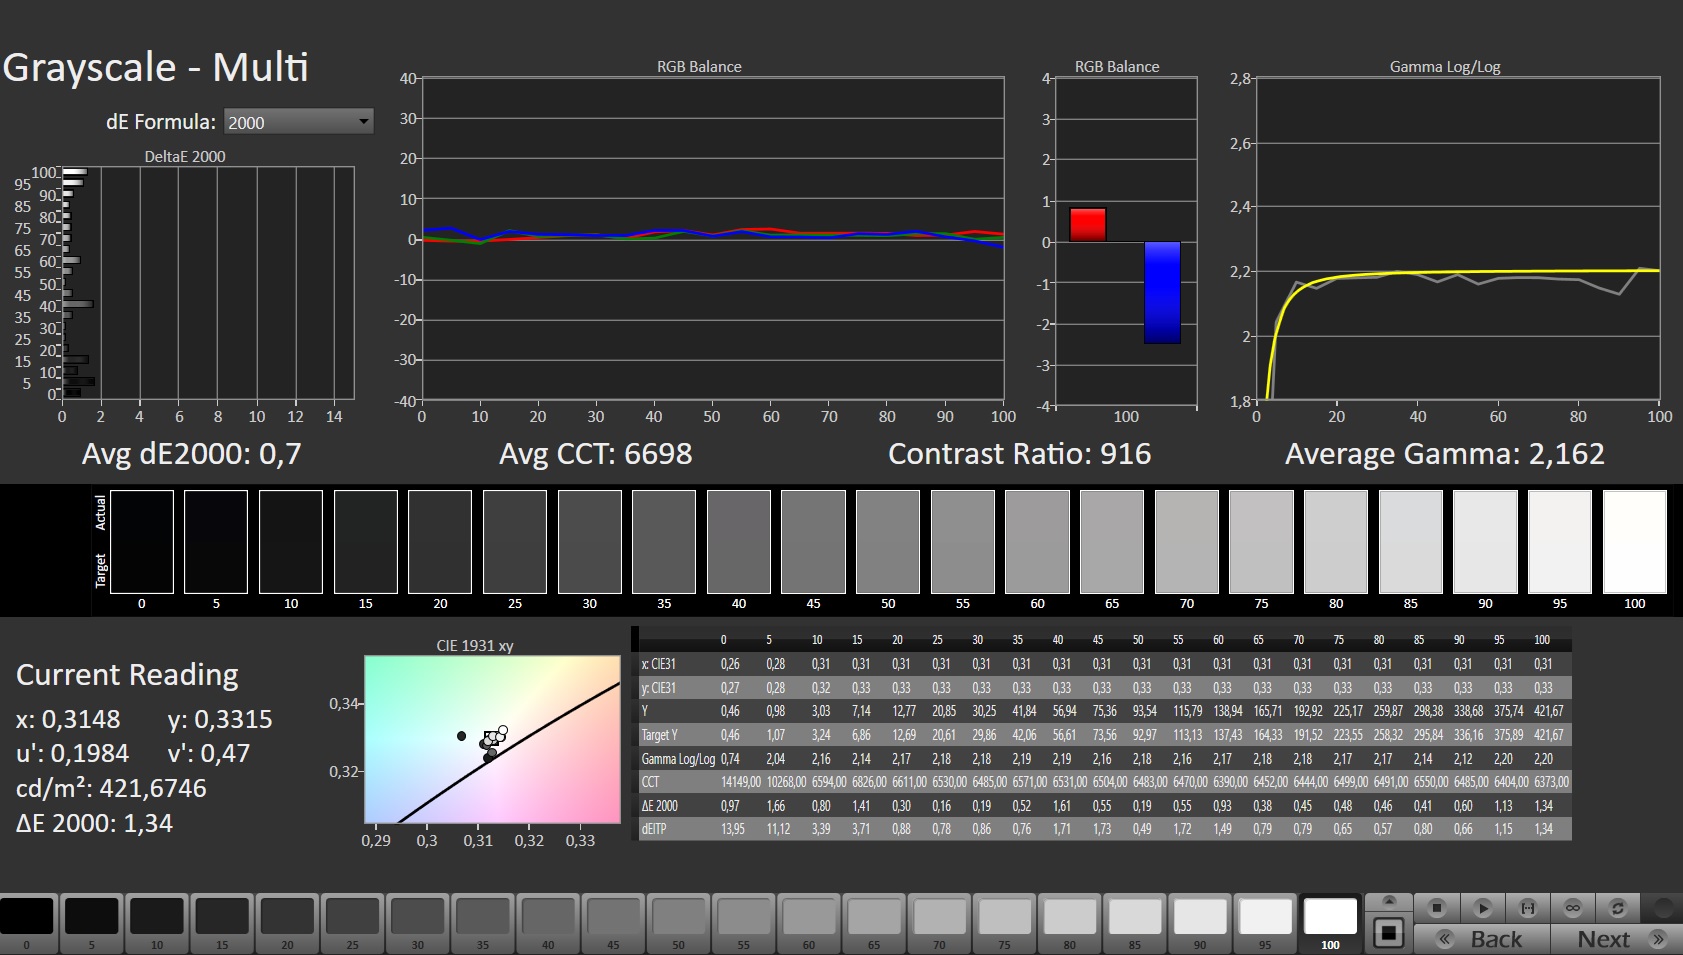
Gamma: 2.129
CCT: 7197 K
| MSI Titan GT77 12UHS 4k AU Optronics B173ZAN06.1, IPS, 3840x2160, 17.3" | Razer Blade 17 Early 2022 AU Optronics B173ZAN06.9, IPS, 3840x2160, 17.3" | Alienware x17 R2 P48E AU Optronics B173HAN, IPS, 1920x1080, 17.3" | Schenker XMG Ultra 17 Rocket Lake AU Optronics B173HAN05.1, IPS, 1920x1080, 17.3" | MSI Titan GT77 12UHS Sharp SHP1544 LQ173M1JW08, IPS-Level, 1920x1080, 17.3" | |
|---|---|---|---|---|---|
| Display | 1% | -9% | -16% | -14% | |
| Display P3 Coverage (%) | 97 | 99.4 2% | 79.2 -18% | 69.8 -28% | 70.8 -27% |
| sRGB Coverage (%) | 99.8 | 100 0% | 99.8 0% | 97.2 -3% | 98.9 -1% |
| AdobeRGB 1998 Coverage (%) | 86.2 | 87.3 1% | 79.6 -8% | 72 -16% | 73 -15% |
| Response Times | -27% | -109% | -44% | 19% | |
| Response Time Grey 50% / Grey 80% * (ms) | 5.2 ? | 7.5 ? -44% | 12.4 ? -138% | 5.6 ? -8% | 3.03 ? 42% |
| Response Time Black / White * (ms) | 5.1 ? | 5.6 ? -10% | 9.2 ? -80% | 9.2 ? -80% | 5.28 ? -4% |
| PWM Frequency (Hz) | |||||
| Screen | 28% | 3% | 9% | -17% | |
| Brightness middle (cd/m²) | 418 | 503 20% | 365.4 -13% | 306 -27% | 280 -33% |
| Brightness (cd/m²) | 401 | 486 21% | 344 -14% | 299 -25% | 275 -31% |
| Brightness Distribution (%) | 91 | 84 -8% | 85 -7% | 93 2% | 79 -13% |
| Black Level * (cd/m²) | 0.48 | 0.44 8% | 0.29 40% | 0.22 54% | 0.4 17% |
| Contrast (:1) | 871 | 1143 31% | 1260 45% | 1391 60% | 700 -20% |
| Colorchecker dE 2000 * | 2.47 | 1.08 56% | 3.17 -28% | 1.92 22% | 2.1 15% |
| Colorchecker dE 2000 max. * | 7.81 | 4.54 42% | 7.69 2% | 4.78 39% | 5.83 25% |
| Colorchecker dE 2000 calibrated * | 0.66 | 0.6 9% | 0.51 23% | 1.34 -103% | 1.58 -139% |
| Greyscale dE 2000 * | 4.4 | 1.3 70% | 5.3 -20% | 2 55% | 3.3 25% |
| Gamma | 2.129 103% | 2.151 102% | 2.18 101% | 2.153 102% | 2.13 103% |
| CCT | 7197 90% | 6541 99% | 5879 111% | 6738 96% | 7060 92% |
| Color Space (Percent of AdobeRGB 1998) (%) | 72 | ||||
| Color Space (Percent of sRGB) (%) | 93 | ||||
| Media total (Programa/Opciones) | 1% /
14% | -38% /
-15% | -17% /
-4% | -4% /
-11% |
* ... más pequeño es mejor
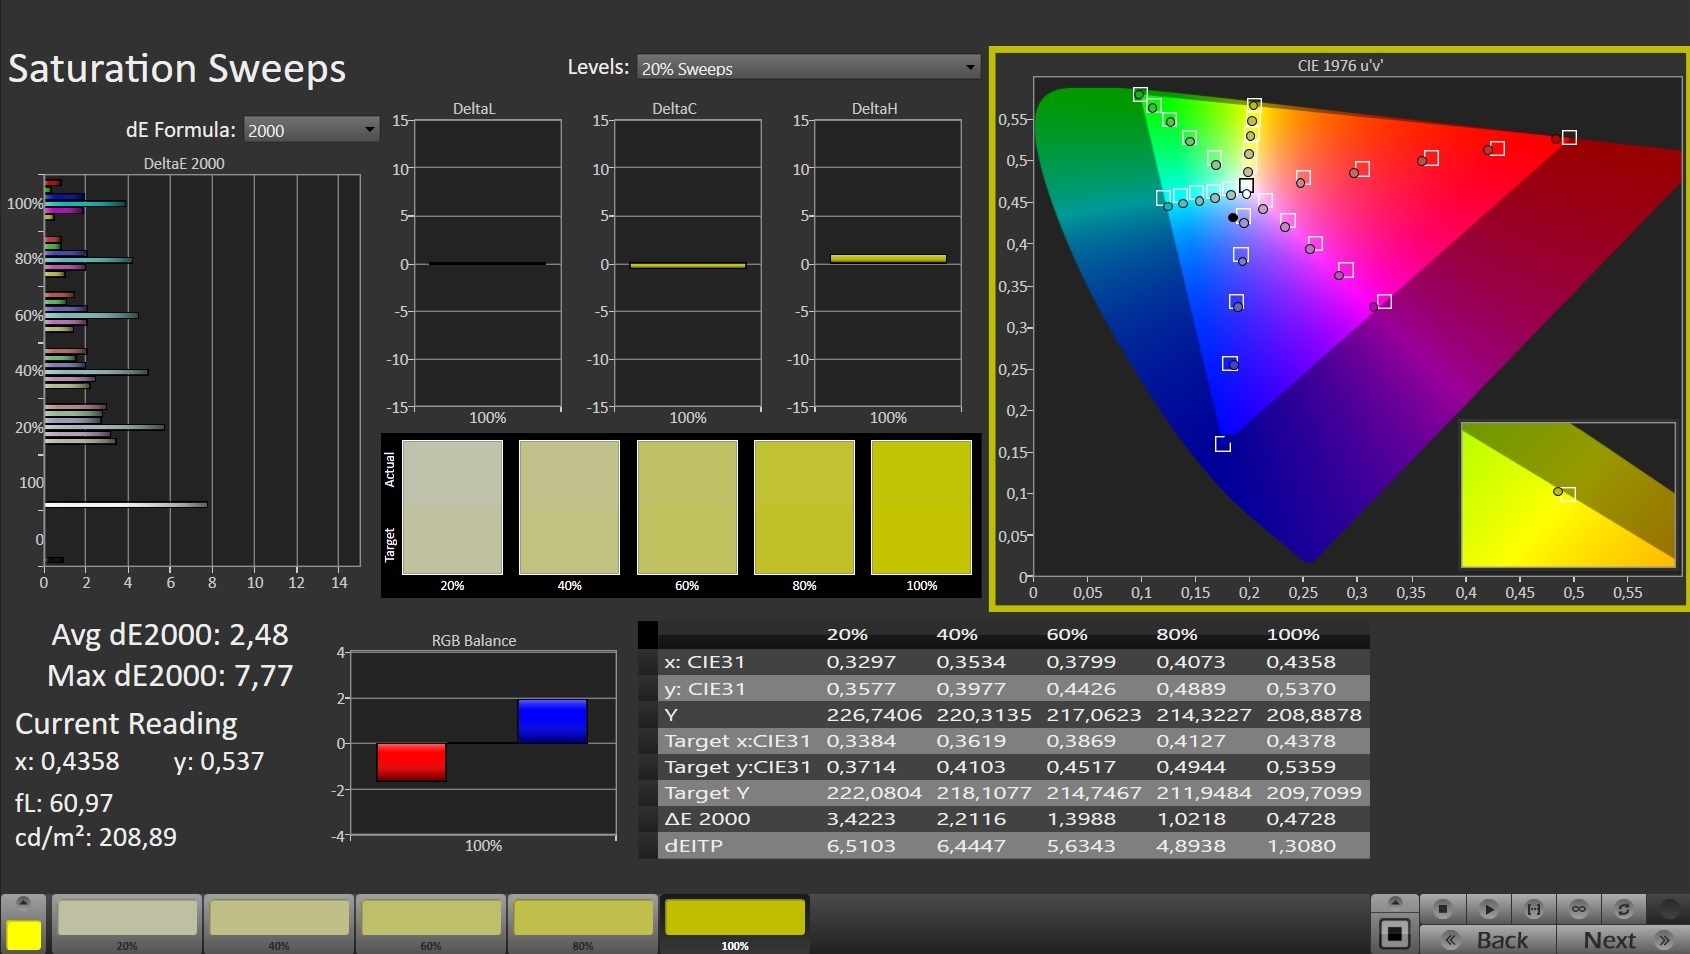
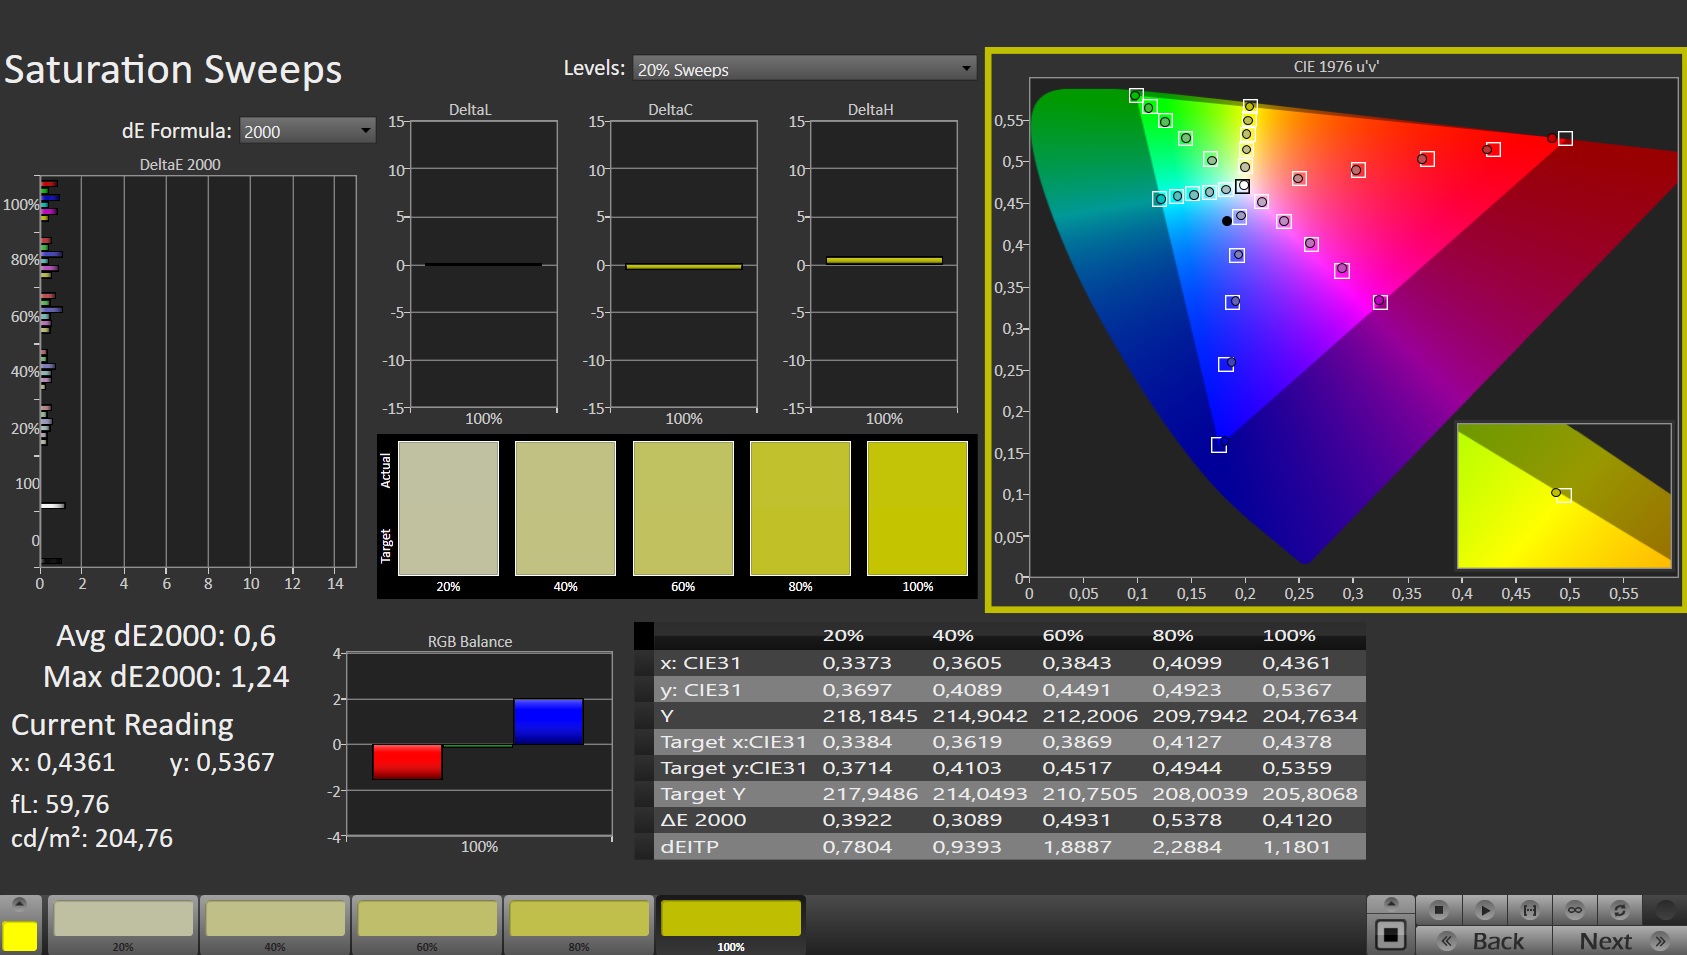
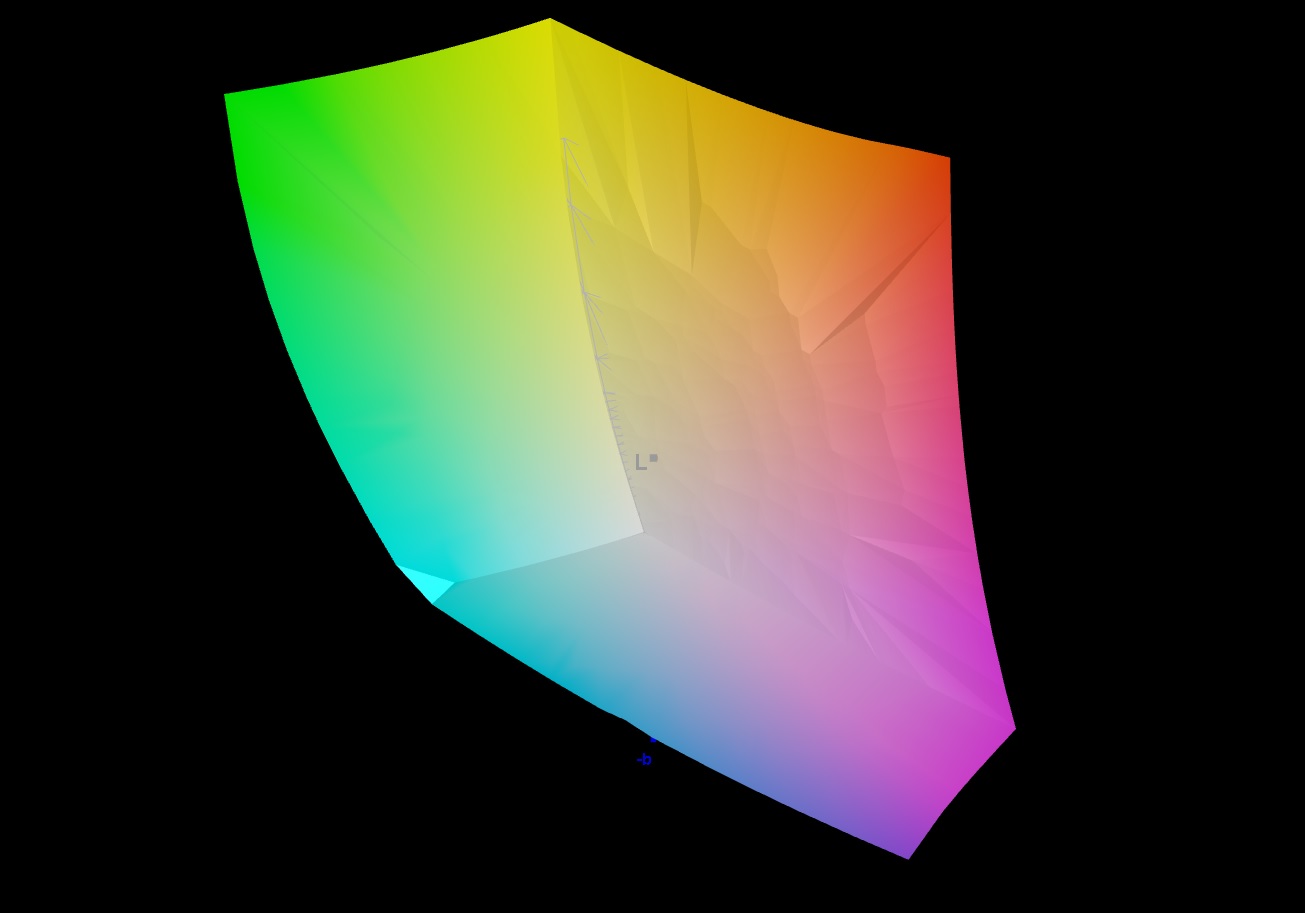
La pantalla 4K cubre casi todo el espacio de color sRGB (99,8%) y DCI-P3 (97%) y hasta el 86% de AdobeRGB. El panel FHD del modelo hermano de ,, es incapaz de mantener este nivel (sRGB: 97%, AdobeRGB: 73%, DCI-P3: 71%). Esto significa que el panel 4K es la mejor opción si la precisión del color es importante para ti
Las pantallas ya tienen una buena reproducción del color nada más sacarlas de la caja: las pantallas UHD y FHD cumplen el valor deseado (Delta E < 3) con sus diferencias de color no perceptibles de 2,47 y 2,1 respectivamente. La calibración de las pantallas hizo que su reproducción de la escala de grises fuera más equilibrada y disminuyó las diferencias de color a 0,66 y 1,58 respectivamente. En el cuadro de información de cada pantalla, puedes encontrar un enlace para descargar gratuitamente los perfiles de color creados por nosotros.
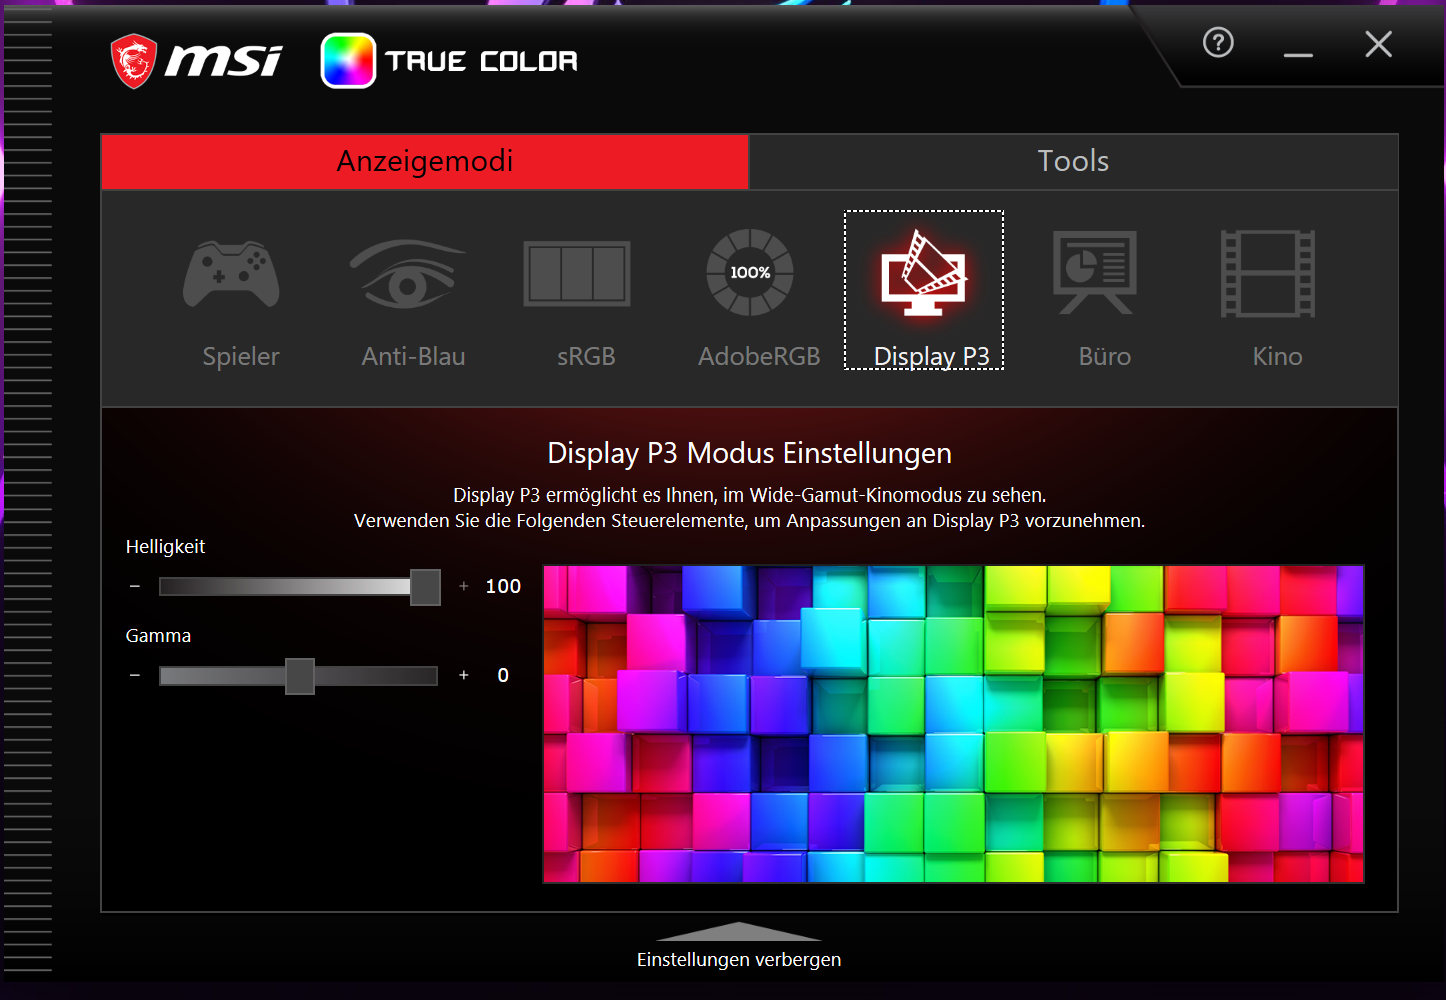
Nota: El software MSI True Color permite ajustar los colores para adaptarse mejor a una gama de colores o a un escenario de uso definido. Elegimos el preajuste "Display P3".

Tiempos de respuesta del display
| ↔ Tiempo de respuesta de Negro a Blanco | ||
|---|---|---|
| 5.1 ms ... subida ↗ y bajada ↘ combinada | ↗ 1.5 ms subida | 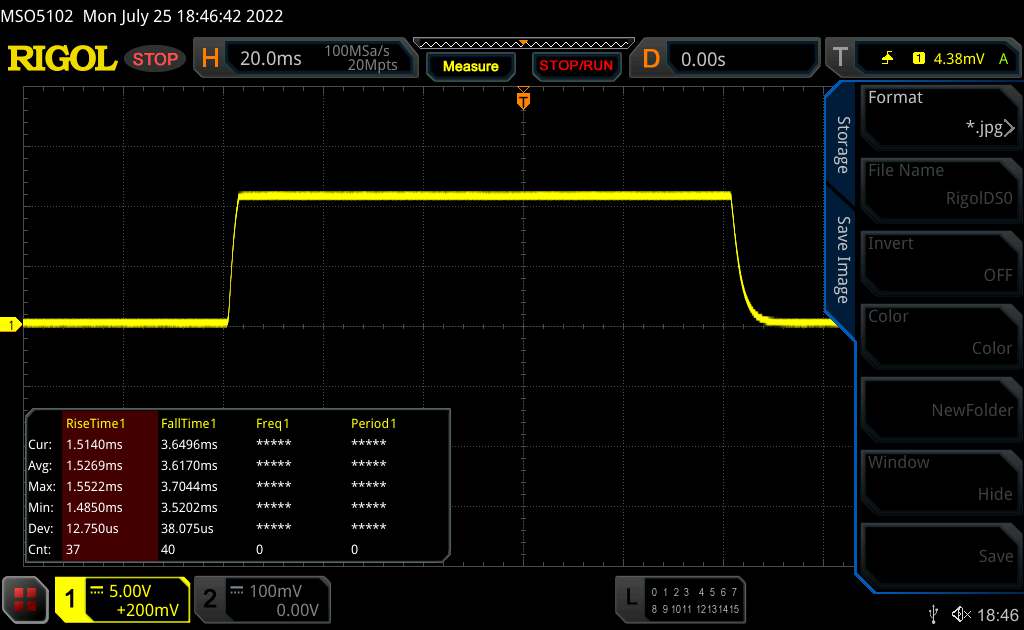 |
| ↘ 3.6 ms bajada | ||
| La pantalla mostró tiempos de respuesta muy rápidos en nuestros tests y debería ser adecuada para juegos frenéticos. En comparación, todos los dispositivos de prueba van de ##min### (mínimo) a 240 (máximo) ms. » 18 % de todos los dispositivos son mejores. Esto quiere decir que el tiempo de respuesta medido es mejor que la media (19.8 ms) de todos los dispositivos testados. | ||
| ↔ Tiempo de respuesta 50% Gris a 80% Gris | ||
| 5.2 ms ... subida ↗ y bajada ↘ combinada | ↗ 1.2 ms subida | 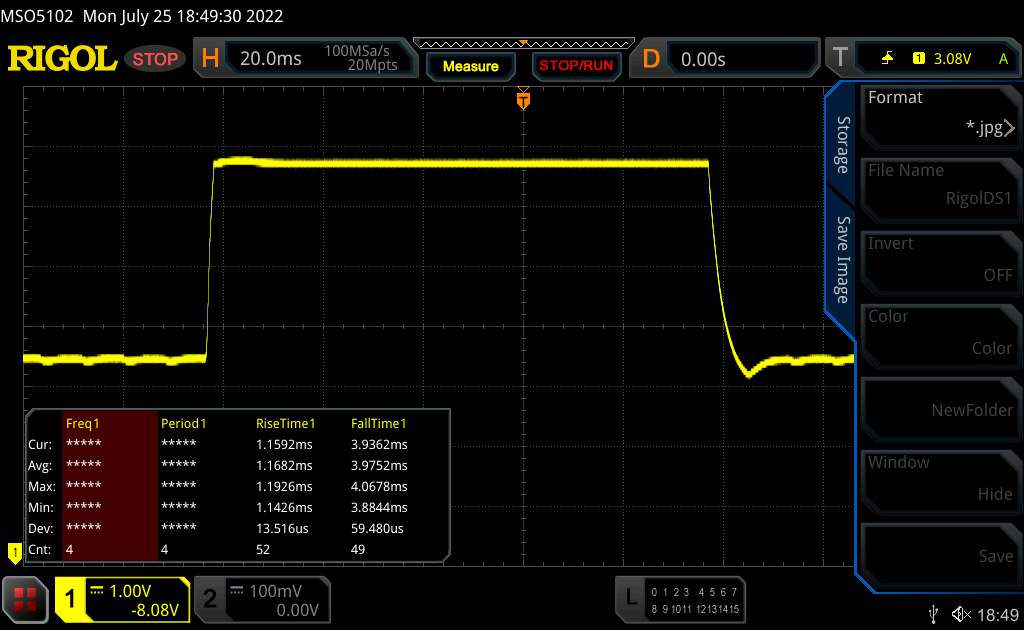 |
| ↘ 4 ms bajada | ||
| La pantalla mostró tiempos de respuesta muy rápidos en nuestros tests y debería ser adecuada para juegos frenéticos. En comparación, todos los dispositivos de prueba van de ##min### (mínimo) a 636 (máximo) ms. » 18 % de todos los dispositivos son mejores. Esto quiere decir que el tiempo de respuesta medido es mejor que la media (31 ms) de todos los dispositivos testados. | ||
Parpadeo de Pantalla / PWM (Pulse-Width Modulation)
| Parpadeo de Pantalla / PWM no detectado | 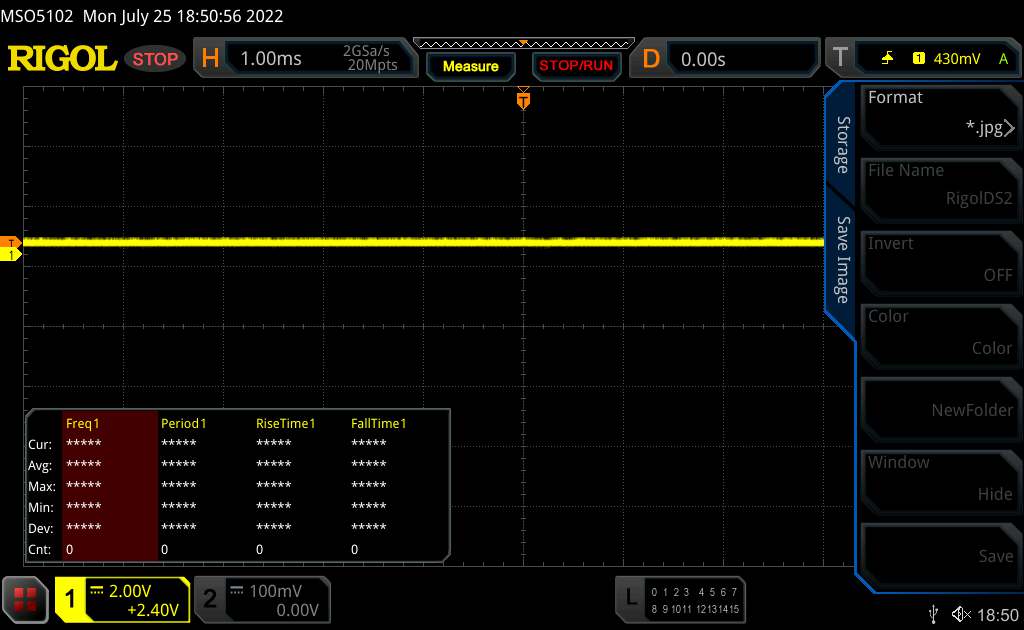 | ||
Comparación: 52 % de todos los dispositivos testados no usaron PWM para atenuar el display. Si se usó, medimos una media de 7751 (mínimo: 5 - máxmo: 343500) Hz. | |||
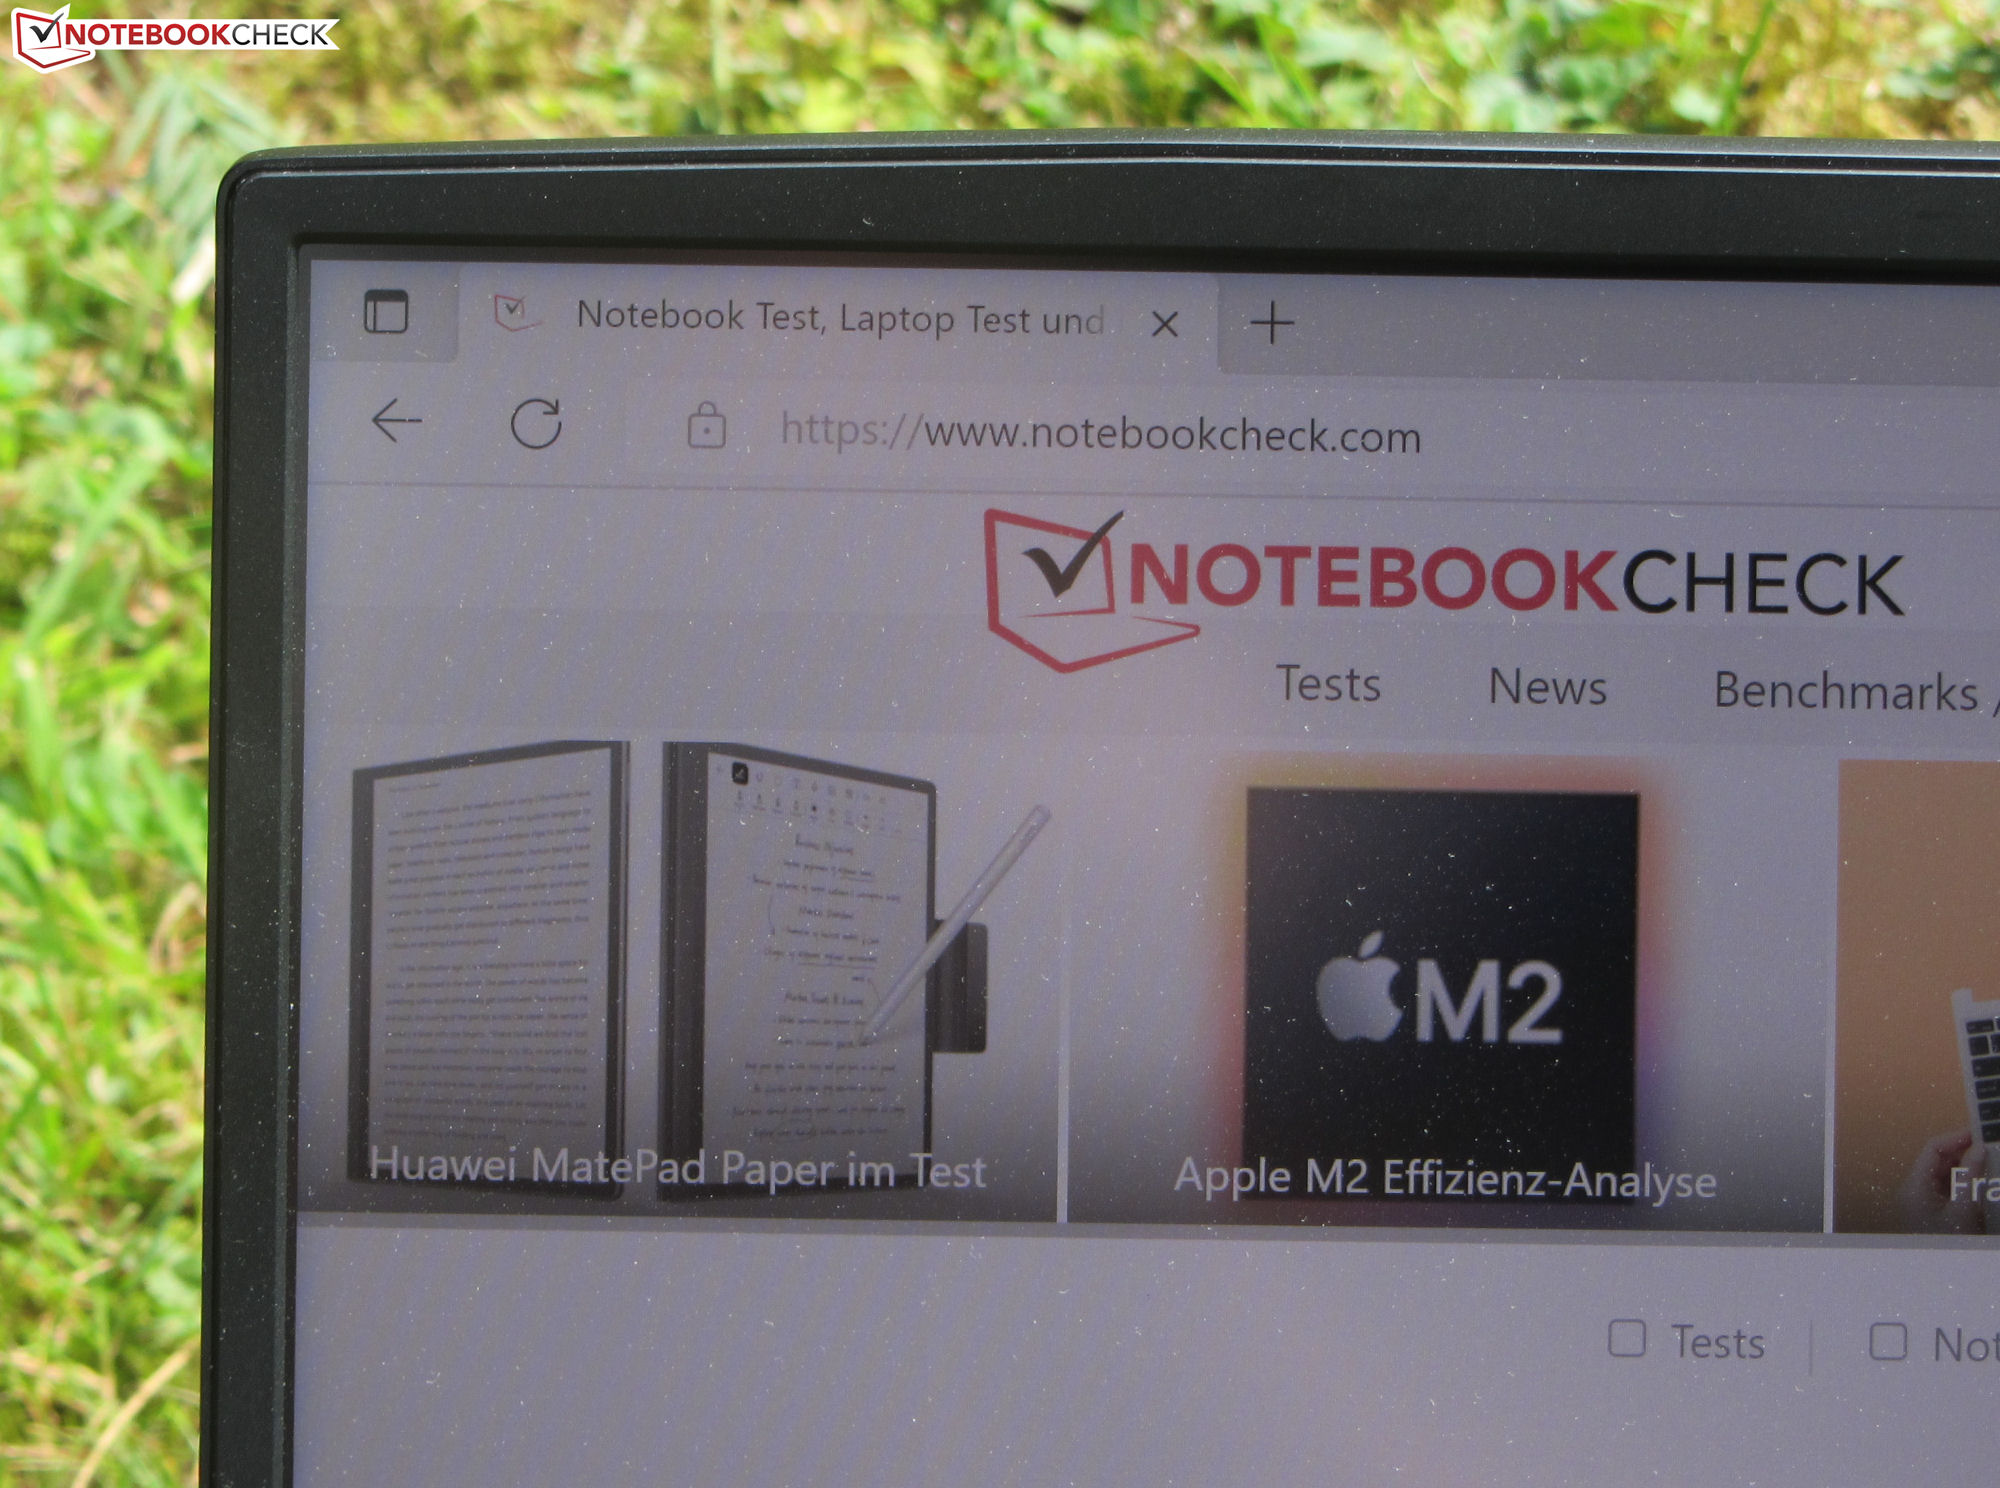
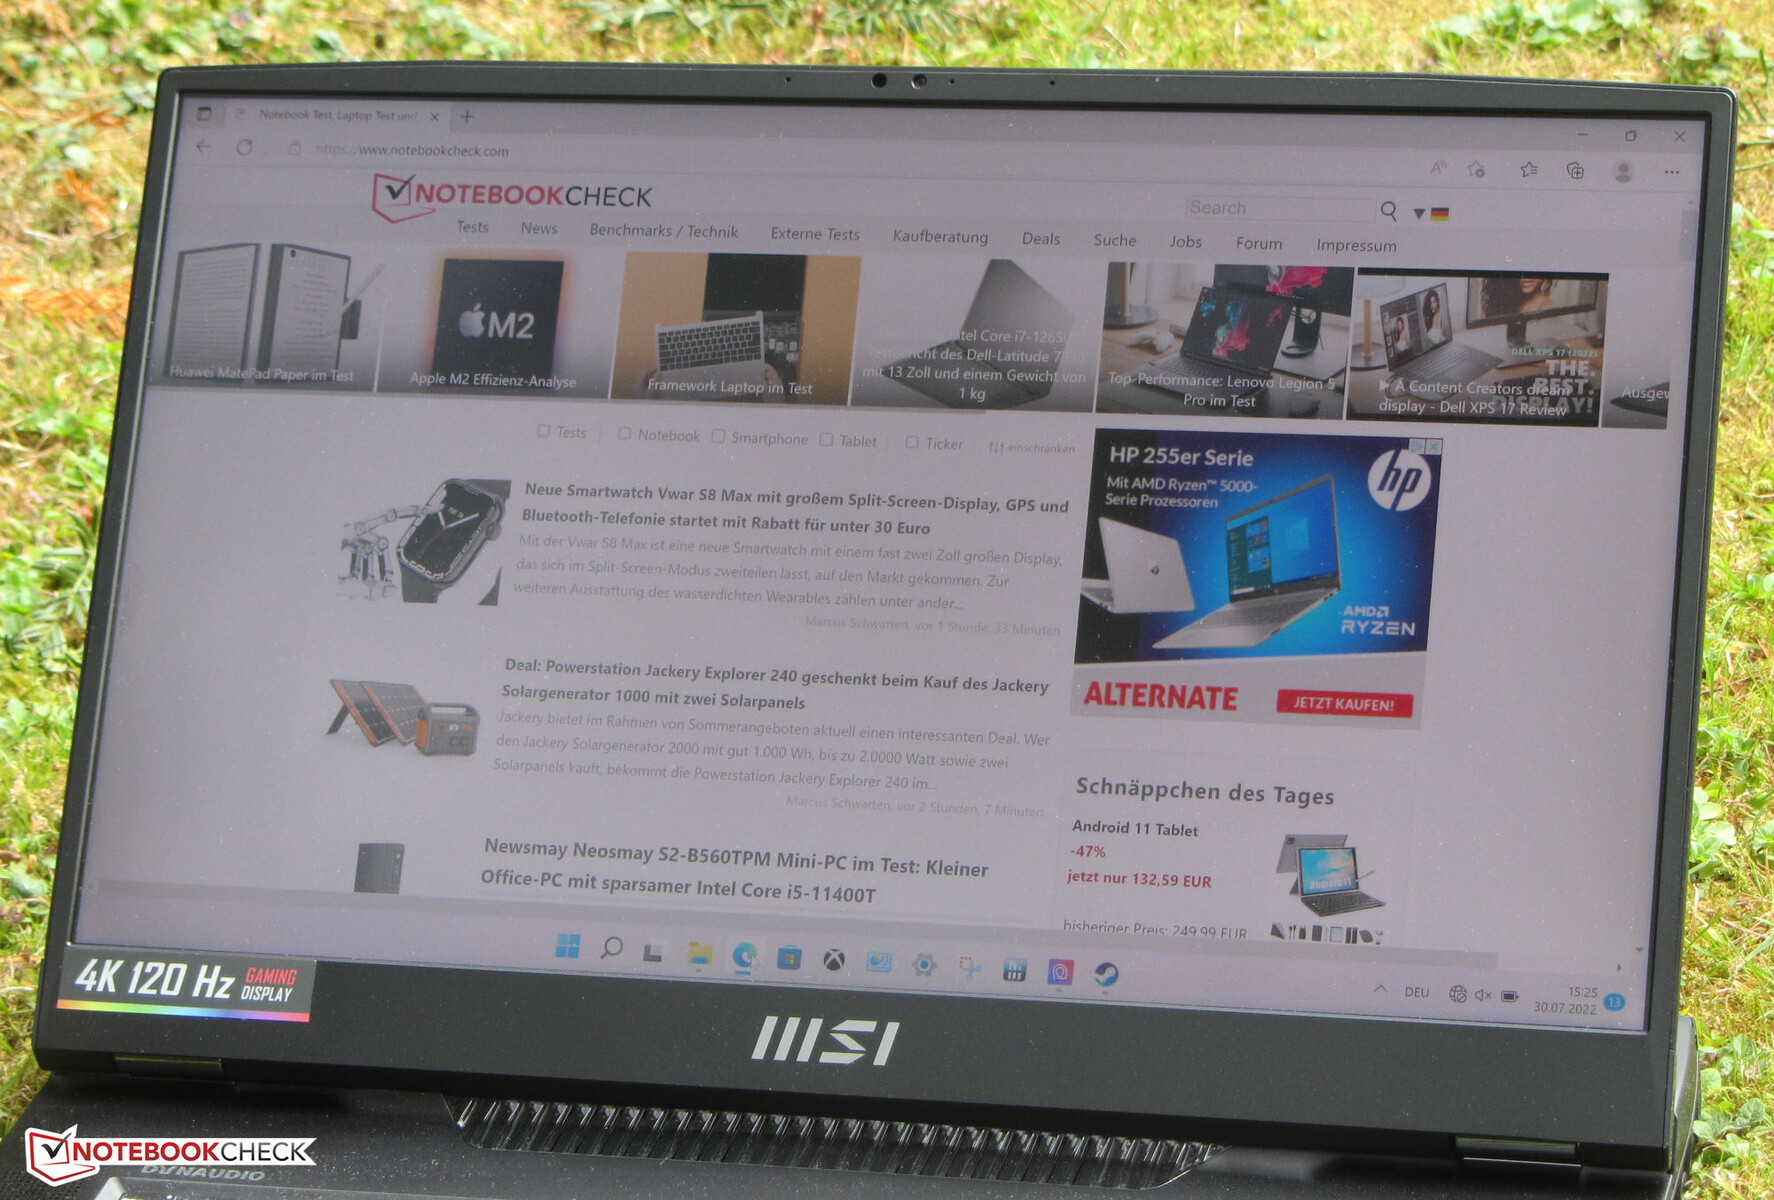
El panel IPS ofrece un ángulo de visión estable, por lo que se puede ver fácilmente desde cualquier posición. La pantalla también es muy legible en exteriores.

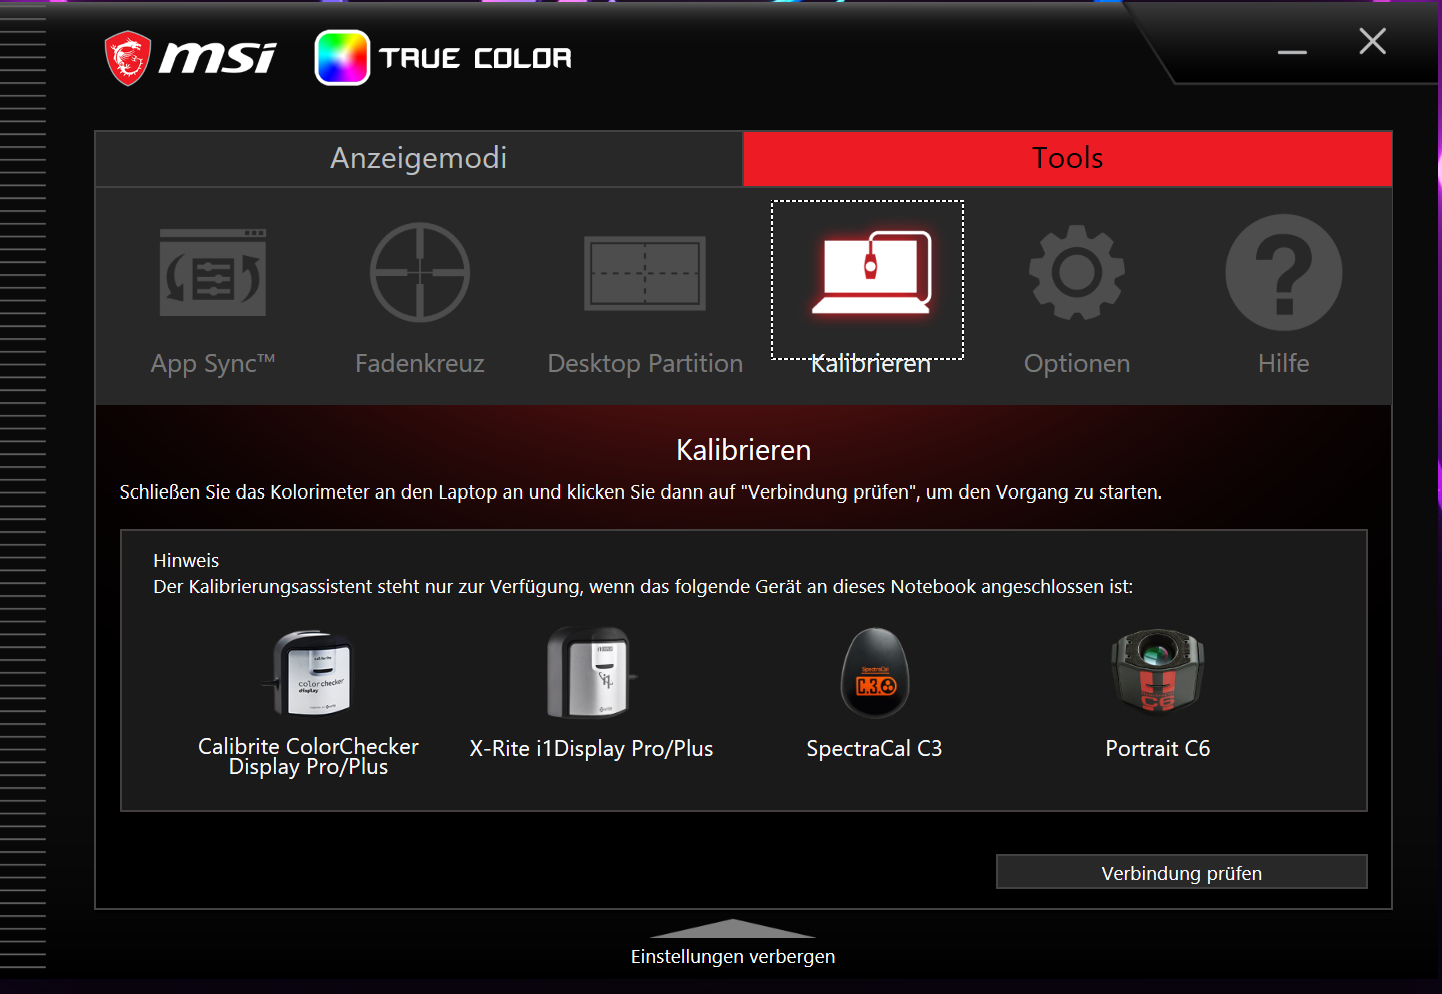
Reproducción inexacta del color debido a problemas de software
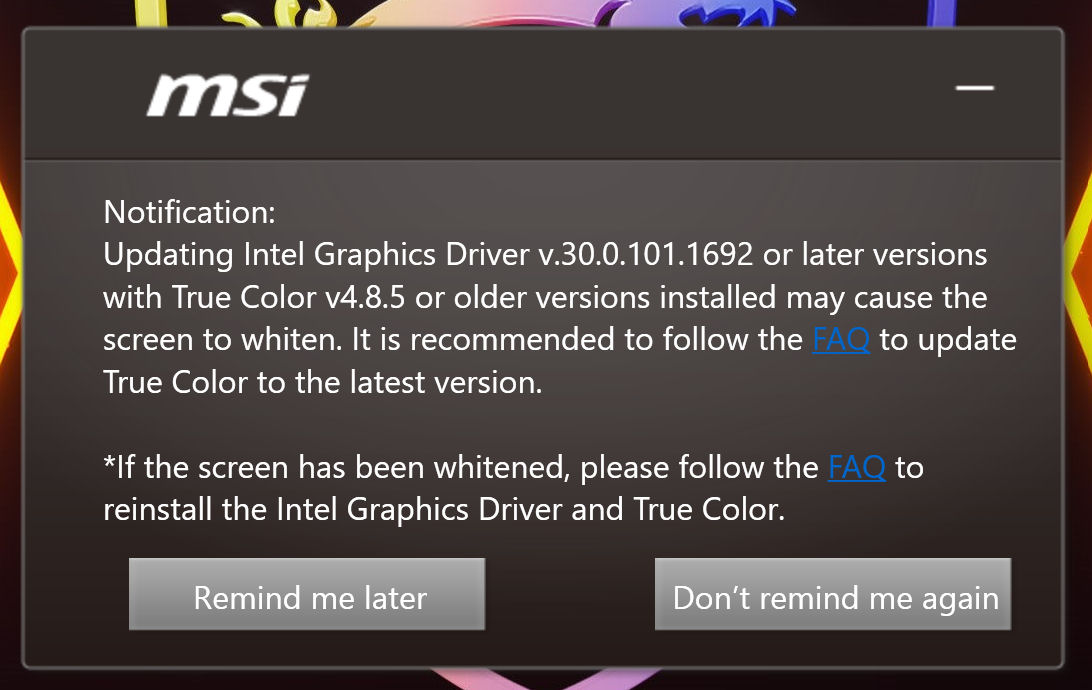
Ciertas combinaciones del software True Color y del controlador iGPU pueden provocar una reproducción inexacta de las imágenes. Cuando esto ocurre, todos los colores mostrados aparecerán distorsionados y blanqueados. MSI recomienda desinstalar completamente y volver a instalar ambos componentes. Después de probarlo, comprobamos que este método resuelve el problema.
Rendimiento - Ampere y Alder Lake proporcionan mucho empuje.
Con la Titan GT77 12UHS, MSI tiene en su gama de productos un portátil de 17,3 pulgadas muy potente que rinde bien en todo tipo de escenarios de uso exigentes.
Condiciones de la prueba
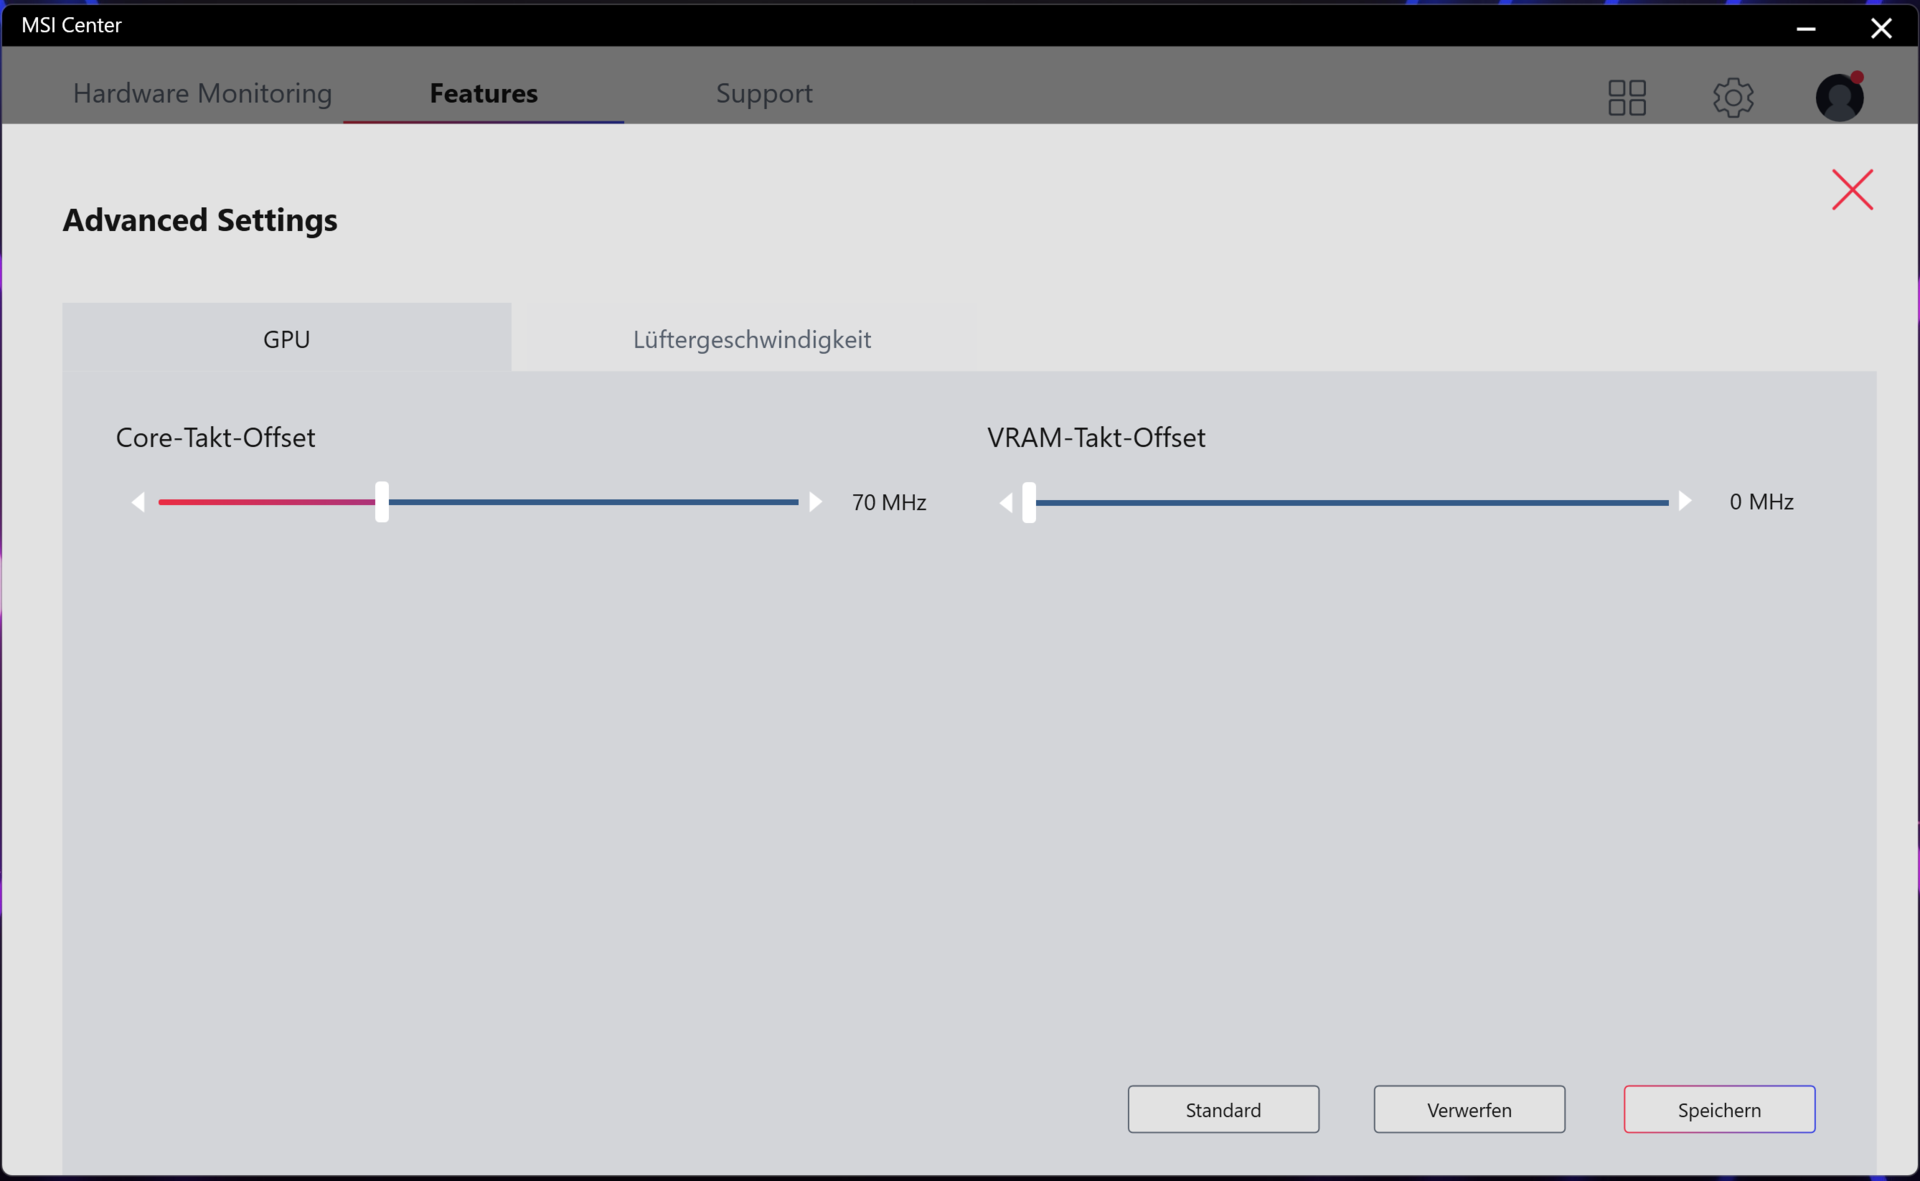
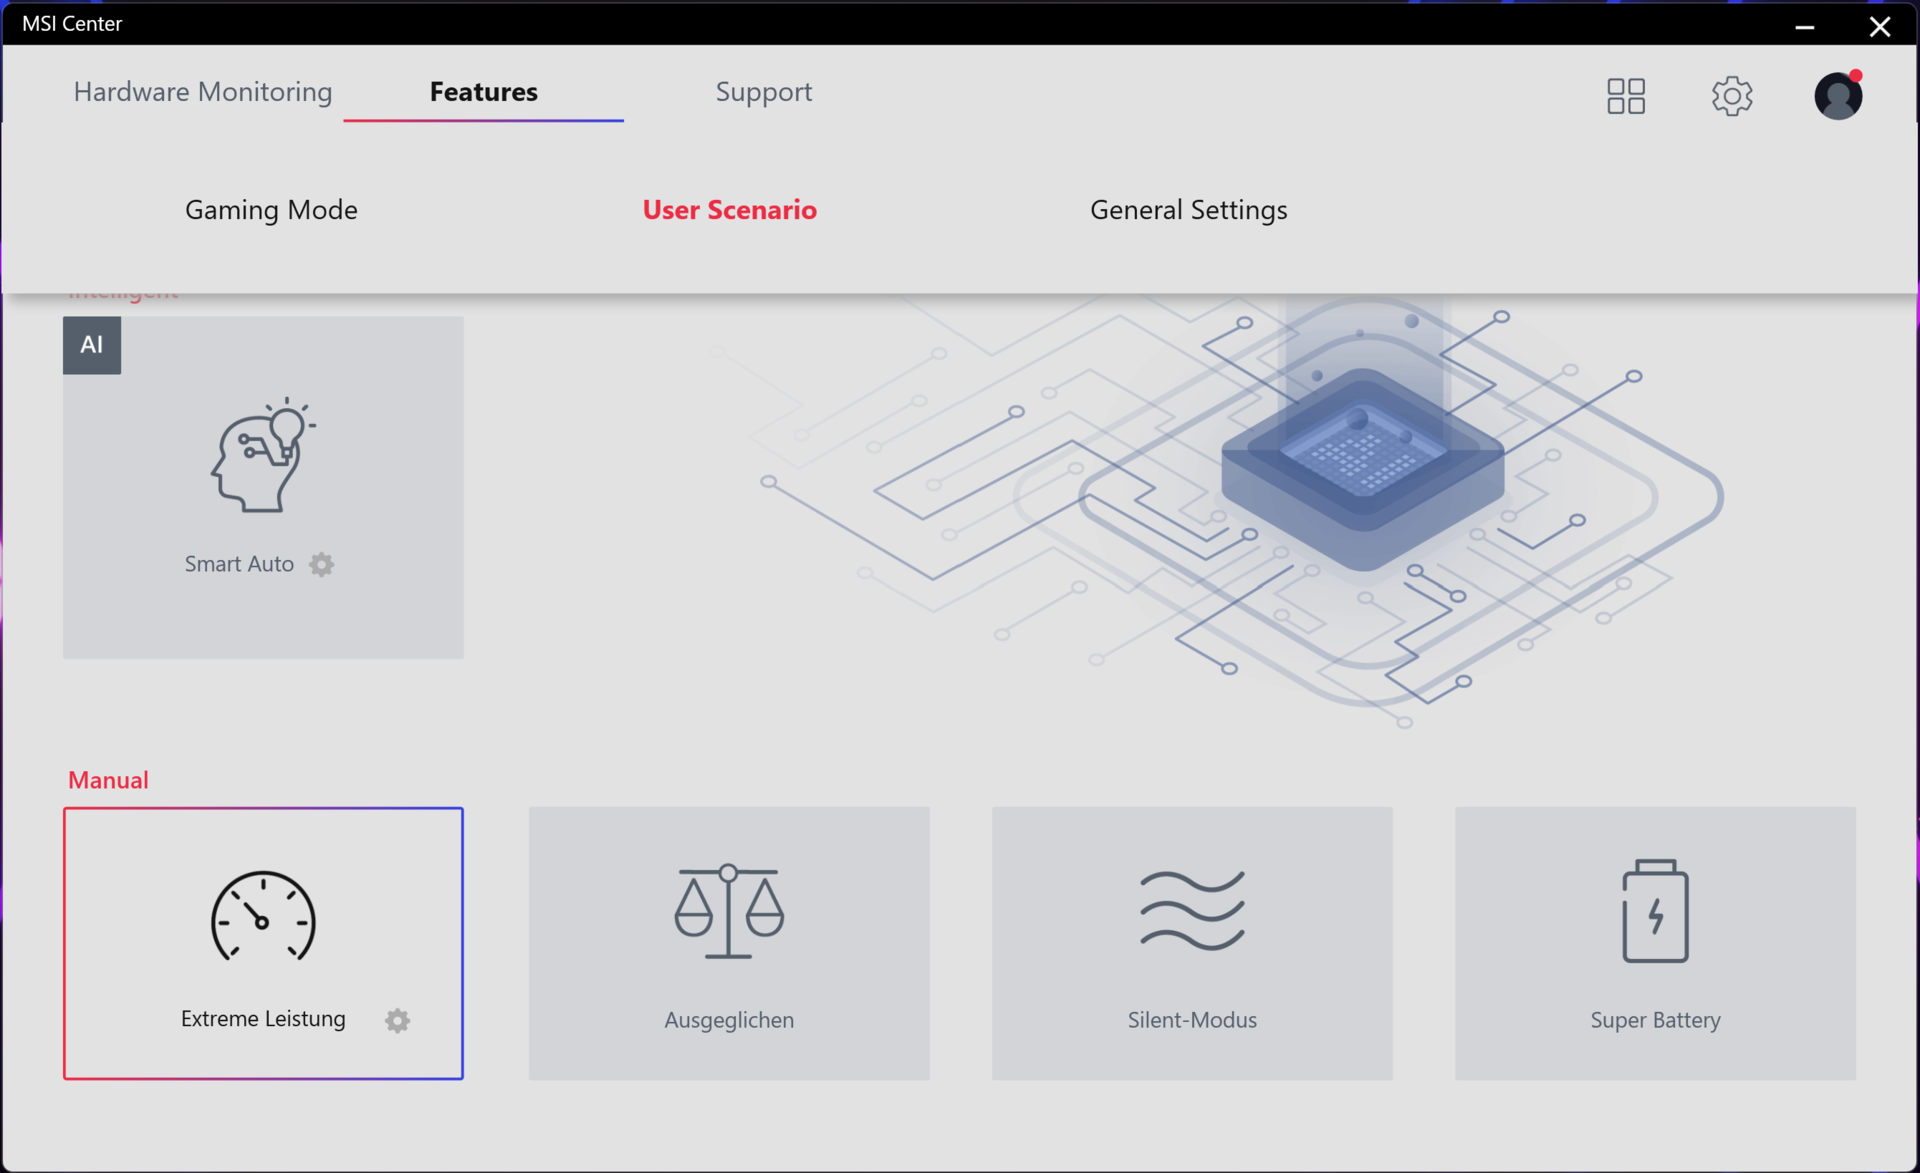
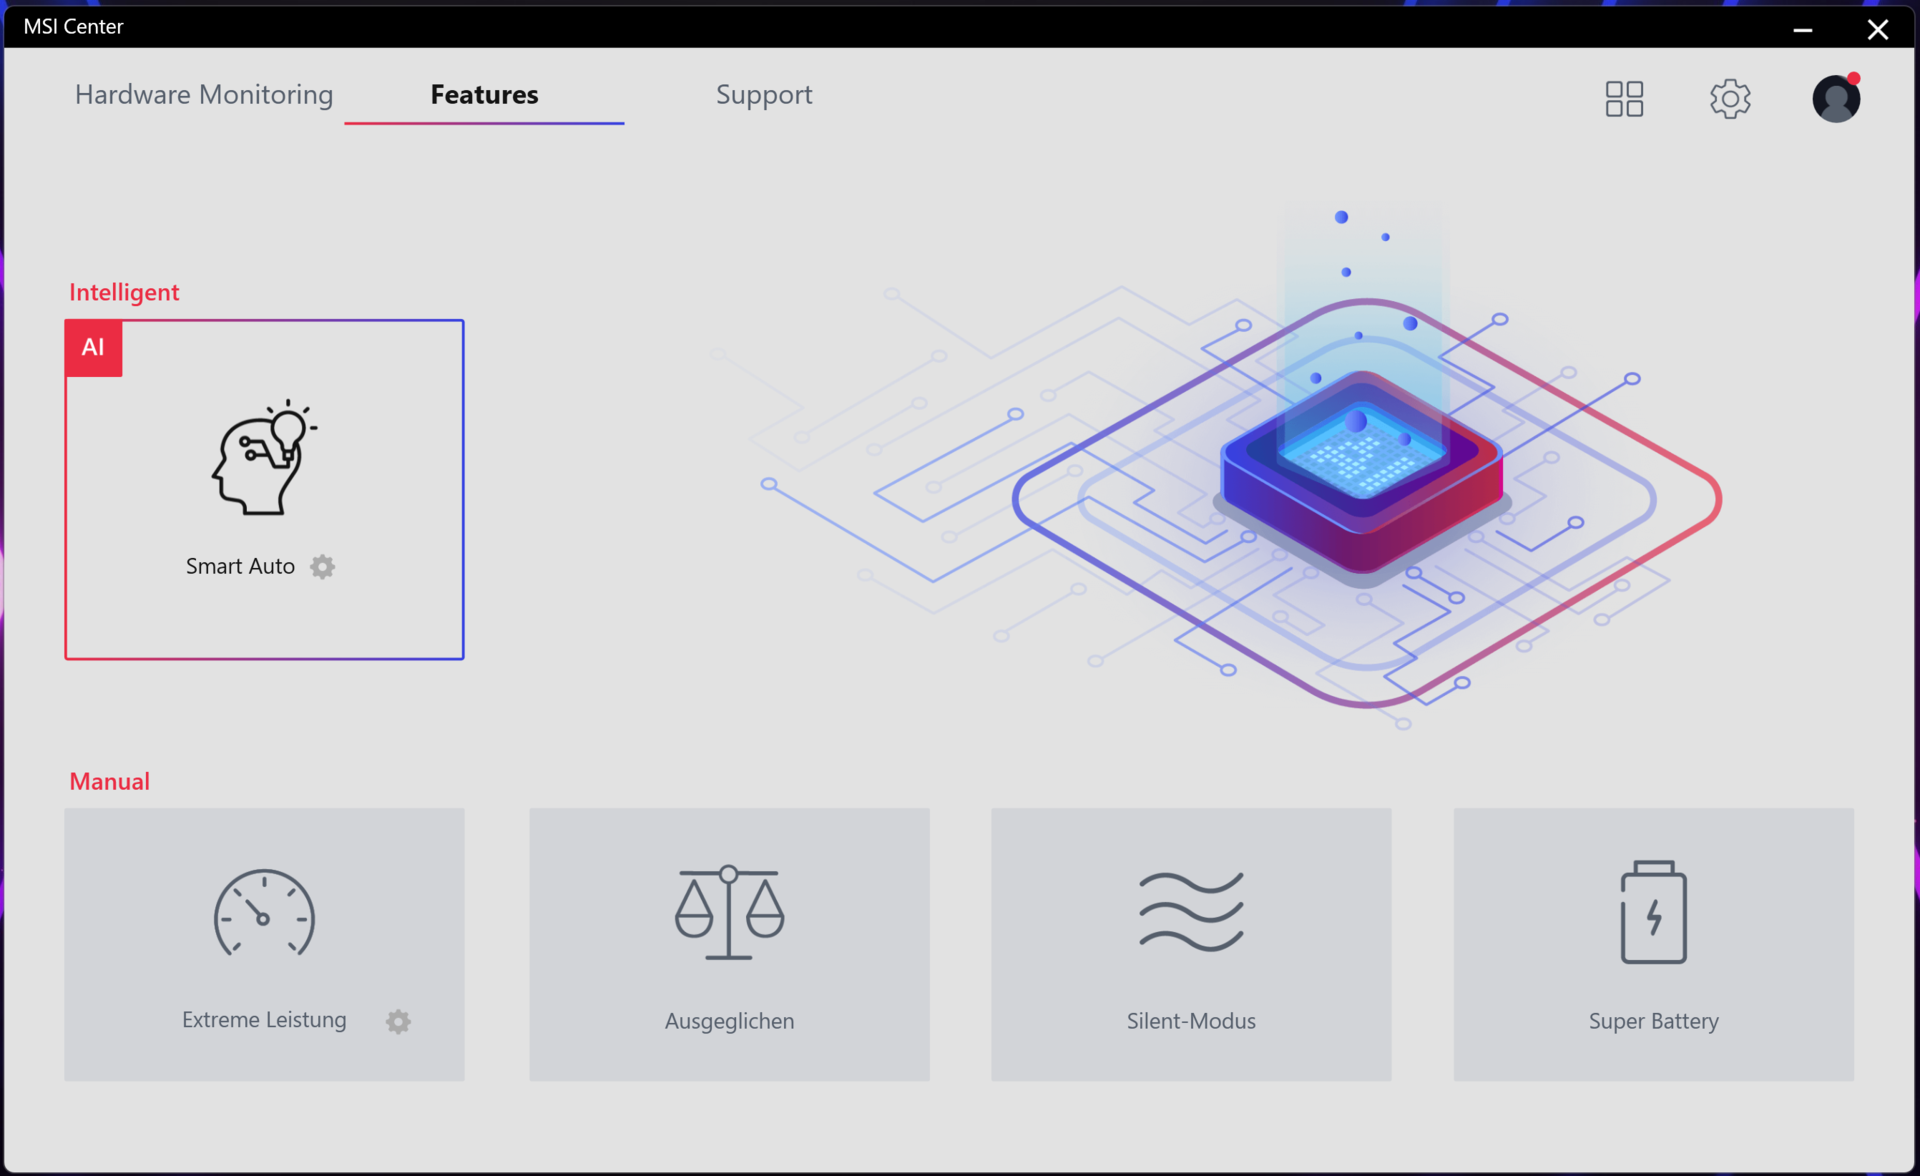
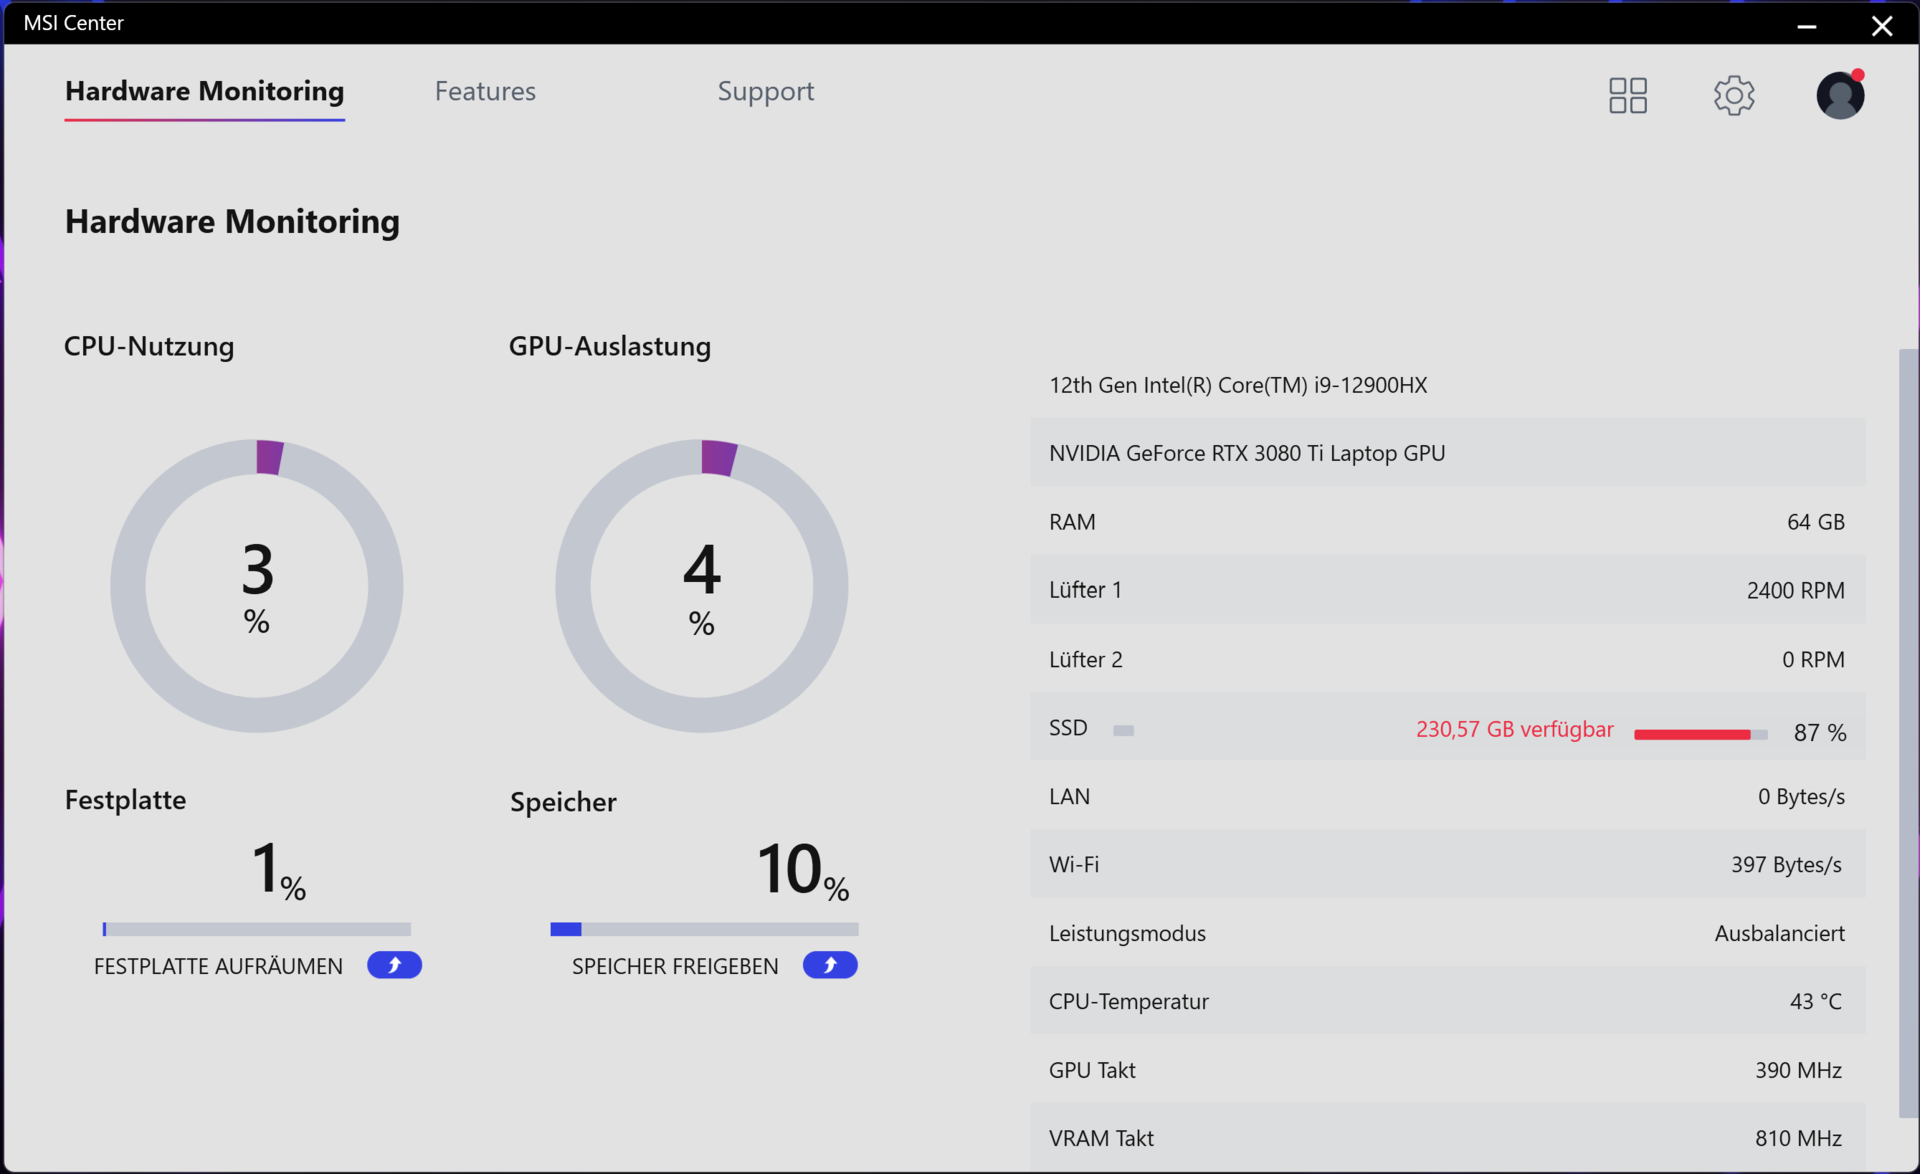
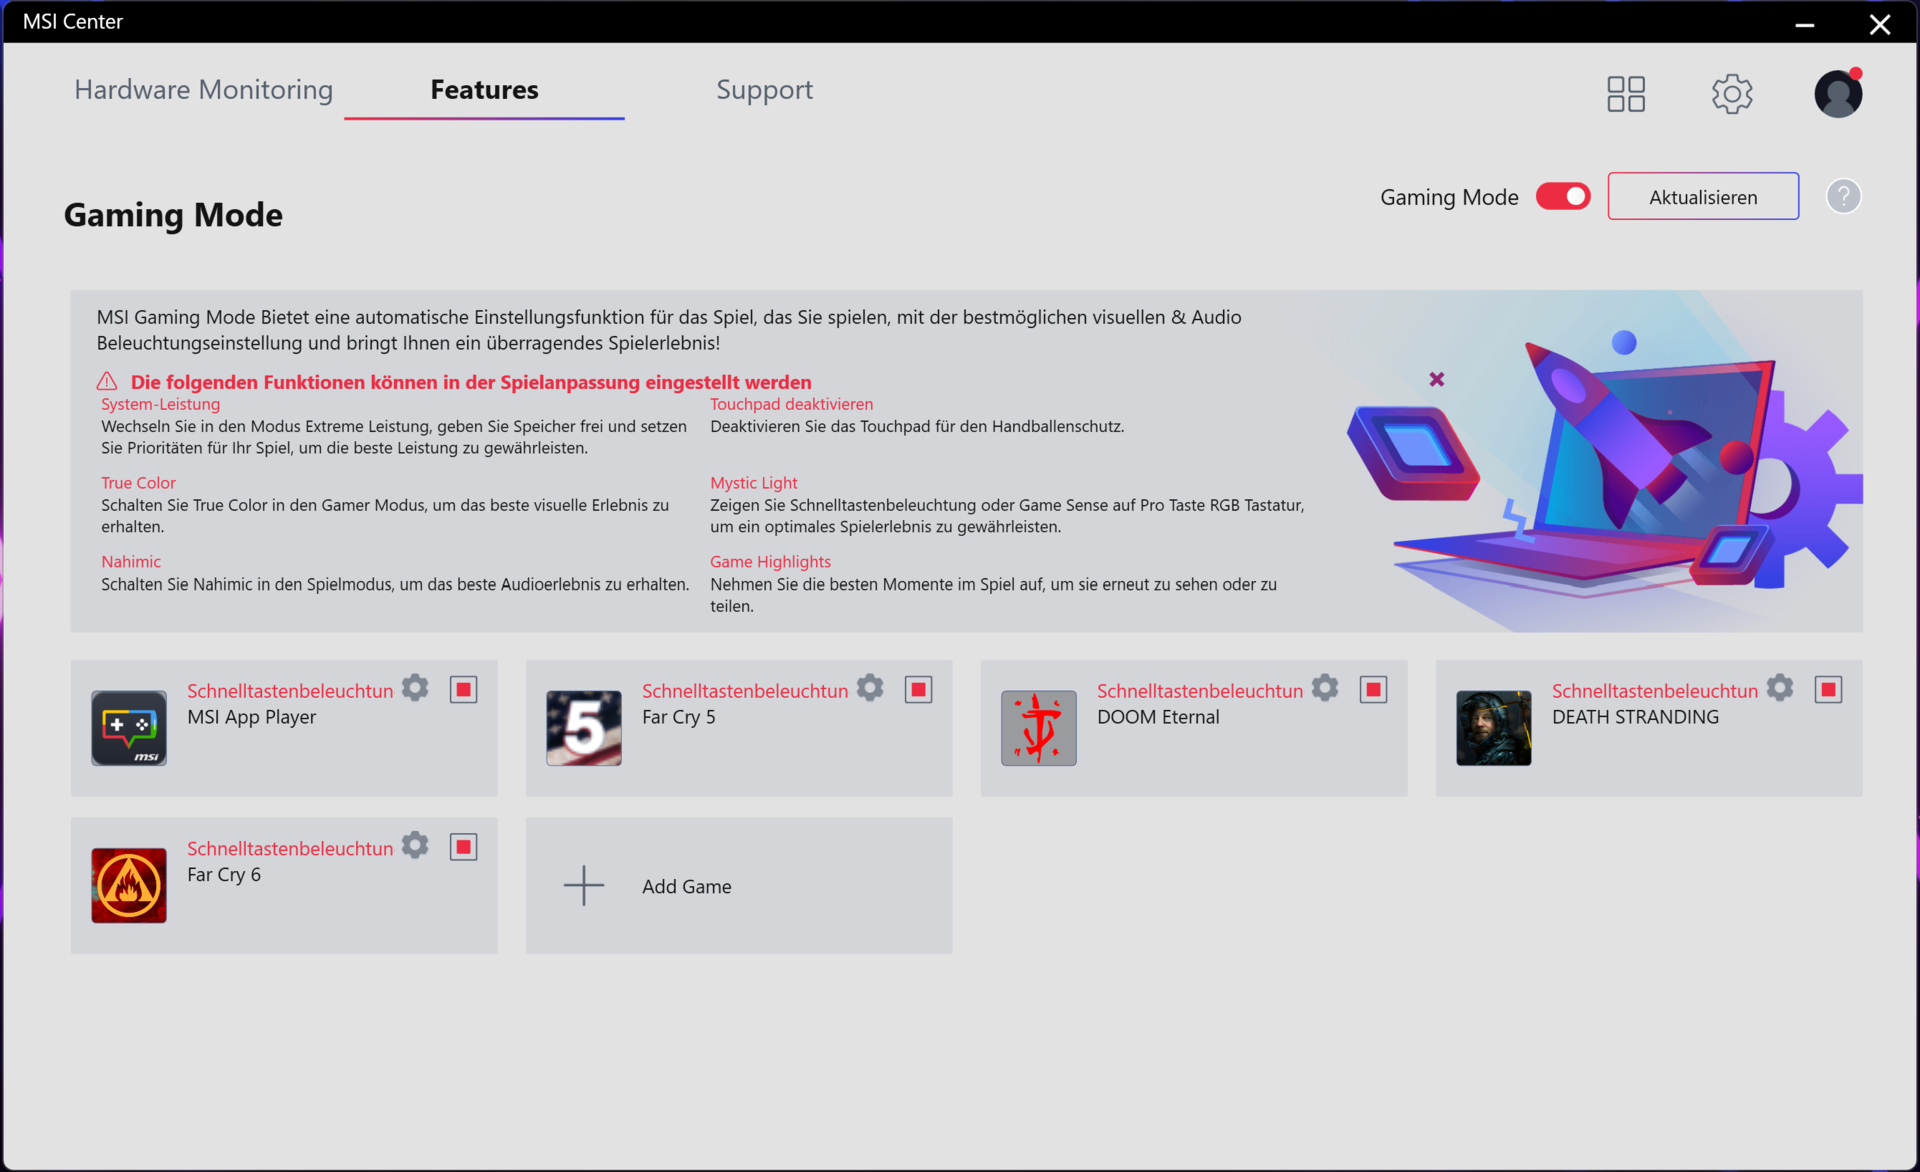
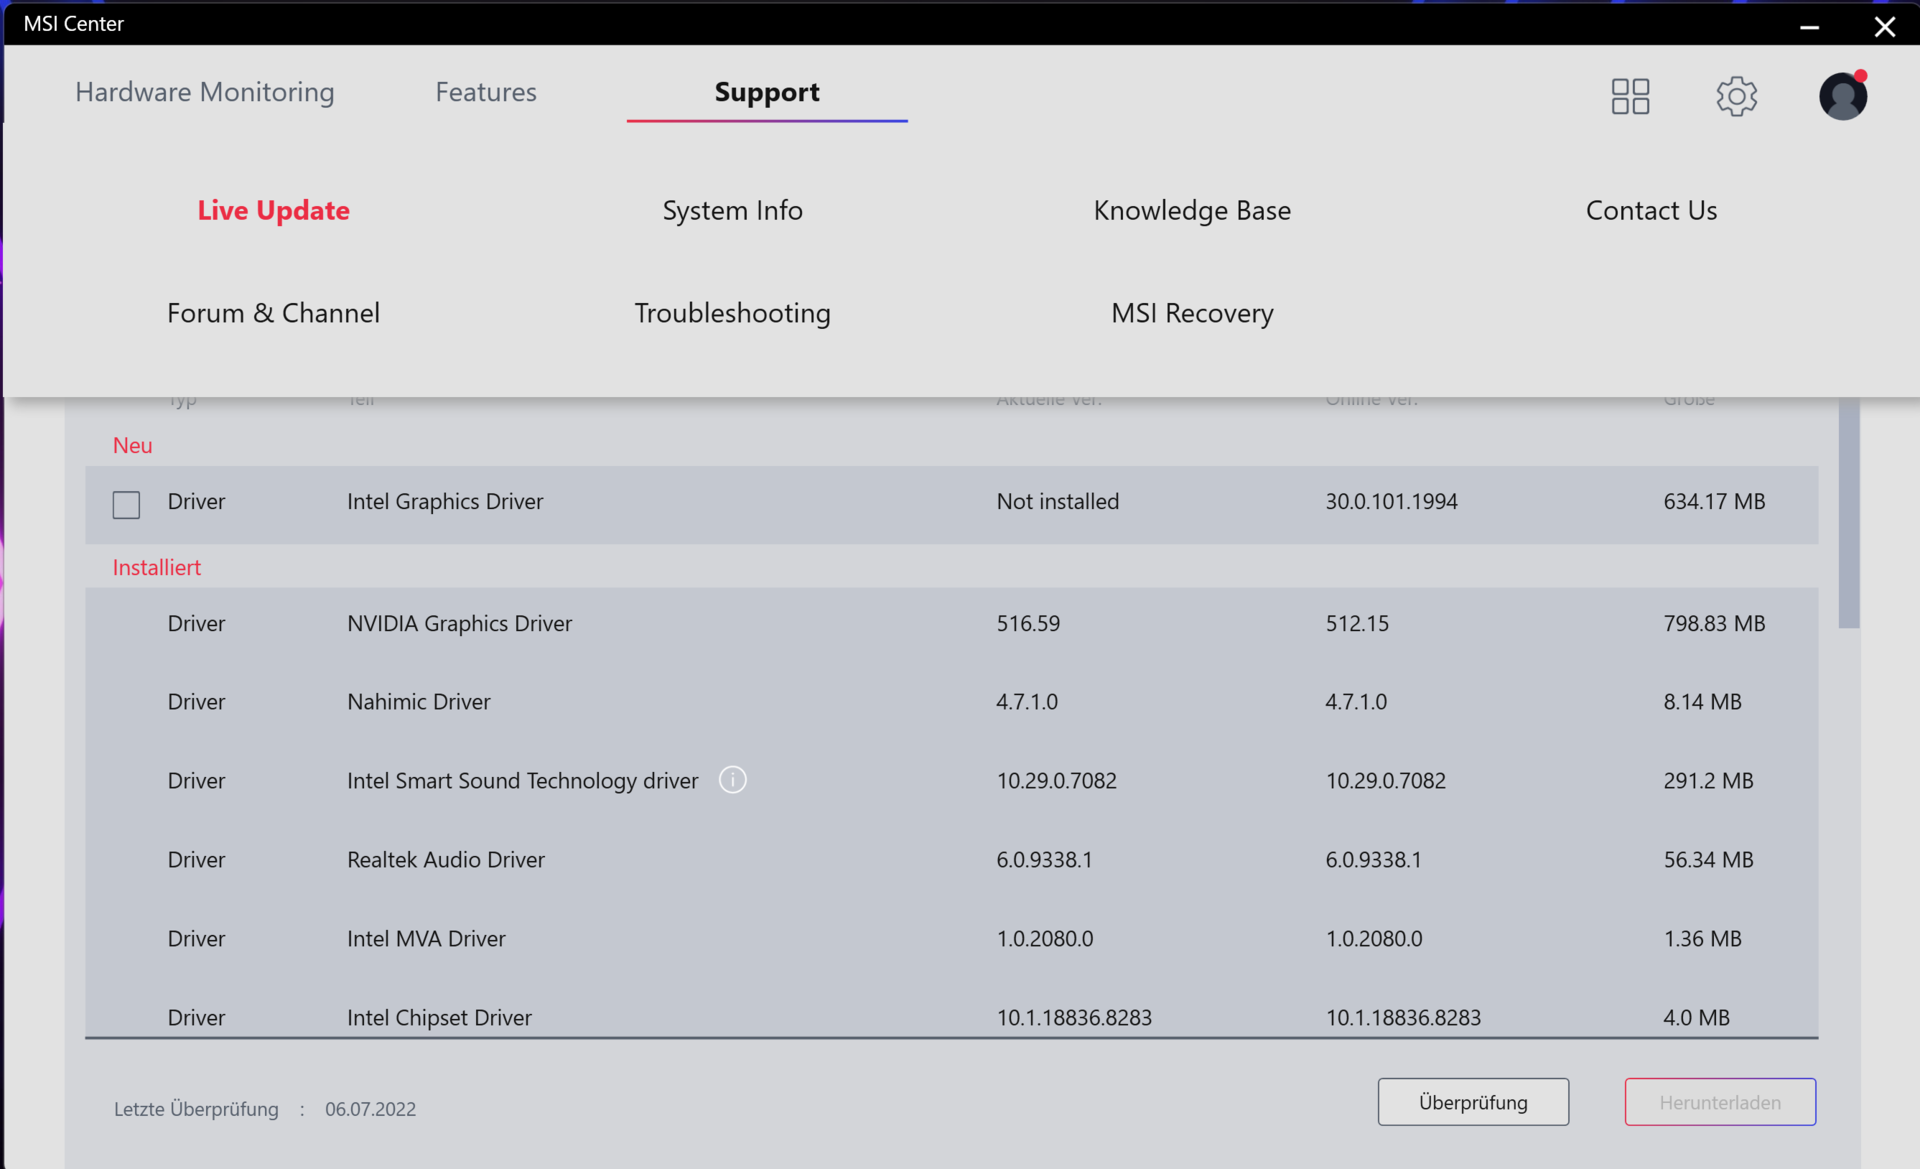
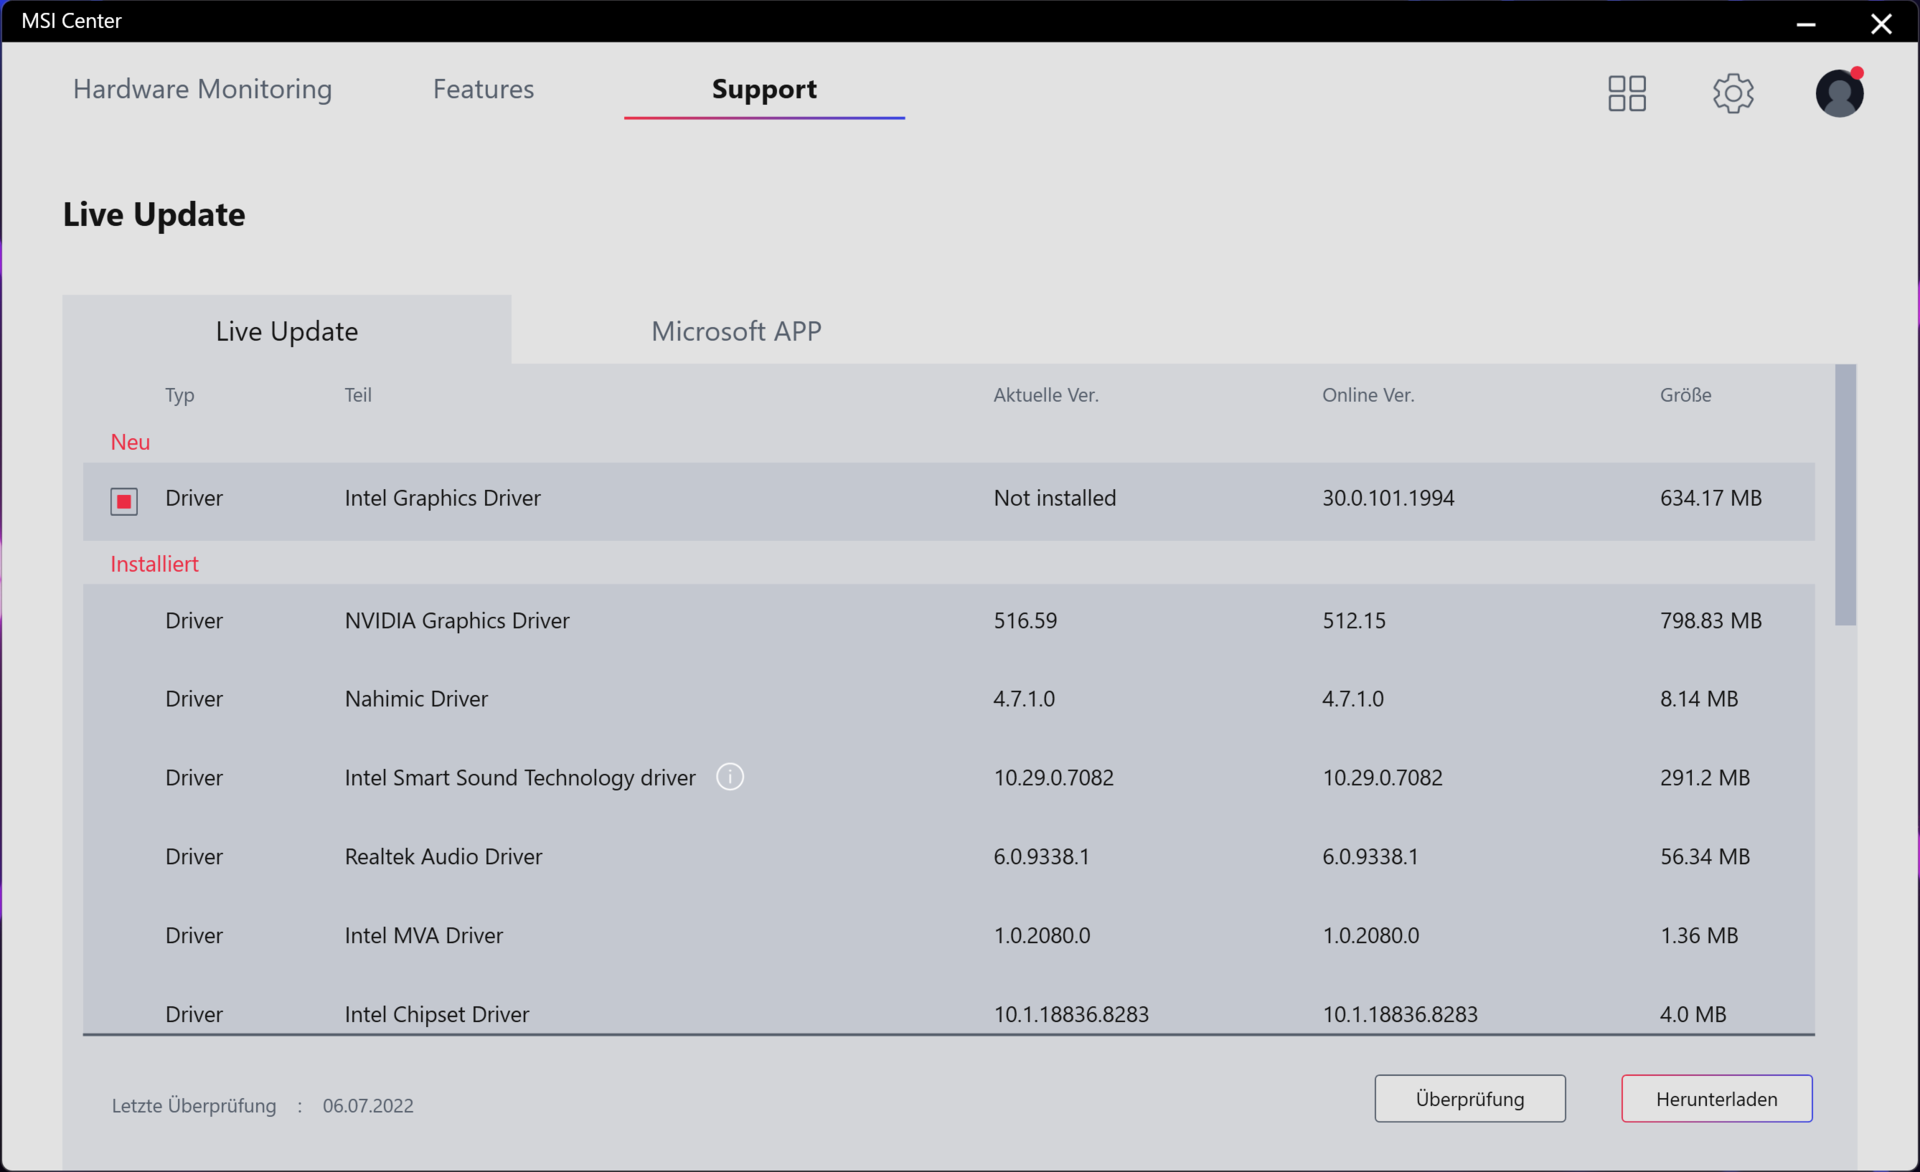
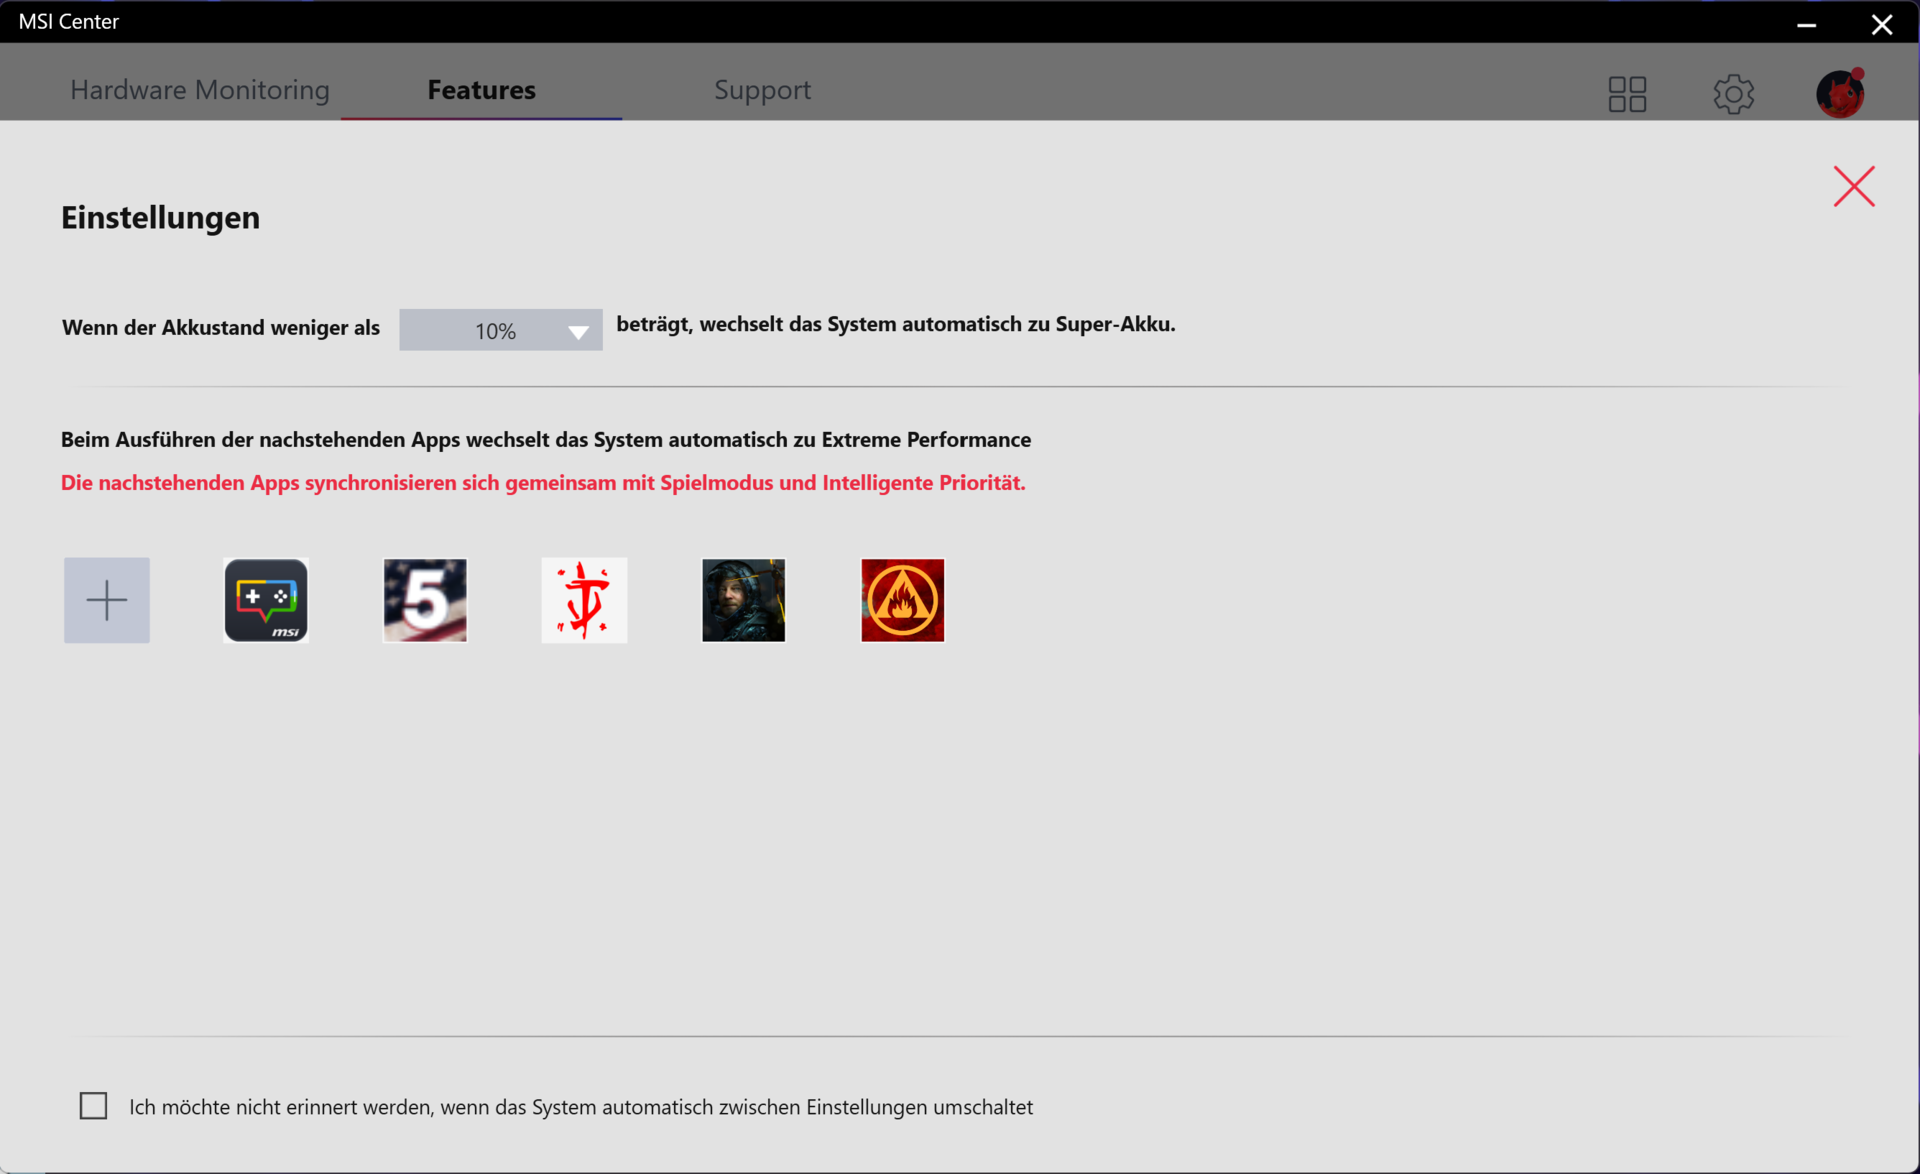
Puedes cambiar entre cuatro perfiles de rendimiento usando el MSI Center preinstalado (ver imágenes) o pulsando la combinación de teclas Fn+F7. Si se activa la función "Smart Auto", de nivel superior y basada en la IA (como en nuestro caso), el Centro MSI elegirá automáticamente el perfil adecuado para la situación actual.
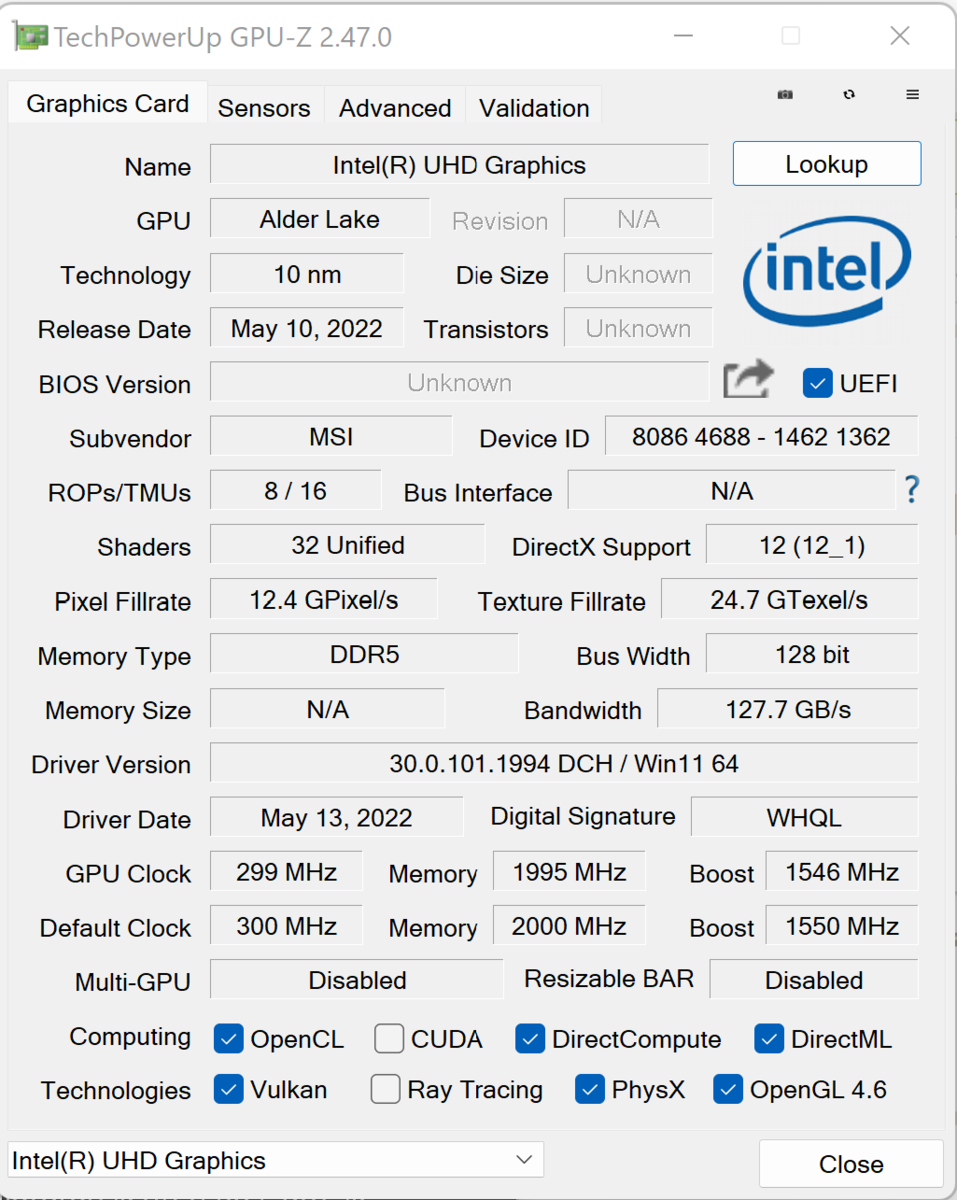
Probamos el modelo FHD con el modo dGPU activo. En cambio, Nvidia Optimus estaba activado durante nuestro análisis del dispositivo actual. Por tanto, los resultados de las mediciones pueden no ser siempre directamente comparables.
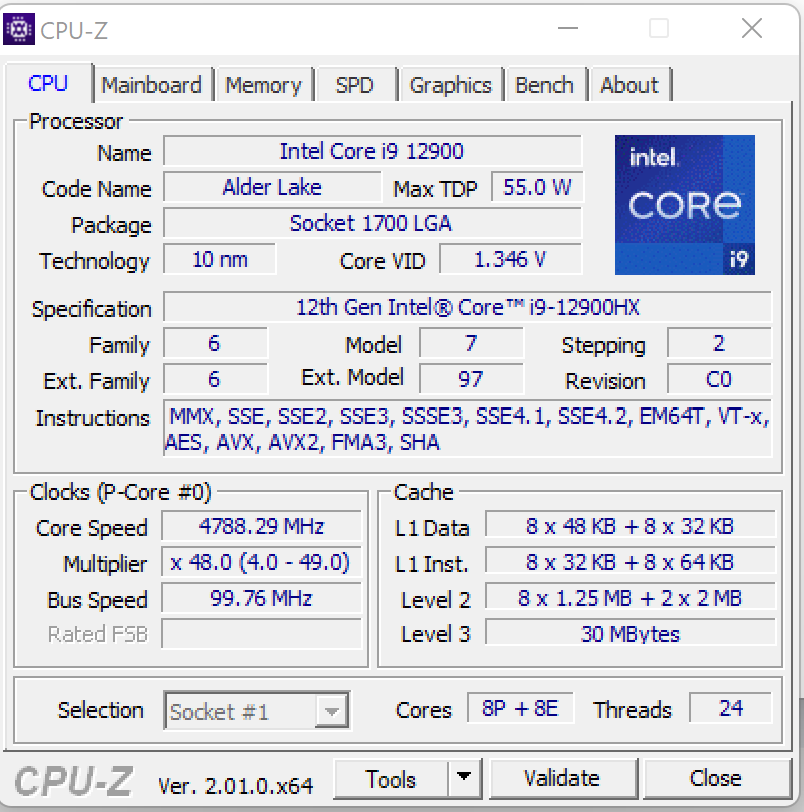
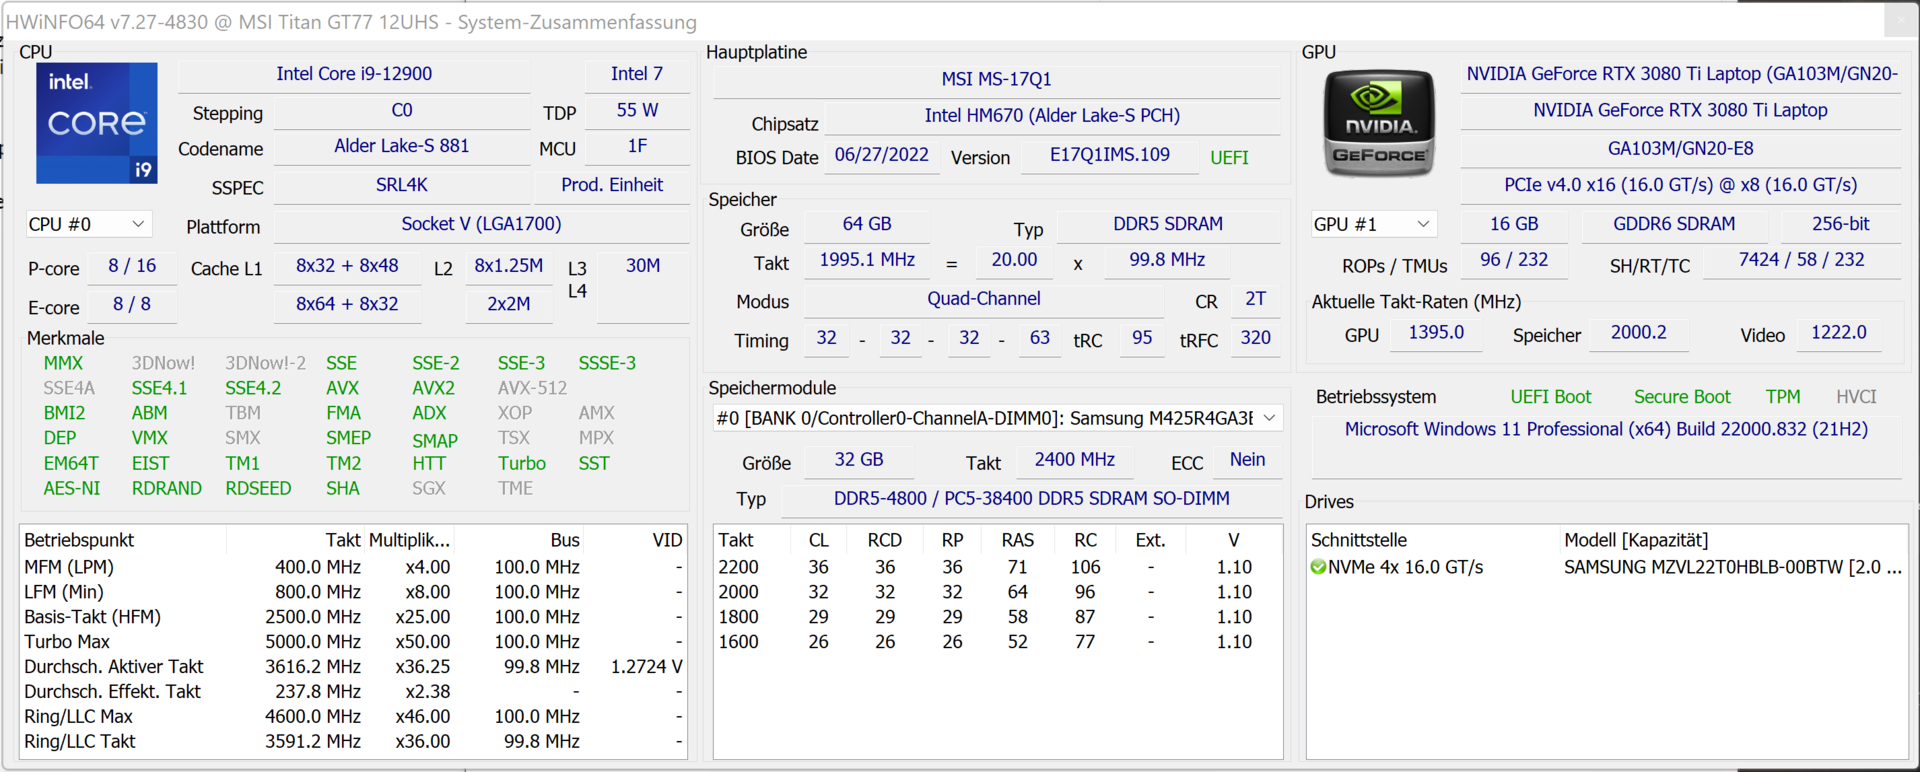
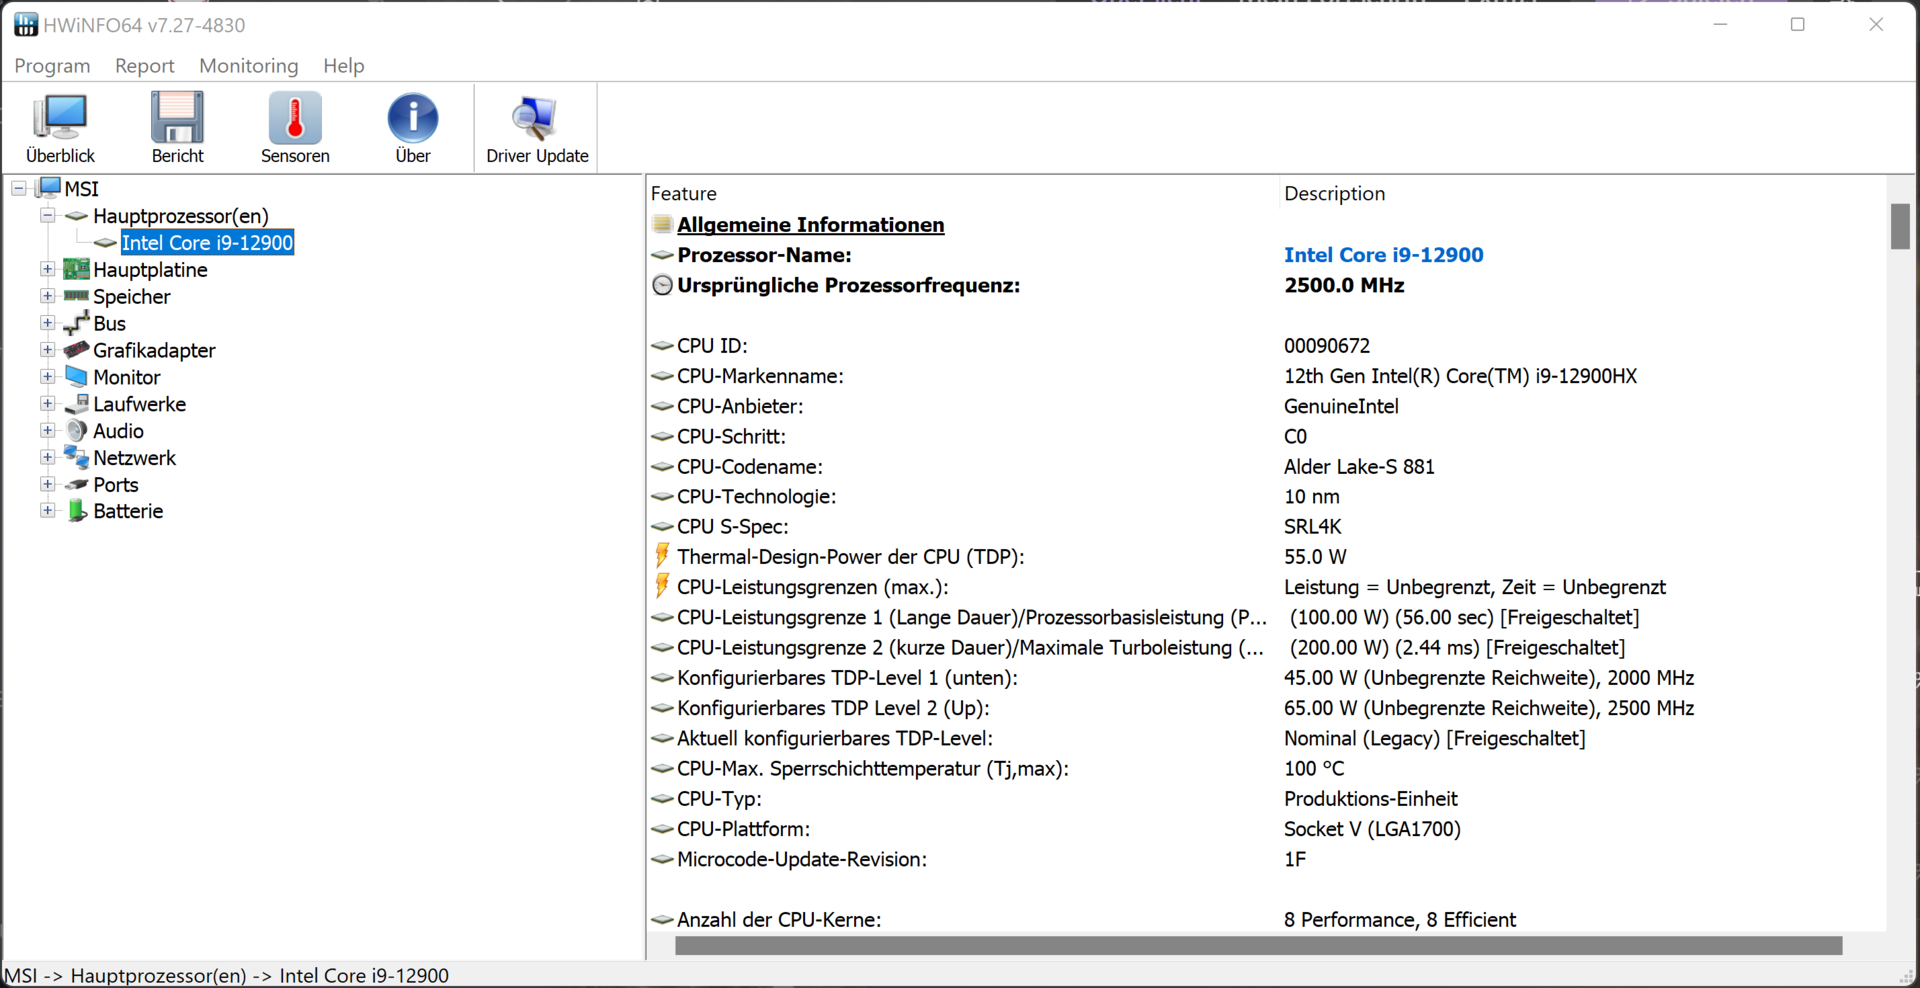
Procesador
El procesador Core i9-12900HX (Alder Lake) consta de ocho núcleos de rendimiento (Hyper-Threading, de 2,3 a 5 GHz) y ocho núcleos de eficiencia (sin Hyper-Threading, de 1,7 a 3,6 GHz), lo que da un total de 24 hilos.
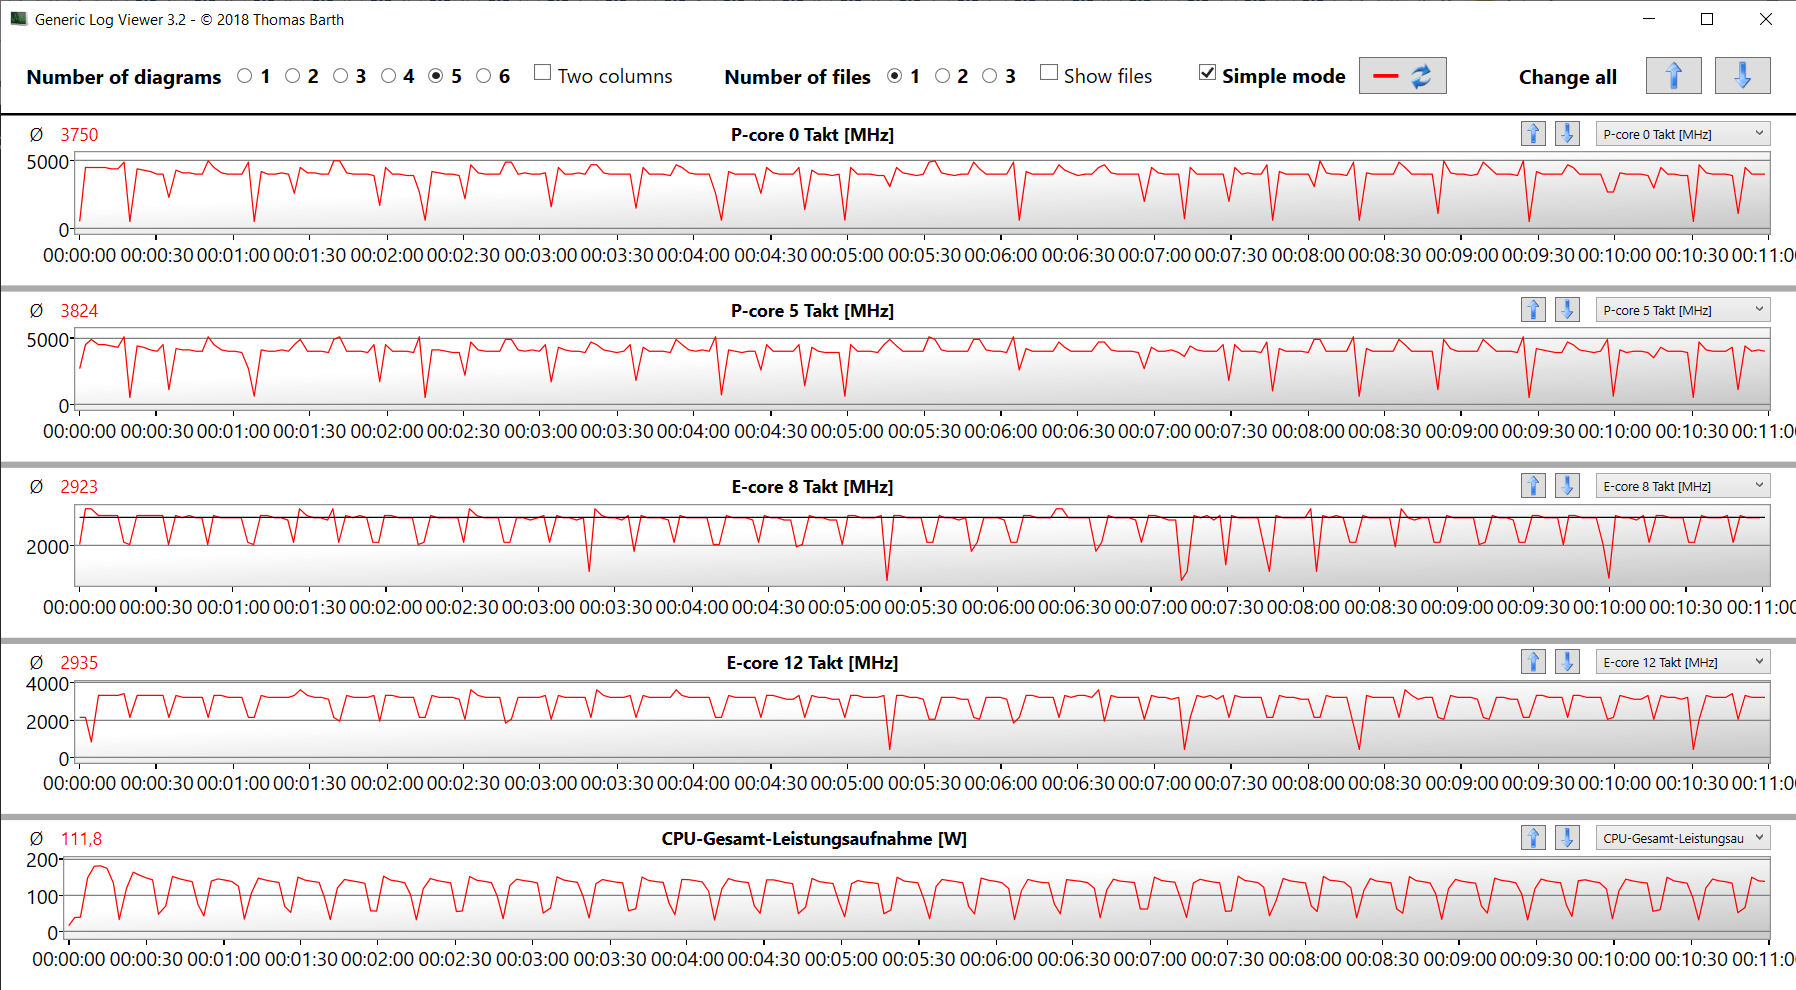
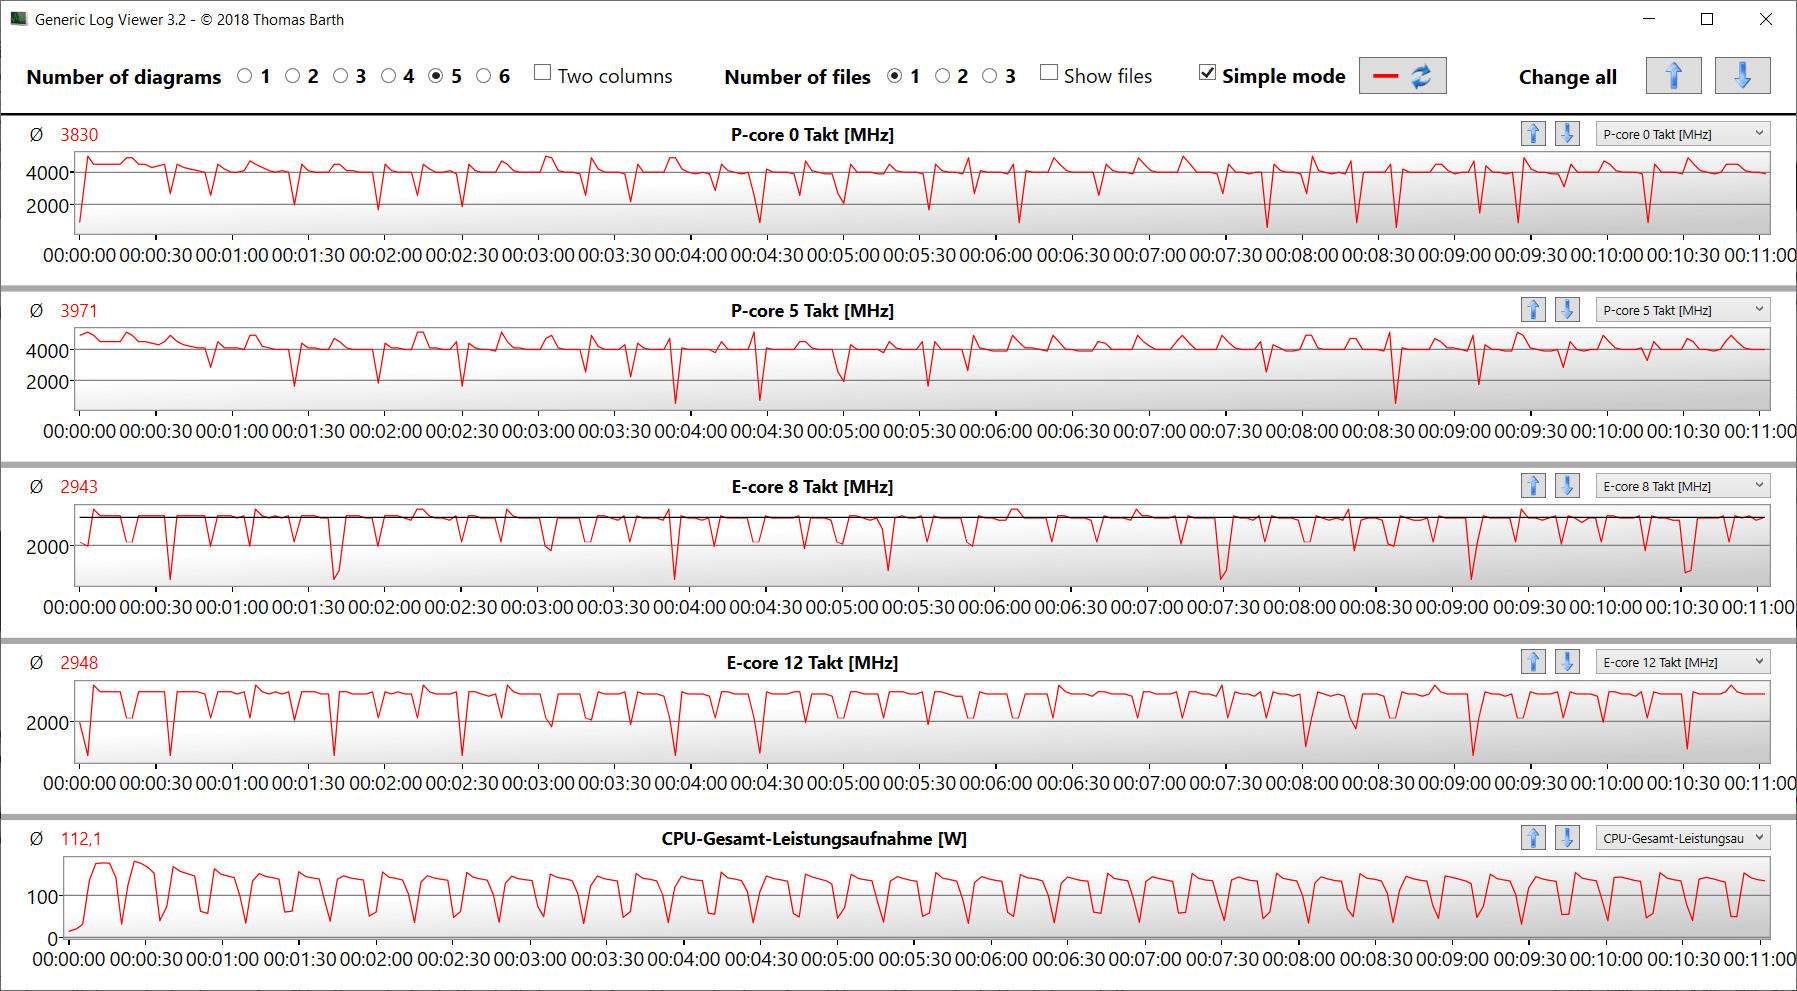
En Cinebench R15, la CPU completó tanto la prueba multihilo (núcleos P: 4,4 GHz, núcleos E: 3,3 GHz) como la prueba de un solo hilo (núcleos P: 500 MHz a 5 GHz, núcleos E: 400 MHz a 3,6 GHz) a altas velocidades de reloj. Su rendimiento es ligeramente inferior en batería.
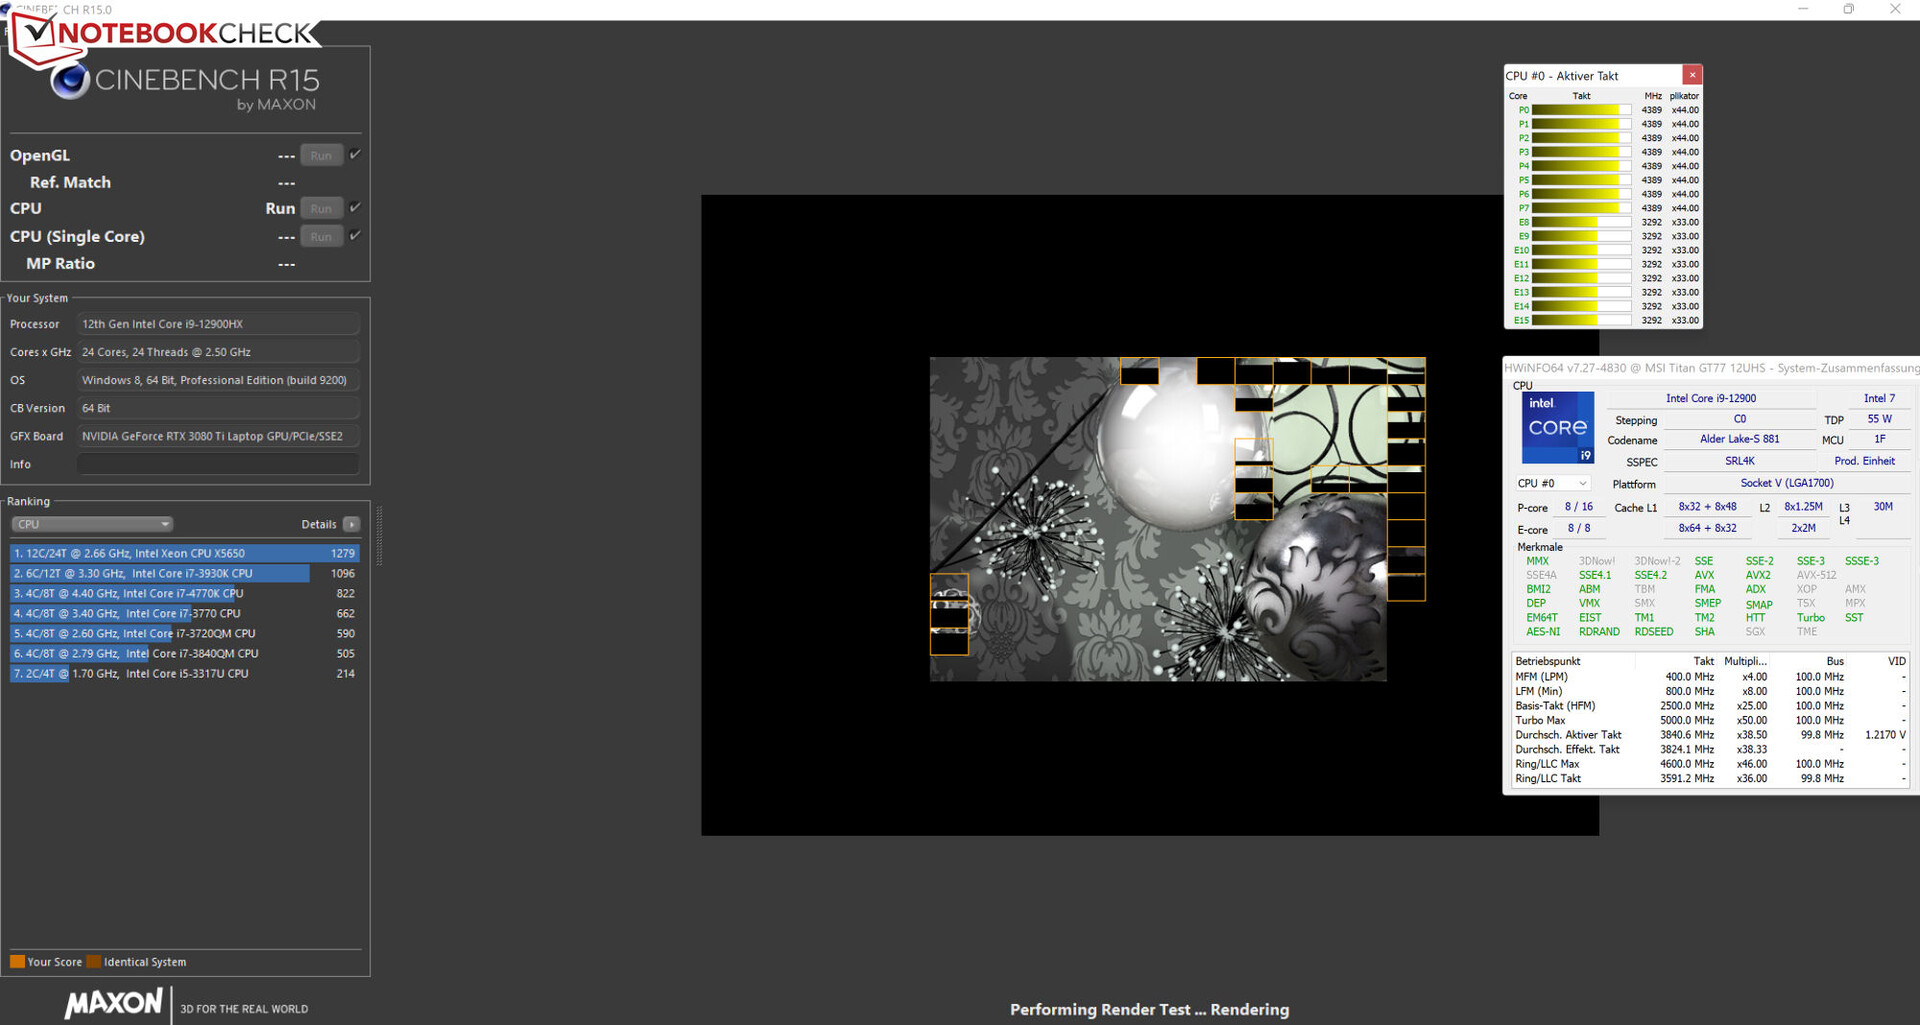
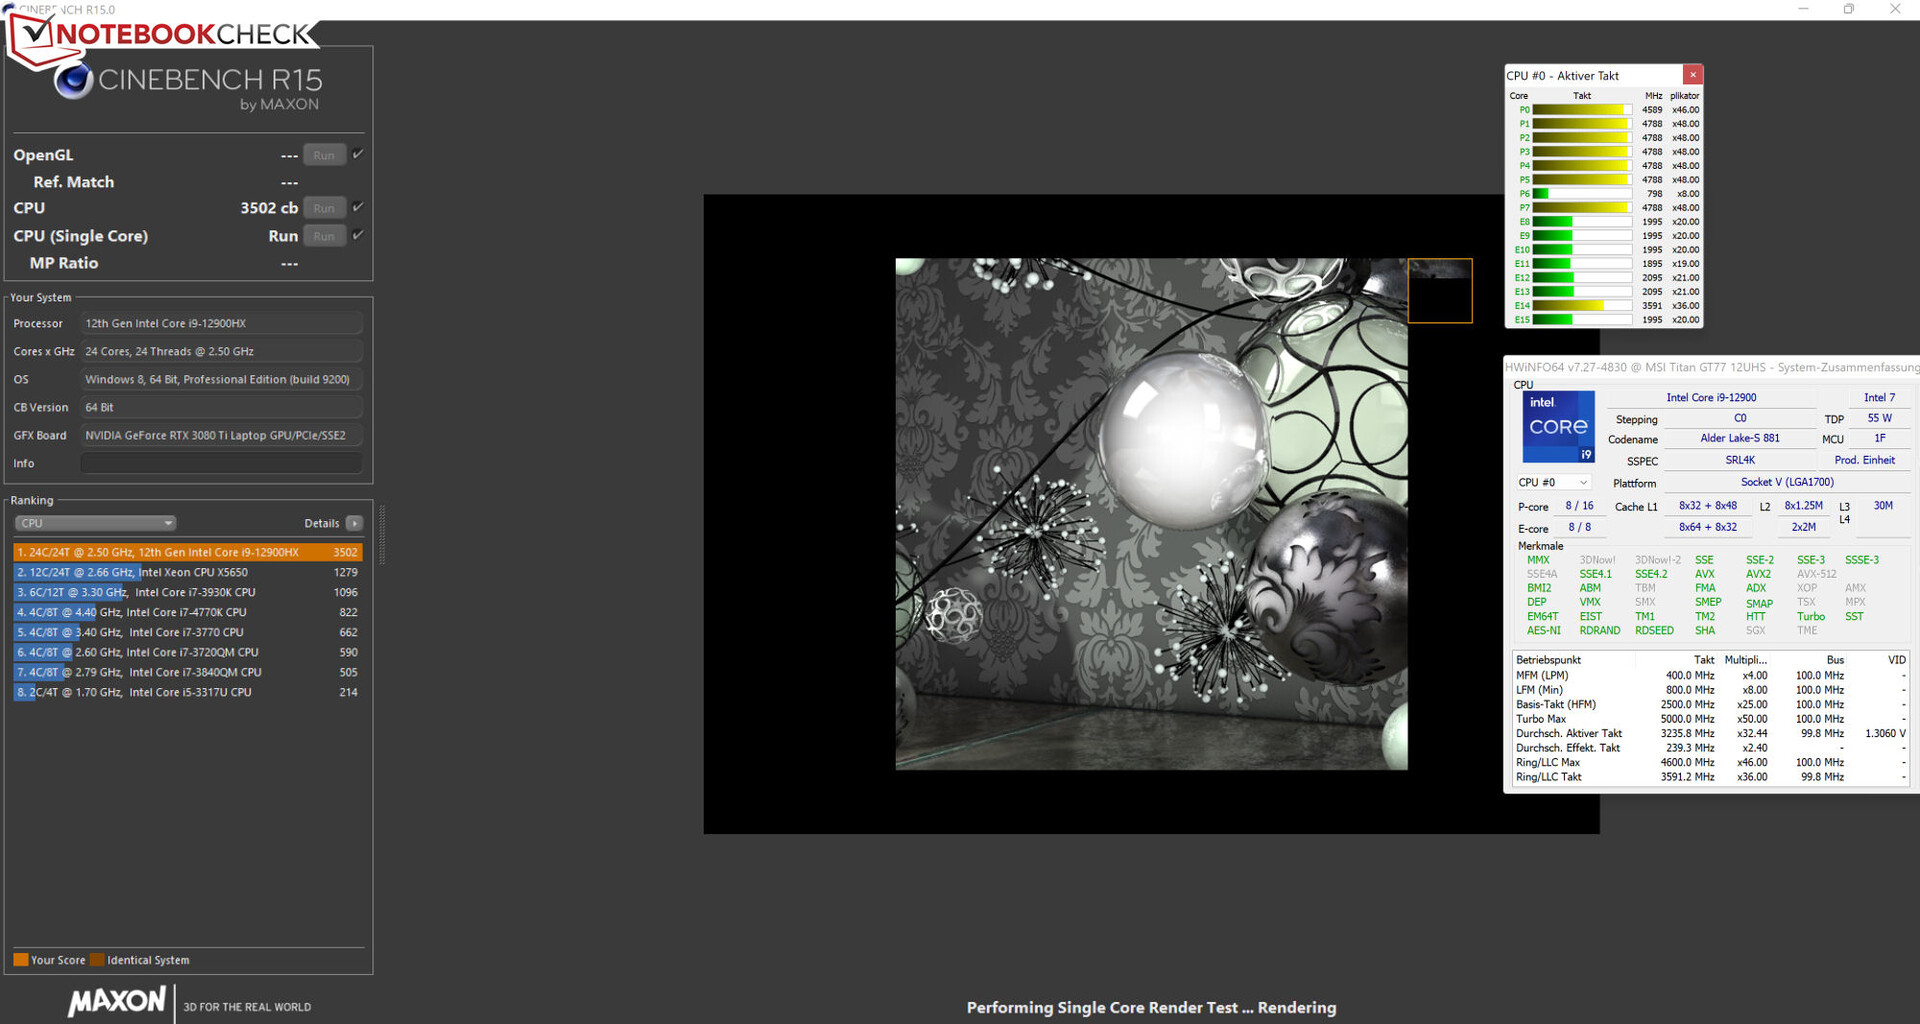
La prueba de bucle de Cinebench 15 reveló que la CPU es capaz de funcionar a altas velocidades de reloj de forma continua. El uso del perfil "Rendimiento extremo" hizo que el rendimiento fuera marginalmente más estable.
Cinebench R15 Multi continuous test
| CPU Performance rating - Percent | |
| Media de la clase Gaming | |
| MSI Titan GT77 12UHS 4k | |
| MSI Titan GT77 12UHS | |
| MSI Titan GT77 12UHS | |
| Medio Intel Core i9-12900HX | |
| Alienware x17 R2 P48E | |
| Schenker XMG Ultra 17 Rocket Lake | |
| Razer Blade 17 Early 2022 | |
| Cinebench R23 | |
| Multi Core | |
| Media de la clase Gaming (10488 - 42661, n=108, últimos 2 años) | |
| MSI Titan GT77 12UHS 4k | |
| MSI Titan GT77 12UHS (4k, Extreme Leistung, Cooler Boost) | |
| MSI Titan GT77 12UHS | |
| Medio Intel Core i9-12900HX (18337 - 23482, n=8) | |
| Alienware x17 R2 P48E | |
| Schenker XMG Ultra 17 Rocket Lake | |
| Razer Blade 17 Early 2022 | |
| Single Core | |
| Media de la clase Gaming (1166 - 2415, n=108, últimos 2 años) | |
| MSI Titan GT77 12UHS 4k | |
| Medio Intel Core i9-12900HX (1897 - 1936, n=8) | |
| MSI Titan GT77 12UHS | |
| MSI Titan GT77 12UHS (4k, Extreme Leistung, Cooler Boost) | |
| Razer Blade 17 Early 2022 | |
| Alienware x17 R2 P48E | |
| Schenker XMG Ultra 17 Rocket Lake | |
| Cinebench R20 | |
| CPU (Multi Core) | |
| Media de la clase Gaming (4029 - 16433, n=107, últimos 2 años) | |
| MSI Titan GT77 12UHS 4k | |
| MSI Titan GT77 12UHS (4k, Extreme Leistung, Cooler Boost) | |
| MSI Titan GT77 12UHS | |
| Medio Intel Core i9-12900HX (7037 - 9042, n=8) | |
| Alienware x17 R2 P48E | |
| Schenker XMG Ultra 17 Rocket Lake | |
| Razer Blade 17 Early 2022 | |
| CPU (Single Core) | |
| Media de la clase Gaming (442 - 913, n=107, últimos 2 años) | |
| MSI Titan GT77 12UHS 4k | |
| MSI Titan GT77 12UHS | |
| Medio Intel Core i9-12900HX (728 - 745, n=8) | |
| MSI Titan GT77 12UHS (4k, Extreme Leistung, Cooler Boost) | |
| Alienware x17 R2 P48E | |
| Razer Blade 17 Early 2022 | |
| Schenker XMG Ultra 17 Rocket Lake | |
| Cinebench R15 | |
| CPU Multi 64Bit | |
| Media de la clase Gaming (1578 - 6330, n=106, últimos 2 años) | |
| MSI Titan GT77 12UHS 4k | |
| MSI Titan GT77 12UHS (4k, Extreme Leistung, Cooler Boost) | |
| MSI Titan GT77 12UHS | |
| Medio Intel Core i9-12900HX (2830 - 3652, n=8) | |
| Alienware x17 R2 P48E | |
| Schenker XMG Ultra 17 Rocket Lake | |
| Razer Blade 17 Early 2022 | |
| CPU Single 64Bit | |
| Media de la clase Gaming (188.8 - 350, n=107, últimos 2 años) | |
| MSI Titan GT77 12UHS 4k | |
| MSI Titan GT77 12UHS | |
| MSI Titan GT77 12UHS (4k, Extreme Leistung, Cooler Boost) | |
| Medio Intel Core i9-12900HX (274 - 282, n=8) | |
| Alienware x17 R2 P48E | |
| Razer Blade 17 Early 2022 | |
| Schenker XMG Ultra 17 Rocket Lake | |
| Blender - v2.79 BMW27 CPU | |
| Razer Blade 17 Early 2022 | |
| Schenker XMG Ultra 17 Rocket Lake | |
| Alienware x17 R2 P48E | |
| Medio Intel Core i9-12900HX (144 - 201, n=8) | |
| Media de la clase Gaming (79 - 330, n=105, últimos 2 años) | |
| MSI Titan GT77 12UHS 4k | |
| MSI Titan GT77 12UHS | |
| MSI Titan GT77 12UHS (4k, Extreme Leistung, Cooler Boost) | |
| 7-Zip 18.03 | |
| 7z b 4 | |
| Media de la clase Gaming (33491 - 148086, n=106, últimos 2 años) | |
| MSI Titan GT77 12UHS 4k | |
| MSI Titan GT77 12UHS (4k, Extreme Leistung, Cooler Boost) | |
| MSI Titan GT77 12UHS | |
| Medio Intel Core i9-12900HX (69778 - 88128, n=7) | |
| Alienware x17 R2 P48E | |
| Schenker XMG Ultra 17 Rocket Lake | |
| Razer Blade 17 Early 2022 | |
| 7z b 4 -mmt1 | |
| Media de la clase Gaming (4199 - 7436, n=106, últimos 2 años) | |
| MSI Titan GT77 12UHS 4k | |
| Medio Intel Core i9-12900HX (6165 - 6358, n=7) | |
| MSI Titan GT77 12UHS | |
| MSI Titan GT77 12UHS | |
| Schenker XMG Ultra 17 Rocket Lake | |
| Razer Blade 17 Early 2022 | |
| Alienware x17 R2 P48E | |
| Geekbench 5.5 | |
| Multi-Core | |
| Media de la clase Gaming (6460 - 28263, n=106, últimos 2 años) | |
| MSI Titan GT77 12UHS 4k | |
| MSI Titan GT77 12UHS (4k, Extreme Leistung, Cooler Boost) | |
| MSI Titan GT77 12UHS | |
| Medio Intel Core i9-12900HX (15116 - 16925, n=8) | |
| Alienware x17 R2 P48E | |
| Schenker XMG Ultra 17 Rocket Lake | |
| Razer Blade 17 Early 2022 | |
| Single-Core | |
| Media de la clase Gaming (986 - 2474, n=106, últimos 2 años) | |
| MSI Titan GT77 12UHS | |
| MSI Titan GT77 12UHS 4k | |
| MSI Titan GT77 12UHS (4k, Extreme Leistung, Cooler Boost) | |
| Medio Intel Core i9-12900HX (1874 - 1949, n=8) | |
| Alienware x17 R2 P48E | |
| Razer Blade 17 Early 2022 | |
| Schenker XMG Ultra 17 Rocket Lake | |
| HWBOT x265 Benchmark v2.2 - 4k Preset | |
| Media de la clase Gaming (11.5 - 44.4, n=106, últimos 2 años) | |
| MSI Titan GT77 12UHS 4k | |
| MSI Titan GT77 12UHS (4k, Extreme Leistung, Cooler Boost) | |
| MSI Titan GT77 12UHS | |
| Medio Intel Core i9-12900HX (19.6 - 26.6, n=7) | |
| Alienware x17 R2 P48E | |
| Schenker XMG Ultra 17 Rocket Lake | |
| Razer Blade 17 Early 2022 | |
| LibreOffice - 20 Documents To PDF | |
| Media de la clase Gaming (33.2 - 88.8, n=106, últimos 2 años) | |
| Alienware x17 R2 P48E | |
| Schenker XMG Ultra 17 Rocket Lake | |
| Razer Blade 17 Early 2022 | |
| MSI Titan GT77 12UHS | |
| MSI Titan GT77 12UHS 4k | |
| Medio Intel Core i9-12900HX (33.6 - 42.4, n=7) | |
| MSI Titan GT77 12UHS (4k, Extreme Leistung, Cooler Boost) | |
| R Benchmark 2.5 - Overall mean | |
| Schenker XMG Ultra 17 Rocket Lake | |
| Razer Blade 17 Early 2022 | |
| Alienware x17 R2 P48E | |
| Media de la clase Gaming (0.3439 - 0.759, n=107, últimos 2 años) | |
| MSI Titan GT77 12UHS 4k | |
| MSI Titan GT77 12UHS (4k, Extreme Leistung, Cooler Boost) | |
| Medio Intel Core i9-12900HX (0.4159 - 0.4242, n=7) | |
| MSI Titan GT77 12UHS | |
* ... más pequeño es mejor
AIDA64: FP32 Ray-Trace | FPU Julia | CPU SHA3 | CPU Queen | FPU SinJulia | FPU Mandel | CPU AES | CPU ZLib | FP64 Ray-Trace | CPU PhotoWorxx
| Performance rating | |
| Media de la clase Gaming | |
| MSI Titan GT77 12UHS 4k | |
| MSI Titan GT77 12UHS | |
| MSI Titan GT77 12UHS | |
| Medio Intel Core i9-12900HX | |
| Schenker XMG Ultra 17 Rocket Lake | |
| Alienware x17 R2 P48E | |
| Razer Blade 17 Early 2022 | |
| AIDA64 / FP32 Ray-Trace | |
| Media de la clase Gaming (10227 - 85542, n=106, últimos 2 años) | |
| MSI Titan GT77 12UHS 4k (v6.70.6000) | |
| MSI Titan GT77 12UHS (v6.70.6000, 4k, Extreme Leistung, Cooler Boost) | |
| MSI Titan GT77 12UHS (v6.70.6000) | |
| Medio Intel Core i9-12900HX (11535 - 22183, n=7) | |
| Schenker XMG Ultra 17 Rocket Lake (v6.32.5600) | |
| Alienware x17 R2 P48E (v6.50.5800) | |
| Razer Blade 17 Early 2022 (v6.50.5800) | |
| AIDA64 / FPU Julia | |
| Media de la clase Gaming (51376 - 372155, n=106, últimos 2 años) | |
| MSI Titan GT77 12UHS 4k (v6.70.6000) | |
| MSI Titan GT77 12UHS (v6.70.6000) | |
| MSI Titan GT77 12UHS (v6.70.6000, 4k, Extreme Leistung, Cooler Boost) | |
| Medio Intel Core i9-12900HX (52916 - 110093, n=7) | |
| Schenker XMG Ultra 17 Rocket Lake (v6.32.5600) | |
| Alienware x17 R2 P48E (v6.50.5800) | |
| Razer Blade 17 Early 2022 (v6.50.5800) | |
| AIDA64 / CPU SHA3 | |
| Media de la clase Gaming (2180 - 10115, n=106, últimos 2 años) | |
| MSI Titan GT77 12UHS 4k (v6.70.6000) | |
| MSI Titan GT77 12UHS (v6.70.6000, 4k, Extreme Leistung, Cooler Boost) | |
| MSI Titan GT77 12UHS (v6.70.6000) | |
| Schenker XMG Ultra 17 Rocket Lake (v6.32.5600) | |
| Medio Intel Core i9-12900HX (3559 - 5123, n=7) | |
| Alienware x17 R2 P48E (v6.50.5800) | |
| Razer Blade 17 Early 2022 (v6.50.5800) | |
| AIDA64 / CPU Queen | |
| Media de la clase Gaming (49785 - 173351, n=90, últimos 2 años) | |
| Alienware x17 R2 P48E (v6.50.5800) | |
| Schenker XMG Ultra 17 Rocket Lake (v6.32.5600) | |
| MSI Titan GT77 12UHS (v6.70.6000) | |
| MSI Titan GT77 12UHS 4k (v6.70.6000) | |
| MSI Titan GT77 12UHS (v6.70.6000, 4k, Extreme Leistung, Cooler Boost) | |
| Medio Intel Core i9-12900HX (101029 - 104457, n=7) | |
| Razer Blade 17 Early 2022 (v6.50.5800) | |
| AIDA64 / FPU SinJulia | |
| Media de la clase Gaming (4424 - 33636, n=106, últimos 2 años) | |
| MSI Titan GT77 12UHS 4k (v6.70.6000) | |
| MSI Titan GT77 12UHS (v6.70.6000, 4k, Extreme Leistung, Cooler Boost) | |
| MSI Titan GT77 12UHS (v6.70.6000) | |
| Medio Intel Core i9-12900HX (10475 - 13062, n=7) | |
| Schenker XMG Ultra 17 Rocket Lake (v6.32.5600) | |
| Alienware x17 R2 P48E (v6.50.5800) | |
| Razer Blade 17 Early 2022 (v6.50.5800) | |
| AIDA64 / FPU Mandel | |
| Media de la clase Gaming (25115 - 196829, n=106, últimos 2 años) | |
| MSI Titan GT77 12UHS 4k (v6.70.6000) | |
| MSI Titan GT77 12UHS (v6.70.6000, 4k, Extreme Leistung, Cooler Boost) | |
| MSI Titan GT77 12UHS (v6.70.6000) | |
| Medio Intel Core i9-12900HX (31779 - 53628, n=7) | |
| Schenker XMG Ultra 17 Rocket Lake (v6.32.5600) | |
| Alienware x17 R2 P48E (v6.50.5800) | |
| Razer Blade 17 Early 2022 (v6.50.5800) | |
| AIDA64 / CPU AES | |
| MSI Titan GT77 12UHS (v6.70.6000, 4k, Extreme Leistung, Cooler Boost) | |
| MSI Titan GT77 12UHS | |
| MSI Titan GT77 12UHS 4k (v6.70.6000) | |
| Medio Intel Core i9-12900HX (125268 - 183146, n=7) | |
| Schenker XMG Ultra 17 Rocket Lake (v6.32.5600) | |
| Media de la clase Gaming (39258 - 247074, n=106, últimos 2 años) | |
| Alienware x17 R2 P48E (v6.50.5800) | |
| Razer Blade 17 Early 2022 (v6.50.5800) | |
| AIDA64 / CPU ZLib | |
| Media de la clase Gaming (574 - 2531, n=106, últimos 2 años) | |
| MSI Titan GT77 12UHS 4k (v6.70.6000) | |
| MSI Titan GT77 12UHS (v6.70.6000, 4k, Extreme Leistung, Cooler Boost) | |
| MSI Titan GT77 12UHS (v6.70.6000) | |
| Medio Intel Core i9-12900HX (990 - 1408, n=7) | |
| Alienware x17 R2 P48E (v6.50.5800) | |
| Schenker XMG Ultra 17 Rocket Lake (v6.32.5600) | |
| Razer Blade 17 Early 2022 (v6.50.5800) | |
| AIDA64 / FP64 Ray-Trace | |
| Media de la clase Gaming (5509 - 45446, n=106, últimos 2 años) | |
| MSI Titan GT77 12UHS 4k (v6.70.6000) | |
| MSI Titan GT77 12UHS (v6.70.6000, 4k, Extreme Leistung, Cooler Boost) | |
| MSI Titan GT77 12UHS (v6.70.6000) | |
| Medio Intel Core i9-12900HX (6663 - 11913, n=7) | |
| Schenker XMG Ultra 17 Rocket Lake (v6.32.5600) | |
| Alienware x17 R2 P48E (v6.50.5800) | |
| Razer Blade 17 Early 2022 (v6.50.5800) | |
| AIDA64 / CPU PhotoWorxx | |
| Media de la clase Gaming (12271 - 89891, n=106, últimos 2 años) | |
| Medio Intel Core i9-12900HX (40239 - 47710, n=7) | |
| MSI Titan GT77 12UHS (v6.70.6000) | |
| MSI Titan GT77 12UHS 4k (v6.70.6000) | |
| MSI Titan GT77 12UHS (v6.70.6000, 4k, Extreme Leistung, Cooler Boost) | |
| Razer Blade 17 Early 2022 (v6.50.5800) | |
| Alienware x17 R2 P48E (v6.50.5800) | |
| Schenker XMG Ultra 17 Rocket Lake (v6.32.5600) | |
Rendimiento del sistema
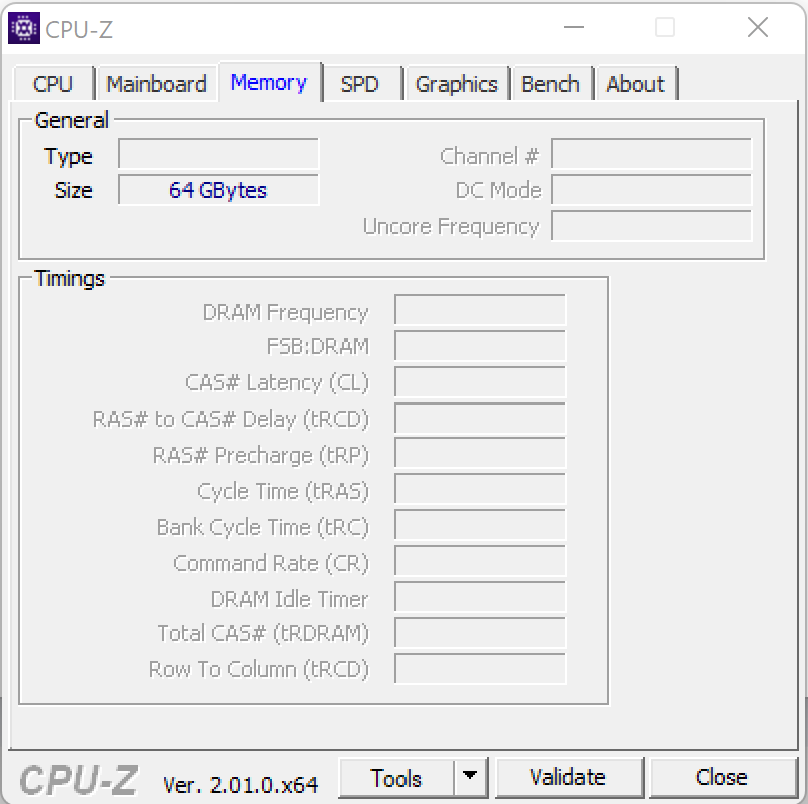
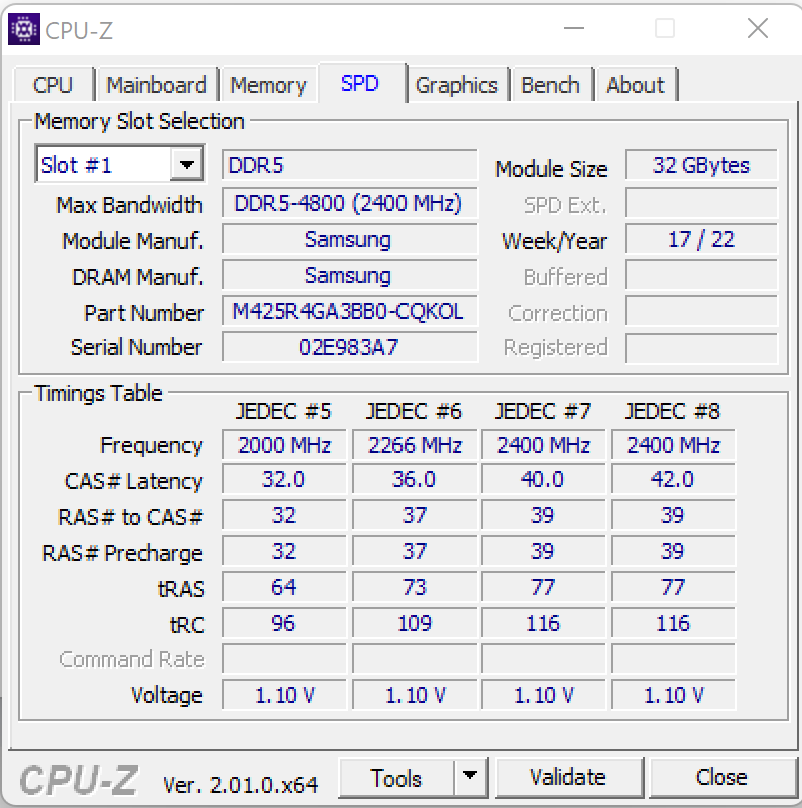
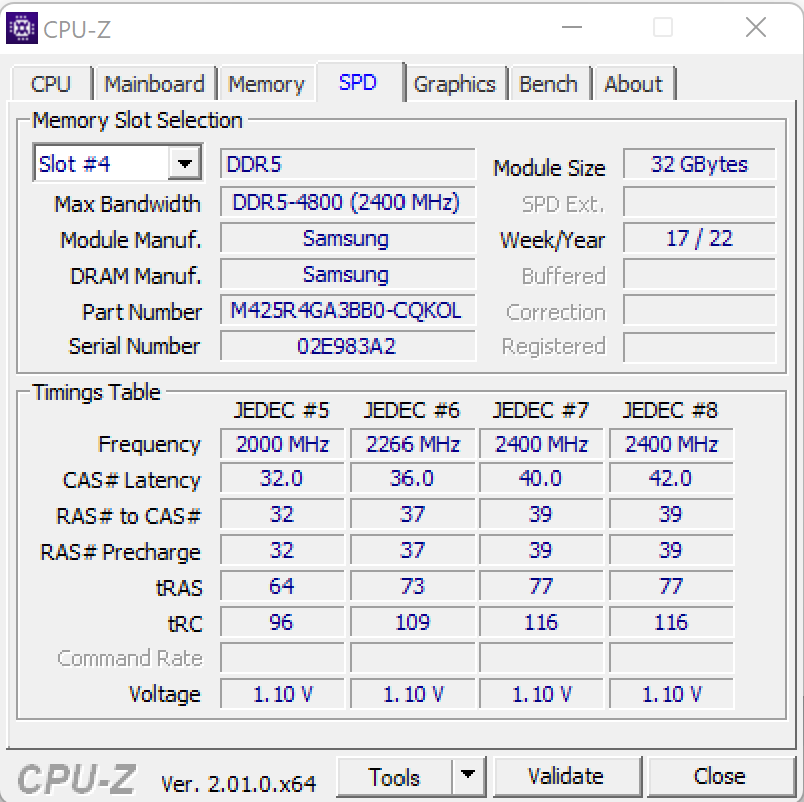
Al GT77 no le falta potencia de cálculo, lo que se nota inmediatamente al ver sus especificaciones. El portátil de 17 pulgadas puede manejar juegos, renderizado y mucho más con facilidad. Las tasas de transferencia de RAM están en línea con el nivel de rendimiento habitual de la memoria DDR4-4800. El sistema también obtuvo buenos resultados en PCMark.
CrossMark: Overall | Productivity | Creativity | Responsiveness
| PCMark 10 / Score | |
| Media de la clase Gaming (5828 - 12414, n=94, últimos 2 años) | |
| MSI Titan GT77 12UHS (dGPU, Extreme Leistung) | |
| MSI Titan GT77 12UHS | |
| Alienware x17 R2 P48E | |
| Medio Intel Core i9-12900HX, NVIDIA GeForce RTX 3080 Ti Laptop GPU (6812 - 8636, n=6) | |
| Schenker XMG Ultra 17 Rocket Lake | |
| Razer Blade 17 Early 2022 | |
| MSI Titan GT77 12UHS 4k | |
| PCMark 10 / Essentials | |
| Alienware x17 R2 P48E | |
| MSI Titan GT77 12UHS (dGPU, Extreme Leistung) | |
| MSI Titan GT77 12UHS | |
| Schenker XMG Ultra 17 Rocket Lake | |
| Media de la clase Gaming (8810 - 11935, n=98, últimos 2 años) | |
| Medio Intel Core i9-12900HX, NVIDIA GeForce RTX 3080 Ti Laptop GPU (9598 - 11192, n=6) | |
| Razer Blade 17 Early 2022 | |
| MSI Titan GT77 12UHS 4k | |
| PCMark 10 / Productivity | |
| Media de la clase Gaming (6845 - 25323, n=96, últimos 2 años) | |
| MSI Titan GT77 12UHS (dGPU, Extreme Leistung) | |
| Medio Intel Core i9-12900HX, NVIDIA GeForce RTX 3080 Ti Laptop GPU (9365 - 10932, n=6) | |
| MSI Titan GT77 12UHS | |
| Alienware x17 R2 P48E | |
| Schenker XMG Ultra 17 Rocket Lake | |
| MSI Titan GT77 12UHS 4k | |
| Razer Blade 17 Early 2022 | |
| PCMark 10 / Digital Content Creation | |
| Media de la clase Gaming (7602 - 19954, n=96, últimos 2 años) | |
| MSI Titan GT77 12UHS (dGPU, Extreme Leistung) | |
| MSI Titan GT77 12UHS | |
| Alienware x17 R2 P48E | |
| Medio Intel Core i9-12900HX, NVIDIA GeForce RTX 3080 Ti Laptop GPU (9543 - 14291, n=6) | |
| Schenker XMG Ultra 17 Rocket Lake | |
| Razer Blade 17 Early 2022 | |
| MSI Titan GT77 12UHS 4k | |
| CrossMark / Overall | |
| MSI Titan GT77 12UHS 4k | |
| Medio Intel Core i9-12900HX, NVIDIA GeForce RTX 3080 Ti Laptop GPU (2108 - 2170, n=5) | |
| MSI Titan GT77 12UHS | |
| Media de la clase Gaming (1366 - 2409, n=95, últimos 2 años) | |
| Alienware x17 R2 P48E | |
| Razer Blade 17 Early 2022 | |
| CrossMark / Productivity | |
| MSI Titan GT77 12UHS 4k | |
| Medio Intel Core i9-12900HX, NVIDIA GeForce RTX 3080 Ti Laptop GPU (1978 - 2047, n=5) | |
| MSI Titan GT77 12UHS | |
| Media de la clase Gaming (1386 - 2254, n=95, últimos 2 años) | |
| Alienware x17 R2 P48E | |
| Razer Blade 17 Early 2022 | |
| CrossMark / Creativity | |
| MSI Titan GT77 12UHS 4k | |
| Medio Intel Core i9-12900HX, NVIDIA GeForce RTX 3080 Ti Laptop GPU (2288 - 2366, n=5) | |
| MSI Titan GT77 12UHS | |
| Media de la clase Gaming (1343 - 2786, n=95, últimos 2 años) | |
| Alienware x17 R2 P48E | |
| Razer Blade 17 Early 2022 | |
| CrossMark / Responsiveness | |
| MSI Titan GT77 12UHS 4k | |
| Medio Intel Core i9-12900HX, NVIDIA GeForce RTX 3080 Ti Laptop GPU (1991 - 2090, n=5) | |
| MSI Titan GT77 12UHS | |
| Media de la clase Gaming (1226 - 2334, n=95, últimos 2 años) | |
| Alienware x17 R2 P48E | |
| Razer Blade 17 Early 2022 | |
| PCMark 8 Home Score Accelerated v2 | 4166 puntos | |
| PCMark 8 Creative Score Accelerated v2 | 6677 puntos | |
| PCMark 8 Work Score Accelerated v2 | 5165 puntos | |
| PCMark 10 Score | 6812 puntos | |
ayuda | ||
| AIDA64 / Memory Copy | |
| Media de la clase Gaming (21750 - 129946, n=106, últimos 2 años) | |
| Medio Intel Core i9-12900HX (62852 - 70863, n=7) | |
| MSI Titan GT77 12UHS | |
| MSI Titan GT77 12UHS 4k | |
| Razer Blade 17 Early 2022 | |
| Alienware x17 R2 P48E | |
| Schenker XMG Ultra 17 Rocket Lake | |
| AIDA64 / Memory Read | |
| Media de la clase Gaming (22956 - 118858, n=106, últimos 2 años) | |
| Medio Intel Core i9-12900HX (62140 - 72930, n=7) | |
| MSI Titan GT77 12UHS 4k | |
| Razer Blade 17 Early 2022 | |
| MSI Titan GT77 12UHS | |
| Alienware x17 R2 P48E | |
| Schenker XMG Ultra 17 Rocket Lake | |
| AIDA64 / Memory Write | |
| Media de la clase Gaming (22297 - 135096, n=106, últimos 2 años) | |
| Medio Intel Core i9-12900HX (60001 - 68782, n=7) | |
| MSI Titan GT77 12UHS 4k | |
| MSI Titan GT77 12UHS | |
| Razer Blade 17 Early 2022 | |
| Alienware x17 R2 P48E | |
| Schenker XMG Ultra 17 Rocket Lake | |
| AIDA64 / Memory Latency | |
| Media de la clase Gaming (75.3 - 259, n=106, últimos 2 años) | |
| Alienware x17 R2 P48E | |
| MSI Titan GT77 12UHS 4k | |
| MSI Titan GT77 12UHS | |
| Medio Intel Core i9-12900HX (83.9 - 93.4, n=7) | |
| Schenker XMG Ultra 17 Rocket Lake | |
* ... más pequeño es mejor
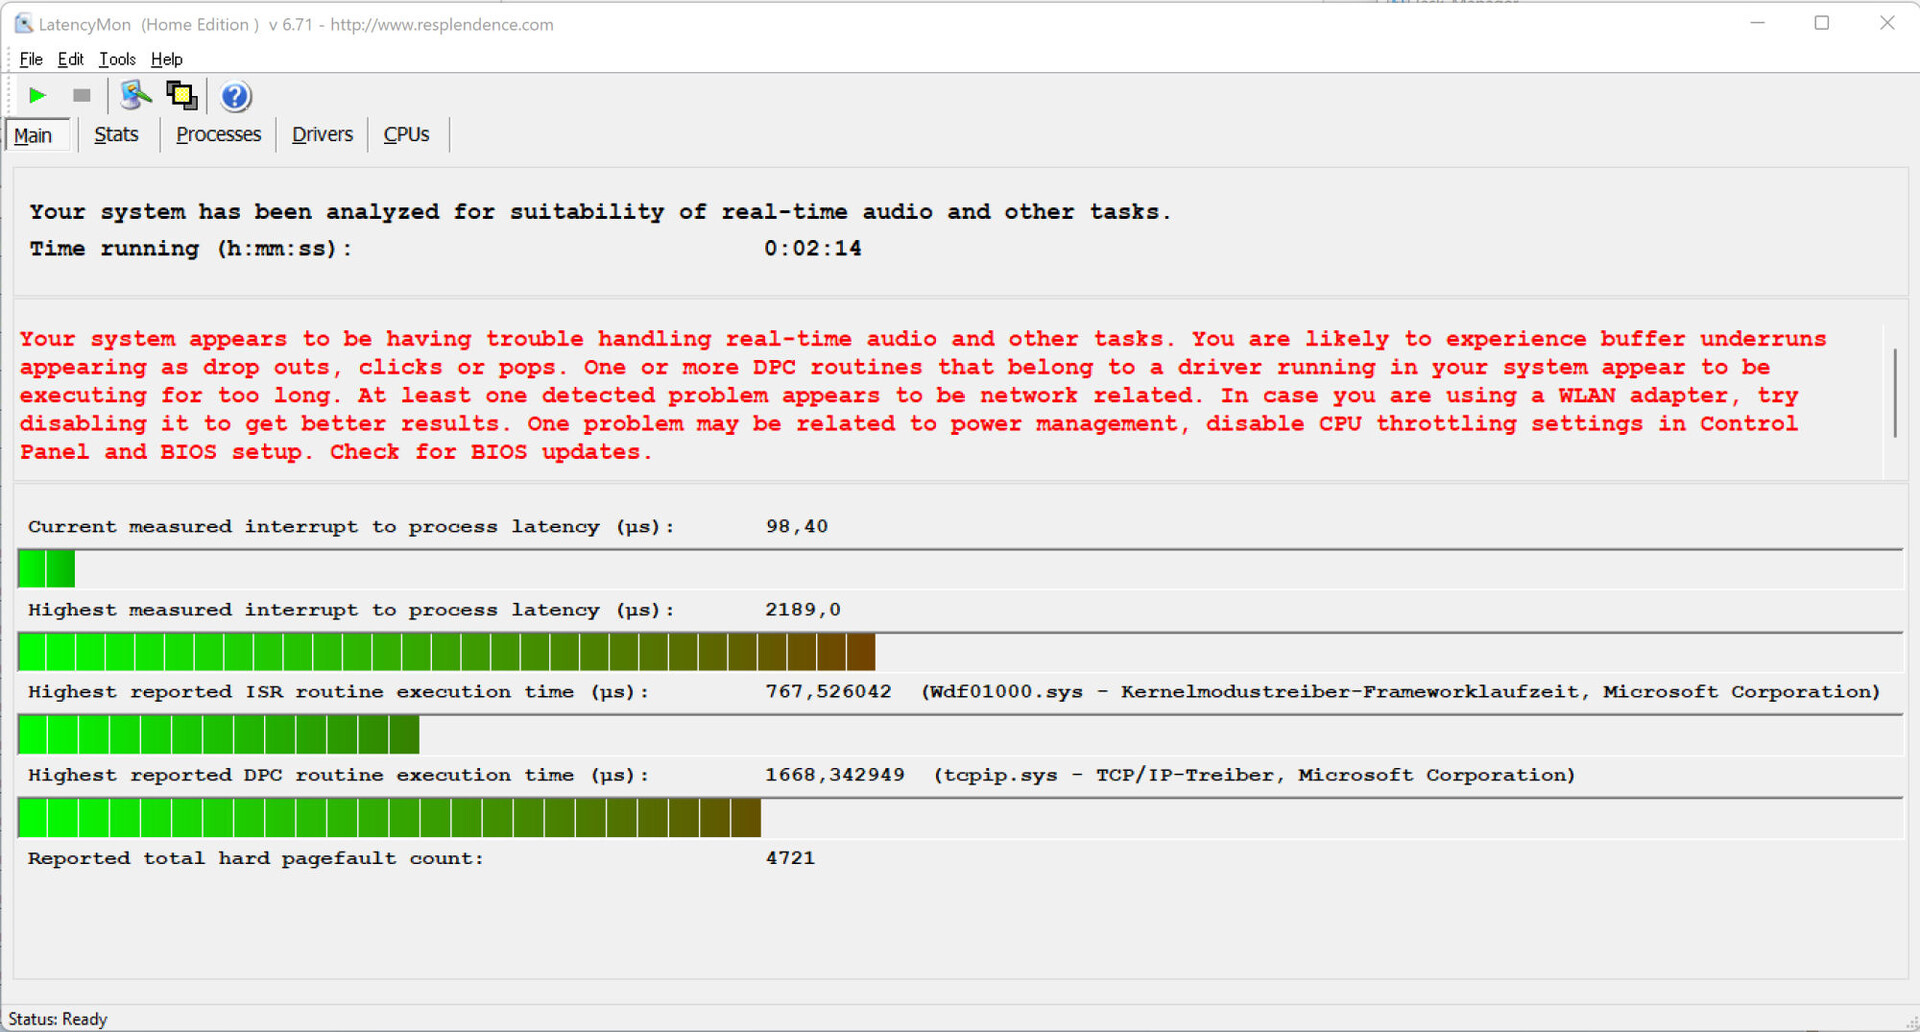
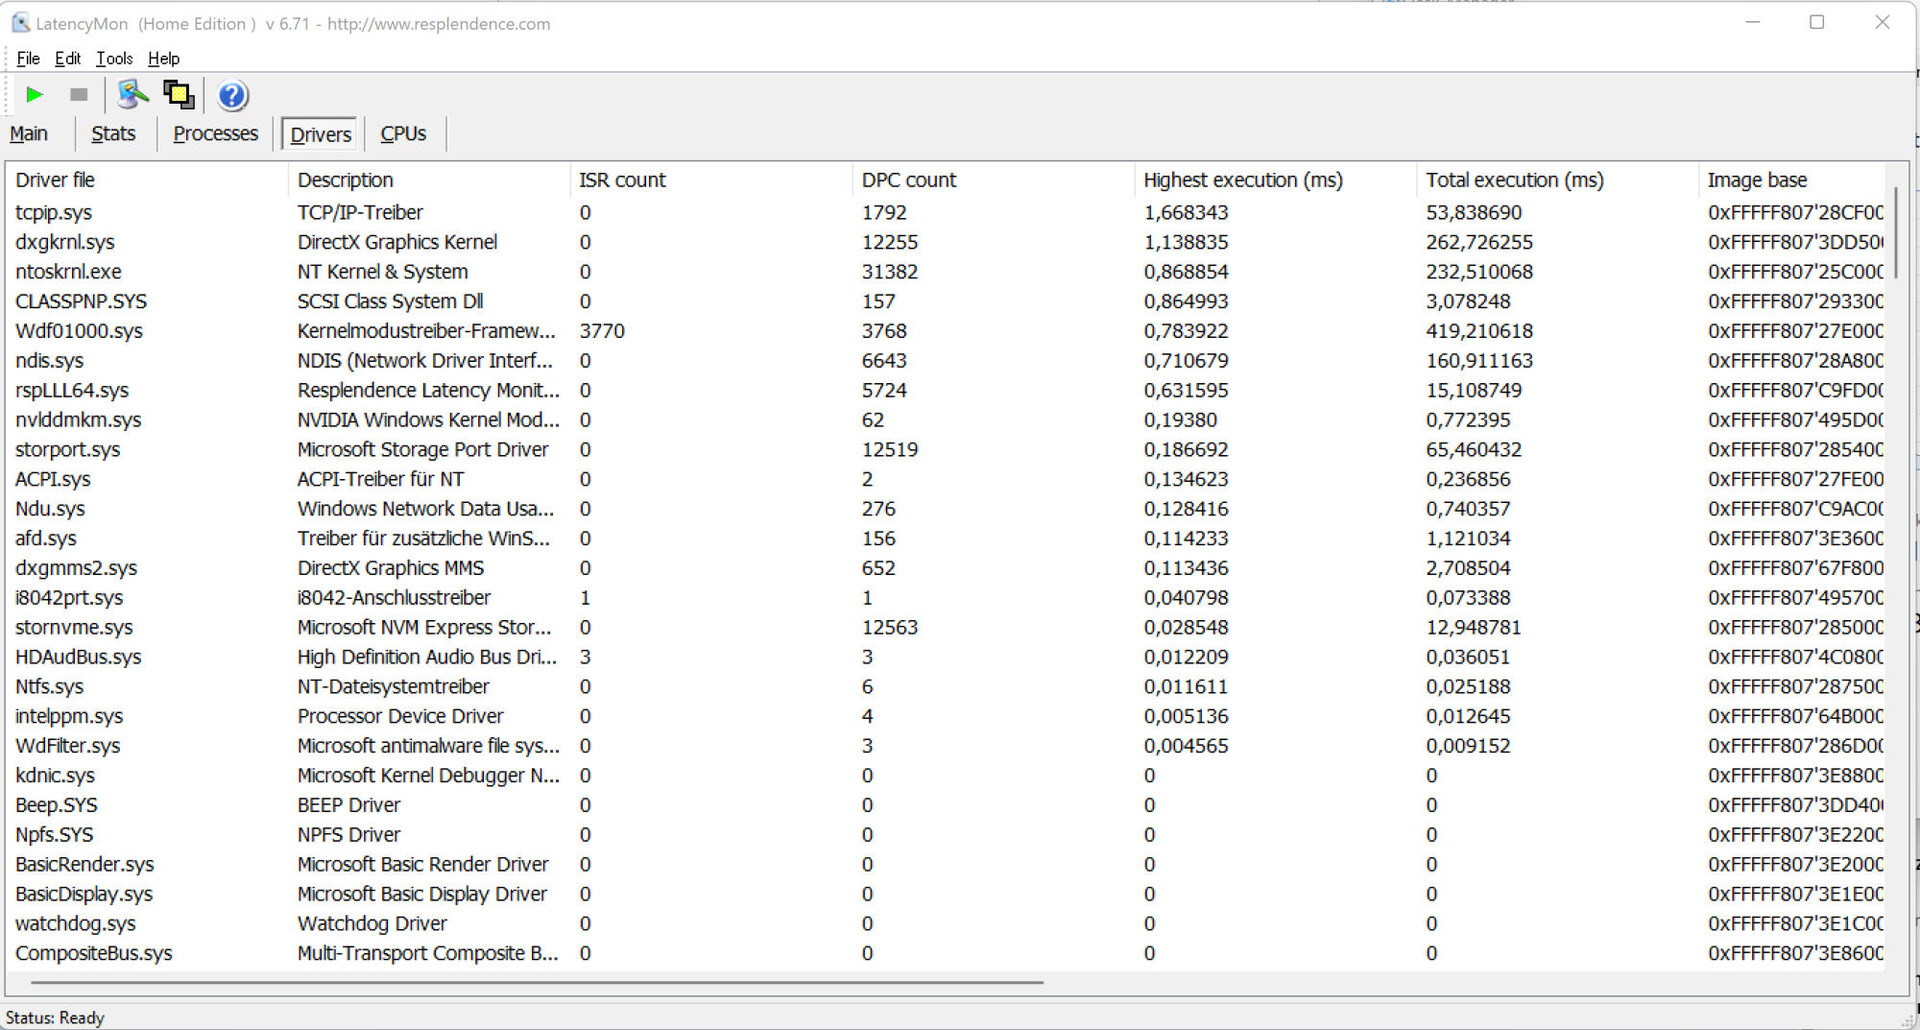
Latencia del CPD
Nuestra prueba de monitorización de la latencia estandarizada (navegación por Internet, reproducción de vídeo 4K, carga alta de Prime95) reveló algunos problemas con la latencia del CPD. El sistema no parece estar bien adaptado al procesamiento de vídeo y audio en tiempo real. Las futuras actualizaciones de software podrían mejorar o incluso empeorar este problema.
| DPC Latencies / LatencyMon - interrupt to process latency (max), Web, Youtube, Prime95 | |
| MSI Titan GT77 12UHS | |
| MSI Titan GT77 12UHS | |
| MSI Titan GT77 12UHS 4k | |
| Alienware x17 R2 P48E | |
| Schenker XMG Ultra 17 Rocket Lake | |
| Razer Blade 17 Early 2022 | |
* ... más pequeño es mejor
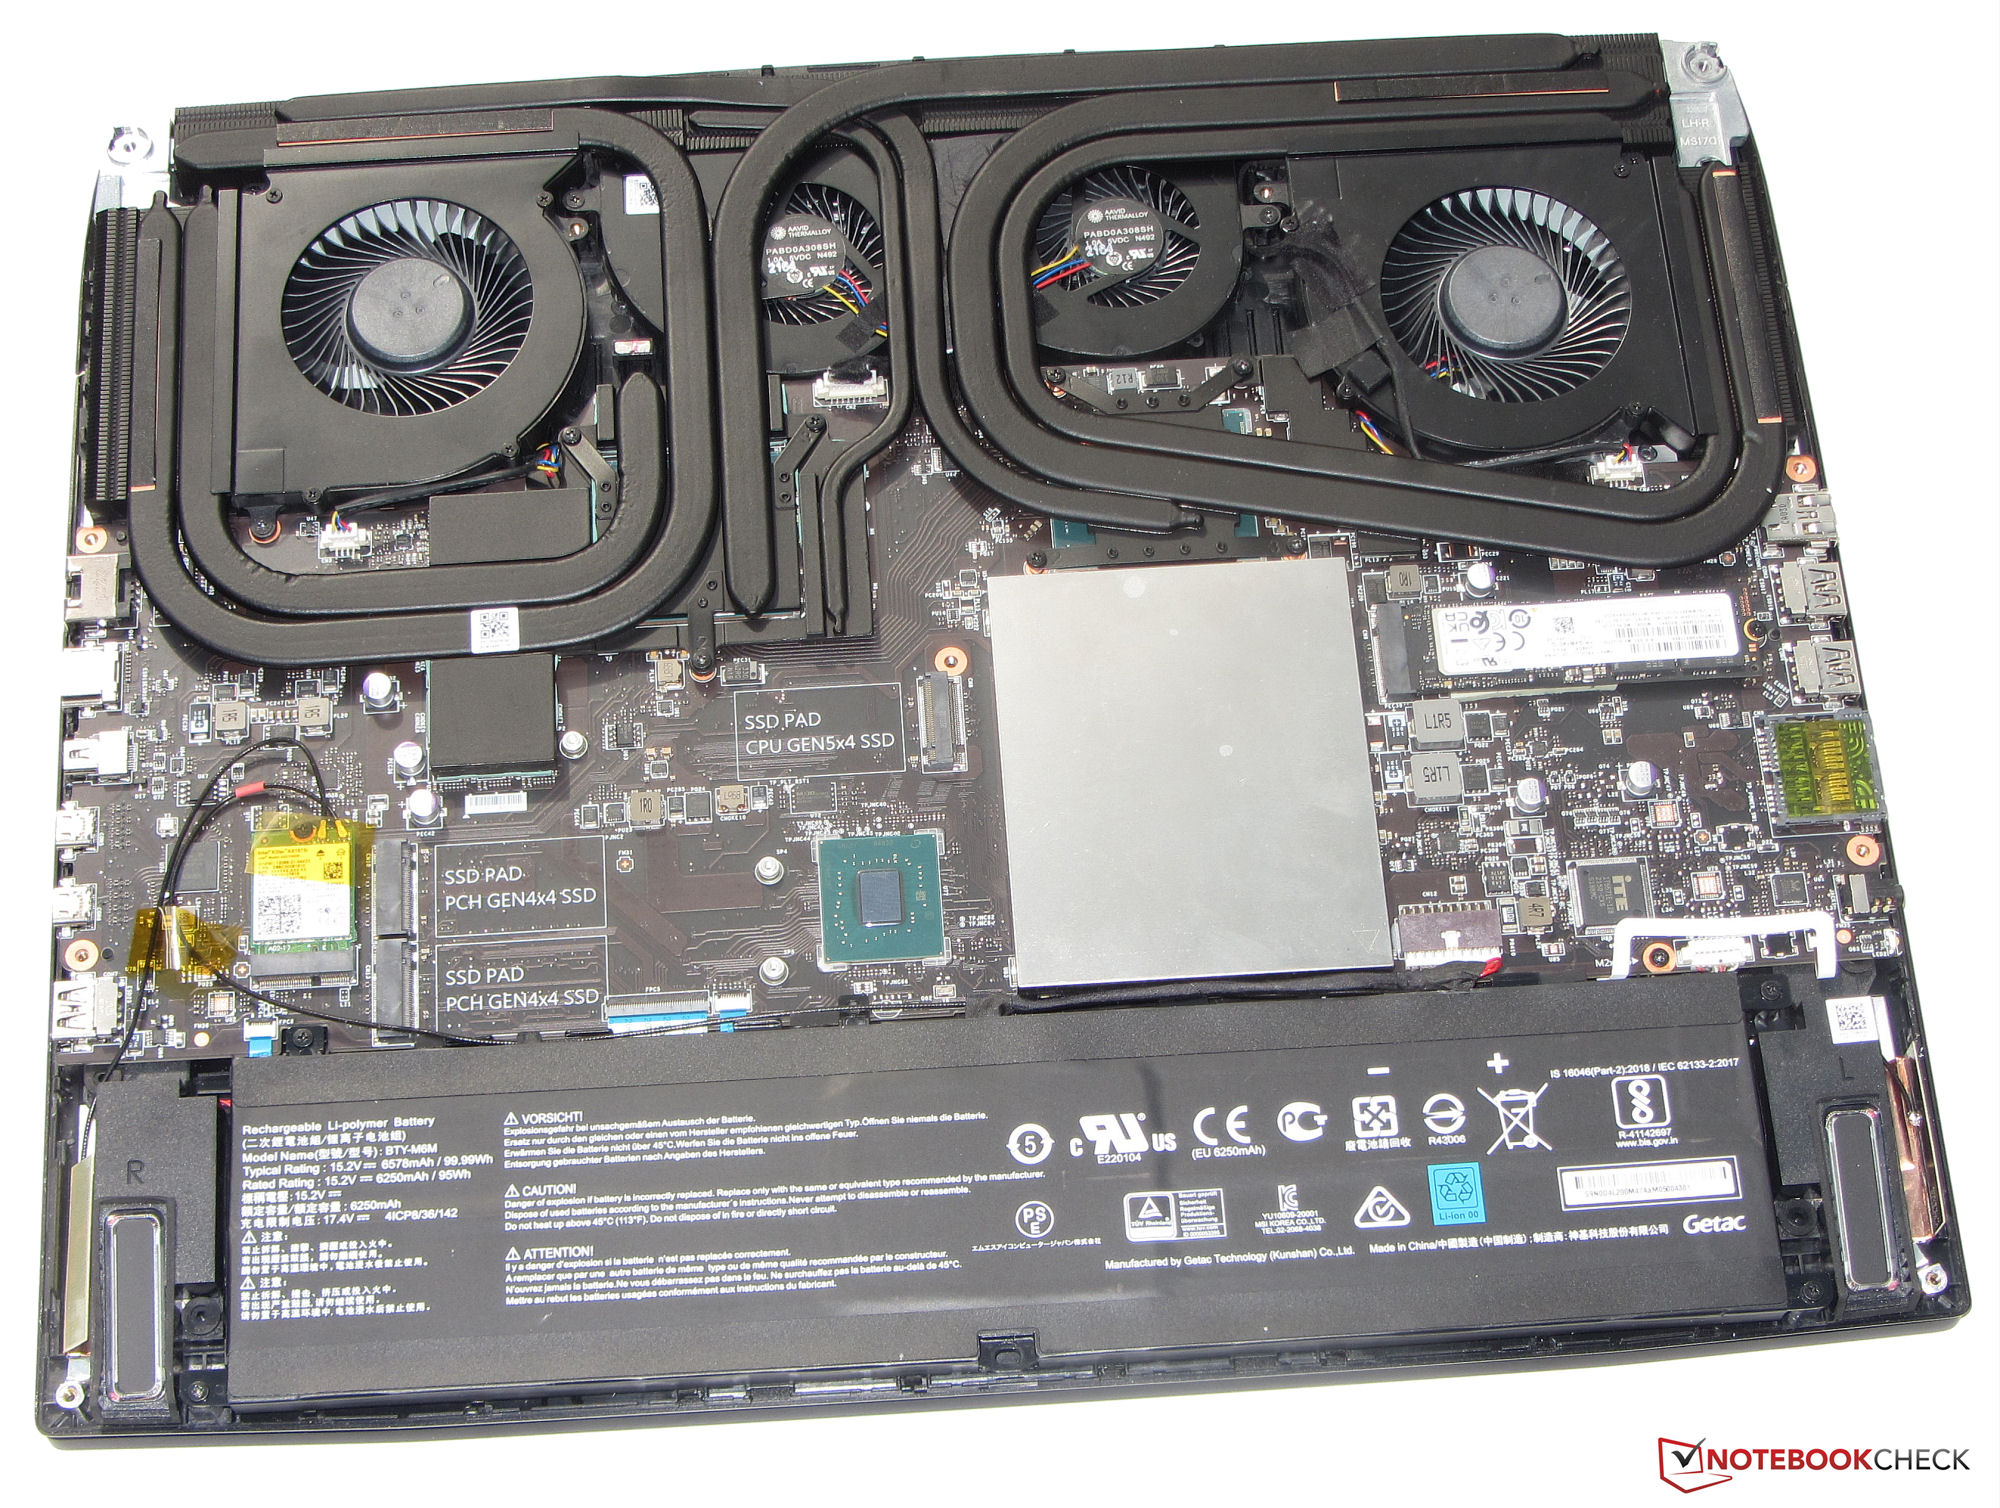
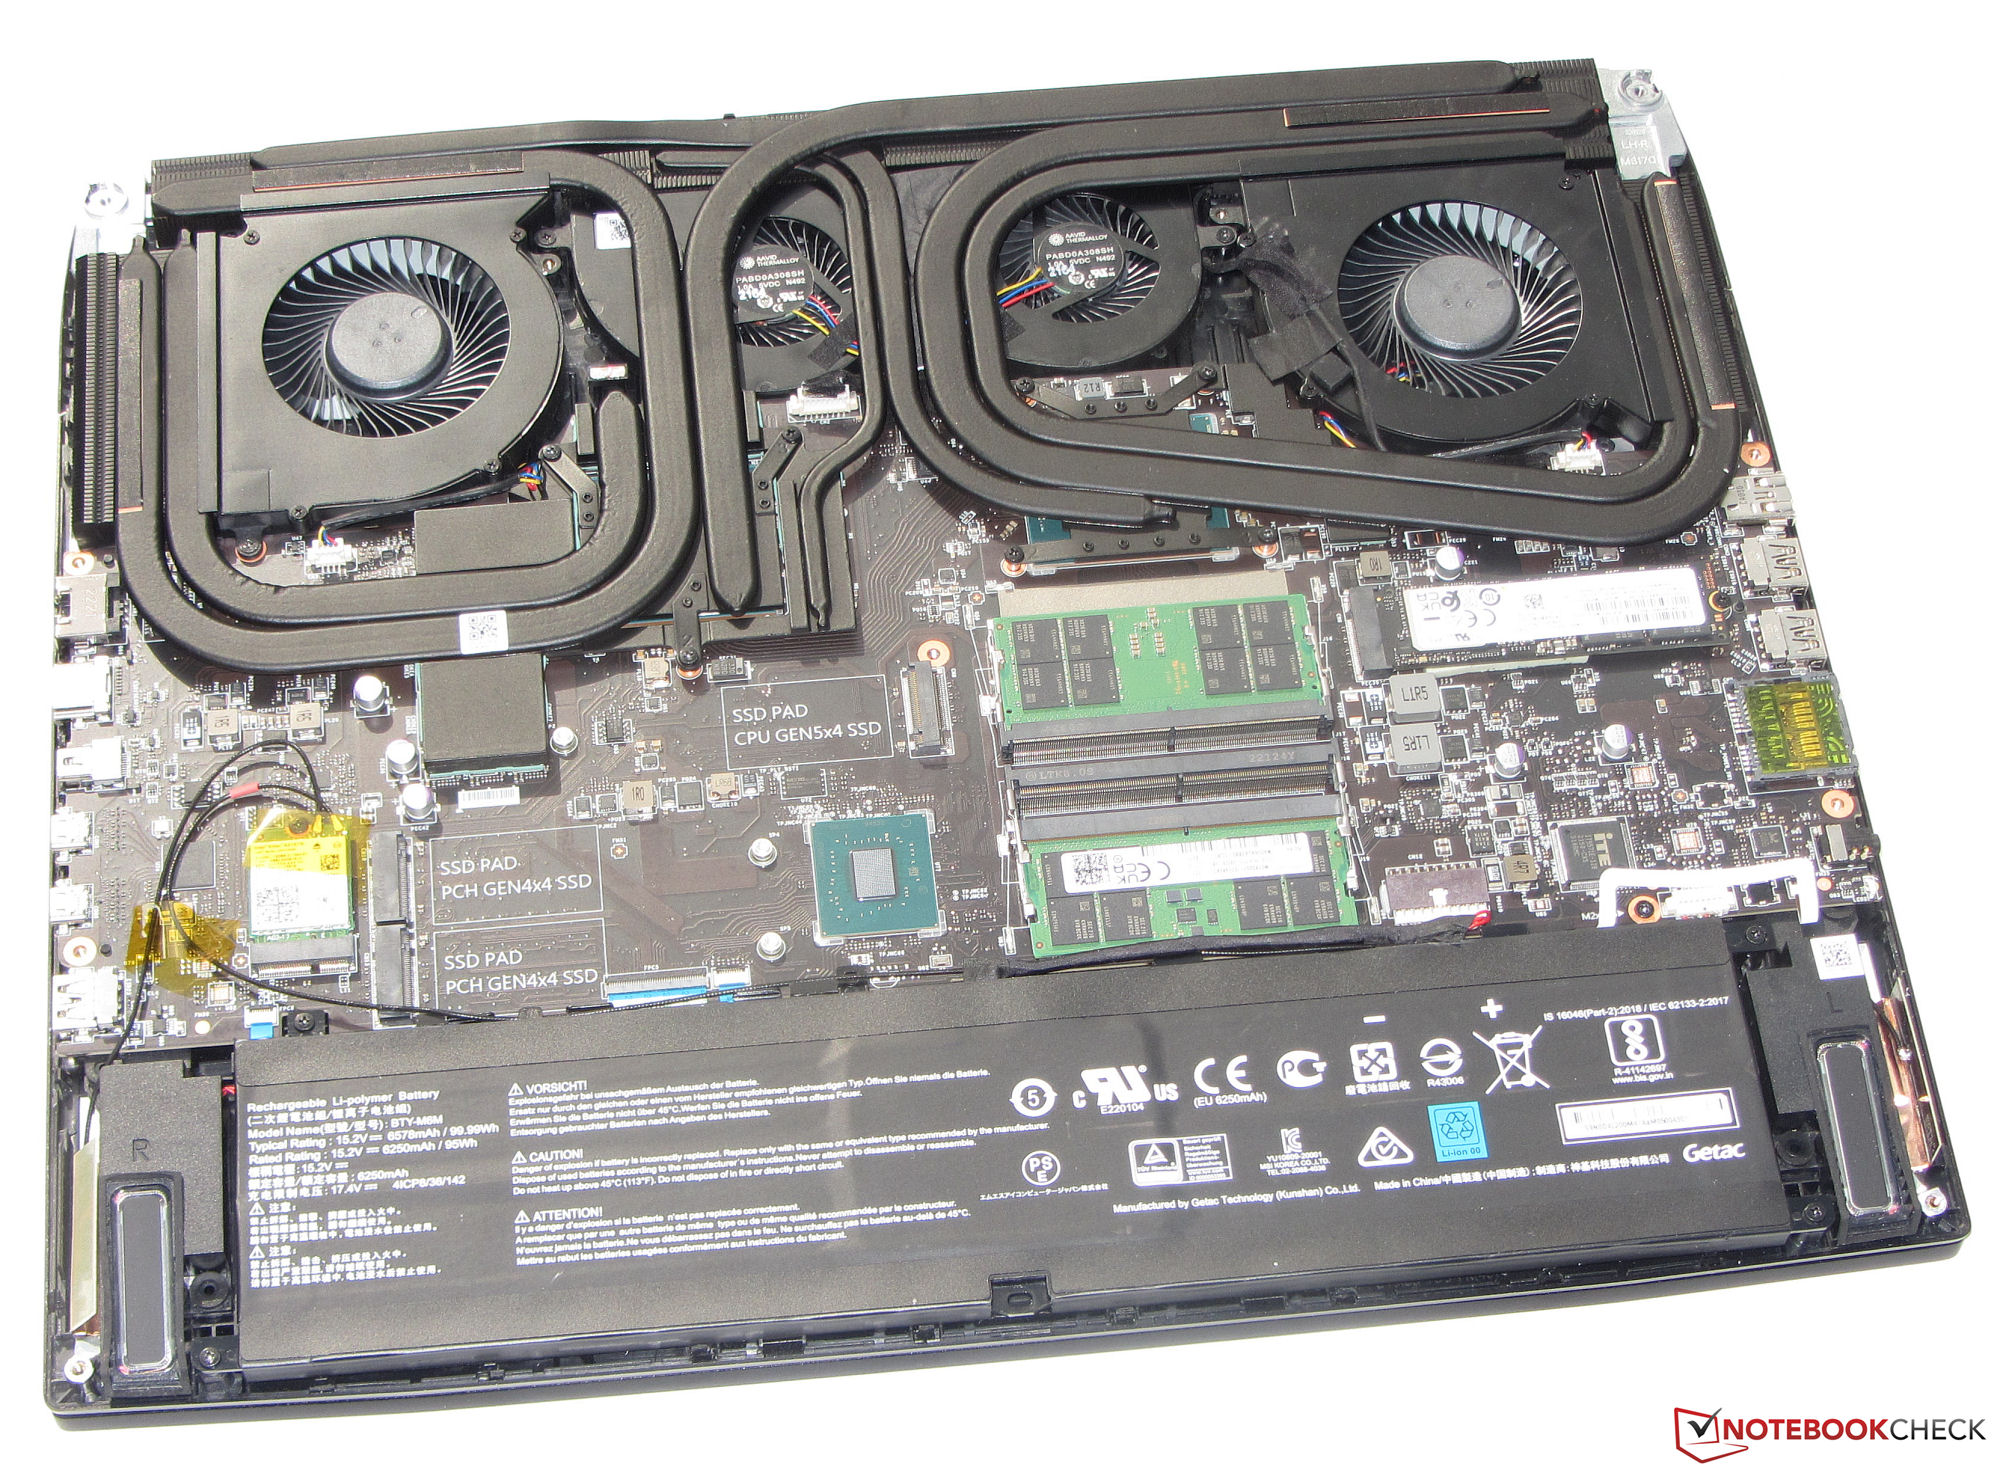
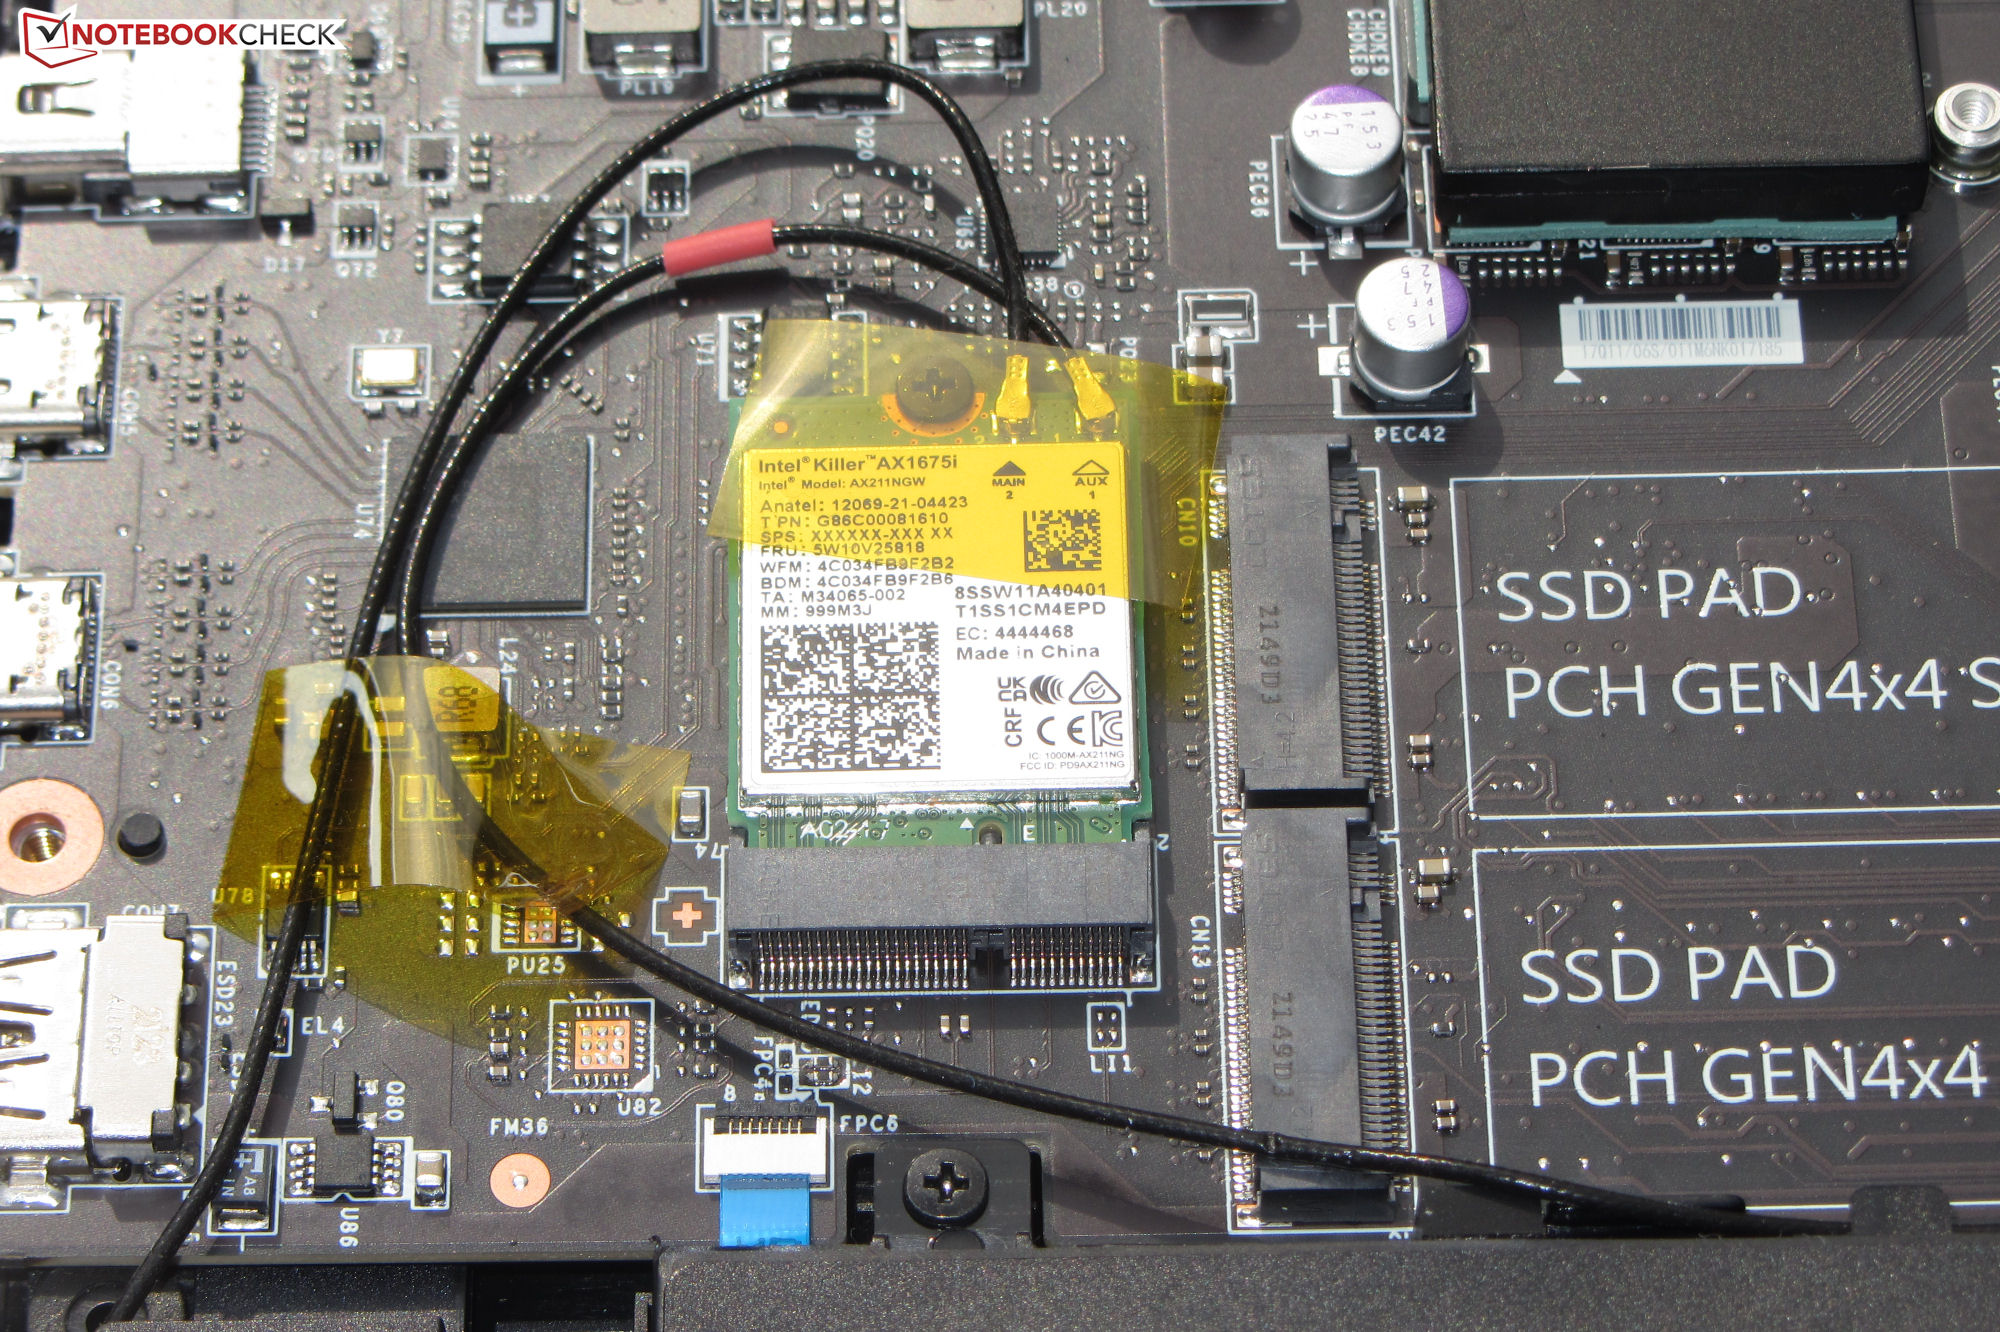
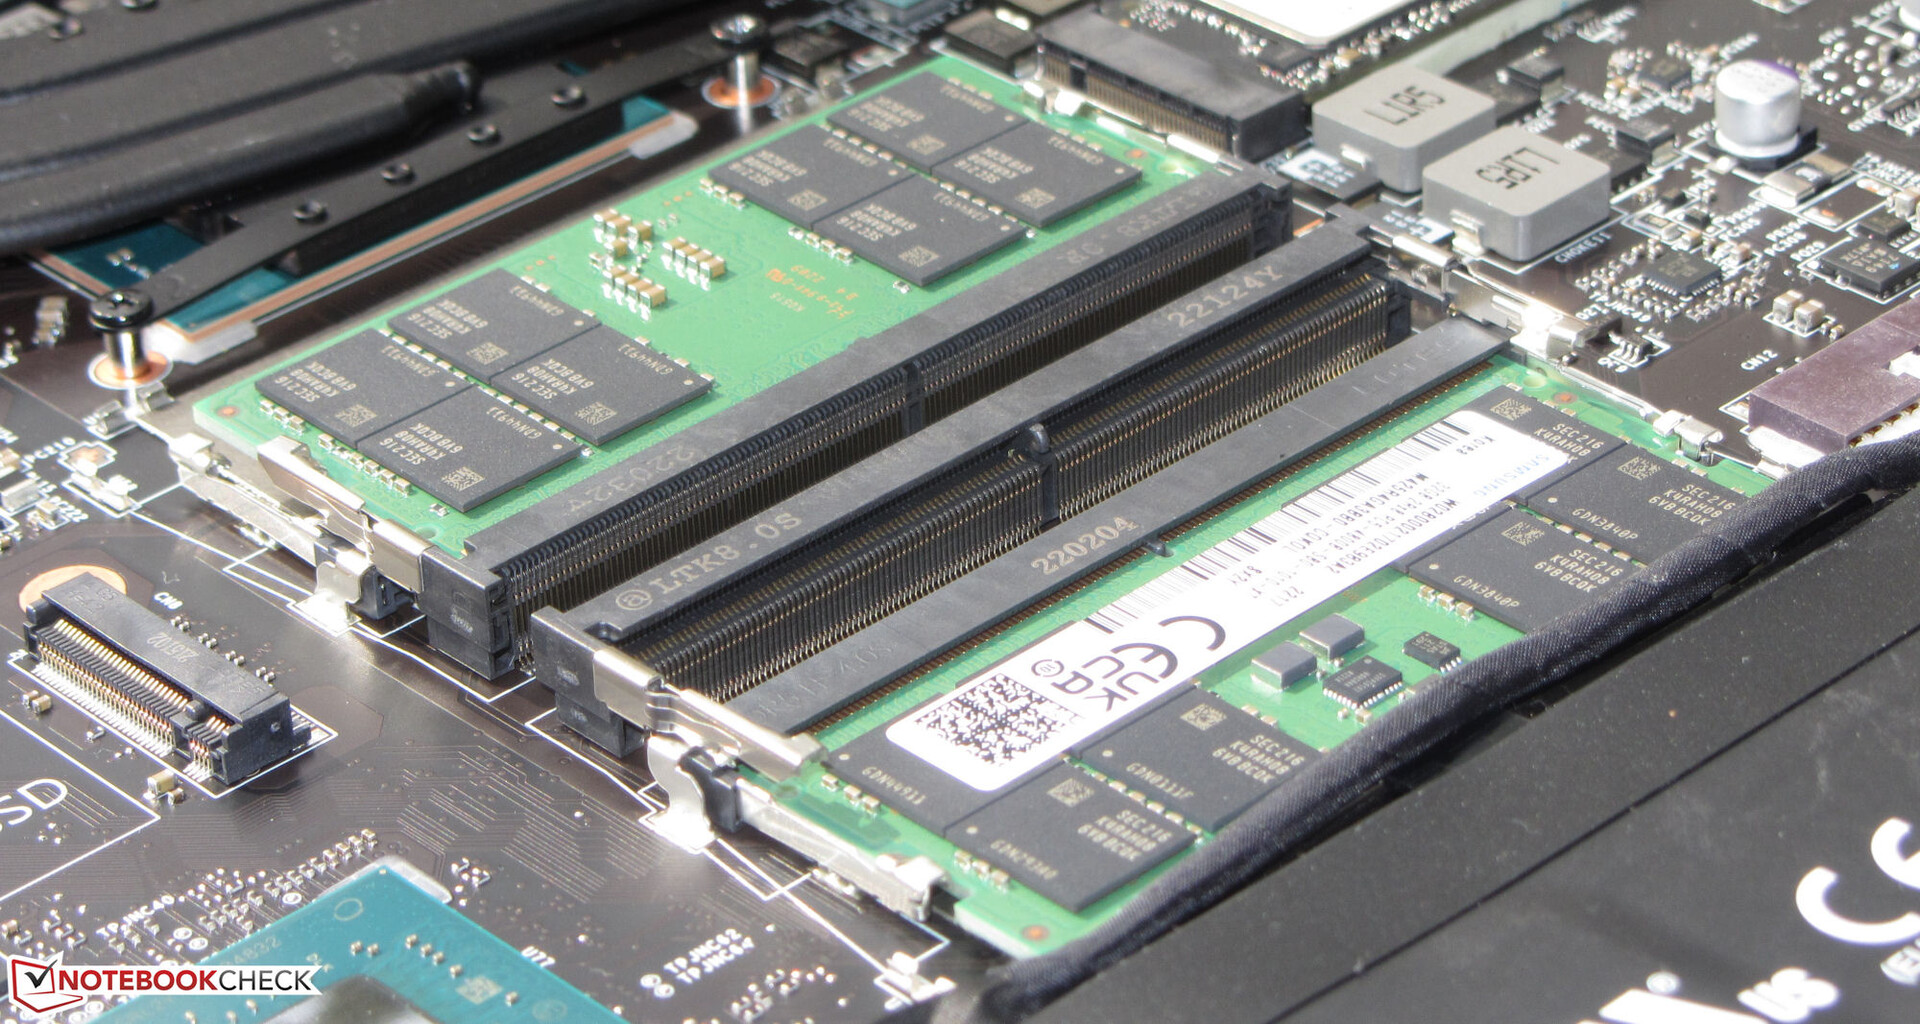
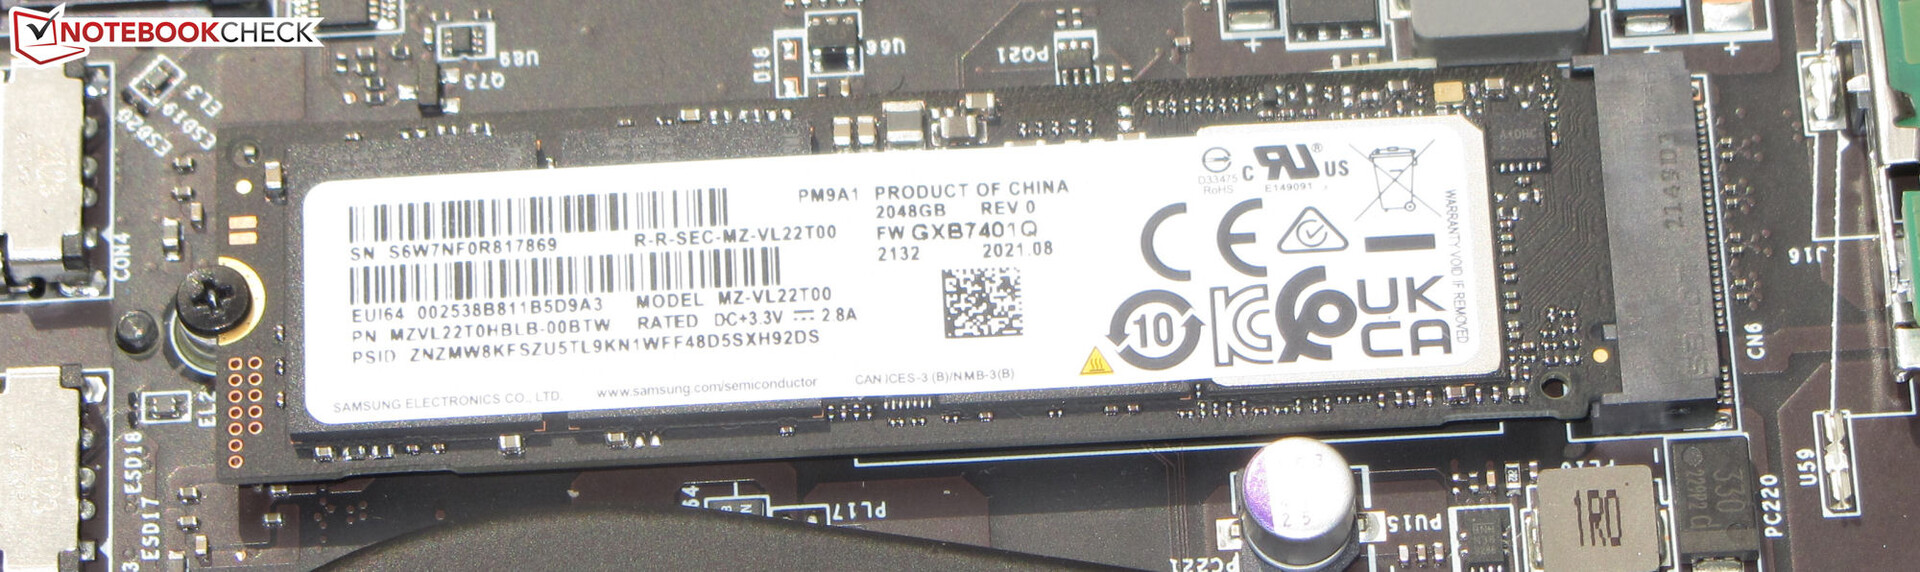
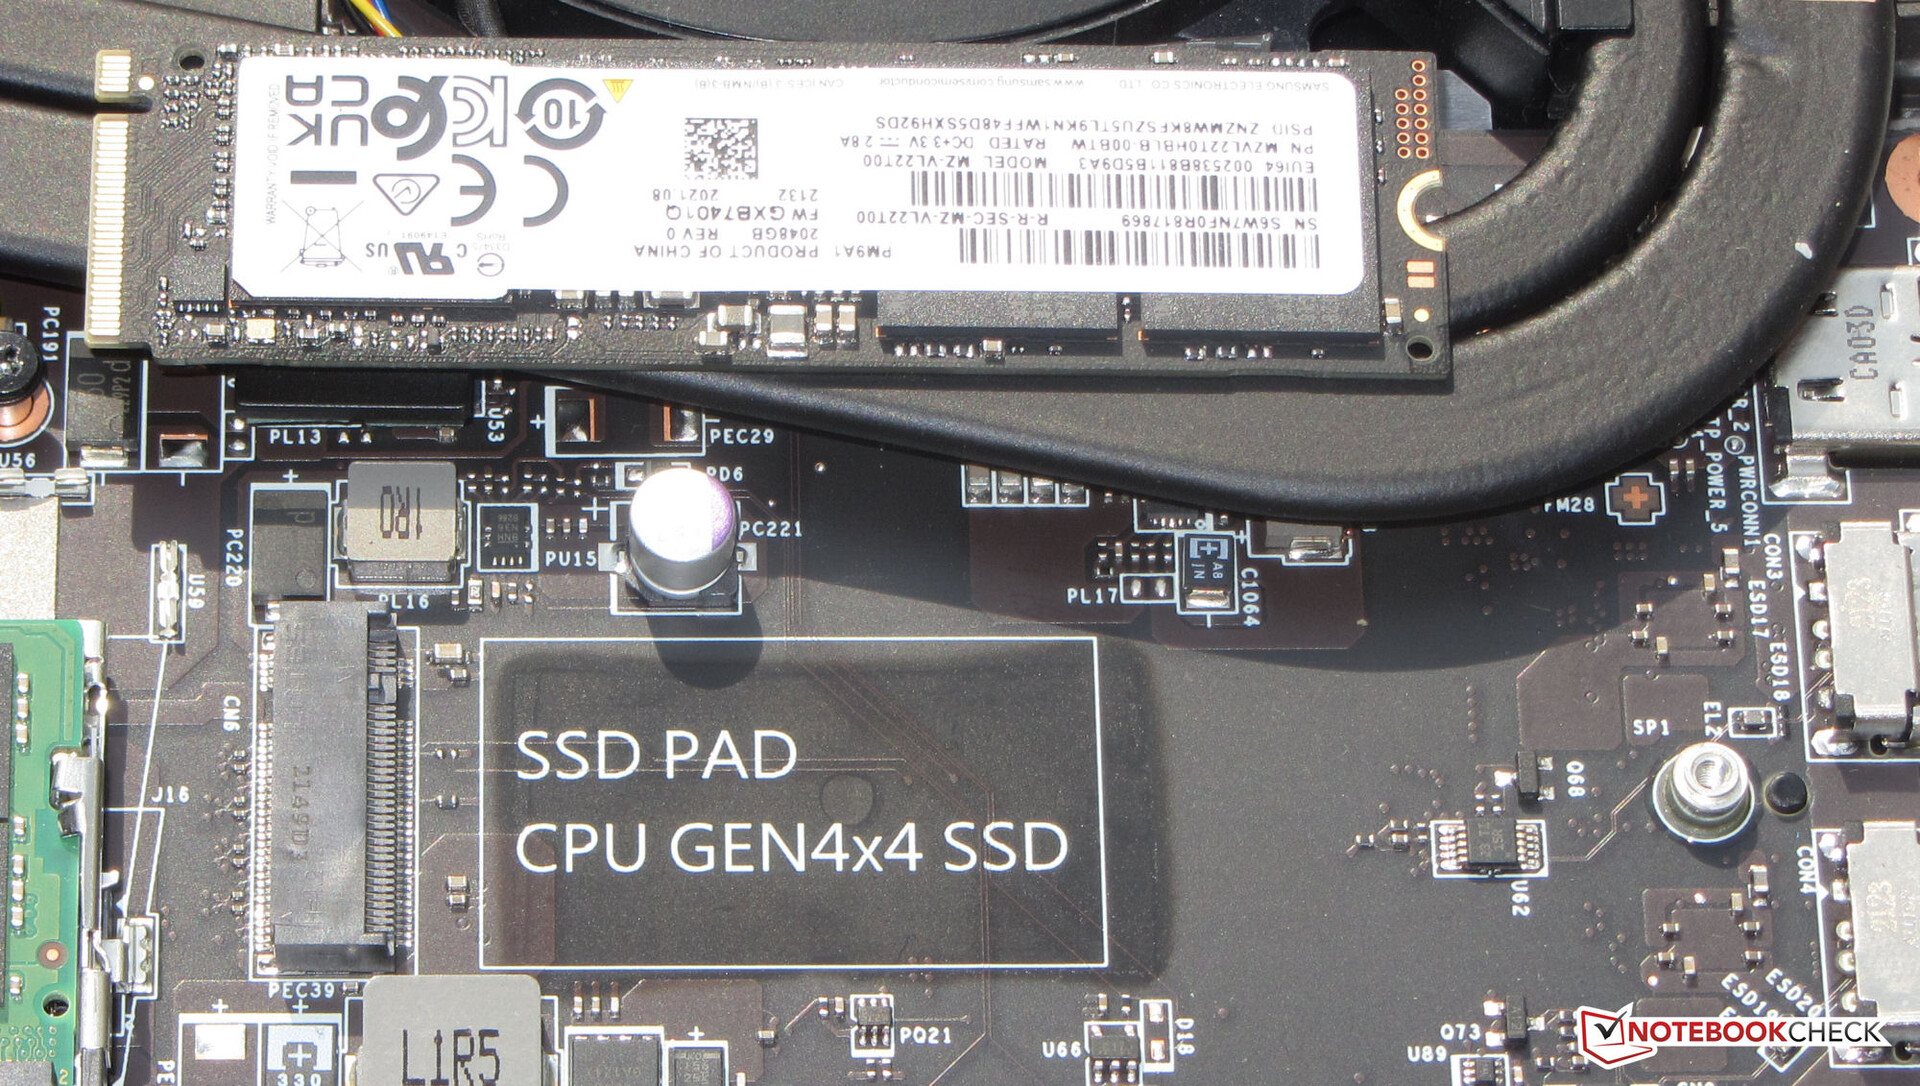
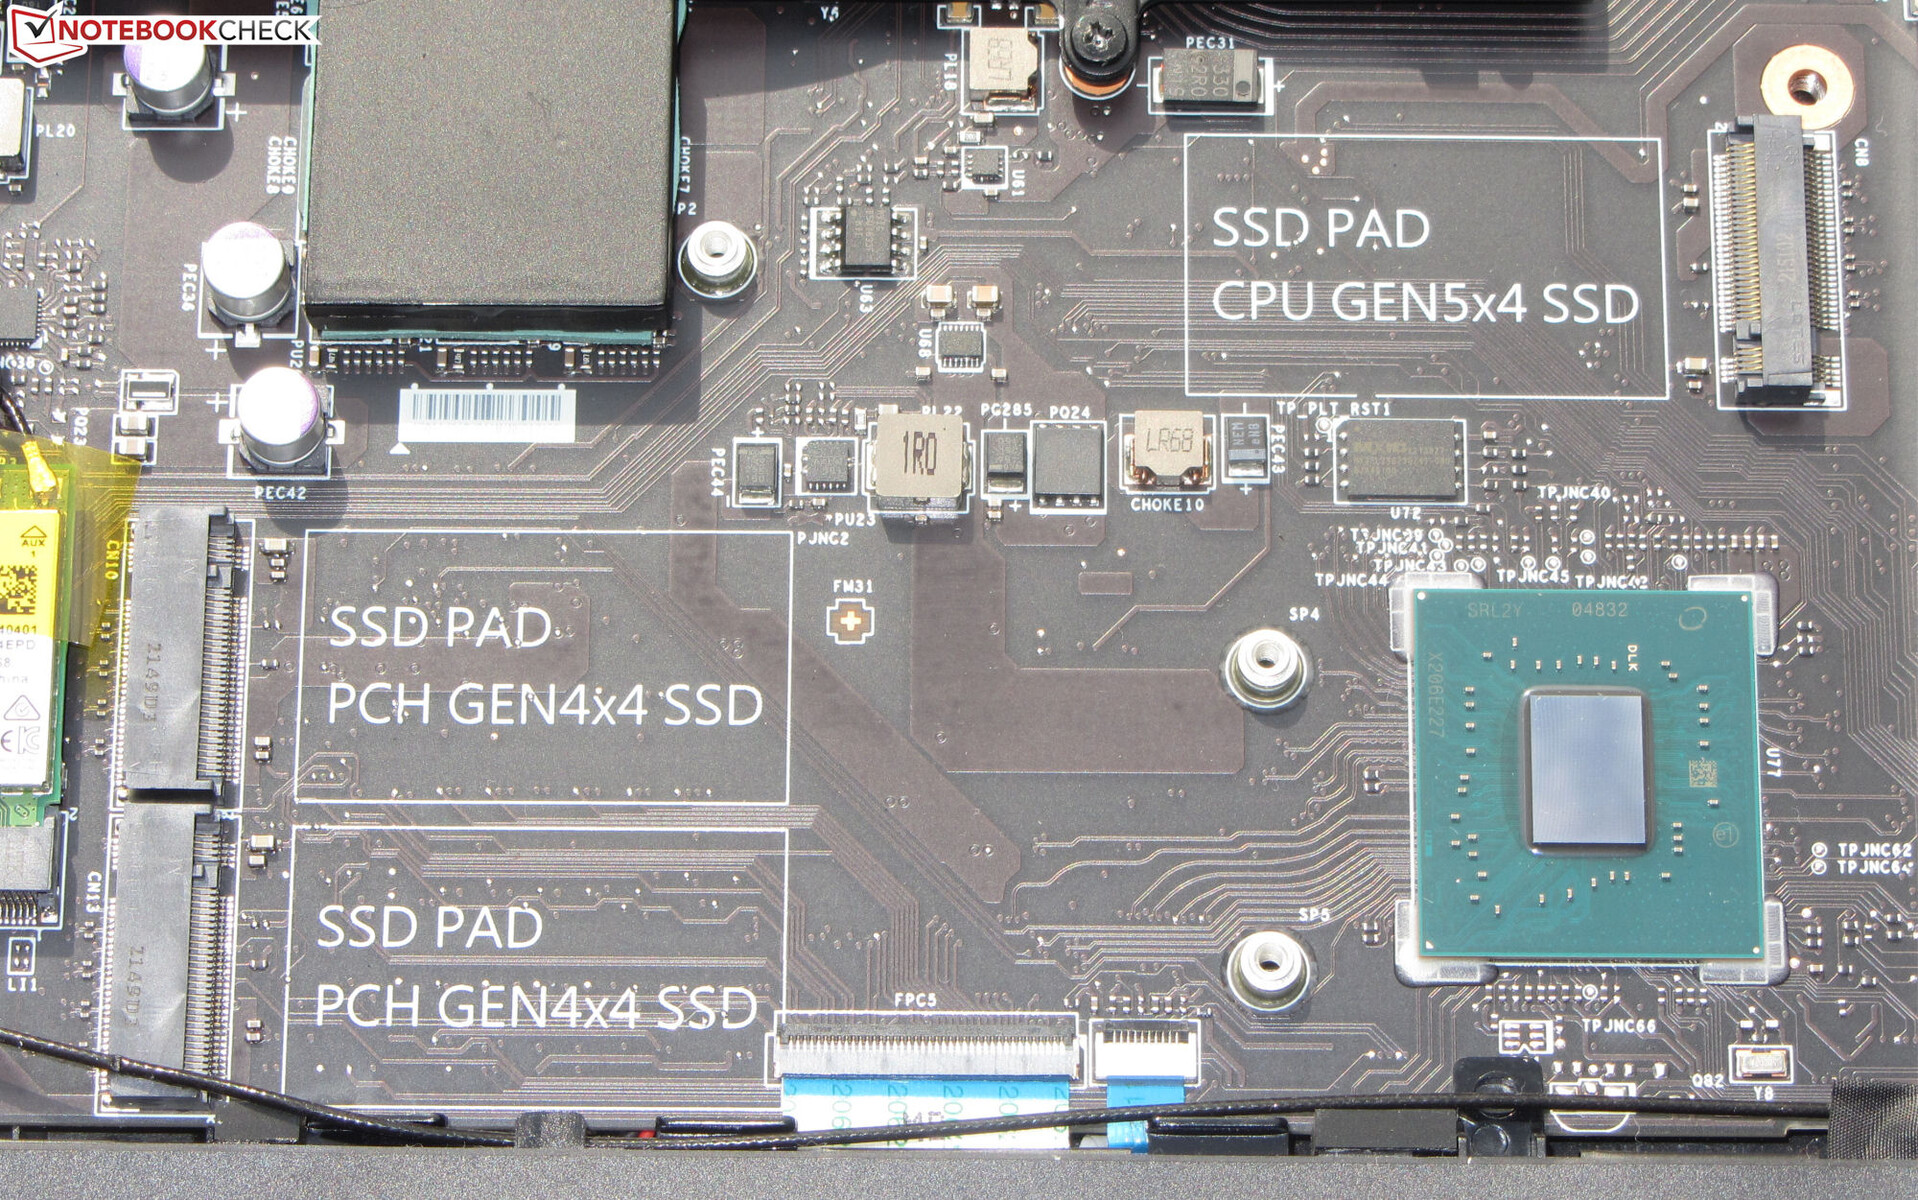
Almacenamiento masivo
El Titan puede albergar hasta cuatro SSD M.2 2280 (3x PCIe 4, 1x PCIe 5). El SSD Samsung de 2 TB incluido (PCIe 4) es capaz de proporcionar excelentes velocidades de transferencia
En el modeloModelo FHDel SSD con el sistema operativo (también de Samsung) sufre caídas de rendimiento debido a la ralentización térmica. Quizá los otros tres SSDs instalados en el portátil impiden un flujo de aire óptimo. El SSD de nuestra unidad de pruebas actual no muestra ninguna caída de rendimiento.

* ... más pequeño es mejor
Continuous read: DiskSpd Read Loop, Queue Depth 8
Tarjeta gráfica
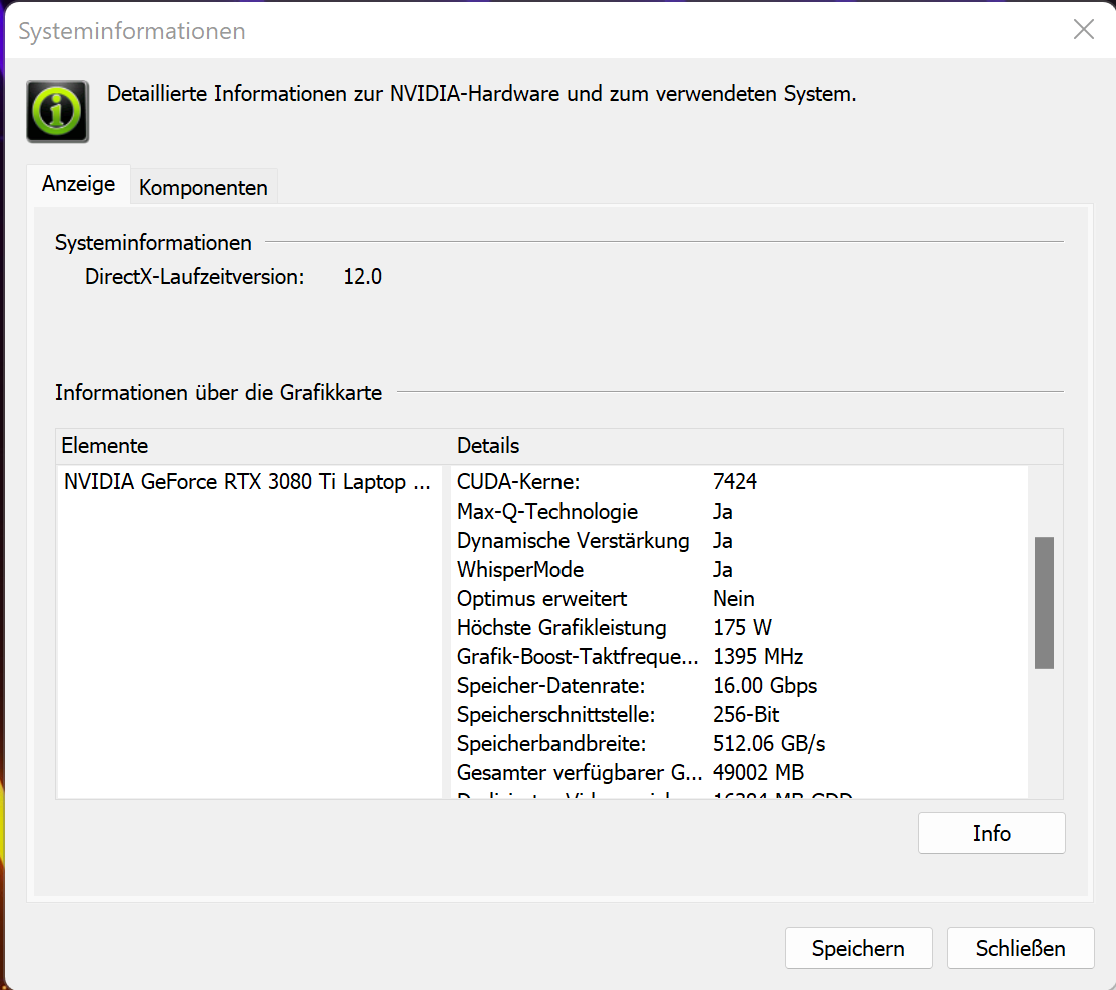
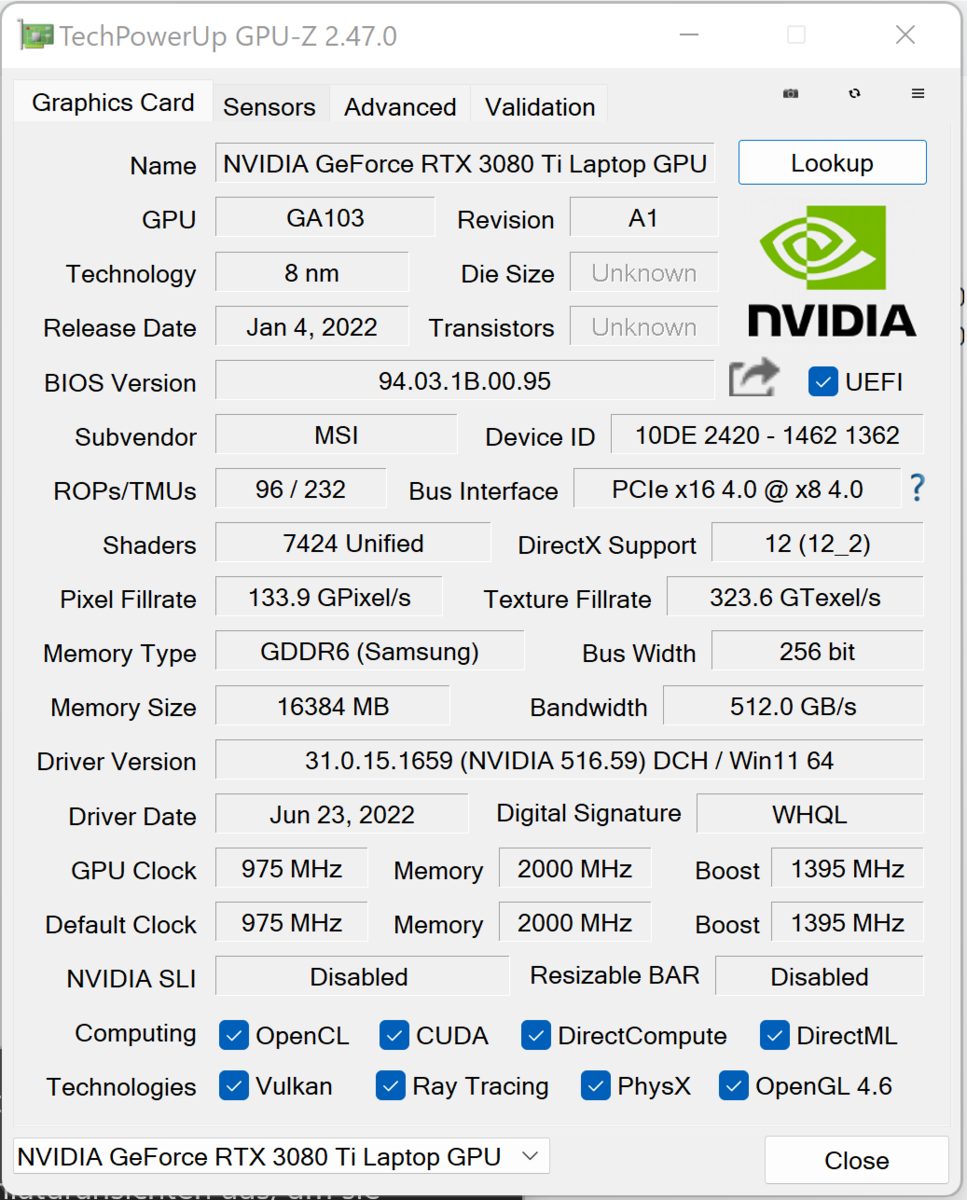
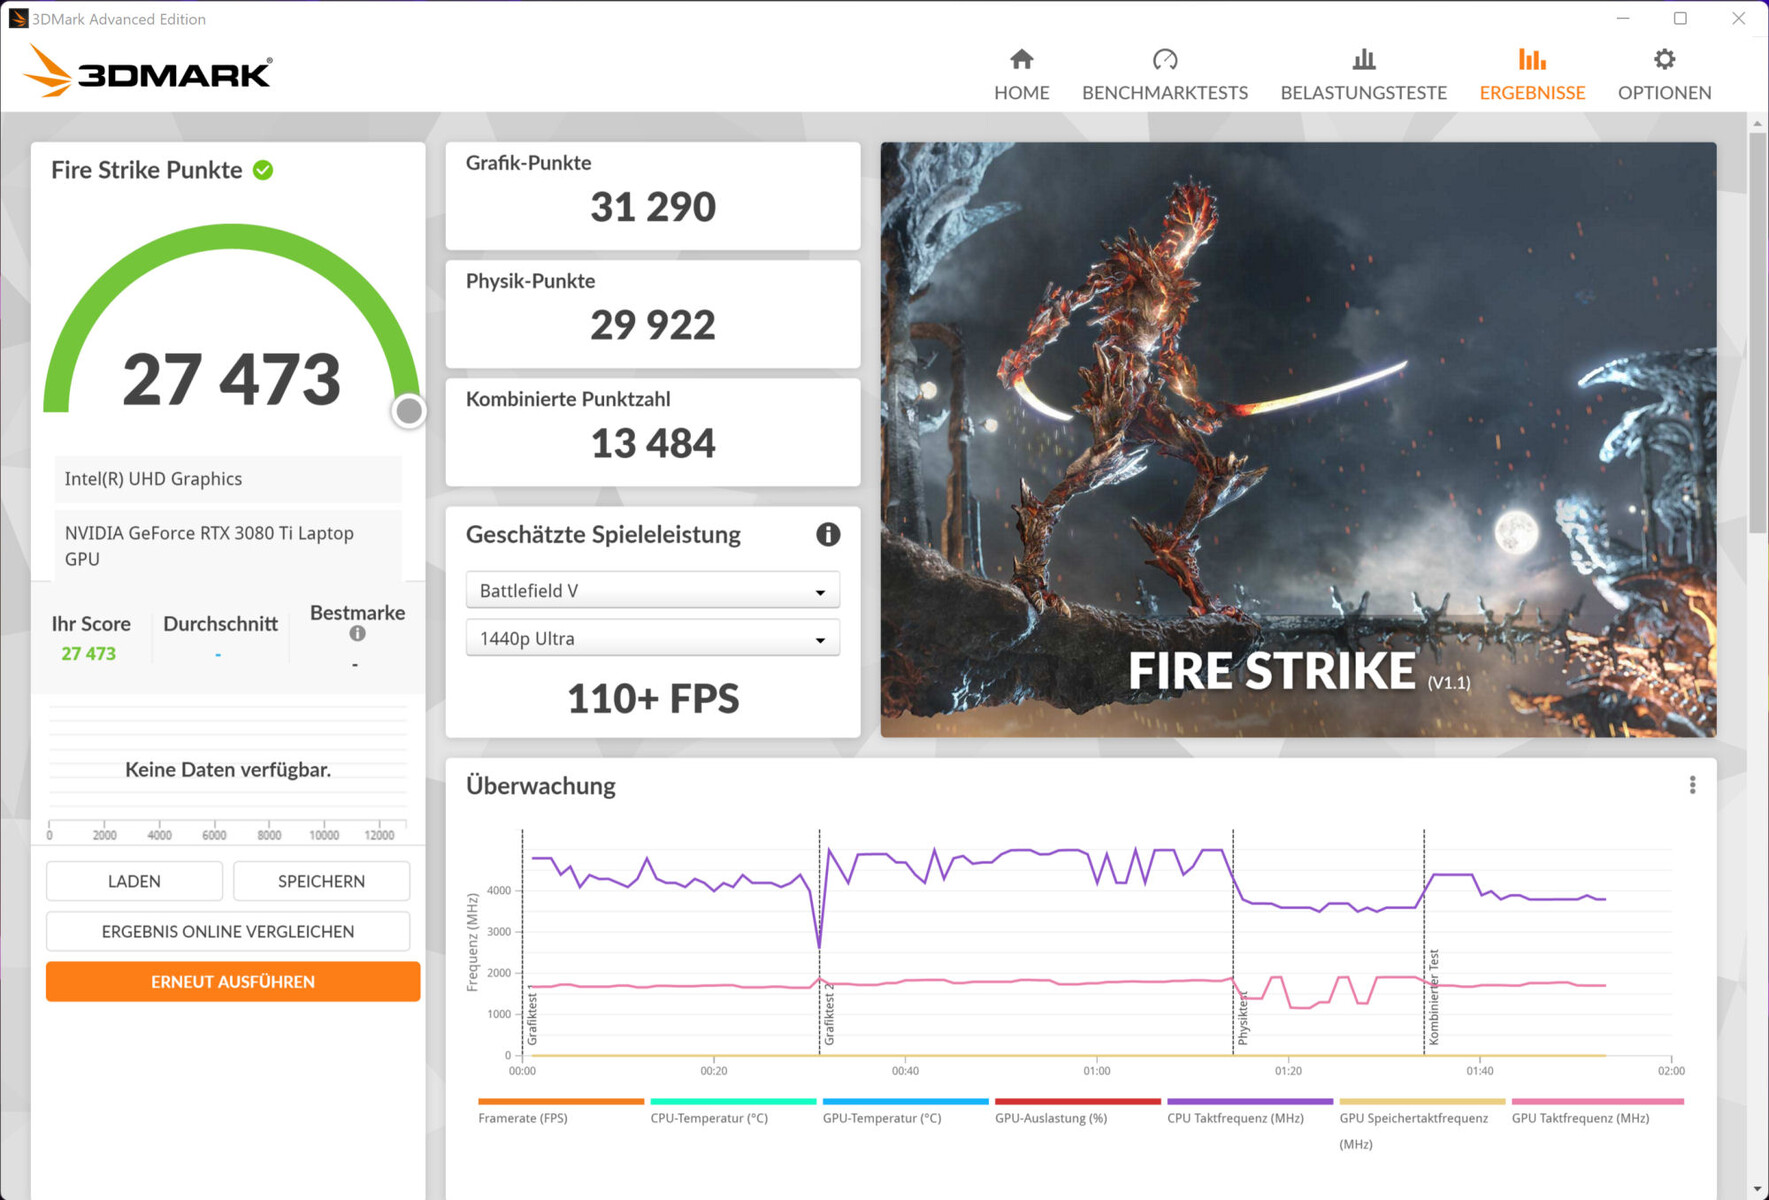
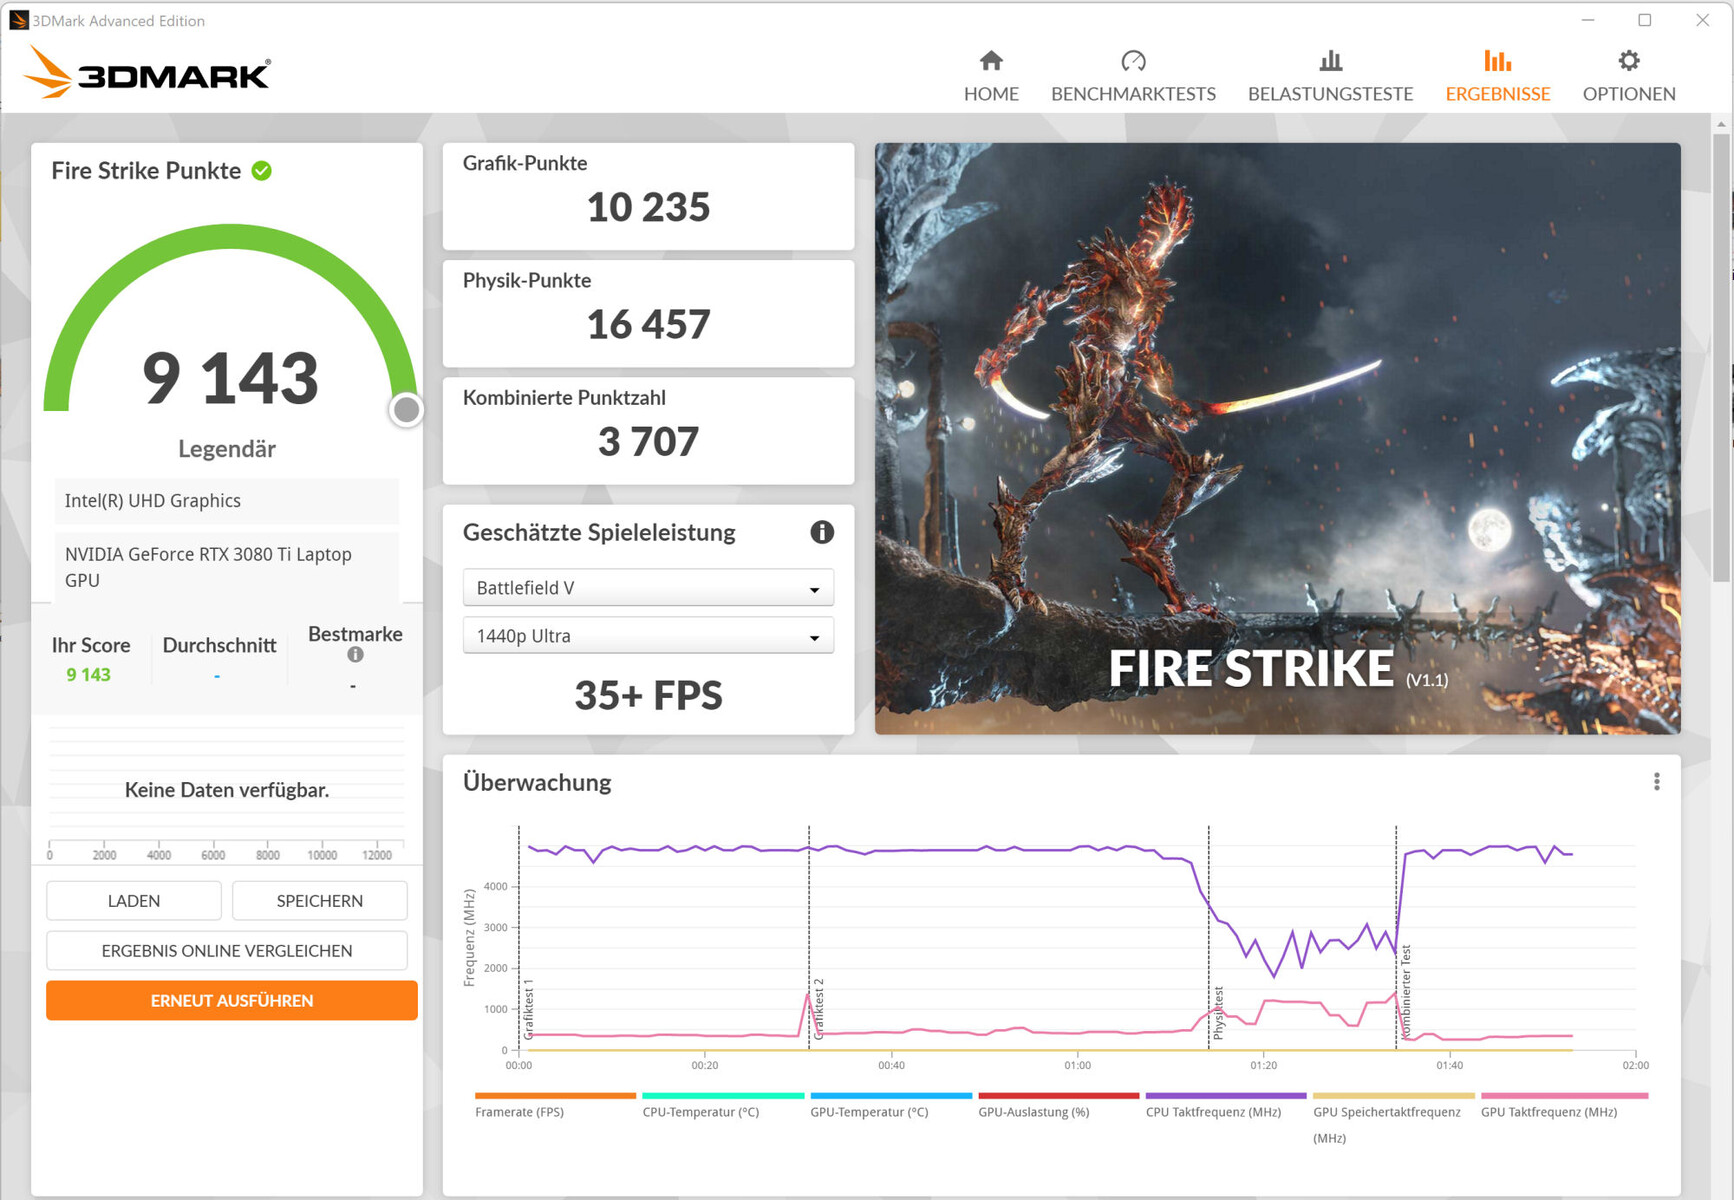
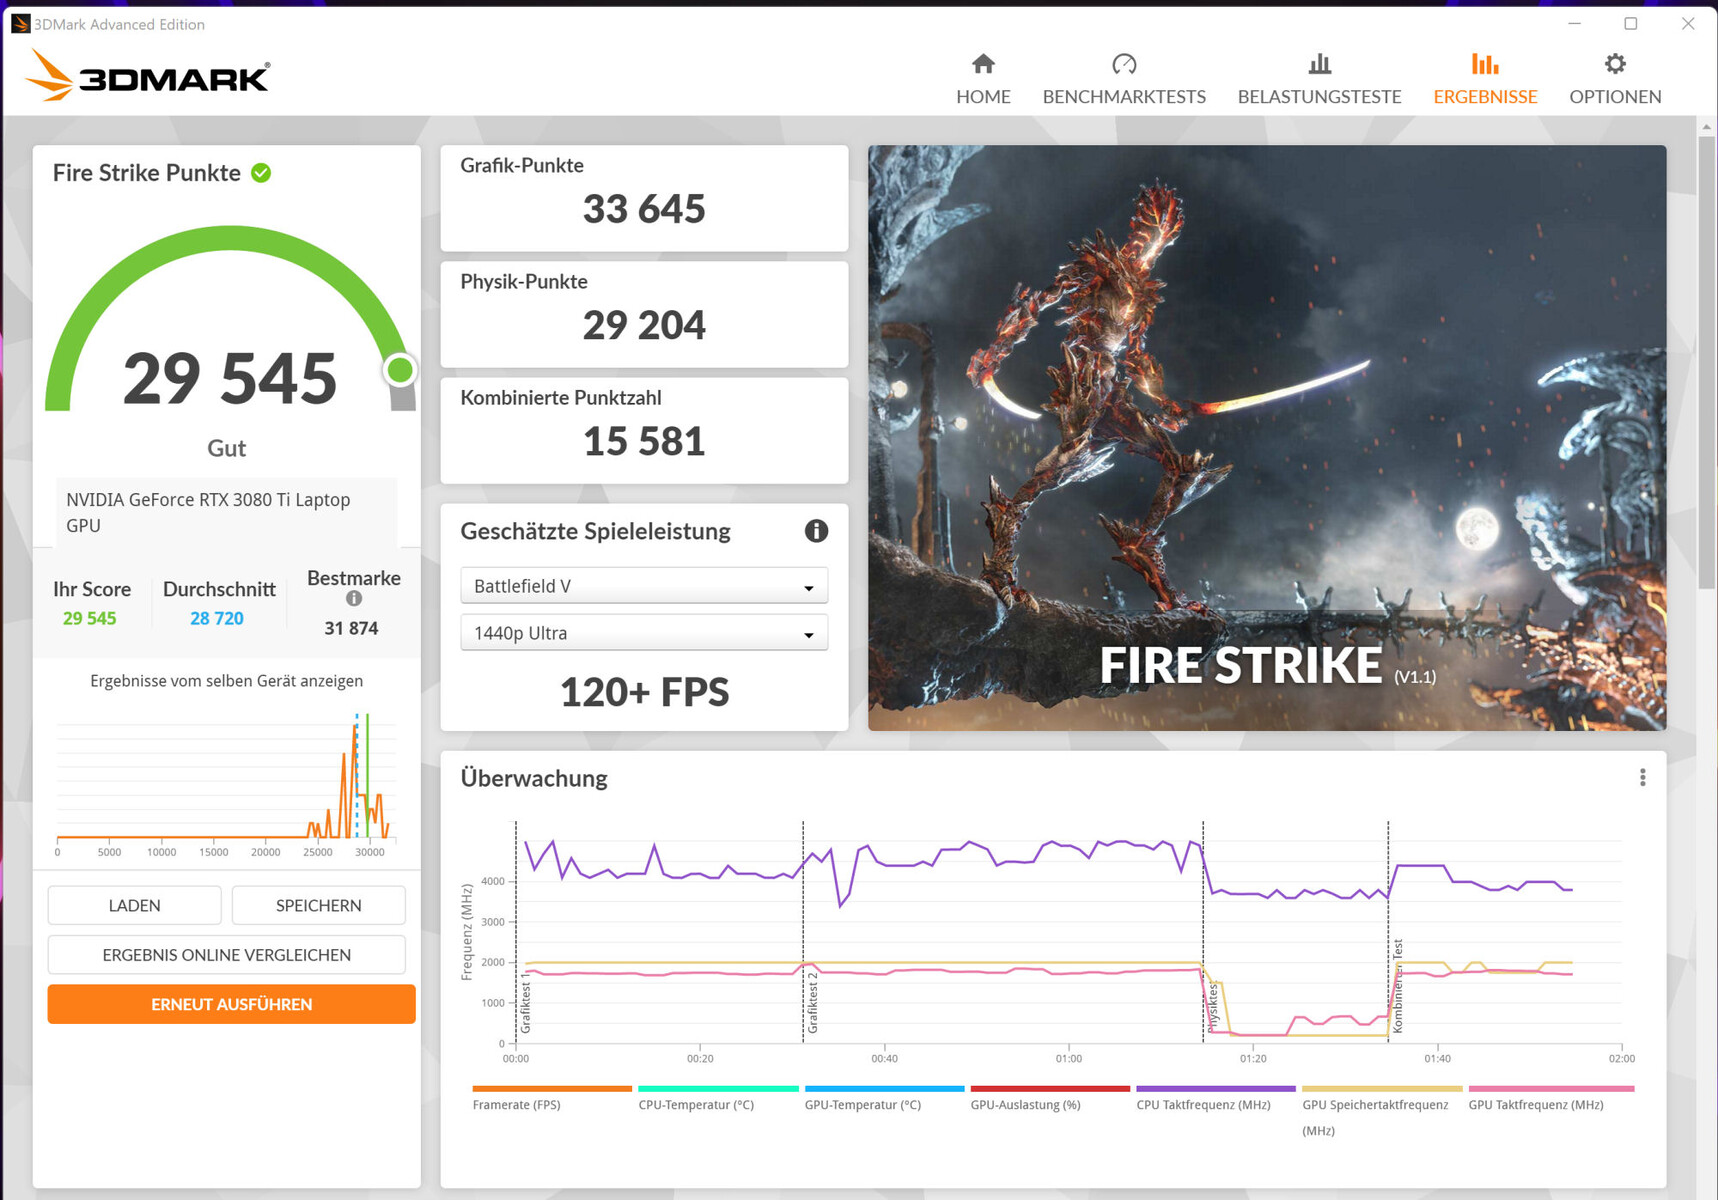
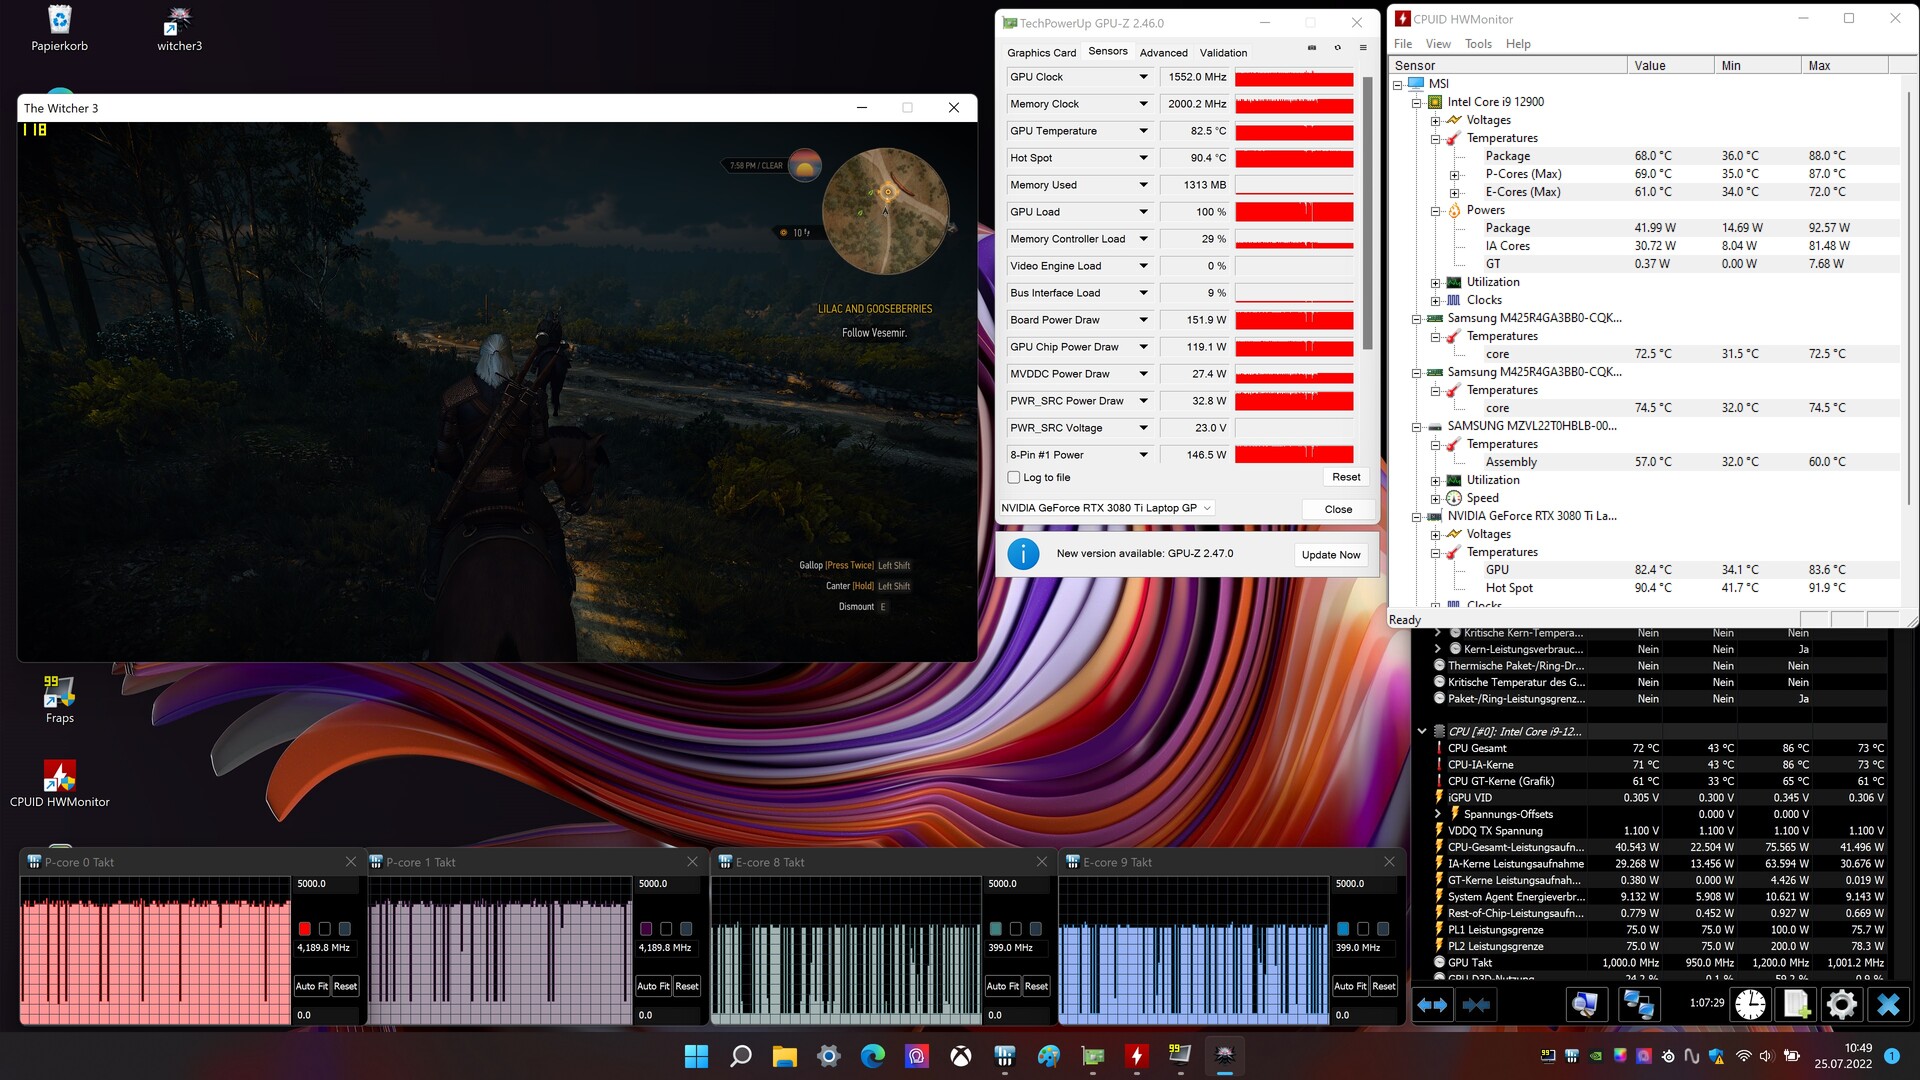
El GeForce RTX 3080 Ti portátil (TGP: 175 vatios, 16 GB de VRAM GDDR6) en la MSI Titan GT77 produjo algunas de las mejores puntuaciones que hemos visto de esta GPU hasta ahora. Sin embargo, el TGP no se aprovecha al máximo, como muestra la prueba Witcher 3. El perfil "Rendimiento Extremo" ofrece opciones para overclockear la GPU y la memoria gráfica. El Optimus Avanzado no está soportado. Cambiar entre la dGPU y el Optimus siempre requiere reiniciar el ordenador
| 3DMark Performance rating - Percent | |
| Media de la clase Gaming | |
| MSI Titan GT77 12UHS | |
| Alienware x17 R2 P48E | |
| MSI Titan GT77 12UHS | |
| MSI Titan GT77 12UHS 4k -1! | |
| Razer Blade 17 Early 2022 | |
| Schenker XMG Ultra 17 Rocket Lake | |
| Medio NVIDIA GeForce RTX 3080 Ti Laptop GPU | |
| 3DMark 11 - 1280x720 Performance GPU | |
| Media de la clase Gaming (21841 - 80022, n=105, últimos 2 años) | |
| MSI Titan GT77 12UHS | |
| Alienware x17 R2 P48E | |
| MSI Titan GT77 12UHS 4k | |
| Razer Blade 17 Early 2022 | |
| MSI Titan GT77 12UHS (dGPU, Extreme Leistung) | |
| Schenker XMG Ultra 17 Rocket Lake | |
| Medio NVIDIA GeForce RTX 3080 Ti Laptop GPU (13920 - 45841, n=45) | |
| 3DMark | |
| 1920x1080 Fire Strike Graphics | |
| Media de la clase Gaming (12242 - 62849, n=116, últimos 2 años) | |
| MSI Titan GT77 12UHS | |
| MSI Titan GT77 12UHS (dGPU, Extreme Leistung) | |
| Alienware x17 R2 P48E | |
| MSI Titan GT77 12UHS 4k | |
| Razer Blade 17 Early 2022 | |
| Schenker XMG Ultra 17 Rocket Lake | |
| Medio NVIDIA GeForce RTX 3080 Ti Laptop GPU (6928 - 34439, n=43) | |
| 2560x1440 Time Spy Graphics | |
| Media de la clase Gaming (5012 - 26212, n=116, últimos 2 años) | |
| MSI Titan GT77 12UHS | |
| Alienware x17 R2 P48E | |
| MSI Titan GT77 12UHS (dGPU, Extreme Leistung) | |
| Schenker XMG Ultra 17 Rocket Lake | |
| MSI Titan GT77 12UHS 4k | |
| Razer Blade 17 Early 2022 | |
| Medio NVIDIA GeForce RTX 3080 Ti Laptop GPU (4921 - 13835, n=43) | |
| 2560x1440 Port Royal Graphics | |
| Media de la clase Gaming (4395 - 17286, n=72, últimos 2 años) | |
| Alienware x17 R2 P48E | |
| MSI Titan GT77 12UHS | |
| MSI Titan GT77 12UHS (dGPU, Extreme Leistung) | |
| Razer Blade 17 Early 2022 | |
| Schenker XMG Ultra 17 Rocket Lake | |
| Medio NVIDIA GeForce RTX 3080 Ti Laptop GPU (6423 - 8462, n=28) | |
| Geekbench 5.5 - OpenCL Score | |
| Media de la clase Gaming (80702 - 277970, n=102, últimos 2 años) | |
| Alienware x17 R2 P48E | |
| MSI Titan GT77 12UHS (dGPU, Extreme Leistung) | |
| MSI Titan GT77 12UHS 4k | |
| Asus ROG Zephyrus Duo 16 GX650RX | |
| Schenker XMG Ultra 17 Rocket Lake | |
| Medio NVIDIA GeForce RTX 3080 Ti Laptop GPU (88580 - 151633, n=41) | |
| MSI Titan GT77 12UHS | |
| Razer Blade 17 Early 2022 | |
| Gigabyte Aero 16 YE5 | |
| V-Ray Benchmark Next 4.10 | |
| GPU | |
| Media de la clase Gaming (427 - 1627, n=100, últimos 2 años) | |
| MSI Titan GT77 12UHS (v4.10.07, dGPU, Extreme Leistung) | |
| MSI Titan GT77 12UHS (v4.10.07 ) | |
| Asus ROG Zephyrus Duo 16 GX650RX (v4.10.07 ) | |
| MSI Titan GT77 12UHS 4k (v4.10.07 ) | |
| Medio NVIDIA GeForce RTX 3080 Ti Laptop GPU (311 - 552, n=35) | |
| Razer Blade 17 Early 2022 (v4.10.07 ) | |
| Gigabyte Aero 16 YE5 (v4.10.07 ) | |
| Schenker XMG Ultra 17 Rocket Lake (v4.10.07 ) | |
| CPU | |
| Media de la clase Gaming (10048 - 45327, n=98, últimos 2 años) | |
| MSI Titan GT77 12UHS 4k (v4.10.07 ) | |
| MSI Titan GT77 12UHS (v4.10.07, dGPU, Extreme Leistung) | |
| MSI Titan GT77 12UHS (v4.10.07 ) | |
| Medio NVIDIA GeForce RTX 3080 Ti Laptop GPU (5564 - 23947, n=35) | |
| Gigabyte Aero 16 YE5 (v4.10.07 ) | |
| Schenker XMG Ultra 17 Rocket Lake (v4.10.07 ) | |
| Asus ROG Zephyrus Duo 16 GX650RX (v4.10.07 ) | |
| Razer Blade 17 Early 2022 (v4.10.07 ) | |
| Blender | |
| v3.3 Classroom CUDA | |
| MSI Titan GT77 12UHS 4k | |
| MSI Titan GT77 12UHS (dGPU, Extreme Leistung) | |
| Medio NVIDIA GeForce RTX 3080 Ti Laptop GPU (32 - 41, n=13) | |
| Media de la clase Gaming (15 - 228, n=107, últimos 2 años) | |
| MSI Titan GT77 12UHS | |
| v3.3 Classroom OPTIX/RTX | |
| MSI Titan GT77 12UHS 4k | |
| Medio NVIDIA GeForce RTX 3080 Ti Laptop GPU (20 - 28, n=13) | |
| MSI Titan GT77 12UHS | |
| MSI Titan GT77 12UHS (dGPU, Extreme Leistung) | |
| Media de la clase Gaming (9 - 32, n=107, últimos 2 años) | |
* ... más pequeño es mejor
| 3DMark 11 Performance | 35867 puntos | |
| 3DMark Cloud Gate Standard Score | 53629 puntos | |
| 3DMark Fire Strike Score | 27273 puntos | |
| 3DMark Fire Strike Extreme Score | 15613 puntos | |
| 3DMark Time Spy Score | 12865 puntos | |
ayuda | ||
Rendimiento de los juegos
El hardware está diseñado para jugar a 4K con ajustes altos o máximos. Las frecuencias de cuadro están por encima de lo que una RTX 3080 Ti es capaz de hacer de media. Cuando la GPU GeForce manejaba la pantalla directamente, a menudo producía las mejores tasas de frames que hemos visto de una RTX 3080 Ti hasta ahora. En cualquier caso, como demuestra la prueba Witcher 3, el portátil ofrece resultados buenos y estables.
| The Witcher 3 | |
| 1920x1080 Ultra Graphics & Postprocessing (HBAO+) | |
| Media de la clase Gaming (104.7 - 240, n=7, últimos 2 años) | |
| MSI Titan GT77 12UHS (dGPU, Extreme Leistung) | |
| MSI Titan GT77 12UHS | |
| Alienware x17 R2 P48E | |
| MSI Titan GT77 12UHS 4k | |
| Schenker XMG Ultra 17 Rocket Lake | |
| Razer Blade 17 Early 2022 | |
| Medio NVIDIA GeForce RTX 3080 Ti Laptop GPU (30 - 130.6, n=43) | |
| 3840x2160 Ultra Graphics & Postprocessing (HBAO+) | |
| Media de la clase Gaming (112.4 - 114.8, n=2, últimos 2 años) | |
| MSI Titan GT77 12UHS (dGPU, Extreme Leistung) | |
| MSI Titan GT77 12UHS 4k | |
| Razer Blade 17 Early 2022 | |
| Medio NVIDIA GeForce RTX 3080 Ti Laptop GPU (44.8 - 62.7, n=5) | |
| Dota 2 Reborn | |
| 1920x1080 ultra (3/3) best looking | |
| MSI Titan GT77 12UHS | |
| MSI Titan GT77 12UHS (dGPU, Extreme Leistung) | |
| MSI Titan GT77 12UHS 4k | |
| Alienware x17 R2 P48E | |
| Schenker XMG Ultra 17 Rocket Lake | |
| Media de la clase Gaming (84.8 - 252, n=108, últimos 2 años) | |
| Medio NVIDIA GeForce RTX 3080 Ti Laptop GPU (29.9 - 170.5, n=45) | |
| Razer Blade 17 Early 2022 | |
| 3840x2160 ultra (3/3) best looking | |
| Media de la clase Gaming (114.9 - 199.2, n=32, últimos 2 años) | |
| MSI Titan GT77 12UHS (dGPU, Extreme Leistung) | |
| MSI Titan GT77 12UHS 4k | |
| Medio NVIDIA GeForce RTX 3080 Ti Laptop GPU (70.8 - 155.6, n=19) | |
| Razer Blade 17 Early 2022 | |
| X-Plane 11.11 | |
| 3840x2160 high (fps_test=3) | |
| MSI Titan GT77 12UHS (dGPU, Extreme Leistung) | |
| MSI Titan GT77 12UHS 4k | |
| Media de la clase Gaming (60 - 124.1, n=32, últimos 2 años) | |
| Medio NVIDIA GeForce RTX 3080 Ti Laptop GPU (32.9 - 109.5, n=20) | |
| Razer Blade 17 Early 2022 | |
| 1920x1080 high (fps_test=3) | |
| MSI Titan GT77 12UHS | |
| MSI Titan GT77 12UHS (dGPU, Extreme Leistung) | |
| MSI Titan GT77 12UHS 4k | |
| Schenker XMG Ultra 17 Rocket Lake | |
| Alienware x17 R2 P48E | |
| Medio NVIDIA GeForce RTX 3080 Ti Laptop GPU (32.6 - 127, n=45) | |
| Media de la clase Gaming (55.5 - 148.5, n=110, últimos 2 años) | |
| Razer Blade 17 Early 2022 | |
| Final Fantasy XV Benchmark | |
| 3840x2160 High Quality | |
| Media de la clase Gaming (49.1 - 111.8, n=33, últimos 2 años) | |
| MSI Titan GT77 12UHS (1.3, dGPU, Extreme Leistung) | |
| MSI Titan GT77 12UHS 4k (1.3) | |
| Razer Blade 17 Early 2022 (1.3) | |
| Medio NVIDIA GeForce RTX 3080 Ti Laptop GPU (35.1 - 61.2, n=18) | |
| 1920x1080 High Quality | |
| Media de la clase Gaming (41 - 215, n=95, últimos 2 años) | |
| MSI Titan GT77 12UHS (1.3, dGPU, Extreme Leistung) | |
| MSI Titan GT77 12UHS (1.3) | |
| MSI Titan GT77 12UHS 4k (1.3) | |
| Alienware x17 R2 P48E (1.3) | |
| Medio NVIDIA GeForce RTX 3080 Ti Laptop GPU (30.7 - 140.6, n=42) | |
| Razer Blade 17 Early 2022 (1.3) | |
| GTA V | |
| 3840x2160 Highest AA:4xMSAA + FX AF:16x | |
| Media de la clase Gaming (53.9 - 123.2, n=25, últimos 2 años) | |
| MSI Titan GT77 12UHS (dGPU, Extreme Leistung) | |
| MSI Titan GT77 12UHS 4k | |
| Razer Blade 17 Early 2022 | |
| Medio NVIDIA GeForce RTX 3080 Ti Laptop GPU (37.7 - 67.2, n=14) | |
| 1920x1080 Highest AA:4xMSAA + FX AF:16x | |
| MSI Titan GT77 12UHS 4k | |
| MSI Titan GT77 12UHS (dGPU, Extreme Leistung) | |
| Media de la clase Gaming (48.3 - 186.9, n=94, últimos 2 años) | |
| MSI Titan GT77 12UHS | |
| Alienware x17 R2 P48E | |
| Medio NVIDIA GeForce RTX 3080 Ti Laptop GPU (30 - 139.2, n=42) | |
| Razer Blade 17 Early 2022 | |
| Strange Brigade | |
| 3840x2160 ultra AA:ultra AF:16 | |
| Media de la clase Gaming (83 - 187.2, n=34, últimos 2 años) | |
| MSI Titan GT77 12UHS (1.47.22.14 D3D12, dGPU, Extreme Leistung) | |
| MSI Titan GT77 12UHS 4k (1.47.22.14 D3D12) | |
| Razer Blade 17 Early 2022 (1.47.22.14 D3D12) | |
| Medio NVIDIA GeForce RTX 3080 Ti Laptop GPU (61.7 - 100.7, n=15) | |
| 1920x1080 ultra AA:ultra AF:16 | |
| Media de la clase Gaming (76.3 - 458, n=87, últimos 2 años) | |
| MSI Titan GT77 12UHS (1.47.22.14 D3D12) | |
| MSI Titan GT77 12UHS (1.47.22.14 D3D12, dGPU, Extreme Leistung) | |
| Alienware x17 R2 P48E (1.47.22.14 D3D12) | |
| MSI Titan GT77 12UHS 4k (1.47.22.14 D3D12) | |
| Razer Blade 17 Early 2022 (1.47.22.14 D3D12) | |
| Medio NVIDIA GeForce RTX 3080 Ti Laptop GPU (42.3 - 224, n=41) | |
| F1 2021 | |
| 3840x2160 Ultra High Preset + Raytracing AA:T AF:16x | |
| MSI Titan GT77 12UHS (874931, dGPU, Extreme Leistung) | |
| MSI Titan GT77 12UHS 4k (874931) | |
| Razer Blade 17 Early 2022 (874931) | |
| Medio NVIDIA GeForce RTX 3080 Ti Laptop GPU (41.1 - 70.2, n=18) | |
| 1920x1080 Ultra High Preset + Raytracing AA:T AF:16x | |
| MSI Titan GT77 12UHS (874931) | |
| MSI Titan GT77 12UHS (874931, dGPU, Extreme Leistung) | |
| Razer Blade 17 Early 2022 (874931) | |
| MSI Titan GT77 12UHS 4k (874931) | |
| Medio NVIDIA GeForce RTX 3080 Ti Laptop GPU (30.2 - 160.6, n=30) | |
| Far Cry 5 | |
| 3840x2160 Ultra Preset AA:T | |
| Media de la clase Gaming (n=1últimos 2 años) | |
| MSI Titan GT77 12UHS 4k | |
| MSI Titan GT77 12UHS (dGPU, Extreme Leistung) | |
| Razer Blade 17 Early 2022 | |
| Medio NVIDIA GeForce RTX 3080 Ti Laptop GPU (45 - 76, n=9) | |
| 1920x1080 Ultra Preset AA:T | |
| MSI Titan GT77 12UHS (dGPU, Extreme Leistung) | |
| MSI Titan GT77 12UHS | |
| MSI Titan GT77 12UHS 4k | |
| Schenker XMG Ultra 17 Rocket Lake | |
| Medio NVIDIA GeForce RTX 3080 Ti Laptop GPU (111 - 162, n=24) | |
| Razer Blade 17 Early 2022 | |
| Media de la clase Gaming (70 - 151, n=6, últimos 2 años) | |
Witcher 3 FPS graph
| bajo | medio | alto | ultra | QHD | 4K | |
|---|---|---|---|---|---|---|
| GTA V (2015) | 187.3 | 186.6 | 182.3 | 134.4 | 117.8 | 121.7 |
| The Witcher 3 (2015) | 480 | 379 | 240 | 123.7 | 91.9 | |
| Dota 2 Reborn (2015) | 199.9 | 180.7 | 169.7 | 162.7 | 139.9 | |
| Final Fantasy XV Benchmark (2018) | 220 | 174.1 | 131 | 100.3 | 58.3 | |
| X-Plane 11.11 (2018) | 170.8 | 150.8 | 118.3 | 100.9 | ||
| Far Cry 5 (2018) | 199 | 169 | 161 | 151 | 134 | 76 |
| Strange Brigade (2018) | 519 | 286 | 233 | 206 | 156.2 | 93.7 |
| F1 2021 (2021) | 348 | 237 | 205 | 130.4 | 103.4 | 62.8 |
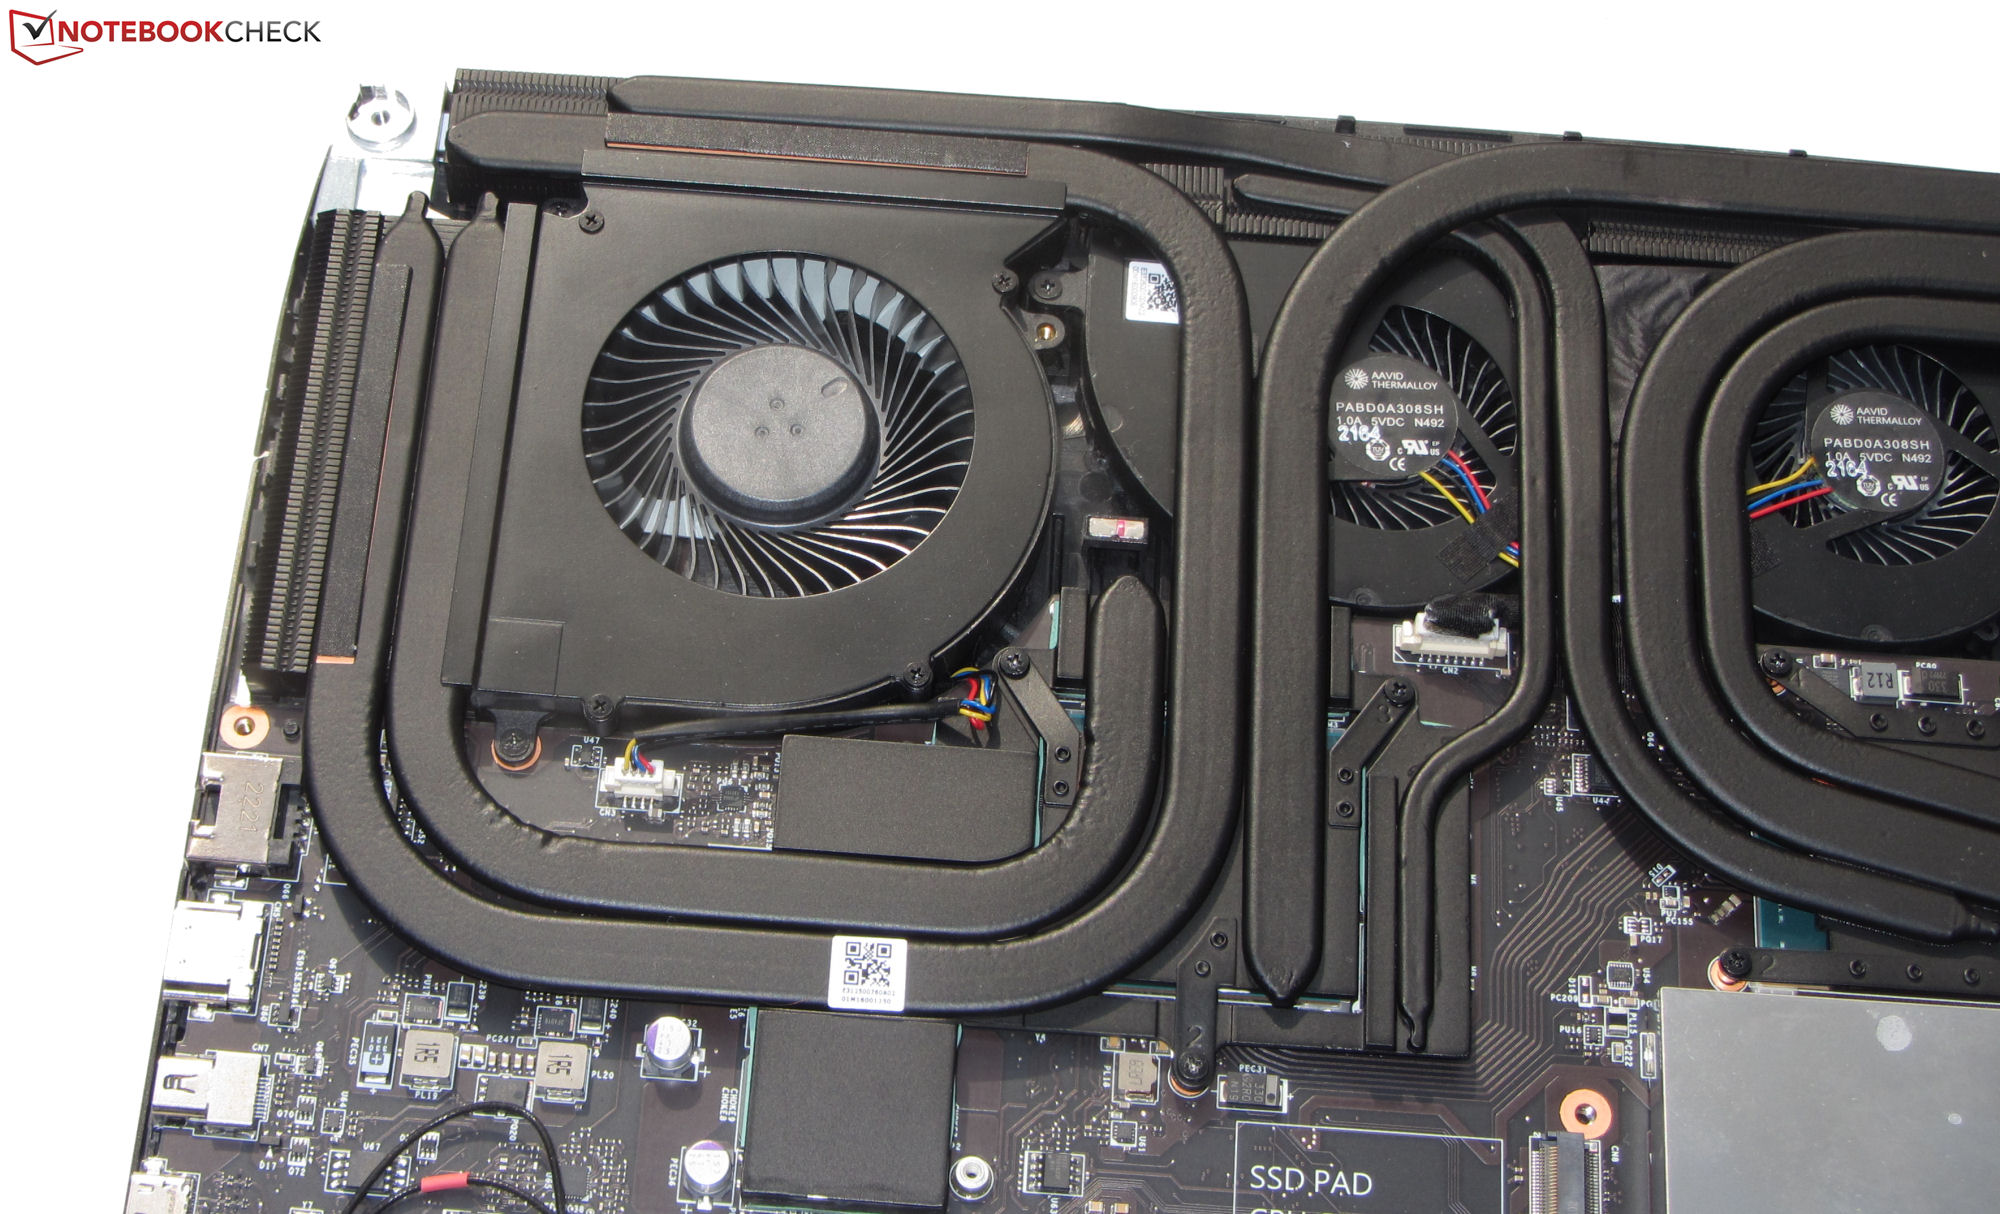
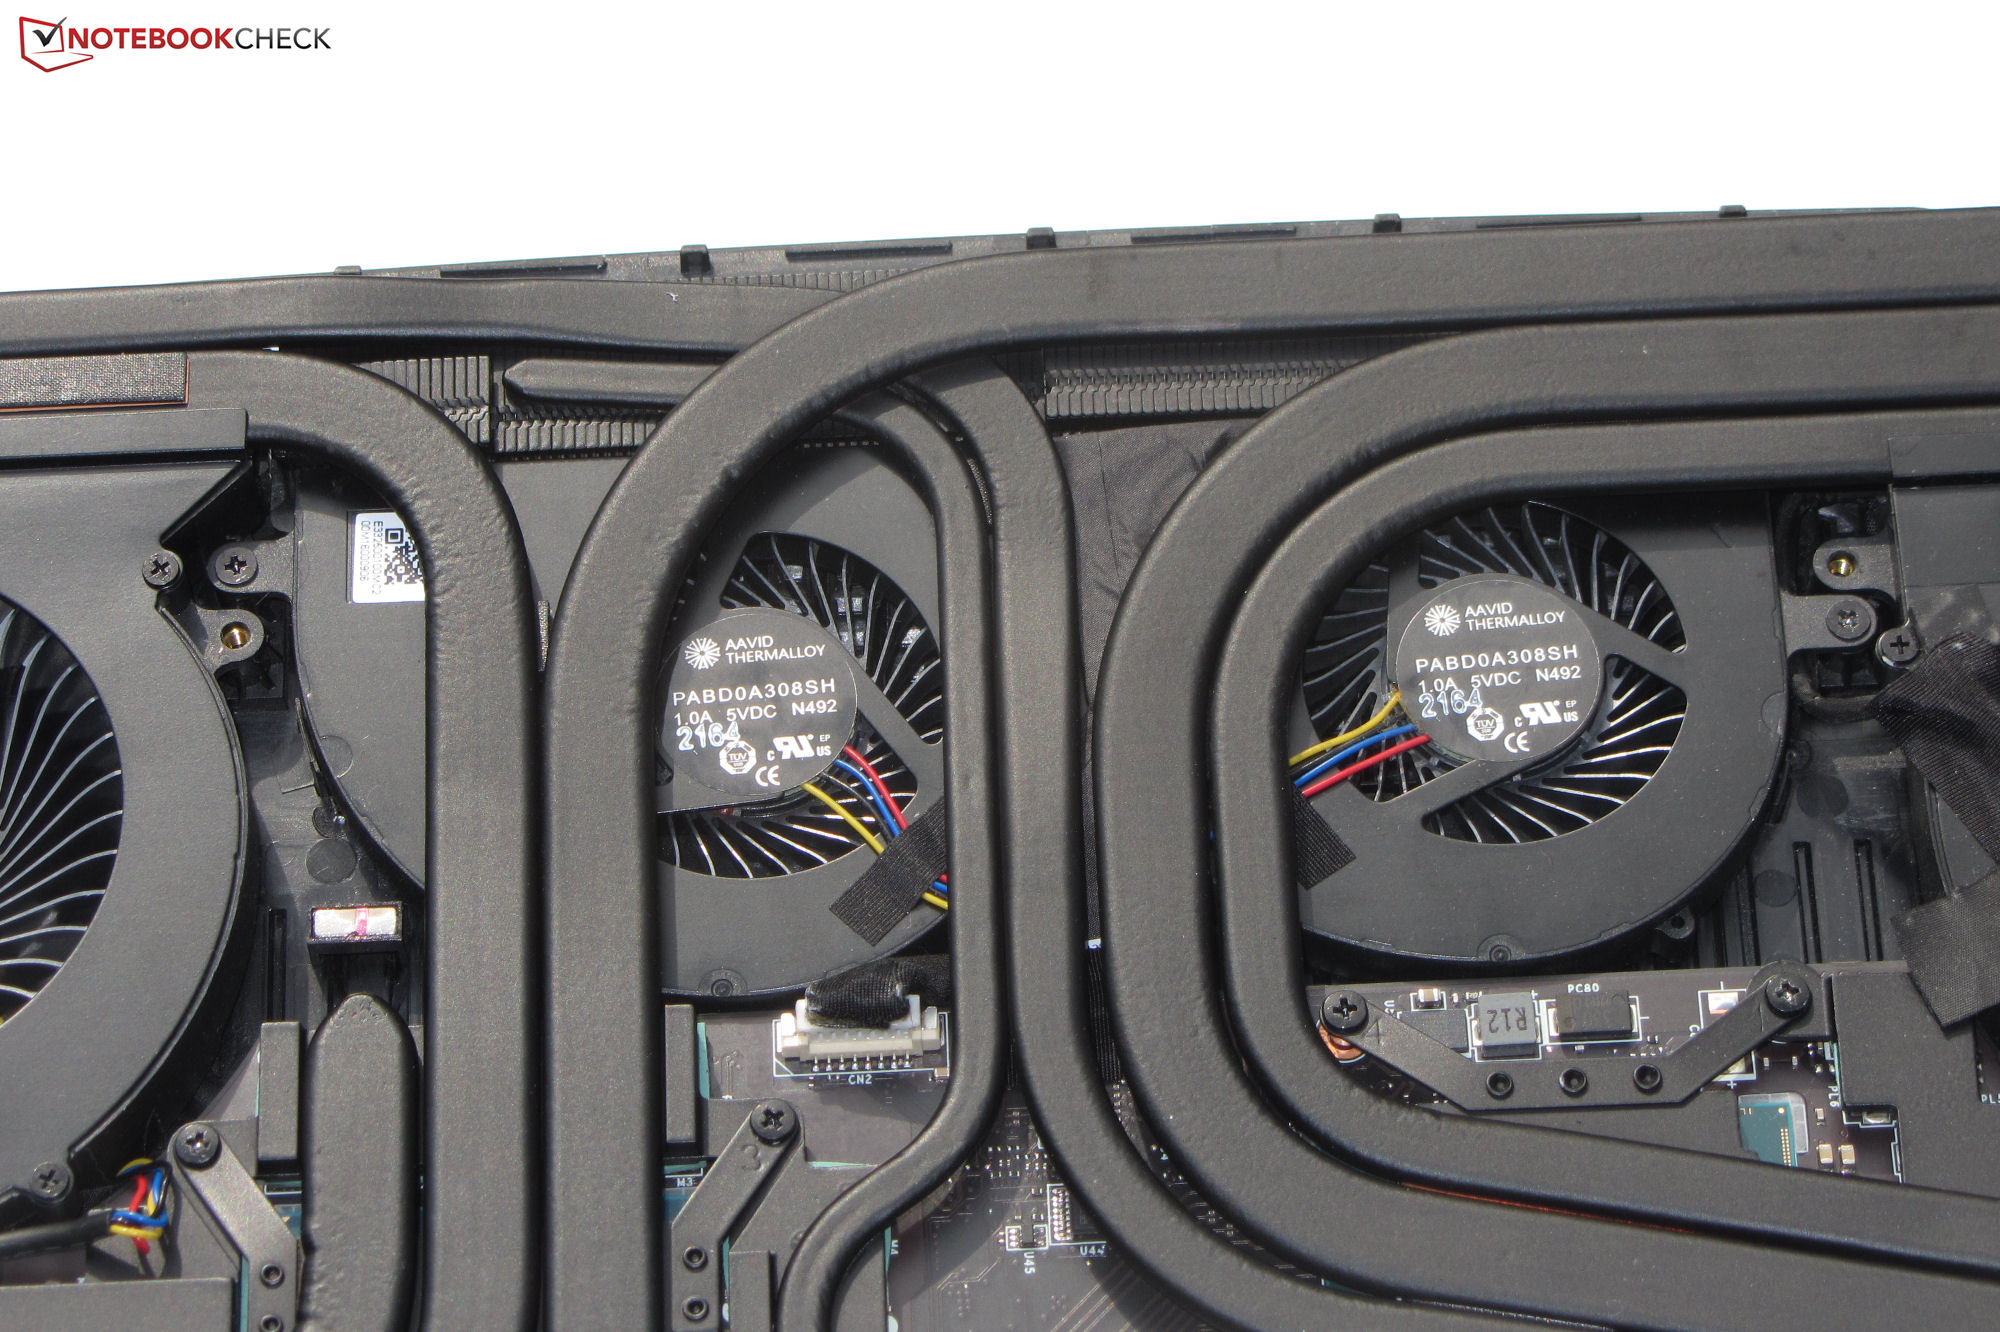
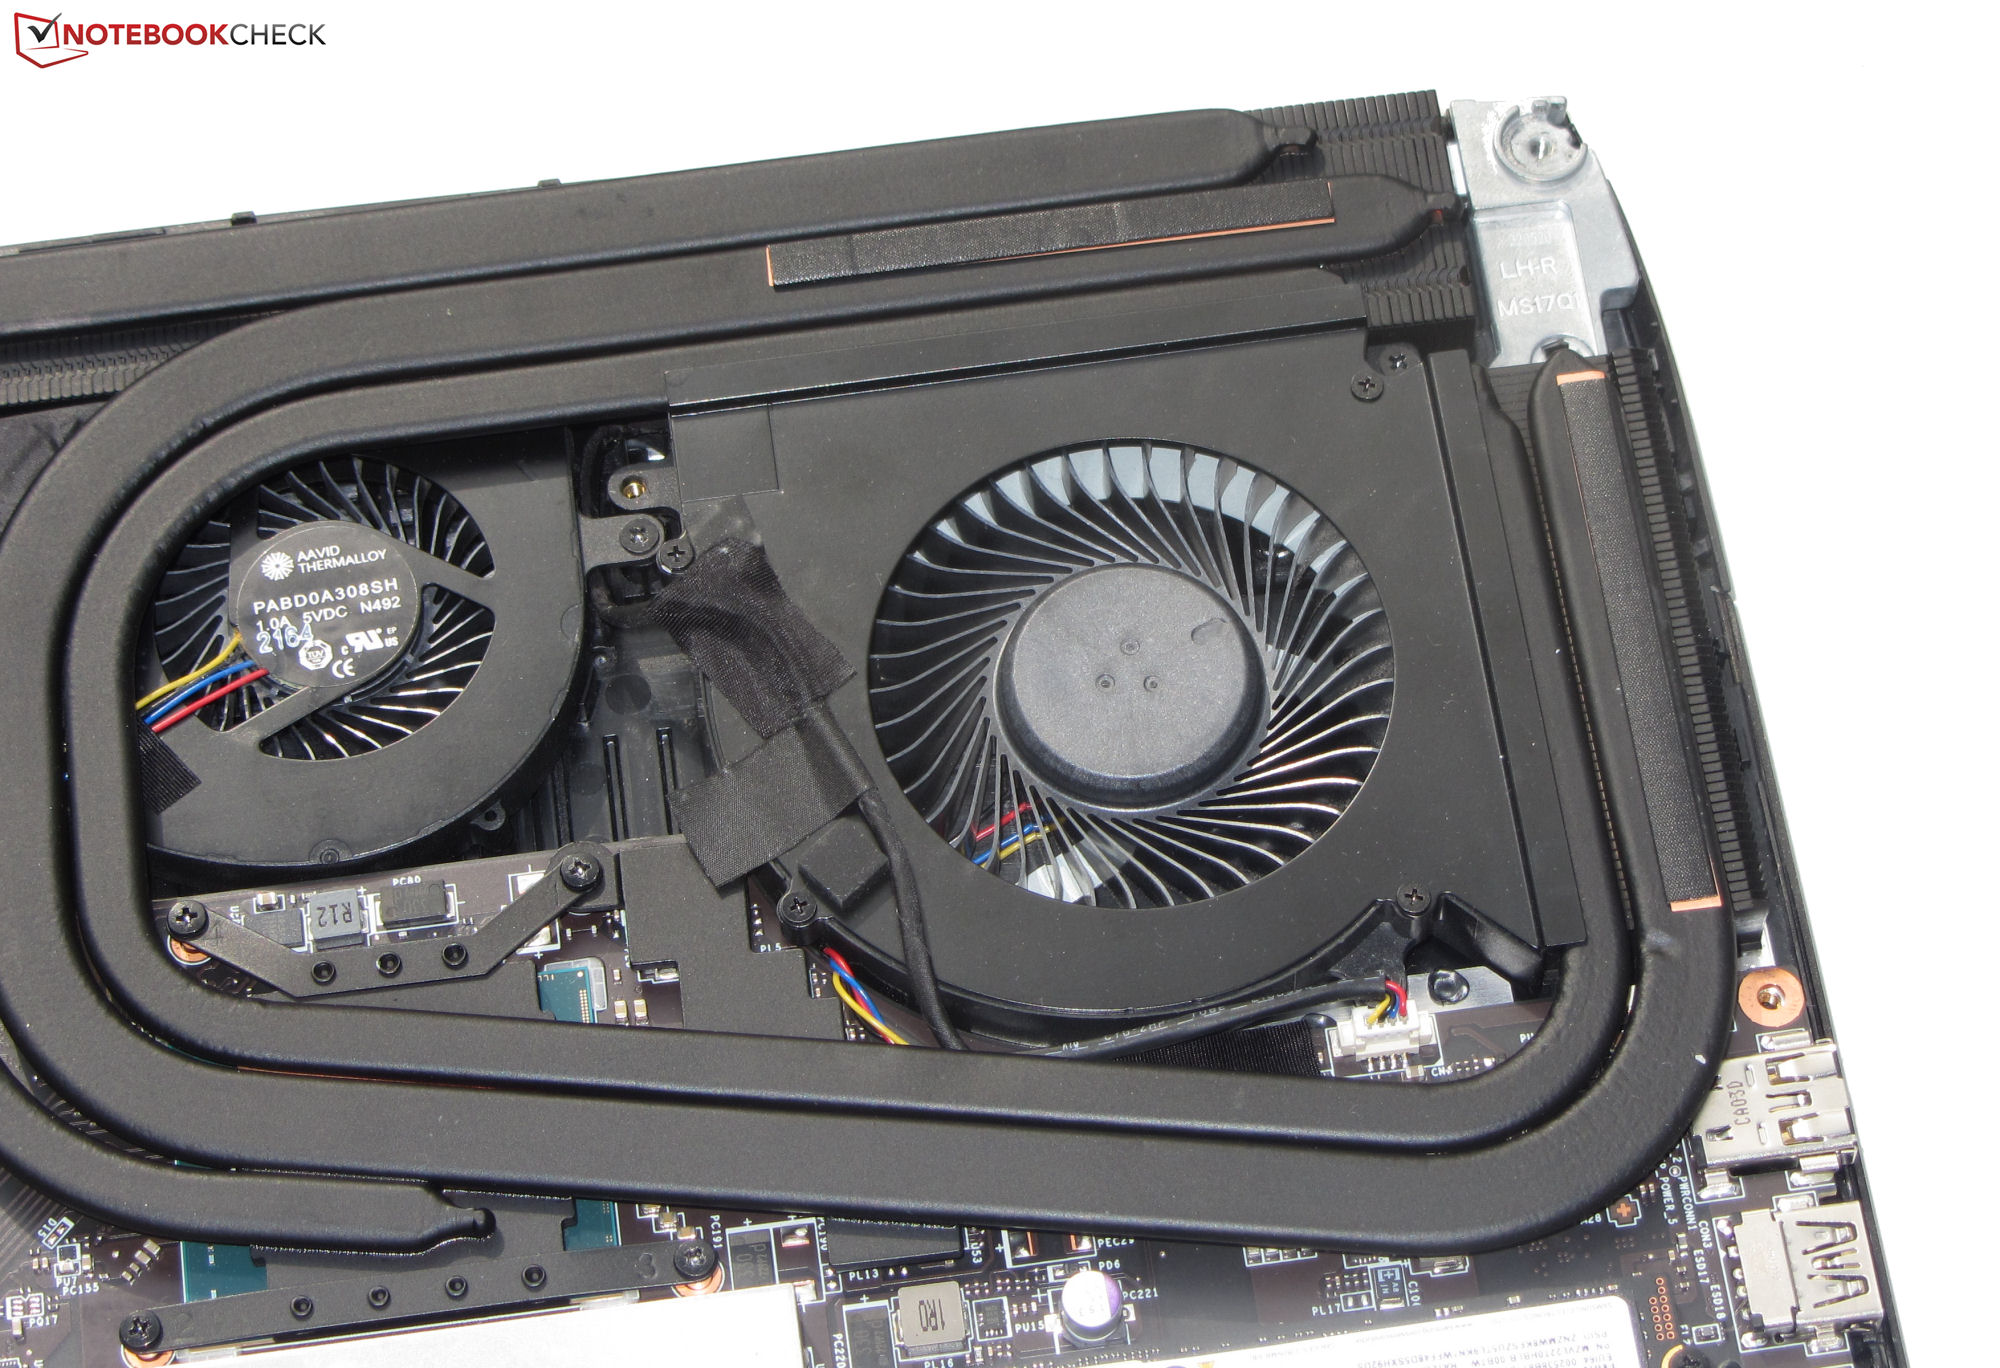
Emisiones - El MSI GT77 tiene cuatro ventiladores
Emisiones acústicas
Los cuatro ventiladores pueden generar bastante ruido: bajo carga, los niveles de ruido alcanzaron los 53 dB(A) durante la prueba Witcher 3 y los 56 dB(A) durante la prueba de estrés. En reposo o con poca carga, al menos uno de los ventiladores suele girar y el ruido del ventilador puede llegar a los 42 dB(A). Sin embargo, el FHD Titan no se ve afectado por esto. Una posible explicación es que el control del ventilador en el modelo 4K podría ser algo más inquieto debido a la función "Smart Auto" activa. El perfil "Modo Silencioso" ayuda a reducir la cantidad de ruido cuando el sistema está funcionando - a costa de la potencia de cálculo
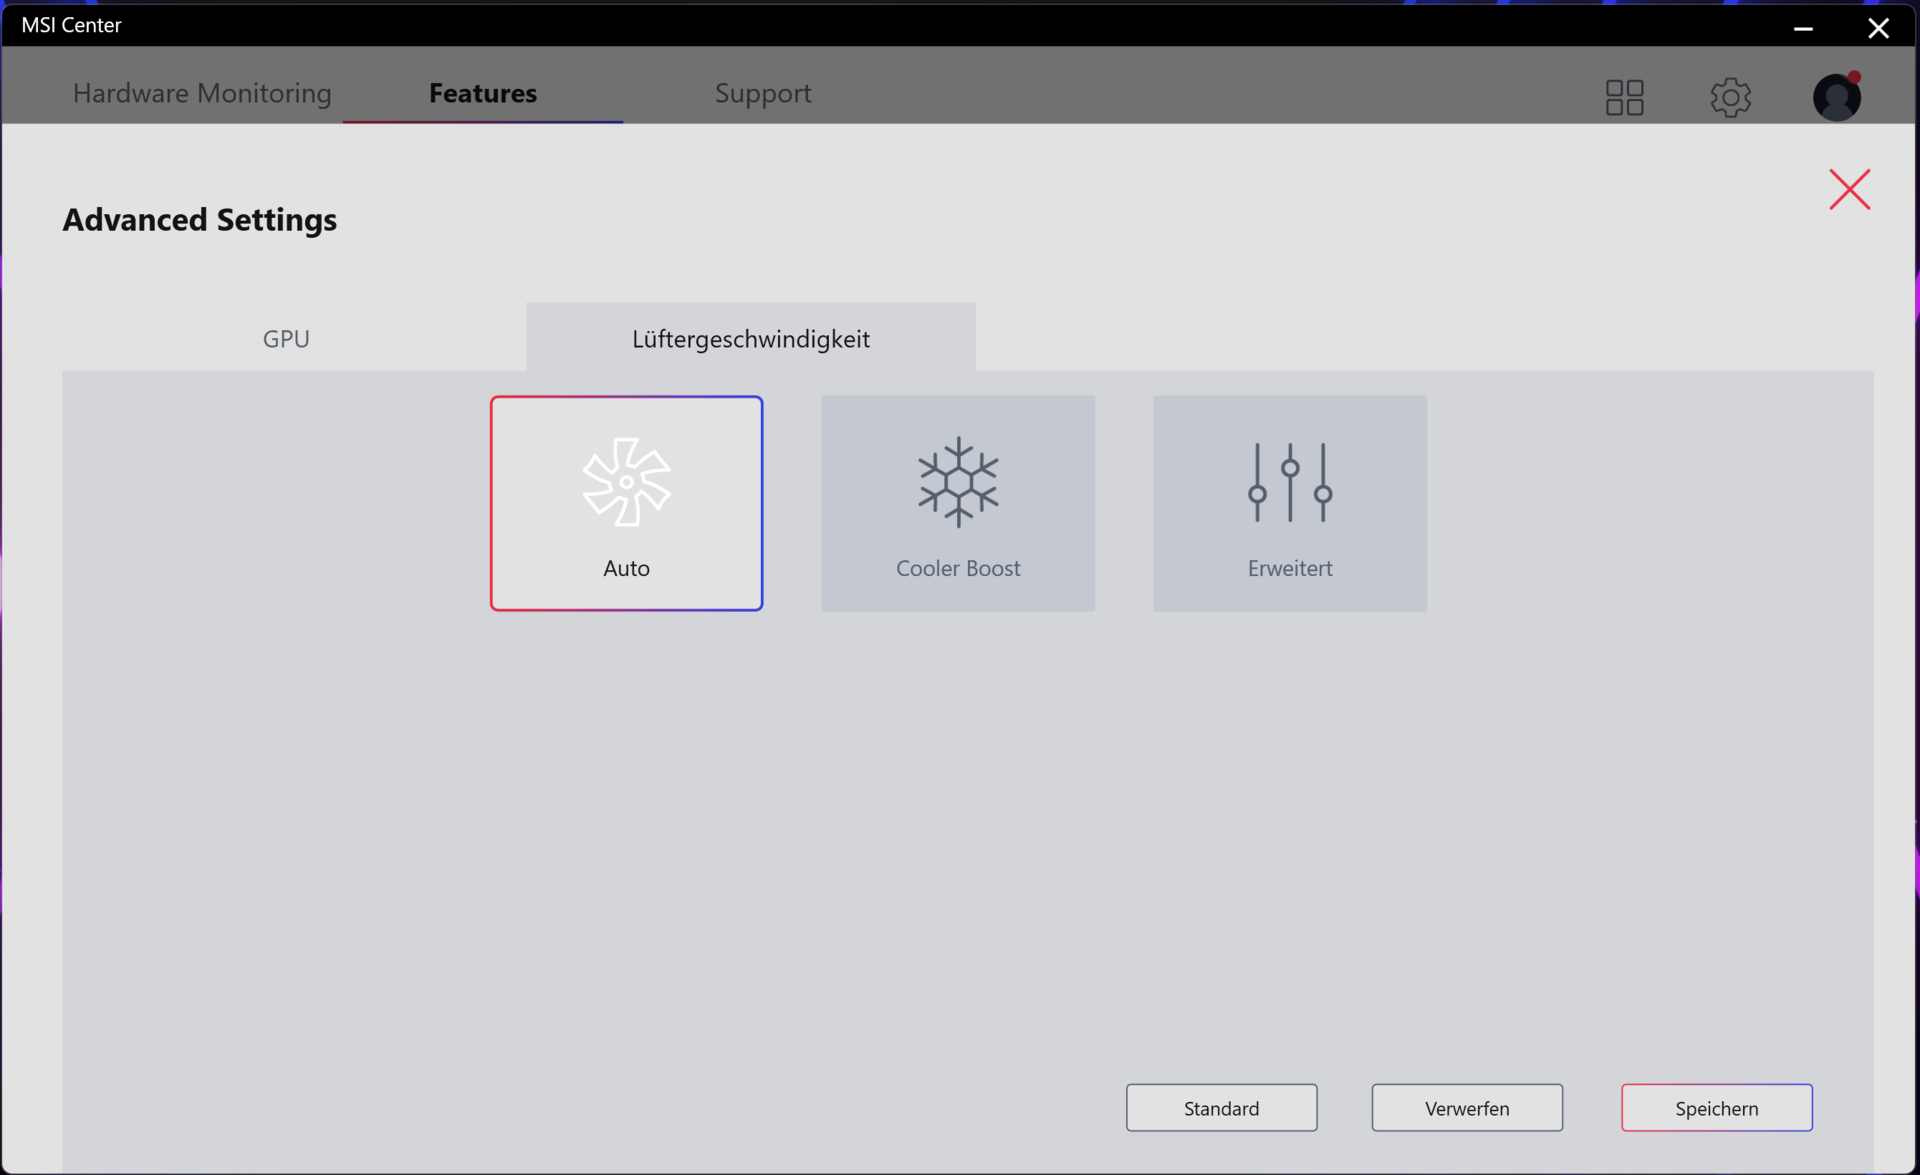
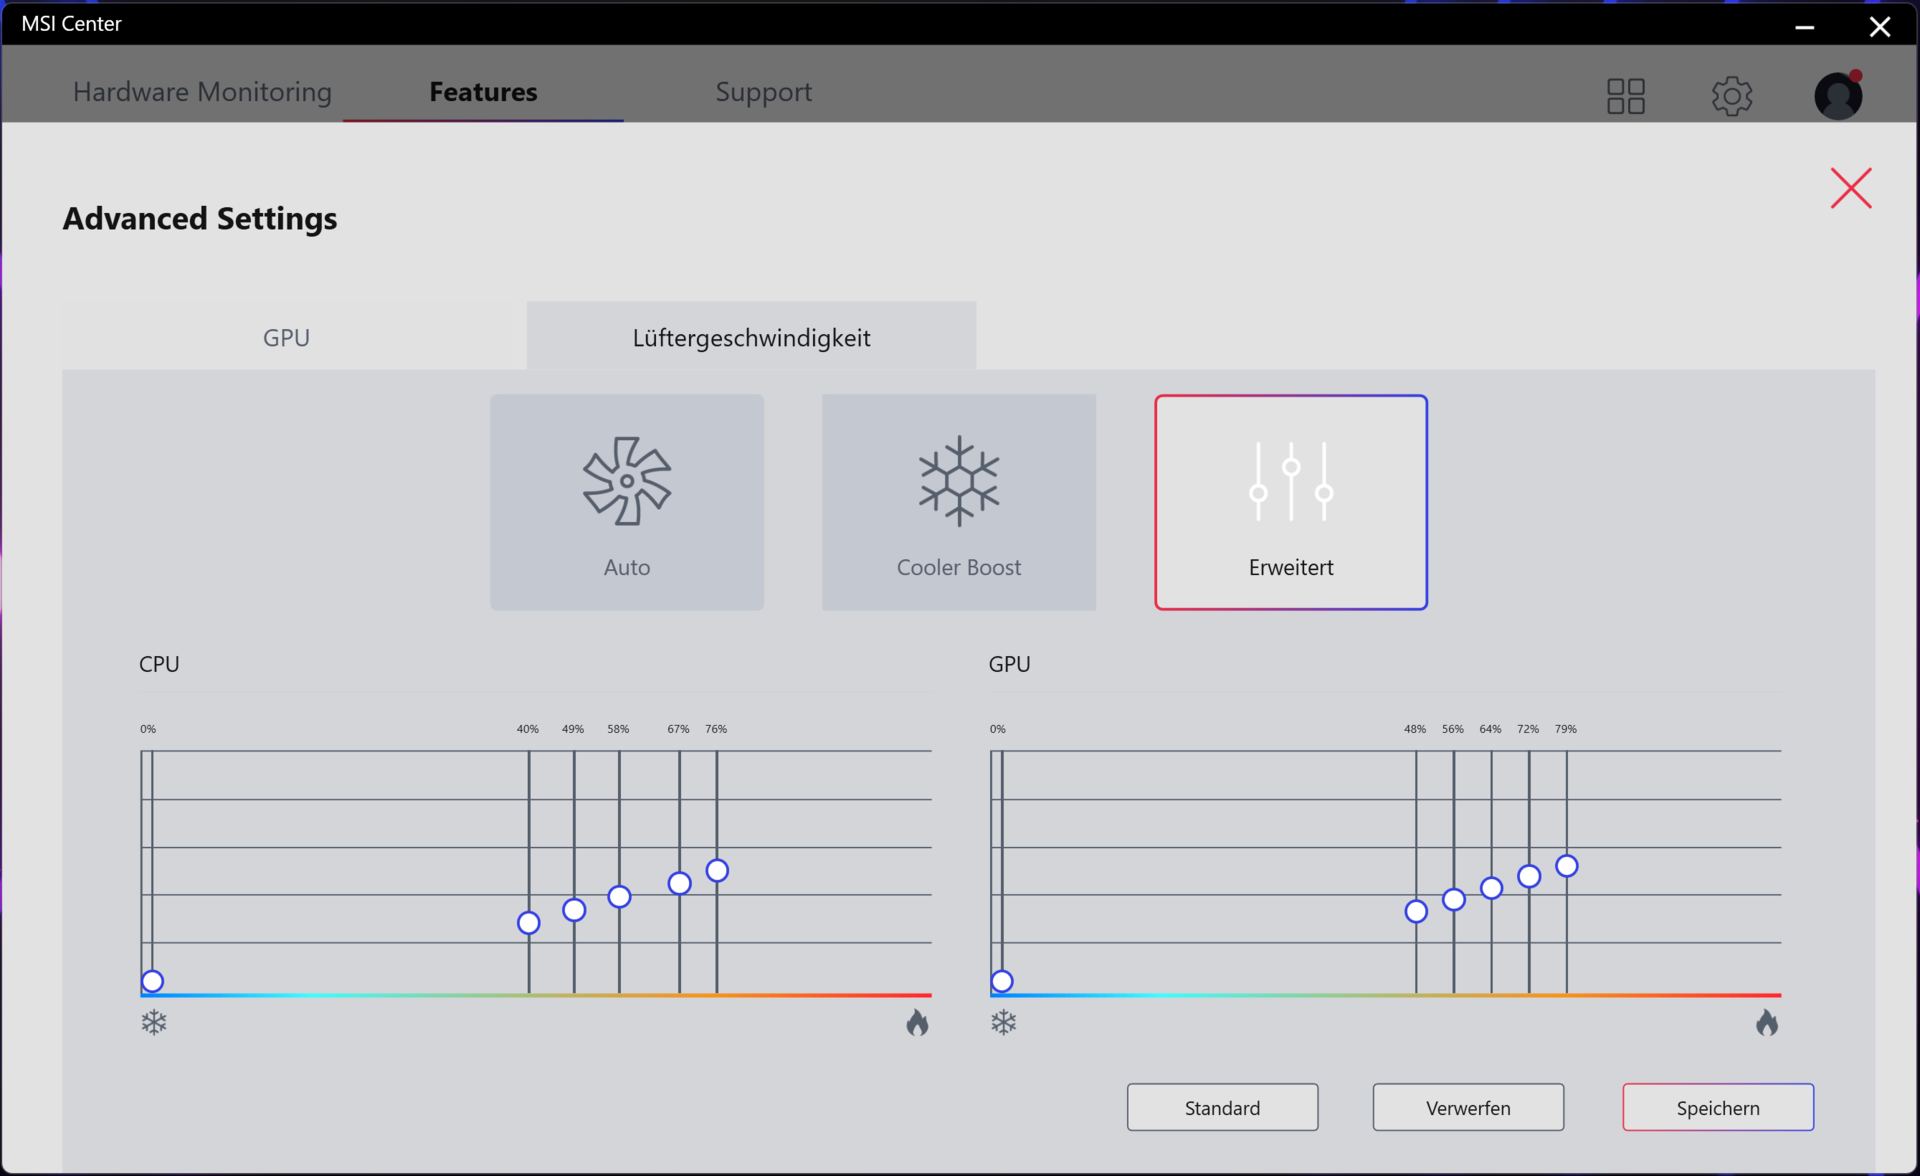
El perfil "Rendimiento extremo" permite modificar el control del ventilador. Las opciones disponibles son "Automático", "Cooler Boost" (los ventiladores funcionan a la máxima velocidad) y "Avanzado" (personalización de las curvas de los ventiladores).
Ruido
| Ocioso |
| 29 / 30 / 42 dB(A) |
| Carga |
| 54 / 56 dB(A) |
 | ||
30 dB silencioso 40 dB(A) audible 50 dB(A) ruidosamente alto |
||
min: | ||
| MSI Titan GT77 12UHS 4k i9-12900HX, GeForce RTX 3080 Ti Laptop GPU | Razer Blade 17 Early 2022 i9-12900H, GeForce RTX 3080 Ti Laptop GPU | Alienware x17 R2 P48E i9-12900HK, GeForce RTX 3080 Ti Laptop GPU | Schenker XMG Ultra 17 Rocket Lake i9-11900K, GeForce RTX 3080 Laptop GPU | MSI Titan GT77 12UHS i9-12900HX, GeForce RTX 3080 Ti Laptop GPU | |
|---|---|---|---|---|---|
| Noise | 9% | 21% | -12% | 14% | |
| apagado / medio ambiente * (dB) | 26 | 26 -0% | 22.7 13% | 24 8% | 21.9 16% |
| Idle Minimum * (dB) | 29 | 26 10% | 23.1 20% | 30 -3% | 24.53 15% |
| Idle Average * (dB) | 30 | 27 10% | 23.1 23% | 31 -3% | 24.53 18% |
| Idle Maximum * (dB) | 42 | 32 24% | 23.1 45% | 57 -36% | 24.53 42% |
| Load Average * (dB) | 54 | 50 7% | 31.9 41% | 63 -17% | 46.25 14% |
| Witcher 3 ultra * (dB) | 52 | 51 2% | 52.5 -1% | 61 -17% | 56.86 -9% |
| Load Maximum * (dB) | 56 | 51 9% | 52.5 6% | 63 -13% | 54.25 3% |
* ... más pequeño es mejor
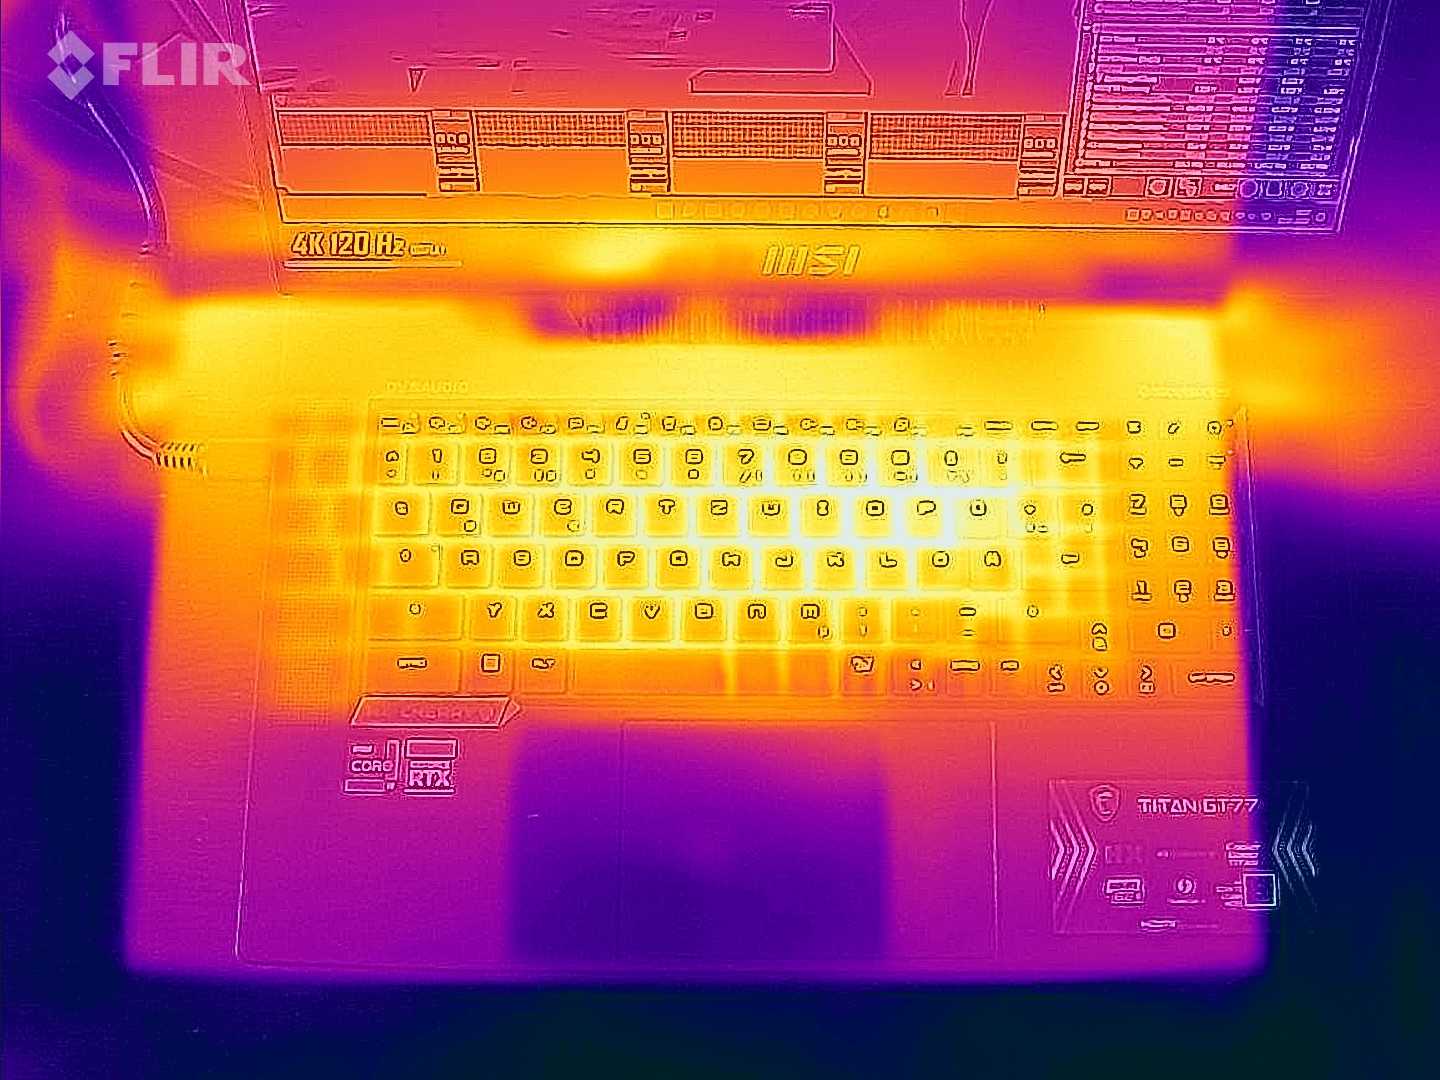
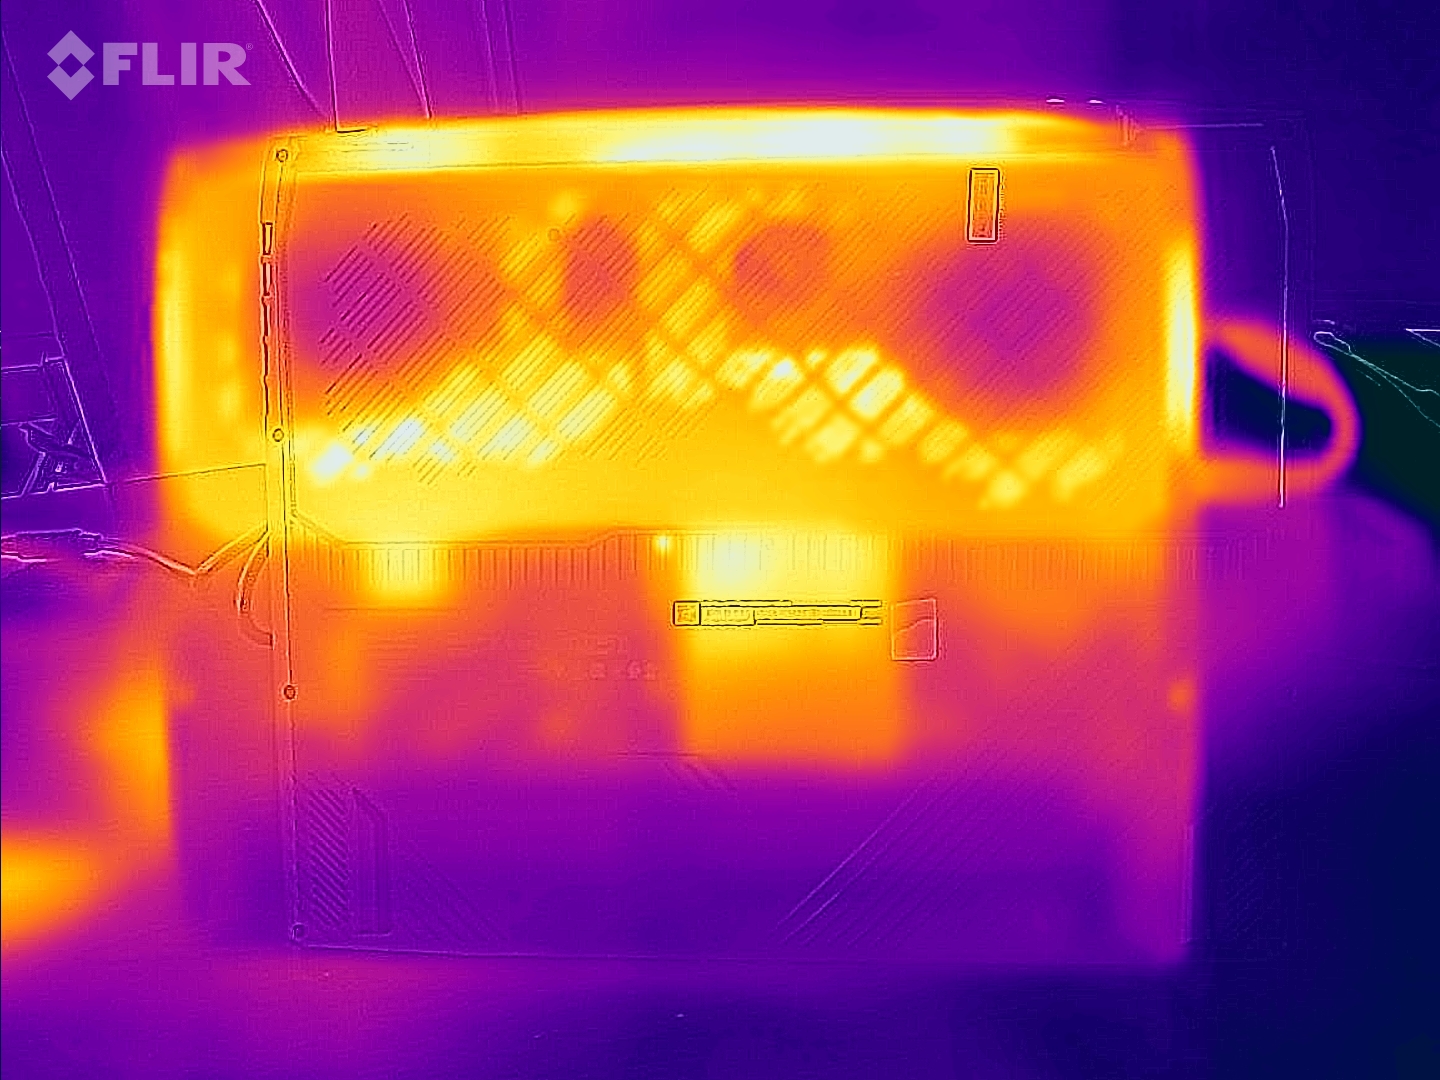
Temperatura
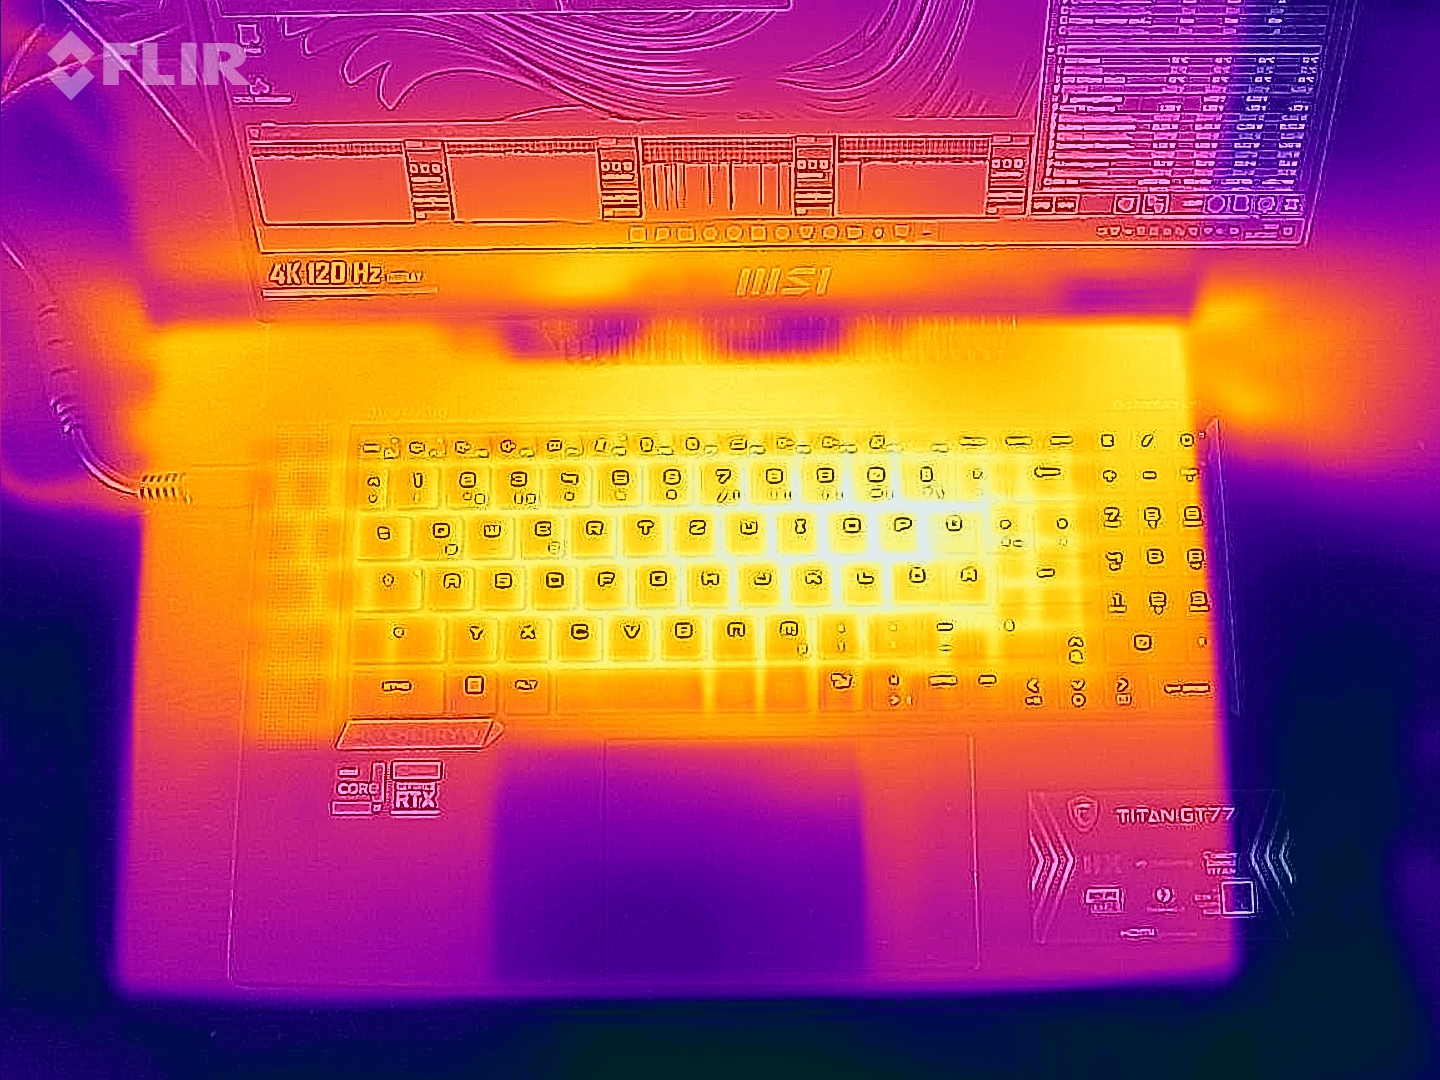
En el uso diario (trabajo de oficina, navegación por Internet), las temperaturas del chasis se mantuvieron dentro de un rango aceptable. Bajo carga (test de estrés, Witcher 3 test), el portátil se calentó significativamente pero no demasiado. No hay motivo de preocupación en cuanto a las temperaturas de la CPU.
(-) La temperatura máxima en la parte superior es de 49 °C / 120 F, frente a la media de 40.4 °C / 105 F, que oscila entre 21.2 y 68.8 °C para la clase Gaming.
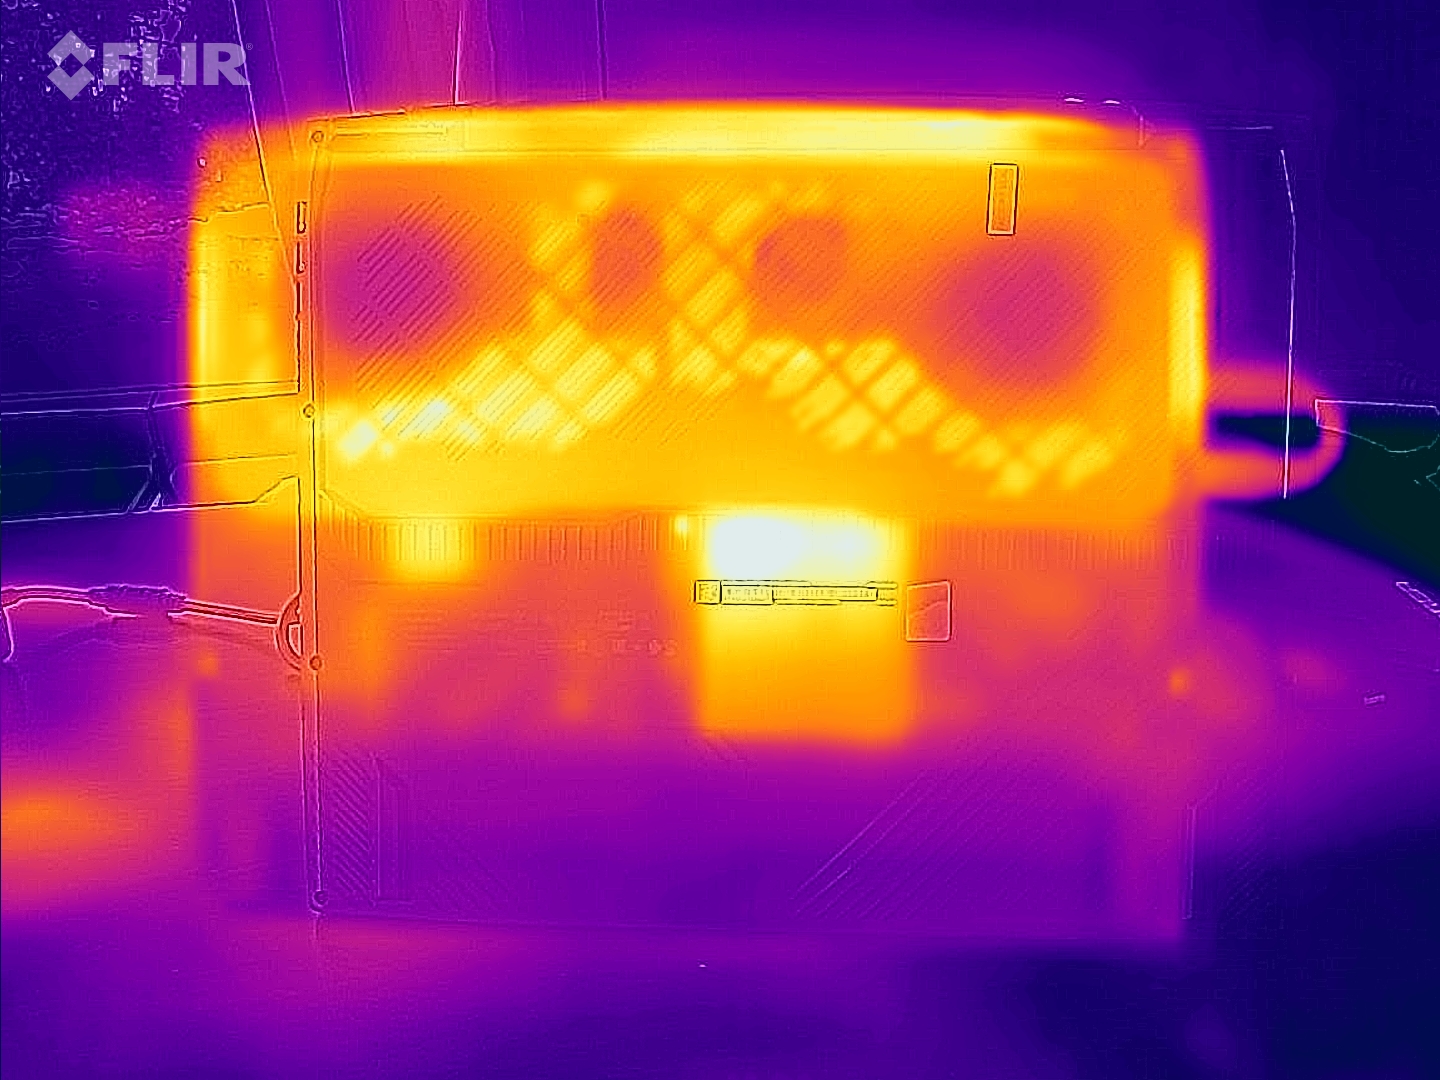
(-) El fondo se calienta hasta un máximo de 50 °C / 122 F, frente a la media de 43.2 °C / 110 F
(±) En reposo, la temperatura media de la parte superior es de 33.2 °C / 92# F, frente a la media del dispositivo de 33.9 °C / 93 F.
(-) Jugando a The Witcher 3, la temperatura media de la parte superior es de 48.1 °C / 119 F, frente a la media del dispositivo de 33.9 °C / 93 F.
(-) El reposamanos y el touchpad pueden calentarse mucho al tacto con un máximo de 43 °C / 109.4 F.
(-) La temperatura media de la zona del reposamanos de dispositivos similares fue de 28.8 °C / 83.8 F (-14.2 °C / -25.6 F).
| MSI Titan GT77 12UHS 4k Intel Core i9-12900HX, NVIDIA GeForce RTX 3080 Ti Laptop GPU | Razer Blade 17 Early 2022 Intel Core i9-12900H, NVIDIA GeForce RTX 3080 Ti Laptop GPU | Alienware x17 R2 P48E Intel Core i9-12900HK, NVIDIA GeForce RTX 3080 Ti Laptop GPU | Schenker XMG Ultra 17 Rocket Lake Intel Core i9-11900K, NVIDIA GeForce RTX 3080 Laptop GPU | MSI Titan GT77 12UHS Intel Core i9-12900HX, NVIDIA GeForce RTX 3080 Ti Laptop GPU | |
|---|---|---|---|---|---|
| Heat | -5% | 11% | 8% | 2% | |
| Maximum Upper Side * (°C) | 49 | 50 -2% | 49.6 -1% | 34 31% | 40.8 17% |
| Maximum Bottom * (°C) | 50 | 56 -12% | 42.4 15% | 43 14% | 52.4 -5% |
| Idle Upper Side * (°C) | 34 | 36 -6% | 29.2 14% | 38 -12% | 34.6 -2% |
| Idle Bottom * (°C) | 38 | 38 -0% | 32 16% | 39 -3% | 38.4 -1% |
* ... más pequeño es mejor
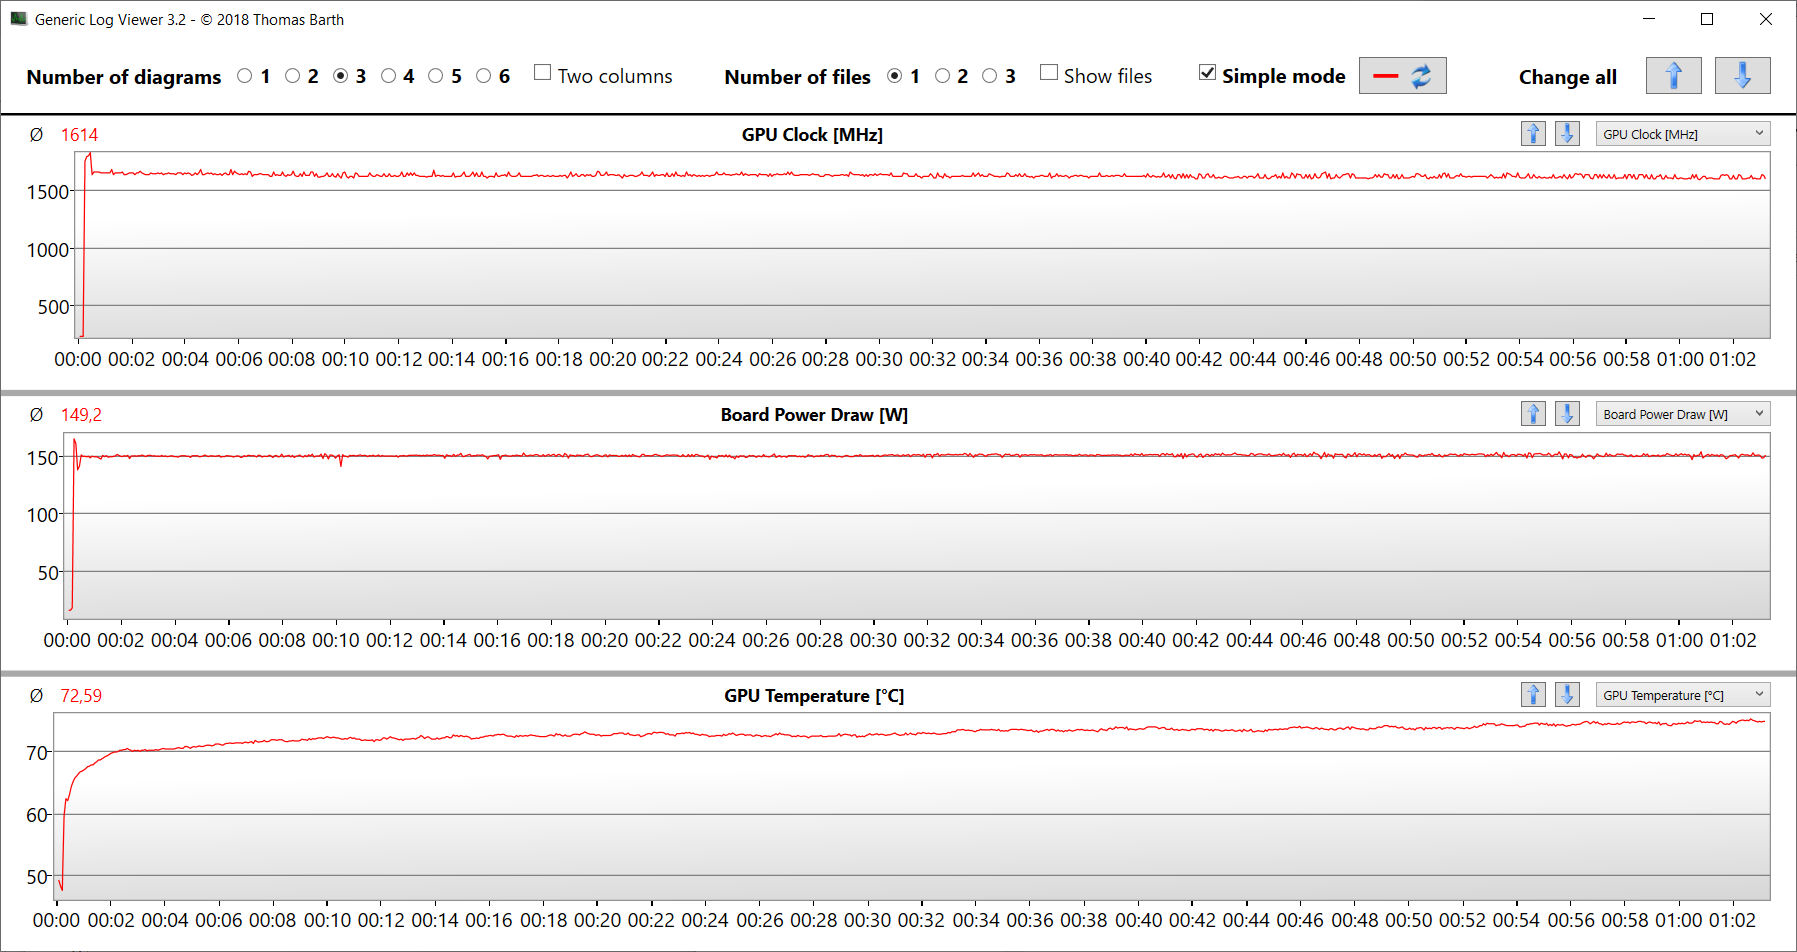
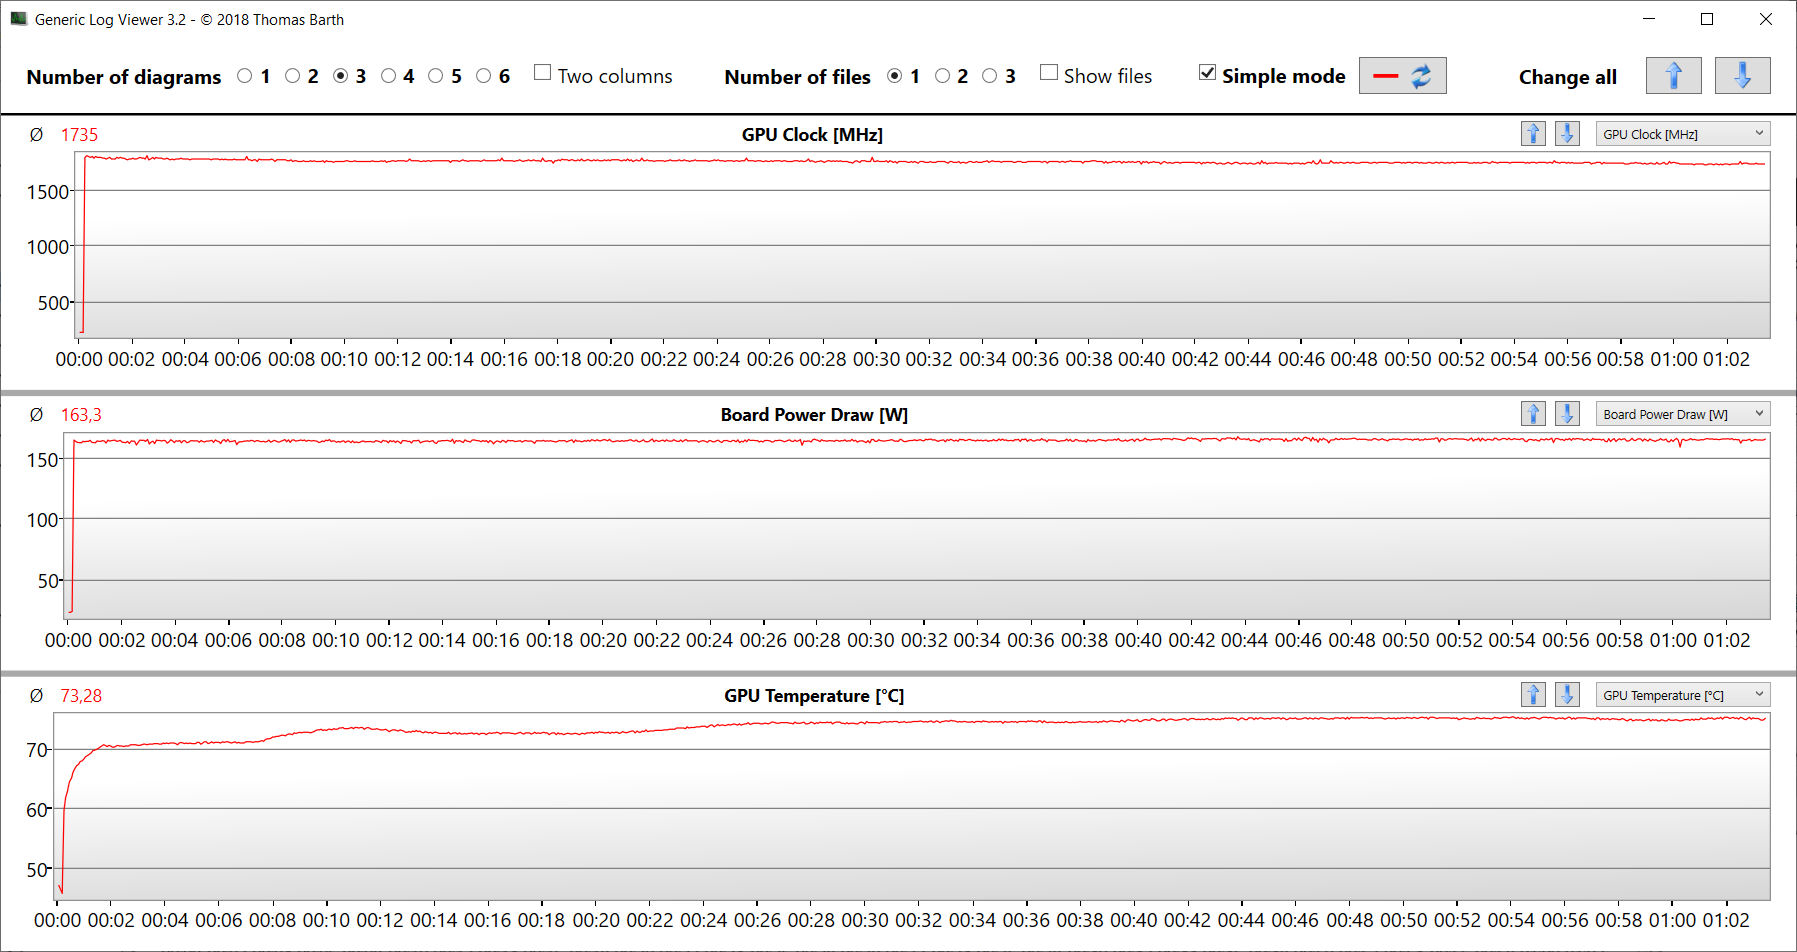
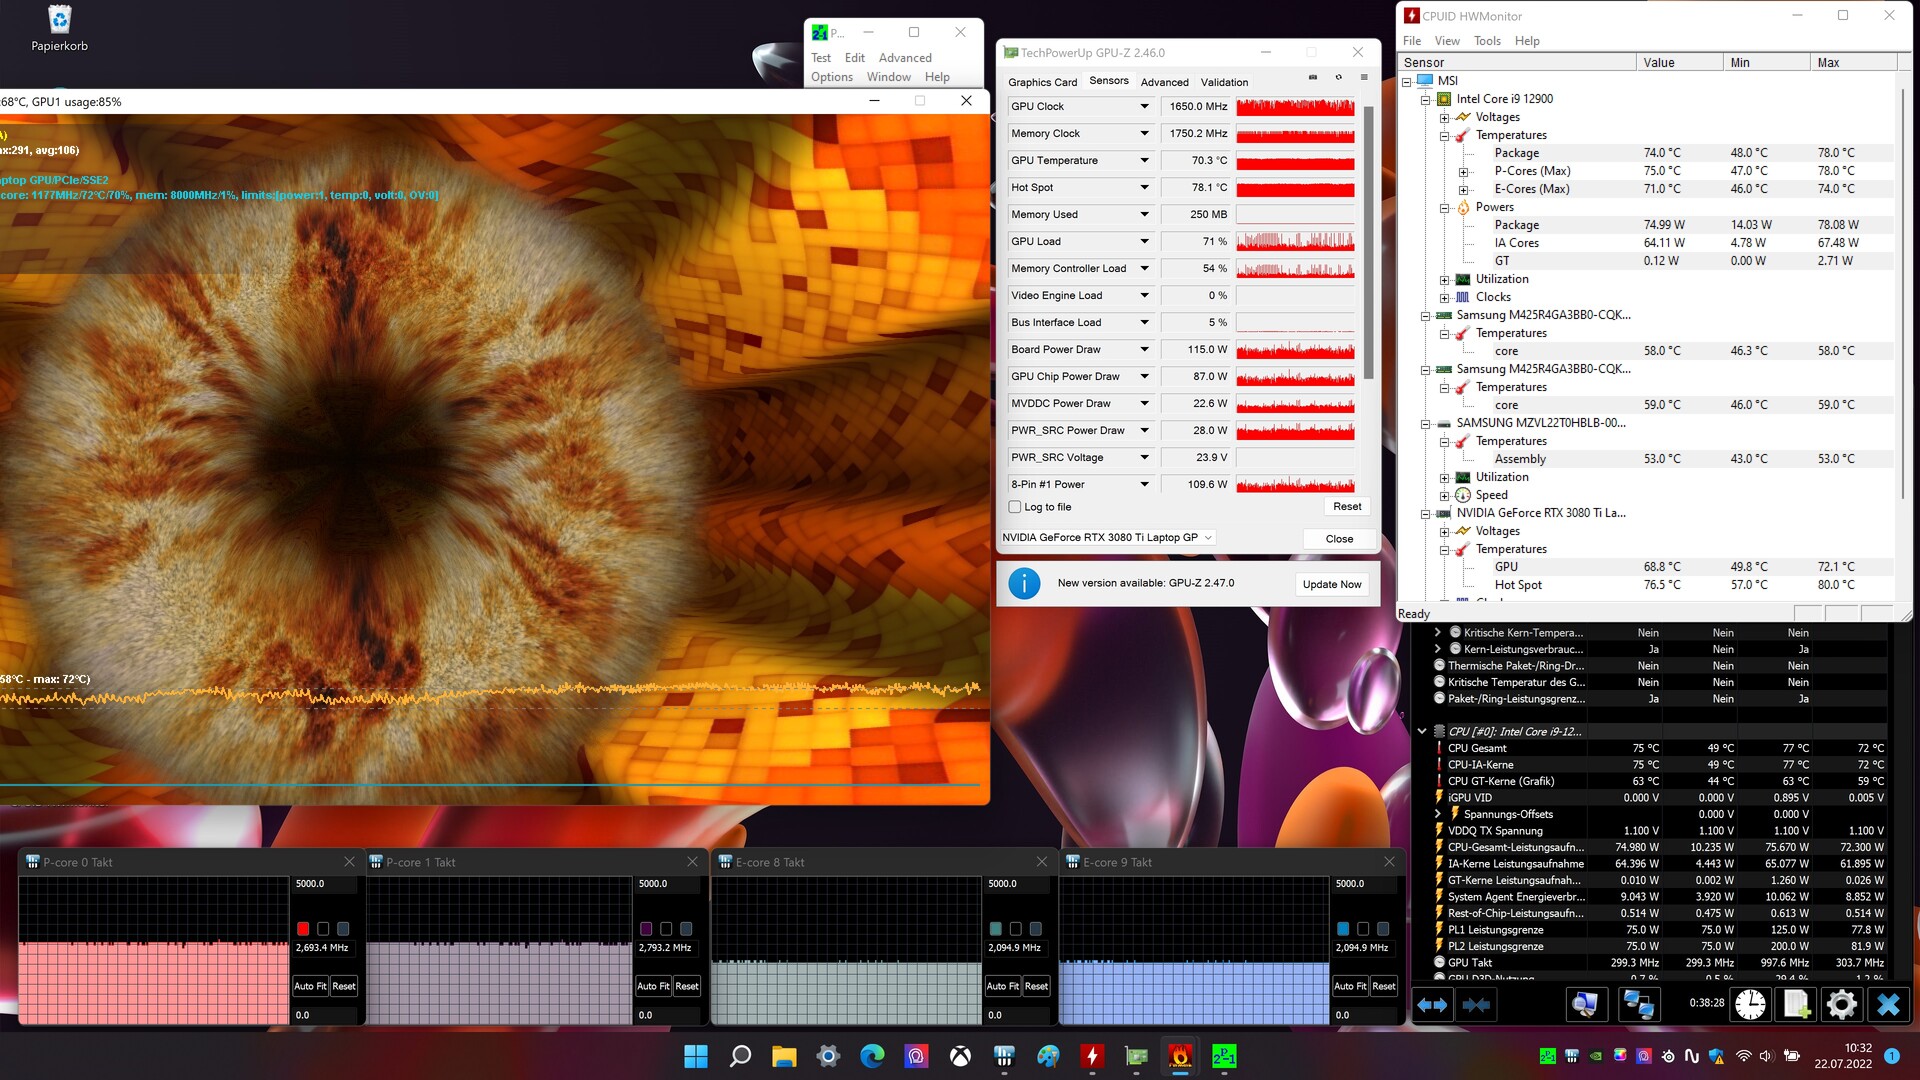
Prueba de esfuerzo
La CPU completó la prueba de estrés (ejecutando Prime95 y FurMark durante al menos una hora) a velocidades de procesamiento medias, mientras que la GPU fue capaz de alcanzar su máxima velocidad de reloj. La prueba de estrés representa una situación extrema. Realizamos esta prueba para comprobar si el sistema es estable cuando funciona a plena carga.
Altavoces
MSI Titan GT77 12UHS análisis de audio
(+) | los altavoces pueden reproducir a un volumen relativamente alto (#91 dB)
Graves 100 - 315 Hz
(±) | lubina reducida - en promedio 13.9% inferior a la mediana
(±) | la linealidad de los graves es media (9.7% delta a frecuencia anterior)
Medios 400 - 2000 Hz
(+) | medios equilibrados - a sólo 4% de la mediana
(+) | los medios son lineales (3.6% delta a la frecuencia anterior)
Altos 2 - 16 kHz
(+) | máximos equilibrados - a sólo 1.8% de la mediana
(+) | los máximos son lineales (3.9% delta a la frecuencia anterior)
Total 100 - 16.000 Hz
(+) | el sonido global es lineal (11.4% de diferencia con la mediana)
En comparación con la misma clase
» 9% de todos los dispositivos probados de esta clase eran mejores, 3% similares, 88% peores
» El mejor tuvo un delta de 6%, la media fue 18%, el peor fue ###max##%
En comparación con todos los dispositivos probados
» 7% de todos los dispositivos probados eran mejores, 2% similares, 90% peores
» El mejor tuvo un delta de 4%, la media fue 23%, el peor fue ###max##%
Alienware x17 R2 P48E análisis de audio
(+) | los altavoces pueden reproducir a un volumen relativamente alto (#84.3 dB)
Graves 100 - 315 Hz
(±) | lubina reducida - en promedio 9.7% inferior a la mediana
(+) | el bajo es lineal (5.5% delta a la frecuencia anterior)
Medios 400 - 2000 Hz
(+) | medios equilibrados - a sólo 1.6% de la mediana
(+) | los medios son lineales (3% delta a la frecuencia anterior)
Altos 2 - 16 kHz
(±) | máximos más altos - de media 5% más altos que la mediana
(±) | la linealidad de los máximos es media (7.6% delta a frecuencia anterior)
Total 100 - 16.000 Hz
(+) | el sonido global es lineal (9.3% de diferencia con la mediana)
En comparación con la misma clase
» 3% de todos los dispositivos probados de esta clase eran mejores, 2% similares, 95% peores
» El mejor tuvo un delta de 6%, la media fue 18%, el peor fue ###max##%
En comparación con todos los dispositivos probados
» 3% de todos los dispositivos probados eran mejores, 1% similares, 96% peores
» El mejor tuvo un delta de 4%, la media fue 23%, el peor fue ###max##%
Gestión de la energía: el portátil de MSI ofrece una duración decente de la batería
Consumo de energía
El consumo de energía del portátil está dentro del rango normal para el hardware que lleva. Durante la prueba Witcher 3 y la prueba de estrés, su consumo de energía aumentó hasta una media de 236 vatios y un pico de 309 vatios. El dispositivo utilizó una cantidad constante de energía durante ambas pruebas
Nota: El modelo Modelo FHDfue probado con el modo dGPU activo. Esto explica que consumiera más energía en reposo.
| Off / Standby | |
| Ocioso | |
| Carga |
|
Clave:
min: | |
| MSI Titan GT77 12UHS i9-12900HX, GeForce RTX 3080 Ti Laptop GPU | Razer Blade 17 Early 2022 i9-12900H, GeForce RTX 3080 Ti Laptop GPU | Alienware x17 R2 P48E i9-12900HK, GeForce RTX 3080 Ti Laptop GPU | Schenker XMG Ultra 17 Rocket Lake i9-11900K, GeForce RTX 3080 Laptop GPU | MSI Titan GT77 12UHS i9-12900HX, GeForce RTX 3080 Ti Laptop GPU | Medio NVIDIA GeForce RTX 3080 Ti Laptop GPU | Media de la clase Gaming | |
|---|---|---|---|---|---|---|---|
| Power Consumption | -7% | -44% | -146% | -41% | -10% | 8% | |
| Idle Minimum * (Watt) | 12 | 17 -42% | 24.1 -101% | 62 -417% | 30.21 -152% | 17.2 ? -43% | 13 ? -8% |
| Idle Average * (Watt) | 18 | 23 -28% | 28.5 -58% | 64 -256% | 32.42 -80% | 23.3 ? -29% | 19 ? -6% |
| Idle Maximum * (Watt) | 30 | 34 -13% | 60 -100% | 69 -130% | 33.7 -12% | 30.8 ? -3% | 24.6 ? 18% |
| Load Average * (Watt) | 141 | 120 15% | 128.7 9% | 183 -30% | 125.09 11% | 121.2 ? 14% | 110.7 ? 21% |
| Witcher 3 ultra * (Watt) | 236 | 229 3% | 254 -8% | 297 -26% | 256 -8% | ||
| Load Maximum * (Watt) | 309 | 243 21% | 323 -5% | 368 -19% | 321.88 -4% | 276 ? 11% | 259 ? 16% |
* ... más pequeño es mejor
Power consumption Witcher 3 / stress test
Power consumption with external monitor
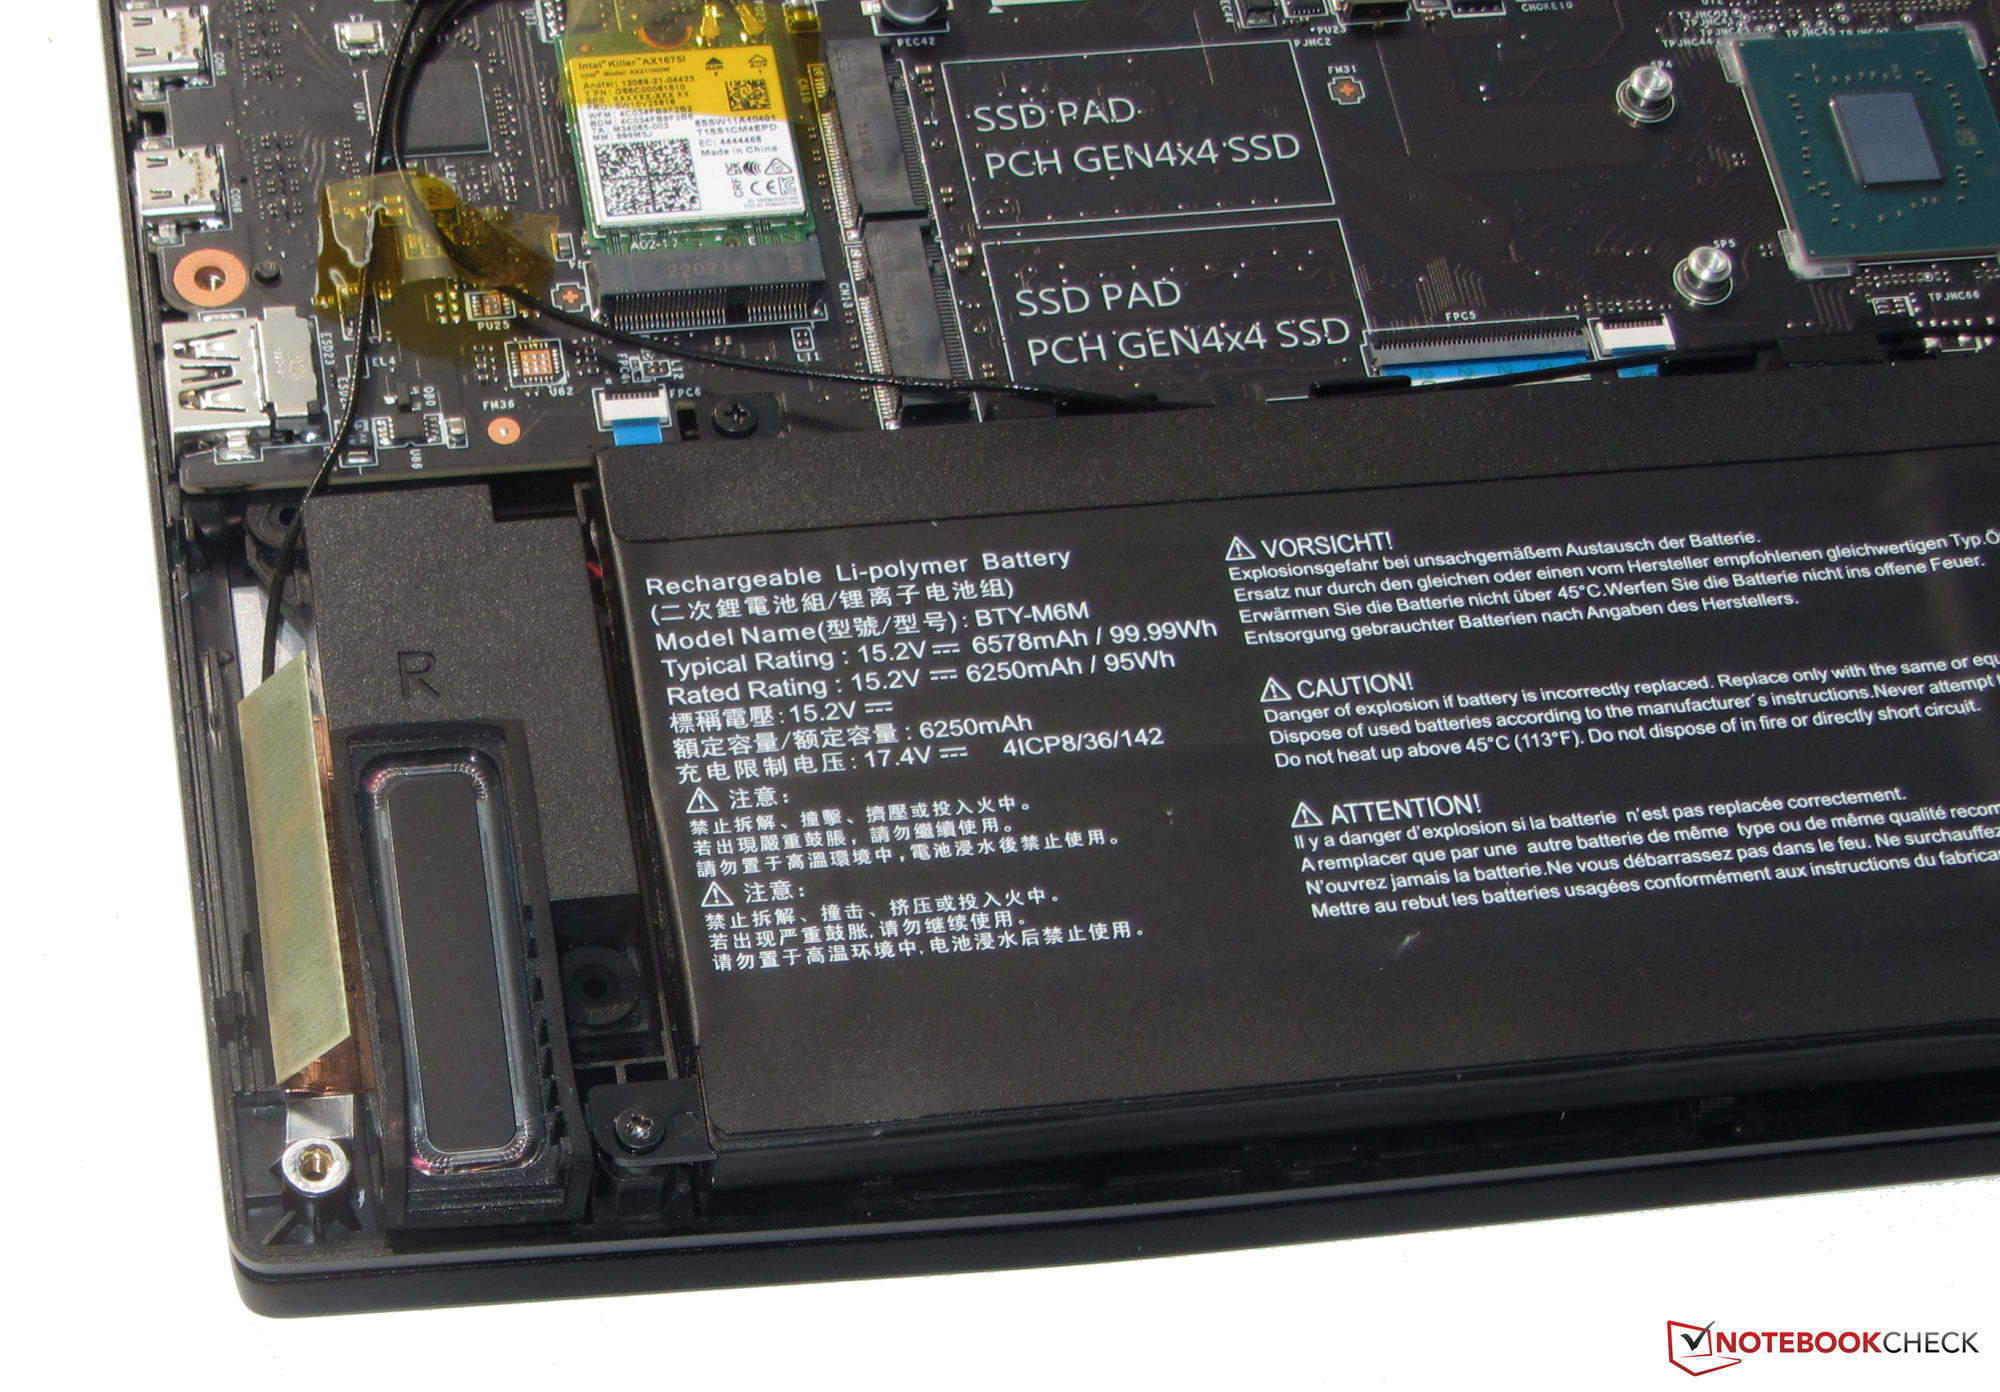
Duración de la batería
Para nuestra prueba de Wi-Fi (visitar sitios web automáticamente usando un script) y la prueba de vídeo (reproducir el cortometraje Big Buck Bunny (codificación H.264, FHD) en bucle), el portátil de 17,3 pulgadas consiguió funcionar durante 5:52 horas y 6:50 horas respectivamente. El Modelo hermano FHDduró un poco más debido a su menor resolución de pantalla.
| MSI Titan GT77 12UHS 4k i9-12900HX, GeForce RTX 3080 Ti Laptop GPU, 99.99 Wh | Razer Blade 17 Early 2022 i9-12900H, GeForce RTX 3080 Ti Laptop GPU, 82 Wh | Alienware x17 R2 P48E i9-12900HK, GeForce RTX 3080 Ti Laptop GPU, 87 Wh | Schenker XMG Ultra 17 Rocket Lake i9-11900K, GeForce RTX 3080 Laptop GPU, 97 Wh | MSI Titan GT77 12UHS i9-12900HX, GeForce RTX 3080 Ti Laptop GPU, 99.9 Wh | Media de la clase Gaming | |
|---|---|---|---|---|---|---|
| Duración de Batería | -16% | -55% | -58% | 5% | 11% | |
| Reader / Idle (h) | 8.2 | 7.1 -13% | 3.9 -52% | 3 -63% | 8.27 ? 1% | |
| H.264 (h) | 6.8 | 4.8 -29% | 1.9 -72% | 7.2 6% | 8.32 ? 22% | |
| WiFi v1.3 (h) | 5.9 | 3.8 -36% | 2 -66% | 1.8 -69% | 6.9 17% | 7.11 ? 21% |
| Load (h) | 1.5 | 1.7 13% | 0.8 -47% | 1.1 -27% | 1.4 -7% | 1.502 ? 0% |
| Witcher 3 ultra (h) | 1.5 |
Pro
Contra
Veredicto: aún mejor con una pantalla 4K
Con la Titan GT77, MSI ofrece uno de los portátiles DTR con mejor rendimiento en la actualidad. Está diseñado para escenarios de uso que requieren una potencia de cálculo intensiva y una gran cantidad de RAM, como el renderizado y los juegos.
El MSI Titan GT77: uno de los portátiles con mejor rendimiento del momento.
El Core i9-12900HX y GeForce Portátil RTX 3080 Ti (175 vatios TGP, 16 GB de VRAM) son capaces de funcionar constantemente a altas velocidades de reloj. El portátil genera bastante calor y ruido, lo que es típico de esta clase de hardware. Los dos puertos Thunderbolt 4 proporcionan opciones de expansión (por ejemplo, GPU externa, soluciones de acoplamiento). Además, el portátil tiene un teclado mecánico bien diseñado y una duración de batería muy decente. Todas estas son cosas que esta variante actual comparte con su modelo hermano que analizamos anteriormente.
La pantalla es la principal diferencia entre los dos modelos Titan: el panel 4K (120 Hz) del actual modelo de pruebas es superior al panel FHD (360 Hz) del otro modelo en términos de resolución, brillo máximo y cobertura de color (casi 100% DCI-P3). Por tanto, es la mejor opción si la precisión del color es importante para ti. La pantalla FHD, por su parte, ofrece una frecuencia de refresco muy alta y debería hacer felices a muchos jugadores. Por desgracia, ambas pantallas carecen de contraste.
El Alienware x17 R2 es una digna alternativa al Titan cuando se trata de rendimiento. Sin embargo, ofrece menos opciones de expansión y ofrece una menor duración de la batería
Precio y disponibilidad
La MSI Titan GT77 12UHS está disponible en tiendas como Amazon.com. La configuración que analizamos tiene un precio de unos 5.600 euros (5.980 dólares).
MSI Titan GT77 12UHS
- 08/28/2022 v7 (old)
Sascha Mölck
Price comparison

