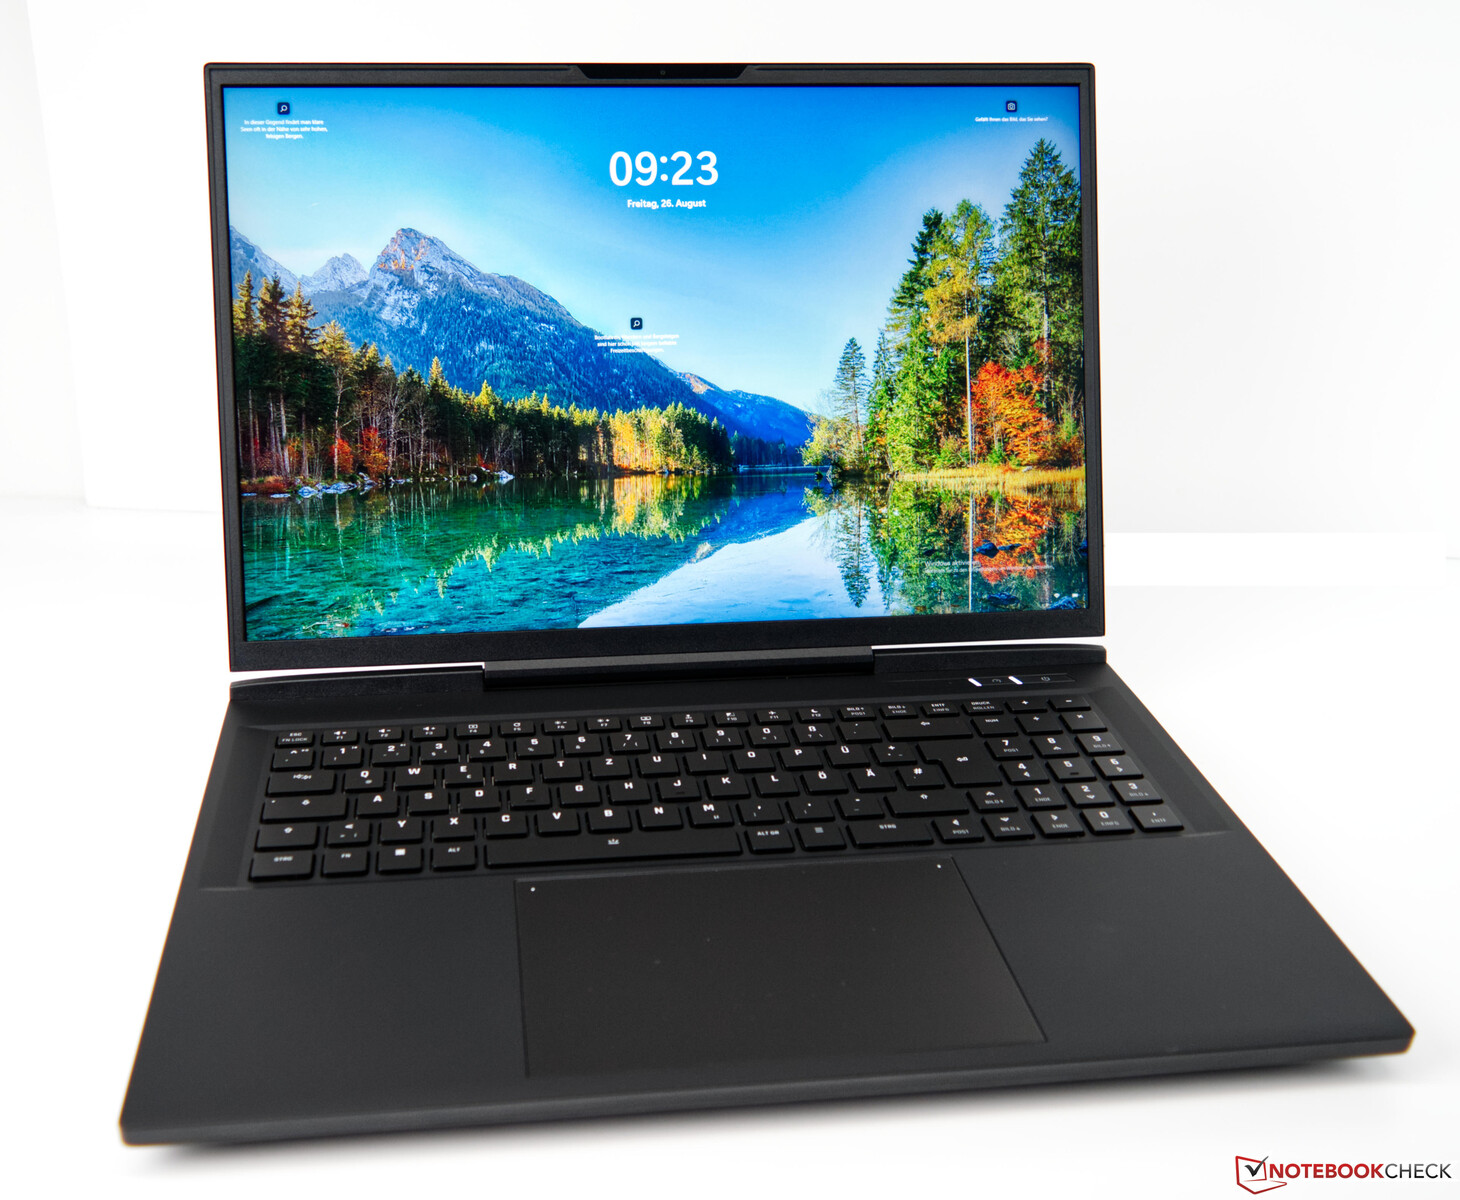
Análisis del Schenker XMG Neo 17 M22: Portátil para juegos de alto rendimiento con teclas mecánicas Cherry MX
XMG son las tres letras que denotan los portátiles para juegos insignia de Schenker. El último Schenker XMG Neo 17, que como su nombre indica, es un portátil de 17 pulgadas, también forma parte de esta serie. Muchos se alegrarán de encontrar que, a diferencia de muchos otros portátiles para juegos, el Schenker utiliza una pantalla 16:10 que se presta ligeramente mejor a las tareas enfocadas al trabajo. Para garantizar un nivel de rendimiento adecuado, el fabricante instala el flamante Ryzen 9 6900HX de AMD en combinación con una GPU Nvidia GeForce RTX 3080 Ti para portátiles en el moderno chasis. Por lo tanto, es uno de los modelos más rápidos disponibles actualmente. Con 32 GB de RAM DDR5 y un SSD de 1 TB, el sistema es muy completo. Sin embargo, con un precio de unos 4200 USD, nuestra configuración del Schenker XMG Neo 17 no es precisamente barata.
Los lectores que estén familiarizados con Schenker sabrán cuántas opciones de configuración suele ofrecer el fabricante. Esto también se aplica a este modelo, para el que el modelo base empieza con la misma CPU y una GeForce GPU RTX 3070 Ti para portátiles a unos 2950 dólares.
A efectos de comparación, también hemos incluido dispositivos con especificaciones similares. La siguiente tabla muestra una lista de estos portátiles.
Posibles contendientes en la comparación
Valoración | Fecha | Modelo | Peso | Altura | Tamaño | Resolución | Precio |
|---|---|---|---|---|---|---|---|
| 87.6 % v7 (old) | 09/2022 | Schenker XMG Neo 17 M22 R9 6900HX, GeForce RTX 3080 Ti Laptop GPU | 2.8 kg | 27 mm | 17.00" | 2560x1600 | |
| 88.3 % v7 (old) | 08/2022 | MSI Titan GT77 12UHS i9-12900HX, GeForce RTX 3080 Ti Laptop GPU | 3.3 kg | 23 mm | 17.30" | 1920x1080 | |
| 89.9 % v7 (old) | 07/2022 | Razer Blade 17 Early 2022 i9-12900H, GeForce RTX 3080 Ti Laptop GPU | 2.8 kg | 19.9 mm | 17.30" | 3840x2160 | |
| 87.2 % v7 (old) | 06/2022 | Acer Predator Triton 500 SE PT516-52s-70KX i7-12700H, GeForce RTX 3080 Ti Laptop GPU | 2.3 kg | 19.9 mm | 16.00" | 2560x1600 | |
| 88.2 % v7 (old) | 05/2022 | Asus ROG Zephyrus Duo 16 GX650RX R9 6900HX, GeForce RTX 3080 Ti Laptop GPU | 2.6 kg | 20.5 mm | 16.00" | 3840x2400 | |
| 86.8 % v7 (old) | 07/2022 | MSI Raider GE77 HX 12UHS i9-12900HX, GeForce RTX 3080 Ti Laptop GPU | 3.1 kg | 25.9 mm | 17.30" | 3840x2160 |
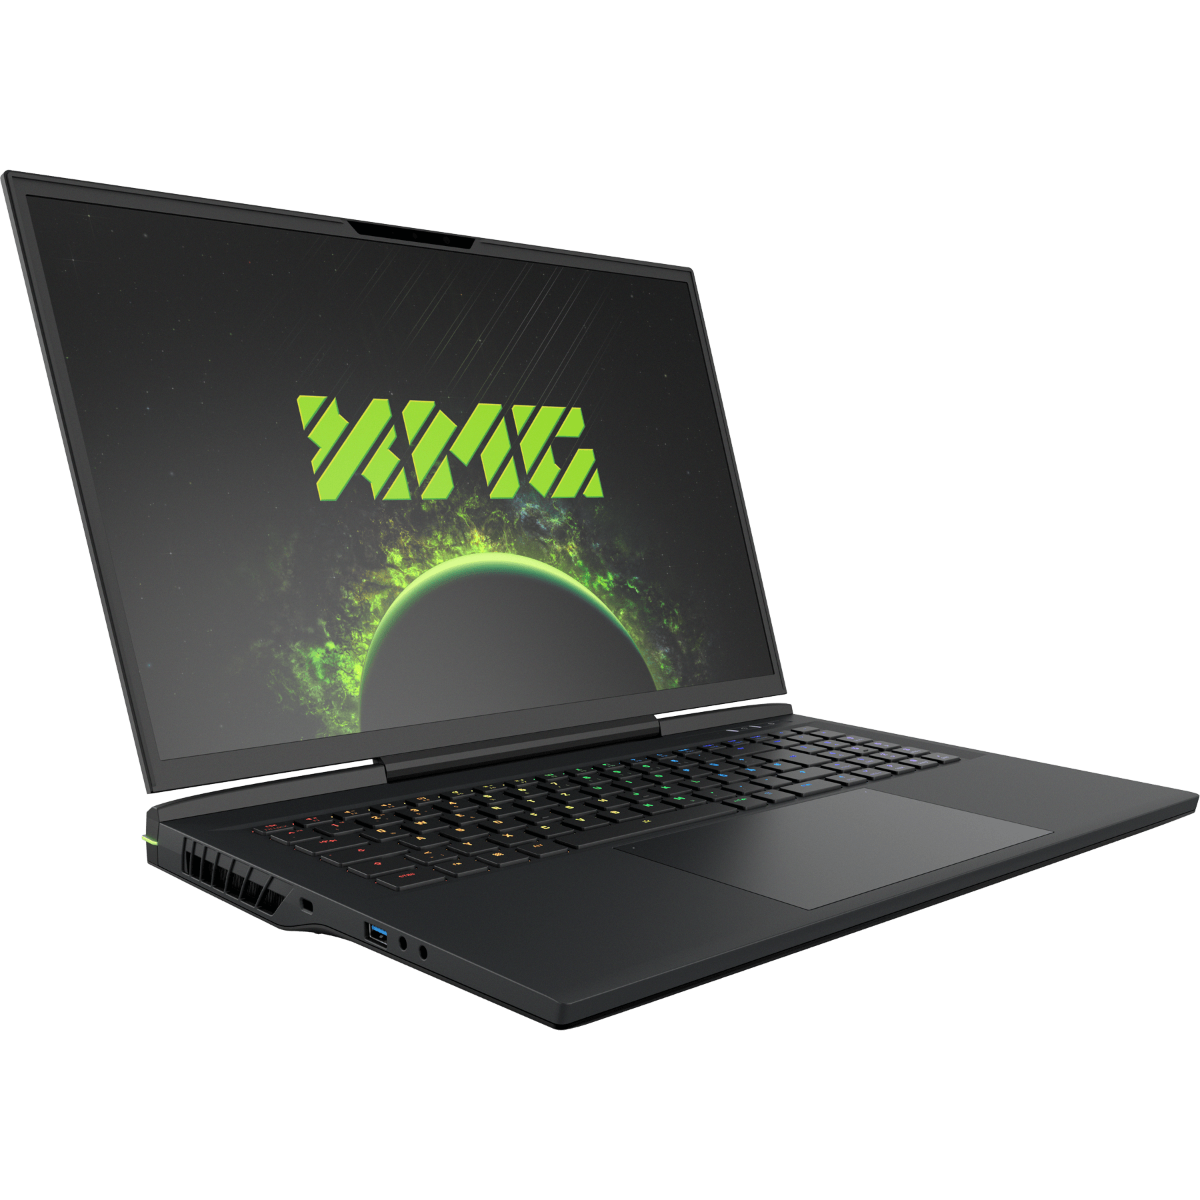
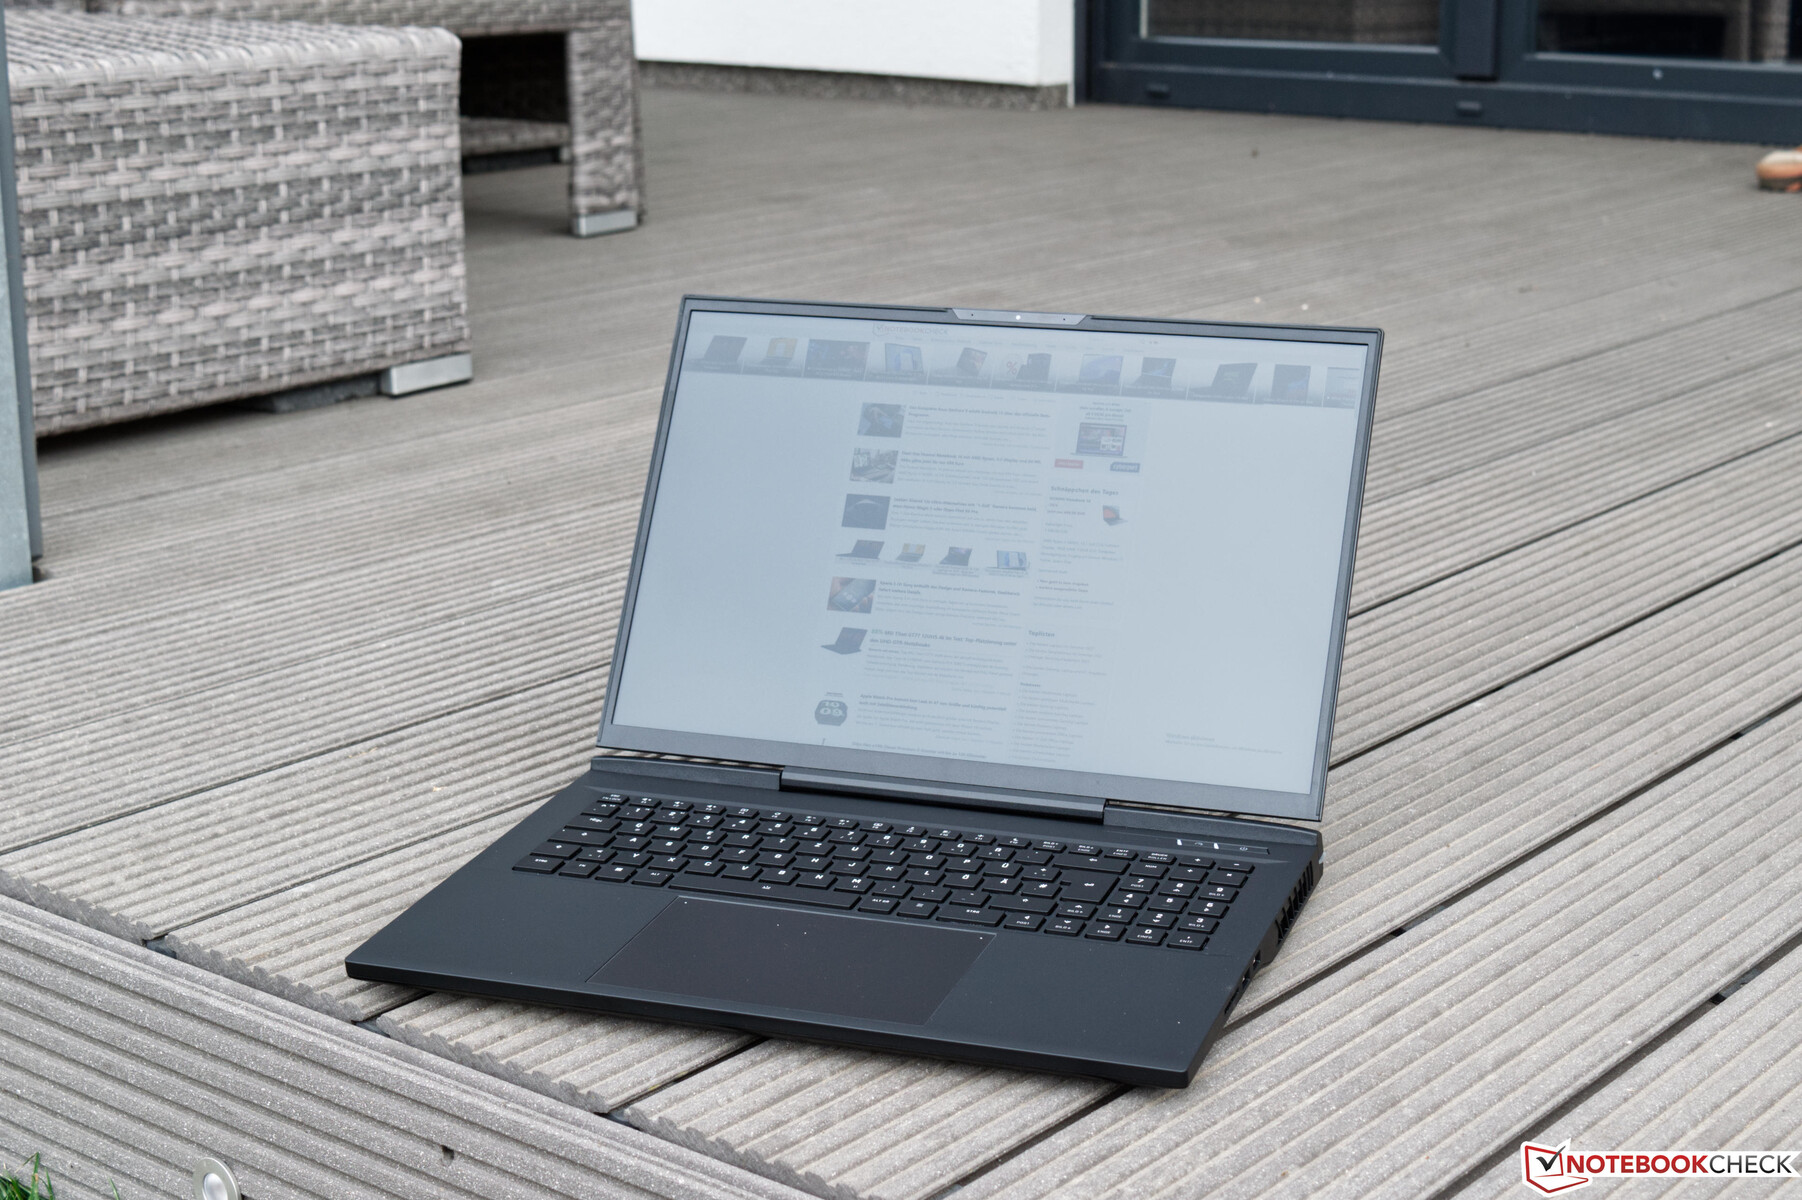
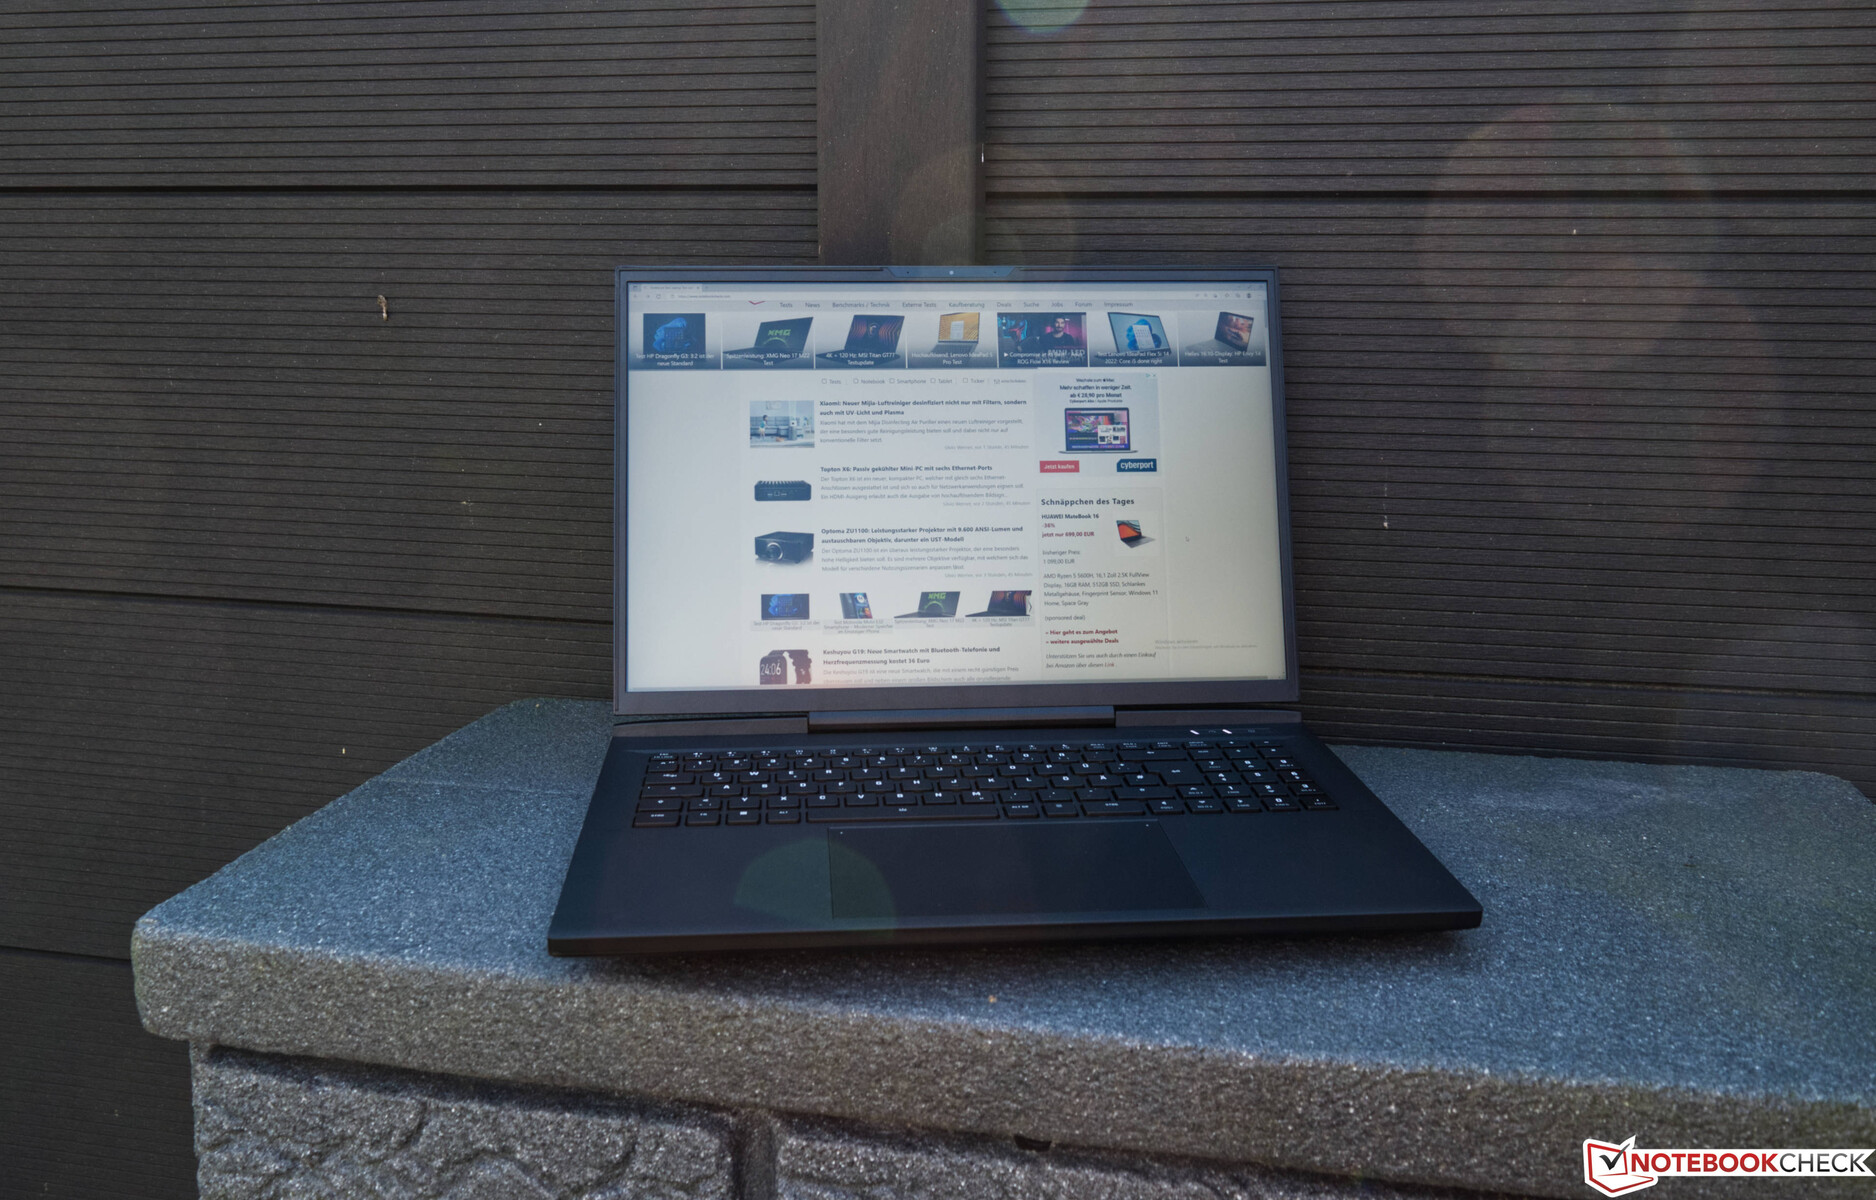
Chasis - Base muy Robus
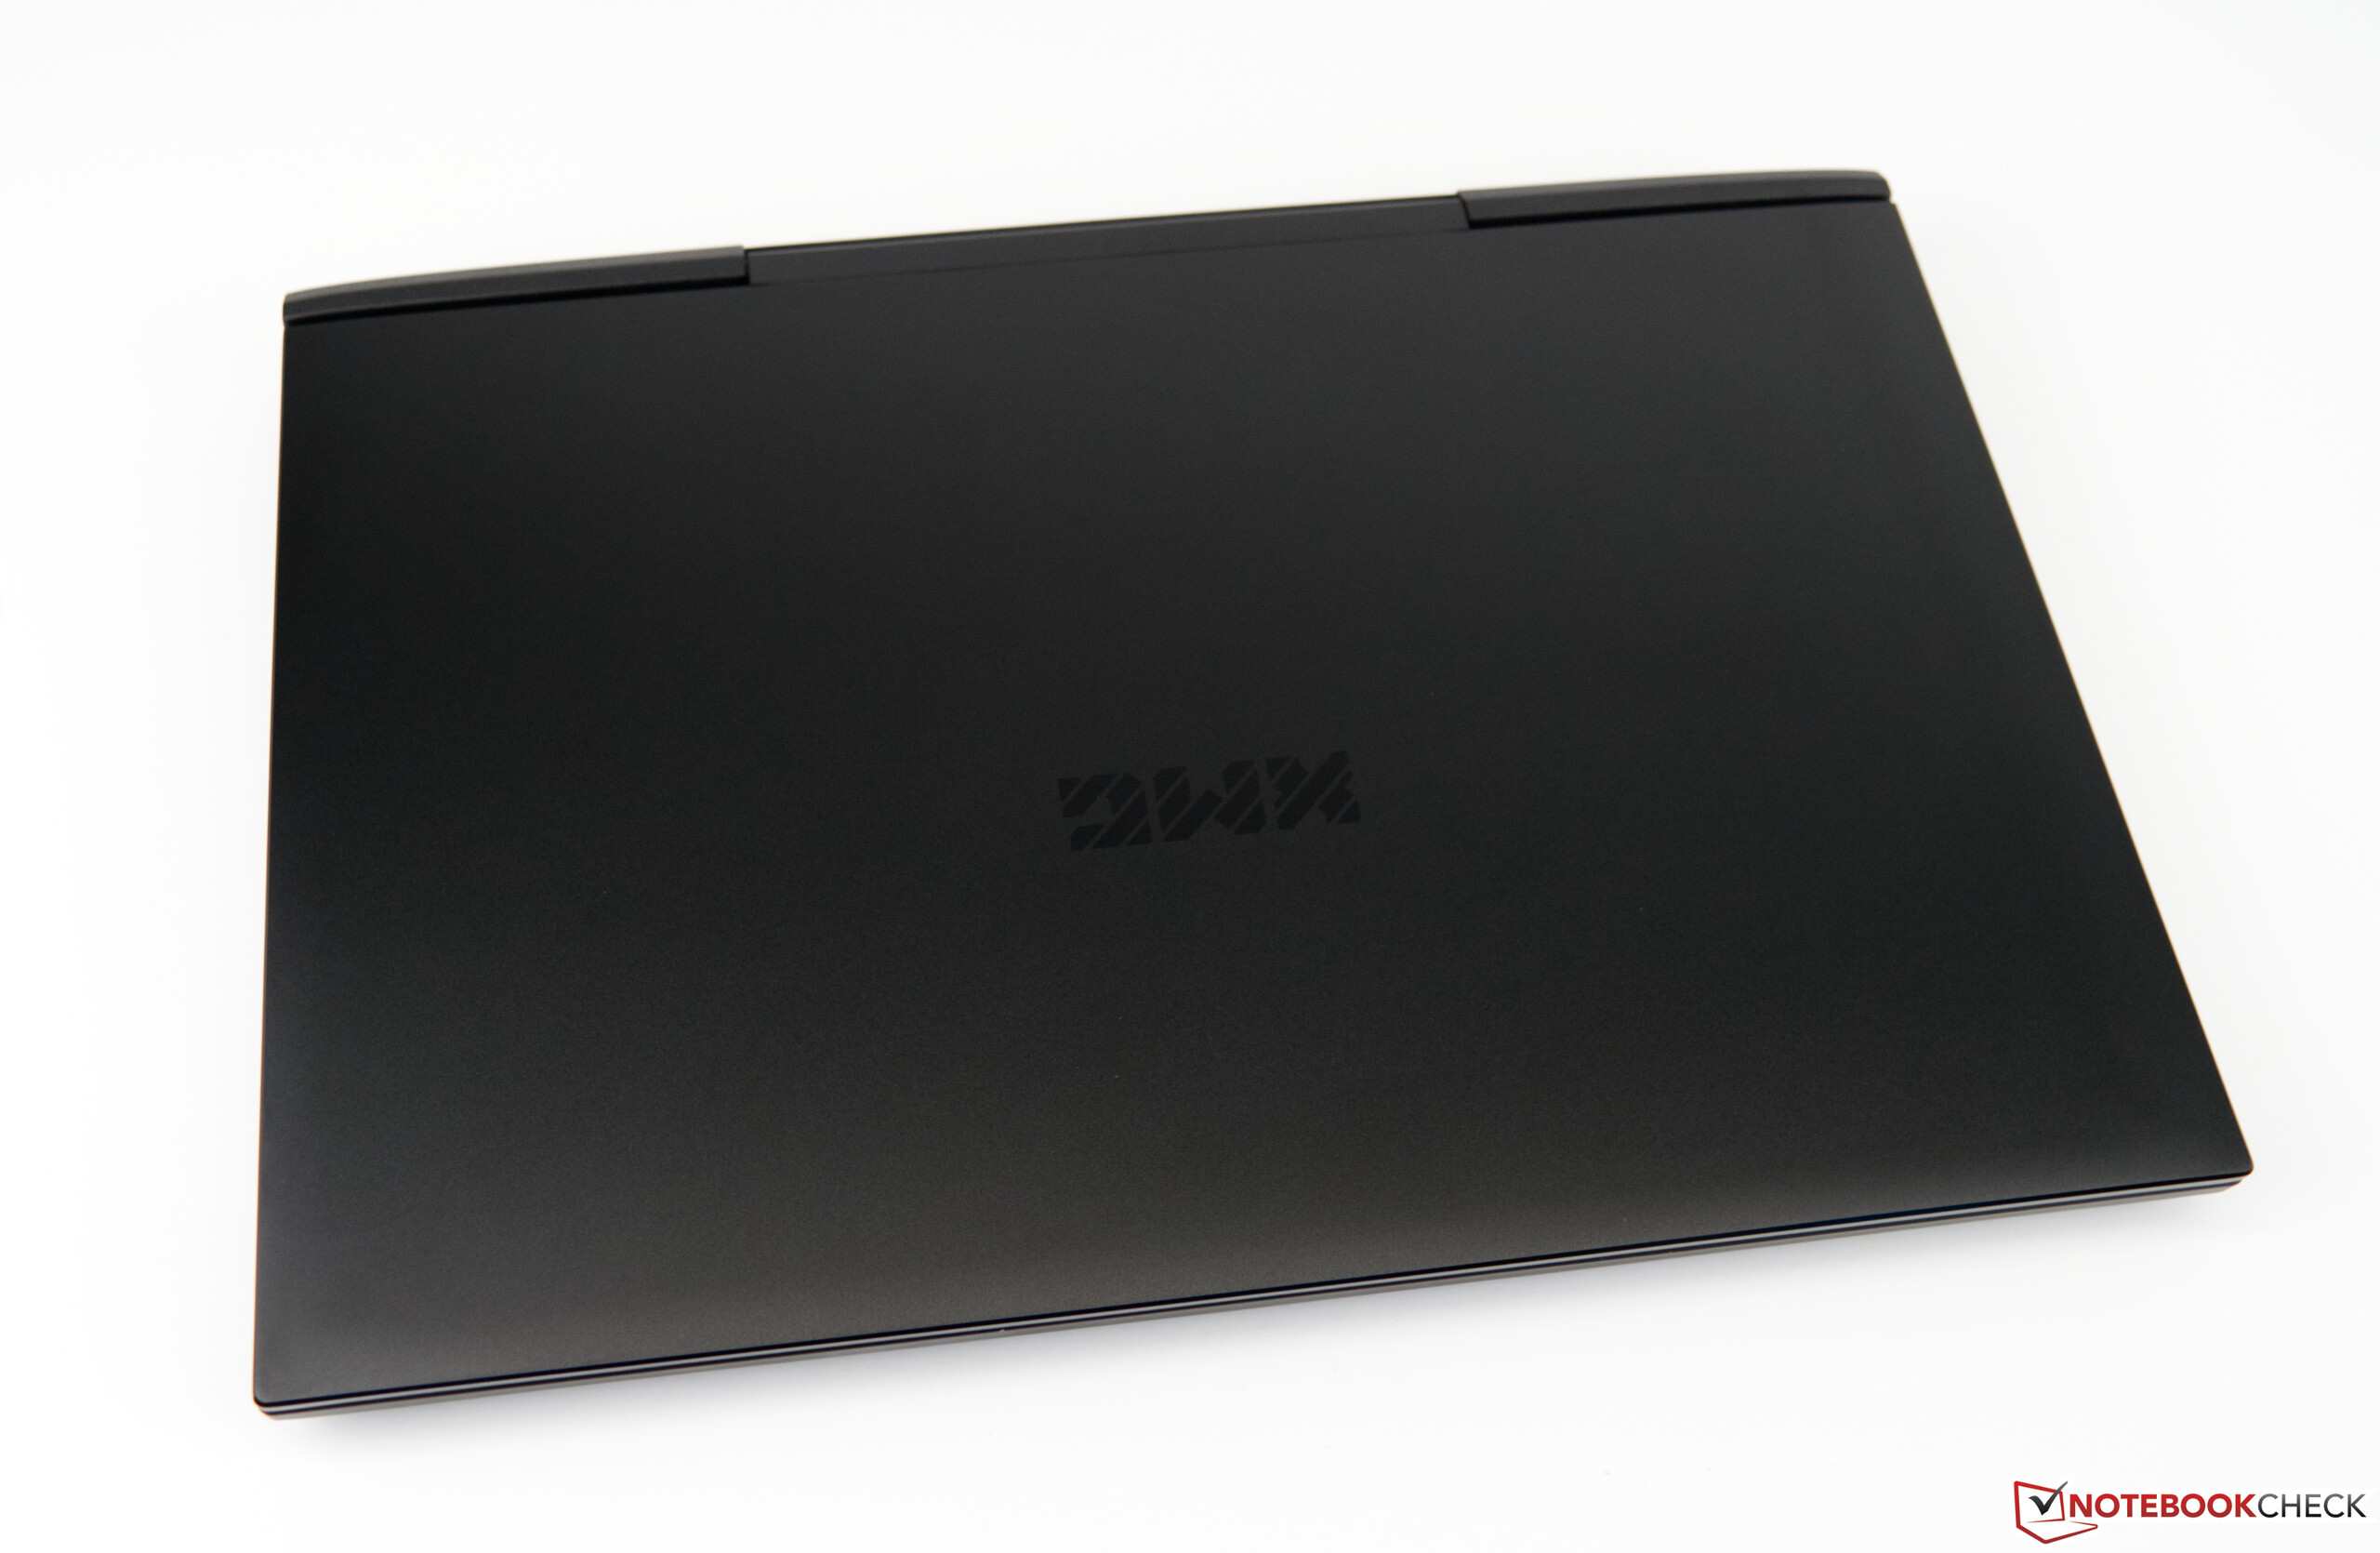
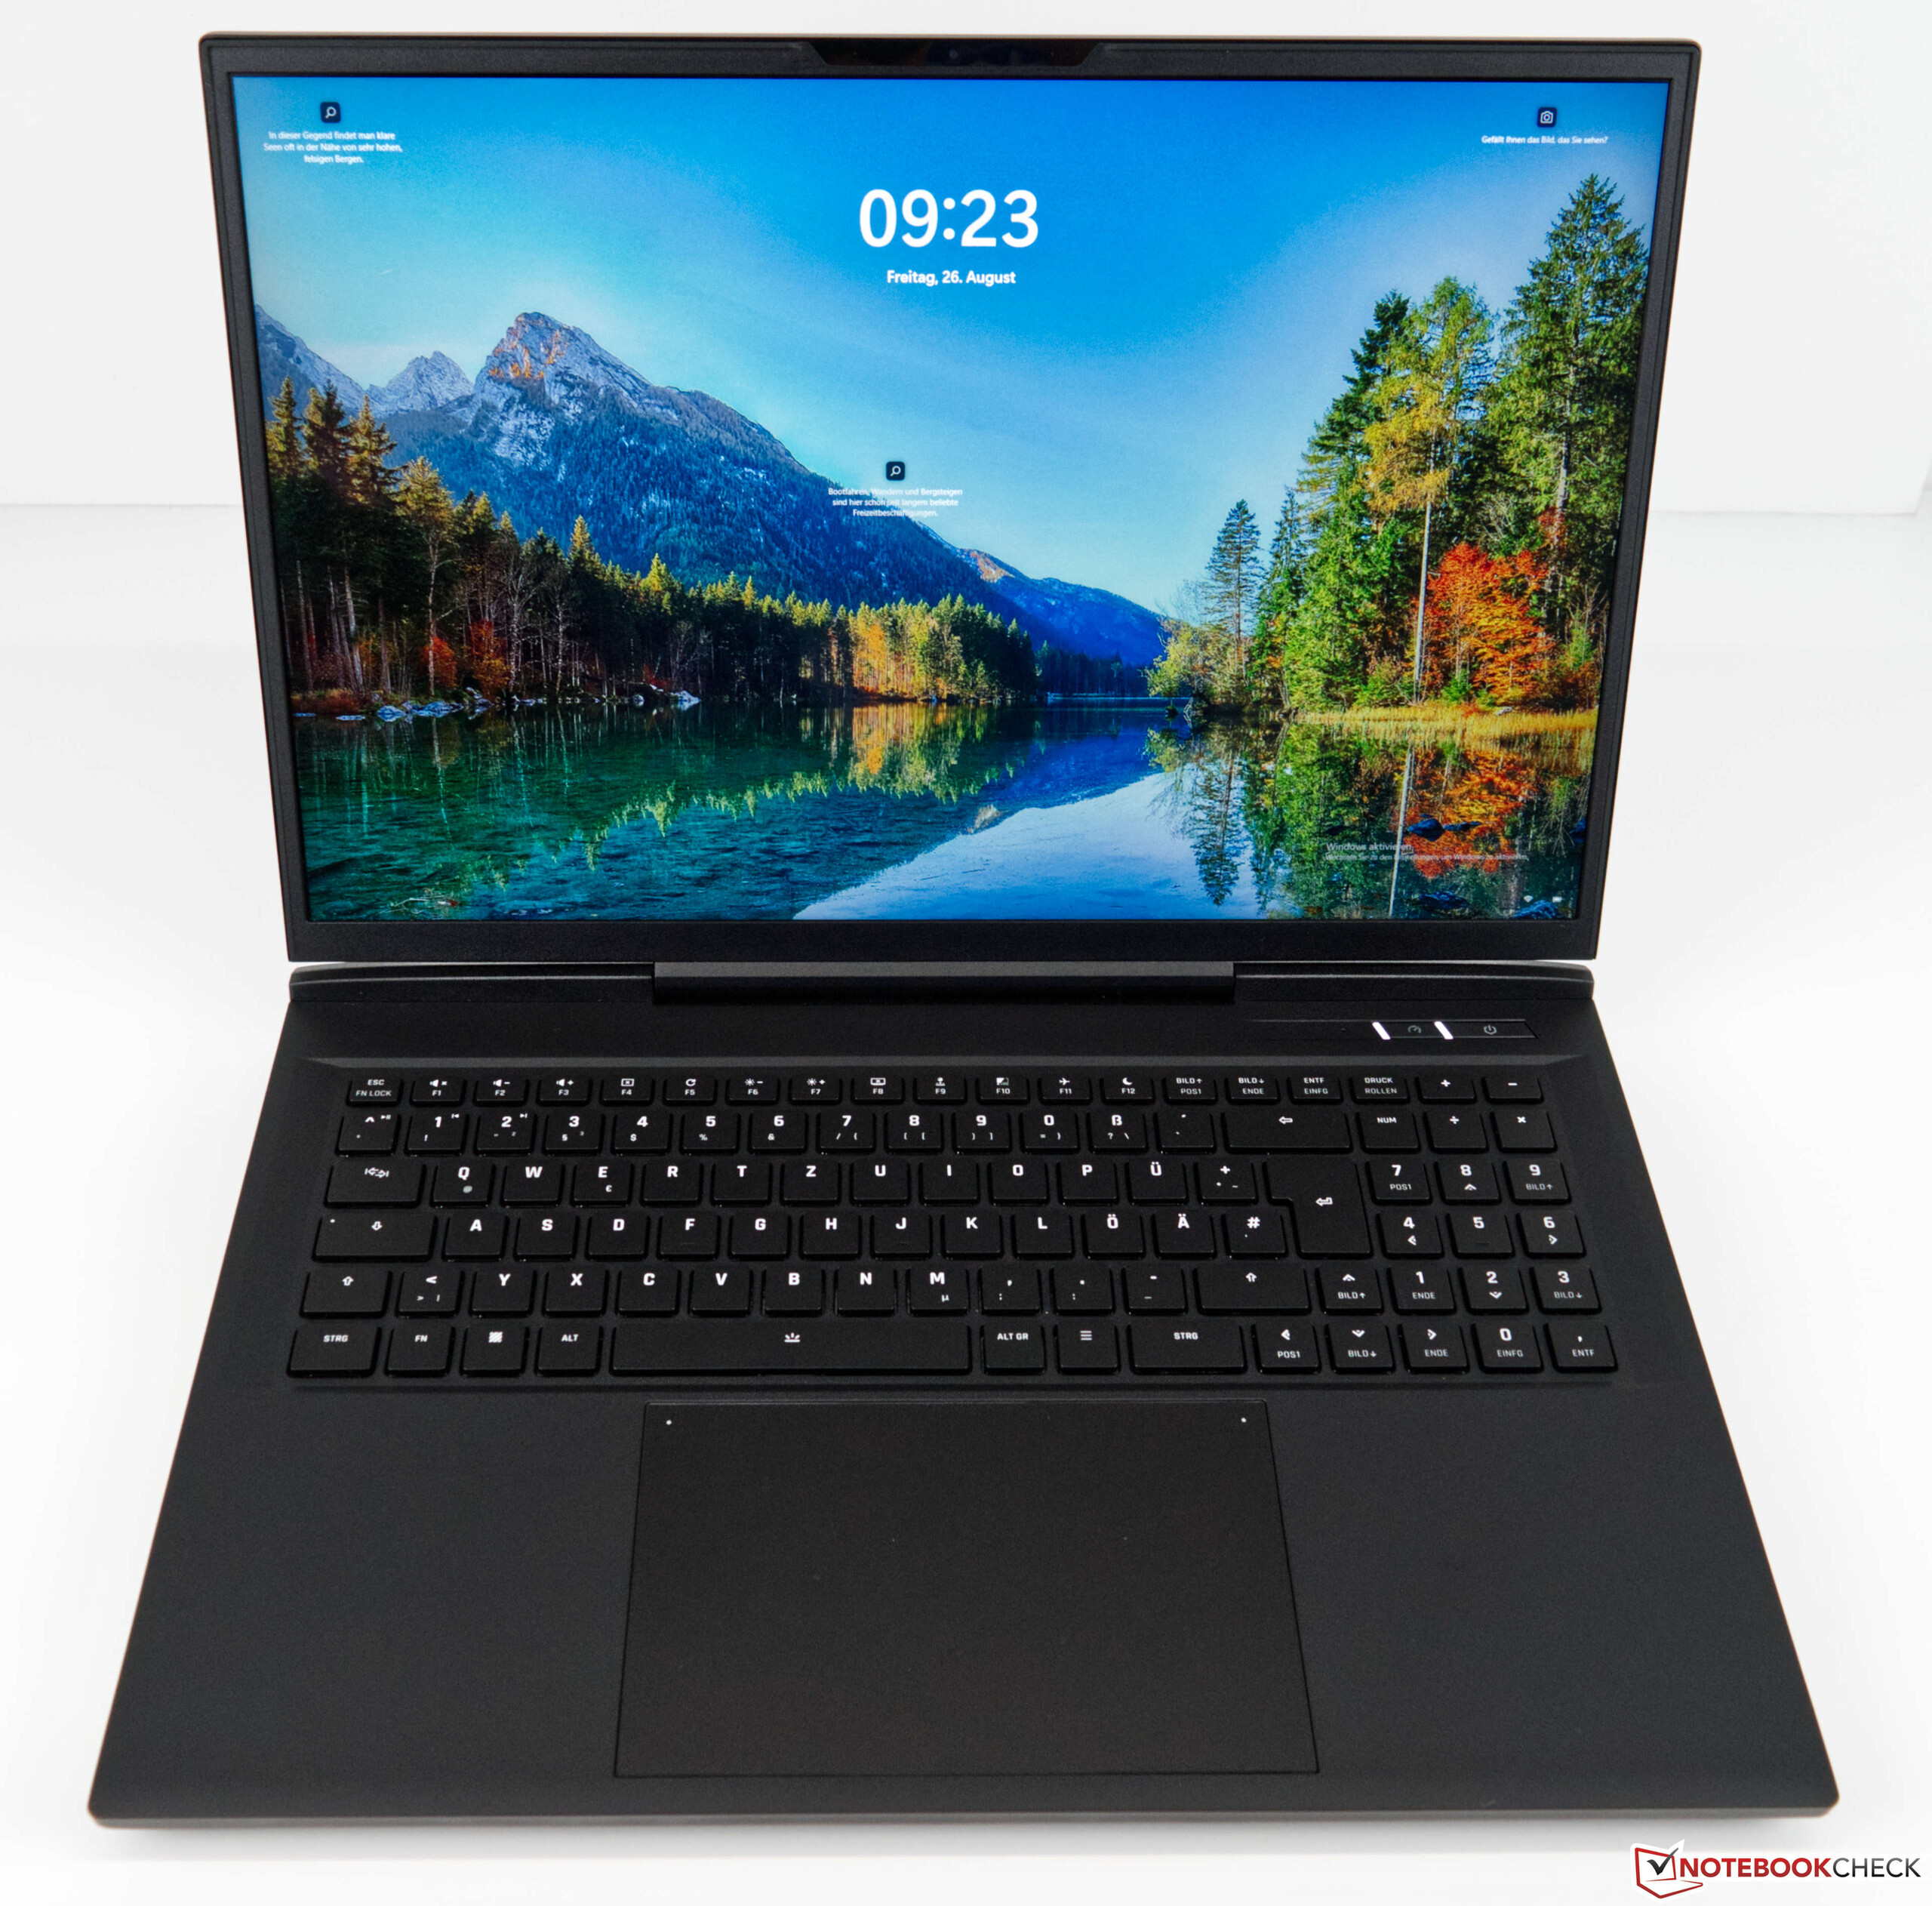
Visualmente, el Schenker XMG Neo 17 es evidentemente un portátil para juegos de Schenker. Parece sutil y omite la iluminación RGB llamativa. Las superficies de metal mate ofrecen una estética de primera, aunque las huellas dactilares se hacen visibles en ellas después de muy poco tiempo. El plástico es el material elegido para los biseles de la pantalla y la unidad base. Esta última está recubierta de una capa suave al tacto. Afortunadamente, es ligeramente menos susceptible a las huellas dactilares. A pesar del tamaño, la base es bastante rígida. Bajo presión, el Neo 17 se muestra robusto y sólo cede ligeramente bajo una gran cantidad de presión. Lo mismo ocurre con la tapa. Las bisagras centradas están a la altura y evitan bien el tambaleo excesivo.


Comparación de tamaños
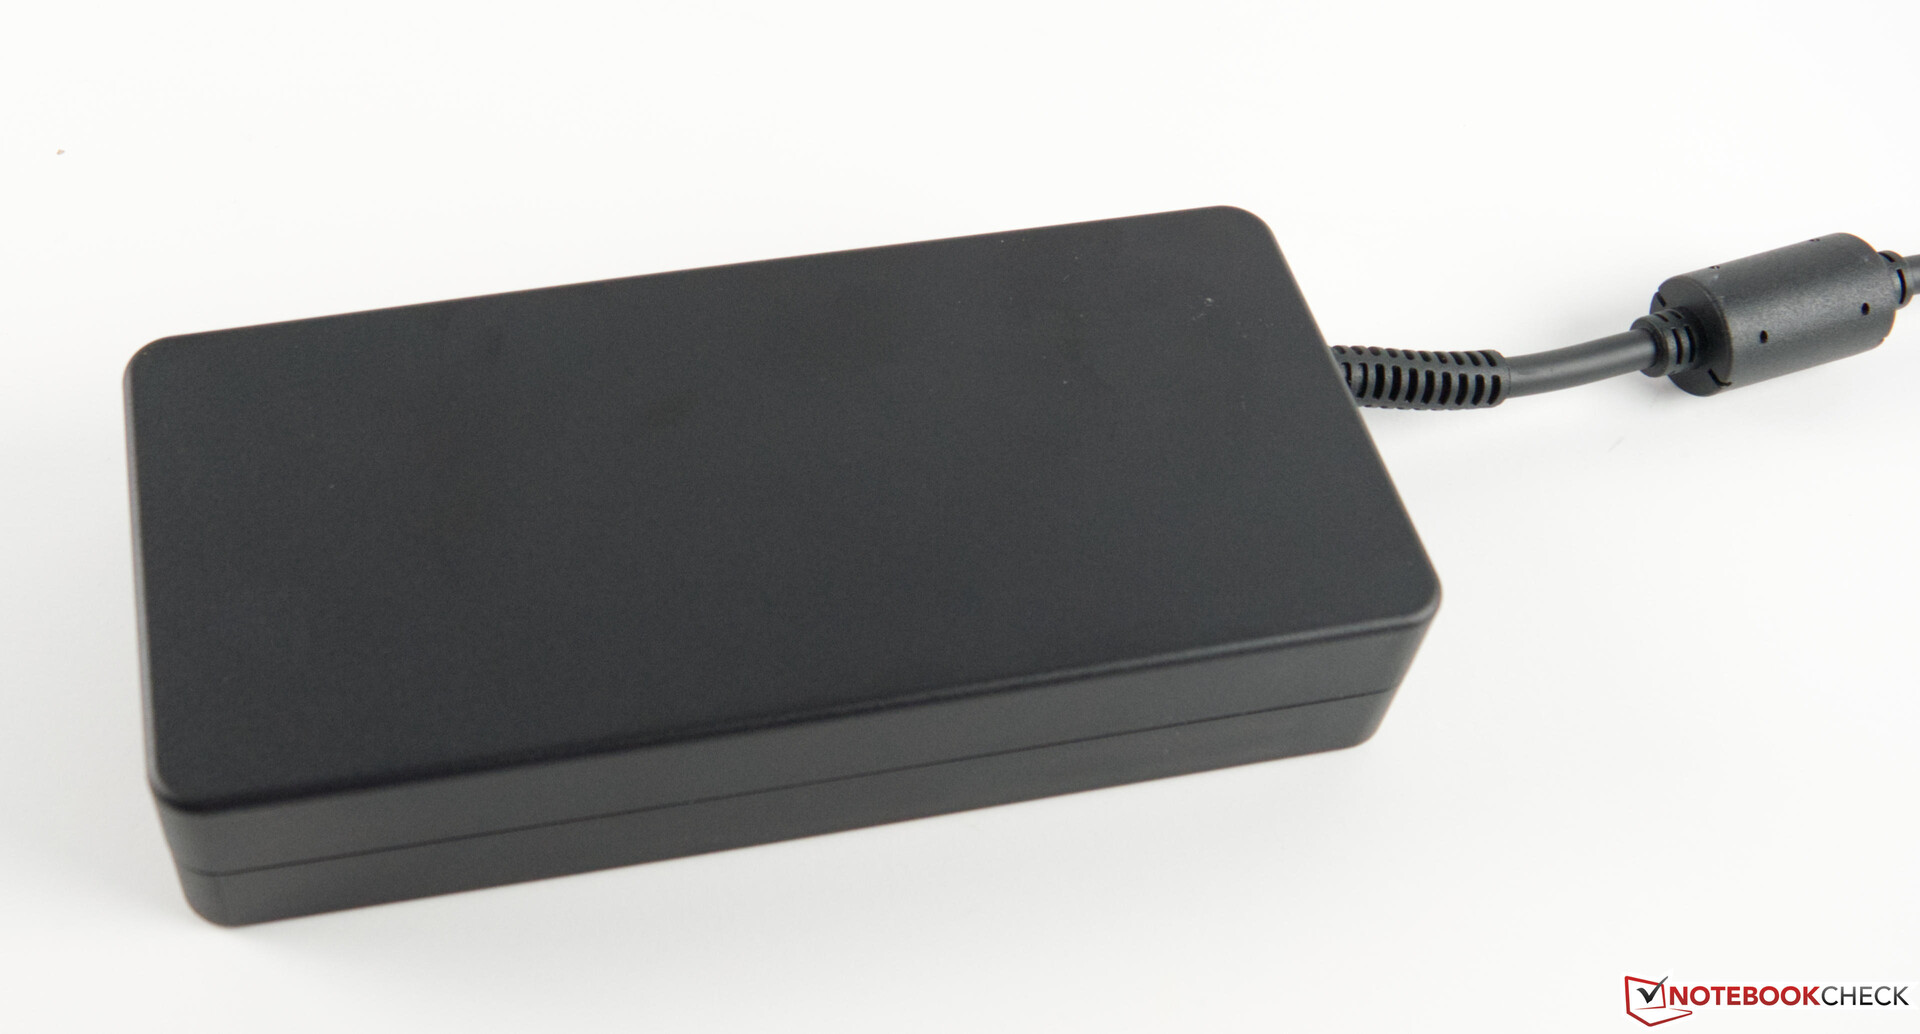
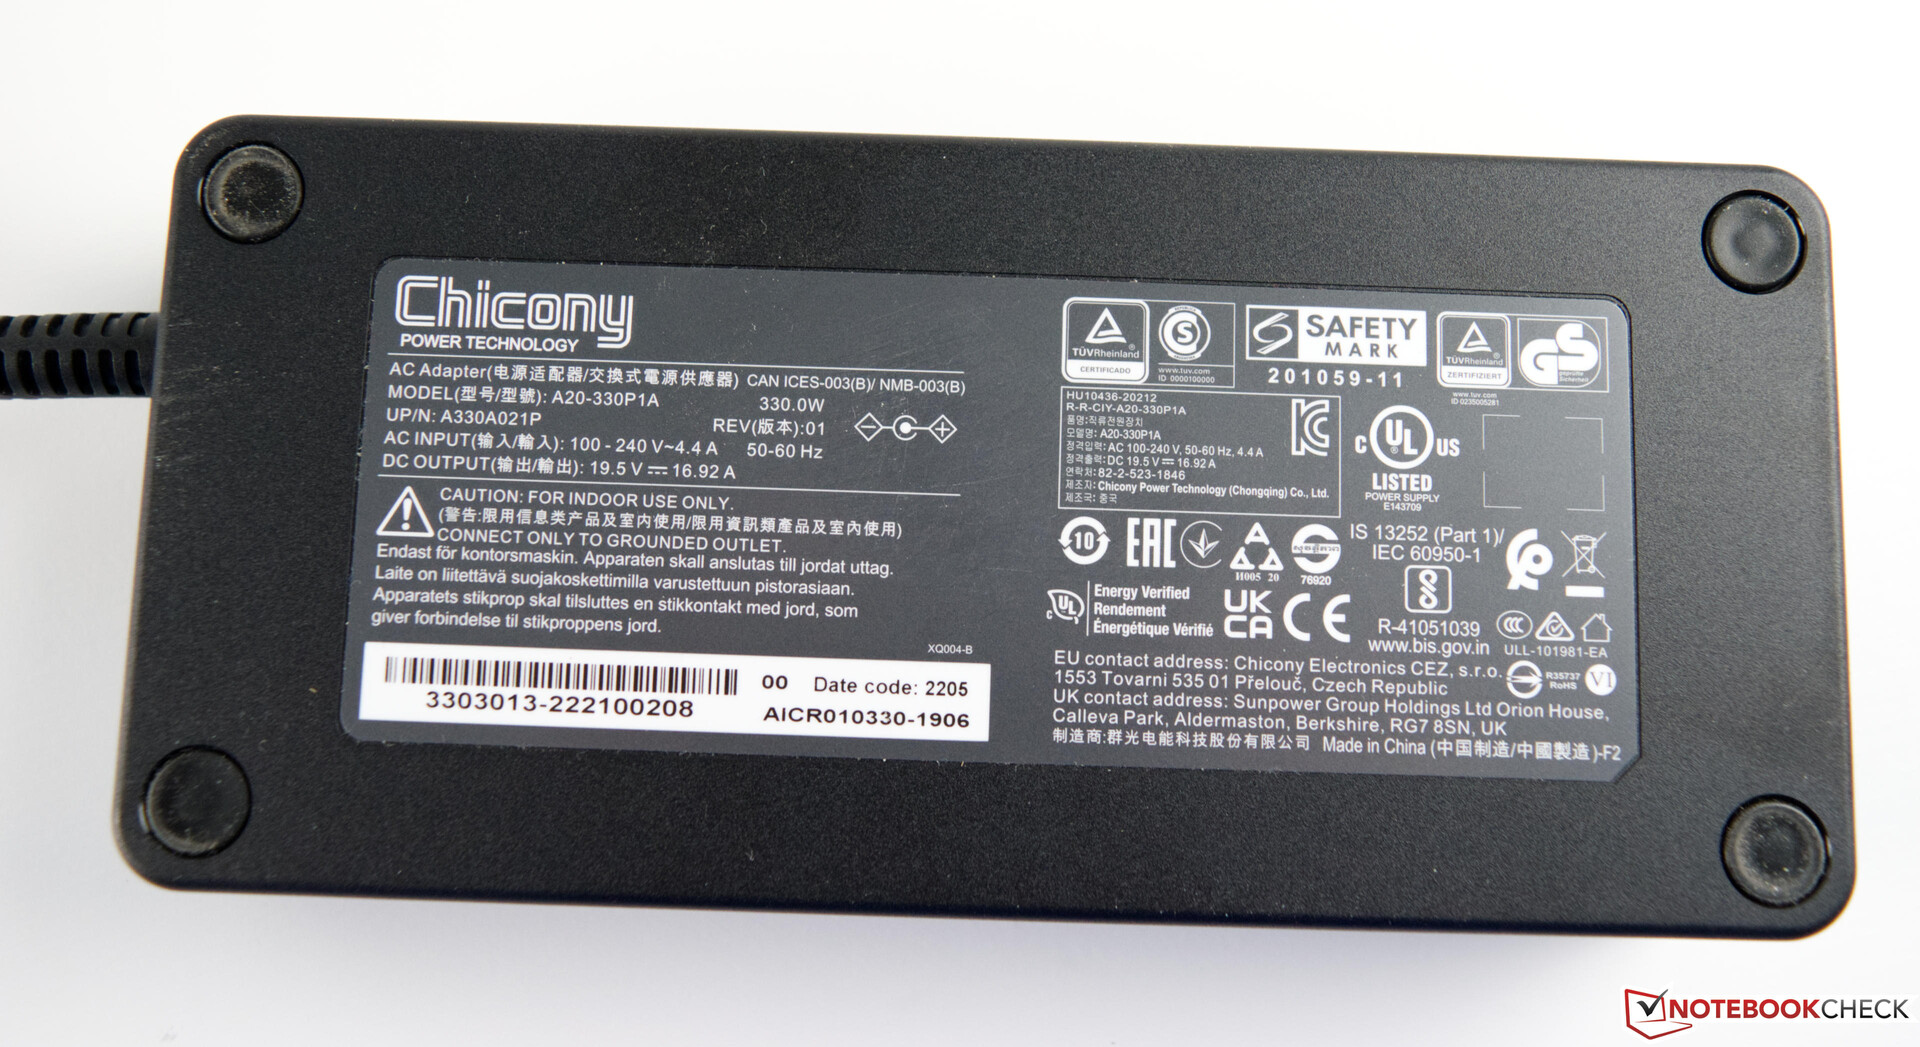
Con 2,8 kg (6,17 lbs), el Schenker XMG Neo 17 se sitúa en el rango medio en cuanto al peso. El potente adaptador de CA de 330 vatios pesa casi un kilo más (980 gramos/2.16 lbs).
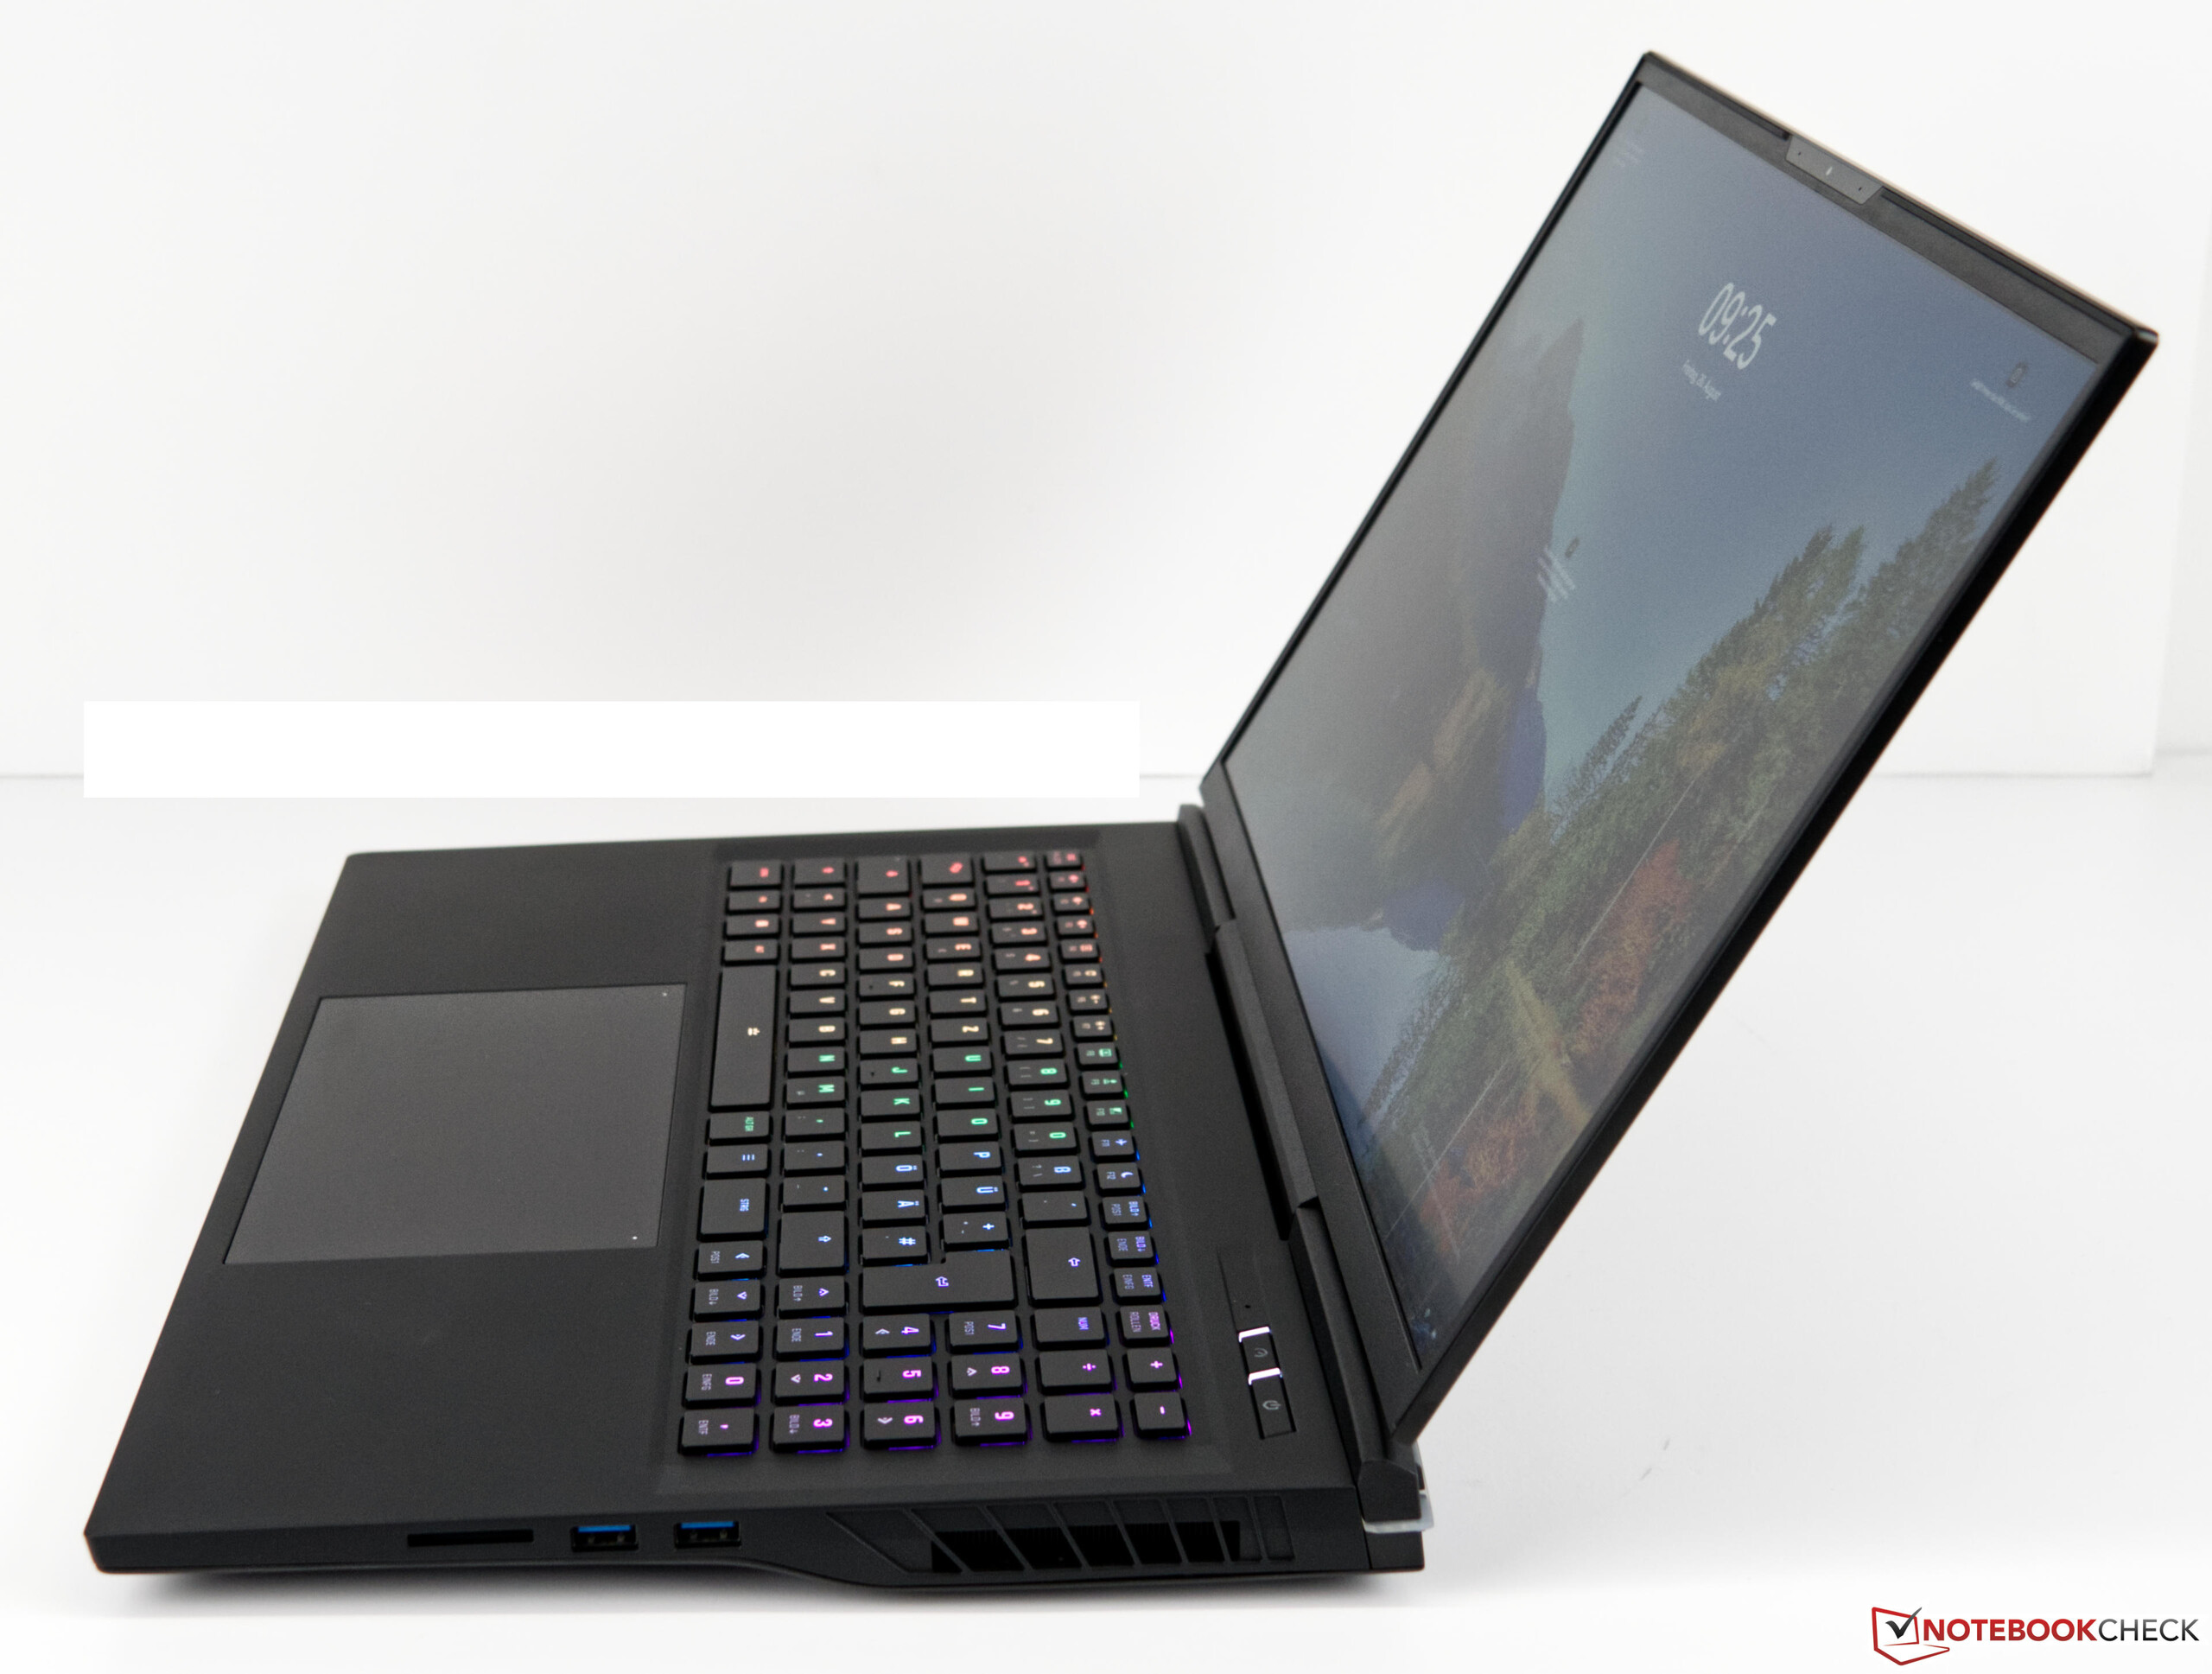
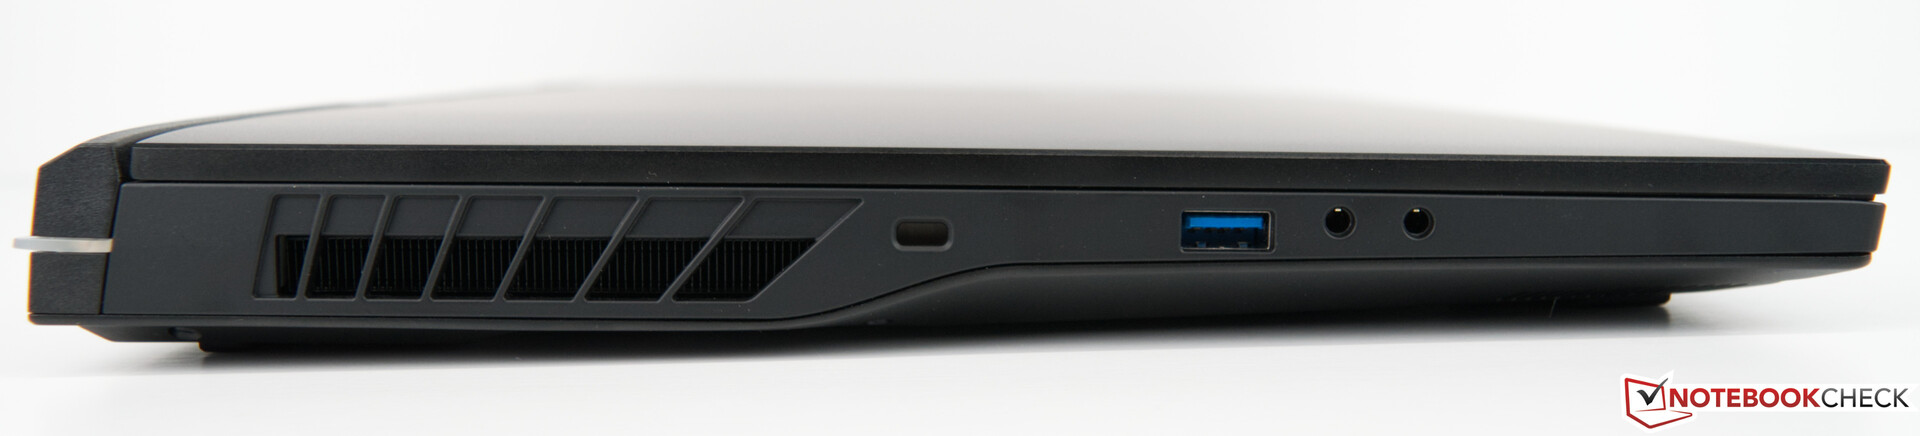
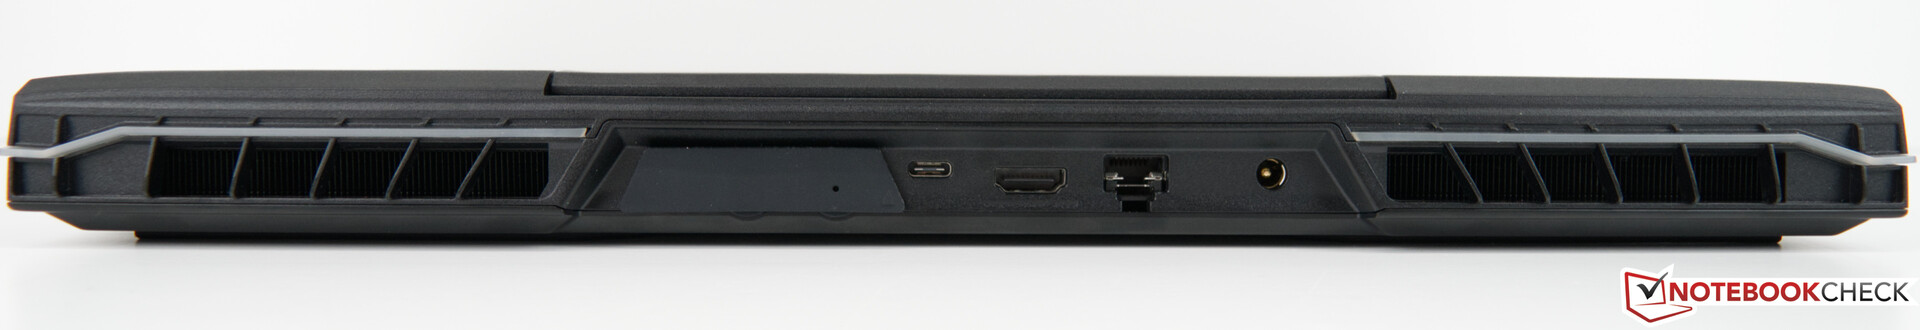
Conectividad - Lamentablemente no hay Thunderbolt 4
El Schenker XMG Neo 17 M22 ofrece una buena variedad de interfaces externas. Los tres puertos USB-A están distribuidos en ambos lados para un uso cómodo en el día a día. Mientras tanto, los puertos que se utilizan con menos frecuencia, como el HDMI o el LAN, se encuentran en la parte trasera. El adaptador de CA también se enchufa aquí y así no interfiere con los periféricos mientras está conectado a la red eléctrica. Desafortunadamente, dado que el enchufe del adaptador de CA está en ángulo, usar los puertos adyacentes requiere más paciencia cuando el cable de alimentación está dirigido hacia el lado derecho detrás del dispositivo. Además, la clavija de barril se enchufa con mucha facilidad, lo que la hace propensa a desenchufarse accidentalmente.
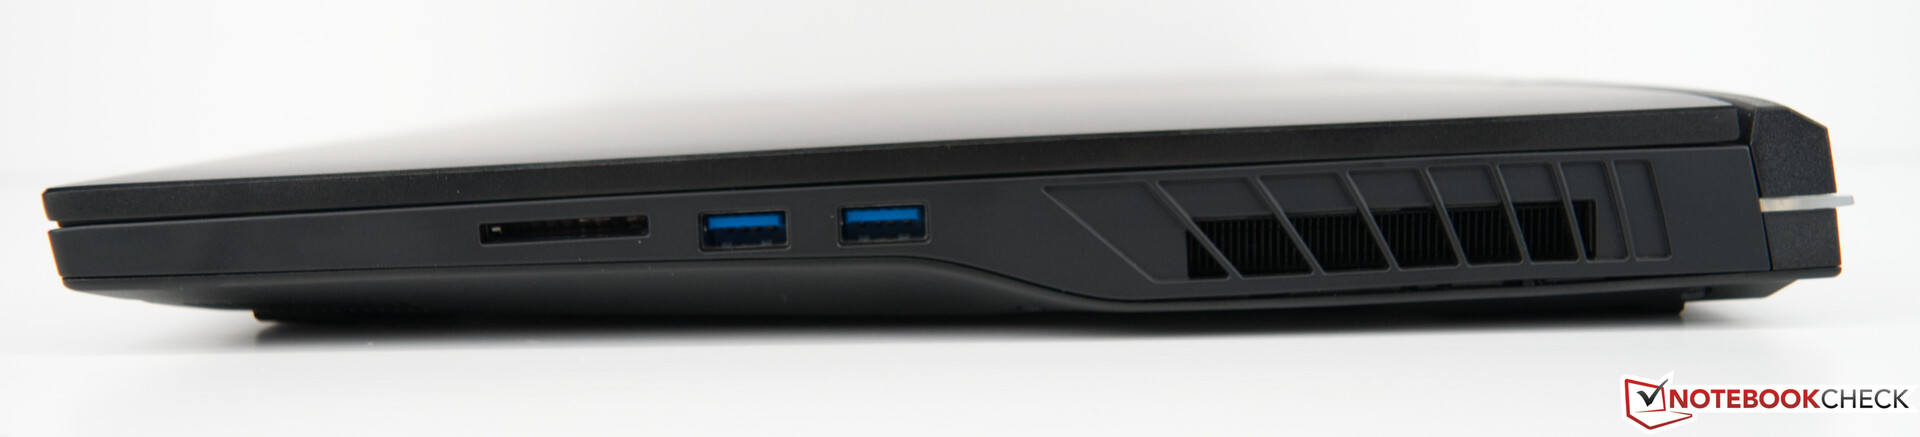
Lector de tarjetas SD
El Schenker XMG Neo 17 M22 está equipado con un lector de tarjetas SD que soporta velocidades USB-3. Con 69 MB/s, su rendimiento está a la altura de dispositivos similares. Tanto el Asus ROG Zephyrus Duo como el Razer Blade 17 demuestran las velocidades de las que es capaz nuestra tarjeta de referencia (Angelbird AV Pro V60) con el estándar UHS-II.
| SD Card Reader - average JPG Copy Test (av. of 3 runs) | |
| Asus ROG Zephyrus Duo 16 GX650RX (AV PRO microSD 128 GB V60) | |
| Razer Blade 17 Early 2022 (AV PRO microSD 128 GB V60) | |
| Media de la clase Gaming (20.9 - 210, n=54, últimos 2 años) | |
| MSI Titan GT77 12UHS (AV PRO microSD 128 GB V60) | |
| Schenker XMG Neo 17 M22 (AV PRO microSD 128 GB V60) | |
| Acer Predator Triton 500 SE PT516-52s-70KX (AV PRO microSD 128 GB V60) | |
| MSI Raider GE77 HX 12UHS (AV PRO microSD 128 GB V60) | |
Comunicación
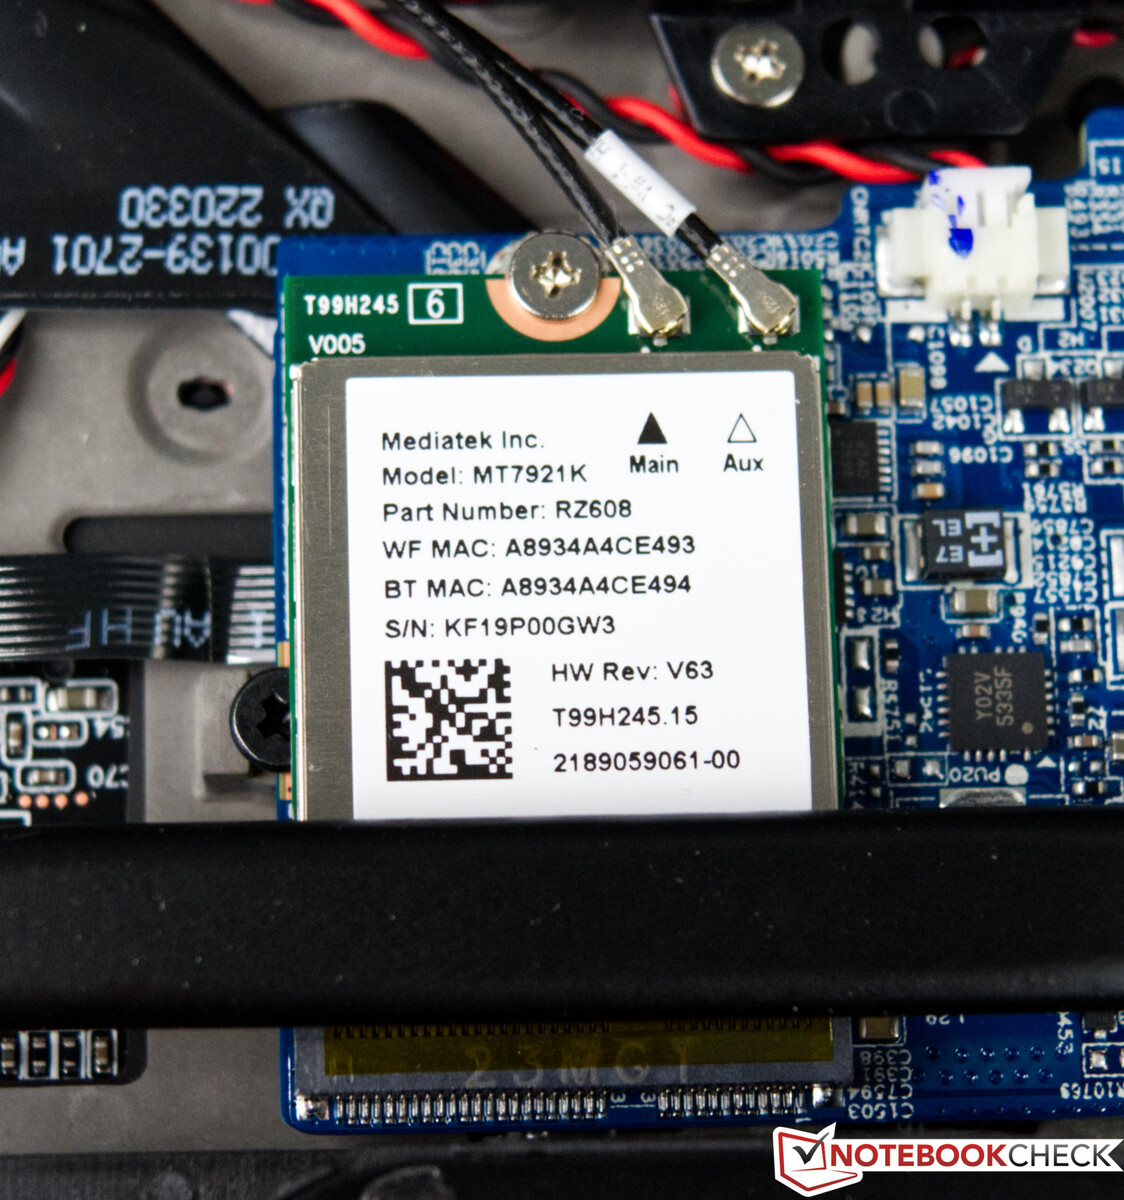
Schenker utiliza un AMD RZ608 como módulo Wi-Fi de elección en nuestro dispositivo. La opción base no es capaz de superar a sus competidores en nuestras pruebas. El Intel Wi-Fi 6 AX200 y el Rivet Networks Killer Wi-Fi 6 AX1650x están disponibles como opciones de configuración alternativas. También nos hubiera gustado ver una opción Wi-Fi 6E. La red por cable es posible hasta 2.5 Gb/s - una buena opción.
Cámara web
No hay muchos portátiles para juegos con buenas cámaras web. Del mismo modo, la webcam del Schenker XMG Neo 17 falla tanto en la precisión del color como en la nitidez, como muestran nuestras fotos. Dado que la cámara integrada soporta "Windows Hello", puede usarse como método de autenticación.


Accesorios
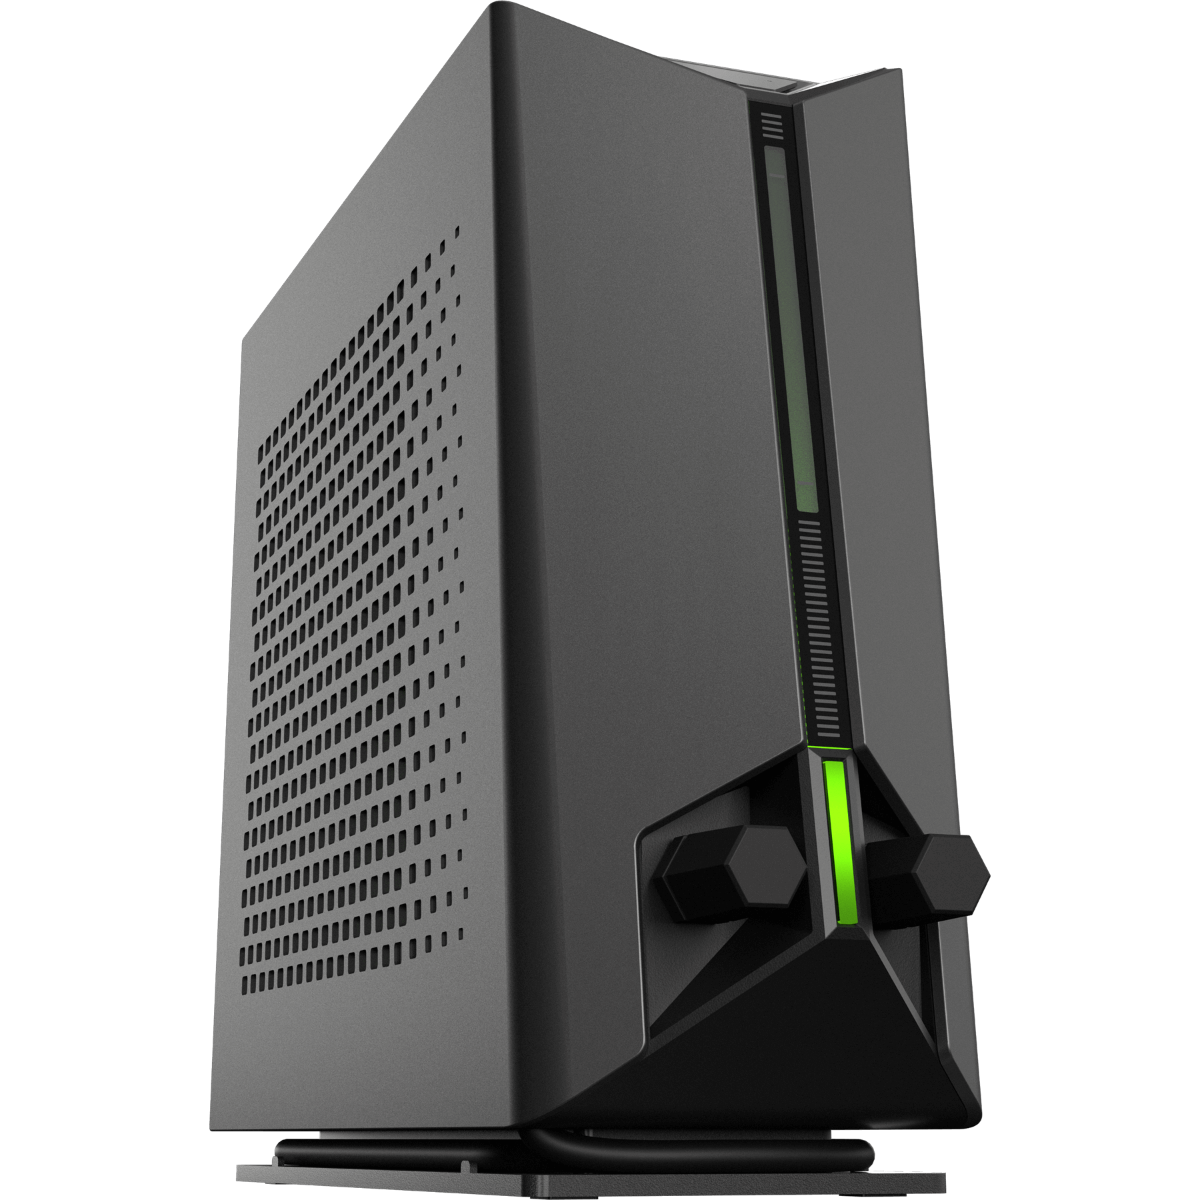
El volumen de suministro incluye el propio dispositivo, un adaptador de CA de 330 vatios y una unidad de disco duro USB con controladores. Con el Schenker Oasis, el XMG Neo 17 M22 ofrece una solución opcional de refrigeración por agua externa. Está disponible por separado por unos 200 dólares en la tienda online de Schenker.
Mantenimiento
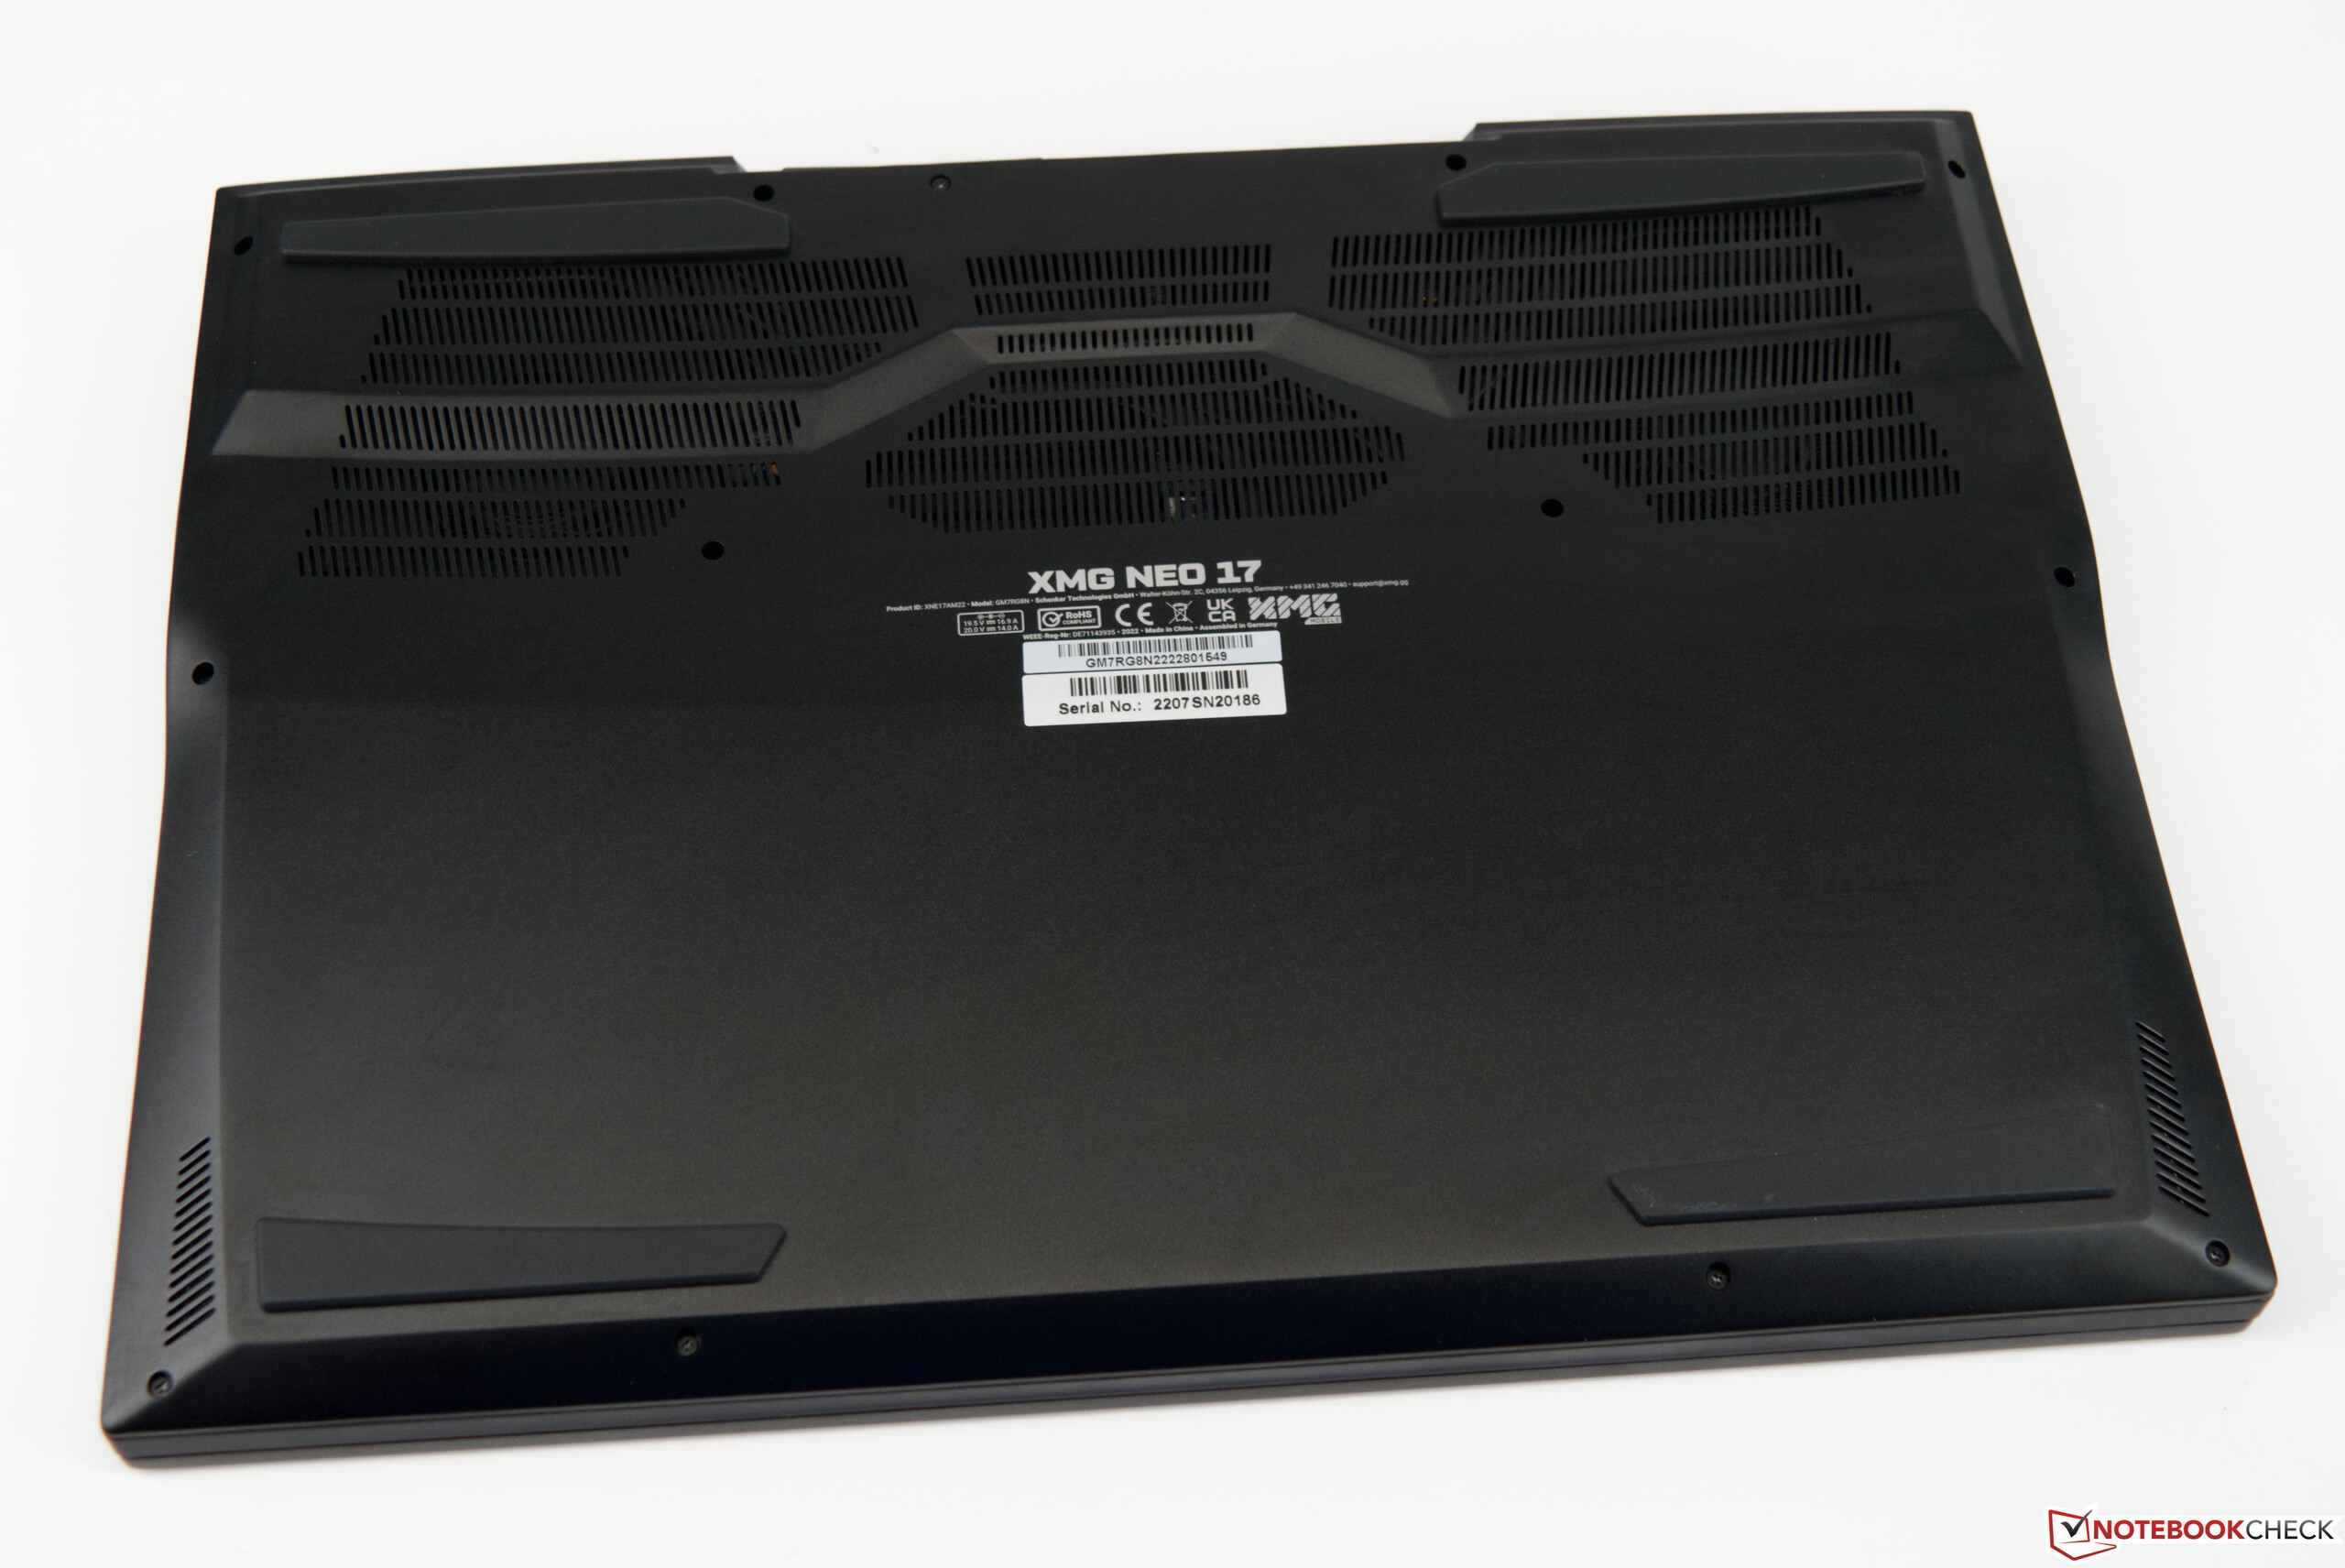
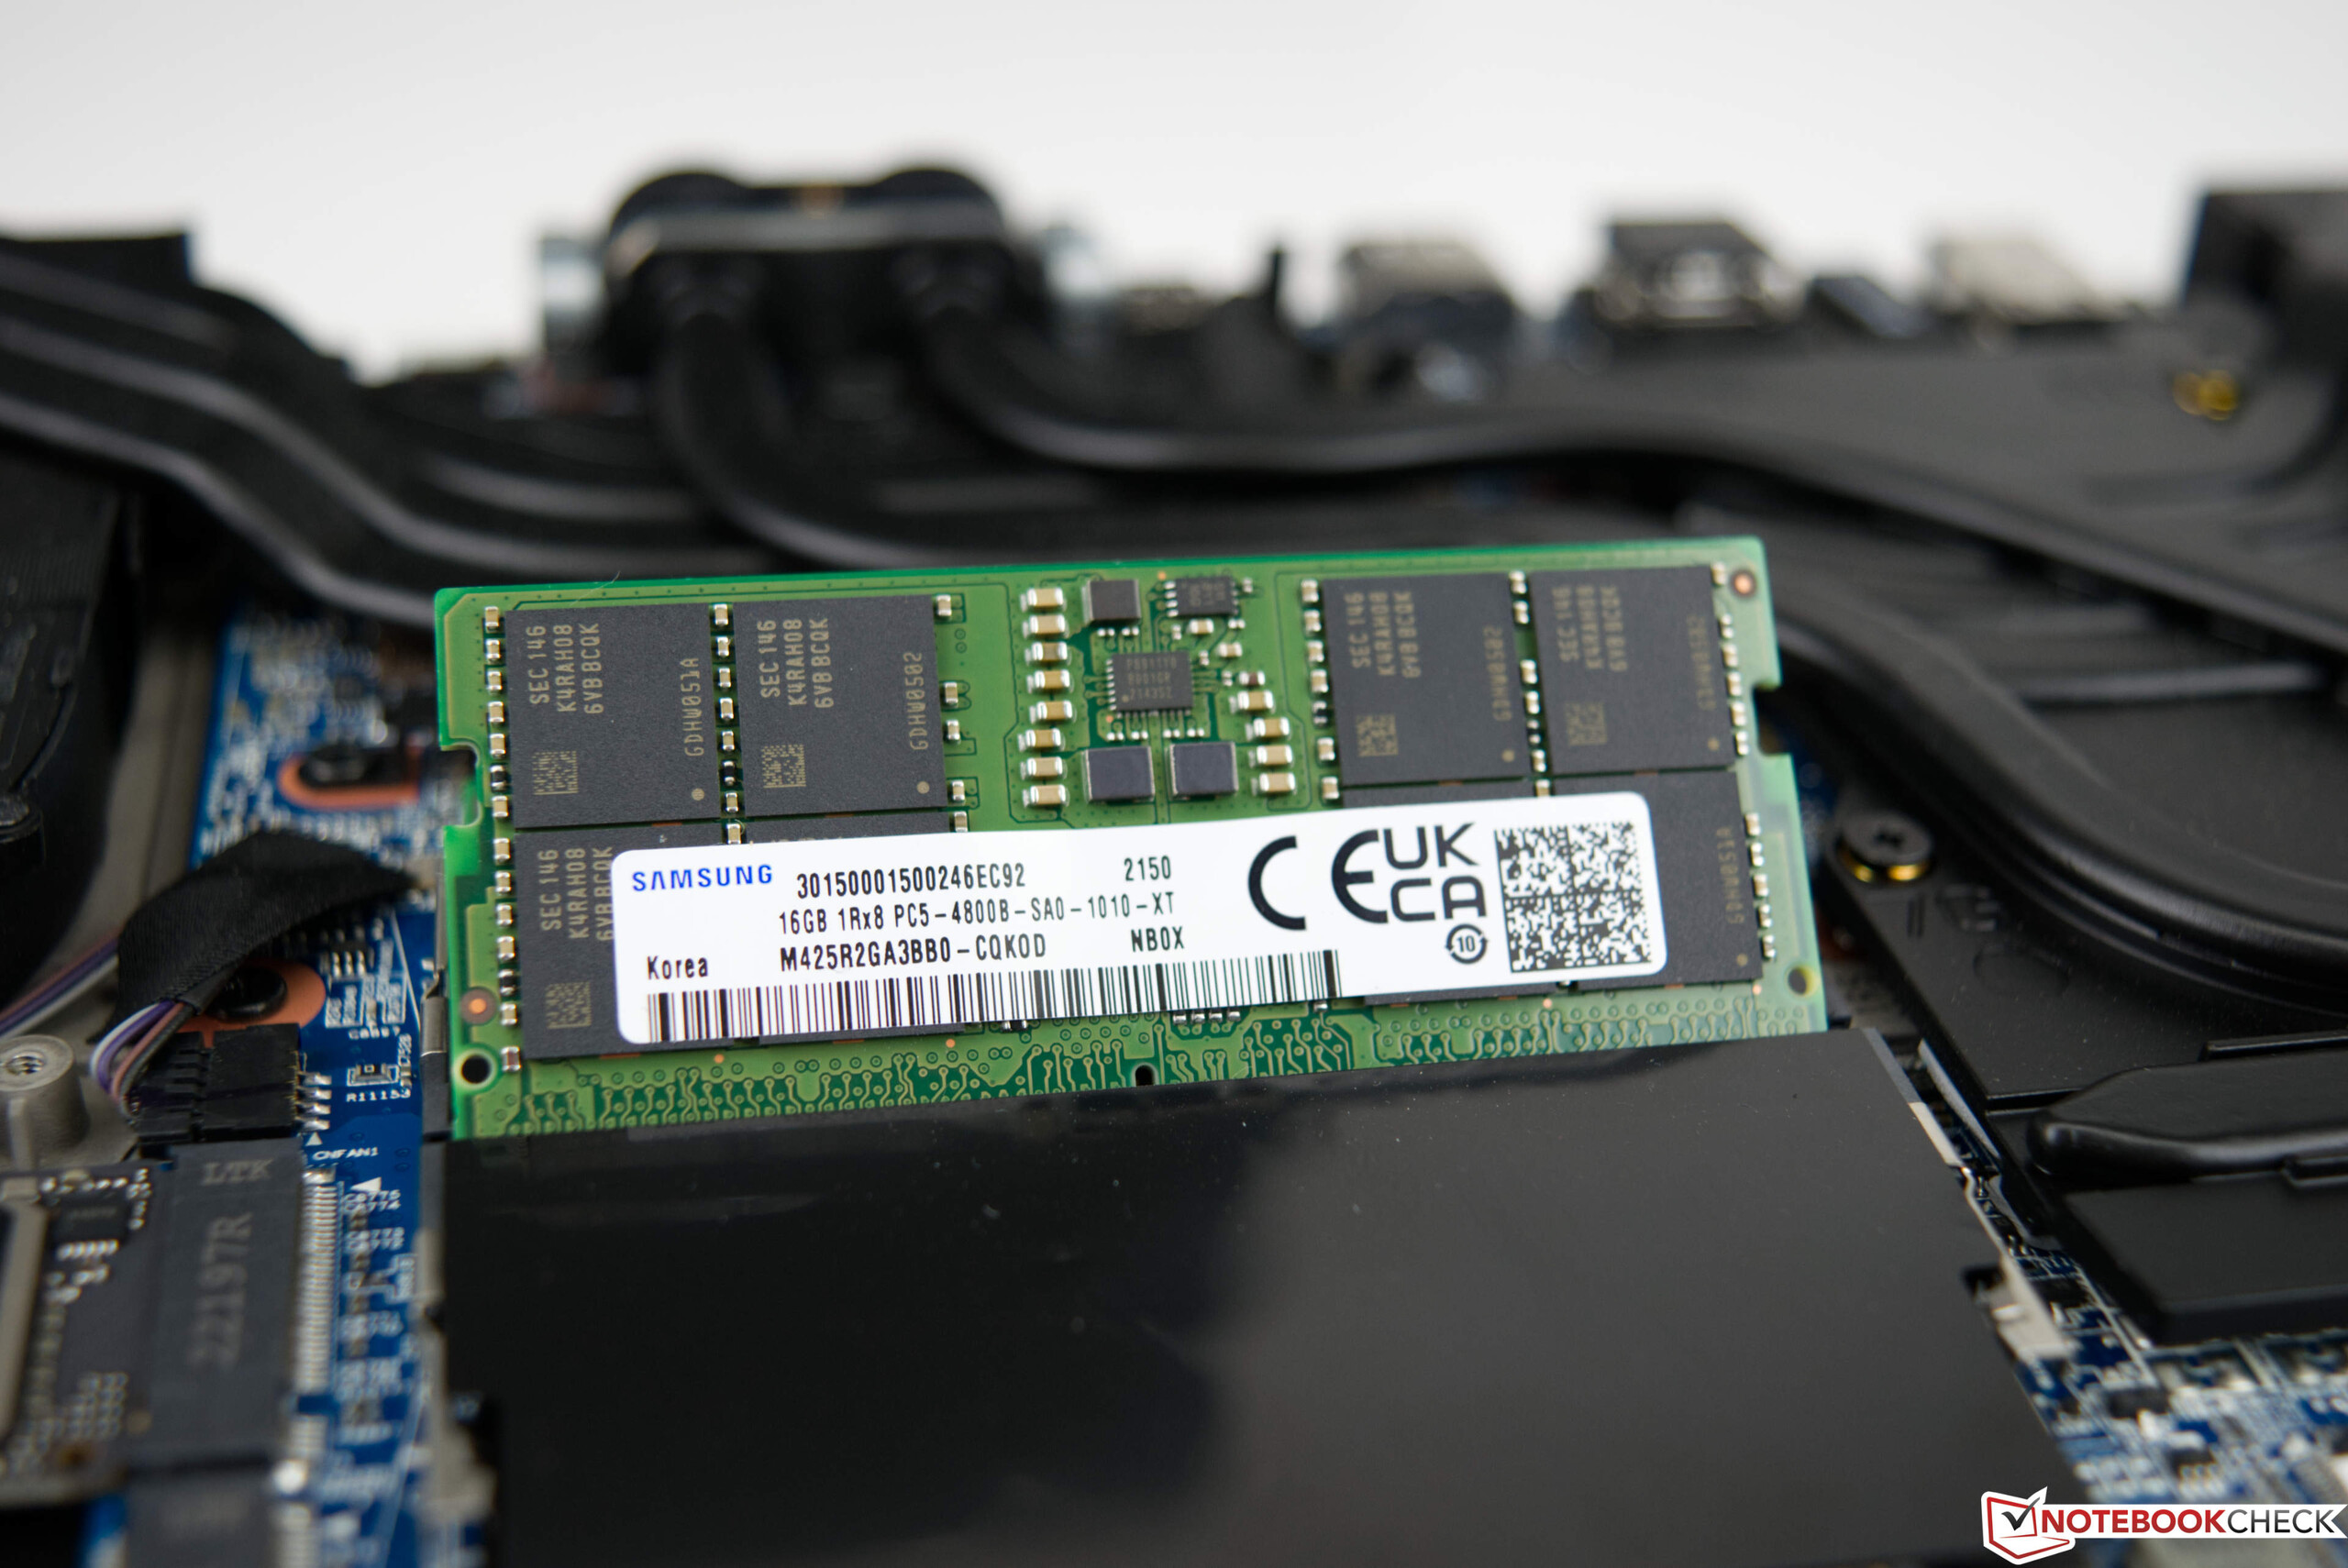
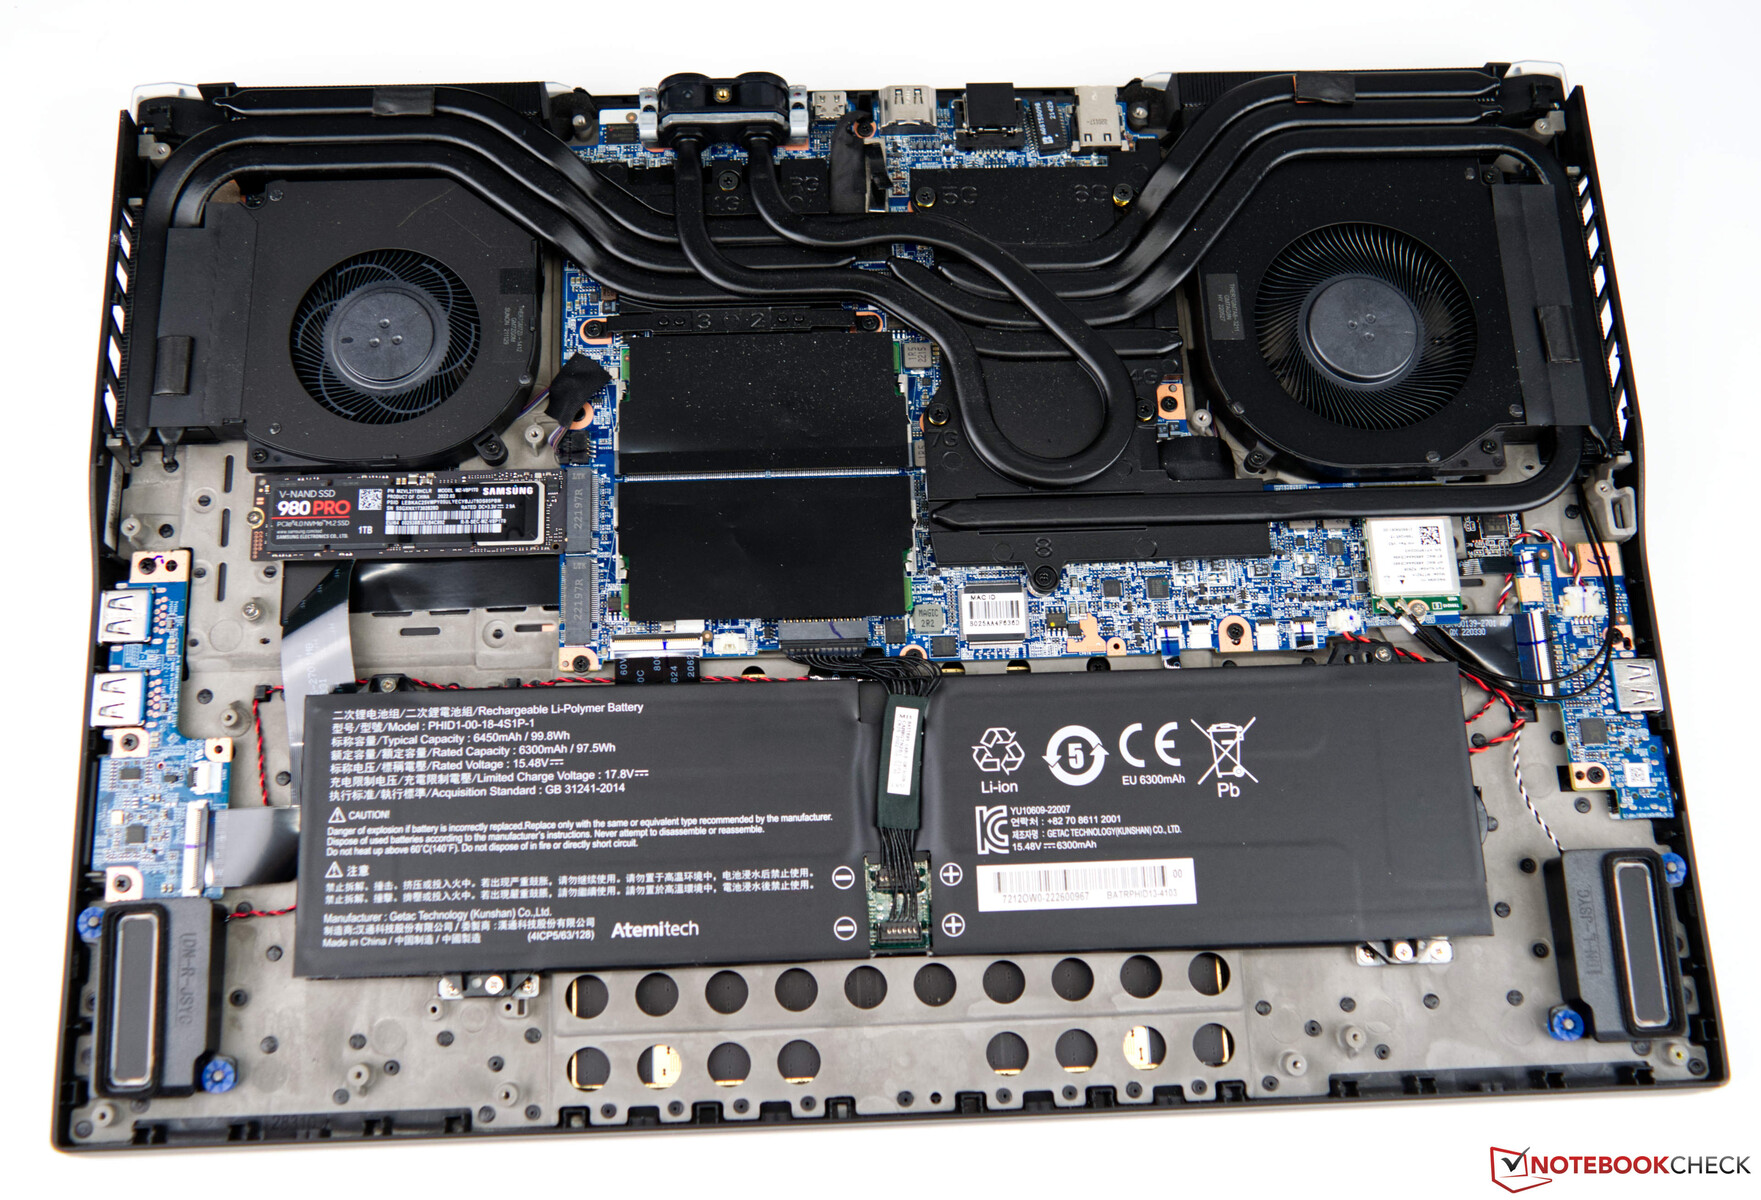
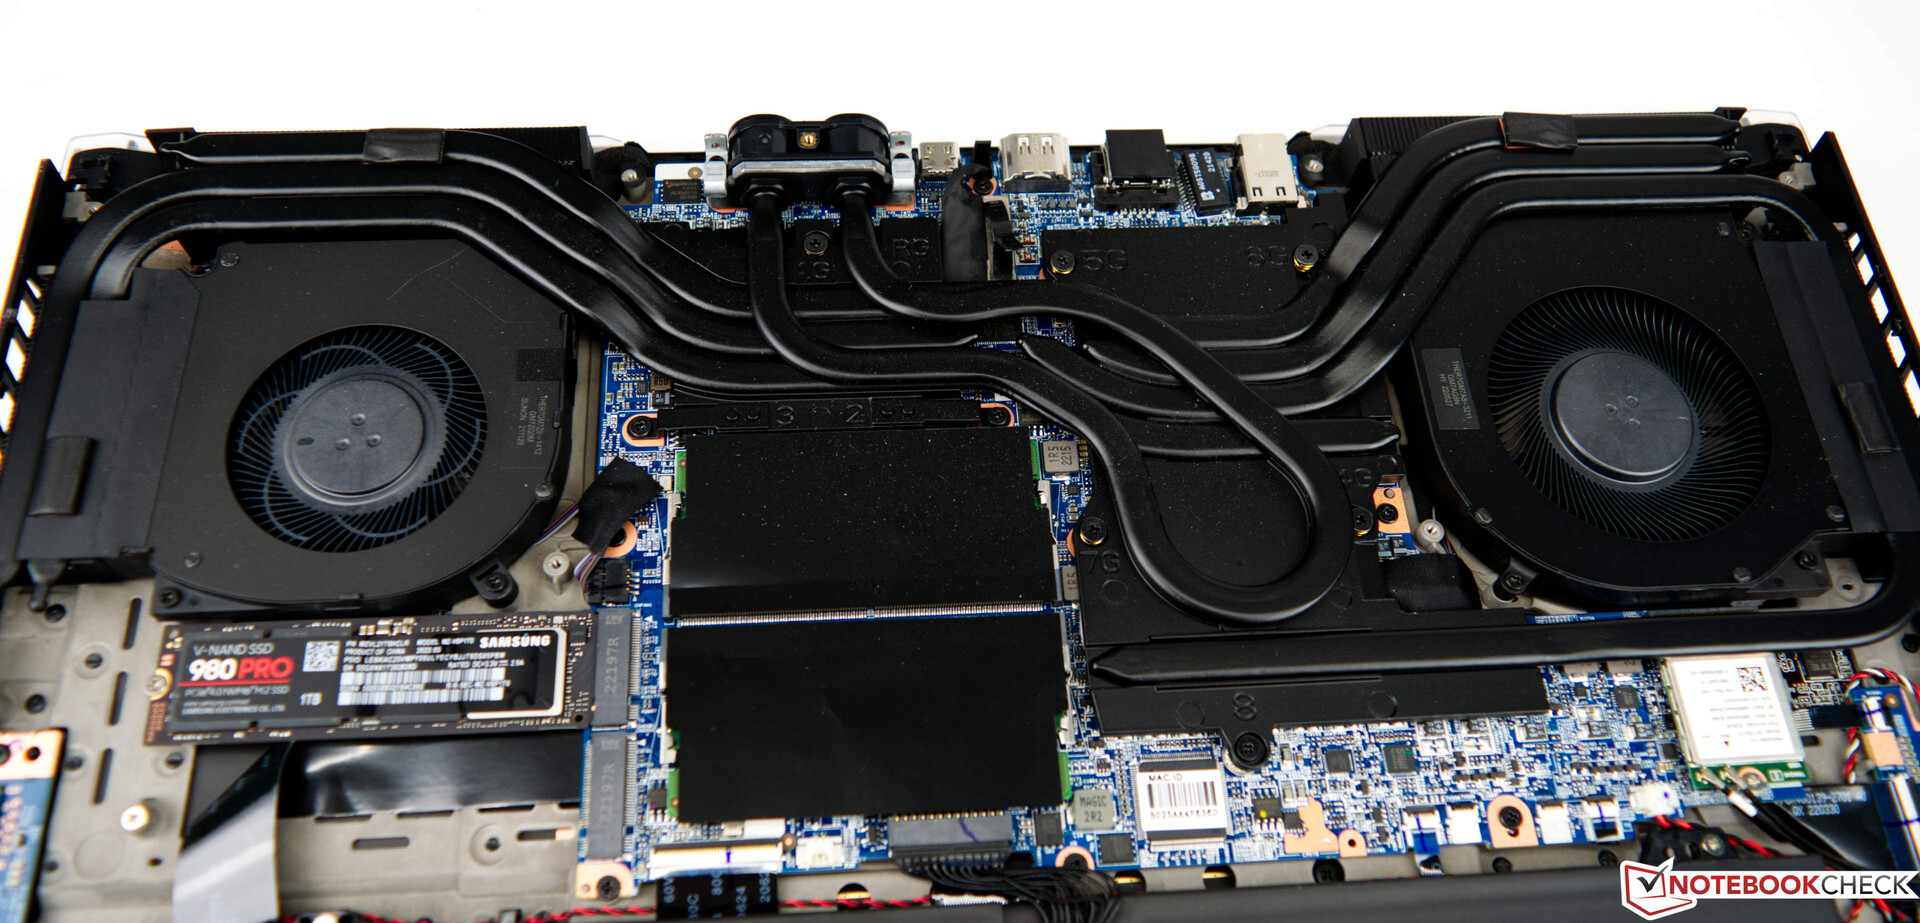
Dado que no hay una escotilla de mantenimiento en el Schenker XMG Neo 17 para acceder rápidamente a la RAM y al SSD, intercambiar estos componentes es algo difícil. Como resultado, la placa inferior tiene que ser retirada, lo que no es una tarea sencilla debido a los muchos clips de plástico que la aseguran. De todos modos, la cubierta inferior se puede retirar con un firme tirón desde abajo, cerca de las rejillas de ventilación.
Garantía
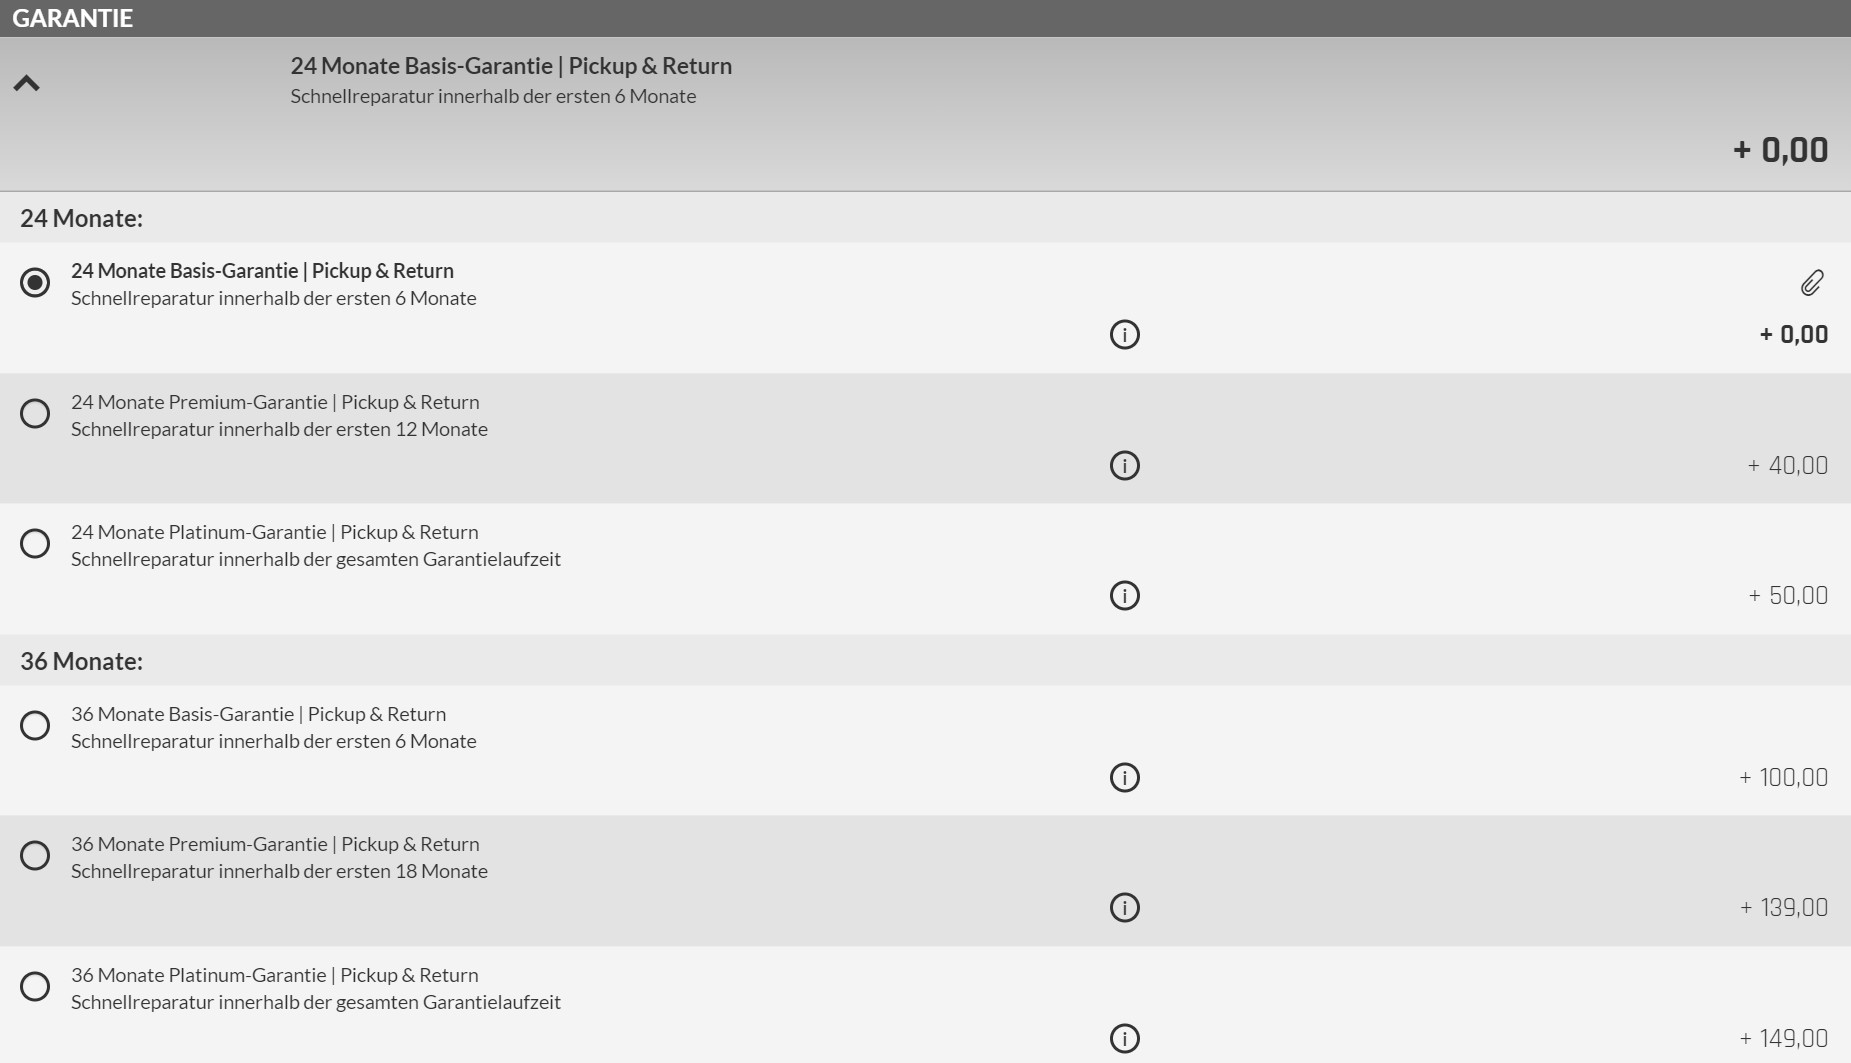
La Schenker XMG Neo 17 tiene una garantía básica de 24 meses que incluye 6 meses de reparación rápida con servicio de recogida y devolución. Durante el proceso de pedido, hay otras opciones. Por un suplemento de unos 150 USD, la garantía puede ampliarse a 36 meses, incluyendo el servicio de reparación rápida durante toda la duración.
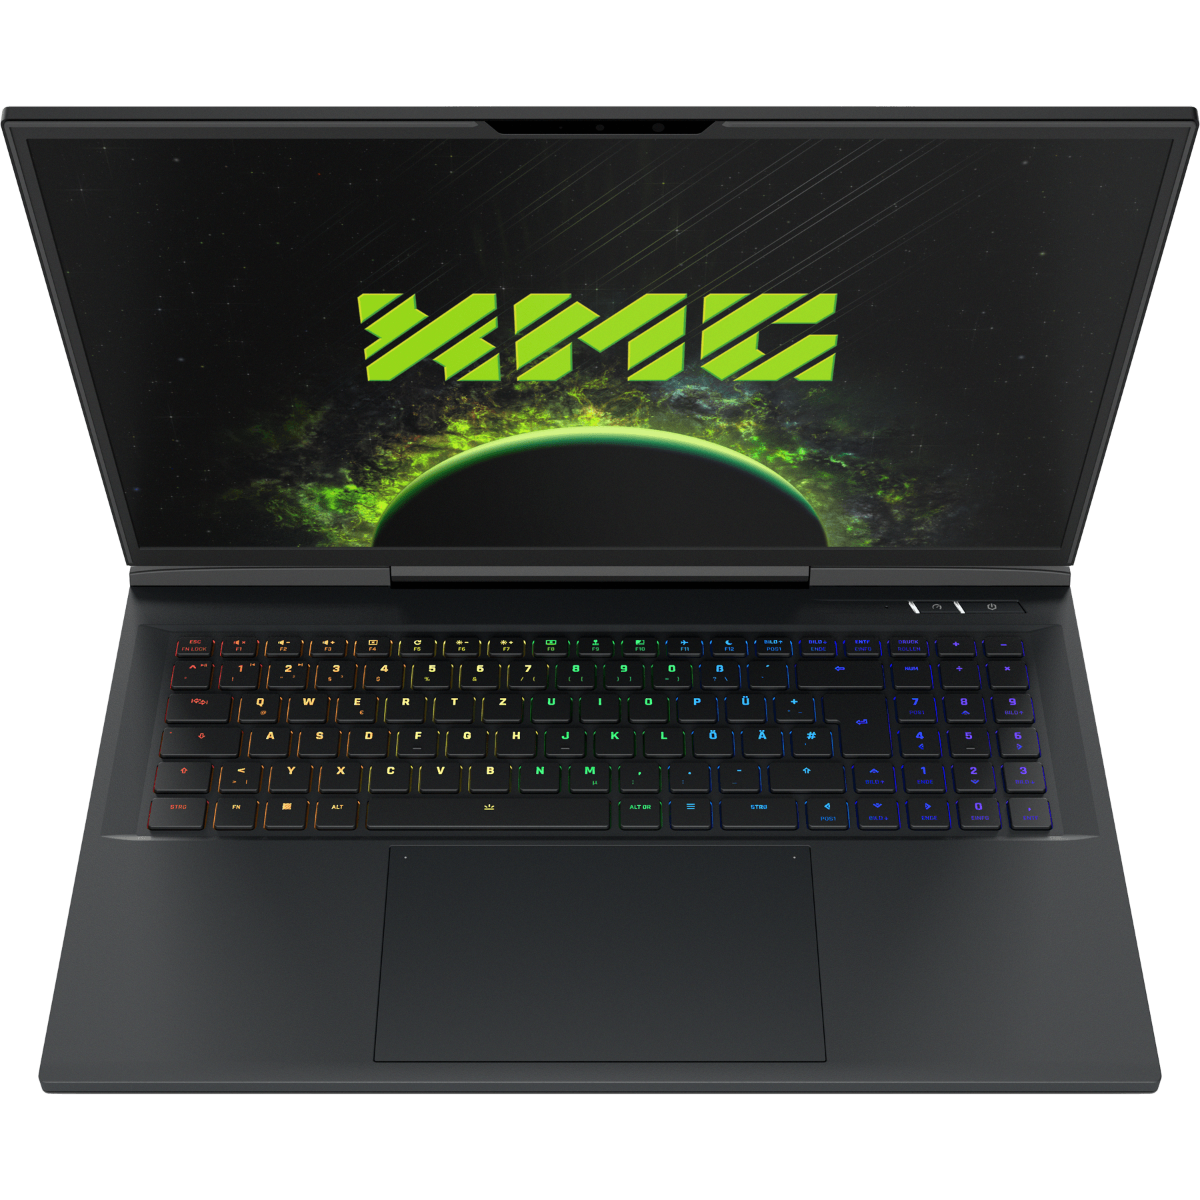
Dispositivos de entrada - Interruptores Cherry MX - ¿pero no para todas las teclas?
Teclado
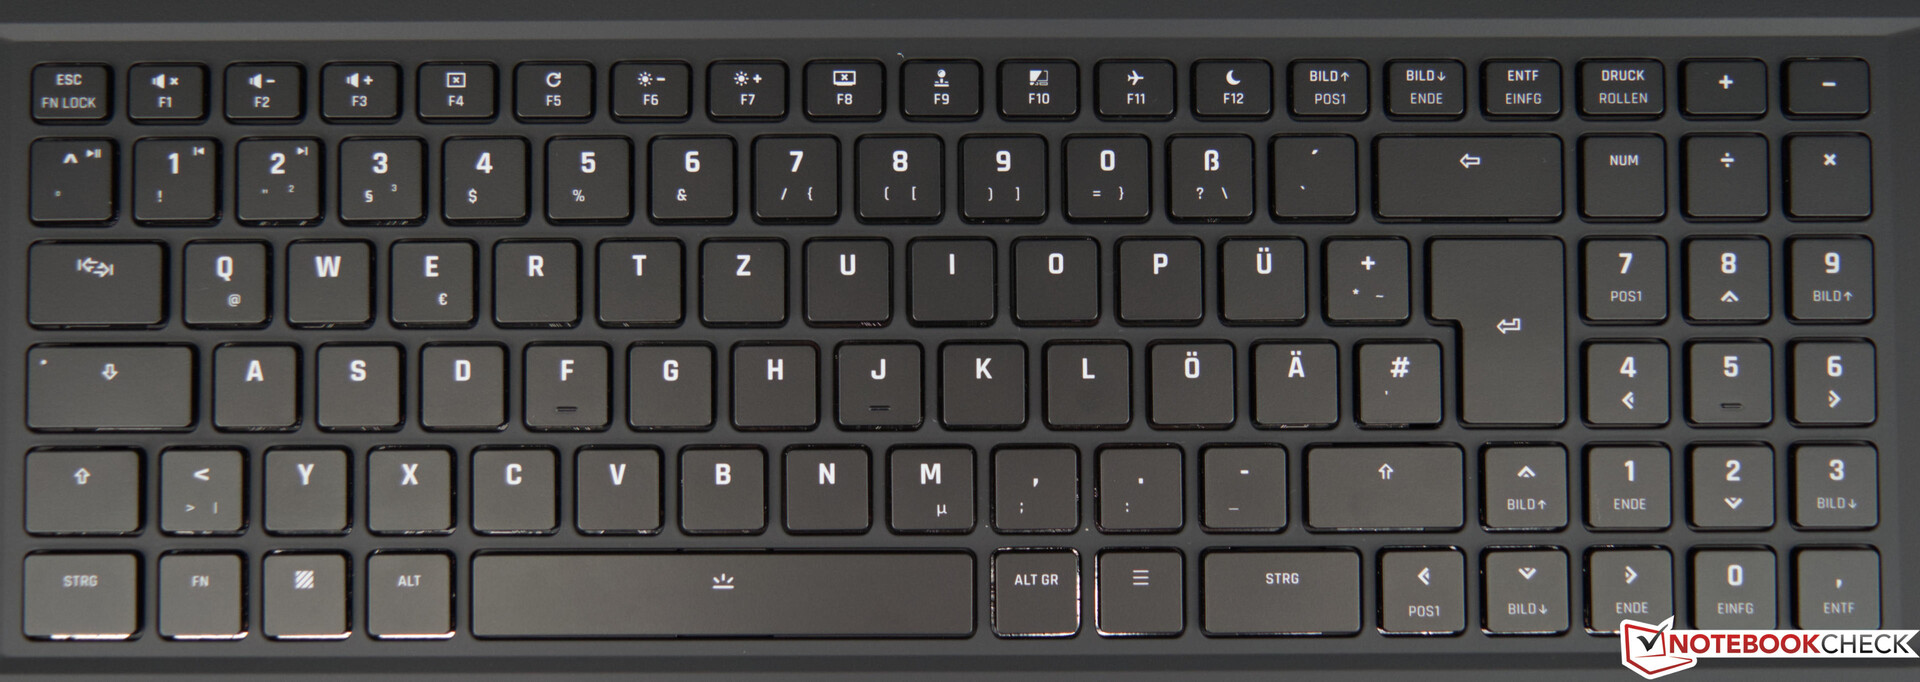
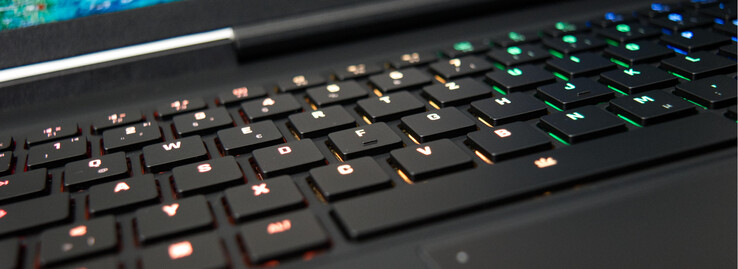
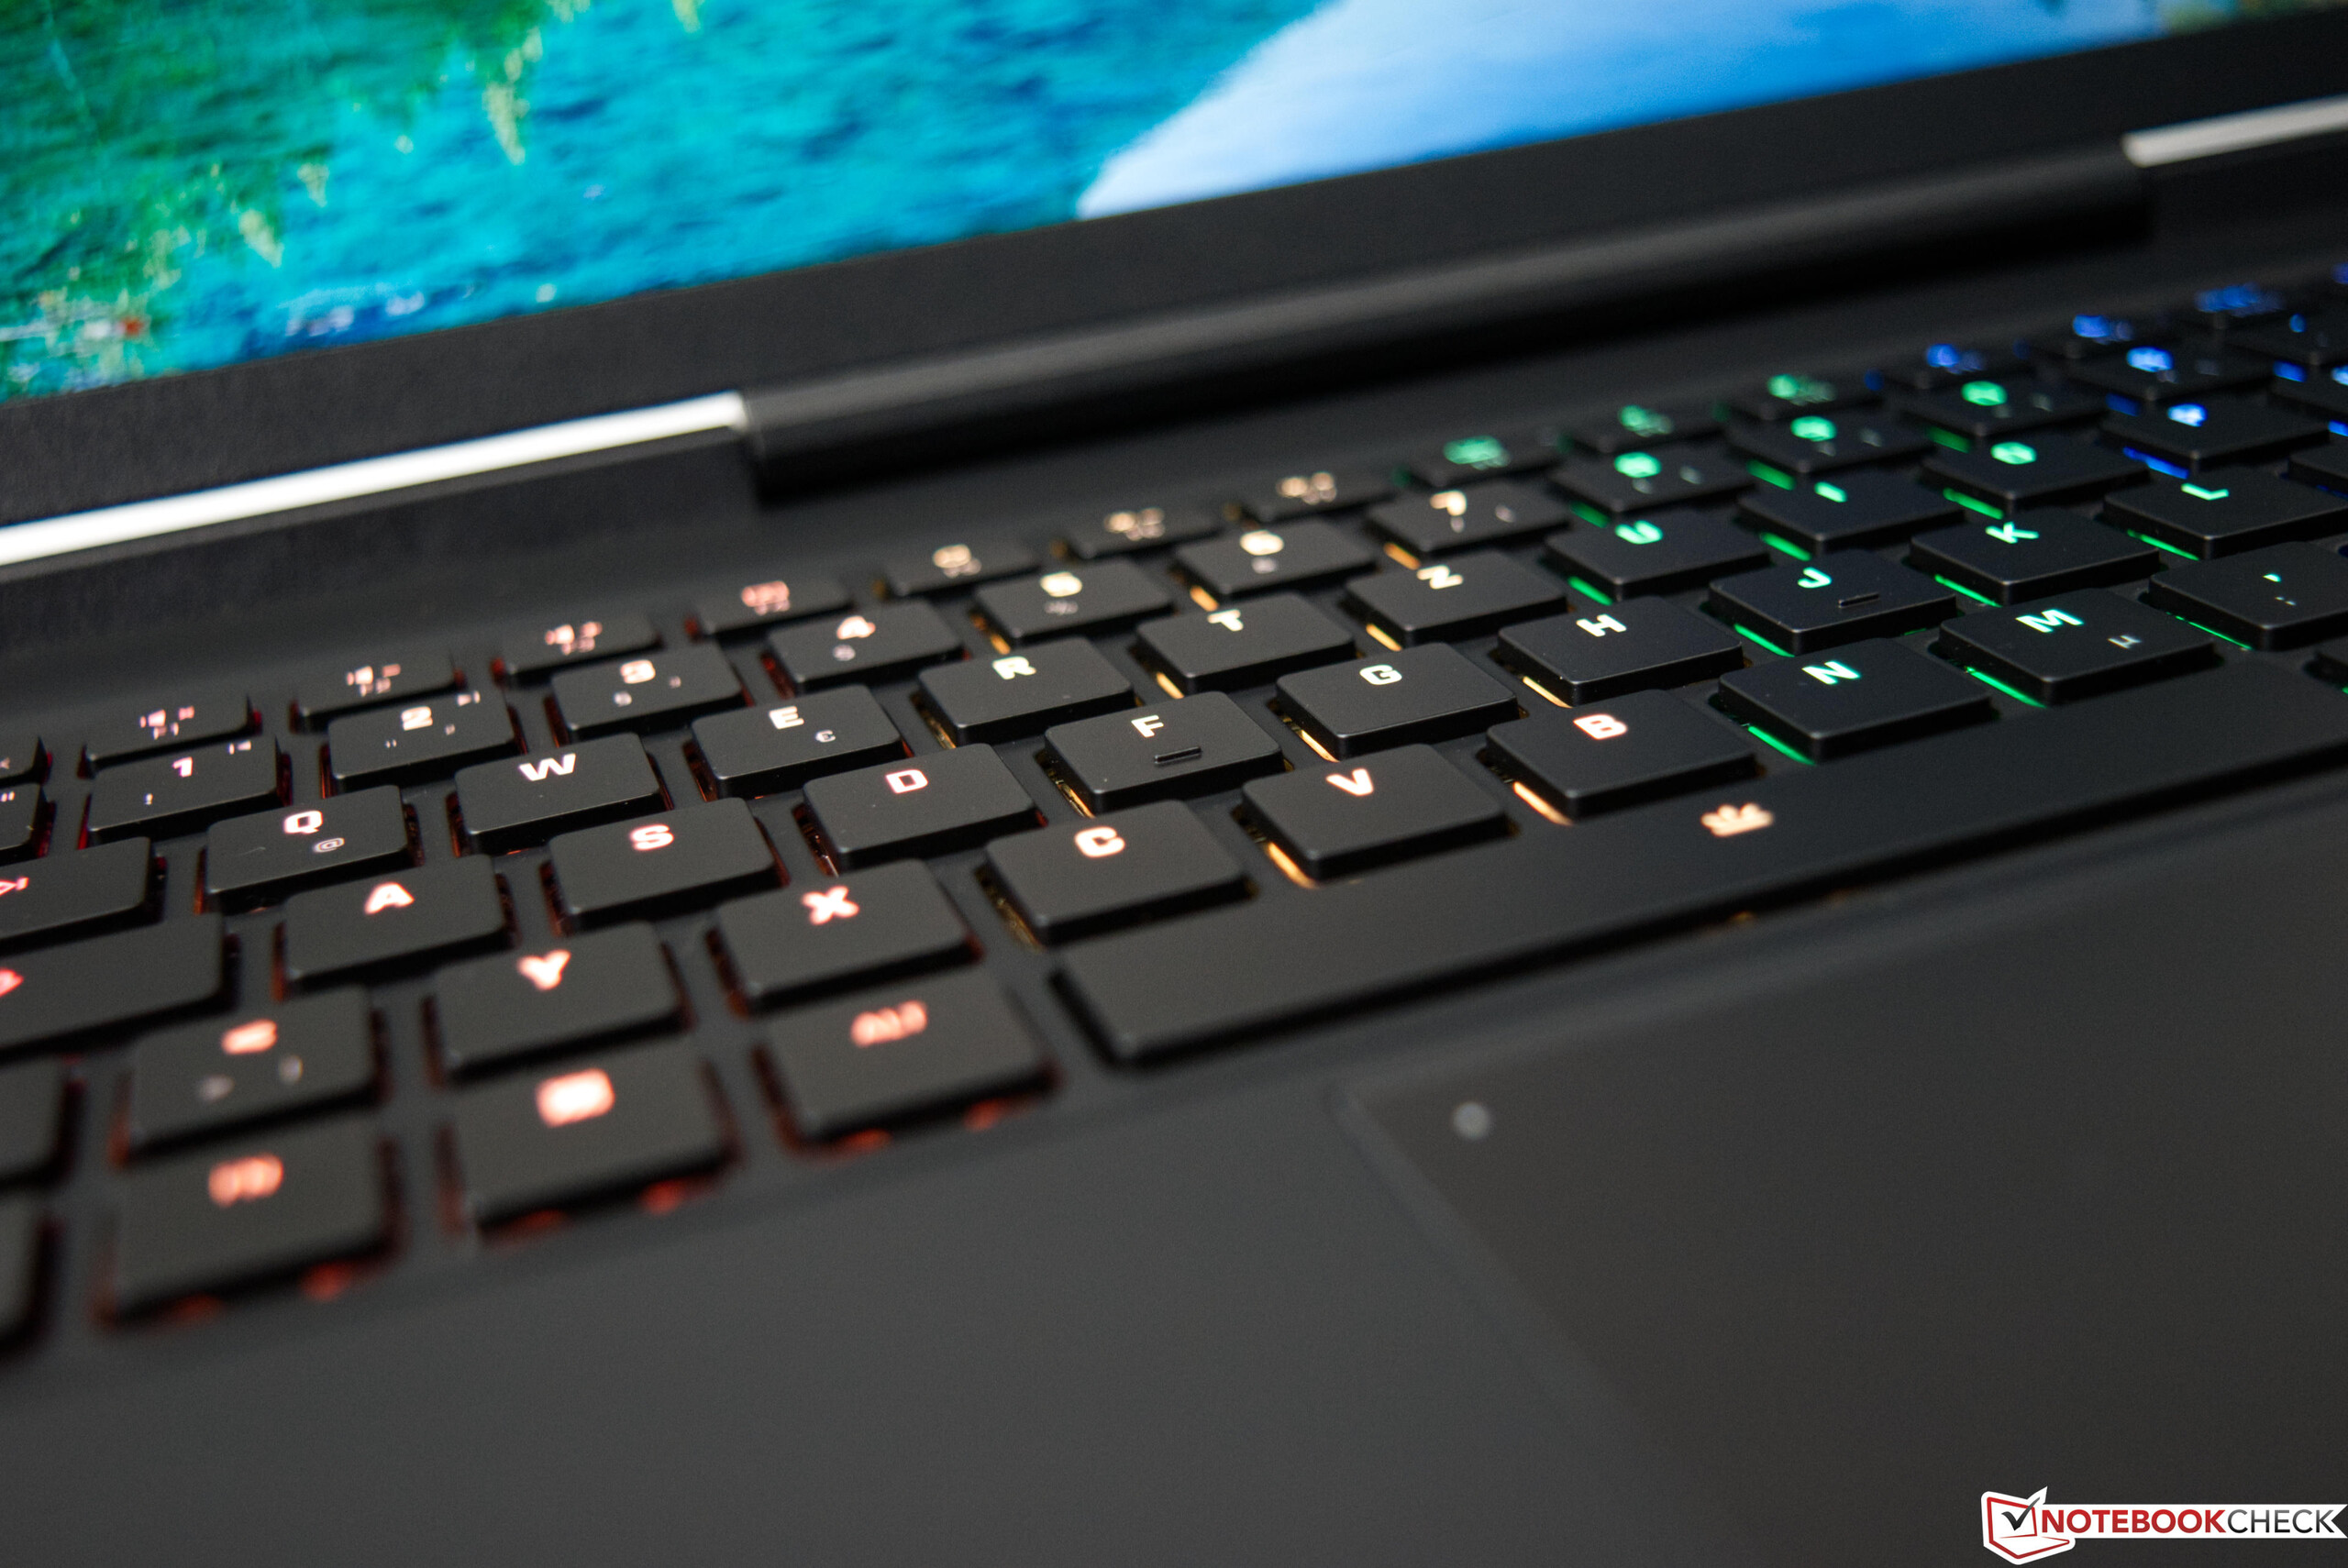
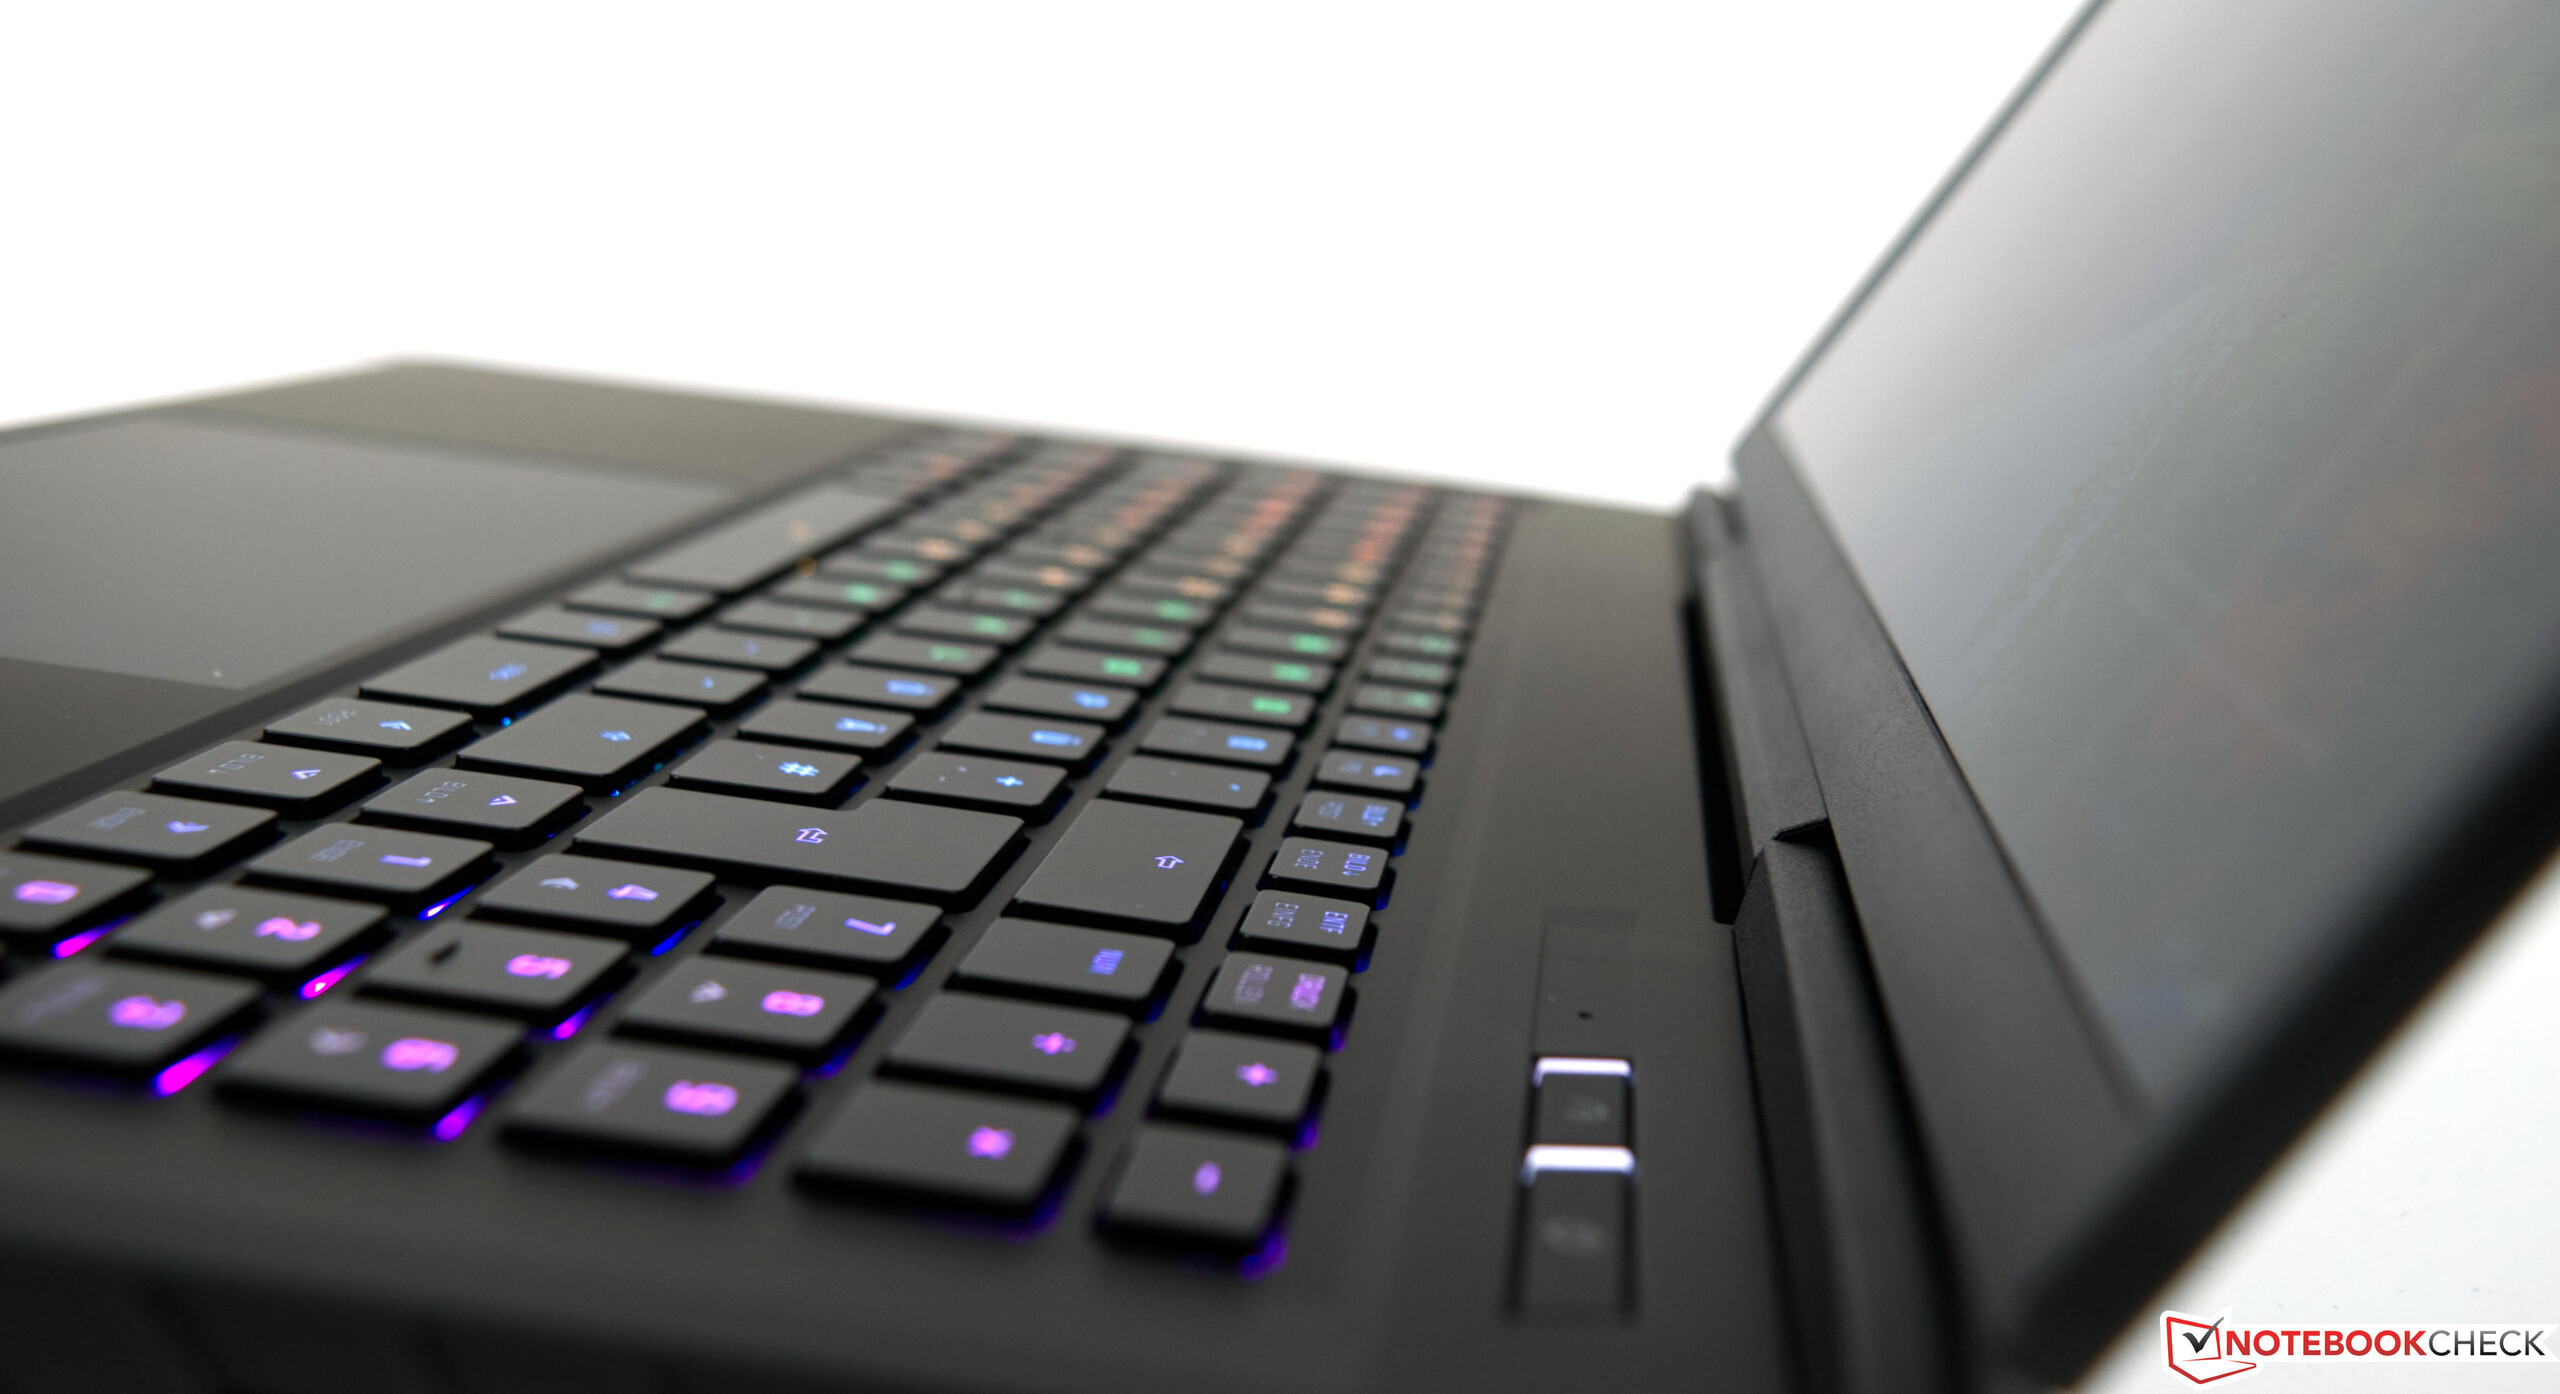
El portátil de 17 pulgadas cuenta con un teclado mecánico basado en interruptores Cherry MX. Son conocidos por su robustez y extrema longevidad. Ofrecen un recorrido poco profundo de sólo 1,8 mm y un punto de accionamiento bien definido para una buena respuesta general. Como las teclas no están amortiguadas, no hay sensación de esponjosidad al escribir. Los teclados mecánicos rara vez ofrecen un sonido silencioso de las teclas. Esto también es cierto para el XMG Neo 17. Los usuarios deben estar seguros de su preferencia y tolerancia a los chasquidos audibles. Aquellos que prefieren teclados silenciosos pueden querer buscar en otra parte.
Hay una explicación plausible de por qué Schenker no utiliza interruptores Cherry MX para todas las teclas. Debido a las limitaciones de espacio, las teclas de media altura de la primera fila no pueden utilizar interruptores mecánicos. Esto deja el teclado numérico, que también se basa en interruptores de cúpula de goma estándar. Según el fabricante, esta decisión se tomó para reducir el peso y los costes. Desde el punto de vista acústico, los interruptores tradicionales son significativamente más silenciosos y las características pulsaciones de las teclas de cúpula de goma se sienten algo amortiguadas, aunque este comportamiento no es demasiado pronunciado en este caso.
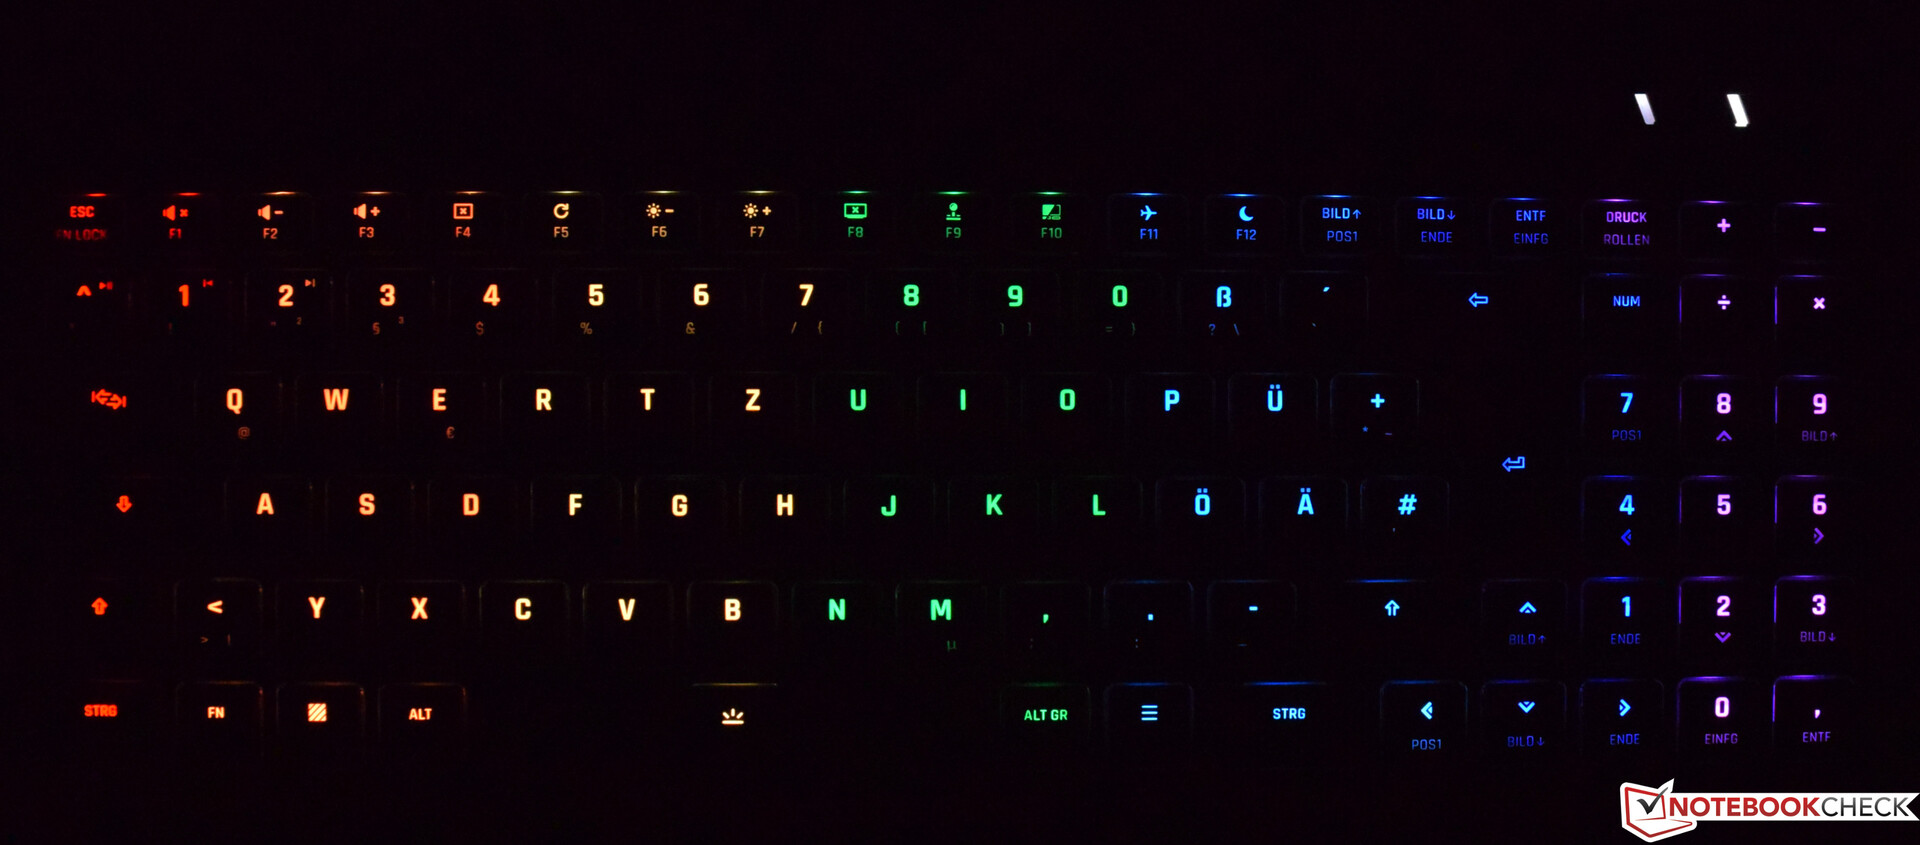
La retroiluminación del teclado se puede ajustar a través del Centro de Control. Los usuarios pueden elegir entre varios efectos y toda la paleta de colores.
Teclado táctil
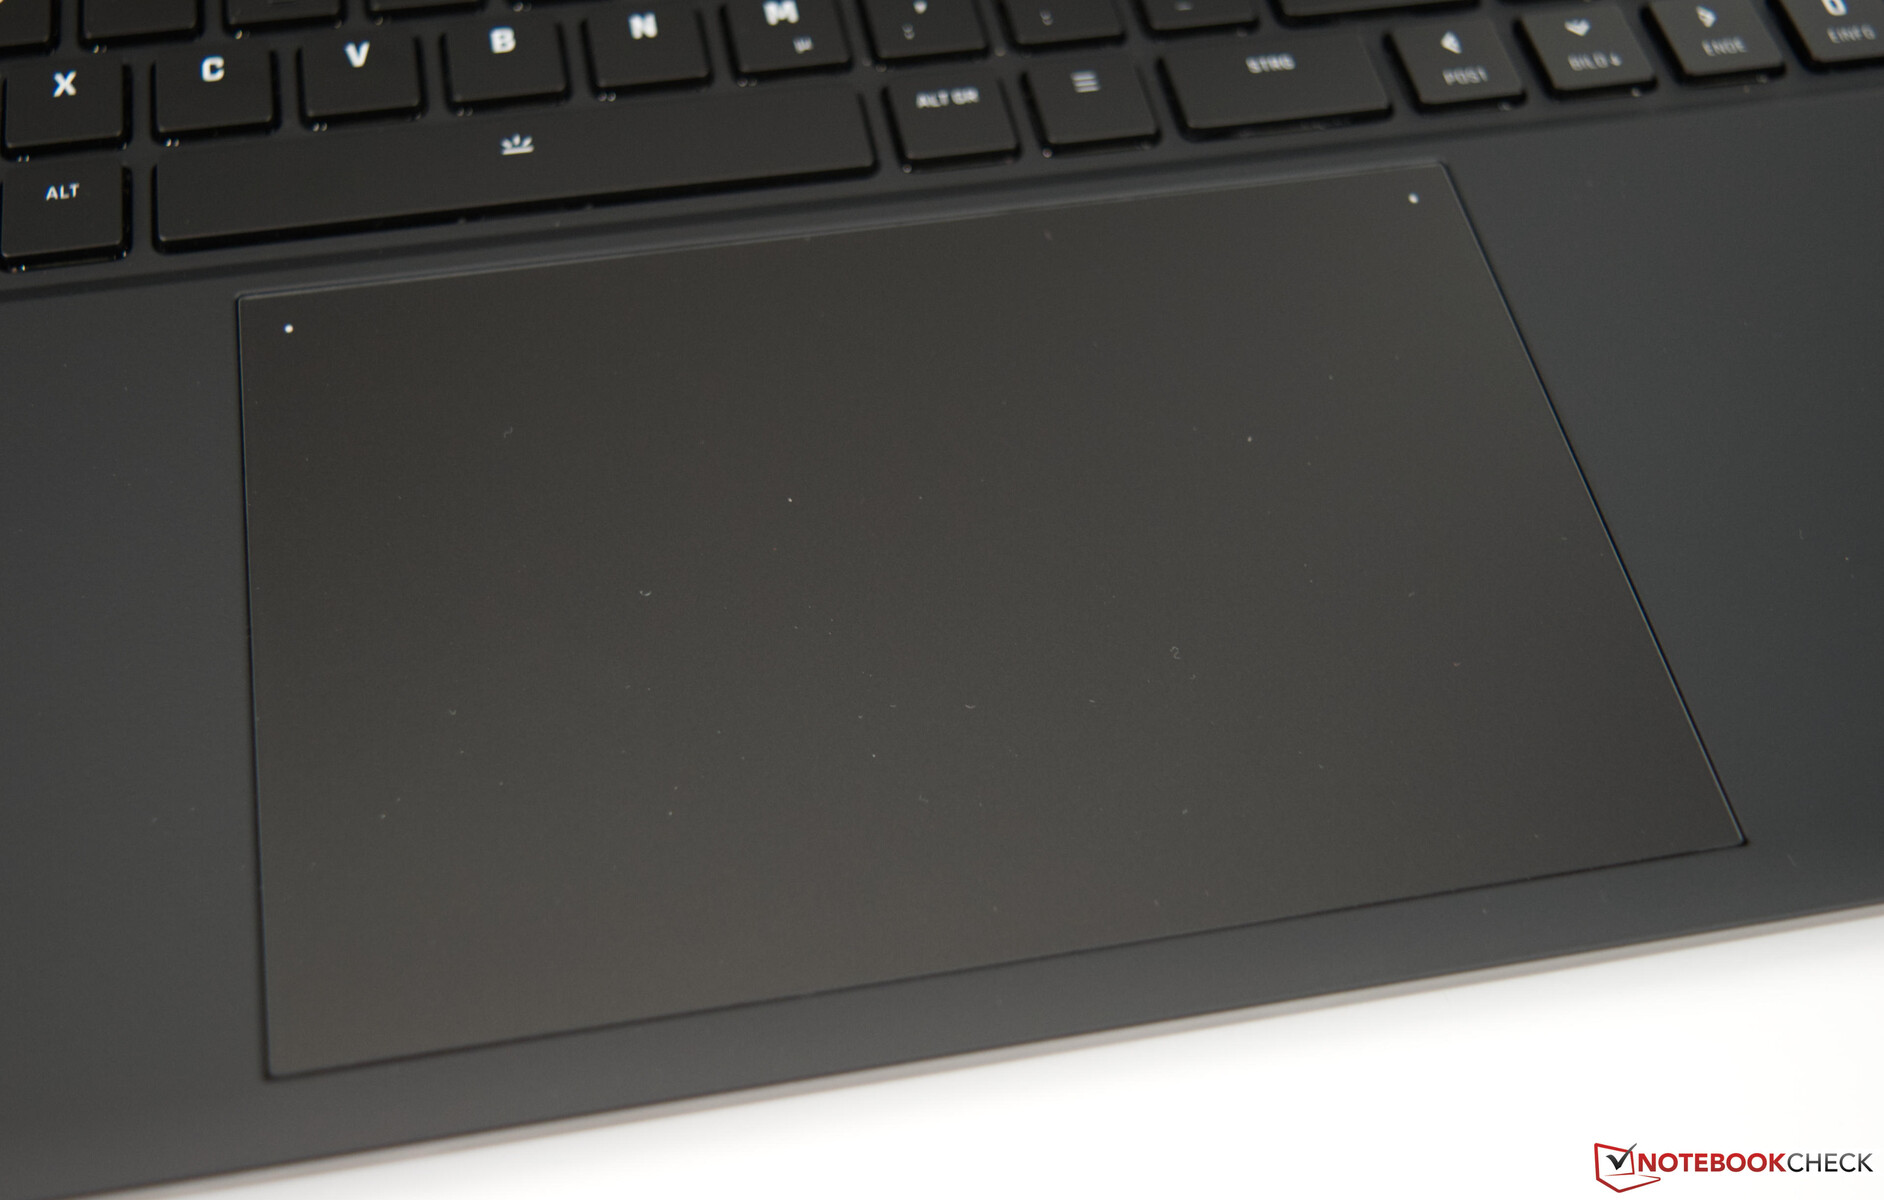
Con 15,5 x 10 centímetros, el touchpad es muy grande y potencialmente demasiado grande para algunos usuarios. Para contrarrestarlo, se puede desactivar la parte derecha de la superficie de entrada. En este caso, no hay ninguna pista visual o háptica que muestre dónde termina el touchpad. Los usuarios que no necesiten en absoluto el clickpad también pueden desactivarlo por completo. Esto se puede conseguir pulsando dos veces el punto blanco situado cerca de la esquina superior izquierda. La superficie de cristal está ligeramente satinada para una experiencia de usuario algo más cómoda con los dedos sudorosos. Encontramos un pequeño problema con la capacidad de respuesta del clickpad cerca de los bordes. Aunque entonces respondía de forma más lenta, su gran tamaño lo compensa en su mayor parte. Los dos botones de la parte inferior del pad funcionan bien y ofrecen clics relativamente silenciosos.
Pantalla - 240 Hz y factor de forma 16:10
El panel IPS de 17 pulgadas y 240 Hz es fijo en el Schenker XMG Neo 17. El factor de forma 16:10 ofrece algunas ventajas sobre el factor de forma 16:9 más común, particularmente cuando se trata de productividad.
Mientras que según nuestras mediciones, el panel alcanza un buen nivel de brillo de 399 nits, algunos competidores son capaces de producir resultados aún mejores. Para ser justos, nuestro valor medido supera ligeramente las especificaciones del XMG Neo 17 (hoja de datos: 380 nits). El contraste se resiente un poco de la combinación del brillo y el valor de negro, lo que resulta en una relación de sólo 965:1. Esto sigue siendo significativamente mejor comparado con los dos competidores de MSI.
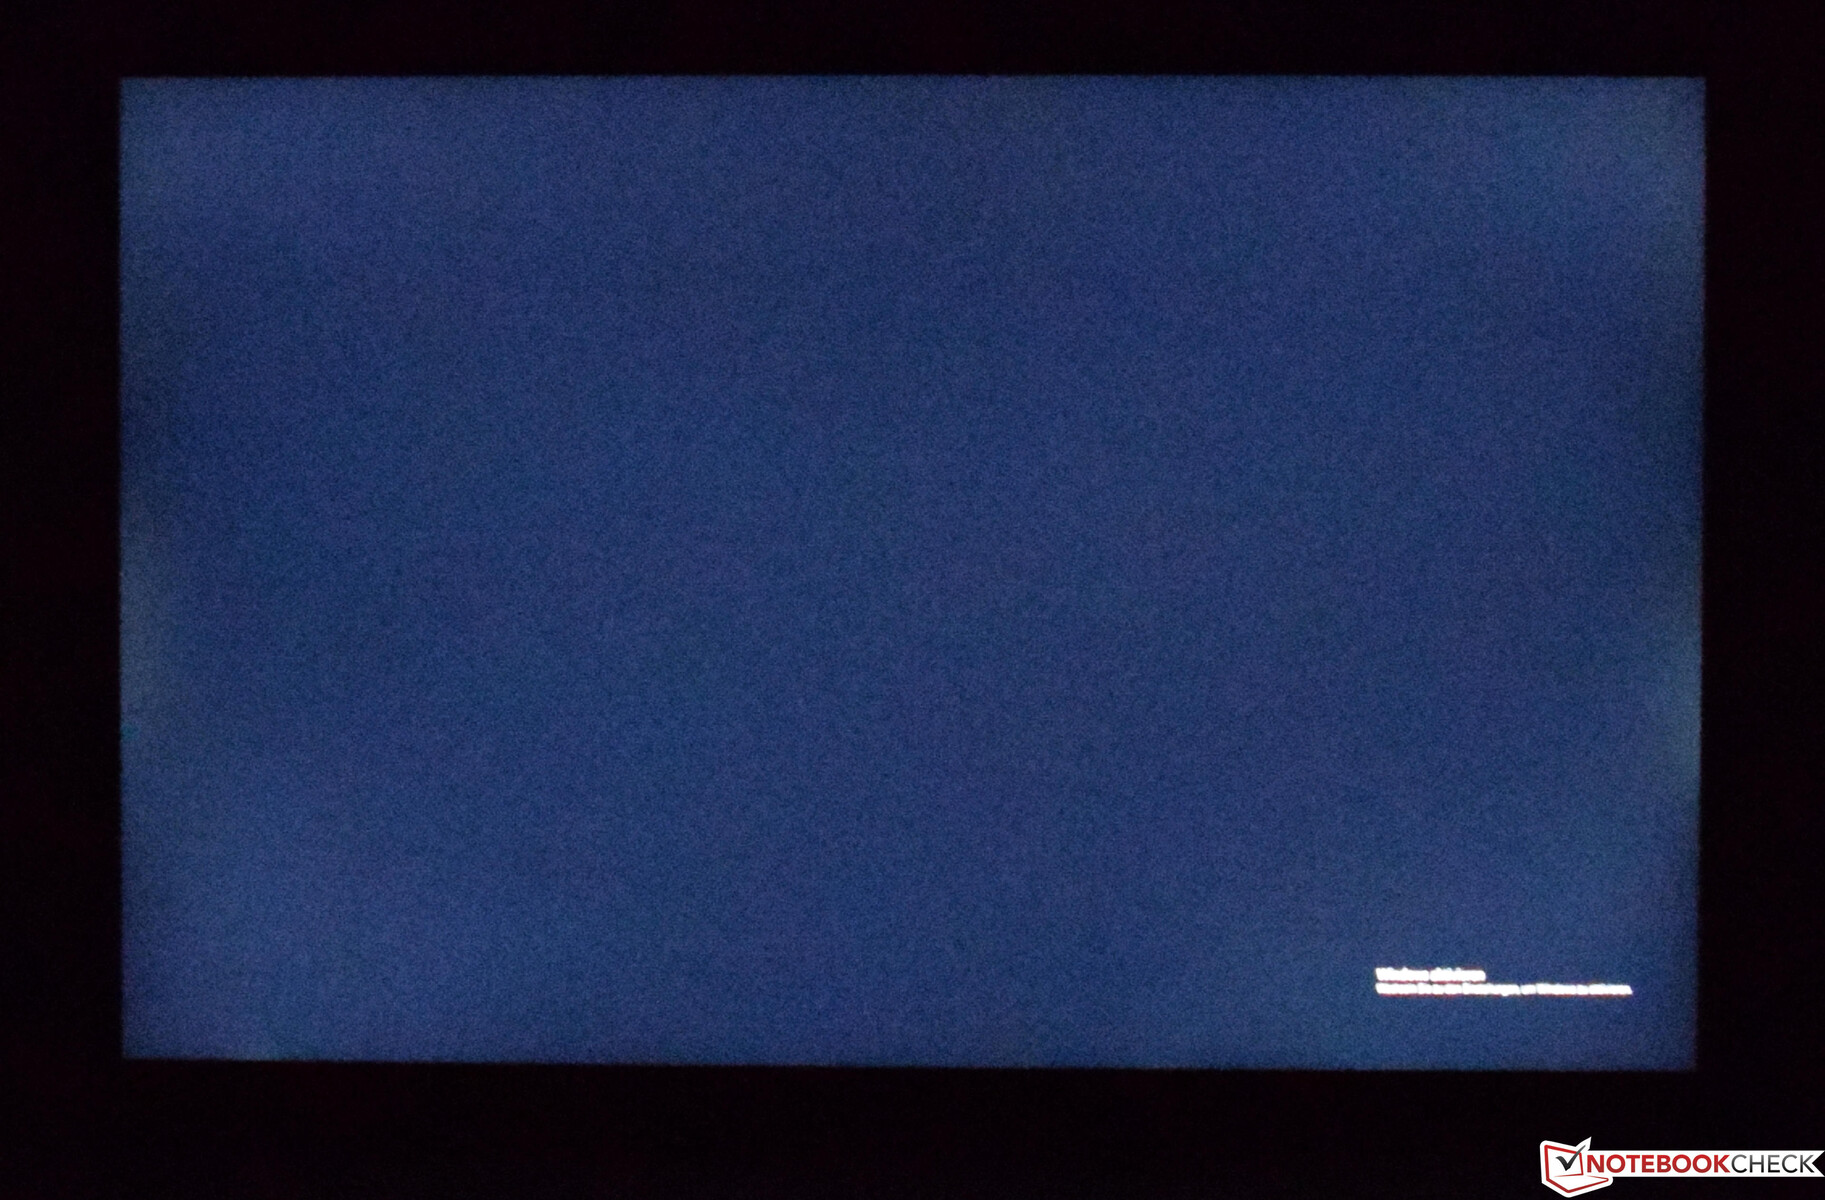
Es poco probable que los usuarios experimenten fatiga ocular debido al PWM con el Schenker XMG Neo 17. Sin embargo, hay un pequeño sangrado de luz de fondo. Sin embargo, sólo se hace evidente en escenas oscuras cerca de los bordes.
| |||||||||||||||||||||||||
iluminación: 90 %
Brillo con batería: 415 cd/m²
Contraste: 965:1 (Negro: 0.43 cd/m²)
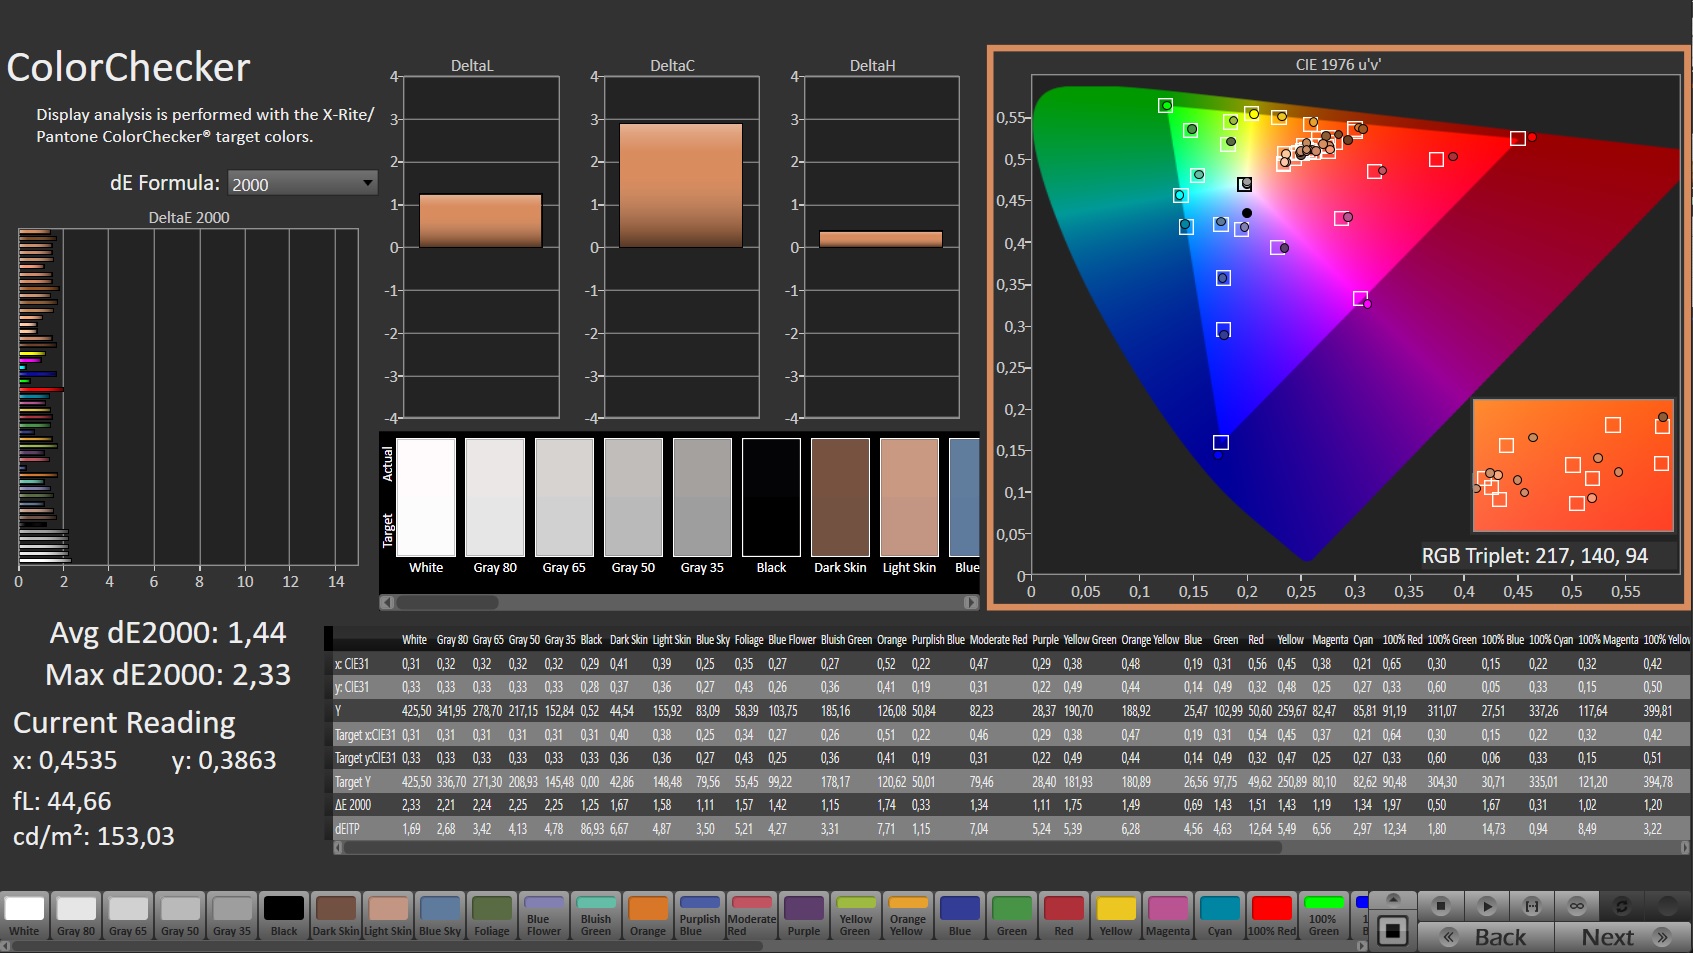
ΔE ColorChecker Calman: 1.44 | ∀{0.5-29.43 Ø4.71}
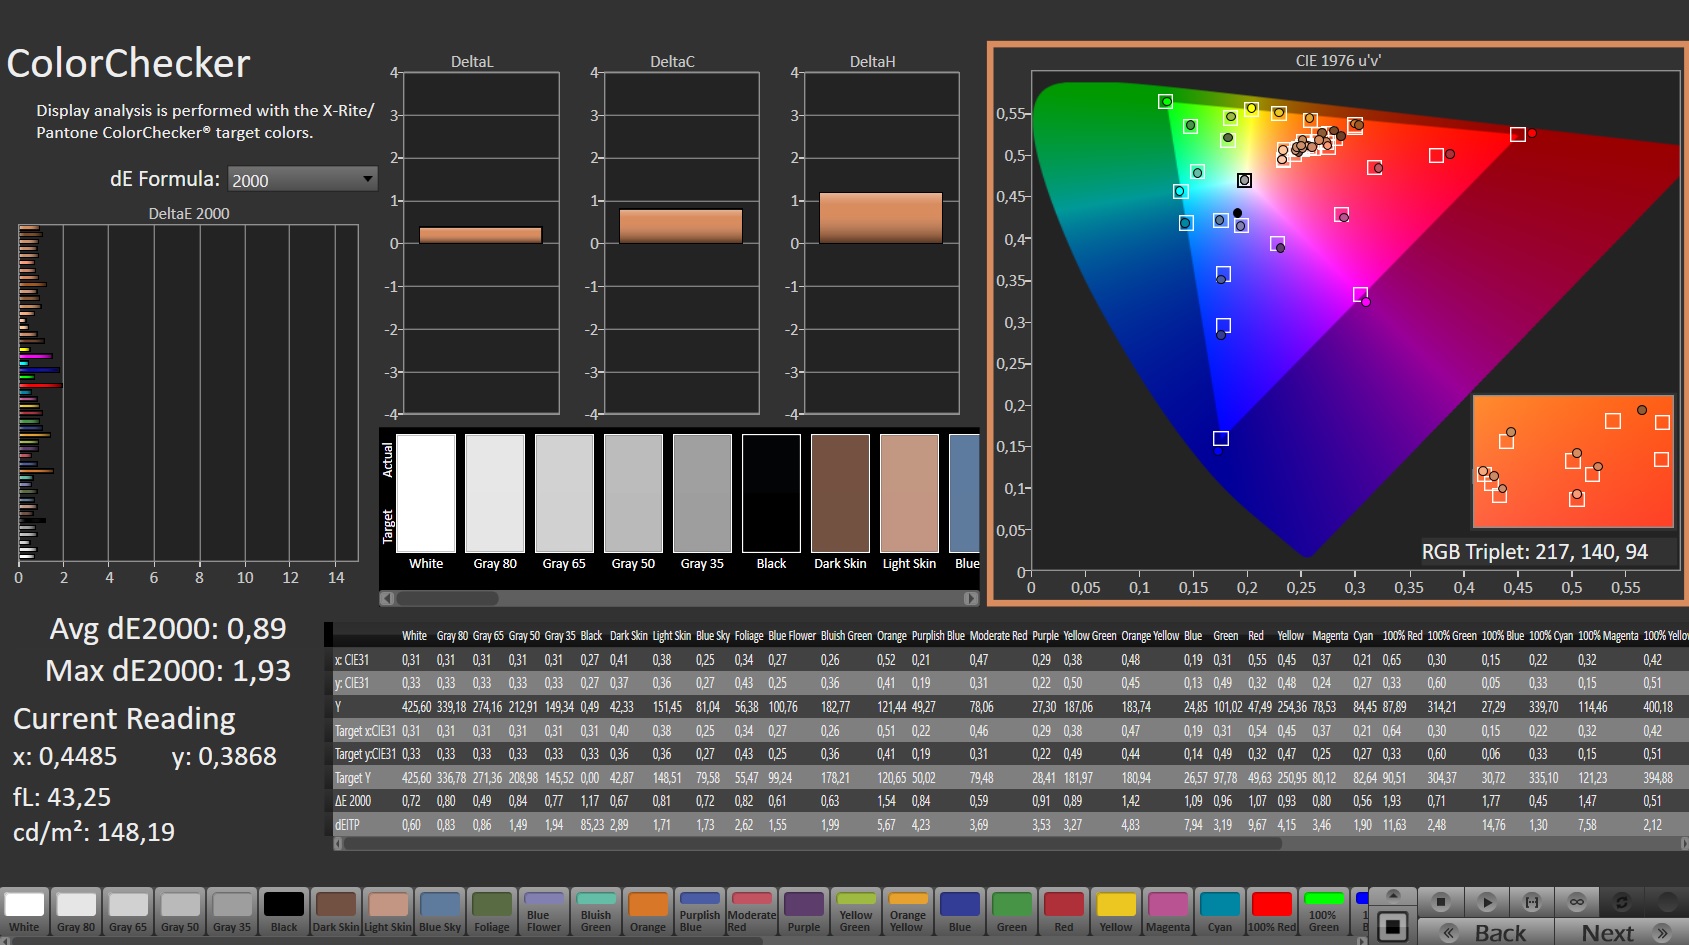
calibrated: 0.89
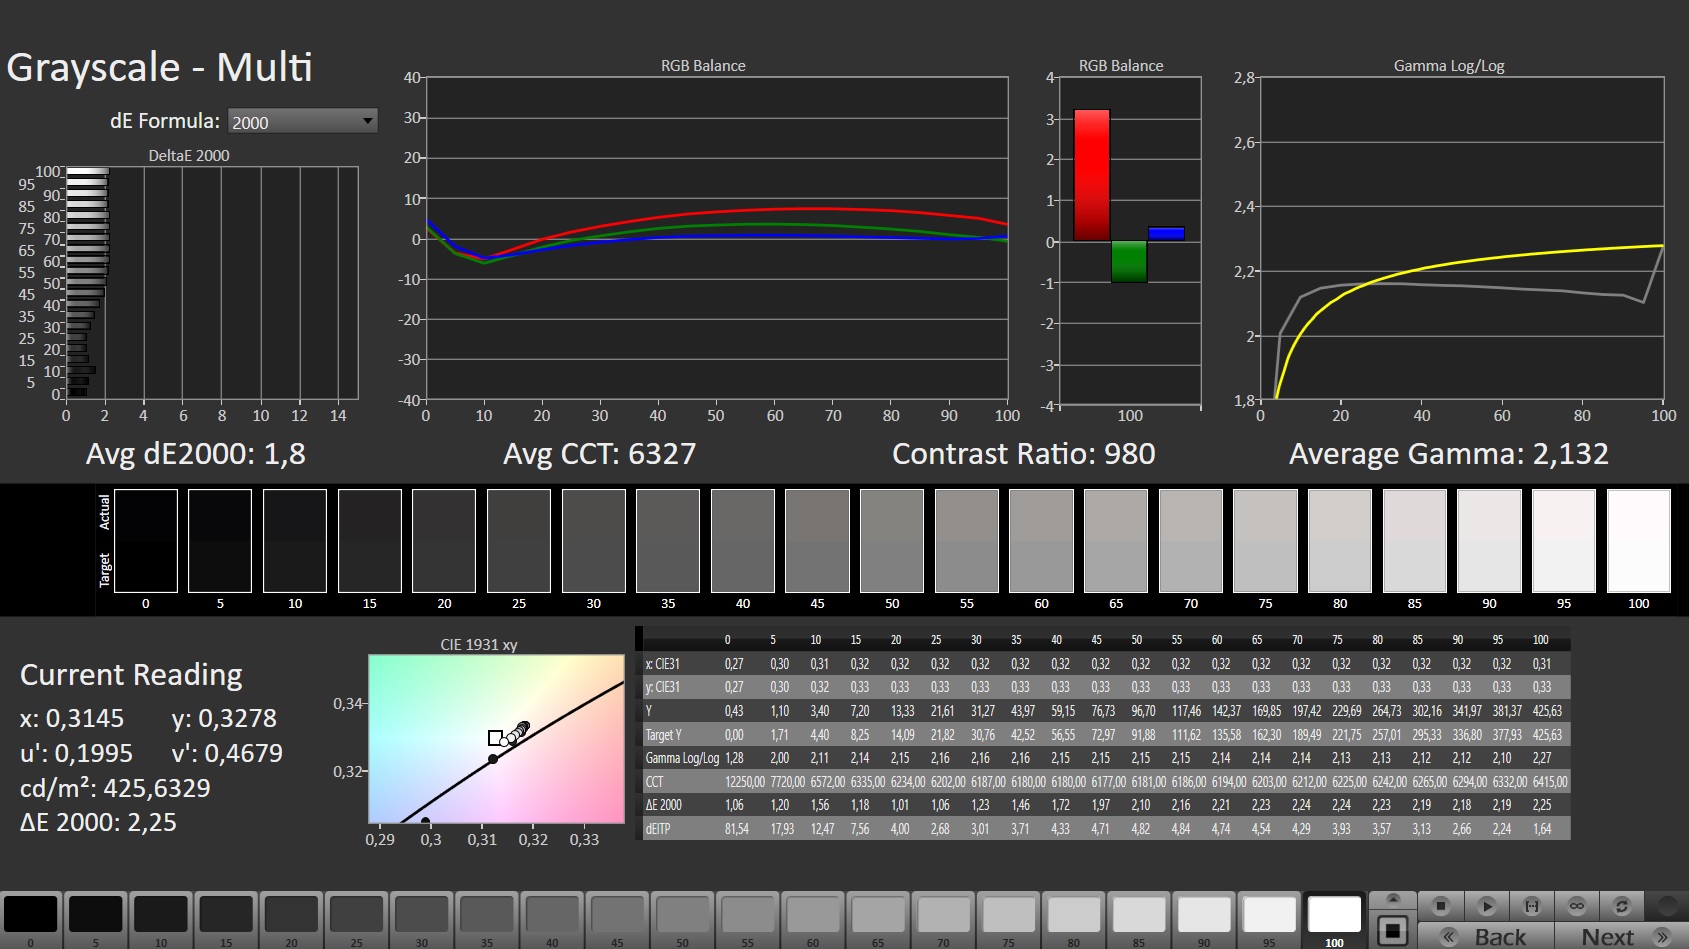
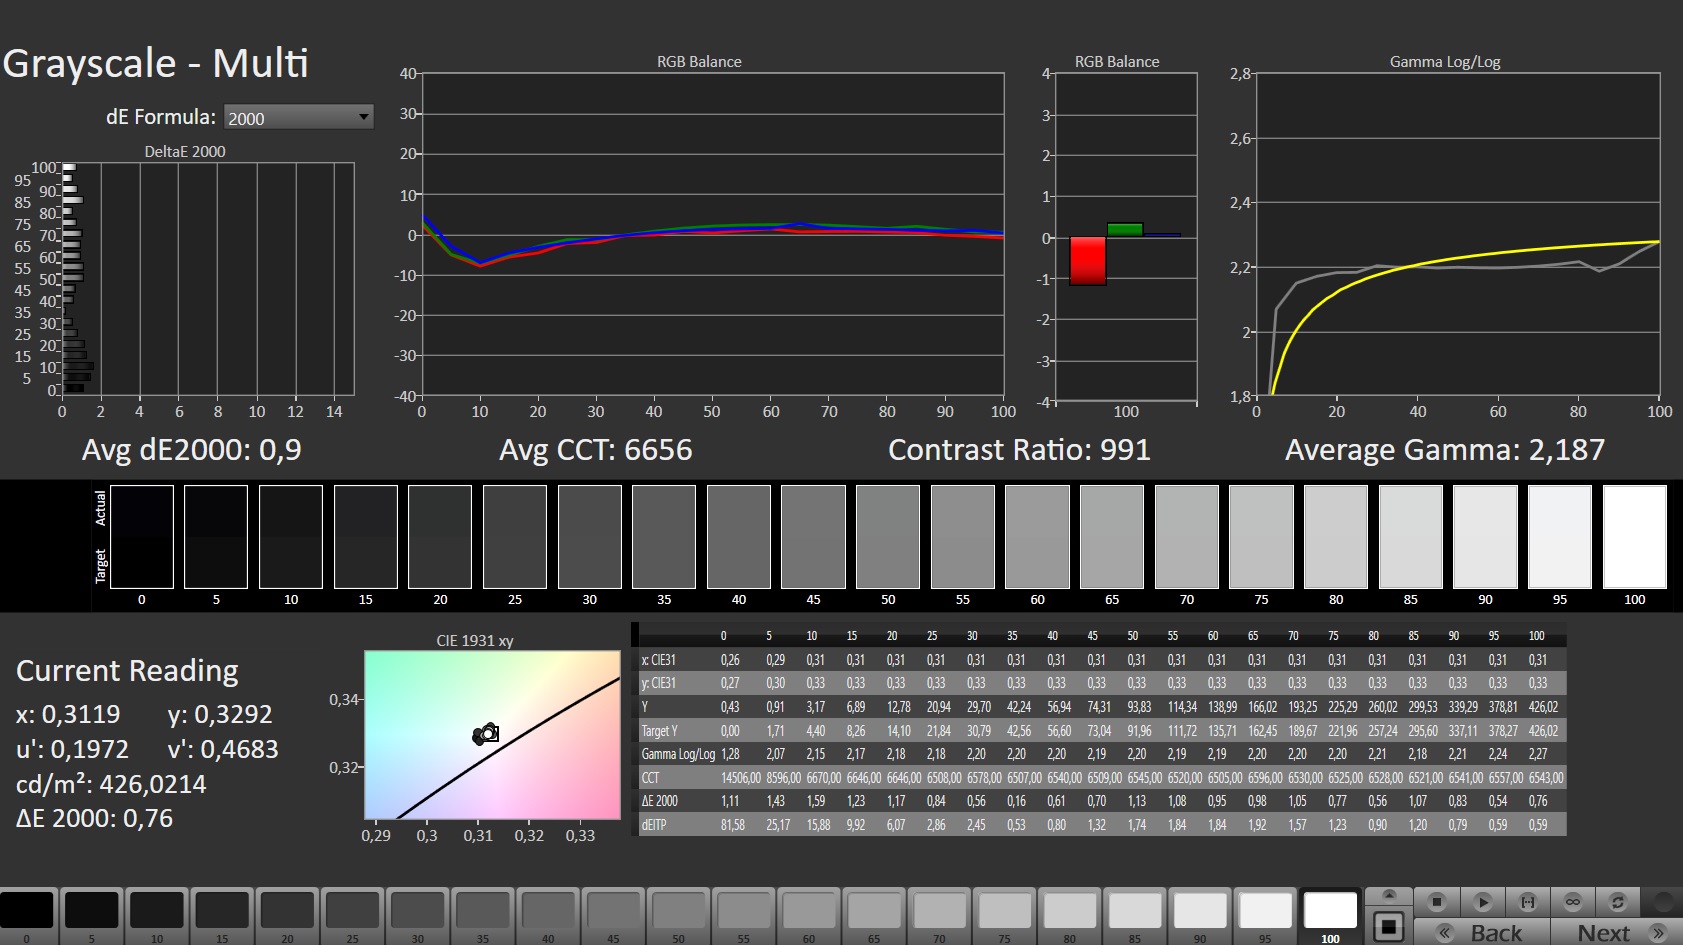
ΔE Greyscale Calman: 1.8 | ∀{0.09-98 Ø4.96}
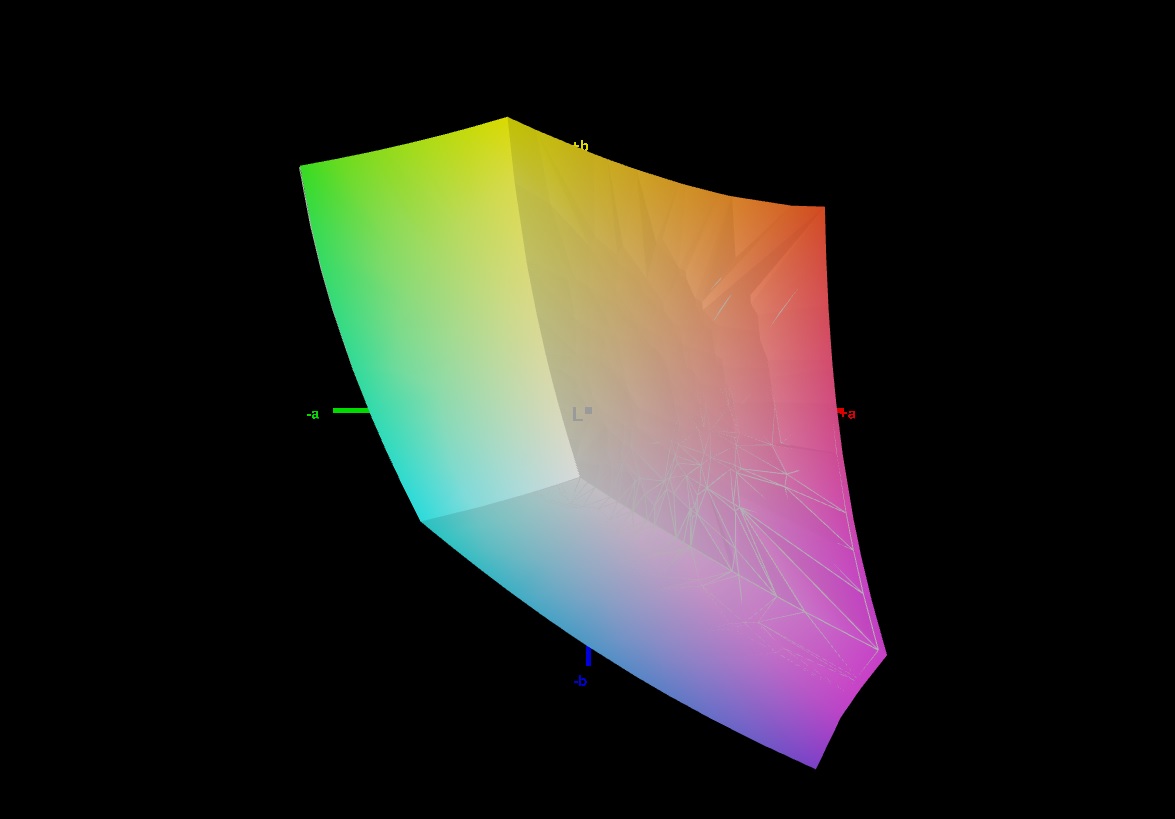
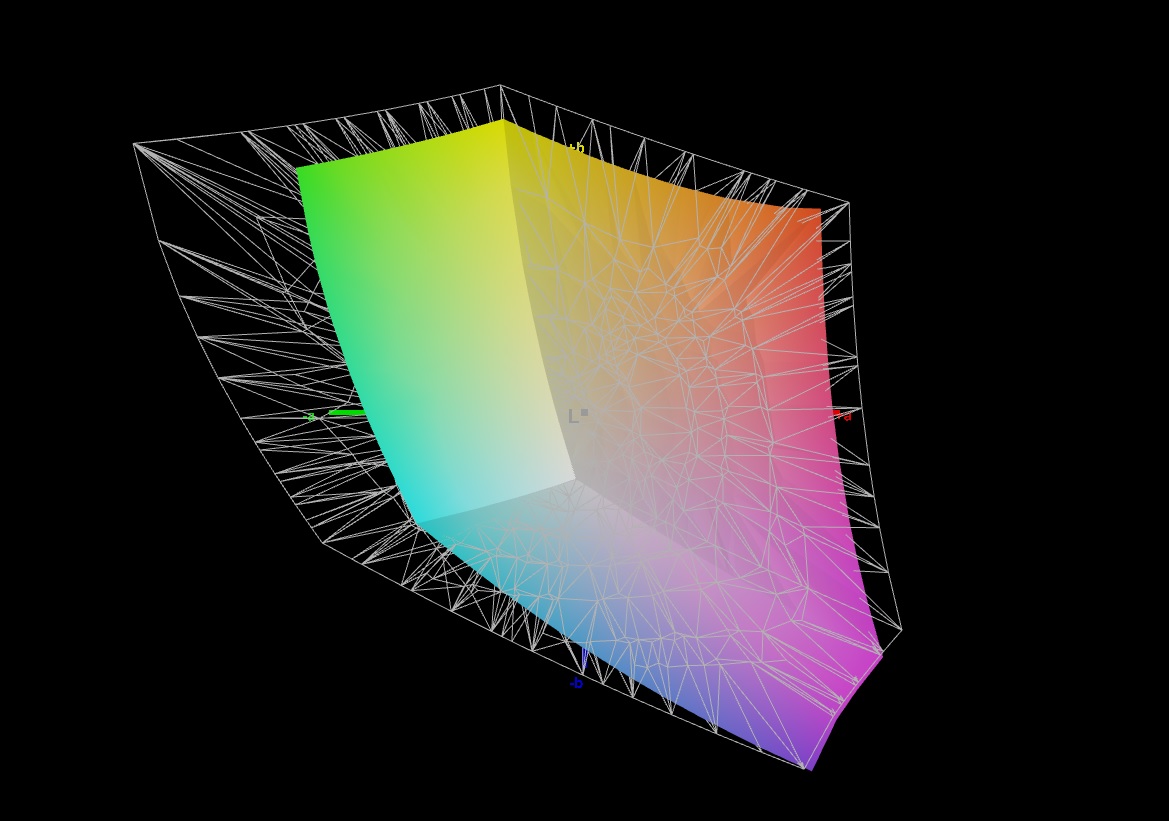
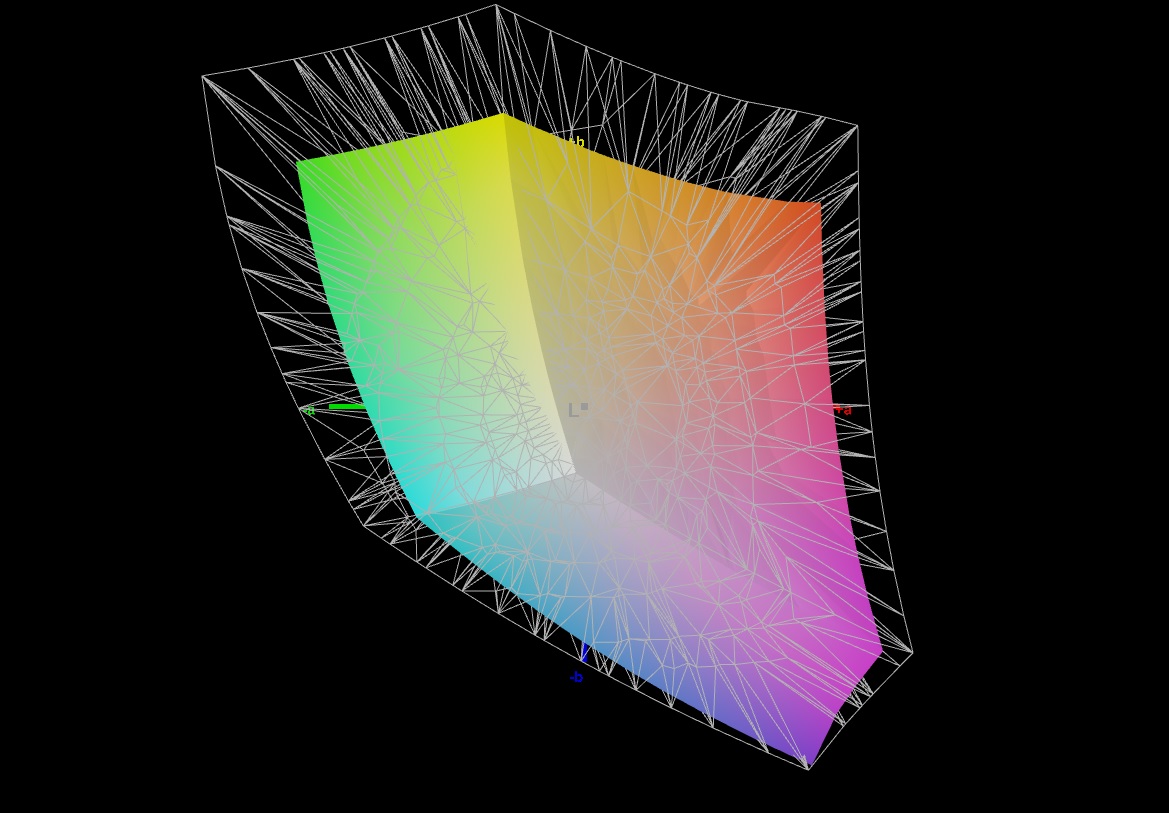
69.6% AdobeRGB 1998 (Argyll 3D)
99.8% sRGB (Argyll 3D)
69% Display P3 (Argyll 3D)
Gamma: 2.132
CCT: 6327 K
| Schenker XMG Neo 17 M22 BOE0A99, IPS, 2560x1600, 17" | MSI Titan GT77 12UHS Sharp SHP1544 LQ173M1JW08, IPS-Level, 1920x1080, 17.3" | Razer Blade 17 Early 2022 AU Optronics B173ZAN06.9, IPS, 3840x2160, 17.3" | Acer Predator Triton 500 SE PT516-52s-70KX NE160QDM-NZ2, IPS LED, 2560x1600, 16" | Asus ROG Zephyrus Duo 16 GX650RX BOE NE160QAM-NX1, IPS-Level, 3840x2400, 16" | MSI Raider GE77 HX 12UHS AU Optronics B173ZAN06.1, IPS, 3840x2160, 17.3" | |
|---|---|---|---|---|---|---|
| Display | 2% | 23% | 21% | 22% | 21% | |
| Display P3 Coverage (%) | 69 | 70.8 3% | 99.4 44% | 97.3 41% | 98 42% | 96.6 40% |
| sRGB Coverage (%) | 99.8 | 98.9 -1% | 100 0% | 100 0% | 99.9 0% | 99.8 0% |
| AdobeRGB 1998 Coverage (%) | 69.6 | 73 5% | 87.3 25% | 84.9 22% | 86.3 24% | 85.8 23% |
| Response Times | 43% | 20% | -17% | -14% | 27% | |
| Response Time Grey 50% / Grey 80% * (ms) | 10.8 ? | 3.03 ? 72% | 7.5 ? 31% | 13.8 ? -28% | 14.6 ? -35% | 5.8 ? 46% |
| Response Time Black / White * (ms) | 6.1 ? | 5.28 ? 13% | 5.6 ? 8% | 6.4 ? -5% | 5.6 ? 8% | 5.6 ? 8% |
| PWM Frequency (Hz) | ||||||
| Screen | -50% | 5% | -7% | -58% | -42% | |
| Brightness middle (cd/m²) | 415 | 280 -33% | 503 21% | 498 20% | 459 11% | 381 -8% |
| Brightness (cd/m²) | 399 | 275 -31% | 486 22% | 468 17% | 434 9% | 371 -7% |
| Brightness Distribution (%) | 90 | 79 -12% | 84 -7% | 80 -11% | 88 -2% | 84 -7% |
| Black Level * (cd/m²) | 0.43 | 0.4 7% | 0.44 -2% | 0.36 16% | 0.44 -2% | 0.52 -21% |
| Contrast (:1) | 965 | 700 -27% | 1143 18% | 1383 43% | 1043 8% | 733 -24% |
| Colorchecker dE 2000 * | 1.44 | 2.1 -46% | 1.08 25% | 1.77 -23% | 2.97 -106% | |
| Colorchecker dE 2000 max. * | 2.33 | 5.83 -150% | 4.54 -95% | 5.24 -125% | 8.13 -249% | |
| Colorchecker dE 2000 calibrated * | 0.89 | 1.58 -78% | 0.6 33% | 0.63 29% | 1.03 -16% | 2.53 -184% |
| Greyscale dE 2000 * | 1.8 | 3.3 -83% | 1.3 28% | 2.4 -33% | 4.9 -172% | |
| Gamma | 2.132 103% | 2.13 103% | 2.151 102% | 2.14 103% | 2.235 98% | |
| CCT | 6327 103% | 7060 92% | 6541 99% | 7046 92% | 6775 96% | |
| Media total (Programa/Opciones) | -2% /
-26% | 16% /
11% | -1% /
-3% | -17% /
-34% | 2% /
-12% |
* ... más pequeño es mejor
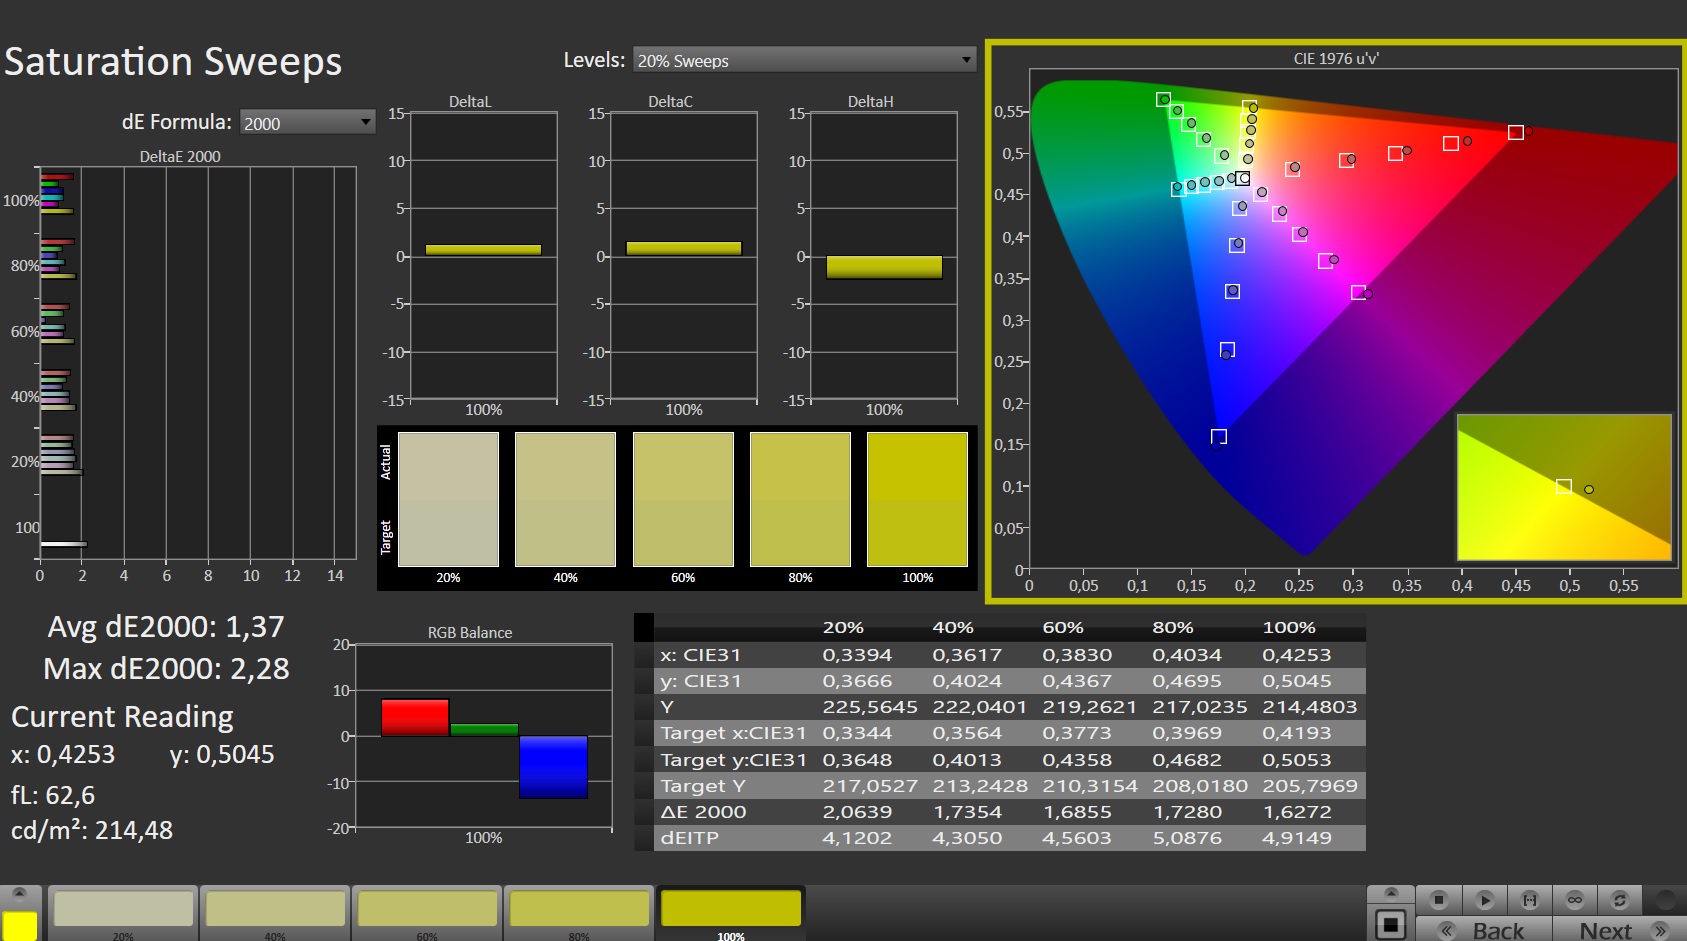
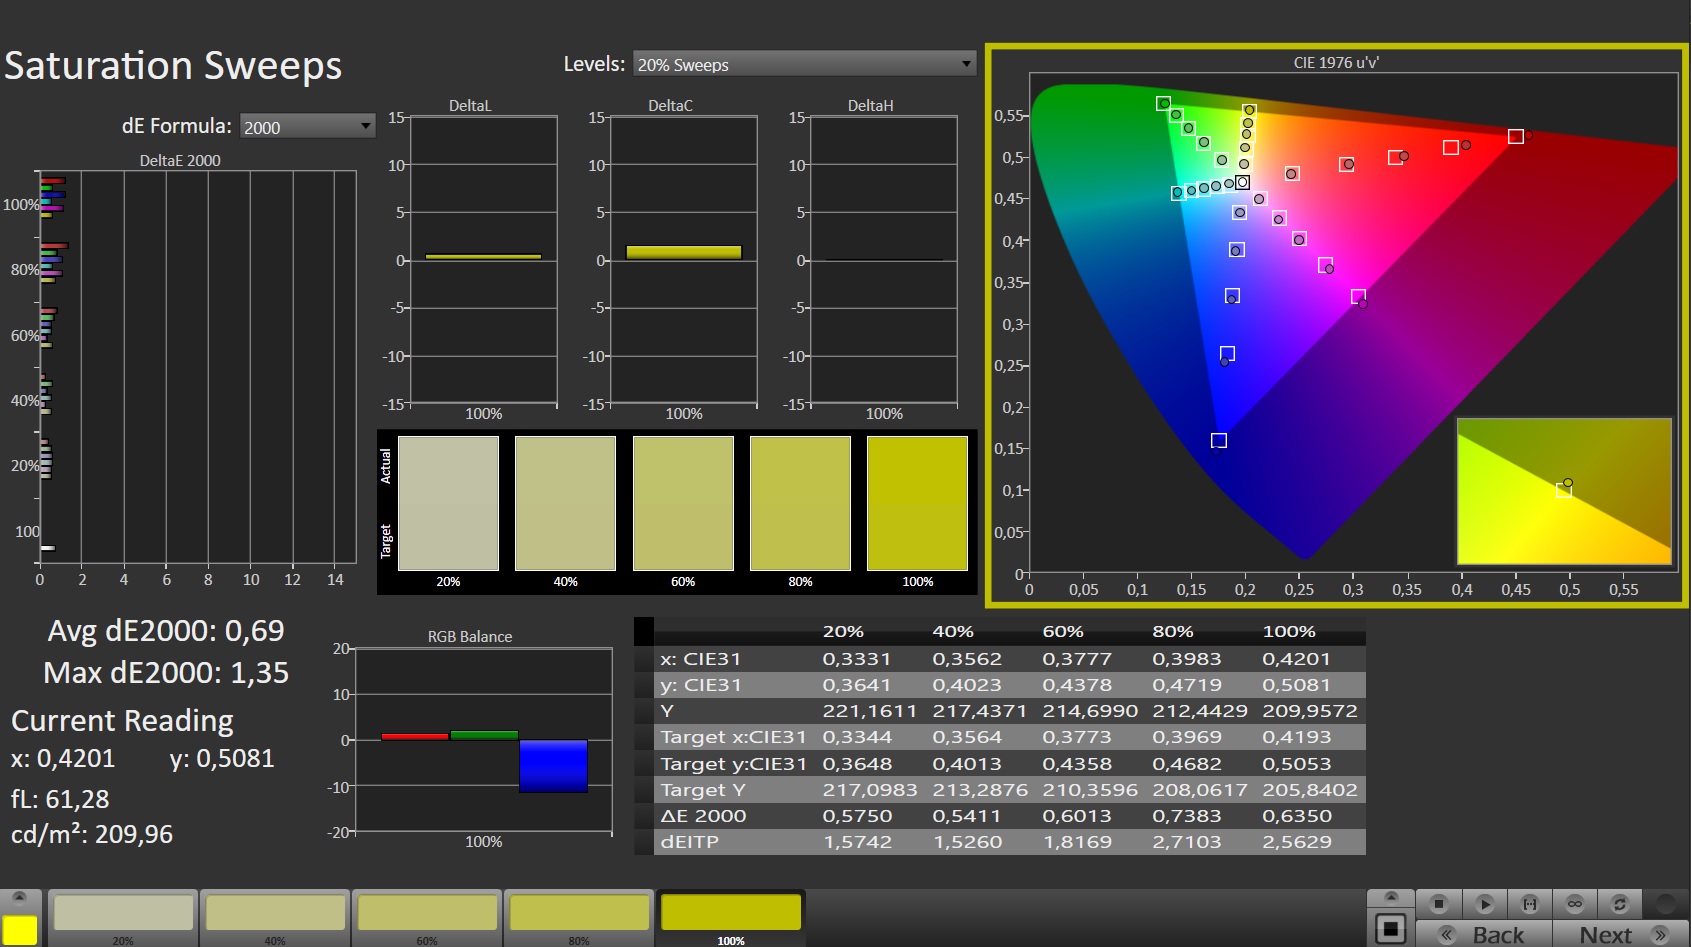
La calidad de la pantalla es buena en general y no observamos granulosidad debido a la capa mate de la pantalla. Además, nuestras mediciones indican que Schenker precalibra la pantalla del Schenker Neo 17. De fábrica, registramos valores deltaE-2000 de escala de grises y color inferiores a 3 cada uno, que es el rango ideal. No obstante, pudimos mejorar aún más estos resultados calibrando manualmente la pantalla. El Neo 17 alcanza la cobertura del espacio de color sRGB anunciada del 99 por ciento. Sin embargo, sólo cubre el 69 por ciento de los espacios de color ampliados AdobeRGB y P3, lo que lo hace inadecuado para cualquier cosa que vaya más allá de la edición no profesional de fotos y vídeos.
Tiempos de respuesta del display
| ↔ Tiempo de respuesta de Negro a Blanco | ||
|---|---|---|
| 6.1 ms ... subida ↗ y bajada ↘ combinada | ↗ 2.5 ms subida | 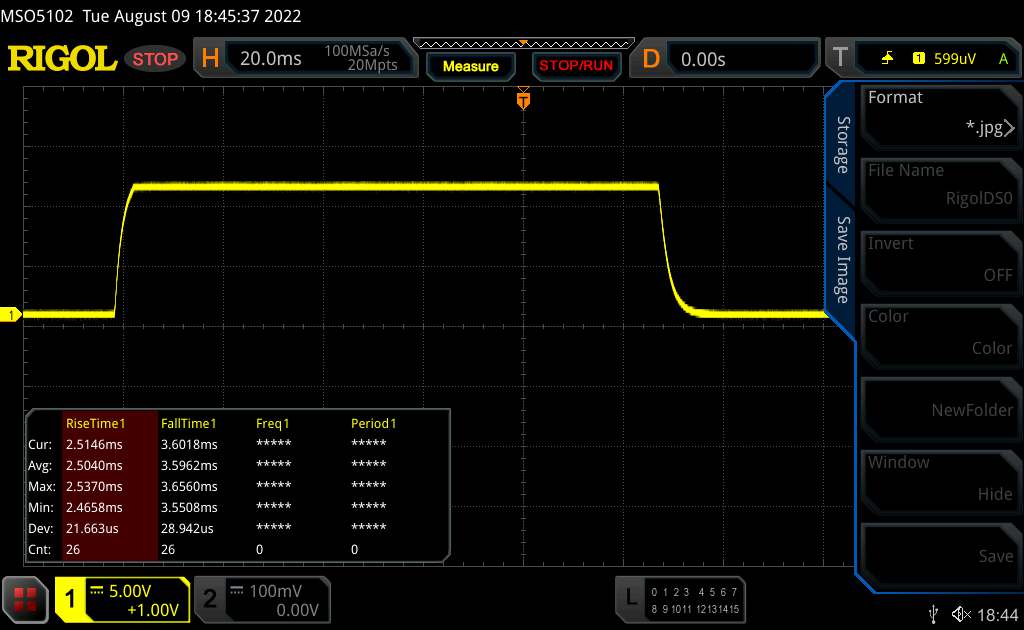 |
| ↘ 3.6 ms bajada | ||
| La pantalla mostró tiempos de respuesta muy rápidos en nuestros tests y debería ser adecuada para juegos frenéticos. En comparación, todos los dispositivos de prueba van de ##min### (mínimo) a 240 (máximo) ms. » 20 % de todos los dispositivos son mejores. Esto quiere decir que el tiempo de respuesta medido es mejor que la media (19.8 ms) de todos los dispositivos testados. | ||
| ↔ Tiempo de respuesta 50% Gris a 80% Gris | ||
| 10.8 ms ... subida ↗ y bajada ↘ combinada | ↗ 5.1 ms subida | 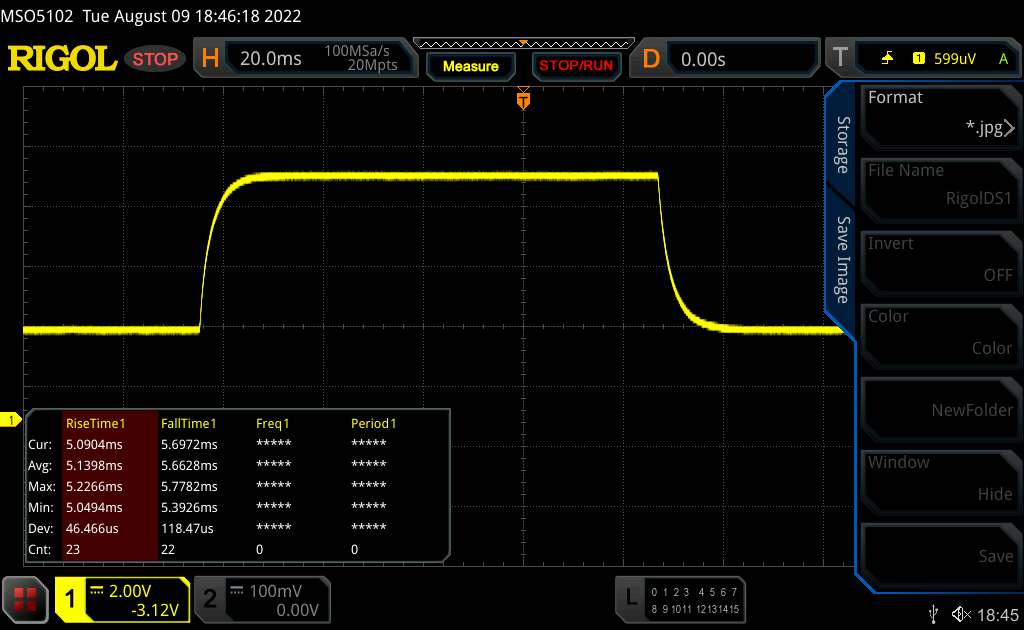 |
| ↘ 5.7 ms bajada | ||
| La pantalla mostró buenos tiempos de respuesta en nuestros tests pero podría ser demasiado lenta para los jugones competitivos. En comparación, todos los dispositivos de prueba van de ##min### (mínimo) a 636 (máximo) ms. » 25 % de todos los dispositivos son mejores. Esto quiere decir que el tiempo de respuesta medido es mejor que la media (31 ms) de todos los dispositivos testados. | ||
Parpadeo de Pantalla / PWM (Pulse-Width Modulation)
| Parpadeo de Pantalla / PWM no detectado | 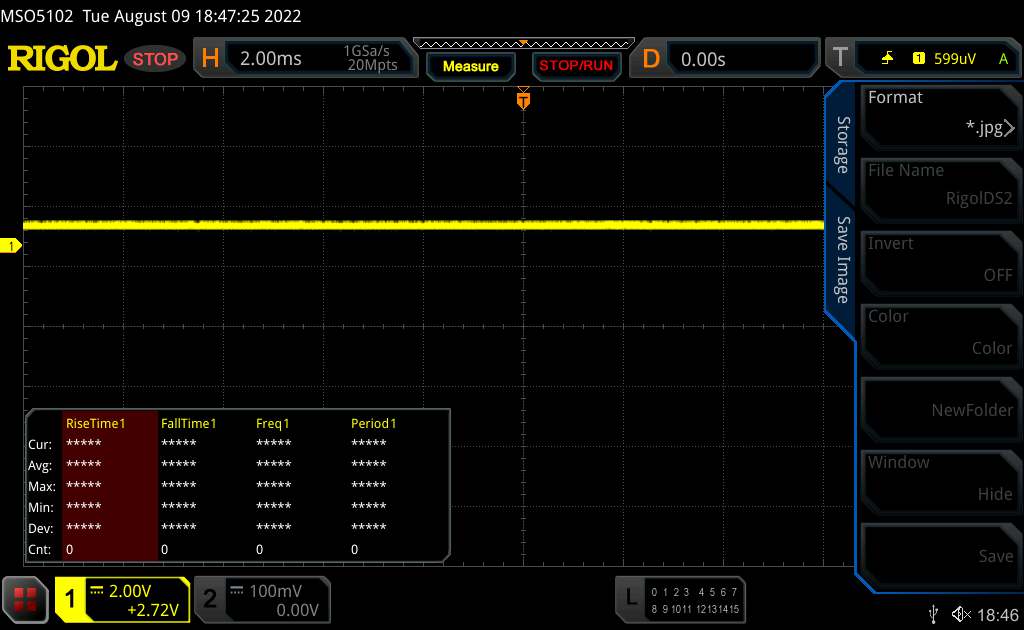 | ||
Comparación: 52 % de todos los dispositivos testados no usaron PWM para atenuar el display. Si se usó, medimos una media de 7757 (mínimo: 5 - máxmo: 343500) Hz. | |||
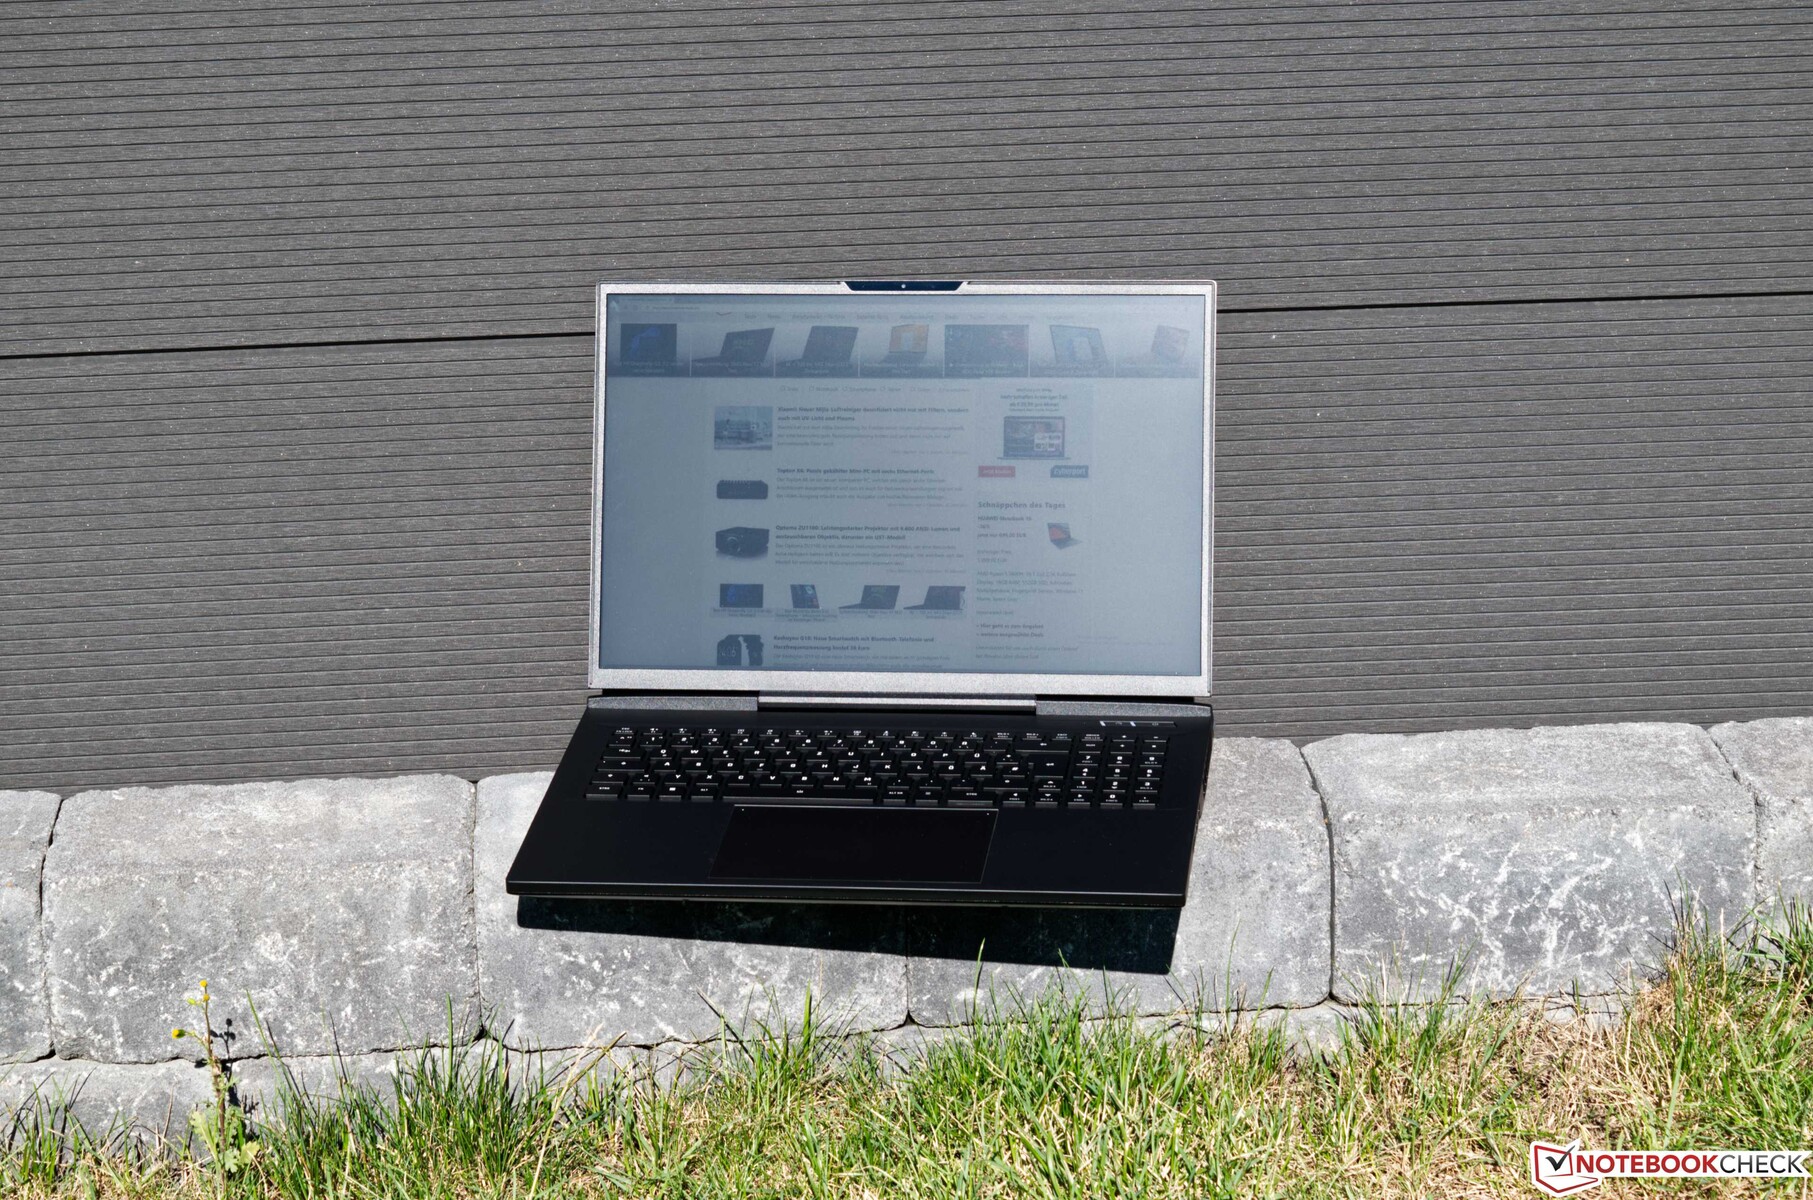
El revestimiento mate de la pantalla es muy adecuado para el uso en exteriores. No obstante, la legibilidad es limitada fuera de la sombra. En particular, los usuarios deben evitar utilizar la pantalla bajo la luz solar directa.
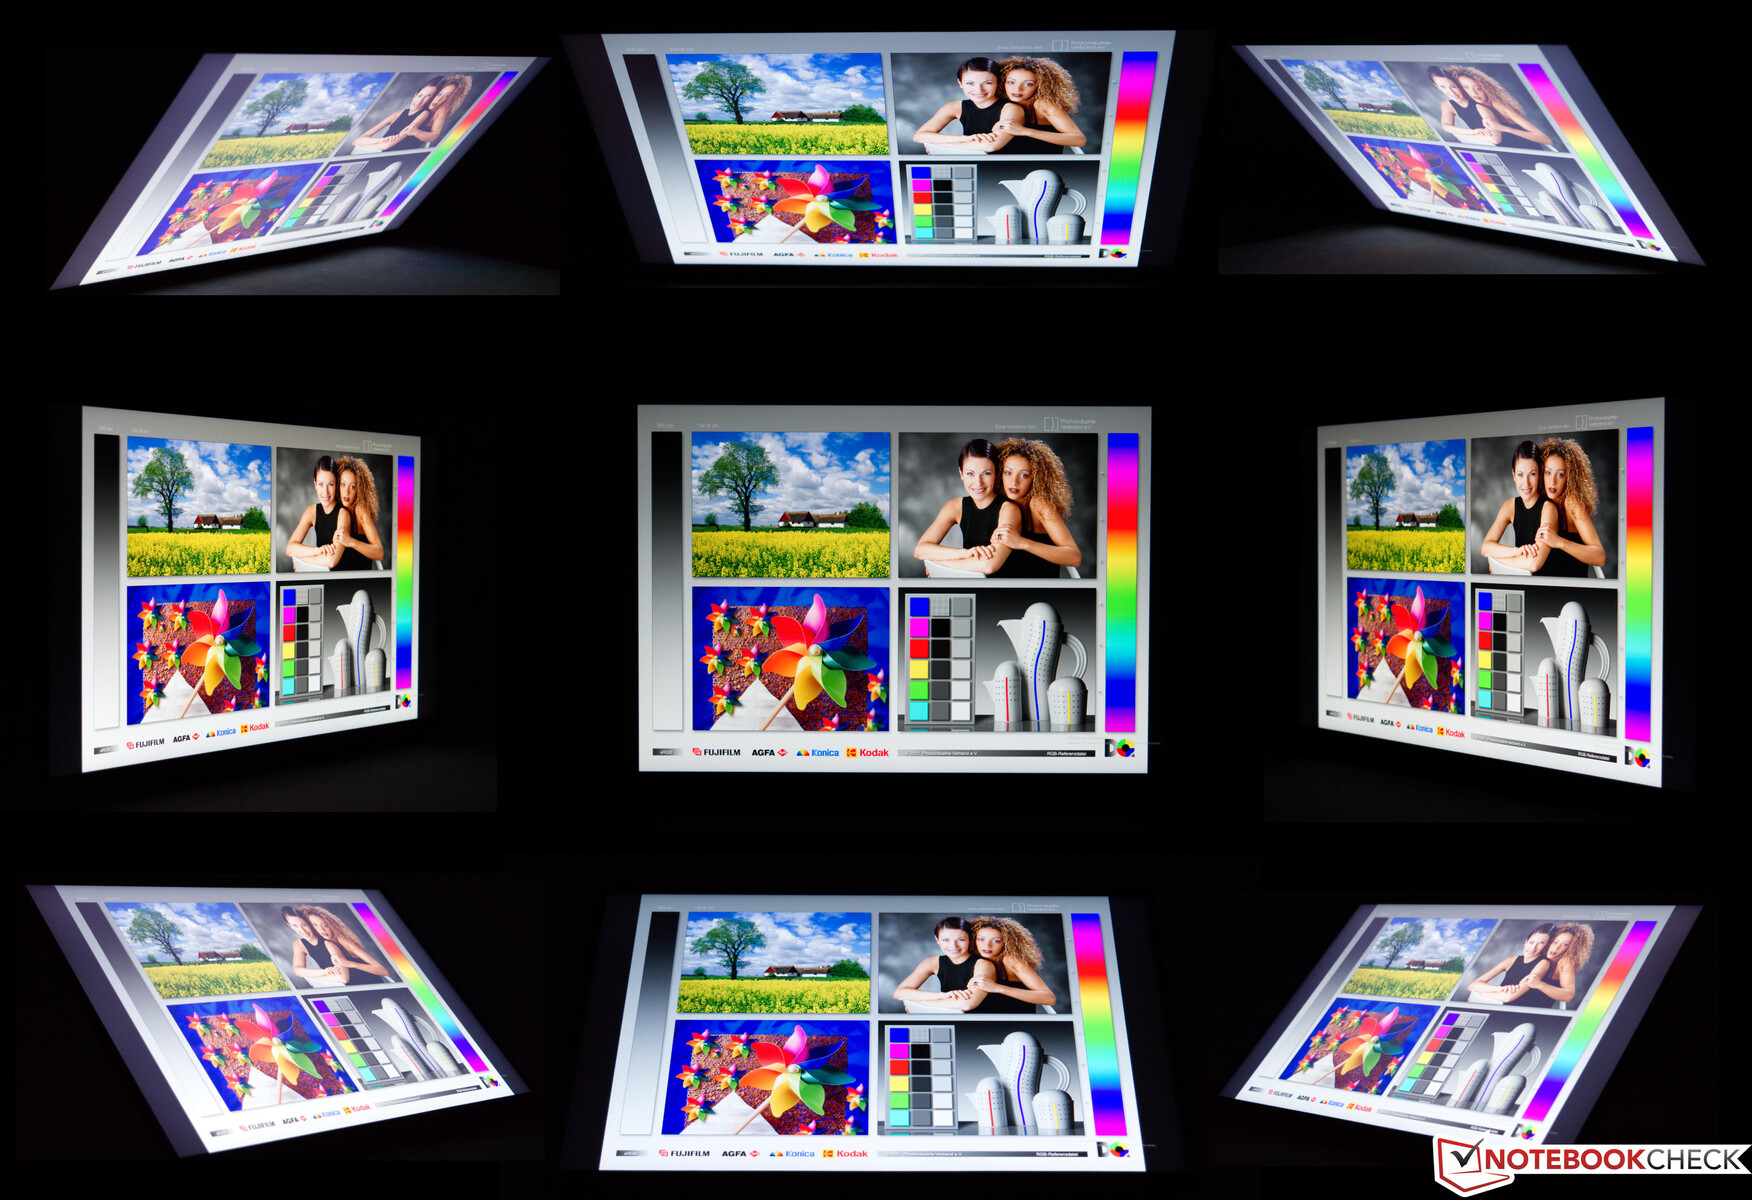
La prueba de ángulo de visión muestra un resultado característico de un panel IPS. Sólo las cuatro imágenes de las esquinas muestran pequeñas desviaciones de color que no estarán presentes durante el uso normal.
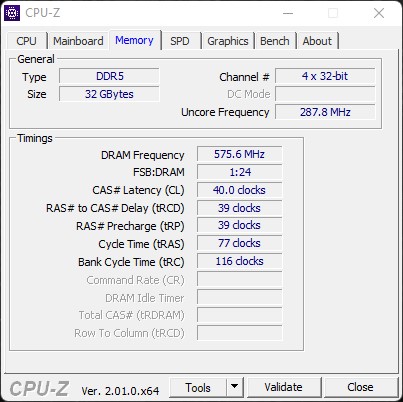
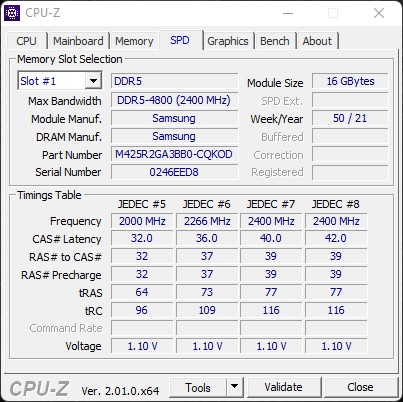
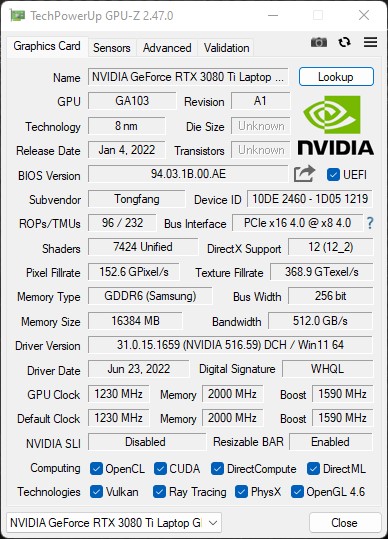
Rendimiento - AMD y Nvidia Unidos
Con elAMD Ryzen 9 6900HX y laGPU para portátiles Nvidia GeForce RTX 3080 Tinuestro dispositivo de pruebas está listo para los últimos juegos con los ajustes de detalle máximos en un portátil. La generosa configuración de la memoria del sistema de 32 GB deja a los usuarios más que suficiente margen de maniobra y soporta el nuevo estándar DDR5. Al estilo típico de Schenker, los usuarios pueden ajustar la configuración según sus preferencias y crear un sistema óptimo. Sin embargo, la CPU y el panel de 17 pulgadas son fijos.
Condiciones de la prueba
El propio Centro de Control de Schenker incluye perfiles de ventilador predefinidos, que también afectan al comportamiento del ventilador a largo plazo. Para lograr las mejores puntuaciones, pusimos el Schenker XMG Neo 17 M22 en "Overboost" antes de ejecutar cualquiera de los siguientes benchmarks.
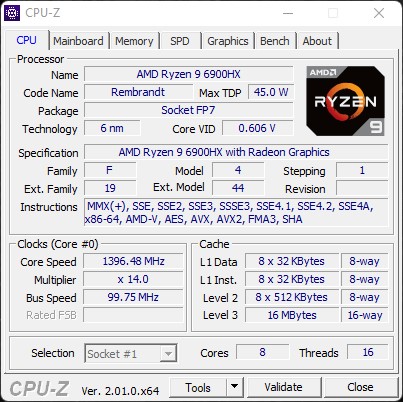
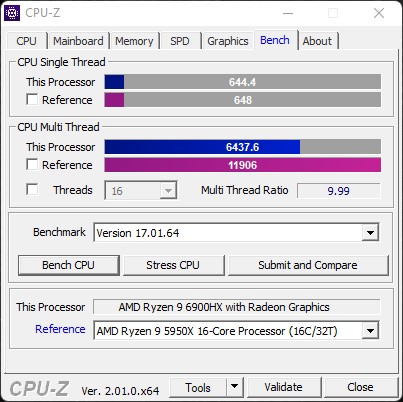
Procesador
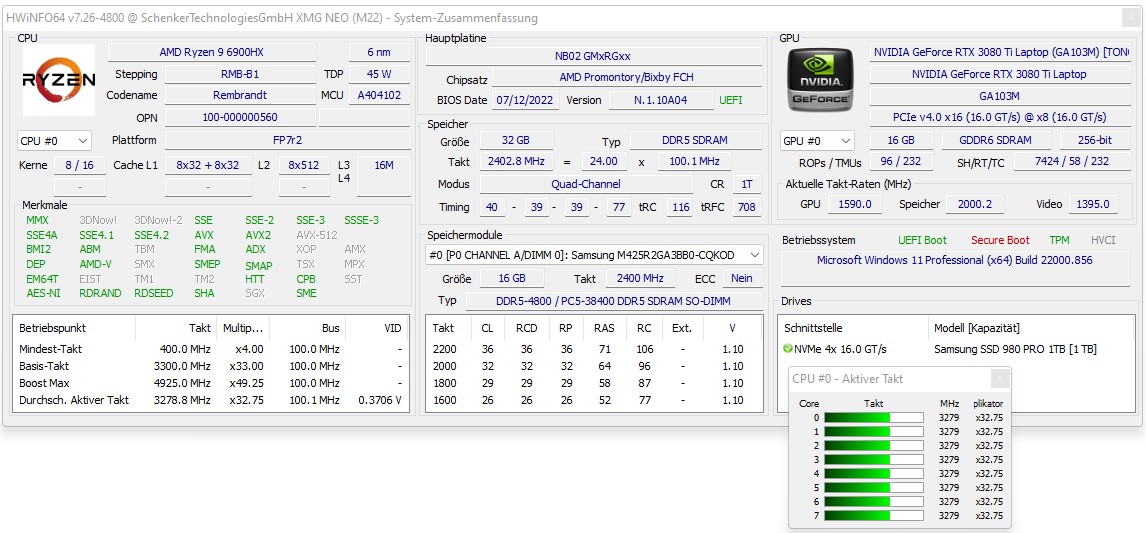
El AMD Ryzen 9 6900HX es una CPU octa-core basada en la última arquitectura Zen-3. El SoC tiene una velocidad de reloj de 3,3 a 4,9 GHz de refuerzo y soporta SMT para un total de 16 hilos. Sin embargo, el AMD Ryzen 9 6900HX se enfrenta a una dura competencia con el Intel 12th Gen, que puede ser significativamente más rápido en una comparación directa.
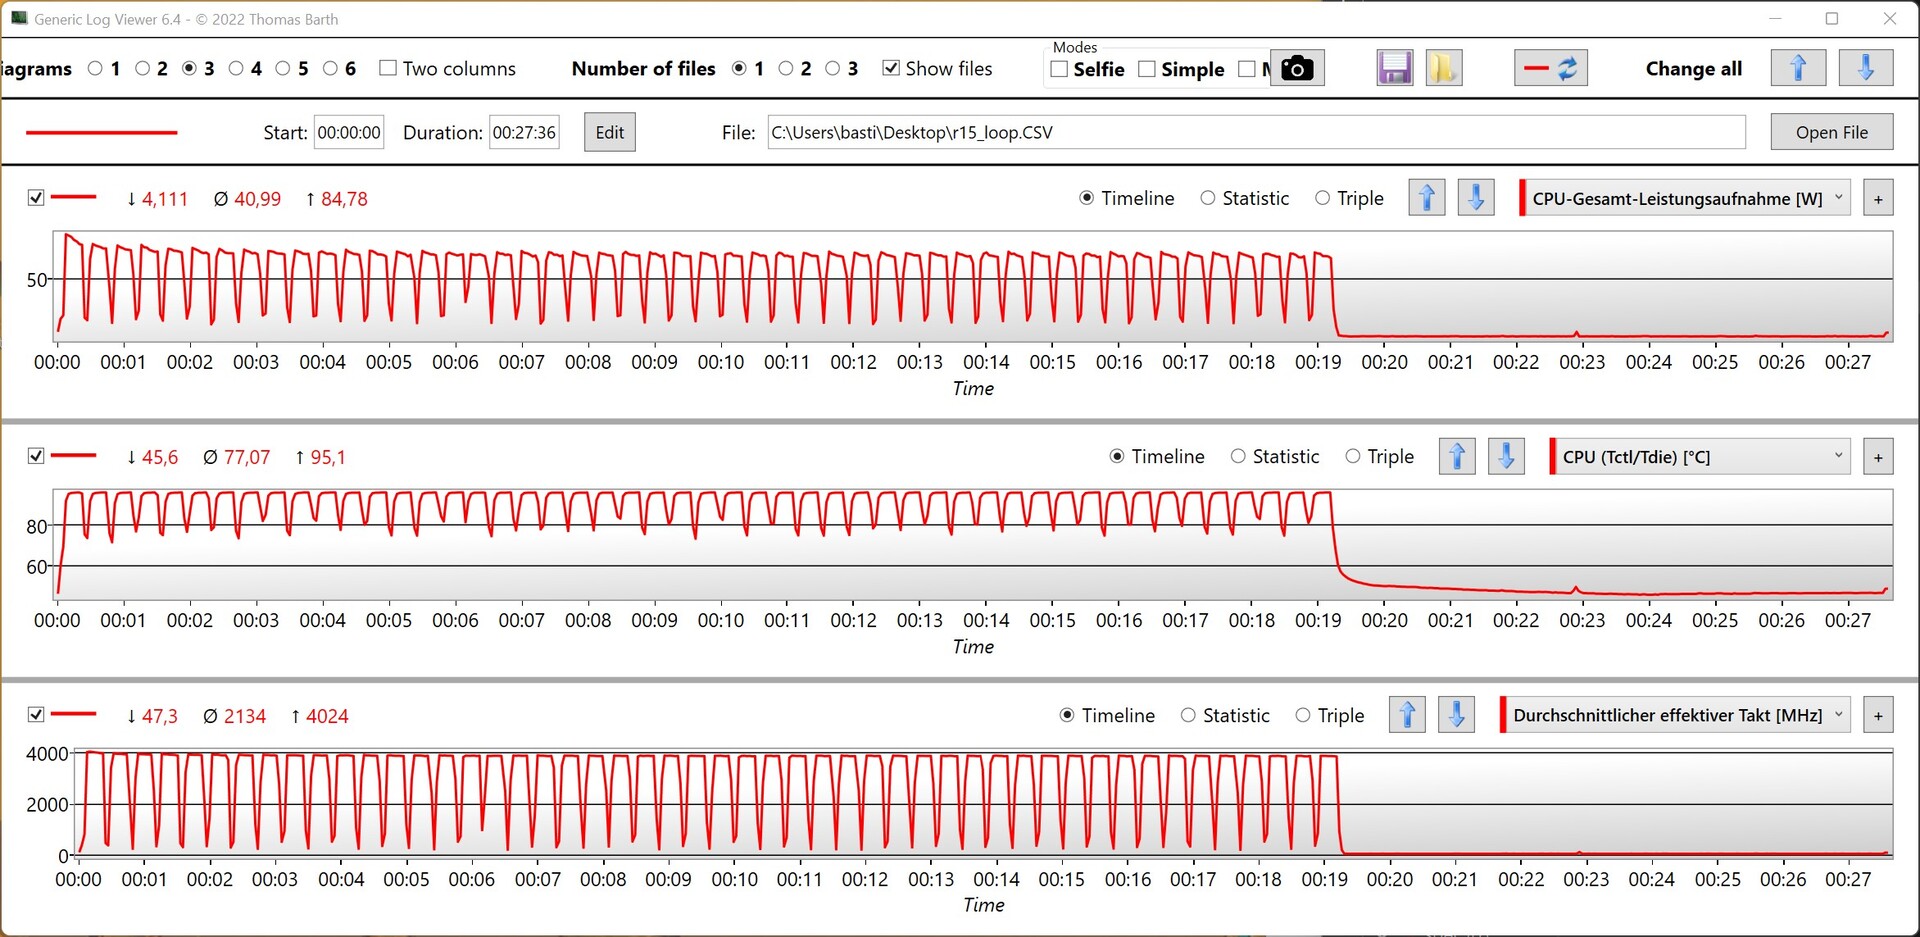
El AMD Ryzen 9 6900HX del Schenker XMG Neo 17 M22 es capaz de mantener un nivel de rendimiento consistente durante nuestra prueba. Hay que tener en cuenta que el rendimiento de la CPU cae un 10% en modo batería.
Se pueden encontrar más pruebas en nuestra Tabla de comparación de CPUs.
Cinebench R15 Multi Loop
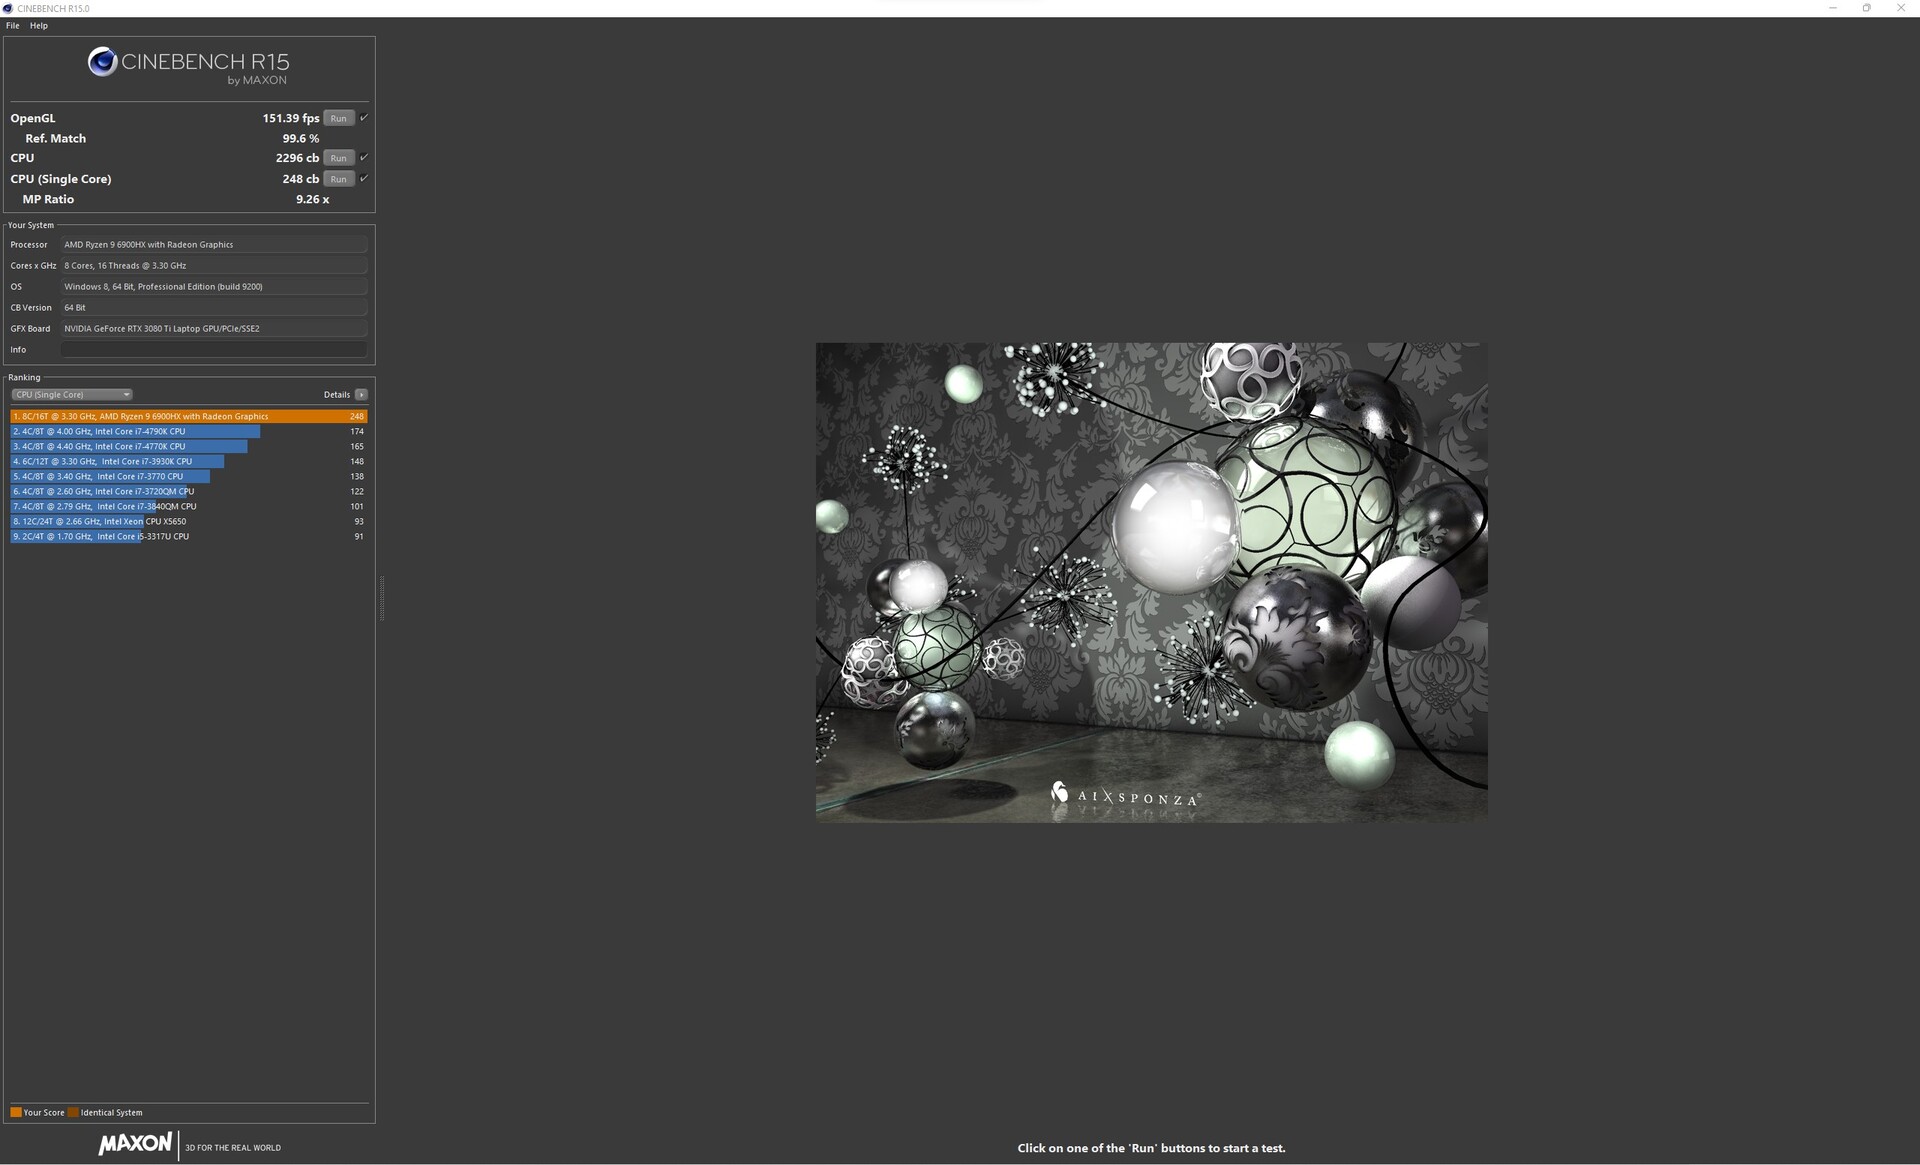
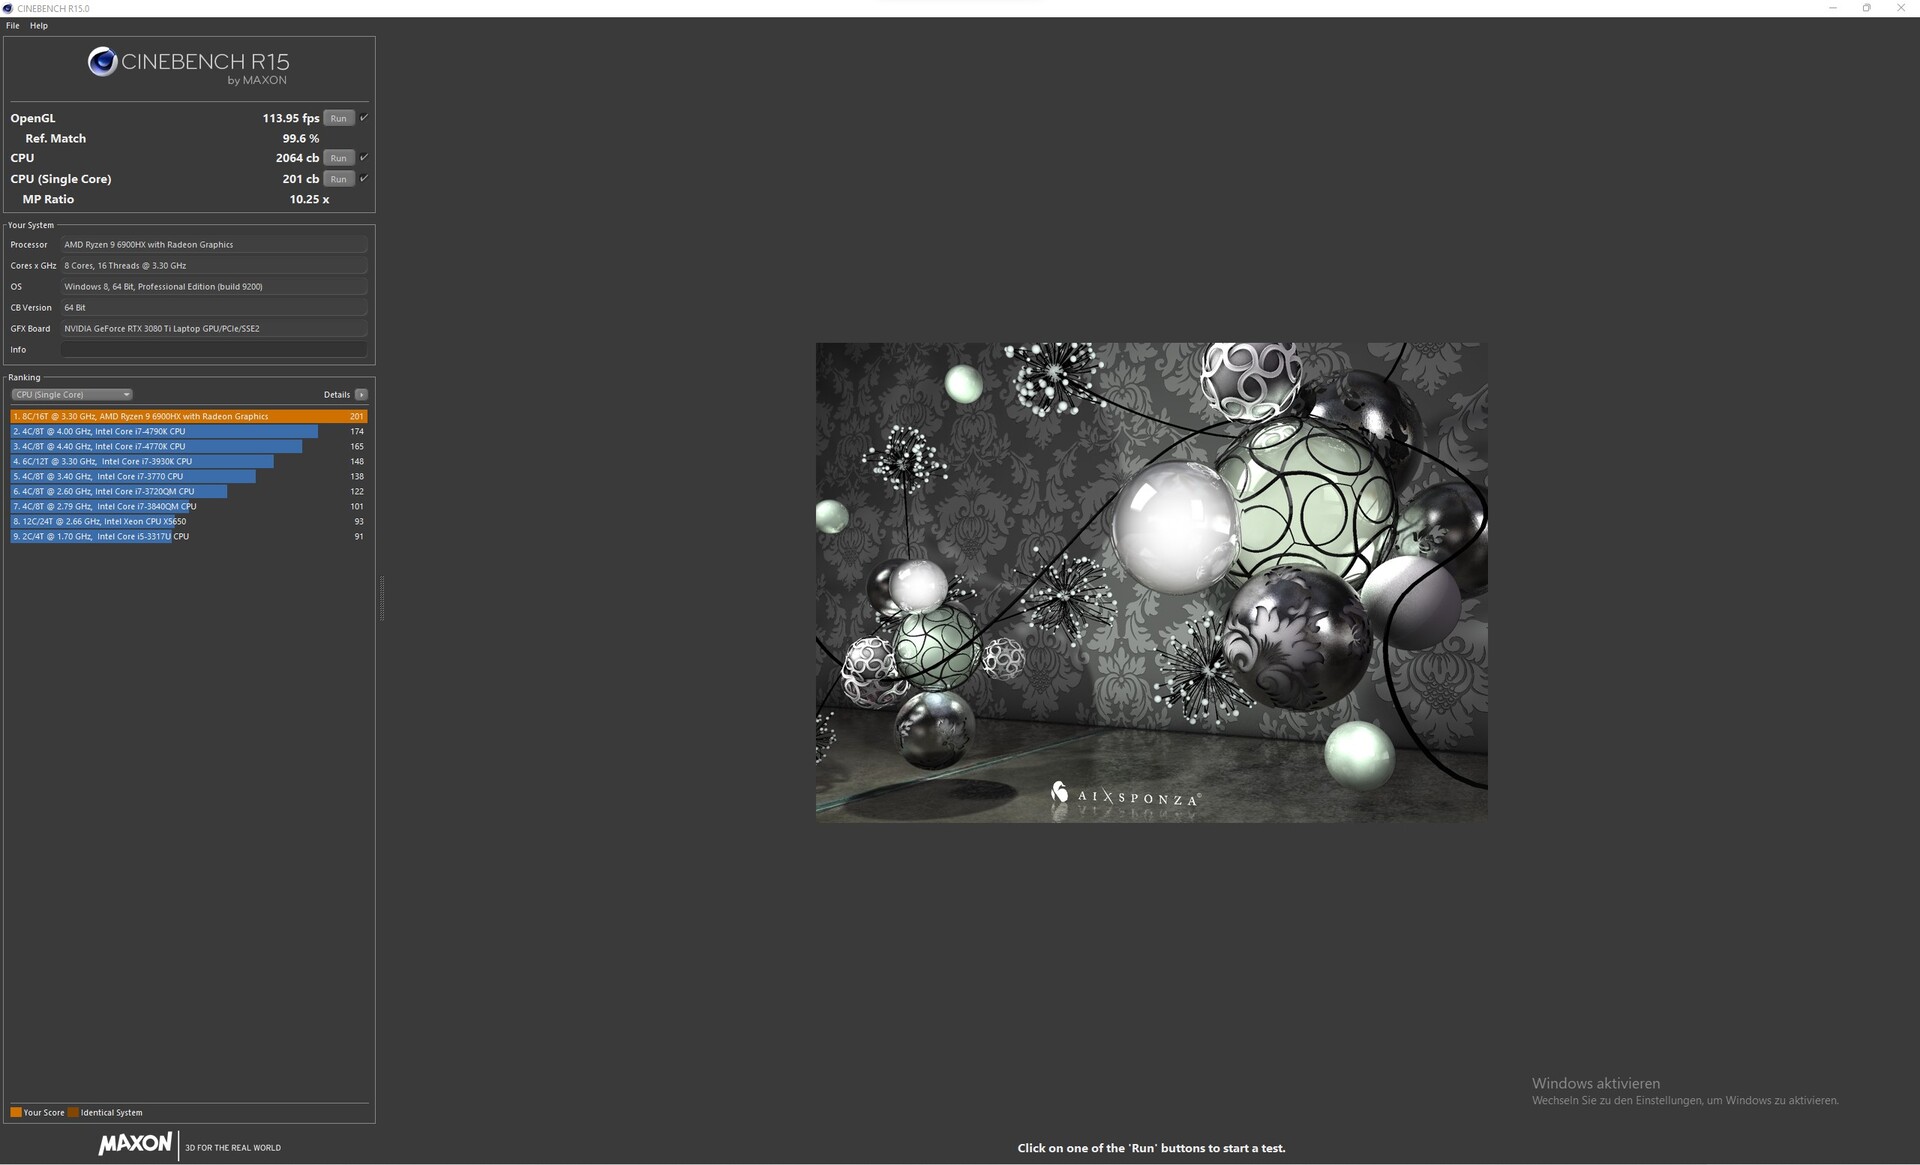
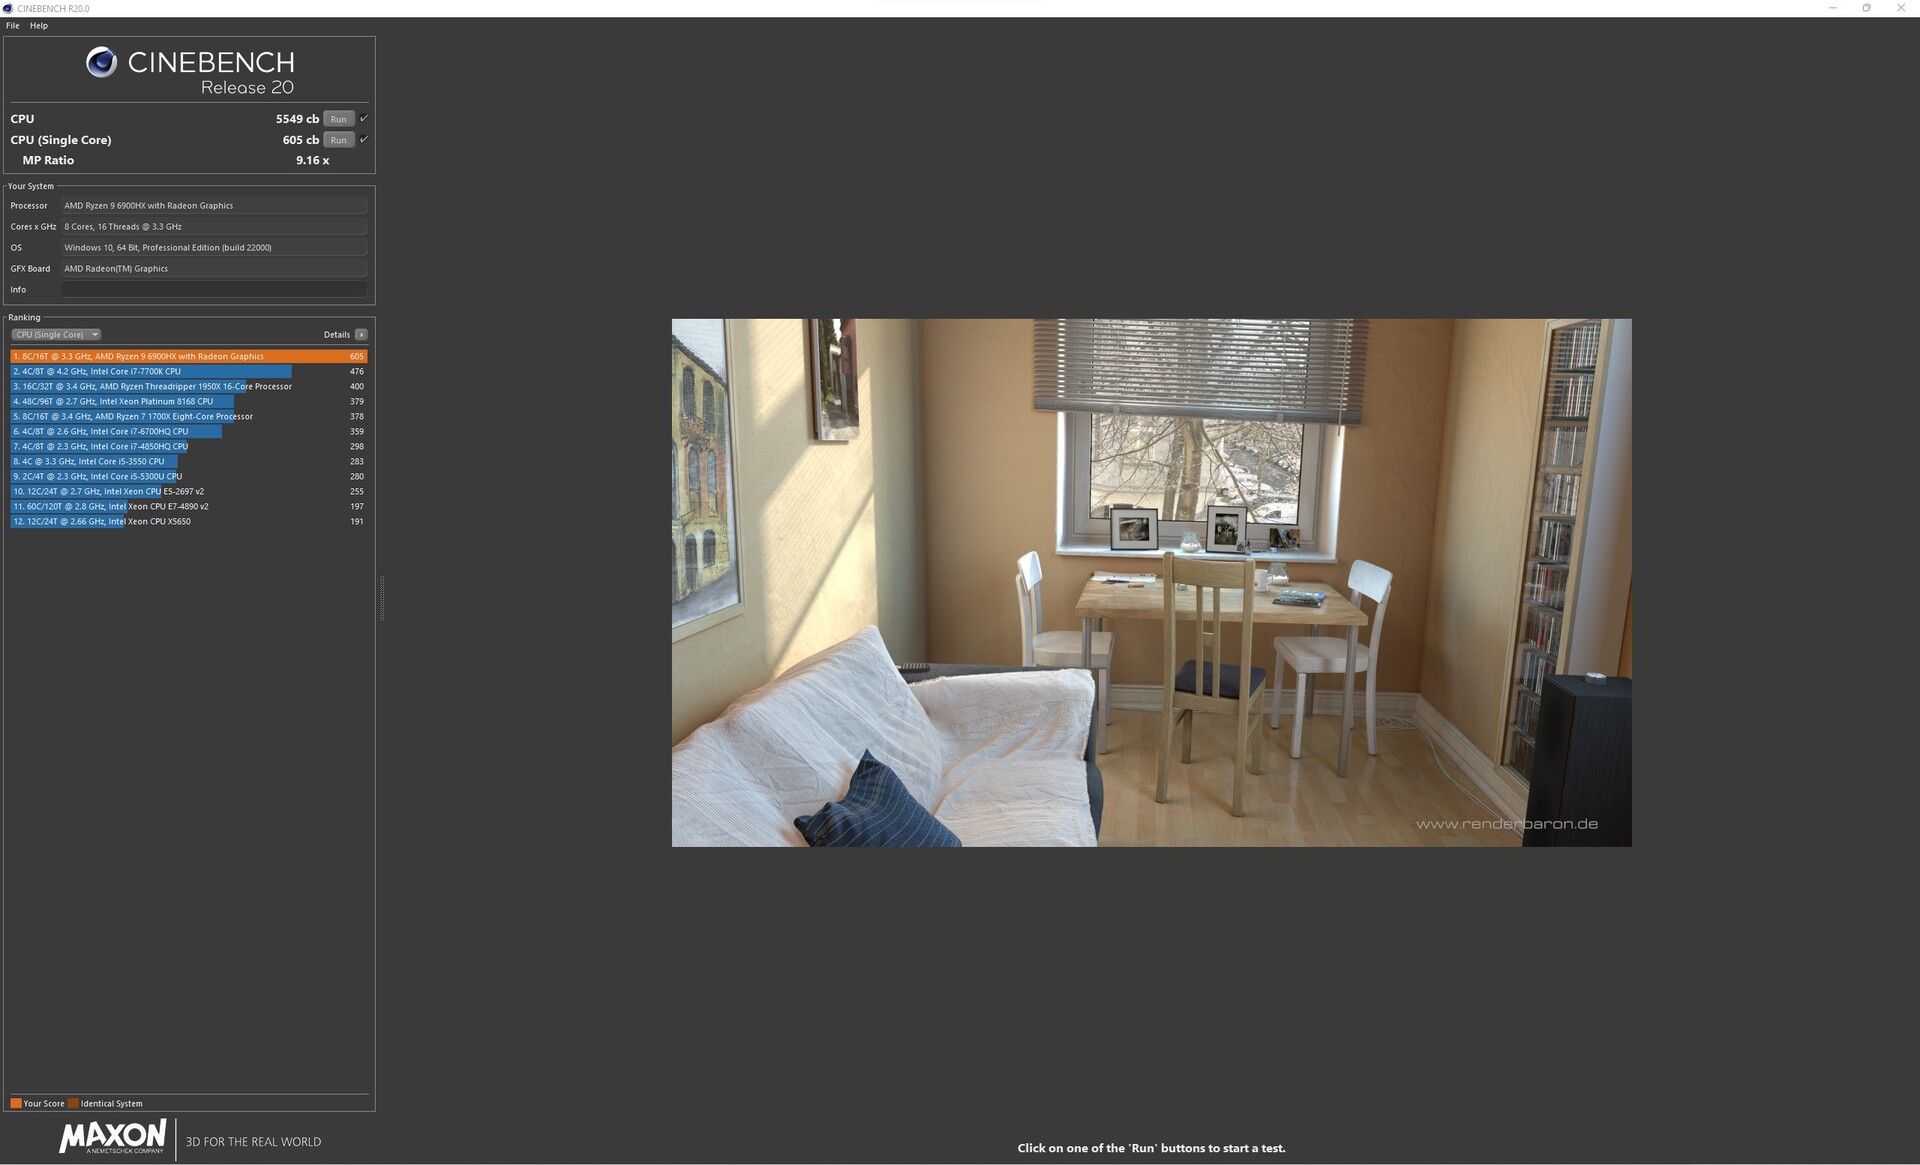
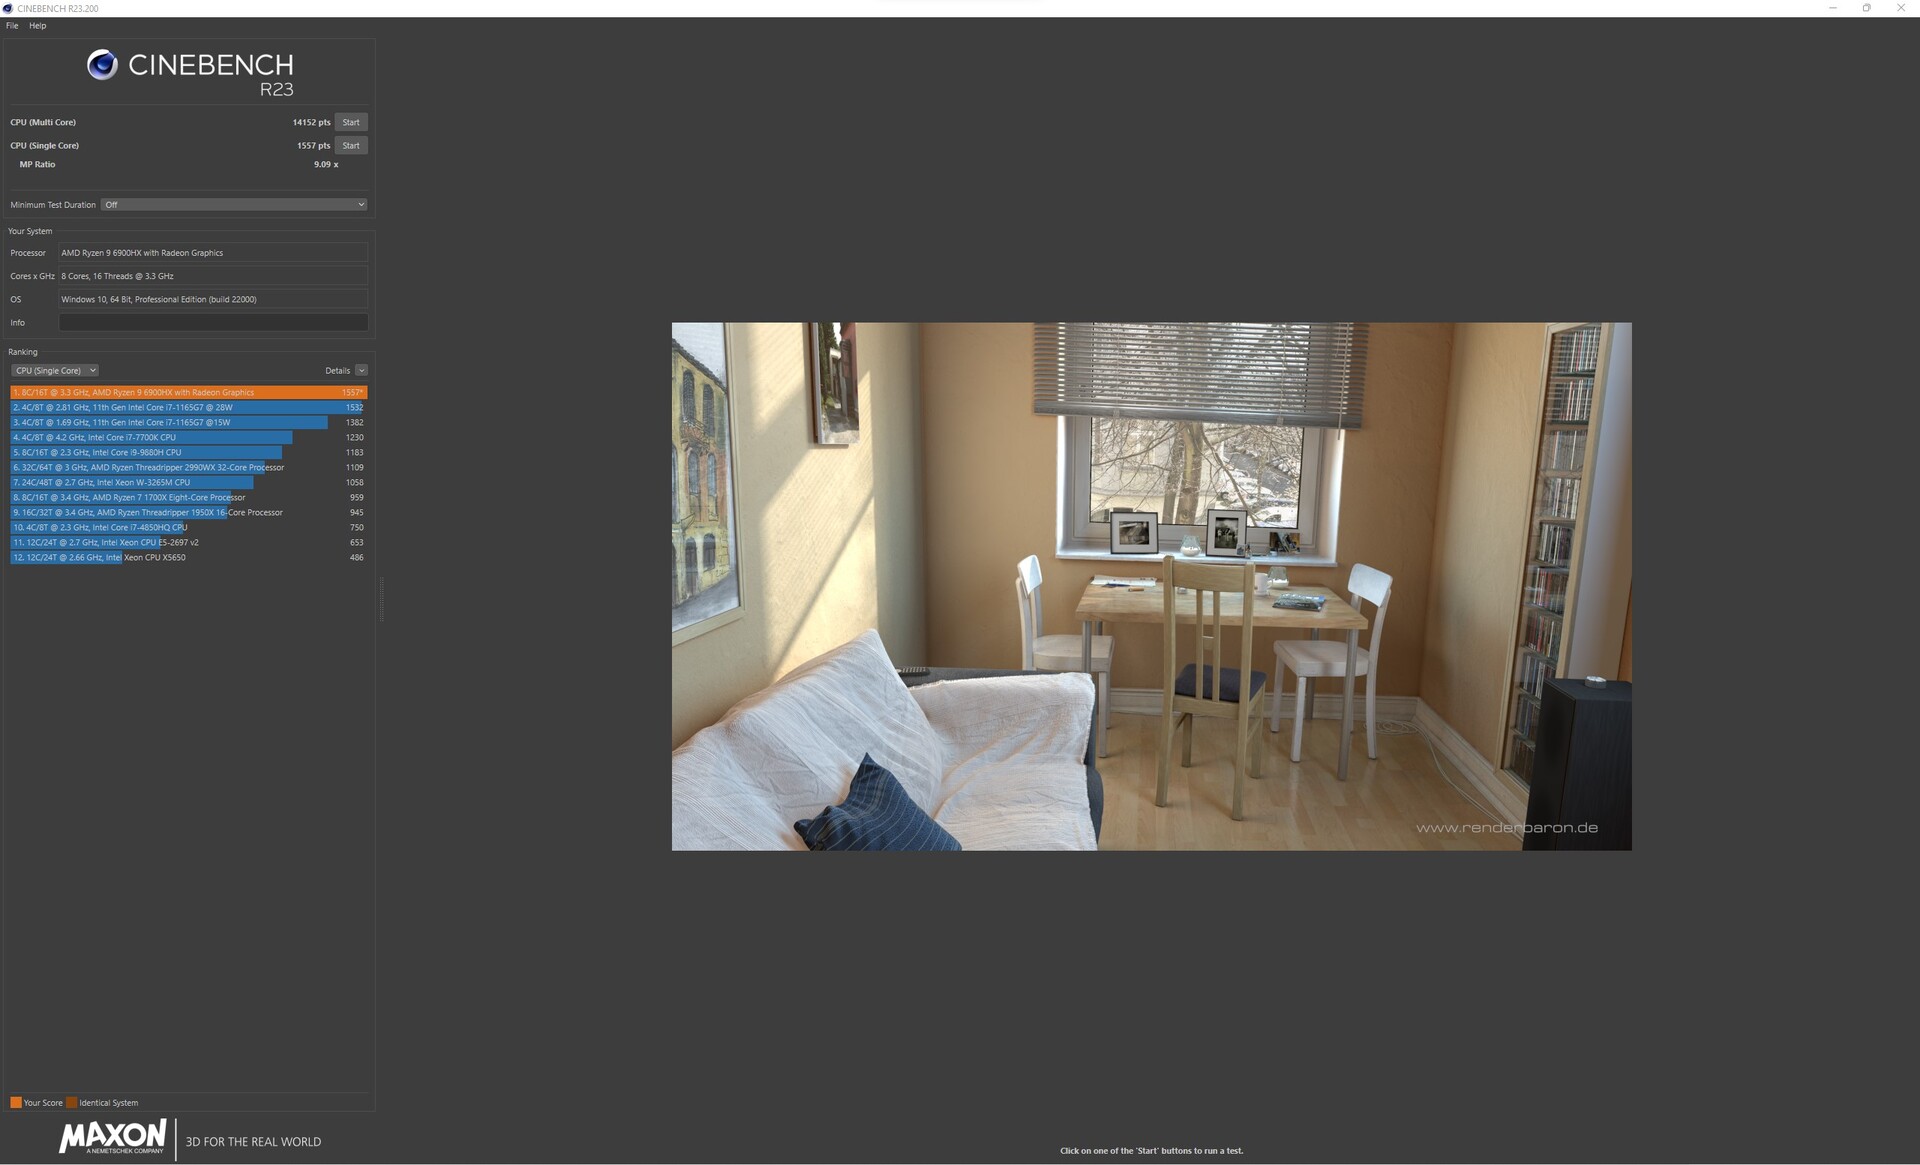
Cinebench R23: Multi Core | Single Core
Cinebench R20: CPU (Multi Core) | CPU (Single Core)
Cinebench R15: CPU Multi 64Bit | CPU Single 64Bit
Blender: v2.79 BMW27 CPU
7-Zip 18.03: 7z b 4 | 7z b 4 -mmt1
Geekbench 5.5: Multi-Core | Single-Core
HWBOT x265 Benchmark v2.2: 4k Preset
LibreOffice : 20 Documents To PDF
R Benchmark 2.5: Overall mean
| CPU Performance rating | |
| Media de la clase Gaming | |
| MSI Titan GT77 12UHS | |
| MSI Raider GE77 HX 12UHS | |
| Acer Predator Triton 500 SE PT516-52s-70KX | |
| Asus ROG Zephyrus Duo 16 GX650RX | |
| Schenker XMG Neo 17 M22 | |
| Medio AMD Ryzen 9 6900HX | |
| Razer Blade 17 Early 2022 | |
| Cinebench R23 / Multi Core | |
| Media de la clase Gaming (10488 - 42661, n=107, últimos 2 años) | |
| MSI Raider GE77 HX 12UHS | |
| MSI Titan GT77 12UHS | |
| Acer Predator Triton 500 SE PT516-52s-70KX | |
| Schenker XMG Neo 17 M22 | |
| Asus ROG Zephyrus Duo 16 GX650RX | |
| Medio AMD Ryzen 9 6900HX (9709 - 15100, n=19) | |
| Razer Blade 17 Early 2022 | |
| Cinebench R23 / Single Core | |
| Media de la clase Gaming (1166 - 2415, n=107, últimos 2 años) | |
| MSI Titan GT77 12UHS | |
| Razer Blade 17 Early 2022 | |
| MSI Raider GE77 HX 12UHS | |
| Acer Predator Triton 500 SE PT516-52s-70KX | |
| Asus ROG Zephyrus Duo 16 GX650RX | |
| Medio AMD Ryzen 9 6900HX (1516 - 1616, n=19) | |
| Schenker XMG Neo 17 M22 | |
| Cinebench R20 / CPU (Multi Core) | |
| Media de la clase Gaming (4029 - 16433, n=106, últimos 2 años) | |
| MSI Raider GE77 HX 12UHS | |
| MSI Titan GT77 12UHS | |
| Acer Predator Triton 500 SE PT516-52s-70KX | |
| Schenker XMG Neo 17 M22 | |
| Asus ROG Zephyrus Duo 16 GX650RX | |
| Medio AMD Ryzen 9 6900HX (3742 - 5813, n=19) | |
| Razer Blade 17 Early 2022 | |
| Cinebench R20 / CPU (Single Core) | |
| Media de la clase Gaming (442 - 913, n=106, últimos 2 años) | |
| MSI Raider GE77 HX 12UHS | |
| MSI Titan GT77 12UHS | |
| Razer Blade 17 Early 2022 | |
| Acer Predator Triton 500 SE PT516-52s-70KX | |
| Medio AMD Ryzen 9 6900HX (595 - 631, n=19) | |
| Schenker XMG Neo 17 M22 | |
| Asus ROG Zephyrus Duo 16 GX650RX | |
| Cinebench R15 / CPU Multi 64Bit | |
| Media de la clase Gaming (1578 - 6330, n=105, últimos 2 años) | |
| MSI Titan GT77 12UHS | |
| MSI Raider GE77 HX 12UHS | |
| Acer Predator Triton 500 SE PT516-52s-70KX | |
| Schenker XMG Neo 17 M22 | |
| Asus ROG Zephyrus Duo 16 GX650RX | |
| Medio AMD Ryzen 9 6900HX (1588 - 2411, n=19) | |
| Razer Blade 17 Early 2022 | |
| Cinebench R15 / CPU Single 64Bit | |
| Media de la clase Gaming (188.8 - 350, n=106, últimos 2 años) | |
| MSI Raider GE77 HX 12UHS | |
| MSI Titan GT77 12UHS | |
| Razer Blade 17 Early 2022 | |
| Medio AMD Ryzen 9 6900HX (241 - 261, n=19) | |
| Asus ROG Zephyrus Duo 16 GX650RX | |
| Schenker XMG Neo 17 M22 | |
| Acer Predator Triton 500 SE PT516-52s-70KX | |
| Blender / v2.79 BMW27 CPU | |
| Razer Blade 17 Early 2022 | |
| Medio AMD Ryzen 9 6900HX (212 - 357, n=21) | |
| Asus ROG Zephyrus Duo 16 GX650RX | |
| Schenker XMG Neo 17 M22 | |
| Acer Predator Triton 500 SE PT516-52s-70KX | |
| MSI Raider GE77 HX 12UHS | |
| Media de la clase Gaming (79 - 330, n=104, últimos 2 años) | |
| MSI Titan GT77 12UHS | |
| 7-Zip 18.03 / 7z b 4 | |
| Media de la clase Gaming (33491 - 148086, n=105, últimos 2 años) | |
| MSI Raider GE77 HX 12UHS | |
| MSI Titan GT77 12UHS | |
| Acer Predator Triton 500 SE PT516-52s-70KX | |
| Asus ROG Zephyrus Duo 16 GX650RX | |
| Schenker XMG Neo 17 M22 | |
| Medio AMD Ryzen 9 6900HX (49526 - 65336, n=20) | |
| Razer Blade 17 Early 2022 | |
| 7-Zip 18.03 / 7z b 4 -mmt1 | |
| Media de la clase Gaming (4199 - 7436, n=105, últimos 2 años) | |
| MSI Raider GE77 HX 12UHS | |
| MSI Titan GT77 12UHS | |
| Razer Blade 17 Early 2022 | |
| Schenker XMG Neo 17 M22 | |
| Medio AMD Ryzen 9 6900HX (5090 - 6070, n=20) | |
| Asus ROG Zephyrus Duo 16 GX650RX | |
| Acer Predator Triton 500 SE PT516-52s-70KX | |
| Geekbench 5.5 / Multi-Core | |
| Media de la clase Gaming (6460 - 28263, n=105, últimos 2 años) | |
| MSI Raider GE77 HX 12UHS | |
| MSI Titan GT77 12UHS | |
| Acer Predator Triton 500 SE PT516-52s-70KX | |
| Asus ROG Zephyrus Duo 16 GX650RX | |
| Schenker XMG Neo 17 M22 | |
| Razer Blade 17 Early 2022 | |
| Medio AMD Ryzen 9 6900HX (8313 - 10490, n=21) | |
| Geekbench 5.5 / Single-Core | |
| Media de la clase Gaming (986 - 2474, n=105, últimos 2 años) | |
| MSI Raider GE77 HX 12UHS | |
| MSI Titan GT77 12UHS | |
| Razer Blade 17 Early 2022 | |
| Acer Predator Triton 500 SE PT516-52s-70KX | |
| Asus ROG Zephyrus Duo 16 GX650RX | |
| Schenker XMG Neo 17 M22 | |
| Medio AMD Ryzen 9 6900HX (1523 - 1652, n=21) | |
| HWBOT x265 Benchmark v2.2 / 4k Preset | |
| Media de la clase Gaming (11.5 - 44.4, n=105, últimos 2 años) | |
| MSI Raider GE77 HX 12UHS | |
| MSI Titan GT77 12UHS | |
| Acer Predator Triton 500 SE PT516-52s-70KX | |
| Asus ROG Zephyrus Duo 16 GX650RX | |
| Schenker XMG Neo 17 M22 | |
| Medio AMD Ryzen 9 6900HX (12.6 - 18.7, n=20) | |
| Razer Blade 17 Early 2022 | |
| LibreOffice / 20 Documents To PDF | |
| Schenker XMG Neo 17 M22 | |
| Medio AMD Ryzen 9 6900HX (44.8 - 81.7, n=20) | |
| Media de la clase Gaming (33.2 - 88.8, n=105, últimos 2 años) | |
| Asus ROG Zephyrus Duo 16 GX650RX | |
| MSI Raider GE77 HX 12UHS | |
| Acer Predator Triton 500 SE PT516-52s-70KX | |
| Razer Blade 17 Early 2022 | |
| MSI Titan GT77 12UHS | |
| R Benchmark 2.5 / Overall mean | |
| Medio AMD Ryzen 9 6900HX (0.4627 - 0.4974, n=20) | |
| Schenker XMG Neo 17 M22 | |
| Asus ROG Zephyrus Duo 16 GX650RX | |
| Acer Predator Triton 500 SE PT516-52s-70KX | |
| Razer Blade 17 Early 2022 | |
| Media de la clase Gaming (0.3439 - 0.759, n=106, últimos 2 años) | |
| MSI Raider GE77 HX 12UHS | |
| MSI Titan GT77 12UHS | |
* ... más pequeño es mejor
AIDA64: FP32 Ray-Trace | FPU Julia | CPU SHA3 | CPU Queen | FPU SinJulia | FPU Mandel | CPU AES | CPU ZLib | FP64 Ray-Trace | CPU PhotoWorxx
| Performance rating | |
| Media de la clase Gaming | |
| MSI Raider GE77 HX 12UHS | |
| MSI Titan GT77 12UHS | |
| Asus ROG Zephyrus Duo 16 GX650RX | |
| Schenker XMG Neo 17 M22 | |
| Medio AMD Ryzen 9 6900HX | |
| Acer Predator Triton 500 SE PT516-52s-70KX | |
| Razer Blade 17 Early 2022 | |
| AIDA64 / FP32 Ray-Trace | |
| Media de la clase Gaming (10227 - 85542, n=105, últimos 2 años) | |
| MSI Titan GT77 12UHS | |
| MSI Raider GE77 HX 12UHS | |
| Asus ROG Zephyrus Duo 16 GX650RX | |
| Schenker XMG Neo 17 M22 | |
| Medio AMD Ryzen 9 6900HX (10950 - 17963, n=20) | |
| Acer Predator Triton 500 SE PT516-52s-70KX | |
| Razer Blade 17 Early 2022 | |
| AIDA64 / FPU Julia | |
| Media de la clase Gaming (51376 - 238426, n=105, últimos 2 años) | |
| MSI Raider GE77 HX 12UHS | |
| MSI Titan GT77 12UHS | |
| Asus ROG Zephyrus Duo 16 GX650RX | |
| Schenker XMG Neo 17 M22 | |
| Medio AMD Ryzen 9 6900HX (71414 - 110797, n=20) | |
| Acer Predator Triton 500 SE PT516-52s-70KX | |
| Razer Blade 17 Early 2022 | |
| AIDA64 / CPU SHA3 | |
| Media de la clase Gaming (2180 - 10115, n=105, últimos 2 años) | |
| MSI Raider GE77 HX 12UHS | |
| MSI Titan GT77 12UHS | |
| Asus ROG Zephyrus Duo 16 GX650RX | |
| Schenker XMG Neo 17 M22 | |
| Acer Predator Triton 500 SE PT516-52s-70KX | |
| Medio AMD Ryzen 9 6900HX (2471 - 3804, n=20) | |
| Razer Blade 17 Early 2022 | |
| AIDA64 / CPU Queen | |
| Media de la clase Gaming (49785 - 173351, n=90, últimos 2 años) | |
| Asus ROG Zephyrus Duo 16 GX650RX | |
| MSI Titan GT77 12UHS | |
| Schenker XMG Neo 17 M22 | |
| MSI Raider GE77 HX 12UHS | |
| Medio AMD Ryzen 9 6900HX (84185 - 107544, n=20) | |
| Acer Predator Triton 500 SE PT516-52s-70KX | |
| Razer Blade 17 Early 2022 | |
| AIDA64 / FPU SinJulia | |
| Media de la clase Gaming (4424 - 33636, n=105, últimos 2 años) | |
| MSI Titan GT77 12UHS | |
| Asus ROG Zephyrus Duo 16 GX650RX | |
| MSI Raider GE77 HX 12UHS | |
| Schenker XMG Neo 17 M22 | |
| Medio AMD Ryzen 9 6900HX (10970 - 13205, n=20) | |
| Acer Predator Triton 500 SE PT516-52s-70KX | |
| Razer Blade 17 Early 2022 | |
| AIDA64 / FPU Mandel | |
| Media de la clase Gaming (25115 - 128721, n=105, últimos 2 años) | |
| Asus ROG Zephyrus Duo 16 GX650RX | |
| Schenker XMG Neo 17 M22 | |
| Medio AMD Ryzen 9 6900HX (39164 - 61370, n=20) | |
| MSI Titan GT77 12UHS | |
| MSI Raider GE77 HX 12UHS | |
| Acer Predator Triton 500 SE PT516-52s-70KX | |
| Razer Blade 17 Early 2022 | |
| AIDA64 / CPU AES | |
| MSI Raider GE77 HX 12UHS | |
| MSI Titan GT77 12UHS | |
| Asus ROG Zephyrus Duo 16 GX650RX | |
| Schenker XMG Neo 17 M22 | |
| Medio AMD Ryzen 9 6900HX (54613 - 142360, n=20) | |
| Media de la clase Gaming (39258 - 247074, n=105, últimos 2 años) | |
| Acer Predator Triton 500 SE PT516-52s-70KX | |
| Razer Blade 17 Early 2022 | |
| AIDA64 / CPU ZLib | |
| Media de la clase Gaming (574 - 2531, n=105, últimos 2 años) | |
| MSI Raider GE77 HX 12UHS | |
| MSI Titan GT77 12UHS | |
| Acer Predator Triton 500 SE PT516-52s-70KX | |
| Asus ROG Zephyrus Duo 16 GX650RX | |
| Schenker XMG Neo 17 M22 | |
| Medio AMD Ryzen 9 6900HX (578 - 911, n=20) | |
| Razer Blade 17 Early 2022 | |
| AIDA64 / FP64 Ray-Trace | |
| Media de la clase Gaming (5509 - 45446, n=105, últimos 2 años) | |
| MSI Titan GT77 12UHS | |
| MSI Raider GE77 HX 12UHS | |
| Asus ROG Zephyrus Duo 16 GX650RX | |
| Schenker XMG Neo 17 M22 | |
| Medio AMD Ryzen 9 6900HX (5798 - 9540, n=20) | |
| Acer Predator Triton 500 SE PT516-52s-70KX | |
| Razer Blade 17 Early 2022 | |
| AIDA64 / CPU PhotoWorxx | |
| MSI Raider GE77 HX 12UHS | |
| Media de la clase Gaming (12271 - 89891, n=105, últimos 2 años) | |
| MSI Titan GT77 12UHS | |
| Razer Blade 17 Early 2022 | |
| Acer Predator Triton 500 SE PT516-52s-70KX | |
| Schenker XMG Neo 17 M22 | |
| Asus ROG Zephyrus Duo 16 GX650RX | |
| Medio AMD Ryzen 9 6900HX (26873 - 30604, n=20) | |
Rendimiento del sistema
En las pruebas de rendimiento del sistema, los resultados del Schenker XMG Neo 17 M22 son similares a los de las pruebas puras de la CPU. El nivel de rendimiento sigue siendo bueno y alrededor de un 10 por ciento más alto comparado con el Asus ROG Zephyrus Duo. Subjetivamente, el XMG Neo 17 se siente muy rápido y apenas hay tiempos de carga durante el uso diario.
CrossMark: Overall | Productivity | Creativity | Responsiveness
| PCMark 10 / Score | |
| Media de la clase Gaming (5828 - 12414, n=93, últimos 2 años) | |
| MSI Titan GT77 12UHS | |
| Acer Predator Triton 500 SE PT516-52s-70KX | |
| Razer Blade 17 Early 2022 | |
| MSI Raider GE77 HX 12UHS | |
| Schenker XMG Neo 17 M22 | |
| Medio AMD Ryzen 9 6900HX, NVIDIA GeForce RTX 3080 Ti Laptop GPU (6351 - 6966, n=2) | |
| Asus ROG Zephyrus Duo 16 GX650RX | |
| PCMark 10 / Essentials | |
| MSI Titan GT77 12UHS | |
| Acer Predator Triton 500 SE PT516-52s-70KX | |
| Media de la clase Gaming (8810 - 11935, n=97, últimos 2 años) | |
| Razer Blade 17 Early 2022 | |
| MSI Raider GE77 HX 12UHS | |
| Schenker XMG Neo 17 M22 | |
| Medio AMD Ryzen 9 6900HX, NVIDIA GeForce RTX 3080 Ti Laptop GPU (9374 - 9740, n=2) | |
| Asus ROG Zephyrus Duo 16 GX650RX | |
| PCMark 10 / Productivity | |
| Media de la clase Gaming (6845 - 25323, n=95, últimos 2 años) | |
| MSI Titan GT77 12UHS | |
| MSI Raider GE77 HX 12UHS | |
| Acer Predator Triton 500 SE PT516-52s-70KX | |
| Schenker XMG Neo 17 M22 | |
| Razer Blade 17 Early 2022 | |
| Medio AMD Ryzen 9 6900HX, NVIDIA GeForce RTX 3080 Ti Laptop GPU (7704 - 9564, n=2) | |
| Asus ROG Zephyrus Duo 16 GX650RX | |
| PCMark 10 / Digital Content Creation | |
| Media de la clase Gaming (7602 - 19954, n=95, últimos 2 años) | |
| MSI Titan GT77 12UHS | |
| Acer Predator Triton 500 SE PT516-52s-70KX | |
| Razer Blade 17 Early 2022 | |
| Schenker XMG Neo 17 M22 | |
| MSI Raider GE77 HX 12UHS | |
| Medio AMD Ryzen 9 6900HX, NVIDIA GeForce RTX 3080 Ti Laptop GPU (9626 - 9848, n=2) | |
| Asus ROG Zephyrus Duo 16 GX650RX | |
| CrossMark / Overall | |
| MSI Raider GE77 HX 12UHS | |
| MSI Titan GT77 12UHS | |
| Media de la clase Gaming (1366 - 2409, n=94, últimos 2 años) | |
| Acer Predator Triton 500 SE PT516-52s-70KX | |
| Razer Blade 17 Early 2022 | |
| Asus ROG Zephyrus Duo 16 GX650RX | |
| Medio AMD Ryzen 9 6900HX, NVIDIA GeForce RTX 3080 Ti Laptop GPU (1699 - 1711, n=2) | |
| Schenker XMG Neo 17 M22 | |
| CrossMark / Productivity | |
| MSI Raider GE77 HX 12UHS | |
| MSI Titan GT77 12UHS | |
| Media de la clase Gaming (1386 - 2254, n=94, últimos 2 años) | |
| Acer Predator Triton 500 SE PT516-52s-70KX | |
| Razer Blade 17 Early 2022 | |
| Asus ROG Zephyrus Duo 16 GX650RX | |
| Medio AMD Ryzen 9 6900HX, NVIDIA GeForce RTX 3080 Ti Laptop GPU (1646 - 1698, n=2) | |
| Schenker XMG Neo 17 M22 | |
| CrossMark / Creativity | |
| MSI Raider GE77 HX 12UHS | |
| MSI Titan GT77 12UHS | |
| Media de la clase Gaming (1343 - 2786, n=94, últimos 2 años) | |
| Acer Predator Triton 500 SE PT516-52s-70KX | |
| Razer Blade 17 Early 2022 | |
| Schenker XMG Neo 17 M22 | |
| Medio AMD Ryzen 9 6900HX, NVIDIA GeForce RTX 3080 Ti Laptop GPU (1724 - 1867, n=2) | |
| Asus ROG Zephyrus Duo 16 GX650RX | |
| CrossMark / Responsiveness | |
| MSI Raider GE77 HX 12UHS | |
| MSI Titan GT77 12UHS | |
| Acer Predator Triton 500 SE PT516-52s-70KX | |
| Asus ROG Zephyrus Duo 16 GX650RX | |
| Media de la clase Gaming (1226 - 2334, n=94, últimos 2 años) | |
| Razer Blade 17 Early 2022 | |
| Medio AMD Ryzen 9 6900HX, NVIDIA GeForce RTX 3080 Ti Laptop GPU (1405 - 1715, n=2) | |
| Schenker XMG Neo 17 M22 | |
| PCMark 10 Score | 6966 puntos | |
ayuda | ||
| AIDA64 / Memory Copy | |
| Media de la clase Gaming (21750 - 129946, n=105, últimos 2 años) | |
| MSI Raider GE77 HX 12UHS | |
| MSI Titan GT77 12UHS | |
| Acer Predator Triton 500 SE PT516-52s-70KX | |
| Razer Blade 17 Early 2022 | |
| Asus ROG Zephyrus Duo 16 GX650RX | |
| Medio AMD Ryzen 9 6900HX (47938 - 53345, n=20) | |
| Schenker XMG Neo 17 M22 | |
| AIDA64 / Memory Read | |
| Media de la clase Gaming (22956 - 118858, n=105, últimos 2 años) | |
| MSI Raider GE77 HX 12UHS | |
| Acer Predator Triton 500 SE PT516-52s-70KX | |
| Razer Blade 17 Early 2022 | |
| MSI Titan GT77 12UHS | |
| Asus ROG Zephyrus Duo 16 GX650RX | |
| Schenker XMG Neo 17 M22 | |
| Medio AMD Ryzen 9 6900HX (43892 - 53321, n=20) | |
| AIDA64 / Memory Write | |
| Media de la clase Gaming (22297 - 135096, n=105, últimos 2 años) | |
| MSI Raider GE77 HX 12UHS | |
| MSI Titan GT77 12UHS | |
| Razer Blade 17 Early 2022 | |
| Asus ROG Zephyrus Duo 16 GX650RX | |
| Schenker XMG Neo 17 M22 | |
| Medio AMD Ryzen 9 6900HX (51085 - 57202, n=20) | |
| Acer Predator Triton 500 SE PT516-52s-70KX | |
| AIDA64 / Memory Latency | |
| Acer Predator Triton 500 SE PT516-52s-70KX | |
| Media de la clase Gaming (75.3 - 259, n=105, últimos 2 años) | |
| Asus ROG Zephyrus Duo 16 GX650RX | |
| Schenker XMG Neo 17 M22 | |
| MSI Titan GT77 12UHS | |
| Medio AMD Ryzen 9 6900HX (80.7 - 120.6, n=20) | |
| MSI Raider GE77 HX 12UHS | |
* ... más pequeño es mejor
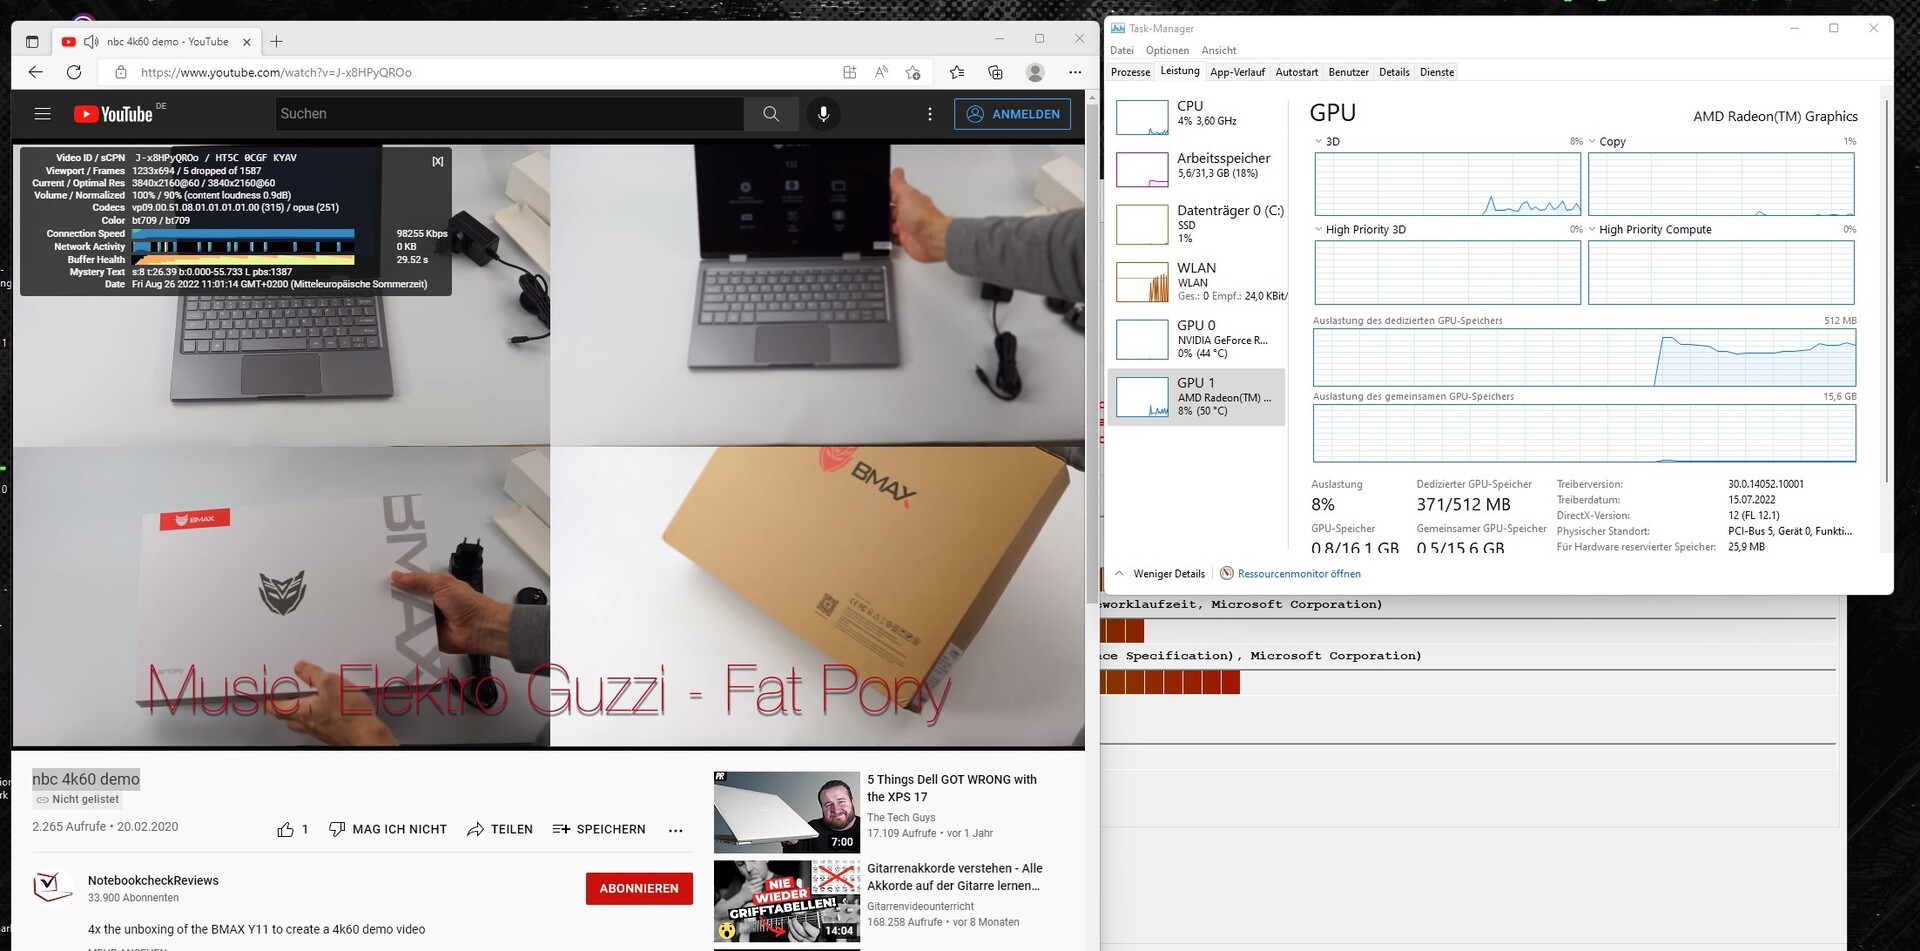
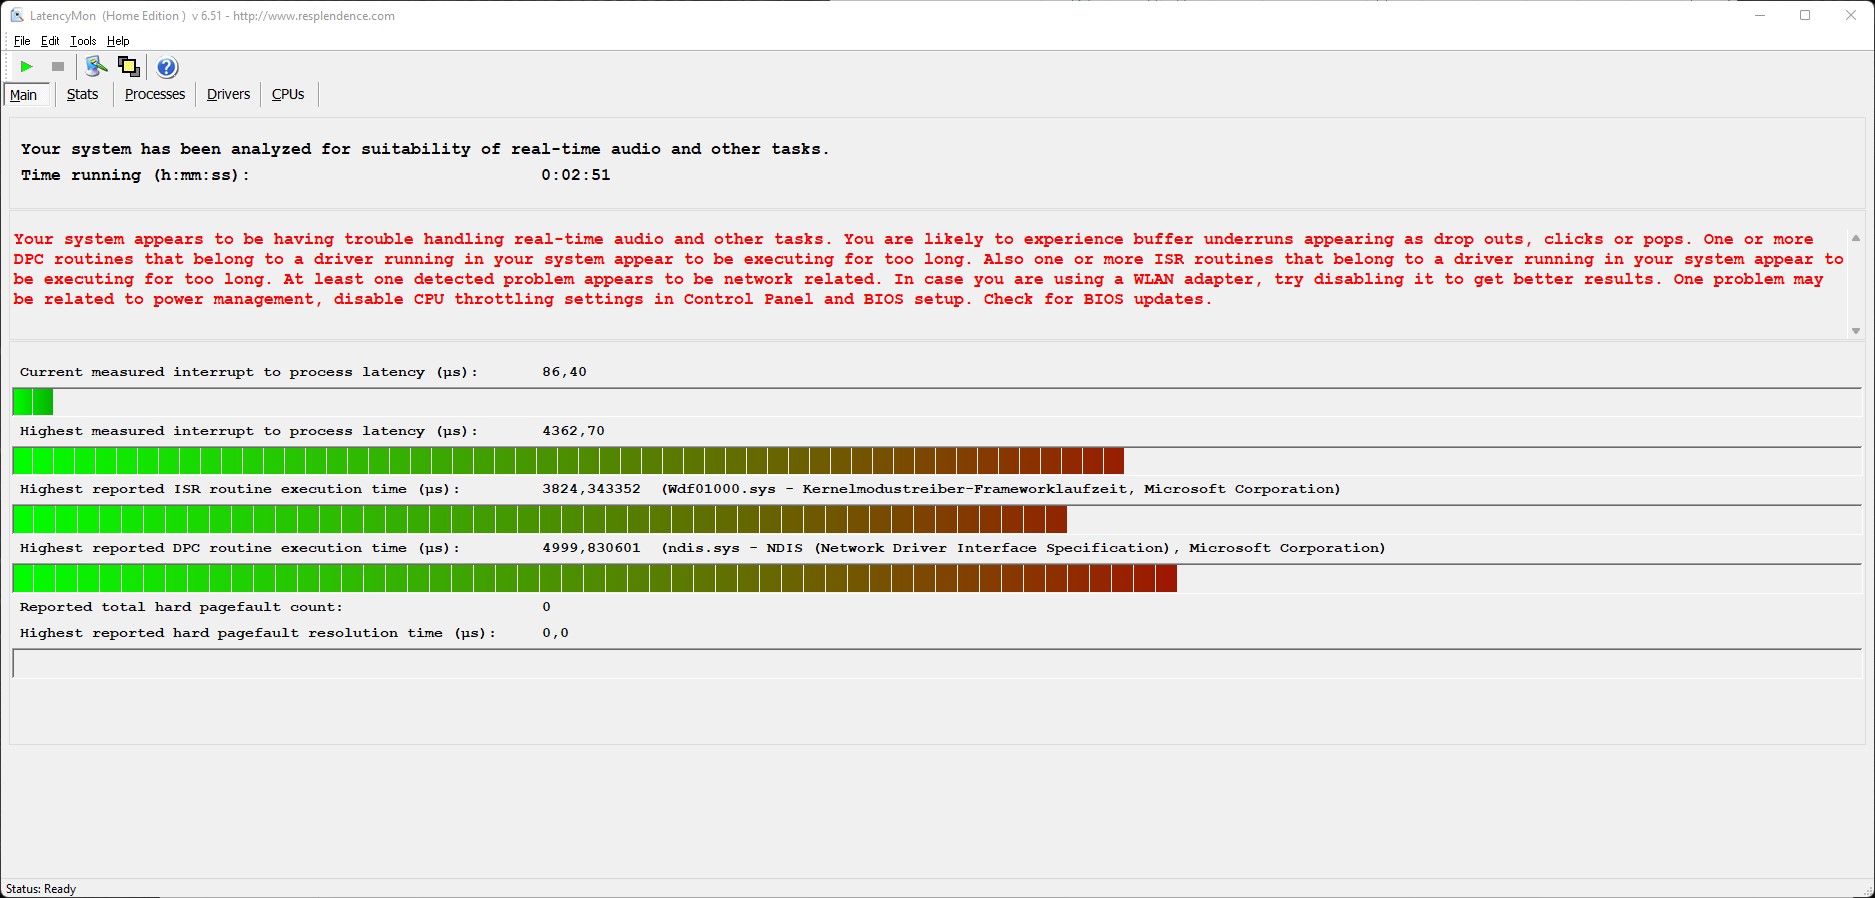
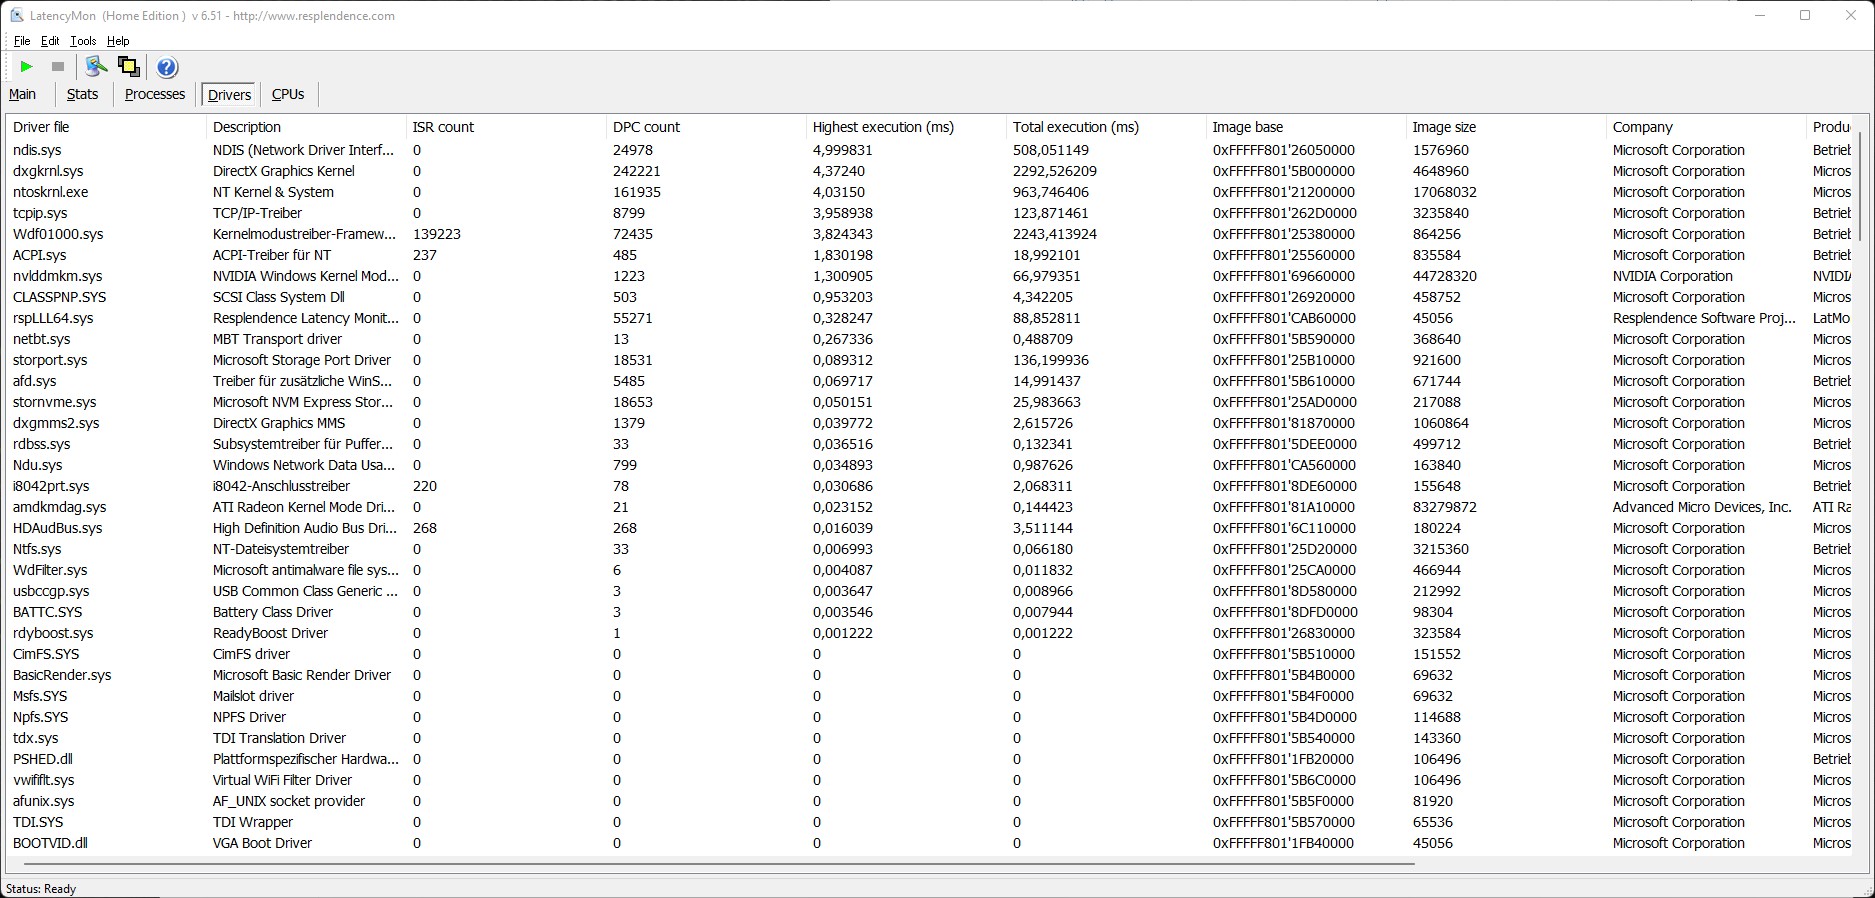
Latencia del CPD
LatencyMon muestra un aumento de las latencias después de abrir varias pestañas del navegador en Edge. Las latencias aumentan ligeramente después de reproducir un vídeo 4K de YouTube e inicializar Prime95. Futuras optimizaciones del driver o la BIOS podrían mejorar el problema. La reproducción de nuestro vídeo de prueba 4K usa alrededor del 10 por ciento de la iGPU del AMD Ryzen 9 6900HX.
| DPC Latencies / LatencyMon - interrupt to process latency (max), Web, Youtube, Prime95 | |
| Schenker XMG Neo 17 M22 | |
| MSI Titan GT77 12UHS | |
| MSI Titan GT77 12UHS | |
| Acer Predator Triton 500 SE PT516-52s-70KX | |
| MSI Raider GE77 HX 12UHS | |
| Asus ROG Zephyrus Duo 16 GX650RX | |
| Razer Blade 17 Early 2022 | |
* ... más pequeño es mejor
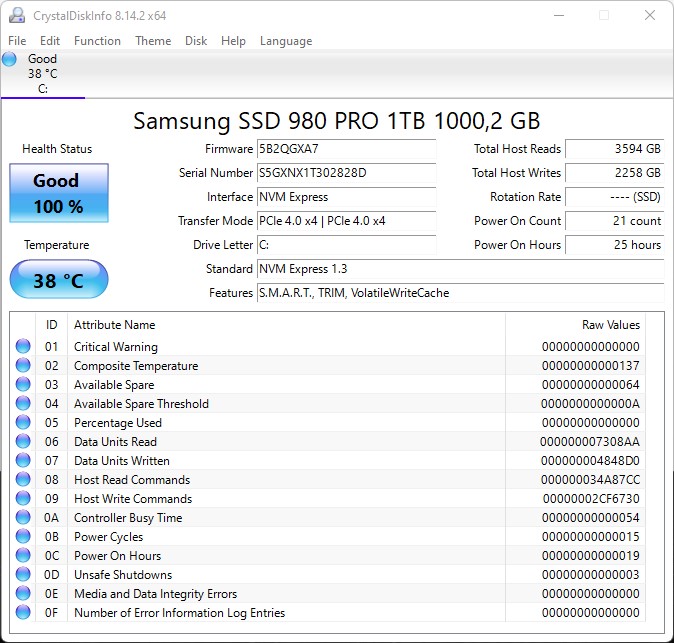
Solución de almacenamiento
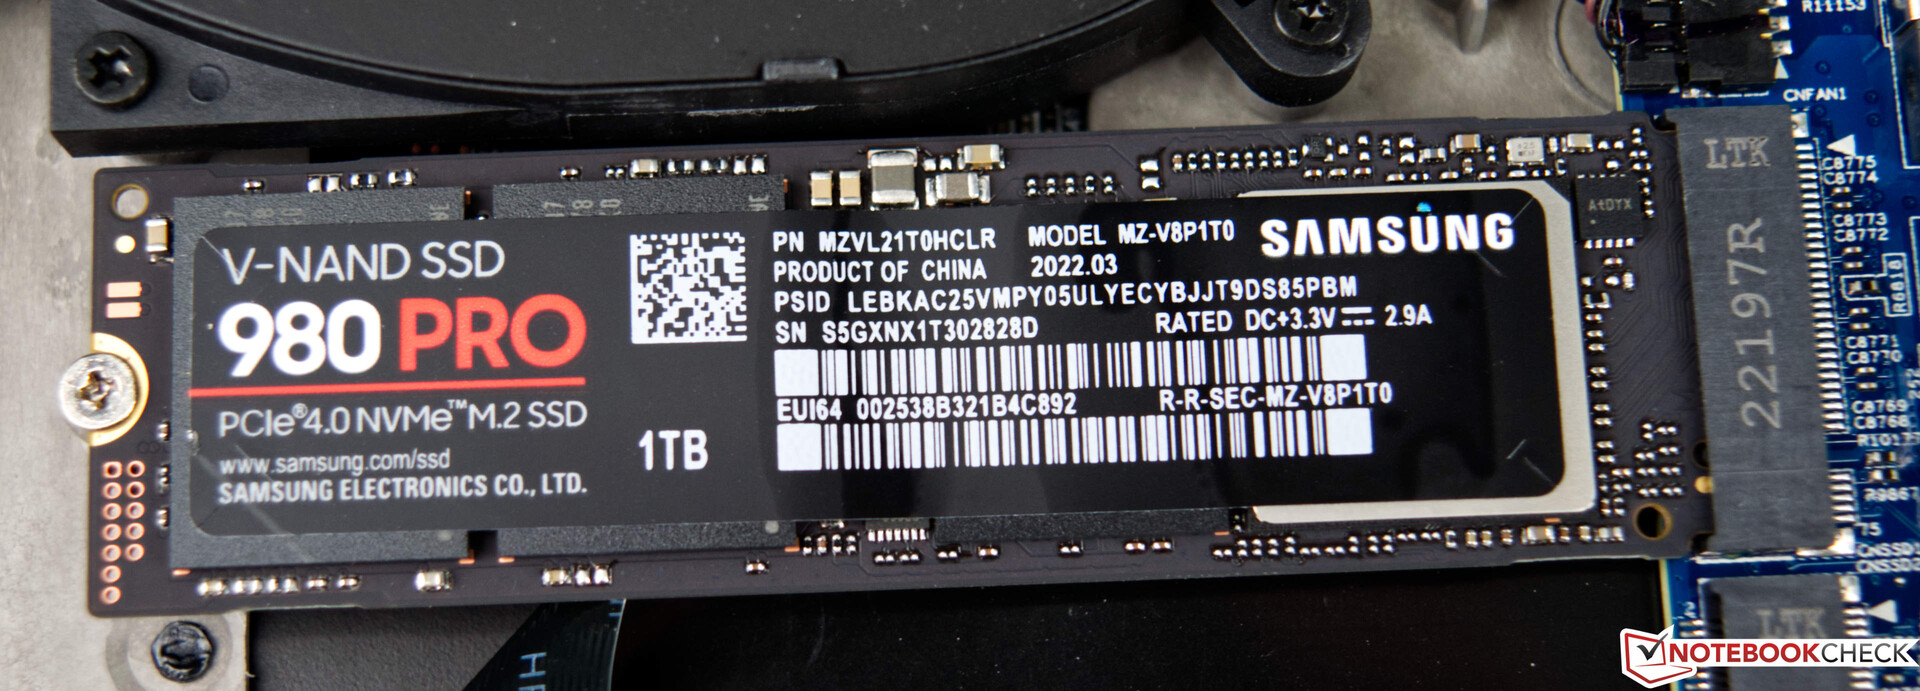
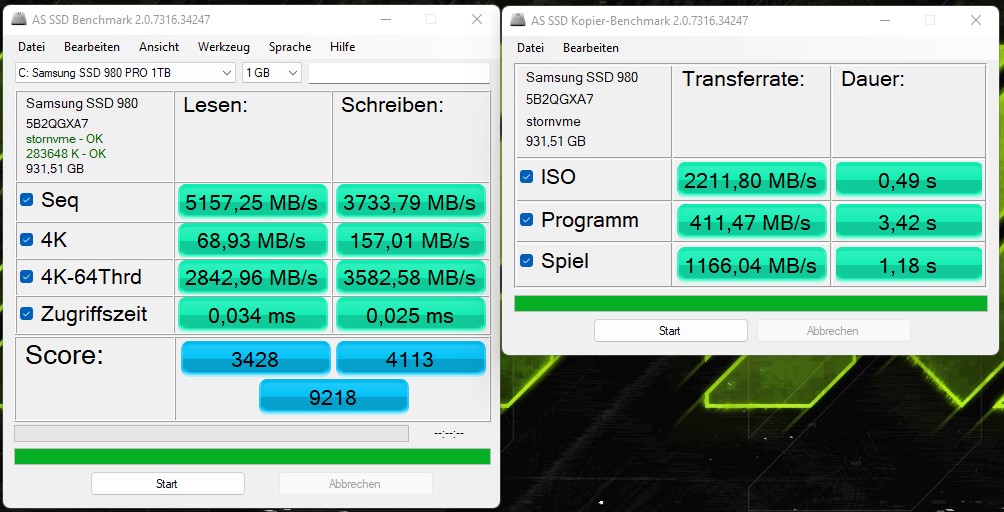
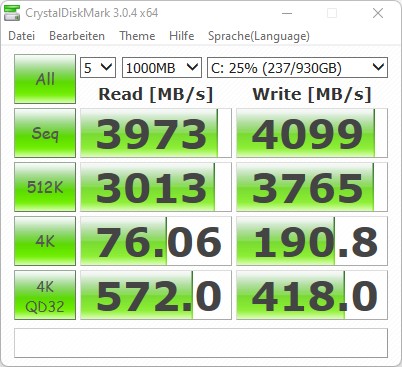
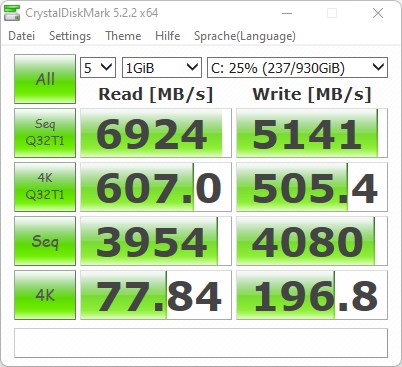
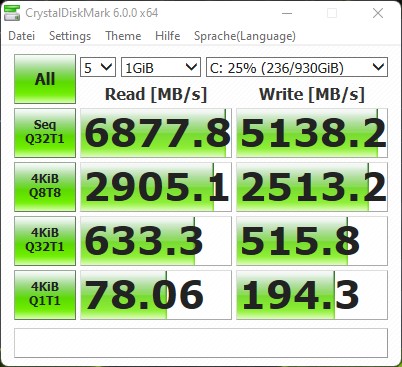
Nuestra muestra de prueba viene con un Samsung 980 Pro. Sin embargo, los usuarios pueden elegir entre los modelos Seagate, Crucial y Corsair para el XMG Neo 17. Al hacer el pedido, los usuarios tendrán que decidir entre los distintos modelos. Aunque el SSD de nuestro dispositivo de prueba es suficientemente grande con 1 TB, aconsejamos no elegir una capacidad menor para evitar quedarse constantemente sin espacio de almacenamiento. Bajo carga, el rendimiento de lectura y escritura secuencial es excelente, lo que hace que el Schenker XMG Neo 17 obtenga un buen resultado global en esta categoría.
El XMG Neo 17 puede equiparse con hasta dos SSD M.2.
Se pueden encontrar más comparaciones y pruebas de rendimiento en nuestra tabla de comparación.

* ... más pequeño es mejor
Disk Throttling: DiskSpd Read Loop, Queue Depth 8
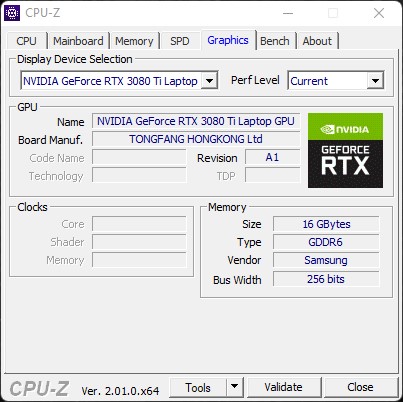
Rendimiento de la GPU
Con laGeForce GPU para portátiles RTX 3080 Tila tarjeta gráfica más rápida de Nvidia es la de Ampere. Con 16 GB de VRAM, los usuarios no tienen de qué preocuparse y la GPU tiene acceso a un presupuesto de energía máximo de 175 vatios. Nuestro modelo rinde muy bien y queda en segundo lugar tras la MSI Titan GT77. Además, el déficit del 4 por ciento es increíblemente pequeño y, a pesar de las diferentes configuraciones de CPU de los dispositivos, su rendimiento es muy similar.
Se pueden encontrar más comparaciones y pruebas de rendimiento en nuestro GTabla comparativa de PU.
| 3DMark 11 Performance | 33102 puntos | |
| 3DMark Fire Strike Score | 27946 puntos | |
| 3DMark Fire Strike Extreme Score | 15762 puntos | |
| 3DMark Time Spy Score | 12300 puntos | |
ayuda | ||
Rendimiento de los juegos
El Schenker XMG Neo 17 ofrece un rendimiento de juego excepcional. En pocas palabras, todos los títulos actuales se ejecutan sin problemas con la resolución nativa y los ajustes de detalle máximos. Las velocidades de fotogramas son constantemente altas y, gracias a la gran VRAM, los usuarios no tendrán que preocuparse de actualizar durante bastante tiempo.
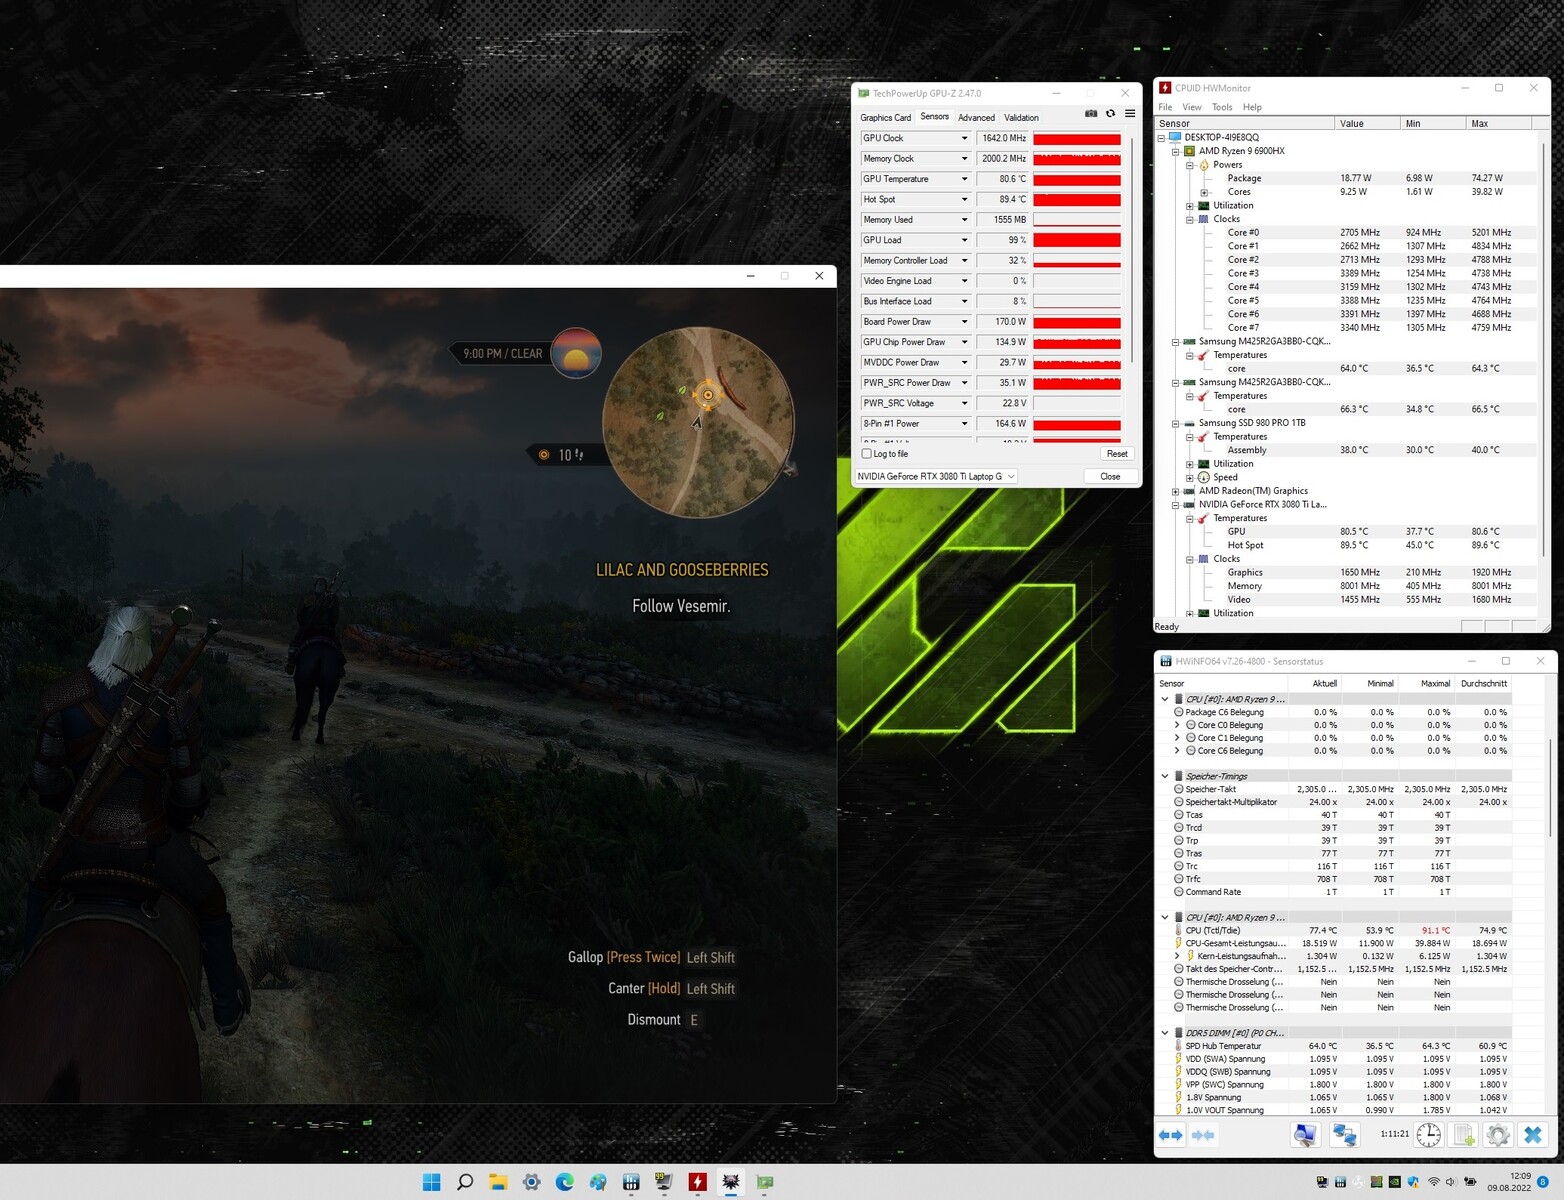
En nuestra prueba de estrés, que consiste en ejecutar The Witcher 3 en el preajuste Ultra, el sistema muestra un rendimiento consistente. No observamos caídas de la velocidad de fotogramas hasta niveles injugables durante la prueba o tras un juego prolongado.
Witcher 3 FPS Graph
| bajo | medio | alto | ultra | QHD | 4K | |
|---|---|---|---|---|---|---|
| GTA V (2015) | 181.2 | 176.1 | 163.8 | 101.8 | 101.1 | 121 |
| The Witcher 3 (2015) | 386 | 335 | 236 | 121 | 90.5 | |
| Dota 2 Reborn (2015) | 146.5 | 133.9 | 129.3 | 121.4 | 122.7 | |
| Final Fantasy XV Benchmark (2018) | 190.8 | 161.5 | 122.8 | 96.4 | 57.9 | |
| X-Plane 11.11 (2018) | 113.7 | 102 | 80.3 | 86.4 | ||
| Far Cry 5 (2018) | 142 | 125 | 118 | 113 | 110 | 70 |
| Strange Brigade (2018) | 205 | 277 | 229 | 201 | 154.4 | 95 |
| Shadow of the Tomb Raider (2018) | 175.2 | 152.9 | 152.6 | 156.5 | 123.9 | 72.4 |
| Far Cry New Dawn (2019) | 125 | 112 | 108 | 96 | 93 | 73 |
| Metro Exodus (2019) | 172.4 | 134.4 | 108.6 | 88.1 | 73.2 | 47.6 |
| Borderlands 3 (2019) | 123.6 | 106.4 | 99.8 | 90.7 | 78.2 | 46.1 |
| F1 2020 (2020) | 304 | 271 | 255 | 197.9 | 153.6 | 88.1 |
| F1 2021 (2021) | 354 | 314 | 269 | 148.5 | 114.2 | 65.3 |
| New World (2021) | 126.4 | 106.5 | 97 | 94.5 | 85.9 | 50.3 |
| Far Cry 6 (2021) | 118.6 | 104 | 95 | 99.4 | 86.6 | 54.2 |
| God of War (2022) | 129.9 | 127.9 | 111.1 | 78.9 | 64.7 | 46.5 |
| Tiny Tina's Wonderlands (2022) | 222 | 185.4 | 137.1 | 110.5 | 79.3 | 43.9 |
| F1 22 (2022) | 193 | 184 | 172 | 91 | 62 | 32 |
Emisiones - Relativamente ruidosas bajo carga
Ruido del sistema
Bajo carga, la solución de refrigeración tiene mucho trabajo, lo que resulta en un nivel de ruido máximo de hasta 54 dB(A). Dado que los otros dispositivos de nuestra comparación no son significativamente más silenciosos, los valores del Schenker XMG Neo 17 no son nada fuera de lo común. El sistema puede conectarse a un XMG Oasis para obtener niveles de ruido potencialmente más bajos. Sin embargo, no podemos verificar esto en este momento.
Ruido
| Ocioso |
| 26 / 29 / 40 dB(A) |
| Carga |
| 47 / 54 dB(A) |
 | ||
30 dB silencioso 40 dB(A) audible 50 dB(A) ruidosamente alto |
||
min: | ||
| Schenker XMG Neo 17 M22 R9 6900HX, GeForce RTX 3080 Ti Laptop GPU | MSI Titan GT77 12UHS i9-12900HX, GeForce RTX 3080 Ti Laptop GPU | Razer Blade 17 Early 2022 i9-12900H, GeForce RTX 3080 Ti Laptop GPU | Acer Predator Triton 500 SE PT516-52s-70KX i7-12700H, GeForce RTX 3080 Ti Laptop GPU | Asus ROG Zephyrus Duo 16 GX650RX R9 6900HX, GeForce RTX 3080 Ti Laptop GPU | MSI Raider GE77 HX 12UHS i9-12900HX, GeForce RTX 3080 Ti Laptop GPU | |
|---|---|---|---|---|---|---|
| Noise | 10% | 4% | 0% | 9% | -7% | |
| apagado / medio ambiente * (dB) | 26 | 21.9 16% | 26 -0% | 26 -0% | 26 -0% | 26 -0% |
| Idle Minimum * (dB) | 26 | 24.53 6% | 26 -0% | 26 -0% | 26 -0% | 26 -0% |
| Idle Average * (dB) | 29 | 24.53 15% | 27 7% | 29 -0% | 27 7% | 34 -17% |
| Idle Maximum * (dB) | 40 | 24.53 39% | 32 20% | 34 15% | 29 27% | 46 -15% |
| Load Average * (dB) | 47 | 46.25 2% | 50 -6% | 50 -6% | 41 13% | 50 -6% |
| Witcher 3 ultra * (dB) | 52 | 56.86 -9% | 51 2% | 53 -2% | 48 8% | 55 -6% |
| Load Maximum * (dB) | 54 | 54.25 -0% | 51 6% | 56 -4% | 50 7% | 57 -6% |
* ... más pequeño es mejor
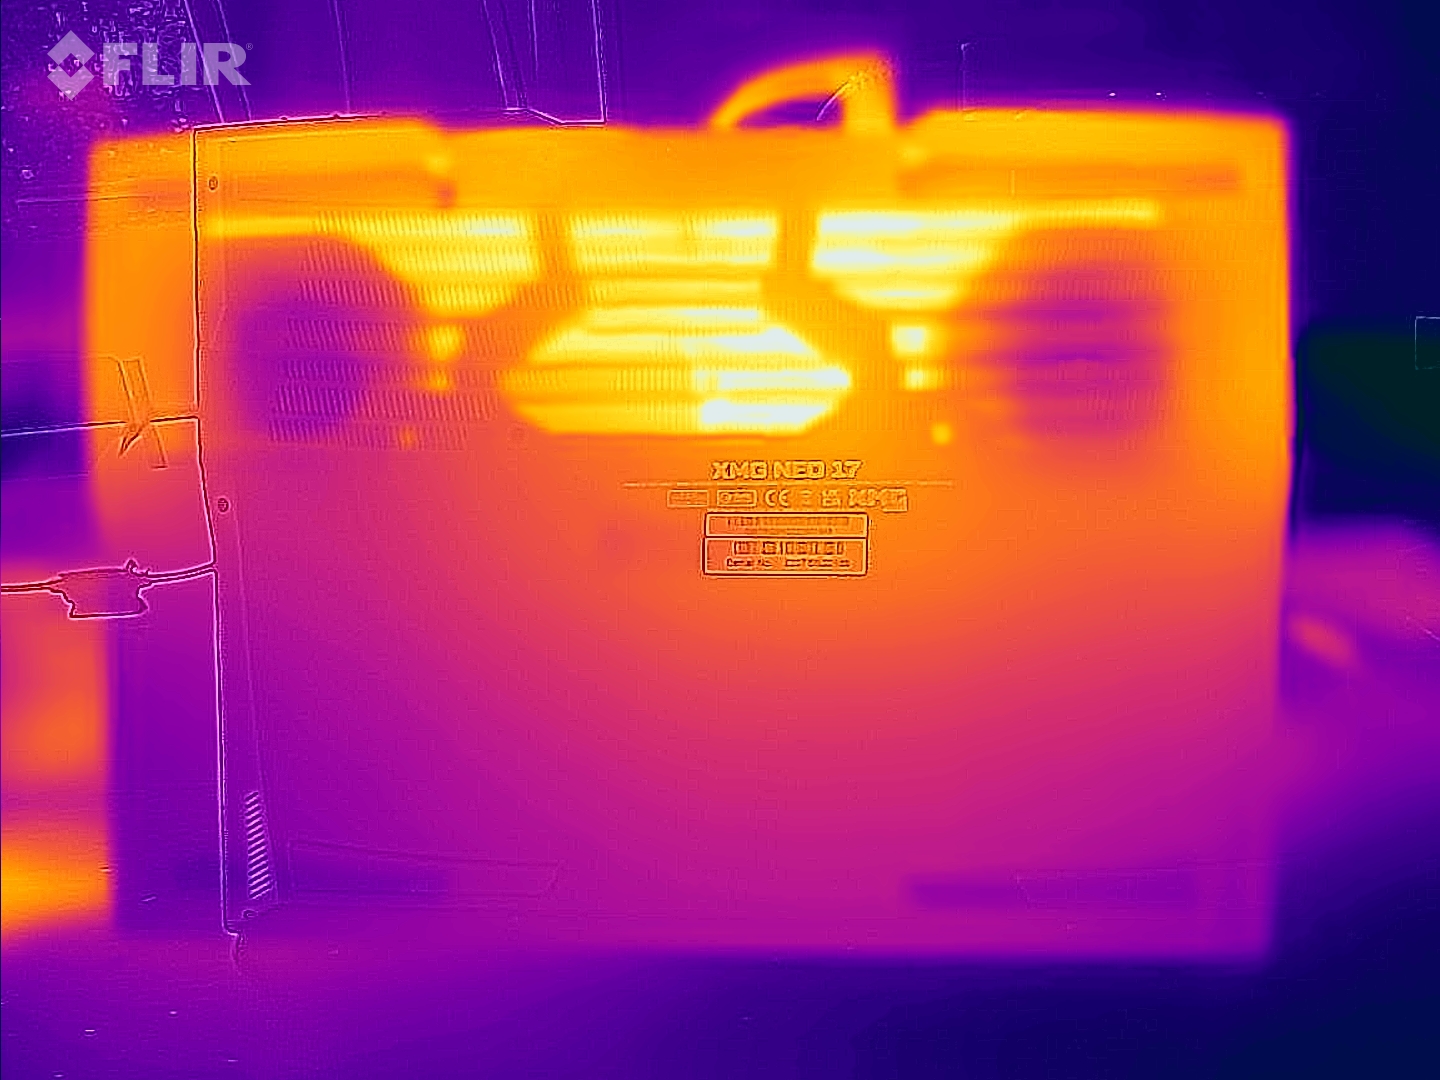
Temperatura
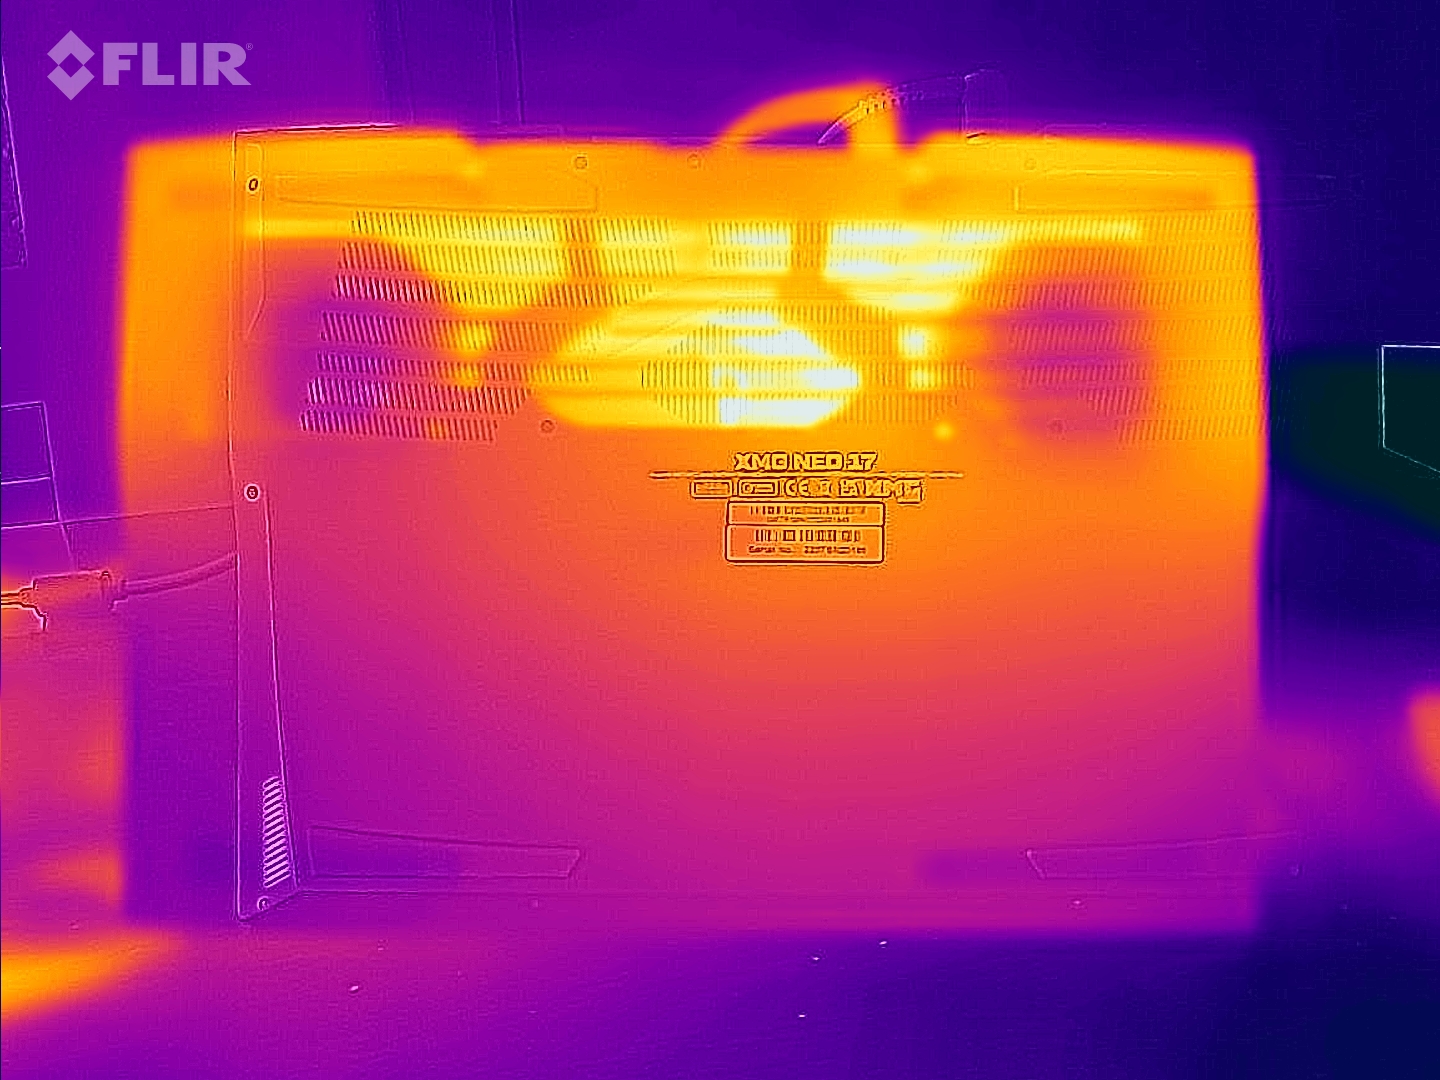
Con hasta 52 °C, la parte inferior del chasis se calienta notablemente. Sin embargo, los otros dispositivos de nuestra comparación alcanzan temperaturas similares. Dado que también medimos temperaturas similares mientras se juega, aconsejamos no usar el sistema sobre el regazo. No hay problemas durante el ralentí. Las temperaturas máximas caen entonces a 30 °C y 33 °C, respectivamente.
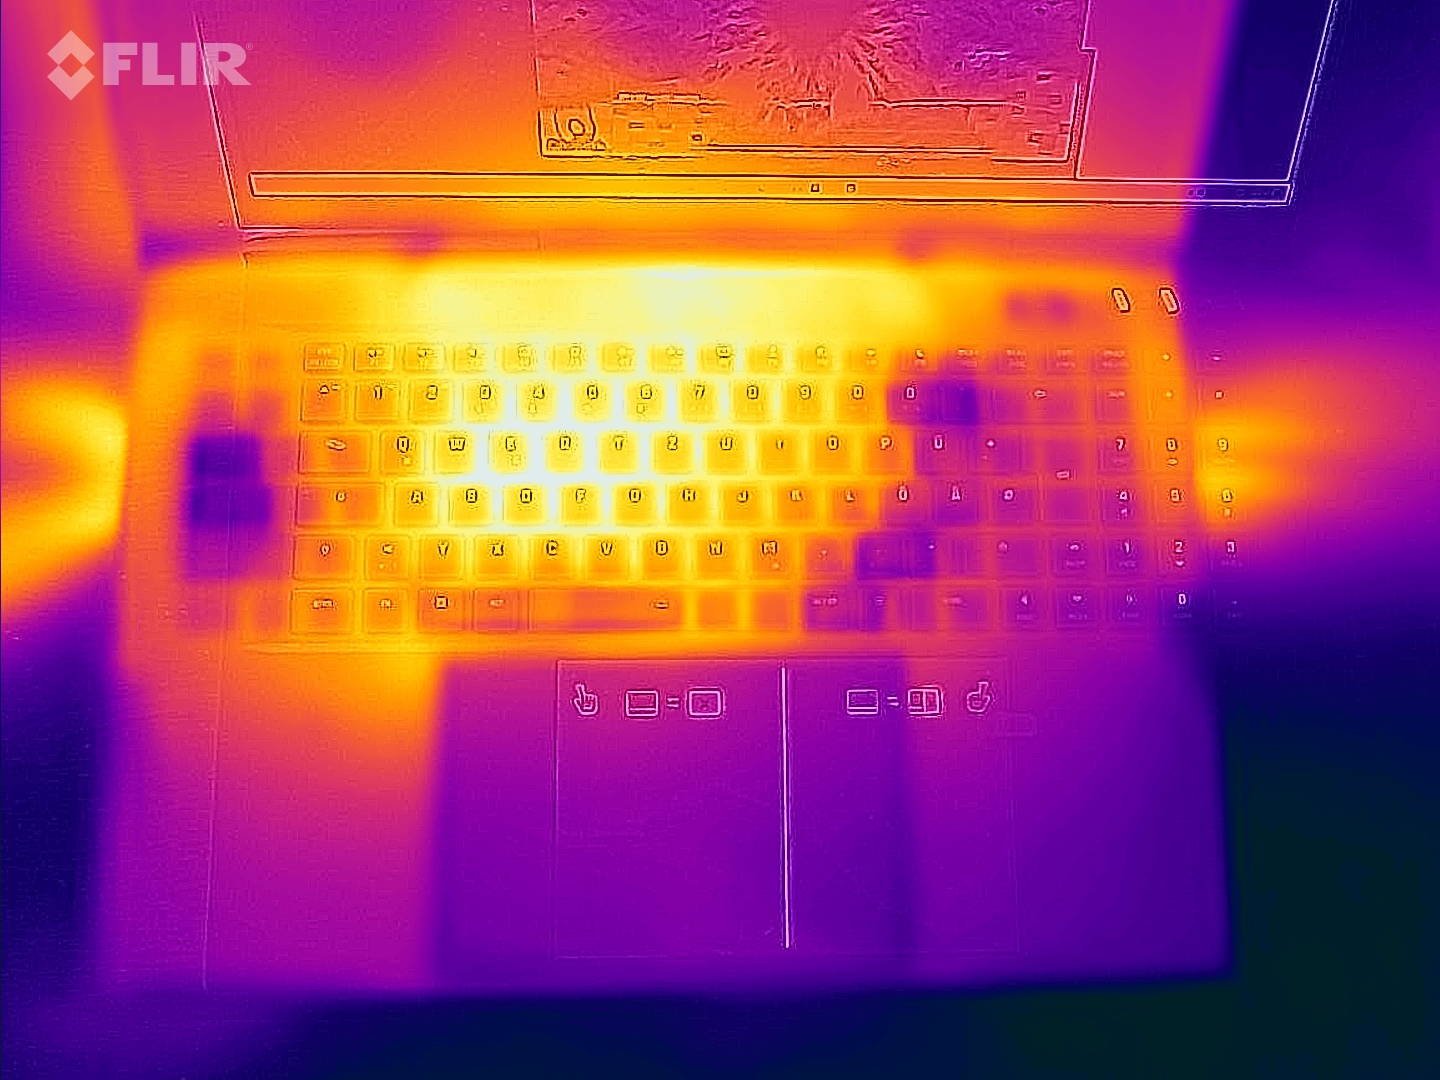
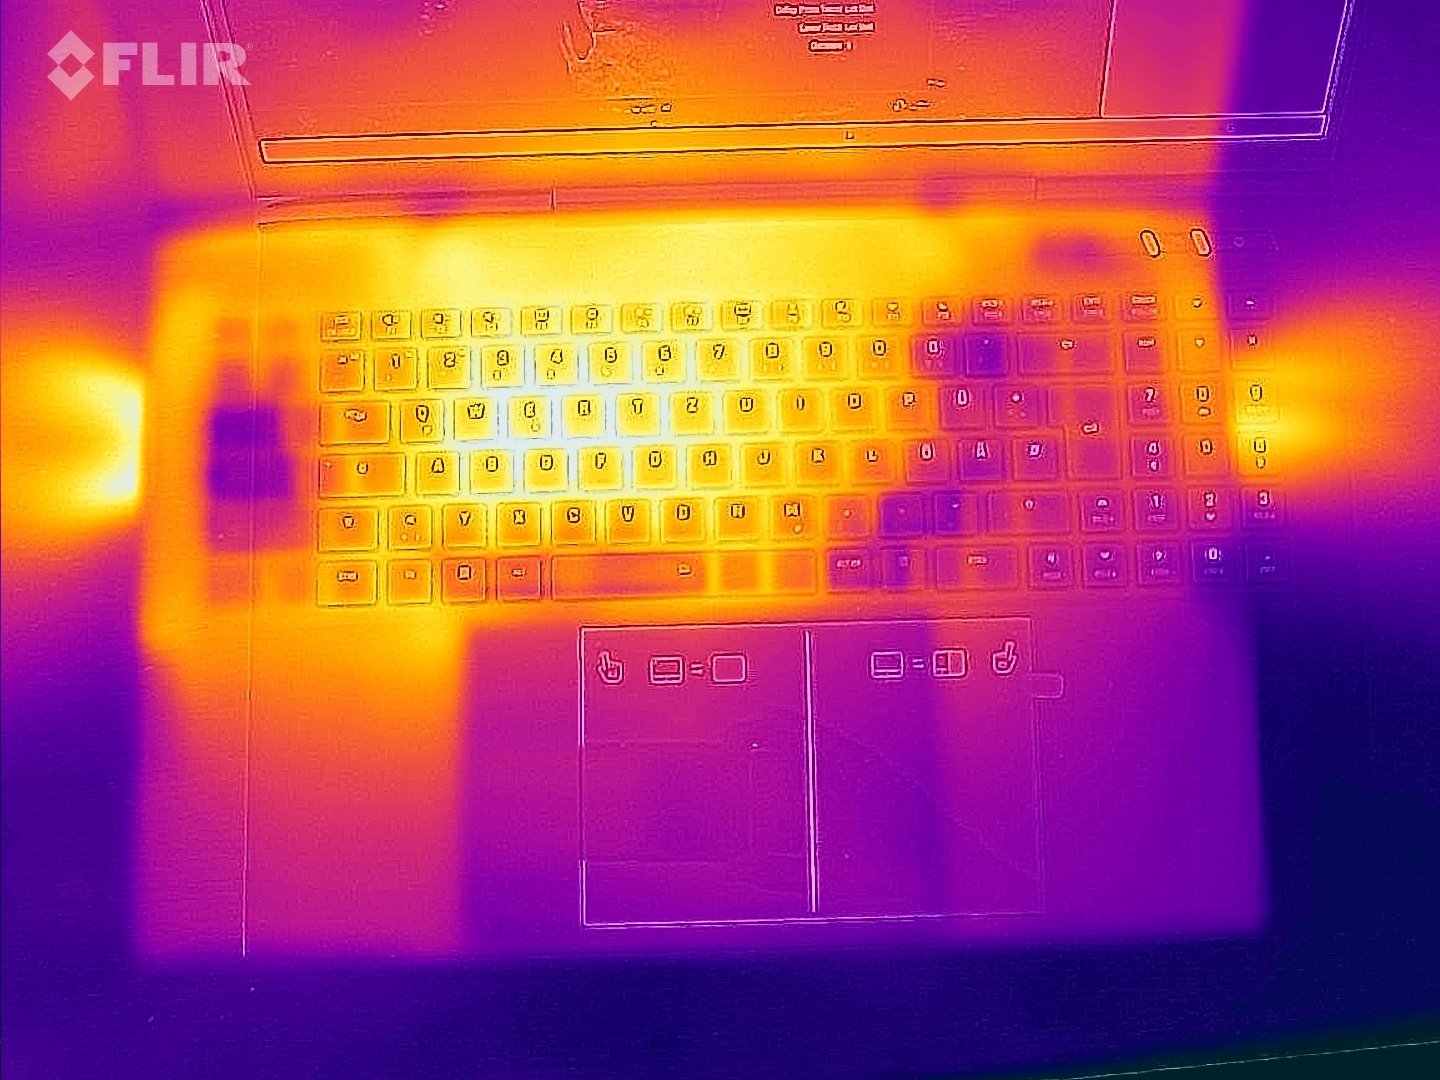
(-) La temperatura máxima en la parte superior es de 49 °C / 120 F, frente a la media de 40.4 °C / 105 F, que oscila entre 21.2 y 68.8 °C para la clase Gaming.
(-) El fondo se calienta hasta un máximo de 52 °C / 126 F, frente a la media de 43.2 °C / 110 F
(+) En reposo, la temperatura media de la parte superior es de 29.7 °C / 85# F, frente a la media del dispositivo de 33.9 °C / 93 F.
(-) Jugando a The Witcher 3, la temperatura media de la parte superior es de 41.9 °C / 107 F, frente a la media del dispositivo de 33.9 °C / 93 F.
(±) El reposamanos y el touchpad pueden calentarse mucho al tacto con un máximo de 39 °C / 102.2 F.
(-) La temperatura media de la zona del reposamanos de dispositivos similares fue de 28.8 °C / 83.8 F (-10.2 °C / -18.4 F).
| Schenker XMG Neo 17 M22 AMD Ryzen 9 6900HX, NVIDIA GeForce RTX 3080 Ti Laptop GPU | MSI Titan GT77 12UHS Intel Core i9-12900HX, NVIDIA GeForce RTX 3080 Ti Laptop GPU | Razer Blade 17 Early 2022 Intel Core i9-12900H, NVIDIA GeForce RTX 3080 Ti Laptop GPU | Acer Predator Triton 500 SE PT516-52s-70KX Intel Core i7-12700H, NVIDIA GeForce RTX 3080 Ti Laptop GPU | Asus ROG Zephyrus Duo 16 GX650RX AMD Ryzen 9 6900HX, NVIDIA GeForce RTX 3080 Ti Laptop GPU | MSI Raider GE77 HX 12UHS Intel Core i9-12900HX, NVIDIA GeForce RTX 3080 Ti Laptop GPU | |
|---|---|---|---|---|---|---|
| Heat | -4% | -11% | 3% | 1% | -19% | |
| Maximum Upper Side * (°C) | 49 | 40.8 17% | 50 -2% | 47 4% | 45 8% | 53 -8% |
| Maximum Bottom * (°C) | 52 | 52.4 -1% | 56 -8% | 49 6% | 50 4% | 58 -12% |
| Idle Upper Side * (°C) | 30 | 34.6 -15% | 36 -20% | 31 -3% | 33 -10% | 38 -27% |
| Idle Bottom * (°C) | 33 | 38.4 -16% | 38 -15% | 32 3% | 33 -0% | 43 -30% |
* ... más pequeño es mejor
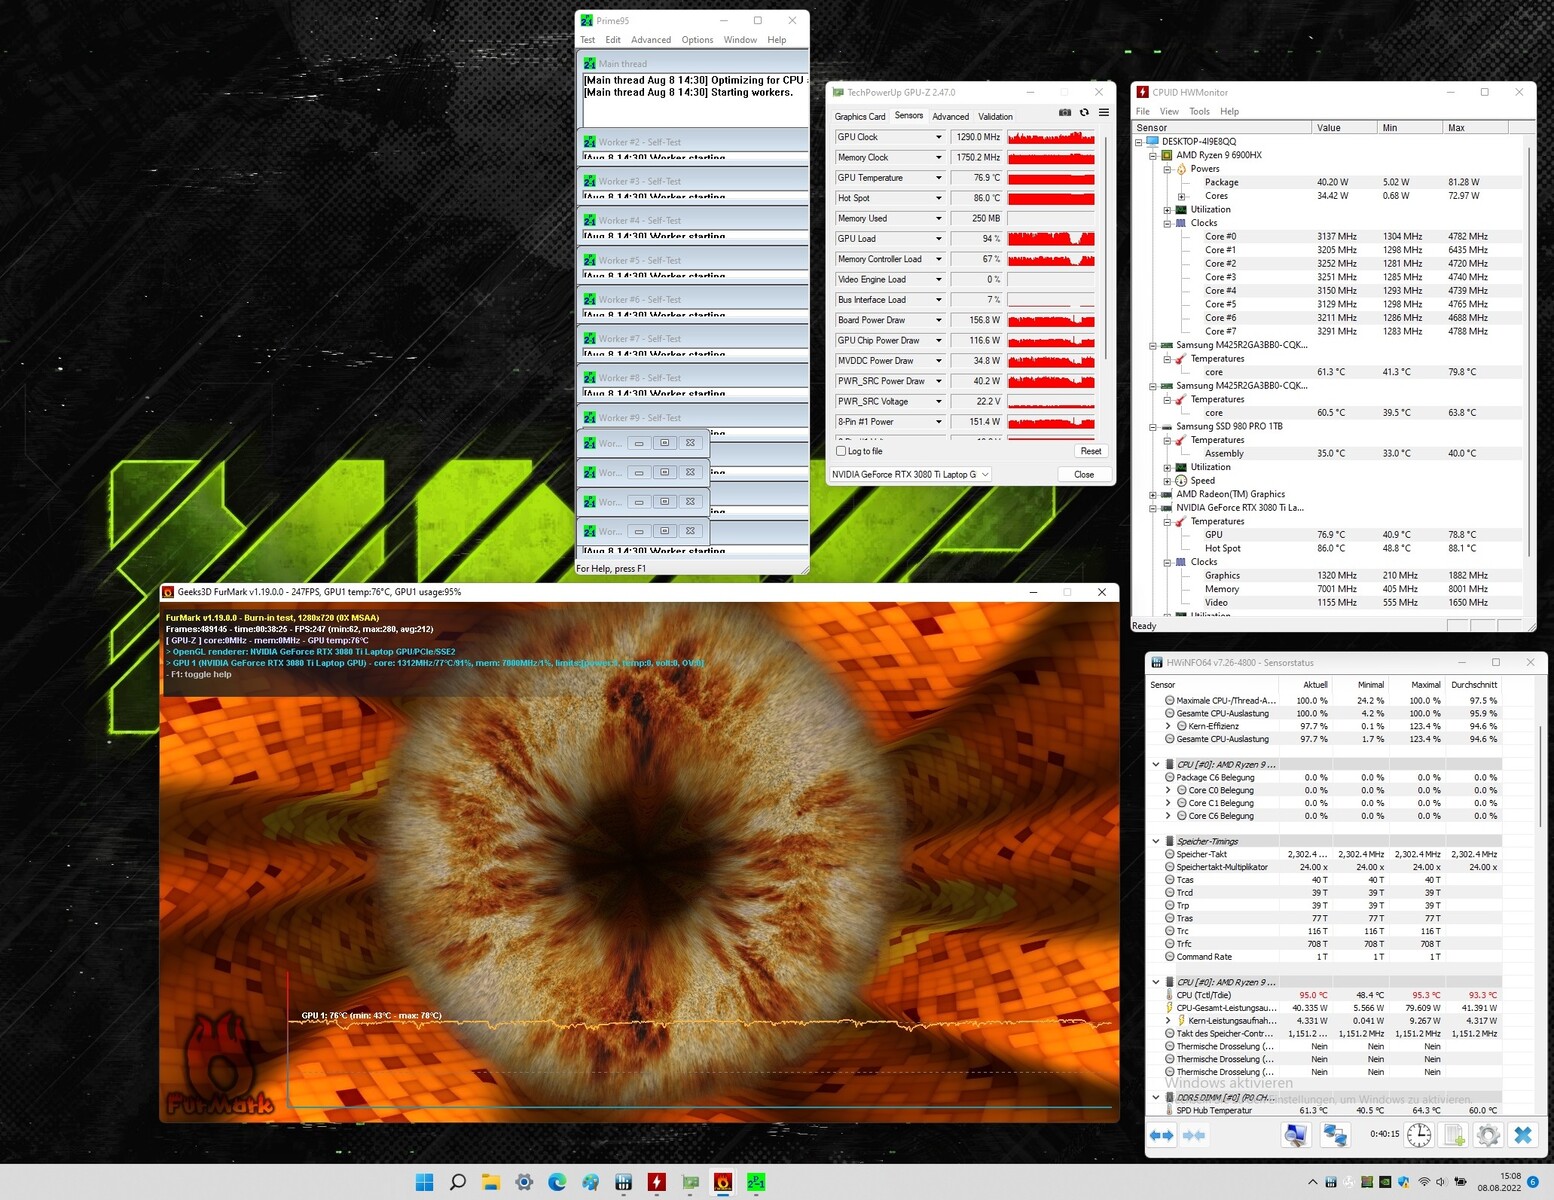
Prueba de esfuerzo
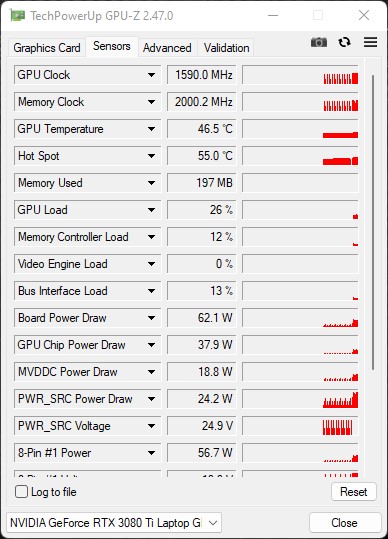
Schenker gestiona el calor de la CPU y la GPU bastante bien, aunque elRyzen 9 6900HXde casi 95 °C está muy cerca de la marca de los 100 °C. No obstante, el rendimiento del SoC es consistente y sin grandes caídas. El SoC alcanza un consumo máximo de 80 vatios, que luego baja y se estabiliza en 40 vatios con el tiempo. Las temperaturas de la GPU son bastante mejores. A pesar de alcanzar un consumo máximo de hasta 170 vatios, registramos una temperatura máxima de sólo 77 °C durante nuestra prueba de estrés.
Altavoces
Hay dos altavoces descendentes debajo del reposamanos. Desgraciadamente, carecen de graves, siendo los medios y los agudos una parte significativamente más dominante del sonido. Para los juegos, los usuarios probablemente optarán por unos auriculares. Se puede conectar un modelo adecuado al portátil a través de la toma de auriculares de 3,5 mm o por USB.
Schenker XMG Neo 17 M22 análisis de audio
(±) | la sonoridad del altavoz es media pero buena (80 dB)
Graves 100 - 315 Hz
(-) | casi sin bajos - de media 18.4% inferior a la mediana
(±) | la linealidad de los graves es media (8.2% delta a frecuencia anterior)
Medios 400 - 2000 Hz
(+) | medios equilibrados - a sólo 4.4% de la mediana
(±) | la linealidad de los medios es media (7% delta respecto a la frecuencia anterior)
Altos 2 - 16 kHz
(+) | máximos equilibrados - a sólo 2.6% de la mediana
(+) | los máximos son lineales (6.2% delta a la frecuencia anterior)
Total 100 - 16.000 Hz
(±) | la linealidad del sonido global es media (17.3% de diferencia con la mediana)
En comparación con la misma clase
» 47% de todos los dispositivos probados de esta clase eran mejores, 12% similares, 41% peores
» El mejor tuvo un delta de 6%, la media fue 18%, el peor fue ###max##%
En comparación con todos los dispositivos probados
» 32% de todos los dispositivos probados eran mejores, 8% similares, 59% peores
» El mejor tuvo un delta de 4%, la media fue 23%, el peor fue ###max##%
Asus ROG Zephyrus Duo 16 GX650RX análisis de audio
(±) | la sonoridad del altavoz es media pero buena (80 dB)
Graves 100 - 315 Hz
(±) | lubina reducida - en promedio 8.9% inferior a la mediana
(±) | la linealidad de los graves es media (12.4% delta a frecuencia anterior)
Medios 400 - 2000 Hz
(±) | medias más altas - de media 6.8% más altas que la mediana
(+) | los medios son lineales (4.3% delta a la frecuencia anterior)
Altos 2 - 16 kHz
(±) | máximos reducidos - de media 6% inferior a la mediana
(±) | la linealidad de los máximos es media (7.3% delta a frecuencia anterior)
Total 100 - 16.000 Hz
(±) | la linealidad del sonido global es media (16.5% de diferencia con la mediana)
En comparación con la misma clase
» 42% de todos los dispositivos probados de esta clase eran mejores, 7% similares, 51% peores
» El mejor tuvo un delta de 6%, la media fue 18%, el peor fue ###max##%
En comparación con todos los dispositivos probados
» 28% de todos los dispositivos probados eran mejores, 6% similares, 66% peores
» El mejor tuvo un delta de 4%, la media fue 23%, el peor fue ###max##%
Gestión de la energía - Buenos valores de consumo
Consumo de energía
El Schenker XMG Neo 17 tiene algunas sorpresas en lo que se refiere al consumo de energía, ya que es muy eficiente durante el ralentí y bajo carga. Ningún otro dispositivo es capaz de igualar a nuestro Schenker en este aspecto. Bajo carga máxima, el sistema demanda hasta 306 vatios del adaptador de CA, lo que no es un problema debido a la capacidad de 330 vatios del bloque de alimentación.
| Off / Standby | |
| Ocioso | |
| Carga |
|
Clave:
min: | |
| Schenker XMG Neo 17 M22 R9 6900HX, GeForce RTX 3080 Ti Laptop GPU | MSI Titan GT77 12UHS i9-12900HX, GeForce RTX 3080 Ti Laptop GPU | Razer Blade 17 Early 2022 i9-12900H, GeForce RTX 3080 Ti Laptop GPU | Acer Predator Triton 500 SE PT516-52s-70KX i7-12700H, GeForce RTX 3080 Ti Laptop GPU | Asus ROG Zephyrus Duo 16 GX650RX R9 6900HX, GeForce RTX 3080 Ti Laptop GPU | MSI Raider GE77 HX 12UHS i9-12900HX, GeForce RTX 3080 Ti Laptop GPU | Medio NVIDIA GeForce RTX 3080 Ti Laptop GPU | Media de la clase Gaming | |
|---|---|---|---|---|---|---|---|---|
| Power Consumption | -114% | -61% | -18% | -59% | -52% | -72% | -42% | |
| Idle Minimum * (Watt) | 7 | 30.21 -332% | 17 -143% | 7 -0% | 19 -171% | 13 -86% | 17.2 ? -146% | 13 ? -86% |
| Idle Average * (Watt) | 11 | 32.42 -195% | 23 -109% | 19 -73% | 24 -118% | 19 -73% | 23.3 ? -112% | 19 ? -73% |
| Idle Maximum * (Watt) | 17 | 33.7 -98% | 34 -100% | 28 -65% | 31 -82% | 29 -71% | 30.8 ? -81% | 24.6 ? -45% |
| Load Average * (Watt) | 92 | 125.09 -36% | 120 -30% | 114 -24% | 104 -13% | 143 -55% | 121.2 ? -32% | 110.7 ? -20% |
| Witcher 3 ultra * (Watt) | 221 | 256 -16% | 229 -4% | 159 28% | 186.5 16% | 247 -12% | ||
| Load Maximum * (Watt) | 306 | 321.88 -5% | 243 21% | 227 26% | 256 16% | 352 -15% | 276 ? 10% | 259 ? 15% |
* ... más pequeño es mejor
Consumption Witcher 3 / Stress Test
Consumption external Monitor
Duración de la batería
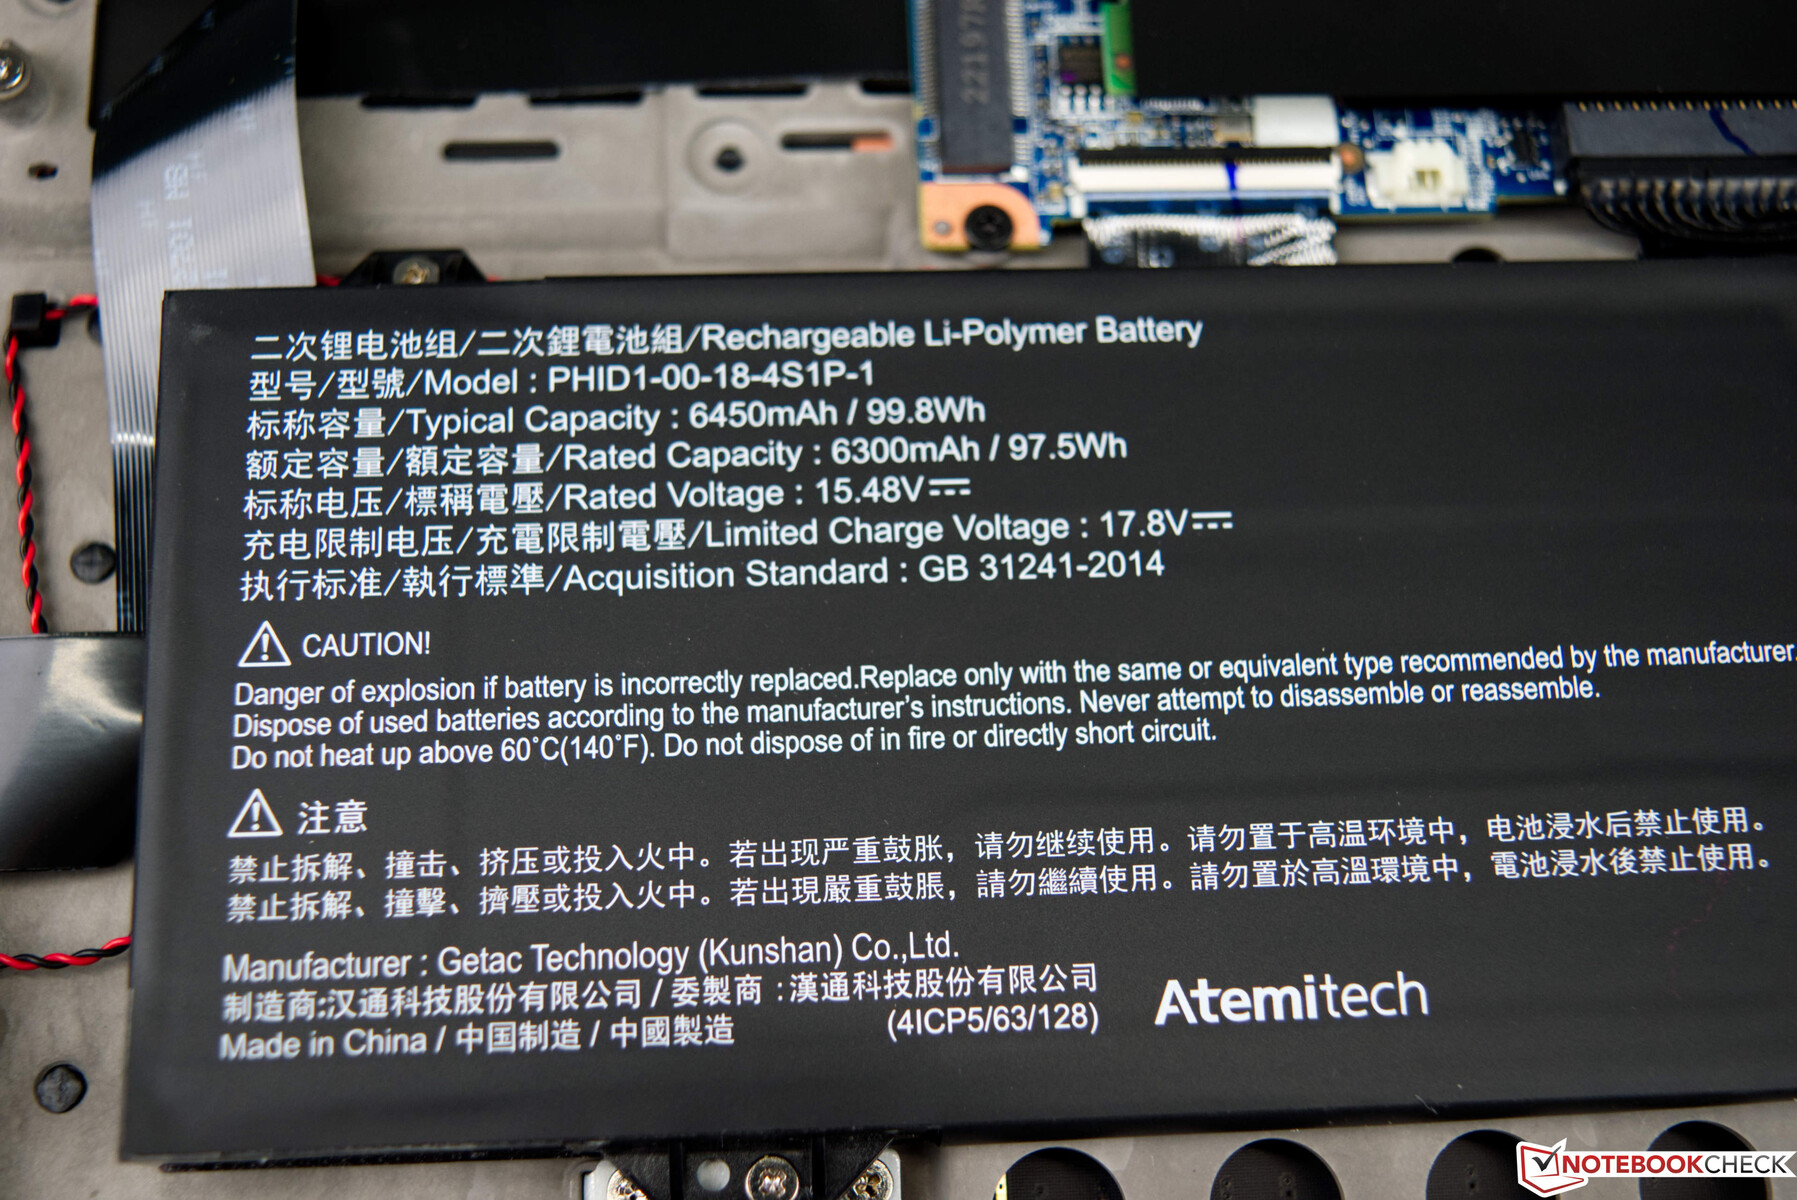
Schenker equipa el XMG Neo 17 con una gran batería de 99 Wh, que es capaz de alimentar nuestra muestra de prueba durante casi 9 horas en nuestro test Wi-Fi. Es un resultado excelente, especialmente en comparación con sus competidores. La duración de la reproducción de vídeo es ligeramente inferior y el dispositivo tiene que ser recargado después de unas 6,5 horas. La recarga completa de la gran batería es sorprendentemente rápida: sólo 102 minutos.
Hay que tener en cuenta que el rendimiento de la CPU y la GPU están limitados en modo batería. Sin embargo, este comportamiento no es exclusivo del Schenker XMG Neo 17 y está presente en casi todos los portátiles de juego actuales.

| Schenker XMG Neo 17 M22 R9 6900HX, GeForce RTX 3080 Ti Laptop GPU, 99 Wh | MSI Titan GT77 12UHS i9-12900HX, GeForce RTX 3080 Ti Laptop GPU, 99.9 Wh | Razer Blade 17 Early 2022 i9-12900H, GeForce RTX 3080 Ti Laptop GPU, 82 Wh | Acer Predator Triton 500 SE PT516-52s-70KX i7-12700H, GeForce RTX 3080 Ti Laptop GPU, 99.98 Wh | Asus ROG Zephyrus Duo 16 GX650RX R9 6900HX, GeForce RTX 3080 Ti Laptop GPU, 90 Wh | MSI Raider GE77 HX 12UHS i9-12900HX, GeForce RTX 3080 Ti Laptop GPU, 99.99 Wh | Media de la clase Gaming | |
|---|---|---|---|---|---|---|---|
| Duración de Batería | -12% | -33% | 3% | -3% | -12% | -11% | |
| Reader / Idle (h) | 12 | 7.1 -41% | 12.5 4% | 9.8 -18% | 8.27 ? -31% | ||
| H.264 (h) | 6.6 | 7.2 9% | 4.8 -27% | 8.2 24% | 9.3 41% | 6.5 -2% | 8.32 ? 26% |
| WiFi v1.3 (h) | 9 | 6.9 -23% | 3.8 -58% | 5.7 -37% | 7.8 -13% | 5.4 -40% | 7.11 ? -21% |
| Load (h) | 1.8 | 1.4 -22% | 1.7 -6% | 2.2 22% | 1 -44% | 2 11% | 1.502 ? -17% |
| Witcher 3 ultra (h) | 1.5 |
Pro
Contra
Veredicto: portátil para juegos rápido con refrigeración por agua opcional
Una carcasa robusta y elegante, un rendimiento casi ilimitado durante el uso diario y la GPU de portátil más rápida de Nvidia, combinados con la posibilidad de refrigerar el dispositivo por líquido, hacen del Schenker XMG Neo 17 una oferta convincente sobre el papel. El fabricante apenas compromete nada y deja que el hardware despliegue todo su potencial, lo que en su mayor parte resulta en excelentes resultados en los benchmarks.
El AMD Ryzen 9 6900HX de nuestro Neo 17 rinde bien y es capaz de mantener su rendimiento durante periodos prolongados. Lo mismo ocurre con la Nvidia GeForce RTX 3080 Ti. Estas son nuestras observaciones sin el XMG Oasis opcional, ya que la solución de refrigeración integrada ya facilita un rendimiento estable. Para los usuarios que prefieren un sistema más silencioso, puede merecer la pena considerar el refrigerador de agua opcional. Nos complace ver una pantalla con el factor de forma 16:10. Su único inconveniente es la cobertura algo estrecha del espacio de color AdobeRGB y P3, que no es lo suficientemente buena para la edición profesional de fotos y vídeos. Dicho esto, esto no es un problema si usted está usando el XMG Neo 17 como un portátil de juegos.
El Schenker XMG Neo 17 es un portátil de juegos rápido que no tiene que acelerar artificialmente su rendimiento. Gracias al accesorio opcional XMG Oasis, el portátil incluso admite refrigeración líquida.
En general, el Schenker XMG Neo 17 es un sólido portátil para juegos que ofrece mucho en términos de rendimiento. Tampoco encontramos ningún inconveniente importante. El Neo 17 también lo hace bien en lo que respecta a la duración de la batería. Si tuviéramos que criticar algo, sería el teclado, que viene con un teclado numérico que desafortunadamente no utiliza interruptores Cherry MX. Además, el enchufe del adaptador de CA en ángulo no es óptimo, ya que un enchufe recto no obstruiría los puertos cercanos innecesariamente. El rendimiento del Wi-Fi es mejorable. Al menos, los usuarios pueden optar por un módulo Wi-Fi más moderno/rápido durante el proceso de configuración. Hablando de eso, este último es característico de Schenker y está bien organizado. El dispositivo se puede personalizar según sus preferencias y hay una amplia gama de opciones. Aparte de la unidad base, tanto la CPU como la pantalla son fijas y no se pueden cambiar.
El Schenker XMG Neo 17 tiene mucha competencia. Como ya se ha mencionado, algunos portátiles equipados con Intel Alder Lake pueden ofrecer un rendimiento aún más rápido. El MSI Titan GT77 12UHS es un ejemplo de uno de esos dispositivos, aunque es (incluso) más caro que nuestra configuración del Neo 17, que cuesta unos 4200 USD.
Precio y disponibilidad
El Schenker XMG Neo 17 está disponible directamente en la tienda online del fabricante https://www.awin1.com/cread.php?awinmid=16273&awinaffid=343879&ued=https%3A%2F%2Fbestware.com%2Fen%2Fxmg-neo-17-amd-m22.html con muchas opciones de configuración diferentes. El modelo básico cuesta unos 2950 USD, mientras que nuestra configuración se vende por unos 4200 USD.
Schenker XMG Neo 17 M22
- 08/31/2022 v7 (old)
Sebastian Bade
Price comparison

