Análisis del mini PC Beelink SER6 Pro Ryzen 7 7735HS: Ahora con DisplayPort integrado

El Beelink SER6 Pro 2023 es una actualización del SER6 Pro 2022. Sustituye las antiguas opciones Ryzen 7 6800 o Ryzen 9 6900HS del modelo del año pasado por el más reciente Ryzen 7 7735HS. Aparte de la actualización del procesador, sin embargo, el chasis sigue siendo idéntico con un solo cambio notable.
Nuestra unidad de análisis con el Ryzen 7 7735HS, 32 GB de RAM, 500 GB de SSD NVMe, y Windows 10 Pro preinstalado se puede encontrar online por unos $650 USD o $550 si está en oferta. El modelo compite directamente con otros mini PCs, entre los que destaca la serie Intel NUC.
Más opiniones sobre Beelink:
- SEi12
- SEi11
- SER5 Pro
- GTR6
- U59
Posibles contendientes en la comparación
Valoración | Fecha | Modelo | Peso | Altura | Tamaño | Resolución | Precio |
|---|---|---|---|---|---|---|---|
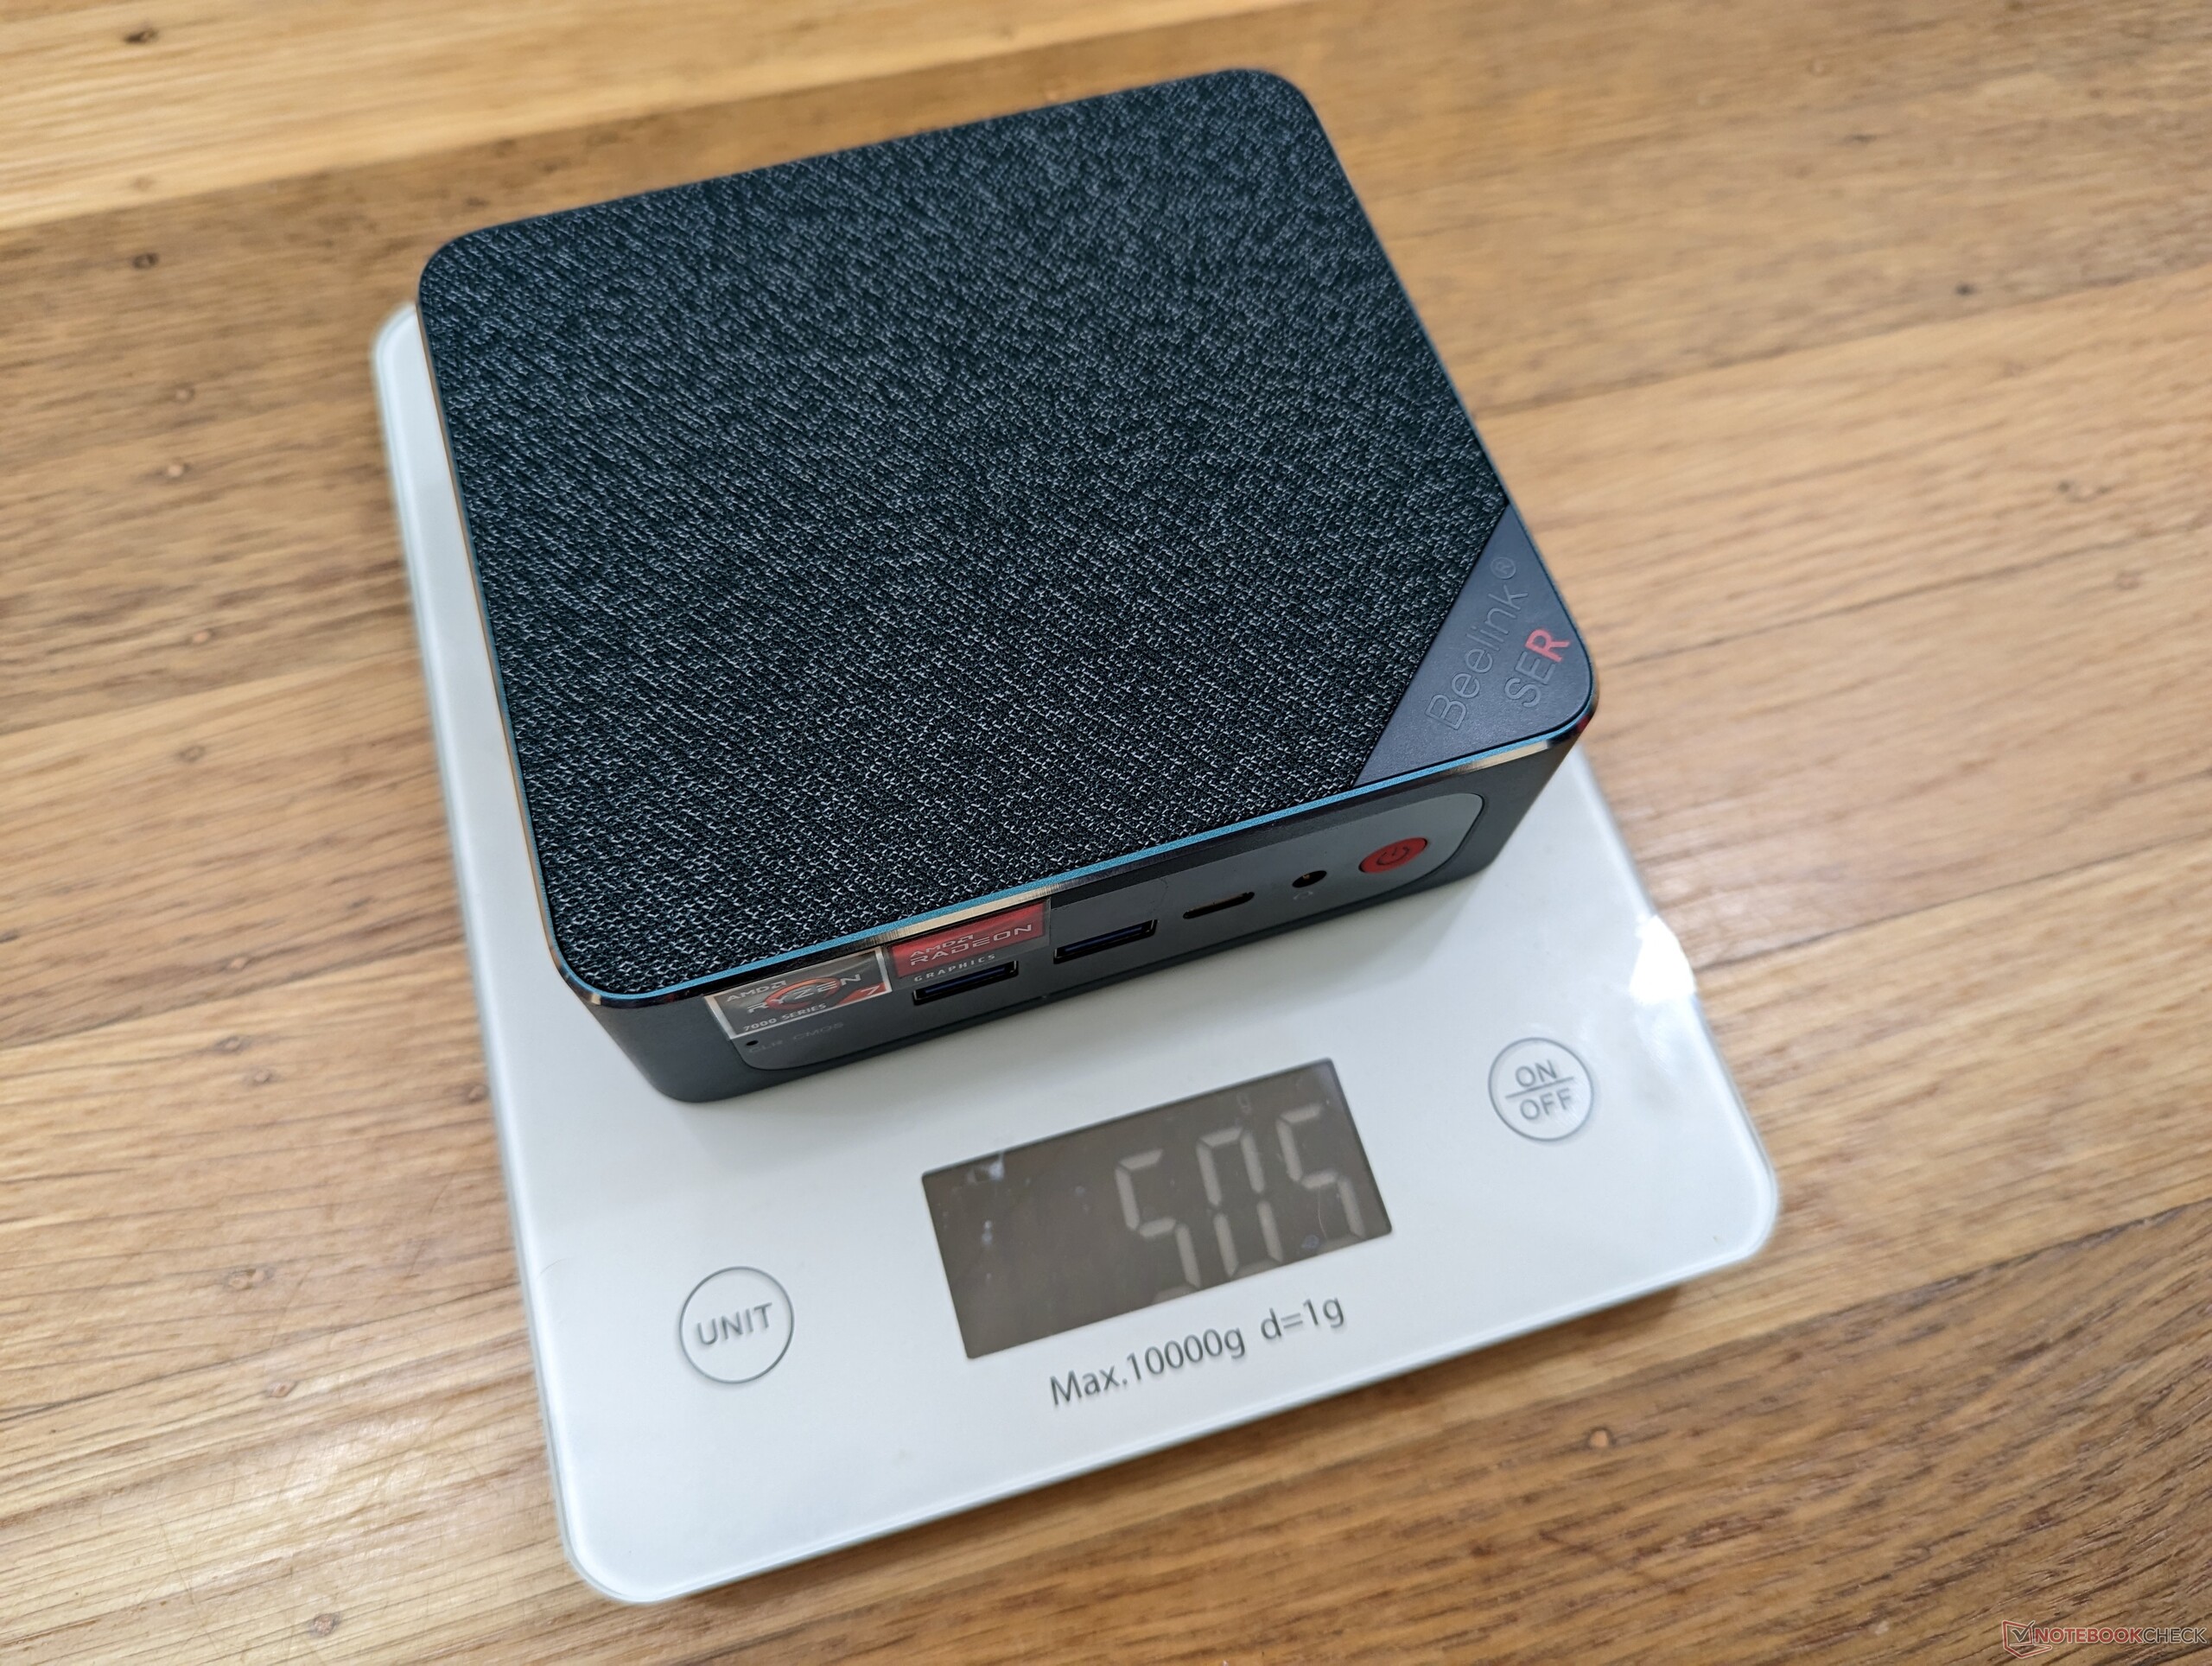
| 84.8 % v7 (old) | 04/2023 | Beelink SER6 Pro Ryzen 7 7735HS R7 7735HS, Radeon 680M | 506 g | 42 mm | x | ||
v (old) | 01/2023 | Beelink SER6 Pro R7 6800H, Radeon 680M | 511 g | 42 mm | x | ||
v (old) | 11/2022 | Beelink GTR6 R9 6900HX, Radeon 680M | 815 g | 43 mm | x | ||
| 80.8 % v7 (old) | 04/2023 | Intel NUC 13 Pro Kit NUC13ANK i7-1360P, Iris Xe G7 96EUs | 538 g | 37 mm | x | ||
v (old) | 03/2023 | Intel NUC 12 Pro Kit NUC12WSBi5 i5-1240P, Iris Xe G7 80EUs | 549 g | 45.6 mm | x | ||
| 86.1 % v7 (old) | 02/2023 | Minisforum Venus Series UM690 R9 6900HX, Radeon 680M | 621 g | 48 mm | x |
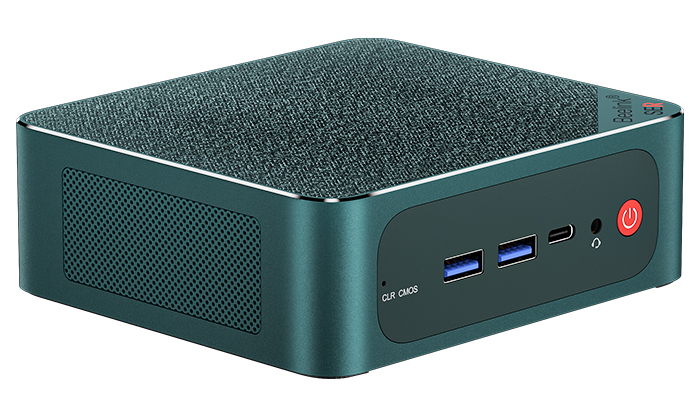
Caso
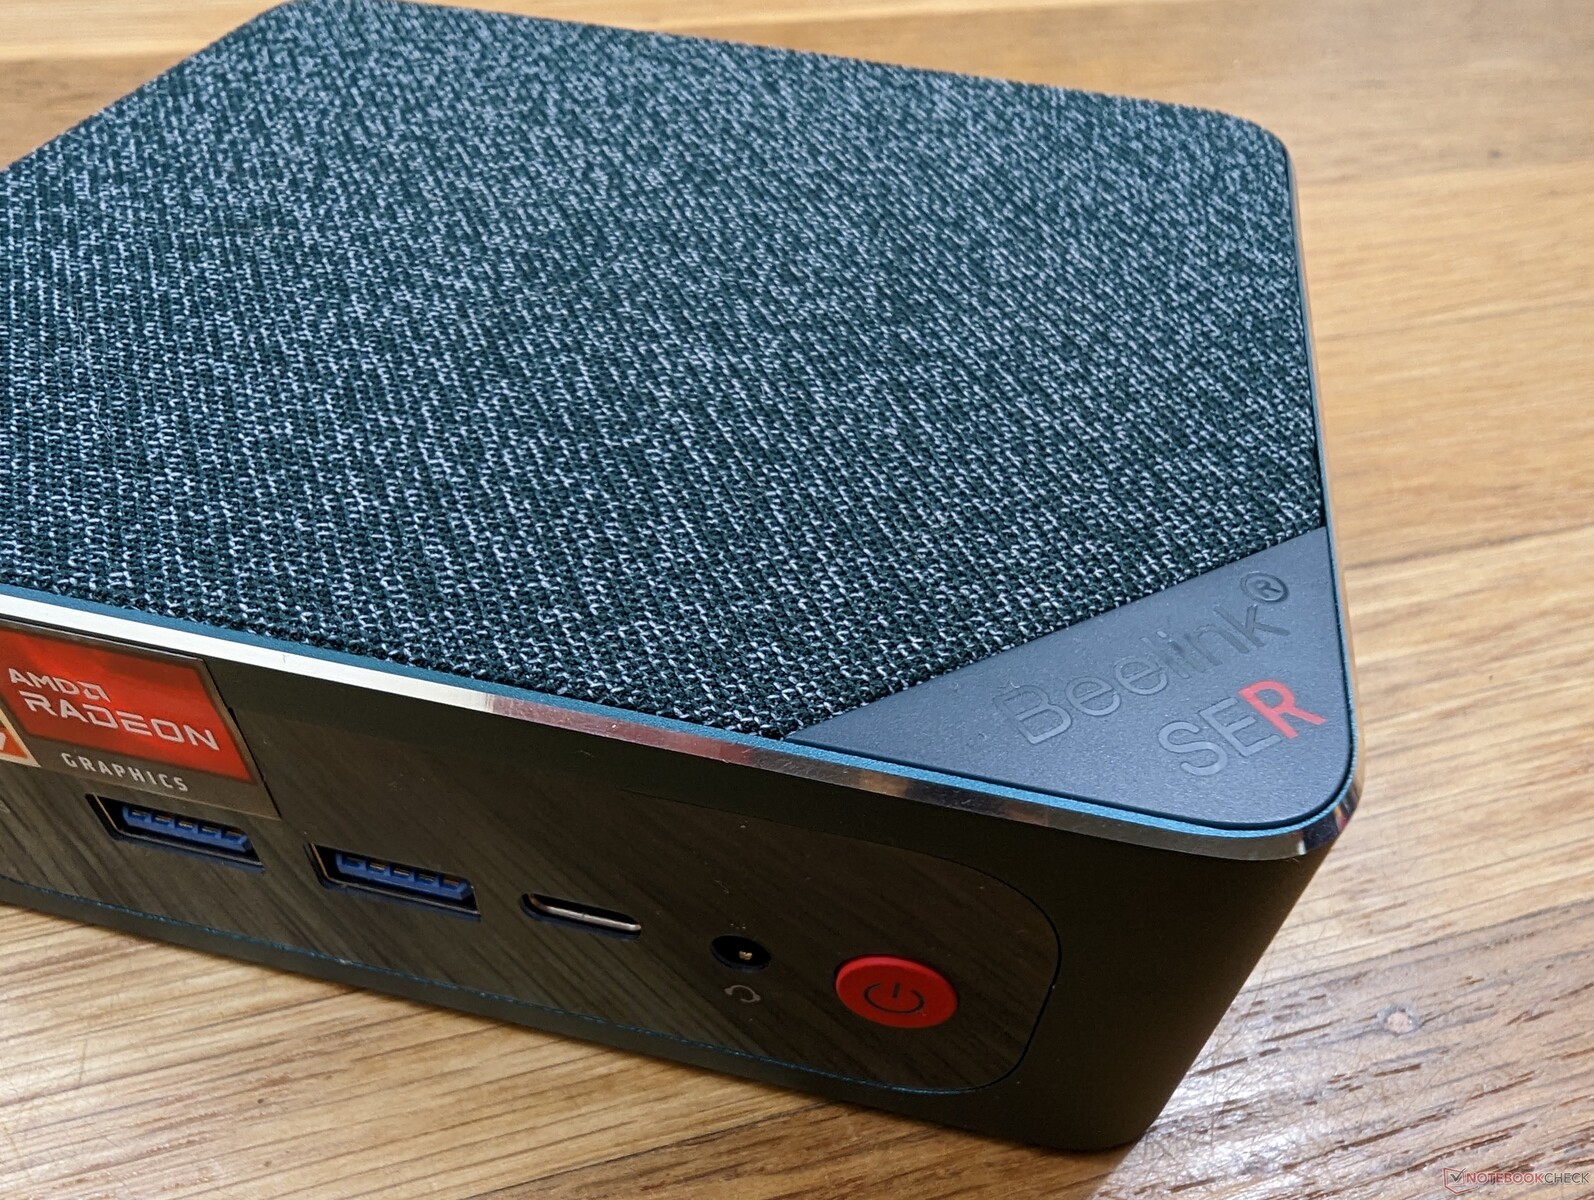
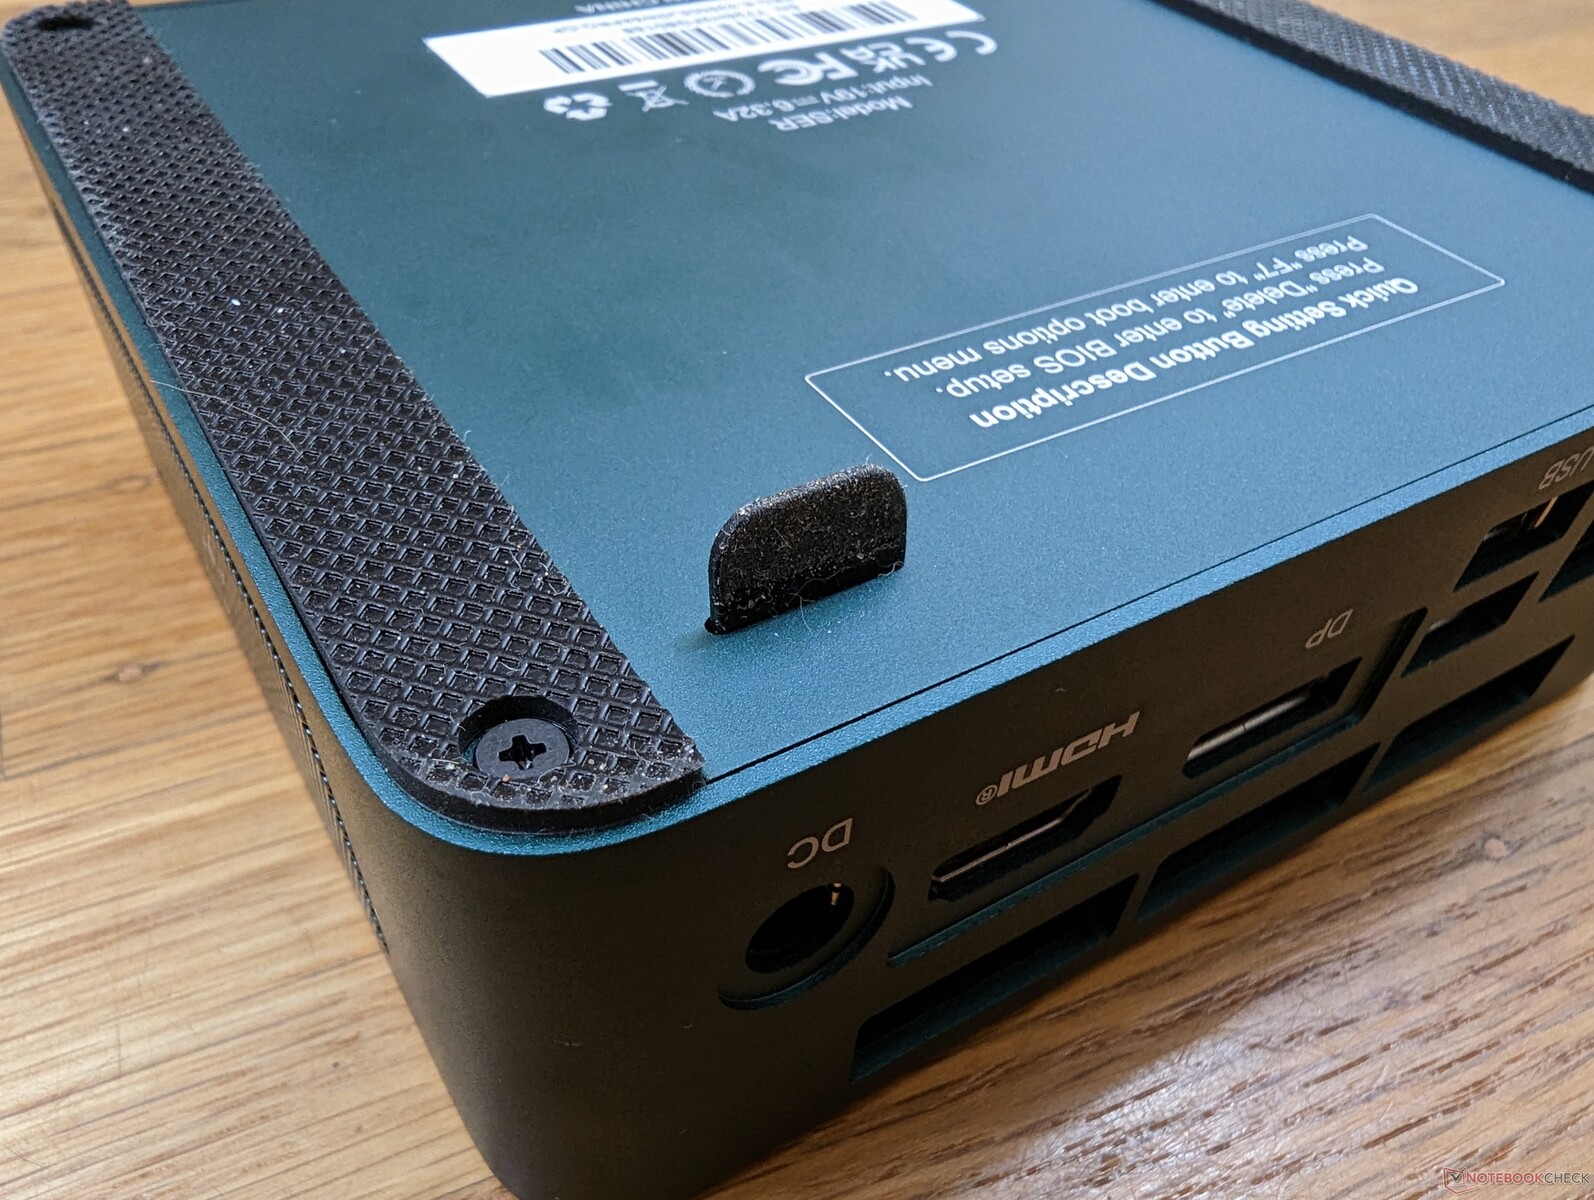
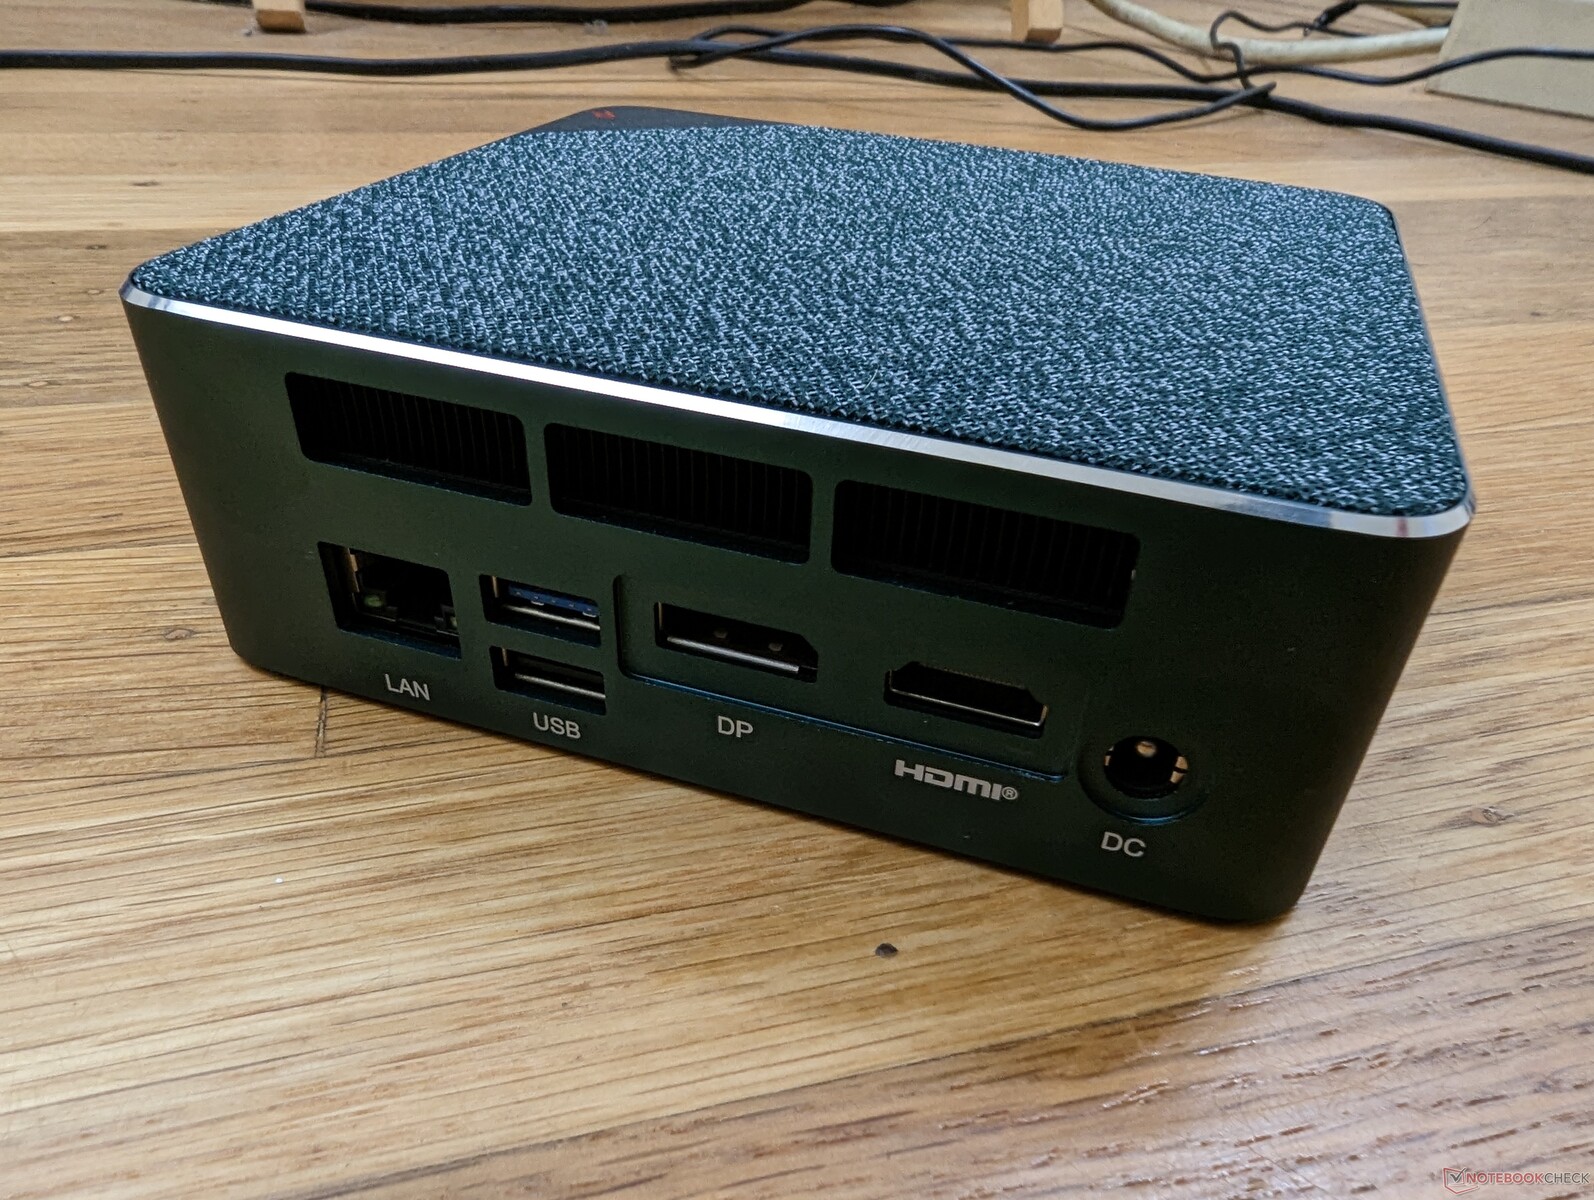
No hay grandes cambios de diseño en el chasis, salvo una excepción: el segundo puerto HDMI del modelo del año pasado se ha cambiado por un DisplayPort de tamaño completo. Esto es preferible, ya que DisplayPort es más compatible que HDMI con monitores de mayor frecuencia de refresco y sincronización adaptativa.
Comunicación
Módulos de comunicación por cable e inalámbricos incorporados, comparación de los datos de las pruebas de red con los de la competencia, soluciones alternativas disponibles (5G/LTE)..., Irregularidades (recepción de radio)..
| Networking | |
| iperf3 transmit AXE11000 | |
| Beelink SER6 Pro | |
| Beelink SER6 Pro Ryzen 7 7735HS | |
| Minisforum Venus Series UM690 | |
| Beelink GTR6 | |
| Intel NUC 13 Pro Kit NUC13ANK | |
| iperf3 receive AXE11000 | |
| Beelink SER6 Pro Ryzen 7 7735HS | |
| Beelink SER6 Pro | |
| Minisforum Venus Series UM690 | |
| Intel NUC 13 Pro Kit NUC13ANK | |
| Beelink GTR6 | |
| iperf3 transmit AXE11000 6GHz | |
| Intel NUC 13 Pro Kit NUC13ANK | |
| Beelink GTR6 | |
| Minisforum Venus Series UM690 | |
| iperf3 receive AXE11000 6GHz | |
| Intel NUC 13 Pro Kit NUC13ANK | |
| Minisforum Venus Series UM690 | |
| Beelink GTR6 | |
Mantenimiento
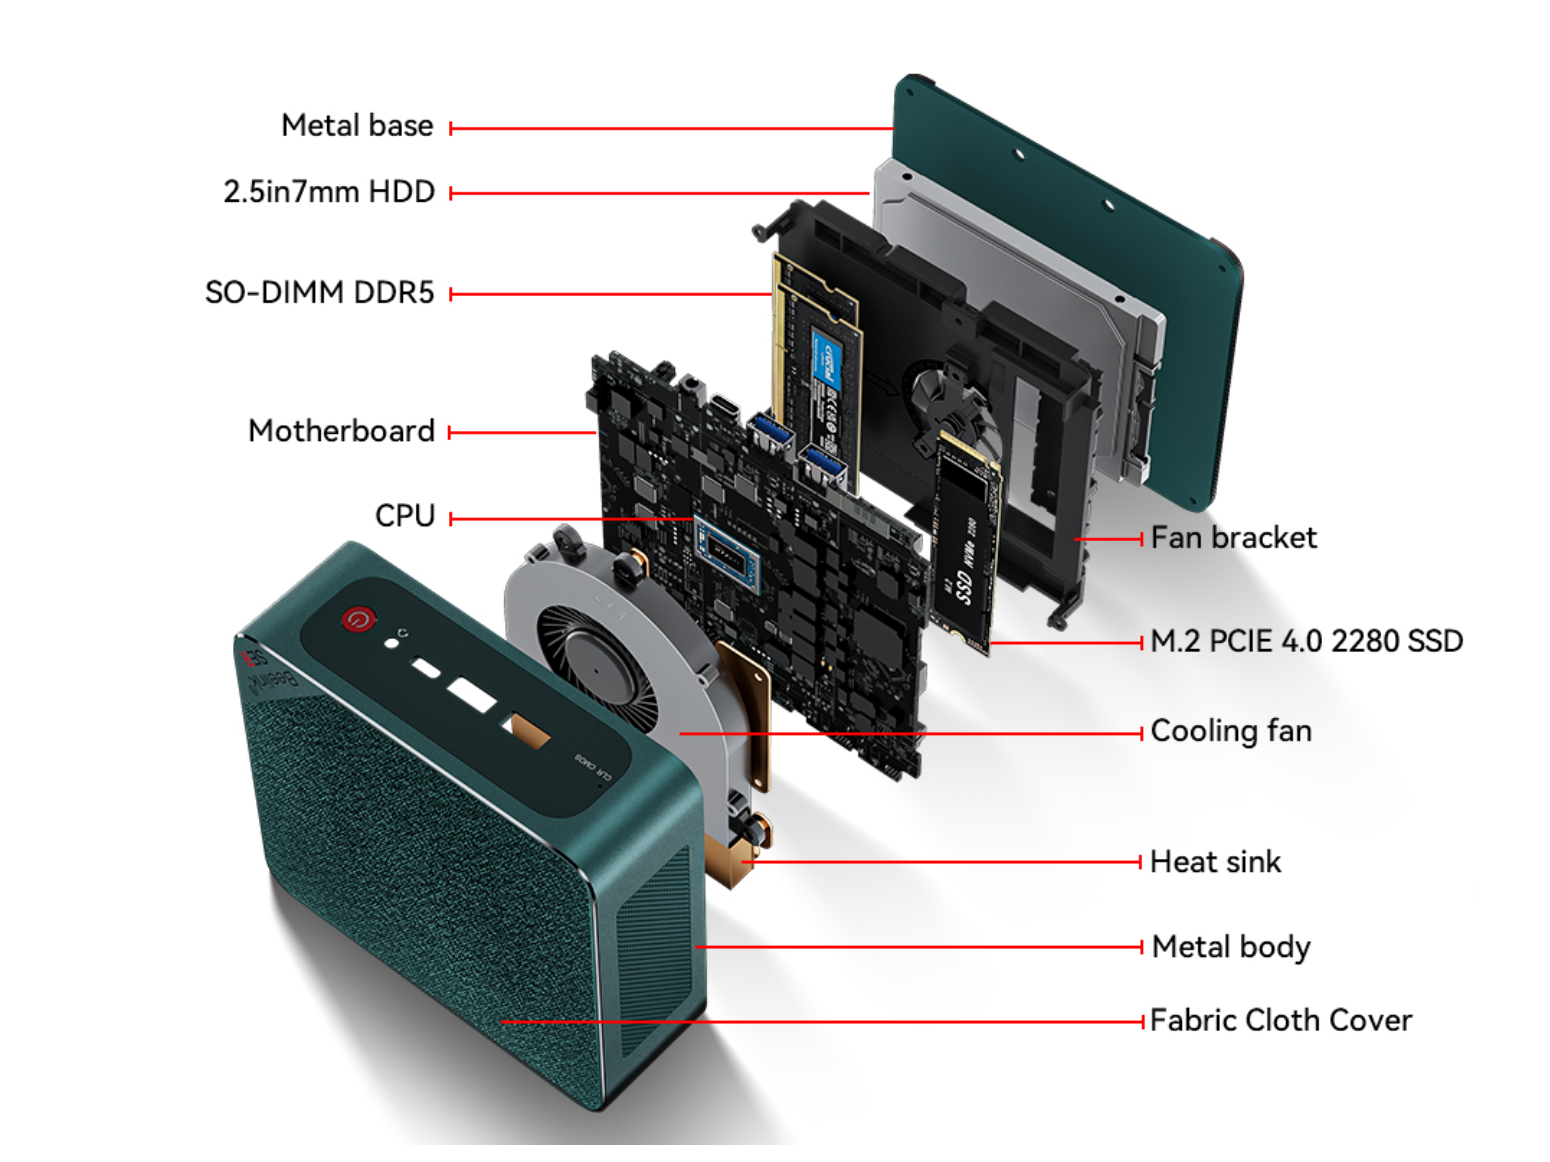
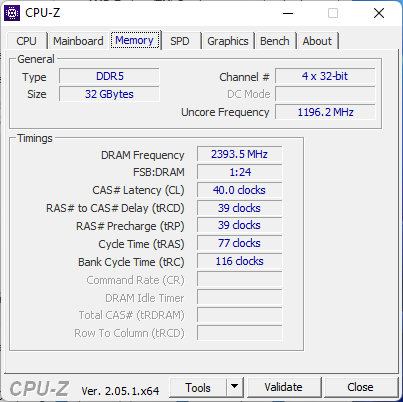
El mantenimiento sigue siendo el mismo que en el modelo del año pasado. Los usuarios tienen 2 bahías de almacenamiento (1x PCIe4 x4 M.2 2280, 1x SATA III de 2,5 pulgadas) y 2x ranuras DDR5 SODIMM para expansión.
Accesorios y garantía
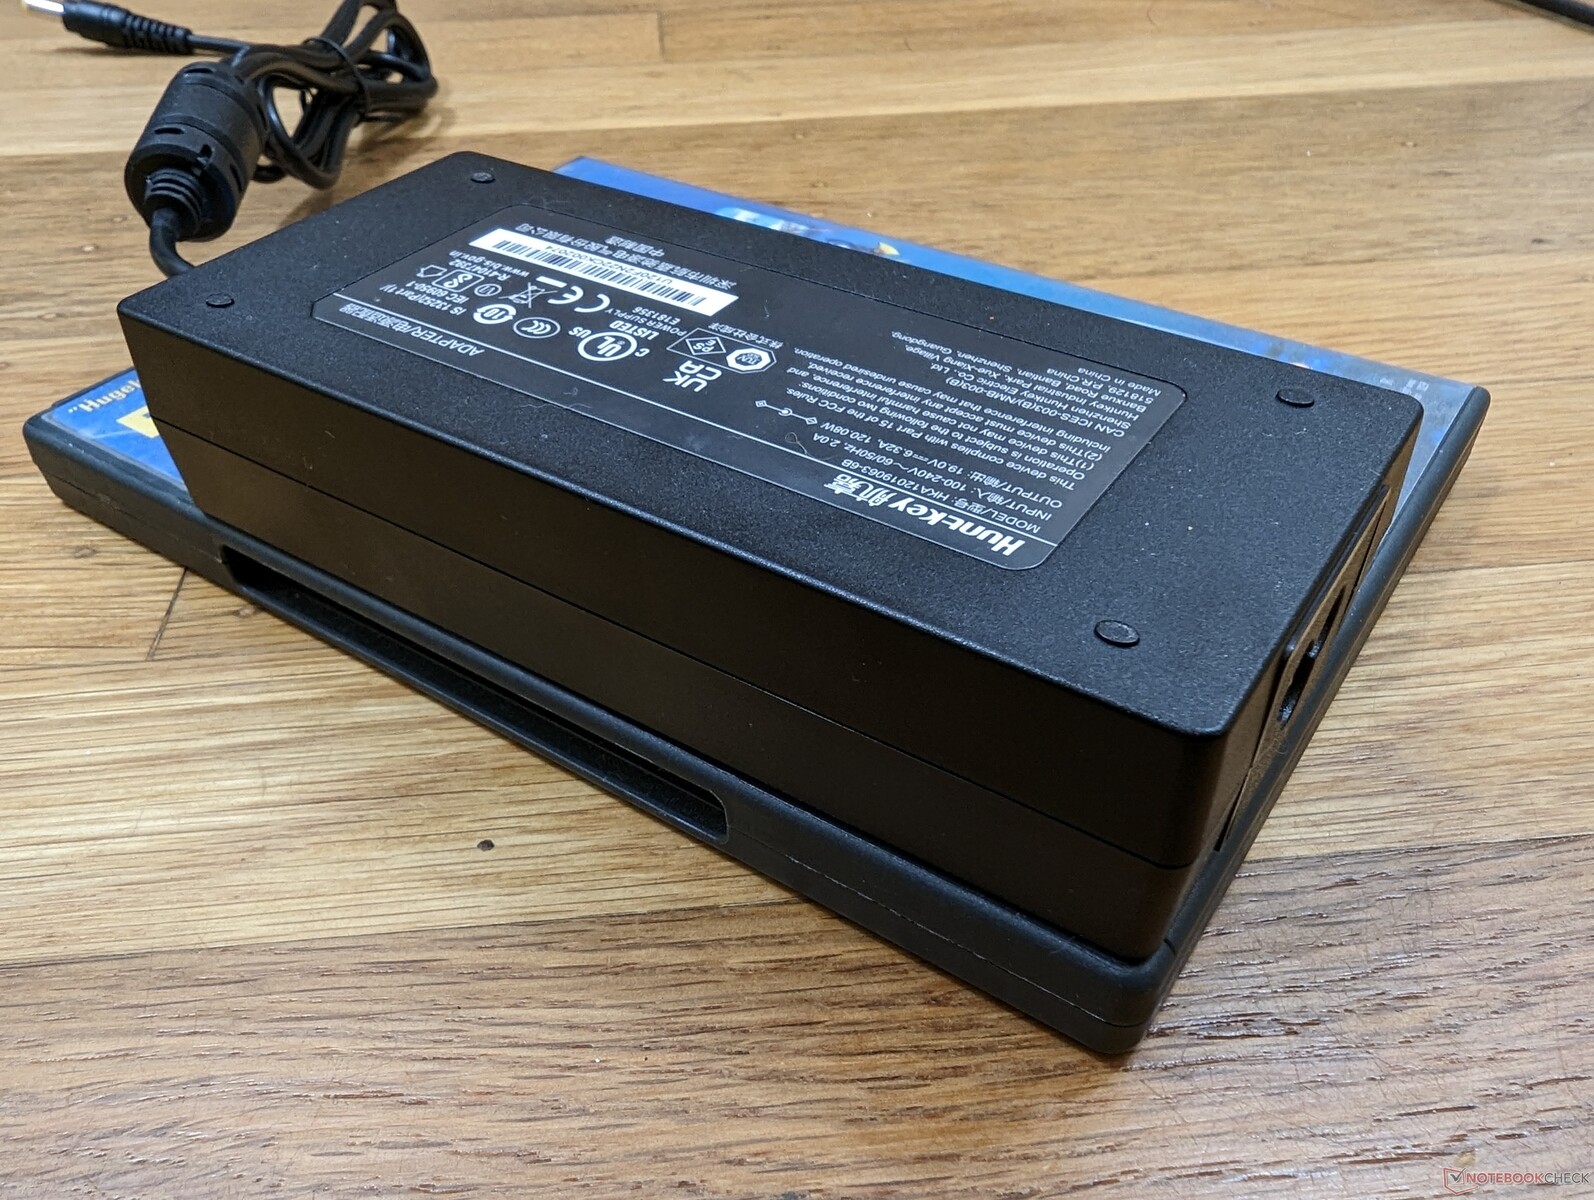
Se aplica la garantía limitada estándar de un año si se adquiere en Estados Unidos. La caja incluye un manual, un soporte VESA desmontable para montaje en pared, dos cables HDMI y el adaptador de CA.
Rendimiento
Condiciones de ensayo
Pusimos nuestra unidad en el modo Rendimiento a través de Windows antes de ejecutar cualquier punto de referencia a continuación. No hay ninguna aplicación de tipo "Centro de comandos" preinstalada, a diferencia de lo que ocurre en muchos otros portátiles o PC de grandes marcas.
Procesador
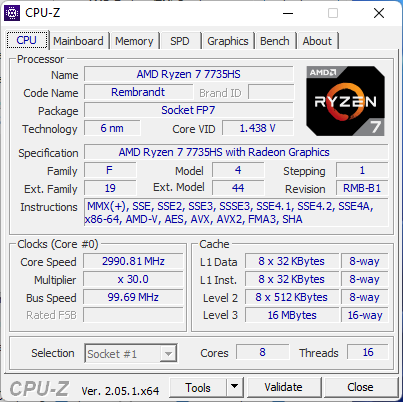
Al igual que descubrimos en el recientemente analizado Lenovo Slim 7 Pro, el Ryzen 7 7735HS 2023 tiene un rendimiento casi idéntico al de los antiguos Ryzen 7 6800H o Ryzen 9 6900HS. Esto se debe a que el Ryzen 7 7735HS es en gran medida una renovación de la antigua serie Zen 3+ a pesar de su reciente lanzamiento a principios del mes pasado. En consecuencia, incluso el antiguo Core i7-12700H de 12ª generación puede superar al Ryzen 7 7735HS en prácticamente todo excepto en rendimiento gráfico integrado.
Para un "verdadero" procesador AMD de última generación, tendrías que comprar el Zen 4 Ryzen 9 7945HX. Por desgracia, esta opción no está disponible en el SER6 Pro.
Cinebench R15 Multi Loop
Cinebench R23: Multi Core | Single Core
Cinebench R20: CPU (Multi Core) | CPU (Single Core)
Cinebench R15: CPU Multi 64Bit | CPU Single 64Bit
Blender: v2.79 BMW27 CPU
7-Zip 18.03: 7z b 4 | 7z b 4 -mmt1
Geekbench 5.5: Multi-Core | Single-Core
HWBOT x265 Benchmark v2.2: 4k Preset
LibreOffice : 20 Documents To PDF
R Benchmark 2.5: Overall mean
| Cinebench R20 / CPU (Multi Core) | |
| Intel NUC13 Raptor Canyon | |
| Asus ROG Strix Scar 17 G733PY-XS96 | |
| Intel NUC 12, NUC12SNKi72_Serpent Canyon | |
| Medio AMD Ryzen 7 7735HS (3968 - 5502, n=15) | |
| Intel NUC 13 Pro Kit NUC13ANK | |
| Beelink GTR6 | |
| Beelink SER6 Pro Ryzen 7 7735HS | |
| Beelink SER6 Pro | |
| Intel NUC 12 Pro Kit NUC12WSBi5 | |
| Intel NUC Pro Chassis_i7_1265U | |
| Intel NUC Pro Chassis_i5_1245U | |
| Trigkey Speed S | |
| Cinebench R20 / CPU (Single Core) | |
| Intel NUC13 Raptor Canyon | |
| Intel NUC 13 Pro Kit NUC13ANK | |
| Asus ROG Strix Scar 17 G733PY-XS96 | |
| Intel NUC 12, NUC12SNKi72_Serpent Canyon | |
| Intel NUC Pro Chassis_i7_1265U | |
| Intel NUC 12 Pro Kit NUC12WSBi5 | |
| Intel NUC Pro Chassis_i5_1245U | |
| Beelink GTR6 | |
| Beelink SER6 Pro Ryzen 7 7735HS | |
| Medio AMD Ryzen 7 7735HS (502 - 613, n=15) | |
| Beelink SER6 Pro | |
| Trigkey Speed S | |
| Geekbench 5.5 / Multi-Core | |
| Intel NUC13 Raptor Canyon | |
| Asus ROG Strix Scar 17 G733PY-XS96 | |
| Intel NUC 13 Pro Kit NUC13ANK | |
| Intel NUC 12, NUC12SNKi72_Serpent Canyon | |
| Beelink SER6 Pro Ryzen 7 7735HS | |
| Beelink GTR6 | |
| Beelink SER6 Pro | |
| Medio AMD Ryzen 7 7735HS (7151 - 10258, n=15) | |
| Intel NUC Pro Chassis_i5_1245U | |
| Intel NUC Pro Chassis_i7_1265U | |
| Trigkey Speed S | |
| Geekbench 5.5 / Single-Core | |
| Intel NUC13 Raptor Canyon | |
| Asus ROG Strix Scar 17 G733PY-XS96 | |
| Intel NUC 13 Pro Kit NUC13ANK | |
| Intel NUC Pro Chassis_i7_1265U | |
| Intel NUC Pro Chassis_i5_1245U | |
| Beelink GTR6 | |
| Intel NUC 12, NUC12SNKi72_Serpent Canyon | |
| Beelink SER6 Pro Ryzen 7 7735HS | |
| Beelink SER6 Pro | |
| Medio AMD Ryzen 7 7735HS (1327 - 1615, n=15) | |
| Trigkey Speed S | |
| HWBOT x265 Benchmark v2.2 / 4k Preset | |
| Asus ROG Strix Scar 17 G733PY-XS96 | |
| Intel NUC13 Raptor Canyon | |
| Intel NUC 12, NUC12SNKi72_Serpent Canyon | |
| Medio AMD Ryzen 7 7735HS (10.8 - 17.9, n=15) | |
| Beelink GTR6 | |
| Beelink SER6 Pro Ryzen 7 7735HS | |
| Beelink SER6 Pro | |
| Intel NUC 13 Pro Kit NUC13ANK | |
| Intel NUC 12 Pro Kit NUC12WSBi5 | |
| Intel NUC Pro Chassis_i7_1265U | |
| Intel NUC Pro Chassis_i5_1245U | |
| Trigkey Speed S | |
| LibreOffice / 20 Documents To PDF | |
| Medio AMD Ryzen 7 7735HS (44.3 - 63.9, n=15) | |
| Intel NUC Pro Chassis_i5_1245U | |
| Intel NUC 12 Pro Kit NUC12WSBi5 | |
| Intel NUC Pro Chassis_i7_1265U | |
| Beelink SER6 Pro | |
| Beelink GTR6 | |
| Intel NUC 12, NUC12SNKi72_Serpent Canyon | |
| Beelink SER6 Pro Ryzen 7 7735HS | |
| Trigkey Speed S | |
| Intel NUC 13 Pro Kit NUC13ANK | |
| Intel NUC13 Raptor Canyon | |
| Asus ROG Strix Scar 17 G733PY-XS96 | |
* ... más pequeño es mejor
* ... más pequeño es mejor
AIDA64: FP32 Ray-Trace | FPU Julia | CPU SHA3 | CPU Queen | FPU SinJulia | FPU Mandel | CPU AES | CPU ZLib | FP64 Ray-Trace | CPU PhotoWorxx
| Performance rating | |
| Minisforum Venus Series UM690 | |
| Beelink GTR6 | |
| Beelink SER6 Pro Ryzen 7 7735HS | |
| Beelink SER6 Pro | |
| Intel NUC 13 Pro Kit NUC13ANK | |
| Intel NUC 12 Pro Kit NUC12WSBi5 | |
| AIDA64 / FP32 Ray-Trace | |
| Minisforum Venus Series UM690 | |
| Beelink GTR6 | |
| Beelink SER6 Pro Ryzen 7 7735HS | |
| Beelink SER6 Pro | |
| Intel NUC 13 Pro Kit NUC13ANK | |
| Intel NUC 12 Pro Kit NUC12WSBi5 | |
| AIDA64 / FPU Julia | |
| Minisforum Venus Series UM690 | |
| Beelink GTR6 | |
| Beelink SER6 Pro Ryzen 7 7735HS | |
| Beelink SER6 Pro | |
| Intel NUC 13 Pro Kit NUC13ANK | |
| Intel NUC 12 Pro Kit NUC12WSBi5 | |
| AIDA64 / CPU SHA3 | |
| Minisforum Venus Series UM690 | |
| Beelink GTR6 | |
| Beelink SER6 Pro | |
| Beelink SER6 Pro Ryzen 7 7735HS | |
| Intel NUC 13 Pro Kit NUC13ANK | |
| Intel NUC 12 Pro Kit NUC12WSBi5 | |
| AIDA64 / CPU Queen | |
| Minisforum Venus Series UM690 | |
| Beelink SER6 Pro Ryzen 7 7735HS | |
| Beelink GTR6 | |
| Beelink SER6 Pro | |
| Intel NUC 13 Pro Kit NUC13ANK | |
| Intel NUC 12 Pro Kit NUC12WSBi5 | |
| AIDA64 / FPU SinJulia | |
| Minisforum Venus Series UM690 | |
| Beelink GTR6 | |
| Beelink SER6 Pro Ryzen 7 7735HS | |
| Beelink SER6 Pro | |
| Intel NUC 13 Pro Kit NUC13ANK | |
| Intel NUC 12 Pro Kit NUC12WSBi5 | |
| AIDA64 / FPU Mandel | |
| Minisforum Venus Series UM690 | |
| Beelink GTR6 | |
| Beelink SER6 Pro Ryzen 7 7735HS | |
| Beelink SER6 Pro | |
| Intel NUC 13 Pro Kit NUC13ANK | |
| Intel NUC 12 Pro Kit NUC12WSBi5 | |
| AIDA64 / CPU AES | |
| Minisforum Venus Series UM690 | |
| Beelink GTR6 | |
| Beelink SER6 Pro | |
| Beelink SER6 Pro Ryzen 7 7735HS | |
| Intel NUC 13 Pro Kit NUC13ANK | |
| Intel NUC 12 Pro Kit NUC12WSBi5 | |
| AIDA64 / CPU ZLib | |
| Minisforum Venus Series UM690 | |
| Intel NUC 12 Pro Kit NUC12WSBi5 | |
| Intel NUC 13 Pro Kit NUC13ANK | |
| Beelink GTR6 | |
| Beelink SER6 Pro | |
| Beelink SER6 Pro Ryzen 7 7735HS | |
| AIDA64 / FP64 Ray-Trace | |
| Minisforum Venus Series UM690 | |
| Beelink GTR6 | |
| Beelink SER6 Pro Ryzen 7 7735HS | |
| Beelink SER6 Pro | |
| Intel NUC 13 Pro Kit NUC13ANK | |
| Intel NUC 12 Pro Kit NUC12WSBi5 | |
| AIDA64 / CPU PhotoWorxx | |
| Beelink GTR6 | |
| Beelink SER6 Pro Ryzen 7 7735HS | |
| Beelink SER6 Pro | |
| Intel NUC 13 Pro Kit NUC13ANK | |
| Intel NUC 12 Pro Kit NUC12WSBi5 | |
| Minisforum Venus Series UM690 | |
Rendimiento del sistema
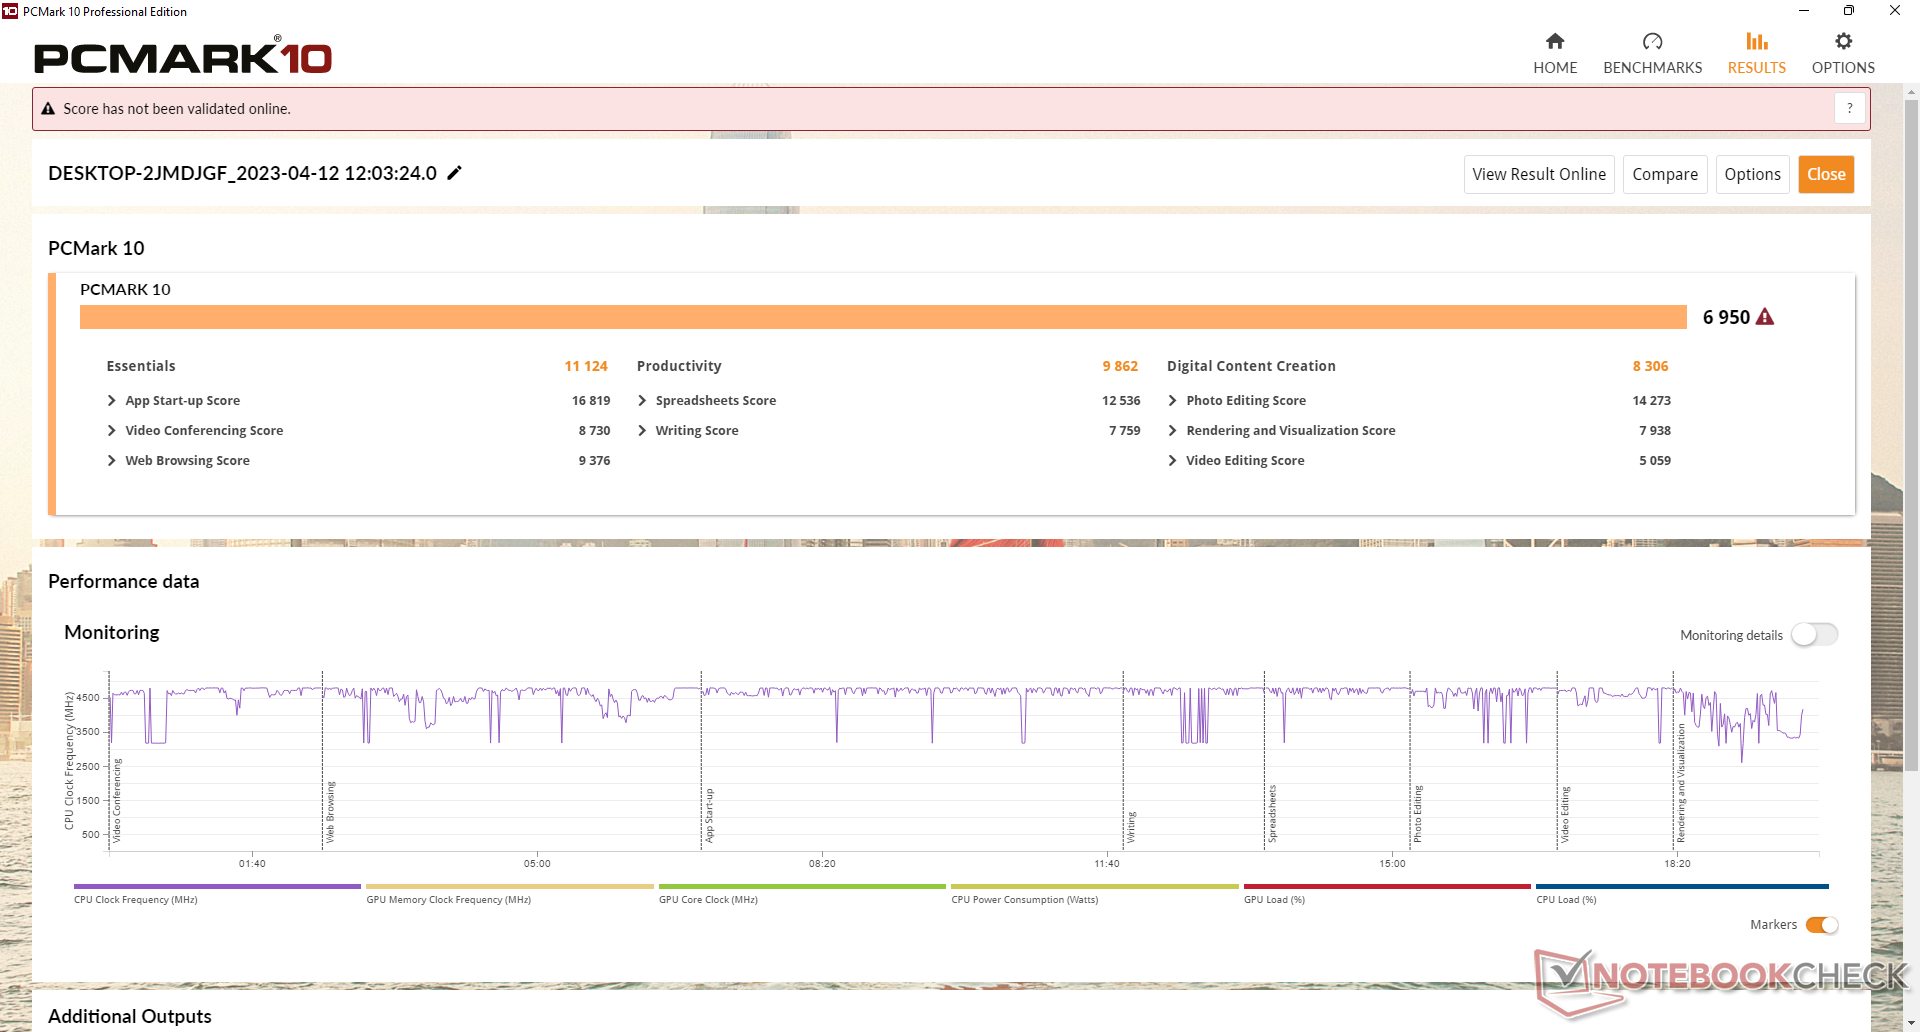
Las pruebas PCMark vuelven a ser esencialmente idénticas a las que registramos en la 2022 SER6 Pro, ya que sus procesadores son muy similares.
CrossMark: Overall | Productivity | Creativity | Responsiveness
| PCMark 10 / Score | |
| Beelink GTR6 | |
| Minisforum Venus Series UM690 | |
| Beelink SER6 Pro Ryzen 7 7735HS | |
| Beelink SER6 Pro | |
| Medio AMD Ryzen 7 7735HS, AMD Radeon 680M (5722 - 7000, n=8) | |
| Intel NUC 13 Pro Kit NUC13ANK | |
| Intel NUC 12 Pro Kit NUC12WSBi5 | |
| PCMark 10 / Essentials | |
| Intel NUC 13 Pro Kit NUC13ANK | |
| Beelink GTR6 | |
| Beelink SER6 Pro | |
| Beelink SER6 Pro Ryzen 7 7735HS | |
| Minisforum Venus Series UM690 | |
| Intel NUC 12 Pro Kit NUC12WSBi5 | |
| Medio AMD Ryzen 7 7735HS, AMD Radeon 680M (8648 - 11124, n=8) | |
| PCMark 10 / Productivity | |
| Beelink GTR6 | |
| Minisforum Venus Series UM690 | |
| Beelink SER6 Pro Ryzen 7 7735HS | |
| Beelink SER6 Pro | |
| Medio AMD Ryzen 7 7735HS, AMD Radeon 680M (8428 - 12153, n=8) | |
| Intel NUC 13 Pro Kit NUC13ANK | |
| Intel NUC 12 Pro Kit NUC12WSBi5 | |
| PCMark 10 / Digital Content Creation | |
| Minisforum Venus Series UM690 | |
| Beelink GTR6 | |
| Beelink SER6 Pro | |
| Beelink SER6 Pro Ryzen 7 7735HS | |
| Medio AMD Ryzen 7 7735HS, AMD Radeon 680M (5798 - 8726, n=8) | |
| Intel NUC 13 Pro Kit NUC13ANK | |
| Intel NUC 12 Pro Kit NUC12WSBi5 | |
| CrossMark / Overall | |
| Intel NUC 13 Pro Kit NUC13ANK | |
| Beelink SER6 Pro Ryzen 7 7735HS | |
| Minisforum Venus Series UM690 | |
| Beelink SER6 Pro | |
| Beelink GTR6 | |
| Medio AMD Ryzen 7 7735HS, AMD Radeon 680M (1280 - 1736, n=8) | |
| CrossMark / Productivity | |
| Intel NUC 13 Pro Kit NUC13ANK | |
| Minisforum Venus Series UM690 | |
| Beelink SER6 Pro Ryzen 7 7735HS | |
| Beelink GTR6 | |
| Beelink SER6 Pro | |
| Medio AMD Ryzen 7 7735HS, AMD Radeon 680M (1336 - 1725, n=8) | |
| CrossMark / Creativity | |
| Intel NUC 13 Pro Kit NUC13ANK | |
| Beelink SER6 Pro Ryzen 7 7735HS | |
| Beelink SER6 Pro | |
| Minisforum Venus Series UM690 | |
| Beelink GTR6 | |
| Medio AMD Ryzen 7 7735HS, AMD Radeon 680M (1273 - 1785, n=8) | |
| CrossMark / Responsiveness | |
| Minisforum Venus Series UM690 | |
| Beelink SER6 Pro Ryzen 7 7735HS | |
| Beelink GTR6 | |
| Beelink SER6 Pro | |
| Intel NUC 13 Pro Kit NUC13ANK | |
| Medio AMD Ryzen 7 7735HS, AMD Radeon 680M (1144 - 1653, n=8) | |
| PCMark 10 Score | 6950 puntos | |
ayuda | ||
| AIDA64 / Memory Copy | |
| Beelink SER6 Pro Ryzen 7 7735HS | |
| Beelink SER6 Pro | |
| Beelink GTR6 | |
| Minisforum Venus Series UM690 | |
| Medio AMD Ryzen 7 7735HS (30324 - 52012, n=16) | |
| Intel NUC 13 Pro Kit NUC13ANK | |
| Intel NUC 12 Pro Kit NUC12WSBi5 | |
| AIDA64 / Memory Read | |
| Beelink GTR6 | |
| Beelink SER6 Pro Ryzen 7 7735HS | |
| Beelink SER6 Pro | |
| Minisforum Venus Series UM690 | |
| Intel NUC 12 Pro Kit NUC12WSBi5 | |
| Medio AMD Ryzen 7 7735HS (33938 - 51856, n=16) | |
| Intel NUC 13 Pro Kit NUC13ANK | |
| AIDA64 / Memory Write | |
| Beelink GTR6 | |
| Beelink SER6 Pro Ryzen 7 7735HS | |
| Beelink SER6 Pro | |
| Minisforum Venus Series UM690 | |
| Medio AMD Ryzen 7 7735HS (33175 - 55284, n=16) | |
| Intel NUC 12 Pro Kit NUC12WSBi5 | |
| Intel NUC 13 Pro Kit NUC13ANK | |
| AIDA64 / Memory Latency | |
| Intel NUC 13 Pro Kit NUC13ANK | |
| Medio AMD Ryzen 7 7735HS (78.2 - 109.8, n=16) | |
| Intel NUC 12 Pro Kit NUC12WSBi5 | |
| Beelink SER6 Pro | |
| Minisforum Venus Series UM690 | |
| Beelink GTR6 | |
| Beelink SER6 Pro Ryzen 7 7735HS | |
* ... más pequeño es mejor
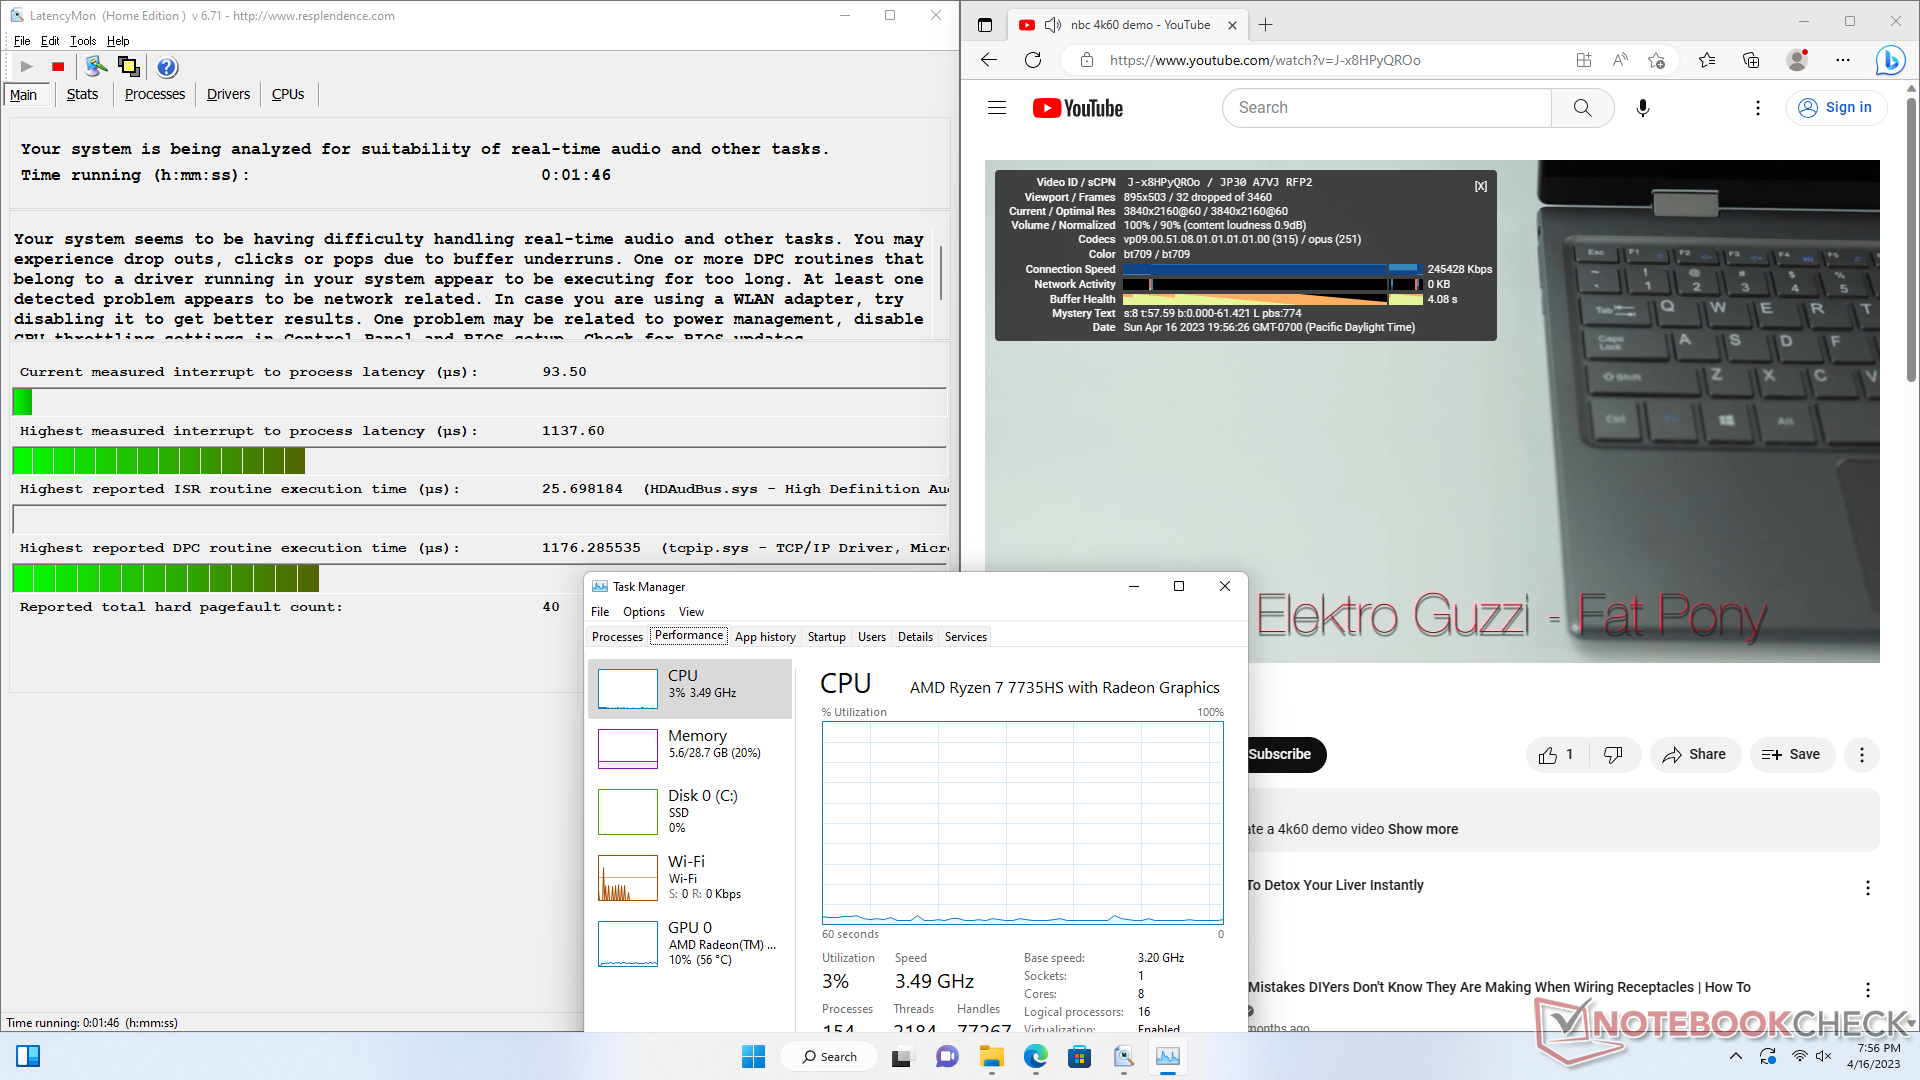
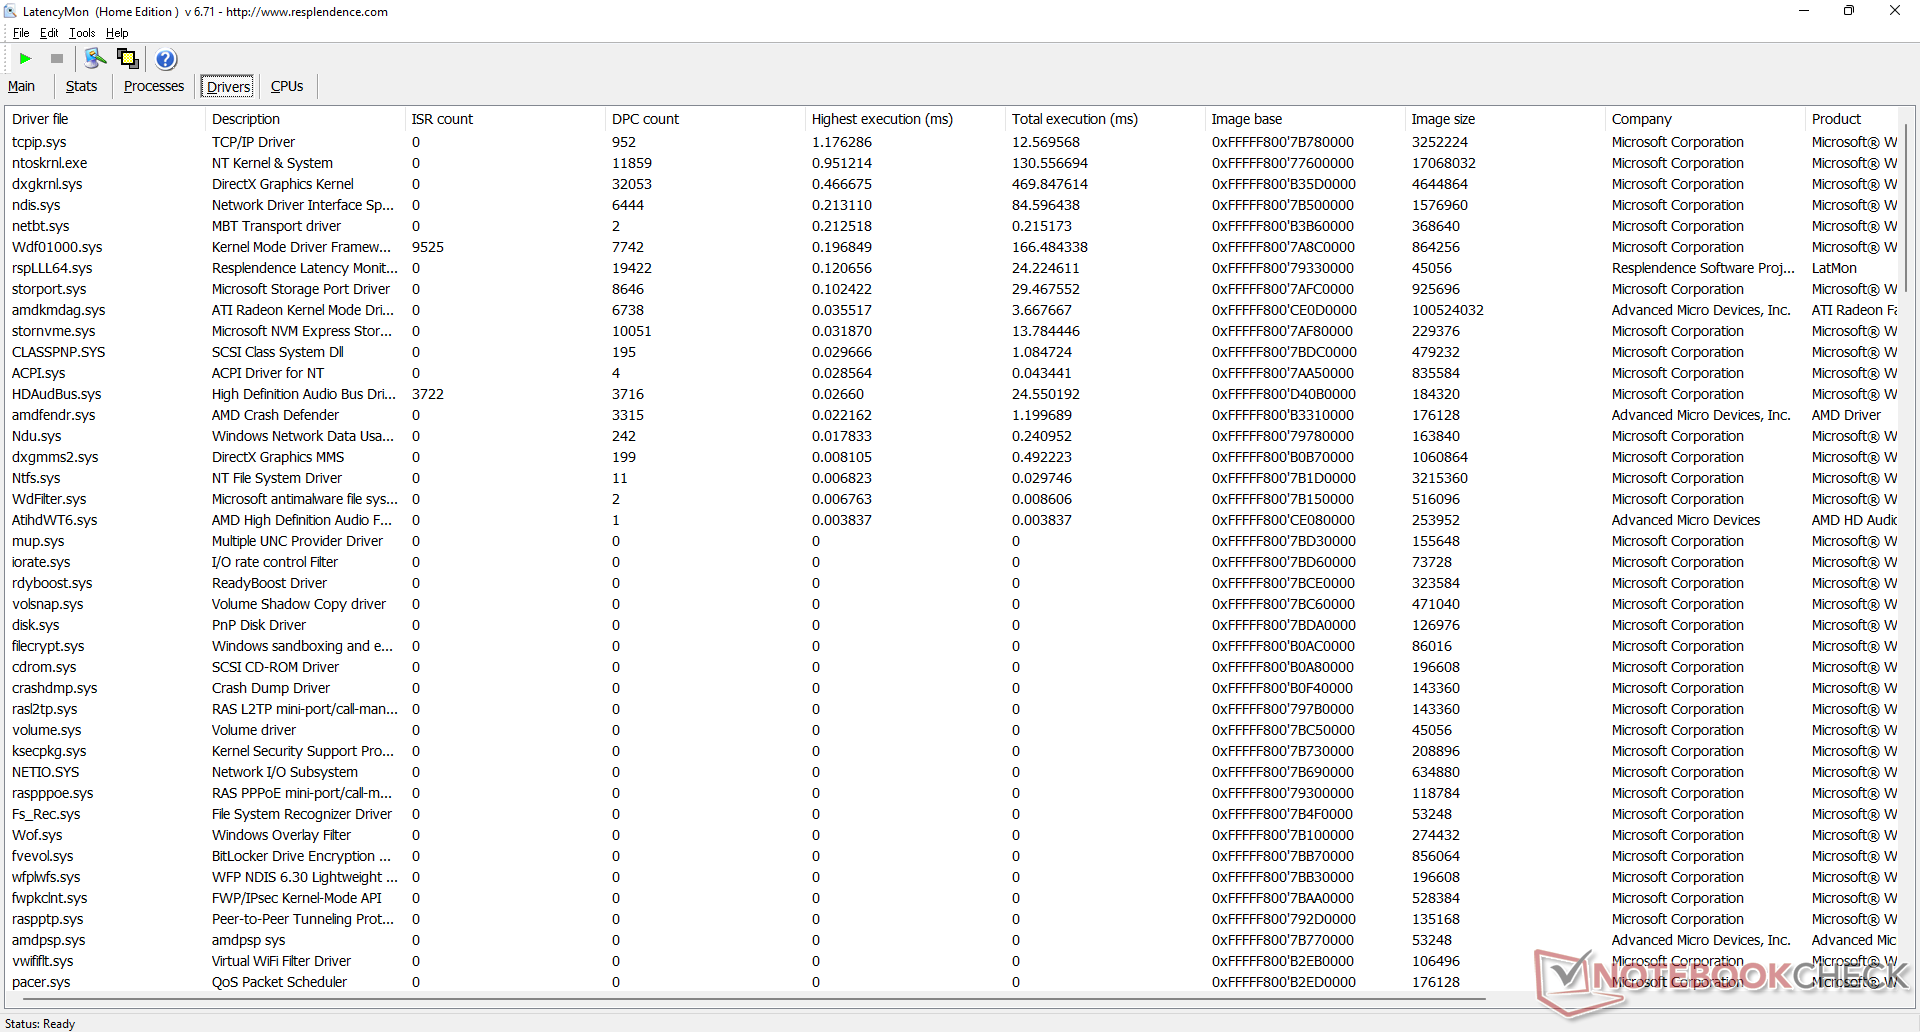
Latencia del CPD
LatencyMon revela problemas de CPD al abrir varias pestañas del navegador de nuestra página de inicio. Además, nuestra unidad mostraba problemas de reproducción de vídeo 4K60 con 32 fotogramas perdidos durante nuestro vídeo de prueba de un minuto de duración.
| DPC Latencies / LatencyMon - interrupt to process latency (max), Web, Youtube, Prime95 | |
| Minisforum Venus Series UM690 | |
| Beelink SER6 Pro | |
| Beelink SER6 Pro Ryzen 7 7735HS | |
| Intel NUC 13 Pro Kit NUC13ANK | |
| Intel NUC 12 Pro Kit NUC12WSBi5 | |
| Beelink GTR6 | |
* ... más pequeño es mejor
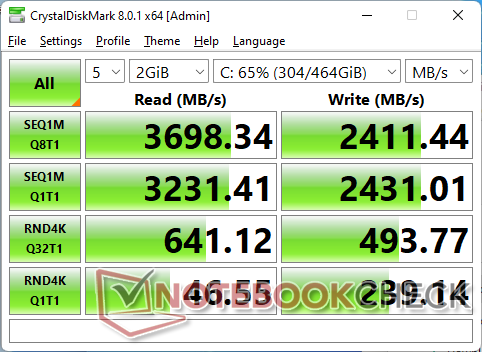
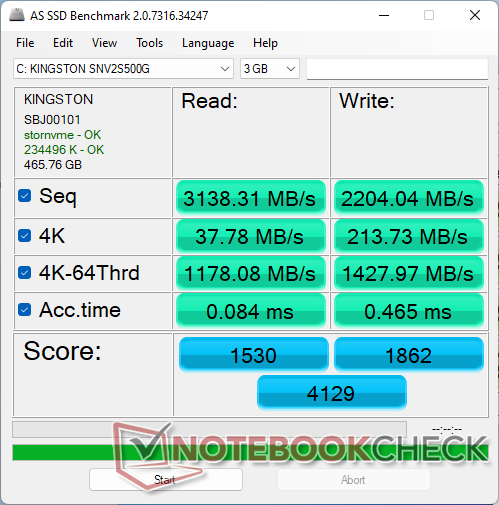
Dispositivos de almacenamiento
Nuestra unidad 2023 SER6 Pro viene con el mismo Kingston NV2 500GB SNV2S/500G que se encuentra en el modelo del año pasado.

| Drive Performance rating - Percent | |
| Beelink GTR6 | |
| Minisforum Venus Series UM690 | |
| Intel NUC 13 Pro Kit NUC13ANK | |
| Beelink SER6 Pro | |
| Beelink SER6 Pro Ryzen 7 7735HS | |
| Intel NUC 12 Pro Kit NUC12WSBi5 | |
* ... más pequeño es mejor
Disk Throttling: DiskSpd Read Loop, Queue Depth 8
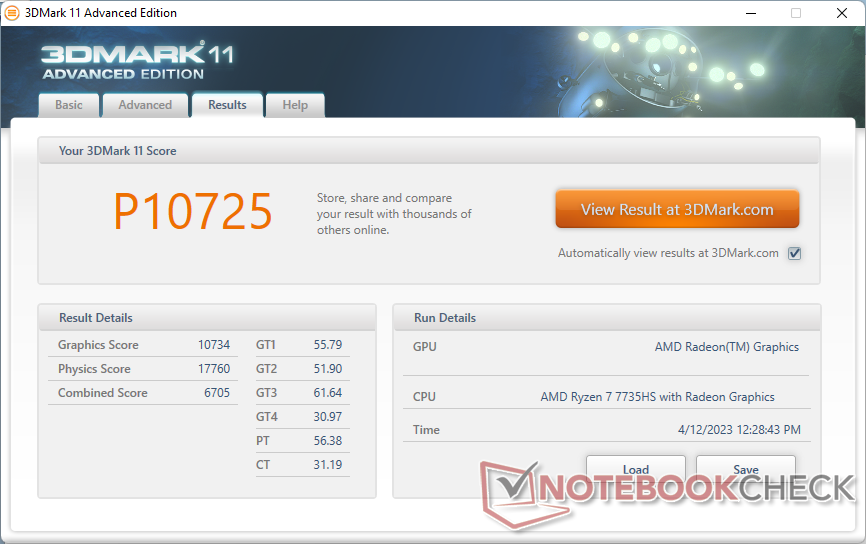
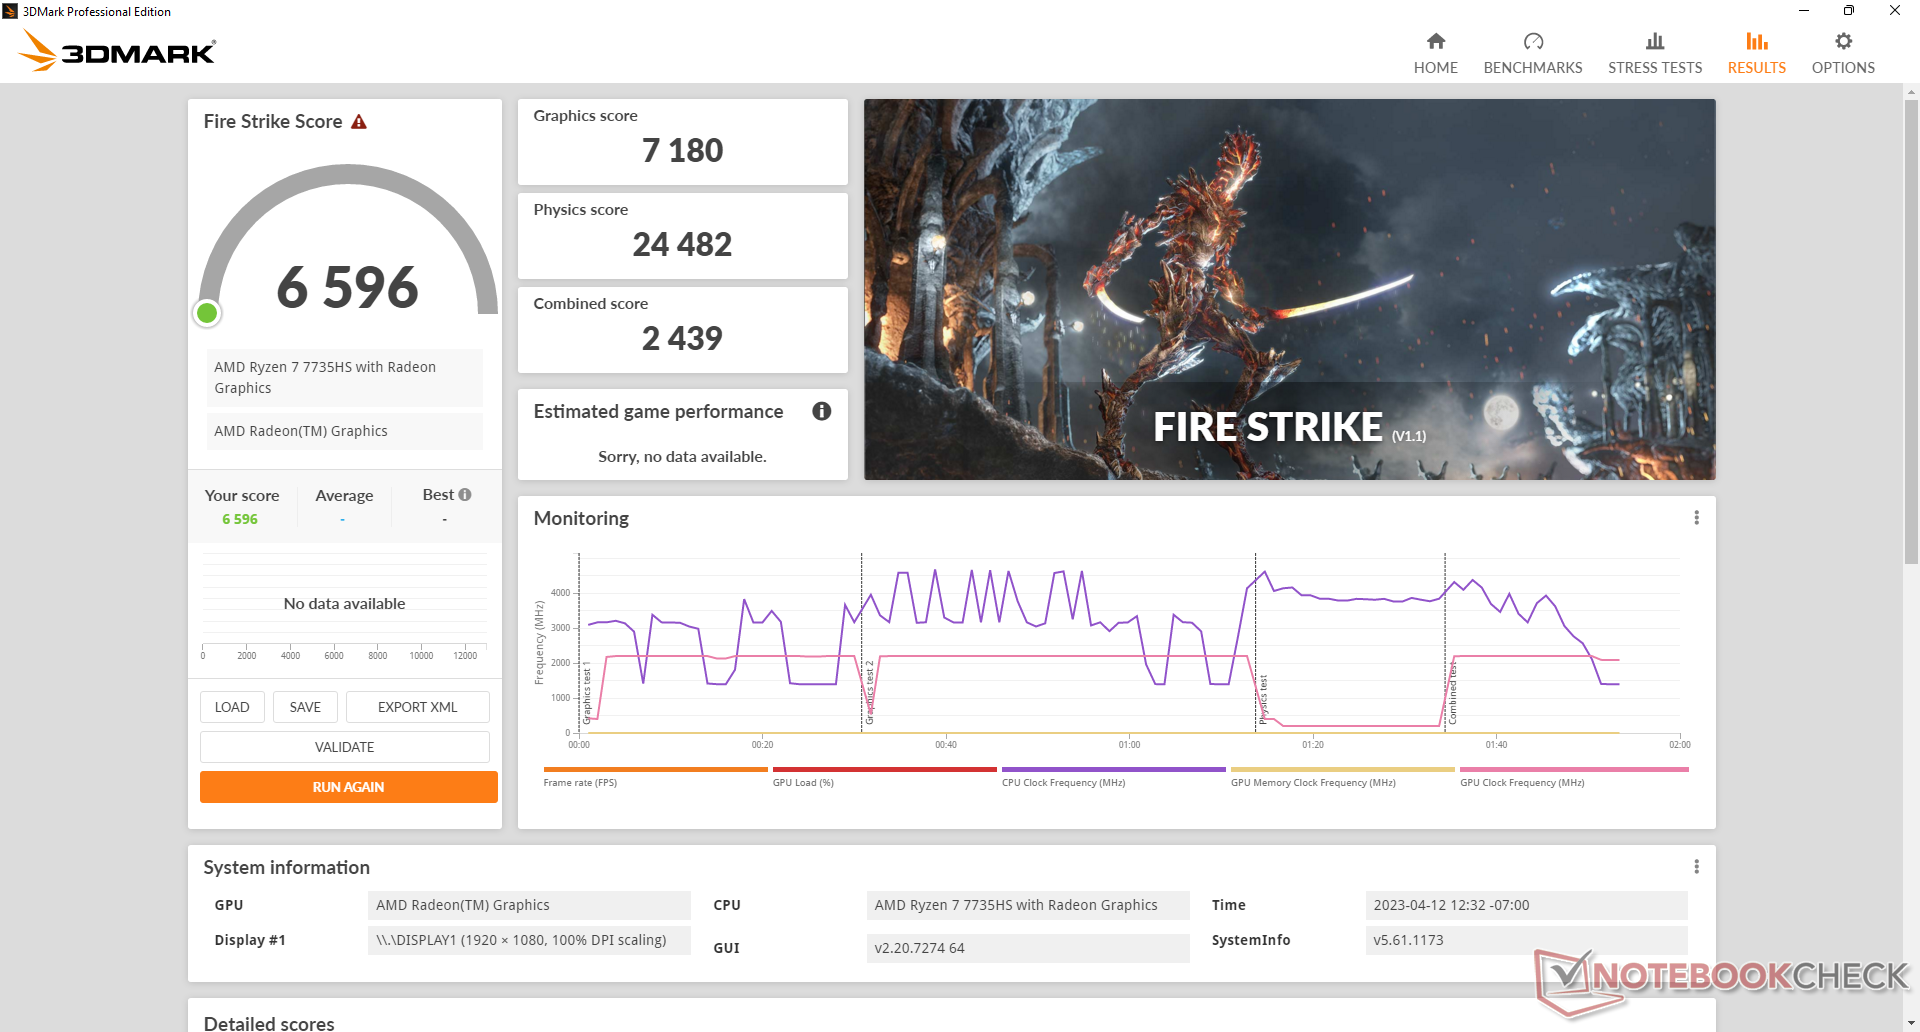
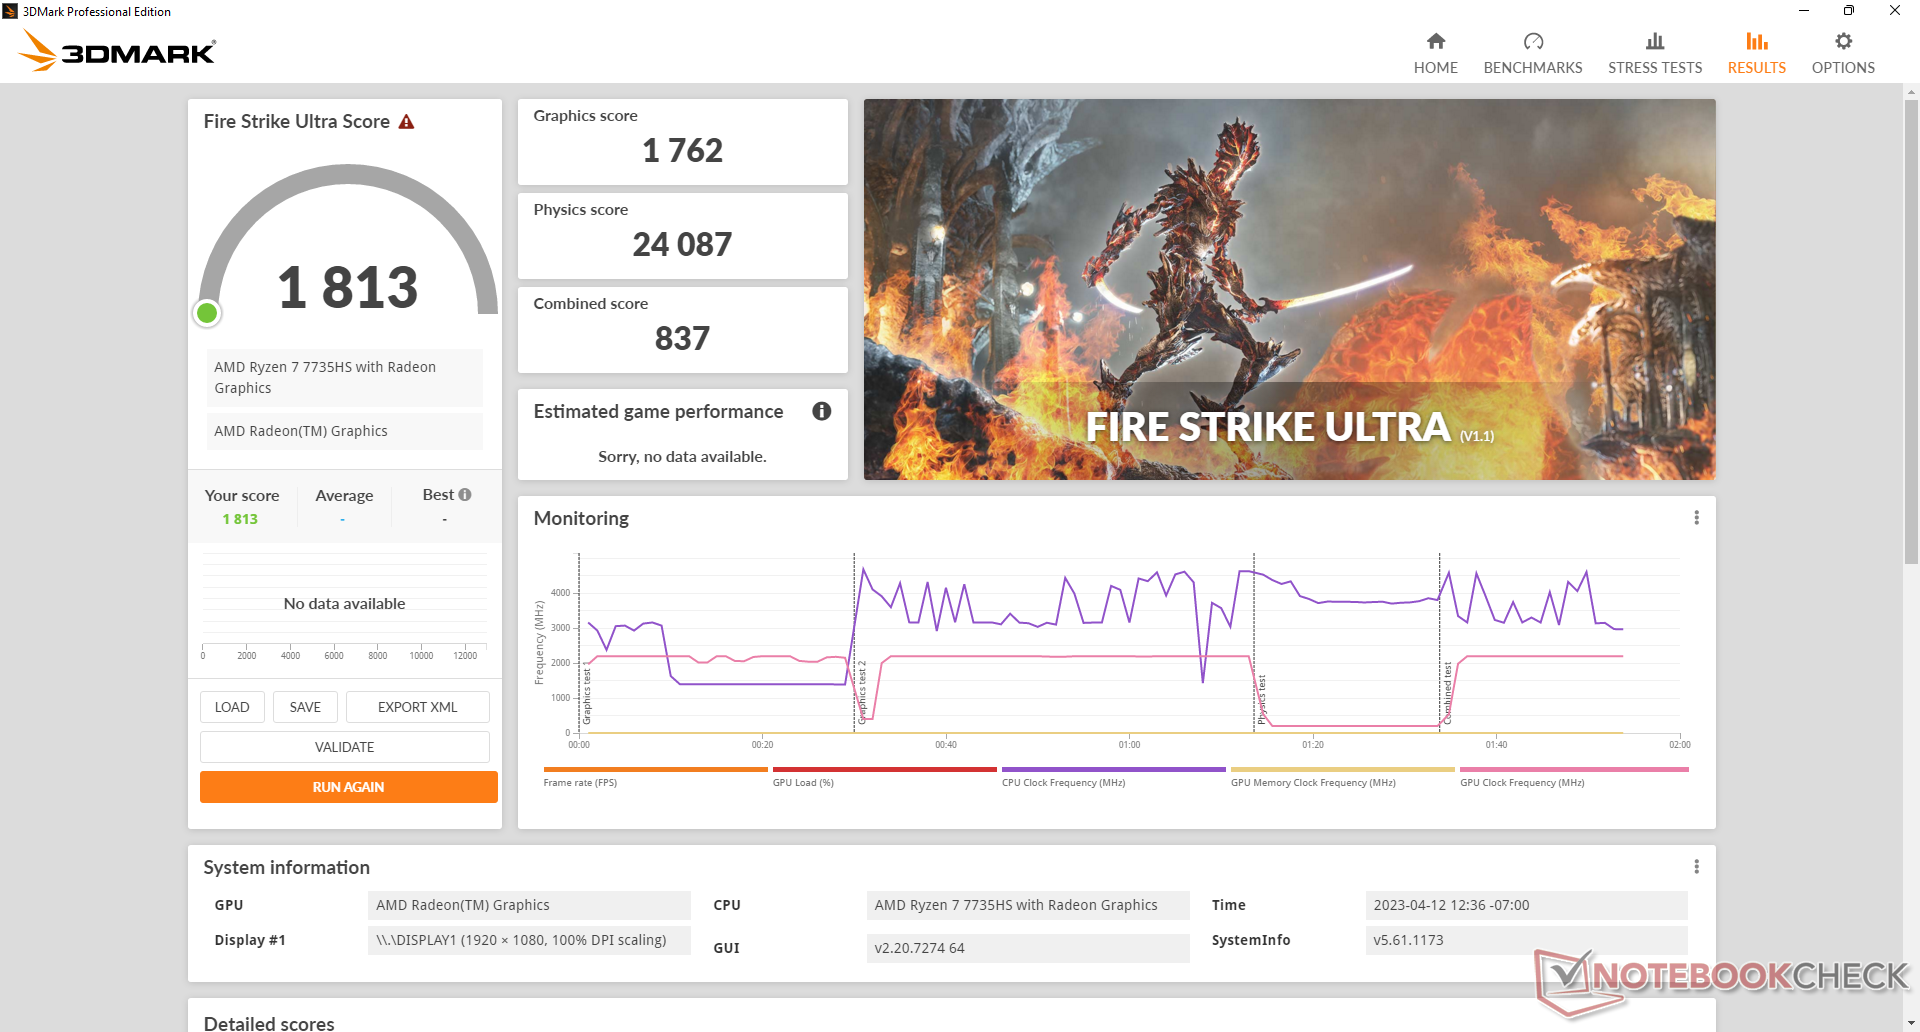
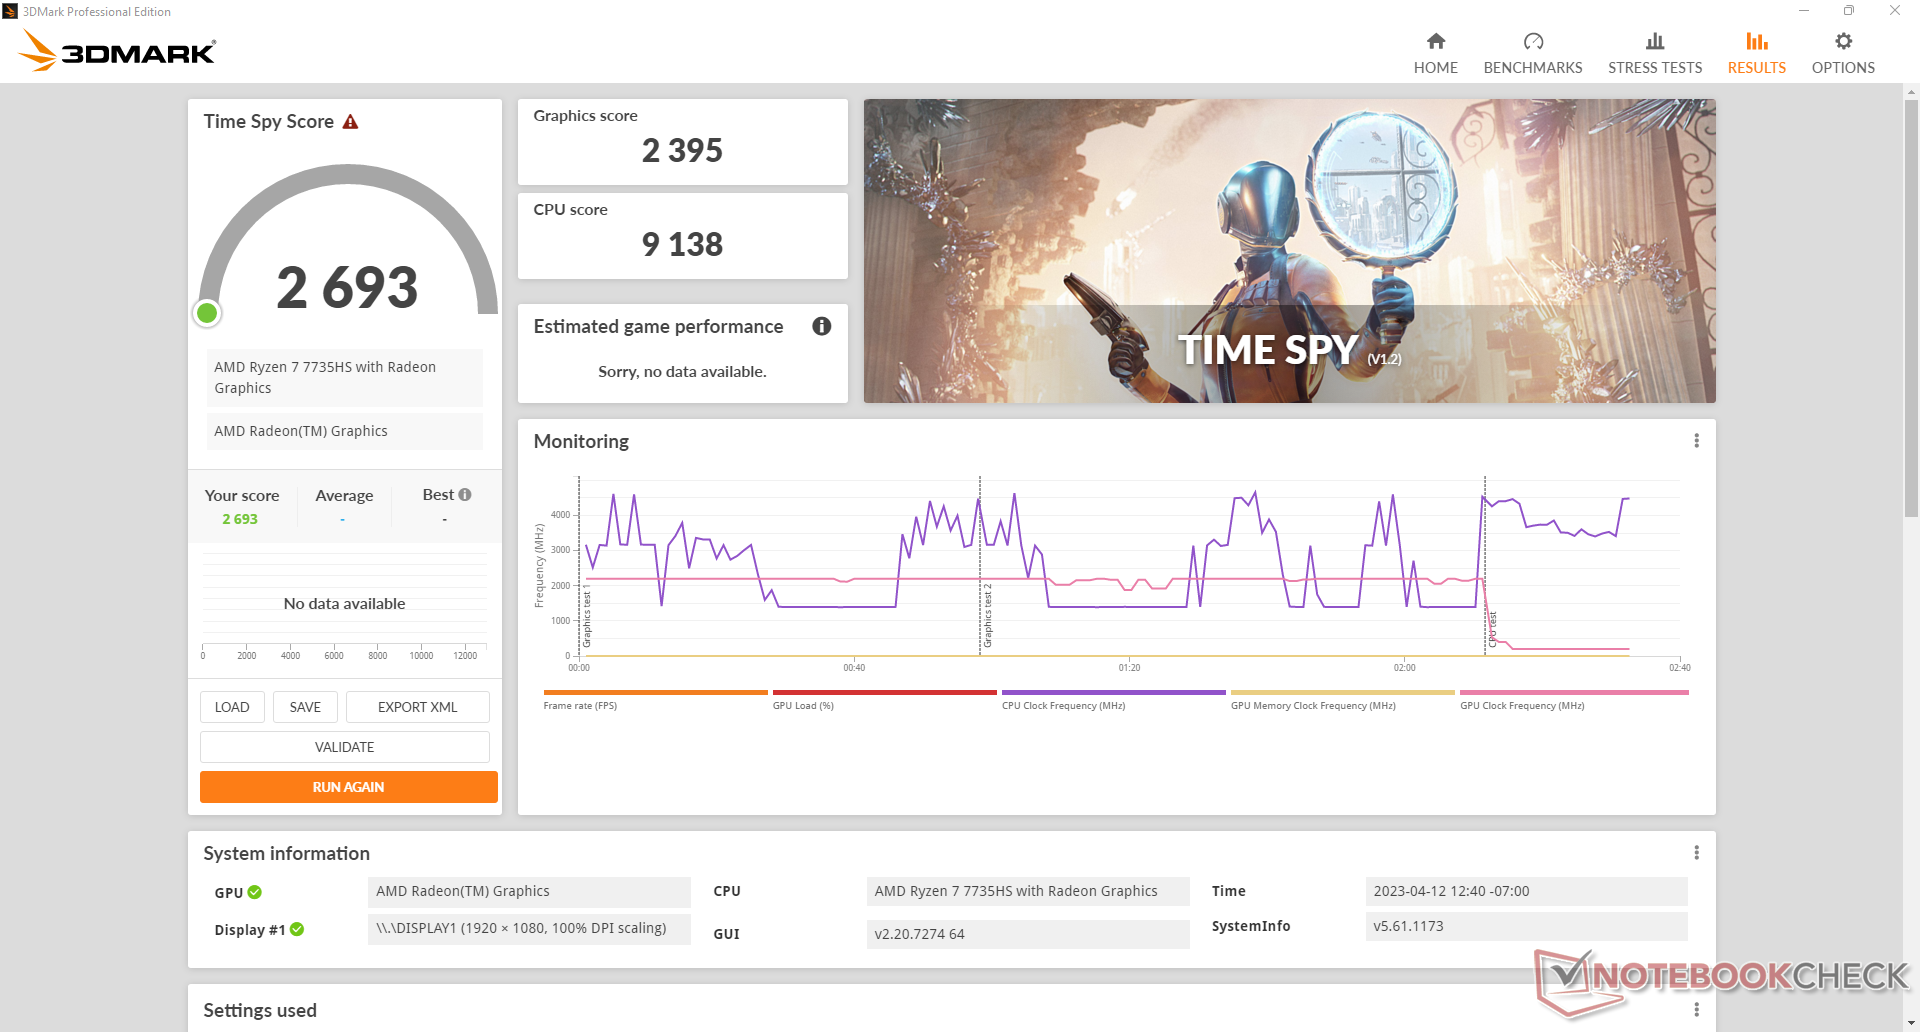
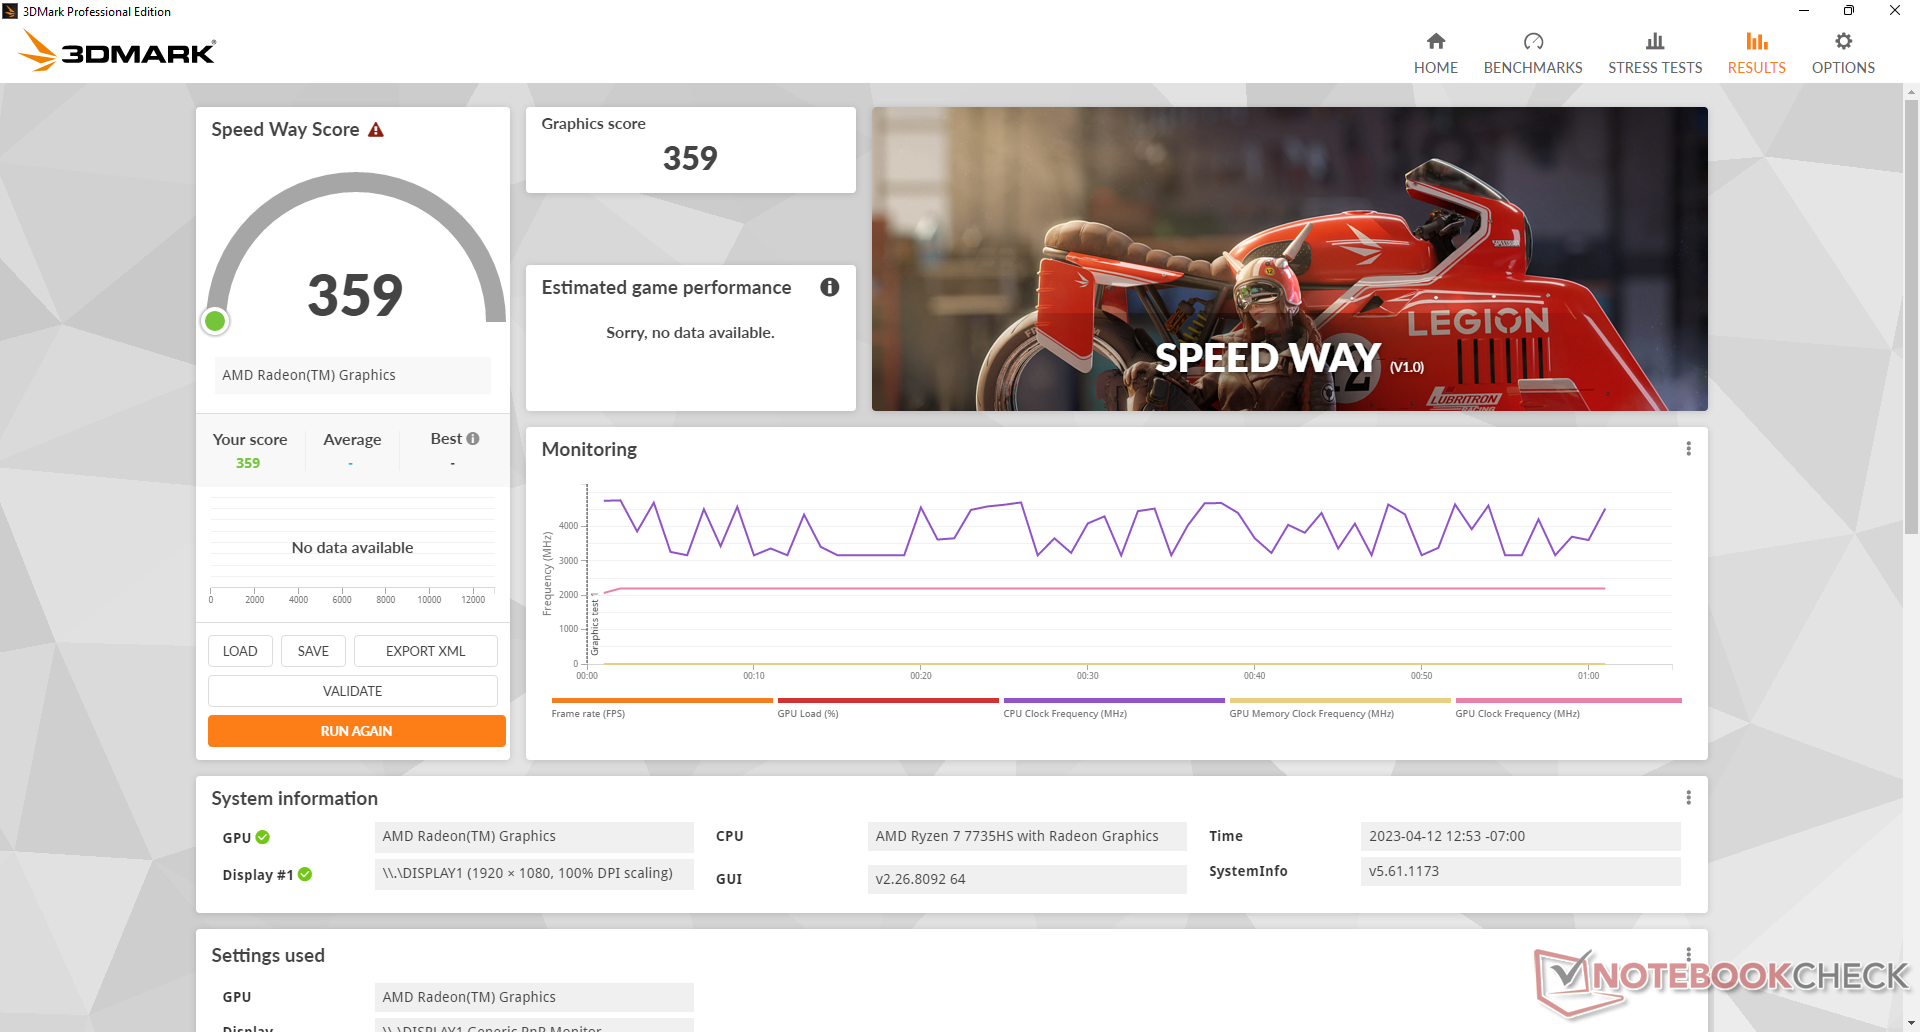
Rendimiento de la GPU
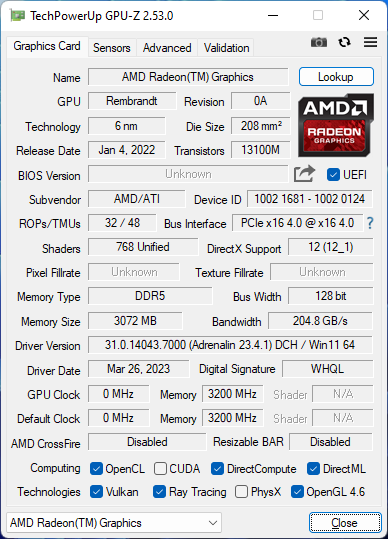
El rendimiento gráfico es el mismo que el de los Ryzen 7 6800H o Ryzen 9 6900HX del año pasado, ya que todas estas CPU llevan integrada la misma GPU Radeon 680M. Esto no es necesariamente malo porque la Radeon 680M ya está muy por delante de las Intel Iris Xe 96 EU en un 40-60 por ciento, pero los usuarios que esperaban algún tipo de mejora este año se sentirán decepcionados.
El ralentí en Witcher 3 revela problemas de estabilidad en el rendimiento, ya que las velocidades de fotogramas caen con frecuencia sin motivo aparente, como se muestra en nuestro gráfico a continuación. Este comportamiento sugiere una mala priorización de las actividades en segundo plano o problemas con los controladores de la GPU integrada. Hemos actualizado nuestros controladores Radeon a las últimas versiones en la fecha de publicación.
| 3DMark Performance rating - Percent | |
| Beelink SER6 Pro | |
| Beelink SER6 Pro Ryzen 7 7735HS | |
| Beelink GTR6 | |
| Medio AMD Radeon 680M | |
| Intel NUC 13 Pro Kit NUC13ANK | |
| Intel NUC Pro Chassis_i7_1265U | |
| Trigkey Speed S | |
| Intel NUC 12 Pro Kit NUC12WSBi5 -2! | |
| Intel NUC Pro Chassis_i5_1245U | |
| 3DMark 11 - 1280x720 Performance GPU | |
| Beelink SER6 Pro | |
| Beelink SER6 Pro Ryzen 7 7735HS | |
| Beelink GTR6 | |
| Medio AMD Radeon 680M (6858 - 11755, n=39) | |
| Intel NUC 13 Pro Kit NUC13ANK | |
| Trigkey Speed S | |
| Intel NUC Pro Chassis_i7_1265U | |
| Intel NUC 12 Pro Kit NUC12WSBi5 | |
| Intel NUC Pro Chassis_i5_1245U | |
| 3DMark 11 Performance | 10725 puntos | |
| 3DMark Fire Strike Score | 6596 puntos | |
| 3DMark Time Spy Score | 2693 puntos | |
ayuda | ||
| Performance rating - Percent | |
| Beelink SER6 Pro | |
| Beelink GTR6 | |
| Beelink SER6 Pro Ryzen 7 7735HS | |
| Intel NUC Pro Chassis_i7_1265U -1! | |
| Intel NUC 13 Pro Kit NUC13ANK -2! | |
| Trigkey Speed S | |
| Intel NUC Pro Chassis_i5_1245U -1! | |
| Intel NUC 12 Pro Kit NUC12WSBi5 -4! | |
| The Witcher 3 - 1920x1080 Ultra Graphics & Postprocessing (HBAO+) | |
| Beelink GTR6 | |
| Beelink SER6 Pro | |
| Beelink SER6 Pro Ryzen 7 7735HS | |
| Intel NUC 13 Pro Kit NUC13ANK | |
| Trigkey Speed S | |
| Final Fantasy XV Benchmark - 1920x1080 High Quality | |
| Intel NUC Pro Chassis_i7_1265U | |
| Beelink SER6 Pro Ryzen 7 7735HS | |
| Beelink SER6 Pro | |
| Beelink GTR6 | |
| Trigkey Speed S | |
| Intel NUC Pro Chassis_i5_1245U | |
| Dota 2 Reborn - 1920x1080 ultra (3/3) best looking | |
| Beelink SER6 Pro | |
| Beelink SER6 Pro Ryzen 7 7735HS | |
| Beelink GTR6 | |
| Intel NUC Pro Chassis_i7_1265U | |
| Intel NUC 13 Pro Kit NUC13ANK | |
| Trigkey Speed S | |
| Intel NUC Pro Chassis_i5_1245U | |
| Intel NUC 12 Pro Kit NUC12WSBi5 | |
| X-Plane 11.11 - 1920x1080 high (fps_test=3) | |
| Beelink SER6 Pro | |
| Beelink SER6 Pro Ryzen 7 7735HS | |
| Beelink GTR6 | |
| Trigkey Speed S | |
| Intel NUC Pro Chassis_i7_1265U | |
| Intel NUC Pro Chassis_i5_1245U | |
| Strange Brigade - 1920x1080 ultra AA:ultra AF:16 | |
| Beelink SER6 Pro | |
| Beelink GTR6 | |
| Beelink SER6 Pro Ryzen 7 7735HS | |
| Intel NUC 13 Pro Kit NUC13ANK | |
| Intel NUC Pro Chassis_i7_1265U | |
| Trigkey Speed S | |
| Intel NUC Pro Chassis_i5_1245U | |
| Final Fantasy XV Benchmark | |
| 1280x720 Lite Quality | |
| Beelink GTR6 | |
| Beelink SER6 Pro | |
| Beelink SER6 Pro Ryzen 7 7735HS | |
| Medio AMD Radeon 680M (34.4 - 74.7, n=39) | |
| Intel NUC Pro Chassis_i7_1265U | |
| Intel NUC Pro Chassis_i5_1245U | |
| Trigkey Speed S | |
| Intel NUC 12 Pro Kit NUC12WSBi5 | |
| 1920x1080 Standard Quality | |
| Beelink GTR6 | |
| Beelink SER6 Pro | |
| Beelink SER6 Pro Ryzen 7 7735HS | |
| Medio AMD Radeon 680M (18.3 - 36.9, n=40) | |
| Intel NUC Pro Chassis_i7_1265U | |
| Intel NUC Pro Chassis_i5_1245U | |
| Trigkey Speed S | |
| Intel NUC 12 Pro Kit NUC12WSBi5 | |
| 1920x1080 High Quality | |
| Intel NUC Pro Chassis_i7_1265U | |
| Beelink SER6 Pro Ryzen 7 7735HS | |
| Beelink SER6 Pro | |
| Beelink GTR6 | |
| Medio AMD Radeon 680M (12.9 - 26.2, n=40) | |
| Trigkey Speed S | |
| Intel NUC Pro Chassis_i5_1245U | |
| X-Plane 11.11 | |
| 1280x720 low (fps_test=1) | |
| Beelink SER6 Pro | |
| Beelink SER6 Pro Ryzen 7 7735HS | |
| Beelink GTR6 | |
| Medio AMD Radeon 680M (26.8 - 66.7, n=41) | |
| Trigkey Speed S | |
| Intel NUC Pro Chassis_i5_1245U | |
| Intel NUC Pro Chassis_i7_1265U | |
| 1920x1080 med (fps_test=2) | |
| Beelink SER6 Pro | |
| Beelink GTR6 | |
| Beelink SER6 Pro Ryzen 7 7735HS | |
| Trigkey Speed S | |
| Medio AMD Radeon 680M (21.1 - 53.1, n=41) | |
| Intel NUC Pro Chassis_i7_1265U | |
| Intel NUC Pro Chassis_i5_1245U | |
| 1920x1080 high (fps_test=3) | |
| Beelink SER6 Pro | |
| Beelink SER6 Pro Ryzen 7 7735HS | |
| Beelink GTR6 | |
| Trigkey Speed S | |
| Medio AMD Radeon 680M (16.6 - 44.5, n=41) | |
| Intel NUC Pro Chassis_i7_1265U | |
| Intel NUC Pro Chassis_i5_1245U | |
| Strange Brigade | |
| 1280x720 lowest AF:1 | |
| Beelink GTR6 | |
| Beelink SER6 Pro | |
| Beelink SER6 Pro Ryzen 7 7735HS | |
| Medio AMD Radeon 680M (72.9 - 167.5, n=38) | |
| Intel NUC 13 Pro Kit NUC13ANK | |
| Intel NUC Pro Chassis_i7_1265U | |
| Trigkey Speed S | |
| Intel NUC Pro Chassis_i5_1245U | |
| 1920x1080 medium AA:medium AF:4 | |
| Beelink SER6 Pro | |
| Beelink GTR6 | |
| Beelink SER6 Pro Ryzen 7 7735HS | |
| Medio AMD Radeon 680M (30 - 63, n=38) | |
| Intel NUC Pro Chassis_i7_1265U | |
| Intel NUC 13 Pro Kit NUC13ANK | |
| Trigkey Speed S | |
| Intel NUC Pro Chassis_i5_1245U | |
| 1920x1080 high AA:high AF:8 | |
| Beelink SER6 Pro | |
| Beelink GTR6 | |
| Beelink SER6 Pro Ryzen 7 7735HS | |
| Medio AMD Radeon 680M (25.3 - 53.1, n=38) | |
| Intel NUC 13 Pro Kit NUC13ANK | |
| Intel NUC Pro Chassis_i7_1265U | |
| Trigkey Speed S | |
| Intel NUC Pro Chassis_i5_1245U | |
| 1920x1080 ultra AA:ultra AF:16 | |
| Beelink SER6 Pro | |
| Beelink GTR6 | |
| Beelink SER6 Pro Ryzen 7 7735HS | |
| Medio AMD Radeon 680M (22 - 46, n=38) | |
| Intel NUC 13 Pro Kit NUC13ANK | |
| Intel NUC Pro Chassis_i7_1265U | |
| Trigkey Speed S | |
| Intel NUC Pro Chassis_i5_1245U | |
| Cyberpunk 2077 1.6 | |
| 1920x1080 Low Preset | |
| Beelink SER6 Pro | |
| Beelink GTR6 | |
| Beelink SER6 Pro Ryzen 7 7735HS | |
| Medio AMD Radeon 680M (26 - 50.6, n=15) | |
| 1920x1080 Medium Preset | |
| Beelink SER6 Pro | |
| Beelink GTR6 | |
| Beelink SER6 Pro Ryzen 7 7735HS | |
| Medio AMD Radeon 680M (20.1 - 41.8, n=15) | |
| 1280x720 Low Preset | |
| Beelink SER6 Pro | |
| Beelink GTR6 | |
| Beelink SER6 Pro Ryzen 7 7735HS | |
| Medio AMD Radeon 680M (46.1 - 77.6, n=14) | |
| 1920x1080 High Preset | |
| Beelink GTR6 | |
| Beelink SER6 Pro Ryzen 7 7735HS | |
| Medio AMD Radeon 680M (16.3 - 33.6, n=15) | |
| Beelink SER6 Pro | |
| 1920x1080 Ultra Preset | |
| Beelink GTR6 | |
| Beelink SER6 Pro Ryzen 7 7735HS | |
| Medio AMD Radeon 680M (14 - 23.8, n=15) | |
| Beelink SER6 Pro | |
| F1 22 | |
| 1280x720 Ultra Low Preset AA:T AF:16x | |
| Beelink SER6 Pro Ryzen 7 7735HS | |
| Medio AMD Radeon 680M (75.5 - 147.3, n=19) | |
| Intel NUC 13 Pro Kit NUC13ANK | |
| Intel NUC Pro Chassis_i7_1265U | |
| Intel NUC Pro Chassis_i5_1245U | |
| 1920x1080 Low Preset AA:T AF:16x | |
| Beelink SER6 Pro Ryzen 7 7735HS | |
| Medio AMD Radeon 680M (44.1 - 85.4, n=25) | |
| Intel NUC 13 Pro Kit NUC13ANK | |
| Intel NUC Pro Chassis_i7_1265U | |
| Intel NUC Pro Chassis_i5_1245U | |
| 1920x1080 Medium Preset AA:T AF:16x | |
| Beelink SER6 Pro Ryzen 7 7735HS | |
| Medio AMD Radeon 680M (38 - 75.1, n=25) | |
| Intel NUC 13 Pro Kit NUC13ANK | |
| Intel NUC Pro Chassis_i7_1265U | |
| Intel NUC Pro Chassis_i5_1245U | |
| 1920x1080 High Preset AA:T AF:16x | |
| Beelink SER6 Pro Ryzen 7 7735HS | |
| Medio AMD Radeon 680M (30 - 56.2, n=25) | |
| Intel NUC 13 Pro Kit NUC13ANK | |
| Intel NUC Pro Chassis_i7_1265U | |
| Intel NUC Pro Chassis_i5_1245U | |
| 1920x1080 Ultra High Preset AA:T AF:16x | |
| Intel NUC 13 Pro Kit NUC13ANK | |
| Intel NUC Pro Chassis_i7_1265U | |
| Beelink SER6 Pro Ryzen 7 7735HS | |
| Medio AMD Radeon 680M (7.85 - 14.7, n=22) | |
Witcher 3 FPS Chart
| bajo | medio | alto | ultra | |
|---|---|---|---|---|
| The Witcher 3 (2015) | 115.6 | 79.8 | 42.4 | 25.2 |
| Dota 2 Reborn (2015) | 142.2 | 113.5 | 89.1 | 72.8 |
| Final Fantasy XV Benchmark (2018) | 62.2 | 33 | 24.7 | |
| X-Plane 11.11 (2018) | 65.2 | 52.3 | 42.2 | |
| Strange Brigade (2018) | 137.8 | 56.4 | 47.1 | 40.7 |
| Cyberpunk 2077 1.6 (2022) | 40.8 | 31.8 | 21.8 | 17.5 |
| Tiny Tina's Wonderlands (2022) | 58.6 | 44.4 | 29.9 | 23.1 |
| F1 22 (2022) | 80.1 | 69.5 | 52.9 | 13.9 |
Emisiones
Ruido del sistema
Hay algunas ligeras diferencias en el ruido del ventilador en comparación con el modelo del año pasado, pero ambos alcanzan un máximo similar de ~40 dB(A) cuando ejecutan cargas muy exigentes como juegos. Cuando se ejecutan cargas menores como navegadores, el modelo más nuevo parece funcionar más silencioso durante periodos más largos antes de recurrir a RPM más altas del ventilador.
Ruido
| Ocioso |
| 23.3 / 23.3 / 26.2 dB(A) |
| Carga |
| 40.2 / 40.2 dB(A) |
 | ||
30 dB silencioso 40 dB(A) audible 50 dB(A) ruidosamente alto |
||
min: | ||
| Beelink SER6 Pro Ryzen 7 7735HS Radeon 680M, R7 7735HS, Kingston NV2 500GB SNV2S/500G | Beelink SER6 Pro Radeon 680M, R7 6800H, Kingston NV2 500GB SNV2S/500G | Beelink GTR6 Radeon 680M, R9 6900HX, Kingston KC3000 512G SKC3000S512G | Intel NUC 13 Pro Kit NUC13ANK Iris Xe G7 96EUs, i7-1360P, Samsung PM9A1 MZVL2512HCJQ | Intel NUC 12 Pro Kit NUC12WSBi5 Iris Xe G7 80EUs, i5-1240P, Lexar 512GB NM6A1 LNM6A1X512G-HNNG | Minisforum Venus Series UM690 Radeon 680M, R9 6900HX, Kingston OM8PGP4512Q-A0 | |
|---|---|---|---|---|---|---|
| Noise | -5% | -8% | -19% | -16% | ||
| apagado / medio ambiente * (dB) | 23.3 | 22.8 2% | 23.2 -0% | 29.8 -28% | 30.5 -31% | |
| Idle Minimum * (dB) | 23.3 | 24.1 -3% | 23.6 -1% | 30.2 -30% | 31.6 -36% | |
| Idle Average * (dB) | 23.3 | 24.1 -3% | 23.8 -2% | 31.1 -33% | 31.6 -36% | |
| Idle Maximum * (dB) | 26.2 | 33.8 -29% | 36.2 -38% | 31.9 -22% | 31.6 -21% | |
| Load Average * (dB) | 40.2 | 40.1 -0% | 39.7 1% | 40 -0% | 33.9 16% | |
| Witcher 3 ultra * (dB) | 37 | 38.7 -5% | 41 -11% | |||
| Load Maximum * (dB) | 40.2 | 40.1 -0% | 43 -7% | 40.5 -1% | 34.4 14% |
* ... más pequeño es mejor
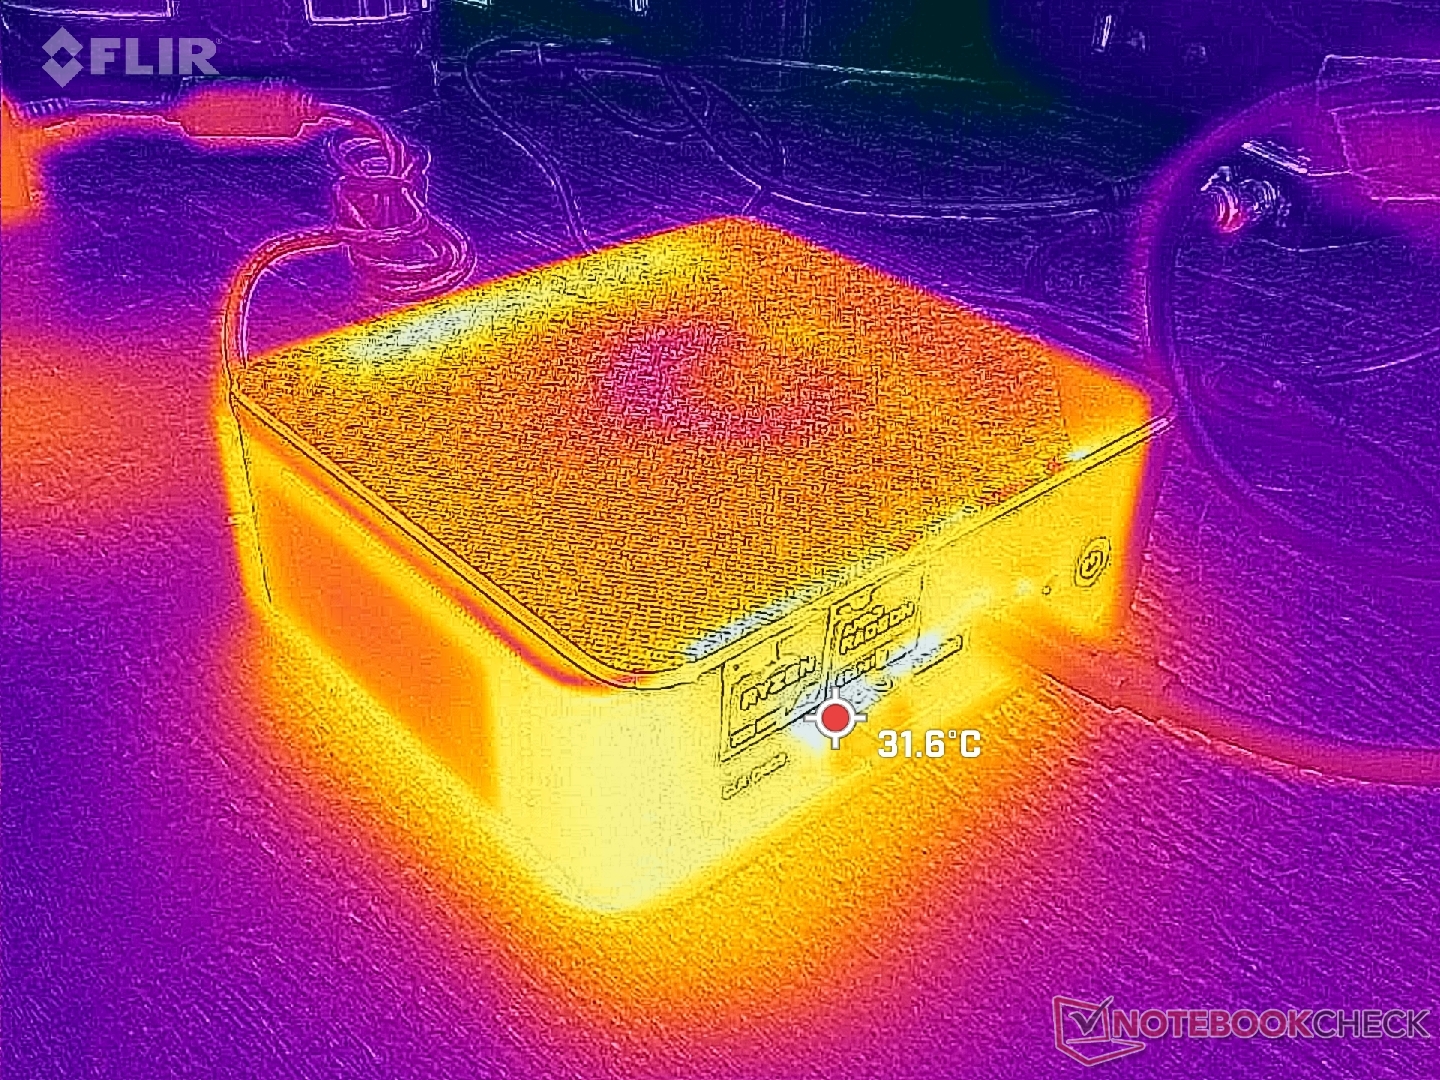
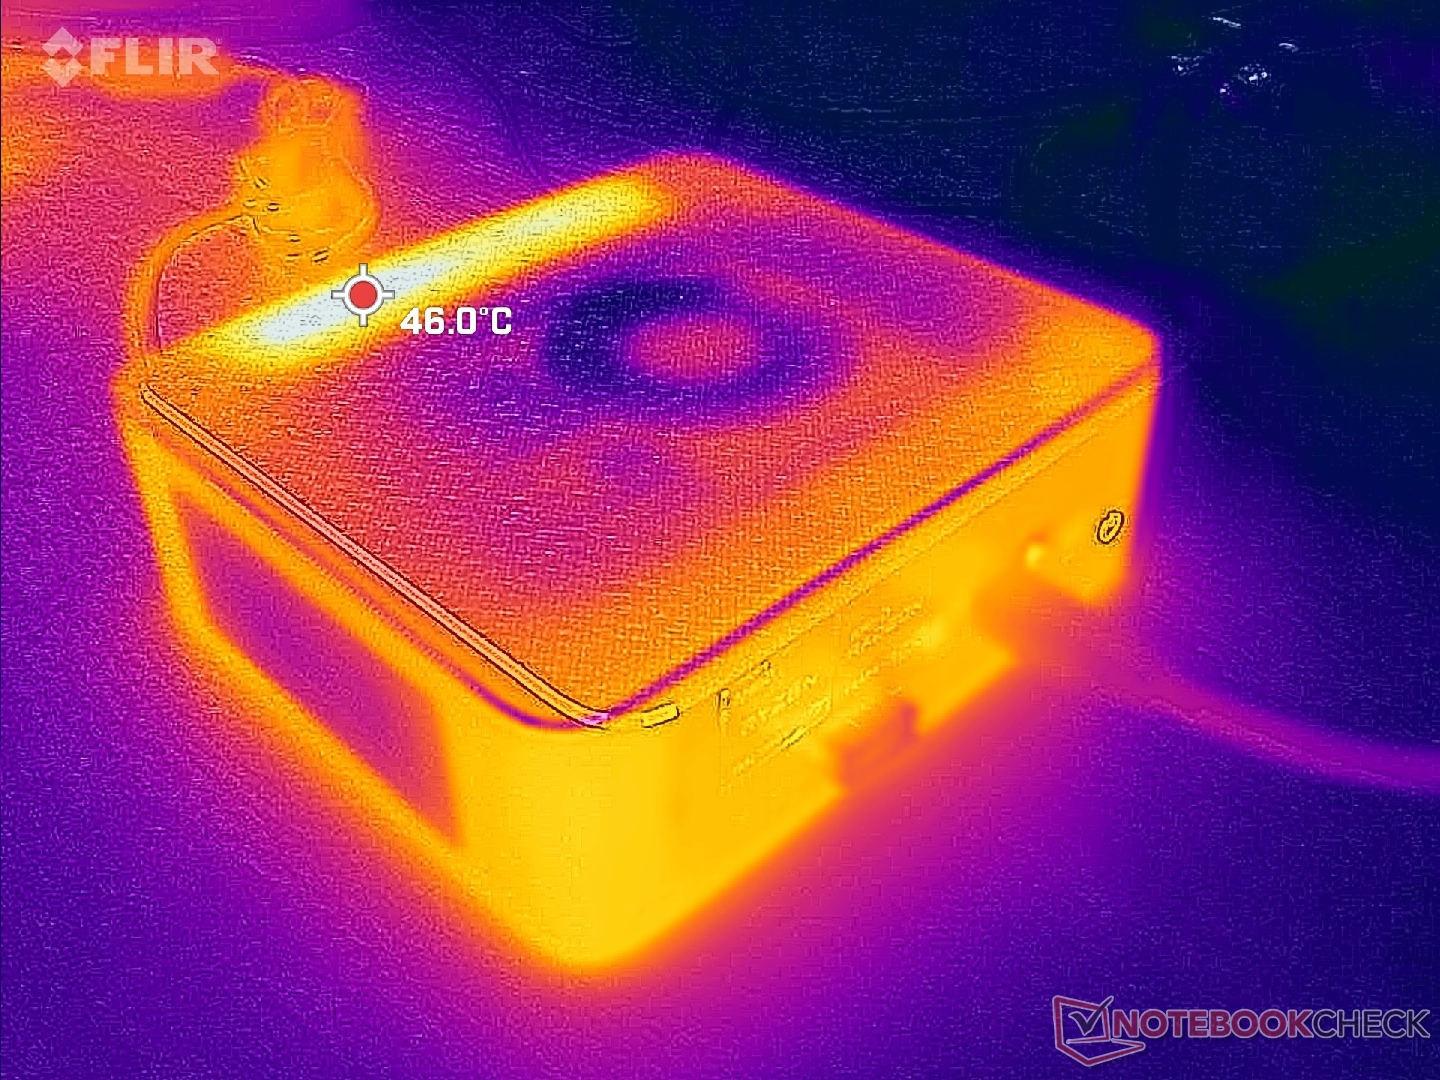
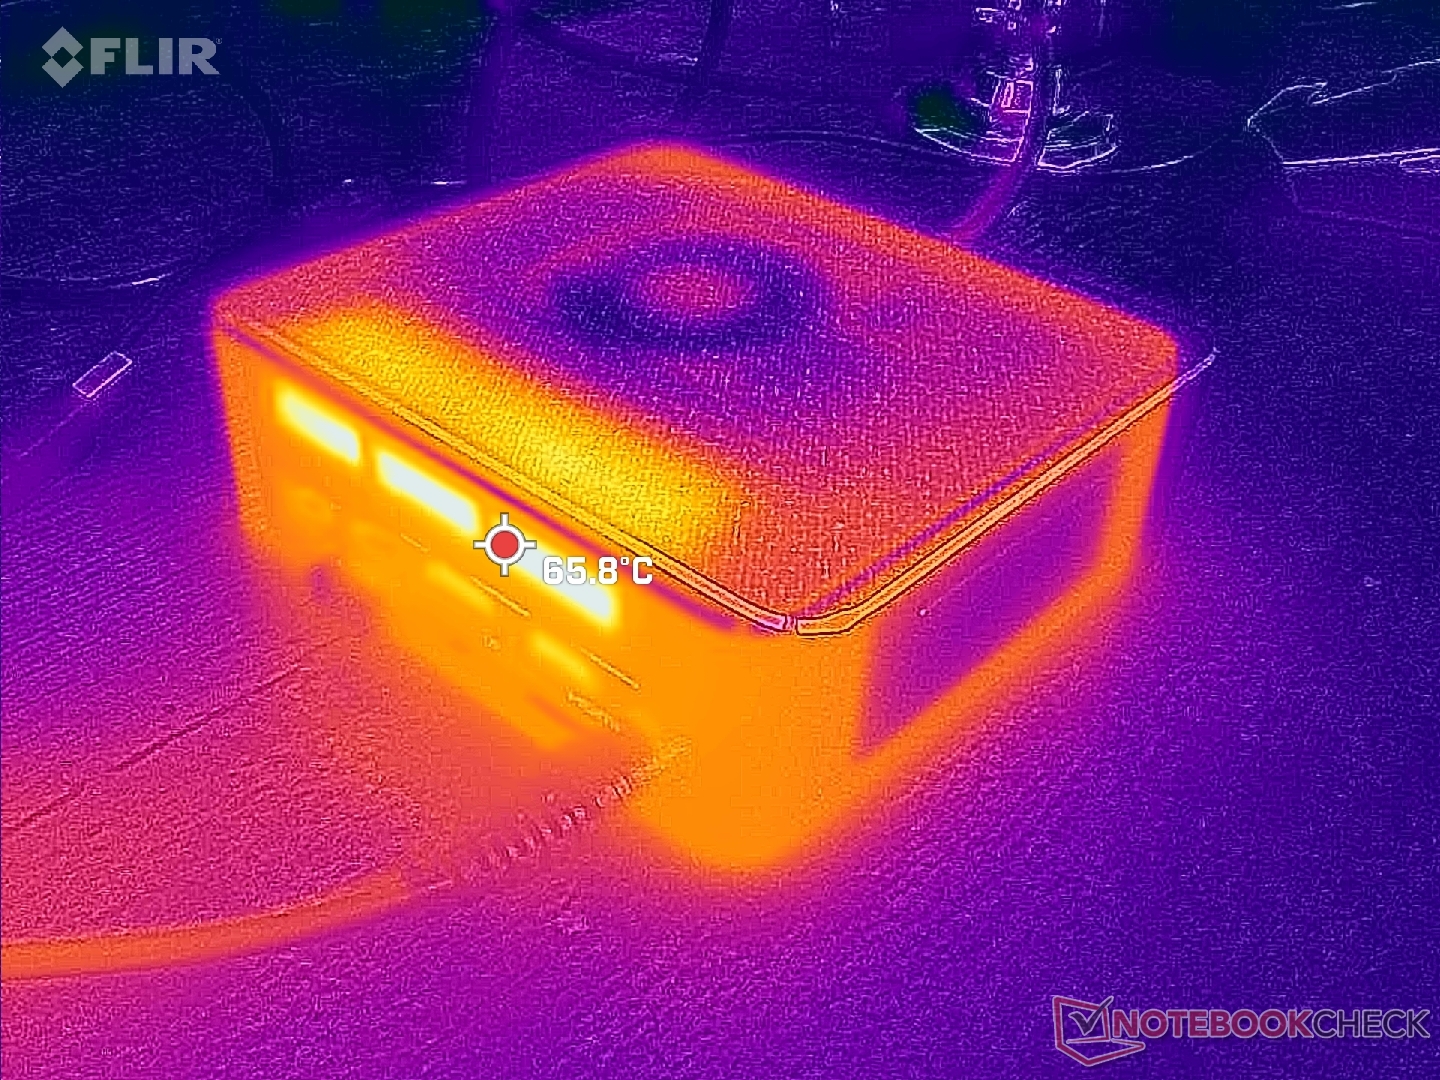
Temperatura
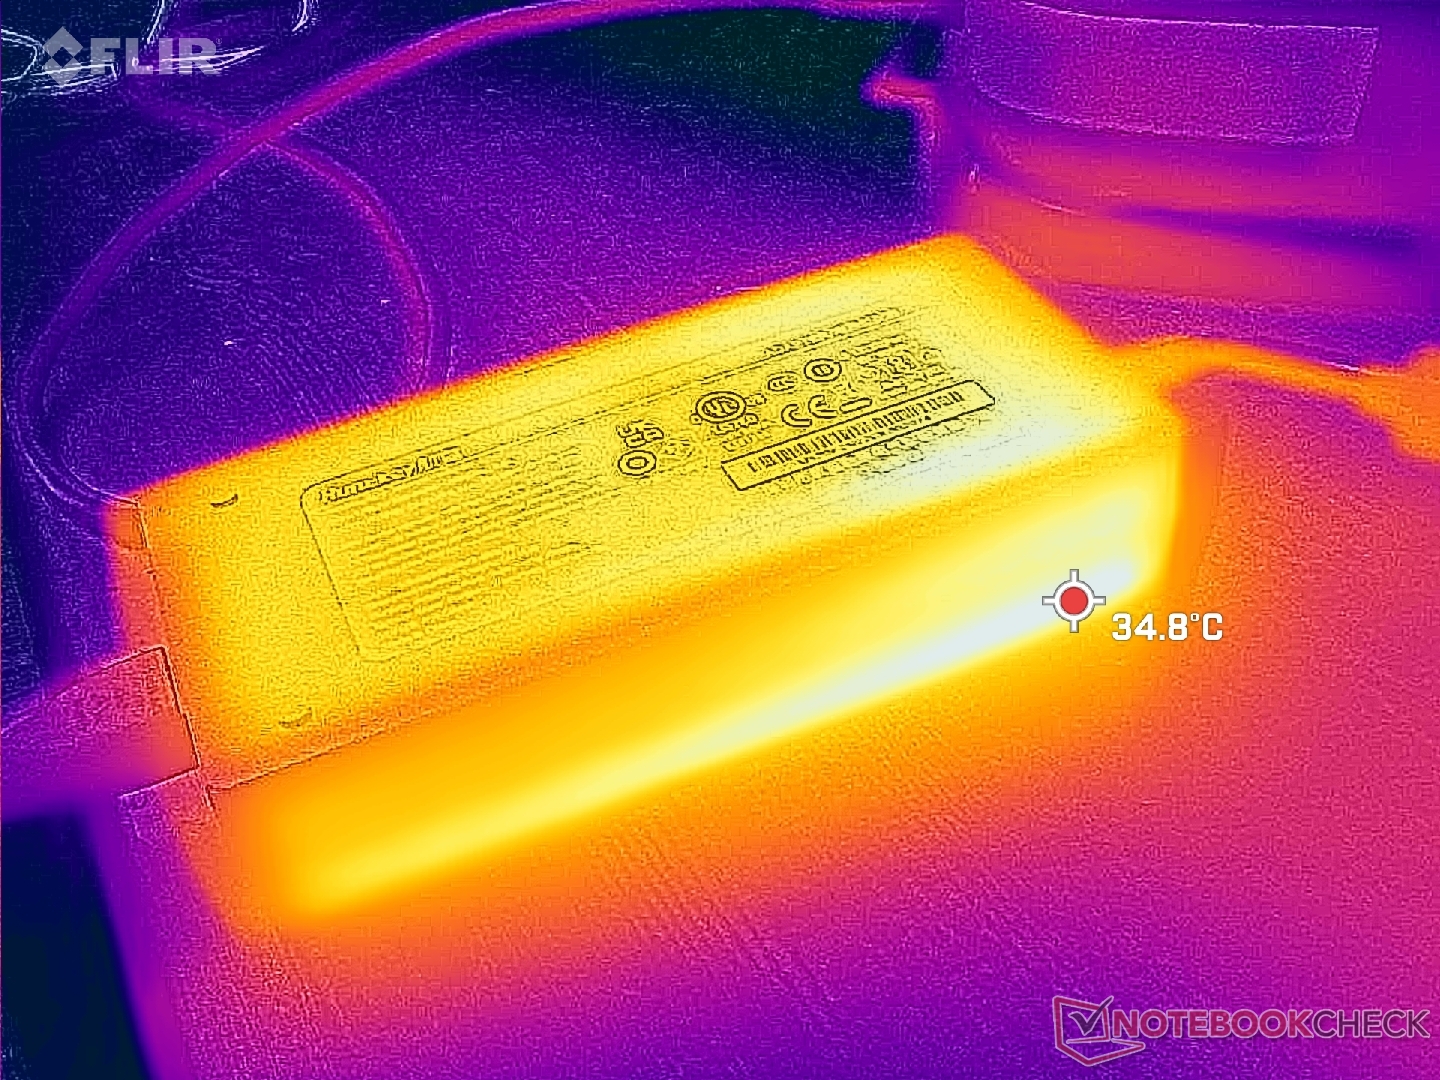
Las temperaturas de la superficie no son un problema en el SER6 Pro. Sin embargo, ten en cuenta que el aire fresco entra por la superficie superior, por lo que no debes colocar encima papeles, libros u objetos. Deja algo de espacio en la parte trasera para que salga el calor residual.
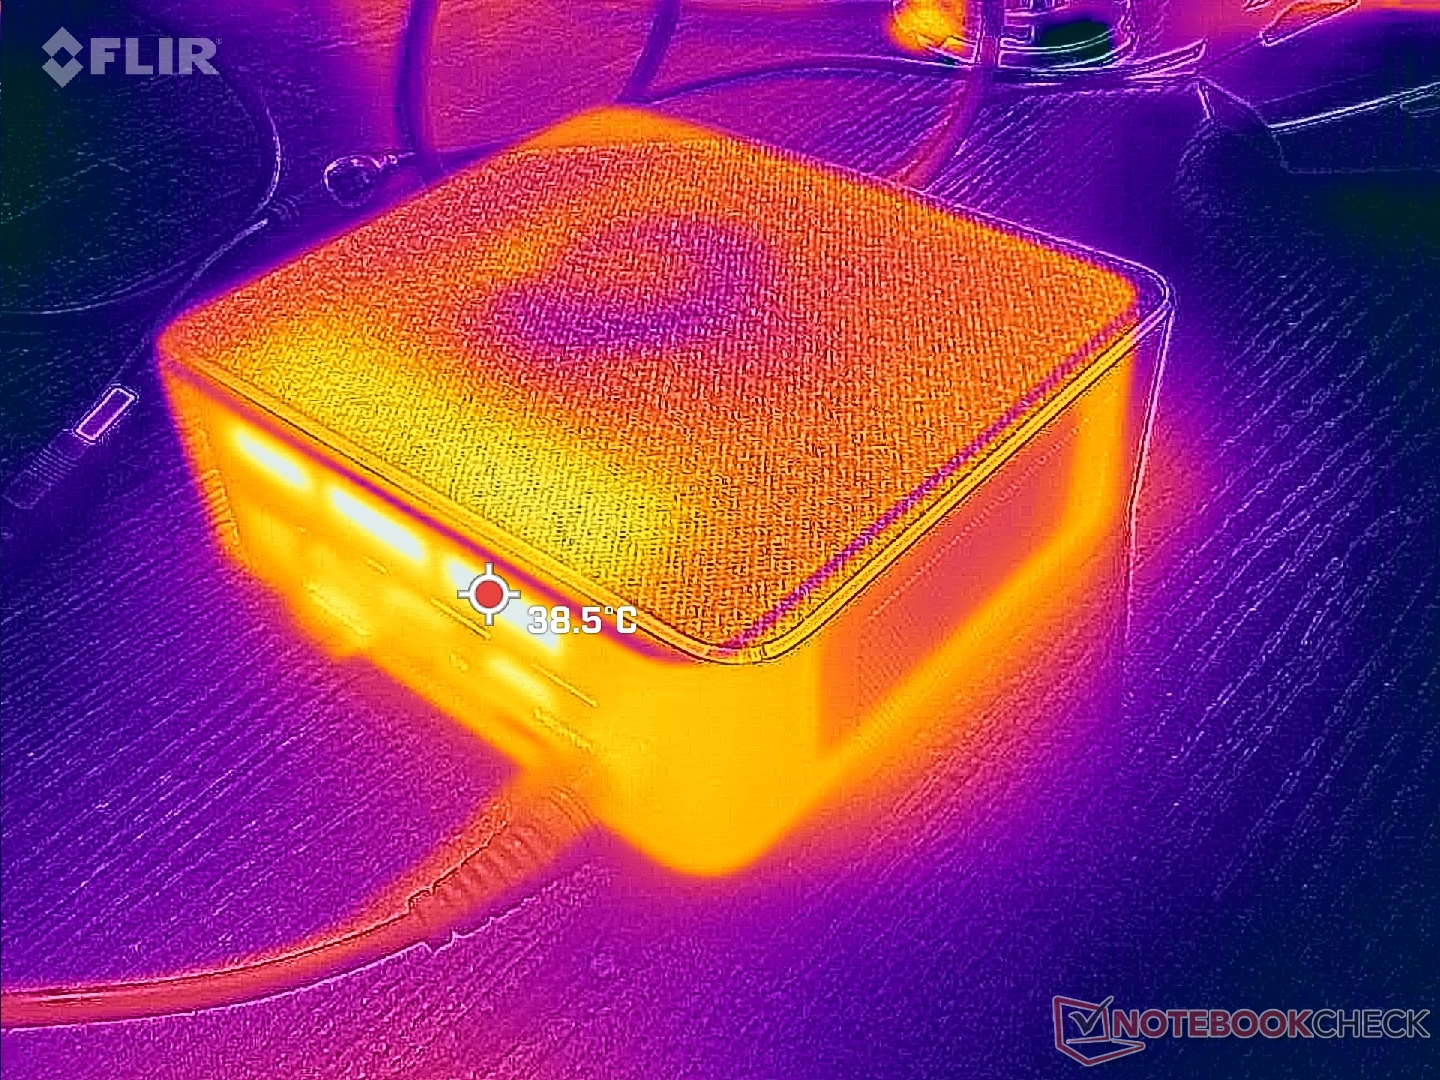
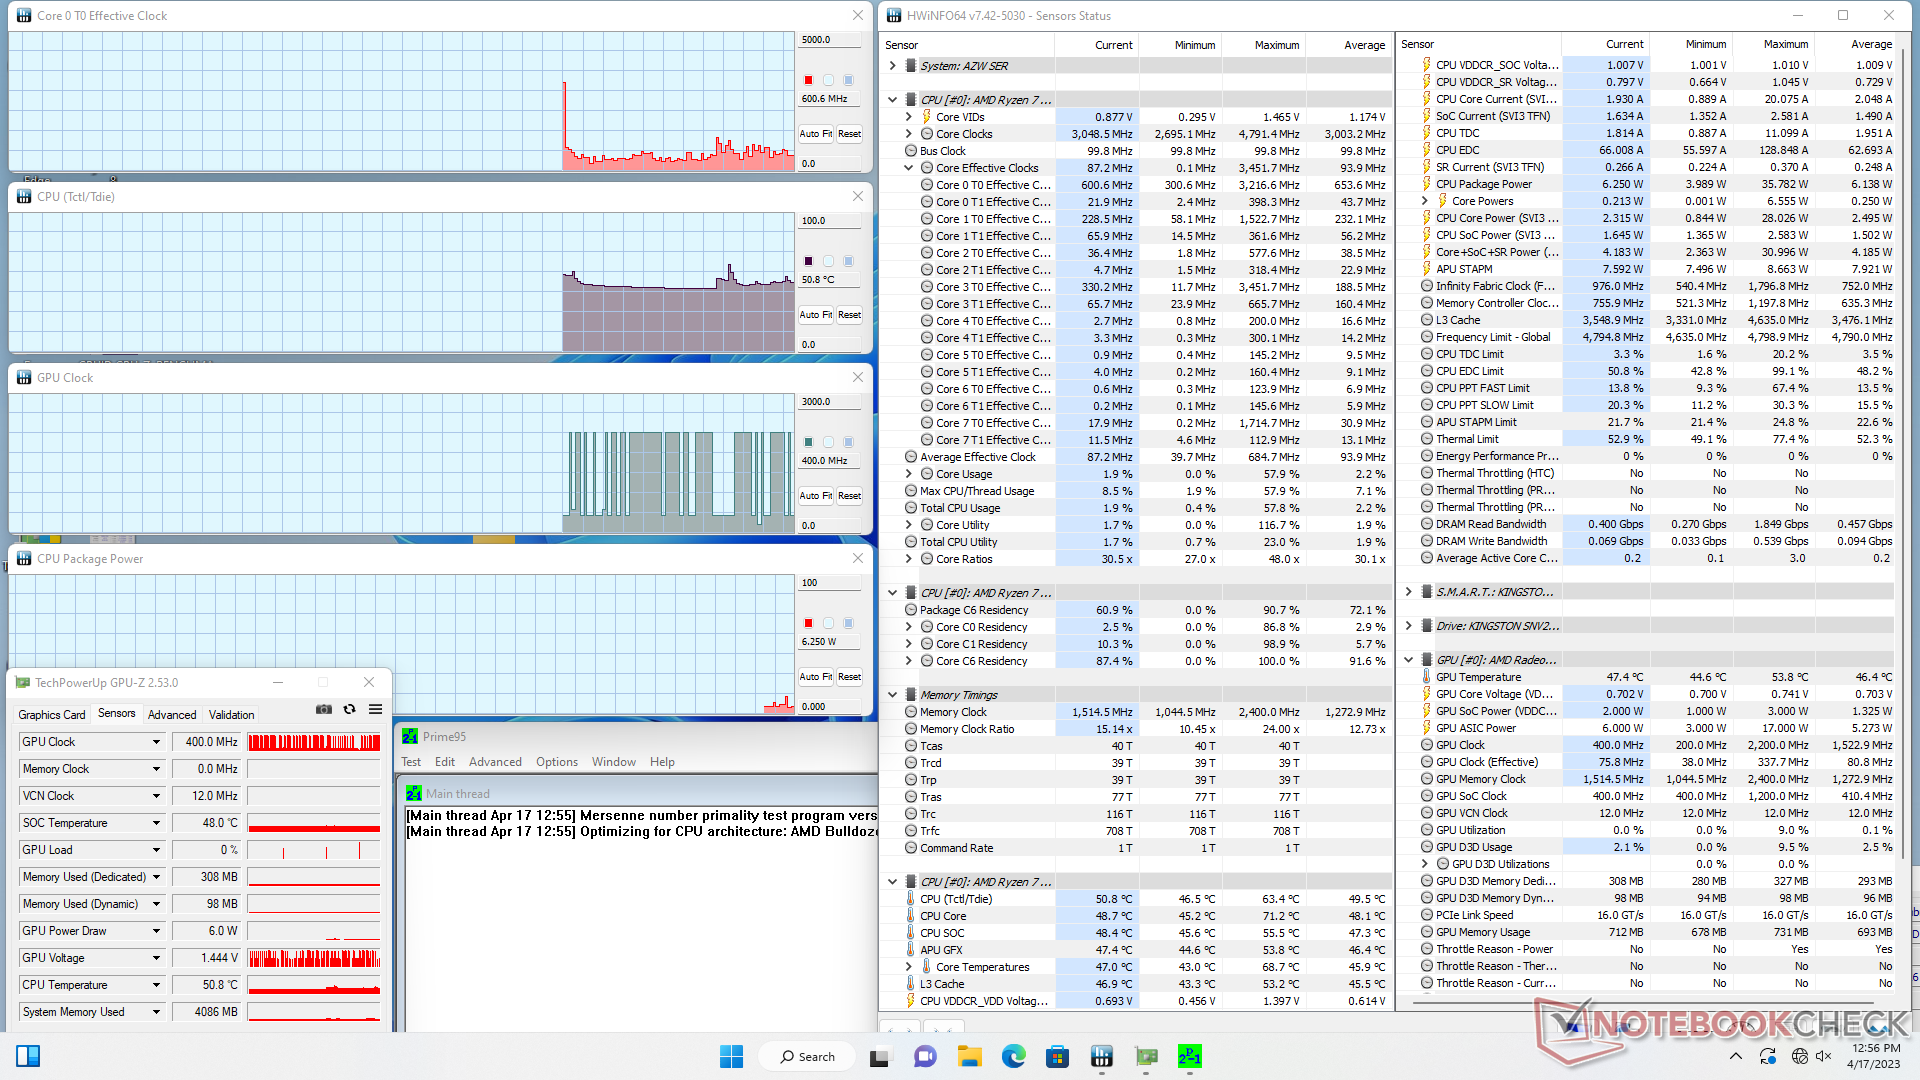
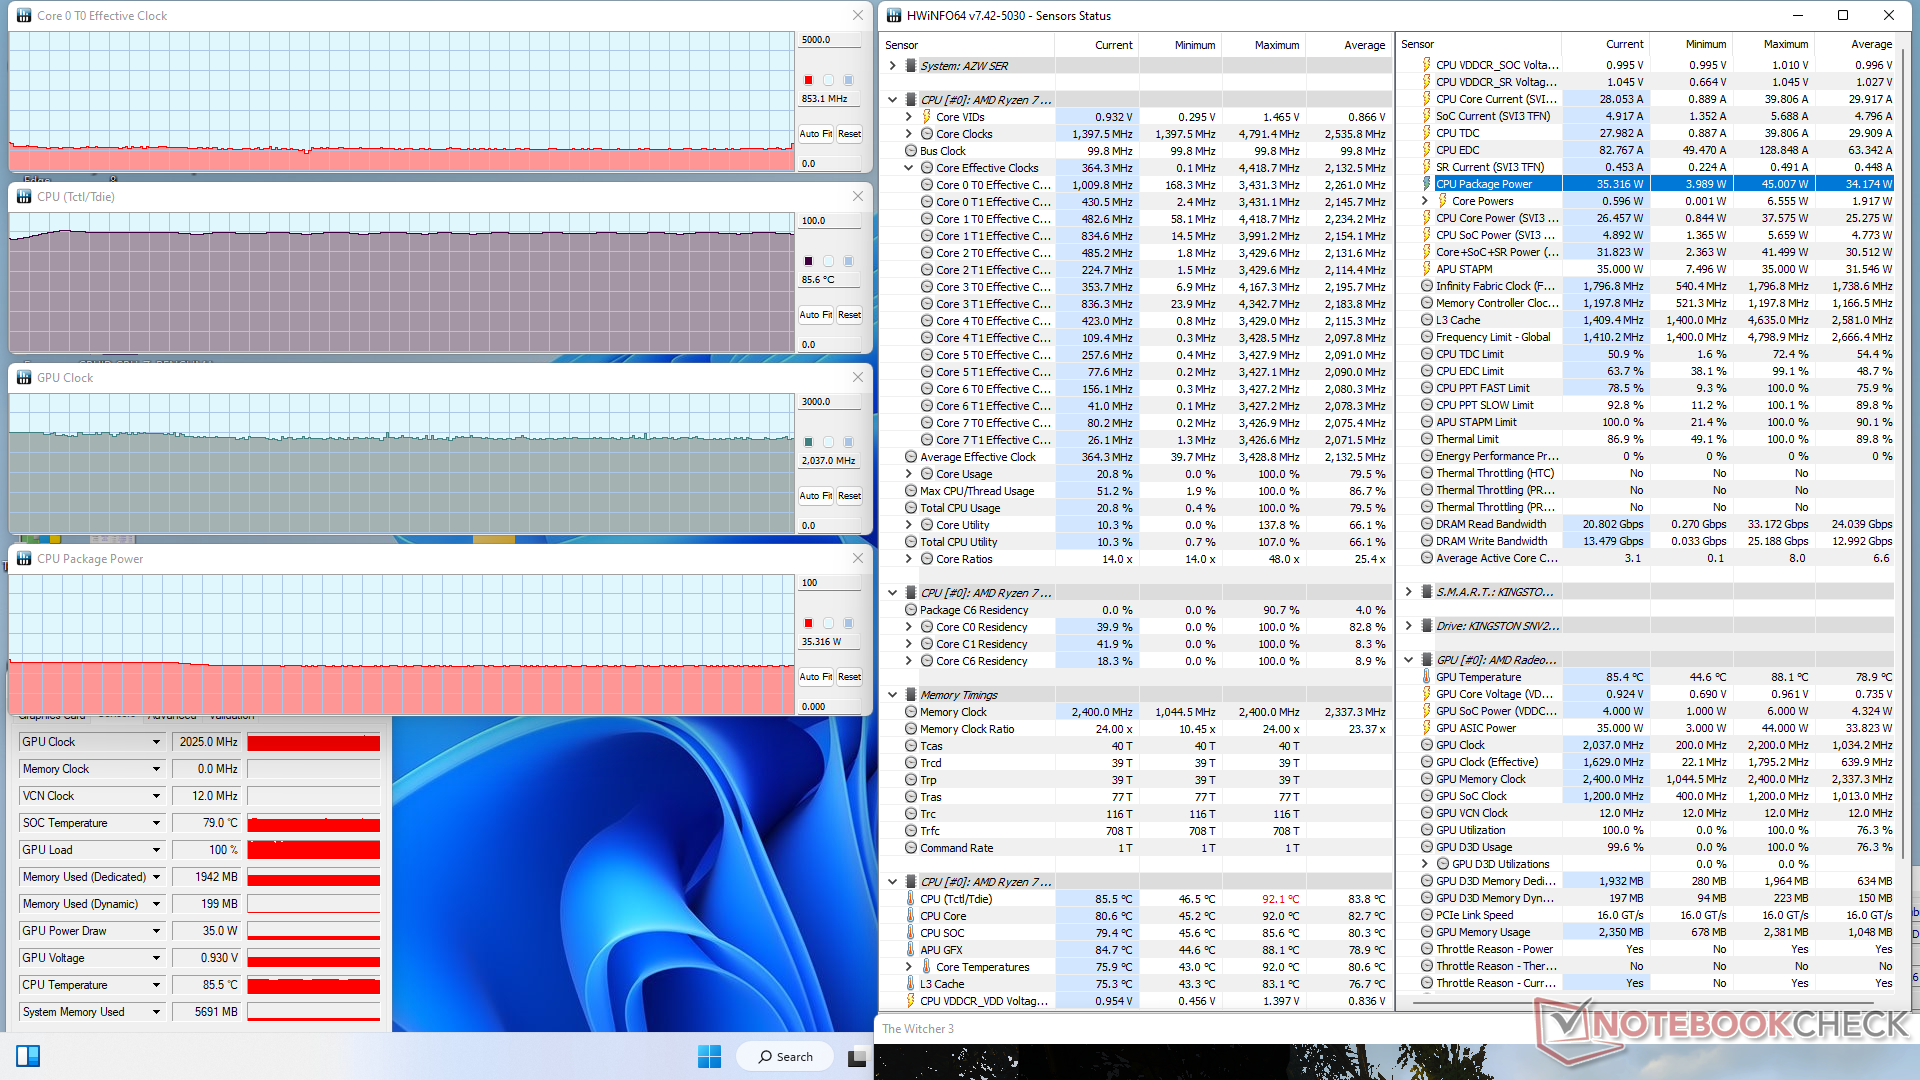
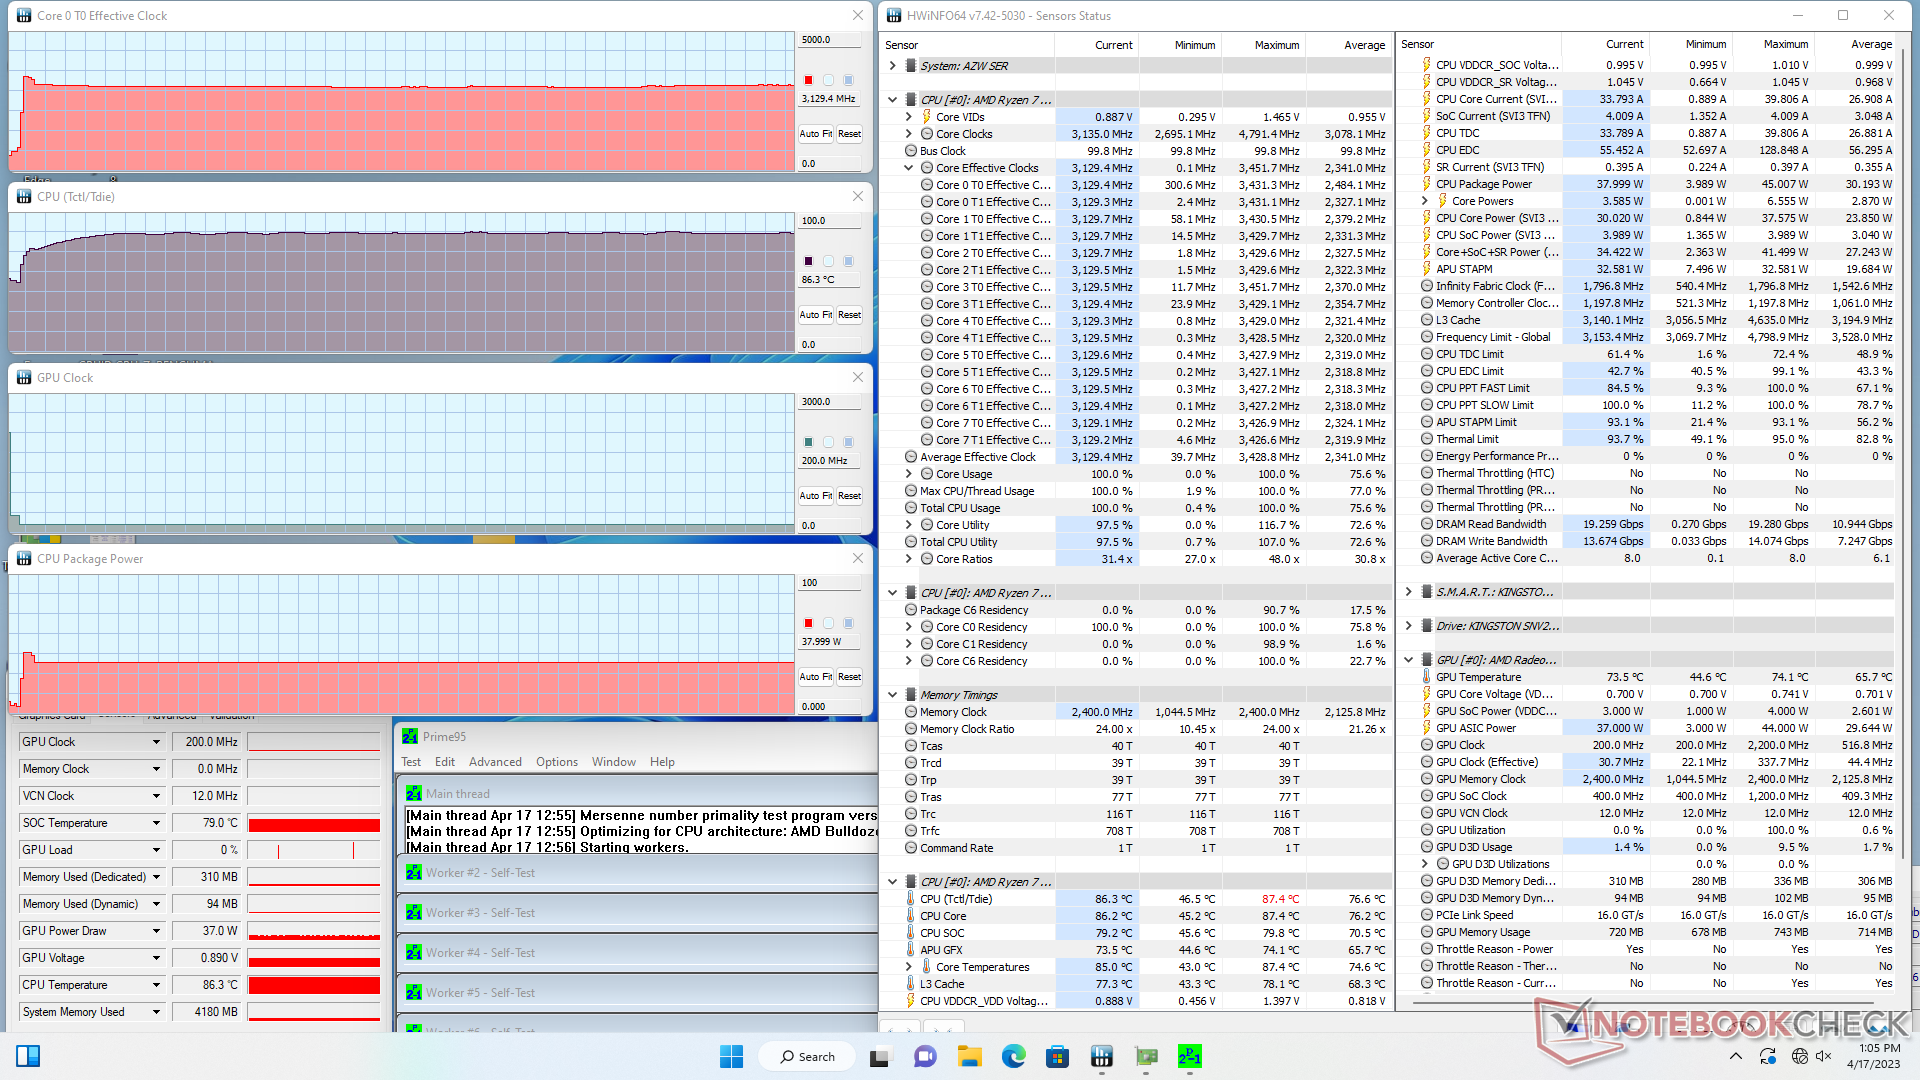
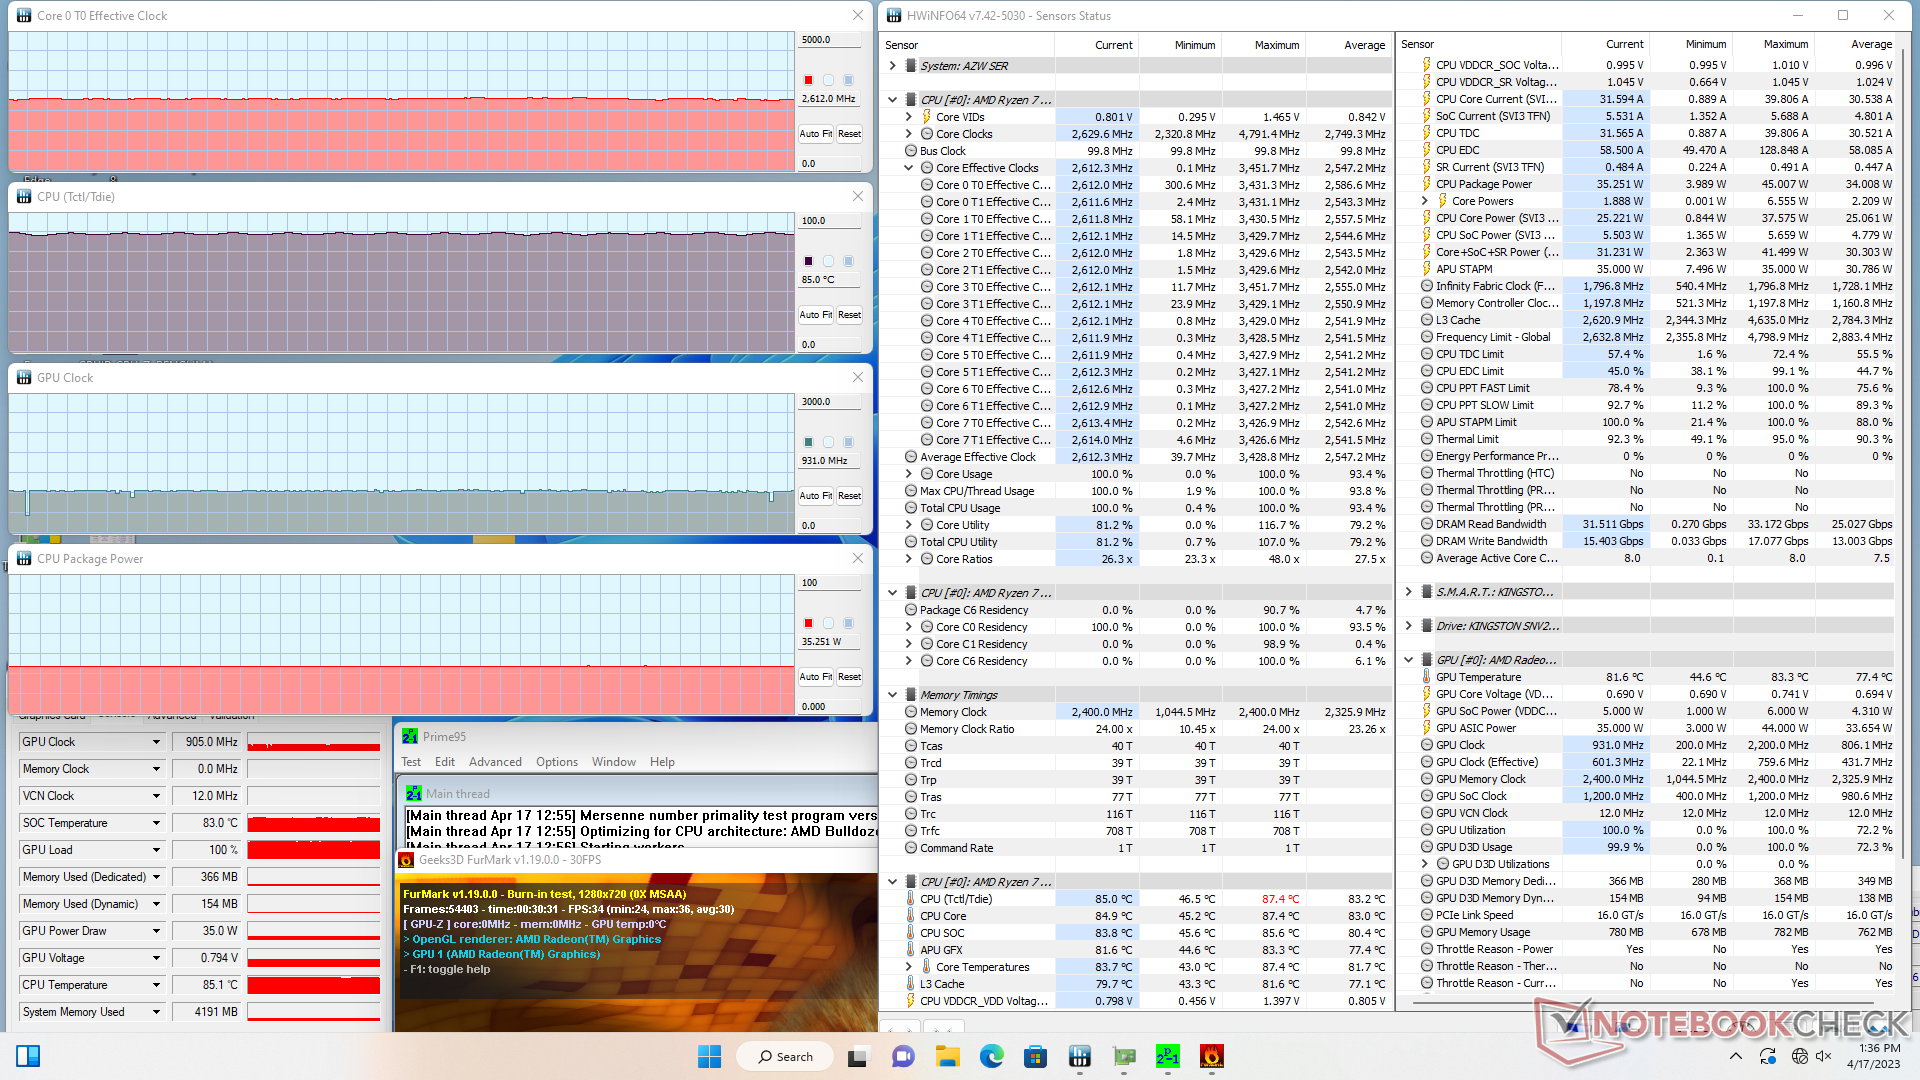
Prueba de resistencia
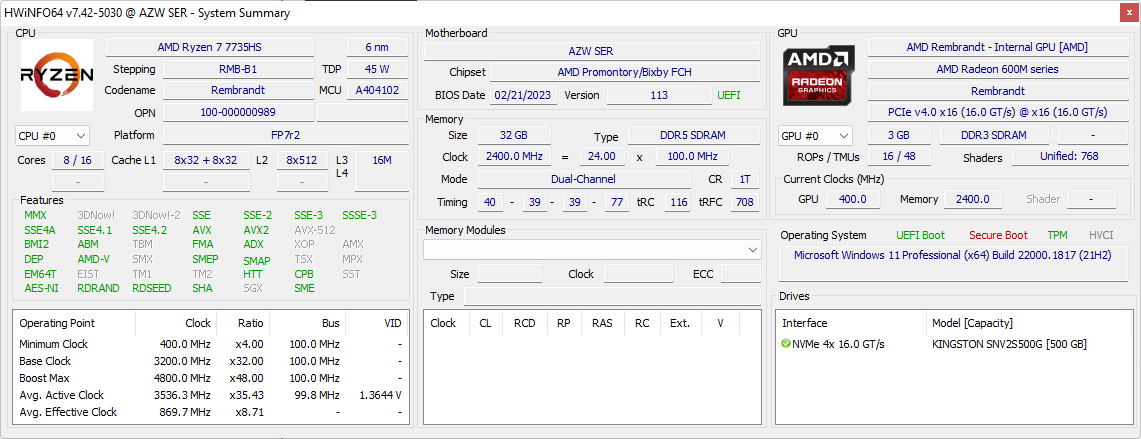
La velocidad de reloj de la CPU y el consumo de energía de la placa al ejecutar Prime95 aumentaban a 3,4 GHz y 45 W, respectivamente, y duraban sólo unos segundos. A continuación, la CPU se estabiliza rápidamente en 3,1 GHz, 38 W y 86 C, una temperatura ligeramente superior a la registrada en el SER6 Pro del año pasado.
Cuando se ejecuta Witcher 3, las frecuencias de reloj de la GPU y la temperatura se estabilizarían en 2037 MHz y 86 C, respectivamente, en comparación con los 1150 MHz y sólo 68 C del SEi12, más lento y potenciado por Intel.
| Relojde laCPU (GHz) | Reloj de la GPU (MHz) | Temperatura media de la CPU (°C) | |
| Sistema en reposo | -- | -- | 51 |
| Prime95 Stress | 3.1 | -- | 86 |
| Prime95+ FurMark Stress | 2,6 | 931 | 85 |
| Witcher 3 Estrés | 0,8 | 2037 | 86 |
Gestión de la energía
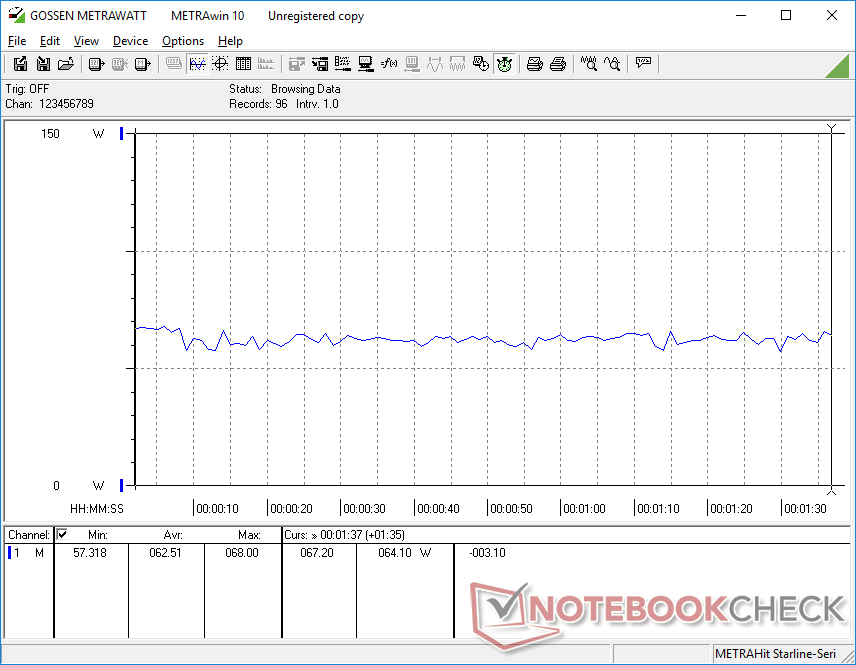
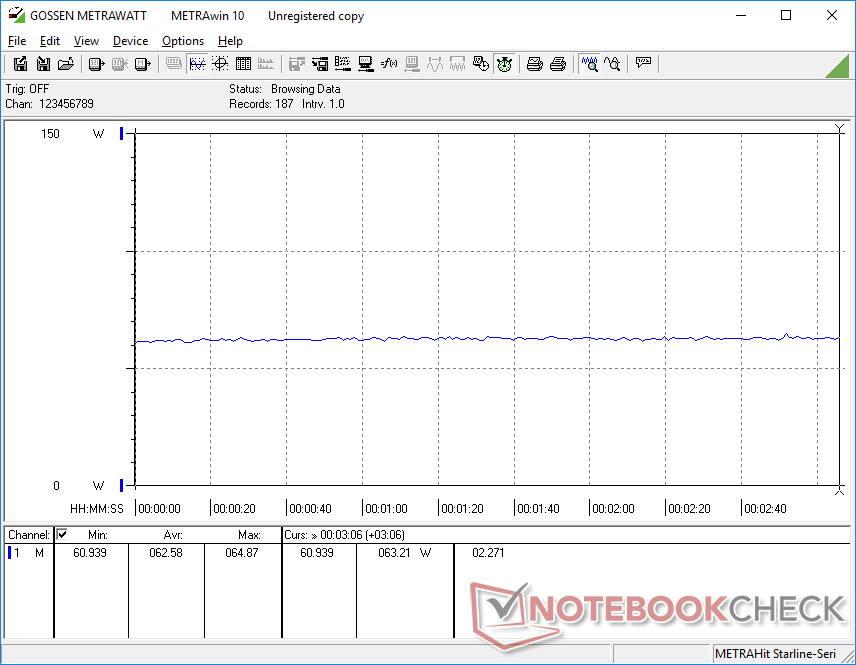
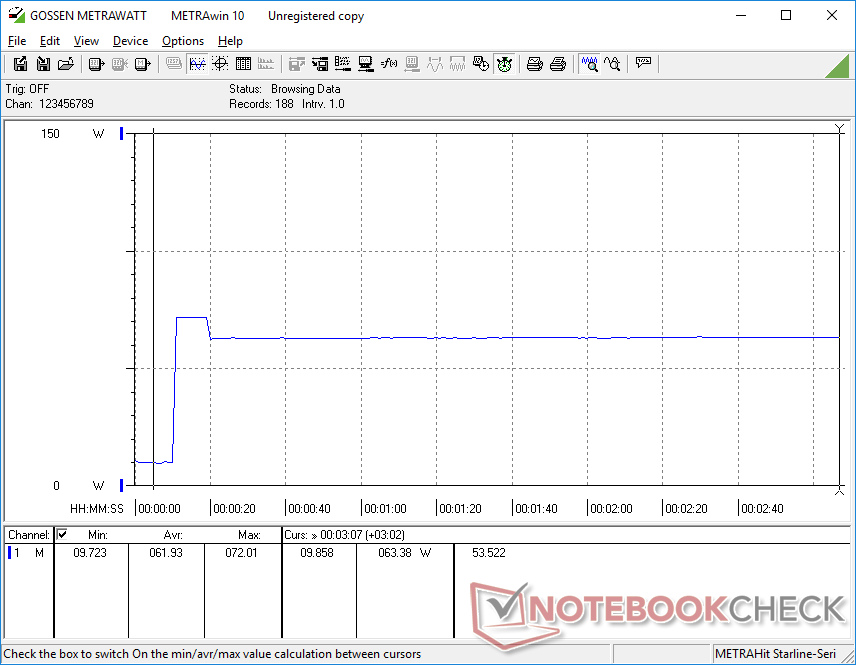
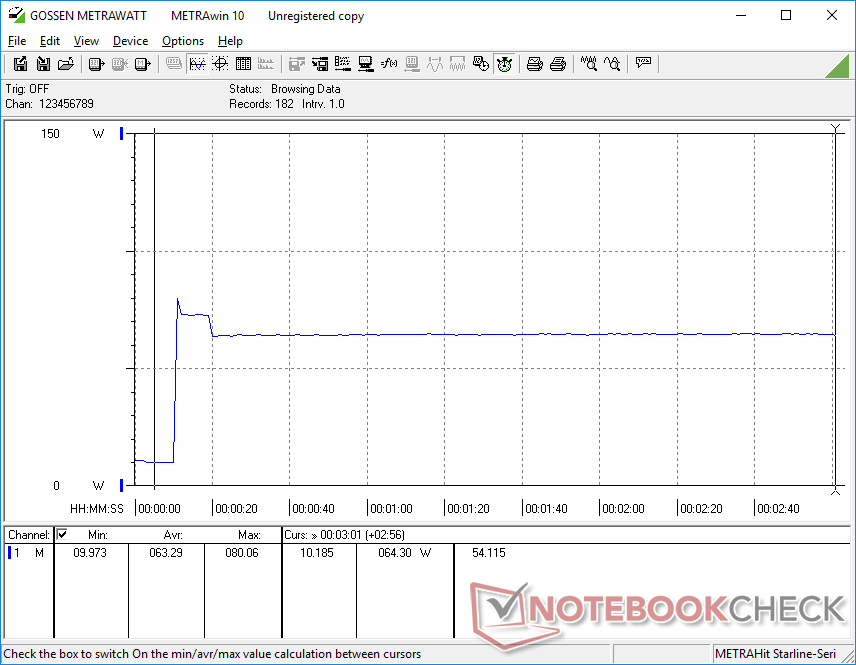
Consumo de energía
El consumo de energía es casi idéntico al del Ryzen 7 6800H del año pasado, como muestran nuestros gráficos comparativos a continuación. Por tanto, el rendimiento por vatio no es, por desgracia, mejor al pasar del antiguo Ryzen 6 6800H al nuevo Ryzen 7 7735HS.
| Off / Standby | |
| Ocioso | |
| Carga |
|
Clave:
min: | |
| Beelink SER6 Pro Ryzen 7 7735HS R7 7735HS, Radeon 680M, Kingston NV2 500GB SNV2S/500G, , x, | Beelink SER6 Pro R7 6800H, Radeon 680M, Kingston NV2 500GB SNV2S/500G, , x, | Beelink GTR6 R9 6900HX, Radeon 680M, Kingston KC3000 512G SKC3000S512G, , x, | Intel NUC 13 Pro Kit NUC13ANK i7-1360P, Iris Xe G7 96EUs, Samsung PM9A1 MZVL2512HCJQ, , x, | Minisforum Venus Series UM690 R9 6900HX, Radeon 680M, Kingston OM8PGP4512Q-A0, , x, | Intel Hades Canyon NUC8i7HVK i7-8809G, Vega M GH, Intel Optane 120 GB SSDPEK1W120GA, , x, | |
|---|---|---|---|---|---|---|
| Power Consumption | 6% | -4% | 5% | -8% | -79% | |
| Idle Minimum * (Watt) | 8.9 | 8.3 7% | 7.6 15% | 5.1 43% | 8.7 2% | 15.5 -74% |
| Idle Average * (Watt) | 9 | 8.4 7% | 9.9 -10% | 5.8 36% | 9.6 -7% | 16.2 -80% |
| Idle Maximum * (Watt) | 9.3 | 8.7 6% | 10.6 -14% | 10.2 -10% | 10.5 -13% | 16.5 -77% |
| Load Average * (Watt) | 62.5 | 60.8 3% | 64 -2% | 68.1 -9% | 65.8 -5% | 83.4 -33% |
| Witcher 3 ultra * (Watt) | 62.6 | 61.4 2% | 69 -10% | 121.7 -94% | ||
| Load Maximum * (Watt) | 80.1 | 72 10% | 80.4 -0% | 108.3 -35% | 94.5 -18% | 173.5 -117% |
* ... más pequeño es mejor
Power Consumption Witcher 3 / Stresstest
Power Consumption external Monitor
Pro
Contra
Veredicto - Nada más que un Zen 3+ rebrand
Lo mejor del SER6 Pro Ryzen 7 7735HS es que el antiguo SER6 Pro Ryzen 7 6800H es ahora más barato. Los dos procesadores son demasiado similares en rendimiento y consumo de energía, lo que significa que puedes comprar el modelo anterior sin miedo a perderte ninguna característica importante.
El rendimiento del Ryzen 7 7735HS es idéntico al del antiguo Ryzen 7 6800H. Por tanto, es difícil recomendar el SER6 Pro 2023 frente al modelo 2022, ya que no ofrece casi ningún otro cambio.
El DisplayPort integrado es un buen añadido, pero creemos que Beelink podría haber hecho más cambios para atraer a los compradores. Un segundo puerto USB-C, por ejemplo, un lector de huellas integrado, o un bloqueo Kensington podrían haber ayudado a diferenciar el modelo 2023 del 2022. Además, los problemas de latencia del CPD y las caídas de fotogramas al reproducir vídeo 4K deberían solucionarse, ya que muchos usuarios pueden usar el SER6 Pro para fines HTC.
Precio y disponibilidad
Amazon ya está enviando el Beelink SER6 Pro configurado por 550 USD.
Beelink SER6 Pro Ryzen 7 7735HS
- 04/20/2023 v7 (old)
Allen Ngo
Transparencia
La selección de los dispositivos que se van a reseñar corre a cargo de nuestro equipo editorial. La muestra de prueba fue proporcionada al autor en calidad de préstamo por el fabricante o el minorista a los efectos de esta reseña. El prestamista no tuvo ninguna influencia en esta reseña, ni el fabricante recibió una copia de la misma antes de su publicación. No había ninguna obligación de publicar esta reseña. Como empresa de medios independiente, Notebookcheck no está sujeta a la autoridad de fabricantes, minoristas o editores.
Así es como prueba Notebookcheck
Cada año, Notebookcheck revisa de forma independiente cientos de portátiles y smartphones utilizando procedimientos estandarizados para asegurar que todos los resultados son comparables. Hemos desarrollado continuamente nuestros métodos de prueba durante unos 20 años y hemos establecido los estándares de la industria en el proceso. En nuestros laboratorios de pruebas, técnicos y editores experimentados utilizan equipos de medición de alta calidad. Estas pruebas implican un proceso de validación en varias fases. Nuestro complejo sistema de clasificación se basa en cientos de mediciones y puntos de referencia bien fundamentados, lo que mantiene la objetividad.Price comparison

