Análisis de Beelink SER6 Pro: La AMD Radeon 680M es impresionante en un mini PC
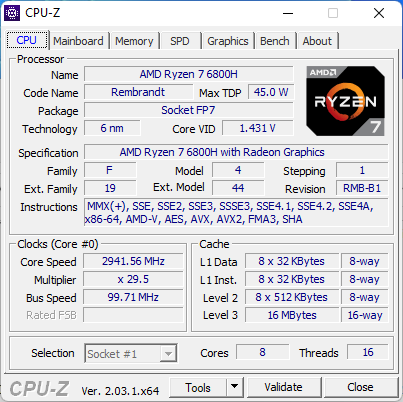
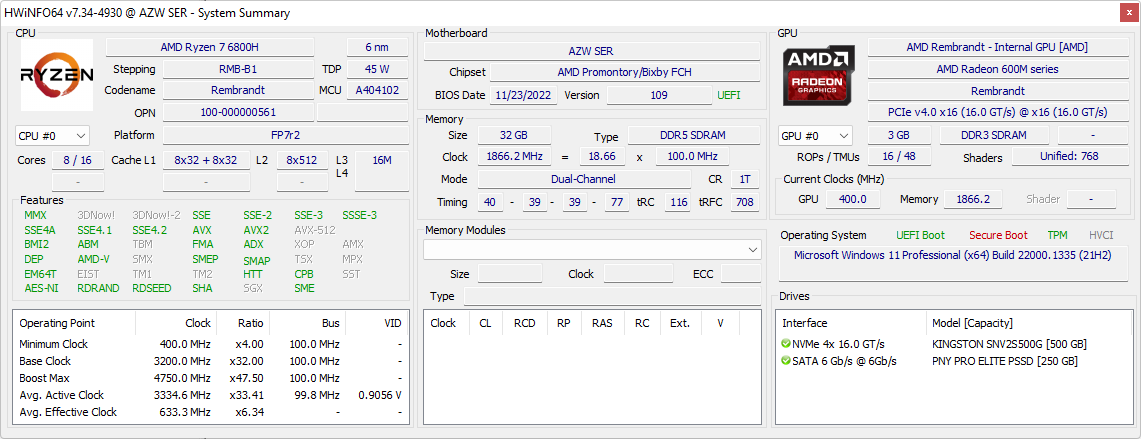
El Beelink SER6 Pro sucede a la generación anterior Beelink SER5 Pro. Introduce nuevos cambios externos y una CPU Zen 3+ Ryzen 7 6800H mejorada que sustituye a la Zen 3 Ryzen 7 5800H del modelo saliente. Por el momento no hay otras opciones de CPU disponibles para el SER6 Pro.
El SER6 Pro compite directamente con muchas soluciones Intel NUC así como con el Zotac ZBox o la serie MSI Cubi. Nuestra configuración específica de Beelink cuesta entre 600 y 700 dólares.
Más opiniones sobre Beelink:
Posibles contendientes en la comparación
Valoración | Fecha | Modelo | Peso | Altura | Tamaño | Resolución | Precio |
|---|---|---|---|---|---|---|---|
v (old) | 01/2023 | Beelink SER6 Pro R7 6800H, Radeon 680M | 511 g | 42 mm | x | ||
v (old) | 11/2022 | Beelink GTR6 R9 6900HX, Radeon 680M | 815 g | 43 mm | x | ||
v (old) | 09/2022 | Beelink SEi11 Pro i5-11320H, Iris Xe G7 96EUs | 440 g | 40 mm | x | ||
| 78.9 % v7 (old) | 11/2022 | Intel NUC 12 Pro Kit NUC12WSKi7 i7-1260P, Iris Xe G7 96EUs | 511 g | 37 mm | x | ||
v (old) | 04/2021 | Intel NUC11PHKi7C i7-1165G7, GeForce RTX 2060 Mobile | 1.4 kg | 42 mm | x | ||
v (old) | 03/2018 | Intel Hades Canyon NUC8i7HVK i7-8809G, Vega M GH | 1.3 kg | 39 mm | x |
Caso
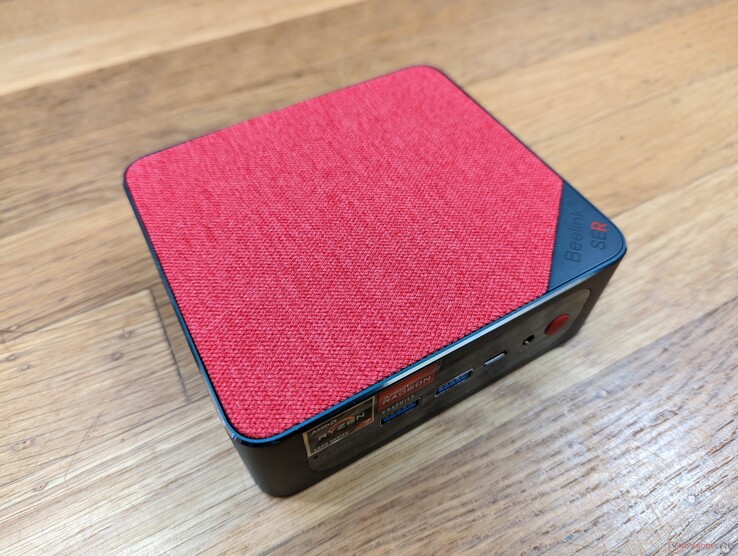
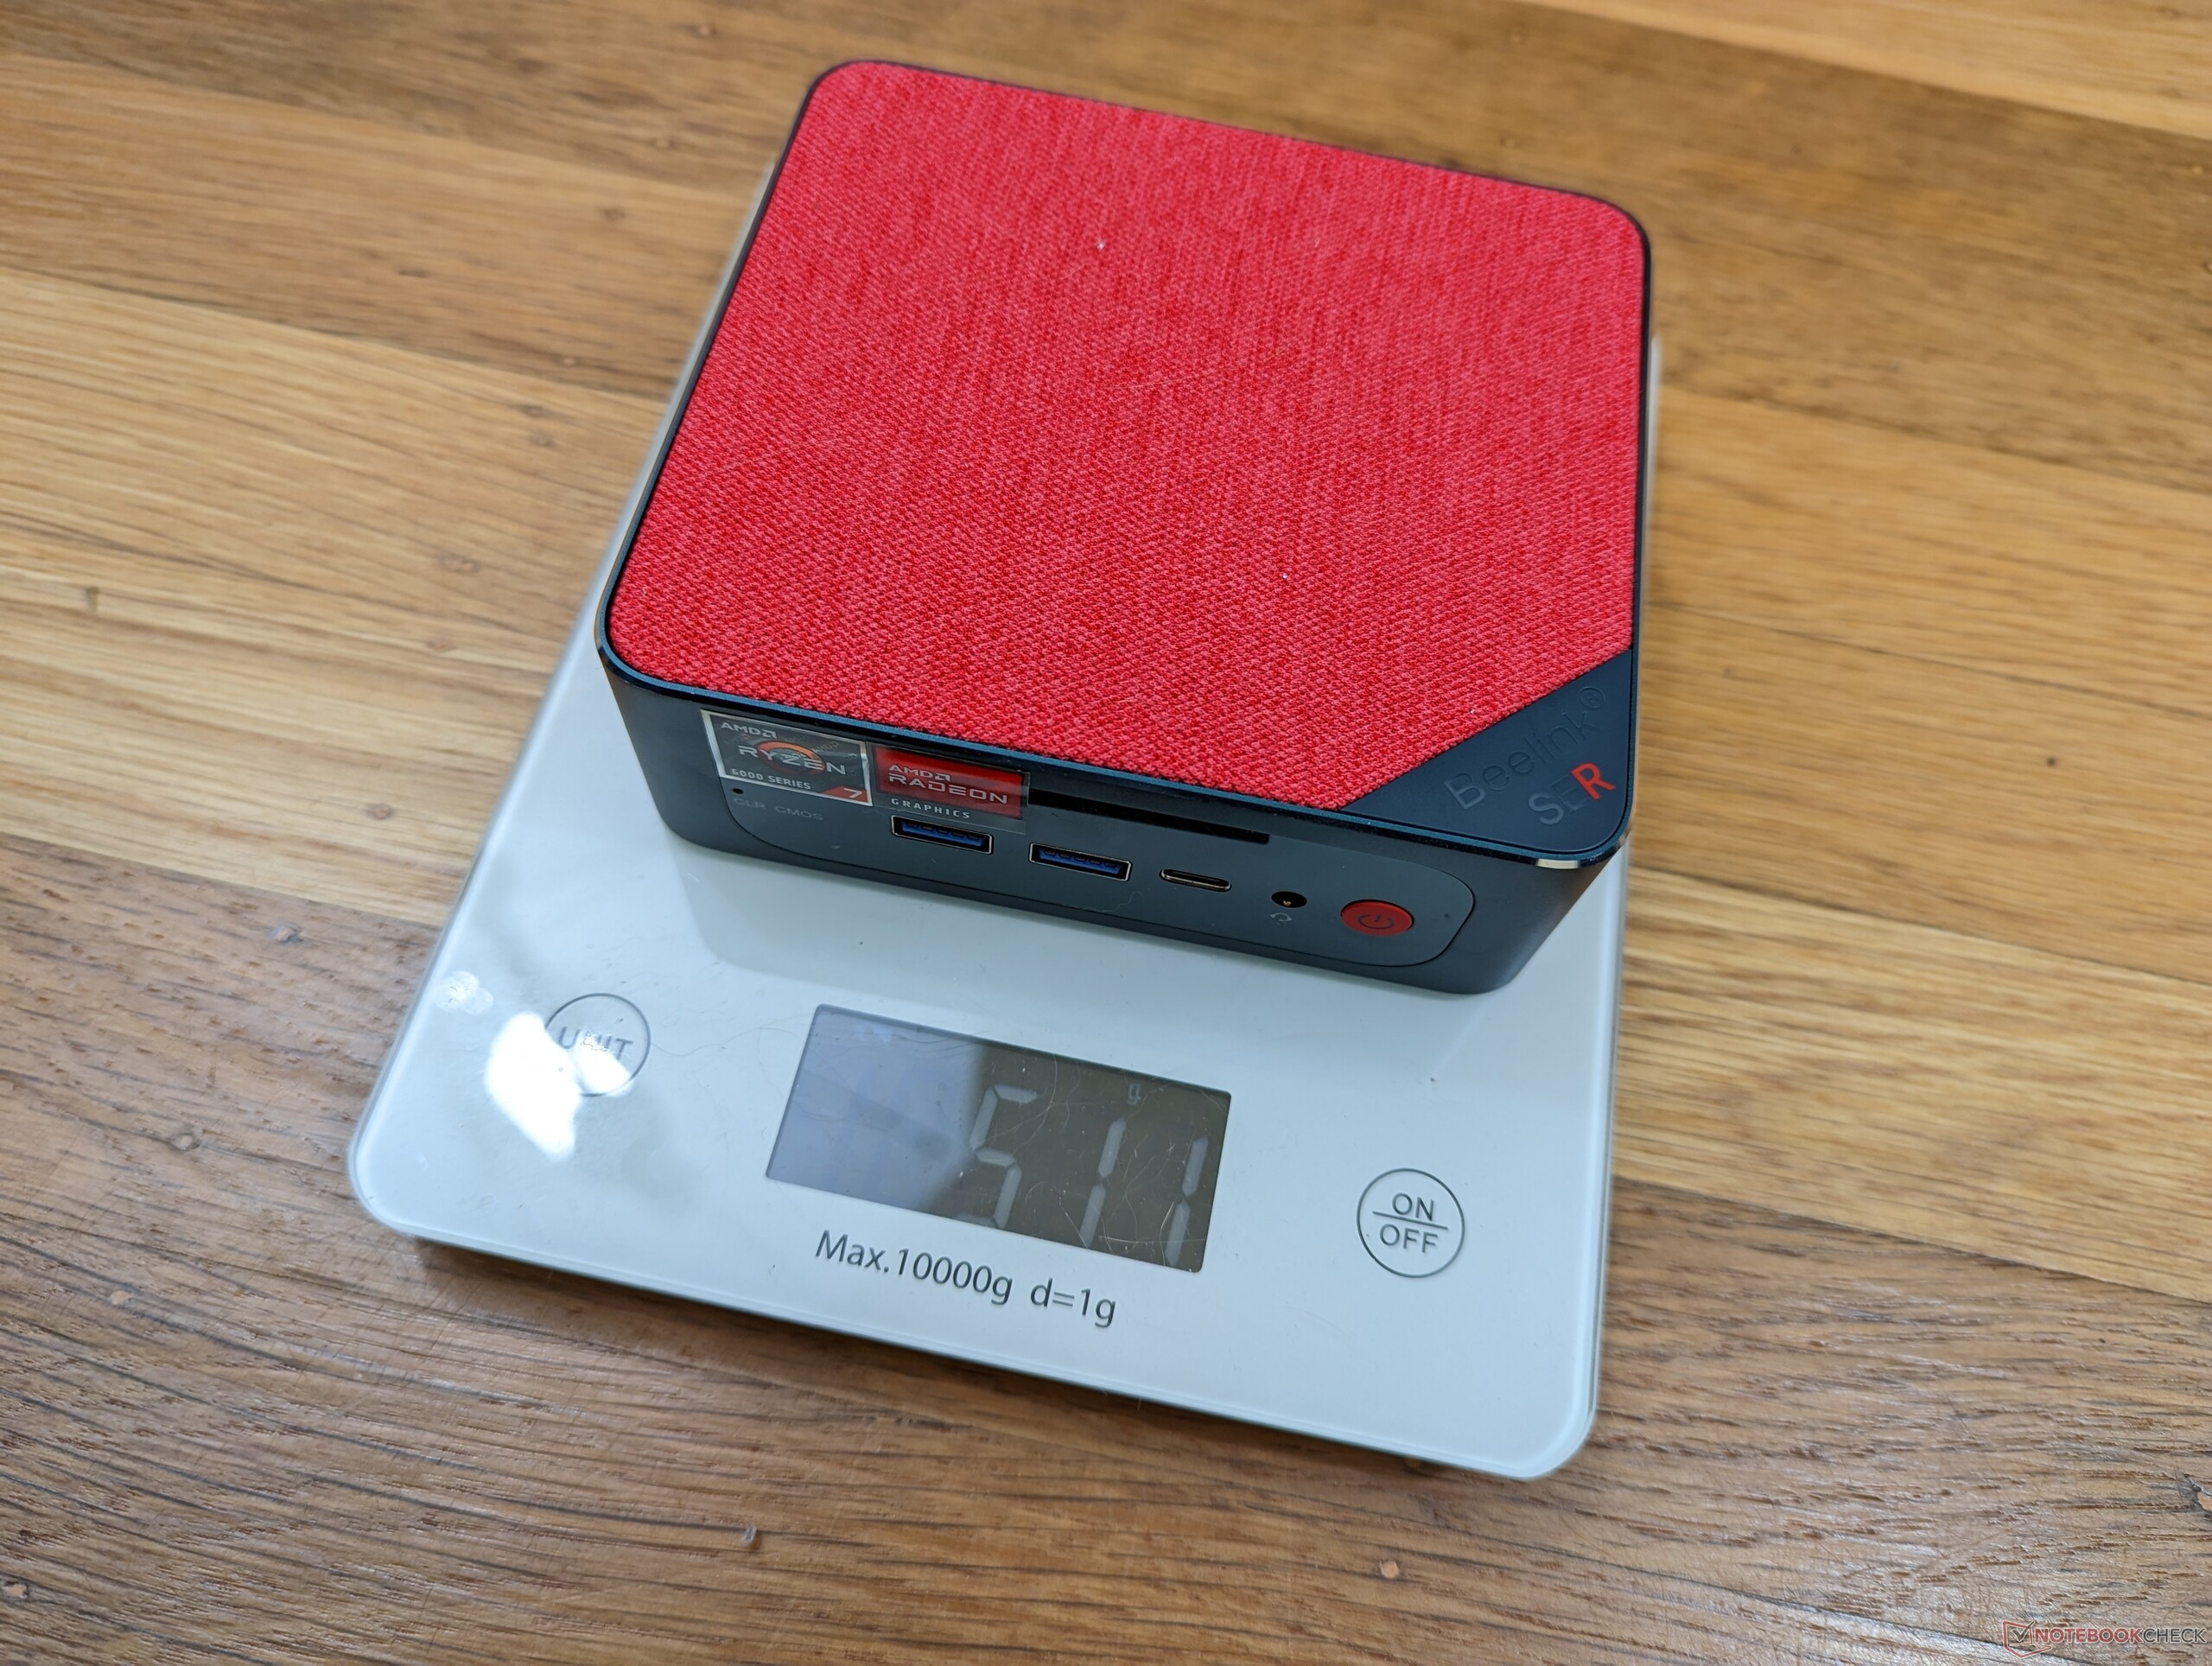
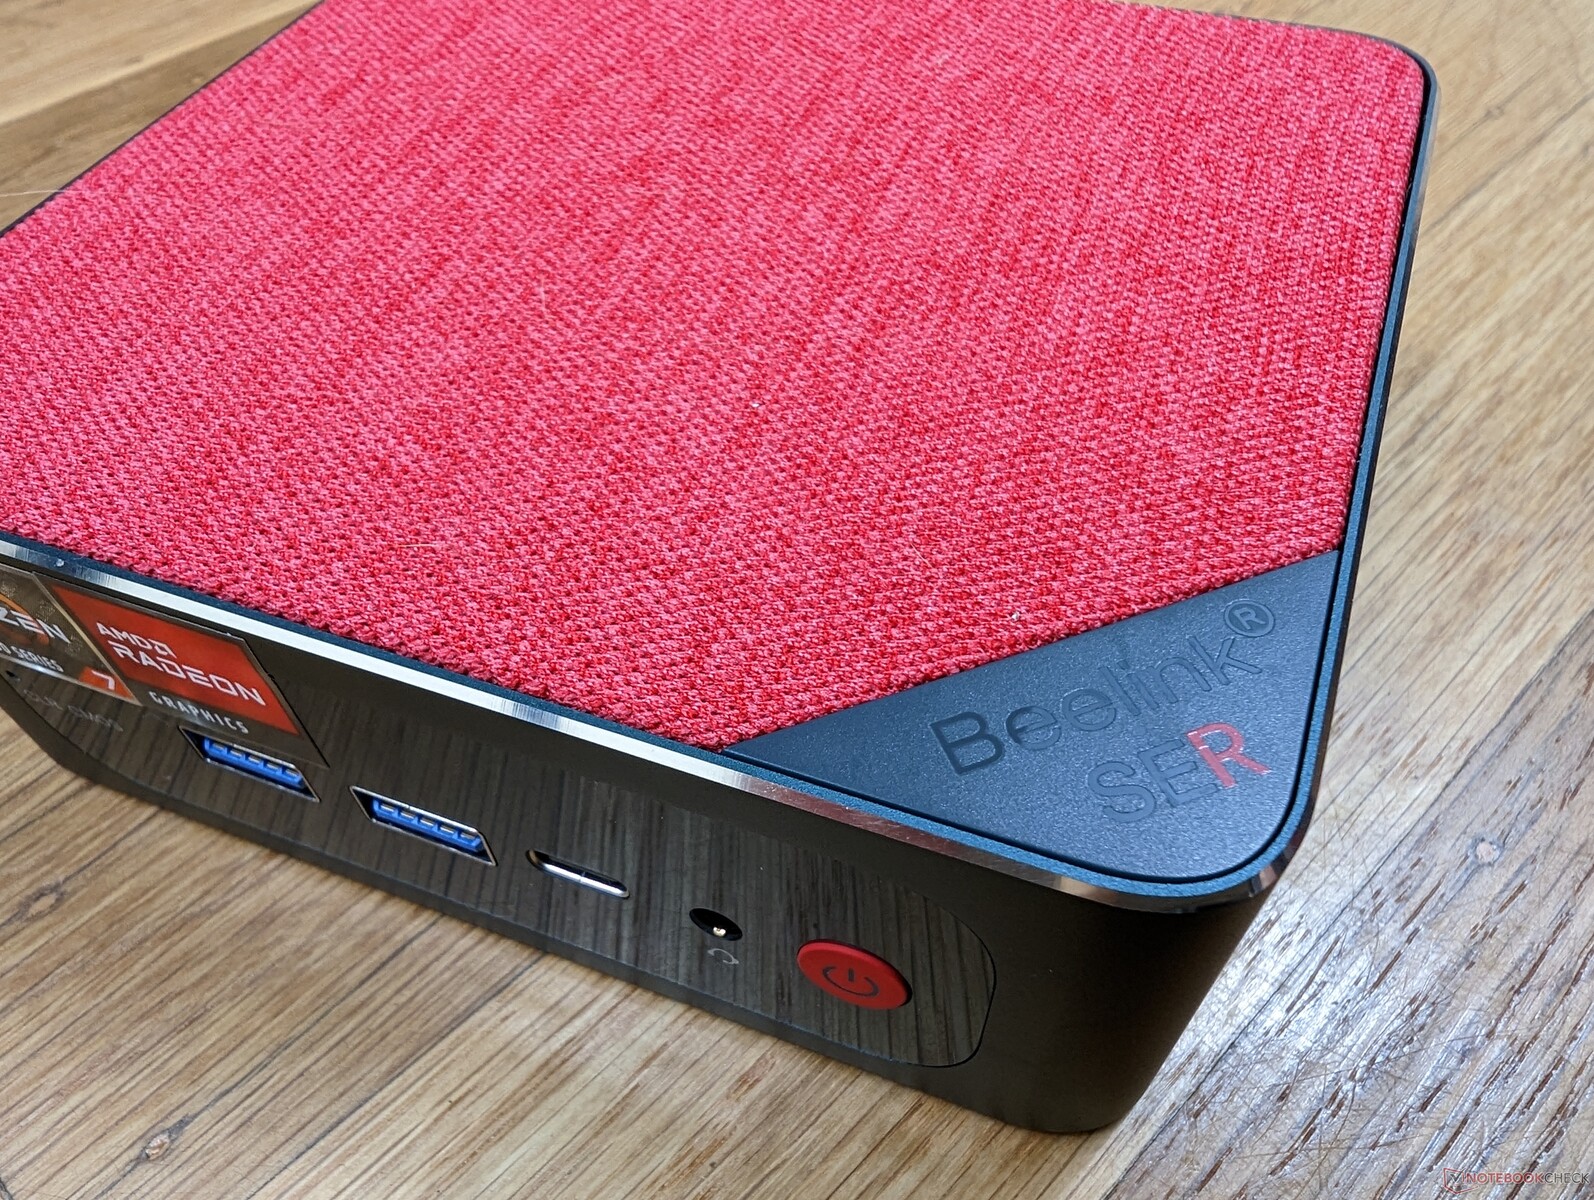
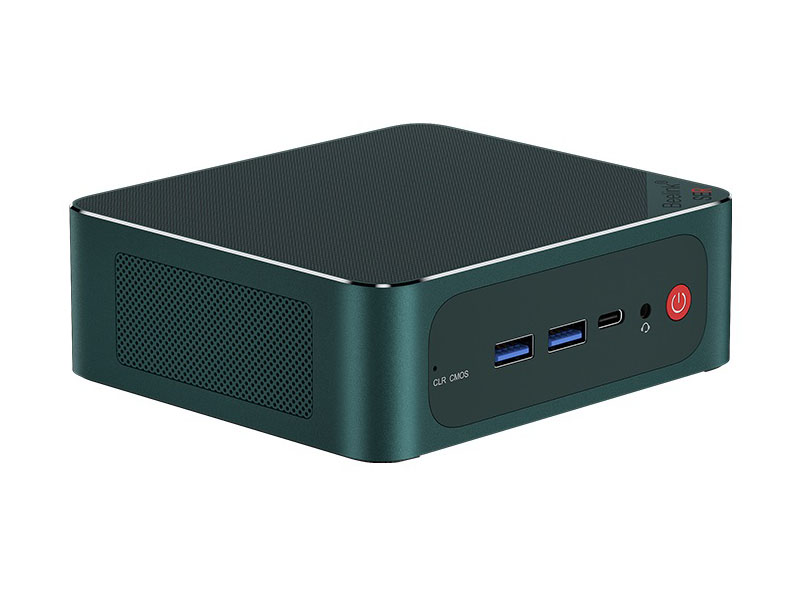
El chasis es metálico en todos sus lados, aparte de la cubierta superior de tela extraíble. Sus dimensiones totales son muy similares a las delSEi11 Pro aunque ligeramente más pesado debido a la revisión de los componentes internos. Sorprendentemente, el SER6 Pro pesa tanto como el NUC 12 Pro a pesar de que el NUC es más pequeño.
Conectividad
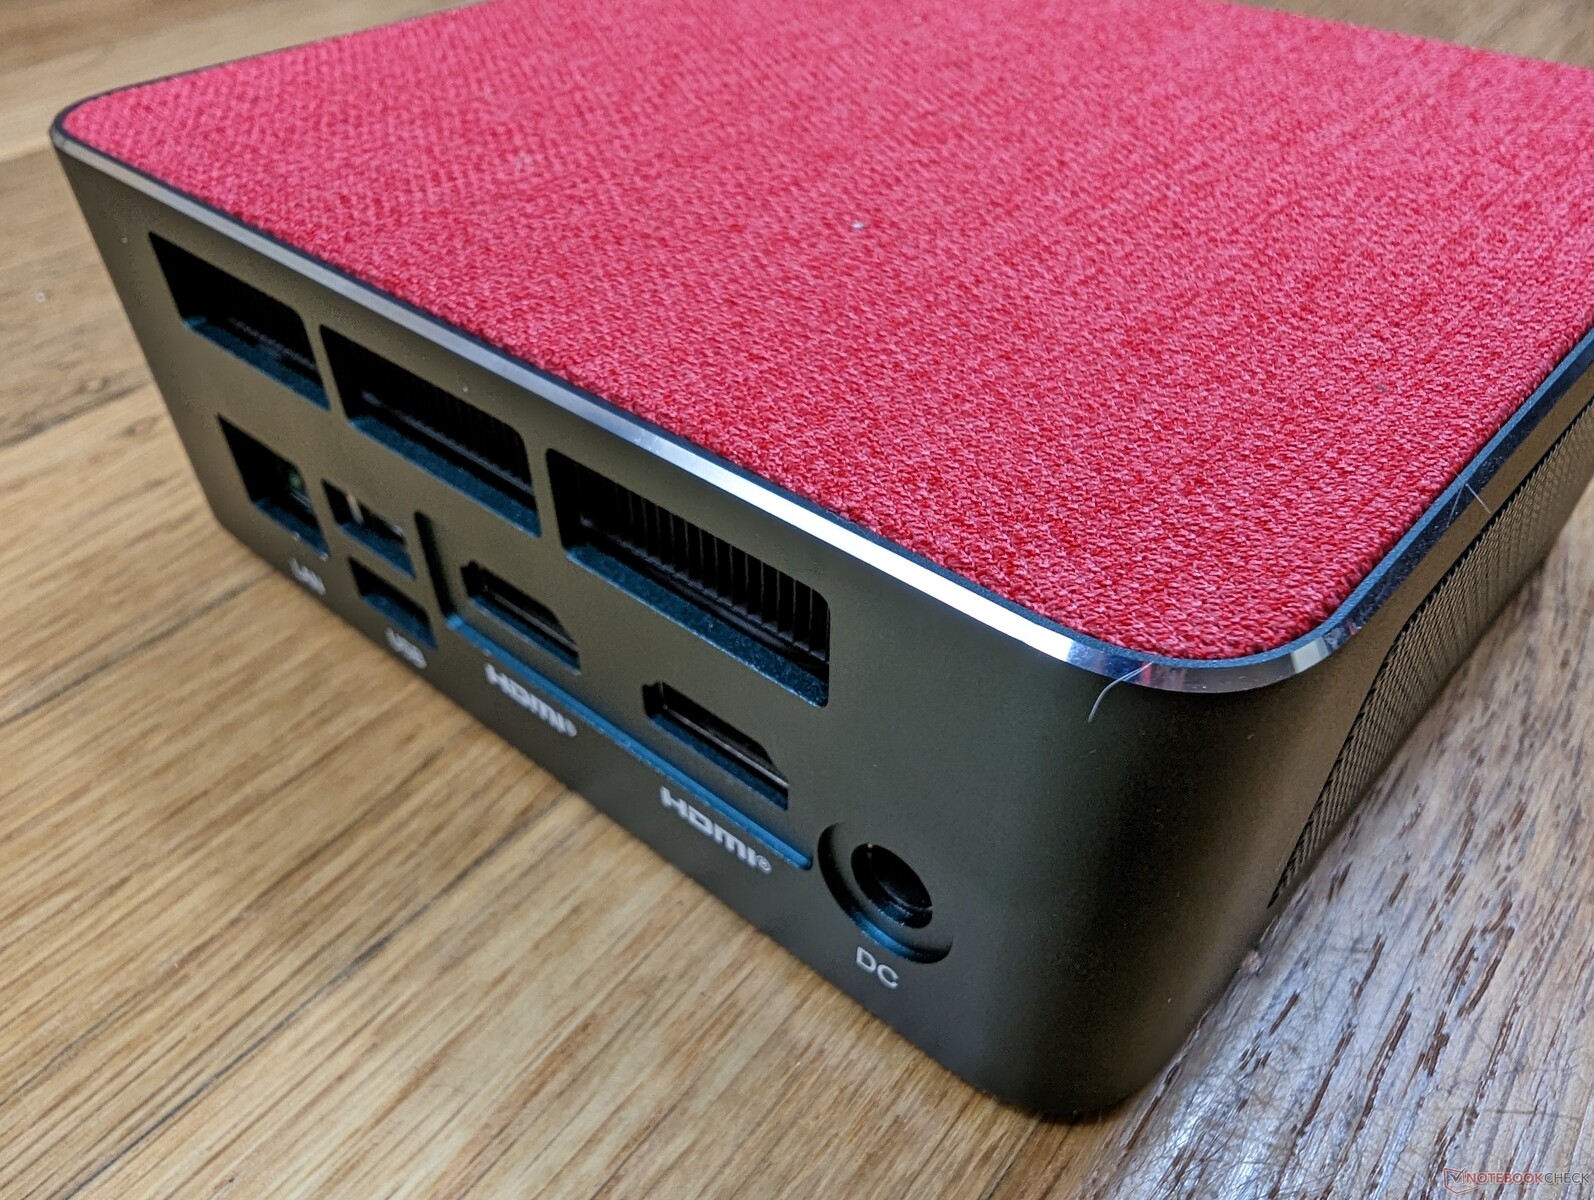
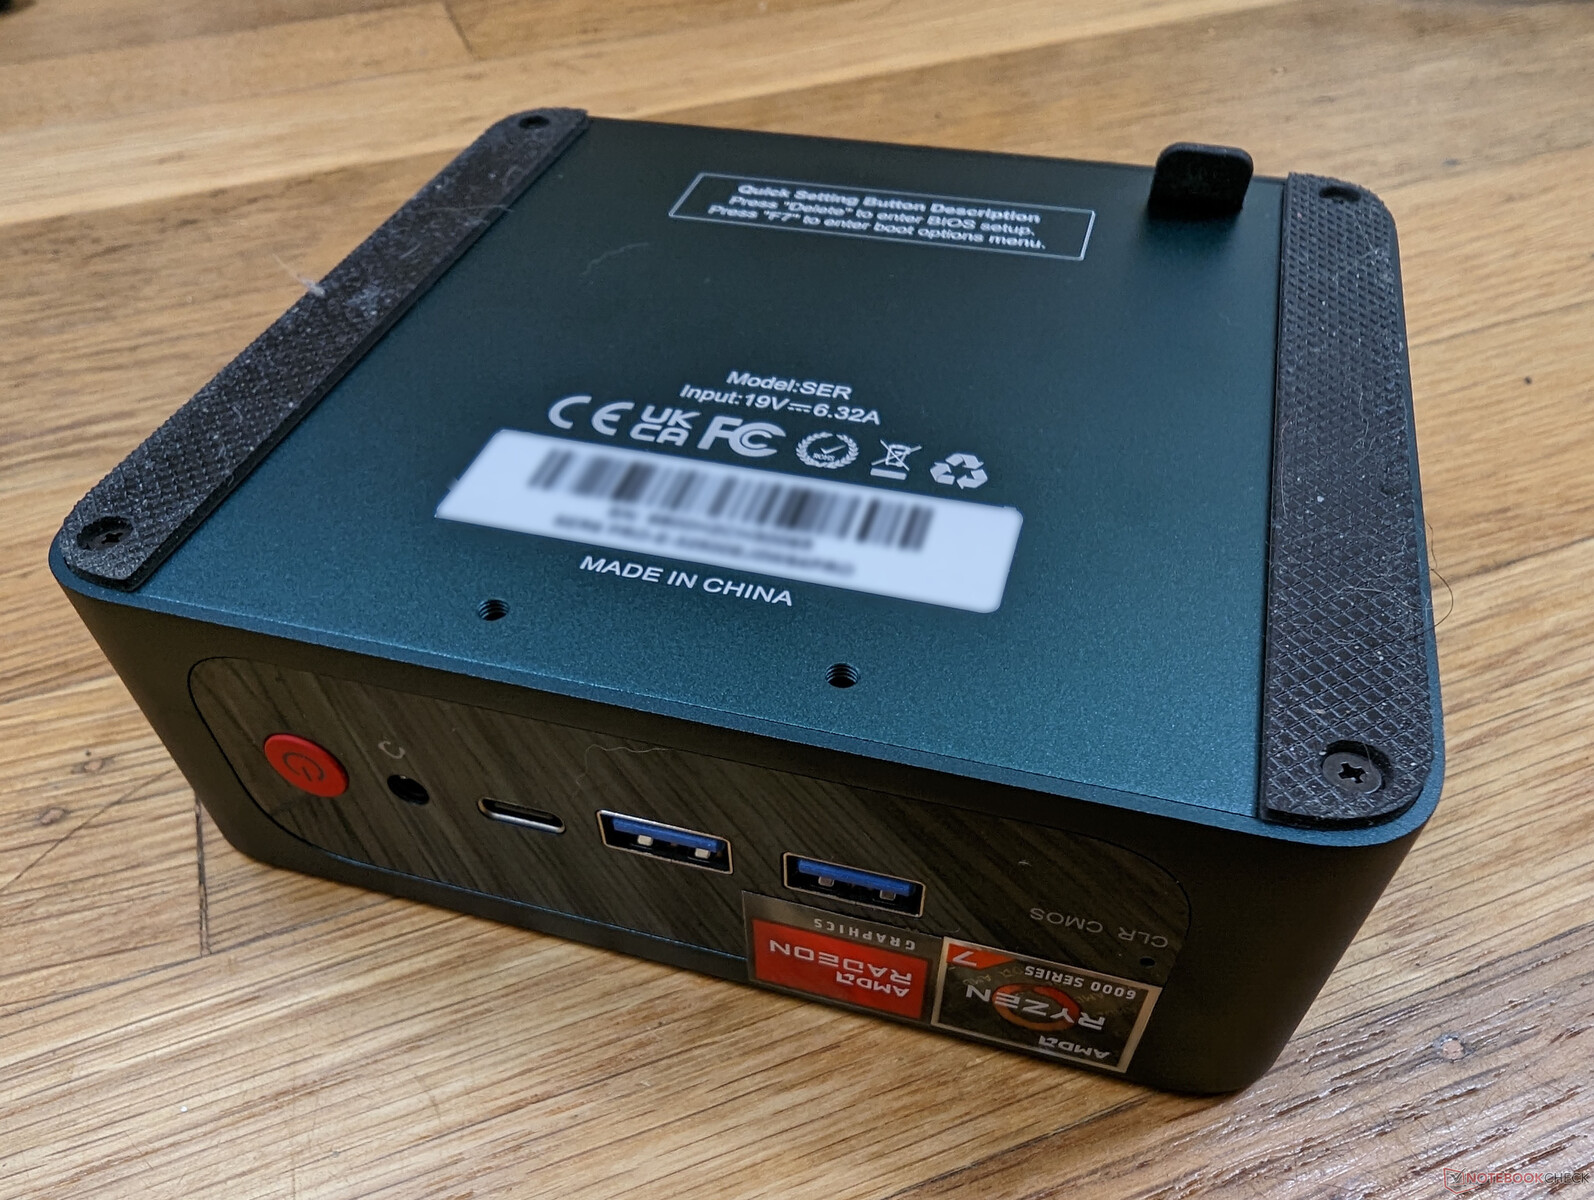
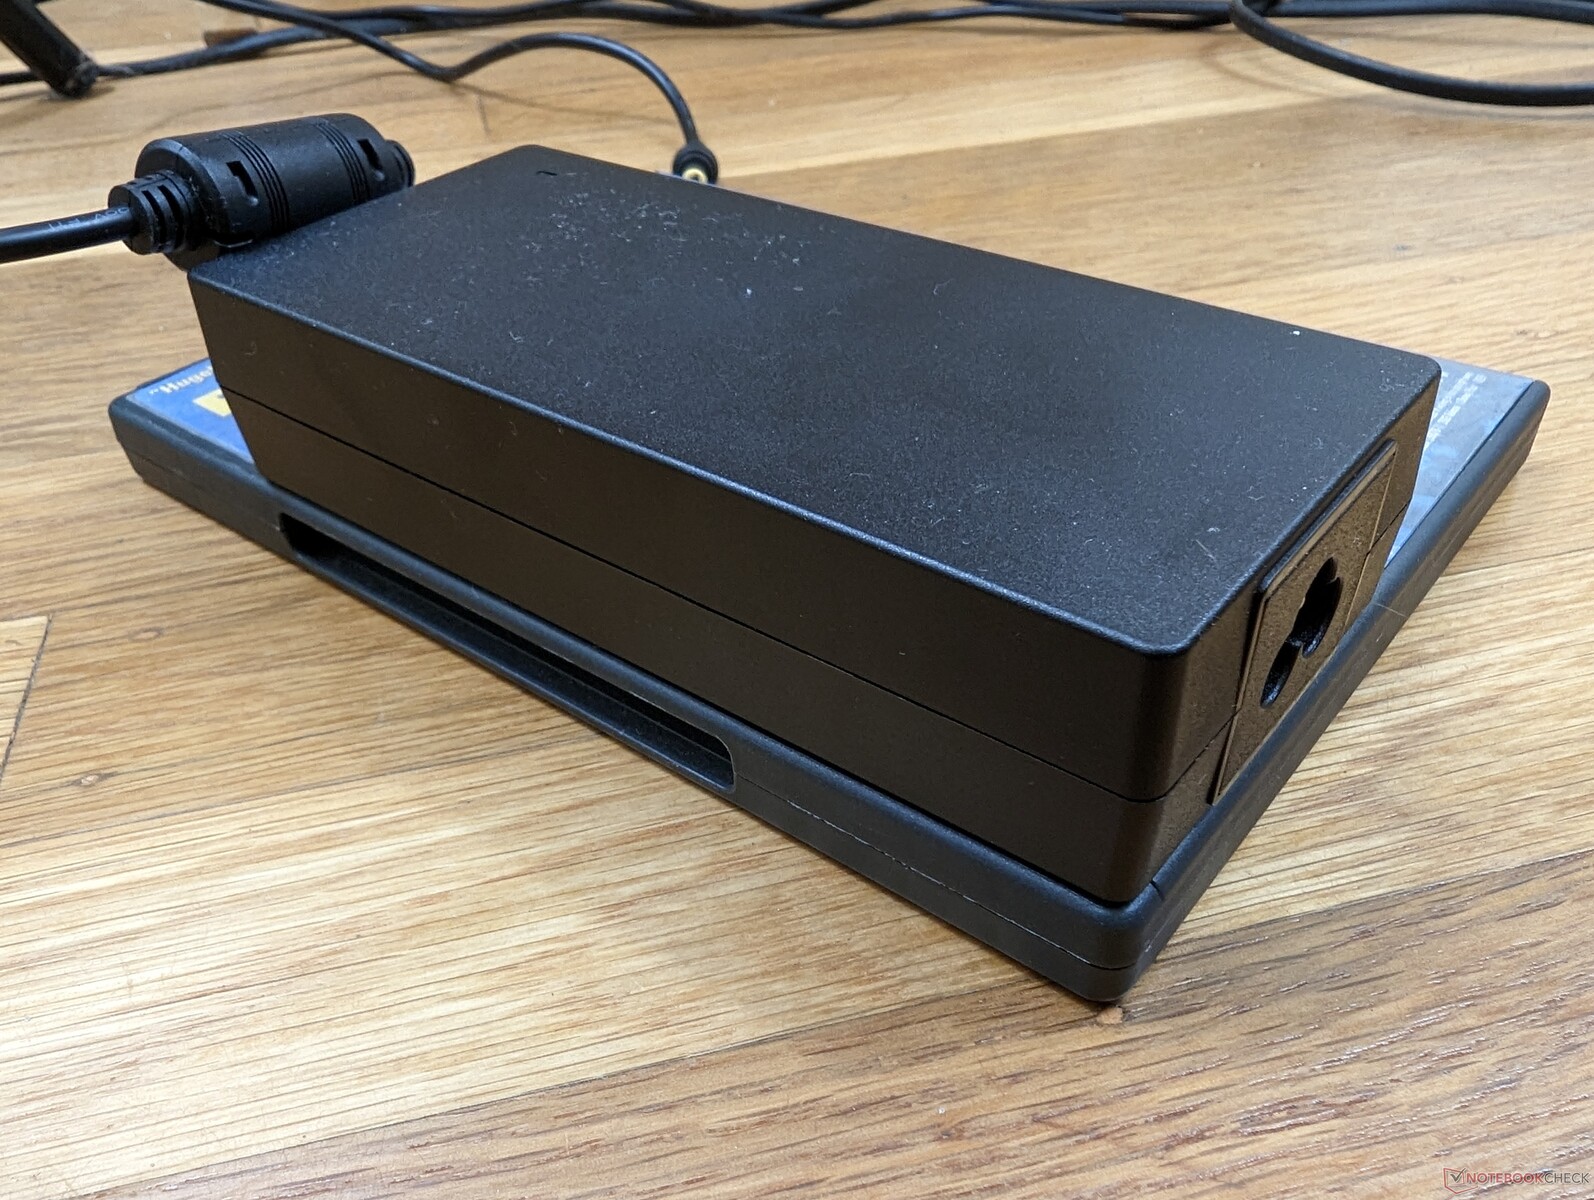
Las opciones de puerto y la posición son idénticas a las del SER5 Pro, pero con una mejora notable: el puerto RJ-45 admite ahora velocidades de 2,5 Gbps en lugar de solo 1 Gbps. El sistema también se puede alimentar con adaptadores de CA USB-C de terceros en caso de que pierda el adaptador propietario que viene en la caja. Nuestro adaptador de CA de 130 W que viene con el Dell XPS 17por ejemplo, alimentaría nuestro SER6 Pro sin problemas.
Comunicación
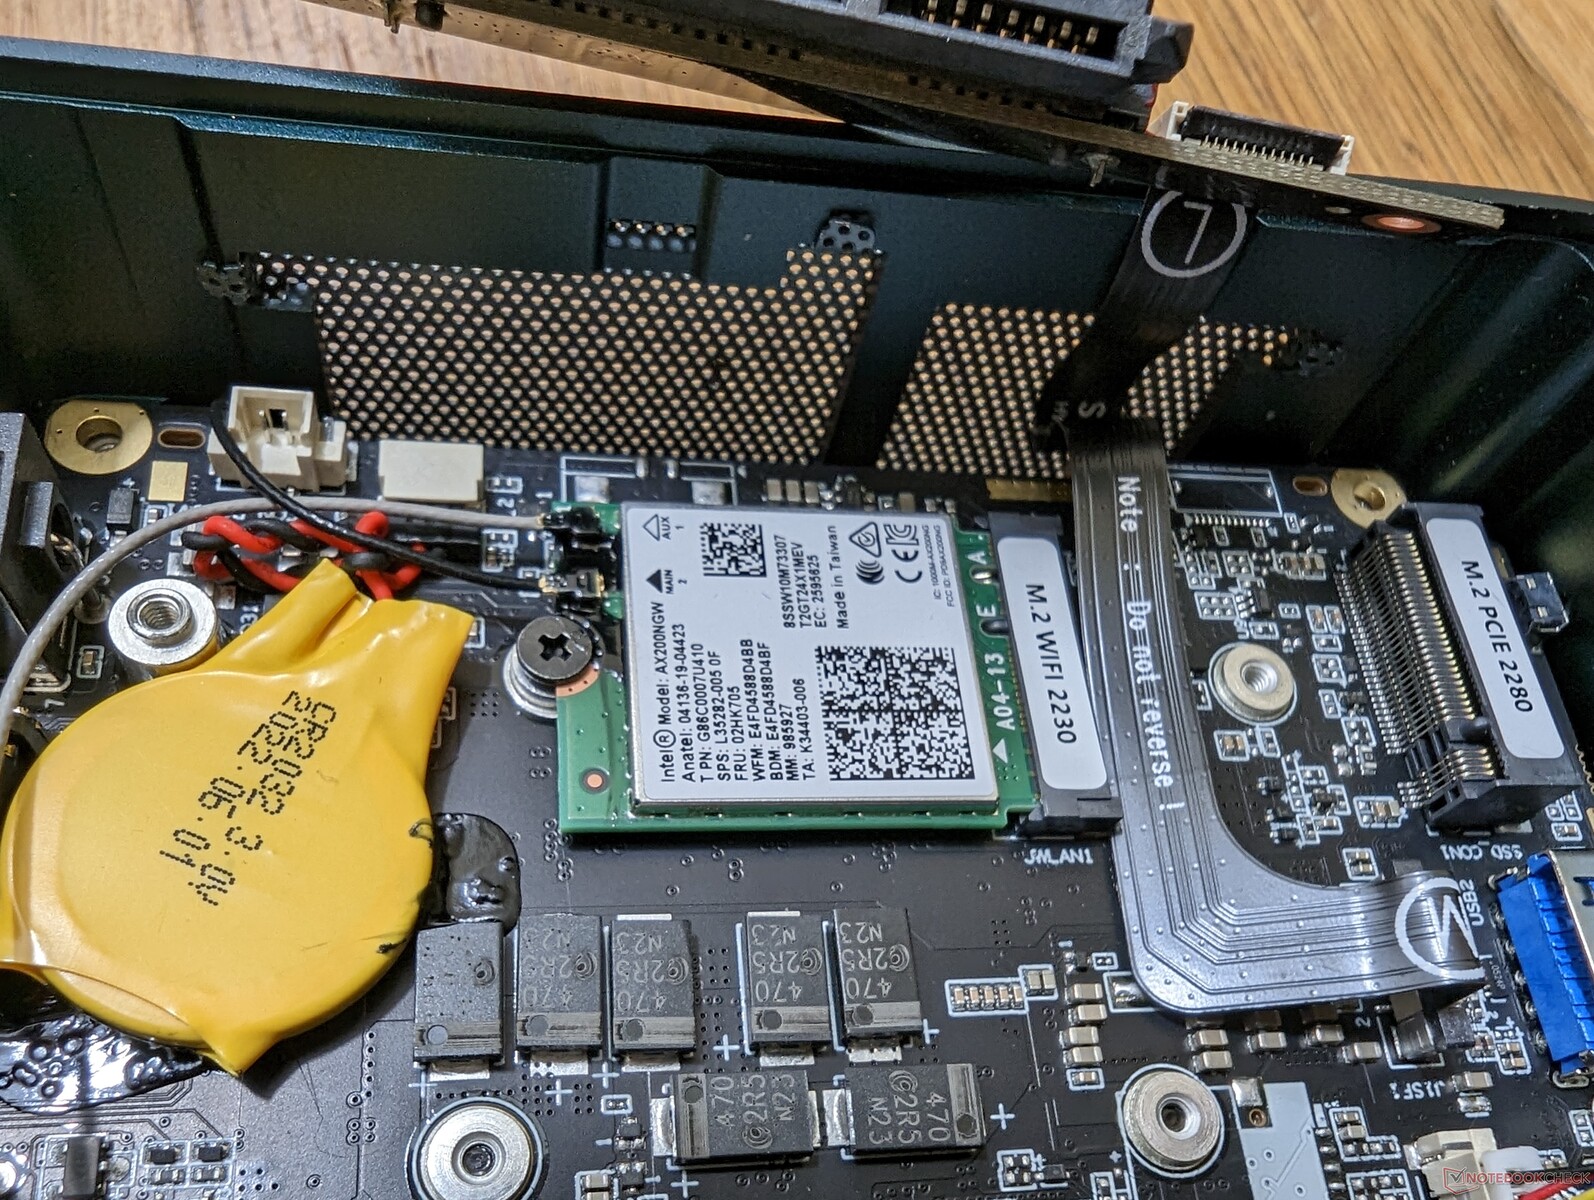
Beelink ha sustituido el MediaTek RZ608 del SER5 Pro por el módulo Intel AX200, más habitual. Este módulo Intel en particular no tiene capacidades Wi-Fi 6E, pero las velocidades de transferencia son rápidas, con una media de 1200 Mbps cuando se combina con nuestro router de prueba Asus AXE11000.
| Networking | |
| iperf3 transmit AX12 | |
| Intel NUC11PHKi7C | |
| Intel Hades Canyon NUC8i7HVK | |
| iperf3 receive AX12 | |
| Intel NUC11PHKi7C | |
| Intel Hades Canyon NUC8i7HVK | |
| iperf3 receive AXE11000 6GHz | |
| Intel NUC 12 Pro Kit NUC12WSKi7 | |
| Beelink GTR6 | |
| Beelink SEi11 Pro | |
| iperf3 receive AXE11000 | |
| Beelink SER6 Pro | |
| Beelink GTR6 | |
| iperf3 transmit AXE11000 | |
| Beelink SER6 Pro | |
| Beelink GTR6 | |
| iperf3 transmit AXE11000 6GHz | |
| Beelink GTR6 | |
| Intel NUC 12 Pro Kit NUC12WSKi7 | |
| Beelink SEi11 Pro | |
Mantenimiento
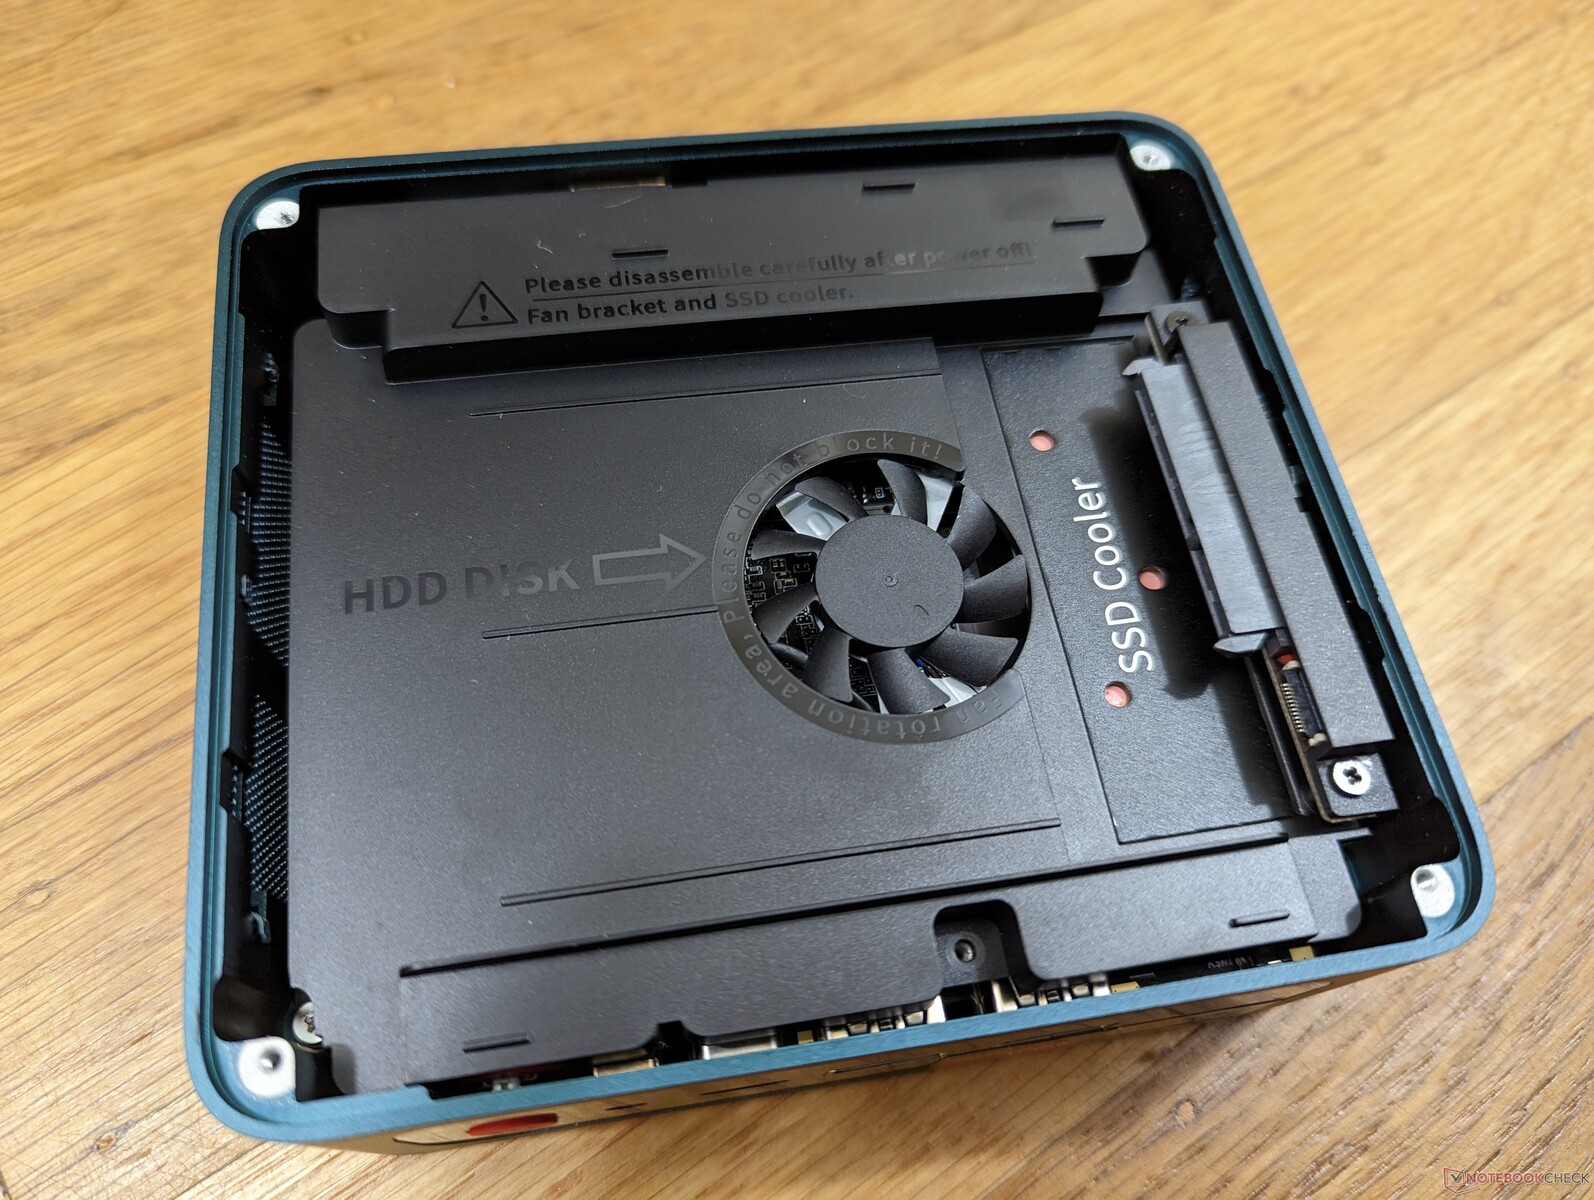
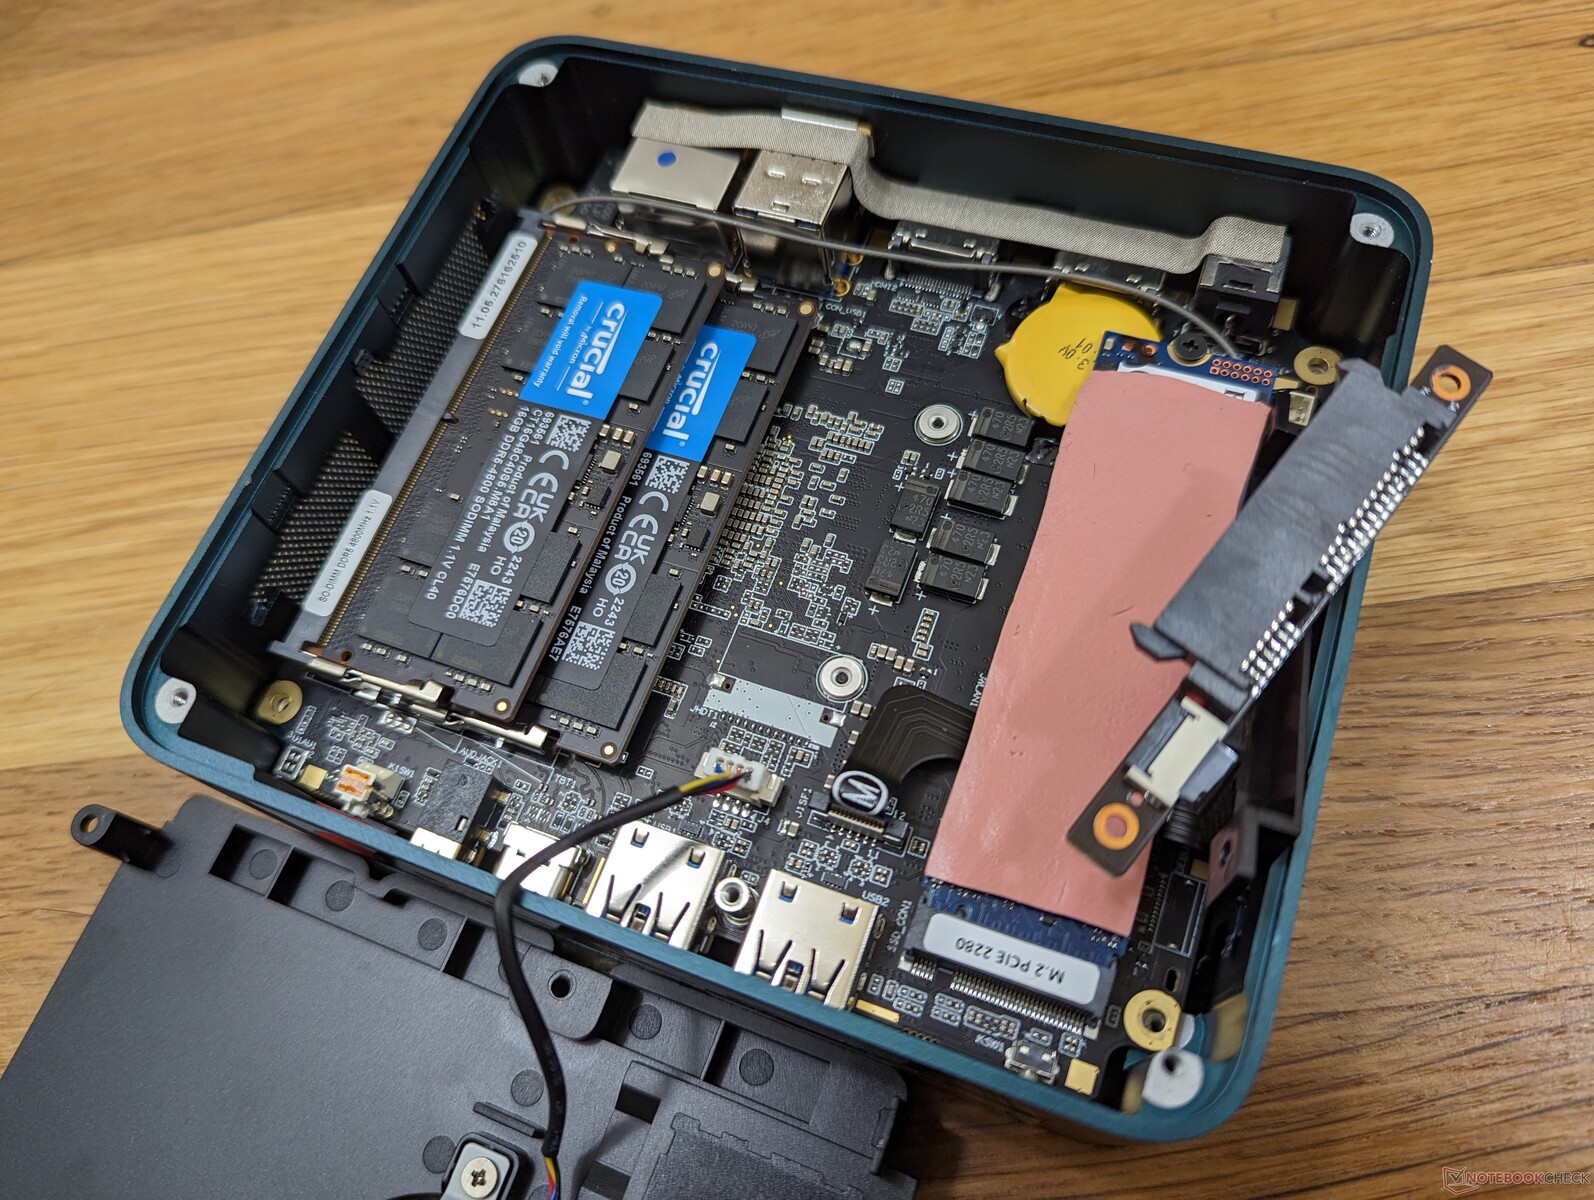
Las ampliaciones de RAM y almacenamiento son sencillas y sólo requieren un destornillador Philips. Los usuarios pueden instalar hasta dos módulos de RAM SODIMM y dos unidades (1x M.2 PCIe4 x4 + 1x SATA III de 2,5 pulgadas).
Accesorios y garantía
La caja incluye dos cables HDMI, un soporte de montaje VESA extraíble, cubiertas superiores de tela negra y roja, adaptador de CA y documentación. Si se adquiere en EE.UU., se aplica la garantía limitada de un año habitual del fabricante.
Rendimiento
Condiciones de ensayo
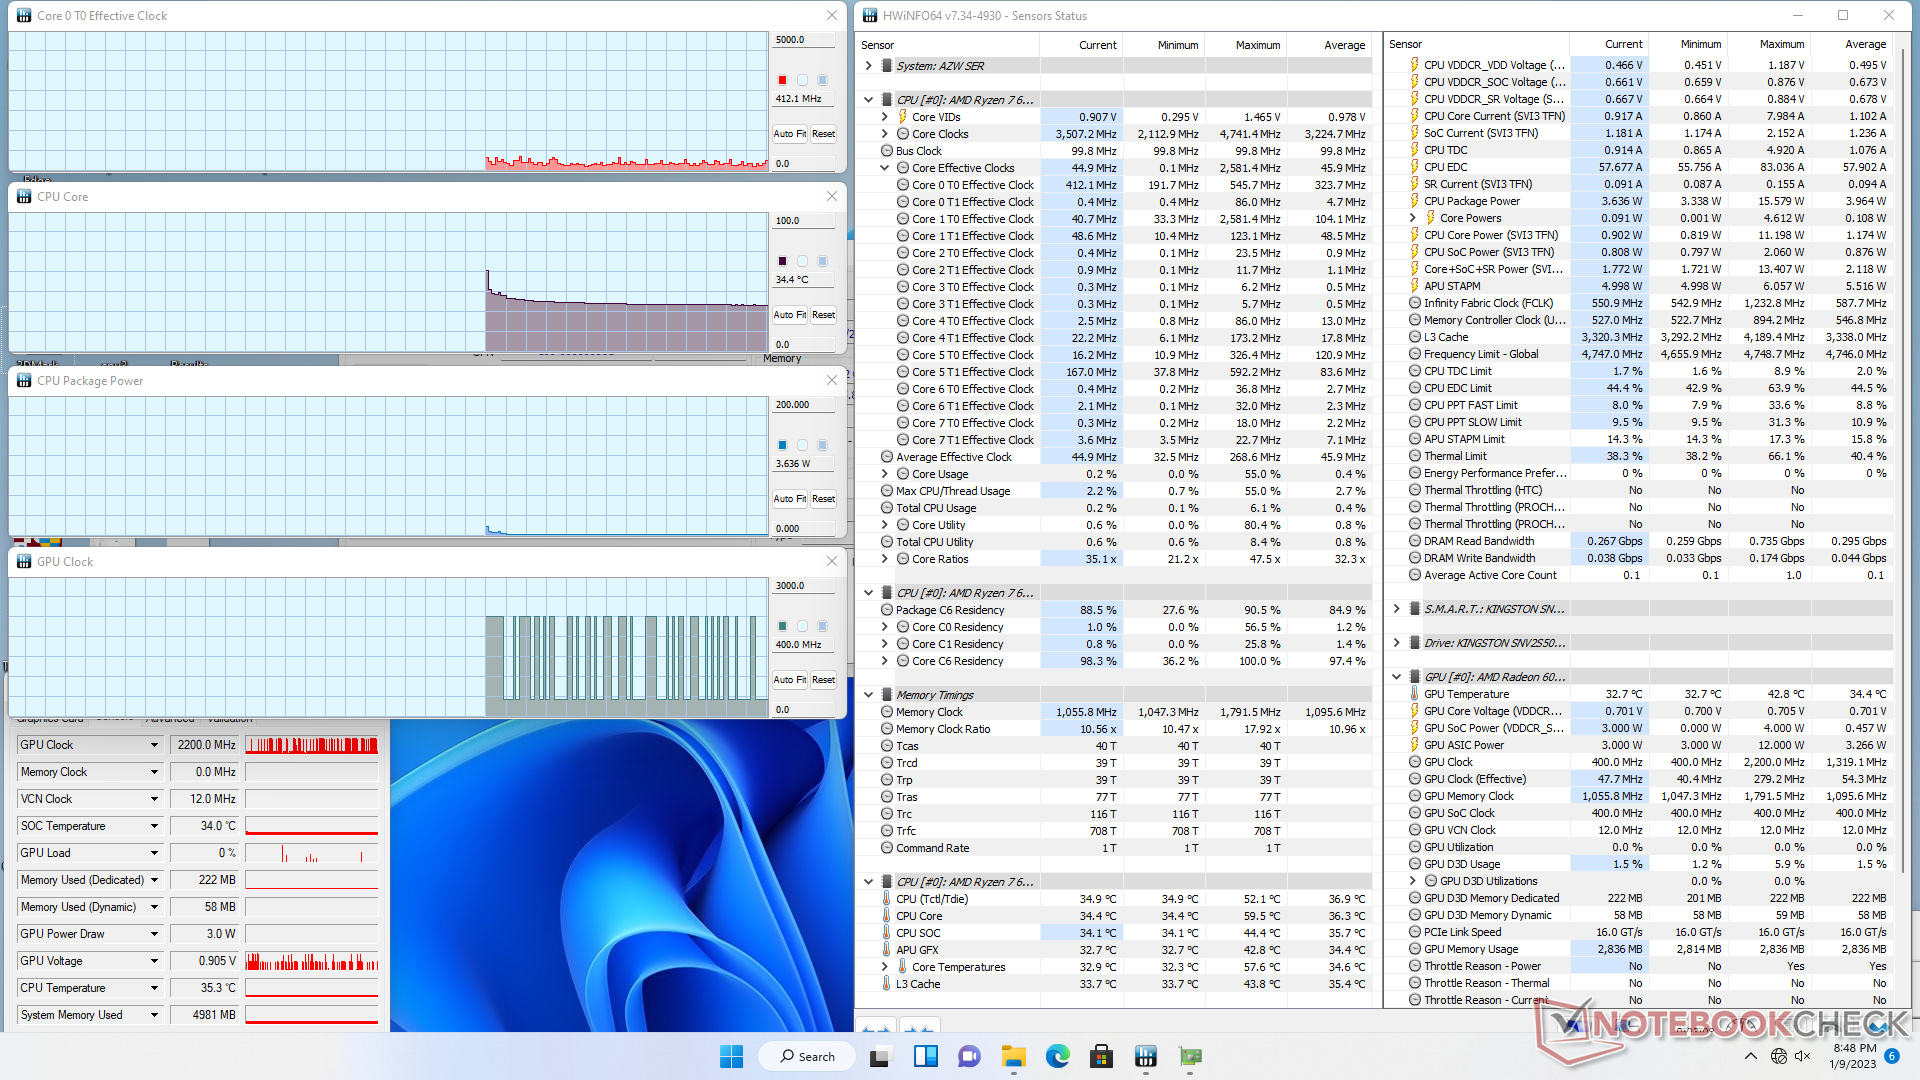
Configuramos nuestra unidad en modo Rendimiento antes de ejecutar las pruebas de rendimiento que se indican a continuación. No hay aplicaciones de tipo centro de control preinstaladas.
Procesador
El rendimiento bruto del procesador es casi idéntico al de la generación anterior Ryzen 7 5800H. El rendimiento de un solo subproceso puede ser hasta un 5% más rápido, pero las diferencias son marginales en el mejor de los casos. En cambio, la mayor mejora entre las dos CPUs se relaciona con sus GPUs integradas, como demostrará nuestra sección de GPU a continuación.
Cinebench R15 Multi Loop
Cinebench R23: Multi Core | Single Core
Cinebench R15: CPU Multi 64Bit | CPU Single 64Bit
Blender: v2.79 BMW27 CPU
7-Zip 18.03: 7z b 4 | 7z b 4 -mmt1
Geekbench 5.5: Multi-Core | Single-Core
HWBOT x265 Benchmark v2.2: 4k Preset
LibreOffice : 20 Documents To PDF
R Benchmark 2.5: Overall mean
Cinebench R23: Multi Core | Single Core
Cinebench R15: CPU Multi 64Bit | CPU Single 64Bit
Blender: v2.79 BMW27 CPU
7-Zip 18.03: 7z b 4 | 7z b 4 -mmt1
Geekbench 5.5: Multi-Core | Single-Core
HWBOT x265 Benchmark v2.2: 4k Preset
LibreOffice : 20 Documents To PDF
R Benchmark 2.5: Overall mean
* ... más pequeño es mejor
AIDA64: FP32 Ray-Trace | FPU Julia | CPU SHA3 | CPU Queen | FPU SinJulia | FPU Mandel | CPU AES | CPU ZLib | FP64 Ray-Trace | CPU PhotoWorxx
| Performance rating | |
| Medio AMD Ryzen 7 6800H | |
| Beelink GTR6 | |
| Beelink SER6 Pro | |
| Intel NUC 12 Pro Kit NUC12WSKi7 | |
| Intel NUC11PHKi7C | |
| Beelink SEi11 Pro | |
| AIDA64 / FP32 Ray-Trace | |
| Medio AMD Ryzen 7 6800H (12876 - 17031, n=8) | |
| Beelink GTR6 | |
| Beelink SER6 Pro | |
| Intel NUC 12 Pro Kit NUC12WSKi7 | |
| Intel NUC11PHKi7C | |
| Beelink SEi11 Pro | |
| AIDA64 / FPU Julia | |
| Medio AMD Ryzen 7 6800H (82673 - 105987, n=8) | |
| Beelink GTR6 | |
| Beelink SER6 Pro | |
| Intel NUC 12 Pro Kit NUC12WSKi7 | |
| Intel NUC11PHKi7C | |
| Beelink SEi11 Pro | |
| AIDA64 / CPU SHA3 | |
| Medio AMD Ryzen 7 6800H (2886 - 3634, n=8) | |
| Beelink GTR6 | |
| Beelink SER6 Pro | |
| Intel NUC 12 Pro Kit NUC12WSKi7 | |
| Intel NUC11PHKi7C | |
| Beelink SEi11 Pro | |
| AIDA64 / CPU Queen | |
| Medio AMD Ryzen 7 6800H (75117 - 106322, n=8) | |
| Beelink GTR6 | |
| Beelink SER6 Pro | |
| Intel NUC 12 Pro Kit NUC12WSKi7 | |
| Intel NUC11PHKi7C | |
| Beelink SEi11 Pro | |
| AIDA64 / FPU SinJulia | |
| Medio AMD Ryzen 7 6800H (11771 - 13120, n=8) | |
| Beelink GTR6 | |
| Beelink SER6 Pro | |
| Intel NUC 12 Pro Kit NUC12WSKi7 | |
| Intel NUC11PHKi7C | |
| Beelink SEi11 Pro | |
| AIDA64 / FPU Mandel | |
| Medio AMD Ryzen 7 6800H (45287 - 58327, n=8) | |
| Beelink GTR6 | |
| Beelink SER6 Pro | |
| Intel NUC 12 Pro Kit NUC12WSKi7 | |
| Intel NUC11PHKi7C | |
| Beelink SEi11 Pro | |
| AIDA64 / CPU AES | |
| Beelink GTR6 | |
| Medio AMD Ryzen 7 6800H (67816 - 137383, n=8) | |
| Beelink SER6 Pro | |
| Intel NUC 12 Pro Kit NUC12WSKi7 | |
| Intel NUC11PHKi7C | |
| Beelink SEi11 Pro | |
| AIDA64 / CPU ZLib | |
| Medio AMD Ryzen 7 6800H (732 - 901, n=8) | |
| Beelink GTR6 | |
| Beelink SER6 Pro | |
| Intel NUC 12 Pro Kit NUC12WSKi7 | |
| Intel NUC11PHKi7C | |
| Beelink SEi11 Pro | |
| AIDA64 / FP64 Ray-Trace | |
| Medio AMD Ryzen 7 6800H (6917 - 8980, n=8) | |
| Beelink GTR6 | |
| Beelink SER6 Pro | |
| Intel NUC 12 Pro Kit NUC12WSKi7 | |
| Intel NUC11PHKi7C | |
| Beelink SEi11 Pro | |
| AIDA64 / CPU PhotoWorxx | |
| Beelink GTR6 | |
| Beelink SER6 Pro | |
| Medio AMD Ryzen 7 6800H (26496 - 30360, n=8) | |
| Intel NUC 12 Pro Kit NUC12WSKi7 | |
| Intel NUC11PHKi7C | |
| Beelink SEi11 Pro | |
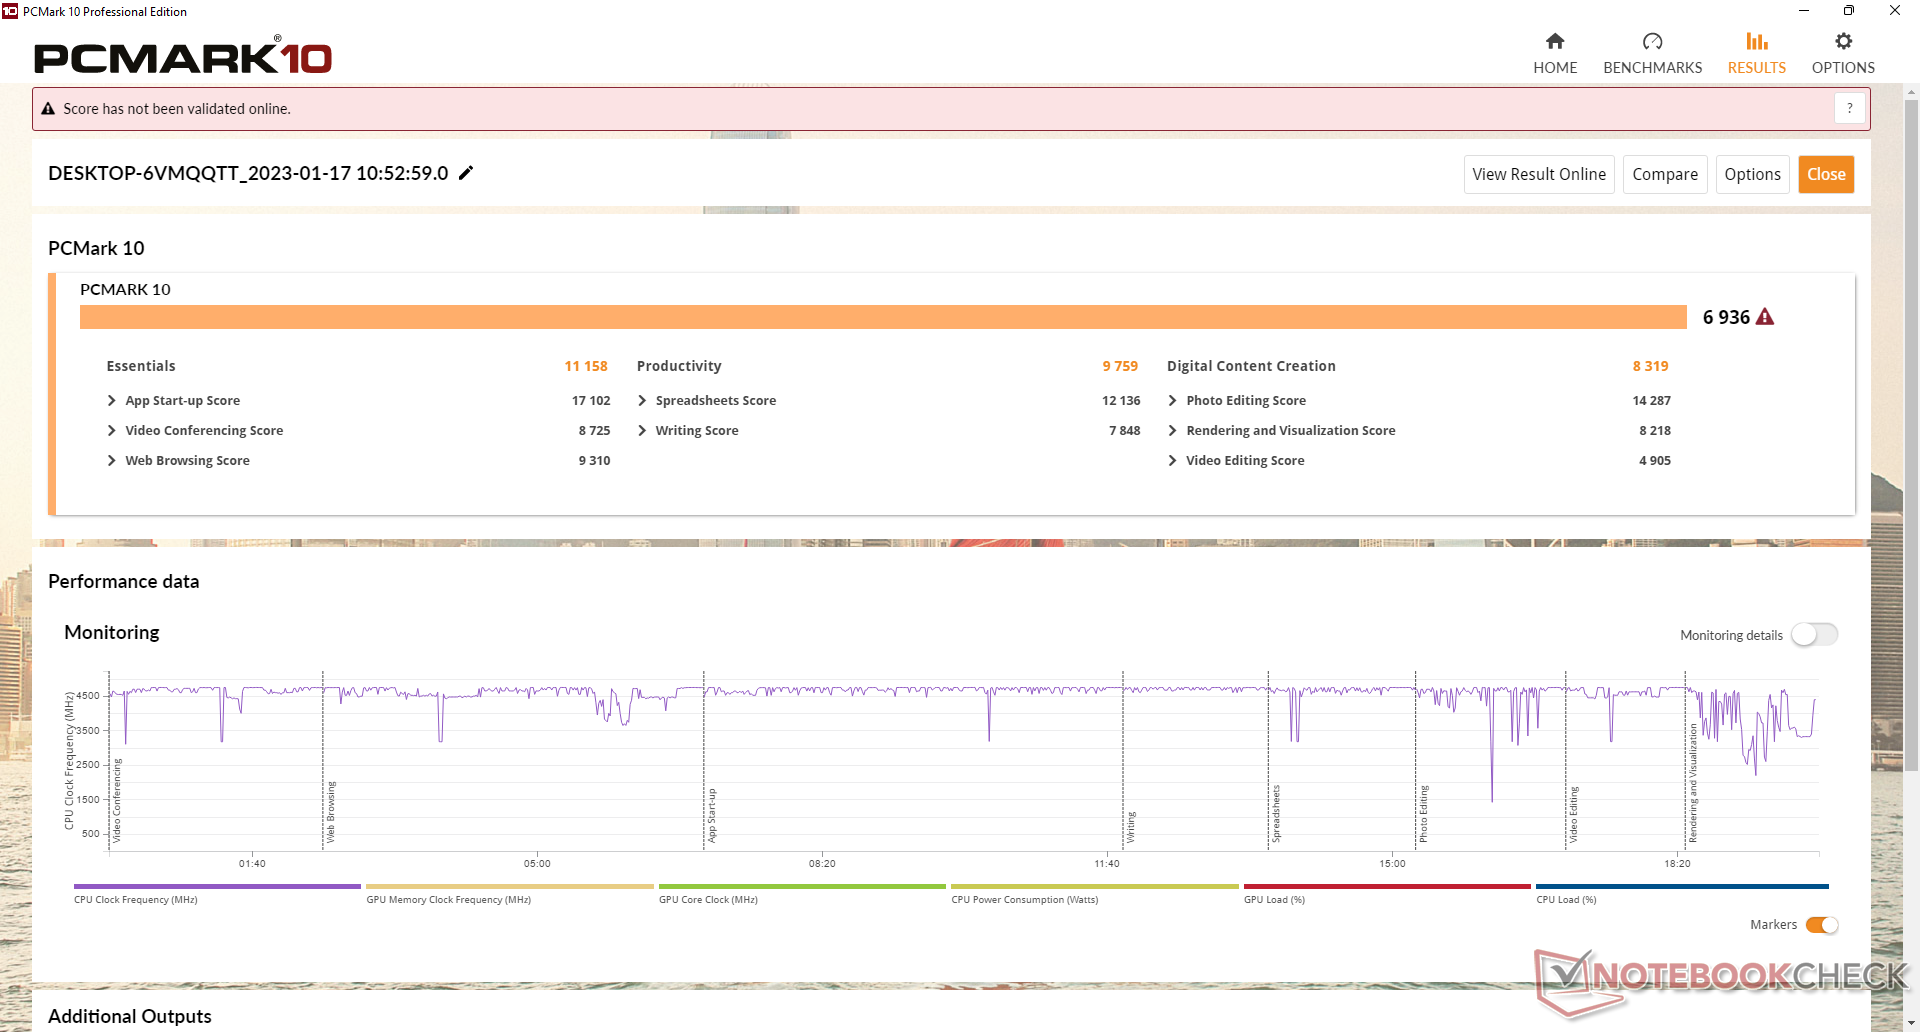
Rendimiento del sistema
Los resultados de PCMark son de los más altos para un mini PC sin gráficos dedicados. Las altas puntuaciones se atribuyen a la nueva Radeon 680M que supone un salto sustancial respecto a la antigua serie integrada Radeon RX Vega o Serie Iris Xe.
CrossMark: Overall | Productivity | Creativity | Responsiveness
| PCMark 10 / Score | |
| Beelink GTR6 | |
| Beelink SER6 Pro | |
| Medio AMD Ryzen 7 6800H, AMD Radeon 680M (6591 - 6936, n=4) | |
| Intel NUC11PHKi7C | |
| Intel NUC 12 Pro Kit NUC12WSKi7 | |
| Beelink SER Pro Ryzen 5 5600H | |
| Intel Hades Canyon NUC8i7HVK | |
| Beelink SEi11 Pro | |
| PCMark 10 / Essentials | |
| Beelink GTR6 | |
| Beelink SER6 Pro | |
| Intel NUC 12 Pro Kit NUC12WSKi7 | |
| Medio AMD Ryzen 7 6800H, AMD Radeon 680M (10381 - 11158, n=4) | |
| Beelink SER Pro Ryzen 5 5600H | |
| Beelink SEi11 Pro | |
| Intel NUC11PHKi7C | |
| Intel Hades Canyon NUC8i7HVK | |
| PCMark 10 / Productivity | |
| Beelink GTR6 | |
| Beelink SER6 Pro | |
| Medio AMD Ryzen 7 6800H, AMD Radeon 680M (9140 - 9759, n=4) | |
| Beelink SER Pro Ryzen 5 5600H | |
| Intel NUC11PHKi7C | |
| Intel Hades Canyon NUC8i7HVK | |
| Intel NUC 12 Pro Kit NUC12WSKi7 | |
| Beelink SEi11 Pro | |
| PCMark 10 / Digital Content Creation | |
| Beelink GTR6 | |
| Medio AMD Ryzen 7 6800H, AMD Radeon 680M (8092 - 8485, n=4) | |
| Beelink SER6 Pro | |
| Intel NUC11PHKi7C | |
| Intel NUC 12 Pro Kit NUC12WSKi7 | |
| Beelink SER Pro Ryzen 5 5600H | |
| Intel Hades Canyon NUC8i7HVK | |
| Beelink SEi11 Pro | |
| CrossMark / Overall | |
| Beelink SER6 Pro | |
| Beelink GTR6 | |
| Intel NUC 12 Pro Kit NUC12WSKi7 | |
| Medio AMD Ryzen 7 6800H, AMD Radeon 680M (1590 - 1704, n=3) | |
| Beelink SEi11 Pro | |
| Beelink SER Pro Ryzen 5 5600H | |
| CrossMark / Productivity | |
| Beelink GTR6 | |
| Beelink SER6 Pro | |
| Intel NUC 12 Pro Kit NUC12WSKi7 | |
| Medio AMD Ryzen 7 6800H, AMD Radeon 680M (1566 - 1674, n=3) | |
| Beelink SEi11 Pro | |
| Beelink SER Pro Ryzen 5 5600H | |
| CrossMark / Creativity | |
| Intel NUC 12 Pro Kit NUC12WSKi7 | |
| Beelink SER6 Pro | |
| Medio AMD Ryzen 7 6800H, AMD Radeon 680M (1696 - 1763, n=3) | |
| Beelink GTR6 | |
| Beelink SER Pro Ryzen 5 5600H | |
| Beelink SEi11 Pro | |
| CrossMark / Responsiveness | |
| Beelink GTR6 | |
| Beelink SER6 Pro | |
| Medio AMD Ryzen 7 6800H, AMD Radeon 680M (1340 - 1625, n=3) | |
| Intel NUC 12 Pro Kit NUC12WSKi7 | |
| Beelink SEi11 Pro | |
| Beelink SER Pro Ryzen 5 5600H | |
| PCMark 10 Score | 6936 puntos | |
ayuda | ||
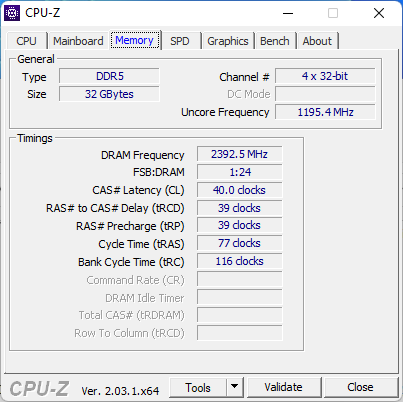
| AIDA64 / Memory Copy | |
| Beelink SER6 Pro | |
| Beelink GTR6 | |
| Medio AMD Ryzen 7 6800H (48209 - 51186, n=8) | |
| Intel NUC 12 Pro Kit NUC12WSKi7 | |
| Beelink SEi11 Pro | |
| Intel NUC11PHKi7C | |
| AIDA64 / Memory Read | |
| Beelink GTR6 | |
| Beelink SER6 Pro | |
| Medio AMD Ryzen 7 6800H (43828 - 51778, n=8) | |
| Intel NUC 12 Pro Kit NUC12WSKi7 | |
| Beelink SEi11 Pro | |
| Intel NUC11PHKi7C | |
| AIDA64 / Memory Write | |
| Beelink GTR6 | |
| Beelink SER6 Pro | |
| Medio AMD Ryzen 7 6800H (51116 - 55307, n=8) | |
| Beelink SEi11 Pro | |
| Intel NUC 12 Pro Kit NUC12WSKi7 | |
| Intel NUC11PHKi7C | |
| AIDA64 / Memory Latency | |
| Intel NUC 12 Pro Kit NUC12WSKi7 | |
| Intel NUC11PHKi7C | |
| Medio AMD Ryzen 7 6800H (83.1 - 104.1, n=8) | |
| Beelink SER6 Pro | |
| Beelink GTR6 | |
| Beelink SEi11 Pro | |
* ... más pequeño es mejor
Latencia del CPD
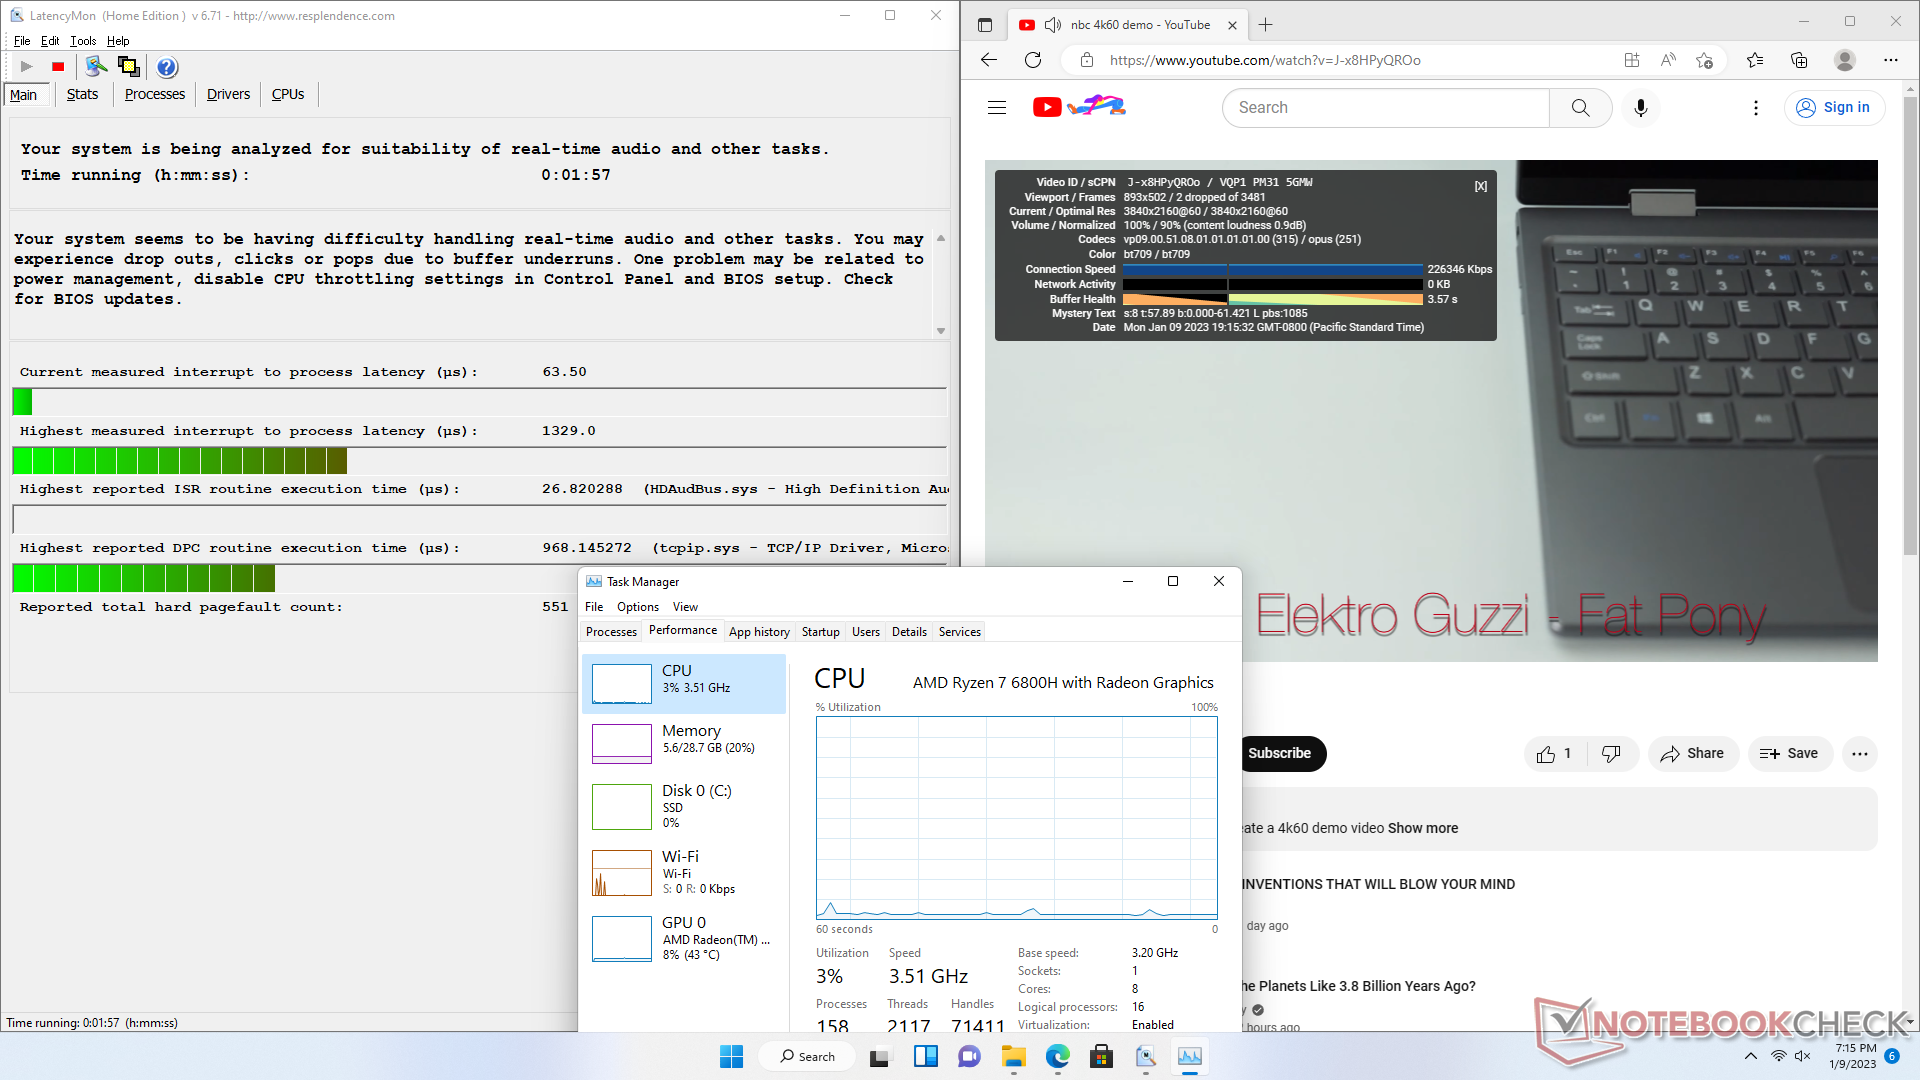
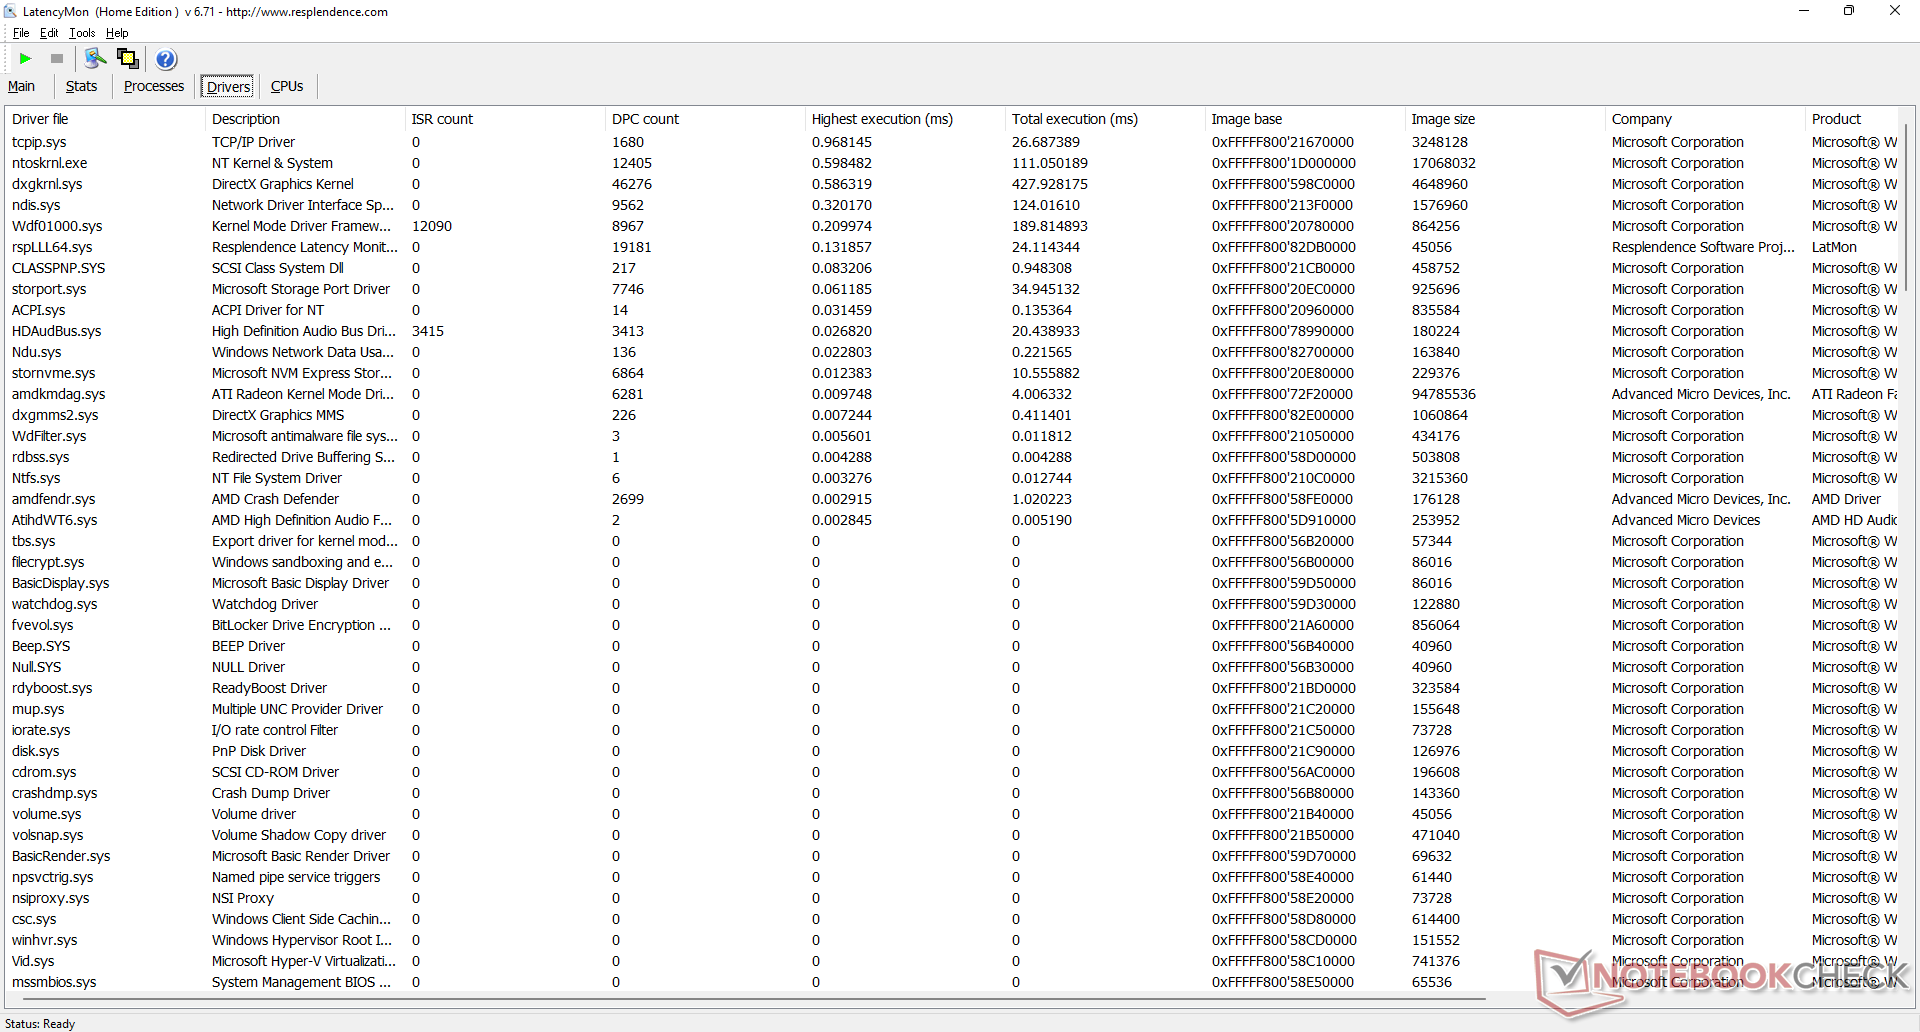
LatencyMon revela problemas de CPD al abrir varias pestañas de nuestra página de inicio. por lo demás, la reproducción de vídeo 4K a 60 FPS es fluida, con sólo dos fotogramas perdidos durante nuestro vídeo de prueba de un minuto.
| DPC Latencies / LatencyMon - interrupt to process latency (max), Web, Youtube, Prime95 | |
| Beelink SER6 Pro | |
| Intel NUC11PHKi7C | |
| Intel NUC 12 Pro Kit NUC12WSKi7 | |
| Beelink GTR6 | |
| Beelink SEi11 Pro | |
* ... más pequeño es mejor
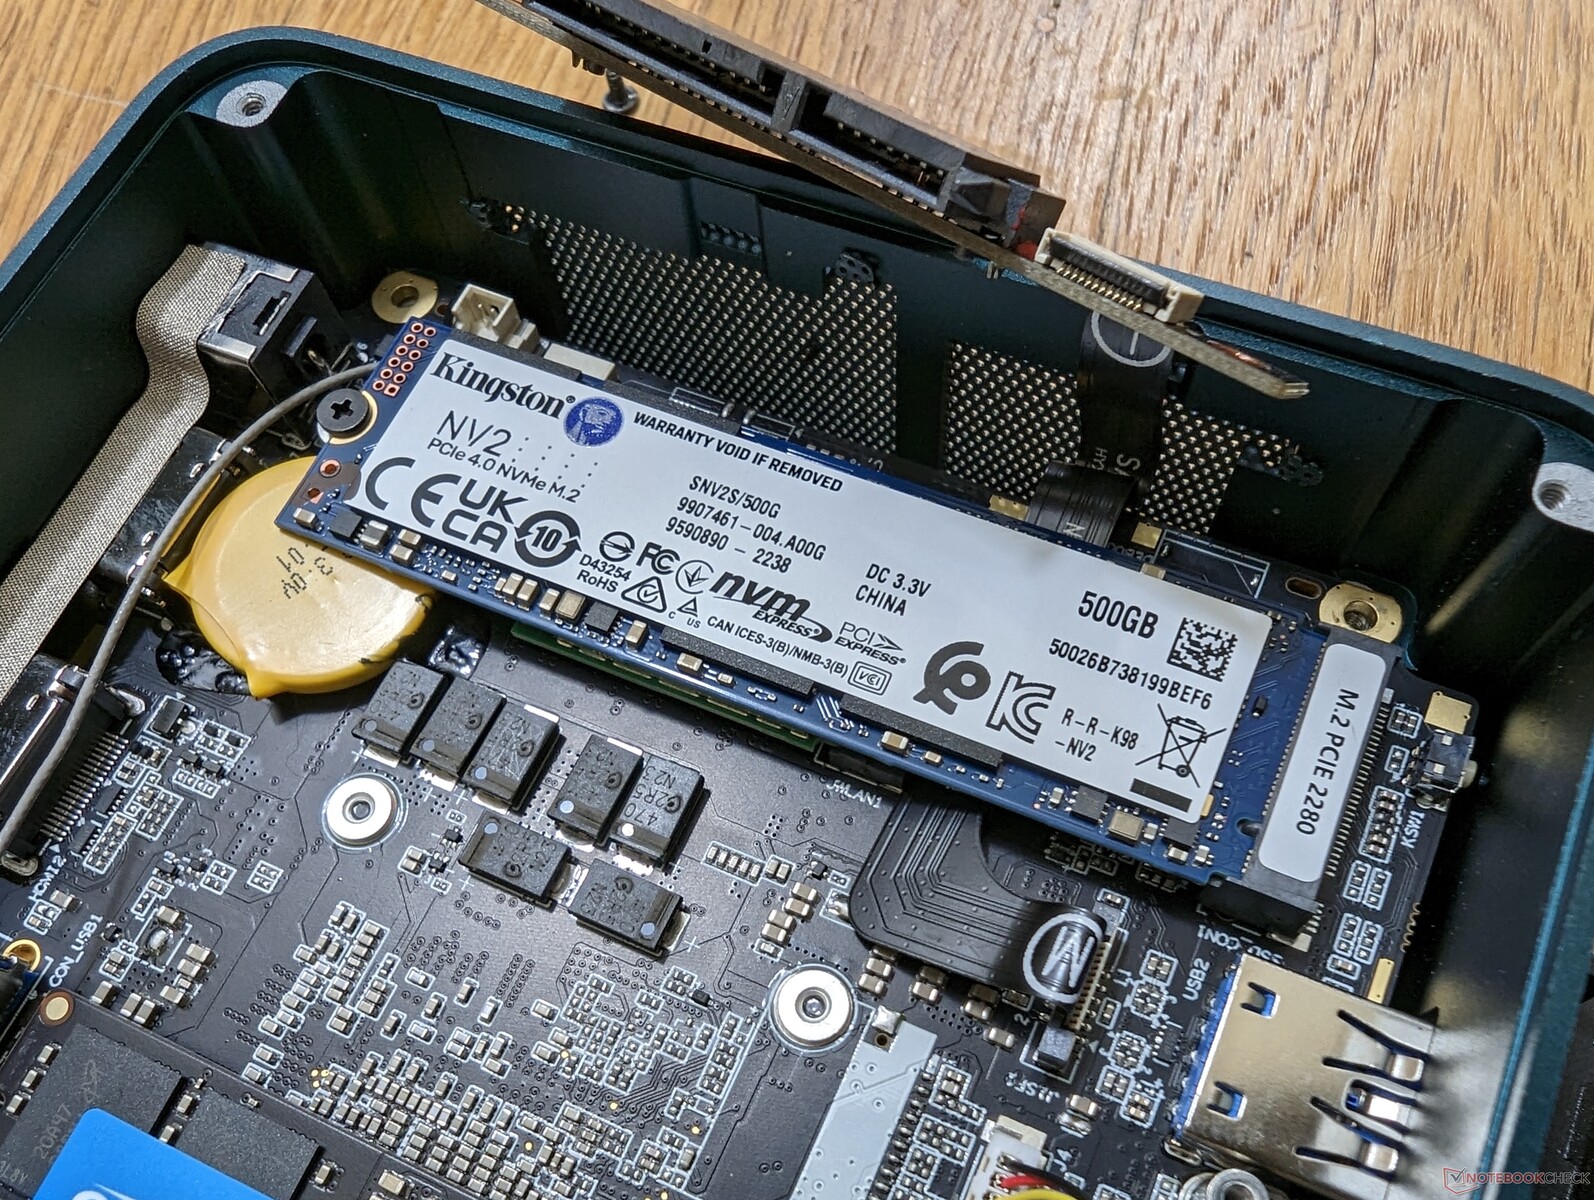
Dispositivos de almacenamiento
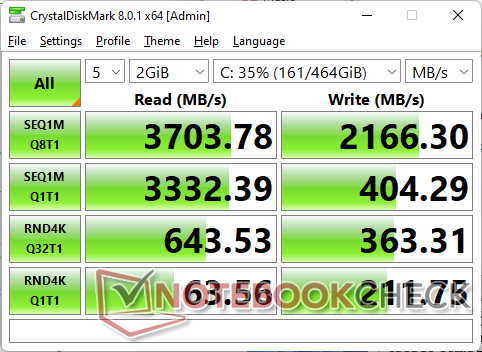
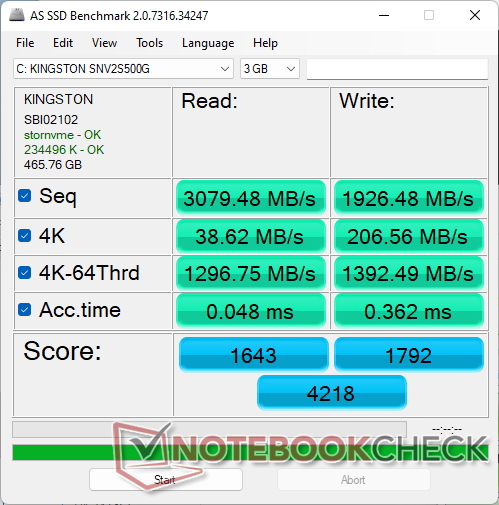
en Kingston SNV2S PCIe4 x4 SSD en nuestra unidad es una unidad NVMe de gama media con lectura secuencial y tasas de alrededor de 3700 MB/s y 2200 MB/s, respectivamente, en comparación con 5000 MB/s o más con alternativas como la Samsung PM9A1. La unidad entra en contacto con una placa metálica interior bajo la ranura SATA III de 2,5 pulgadas para disipar el calor.

| Drive Performance rating - Percent | |
| Beelink GTR6 | |
| Beelink SER6 Pro | |
| Intel Hades Canyon NUC8i7HVK -8! | |
| Intel NUC11PHKi7C | |
| Beelink SEi11 Pro | |
| Intel NUC 12 Pro Kit NUC12WSKi7 | |
* ... más pequeño es mejor
Disk Throttling: DiskSpd Read Loop, Queue Depth 8
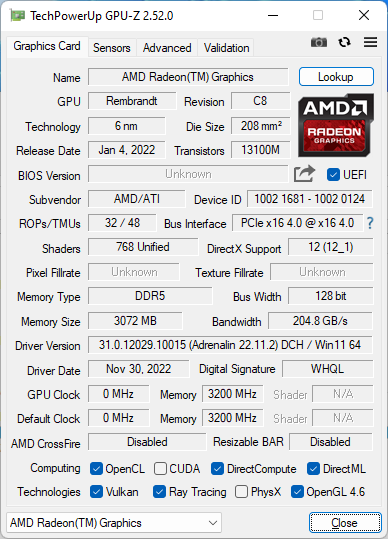
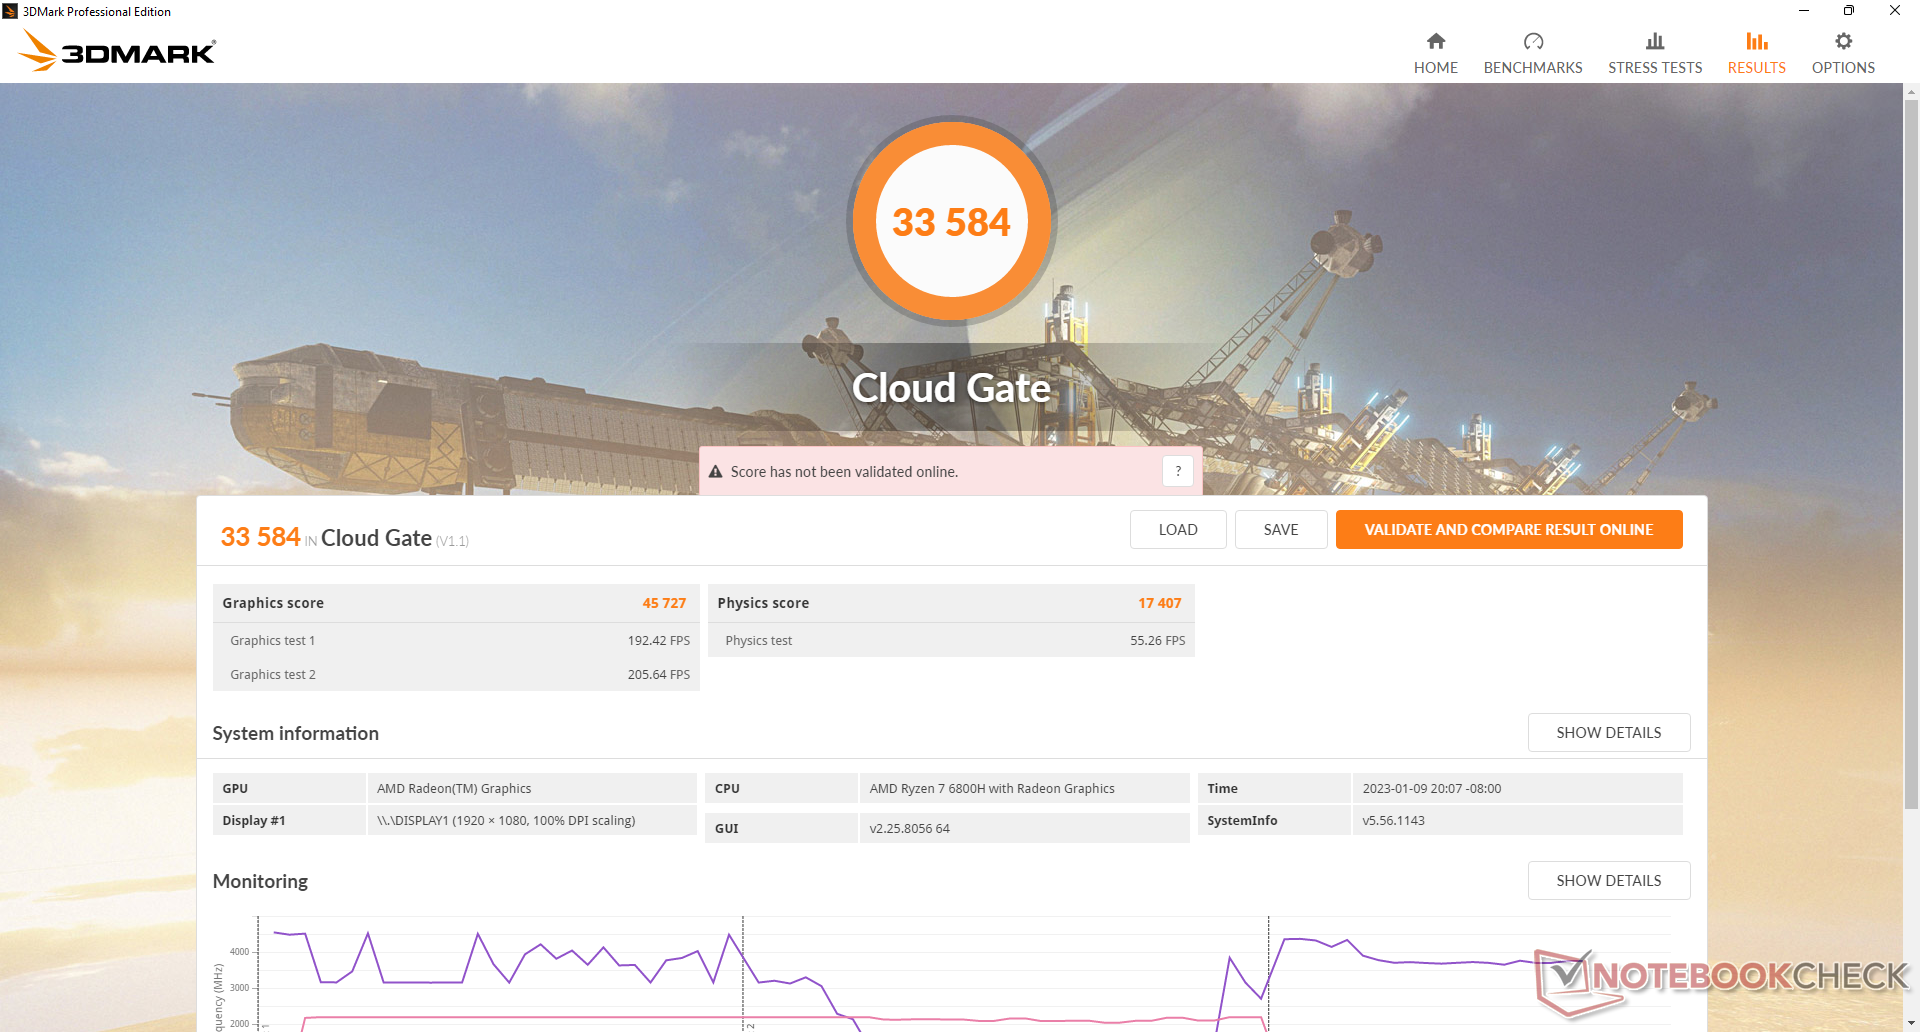
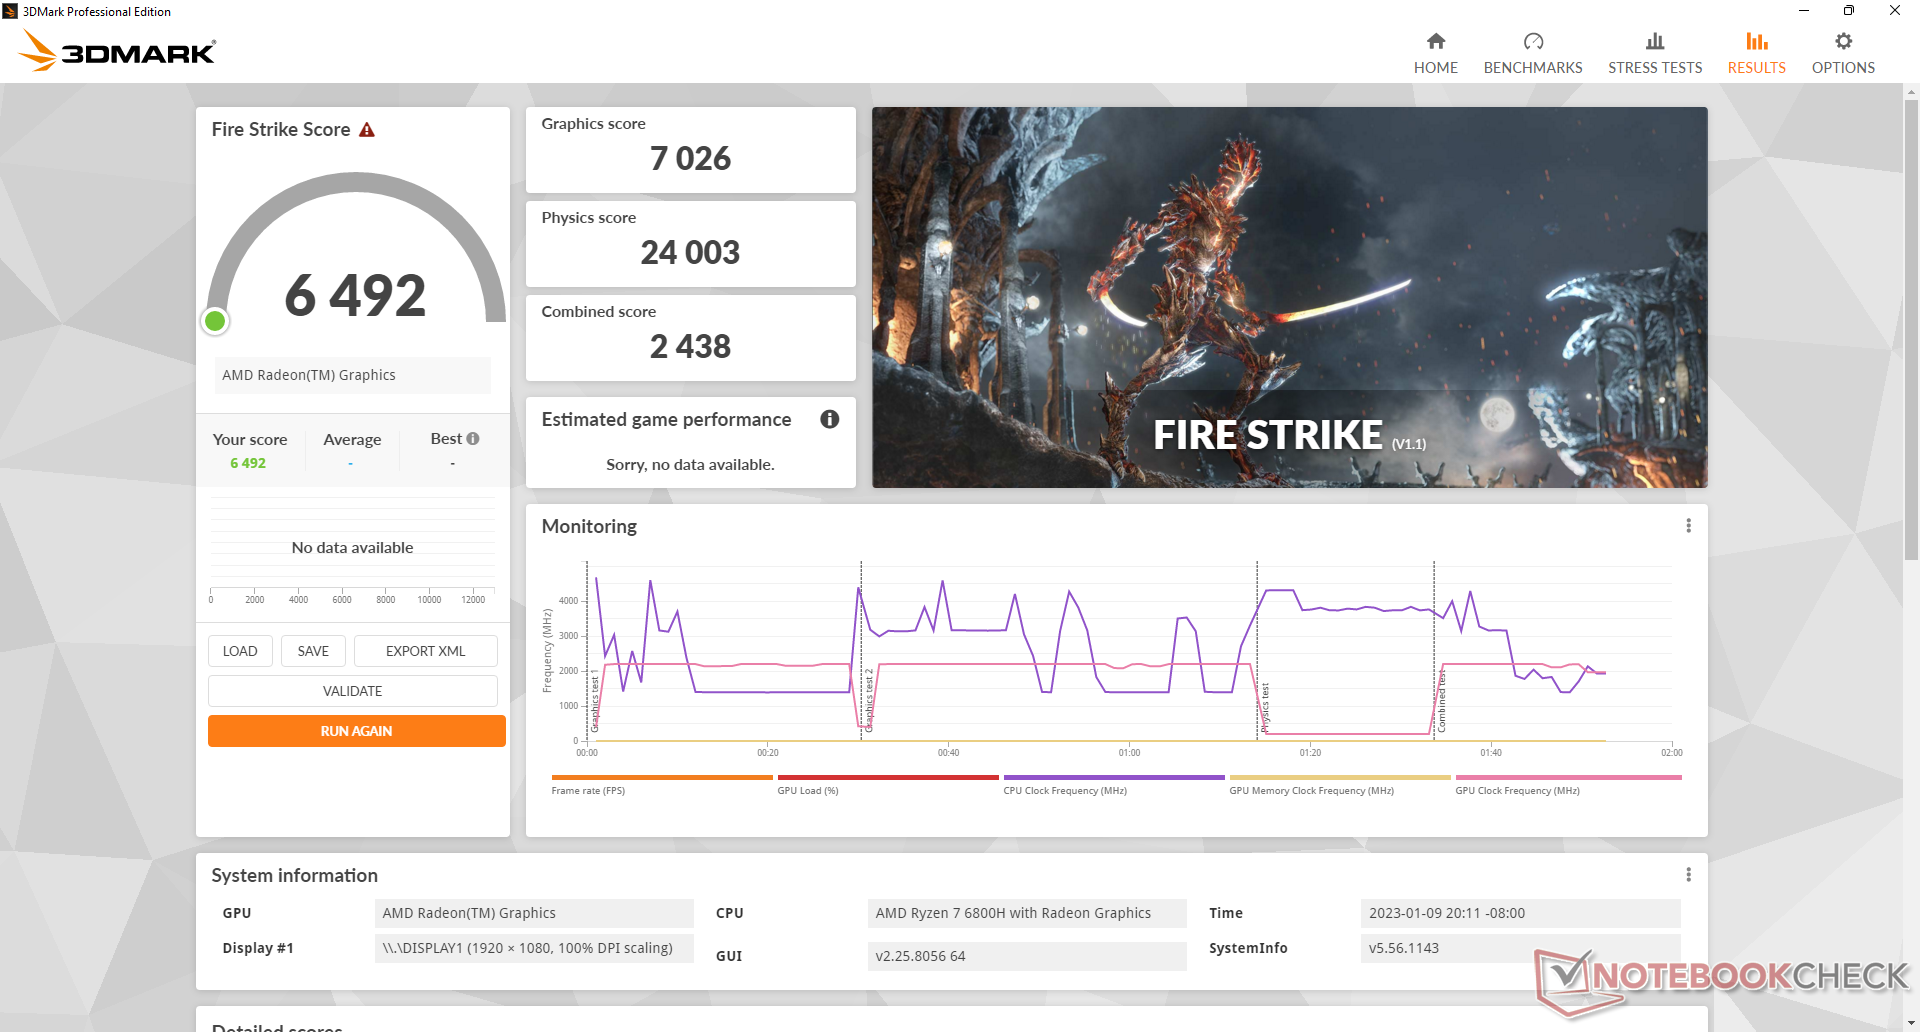
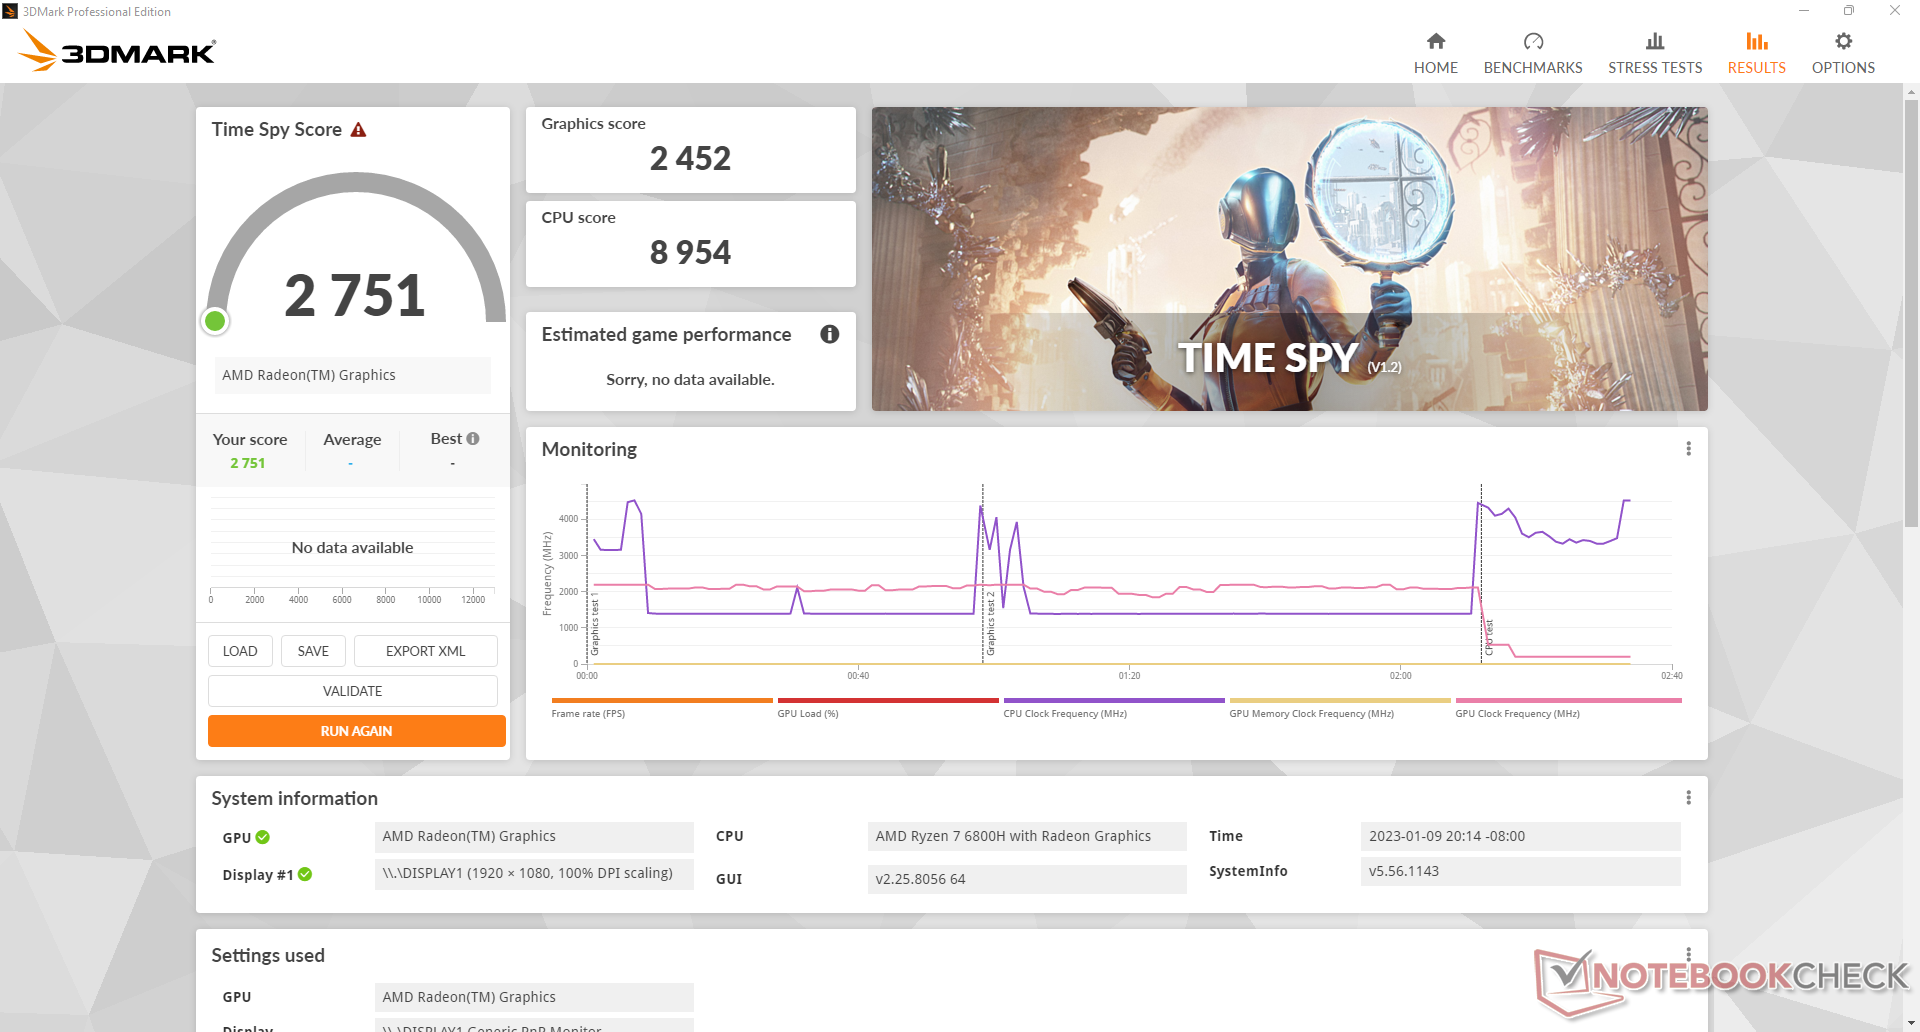
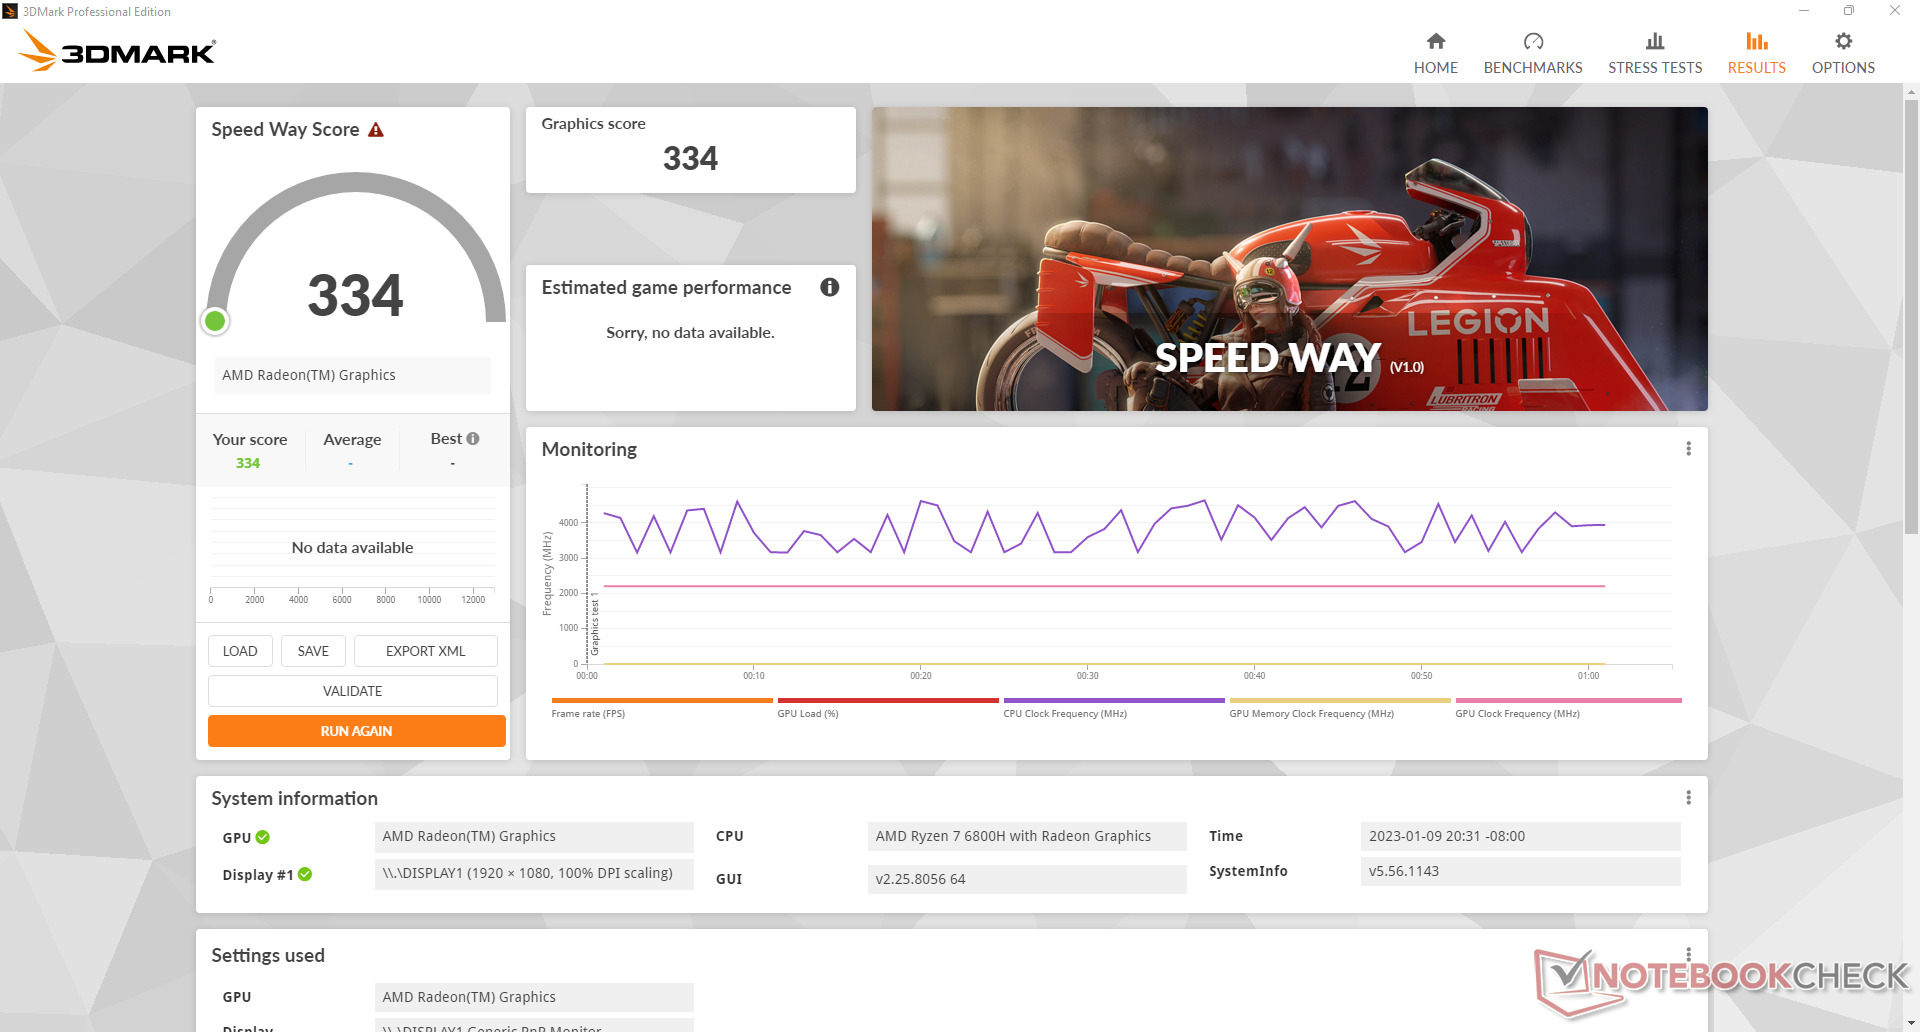
Rendimiento de la GPU
La tarjeta integrada Radeon 680M es una mejora significativa con respecto a la generación anterior Radeon RX Vega 7 o Vega 8 que se encuentran en el Ryzen 5 5600H o Ryzen 7 5800H, respectivamente. El rendimiento bruto es entre un 70% y un 100% más rápido, lo que mejora notablemente la experiencia de juego. Esto no quiere decir que la SER6 Pro sea una máquina de juegos, ya que sigue siendo 2 veces más lenta que un portátil equipado con GeForce Portátil con RTX 2060pero sigue teniendo potencia suficiente para ejecutar cómodamente la mayoría de juegos a 1080p con ajustes bajos o medios.
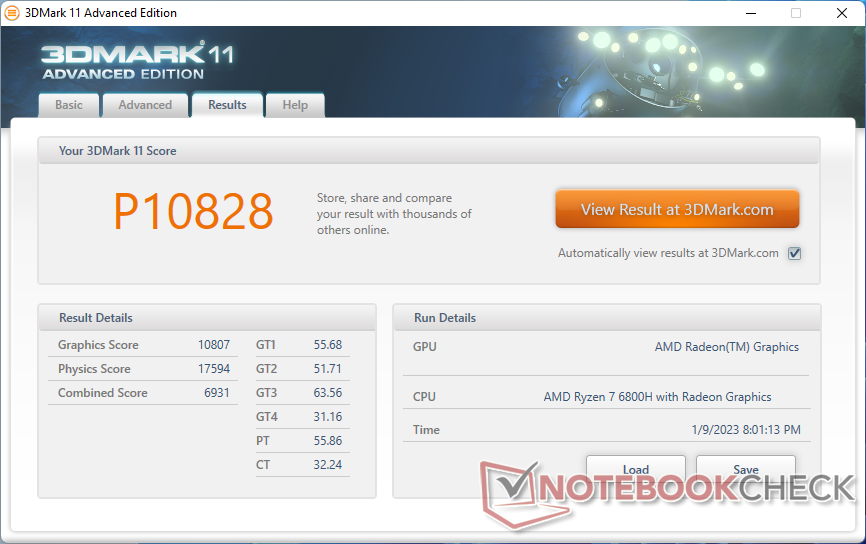
| 3DMark 11 Performance | 10825 puntos | |
| 3DMark Cloud Gate Standard Score | 33584 puntos | |
| 3DMark Fire Strike Score | 6492 puntos | |
| 3DMark Time Spy Score | 2751 puntos | |
ayuda | ||
* ... más pequeño es mejor
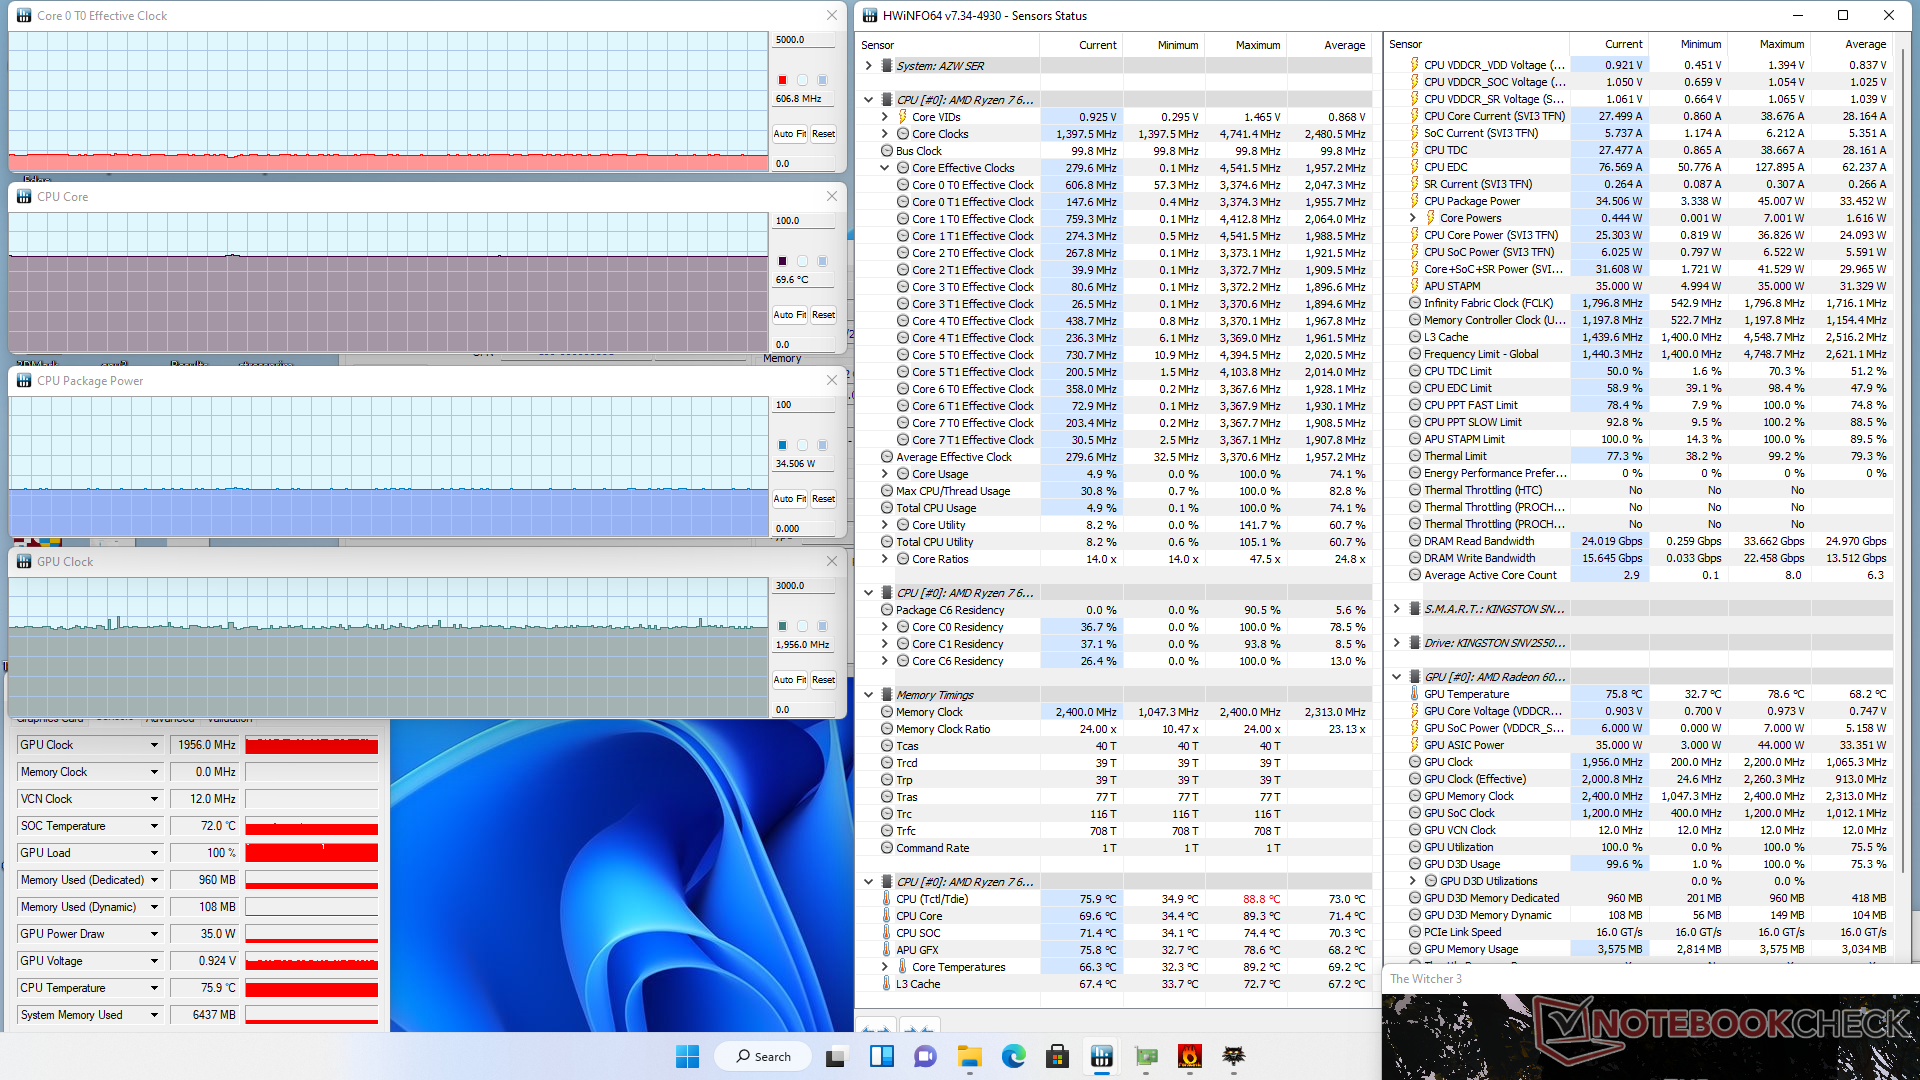
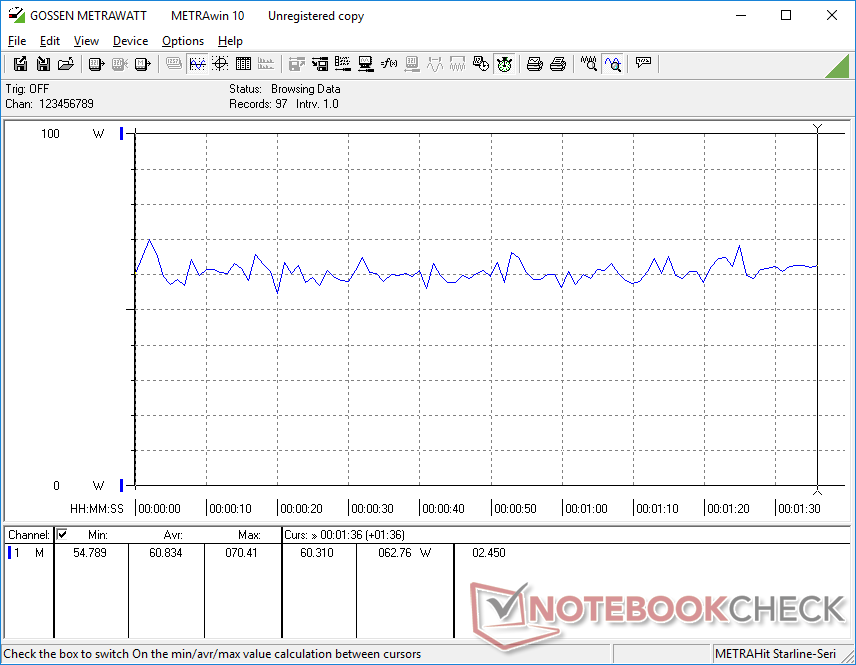
Nuestra unidad mostraba problemas para mantener la velocidad de fotogramas. En ralentí en Witcher 3la velocidad de fotogramas bajaba periódicamente de ~80 FPS a ~70 FPS sin motivo aparente. Incluso experimentamos una caída de hasta 18 FPS, como se muestra en el siguiente gráfico. La inestabilidad sugiere una interrupción de la actividad en segundo plano o una mala gestión de las aplicaciones en segundo plano.
Witcher 3 FPS Chart
| bajo | medio | alto | ultra | |
|---|---|---|---|---|
| GTA V (2015) | 152.3 | 139.7 | 51.9 | 23.7 |
| The Witcher 3 (2015) | 138.1 | 85.1 | 43.3 | 27 |
| Dota 2 Reborn (2015) | 143.3 | 113.4 | 83.9 | 73.1 |
| Final Fantasy XV Benchmark (2018) | 68.1 | 34.7 | 24.6 | |
| X-Plane 11.11 (2018) | 66.4 | 52.9 | 43 | |
| Strange Brigade (2018) | 141.9 | 57.8 | 48.6 | 41.9 |
| Cyberpunk 2077 1.6 (2022) | 43.3 | 33.1 | 21.3 | 17.2 |
Emisiones
Ruido del sistema
Los ventiladores internos son sensibles a las cargas en pantalla. Cuando se navega por la web o se hace streaming de vídeo, por ejemplo, el ruido del ventilador puede aumentar ocasionalmente hasta 33 dB(A) durante breves periodos. El ruido del ventilador también alcanzaría su máximo de unos 40 dB(A) más rápidamente que en la mayoría de otros mini PCs.
Experimentamos un ligero ruido electrónico o zumbido de bobina en nuestra unidad de pruebas. Así, pudimos registrar un ruido de 24,1 dB(A) contra un fondo silencioso de 22,8 dB(A) incluso cuando el ventilador estaba en reposo.
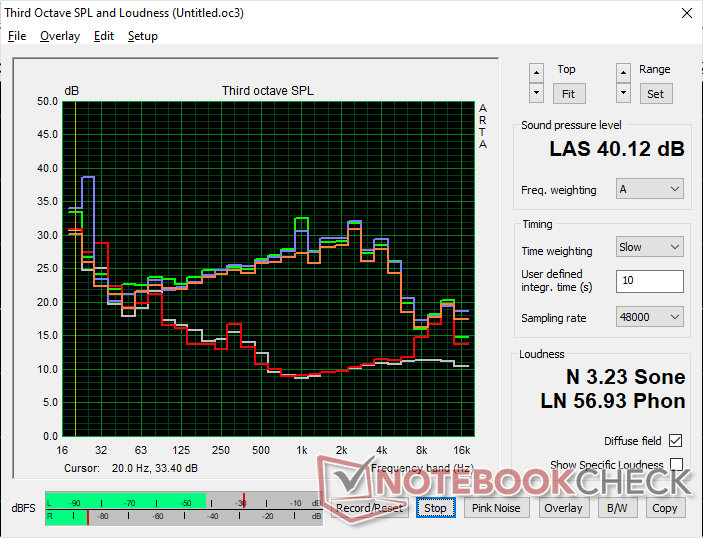
Ruido
| Ocioso |
| 24.1 / 24.1 / 33.8 dB(A) |
| Carga |
| 40.1 / 40.1 dB(A) |
 | ||
30 dB silencioso 40 dB(A) audible 50 dB(A) ruidosamente alto |
||
min: | ||
| Beelink SER6 Pro Radeon 680M, R7 6800H, Kingston NV2 500GB SNV2S/500G | Beelink GTR6 Radeon 680M, R9 6900HX, Kingston KC3000 512G SKC3000S512G | Beelink SEi11 Pro Iris Xe G7 96EUs, i5-11320H, Kingston NV1 SNVS/500GCN | Intel NUC 12 Pro Kit NUC12WSKi7 Iris Xe G7 96EUs, i7-1260P, Transcend M.2 SSD 2200S TS512GMTE220S | Intel NUC11PHKi7C GeForce RTX 2060 Mobile, i7-1165G7, Samsung SSD 980 Pro 500GB MZ-V8P500BW | Intel Hades Canyon NUC8i7HVK Vega M GH, i7-8809G, Intel Optane 120 GB SSDPEK1W120GA | |
|---|---|---|---|---|---|---|
| Noise | -3% | 8% | -18% | -1% | -11% | |
| apagado / medio ambiente * (dB) | 22.8 | 23.2 -2% | 22.8 -0% | 30.4 -33% | 24.5 -7% | 28.7 -26% |
| Idle Minimum * (dB) | 24.1 | 23.6 2% | 24.7 -2% | 33.1 -37% | 25.3 -5% | 29 -20% |
| Idle Average * (dB) | 24.1 | 23.8 1% | 24.7 -2% | 33.1 -37% | 25.3 -5% | 29 -20% |
| Idle Maximum * (dB) | 33.8 | 36.2 -7% | 25.3 25% | 33.1 2% | 25.3 25% | 29 14% |
| Load Average * (dB) | 40.1 | 39.7 1% | 33.2 17% | 38.1 5% | 36.4 9% | 36 10% |
| Witcher 3 ultra * (dB) | 38.7 | 41 -6% | 34.5 11% | 39.7 -3% | 42 -9% | |
| Load Maximum * (dB) | 40.1 | 43 -7% | 37.8 6% | 43.6 -9% | 47.9 -19% | 49.4 -23% |
* ... más pequeño es mejor
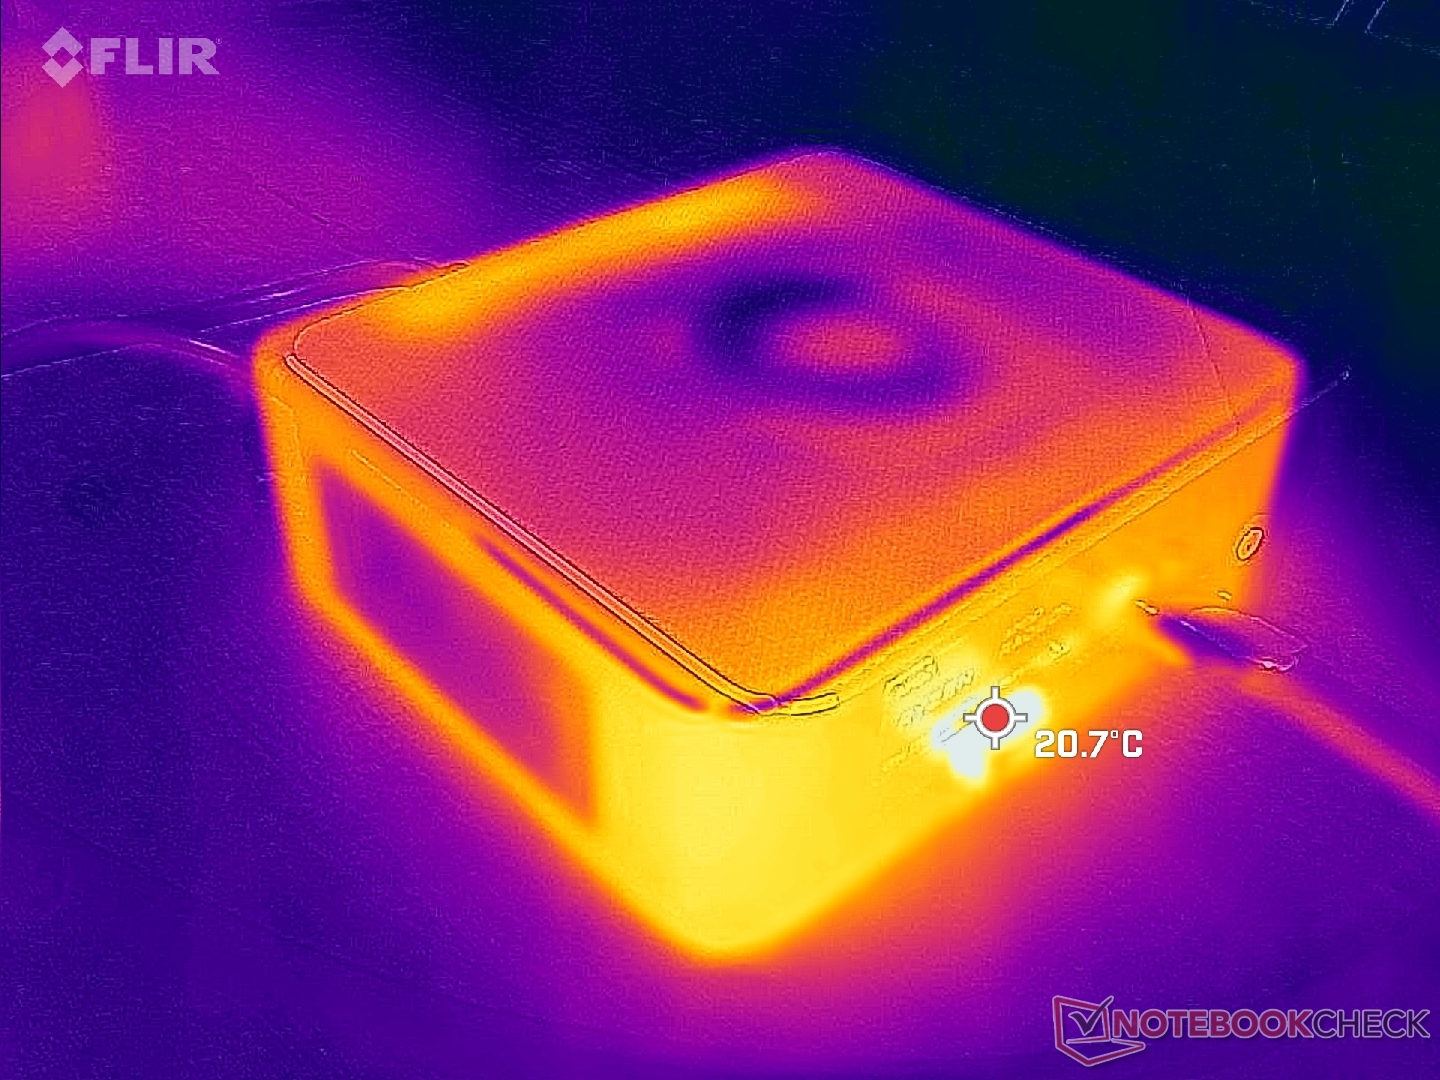
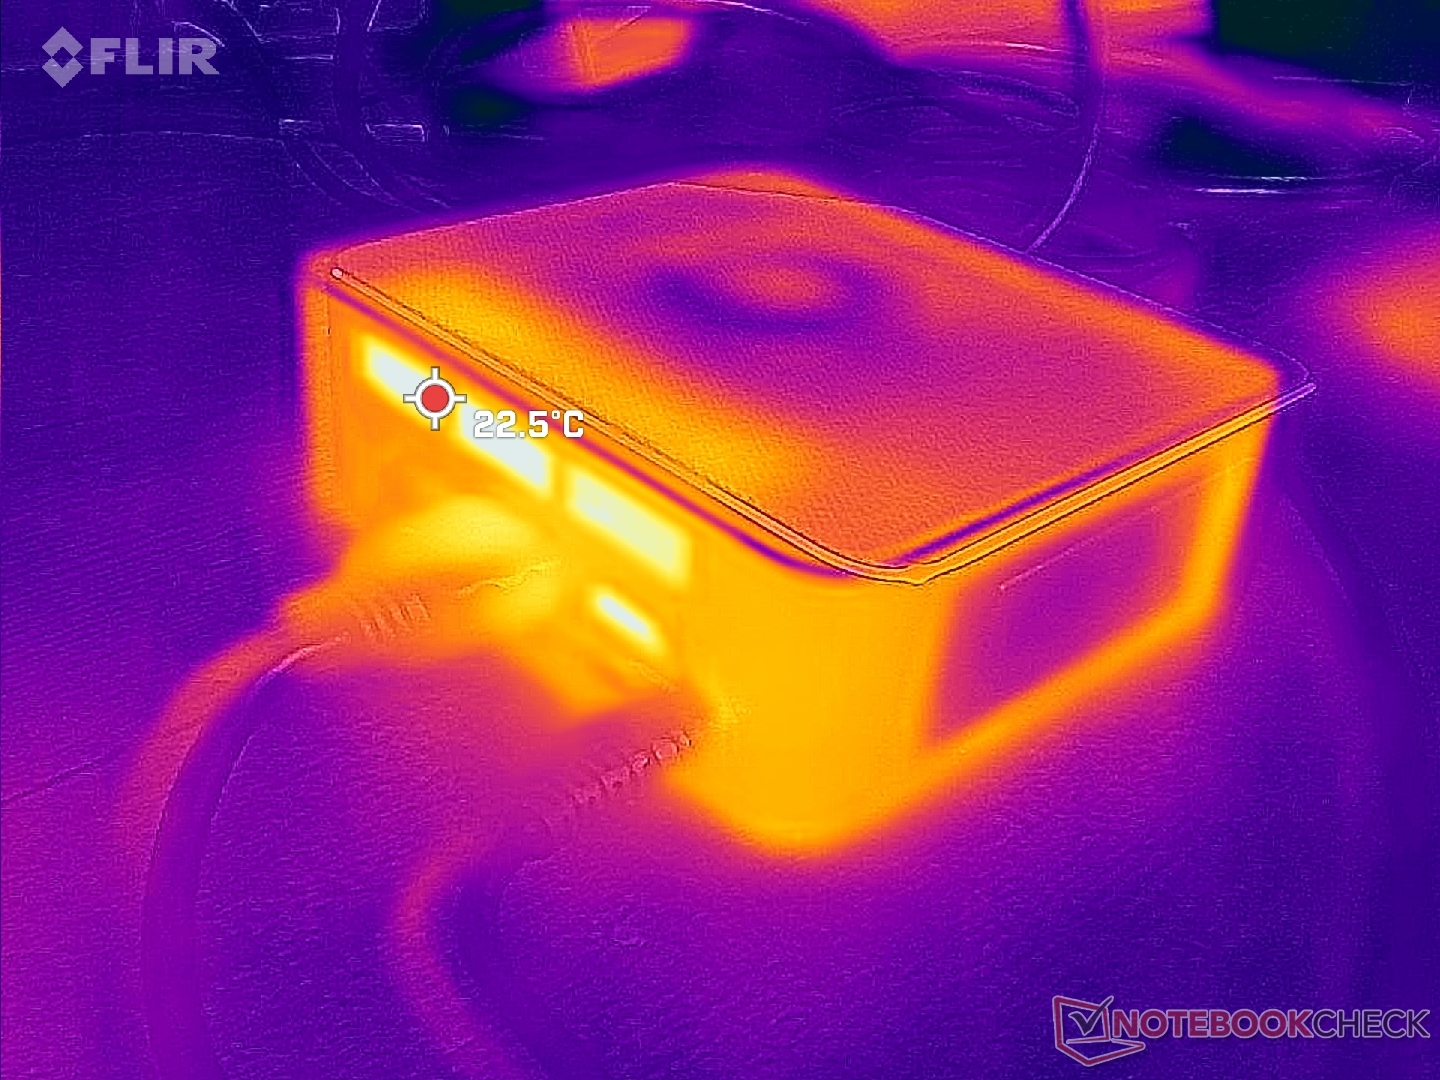
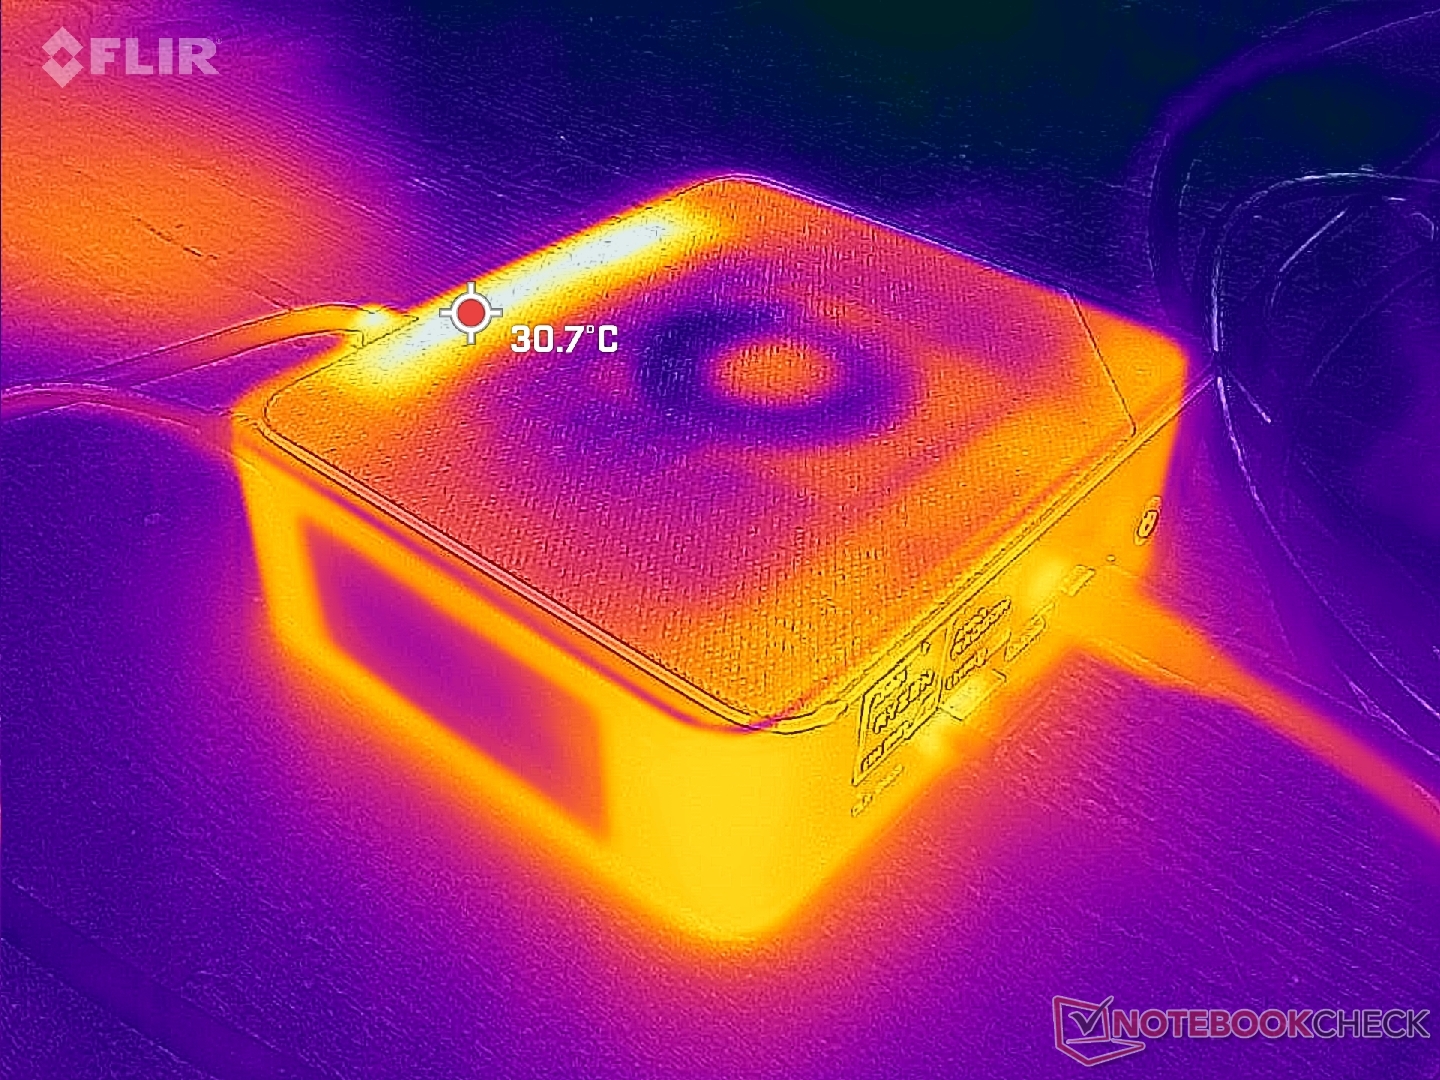
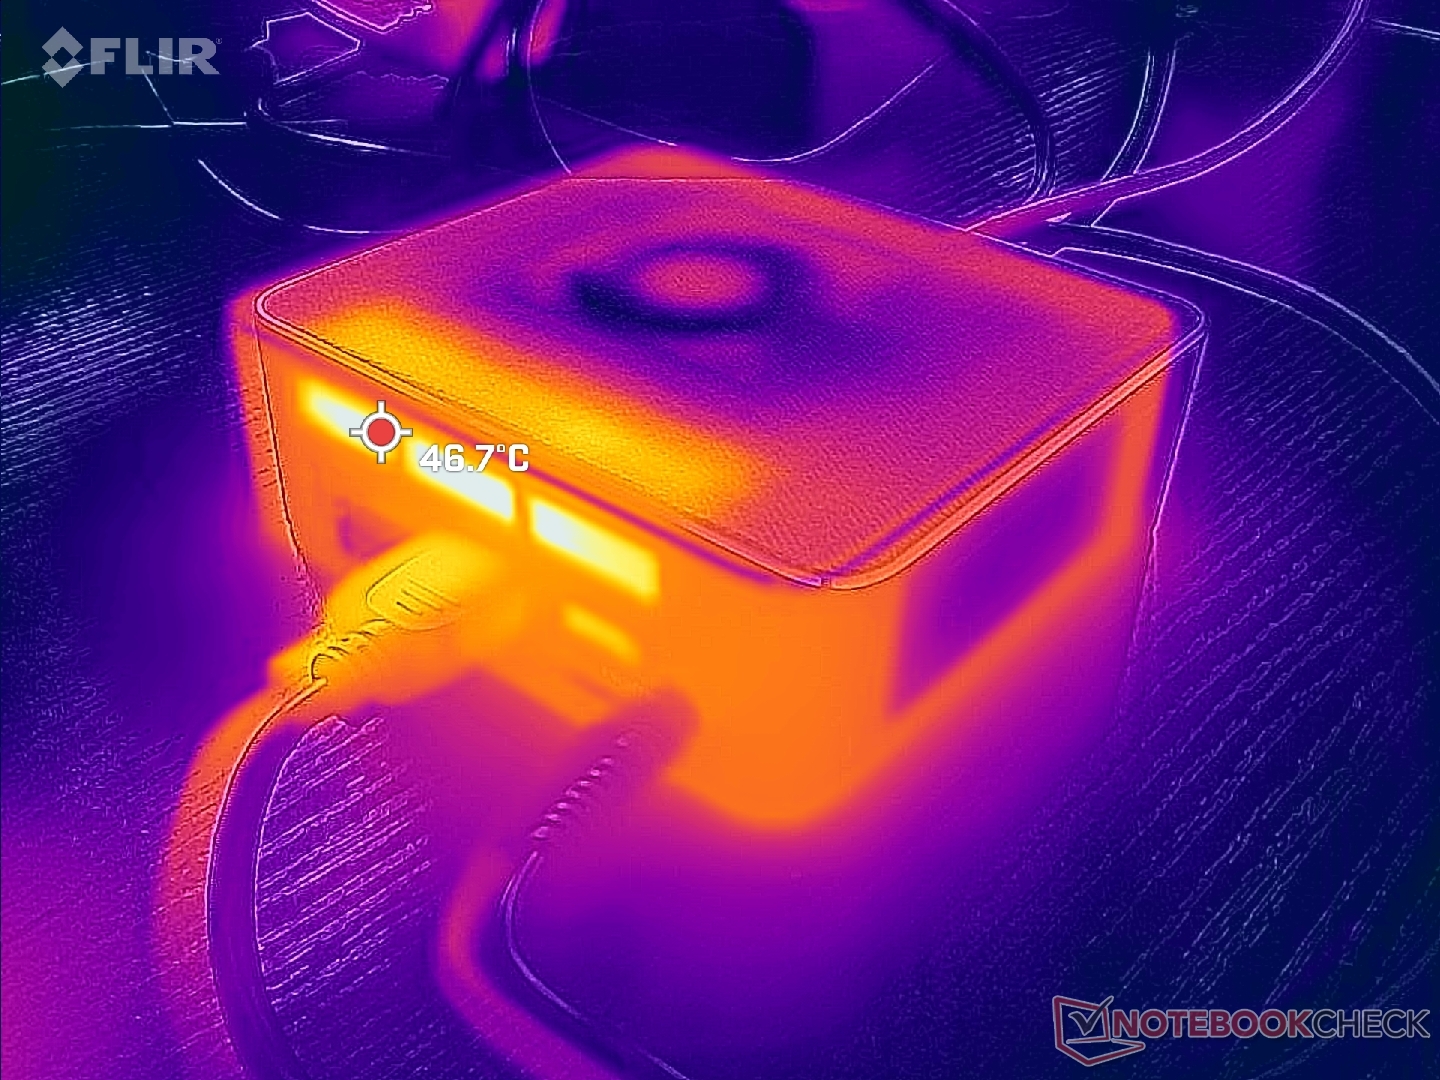
Temperatura
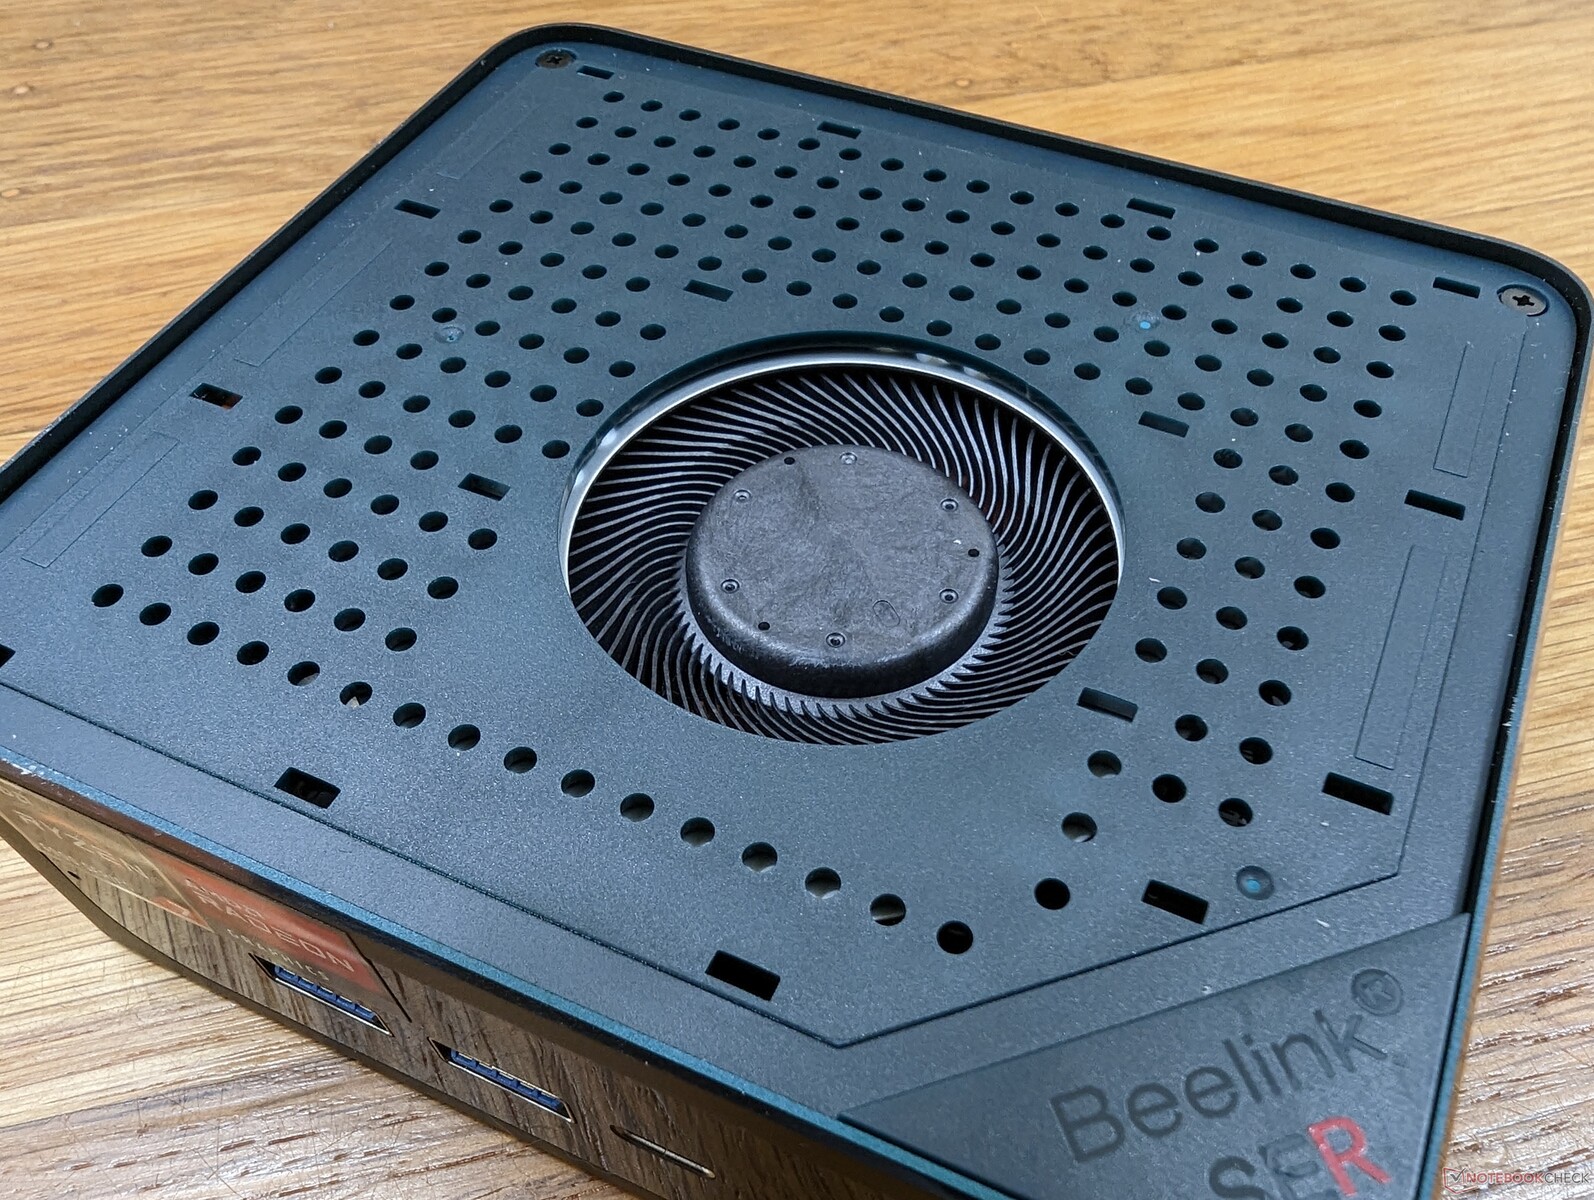
Las temperaturas superficiales no son un problema. A diferencia de muchos otros mini PC, el SER6 Pro incorpora dos ventiladores para mejorar el potencial de refrigeración. El aire frío entra por los laterales y la parte superior, mientras que el aire caliente sale por la parte trasera. Por lo tanto, colocar objetos encima del mini PC o colocarlo en vertical obstruirá parte del flujo de aire.
Prueba de resistencia
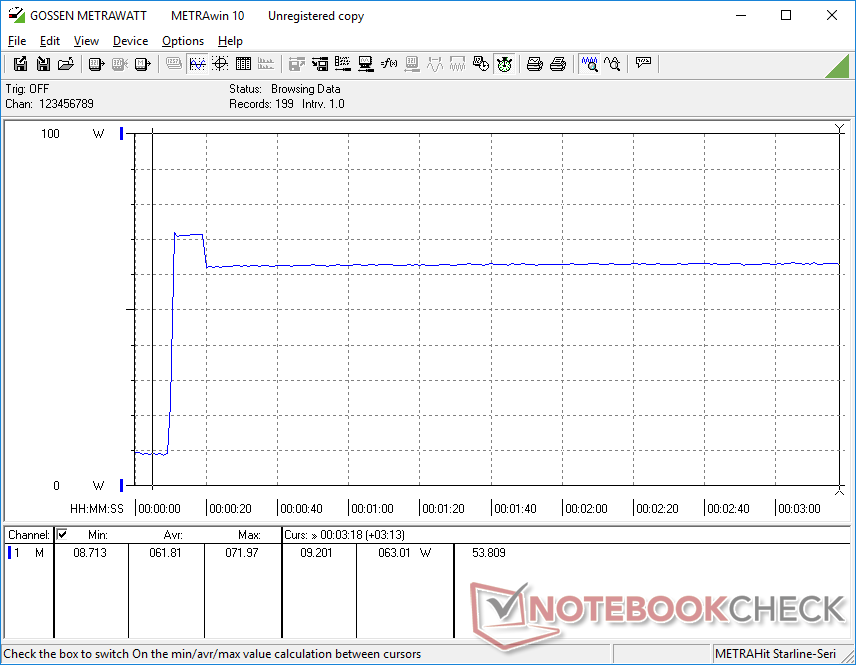
Al ejecutar Prime95 para estresar la CPU, las frecuencias de reloj y el consumo de la placa aumentaban hasta 3,3 GHz y 45 W, respectivamente, y duraban sólo unos segundos. A continuación, la CPU se estabilizó rápidamente en 3 GHz, 38 W y 82 C. Repitiendo esta misma prueba en elBeelink SEi11 con el Core i5-11320H, más lento, la temperatura del núcleo se calienta a 89 C.
Cuando se ejecuta Witcher 3 para representar cargas de juego típicas, la velocidad de reloj de la GPU y la temperatura se estabilizarían en 1956 MHz y 70 C, respectivamente, frente a los 83 C del SEi11. El SER6 Pro no sólo es más rápido, sino que también funciona más frío.
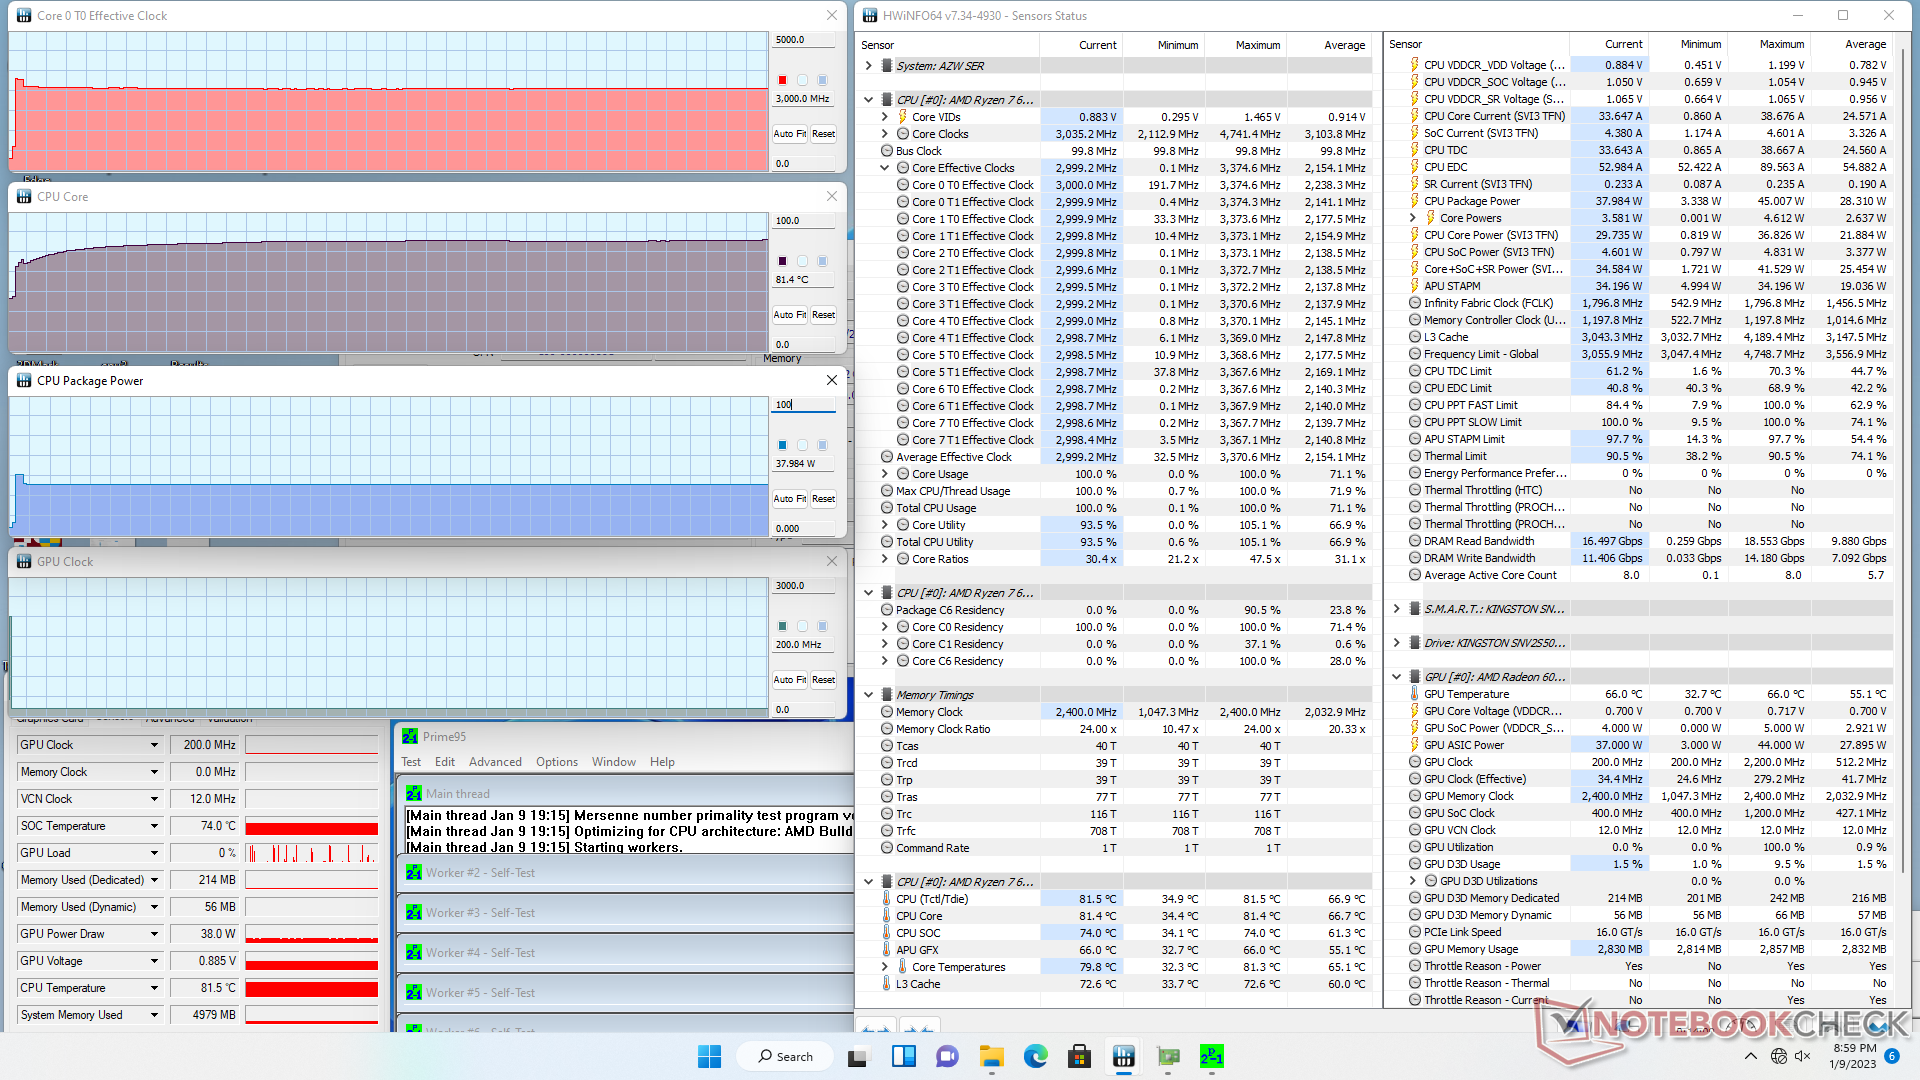
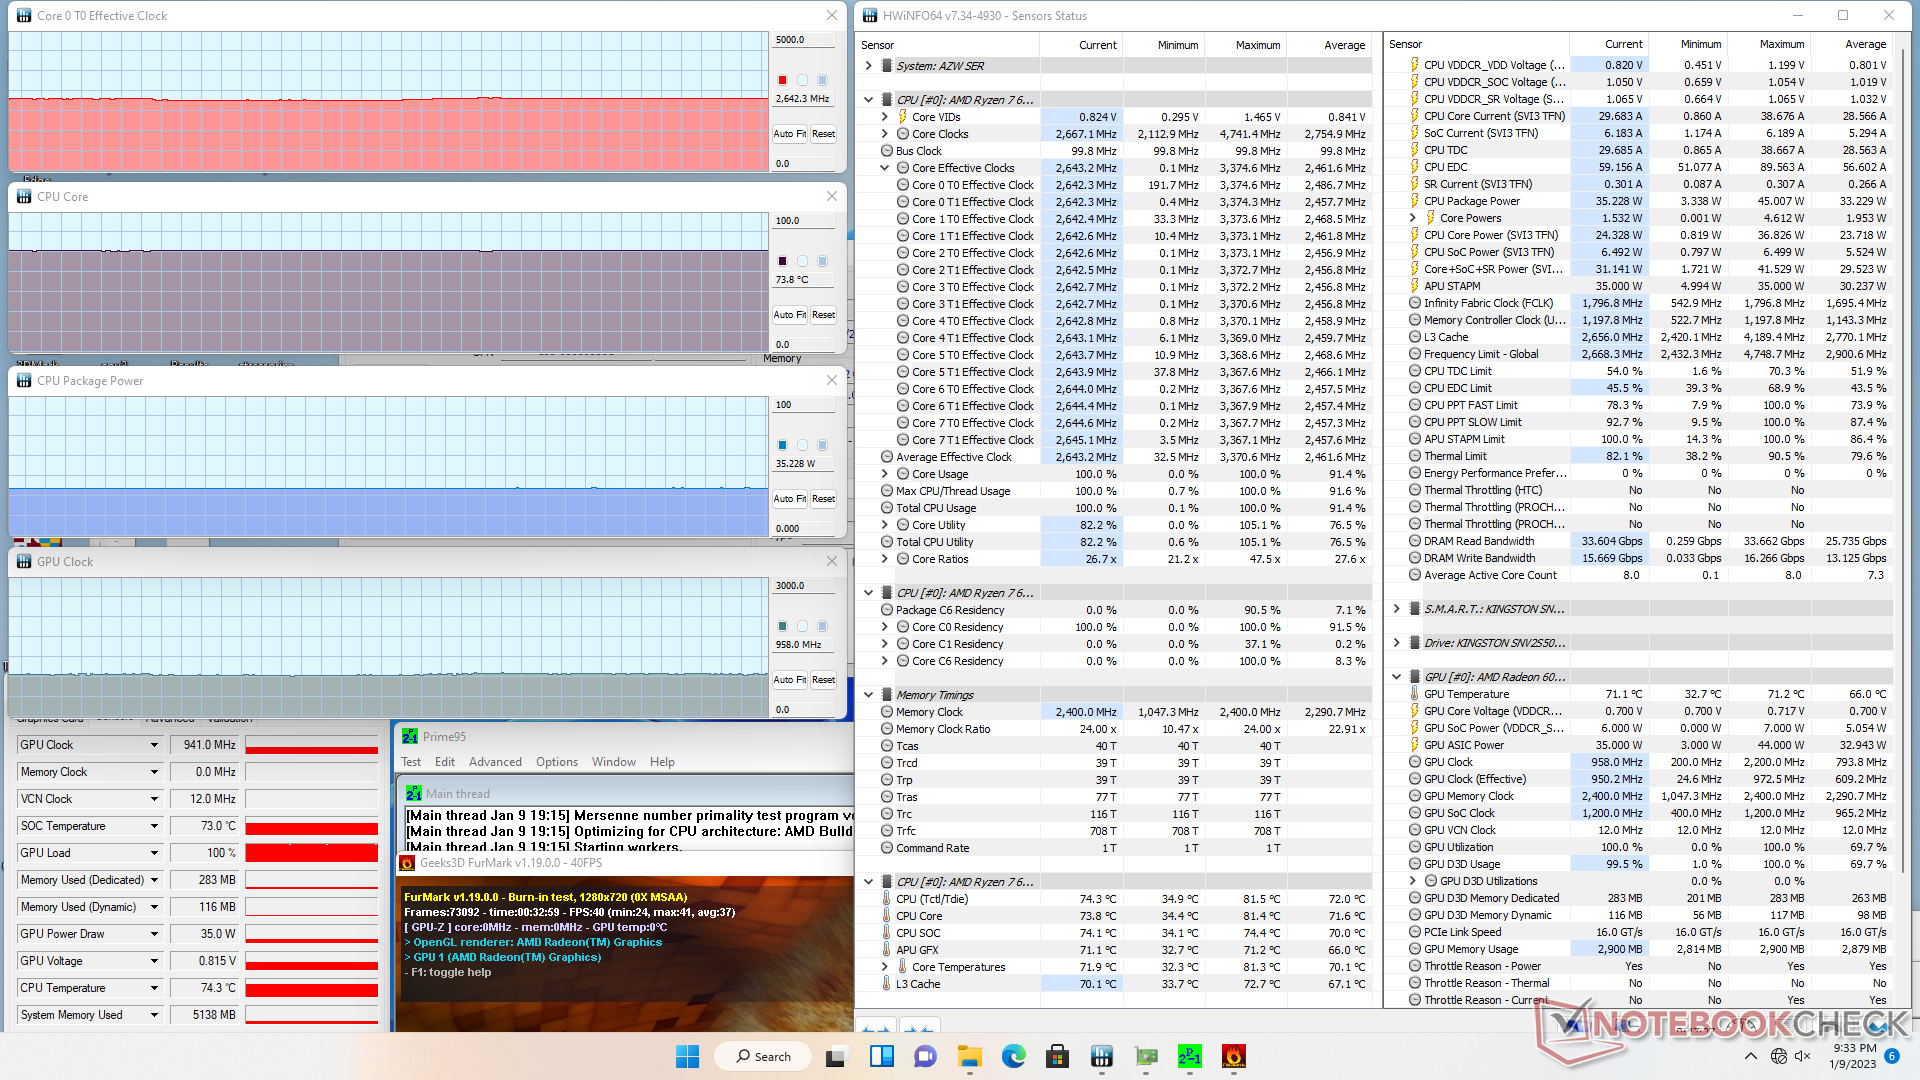
| Relojde laCPU (GHz) | Reloj de la GPU (MHz) | Temperatura media de la CPU (°C) | |
| Sistema en reposo | -- | -- | 34 |
| Prime95 Stress | 3.0 | -- | 82 |
| Prime95+ FurMark Stress | 2,7 | 941 | 74 |
| Witcher 3 Estrés | ~0,6 | 1956 | 70 |
Gestión de la energía
Consumo de energía
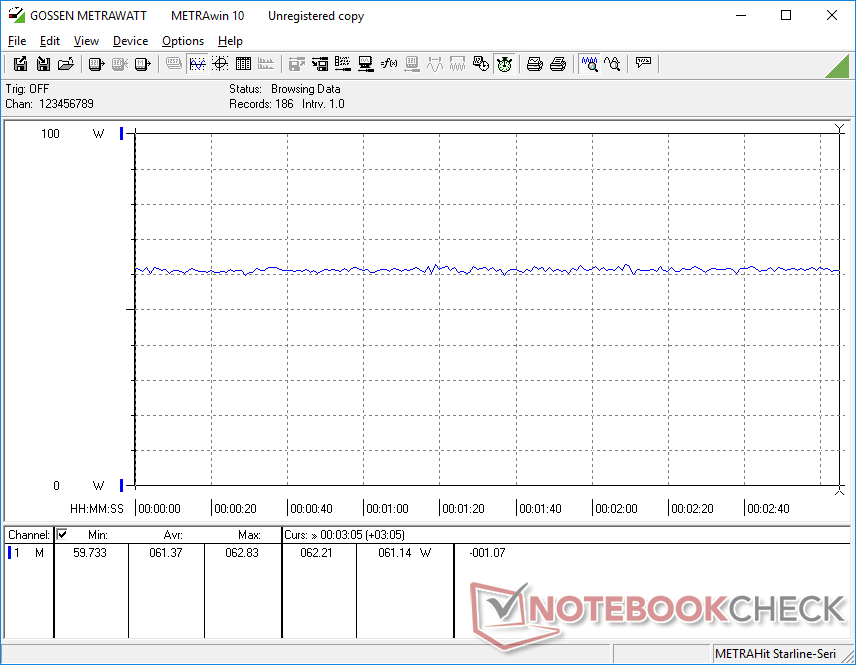
El consumo de energía en juegos es un 33% superior al del SER5 Pro con la generación anterior Ryzen 5 5600H y también ligeramente superior al del SEi11 Pro con una CPU Intel Core serie H de 12ª generación. Sin embargo, si tenemos en cuenta que nuestra Radeon 680M puede ofrecer hasta el doble de rendimiento que la Radeon RX Vega 7, el mayor consumo de energía merece la pena. A ralentí en el escritorio todavía consume tanta energía como en el modelo del año pasado a pesar de los gráficos mejorados.
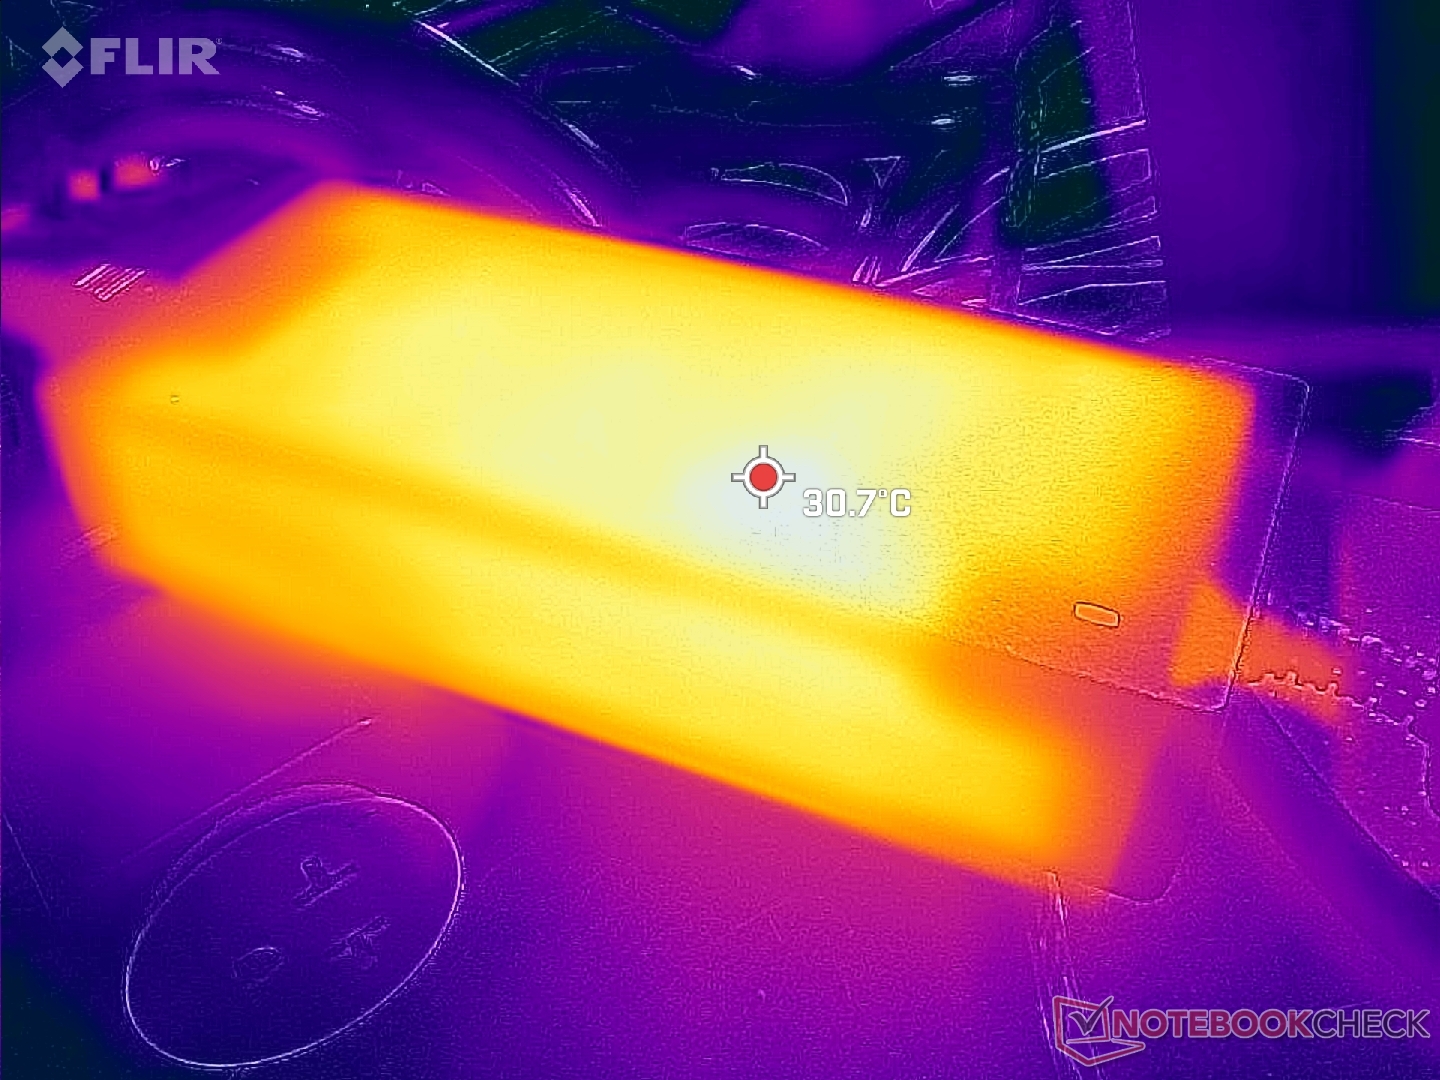
Registramos un consumo máximo de 72 W del adaptador de CA de 120 W cuando la CPU está al 100% de su capacidad. La elevada sobrecarga permite al mini PC alimentar o cargar ciertos dispositivos USB-C a expensas de un adaptador de CA más voluminoso.

| Off / Standby | |
| Ocioso | |
| Carga |
|
Clave:
min: | |
| Beelink SER6 Pro R7 6800H, Radeon 680M, Kingston NV2 500GB SNV2S/500G, , x, | Beelink SER Pro Ryzen 5 5600H R5 5600H, Vega 7, Kingston NV1 SNVS/500GCN, , x, | Beelink SEi11 Pro i5-11320H, Iris Xe G7 96EUs, Kingston NV1 SNVS/500GCN, , x, | Intel NUC 12 Pro Kit NUC12WSKi7 i7-1260P, Iris Xe G7 96EUs, Transcend M.2 SSD 2200S TS512GMTE220S, , x, | Intel NUC11PHKi7C i7-1165G7, GeForce RTX 2060 Mobile, Samsung SSD 980 Pro 500GB MZ-V8P500BW, , x, | Intel Hades Canyon NUC8i7HVK i7-8809G, Vega M GH, Intel Optane 120 GB SSDPEK1W120GA, , x, | |
|---|---|---|---|---|---|---|
| Power Consumption | 19% | -3% | -35% | -93% | -91% | |
| Idle Minimum * (Watt) | 8.3 | 5.4 35% | 9.8 -18% | 12.1 -46% | 5.8 30% | 15.5 -87% |
| Idle Average * (Watt) | 8.4 | 8.2 2% | 10.3 -23% | 12.2 -45% | 5.9 30% | 16.2 -93% |
| Idle Maximum * (Watt) | 8.7 | 8.3 5% | 10.5 -21% | 12.3 -41% | 20.7 -138% | 16.5 -90% |
| Load Average * (Watt) | 60.8 | 49.3 19% | 54.2 11% | 64 -5% | 130.8 -115% | 83.4 -37% |
| Witcher 3 ultra * (Watt) | 61.4 | 46.1 25% | 53.1 14% | 154.4 -151% | 121.7 -98% | |
| Load Maximum * (Watt) | 72 | 50.2 30% | 59 18% | 98.8 -37% | 225.2 -213% | 173.5 -141% |
* ... más pequeño es mejor
Power Consumption Witcher 3 / Stresstest
Power Consumption external Monitor
Pro
Contra
Veredicto - Un éxito inesperado
El SER6 Pro comparte muchas de las ventajas y desventajas del reciente GTR6. Más concretamente, el rendimiento es especialmente bueno en comparación con otros mini PC con gráficos integrados, pero tanto el ruido del ventilador como el consumo de energía son más ruidosos y ligeramente superiores, respectivamente. Sus dos principales desventajas no desmerecen el increíble valor que estarían obteniendo los compradores: 32 GB de RAM, 500 GB de SSD NVMe, Windows 11 Pro y uno de los mini PC más rápidos con gráficos integrados, todo por solo 650 USD.
El Beelink SER6 Pro supera a un NUC Intel Core serie U de precio equivalente tanto en rendimiento como en valor por amplios márgenes.
Para futuras revisiones, nos gustaría ver un adaptador de CA más pequeño y un solo ventilador interno grande en lugar de dos más pequeños. El adaptador de CA actual es más pesado que el propio mini PC, mientras que un ventilador más grande haría que el ruido del ventilador fuera más grave y menos perceptible. Los usuarios también deben tener cuidado con los posibles problemas de estabilidad de la velocidad de fotogramas al jugar. Aparte de eso, Beelink ha dado en el clavo con su SEi y SER tanto en rendimiento como en valor.
Precio y disponibilidad
Amazon está enviando actualmente nuestra configuración exacta SER6 Pro por $ 650 USD. Los usuarios también pueden comprar directamente del fabricante por 659 dólares.
Transparencia
La selección de los dispositivos que se van a reseñar corre a cargo de nuestro equipo editorial. La muestra de prueba fue proporcionada al autor en calidad de préstamo por el fabricante o el minorista a los efectos de esta reseña. El prestamista no tuvo ninguna influencia en esta reseña, ni el fabricante recibió una copia de la misma antes de su publicación. No había ninguna obligación de publicar esta reseña. Como empresa de medios independiente, Notebookcheck no está sujeta a la autoridad de fabricantes, minoristas o editores.
Así es como prueba Notebookcheck
Cada año, Notebookcheck revisa de forma independiente cientos de portátiles y smartphones utilizando procedimientos estandarizados para asegurar que todos los resultados son comparables. Hemos desarrollado continuamente nuestros métodos de prueba durante unos 20 años y hemos establecido los estándares de la industria en el proceso. En nuestros laboratorios de pruebas, técnicos y editores experimentados utilizan equipos de medición de alta calidad. Estas pruebas implican un proceso de validación en varias fases. Nuestro complejo sistema de clasificación se basa en cientos de mediciones y puntos de referencia bien fundamentados, lo que mantiene la objetividad.Price comparison

