Análisis del mini PC Beelink SER5 Pro 5600H: NUC 11 velocidades con AMD Ryzen
")
Al igual que Zotac y su notoria selección de mini PCs ZBox, Beelink busca hacer lo mismo lanzando nuevos modelos cada pocos meses equipados con procesadores cada vez más rápidos. El Beelink SER4 se lanzó a principios de este año con el procesador Zen 2 Ryzen 7 4800U, pero ahora el SER5 ha llegado al mercado con un Zen 3 Ryzen 5 5600H todo ello manteniendo los precios muy por debajo de los 500 dólares
Los competidores en este espacio incluyen otros mini PCs o HTPCs sin gráficos discretos como el Ace Magician TK11, Geekom MiniAir 11, Zotac ZBox PI336y la mayoría de los Modelos de Intel NUC
Más opiniones de Beelink:
Posibles contendientes en la comparación
Valoración | Fecha | Modelo | Peso | Altura | Tamaño | Resolución | Precio |
|---|---|---|---|---|---|---|---|
v (old) | 10/2022 | Beelink SER Pro Ryzen 5 5600H R5 5600H, Vega 7 | 498 g | 42 mm | x | ||
v (old) | 09/2022 | Beelink SEi11 Pro i5-11320H, Iris Xe G7 96EUs | 440 g | 40 mm | x | ||
v (old) | 01/2022 | Beelink GTR5 R9 5900HX, Vega 8 | 686 g | 39 mm | x | ||
v (old) | 04/2021 | Intel NUC11TNKi5 i5-1135G7, Iris Xe G7 80EUs | 504 g | 37 mm | x | ||
v (old) | 02/2020 | Intel NUC10i7FNH i7-10710U, UHD Graphics 620 | 697 g | 51 mm | 0.00" | 0x0 | |
v (old) | 07/2022 | Zotac ZBOX PI336 pico Celeron N6211, UHD Graphics (Elkhart Lake 16 EU) | 293 g | 20.7 mm | x |
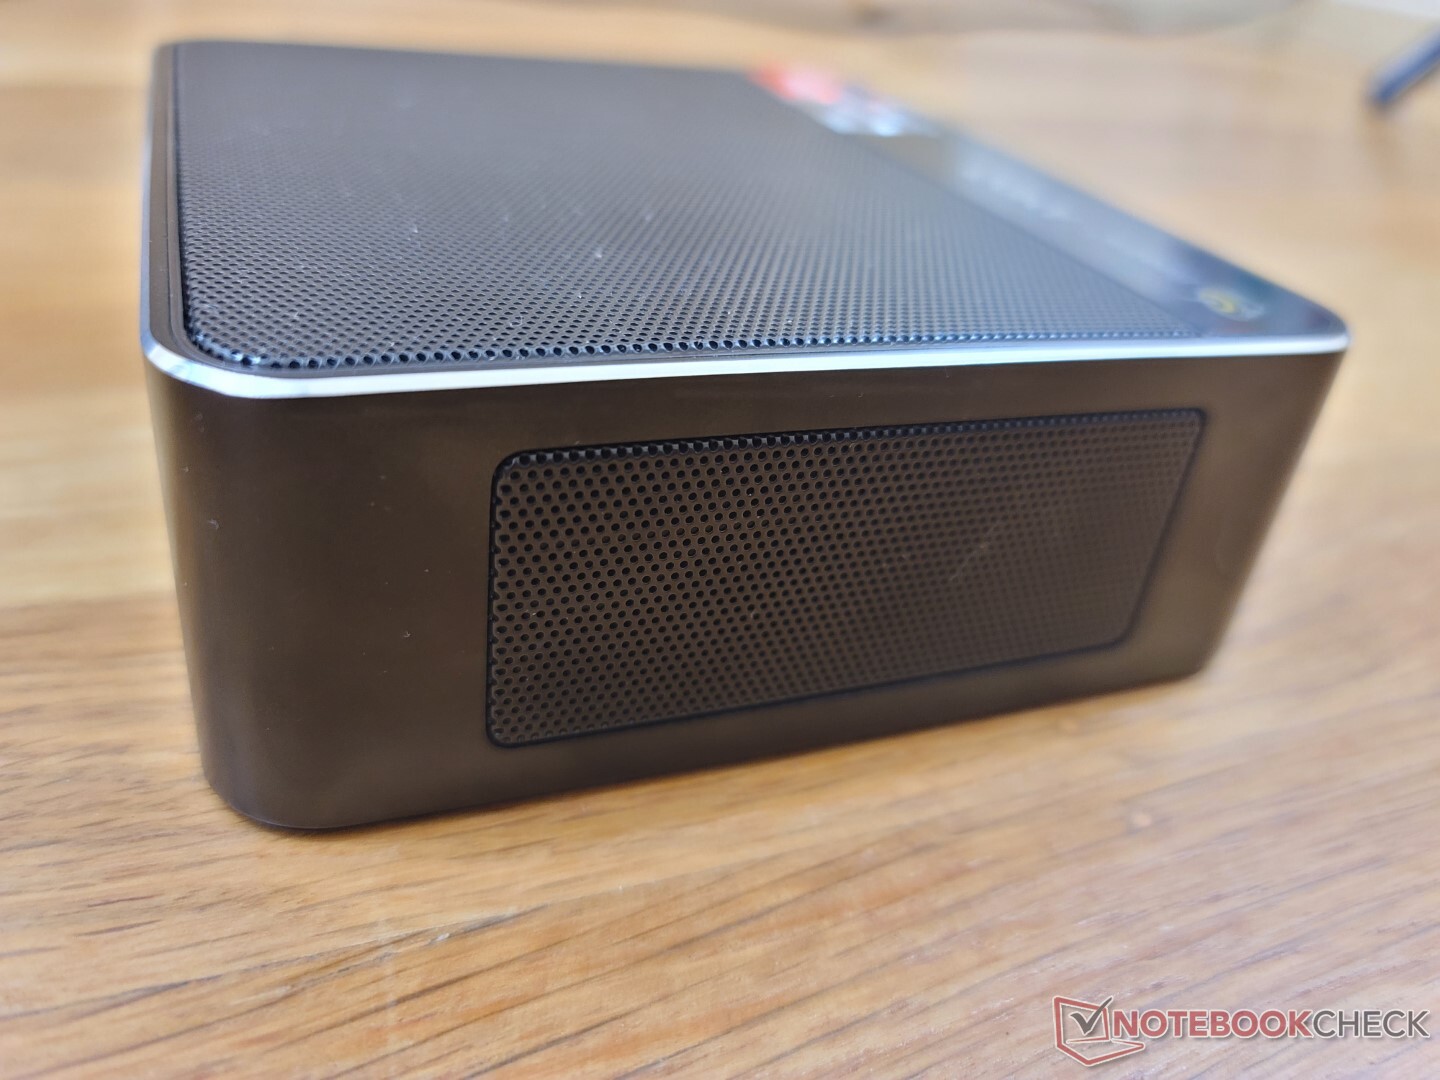
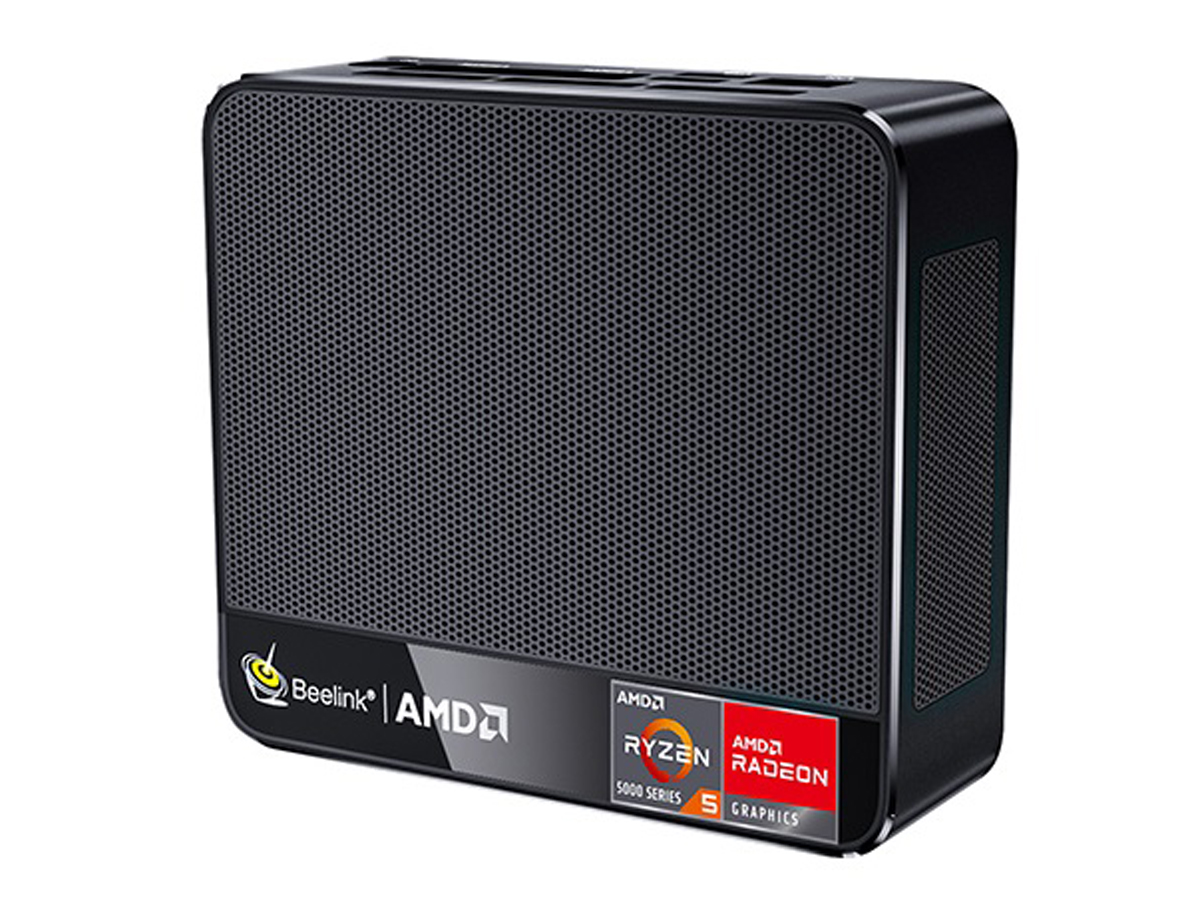
Caso
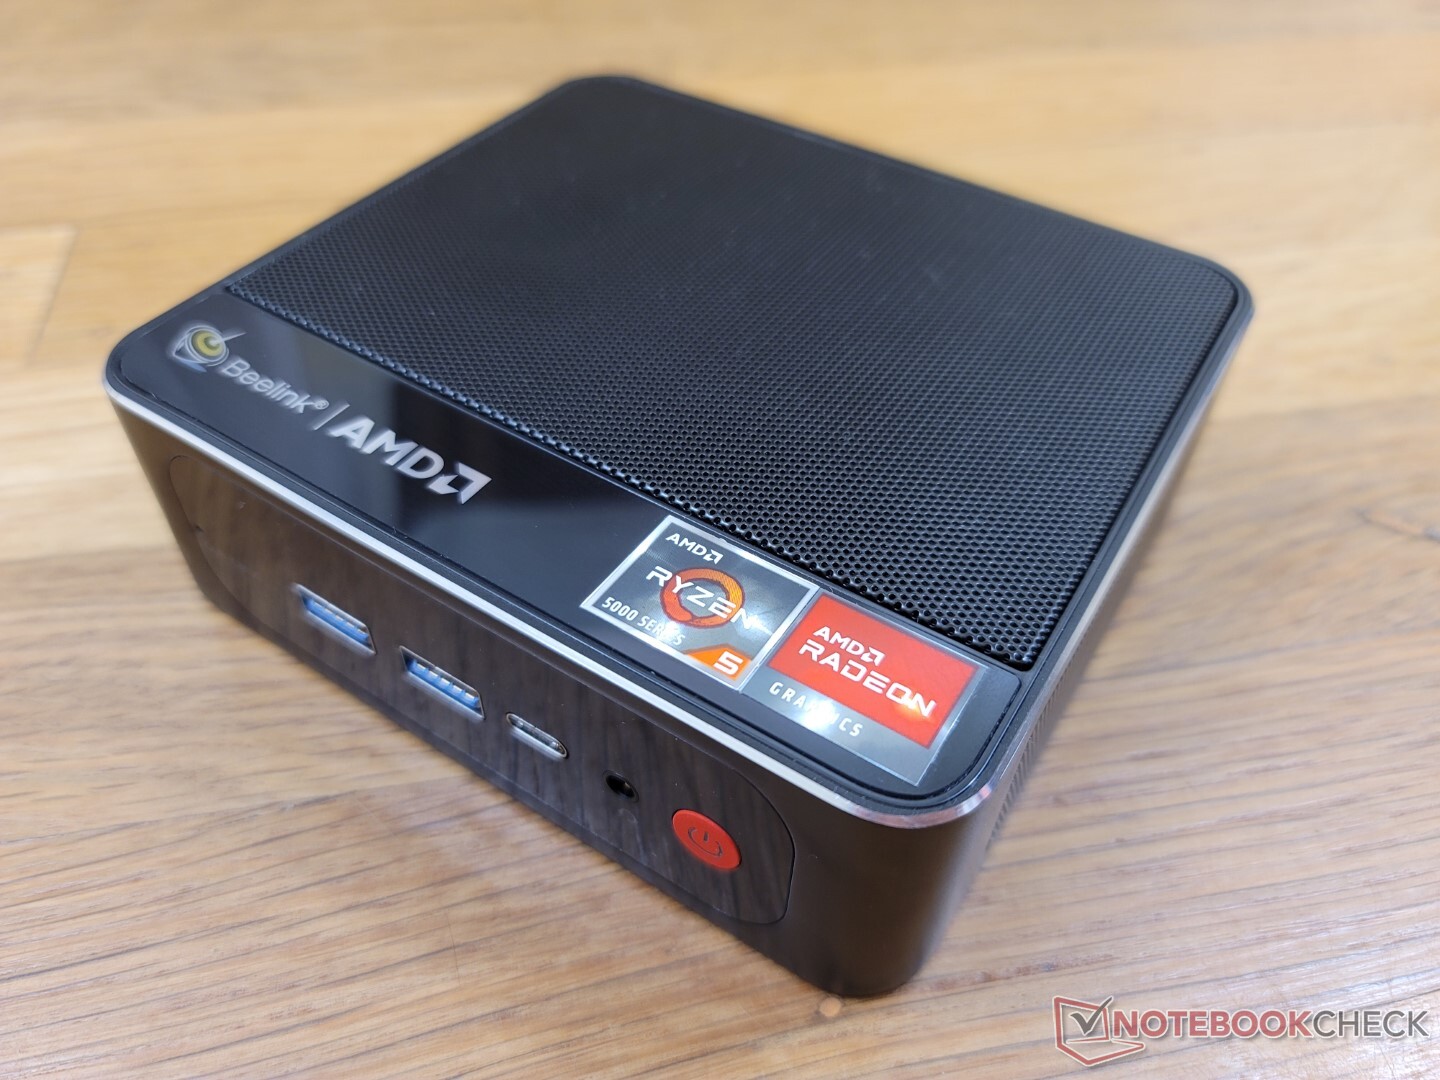
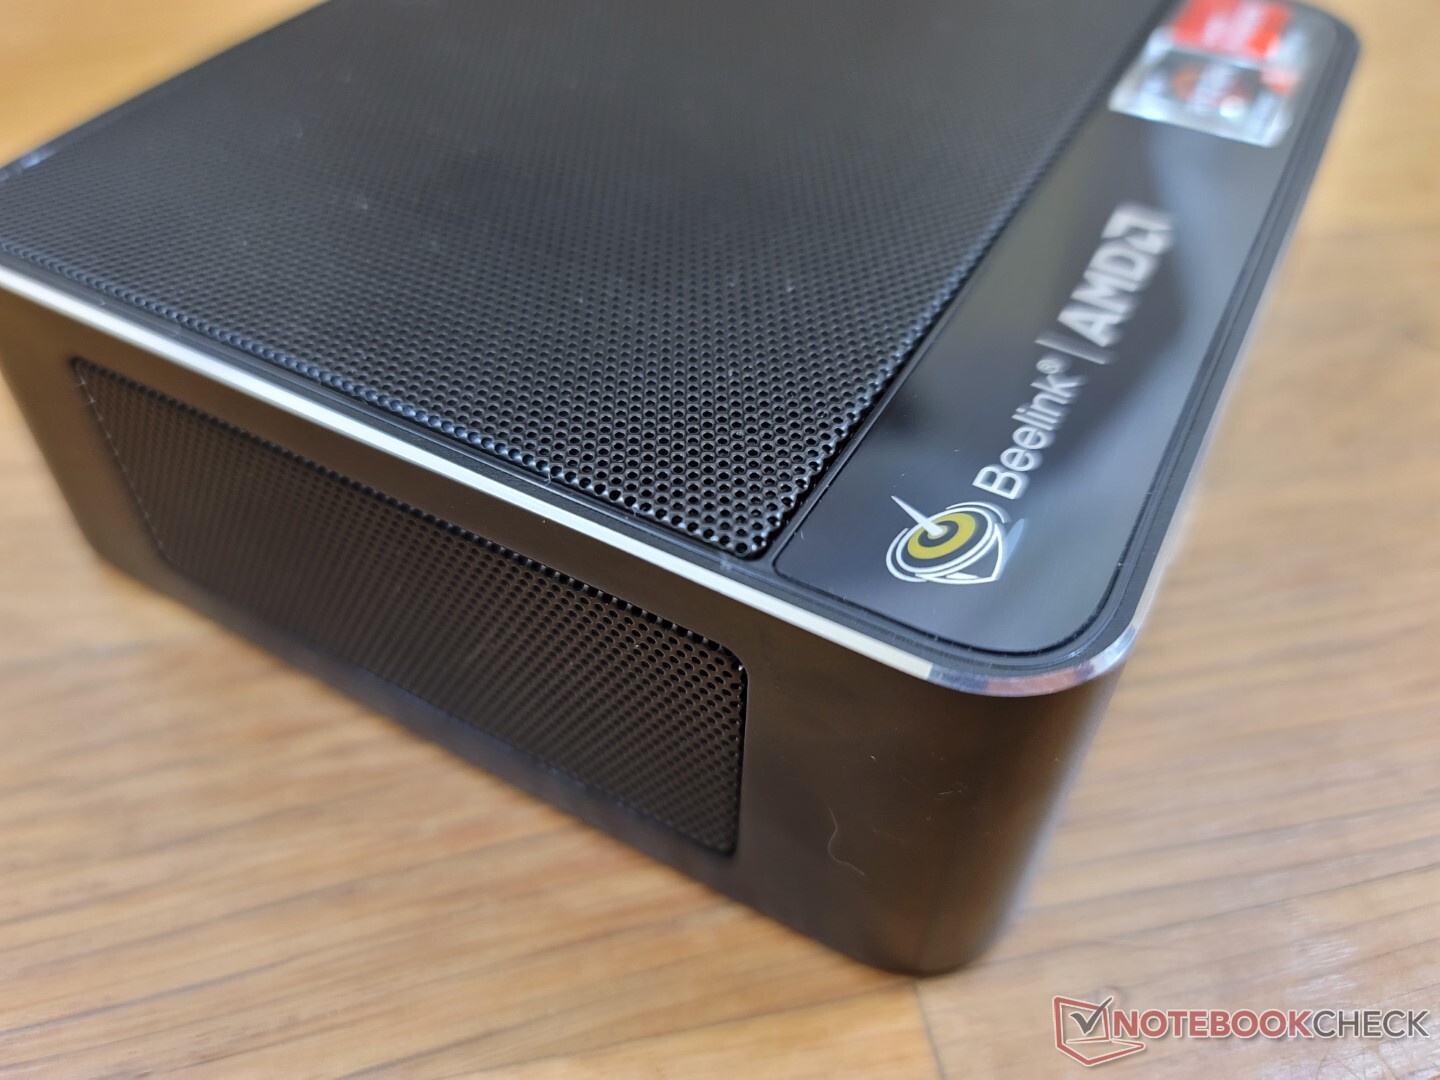
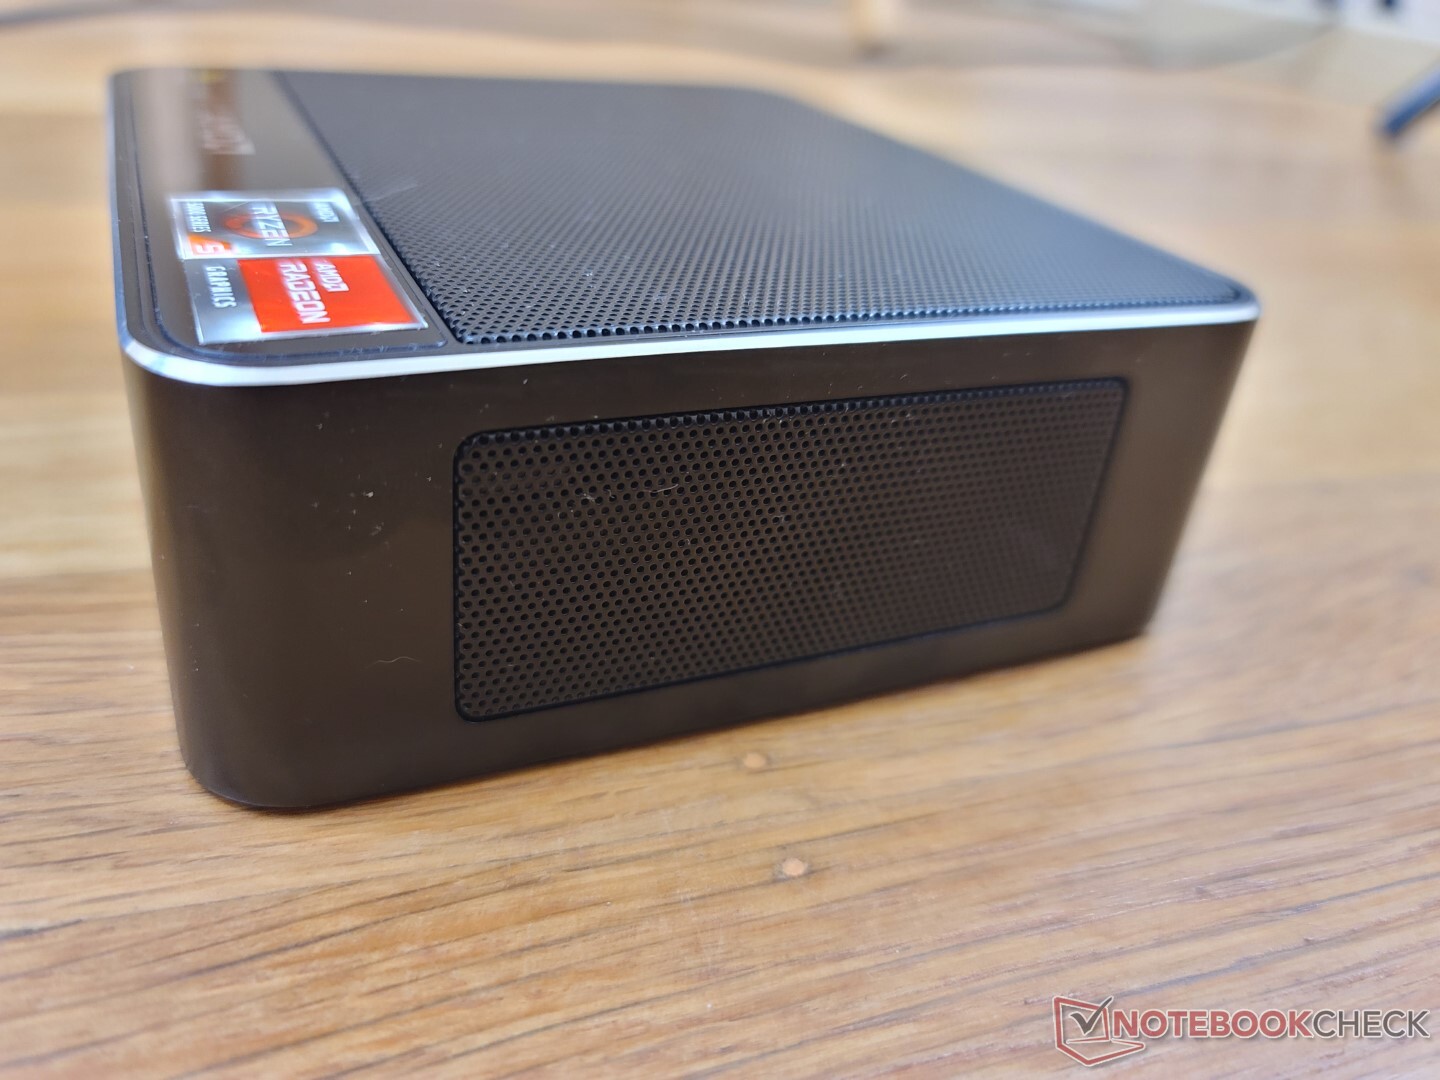
Tanto el SER4 como el SER5 utilizan el mismo esqueleto de chasis, aunque con marcas y colores superficiales ligeramente diferentes. En el SER5, las rejillas de ventilación laterales son negras en lugar de rojas
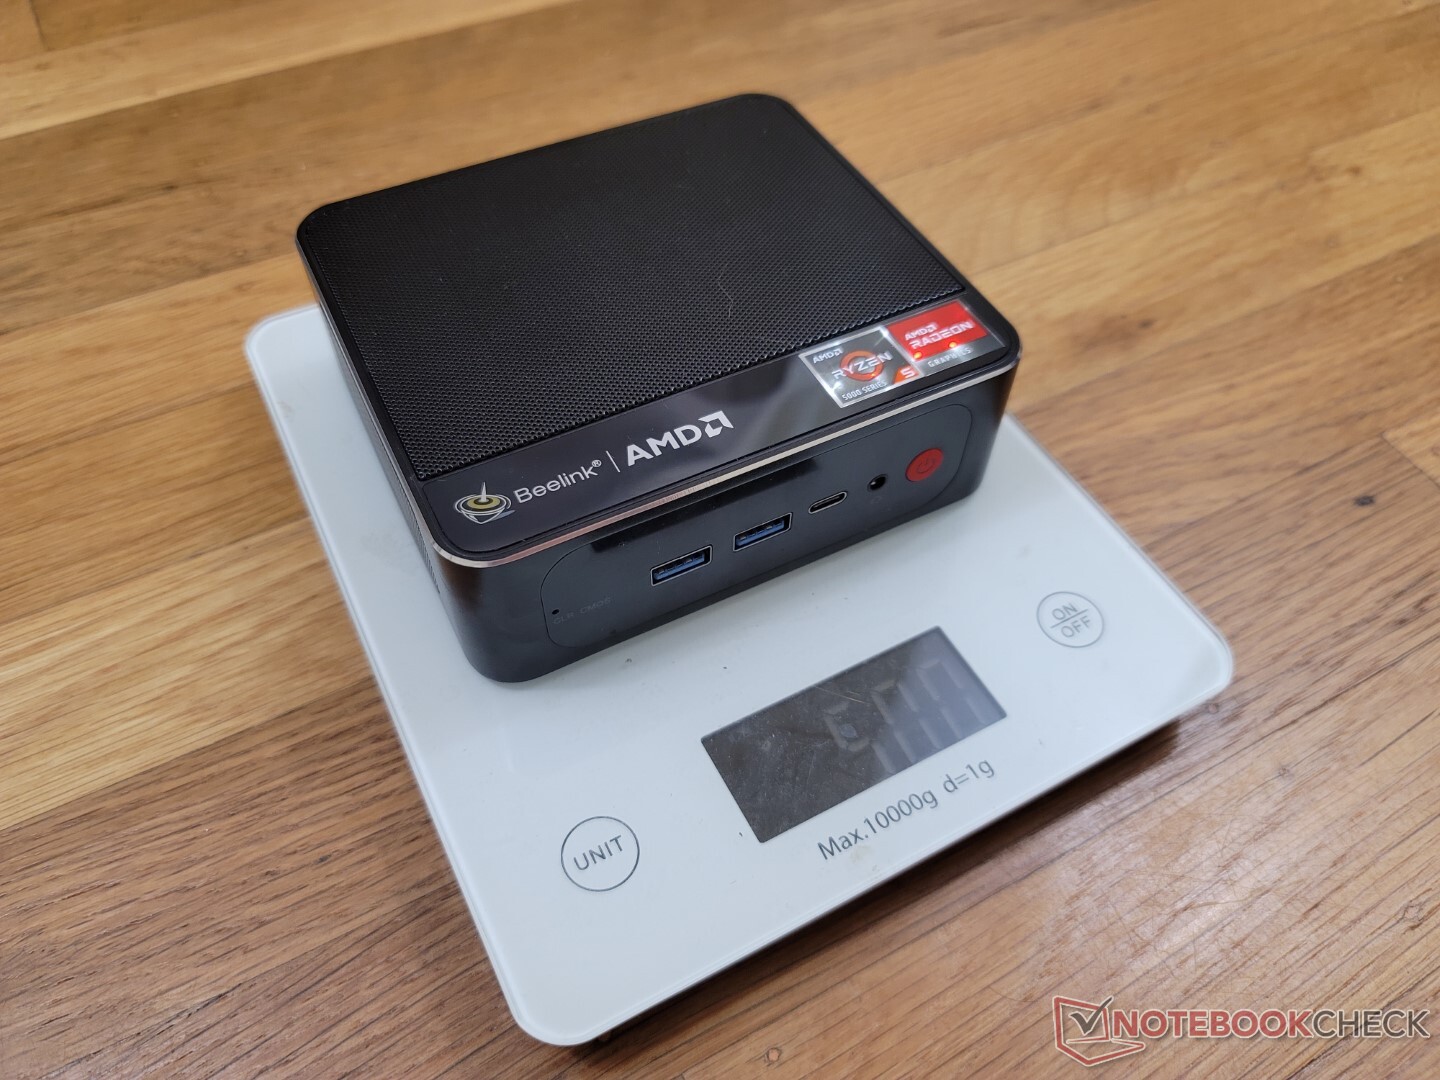
En términos de tamaño, el SER5 es apenas más grueso que el Intel NUC 11TNK. Sin embargo, es igual de pesado, con cerca de medio kilo.
Conectividad
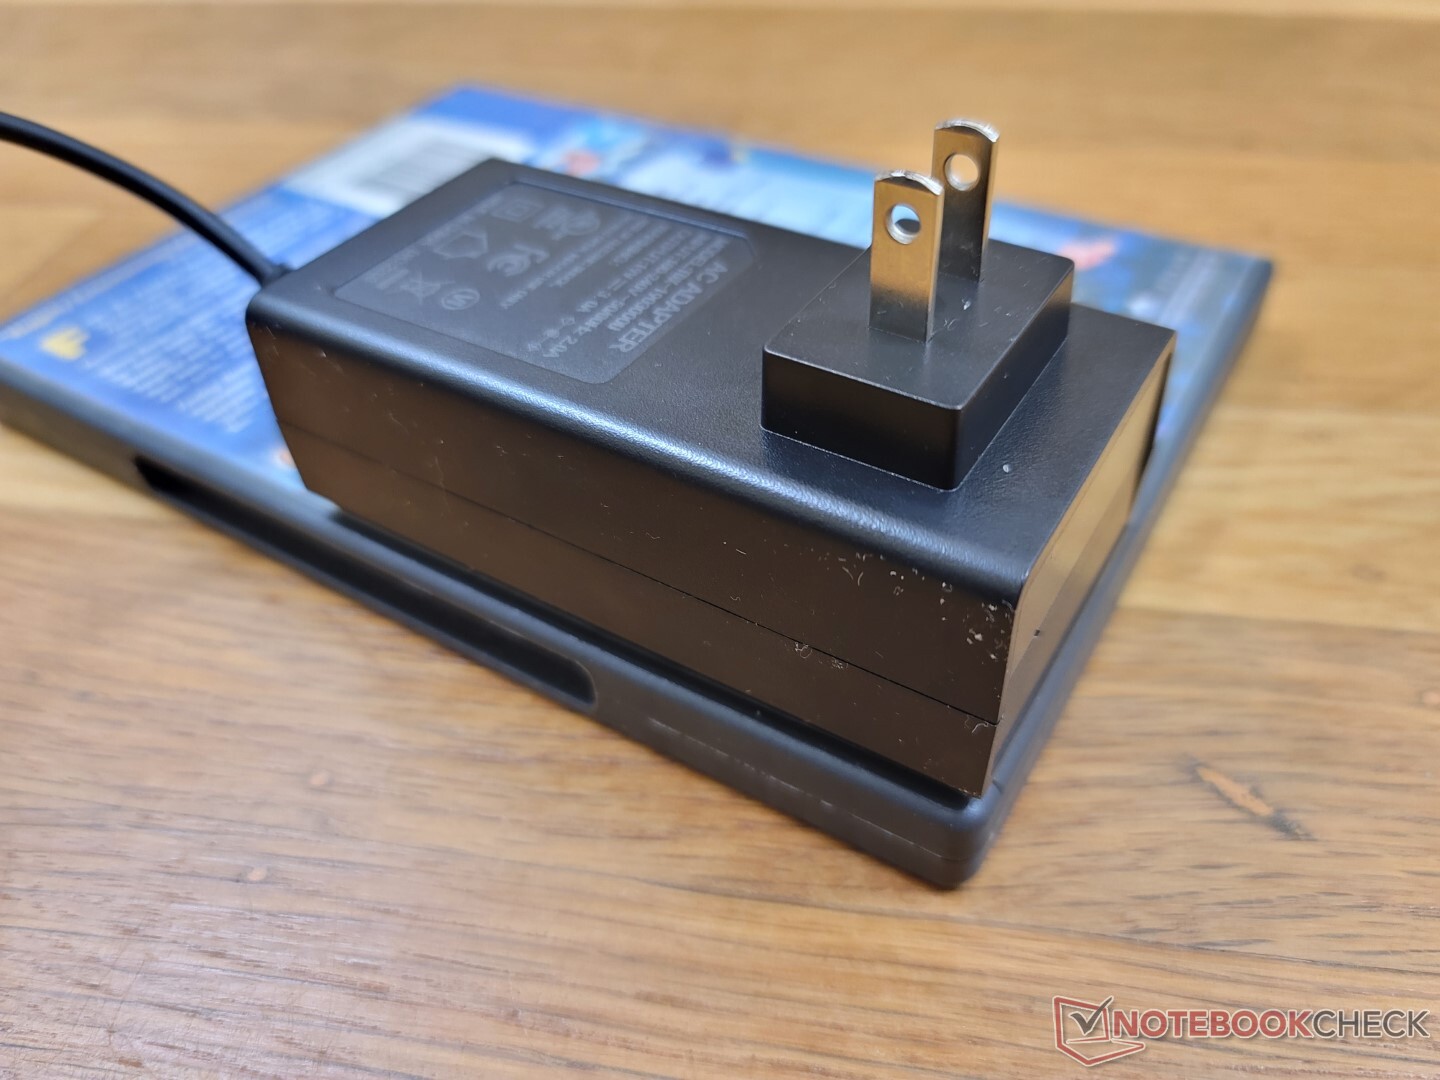
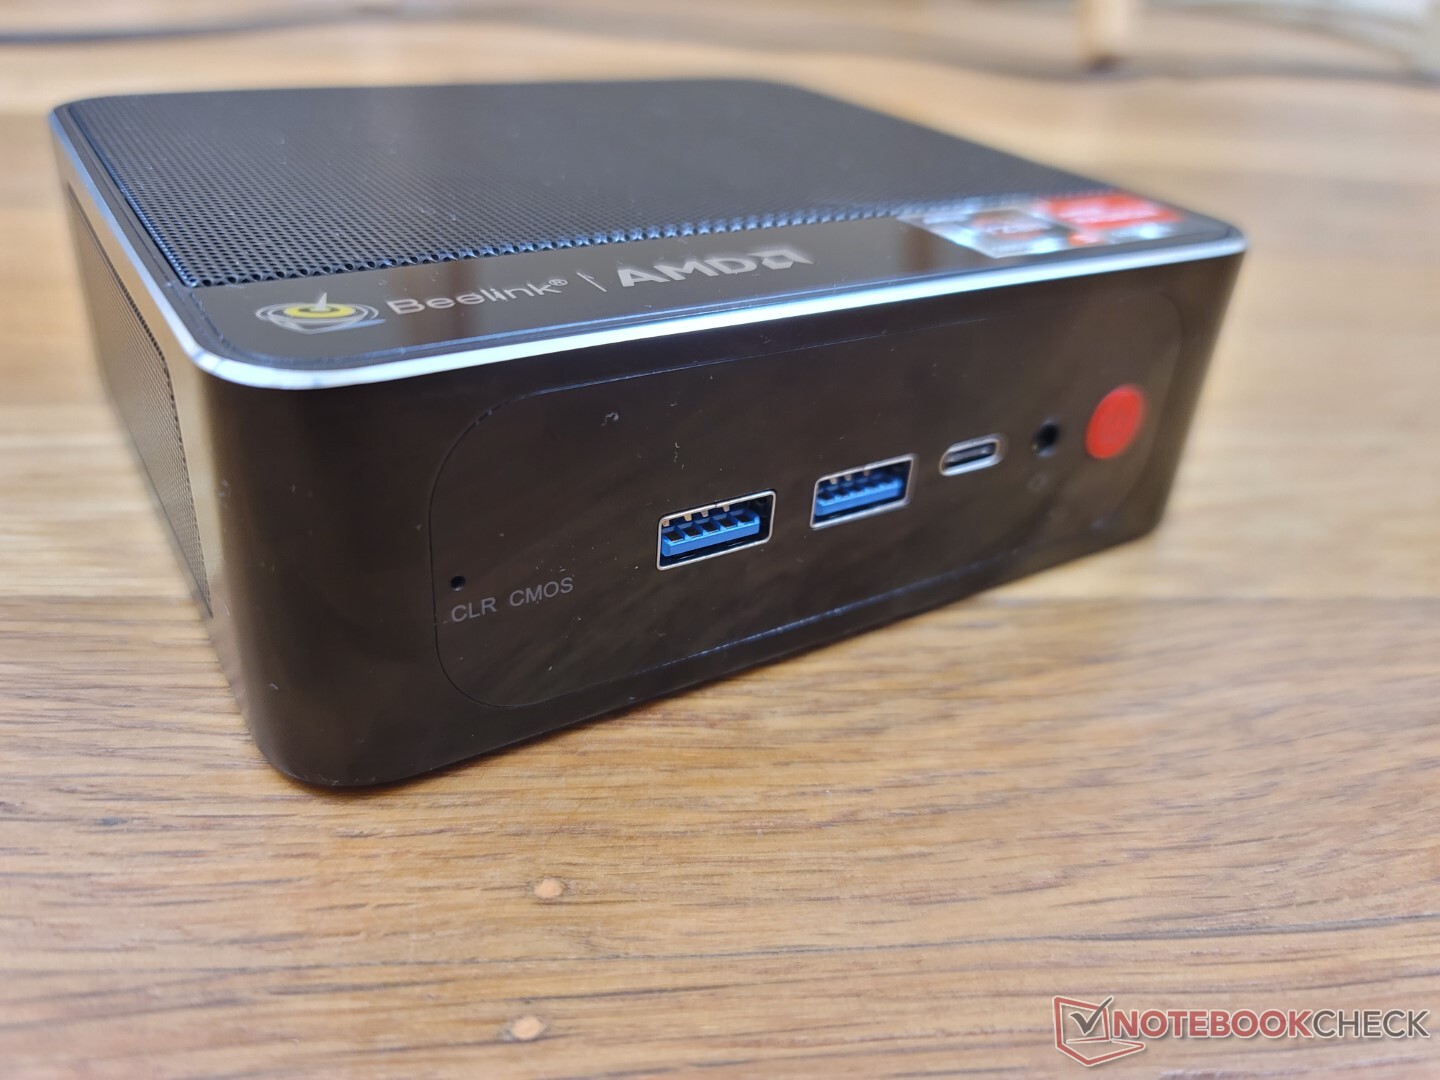
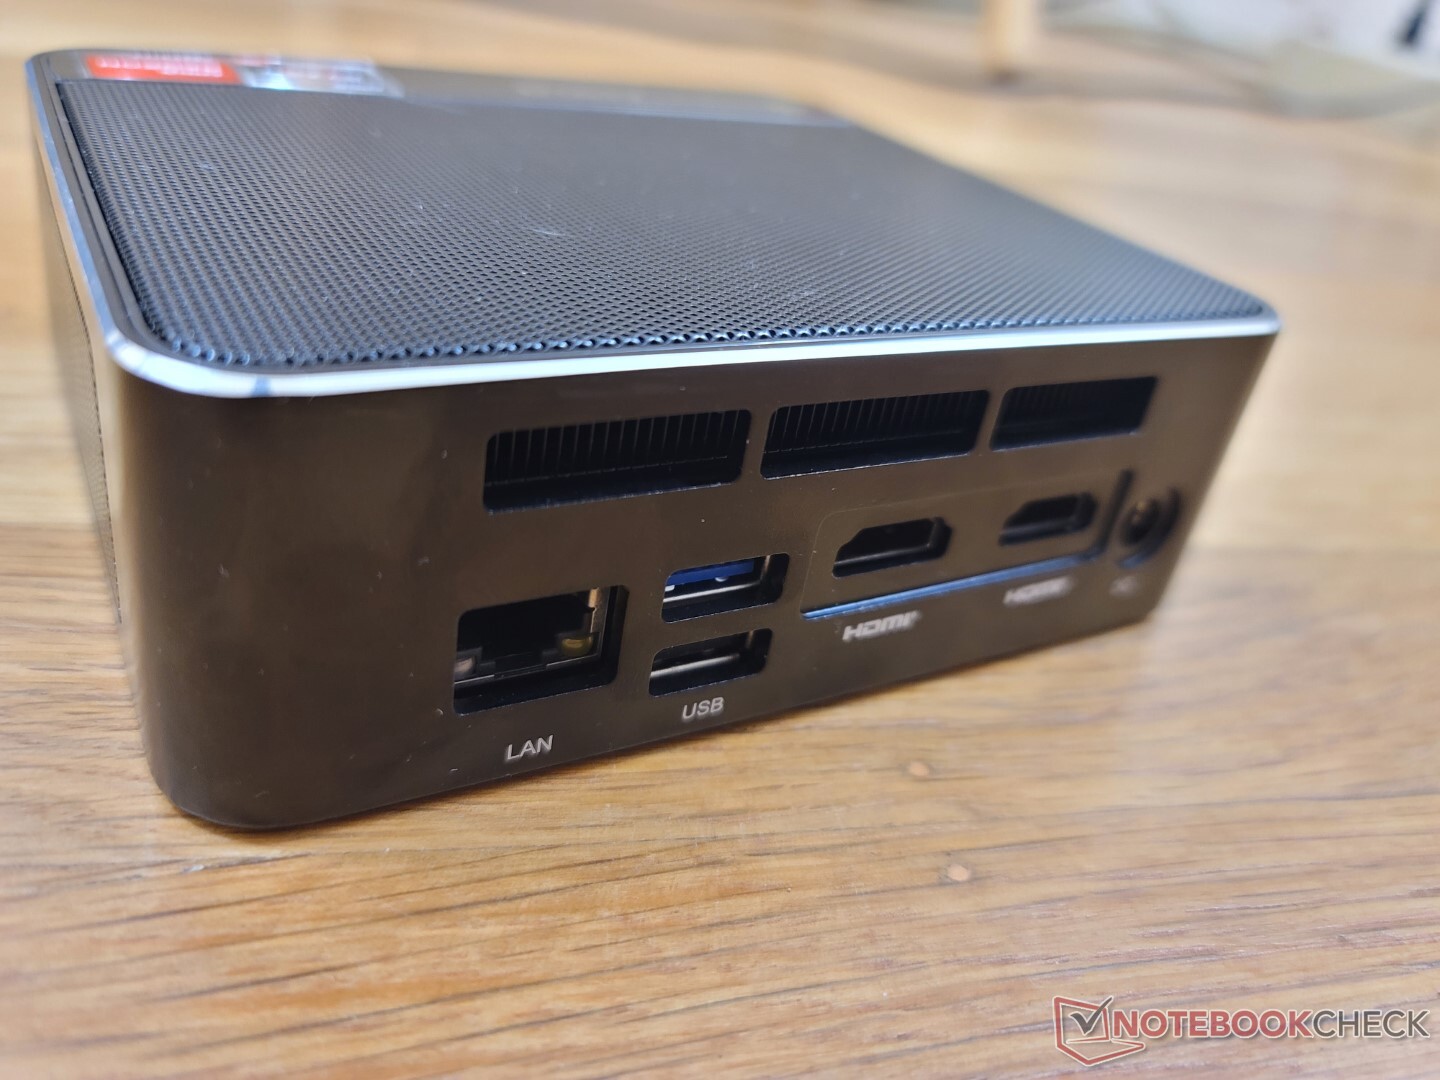
Las opciones de puerto son las mismas que en el SER4. Es decepcionante que Beelink aún no haya pasado a los adaptadores de CA USB-C, ya que el SER5 utiliza un adaptador de barril de CA propio. El único puerto USB-C frontal es compatible con DisplayPort 1.4 pero no con PD-in.
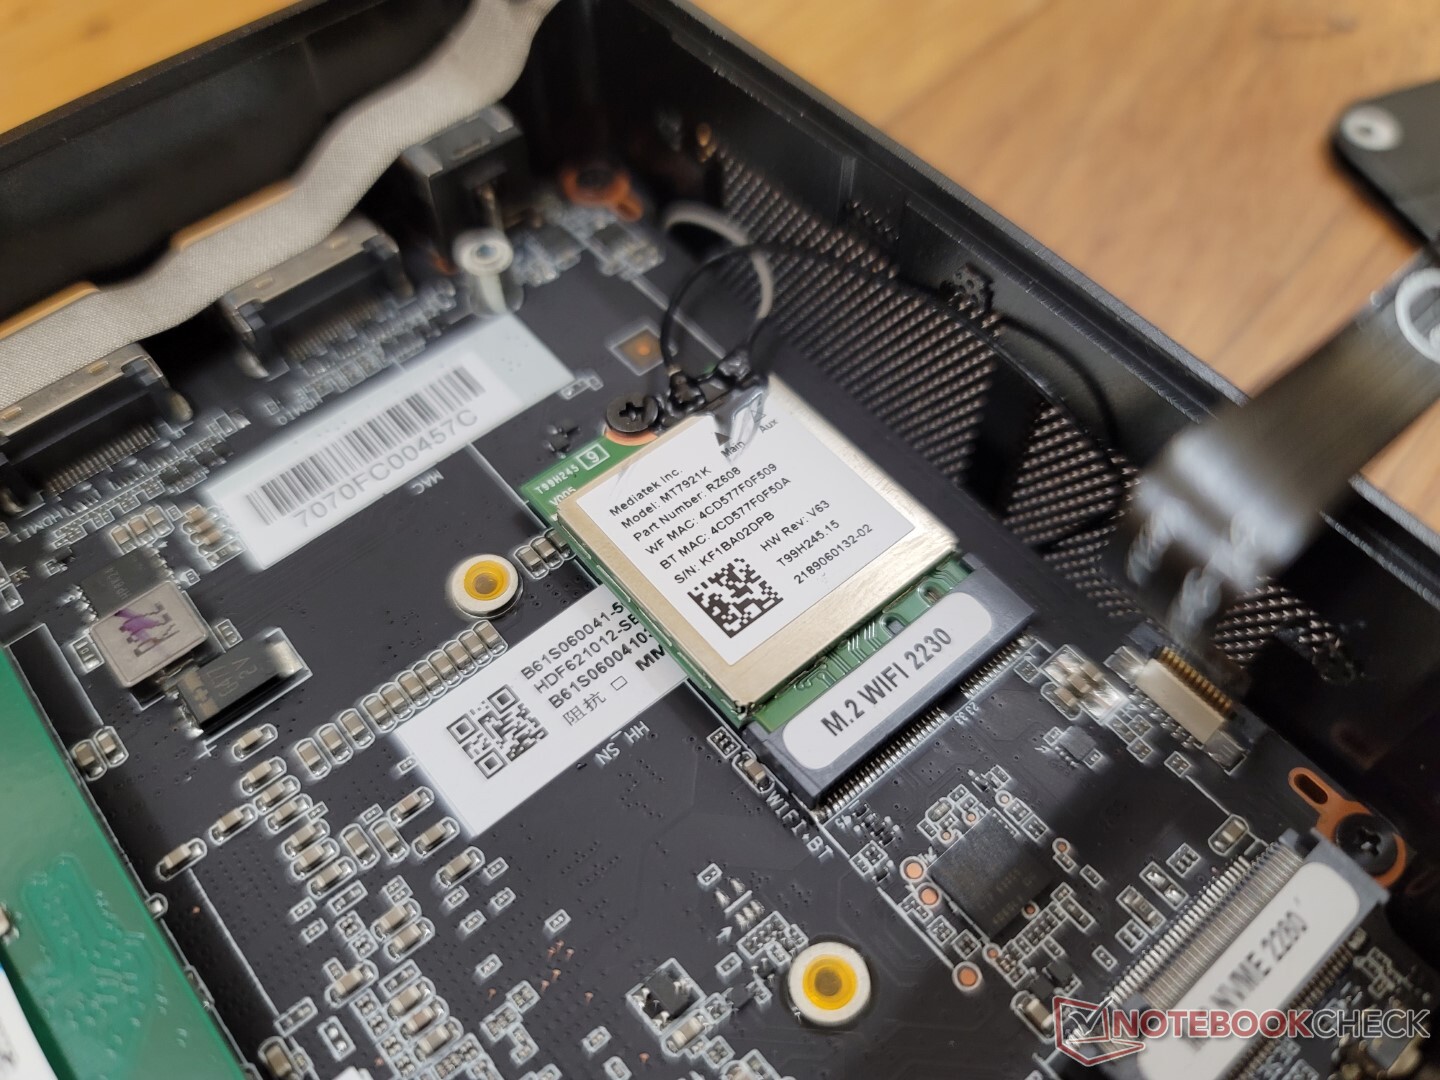
Comunicación
Un MediaTek RZ608 viene de serie para la compatibilidad con Wi-Fi 6E al igual que en el Beelink SEi11 Pro. Sin embargo, el rendimiento sigue siendo deficiente en comparación con la serie común de Intel AX200/210 como se muestra en los gráficos siguientes.
| Networking | |
| iperf3 transmit AX12 | |
| Intel NUC11TNKi5 | |
| Beelink GTR5 | |
| iperf3 receive AX12 | |
| Intel NUC11TNKi5 | |
| Beelink GTR5 | |
| iperf3 receive AXE11000 6GHz | |
| Zotac ZBOX PI336 pico | |
| Beelink SER Pro Ryzen 5 5600H | |
| Beelink SEi11 Pro | |
| iperf3 transmit AXE11000 6GHz | |
| Zotac ZBOX PI336 pico | |
| Beelink SER Pro Ryzen 5 5600H | |
| Beelink SEi11 Pro | |
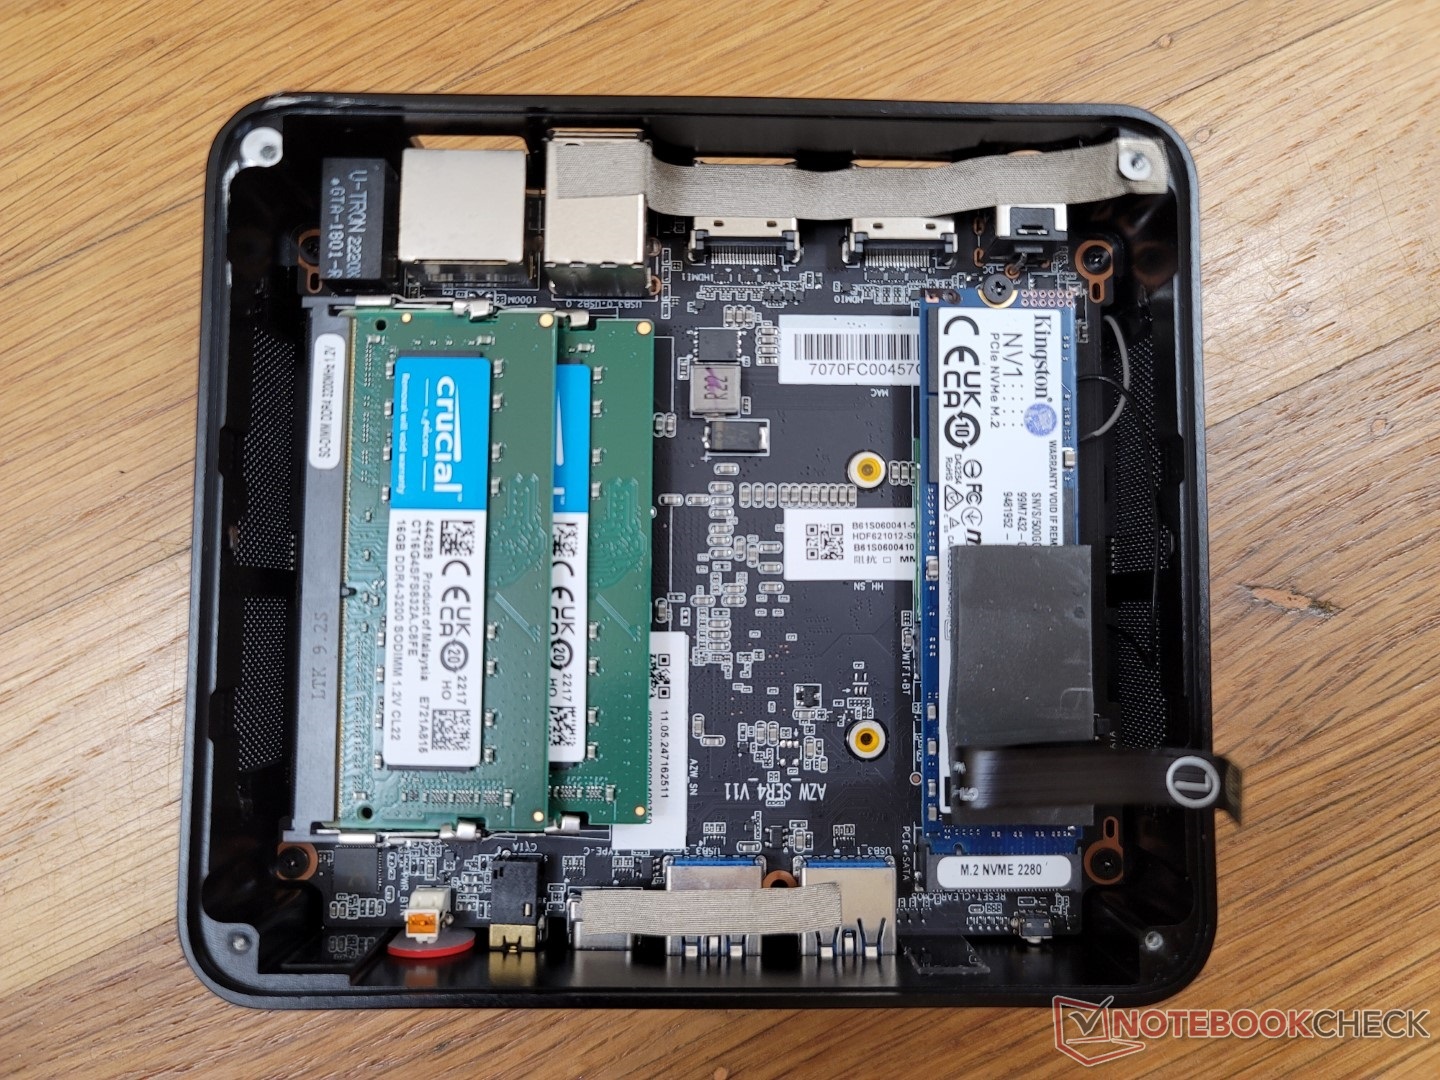
Mantenimiento
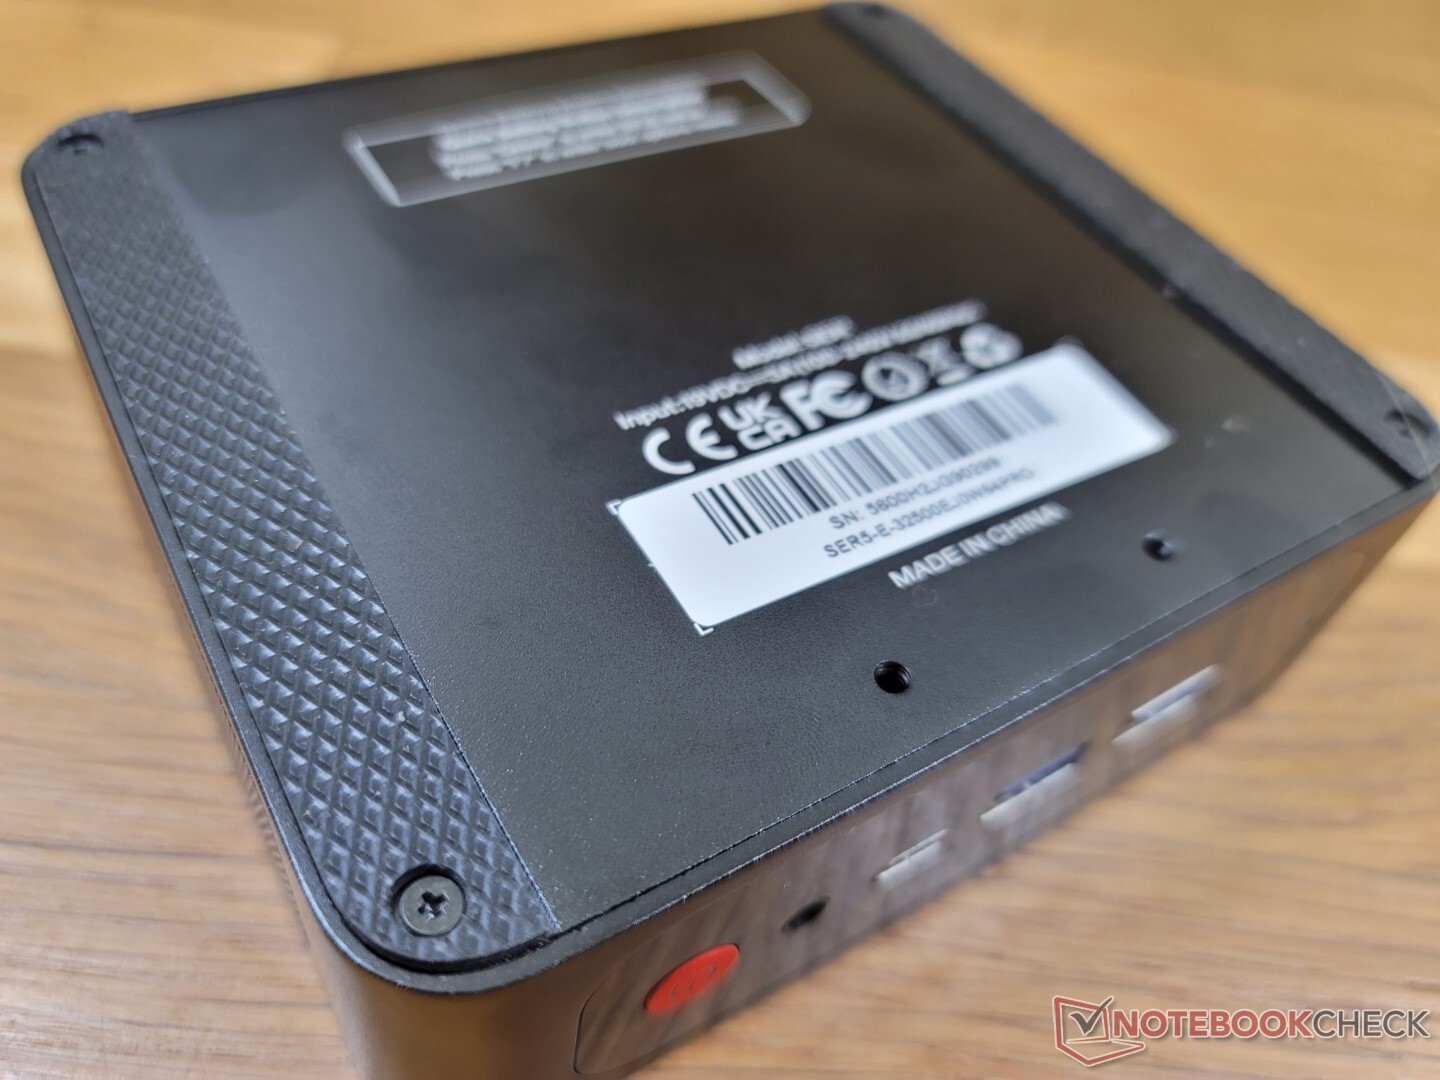
El panel inferior está asegurado por cuatro tornillos Philips. Estos tornillos son mucho más pequeños que los tornillos de giro manual en un Intel NUC y requerirá un destornillador para quitar. Ten en cuenta que estos tornillos también son bastante blandos y pueden desprenderse fácilmente si no tienes cuidado.
Accesorios y garantía
La caja incluye un soporte de montaje VESA extraíble, tornillos adicionales, un manual de usuario, dos cables HDMI y el adaptador de CA.
La garantía estándar de un año limitada del fabricante se aplica si se adquiere en los Estados Unidos.
Rendimiento
Condiciones de la prueba
Hemos puesto nuestra unidad en el modo de rendimiento a través de Windows antes de ejecutar las pruebas de referencia que se indican a continuación.
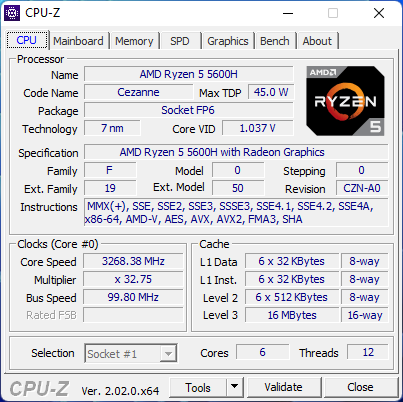
Procesador
El rendimiento multihilo es aproximadamente un 15 por ciento más lento que el PC medio de nuestra base de datos equipado con el mismo Ryzen 5 5600H CPU. Aun así, el rendimiento general sigue siendo mucho más rápido que el Core i7-1165G7 que se encuentra en muchos Ultrabooks y NUCs de Intel.
Cinebench R15 Multi Loop
Cinebench R23: Multi Core | Single Core
Cinebench R15: CPU Multi 64Bit | CPU Single 64Bit
Blender: v2.79 BMW27 CPU
7-Zip 18.03: 7z b 4 | 7z b 4 -mmt1
Geekbench 5.5: Multi-Core | Single-Core
HWBOT x265 Benchmark v2.2: 4k Preset
LibreOffice : 20 Documents To PDF
R Benchmark 2.5: Overall mean
| Cinebench R20 / CPU (Multi Core) | |
| HP Envy 16 h0112nr | |
| Schenker XMG Apex 15 NH57E PS | |
| Honor MagicBook 14 2022 | |
| Beelink GTR5 | |
| Medio AMD Ryzen 5 5600H (3074 - 4059, n=16) | |
| Beelink SER4 | |
| Beelink SER Pro Ryzen 5 5600H | |
| Intel NUC10i7FNH | |
| Beelink SEi11 Pro | |
| Framework Laptop 13.5 | |
| Intel NUC11TNKi5 | |
| Zotac ZBOX PI336 pico | |
| Cinebench R20 / CPU (Single Core) | |
| HP Envy 16 h0112nr | |
| Honor MagicBook 14 2022 | |
| Framework Laptop 13.5 | |
| Beelink GTR5 | |
| Beelink SEi11 Pro | |
| Schenker XMG Apex 15 NH57E PS | |
| Medio AMD Ryzen 5 5600H (527 - 538, n=15) | |
| Beelink SER Pro Ryzen 5 5600H | |
| Intel NUC11TNKi5 | |
| Beelink SER4 | |
| Intel NUC10i7FNH | |
| Zotac ZBOX PI336 pico | |
| Cinebench R23 / Single Core | |
| HP Envy 16 h0112nr | |
| Honor MagicBook 14 2022 | |
| Framework Laptop 13.5 | |
| Beelink GTR5 | |
| Beelink SEi11 Pro | |
| Schenker XMG Apex 15 NH57E PS | |
| Intel NUC11TNKi5 | |
| Beelink SER Pro Ryzen 5 5600H | |
| Medio AMD Ryzen 5 5600H (1316 - 1381, n=13) | |
| Beelink SER4 | |
| Zotac ZBOX PI336 pico | |
| Cinebench R15 / CPU Single 64Bit | |
| HP Envy 16 h0112nr | |
| Beelink GTR5 | |
| Honor MagicBook 14 2022 | |
| Schenker XMG Apex 15 NH57E PS | |
| Framework Laptop 13.5 | |
| Medio AMD Ryzen 5 5600H (218 - 225, n=14) | |
| Beelink SER Pro Ryzen 5 5600H | |
| Beelink SEi11 Pro | |
| Intel NUC11TNKi5 | |
| Intel NUC10i7FNH | |
| Beelink SER4 | |
| Zotac ZBOX PI336 pico | |
| Geekbench 5.5 / Multi-Core | |
| HP Envy 16 h0112nr | |
| Honor MagicBook 14 2022 | |
| Schenker XMG Apex 15 NH57E PS | |
| Beelink GTR5 | |
| Medio AMD Ryzen 5 5600H (4990 - 7253, n=14) | |
| Beelink SER4 | |
| Beelink SER Pro Ryzen 5 5600H | |
| Intel NUC10i7FNH | |
| Beelink SEi11 Pro | |
| Intel NUC11TNKi5 | |
| Zotac ZBOX PI336 pico | |
| Geekbench 5.5 / Single-Core | |
| HP Envy 16 h0112nr | |
| Honor MagicBook 14 2022 | |
| Beelink GTR5 | |
| Beelink SEi11 Pro | |
| Schenker XMG Apex 15 NH57E PS | |
| Beelink SER Pro Ryzen 5 5600H | |
| Medio AMD Ryzen 5 5600H (1365 - 1445, n=14) | |
| Intel NUC11TNKi5 | |
| Intel NUC10i7FNH | |
| Beelink SER4 | |
| Zotac ZBOX PI336 pico | |
| HWBOT x265 Benchmark v2.2 / 4k Preset | |
| Schenker XMG Apex 15 NH57E PS | |
| HP Envy 16 h0112nr | |
| Beelink GTR5 | |
| Honor MagicBook 14 2022 | |
| Medio AMD Ryzen 5 5600H (9.92 - 13.3, n=14) | |
| Beelink SER Pro Ryzen 5 5600H | |
| Beelink SER4 | |
| Intel NUC10i7FNH | |
| Beelink SEi11 Pro | |
| Framework Laptop 13.5 | |
| Intel NUC11TNKi5 | |
| Zotac ZBOX PI336 pico | |
| LibreOffice / 20 Documents To PDF | |
| Zotac ZBOX PI336 pico | |
| Beelink SER4 | |
| Medio AMD Ryzen 5 5600H (52.2 - 81.5, n=14) | |
| Schenker XMG Apex 15 NH57E PS | |
| Beelink SER Pro Ryzen 5 5600H | |
| Intel NUC11TNKi5 | |
| Beelink GTR5 | |
| Beelink SEi11 Pro | |
| HP Envy 16 h0112nr | |
| Framework Laptop 13.5 | |
| Honor MagicBook 14 2022 | |
* ... más pequeño es mejor
AIDA64: FP32 Ray-Trace | FPU Julia | CPU SHA3 | CPU Queen | FPU SinJulia | FPU Mandel | CPU AES | CPU ZLib | FP64 Ray-Trace | CPU PhotoWorxx
| Performance rating | |
| Beelink GTR5 | |
| Beelink SER Pro Ryzen 5 5600H | |
| Beelink SEi11 Pro | |
| Intel NUC11TNKi5 | |
| Zotac ZBOX PI336 pico | |
| AIDA64 / FP32 Ray-Trace | |
| Beelink GTR5 | |
| Beelink SER Pro Ryzen 5 5600H | |
| Beelink SEi11 Pro | |
| Intel NUC11TNKi5 | |
| Zotac ZBOX PI336 pico | |
| AIDA64 / FPU Julia | |
| Beelink GTR5 | |
| Beelink SER Pro Ryzen 5 5600H | |
| Beelink SEi11 Pro | |
| Intel NUC11TNKi5 | |
| Zotac ZBOX PI336 pico | |
| AIDA64 / CPU SHA3 | |
| Beelink GTR5 | |
| Beelink SER Pro Ryzen 5 5600H | |
| Beelink SEi11 Pro | |
| Intel NUC11TNKi5 | |
| Zotac ZBOX PI336 pico | |
| AIDA64 / CPU Queen | |
| Beelink GTR5 | |
| Beelink SER Pro Ryzen 5 5600H | |
| Beelink SEi11 Pro | |
| Intel NUC11TNKi5 | |
| Zotac ZBOX PI336 pico | |
| AIDA64 / FPU SinJulia | |
| Beelink GTR5 | |
| Beelink SER Pro Ryzen 5 5600H | |
| Beelink SEi11 Pro | |
| Intel NUC11TNKi5 | |
| Zotac ZBOX PI336 pico | |
| AIDA64 / FPU Mandel | |
| Beelink GTR5 | |
| Beelink SER Pro Ryzen 5 5600H | |
| Beelink SEi11 Pro | |
| Intel NUC11TNKi5 | |
| Zotac ZBOX PI336 pico | |
| AIDA64 / CPU AES | |
| Beelink GTR5 | |
| Beelink SER Pro Ryzen 5 5600H | |
| Beelink SEi11 Pro | |
| Intel NUC11TNKi5 | |
| Zotac ZBOX PI336 pico | |
| AIDA64 / CPU ZLib | |
| Beelink GTR5 | |
| Beelink SER Pro Ryzen 5 5600H | |
| Intel NUC11TNKi5 | |
| Beelink SEi11 Pro | |
| Zotac ZBOX PI336 pico | |
| AIDA64 / FP64 Ray-Trace | |
| Beelink GTR5 | |
| Beelink SER Pro Ryzen 5 5600H | |
| Beelink SEi11 Pro | |
| Intel NUC11TNKi5 | |
| Zotac ZBOX PI336 pico | |
| AIDA64 / CPU PhotoWorxx | |
| Beelink SEi11 Pro | |
| Beelink GTR5 | |
| Beelink SER Pro Ryzen 5 5600H | |
| Intel NUC11TNKi5 | |
| Zotac ZBOX PI336 pico | |
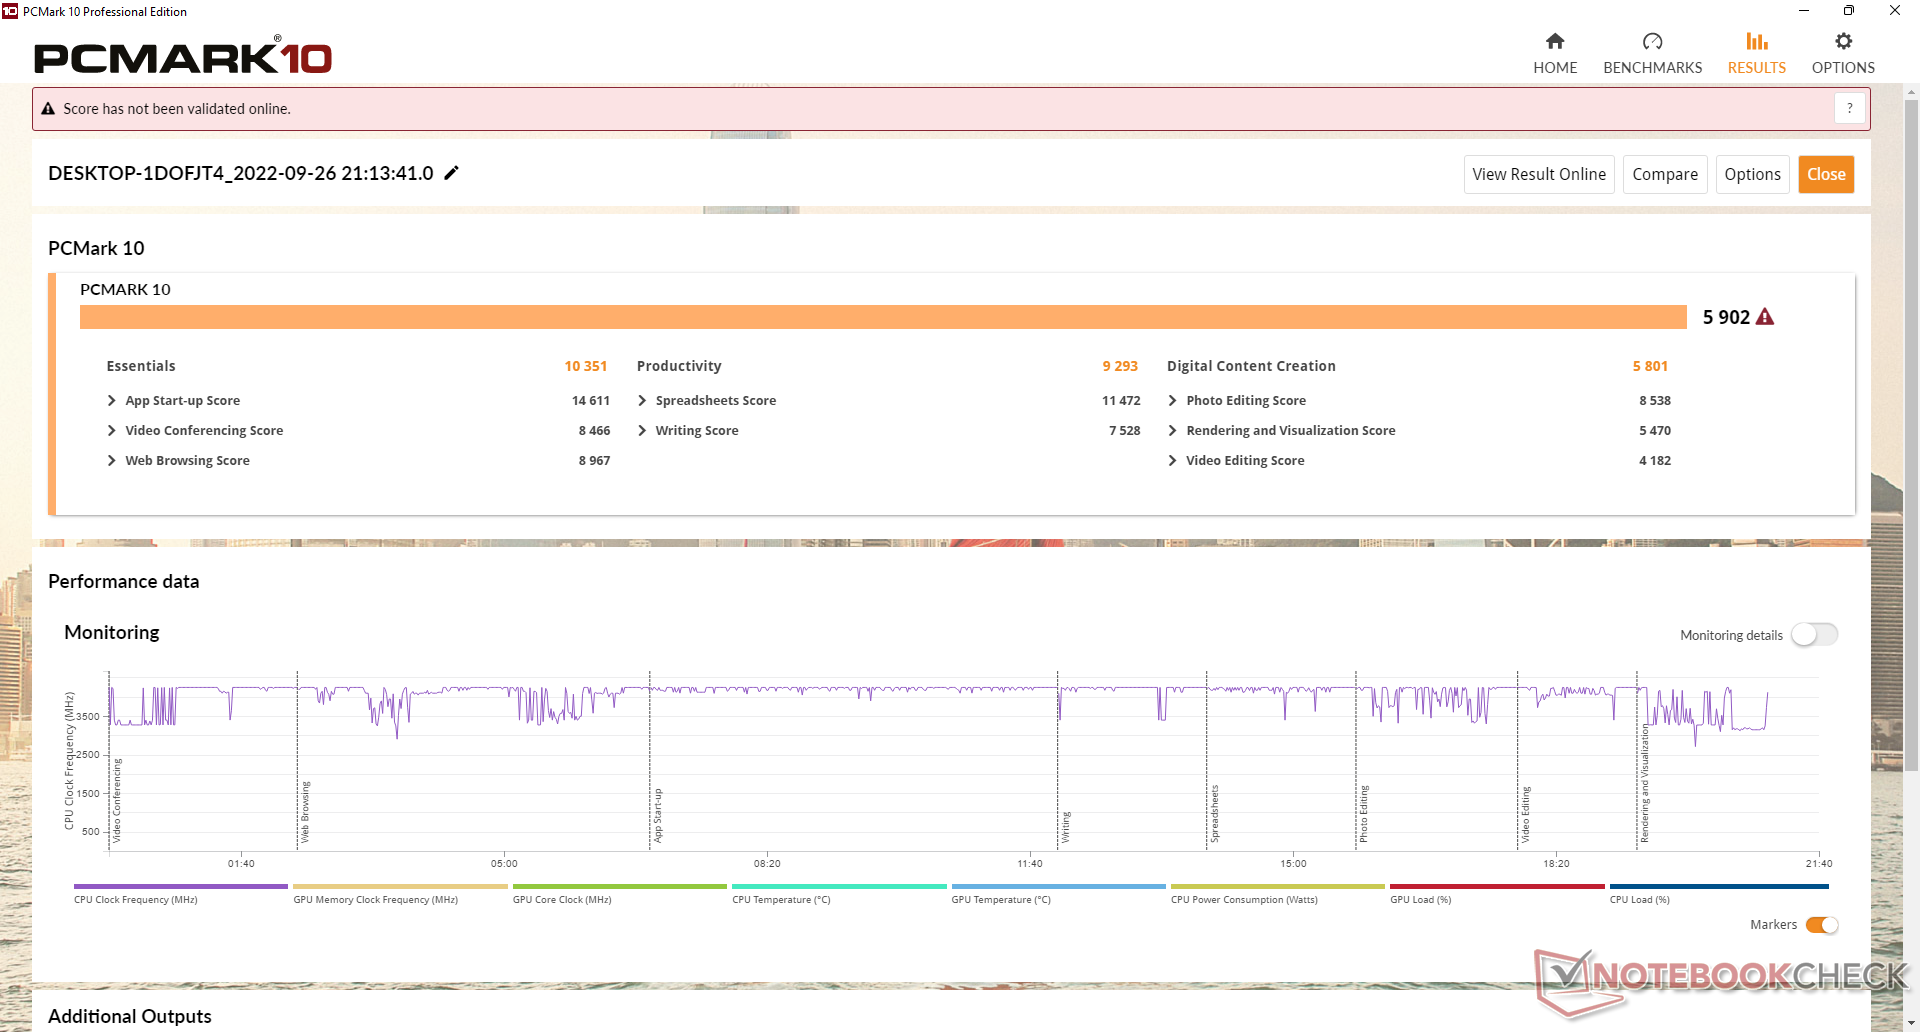
Rendimiento del sistema
Los resultados de PCMark 10 están donde esperamos que estén cuando se comparan con otros portátiles o mini PCs Ryzen 5 5600H, excepto en la subprueba de Creación de Contenido Digital, donde el rendimiento de la GPU es lo más importante. Esto se debe a que muchos portátiles con este mismo procesador suelen venir con gráficos discretos más rápidos.
CrossMark: Overall | Productivity | Creativity | Responsiveness
| PCMark 10 / Score | |
| Beelink GTR5 | |
| Medio AMD Ryzen 5 5600H (5309 - 7091, n=14) | |
| Beelink SER Pro Ryzen 5 5600H | |
| Beelink SEi11 Pro | |
| Intel NUC11TNKi5 | |
| Intel NUC10i7FNH | |
| PCMark 10 / Essentials | |
| Beelink GTR5 | |
| Beelink SER Pro Ryzen 5 5600H | |
| Beelink SEi11 Pro | |
| Medio AMD Ryzen 5 5600H (9326 - 10506, n=14) | |
| Intel NUC10i7FNH | |
| Intel NUC11TNKi5 | |
| PCMark 10 / Productivity | |
| Beelink GTR5 | |
| Beelink SER Pro Ryzen 5 5600H | |
| Medio AMD Ryzen 5 5600H (7975 - 9642, n=14) | |
| Beelink SEi11 Pro | |
| Intel NUC10i7FNH | |
| Intel NUC11TNKi5 | |
| PCMark 10 / Digital Content Creation | |
| Medio AMD Ryzen 5 5600H (4921 - 9907, n=14) | |
| Beelink GTR5 | |
| Beelink SER Pro Ryzen 5 5600H | |
| Beelink SEi11 Pro | |
| Intel NUC11TNKi5 | |
| Intel NUC10i7FNH | |
| CrossMark / Overall | |
| Beelink GTR5 | |
| Beelink SEi11 Pro | |
| Beelink SER Pro Ryzen 5 5600H | |
| Medio AMD Ryzen 5 5600H (1157 - 1353, n=7) | |
| CrossMark / Productivity | |
| Beelink GTR5 | |
| Beelink SEi11 Pro | |
| Beelink SER Pro Ryzen 5 5600H | |
| Medio AMD Ryzen 5 5600H (1217 - 1384, n=7) | |
| CrossMark / Creativity | |
| Beelink GTR5 | |
| Medio AMD Ryzen 5 5600H (1184 - 1377, n=7) | |
| Beelink SER Pro Ryzen 5 5600H | |
| Beelink SEi11 Pro | |
| CrossMark / Responsiveness | |
| Beelink SEi11 Pro | |
| Beelink GTR5 | |
| Beelink SER Pro Ryzen 5 5600H | |
| Medio AMD Ryzen 5 5600H (926 - 1225, n=7) | |
| PCMark 10 Score | 5902 puntos | |
ayuda | ||
| AIDA64 / Memory Copy | |
| Beelink GTR5 | |
| Beelink SER Pro Ryzen 5 5600H | |
| Beelink SEi11 Pro | |
| Medio AMD Ryzen 5 5600H (20549 - 42141, n=14) | |
| Intel NUC11TNKi5 | |
| Zotac ZBOX PI336 pico | |
| AIDA64 / Memory Read | |
| Beelink SER Pro Ryzen 5 5600H | |
| Beelink GTR5 | |
| Beelink SEi11 Pro | |
| Medio AMD Ryzen 5 5600H (22917 - 47595, n=14) | |
| Intel NUC11TNKi5 | |
| Zotac ZBOX PI336 pico | |
| AIDA64 / Memory Write | |
| Beelink SEi11 Pro | |
| Beelink SER Pro Ryzen 5 5600H | |
| Beelink GTR5 | |
| Medio AMD Ryzen 5 5600H (20226 - 44872, n=14) | |
| Intel NUC11TNKi5 | |
| Zotac ZBOX PI336 pico | |
| AIDA64 / Memory Latency | |
| Intel NUC11TNKi5 | |
| Beelink SEi11 Pro | |
| Beelink SER Pro Ryzen 5 5600H | |
| Beelink GTR5 | |
| Medio AMD Ryzen 5 5600H (75 - 89.1, n=14) | |
| Zotac ZBOX PI336 pico | |
* ... más pequeño es mejor
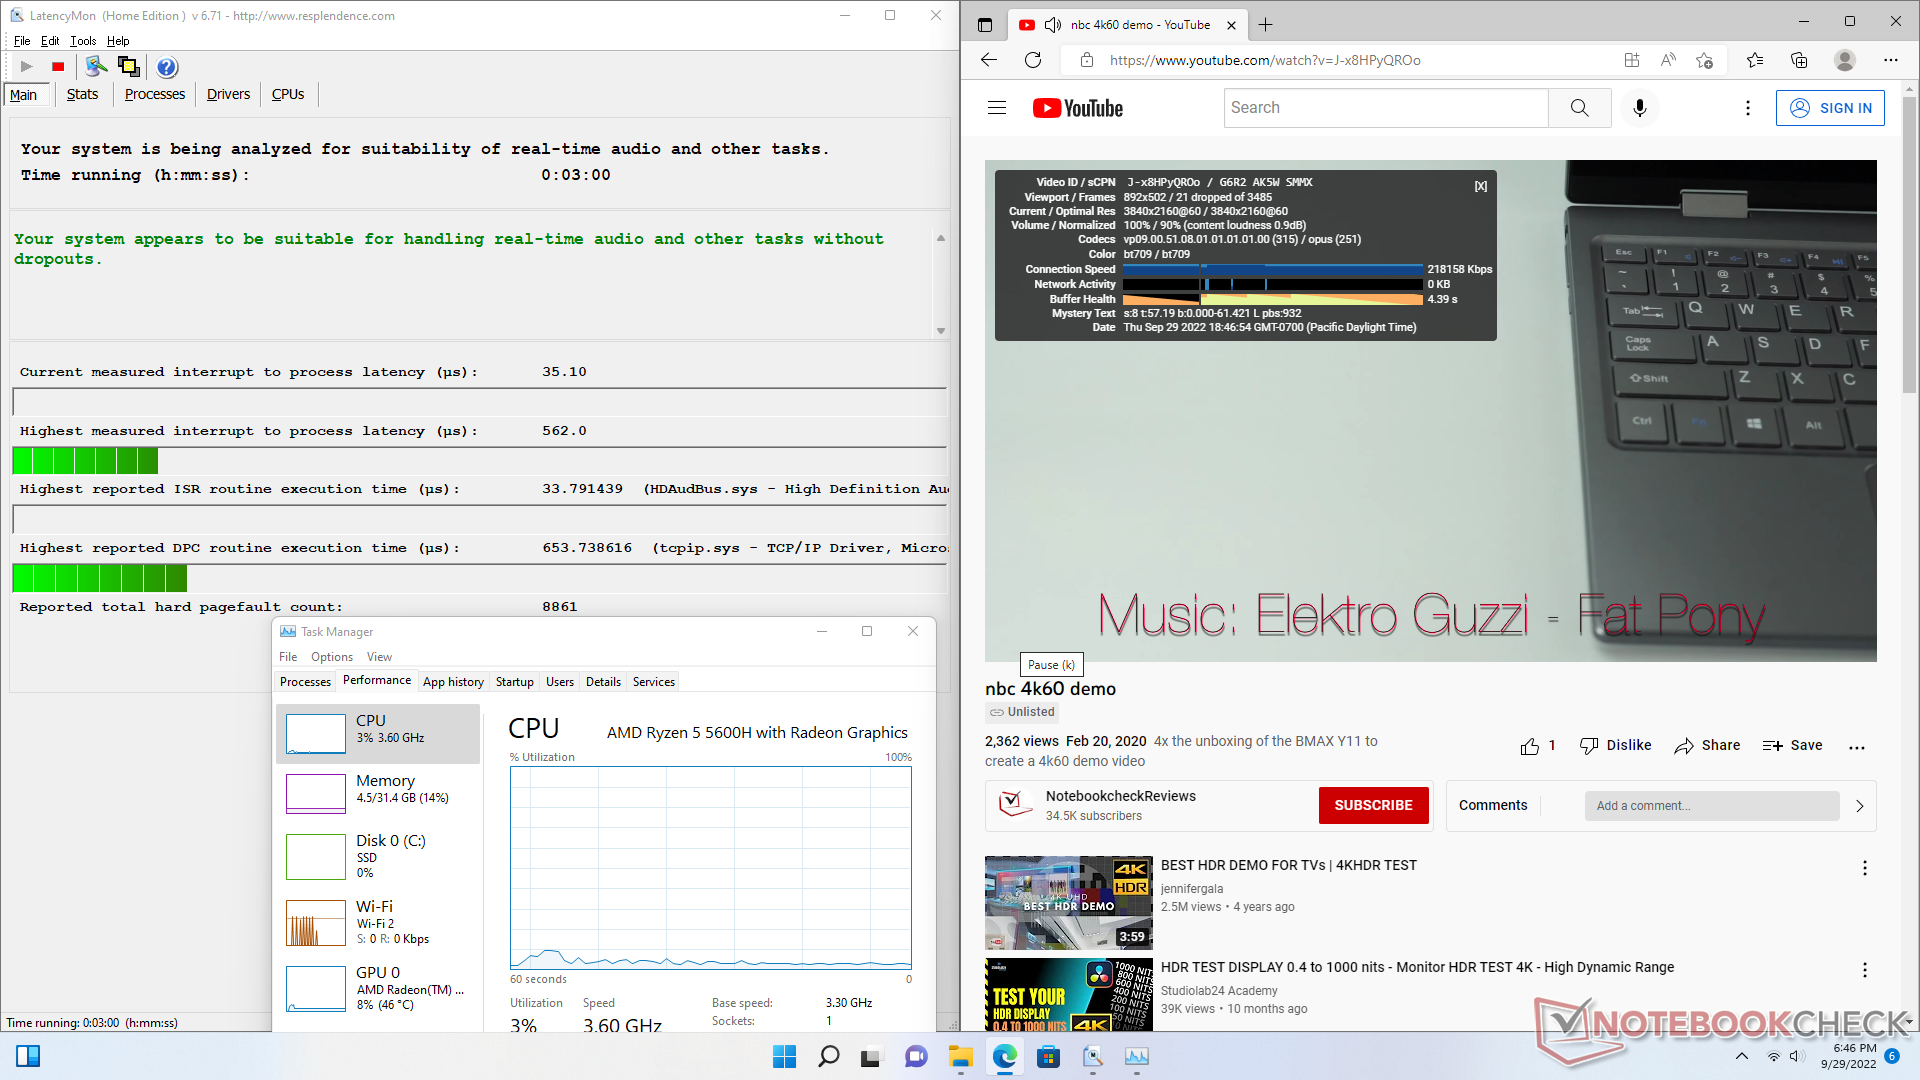
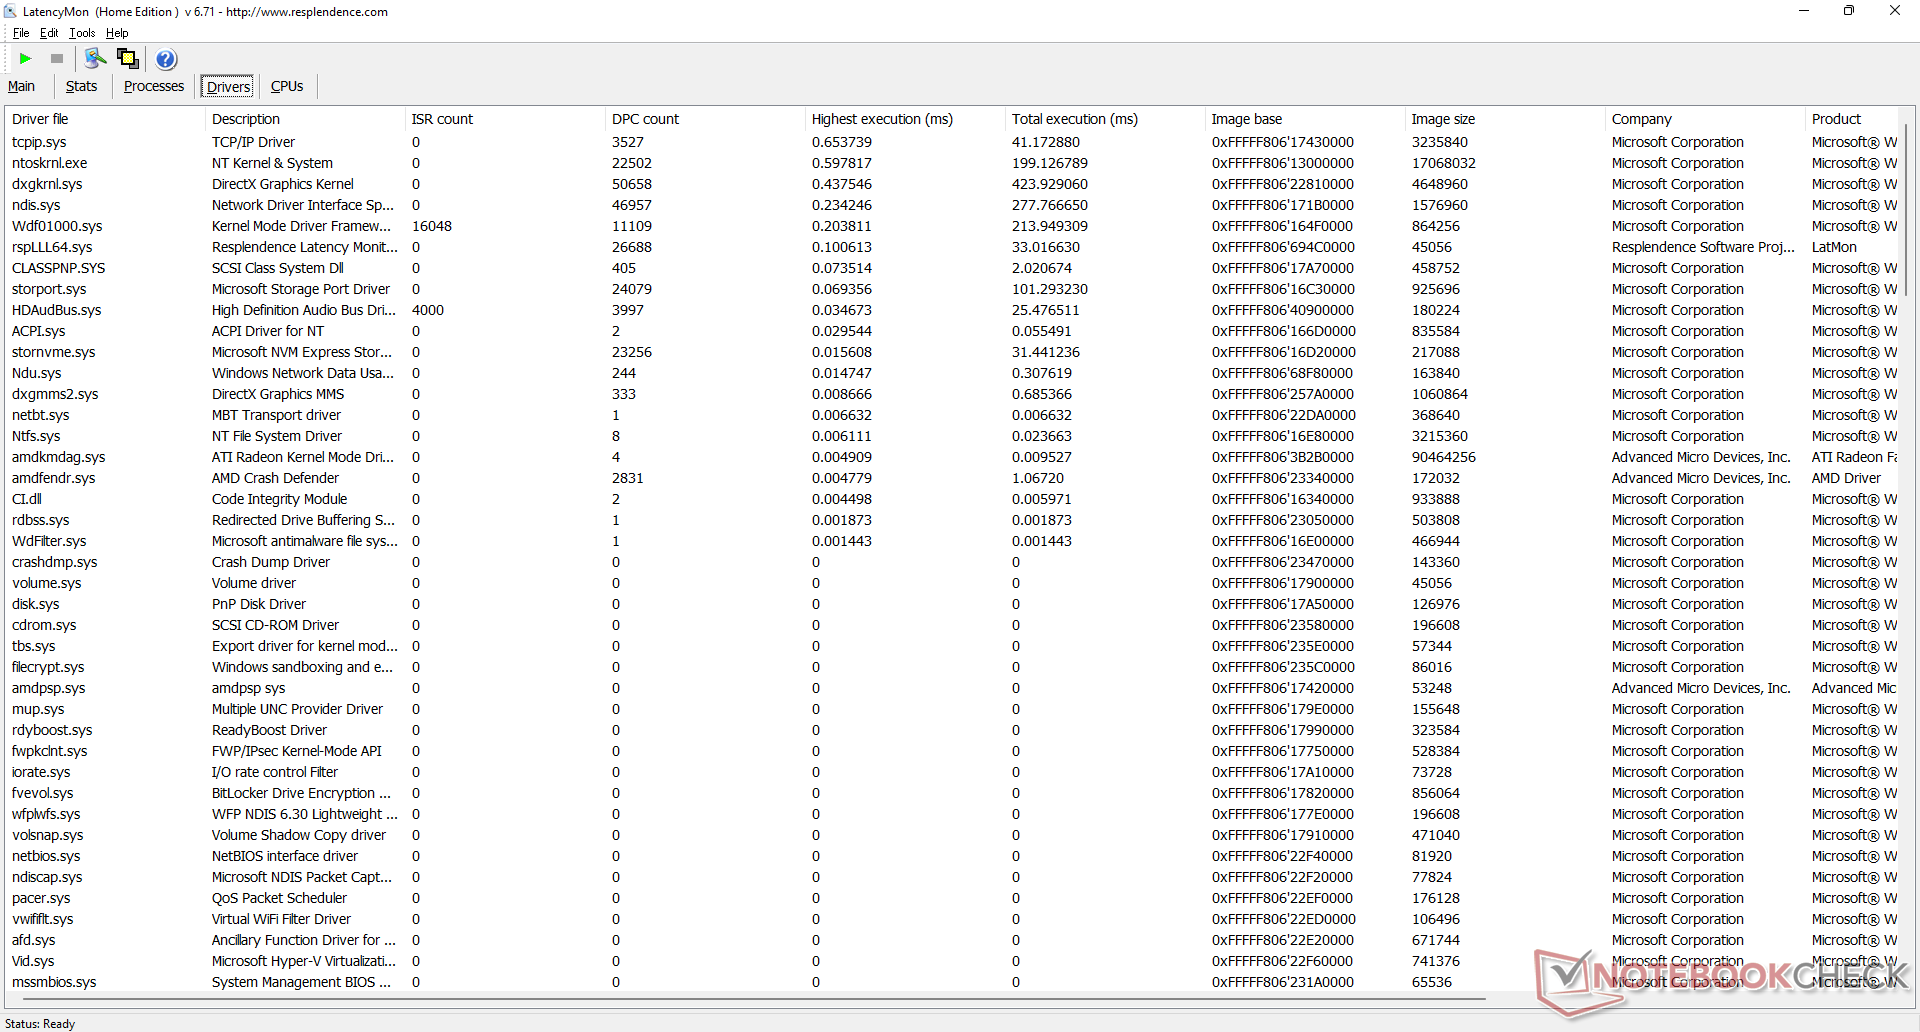
Latencia del CPD
LatencyMon no muestra problemas importantes de CPD al abrir varias pestañas del navegador en nuestra página de inicio. Por desgracia, la reproducción de vídeo 4K a 60 FPS es imperfecta, con 21 fotogramas perdidos durante nuestro vídeo de un minuto de duración.
| DPC Latencies / LatencyMon - interrupt to process latency (max), Web, Youtube, Prime95 | |
| Zotac ZBOX PI336 pico | |
| Beelink SER Pro Ryzen 5 5600H | |
| Intel NUC11TNKi5 | |
| Beelink SEi11 Pro | |
| Beelink GTR5 | |
* ... más pequeño es mejor
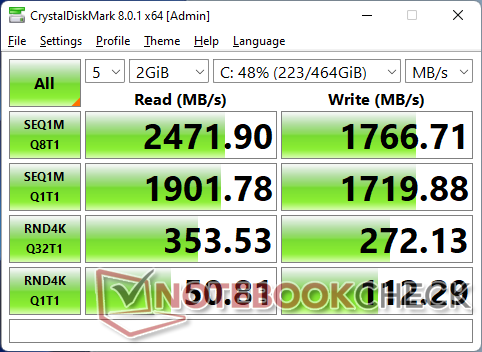
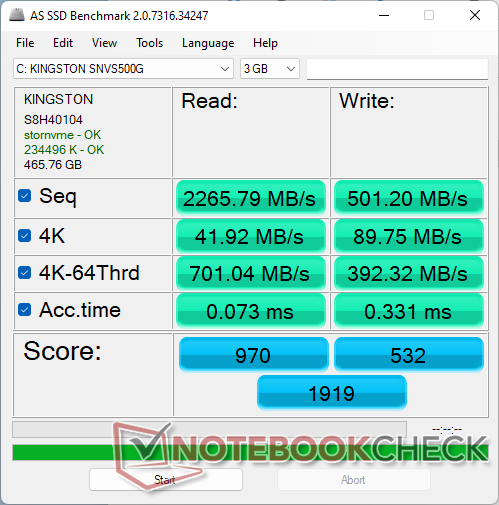
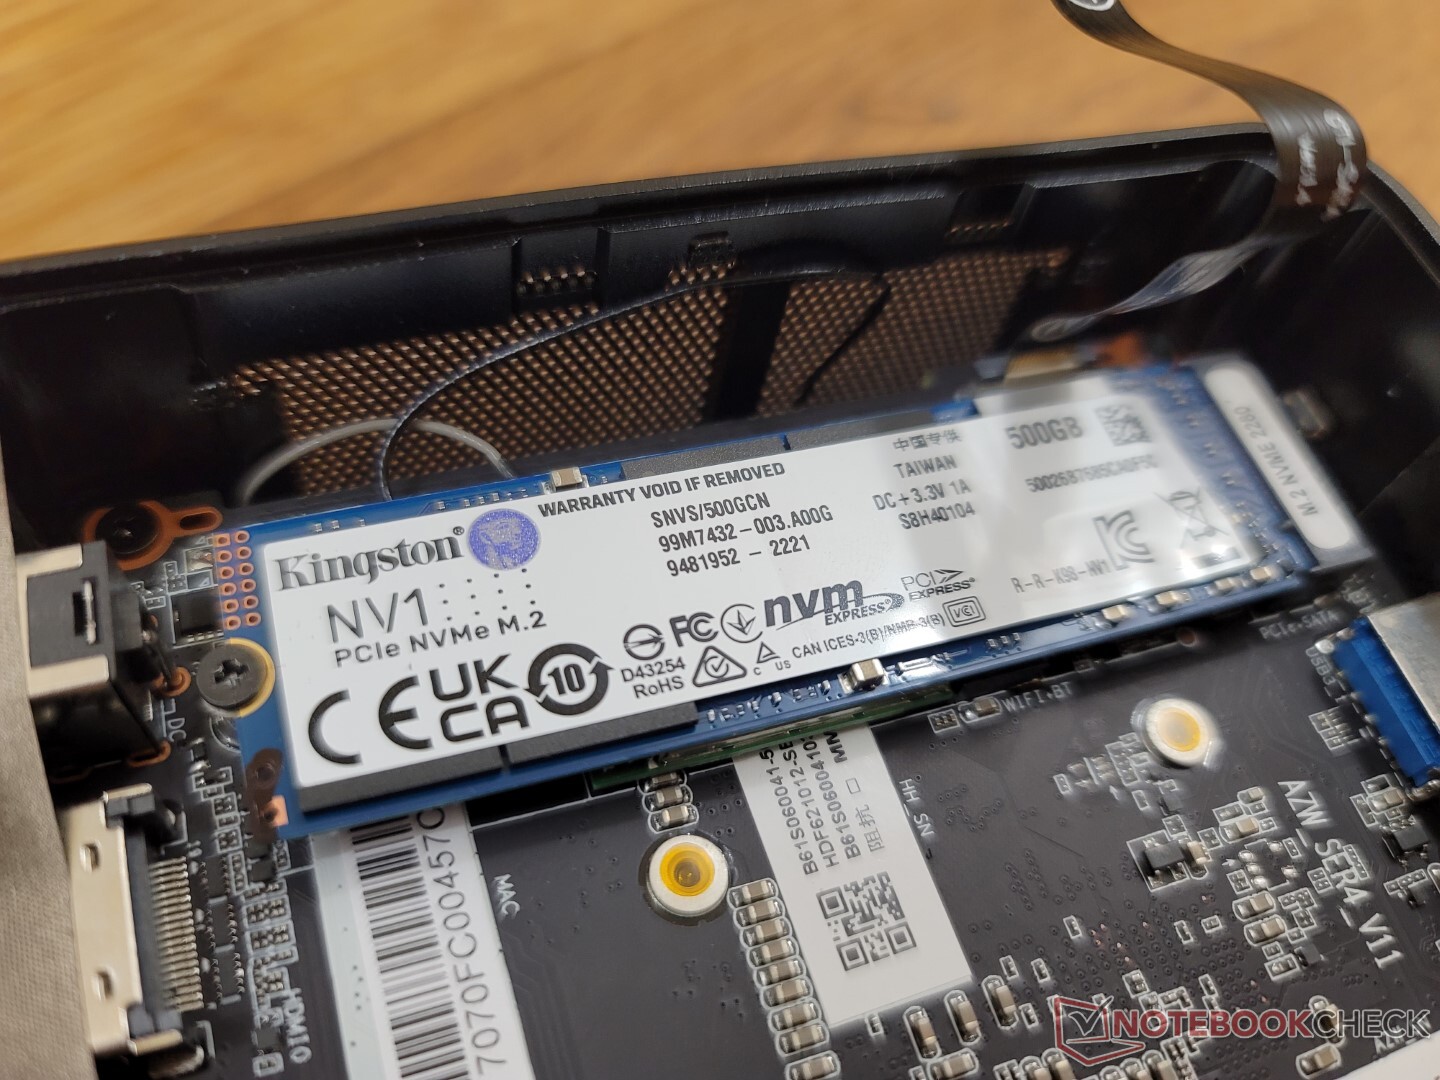
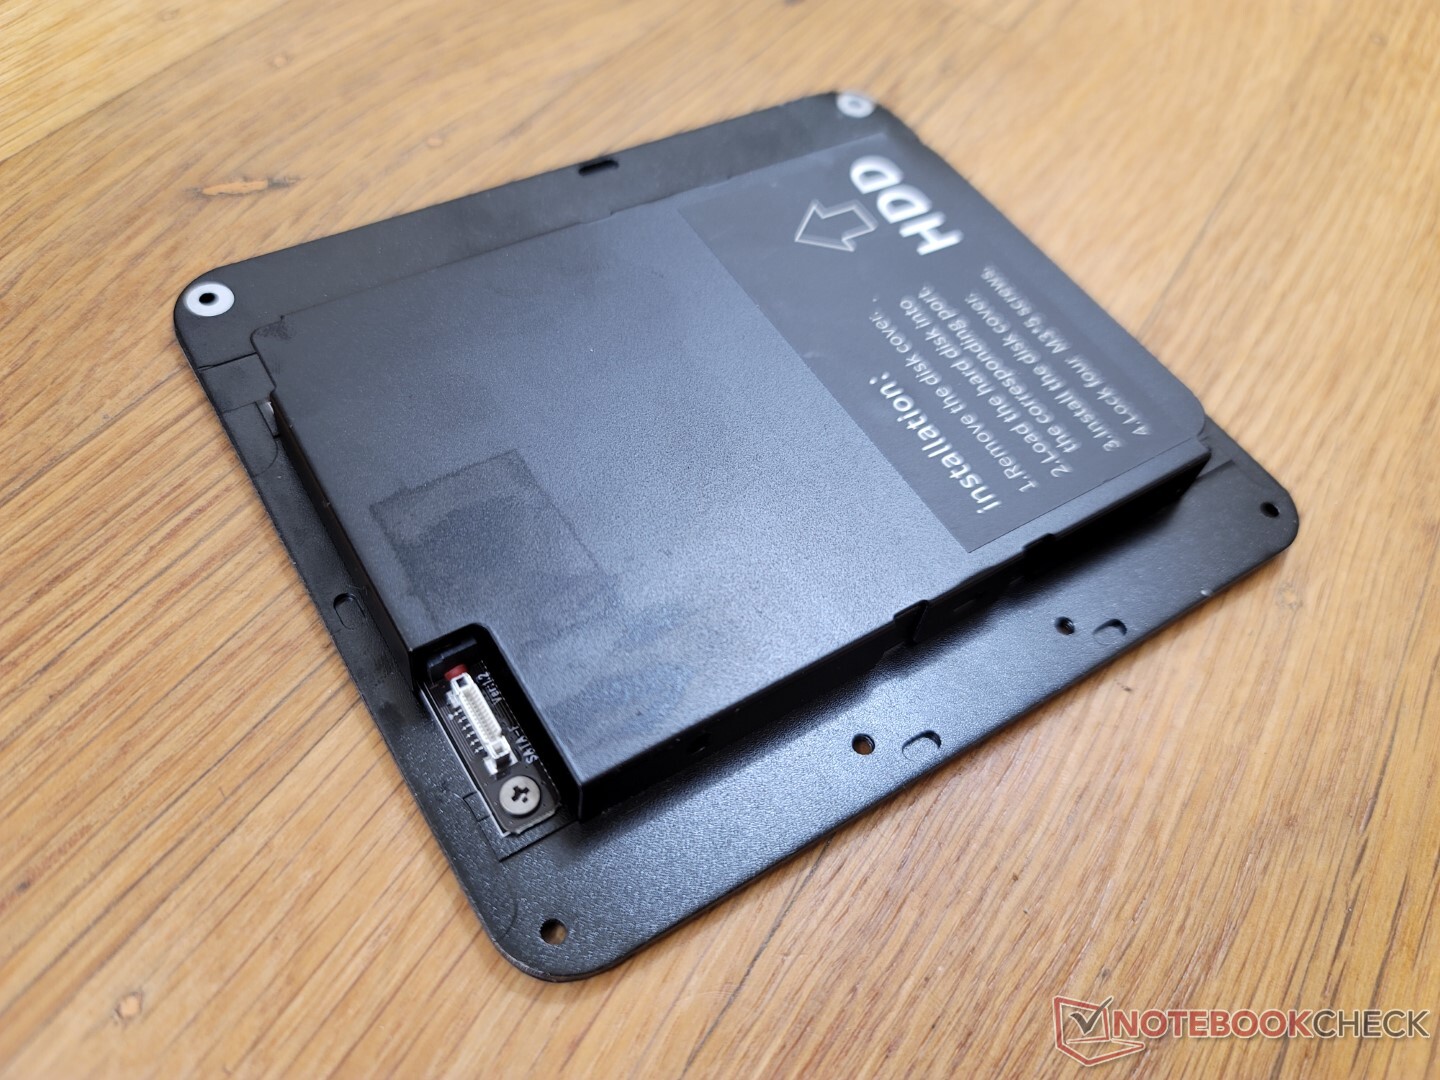
Dispositivos de almacenamiento
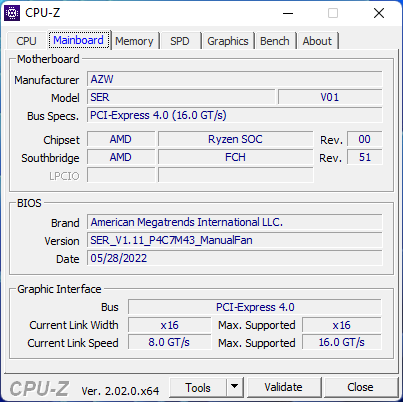
Las velocidades de NVMe están limitadas a PCIe3 x4, mientras que la mayoría de los nuevos modelos de NUC de Intel son totalmente compatibles con PCIe4 x4. Sin embargo, PCIe3 es más que suficiente para la mayoría de los usuarios, por lo que el recorte no es significativo. Nuestra gama media de 500 GB SSD Kingston NV1 es capaz de mantener sus tasas máximas de lectura de ~2500 MB/s sin ningún problema térmico.

| Drive Performance rating - Percent | |
| Beelink SER Pro Ryzen 5 5600H -11! | |
| Beelink GTR5 | |
| Beelink SEi11 Pro | |
| Intel NUC10i7FNH | |
| Intel NUC11TNKi5 | |
| Zotac ZBOX PI336 pico | |
* ... más pequeño es mejor
Disk Throttling: DiskSpd Read Loop, Queue Depth 8
Rendimiento de la GPU
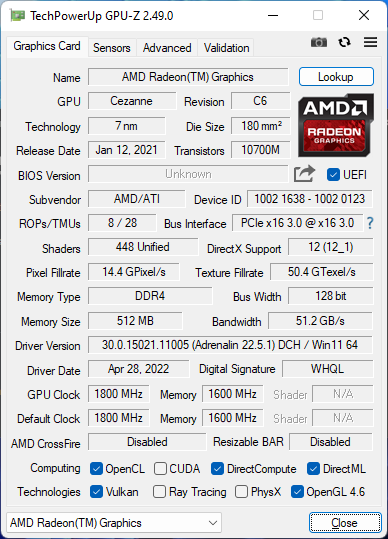
El rendimiento gráfico es mucho más rápido que el de la mayoría de los portátiles o mini PC con la misma integración Radeon RX Vega 7 Entre un 30 y un 35 por ciento, ya que estos productos suelen combinar la GPU con CPUs de la serie Ryzen U, más lentas, o con memoria RAM de un solo canal. El Ryzen 5 5600H supone un menor cuello de botella para la GPU y, en consecuencia, las velocidades de fotogramas se ven beneficiadas. Sin embargo, sigue sin ser una máquina de juegos.
El Iris Xe 96 EUs que se encuentra habitualmente en la mayoría de los portátiles o mini PC Intel Core i7 de 11ª generación sigue siendo entre un 10 y un 15 por ciento más rápido.
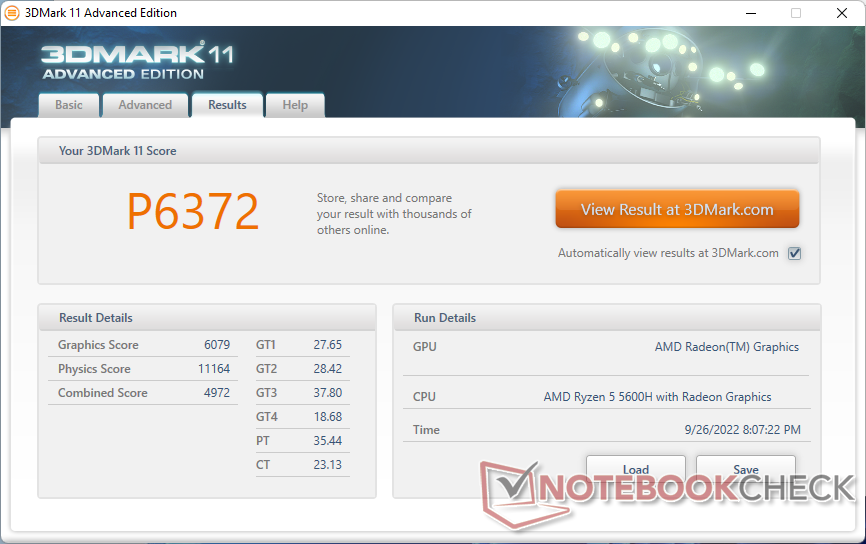
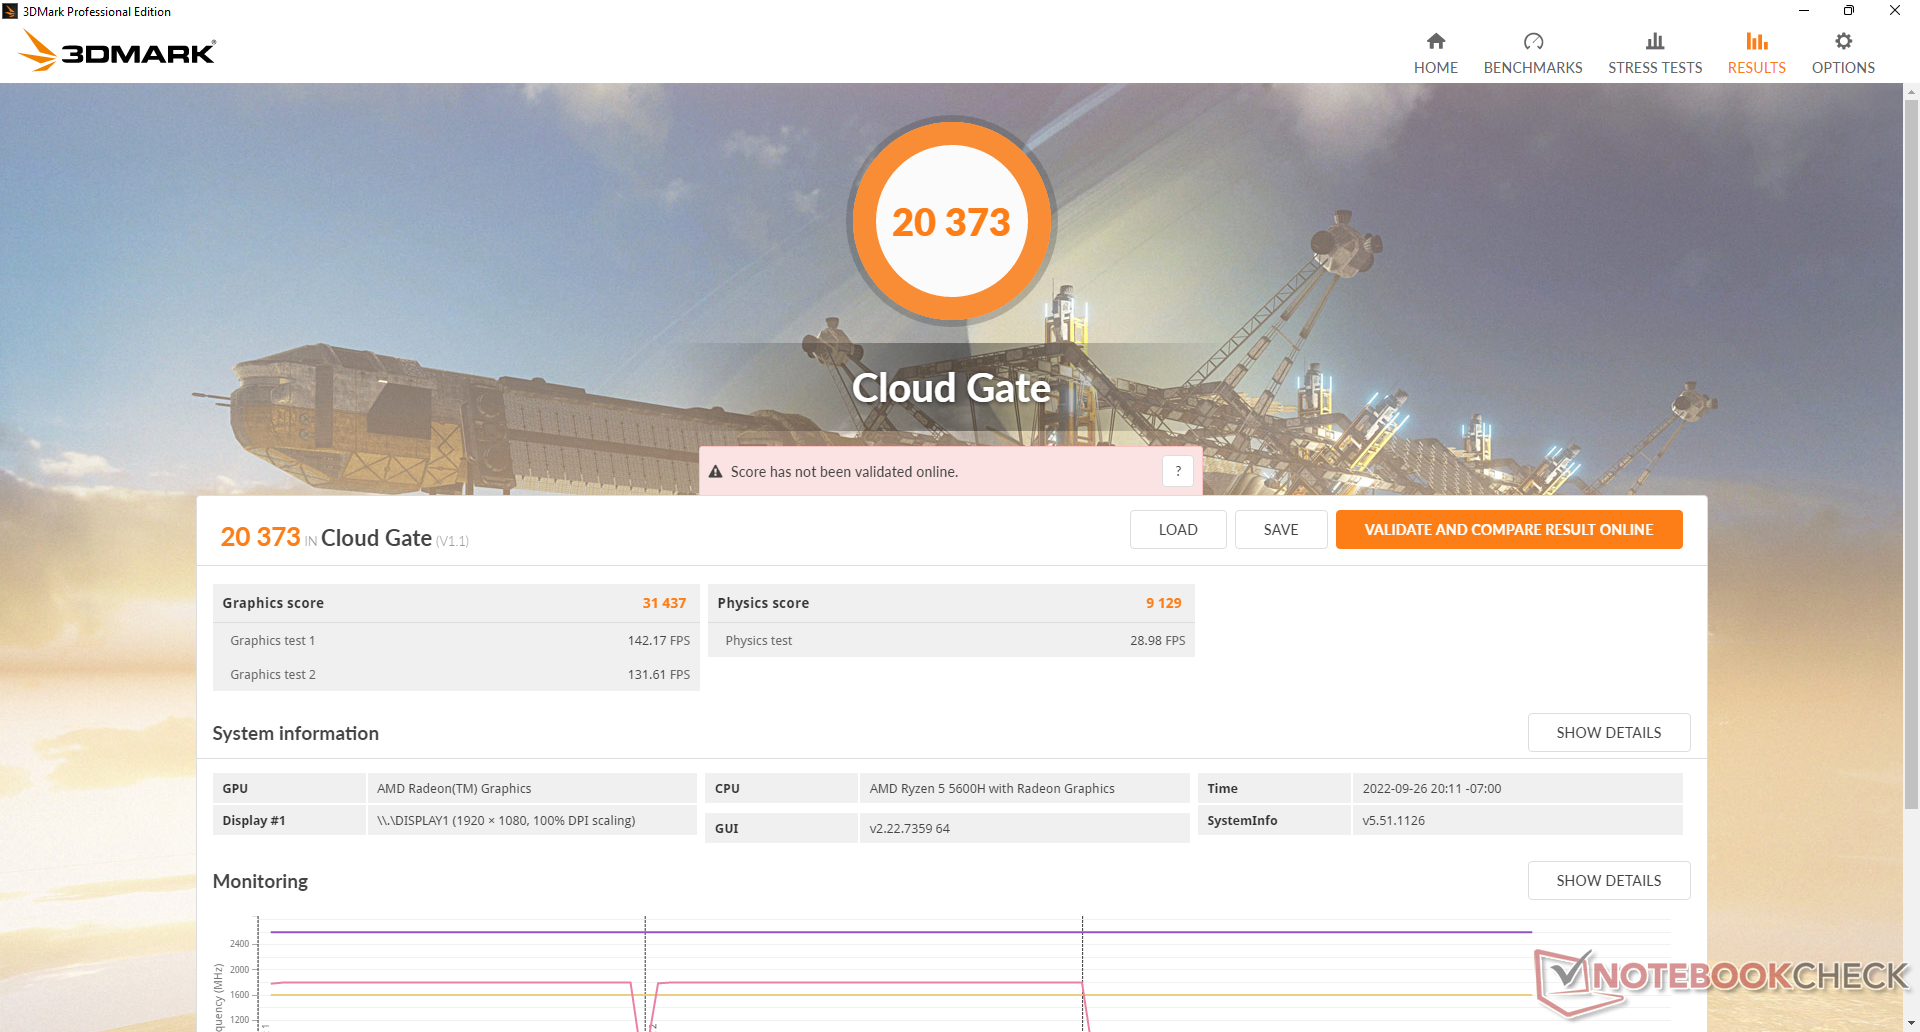
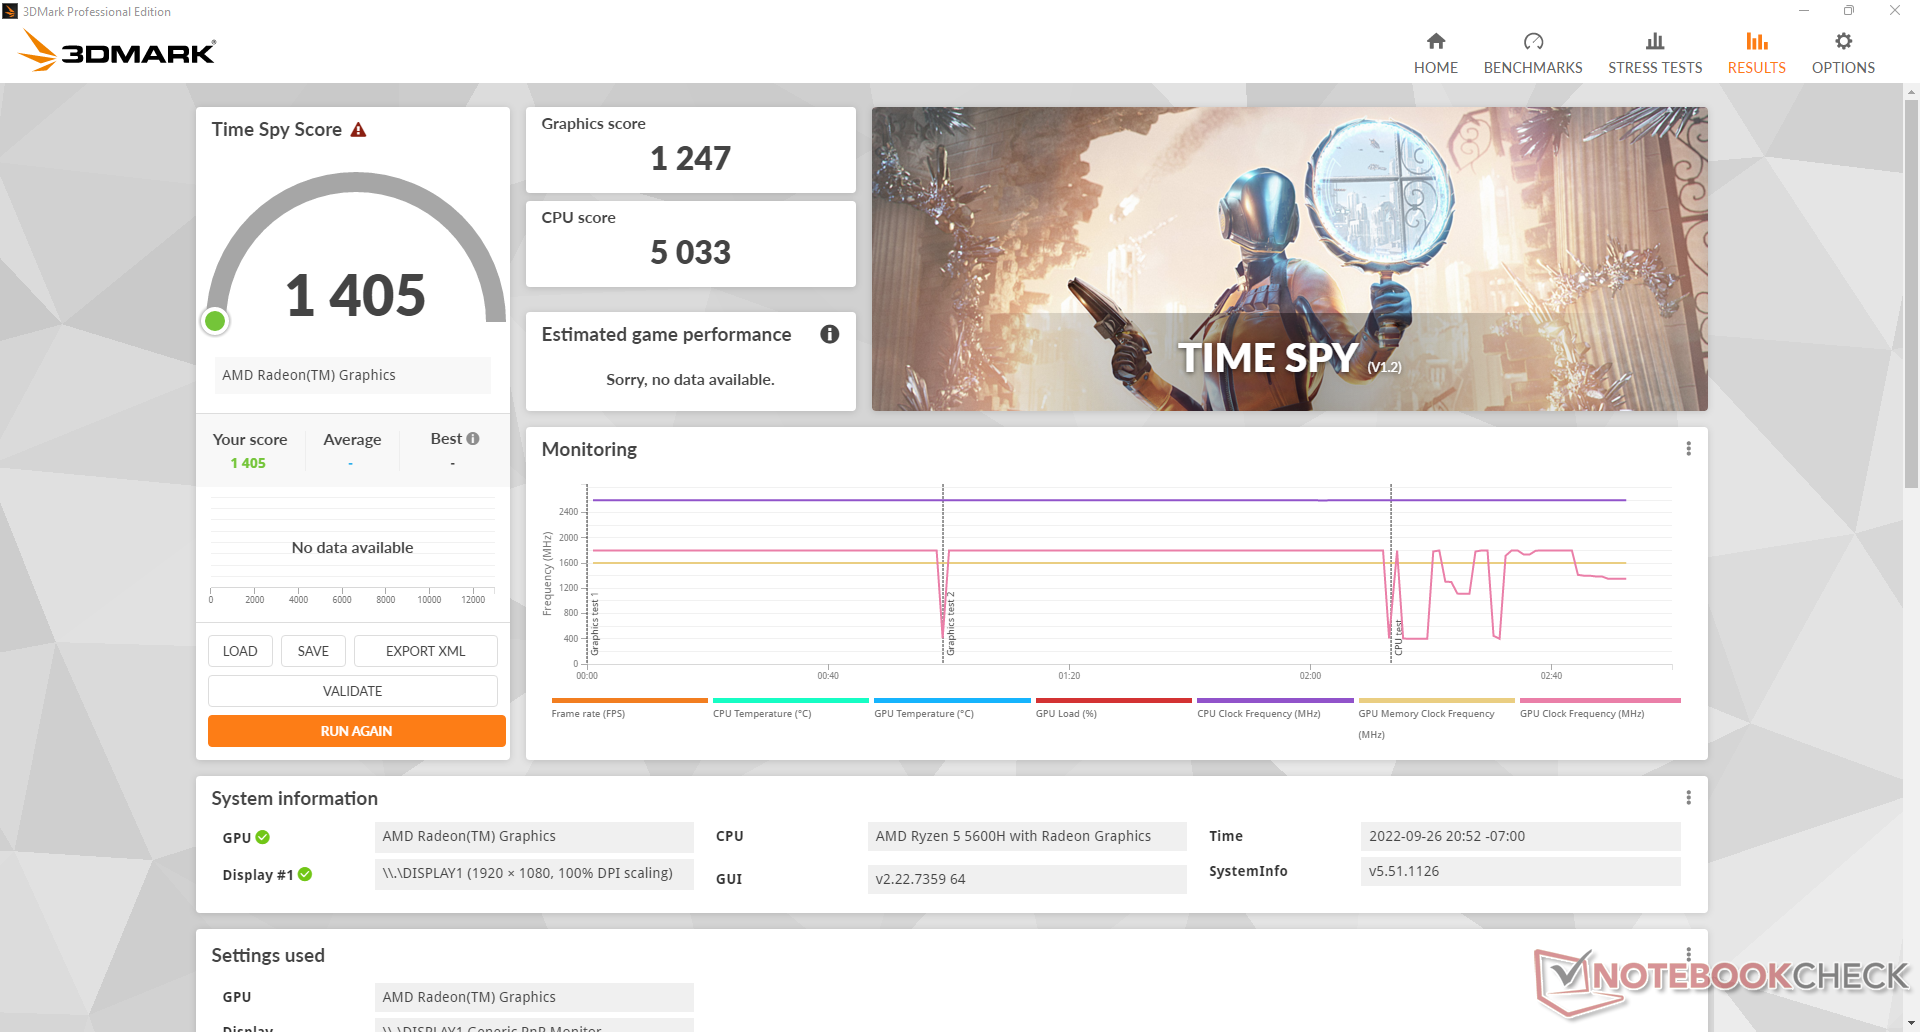
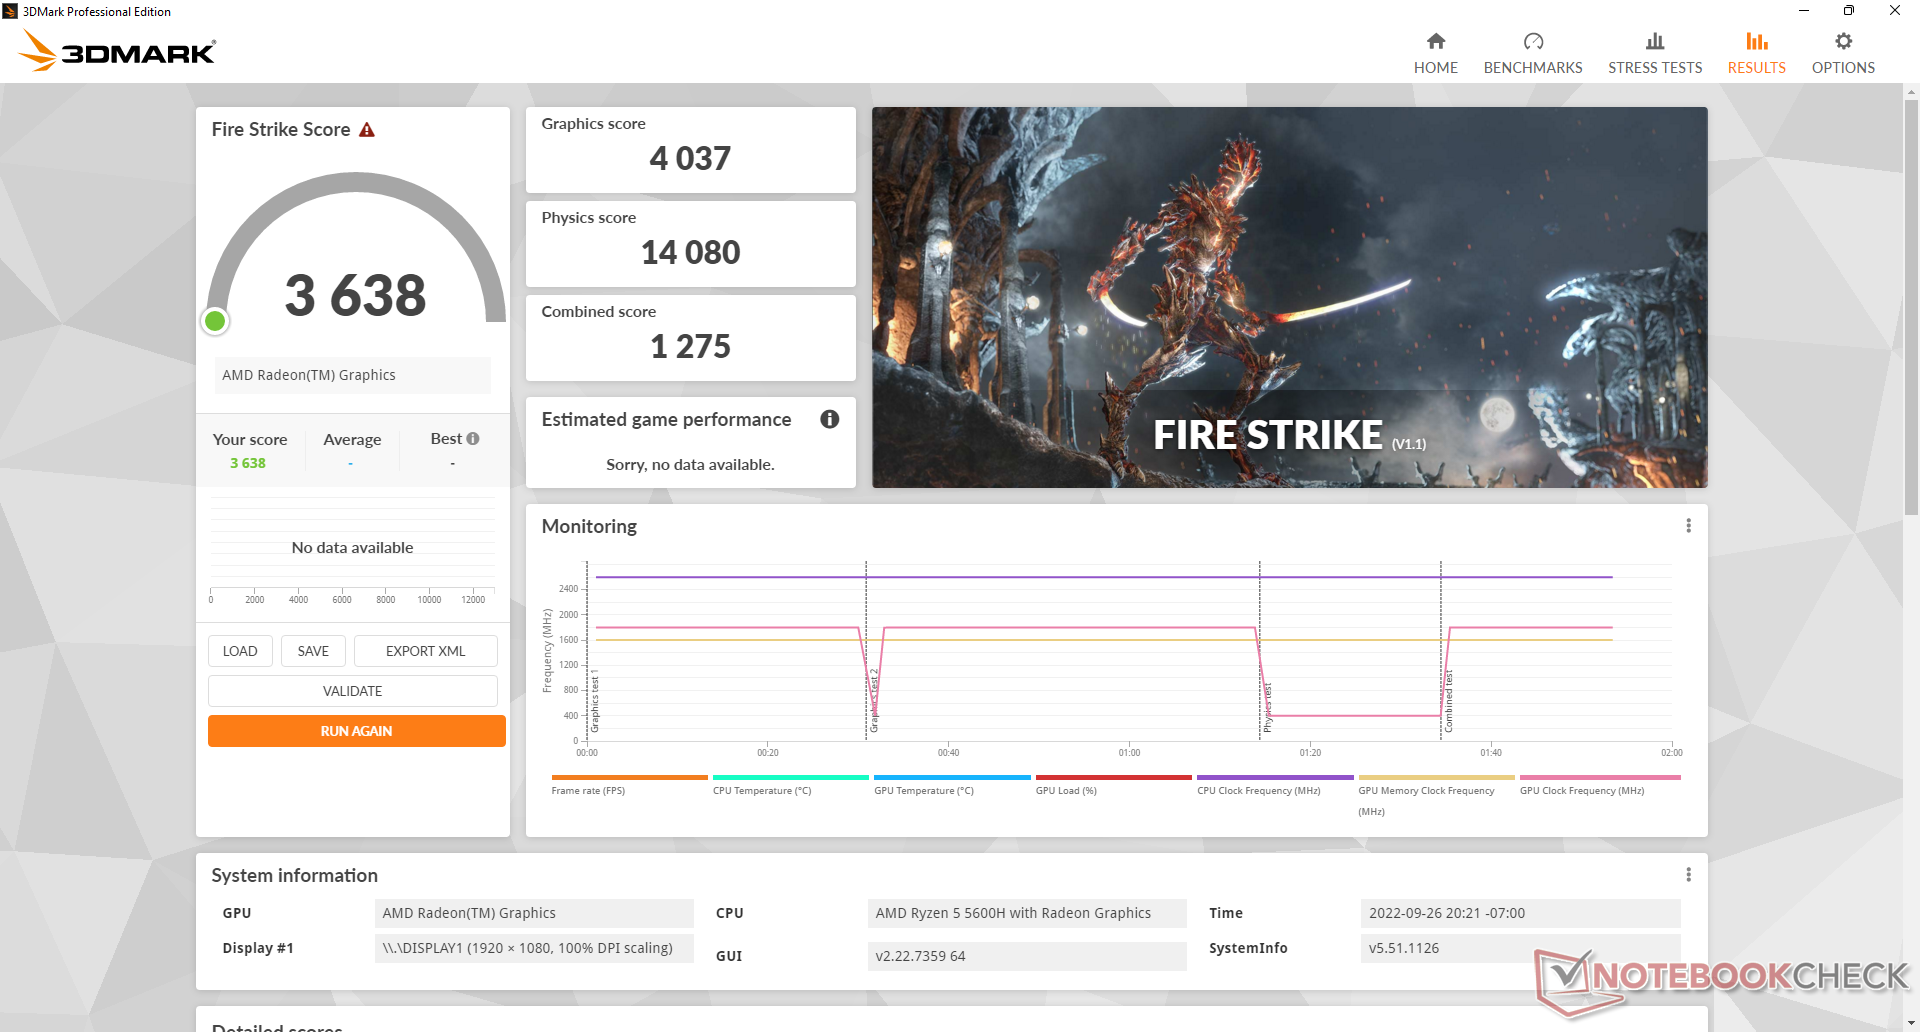
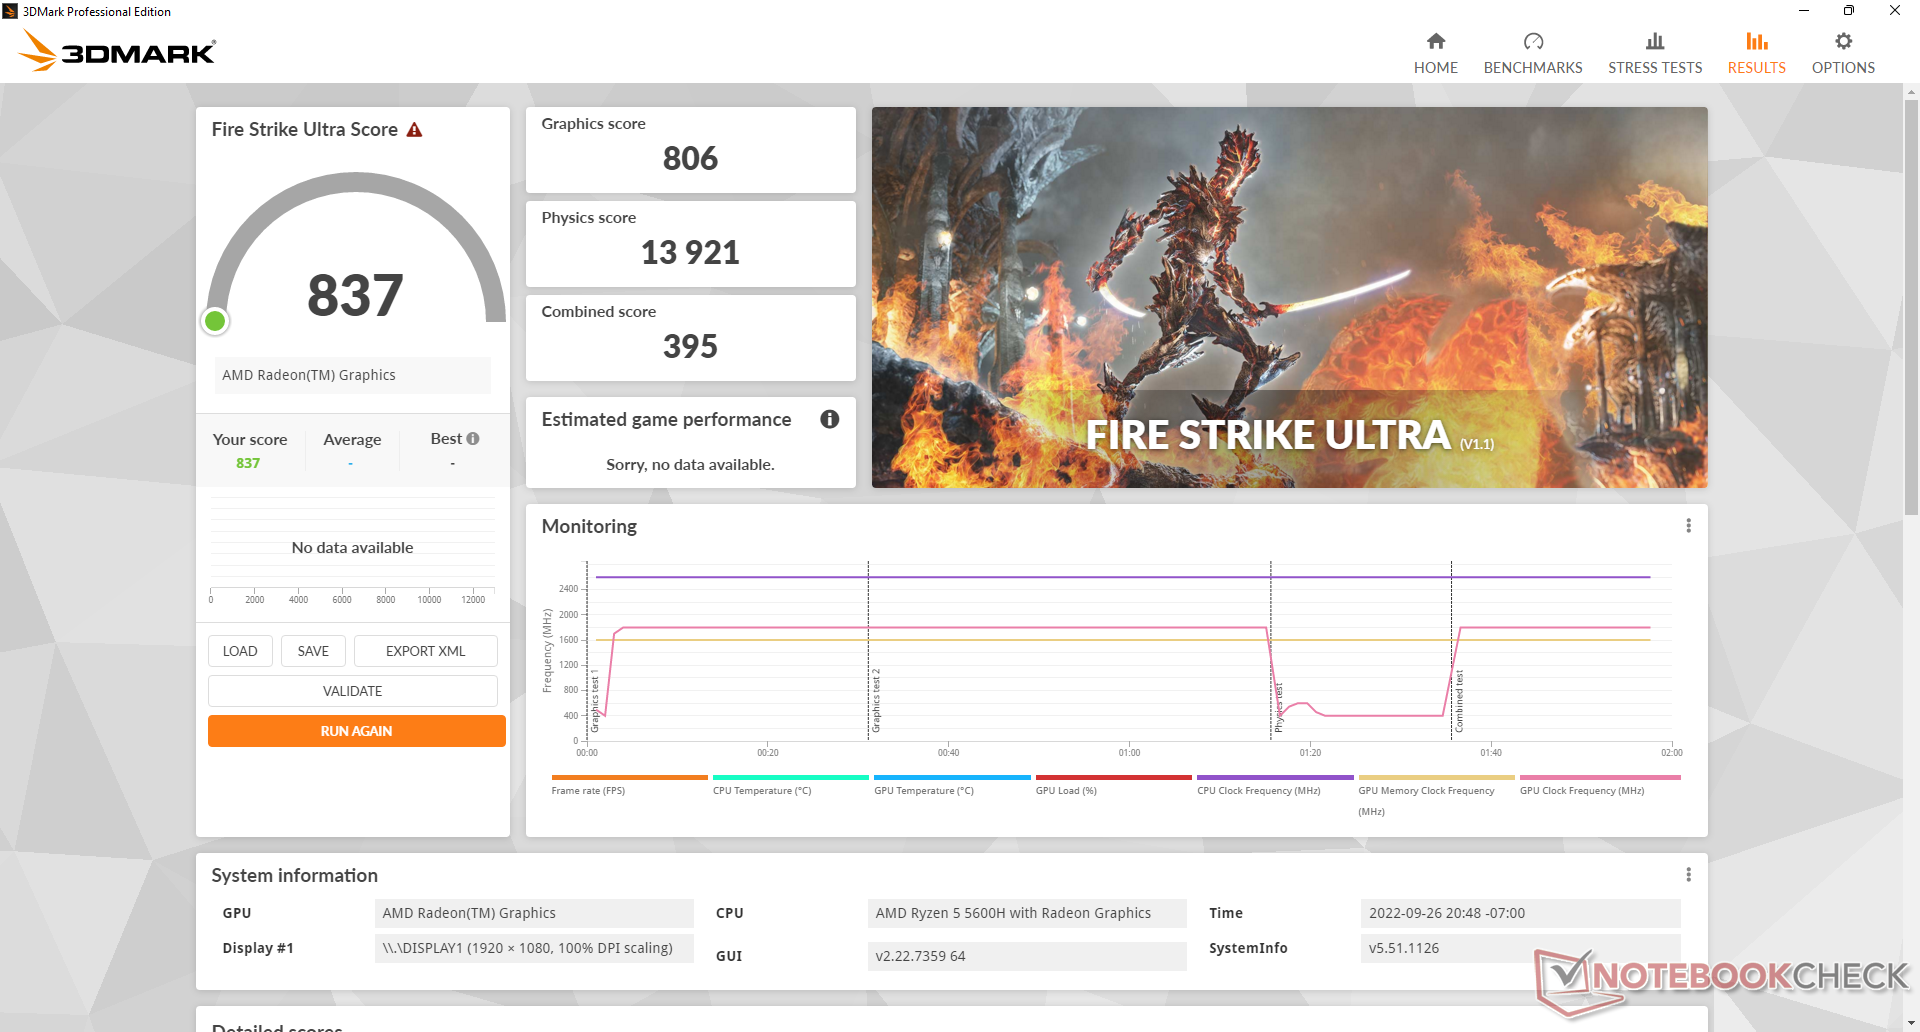
| 3DMark 11 Performance | 6372 puntos | |
| 3DMark Cloud Gate Standard Score | 20373 puntos | |
| 3DMark Fire Strike Score | 3638 puntos | |
| 3DMark Time Spy Score | 1405 puntos | |
ayuda | ||
| Blender - v3.3 Classroom CPU | |
| Beelink SER Pro Ryzen 5 5600H | |
| Media de la clase Mini PC (132 - 4571, n=83, últimos 2 años) | |
* ... más pequeño es mejor
| The Witcher 3 | |
| 1024x768 Low Graphics & Postprocessing | |
| Intel NUC11PHKi7C | |
| Honor MagicBook 14 2022 | |
| Lenovo Yoga 7-14ARB G7 | |
| Beelink SEi11 Pro | |
| Beelink GTR5 | |
| Beelink SER Pro Ryzen 5 5600H | |
| Beelink SER4 | |
| Intel NUC11TNKi5 | |
| Medio AMD Radeon RX Vega 7 (25.5 - 105.8, n=53) | |
| 1366x768 Medium Graphics & Postprocessing | |
| Intel NUC11PHKi7C | |
| Honor MagicBook 14 2022 | |
| Lenovo Yoga 7-14ARB G7 | |
| Beelink GTR5 | |
| Beelink SEi11 Pro | |
| Beelink SER Pro Ryzen 5 5600H | |
| Beelink SER4 | |
| Medio AMD Radeon RX Vega 7 (9.74 - 81.3, n=39) | |
| 1920x1080 High Graphics & Postprocessing (Nvidia HairWorks Off) | |
| Intel NUC11PHKi7C | |
| Honor MagicBook 14 2022 | |
| Lenovo Yoga 7-14ARB G7 | |
| Beelink SEi11 Pro | |
| Beelink GTR5 | |
| Beelink SER Pro Ryzen 5 5600H | |
| Beelink SER4 | |
| Medio AMD Radeon RX Vega 7 (8.96 - 26.2, n=52) | |
| 1920x1080 Ultra Graphics & Postprocessing (HBAO+) | |
| Intel NUC11PHKi7C | |
| Honor MagicBook 14 2022 | |
| Lenovo Yoga 7-14ARB G7 | |
| Beelink GTR5 | |
| Beelink SER Pro Ryzen 5 5600H | |
| Beelink SER4 | |
| Beelink SEi11 Pro | |
| Medio AMD Radeon RX Vega 7 (6.5 - 15.8, n=44) | |
Lamentablemente, las tasas de imágenes no son tan estables como esperábamos. Al estar en reposo en Witcher 3 a una configuración baja de 720p, las tasas de fotogramas a veces caen a 60 FPS o incluso a 19 FPS sin motivo aparente, como se muestra en el siguiente gráfico. Es probable que la interrupción de la velocidad de fotogramas se deba a una mala gestión de la actividad de fondo.
Witcher 3 FPS Chart
| bajo | medio | alto | ultra | |
|---|---|---|---|---|
| GTA V (2015) | 132.9 | 117.6 | 32.2 | 14.5 |
| The Witcher 3 (2015) | 79.2 | 48.7 | 25.1 | 15.8 |
| Dota 2 Reborn (2015) | 137.5 | 103.1 | 59.3 | 56.3 |
| Final Fantasy XV Benchmark (2018) | 41.1 | 20.3 | 14.3 | |
| X-Plane 11.11 (2018) | 53.4 | 40.3 | 35.7 | |
| Strange Brigade (2018) | 95.3 | 36 | 30.1 | 25.5 |
| Cyberpunk 2077 1.6 (2022) | 20.9 | 16.2 | 11.4 |
Emisiones
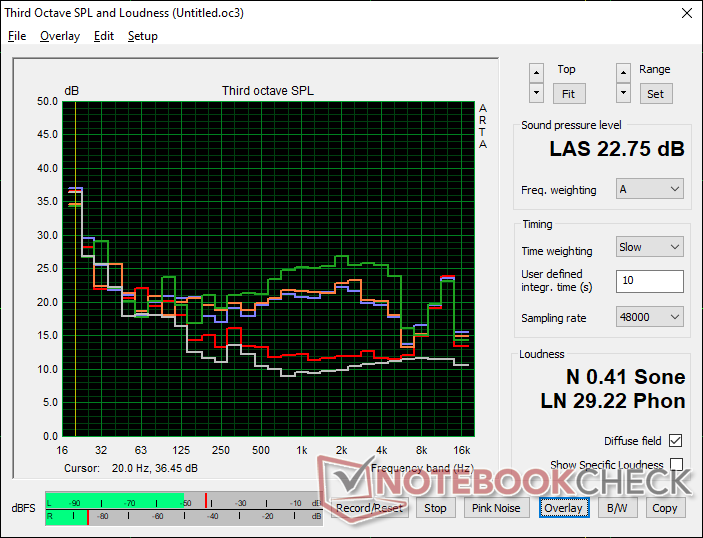
Ruido del sistema
Nuestra unidad de prueba sufre de ruido electrónico o silbido de la bobina. Así, pudimos registrar un ruido de 26,1 dB(A) frente a un fondo silencioso de 22,8 dB(A) incluso cuando está en reposo en el escritorio sin aplicaciones en ejecución. El ruido del ventilador rondaría los 28,7 dB(A) durante cargas típicas como la navegación web o el streaming de vídeo, lo que es más silencioso que el NUC11TNK.
El ruido del ventilador oscila entre 32 y 37 dB(A) cuando se ejecutan cargas más exigentes como juegos, lo cual es de nuevo más silencioso que el NUC11TNK y el más rápido Beelink GTR5. Este es un mini PC silencioso en relación con el rendimiento que se obtiene.
Ruido
| Ocioso |
| 26.1 / 26.1 / 28.7 dB(A) |
| Carga |
| 32.3 / 36.4 dB(A) |
 | ||
30 dB silencioso 40 dB(A) audible 50 dB(A) ruidosamente alto |
||
min: | ||
| Beelink SER Pro Ryzen 5 5600H Vega 7, R5 5600H, Kingston NV1 SNVS/500GCN | Beelink SEi11 Pro Iris Xe G7 96EUs, i5-11320H, Kingston NV1 SNVS/500GCN | Beelink GTR5 Vega 8, R9 5900HX, Kingston NV1 SNVS/500GCN | Intel NUC11TNKi5 Iris Xe G7 80EUs, i5-1135G7, Transcend M.2 SSD 430S TS512GMTS430S | Beelink SEi8 Iris Plus Graphics 655, i3-8109U, Intel SSD 660p SSDPEKNW512G8 | Beelink SER4 Vega 8, R7 4800U, Intel SSD 660p SSDPEKNW512G8 | |
|---|---|---|---|---|---|---|
| Noise | 1% | -24% | -23% | -7% | -18% | |
| apagado / medio ambiente * (dB) | 22.8 | 22.8 -0% | 23.1 -1% | 24.8 -9% | 24.5 -7% | 23.4 -3% |
| Idle Minimum * (dB) | 26.1 | 24.7 5% | 34.2 -31% | 35.6 -36% | 26.5 -2% | 33.2 -27% |
| Idle Average * (dB) | 26.1 | 24.7 5% | 34.2 -31% | 35.6 -36% | 26.5 -2% | 33.2 -27% |
| Idle Maximum * (dB) | 28.7 | 25.3 12% | 34.2 -19% | 35.6 -24% | 31.1 -8% | 33.2 -16% |
| Load Average * (dB) | 32.3 | 33.2 -3% | 44.6 -38% | 36.2 -12% | 37.7 -17% | 38.6 -20% |
| Witcher 3 ultra * (dB) | 32.8 | 34.5 -5% | 41.4 -26% | 38 -16% | 39.2 -20% | |
| Load Maximum * (dB) | 36.4 | 37.8 -4% | 45.1 -24% | 47.6 -31% | 37.5 -3% | 40.8 -12% |
* ... más pequeño es mejor
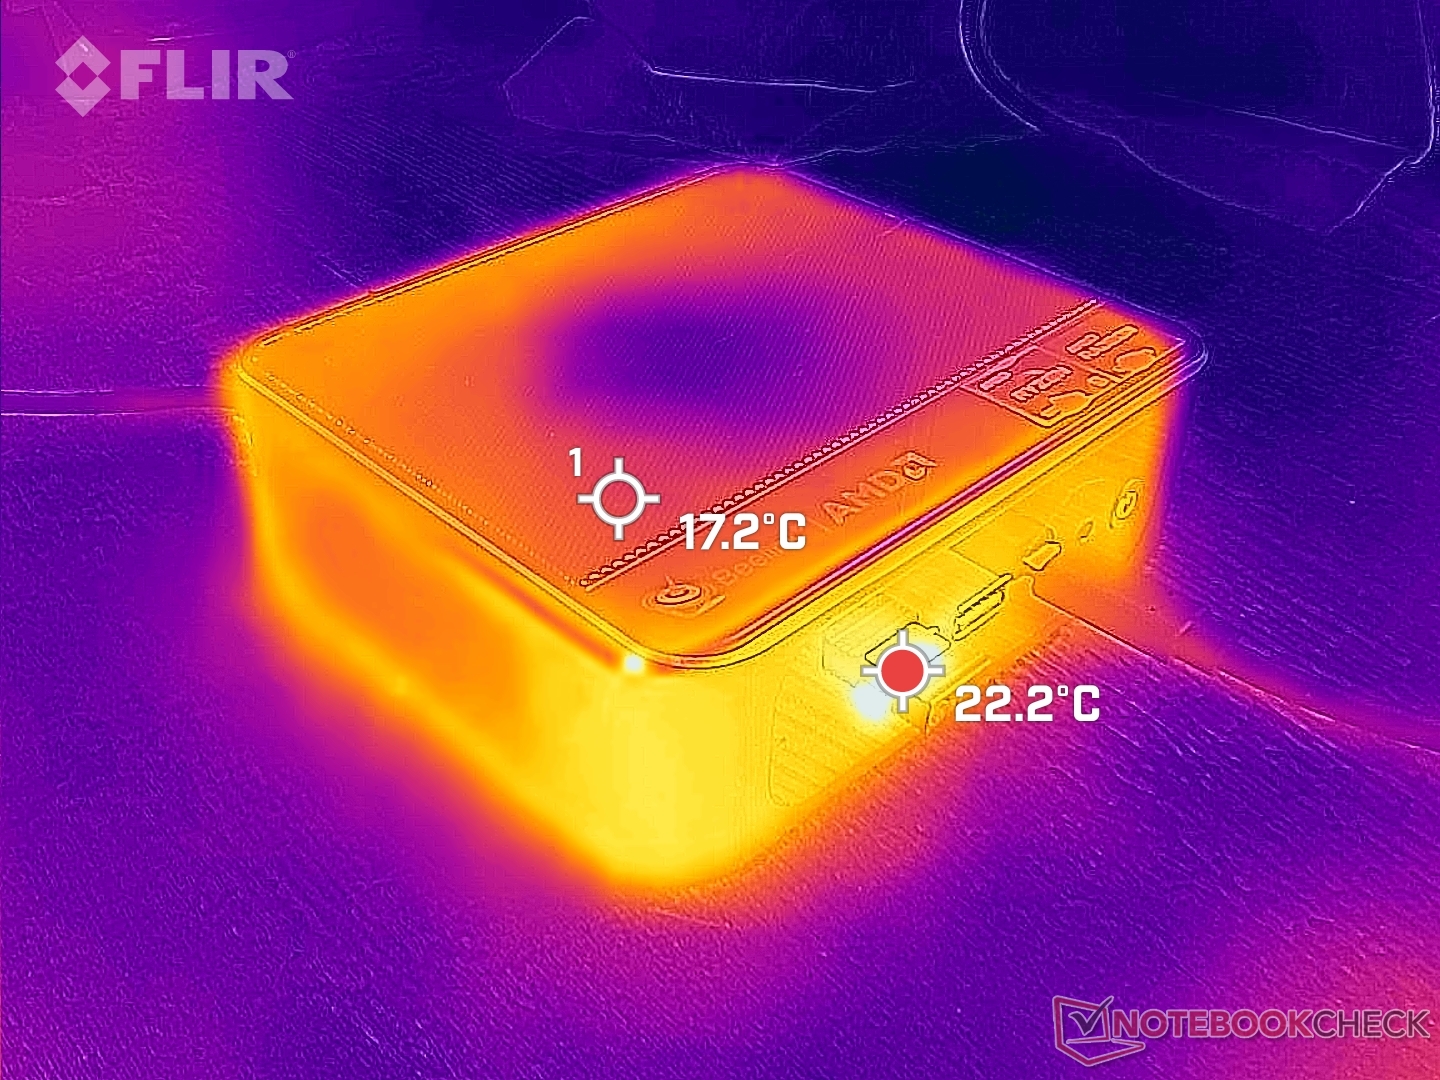
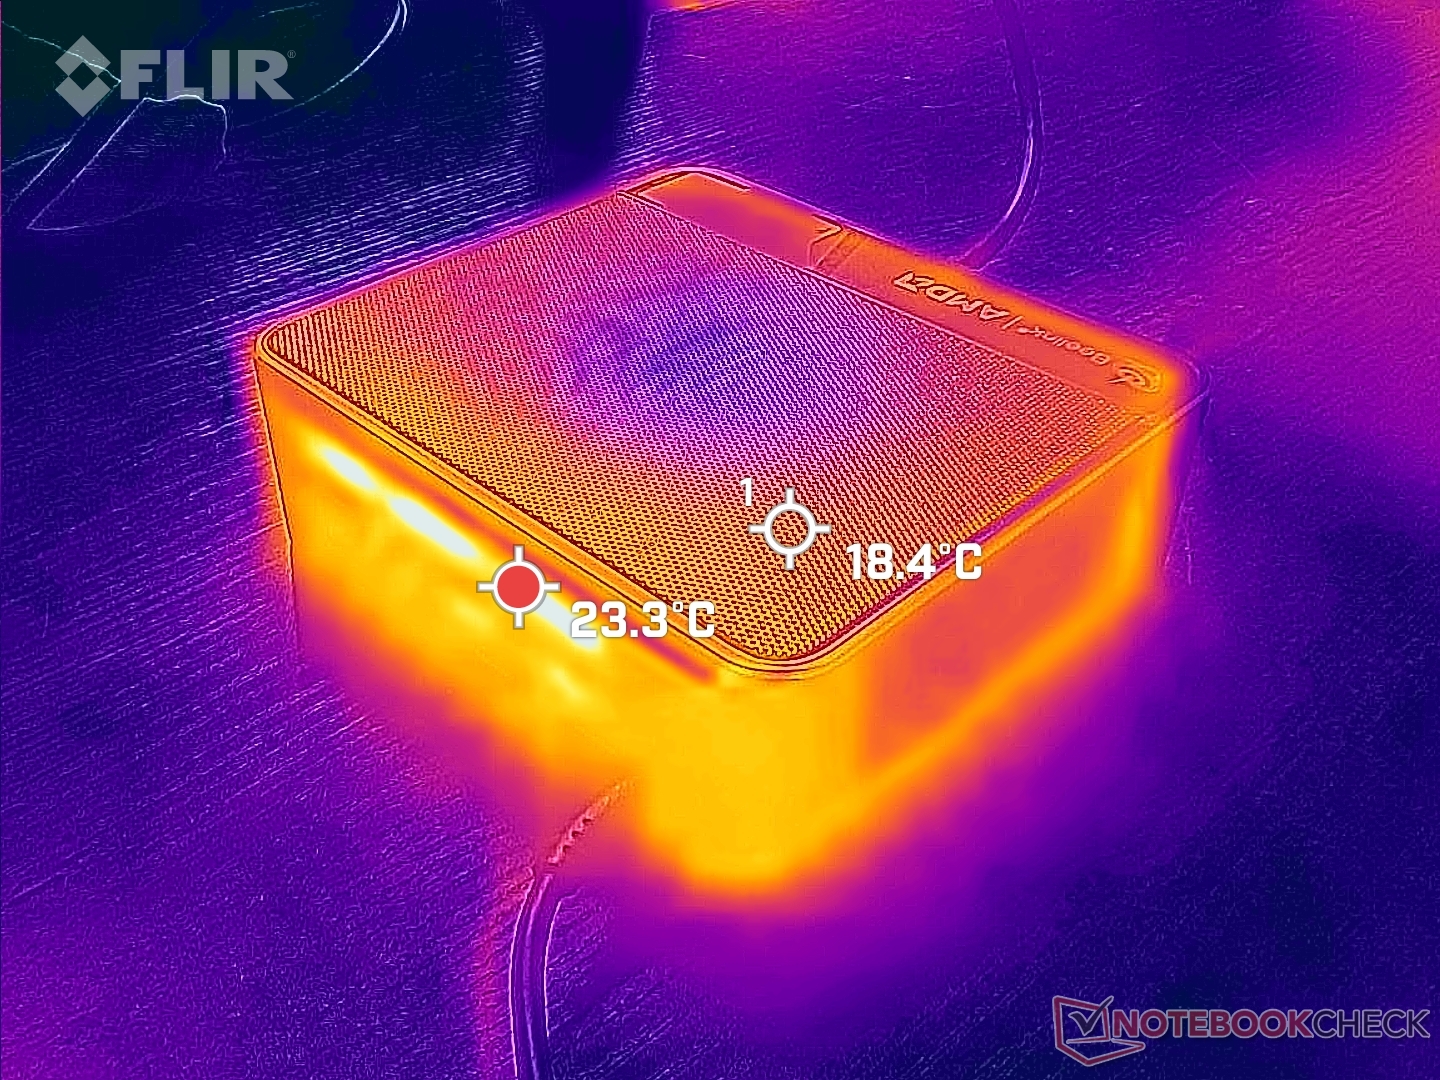
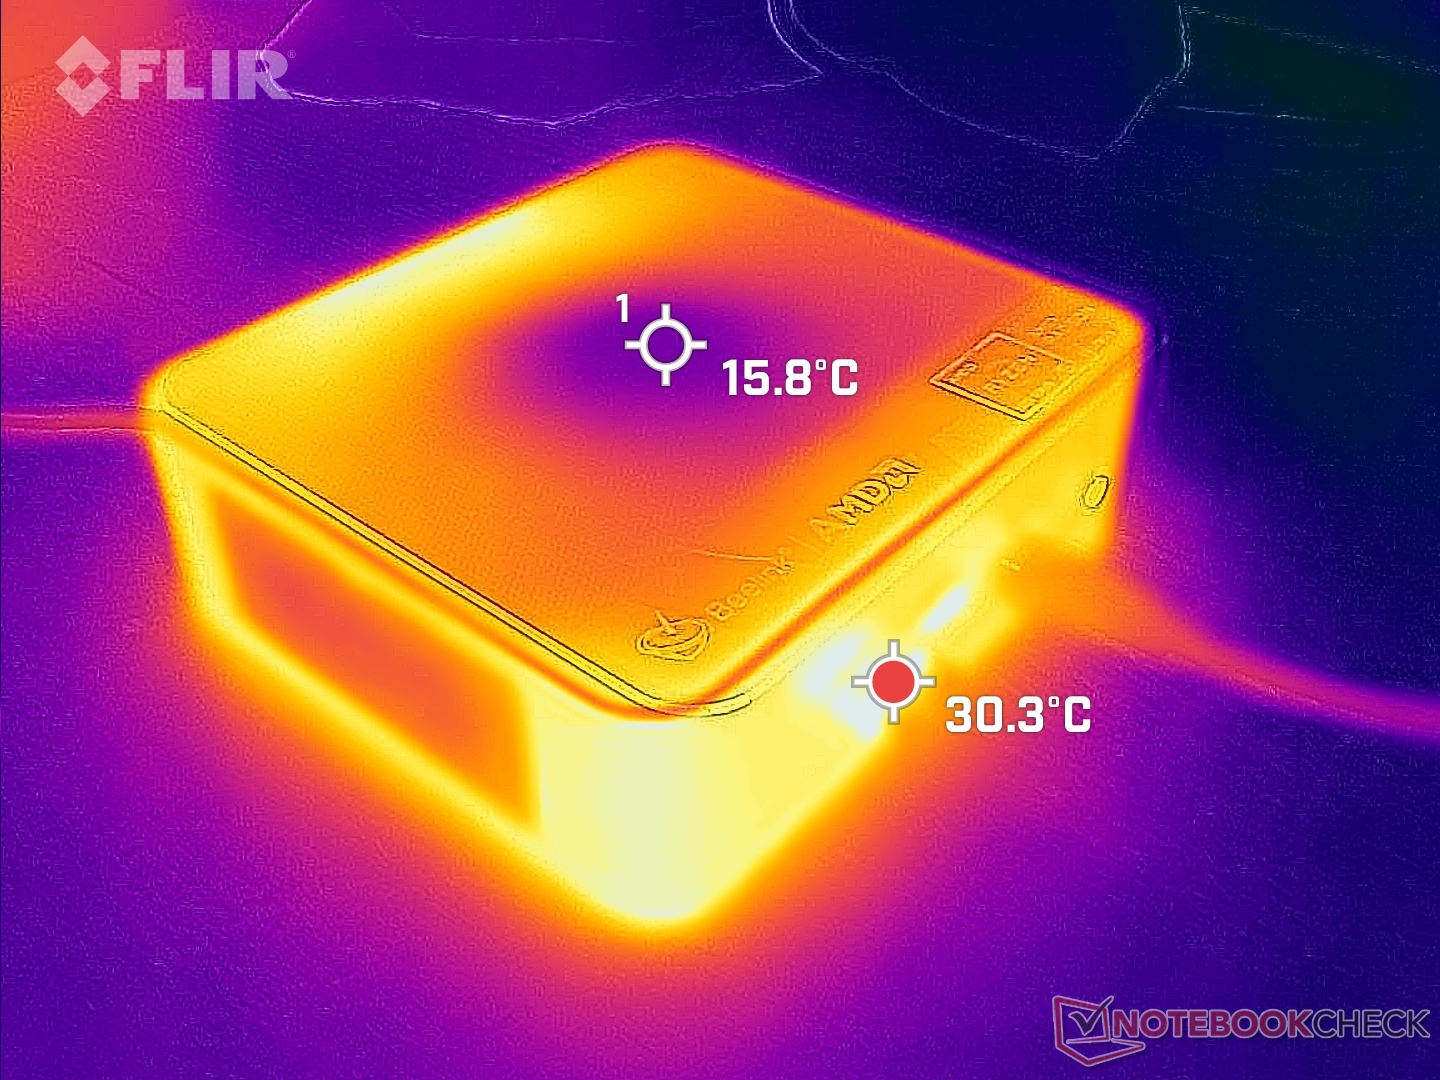
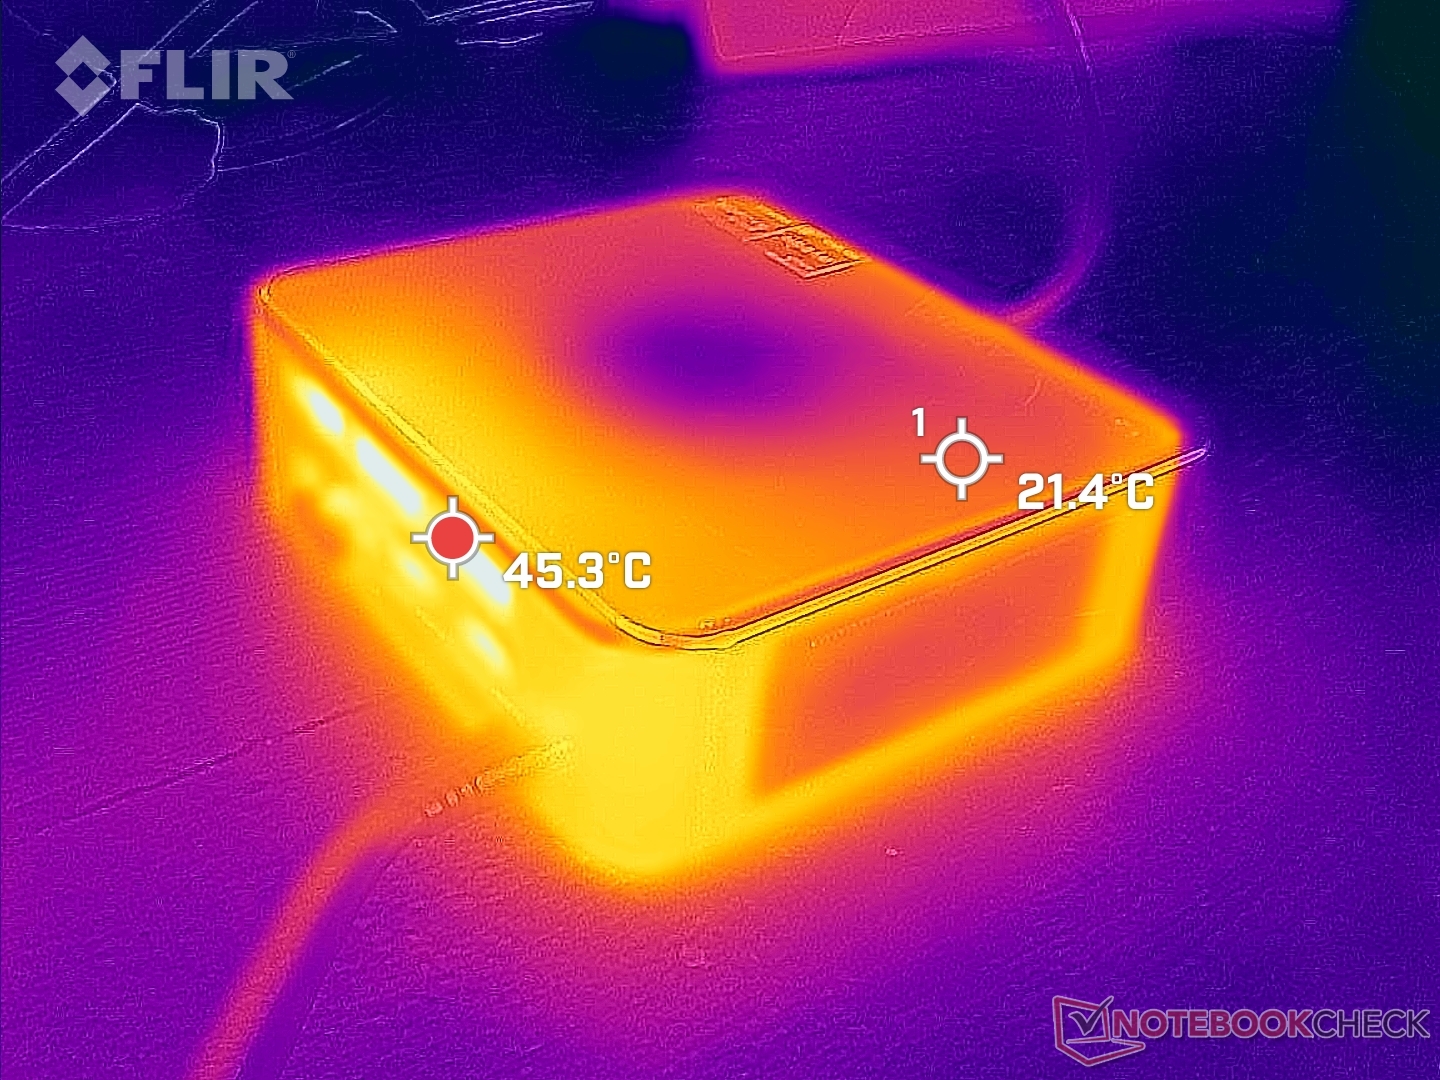
Temperatura
El aire frío entra por la parte superior y el calor residual sale por la parte trasera. Para que la refrigeración sea óptima, es conveniente mantener la parte superior libre de libros, papeles u otras obstrucciones.
Prueba de esfuerzo
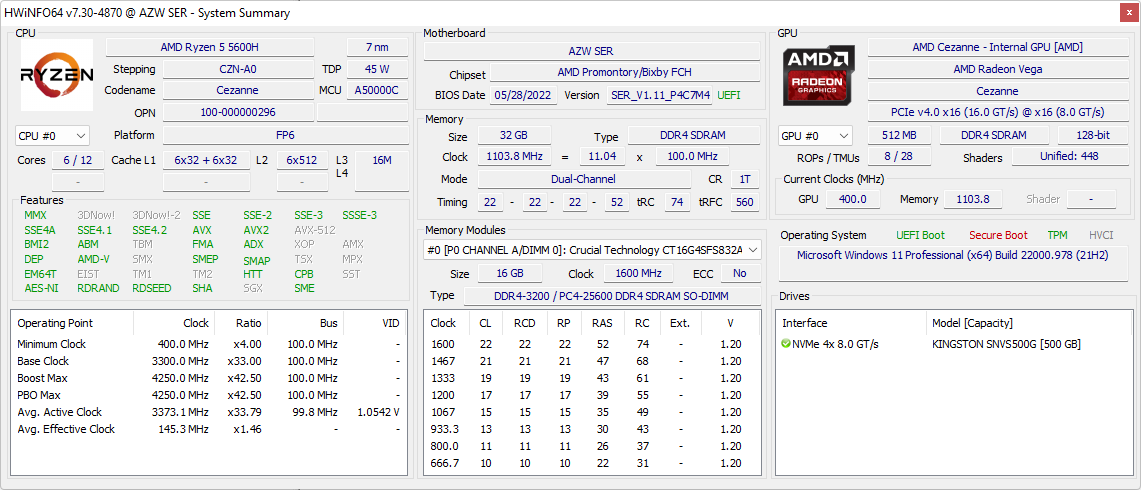
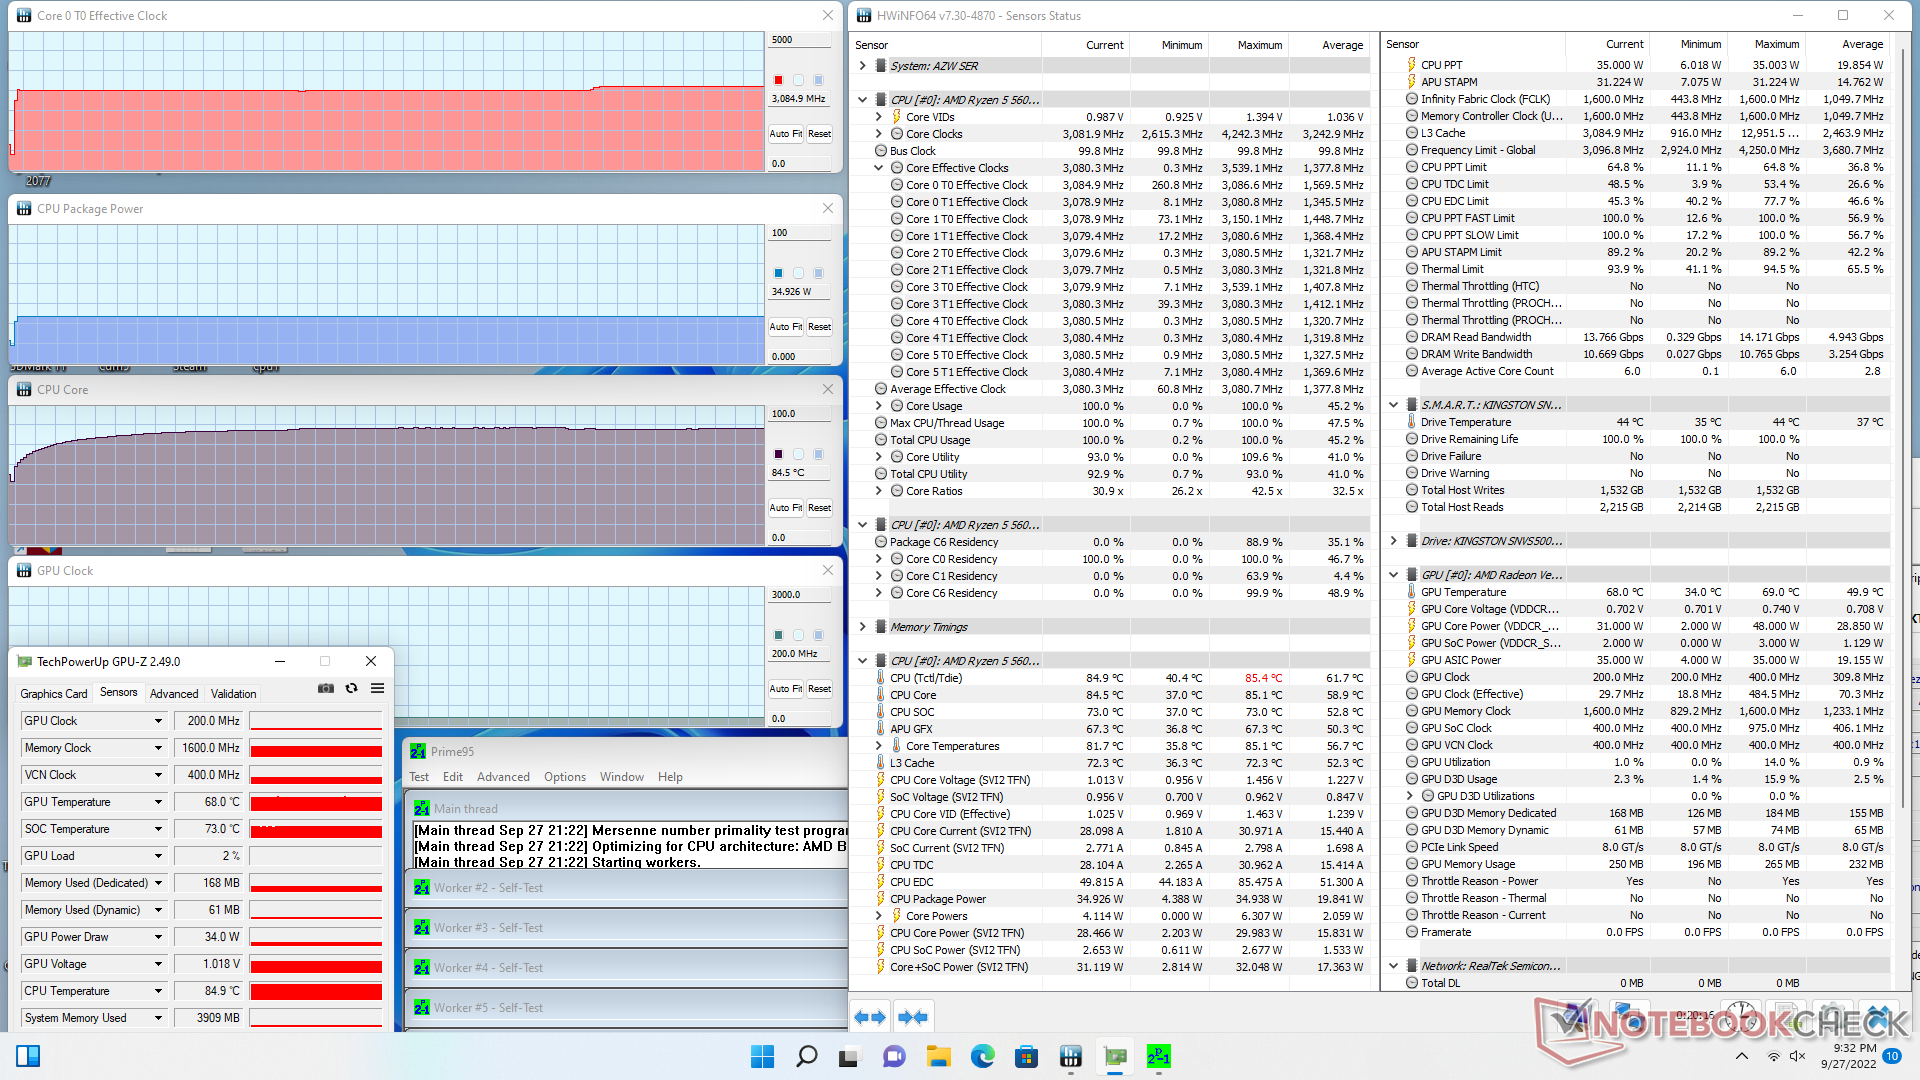
Las velocidades de reloj de la CPU y el consumo de energía de la placa se estabilizan en 3,0 GHz y 35 W, respectivamente, al iniciar Prime95. 35 W está en el extremo inferior del espectro para el Ryzen 5 5600H, por lo que es un poco decepcionante no ver objetivos de TDP más altos en el SER5. La temperatura del núcleo ya es bastante alta, 85 C, lo que puede explicar el bajo valor de 35 W.
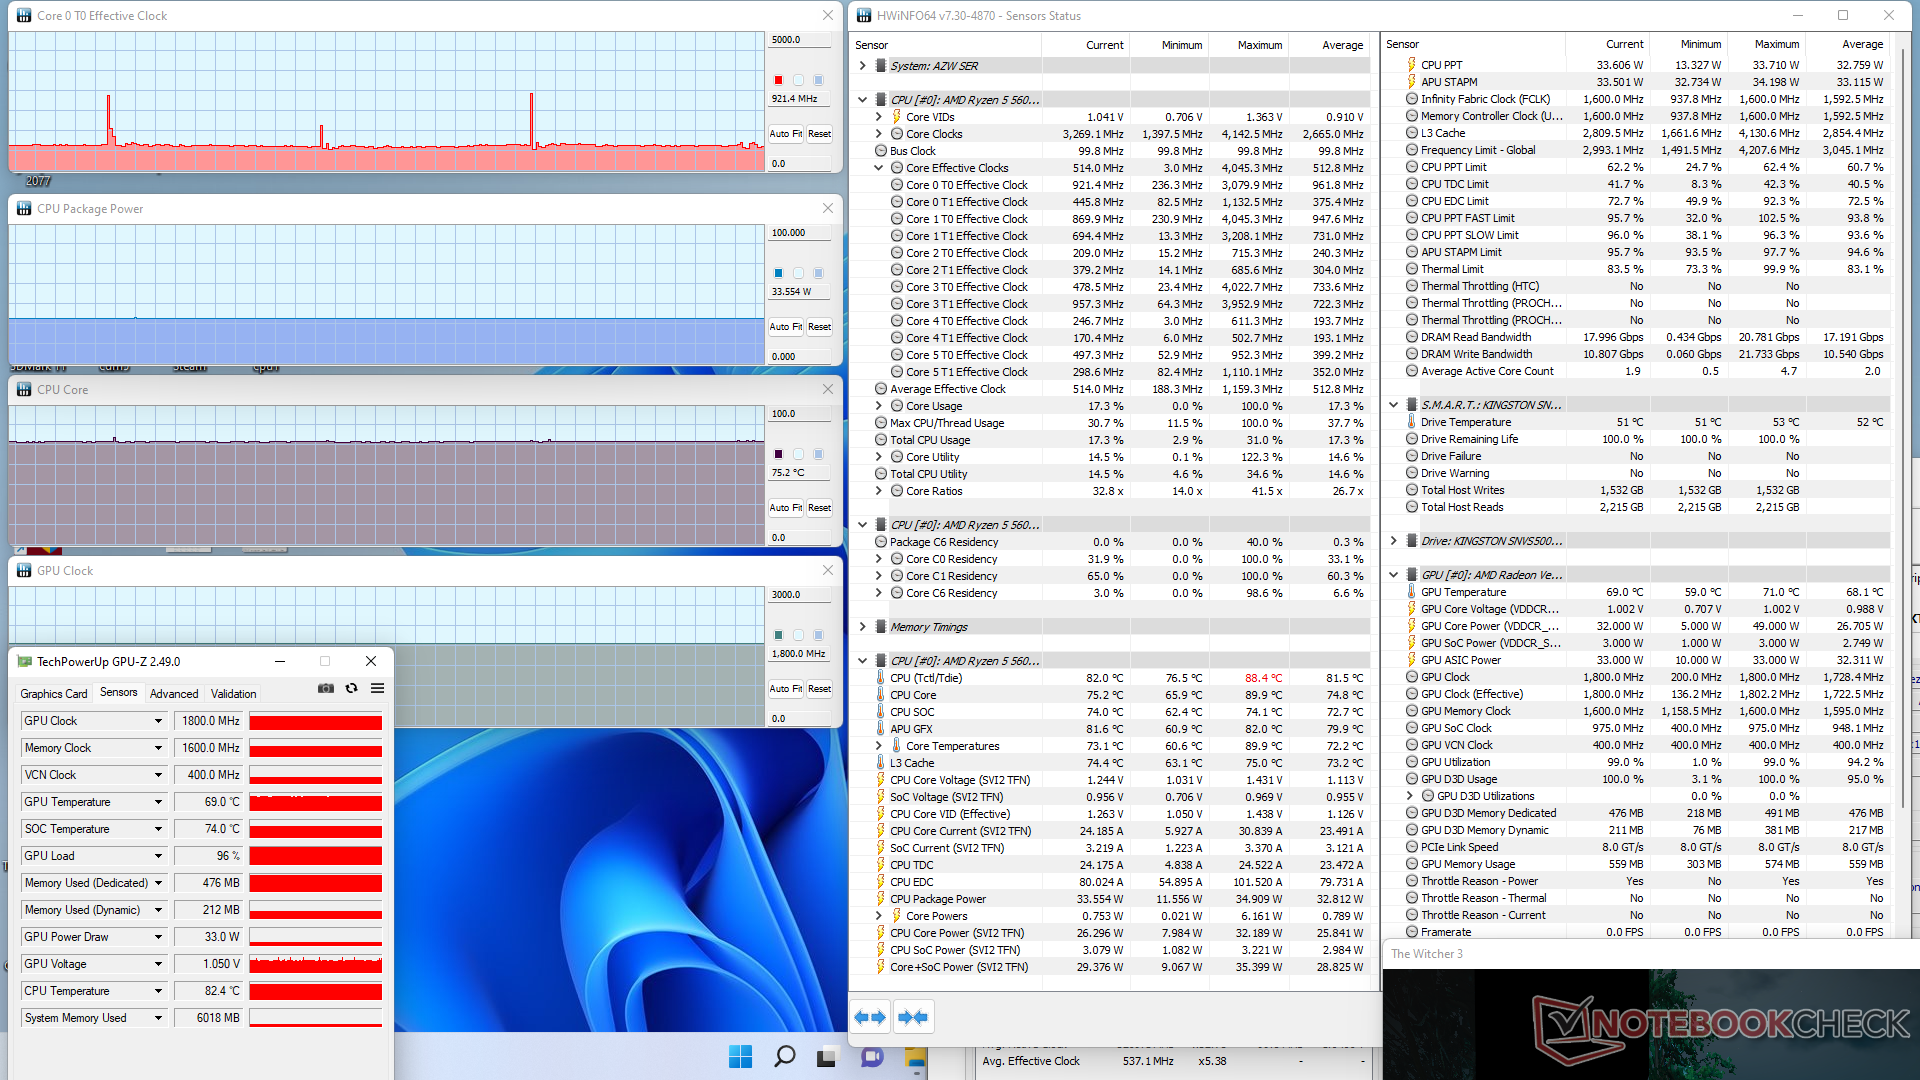
Si se ejecuta Witcher 3 se obtiene una temperatura del núcleo de 75 C en comparación con los 57 C del Intel NUC11PAQ. El sistema Beelink funciona un poco más caliente que el Intel en la mayoría de las condiciones.
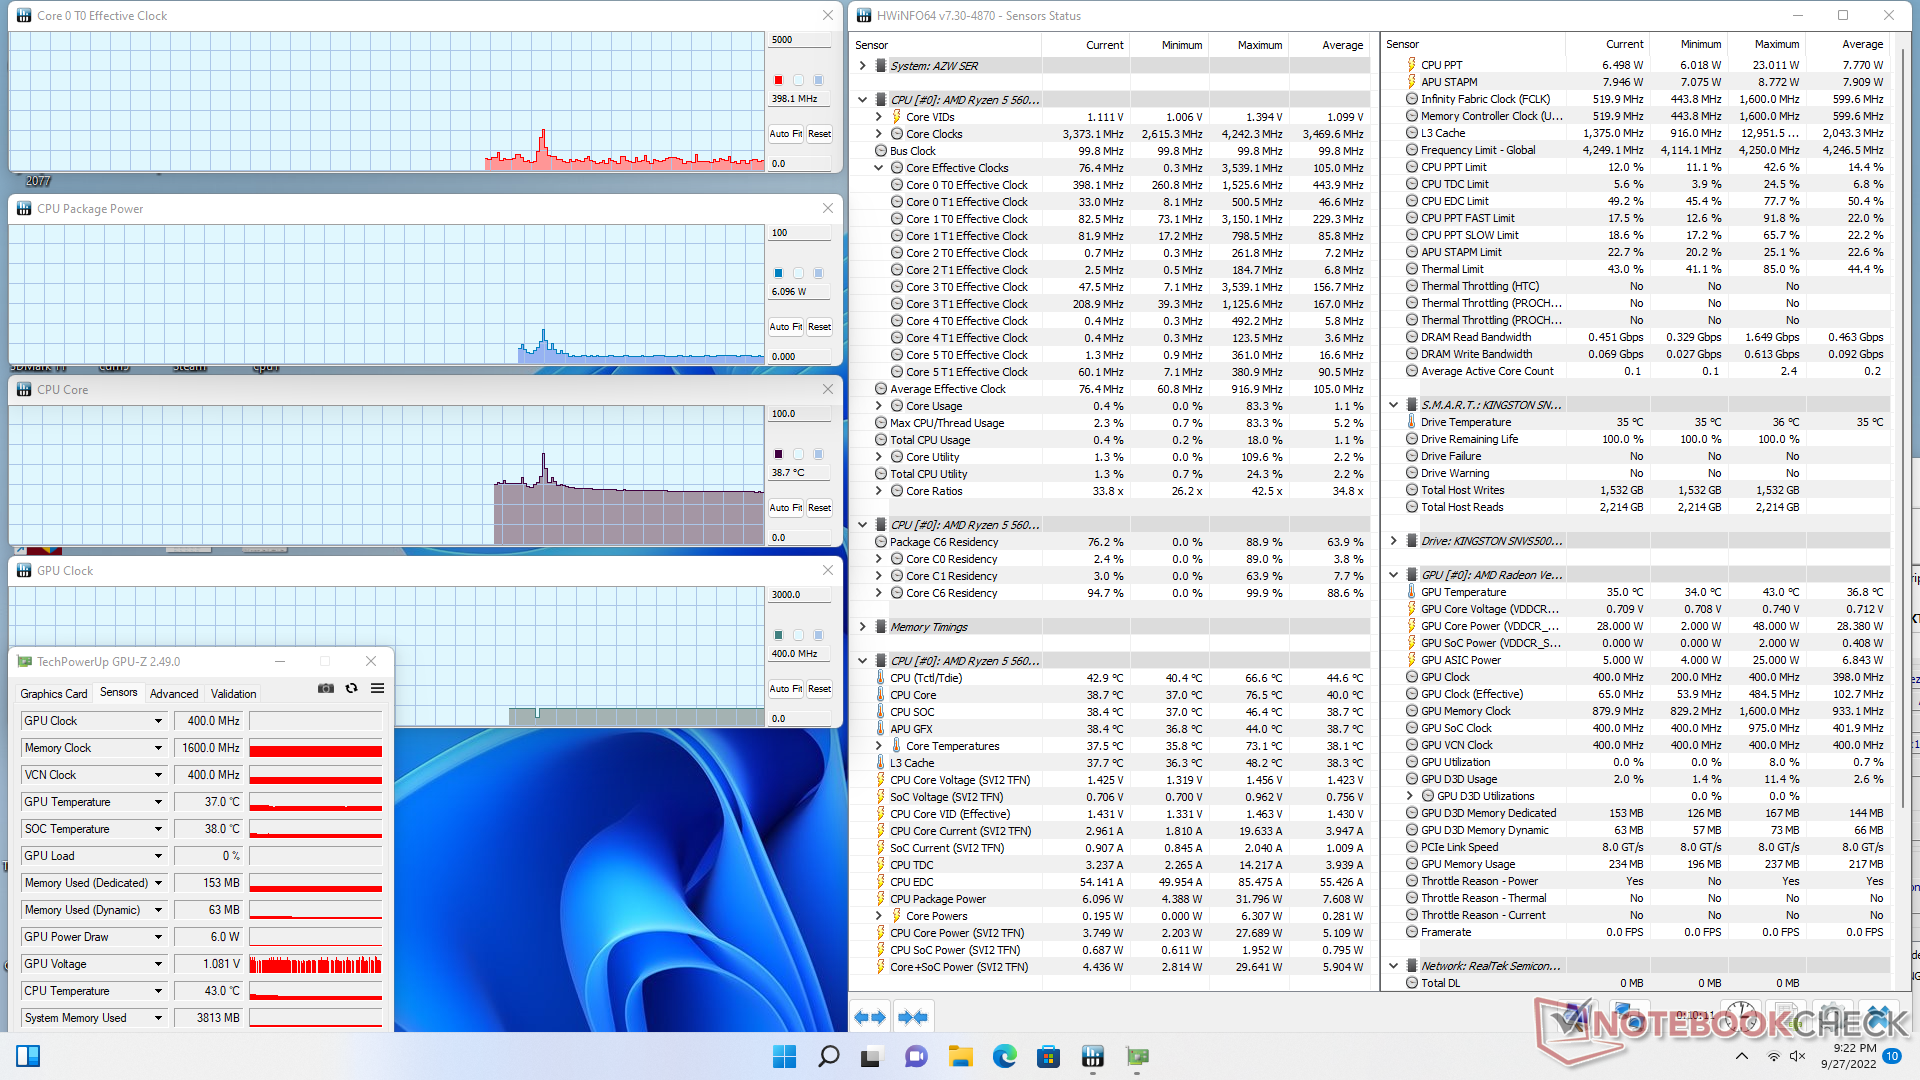
| Reloj dela CPU (GHz) | Reloj de la GPU (MHz) | Temperatura media de la CPU (°C) | |
| Sistema en reposo | -- | -- | 39 |
| Prime95 Stress | 3.0 | -- | 85 |
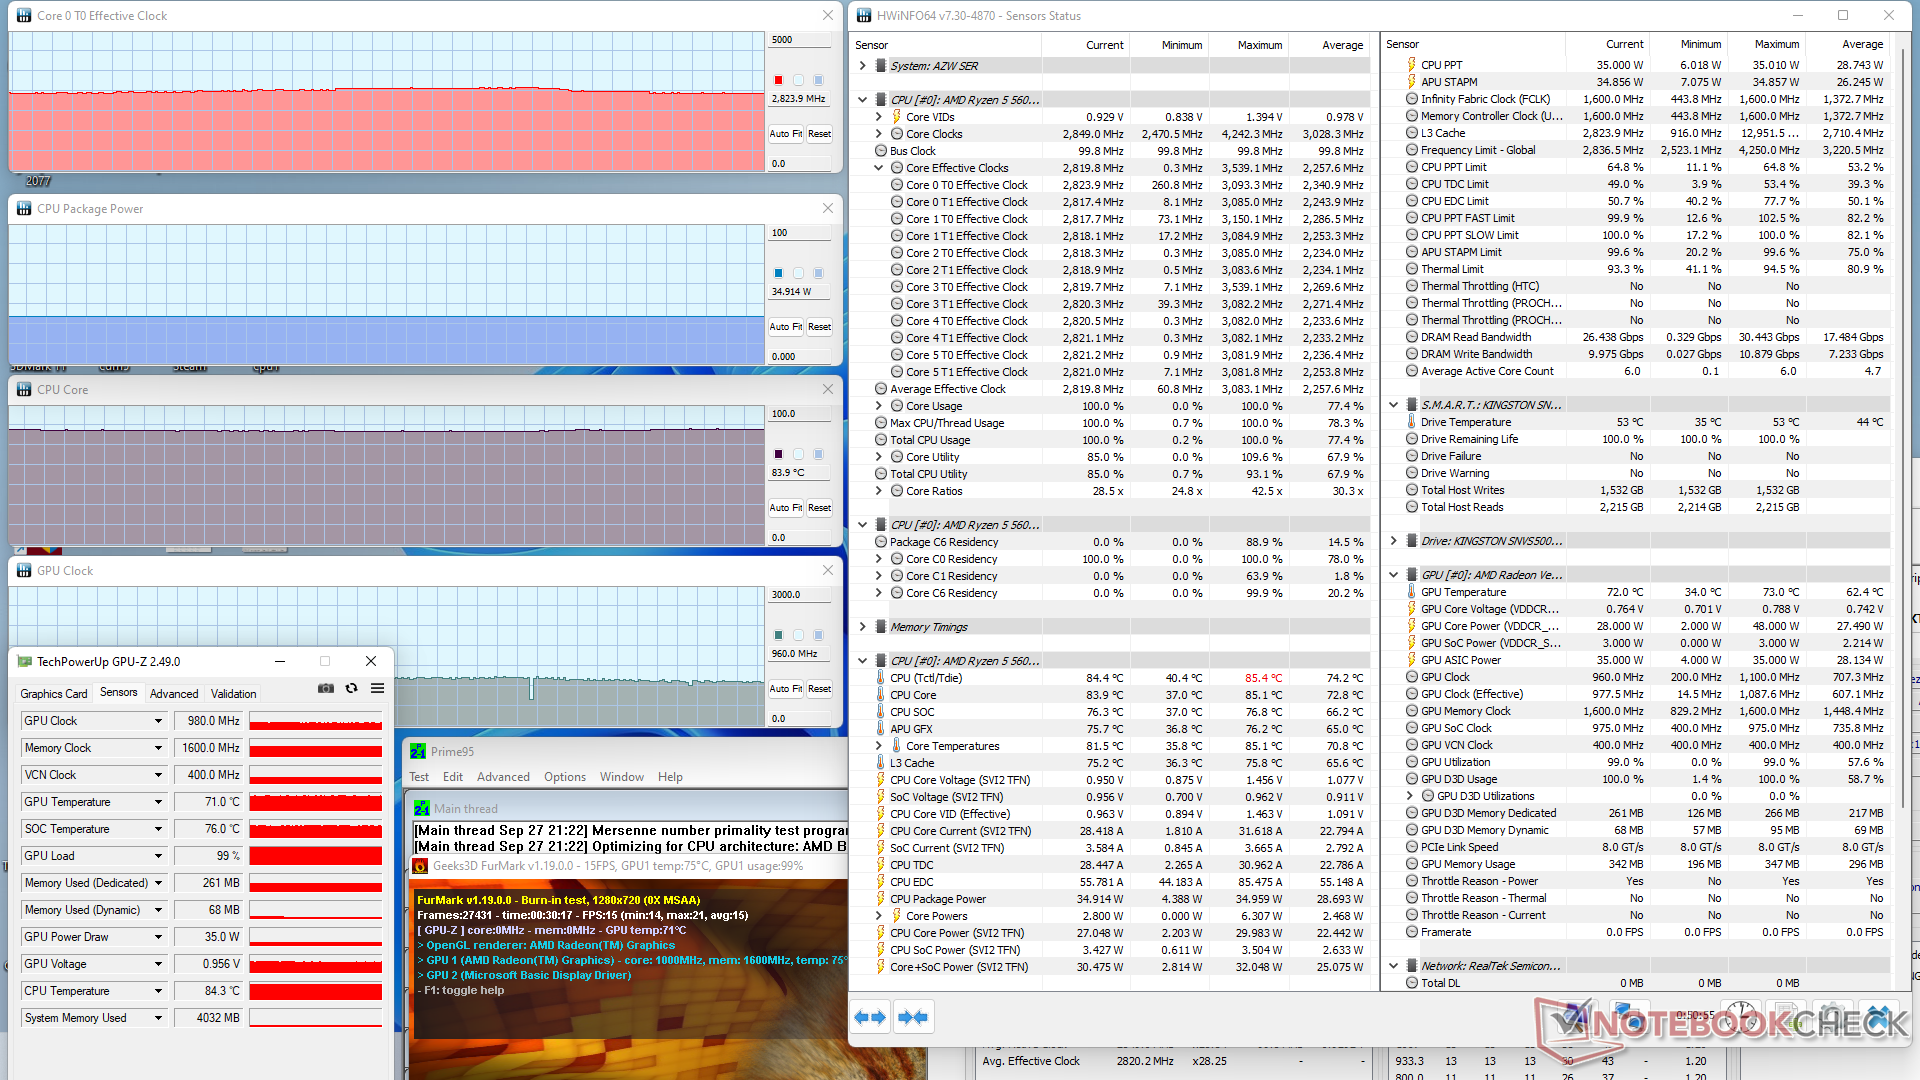
| Prime95+ FurMark Stress | 2,8 | 980 | 84 |
| Witcher 3 Estrés | ~0,9 | 1800 | 75 |
Gestión de la energía
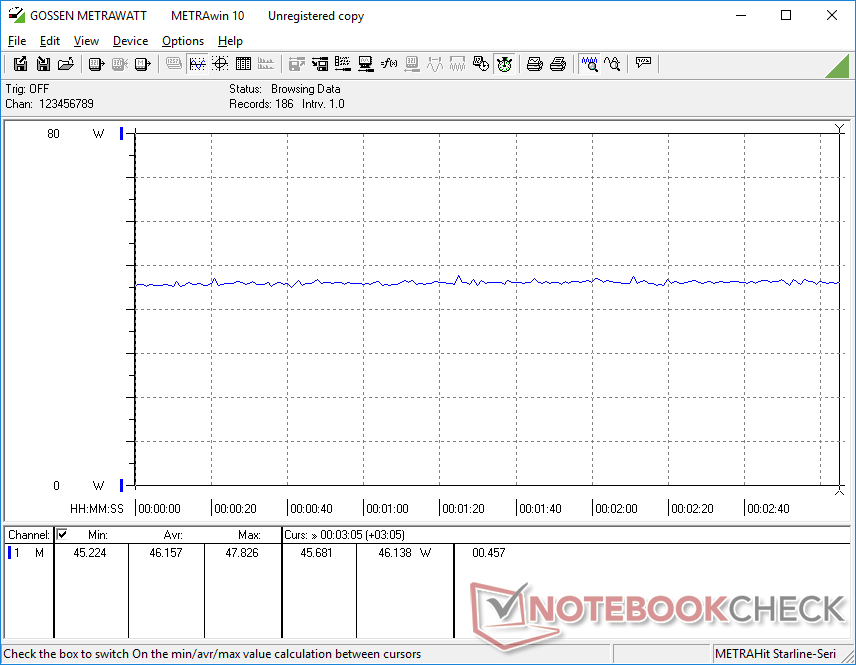
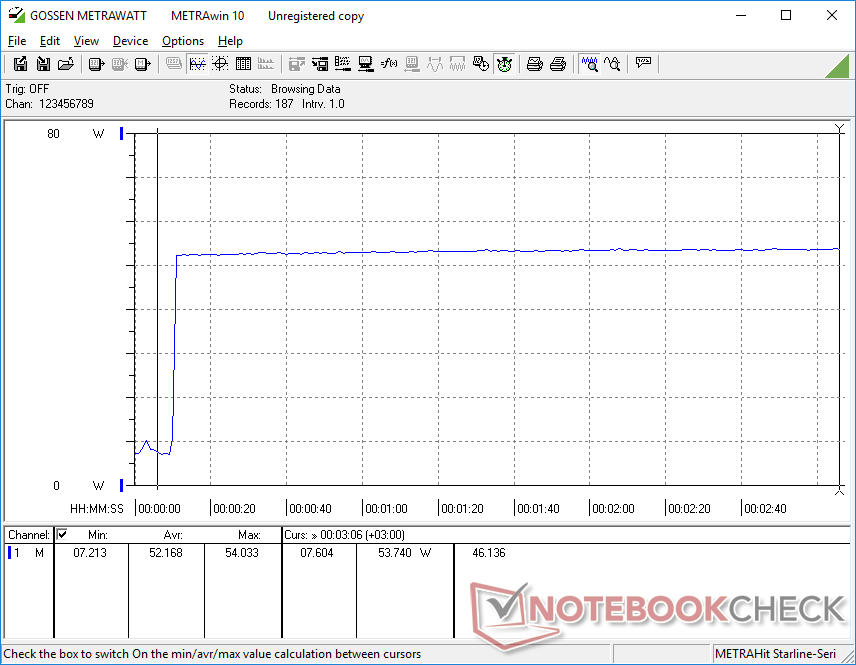
Consumo de energía
El consumo de energía es generalmente más alto que los modelos que funcionan con CPUs de la serie Ryzen U o Core U, ya que nuestra CPU de la serie Ryzen H apunta a niveles de TDP comparativamente más altos. El Intel NUC11 con el Core i5-1135G7por ejemplo, demandaría entre 40 y 44 W en juegos, en comparación con los 46 a 50 W de nuestro Beelink. El rendimiento por vatio sigue siendo mejor con el Ryzen 5 5600H especialmente en términos de rendimiento multihilo de la CPU
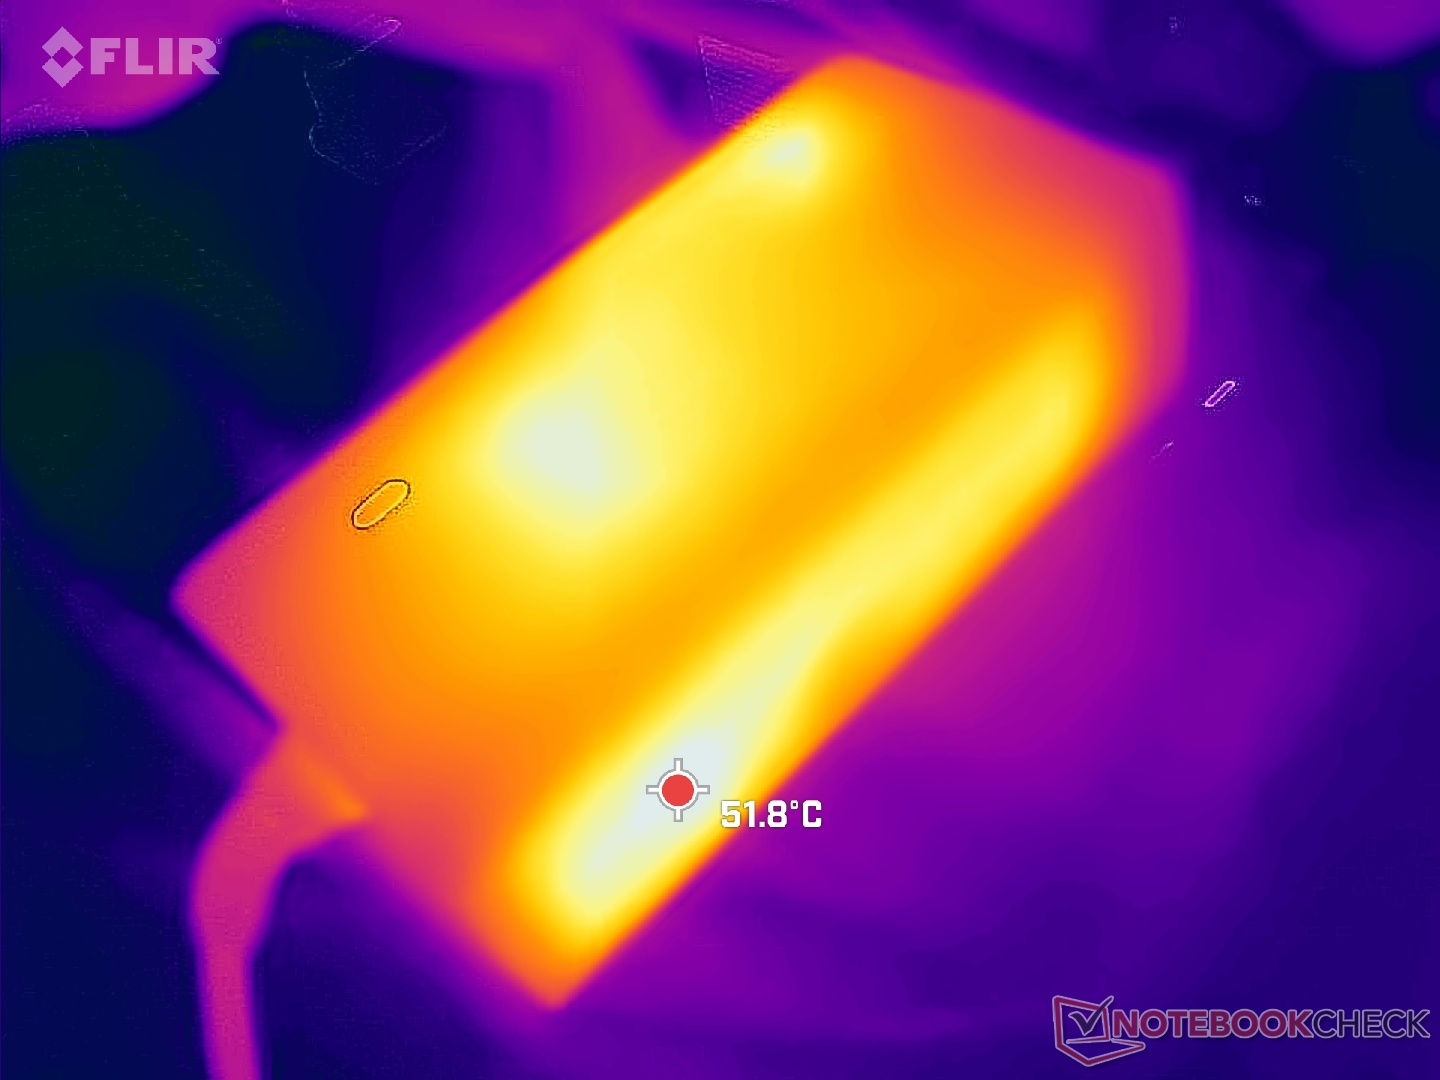
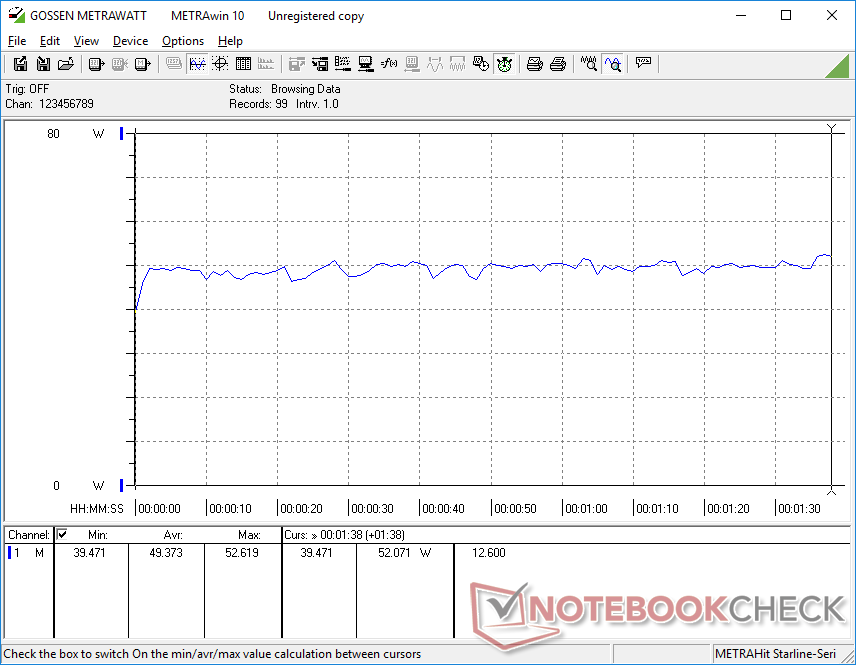
Registramos un consumo máximo de 50,2 W con el adaptador de pared pequeño-mediano (~10 x 4,9 x 3,3 cm) de 57 W cuando la CPU se utiliza al 100%. Sospechamos que puede ser aún mayor si se conectan varios dispositivos USB o monitores USB-C externos.

| Off / Standby | |
| Ocioso | |
| Carga |
|
Clave:
min: | |
| Beelink SER Pro Ryzen 5 5600H R5 5600H, Vega 7, Kingston NV1 SNVS/500GCN, , x, | Beelink SEi11 Pro i5-11320H, Iris Xe G7 96EUs, Kingston NV1 SNVS/500GCN, , x, | Beelink GTR5 R9 5900HX, Vega 8, Kingston NV1 SNVS/500GCN, , x, | Intel NUC11TNKi5 i5-1135G7, Iris Xe G7 80EUs, Transcend M.2 SSD 430S TS512GMTS430S, , x, | Beelink SEi8 i3-8109U, Iris Plus Graphics 655, Intel SSD 660p SSDPEKNW512G8, , x, | Beelink SER4 R7 4800U, Vega 8, Intel SSD 660p SSDPEKNW512G8, , x, | |
|---|---|---|---|---|---|---|
| Power Consumption | -30% | -28% | -41% | -2% | 32% | |
| Idle Minimum * (Watt) | 5.4 | 9.8 -81% | 6.2 -15% | 11.5 -113% | 7.5 -39% | 4.1 24% |
| Idle Average * (Watt) | 8.2 | 10.3 -26% | 8.9 -9% | 12.4 -51% | 7.6 7% | 4.1 50% |
| Idle Maximum * (Watt) | 8.3 | 10.5 -27% | 9 -8% | 12.9 -55% | 9.2 -11% | 4.6 45% |
| Load Average * (Watt) | 49.3 | 54.2 -10% | 66.8 -35% | 40.7 17% | 41.1 17% | 35.6 28% |
| Witcher 3 ultra * (Watt) | 46.1 | 53.1 -15% | 62.6 -36% | 43.9 5% | 35.6 23% | |
| Load Maximum * (Watt) | 50.2 | 59 -18% | 81.6 -63% | 73.5 -46% | 41.4 18% | 39.9 21% |
* ... más pequeño es mejor
Power Consumption Witcher 3 / Stresstest
Power Consumption external Monitor
Pro
Contra
Veredicto - Otra excelente alternativa al Intel NUC11
Por unos 450 dólares, el Beelink SER5 Pro viene completamente cargado con 16 GB de RAM, 500 GB de almacenamiento y una copia con licencia de Windows 11 Pro. En cambio, un Intel NUC11PAHi7 equipado con la misma capacidad de almacenamiento y RAM se vende actualmente por casi 900 dólares. El SER5 es incluso capaz de ofrecer un rendimiento de procesador más rápido que el Intel y muchas de las mismas opciones de actualización, incluyendo SODIMM y almacenamiento dual. Si quieres ahorrarte unos cuantos cientos de dólares, el Beelink debería estar en lo alto de tu lista de consideraciones.
El Beelink SER5 Pro es cientos de dólares más barato que un NUC de Intel de rendimiento similar. Las empresas pueden seguir prefiriendo la fiabilidad del NUC, pero la mayoría de los usuarios domésticos querrán considerar el más asequible Beelink.
Hay una serie de recortes, pero ninguno de ellos afecta a la experiencia del usuario. En comparación con el NUC de Intel, el SER5 Pro carece de Thunderbolt, de un bloqueo antirrobo, de soporte para SSD PCIe4, de una garantía del fabricante de tres años y de un esqueleto de chasis más resistente. El NUC puede seguir siendo la mejor inversión si esas características son importantes para ti, pero el ahorro de precio es, por lo demás, sustancial.
Precio y disponibilidad
El Beelink SER5 está ahora disponible en Amazon por algo menos de 400 dólares.
Price comparison

