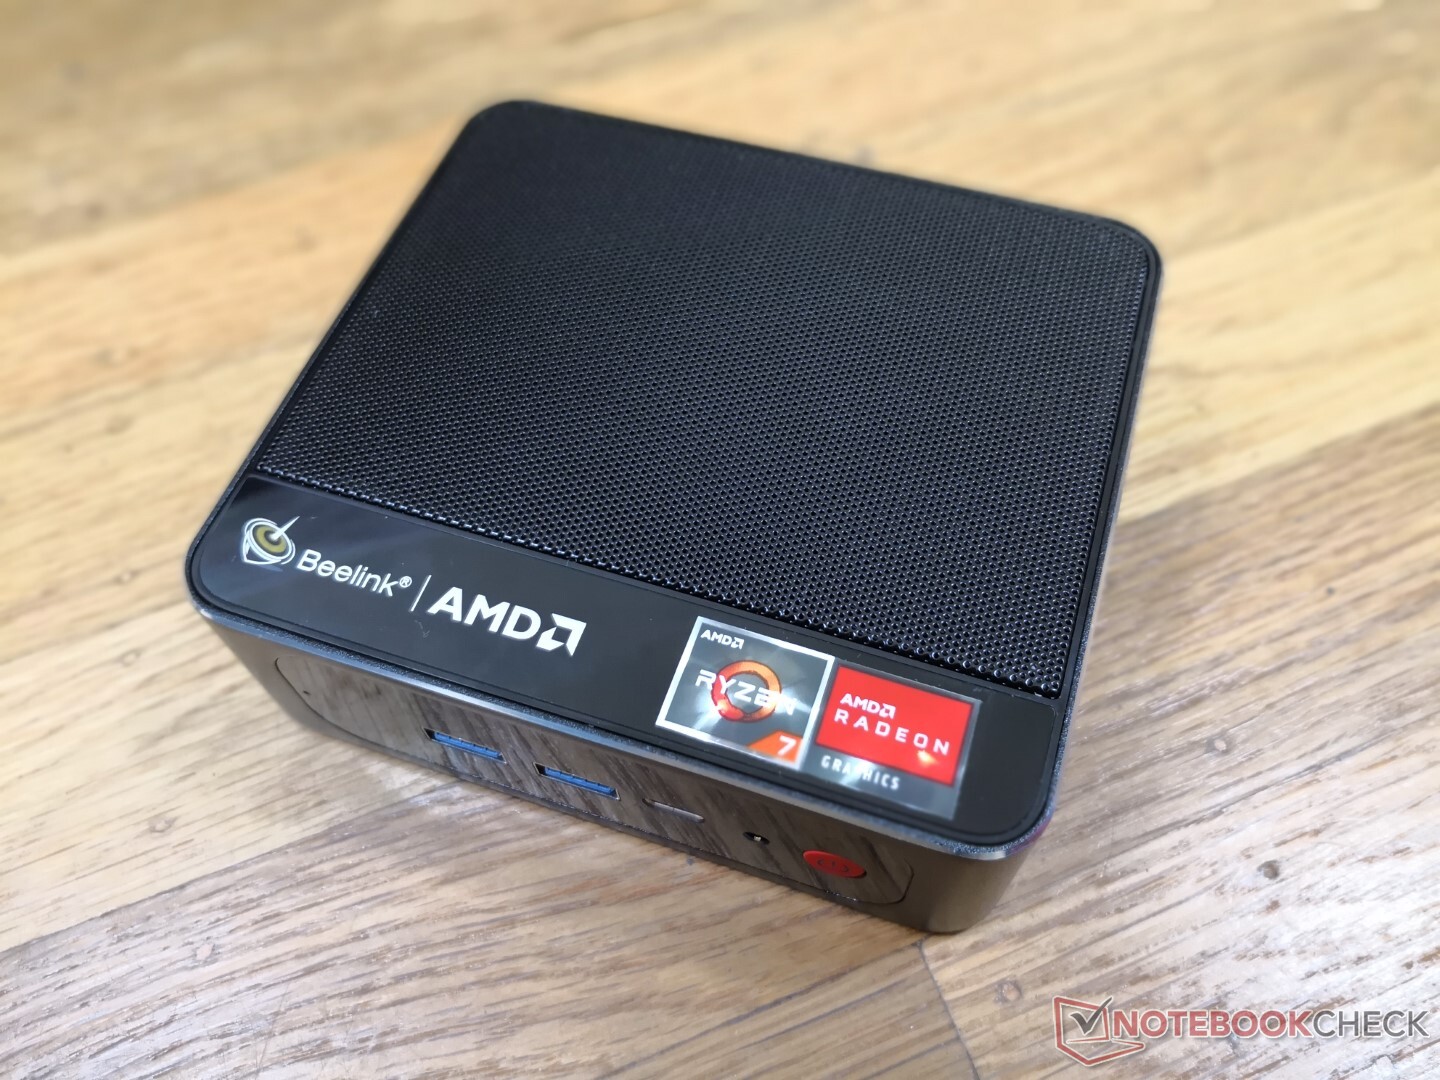
Análisis del mini PC Beelink SER3: El antiguo Ryzen 7 3750H tiene sus usos

Beelink ofrece varios mini PCs con CPUs Intel y AMD más antiguos como alternativas más baratas a los nuevos NUCs Intel con procesadores de última generación. Casi todas las aplicaciones de los HTPC, desde la navegación por la web hasta la transmisión de vídeo en 4K, no requieren las CPU más rápidas y mejores, lo que significa que la mayoría de los usuarios pueden salirse con la suya con un hardware menos costoso.
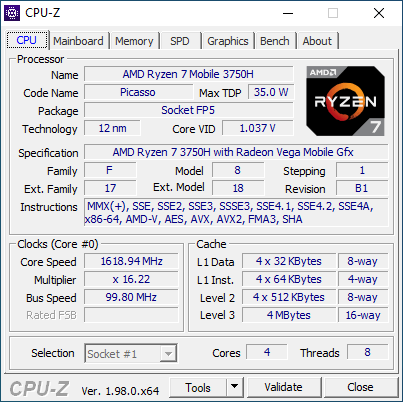
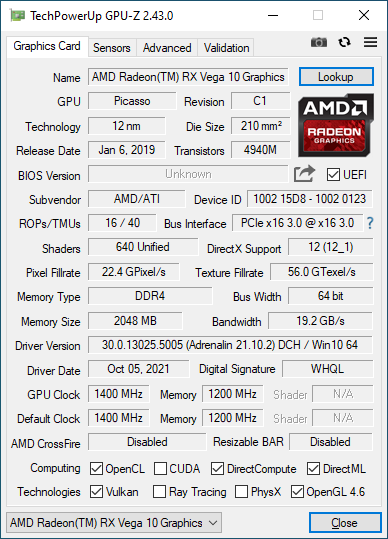
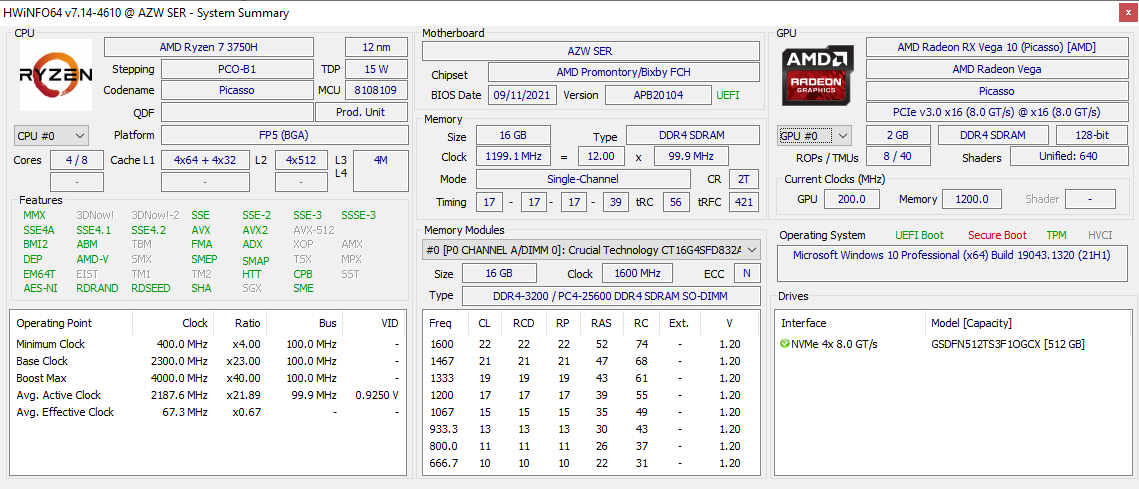
Nuestra unidad de prueba Beelink SER3 viene equipada con el AMD Zen+ de hace dos años Ryzen 7 3750H Que ha sido sustituida por las nuevas series Zen 2 4000H y Zen 3 5000H.
Más análisis de Beelink
No, or more than one (0) Rating for the given SpecsID 326081 found
Potential Competitors in Comparison
Valoración | Fecha | Modelo | Peso | Altura | Tamaño | Resolución | Precio |
|---|---|---|---|---|---|---|---|
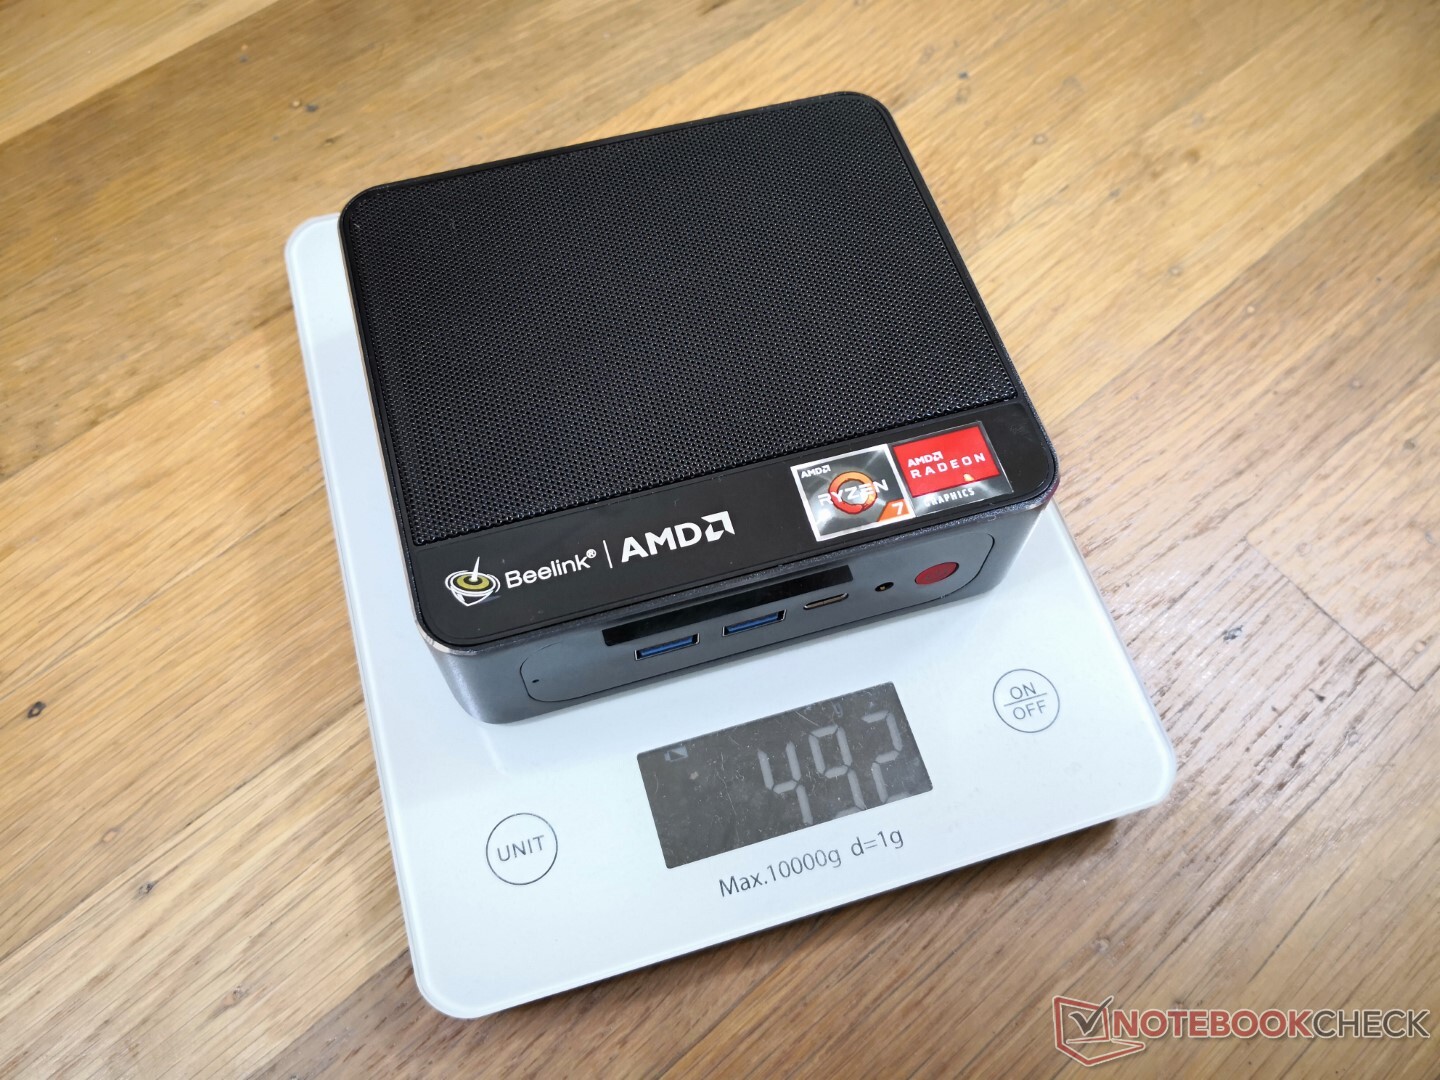
v (old) | 11/2021 | Beelink SER3 R7 3750H, Vega 10 | 492 g | 40 mm | x | ||
v (old) | Beelink SEi10 i3-1005G1, UHD Graphics G1 (Ice Lake 32 EU) | 350 g | 41 mm | x | |||
v (old) | 11/2018 | Intel NUC8i7BE i7-8559U, Iris Plus Graphics 655 | 683 g | 51 mm | x | ||
v (old) | 03/2021 | GMK NucBox 2 i5-8259U, Iris Plus Graphics 655 | 430 g | 50 mm | x | ||
v (old) | 07/2020 | Zotac ZBox MI643 i5-10210U, UHD Graphics 620 | 550 g | 28.5 mm | x | ||
v (old) | 04/2021 | Intel NUC11TNKi5 i5-1135G7, Iris Xe G7 80EUs | 504 g | 37 mm | x |
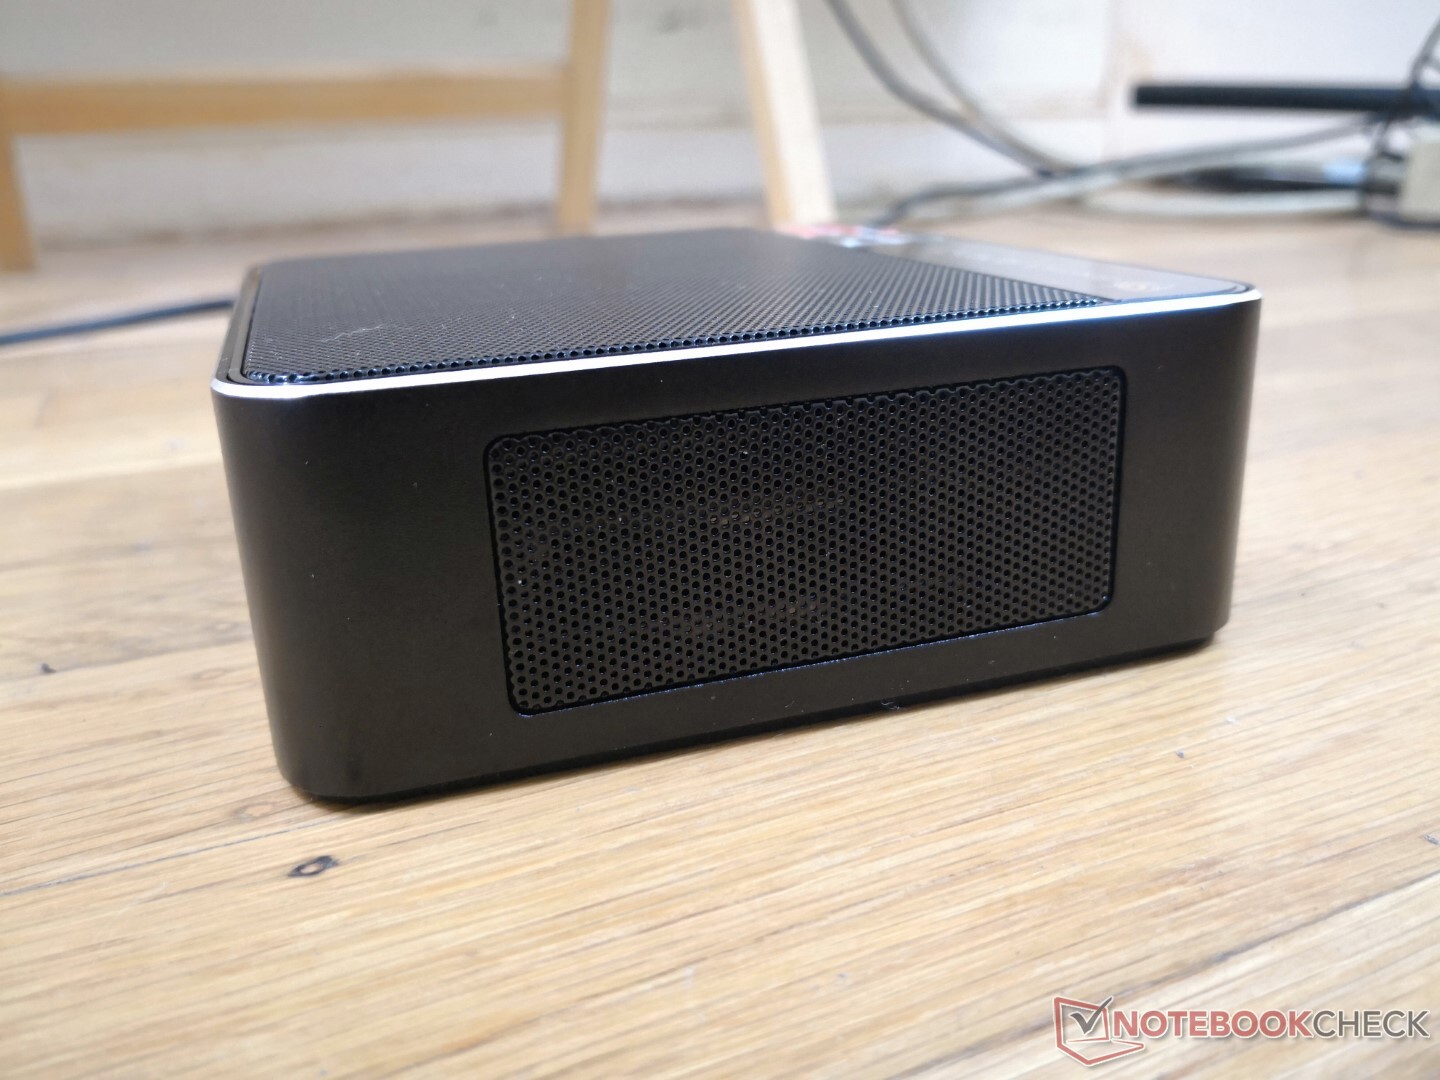
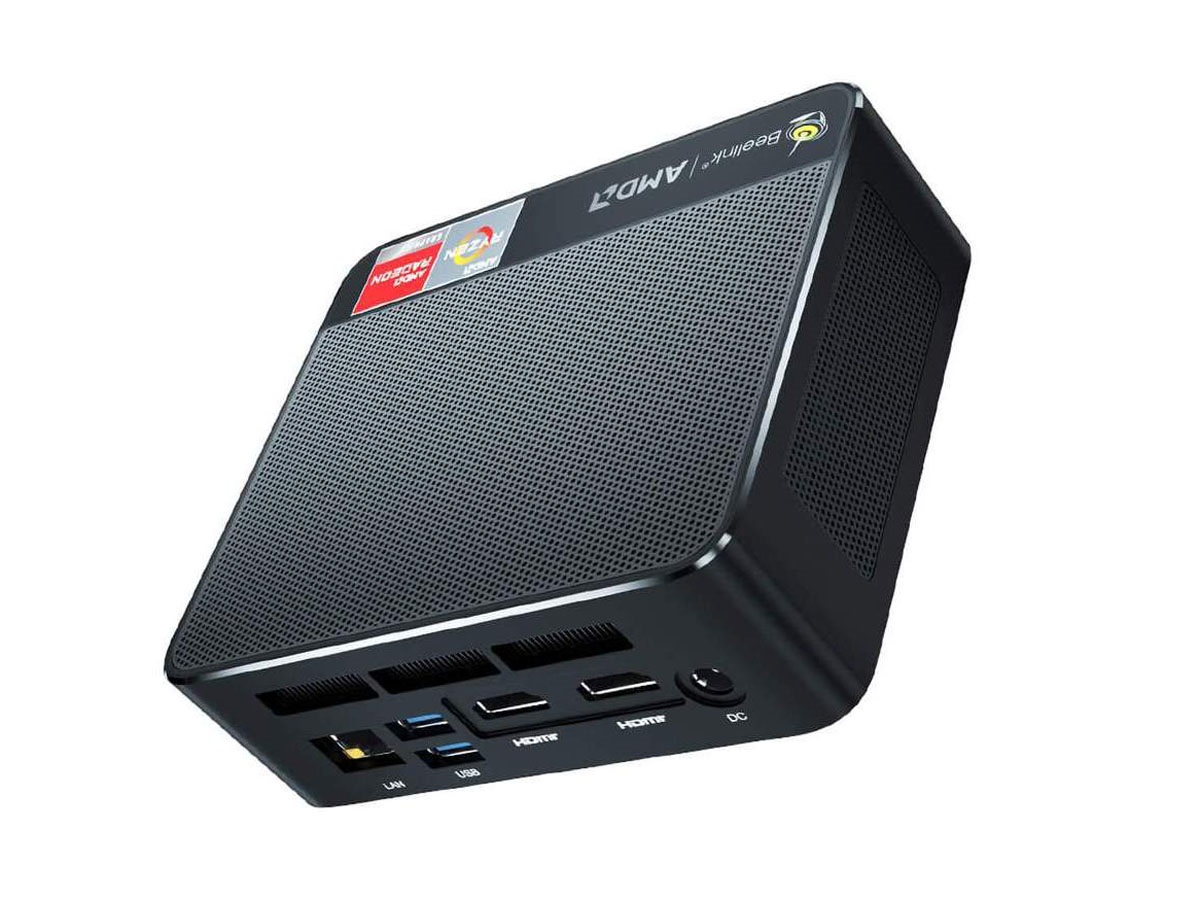
Caso
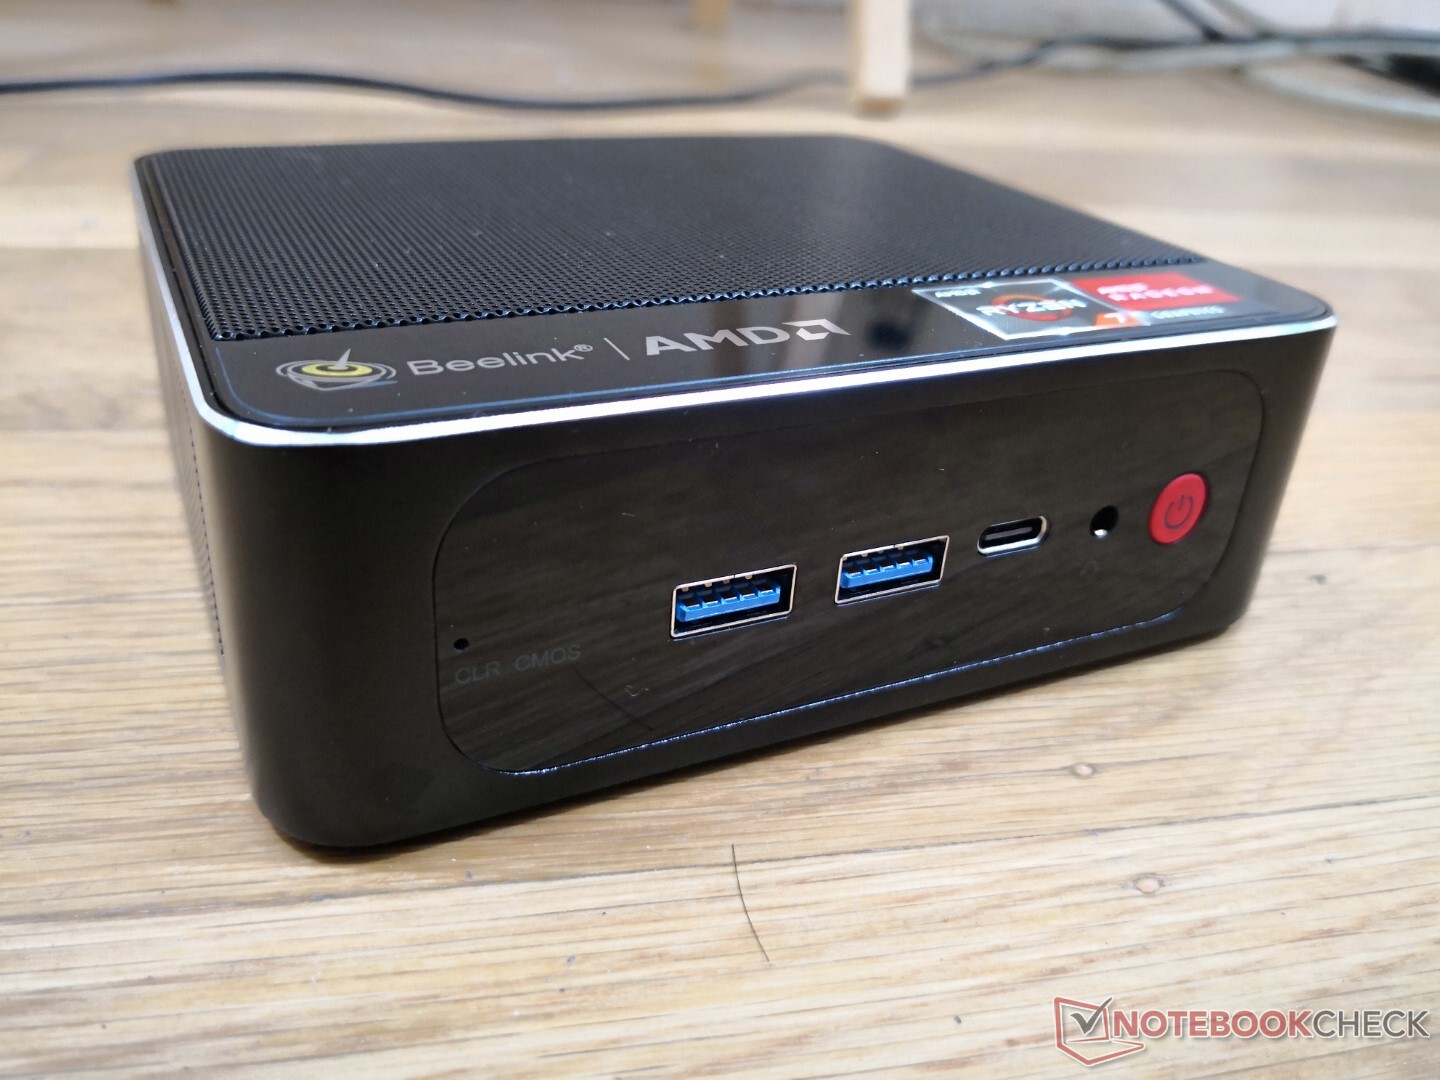
El chasis es principalmente de metal mate con un poco de plástico brillante en la parte delantera y parte de la parte superior. Las primeras impresiones son fuertes aunque no tan rígidas como un NUC de Intel que utiliza materiales metálicos más gruesos y pesados.
Conectividad
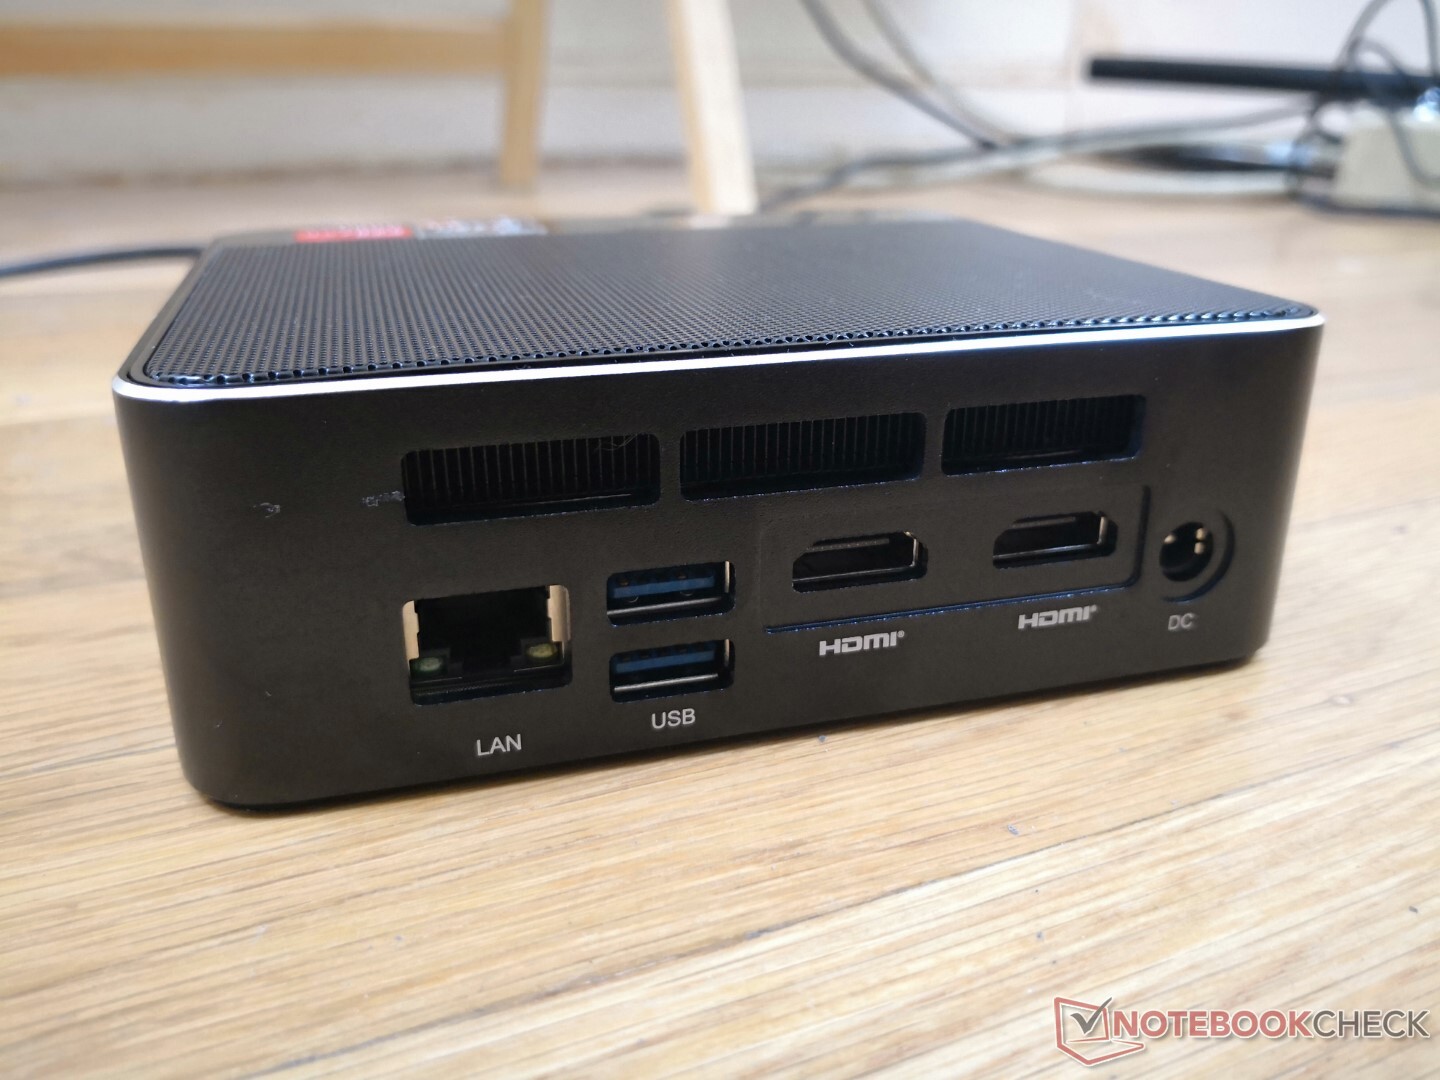
Las opciones de puerto son exactamente las mismas que en el Beelink SEi10. Sin embargo, hay que tener en cuenta que no hay Thunderbolt en el SER3 ya que su CPU AMD no soporta la interfaz de forma nativa
El puerto USB-C admite la salida DisplayPort, pero extrañamente sólo funcionaría con algunos y no todos nuestros monitores externos.
Comunicación
| Networking | |
| iperf3 transmit AX12 | |
| Intel NUC11TNKi5 | |
| Beelink SEi10 | |
| Intel NUC8i7BE | |
| GMK NucBox 2 | |
| Beelink SER3 | |
| Zotac ZBox MI643 | |
| iperf3 receive AX12 | |
| Intel NUC11TNKi5 | |
| Beelink SEi10 | |
| Beelink SER3 | |
| GMK NucBox 2 | |
| Intel NUC8i7BE | |
| Zotac ZBox MI643 | |
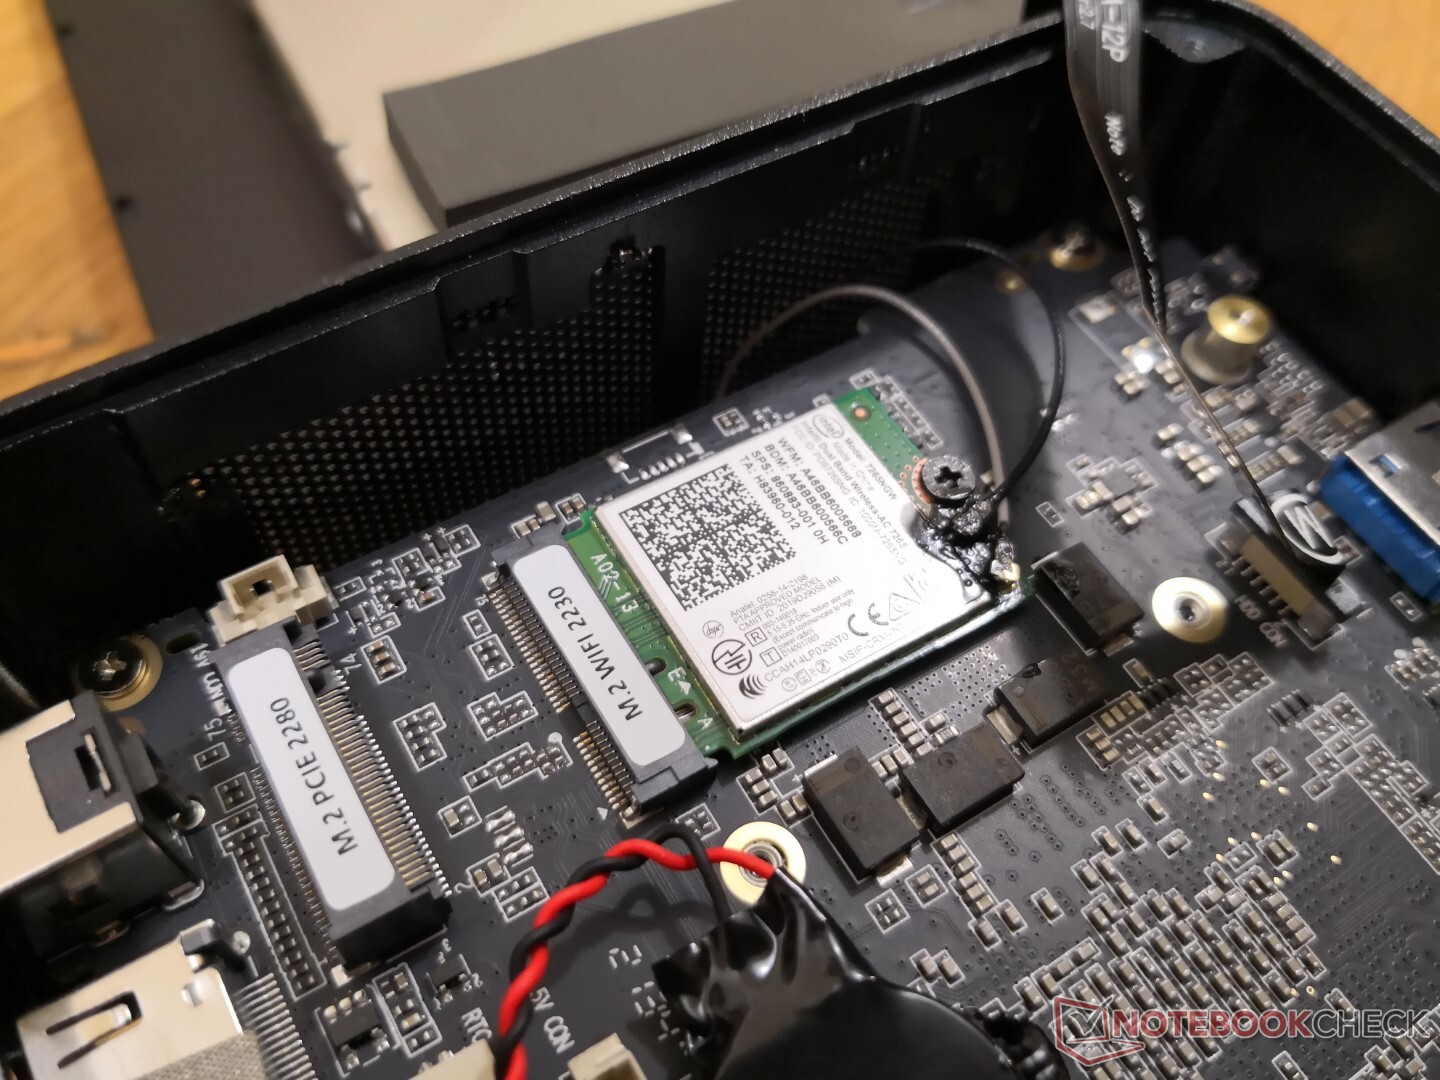
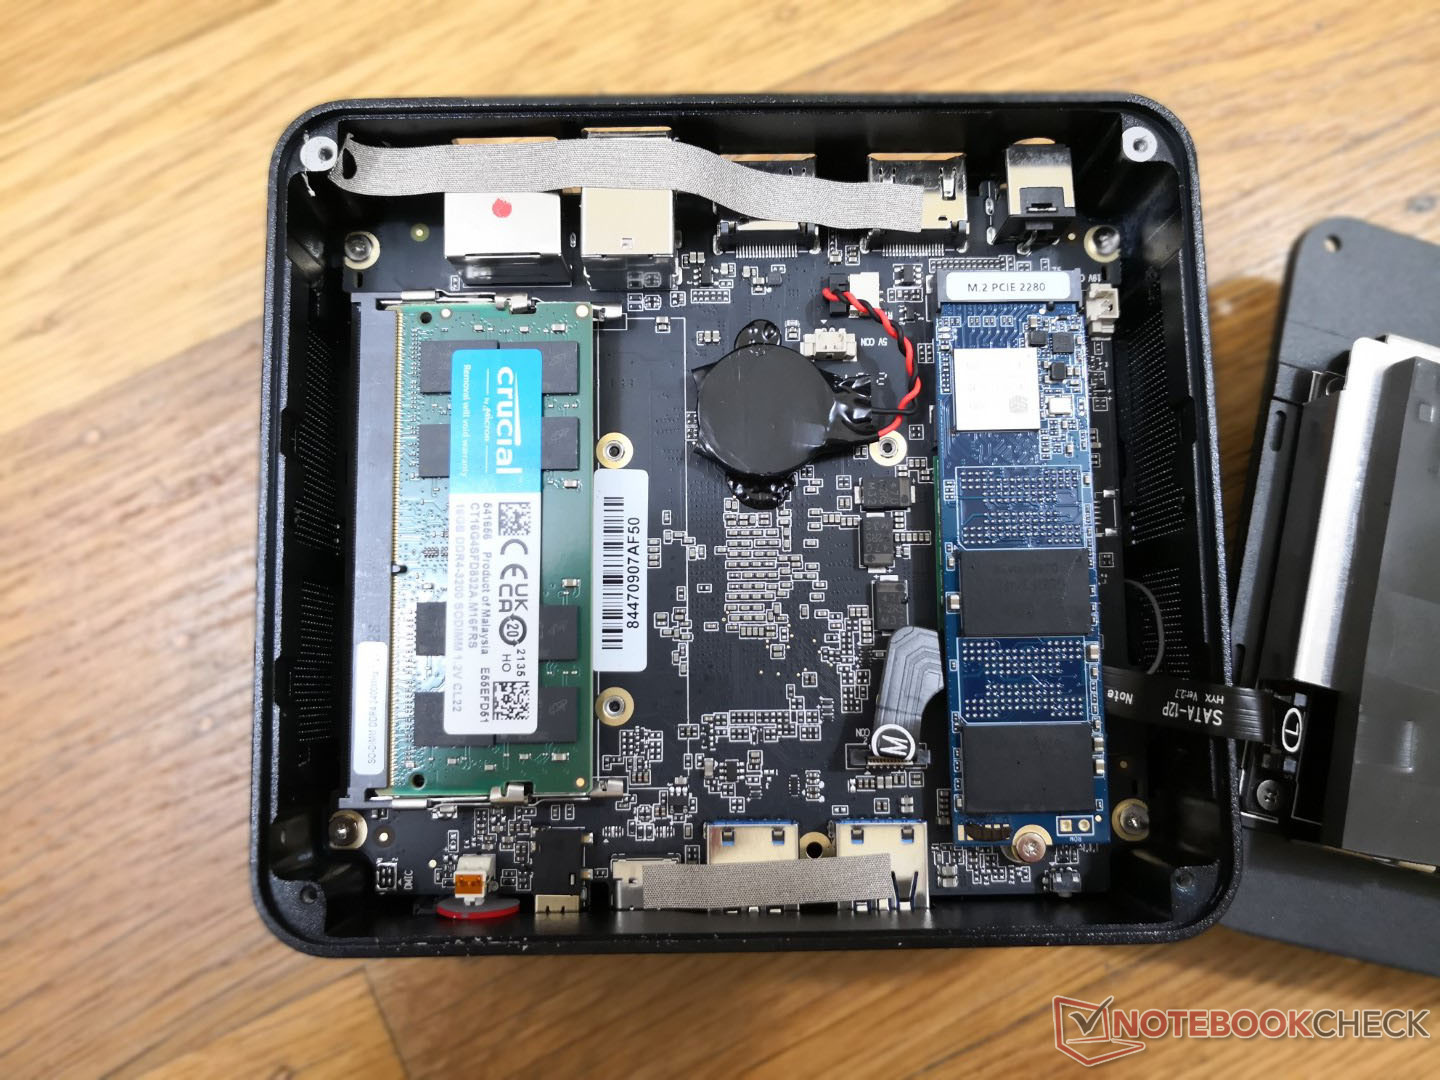
Mantenimiento
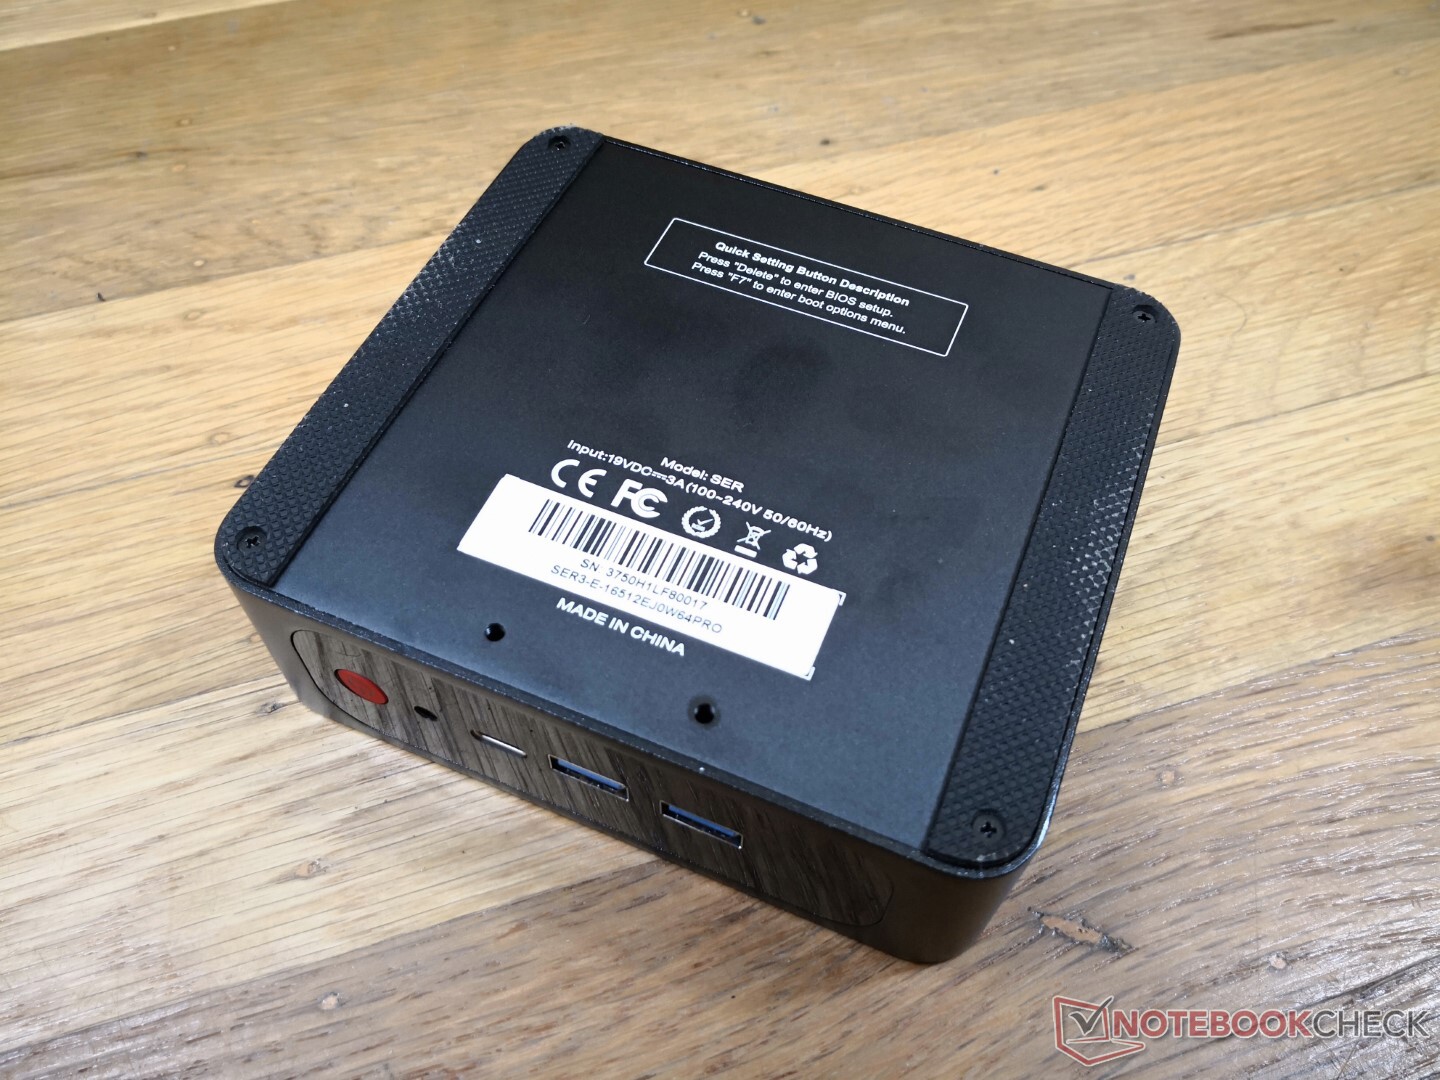
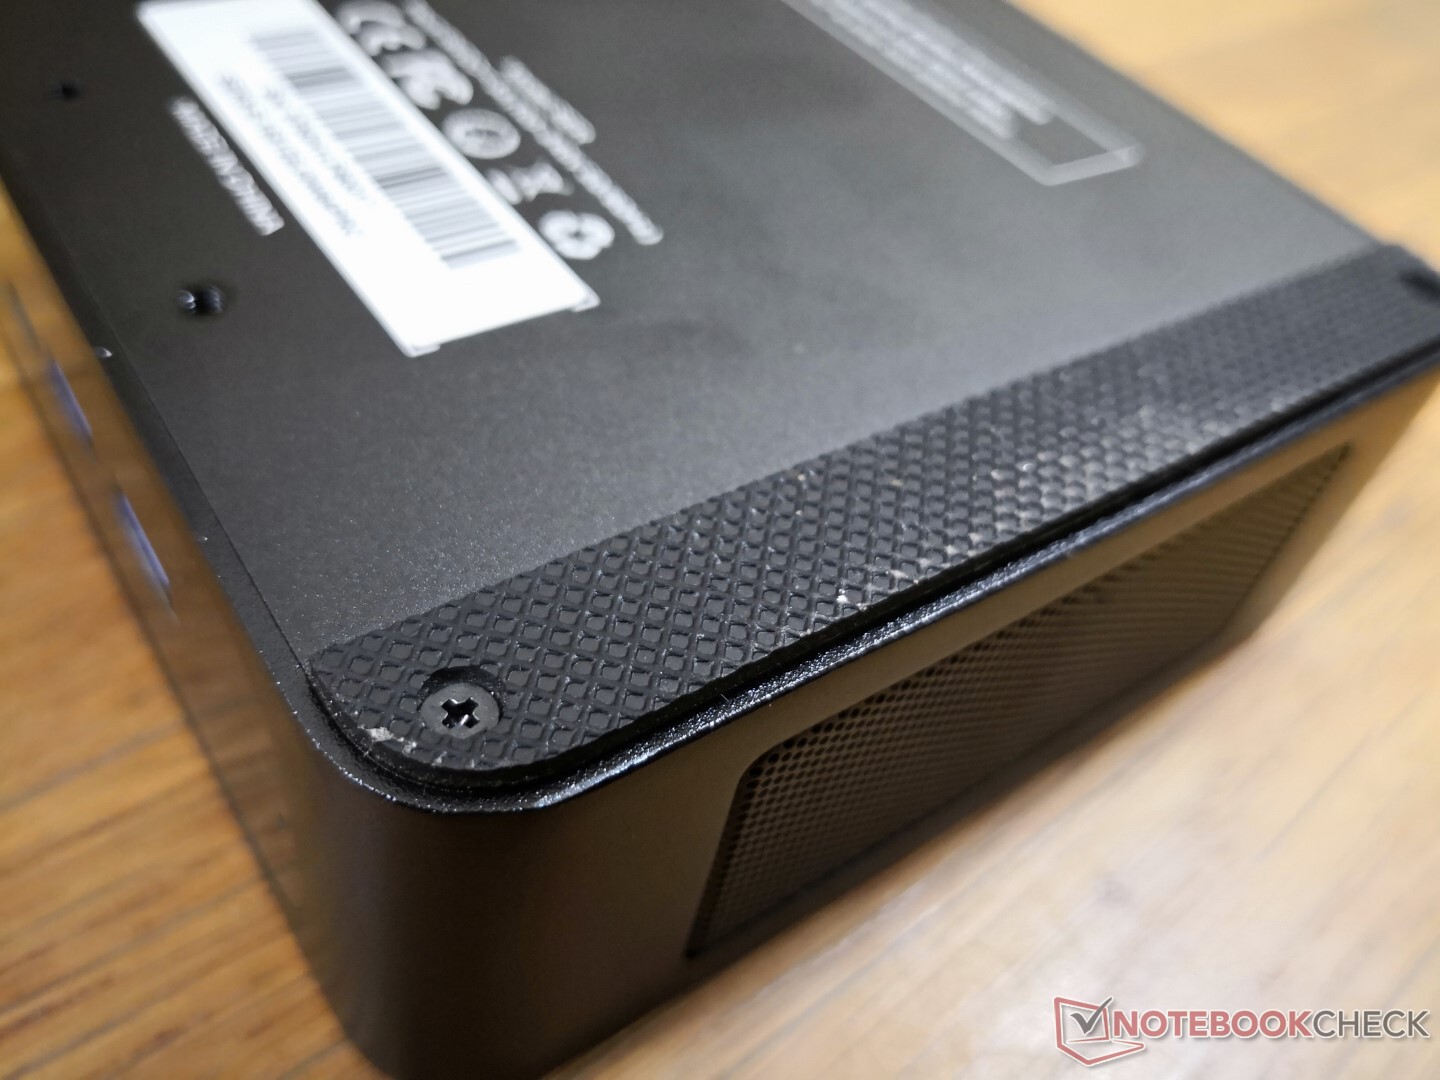
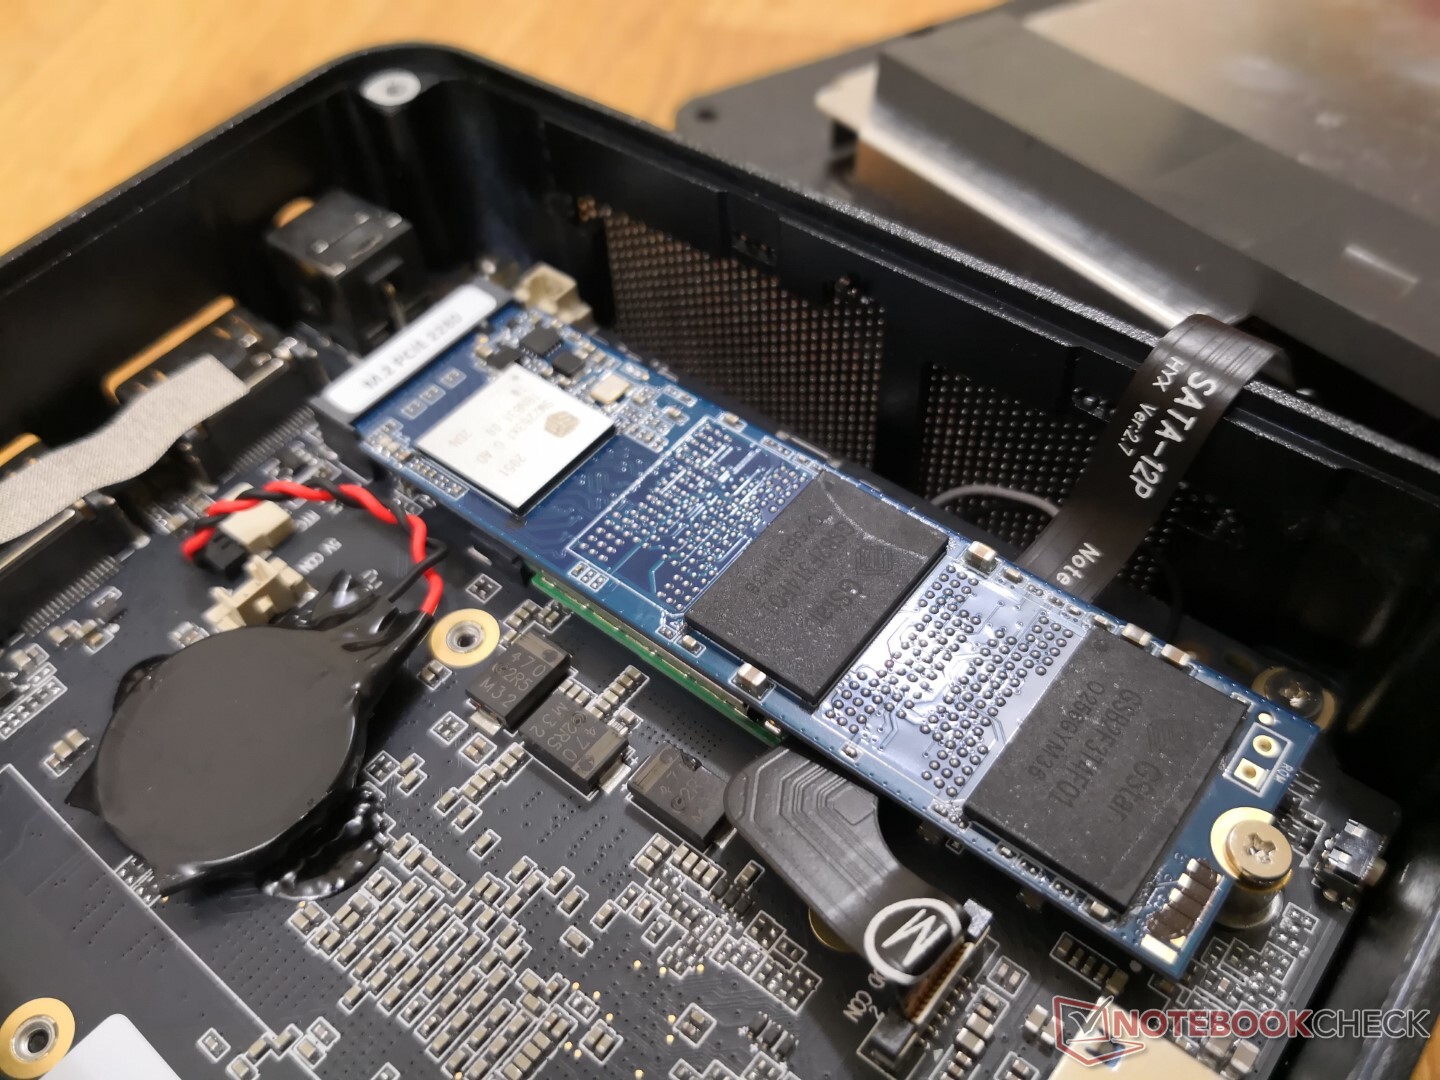
El panel inferior se puede retirar fácilmente con solo un destornillador Philips para revelar un módulo WLAN extraíble, una SSD M.2 2280 NVMe extraíble y 2 ranuras SODIMM.
Accesorios y garantía
El embalaje de venta incluye dos cables HDMI cortos, un soporte de montaje de 50 mm o 100 mm y tornillos adicionales, además del manual habitual y el adaptador de CA. Se aplica una garantía del fabricante de un año
Rendimiento
Condiciones de la prueba
Nuestra unidad fue configurada en el modo de Rendimiento antes de ejecutar los benchmarks que se muestran a continuación para obtener las puntuaciones más altas posibles.
Procesador
El rendimiento bruto de la CPU es comparable al delCore i5-8259U en el GMK NucBox 2 de la competencia. No alcanza el rendimiento de las nuevas CPU de la serie Zen 2 o Tiger Lake U, como el Ryzen 7 5700U o Core i5-1135G7 que se encuentran habitualmente en los últimos Ultrabooks. El rendimiento bajo cargas elevadas durante largos periodos es consistente, no obstante, sin problemas de ralentización importantes.
Cinebench R15 Multi Loop
Cinebench R23: Multi Core | Single Core
Cinebench R20: CPU (Multi Core) | CPU (Single Core)
Cinebench R15: CPU Multi 64Bit | CPU Single 64Bit
Blender: v2.79 BMW27 CPU
7-Zip 18.03: 7z b 4 | 7z b 4 -mmt1
Geekbench 5.5: Multi-Core | Single-Core
HWBOT x265 Benchmark v2.2: 4k Preset
LibreOffice : 20 Documents To PDF
R Benchmark 2.5: Overall mean
| CPU Performance rating | |
| Intel NUC11TNKi5 | |
| Intel NUC8i7BE -3! | |
| GMK NucBox 2 | |
| Medio AMD Ryzen 7 3750H | |
| Zotac ZBox MI643 -2! | |
| Beelink SER3 -2! | |
| Beelink SEi10 -2! | |
| Cinebench R23 / Multi Core | |
| Intel NUC11TNKi5 | |
| Beelink SER3 | |
| Medio AMD Ryzen 7 3750H (n=1) | |
| GMK NucBox 2 | |
| Cinebench R23 / Single Core | |
| Intel NUC11TNKi5 | |
| GMK NucBox 2 | |
| Beelink SER3 | |
| Medio AMD Ryzen 7 3750H (n=1) | |
| Cinebench R20 / CPU (Multi Core) | |
| Intel NUC11TNKi5 | |
| Intel NUC8i7BE | |
| Medio AMD Ryzen 7 3750H (1514 - 1825, n=4) | |
| Beelink SER3 | |
| GMK NucBox 2 | |
| Zotac ZBox MI643 | |
| Beelink SEi10 | |
| Cinebench R20 / CPU (Single Core) | |
| Intel NUC11TNKi5 | |
| Intel NUC8i7BE | |
| Zotac ZBox MI643 | |
| Beelink SEi10 | |
| GMK NucBox 2 | |
| Beelink SER3 | |
| Medio AMD Ryzen 7 3750H (340 - 386, n=4) | |
| Cinebench R15 / CPU Multi 64Bit | |
| Intel NUC8i7BE | |
| Intel NUC11TNKi5 | |
| Medio AMD Ryzen 7 3750H (672 - 805, n=7) | |
| Beelink SER3 | |
| GMK NucBox 2 | |
| Zotac ZBox MI643 | |
| Beelink SEi10 | |
| Cinebench R15 / CPU Single 64Bit | |
| Intel NUC11TNKi5 | |
| Intel NUC8i7BE | |
| Zotac ZBox MI643 | |
| Beelink SEi10 | |
| GMK NucBox 2 | |
| Beelink SER3 | |
| Medio AMD Ryzen 7 3750H (135 - 157, n=7) | |
| Blender / v2.79 BMW27 CPU | |
| Beelink SEi10 | |
| Zotac ZBox MI643 | |
| GMK NucBox 2 | |
| Intel NUC8i7BE | |
| Intel NUC8i7BE | |
| Beelink SER3 | |
| Medio AMD Ryzen 7 3750H (584 - 672, n=3) | |
| Intel NUC11TNKi5 | |
| 7-Zip 18.03 / 7z b 4 | |
| Intel NUC8i7BE | |
| Intel NUC8i7BE | |
| Intel NUC11TNKi5 | |
| GMK NucBox 2 | |
| Medio AMD Ryzen 7 3750H (17077 - 19187, n=3) | |
| Beelink SER3 | |
| Zotac ZBox MI643 | |
| Beelink SEi10 | |
| 7-Zip 18.03 / 7z b 4 -mmt1 | |
| Intel NUC8i7BE | |
| Intel NUC8i7BE | |
| Intel NUC11TNKi5 | |
| Zotac ZBox MI643 | |
| Beelink SEi10 | |
| GMK NucBox 2 | |
| Beelink SER3 | |
| Medio AMD Ryzen 7 3750H (3511 - 3752, n=3) | |
| Geekbench 5.5 / Multi-Core | |
| Intel NUC11TNKi5 | |
| Zotac ZBox MI643 | |
| Intel NUC8i7BE | |
| Medio AMD Ryzen 7 3750H (n=1) | |
| GMK NucBox 2 | |
| Beelink SEi10 | |
| Geekbench 5.5 / Single-Core | |
| Intel NUC11TNKi5 | |
| Zotac ZBox MI643 | |
| Beelink SEi10 | |
| GMK NucBox 2 | |
| Medio AMD Ryzen 7 3750H (n=1) | |
| Intel NUC8i7BE | |
| HWBOT x265 Benchmark v2.2 / 4k Preset | |
| Intel NUC11TNKi5 | |
| Intel NUC8i7BE | |
| Intel NUC8i7BE | |
| GMK NucBox 2 | |
| Medio AMD Ryzen 7 3750H (4.14 - 4.4, n=3) | |
| Zotac ZBox MI643 | |
| Beelink SER3 | |
| Beelink SEi10 | |
| LibreOffice / 20 Documents To PDF | |
| Beelink SER3 | |
| Medio AMD Ryzen 7 3750H (n=1) | |
| GMK NucBox 2 | |
| Zotac ZBox MI643 | |
| Beelink SEi10 | |
| Intel NUC11TNKi5 | |
| R Benchmark 2.5 / Overall mean | |
| GMK NucBox 2 | |
| Beelink SEi10 | |
| Beelink SER3 | |
| Medio AMD Ryzen 7 3750H (0.69 - 0.723, n=2) | |
| Zotac ZBox MI643 | |
| Intel NUC8i7BE | |
| Intel NUC11TNKi5 | |
* ... más pequeño es mejor
AIDA64: FP32 Ray-Trace | FPU Julia | CPU SHA3 | CPU Queen | FPU SinJulia | FPU Mandel | CPU AES | CPU ZLib | FP64 Ray-Trace | CPU PhotoWorxx
| Performance rating | |
| Intel NUC11TNKi5 | |
| Intel NUC8i7BE -1! | |
| GMK NucBox 2 | |
| Medio AMD Ryzen 7 3750H | |
| Zotac ZBox MI643 | |
| Beelink SER3 | |
| AIDA64 / FP32 Ray-Trace | |
| Intel NUC11TNKi5 | |
| Intel NUC8i7BE | |
| GMK NucBox 2 | |
| Zotac ZBox MI643 | |
| Medio AMD Ryzen 7 3750H (3338 - 3668, n=2) | |
| Beelink SER3 | |
| AIDA64 / FPU Julia | |
| Intel NUC11TNKi5 | |
| Intel NUC8i7BE | |
| GMK NucBox 2 | |
| Zotac ZBox MI643 | |
| Medio AMD Ryzen 7 3750H (16912 - 19132, n=2) | |
| Beelink SER3 | |
| AIDA64 / CPU SHA3 | |
| Intel NUC11TNKi5 | |
| GMK NucBox 2 | |
| Medio AMD Ryzen 7 3750H (897 - 1001, n=2) | |
| Zotac ZBox MI643 | |
| Beelink SER3 | |
| AIDA64 / CPU Queen | |
| Intel NUC8i7BE | |
| Zotac ZBox MI643 | |
| Medio AMD Ryzen 7 3750H (43632 - 50328, n=2) | |
| Intel NUC11TNKi5 | |
| Beelink SER3 | |
| GMK NucBox 2 | |
| AIDA64 / FPU SinJulia | |
| Medio AMD Ryzen 7 3750H (5639 - 6478, n=2) | |
| Beelink SER3 | |
| Intel NUC8i7BE | |
| Intel NUC11TNKi5 | |
| GMK NucBox 2 | |
| Zotac ZBox MI643 | |
| AIDA64 / FPU Mandel | |
| Intel NUC11TNKi5 | |
| Intel NUC8i7BE | |
| GMK NucBox 2 | |
| Zotac ZBox MI643 | |
| Medio AMD Ryzen 7 3750H (8846 - 9928, n=2) | |
| Beelink SER3 | |
| AIDA64 / CPU AES | |
| Intel NUC11TNKi5 | |
| Medio AMD Ryzen 7 3750H (28977 - 32668, n=2) | |
| Beelink SER3 | |
| Intel NUC8i7BE | |
| GMK NucBox 2 | |
| Zotac ZBox MI643 | |
| AIDA64 / CPU ZLib | |
| Intel NUC11TNKi5 | |
| Intel NUC8i7BE | |
| Medio AMD Ryzen 7 3750H (313 - 350, n=2) | |
| Beelink SER3 | |
| GMK NucBox 2 | |
| Zotac ZBox MI643 | |
| AIDA64 / FP64 Ray-Trace | |
| Intel NUC11TNKi5 | |
| Intel NUC8i7BE | |
| GMK NucBox 2 | |
| Zotac ZBox MI643 | |
| Medio AMD Ryzen 7 3750H (1758 - 1935, n=2) | |
| Beelink SER3 | |
| AIDA64 / CPU PhotoWorxx | |
| Zotac ZBox MI643 | |
| Intel NUC8i7BE | |
| Intel NUC11TNKi5 | |
| Medio AMD Ryzen 7 3750H (10338 - 18898, n=2) | |
| Beelink SER3 | |
| GMK NucBox 2 | |
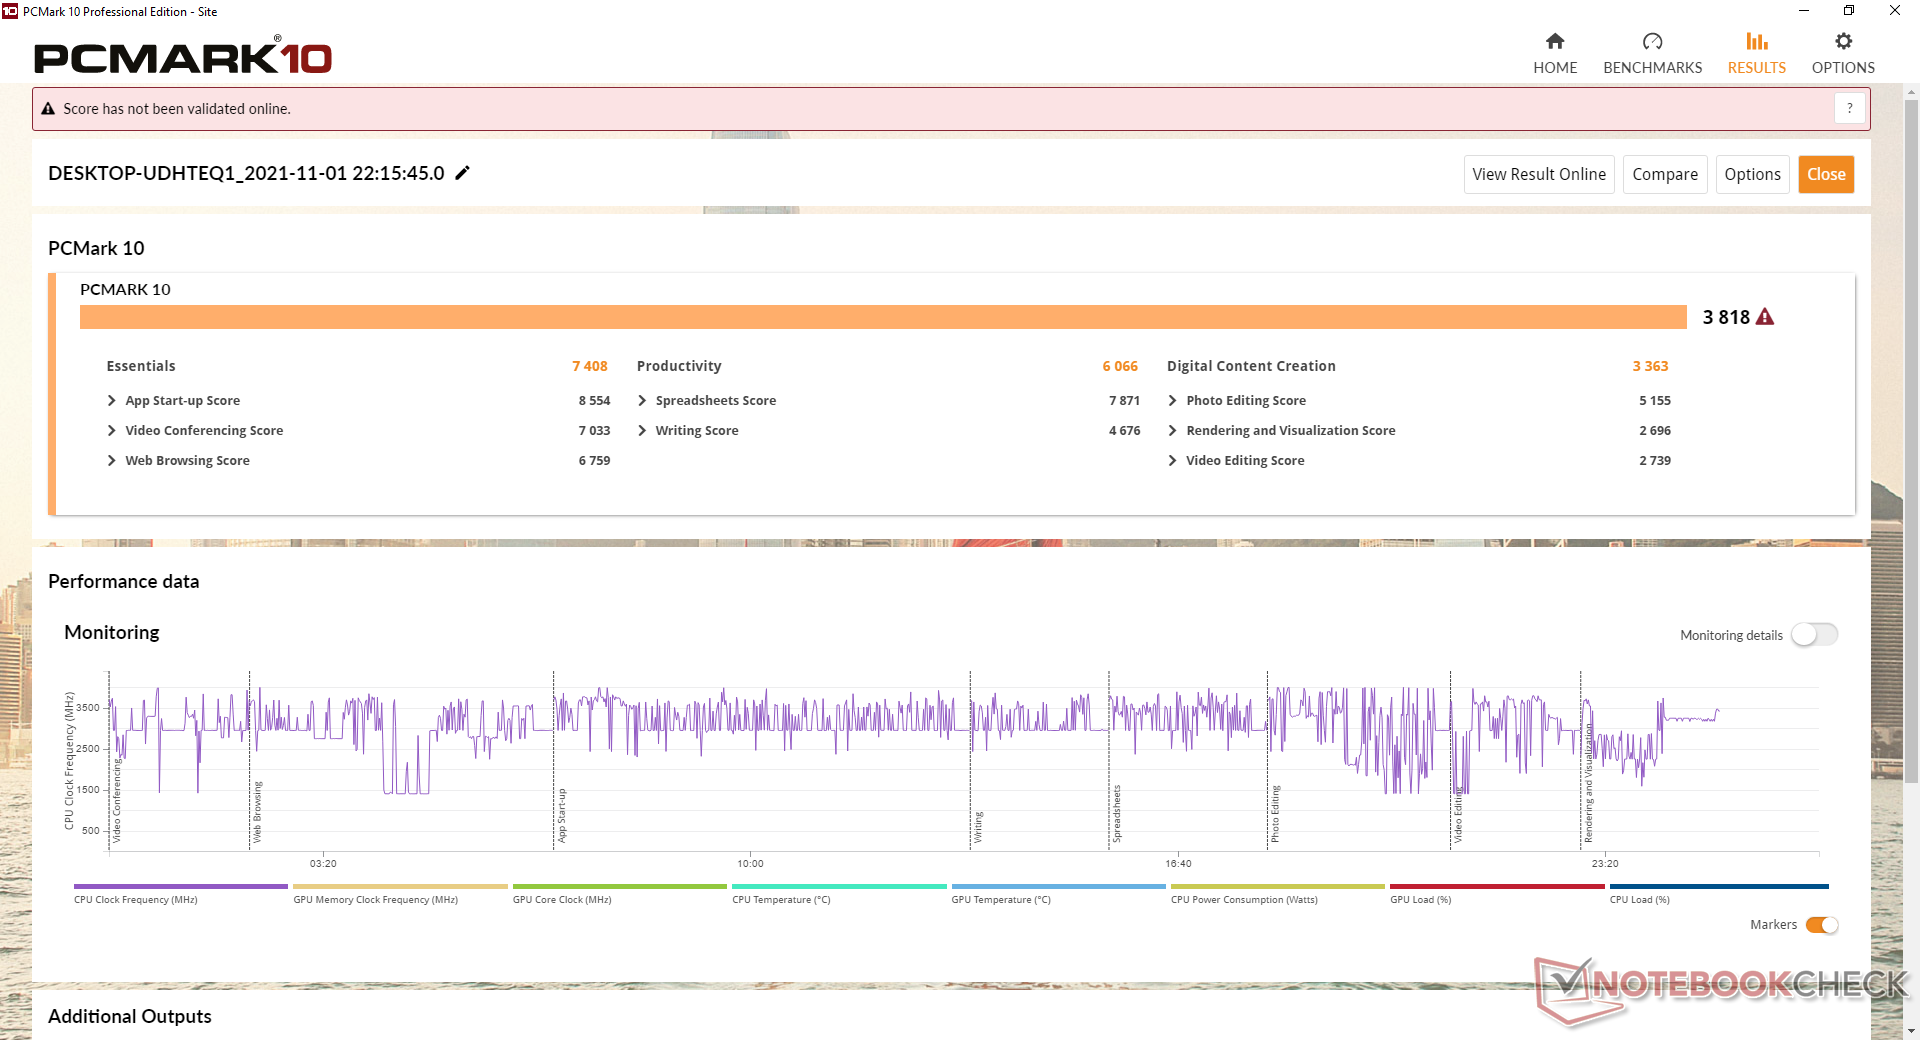
Rendimiento del sistema
| PCMark 10 / Score | |
| Intel NUC8i7BE | |
| Intel NUC11TNKi5 | |
| Zotac ZBox MI643 | |
| GMK NucBox 2 | |
| Beelink SER3 | |
| Medio AMD Ryzen 7 3750H, AMD Radeon RX Vega 10 (n=1) | |
| Beelink SEi10 | |
| PCMark 10 / Essentials | |
| Zotac ZBox MI643 | |
| Intel NUC11TNKi5 | |
| Intel NUC8i7BE | |
| GMK NucBox 2 | |
| Beelink SEi10 | |
| Beelink SER3 | |
| Medio AMD Ryzen 7 3750H, AMD Radeon RX Vega 10 (n=1) | |
| PCMark 10 / Productivity | |
| Intel NUC8i7BE | |
| Zotac ZBox MI643 | |
| GMK NucBox 2 | |
| Intel NUC11TNKi5 | |
| Beelink SER3 | |
| Medio AMD Ryzen 7 3750H, AMD Radeon RX Vega 10 (n=1) | |
| Beelink SEi10 | |
| PCMark 10 / Digital Content Creation | |
| Intel NUC11TNKi5 | |
| Intel NUC8i7BE | |
| GMK NucBox 2 | |
| Beelink SER3 | |
| Medio AMD Ryzen 7 3750H, AMD Radeon RX Vega 10 (n=1) | |
| Zotac ZBox MI643 | |
| Beelink SEi10 | |
| PCMark 10 Score | 3818 puntos | |
ayuda | ||
| AIDA64 / Memory Copy | |
| Intel NUC8i7BE | |
| GMK NucBox 2 | |
| Zotac ZBox MI643 | |
| Medio AMD Ryzen 7 3750H (16249 - 30963, n=2) | |
| Intel NUC11TNKi5 | |
| Beelink SER3 | |
| AIDA64 / Memory Read | |
| Intel NUC8i7BE | |
| GMK NucBox 2 | |
| Zotac ZBox MI643 | |
| Medio AMD Ryzen 7 3750H (18268 - 35218, n=2) | |
| Intel NUC11TNKi5 | |
| Beelink SER3 | |
| AIDA64 / Memory Write | |
| Intel NUC8i7BE | |
| GMK NucBox 2 | |
| Zotac ZBox MI643 | |
| Medio AMD Ryzen 7 3750H (18455 - 35988, n=2) | |
| Intel NUC11TNKi5 | |
| Beelink SER3 | |
| AIDA64 / Memory Latency | |
| Medio AMD Ryzen 7 3750H (95.8 - 118, n=2) | |
| Beelink SER3 | |
| Intel NUC11TNKi5 | |
| Zotac ZBox MI643 | |
| GMK NucBox 2 | |
| Intel NUC8i7BE | |
* ... más pequeño es mejor
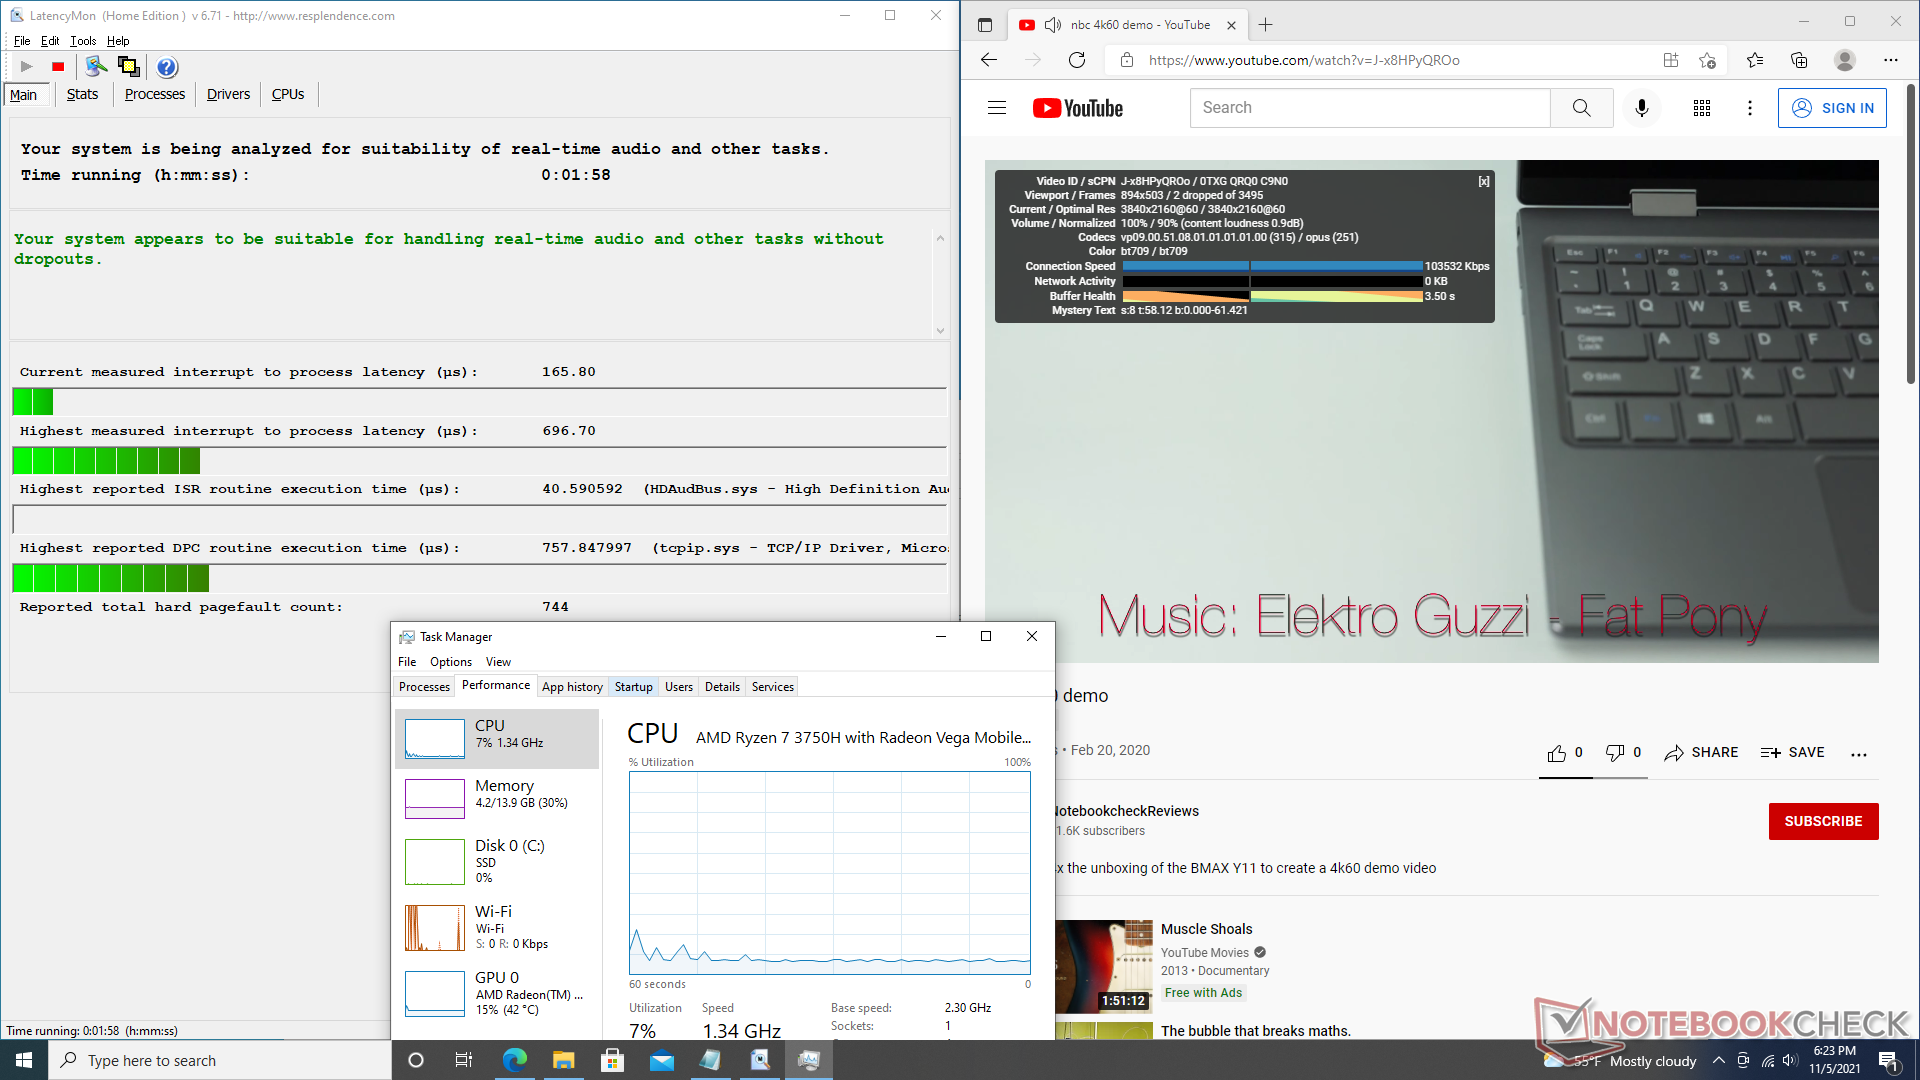
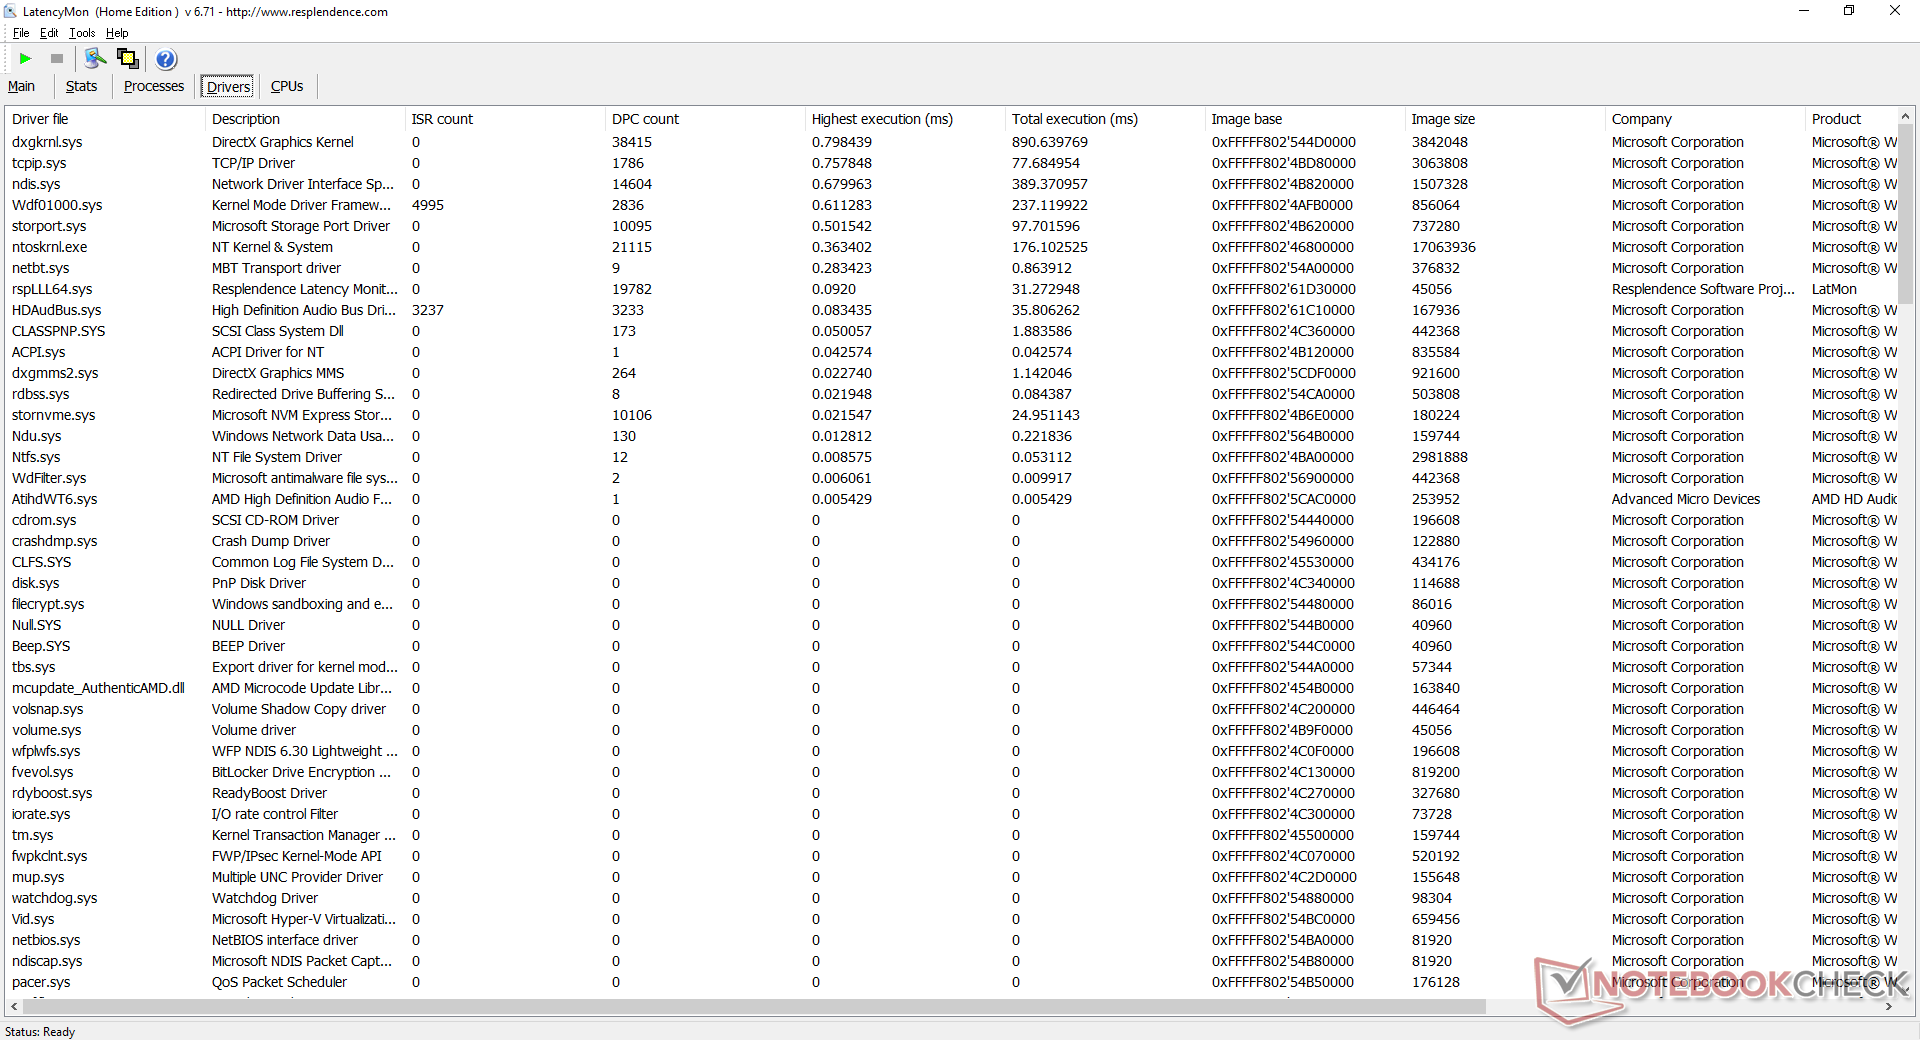
Latencia del CPD
LatencyMon no muestra problemas de CPD al abrir varias pestañas del navegador en nuestra página web o al ejecutar el estrés de Prime95. La reproducción de vídeo 4K a 60 FPS es fluida y casi sin pérdida de fotogramas.
| DPC Latencies / LatencyMon - interrupt to process latency (max), Web, Youtube, Prime95 | |
| Beelink SEi10 | |
| GMK NucBox 2 | |
| Zotac ZBox MI643 | |
| Beelink SER3 | |
| Intel NUC11TNKi5 | |
* ... más pequeño es mejor
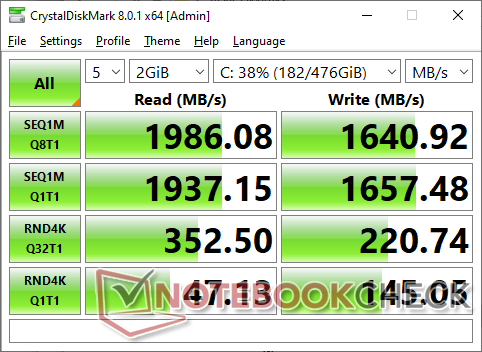
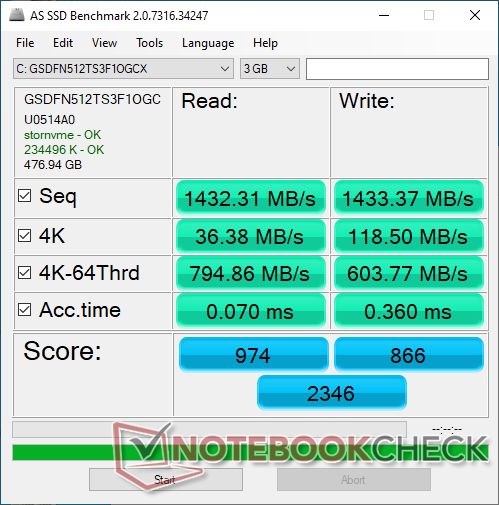
Dispositivos de almacenamiento
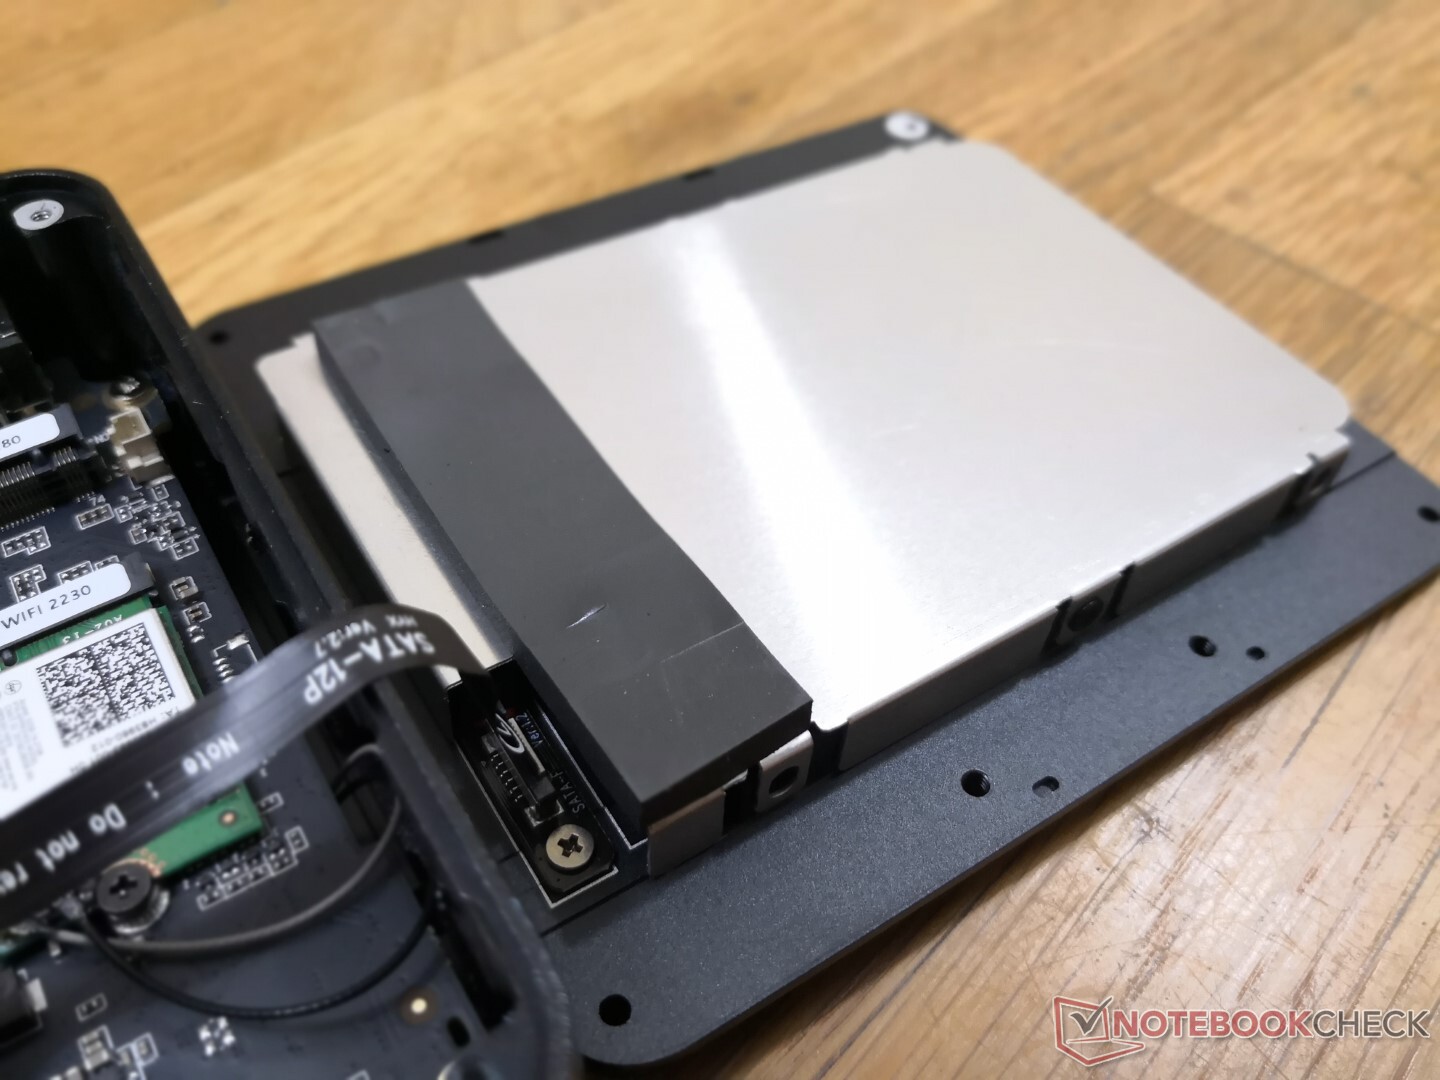
Mientras que nuestro SEi10 viene con un SSD NVMe Silicon Motion AZW de 256 GB, nuestro SER3 viene con la versión de 512 GB. Las tasas de lectura y escritura secuencial revelan que la unidad es una oferta NVMe de gama media. Las tasas de transferencia se ralentizarán con el tiempo cuando se estresen de 1900 MB/s a 1400 MB/s o menos debido a las limitaciones térmicas. Muchos NUC de Intel integran un disipador de calor en la parte superior de la unidad SSD NVMe para refrigerarla y evitar o retrasar la ralentización del rendimiento.

| Drive Performance rating - Percent | |
| Zotac ZBox MI643 | |
| Beelink SER3 | |
| GMK NucBox 2 | |
| Beelink SEi10 | |
| Intel NUC11TNKi5 | |
| DiskSpd | |
| seq read | |
| Zotac ZBox MI643 | |
| GMK NucBox 2 | |
| Beelink SER3 | |
| Beelink SEi10 | |
| Intel NUC11TNKi5 | |
| seq write | |
| Zotac ZBox MI643 | |
| Beelink SER3 | |
| GMK NucBox 2 | |
| Beelink SEi10 | |
| Intel NUC11TNKi5 | |
| seq q8 t1 read | |
| GMK NucBox 2 | |
| Zotac ZBox MI643 | |
| Beelink SER3 | |
| Beelink SEi10 | |
| Intel NUC11TNKi5 | |
| seq q8 t1 write | |
| Zotac ZBox MI643 | |
| Beelink SER3 | |
| GMK NucBox 2 | |
| Beelink SEi10 | |
| Intel NUC11TNKi5 | |
| 4k q1 t1 read | |
| Zotac ZBox MI643 | |
| Beelink SEi10 | |
| Beelink SER3 | |
| GMK NucBox 2 | |
| Intel NUC11TNKi5 | |
| 4k q1 t1 write | |
| Zotac ZBox MI643 | |
| Beelink SEi10 | |
| GMK NucBox 2 | |
| Beelink SER3 | |
| Intel NUC11TNKi5 | |
| 4k q32 t16 read | |
| Beelink SER3 | |
| Zotac ZBox MI643 | |
| Beelink SEi10 | |
| GMK NucBox 2 | |
| Intel NUC11TNKi5 | |
| 4k q32 t16 write | |
| Zotac ZBox MI643 | |
| GMK NucBox 2 | |
| Beelink SEi10 | |
| Beelink SER3 | |
| Intel NUC11TNKi5 | |
| AS SSD | |
| Score Total | |
| Zotac ZBox MI643 | |
| Beelink SER3 | |
| GMK NucBox 2 | |
| Beelink SEi10 | |
| Intel NUC11TNKi5 | |
| Score Read | |
| Zotac ZBox MI643 | |
| Beelink SER3 | |
| GMK NucBox 2 | |
| Beelink SEi10 | |
| Intel NUC11TNKi5 | |
| Score Write | |
| Zotac ZBox MI643 | |
| Beelink SER3 | |
| GMK NucBox 2 | |
| Intel NUC11TNKi5 | |
| Beelink SEi10 | |
| Seq Read | |
| GMK NucBox 2 | |
| Zotac ZBox MI643 | |
| Beelink SER3 | |
| Beelink SEi10 | |
| Intel NUC11TNKi5 | |
| Seq Write | |
| Zotac ZBox MI643 | |
| Beelink SER3 | |
| GMK NucBox 2 | |
| Intel NUC11TNKi5 | |
| Beelink SEi10 | |
| 4K Read | |
| Zotac ZBox MI643 | |
| GMK NucBox 2 | |
| Beelink SER3 | |
| Beelink SEi10 | |
| Intel NUC11TNKi5 | |
| 4K Write | |
| GMK NucBox 2 | |
| Zotac ZBox MI643 | |
| Beelink SER3 | |
| Beelink SEi10 | |
| Intel NUC11TNKi5 | |
| 4K-64 Read | |
| Zotac ZBox MI643 | |
| Beelink SER3 | |
| GMK NucBox 2 | |
| Beelink SEi10 | |
| Intel NUC11TNKi5 | |
| 4K-64 Write | |
| Zotac ZBox MI643 | |
| Beelink SER3 | |
| GMK NucBox 2 | |
| Intel NUC11TNKi5 | |
| Beelink SEi10 | |
| Access Time Read | |
| Intel NUC11TNKi5 | |
| Beelink SER3 | |
| Beelink SEi10 | |
| GMK NucBox 2 | |
| Zotac ZBox MI643 | |
| Access Time Write | |
| Beelink SEi10 | |
| Beelink SER3 | |
| GMK NucBox 2 | |
| Intel NUC11TNKi5 | |
| Zotac ZBox MI643 | |
* ... más pequeño es mejor
Disk Throttling: DiskSpd Read Loop, Queue Depth 8
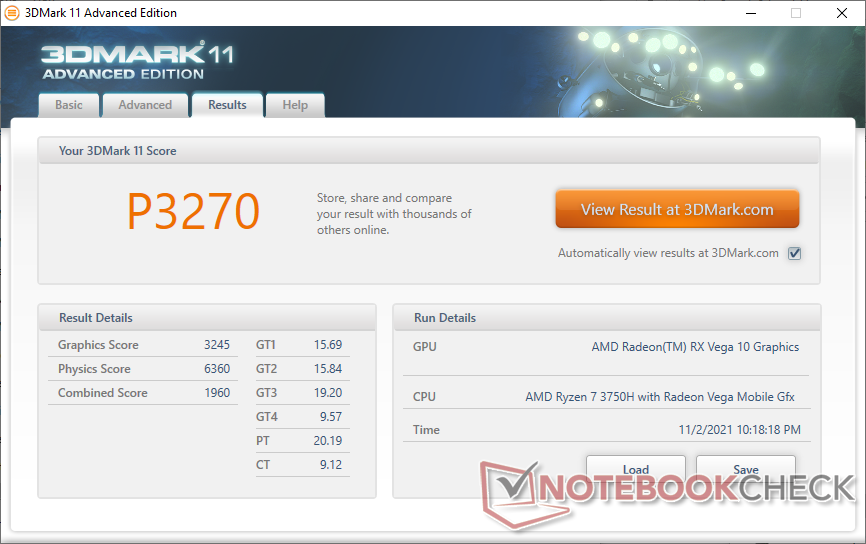
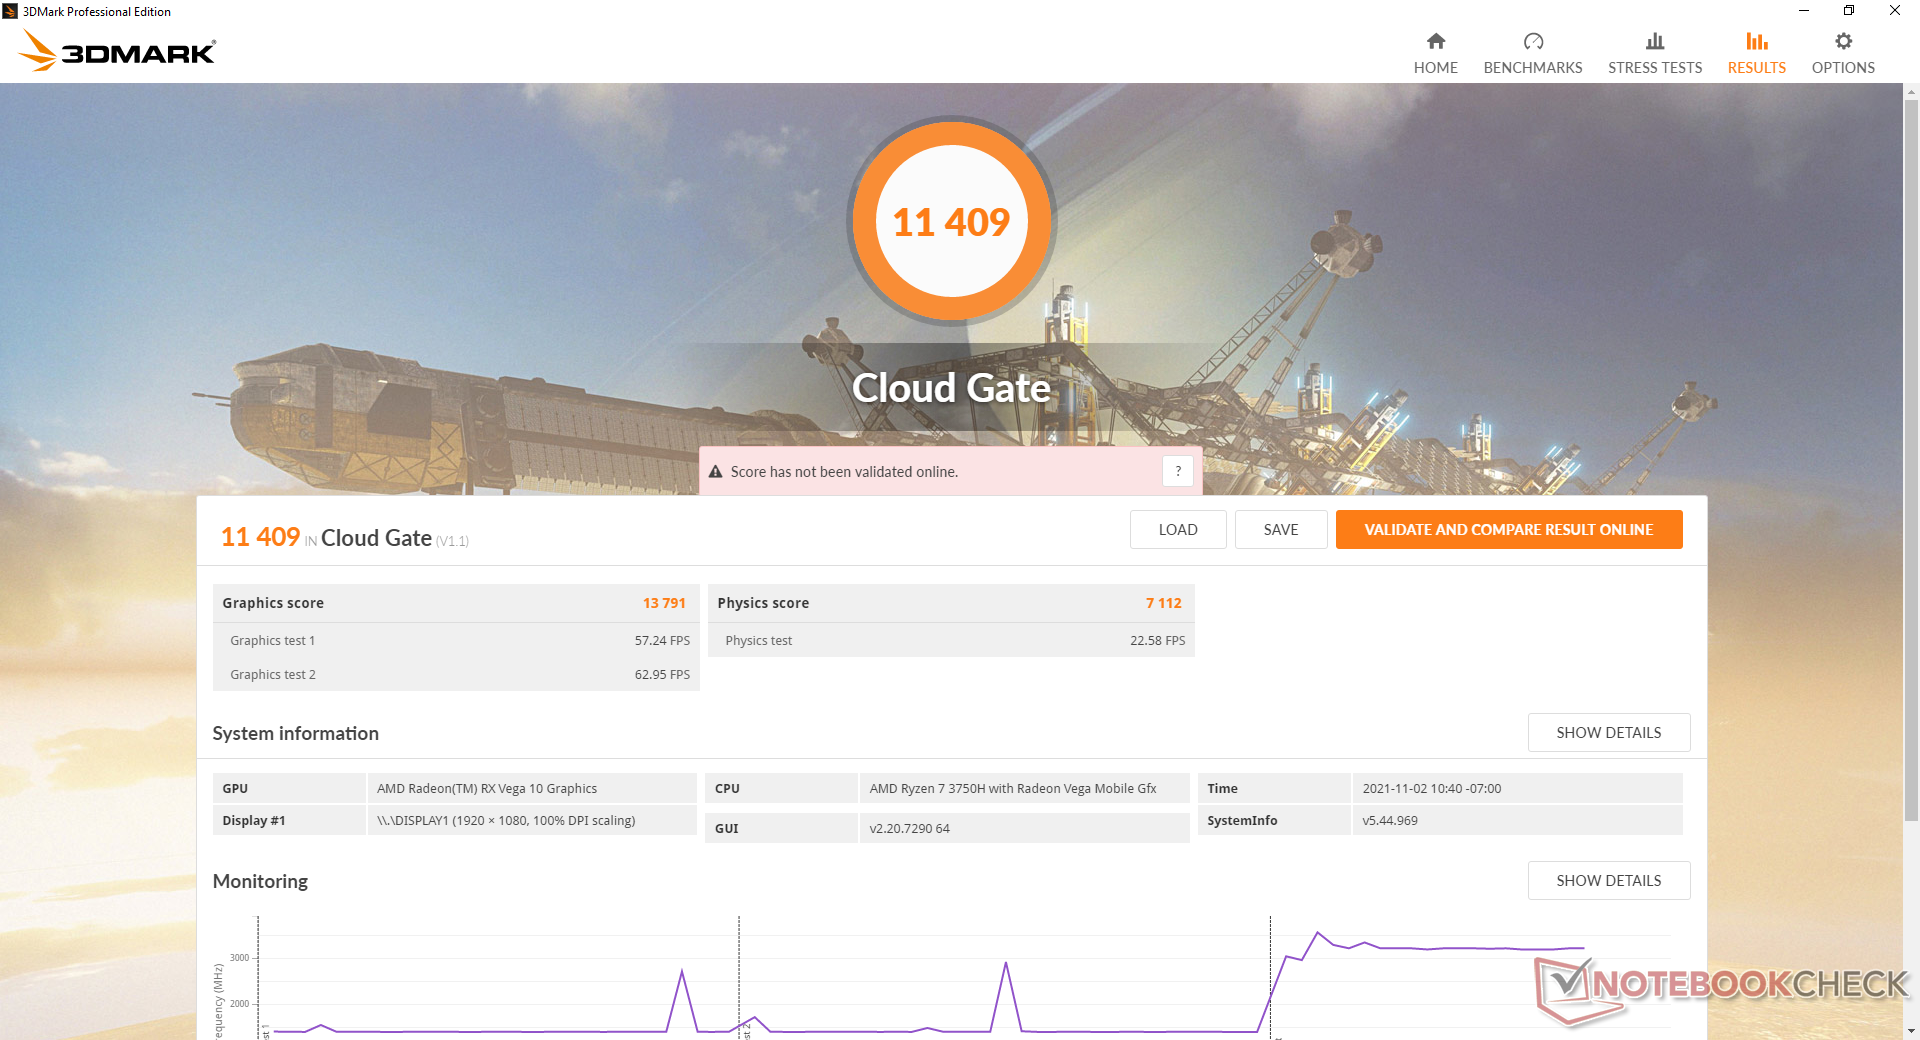
Rendimiento de la GPU
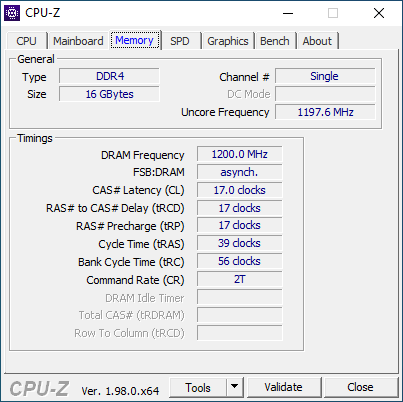
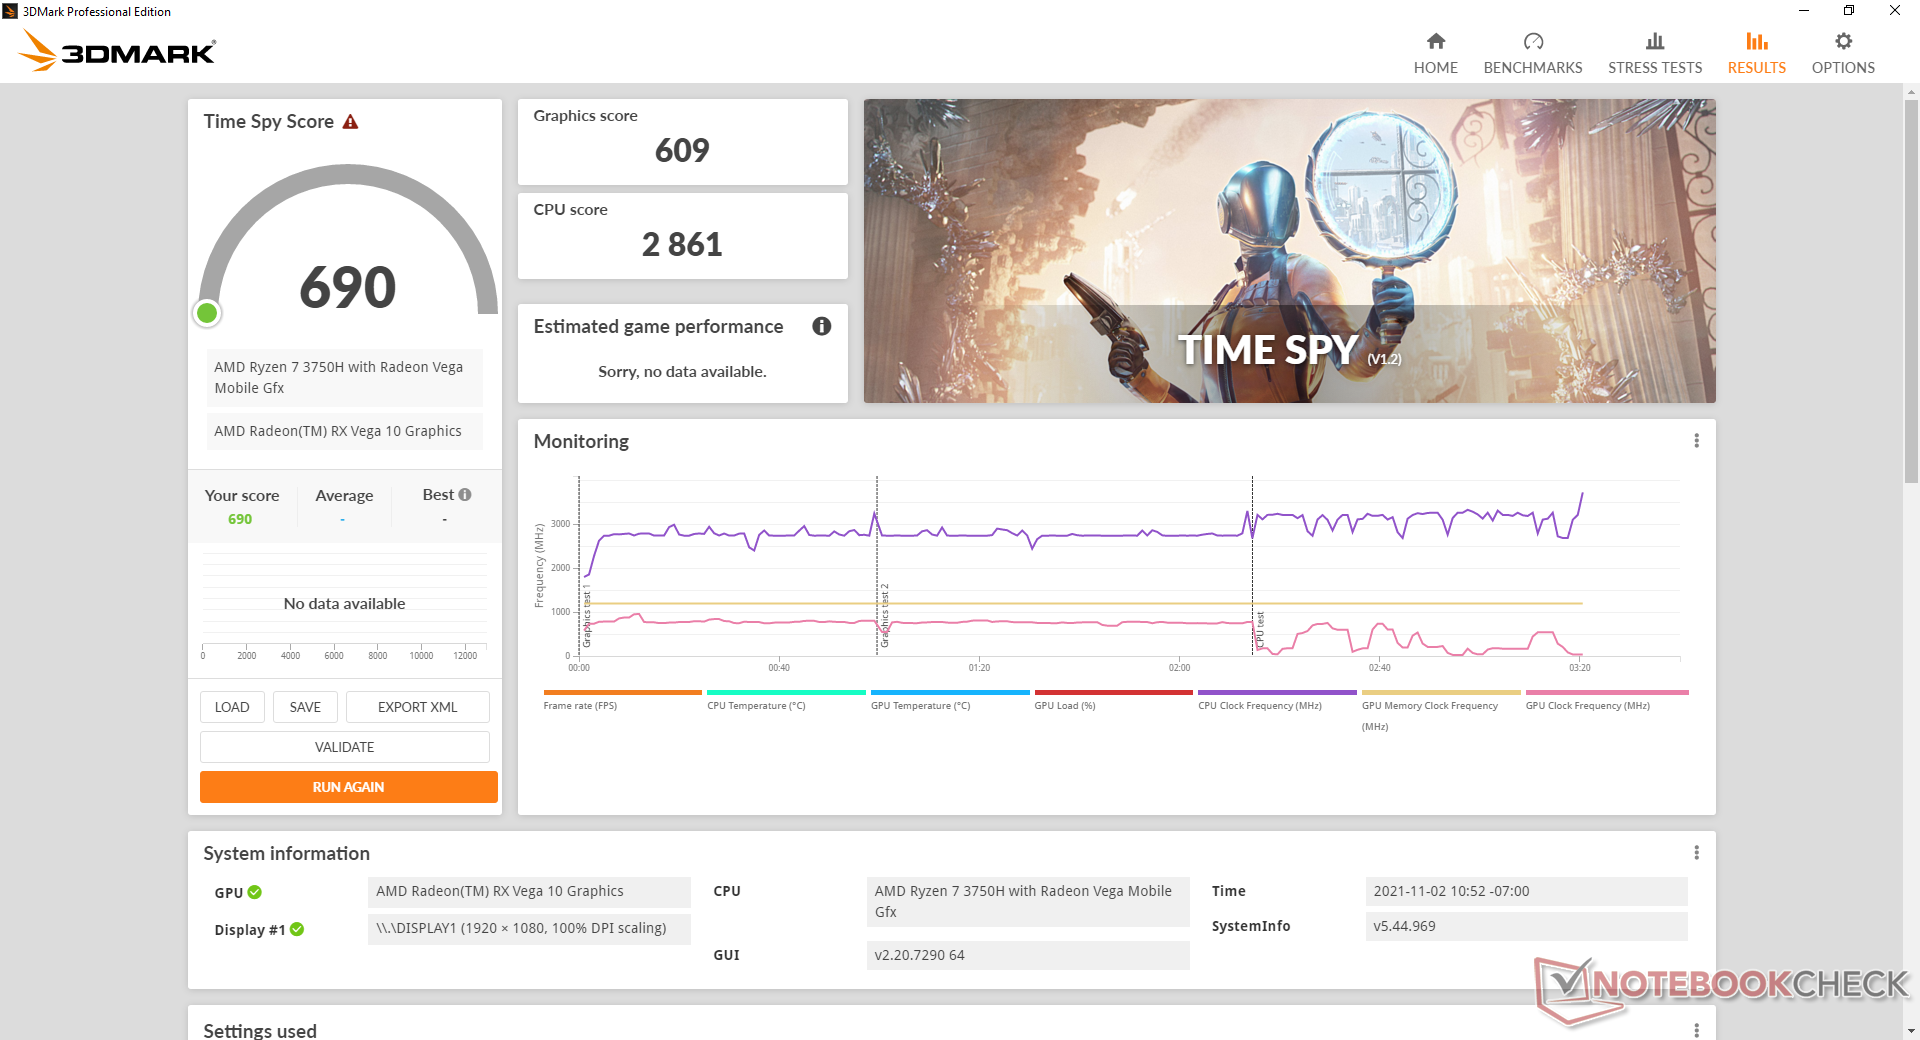
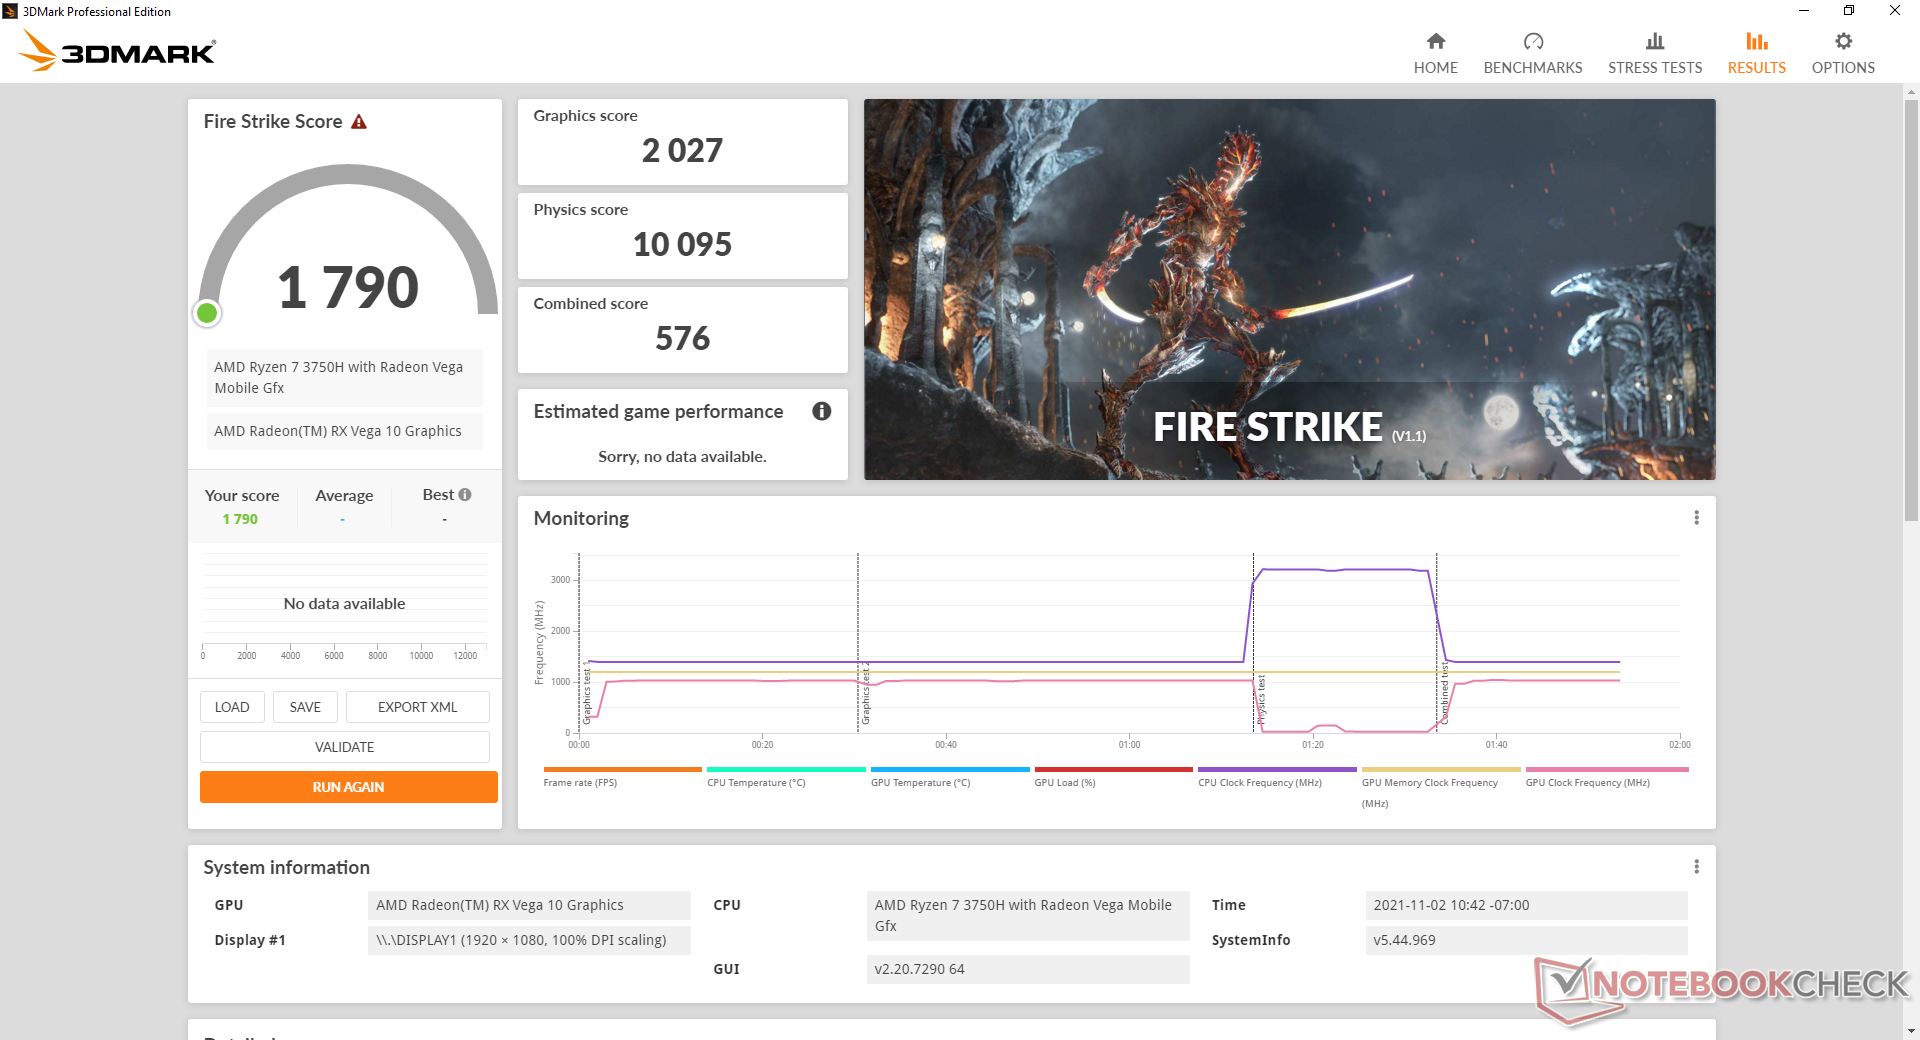
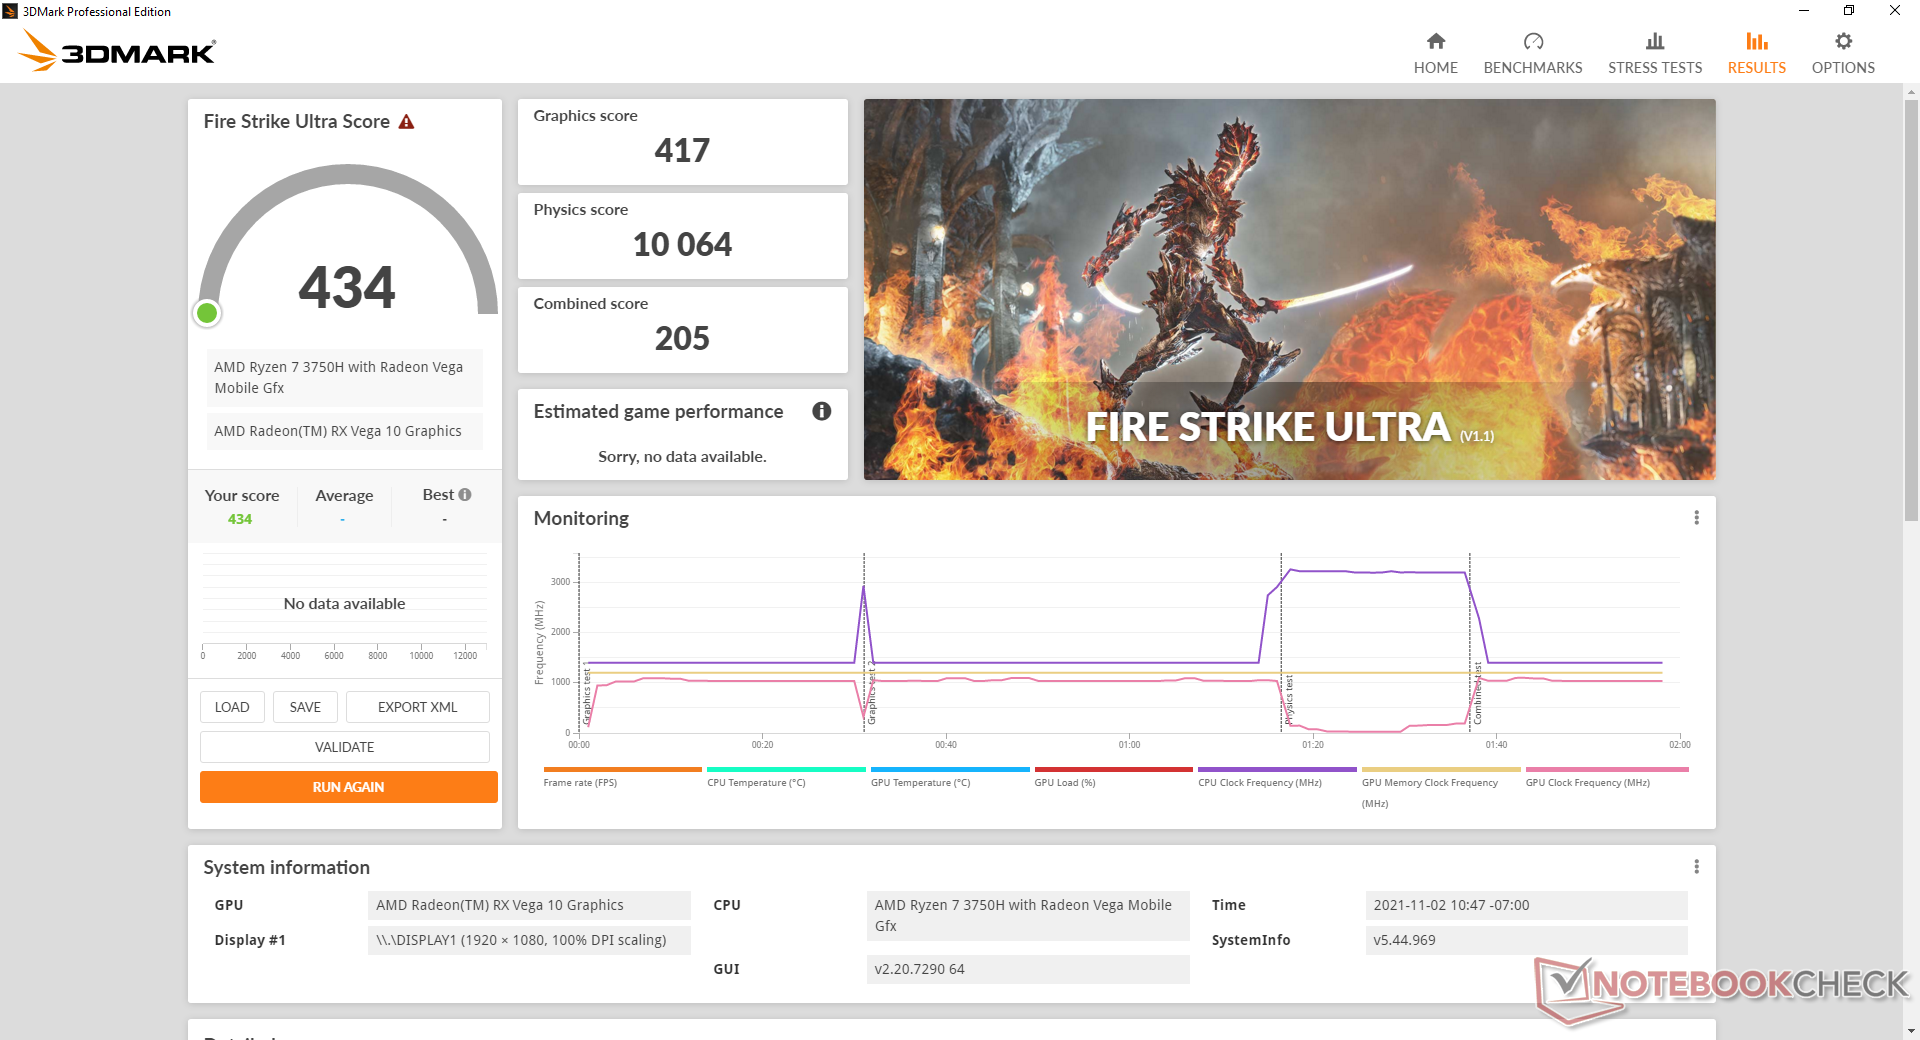
El rendimiento de los gráficos es muy similar al de la Iris Plus Graphics 655. Mientras que nuestra Radeon RX Vega 10 es una mejora decente respecto a la UHD Graphics 620sigue siendo significativamente más lenta que las últimas opciones de Opciones de NUC Iris Xe de Intel. El rendimiento general es ligeramente más lento que la media de las RX Vega 10 de nuestra base de datos porque nuestra unidad de pruebas SER3 viene sólo con RAM de un canal. Los usuarios pueden exprimir más rendimiento de la GPU si se configura con RAM de doble canal.
| 3DMark 11 - 1280x720 Performance GPU | |
| VAIO SX14 VJS144X0111K | |
| Huawei MateBook 16 R7 5800H | |
| Lenovo Yoga 6 13ALC6 | |
| Intel NUC11TNKi5 | |
| Dell Latitude 14 5411-WJ40N | |
| Medio AMD Radeon RX Vega 10 (2688 - 4165, n=17) | |
| Beelink SER3 | |
| Intel NUC8i7BE | |
| GMK NucBox 2 | |
| Zotac ZBox MI643 | |
| Beelink SEi10 | |
| 3DMark 11 Performance | 3270 puntos | |
| 3DMark Cloud Gate Standard Score | 11409 puntos | |
| 3DMark Fire Strike Score | 1790 puntos | |
| 3DMark Time Spy Score | 690 puntos | |
ayuda | ||
Witcher 3 FPS Chart
| bajo | medio | alto | ultra | |
|---|---|---|---|---|
| GTA V (2015) | 51.8 | 46.3 | 13.2 | 6.76 |
| The Witcher 3 (2015) | 35.7 | 22.9 | 12.2 | 8 |
| Dota 2 Reborn (2015) | 67.4 | 52 | 30.1 | 28.3 |
| Final Fantasy XV Benchmark (2018) | 19 | 9.98 | 6.8 | |
| X-Plane 11.11 (2018) | 23.8 | 18.5 | 16.7 | |
| Far Cry 5 (2018) | 23 | 12 | 11 | 10 |
| Strange Brigade (2018) | 37.9 | 15.1 | 12.6 | 10.9 |
Emisiones
Ruido del sistema
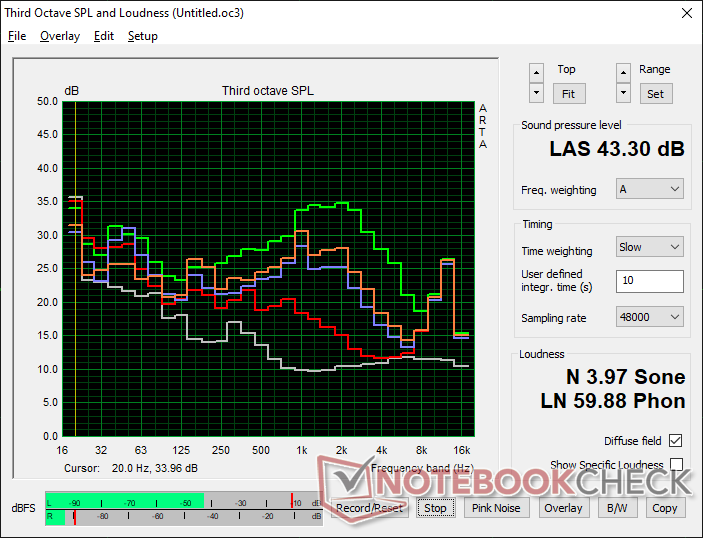
El ventilador pulsa con frecuencia cuando se ejecutan cargas típicas de HTPC como la navegación o el streaming de vídeo. Las pulsaciones no son extremas, con sólo 29,4 dB(A) frente a un fondo silencioso de 23,4 dB(A), pero se notan en un entorno de oficina tranquilo. Afortunadamente, no es lo suficientemente fuerte como para distraer durante la reproducción de música o vídeo.
La ejecución de cargas más altas, como los juegos, puede inducir un ruido de ventilador de hasta 37 a 43 dB(A), a diferencia de muchos Ultrabooks de la serie U o el antiguoIntel NUC8i7BE.
Ruido
| Ocioso |
| 23.4 / 23.4 / 29.4 dB(A) |
| Carga |
| 35.2 / 43.3 dB(A) |
 | ||
30 dB silencioso 40 dB(A) audible 50 dB(A) ruidosamente alto |
||
min: | ||
| Beelink SER3 Vega 10, R7 3750H, GSemi AZW GSDFN512TS3F1OGCX | Beelink SEi10 UHD Graphics G1 (Ice Lake 32 EU), i3-1005G1, Silicon Motion AZW 256G M.2280 NVMe 4X 200725 D | Intel NUC8i7BE Iris Plus Graphics 655, i7-8559U | GMK NucBox 2 Iris Plus Graphics 655, i5-8259U, Netac S930E8/256GPN | Zotac ZBox MI643 UHD Graphics 620, i5-10210U, Lexar NM610 1TB | Intel NUC11TNKi5 Iris Xe G7 80EUs, i5-1135G7, Transcend M.2 SSD 430S TS512GMTS430S | |
|---|---|---|---|---|---|---|
| Noise | -23% | -13% | 1% | -4% | -21% | |
| apagado / medio ambiente * (dB) | 23.4 | 27.5 -18% | 28.7 -23% | 25.6 -9% | 26.1 -12% | 24.8 -6% |
| Idle Minimum * (dB) | 23.4 | 30.9 -32% | 28.7 -23% | 25.7 -10% | 27.5 -18% | 35.6 -52% |
| Idle Average * (dB) | 23.4 | 33.5 -43% | 29.3 -25% | 25.7 -10% | 27.5 -18% | 35.6 -52% |
| Idle Maximum * (dB) | 29.4 | 33.5 -14% | 31.8 -8% | 25.7 13% | 27.5 6% | 35.6 -21% |
| Load Average * (dB) | 35.2 | 38.5 -9% | 39 -11% | 35.3 -0% | 28.9 18% | 36.2 -3% |
| Witcher 3 ultra * (dB) | 37.2 | 39 -5% | 38 -2% | |||
| Load Maximum * (dB) | 43.3 | 51.6 -19% | 41.4 4% | 35.1 19% | 42 3% | 47.6 -10% |
* ... más pequeño es mejor
Temperatura
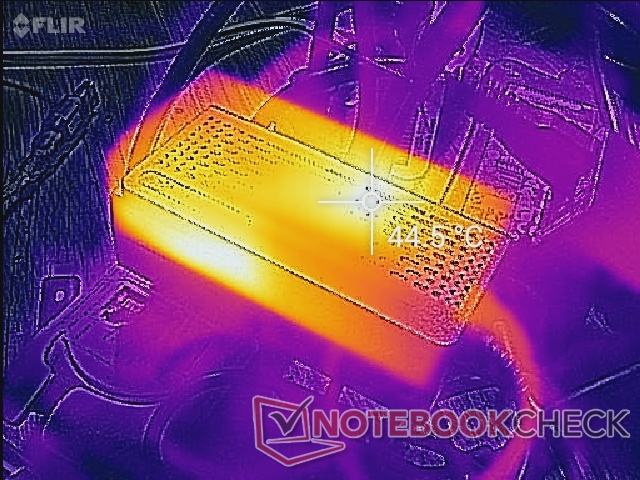
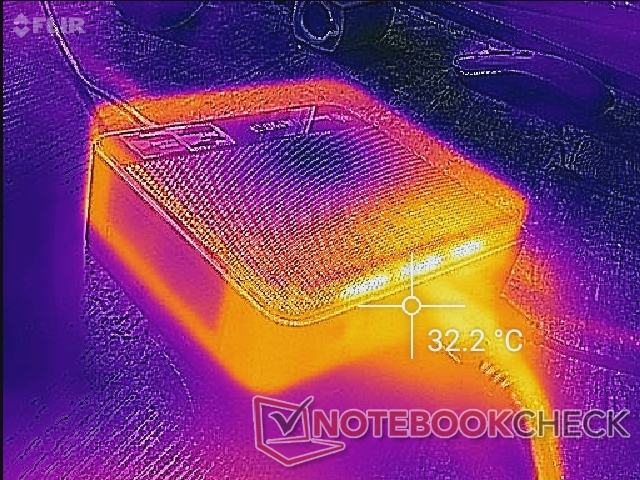
Las temperaturas superficiales no son un problema para el SER3. El aire caliente sale por la parte trasera mientras que el aire frío entra por la parte superior, por lo que no recomendamos apilar libros o papeles sobre el mini PC
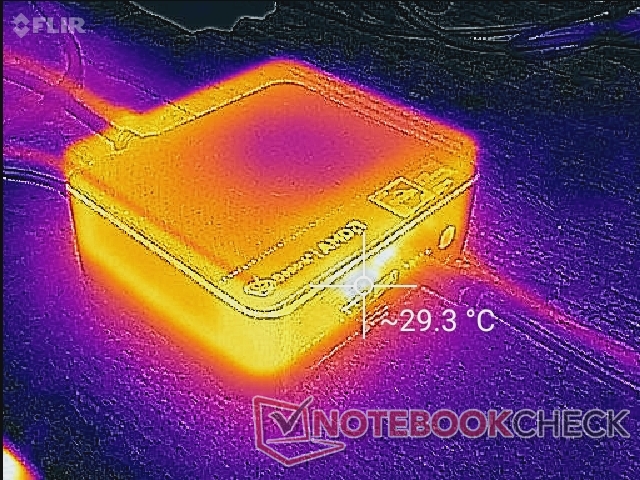
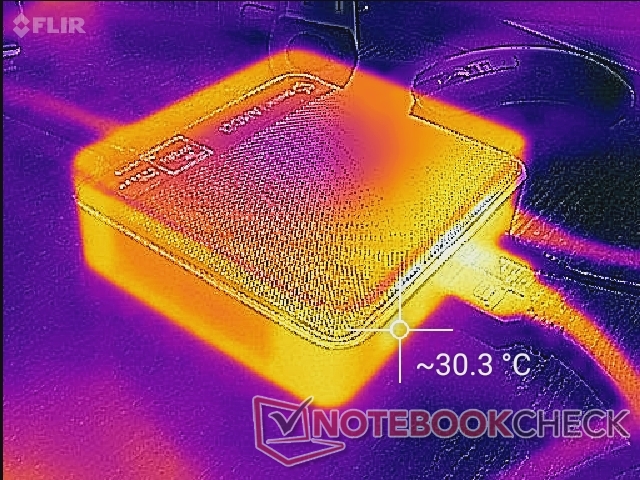
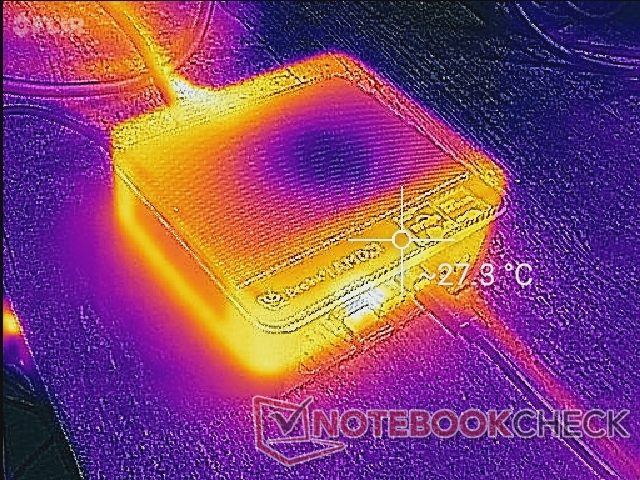
El adaptador de CA puede calentarse más que el propio mini PC cuando se ejecutan cargas elevadas, como muestran nuestros mapas de temperatura.
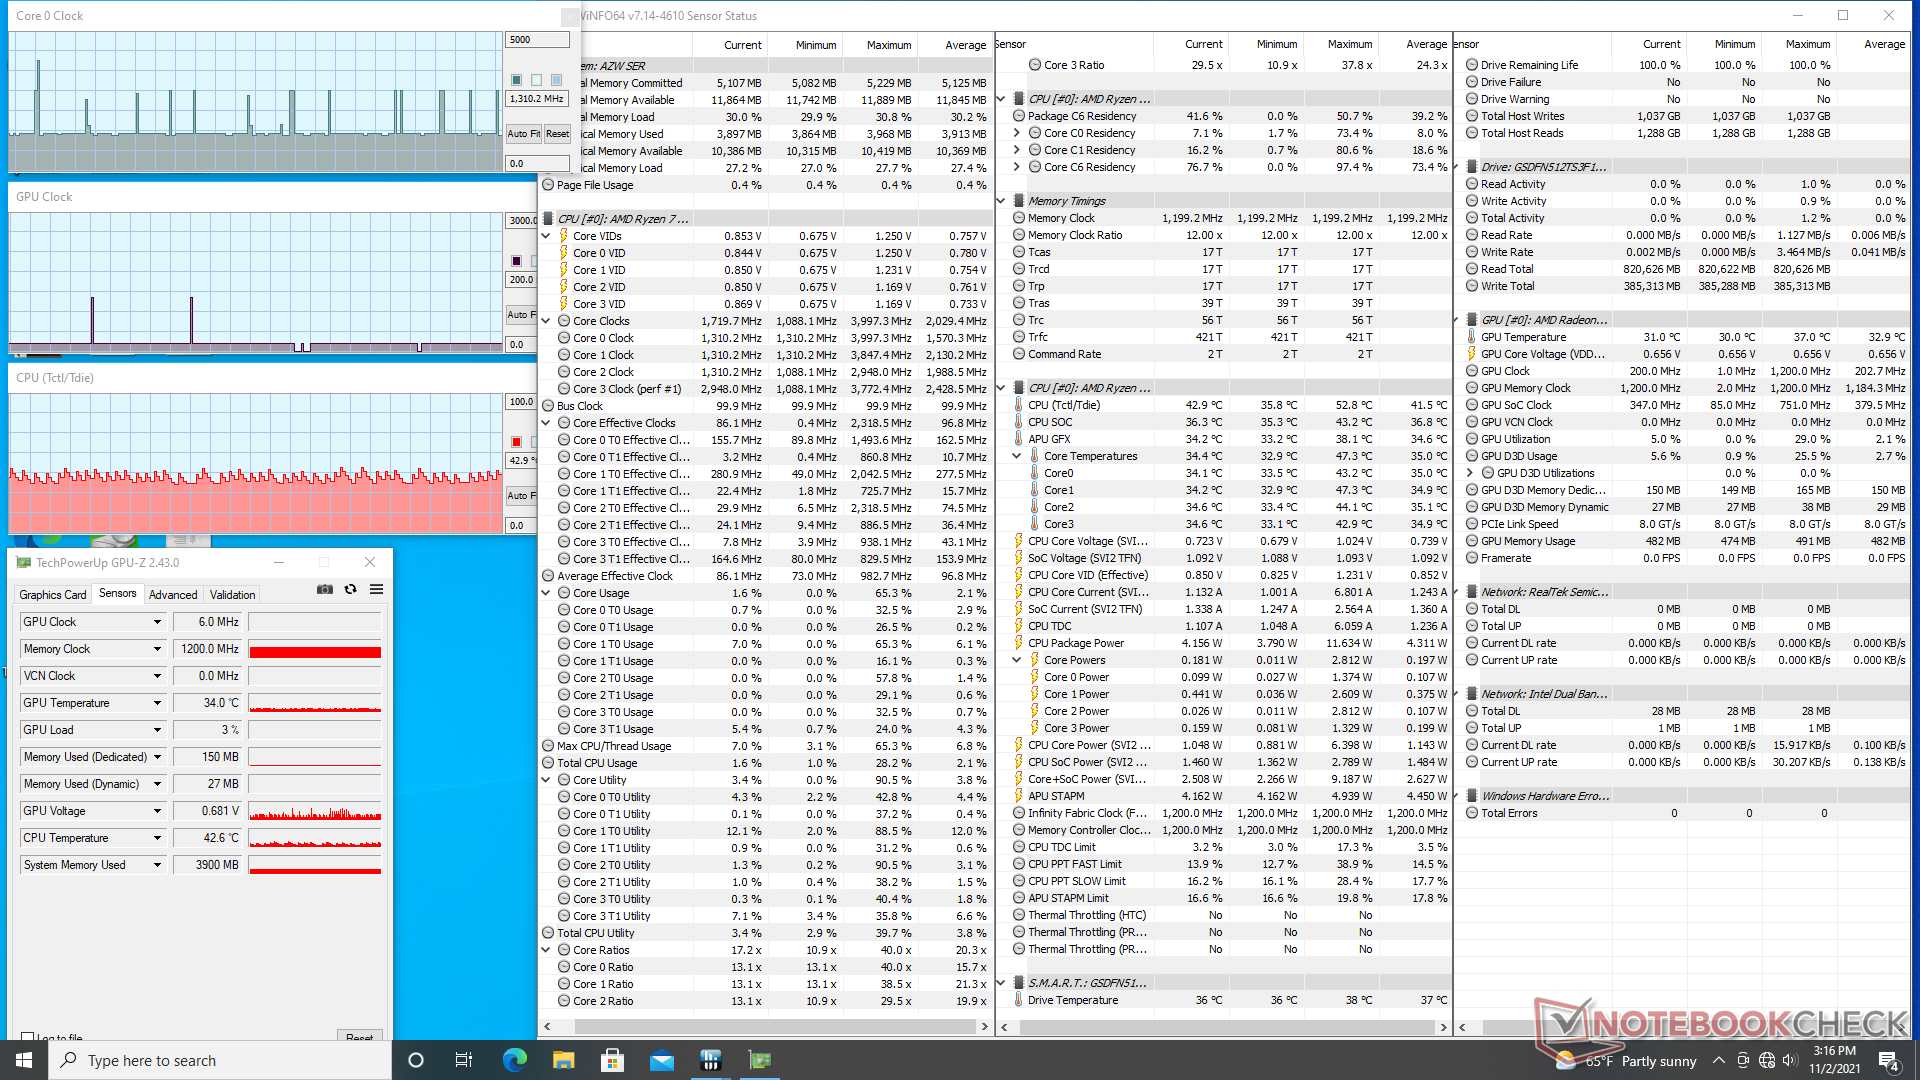
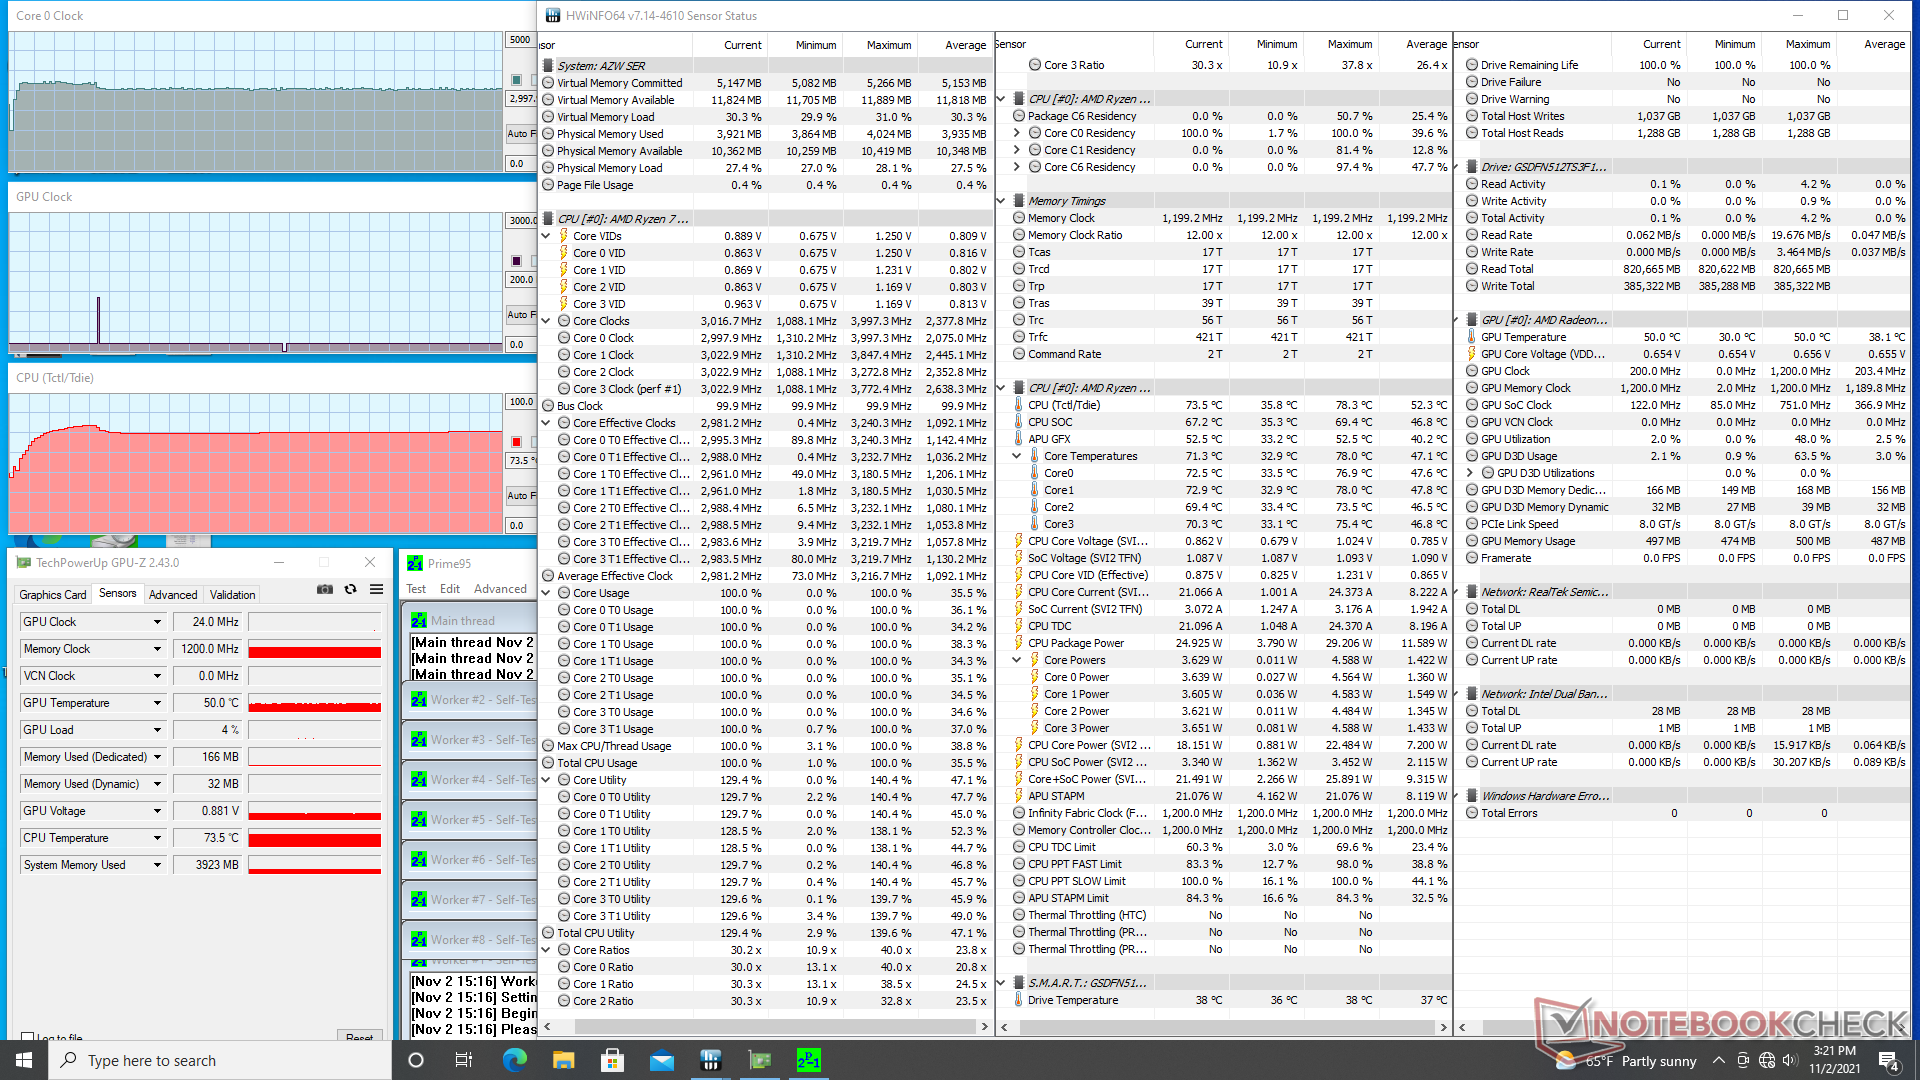
Prueba de esfuerzo
Cuando se ejecuta prime95, la velocidad de reloj de la CPU aumenta a 3,3 GHz durante el primer minuto aproximadamente hasta alcanzar una temperatura del núcleo de 78 C. A continuación, la velocidad de reloj desciende a 3,0 GHz para mantener una temperatura del núcleo más fría, de 72 C.
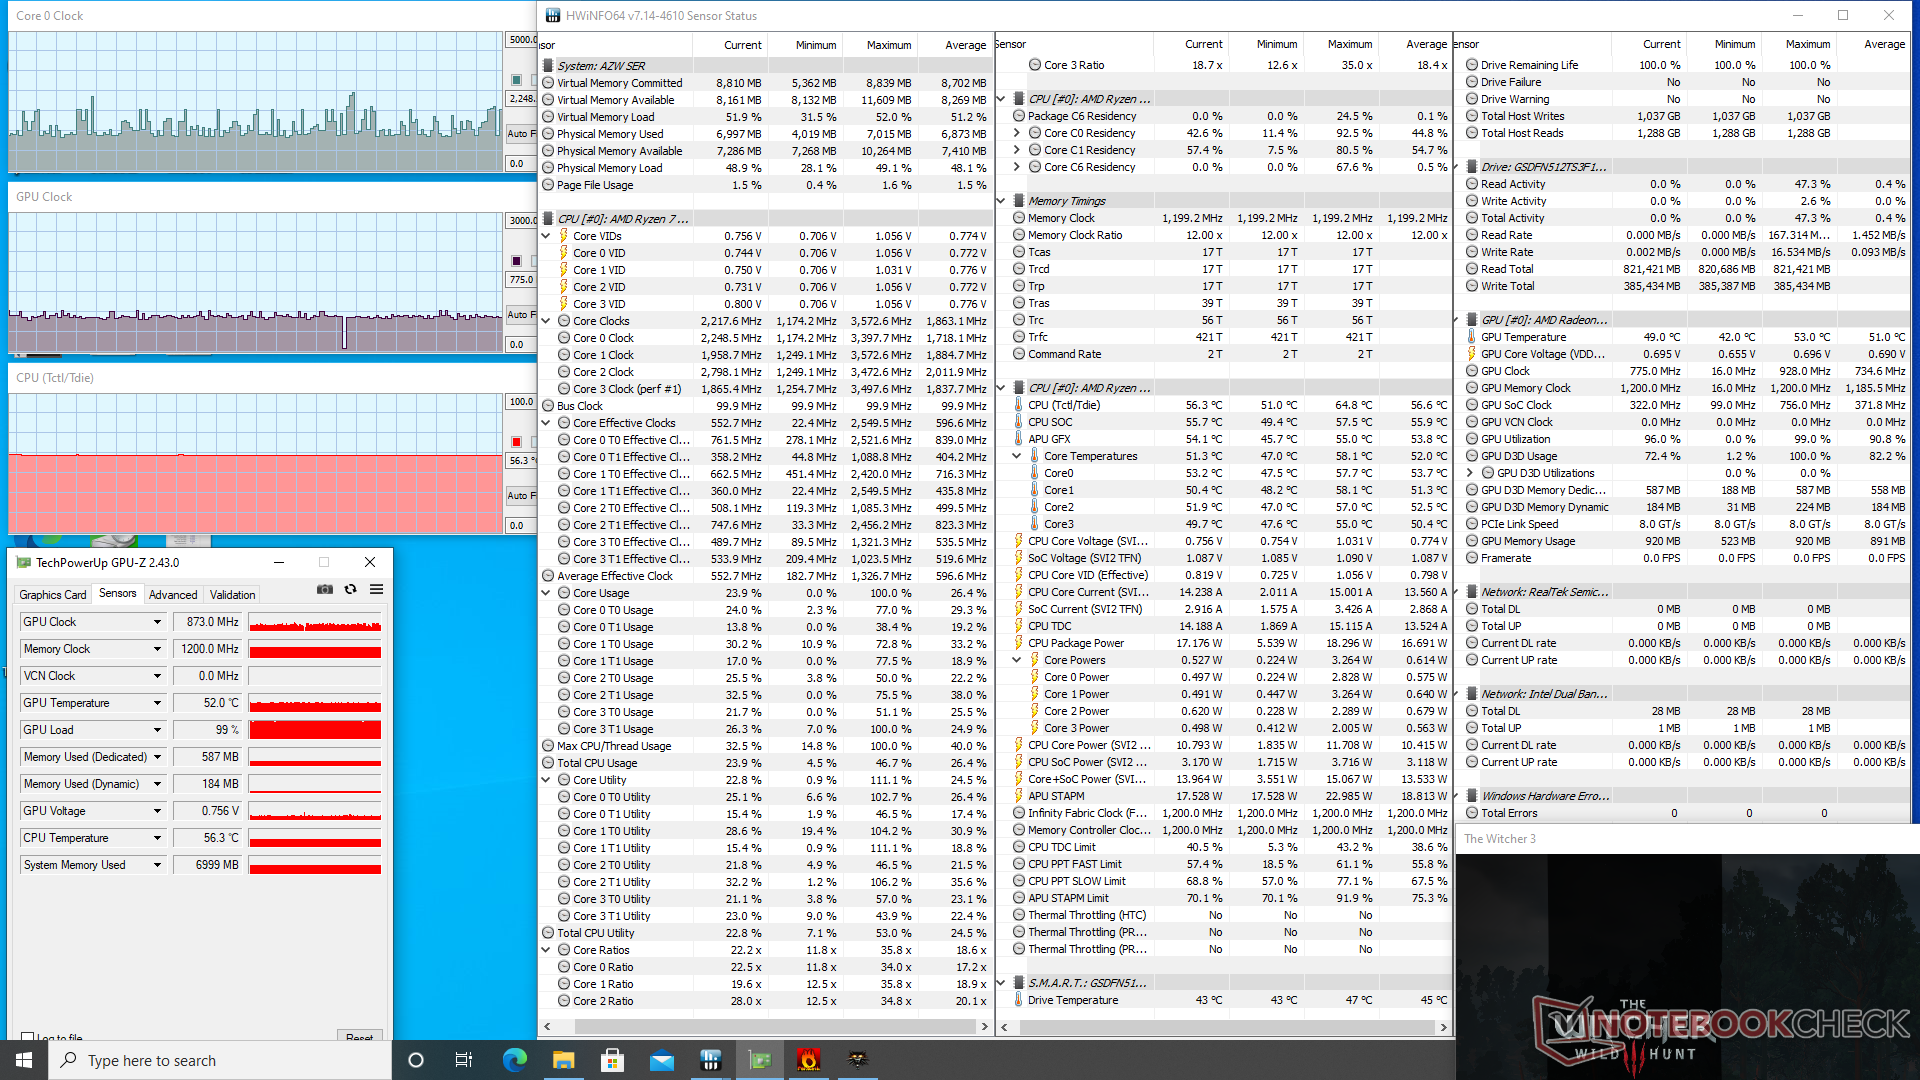
La temperatura del núcleo es relativamente fría, de sólo 56 C en funcionamiento Witcher 3 en comparación con los 62 C del Intel NUC11TNKi5 Pro.
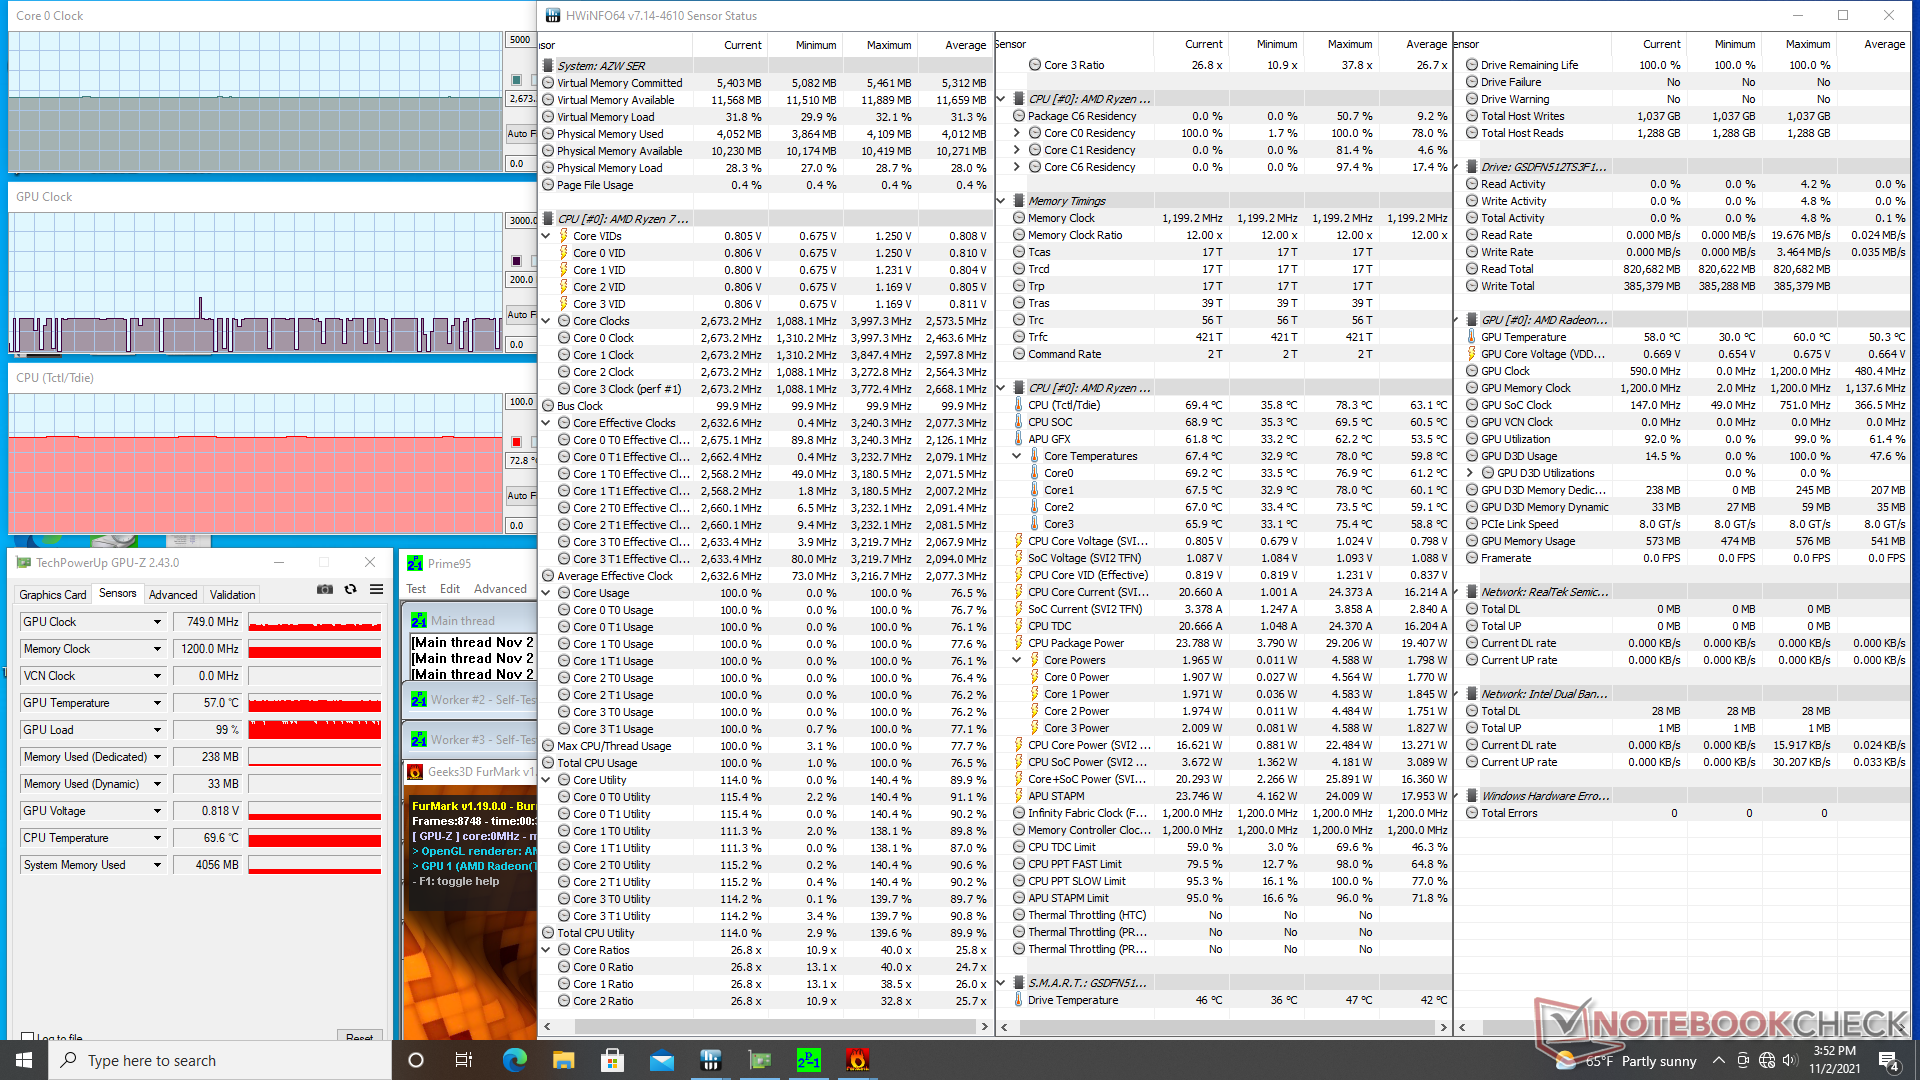
| Relojde la CPU(GHz) | Reloj dela GPU(MHz) | Temperaturamediade la CPU Tctl/Tdie (°C) | |
| Sistema en reposo | |||
| Estrés dePrime95 | 3.0 | -- | 74 |
| Estrés Prime95+ FurMark | 2,7 | 749 | 73 |
| Witcher 3 Estrés | 0,3 - 0,8 | ~873 | 56 |
Gestión de la energía
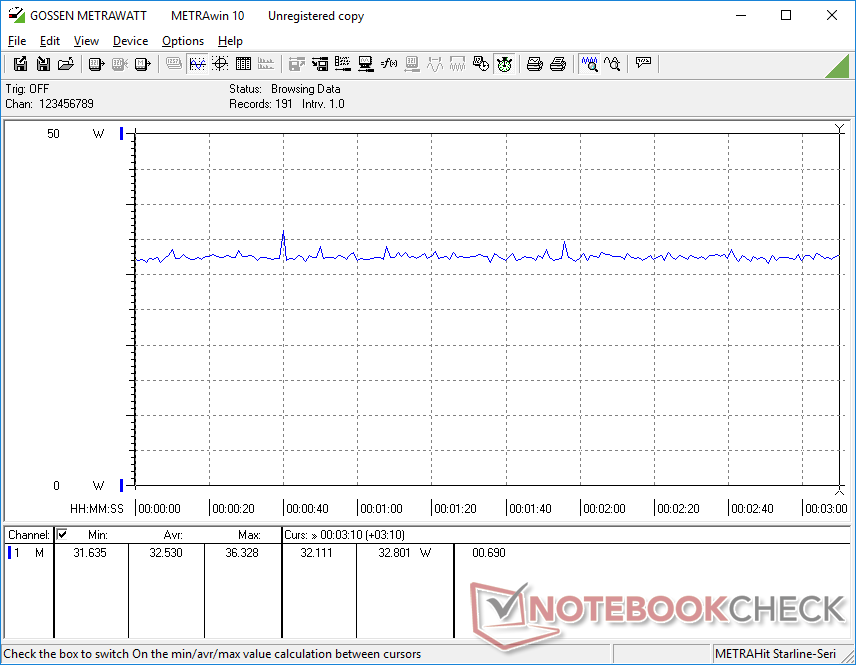
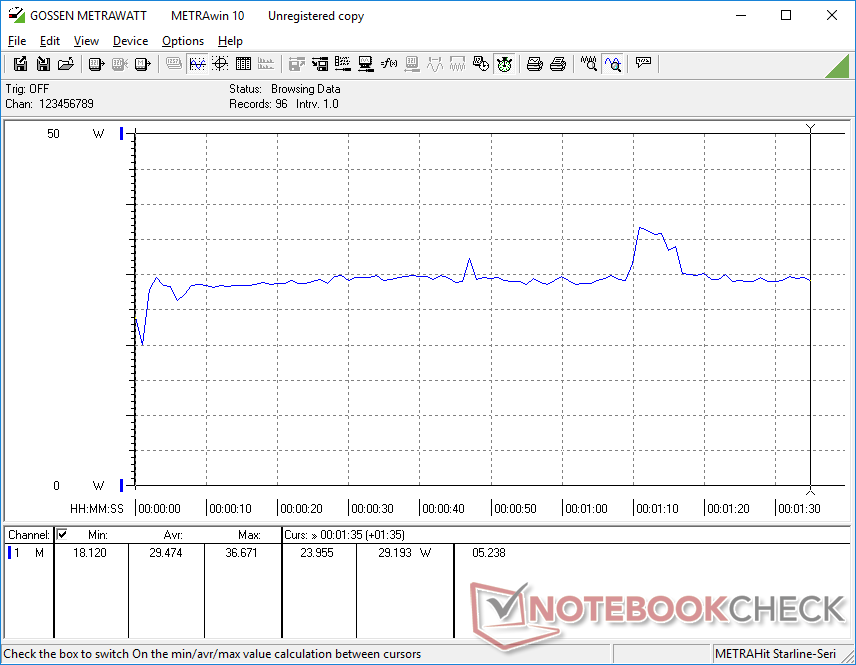
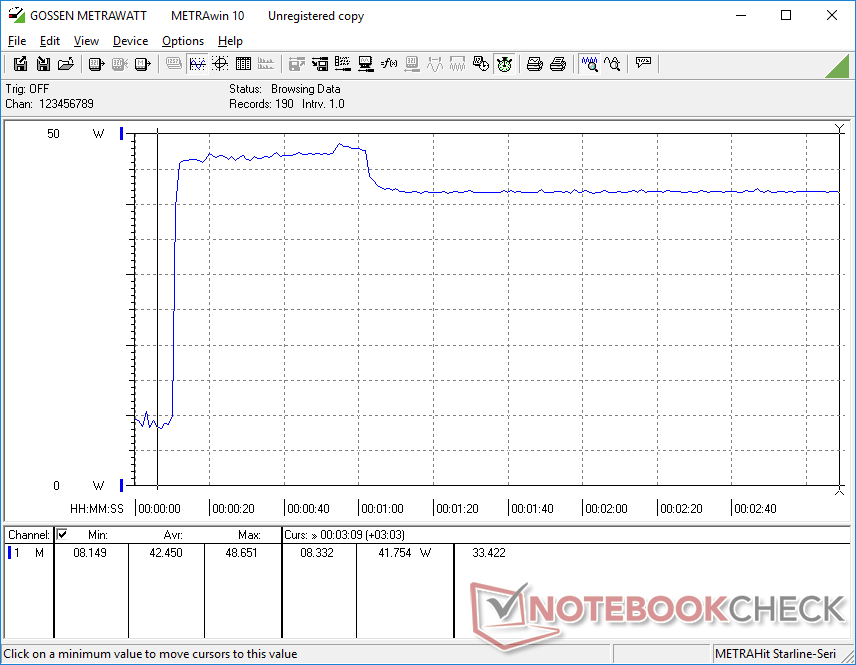
Consumo de energía
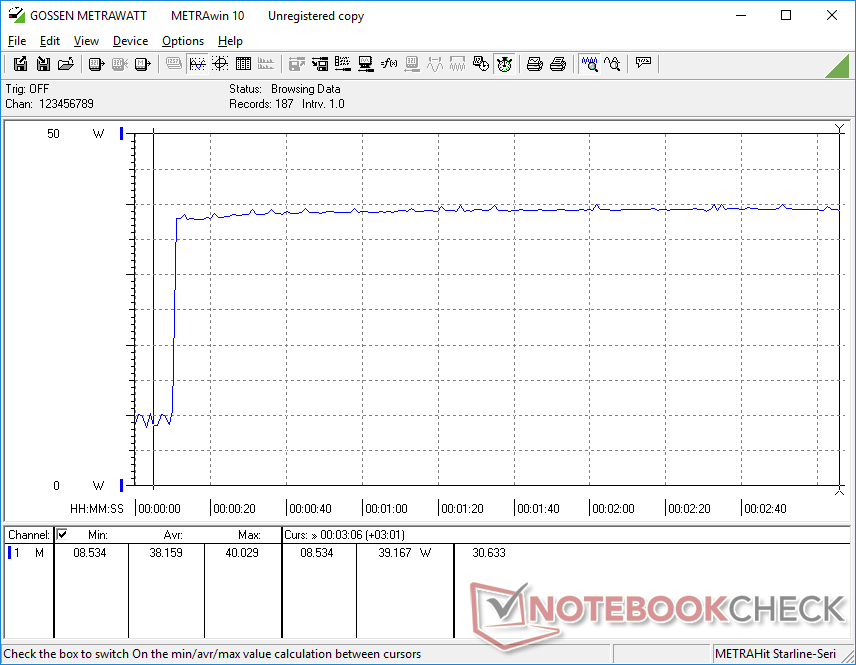
El consumo de energía cuando está en reposo en el escritorio es ligeramente superior al de la mayoría de los otros mini PC que funcionan con CPUs de la serie U, ya que nuestro SER3 utiliza un procesador de la serie H más exigente. No obstante, el consumo de energía cuando se ejecutan cargas más altas es menor de lo esperado, con una media de entre 30 y 40 W
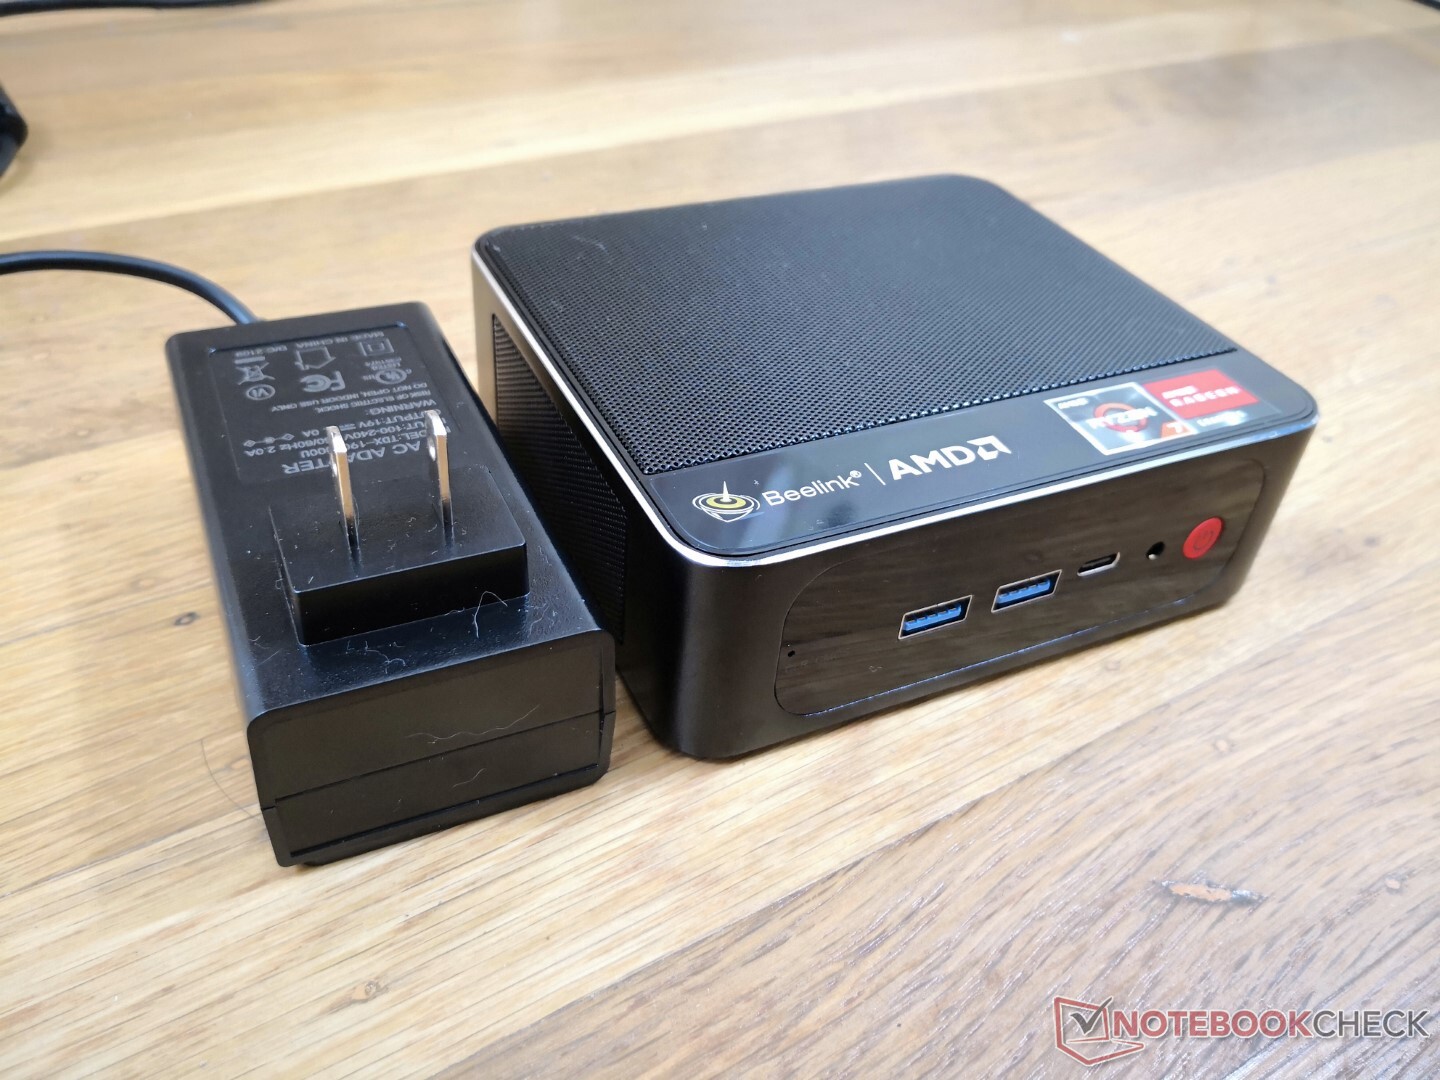
Podemos registrar un máximo de algo menos de 49 W con el adaptador de CA de tamaño medio (~10 x 5 x 6 cm incluyendo las clavijas) de 57 W cuando se utiliza el 100% de la CPU. Esta tasa cae después de aproximadamente un minuto debido a las limitaciones térmicas.
| Off / Standby | |
| Ocioso | |
| Carga |
|
Clave:
min: | |
| Beelink SER3 R7 3750H, Vega 10, GSemi AZW GSDFN512TS3F1OGCX, , x, | Beelink SEi10 i3-1005G1, UHD Graphics G1 (Ice Lake 32 EU), Silicon Motion AZW 256G M.2280 NVMe 4X 200725 D, , x, | Intel NUC8i7BE i7-8559U, Iris Plus Graphics 655, , , x, | GMK NucBox 2 i5-8259U, Iris Plus Graphics 655, Netac S930E8/256GPN, , x, | Zotac ZBox MI643 i5-10210U, UHD Graphics 620, Lexar NM610 1TB, , x, | Intel NUC11TNKi5 i5-1135G7, Iris Xe G7 80EUs, Transcend M.2 SSD 430S TS512GMTS430S, , x, | |
|---|---|---|---|---|---|---|
| Power Consumption | 17% | -8% | 0% | -10% | -43% | |
| Idle Minimum * (Watt) | 7 | 6.3 10% | 2.7 61% | 6.1 13% | 7.5 -7% | 11.5 -64% |
| Idle Average * (Watt) | 9.1 | 6.6 27% | 3.1 66% | 6.8 25% | 9.2 -1% | 12.4 -36% |
| Idle Maximum * (Watt) | 9.7 | 6.7 31% | 6.3 35% | 7.3 25% | 9.6 1% | 12.9 -33% |
| Load Average * (Watt) | 29.5 | 25.9 12% | 59.7 -102% | 46.3 -57% | 34.4 -17% | 40.7 -38% |
| Witcher 3 ultra * (Watt) | 32.5 | 47.2 -45% | 43.9 -35% | |||
| Load Maximum * (Watt) | 48.7 | 46.7 4% | 78 -60% | 50.7 -4% | 60.6 -24% | 73.5 -51% |
* ... más pequeño es mejor
Power Consumption Witcher 3 / Stresstest
Pro
Contra
Veredicto
Por menos de 500 dólares, los usuarios obtienen un mini PC preparado para HTPC con un nivel de rendimiento similar al del Core i5-8259U de algunos NUC de Intel. El sistema está varios pasos por encima de otros mini PC económicos que funcionan con CPU Atom o Celeron, como el Chuwi LarkBox o GBox que son notoriamente lentos incluso cuando se ejecutan aplicaciones poco exigentes. Apreciamos que Beelink ofrezca el SER3 como un PC listo para usar, con memoria RAM y almacenamiento, mientras que los NUC de Intel casi siempre se venden como SKUs barebone.
El Beelink SER3 es un HTPC discreto y fácil de usar con opciones de actualización accesibles. Prepárate para un poco de ruido del ventilador, especialmente cuando se ejecutan aplicaciones muy exigentes.
Los compradores deben ser conscientes de que el SER3 omite un puñado de características auxiliares probablemente para mantener los costos bajos. No hay bloqueo Kensington, lector SD, receptor IR o soporte Thunderbolt, mientras que DP-sobre-USB-C puede ser poco fiable. El ventilador pulsa con frecuencia y el adaptador de corriente eléctrica es grueso y corto. El SSD NVMe incluido, aunque es decentemente rápido, se ralentiza cuando se estresa debido a la falta de un disipador de calor integrado.
Precio y disponibilidad
El Beelink SER3 se puede encontrar en en Amazon por $479 USD con 8 GB de RAM y 256 GB de SSD o $559 USD con el doble de RAM y almacenamiento.
No, or more than one (0) Rating for the given SpecsID 326081 found

