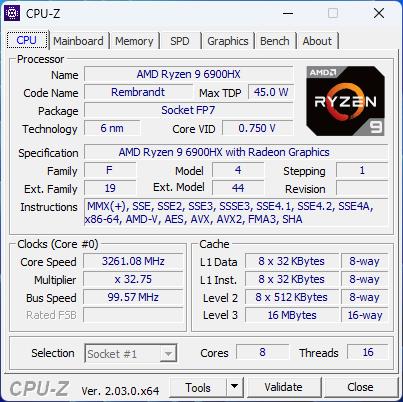
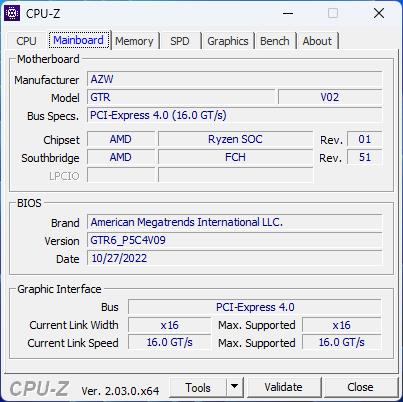
Análisis del mini PC Beelink GTR6 Ryzen 9 6900HX: Más rápido que la mayoría de los NUC de Intel

A diferencia de las series SEi o SER de Beelink, más pequeñas y equipadas con procesadores de la serie U, la serie GTR consta de modelos equipados con procesadores más rápidos de la serie H. El GTR6 sucede directamente al antiguo GTR5 con una CPU mejorada (Zen 3 Ryzen 9 5900HX a Zen 3+ Ryzen 9 6900HX) y un ligero rediseño del chasis. Nuestras pruebas de rendimiento muestran que es uno de los mini PC más rápidos de la amplia gama de Beelink.
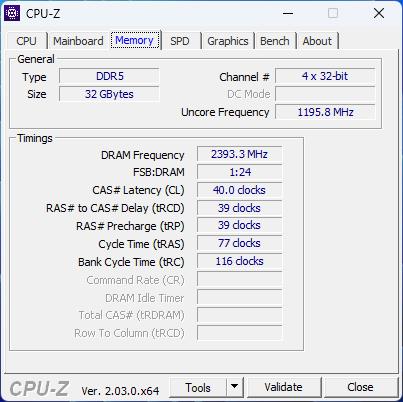
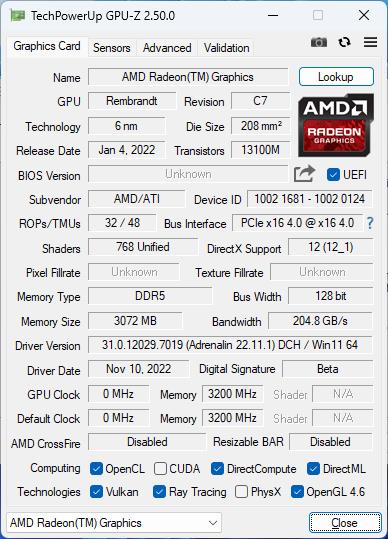
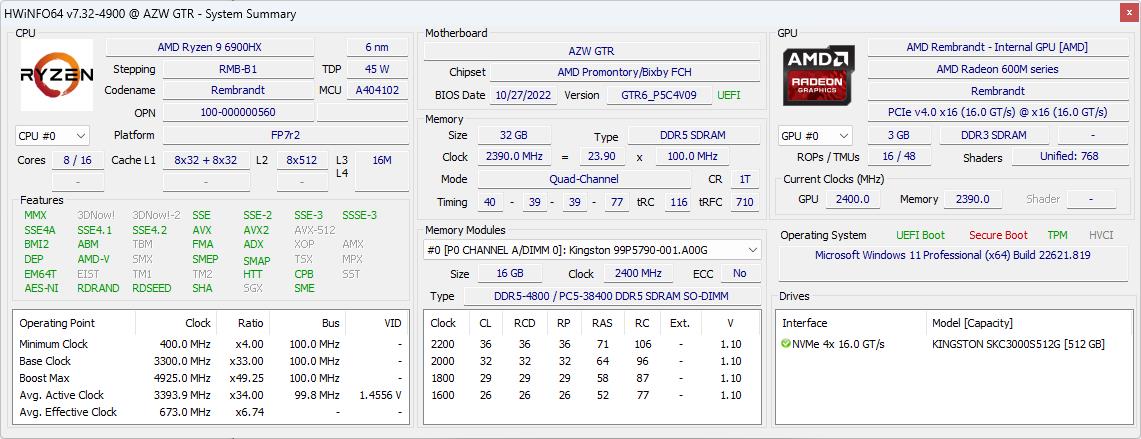
Nuestra unidad de análisis es un GTR6 totalmente configurado con 32 GB de RAM y 512 GB de SSD NVMe por aproximadamente 750 dólares. Todas las opciones vienen con la misma CPU Ryzen 9 6900HX y la GPU Radeon 680M integrada. El GTR6 compite directamente con los NUC de Intel con gráficos integrados.
Más opiniones de Beelink:
Posibles contendientes en la comparación
Valoración | Fecha | Modelo | Peso | Altura | Tamaño | Resolución | Precio |
|---|---|---|---|---|---|---|---|
v (old) | 11/2022 | Beelink GTR6 R9 6900HX, Radeon 680M | 815 g | 43 mm | x | ||
v (old) | 09/2022 | Beelink SEi11 Pro i5-11320H, Iris Xe G7 96EUs | 440 g | 40 mm | x | ||
v (old) | 01/2022 | Beelink GTR5 R9 5900HX, Vega 8 | 686 g | 39 mm | x | ||
v (old) | 04/2021 | Intel NUC11PHKi7C i7-1165G7, GeForce RTX 2060 Mobile | 1.4 kg | 42 mm | x | ||
v (old) | 04/2021 | Intel NUC11TNKi5 i5-1135G7, Iris Xe G7 80EUs | 504 g | 37 mm | x | ||
v (old) | 03/2021 | GMK NucBox 2 i5-8259U, Iris Plus Graphics 655 | 430 g | 50 mm | x |
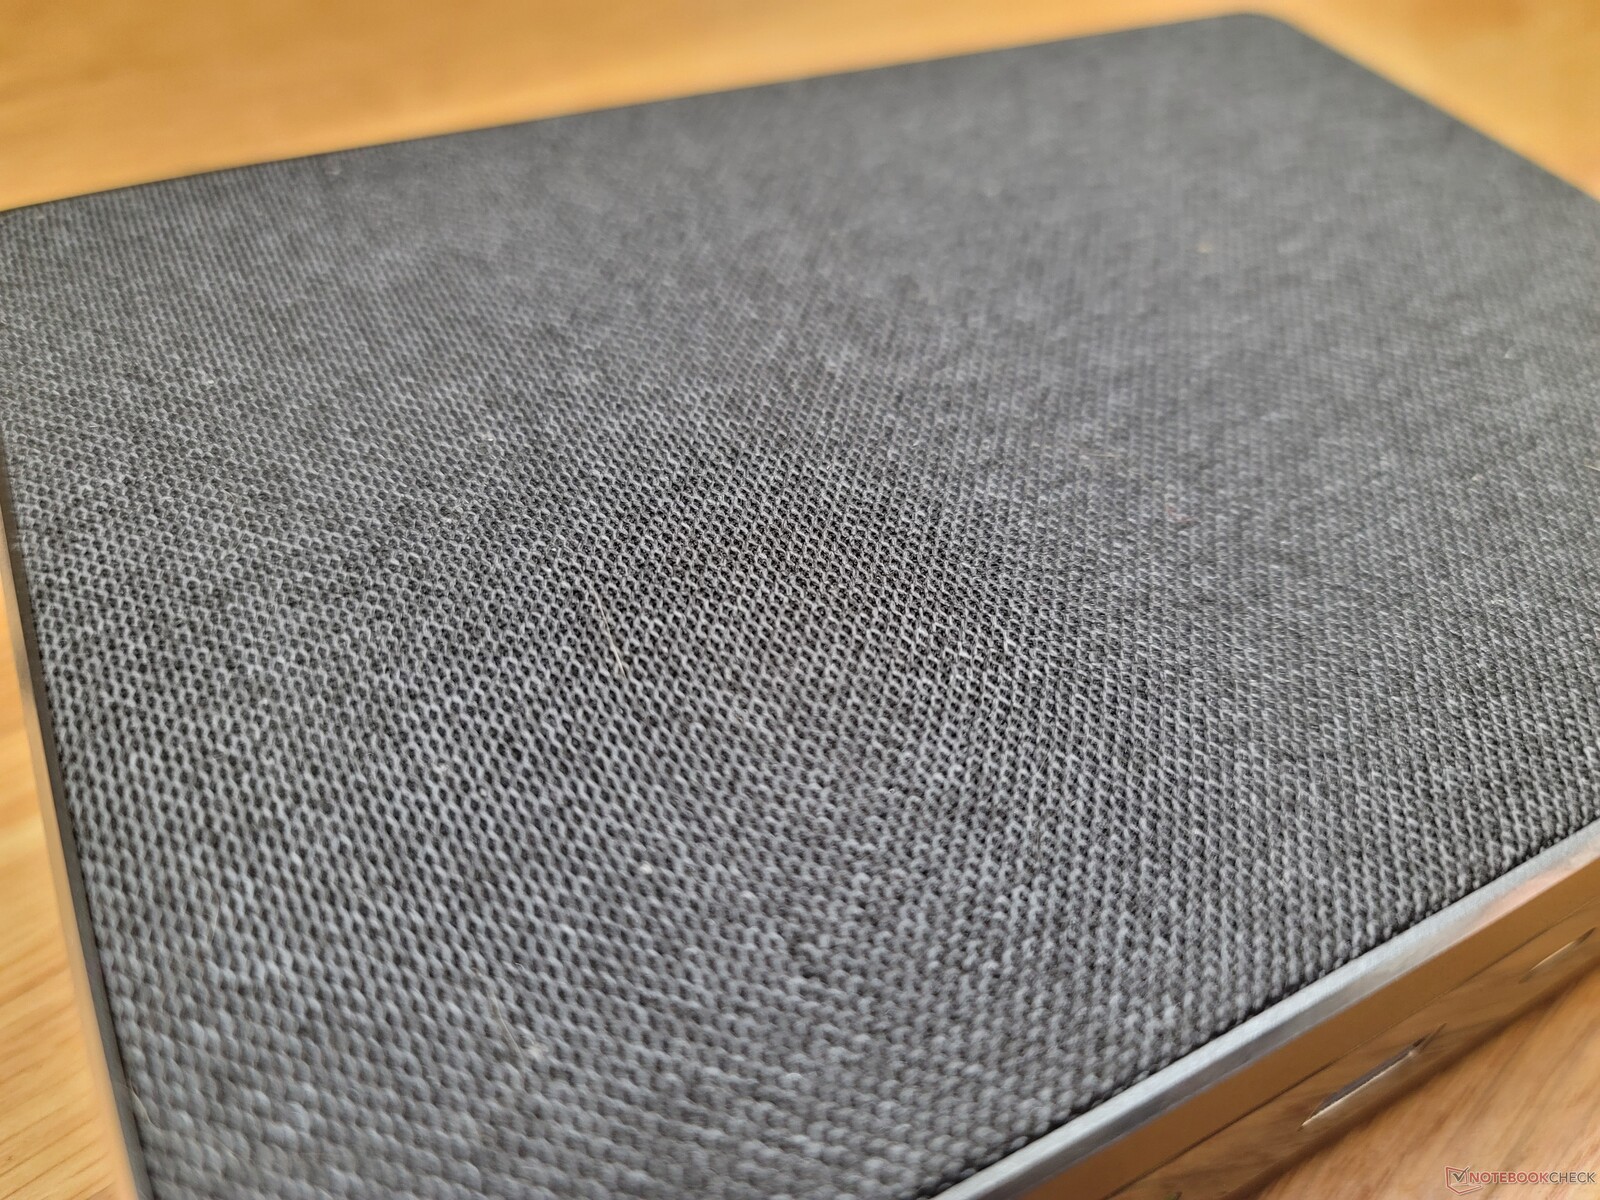
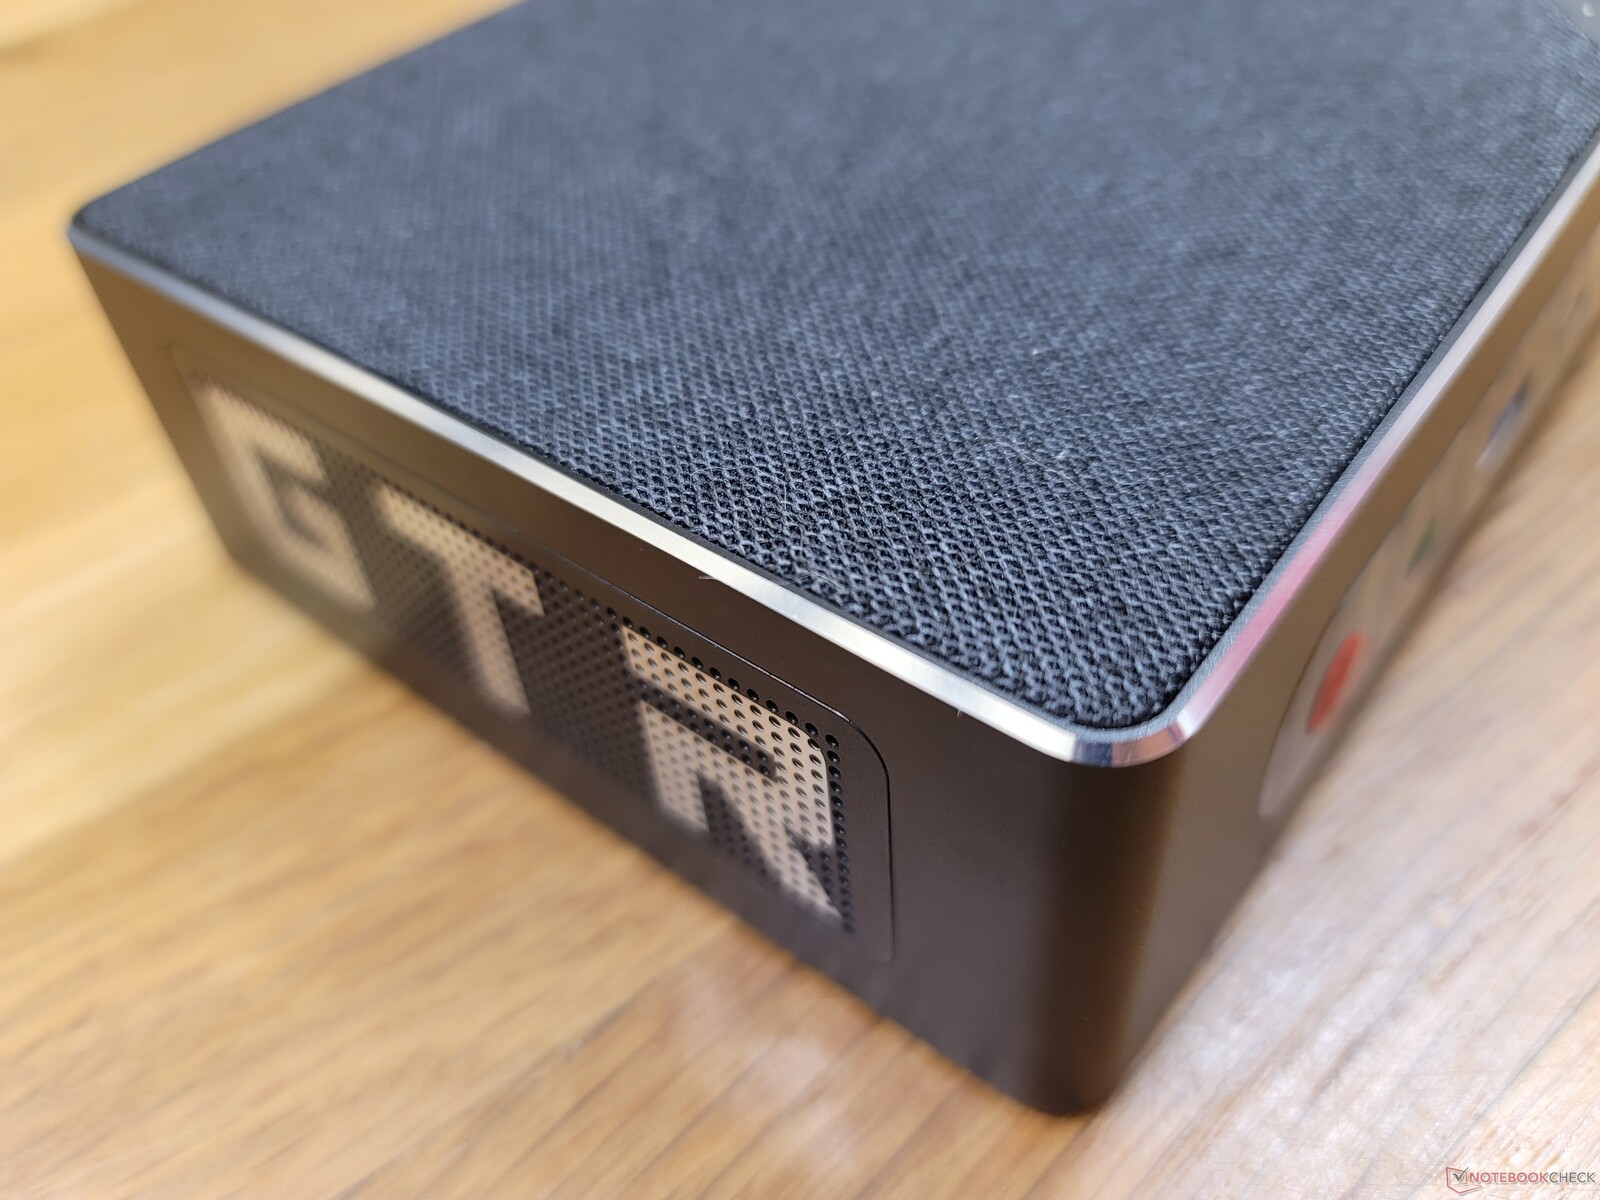
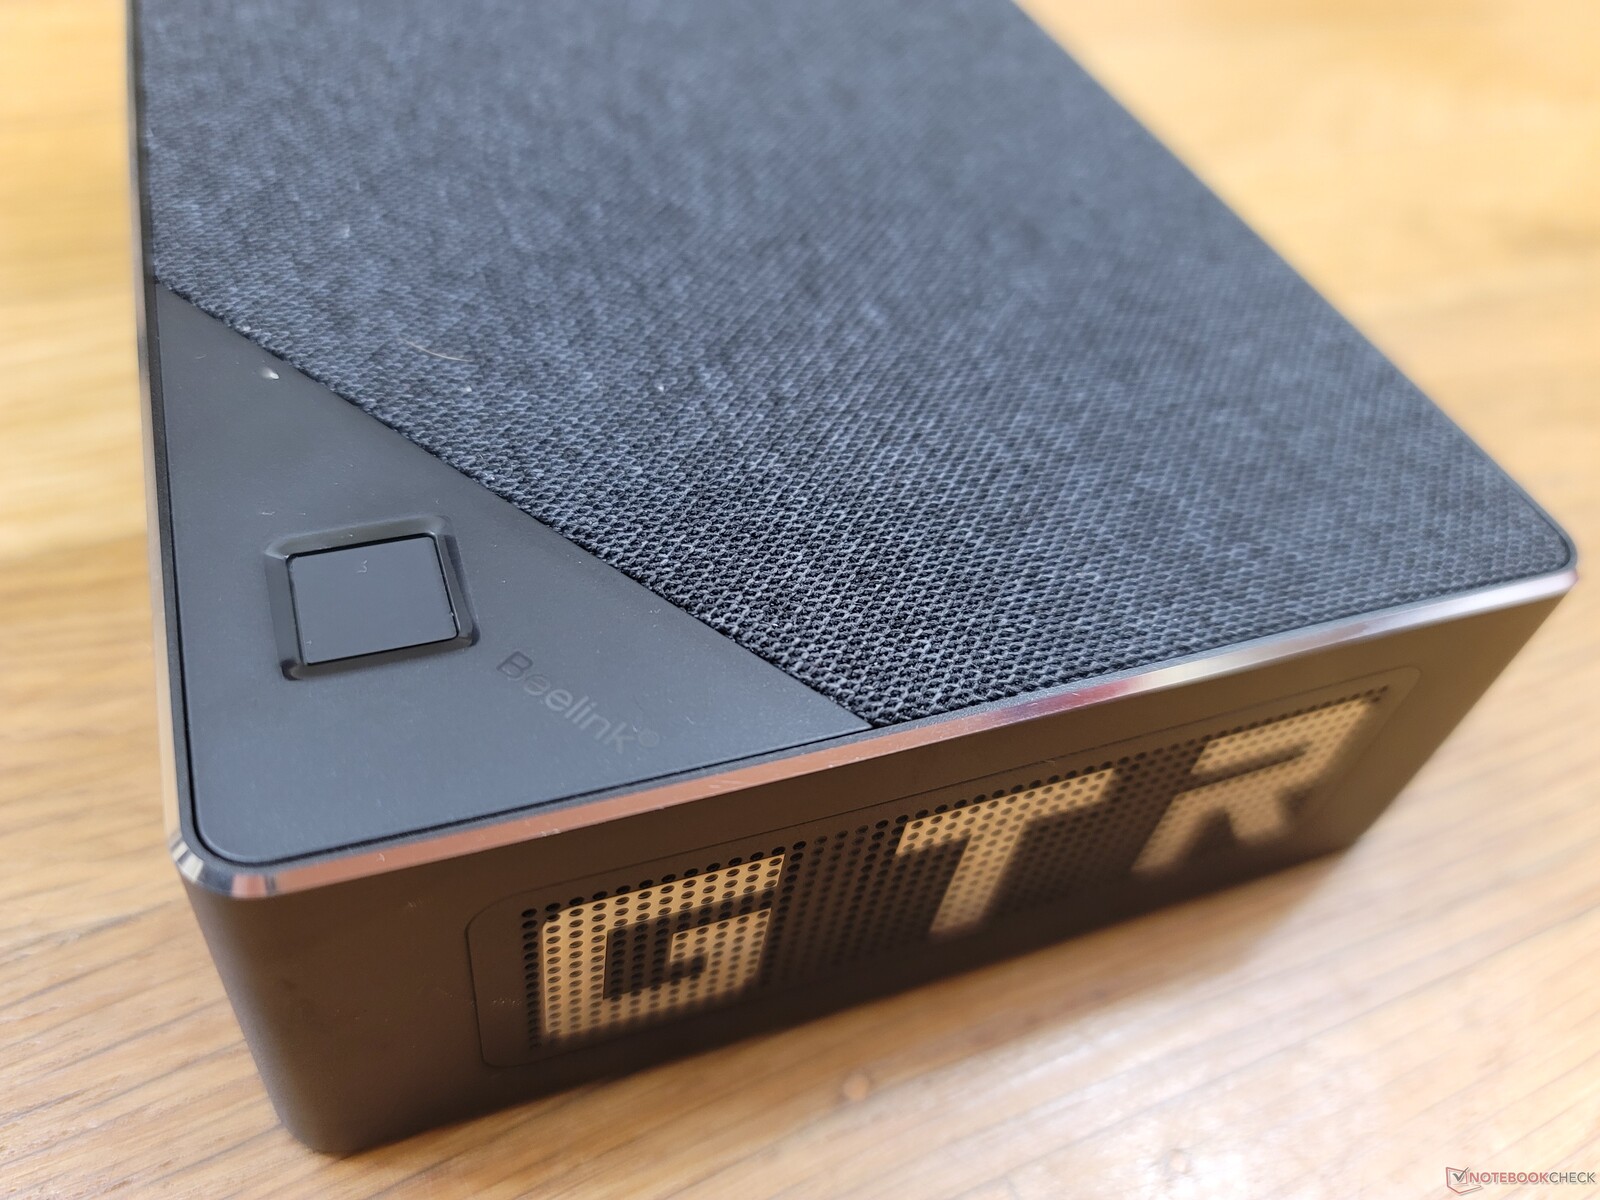
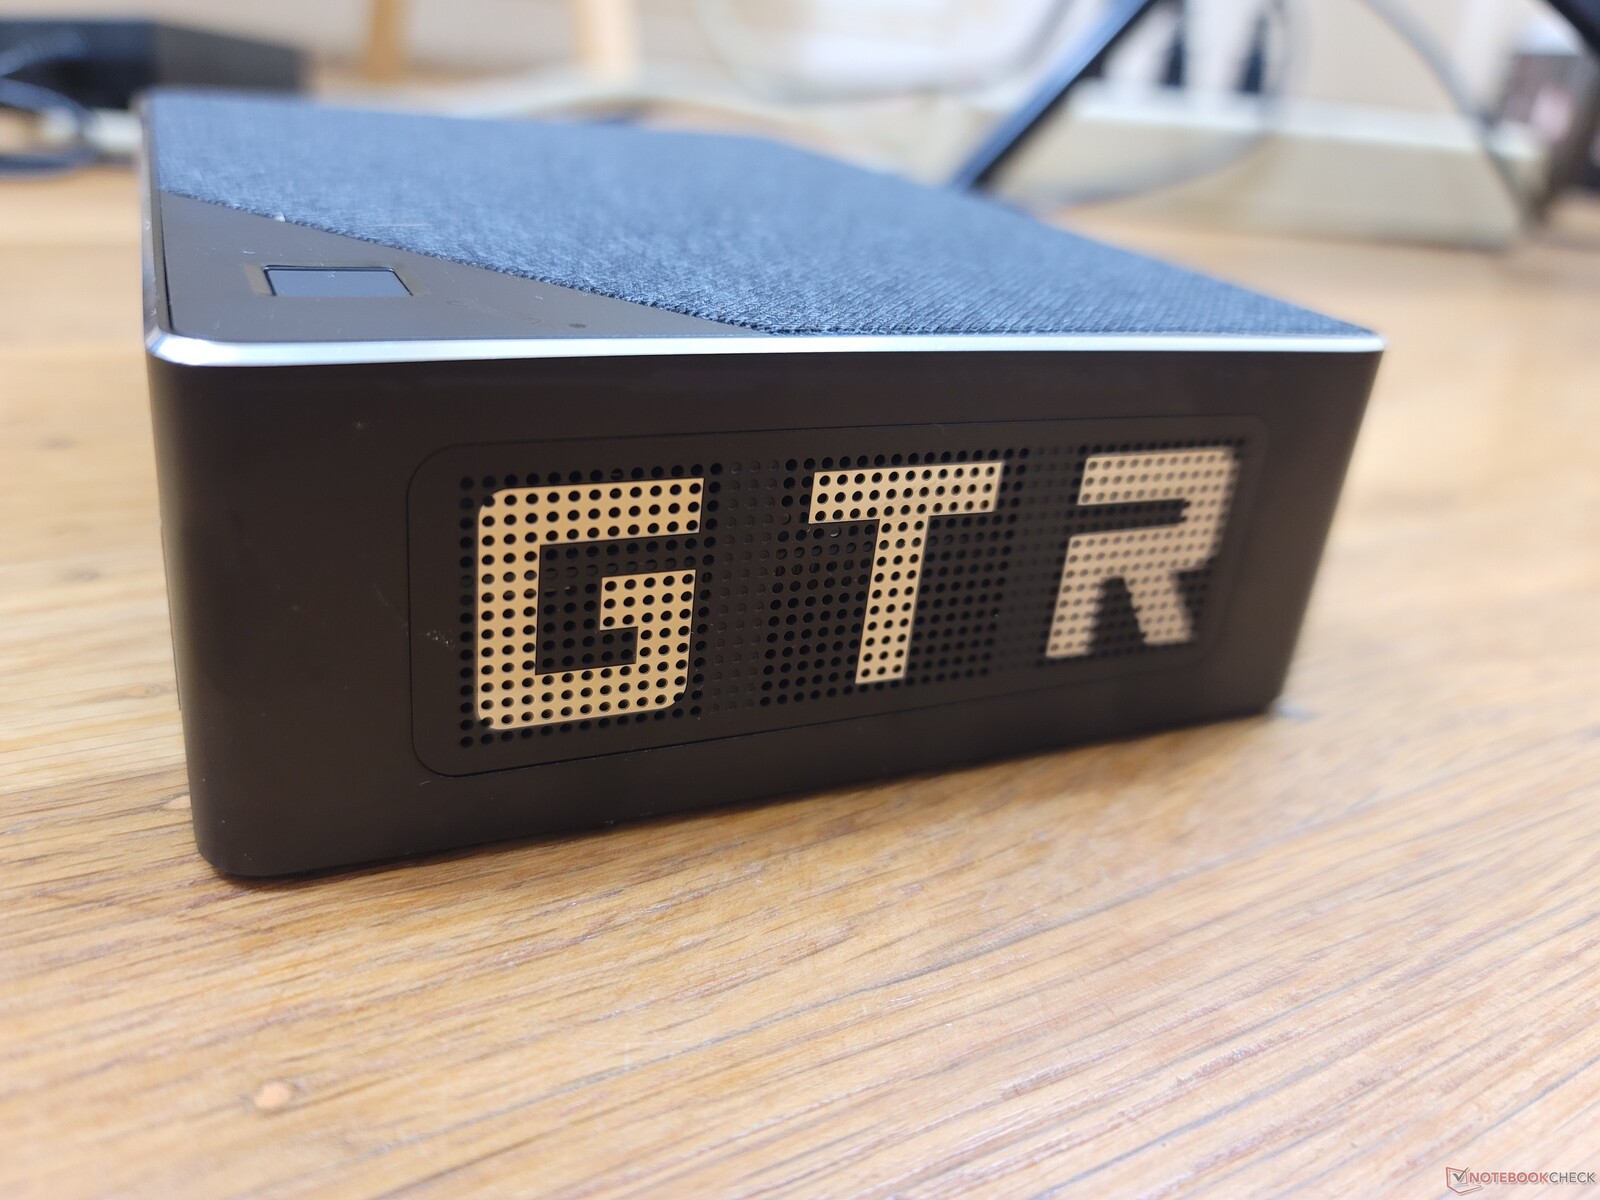
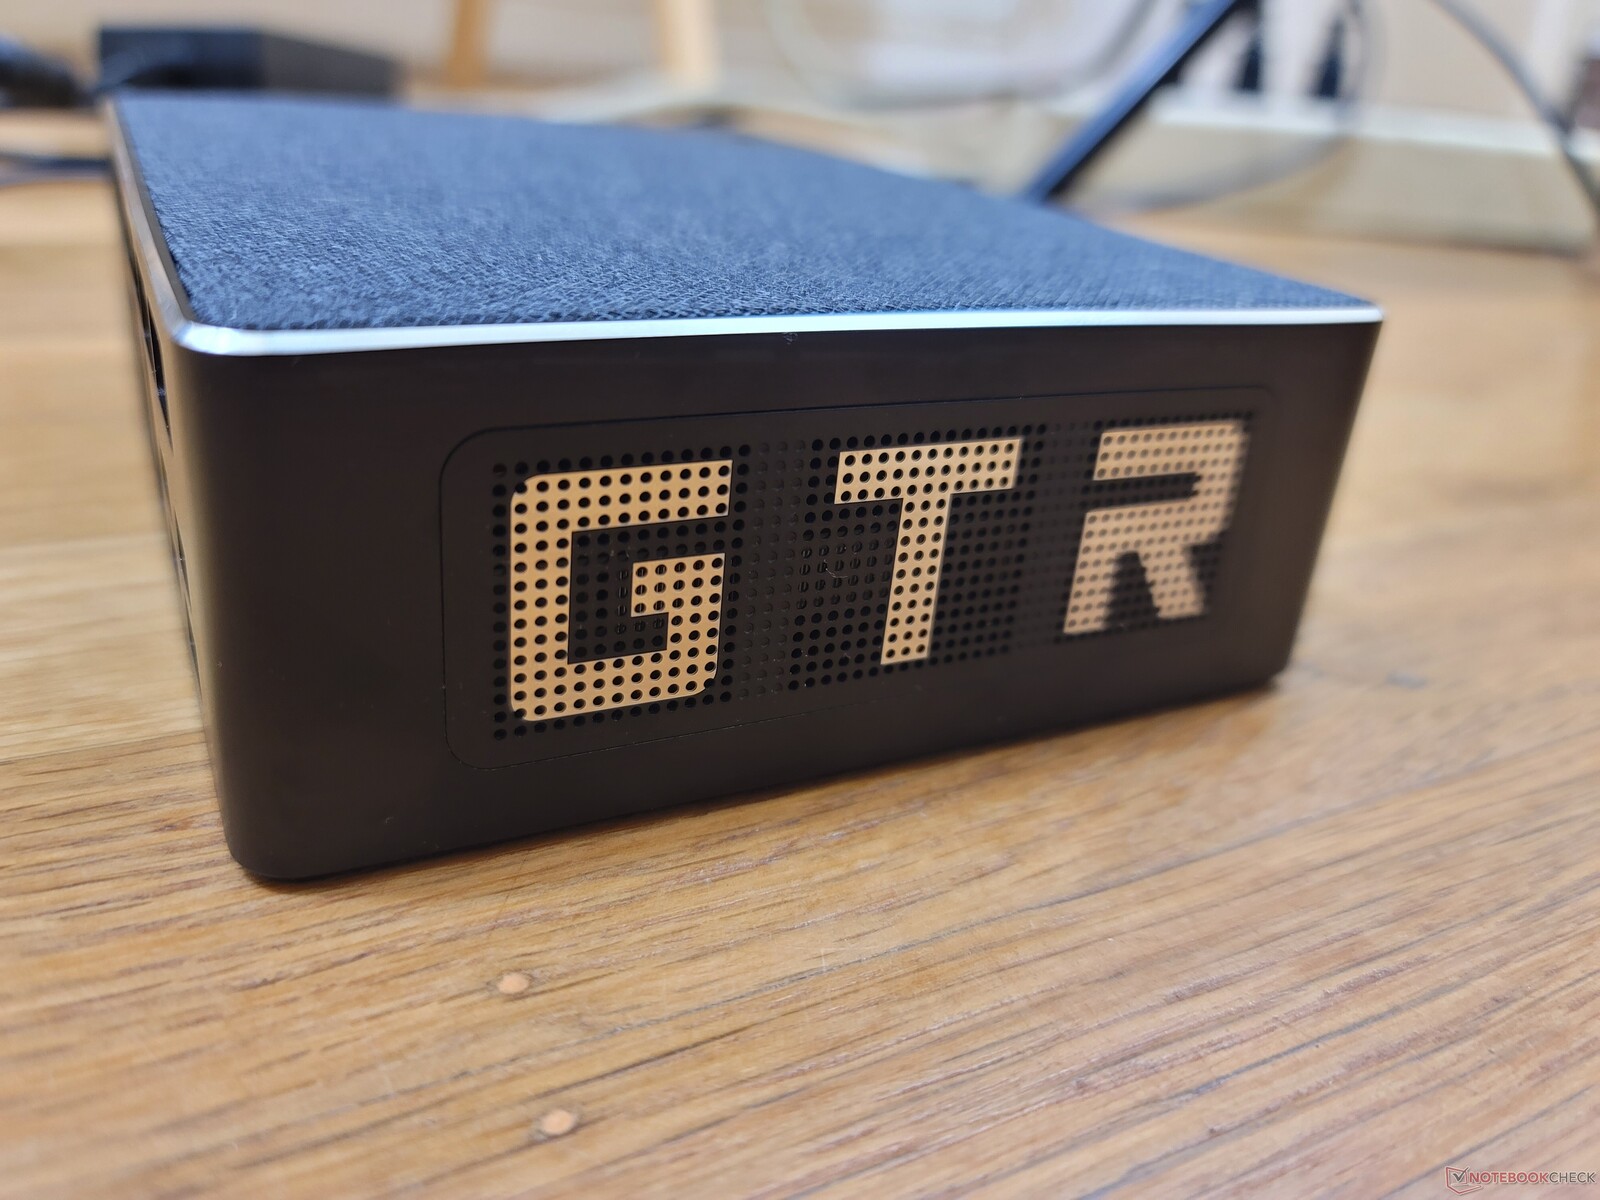
Maletín - Nueva tapa de malla suave
La carcasa se siente fuerte con sus lados de metal y malla suave transpirable en la parte superior para el flujo de aire. Esto último, en particular, es una novedad para Beelink, ya que los anteriores mini PC de la compañía tenían la parte superior de plástico o metal. La malla extraíble añade un elemento de calidad o lujo al diseño general.
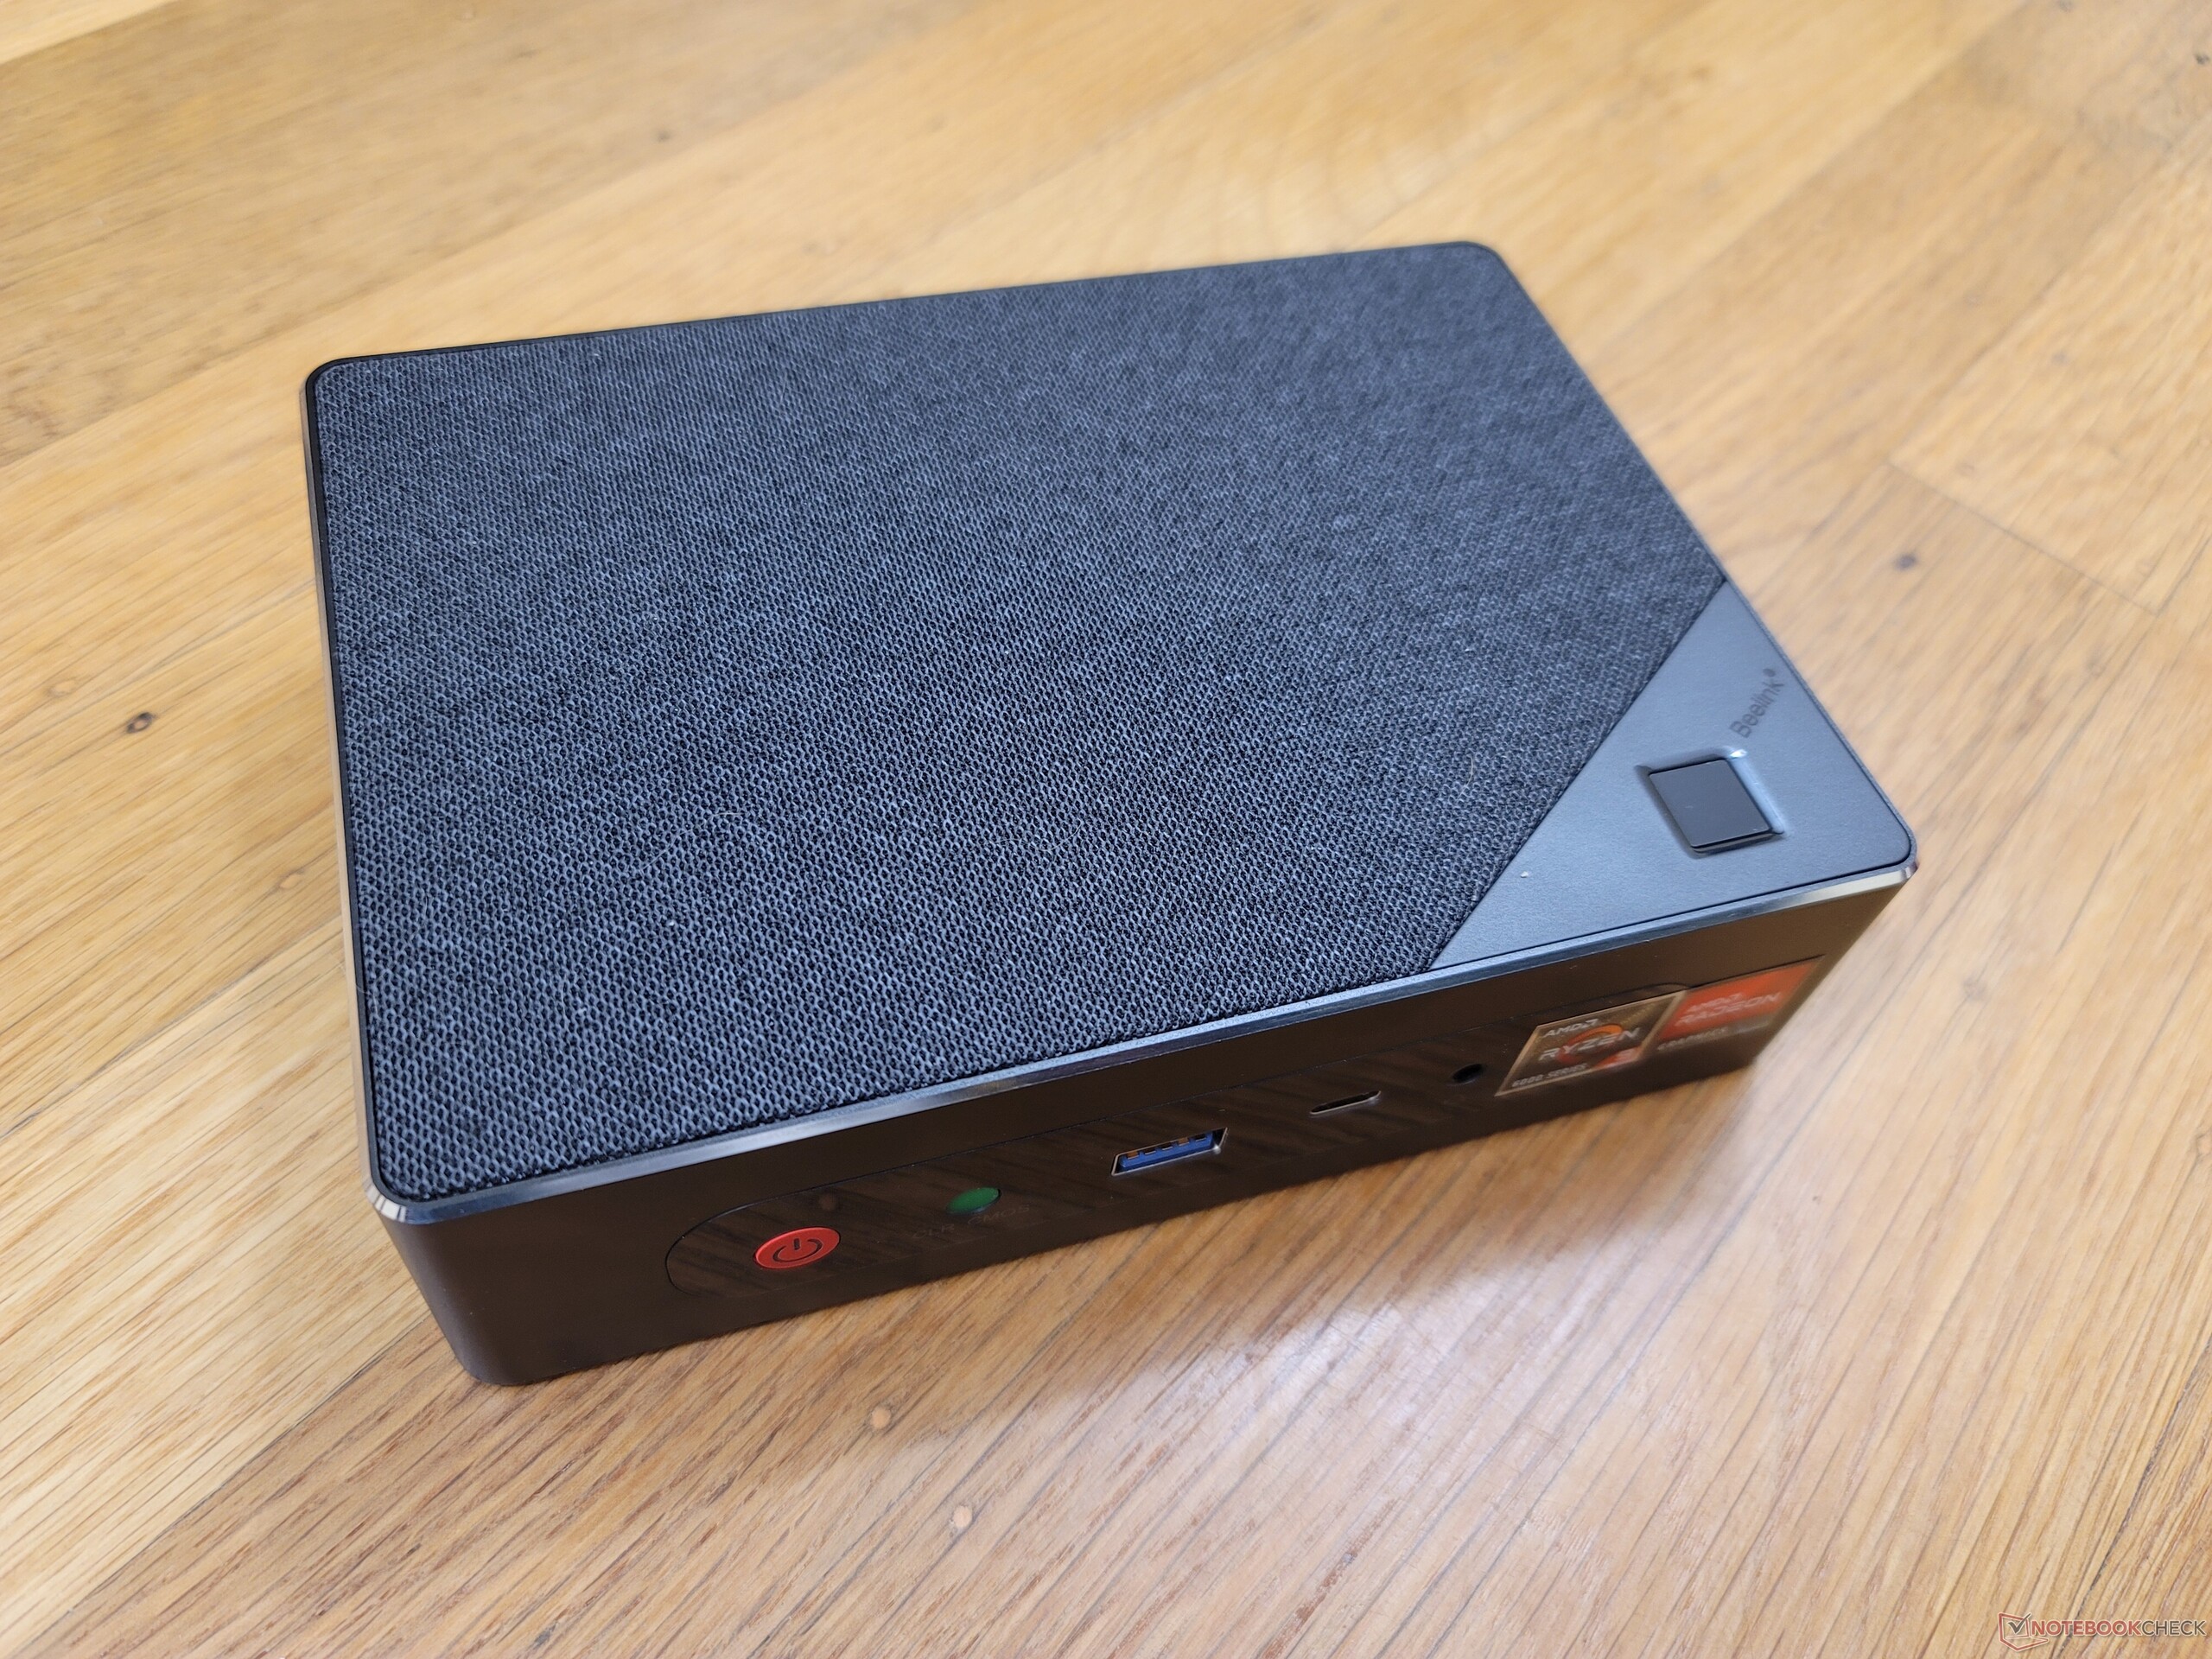
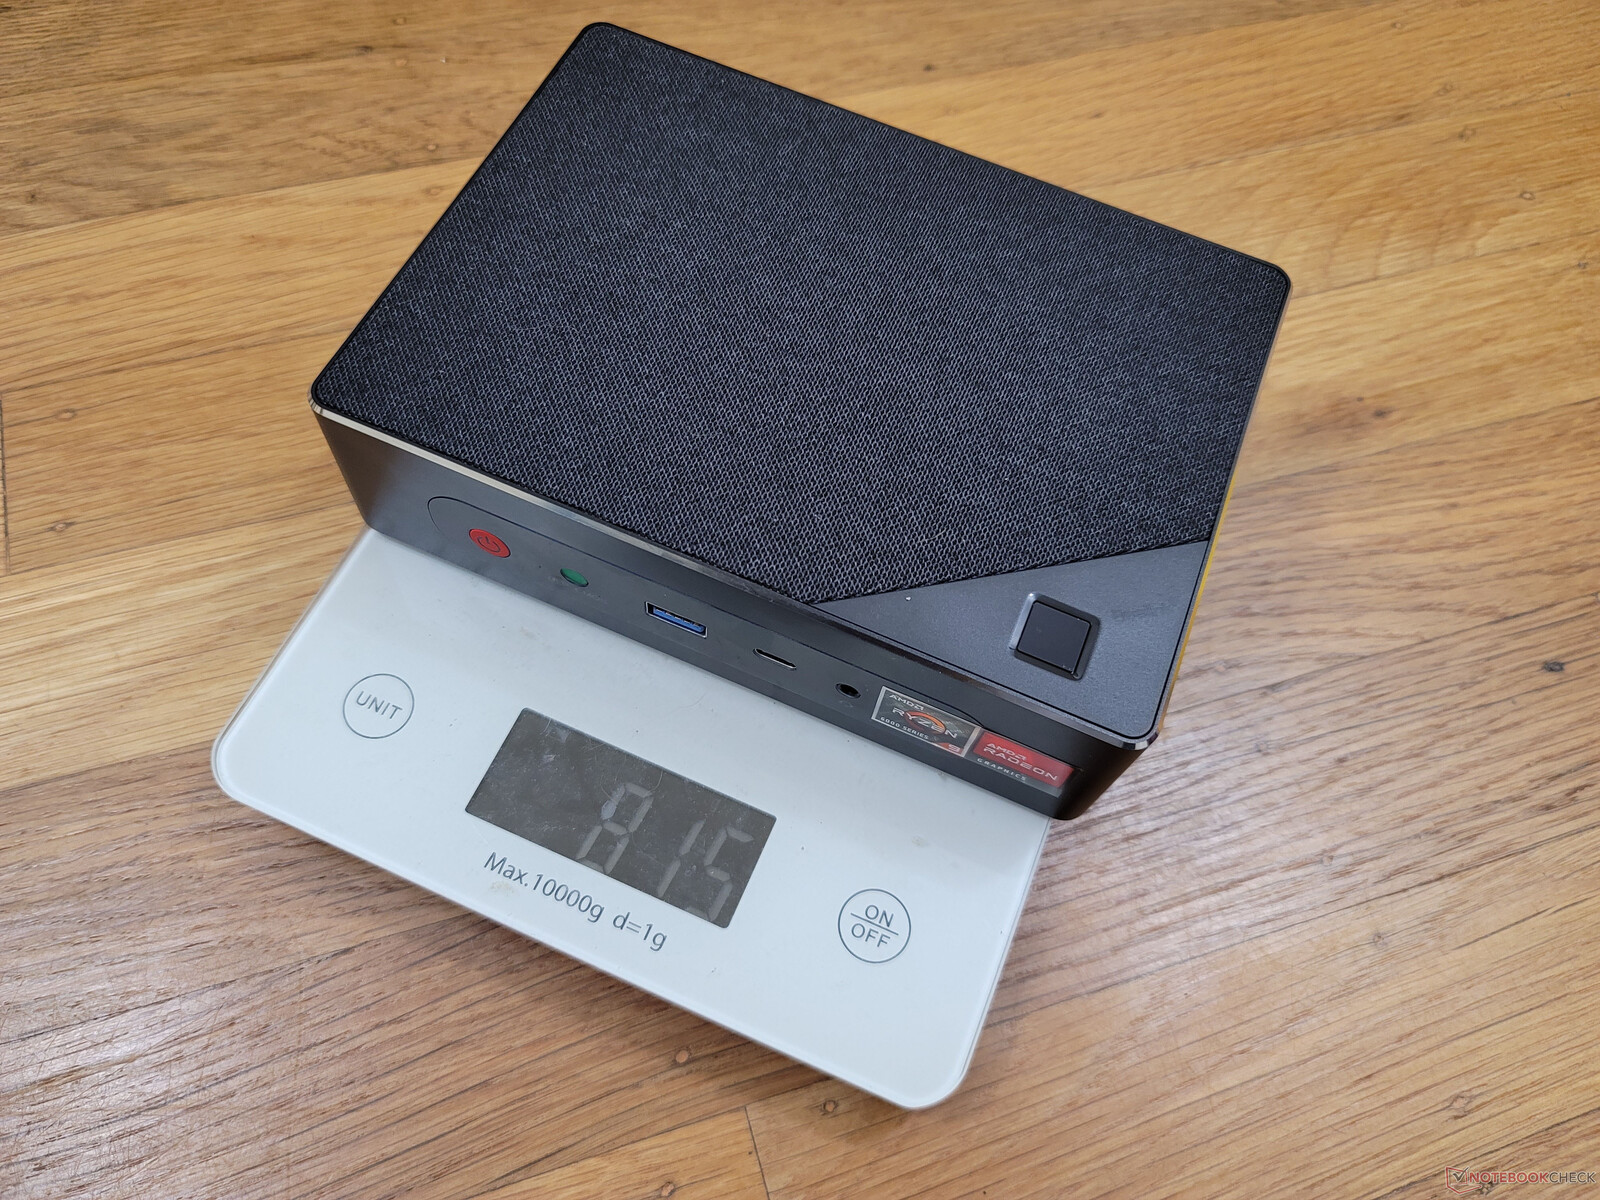
El GTR6 es más grueso y pesado que el GTR5 y la mayoría de los modelos NUC de Intel. El mayor tamaño se debe en parte al procesador AMD HX, más exigente en comparación con la serie Intel Core U.
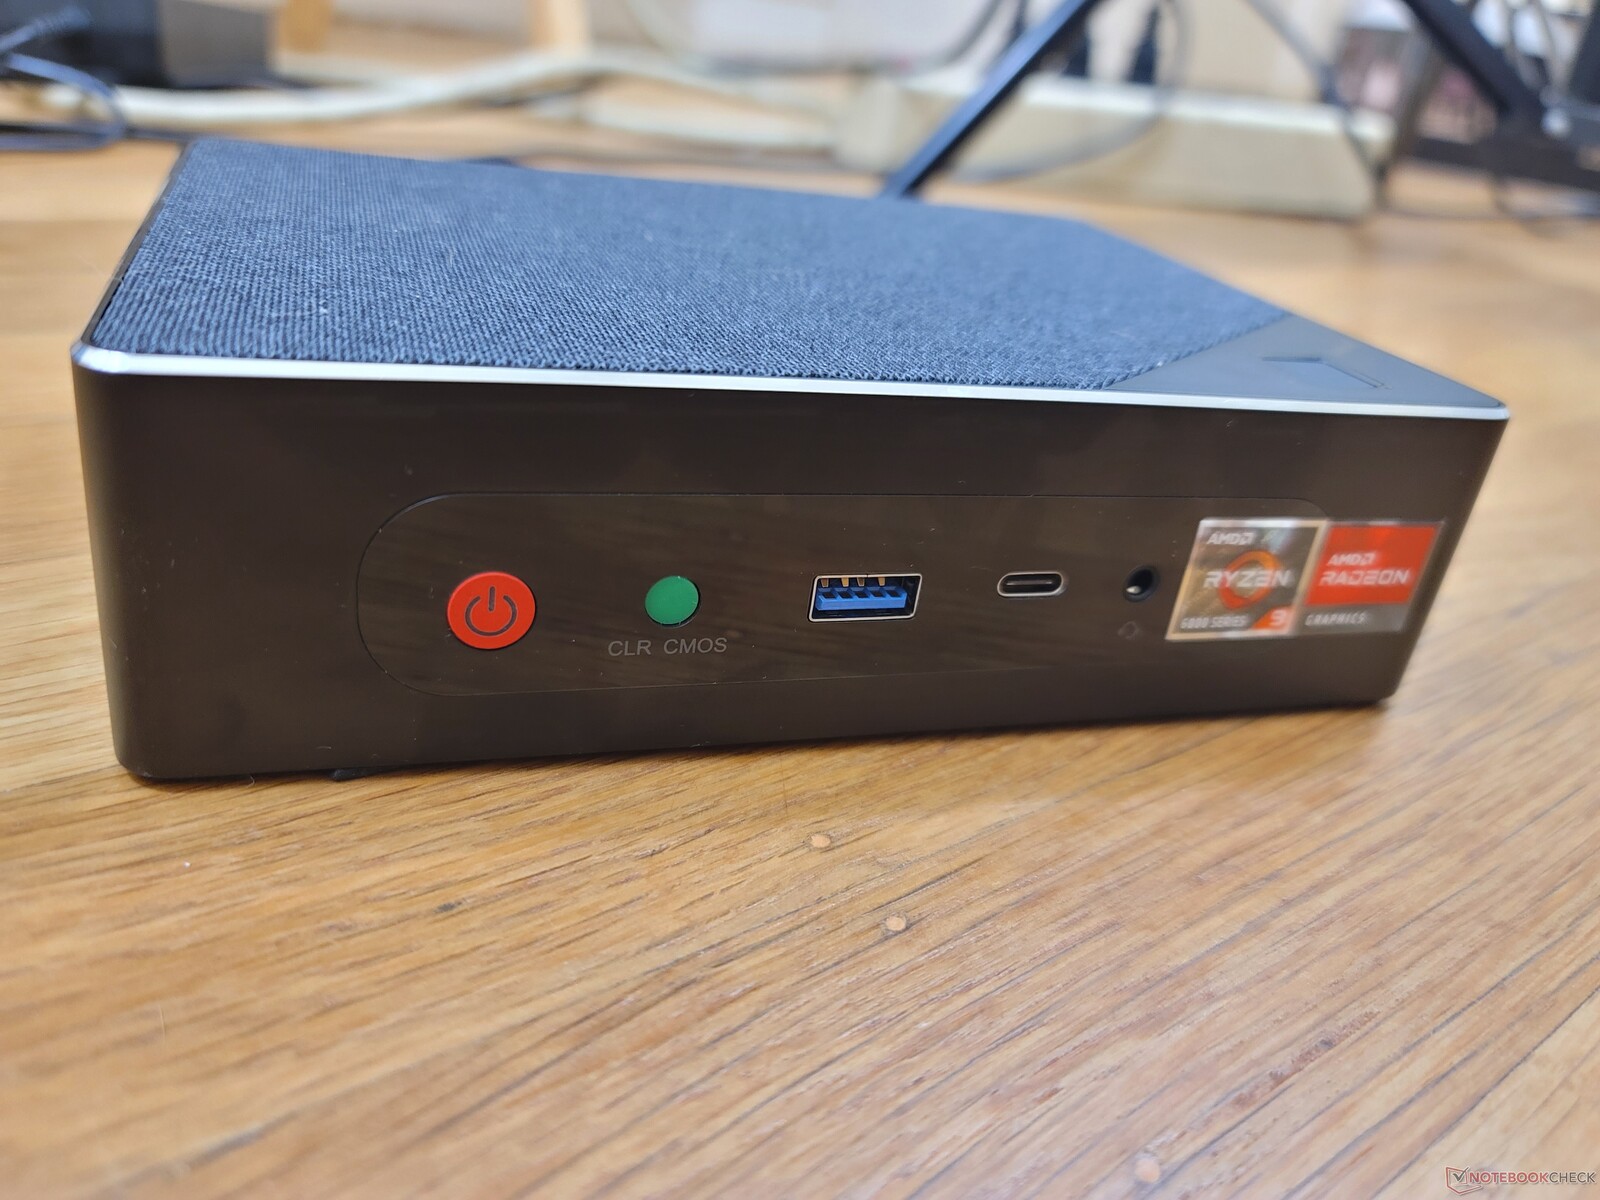
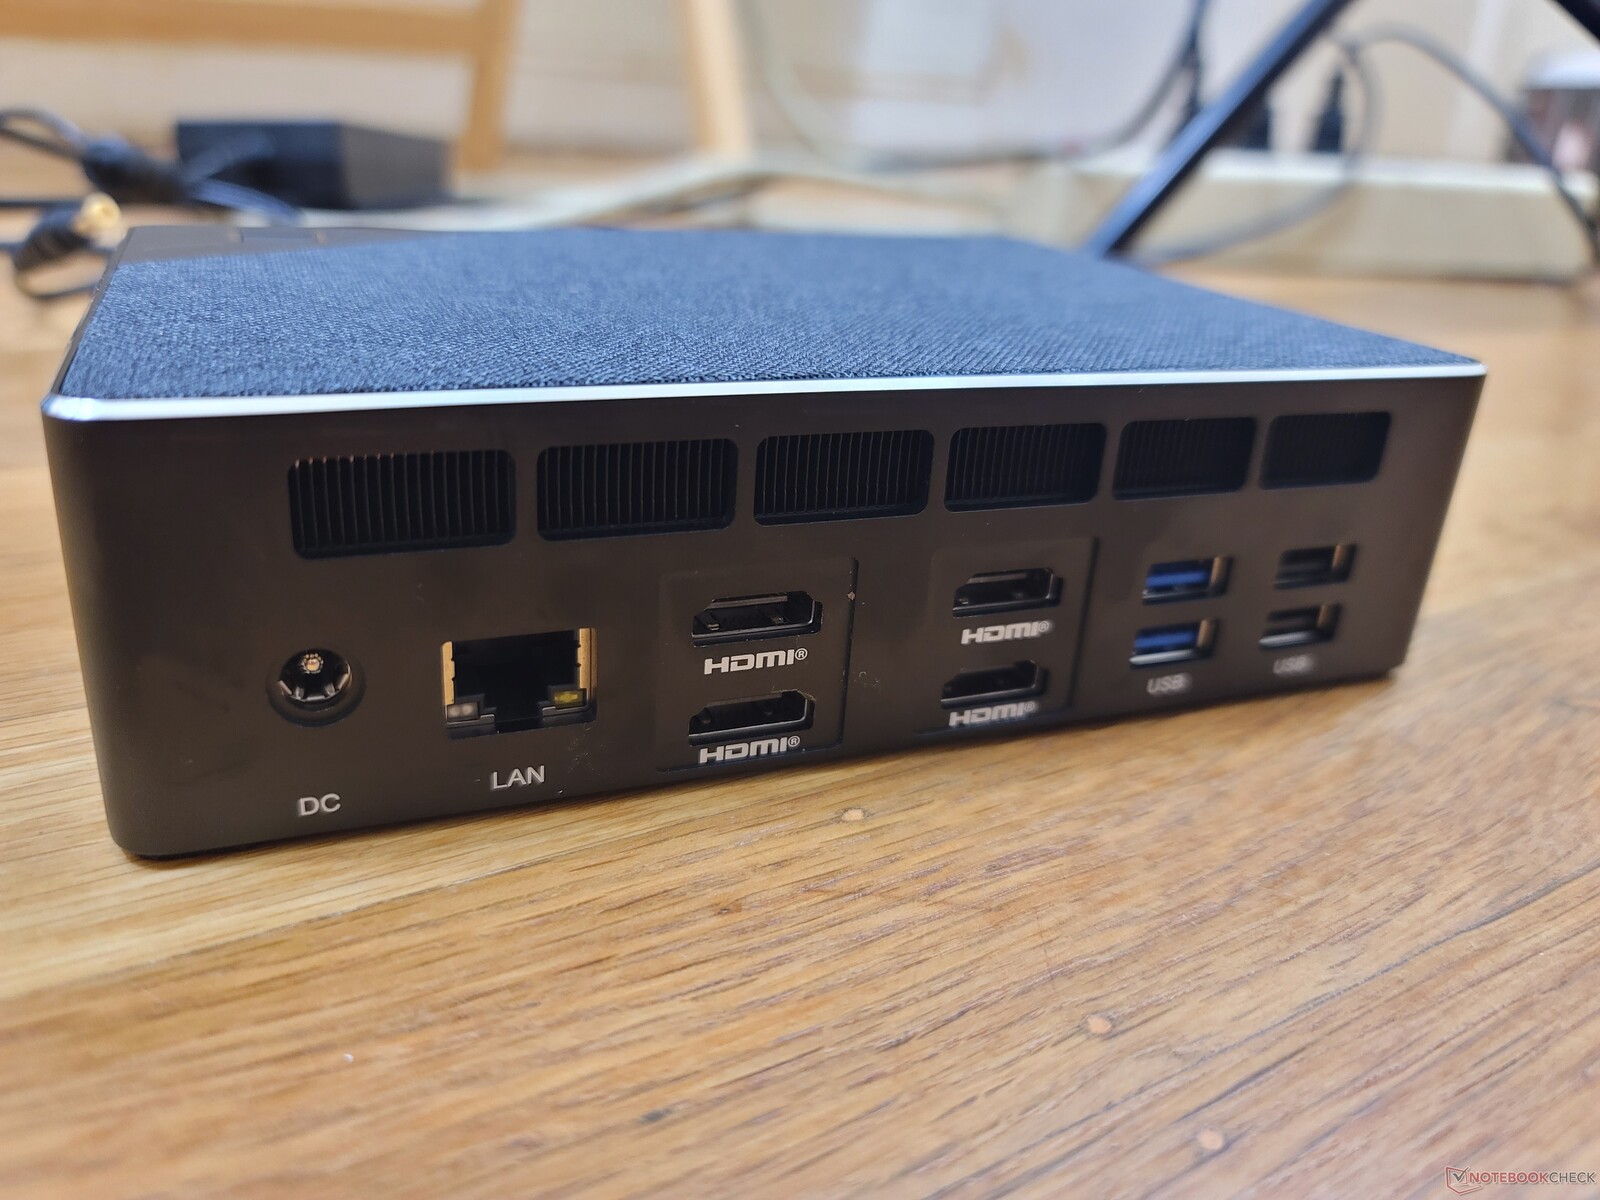
Conectividad - Sin Thunderbolt
Las opciones de puerto son excelentes, con cuatro puertos individuales HDMI 2.1 que soportan monitores de hasta 8K a 60 Hz. Sólo hay un puerto USB-C, sin embargo, y el puerto LAN es sólo de 1 Gbps mientras que muchos modelos NUC soportan ahora 10 Gbps
No soporta Thunderbolt debido a la CPU AMD.
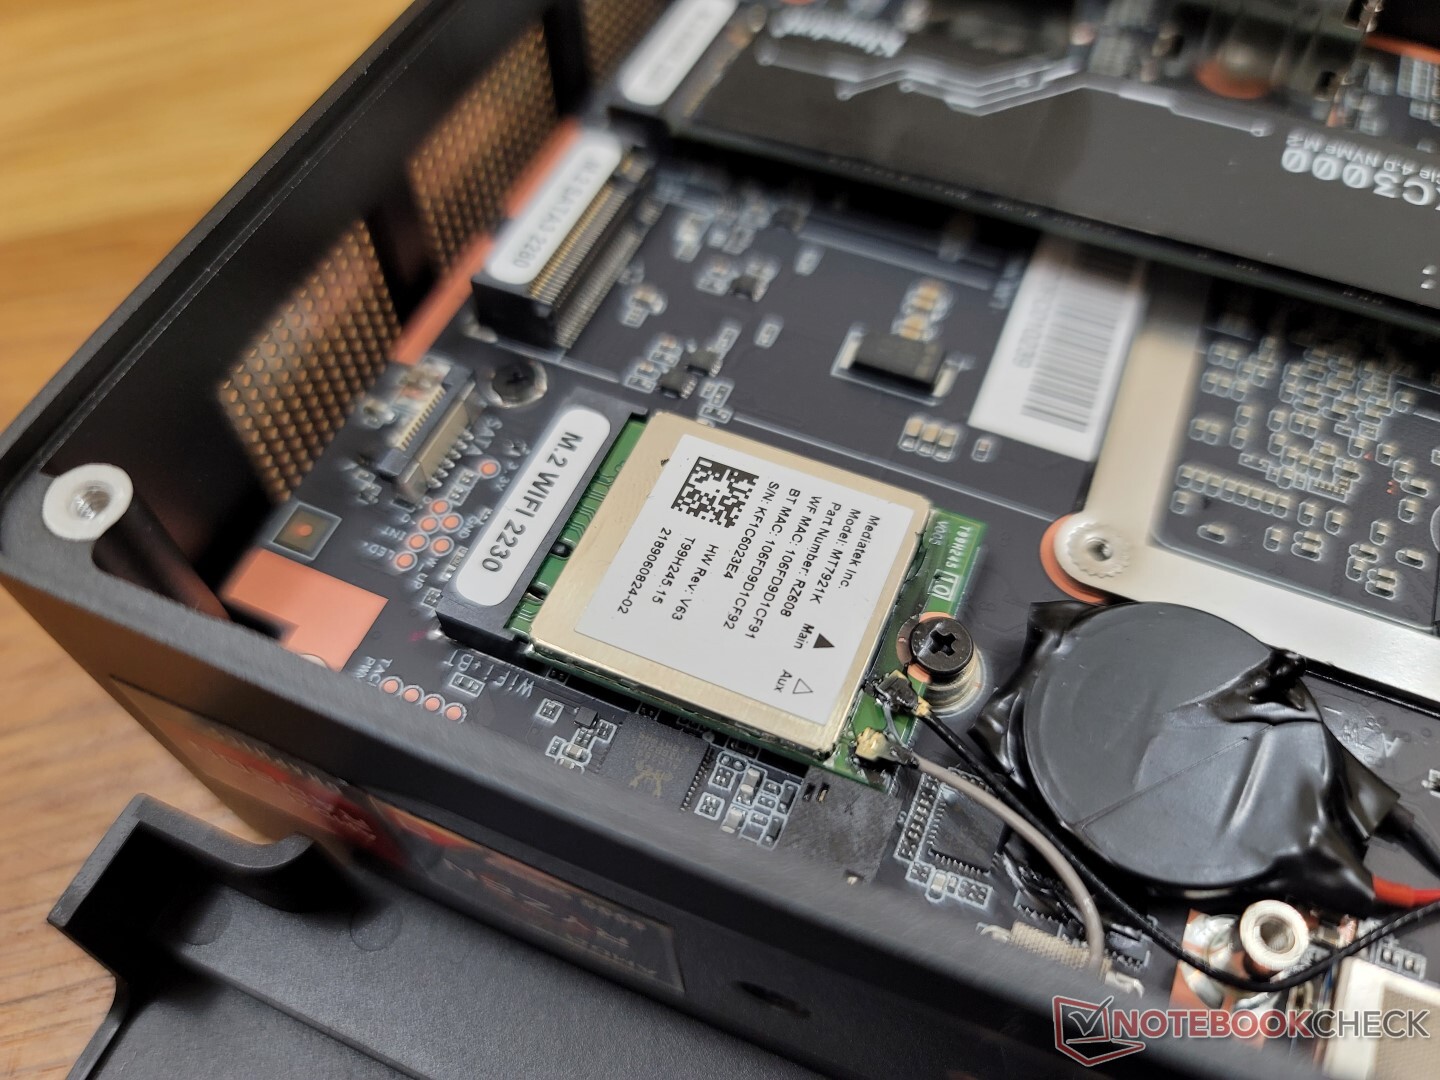
Comunicación - Wi-Fi 6E Standard
Un MediaTek RZ608 viene de serie para la conectividad Wi-Fi 6E y Bluetooth 5.2. Las velocidades de transferencia son constantes, aunque más lentas que la mayoría de las soluciones Intel AX201/210
El RZ608 de nuestra unidad de pruebas tardó en detectar nuestra red AXE11000 de 6 GHz, incluso después de actualizar a los últimos controladores en el momento de escribir este artículo. Es posible que tenga que esperar varios minutos antes de que el sistema pueda detectar y conectarse a su red de 6 GHz.
| Networking | |
| iperf3 transmit AX12 | |
| Intel NUC11TNKi5 | |
| Intel NUC11PHKi7C | |
| Beelink GTR5 | |
| GMK NucBox 2 | |
| iperf3 receive AX12 | |
| Intel NUC11TNKi5 | |
| Intel NUC11PHKi7C | |
| Beelink GTR5 | |
| GMK NucBox 2 | |
| iperf3 receive AXE11000 6GHz | |
| Beelink GTR6 | |
| Beelink SEi11 Pro | |
| iperf3 receive AXE11000 | |
| Beelink GTR6 | |
| iperf3 transmit AXE11000 | |
| Beelink GTR6 | |
| iperf3 transmit AXE11000 6GHz | |
| Beelink GTR6 | |
| Beelink SEi11 Pro | |
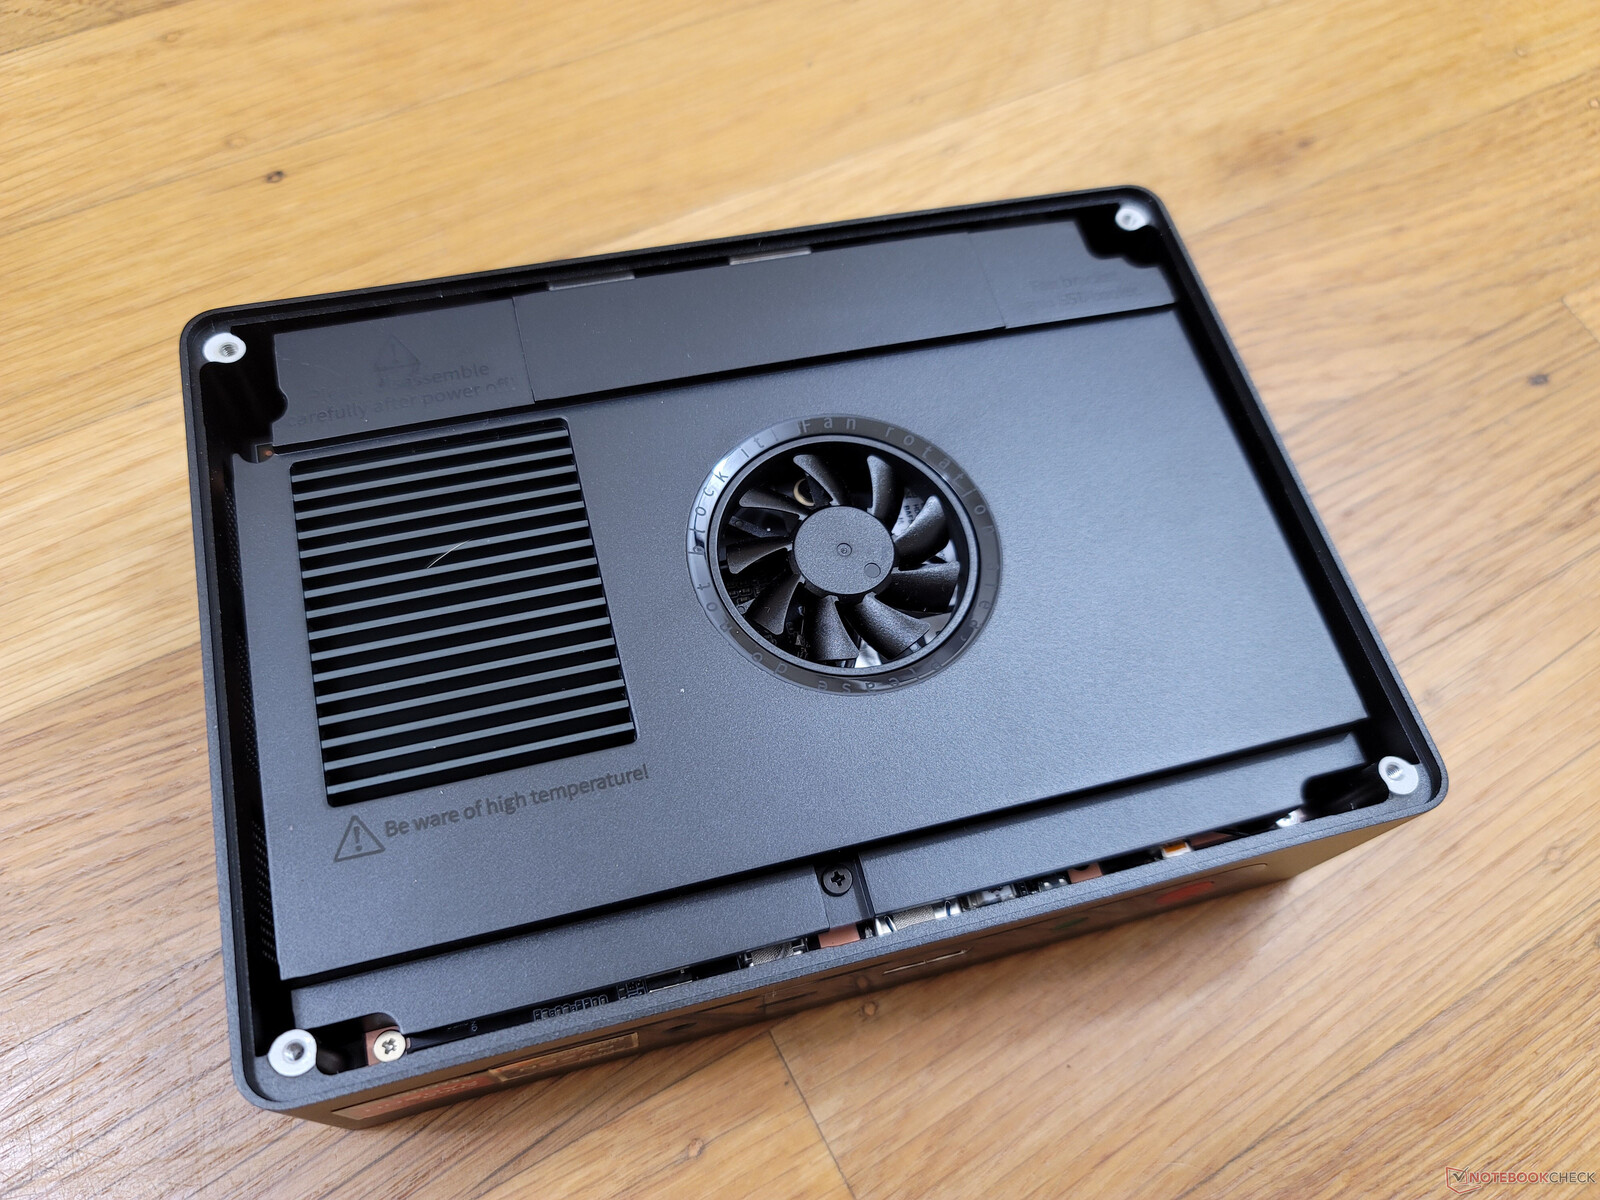
Mantenimiento
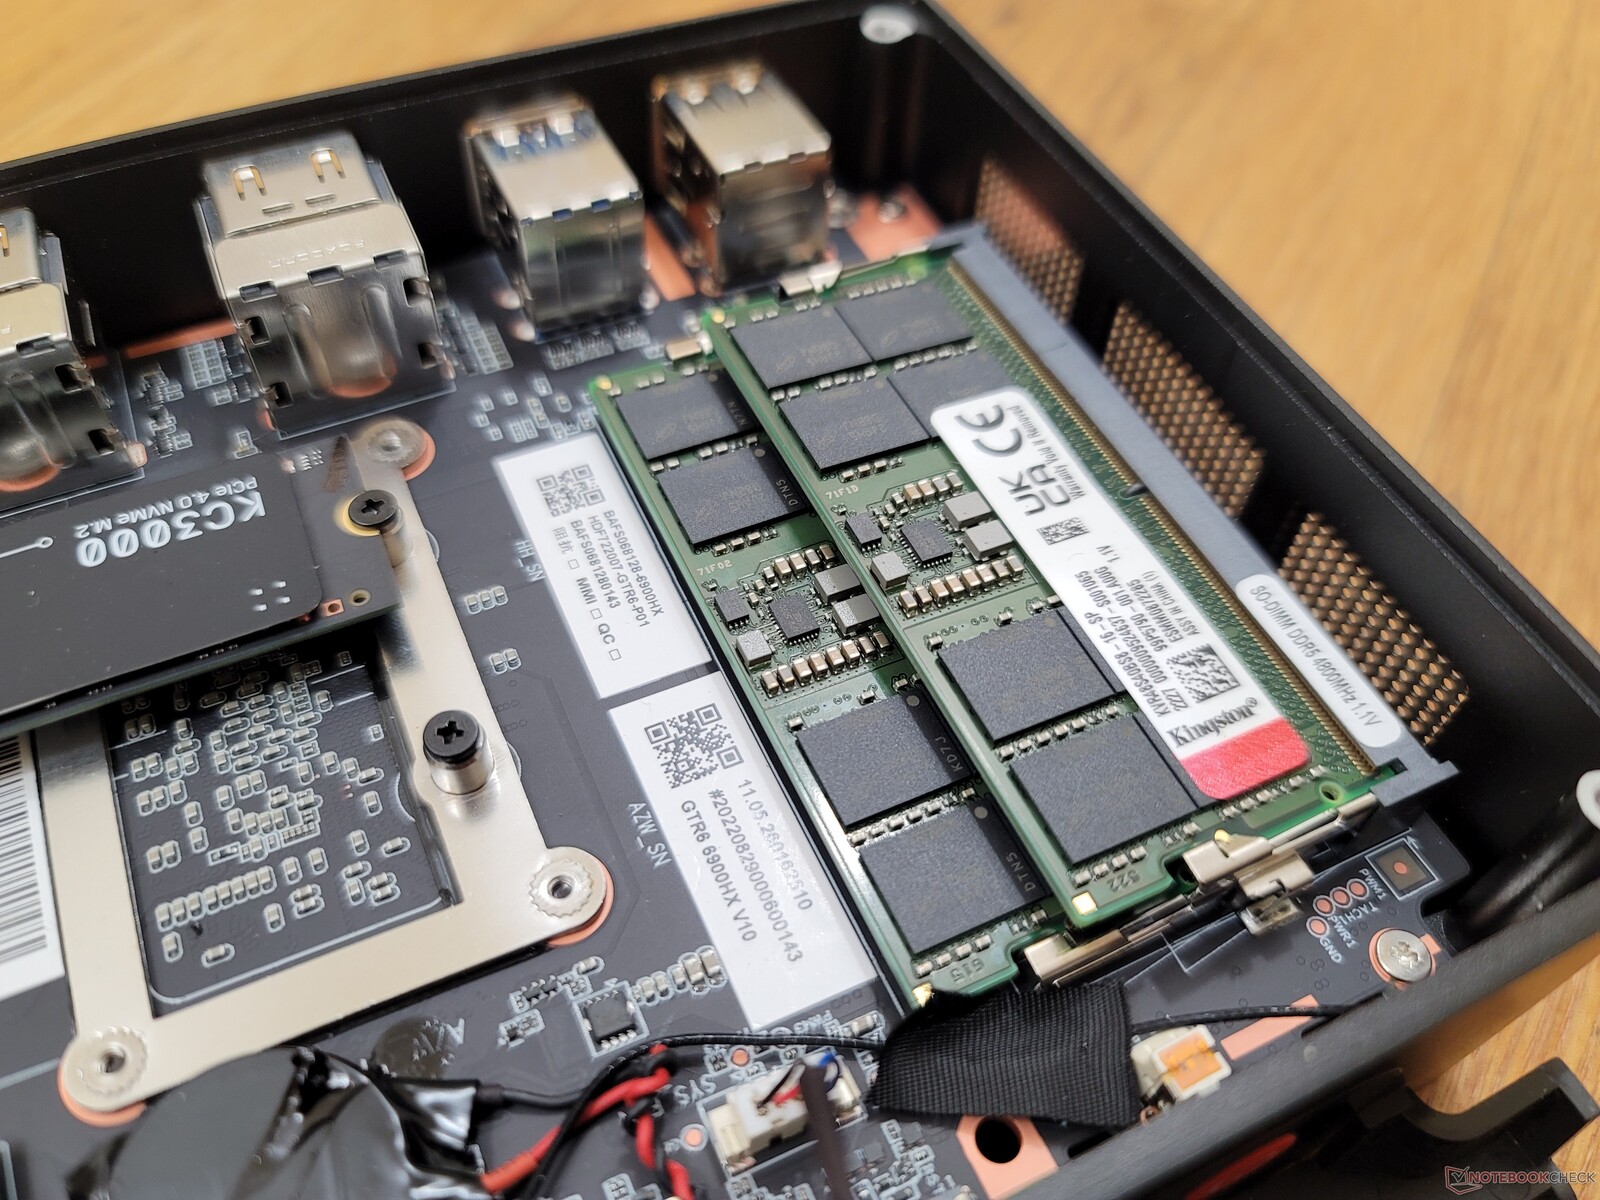
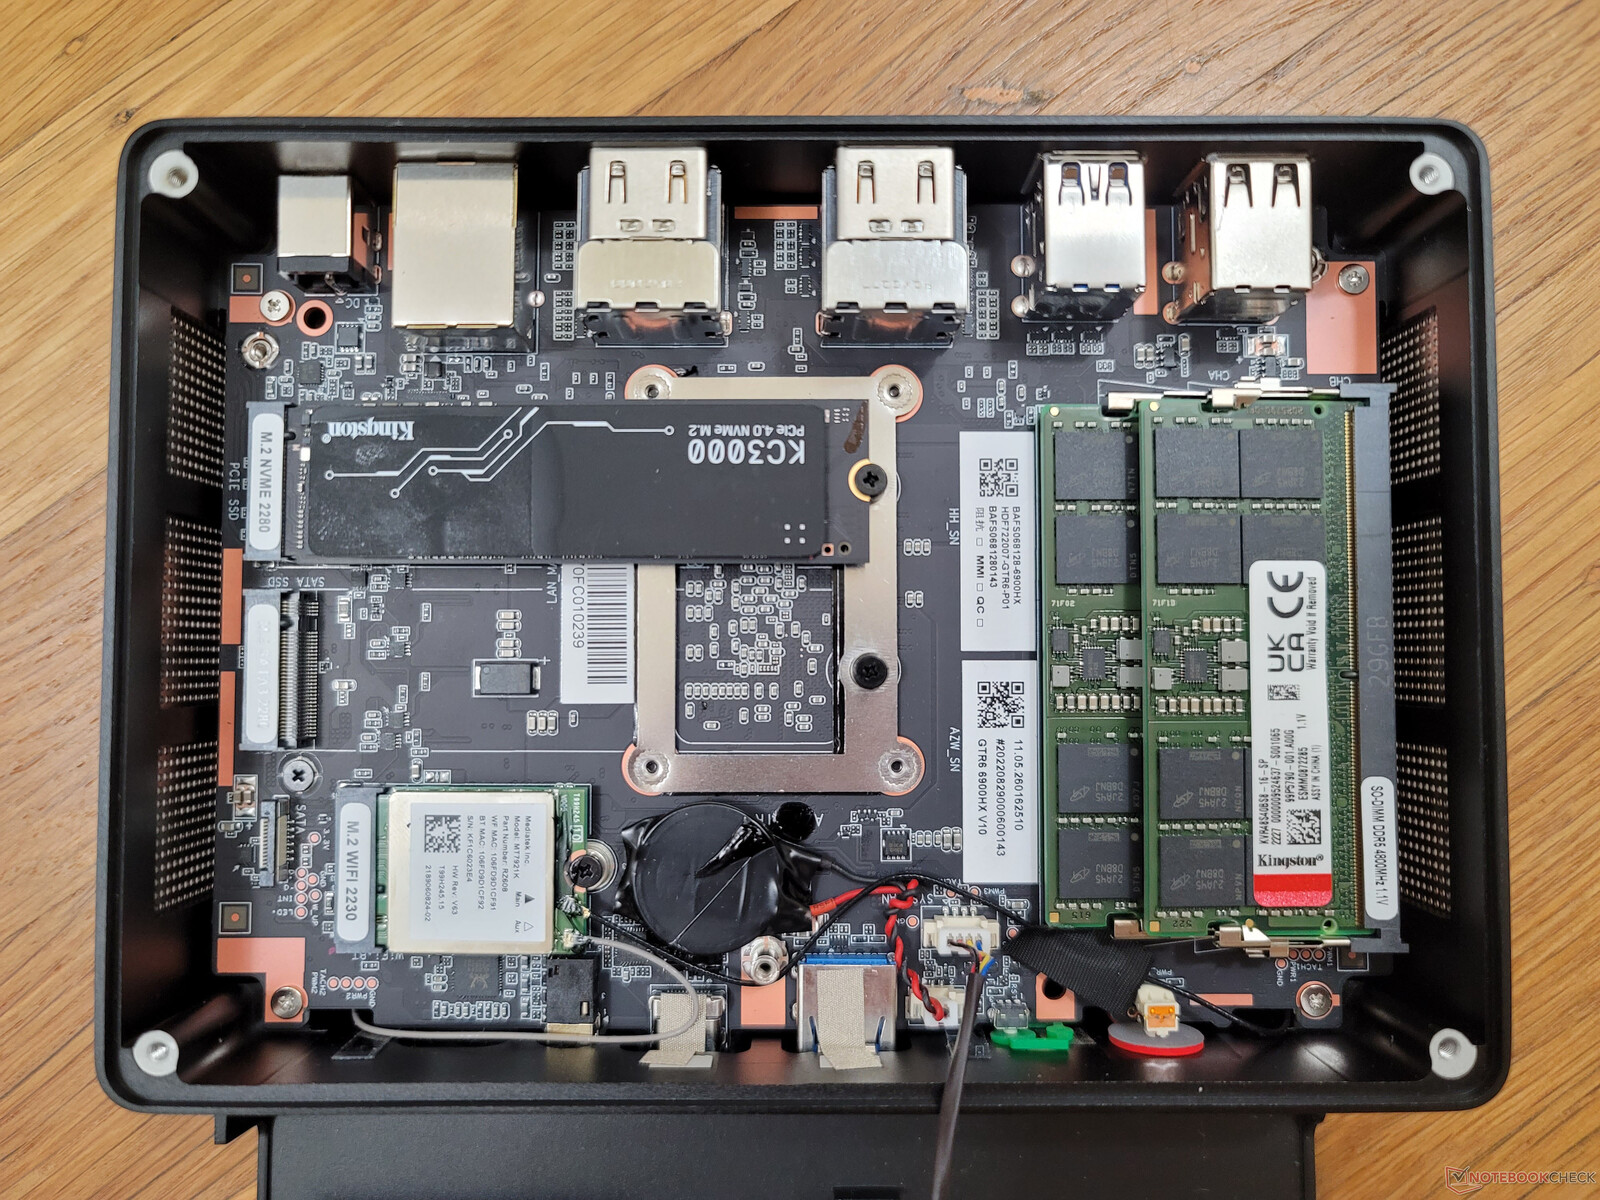
El panel inferior se fija con sólo cuatro tornillos Philips para facilitar el mantenimiento. Sin embargo, debajo hay otra placa que requiere la extracción de otros cuatro tornillos, como se muestra en las imágenes siguientes.
Accesorios y garantía
La caja incluye dos cables HDMI, un soporte VESA extraíble con tornillos adicionales, el manual de usuario y dos cubiertas de malla de tacto suave para la parte superior de la unidad. Una de estas cubiertas es de color rojo para complementar el hardware basado en AMD y el color de las molduras.
Rendimiento - Actualización de Zen 3+
Condiciones de la prueba
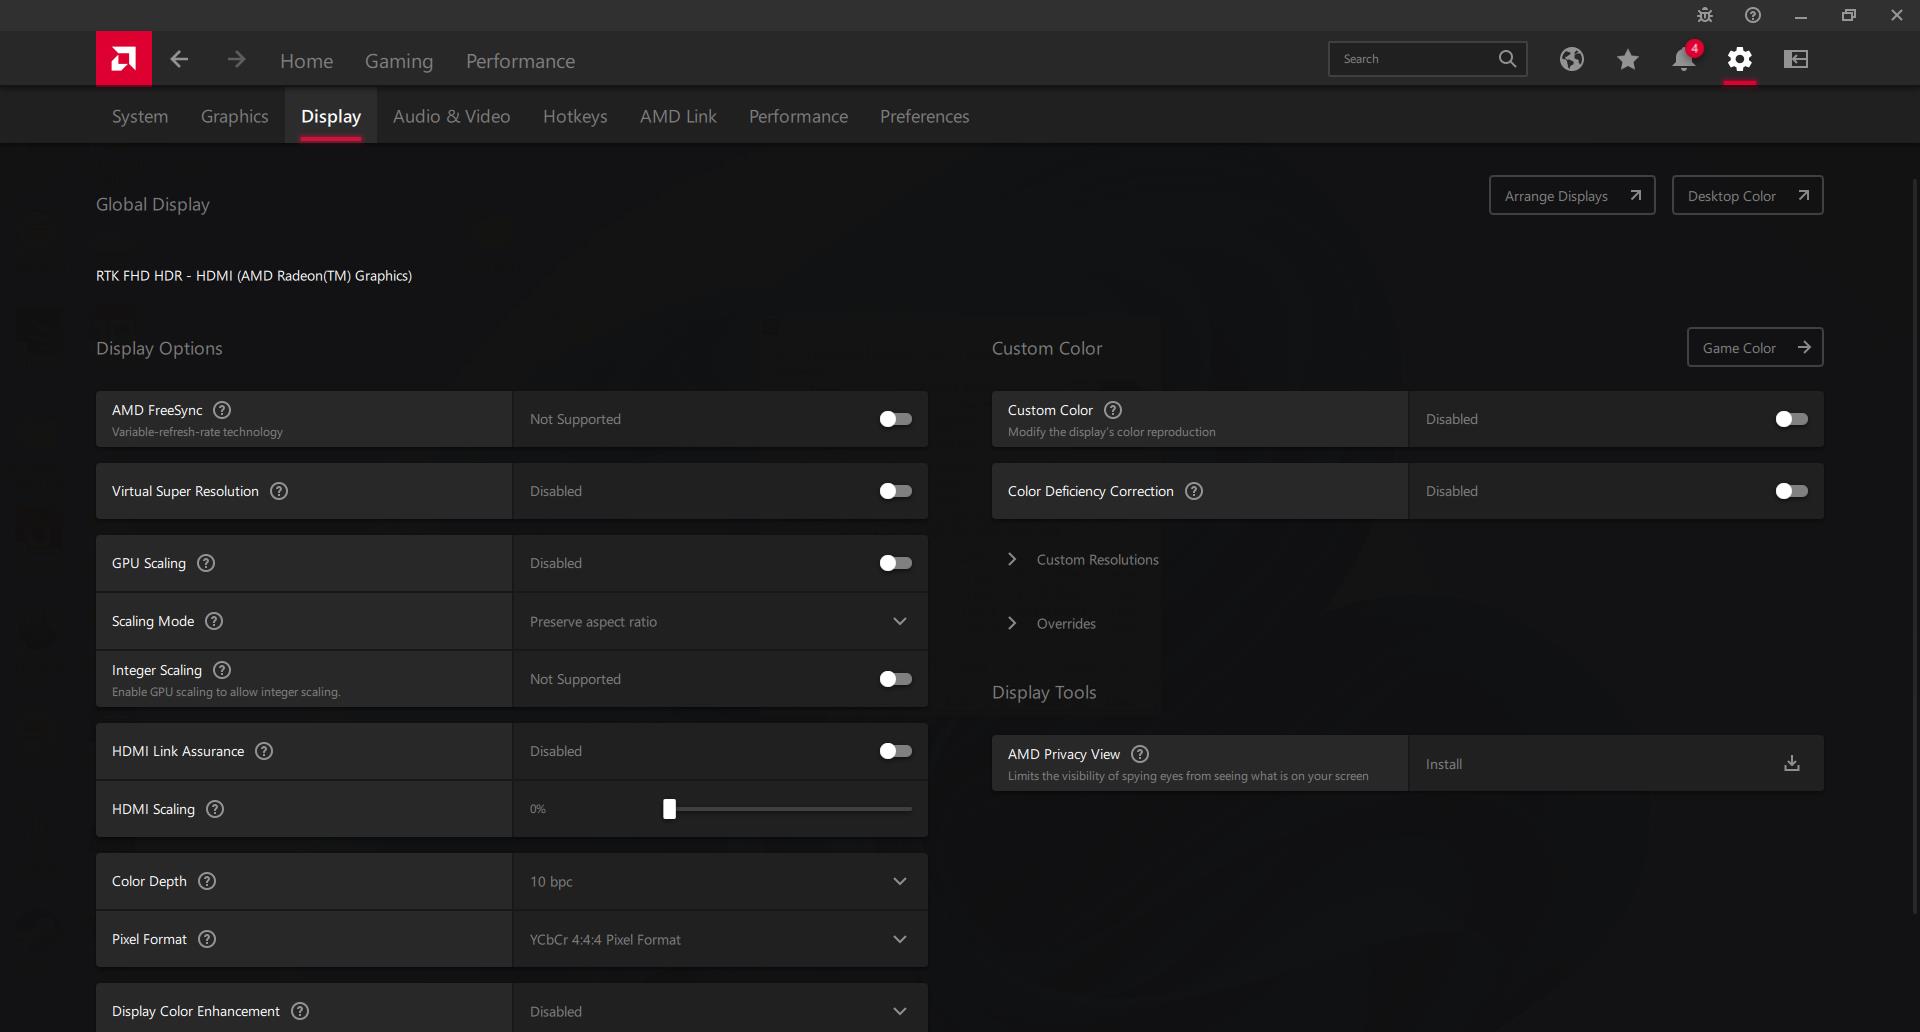
Configuramos nuestra unidad en el modo de rendimiento a través de Windows antes de ejecutar cualquier punto de referencia a continuación. Beelink no incluye aplicaciones preinstaladas para una experiencia limpia de Windows 11 Pro. No obstante, recomendamos instalar el software AMD Radeon para obtener ajustes adicionales, como se muestra en las capturas de pantalla siguientes.
Procesador
El rendimiento de la CPU es, por desgracia, sólo un pequeño paso adelante respecto al Ryzen 9 5900HX en el mejor de los casos. Las pruebas muestran un rendimiento multihilo idéntico al del Ryzen 9 5900HX en el Beelink GTR5 y un rendimiento monohilo ligeramente superior en hasta un 10 por ciento. El rendimiento multihilo medio es aproximadamente un 15 por ciento más lento que en los portátiles que llevan el mismo CPU Ryzen 9 6900HX como en el Lenovo Legion S7 16. Aun así, el GTR6 sigue siendo uno de los mini PC más rápidos para su tamaño a pesar de los ligeros reveses de rendimiento.
Cinebench R15 Multi Loop
Cinebench R23: Multi Core | Single Core
Cinebench R15: CPU Multi 64Bit | CPU Single 64Bit
Blender: v2.79 BMW27 CPU
7-Zip 18.03: 7z b 4 | 7z b 4 -mmt1
Geekbench 5.5: Multi-Core | Single-Core
HWBOT x265 Benchmark v2.2: 4k Preset
LibreOffice : 20 Documents To PDF
R Benchmark 2.5: Overall mean
| Cinebench R20 / CPU (Multi Core) | |
| MSI GE67 HX 12UGS | |
| Schenker Vision 14 2022 RTX 3050 Ti | |
| Medio AMD Ryzen 9 6900HX (3742 - 5813, n=19) | |
| Beelink GTR6 | |
| Beelink GTR5 | |
| Alienware m15 R4 RTX 3080 | |
| Lenovo Legion C7 15IMH05 82EH0030GE | |
| Beelink SEi11 Pro | |
| Intel NUC11TNKi5 | |
| Intel NUC11PHKi7C | |
| GMK NucBox 2 | |
| Cinebench R20 / CPU (Single Core) | |
| Schenker Vision 14 2022 RTX 3050 Ti | |
| MSI GE67 HX 12UGS | |
| Beelink GTR6 | |
| Medio AMD Ryzen 9 6900HX (595 - 631, n=19) | |
| Intel NUC11PHKi7C | |
| Beelink GTR5 | |
| Beelink SEi11 Pro | |
| Intel NUC11TNKi5 | |
| Lenovo Legion C7 15IMH05 82EH0030GE | |
| Alienware m15 R4 RTX 3080 | |
| GMK NucBox 2 | |
| Cinebench R23 / Multi Core | |
| MSI GE67 HX 12UGS | |
| Schenker Vision 14 2022 RTX 3050 Ti | |
| Medio AMD Ryzen 9 6900HX (9709 - 15100, n=19) | |
| Beelink GTR6 | |
| Beelink GTR5 | |
| Alienware m15 R4 RTX 3080 | |
| Lenovo Legion C7 15IMH05 82EH0030GE | |
| Intel NUC11PHKi7C | |
| Beelink SEi11 Pro | |
| Intel NUC11TNKi5 | |
| GMK NucBox 2 | |
| Cinebench R23 / Single Core | |
| MSI GE67 HX 12UGS | |
| Schenker Vision 14 2022 RTX 3050 Ti | |
| Beelink GTR6 | |
| Medio AMD Ryzen 9 6900HX (1516 - 1616, n=19) | |
| Intel NUC11PHKi7C | |
| Beelink GTR5 | |
| Beelink SEi11 Pro | |
| Intel NUC11TNKi5 | |
| Lenovo Legion C7 15IMH05 82EH0030GE | |
| Alienware m15 R4 RTX 3080 | |
| GMK NucBox 2 | |
| Cinebench R15 / CPU Multi 64Bit | |
| MSI GE67 HX 12UGS | |
| Schenker Vision 14 2022 RTX 3050 Ti | |
| Medio AMD Ryzen 9 6900HX (1588 - 2411, n=19) | |
| Beelink GTR6 | |
| Beelink GTR5 | |
| Alienware m15 R4 RTX 3080 | |
| Lenovo Legion C7 15IMH05 82EH0030GE | |
| Intel NUC11PHKi7C | |
| Beelink SEi11 Pro | |
| Intel NUC11TNKi5 | |
| GMK NucBox 2 | |
| Cinebench R15 / CPU Single 64Bit | |
| Schenker Vision 14 2022 RTX 3050 Ti | |
| MSI GE67 HX 12UGS | |
| Beelink GTR6 | |
| Medio AMD Ryzen 9 6900HX (241 - 261, n=19) | |
| Beelink GTR5 | |
| Intel NUC11PHKi7C | |
| Beelink SEi11 Pro | |
| Lenovo Legion C7 15IMH05 82EH0030GE | |
| Intel NUC11TNKi5 | |
| Alienware m15 R4 RTX 3080 | |
| GMK NucBox 2 | |
| 7-Zip 18.03 / 7z b 4 -mmt1 | |
| Beelink GTR6 | |
| Schenker Vision 14 2022 RTX 3050 Ti | |
| Medio AMD Ryzen 9 6900HX (5090 - 6070, n=20) | |
| Beelink GTR5 | |
| MSI GE67 HX 12UGS | |
| Lenovo Legion C7 15IMH05 82EH0030GE | |
| Alienware m15 R4 RTX 3080 | |
| Intel NUC11PHKi7C | |
| Beelink SEi11 Pro | |
| Intel NUC11TNKi5 | |
| GMK NucBox 2 | |
| Geekbench 5.5 / Multi-Core | |
| MSI GE67 HX 12UGS | |
| Schenker Vision 14 2022 RTX 3050 Ti | |
| Medio AMD Ryzen 9 6900HX (8313 - 10490, n=21) | |
| Beelink GTR6 | |
| Lenovo Legion C7 15IMH05 82EH0030GE | |
| Beelink GTR5 | |
| Alienware m15 R4 RTX 3080 | |
| Intel NUC11PHKi7C | |
| Beelink SEi11 Pro | |
| Intel NUC11TNKi5 | |
| GMK NucBox 2 | |
| Geekbench 5.5 / Single-Core | |
| Schenker Vision 14 2022 RTX 3050 Ti | |
| MSI GE67 HX 12UGS | |
| Beelink GTR6 | |
| Medio AMD Ryzen 9 6900HX (1523 - 1652, n=21) | |
| Beelink GTR5 | |
| Intel NUC11PHKi7C | |
| Beelink SEi11 Pro | |
| Intel NUC11TNKi5 | |
| Lenovo Legion C7 15IMH05 82EH0030GE | |
| Alienware m15 R4 RTX 3080 | |
| GMK NucBox 2 | |
| HWBOT x265 Benchmark v2.2 / 4k Preset | |
| MSI GE67 HX 12UGS | |
| Medio AMD Ryzen 9 6900HX (12.6 - 18.7, n=20) | |
| Beelink GTR6 | |
| Beelink GTR5 | |
| Schenker Vision 14 2022 RTX 3050 Ti | |
| Alienware m15 R4 RTX 3080 | |
| Lenovo Legion C7 15IMH05 82EH0030GE | |
| Beelink SEi11 Pro | |
| Intel NUC11PHKi7C | |
| Intel NUC11TNKi5 | |
| GMK NucBox 2 | |
| LibreOffice / 20 Documents To PDF | |
| Alienware m15 R4 RTX 3080 | |
| GMK NucBox 2 | |
| Lenovo Legion C7 15IMH05 82EH0030GE | |
| Medio AMD Ryzen 9 6900HX (44.8 - 81.7, n=20) | |
| Intel NUC11TNKi5 | |
| Beelink GTR5 | |
| Beelink SEi11 Pro | |
| Intel NUC11PHKi7C | |
| Beelink GTR6 | |
| Schenker Vision 14 2022 RTX 3050 Ti | |
| MSI GE67 HX 12UGS | |
| R Benchmark 2.5 / Overall mean | |
| GMK NucBox 2 | |
| Intel NUC11TNKi5 | |
| Alienware m15 R4 RTX 3080 | |
| Lenovo Legion C7 15IMH05 82EH0030GE | |
| Beelink SEi11 Pro | |
| Intel NUC11PHKi7C | |
| Medio AMD Ryzen 9 6900HX (0.4627 - 0.4974, n=20) | |
| Beelink GTR5 | |
| Beelink GTR6 | |
| MSI GE67 HX 12UGS | |
| Schenker Vision 14 2022 RTX 3050 Ti | |
* ... más pequeño es mejor
AIDA64: FP32 Ray-Trace | FPU Julia | CPU SHA3 | CPU Queen | FPU SinJulia | FPU Mandel | CPU AES | CPU ZLib | FP64 Ray-Trace | CPU PhotoWorxx
| Performance rating | |
| Medio AMD Ryzen 9 6900HX | |
| Beelink GTR6 | |
| Beelink GTR5 | |
| Intel NUC11PHKi7C | |
| Beelink SEi11 Pro | |
| Intel NUC11TNKi5 | |
| GMK NucBox 2 | |
| AIDA64 / FP32 Ray-Trace | |
| Medio AMD Ryzen 9 6900HX (10950 - 17963, n=20) | |
| Beelink GTR5 | |
| Beelink GTR6 | |
| Intel NUC11PHKi7C | |
| Beelink SEi11 Pro | |
| Intel NUC11TNKi5 | |
| GMK NucBox 2 | |
| AIDA64 / FPU Julia | |
| Medio AMD Ryzen 9 6900HX (71414 - 110797, n=20) | |
| Beelink GTR5 | |
| Beelink GTR6 | |
| Intel NUC11PHKi7C | |
| Beelink SEi11 Pro | |
| Intel NUC11TNKi5 | |
| GMK NucBox 2 | |
| AIDA64 / CPU SHA3 | |
| Medio AMD Ryzen 9 6900HX (2471 - 3804, n=20) | |
| Beelink GTR6 | |
| Beelink GTR5 | |
| Intel NUC11PHKi7C | |
| Beelink SEi11 Pro | |
| Intel NUC11TNKi5 | |
| GMK NucBox 2 | |
| AIDA64 / CPU Queen | |
| Medio AMD Ryzen 9 6900HX (84185 - 107544, n=20) | |
| Beelink GTR5 | |
| Beelink GTR6 | |
| Intel NUC11PHKi7C | |
| Beelink SEi11 Pro | |
| Intel NUC11TNKi5 | |
| GMK NucBox 2 | |
| AIDA64 / FPU SinJulia | |
| Medio AMD Ryzen 9 6900HX (10970 - 13205, n=20) | |
| Beelink GTR5 | |
| Beelink GTR6 | |
| Intel NUC11PHKi7C | |
| Beelink SEi11 Pro | |
| Intel NUC11TNKi5 | |
| GMK NucBox 2 | |
| AIDA64 / FPU Mandel | |
| Medio AMD Ryzen 9 6900HX (39164 - 61370, n=20) | |
| Beelink GTR5 | |
| Beelink GTR6 | |
| Intel NUC11PHKi7C | |
| Beelink SEi11 Pro | |
| Intel NUC11TNKi5 | |
| GMK NucBox 2 | |
| AIDA64 / CPU AES | |
| Beelink GTR6 | |
| Beelink GTR5 | |
| Medio AMD Ryzen 9 6900HX (54613 - 142360, n=20) | |
| Intel NUC11PHKi7C | |
| Beelink SEi11 Pro | |
| Intel NUC11TNKi5 | |
| GMK NucBox 2 | |
| AIDA64 / CPU ZLib | |
| Medio AMD Ryzen 9 6900HX (578 - 911, n=20) | |
| Beelink GTR5 | |
| Beelink GTR6 | |
| Intel NUC11PHKi7C | |
| Intel NUC11TNKi5 | |
| Beelink SEi11 Pro | |
| GMK NucBox 2 | |
| AIDA64 / FP64 Ray-Trace | |
| Medio AMD Ryzen 9 6900HX (5798 - 9540, n=20) | |
| Beelink GTR5 | |
| Beelink GTR6 | |
| Intel NUC11PHKi7C | |
| Beelink SEi11 Pro | |
| Intel NUC11TNKi5 | |
| GMK NucBox 2 | |
| AIDA64 / CPU PhotoWorxx | |
| Beelink GTR6 | |
| Medio AMD Ryzen 9 6900HX (26873 - 30604, n=20) | |
| Intel NUC11PHKi7C | |
| Beelink SEi11 Pro | |
| Beelink GTR5 | |
| Intel NUC11TNKi5 | |
| GMK NucBox 2 | |
Rendimiento del sistema
Los resultados de PCMark 10 son sistemáticamente superiores a los del GTR5 especialmente en la subprueba de creación de contenidos digitales, donde el rendimiento gráfico es lo más importante.
CrossMark: Overall | Productivity | Creativity | Responsiveness
| PCMark 10 / Score | |
| Beelink GTR6 | |
| Medio AMD Ryzen 9 6900HX, AMD Radeon 680M (6251 - 7109, n=7) | |
| Beelink GTR5 | |
| Intel NUC11PHKi7C | |
| Beelink SEi11 Pro | |
| Intel NUC11TNKi5 | |
| GMK NucBox 2 | |
| PCMark 10 / Essentials | |
| Beelink GTR6 | |
| Beelink GTR5 | |
| Medio AMD Ryzen 9 6900HX, AMD Radeon 680M (10029 - 11323, n=7) | |
| Beelink SEi11 Pro | |
| Intel NUC11PHKi7C | |
| Intel NUC11TNKi5 | |
| GMK NucBox 2 | |
| PCMark 10 / Productivity | |
| Beelink GTR6 | |
| Beelink GTR5 | |
| Medio AMD Ryzen 9 6900HX, AMD Radeon 680M (9550 - 10210, n=7) | |
| Intel NUC11PHKi7C | |
| Beelink SEi11 Pro | |
| GMK NucBox 2 | |
| Intel NUC11TNKi5 | |
| PCMark 10 / Digital Content Creation | |
| Beelink GTR6 | |
| Medio AMD Ryzen 9 6900HX, AMD Radeon 680M (6920 - 8703, n=7) | |
| Beelink GTR5 | |
| Intel NUC11PHKi7C | |
| Beelink SEi11 Pro | |
| Intel NUC11TNKi5 | |
| GMK NucBox 2 | |
| CrossMark / Overall | |
| Beelink GTR6 | |
| Medio AMD Ryzen 9 6900HX, AMD Radeon 680M (1476 - 1731, n=7) | |
| Beelink GTR5 | |
| Beelink SEi11 Pro | |
| CrossMark / Productivity | |
| Beelink GTR6 | |
| Medio AMD Ryzen 9 6900HX, AMD Radeon 680M (1451 - 1738, n=7) | |
| Beelink GTR5 | |
| Beelink SEi11 Pro | |
| CrossMark / Creativity | |
| Beelink GTR6 | |
| Medio AMD Ryzen 9 6900HX, AMD Radeon 680M (1632 - 1745, n=7) | |
| Beelink GTR5 | |
| Beelink SEi11 Pro | |
| CrossMark / Responsiveness | |
| Beelink GTR6 | |
| Medio AMD Ryzen 9 6900HX, AMD Radeon 680M (1060 - 1671, n=7) | |
| Beelink SEi11 Pro | |
| Beelink GTR5 | |
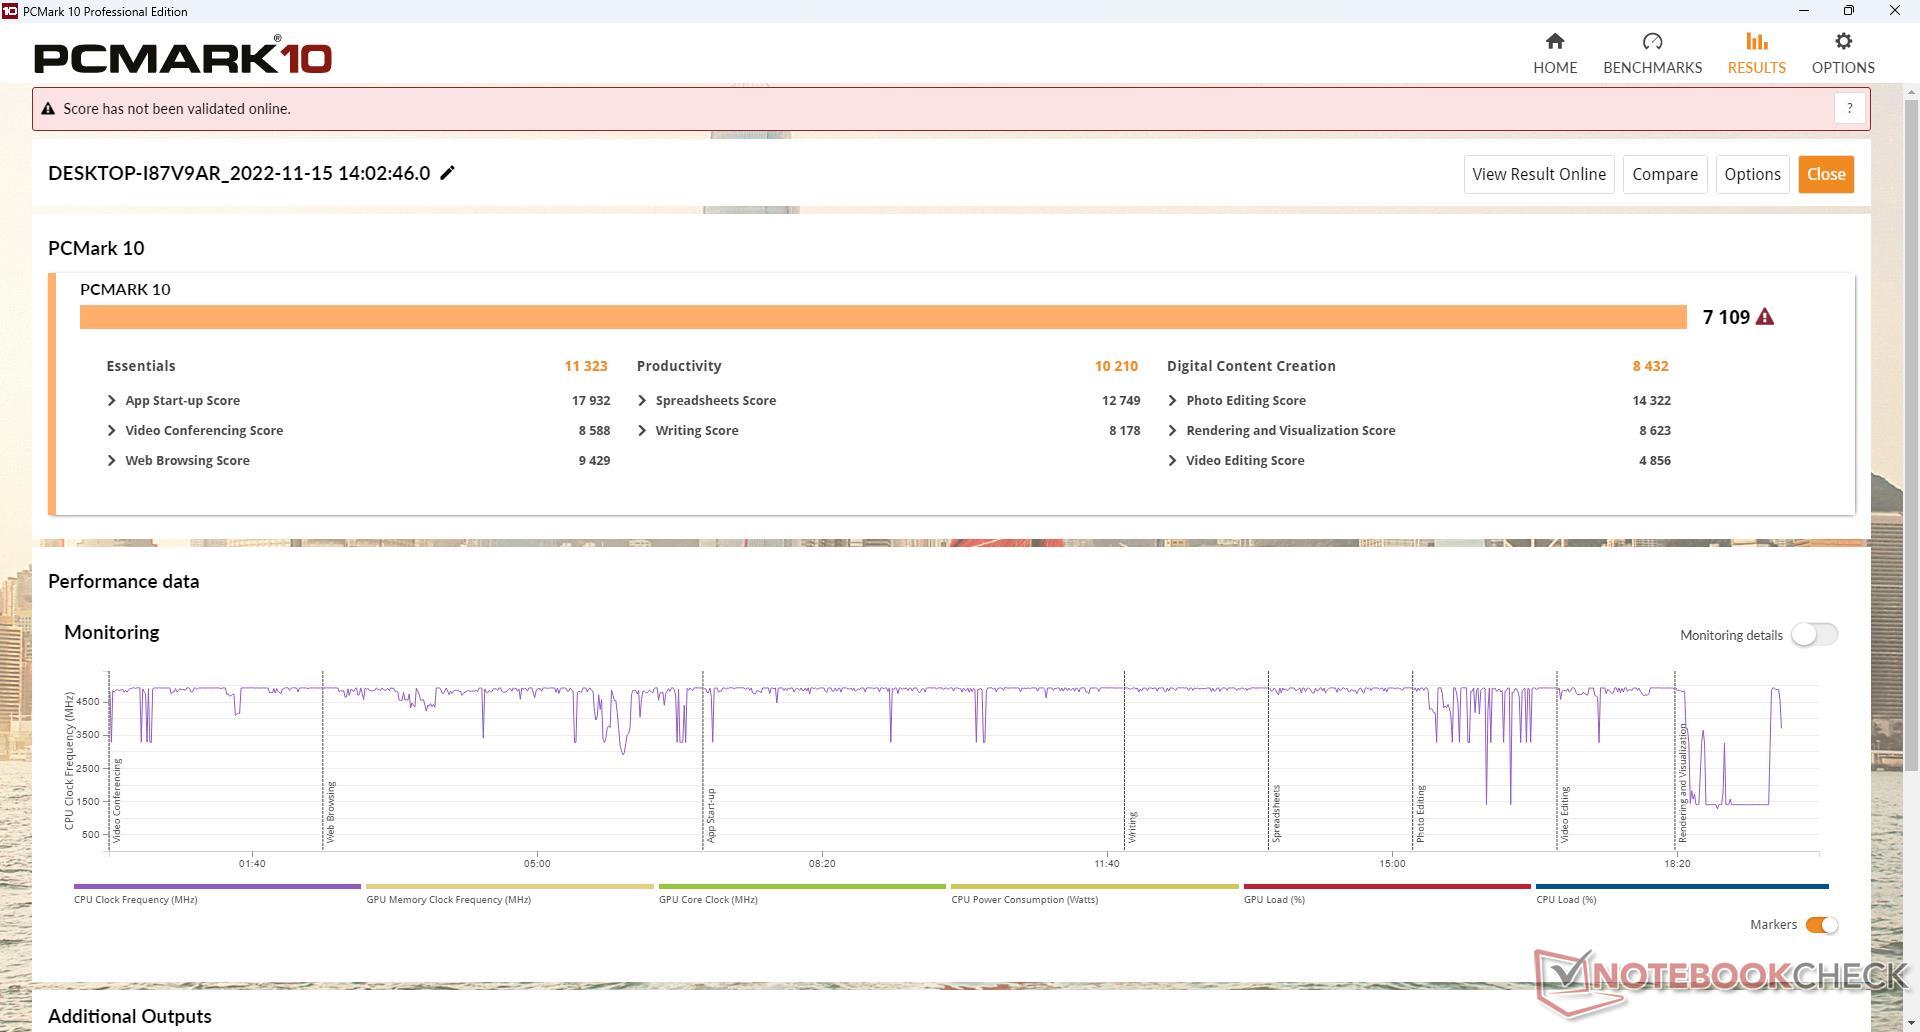
| PCMark 10 Score | 7109 puntos | |
ayuda | ||
| AIDA64 / Memory Copy | |
| Beelink GTR6 | |
| Medio AMD Ryzen 9 6900HX (47938 - 53345, n=20) | |
| GMK NucBox 2 | |
| Beelink GTR5 | |
| Beelink SEi11 Pro | |
| Intel NUC11PHKi7C | |
| Intel NUC11TNKi5 | |
| AIDA64 / Memory Read | |
| Beelink GTR6 | |
| Medio AMD Ryzen 9 6900HX (43892 - 53321, n=20) | |
| Beelink GTR5 | |
| Beelink SEi11 Pro | |
| Intel NUC11PHKi7C | |
| GMK NucBox 2 | |
| Intel NUC11TNKi5 | |
| AIDA64 / Memory Write | |
| Beelink GTR6 | |
| Medio AMD Ryzen 9 6900HX (51085 - 57202, n=20) | |
| GMK NucBox 2 | |
| Beelink SEi11 Pro | |
| Beelink GTR5 | |
| Intel NUC11PHKi7C | |
| Intel NUC11TNKi5 | |
| AIDA64 / Memory Latency | |
| Intel NUC11PHKi7C | |
| Medio AMD Ryzen 9 6900HX (80.7 - 120.6, n=20) | |
| Intel NUC11TNKi5 | |
| Beelink GTR6 | |
| Beelink SEi11 Pro | |
| Beelink GTR5 | |
| GMK NucBox 2 | |
* ... más pequeño es mejor
Latencia del CPD
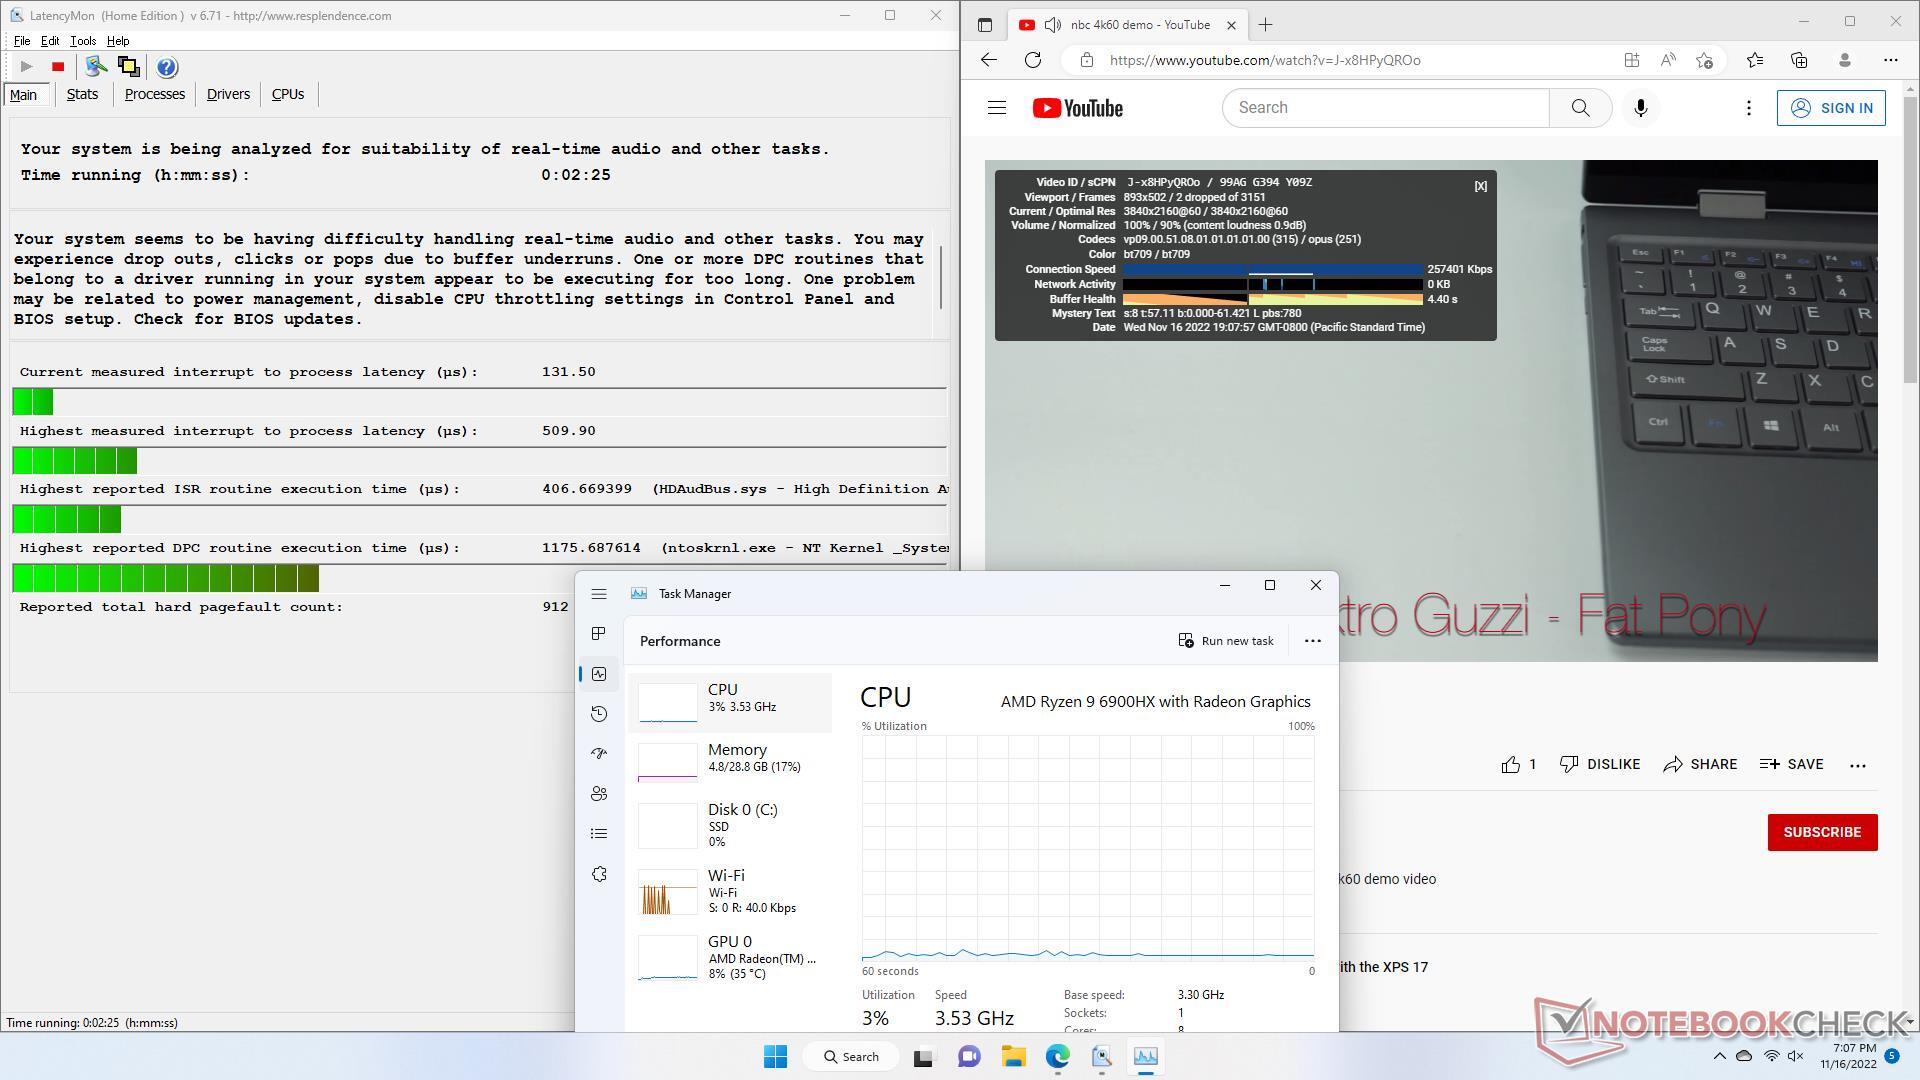
Hay problemas menores de CPD al abrir varias pestañas del navegador en nuestra página de inicio. la reproducción de vídeo 4K a 60 FPS es, por lo demás, excelente, con sólo 2 fotogramas perdidos durante nuestro vídeo de prueba de un minuto. El uso del procesador es muy bajo en comparación con los PCs con CPUs de la serie U más lentas.
| DPC Latencies / LatencyMon - interrupt to process latency (max), Web, Youtube, Prime95 | |
| Intel NUC11PHKi7C | |
| GMK NucBox 2 | |
| Intel NUC11TNKi5 | |
| Beelink GTR6 | |
| Beelink SEi11 Pro | |
| Beelink GTR5 | |
* ... más pequeño es mejor
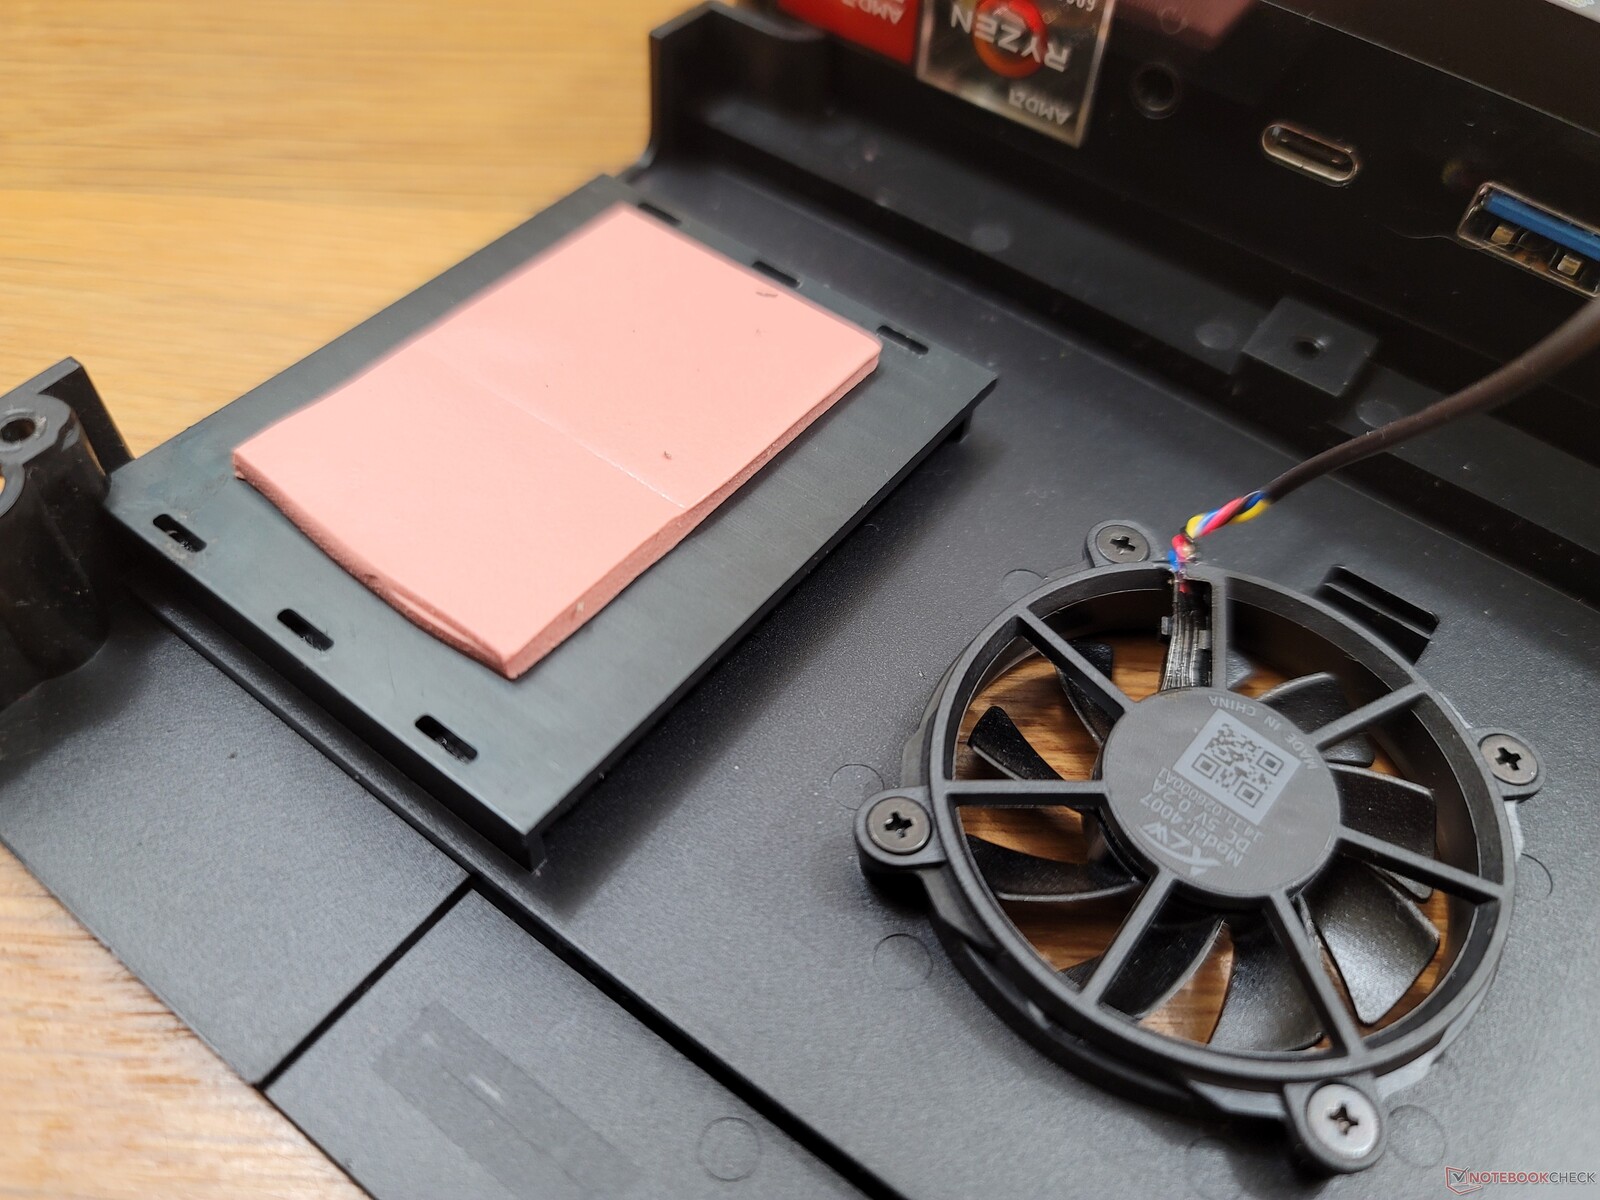
Dispositivos de almacenamiento - Refrigeración SSD incluida
Nuestra unidad se envía con una unidad de 512 GB Kingston KC3000 PCIe4 x4 NVMe SSD que ofrece velocidades de lectura y escritura secuenciales de hasta 7000 MB/s y 4000 MB/s, respectivamente. La unidad no presenta problemas para mantener las tasas de transferencia máximas durante periodos prolongados, ya que el disipador de calor y la almohadilla térmica del SSD vienen preinstalados.

| Drive Performance rating - Percent | |
| Beelink GTR6 | |
| Intel NUC11PHKi7C | |
| Beelink SEi11 Pro | |
| Beelink GTR5 | |
| GMK NucBox 2 | |
| Intel NUC11TNKi5 | |
* ... más pequeño es mejor
Disk Throttling: DiskSpd Read Loop, Queue Depth 8
Rendimiento de la GPU: los gráficos integrados más rápidos
El Radeon 680M sigue impresionando con resultados que son aproximadamente un 60% más rápidos que la Radeon RX Vega 8 en el Ryzen 9 5900HX de última generación. Esto sitúa a la nueva GPU integrada de AMD muy por delante de cualquier solución Intel Iris Xe 96 EUs en un 50 por ciento o más. Las GPU dedicadas de gama baja como la GeForce GTX 1060 o la GTX 1650 siguen siendo mucho más rápidas, pero la 680M es impresionante para una GPU integrada. La mayoría de los títulos se pueden jugar con ajustes bajos o medios a una resolución de 1080p, incluso Cyberpunk 2077.
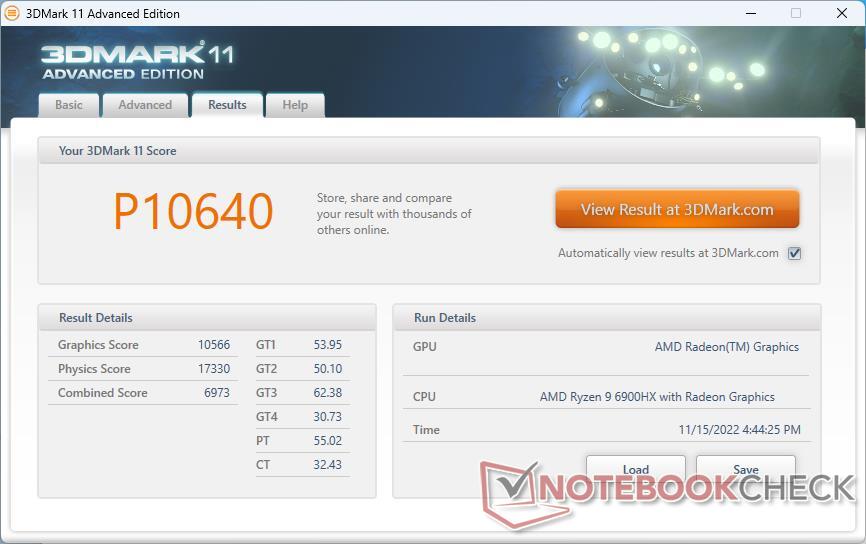
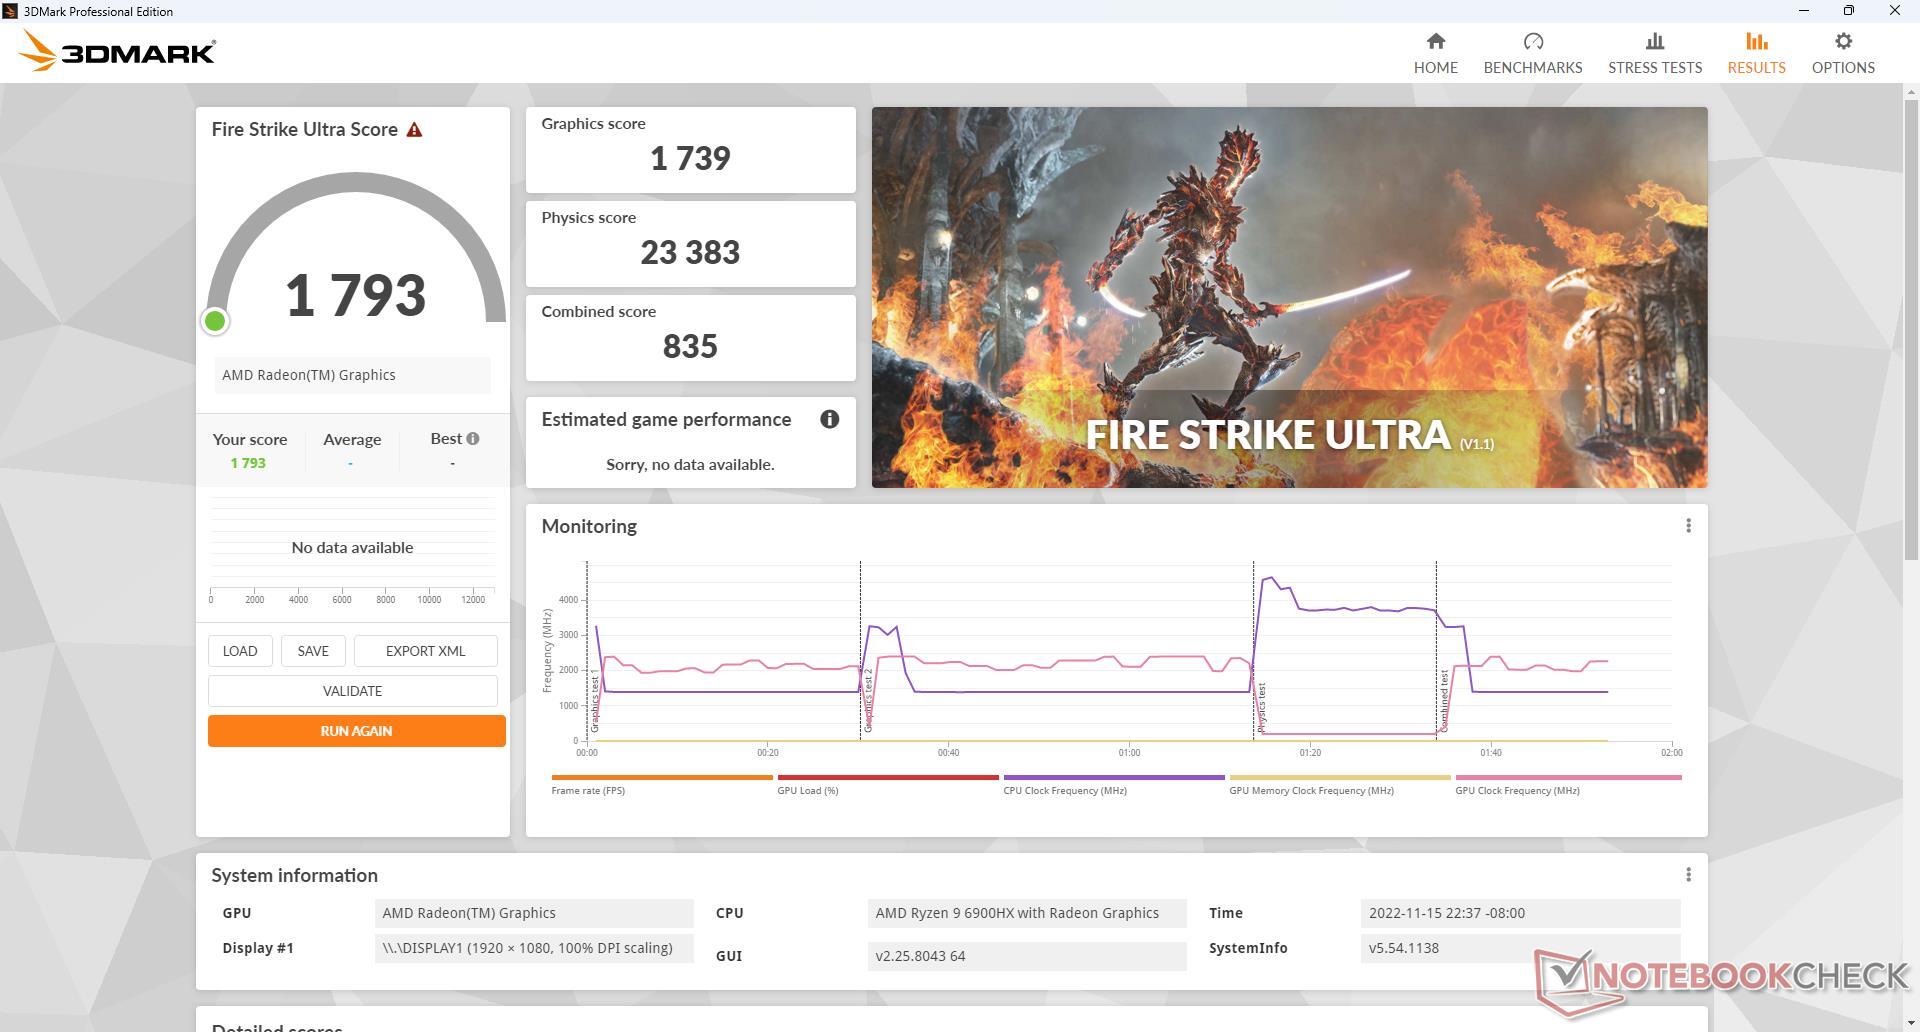
| 3DMark 11 Performance | 10640 puntos | |
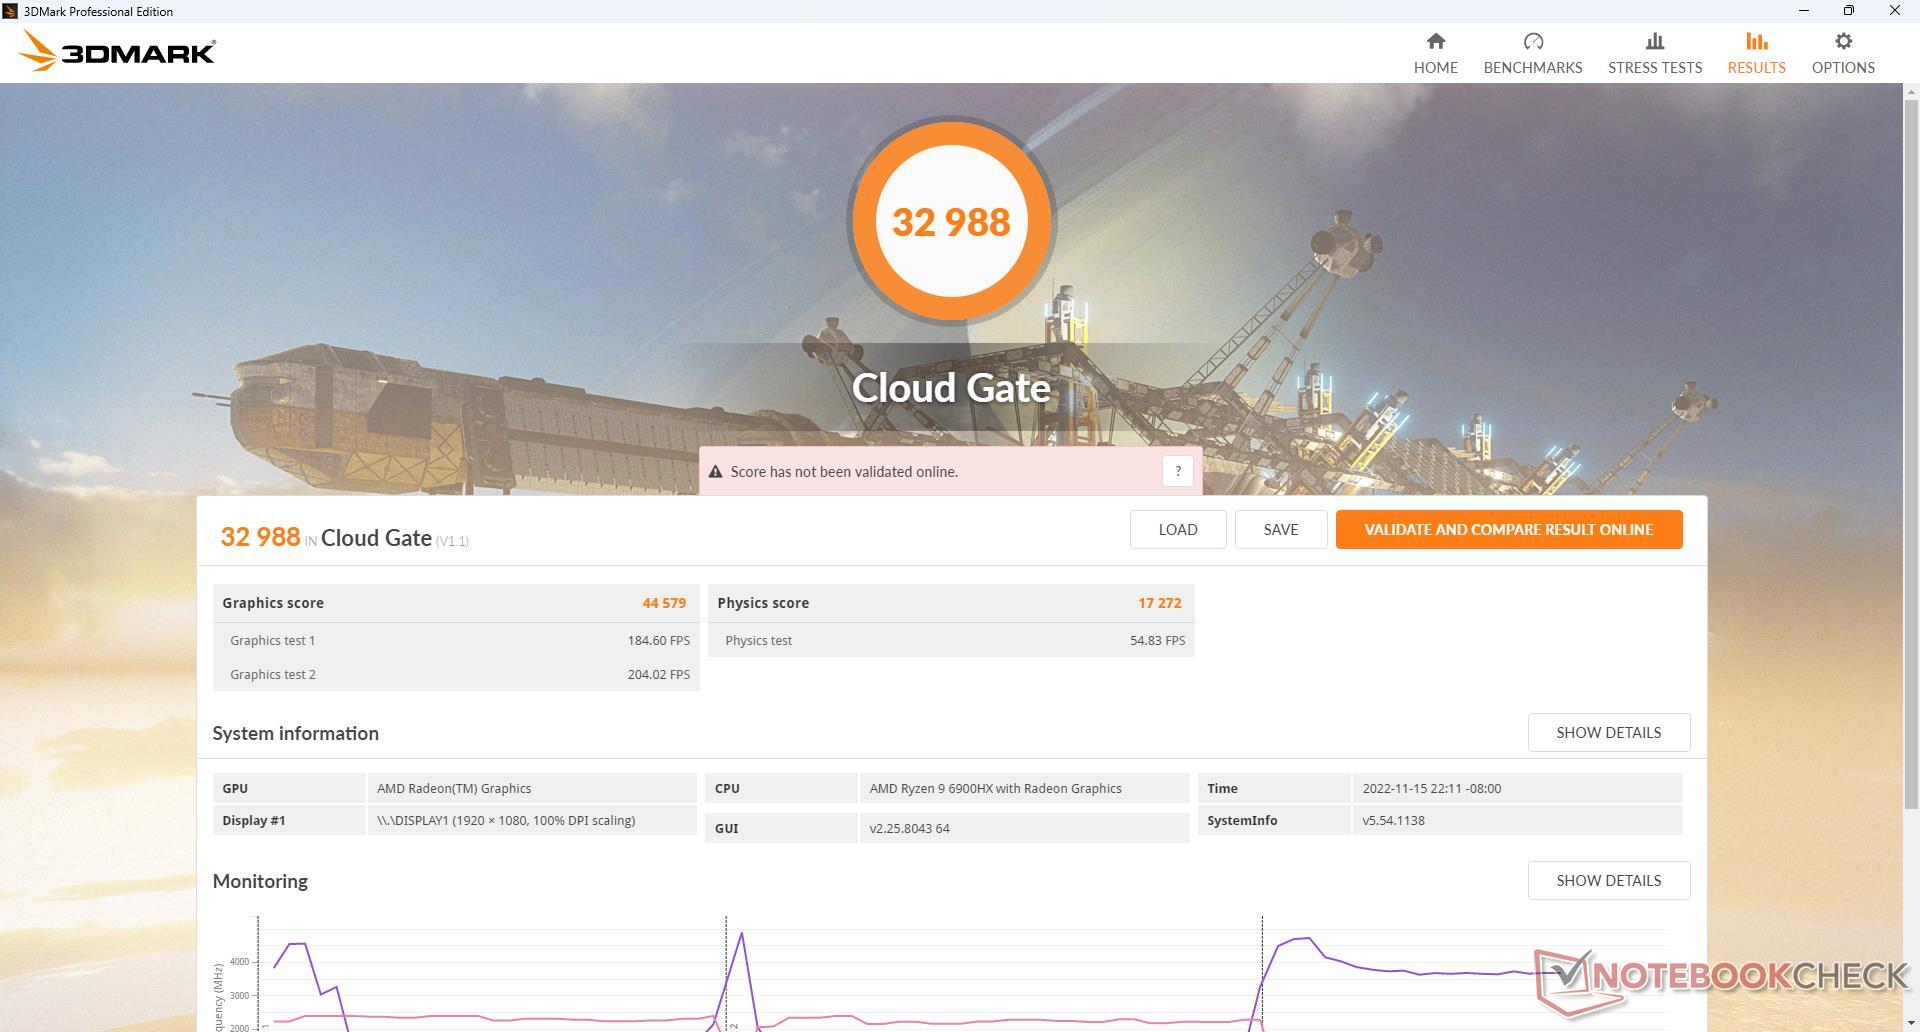
| 3DMark Cloud Gate Standard Score | 32988 puntos | |
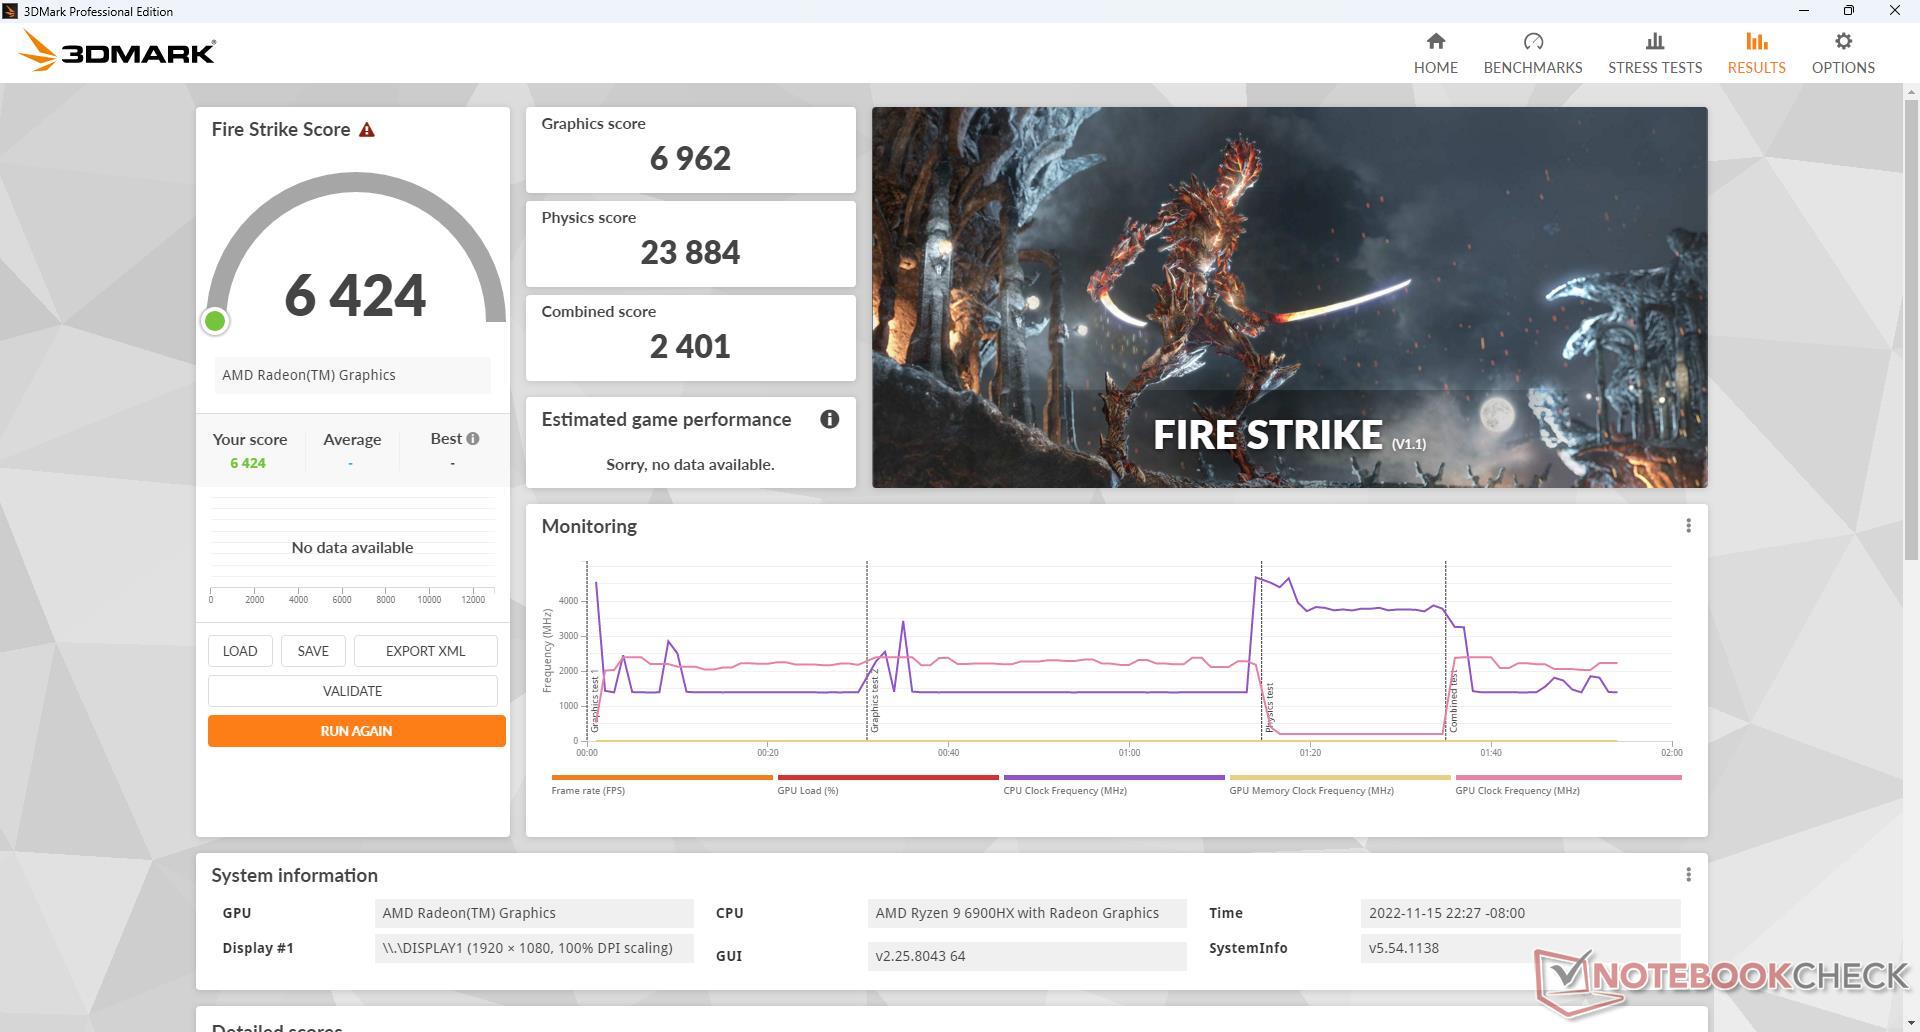
| 3DMark Fire Strike Score | 6424 puntos | |
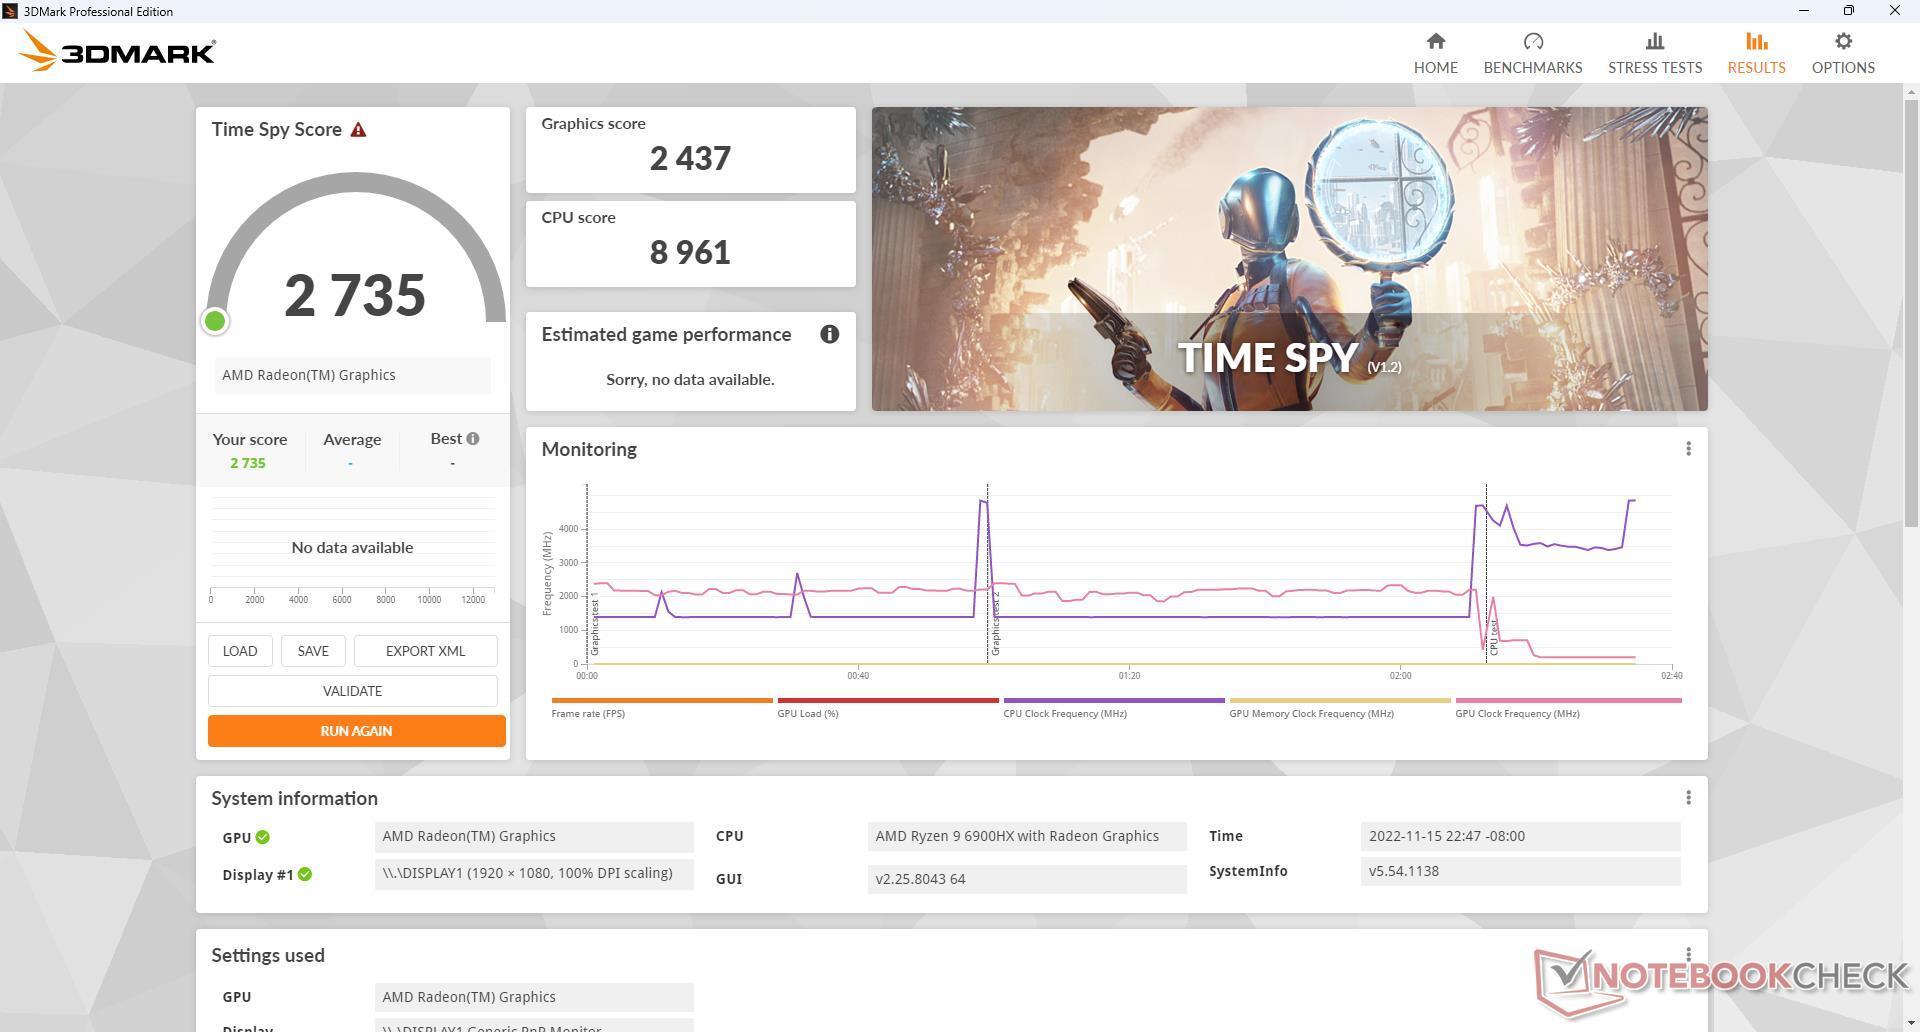
| 3DMark Time Spy Score | 2735 puntos | |
ayuda | ||
| Blender | |
| v3.3 Classroom HIP/AMD | |
| Beelink GTR6 | |
| Medio AMD Radeon 680M (270 - 555, n=34) | |
| v3.3 Classroom CPU | |
| Beelink SEi11 Pro | |
| Medio AMD Radeon 680M (389 - 980, n=37) | |
| Beelink GTR6 | |
* ... más pequeño es mejor
| Performance rating - Percent | |
| Intel NUC11PHKi7C | |
| Beelink GTR6 | |
| Beelink GTR5 | |
| Beelink SEi11 Pro -1! | |
| Intel NUC11TNKi5 -3! | |
| GMK NucBox 2 -3! | |
| The Witcher 3 - 1920x1080 Ultra Graphics & Postprocessing (HBAO+) | |
| Intel NUC11PHKi7C | |
| Beelink GTR6 | |
| Beelink GTR5 | |
| Beelink SEi11 Pro | |
| GTA V - 1920x1080 Highest AA:4xMSAA + FX AF:16x | |
| Intel NUC11PHKi7C | |
| Beelink GTR6 | |
| Beelink GTR5 | |
| Final Fantasy XV Benchmark - 1920x1080 High Quality | |
| Intel NUC11PHKi7C | |
| Beelink GTR6 | |
| Beelink GTR5 | |
| Beelink SEi11 Pro | |
| Intel NUC11TNKi5 | |
| GMK NucBox 2 | |
| Strange Brigade - 1920x1080 ultra AA:ultra AF:16 | |
| Intel NUC11PHKi7C | |
| Beelink GTR6 | |
| Beelink GTR5 | |
| Beelink SEi11 Pro | |
| Dota 2 Reborn - 1920x1080 ultra (3/3) best looking | |
| Intel NUC11PHKi7C | |
| Beelink GTR6 | |
| Beelink GTR5 | |
| Beelink SEi11 Pro | |
| Intel NUC11TNKi5 | |
| GMK NucBox 2 | |
| X-Plane 11.11 - 1920x1080 high (fps_test=3) | |
| Intel NUC11PHKi7C | |
| Beelink GTR6 | |
| Beelink GTR5 | |
| Beelink SEi11 Pro | |
| Intel NUC11TNKi5 | |
| GMK NucBox 2 | |
| Final Fantasy XV Benchmark | |
| 1280x720 Lite Quality | |
| Intel NUC11PHKi7C | |
| Beelink GTR6 | |
| Medio AMD Radeon 680M (34.4 - 74.7, n=39) | |
| Beelink GTR5 | |
| Beelink SEi11 Pro | |
| Intel NUC11TNKi5 | |
| GMK NucBox 2 | |
| 1920x1080 Standard Quality | |
| Intel NUC11PHKi7C | |
| Beelink GTR6 | |
| Medio AMD Radeon 680M (18.3 - 36.9, n=40) | |
| Beelink GTR5 | |
| Beelink SEi11 Pro | |
| Intel NUC11TNKi5 | |
| GMK NucBox 2 | |
| 1920x1080 High Quality | |
| Intel NUC11PHKi7C | |
| Beelink GTR6 | |
| Medio AMD Radeon 680M (12.9 - 26.2, n=40) | |
| Beelink GTR5 | |
| Beelink SEi11 Pro | |
| Intel NUC11TNKi5 | |
| GMK NucBox 2 | |
| The Witcher 3 | |
| 1024x768 Low Graphics & Postprocessing | |
| Intel NUC11PHKi7C | |
| Beelink GTR6 | |
| Medio AMD Radeon 680M (67.4 - 150, n=31) | |
| Beelink SEi11 Pro | |
| Beelink GTR5 | |
| Intel NUC11TNKi5 | |
| 1366x768 Medium Graphics & Postprocessing | |
| Intel NUC11PHKi7C | |
| Beelink GTR6 | |
| Medio AMD Radeon 680M (44.5 - 85.3, n=24) | |
| Beelink GTR5 | |
| Beelink SEi11 Pro | |
| 1920x1080 High Graphics & Postprocessing (Nvidia HairWorks Off) | |
| Intel NUC11PHKi7C | |
| Beelink GTR6 | |
| Medio AMD Radeon 680M (22.3 - 48, n=33) | |
| Beelink SEi11 Pro | |
| Beelink GTR5 | |
| 1920x1080 Ultra Graphics & Postprocessing (HBAO+) | |
| Intel NUC11PHKi7C | |
| Beelink GTR6 | |
| Medio AMD Radeon 680M (14.3 - 27.1, n=33) | |
| Beelink GTR5 | |
| Beelink SEi11 Pro | |
| GTA V | |
| 1024x768 Lowest Settings possible | |
| Intel NUC11PHKi7C | |
| Beelink GTR6 | |
| Beelink GTR5 | |
| Medio AMD Radeon 680M (67.7 - 155.4, n=35) | |
| Beelink SEi11 Pro | |
| 1920x1080 Lowest Settings possible | |
| Intel NUC11PHKi7C | |
| Beelink GTR6 | |
| Medio AMD Radeon 680M (56.9 - 115.8, n=27) | |
| Beelink GTR5 | |
| Beelink SEi11 Pro | |
| 1366x768 Normal/Off AF:4x | |
| Intel NUC11PHKi7C | |
| Beelink GTR6 | |
| Beelink GTR5 | |
| Medio AMD Radeon 680M (60.7 - 143.9, n=32) | |
| Beelink SEi11 Pro | |
| 1920x1080 Normal/Off AF:4x | |
| Intel NUC11PHKi7C | |
| Beelink GTR6 | |
| Medio AMD Radeon 680M (54.9 - 117.3, n=27) | |
| Beelink GTR5 | |
| Beelink SEi11 Pro | |
| 1920x1080 High/On (Advanced Graphics Off) AA:2xMSAA + FX AF:8x | |
| Intel NUC11PHKi7C | |
| Beelink GTR6 | |
| Medio AMD Radeon 680M (25.9 - 99.1, n=37) | |
| Beelink GTR5 | |
| Beelink SEi11 Pro | |
| 1920x1080 Highest AA:4xMSAA + FX AF:16x | |
| Intel NUC11PHKi7C | |
| Beelink GTR6 | |
| Medio AMD Radeon 680M (11.3 - 25.3, n=37) | |
| Beelink GTR5 | |
| Cyberpunk 2077 1.6 | |
| 1280x720 Low Preset | |
| Beelink GTR6 | |
| Medio AMD Radeon 680M (46.1 - 77.6, n=14) | |
| 1920x1080 Low Preset | |
| Beelink GTR6 | |
| Medio AMD Radeon 680M (26 - 50.6, n=15) | |
| Beelink SEi11 Pro | |
| 1920x1080 Medium Preset | |
| Beelink GTR6 | |
| Medio AMD Radeon 680M (20.1 - 41.8, n=15) | |
| Beelink SEi11 Pro | |
| 1920x1080 High Preset | |
| Beelink GTR6 | |
| Medio AMD Radeon 680M (16.3 - 33.6, n=15) | |
| Beelink SEi11 Pro | |
| 1920x1080 Ultra Preset | |
| Beelink GTR6 | |
| Medio AMD Radeon 680M (14 - 23.8, n=15) | |
| Beelink SEi11 Pro | |
| X-Plane 11.11 | |
| 1280x720 low (fps_test=1) | |
| Intel NUC11PHKi7C | |
| Beelink GTR6 | |
| Beelink GTR5 | |
| Beelink SEi11 Pro | |
| Medio AMD Radeon 680M (26.8 - 66.7, n=41) | |
| Intel NUC11TNKi5 | |
| GMK NucBox 2 | |
| 1920x1080 med (fps_test=2) | |
| Intel NUC11PHKi7C | |
| Beelink GTR6 | |
| Beelink GTR5 | |
| Medio AMD Radeon 680M (21.1 - 53.1, n=41) | |
| Beelink SEi11 Pro | |
| Intel NUC11TNKi5 | |
| GMK NucBox 2 | |
| 1920x1080 high (fps_test=3) | |
| Intel NUC11PHKi7C | |
| Beelink GTR6 | |
| Beelink GTR5 | |
| Beelink SEi11 Pro | |
| Medio AMD Radeon 680M (16.6 - 44.5, n=41) | |
| Intel NUC11TNKi5 | |
| GMK NucBox 2 | |
| Strange Brigade | |
| 1280x720 lowest AF:1 | |
| Intel NUC11PHKi7C | |
| Beelink GTR6 | |
| Medio AMD Radeon 680M (72.9 - 167.5, n=38) | |
| Beelink GTR5 | |
| Beelink SEi11 Pro | |
| 1920x1080 medium AA:medium AF:4 | |
| Intel NUC11PHKi7C | |
| Beelink GTR6 | |
| Medio AMD Radeon 680M (30 - 63, n=38) | |
| Beelink GTR5 | |
| Beelink SEi11 Pro | |
| 1920x1080 high AA:high AF:8 | |
| Intel NUC11PHKi7C | |
| Beelink GTR6 | |
| Medio AMD Radeon 680M (25.3 - 53.1, n=38) | |
| Beelink GTR5 | |
| Beelink SEi11 Pro | |
| 1920x1080 ultra AA:ultra AF:16 | |
| Intel NUC11PHKi7C | |
| Beelink GTR6 | |
| Medio AMD Radeon 680M (22 - 46, n=38) | |
| Beelink GTR5 | |
| Beelink SEi11 Pro | |
Witcher 3 FPS Chart
| bajo | medio | alto | ultra | |
|---|---|---|---|---|
| GTA V (2015) | 152.6 | 138 | 51.8 | 23.7 |
| The Witcher 3 (2015) | 139.2 | 84 | 46 | 27.1 |
| Dota 2 Reborn (2015) | 141.9 | 112.7 | 80.9 | 71.4 |
| Final Fantasy XV Benchmark (2018) | 68.5 | 34.9 | 24.5 | |
| X-Plane 11.11 (2018) | 64.8 | 52.6 | 41.8 | |
| Strange Brigade (2018) | 142.4 | 57.4 | 48.5 | 41.6 |
| Cyberpunk 2077 1.6 (2022) | 43 | 33 | 22.3 | 17.5 |
Emisiones
Ruido del sistema
El ruido del ventilador es quizás el que más atención necesita por parte del fabricante. El GTR6 pulsa constantemente entre 23 dB(A) y hasta 36 dB(A) incluso cuando no hay actividad en la pantalla. Los cambios en el ruido del ventilador son notables y distraen si simplemente se navega por la web o se hace streaming de vídeo. La mayoría de los otros mini PCs tienen controles de ventilador y comportamiento de RPM superiores a los del GTR6
El ruido del ventilador se estabiliza en el rango bajo de 40 dB(A) cuando se juega, lo que es al menos comparable a muchos Ultrabooks y al antiguo GTR5 bajo condiciones de prueba similares. Es una pena que el ventilador pulse con tanta frecuencia durante cargas bajas o medias.
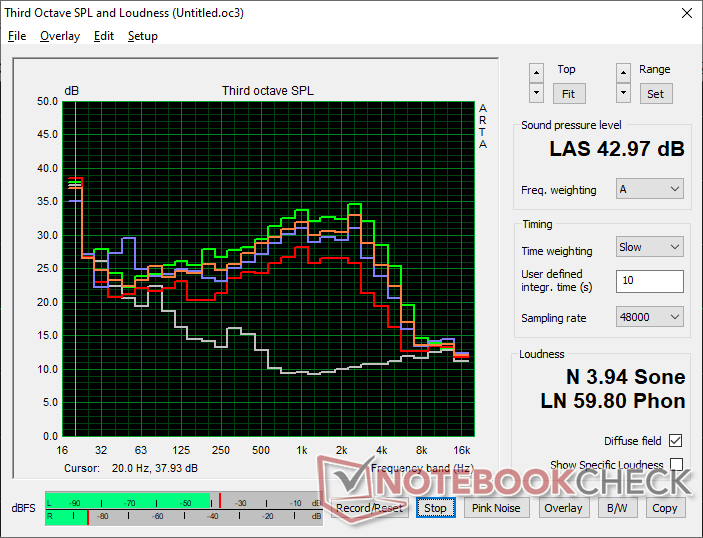
Ruido
| Ocioso |
| 23.6 / 23.8 / 36.2 dB(A) |
| Carga |
| 39.7 / 43 dB(A) |
 | ||
30 dB silencioso 40 dB(A) audible 50 dB(A) ruidosamente alto |
||
min: | ||
| Beelink GTR6 Radeon 680M, R9 6900HX, Kingston KC3000 512G SKC3000S512G | Beelink SEi11 Pro Iris Xe G7 96EUs, i5-11320H, Kingston NV1 SNVS/500GCN | Beelink GTR5 Vega 8, R9 5900HX, Kingston NV1 SNVS/500GCN | Intel NUC11PHKi7C GeForce RTX 2060 Mobile, i7-1165G7, Samsung SSD 980 Pro 500GB MZ-V8P500BW | Intel NUC11TNKi5 Iris Xe G7 80EUs, i5-1135G7, Transcend M.2 SSD 430S TS512GMTS430S | GMK NucBox 2 Iris Plus Graphics 655, i5-8259U, Netac S930E8/256GPN | |
|---|---|---|---|---|---|---|
| Noise | 10% | -14% | 2% | -14% | 5% | |
| apagado / medio ambiente * (dB) | 23.2 | 22.8 2% | 23.1 -0% | 24.5 -6% | 24.8 -7% | 25.6 -10% |
| Idle Minimum * (dB) | 23.6 | 24.7 -5% | 34.2 -45% | 25.3 -7% | 35.6 -51% | 25.7 -9% |
| Idle Average * (dB) | 23.8 | 24.7 -4% | 34.2 -44% | 25.3 -6% | 35.6 -50% | 25.7 -8% |
| Idle Maximum * (dB) | 36.2 | 25.3 30% | 34.2 6% | 25.3 30% | 35.6 2% | 25.7 29% |
| Load Average * (dB) | 39.7 | 33.2 16% | 44.6 -12% | 36.4 8% | 36.2 9% | 35.3 11% |
| Witcher 3 ultra * (dB) | 41 | 34.5 16% | 41.4 -1% | 39.7 3% | 38 7% | |
| Load Maximum * (dB) | 43 | 37.8 12% | 45.1 -5% | 47.9 -11% | 47.6 -11% | 35.1 18% |
* ... más pequeño es mejor
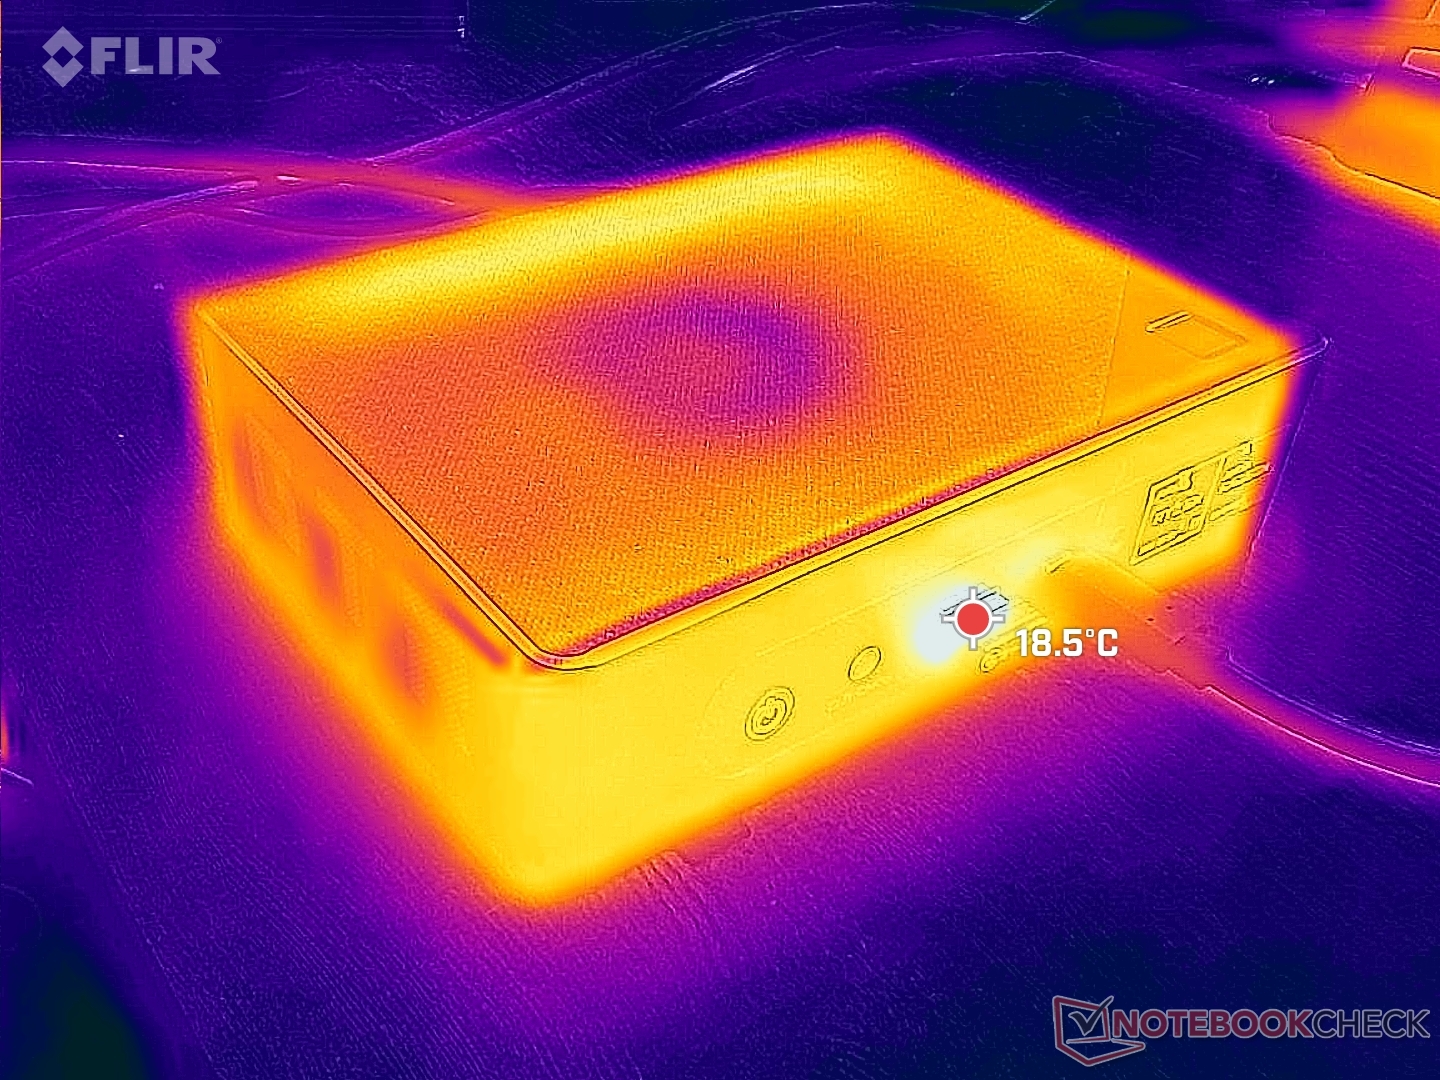
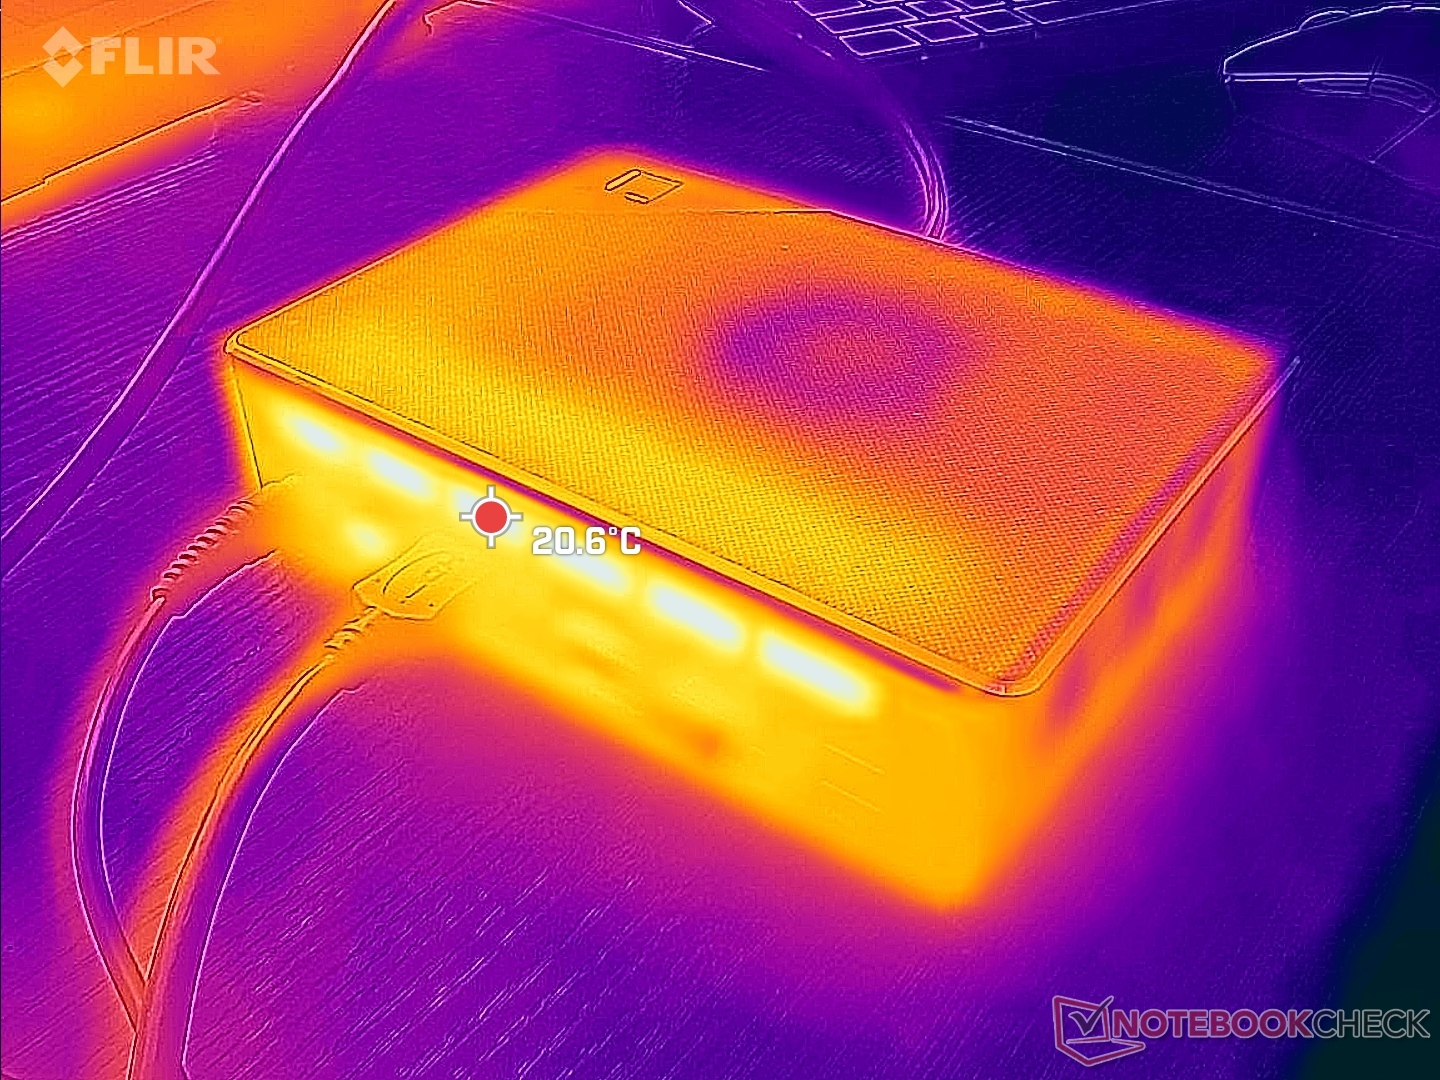
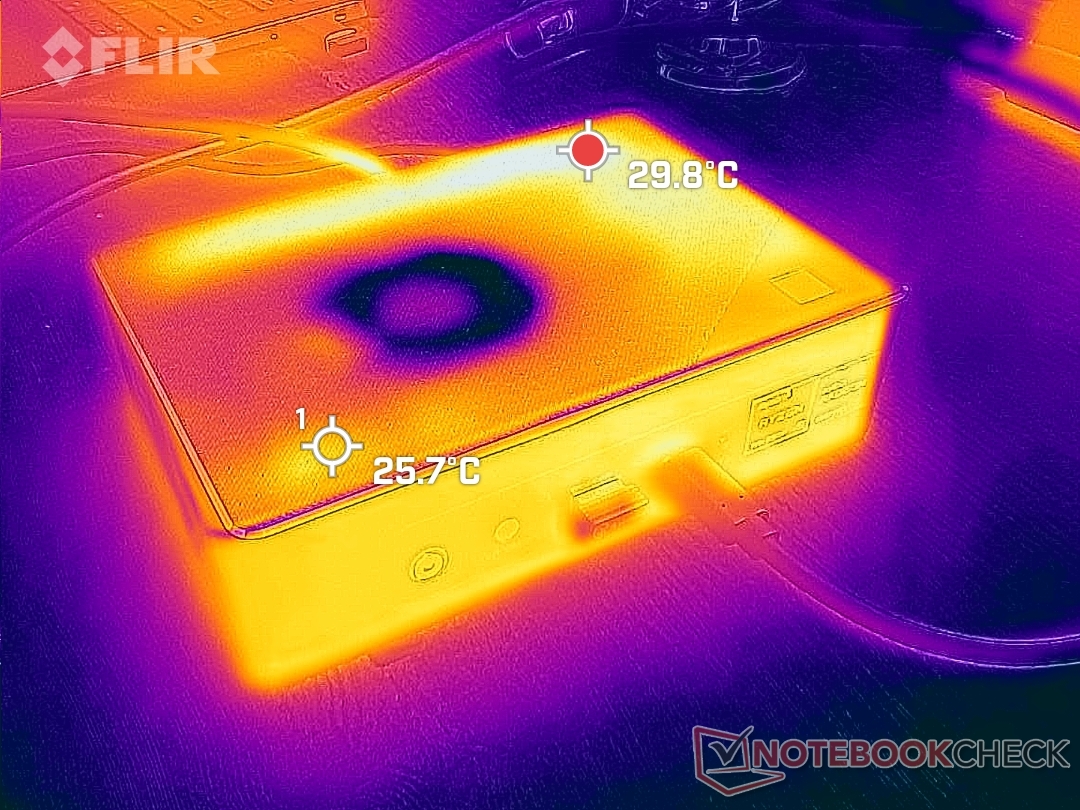
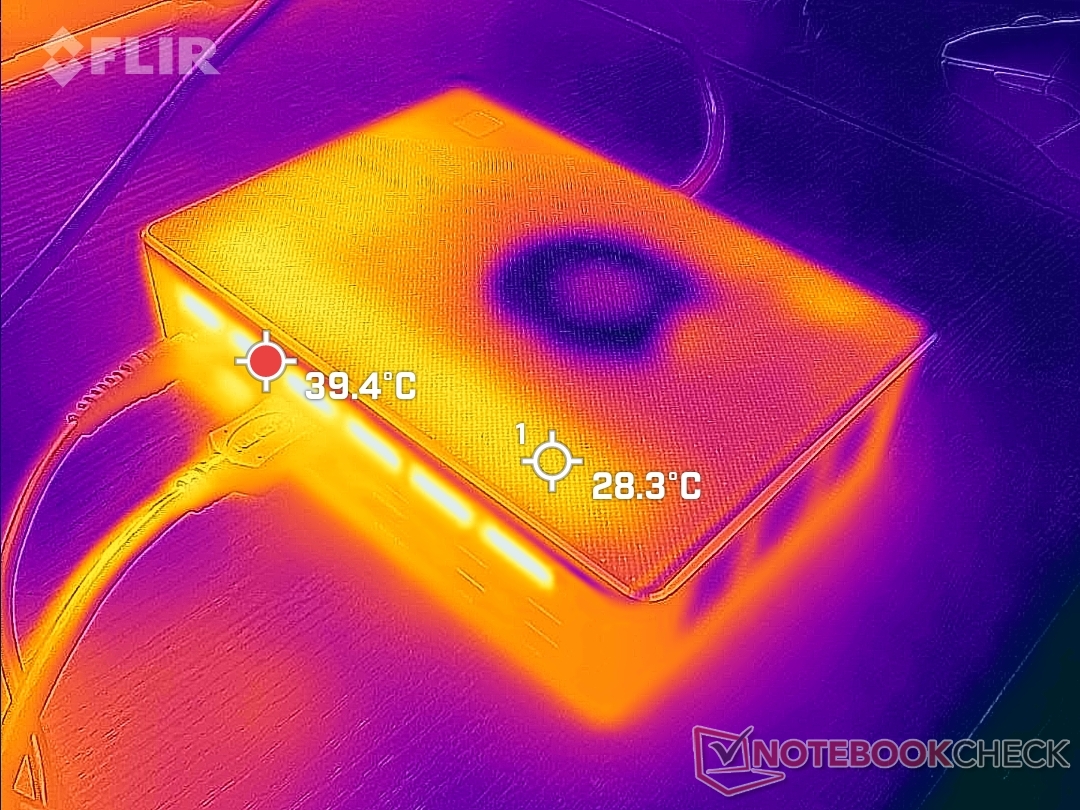
Temperatura
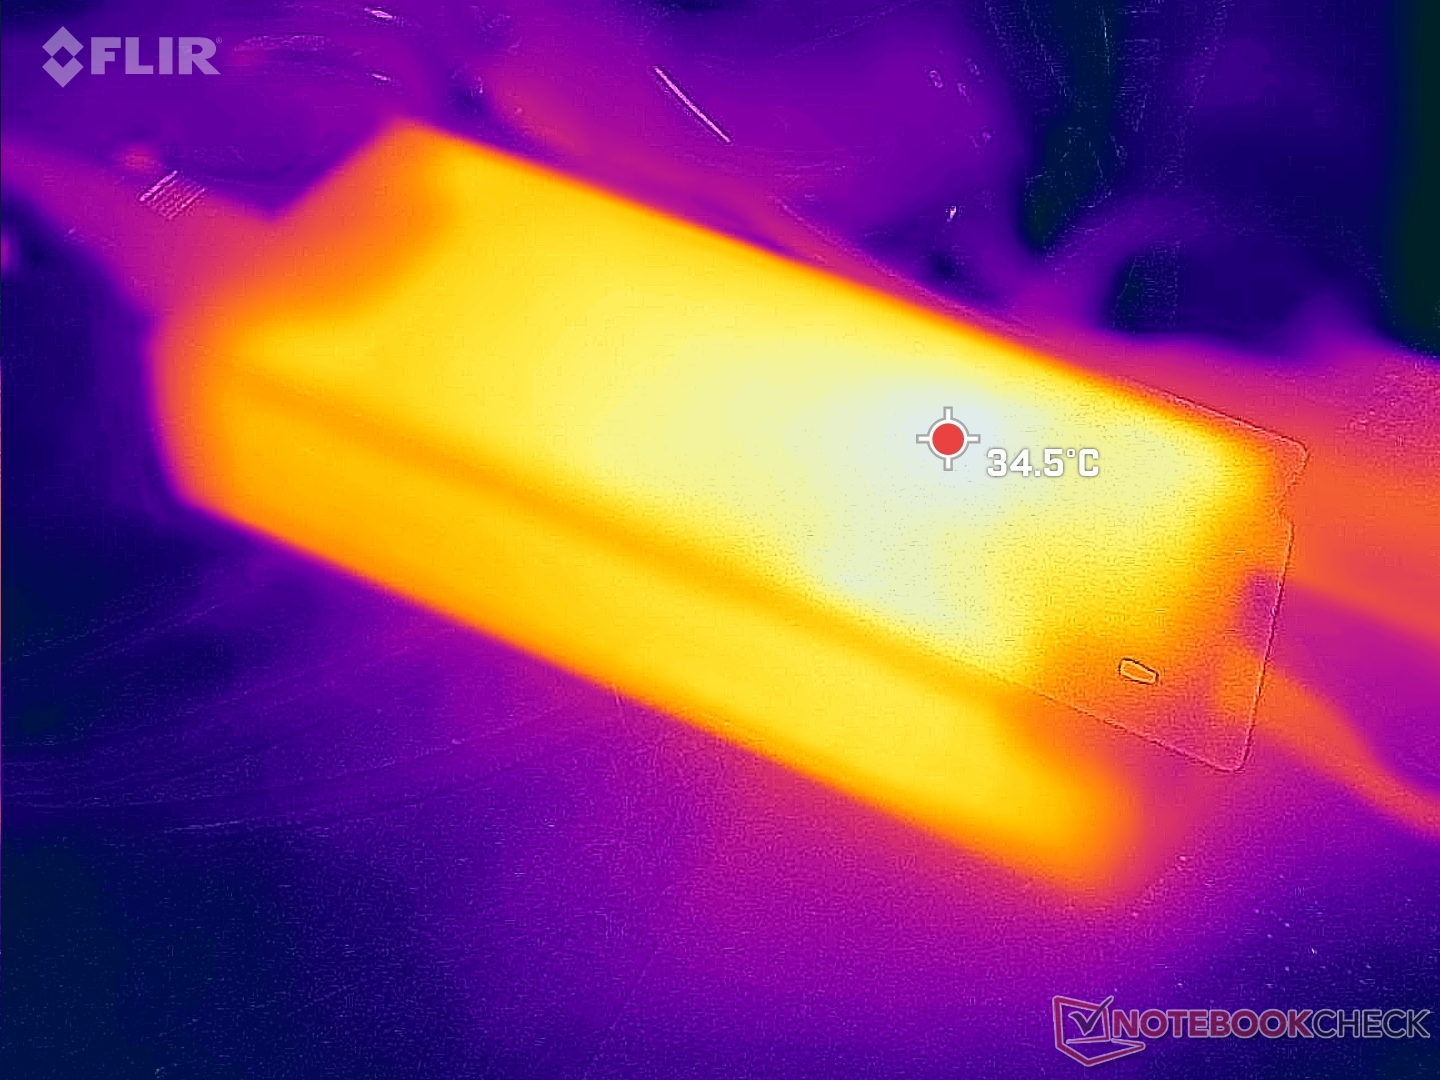
La temperatura de la superficie no es un problema, ya que nunca está incómodamente caliente. Sin embargo, tenga en cuenta que el aire frío entra por la parte superior, por lo que no se recomienda colocar libros u objetos encima de la unidad. Asegúrese de dejar un amplio espacio detrás de la unidad donde el calor residual sale.
Prueba de esfuerzo
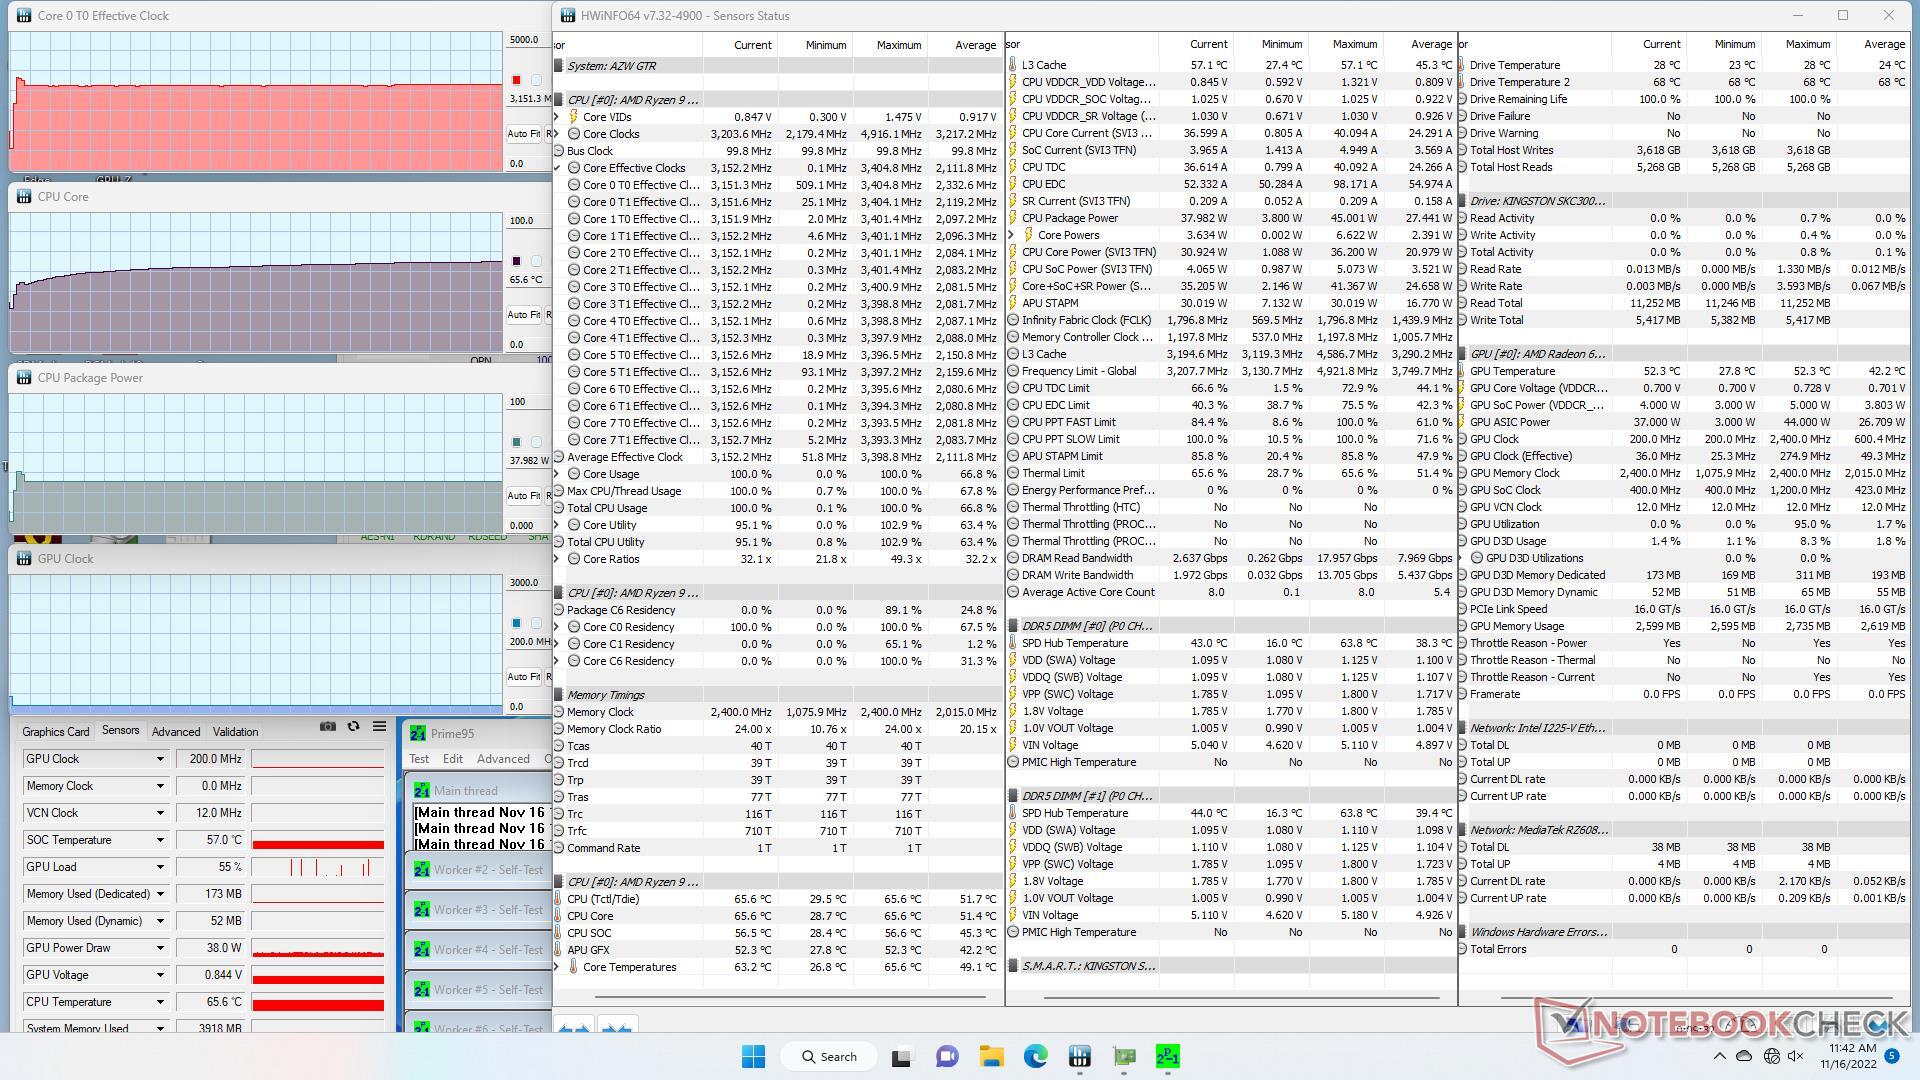
Cuando se estresa con Prime95, la CPU sube a 3,4 GHz y 45 W durante unos pocos segundos antes de estabilizarse en 3,1 GHz, 38 W y 66 C. Definitivamente, hay espacio para el overclocking del usuario final, ya que el fabricante parece haber establecido un techo de temperatura conservador con la configuración predeterminada.
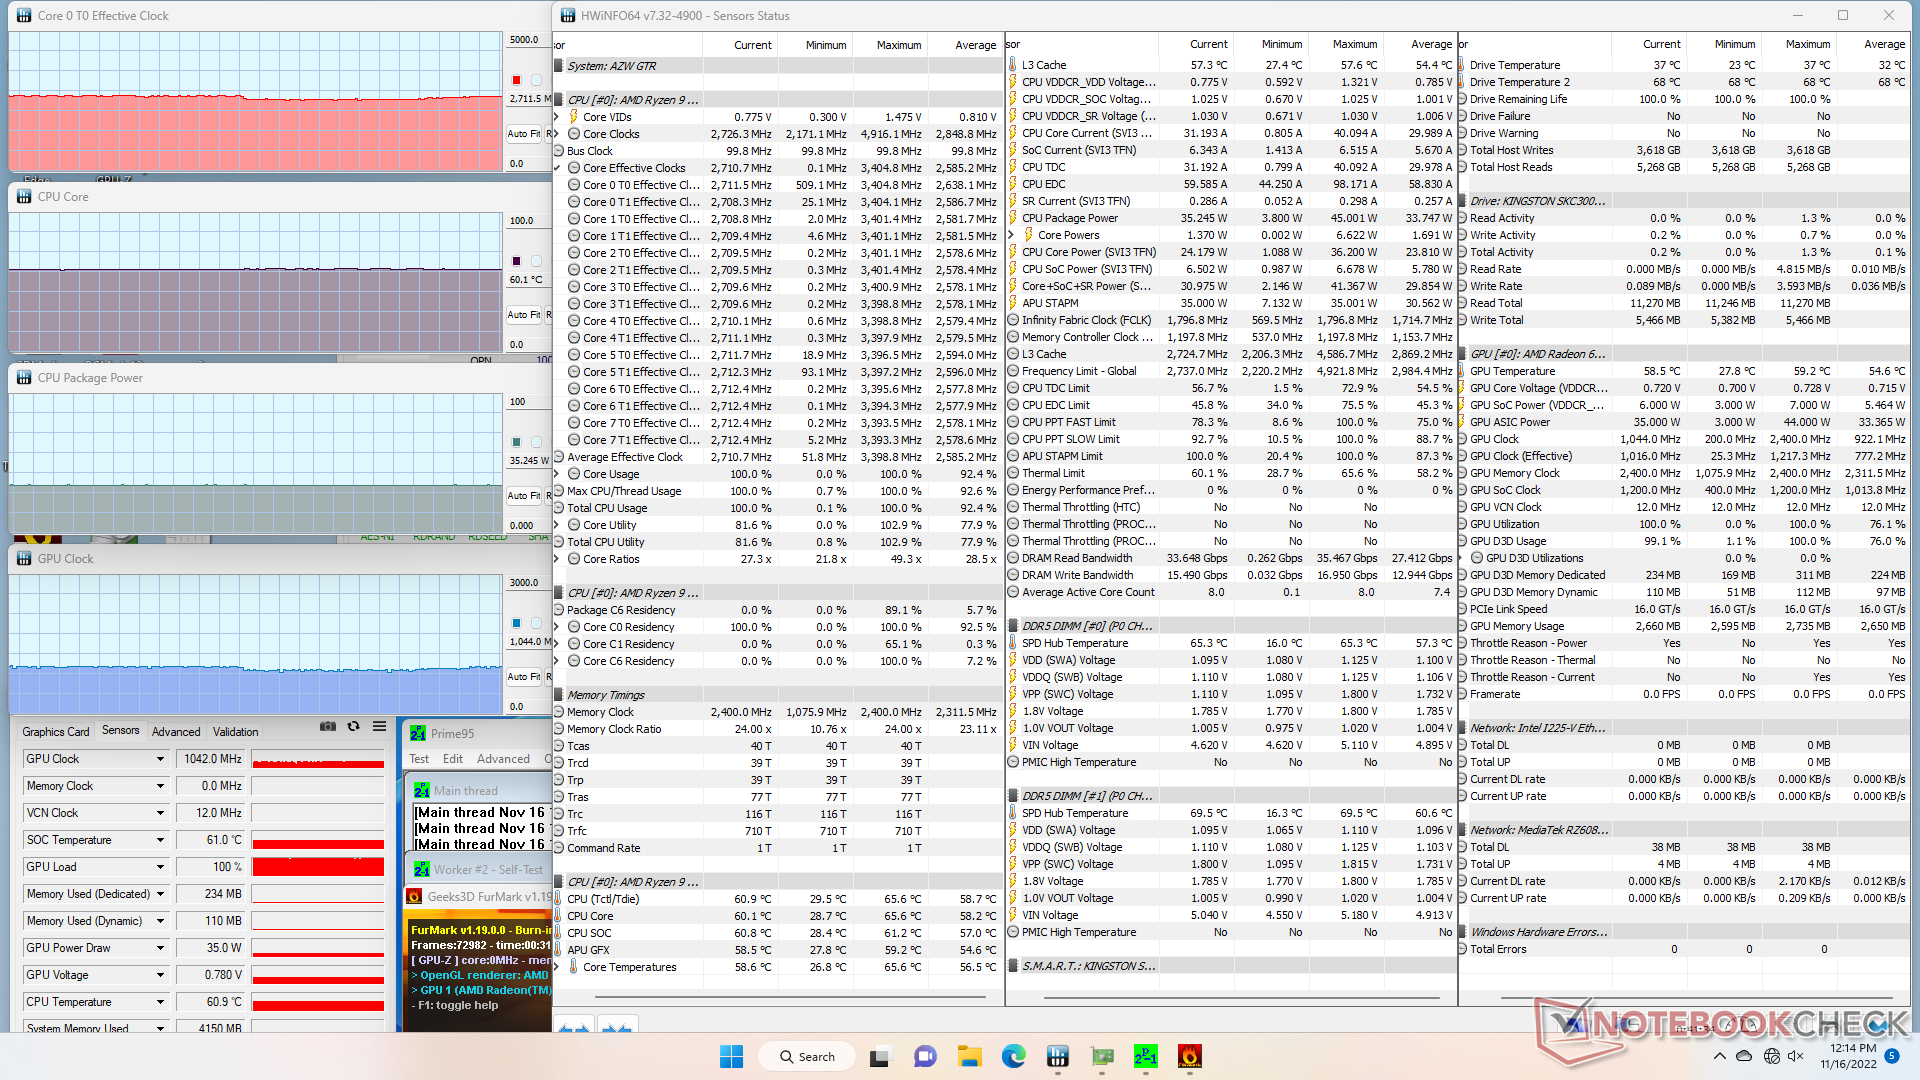
La velocidad de reloj de la GPU y la temperatura se estabilizan en 1977 MHz y 56 C, respectivamente, cuando se ejecuta Witcher 3 para representar las cargas típicas de los juegos.
| Reloj dela CPU (GHz) | Reloj de la GPU (MHz) | Temperatura media de la CPU (°C) | |
| Sistema en reposo | -- | -- | 28 |
| Prime95 Stress | 3.2 | -- | 66 |
| Prime95+ FurMark Stress | 2,7 | 1042 | 60 |
| Witcher 3 Estrés | ~0,8 | 1977 | 56 |
Gestión de la energía
Consumo de energía
El consumo total es casi idéntico al que registramos en el GTR5 a pesar del aumento del 60% en el rendimiento gráfico. En otras palabras, el GTR6 es capaz de proporcionar un rendimiento gráfico significativamente más rápido que su predecesor bajo la misma dotación de energía para un rendimiento por vatio mucho mayor. Sin embargo, el consumo de energía sigue siendo mucho mayor que el de la mayoría de los portátiles y mini PCs con CPUs Intel Core U y los Iris Xe 96 EU, lo que explica el mayor tamaño físico del GTR6 en relación con muchos NUC de Intel.
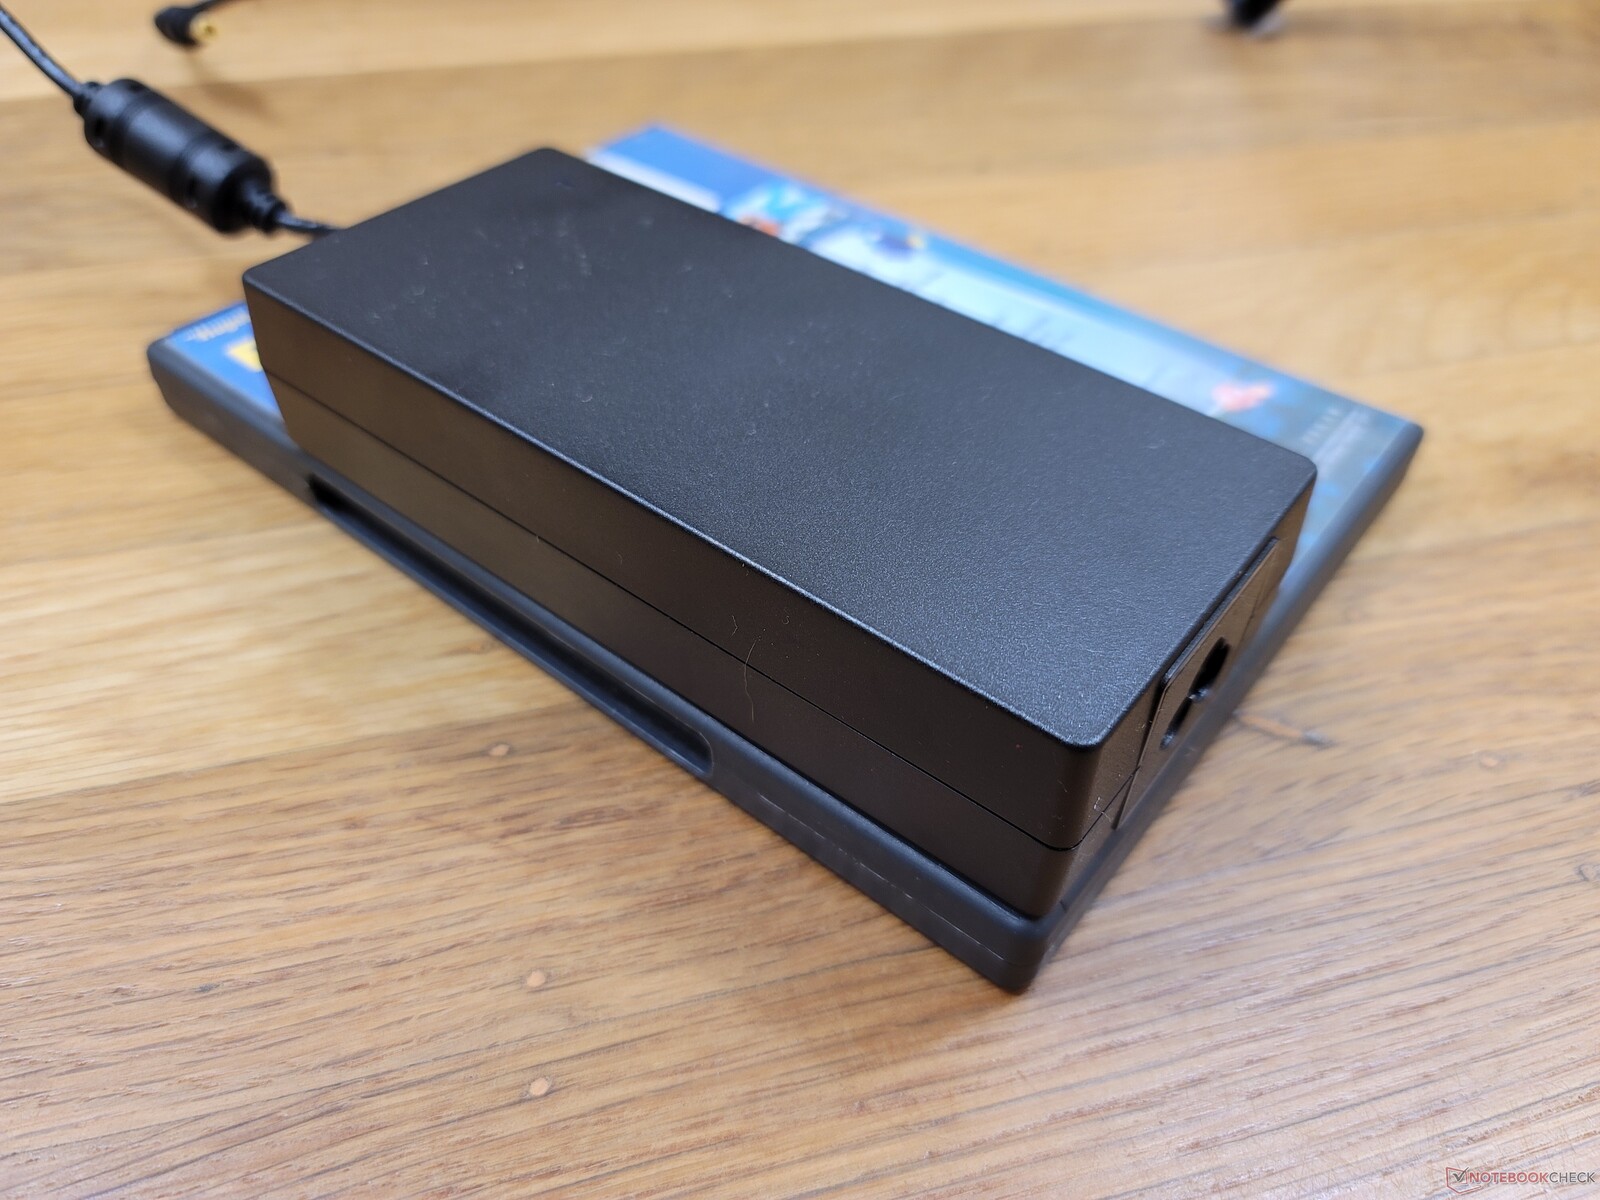
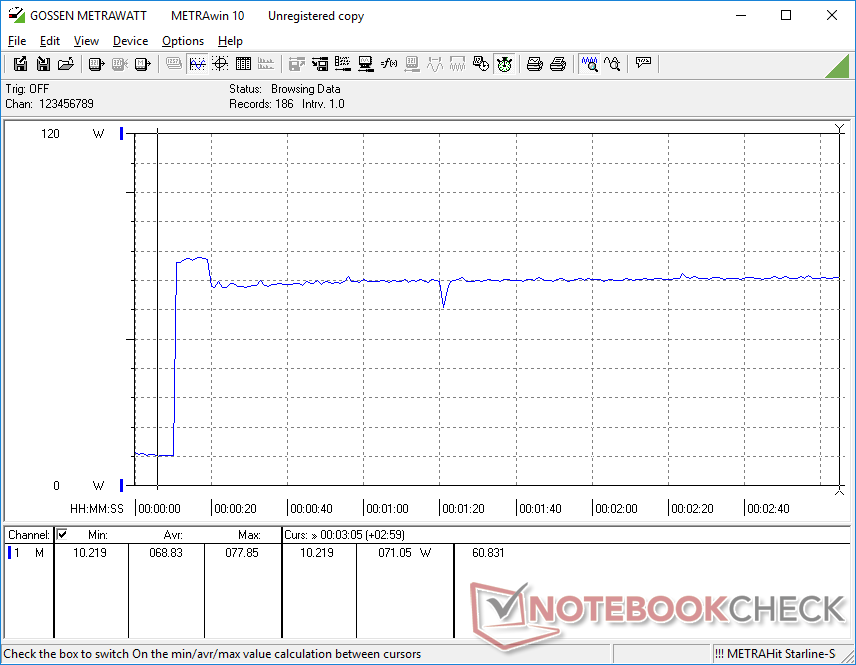
Registramos un consumo máximo temporal de 81 W del adaptador de CA de 120 W de tamaño medio (~14,4 x 6,3 x 3 cm) cuando la CPU está al 100% de utilización.


| Off / Standby | |
| Ocioso | |
| Carga |
|
Clave:
min: | |
| Beelink GTR6 R9 6900HX, Radeon 680M, Kingston KC3000 512G SKC3000S512G, , x, | Beelink SEi11 Pro i5-11320H, Iris Xe G7 96EUs, Kingston NV1 SNVS/500GCN, , x, | Beelink GTR5 R9 5900HX, Vega 8, Kingston NV1 SNVS/500GCN, , x, | Intel NUC11PHKi7C i7-1165G7, GeForce RTX 2060 Mobile, Samsung SSD 980 Pro 500GB MZ-V8P500BW, , x, | Intel NUC11TNKi5 i5-1135G7, Iris Xe G7 80EUs, Transcend M.2 SSD 430S TS512GMTS430S, , x, | GMK NucBox 2 i5-8259U, Iris Plus Graphics 655, Netac S930E8/256GPN, , x, | |
|---|---|---|---|---|---|---|
| Power Consumption | 6% | 8% | -73% | -3% | 29% | |
| Idle Minimum * (Watt) | 7.6 | 9.8 -29% | 6.2 18% | 5.8 24% | 11.5 -51% | 6.1 20% |
| Idle Average * (Watt) | 9.9 | 10.3 -4% | 8.9 10% | 5.9 40% | 12.4 -25% | 6.8 31% |
| Idle Maximum * (Watt) | 10.6 | 10.5 1% | 9 15% | 20.7 -95% | 12.9 -22% | 7.3 31% |
| Load Average * (Watt) | 64 | 54.2 15% | 66.8 -4% | 130.8 -104% | 40.7 36% | 46.3 28% |
| Witcher 3 ultra * (Watt) | 69 | 53.1 23% | 62.6 9% | 154.4 -124% | 43.9 36% | |
| Load Maximum * (Watt) | 80.4 | 59 27% | 81.6 -1% | 225.2 -180% | 73.5 9% | 50.7 37% |
* ... más pequeño es mejor
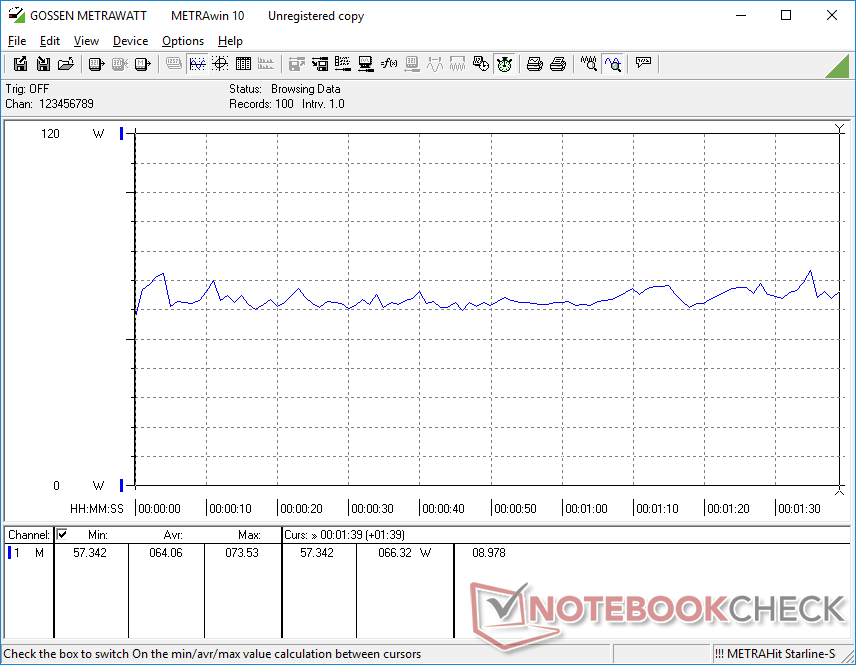
Power Consumption Witcher 3 / Stresstest
Power Consumption external Monitor
Pro
Contra
Veredicto - Todo sobre la GPU
La principal ventaja de elegir el Beelink GTR6 sobre el GTR5 es por sus gráficos integrados significativamente mejorados. Por lo demás, el Zen 3+ Ryzen 9 6900HX ofrece un rendimiento de procesador apenas más rápido que el Zen 3 Ryzen 9 5900HX. Si planeas principalmente transmitir contenido a tu mini PC con la multitarea moderada ocasional, entonces el GTR5 tiene potencia más que suficiente para tus propósitos. Si planeas ejecutar juegos localmente u otras tareas intensivas de la GPU, entonces el GTR6 puede valer la pena la inversión.
El precio es otro factor importante a tener en cuenta. Por $750 USD, el GTR6 viene completo con RAM, SSD, Windows 11 Pro con licencia, y una CPU y GPU integrada más rápida que la mayoría de las opciones de Intel NUC, incluyendo incluso los últimos modelos 12th gen NUC Pro. Beelink incluso ofrece una SKU barebone sin RAM ni almacenamiento por sólo 540 dólares.
La GPU AMD Radeon 680M es lo más destacado del Beelink GTR6. El rendimiento por dólar es alto en relación con los NUC de Intel de la competencia en el mismo rango de precios de 750 dólares.
El ruido del ventilador es tal vez nuestra mayor queja sobre el GTR6, ya que pulsa sin razón aparente cuando el sistema está en reposo o ejecutando cargas poco exigentes. Por lo demás, el rendimiento por dólar y el conjunto de características del GTR6 son muy competitivos.
Precio y disponibilidad
El Beelink GTR6 ya se está enviando en nuestra configuración exacta en Amazon por $999 USD o sólo $749 USD si se compra directamente al fabricante.
Price comparison

