Análisis del portátil Dell XPS 13 9340 - El subportátil compacto con larga autonomía y bastantes defectos
Tras probar previamente los nuevos modelos de 14 y 16 pulgadas de la última serie XPS, ha llegado el momento de echar un vistazo al compacto Dell XPS 13 9340. El antiguo XPS 13 Plus, que inspiró el diseño de los nuevos modelos, ya no está disponible. Sin embargo, Dell ofrece un estilizado XPS 13 9315 con los antiguos procesadores Alder Lake, así como dispositivos de entrada convencionales; aparte de esto, tienen una carcasa idéntica.
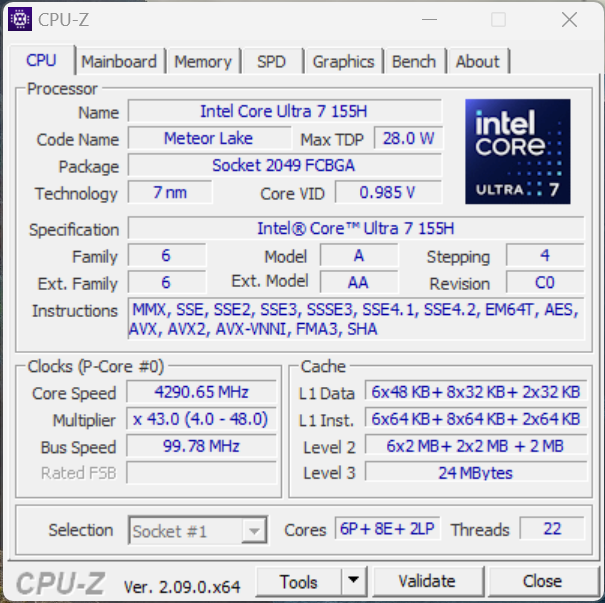
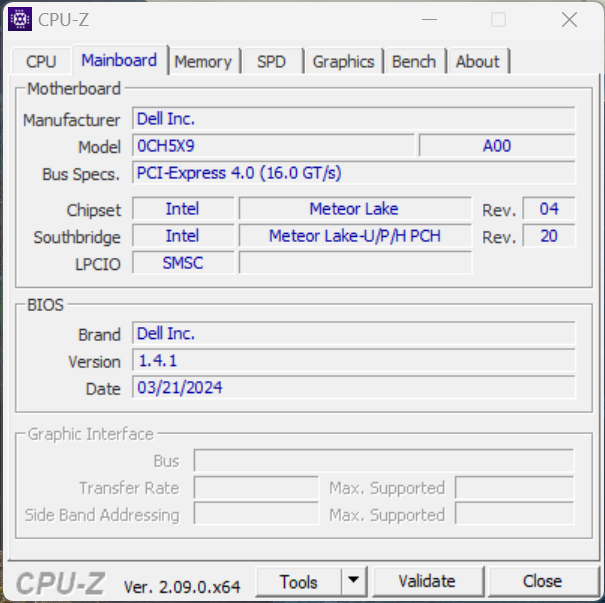
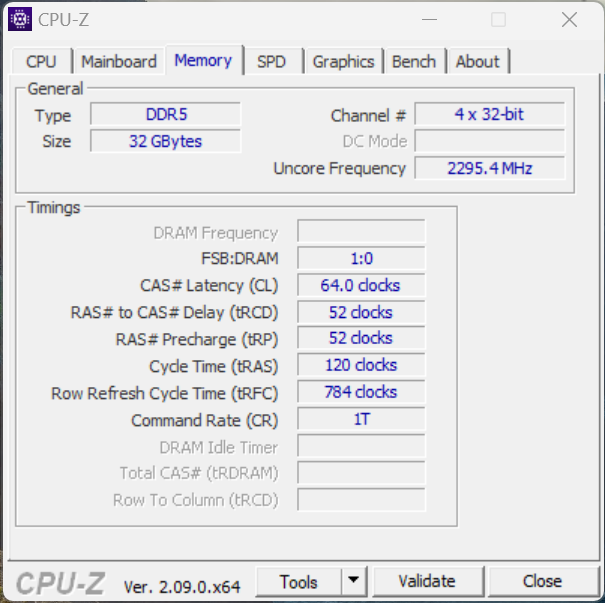
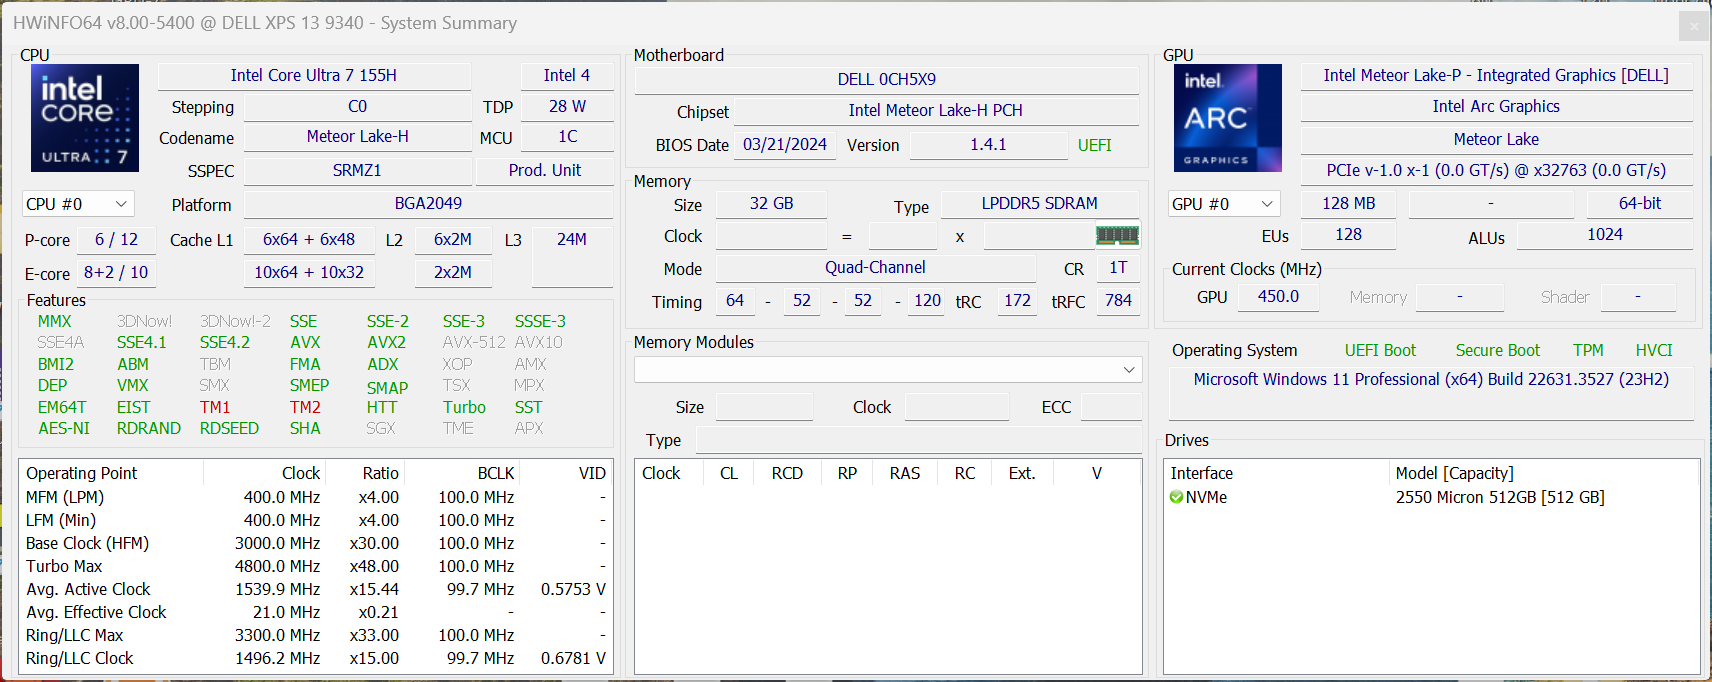
Nuestro dispositivo de prueba está equipado con el nuevo procesador Meteor Lake -el Core Ultra 7 155H-así como 32 GB de RAM, una unidad SSD PCIe de 512 GB y un panel Full HD. El precio que Dell pide por esta configuración es de 1.599 dólares (el precio de lanzamiento con el Core Ultra 5 y 16 GB de RAM es de 1.149 dólares). Puede subir este precio hasta un máximo de 2.659 dólares (Core Ultra 7, 64 GB de RAM, SSD de 2 TB, QHD+).
Posibles contendientes en la comparación
Valoración | Fecha | Modelo | Peso | Altura | Tamaño | Resolución | Precio |
|---|---|---|---|---|---|---|---|
| 86.5 % v7 (old) | 05/2024 | Dell XPS 13 9340 Core Ultra 7 Ultra 7 155H, Arc 8-Core | 1.2 kg | 15.3 mm | 13.40" | 1920x1200 | |
| 92.4 % v7 (old) | 03/2024 | Apple MacBook Air 13 M3 10C GPU M3, M3 10-Core GPU | 1.2 kg | 11.3 mm | 13.60" | 2560x1664 | |
| 85.4 % v7 (old) | 05/2023 | Asus ZenBook S13 OLED UX5304 i7-1355U, Iris Xe G7 96EUs | 1 kg | 11.8 mm | 13.30" | 2880x1800 | |
| 89.5 % v7 (old) | 01/2024 | Lenovo ThinkPad Z13 Gen 2 R7 PRO 7840U, Radeon 780M | 1.2 kg | 13.99 mm | 13.30" | 2880x1800 | |
| 91.9 % v7 (old) | 07/2023 | HP Dragonfly G4 i7-1365U, Iris Xe G7 96EUs | 1.1 kg | 16.3 mm | 13.50" | 1920x1280 |
Caja - Aluminio estable
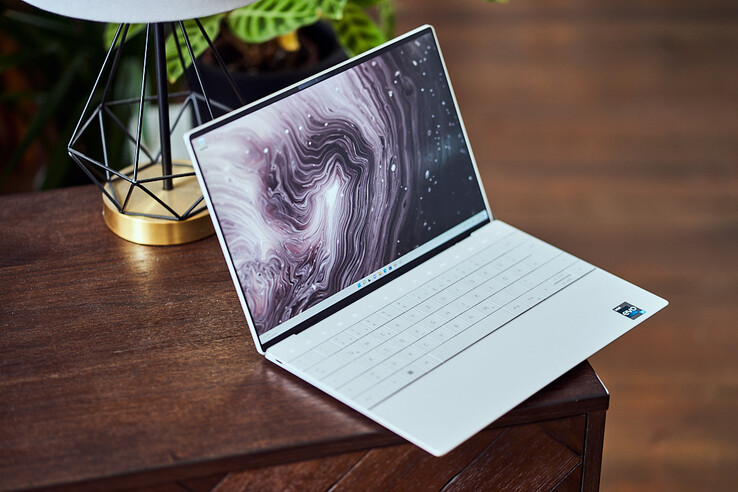
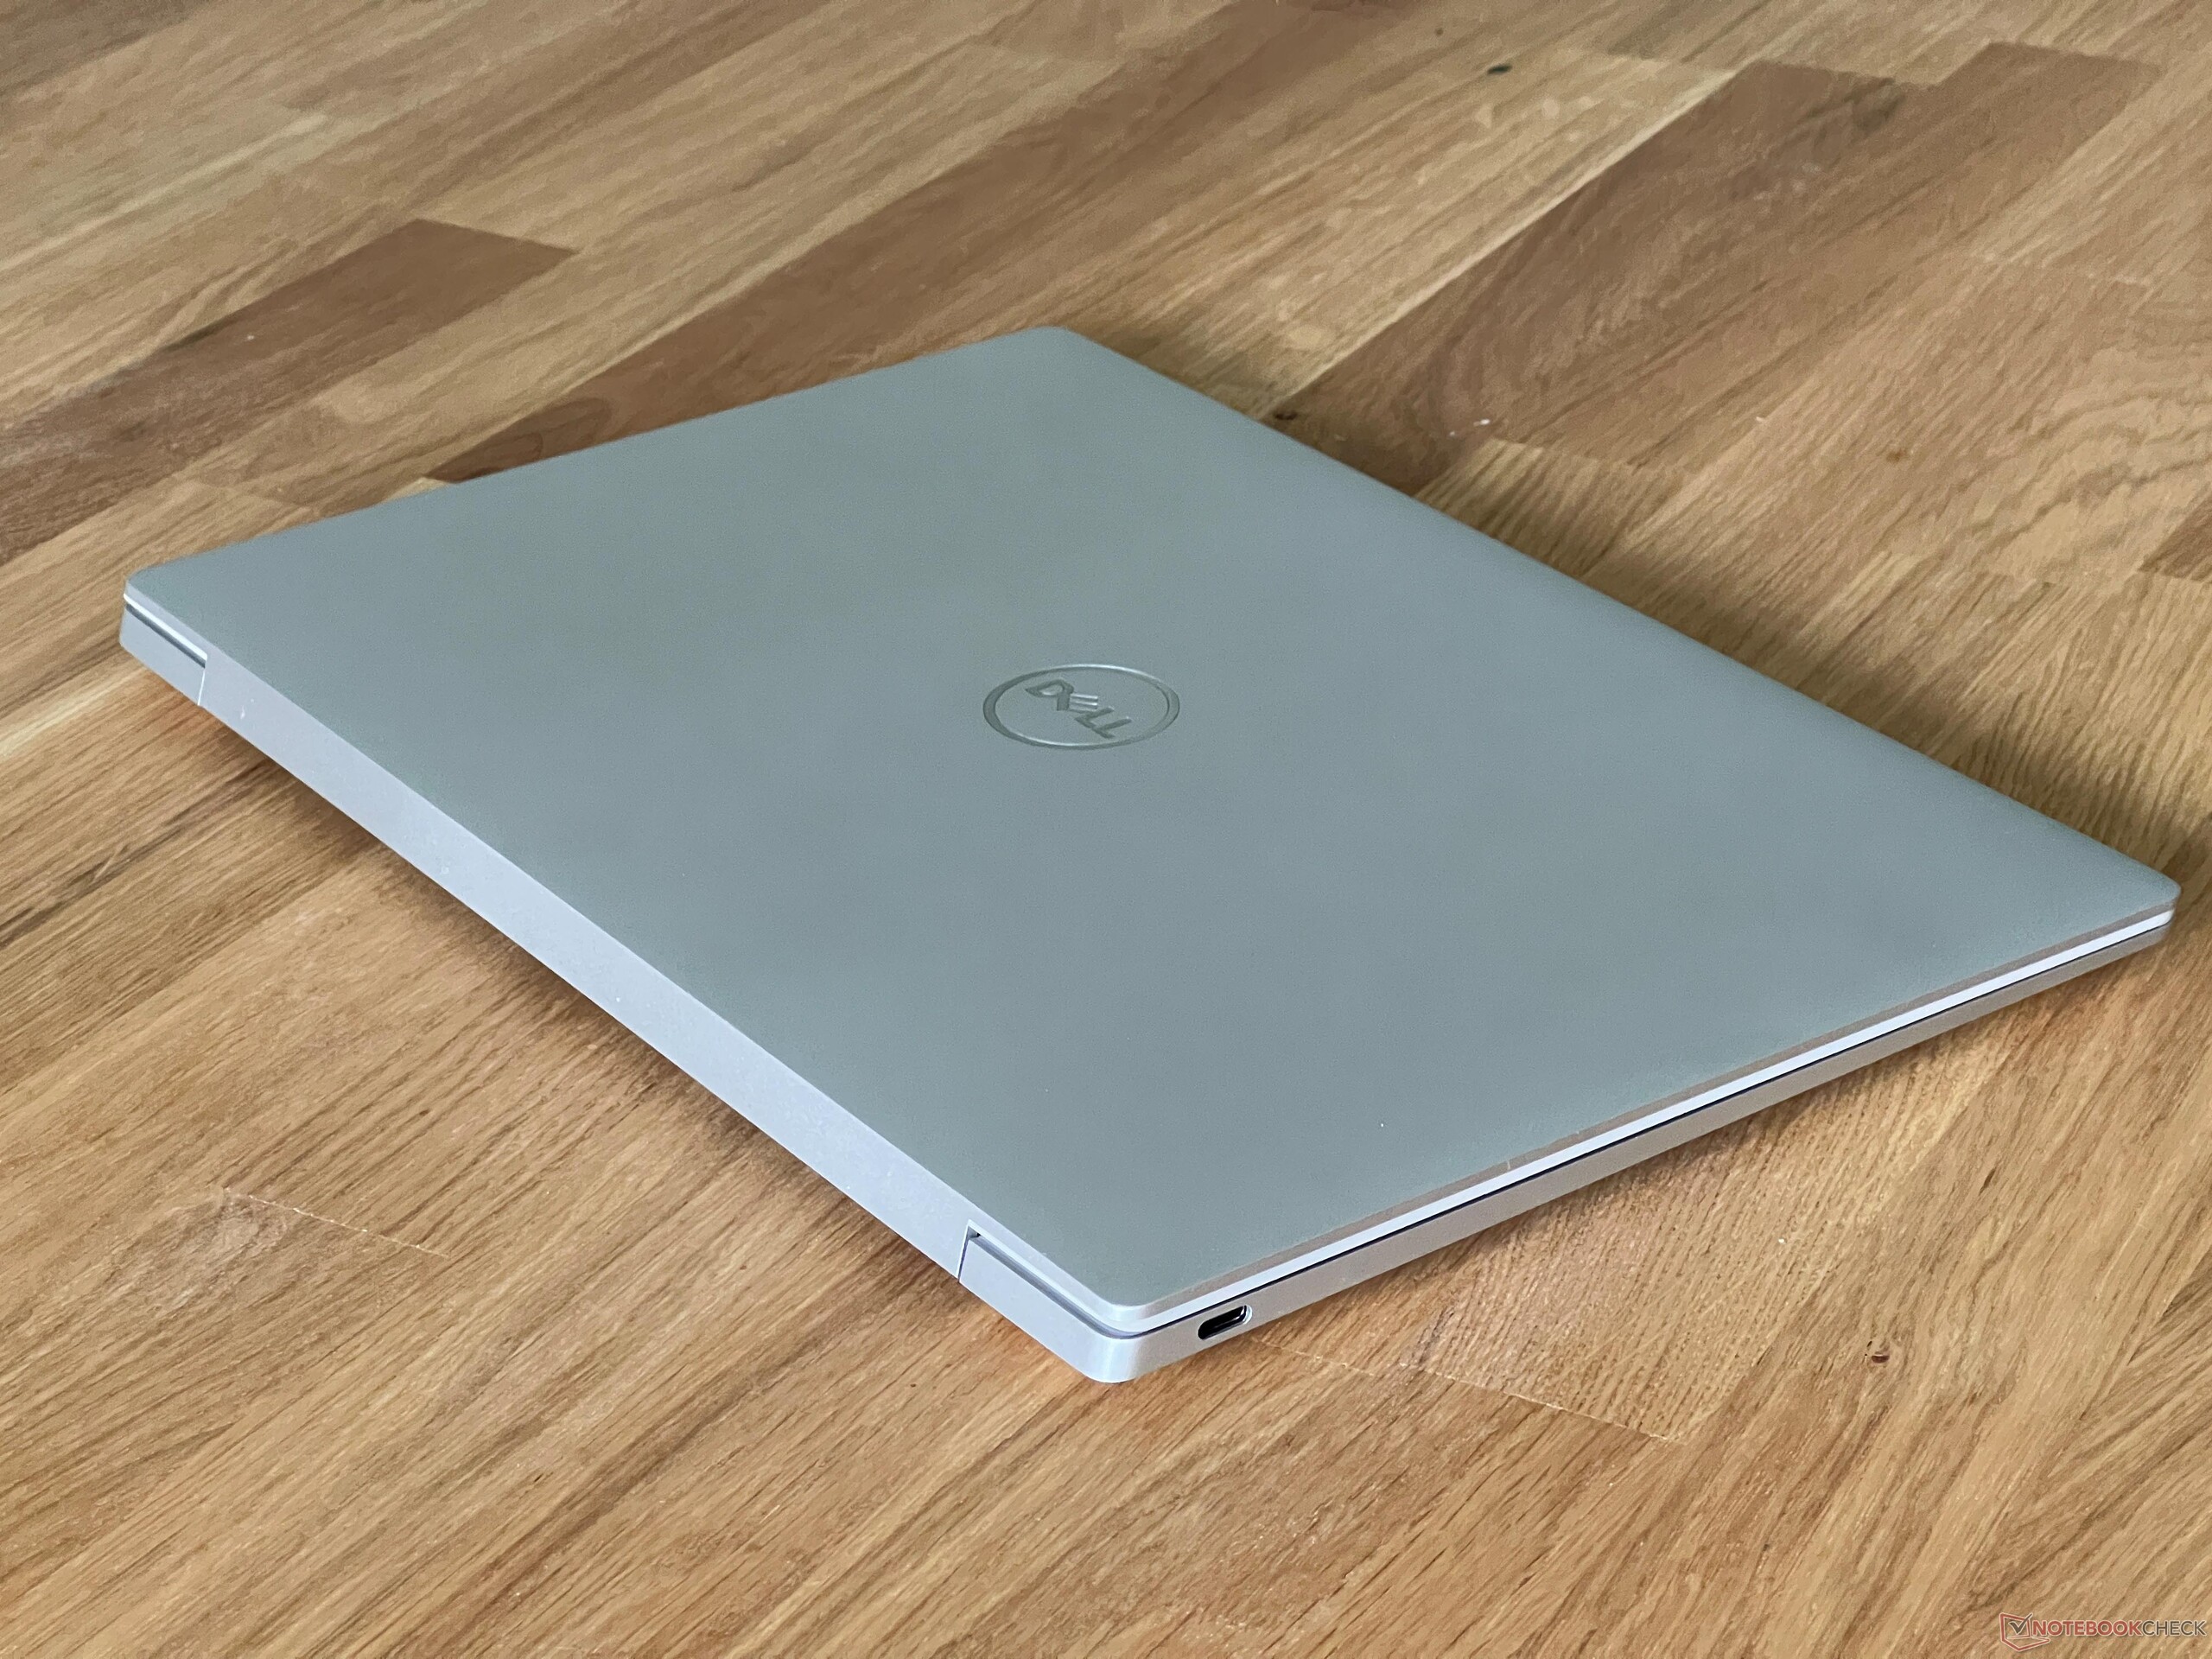
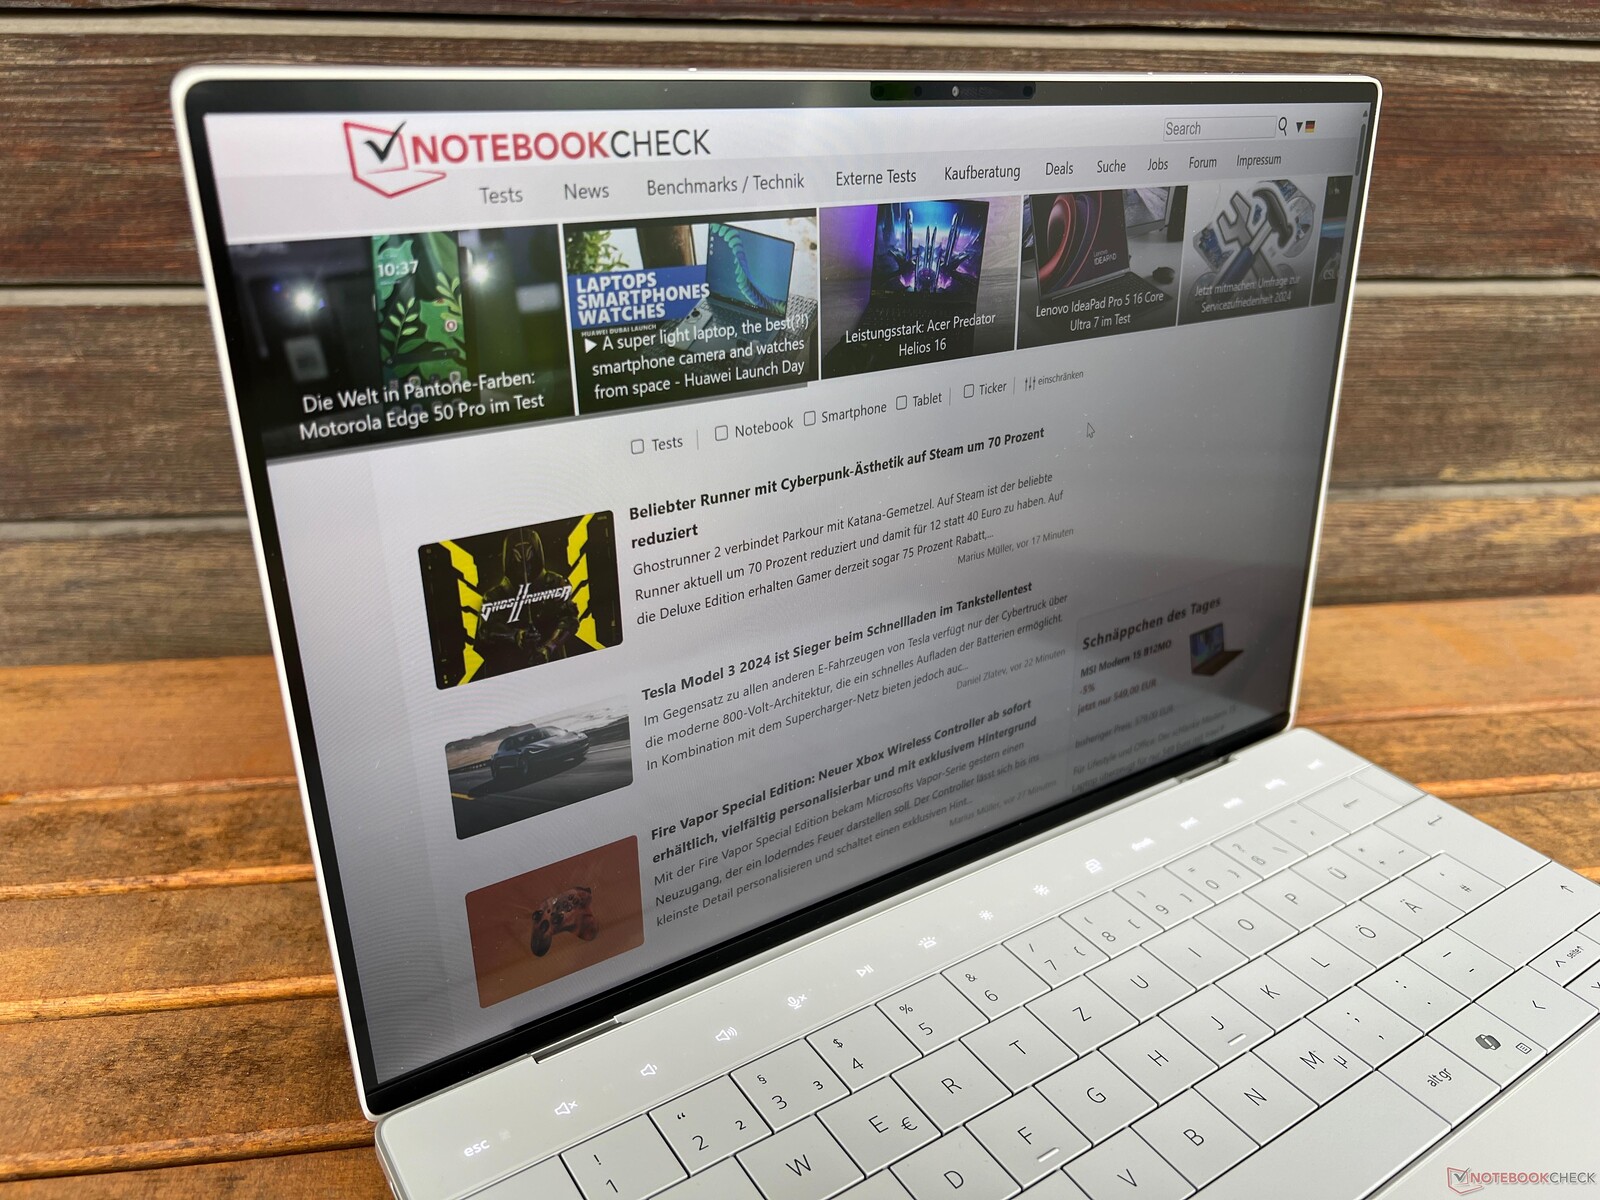
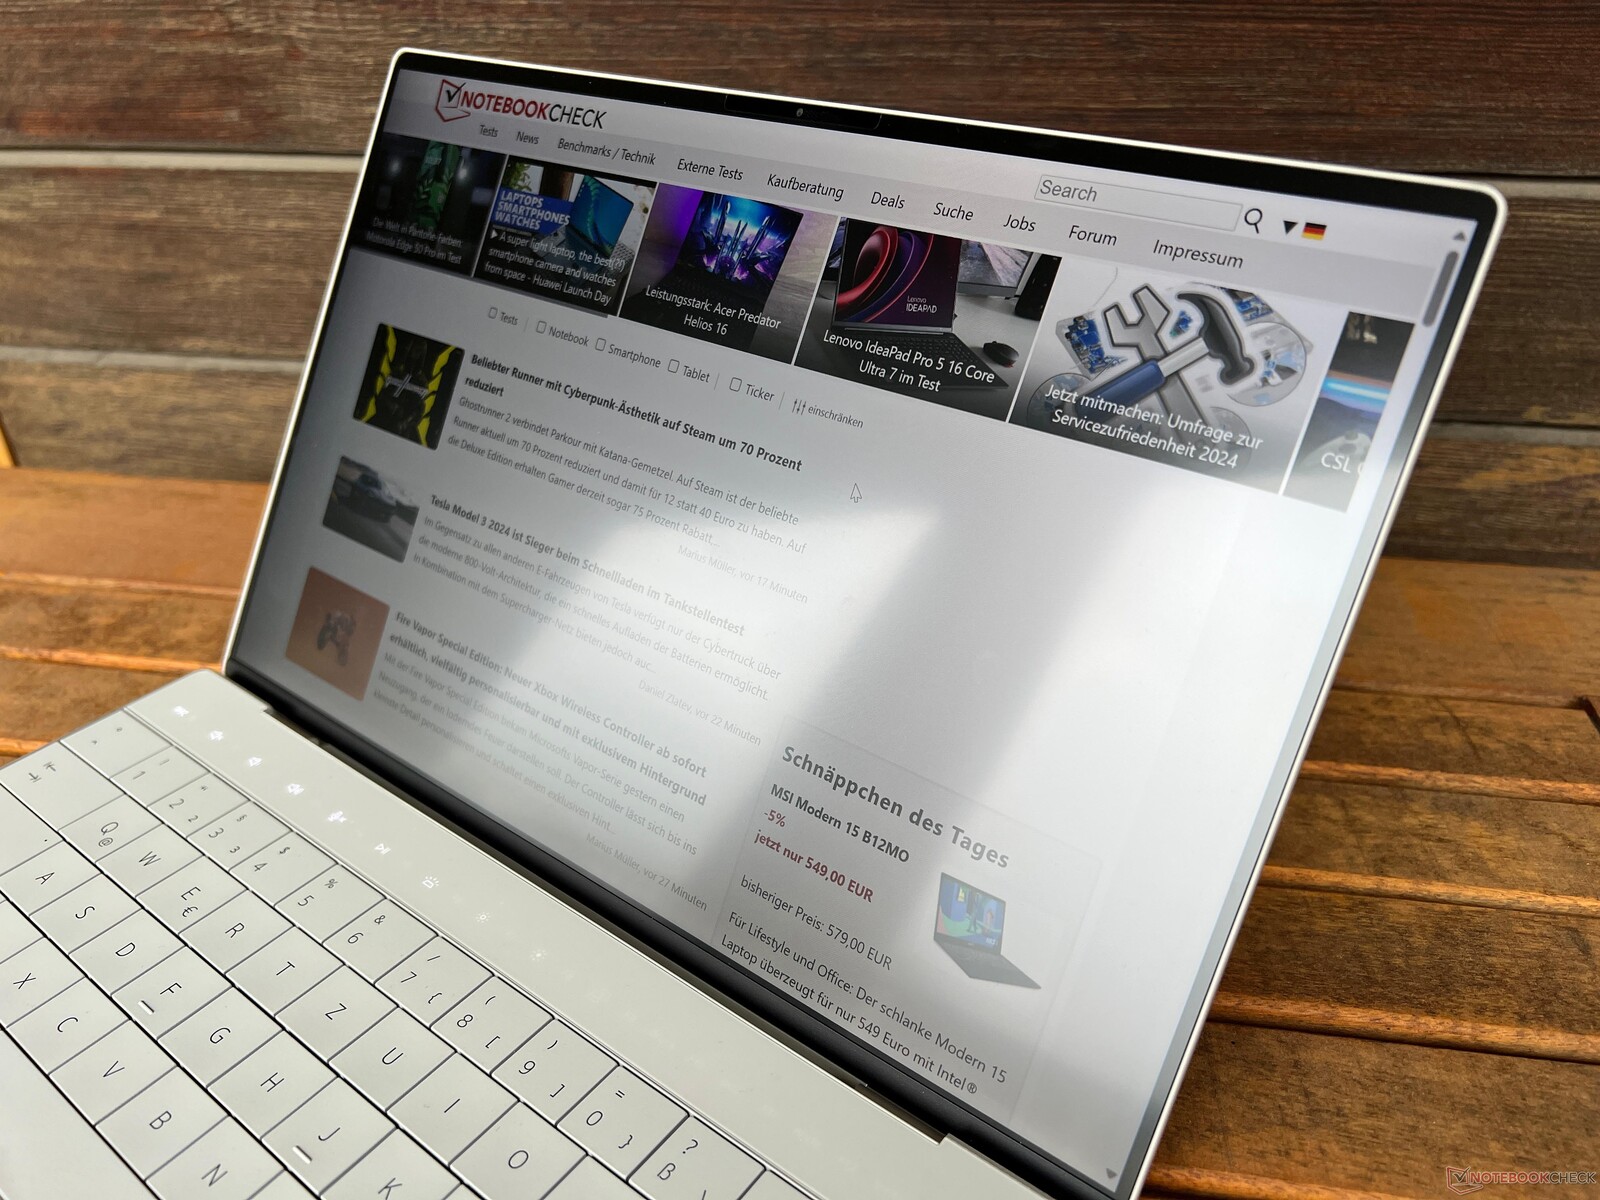
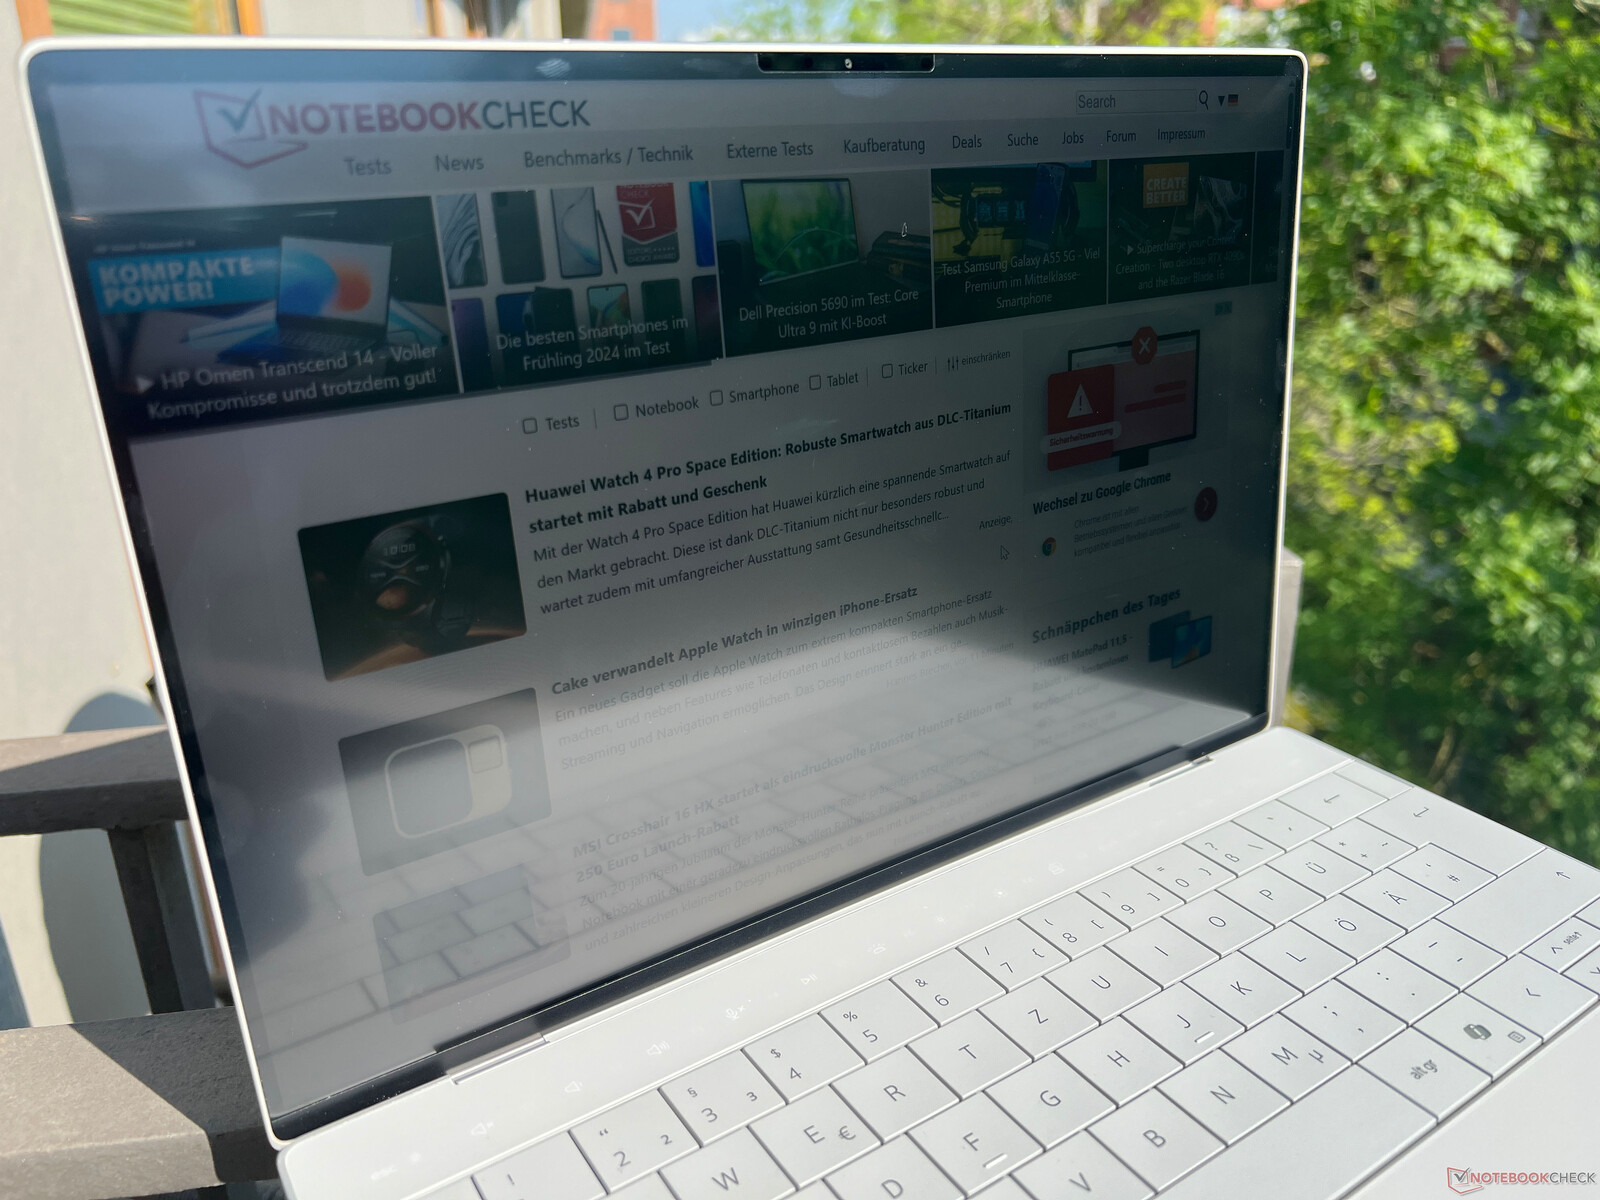
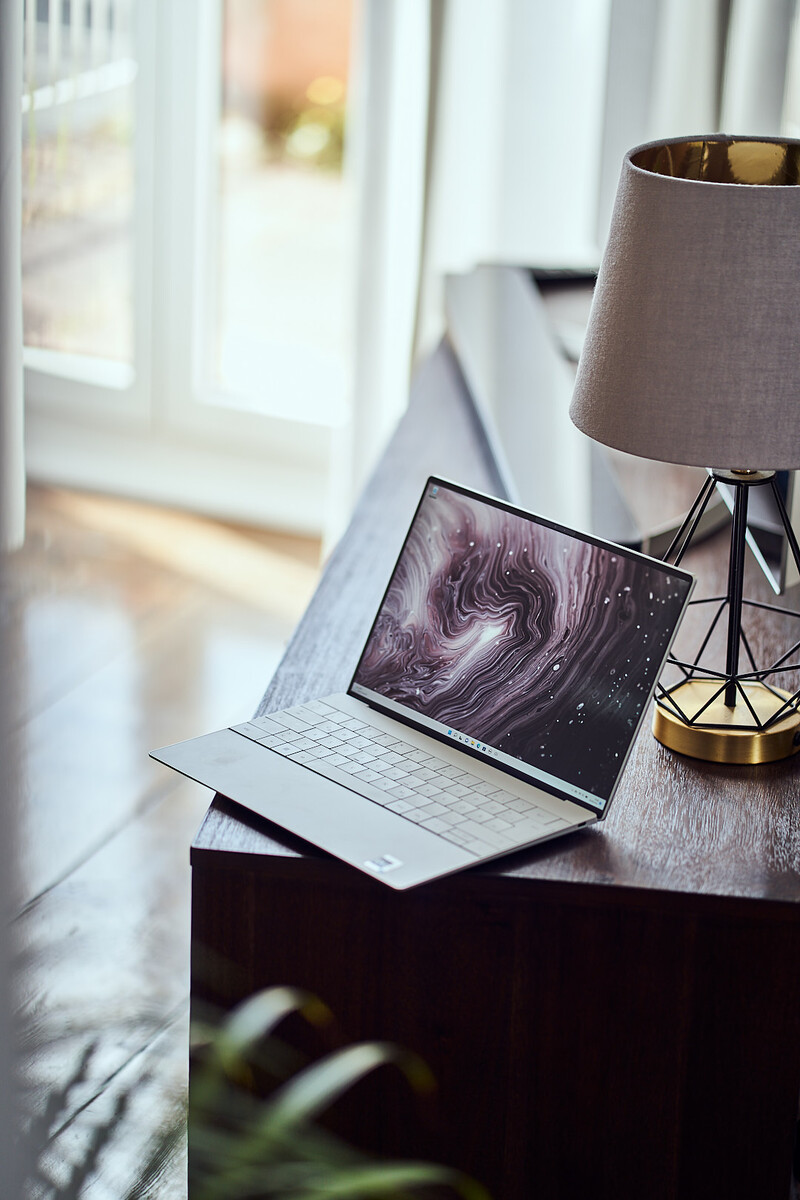
Dell introdujo su actual diseño XPS hace un tiempo en el XPS 13 Plus, y ahora lo utiliza para toda la serie. Creemos que el diseño funciona mejor en el pequeño XPS 13 9340, ya que el dispositivo se siente extremadamente compacto (especialmente en comparación con el voluminoso XPS 14). Además de una variante plateada, el fabricante también ofrece un modelo gris oscuro. El dispositivo parece de alta calidad y no observamos ningún problema de construcción. Además, no parece ser un gran imán para las huellas dactilares.
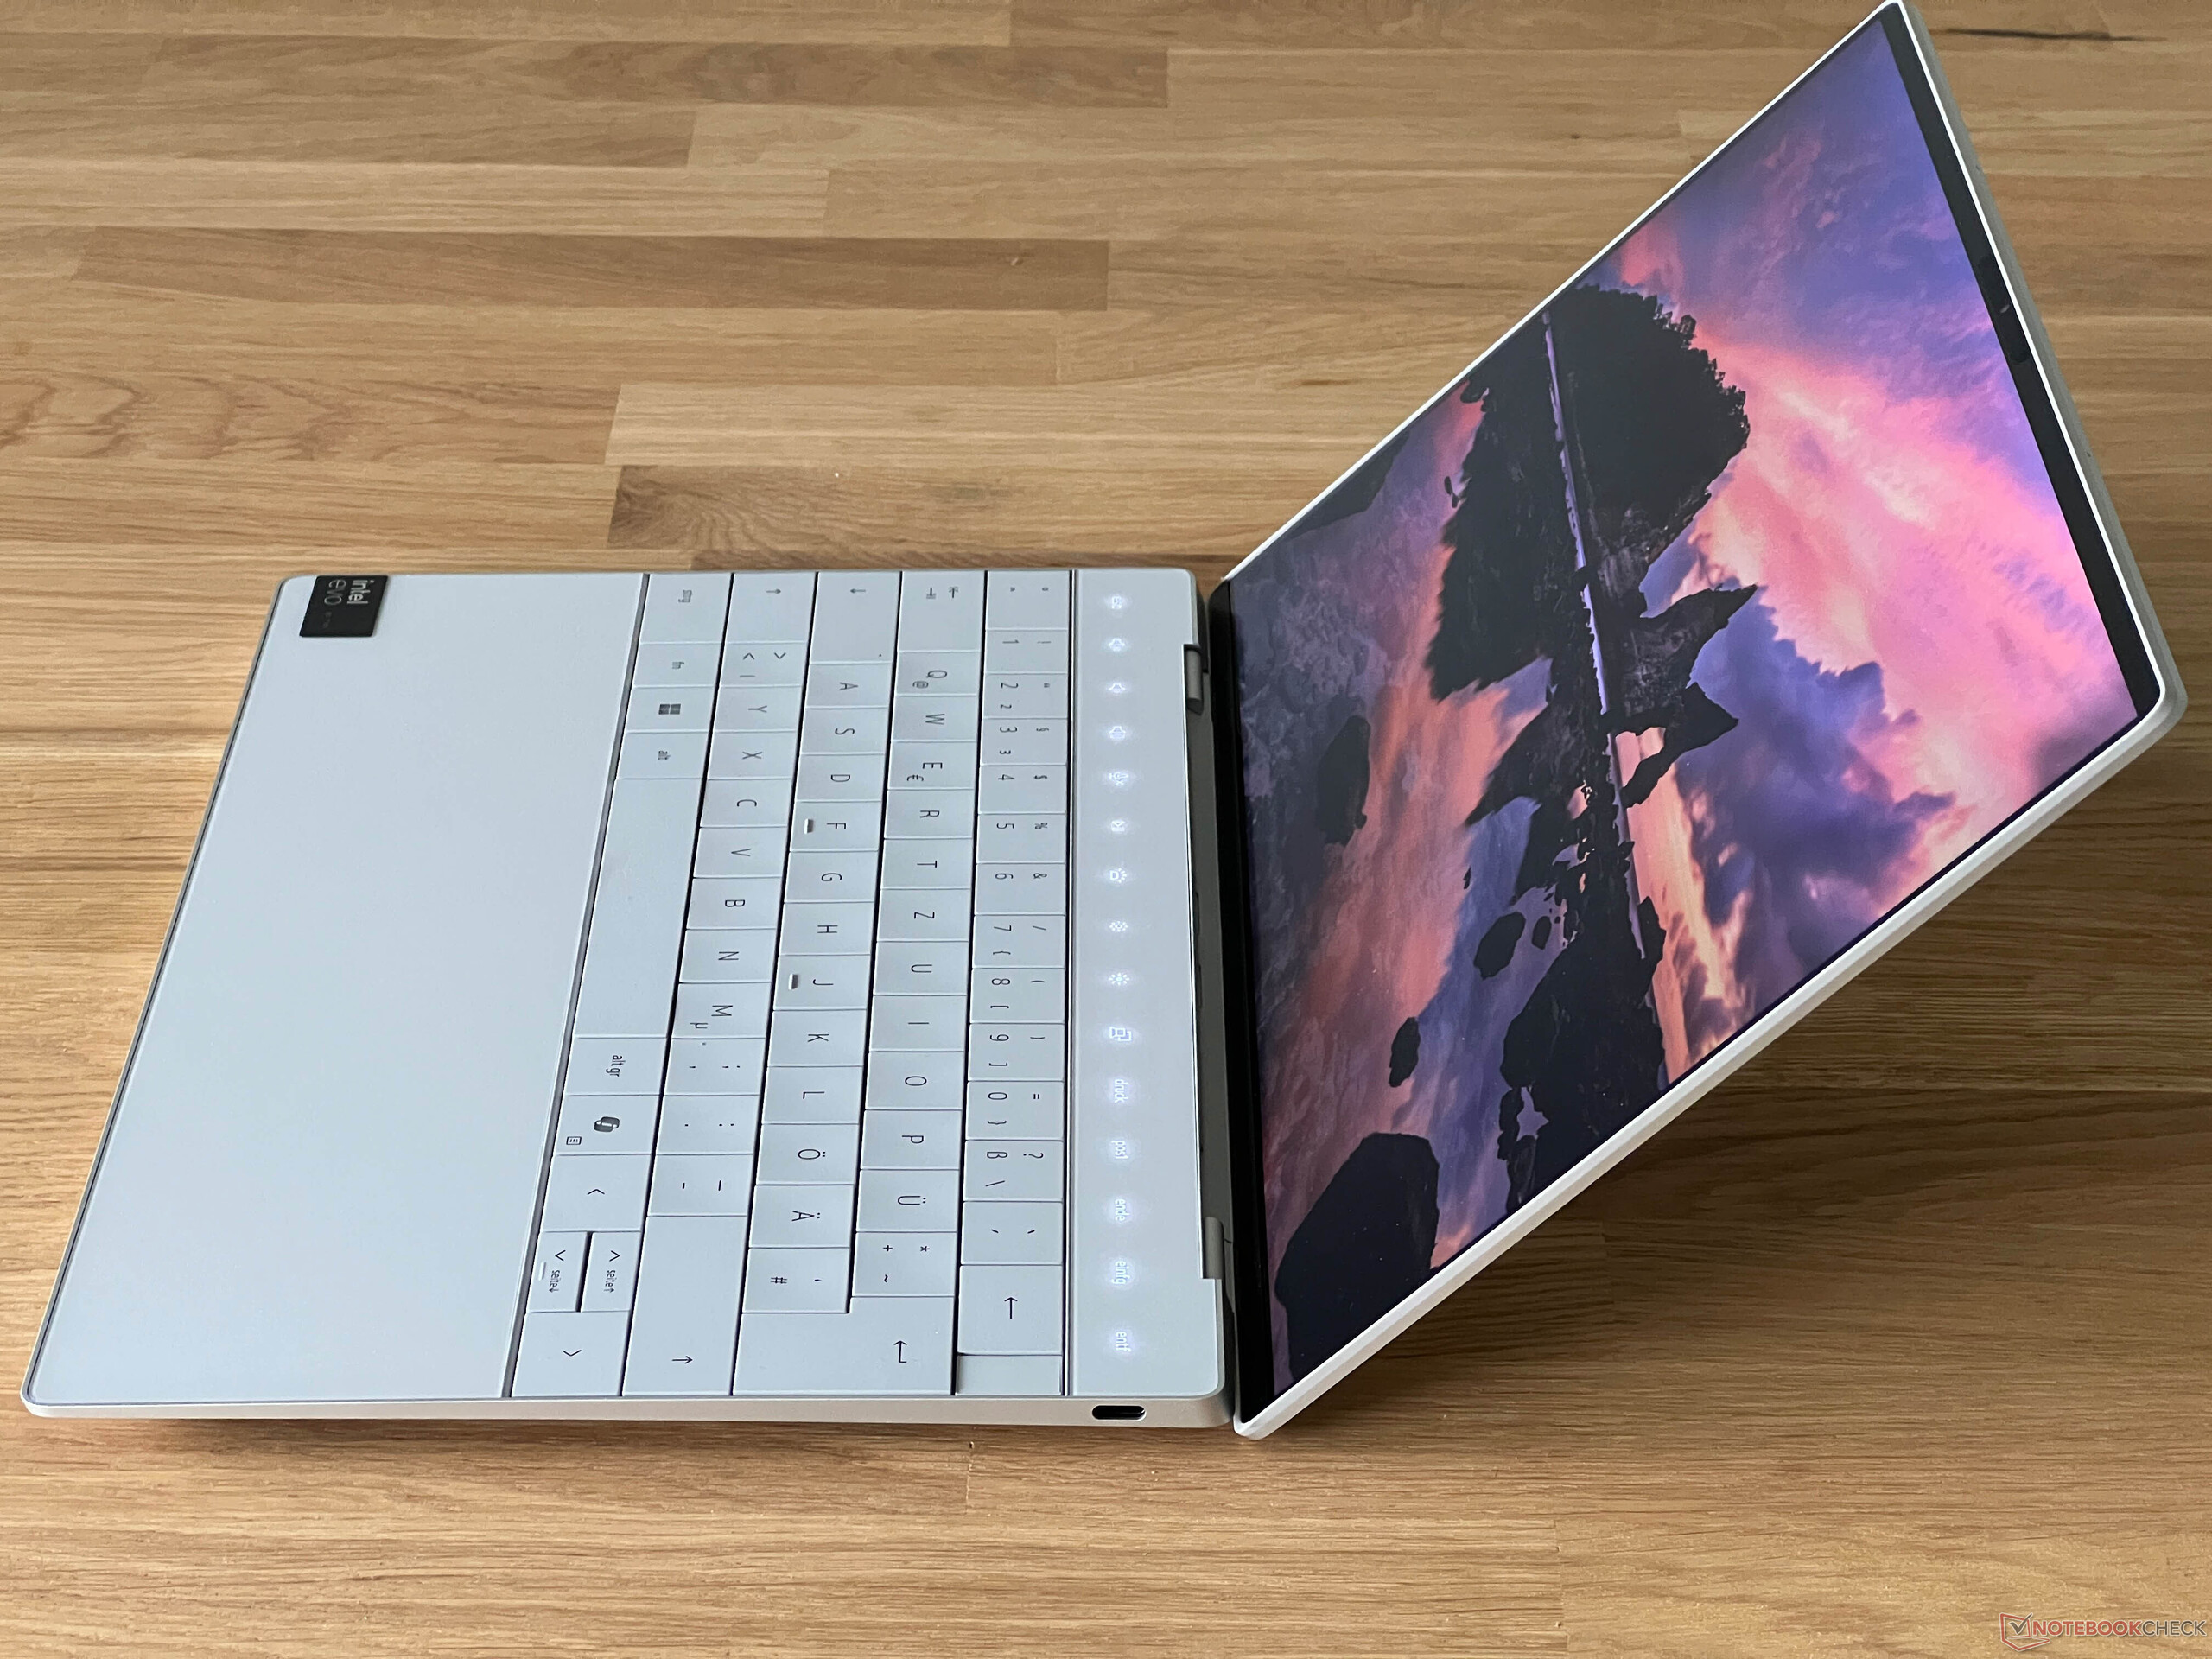
La tapa de la pantalla puede abrirse fácilmente con una mano y, aparte de sus exclusivos dispositivos de entrada (hablaremos de ello más adelante), los delgados biseles del portátil llaman la atención de inmediato. Las bisagras se ajustan bien, sin embargo, el ángulo máximo de apertura de la pantalla está limitado a ~135 grados. La estabilidad de la unidad base es estupenda e incluso ejerciendo mucha presión, sólo pudimos abollar ligeramente el teclado. Lo mismo puede decirse de la tapa de la pantalla de la que no pudimos sacar ningún error de imagen.
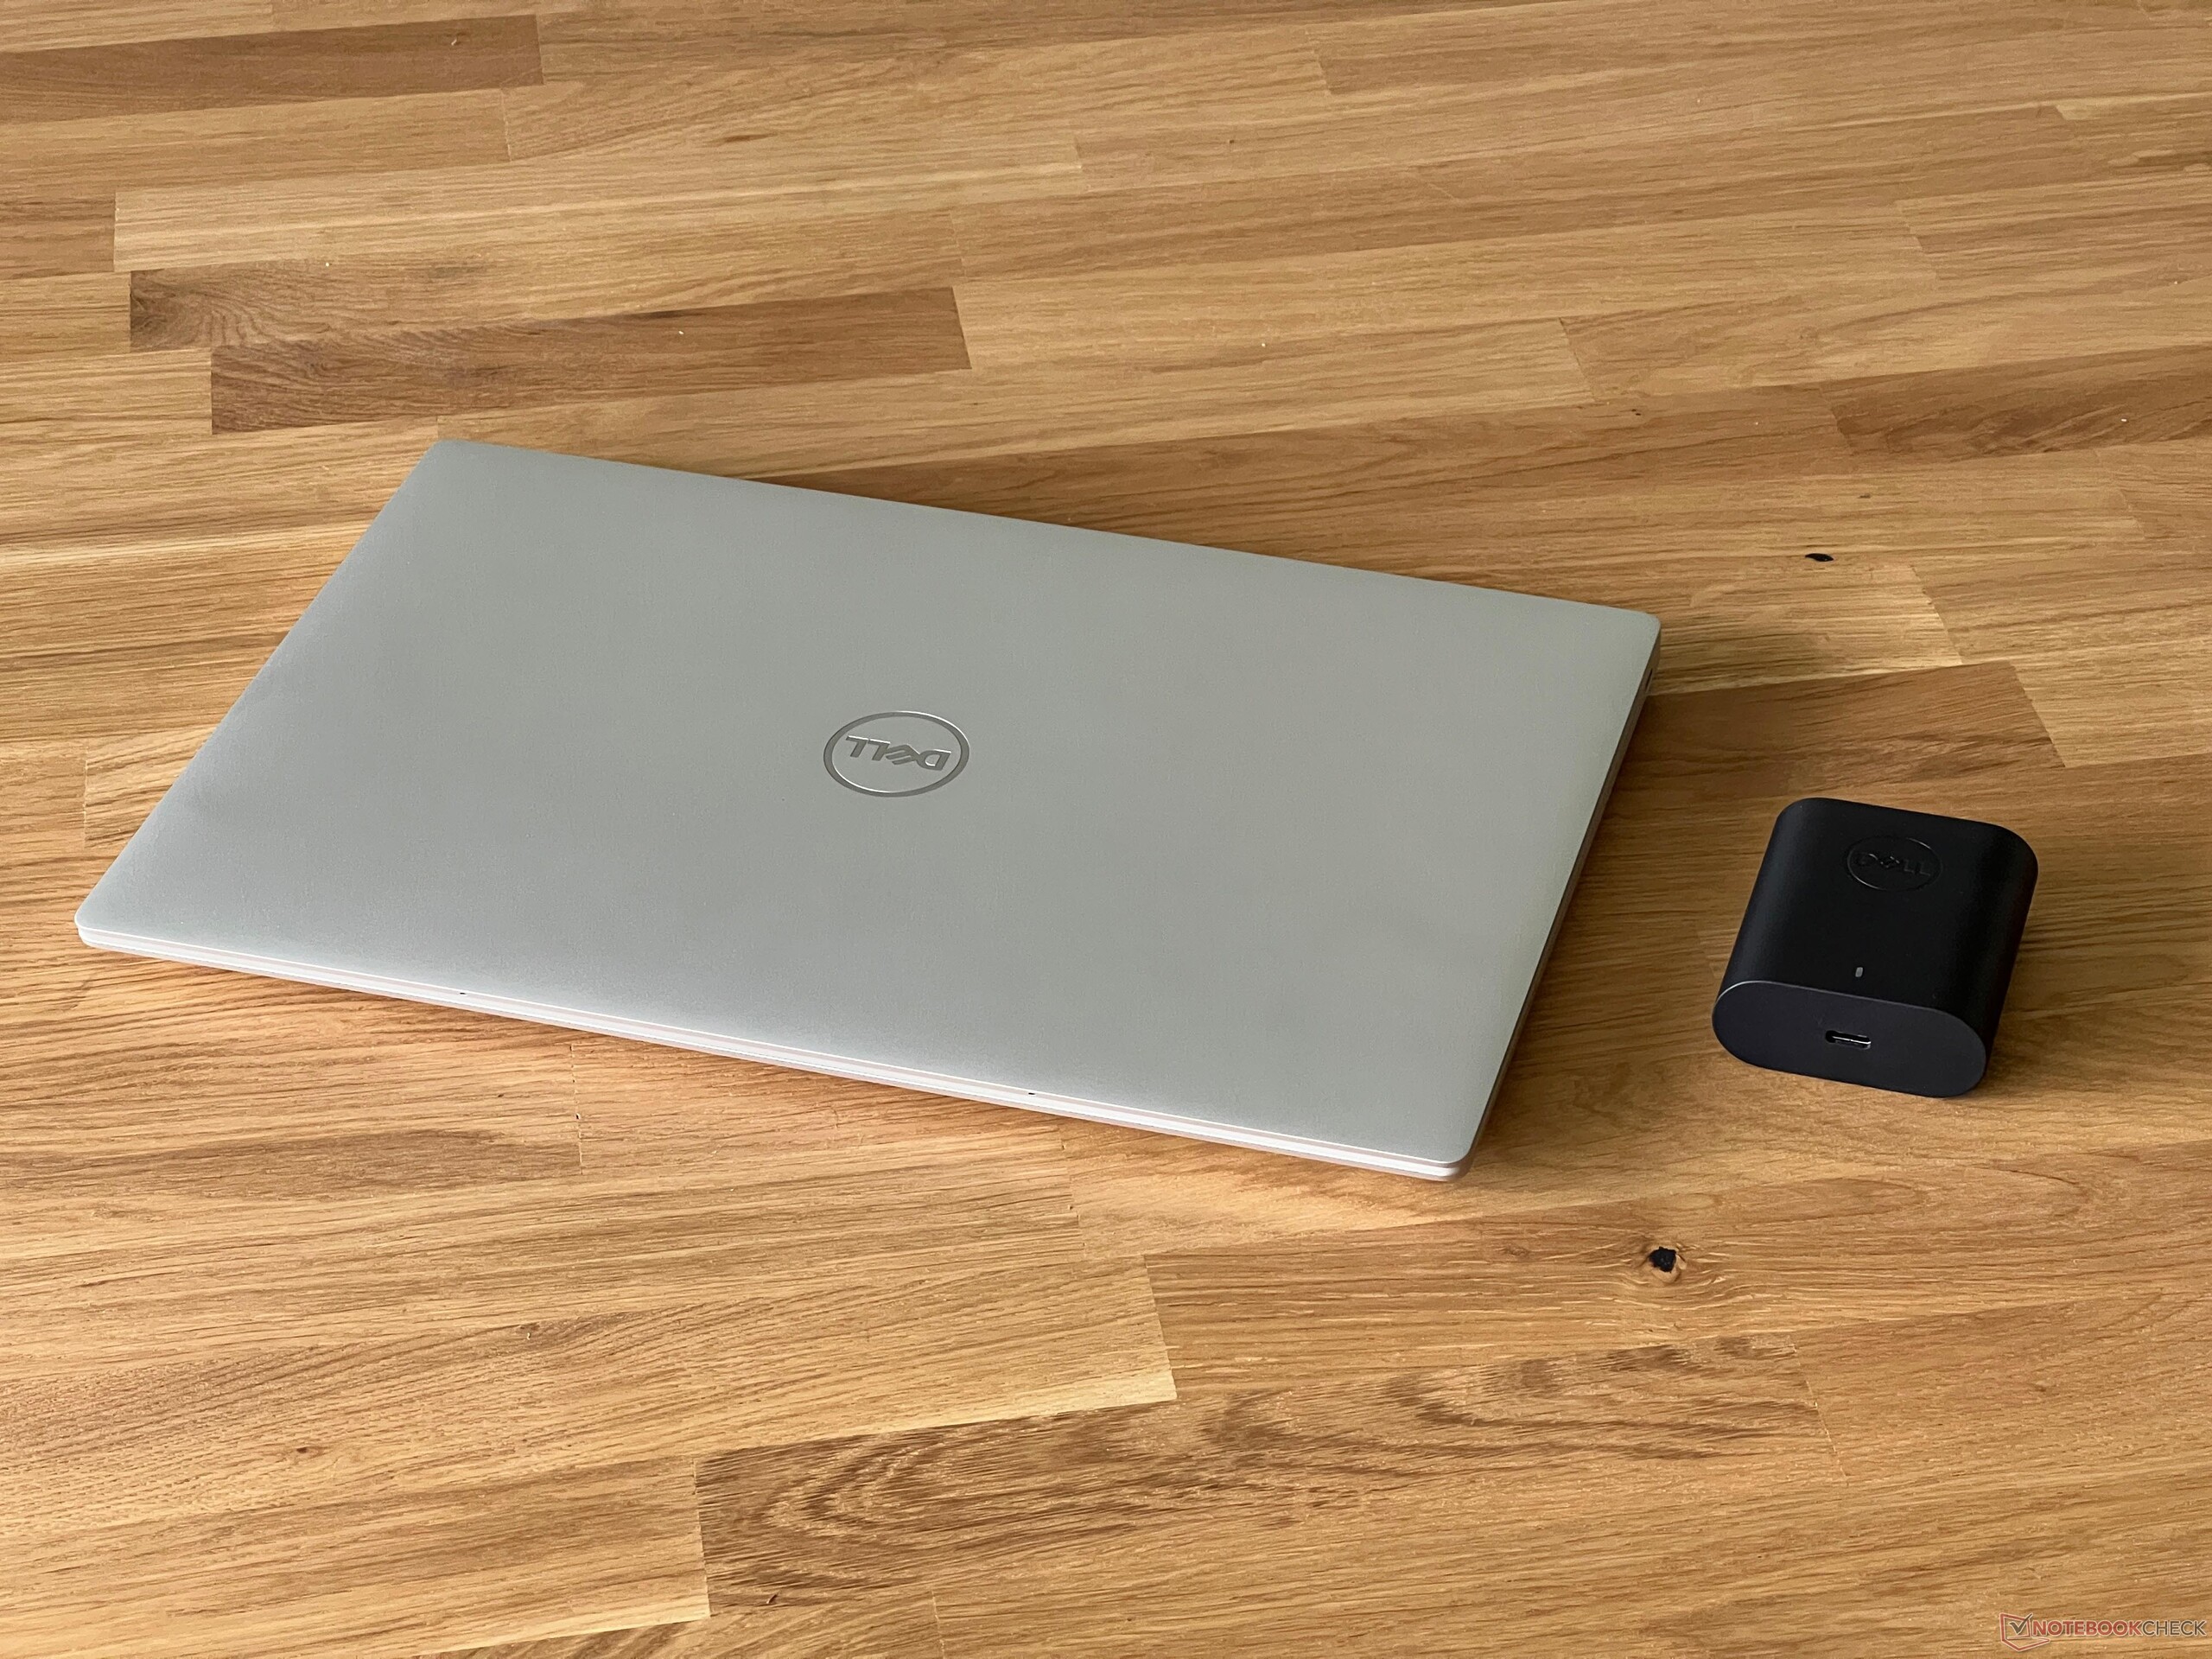
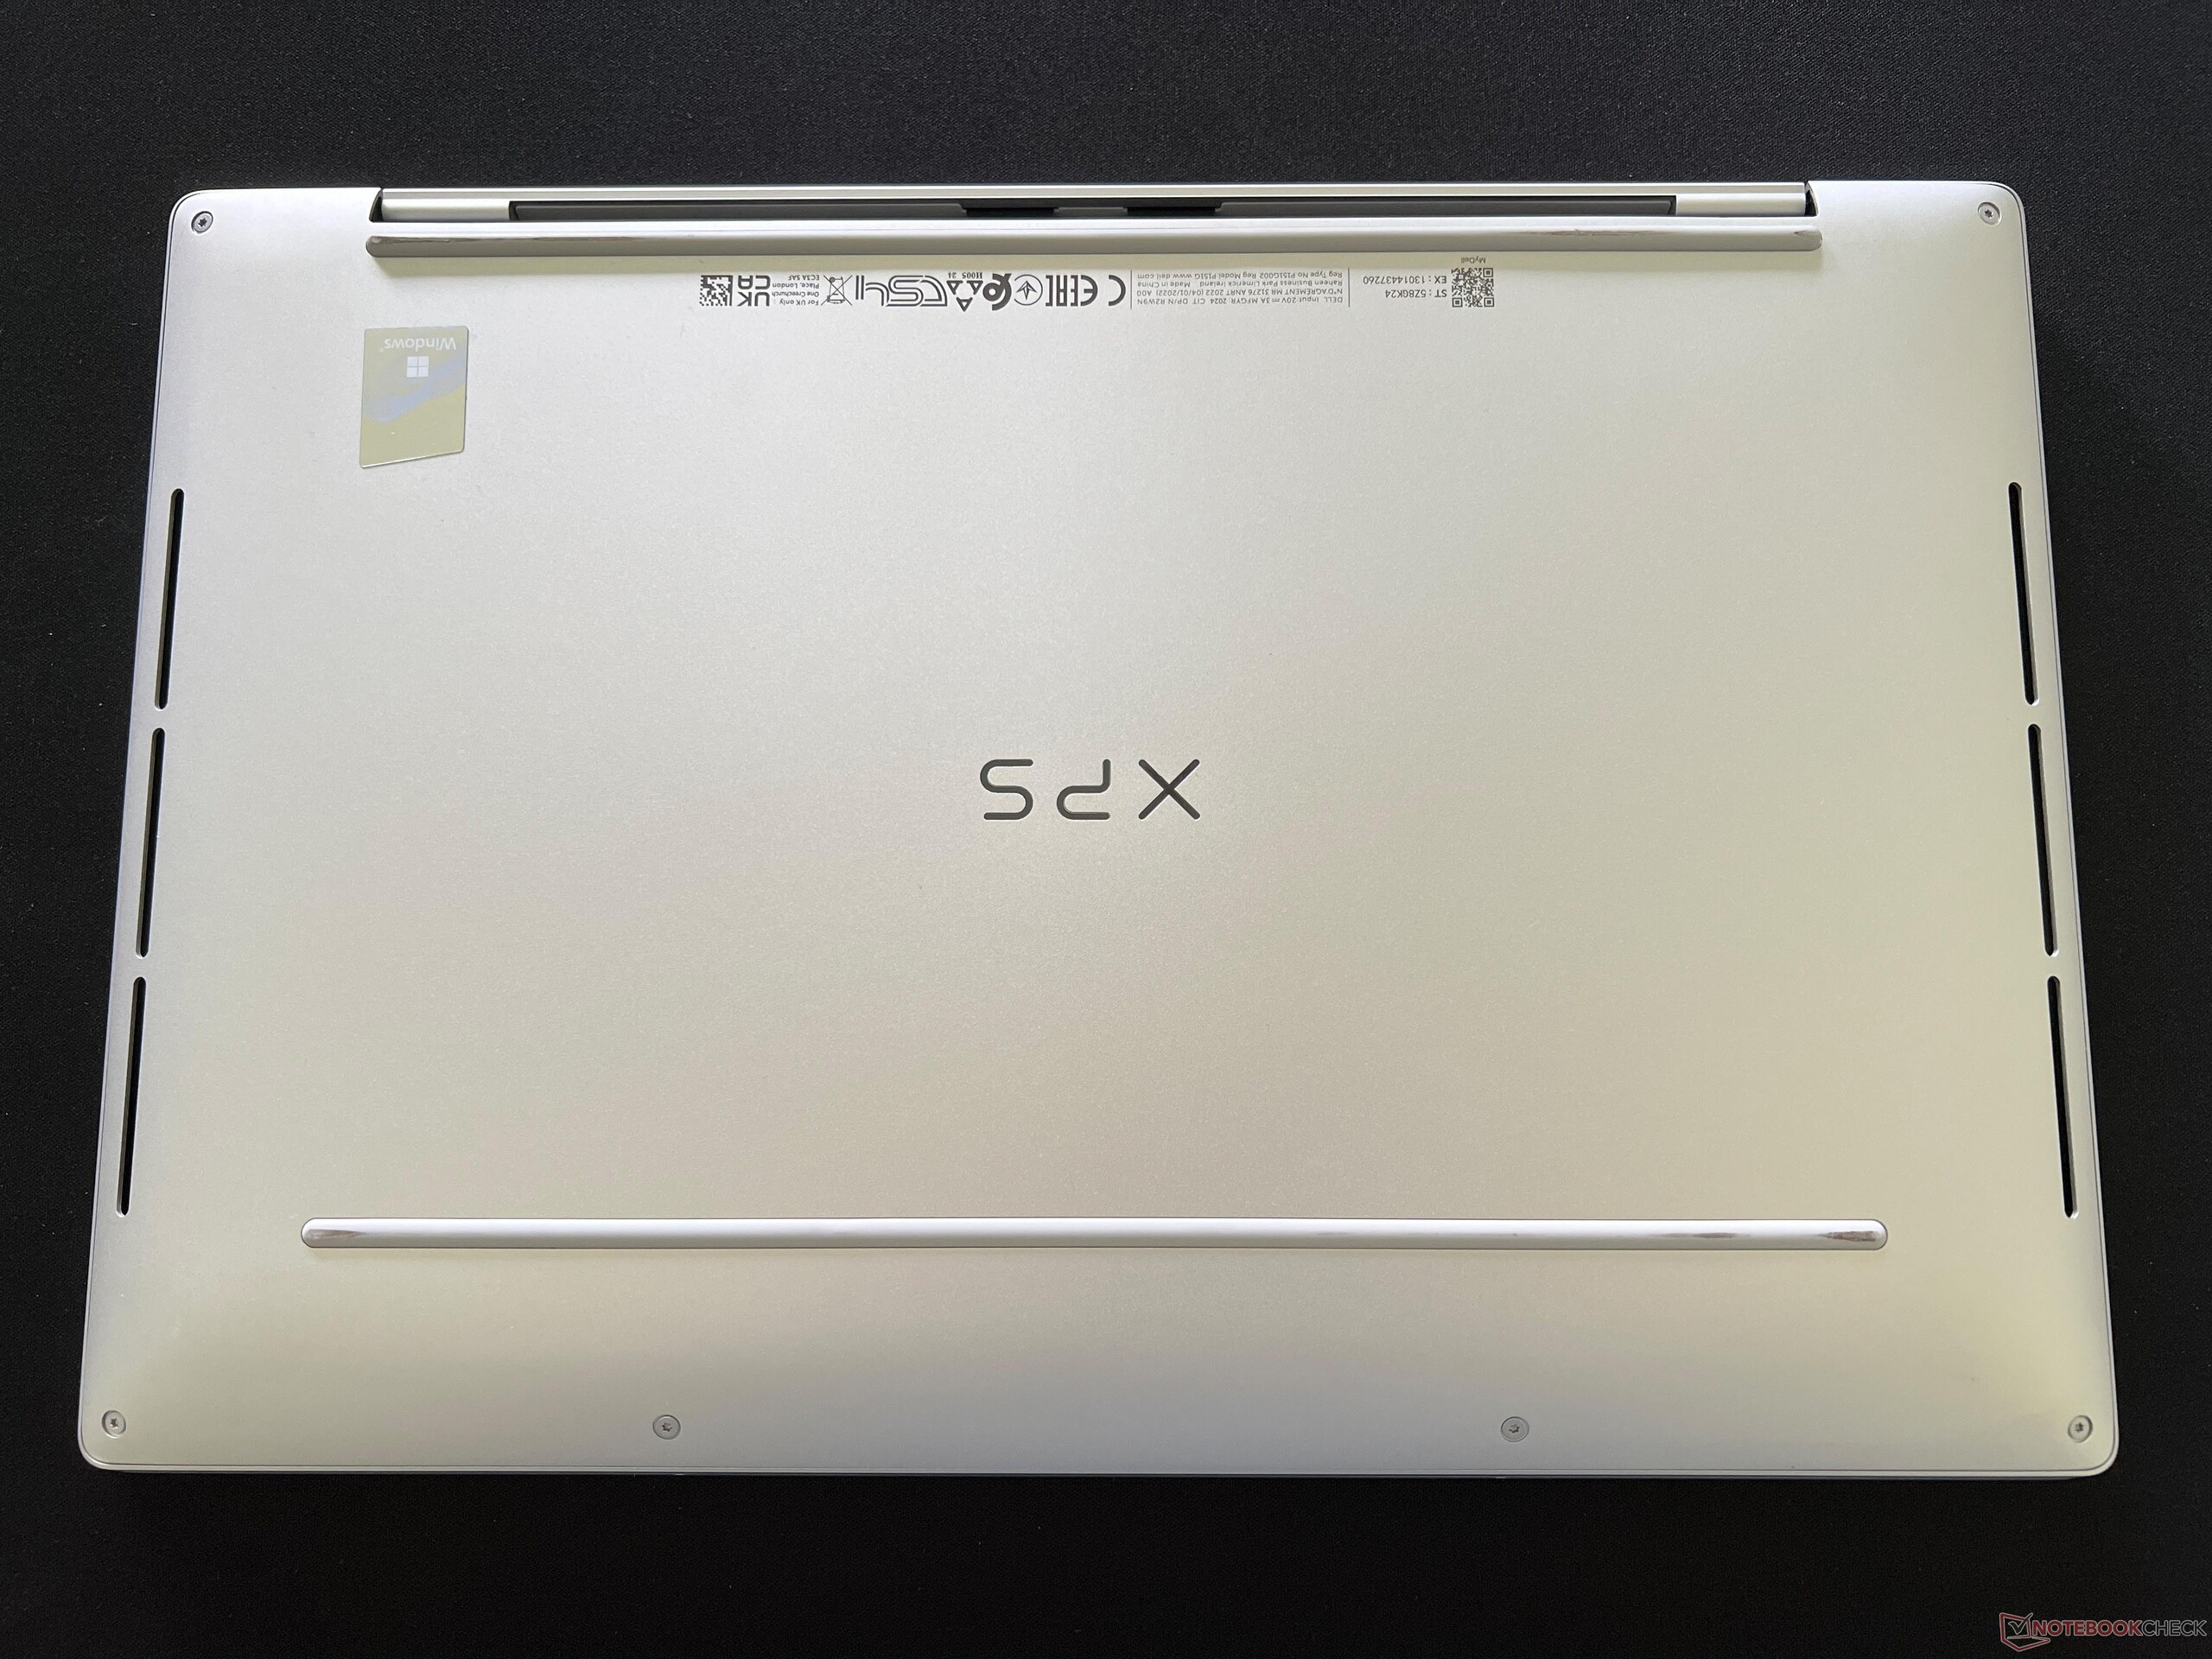
El XPS 13 9340 es el dispositivo más compacto de nuestro grupo de comparación y no ocupa mucho espacio. Esto es práctico si está de viaje (tren, avión), por ejemplo. Con un peso de poco más de 1,2 kg, sin embargo, no es el modelo más ligero. La fuente de alimentación de 60 vatios suministrada también es bastante compacta y, junto con su cable USB-C, añade otros 256 gramos a la balanza.
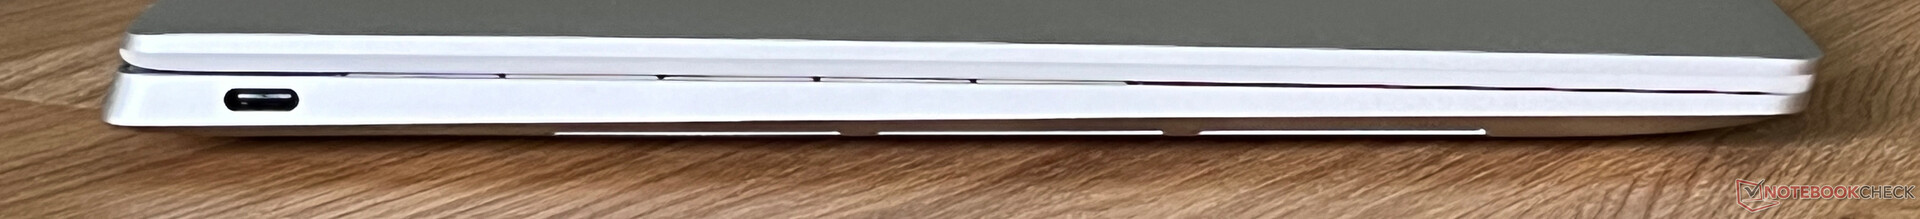
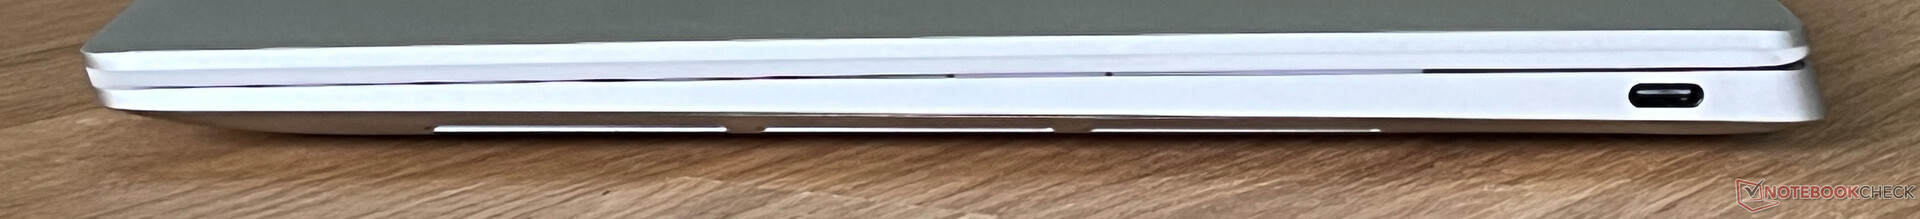
Conectividad - El XPS 13 sin conector de audio
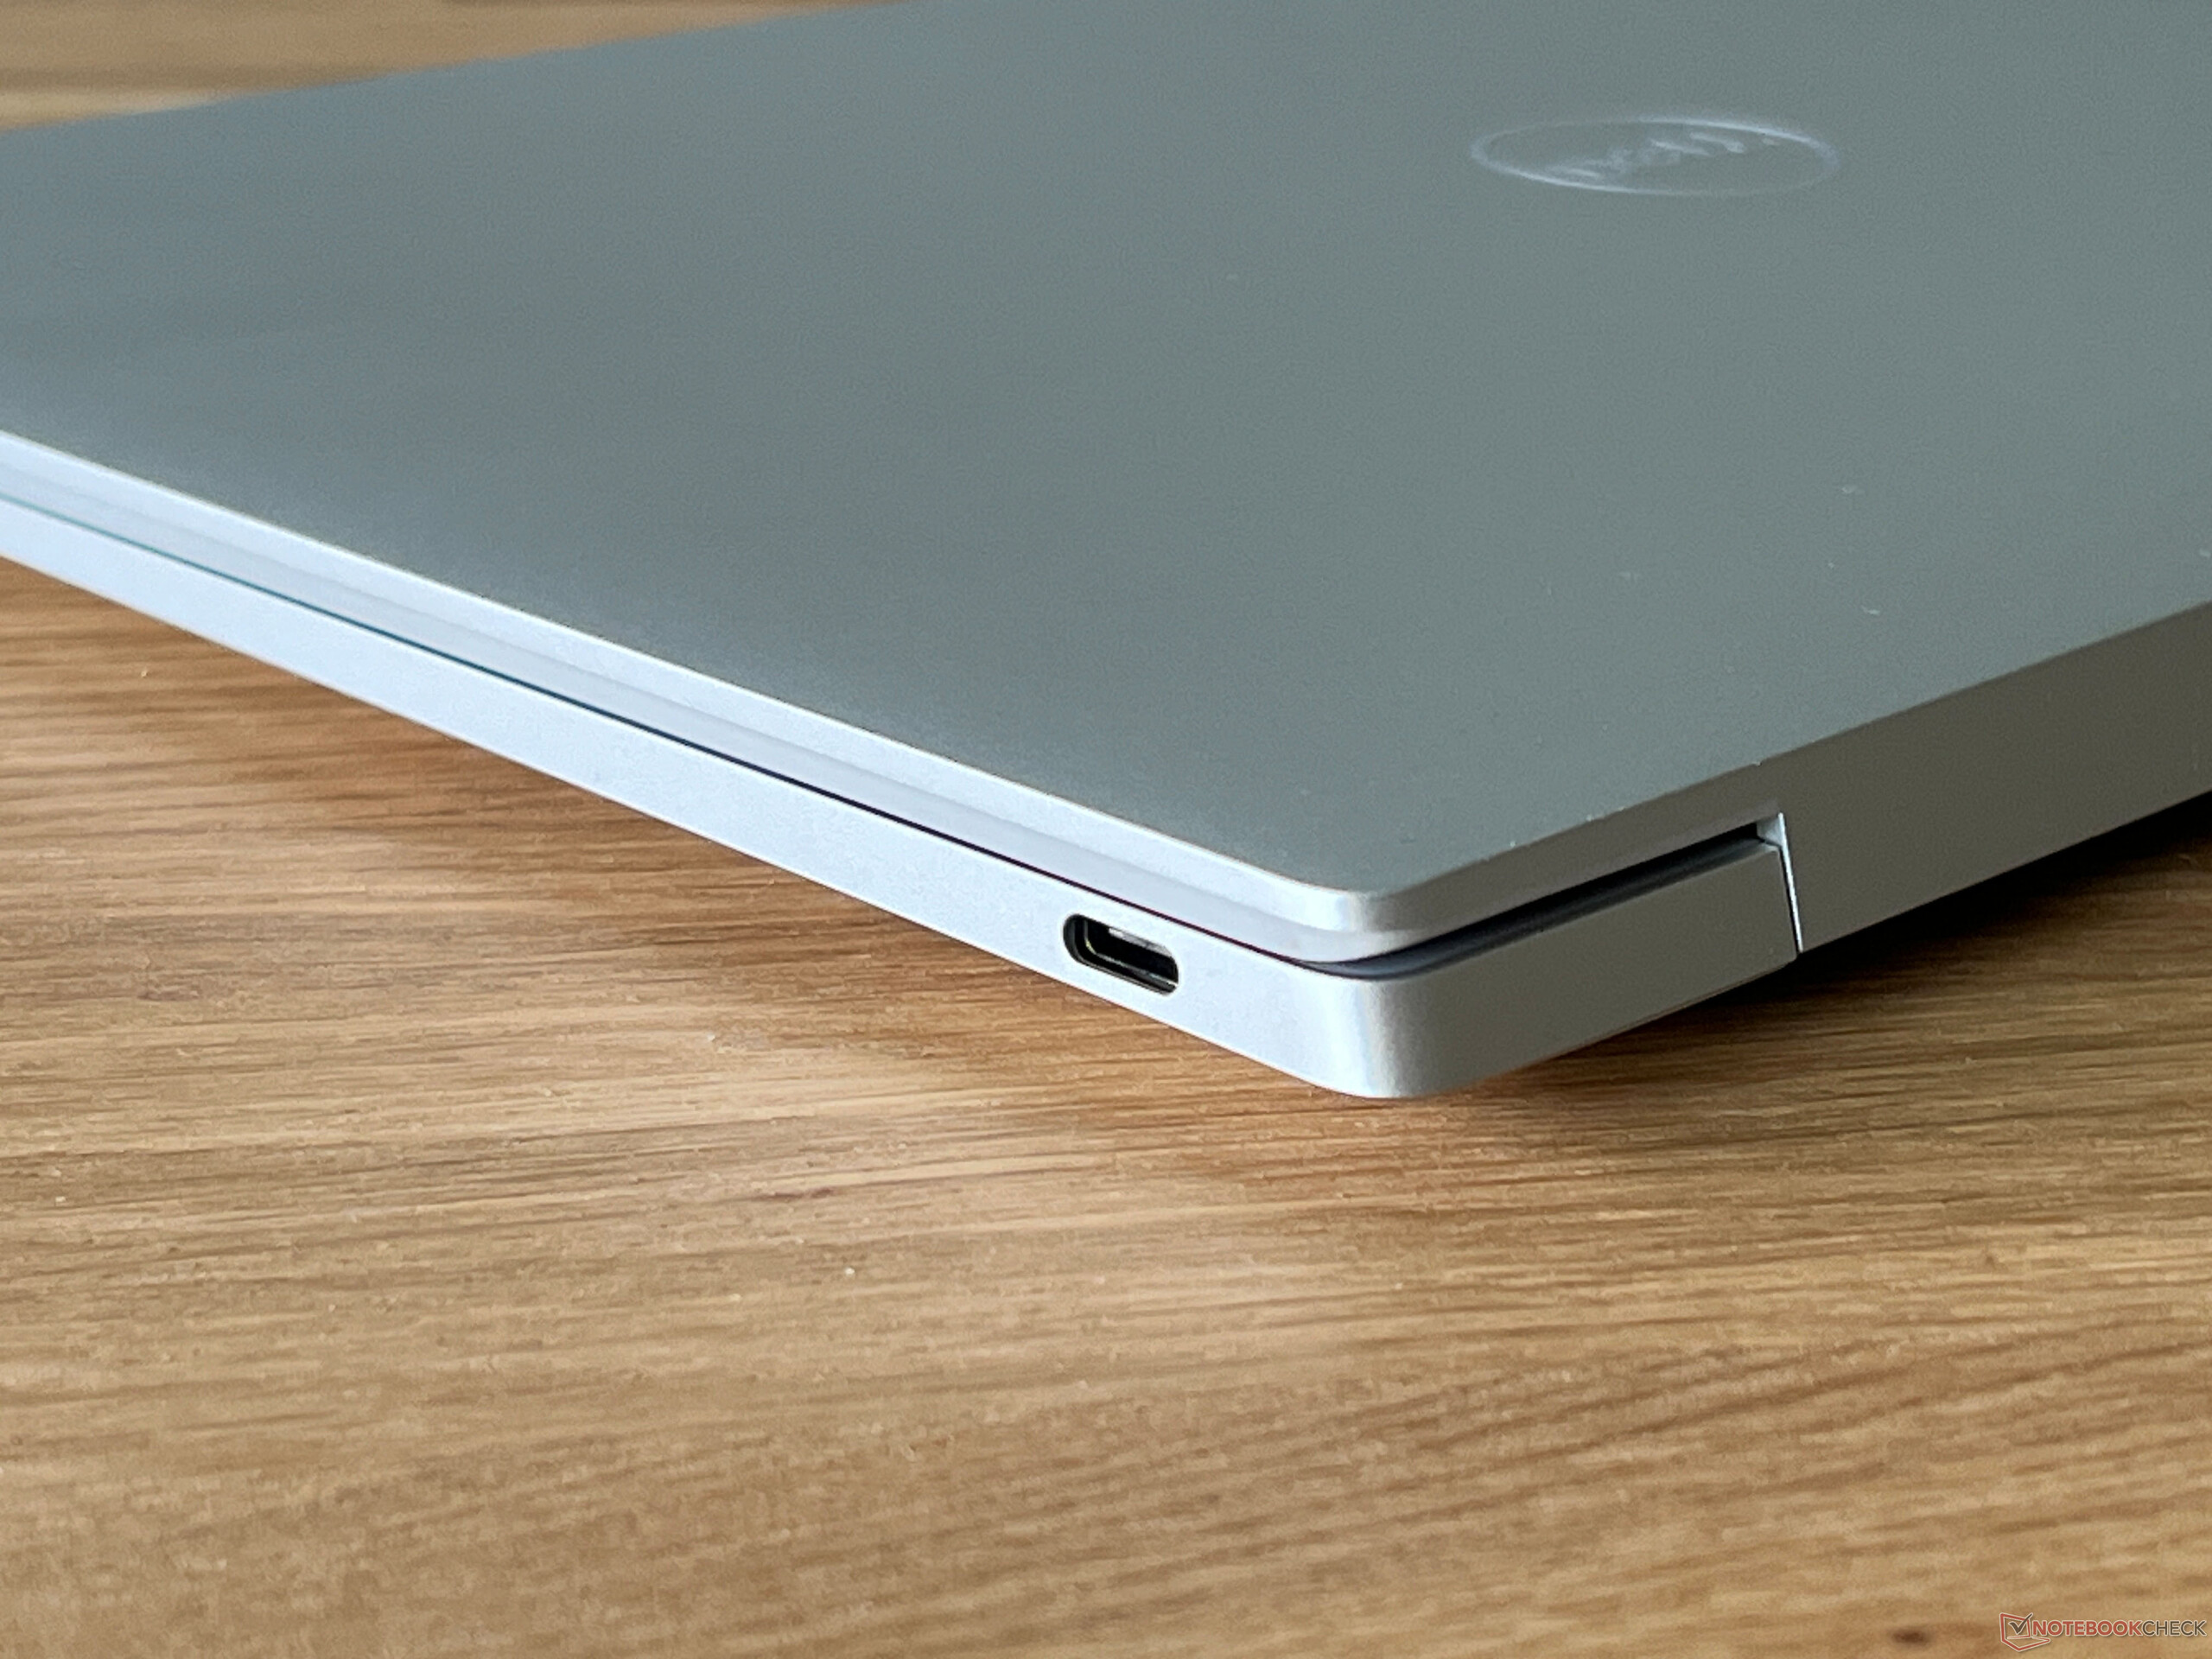
En comparación con sus dos hermanos mayores, el XPS 13 tiene que recuperar mucho terreno en lo que a puertos se refiere, ya que se han eliminado tanto el lector de tarjetas como el conector de audio. Solo tiene un puerto USB-C con Thunderbolt 4 a cada lado. En la práctica, es agradable que pueda conectar la fuente de alimentación en ambos lados, pero esto a menudo deja solo un puerto libre para usar.
Comunicación
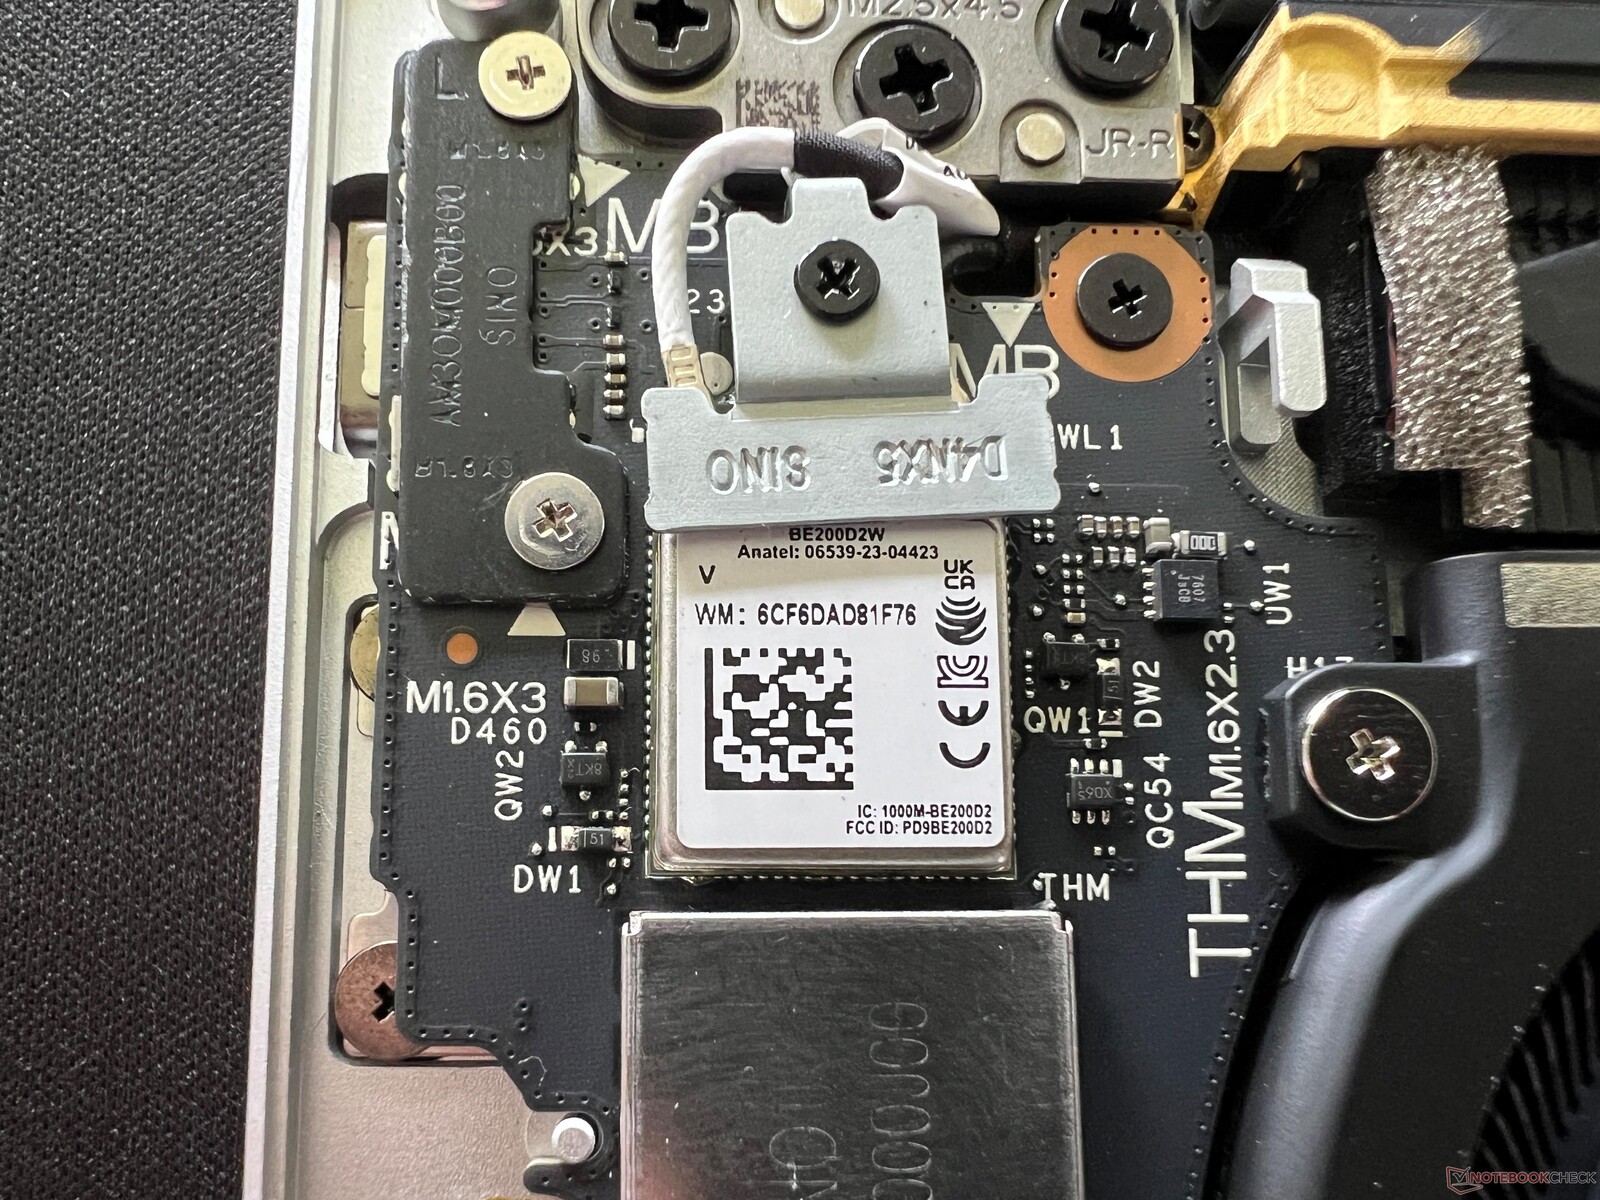
El módulo WLAN Intel BE200 ya es compatible con Wi-Fi 7, así como con Bluetooth 5.4. Durante nuestra prueba WLAN, ofreció unas tasas de transferencia globalmente altas y estables en combinación con nuestro router de referencia de Asus. No observamos ningún problema durante toda nuestra fase de pruebas.
| Networking | |
| Dell XPS 13 9340 Core Ultra 7 | |
| iperf3 transmit AXE11000 | |
| iperf3 receive AXE11000 | |
| Apple MacBook Air 13 M3 10C GPU | |
| iperf3 transmit AXE11000 | |
| iperf3 receive AXE11000 | |
| Asus ZenBook S13 OLED UX5304 | |
| iperf3 transmit AXE11000 | |
| iperf3 receive AXE11000 | |
| Lenovo ThinkPad Z13 Gen 2 | |
| iperf3 transmit AXE11000 | |
| iperf3 receive AXE11000 | |
| iperf3 transmit AXE11000 6GHz | |
| iperf3 receive AXE11000 6GHz | |
| HP Dragonfly G4 | |
| iperf3 transmit AXE11000 | |
| iperf3 receive AXE11000 | |
| iperf3 transmit AXE11000 6GHz | |
| iperf3 receive AXE11000 6GHz | |
| Dell XPS 13 Plus 9320 Core i7-1360P | |
| iperf3 transmit AXE11000 | |
| iperf3 receive AXE11000 | |
| iperf3 transmit AXE11000 6GHz | |
| iperf3 receive AXE11000 6GHz | |
Cámara web
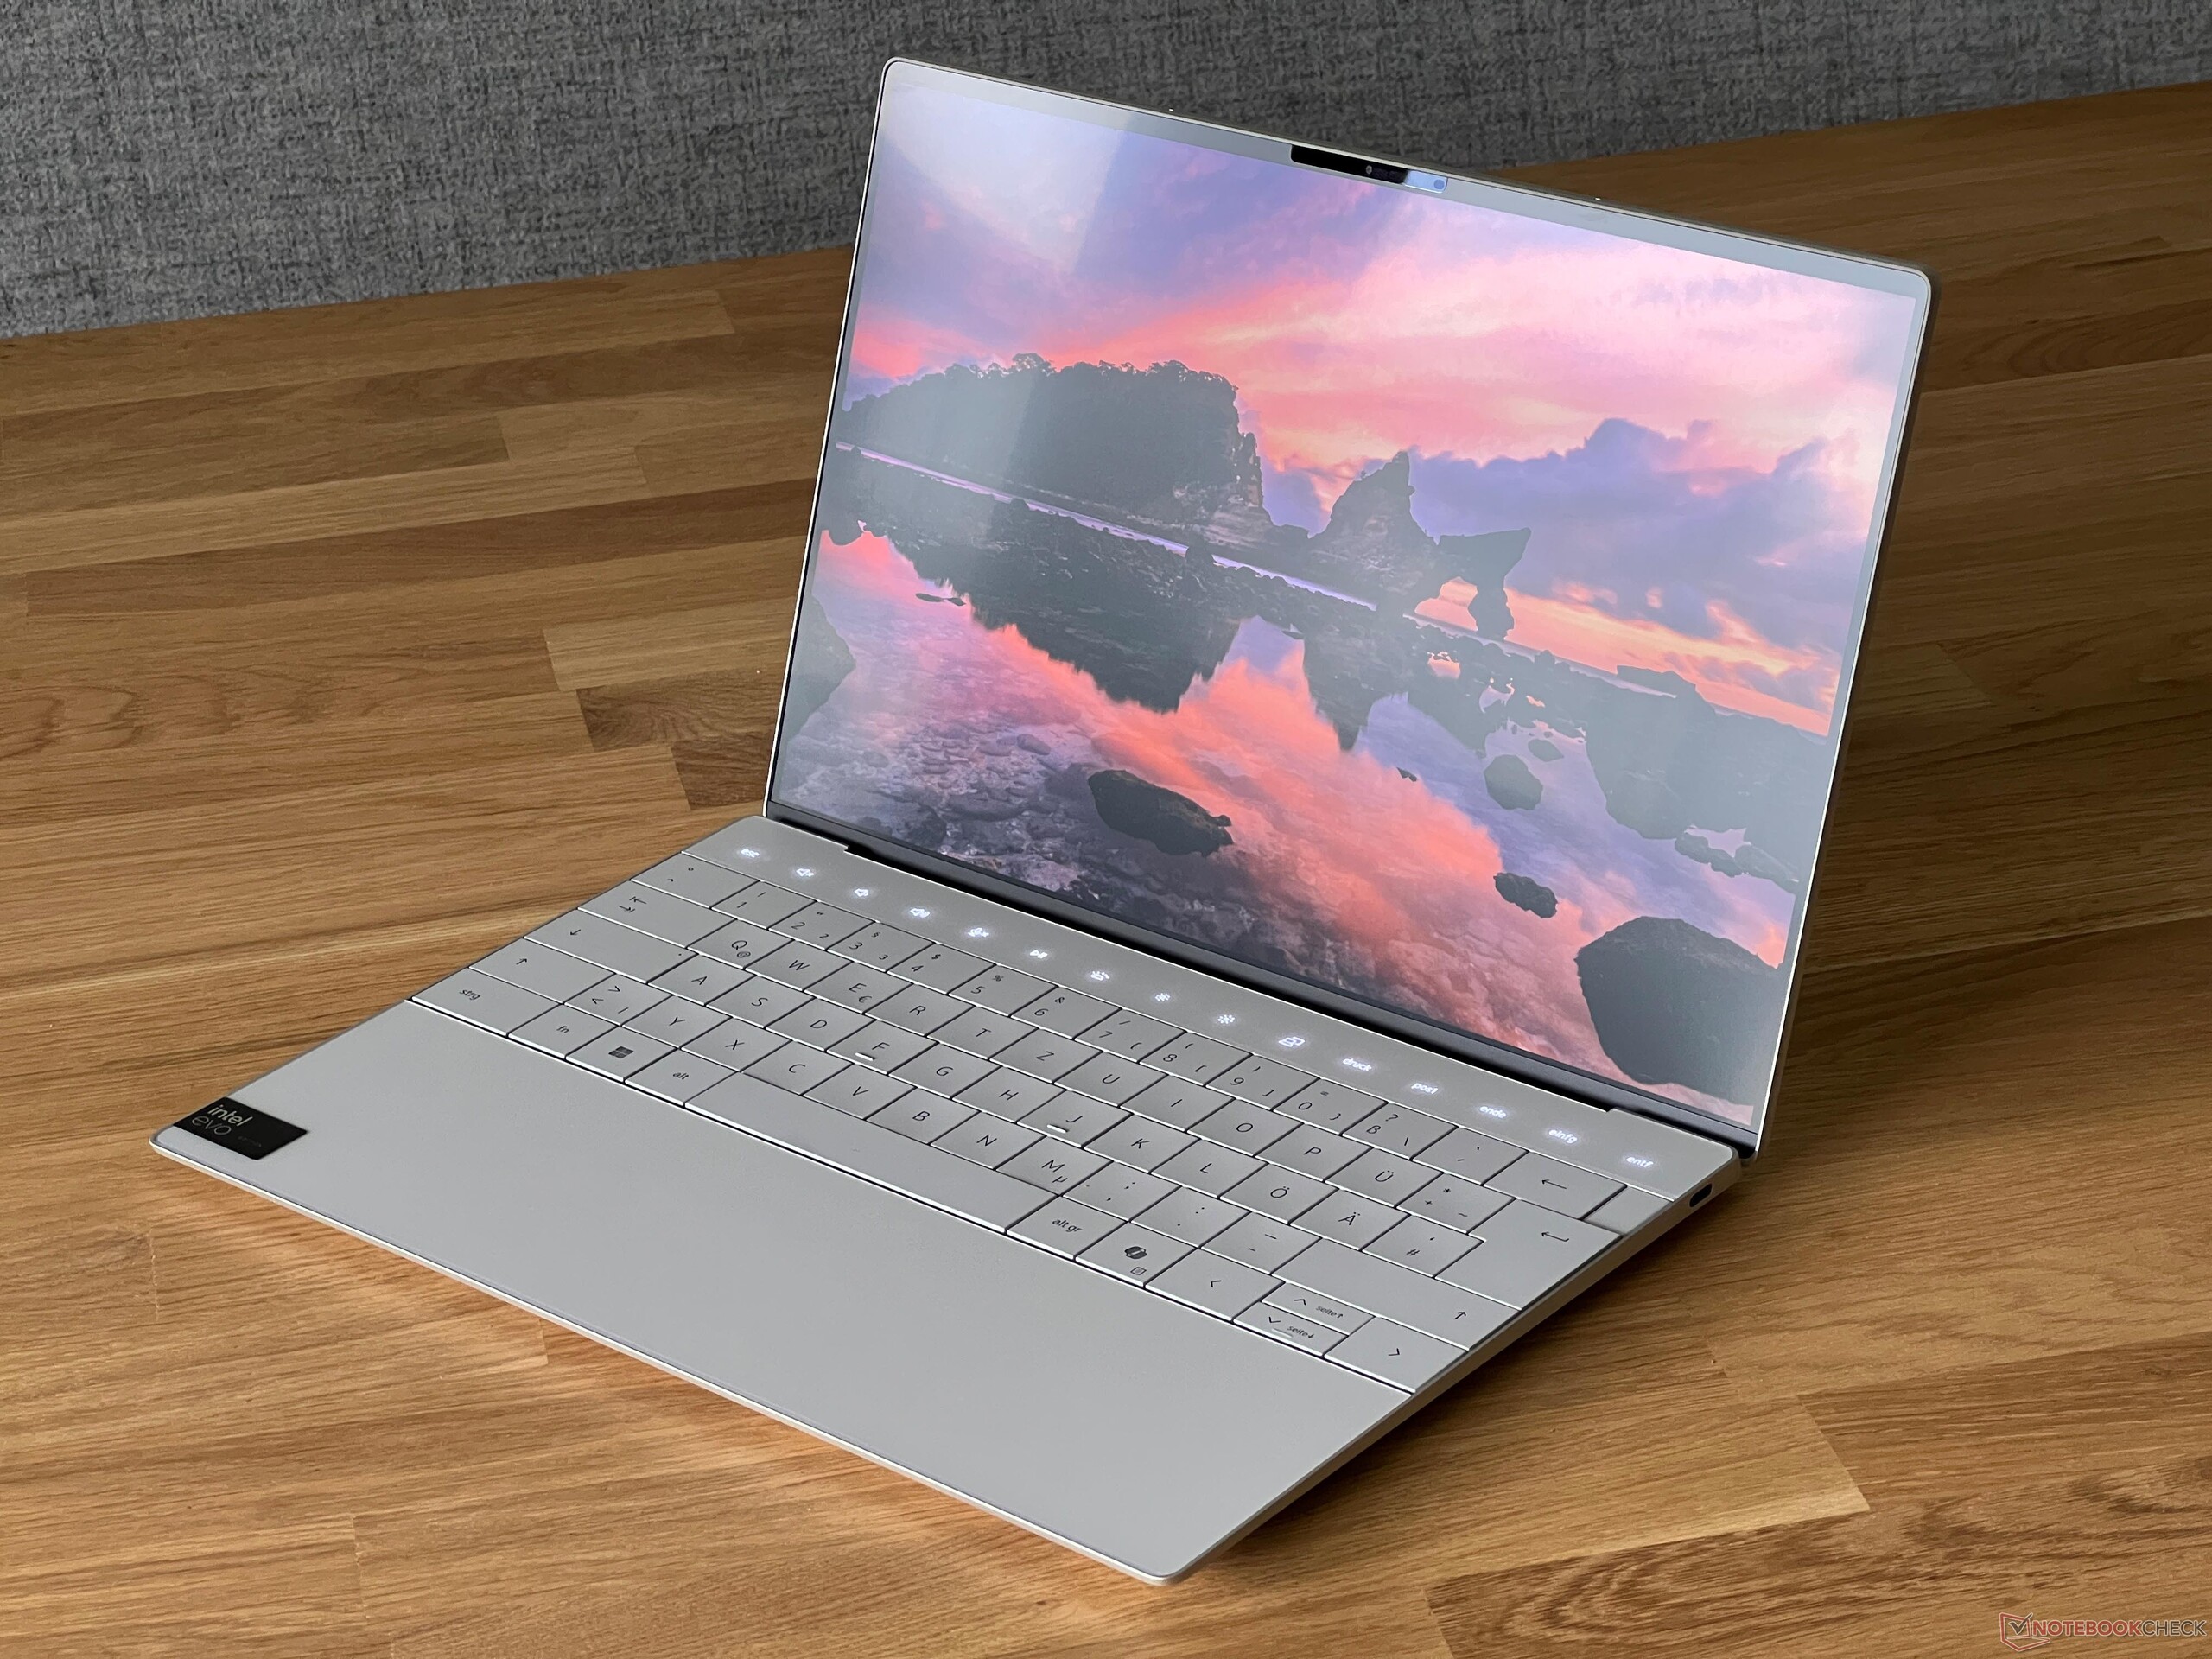
La cámara de 1080p instalada en el borde superior de la pantalla hace fotos decentes y, en combinación con el procesador Meteor Lake, se supone que los efectos de estudio (como el enfoque suave del fondo) forman parte del sistema operativo del portátil. Además, el dispositivo puede hacer uso de una cámara de infrarrojos para el reconocimiento facial a través de Windows Hello.


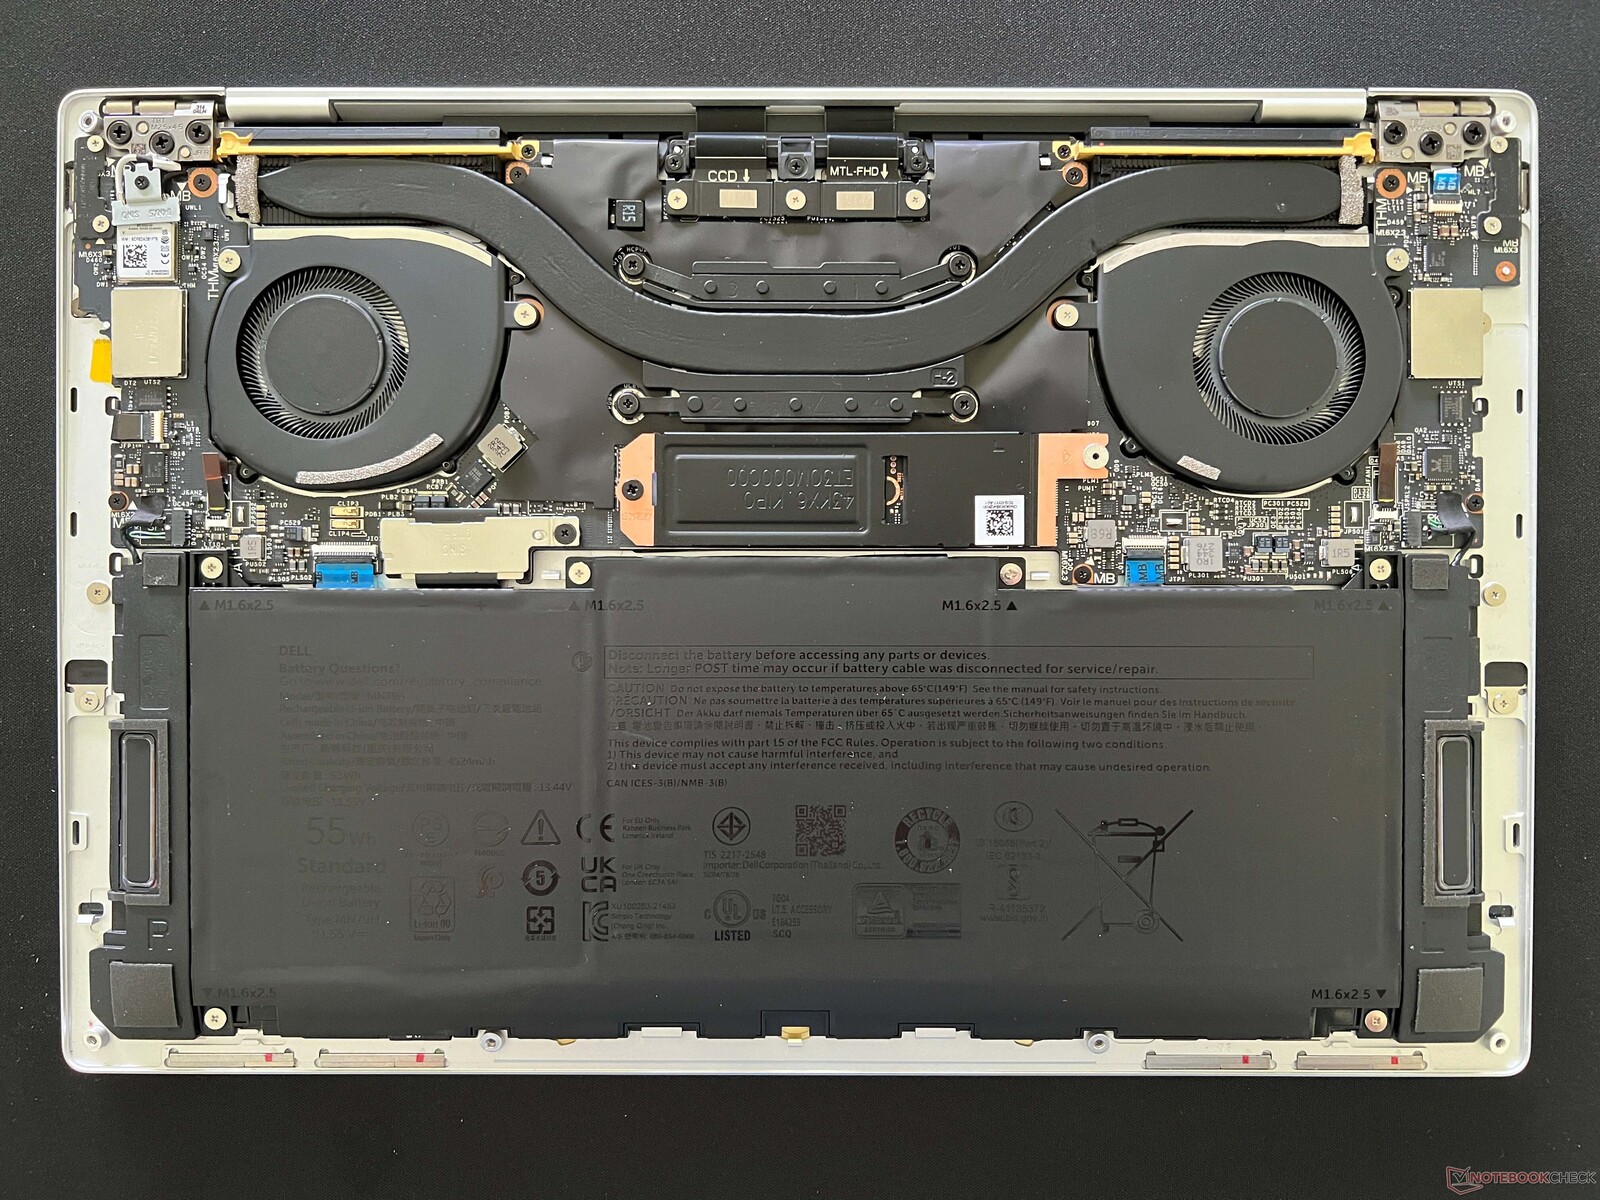
Mantenimiento
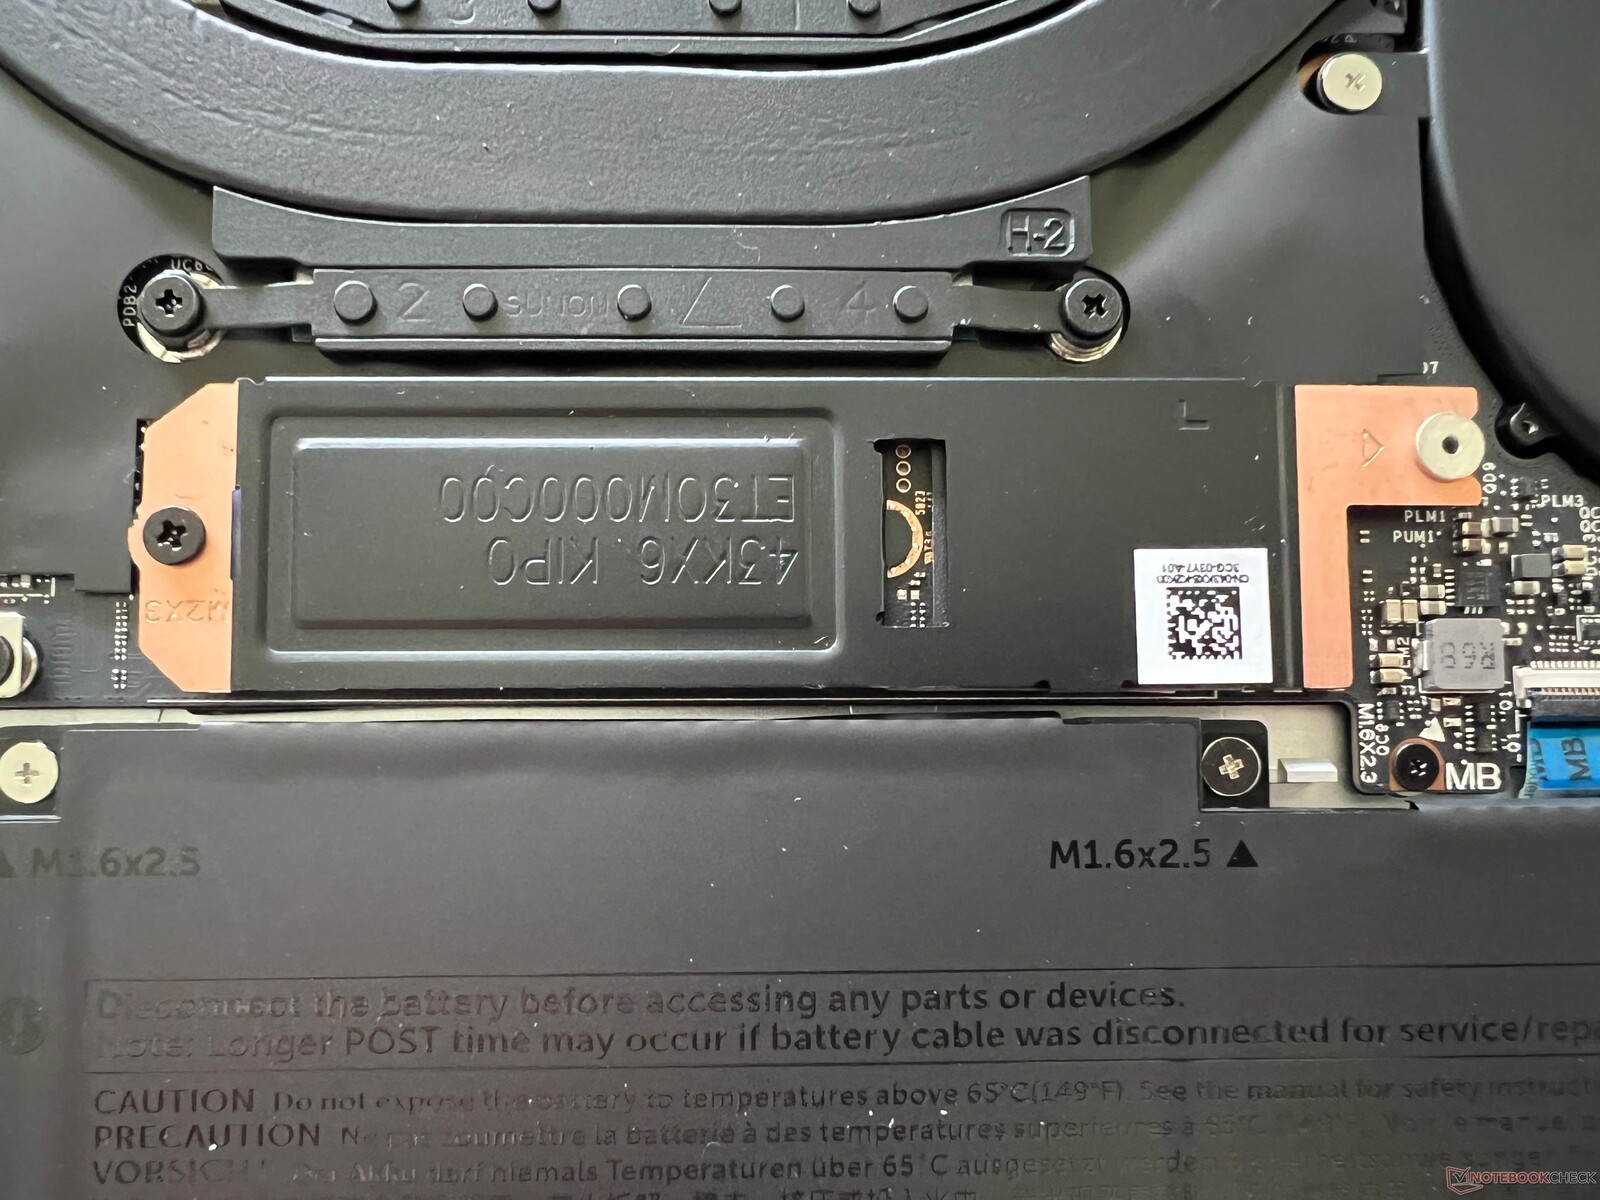
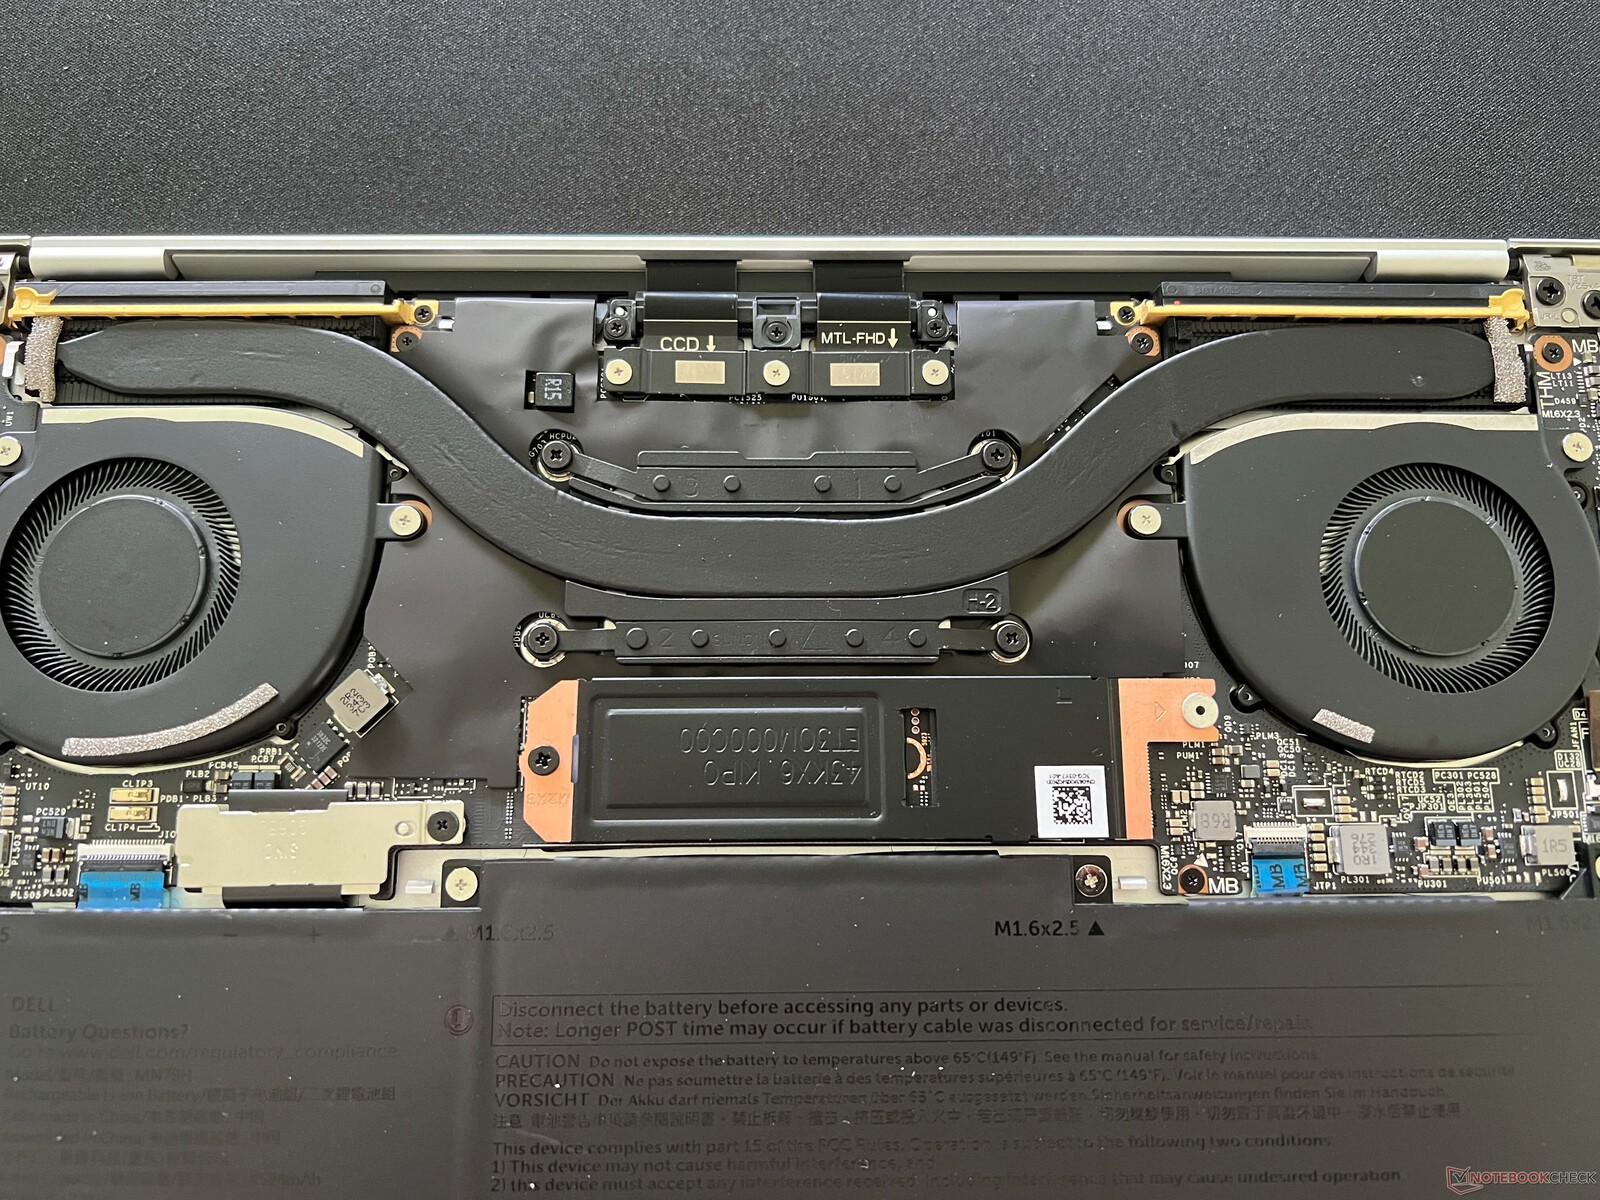
La cubierta inferior está fijada con tornillos Torx (T5) y puede retirarse fácilmente. En el interior, sin embargo, sus opciones de mantenimiento se limitan a limpiar los ventiladores e intercambiar la SSD M.2-2280 que está situada bajo una cubierta adicional. La batería está atornillada y puede sustituirse en caso necesario.
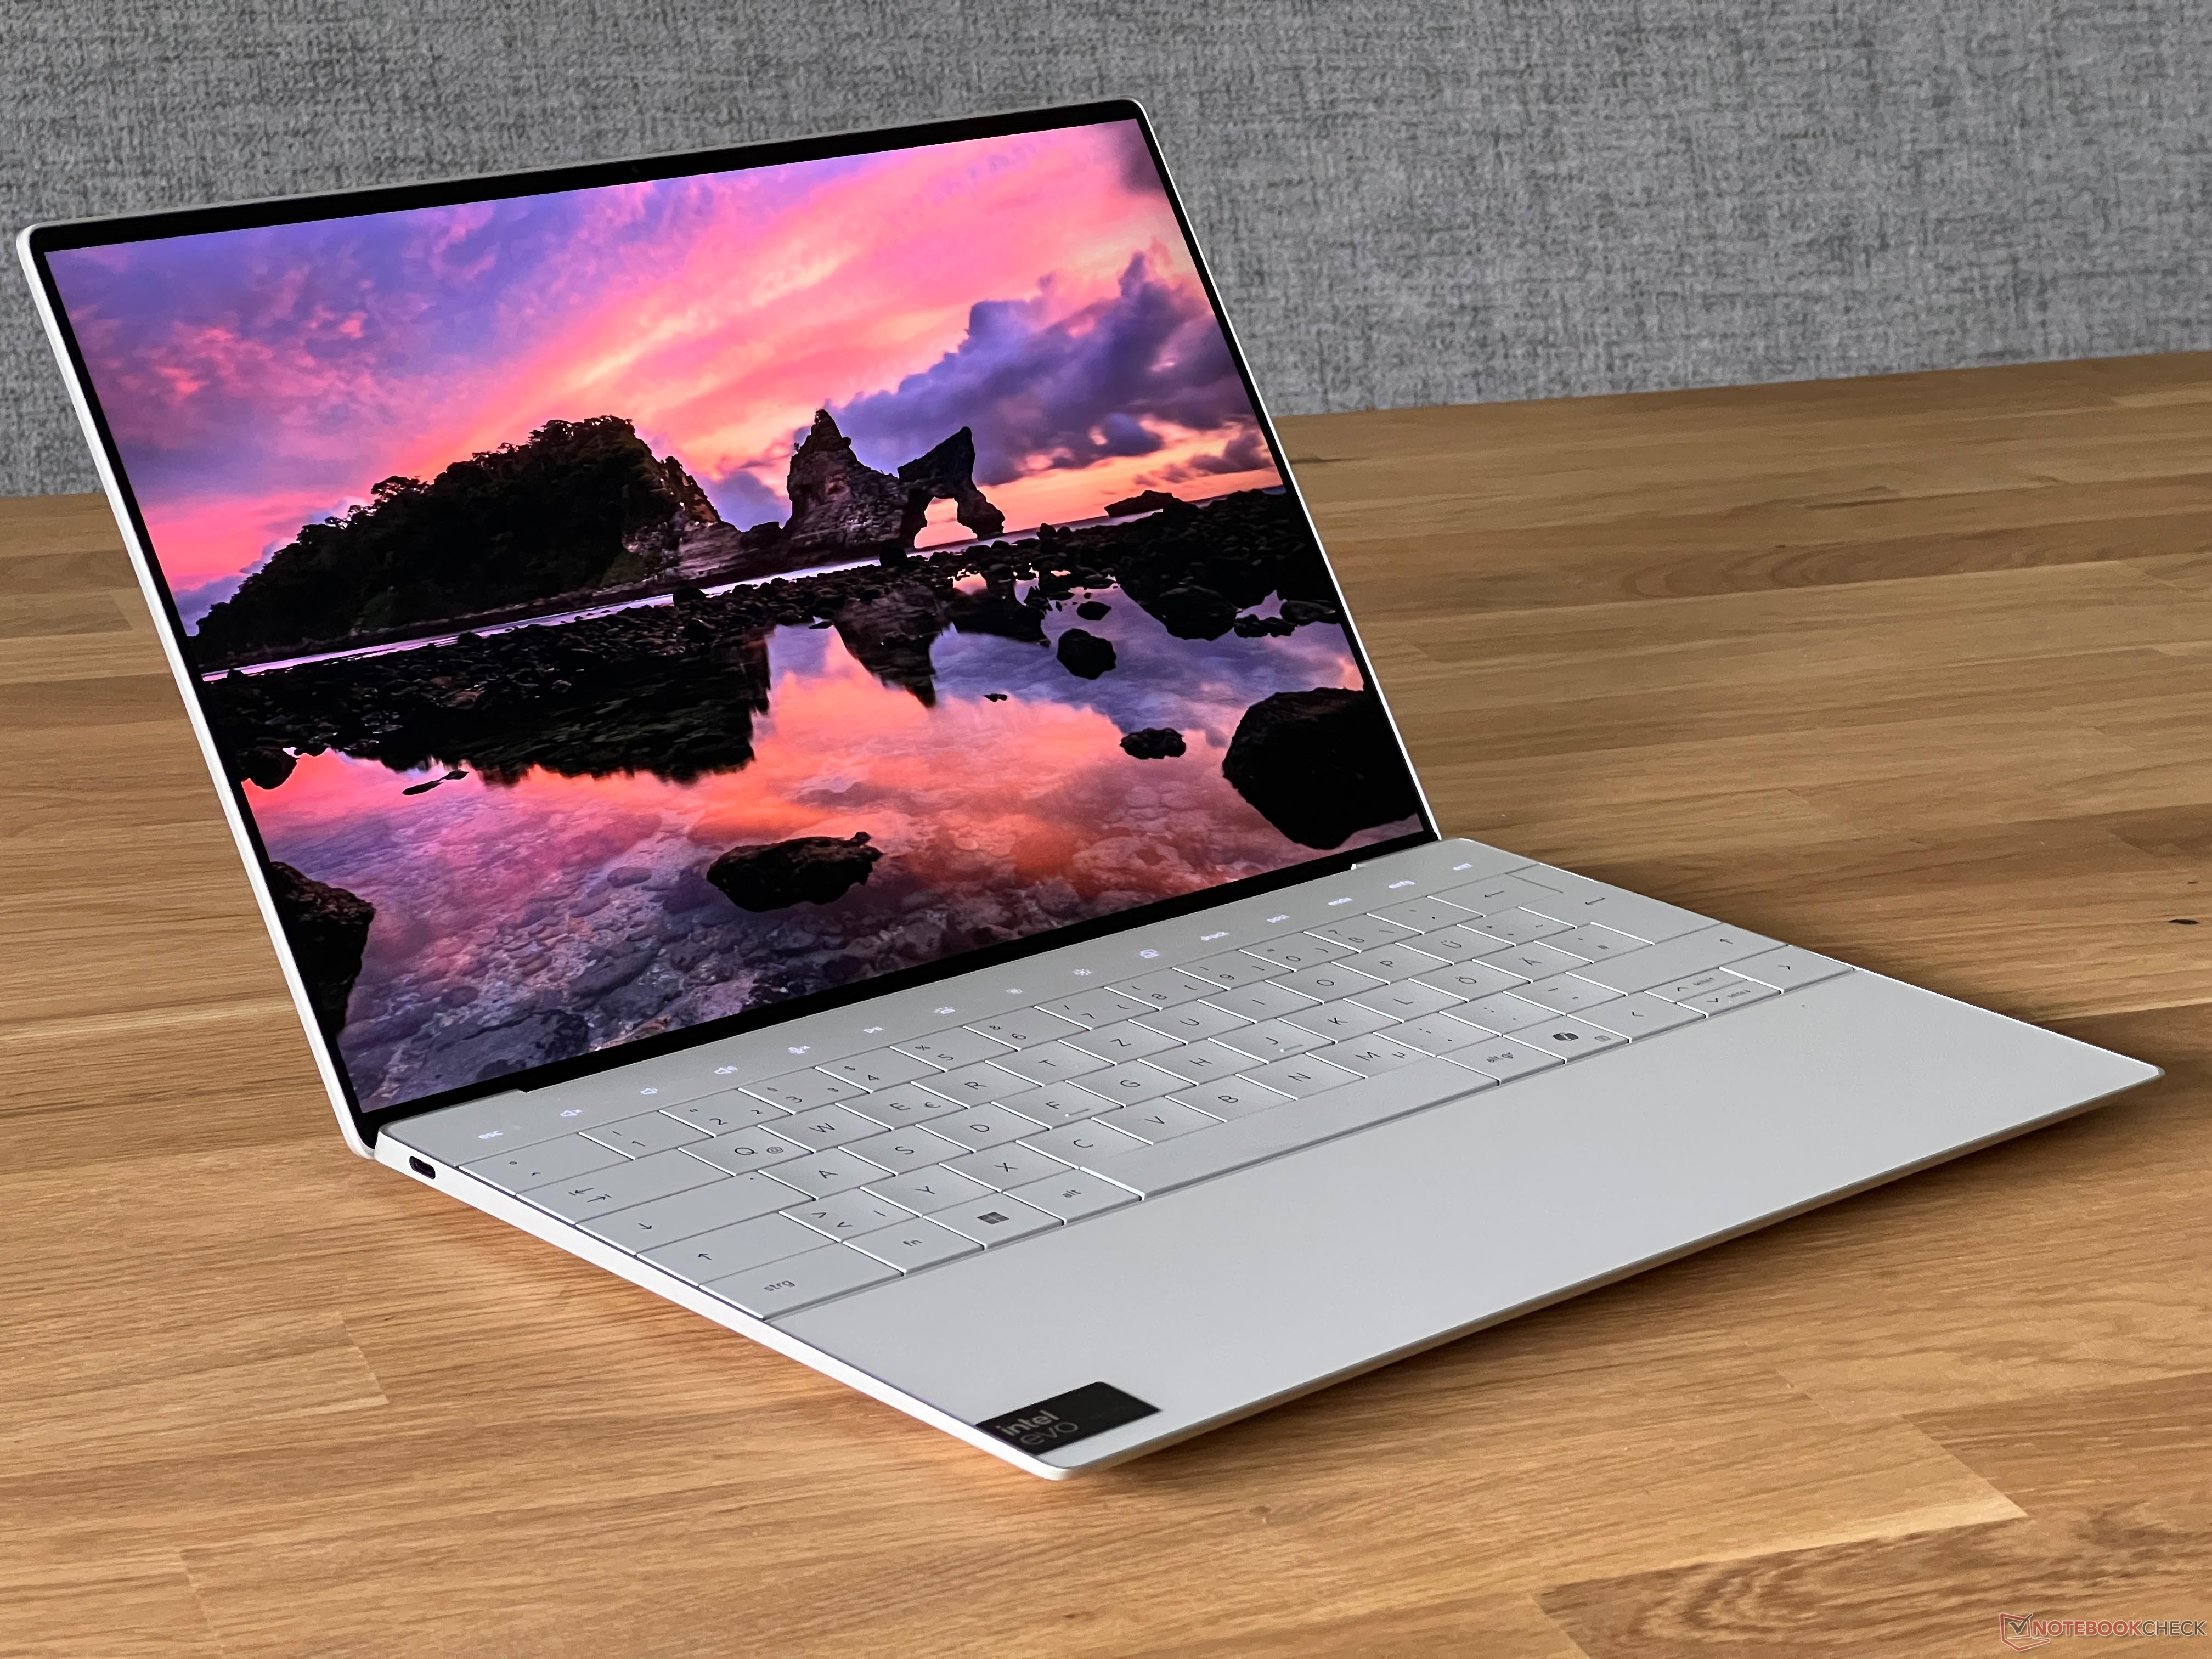
Dispositivos de entrada - Teclado al que cuesta acostumbrarse y teclas de función molestas
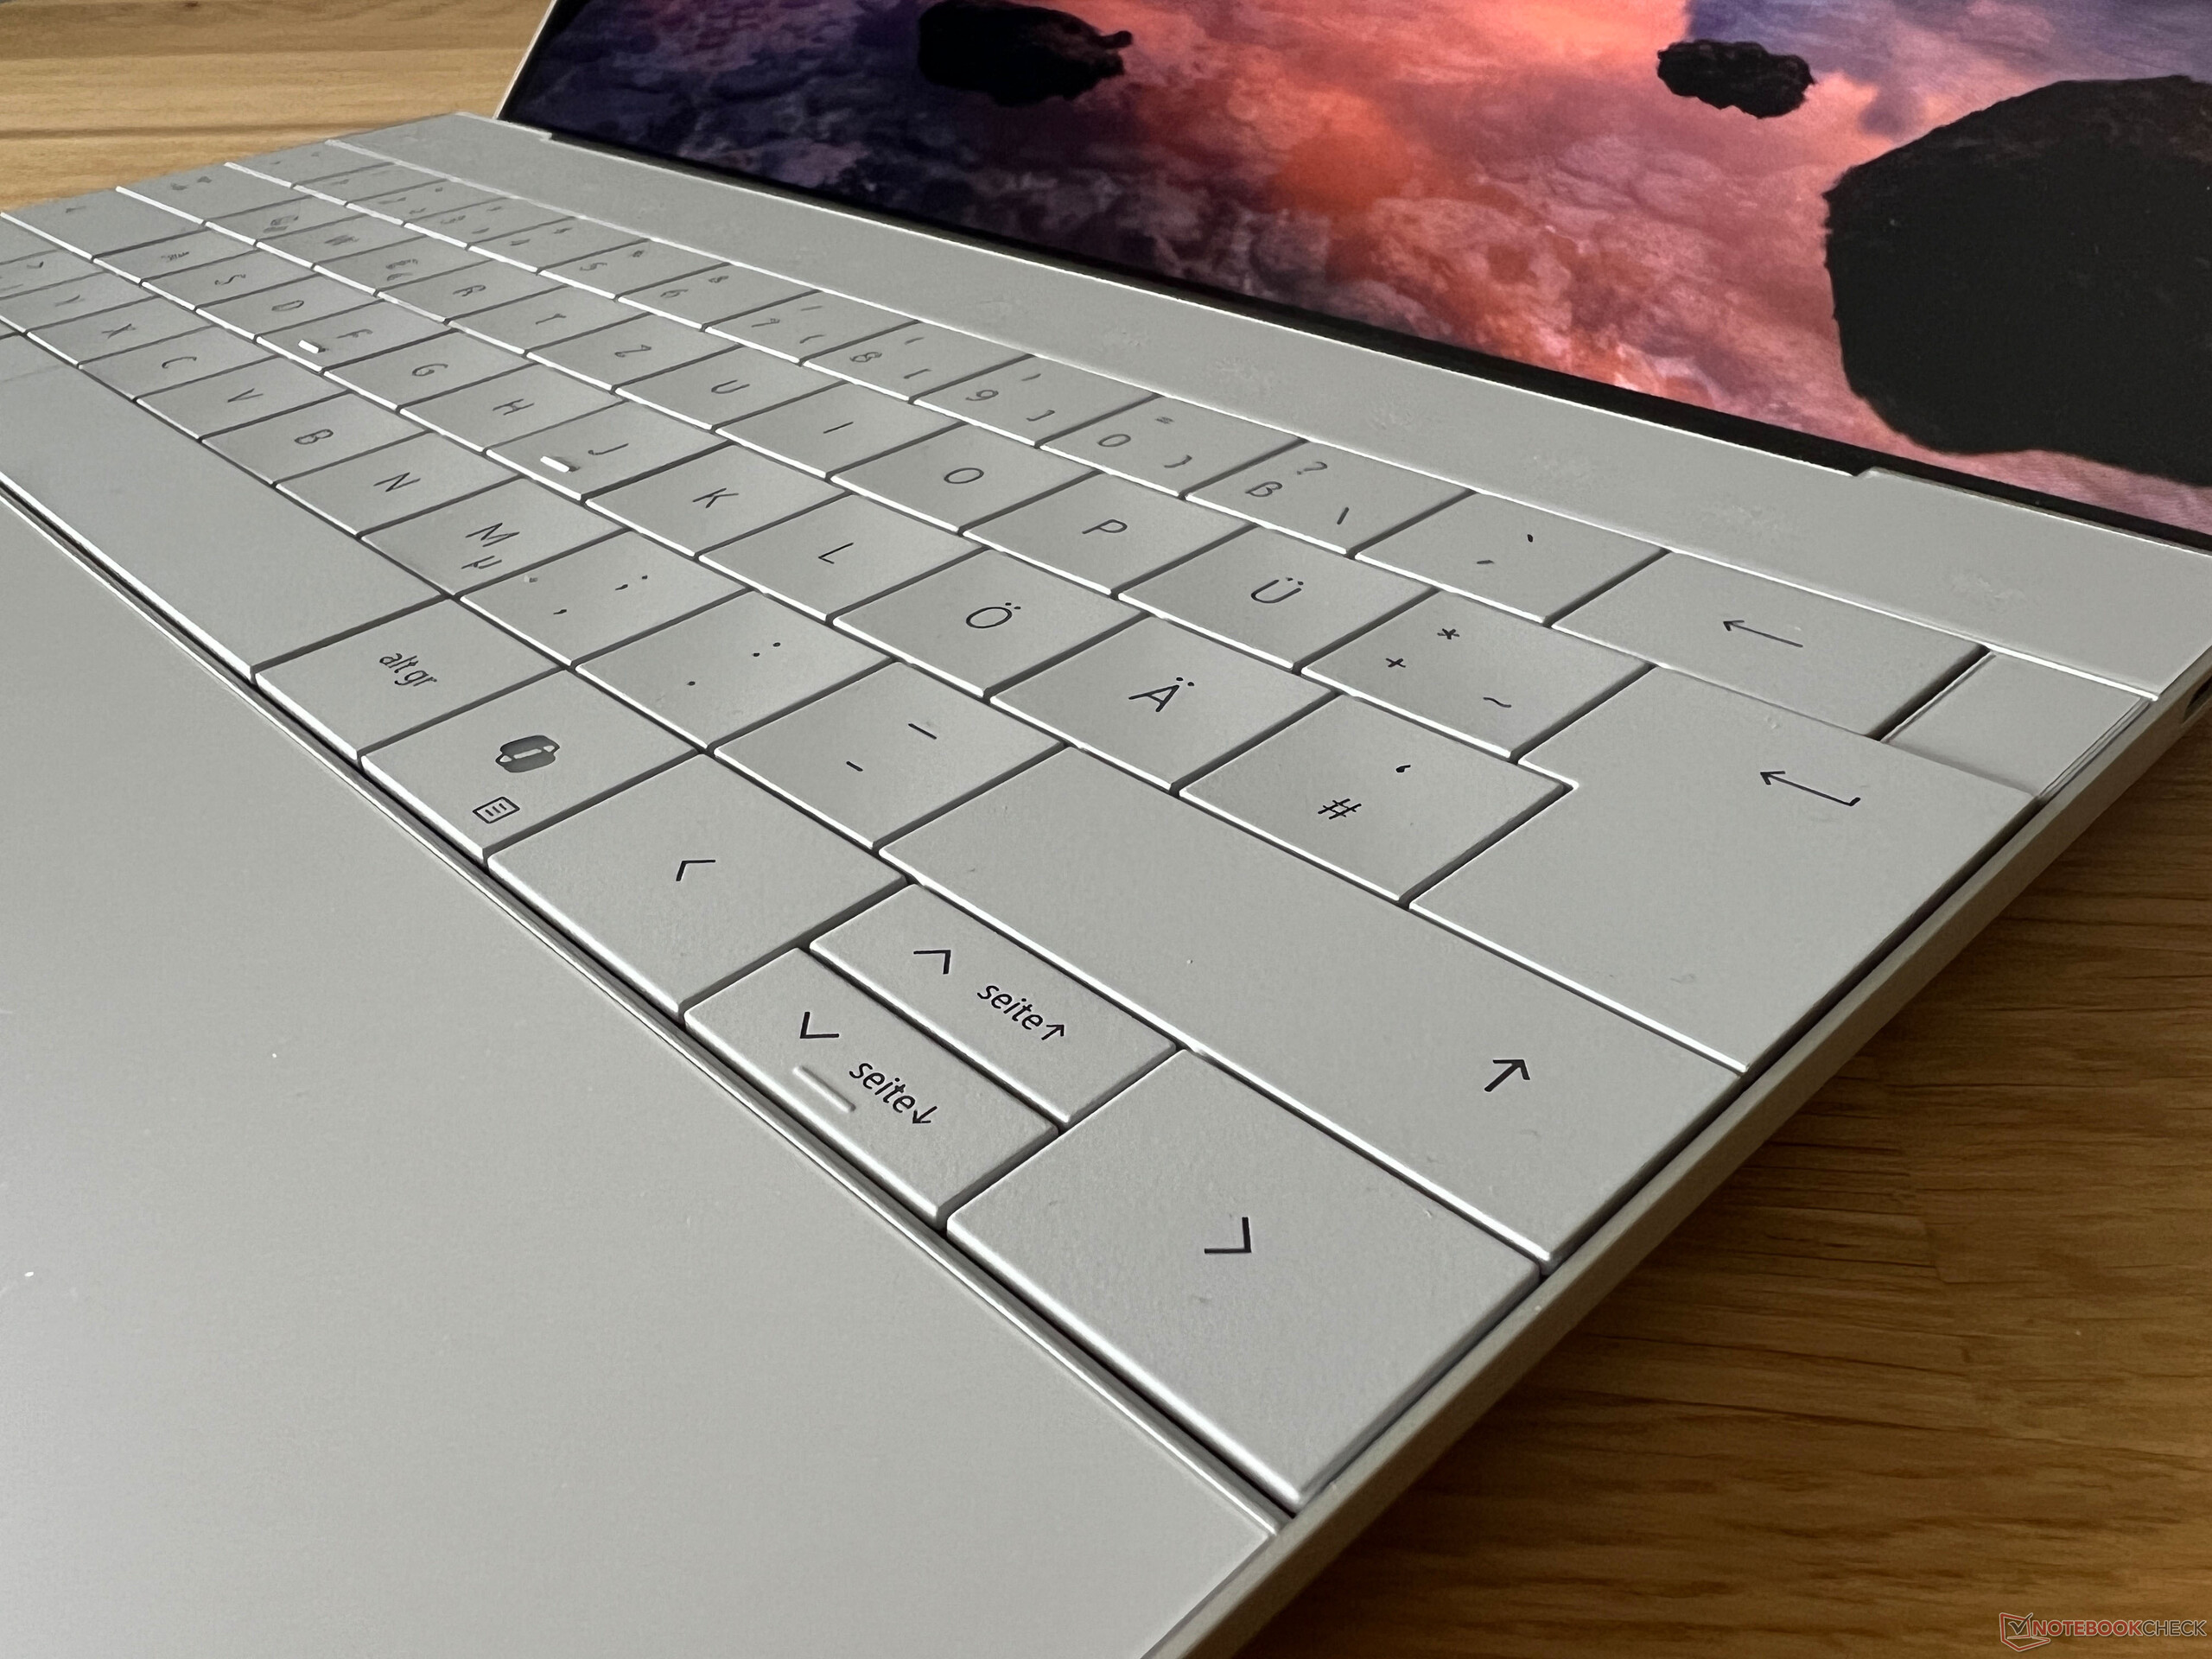
Al igual que en el antiguo XPS 13 Plus, el diseño del teclado de este modelo no presenta ningún espacio entre las teclas individuales. Las teclas en sí son ligeramente cóncavas y en general resultan cómodas para teclear, ya que su pulsación es precisa. Sin embargo, observamos algunos problemas, a saber, que a menudo pulsamos la tecla equivocada por accidente y que definitivamente hay que acostumbrarse al teclado. También nos resultaron un poco molestas las diminutas teclas de flecha verticales, que apenas se pueden pulsar con los dedos grandes. Además, el sonido de las teclas más grandes (barra espaciadora, enter) es considerablemente más fuerte. El botón de encendido (que incluye un escáner de huellas dactilares) se sitúa en la parte superior derecha, donde normalmente se esperaría que estuviera la tecla Esc, y esto nos lleva a nuestro siguiente problema.
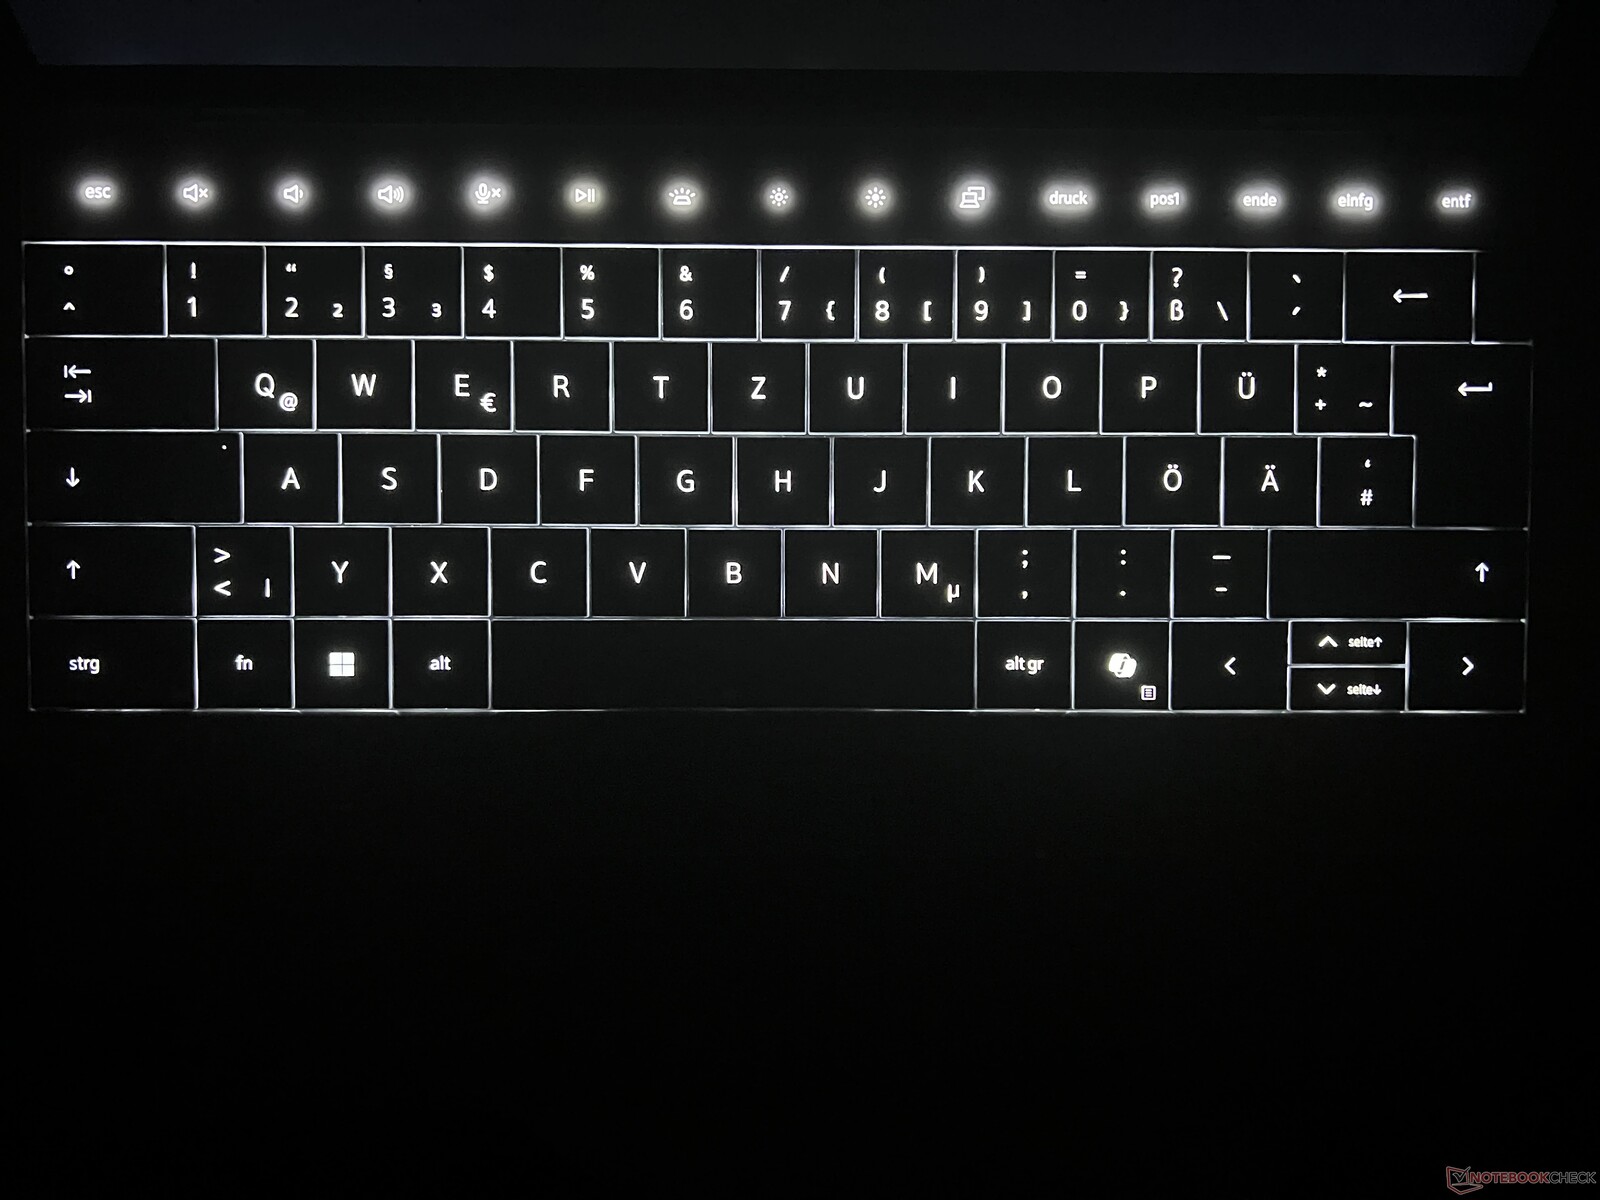
Las teclas de función están instaladas como una barra táctil que, en la práctica, no añade ningún valor adicional para los usuarios, sino que resulta bastante molesta. Esto significa que ni siquiera puede pulsar la tecla Esc a ciegas y que tiene que mirar las teclas cada vez. Su retroiluminación también es un pequeño problema, ya que se apaga inmediatamente durante los periodos de inactividad, mientras que no lo hacía durante horas de reproducción de vídeo sin entradas. Además, si se desactiva la retroiluminación del teclado, no se sabe dónde hay que pulsar, lo que lleva a que los usuarios puedan pulsar las teclas equivocadas antes de que se vuelva a encender la retroiluminación. La propia retroiluminación blanca se ajusta constantemente a través de un sensor y no se puede cambiar su intensidad en absoluto, al menos no pudimos encontrar una opción para hacerlo. Al sensor tampoco le interesa si ha desactivado la retroiluminación poco antes, porque en cuanto cambian las condiciones de luz ambiental, la retroiluminación se reactiva.
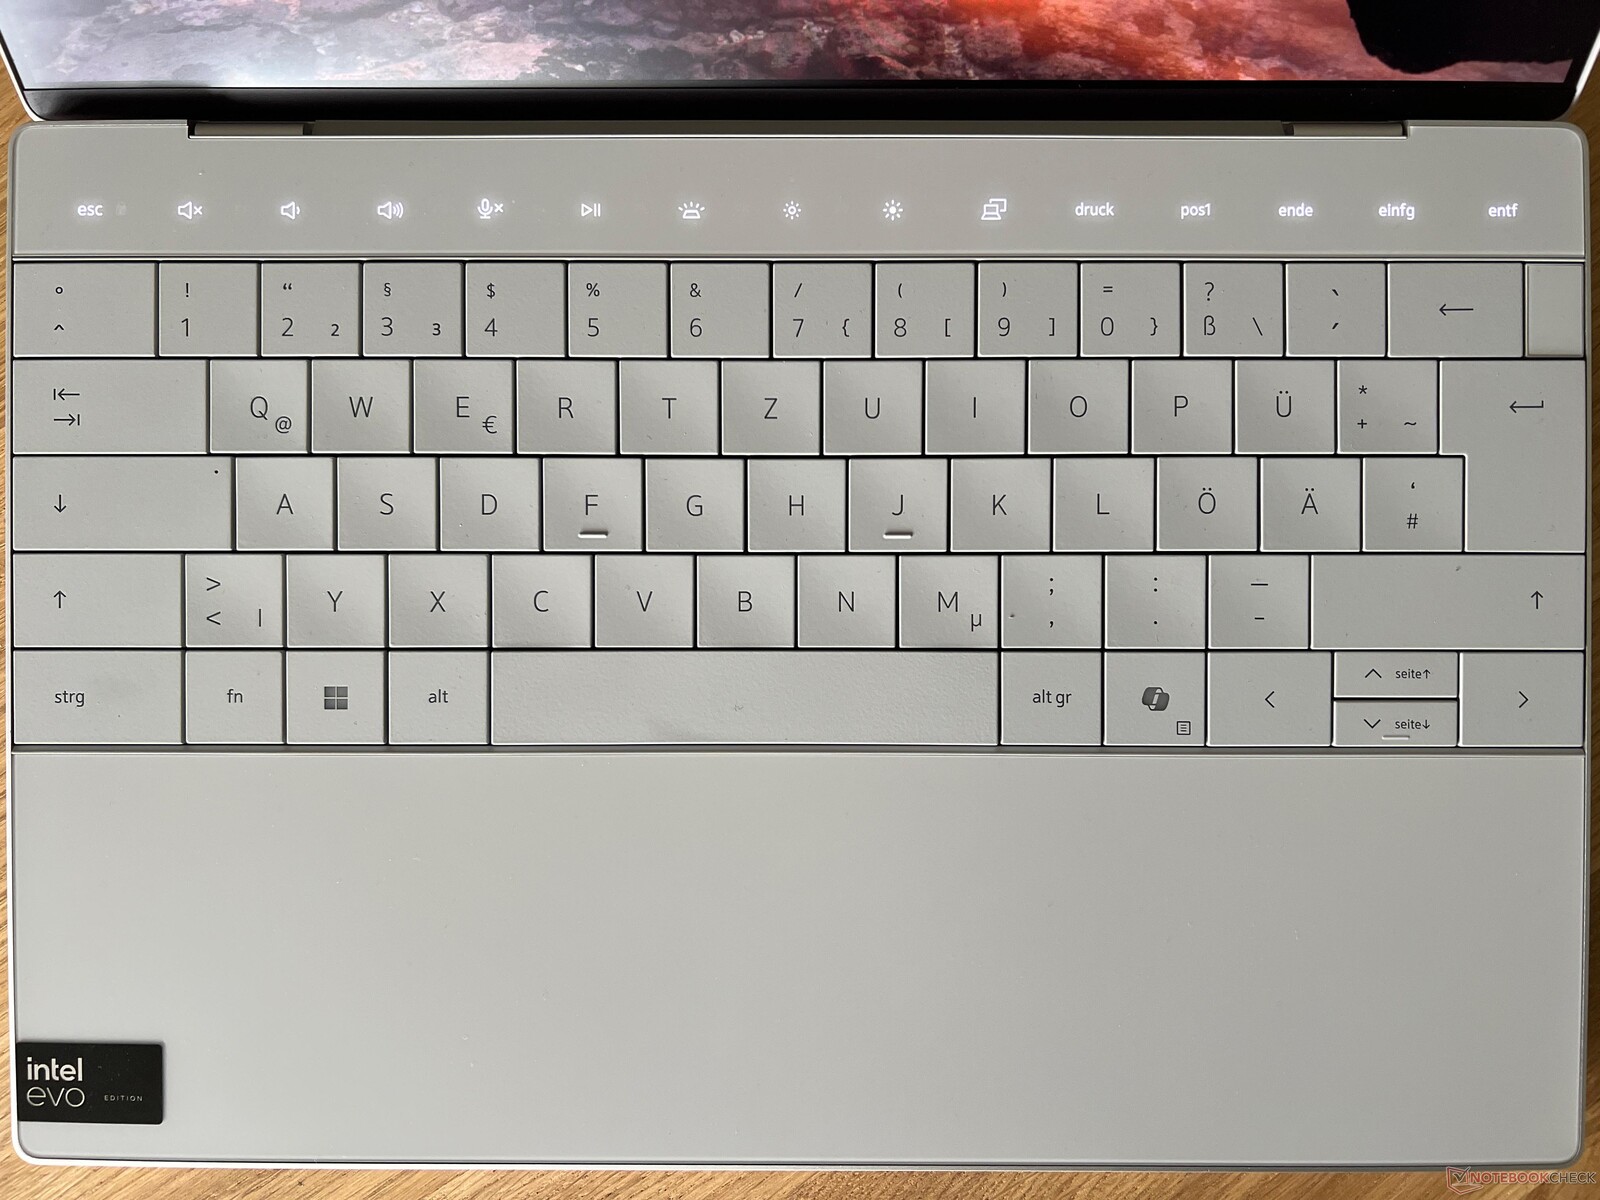
El touchpad está totalmente integrado en el reposamanos y no hay límites visibles. El touchpad utiliza toda la altura del reposamanos y su anchura se extiende desde la mitad de la tecla Alt izquierda hasta justo debajo de la nueva tecla Copilot. En general, funciona bien, es agradable y suave y la sensación de clic del pad háptico es agradable. A cambio, en ocasiones hemos encontrado problemas si se salía de la zona o se iniciaban movimientos ligeramente próximos a la zona real del touchpad. Sin embargo, en contraste con la barra táctil, éste es sólo un punto de crítica menor.
Pantalla - La XPS base con una frecuencia de actualización de 120-Hz
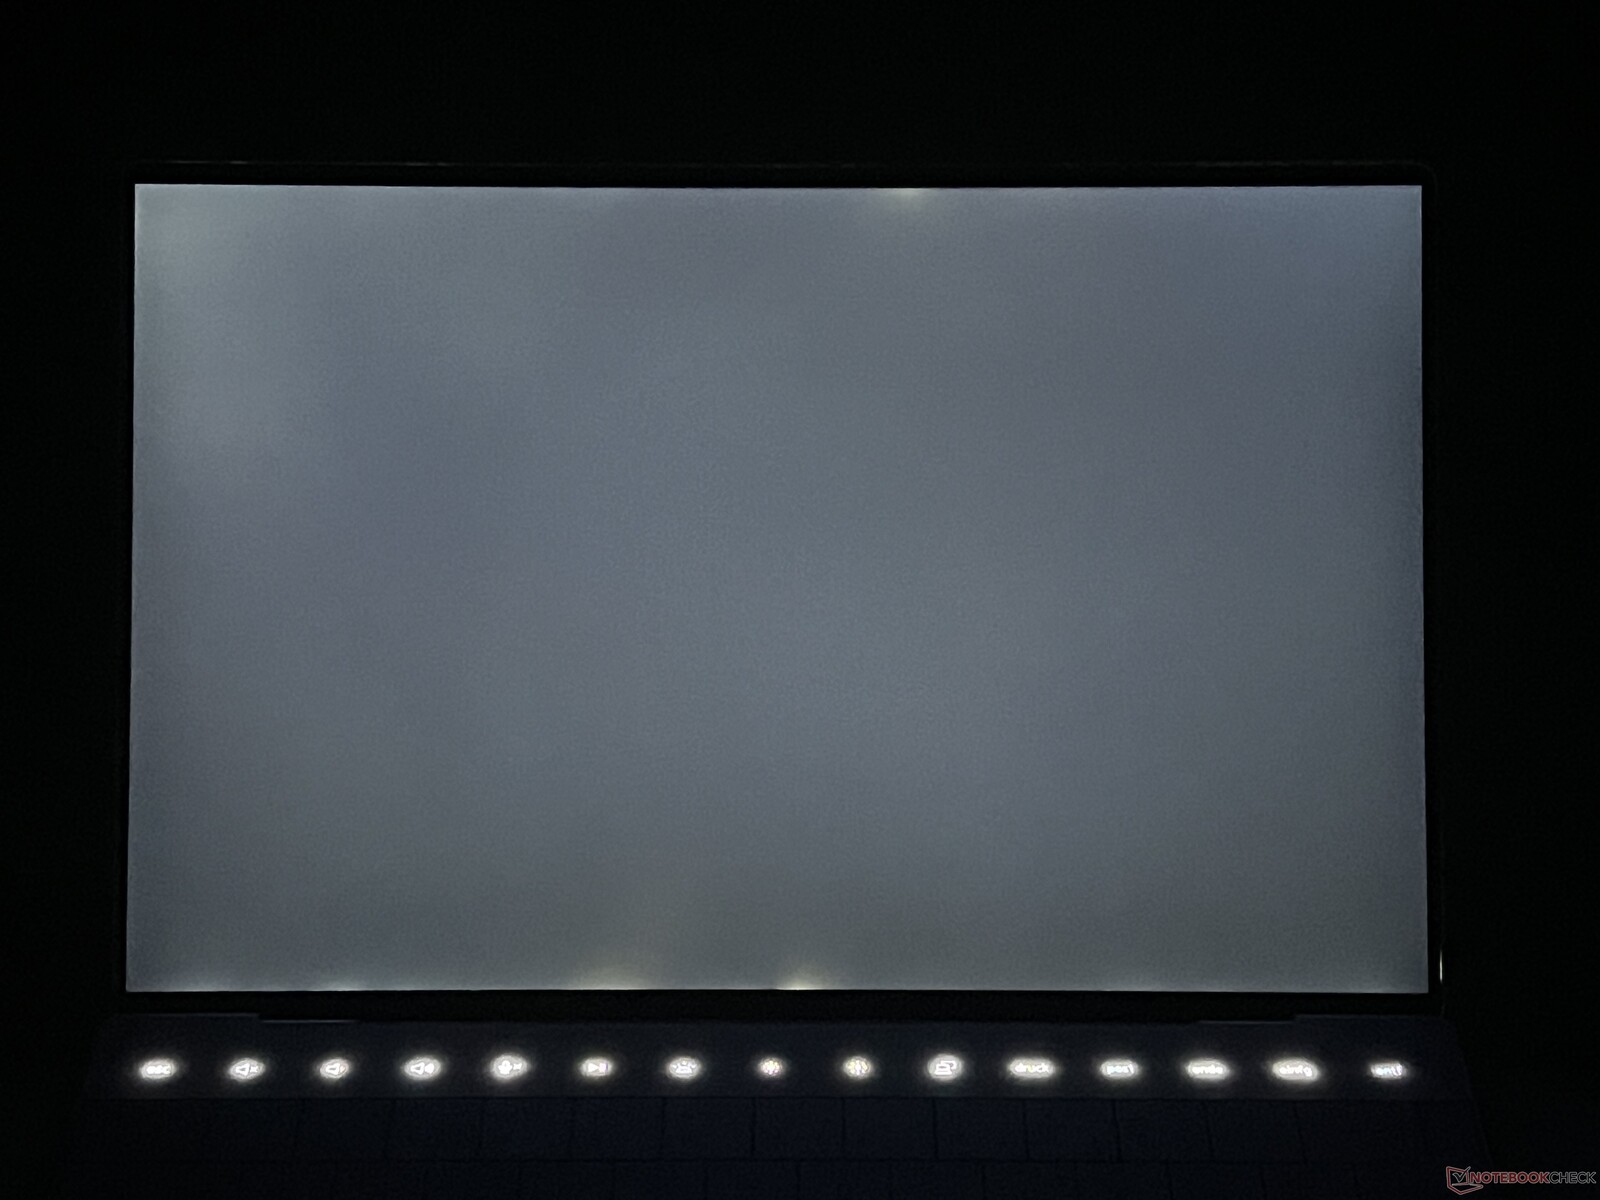
El nuevo XPS 13 9340 está disponible con tres pantallas IPS diferentes de 13,4 pulgadas. Puede elegir opcionalmente un panel 3K con una frecuencia de actualización de 60 Hz (400 cd/m², recargo de 300 dólares), así como una pantalla táctil QHD+ con una frecuencia de actualización de 120 Hz (500 cd/m², recargo de 300 dólares). Nuestra muestra de prueba, sin embargo, está equipada con el panel base con una resolución de 1.920 x 1.200 y sin función táctil. Subjetivamente, su calidad de imagen se beneficia de la mayor frecuencia de 120 Hz, lo que hace que los movimientos parezcan muy suaves. Además, los contenidos se representan con suficiente nitidez, pero los colores no parecen tan vivos como en los paneles OLED. Además, las zonas claras se ven un poco granuladas. La pantalla no utiliza parpadeo PWM, pero sus tiempos de respuesta son un poco lentos. El sangrado de la retroiluminación no es un gran problema y su brillo se ajusta automáticamente mediante un sensor.
Dell declara un brillo de 500 cd/m², que nuestra muestra de prueba no logró alcanzar. Medimos un máximo de 429 cd/m² y una media de poco más de 400 cd/m². Su valor de negro es decente con 0,28 y esto al menos da lugar a una relación de contraste máxima muy buena de ~1.500:1. Otro problema es su brillo mínimo de casi 45 cd/m², que es sencillamente demasiado alto.
| |||||||||||||||||||||||||
iluminación: 90 %
Brillo con batería: 429 cd/m²
Contraste: 1532:1 (Negro: 0.28 cd/m²)
ΔE ColorChecker Calman: 2.6 | ∀{0.5-29.43 Ø4.71}
calibrated: 1.4
ΔE Greyscale Calman: 4 | ∀{0.09-98 Ø4.96}
71.7% AdobeRGB 1998 (Argyll 3D)
97.8% sRGB (Argyll 3D)
69.4% Display P3 (Argyll 3D)
Gamma: 2.23
CCT: 7332 K
| Dell XPS 13 9340 Core Ultra 7 SHP1593, IPS, 1920x1200, 13.4" | Apple MacBook Air 13 M3 10C GPU IPS, 2560x1664, 13.6" | Asus ZenBook S13 OLED UX5304 SDC417B, OLED, 2880x1800, 13.3" | Lenovo ThinkPad Z13 Gen 2 ATNA33AA02-0, OLED, 2880x1800, 13.3" | HP Dragonfly G4 Chi Mei CMN13C0, IPS, 1920x1280, 13.5" | Dell XPS 13 Plus 9320 Core i7-1360P Samsung 134XK04, OLED, 3456x2160, 13.4" | |
|---|---|---|---|---|---|---|
| Display | 22% | 27% | 27% | -1% | 27% | |
| Display P3 Coverage (%) | 69.4 | 98.4 42% | 99.7 44% | 99.7 44% | 68.4 -1% | 99.7 44% |
| sRGB Coverage (%) | 97.8 | 99.9 2% | 100 2% | 100 2% | 98.3 1% | 100 2% |
| AdobeRGB 1998 Coverage (%) | 71.7 | 87.9 23% | 96.9 35% | 97.3 36% | 70.4 -2% | 96.8 35% |
| Response Times | 11% | 95% | 94% | -13% | 94% | |
| Response Time Grey 50% / Grey 80% * (ms) | 43.2 ? | 34.5 ? 20% | 2 ? 95% | 2.1 ? 95% | 48.8 ? -13% | 2.18 ? 95% |
| Response Time Black / White * (ms) | 27.6 ? | 27.2 ? 1% | 1.6 ? 94% | 2.2 ? 92% | 31.3 ? -13% | 2.08 ? 92% |
| PWM Frequency (Hz) | 240 ? | 60.1 ? | 238.6 ? | |||
| Screen | 17% | 30% | 29% | 14% | -39% | |
| Brightness middle (cd/m²) | 429 | 525 22% | 361 -16% | 372 -13% | 408.8 -5% | 361.7 -16% |
| Brightness (cd/m²) | 407 | 506 24% | 365 -10% | 375 -8% | 399 -2% | 367 -10% |
| Brightness Distribution (%) | 90 | 92 2% | 98 9% | 99 10% | 90 0% | 96 7% |
| Black Level * (cd/m²) | 0.28 | 0.42 -50% | 0.32 -14% | |||
| Contrast (:1) | 1532 | 1250 -18% | 1278 -17% | |||
| Colorchecker dE 2000 * | 2.6 | 1.4 46% | 1.2 54% | 0.88 66% | 2.02 22% | 4.83 -86% |
| Colorchecker dE 2000 max. * | 6.6 | 2.8 58% | 1.9 71% | 3.22 51% | 3.84 42% | 9.34 -42% |
| Colorchecker dE 2000 calibrated * | 1.4 | 0.61 56% | 3.97 -184% | |||
| Greyscale dE 2000 * | 4 | 2 50% | 1.2 70% | 1.2 70% | 2.3 43% | 1.8 55% |
| Gamma | 2.23 99% | 2.2 100% | 2.27 97% | 2.18 101% | 2.2 100% | 2.33 94% |
| CCT | 7332 89% | 6876 95% | 6486 100% | 6326 103% | 6203 105% | 6438 101% |
| Media total (Programa/Opciones) | 17% /
17% | 51% /
41% | 50% /
40% | 0% /
7% | 27% /
-1% |
* ... más pequeño es mejor
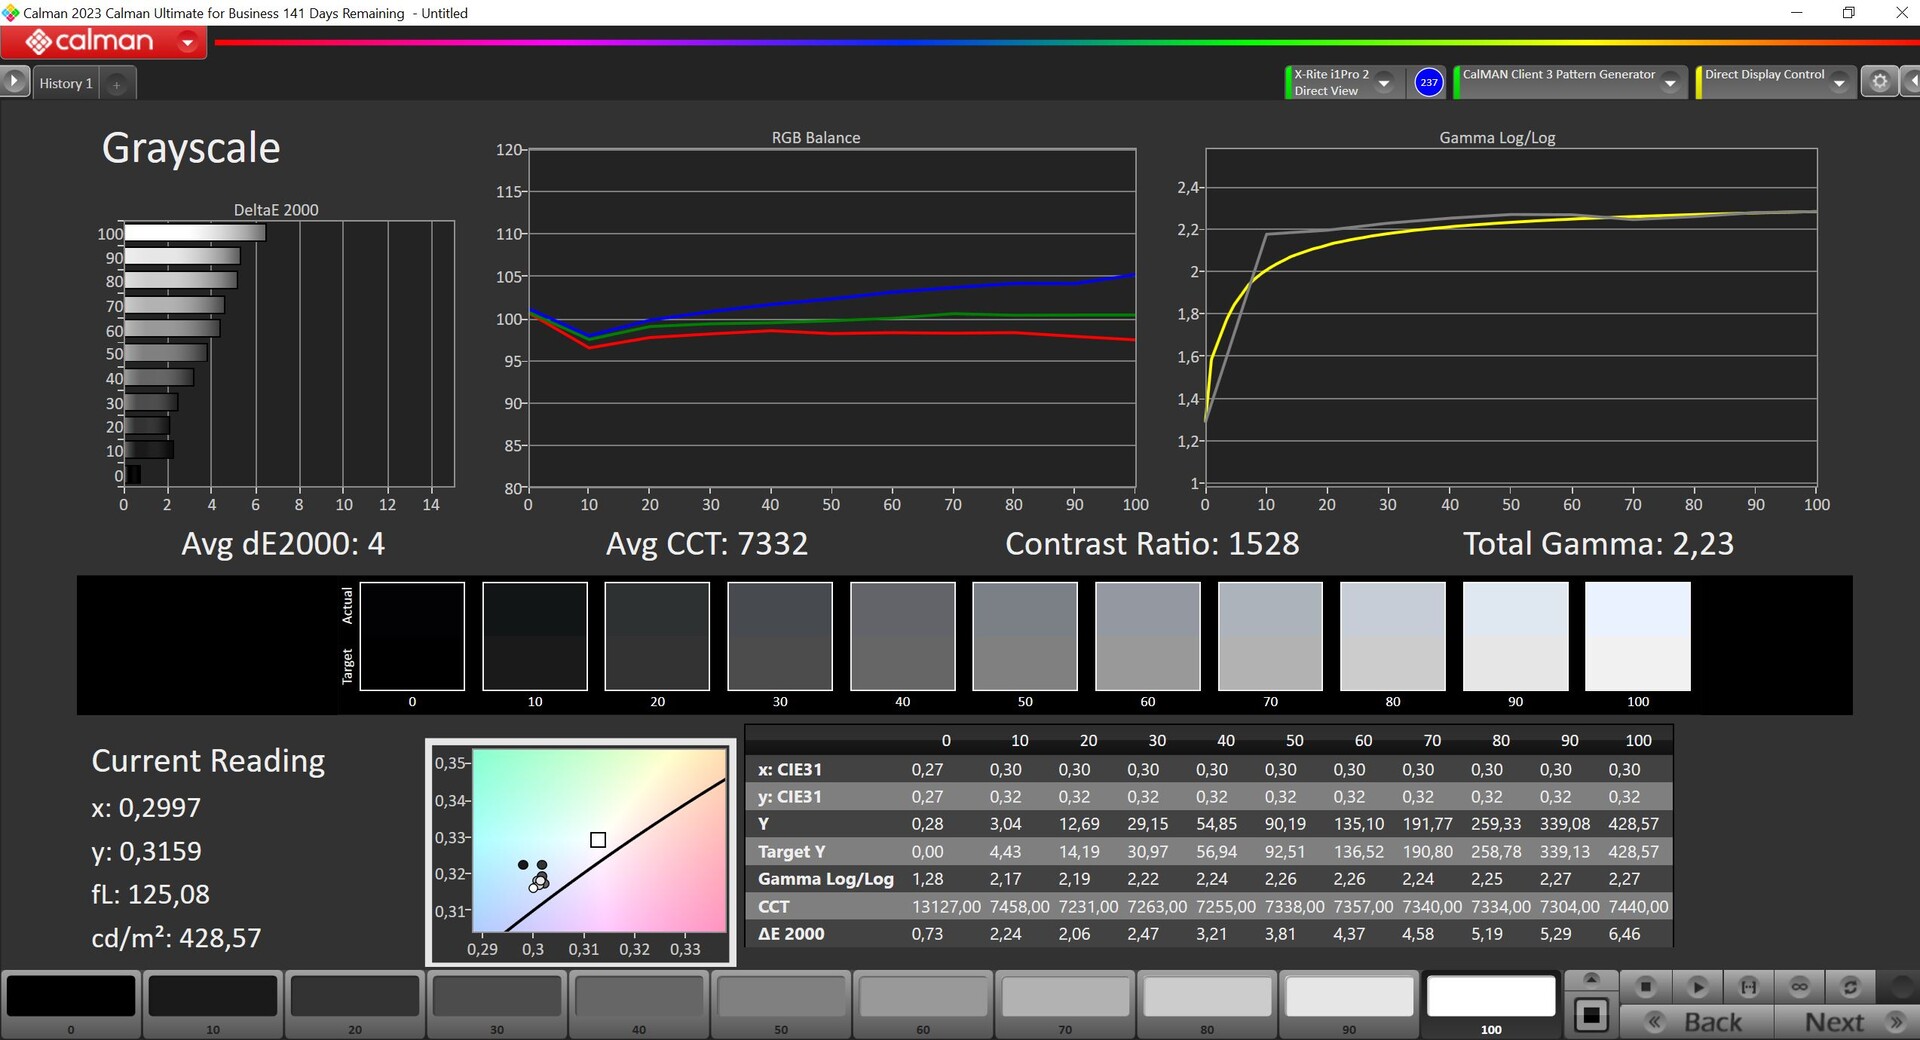
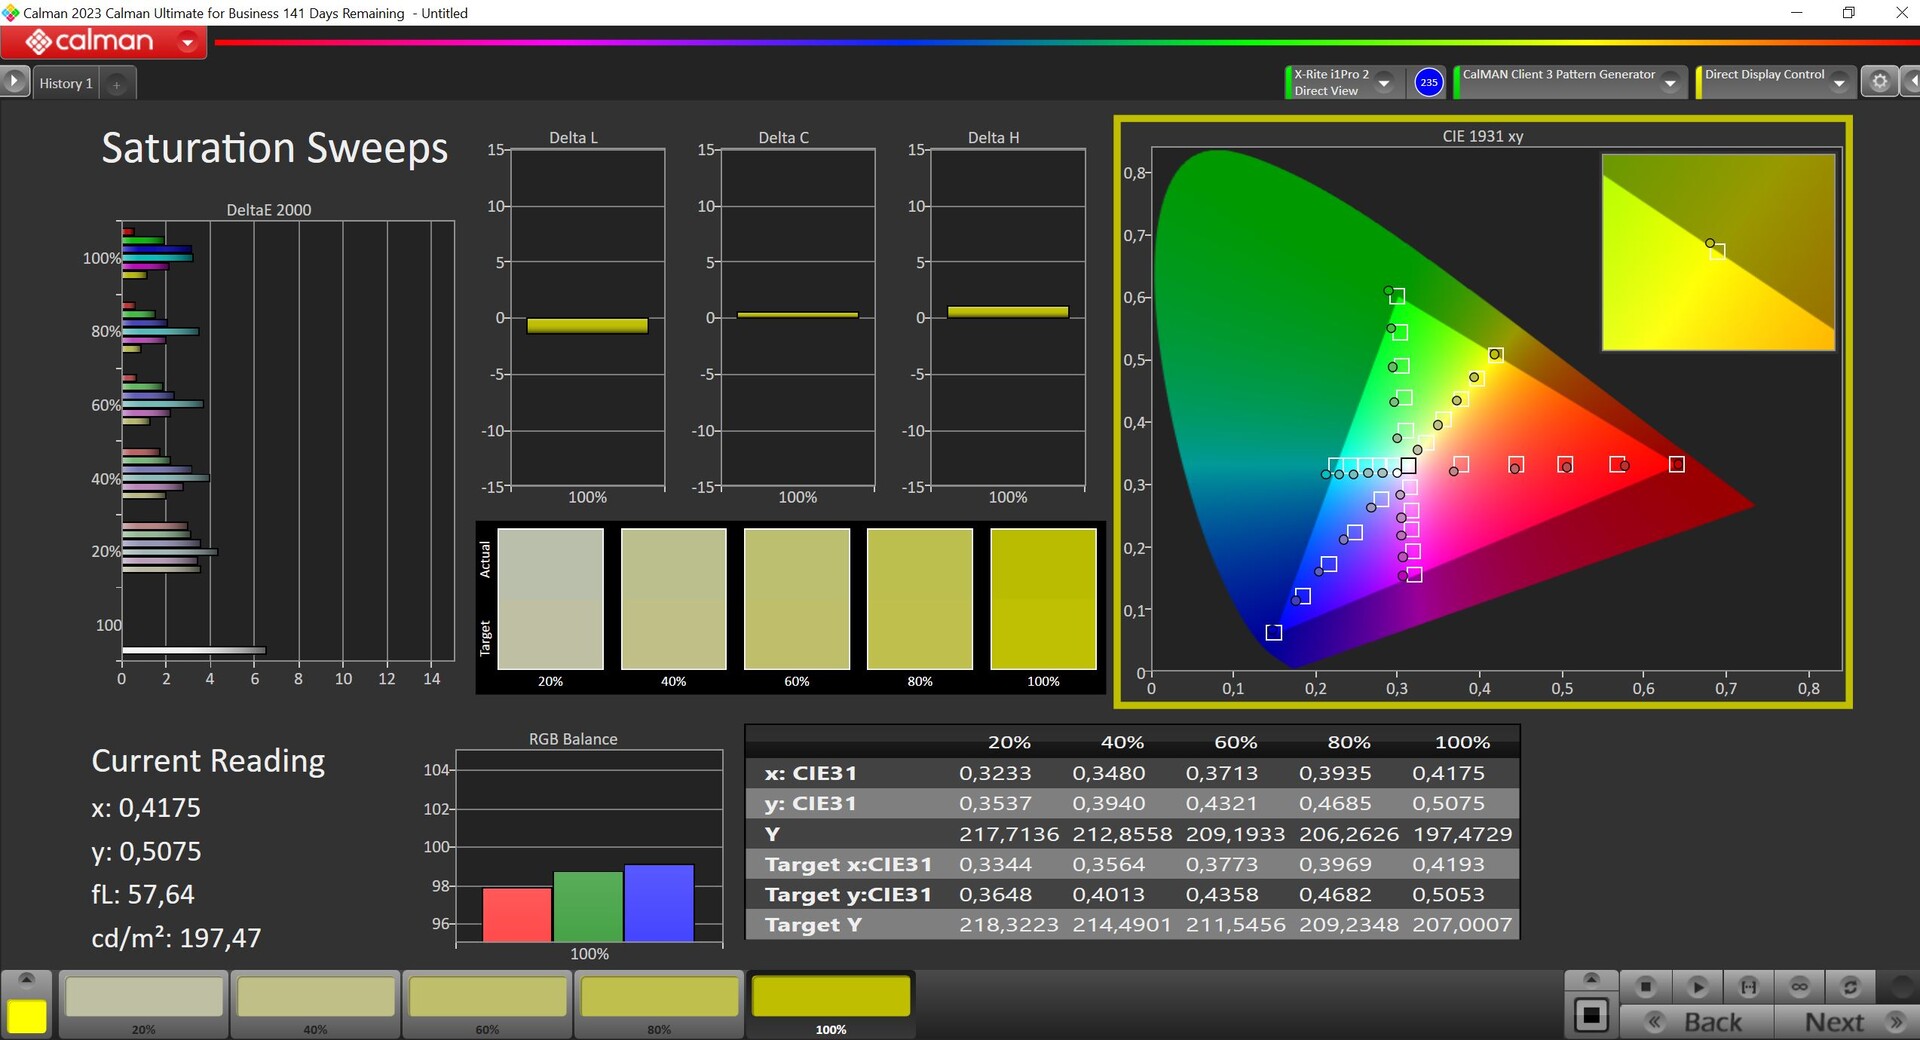
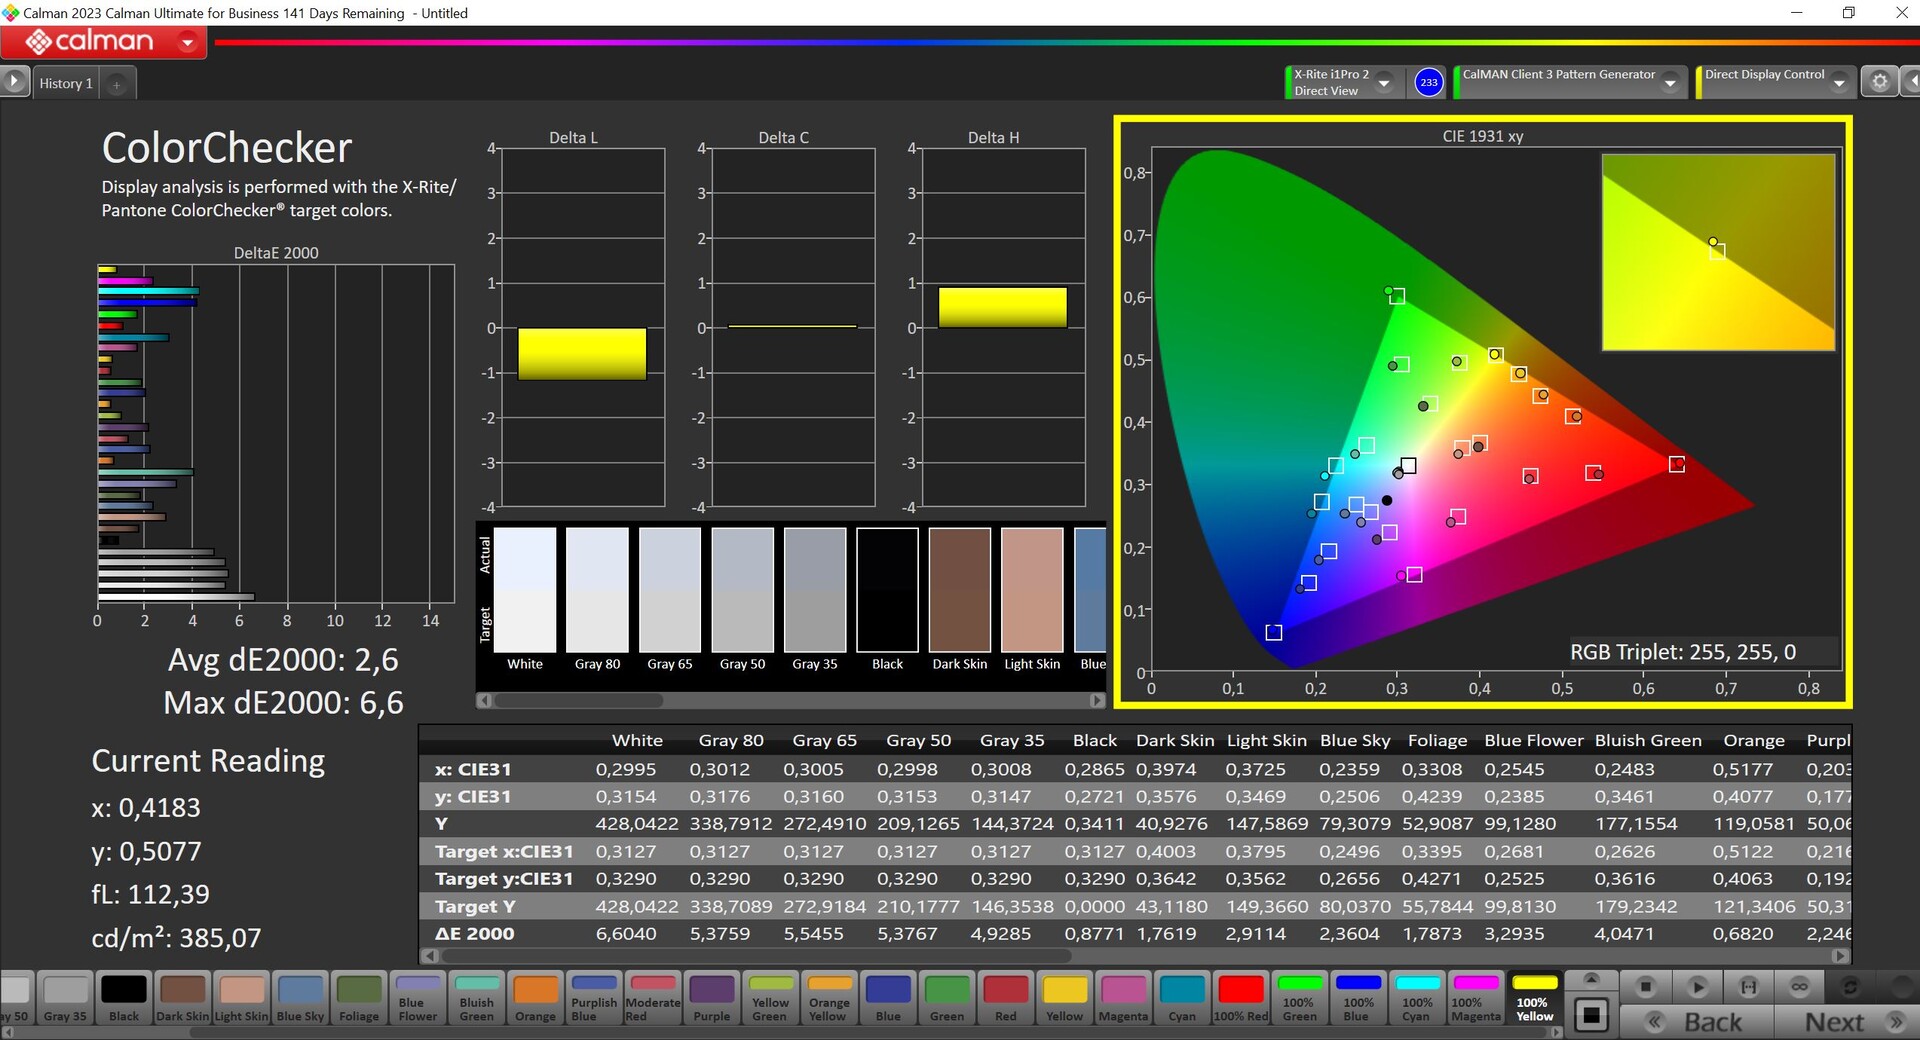
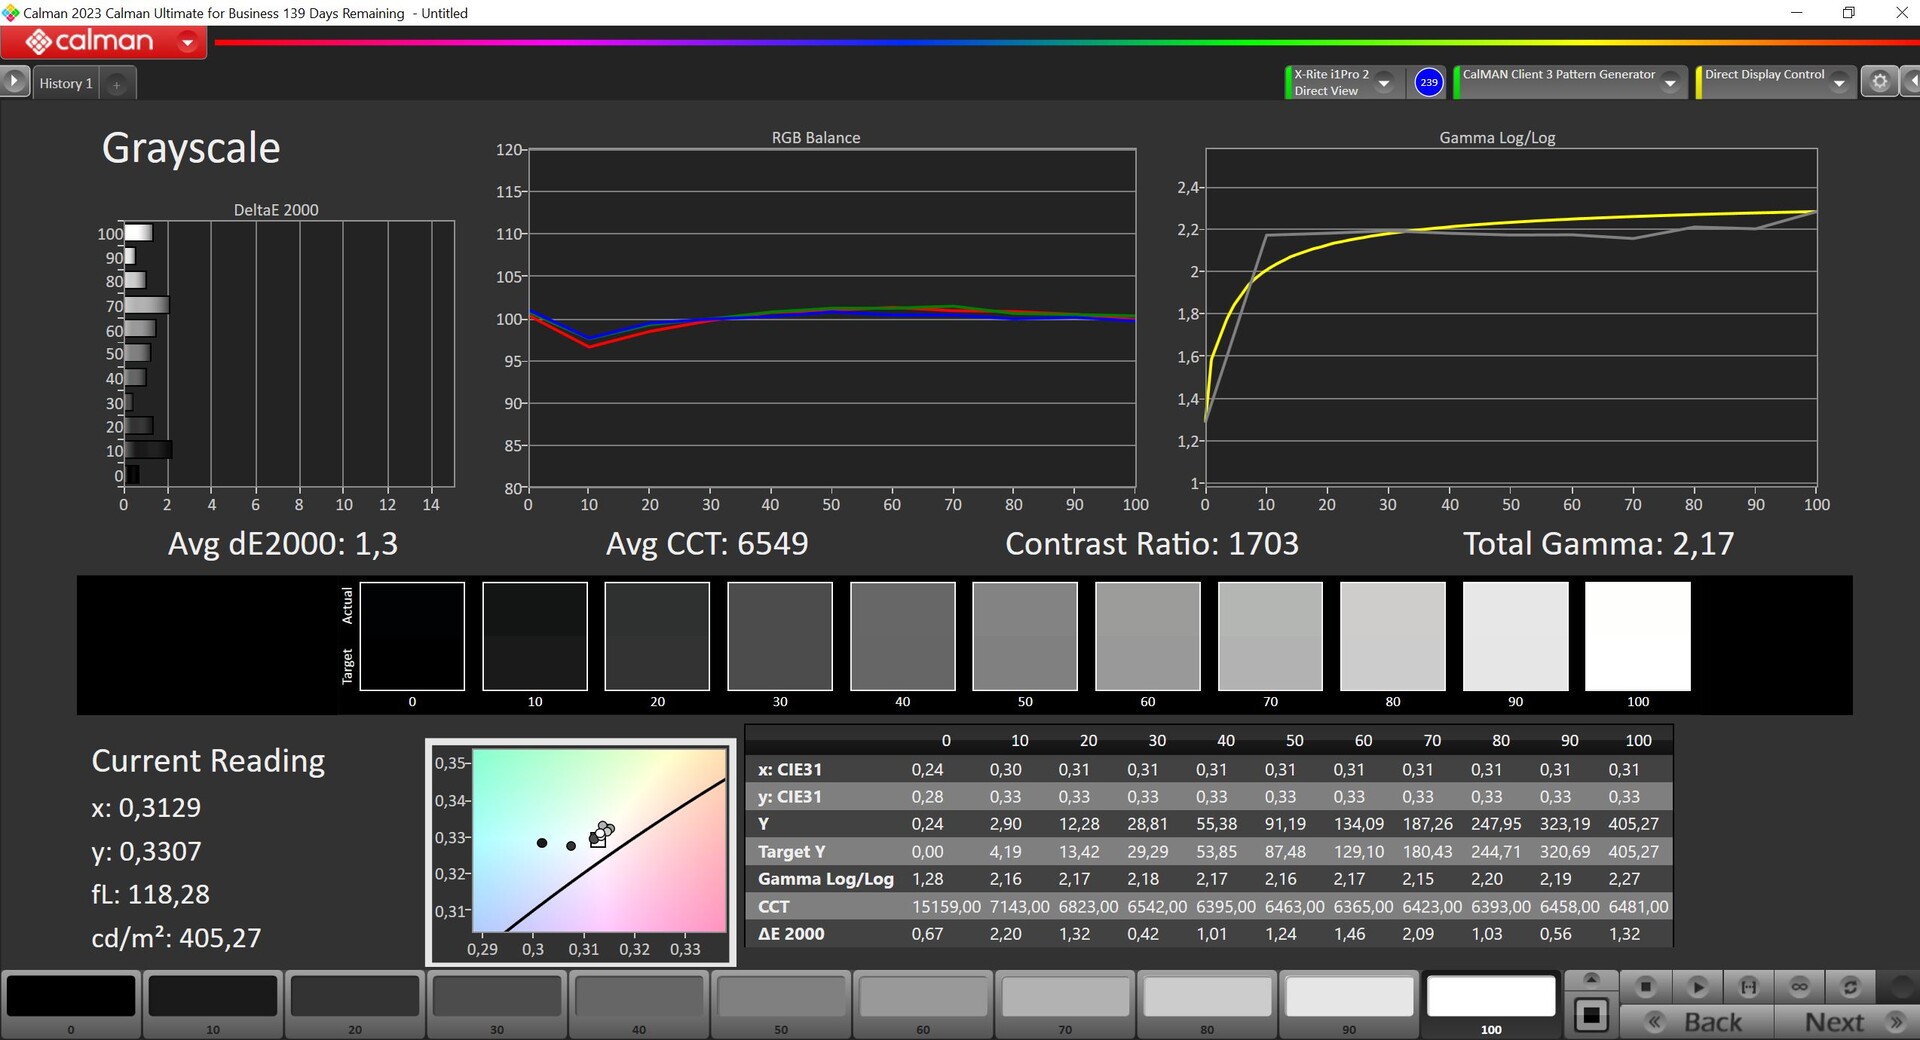


Medimos el panel utilizando el software profesional CalMAN (X-Rite i1 Pro 2) y nada más sacarlo de la caja, su calibración no es especialmente buena. Observamos un tinte azul considerable y su temperatura de color es demasiado fría. Además, sus desviaciones de escala de grises y bastantes desviaciones de color están por encima del valor objetivo de 3. Utilizando nuestra propia calibración (el perfil puede descargarse gratuitamente más arriba), pudimos mejorar su representación considerablemente, sin embargo, esto reduce el brillo máximo de la pantalla en unos 25 cd/m². El pequeño espacio de color sRGB está cubierto casi por completo, por lo que también puede utilizar el panel para editar imágenes.
Tiempos de respuesta del display
| ↔ Tiempo de respuesta de Negro a Blanco | ||
|---|---|---|
| 27.6 ms ... subida ↗ y bajada ↘ combinada | ↗ 16 ms subida |  |
| ↘ 11.6 ms bajada | ||
| La pantalla mostró tiempos de respuesta relativamente lentos en nuestros tests pero podría ser demasiado lenta para los jugones. En comparación, todos los dispositivos de prueba van de ##min### (mínimo) a 240 (máximo) ms. » 70 % de todos los dispositivos son mejores. Eso quiere decir que el tiempo de respuesta es peor que la media (19.8 ms) de todos los dispositivos testados. | ||
| ↔ Tiempo de respuesta 50% Gris a 80% Gris | ||
| 43.2 ms ... subida ↗ y bajada ↘ combinada | ↗ 21.1 ms subida |  |
| ↘ 22.1 ms bajada | ||
| La pantalla mostró tiempos de respuesta lentos en nuestros tests y podría ser demasiado lenta para los jugones. En comparación, todos los dispositivos de prueba van de ##min### (mínimo) a 636 (máximo) ms. » 72 % de todos los dispositivos son mejores. Eso quiere decir que el tiempo de respuesta es peor que la media (30.9 ms) de todos los dispositivos testados. | ||
Parpadeo de Pantalla / PWM (Pulse-Width Modulation)
| Parpadeo de Pantalla / PWM no detectado |  | ||
Comparación: 52 % de todos los dispositivos testados no usaron PWM para atenuar el display. Si se usó, medimos una media de 7748 (mínimo: 5 - máxmo: 343500) Hz. | |||

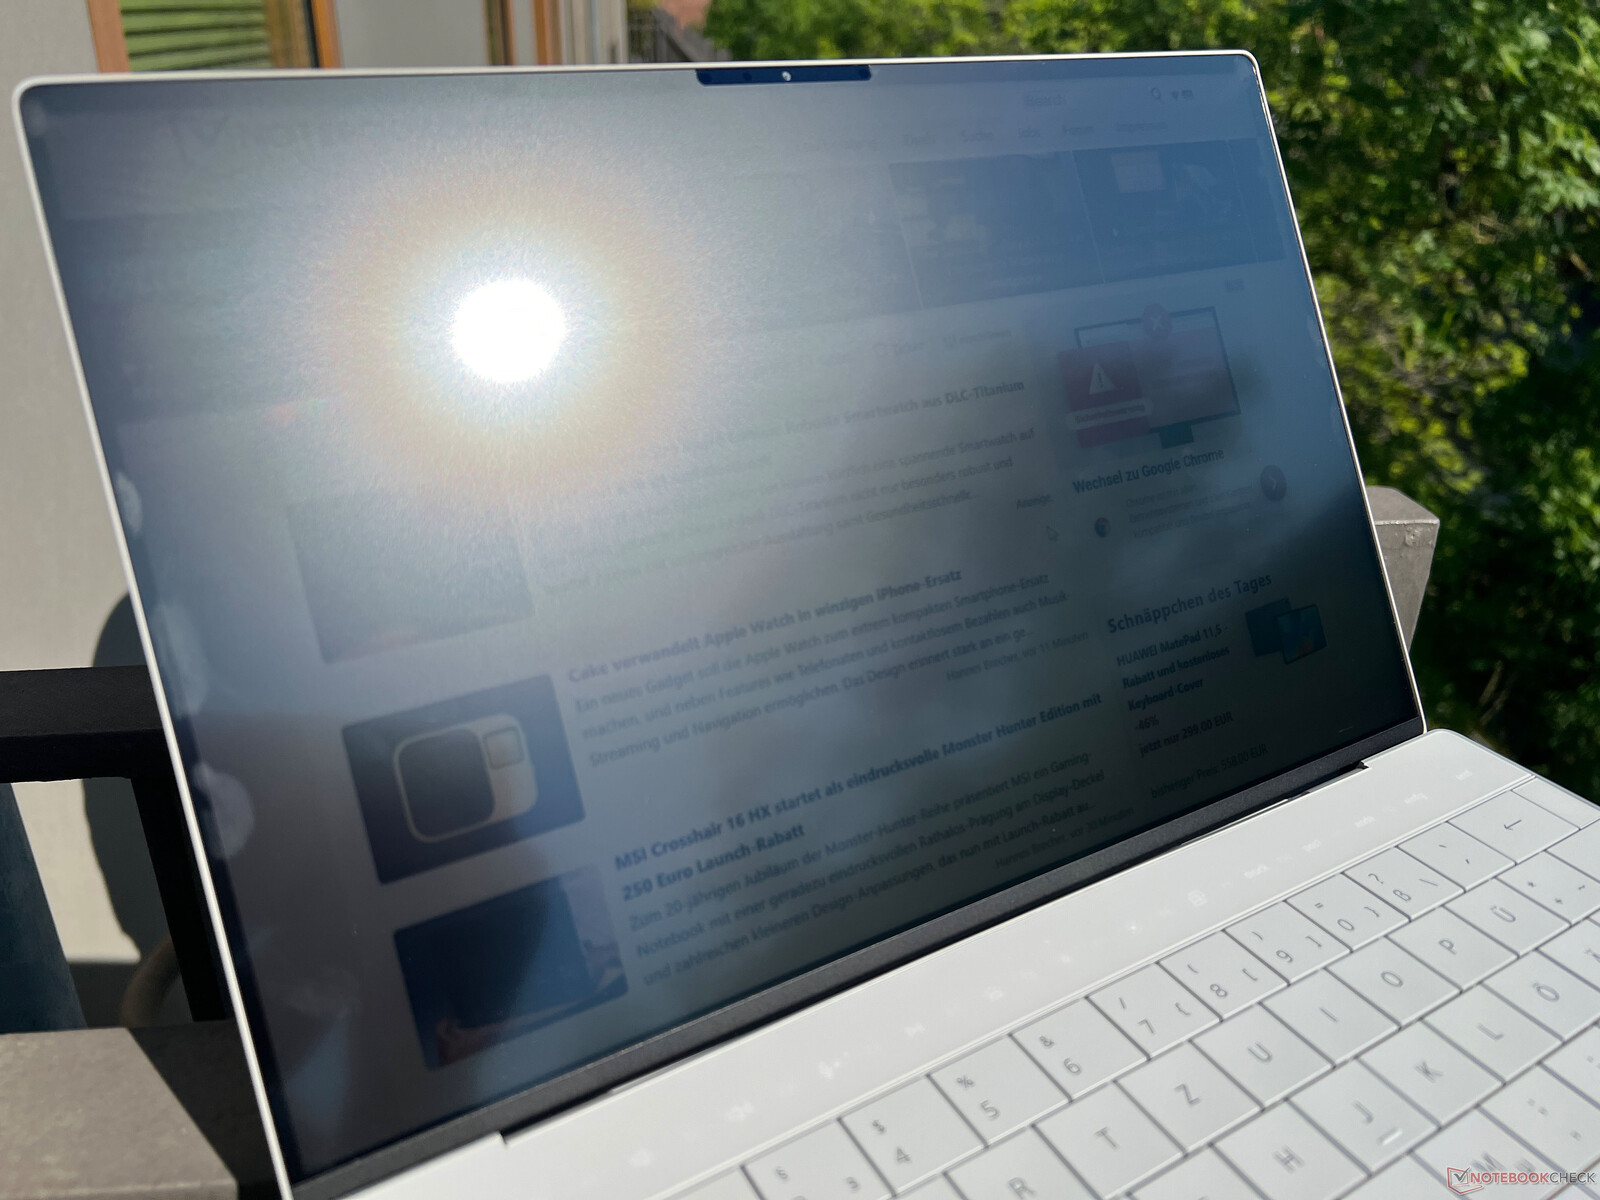

En general, el panel mate es útil en exteriores, pero en días luminosos, el funcionamiento es ligeramente limitado. El panel tendría que ser aún más brillante para garantizar una experiencia de manejo cómoda. Su estabilidad del ángulo de visión es buena.

Rendimiento - El XPS 13 con hasta 64 GB de RAM
Dell solo ofrece el nuevo XPS 13 9340 con los procesadores Meteor Lake de Intel (Core Ultra 5/7) y no hay tarjetas gráficas dedicadas. Se puede elegir entre 8, 16, 32 o 64 GB de RAM (8 GB solo con el Core Ultra 7 155H, el Core Ultra 5 125H solo está disponible con 16 GB).
Condiciones de prueba
El software MyDell dispone de varios modos de rendimiento, pero no se puede cambiar entre ellos mediante una combinación de teclas. Hemos utilizado el modo optimizado para las siguientes pruebas.
Procesador - Core Ultra 7 155H
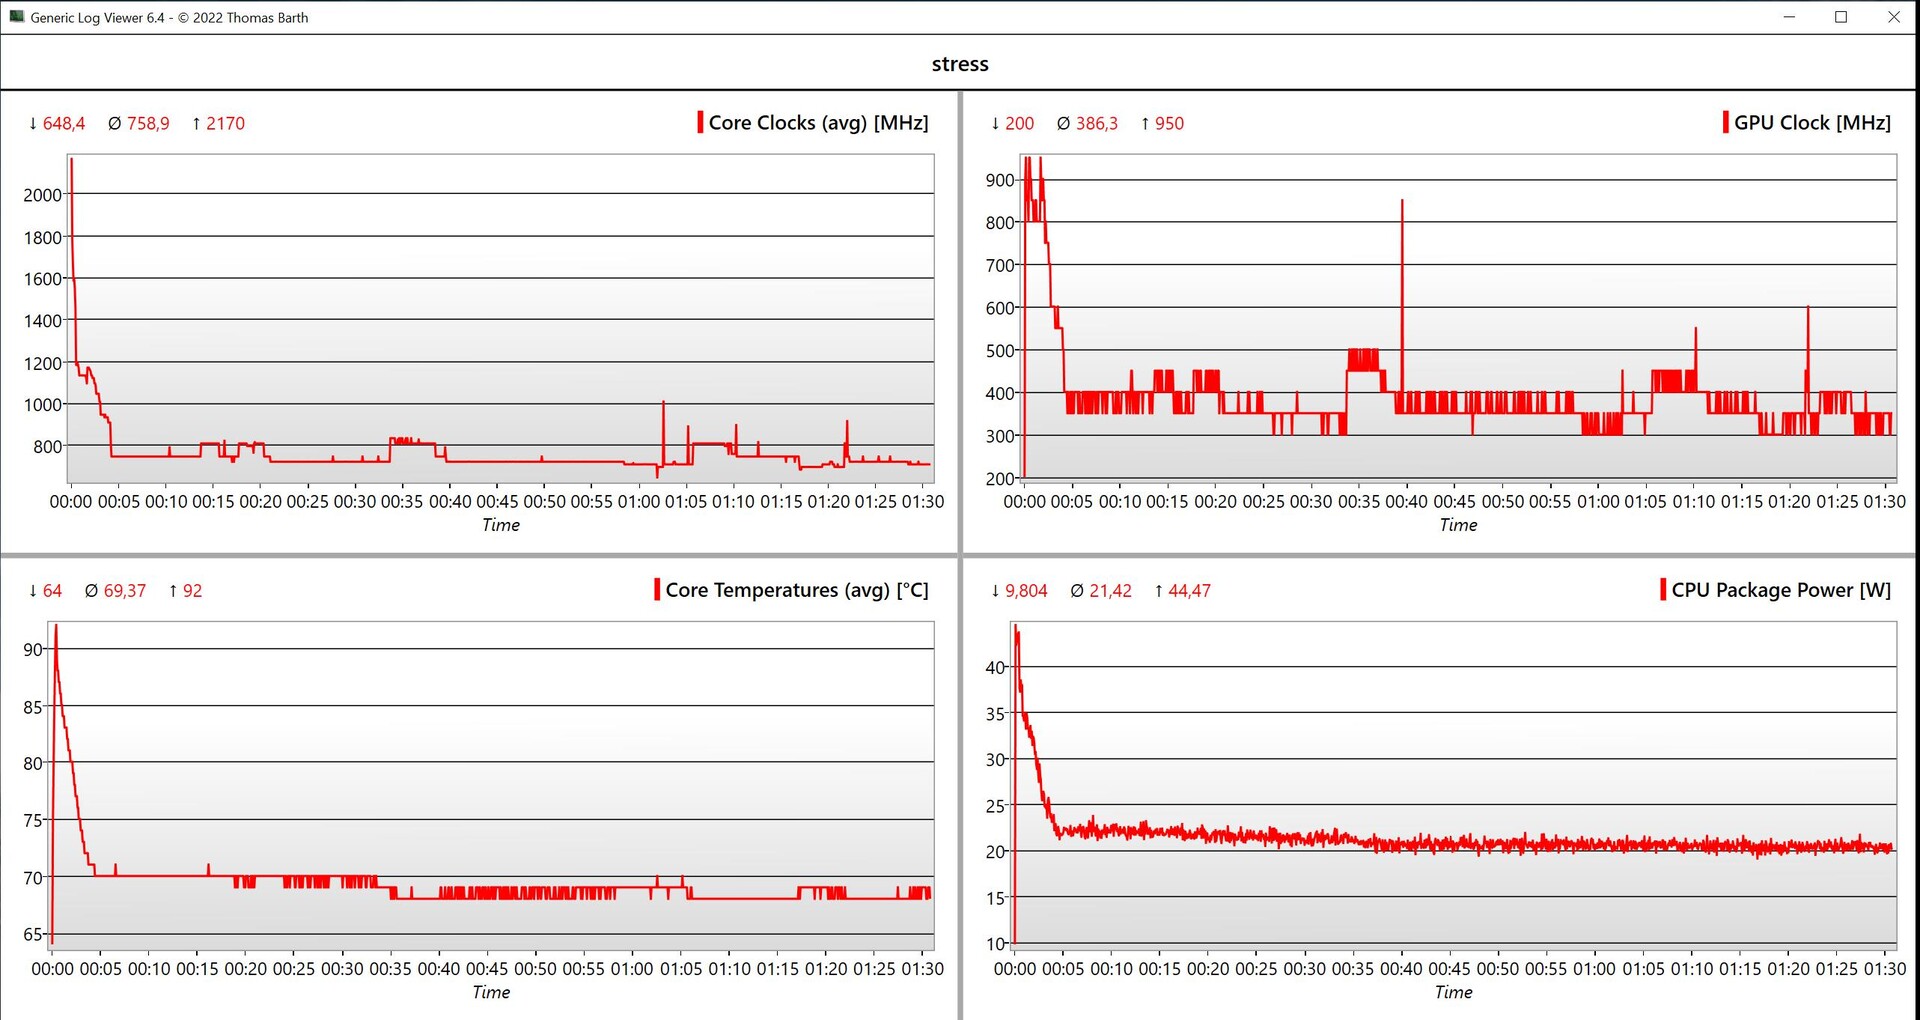
El Core Ultra 7 155H pertenece a la actual generación Meteor Lake de Intel y es el sucesor del antiguo Core i7-13700H. En el XPS 13, el procesador puede consumir un máximo de 45 vatios en ráfagas cortas, pero bajo carga continua, se equilibra en unos 24 vatios después de 5 minutos (~40 % menos de rendimiento). Durante el inicio de las pruebas multinúcleo, su rendimiento fue decente, pero no mucho mejor que el antiguo Core i7-1360P con dos núcleos de rendimiento menos. Además, su rendimiento mononúcleo también es peor que en el antiguo XPS 13. Apple's SoC M3 también fue mucho más rápido durante las pruebas mononúcleo, pero en las pruebas multinúcleo fue más lento. En uso de batería, el procesador puede consumir 42 vatios durante un breve periodo de tiempo antes de descender inmediatamente a 20 vatios. Esto significa que su rendimiento multinúcleo lejos de un enchufe se reduce en torno al 43 %. Encontrará más pruebas comparativas de la CPU en nuestra sección de tecnología.
Cinebench R15 Multi continuous test
Cinebench R23: Multi Core | Single Core
Cinebench R20: CPU (Multi Core) | CPU (Single Core)
Cinebench R15: CPU Multi 64Bit | CPU Single 64Bit
Blender: v2.79 BMW27 CPU
7-Zip 18.03: 7z b 4 | 7z b 4 -mmt1
Geekbench 6.7: Multi-Core | Single-Core
Geekbench 5.5: Multi-Core | Single-Core
HWBOT x265 Benchmark v2.2: 4k Preset
LibreOffice : 20 Documents To PDF
R Benchmark 2.5: Overall mean
| CPU Performance rating | |
| Medio Intel Core Ultra 7 155H | |
| Lenovo ThinkPad Z13 Gen 2 | |
| Apple MacBook Air 13 M3 10C GPU -9! | |
| Dell XPS 13 9340 Core Ultra 7 | |
| Media de la clase Subnotebook | |
| Dell XPS 13 Plus 9320 Core i7-1360P -2! | |
| HP Dragonfly G4 -2! | |
| Asus ZenBook S13 OLED UX5304 -2! | |
| Cinebench R23 / Multi Core | |
| Medio Intel Core Ultra 7 155H (9769 - 19007, n=52) | |
| Lenovo ThinkPad Z13 Gen 2 | |
| Dell XPS 13 9340 Core Ultra 7 | |
| Media de la clase Subnotebook (1555 - 21812, n=60, últimos 2 años) | |
| Dell XPS 13 Plus 9320 Core i7-1360P | |
| Apple MacBook Air 13 M3 10C GPU | |
| HP Dragonfly G4 | |
| Asus ZenBook S13 OLED UX5304 | |
| Cinebench R23 / Single Core | |
| Apple MacBook Air 13 M3 10C GPU | |
| HP Dragonfly G4 | |
| Dell XPS 13 Plus 9320 Core i7-1360P | |
| Media de la clase Subnotebook (358 - 2213, n=61, últimos 2 años) | |
| Asus ZenBook S13 OLED UX5304 | |
| Medio Intel Core Ultra 7 155H (1496 - 1815, n=52) | |
| Lenovo ThinkPad Z13 Gen 2 | |
| Dell XPS 13 9340 Core Ultra 7 | |
| Cinebench R20 / CPU (Multi Core) | |
| Medio Intel Core Ultra 7 155H (3798 - 7409, n=50) | |
| Lenovo ThinkPad Z13 Gen 2 | |
| Dell XPS 13 9340 Core Ultra 7 | |
| Media de la clase Subnotebook (579 - 8541, n=57, últimos 2 años) | |
| Dell XPS 13 Plus 9320 Core i7-1360P | |
| HP Dragonfly G4 | |
| Asus ZenBook S13 OLED UX5304 | |
| Cinebench R20 / CPU (Single Core) | |
| Dell XPS 13 Plus 9320 Core i7-1360P | |
| HP Dragonfly G4 | |
| Asus ZenBook S13 OLED UX5304 | |
| Lenovo ThinkPad Z13 Gen 2 | |
| Media de la clase Subnotebook (128 - 832, n=57, últimos 2 años) | |
| Medio Intel Core Ultra 7 155H (601 - 696, n=50) | |
| Dell XPS 13 9340 Core Ultra 7 | |
| Cinebench R15 / CPU Multi 64Bit | |
| Medio Intel Core Ultra 7 155H (1932 - 2880, n=56) | |
| Dell XPS 13 9340 Core Ultra 7 | |
| Lenovo ThinkPad Z13 Gen 2 | |
| Media de la clase Subnotebook (327 - 3345, n=57, últimos 2 años) | |
| Dell XPS 13 Plus 9320 Core i7-1360P | |
| Asus ZenBook S13 OLED UX5304 | |
| HP Dragonfly G4 | |
| Cinebench R15 / CPU Single 64Bit | |
| Media de la clase Subnotebook (72.4 - 322, n=57, últimos 2 años) | |
| Dell XPS 13 Plus 9320 Core i7-1360P | |
| Lenovo ThinkPad Z13 Gen 2 | |
| HP Dragonfly G4 | |
| Dell XPS 13 9340 Core Ultra 7 | |
| Medio Intel Core Ultra 7 155H (99.6 - 268, n=52) | |
| Asus ZenBook S13 OLED UX5304 | |
| Blender / v2.79 BMW27 CPU | |
| Apple MacBook Air 13 M3 10C GPU | |
| Asus ZenBook S13 OLED UX5304 | |
| Asus ZenBook S13 OLED UX5304 | |
| HP Dragonfly G4 | |
| Media de la clase Subnotebook (159 - 2271, n=58, últimos 2 años) | |
| Dell XPS 13 Plus 9320 Core i7-1360P | |
| Dell XPS 13 9340 Core Ultra 7 | |
| Lenovo ThinkPad Z13 Gen 2 | |
| Medio Intel Core Ultra 7 155H (175 - 381, n=47) | |
| 7-Zip 18.03 / 7z b 4 | |
| Medio Intel Core Ultra 7 155H (41739 - 70254, n=50) | |
| Lenovo ThinkPad Z13 Gen 2 | |
| Dell XPS 13 9340 Core Ultra 7 | |
| Dell XPS 13 Plus 9320 Core i7-1360P | |
| Media de la clase Subnotebook (11668 - 77867, n=57, últimos 2 años) | |
| HP Dragonfly G4 | |
| Asus ZenBook S13 OLED UX5304 | |
| 7-Zip 18.03 / 7z b 4 -mmt1 | |
| HP Dragonfly G4 | |
| Asus ZenBook S13 OLED UX5304 | |
| Lenovo ThinkPad Z13 Gen 2 | |
| Media de la clase Subnotebook (2643 - 6699, n=59, últimos 2 años) | |
| Dell XPS 13 Plus 9320 Core i7-1360P | |
| Dell XPS 13 9340 Core Ultra 7 | |
| Medio Intel Core Ultra 7 155H (4594 - 5621, n=50) | |
| Geekbench 6.7 / Multi-Core | |
| Media de la clase Subnotebook (2244 - 20325, n=63, últimos 2 años) | |
| Medio Intel Core Ultra 7 155H (7732 - 13656, n=55) | |
| Lenovo ThinkPad Z13 Gen 2 | |
| Apple MacBook Air 13 M3 10C GPU | |
| Dell XPS 13 9340 Core Ultra 7 | |
| Geekbench 6.7 / Single-Core | |
| Apple MacBook Air 13 M3 10C GPU | |
| Media de la clase Subnotebook (960 - 4195, n=62, últimos 2 años) | |
| Lenovo ThinkPad Z13 Gen 2 | |
| Dell XPS 13 9340 Core Ultra 7 | |
| Medio Intel Core Ultra 7 155H (1901 - 2473, n=52) | |
| Geekbench 5.5 / Multi-Core | |
| Medio Intel Core Ultra 7 155H (10017 - 13556, n=52) | |
| Dell XPS 13 9340 Core Ultra 7 | |
| Lenovo ThinkPad Z13 Gen 2 | |
| Dell XPS 13 Plus 9320 Core i7-1360P | |
| Apple MacBook Air 13 M3 10C GPU | |
| Media de la clase Subnotebook (2557 - 17218, n=49, últimos 2 años) | |
| HP Dragonfly G4 | |
| Asus ZenBook S13 OLED UX5304 | |
| Geekbench 5.5 / Single-Core | |
| Apple MacBook Air 13 M3 10C GPU | |
| Media de la clase Subnotebook (726 - 2224, n=49, últimos 2 años) | |
| HP Dragonfly G4 | |
| Lenovo ThinkPad Z13 Gen 2 | |
| Dell XPS 13 Plus 9320 Core i7-1360P | |
| Asus ZenBook S13 OLED UX5304 | |
| Dell XPS 13 9340 Core Ultra 7 | |
| Medio Intel Core Ultra 7 155H (1462 - 1824, n=52) | |
| HWBOT x265 Benchmark v2.2 / 4k Preset | |
| Lenovo ThinkPad Z13 Gen 2 | |
| Medio Intel Core Ultra 7 155H (9.93 - 21.2, n=50) | |
| Dell XPS 13 9340 Core Ultra 7 | |
| Media de la clase Subnotebook (0.97 - 25.1, n=57, últimos 2 años) | |
| Dell XPS 13 Plus 9320 Core i7-1360P | |
| HP Dragonfly G4 | |
| Asus ZenBook S13 OLED UX5304 | |
| LibreOffice / 20 Documents To PDF | |
| Media de la clase Subnotebook (39.9 - 220, n=56, últimos 2 años) | |
| Medio Intel Core Ultra 7 155H (37.5 - 79.2, n=49) | |
| Lenovo ThinkPad Z13 Gen 2 | |
| Dell XPS 13 9340 Core Ultra 7 | |
| Asus ZenBook S13 OLED UX5304 | |
| Dell XPS 13 Plus 9320 Core i7-1360P | |
| HP Dragonfly G4 | |
| R Benchmark 2.5 / Overall mean | |
| Media de la clase Subnotebook (0.4024 - 1.456, n=58, últimos 2 años) | |
| Dell XPS 13 9340 Core Ultra 7 | |
| Medio Intel Core Ultra 7 155H (0.4457 - 0.53, n=49) | |
| Lenovo ThinkPad Z13 Gen 2 | |
| Asus ZenBook S13 OLED UX5304 | |
| Dell XPS 13 Plus 9320 Core i7-1360P | |
| HP Dragonfly G4 | |
* ... más pequeño es mejor
AIDA64: FP32 Ray-Trace | FPU Julia | CPU SHA3 | CPU Queen | FPU SinJulia | FPU Mandel | CPU AES | CPU ZLib | FP64 Ray-Trace | CPU PhotoWorxx
| Performance rating | |
| Lenovo ThinkPad Z13 Gen 2 | |
| Medio Intel Core Ultra 7 155H | |
| Dell XPS 13 9340 Core Ultra 7 | |
| Media de la clase Subnotebook | |
| Dell XPS 13 Plus 9320 Core i7-1360P | |
| HP Dragonfly G4 | |
| Asus ZenBook S13 OLED UX5304 | |
| AIDA64 / FP32 Ray-Trace | |
| Lenovo ThinkPad Z13 Gen 2 | |
| Media de la clase Subnotebook (1135 - 32888, n=58, últimos 2 años) | |
| Medio Intel Core Ultra 7 155H (6670 - 18470, n=50) | |
| Dell XPS 13 9340 Core Ultra 7 | |
| Dell XPS 13 Plus 9320 Core i7-1360P | |
| HP Dragonfly G4 | |
| Asus ZenBook S13 OLED UX5304 | |
| AIDA64 / FPU Julia | |
| Lenovo ThinkPad Z13 Gen 2 | |
| Medio Intel Core Ultra 7 155H (40905 - 93181, n=50) | |
| Dell XPS 13 9340 Core Ultra 7 | |
| Media de la clase Subnotebook (5218 - 123315, n=58, últimos 2 años) | |
| Dell XPS 13 Plus 9320 Core i7-1360P | |
| HP Dragonfly G4 | |
| Asus ZenBook S13 OLED UX5304 | |
| AIDA64 / CPU SHA3 | |
| Lenovo ThinkPad Z13 Gen 2 | |
| Medio Intel Core Ultra 7 155H (1940 - 4436, n=50) | |
| Media de la clase Subnotebook (444 - 5287, n=58, últimos 2 años) | |
| Dell XPS 13 9340 Core Ultra 7 | |
| Dell XPS 13 Plus 9320 Core i7-1360P | |
| HP Dragonfly G4 | |
| Asus ZenBook S13 OLED UX5304 | |
| AIDA64 / CPU Queen | |
| Lenovo ThinkPad Z13 Gen 2 | |
| Dell XPS 13 Plus 9320 Core i7-1360P | |
| Medio Intel Core Ultra 7 155H (64698 - 94181, n=50) | |
| Dell XPS 13 9340 Core Ultra 7 | |
| HP Dragonfly G4 | |
| Asus ZenBook S13 OLED UX5304 | |
| Media de la clase Subnotebook (10579 - 95002, n=48, últimos 2 años) | |
| AIDA64 / FPU SinJulia | |
| Lenovo ThinkPad Z13 Gen 2 | |
| Medio Intel Core Ultra 7 155H (5639 - 10647, n=50) | |
| Dell XPS 13 9340 Core Ultra 7 | |
| Media de la clase Subnotebook (744 - 18418, n=58, últimos 2 años) | |
| Dell XPS 13 Plus 9320 Core i7-1360P | |
| HP Dragonfly G4 | |
| Asus ZenBook S13 OLED UX5304 | |
| AIDA64 / FPU Mandel | |
| Lenovo ThinkPad Z13 Gen 2 | |
| Medio Intel Core Ultra 7 155H (18236 - 47685, n=50) | |
| Media de la clase Subnotebook (3341 - 65433, n=58, últimos 2 años) | |
| Dell XPS 13 9340 Core Ultra 7 | |
| Dell XPS 13 Plus 9320 Core i7-1360P | |
| HP Dragonfly G4 | |
| Asus ZenBook S13 OLED UX5304 | |
| AIDA64 / CPU AES | |
| Medio Intel Core Ultra 7 155H (45713 - 152179, n=50) | |
| Lenovo ThinkPad Z13 Gen 2 | |
| Dell XPS 13 9340 Core Ultra 7 | |
| Media de la clase Subnotebook (638 - 96917, n=58, últimos 2 años) | |
| Dell XPS 13 Plus 9320 Core i7-1360P | |
| HP Dragonfly G4 | |
| Asus ZenBook S13 OLED UX5304 | |
| AIDA64 / CPU ZLib | |
| Medio Intel Core Ultra 7 155H (557 - 1250, n=50) | |
| Lenovo ThinkPad Z13 Gen 2 | |
| Dell XPS 13 9340 Core Ultra 7 | |
| Media de la clase Subnotebook (164.9 - 1379, n=58, últimos 2 años) | |
| Dell XPS 13 Plus 9320 Core i7-1360P | |
| HP Dragonfly G4 | |
| Asus ZenBook S13 OLED UX5304 | |
| AIDA64 / FP64 Ray-Trace | |
| Lenovo ThinkPad Z13 Gen 2 | |
| Media de la clase Subnotebook (610 - 17495, n=58, últimos 2 años) | |
| Medio Intel Core Ultra 7 155H (3569 - 9802, n=50) | |
| Dell XPS 13 9340 Core Ultra 7 | |
| Dell XPS 13 Plus 9320 Core i7-1360P | |
| HP Dragonfly G4 | |
| Asus ZenBook S13 OLED UX5304 | |
| AIDA64 / CPU PhotoWorxx | |
| Dell XPS 13 9340 Core Ultra 7 | |
| Dell XPS 13 Plus 9320 Core i7-1360P | |
| Media de la clase Subnotebook (6569 - 85600, n=58, últimos 2 años) | |
| Medio Intel Core Ultra 7 155H (32719 - 54223, n=50) | |
| Asus ZenBook S13 OLED UX5304 | |
| Lenovo ThinkPad Z13 Gen 2 | |
| HP Dragonfly G4 | |
Rendimiento del sistema
El XPS 13 es un dispositivo que responde bien en el uso diario y sus resultados en los benchmarks también fueron correctos. No pudimos detectar ningún problema de estabilidad durante nuestra prueba.
CrossMark: Overall | Productivity | Creativity | Responsiveness
WebXPRT 3: Overall
WebXPRT 4: Overall
Mozilla Kraken 1.1: Total
| PCMark 10 / Score | |
| Media de la clase Subnotebook (4920 - 9939, n=46, últimos 2 años) | |
| Lenovo ThinkPad Z13 Gen 2 | |
| Medio Intel Core Ultra 7 155H, Intel Arc 8-Core iGPU (4809 - 7529, n=34) | |
| Dell XPS 13 9340 Core Ultra 7 | |
| Dell XPS 13 Plus 9320 Core i7-1360P | |
| HP Dragonfly G4 | |
| Asus ZenBook S13 OLED UX5304 | |
| PCMark 10 / Essentials | |
| Dell XPS 13 Plus 9320 Core i7-1360P | |
| Lenovo ThinkPad Z13 Gen 2 | |
| HP Dragonfly G4 | |
| Dell XPS 13 9340 Core Ultra 7 | |
| Asus ZenBook S13 OLED UX5304 | |
| Medio Intel Core Ultra 7 155H, Intel Arc 8-Core iGPU (7605 - 11289, n=34) | |
| Media de la clase Subnotebook (8552 - 11646, n=46, últimos 2 años) | |
| PCMark 10 / Productivity | |
| Media de la clase Subnotebook (5435 - 16606, n=46, últimos 2 años) | |
| Lenovo ThinkPad Z13 Gen 2 | |
| Medio Intel Core Ultra 7 155H, Intel Arc 8-Core iGPU (6042 - 10591, n=34) | |
| Dell XPS 13 9340 Core Ultra 7 | |
| Dell XPS 13 Plus 9320 Core i7-1360P | |
| HP Dragonfly G4 | |
| Asus ZenBook S13 OLED UX5304 | |
| PCMark 10 / Digital Content Creation | |
| Media de la clase Subnotebook (5722 - 13779, n=46, últimos 2 años) | |
| Medio Intel Core Ultra 7 155H, Intel Arc 8-Core iGPU (4985 - 10709, n=34) | |
| Lenovo ThinkPad Z13 Gen 2 | |
| Dell XPS 13 9340 Core Ultra 7 | |
| Dell XPS 13 Plus 9320 Core i7-1360P | |
| HP Dragonfly G4 | |
| Asus ZenBook S13 OLED UX5304 | |
| CrossMark / Overall | |
| Apple MacBook Air 13 M3 10C GPU | |
| Dell XPS 13 Plus 9320 Core i7-1360P | |
| Dell XPS 13 9340 Core Ultra 7 | |
| Media de la clase Subnotebook (365 - 2356, n=60, últimos 2 años) | |
| Medio Intel Core Ultra 7 155H, Intel Arc 8-Core iGPU (1366 - 1903, n=34) | |
| HP Dragonfly G4 | |
| Asus ZenBook S13 OLED UX5304 | |
| Lenovo ThinkPad Z13 Gen 2 | |
| CrossMark / Productivity | |
| Apple MacBook Air 13 M3 10C GPU | |
| Dell XPS 13 Plus 9320 Core i7-1360P | |
| HP Dragonfly G4 | |
| Dell XPS 13 9340 Core Ultra 7 | |
| Media de la clase Subnotebook (364 - 2277, n=60, últimos 2 años) | |
| Medio Intel Core Ultra 7 155H, Intel Arc 8-Core iGPU (1291 - 1798, n=33) | |
| Asus ZenBook S13 OLED UX5304 | |
| Lenovo ThinkPad Z13 Gen 2 | |
| CrossMark / Creativity | |
| Apple MacBook Air 13 M3 10C GPU | |
| Dell XPS 13 Plus 9320 Core i7-1360P | |
| Media de la clase Subnotebook (372 - 2743, n=60, últimos 2 años) | |
| Dell XPS 13 9340 Core Ultra 7 | |
| Lenovo ThinkPad Z13 Gen 2 | |
| Medio Intel Core Ultra 7 155H, Intel Arc 8-Core iGPU (1519 - 1929, n=33) | |
| HP Dragonfly G4 | |
| Asus ZenBook S13 OLED UX5304 | |
| CrossMark / Responsiveness | |
| Dell XPS 13 Plus 9320 Core i7-1360P | |
| Medio Intel Core Ultra 7 155H, Intel Arc 8-Core iGPU (939 - 1802, n=33) | |
| Dell XPS 13 9340 Core Ultra 7 | |
| Asus ZenBook S13 OLED UX5304 | |
| HP Dragonfly G4 | |
| Media de la clase Subnotebook (312 - 1854, n=60, últimos 2 años) | |
| Apple MacBook Air 13 M3 10C GPU | |
| Lenovo ThinkPad Z13 Gen 2 | |
| WebXPRT 3 / Overall | |
| Apple MacBook Air 13 M3 10C GPU | |
| Media de la clase Subnotebook (156 - 530, n=56, últimos 2 años) | |
| Dell XPS 13 Plus 9320 Core i7-1360P | |
| HP Dragonfly G4 | |
| Lenovo ThinkPad Z13 Gen 2 | |
| Asus ZenBook S13 OLED UX5304 | |
| Medio Intel Core Ultra 7 155H, Intel Arc 8-Core iGPU (252 - 299, n=34) | |
| Dell XPS 13 9340 Core Ultra 7 | |
| WebXPRT 4 / Overall | |
| Apple MacBook Air 13 M3 10C GPU | |
| Media de la clase Subnotebook (132 - 378, n=61, últimos 2 años) | |
| Dell XPS 13 Plus 9320 Core i7-1360P | |
| HP Dragonfly G4 | |
| Dell XPS 13 9340 Core Ultra 7 | |
| Asus ZenBook S13 OLED UX5304 | |
| Medio Intel Core Ultra 7 155H, Intel Arc 8-Core iGPU (166.4 - 309, n=29) | |
| Lenovo ThinkPad Z13 Gen 2 | |
| Mozilla Kraken 1.1 / Total | |
| Lenovo ThinkPad Z13 Gen 2 | |
| Medio Intel Core Ultra 7 155H, Intel Arc 8-Core iGPU (517 - 614, n=35) | |
| Dell XPS 13 9340 Core Ultra 7 | |
| Asus ZenBook S13 OLED UX5304 | |
| Dell XPS 13 Plus 9320 Core i7-1360P | |
| HP Dragonfly G4 | |
| Media de la clase Subnotebook (234 - 1104, n=61, últimos 2 años) | |
| Apple MacBook Air 13 M3 10C GPU | |
* ... más pequeño es mejor
| PCMark 10 Score | 6555 puntos | |
ayuda | ||
| AIDA64 / Memory Copy | |
| Dell XPS 13 9340 Core Ultra 7 | |
| Media de la clase Subnotebook (14554 - 131023, n=58, últimos 2 años) | |
| Medio Intel Core Ultra 7 155H (62397 - 96791, n=50) | |
| Dell XPS 13 Plus 9320 Core i7-1360P | |
| Lenovo ThinkPad Z13 Gen 2 | |
| Asus ZenBook S13 OLED UX5304 | |
| HP Dragonfly G4 | |
| AIDA64 / Memory Read | |
| Dell XPS 13 9340 Core Ultra 7 | |
| Media de la clase Subnotebook (15948 - 127174, n=58, últimos 2 años) | |
| Medio Intel Core Ultra 7 155H (60544 - 90647, n=50) | |
| Dell XPS 13 Plus 9320 Core i7-1360P | |
| Lenovo ThinkPad Z13 Gen 2 | |
| Asus ZenBook S13 OLED UX5304 | |
| HP Dragonfly G4 | |
| AIDA64 / Memory Write | |
| Media de la clase Subnotebook (15709 - 135141, n=58, últimos 2 años) | |
| Lenovo ThinkPad Z13 Gen 2 | |
| Dell XPS 13 Plus 9320 Core i7-1360P | |
| Dell XPS 13 9340 Core Ultra 7 | |
| Medio Intel Core Ultra 7 155H (58692 - 93451, n=50) | |
| Asus ZenBook S13 OLED UX5304 | |
| HP Dragonfly G4 | |
| AIDA64 / Memory Latency | |
| Medio Intel Core Ultra 7 155H (116.2 - 233, n=50) | |
| Lenovo ThinkPad Z13 Gen 2 | |
| Dell XPS 13 9340 Core Ultra 7 | |
| Dell XPS 13 Plus 9320 Core i7-1360P | |
| Media de la clase Subnotebook (6.1 - 159.9, n=56, últimos 2 años) | |
| HP Dragonfly G4 | |
| Asus ZenBook S13 OLED UX5304 | |
* ... más pequeño es mejor
Latencias del CPD
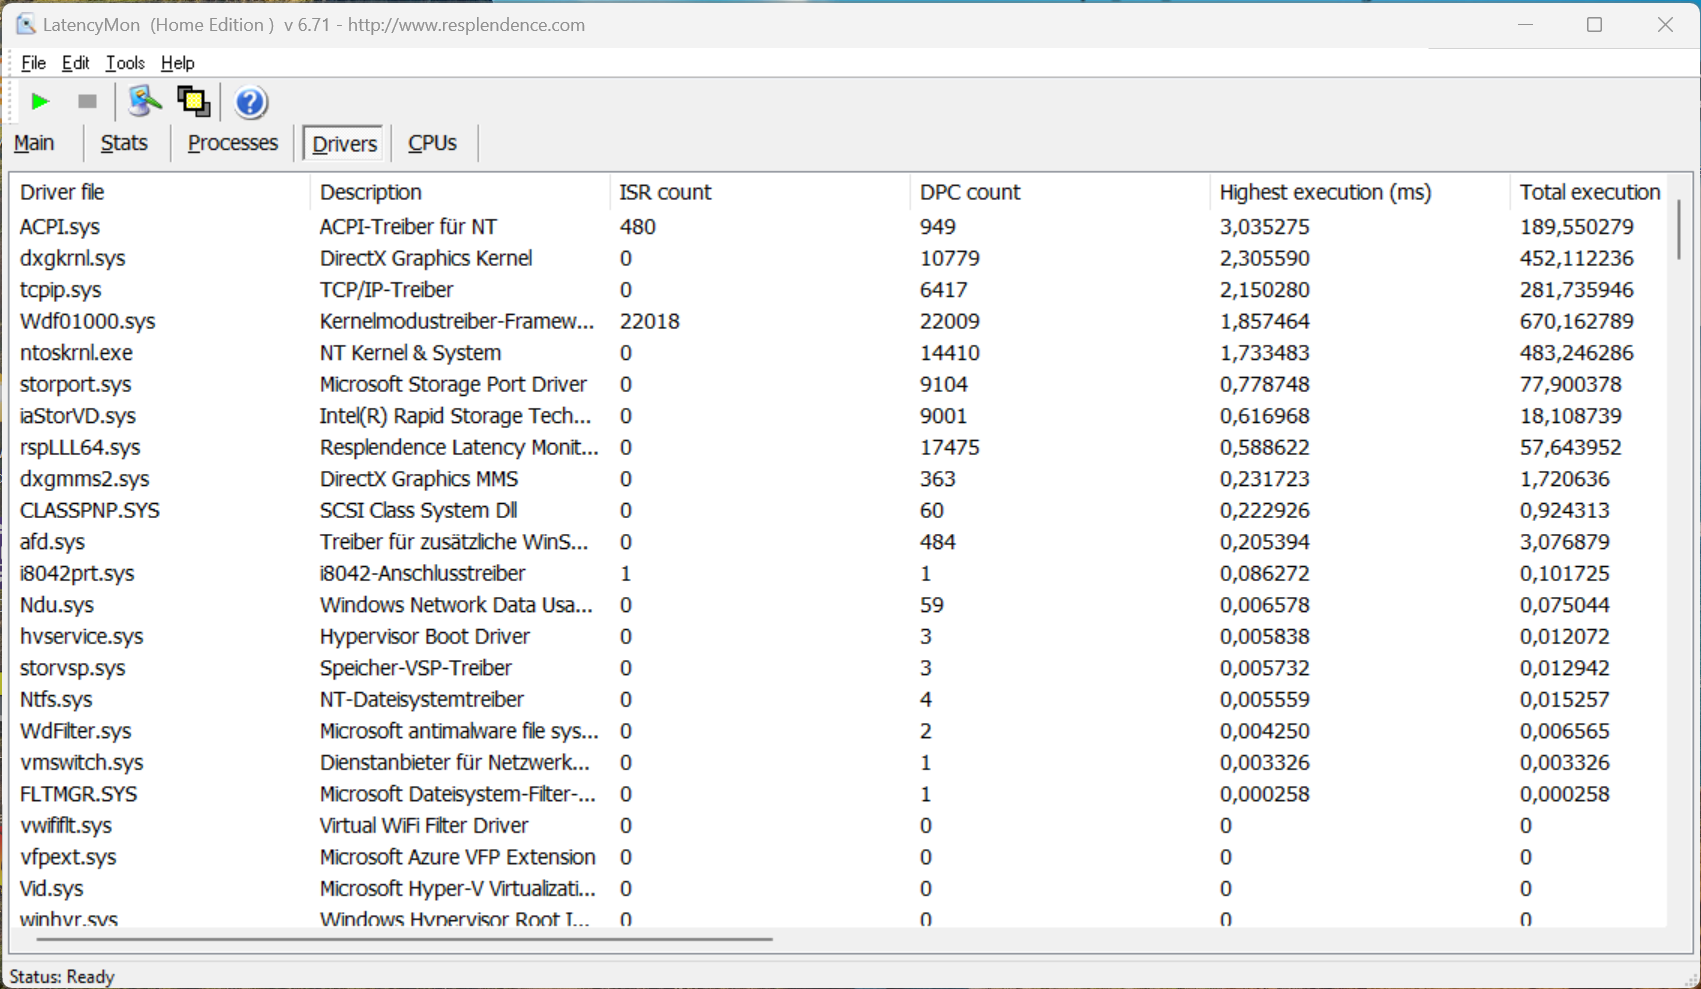
En nuestra prueba de latencia estandarizada (navegación por Internet, reproducción 4K de YouTube, carga de la CPU), el dispositivo de prueba con la versión actual de la BIOS no mostró limitaciones al utilizar aplicaciones de audio en tiempo real. Aunque un controlador mostró una desviación, el importante valor "interrupt-to-process-latency" fue muy bajo.
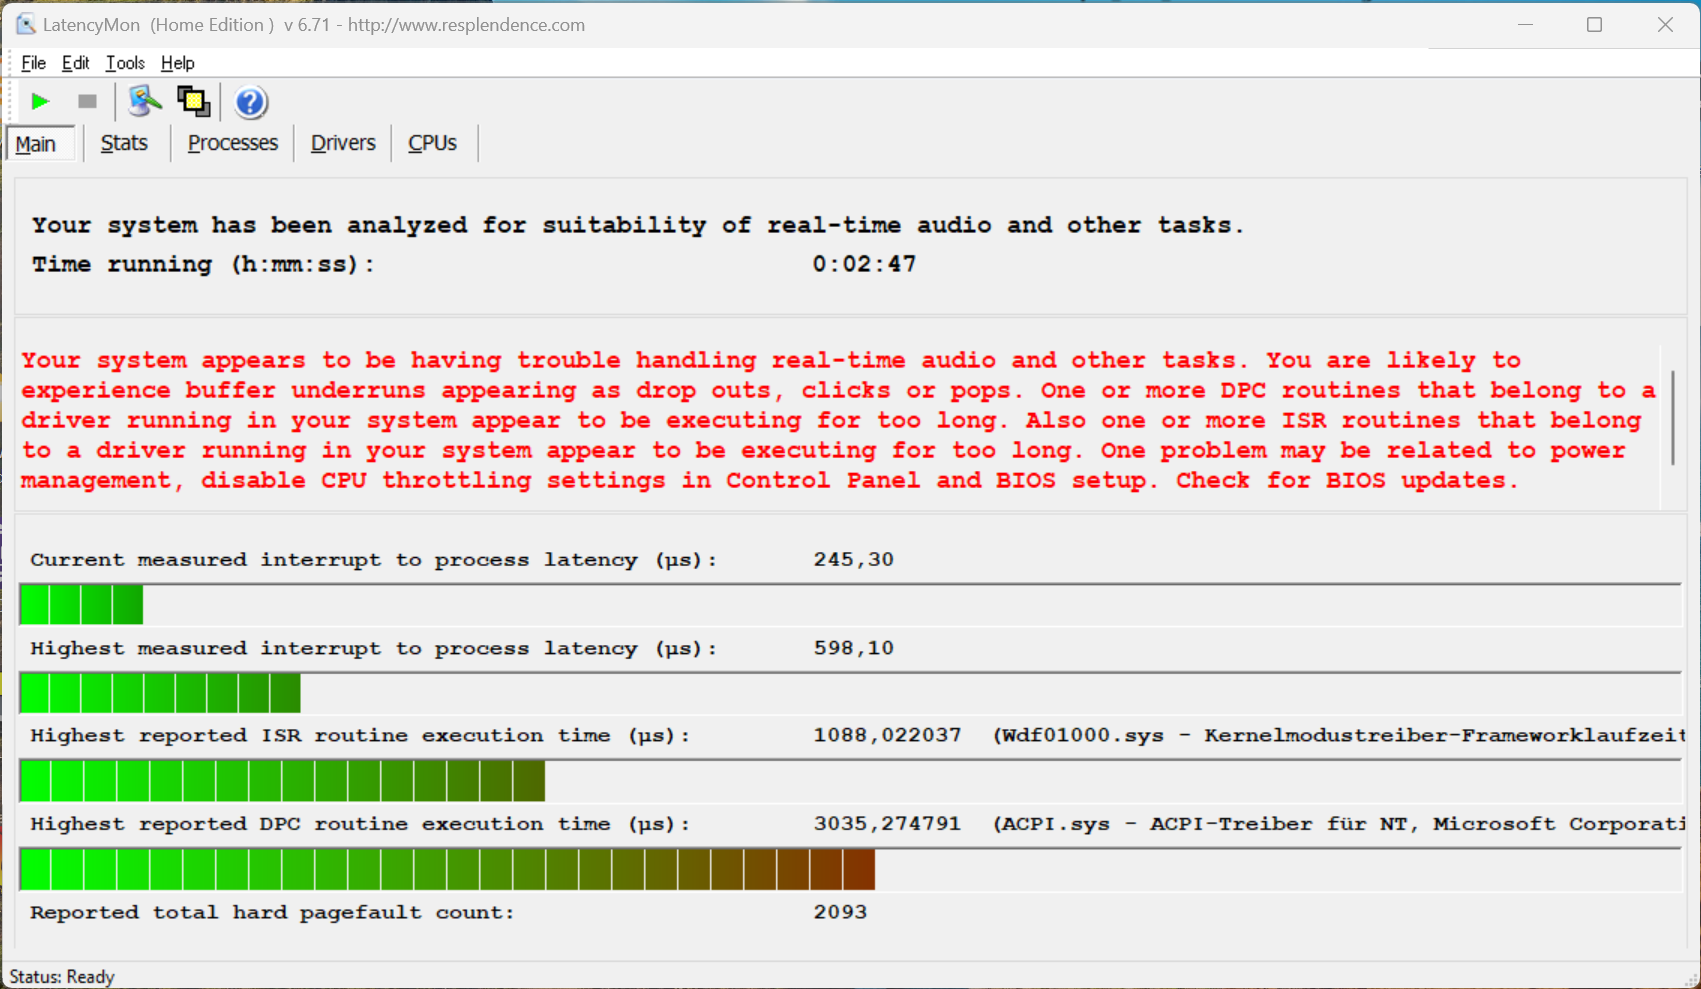
| DPC Latencies / LatencyMon - interrupt to process latency (max), Web, Youtube, Prime95 | |
| Dell XPS 13 Plus 9320 Core i7-1360P | |
| Lenovo ThinkPad Z13 Gen 2 | |
| Asus ZenBook S13 OLED UX5304 | |
| HP Dragonfly G4 | |
| Dell XPS 13 9340 Core Ultra 7 | |
* ... más pequeño es mejor
Dispositivo de almacenamiento
Nuestro dispositivo de pruebas está equipado con la unidad SSD PCIe 4.0 Micron 2550 con una capacidad de 512 GB, de los cuales 371 GB siguen libres para su uso tras el arranque inicial. Sus velocidades de transferencia son perfectamente correctas, con un máximo de más de 4 GB/s, y no se aprecia una caída del rendimiento ni siquiera bajo carga prolongada. Encontrará más pruebas comparativas de SSD aquí.

* ... más pequeño es mejor
Reading continuous performance: DiskSpd Read Loop, Queue Depth 8
Tarjeta gráfica
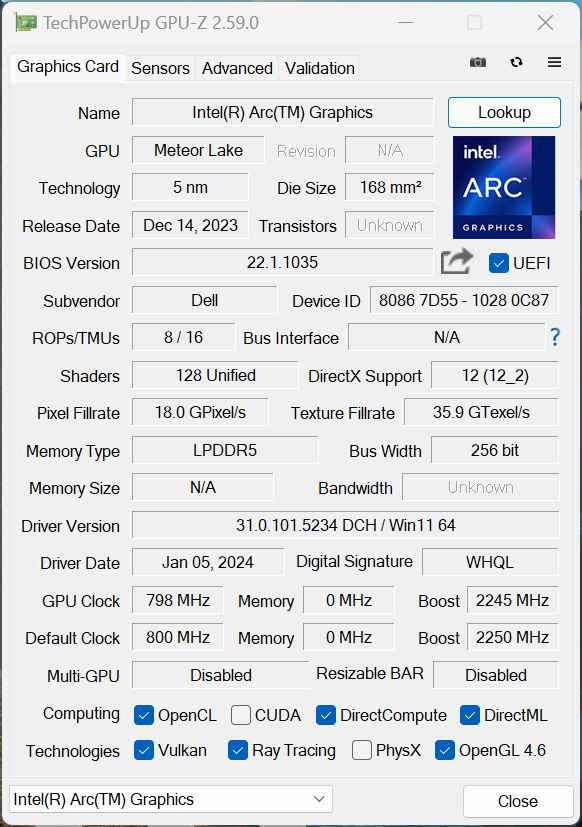
De los cálculos gráficos se encarga el nuevo Gráficos Intel Arcque es la versión más rápida con 8 núcleos Xe junto con el Core Ultra 7 155H. En general, el rendimiento de la GPU es significativamente superior al de la antigua Gráficos Iris Xe G7y la rápida Radeon 780M también pudo ser superada en la mayoría de los puntos de referencia. Durante las pruebas de juegos, por otra parte, la iGPU de AMD siguió estando por delante en general; Intel aún tiene que trabajar un poco en sus controladores en este aspecto.
En principio, su rendimiento en juegos es suficientemente bueno para muchos juegos antiguos con detalles medios a altos y tampoco observamos caídas de fotogramas, aunque su rendimiento no se mantuvo estable. Alcanzando sólo el 70 %, no superó la prueba de estrés de Time Spy y nuestra Witcher 3 prueba también mostró una pérdida significativa de rendimiento al cabo de unos minutos. El rendimiento de la GPU cae mínimamente en modo batería (8 %). Encontrará más pruebas de rendimiento de la GPU aquí.
| 3DMark 11 Performance | 9575 puntos | |
| 3DMark Fire Strike Score | 6900 puntos | |
| 3DMark Time Spy Score | 3106 puntos | |
ayuda | ||
* ... más pequeño es mejor
| Performance rating - Percent | |
| Media de la clase Subnotebook | |
| Lenovo ThinkPad Z13 Gen 2 -1! | |
| Dell XPS 13 9340 Core Ultra 7 | |
| Dell XPS 13 Plus 9320 Core i7-1360P | |
| HP Dragonfly G4 | |
| Asus ZenBook S13 OLED UX5304 | |
| The Witcher 3 - 1920x1080 Ultra Graphics & Postprocessing (HBAO+) | |
| Lenovo ThinkPad Z13 Gen 2 | |
| Media de la clase Subnotebook (13.9 - 34.6, n=12, últimos 2 años) | |
| Dell XPS 13 9340 Core Ultra 7 | |
| Dell XPS 13 Plus 9320 Core i7-1360P | |
| HP Dragonfly G4 | |
| Asus ZenBook S13 OLED UX5304 | |
| GTA V - 1920x1080 Highest AA:4xMSAA + FX AF:16x | |
| Media de la clase Subnotebook (10.7 - 43.7, n=56, últimos 2 años) | |
| Dell XPS 13 9340 Core Ultra 7 | |
| Dell XPS 13 Plus 9320 Core i7-1360P | |
| HP Dragonfly G4 | |
| Asus ZenBook S13 OLED UX5304 | |
| Final Fantasy XV Benchmark - 1920x1080 High Quality | |
| Media de la clase Subnotebook (11.6 - 54.5, n=54, últimos 2 años) | |
| Lenovo ThinkPad Z13 Gen 2 | |
| Dell XPS 13 9340 Core Ultra 7 | |
| Dell XPS 13 Plus 9320 Core i7-1360P | |
| HP Dragonfly G4 | |
| Asus ZenBook S13 OLED UX5304 | |
| Strange Brigade - 1920x1080 ultra AA:ultra AF:16 | |
| Media de la clase Subnotebook (19 - 101.3, n=50, últimos 2 años) | |
| Lenovo ThinkPad Z13 Gen 2 | |
| Dell XPS 13 9340 Core Ultra 7 | |
| Dell XPS 13 Plus 9320 Core i7-1360P | |
| HP Dragonfly G4 | |
| Asus ZenBook S13 OLED UX5304 | |
| Dota 2 Reborn - 1920x1080 ultra (3/3) best looking | |
| Lenovo ThinkPad Z13 Gen 2 | |
| Media de la clase Subnotebook (13 - 97, n=61, últimos 2 años) | |
| Dell XPS 13 9340 Core Ultra 7 | |
| Dell XPS 13 Plus 9320 Core i7-1360P | |
| HP Dragonfly G4 | |
| Asus ZenBook S13 OLED UX5304 | |
Witcher 3 FPS diagram
| bajo | medio | alto | ultra | |
|---|---|---|---|---|
| GTA V (2015) | 157.8 | 129.8 | 32.8 | 14.7 |
| The Witcher 3 (2015) | 152 | 89 | 47 | 20.8 |
| Dota 2 Reborn (2015) | 106.2 | 89.8 | 72 | 65.2 |
| Final Fantasy XV Benchmark (2018) | 61.3 | 36.2 | 26.4 | |
| X-Plane 11.11 (2018) | 53 | 40.7 | 30.8 | |
| Far Cry 5 (2018) | 57 | 33 | 30 | 28 |
| Strange Brigade (2018) | 156 | 68 | 54 | 41 |
| F1 23 (2023) | 67.9 | 60.5 | 39.5 | 10.7 |
Emisiones - A menudo silenciosas en el uso diario
Emisiones sonoras
La unidad de refrigeración del XPS 13 consta de dos ventiladores y un tubo de calor. En modo inactivo y durante tareas sencillas, el portátil permanece generalmente silencioso o muy silencioso. En cuanto se exige más al procesador o a la iGPU, la refrigeración se hace rápidamente audible. Medimos entre 37-42 dB(A), pero no hubo ruidos agudos. En conjunto, el XPS 13 se comporta de forma similar a su predecesor en este aspecto y es uno de los modelos más ruidosos dentro del campo de comparación. Al utilizar el modo de rendimiento opcional ultra, sus emisiones de ruido se elevan a 47 dB(A) y observamos 32 dB(A) utilizando el modo silencioso. De nuestro aparato de pruebas no se desprendió ningún ruido electrónico adicional.
Ruido
| Ocioso |
| 25.1 / 25.1 / 25.1 dB(A) |
| Carga |
| 37.4 / 42.5 dB(A) |
 | ||
30 dB silencioso 40 dB(A) audible 50 dB(A) ruidosamente alto |
||
min: | ||
| Dell XPS 13 9340 Core Ultra 7 Arc 8-Core, Ultra 7 155H, Micron 2550 512GB | Apple MacBook Air 13 M3 10C GPU M3 10-Core GPU, M3, Apple SSD AP0512Z | Asus ZenBook S13 OLED UX5304 Iris Xe G7 96EUs, i7-1355U, Samsung PM9A1 MZVL21T0HCLR | Lenovo ThinkPad Z13 Gen 2 Radeon 780M, R7 PRO 7840U, SK hynix BC901 HFS001TEJ4X164N | HP Dragonfly G4 Iris Xe G7 96EUs, i7-1365U, Micron 3400 MTFDKBA512TFH 512GB | Dell XPS 13 Plus 9320 Core i7-1360P Iris Xe G7 96EUs, i7-1360P, Samsung PM9A1 MZVL2512HCJQ | |
|---|---|---|---|---|---|---|
| Noise | 6% | -1% | 11% | 3% | ||
| apagado / medio ambiente * (dB) | 25.1 | 23.3 7% | 25.1 -0% | 23.3 7% | 23.7 6% | |
| Idle Minimum * (dB) | 25.1 | 23.3 7% | 25.8 -3% | 23.5 6% | 24 4% | |
| Idle Average * (dB) | 25.1 | 23.3 7% | 25.8 -3% | 23.5 6% | 24 4% | |
| Idle Maximum * (dB) | 25.1 | 23.3 7% | 28.3 -13% | 26.8 -7% | 24.4 3% | |
| Load Average * (dB) | 37.4 | 37.7 -1% | 28.3 24% | 27.2 27% | 37 1% | |
| Witcher 3 ultra * (dB) | 42.5 | 40.1 6% | 44.8 -5% | 32.7 23% | 42.1 1% | |
| Load Maximum * (dB) | 42.5 | 40.1 6% | 44.8 -5% | 35 18% | 42 1% |
* ... más pequeño es mejor
Temperatura
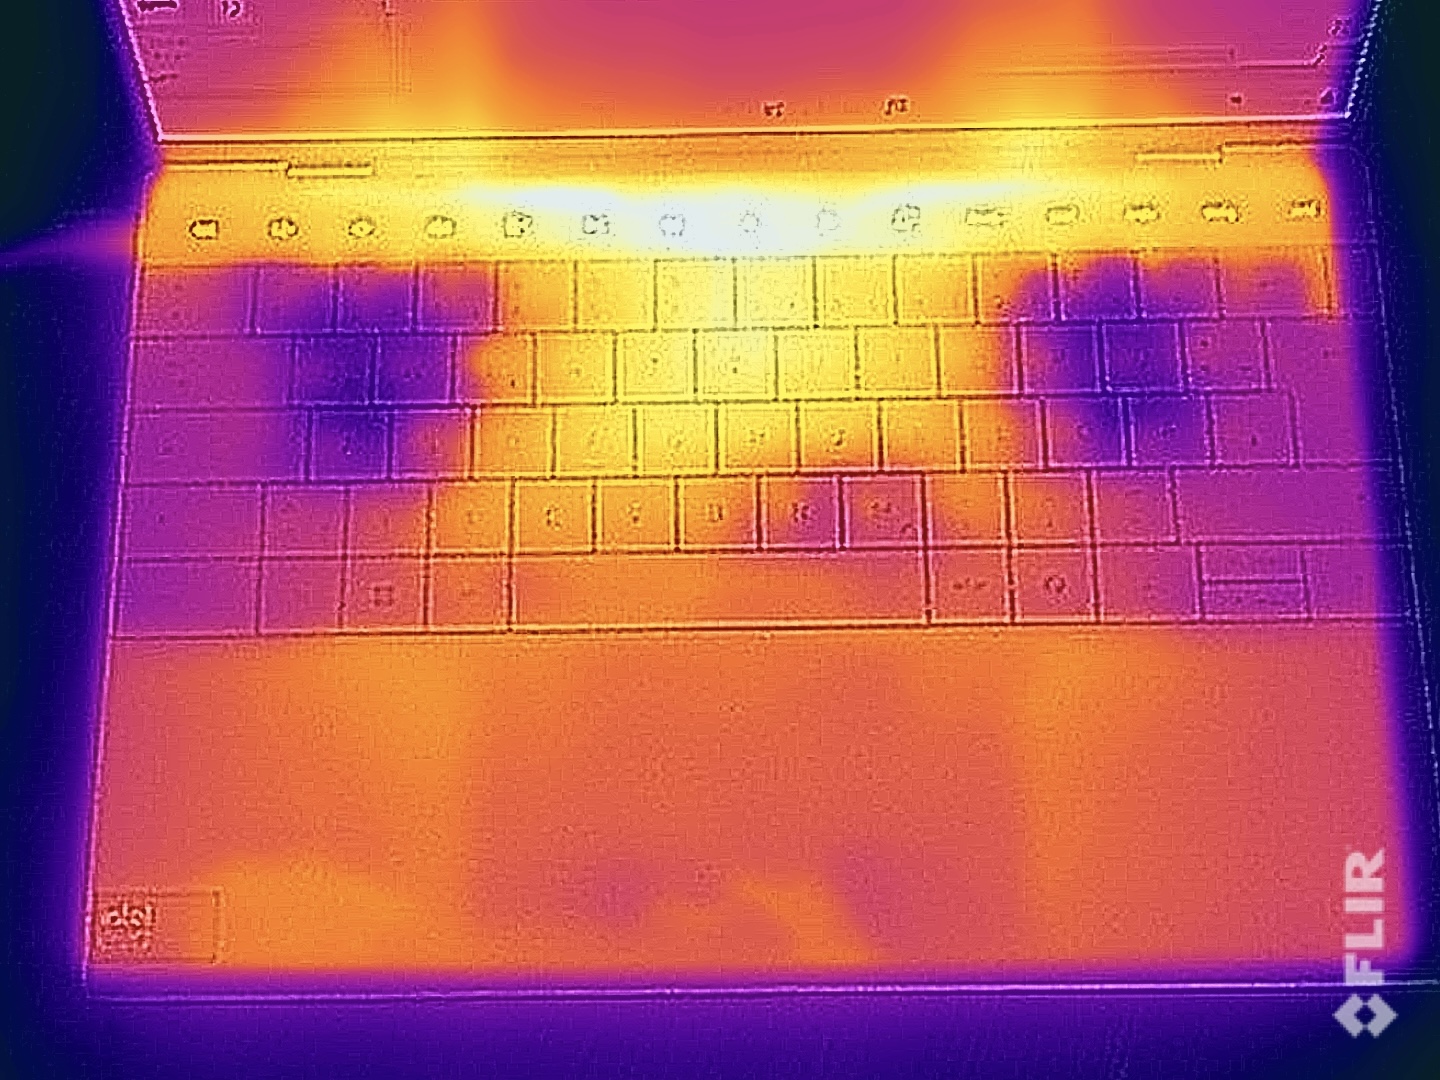
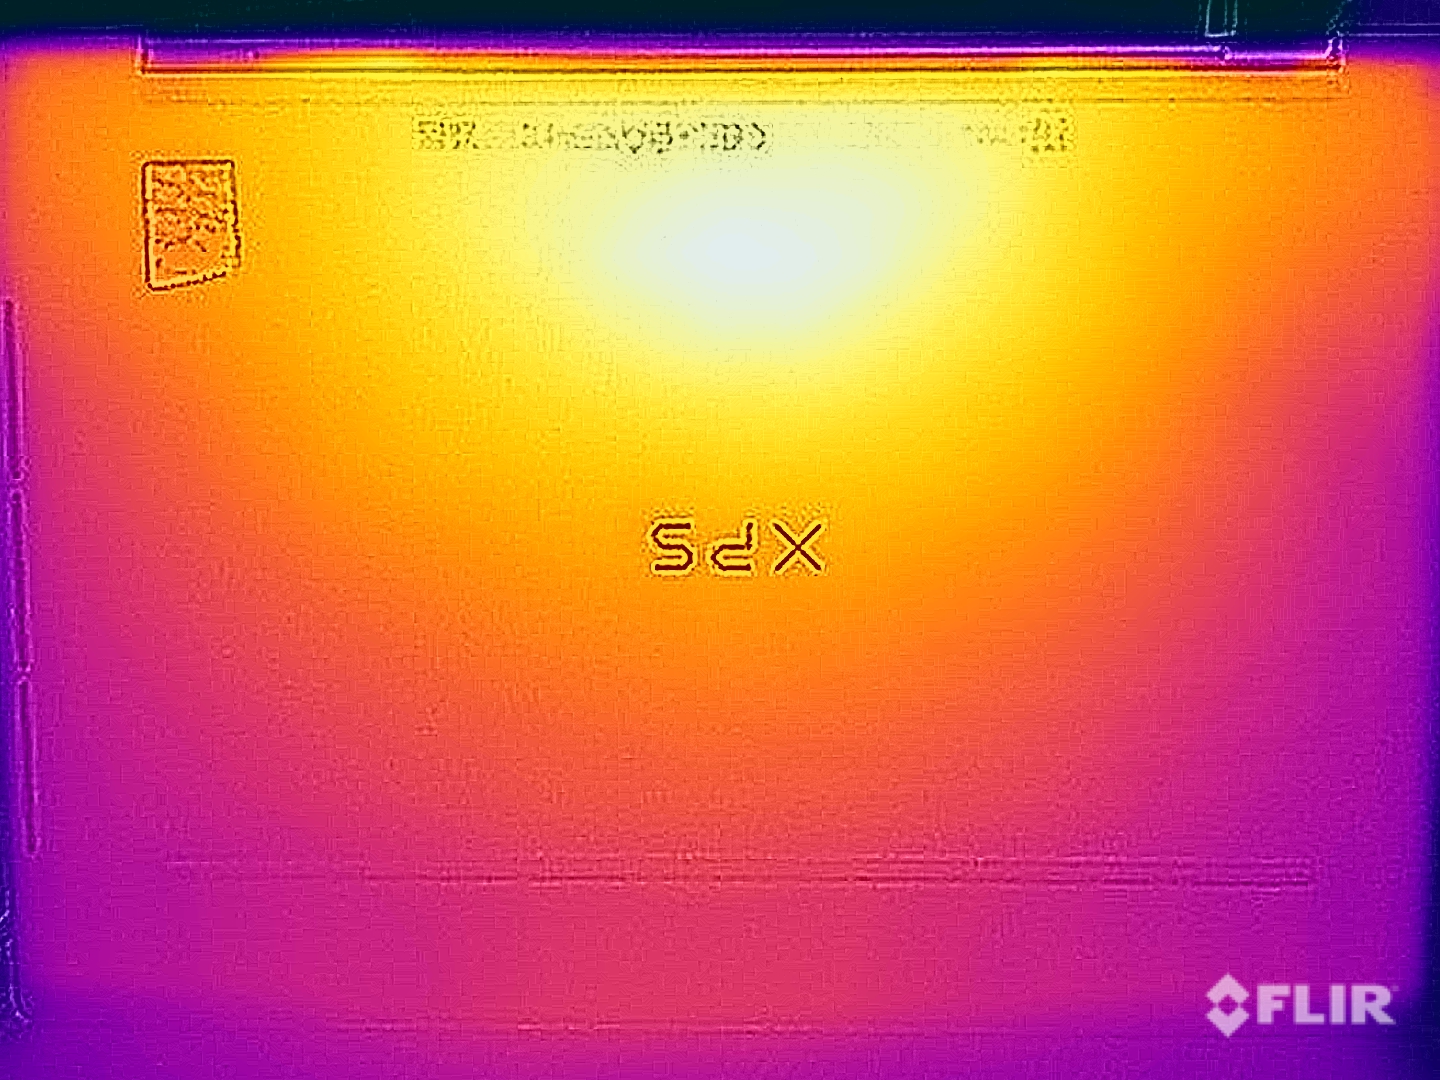
Las superficies del XPS 13 permanecen muy frías en modo inactivo y durante tareas sencillas, y no notamos ningún problema. Cuando se juega o bajo una carga elevada, la parte inferior del portátil en particular se calienta notablemente a unos 44 °C (110 °F). Sin embargo, no hay limitaciones a la hora de utilizar el dispositivo y tampoco hay que preocuparse por el teclado. Sólo la barra táctil se calienta mucho en la zona central. Durante la prueba de estrés, el procesador consumió brevemente hasta 45 vatios y luego bajó rápidamente a unos 24 vatios. A continuación, el XPS se mantuvo en este rango durante algún tiempo antes de que el valor se estabilizara finalmente en torno a los 21 vatios.
(±) La temperatura máxima en la parte superior es de 41 °C / 106 F, frente a la media de 35.9 °C / 97 F, que oscila entre 21.4 y 59 °C para la clase Subnotebook.
(±) El fondo se calienta hasta un máximo de 43.5 °C / 110 F, frente a la media de 39.2 °C / 103 F
(+) En reposo, la temperatura media de la parte superior es de 24.6 °C / 76# F, frente a la media del dispositivo de 30.8 °C / 87 F.
(±) Jugando a The Witcher 3, la temperatura media de la parte superior es de 33.3 °C / 92 F, frente a la media del dispositivo de 30.8 °C / 87 F.
(+) Los reposamanos y el panel táctil alcanzan como máximo la temperatura de la piel (32.5 °C / 90.5 F) y, por tanto, no están calientes.
(-) La temperatura media de la zona del reposamanos de dispositivos similares fue de 28.2 °C / 82.8 F (-4.3 °C / -7.7 F).
| Dell XPS 13 9340 Core Ultra 7 Intel Core Ultra 7 155H, Intel Arc 8-Core iGPU | Apple MacBook Air 13 M3 10C GPU Apple M3, Apple M3 10-Core GPU | Asus ZenBook S13 OLED UX5304 Intel Core i7-1355U, Intel Iris Xe Graphics G7 96EUs | Lenovo ThinkPad Z13 Gen 2 AMD Ryzen 7 PRO 7840U, AMD Radeon 780M | HP Dragonfly G4 Intel Core i7-1365U, Intel Iris Xe Graphics G7 96EUs | Dell XPS 13 Plus 9320 Core i7-1360P Intel Core i7-1360P, Intel Iris Xe Graphics G7 96EUs | |
|---|---|---|---|---|---|---|
| Heat | 4% | -6% | -2% | -3% | -1% | |
| Maximum Upper Side * (°C) | 41 | 44.3 -8% | 43.1 -5% | 46.2 -13% | 38.6 6% | 43.8 -7% |
| Maximum Bottom * (°C) | 43.5 | 43.4 -0% | 45 -3% | 48.4 -11% | 40.4 7% | 44.4 -2% |
| Idle Upper Side * (°C) | 25.3 | 22.3 12% | 27.3 -8% | 23.2 8% | 28.2 -11% | 24 5% |
| Idle Bottom * (°C) | 25.5 | 22.1 13% | 27.8 -9% | 23 10% | 29 -14% | 25.2 1% |
* ... más pequeño es mejor
Altavoces
El XPS incorpora un sistema de sonido con cuatro altavoces y su rendimiento general es bastante bueno, con los módulos quedándose sólo un poco cortos en lo que se refiere a los graves. Aún así, los altavoces suelen ser suficientes para algo de música de fondo o streaming de Netflix.
Dell XPS 13 9340 Core Ultra 7 análisis de audio
(+) | los altavoces pueden reproducir a un volumen relativamente alto (#83.2 dB)
Graves 100 - 315 Hz
(-) | casi sin bajos - de media 17% inferior a la mediana
(±) | la linealidad de los graves es media (9.3% delta a frecuencia anterior)
Medios 400 - 2000 Hz
(+) | medios equilibrados - a sólo 2.1% de la mediana
(+) | los medios son lineales (4.7% delta a la frecuencia anterior)
Altos 2 - 16 kHz
(+) | máximos equilibrados - a sólo 2.5% de la mediana
(+) | los máximos son lineales (4.6% delta a la frecuencia anterior)
Total 100 - 16.000 Hz
(+) | el sonido global es lineal (11.6% de diferencia con la mediana)
En comparación con la misma clase
» 13% de todos los dispositivos probados de esta clase eran mejores, 3% similares, 84% peores
» El mejor tuvo un delta de 5%, la media fue 18%, el peor fue ###max##%
En comparación con todos los dispositivos probados
» 8% de todos los dispositivos probados eran mejores, 2% similares, 90% peores
» El mejor tuvo un delta de 4%, la media fue 23%, el peor fue ###max##%
Apple MacBook Air 13 M3 10C GPU análisis de audio
(+) | los altavoces pueden reproducir a un volumen relativamente alto (#83.2 dB)
Graves 100 - 315 Hz
(±) | lubina reducida - en promedio 13.3% inferior a la mediana
(±) | la linealidad de los graves es media (11.3% delta a frecuencia anterior)
Medios 400 - 2000 Hz
(+) | medios equilibrados - a sólo 0.4% de la mediana
(+) | los medios son lineales (1.6% delta a la frecuencia anterior)
Altos 2 - 16 kHz
(+) | máximos equilibrados - a sólo 4.5% de la mediana
(+) | los máximos son lineales (1.9% delta a la frecuencia anterior)
Total 100 - 16.000 Hz
(+) | el sonido global es lineal (10.7% de diferencia con la mediana)
En comparación con la misma clase
» 9% de todos los dispositivos probados de esta clase eran mejores, 3% similares, 88% peores
» El mejor tuvo un delta de 5%, la media fue 18%, el peor fue ###max##%
En comparación con todos los dispositivos probados
» 6% de todos los dispositivos probados eran mejores, 2% similares, 93% peores
» El mejor tuvo un delta de 4%, la media fue 23%, el peor fue ###max##%
Gestión de la energía - Largos tiempos de funcionamiento a 60 Hz
Consumo de energía
Con un consumo máximo en reposo de menos de 8 vatios, el nuevo XPS 13 es muy frugal. Medimos un máximo de 62,7 vatios, pero este es el límite de la fuente de alimentación de 60 vatios. El consumo del portátil puede volver a bajar al cabo de poco tiempo, pero la batería tiene que compensar esta diferencia mientras tanto. A lo largo de la prueba, su consumo se estabilizó entonces en torno a los 37 vatios.
| Off / Standby | |
| Ocioso | |
| Carga |
|
Clave:
min: | |
| Dell XPS 13 9340 Core Ultra 7 Ultra 7 155H, Arc 8-Core, Micron 2550 512GB, IPS, 1920x1200, 13.4" | Apple MacBook Air 13 M3 10C GPU M3, M3 10-Core GPU, Apple SSD AP0512Z, IPS, 2560x1664, 13.6" | Asus ZenBook S13 OLED UX5304 i7-1355U, Iris Xe G7 96EUs, Samsung PM9A1 MZVL21T0HCLR, OLED, 2880x1800, 13.3" | Lenovo ThinkPad Z13 Gen 2 R7 PRO 7840U, Radeon 780M, SK hynix BC901 HFS001TEJ4X164N, OLED, 2880x1800, 13.3" | HP Dragonfly G4 i7-1365U, Iris Xe G7 96EUs, Micron 3400 MTFDKBA512TFH 512GB, IPS, 1920x1280, 13.5" | Dell XPS 13 Plus 9320 Core i7-1360P i7-1360P, Iris Xe G7 96EUs, Samsung PM9A1 MZVL2512HCJQ, OLED, 3456x2160, 13.4" | Medio Intel Arc 8-Core iGPU | Media de la clase Subnotebook | |
|---|---|---|---|---|---|---|---|---|
| Power Consumption | 18% | -5% | -18% | 0% | -31% | -32% | 3% | |
| Idle Minimum * (Watt) | 3.8 | 1.95 49% | 5.8 -53% | 5.8 -53% | 4.1 -8% | 6.9 -82% | 5.31 ? -40% | 3.71 ? 2% |
| Idle Average * (Watt) | 7 | 8.7 -24% | 8.5 -21% | 6.2 11% | 7.5 -7% | 7.4 -6% | 8.56 ? -22% | 6.54 ? 7% |
| Idle Maximum * (Watt) | 7.3 | 8.9 -22% | 8.8 -21% | 12.7 -74% | 8.2 -12% | 13.6 -86% | 11.9 ? -63% | 7.89 ? -8% |
| Load Average * (Watt) | 52.6 | 34.3 35% | 35.1 33% | 27.2 48% | 35.5 33% | 43.5 17% | 53.6 ? -2% | 42.1 ? 20% |
| Witcher 3 ultra * (Watt) | 38.3 | 28.6 25% | 27.6 28% | 54.1 -41% | 37.5 2% | 48 -25% | ||
| Load Maximum * (Watt) | 62.7 | 35.4 44% | 59.5 5% | 61.4 2% | 66.5 -6% | 63.3 -1% | 84.2 ? -34% | 65.1 ? -4% |
* ... más pequeño es mejor
Power consumption Witcher 3 / stress test
Power consumption with external monitor
Tiempos de ejecución
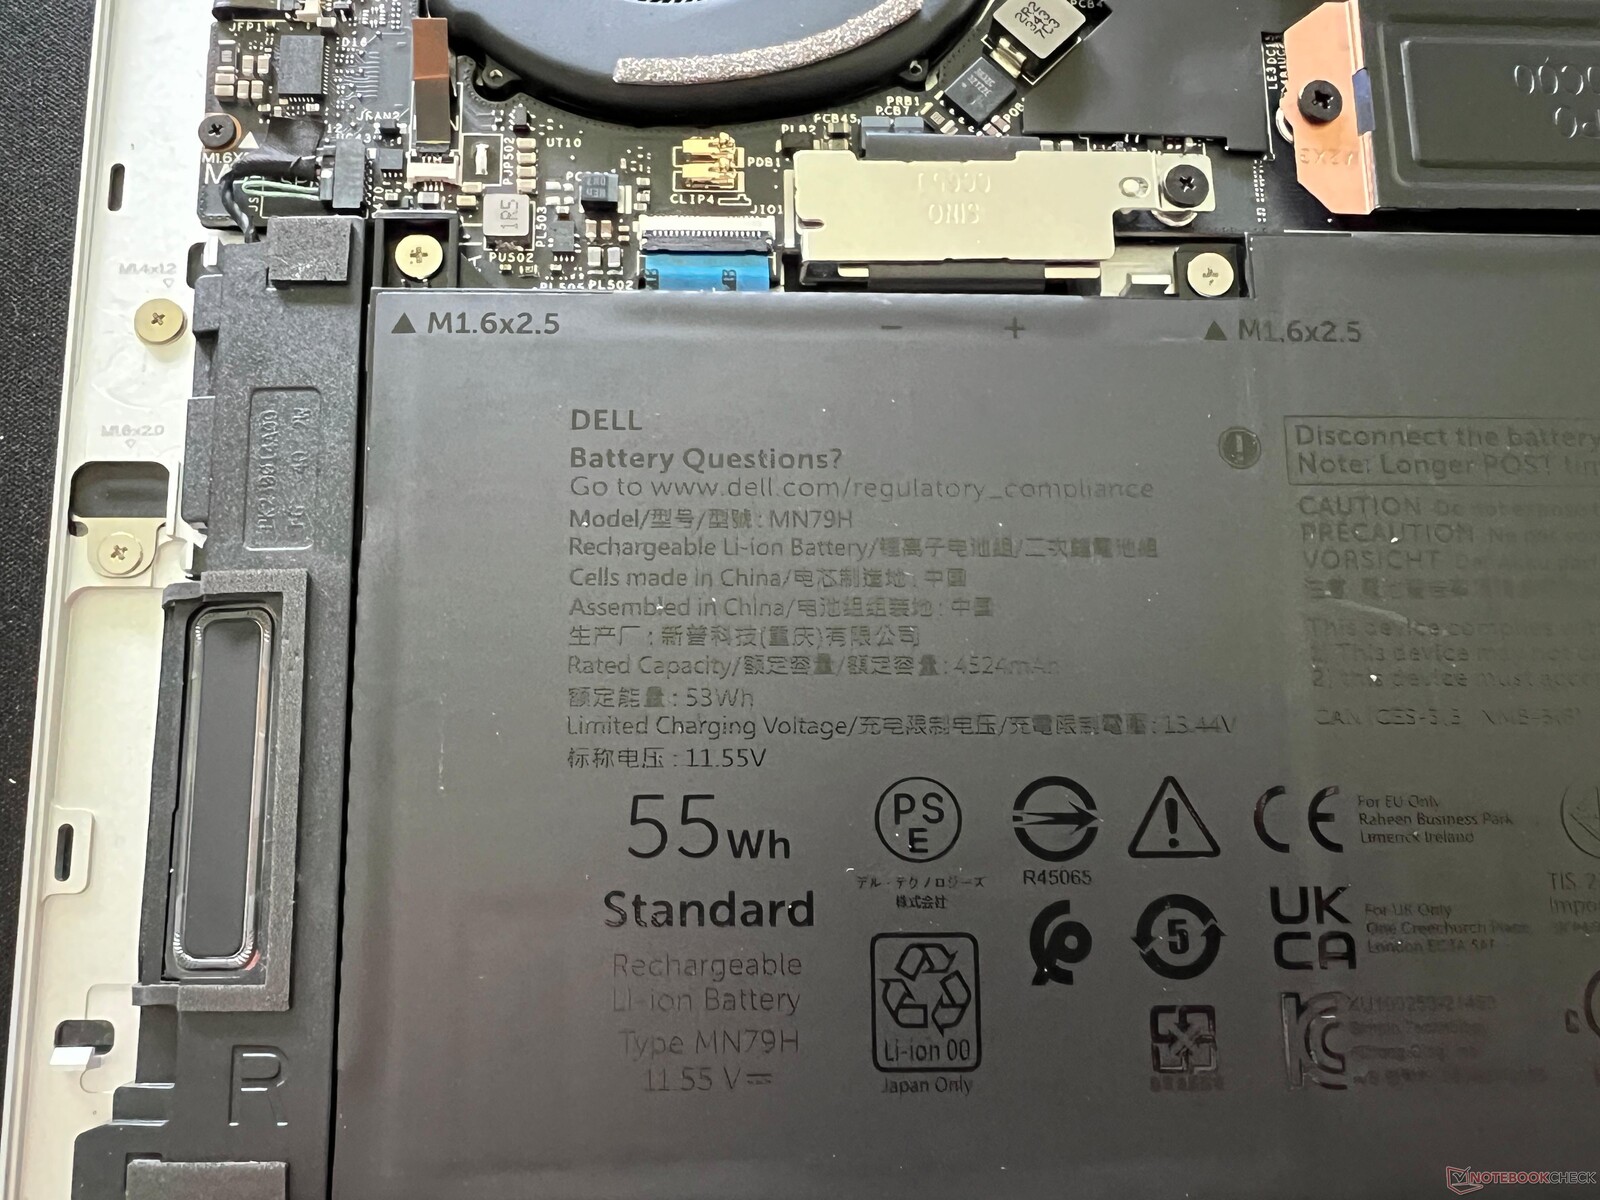
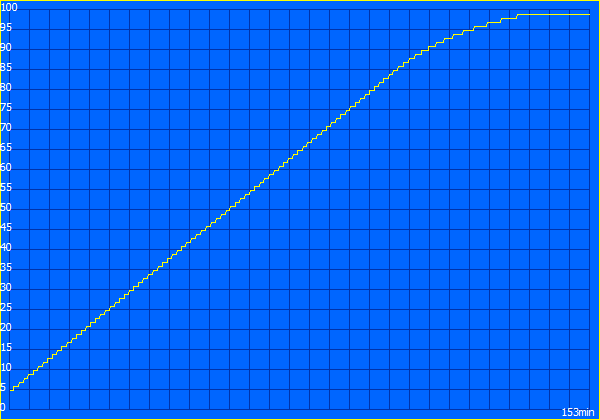
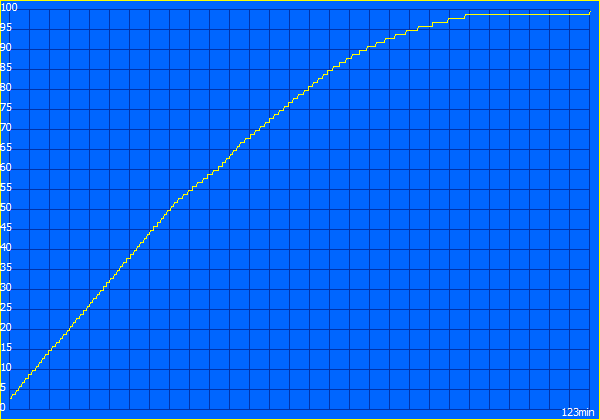
La batería de 55 Wh del dispositivo permite una buena autonomía. En nuestra prueba WLAN a 150 cd/m² (corresponde al 51% del brillo máximo de nuestro dispositivo de prueba), medimos una muy buena autonomía de casi 13 horas a 60 Hz (algo menos de 11 horas a 120 Hz), lo que significa que el XPS 13 sólo pudo ser superado por el MacBook Air 13 M3 y el HP Dragonfly G4. El antiguo XPS 13 con su panel OLED de alta resolución logró algo más de 7 horas. Con el brillo al máximo, la prueba WLAN aún duró casi 9 horas (60 Hz) y la mayor frecuencia de actualización apenas influyó en los resultados (sólo 10 minutos menos a 120 Hz). Durante la prueba de vídeo a 150 cd/m², el nuevo procesador Meteor Lake con su diseño en mosaico se hizo notar una vez más, ya que los dos núcleos de eficiencia en el mosaico del SoC hicieron todo el trabajo aquí. El resultado son unas extraordinarias 17,5 horas, que incluso superan por poco al MacBook Air 13. En el peor de los casos, el portátil puede apagarse tras poco más de 2 horas.
Puede seleccionar diferentes modos de carga y, utilizando el ajuste estándar, tarda 2,5 horas en cargar la batería desde 0 con el aparato encendido (80 % tras 95 minutos). Utilizando el modo exprés, el tiempo se reduce a algo menos de 2 horas (80 % tras 64 minutos).
| Dell XPS 13 9340 Core Ultra 7 Ultra 7 155H, Arc 8-Core, 55 Wh | Apple MacBook Air 13 M3 10C GPU M3, M3 10-Core GPU, 52.6 Wh | Asus ZenBook S13 OLED UX5304 i7-1355U, Iris Xe G7 96EUs, 63 Wh | Lenovo ThinkPad Z13 Gen 2 R7 PRO 7840U, Radeon 780M, 51.5 Wh | HP Dragonfly G4 i7-1365U, Iris Xe G7 96EUs, 68 Wh | Dell XPS 13 Plus 9320 Core i7-1360P i7-1360P, Iris Xe G7 96EUs, 55 Wh | Media de la clase Subnotebook | |
|---|---|---|---|---|---|---|---|
| Duración de Batería | 17% | -8% | -39% | 35% | -43% | -4% | |
| H.264 (h) | 17.6 | 17.4 -1% | 13.8 -22% | 15.3 ? -13% | |||
| WiFi v1.3 (h) | 12.8 | 15.2 19% | 11.3 -12% | 7.8 -39% | 15.9 24% | 7.3 -43% | 14.1 ? 10% |
| Load (h) | 2.2 | 2.9 32% | 2.4 9% | 3.2 45% | 1.998 ? -9% |
Pro
Contra
Veredicto - El XPS 13 sigue siendo un compañero compacto, pero la pantalla básica y la barra táctil son decepcionantes
El nuevo XPS 13 utiliza el diseño del antiguo XPS 13 Plus, el mismo que Dell utiliza ahora también en los modelos más grandes XPS 14 y XPS 16. Especialmente en comparación con el corpulento XPS 14, el modelo de 13 pulgadas parece muy compacto y, con sus finos biseles, también es uno de los dispositivos más delgados dentro del campo de comparación. En términos de calidad, apenas tenemos nada de lo que quejarnos, sin embargo, con 1,2 kg, no es especialmente ligero. Otro punto a favor es la gran duración de su batería, al menos en combinación con la pantalla base.
Aquí es donde se pone un poco más difícil para el XPS 13, ya que el panel base no es realmente tan impresionante en absoluto. Aunque la imagen del panel IPS mate se ve bien y su frecuencia de actualización de 120-Hz ayuda con el movimiento, el panel del dispositivo de prueba claramente no alcanzó el brillo declarado por el fabricante de 500 cd/m² durante nuestra prueba- además, no está calibrado demasiado bien (tinte azul en estado de entrega). Unos valores de brillo más elevados serían útiles sobre todo en exteriores. Su situación en cuanto a conectividad es igual de delicada, ya que sólo dispone de 2x USB-C. La RAM no se puede ampliar, pero al menos puede elegir el XPS con hasta 64 GB de RAM.
El XPS 13 9340 impresiona por su tamaño compacto y su larga autonomía, al menos en combinación con la pantalla base. Sin embargo, sus escasas opciones de conectividad son un problema y también lo es la molesta barra táctil con sus teclas de función.
Los dispositivos de entrada del portátil son un poco más problemáticos. El touchpad sin marco funciona bien en la práctica, pero el teclado es más un problema. Debido a que su diseño no presenta ningún espacio entre las teclas, no puede sentirlas bien en absoluto, lo que lleva a muchas erratas accidentales. Es una pena, ya que aparte de esto, el teclado resulta bastante cómodo para escribir. Además, la intensidad de su retroiluminación no se puede ajustar y el sensor la activa ante el más mínimo cambio de luz, lo quiera usted o no. A su vez, no podemos decir nada positivo de la barra táctil del dispositivo, ya que es simplemente molesta en el uso diario. No se puede usar a ciegas, no se sabe qué tecla es cuál con la retroiluminación desactivada (lo que a menudo lleva a pulsar la equivocada por error), y las teclas de función permanecieron constantemente iluminadas al reproducir vídeos durante nuestra prueba, lo que es súper molesto.
El rendimiento de la CPU del nuevo procesador Meteor Lake sólo es mejor que el de su predecesor en ráfagas cortas. Su rendimiento gráfico también muestra una mejora, sin embargo, no se mantiene estable, por ejemplo al jugar. Aun así, su rendimiento es, por supuesto, totalmente suficiente para las tareas cotidianas. Comparado con sus competidores, sin embargo, el nuevo XPS 13 no lo tiene fácil. Uno de sus principales competidores es el MacBook Air que sigue impresionando por su refrigeración pasiva y su mayor número de puertos. El ThinkPad Z13 con su procesador AMD ofrece un rendimiento superior y más estable. Además, actualmente estamos probando el nuevo ThinkBook 13x G4, otro competidor del XPS 13 que cuenta con una pantalla IPS de alta resolución.
Precio y disponibilidad
El nuevo XPS 13 9340 puede adquirirse directamente a través del sitio web de Dell. Los precios comienzan a partir de 1.149 dólares para la variante base.
Dell XPS 13 9340 Core Ultra 7
- 05/14/2024 v7 (old)
Andreas Osthoff
Transparencia
La selección de los dispositivos que se van a reseñar corre a cargo de nuestro equipo editorial. La muestra de prueba fue proporcionada al autor en calidad de préstamo por el fabricante o el minorista a los efectos de esta reseña. El prestamista no tuvo ninguna influencia en esta reseña, ni el fabricante recibió una copia de la misma antes de su publicación. No había ninguna obligación de publicar esta reseña. Como empresa de medios independiente, Notebookcheck no está sujeta a la autoridad de fabricantes, minoristas o editores.
Así es como prueba Notebookcheck
Cada año, Notebookcheck revisa de forma independiente cientos de portátiles y smartphones utilizando procedimientos estandarizados para asegurar que todos los resultados son comparables. Hemos desarrollado continuamente nuestros métodos de prueba durante unos 20 años y hemos establecido los estándares de la industria en el proceso. En nuestros laboratorios de pruebas, técnicos y editores experimentados utilizan equipos de medición de alta calidad. Estas pruebas implican un proceso de validación en varias fases. Nuestro complejo sistema de clasificación se basa en cientos de mediciones y puntos de referencia bien fundamentados, lo que mantiene la objetividad.Price comparison

