Análisis para el Intel Core i7-1360P procesador
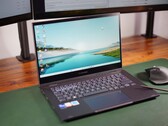
Analisis del Asus Expertbook B5 Flip B5402F - Un gran convertible con truco
Asus ha actualizado su Expertbook B5 Flip, equipándolo con un nuevo procesador Intel de 13ª generación. Aunque su flexibilidad y construcción son igual de buenas que las de su predecesor, el convertible ha recibido un gran aumento de rendimiento; además, ahora cuenta con mejores opciones de conectividad.
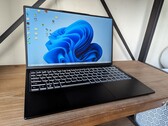
Intel Core i7-1360P, Iris Xe G7 96EUs, 14", 1.4 kgAnálisis del portátil Eurocom C315 Blitz: Core i7-1360P es una bolsa mixta
El C315 Blitz cambia el antiguo procesador Core i7 serie H de 11ª generación por una opción más reciente Core i7 serie P de 13ª generación. Sin embargo, el cambio es más un paso lateral que un salto adelante en términos de rendimiento.
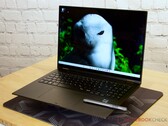
Intel Core i7-1360P, Iris Xe G7 96EUs, 15.6", 1.7 kgAnálisis del LG Gram 2 en 1 de 16 pulgadas - El peso ya no es un punto de venta único
Externamente sin cambios, al menos el nuevo LG Gram 2 en 1 ofrece un hardware actualizado en lo que se refiere al interior. En nuestro dispositivo de análisis, el Intel Core i7 demuestra que es capaz de ofrecer un alto rendimiento, incluso en un factor de forma ligero. Sin embargo, en 2023, LG aún no ha conseguido eliminar otros puntos débiles del dispositivo.
Intel Core i7-1360P, Iris Xe G7 96EUs, 16", 1.5 kgAnálisis del portátil LG Gram Style 14: Elegante, rápido y (demasiado) caliente
Aunque apenas pesa 1 kg, el subportátil de LG está muy bien equipado con Intel Core i7-1360P, 32 GB de memoria de trabajo y pantalla OLED. Aparte del rendimiento, el Gram Style también ofrece otras cualidades. Lo que nos llama inmediatamente la atención es la superficie de la carcasa, que puede brillar en todos los colores del arco iris. Y el portátil también es capaz de funcionar de forma completamente silenciosa, salvo alguna extraña excepción.
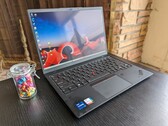
Intel Core i7-1360P, Iris Xe G7 96EUs, 14", 987 gAnálisis del portátil Lenovo ThinkPad X1 Nano Gen 3: Intel Core-P con menos de 1 kg
El ThinkPad X1 Nano vuelve por tercer año consecutivo con exactamente el mismo diseño de chasis que en su lanzamiento de primera generación. Sigue siendo uno de los subportátiles más ligeros y portátiles del mercado, pero los compromisos con el rendimiento siguen vivos.
Intel Core i7-1360P, Iris Xe G7 96EUs, 13", 989 gIntel NUC 13 Pro Desk Edition Kit: Intel Iris Xe Graphics G7 96EUs, 0.6 kg
análise » Intel NUC 13 Pro Kit - Análisis de Vivid Canyon: El último NUC de Intel tiene una nueva carcasa y un Core i7-1360P
Khadas Mind: Intel Iris Xe Graphics G7 96EUs, 0.4 kg
análise » Análisis de la estación de trabajo Khadas Mind: ¿Puede este mini PC portátil con batería y un Core i7-1360P sustituir a un portátil?
LG Gram SuperSlim (2023): Intel Iris Xe Graphics G7 96EUs, 15.60", 1 kg
análise » Análisis del LG Gram SuperSlim (2023): portátil de 990 gramos con batería de larga duración y pantalla OLED
Dell XPS 13 Plus 9320 Core i7-1360P: Intel Iris Xe Graphics G7 96EUs, 13.40", 1.3 kg
análise » Apenas mejor que el año anterior: 2023 Análisis del Dell XPS 13 Plus 9320 Core i7-1360P
Huawei MateBook X Pro 2023: Intel Iris Xe Graphics G7 96EUs, 14.20", 1.3 kg
análise » Análisis del Huawei MateBook X Pro 2023: el competidor del MacBook Air también admite GPU externas
Samsung Galaxy Book3 Pro 14: Intel Iris Xe Graphics G7 96EUs, 14.00", 1.2 kg
análise » Análisis del Samsung Galaxy Book3 Pro 14: Portátil de oficina ligero con 20 horas de batería
LG Gram 17 (2023): Intel Iris Xe Graphics G7 96EUs, 17.00", 1.4 kg
análise » Análisis del LG Gram 17 (2023): Portátil de oficina ultraligero con Core i7 y batería de larga duración
Intel NUC 13 Pro Kit NUC13ANK: Intel Iris Xe Graphics G7 96EUs, 0.5 kg
análise » Reseña del Intel NUC 13 Pro Kit alias Arena Canyon: Moderno mini PC con Intel Core i7-1360P para aplicaciones exigentes
Lenovo Yoga 9 14IRP G8: Intel Iris Xe Graphics G7 96EUs, 14.00", 1.4 kg
análise » Análisis del convertible Lenovo Yoga 9i 14 G8 2023: Intel Raptor Lake decepciona
análise » Análisis de Intel Raptor Lake-P - Debut del Core i7-1360P
Dell Inspiron 16 5630: NVIDIA GeForce RTX 2050 Mobile, 16.00", 1.9 kg
análise externo » Dell Inspiron 16 5630
HP EliteBook 840 G10, i7-1360P: Intel Iris Xe Graphics G7 96EUs, 14.00", 1.4 kg
análise externo » HP EliteBook 840 G10, i7-1360P
Dell Inspiron 5330: Intel Iris Xe Graphics G7 96EUs, 13.30", 1.3 kg
análise externo » Dell Inspiron 5330
Asus Vivobook 16X K3604: Intel Iris Xe Graphics G7 80EUs, 16.00", 1.6 kg
análise externo » Asus Vivobook 16X K3604
Framework Laptop 13.5, i7-1360P: Intel Iris Xe Graphics G7 96EUs, 13.50", 1.3 kg
análise externo » Framework Laptop 13.5, i7-1360P
Lenovo Yoga Slim 7 Carbon 13IRP8: Intel Iris Xe Graphics G7 96EUs, 13.30", 1 kg
análise externo » Lenovo Yoga Slim 7 Carbon 13IRP8
Lenovo Yoga 7 14IRL8, i7-1360P: Intel Iris Xe Graphics G7 96EUs, 14.00", 1.5 kg
análise externo » Lenovo Yoga 7 14IRL8, i7-1360P
Lenovo Yoga 7 16IRL8, i7-1360P: Intel Iris Xe Graphics G7 96EUs, 16.00", 2 kg
análise externo » Lenovo Yoga 7 16IRL8, i7-1360P
HP Spectre x360 16-f2000: Intel Iris Xe Graphics G7 96EUs, 16.00", 2.2 kg
análise externo » HP Spectre x360 16-f2000
Dell Precision 15 3580: NVIDIA RTX A500 Laptop GPU, 15.60", 1.6 kg
análise externo » Dell Precision 15 3580
Asus Zenbook 14 UX3402VA, i7-1360P: Intel Iris Xe Graphics G7 96EUs, 14.00", 1.4 kg
análise externo » Asus Zenbook 14 UX3402VA, i7-1360P
LG Gram Style 14Z90RS-G.AD7AG: Intel Iris Xe Graphics G7 96EUs, 14.00", 1 kg
análise externo » LG Gram Style 14Z90RS-G.AD7AG
Lenovo ThinkPad X1 Nano Gen 3: Intel Iris Xe Graphics G7 96EUs, 13.00", 1 kg
análise externo » Lenovo ThinkPad X1 Nano Gen 3
Dell XPS 13 Plus 9320 Core i7-1360P: Intel Iris Xe Graphics G7 96EUs, 13.40", 1.3 kg
análise externo » Dell XPS 13 Plus 9320 Core i7-1360P
Asus Vivobook 15X K3504VA: Intel Iris Xe Graphics G7 96EUs, 15.60", 1.6 kg
análise externo » Asus Vivobook 15X K3504VA
LG Gram SuperSlim (2023): Intel Iris Xe Graphics G7 96EUs, 15.60", 1 kg
análise externo » LG Gram SuperSlim (2023)
Huawei MateBook X Pro 2023: Intel Iris Xe Graphics G7 96EUs, 14.20", 1.3 kg
análise externo » Huawei MateBook X Pro 2023
Lenovo Yoga 7 14IRL8: Intel Iris Xe Graphics G7 96EUs, 14.00", 1.6 kg
análise externo » Lenovo Yoga 7 14IRL8
MSI Summit E14 Flip Evo A13MT: Intel Iris Xe Graphics G7 96EUs, 14.00", 1.6 kg
análise externo » MSI Summit E14 Flip Evo A13MT
MSI Summit E16 Flip A13 VFT: NVIDIA GeForce RTX 4060 Laptop GPU, 16.00", 2.1 kg
análise externo » MSI Summit E16 Flip A13 VFT
Samsung Galaxy Book3 Pro 16, i7-1360P: Intel Iris Xe Graphics G7 96EUs, 16.00", 1.6 kg
análise externo » Samsung Galaxy Book3 Pro 16, i7-1360P
LG gram Style 16Z90RS: Intel Iris Xe Graphics G7 96EUs, 16.00", 1.3 kg
análise externo » LG gram Style 16Z90RS
MSI Prestige 13 Evo A13M: Intel Iris Xe Graphics G7 96EUs, 13.30", 1 kg
análise externo » MSI Prestige 13 Evo A13M
MSI Summit E13 Flip Evo A13MT: Intel Iris Xe Graphics G7 96EUs, 13.40", 1.4 kg
análise externo » MSI Summit E13 Flip Evo A13MT
LG gram Style 14Z90RS: Intel Iris Xe Graphics G7 96EUs, 14.00", 1 kg
análise externo » LG gram Style 14Z90RS
Samsung Galaxy Book3 360 13, i7-1360P: Intel Iris Xe Graphics G7 96EUs, 13.30", 1.2 kg
análise externo » Samsung Galaxy Book3 360 13, i7-1360P
Samsung Galaxy Book3 Pro 14: Intel Iris Xe Graphics G7 96EUs, 14.00", 1.2 kg
análise externo » Samsung Galaxy Book3 Pro 14, Core i7-1360P
Asus Zenbook 14 Flip UP3404VA-KN026W: Intel Iris Xe Graphics G7 96EUs, 14.00", 1.5 kg
análise externo » Asus Zenbook 14 Flip 2023 UP3404VA-KN026W
LG Gram 17 2023 17Z90R: NVIDIA GeForce RTX 3050 4GB Laptop GPU, 17.00", 1.5 kg
análise externo » LG Gram 17 2023 17Z90R
LG Gram 17 (2023): Intel Iris Xe Graphics G7 96EUs, 17.00", 1.4 kg
análise externo » LG Gram 17Z90R-G.AA77G
Lenovo Yoga 9 14IRP G8: Intel Iris Xe Graphics G7 96EUs, 14.00", 1.4 kg
análise externo » Lenovo Yoga 9 14IRP G8
Lenovo Yoga 9 14IRP8, i7-1360P: Intel Iris Xe Graphics G7 96EUs, 14.00", 1.4 kg
análise externo » Lenovo Yoga 9 14IRP8, i7-1360P
Samsung Galaxy Book3 Pro 360 16, i7-1360P: Intel Iris Xe Graphics G7 96EUs, 16.00", 1.7 kg
análise externo » Samsung Galaxy Book3 Pro 360 16, i7-1360P
Framework Laptop 13.5, i7-1360P: Intel Iris Xe Graphics G7 96EUs, 13.50", 1.3 kg
» El sistema Framework Laptop Brick amplía el portátil con pies Lego, ruedas, soportes para cables y mucho más
Khadas Mind: Intel Iris Xe Graphics G7 96EUs, 0.4 kg
» Lanzamiento del Khadas Mind 2 de aspecto elegante con una CPU de hasta Core Ultra 7 155H, 64 GB de memoria y una excelente capacidad de ampliación por un precio superior