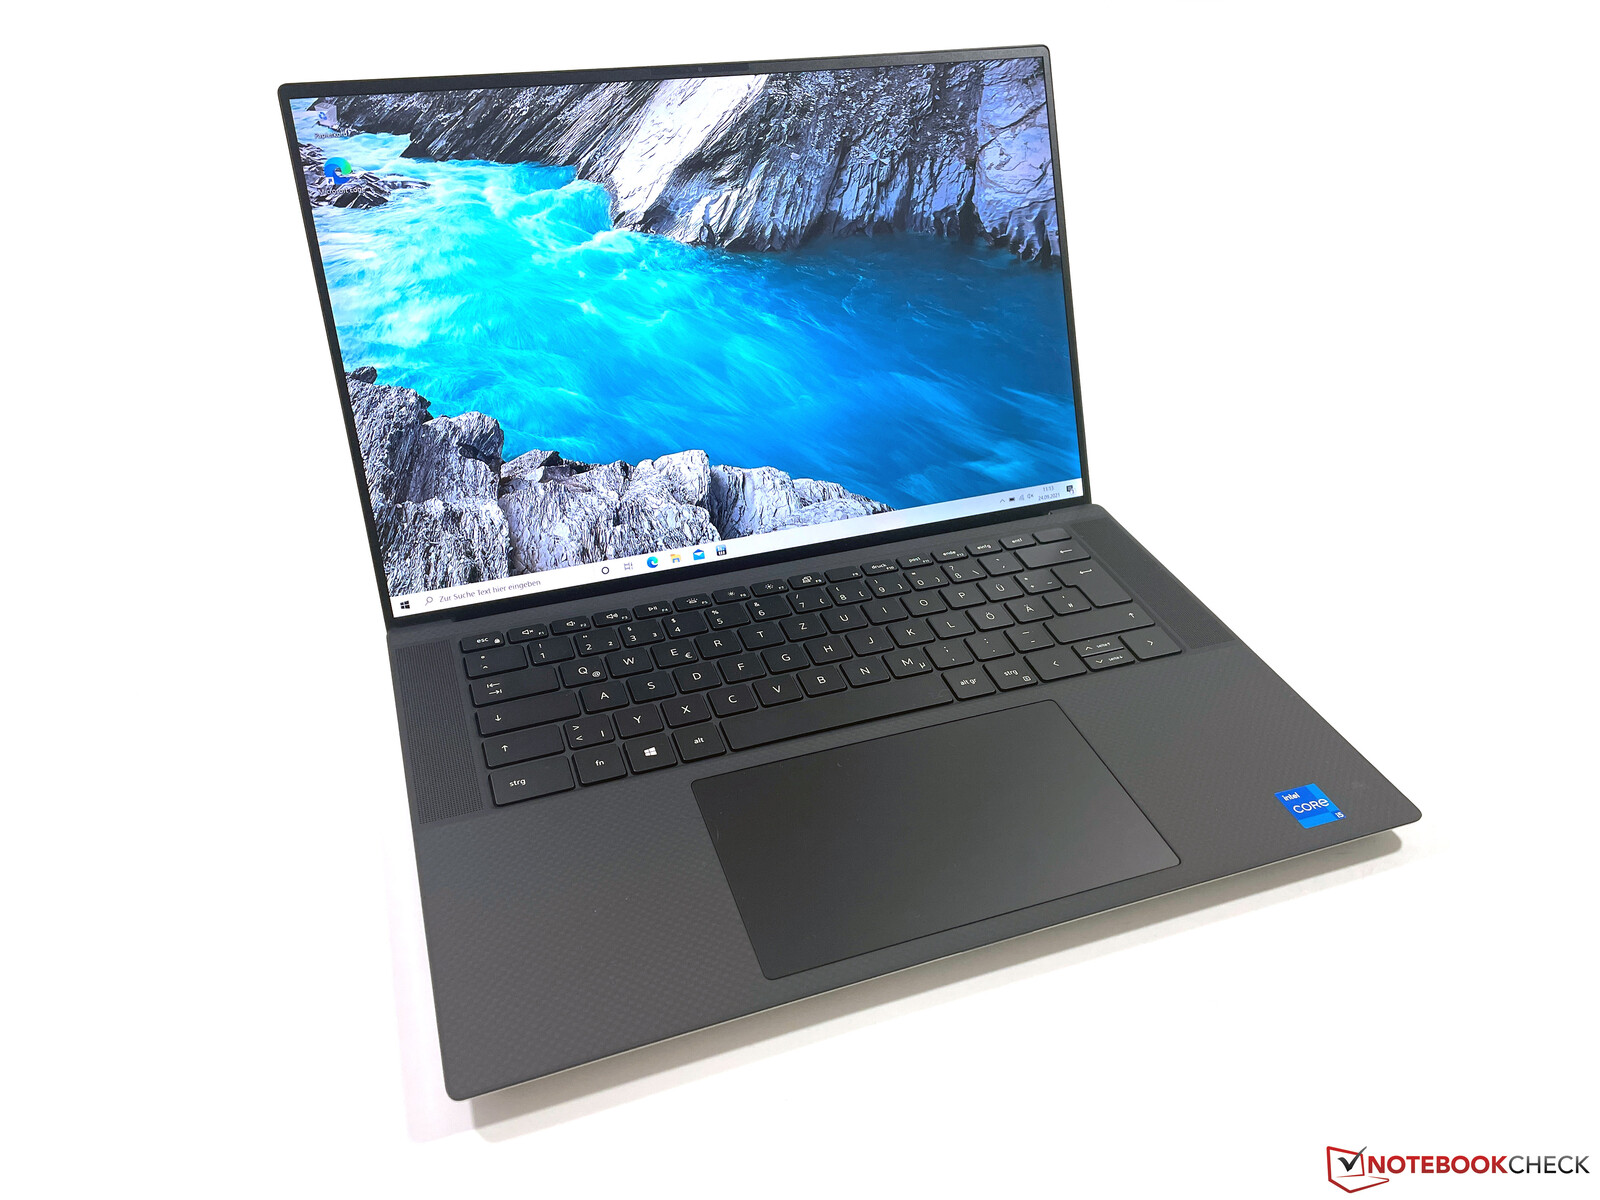
Análisis del portátil Dell XPS 15 9510 Core i5: Modelo básico con los frenos puestos
Conocemos el Dell XPS 15 desde hace años como un portátil multimedia de gran calidad que suele estar equipado también con una tarjeta gráfica dedicada. Sin embargo, Dell también ofrece siempre un modelo con gráficos de procesador puro, en caso de que realmente no necesites una tarjeta gráfica rápida. Pero como hay que pagar 1599 euros por el Core i5-11400H con 8 GB de RAM, un SSD PCIe de 512 GB, y el panel FHD mate (16:10), el dispositivo sigue sin ser asequible.
También hay algunos competidores sin las GPUs dedicadas, y suelen ser bastante más asequibles. Con el nuevo Huawei MateBook 16que estamos probando actualmente, ya hay otro competidor en la salida. Para información detallada sobre la carcasa, los dispositivos de entrada y los altavoces, te remitimos a nuestro análisis del modelo i7:
Possible Competitors in Comparison
Valoración | Fecha | Modelo | Peso | Altura | Tamaño | Resolución | Precio |
|---|---|---|---|---|---|---|---|
| 84.2 % v7 (old) | 10/2021 | Dell XPS 15 9510 i5 11400H FHD i5-11400H, UHD Graphics Xe 16EUs | 1.8 kg | 18 mm | 15.60" | 1920x1200 | |
| 88.6 % v7 (old) | 10/2021 | Huawei MateBook 14s i7 i7-11370H, Iris Xe G7 96EUs | 1.4 kg | 16.7 mm | 14.20" | 2520x1680 | |
| 86.4 % v7 (old) | 10/2021 | Acer Swift 3 SF316-51 i7-11370H, Iris Xe G7 96EUs | 1.7 kg | 15.9 mm | 16.10" | 1920x1080 | |
| 87.7 % v7 (old) | 12/2020 | Schenker Vision 15 i7-1165G7, Iris Xe G7 96EUs | 1.7 kg | 15 mm | 15.60" | 1920x1080 | |
| 84.5 % v7 (old) | 11/2020 | Honor MagicBook Pro (AMD) R5 4600H, Vega 6 | 1.7 kg | 16.9 mm | 16.10" | 1920x1080 | |
| 86.8 % v7 (old) | 05/2020 | Dell XPS 15 9500 Core i5 i5-10300H, UHD Graphics 630 | 1.8 kg | 18 mm | 15.60" | 1920x1200 |
Maletín y equipo
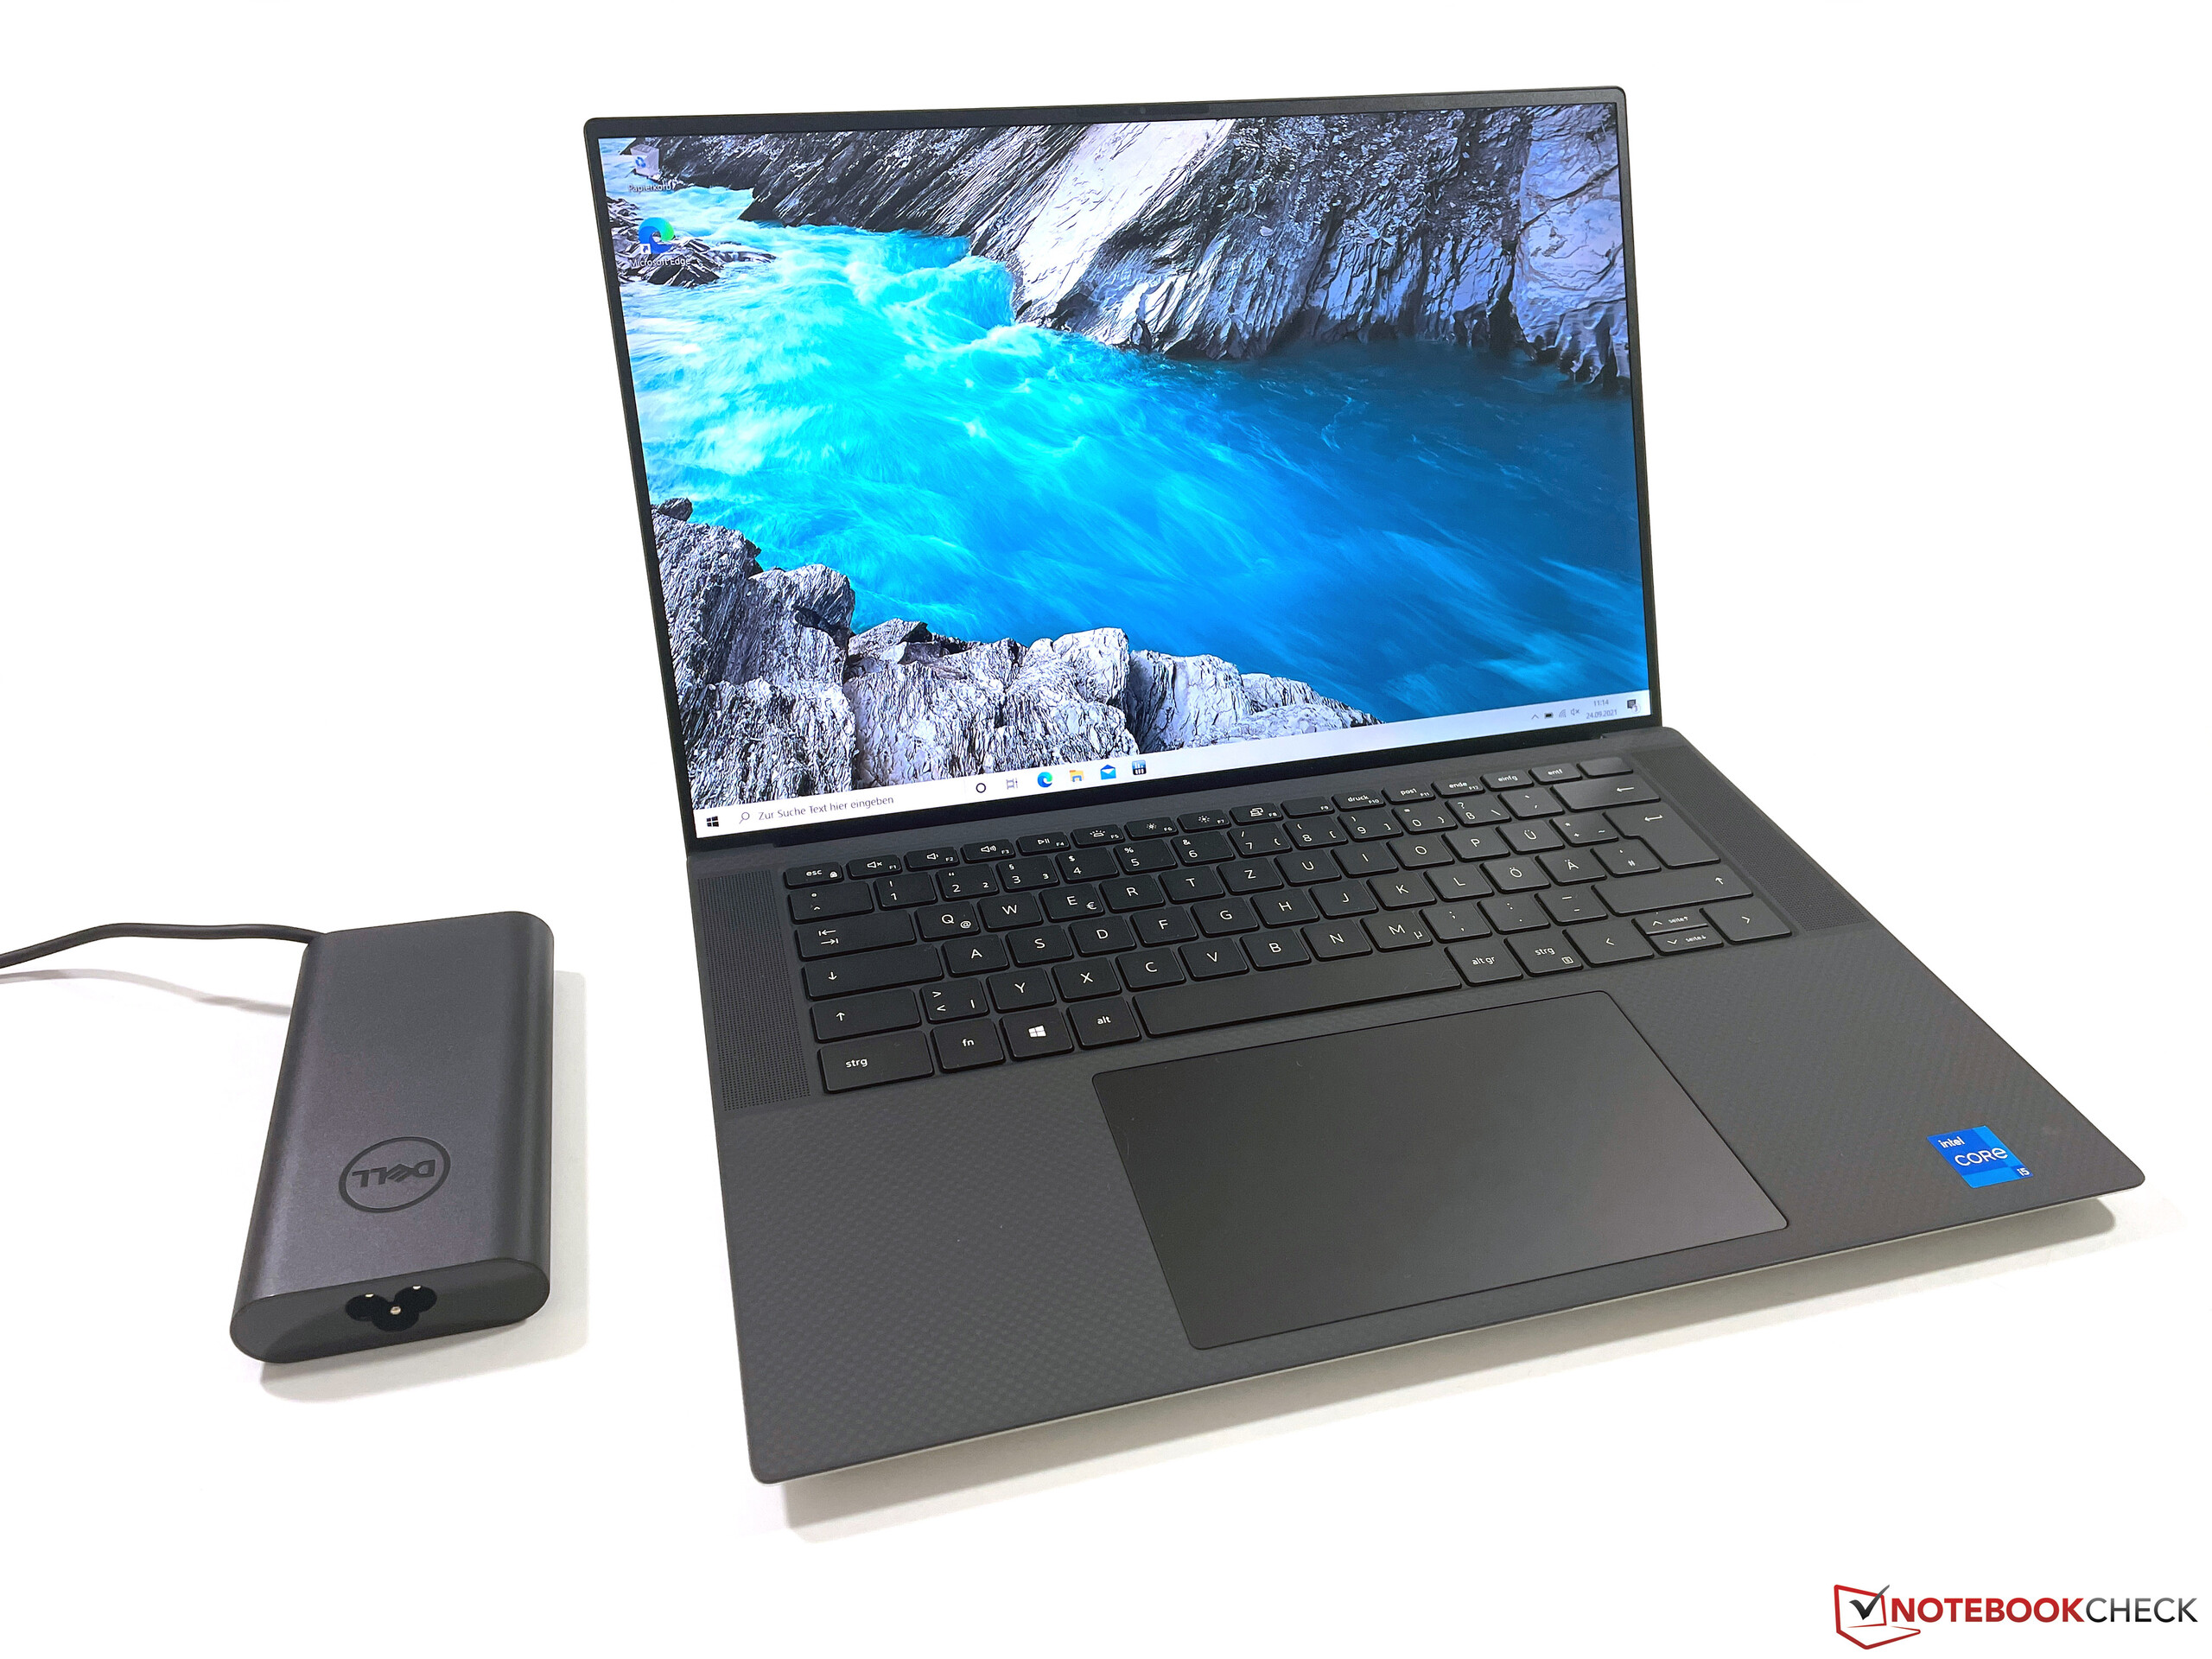
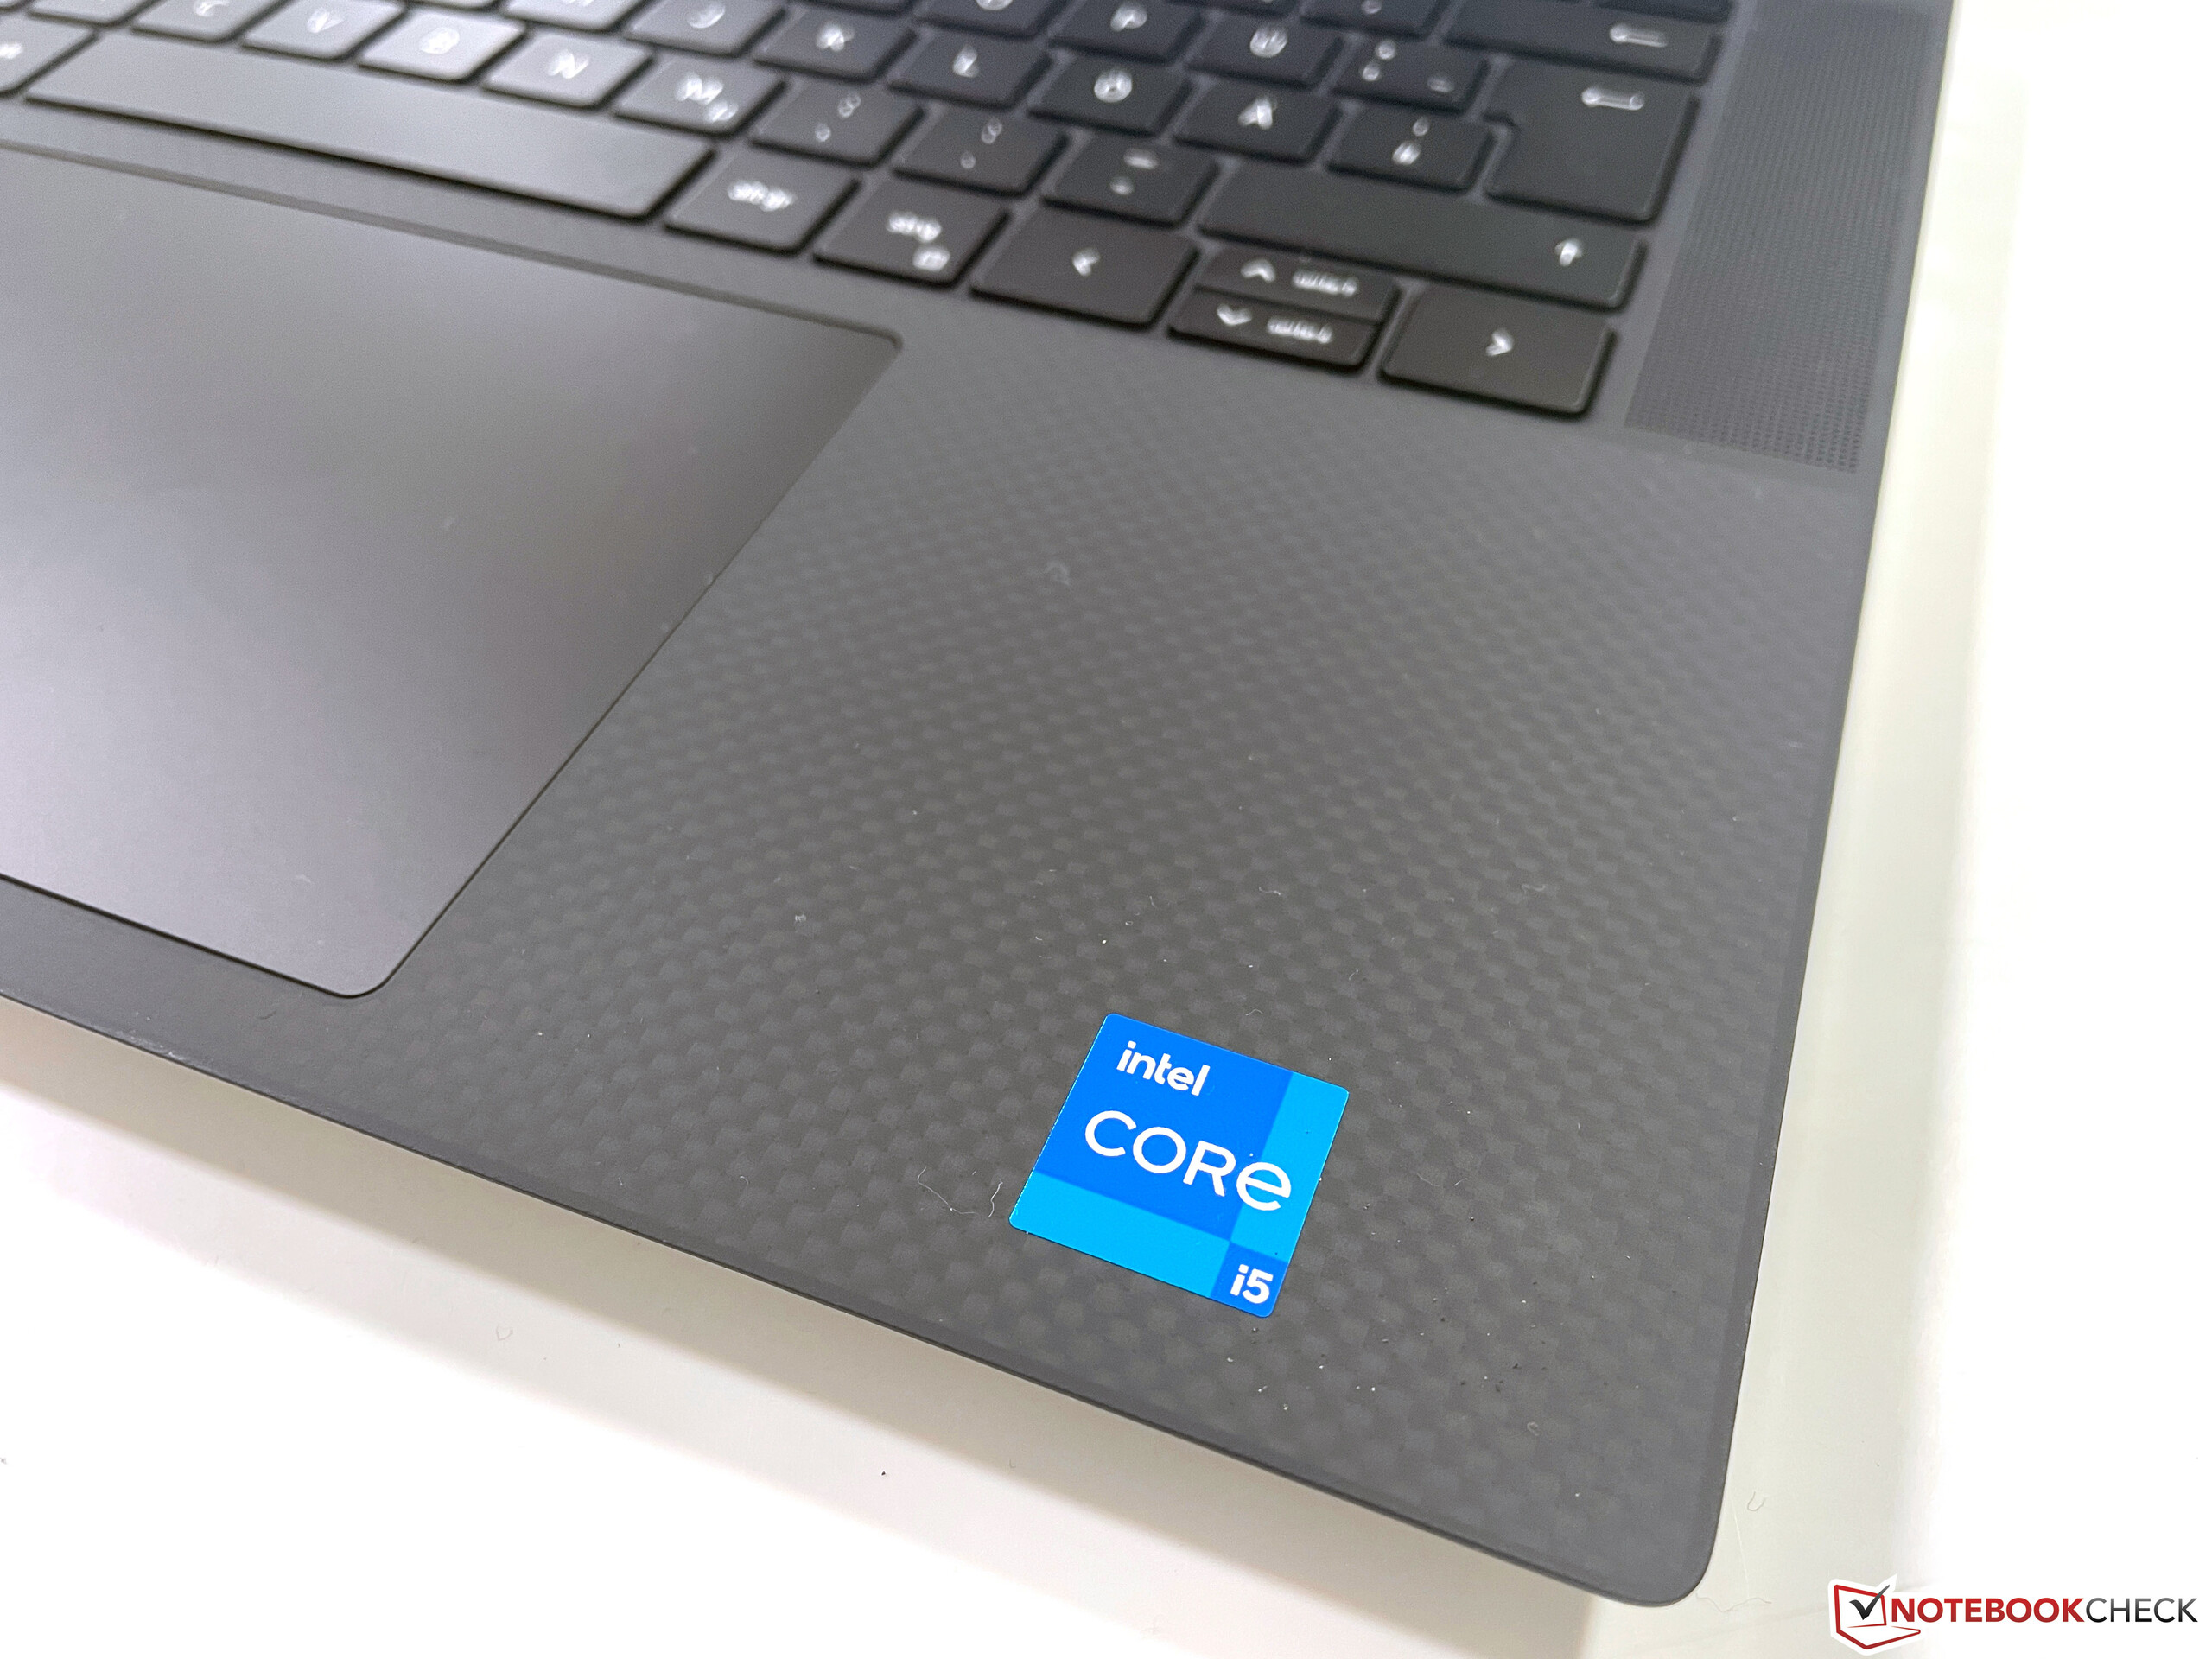
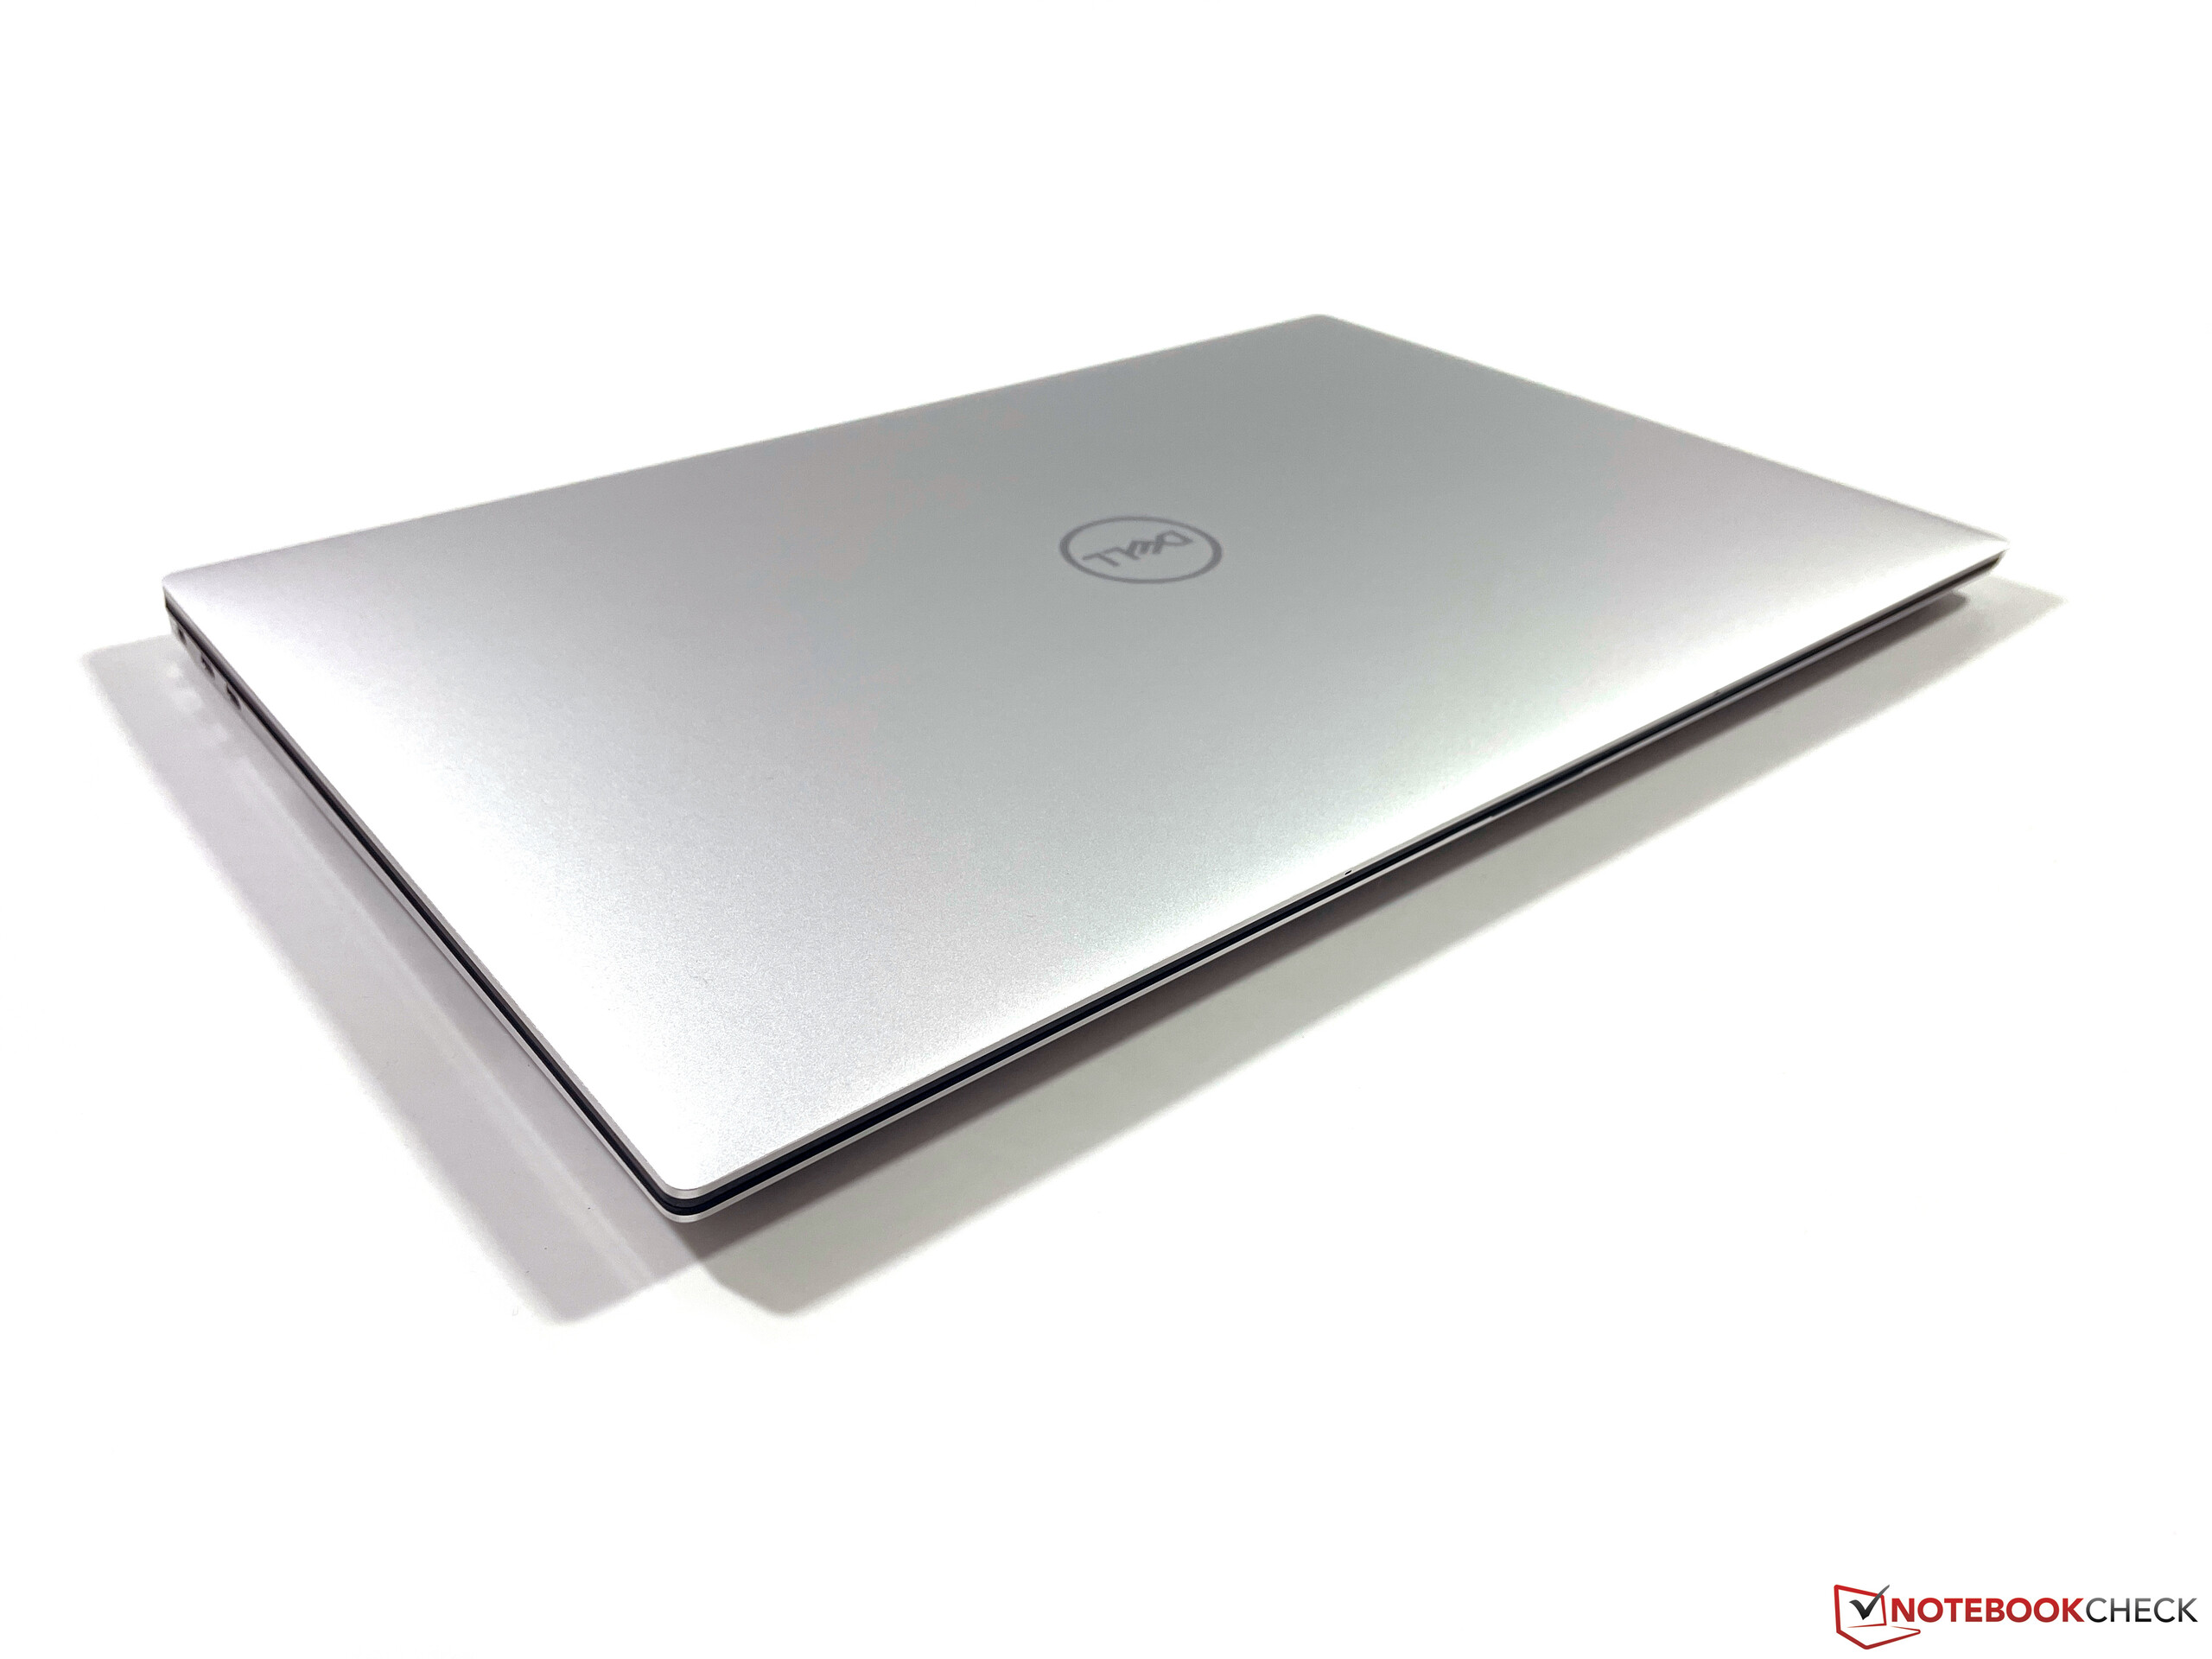
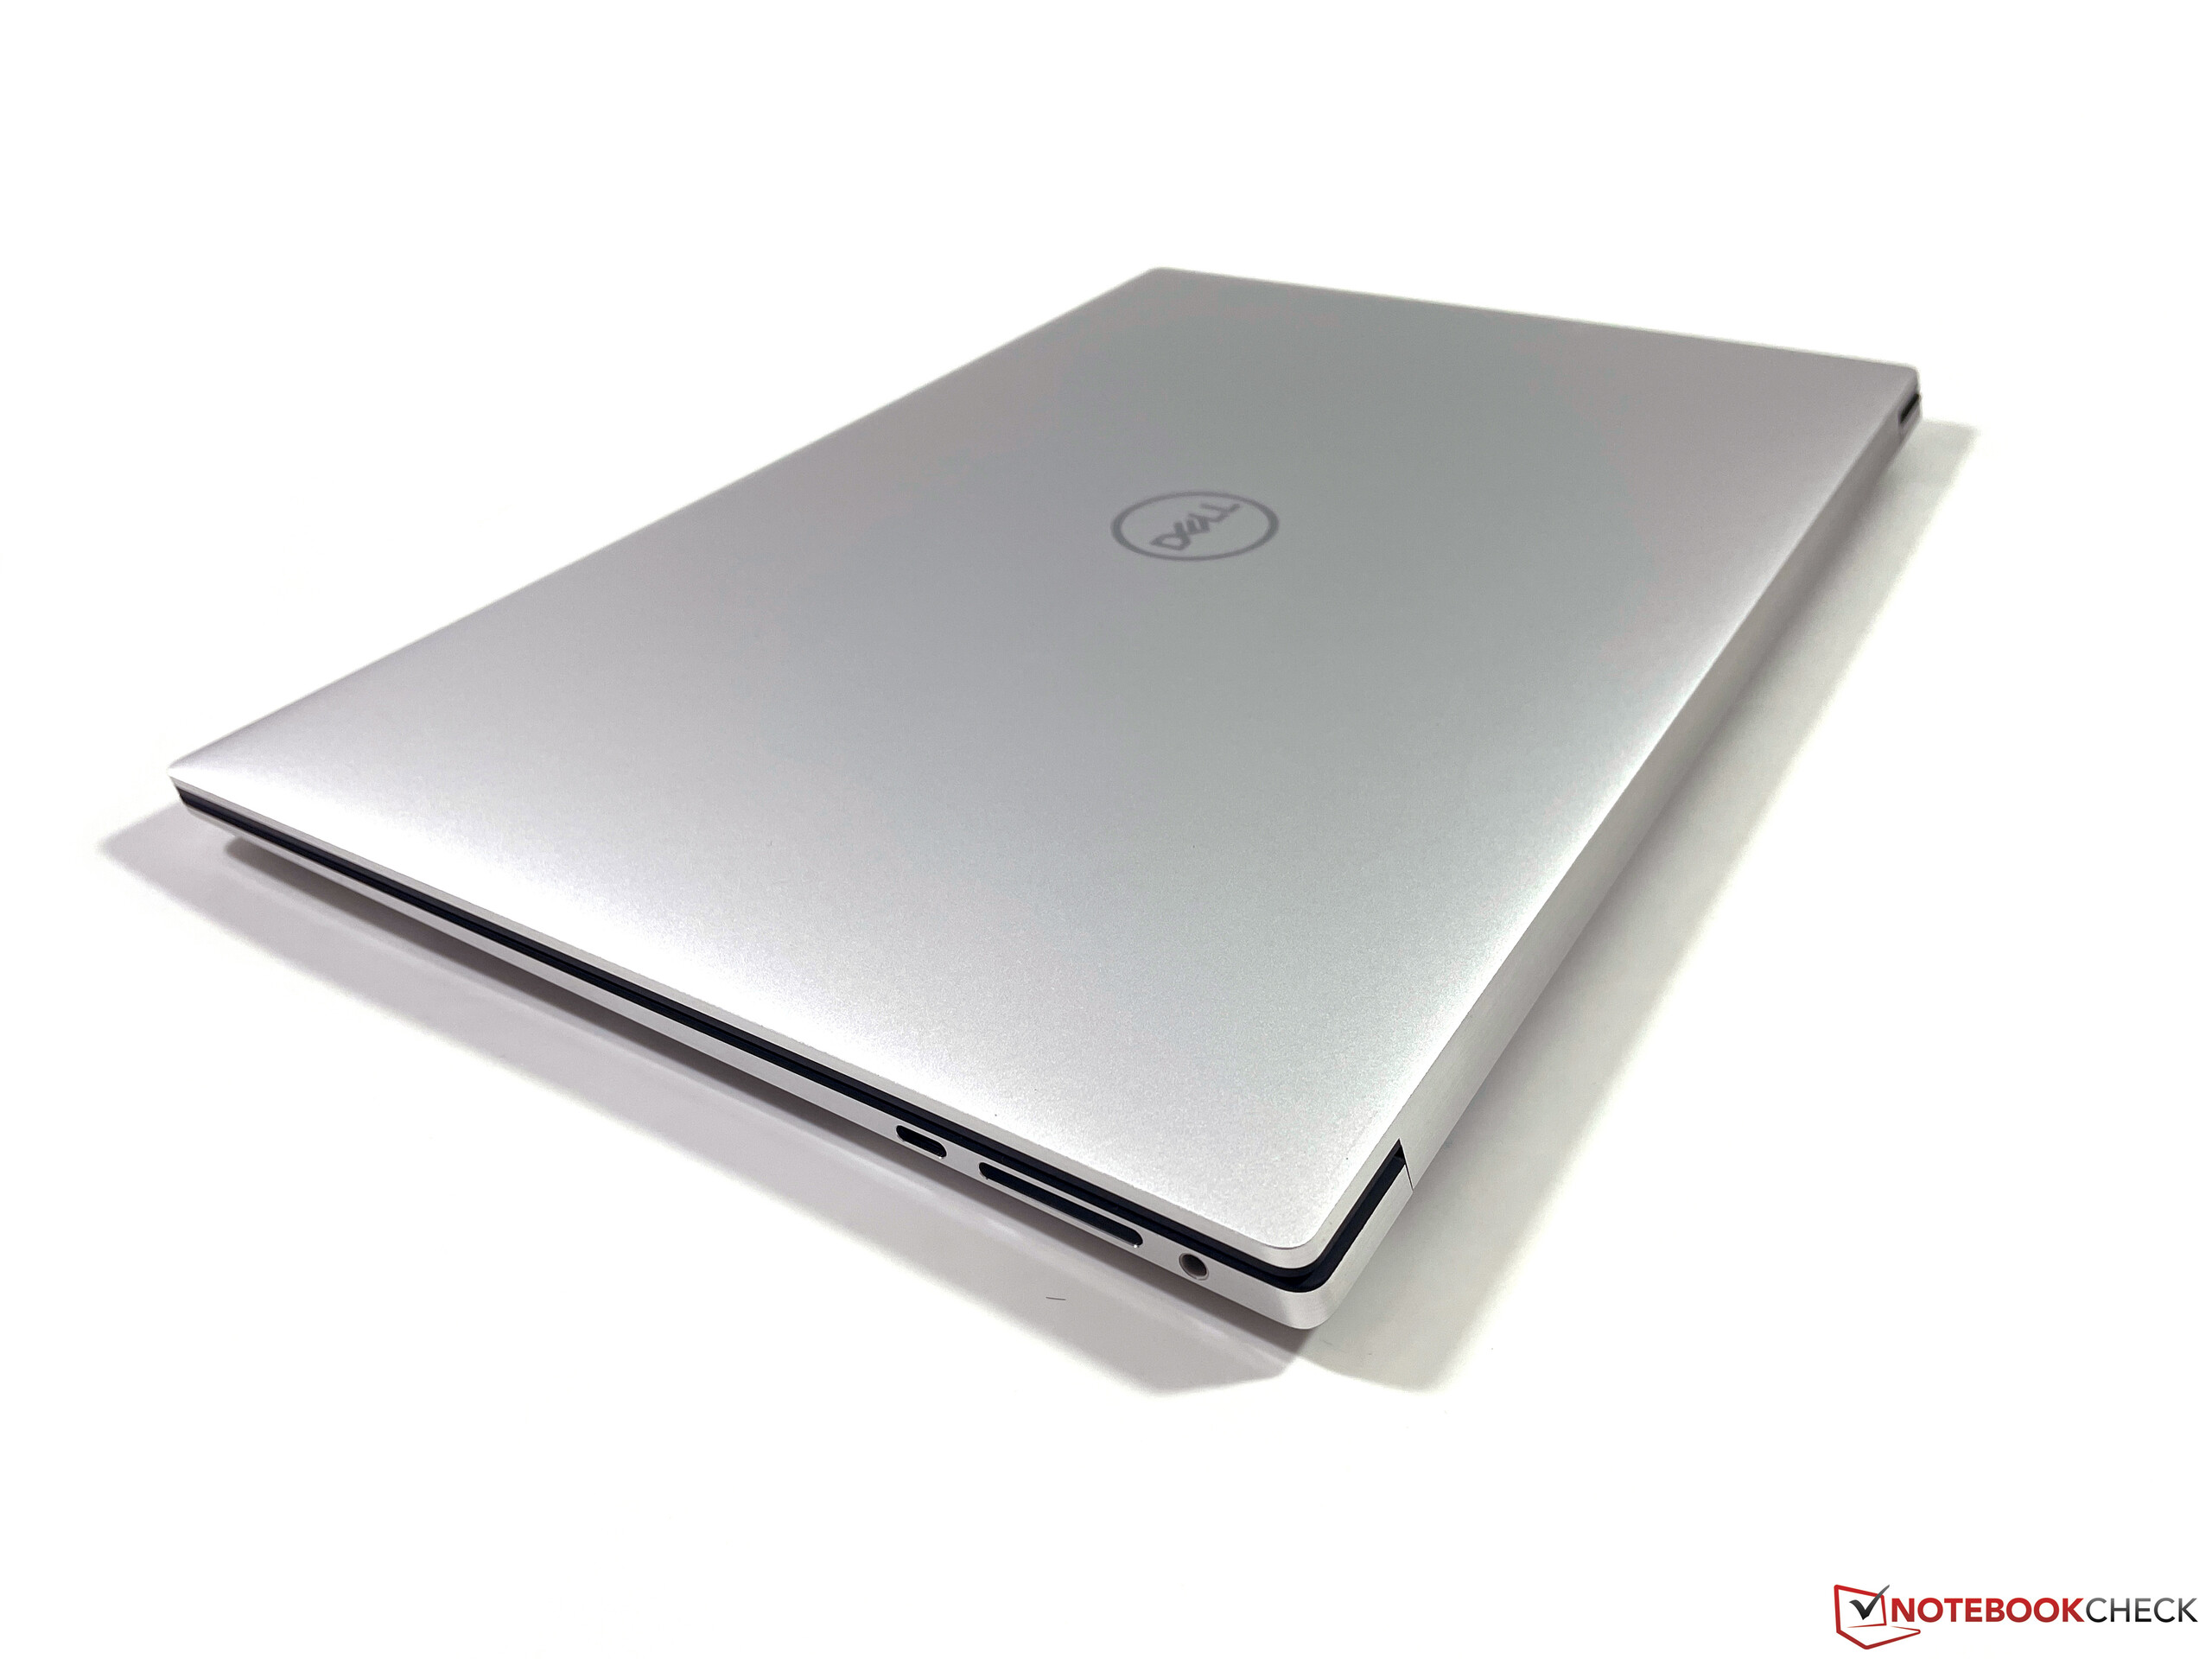
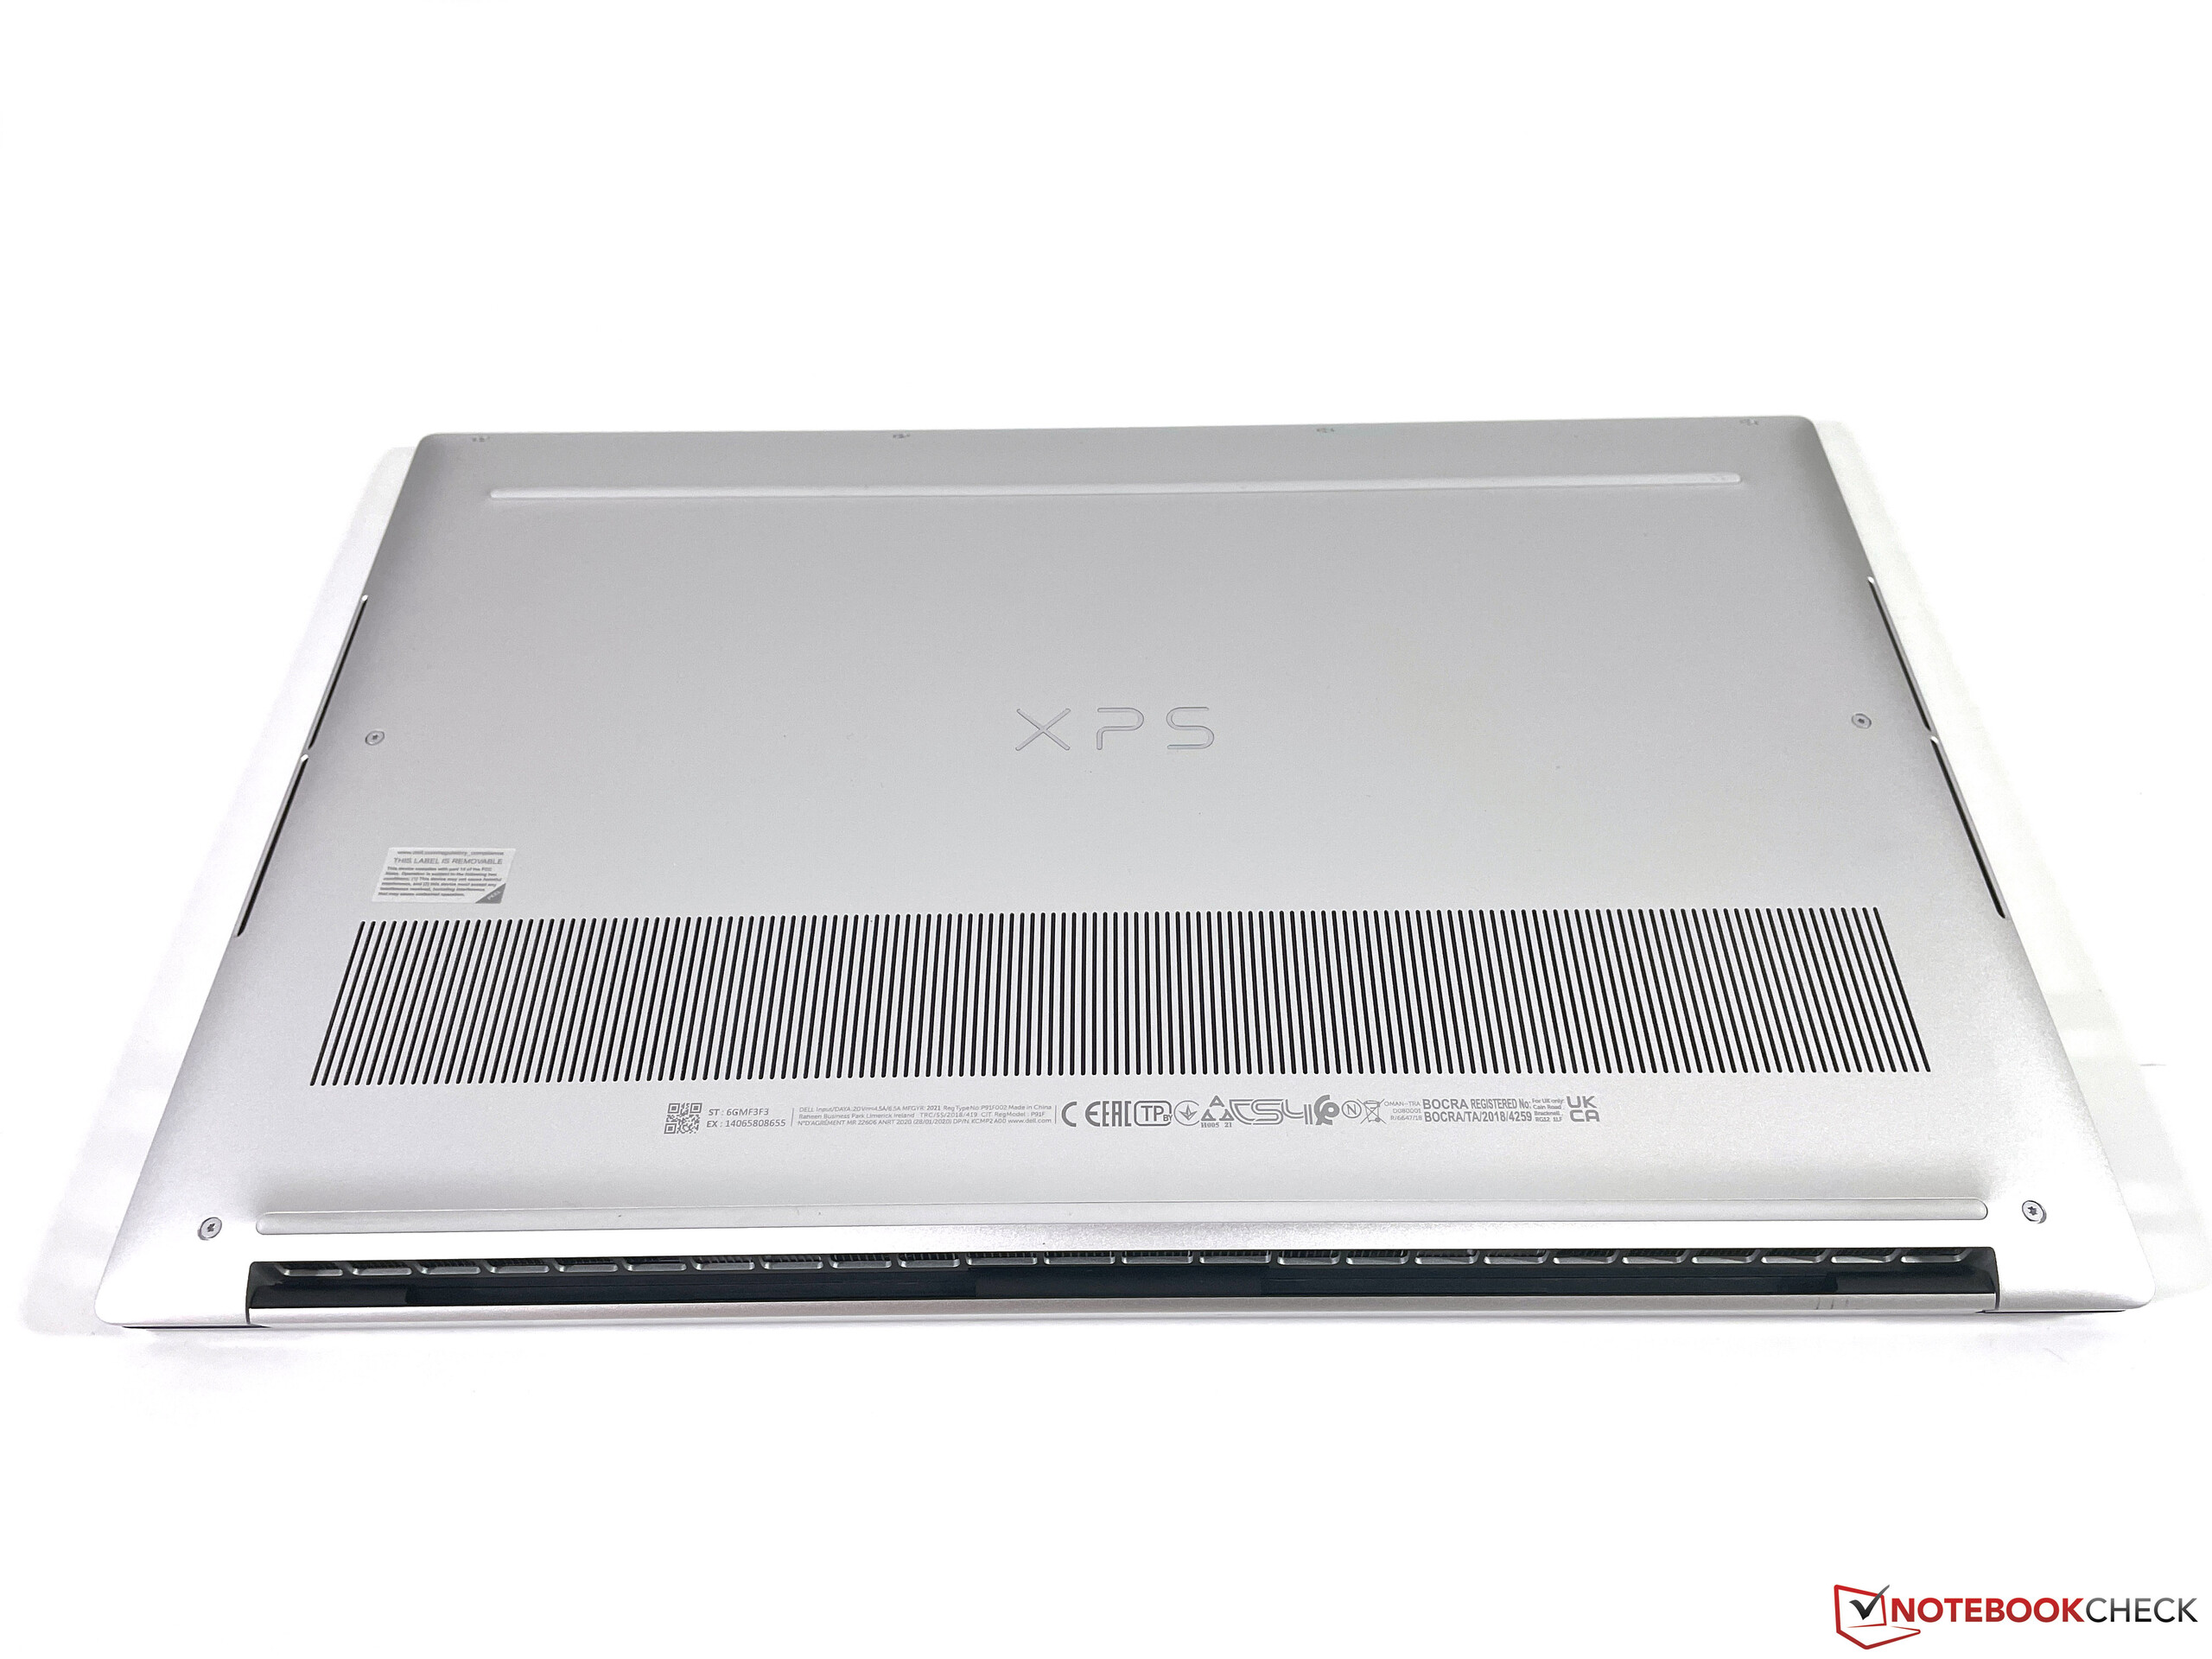
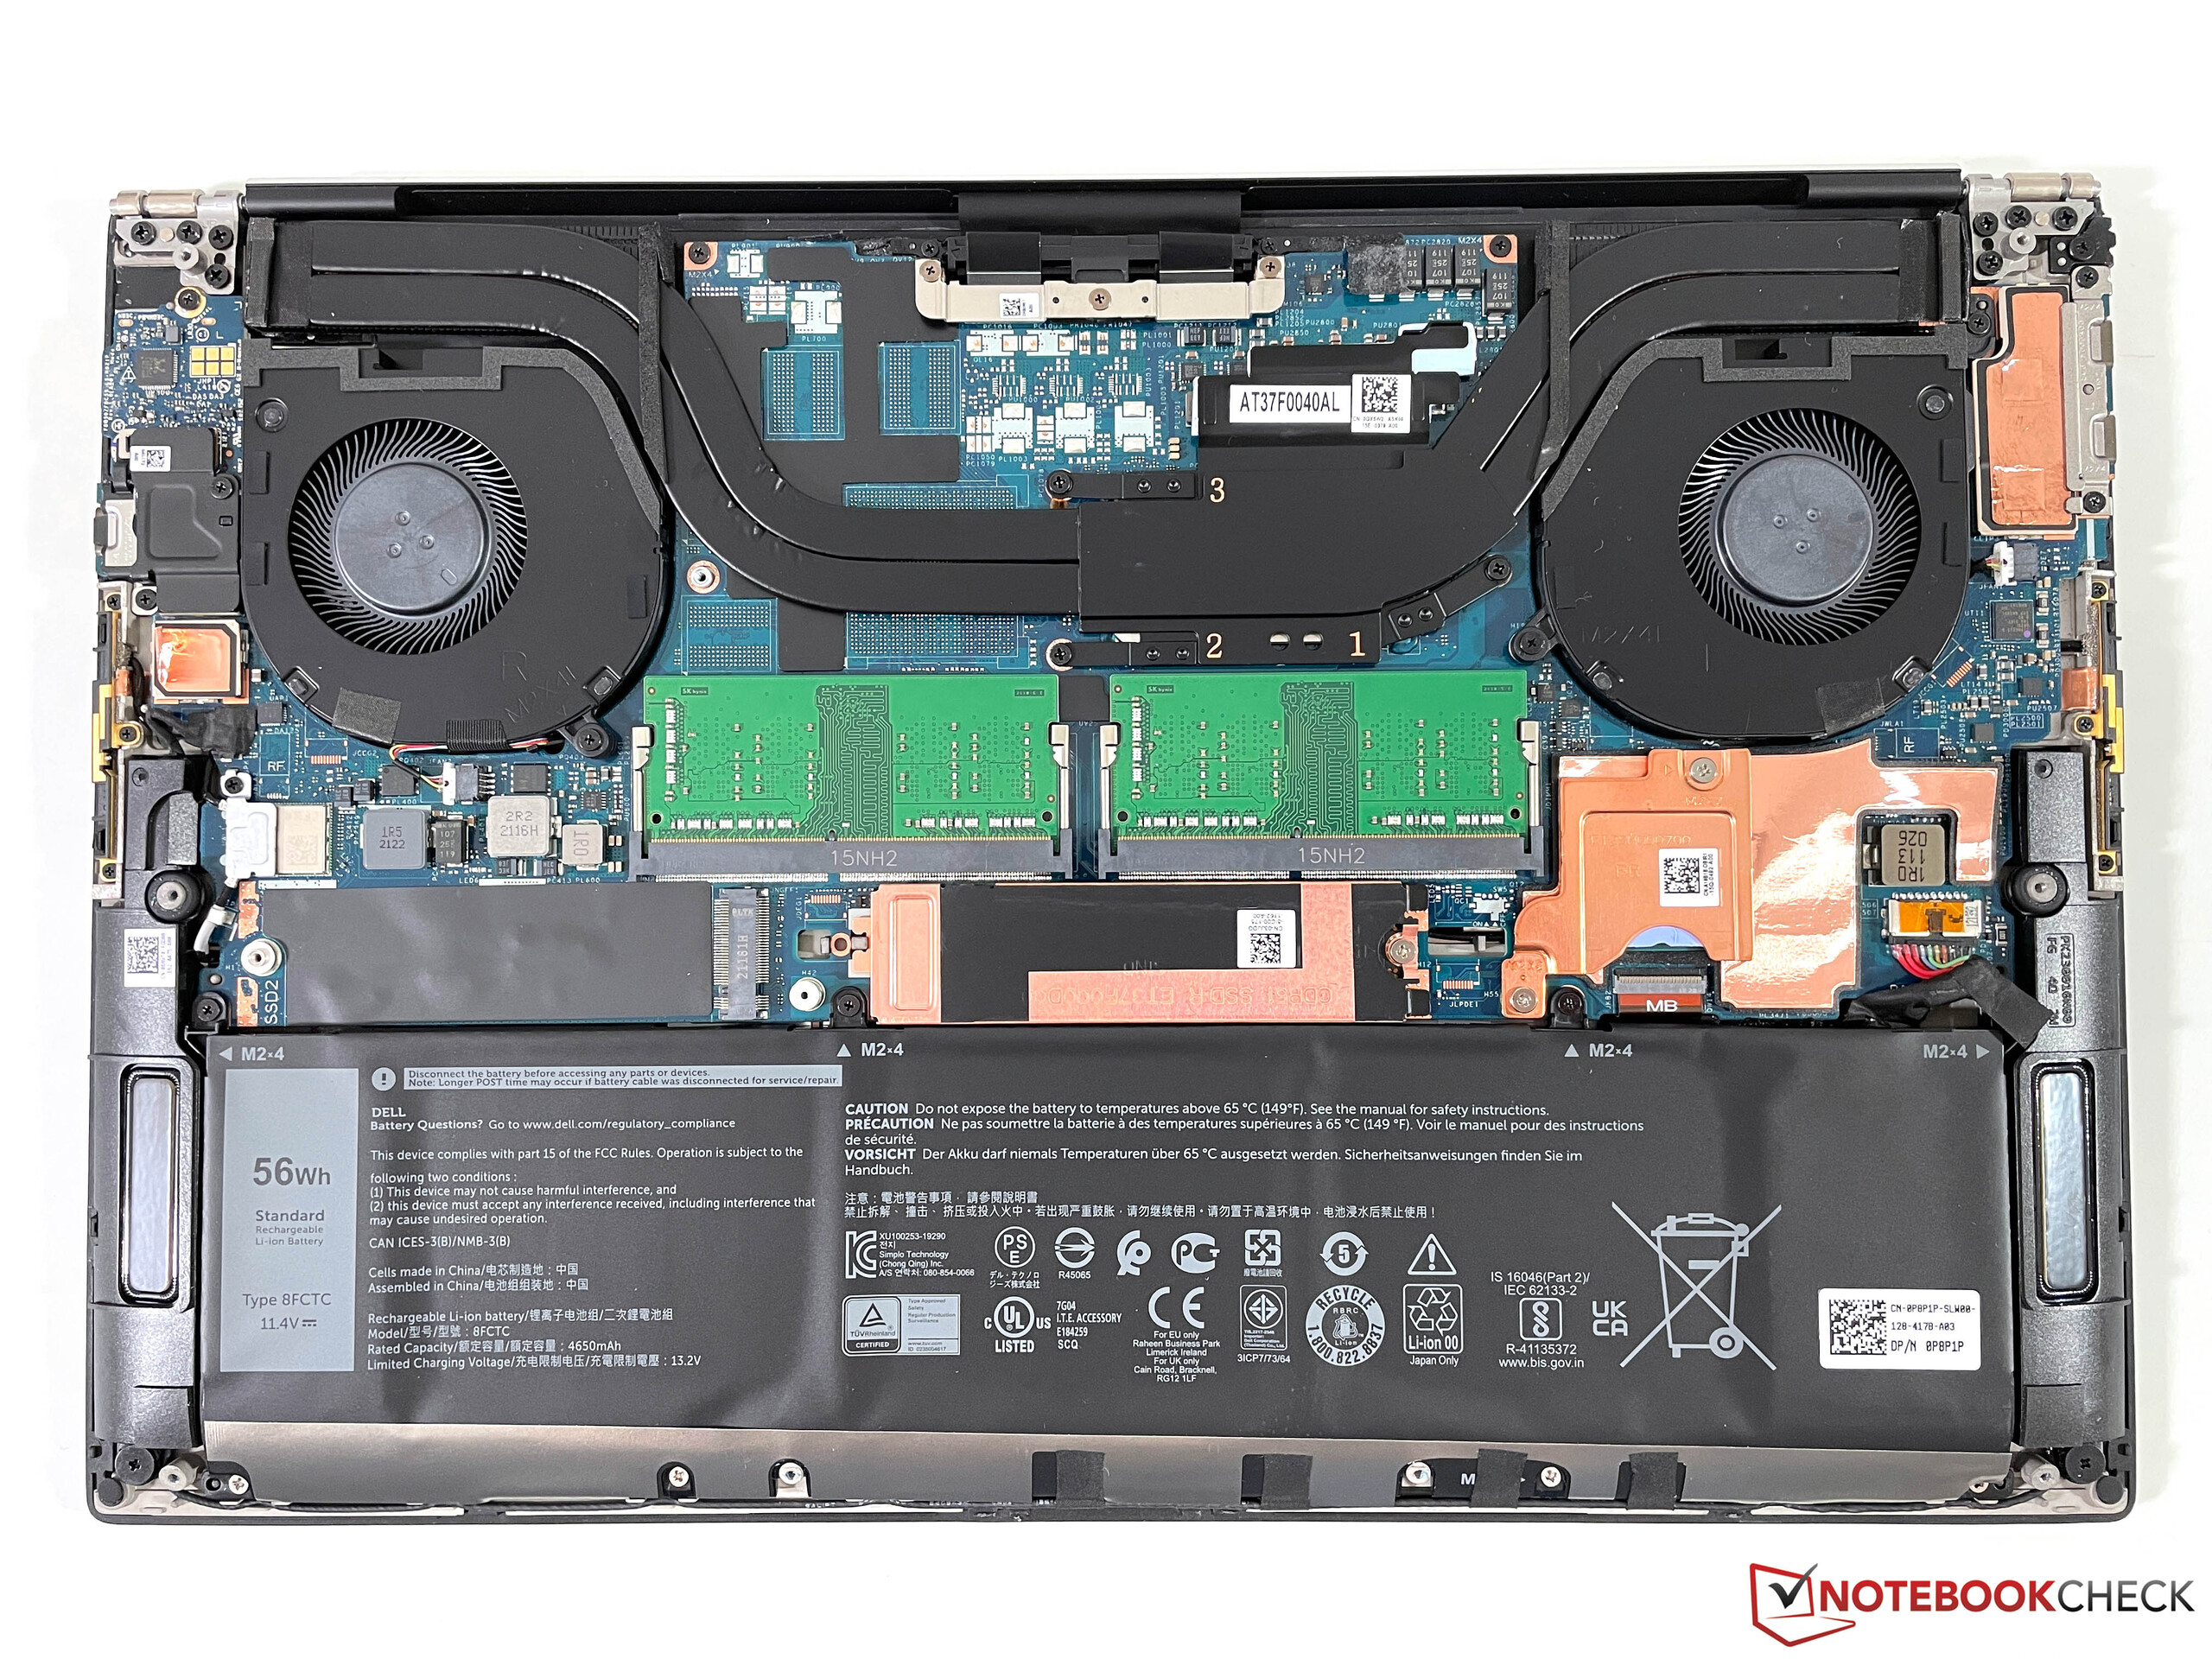
La carcasa es prácticamente idéntica a la versión de gama alta del XPS 15 9510que ya probamos. Sin embargo, esta vez estamos probando el modelo con una unidad base negra y una tapa de color plata. Como ya fue el caso de los modelos predecesores, la superficie negra sigue siendo susceptible a la suciedad y las huellas dactilares. Al echar un vistazo al interior, no verás ninguna diferencia, aparte de la falta de la GPU dedicada. La refrigeración también es idéntica, y la batería tiene el mismo tamaño, aunque la capacidad es significativamente menor, 56 en lugar de 86 Wh. Al menos esto se nota en términos de peso, ya que el modelo básico del XPS 15sin pantalla táctil es unos 200 gramos más ligero.
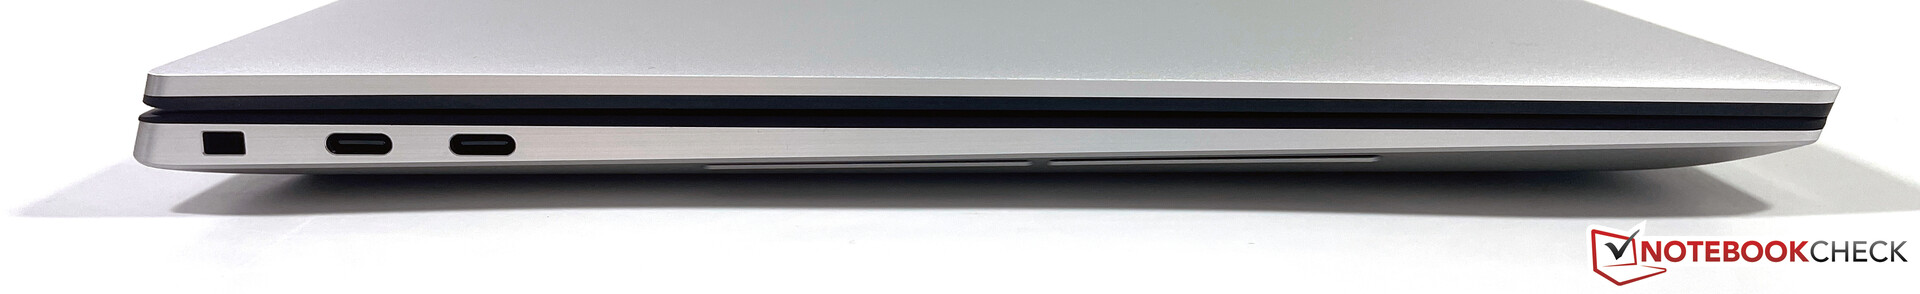
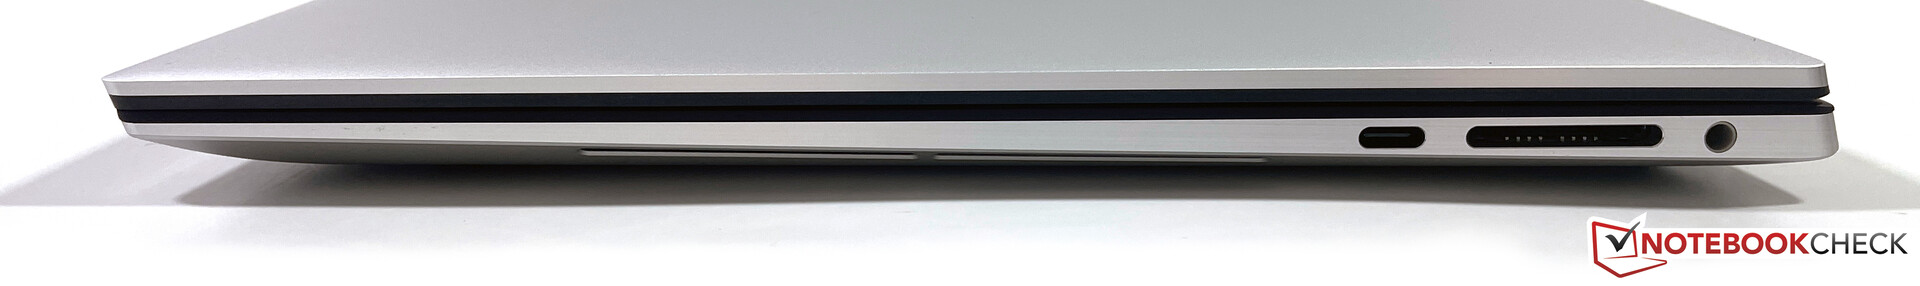
El resto de la equipación con las conexiones Thunderbolt 4, el rápido módulo WLAN de Killer, y el lector de tarjetas SD es idéntico al XPS 15 9510 de gama alta.
Equipo de conexión
| SD Card Reader | |
| average JPG Copy Test (av. of 3 runs) | |
| Dell XPS 15 9500 Core i5 (Toshiba Exceria Pro SDXC 64 GB UHS-II) | |
| Dell XPS 15 9510 i5 11400H FHD (AV Pro V60) | |
| Media de la clase Multimedia (23 - 531, n=43, últimos 2 años) | |
| maximum AS SSD Seq Read Test (1GB) | |
| Dell XPS 15 9510 i5 11400H FHD (AV Pro V60) | |
| Dell XPS 15 9500 Core i5 (Toshiba Exceria Pro SDXC 64 GB UHS-II) | |
| Media de la clase Multimedia (27.9 - 1455, n=42, últimos 2 años) | |


Pantalla - Una pantalla mate de 1080p en formato 16:10
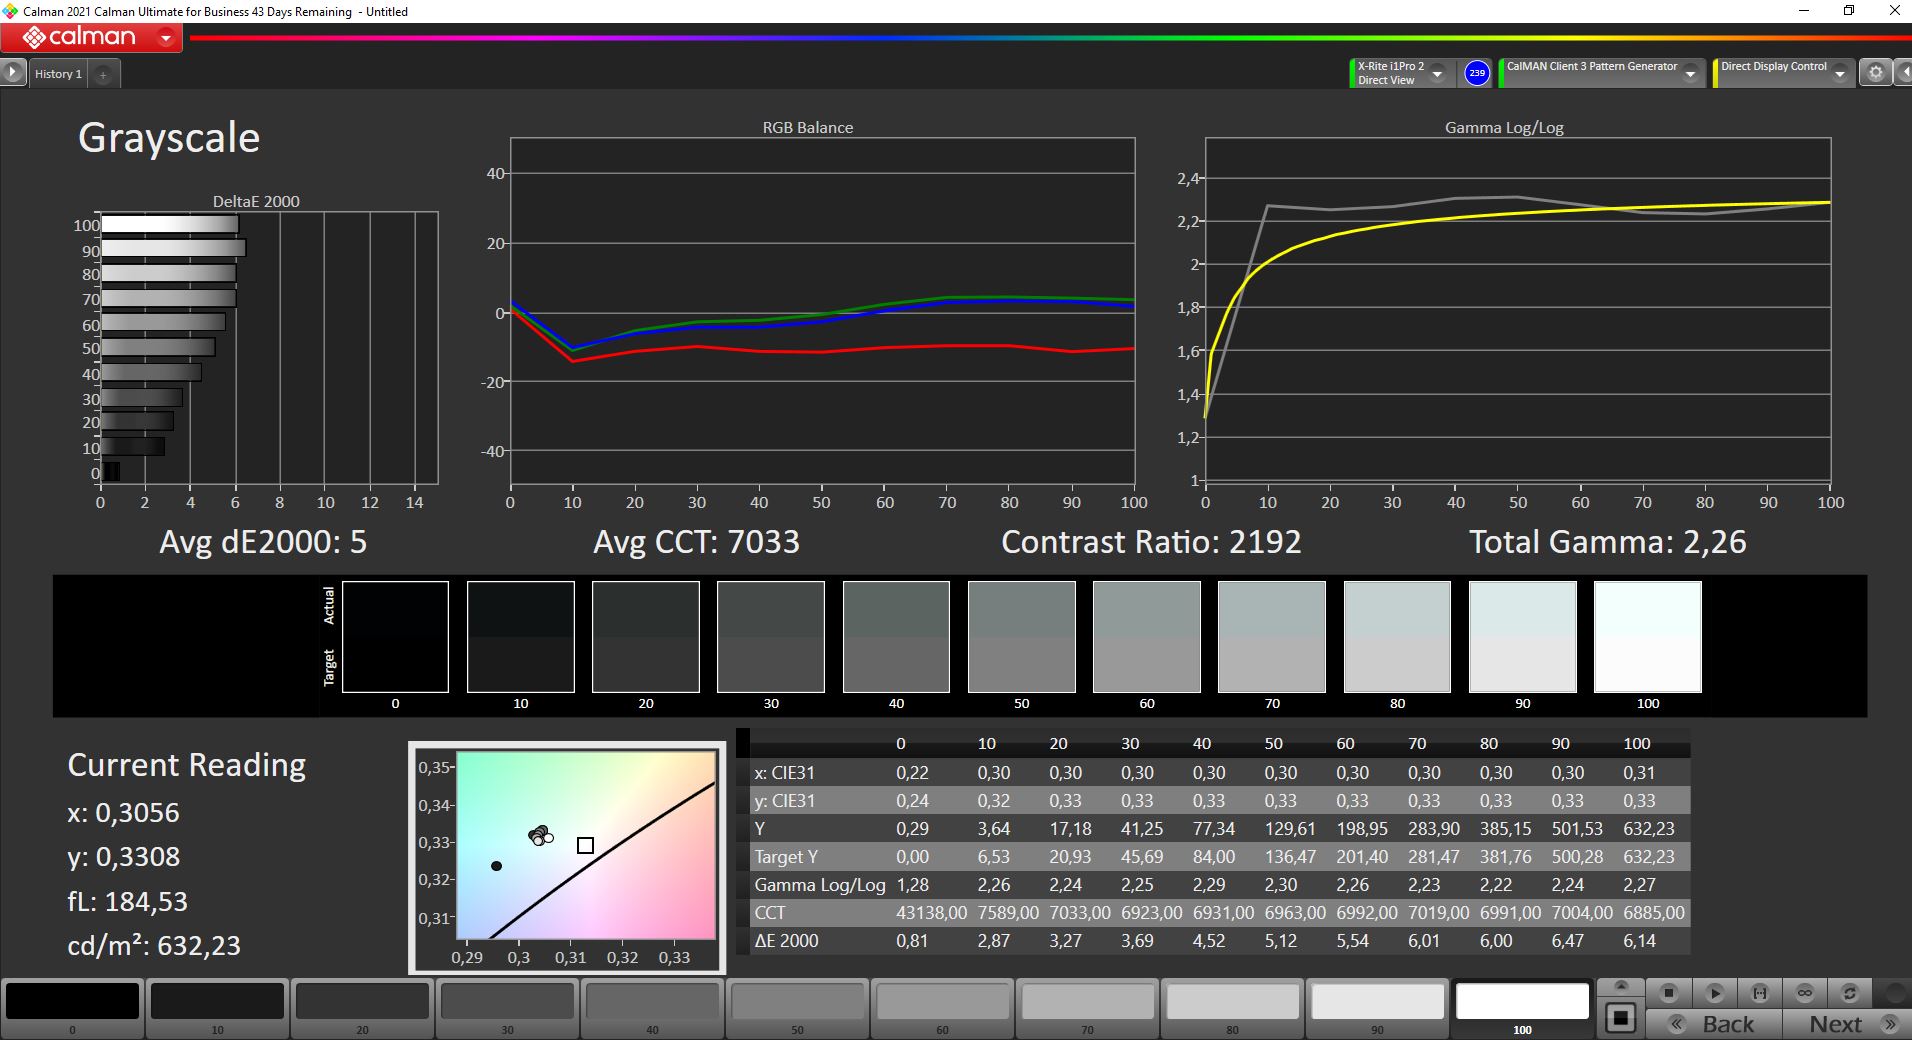
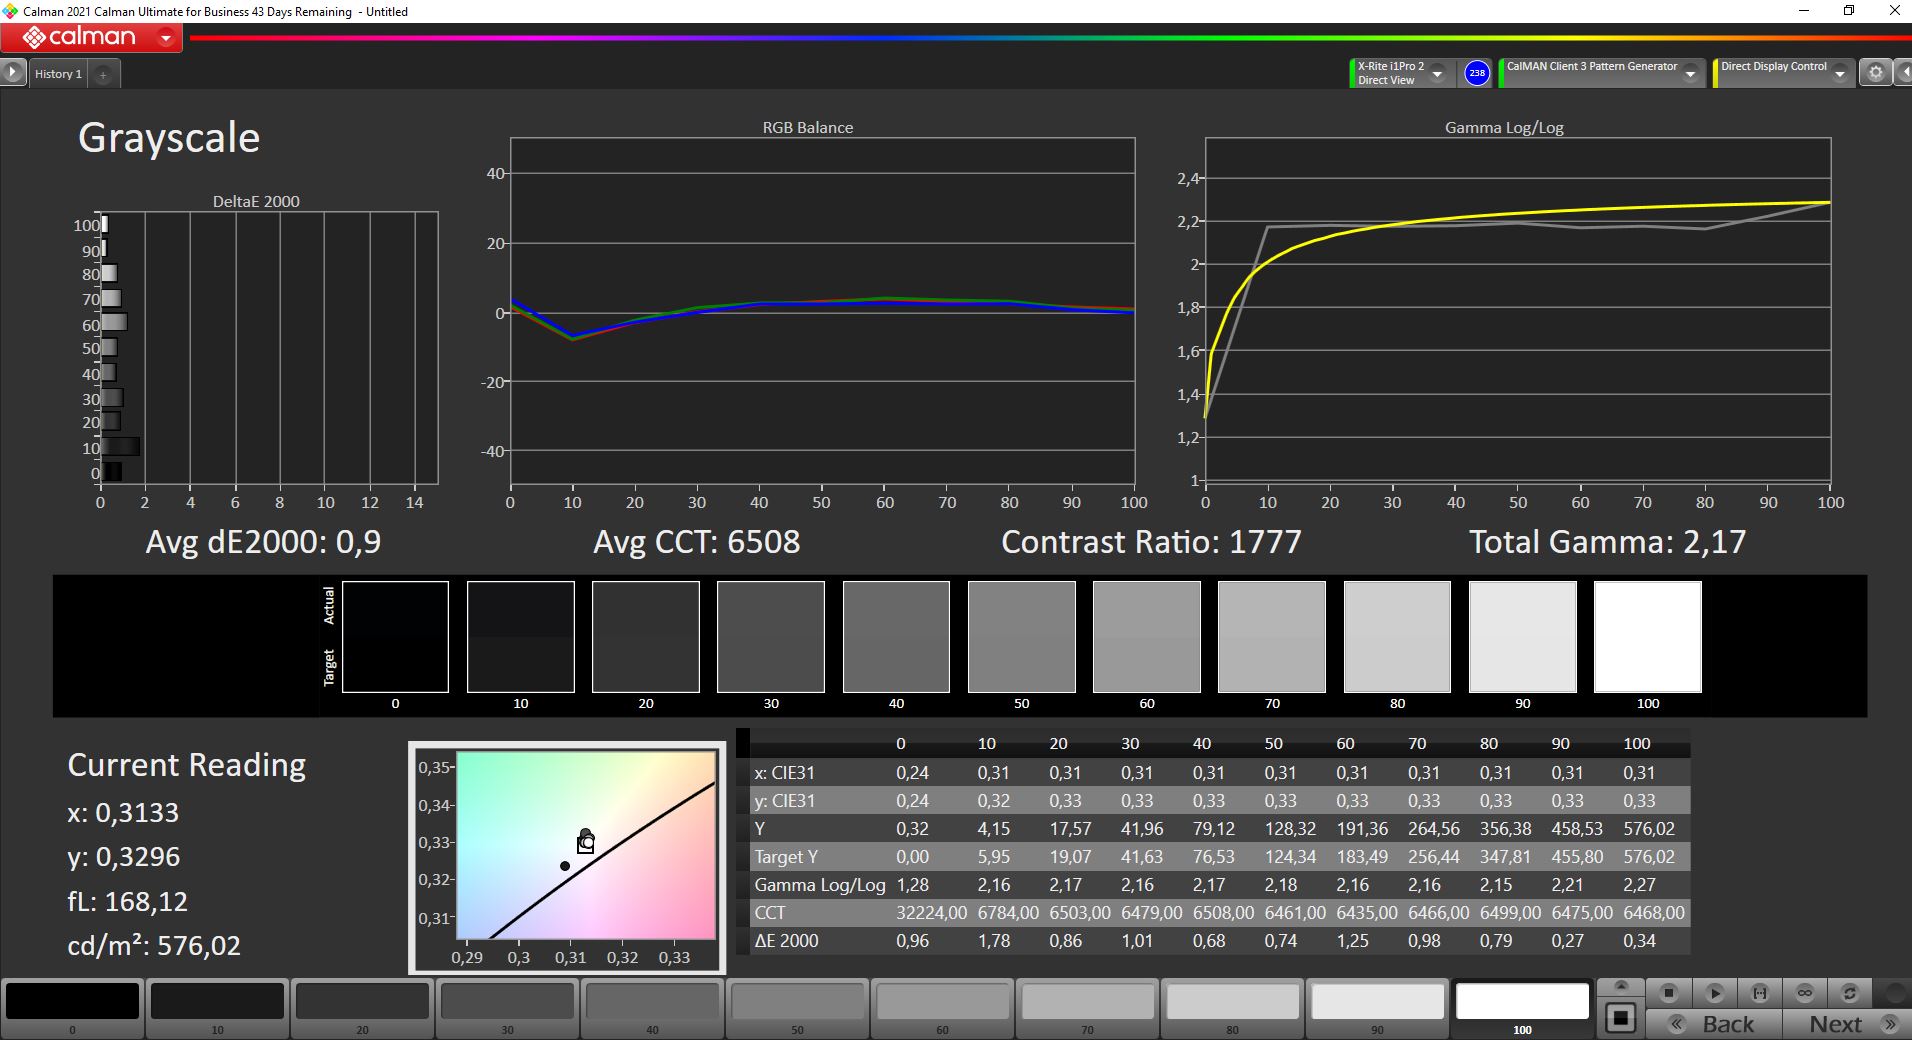
Ya conocemos el panel mate Full-HD de Sharp con una resolución de 1920 x 1200 píxeles del antiguo XPS 15 9500. Con un brillo medio de más de 600 cd/m², el panel sigue siendo uno de los más brillantes del mercado. El valor de negro es relativamente bajo, lo que lleva a una relación de contraste extremadamente alta de más de 2000:1
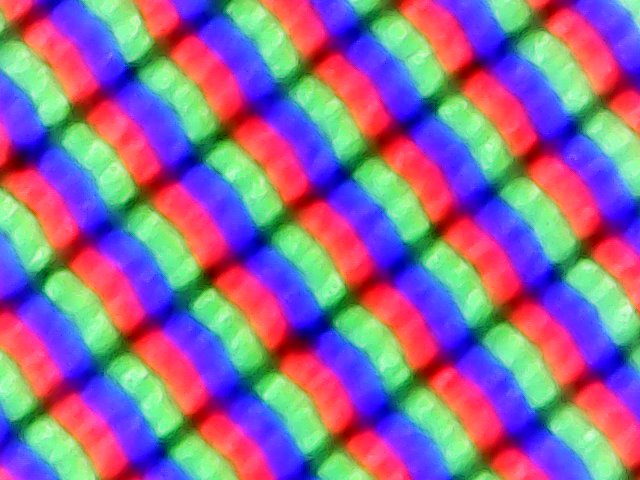
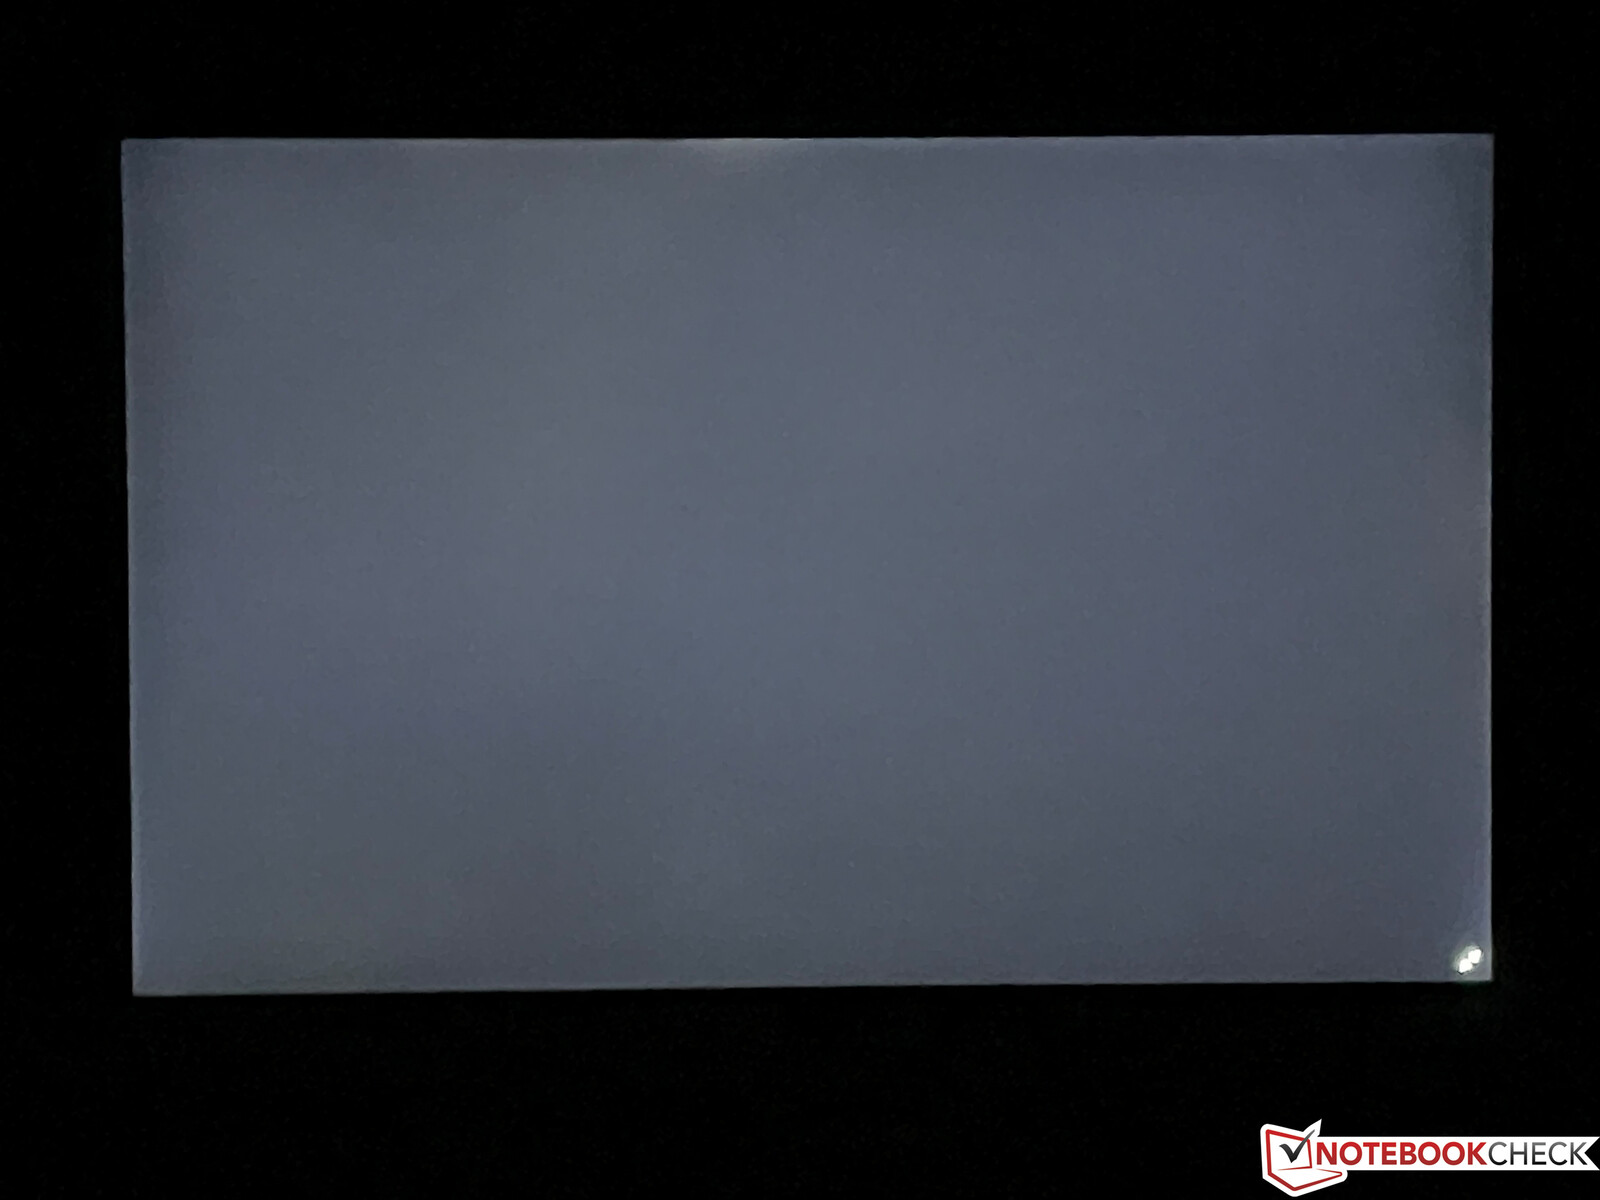
La impresión subjetiva de la imagen es muy buena, e incluso las zonas brillantes no parecen muy granuladas. El predecesor era ligeramente más problemático en este aspecto (ver las imágenes de subpíxeles para comparar). No hay parpadeo PWM y, a pesar del alto brillo, el sangrado de pantalla tampoco es un problema. Sólo notamos una zona mínimamente brillante en el borde superior. En la práctica, el brillo puede ser controlado cómodamente por el sensor de brillo automático. La estabilidad del ángulo de visión del panel IPS es muy buena. Lo que es problemático es el lento tiempo de respuesta que también puede llevar a fantasmas visibles en la práctica.
| |||||||||||||||||||||||||
iluminación: 91 %
Brillo con batería: 634 cd/m²
Contraste: 2179:1 (Negro: 0.29 cd/m²)
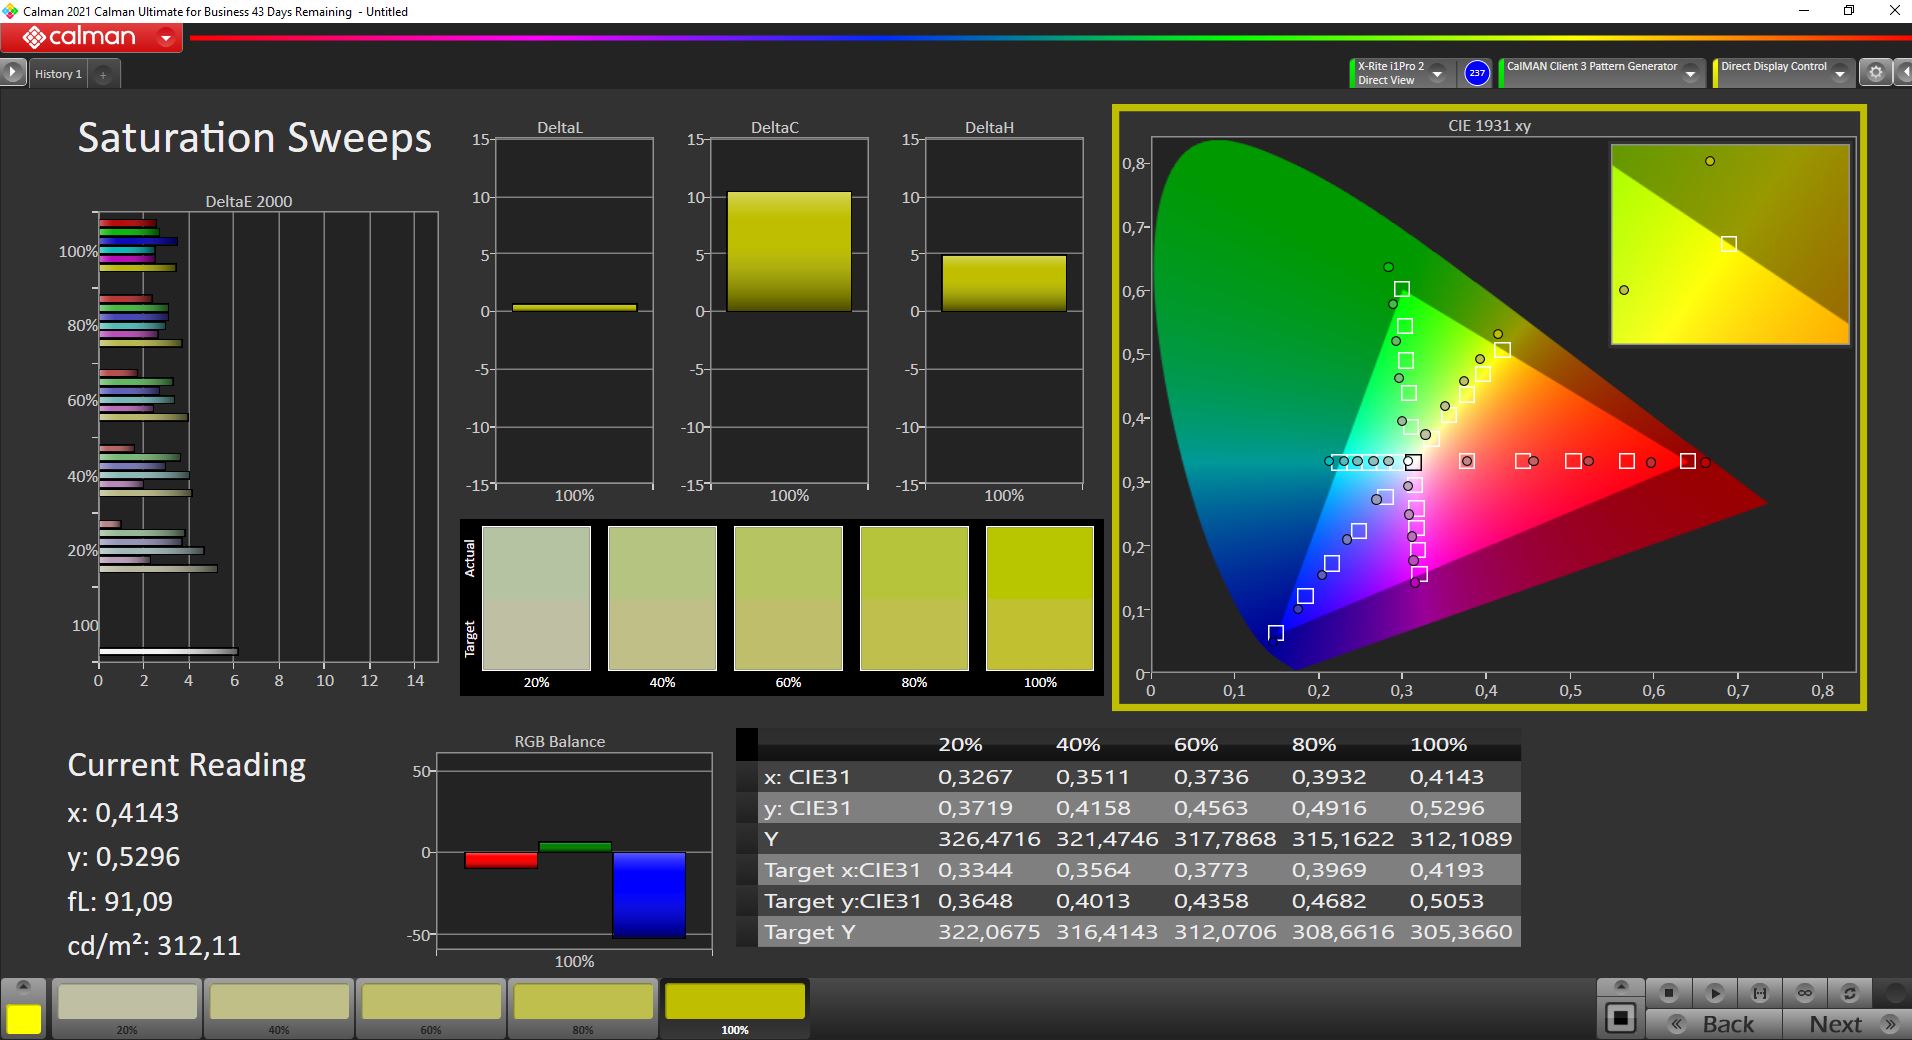
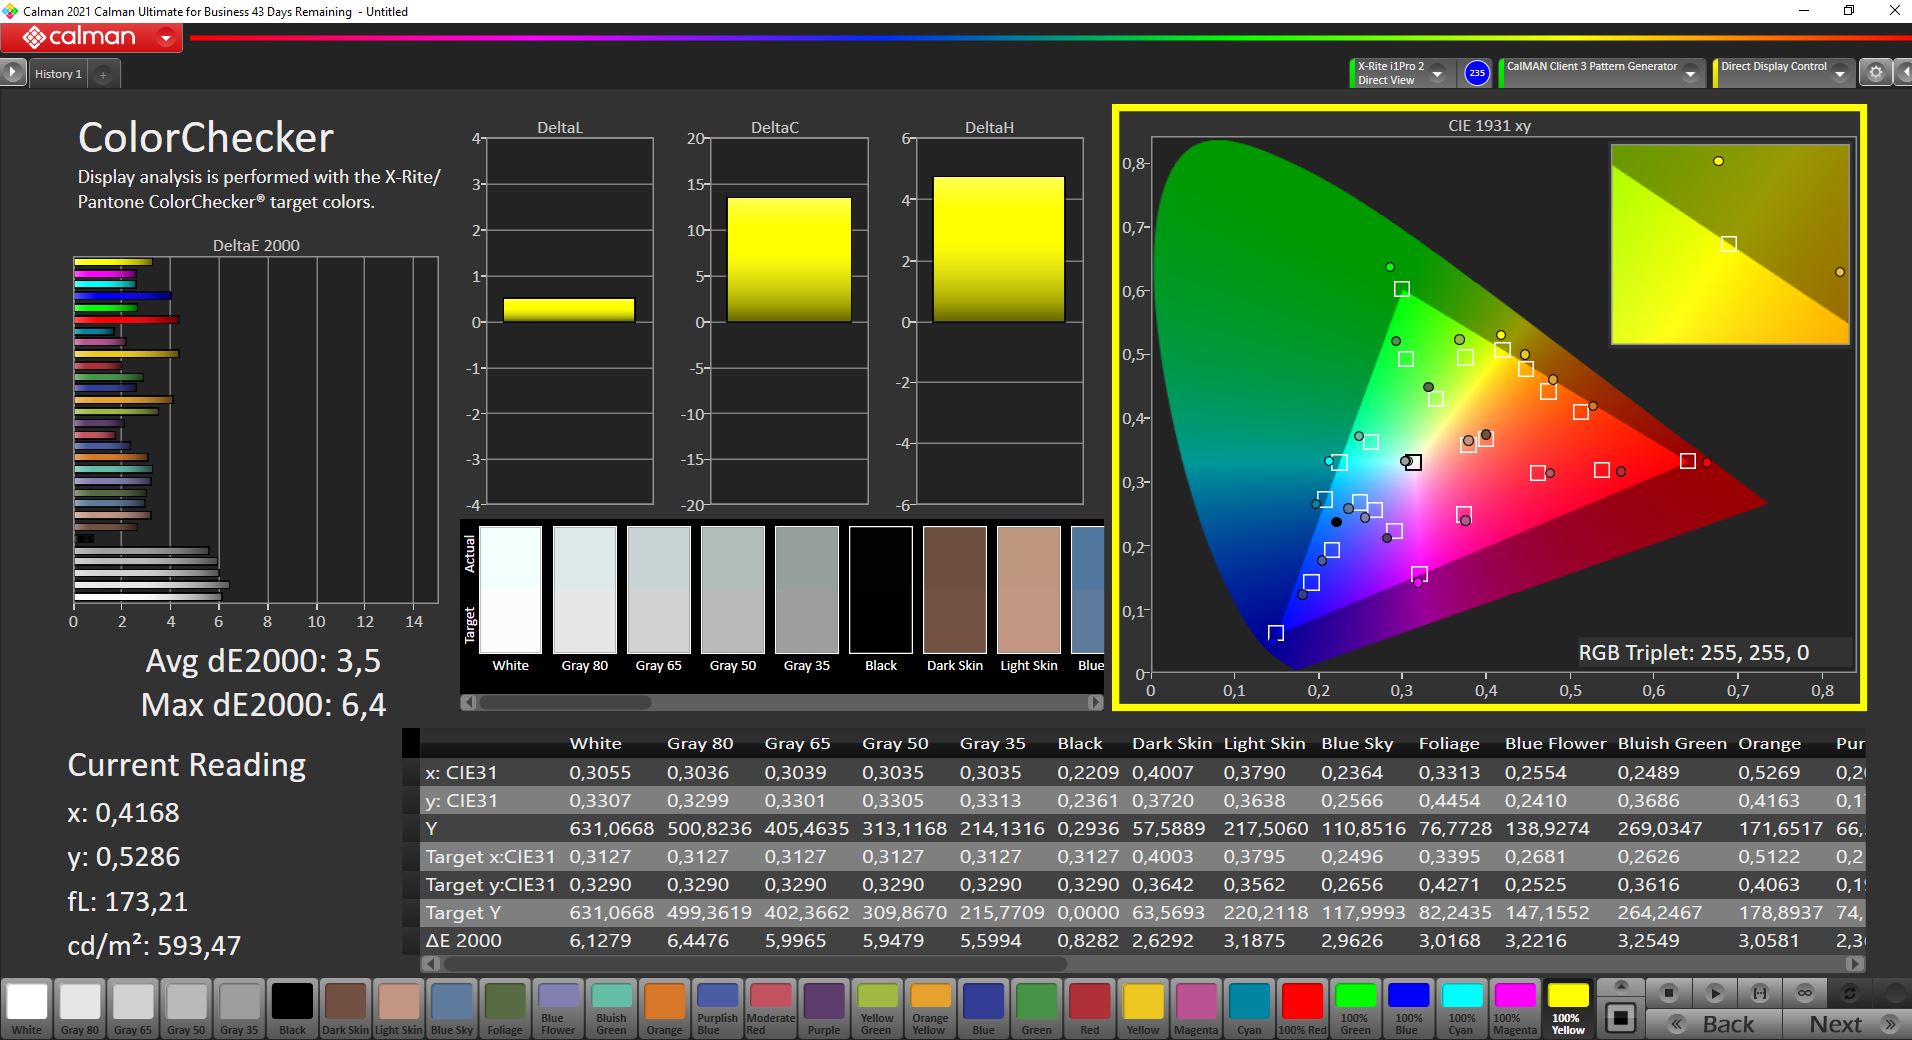
ΔE ColorChecker Calman: 3.5 | ∀{0.5-29.43 Ø4.73}
calibrated: 2
ΔE Greyscale Calman: 5 | ∀{0.09-98 Ø4.97}
79.1% AdobeRGB 1998 (Argyll 3D)
100% sRGB (Argyll 3D)
80.9% Display P3 (Argyll 3D)
Gamma: 2.26
CCT: 7033 K
| Dell XPS 15 9510 i5 11400H FHD Sharp LQ156N1, IPS, 1920x1200, 15.6" | Huawei MateBook 14s i7 CSOTT3 U17B MNE208ZA1-3, LTPS, 2520x1680, 14.2" | Acer Swift 3 SF316-51 Chi Mei CMN160B, IPS, 1920x1080, 16.1" | Honor MagicBook Pro (AMD) N161HCA-EA3, IPS, 1920x1080, 16.1" | Dell XPS 15 9500 Core i5 Sharp LQ156N1, IPS, 1920x1200, 15.6" | Dell XPS 15 9510 11800H RTX 3050 Ti OLED SDC414D, OLED, 3456x2160, 15.6" | Schenker Vision 15 BOE08F5, IPS, 1920x1080, 15.6" | |
|---|---|---|---|---|---|---|---|
| Display | -10% | -10% | -20% | 1% | 16% | -10% | |
| Display P3 Coverage (%) | 80.9 | 67.8 -16% | 66.6 -18% | 67.5 -17% | 81.5 1% | 99.9 23% | 69.3 -14% |
| sRGB Coverage (%) | 100 | 98.3 -2% | 99.5 0% | 69.7 -30% | 100 0% | 100 0% | 94 -6% |
| AdobeRGB 1998 Coverage (%) | 79.1 | 70.1 -11% | 68.5 -13% | 69.7 -12% | 79.6 1% | 98.1 24% | 70.8 -10% |
| Response Times | 42% | 49% | 37% | 30% | 94% | 2% | |
| Response Time Grey 50% / Grey 80% * (ms) | 62.4 ? | 37.6 ? 40% | 32 ? 49% | 37.6 ? 40% | 42 ? 33% | 3.6 ? 94% | 60 ? 4% |
| Response Time Black / White * (ms) | 38.8 ? | 21.6 ? 44% | 20 ? 48% | 25.6 ? 34% | 28.8 ? 26% | 2.8 ? 93% | 39 ? -1% |
| PWM Frequency (Hz) | 27780 ? | 2500 ? | 25250 ? | 59.5 ? | |||
| Screen | 14% | 9% | 24% | -8% | 34% | -8% | |
| Brightness middle (cd/m²) | 632 | 419 -34% | 304 -52% | 337 -47% | 592 -6% | 362 -43% | 478 -24% |
| Brightness (cd/m²) | 606 | 407 -33% | 284 -53% | 312 -49% | 565 -7% | 367 -39% | 462 -24% |
| Brightness Distribution (%) | 91 | 93 2% | 88 -3% | 89 -2% | 85 -7% | 97 7% | 94 3% |
| Black Level * (cd/m²) | 0.29 | 0.23 21% | 0.165 43% | 0.2 31% | 0.46 -59% | 0.06 79% | 0.27 7% |
| Contrast (:1) | 2179 | 1822 -16% | 1842 -15% | 1685 -23% | 1287 -41% | 6033 177% | 1770 -19% |
| Colorchecker dE 2000 * | 3.5 | 1.9 46% | 1.44 59% | 0.8 77% | 3.19 9% | 2.1 40% | 3.2 9% |
| Colorchecker dE 2000 max. * | 6.4 | 3.6 44% | 3.62 43% | 1.1 83% | 5.45 15% | 4.1 36% | 8.4 -31% |
| Colorchecker dE 2000 calibrated * | 2 | 0.9 55% | 0.7 65% | 2.03 -1% | 2.5 -25% | 2 -0% | |
| Greyscale dE 2000 * | 5 | 2.9 42% | 2.6 48% | 1 80% | 3.9 22% | 1.4 72% | 4.5 10% |
| Gamma | 2.26 97% | 2.14 103% | 2.41 91% | 2.2 100% | 2.25 98% | 2.18 101% | 2.16 102% |
| CCT | 7033 92% | 6733 97% | 6527 100% | 6538 99% | 6522 100% | 6608 98% | 6788 96% |
| Color Space (Percent of AdobeRGB 1998) (%) | 68.5 | 63.8 | 71.6 | 63.1 | |||
| Color Space (Percent of sRGB) (%) | 99.5 | 99.5 | 100 | 93.6 | |||
| Media total (Programa/Opciones) | 15% /
13% | 16% /
10% | 14% /
16% | 8% /
-1% | 48% /
38% | -5% /
-7% |
* ... más pequeño es mejor
Tiempos de respuesta del display
| ↔ Tiempo de respuesta de Negro a Blanco | ||
|---|---|---|
| 38.8 ms ... subida ↗ y bajada ↘ combinada | ↗ 20.8 ms subida | 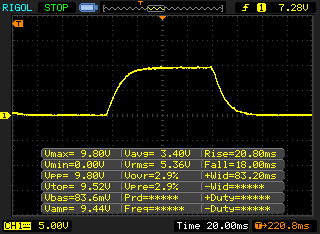 |
| ↘ 18 ms bajada | ||
| La pantalla mostró tiempos de respuesta lentos en nuestros tests y podría ser demasiado lenta para los jugones. En comparación, todos los dispositivos de prueba van de ##min### (mínimo) a 240 (máximo) ms. » 96 % de todos los dispositivos son mejores. Eso quiere decir que el tiempo de respuesta es peor que la media (19.9 ms) de todos los dispositivos testados. | ||
| ↔ Tiempo de respuesta 50% Gris a 80% Gris | ||
| 62.4 ms ... subida ↗ y bajada ↘ combinada | ↗ 31.6 ms subida | 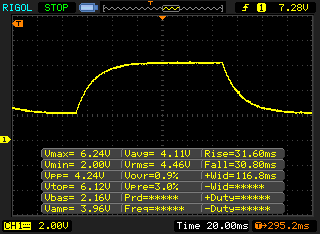 |
| ↘ 30.8 ms bajada | ||
| La pantalla mostró tiempos de respuesta lentos en nuestros tests y podría ser demasiado lenta para los jugones. En comparación, todos los dispositivos de prueba van de ##min### (mínimo) a 636 (máximo) ms. » 97 % de todos los dispositivos son mejores. Eso quiere decir que el tiempo de respuesta es peor que la media (31.1 ms) de todos los dispositivos testados. | ||
Parpadeo de Pantalla / PWM (Pulse-Width Modulation)
| Parpadeo de Pantalla / PWM no detectado |  | ||
Comparación: 52 % de todos los dispositivos testados no usaron PWM para atenuar el display. Si se usó, medimos una media de 7794 (mínimo: 5 - máxmo: 343500) Hz. | |||
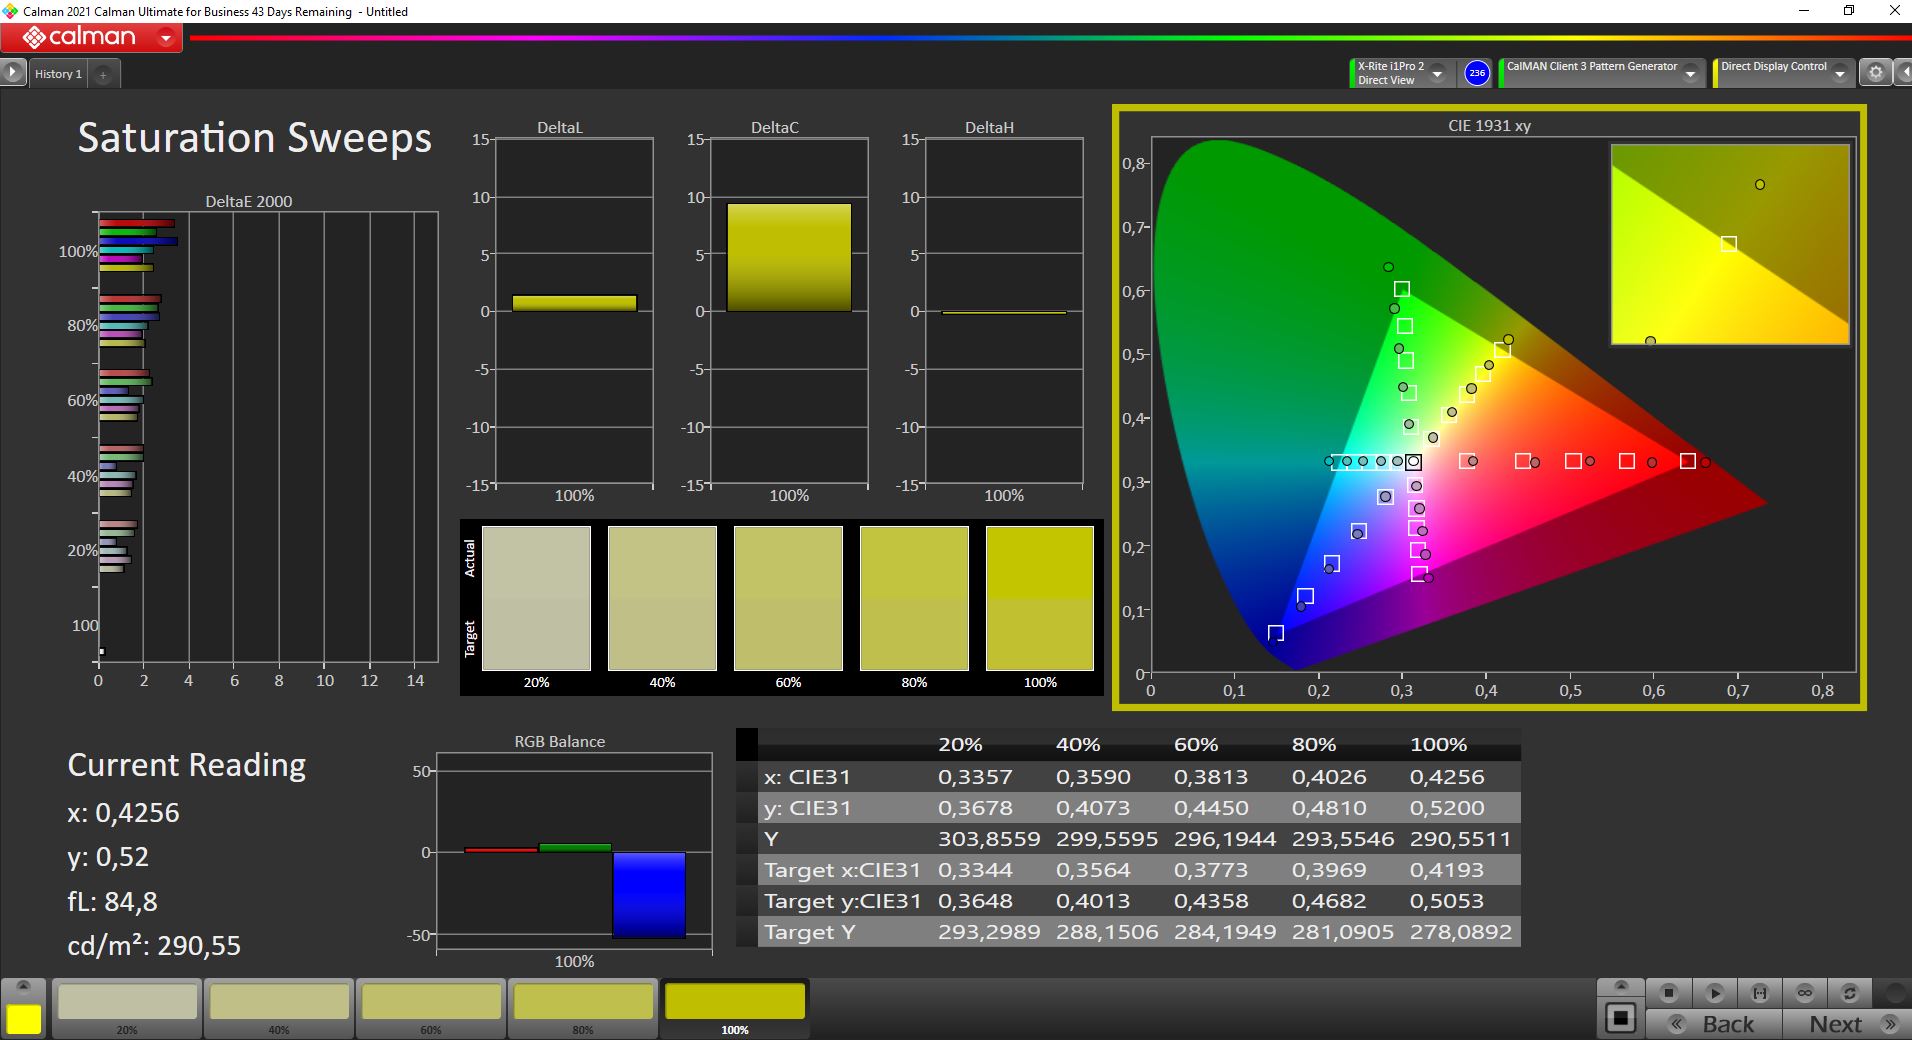
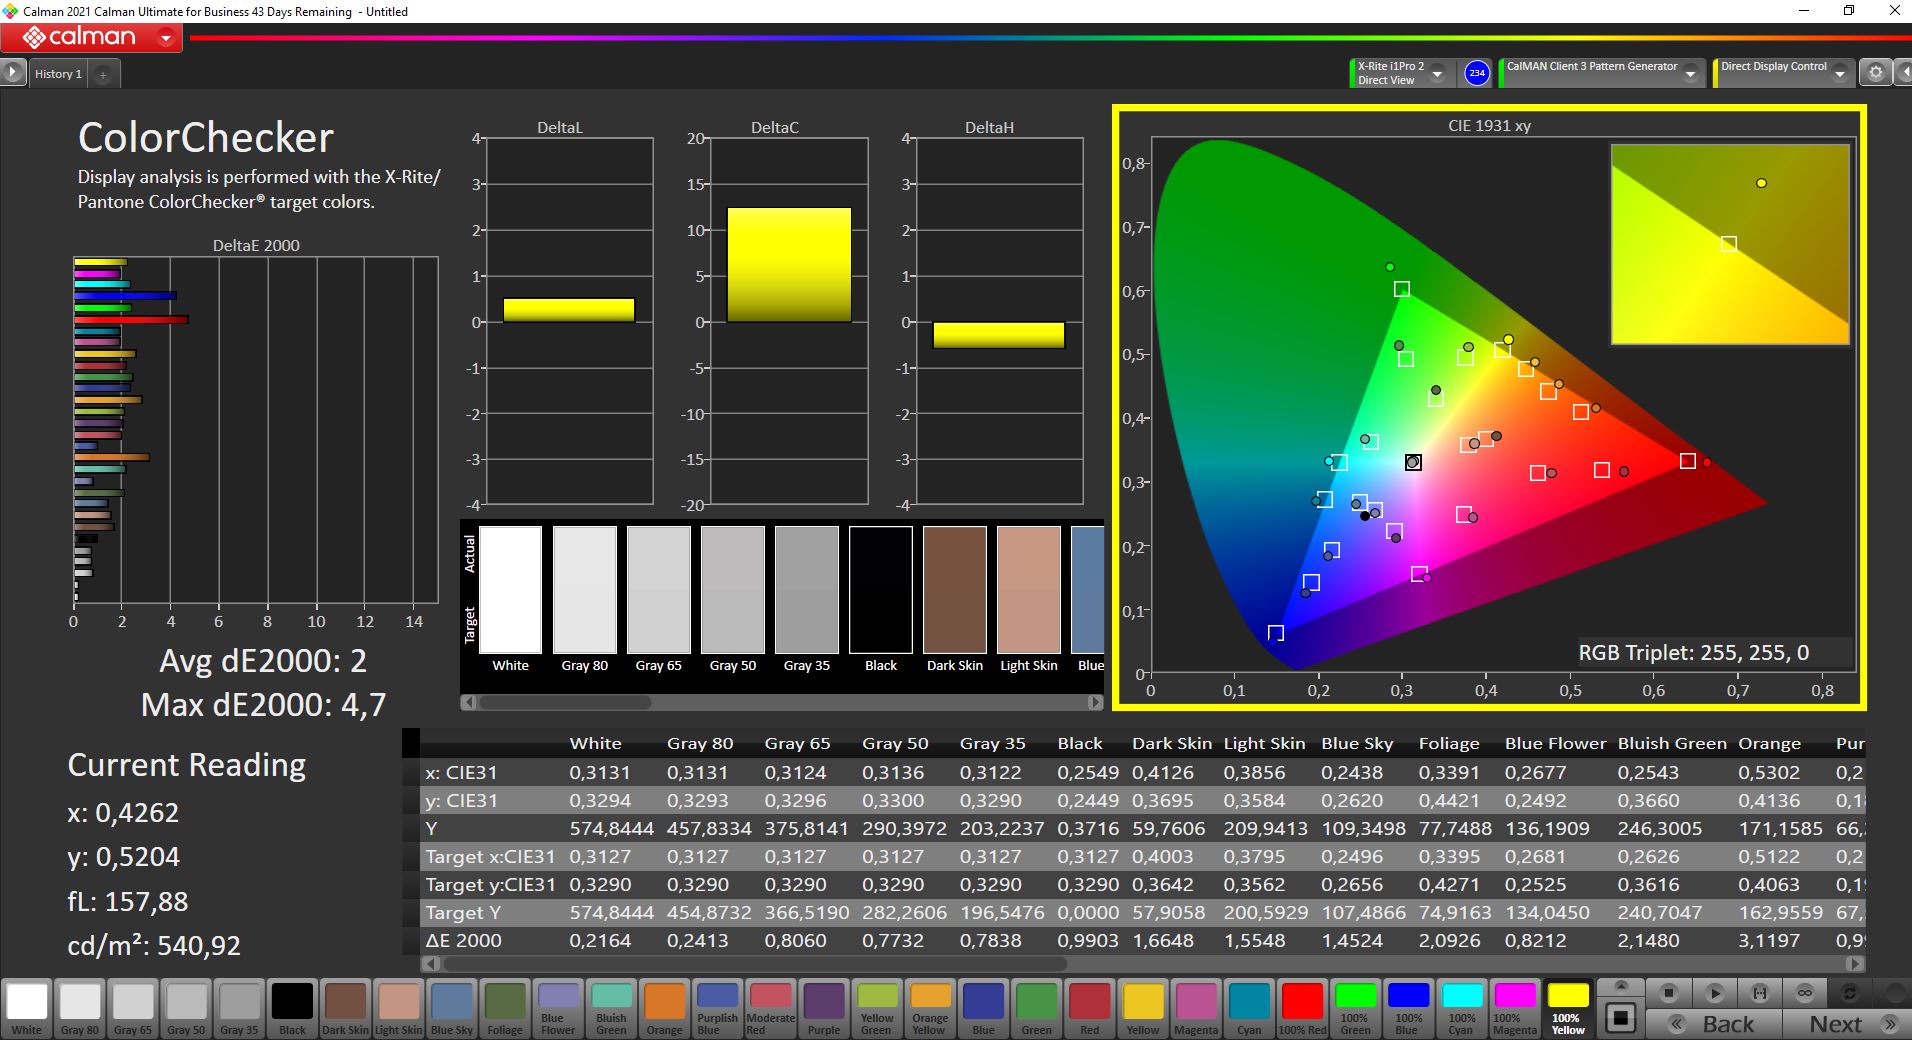
En el estado de entrega, el panel no está especialmente bien calibrado, y hay un ligero tinte verde en combinación con una temperatura de color demasiado fría. Nuestro análisis con el software profesional CalMAN y el colorímetro X-Rite i1 Pro 2 también muestra desviaciones de color ligeramente demasiado altas. Con nuestra calibración (perfil disponible para su descarga gratuita en el cuadro de información anterior), podemos mejorar la reproducción de la escala de grises en particular y también eliminar el tinte de color. También se reducen las desviaciones de color con respecto al espacio de color de referencia sRGB (que cubre completamente el panel). Sólo hay dos colores (100% rojo y azul) que siguen estando mínimamente por encima del importante valor objetivo de 3. No obstante, el panel sigue siendo adecuado para el procesamiento de imágenes.
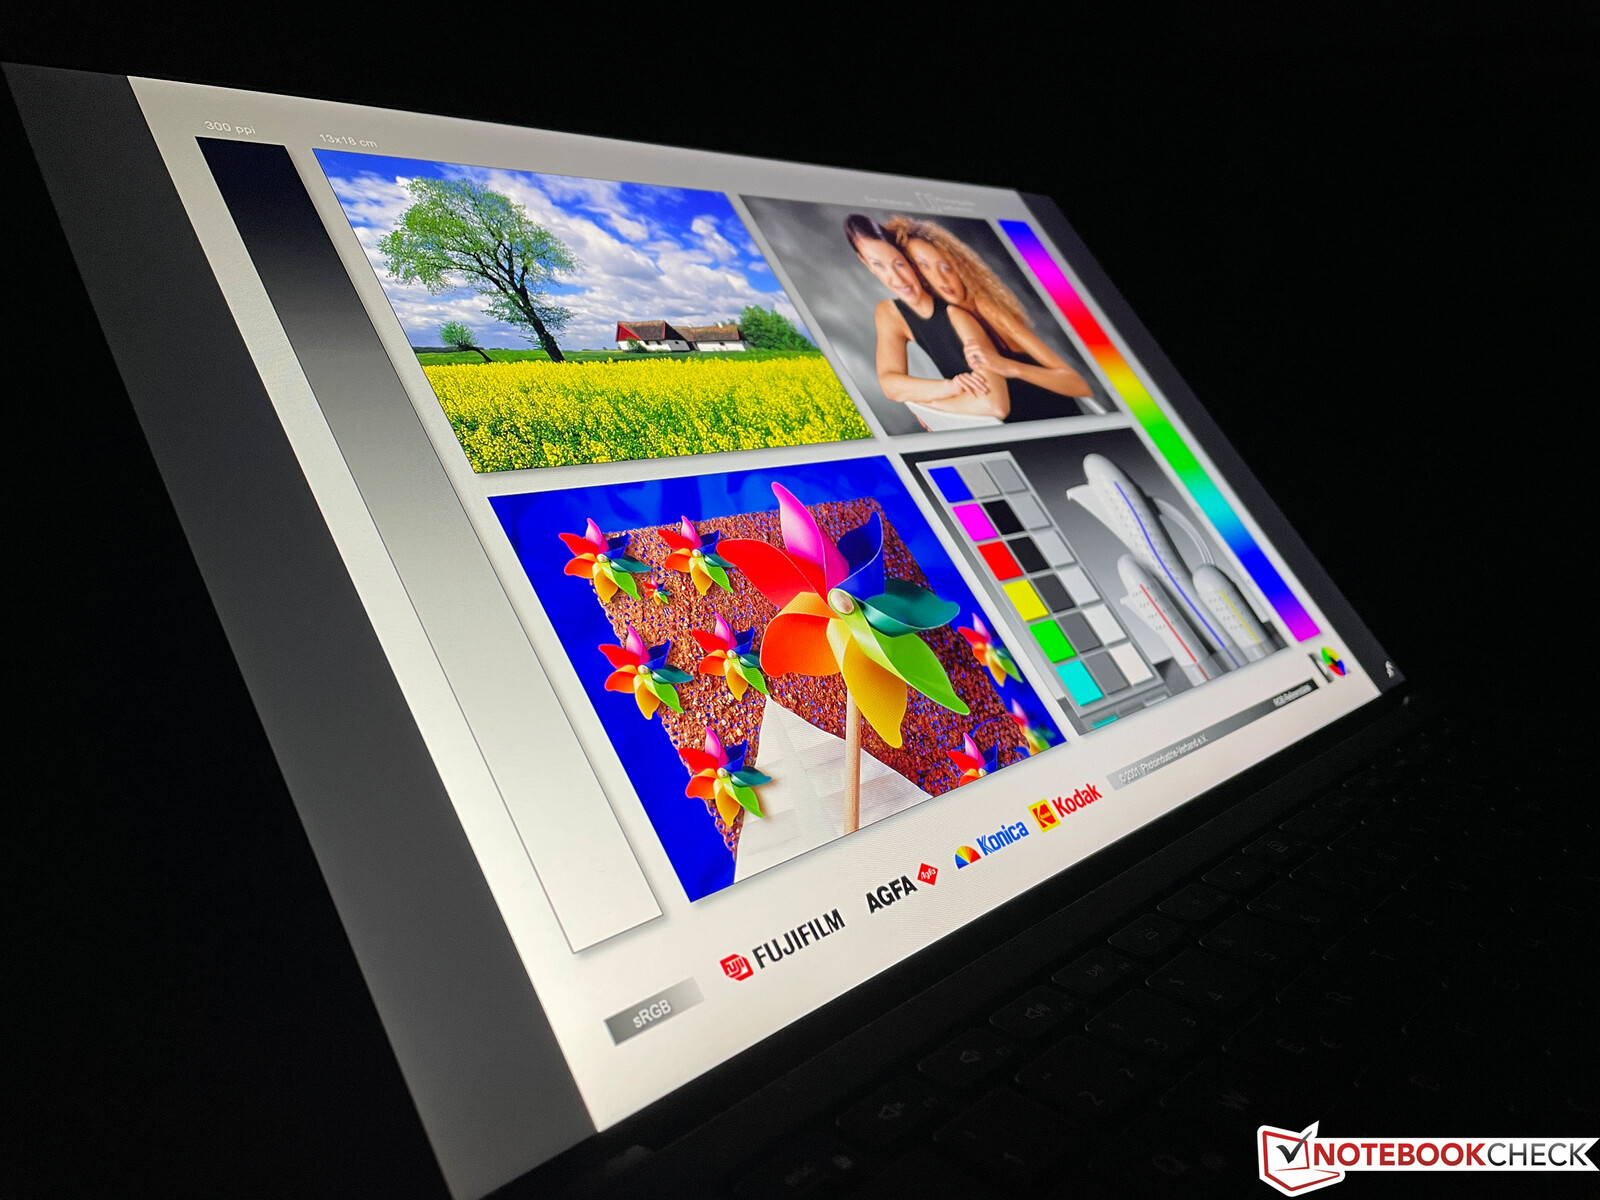
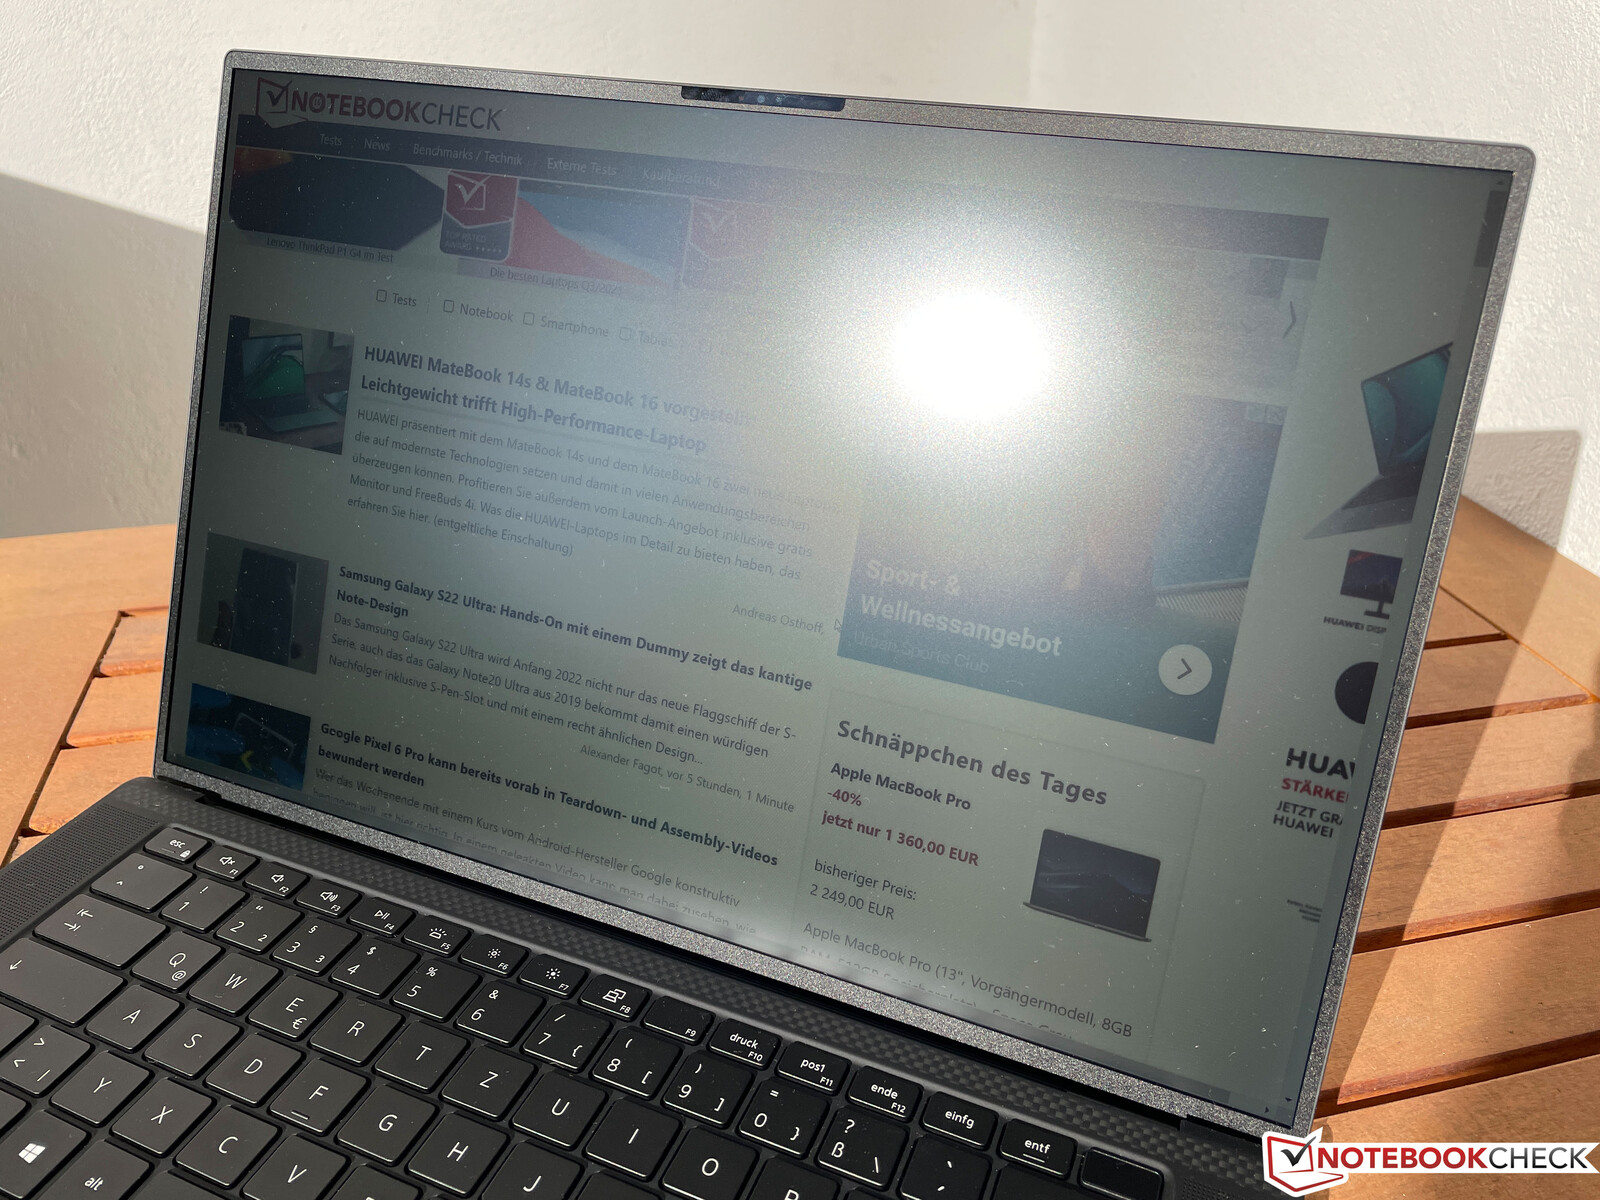
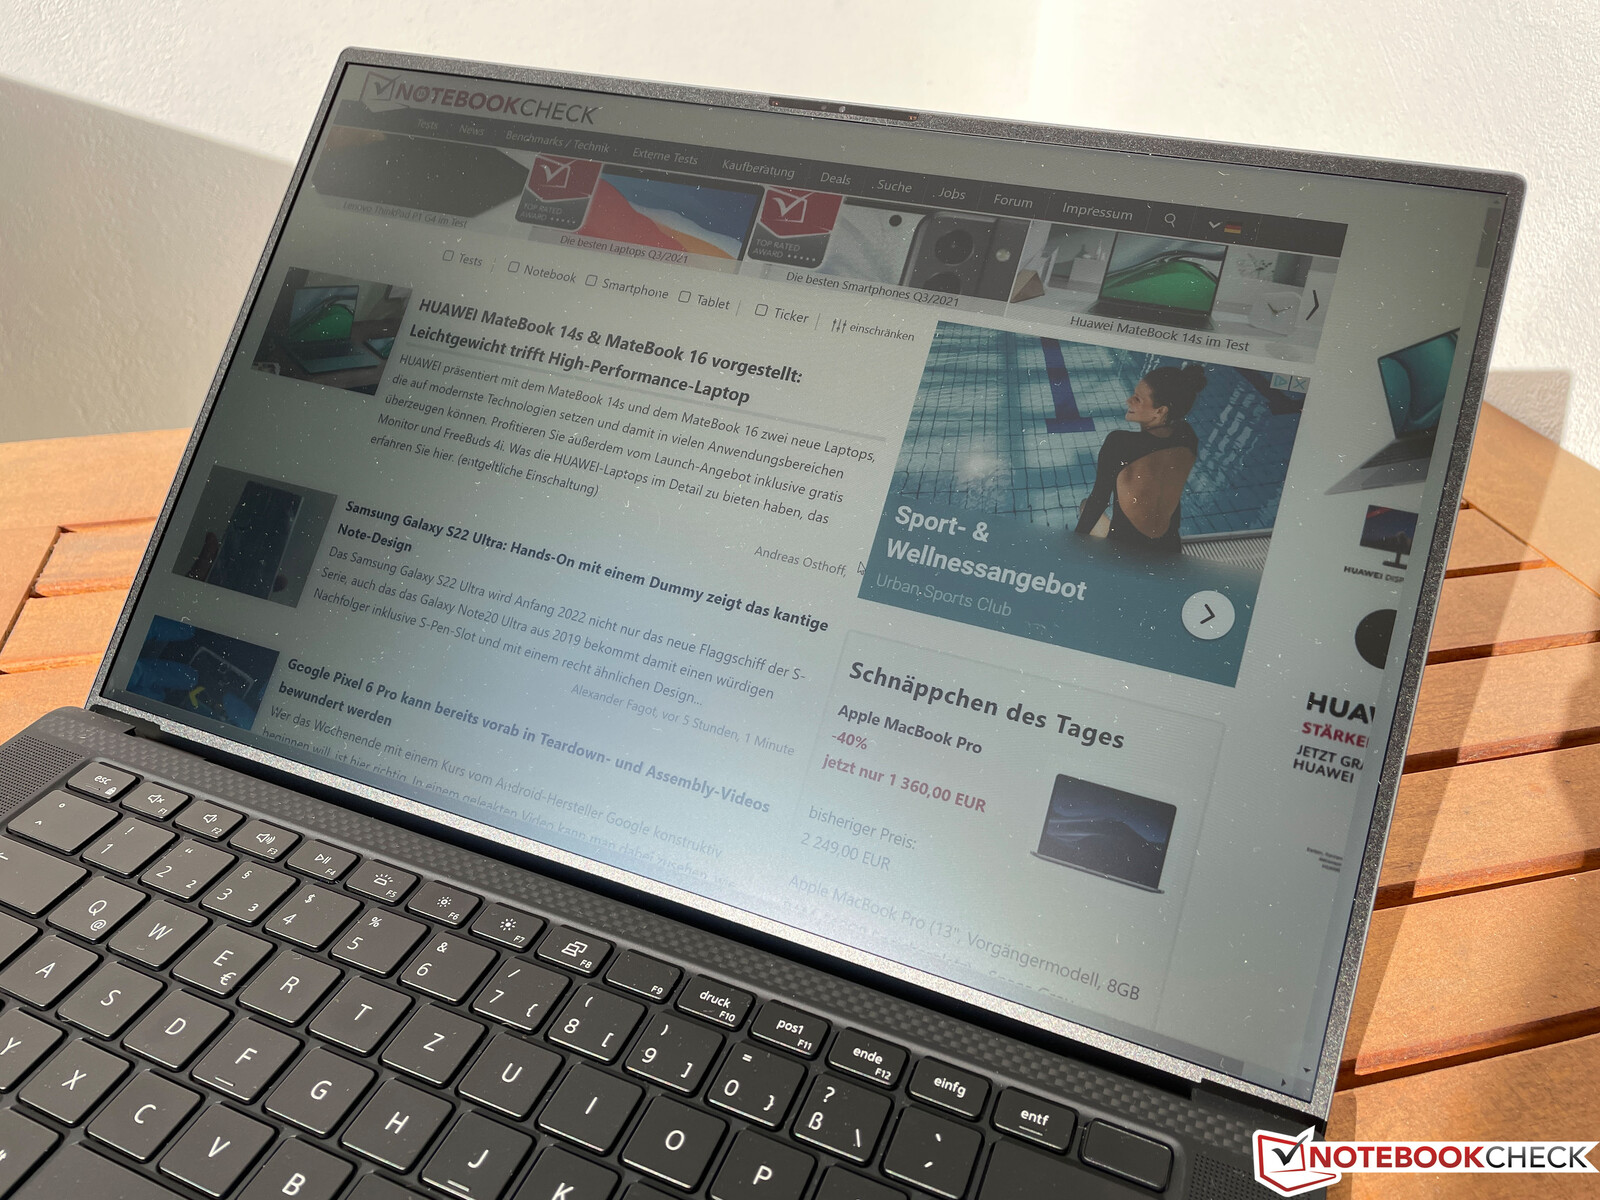
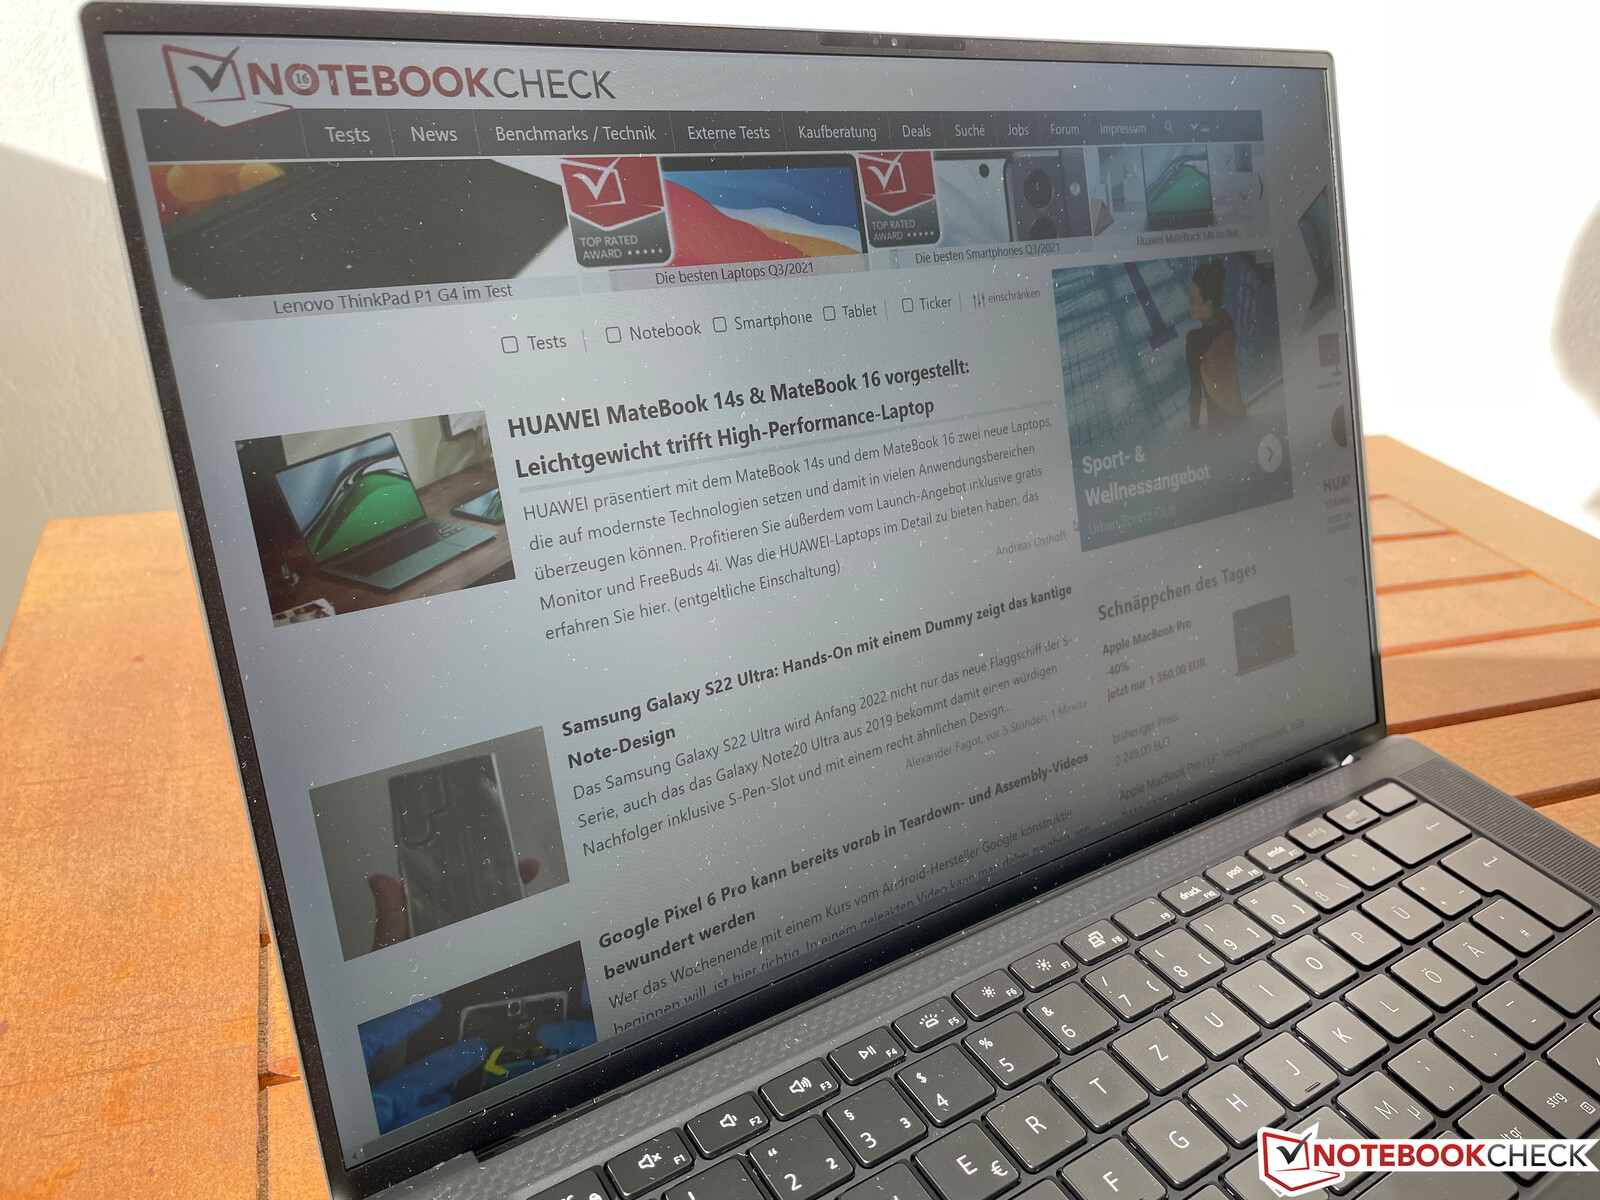
Gracias a su alto brillo, la pantalla está completamente en su elemento en exteriores. Si se evitan los reflejos directos de las fuentes de luz, también se puede usar el XPS 15 sin problemas en entornos muy luminosos.
Rendimiento - Tiger Lake H con 6 núcleos
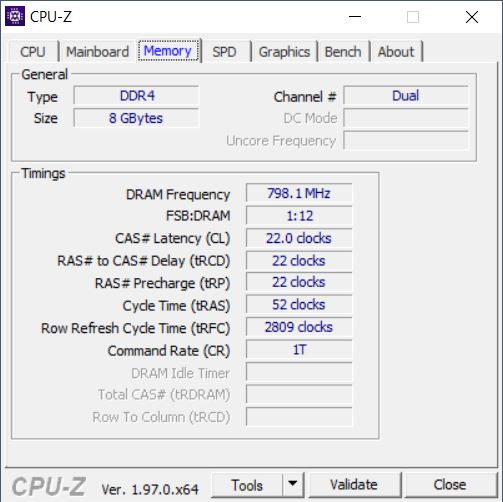
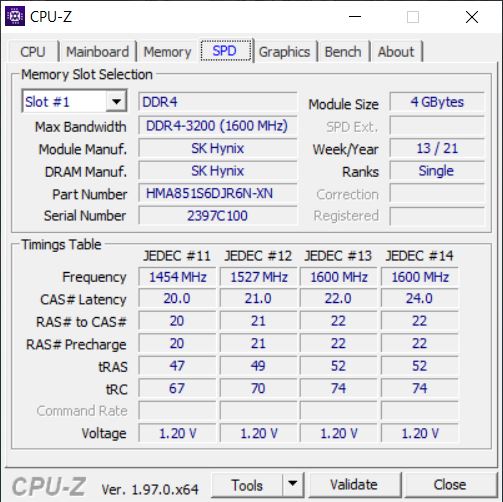
El modelo básico es principalmente adecuado para los usuarios que buscan un gran portátil multimedia y no quieren utilizarlo para jugar. Dell lo ha equipado con un procesador Intel Tiger Lake-H actual que suele funcionar con un TDP de 45 vatios. Como la refrigeración es idéntica a la del modelo de gama alta, esto no debería crear ningún problema. Sin embargo, Dell aún decidió hacer funcionar el procesador a sólo unos 40 watts, lo cual no podemos explicar. Con 8 GB, la cantidad de memoria de trabajo también está en el lado pequeño. Mientras que puedes actualizarla fácilmente con la disponibilidad de dos ranuras SODIMM, ya que Dell usa dos módulos de 4 GB, tienes que pagar más dinero para reemplazarlos con 16 GB, por ejemplo.
El Dell Power Manager preinstalado también ofrece la opción de activar el modo Ultra Performance, pero veremos en un momento por qué esto no tiene mucho efecto. Las siguientes pruebas y mediciones se realizaron con la configuración estándar Optimizada.
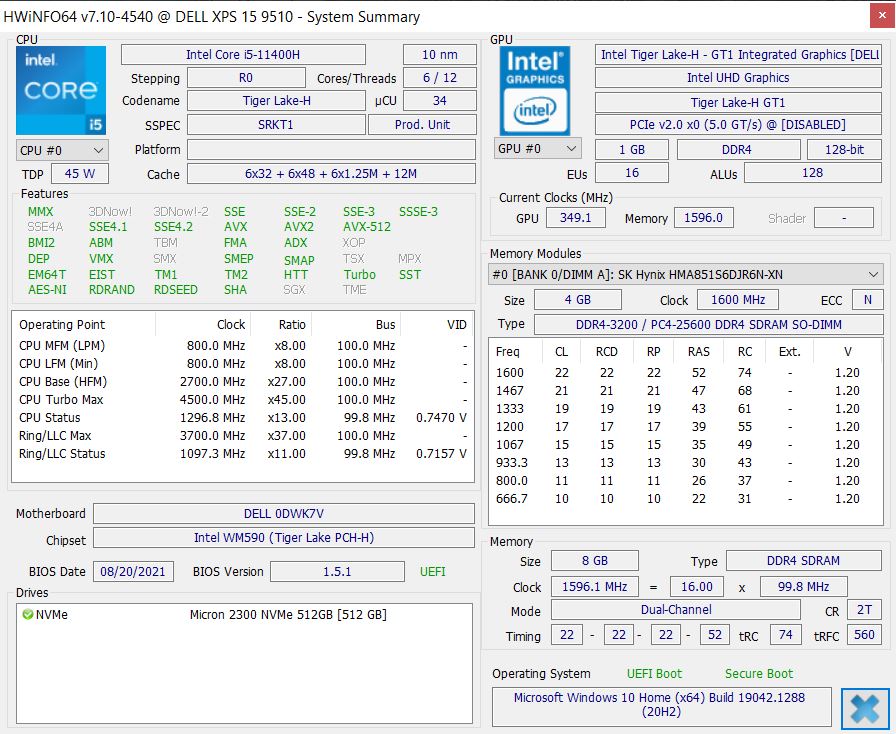
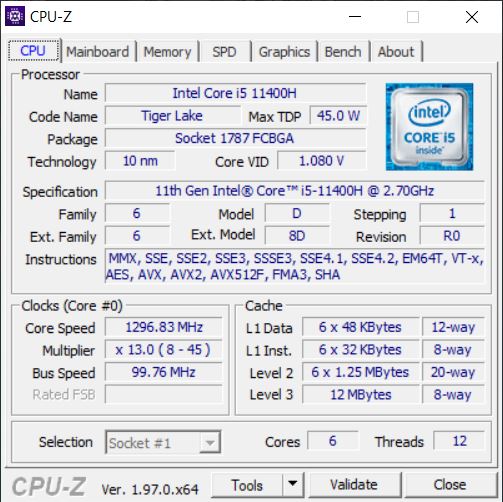
Procesador - Core i5-11400H
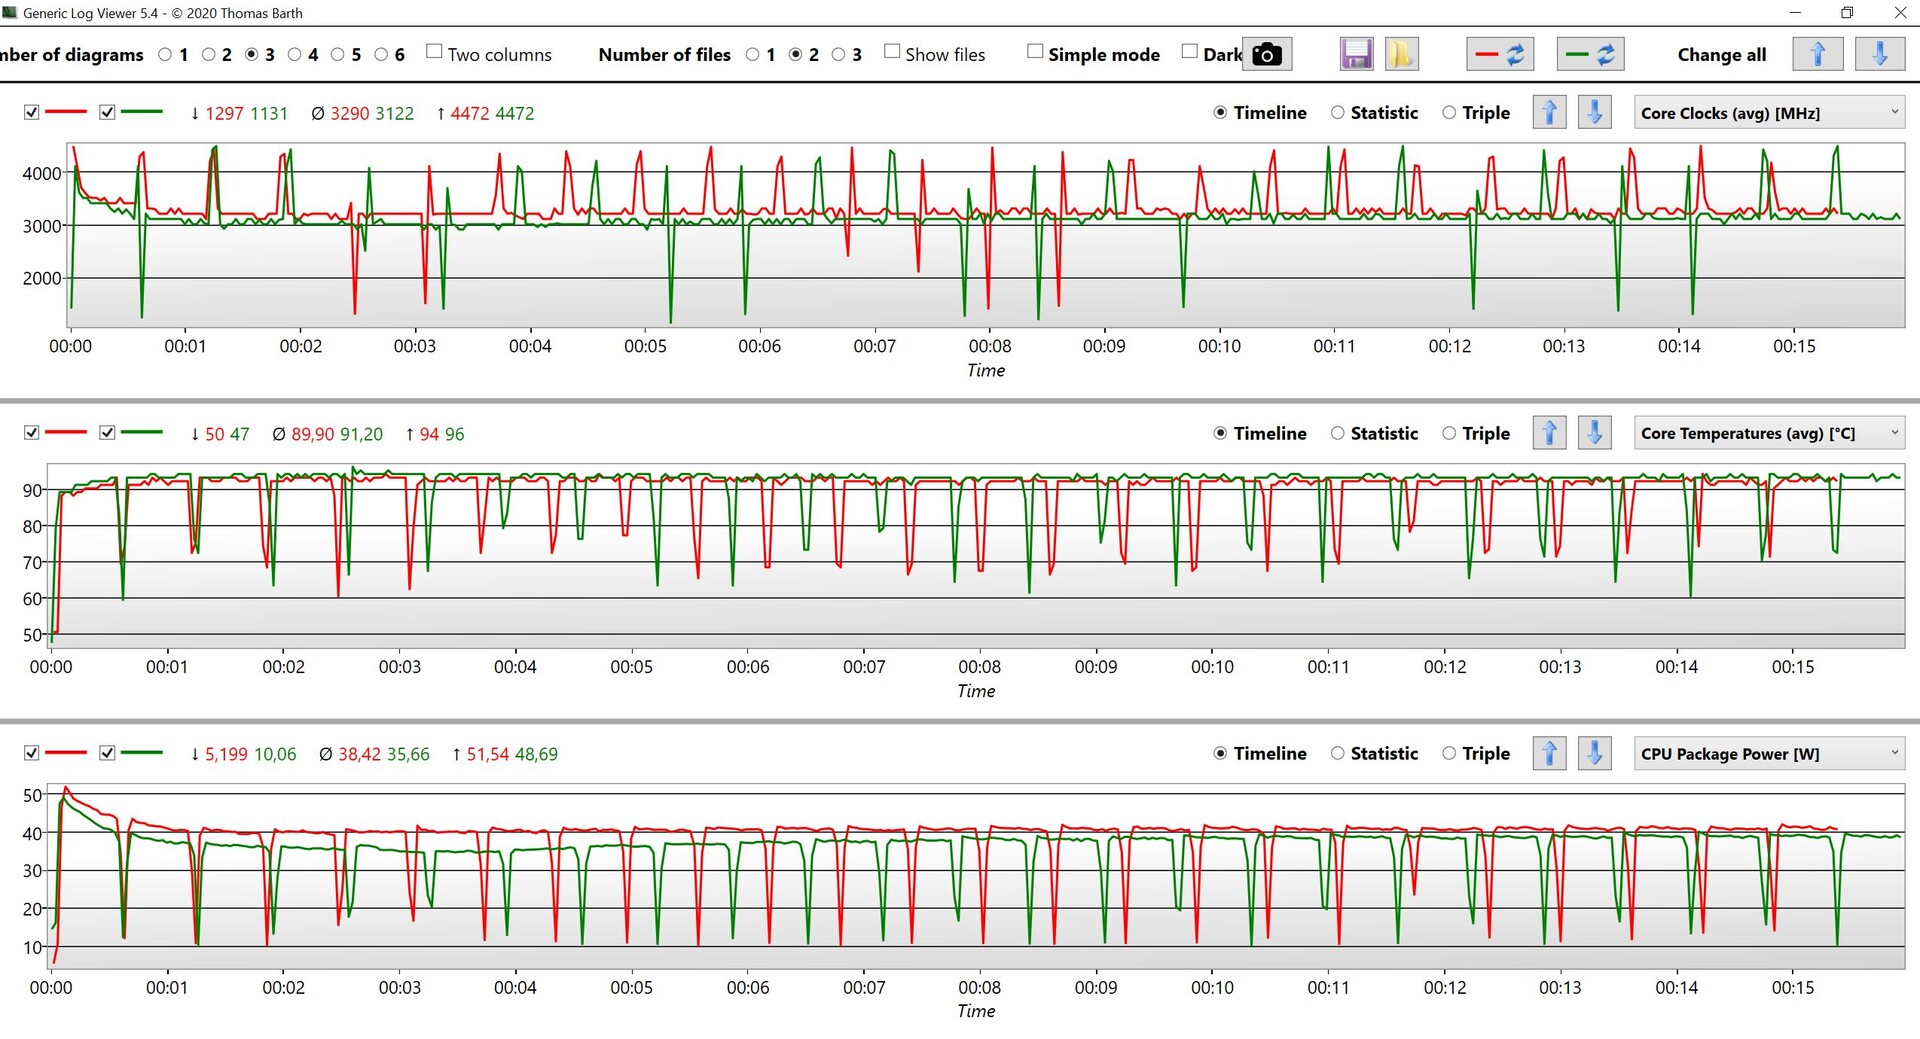
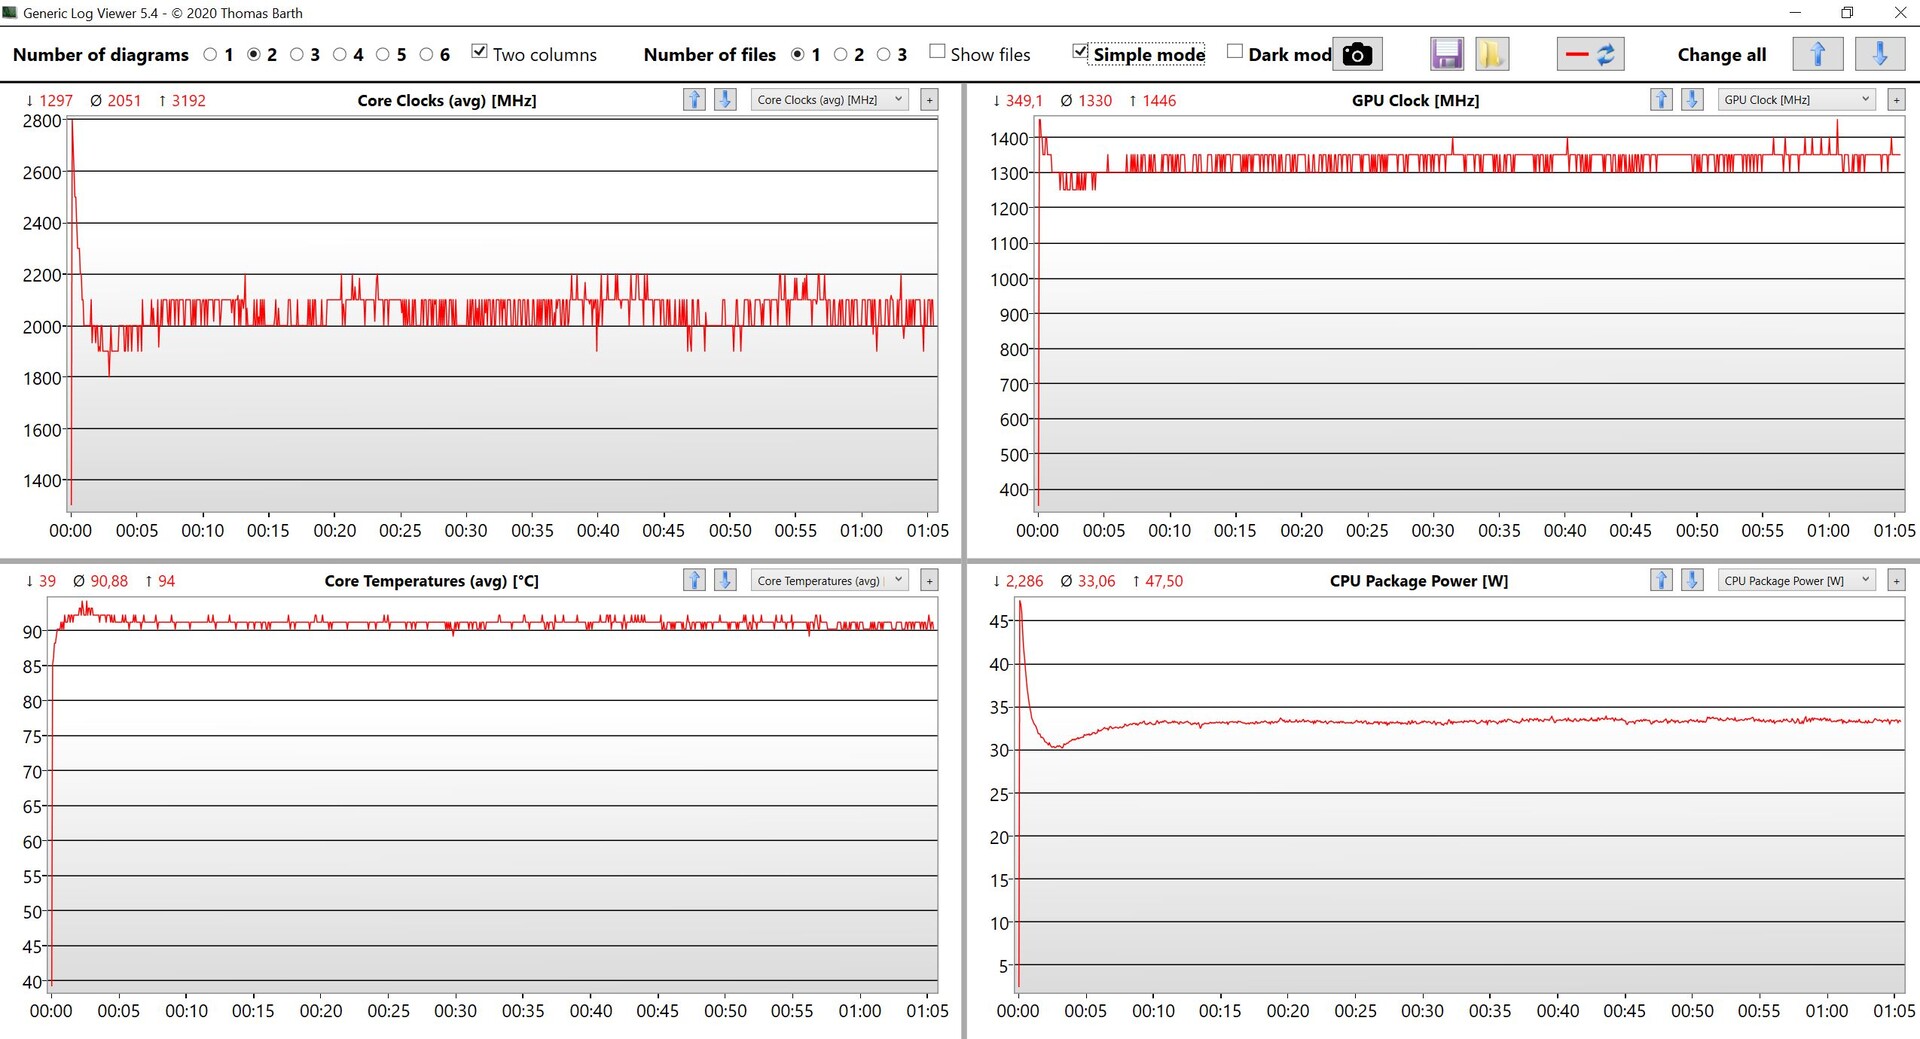
ElCore i5-11400Hes un procesador hexacore que es capaz de alcanzar una velocidad máxima de 4,5 GHz en un solo núcleo y 4,1 GHz en todos los núcleos. Al principio, el procesador se acerca a la marca de los 50 vatios, pero luego se nivela rápidamente por debajo de los 40 vatios (o a 40 vatios en el modo de Ultra Rendimiento). Debido a la potente refrigeración, habríamos esperado que fuera capaz de utilizar todo el potencial del Core i5-11400H.
En comparación con el antiguo Core i5-10300H(quadcore) delXPS 15 9500hay una ventaja de rendimiento de alrededor del 30%, pero el nuevo procesador hexacore apenas es más rápido que el Core i7-11370Hde cuatro núcleos del MateBook 14s. El nuevoHuawei MateBook 16también muestra de forma impresionante lo que es posible con un procesador Ryzen actual de 45 vatios de AMD (~70% más rápido de media en las pruebas múltiples @54 vatios). Si bien el rendimiento es, por supuesto, completamente suficiente para las tareas diarias, está claro que hay cierto potencial desperdiciado aquí.
En funcionamiento de batería, el TDP se reduce a sólo 15 vatios, lo que hace que el rendimiento de la CPU caiga alrededor de un 50% en las pruebas multinúcleo (579 puntos @ CB R15 Multi). Puedes encontrar más pruebas en nuestra sección técnica.
Cinebench R15 Multi Constant Load Test
Cinebench R20: CPU (Multi Core) | CPU (Single Core)
Cinebench R15: CPU Multi 64Bit | CPU Single 64Bit
Blender: v2.79 BMW27 CPU
7-Zip 18.03: 7z b 4 | 7z b 4 -mmt1
Geekbench 5.5: Multi-Core | Single-Core
HWBOT x265 Benchmark v2.2: 4k Preset
LibreOffice : 20 Documents To PDF
R Benchmark 2.5: Overall mean
| Cinebench R23 / Multi Core | |
| Media de la clase Multimedia (4861 - 33362, n=81, últimos 2 años) | |
| Dell XPS 15 9510 11800H RTX 3050 Ti OLED | |
| Medio Intel Core i5-11400H (6674 - 9406, n=7) | |
| Dell XPS 15 9510 i5 11400H FHD | |
| Huawei MateBook 14s i7 | |
| Acer Swift 3 SF316-51 | |
| Schenker Vision 15 | |
| Cinebench R23 / Single Core | |
| Media de la clase Multimedia (1128 - 2459, n=73, últimos 2 años) | |
| Acer Swift 3 SF316-51 | |
| Huawei MateBook 14s i7 | |
| Dell XPS 15 9510 11800H RTX 3050 Ti OLED | |
| Medio Intel Core i5-11400H (1349 - 1472, n=6) | |
| Dell XPS 15 9510 i5 11400H FHD | |
| Schenker Vision 15 | |
| Cinebench R20 / CPU (Multi Core) | |
| Media de la clase Multimedia (1887 - 12912, n=64, últimos 2 años) | |
| Dell XPS 15 9510 11800H RTX 3050 Ti OLED | |
| Honor MagicBook Pro (AMD) | |
| Medio Intel Core i5-11400H (2550 - 3740, n=7) | |
| Dell XPS 15 9510 i5 11400H FHD | |
| Huawei MateBook 14s i7 | |
| Acer Swift 3 SF316-51 | |
| Dell XPS 15 9500 Core i5 | |
| Schenker Vision 15 | |
| Cinebench R20 / CPU (Single Core) | |
| Media de la clase Multimedia (425 - 853, n=64, últimos 2 años) | |
| Acer Swift 3 SF316-51 | |
| Huawei MateBook 14s i7 | |
| Dell XPS 15 9510 11800H RTX 3050 Ti OLED | |
| Dell XPS 15 9510 i5 11400H FHD | |
| Medio Intel Core i5-11400H (522 - 569, n=6) | |
| Schenker Vision 15 | |
| Honor MagicBook Pro (AMD) | |
| Dell XPS 15 9500 Core i5 | |
| Cinebench R15 / CPU Multi 64Bit | |
| Media de la clase Multimedia (856 - 5224, n=68, últimos 2 años) | |
| Dell XPS 15 9510 11800H RTX 3050 Ti OLED | |
| Dell XPS 15 9510 11800H RTX 3050 Ti OLED | |
| Honor MagicBook Pro (AMD) | |
| Medio Intel Core i5-11400H (1014 - 1532, n=7) | |
| Dell XPS 15 9510 i5 11400H FHD | |
| Dell XPS 15 9510 i5 11400H FHD | |
| Huawei MateBook 14s i7 | |
| Schenker Vision 15 | |
| Acer Swift 3 SF316-51 | |
| Dell XPS 15 9500 Core i5 | |
| Cinebench R15 / CPU Single 64Bit | |
| Media de la clase Multimedia (184.8 - 326, n=66, últimos 2 años) | |
| Huawei MateBook 14s i7 | |
| Acer Swift 3 SF316-51 | |
| Schenker Vision 15 | |
| Dell XPS 15 9510 11800H RTX 3050 Ti OLED | |
| Medio Intel Core i5-11400H (202 - 219, n=6) | |
| Dell XPS 15 9510 i5 11400H FHD | |
| Dell XPS 15 9500 Core i5 | |
| Honor MagicBook Pro (AMD) | |
| Blender / v2.79 BMW27 CPU | |
| Schenker Vision 15 | |
| Dell XPS 15 9500 Core i5 | |
| Acer Swift 3 SF316-51 | |
| Huawei MateBook 14s i7 | |
| Dell XPS 15 9510 i5 11400H FHD | |
| Medio Intel Core i5-11400H (340 - 483, n=6) | |
| Honor MagicBook Pro (AMD) | |
| Dell XPS 15 9510 11800H RTX 3050 Ti OLED | |
| Media de la clase Multimedia (100 - 557, n=65, últimos 2 años) | |
| 7-Zip 18.03 / 7z b 4 | |
| Media de la clase Multimedia (29095 - 130368, n=62, últimos 2 años) | |
| Dell XPS 15 9510 11800H RTX 3050 Ti OLED | |
| Honor MagicBook Pro (AMD) | |
| Medio Intel Core i5-11400H (27615 - 40268, n=6) | |
| Dell XPS 15 9510 i5 11400H FHD | |
| Huawei MateBook 14s i7 | |
| Acer Swift 3 SF316-51 | |
| Schenker Vision 15 | |
| Dell XPS 15 9500 Core i5 | |
| 7-Zip 18.03 / 7z b 4 -mmt1 | |
| Media de la clase Multimedia (3666 - 7545, n=63, últimos 2 años) | |
| Dell XPS 15 9510 11800H RTX 3050 Ti OLED | |
| Acer Swift 3 SF316-51 | |
| Huawei MateBook 14s i7 | |
| Medio Intel Core i5-11400H (4802 - 5343, n=6) | |
| Schenker Vision 15 | |
| Dell XPS 15 9510 i5 11400H FHD | |
| Dell XPS 15 9500 Core i5 | |
| Honor MagicBook Pro (AMD) | |
| Geekbench 5.5 / Multi-Core | |
| Media de la clase Multimedia (4652 - 20422, n=62, últimos 2 años) | |
| Dell XPS 15 9510 11800H RTX 3050 Ti OLED | |
| Medio Intel Core i5-11400H (4679 - 7018, n=7) | |
| Acer Swift 3 SF316-51 | |
| Honor MagicBook Pro (AMD) | |
| Huawei MateBook 14s i7 | |
| Dell XPS 15 9510 i5 11400H FHD | |
| Schenker Vision 15 | |
| Dell XPS 15 9500 Core i5 | |
| Geekbench 5.5 / Single-Core | |
| Media de la clase Multimedia (805 - 2974, n=62, últimos 2 años) | |
| Acer Swift 3 SF316-51 | |
| Huawei MateBook 14s i7 | |
| Schenker Vision 15 | |
| Dell XPS 15 9510 11800H RTX 3050 Ti OLED | |
| Dell XPS 15 9510 i5 11400H FHD | |
| Medio Intel Core i5-11400H (1396 - 1528, n=7) | |
| Dell XPS 15 9500 Core i5 | |
| Honor MagicBook Pro (AMD) | |
| HWBOT x265 Benchmark v2.2 / 4k Preset | |
| Media de la clase Multimedia (5.26 - 36.1, n=63, últimos 2 años) | |
| Dell XPS 15 9510 11800H RTX 3050 Ti OLED | |
| Honor MagicBook Pro (AMD) | |
| Medio Intel Core i5-11400H (8.19 - 11.3, n=6) | |
| Dell XPS 15 9510 i5 11400H FHD | |
| Huawei MateBook 14s i7 | |
| Acer Swift 3 SF316-51 | |
| Schenker Vision 15 | |
| Dell XPS 15 9500 Core i5 | |
| LibreOffice / 20 Documents To PDF | |
| Dell XPS 15 9500 Core i5 | |
| Honor MagicBook Pro (AMD) | |
| Media de la clase Multimedia (23.9 - 146.7, n=64, últimos 2 años) | |
| Dell XPS 15 9510 11800H RTX 3050 Ti OLED | |
| Medio Intel Core i5-11400H (41.4 - 53, n=6) | |
| Dell XPS 15 9510 i5 11400H FHD | |
| Schenker Vision 15 | |
| Huawei MateBook 14s i7 | |
| Acer Swift 3 SF316-51 | |
| R Benchmark 2.5 / Overall mean | |
| Dell XPS 15 9500 Core i5 | |
| Honor MagicBook Pro (AMD) | |
| Medio Intel Core i5-11400H (0.581 - 0.644, n=6) | |
| Dell XPS 15 9510 i5 11400H FHD | |
| Schenker Vision 15 | |
| Dell XPS 15 9510 11800H RTX 3050 Ti OLED | |
| Huawei MateBook 14s i7 | |
| Acer Swift 3 SF316-51 | |
| Media de la clase Multimedia (0.3604 - 0.947, n=63, últimos 2 años) | |
* ... más pequeño es mejor
Rendimiento del sistema
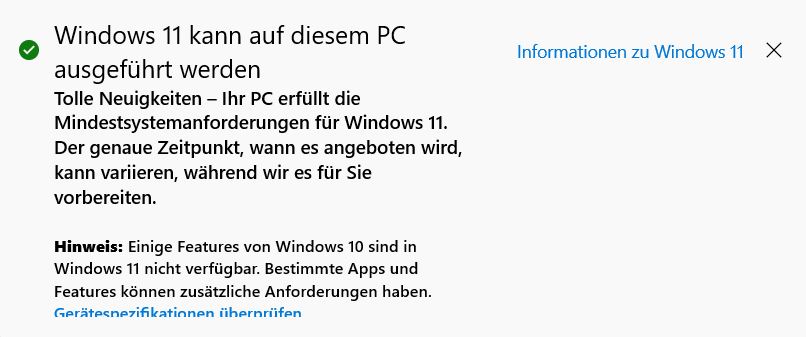
Debido a la combinación relativamente débil de CPU/iGPU, el XPS 15 9510 apenas se sitúa por delante del antiguo XPS 15al final del grupo de comparación en las pruebas sintéticas de PCMark 10. Sin embargo, en las tareas diarias esto no se nota, y el XPS 15 es simplemente un ordenador muy sensible, lo que por supuesto también se debe al rápido SSD PCIe. El XPS 15 9510 es compatible con Windows 11.
| PCMark 10 / Score | |
| Media de la clase Multimedia (4325 - 10386, n=58, últimos 2 años) | |
| Dell XPS 15 9510 11800H RTX 3050 Ti OLED | |
| Acer Swift 3 SF316-51 | |
| Huawei MateBook 14s i7 | |
| Schenker Vision 15 | |
| Honor MagicBook Pro (AMD) | |
| Medio Intel Core i5-11400H, Intel UHD Graphics Xe 16EUs (4502 - 4525, n=2) | |
| Dell XPS 15 9510 i5 11400H FHD | |
| Dell XPS 15 9500 Core i5 | |
| PCMark 10 / Essentials | |
| Huawei MateBook 14s i7 | |
| Schenker Vision 15 | |
| Media de la clase Multimedia (8025 - 11664, n=57, últimos 2 años) | |
| Acer Swift 3 SF316-51 | |
| Dell XPS 15 9500 Core i5 | |
| Dell XPS 15 9510 11800H RTX 3050 Ti OLED | |
| Medio Intel Core i5-11400H, Intel UHD Graphics Xe 16EUs (9463 - 9513, n=2) | |
| Dell XPS 15 9510 i5 11400H FHD | |
| Honor MagicBook Pro (AMD) | |
| PCMark 10 / Productivity | |
| Media de la clase Multimedia (7323 - 18233, n=57, últimos 2 años) | |
| Dell XPS 15 9510 11800H RTX 3050 Ti OLED | |
| Acer Swift 3 SF316-51 | |
| Honor MagicBook Pro (AMD) | |
| Huawei MateBook 14s i7 | |
| Dell XPS 15 9500 Core i5 | |
| Schenker Vision 15 | |
| Medio Intel Core i5-11400H, Intel UHD Graphics Xe 16EUs (6466 - 6495, n=2) | |
| Dell XPS 15 9510 i5 11400H FHD | |
| PCMark 10 / Digital Content Creation | |
| Media de la clase Multimedia (3651 - 16240, n=57, últimos 2 años) | |
| Dell XPS 15 9510 11800H RTX 3050 Ti OLED | |
| Acer Swift 3 SF316-51 | |
| Huawei MateBook 14s i7 | |
| Honor MagicBook Pro (AMD) | |
| Schenker Vision 15 | |
| Medio Intel Core i5-11400H, Intel UHD Graphics Xe 16EUs (4047 - 4072, n=2) | |
| Dell XPS 15 9510 i5 11400H FHD | |
| Dell XPS 15 9500 Core i5 | |
| PCMark 10 Score | 4502 puntos | |
ayuda | ||
Latencias del CPD
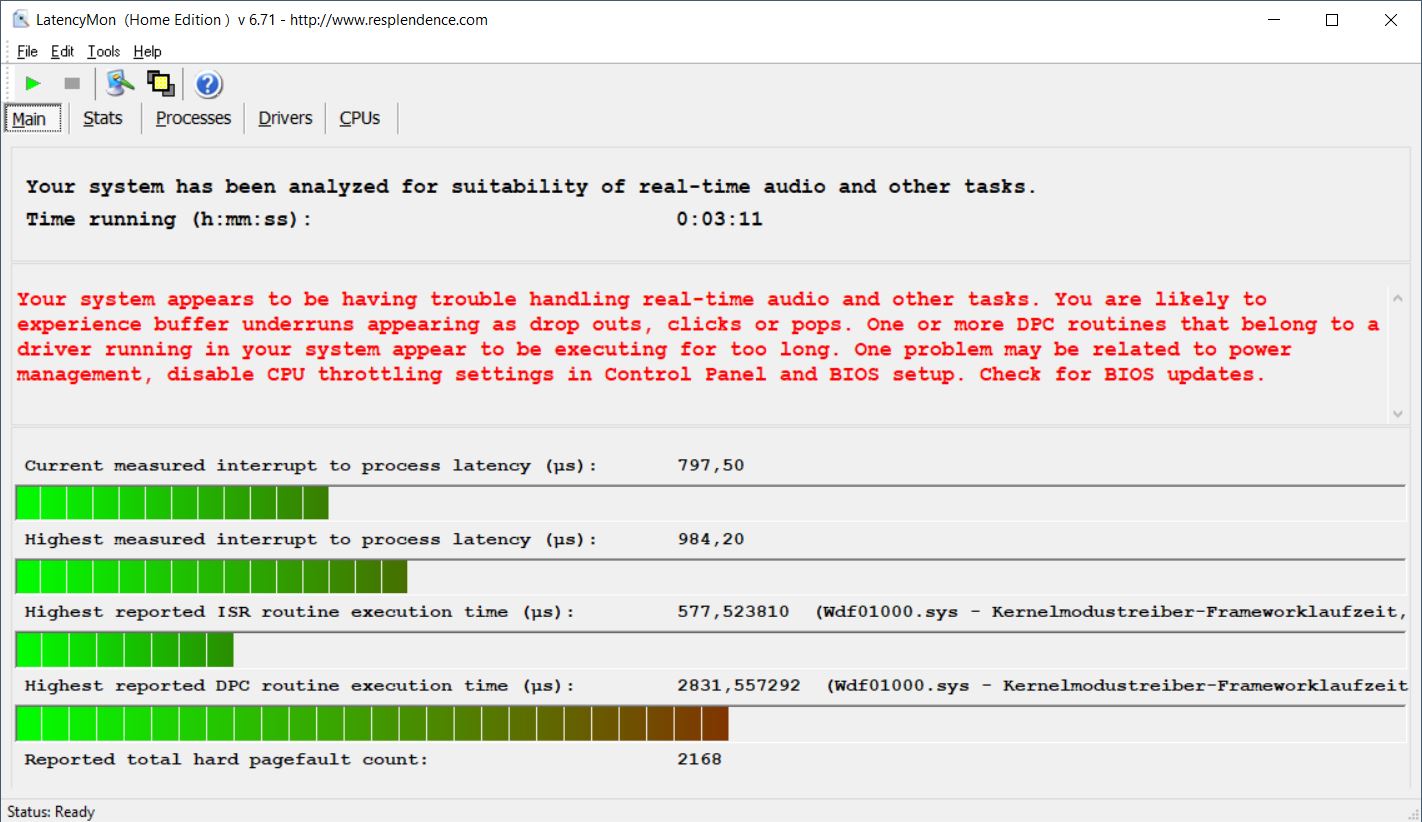
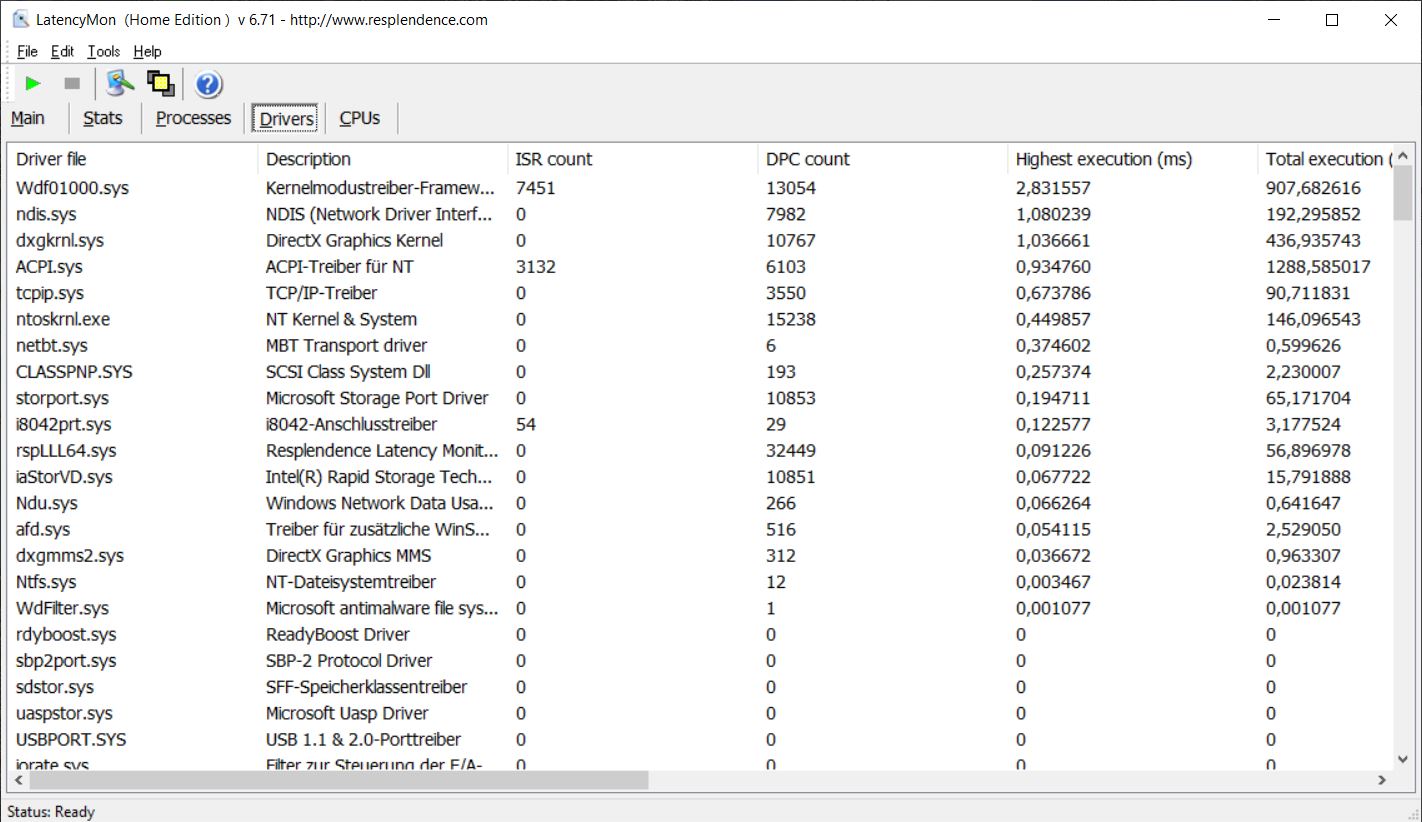
| DPC Latencies / LatencyMon - interrupt to process latency (max), Web, Youtube, Prime95 | |
| Schenker Vision 15 | |
| Dell XPS 15 9510 11800H RTX 3050 Ti OLED | |
| Dell XPS 15 9500 Core i5 | |
| Honor MagicBook Pro (AMD) | |
| Dell XPS 15 9510 i5 11400H FHD | |
| Huawei MateBook 14s i7 | |
| Acer Swift 3 SF316-51 | |
* ... más pequeño es mejor
Solución de almacenamiento
Nuestra unidad de pruebas está equipada con un rápido SSD PCIe 3.0 de Micron, que ofrece una capacidad de almacenamiento de 512 GB (411 GB disponibles tras encenderlo por primera vez). Gracias a la segunda ranura M.2 2280, la capacidad de almacenamiento puede ampliarse fácilmente si es necesario. Puedes encontrar más pruebas de SSD aquí.
| Dell XPS 15 9510 i5 11400H FHD Micron 2300 512GB MTFDHBA512TDV | Huawei MateBook 14s i7 Toshiba XG6 KXG60ZNV512G | Acer Swift 3 SF316-51 Micron 2210 MTFDHBA512QFD | Honor MagicBook Pro (AMD) WDC PC SN730 SDBPNTY-512G | Dell XPS 15 9500 Core i5 Toshiba KBG40ZNS256G NVMe | Dell XPS 15 9510 11800H RTX 3050 Ti OLED Micron 2300 512GB MTFDHBA512TDV | Schenker Vision 15 Samsung SSD 980 Pro 1TB MZ-V8P1T0BW | Medio Micron 2300 512GB MTFDHBA512TDV | Media de la clase Multimedia | |
|---|---|---|---|---|---|---|---|---|---|
| CrystalDiskMark 5.2 / 6 | 28% | -2% | -6% | -30% | -2% | 88% | -1% | 42% | |
| Write 4K (MB/s) | 110.3 | 209.4 90% | 171.8 56% | 156.9 42% | 93.3 -15% | 109.3 -1% | 238.1 116% | 105.5 ? -4% | 163.8 ? 49% |
| Read 4K (MB/s) | 57.1 | 56.8 -1% | 79.4 39% | 48.81 -15% | 45.9 -20% | 53.9 -6% | 79.2 39% | 51.2 ? -10% | 67.5 ? 18% |
| Write Seq (MB/s) | 1958 | 1099 -44% | 1050 -46% | 1211 -38% | 1991 2% | 4139 111% | 2041 ? 4% | 2715 ? 39% | |
| Read Seq (MB/s) | 1781 | 1847 4% | 2517 41% | 1633 -8% | 1759 -1% | 4133 132% | 1845 ? 4% | 3120 ? 75% | |
| Write 4K Q32T1 (MB/s) | 495.7 | 606 22% | 539 9% | 408.7 -18% | 273.1 -45% | 499.8 1% | 697 41% | 494 ? 0% | 454 ? -8% |
| Read 4K Q32T1 (MB/s) | 474.4 | 792 67% | 555 17% | 504 6% | 356 -25% | 438.8 -8% | 758 60% | 445 ? -6% | 581 ? 22% |
| Write Seq Q32T1 (MB/s) | 2839 | 2322 -18% | 1095 -61% | 1087 -62% | 1198 -58% | 2835 0% | 5187 83% | 2867 ? 1% | 4593 ? 62% |
| Read Seq Q32T1 (MB/s) | 3243 | 3511 8% | 1988 -39% | 3407 5% | 2269 -30% | 3235 0% | 7117 119% | 3272 ? 1% | 5776 ? 78% |
| Write 4K Q8T8 (MB/s) | 1573 | 1077 ? | |||||||
| Read 4K Q8T8 (MB/s) | 1202 | 1365 ? | |||||||
| AS SSD | 46% | 11% | 74% | -55% | -8% | 135% | 10% | 75% | |
| Seq Read (MB/s) | 2602 | 2961 14% | 2015 -23% | 2749 6% | 1423 -45% | 1362 -48% | 5427 109% | 2300 ? -12% | 4442 ? 71% |
| Seq Write (MB/s) | 976 | 2098 115% | 1055 8% | 2348 141% | 766 -22% | 1440 48% | 3886 298% | 1550 ? 59% | 3060 ? 214% |
| 4K Read (MB/s) | 42.99 | 53 23% | 73.9 72% | 44.22 3% | 42.21 -2% | 38.43 -11% | 72.9 70% | 45 ? 5% | 61.2 ? 42% |
| 4K Write (MB/s) | 127.1 | 186.9 47% | 223.2 76% | 140.5 11% | 74.8 -41% | 121.4 -4% | 219.3 73% | 106.6 ? -16% | 185.6 ? 46% |
| 4K-64 Read (MB/s) | 383.3 | 1131 195% | 589 54% | 1450 278% | 973 154% | 370.5 -3% | 2209 476% | 676 ? 76% | 1085 ? 183% |
| 4K-64 Write (MB/s) | 1346 | 1502 12% | 1029 -24% | 2346 74% | 218.8 -84% | 1054 -22% | 2265 68% | 1616 ? 20% | 2213 ? 64% |
| Access Time Read * (ms) | 0.037 | 0.029 22% | 0.056 -51% | 0.079 -114% | 0.125 -238% | 0.042 -14% | 0.033 11% | 0.059 ? -59% | 0.05759 ? -56% |
| Access Time Write * (ms) | 0.117 | 0.026 78% | 0.039 67% | 0.027 77% | 0.552 -372% | 0.135 -15% | 0.02 83% | 0.1807 ? -54% | 0.07513 ? 36% |
| Score Read (Points) | 687 | 1480 115% | 865 26% | 1769 157% | 1157 68% | 545 -21% | 2825 311% | 952 ? 39% | 1590 ? 131% |
| Score Write (Points) | 1571 | 1899 21% | 1358 -14% | 2721 73% | 370 -76% | 1319 -16% | 2873 83% | 1877 ? 19% | 2705 ? 72% |
| Score Total (Points) | 2541 | 4102 61% | 2644 4% | 5376 112% | 2094 -18% | 2160 -15% | 7069 178% | 3290 ? 29% | 5052 ? 99% |
| Copy ISO MB/s (MB/s) | 1074 | 1512 41% | 1186 10% | 1151 7% | 1406 31% | 2775 158% | 1603 ? 49% | 2777 ? 159% | |
| Copy Program MB/s (MB/s) | 874 | 376.3 -57% | 782 -11% | 499.4 -43% | 844 -3% | 662 -24% | 843 ? -4% | 852 ? -3% | |
| Copy Game MB/s (MB/s) | 1805 | 1115 -38% | 1028 -43% | 733 -59% | 1353 -25% | 1655 -8% | 1570 ? -13% | 1723 ? -5% | |
| Media total (Programa/Opciones) | 37% /
41% | 5% /
6% | 34% /
41% | -43% /
-46% | -5% /
-6% | 112% /
118% | 5% /
6% | 59% /
63% |
* ... más pequeño es mejor

Constant Performance Reading: DiskSpd Read Loop, Queue Depth 8
Tarjeta gráfica
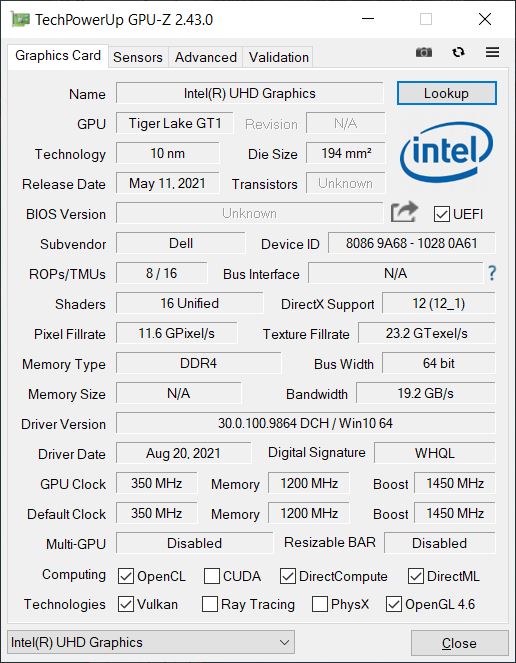
La mayor diferencia entre el i5-11400H y otras CPUs Tiger Lake H45 es la GPU integrada, ya que sólo hay un chip gráfico UHD Graphics Xe reducido con 16 UE (Core i7-11800H: 32 EUs, Core i7-11370H: 96 EUs). El rendimiento gráfico puro está, por tanto, sólo al nivel del antiguo XPS 15 9500 con elUHD Graphics 630a pesar de que ya se utiliza la RAM de doble canal. La única ventaja de la nueva iGPU es el decodificador de vídeo mejorado de la generación Tiger Lake, que reduce significativamente la carga de la GPU durante la reproducción de vídeo 4K (~30% vs. 60% para el antiguo UHD Graphics 630).
Con esta configuración, el XPS 15 apenas es adecuado para jugar, y muchos juegos no se ejecutan con fluidez ni siquiera con los ajustes de detalle mínimos. Los que aún quieran jugar deberían concentrarse en juegos sencillos de la tienda Windows.
El rendimiento gráfico se mantiene estable bajo carga constante, así como durante el funcionamiento en batería. Puedes encontrar más pruebas de rendimiento aquí.
| 3DMark 06 Standard Score | 12803 puntos | |
| 3DMark Vantage P Result | 7609 puntos | |
| 3DMark 11 Performance | 1979 puntos | |
| 3DMark Ice Storm Standard Score | 57212 puntos | |
| 3DMark Cloud Gate Standard Score | 10288 puntos | |
| 3DMark Fire Strike Score | 1298 puntos | |
| 3DMark Time Spy Score | 433 puntos | |
ayuda | ||
| bajo | medio | alto | ultra | |
|---|---|---|---|---|
| GTA V (2015) | 62.8 | 50 | 9.2 | |
| The Witcher 3 (2015) | 27 | 17 | 9 | 5 |
| Dota 2 Reborn (2015) | 108 | 57 | 23.1 | 21.5 |
| Final Fantasy XV Benchmark (2018) | 14.6 | 6.87 | 4.79 | |
| X-Plane 11.11 (2018) | 18.4 | 16.8 | 15.4 | |
| Strange Brigade (2018) | 31 | 12 | 11 | 7 |
| F1 2020 (2020) | 26 | 12 | ||
| F1 2021 (2021) | 34 |
Emissions and Power
Emisiones acústicas
La ventaja del bajo rendimiento radica en los silenciosos ventiladores que prácticamente no se oyen en el funcionamiento cotidiano (navegación por Internet, streaming de vídeo). Incluso a plena carga, se tarda unos minutos en alcanzar el nivel máximo de casi 38 dB(A). No notamos ningún otro ruido electrónico, como el silbido de la bobina.
Ruido
| Ocioso |
| 24.4 / 24.4 / 24.4 dB(A) |
| Carga |
| 26.1 / 37.7 dB(A) |
 | ||
30 dB silencioso 40 dB(A) audible 50 dB(A) ruidosamente alto |
||
min: | ||
| Dell XPS 15 9510 i5 11400H FHD UHD Graphics Xe 16EUs, i5-11400H, Micron 2300 512GB MTFDHBA512TDV | Huawei MateBook 14s i7 Iris Xe G7 96EUs, i7-11370H, Toshiba XG6 KXG60ZNV512G | Acer Swift 3 SF316-51 Iris Xe G7 96EUs, i7-11370H, Micron 2210 MTFDHBA512QFD | Honor MagicBook Pro (AMD) Vega 6, R5 4600H, WDC PC SN730 SDBPNTY-512G | Dell XPS 15 9500 Core i5 UHD Graphics 630, i5-10300H, Toshiba KBG40ZNS256G NVMe | Dell XPS 15 9510 11800H RTX 3050 Ti OLED GeForce RTX 3050 Ti Laptop GPU, i7-11800H, Micron 2300 512GB MTFDHBA512TDV | Schenker Vision 15 Iris Xe G7 96EUs, i7-1165G7, Samsung SSD 980 Pro 1TB MZ-V8P1T0BW | |
|---|---|---|---|---|---|---|---|
| Noise | -8% | -11% | -14% | -13% | -6% | -25% | |
| apagado / medio ambiente * (dB) | 24.4 | 24.3 -0% | 26 -7% | 29.7 -22% | 28 -15% | 23.8 2% | 29.8 -22% |
| Idle Minimum * (dB) | 24.4 | 24.3 -0% | 26 -7% | 29.7 -22% | 28 -15% | 23.8 2% | 29.8 -22% |
| Idle Average * (dB) | 24.4 | 24.3 -0% | 26 -7% | 29.7 -22% | 28 -15% | 23.8 2% | 29.8 -22% |
| Idle Maximum * (dB) | 24.4 | 28.4 -16% | 27.7 -14% | 30.5 -25% | 28 -15% | 23.8 2% | 31.1 -27% |
| Load Average * (dB) | 26.1 | 31.7 -21% | 32.7 -25% | 31 -19% | 28 -7% | 36 -38% | 40.5 -55% |
| Witcher 3 ultra * (dB) | 33.2 | 31.7 5% | 31.3 6% | 36 -8% | 40.5 -22% | ||
| Load Maximum * (dB) | 37.7 | 46.8 -24% | 39 -3% | 36.7 3% | 41.9 -11% | 38.2 -1% | 40.5 -7% |
* ... más pequeño es mejor
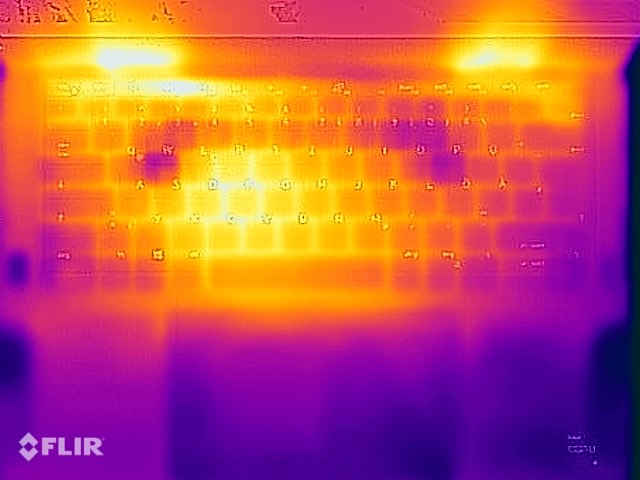
Temperatura
Las temperaturas superficiales no dan motivos de preocupación en ninguna situación, y puedes colocar el ordenador en tu regazo incluso bajo carga. Durante la prueba de estrés, el rendimiento se reduce aún más, y se nivela a sólo 34 vatios (CPU: ~2 GHz, iGPU: ~1.3 GHz), lo que vuelve a ser muy poco.
(±) La temperatura máxima en la parte superior es de 42.8 °C / 109 F, frente a la media de 36.8 °C / 98 F, que oscila entre 21 y 71 °C para la clase Multimedia.
(±) El fondo se calienta hasta un máximo de 41.2 °C / 106 F, frente a la media de 39.1 °C / 102 F
(+) En reposo, la temperatura media de la parte superior es de 25.2 °C / 77# F, frente a la media del dispositivo de 31.3 °C / 88 F.
(±) Jugando a The Witcher 3, la temperatura media de la parte superior es de 34.5 °C / 94 F, frente a la media del dispositivo de 31.3 °C / 88 F.
(+) El reposamanos y el panel táctil están a una temperatura inferior a la de la piel, con un máximo de 31.5 °C / 88.7 F y, por tanto, son fríos al tacto.
(-) La temperatura media de la zona del reposamanos de dispositivos similares fue de 28.7 °C / 83.7 F (-2.8 °C / -5 F).

Altavoces
Dell XPS 15 9510 i5 11400H FHD análisis de audio
(+) | los altavoces pueden reproducir a un volumen relativamente alto (#88.8 dB)
Graves 100 - 315 Hz
(±) | lubina reducida - en promedio 5.6% inferior a la mediana
(+) | el bajo es lineal (4.3% delta a la frecuencia anterior)
Medios 400 - 2000 Hz
(+) | medios equilibrados - a sólo 3.9% de la mediana
(+) | los medios son lineales (4.1% delta a la frecuencia anterior)
Altos 2 - 16 kHz
(+) | máximos equilibrados - a sólo 2.4% de la mediana
(+) | los máximos son lineales (4.9% delta a la frecuencia anterior)
Total 100 - 16.000 Hz
(+) | el sonido global es lineal (8.4% de diferencia con la mediana)
En comparación con la misma clase
» 9% de todos los dispositivos probados de esta clase eran mejores, 2% similares, 89% peores
» El mejor tuvo un delta de 5%, la media fue 17%, el peor fue ###max##%
En comparación con todos los dispositivos probados
» 2% de todos los dispositivos probados eran mejores, 1% similares, 97% peores
» El mejor tuvo un delta de 4%, la media fue 24%, el peor fue ###max##%
Acer Swift 3 SF316-51 análisis de audio
(±) | la sonoridad del altavoz es media pero buena (75.2 dB)
Graves 100 - 315 Hz
(-) | casi sin bajos - de media 25.5% inferior a la mediana
(±) | la linealidad de los graves es media (12.1% delta a frecuencia anterior)
Medios 400 - 2000 Hz
(+) | medios equilibrados - a sólo 2.7% de la mediana
(+) | los medios son lineales (5.2% delta a la frecuencia anterior)
Altos 2 - 16 kHz
(+) | máximos equilibrados - a sólo 3.8% de la mediana
(+) | los máximos son lineales (2.9% delta a la frecuencia anterior)
Total 100 - 16.000 Hz
(±) | la linealidad del sonido global es media (17.7% de diferencia con la mediana)
En comparación con la misma clase
» 51% de todos los dispositivos probados de esta clase eran mejores, 7% similares, 42% peores
» El mejor tuvo un delta de 5%, la media fue 17%, el peor fue ###max##%
En comparación con todos los dispositivos probados
» 35% de todos los dispositivos probados eran mejores, 8% similares, 57% peores
» El mejor tuvo un delta de 4%, la media fue 24%, el peor fue ###max##%
Consumo de energía
Teniendo en cuenta la gran y muy brillante pantalla, el consumo en inactividad del XPS 15 es muy bajo. Por cierto, el modelo básico viene con una fuente de alimentación más débil de 90 vatios (USB-C), mientras que el XPS 15 de gama alta incluye una fuente de alimentación de 130 vatios). Sin embargo, dado que el consumo máximo durante el test de estrés es de sólo 76 vatios y luego se nivela rápidamente a 57 vatios, la fuente de alimentación de 90 vatios es completamente suficiente.
| Off / Standby | |
| Ocioso | |
| Carga |
|
Clave:
min: | |
Power Consumption Witcher 3 / Stress Test
Duración de la batería
El eficiente panel FHD también se hace notar en términos de duración de la batería, y a pesar de la batería más pequeña, en la práctica es posible una duración de 6,5 a 7,5 horas en nuestra prueba WLAN (dependiendo del brillo; 150 cd/m² @24%). Sin embargo, también hay algo de potencial desperdiciado aquí, ya que con la batería más grande de 86-Wh, 10-11 horas probablemente serían posibles aquí. Aunque el XPS i5 sigue estando por delante de su Hermano OLEDtermina en último lugar de nuestro grupo de comparación en general.
Pro
Contra
Veredicto - El XPS 15 9510 con el Core i5 y la iGPU es demasiado caro
En principio, el concepto de ofrecer un portátil multimedia de alta calidad sin una tarjeta gráfica dedicada definitivamente tiene sentido, porque no todo el mundo quiere también jugar con su portátil. Sin embargo, el nuevo XPS 15 9510 no parece estar bien pensado en este sentido, y el i5-11400H utilizado es inadecuado. Se sabe que Dell no usa CPUs AMD para el XPS 15, pero habría sido mejor usar el Core i7-11370H. A pesar de tener dos núcleos de CPU menos, el rendimiento de la CPU en el funcionamiento diario no es notablemente peor, pero la GPU integrada es significativamente más rápida
En general, el rendimiento real de la unidad de pruebas es muy decepcionante. A pesar de tener la misma refrigeración que el modelo de gama alta, el TDP se limita a 40 vatios ya después de varios segundos. El rendimiento gráfico tampoco ha mejorado en comparación con el antiguo XPS 15 9500 iGPU. Pero al menos el XPS 15 permanece casi siempre silencioso en el funcionamiento diario con esto, y los ventiladores permanecen muy silenciosos incluso bajo carga. Si bien esto es probablemente positivo en la operación diaria, al menos en el modo opcional de Ultra Rendimiento, nos hubiera gustado el máximo rendimiento de la CPU, incluso si los ventiladores son más ruidosos entonces.
El modelo iGPU del nuevo XPS 15 9510 es simplemente demasiado caro para el rendimiento ofrecido. Para los que estén interesados en un XPS 15 sin GPU dedicada, recomendamos el antiguo XPS 15 9500, que sigue estando disponible en Dell por 1250 Euros y apenas es más lento.
El display mate Full-HD sigue siendo extremadamente brillante, por lo que es muy adecuado para usarlo en exteriores. El consumo de energía también se mantiene dentro de los límites, pero por desgracia Dell también usa una batería más pequeña en su modelo básico, lo que significa que la duración de la batería tampoco es particularmente buena. Definitivamente hay un potencial desperdiciado aquí. En general, el Schenker Vision 15es una alternativa mejor, y también hay muchos portátiles multimedia con una relación precio-rendimiento mucho mejor, como el Honor MagicBook Proy elAcer Swift 3 16y también el Huawei MateBook 14scon su gran pantalla 3:2. Además, se presenta otro competidor con el MateBook 16, que ofrece un rendimiento significativamente mayor gracias al Procesador Ryzen 7-5800H. Pero si tiene que ser absolutamente el XPS 15 con el brillante panel FHD, recomendamos el XPS 15 9500que apenas ofrece menos rendimiento de CPU para las tareas diarias y sigue estando disponible en Dell por 1250 Euros.
Precio y disponibilidad
Nuestra configuración de prueba está disponible en Dell por unos 1300 dólarescon muchas otras configuraciones también disponibles. Por ejemplo, el modelo con el Core i7-11800H, la GeForce RTX 3050 dedicada, 16 GB de RAM, el panel FHD mate y la batería más grande cuesta unos $1900.
Dell XPS 15 9510 i5 11400H FHD
- 10/20/2021 v7 (old)
Andreas Osthoff
Price comparison

