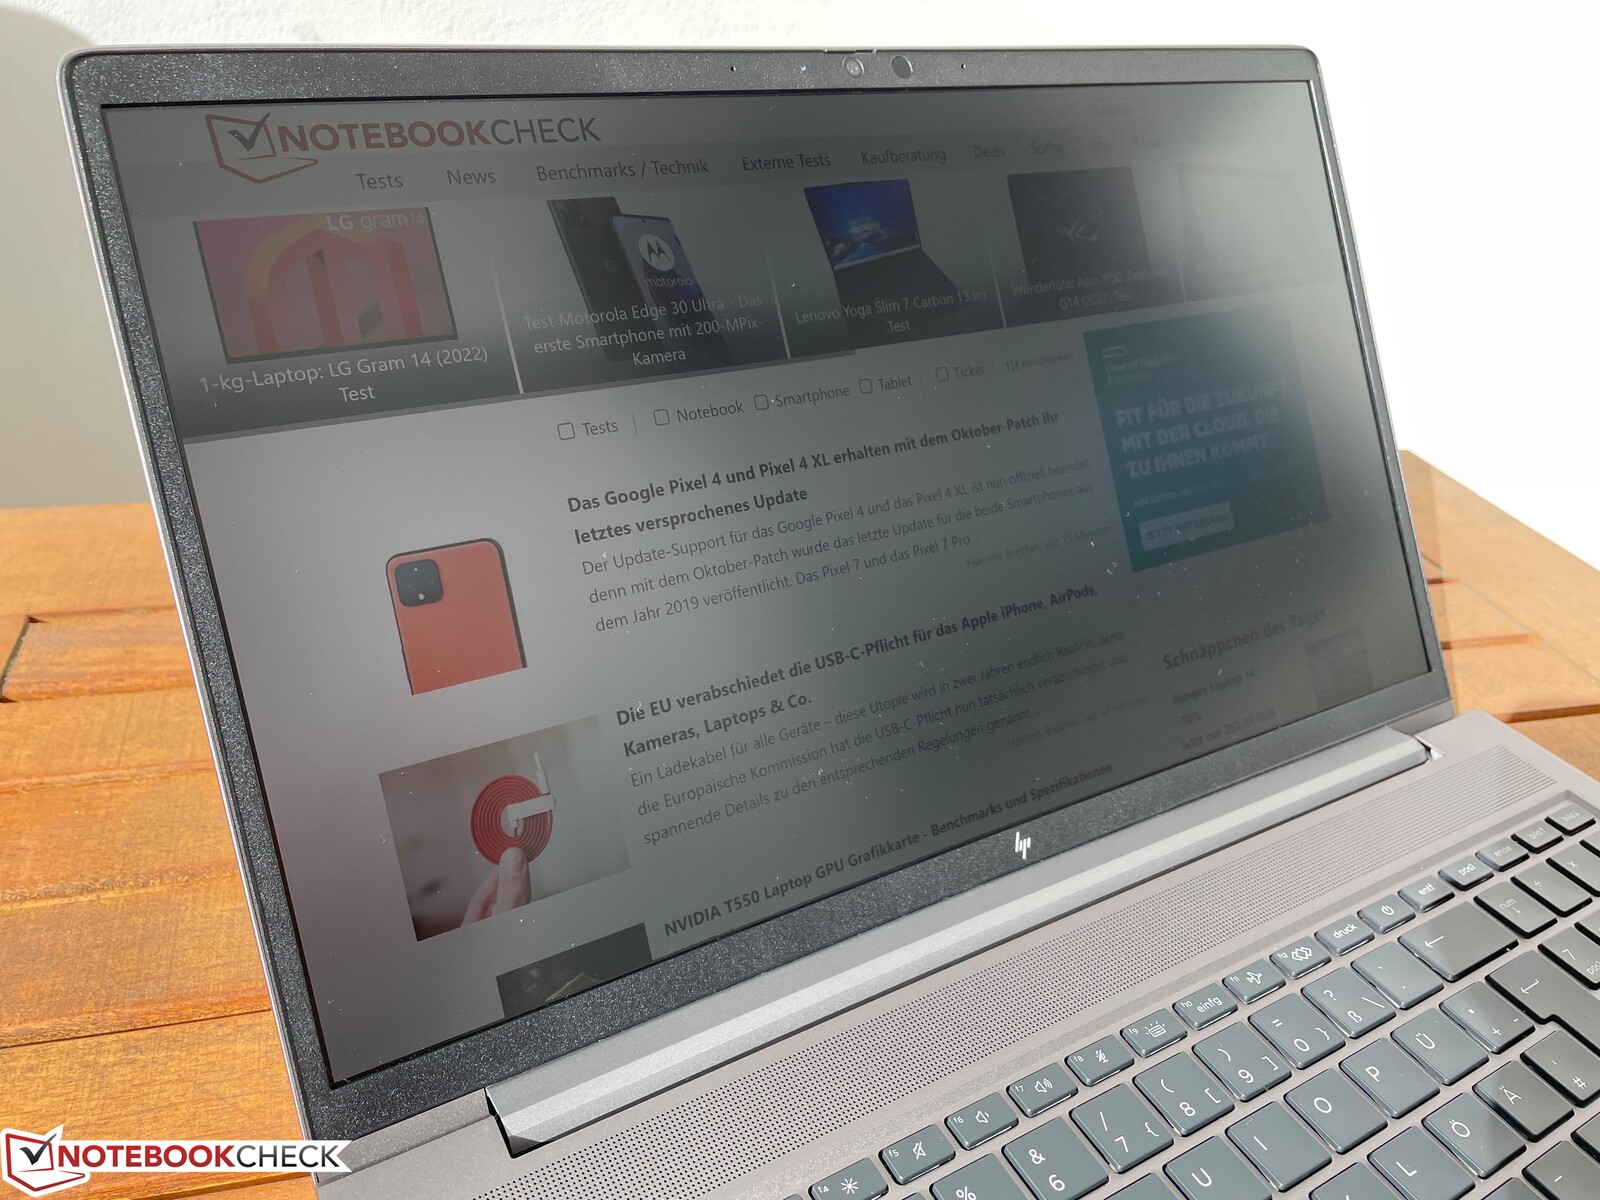
Análisis del portátil HP ZBook Power 15 G9: estación de trabajo móvil con pantalla mate 4K
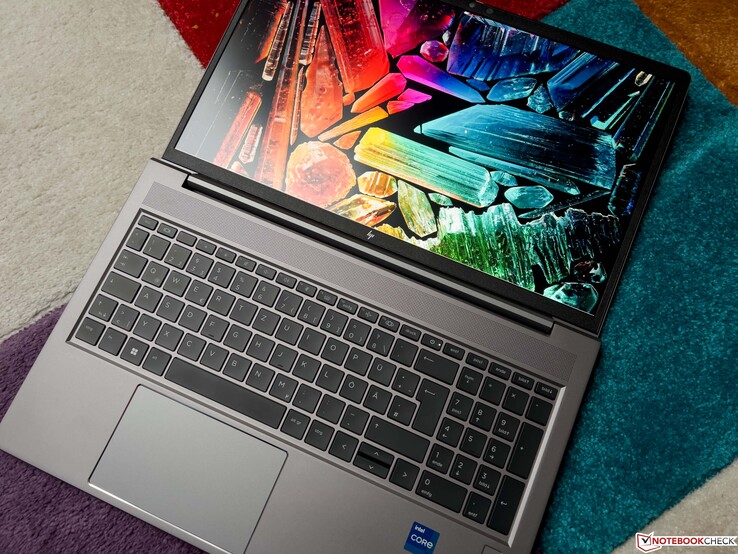
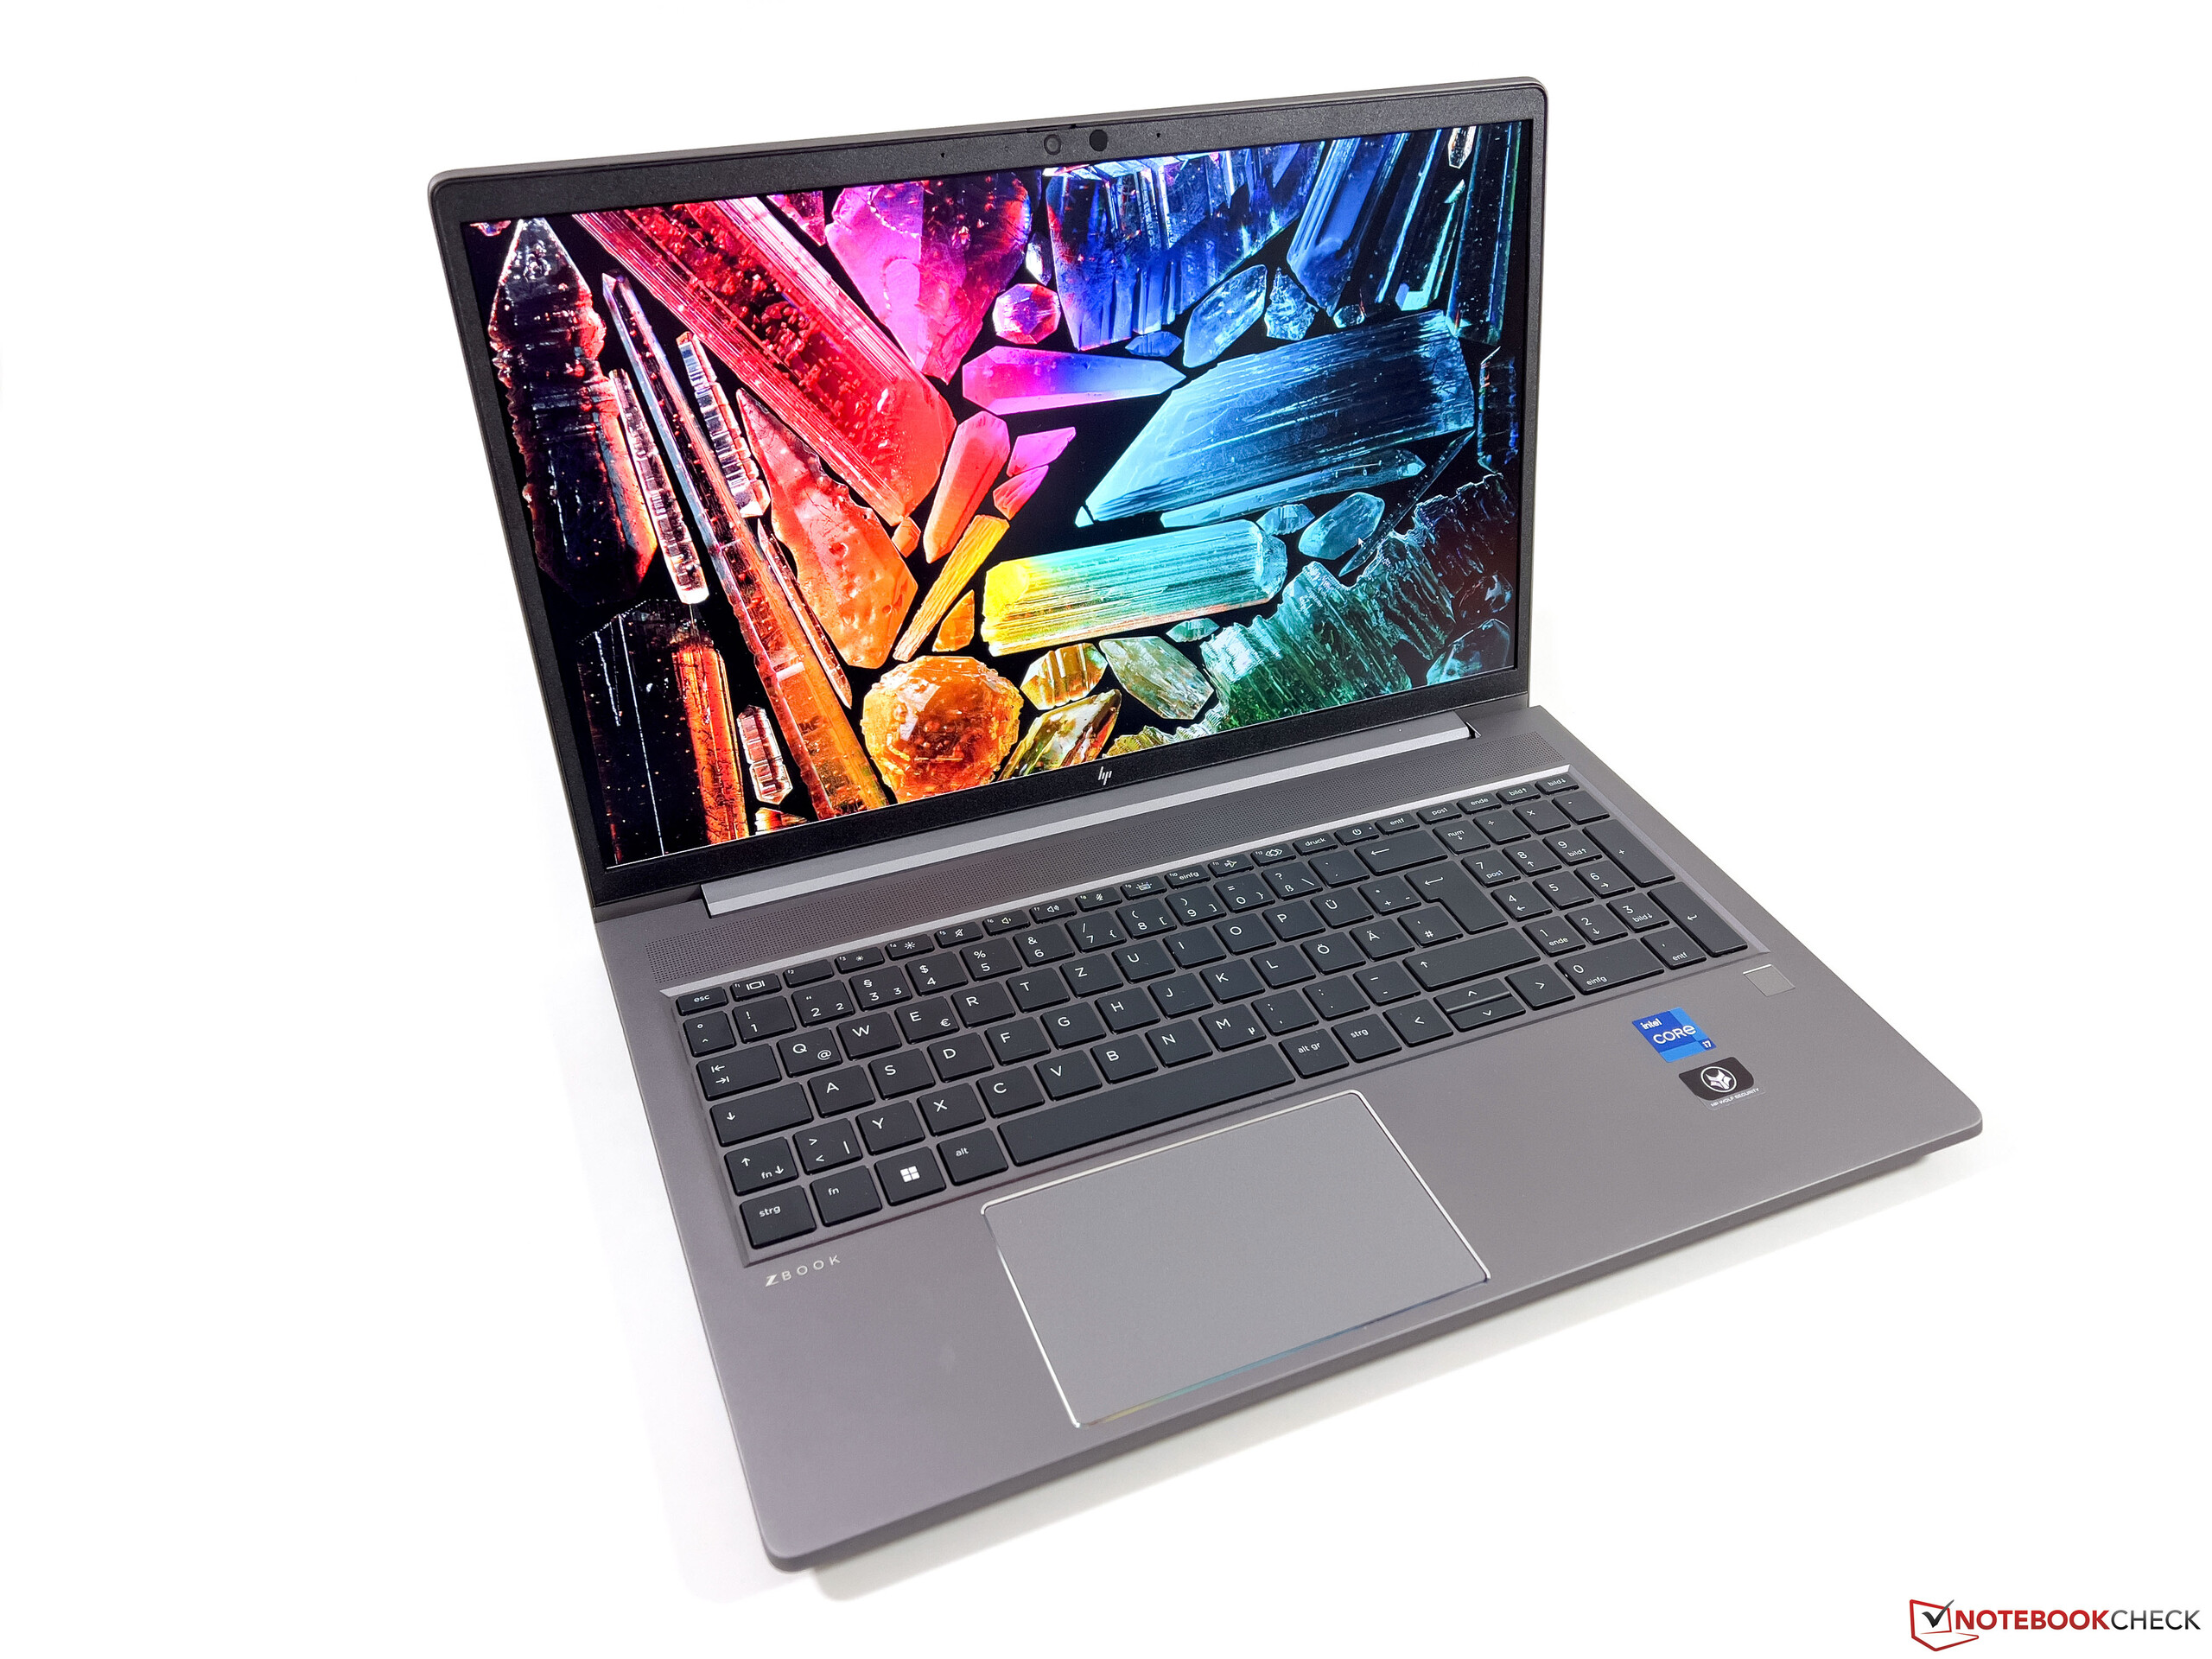
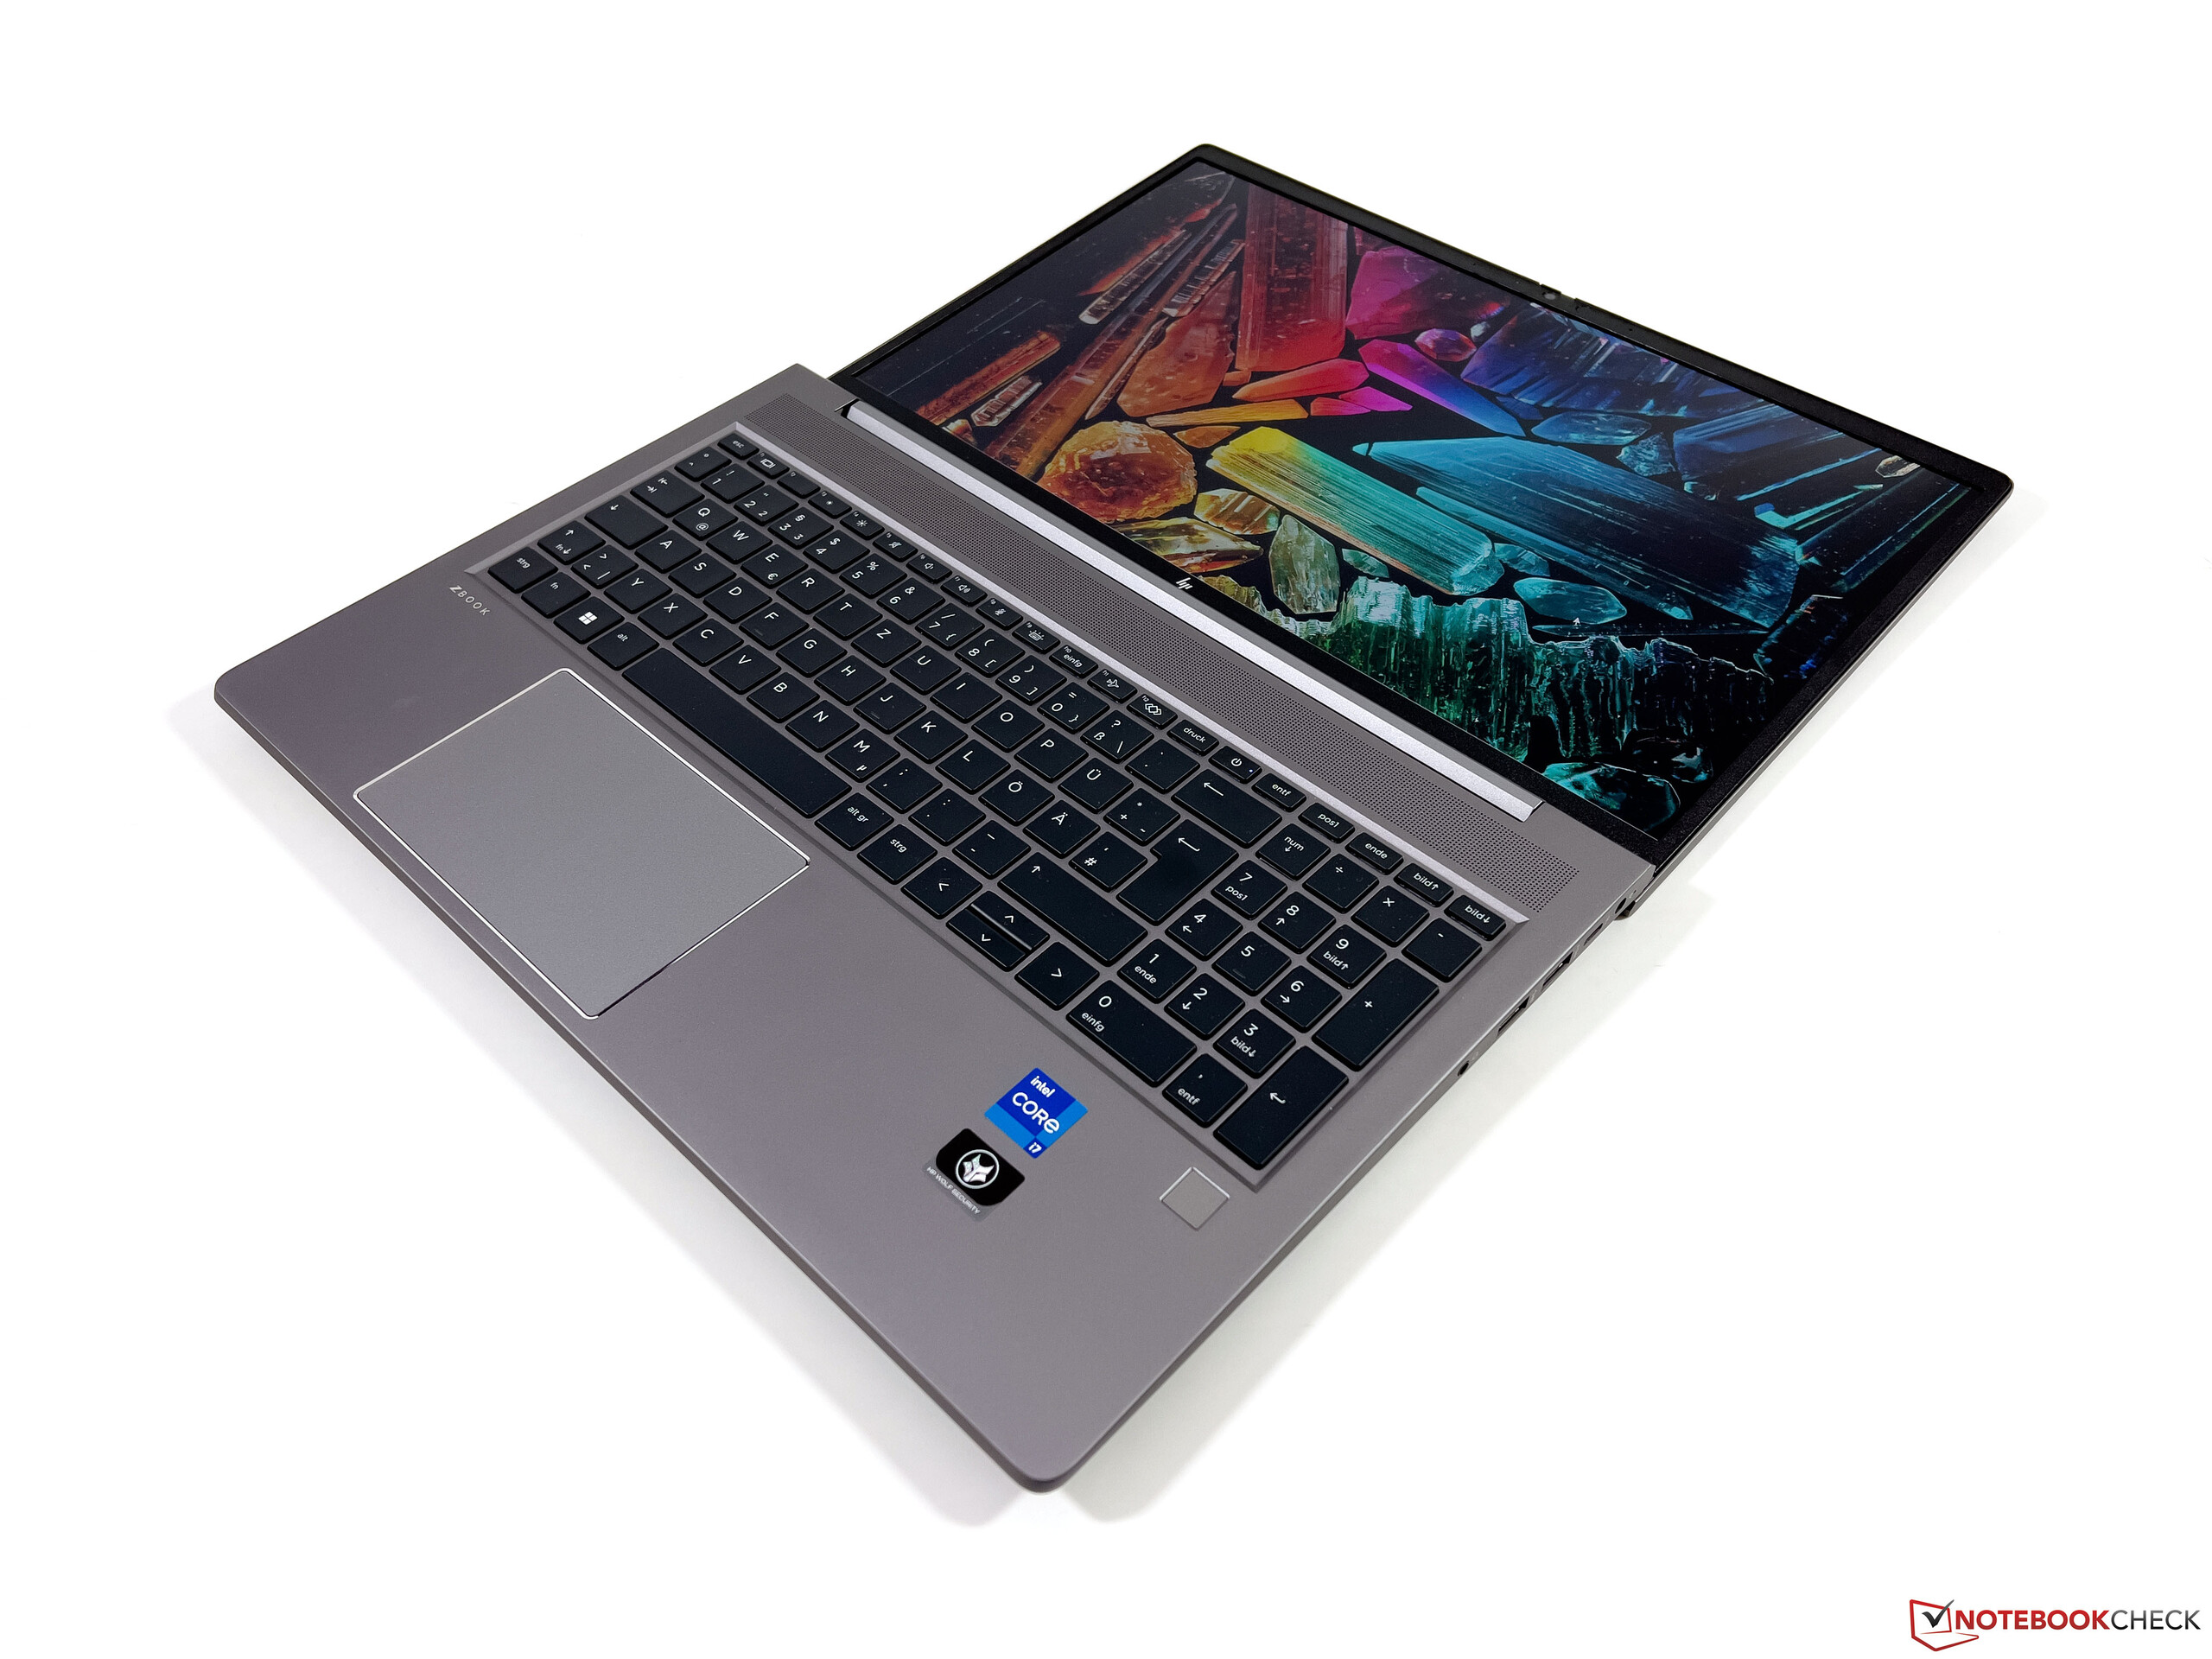
HP ofrece varias series de modelos de estaciones de trabajo móviles, empezando por la delgada ZBook Fireflypara principiantes, seguida de laZBook Studioy el ZBook Furyde gama alta, y el ZBook Power, que se supone representa una buena combinación de precio y rendimiento. Aunque la carcasa no es especialmente delgada, esto también trae consigo un número suficiente de puertos. Probamos la versión ZBook Power 15 G9 6B8C4EA por unos 2.800 Euros (~$2981), que está muy bien equipada con un Core i7-12700Hy laRTX A200032 GB de RAM, un SSD de 1 TB, y una pantalla mate 4K. En comparación con el predecesor ZBook Power 15 G8 (aquí en nuestra prueba), no hay cambios en la carcasa y los dispositivos de entrada, por lo que mantendremos esas secciones breves aquí, centrándonos en cambio en las secciones de rendimiento.
Posibles contendientes en la comparación
Valoración | Fecha | Modelo | Peso | Altura | Tamaño | Resolución | Precio |
|---|---|---|---|---|---|---|---|
| 87.4 % v7 (old) | 01/2023 | HP ZBook Power 15 G9 6B8C4EA i7-12700H, RTX A2000 Laptop GPU | 2 kg | 22.8 mm | 15.60" | 3840x2160 | |
| 90.1 % v7 (old) | 11/2022 | HP ZBook Studio 16 G9 62U04EA i7-12800H, RTX A2000 Laptop GPU | 1.8 kg | 19 mm | 16.00" | 3840x2400 | |
| 88.3 % v7 (old) | 10/2021 | Dell Precision 5000 5560 i7-11850H, RTX A2000 Laptop GPU | 2 kg | 18 mm | 15.60" | 3840x2400 | |
| 86.2 % v7 (old) | 06/2022 | Lenovo ThinkPad P15v G2 21A9000XGE i7-11800H, T1200 Laptop GPU | 2.3 kg | 22.7 mm | 15.60" | 1920x1080 | |
| 87.7 % v7 (old) | 07/2022 | HP ZBook Power 15 G8 313S5EA i7-11800H, T600 Laptop GPU | 2 kg | 22.8 mm | 15.60" | 1920x1080 |
Maletín y equipamiento
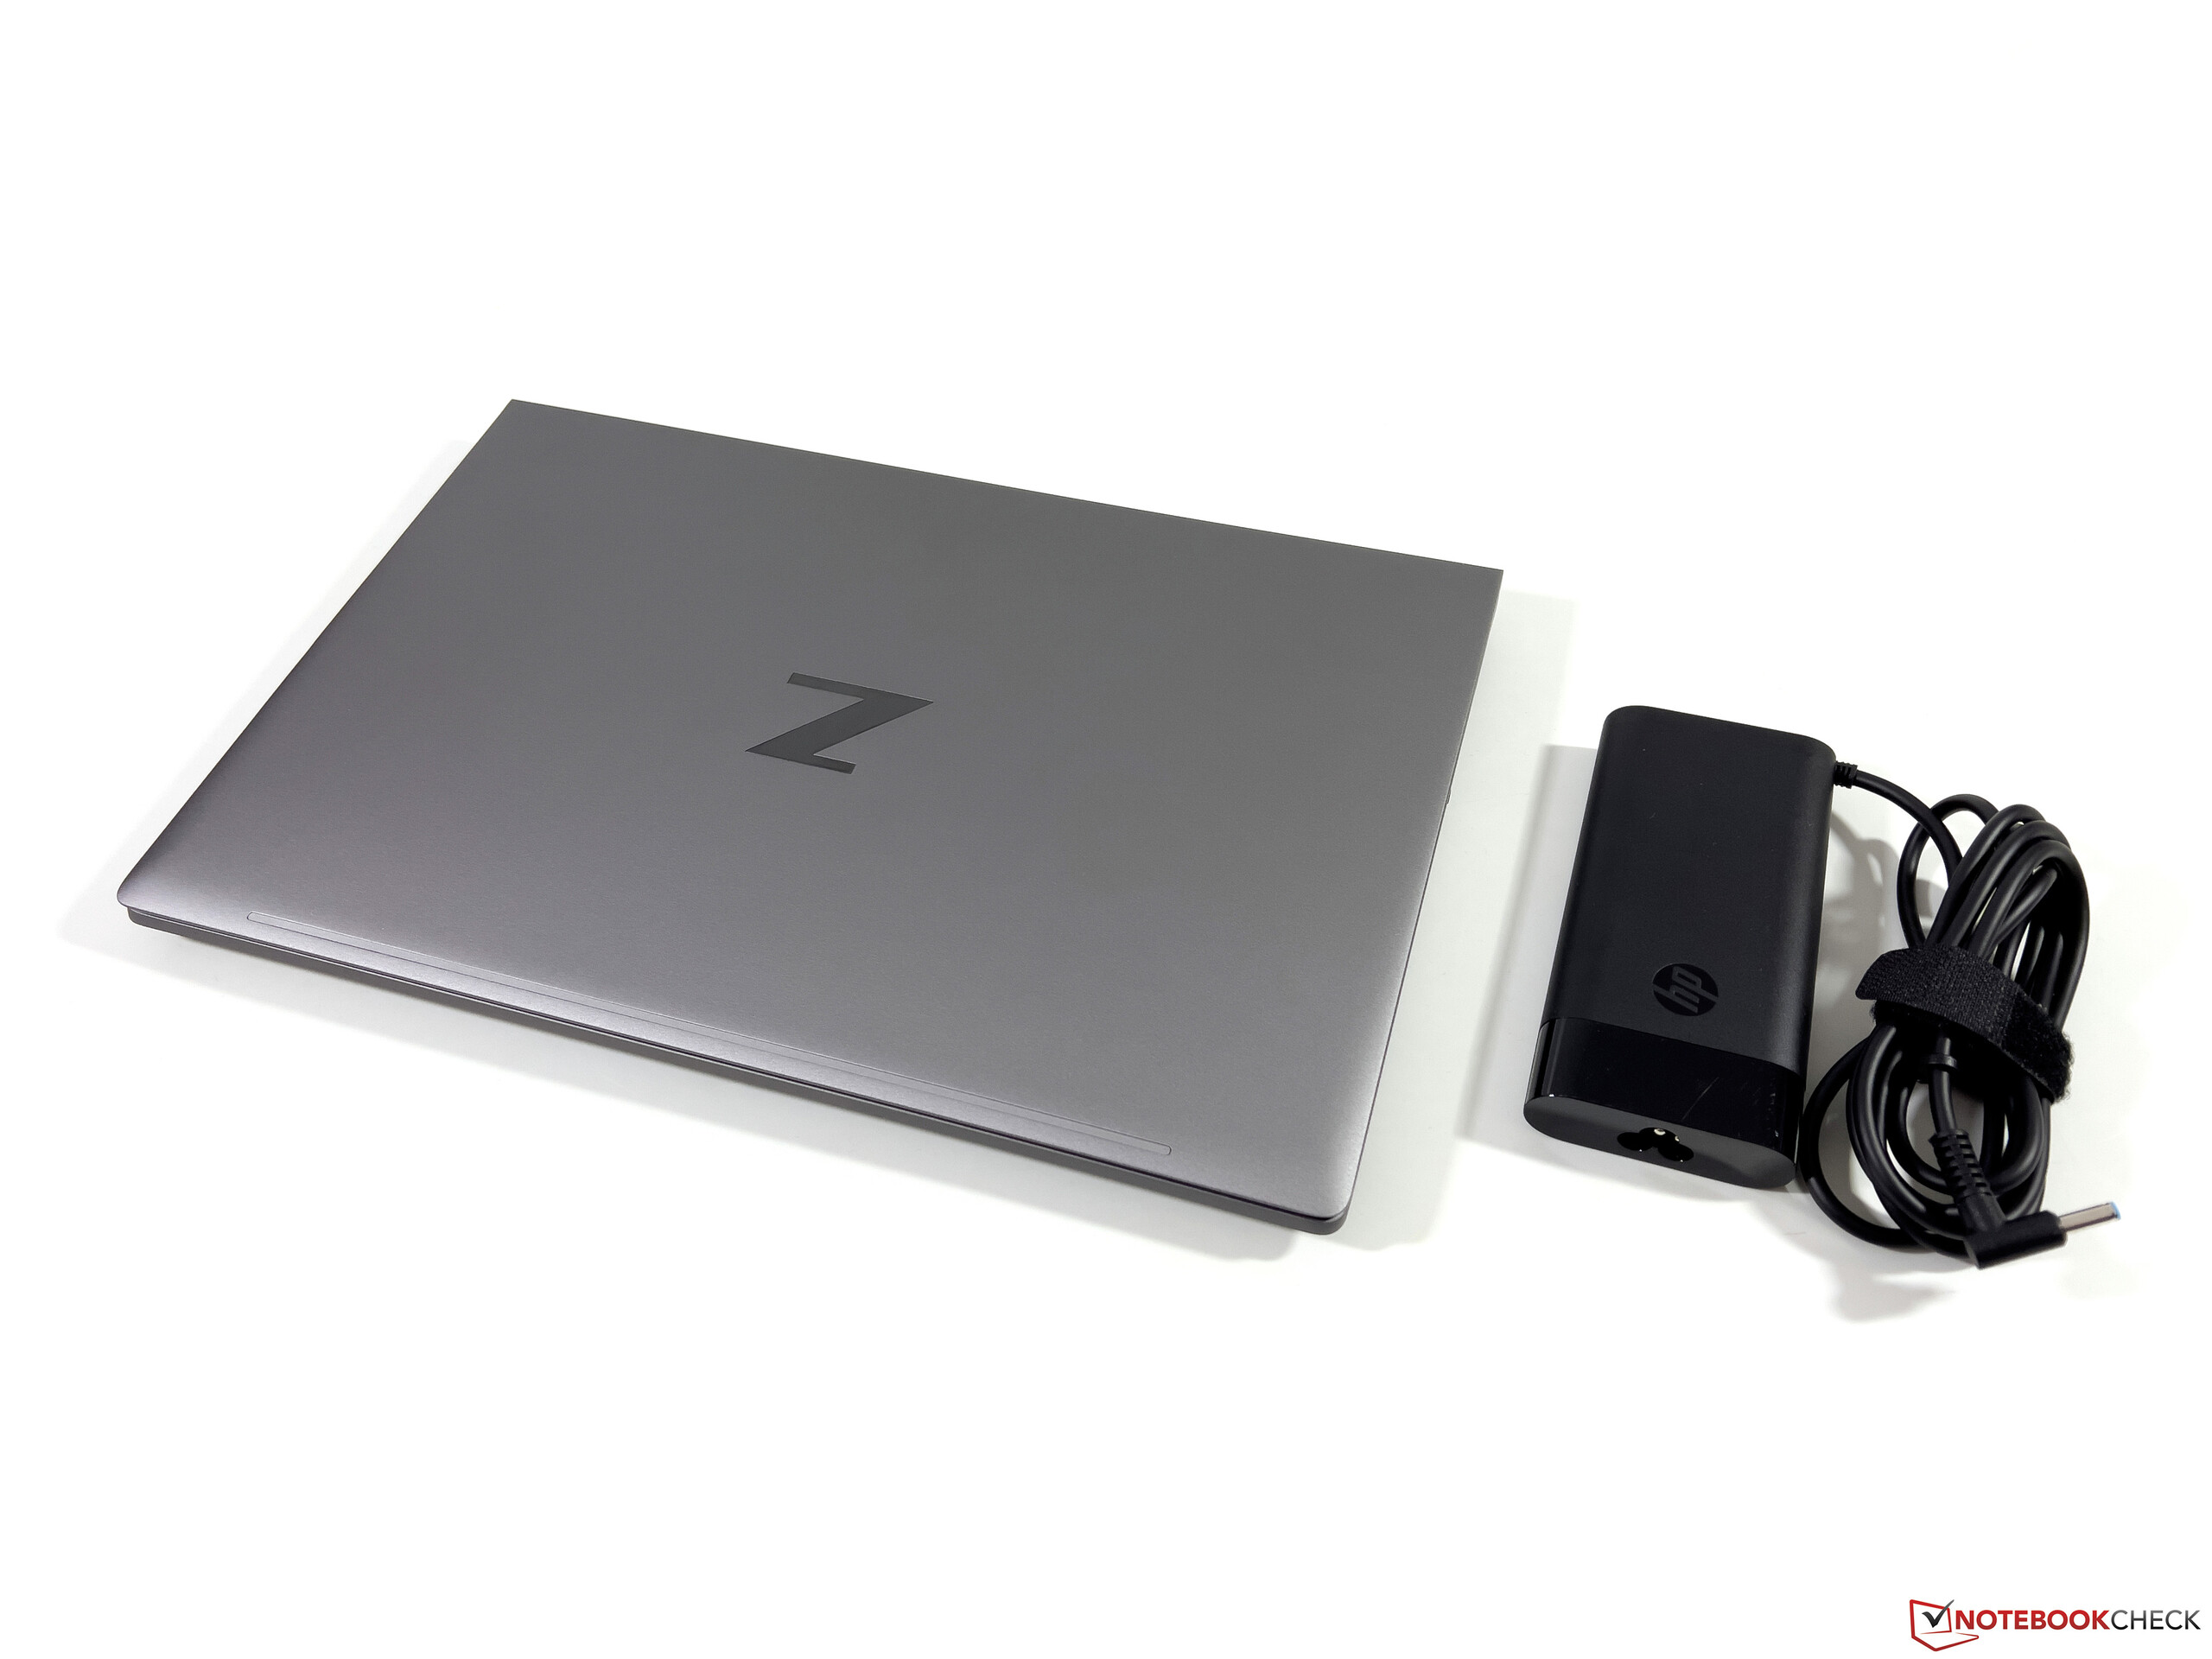
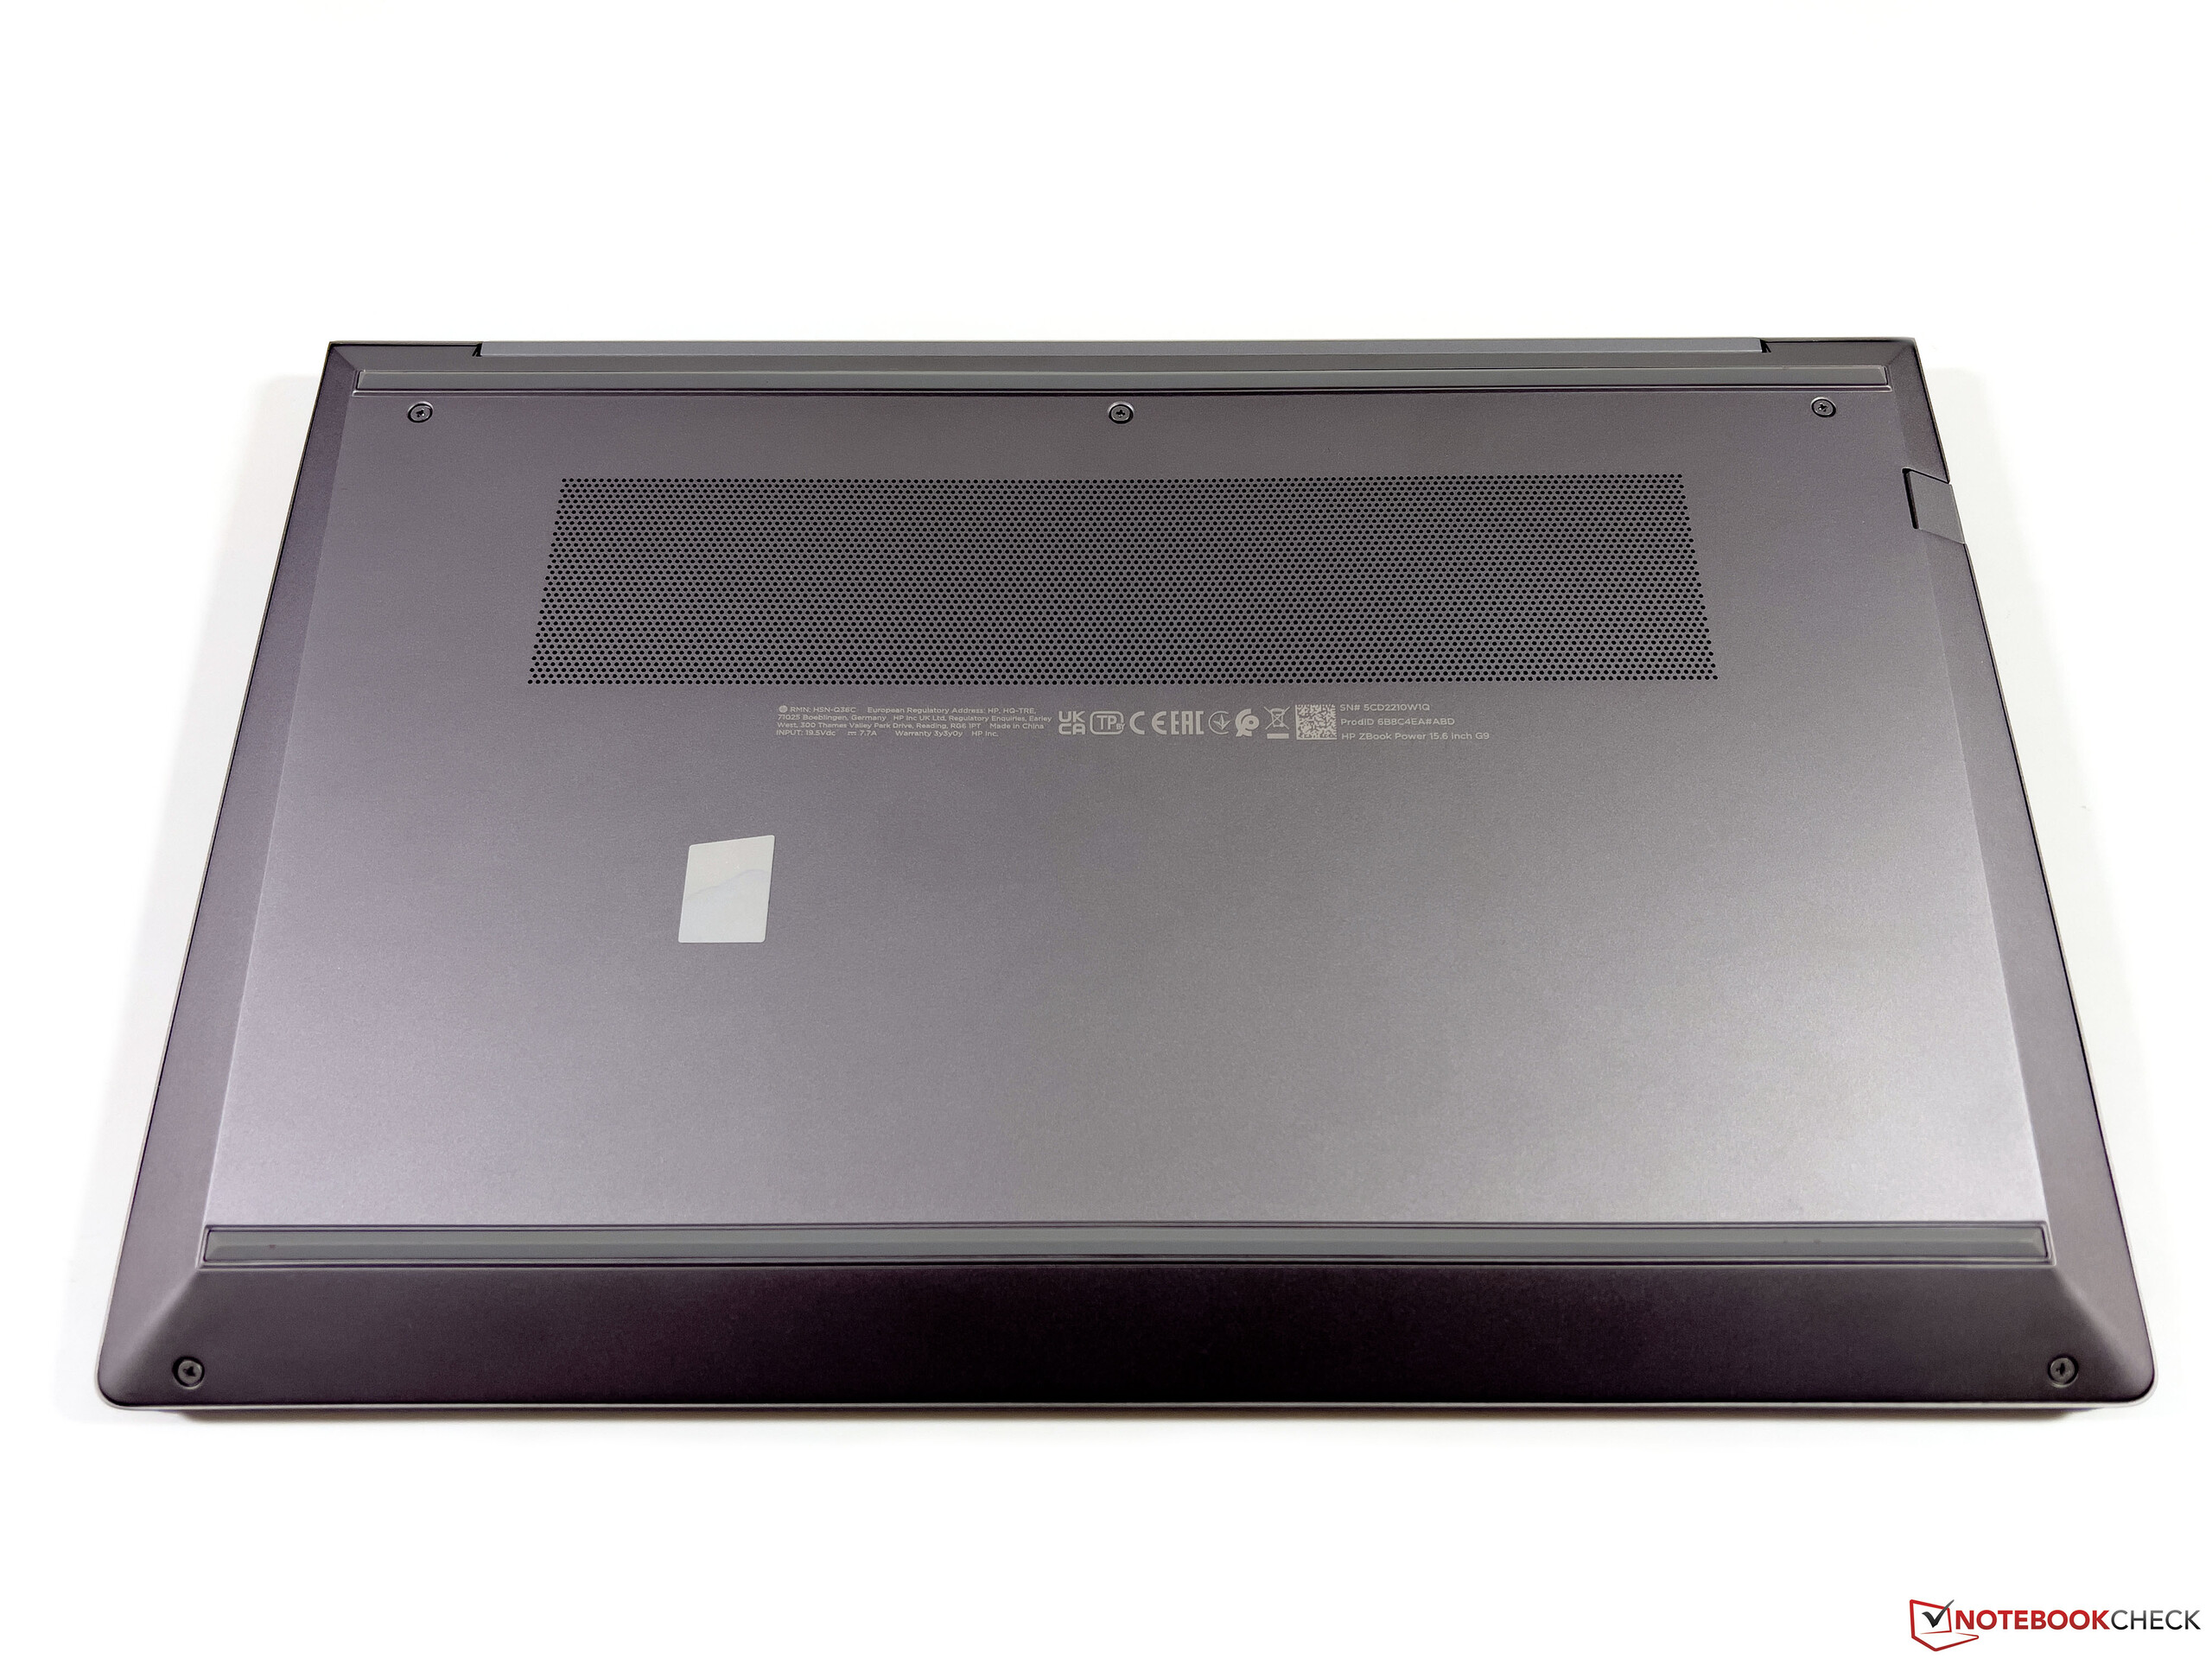
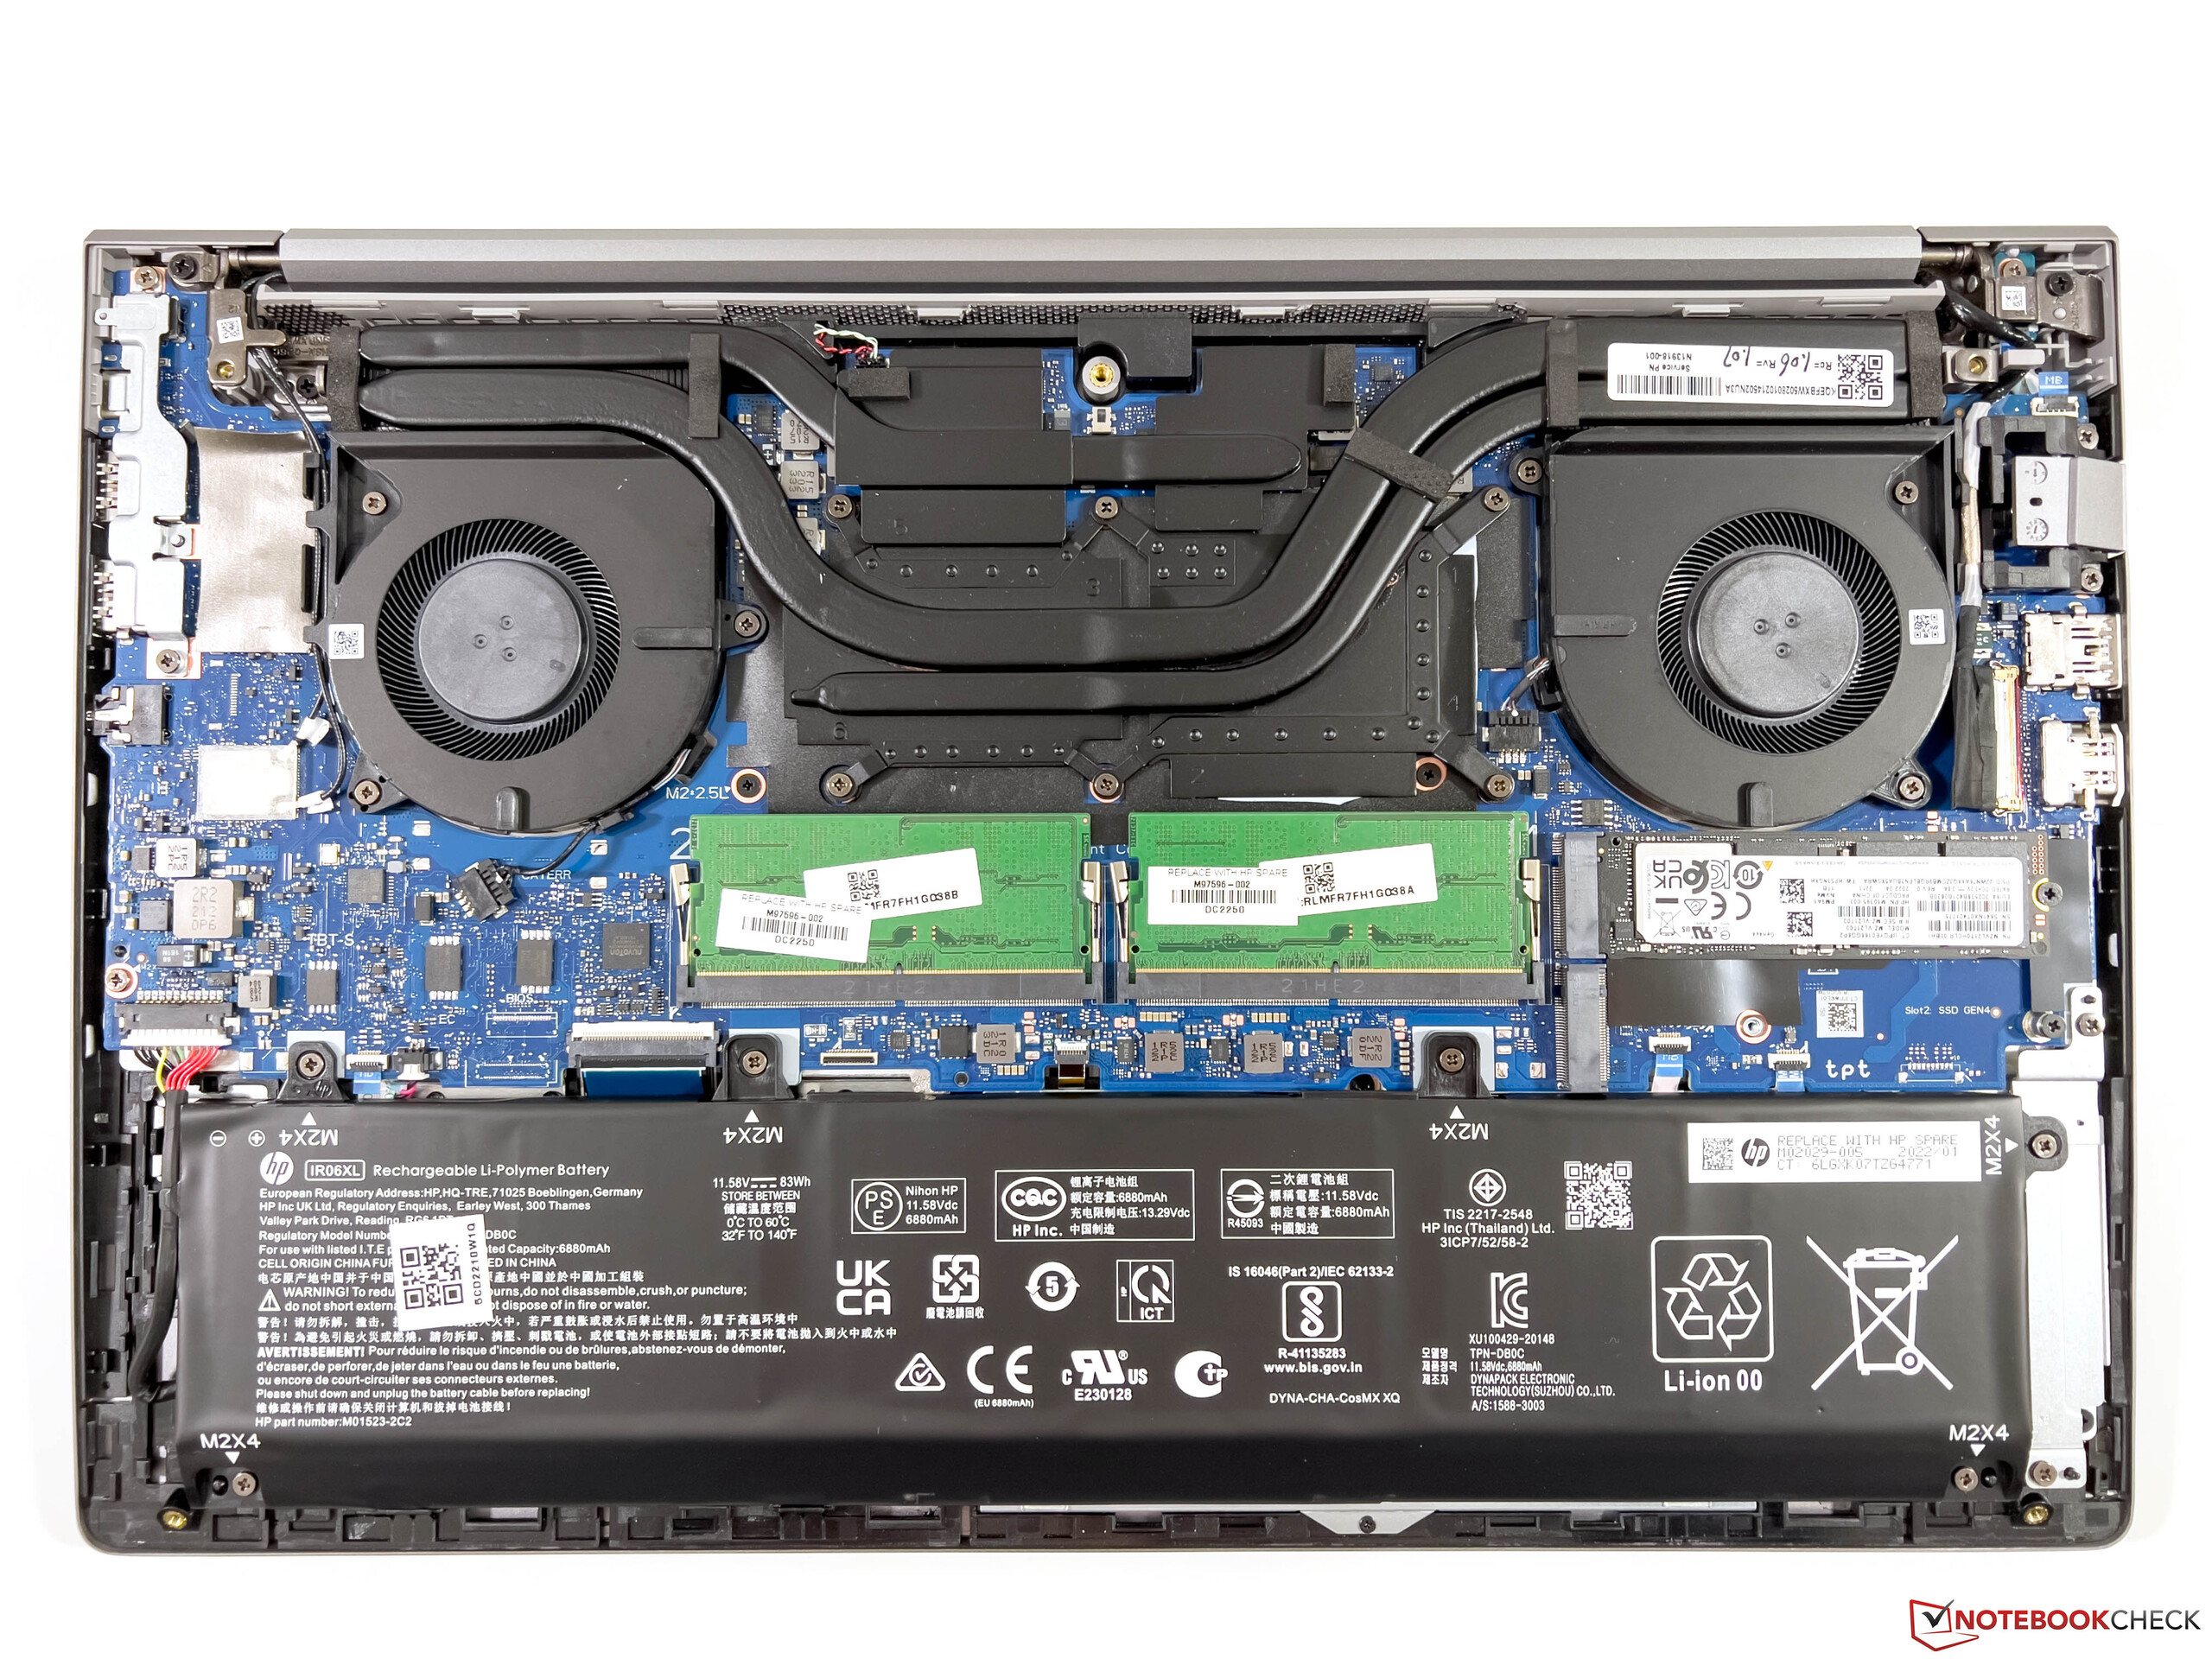
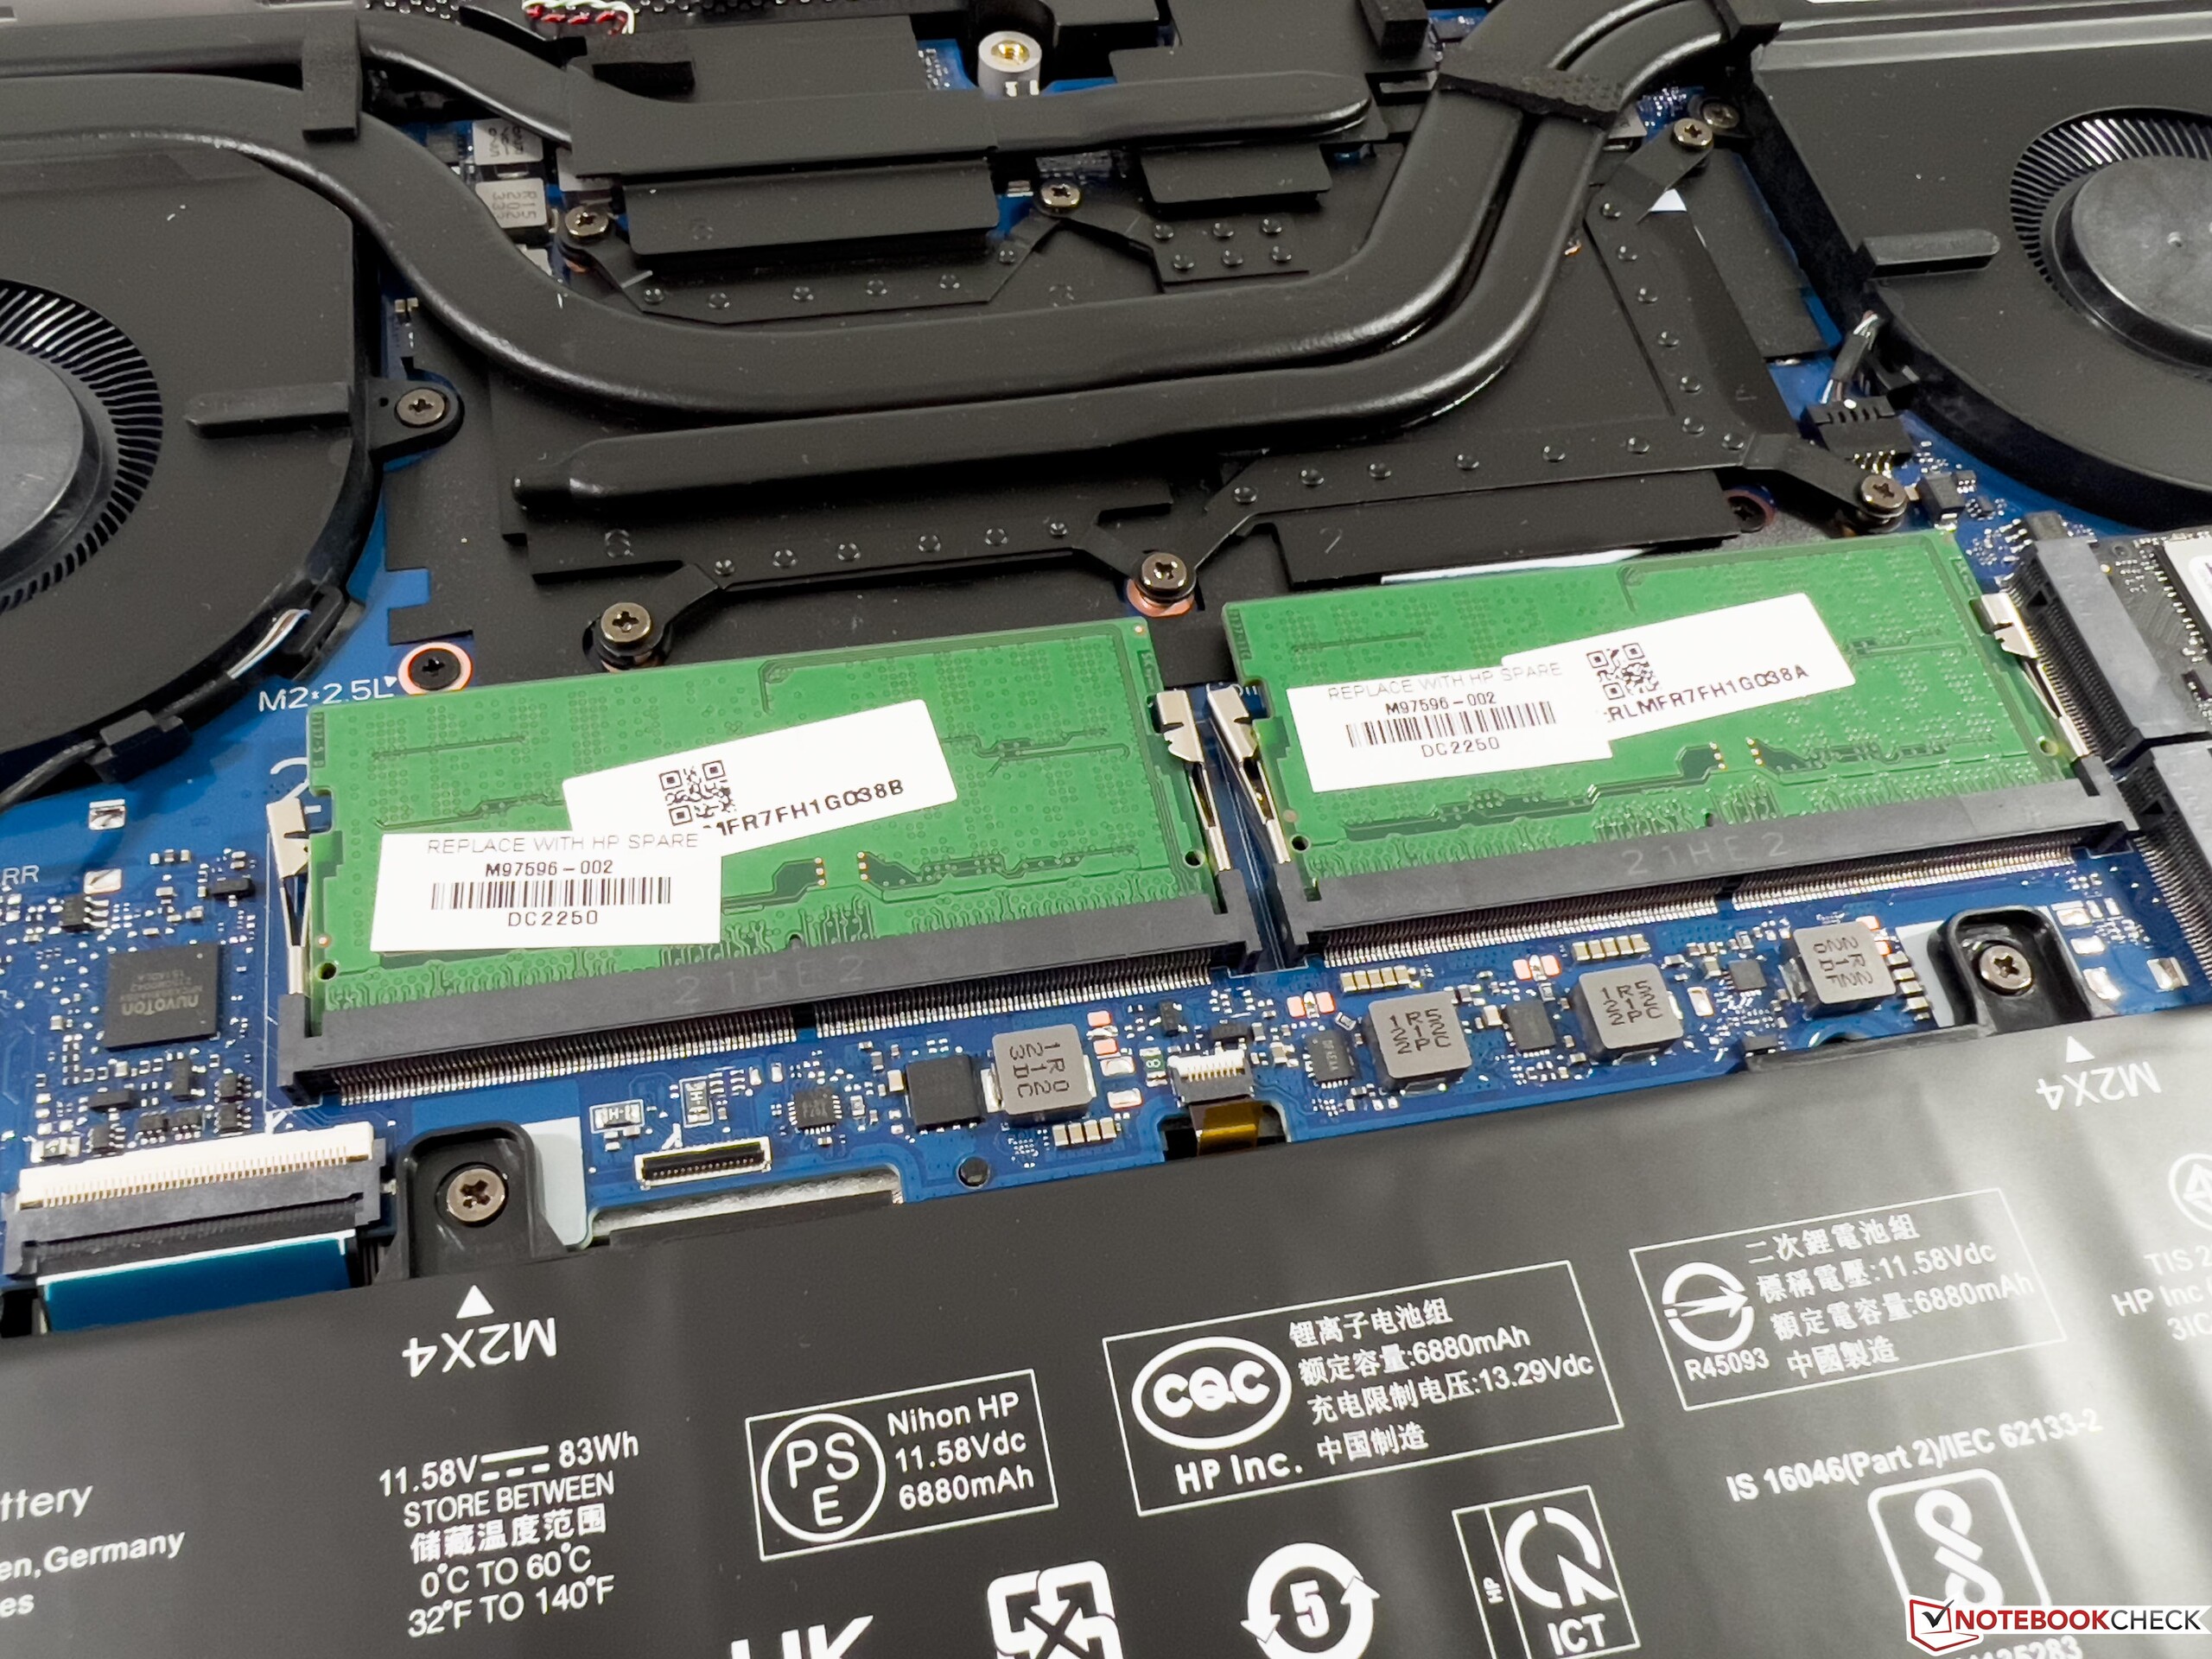
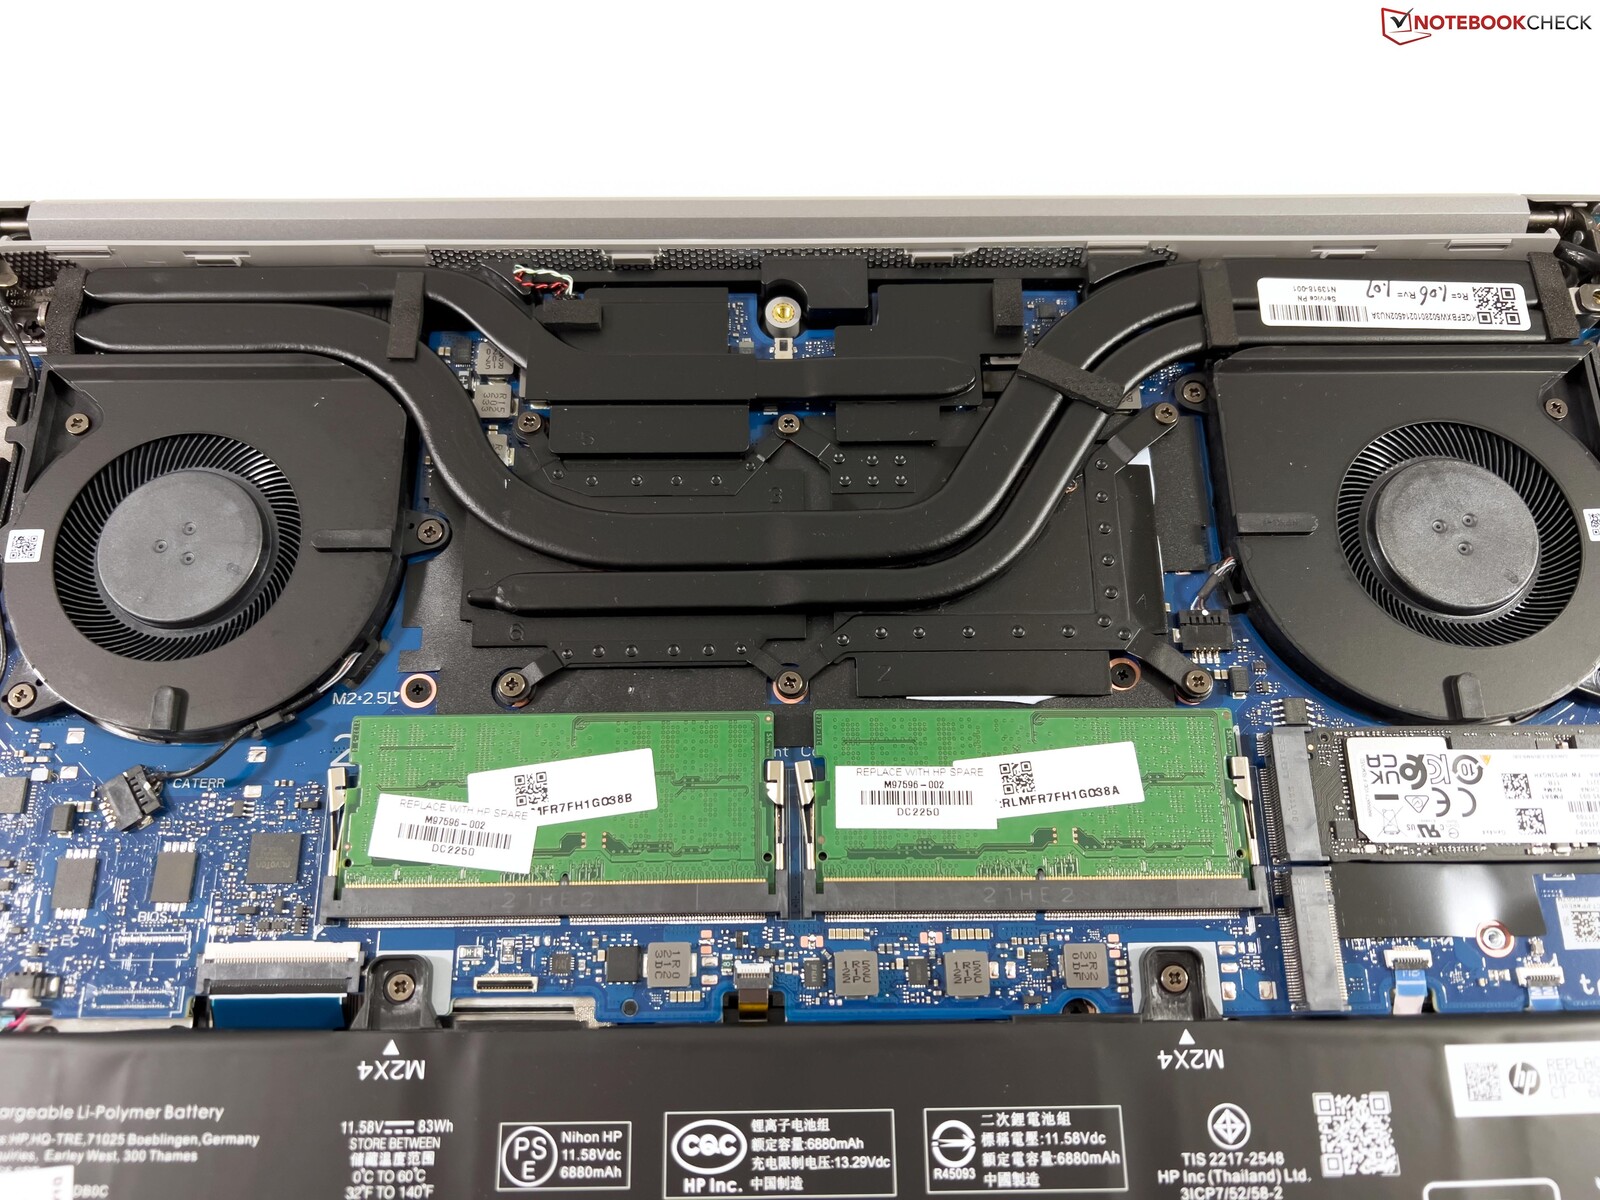
La carcasa de aluminio no ha cambiado con respecto al modelo G8 anterior. Aunque la calidad es buena en general, la estabilidad no alcanza la de los modelos de estación de trabajo más caros como el ZBook Studio o el ZBook Fury. Además, la pantalla se tambalea ligeramente después de cambiar el ángulo de apertura. Visualmente, el ZBook Power 15 G9 parece modesto y poco llamativo con su color gris más oscuro. La parte inferior de la carcasa sólo está atornillada y se puede quitar fácilmente. Además de la memoria de trabajo, también puedes acceder a las dos ranuras SSD M.2, pero el módulo WLAN está soldado.
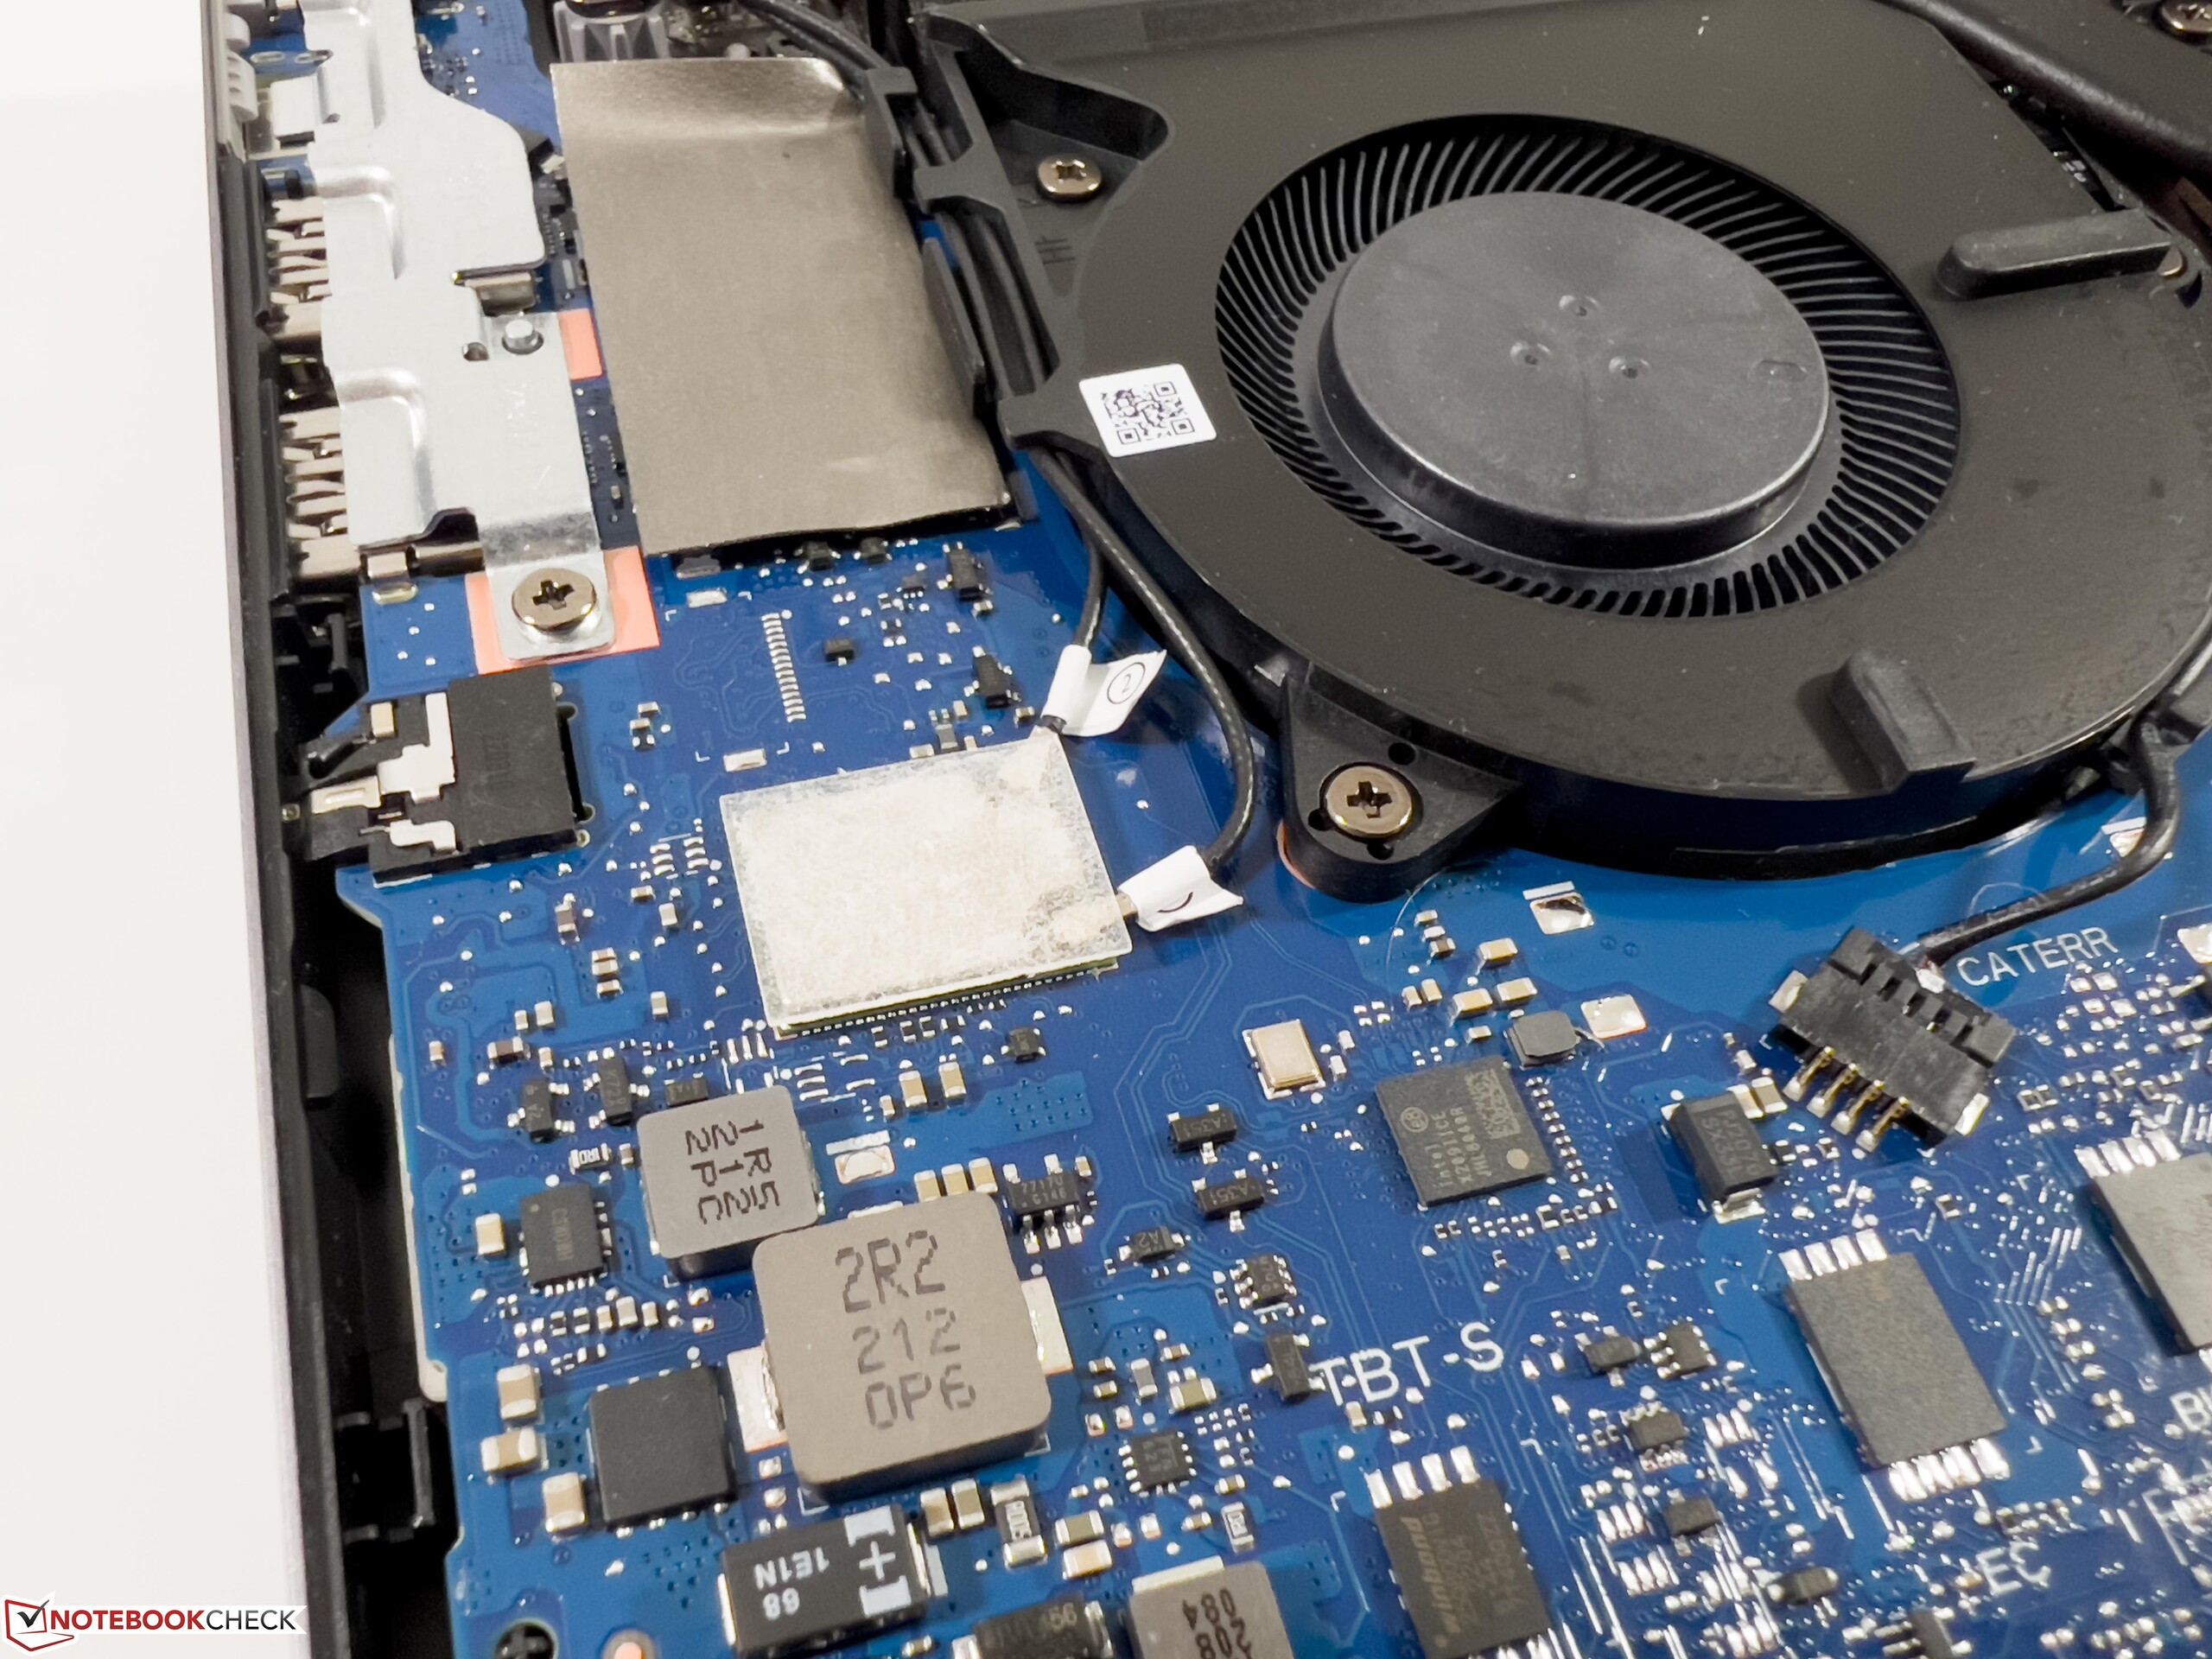
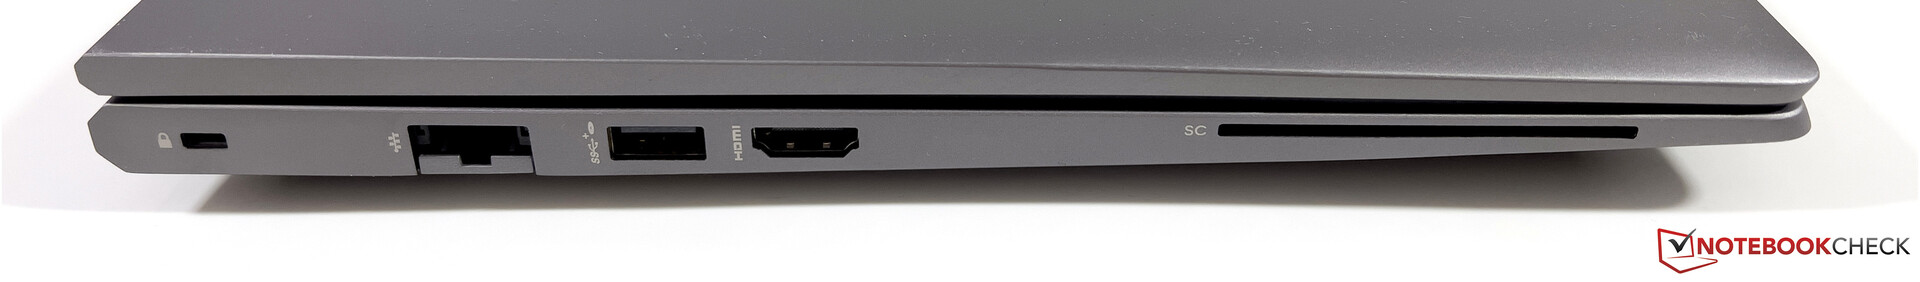
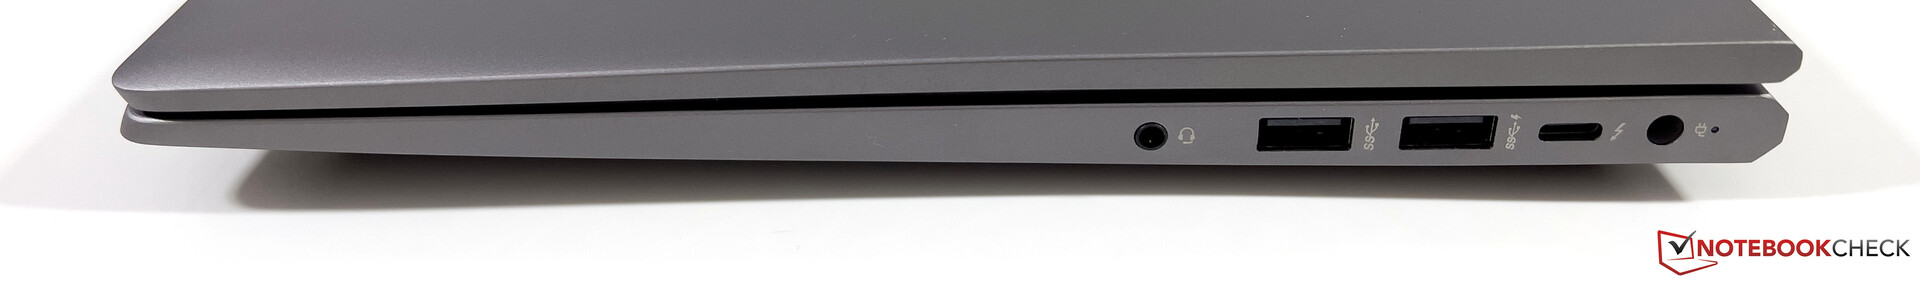
En cuanto al equipo de conexión, sigue habiendo varios puertos USB-A así como USB-C con Thunderbolt 4, Ethernet, y un puerto HDMI. Sin embargo, carece de lector de tarjetas. El módulo WLAN se actualizó, y la tarjeta AX211 de Intel ahora también soporta el estándar Wi-Fi 6E. Podemos conectarnos a la red de 6 GHz desde nuestro router de referencia Asus sin problemas. Las tasas de transferencia que medimos son muy altas y también estables. No hay disponible un módulo LTE/5G para el ZBook Power.
Como webcam, sigue habiendo un sensor 720p que incluye una cámara IR para reconocimiento facial. La webcam hace su trabajo, pero la calidad de imagen no es muy buena incluso en buenas condiciones de luz.
| Networking | |
| HP ZBook Power 15 G9 6B8C4EA | |
| iperf3 receive AXE11000 6GHz | |
| iperf3 transmit AXE11000 6GHz | |
| HP ZBook Studio 16 G9 62U04EA | |
| iperf3 receive AXE11000 6GHz | |
| iperf3 transmit AXE11000 6GHz | |
| Dell Precision 5000 5560 | |
| iperf3 transmit AX12 | |
| iperf3 receive AX12 | |
| Lenovo ThinkPad P15v G2 21A9000XGE | |
| iperf3 transmit AX12 | |
| iperf3 receive AX12 | |
| HP ZBook Power 15 G8 313S5EA | |
| iperf3 transmit AX12 | |
| iperf3 receive AX12 | |


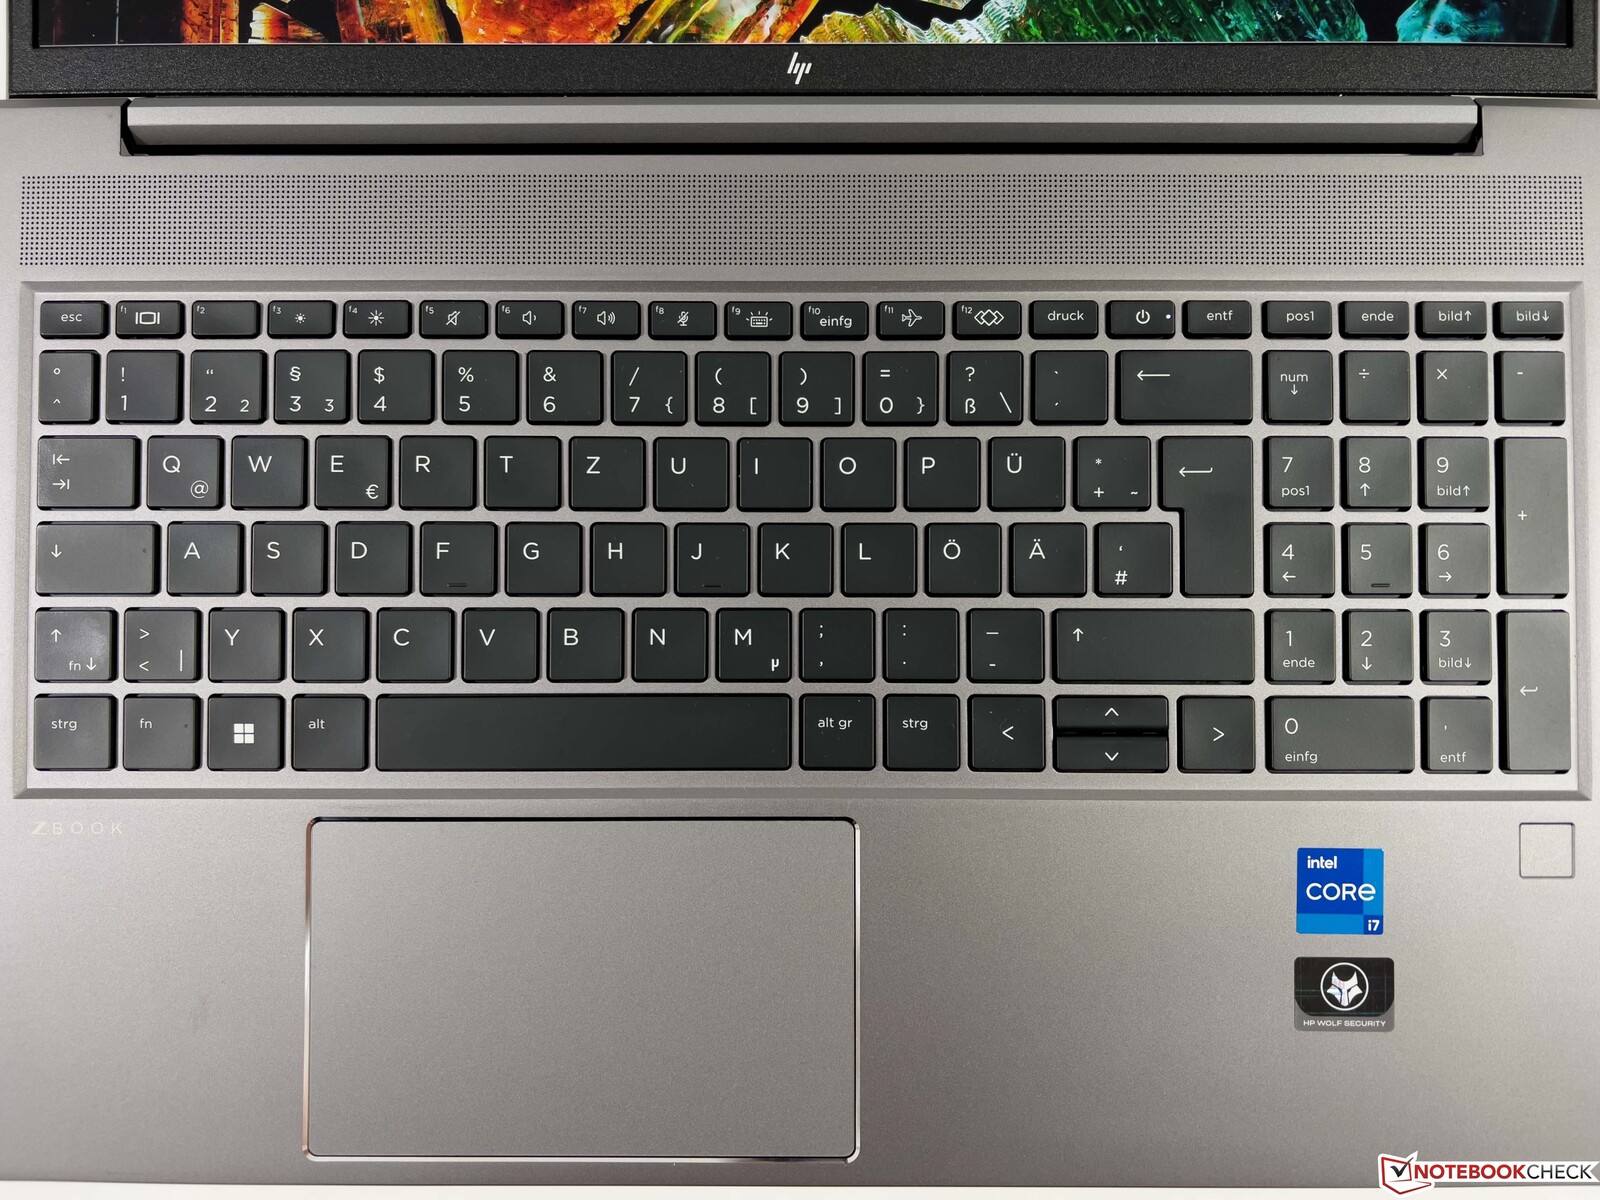
Dispositivos de entrada - ZBook Power con un buen teclado
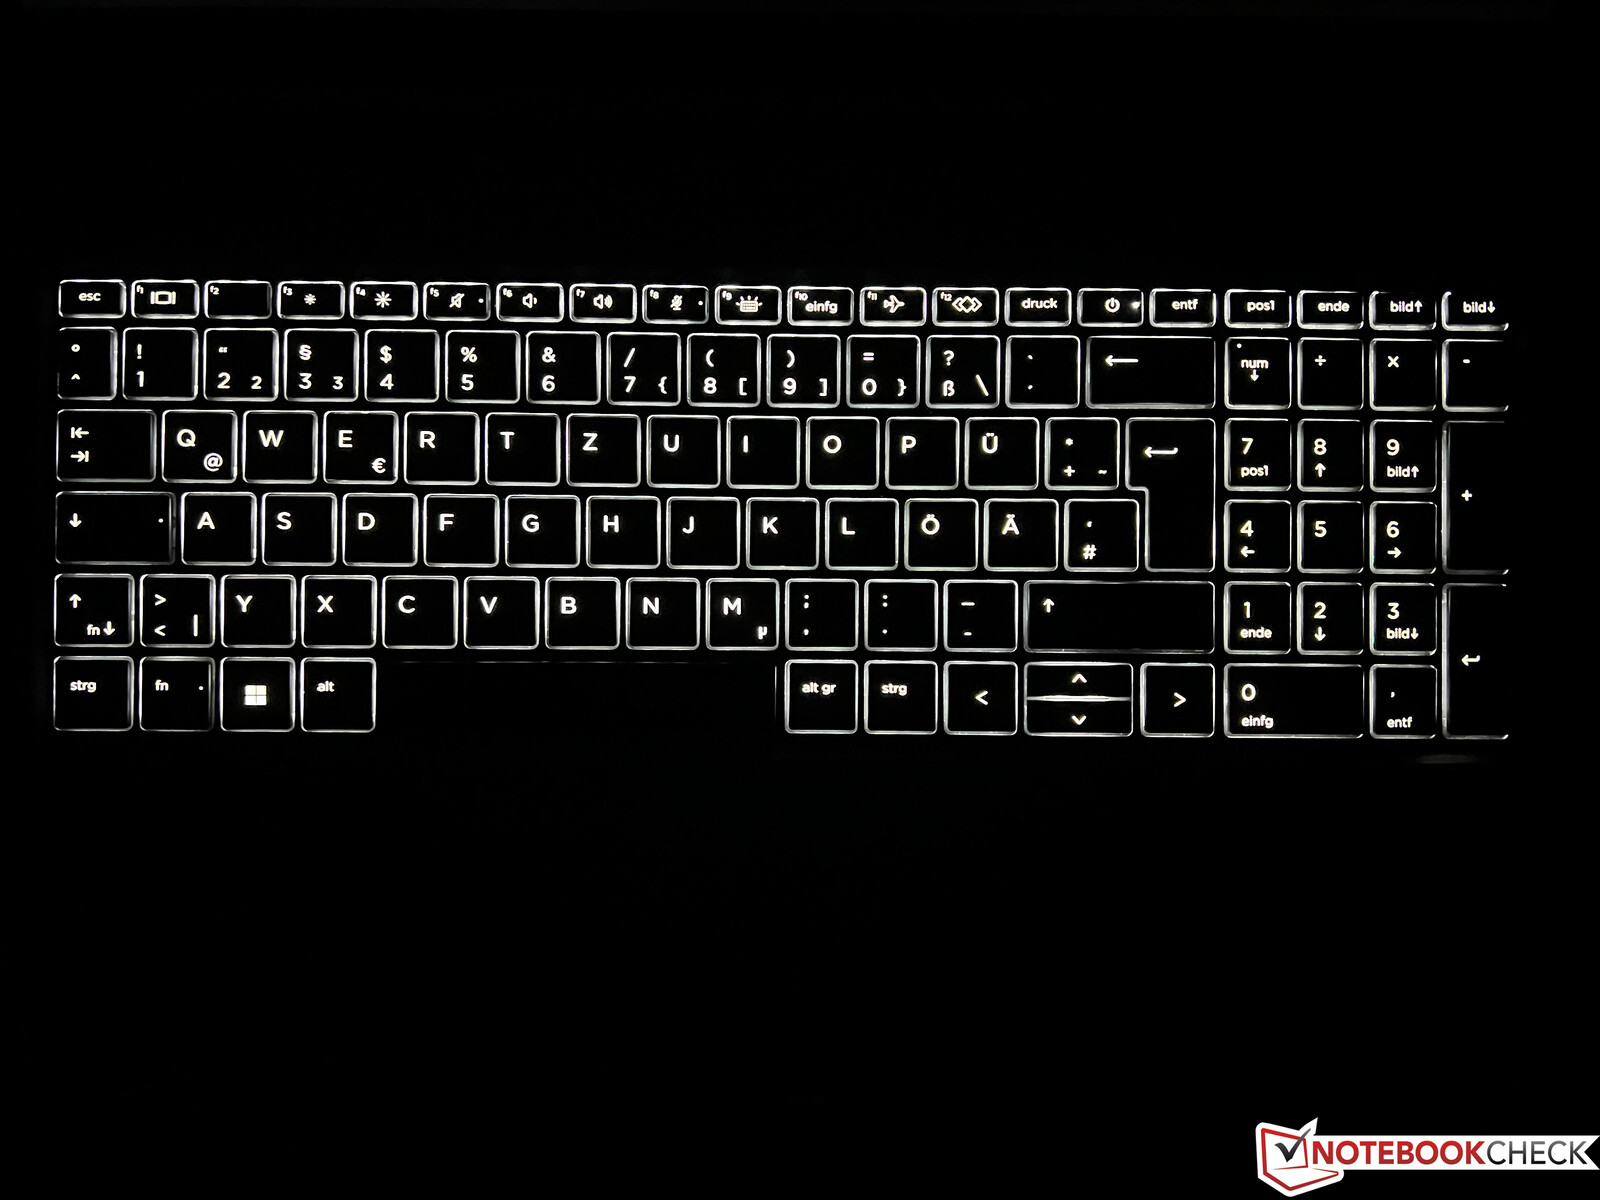
En comparación con el ZBook Power 15 G8tampoco hay cambios en los dispositivos de entrada. El teclado con iluminación de fondo ofrece una experiencia de mecanografiado muy buena, y hay un bloque numérico dedicado en el lado derecho. En términos de distribución, hay que acostumbrarse a las teclas de flecha ligeramente más pequeñas y al botón de encendido en la fila superior. El escáner de huellas dactilares está situado a la derecha, debajo del teclado. En nuestra prueba, el ClickPad funciona con fiabilidad, pero el sonido de clic es un poco alto.
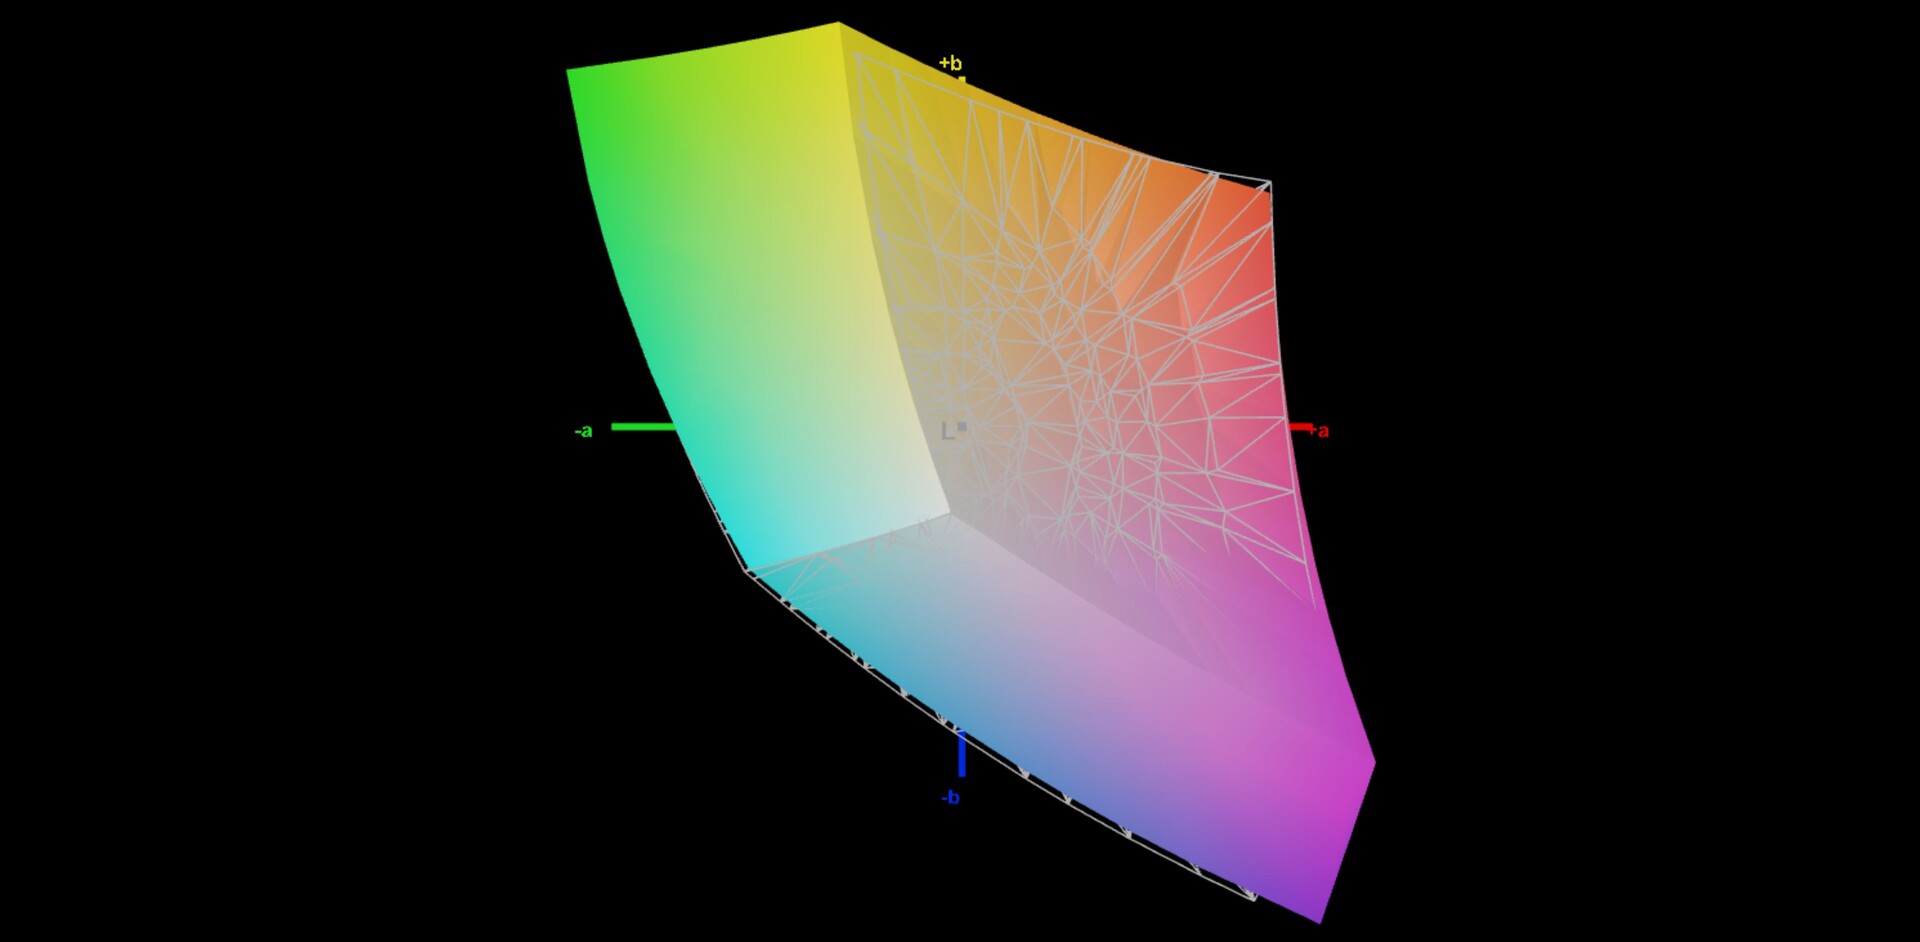
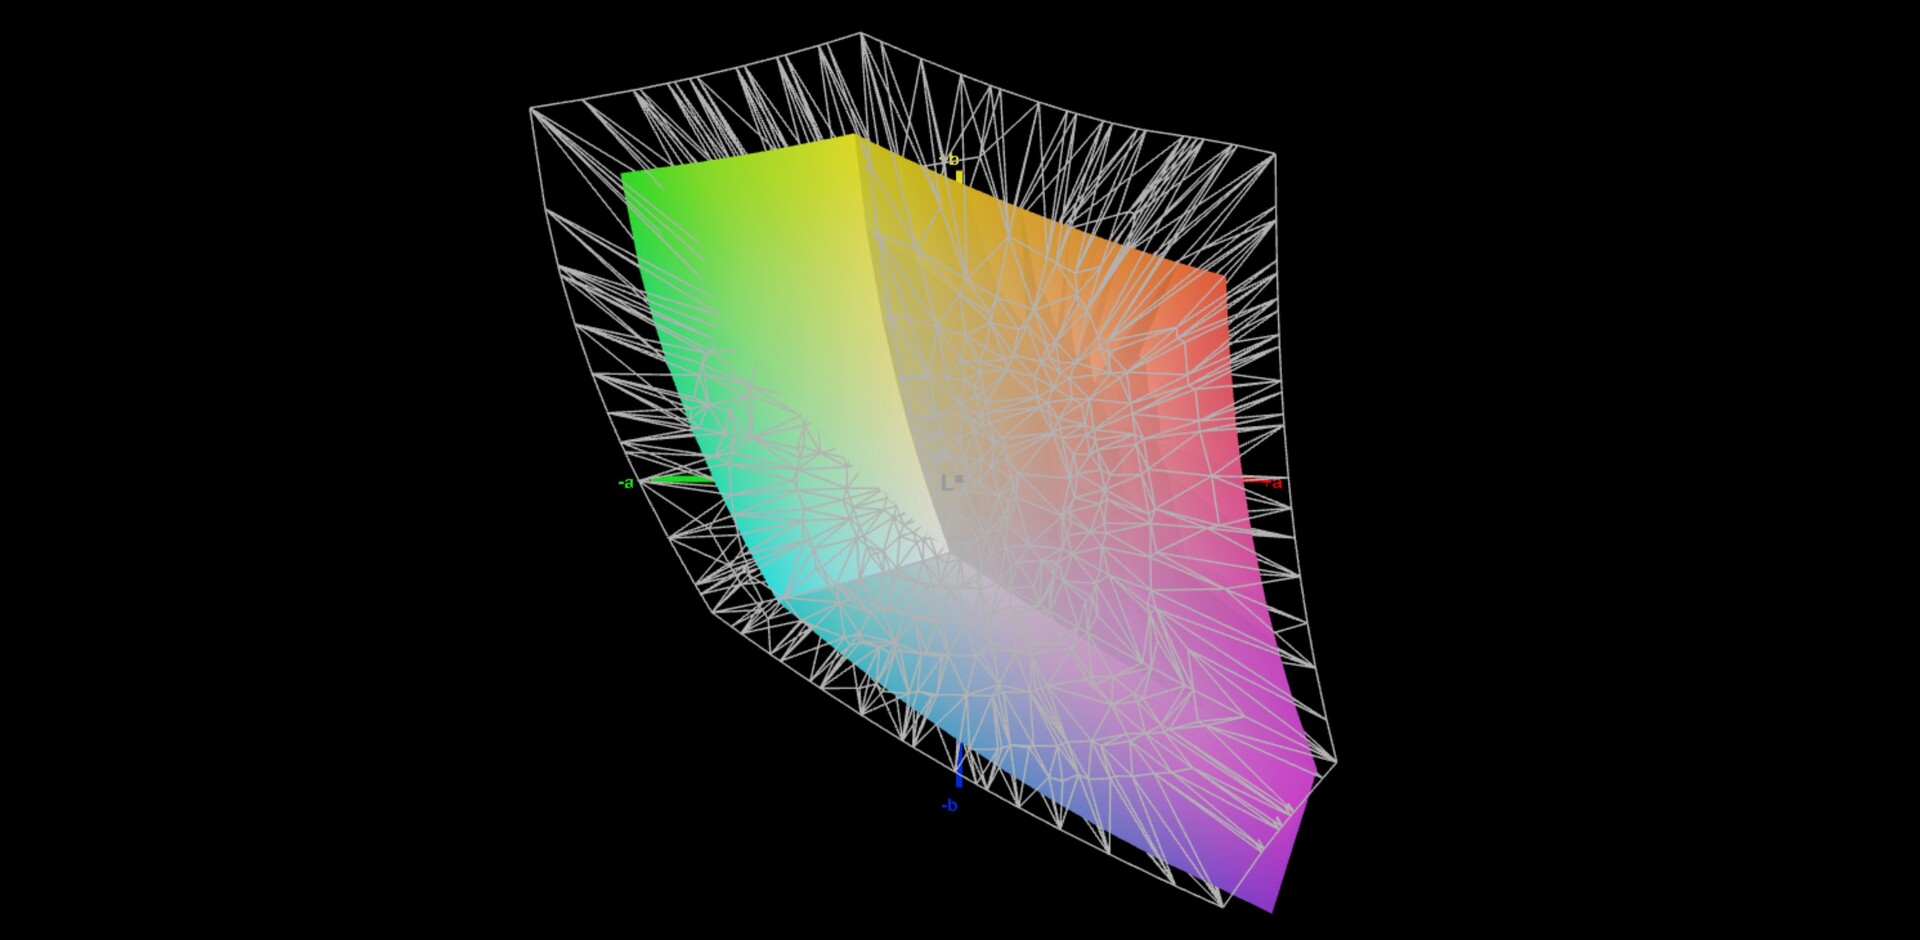
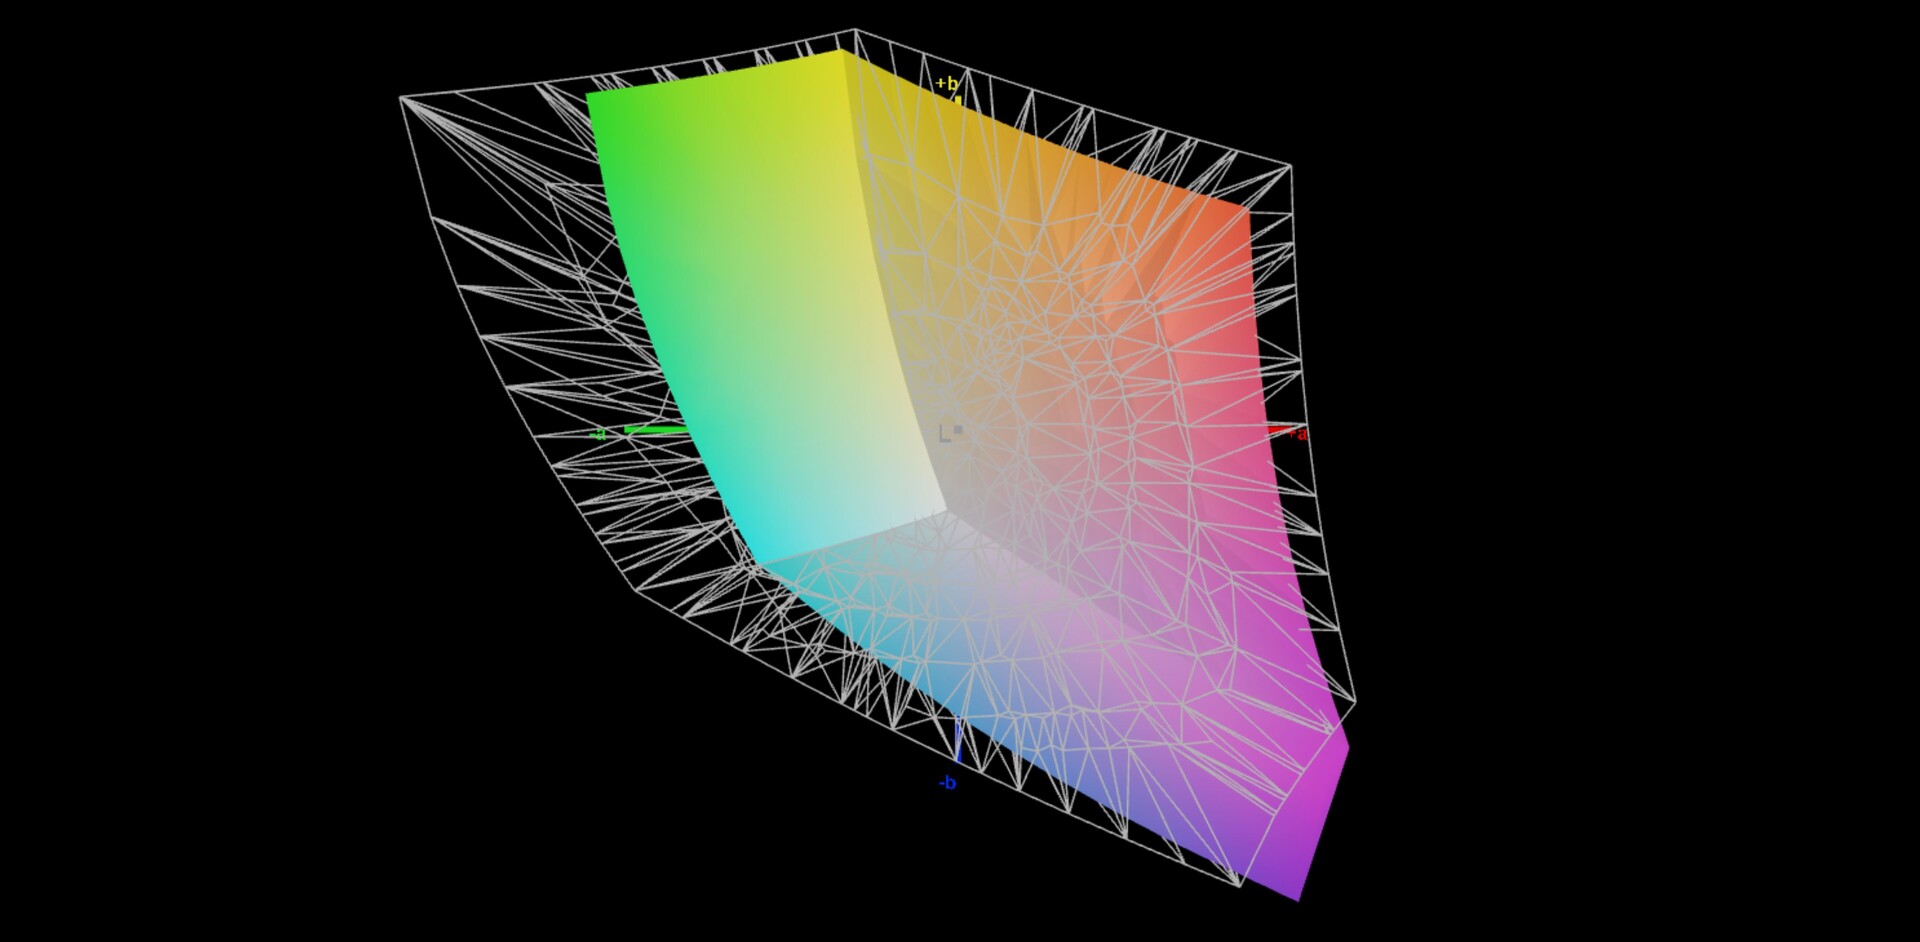
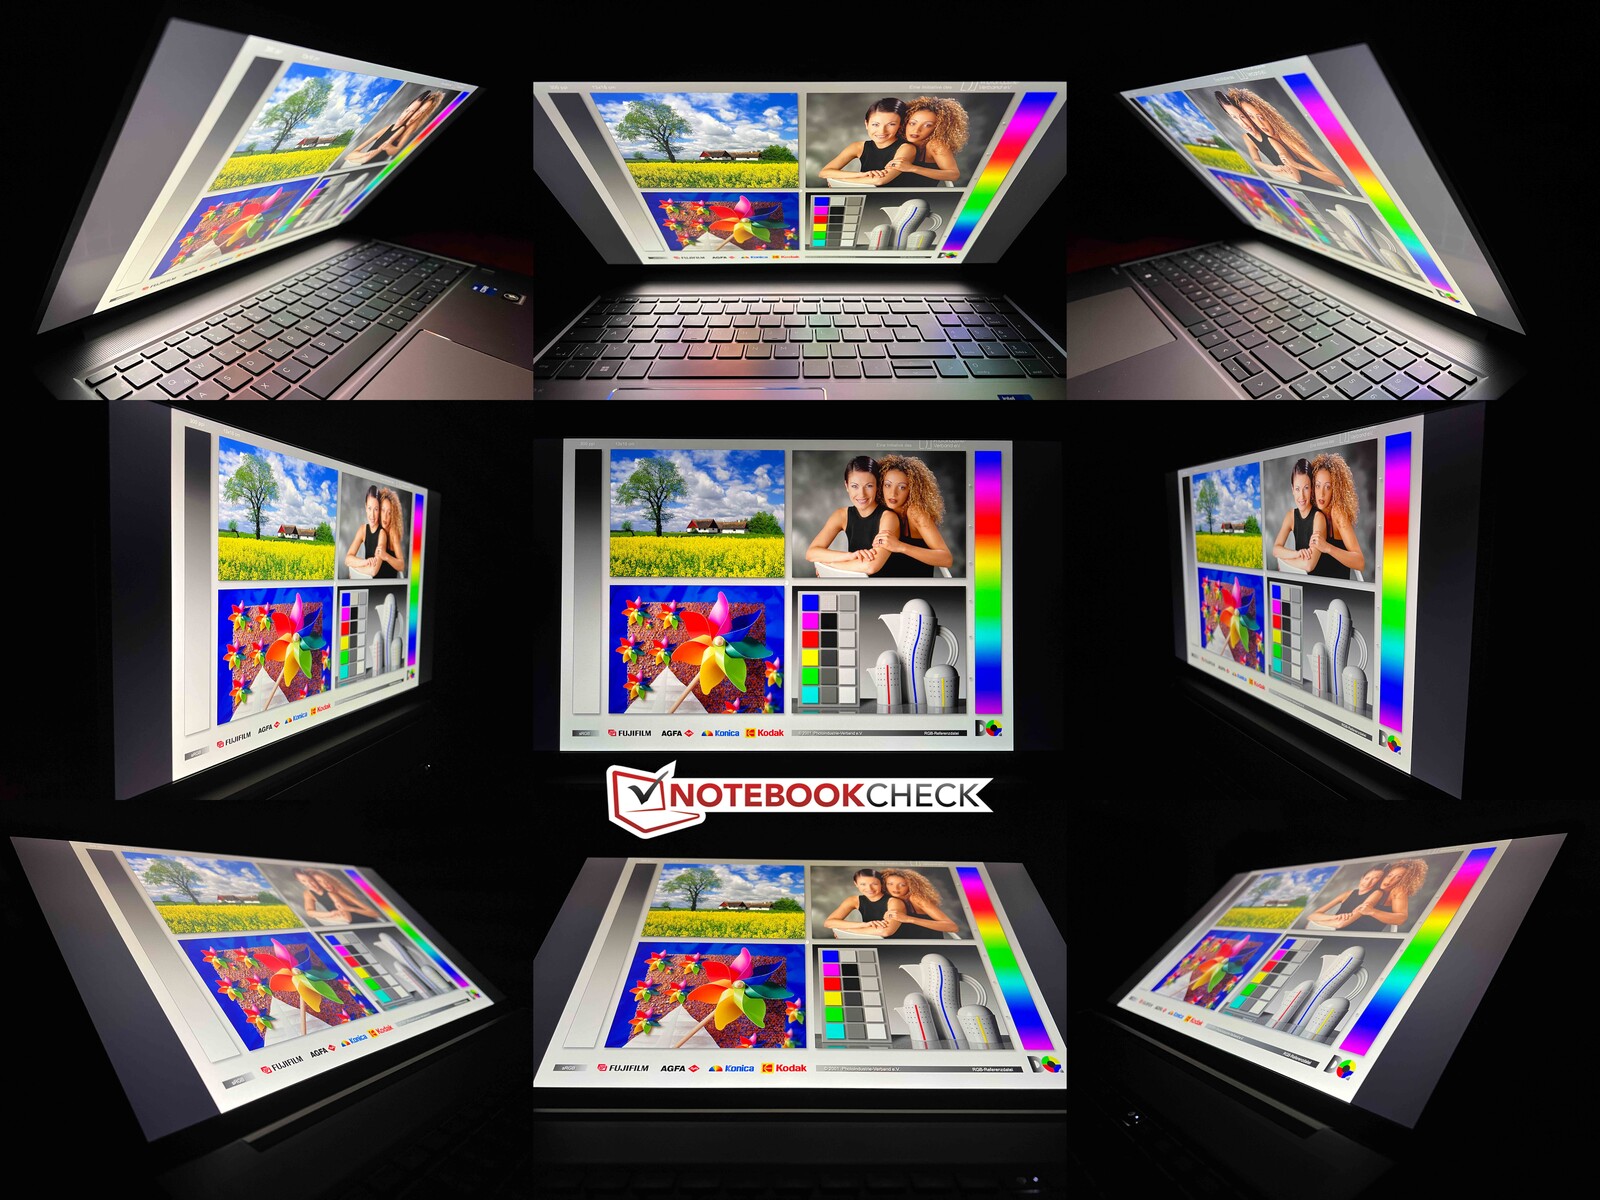
Pantalla - 4K IPS con cobertura 100% sRGB
Ya probamos el panel Full HD normal con el predecesory nuestra configuración de pruebas actual del ZBook Power G9 está equipada con la pantalla IPS 4K de bajo consumo opcional. Como en el predecesor, sigue teniendo el formato 16:9 (3,840 x 2,160 pixels). Subjetivamente, el panel LG-Philips produce una buena calidad de imagen, pero los contenidos brillantes aparecen ligeramente granulados en la superficie mate de la pantalla. Además, los tiempos de respuesta no son particularmente rápidos, y también vemos algunos claros efectos fantasma en la práctica, por ejemplo en el puntero del ratón.
HP anuncia un brillo de 400 cd/m², y nuestra unidad de pruebas también lo alcanza en el rango superior. Al mismo tiempo, el valor de negro es muy bajo, de 0,15, lo que lleva a una muy buena relación de contraste de más de 2.500:1. A pleno brillo y con un fondo oscuro, se aprecian algunos halos de luz. No se utiliza PWM.
| |||||||||||||||||||||||||
iluminación: 88 %
Brillo con batería: 391 cd/m²
Contraste: 2613:1 (Negro: 0.15 cd/m²)
ΔE ColorChecker Calman: 3.2 | ∀{0.5-29.43 Ø4.71}
calibrated: 1.2
ΔE Greyscale Calman: 4.9 | ∀{0.09-98 Ø4.96}
69.6% AdobeRGB 1998 (Argyll 3D)
97.7% sRGB (Argyll 3D)
69.1% Display P3 (Argyll 3D)
Gamma: 2.13
CCT: 5982 K
| HP ZBook Power 15 G9 6B8C4EA LGD073F, IPS, 3840x2160, 15.6" | HP ZBook Studio 16 G9 62U04EA BOE0A52, IPS, 3840x2400, 16" | Dell Precision 5000 5560 Sharp LQ156R1, IPS, 3840x2400, 15.6" | Lenovo ThinkPad P15v G2 21A9000XGE N156HCA-EAC, IPS LED, 1920x1080, 15.6" | HP ZBook Power 15 G8 313S5EA AUOA08B, IPS LED, 1920x1080, 15.6" | |
|---|---|---|---|---|---|
| Display | 22% | 28% | -35% | 2% | |
| Display P3 Coverage (%) | 69.1 | 97.5 41% | 94.9 37% | 43.7 -37% | 70.5 2% |
| sRGB Coverage (%) | 97.7 | 99.9 2% | 100 2% | 65.1 -33% | 99 1% |
| AdobeRGB 1998 Coverage (%) | 69.6 | 86.3 24% | 100 44% | 45.3 -35% | 71.3 2% |
| Response Times | 73% | -5% | -2% | -33% | |
| Response Time Grey 50% / Grey 80% * (ms) | 45.8 ? | 15.3 ? 67% | 47.2 ? -3% | 48 ? -5% | 61 -33% |
| Response Time Black / White * (ms) | 28.6 ? | 6.1 ? 79% | 30.4 ? -6% | 28 ? 2% | 38 ? -33% |
| PWM Frequency (Hz) | |||||
| Screen | 6% | -21% | -87% | 3% | |
| Brightness middle (cd/m²) | 392 | 554 41% | 501.5 28% | 305 -22% | 393 0% |
| Brightness (cd/m²) | 388 | 516 33% | 467 20% | 281 -28% | 385 -1% |
| Brightness Distribution (%) | 88 | 84 -5% | 83 -6% | 88 0% | 78 -11% |
| Black Level * (cd/m²) | 0.15 | 0.47 -213% | 0.44 -193% | 0.32 -113% | 0.25 -67% |
| Contrast (:1) | 2613 | 1179 -55% | 1140 -56% | 953 -64% | 1572 -40% |
| Colorchecker dE 2000 * | 3.2 | 1 69% | 4.73 -48% | 5.9 -84% | 1.5 53% |
| Colorchecker dE 2000 max. * | 7 | 2.4 66% | 8.45 -21% | 20.1 -187% | 4.3 39% |
| Colorchecker dE 2000 calibrated * | 1.2 | 0.6 50% | 0.51 57% | 4.5 -275% | 1.4 -17% |
| Greyscale dE 2000 * | 4.9 | 1.6 67% | 3.6 27% | 5.3 -8% | 1.3 73% |
| Gamma | 2.13 103% | 2.29 96% | 2.08 106% | 2.1 105% | 2.26 97% |
| CCT | 5982 109% | 6458 101% | 6447 101% | 6307 103% | 6435 101% |
| Media total (Programa/Opciones) | 34% /
19% | 1% /
-8% | -41% /
-64% | -9% /
-2% |
* ... más pequeño es mejor
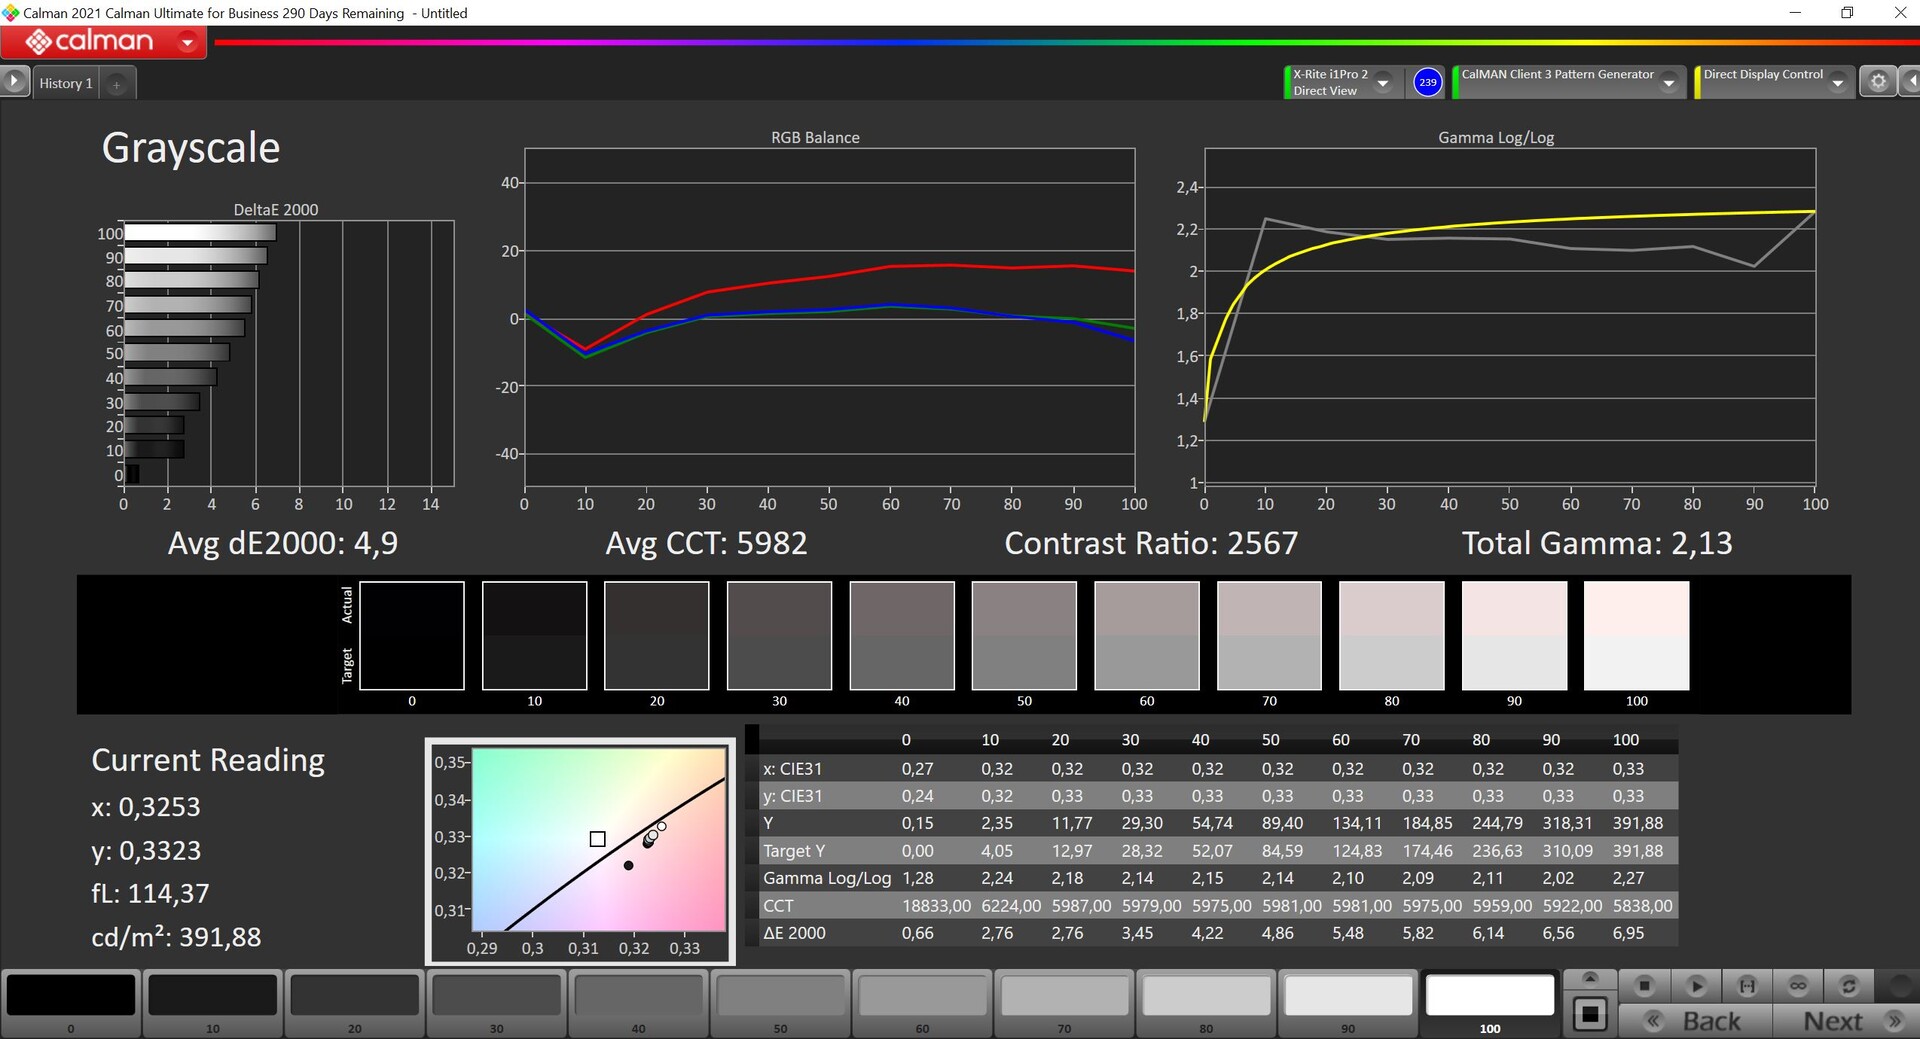
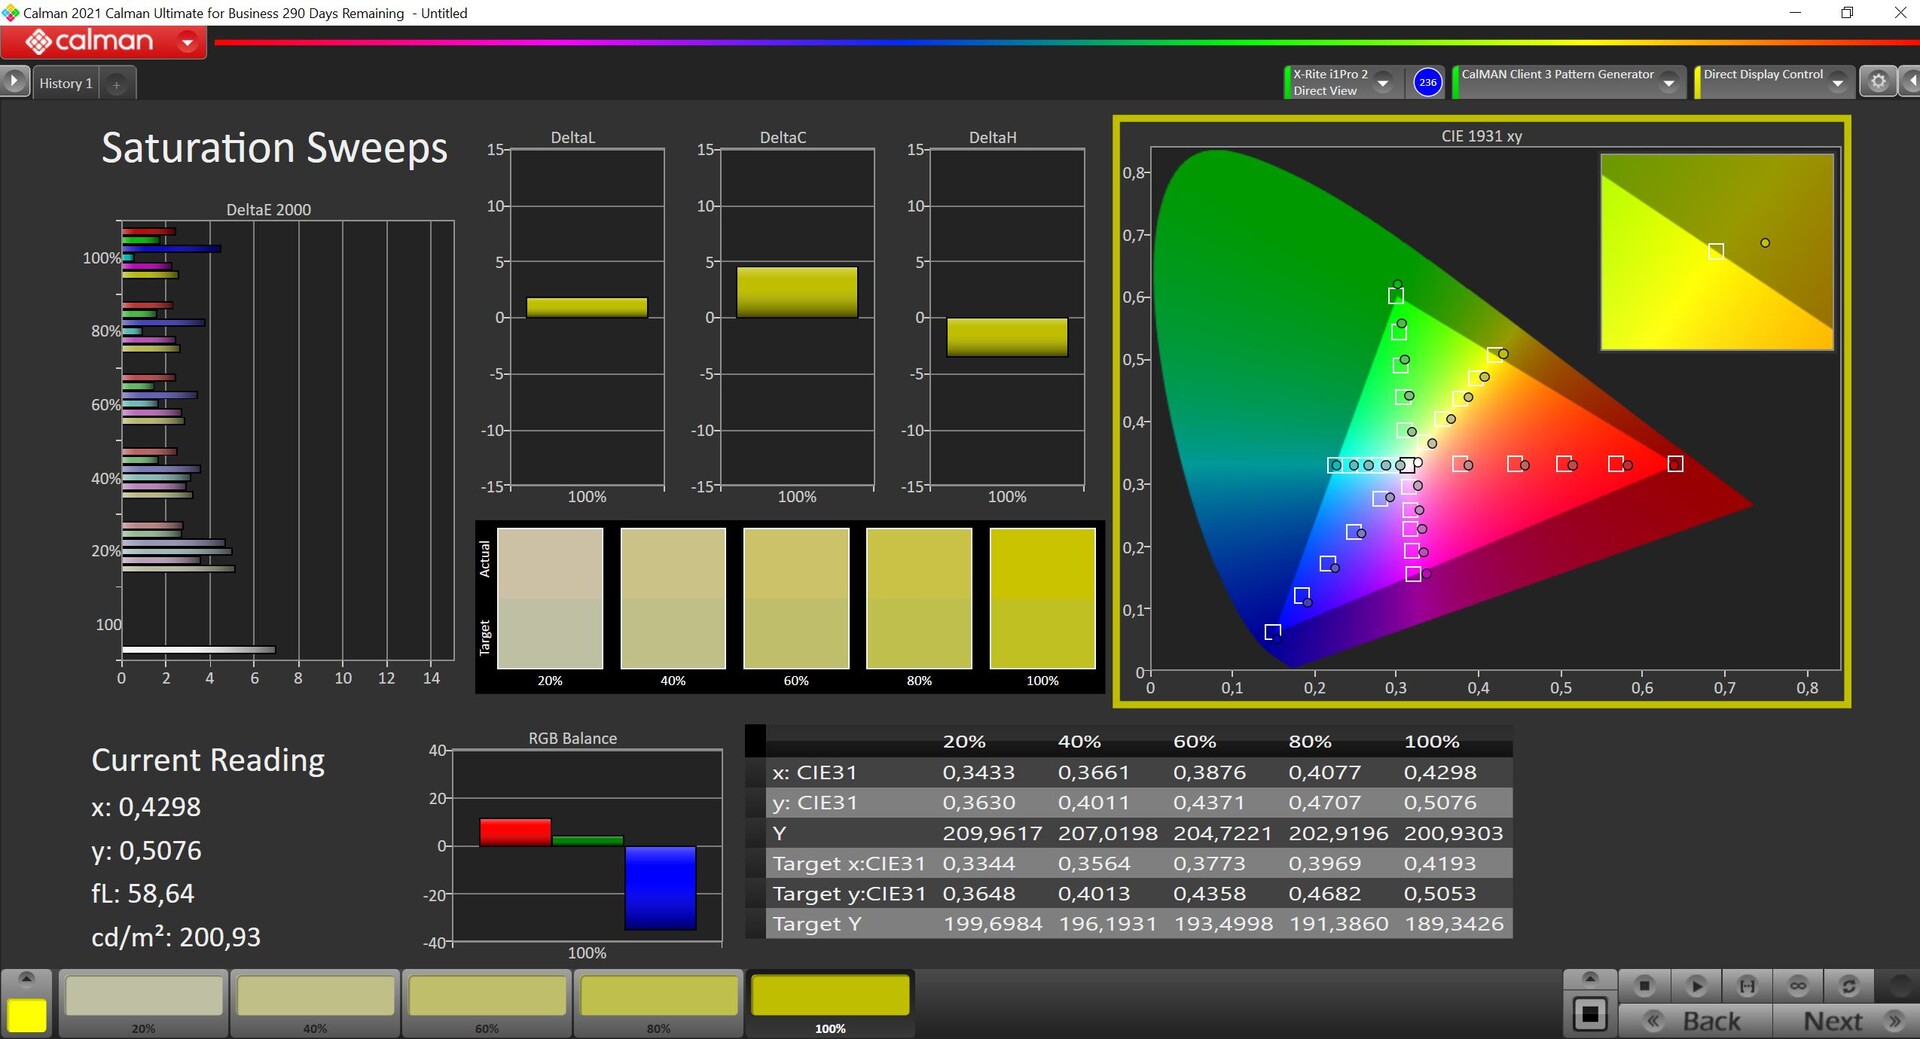
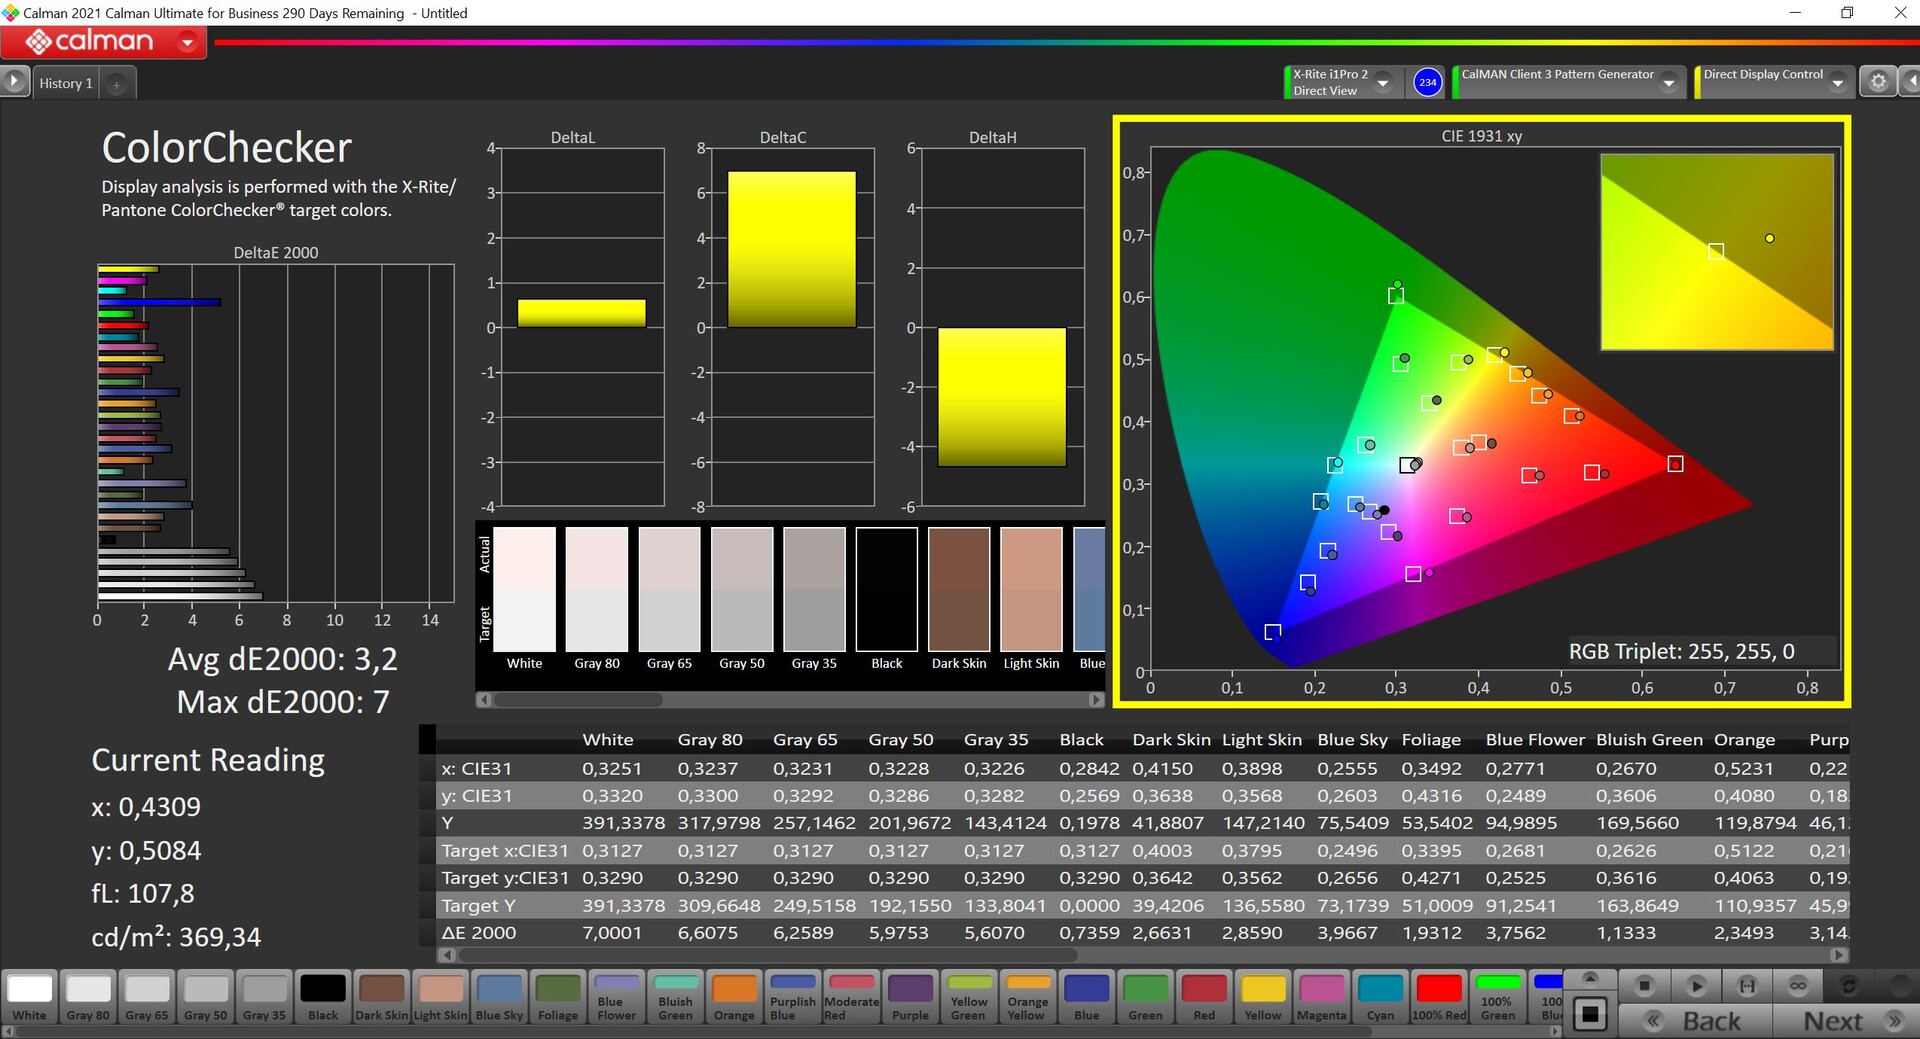
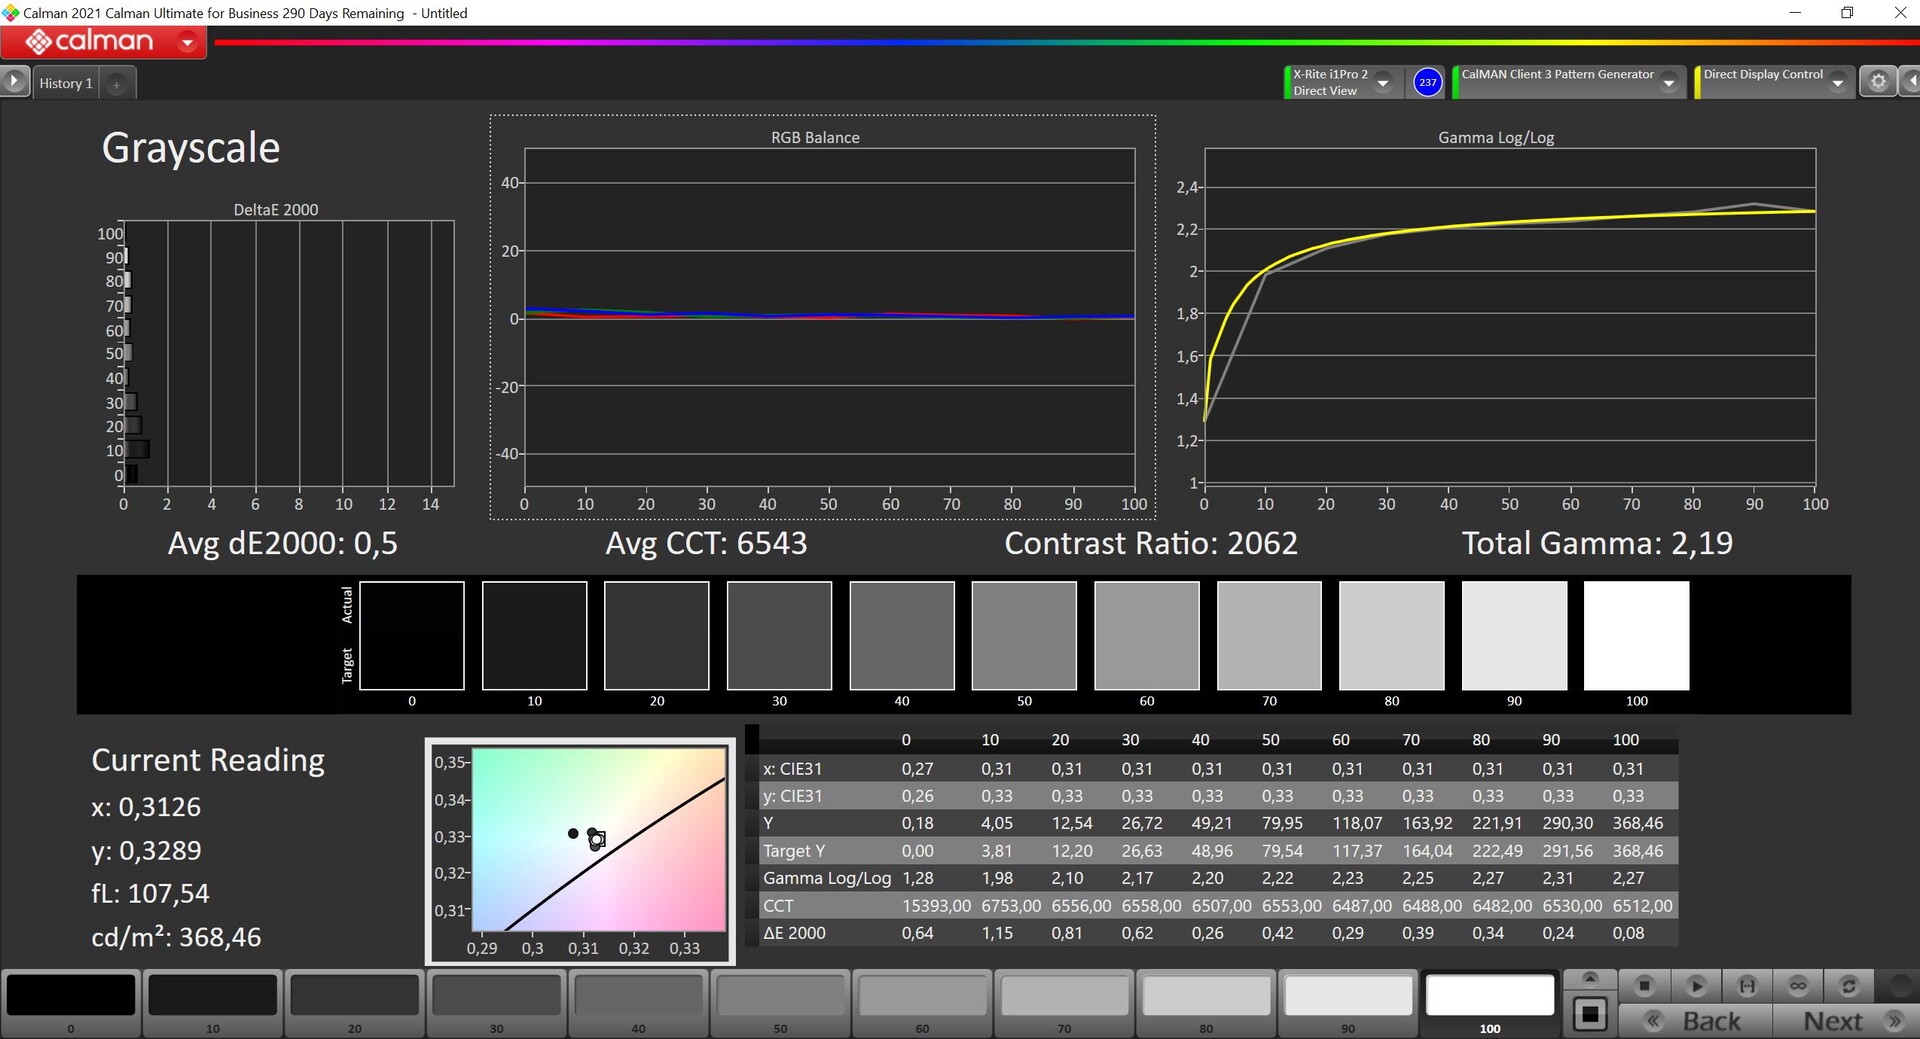
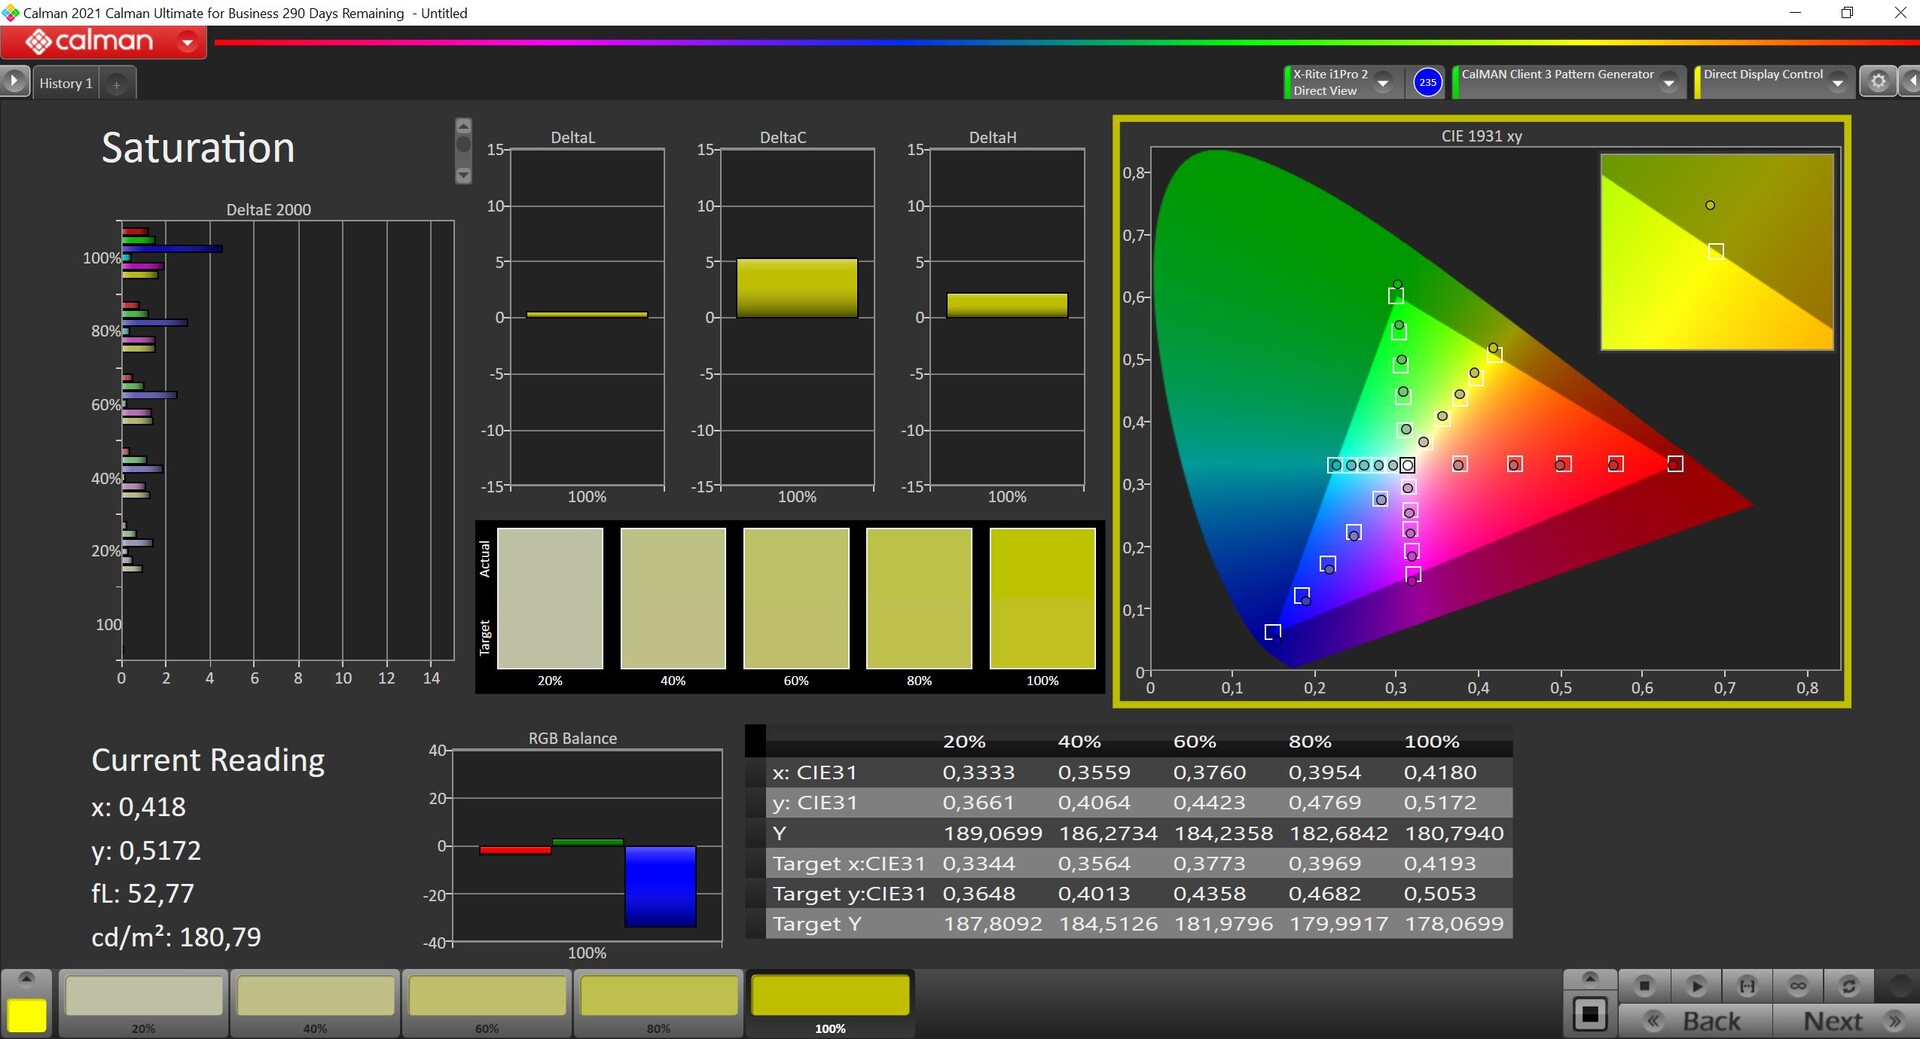
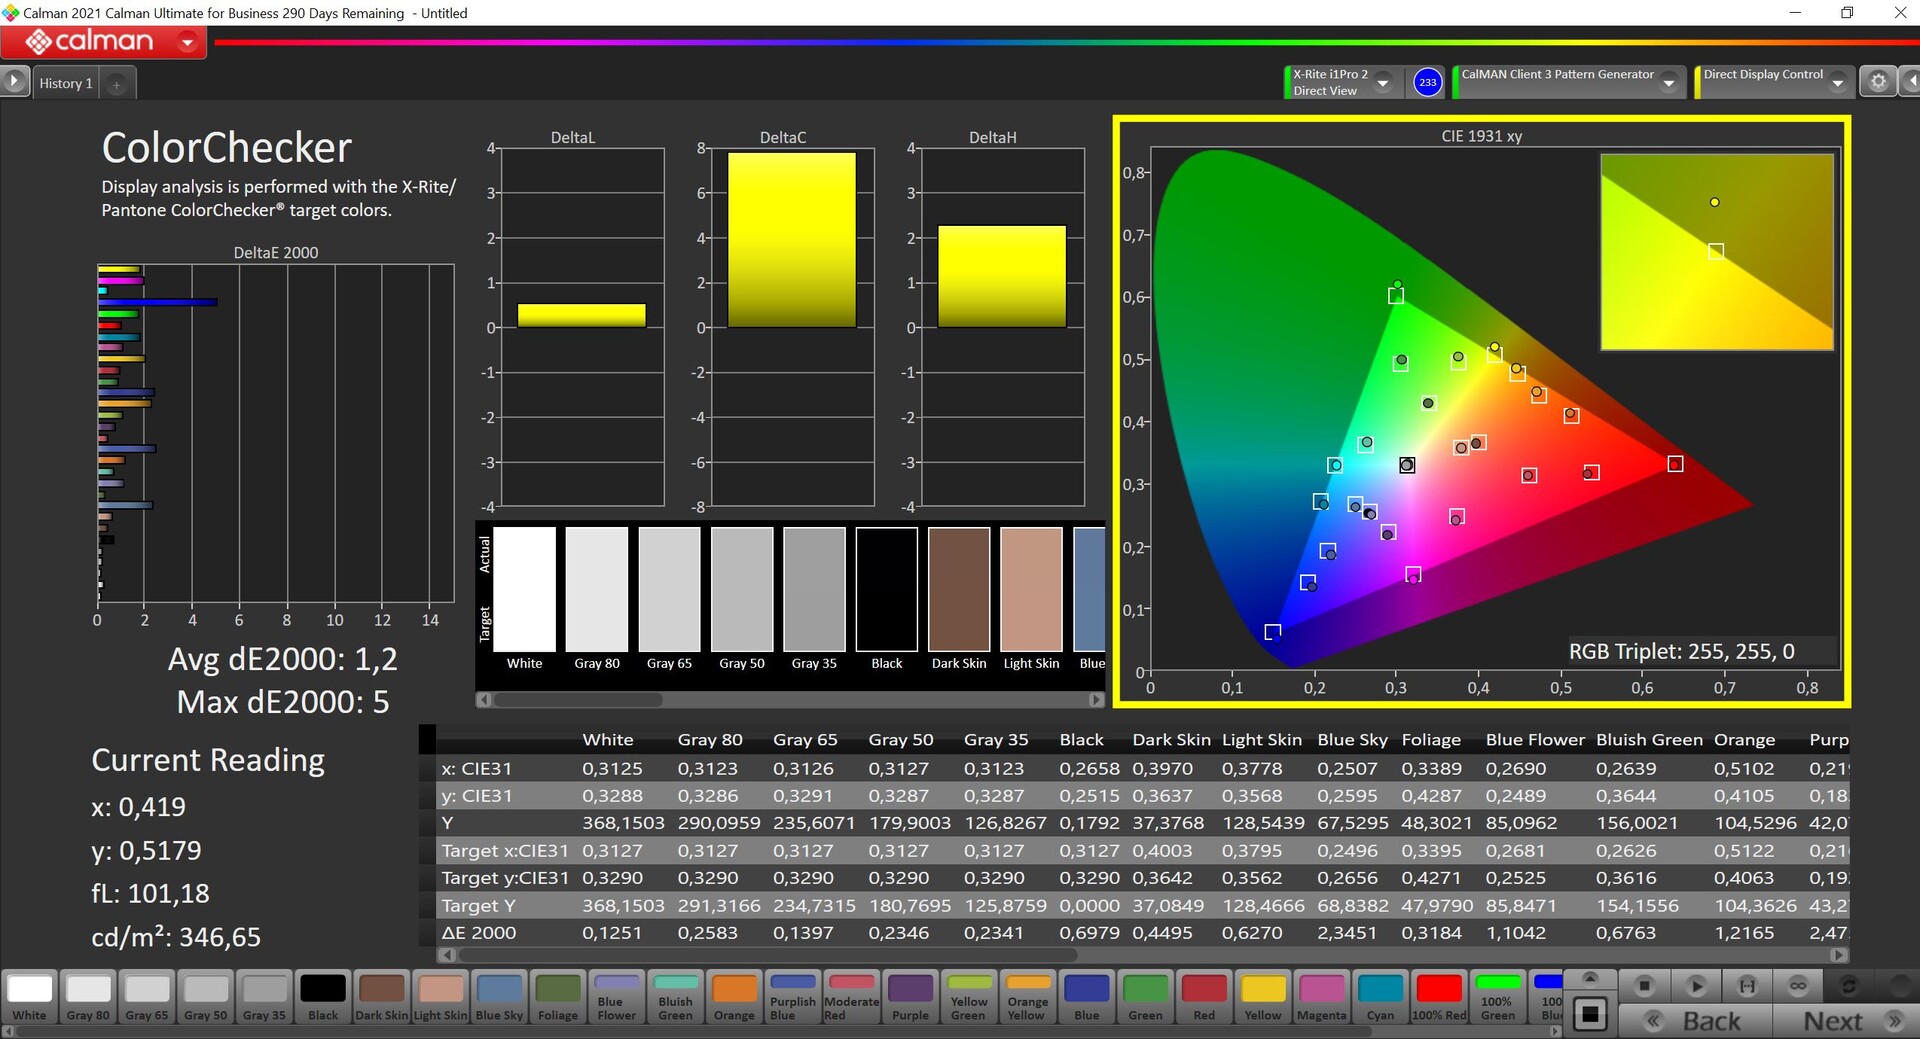
Medimos el panel con el software profesional CalMAN. Hay un tinte rojo claramente visible en el estado de entrega, y la temperatura de color también es demasiado cálida. Es una lástima, ya que podemos mejorar significativamente la pantalla con nuestra propia calibración (perfil de color disponible para su descarga gratuita desde el enlace anterior), lo que conduce a excelentes resultados, en particular en la escala de grises y se deshace por completo del tinte de color. Las desviaciones de color comparadas con el espacio de color de referencia sRGB (que se cubre por completo) también son ligeramente inferiores, dejando sólo el 100% de azul como valor atípico. Sin embargo, el panel calibrado sigue siendo adecuado para el procesamiento de imágenes.
Tiempos de respuesta del display
| ↔ Tiempo de respuesta de Negro a Blanco | ||
|---|---|---|
| 28.6 ms ... subida ↗ y bajada ↘ combinada | ↗ 14.5 ms subida | 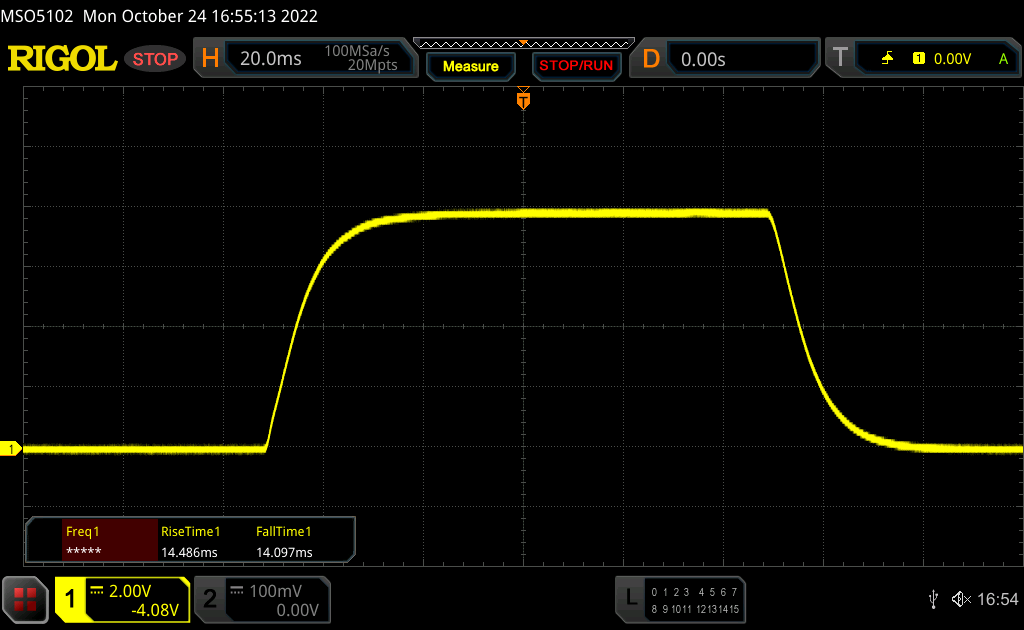 |
| ↘ 14.1 ms bajada | ||
| La pantalla mostró tiempos de respuesta relativamente lentos en nuestros tests pero podría ser demasiado lenta para los jugones. En comparación, todos los dispositivos de prueba van de ##min### (mínimo) a 240 (máximo) ms. » 76 % de todos los dispositivos son mejores. Eso quiere decir que el tiempo de respuesta es peor que la media (19.8 ms) de todos los dispositivos testados. | ||
| ↔ Tiempo de respuesta 50% Gris a 80% Gris | ||
| 45.8 ms ... subida ↗ y bajada ↘ combinada | ↗ 21.2 ms subida | 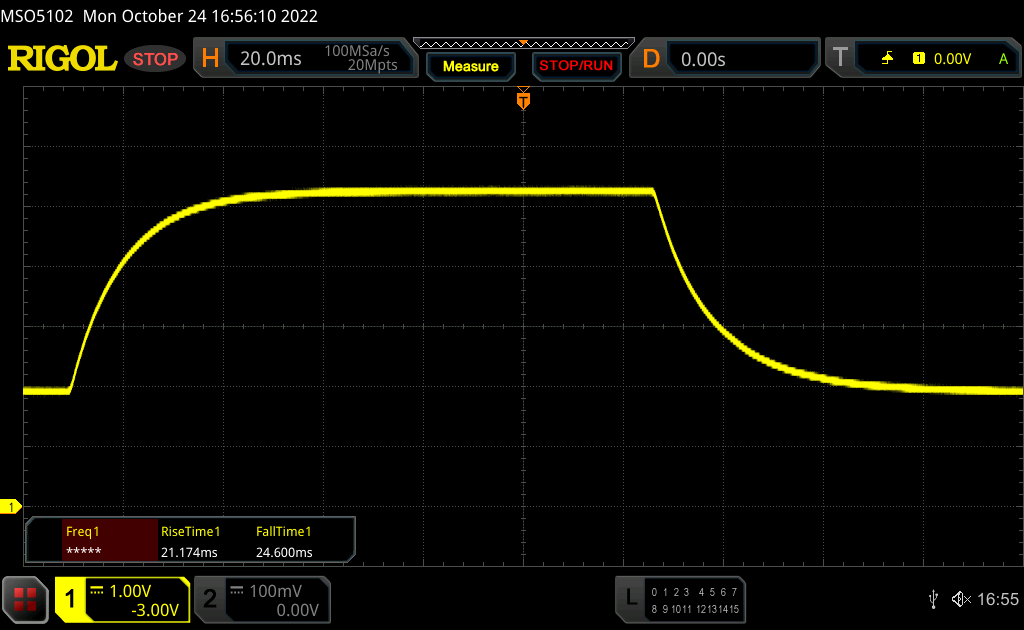 |
| ↘ 24.6 ms bajada | ||
| La pantalla mostró tiempos de respuesta lentos en nuestros tests y podría ser demasiado lenta para los jugones. En comparación, todos los dispositivos de prueba van de ##min### (mínimo) a 636 (máximo) ms. » 79 % de todos los dispositivos son mejores. Eso quiere decir que el tiempo de respuesta es peor que la media (31 ms) de todos los dispositivos testados. | ||
Parpadeo de Pantalla / PWM (Pulse-Width Modulation)
| Parpadeo de Pantalla / PWM no detectado | 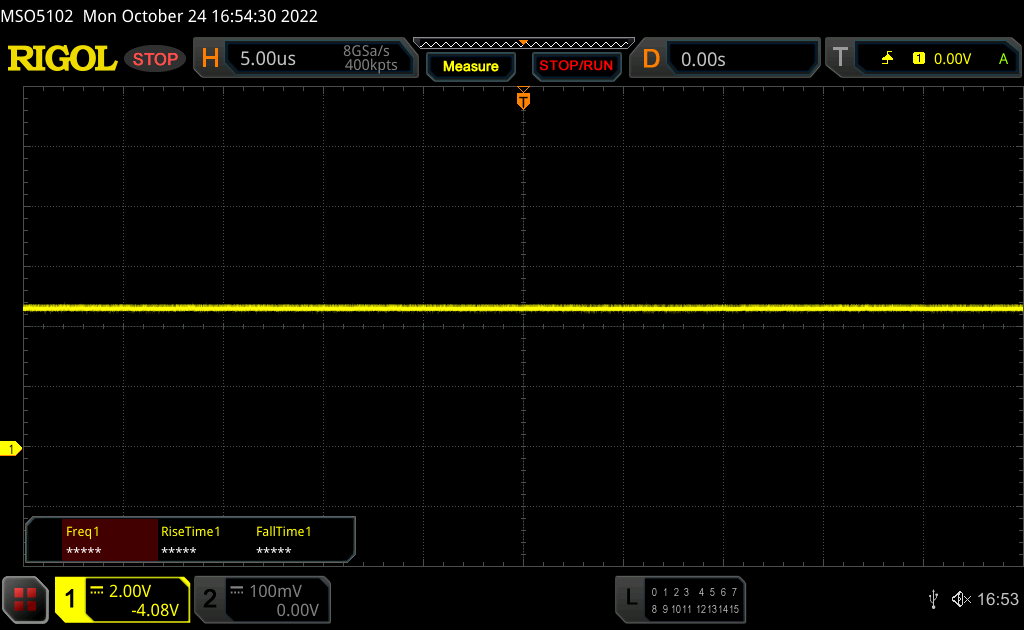 | ||
Comparación: 52 % de todos los dispositivos testados no usaron PWM para atenuar el display. Si se usó, medimos una media de 7754 (mínimo: 5 - máxmo: 343500) Hz. | |||
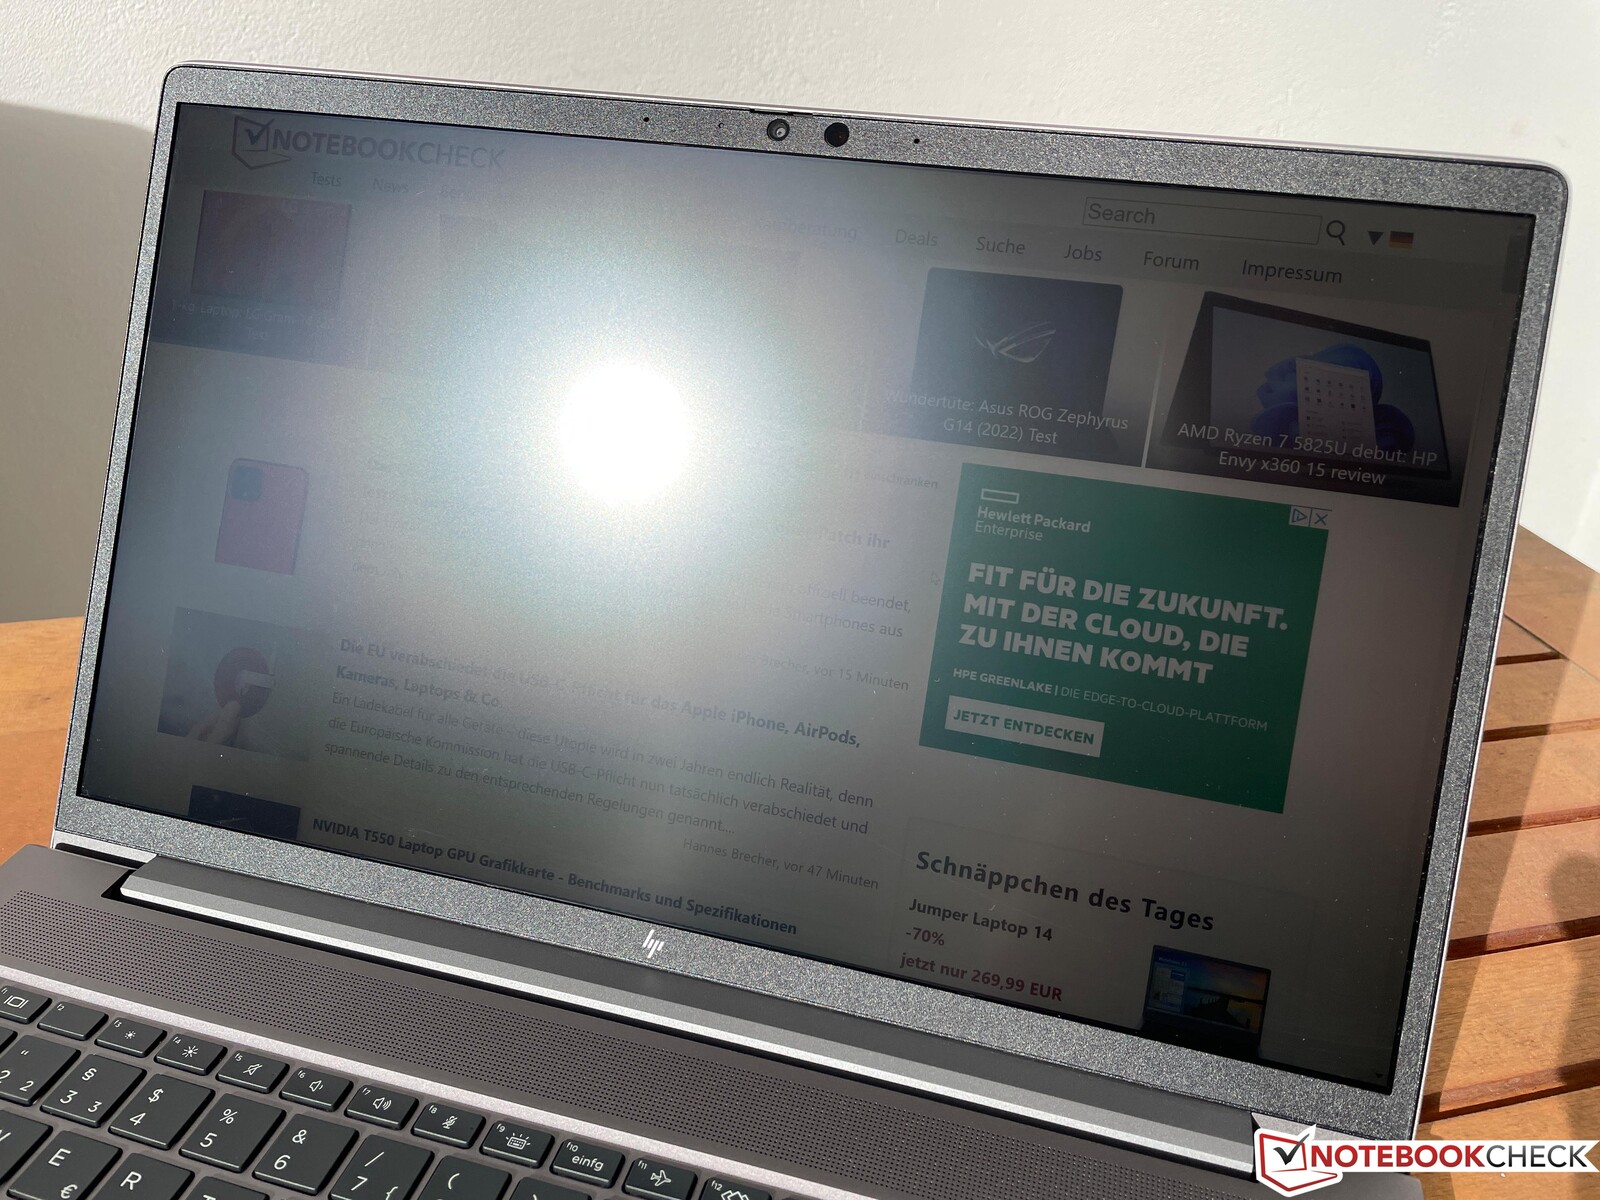
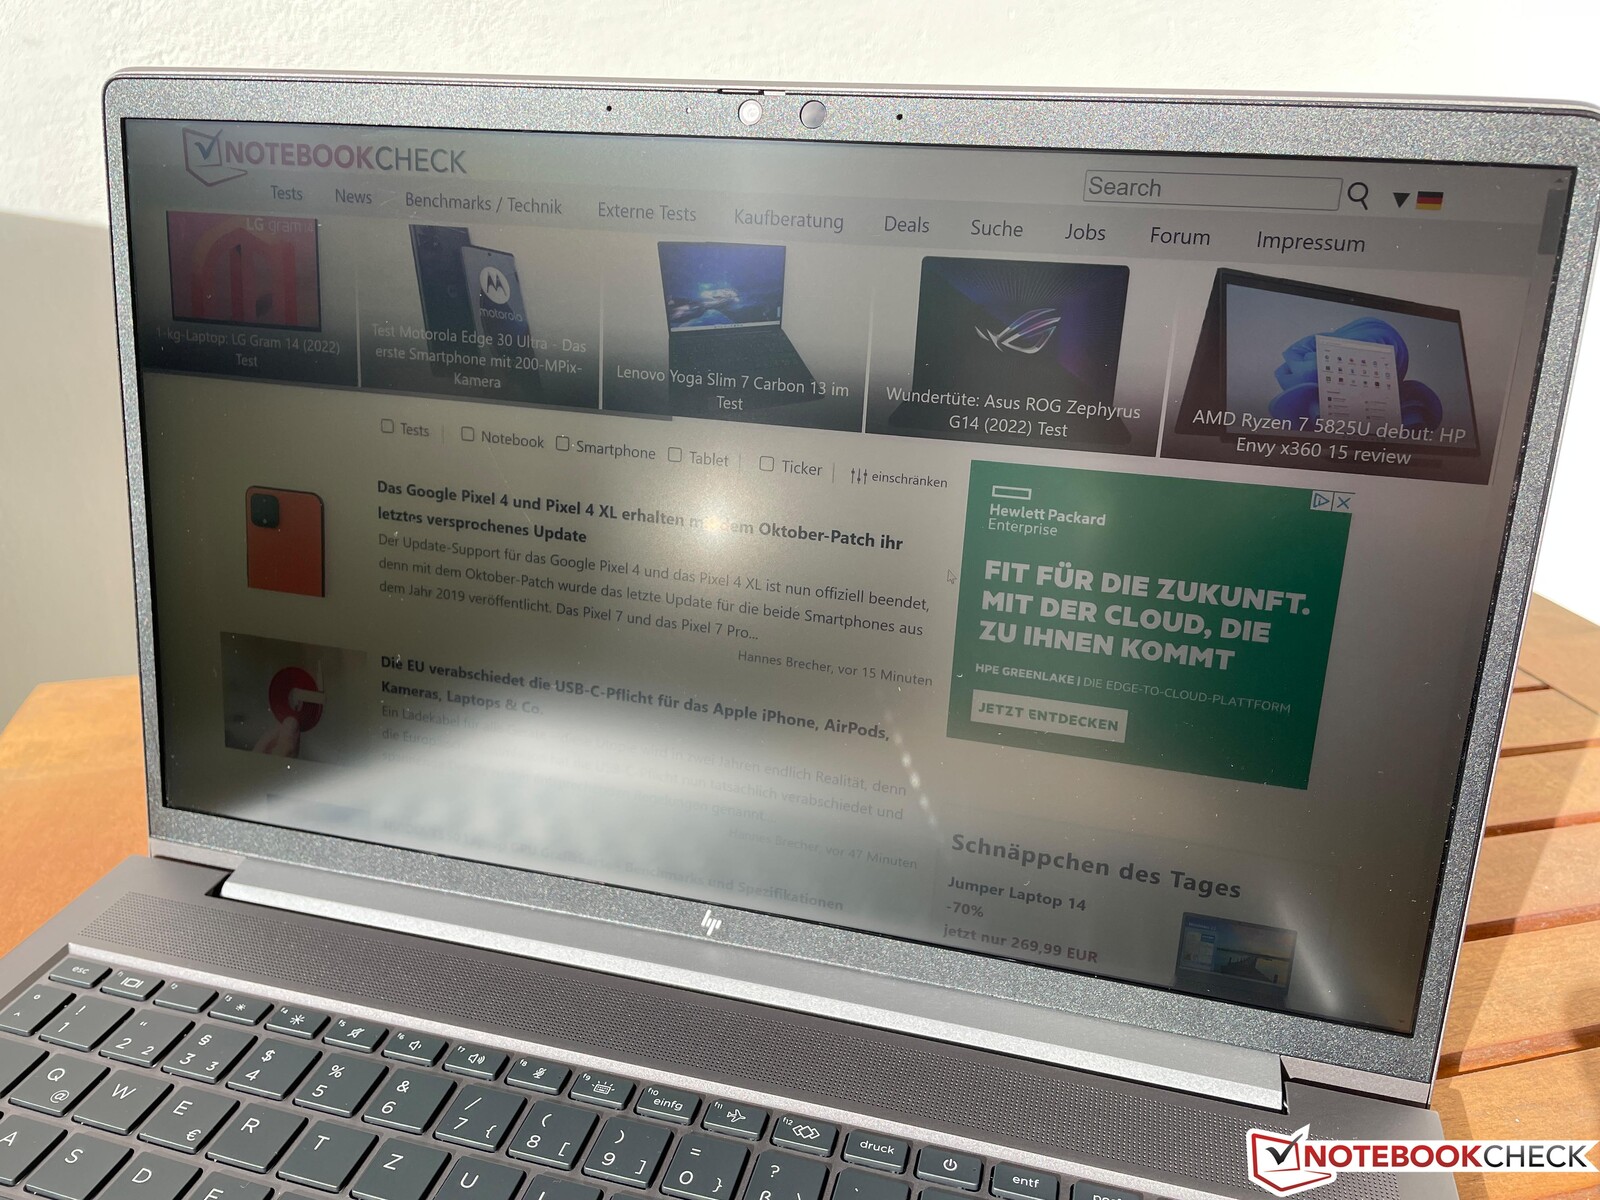
En exteriores, la pantalla se beneficia de la superficie mate, y siempre que evites los reflejos directos de las fuentes de luz, podrás reconocer fácilmente el contenido de la pantalla incluso en días luminosos. La estabilidad del ángulo de visión del panel IPS es muy buena.
Rendimiento - ZBook con Intel Alder Lake
Condiciones de la prueba
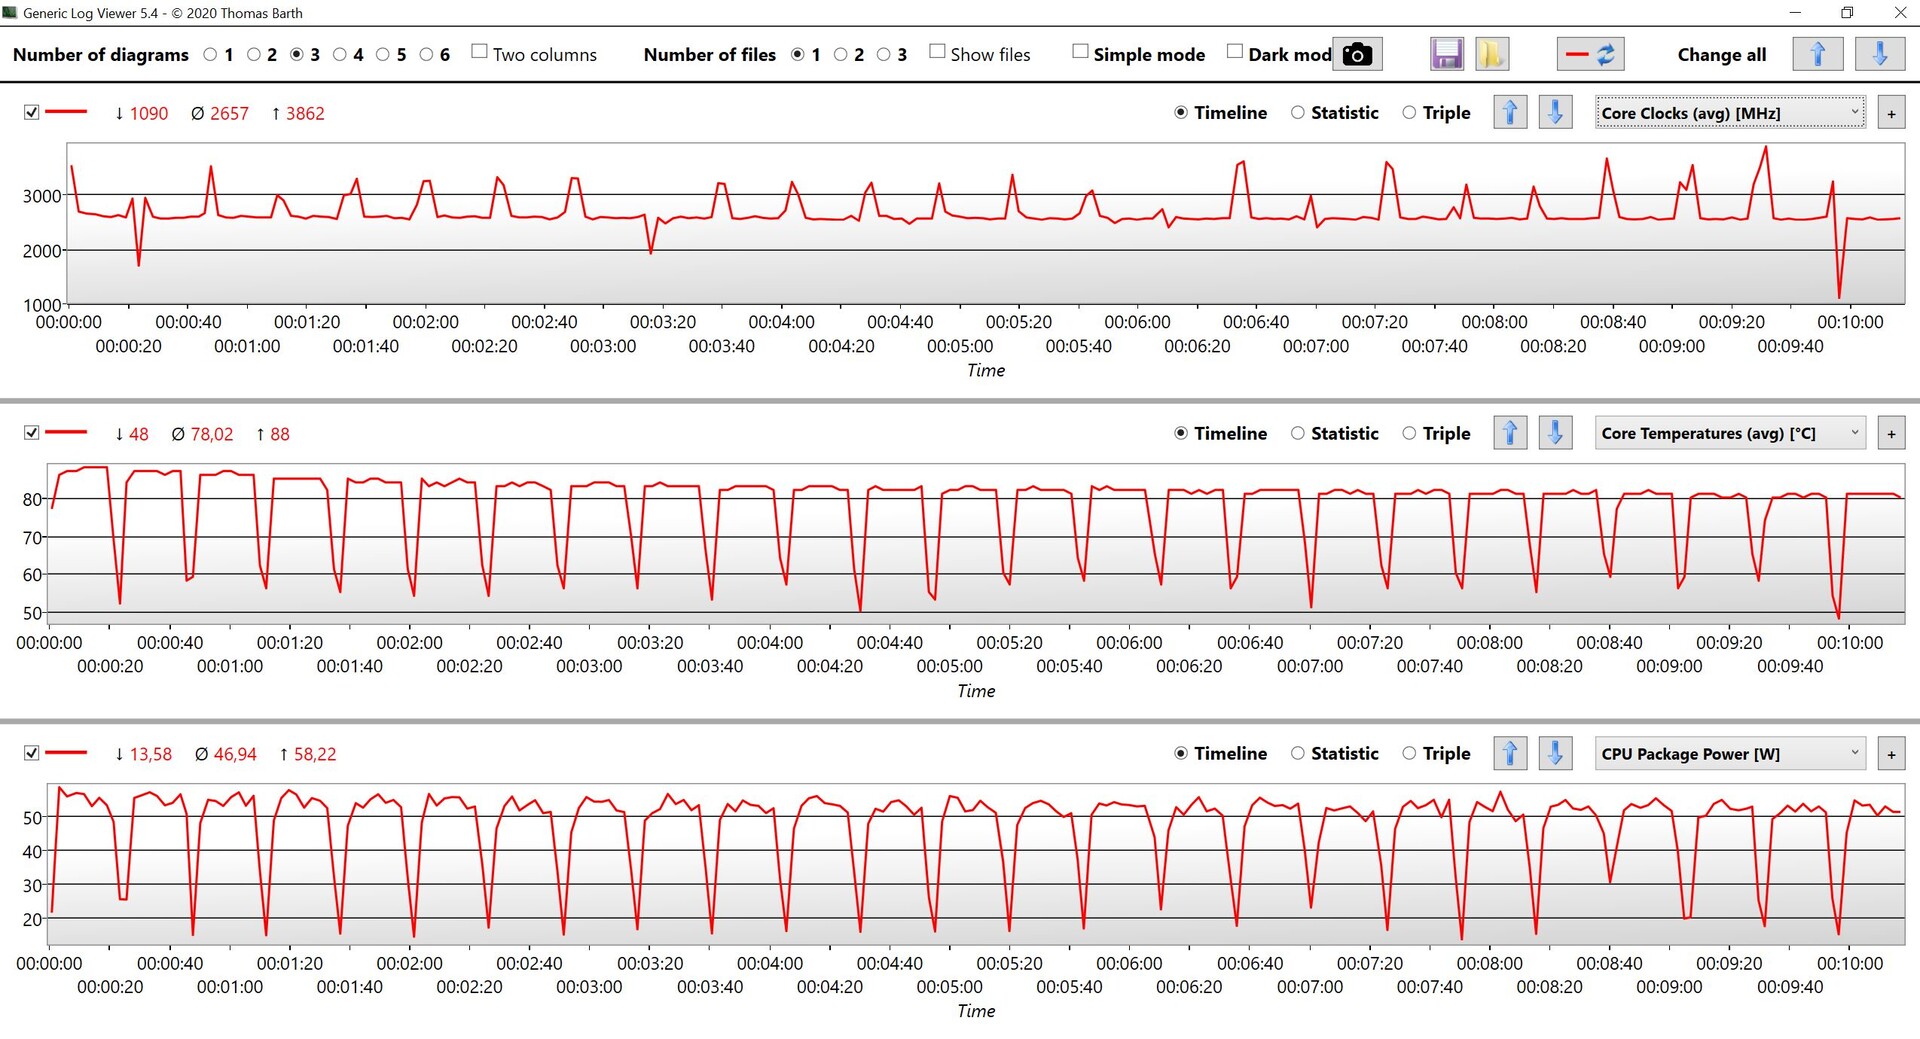
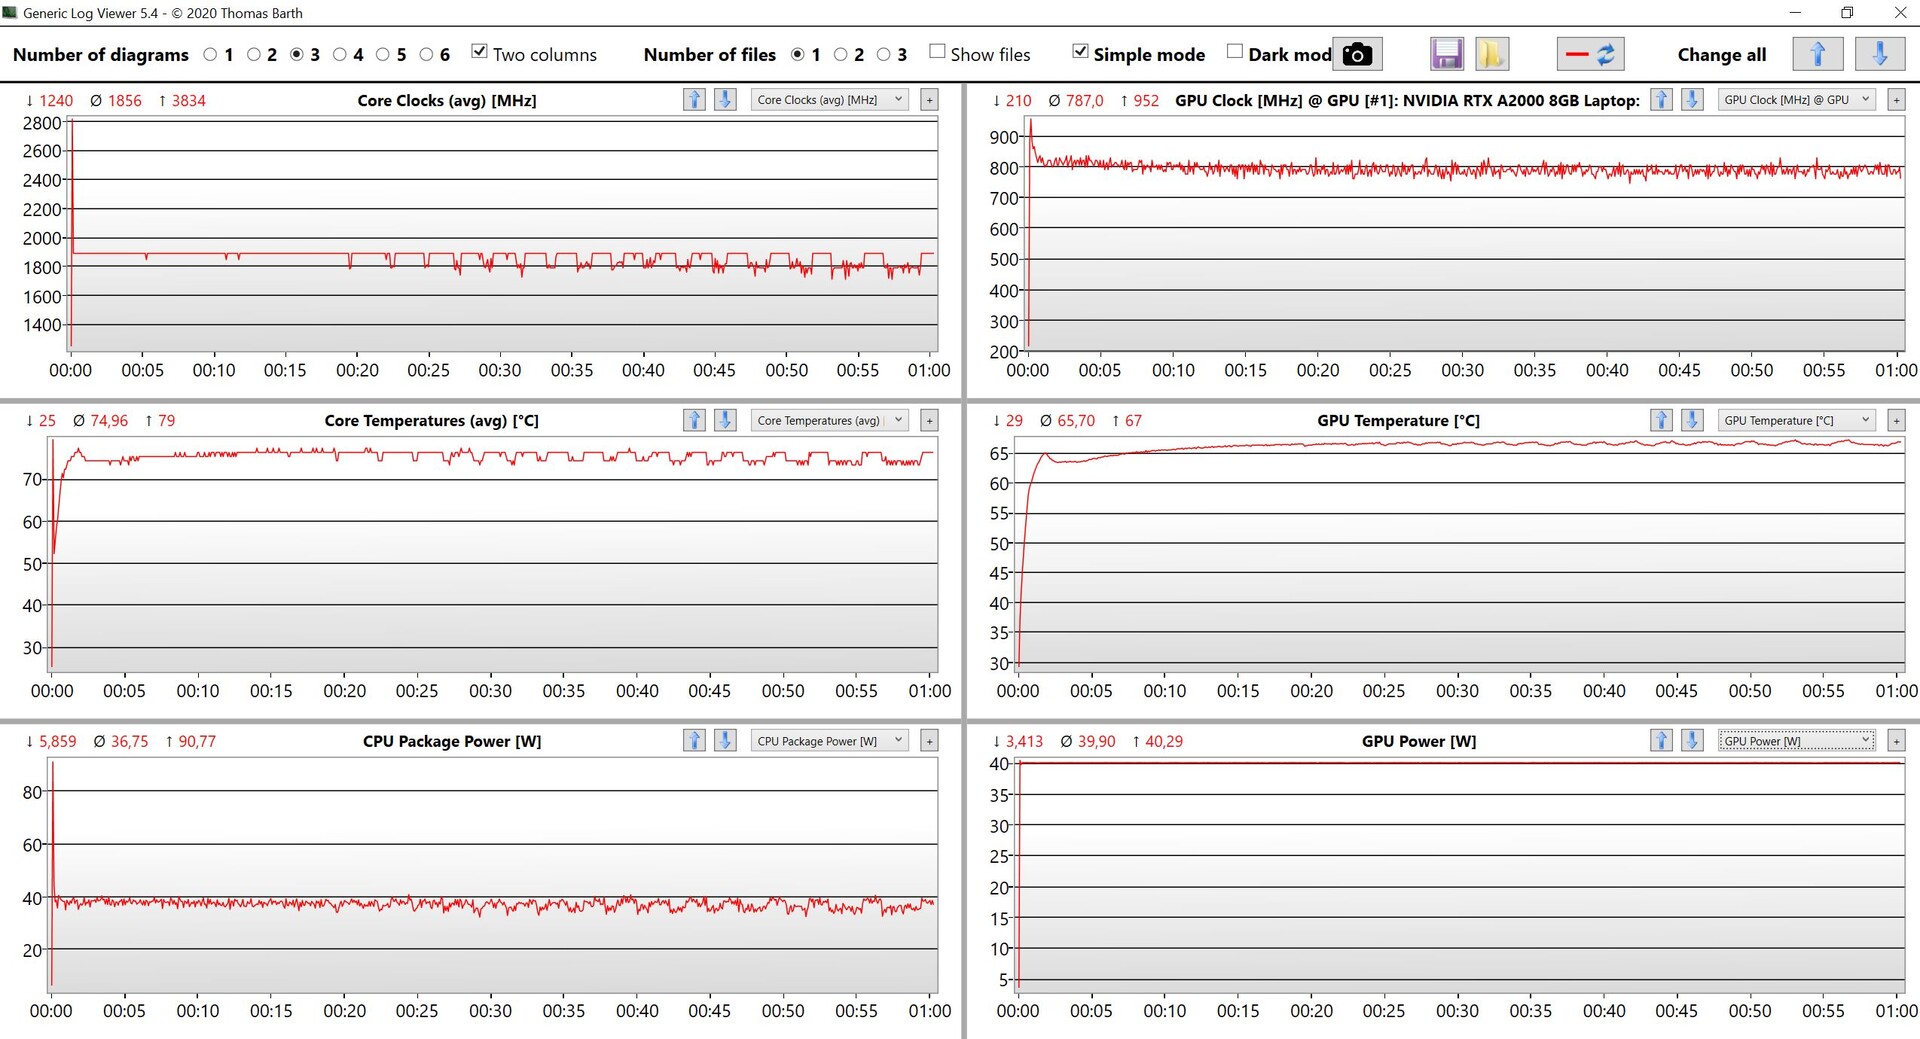
HP no ofrece ninguna opción adicional de configuración de energía. Durante la prueba, podemos observar algunos valores de rendimiento muy variables. Aunque la situación mejora ligeramente con algunas actualizaciones de la BIOS, sigue sin ser completamente estable. Con 105/75 vatios, los valores de TDP se configuran básicamente altos, pero el procesador sólo es capaz de usar hasta 90 vatios como mucho durante un segundo de vez en cuando, antes de nivelarse rápidamente en torno a los 55 vatios. A veces, el procesador incluso empieza con este valor (con versiones anteriores de la BIOS, era incluso inferior a 40 vatios).
Procesador
ElCore i7-12700Hprocede de la actual generación Alder Lake de Intel y combina 6 rápidos núcleos de Rendimiento con 8 núcleos de Eficiencia. El rendimiento mononúcleo es muy bueno y en torno a un 15-20% más rápido que el de su predecesor con el Core i7-11800H. Sin embargo, en las pruebas multinúcleo el rendimiento es ligeramente decepcionante teniendo en cuenta la gran carcasa, con mucho potencial sin usar. Por ejemplo, elZBook Studio 16 G9con el mismo procesador es un 20% más rápido en las pruebas multinúcleo. También intentamos aumentar los valores TDP manualmente, pero la refrigeración es incapaz de manejar más de 60-65 vatios, ya que las temperaturas de la CPU aumentarán a más de 95 °C.
En funcionamiento con batería, el consumo de energía de la CPU está limitado a 30 vatios. Esto no influye en el rendimiento mononúcleo, pero resulta en un déficit de rendimiento de alrededor del 30% en las pruebas multinúcleo (9.926 puntos CB R23 Multi). Encontrará más pruebas de rendimiento de la CPU en nuestra sección técnica.
Cinebench R15 Multi Constant Load Test
Cinebench R23: Multi Core | Single Core
Cinebench R20: CPU (Multi Core) | CPU (Single Core)
Cinebench R15: CPU Multi 64Bit | CPU Single 64Bit
Blender: v2.79 BMW27 CPU
7-Zip 18.03: 7z b 4 | 7z b 4 -mmt1
Geekbench 5.5: Multi-Core | Single-Core
HWBOT x265 Benchmark v2.2: 4k Preset
LibreOffice : 20 Documents To PDF
R Benchmark 2.5: Overall mean
| CPU Performance rating | |
| Media de la clase Workstation | |
| HP ZBook Studio 16 G9 62U04EA | |
| Medio Intel Core i7-12700H | |
| HP ZBook Power 15 G9 6B8C4EA | |
| HP ZBook Power 15 G8 313S5EA | |
| Dell Precision 5000 5560 -2! | |
| Lenovo ThinkPad P15v G2 21A9000XGE -1! | |
| Cinebench R23 / Multi Core | |
| Media de la clase Workstation (14621 - 38520, n=23, últimos 2 años) | |
| HP ZBook Studio 16 G9 62U04EA | |
| Medio Intel Core i7-12700H (4032 - 19330, n=64) | |
| HP ZBook Power 15 G9 6B8C4EA | |
| HP ZBook Power 15 G8 313S5EA | |
| Lenovo ThinkPad P15v G2 21A9000XGE | |
| Dell Precision 5000 5560 | |
| Cinebench R23 / Single Core | |
| Media de la clase Workstation (1712 - 2228, n=23, últimos 2 años) | |
| HP ZBook Studio 16 G9 62U04EA | |
| HP ZBook Power 15 G9 6B8C4EA | |
| Medio Intel Core i7-12700H (778 - 1826, n=63) | |
| HP ZBook Power 15 G8 313S5EA | |
| Dell Precision 5000 5560 | |
| Cinebench R20 / CPU (Multi Core) | |
| Media de la clase Workstation (5760 - 15043, n=23, últimos 2 años) | |
| HP ZBook Studio 16 G9 62U04EA | |
| Medio Intel Core i7-12700H (1576 - 7407, n=64) | |
| HP ZBook Power 15 G9 6B8C4EA | |
| HP ZBook Power 15 G8 313S5EA | |
| Dell Precision 5000 5560 | |
| Lenovo ThinkPad P15v G2 21A9000XGE | |
| Cinebench R20 / CPU (Single Core) | |
| Media de la clase Workstation (671 - 857, n=23, últimos 2 años) | |
| HP ZBook Studio 16 G9 62U04EA | |
| HP ZBook Power 15 G9 6B8C4EA | |
| Medio Intel Core i7-12700H (300 - 704, n=64) | |
| HP ZBook Power 15 G8 313S5EA | |
| Dell Precision 5000 5560 | |
| Lenovo ThinkPad P15v G2 21A9000XGE | |
| Cinebench R15 / CPU Multi 64Bit | |
| Media de la clase Workstation (2489 - 5810, n=23, últimos 2 años) | |
| HP ZBook Studio 16 G9 62U04EA | |
| Medio Intel Core i7-12700H (1379 - 2916, n=70) | |
| HP ZBook Power 15 G8 313S5EA | |
| HP ZBook Power 15 G8 313S5EA | |
| HP ZBook Power 15 G9 6B8C4EA | |
| Lenovo ThinkPad P15v G2 21A9000XGE | |
| Dell Precision 5000 5560 | |
| Cinebench R15 / CPU Single 64Bit | |
| Media de la clase Workstation (191.4 - 328, n=23, últimos 2 años) | |
| HP ZBook Studio 16 G9 62U04EA | |
| Medio Intel Core i7-12700H (113 - 263, n=65) | |
| HP ZBook Power 15 G9 6B8C4EA | |
| Dell Precision 5000 5560 | |
| HP ZBook Power 15 G8 313S5EA | |
| Lenovo ThinkPad P15v G2 21A9000XGE | |
| Blender / v2.79 BMW27 CPU | |
| Lenovo ThinkPad P15v G2 21A9000XGE | |
| Dell Precision 5000 5560 | |
| HP ZBook Power 15 G8 313S5EA | |
| HP ZBook Power 15 G9 6B8C4EA | |
| Medio Intel Core i7-12700H (168 - 732, n=63) | |
| HP ZBook Studio 16 G9 62U04EA | |
| Media de la clase Workstation (91 - 222, n=23, últimos 2 años) | |
| 7-Zip 18.03 / 7z b 4 | |
| Media de la clase Workstation (60489 - 116969, n=23, últimos 2 años) | |
| HP ZBook Studio 16 G9 62U04EA | |
| Medio Intel Core i7-12700H (22844 - 73067, n=63) | |
| HP ZBook Power 15 G9 6B8C4EA | |
| HP ZBook Power 15 G8 313S5EA | |
| Dell Precision 5000 5560 | |
| Lenovo ThinkPad P15v G2 21A9000XGE | |
| 7-Zip 18.03 / 7z b 4 -mmt1 | |
| Media de la clase Workstation (5126 - 6960, n=23, últimos 2 años) | |
| HP ZBook Studio 16 G9 62U04EA | |
| HP ZBook Power 15 G9 6B8C4EA | |
| Dell Precision 5000 5560 | |
| HP ZBook Power 15 G8 313S5EA | |
| Medio Intel Core i7-12700H (2743 - 5972, n=63) | |
| Lenovo ThinkPad P15v G2 21A9000XGE | |
| Geekbench 5.5 / Multi-Core | |
| Media de la clase Workstation (11542 - 25554, n=23, últimos 2 años) | |
| HP ZBook Studio 16 G9 62U04EA | |
| HP ZBook Power 15 G9 6B8C4EA | |
| Medio Intel Core i7-12700H (5144 - 13745, n=64) | |
| HP ZBook Power 15 G8 313S5EA | |
| Lenovo ThinkPad P15v G2 21A9000XGE | |
| Geekbench 5.5 / Single-Core | |
| Media de la clase Workstation (1783 - 2183, n=23, últimos 2 años) | |
| HP ZBook Studio 16 G9 62U04EA | |
| Medio Intel Core i7-12700H (803 - 1851, n=64) | |
| HP ZBook Power 15 G9 6B8C4EA | |
| HP ZBook Power 15 G8 313S5EA | |
| Lenovo ThinkPad P15v G2 21A9000XGE | |
| HWBOT x265 Benchmark v2.2 / 4k Preset | |
| Media de la clase Workstation (17.8 - 40.5, n=23, últimos 2 años) | |
| HP ZBook Studio 16 G9 62U04EA | |
| Medio Intel Core i7-12700H (4.67 - 21.8, n=64) | |
| HP ZBook Power 15 G9 6B8C4EA | |
| HP ZBook Power 15 G8 313S5EA | |
| Dell Precision 5000 5560 | |
| Lenovo ThinkPad P15v G2 21A9000XGE | |
| LibreOffice / 20 Documents To PDF | |
| Lenovo ThinkPad P15v G2 21A9000XGE | |
| Dell Precision 5000 5560 | |
| Media de la clase Workstation (37.1 - 74.7, n=23, últimos 2 años) | |
| Medio Intel Core i7-12700H (34.2 - 95.3, n=63) | |
| HP ZBook Power 15 G9 6B8C4EA | |
| HP ZBook Studio 16 G9 62U04EA | |
| HP ZBook Power 15 G8 313S5EA | |
| R Benchmark 2.5 / Overall mean | |
| HP ZBook Power 15 G8 313S5EA | |
| Lenovo ThinkPad P15v G2 21A9000XGE | |
| Dell Precision 5000 5560 | |
| HP ZBook Power 15 G9 6B8C4EA | |
| Medio Intel Core i7-12700H (0.4441 - 1.052, n=63) | |
| HP ZBook Studio 16 G9 62U04EA | |
| Media de la clase Workstation (0.3825 - 0.603, n=23, últimos 2 años) | |
* ... más pequeño es mejor
AIDA64: FP32 Ray-Trace | FPU Julia | CPU SHA3 | CPU Queen | FPU SinJulia | FPU Mandel | CPU AES | CPU ZLib | FP64 Ray-Trace | CPU PhotoWorxx
| Performance rating | |
| Media de la clase Workstation | |
| HP ZBook Studio 16 G9 62U04EA | |
| HP ZBook Power 15 G9 6B8C4EA | |
| HP ZBook Power 15 G8 313S5EA | |
| Medio Intel Core i7-12700H | |
| Lenovo ThinkPad P15v G2 21A9000XGE | |
| Dell Precision 5000 5560 -9! | |
| AIDA64 / FP32 Ray-Trace | |
| Media de la clase Workstation (16730 - 61611, n=23, últimos 2 años) | |
| HP ZBook Studio 16 G9 62U04EA | |
| HP ZBook Power 15 G8 313S5EA | |
| HP ZBook Power 15 G9 6B8C4EA | |
| Lenovo ThinkPad P15v G2 21A9000XGE | |
| Medio Intel Core i7-12700H (2585 - 17957, n=64) | |
| AIDA64 / FPU Julia | |
| Media de la clase Workstation (89597 - 186971, n=23, últimos 2 años) | |
| HP ZBook Studio 16 G9 62U04EA | |
| HP ZBook Power 15 G9 6B8C4EA | |
| HP ZBook Power 15 G8 313S5EA | |
| Medio Intel Core i7-12700H (12439 - 90760, n=64) | |
| Lenovo ThinkPad P15v G2 21A9000XGE | |
| AIDA64 / CPU SHA3 | |
| Media de la clase Workstation (4178 - 8975, n=23, últimos 2 años) | |
| HP ZBook Power 15 G8 313S5EA | |
| HP ZBook Studio 16 G9 62U04EA | |
| Lenovo ThinkPad P15v G2 21A9000XGE | |
| HP ZBook Power 15 G9 6B8C4EA | |
| Medio Intel Core i7-12700H (833 - 4242, n=64) | |
| AIDA64 / CPU Queen | |
| Media de la clase Workstation (60778 - 144411, n=23, últimos 2 años) | |
| HP ZBook Studio 16 G9 62U04EA | |
| HP ZBook Power 15 G9 6B8C4EA | |
| Medio Intel Core i7-12700H (57923 - 103202, n=63) | |
| HP ZBook Power 15 G8 313S5EA | |
| Lenovo ThinkPad P15v G2 21A9000XGE | |
| AIDA64 / FPU SinJulia | |
| Media de la clase Workstation (8165 - 29343, n=23, últimos 2 años) | |
| HP ZBook Power 15 G8 313S5EA | |
| HP ZBook Studio 16 G9 62U04EA | |
| Medio Intel Core i7-12700H (3249 - 9939, n=64) | |
| Lenovo ThinkPad P15v G2 21A9000XGE | |
| HP ZBook Power 15 G9 6B8C4EA | |
| AIDA64 / FPU Mandel | |
| Media de la clase Workstation (44497 - 98153, n=23, últimos 2 años) | |
| HP ZBook Studio 16 G9 62U04EA | |
| HP ZBook Power 15 G8 313S5EA | |
| HP ZBook Power 15 G9 6B8C4EA | |
| Lenovo ThinkPad P15v G2 21A9000XGE | |
| Medio Intel Core i7-12700H (7135 - 44760, n=64) | |
| AIDA64 / CPU AES | |
| Media de la clase Workstation (73133 - 187841, n=23, últimos 2 años) | |
| Medio Intel Core i7-12700H (31839 - 144360, n=64) | |
| HP ZBook Power 15 G8 313S5EA | |
| Lenovo ThinkPad P15v G2 21A9000XGE | |
| HP ZBook Studio 16 G9 62U04EA | |
| HP ZBook Power 15 G9 6B8C4EA | |
| AIDA64 / CPU ZLib | |
| Media de la clase Workstation (929 - 2148, n=23, últimos 2 años) | |
| HP ZBook Studio 16 G9 62U04EA | |
| Medio Intel Core i7-12700H (305 - 1171, n=64) | |
| HP ZBook Power 15 G9 6B8C4EA | |
| HP ZBook Power 15 G8 313S5EA | |
| Lenovo ThinkPad P15v G2 21A9000XGE | |
| Dell Precision 5000 5560 | |
| AIDA64 / FP64 Ray-Trace | |
| Media de la clase Workstation (8545 - 32891, n=23, últimos 2 años) | |
| HP ZBook Studio 16 G9 62U04EA | |
| HP ZBook Power 15 G8 313S5EA | |
| HP ZBook Power 15 G9 6B8C4EA | |
| Lenovo ThinkPad P15v G2 21A9000XGE | |
| Medio Intel Core i7-12700H (1437 - 9692, n=64) | |
| AIDA64 / CPU PhotoWorxx | |
| Media de la clase Workstation (37151 - 93684, n=23, últimos 2 años) | |
| HP ZBook Power 15 G9 6B8C4EA | |
| HP ZBook Studio 16 G9 62U04EA | |
| Medio Intel Core i7-12700H (12863 - 52207, n=64) | |
| HP ZBook Power 15 G8 313S5EA | |
| Lenovo ThinkPad P15v G2 21A9000XGE | |
Rendimiento del sistema
El ZBook Power 15 G9 es un dispositivo muy sensible, y no encontramos ningún problema durante nuestras pruebas. Los resultados sintéticos también son muy buenos y confirman nuestra impresión subjetiva del rendimiento.
CrossMark: Overall | Productivity | Creativity | Responsiveness
| PCMark 10 / Score | |
| Media de la clase Workstation (6563 - 10409, n=19, últimos 2 años) | |
| Dell Precision 5000 5560 | |
| HP ZBook Studio 16 G9 62U04EA | |
| HP ZBook Power 15 G9 6B8C4EA | |
| Medio Intel Core i7-12700H, NVIDIA RTX A2000 Laptop GPU (n=1) | |
| Lenovo ThinkPad P15v G2 21A9000XGE | |
| HP ZBook Power 15 G8 313S5EA | |
| PCMark 10 / Essentials | |
| Dell Precision 5000 5560 | |
| Media de la clase Workstation (9622 - 11157, n=19, últimos 2 años) | |
| HP ZBook Power 15 G9 6B8C4EA | |
| Medio Intel Core i7-12700H, NVIDIA RTX A2000 Laptop GPU (n=1) | |
| Lenovo ThinkPad P15v G2 21A9000XGE | |
| HP ZBook Studio 16 G9 62U04EA | |
| HP ZBook Power 15 G8 313S5EA | |
| PCMark 10 / Productivity | |
| Media de la clase Workstation (8789 - 20616, n=19, últimos 2 años) | |
| Dell Precision 5000 5560 | |
| Lenovo ThinkPad P15v G2 21A9000XGE | |
| HP ZBook Studio 16 G9 62U04EA | |
| HP ZBook Power 15 G9 6B8C4EA | |
| Medio Intel Core i7-12700H, NVIDIA RTX A2000 Laptop GPU (n=1) | |
| HP ZBook Power 15 G8 313S5EA | |
| PCMark 10 / Digital Content Creation | |
| Media de la clase Workstation (8108 - 15631, n=19, últimos 2 años) | |
| HP ZBook Studio 16 G9 62U04EA | |
| HP ZBook Power 15 G9 6B8C4EA | |
| Medio Intel Core i7-12700H, NVIDIA RTX A2000 Laptop GPU (n=1) | |
| Dell Precision 5000 5560 | |
| Lenovo ThinkPad P15v G2 21A9000XGE | |
| HP ZBook Power 15 G8 313S5EA | |
| CrossMark / Overall | |
| Media de la clase Workstation (1307 - 2267, n=22, últimos 2 años) | |
| HP ZBook Studio 16 G9 62U04EA | |
| HP ZBook Power 15 G9 6B8C4EA | |
| Medio Intel Core i7-12700H, NVIDIA RTX A2000 Laptop GPU (n=1) | |
| HP ZBook Power 15 G8 313S5EA | |
| Lenovo ThinkPad P15v G2 21A9000XGE | |
| CrossMark / Productivity | |
| Media de la clase Workstation (1130 - 2122, n=22, últimos 2 años) | |
| HP ZBook Studio 16 G9 62U04EA | |
| HP ZBook Power 15 G9 6B8C4EA | |
| Medio Intel Core i7-12700H, NVIDIA RTX A2000 Laptop GPU (n=1) | |
| HP ZBook Power 15 G8 313S5EA | |
| Lenovo ThinkPad P15v G2 21A9000XGE | |
| CrossMark / Creativity | |
| Media de la clase Workstation (1657 - 2725, n=22, últimos 2 años) | |
| HP ZBook Studio 16 G9 62U04EA | |
| HP ZBook Power 15 G9 6B8C4EA | |
| Medio Intel Core i7-12700H, NVIDIA RTX A2000 Laptop GPU (n=1) | |
| HP ZBook Power 15 G8 313S5EA | |
| Lenovo ThinkPad P15v G2 21A9000XGE | |
| CrossMark / Responsiveness | |
| Media de la clase Workstation (993 - 2096, n=22, últimos 2 años) | |
| HP ZBook Studio 16 G9 62U04EA | |
| HP ZBook Power 15 G9 6B8C4EA | |
| Medio Intel Core i7-12700H, NVIDIA RTX A2000 Laptop GPU (n=1) | |
| HP ZBook Power 15 G8 313S5EA | |
| Lenovo ThinkPad P15v G2 21A9000XGE | |
| PCMark 10 Score | 6232 puntos | |
ayuda | ||
| AIDA64 / Memory Copy | |
| Media de la clase Workstation (56003 - 164795, n=23, últimos 2 años) | |
| HP ZBook Power 15 G9 6B8C4EA | |
| HP ZBook Studio 16 G9 62U04EA | |
| Medio Intel Core i7-12700H (25615 - 80511, n=64) | |
| HP ZBook Power 15 G8 313S5EA | |
| Lenovo ThinkPad P15v G2 21A9000XGE | |
| AIDA64 / Memory Read | |
| Media de la clase Workstation (55795 - 121563, n=23, últimos 2 años) | |
| HP ZBook Power 15 G9 6B8C4EA | |
| HP ZBook Studio 16 G9 62U04EA | |
| Medio Intel Core i7-12700H (25586 - 79442, n=64) | |
| HP ZBook Power 15 G8 313S5EA | |
| Lenovo ThinkPad P15v G2 21A9000XGE | |
| AIDA64 / Memory Write | |
| Media de la clase Workstation (55663 - 214520, n=23, últimos 2 años) | |
| HP ZBook Power 15 G9 6B8C4EA | |
| HP ZBook Studio 16 G9 62U04EA | |
| Medio Intel Core i7-12700H (23679 - 88660, n=64) | |
| HP ZBook Power 15 G8 313S5EA | |
| Lenovo ThinkPad P15v G2 21A9000XGE | |
| AIDA64 / Memory Latency | |
| Media de la clase Workstation (84.5 - 165.2, n=23, últimos 2 años) | |
| Lenovo ThinkPad P15v G2 21A9000XGE | |
| HP ZBook Power 15 G9 6B8C4EA | |
| HP ZBook Studio 16 G9 62U04EA | |
| Medio Intel Core i7-12700H (76.2 - 133.9, n=62) | |
| HP ZBook Power 15 G8 313S5EA | |
* ... más pequeño es mejor
Latencias del CPD
En nuestra prueba de latencia estandarizada (navegación por Internet, reproducción de vídeos 4K de YouTube, carga de la CPU), hay algunas ligeras limitaciones. Como resultado, el dispositivo con la versión actual de la BIOS no es óptimo para usar aplicaciones de audio en tiempo real.
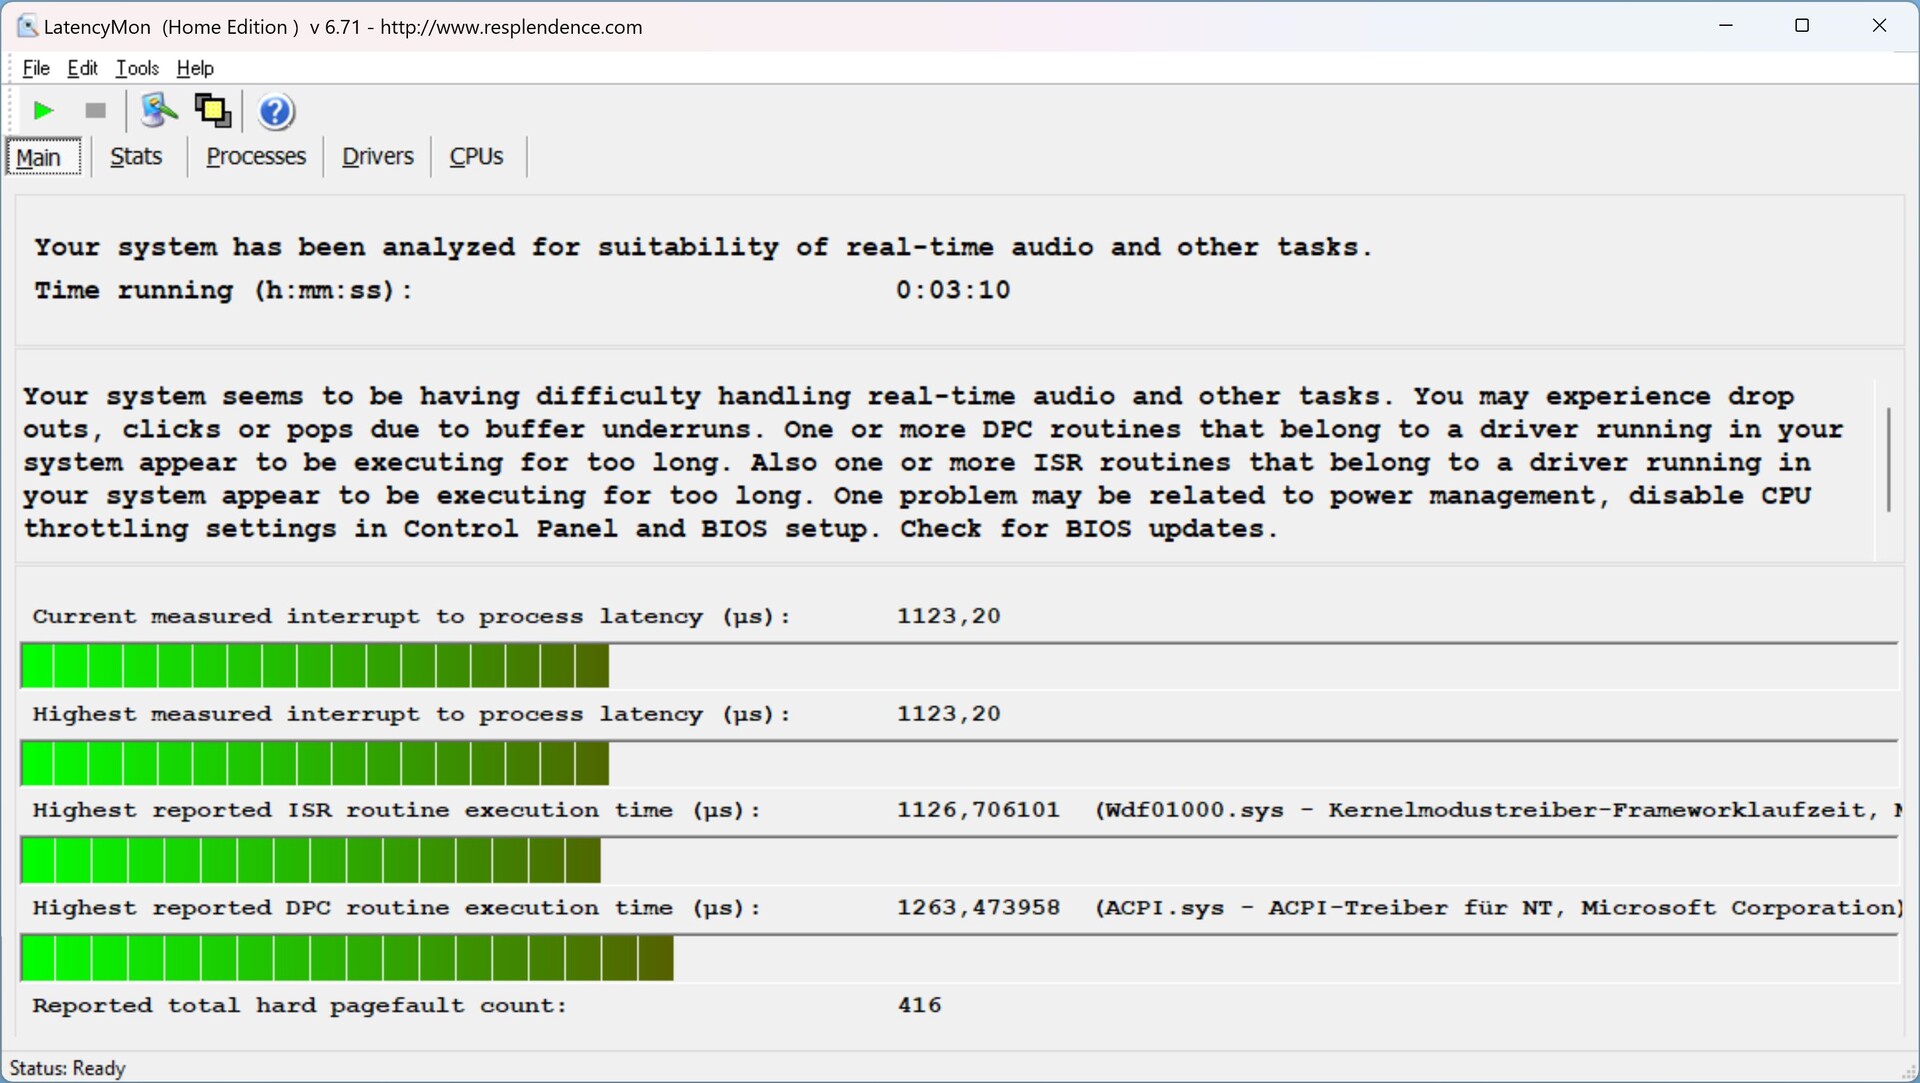
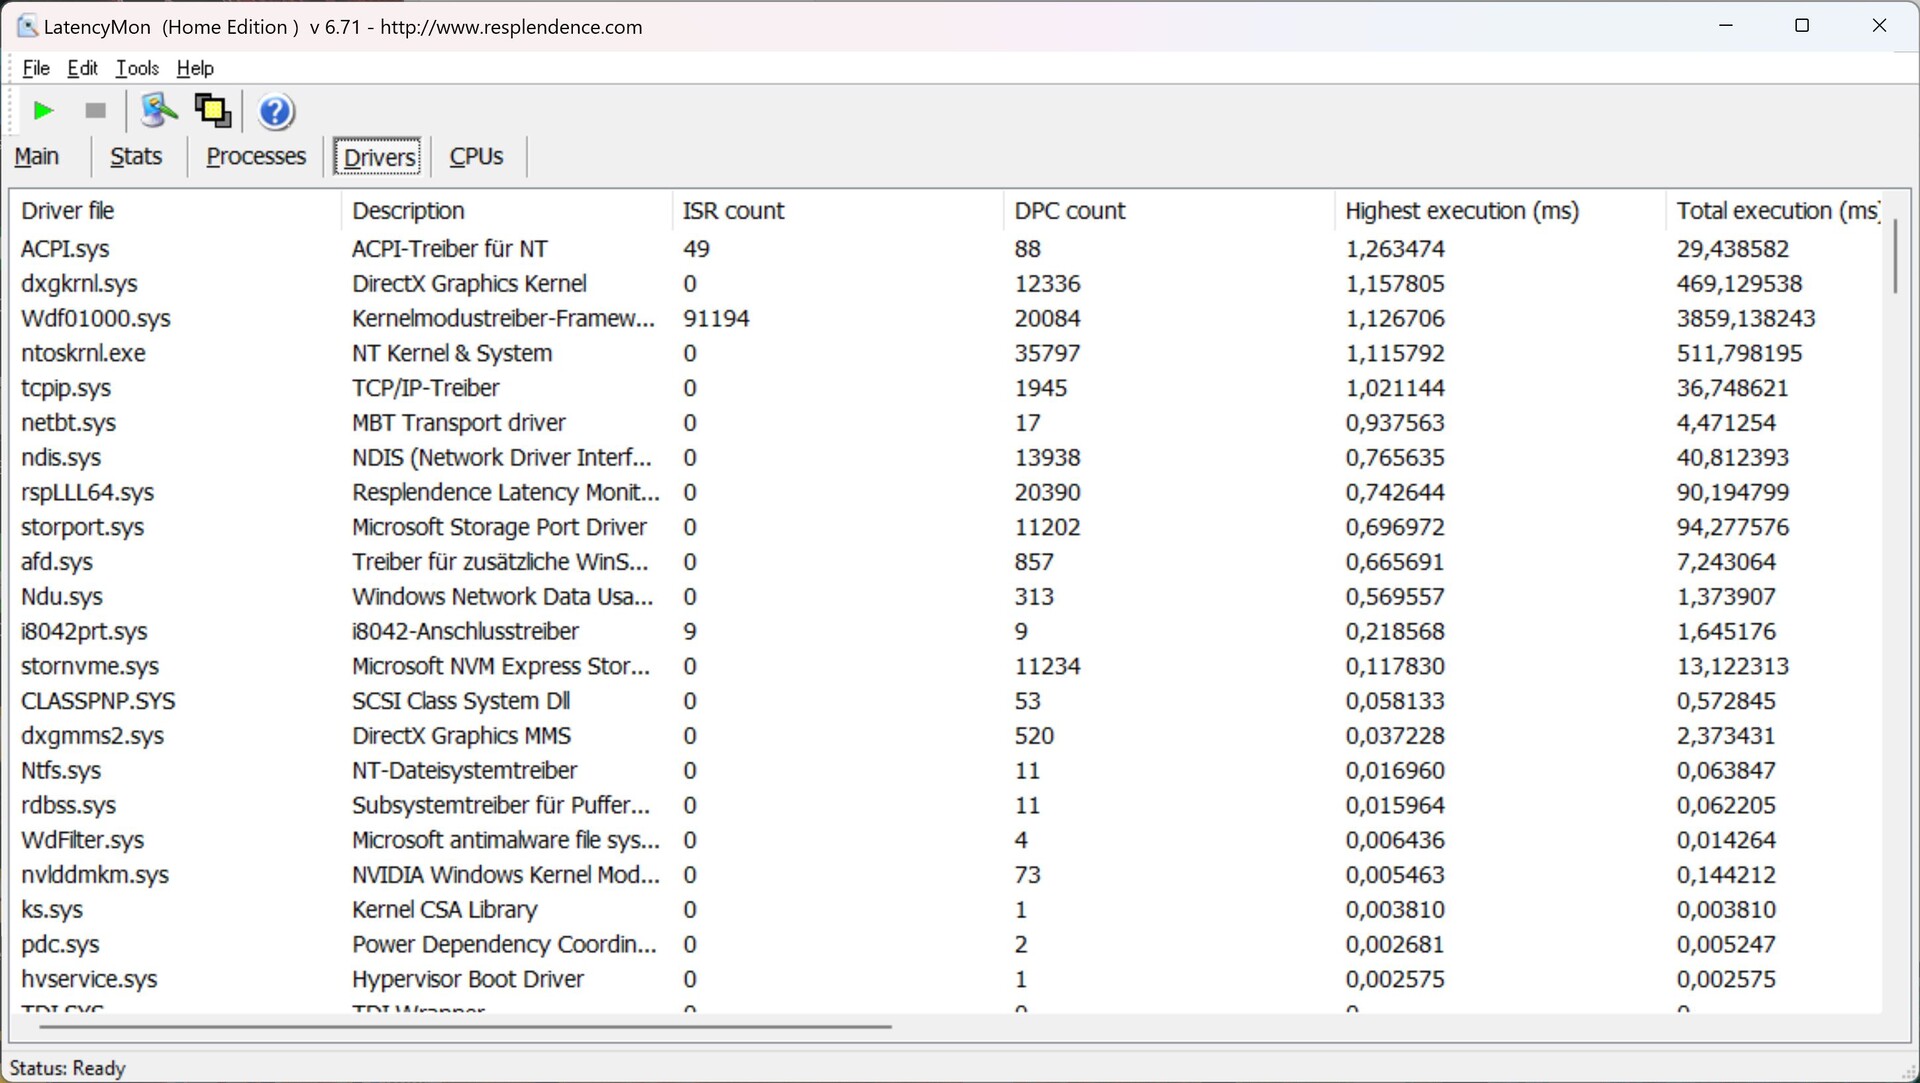
| DPC Latencies / LatencyMon - interrupt to process latency (max), Web, Youtube, Prime95 | |
| Lenovo ThinkPad P15v G2 21A9000XGE | |
| HP ZBook Studio 16 G9 62U04EA | |
| HP ZBook Power 15 G9 6B8C4EA | |
| Dell Precision 5000 5560 | |
| HP ZBook Power 15 G8 313S5EA | |
* ... más pequeño es mejor
Solución de almacenamiento
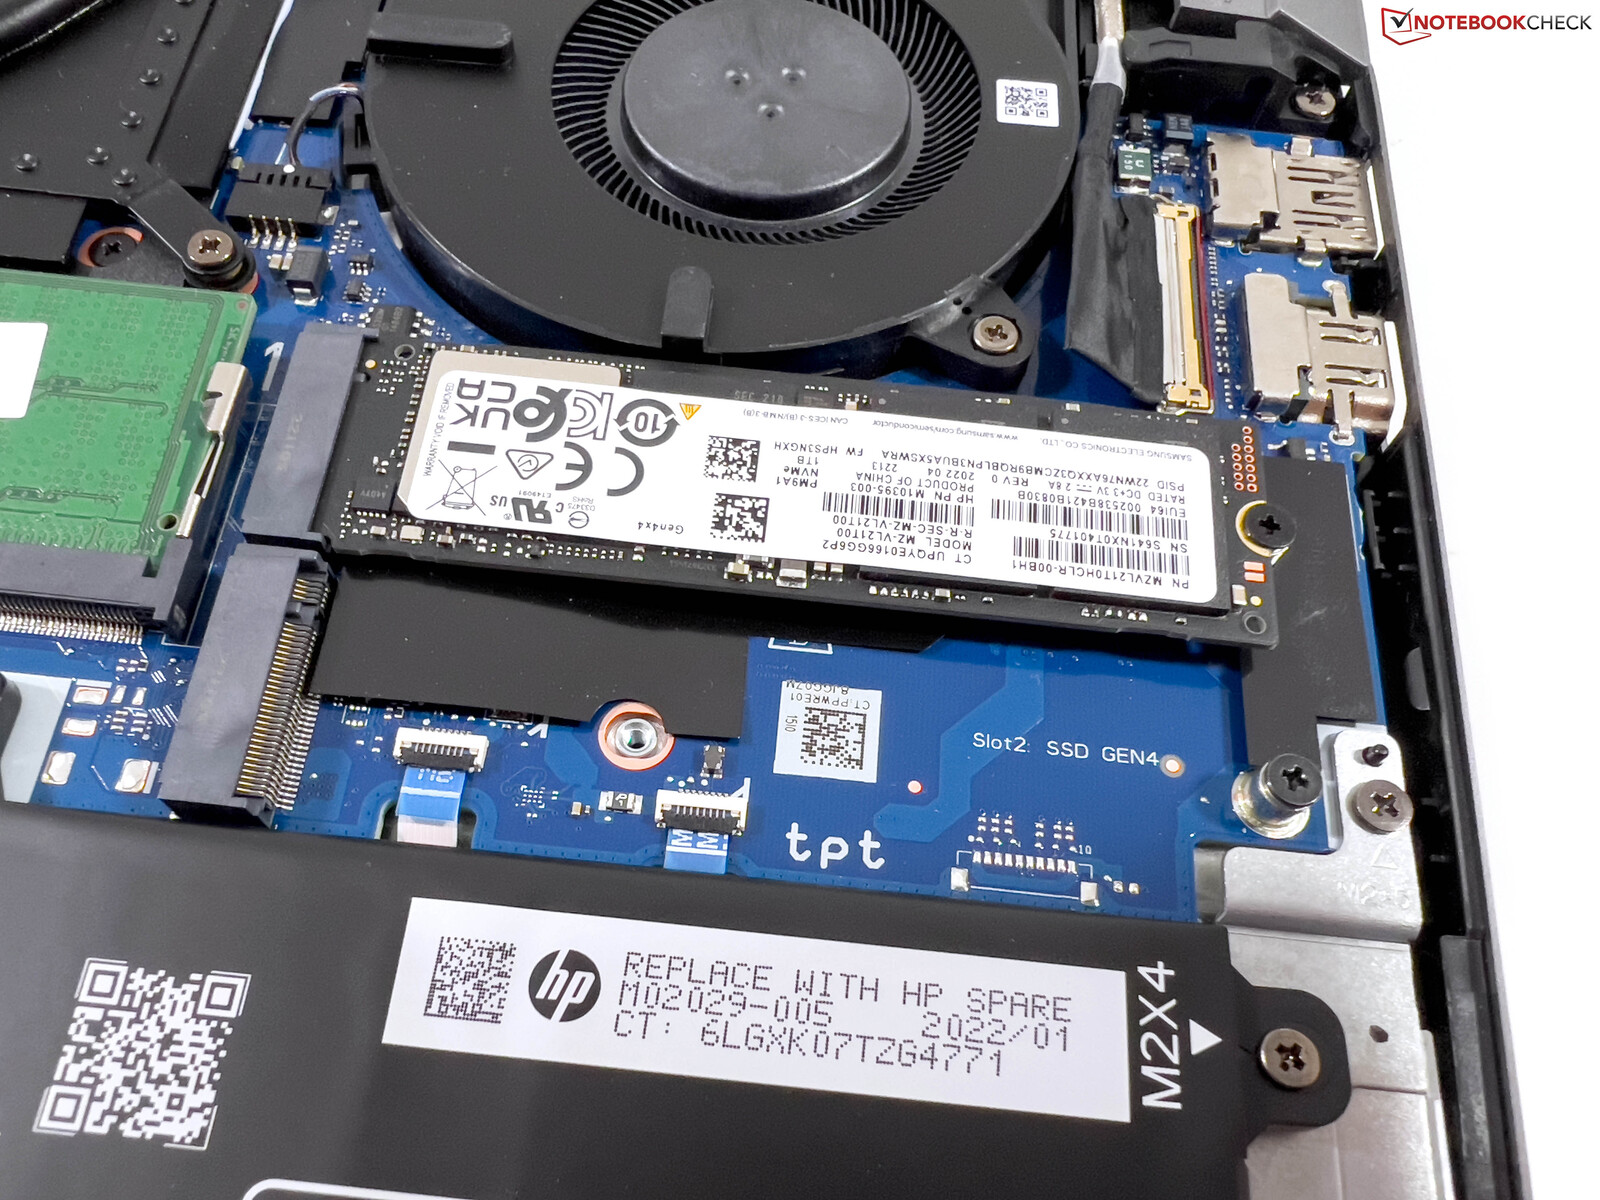
El ZBook Power 15 G9 ofrece dos rápidas ranuras PCIe 4.0 para SSD M.2. Nuestra unidad de pruebas usa un gran PM9A1 de 1 TB de Samsung (versión OEM del 980 Pro). Tras encenderlo por primera vez, el usuario dispone de 890 GB. Las tasas de transferencia del SSD son excelentes, y el rendimiento también permanece casi completamente estable incluso tras una carga prolongada. Puedes encontrar más pruebas de SSD aquí.

* ... más pequeño es mejor
Disk Throttling: DiskSpd Read Loop, Queue Depth 8
Tarjeta gráfica
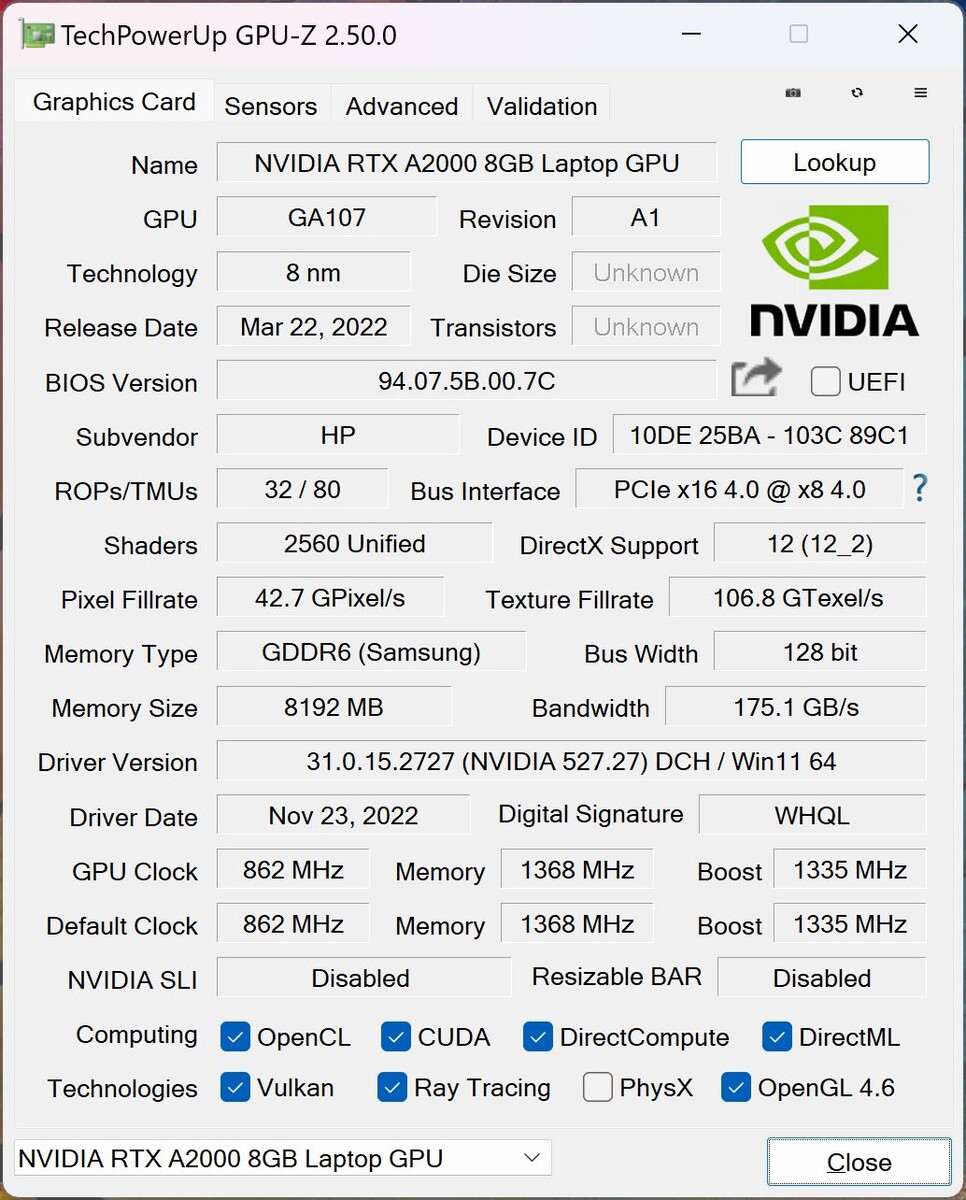
EnNvidia RTX A2000 es la GPU más rápida que HP ofrece para el ZBook Power 15 G9. Es la versión actualizada con 8 GB de GDDR6-VRAM. Sin embargo, la GPU sólo puede consumir un máximo de 45 vatios (incluyendo 5 vatios de Dynamic Boost), lo que la convierte en una de las versiones más lentas. Por tanto, en nuestros benchmarks, la GPU también queda por debajo de la media de los resultados que hemos medido hasta ahora para la RTX A2000. El rendimiento en juegos es comparable al de la GeForce GPU de consumo RTX 3050 Tipero gracias a los controladores certificados, el rendimiento en aplicaciones profesionales también puede resultar significativamente mejor.
Bajo carga constante, el rendimiento de la GPU permanece completamente estable. Al igual que en el procesador, el consumo de energía de la tarjeta gráfica en funcionamiento con batería también se limita a 30 vatios, lo que se traduce en una reducción del rendimiento de casi el 25% (3.589 puntos Time Spy Graphics). Puedes encontrar más pruebas de rendimiento de la GPU aquí.
| 3DMark 11 Performance | 16503 puntos | |
| 3DMark Fire Strike Score | 11074 puntos | |
| 3DMark Time Spy Score | 5106 puntos | |
ayuda | ||
| Blender / v3.3 Classroom OPTIX/RTX | |
| HP ZBook Studio 16 G9 62U04EA | |
| HP ZBook Power 15 G9 6B8C4EA | |
| Medio NVIDIA RTX A2000 Laptop GPU (42 - 54, n=7) | |
| Media de la clase Workstation (10 - 43, n=17, últimos 2 años) | |
| Blender / v3.3 Classroom CUDA | |
| HP ZBook Studio 16 G9 62U04EA | |
| HP ZBook Power 15 G9 6B8C4EA | |
| Medio NVIDIA RTX A2000 Laptop GPU (78 - 98, n=7) | |
| Media de la clase Workstation (16 - 74, n=17, últimos 2 años) | |
| Blender / v3.3 Classroom CPU | |
| HP ZBook Power 15 G9 6B8C4EA | |
| Medio NVIDIA RTX A2000 Laptop GPU (312 - 414, n=7) | |
| HP ZBook Studio 16 G9 62U04EA | |
| Media de la clase Workstation (148 - 364, n=23, últimos 2 años) | |
* ... más pequeño es mejor
| The Witcher 3 - 1920x1080 Ultra Graphics & Postprocessing (HBAO+) | |
| Media de la clase Workstation (n=1últimos 2 años) | |
| Dell Precision 5000 5560 | |
| HP ZBook Studio 16 G9 62U04EA | |
| HP ZBook Power 15 G9 6B8C4EA | |
| Lenovo ThinkPad P15v G2 21A9000XGE | |
| HP ZBook Power 15 G8 313S5EA | |
| Final Fantasy XV Benchmark - 1920x1080 High Quality | |
| Media de la clase Workstation (26.4 - 197.6, n=23, últimos 2 años) | |
| HP ZBook Studio 16 G9 62U04EA | |
| HP ZBook Power 15 G9 6B8C4EA | |
| Dell Precision 5000 5560 | |
| Lenovo ThinkPad P15v G2 21A9000XGE | |
| HP ZBook Power 15 G8 313S5EA | |
| Strange Brigade - 1920x1080 ultra AA:ultra AF:16 | |
| Media de la clase Workstation (93.2 - 418, n=17, últimos 2 años) | |
| HP ZBook Studio 16 G9 62U04EA | |
| HP ZBook Power 15 G9 6B8C4EA | |
| Lenovo ThinkPad P15v G2 21A9000XGE | |
| HP ZBook Power 15 G8 313S5EA | |
| Dota 2 Reborn - 1920x1080 ultra (3/3) best looking | |
| HP ZBook Studio 16 G9 62U04EA | |
| Media de la clase Workstation (50.7 - 178.4, n=23, últimos 2 años) | |
| Dell Precision 5000 5560 | |
| HP ZBook Power 15 G9 6B8C4EA | |
| HP ZBook Power 15 G8 313S5EA | |
| Lenovo ThinkPad P15v G2 21A9000XGE | |
The Witcher 3 FPS Chart
| bajo | medio | alto | ultra | QHD | 4K | |
|---|---|---|---|---|---|---|
| GTA V (2015) | 182.9 | 177.1 | 134.7 | 65.4 | 47.3 | 45 |
| The Witcher 3 (2015) | 264 | 171 | 45 | 44.5 | ||
| Dota 2 Reborn (2015) | 179.3 | 133.5 | 126.1 | 118.6 | 68.9 | |
| Final Fantasy XV Benchmark (2018) | 121.9 | 68.2 | 48.6 | 34.9 | 20.6 | |
| X-Plane 11.11 (2018) | 122.6 | 103.6 | 87.6 | 73.1 | ||
| Strange Brigade (2018) | 266 | 126 | 100 | 86 | 36 | |
| F1 2021 (2021) | 287 | 153.1 | 124.4 | 62.7 | 44.4 | 23.9 |
| F1 22 (2022) | 147.1 | 137.9 | 100.6 | 30.8 | 19.1 | 9.05 |
Gestión de emisiones y energía
Nivel de ruido
Normalmente, los dos ventiladores del ZBook Power 15 G9 suelen permanecer desactivados durante tareas sencillas. Sólo cuando pones el procesador o la tarjeta gráfica dedicada bajo carga los ventiladores se encienden rápidamente, produciendo normalmente un nivel de ruido de entre 42 y 45 dB(A), con la velocidad de los ventiladores no siempre estable sino fluctuante a veces. Durante la prueba de estrés con carga máxima para los dos componentes, medimos un máximo de 47,9 dB(A). Con esto, la actual generación G9 sigue siendo ligeramente más silenciosa que la predecesora. No hay otros ruidos electrónicos.
Ruido
| Ocioso |
| 23.8 / 23.8 / 23.8 dB(A) |
| Carga |
| 42.9 / 47.9 dB(A) |
 | ||
30 dB silencioso 40 dB(A) audible 50 dB(A) ruidosamente alto |
||
min: | ||
| HP ZBook Power 15 G9 6B8C4EA RTX A2000 Laptop GPU, i7-12700H, Samsung PM9A1 MZVL21T0HCLR | HP ZBook Studio 16 G9 62U04EA RTX A2000 Laptop GPU, i7-12800H, Micron 3400 1TB MTFDKBA1T0TFH | Dell Precision 5000 5560 RTX A2000 Laptop GPU, i7-11850H, Samsung PM9A1 MZVL22T0HBLB | Lenovo ThinkPad P15v G2 21A9000XGE T1200 Laptop GPU, i7-11800H, Toshiba XG6 KXG6AZNV512G | HP ZBook Power 15 G8 313S5EA T600 Laptop GPU, i7-11800H, Samsung PM9A1 MZVL2512HCJQ | |
|---|---|---|---|---|---|
| Noise | -4% | 10% | 2% | -8% | |
| apagado / medio ambiente * (dB) | 23.8 | 24 -1% | 23.4 2% | 25.21 -6% | 25.54 -7% |
| Idle Minimum * (dB) | 23.8 | 24 -1% | 23.6 1% | 25.21 -6% | 25.54 -7% |
| Idle Average * (dB) | 23.8 | 27.7 -16% | 23.6 1% | 25.21 -6% | 25.54 -7% |
| Idle Maximum * (dB) | 23.8 | 27.7 -16% | 23.6 1% | 25.21 -6% | 25.54 -7% |
| Load Average * (dB) | 42.9 | 39.8 7% | 25.8 40% | 39.09 9% | 48.85 -14% |
| Witcher 3 ultra * (dB) | 44.5 | 44.3 -0% | 40.1 10% | 36.6 18% | 46.58 -5% |
| Load Maximum * (dB) | 47.9 | 47.7 -0% | 41.4 14% | 43.53 9% | 50.98 -6% |
* ... más pequeño es mejor
Temperaturas
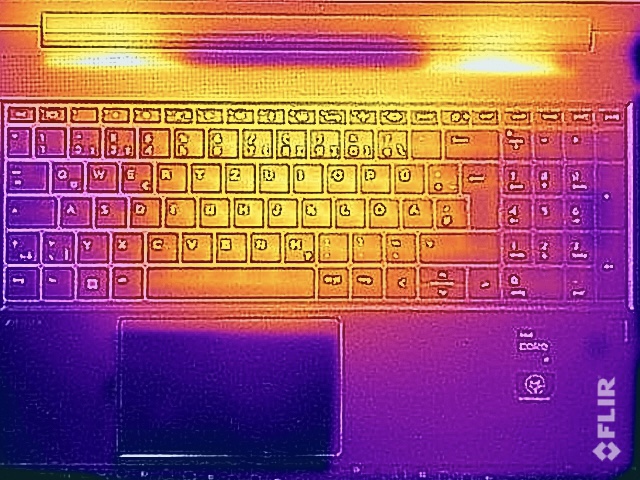
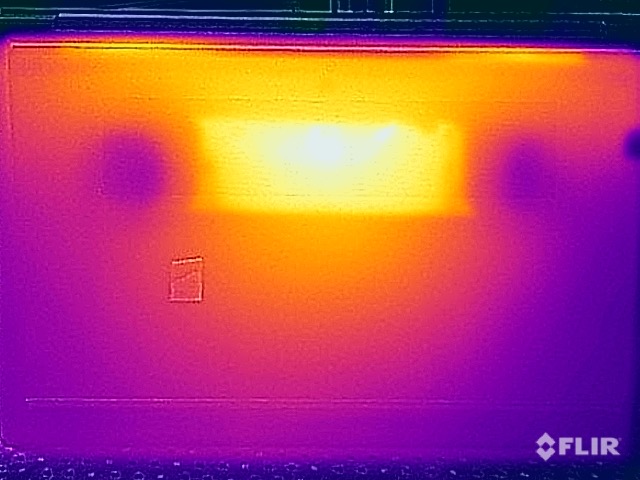
Las temperaturas de la superficie de la estación de trabajo móvil suelen permanecer muy bajas en el funcionamiento diario, por lo que no son motivo de preocupación en absoluto, ni siquiera bajo carga. A 48 °C, el único punto caliente está en la parte inferior, en la zona central hacia la parte trasera, pero debido a su posición, puedes seguir colocando el dispositivo sobre el regazo. Sin embargo, la parte superior de la unidad base, incluyendo el teclado, se mantiene significativamente más fría con un máximo de 40 °C (104 °F).
Durante la prueba de estrés, el procesador se estabiliza en 35-39 vatios tras un breve pico de 90 vatios, mientras que la tarjeta gráfica se mantiene estable en 40 vatios. Tras la prueba de estrés, el rendimiento no se reduce. En funcionamiento con batería, los valores descienden ligeramente, pudiendo la CPU seguir consumiendo 25 vatios y la GPU, 30 vatios bajo carga combinada.
(±) La temperatura máxima en la parte superior es de 40.3 °C / 105 F, frente a la media de 38.2 °C / 101 F, que oscila entre 22.2 y 69.8 °C para la clase Workstation.
(-) El fondo se calienta hasta un máximo de 48.3 °C / 119 F, frente a la media de 41.1 °C / 106 F
(+) En reposo, la temperatura media de la parte superior es de 23.1 °C / 74# F, frente a la media del dispositivo de 32 °C / 90 F.
(±) Jugando a The Witcher 3, la temperatura media de la parte superior es de 33.5 °C / 92 F, frente a la media del dispositivo de 32 °C / 90 F.
(+) El reposamanos y el panel táctil están a una temperatura inferior a la de la piel, con un máximo de 28.6 °C / 83.5 F y, por tanto, son fríos al tacto.
(±) La temperatura media de la zona del reposamanos de dispositivos similares fue de 27.8 °C / 82 F (-0.8 °C / -1.5 F).
| HP ZBook Power 15 G9 6B8C4EA Intel Core i7-12700H, NVIDIA RTX A2000 Laptop GPU | HP ZBook Studio 16 G9 62U04EA Intel Core i7-12800H, NVIDIA RTX A2000 Laptop GPU | Dell Precision 5000 5560 Intel Core i7-11850H, NVIDIA RTX A2000 Laptop GPU | Lenovo ThinkPad P15v G2 21A9000XGE Intel Core i7-11800H, NVIDIA T1200 Laptop GPU | HP ZBook Power 15 G8 313S5EA Intel Core i7-11800H, NVIDIA T600 Laptop GPU | |
|---|---|---|---|---|---|
| Heat | -14% | -26% | -18% | 2% | |
| Maximum Upper Side * (°C) | 40.3 | 38.7 4% | 48.2 -20% | 53.8 -33% | 41.4 -3% |
| Maximum Bottom * (°C) | 48.3 | 53.4 -11% | 42.6 12% | 52.1 -8% | 41.5 14% |
| Idle Upper Side * (°C) | 23.7 | 27.3 -15% | 34.8 -47% | 27.6 -16% | 23.8 -0% |
| Idle Bottom * (°C) | 23.8 | 31.6 -33% | 35.2 -48% | 27.7 -16% | 25 -5% |
* ... más pequeño es mejor
Altavoces
Los dos altavoces estéreo representan uno de los puntos débiles de la estación de trabajo portátil, ya que su sonido es muy fino y poco convincente. Aunque hacen su trabajo durante videoconferencias o llamadas de voz, definitivamente recomendaríamos usar auriculares o altavoces externos para la reproducción de música o películas.
HP ZBook Power 15 G9 6B8C4EA análisis de audio
(±) | la sonoridad del altavoz es media pero buena (77.9 dB)
Graves 100 - 315 Hz
(-) | casi sin bajos - de media 28.5% inferior a la mediana
(±) | la linealidad de los graves es media (9.4% delta a frecuencia anterior)
Medios 400 - 2000 Hz
(+) | medios equilibrados - a sólo 3.9% de la mediana
(+) | los medios son lineales (5.1% delta a la frecuencia anterior)
Altos 2 - 16 kHz
(±) | máximos más altos - de media 5.1% más altos que la mediana
(+) | los máximos son lineales (4.1% delta a la frecuencia anterior)
Total 100 - 16.000 Hz
(±) | la linealidad del sonido global es media (22.9% de diferencia con la mediana)
En comparación con la misma clase
» 82% de todos los dispositivos probados de esta clase eran mejores, 3% similares, 15% peores
» El mejor tuvo un delta de 7%, la media fue 17%, el peor fue ###max##%
En comparación con todos los dispositivos probados
» 68% de todos los dispositivos probados eran mejores, 6% similares, 26% peores
» El mejor tuvo un delta de 4%, la media fue 23%, el peor fue ###max##%
Dell Precision 5000 5560 análisis de audio
(±) | la sonoridad del altavoz es media pero buena (75.2 dB)
Graves 100 - 315 Hz
(±) | lubina reducida - en promedio 9.8% inferior a la mediana
(±) | la linealidad de los graves es media (8.8% delta a frecuencia anterior)
Medios 400 - 2000 Hz
(±) | medias más altas - de media 5.7% más altas que la mediana
(+) | los medios son lineales (3.7% delta a la frecuencia anterior)
Altos 2 - 16 kHz
(+) | máximos equilibrados - a sólo 2.7% de la mediana
(+) | los máximos son lineales (6.4% delta a la frecuencia anterior)
Total 100 - 16.000 Hz
(+) | el sonido global es lineal (14.8% de diferencia con la mediana)
En comparación con la misma clase
» 33% de todos los dispositivos probados de esta clase eran mejores, 6% similares, 61% peores
» El mejor tuvo un delta de 7%, la media fue 17%, el peor fue ###max##%
En comparación con todos los dispositivos probados
» 20% de todos los dispositivos probados eran mejores, 4% similares, 76% peores
» El mejor tuvo un delta de 4%, la media fue 23%, el peor fue ###max##%
Consumo de energía
A pesar de la pantalla 4K, el ZBook Power 15 G9 es un dispositivo muy eficiente con un máximo de 8.5 vatios en inactivo. Bajo carga, puedes esperar unos 85-100w, y tras un breve pico de consumo de 139w, también se nivela en ese rango tras varios minutos durante el test de estrés. Por tanto, la fuente de alimentación de 150 vatios incluida es completamente suficiente.
| Off / Standby | |
| Ocioso | |
| Carga |
|
Clave:
min: | |
Power Consumption The Witcher 3 / Stress Test
Power Consumption With External Monitor
Duración de la batería
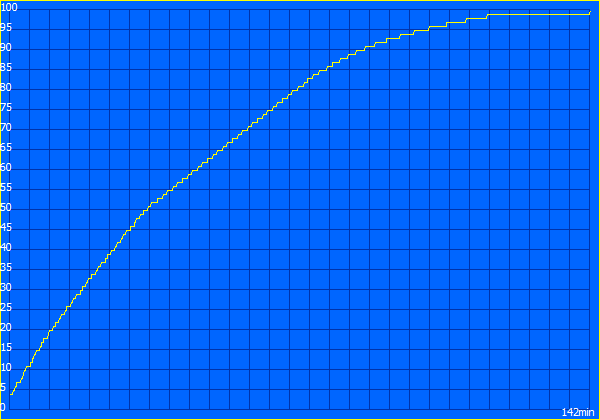
La gran batería de 83 Wh permanece inalterada, lo que permite una buena duración de batería, aunque el predecesor con panel Full HD aún duraba más. Considerando el panel 4K, con unas 10 horas en nuestro test WLAN a 150 cd/m² (correspondiente al 65% del brillo máximo en nuestra unidad de pruebas) y aún 9 horas a brillo máximo, los resultados son muy buenos. El display de bajo consumo se hace definitivamente notable aquí.
Tardo unas 2,5 horas en recargar completamente el dispositivo cuando está encendido, con un 50% ya disponible tras 34 minutos, y un 80% tras 70 minutos.
Pro
Contra
Veredicto - El HP ZBook Power 15 G9 se beneficiaría de una refrigeración más potente
El ZBook Power 15 G9 es una estación de trabajo básica, dirigida a usuarios que necesitan un rendimiento fiable y tarjetas gráficas profesionales. Aparte del procesador, nuestra configuración de pruebas ya corresponde a la configuración máxima con el display 4K, la Nvidia RTX A2000, y abundante almacenamiento, lo que por supuesto también sube el precio. Como su predecesorAnálisis del portátil HP ZBook Power 15 G8: Mucha gama alta en una estación de trabajo asequible, el ZBook Power G9 también ofrece un rendimiento sólido en muchas áreas. Pero particularmente en el rendimiento de la CPU, los resultados de nuevo no son siempre constantes. La situación se ha estabilizado ligeramente con algunas actualizaciones de BIOS, pero la estación de trabajo sigue sin poder aprovechar todo el potencial real del Core i7-12700H.
Particularmente en términos de desarrollo de rendimiento, el ZBook Power 15 G9 es incapaz de alcanzar valores máximos, pero gracias a algunas actualizaciones de BIOS, el rendimiento de la CPU se ha estabilizado en gran medida. Tras un calibrado, el display 4K de bajo consumo ofrece una buena calidad de imagen y permite una larga duración de batería.
Sin embargo, para ser justos también tenemos que mencionar que las estaciones de trabajo básicas de la competencia, como el Lenovo ThinkPad P15v o Dell Precision 5560tampoco ofrecen mucho más rendimiento, con los tres modelos rindiendo a la altura de los ojos en general. El panel 4K es básicamente una muy buena elección, ya que funciona muy eficientemente sin disparar el consumo de energía, pero deberías calibrarlo si es posible.
Precio y disponibilidad
El ZBook Power 15 G9 está disponible actualmente directamente en HP a partir de unos 1455 dólares, y algunas configuraciones también están disponibles en Amazon, por ejemplo.
HP ZBook Power 15 G9 6B8C4EA
- 01/05/2023 v7 (old)
Andreas Osthoff
Price comparison

