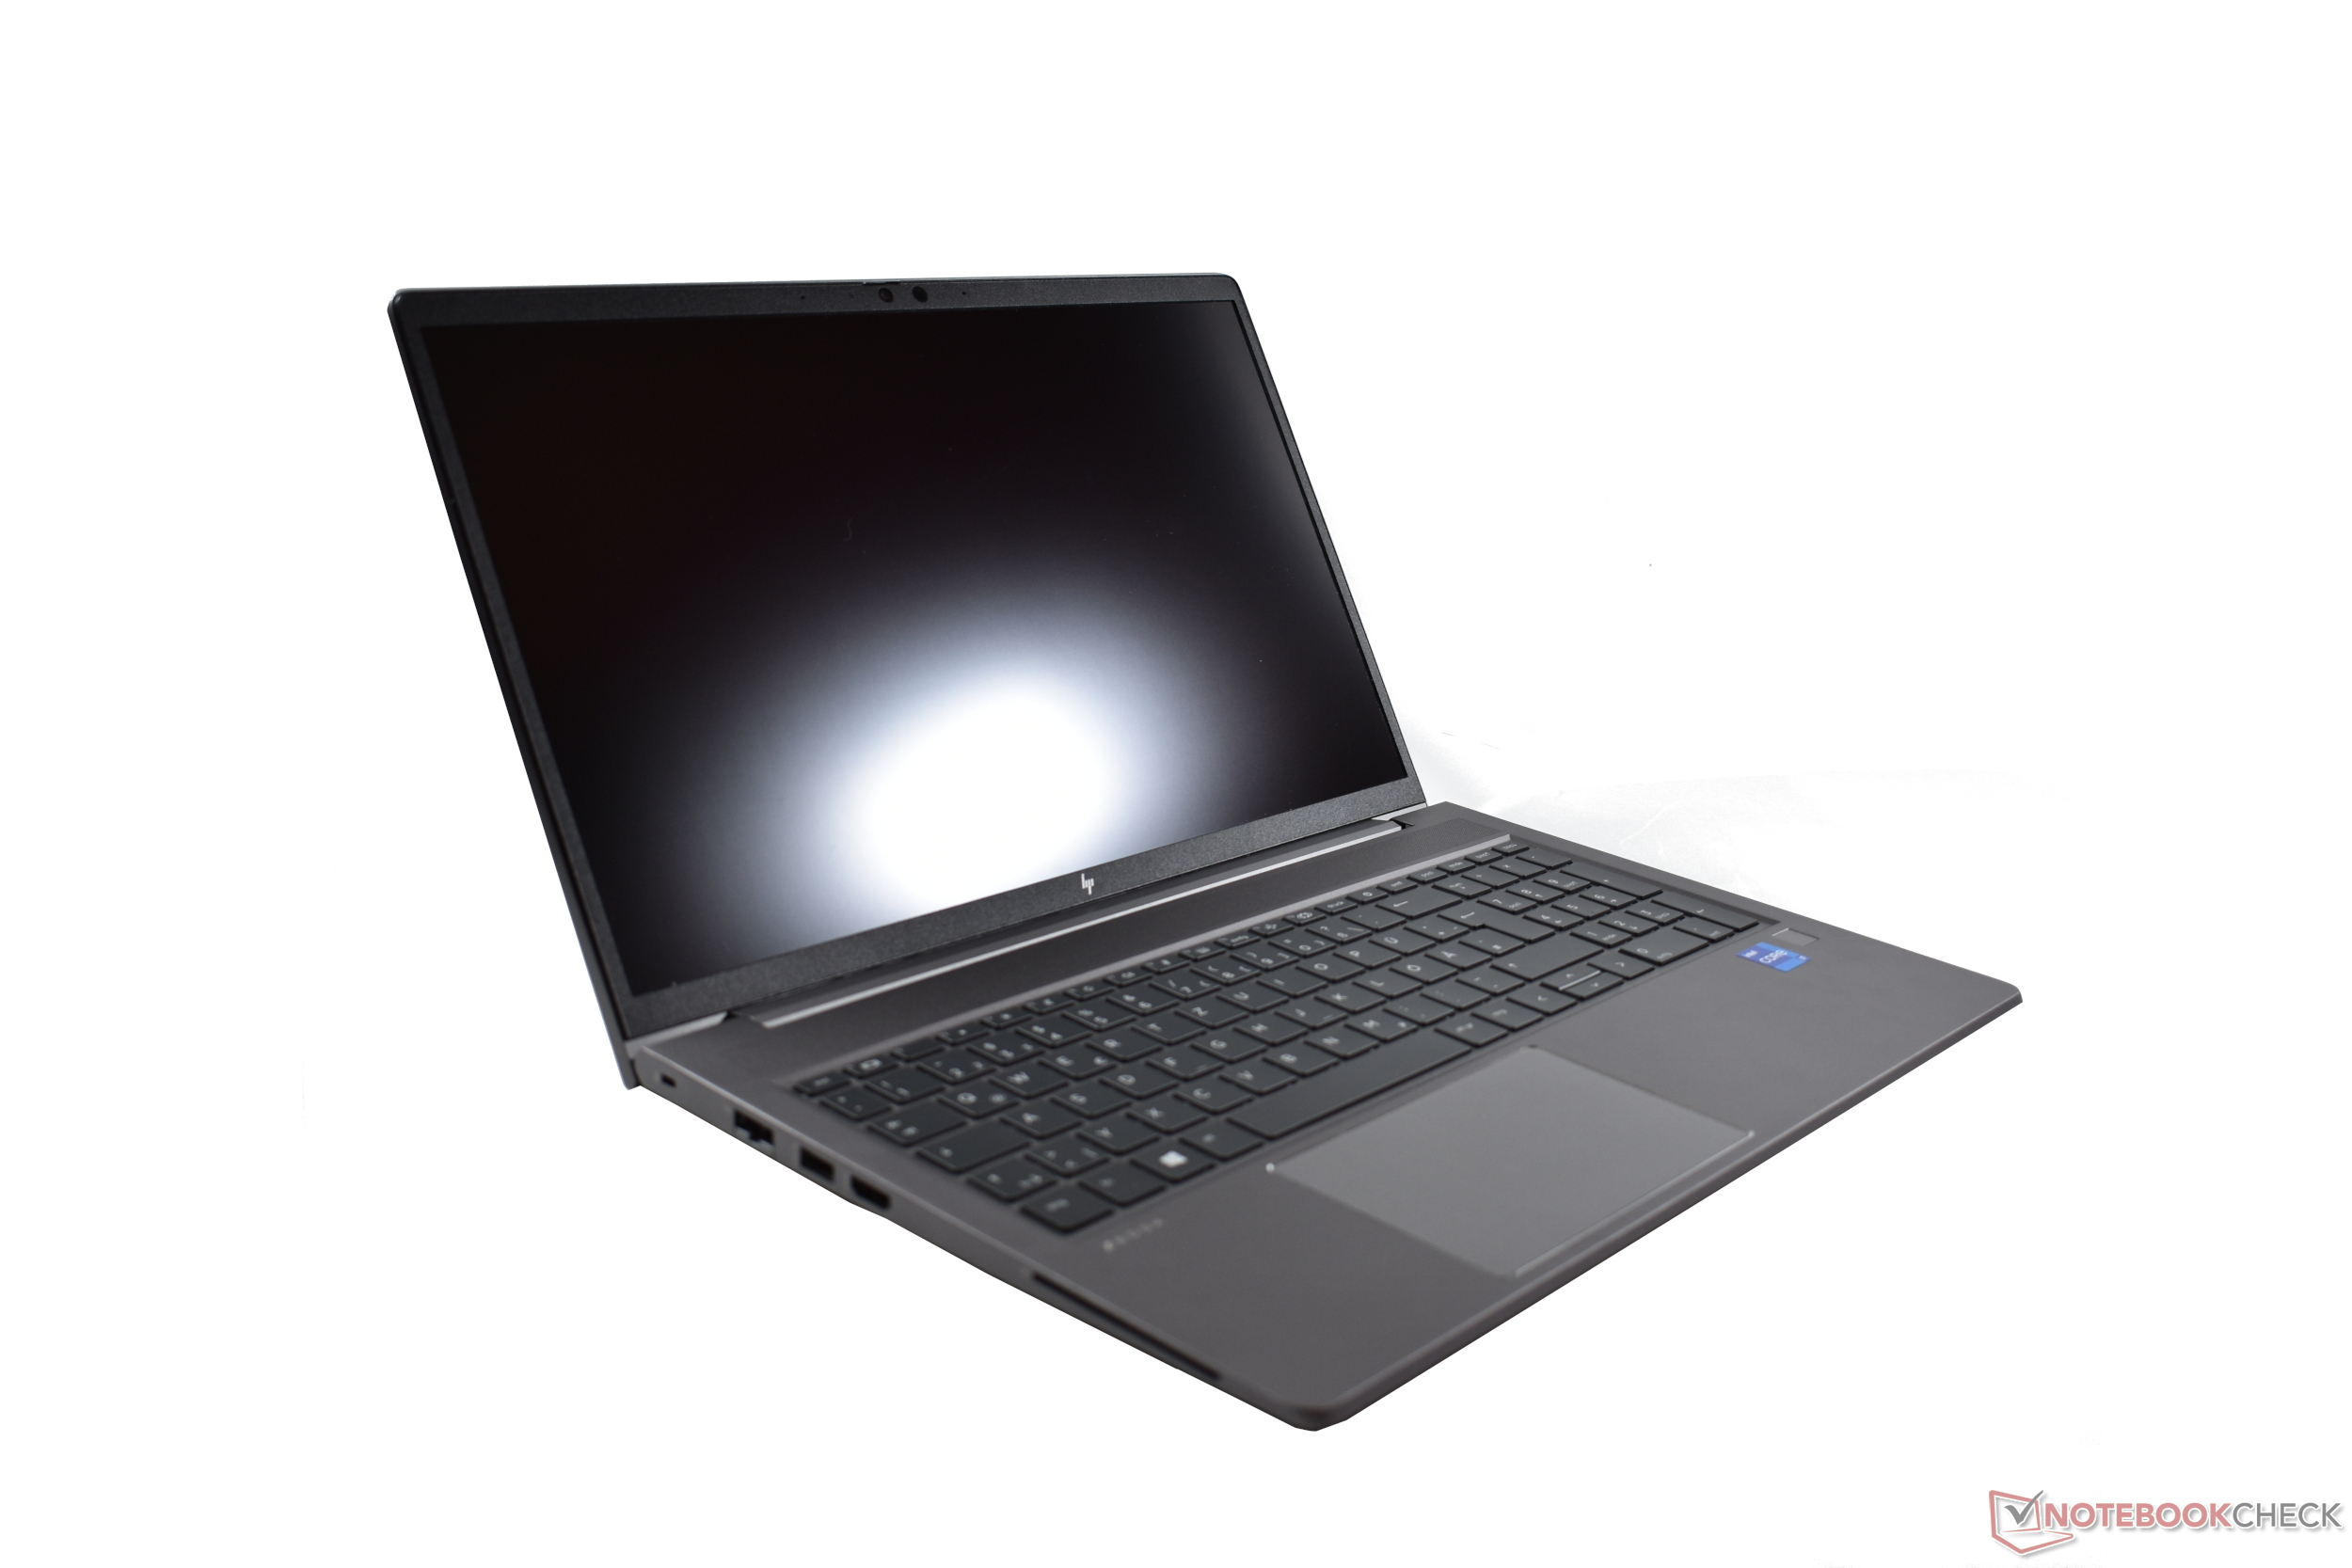
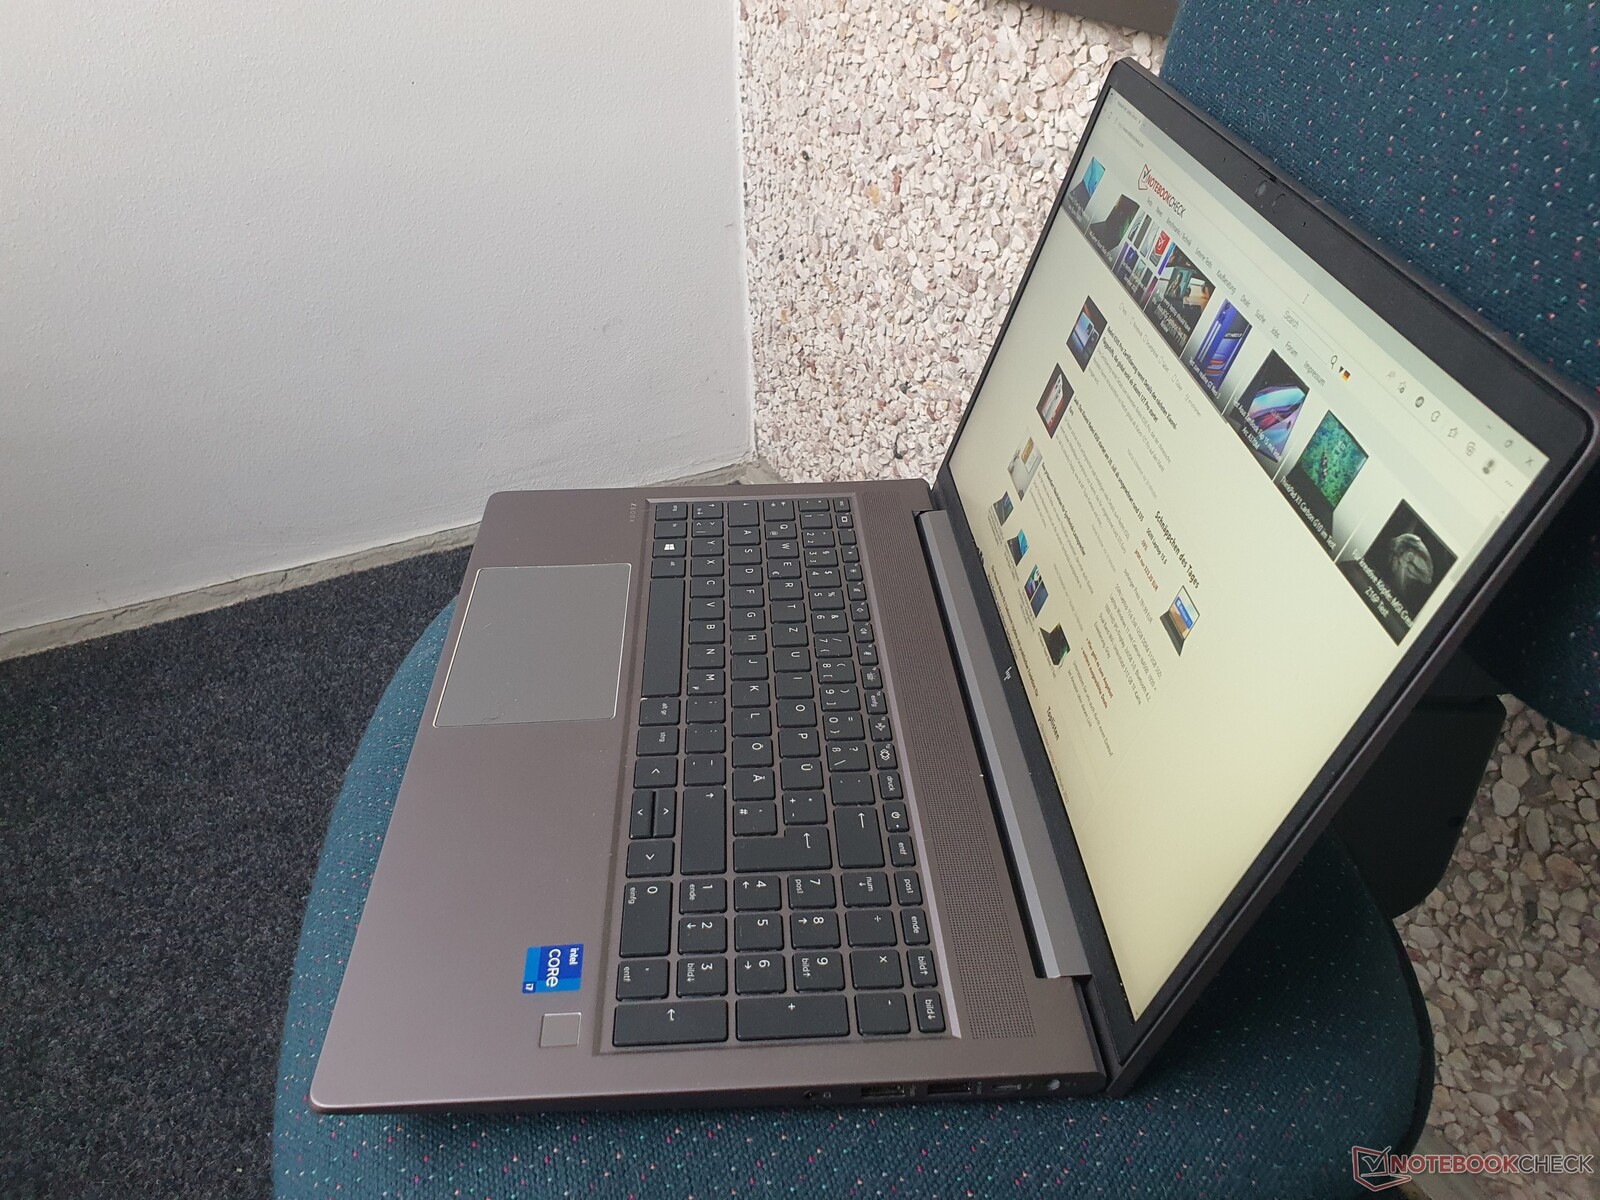
Análisis del portátil HP ZBook Power 15 G8: Mucha gama alta en una estación de trabajo asequible
Como estación de trabajo asequible, la HP ZBook Power 15 G8 trae actualizaciones para la CPU y la GPU en la generación actual, con la configuración máxima que ofrece un Intel Tiger Lake Core i9-11950Hy Nvidia RTX A2000. Mientras que además de una pantalla 4K, las CPUs vPRO también están disponibles, desafortunadamente los procesadores Xeon y con ello también la RAM ECC no estarán disponibles este año. Pero el dispositivo sigue ofreciendo muchas características de una estación de trabajo de gama alta.
Por unos 1600 euros (~1630 dólares), nuestra configuración está equipada con el Core i7-11800H, T600 de Nvidia como GPU profesional, y una pantalla FHD. Como competidores directos en el segmento de estaciones de trabajo de nivel básico, tenemos el Lenovo ThinkPad P15v G2y Dell Precision 3551. Nuestra prueba mostrará si el ZBook Power 15 G8, con sus componentes bastante potentes, también aporta una buena relación precio-rendimiento.
Posibles contendientes en la comparación
Valoración | Fecha | Modelo | Peso | Altura | Tamaño | Resolución | Precio |
|---|---|---|---|---|---|---|---|
| 87.7 % v7 (old) | 07/2022 | HP ZBook Power 15 G8 313S5EA i7-11800H, T600 Laptop GPU | 2 kg | 22.8 mm | 15.60" | 1920x1080 | |
| 90.3 % v7 (old) | 10/2021 | HP ZBook Fury 15 G8 i9-11950H, RTX A5000 Laptop GPU | 2.5 kg | 25.9 mm | 15.60" | 3840x2160 | |
| 87.8 % v7 (old) | 08/2021 | HP ZBook Studio 15 G8 i9-11950H, GeForce RTX 3070 Laptop GPU | 1.9 kg | 18 mm | 15.60" | 3840x2160 | |
| 83.8 % v7 (old) | 04/2021 | HP ZBook Firefly 15 G8 2C9R7EA i7-1165G7, T500 Laptop GPU | 1.8 kg | 19.2 mm | 15.60" | 1920x1080 | |
| 86.2 % v7 (old) | 06/2022 | Lenovo ThinkPad P15v G2 21A9000XGE i7-11800H, T1200 Laptop GPU | 2.3 kg | 22.7 mm | 15.60" | 1920x1080 | |
| 81.2 % v7 (old) | 10/2020 | Dell Precision 3000 3551 i9-10885H, Quadro P620 | 2.2 kg | 24.92 mm | 15.60" | 1920x1080 |
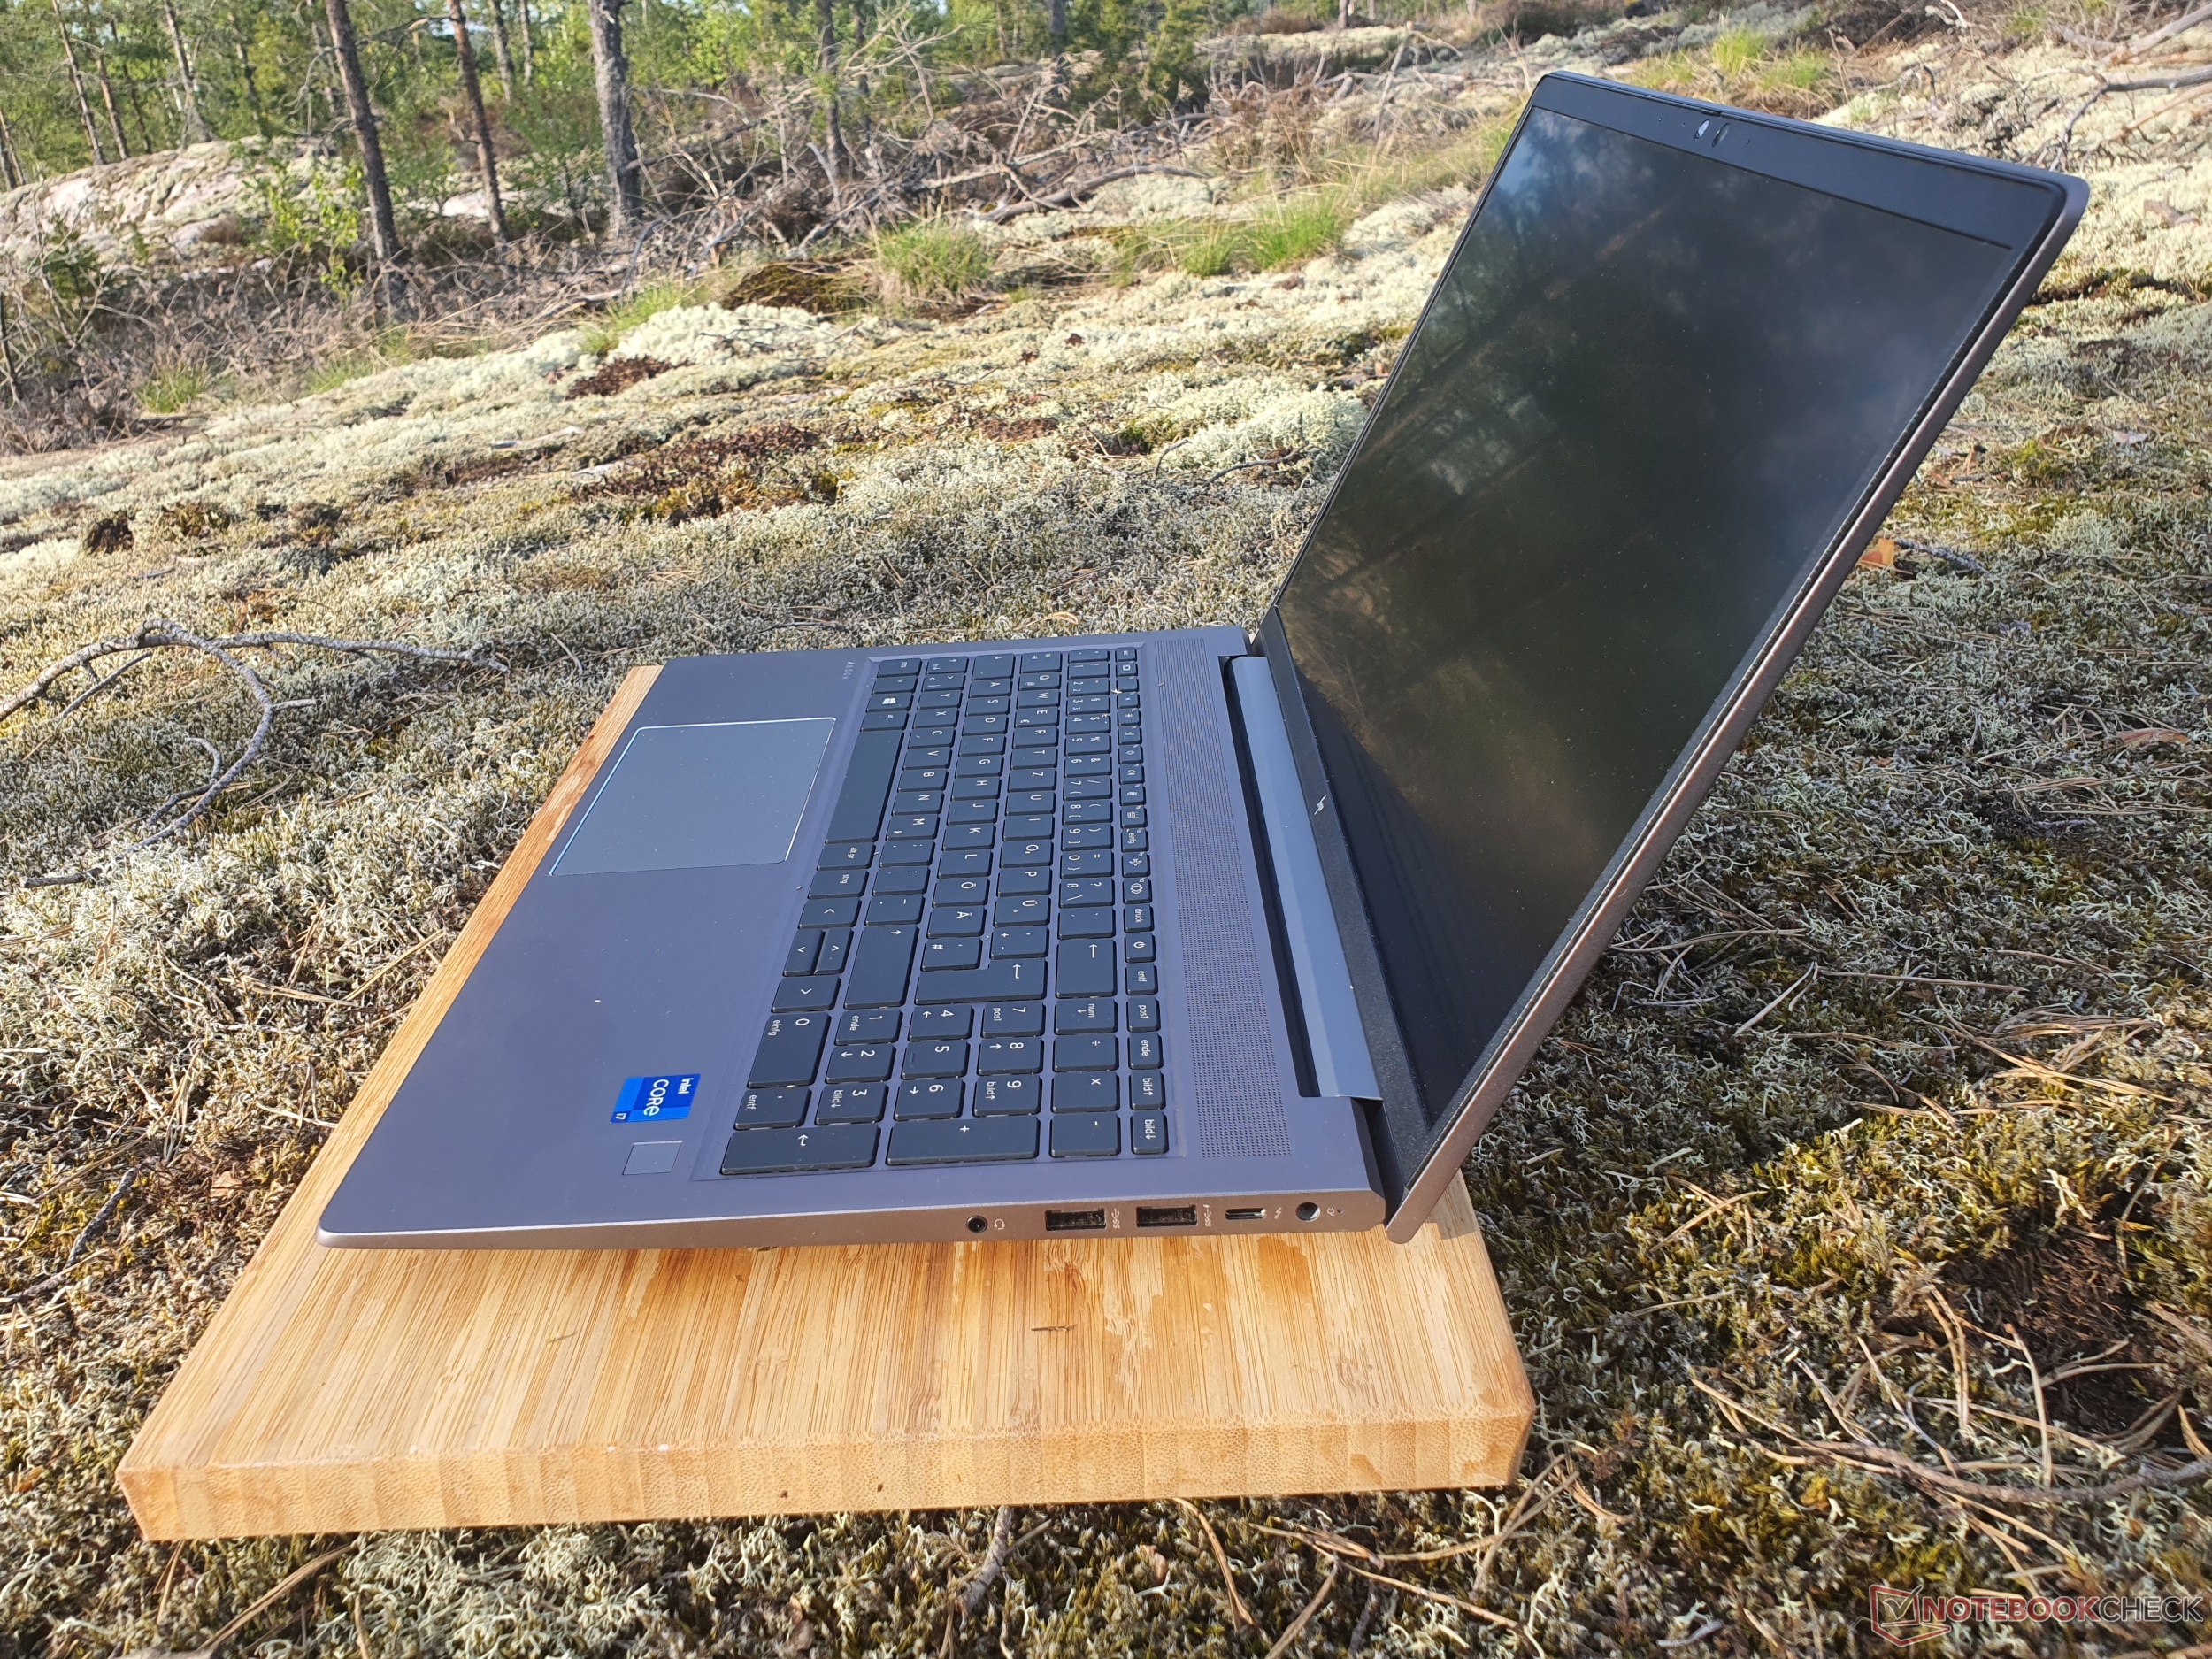
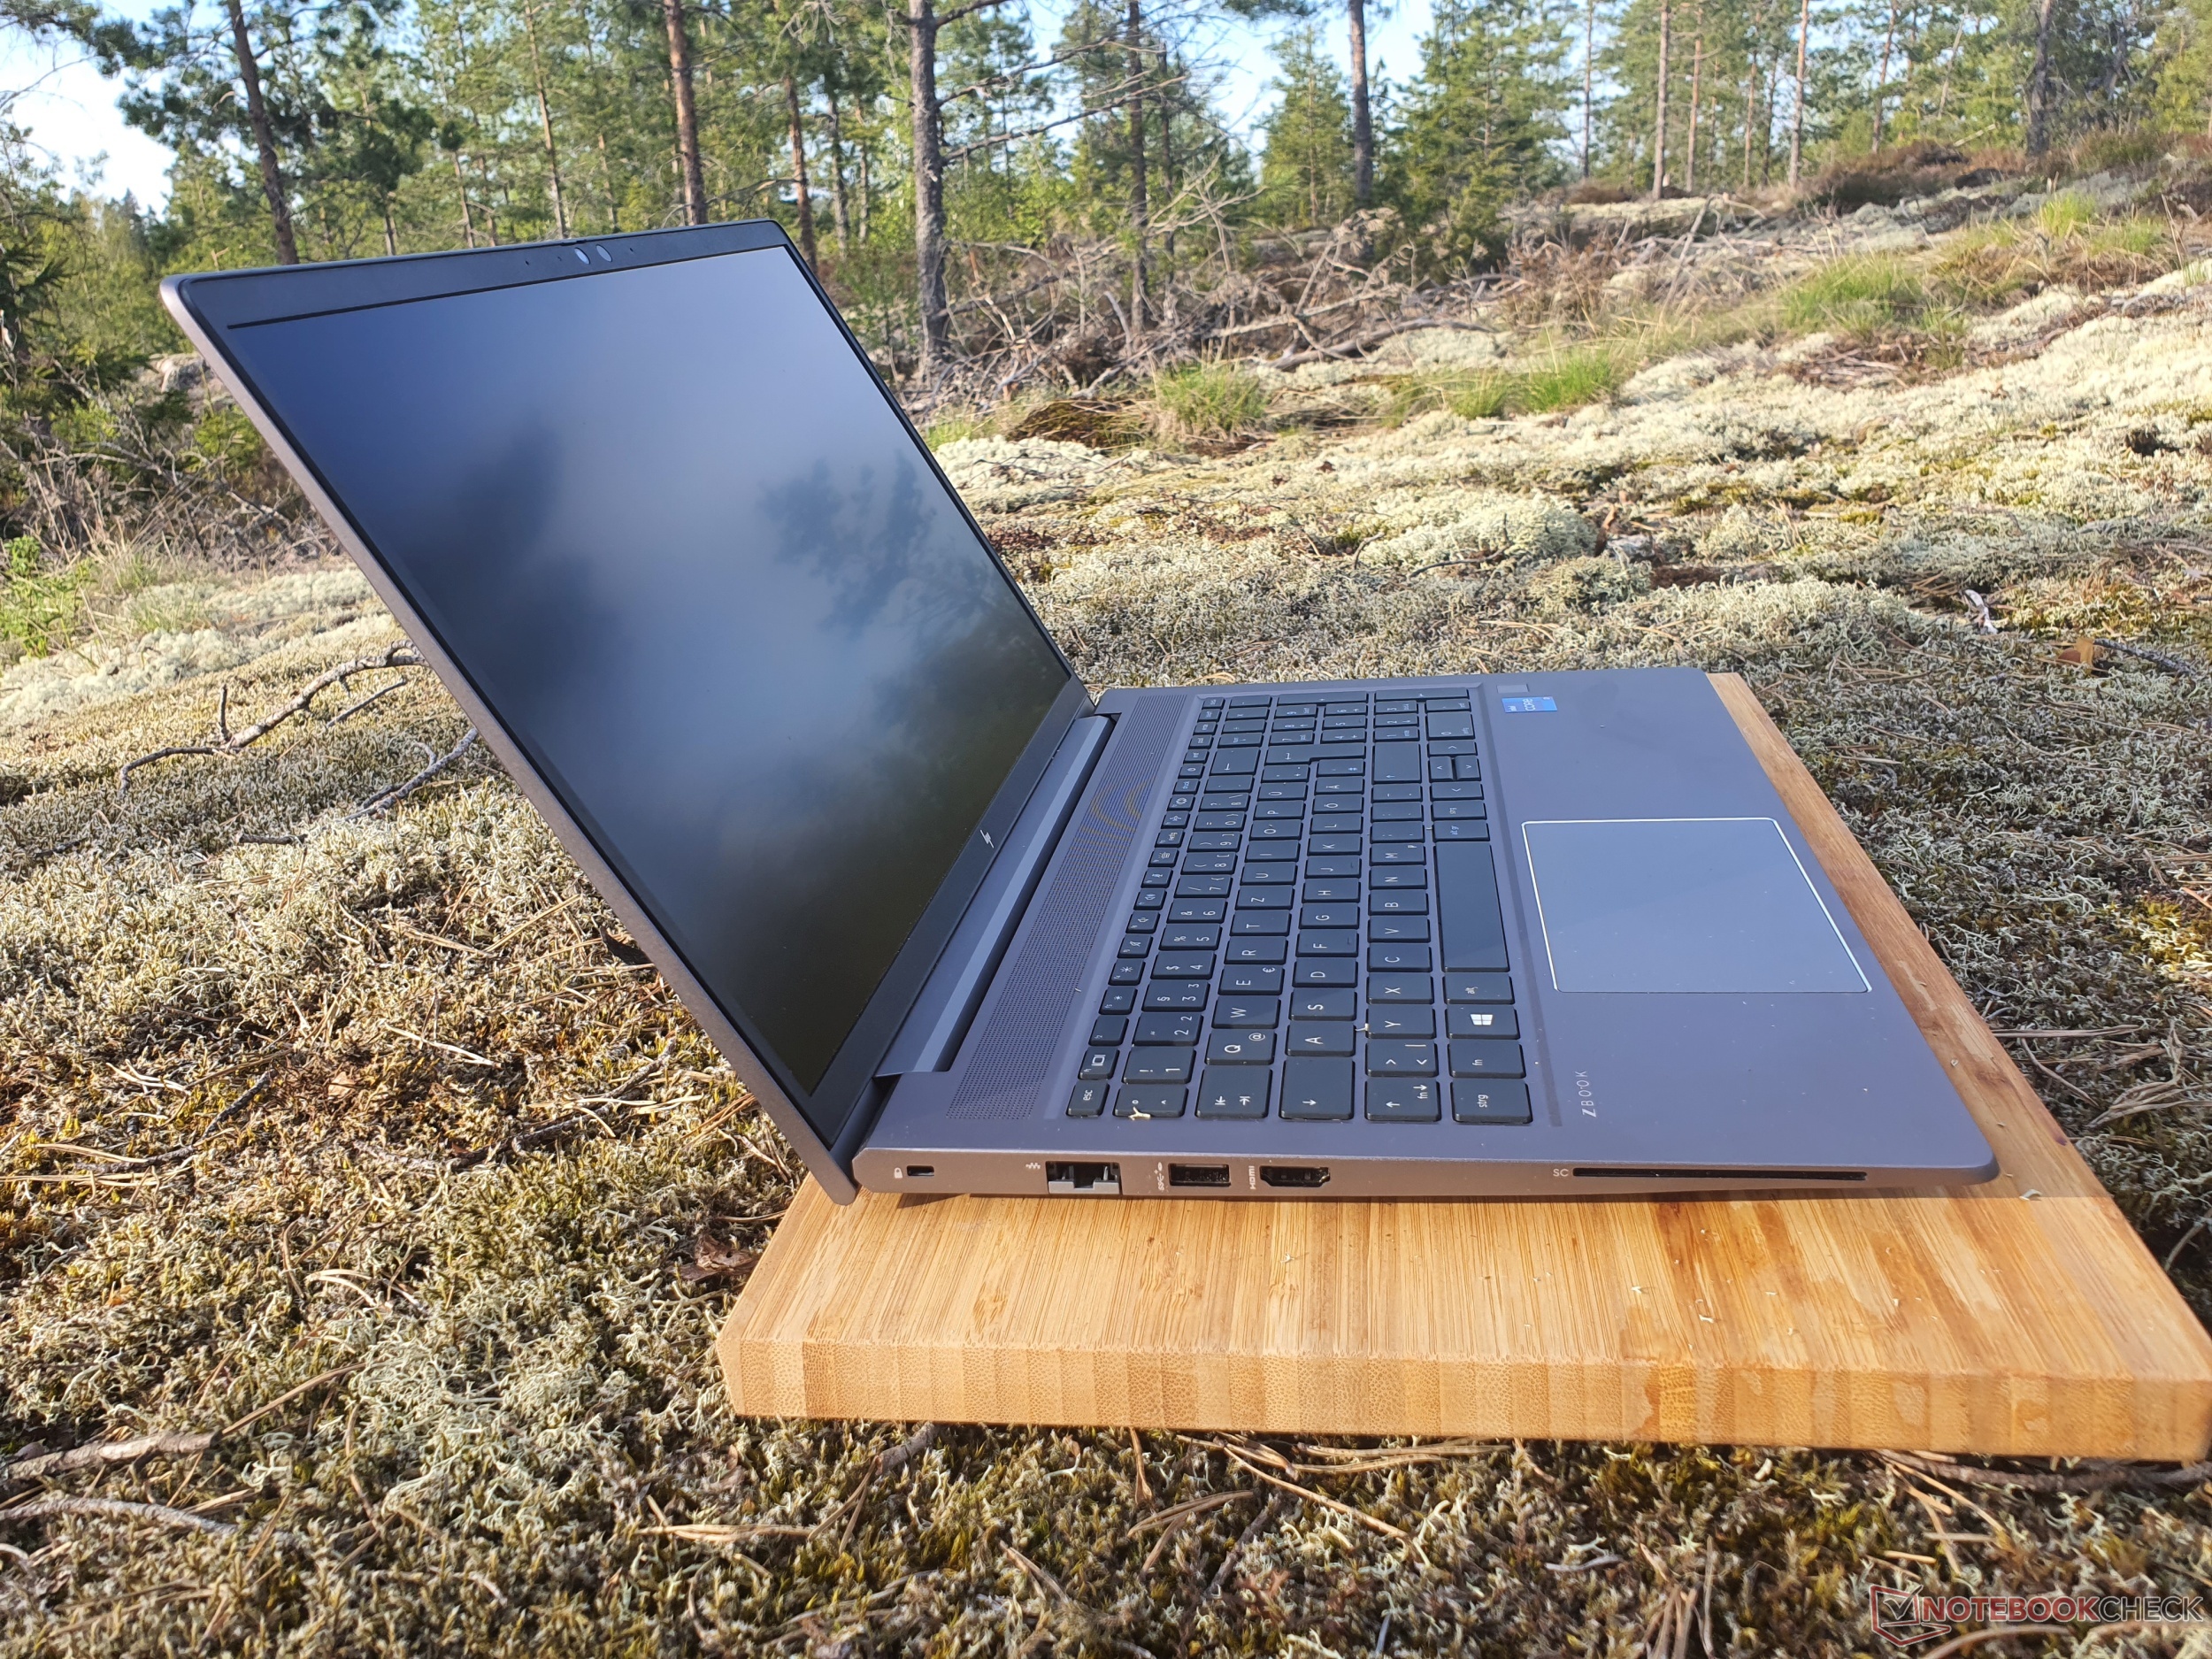
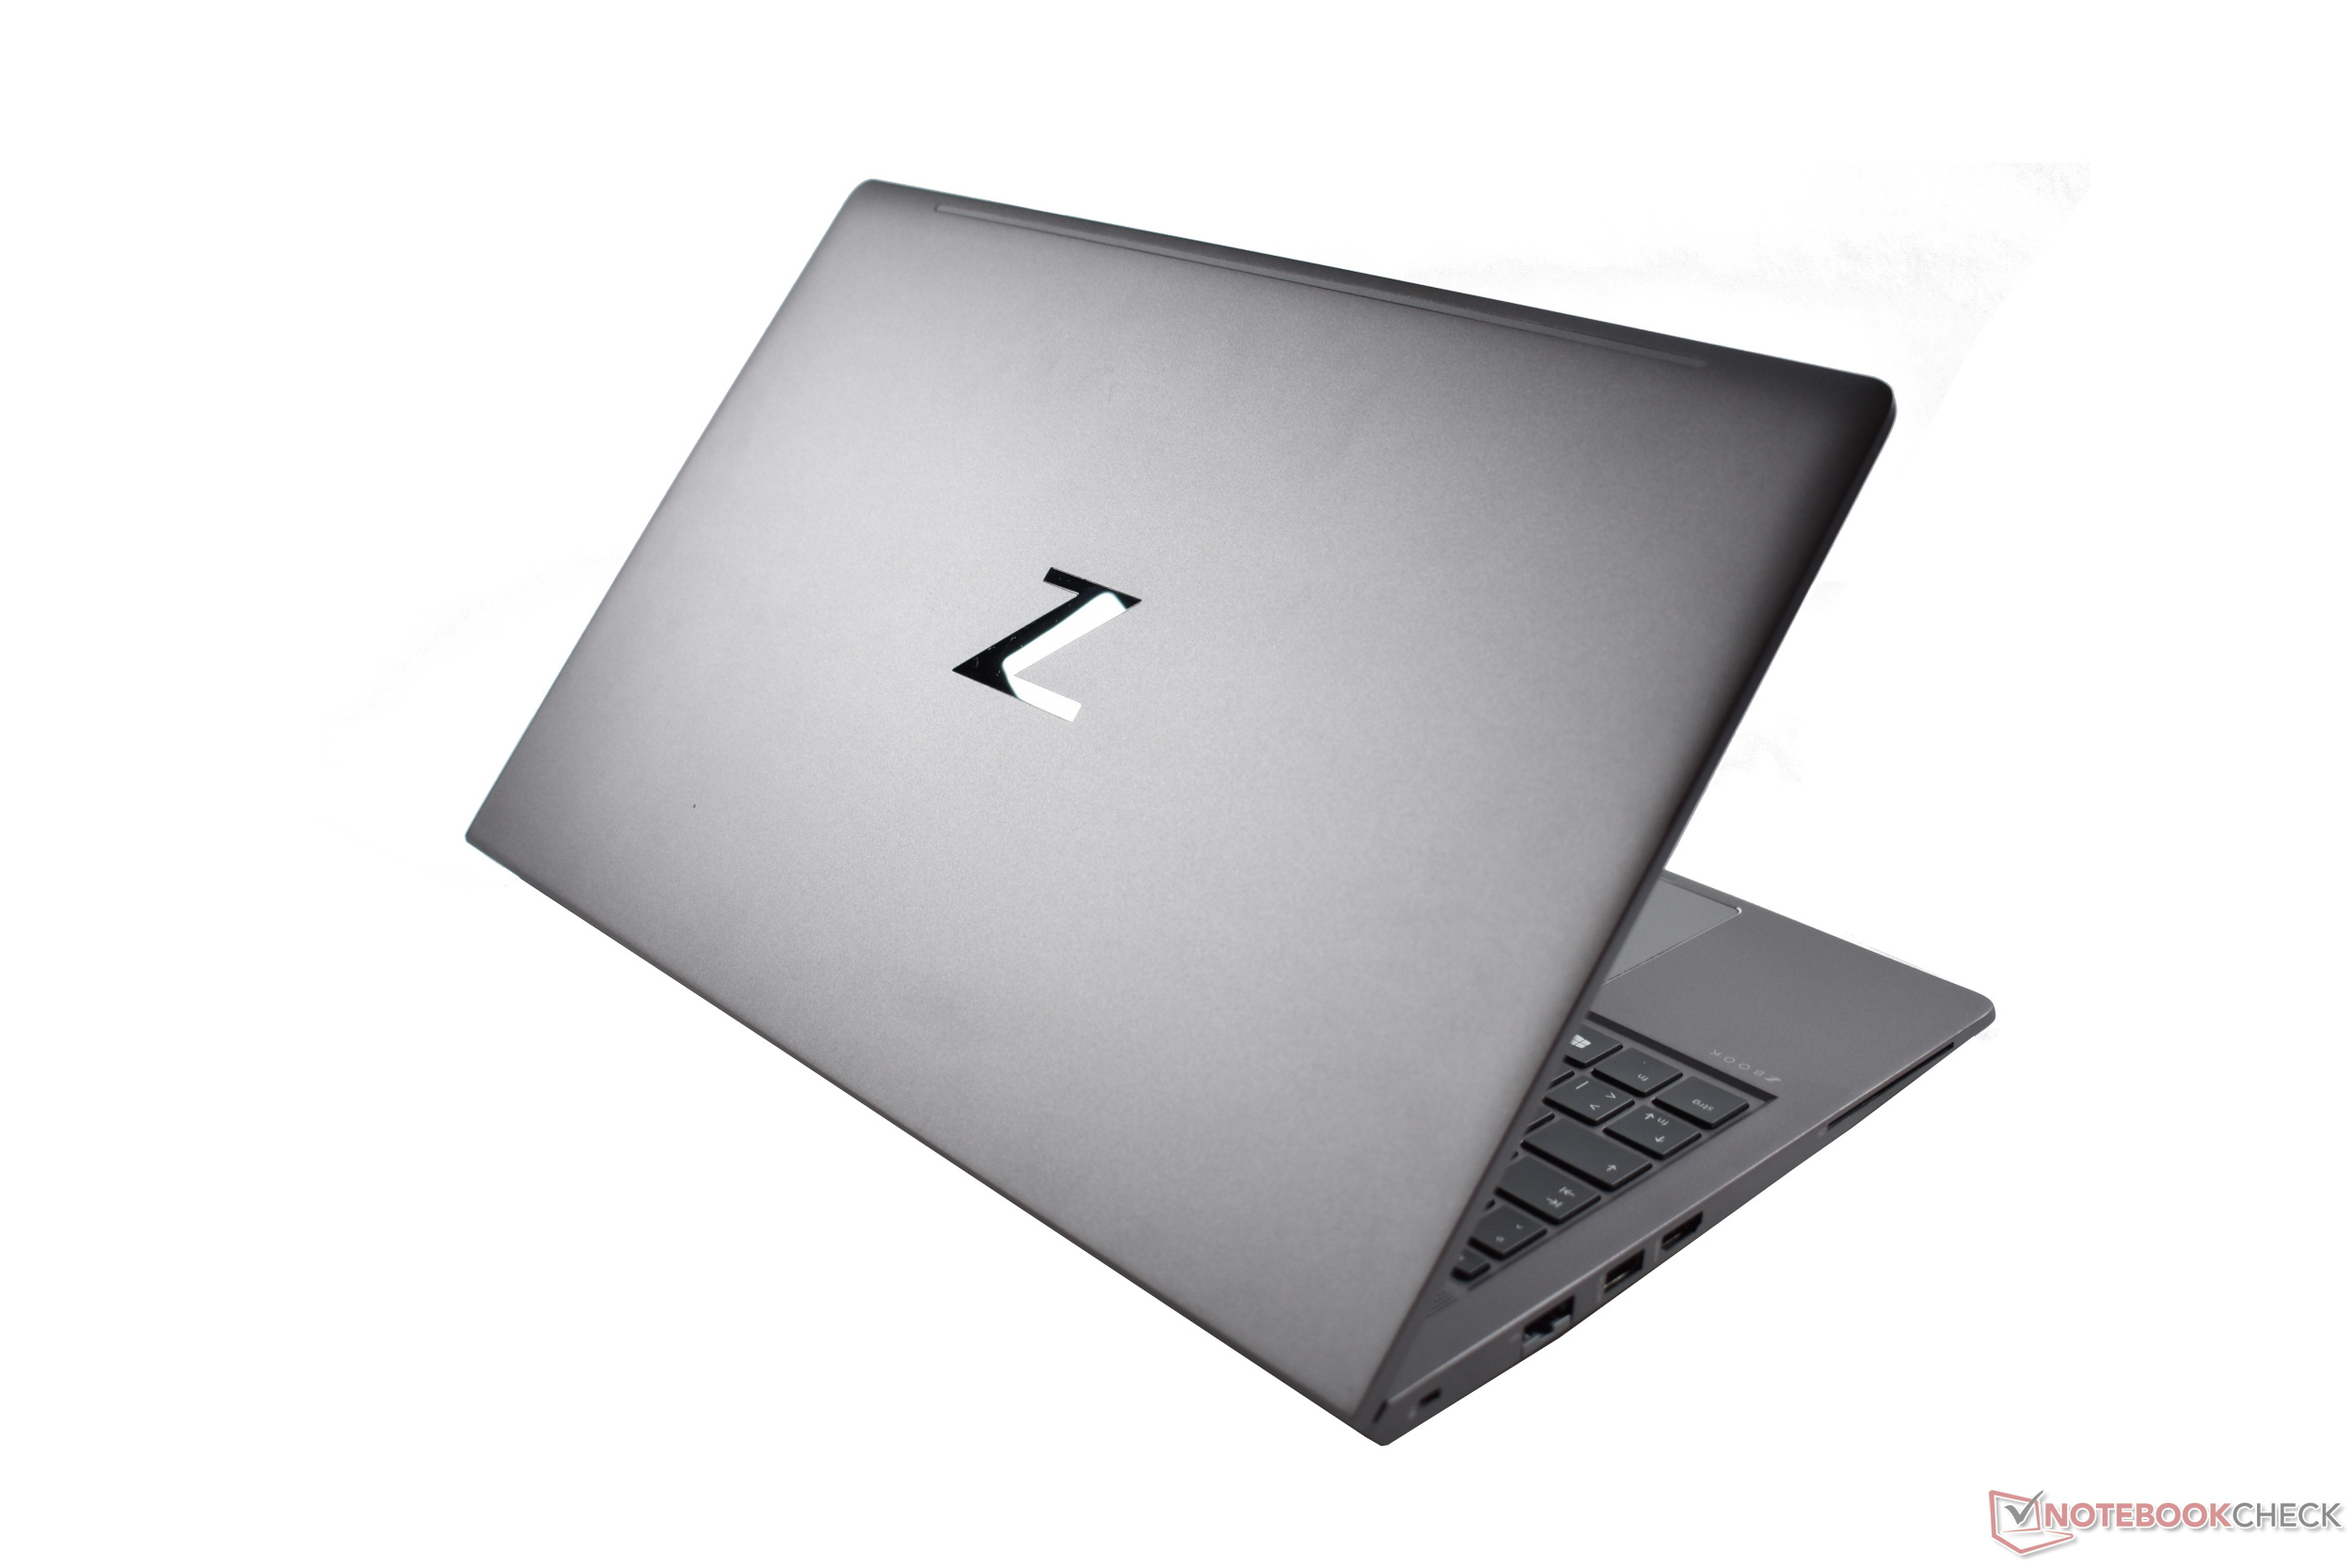
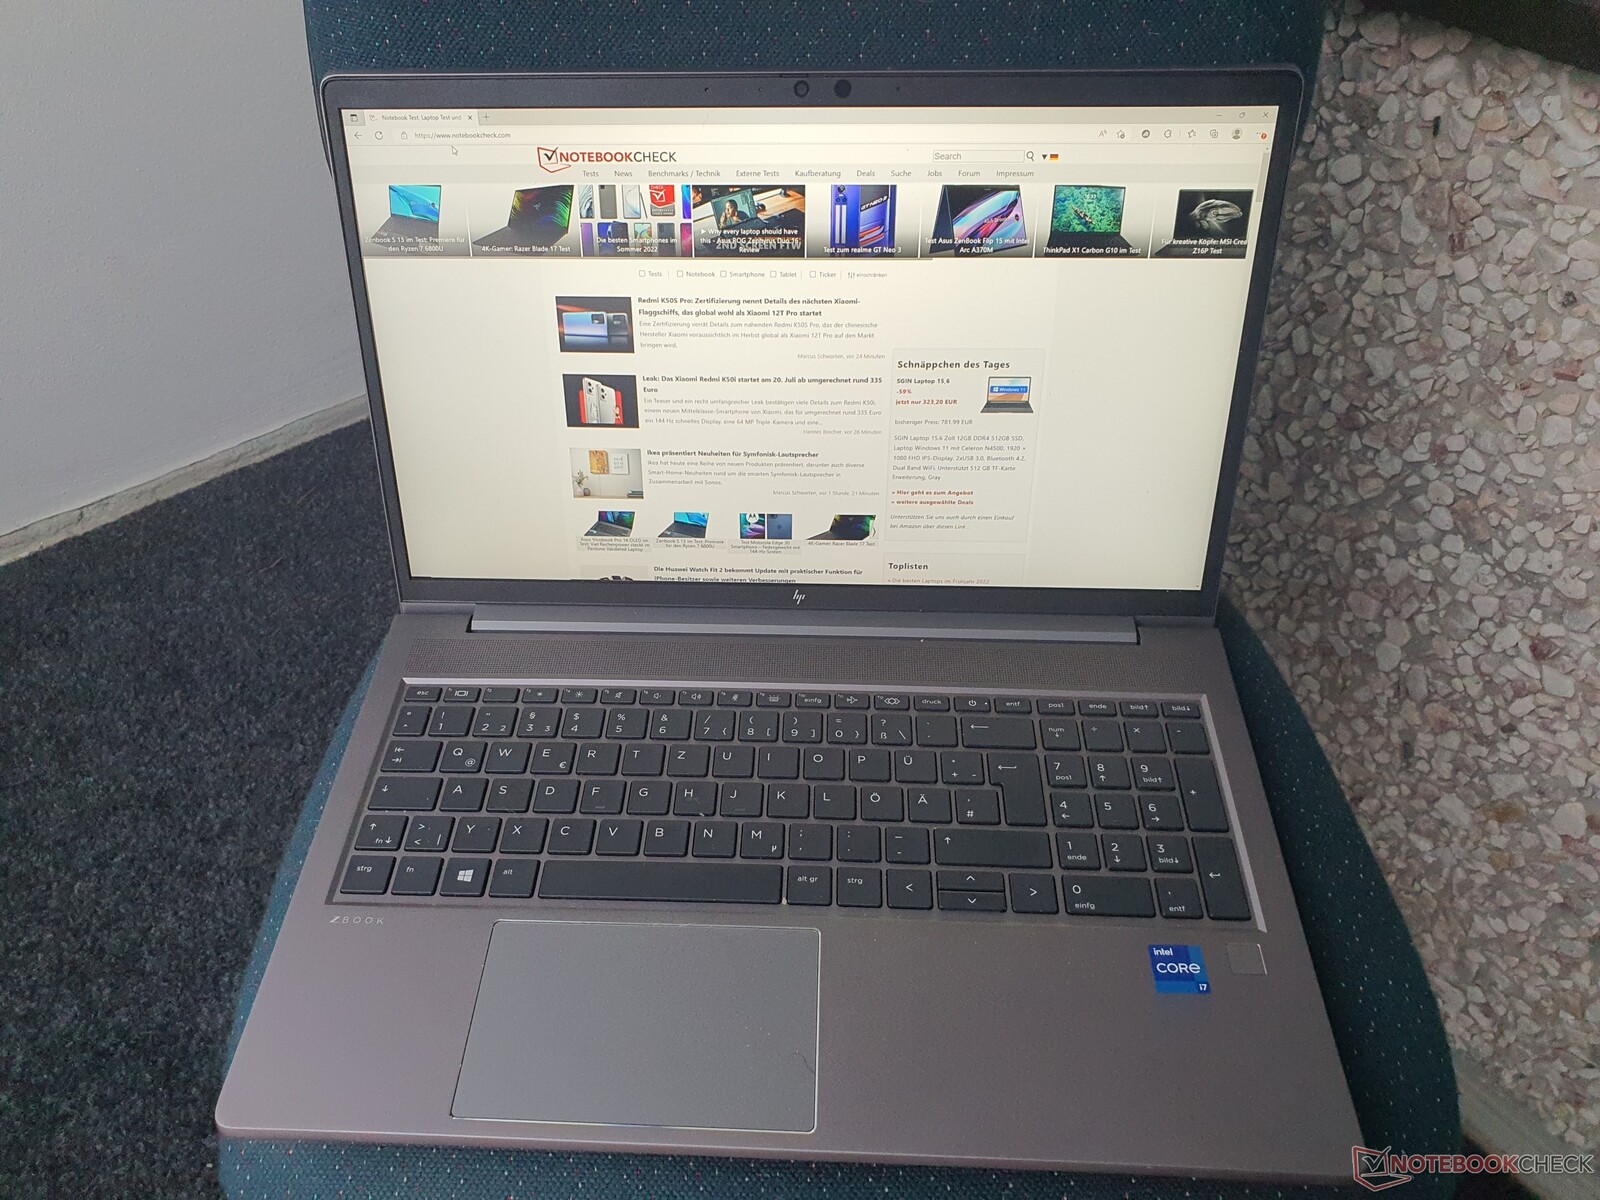
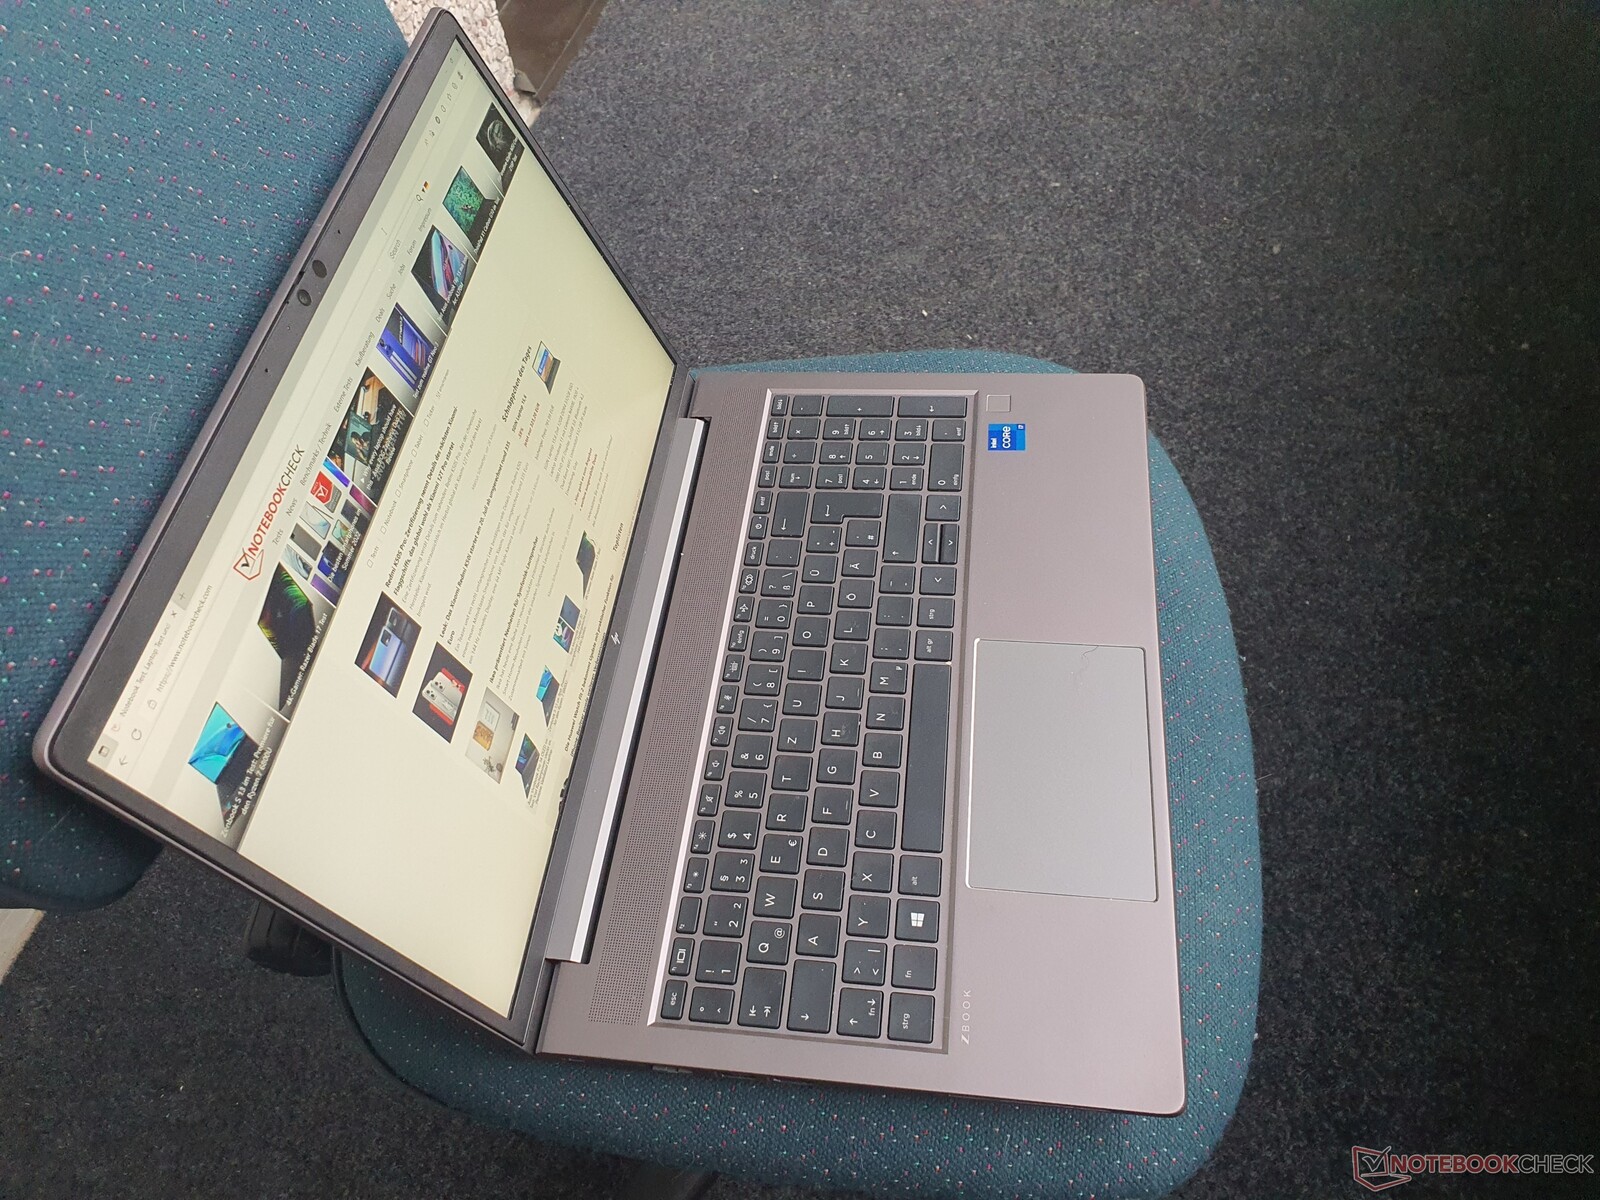
Carcasa: ZBook Power de aluminio robusto
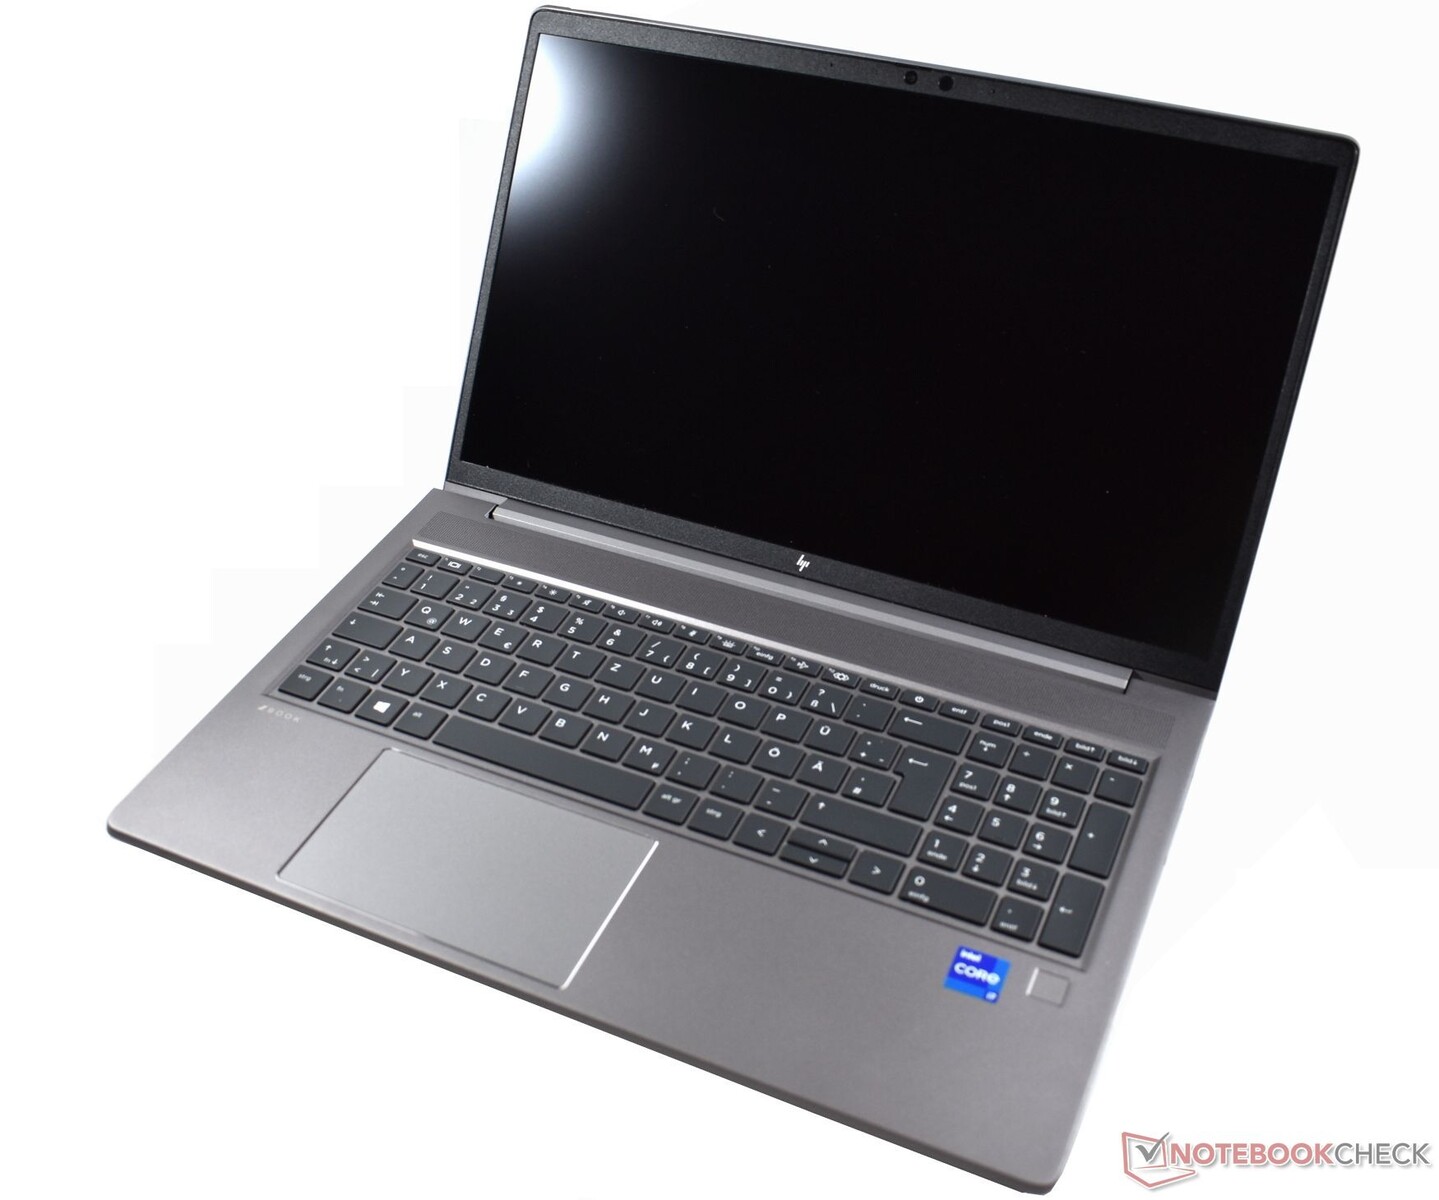
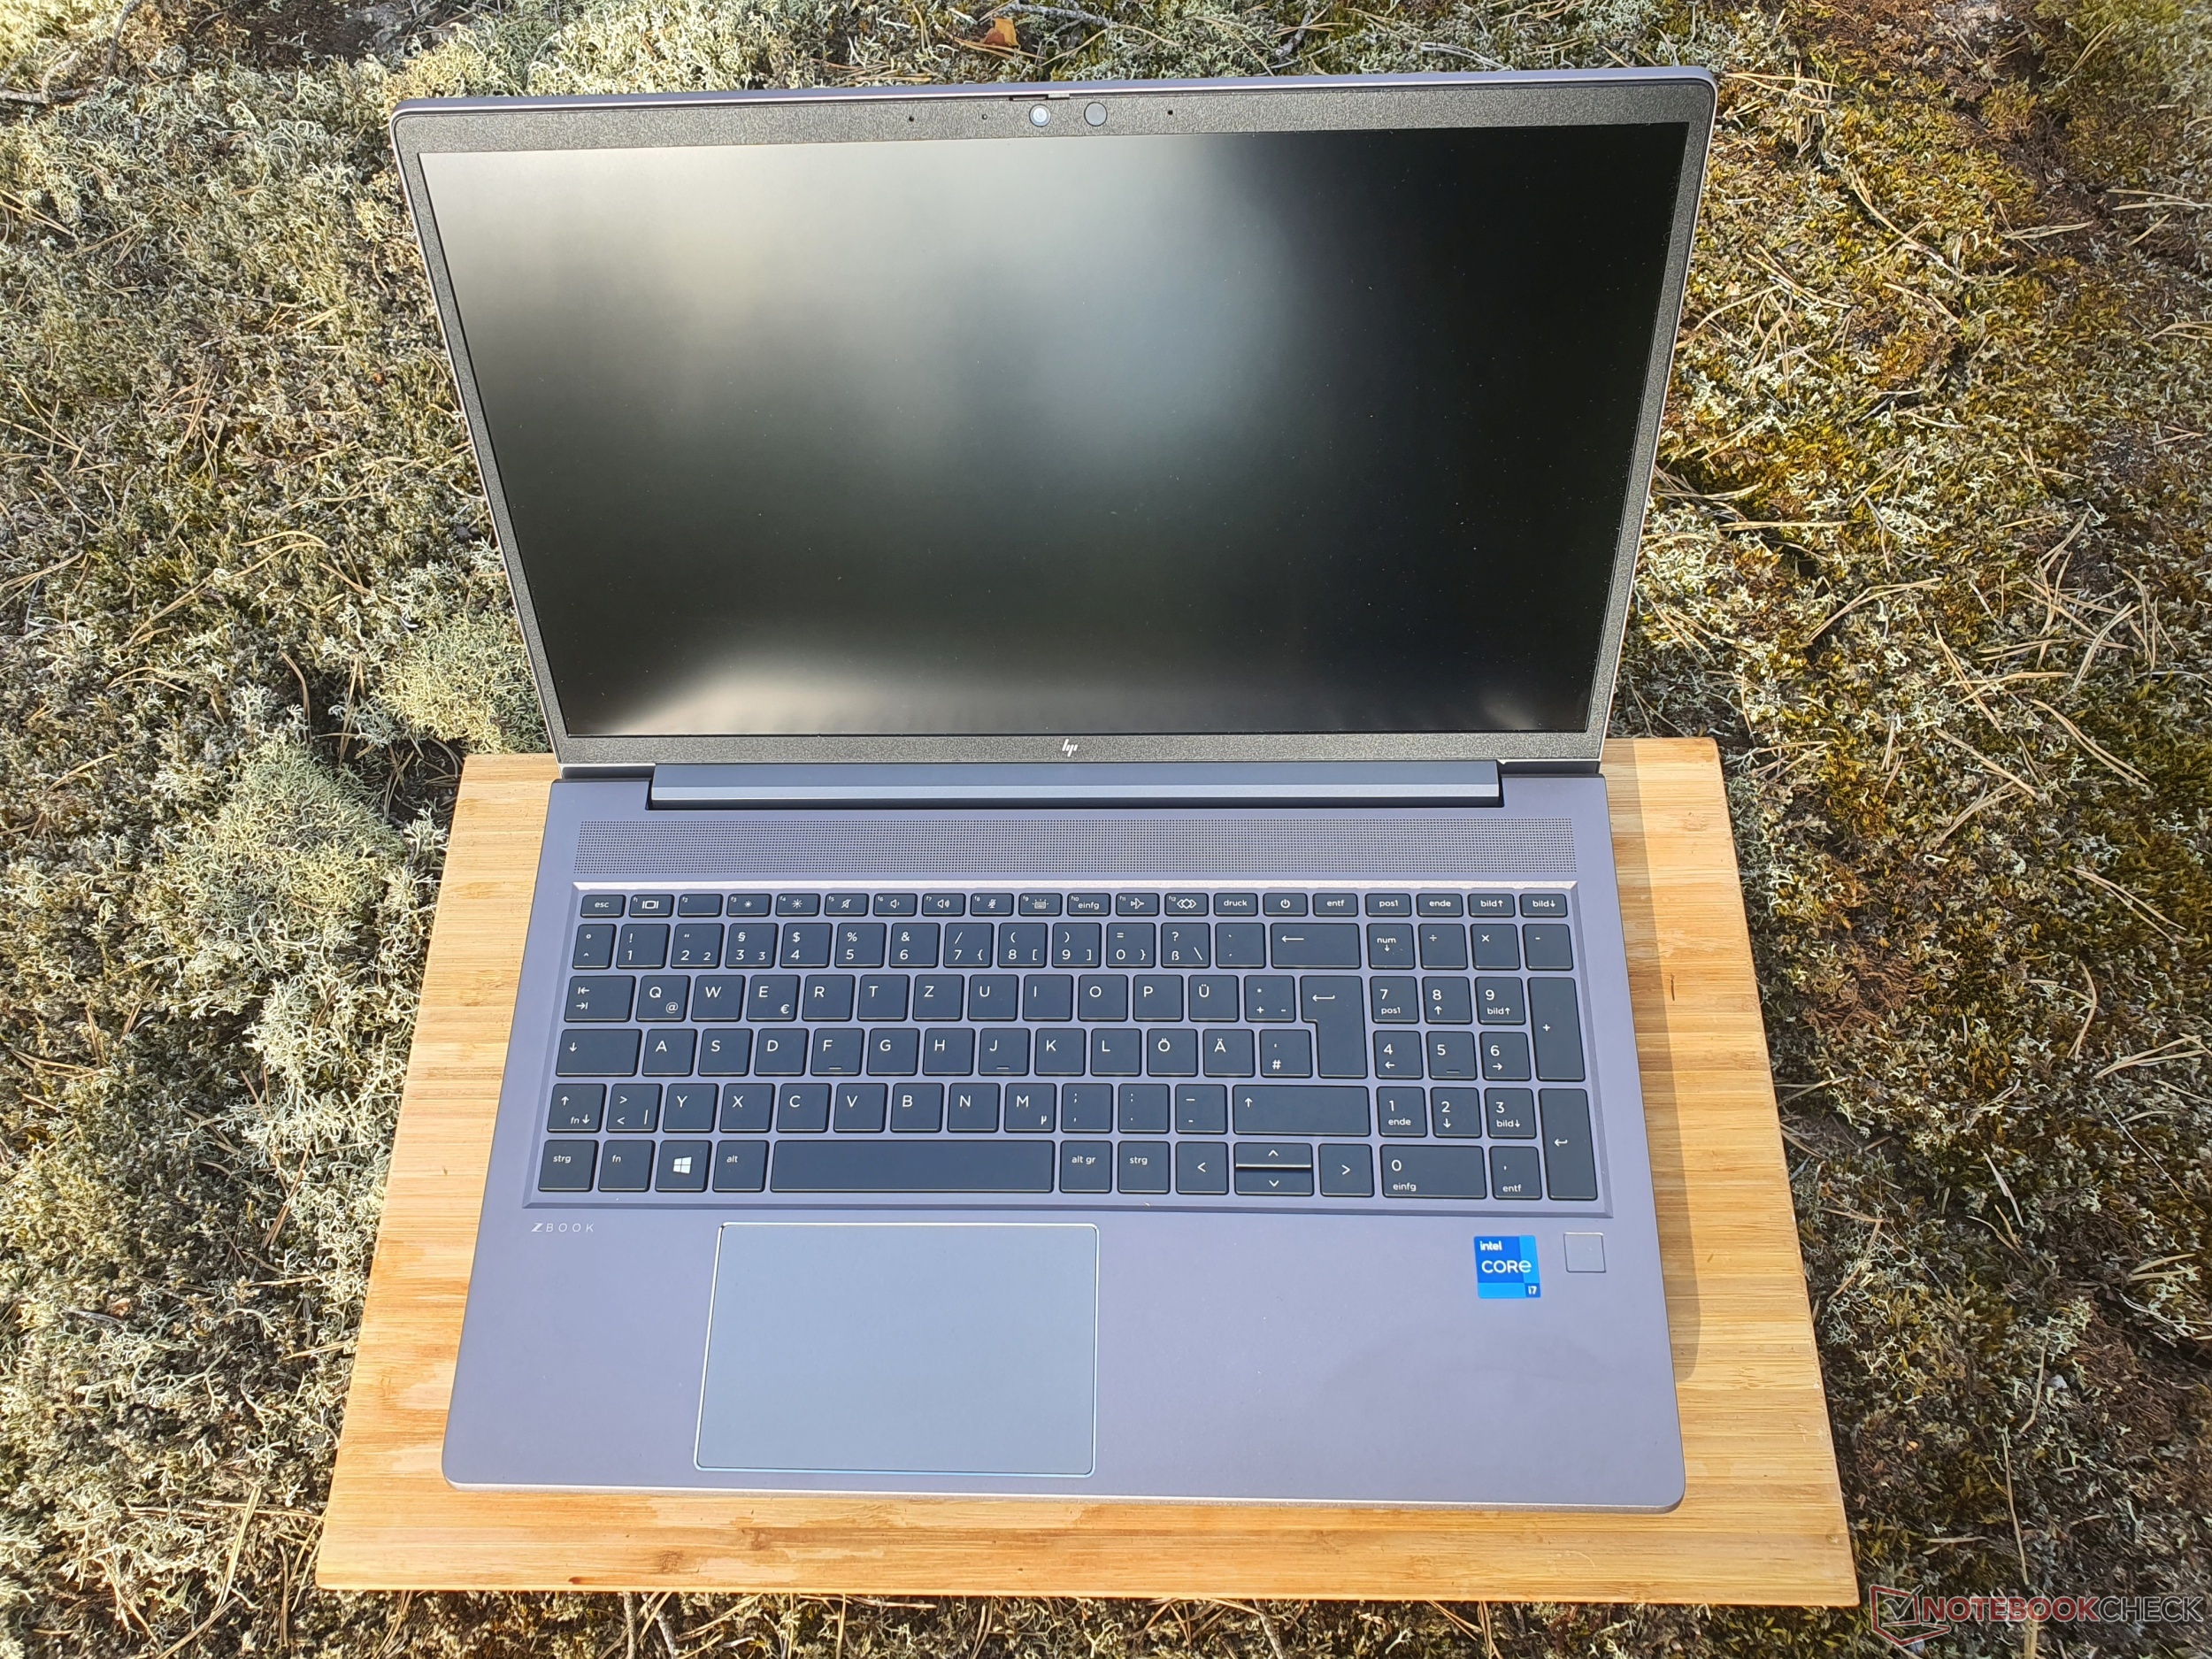
La carcasa de aluminio gris oscuro confiere al ZBook Power 15 un aspecto elegante y una robustez bastante notable, lo que también confirma su certificación MIL STD-810H. La háptica, incluyendo las superficies mate, tampoco deja nada que desear.
El dispositivo muestra un acabado limpio, y las huellas dactilares no son un problema. La tapa se puede abrir con una sola mano, y la gran bisagra que lo atraviesa es extremadamente robusta.
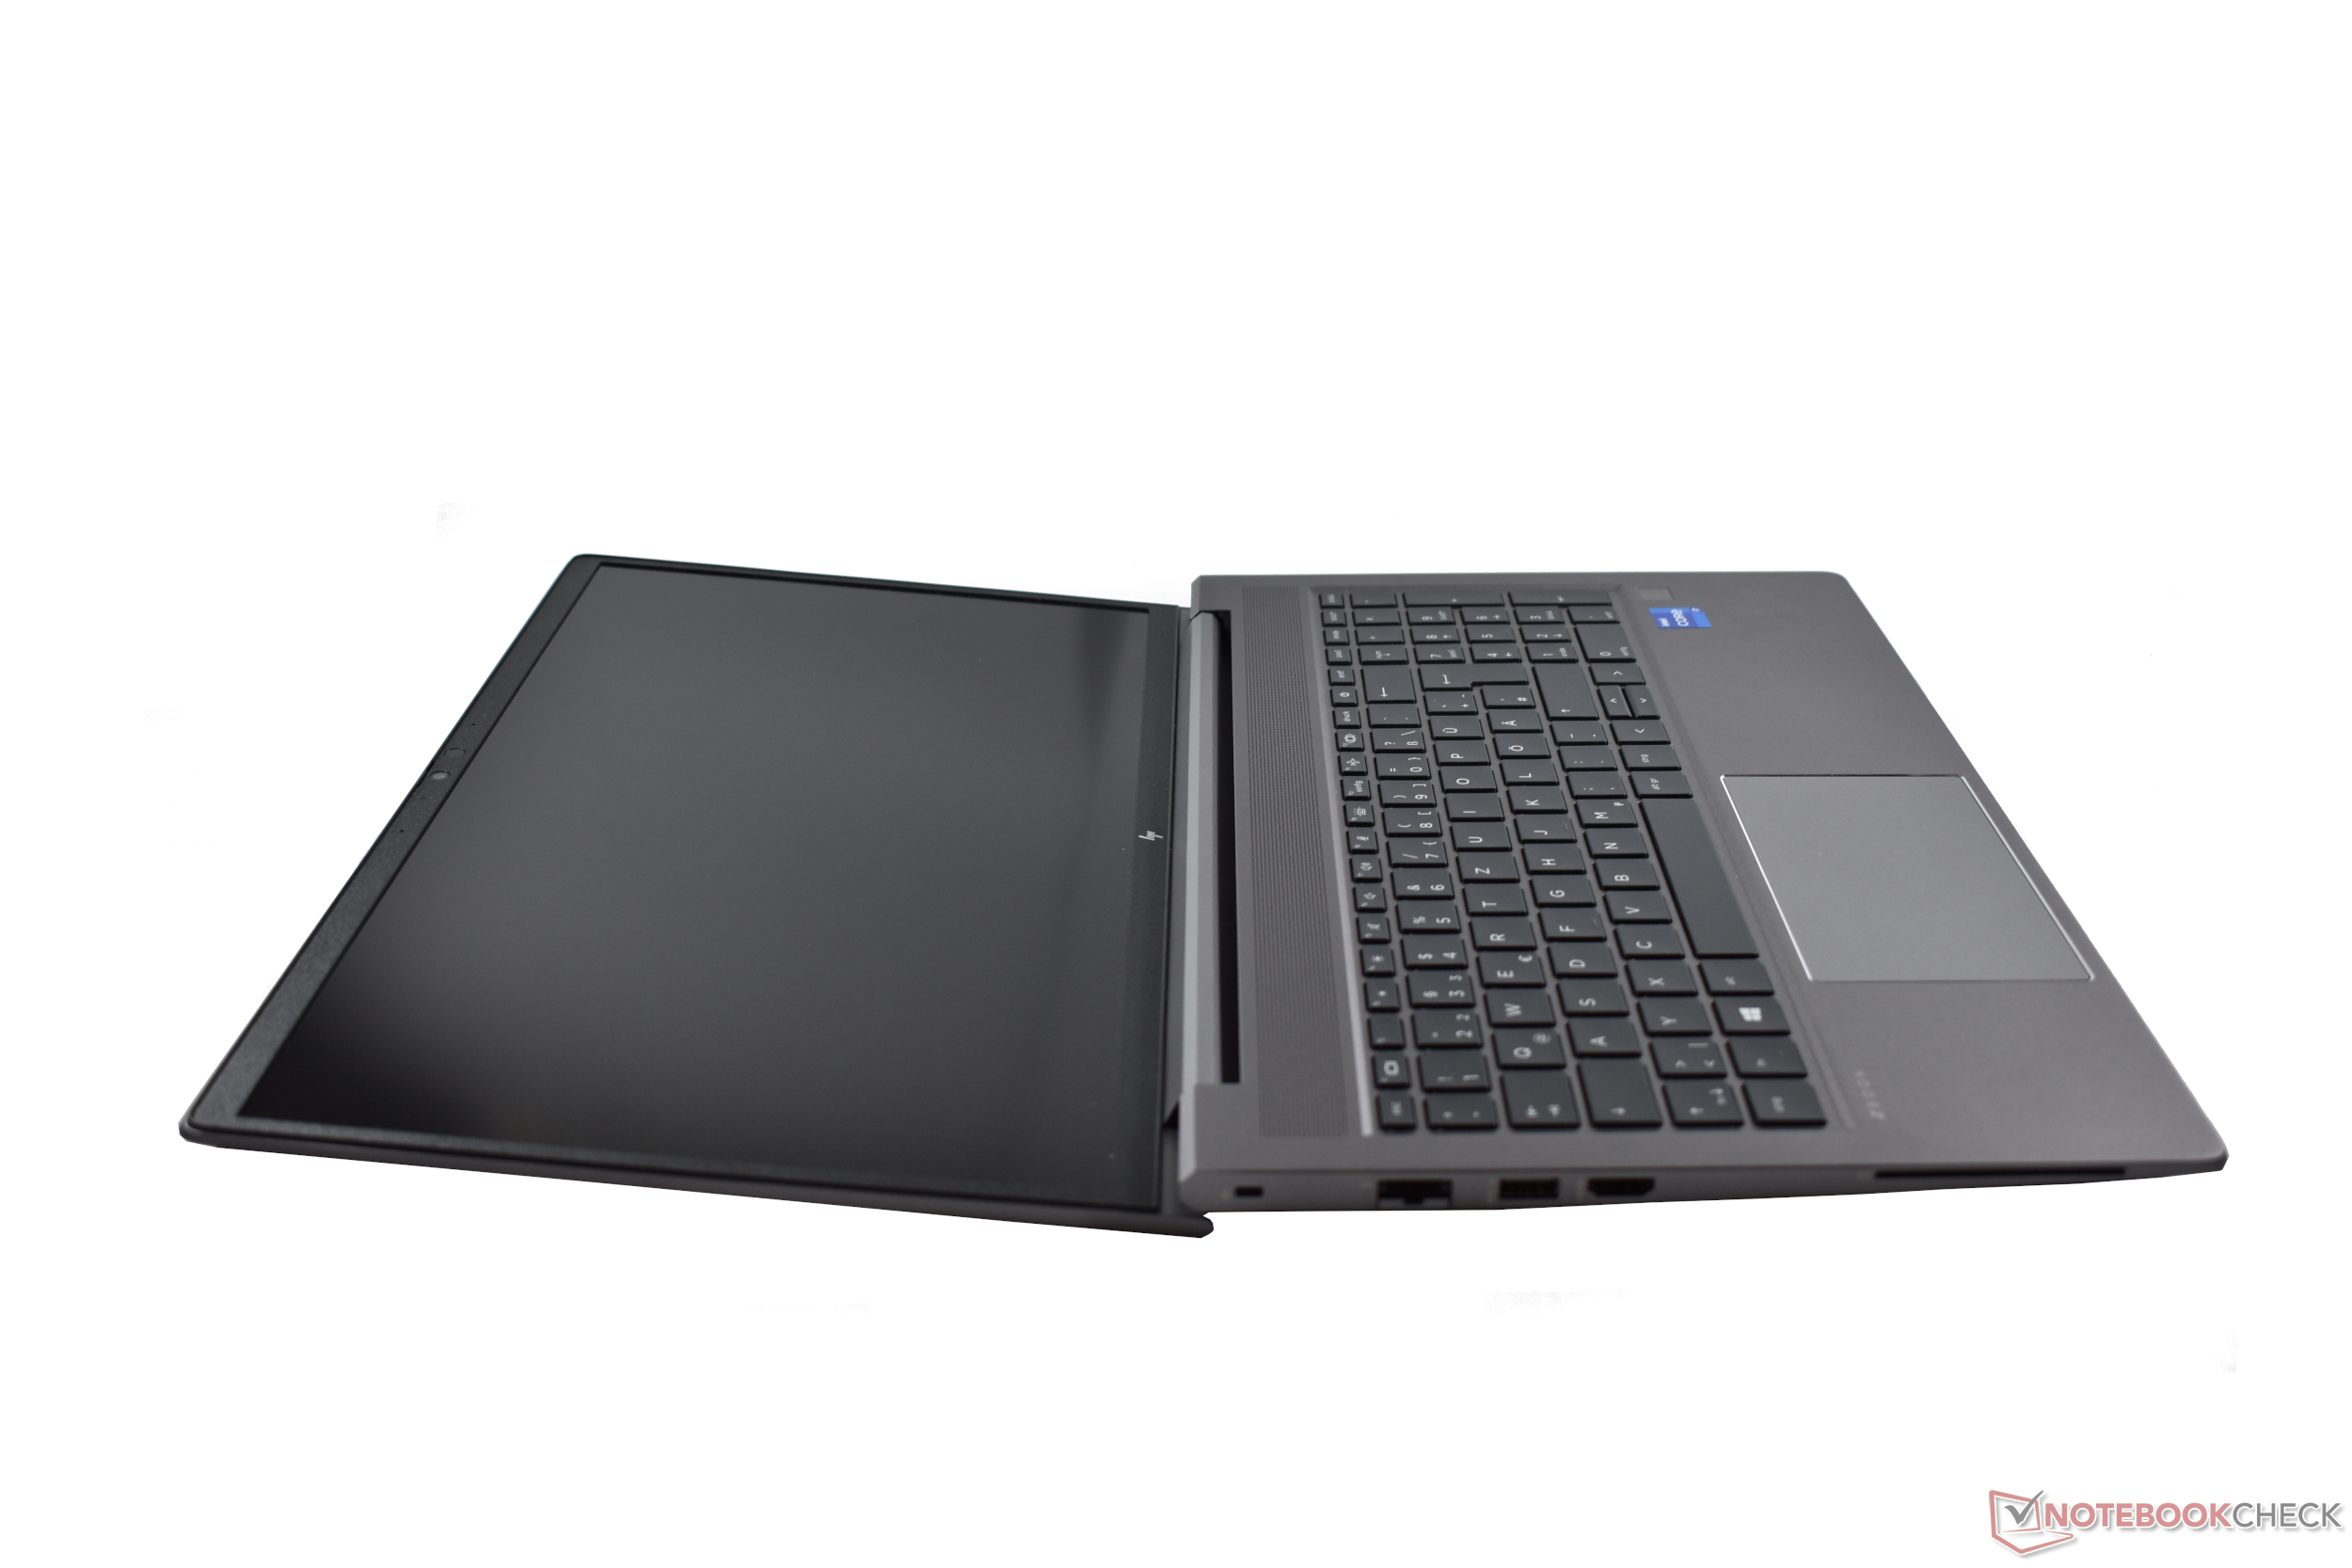
Por otro lado, la parte posterior de la tapa puede presionarse fácilmente con un poco de presión de un solo punto, aunque esto no provocará ninguna distorsión de la imagen. Los puntos positivos son el hecho de que la tapa, con sus delgados biseles, sólo puede girarse mínimamente y que el ángulo máximo de apertura es de ~180 grados.
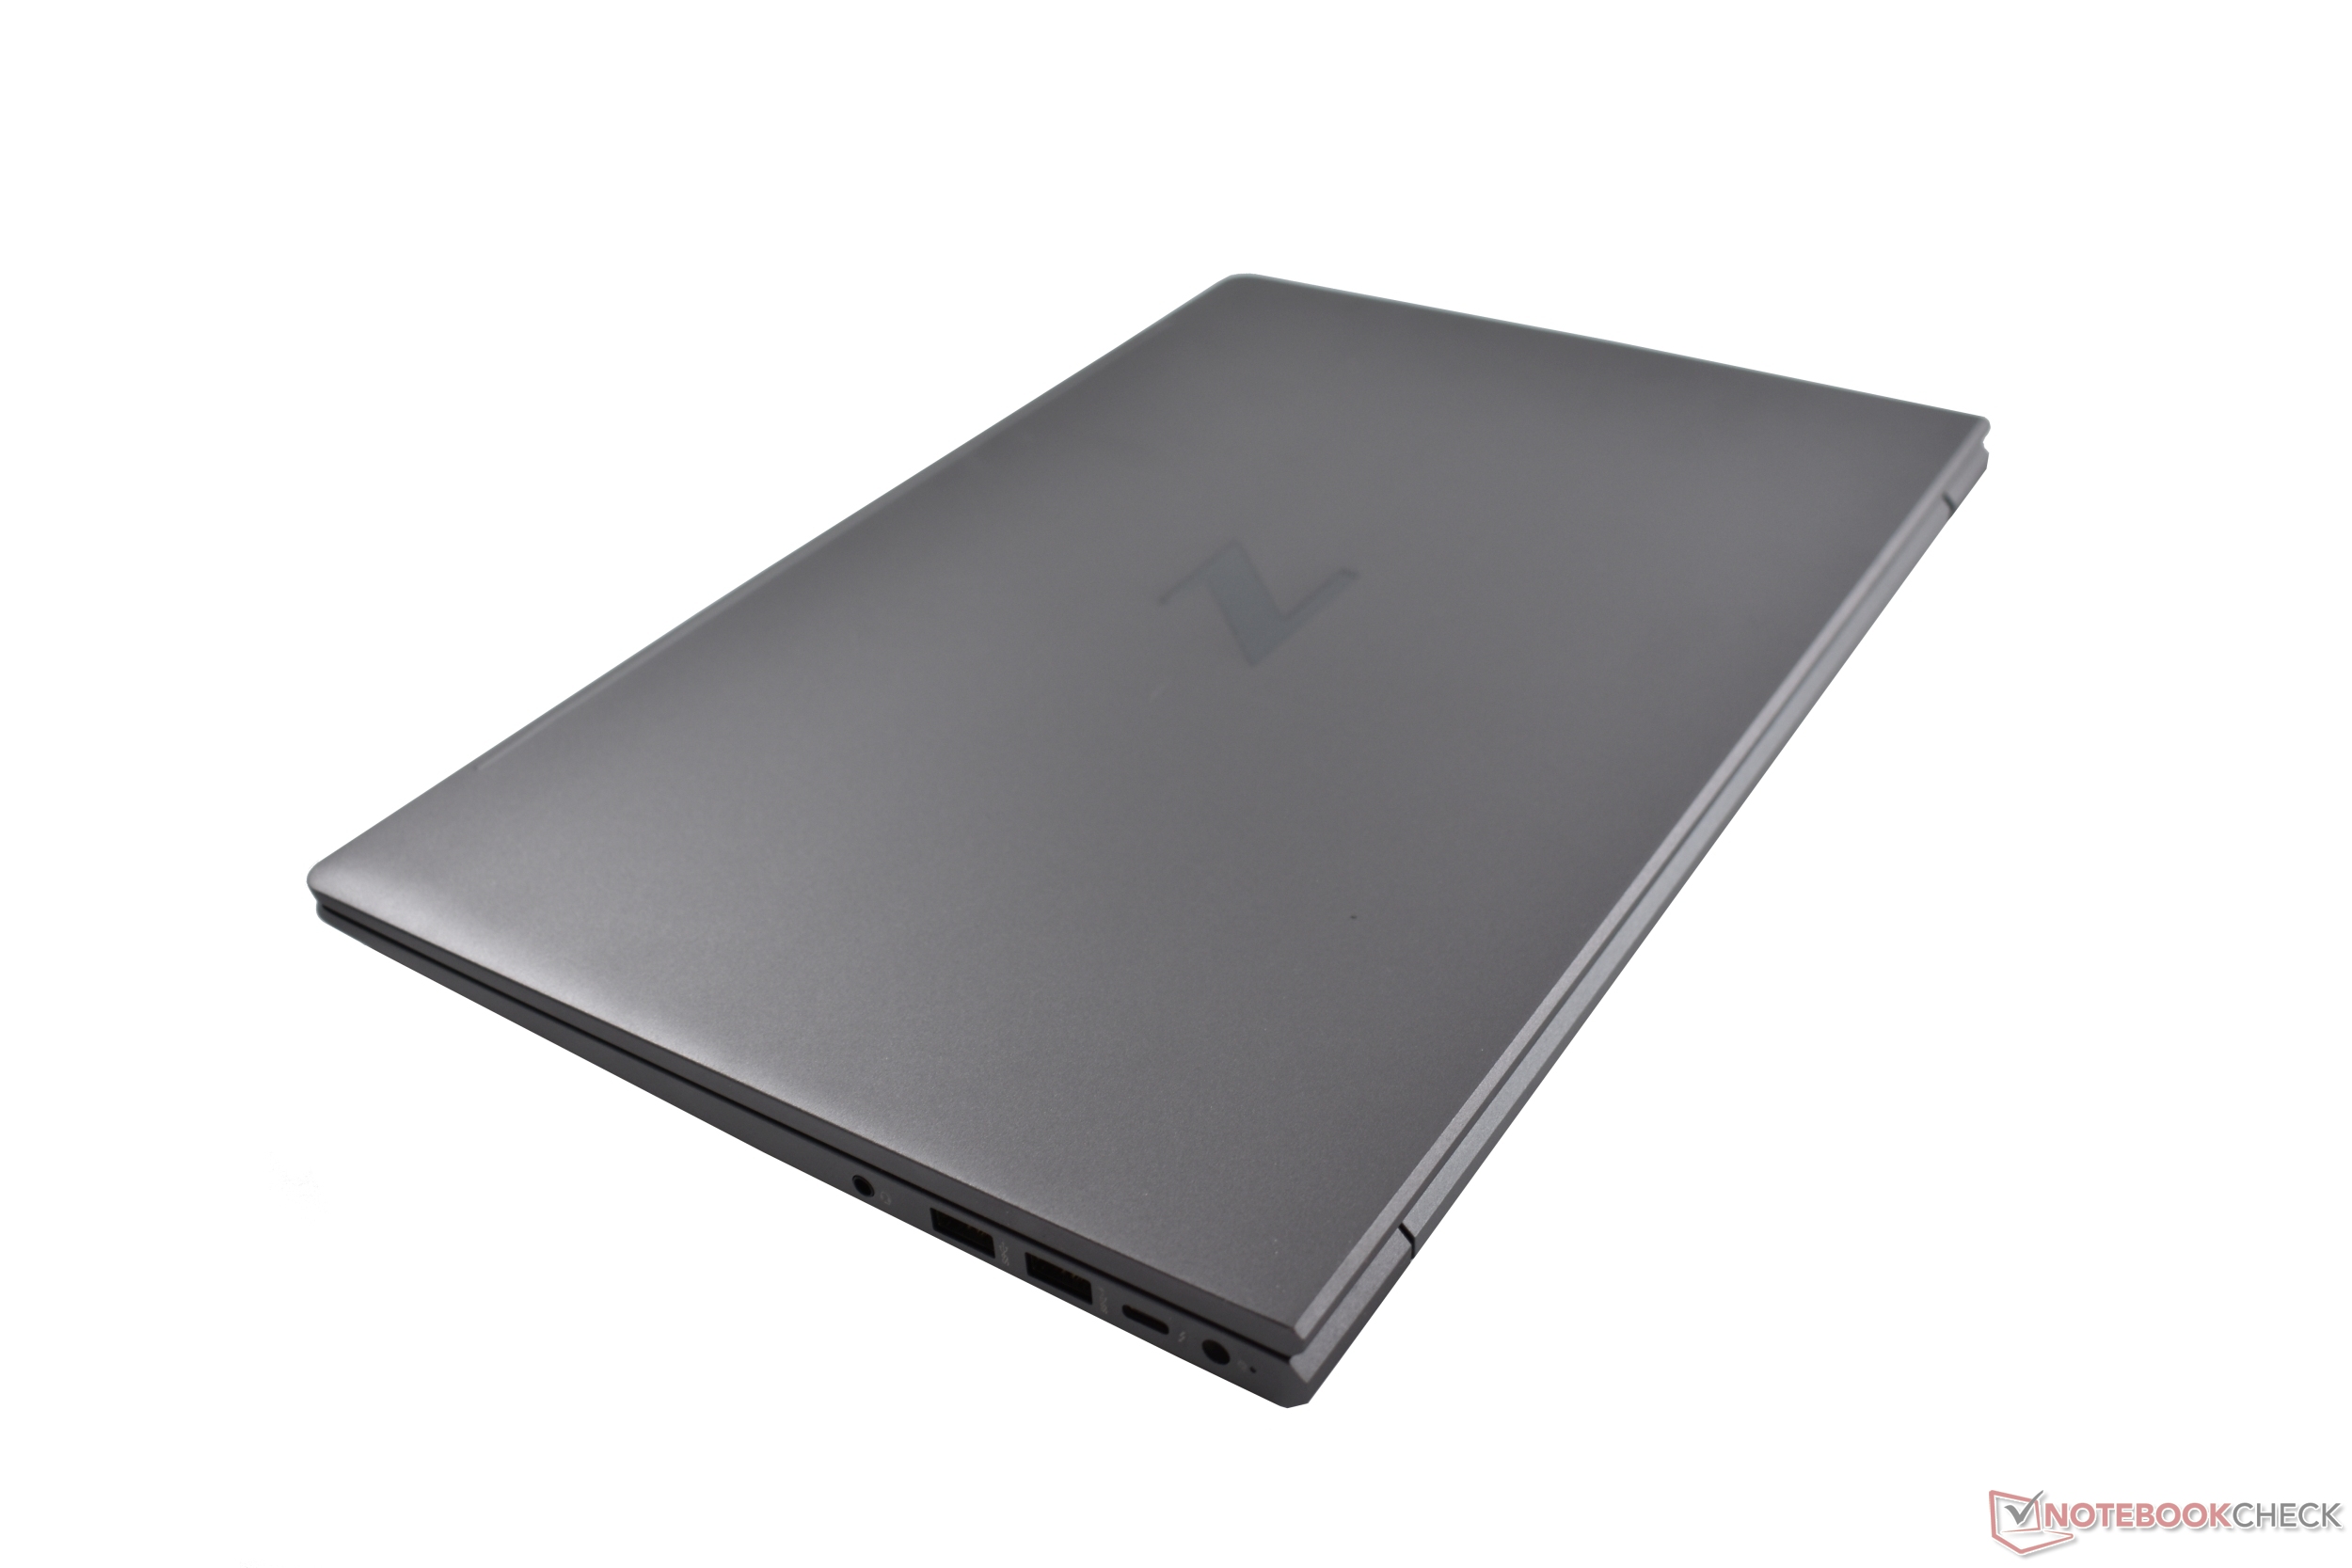
En general, la estación de trabajo es más ligera, con 1,97 kg, y también más compacta que las de la competencia. Sin embargo, como estación de trabajo premium, la HP ZBook Studio 15 vuelve a ser más delgada con 18 mm, al igual que la estación de trabajo compacta ligera de HP, laFirefly 15que también pesa sólo 1,75 kg.
Equipo: HP ZBook con USB-C PD y WiFi rápido 6
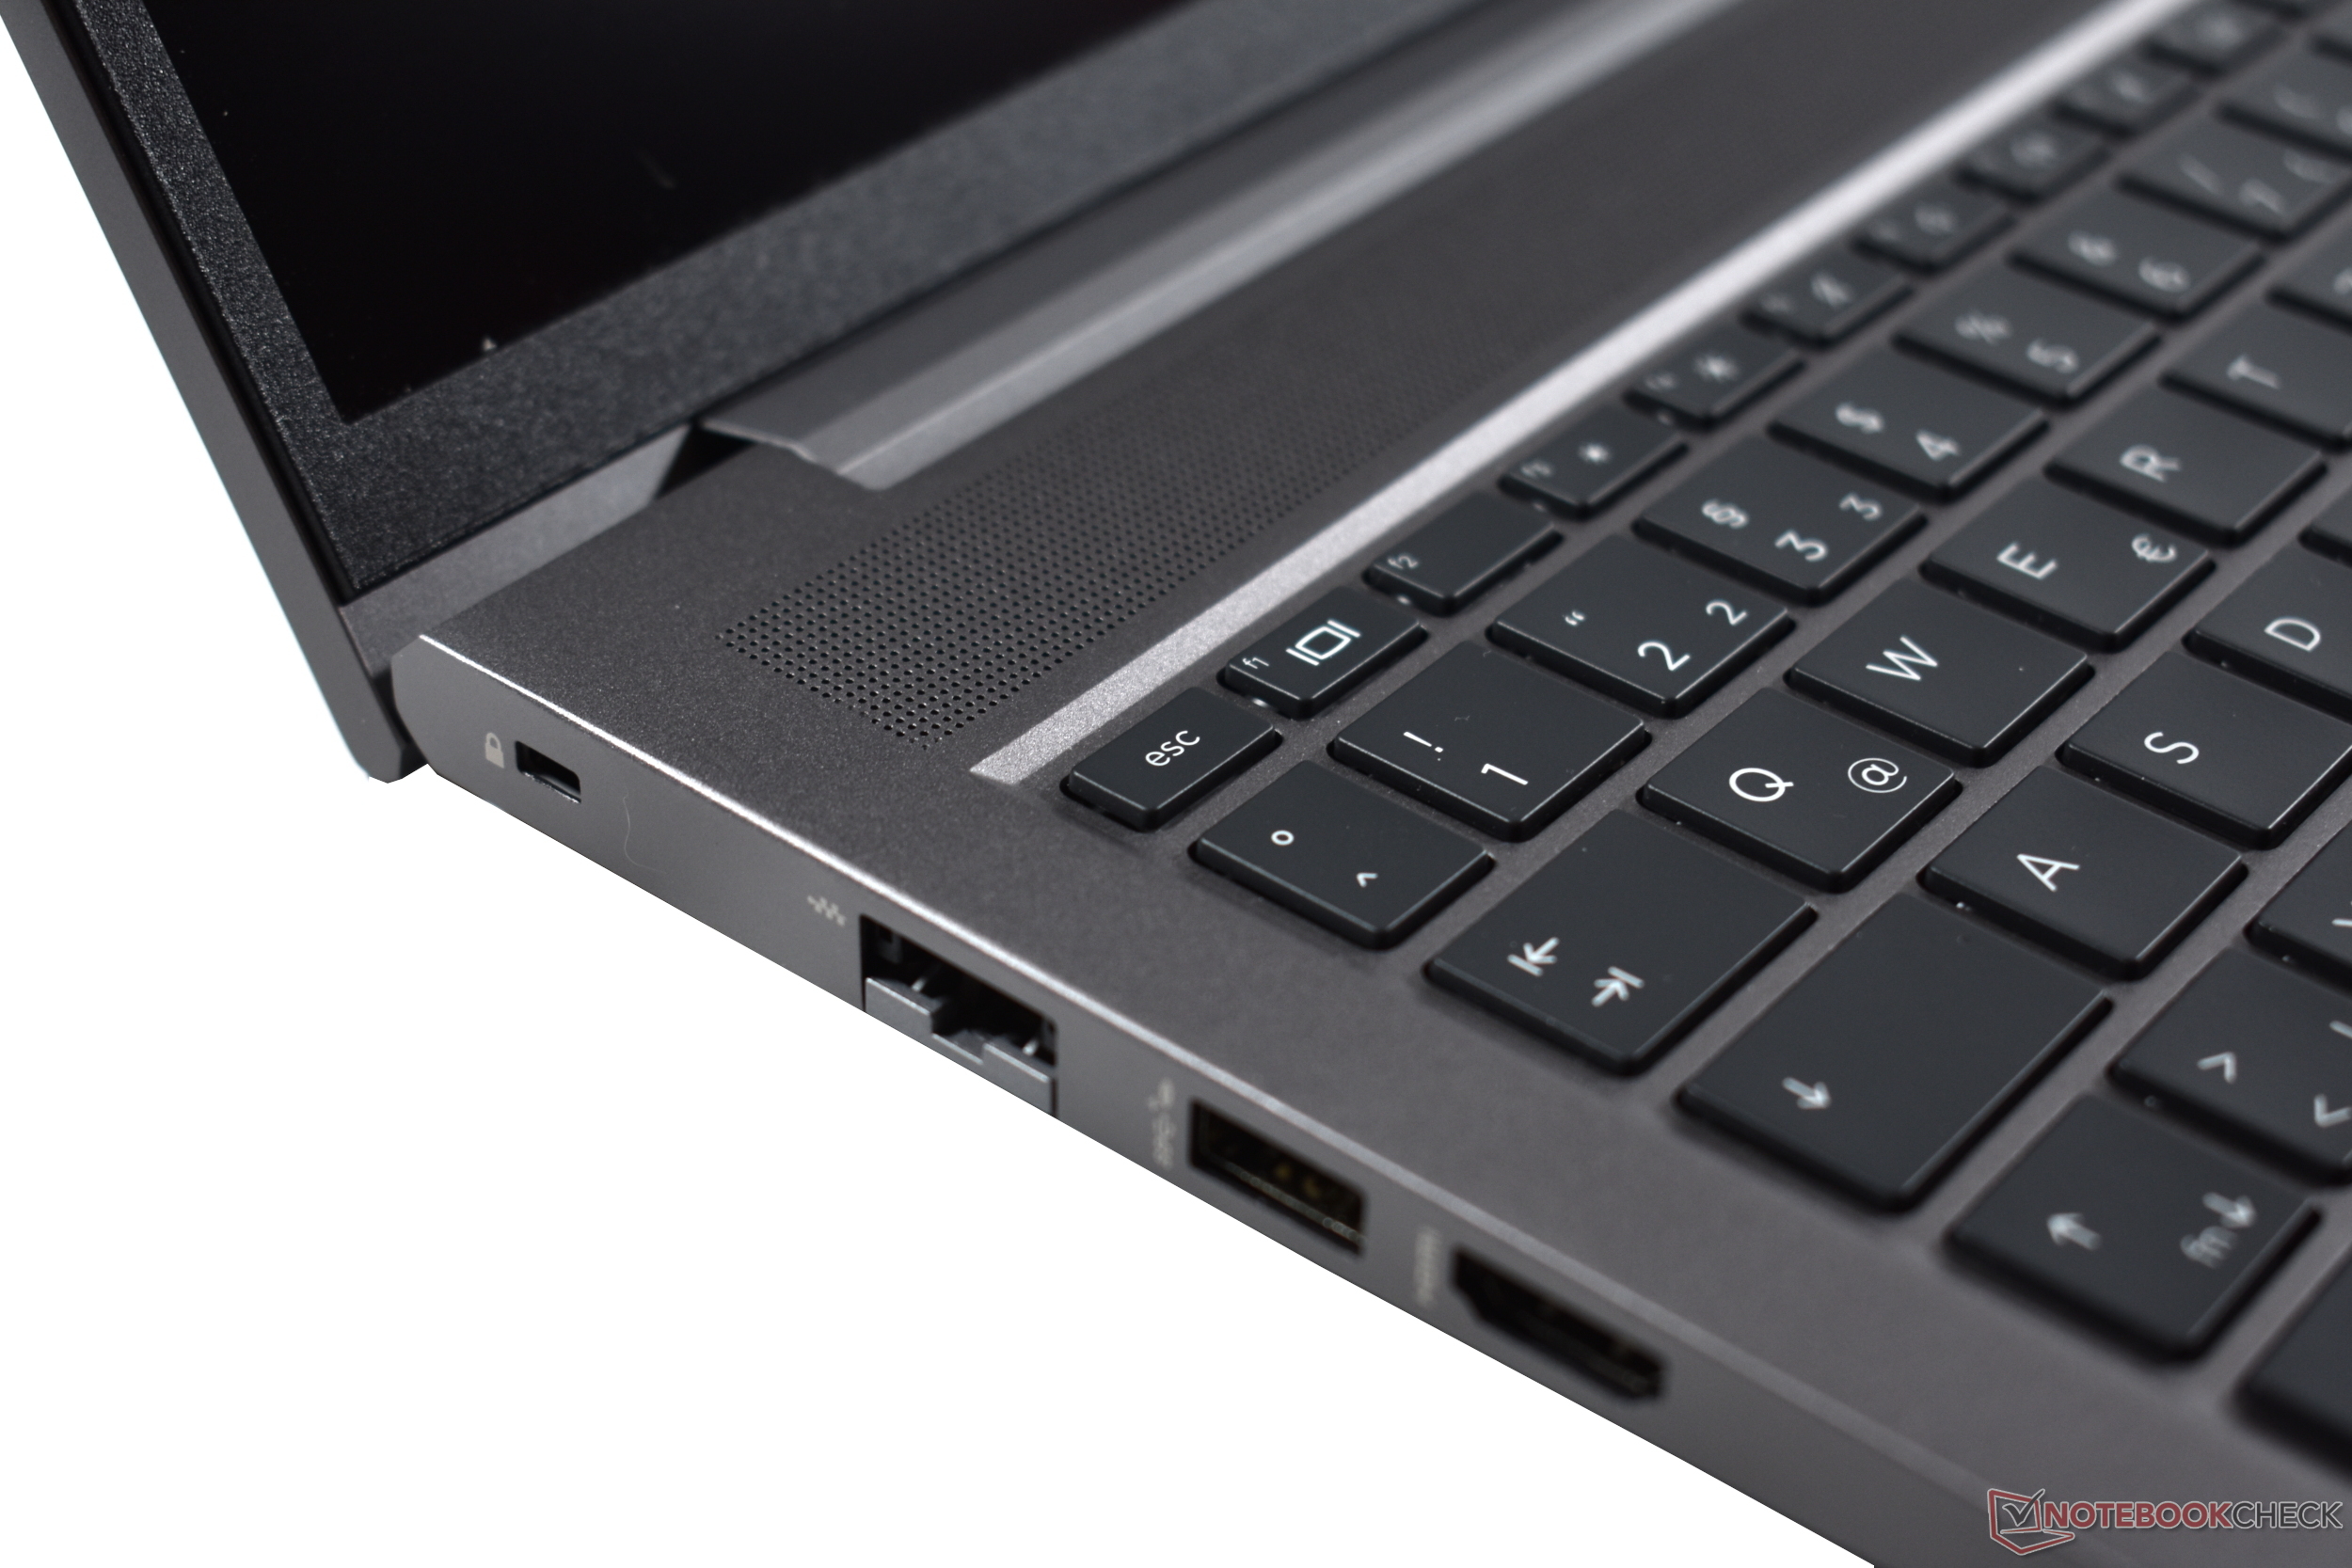
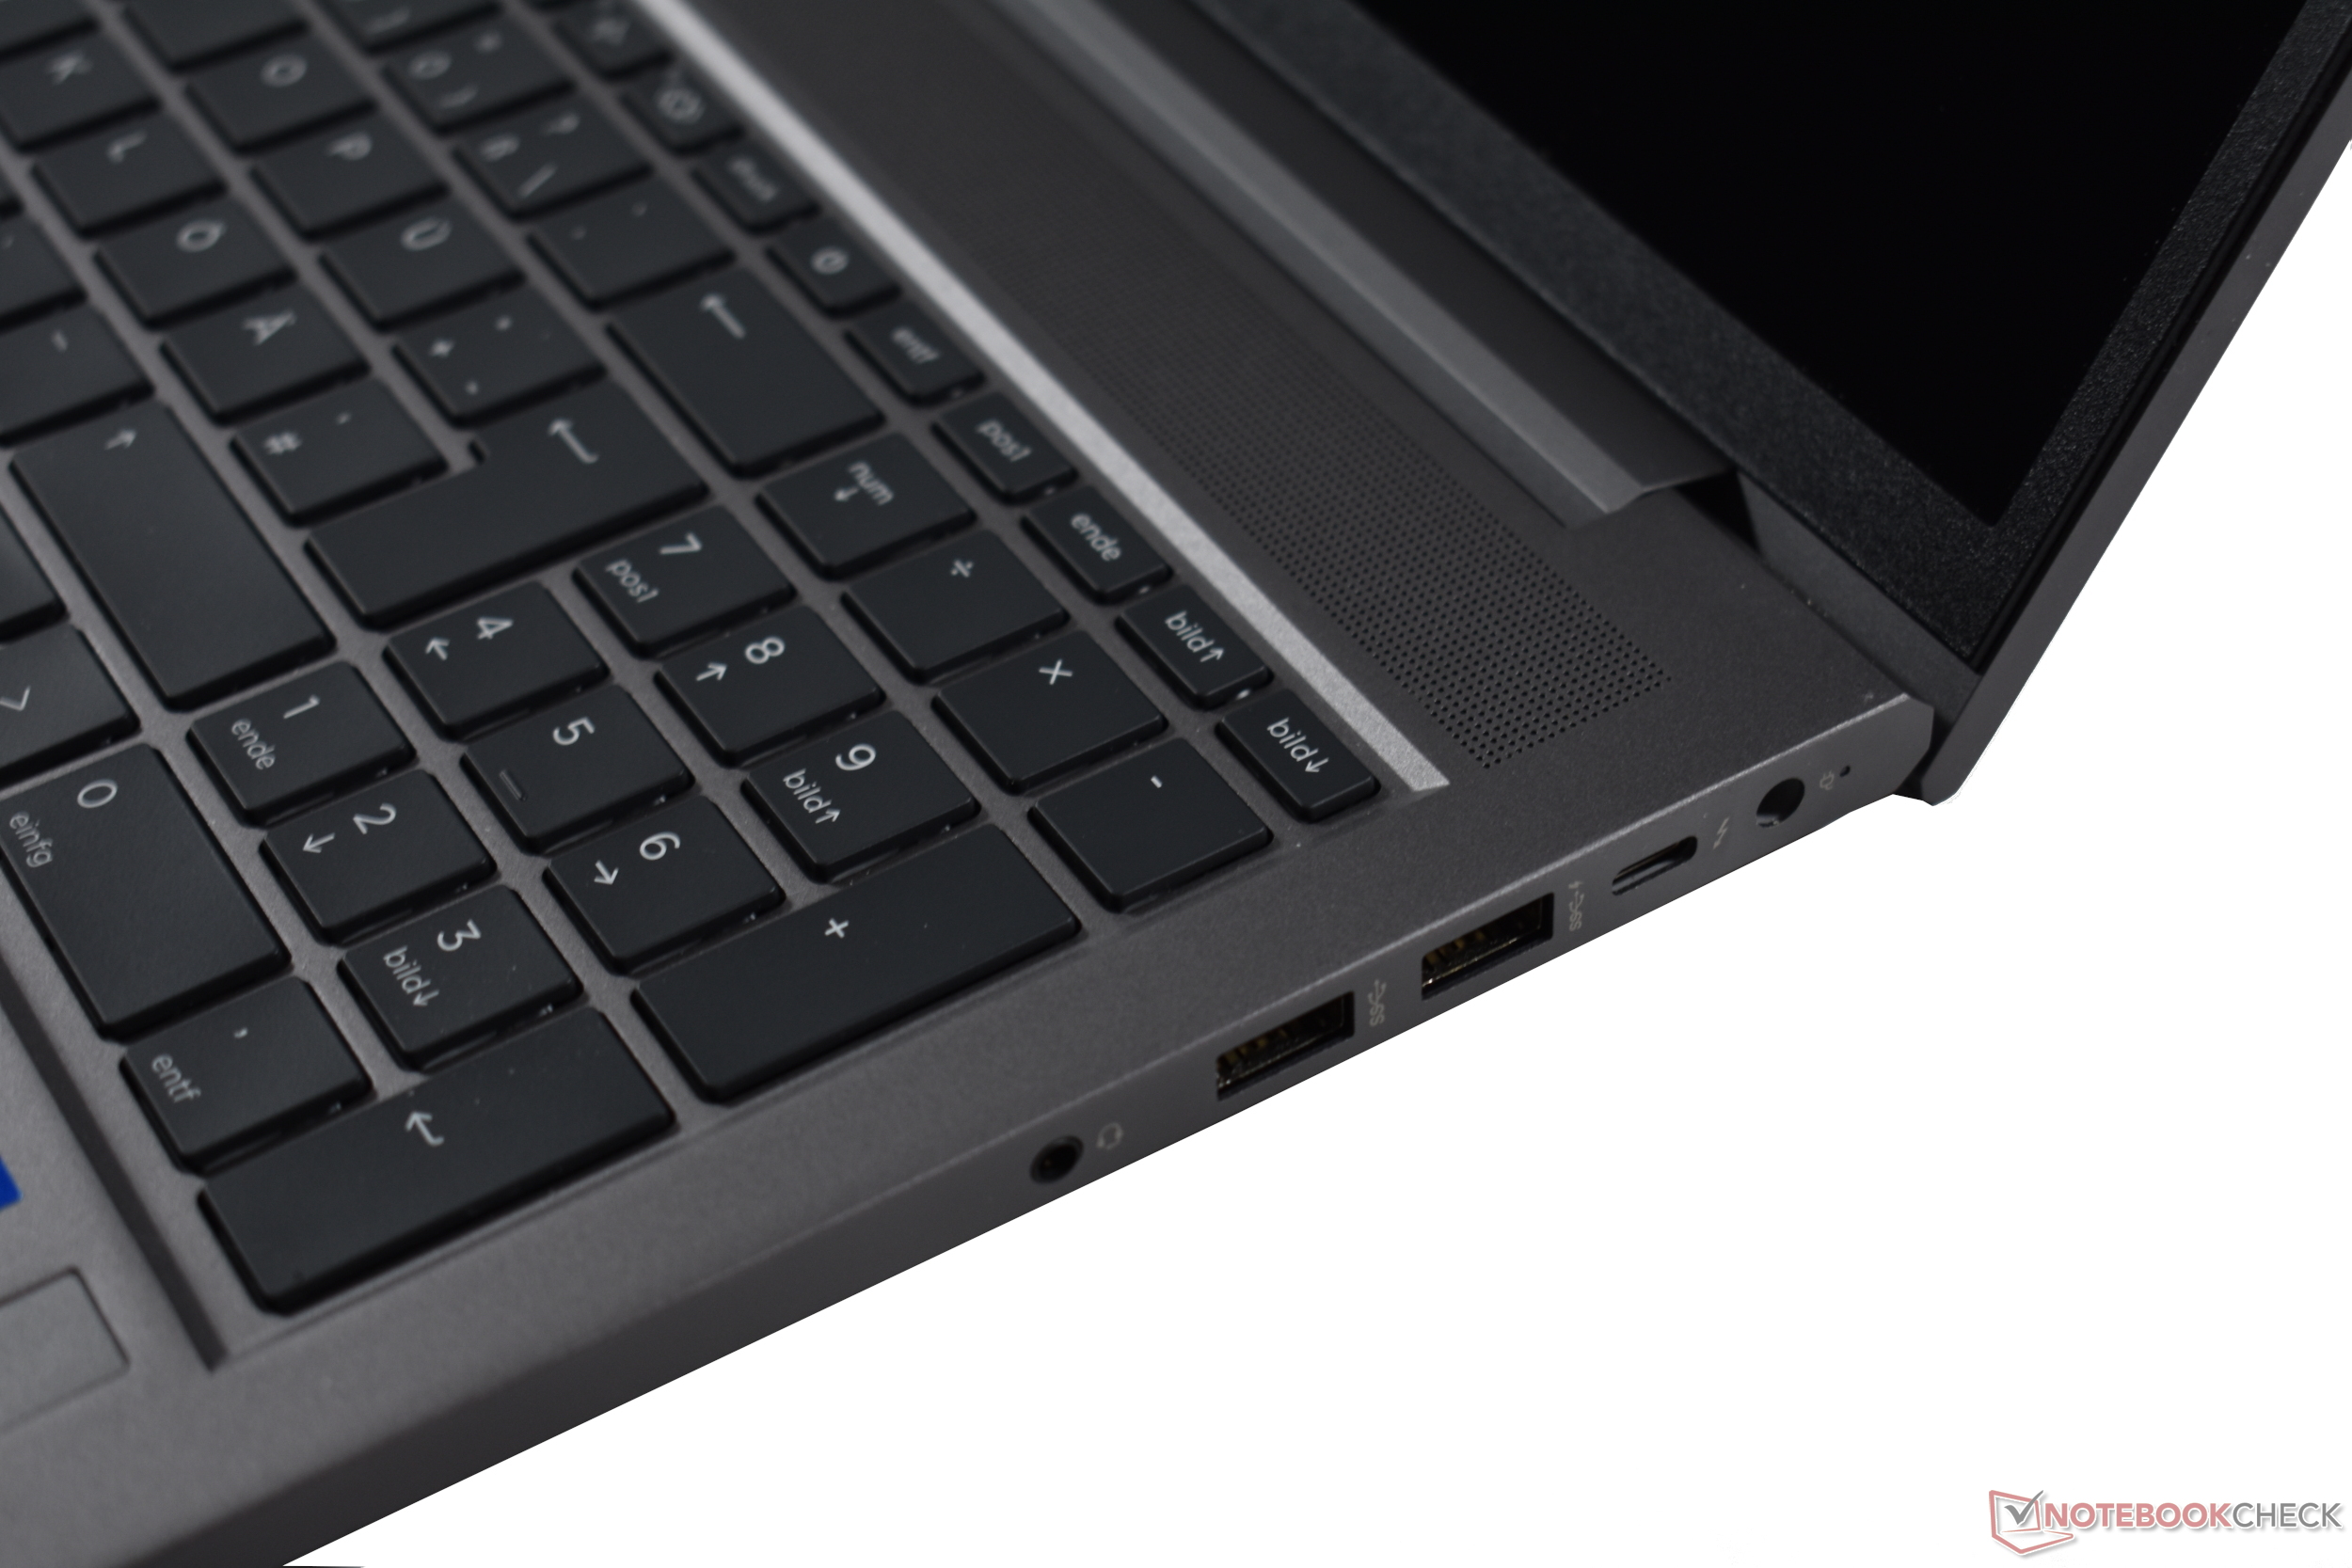
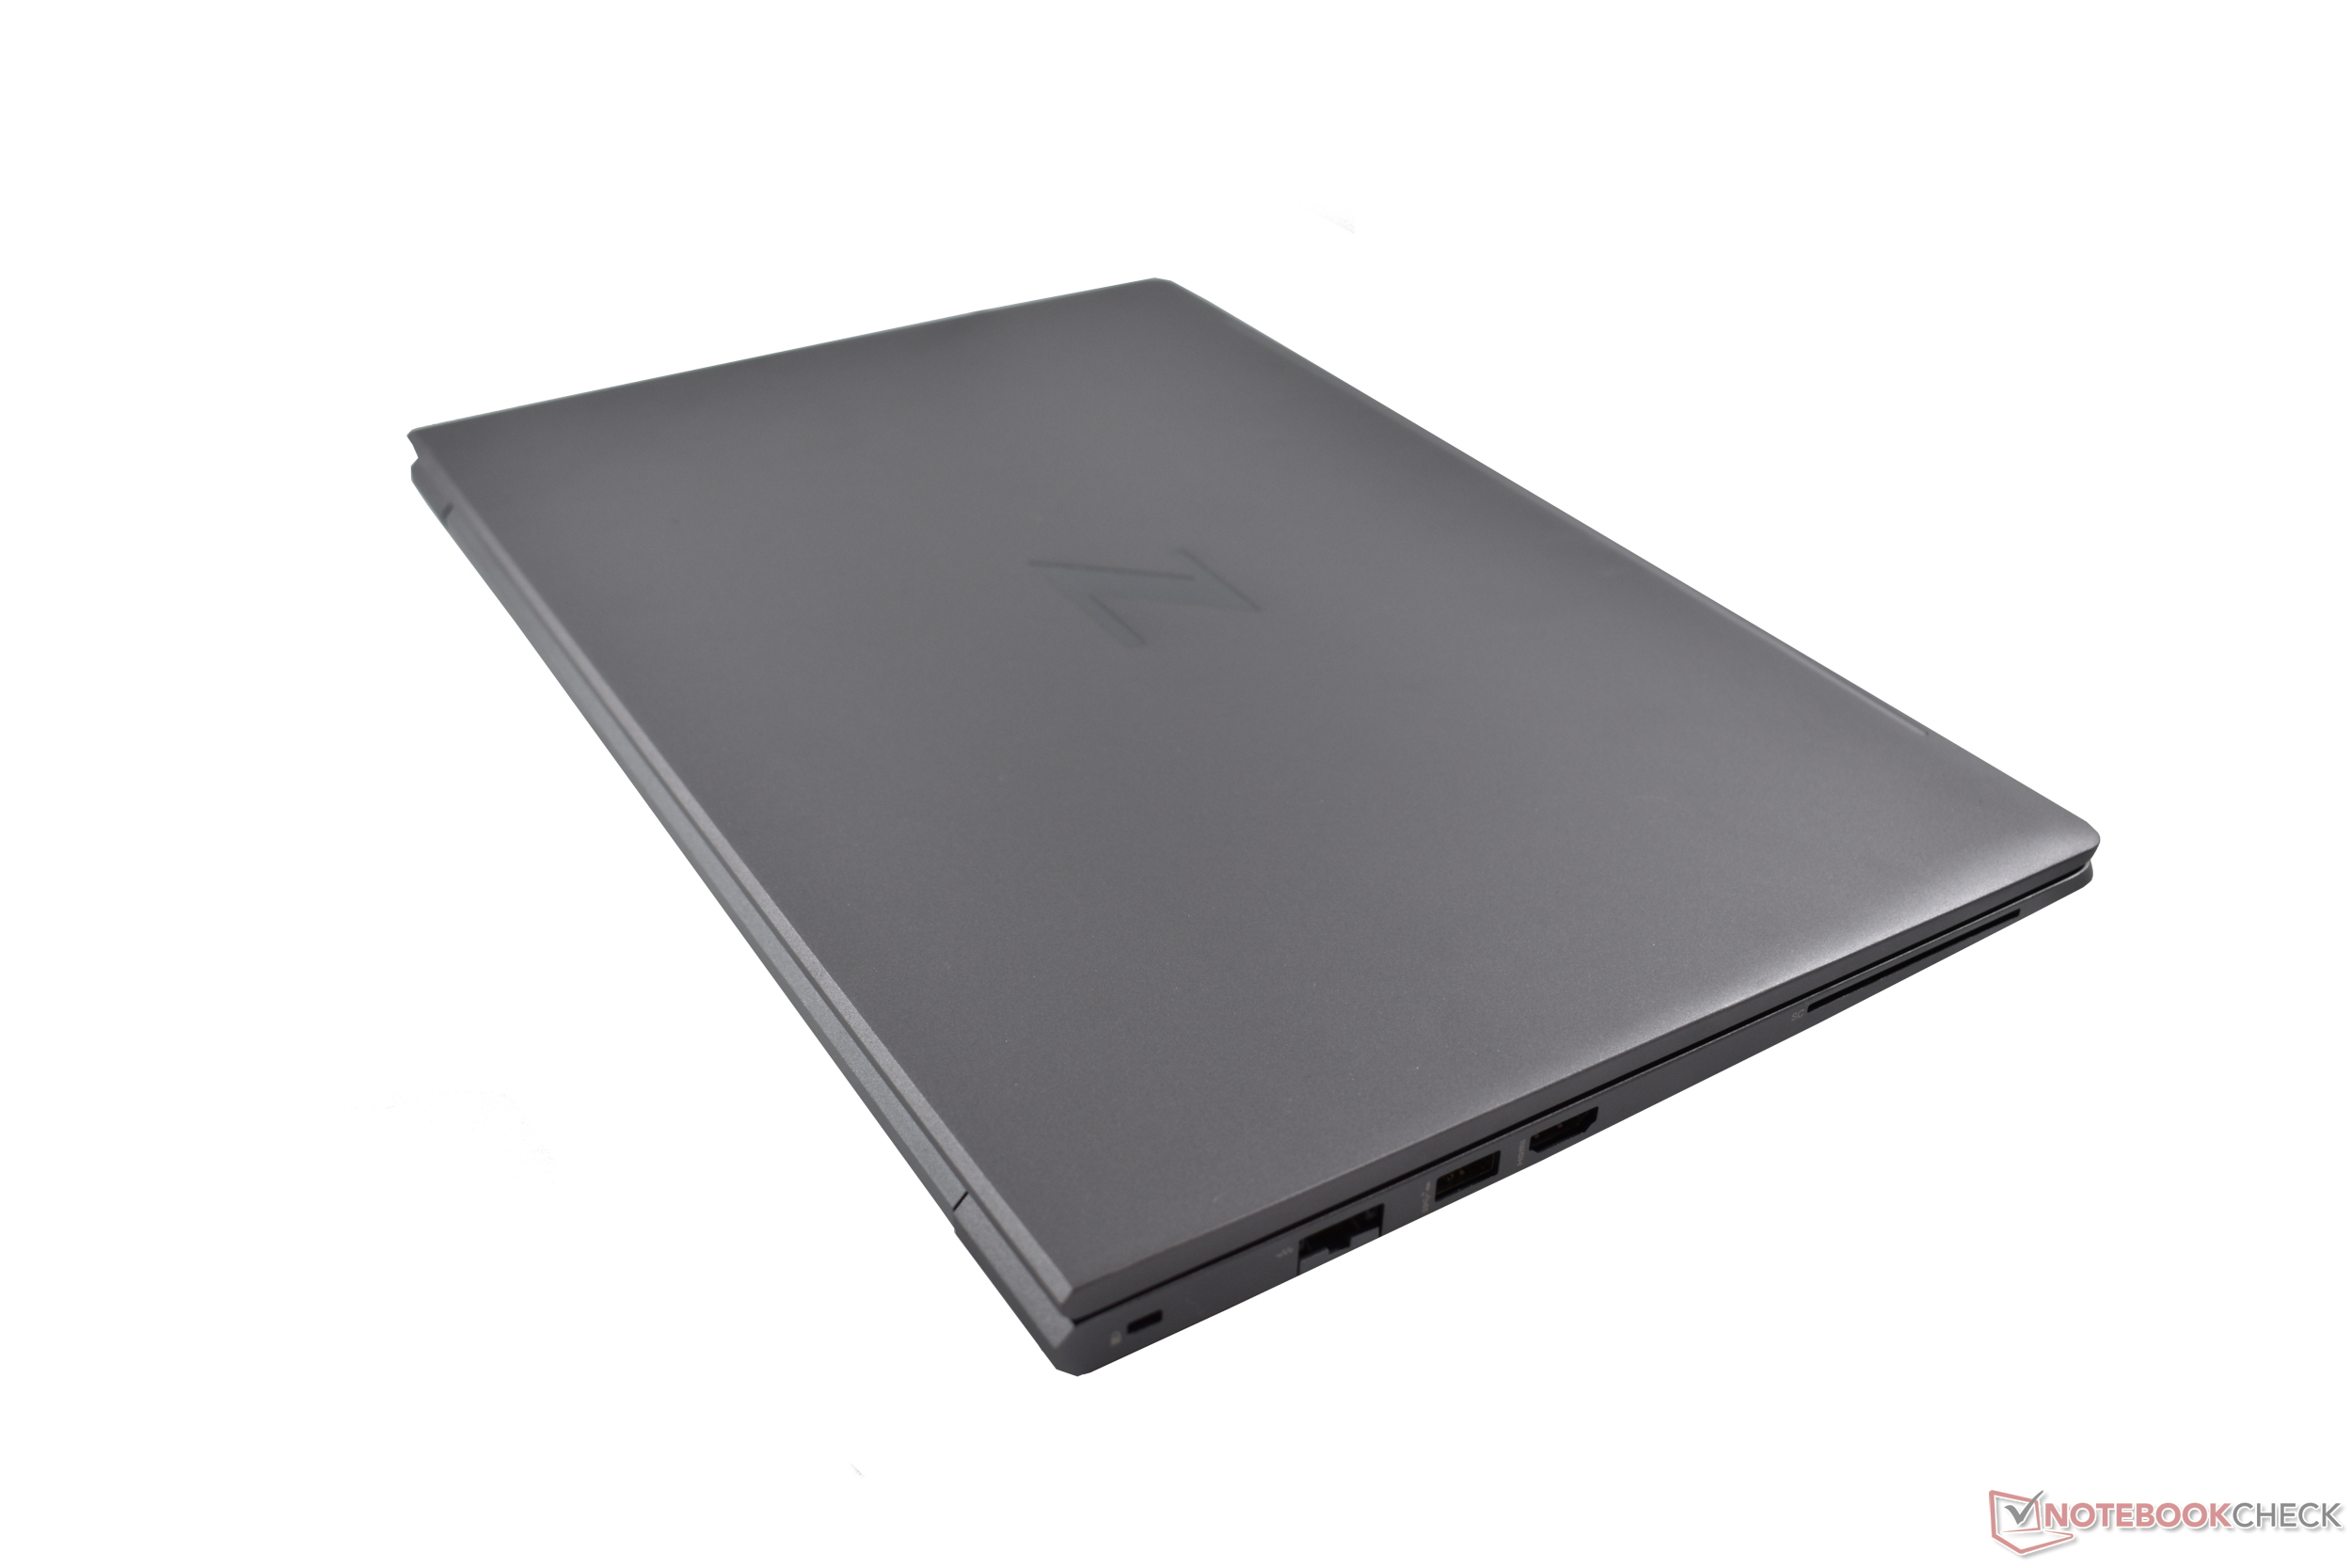
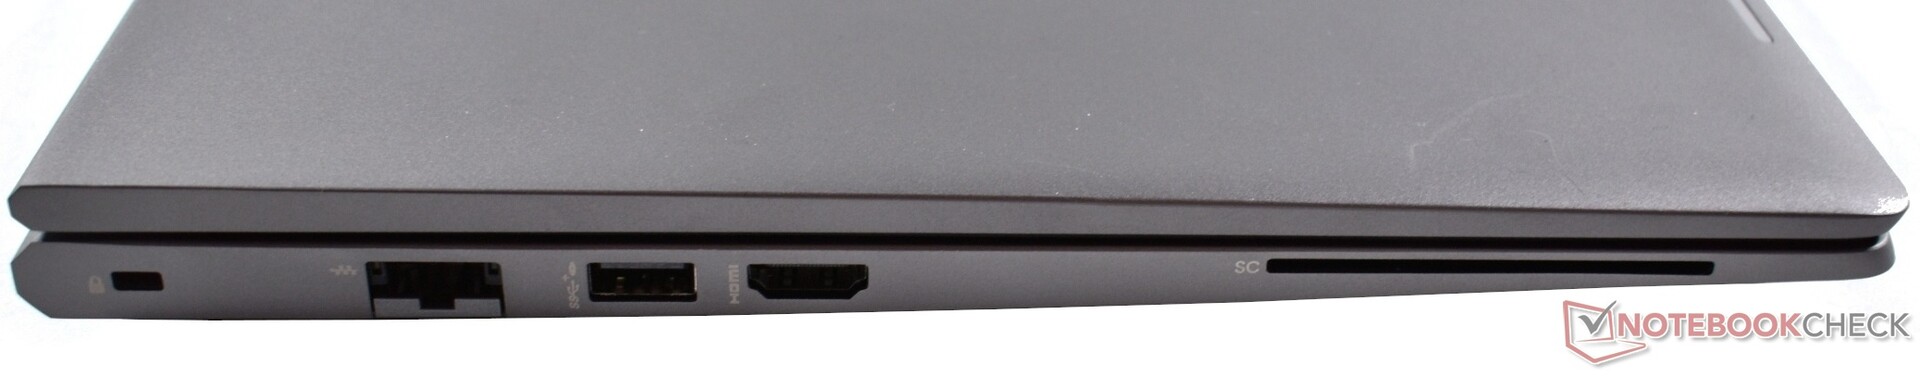
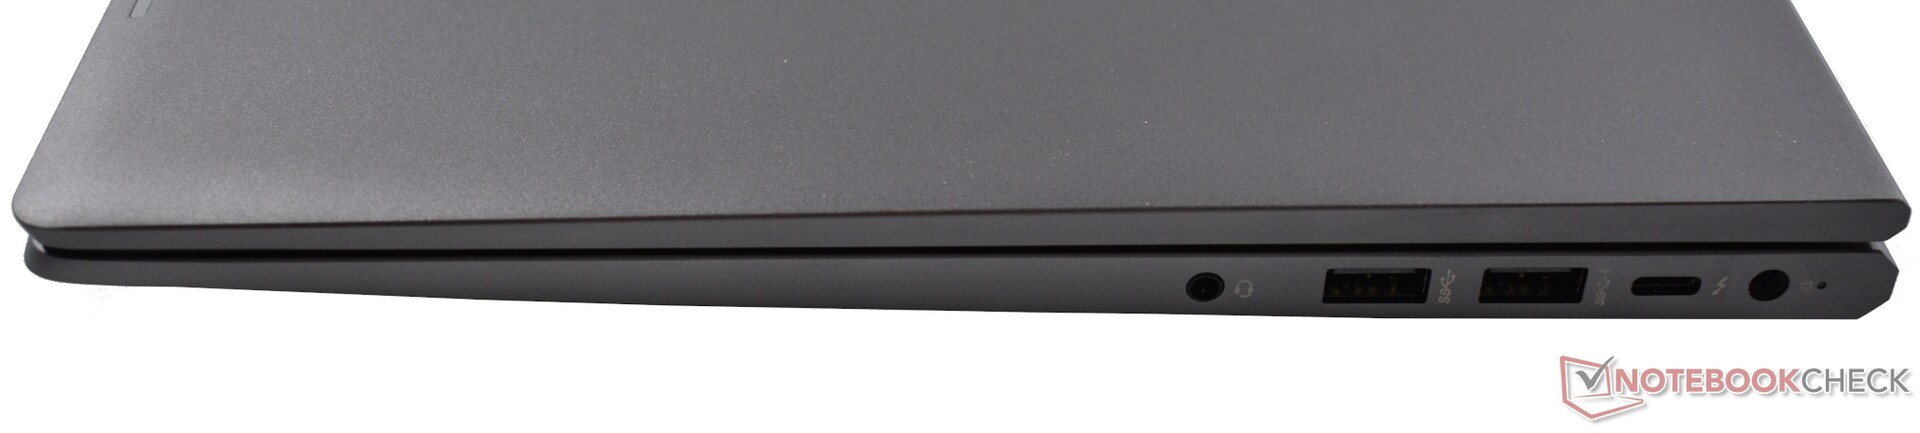
Incluso como estación de trabajo básica, el ZBook 15 G8 ofrece muchas conexiones importantes: Hay LAN Gbit (aunque no sea de 2.5 Gbps), hay un total de tres puertos USB-A 3.1 Gen1 (5 Gbps), mientras que sólo hay una única conexión Thunderbolt 4, y también ofrece DisplayPort 1.4 y Power Delivery en general. También apreciamos ver el HDMI en su versión 2.0.
Un lector de SmartCard es opcional, pero siempre hay un bloqueo Kensington (nano). Junto con el puerto de carga propietario, el paquete completo se completa con un puerto de audio combinado. Sin embargo, echamos de menos una ranura para tarjetas SD.
Comunicación
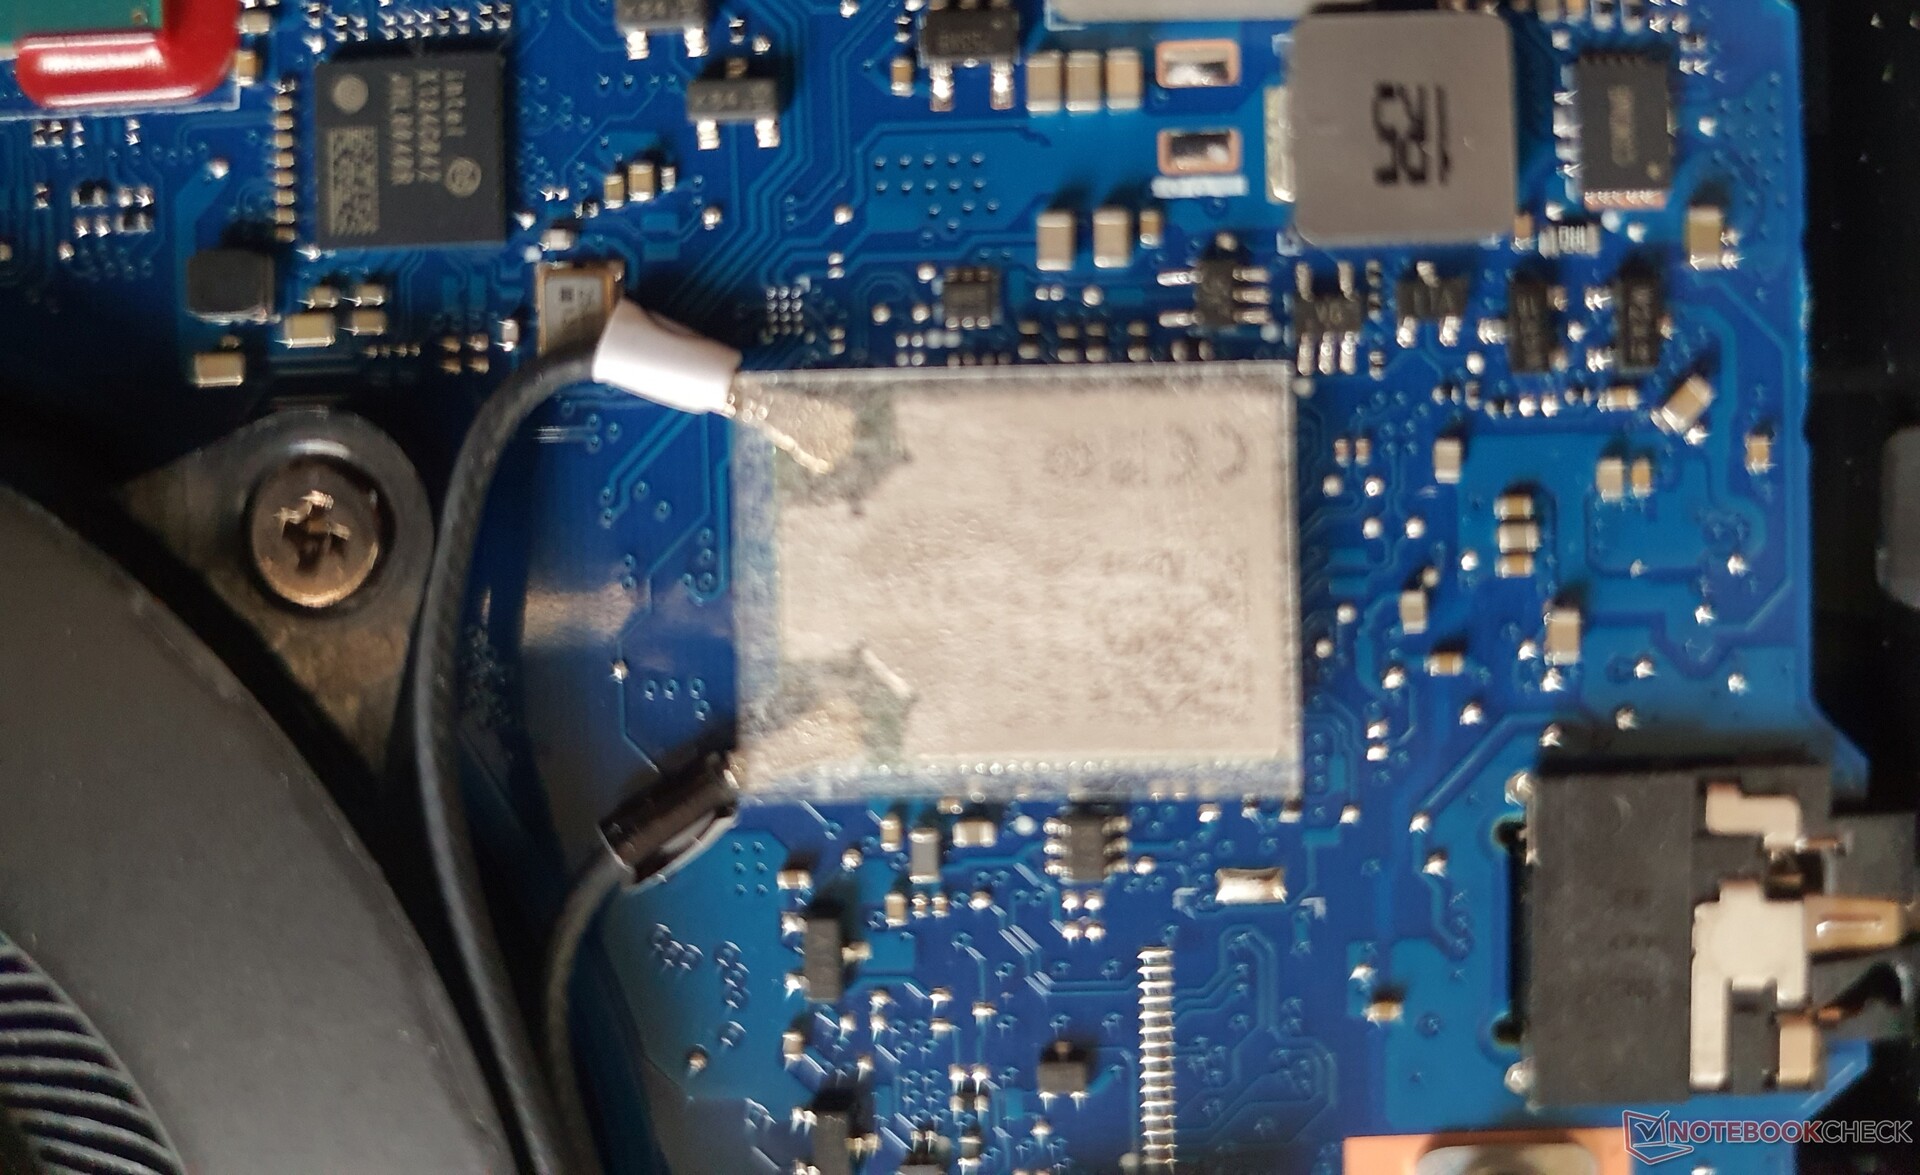
Además de la LAN de Gbit, el Wi-Fi 6 AX201 + Bluetooth 5.2 de Intel también está disponible en forma soldada. ~1,5 Gbps al enviar y 1,33 Gbps al recibir corresponden a la alta velocidad Wi-Fi de los competidores. Aunque no hay ranura WWAN, NFC está disponible opcionalmente.
Cámara web

La cámara web de 720p ofrece un SureShutter (tapa), micrófonos de doble matriz y un infrarrojo opcional para Windows Hello. Sin embargo, la calidad de imagen es ruidosa.


Seguridad
HP no se anda con medias tintas en cuanto a seguridad. En el lado de las opciones de hardware, hay un lector de SmartCard y una cámara IR para Windows Hello. Además, hay un mecanismo para un bloqueo de seguridad, un lector de huellas dactilares, TPM 2.0, y un obturador de cámara.
Por el lado del software, hay más seguridad gracias al HP System Safeguard contra ataques de firmware o errores repentinos de firmware, el HP Client Security Manager, HP Sure Click & Sure Sense contra el phishing y el malware, y una BIOS de "autocuración".
Accesorios
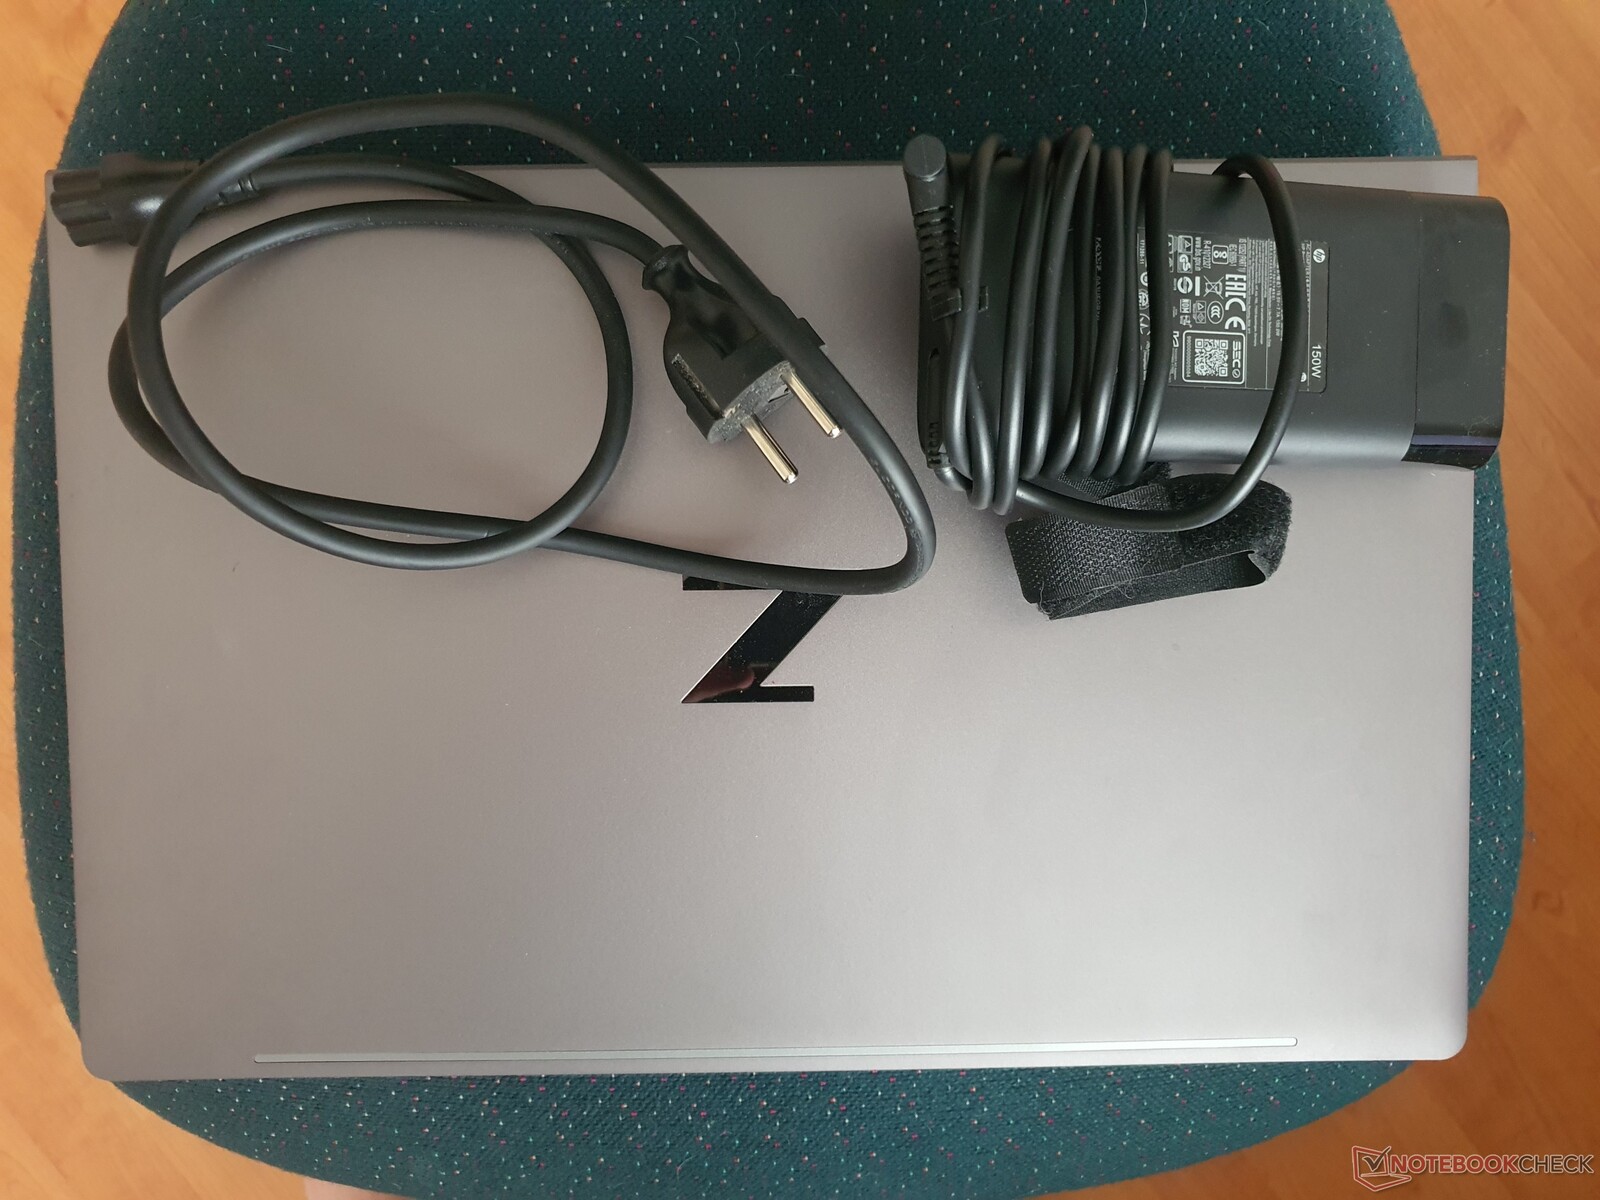
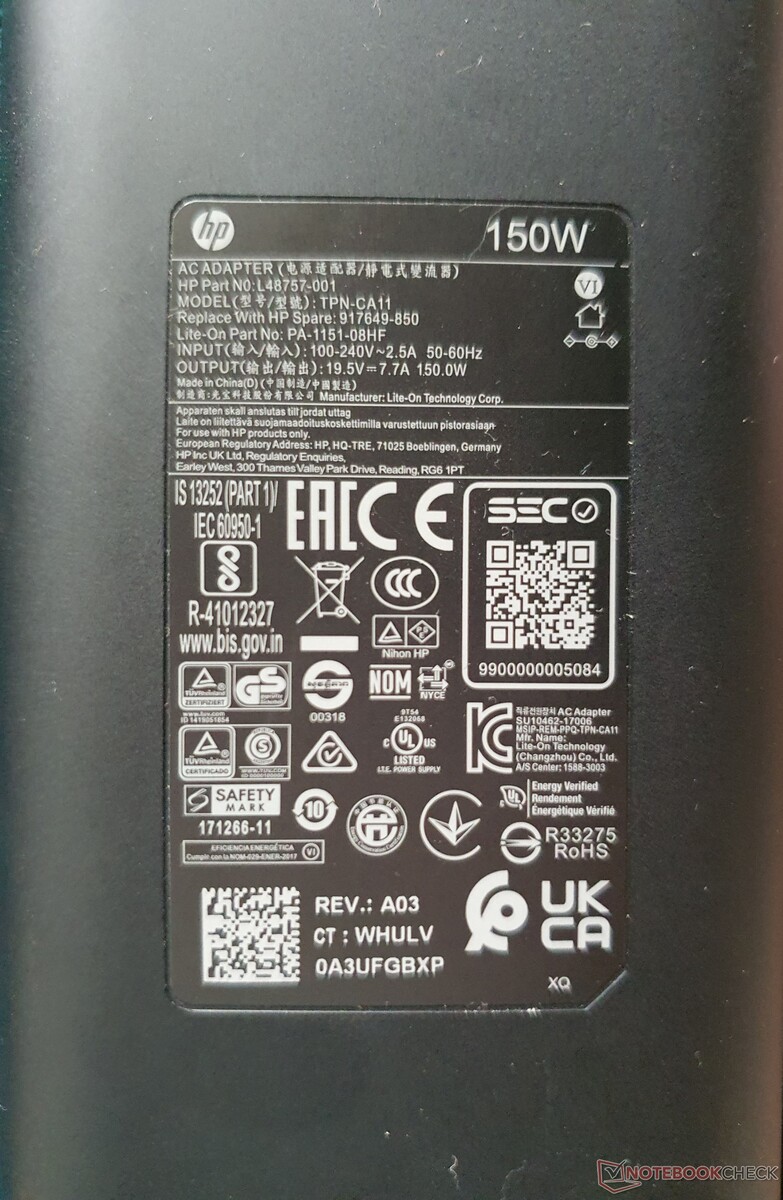
Se incluye una fuente de alimentación de 150 vatios (120 vatios en las configuraciones sin dGPU). El embalaje no tiene plástico (es decir, sólo el 10%), la mayor parte es de cartón (45% reciclado) y papel de celulosa. Opcionalmente, HP ofrece varios docks USB-C/Thunderbolt, pero sólo el HP TB Dock G2 con cable combinado (unos 200 euros, ~204 dólares) incluye Power Delivery.
Mantenimiento
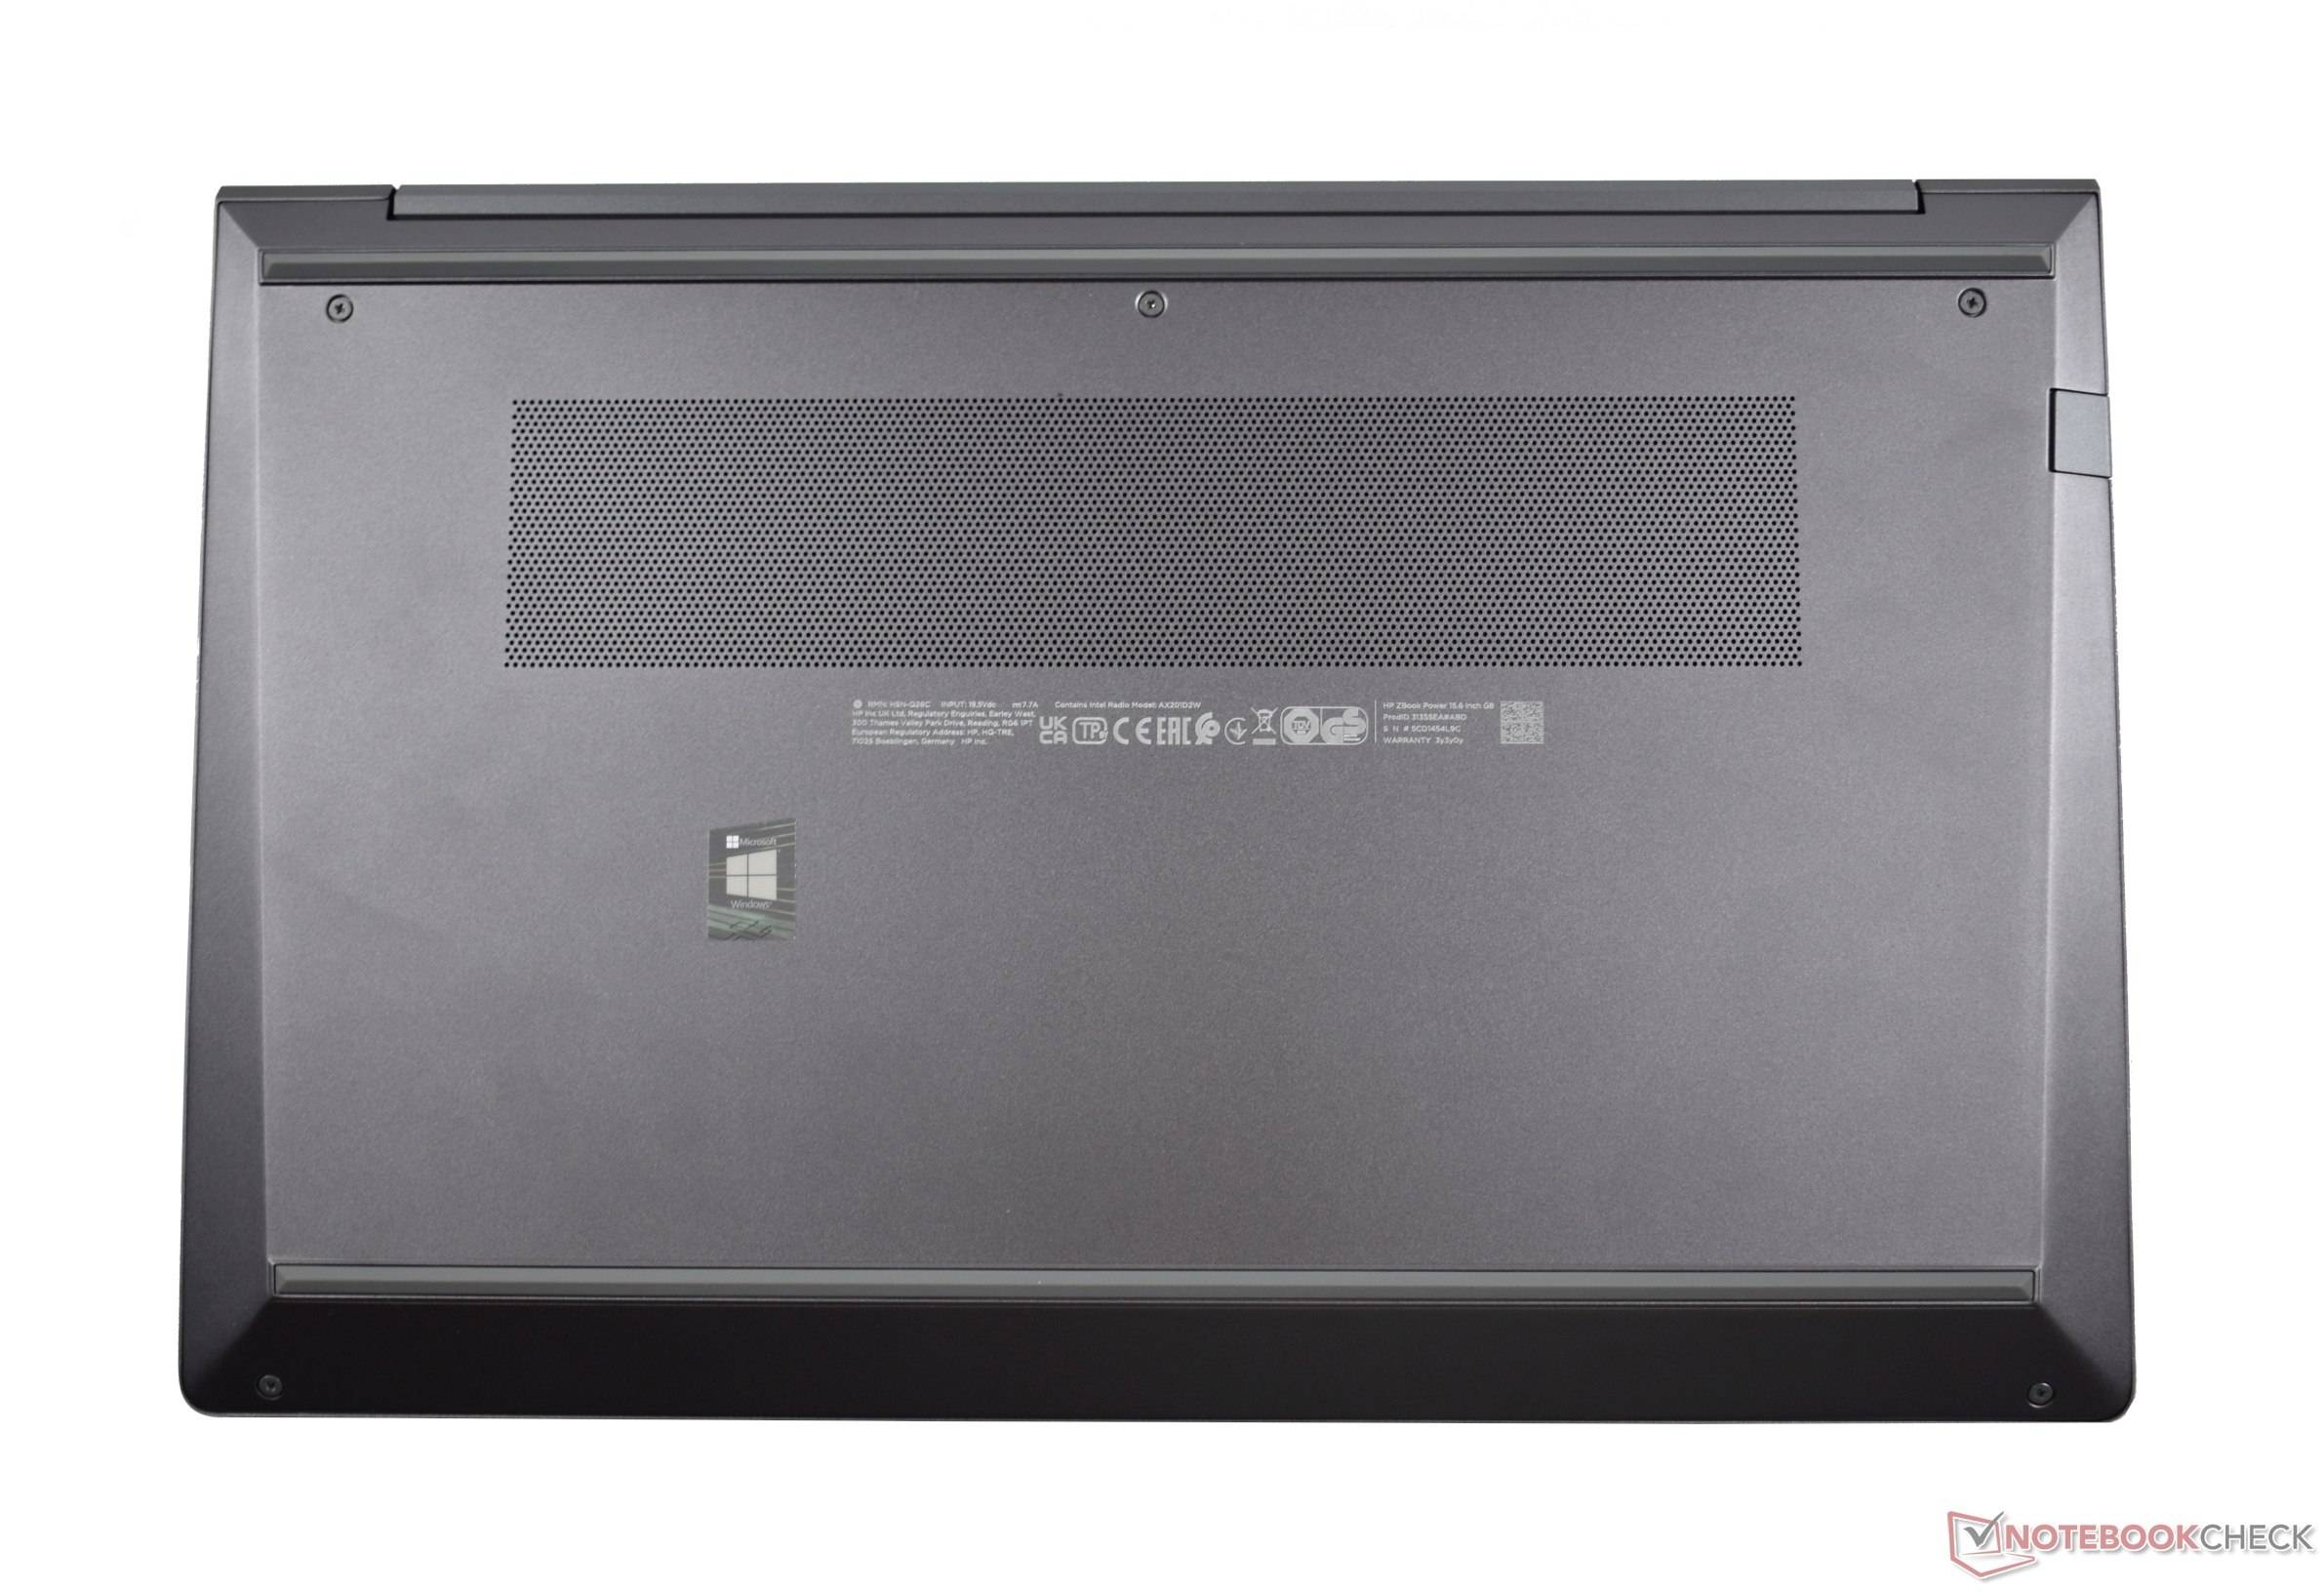
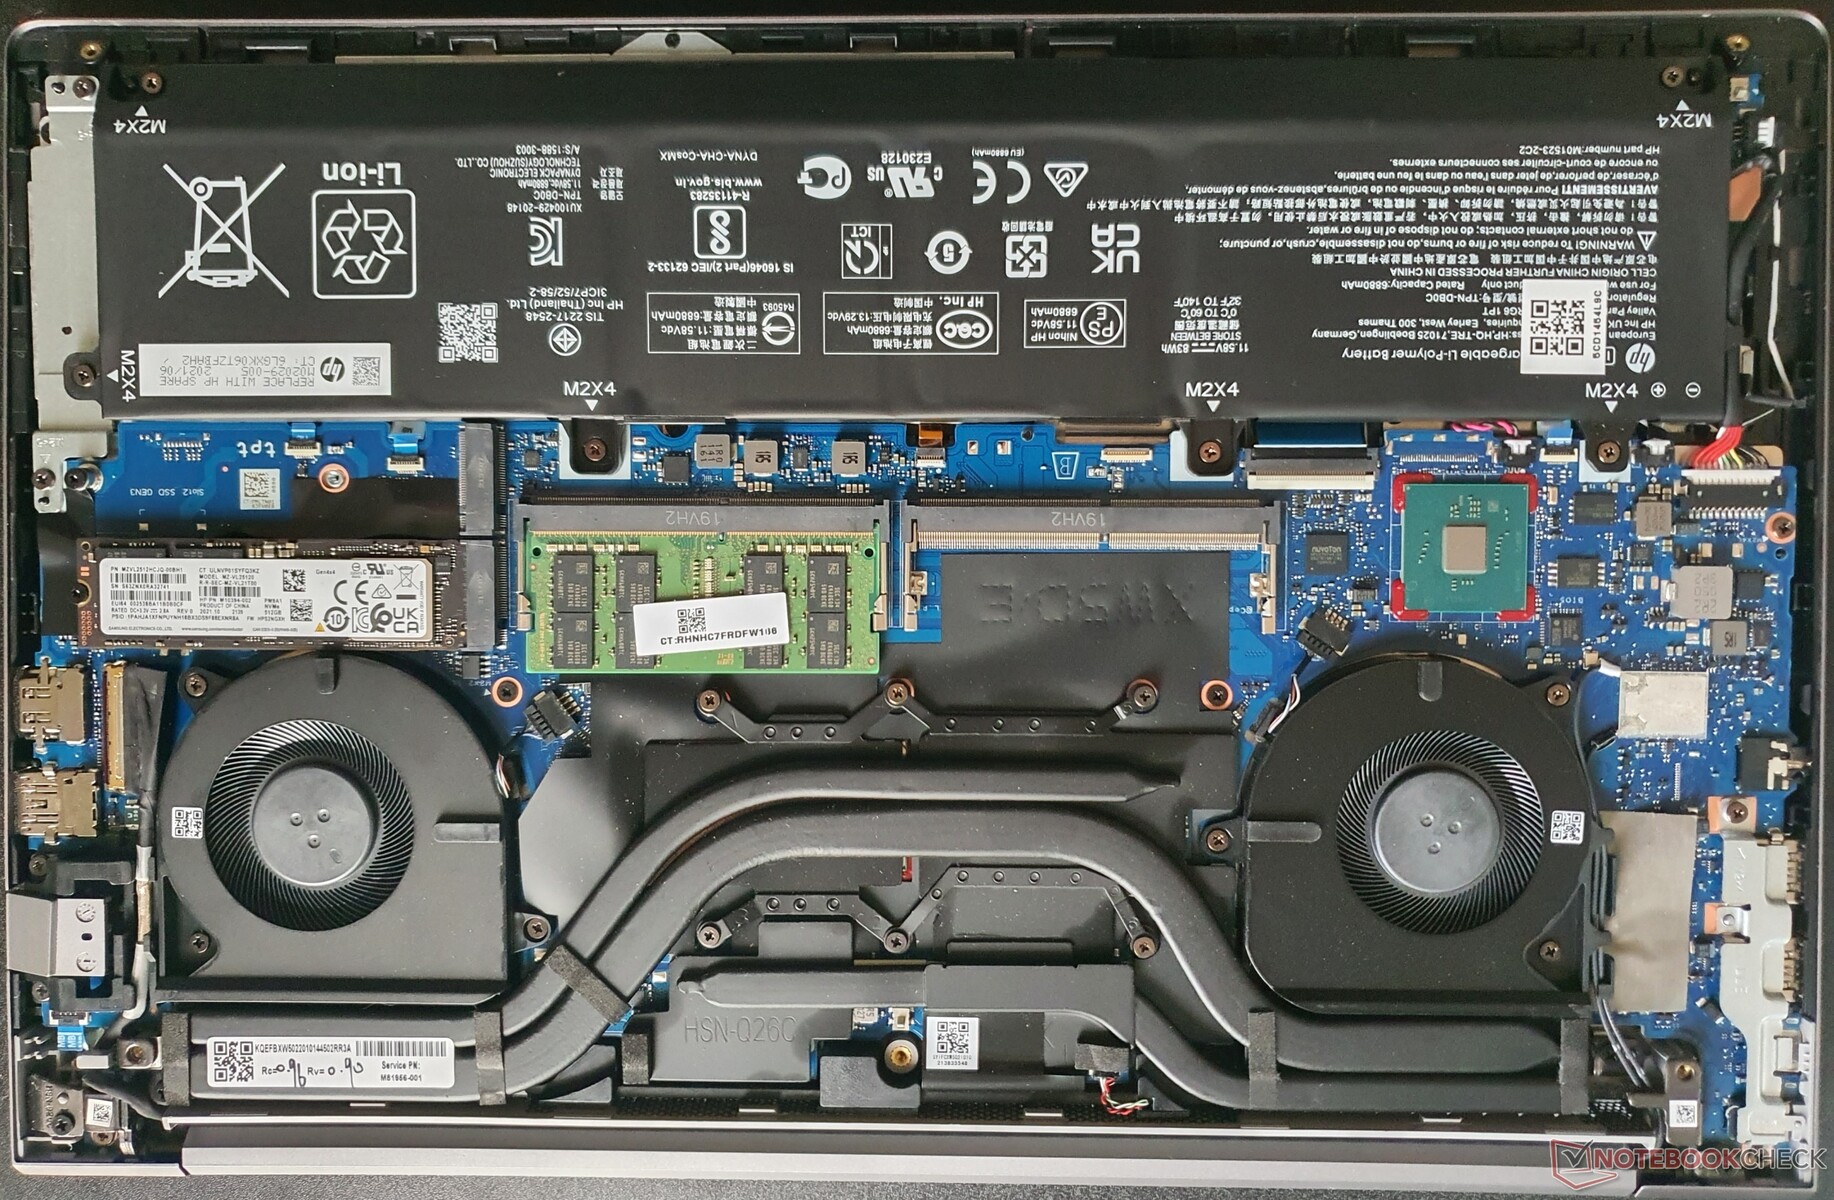
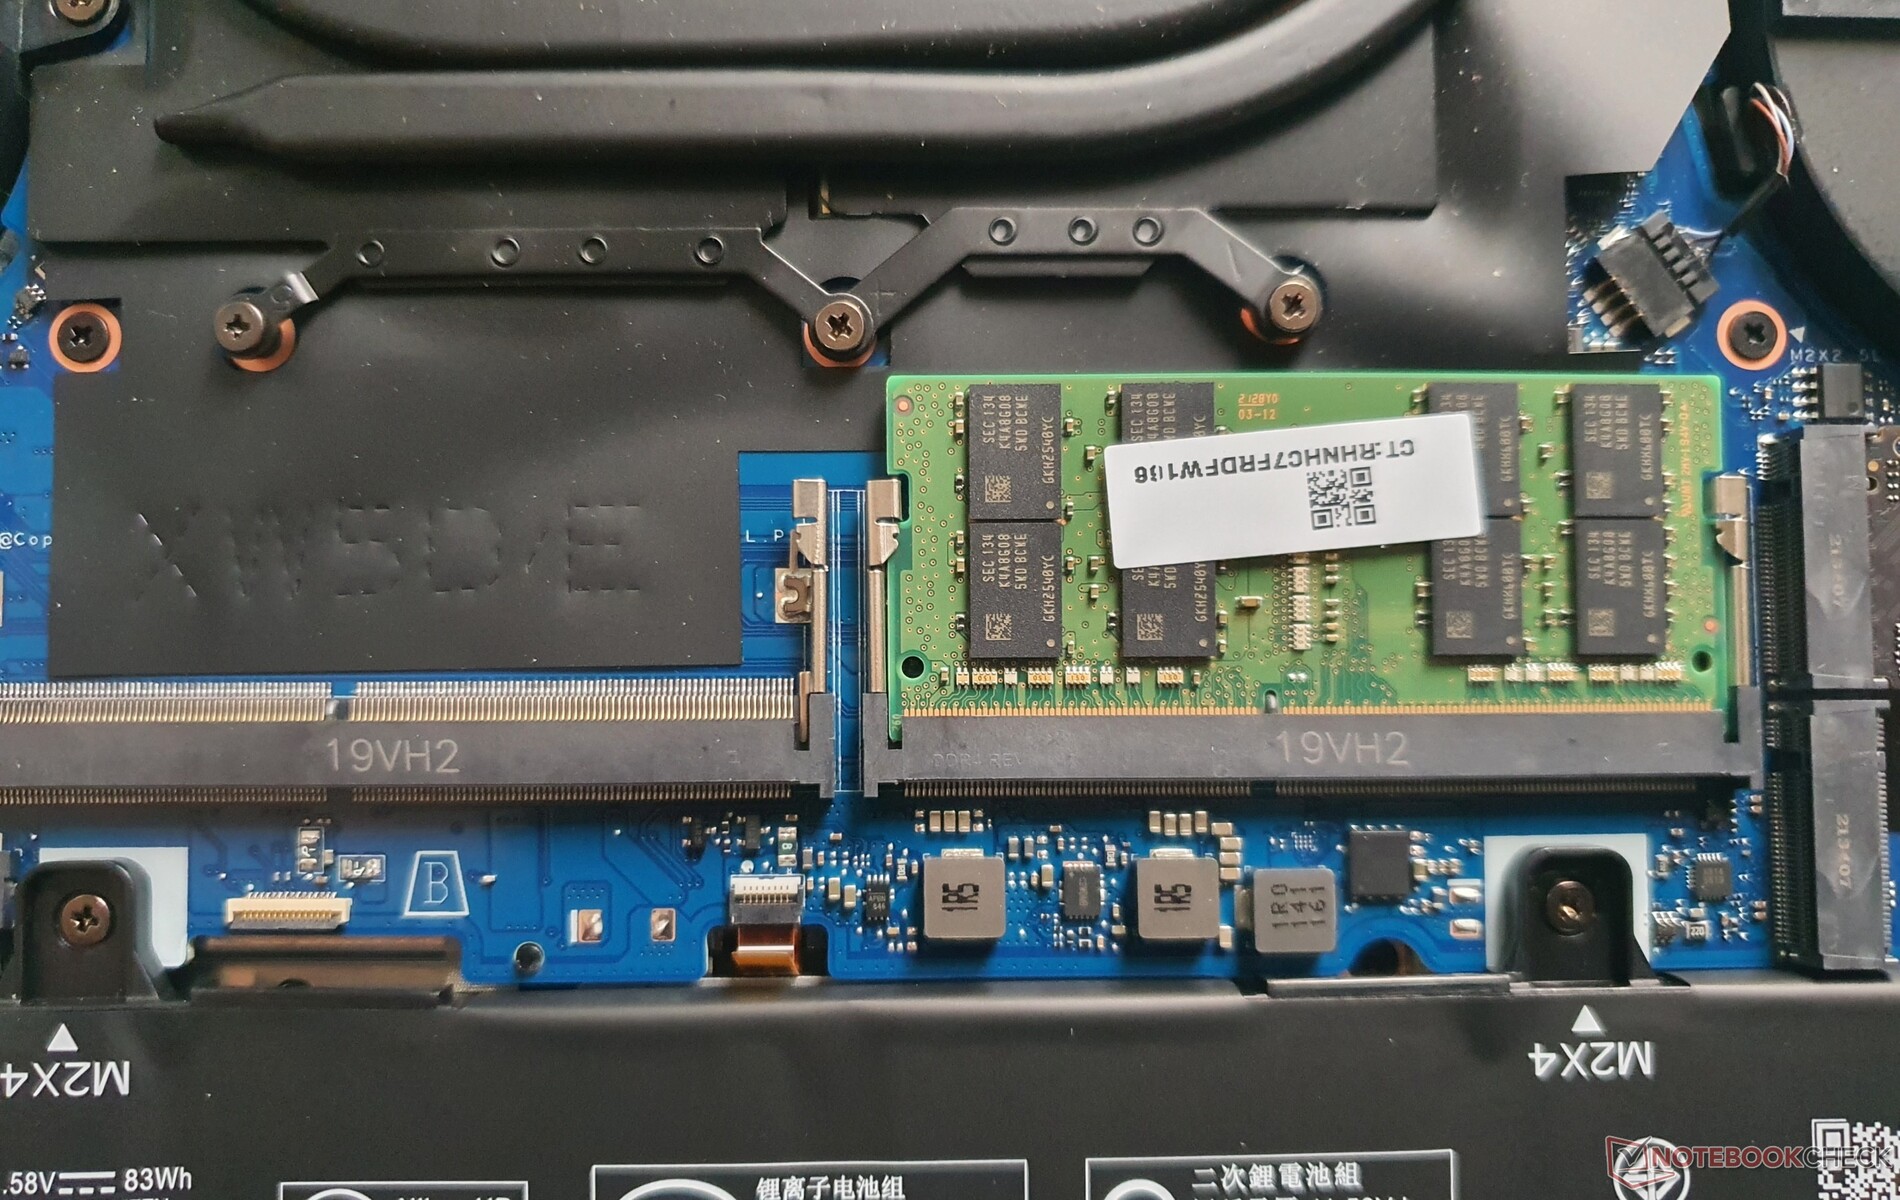
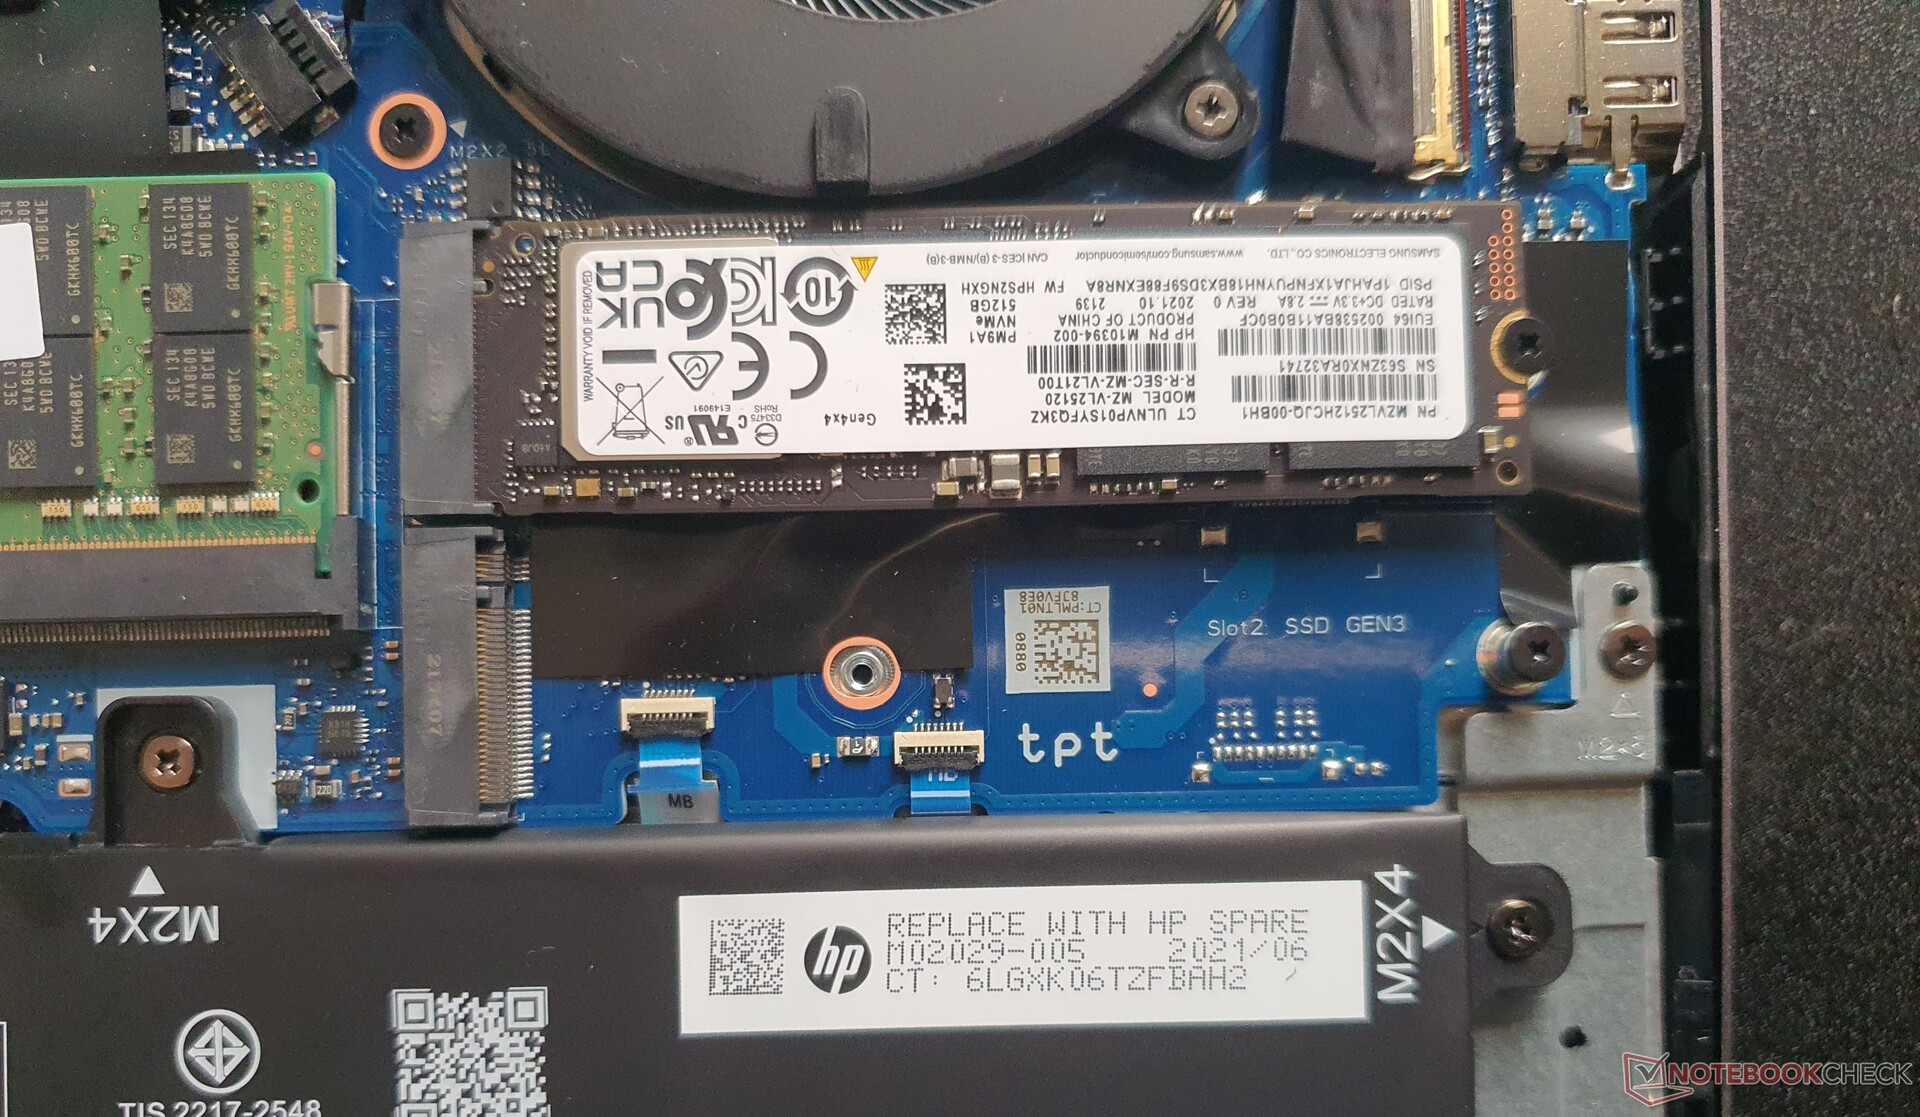
Después de quitar sólo cinco tornillos Philips, el fondo de la carcasa se puede quitar fácilmente usando una herramienta de palanca de plástico. De este modo, se obtiene acceso a 2x DIMMs SO y 2x ranuras M.2-2280, mientras que la batería también es reemplazable y se puede mantener el sistema de refrigeración atornillado. El módulo WLAN está soldado, y el teclado también es fijo. No hay WWAN.
Garantía
En el área de lengua alemana, HP ofrece una garantía estándar de 3 años, que puede ampliarse hasta 5 años. Incluye servicio de recogida y devolución, y el servicio in situ tiene un coste adicional. Esto se corresponde con las políticas de HP para los portátiles de gama alta para empresas.
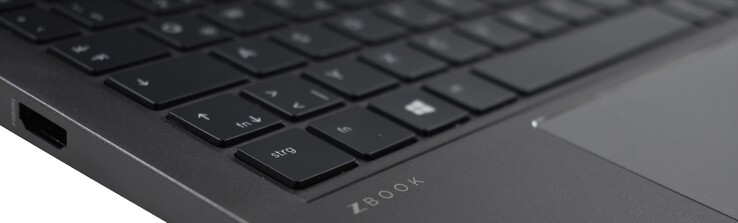
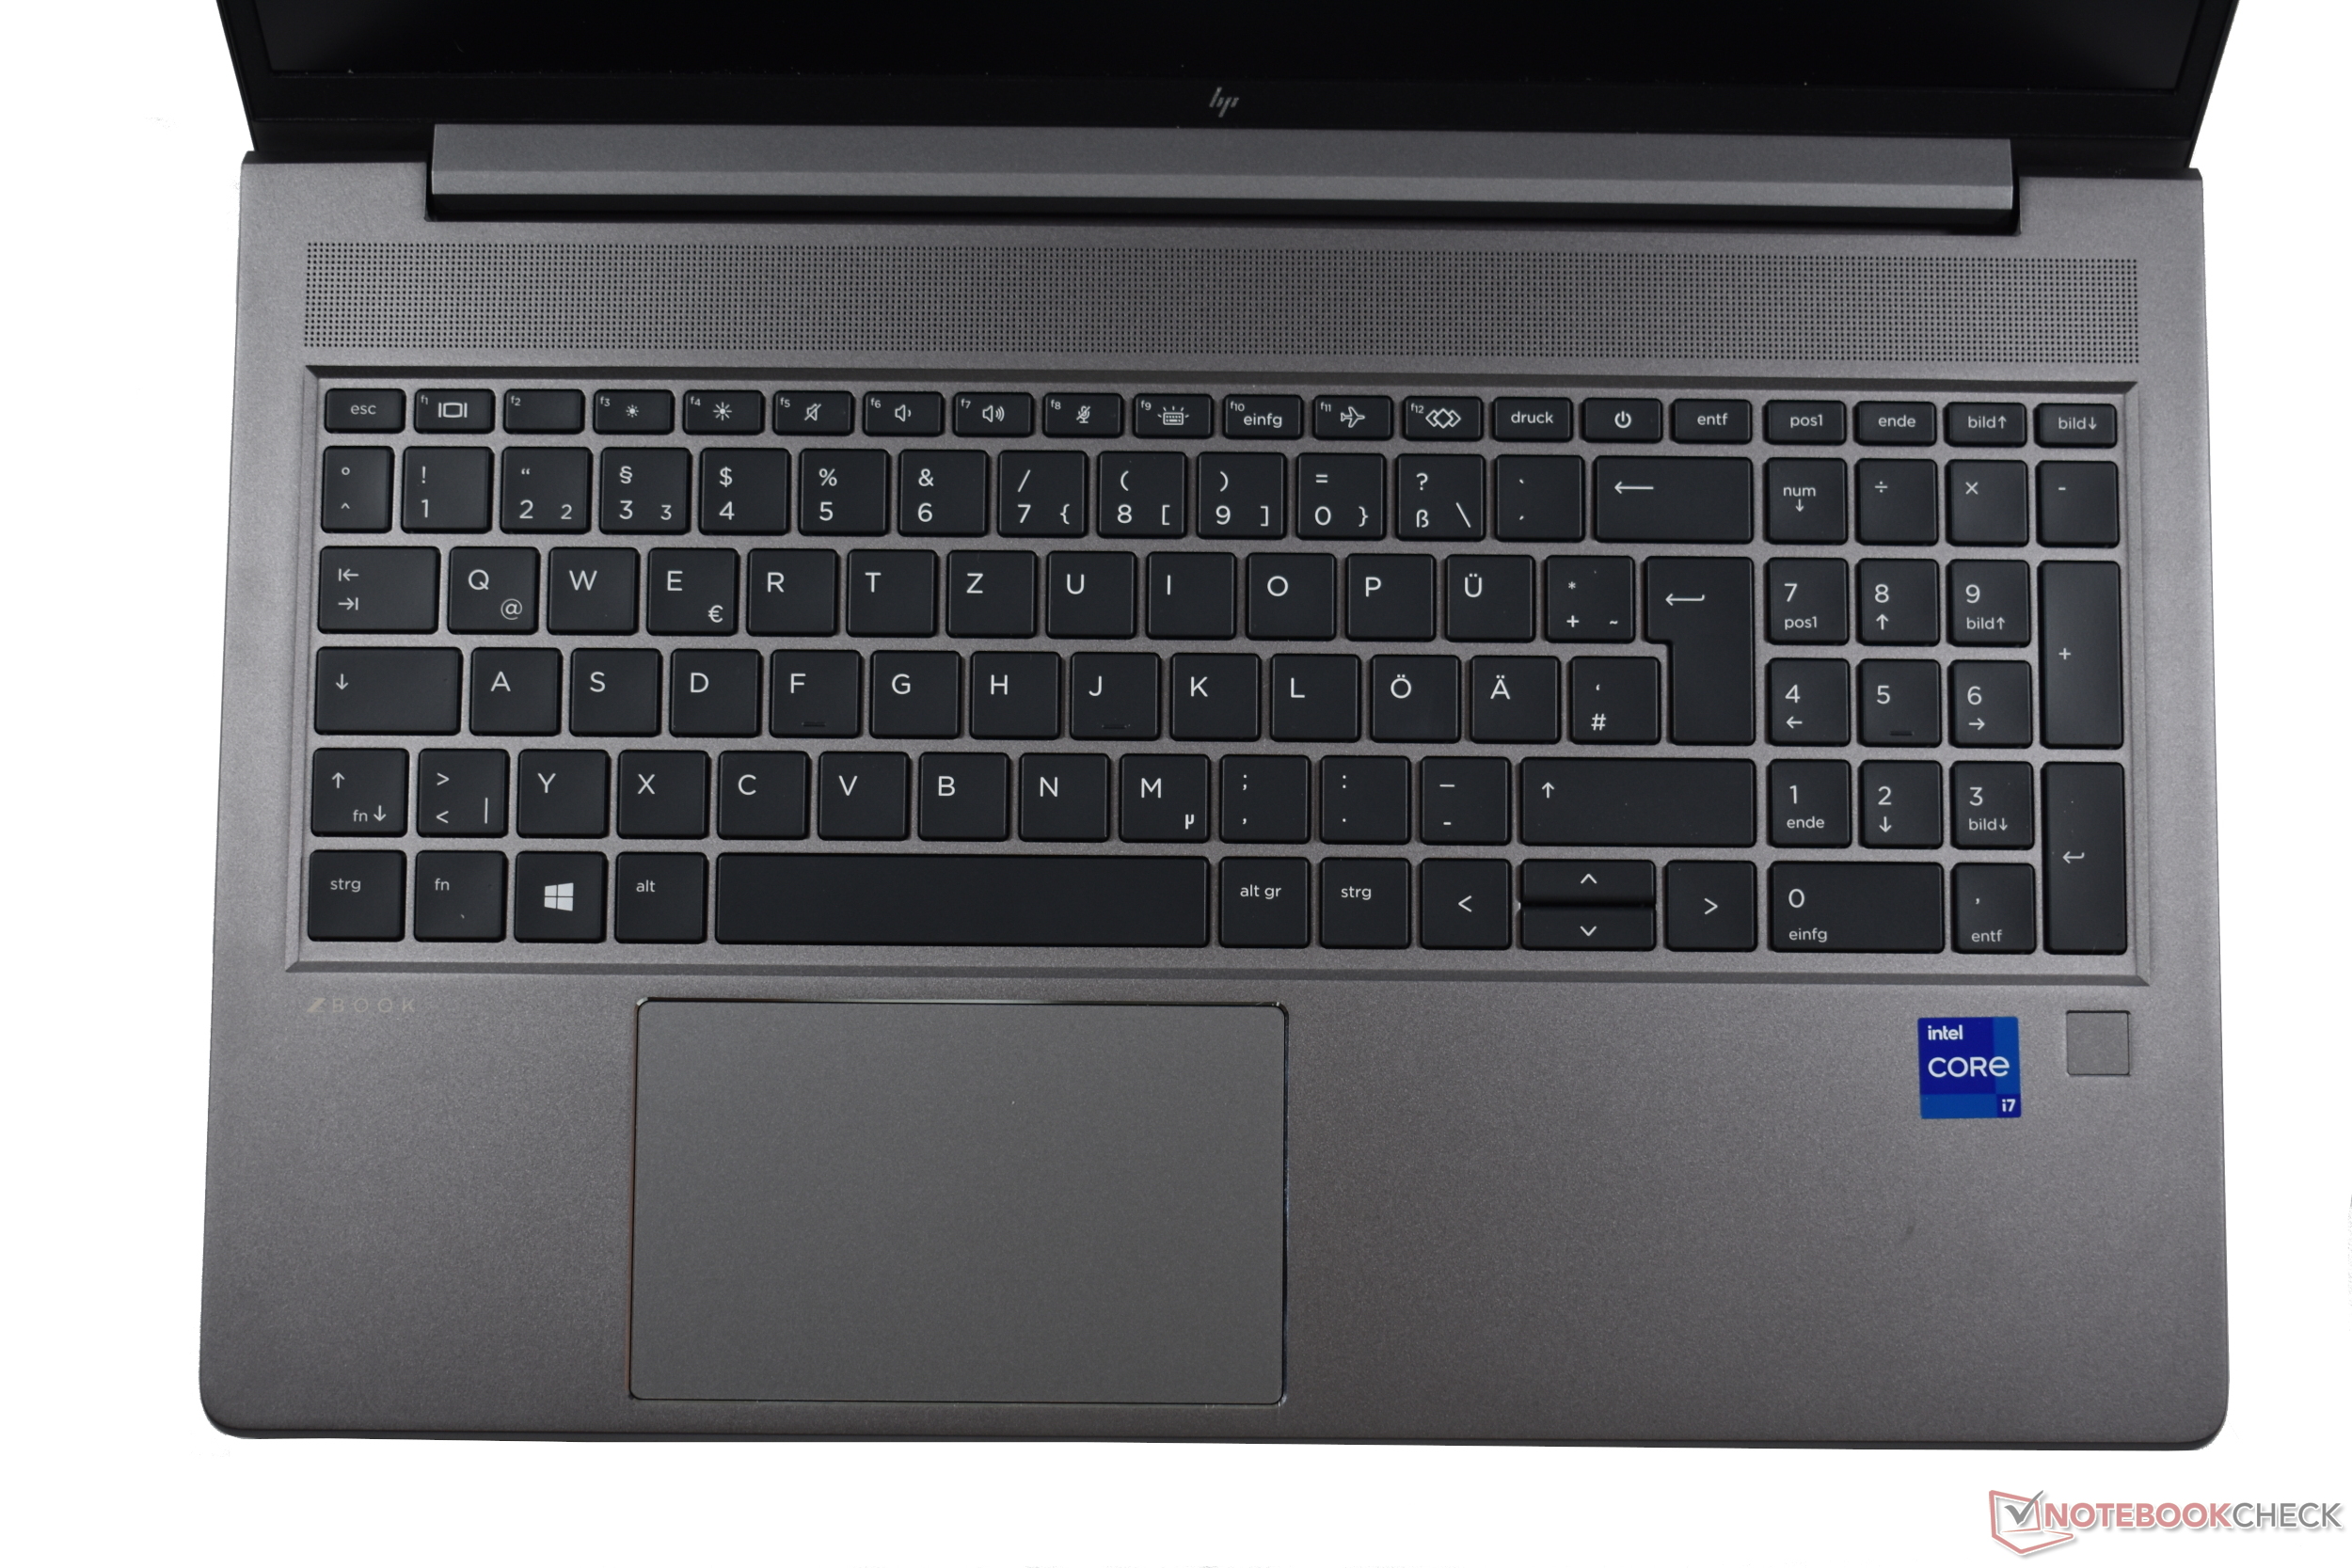
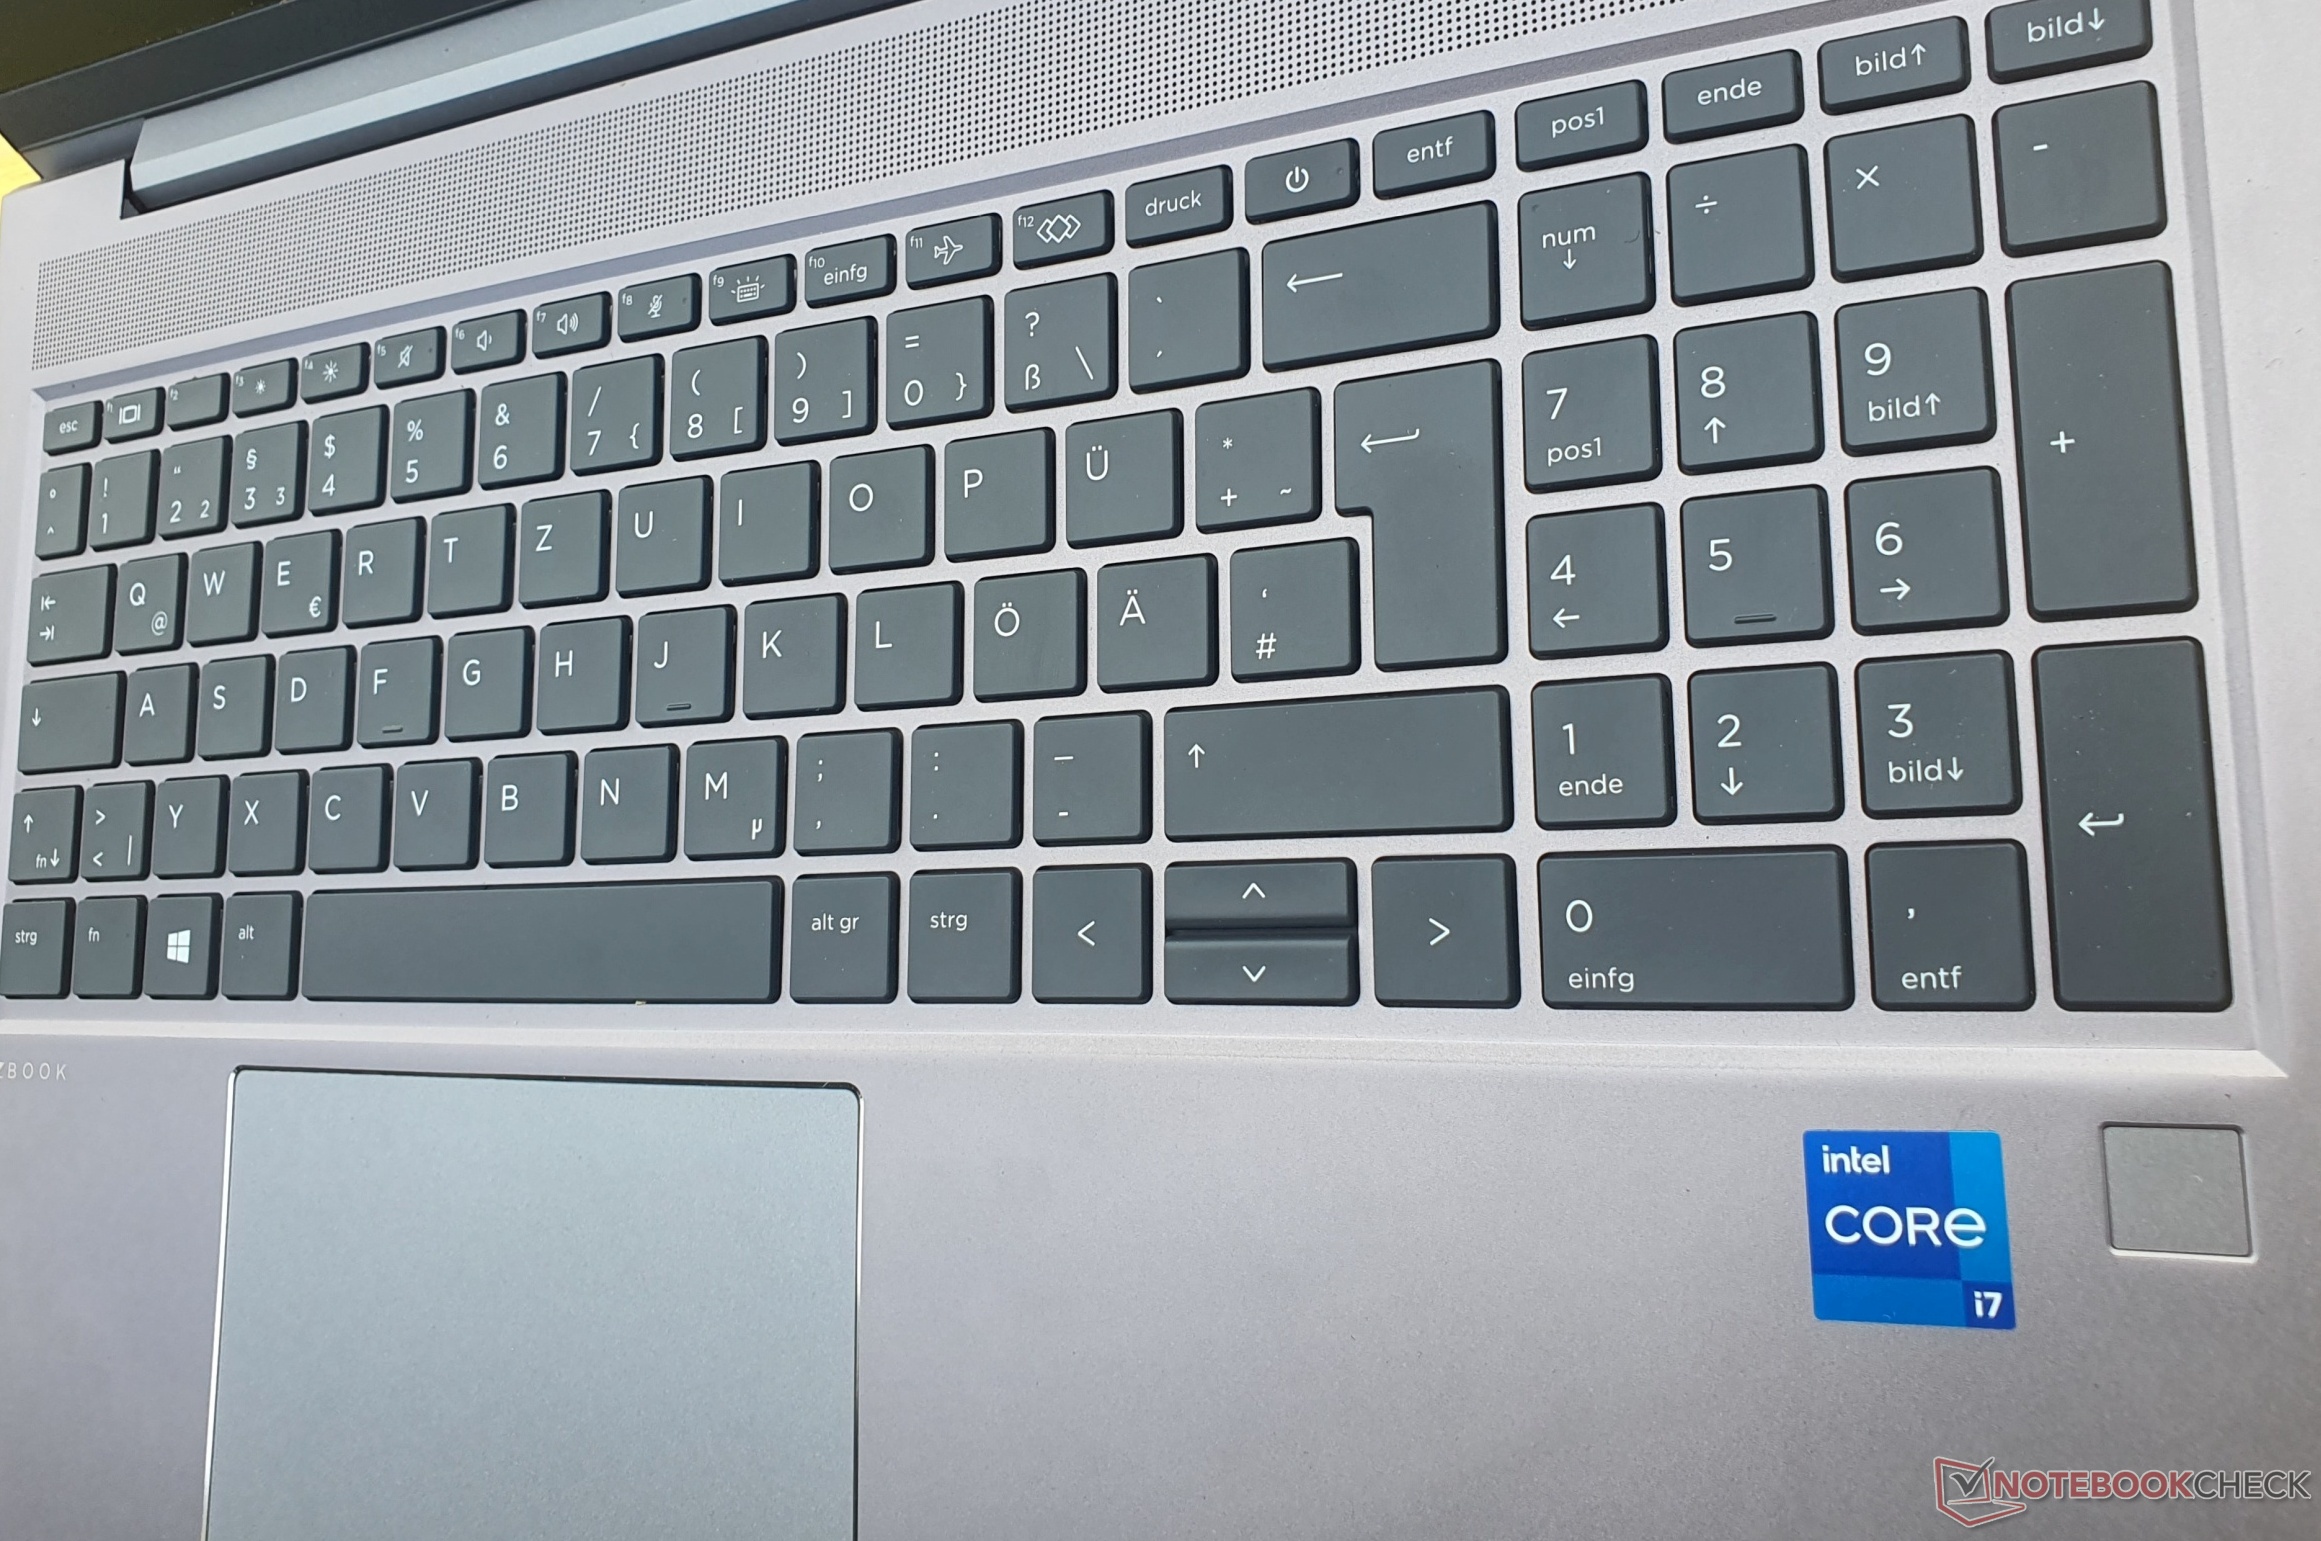
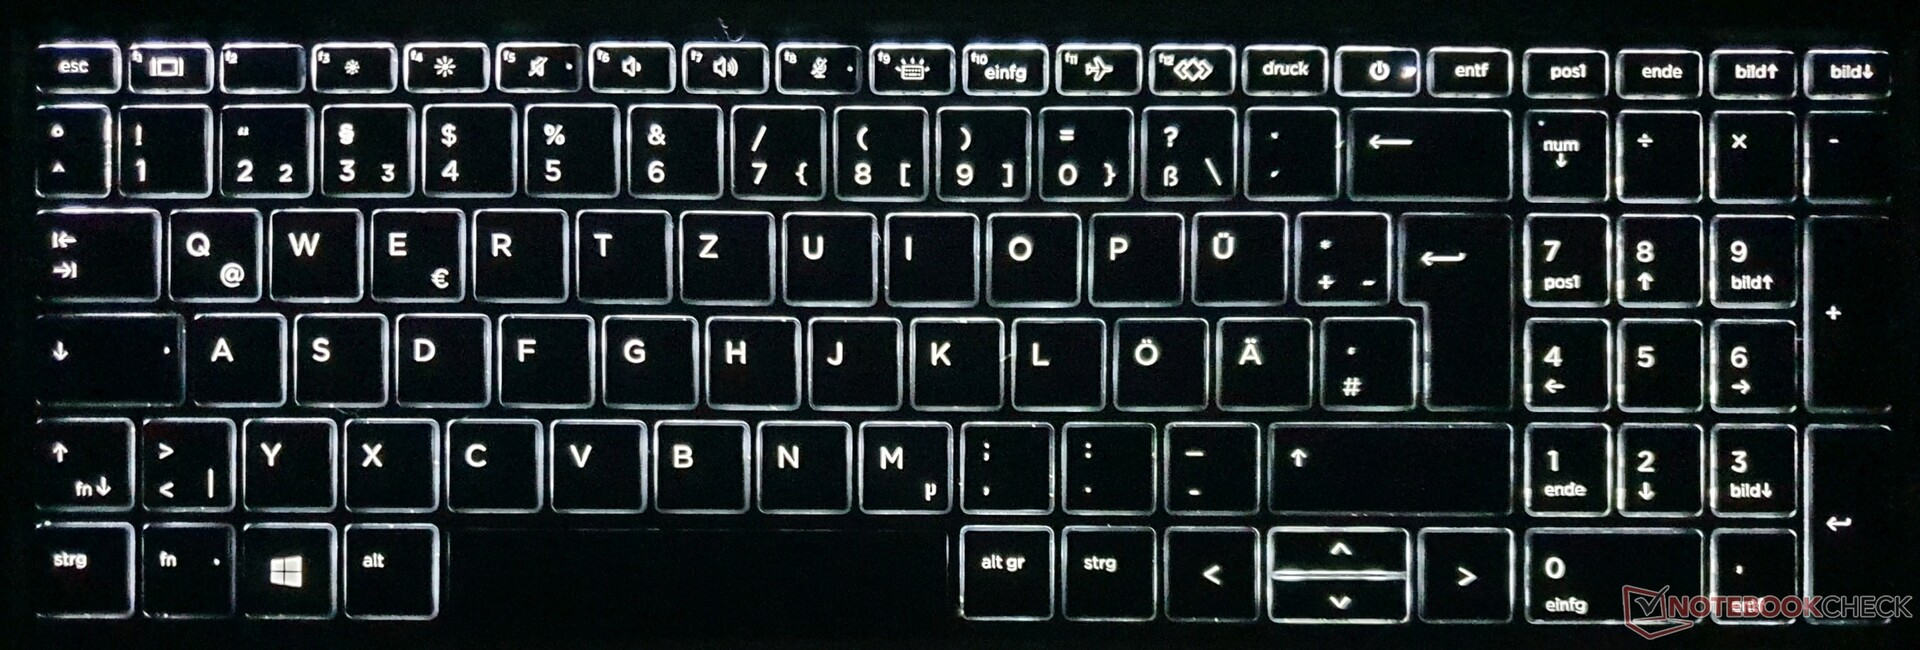
Dispositivos de entrada: El ZBook Power impresiona con un teclado nítido
Teclado
Aunque el teclado tiene teclas ligeramente más pequeñas (15 × 15 mm, ~0,6 x 0,6 pulgadas) y distancias, la letra es más grande. Tiene un gran parecido con el del ZBook Firefly yZBook Furypor lo que la experiencia de tecleo es igual de nítida y el punto de presión se nota claramente. El trazo de ~1,5 mm se suma a la atractiva impresión general
El teclado es a prueba de salpicaduras y su funcionamiento es atractivamente silencioso. Sólo se puede presionar muy levemente aplicando algo de presión en un solo punto. No es necesariamente peor que el del ThinkPad P15v.
La distribución está muy lograda, pero las teclas que son más pequeñas incluyen el Enter, Shift izquierdo, las teclas de flechas verticales, el bloque numérico, y la fila superior. El botón de encendido también está integrado en la fila superior, pero pulsarlo accidentalmente no hará que el portátil entre en reposo. Hay una iluminación de dos pasos, y su duración se puede configurar en la BIOS.
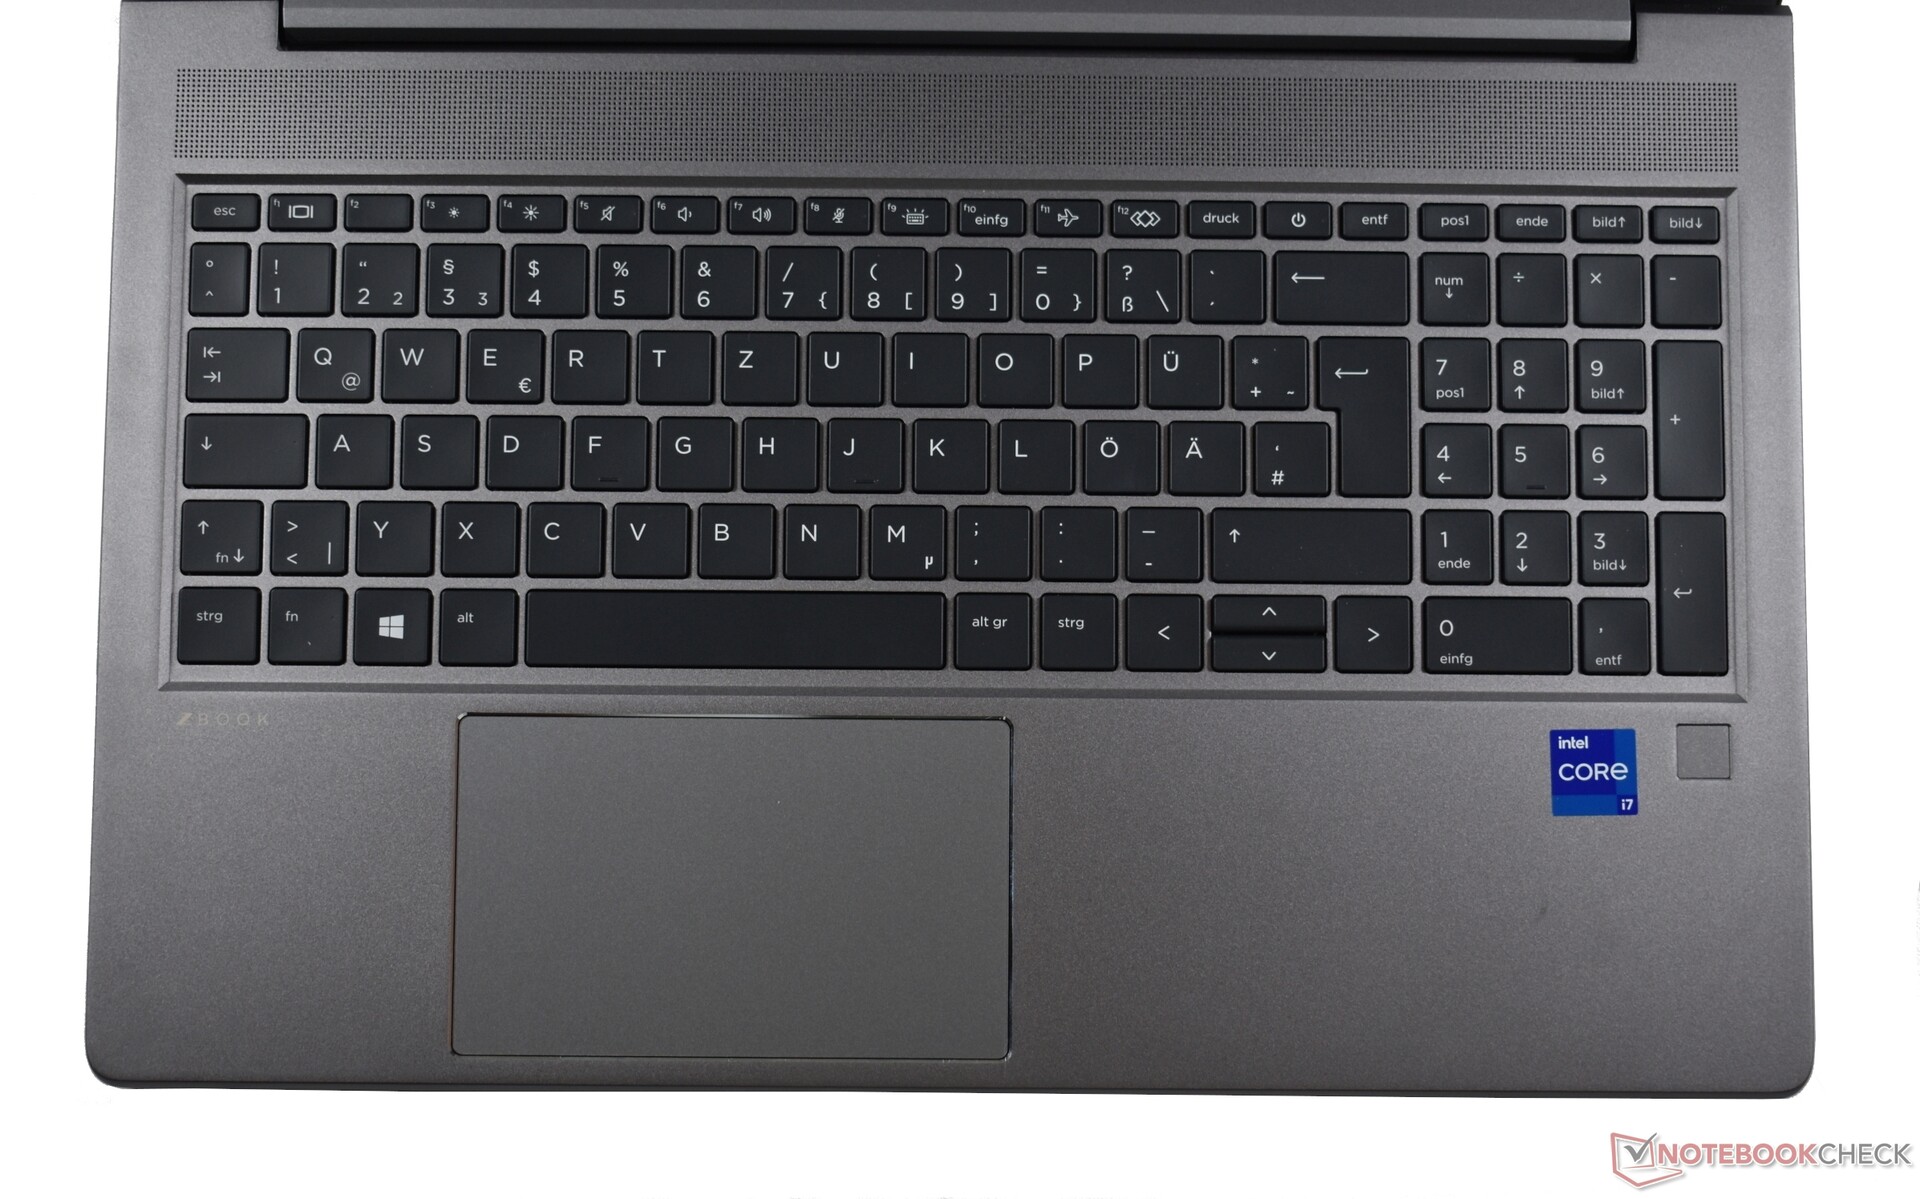
Teclado táctil
La pantalla de 11,5 × 7 cm (~4,5 x 2,75 pulgadas) es extremadamente sensible y precisa. La suave superficie de cristal ofrece muy buenas características de deslizamiento, y todos los gestos se implementan de forma impecable. Las teclas integradas tienen un recorrido medio y producen una respuesta potente y sonora.
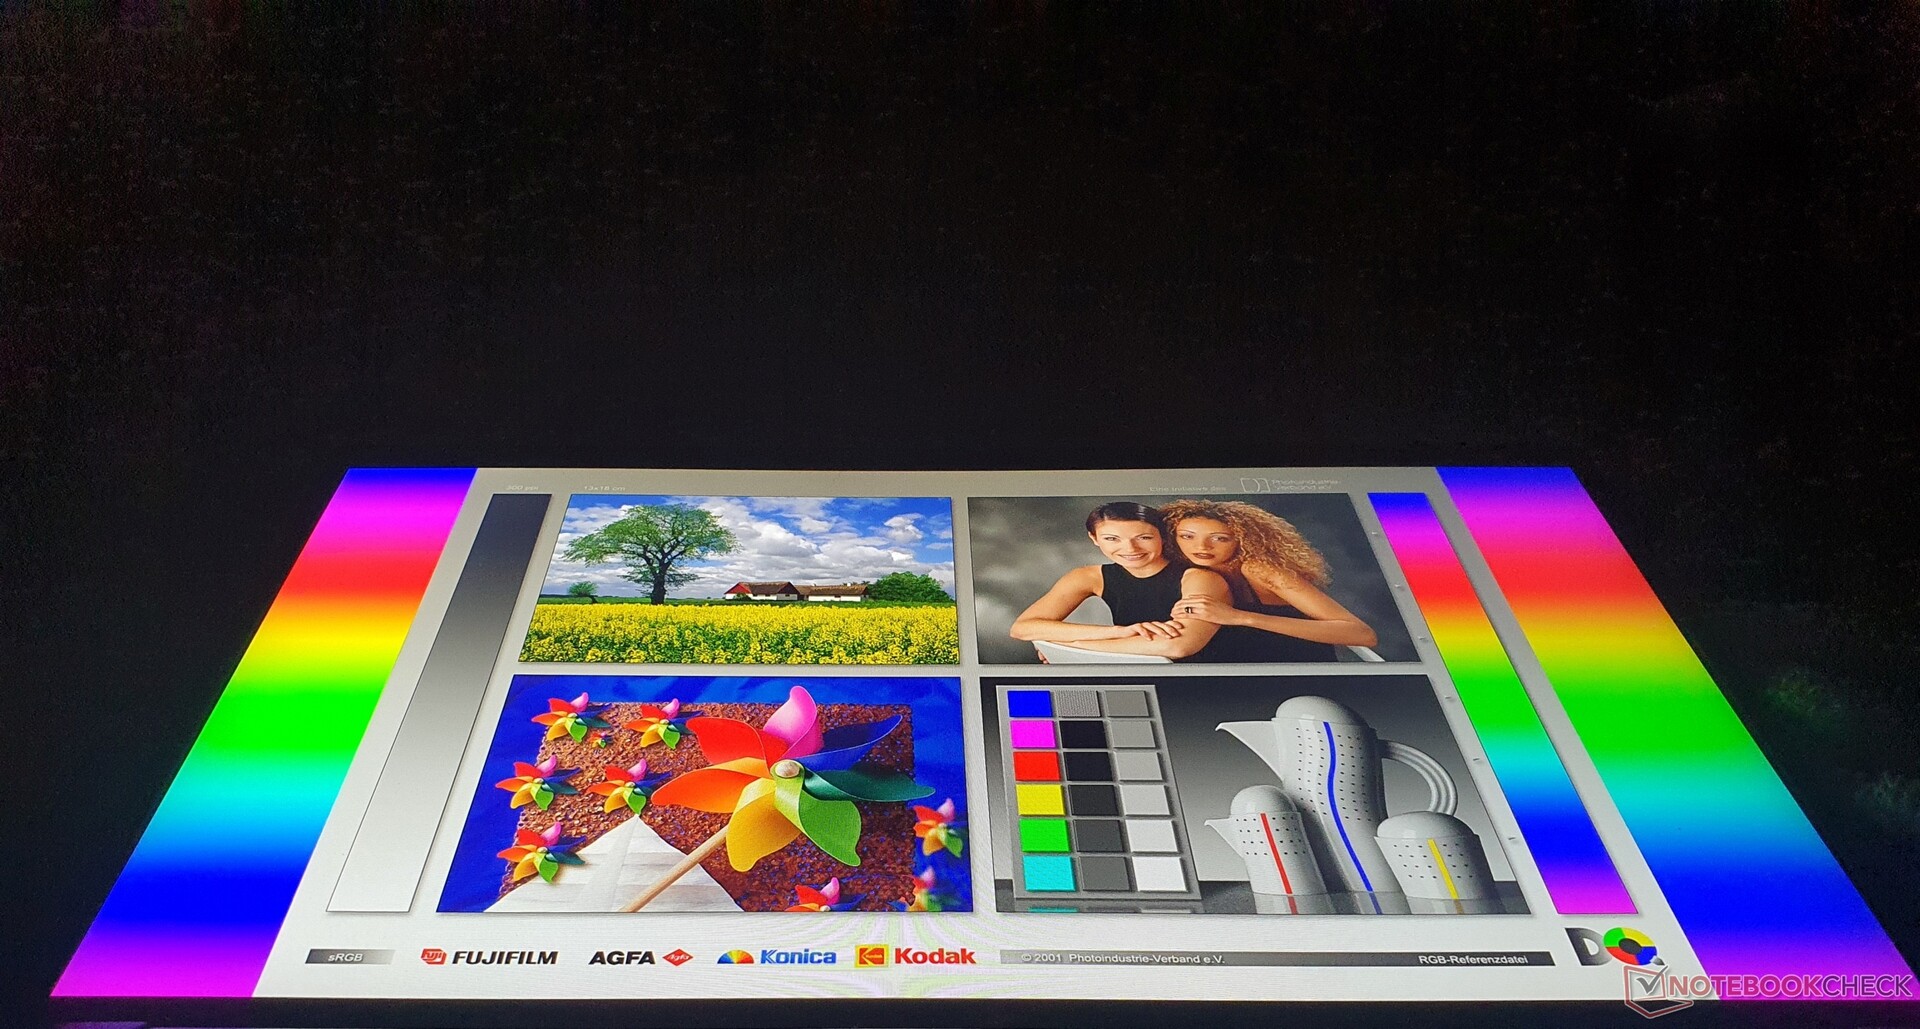
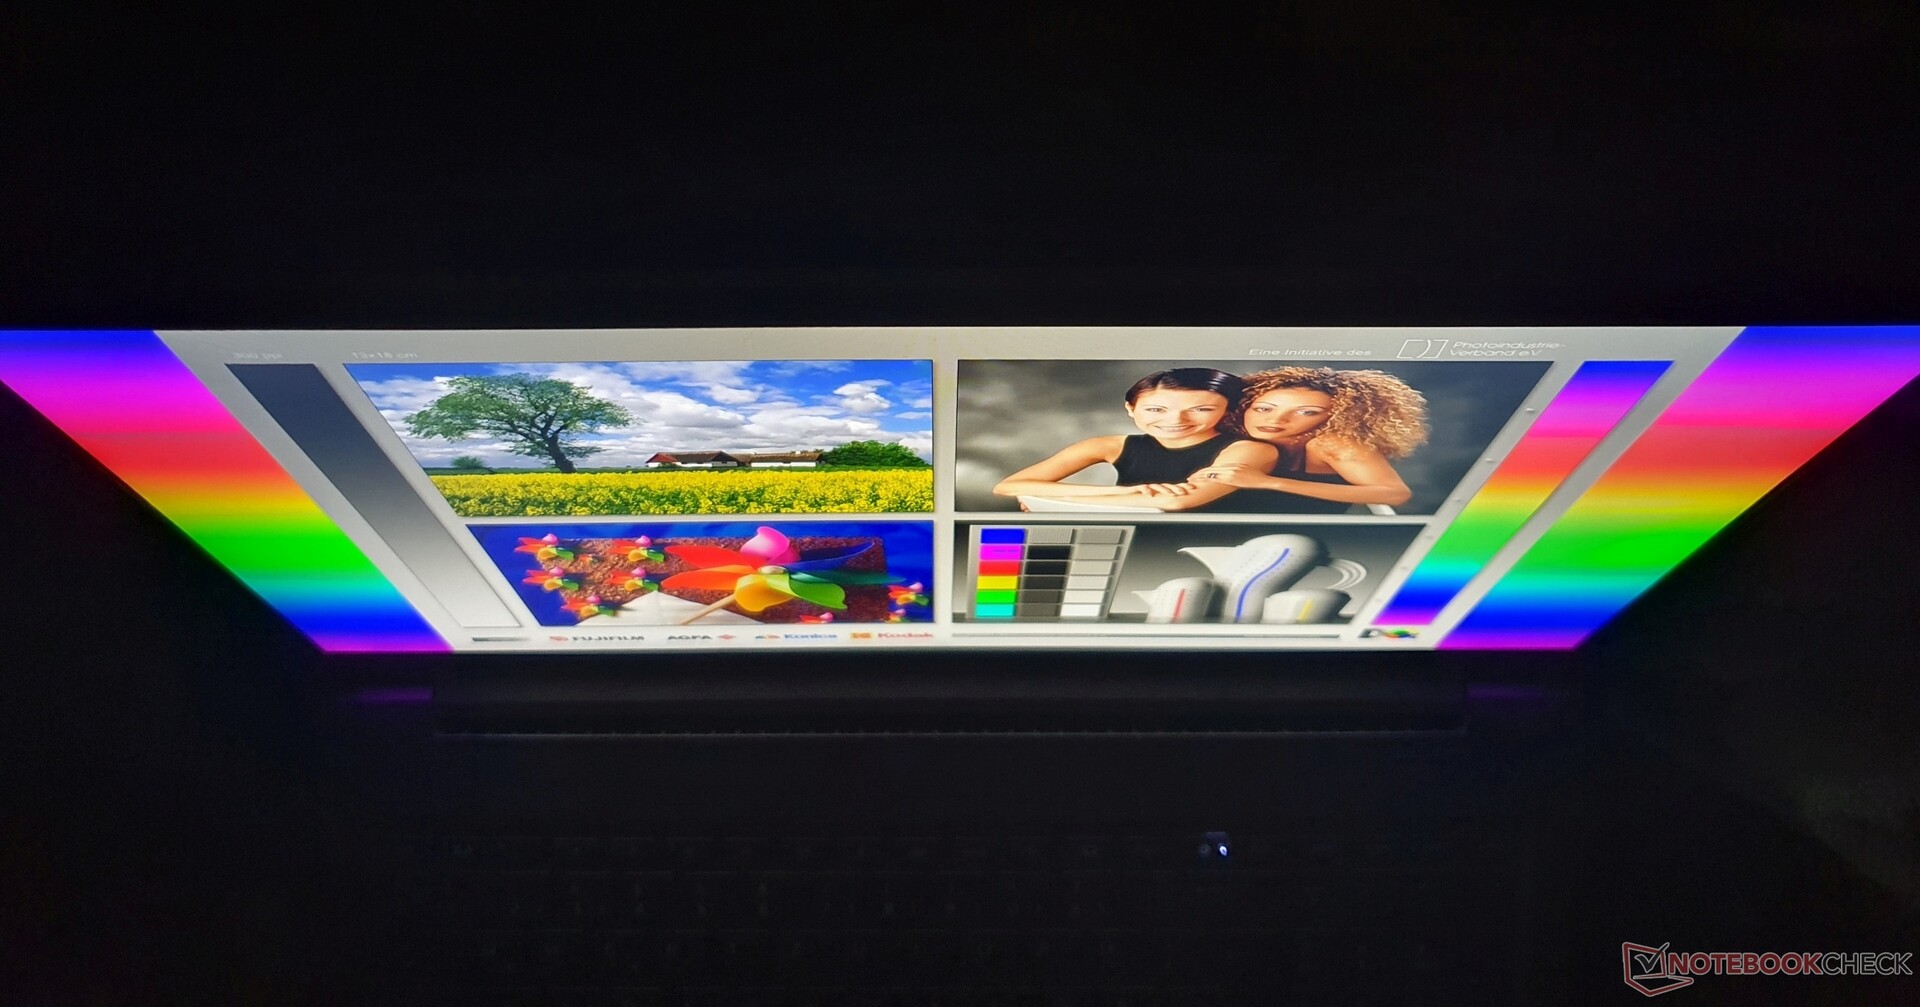
Pantalla FHD brillante y de alto contraste en el ZBook Power
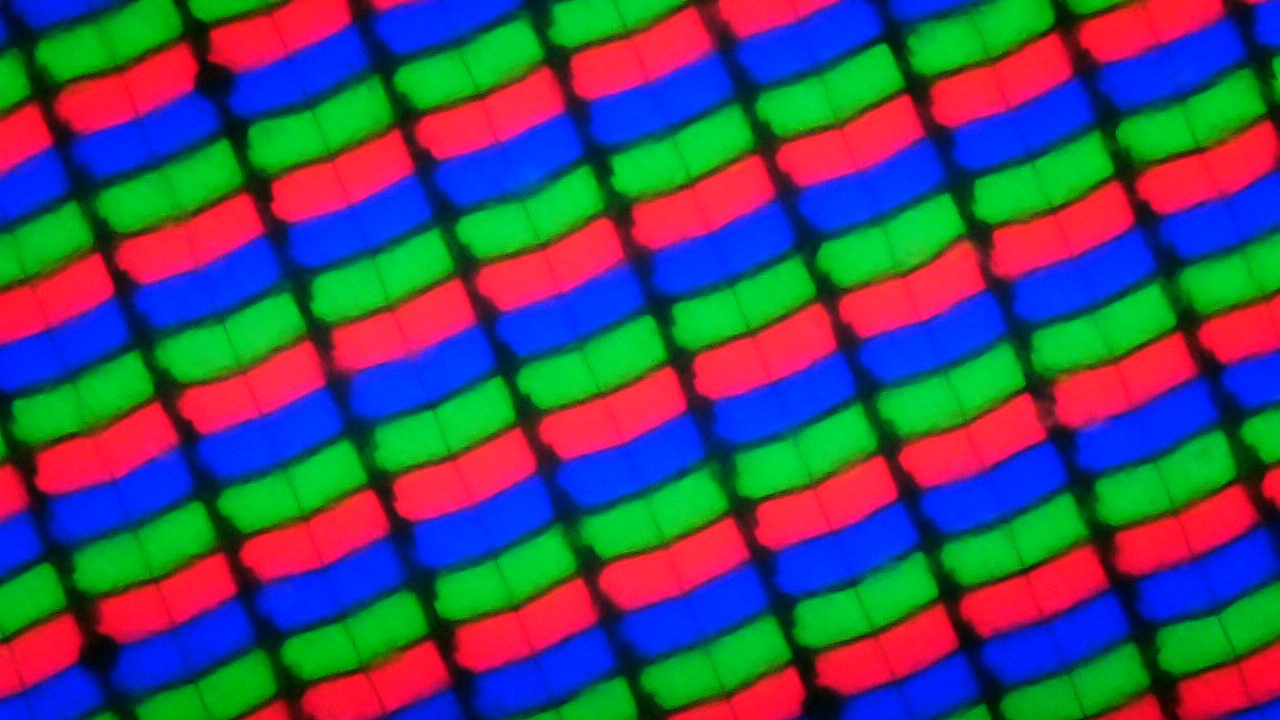

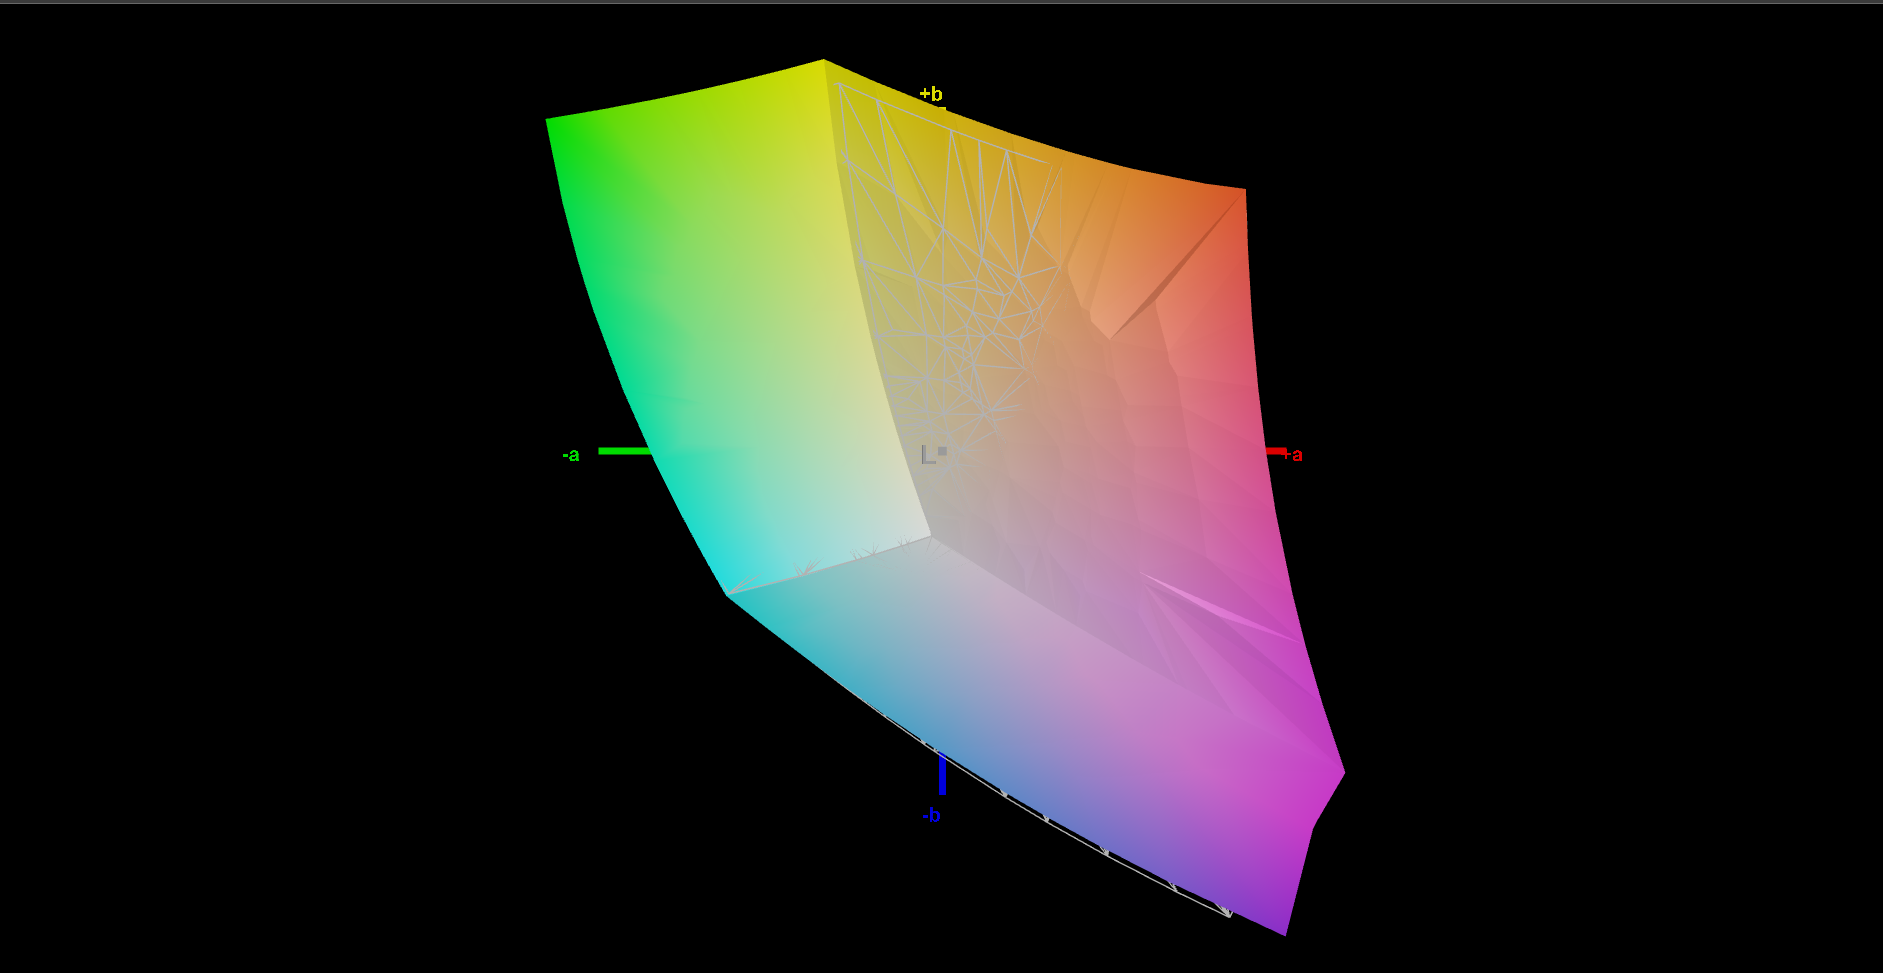
Nuestra configuración incluye el mismo panel IPS FHD mate, de 15,6 pulgadas, brillante (400 nits) y de bajo consumo (AUOA08B) en formato 16:9 que el predecesor. También se utiliza en varios HP Elite y ProBooks, así como en el HP Envy x360 15.
La opción 4K (3840 x 2160 pixels) debería reducir notablemente la duración de la batería y, según la hoja de datos, sólo ofrece una cobertura completa del espacio de color sRGB, como el panel 4K del ZBook Firefly G7 - por lo que buscará en vano Dreamcolor. El panel básico usa FHD IPS con sólo 250 nits de brillo y con toque opcional.
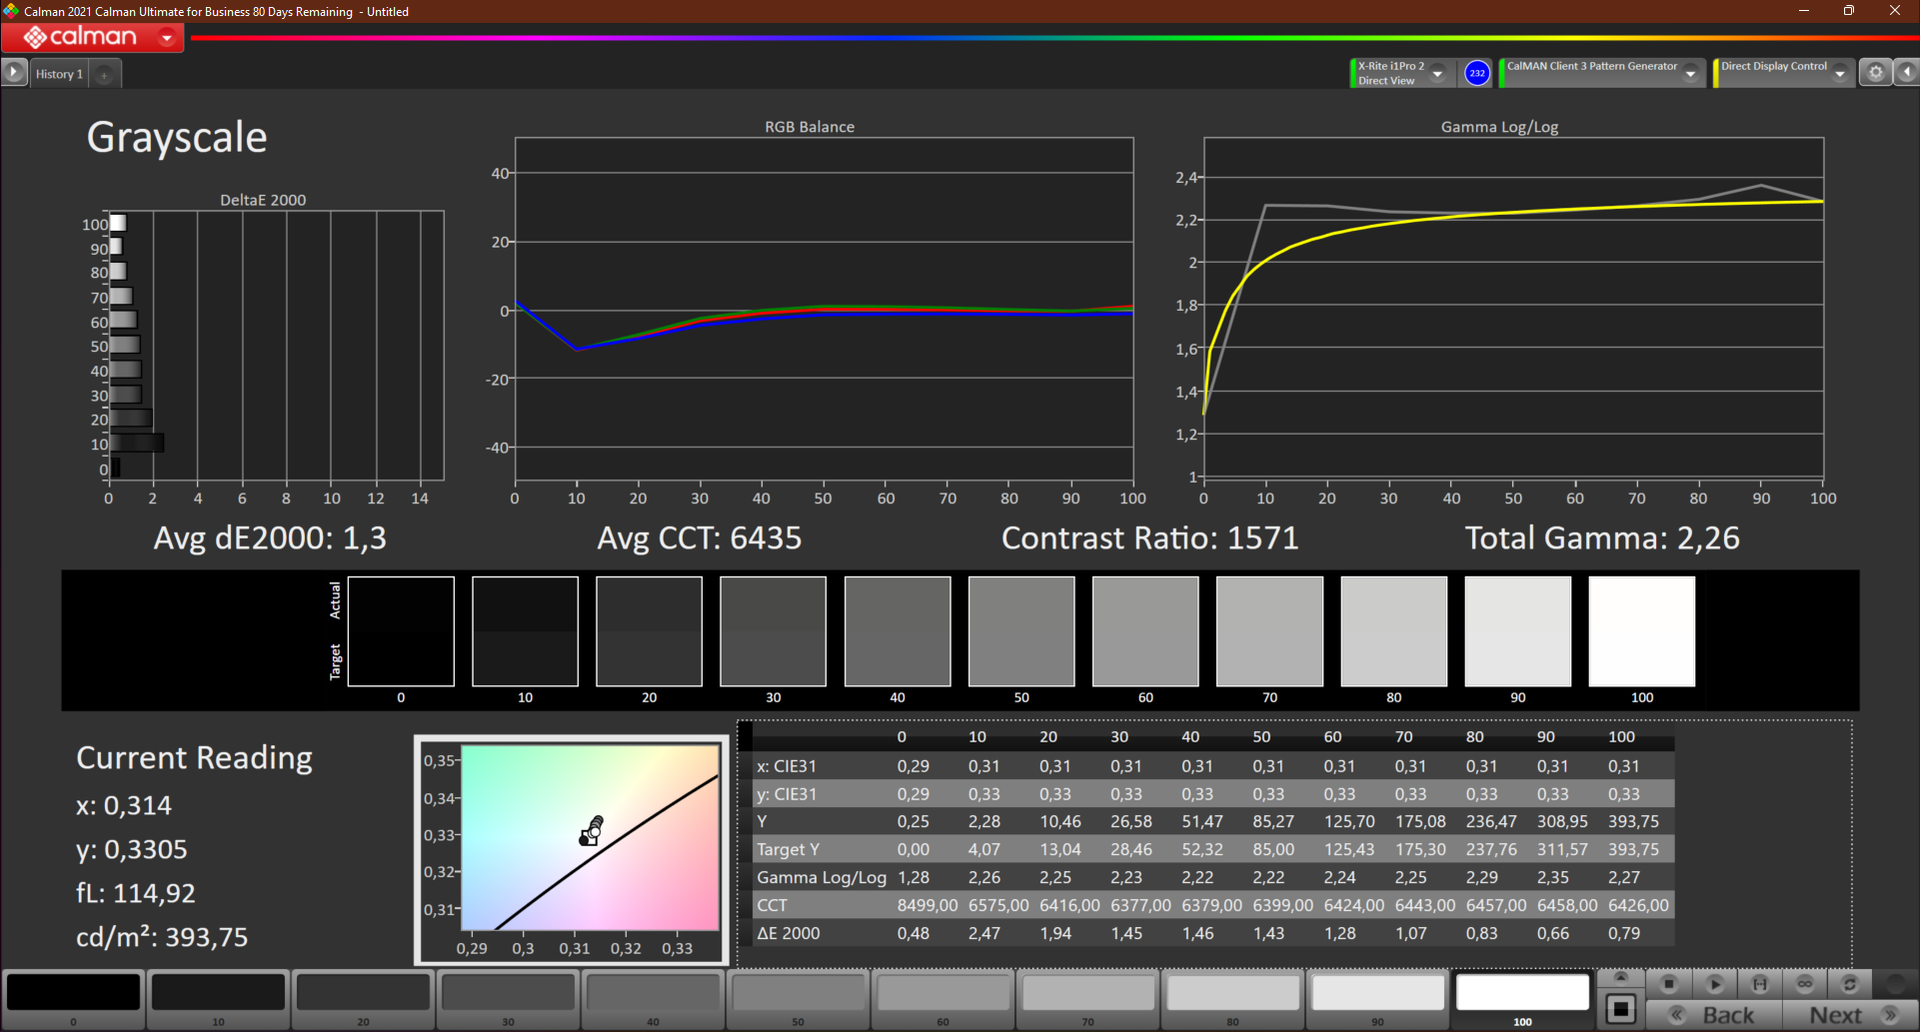
Con una media de 385 nits, el panel se vuelve significativamente más brillante que el del ThinkPad P15vy Precision 3551. Los valores DeltaE (< 2) también son mucho más precisos. El contraste es un buen 1574:1 y junto con el valor de negro de 0.25 nits produce un negro saturado. Los tiempos de respuesta lentos son una desventaja. No hay parpadeo PWM
| |||||||||||||||||||||||||
iluminación: 78 %
Brillo con batería: 393 cd/m²
Contraste: 1572:1 (Negro: 0.25 cd/m²)
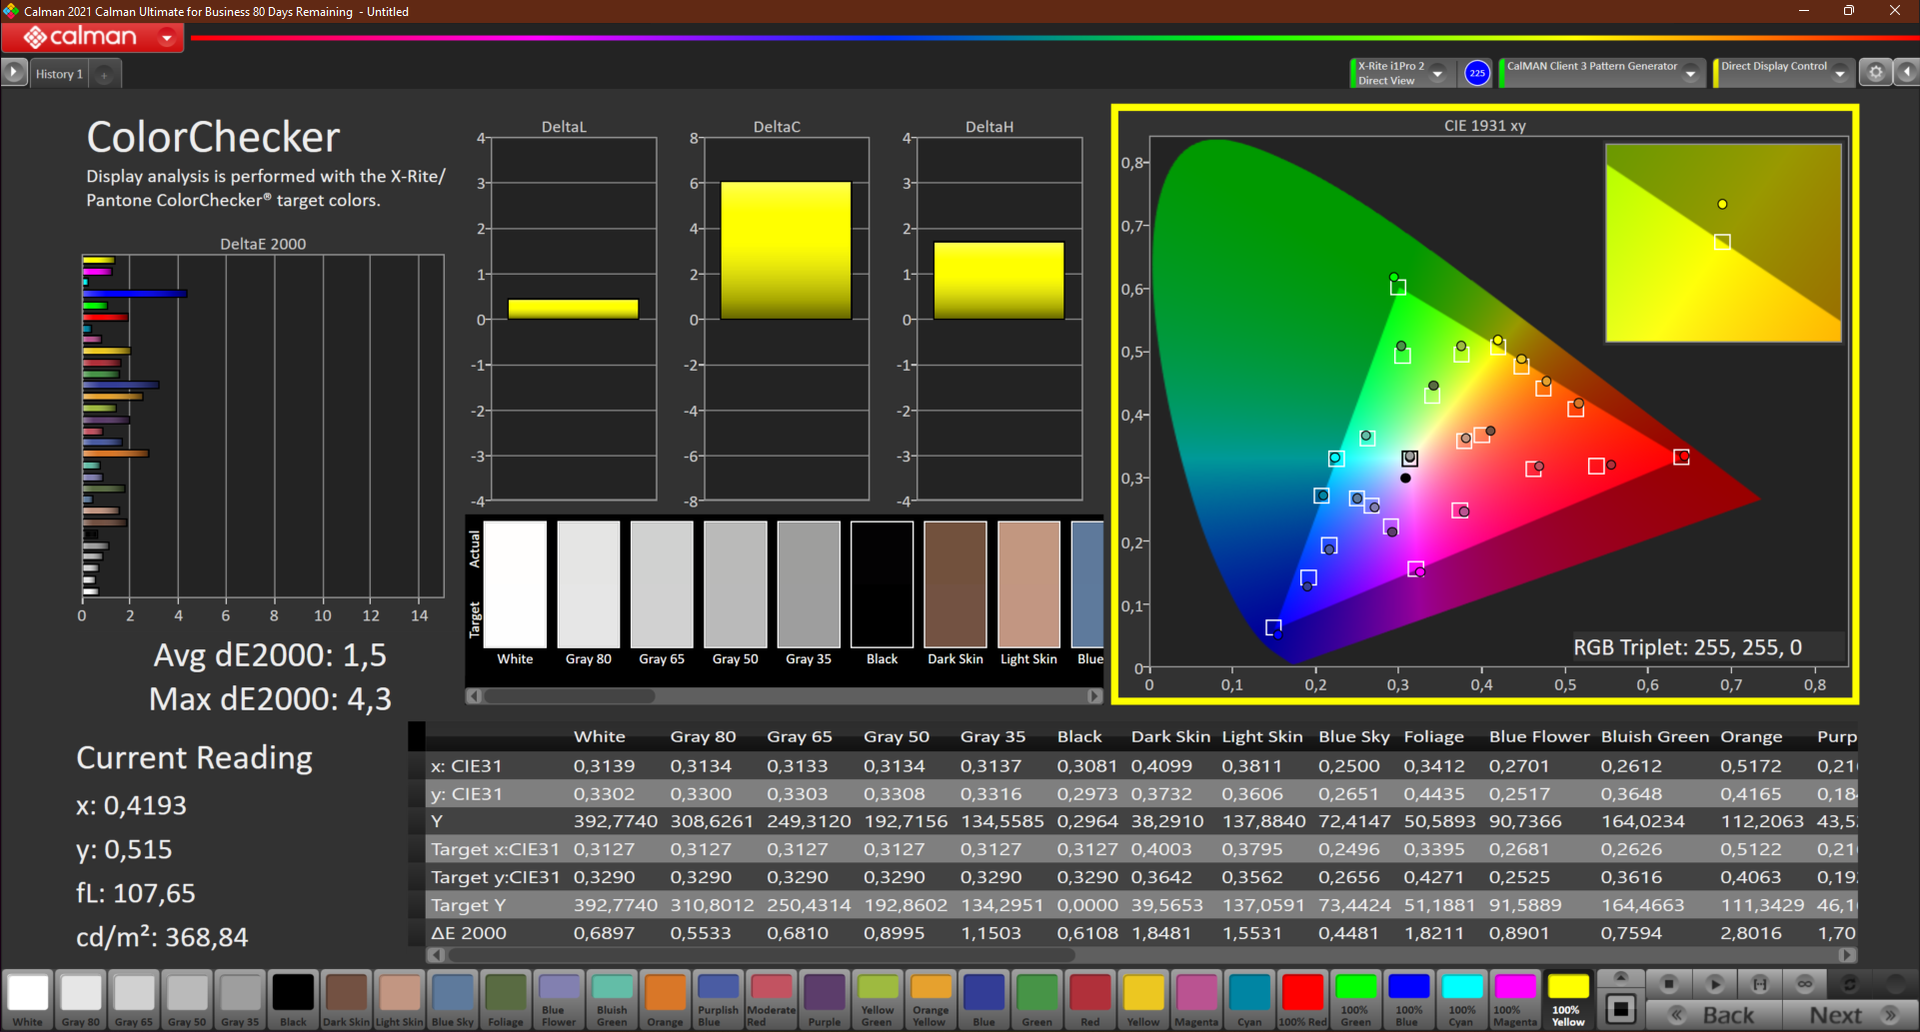
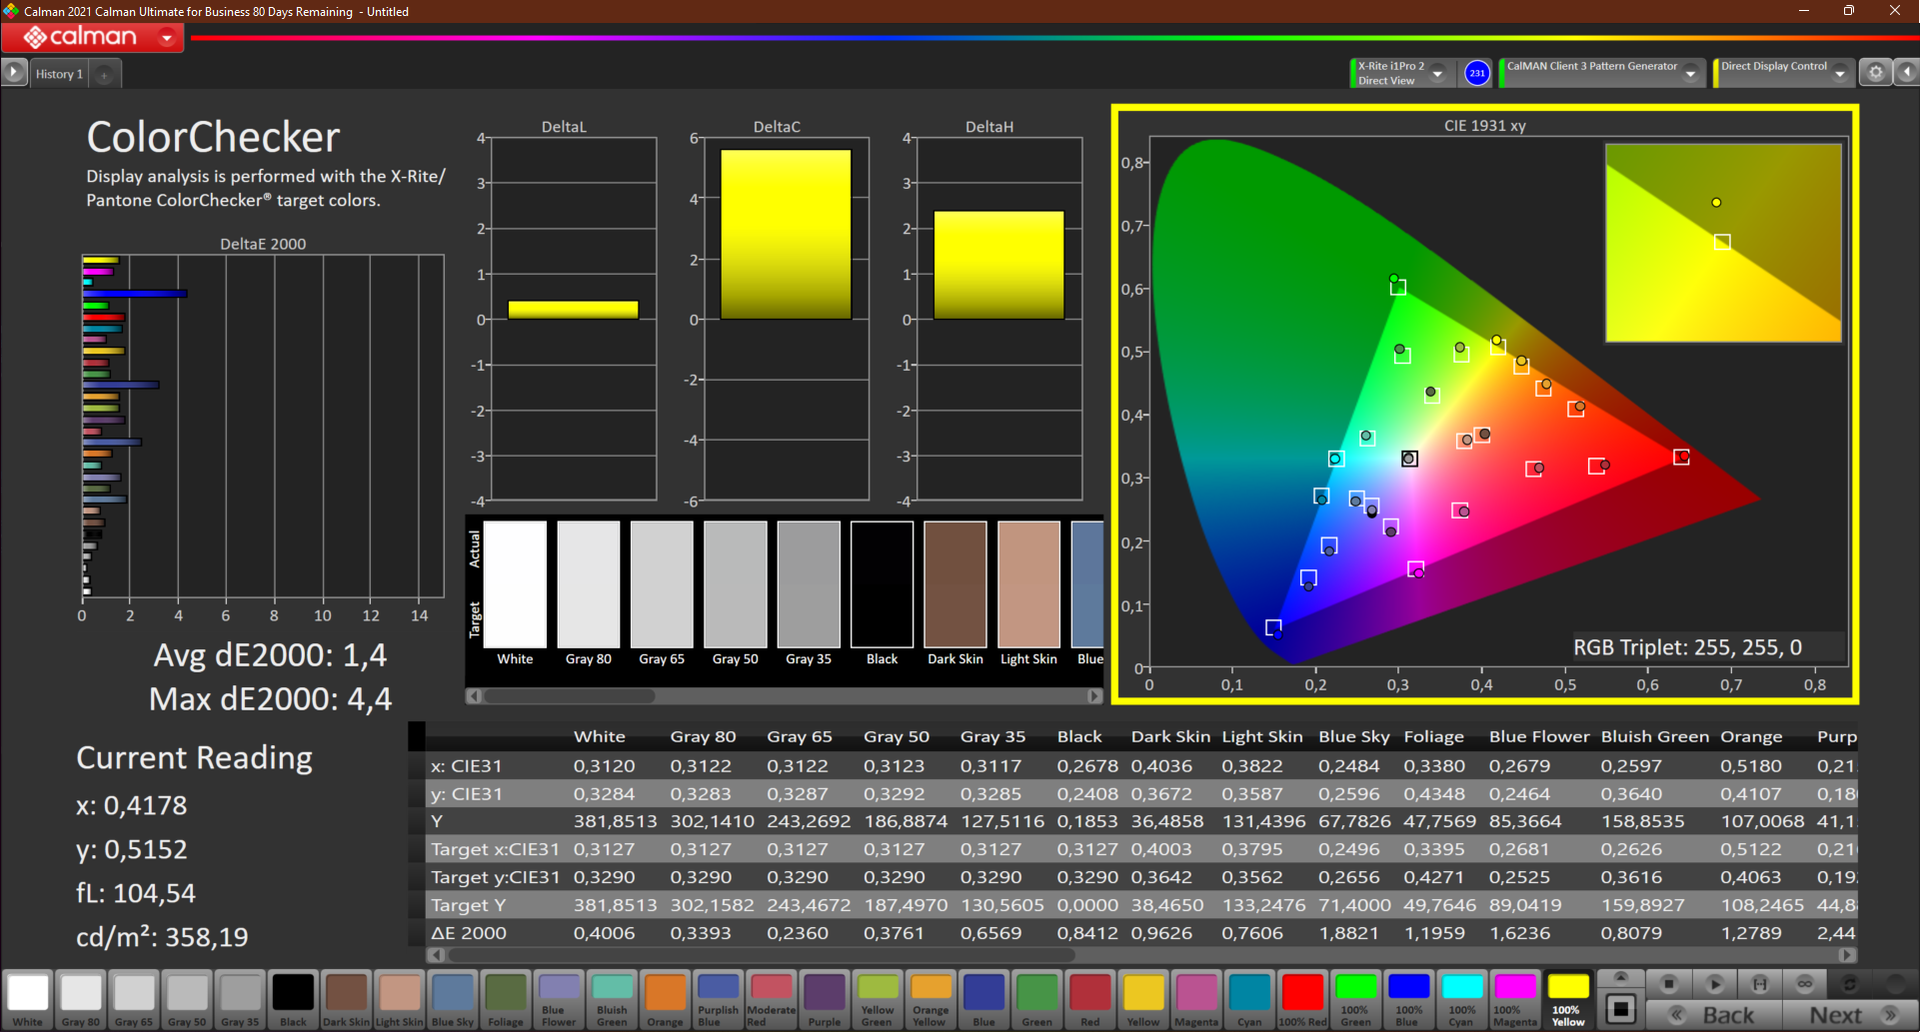
ΔE ColorChecker Calman: 1.5 | ∀{0.5-29.43 Ø4.71}
calibrated: 1.4
ΔE Greyscale Calman: 1.3 | ∀{0.09-98 Ø4.96}
71.3% AdobeRGB 1998 (Argyll 3D)
99% sRGB (Argyll 3D)
70.5% Display P3 (Argyll 3D)
Gamma: 2.26
CCT: 6435 K
| HP ZBook Power 15 G8 313S5EA AUOA08B, IPS LED, 1920x1080, 15.6" | HP ZBook Fury 15 G8 BOE0969, IPS, 3840x2160, 15.6" | HP ZBook Studio 15 G8 SDC4145, OLED, 3840x2160, 15.6" | HP ZBook Firefly 15 G8 2C9R7EA LGD069B, IPS, 1920x1080, 15.6" | Lenovo ThinkPad P15v G2 21A9000XGE N156HCA-EAC, IPS LED, 1920x1080, 15.6" | Dell Precision 3000 3551 LG Philips 156WFD, IPS, 1920x1080, 15.6" | |
|---|---|---|---|---|---|---|
| Display | 20% | 26% | -2% | -36% | -45% | |
| Display P3 Coverage (%) | 70.5 | 95.9 36% | 99.9 42% | 68.6 -3% | 43.7 -38% | 37.5 -47% |
| sRGB Coverage (%) | 99 | 100 1% | 100 1% | 98.5 -1% | 65.1 -34% | 56.5 -43% |
| AdobeRGB 1998 Coverage (%) | 71.3 | 87.3 22% | 95.3 34% | 70 -2% | 45.3 -36% | 38.74 -46% |
| Response Times | 74% | 95% | 12% | 24% | 41% | |
| Response Time Grey 50% / Grey 80% * (ms) | 61 | 14.8 ? 76% | 2.4 ? 96% | 56 ? 8% | 48 ? 21% | 29.6 ? 51% |
| Response Time Black / White * (ms) | 38 ? | 11 ? 71% | 2.4 ? 94% | 32 ? 16% | 28 ? 26% | 26.4 ? 31% |
| PWM Frequency (Hz) | 240.4 ? | |||||
| Screen | -81% | -75% | -90% | -144% | -111% | |
| Brightness middle (cd/m²) | 393 | 626 59% | 379.6 -3% | 397 1% | 305 -22% | 235.5 -40% |
| Brightness (cd/m²) | 385 | 589 53% | 380 -1% | 402 4% | 281 -27% | 228 -41% |
| Brightness Distribution (%) | 78 | 87 12% | 95 22% | 84 8% | 88 13% | 89 14% |
| Black Level * (cd/m²) | 0.25 | 0.58 -132% | 0.13 48% | 0.32 -28% | 0.25 -0% | |
| Contrast (:1) | 1572 | 1079 -31% | 3054 94% | 953 -39% | 942 -40% | |
| Colorchecker dE 2000 * | 1.5 | 5.41 -261% | 5.15 -243% | 5.9 -293% | 5.9 -293% | 5.44 -263% |
| Colorchecker dE 2000 max. * | 4.3 | 9.05 -110% | 7.79 -81% | 9.4 -119% | 20.1 -367% | 13.58 -216% |
| Colorchecker dE 2000 calibrated * | 1.4 | 0.6 57% | 3.1 -121% | 1.1 21% | 4.5 -221% | 5.2 -271% |
| Greyscale dE 2000 * | 1.3 | 6.2 -377% | 2.6 -100% | 8.8 -577% | 5.3 -308% | 3.1 -138% |
| Gamma | 2.26 97% | 2.66 83% | 1.99 111% | 2.47 89% | 2.1 105% | 2.42 91% |
| CCT | 6435 101% | 6101 107% | 6166 105% | 6416 101% | 6307 103% | 7070 92% |
| Color Space (Percent of AdobeRGB 1998) (%) | 63.7 | 35.5 | ||||
| Color Space (Percent of sRGB) (%) | 98.5 | 56.1 | ||||
| Media total (Programa/Opciones) | 4% /
-37% | 15% /
-22% | -27% /
-57% | -52% /
-97% | -38% /
-75% |
* ... más pequeño es mejor
El espacio de color sRGB está cubierto al 99%, pero sólo se reproduce el ~71% de DCI-P3 y AdobeRGB. Con esto, puedes usar el portátil para el procesado de imagen y vídeo a un nivel semiprofesional. El ThinkPad P15v G2 lo hace significativamente peor (sRGB < 57%) aquí también.
Con un DeltaE de 4,3, la mayor desviación está en el color azul, incluso después de la calibración. Sin embargo, el equilibrio RGB es bueno en general. Después de la calibración, el contraste incluso aumenta a 2151:1, mientras que el brillo se reduce en sólo 10 nits. Como siempre, nuestro perfil de color ICC está disponible para su descarga gratuita junto al gráfico de distribución del brillo de arriba.

Tiempos de respuesta del display
| ↔ Tiempo de respuesta de Negro a Blanco | ||
|---|---|---|
| 38 ms ... subida ↗ y bajada ↘ combinada | ↗ 19 ms subida | 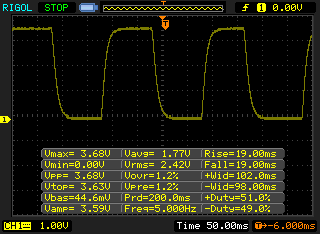 |
| ↘ 19 ms bajada | ||
| La pantalla mostró tiempos de respuesta lentos en nuestros tests y podría ser demasiado lenta para los jugones. En comparación, todos los dispositivos de prueba van de ##min### (mínimo) a 240 (máximo) ms. » 96 % de todos los dispositivos son mejores. Eso quiere decir que el tiempo de respuesta es peor que la media (19.8 ms) de todos los dispositivos testados. | ||
| ↔ Tiempo de respuesta 50% Gris a 80% Gris | ||
| 61 ms ... subida ↗ y bajada ↘ combinada | ↗ ms subida | 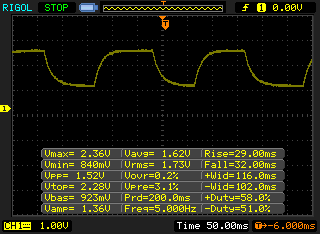 |
| ↘ ms bajada | ||
| La pantalla mostró tiempos de respuesta lentos en nuestros tests y podría ser demasiado lenta para los jugones. En comparación, todos los dispositivos de prueba van de ##min### (mínimo) a 636 (máximo) ms. » 96 % de todos los dispositivos son mejores. Eso quiere decir que el tiempo de respuesta es peor que la media (31 ms) de todos los dispositivos testados. | ||
Parpadeo de Pantalla / PWM (Pulse-Width Modulation)
| Parpadeo de Pantalla / PWM no detectado |  | ||
Comparación: 52 % de todos los dispositivos testados no usaron PWM para atenuar el display. Si se usó, medimos una media de 7754 (mínimo: 5 - máxmo: 343500) Hz. | |||
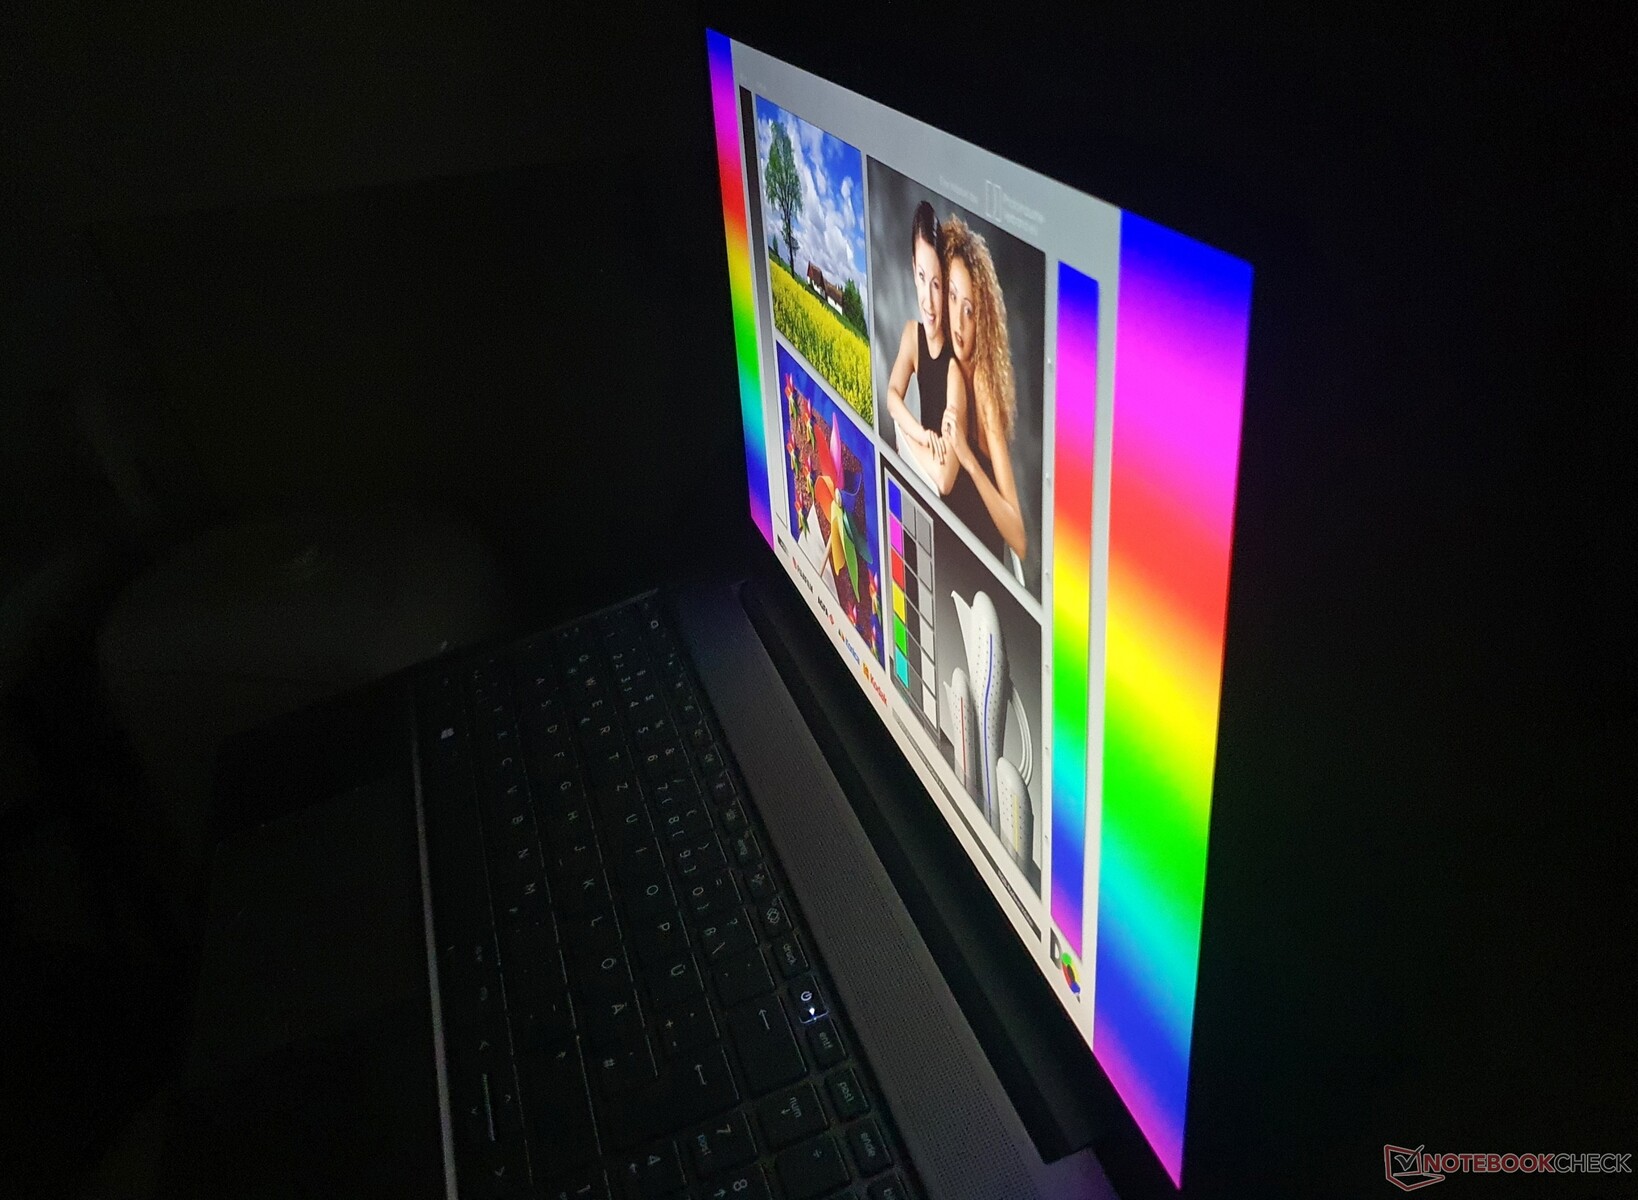
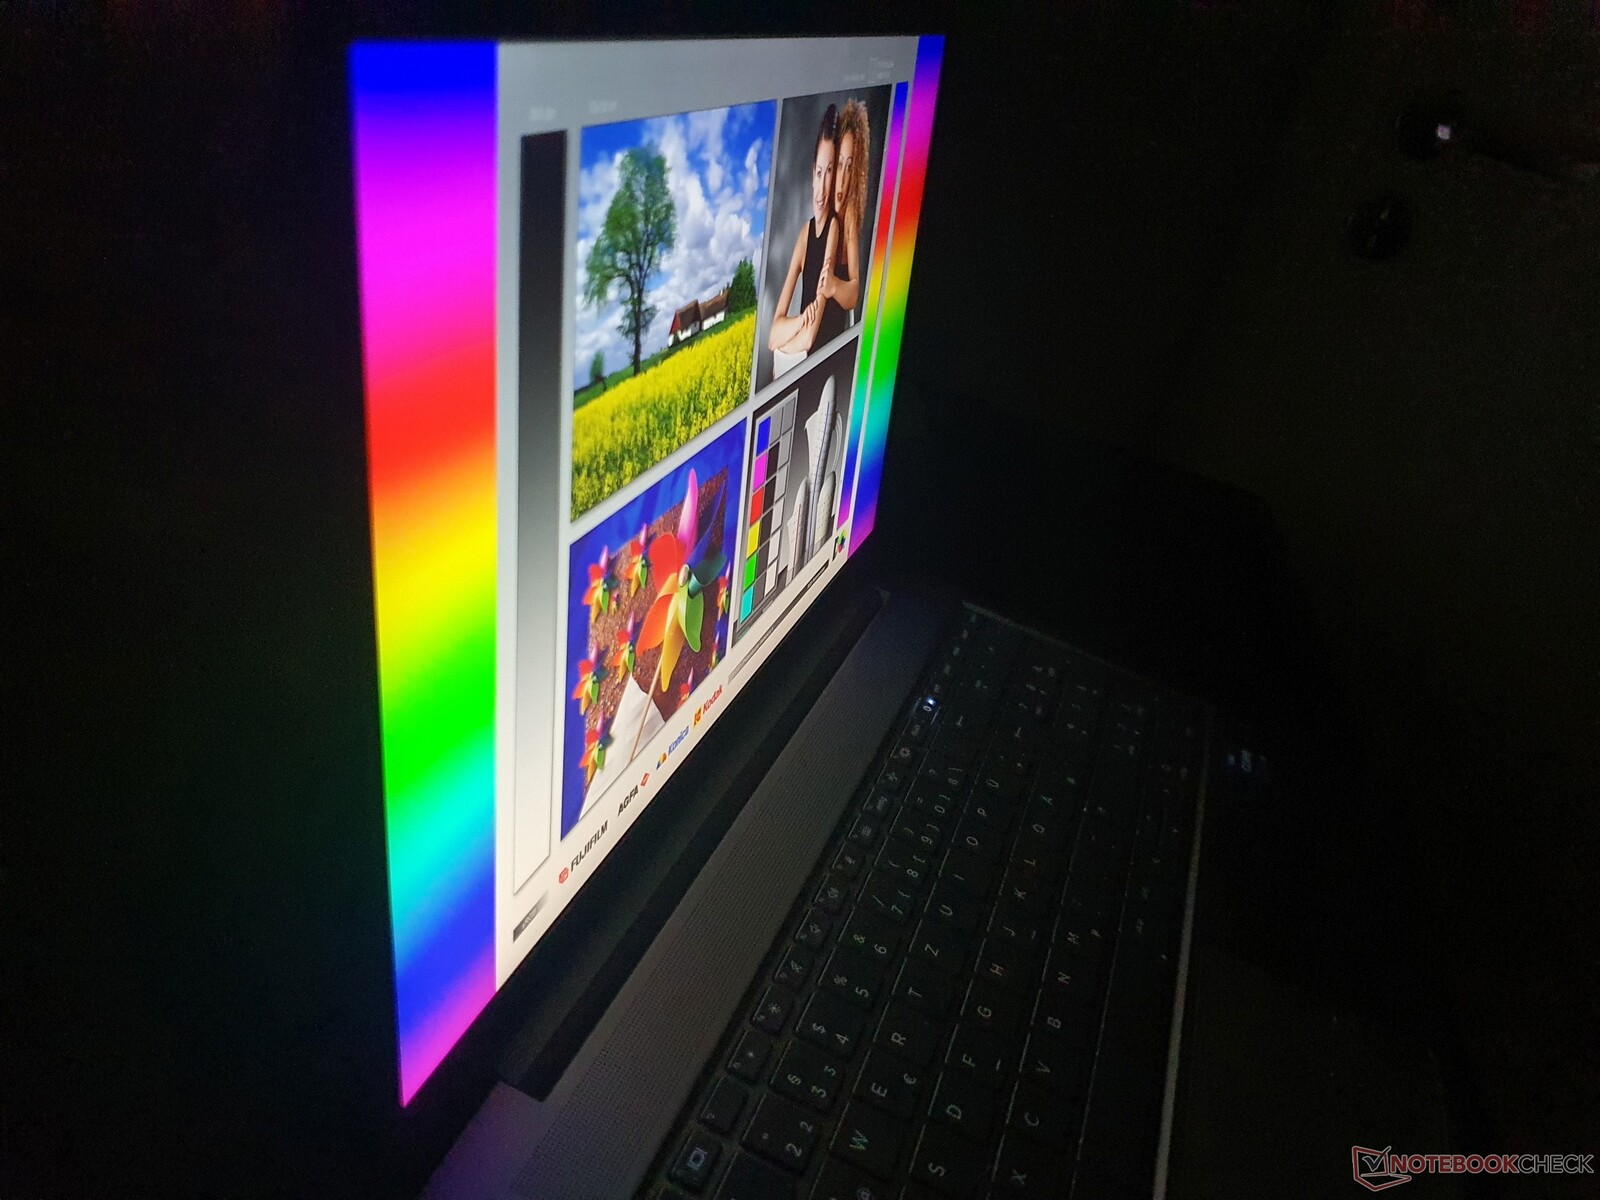
La superficie mate de la pantalla junto con el alto brillo de 385 nits hacen que el ZBook Power 15 sea adecuado para funcionar en exteriores. Sin embargo, debes evitar la luz solar directa.
Como es típico de las pantallas IPS, la estabilidad del ángulo de visión es de un nivel muy alto, sin crear nunca ningún problema, por ejemplo, si quieres ver vídeos junto a varias personas.
¿Alto rendimiento limitado por la propia IA de HP?
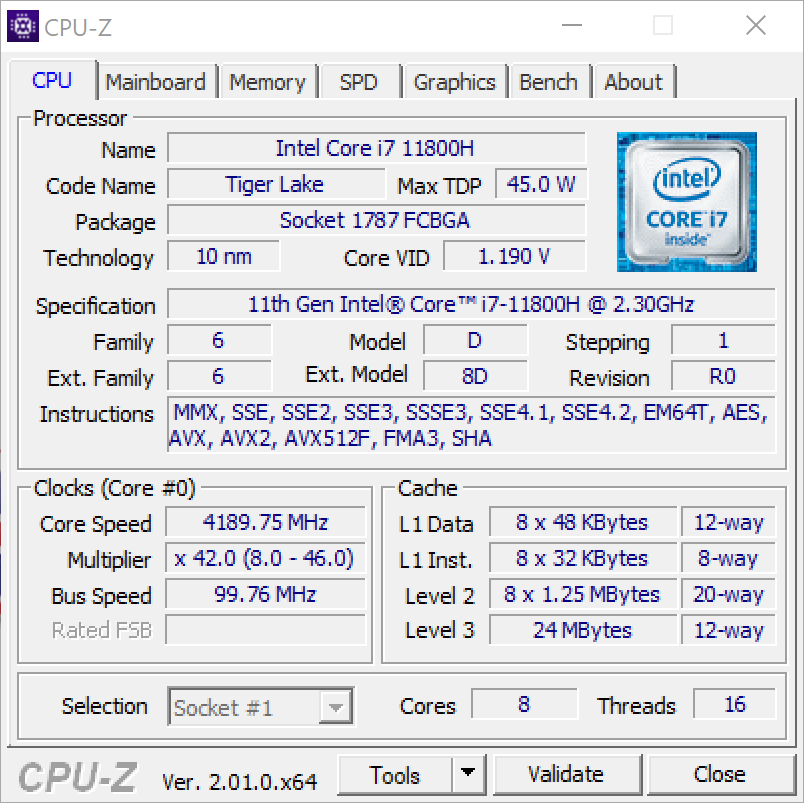
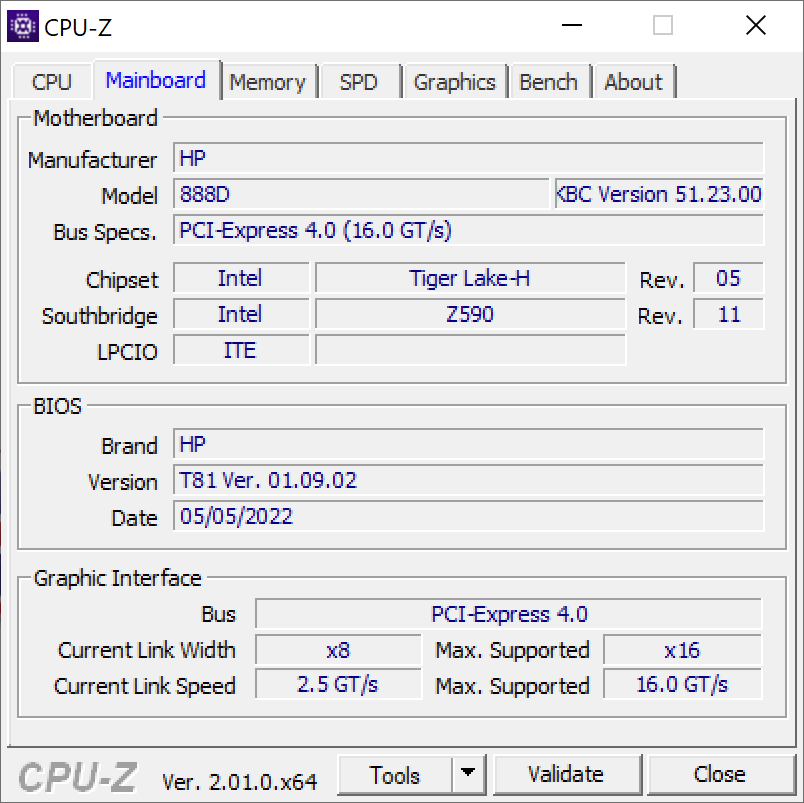
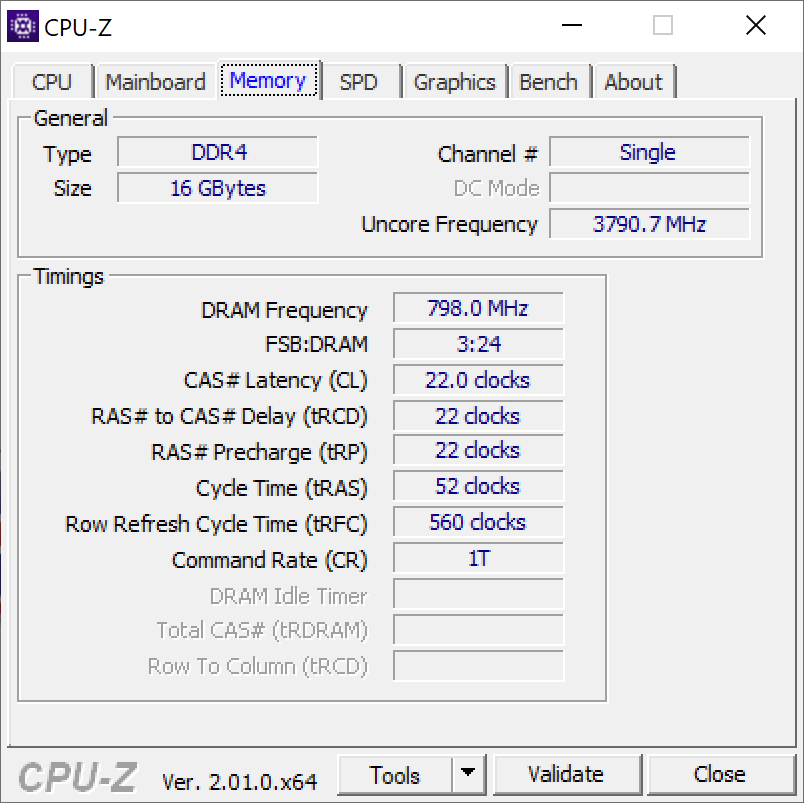
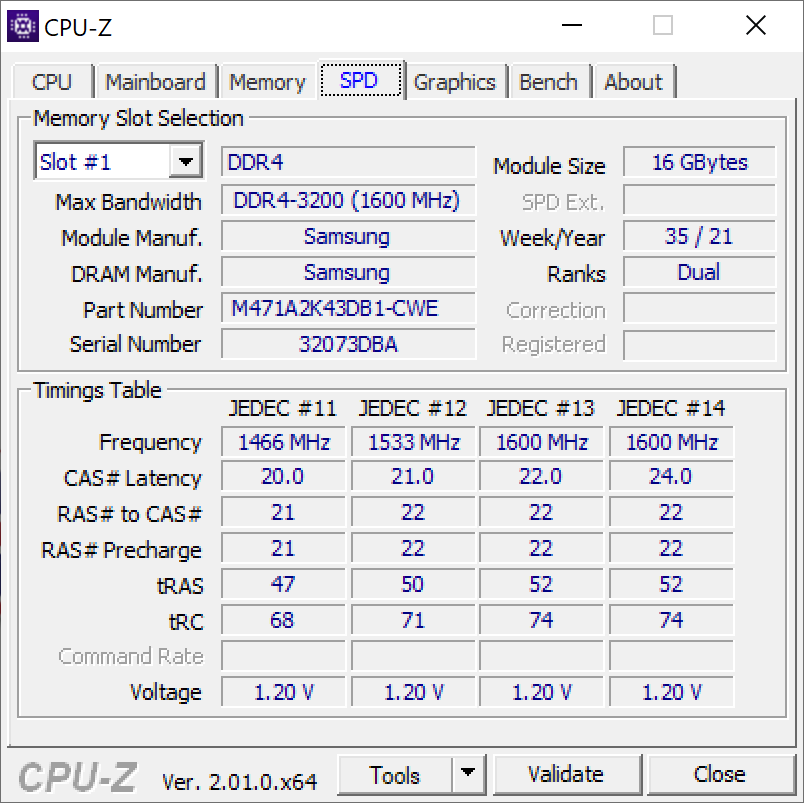
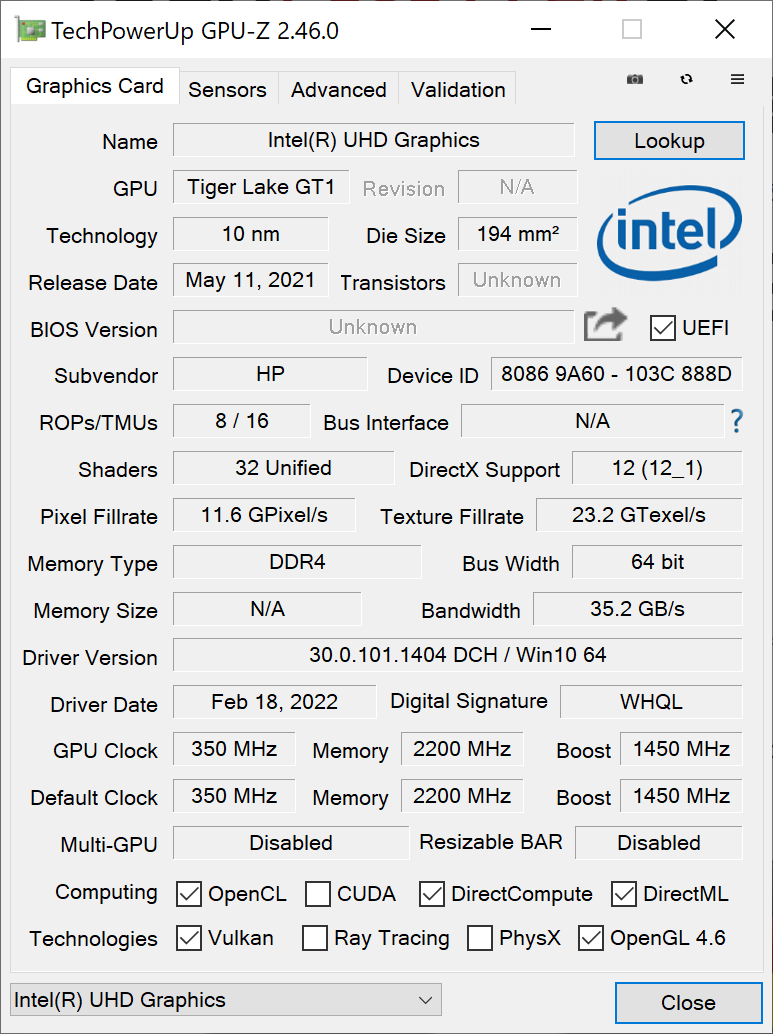
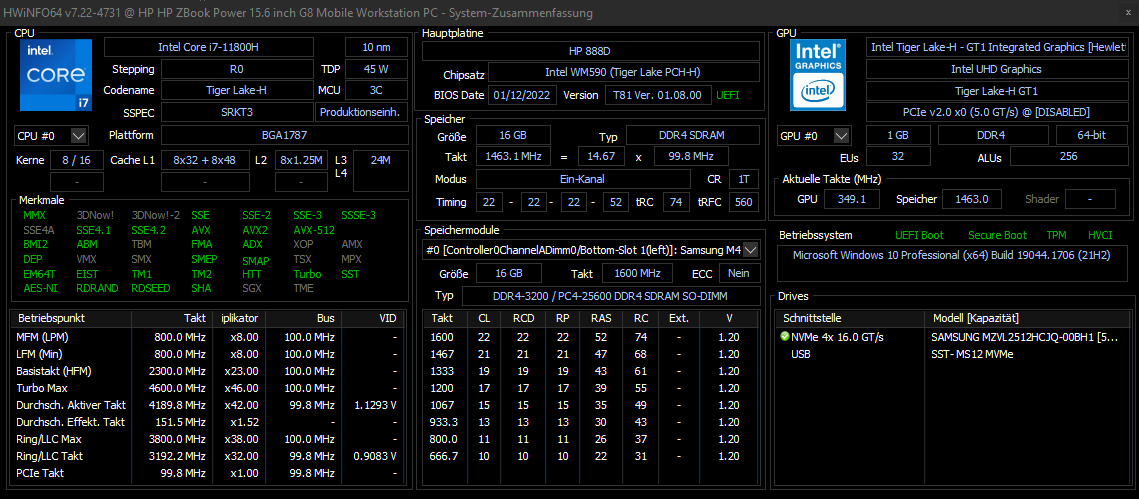
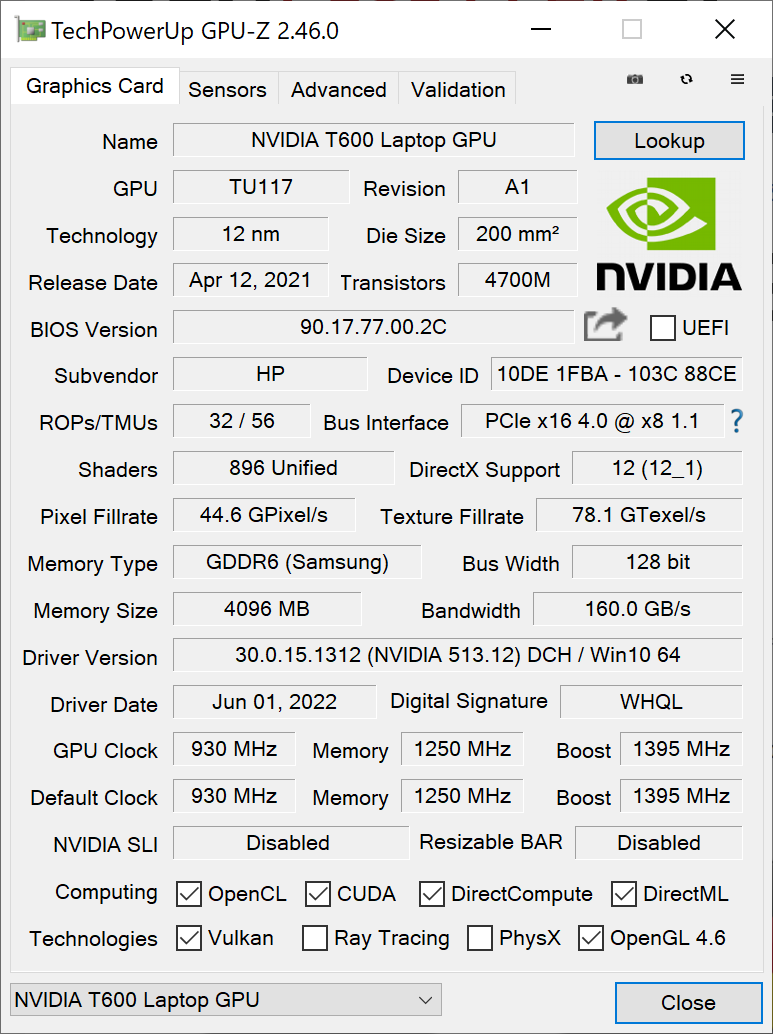
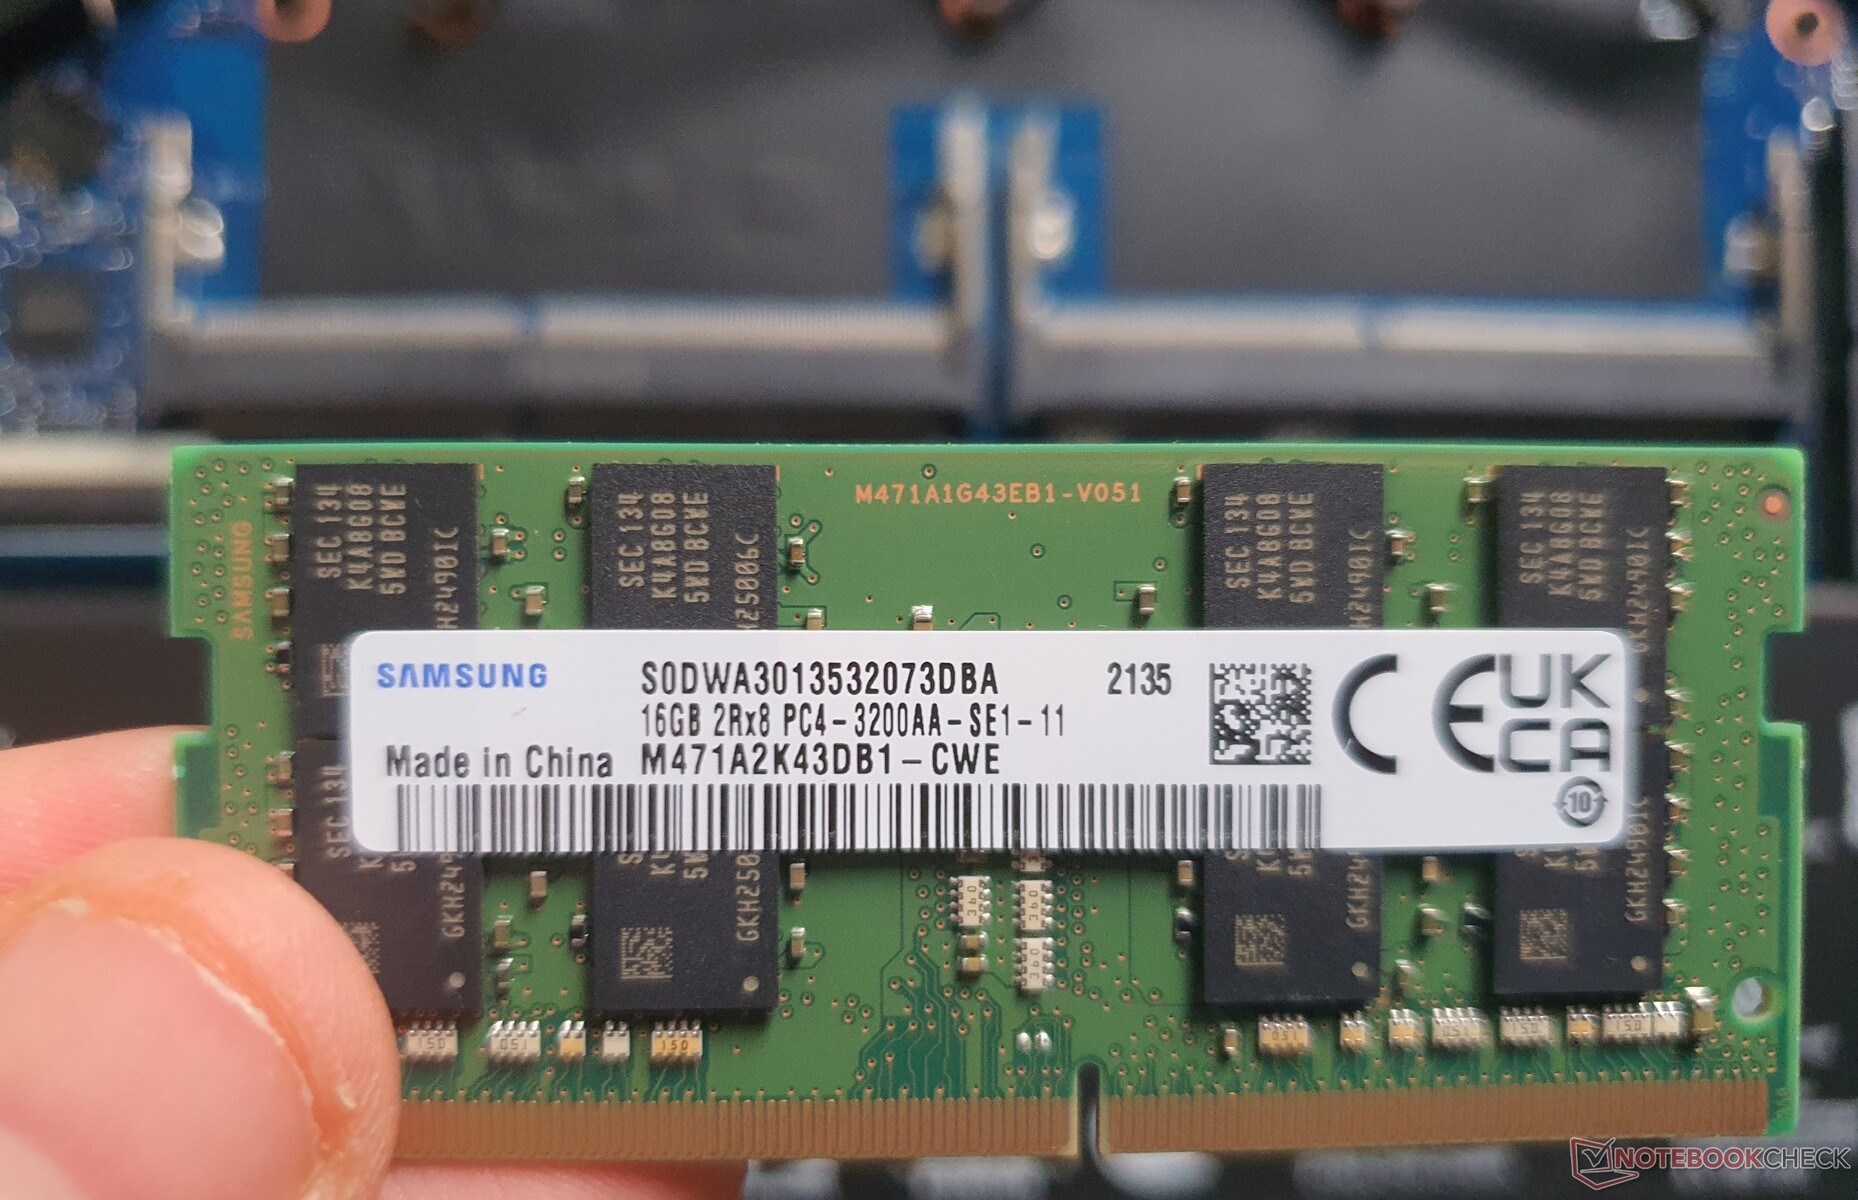
Nuestra unidad de prueba ofrece un Core i7-11800H (Tiger Lake, sin vPRO) y elNvidia T600 dGPU, junto con la integrada Intel UHD Xe (32 EUs). Esto se completa con un módulo de RAM de 16-GB (DDR4-3200 @DDR4-2933) y un SSD PCIe4x4 de 512-GB. Las CPUs Xeon y la RAM ECC no están disponibles este año.
La configuración máxima incluye elCore i9-11950H (vPRO), el Nvidia RTX A2000dos módulos de RAM de 32 GB y dos SSD M.2-2280 de 2 TB. También hay modelos más asequibles con un Intel Core i5 (hexa-core) y con o sin GPU Nvidia
Condiciones de la prueba
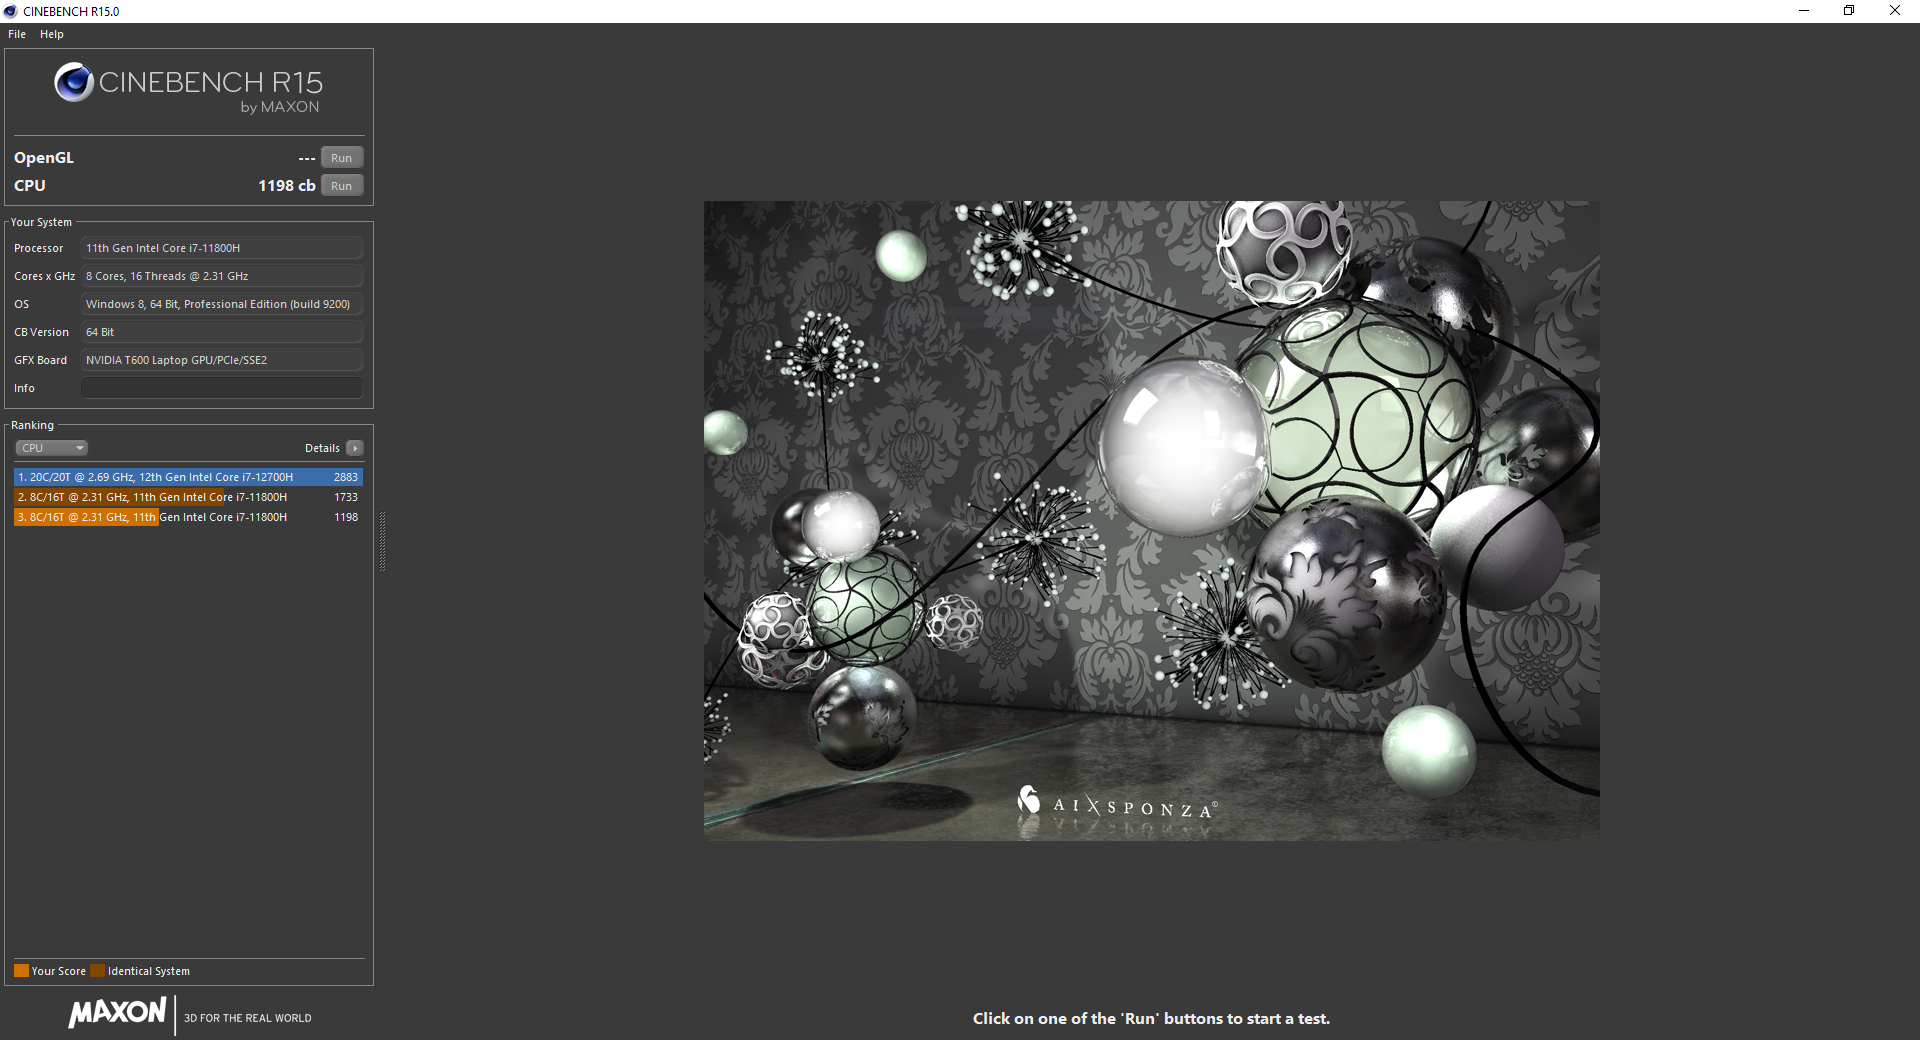
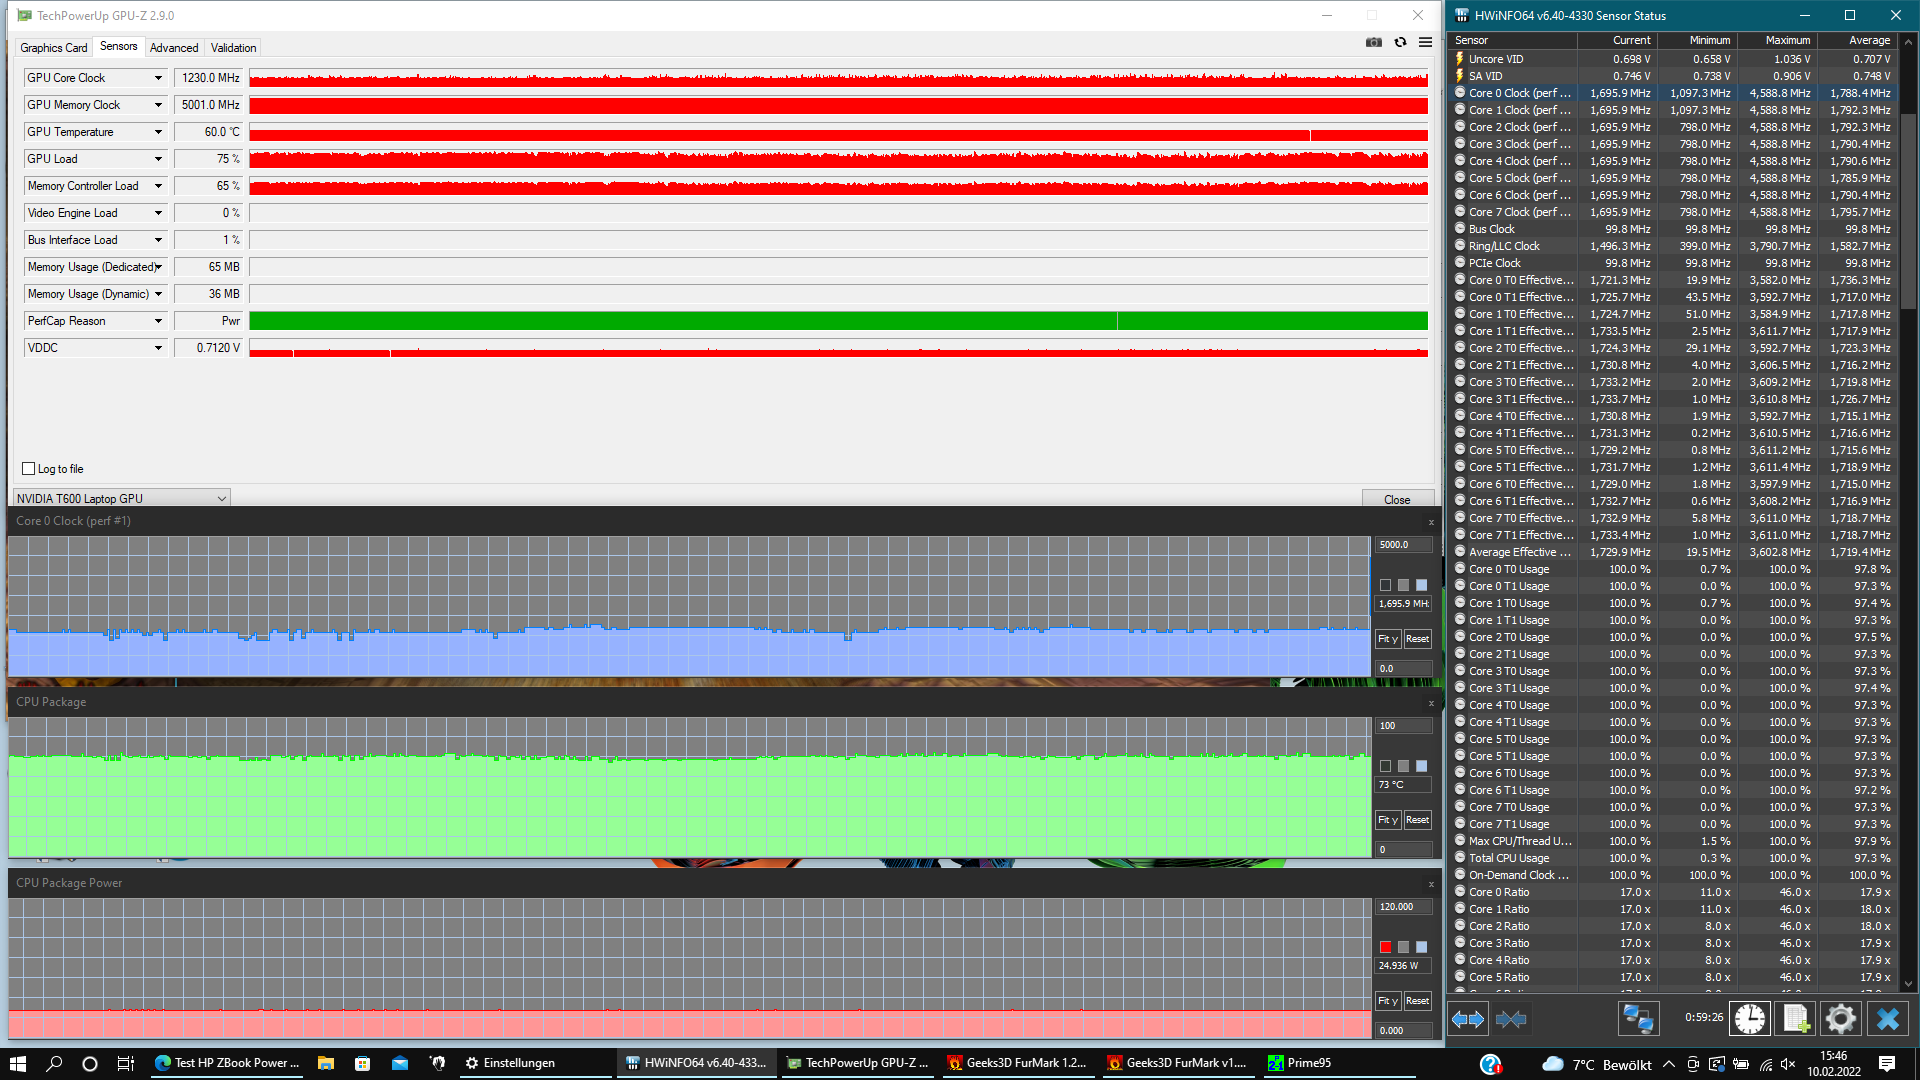
HP controla el rendimiento y el comportamiento del ventilador en el ZBook 15 G8 usando una IA llamada "Z Algorithms", que opera usando el Dynamic Tuning de Intel. Sin embargo, esto no parece estar del todo maduro aún, ya que el rendimiento no es constante. Una vez, nuestro bucle de pruebas Cinebench R15 logra una constante de 1.550 puntos en 25 ejecuciones, mientras que otro bucle resulta en sólo ~1.100 puntos y un tercero en ~1.300 puntos
Una actualización de la BIOS de la v1.01 a la v1.09 no mejoró las cosas, sino que resultó lo contrario: Los 2.075 puntos logrados inicialmente (constante: 1.826) en CBR15 ya no son reproducibles en ningún punto, pero los ventiladores son ahora significativamente menos agresivos. Según el resultado, el consumo constante fue de 40 vatios una vez y 47 vatios otra, o un máximo de 55 vatios constantemente.
Procesador
Con el comportamiento descrito de la IA, el rendimiento real del Intel Core i7-11800Hen combinación con la capacidad de refrigeración es difícil de precisar.
Mientras que todas las pruebas de CPU se realizaron con la antigua BIOS v1.01 cuando la IA aún era más benévola, el ZBook Power 15 lideró el campo de pruebas la mayoría de las veces. Tras la actualización de la BIOS, el rendimiento cae apenas por encima del ThinkPad P15v G2en promedio.
Tampoco parece haber ya un Turbo a corto plazo (PL2). Además, los ventiladores empiezan a revolucionar muy tarde (justo antes de terminar la primera carrera) y funcionan más silenciosamente que al principio, ya sea debido a la nueva BIOS o a una fuente de alimentación que no funciona bien. En funcionamiento con batería, el rendimiento se reduce de nuevo en un 25% aproximadamente.
Cinebench R15 Multi Constant Load Test
Cinebench R23: Multi Core | Single Core
Cinebench R20: CPU (Multi Core) | CPU (Single Core)
Cinebench R15: CPU Multi 64Bit | CPU Single 64Bit
Blender: v2.79 BMW27 CPU
7-Zip 18.03: 7z b 4 | 7z b 4 -mmt1
Geekbench 5.5: Multi-Core | Single-Core
HWBOT x265 Benchmark v2.2: 4k Preset
LibreOffice : 20 Documents To PDF
R Benchmark 2.5: Overall mean
Octane V2: Total Score
Jetstream 2: 2.0 Total
| CPU Performance rating | |
| Media de la clase Workstation | |
| HP ZBook Studio 15 G8 -1! | |
| HP ZBook Power 15 G8 313S5EA | |
| HP ZBook Fury 15 G8 -3! | |
| Medio Intel Core i7-11800H | |
| Lenovo ThinkPad P15v G2 21A9000XGE -3! | |
| Dell Precision 3000 3551 -4! | |
| HP ZBook Firefly 15 G8 2C9R7EA -4! | |
| Cinebench R23 / Multi Core | |
| Media de la clase Workstation (14621 - 38520, n=23, últimos 2 años) | |
| HP ZBook Power 15 G8 313S5EA | |
| HP ZBook Fury 15 G8 | |
| HP ZBook Studio 15 G8 | |
| Medio Intel Core i7-11800H (6508 - 14088, n=48) | |
| Lenovo ThinkPad P15v G2 21A9000XGE | |
| Cinebench R23 / Single Core | |
| Media de la clase Workstation (1712 - 2228, n=23, últimos 2 años) | |
| HP ZBook Fury 15 G8 | |
| HP ZBook Studio 15 G8 | |
| HP ZBook Power 15 G8 313S5EA | |
| Medio Intel Core i7-11800H (1386 - 1522, n=45) | |
| Cinebench R20 / CPU (Multi Core) | |
| Media de la clase Workstation (5760 - 15043, n=23, últimos 2 años) | |
| HP ZBook Fury 15 G8 | |
| HP ZBook Studio 15 G8 | |
| Medio Intel Core i7-11800H (2498 - 5408, n=50) | |
| HP ZBook Power 15 G8 313S5EA | |
| Lenovo ThinkPad P15v G2 21A9000XGE | |
| Dell Precision 3000 3551 | |
| HP ZBook Firefly 15 G8 2C9R7EA | |
| Cinebench R20 / CPU (Single Core) | |
| Media de la clase Workstation (671 - 857, n=23, últimos 2 años) | |
| HP ZBook Fury 15 G8 | |
| HP ZBook Studio 15 G8 | |
| HP ZBook Firefly 15 G8 2C9R7EA | |
| HP ZBook Power 15 G8 313S5EA | |
| Medio Intel Core i7-11800H (520 - 586, n=47) | |
| Lenovo ThinkPad P15v G2 21A9000XGE | |
| Dell Precision 3000 3551 | |
| Cinebench R15 / CPU Multi 64Bit | |
| Media de la clase Workstation (2489 - 5810, n=23, últimos 2 años) | |
| HP ZBook Power 15 G8 313S5EA | |
| HP ZBook Power 15 G8 313S5EA | |
| Medio Intel Core i7-11800H (1342 - 2173, n=50) | |
| HP ZBook Studio 15 G8 | |
| HP ZBook Fury 15 G8 | |
| Lenovo ThinkPad P15v G2 21A9000XGE | |
| Dell Precision 3000 3551 | |
| HP ZBook Firefly 15 G8 2C9R7EA | |
| Cinebench R15 / CPU Single 64Bit | |
| Media de la clase Workstation (191.4 - 328, n=23, últimos 2 años) | |
| HP ZBook Fury 15 G8 | |
| HP ZBook Studio 15 G8 | |
| HP ZBook Power 15 G8 313S5EA | |
| HP ZBook Firefly 15 G8 2C9R7EA | |
| Medio Intel Core i7-11800H (201 - 231, n=46) | |
| Lenovo ThinkPad P15v G2 21A9000XGE | |
| Dell Precision 3000 3551 | |
| Blender / v2.79 BMW27 CPU | |
| HP ZBook Firefly 15 G8 2C9R7EA | |
| Dell Precision 3000 3551 | |
| Lenovo ThinkPad P15v G2 21A9000XGE | |
| Medio Intel Core i7-11800H (217 - 454, n=46) | |
| HP ZBook Fury 15 G8 | |
| HP ZBook Power 15 G8 313S5EA | |
| HP ZBook Studio 15 G8 | |
| Media de la clase Workstation (91 - 222, n=23, últimos 2 años) | |
| 7-Zip 18.03 / 7z b 4 | |
| Media de la clase Workstation (60489 - 116969, n=23, últimos 2 años) | |
| HP ZBook Fury 15 G8 | |
| HP ZBook Studio 15 G8 | |
| HP ZBook Power 15 G8 313S5EA | |
| Medio Intel Core i7-11800H (33718 - 56758, n=46) | |
| Lenovo ThinkPad P15v G2 21A9000XGE | |
| Dell Precision 3000 3551 | |
| HP ZBook Firefly 15 G8 2C9R7EA | |
| 7-Zip 18.03 / 7z b 4 -mmt1 | |
| Media de la clase Workstation (5126 - 6960, n=23, últimos 2 años) | |
| HP ZBook Studio 15 G8 | |
| HP ZBook Fury 15 G8 | |
| HP ZBook Power 15 G8 313S5EA | |
| Medio Intel Core i7-11800H (5138 - 5732, n=46) | |
| HP ZBook Firefly 15 G8 2C9R7EA | |
| Dell Precision 3000 3551 | |
| Lenovo ThinkPad P15v G2 21A9000XGE | |
| Geekbench 5.5 / Multi-Core | |
| Media de la clase Workstation (11542 - 25554, n=23, últimos 2 años) | |
| Medio Intel Core i7-11800H (4655 - 9851, n=40) | |
| HP ZBook Power 15 G8 313S5EA | |
| HP ZBook Studio 15 G8 | |
| Dell Precision 3000 3551 | |
| Lenovo ThinkPad P15v G2 21A9000XGE | |
| HP ZBook Firefly 15 G8 2C9R7EA | |
| Geekbench 5.5 / Single-Core | |
| Media de la clase Workstation (1783 - 2183, n=23, últimos 2 años) | |
| HP ZBook Studio 15 G8 | |
| Medio Intel Core i7-11800H (1429 - 1625, n=40) | |
| HP ZBook Firefly 15 G8 2C9R7EA | |
| HP ZBook Power 15 G8 313S5EA | |
| Lenovo ThinkPad P15v G2 21A9000XGE | |
| Dell Precision 3000 3551 | |
| HWBOT x265 Benchmark v2.2 / 4k Preset | |
| Media de la clase Workstation (17.8 - 40.5, n=23, últimos 2 años) | |
| HP ZBook Studio 15 G8 | |
| HP ZBook Fury 15 G8 | |
| HP ZBook Power 15 G8 313S5EA | |
| Medio Intel Core i7-11800H (7.38 - 17.4, n=46) | |
| Lenovo ThinkPad P15v G2 21A9000XGE | |
| Dell Precision 3000 3551 | |
| HP ZBook Firefly 15 G8 2C9R7EA | |
| LibreOffice / 20 Documents To PDF | |
| Lenovo ThinkPad P15v G2 21A9000XGE | |
| HP ZBook Fury 15 G8 | |
| HP ZBook Studio 15 G8 | |
| Media de la clase Workstation (37.1 - 74.7, n=23, últimos 2 años) | |
| Medio Intel Core i7-11800H (38.6 - 59.9, n=45) | |
| Dell Precision 3000 3551 | |
| HP ZBook Power 15 G8 313S5EA | |
| HP ZBook Firefly 15 G8 2C9R7EA | |
| R Benchmark 2.5 / Overall mean | |
| HP ZBook Power 15 G8 313S5EA | |
| Lenovo ThinkPad P15v G2 21A9000XGE | |
| Dell Precision 3000 3551 | |
| Medio Intel Core i7-11800H (0.548 - 0.615, n=46) | |
| HP ZBook Firefly 15 G8 2C9R7EA | |
| HP ZBook Studio 15 G8 | |
| HP ZBook Fury 15 G8 | |
| Media de la clase Workstation (0.3825 - 0.603, n=23, últimos 2 años) | |
| Octane V2 / Total Score | |
| Media de la clase Workstation (112382 - 129420, n=3, últimos 2 años) | |
| Medio Intel Core i7-11800H (63248 - 70549, n=10) | |
| HP ZBook Power 15 G8 313S5EA | |
| Jetstream 2 / 2.0 Total | |
| Media de la clase Workstation (327 - 466, n=4, últimos 2 años) | |
| HP ZBook Power 15 G8 313S5EA | |
| HP ZBook Fury 15 G8 | |
| HP ZBook Studio 15 G8 | |
| Medio Intel Core i7-11800H (159.8 - 214, n=16) | |
* ... más pequeño es mejor
AIDA64: FP32 Ray-Trace | FPU Julia | CPU SHA3 | CPU Queen | FPU SinJulia | FPU Mandel | CPU AES | CPU ZLib | FP64 Ray-Trace | CPU PhotoWorxx
| Performance rating | |
| Media de la clase Workstation | |
| HP ZBook Fury 15 G8 | |
| HP ZBook Studio 15 G8 | |
| HP ZBook Power 15 G8 313S5EA | |
| Medio Intel Core i7-11800H | |
| Lenovo ThinkPad P15v G2 21A9000XGE | |
| HP ZBook Firefly 15 G8 2C9R7EA | |
| AIDA64 / FP32 Ray-Trace | |
| Media de la clase Workstation (16730 - 61611, n=23, últimos 2 años) | |
| HP ZBook Power 15 G8 313S5EA | |
| HP ZBook Fury 15 G8 | |
| HP ZBook Studio 15 G8 | |
| Medio Intel Core i7-11800H (8772 - 15961, n=20) | |
| Lenovo ThinkPad P15v G2 21A9000XGE | |
| HP ZBook Firefly 15 G8 2C9R7EA | |
| AIDA64 / FPU Julia | |
| Media de la clase Workstation (89597 - 186971, n=23, últimos 2 años) | |
| HP ZBook Fury 15 G8 | |
| HP ZBook Studio 15 G8 | |
| HP ZBook Power 15 G8 313S5EA | |
| Medio Intel Core i7-11800H (39404 - 65636, n=20) | |
| Lenovo ThinkPad P15v G2 21A9000XGE | |
| HP ZBook Firefly 15 G8 2C9R7EA | |
| AIDA64 / CPU SHA3 | |
| Media de la clase Workstation (4178 - 8975, n=23, últimos 2 años) | |
| HP ZBook Power 15 G8 313S5EA | |
| HP ZBook Fury 15 G8 | |
| HP ZBook Studio 15 G8 | |
| Medio Intel Core i7-11800H (2599 - 4439, n=20) | |
| Lenovo ThinkPad P15v G2 21A9000XGE | |
| HP ZBook Firefly 15 G8 2C9R7EA | |
| AIDA64 / CPU Queen | |
| Media de la clase Workstation (60778 - 144411, n=23, últimos 2 años) | |
| HP ZBook Studio 15 G8 | |
| HP ZBook Fury 15 G8 | |
| HP ZBook Power 15 G8 313S5EA | |
| Medio Intel Core i7-11800H (85233 - 91941, n=20) | |
| Lenovo ThinkPad P15v G2 21A9000XGE | |
| HP ZBook Firefly 15 G8 2C9R7EA | |
| AIDA64 / FPU SinJulia | |
| Media de la clase Workstation (8165 - 29343, n=23, últimos 2 años) | |
| HP ZBook Fury 15 G8 | |
| HP ZBook Studio 15 G8 | |
| HP ZBook Power 15 G8 313S5EA | |
| Medio Intel Core i7-11800H (6420 - 9792, n=20) | |
| Lenovo ThinkPad P15v G2 21A9000XGE | |
| HP ZBook Firefly 15 G8 2C9R7EA | |
| AIDA64 / FPU Mandel | |
| Media de la clase Workstation (44497 - 98153, n=23, últimos 2 años) | |
| HP ZBook Fury 15 G8 | |
| HP ZBook Power 15 G8 313S5EA | |
| HP ZBook Studio 15 G8 | |
| Medio Intel Core i7-11800H (23365 - 39464, n=20) | |
| Lenovo ThinkPad P15v G2 21A9000XGE | |
| HP ZBook Firefly 15 G8 2C9R7EA | |
| AIDA64 / CPU AES | |
| Medio Intel Core i7-11800H (74617 - 149388, n=20) | |
| Media de la clase Workstation (73133 - 187841, n=23, últimos 2 años) | |
| HP ZBook Power 15 G8 313S5EA | |
| HP ZBook Studio 15 G8 | |
| HP ZBook Fury 15 G8 | |
| Lenovo ThinkPad P15v G2 21A9000XGE | |
| HP ZBook Firefly 15 G8 2C9R7EA | |
| AIDA64 / CPU ZLib | |
| Media de la clase Workstation (929 - 2148, n=23, últimos 2 años) | |
| HP ZBook Power 15 G8 313S5EA | |
| HP ZBook Studio 15 G8 | |
| HP ZBook Fury 15 G8 | |
| Lenovo ThinkPad P15v G2 21A9000XGE | |
| HP ZBook Firefly 15 G8 2C9R7EA | |
| Medio Intel Core i7-11800H (461 - 830, n=43) | |
| AIDA64 / FP64 Ray-Trace | |
| Media de la clase Workstation (8545 - 32891, n=23, últimos 2 años) | |
| HP ZBook Power 15 G8 313S5EA | |
| HP ZBook Fury 15 G8 | |
| HP ZBook Studio 15 G8 | |
| Medio Intel Core i7-11800H (4545 - 8717, n=21) | |
| Lenovo ThinkPad P15v G2 21A9000XGE | |
| HP ZBook Firefly 15 G8 2C9R7EA | |
| AIDA64 / CPU PhotoWorxx | |
| Media de la clase Workstation (37151 - 93684, n=23, últimos 2 años) | |
| HP ZBook Fury 15 G8 | |
| HP ZBook Studio 15 G8 | |
| Medio Intel Core i7-11800H (11898 - 26757, n=21) | |
| HP ZBook Firefly 15 G8 2C9R7EA | |
| HP ZBook Power 15 G8 313S5EA | |
| Lenovo ThinkPad P15v G2 21A9000XGE | |
Rendimiento de la estación de trabajo
El rendimiento en las aplicaciones relacionadas con la estación de trabajo se evaluó con la nueva BIOS (v1.09). Aquí, se coloca alrededor de un 10% por detrás del ThinkPad P15v G2con laNvidia T1200mientras que el HP Fireflycon laNvidia T500es superado por cerca del 45%. Por otro lado, el ZBook Fury conRTX A5000ofrece el doble de rendimiento la mayor parte del tiempo.
ElRTX A2000que es el máximo que puedes seleccionar para el ZBook Power 15, debería funcionar un 50% más rápido.
| V-Ray 5 Benchmark | |
| CPU | |
| HP ZBook Fury 15 G8 | |
| Lenovo ThinkPad P15v G2 21A9000XGE | |
| GPU CUDA | |
| Lenovo ThinkPad P15v G2 21A9000XGE | |
| HP ZBook Power 15 G8 313S5EA | |
| Geekbench 5.5 - OpenCL Score | |
| Lenovo ThinkPad P15v G2 21A9000XGE | |
| HP ZBook Power 15 G8 313S5EA | |
| HP ZBook Firefly 15 G8 2C9R7EA | |
| Dell Precision 3000 3551 | |
Rendimiento del sistema
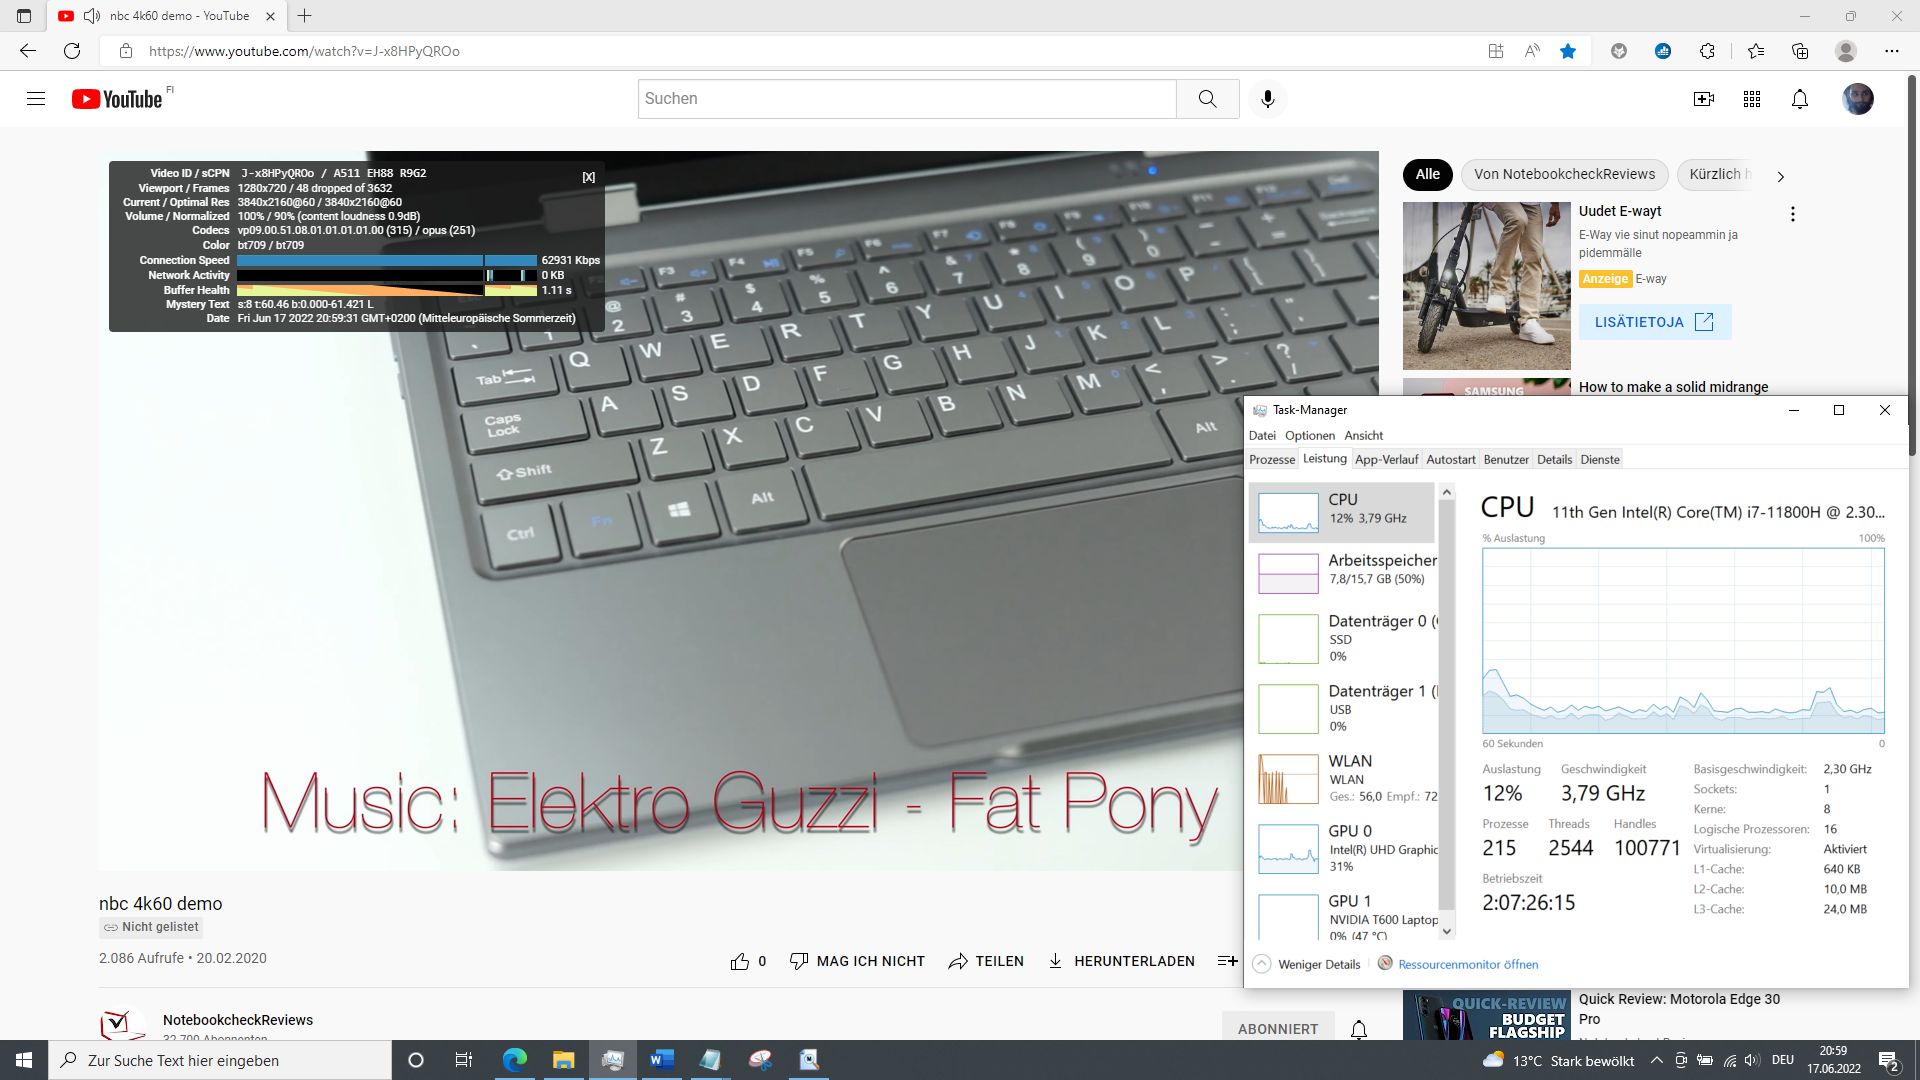
A pesar de la RAM monocanal, el sistema va absolutamente libre de retrasos, incluso cuando se trabaja con múltiples pestañas del navegador mientras se ejecuta un vídeo 4K de YouTube en segundo plano.
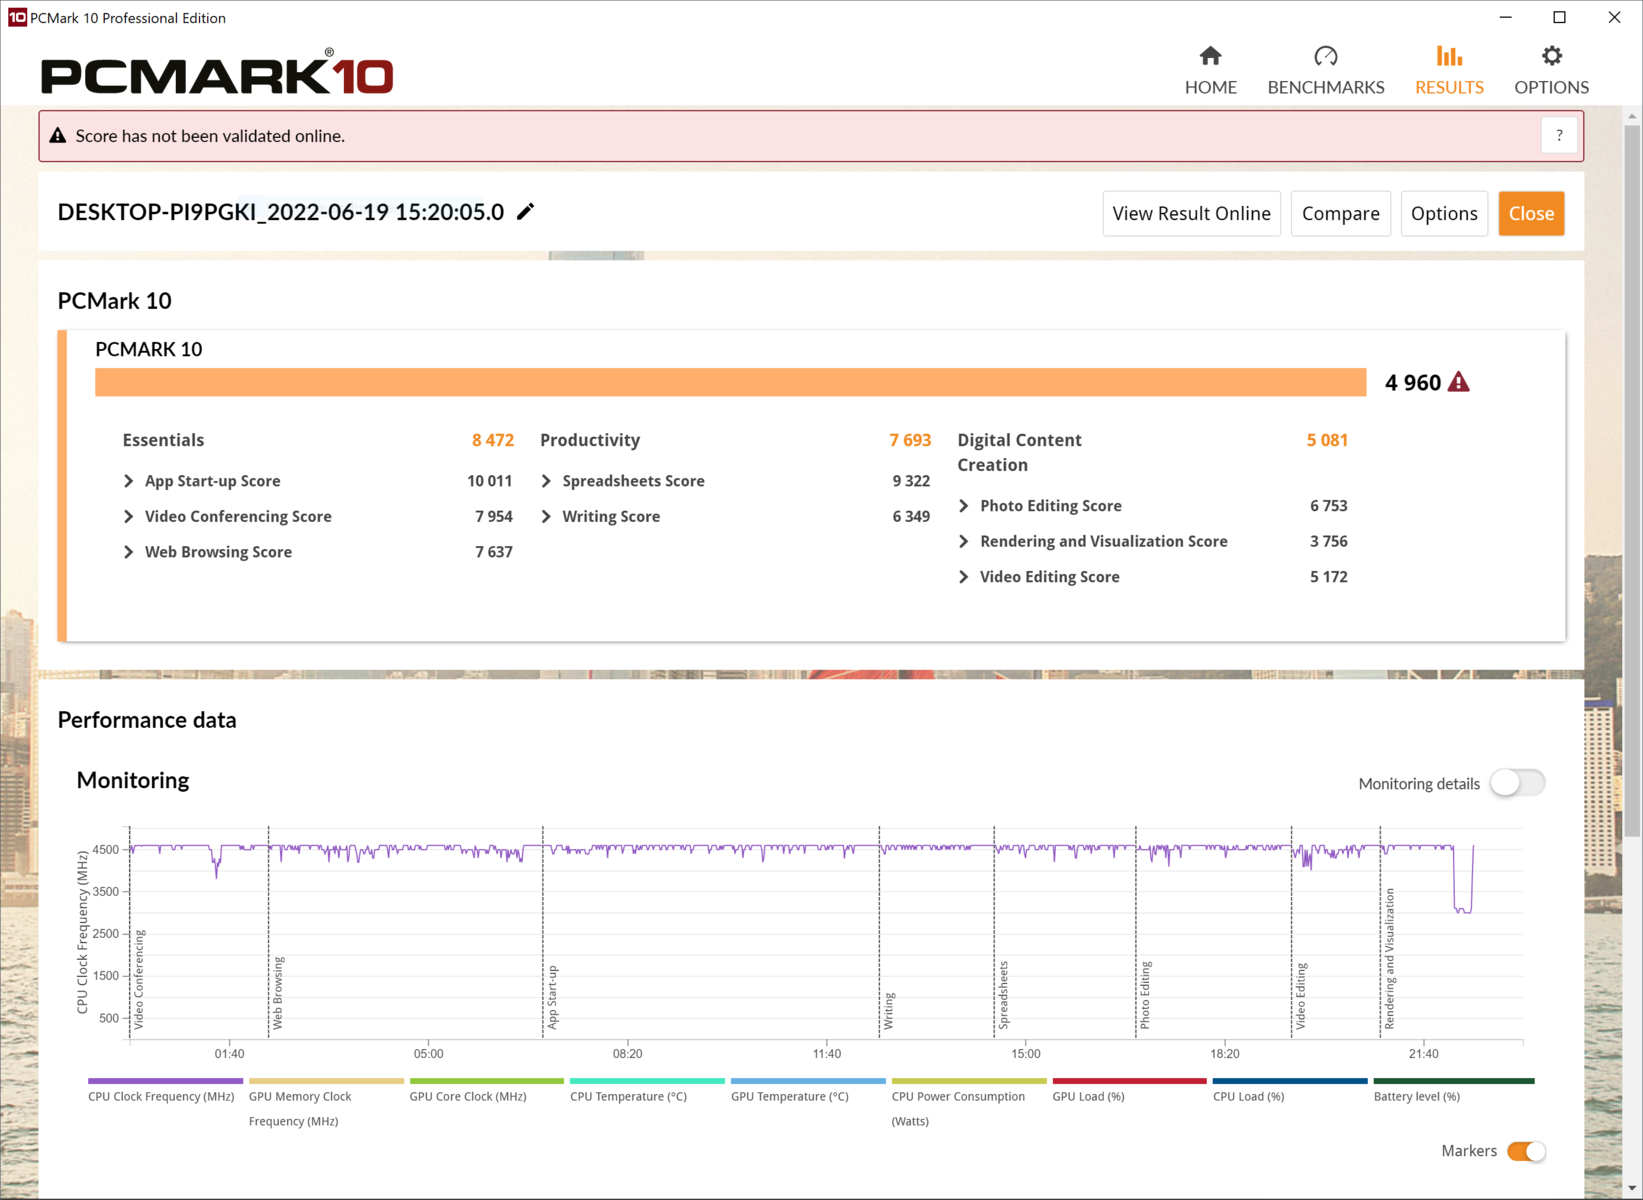
Con la nueva BIOS, se pierde alrededor de un 15% del rendimiento, por lo que nuestra unidad de pruebas acaba en último lugar en el benchmark PCMark 10. En particular, la puntuación de Creación de Contenido ha caído en torno al 28%.
CrossMark: Overall | Productivity | Creativity | Responsiveness
| PCMark 10 / Score | |
| Media de la clase Workstation (6563 - 10409, n=19, últimos 2 años) | |
| HP ZBook Fury 15 G8 | |
| HP ZBook Studio 15 G8 | |
| Lenovo ThinkPad P15v G2 21A9000XGE | |
| HP ZBook Firefly 15 G8 2C9R7EA | |
| Dell Precision 3000 3551 | |
| HP ZBook Power 15 G8 313S5EA | |
| Medio Intel Core i7-11800H, NVIDIA T600 Laptop GPU (n=1) | |
| PCMark 10 / Essentials | |
| Media de la clase Workstation (9622 - 11157, n=19, últimos 2 años) | |
| Dell Precision 3000 3551 | |
| HP ZBook Fury 15 G8 | |
| HP ZBook Studio 15 G8 | |
| Lenovo ThinkPad P15v G2 21A9000XGE | |
| HP ZBook Firefly 15 G8 2C9R7EA | |
| HP ZBook Power 15 G8 313S5EA | |
| Medio Intel Core i7-11800H, NVIDIA T600 Laptop GPU (n=1) | |
| PCMark 10 / Productivity | |
| Media de la clase Workstation (8789 - 20616, n=19, últimos 2 años) | |
| HP ZBook Firefly 15 G8 2C9R7EA | |
| HP ZBook Fury 15 G8 | |
| HP ZBook Studio 15 G8 | |
| Lenovo ThinkPad P15v G2 21A9000XGE | |
| Dell Precision 3000 3551 | |
| HP ZBook Power 15 G8 313S5EA | |
| Medio Intel Core i7-11800H, NVIDIA T600 Laptop GPU (n=1) | |
| PCMark 10 / Digital Content Creation | |
| Media de la clase Workstation (8108 - 15631, n=19, últimos 2 años) | |
| HP ZBook Fury 15 G8 | |
| HP ZBook Studio 15 G8 | |
| Lenovo ThinkPad P15v G2 21A9000XGE | |
| HP ZBook Firefly 15 G8 2C9R7EA | |
| HP ZBook Power 15 G8 313S5EA | |
| Medio Intel Core i7-11800H, NVIDIA T600 Laptop GPU (n=1) | |
| Dell Precision 3000 3551 | |
| CrossMark / Overall | |
| Media de la clase Workstation (1307 - 2267, n=22, últimos 2 años) | |
| HP ZBook Power 15 G8 313S5EA | |
| Medio Intel Core i7-11800H, NVIDIA T600 Laptop GPU (n=1) | |
| Lenovo ThinkPad P15v G2 21A9000XGE | |
| CrossMark / Productivity | |
| Media de la clase Workstation (1130 - 2122, n=22, últimos 2 años) | |
| HP ZBook Power 15 G8 313S5EA | |
| Medio Intel Core i7-11800H, NVIDIA T600 Laptop GPU (n=1) | |
| Lenovo ThinkPad P15v G2 21A9000XGE | |
| CrossMark / Creativity | |
| Media de la clase Workstation (1657 - 2725, n=22, últimos 2 años) | |
| HP ZBook Power 15 G8 313S5EA | |
| Medio Intel Core i7-11800H, NVIDIA T600 Laptop GPU (n=1) | |
| Lenovo ThinkPad P15v G2 21A9000XGE | |
| CrossMark / Responsiveness | |
| Media de la clase Workstation (993 - 2096, n=22, últimos 2 años) | |
| HP ZBook Power 15 G8 313S5EA | |
| Medio Intel Core i7-11800H, NVIDIA T600 Laptop GPU (n=1) | |
| Lenovo ThinkPad P15v G2 21A9000XGE | |
| PCMark 10 Score | 4960 puntos | |
ayuda | ||
| AIDA64 / Memory Copy | |
| Media de la clase Workstation (56003 - 164795, n=23, últimos 2 años) | |
| HP ZBook Fury 15 G8 | |
| HP ZBook Studio 15 G8 | |
| Medio Intel Core i7-11800H (24508 - 48144, n=21) | |
| HP ZBook Power 15 G8 313S5EA | |
| HP ZBook Firefly 15 G8 2C9R7EA | |
| Lenovo ThinkPad P15v G2 21A9000XGE | |
| AIDA64 / Memory Read | |
| Media de la clase Workstation (55795 - 121563, n=23, últimos 2 años) | |
| HP ZBook Studio 15 G8 | |
| HP ZBook Fury 15 G8 | |
| Medio Intel Core i7-11800H (25882 - 50365, n=20) | |
| HP ZBook Power 15 G8 313S5EA | |
| Lenovo ThinkPad P15v G2 21A9000XGE | |
| HP ZBook Firefly 15 G8 2C9R7EA | |
| AIDA64 / Memory Write | |
| Media de la clase Workstation (55663 - 214520, n=23, últimos 2 años) | |
| HP ZBook Studio 15 G8 | |
| HP ZBook Fury 15 G8 | |
| Medio Intel Core i7-11800H (22240 - 46214, n=20) | |
| HP ZBook Firefly 15 G8 2C9R7EA | |
| HP ZBook Power 15 G8 313S5EA | |
| Lenovo ThinkPad P15v G2 21A9000XGE | |
| AIDA64 / Memory Latency | |
| Media de la clase Workstation (84.5 - 165.2, n=23, últimos 2 años) | |
| Lenovo ThinkPad P15v G2 21A9000XGE | |
| HP ZBook Fury 15 G8 | |
| HP ZBook Studio 15 G8 | |
| HP ZBook Power 15 G8 313S5EA | |
| HP ZBook Firefly 15 G8 2C9R7EA | |
| Medio Intel Core i7-11800H (71.9 - 104.1, n=44) | |
* ... más pequeño es mejor
Latencias del CPD
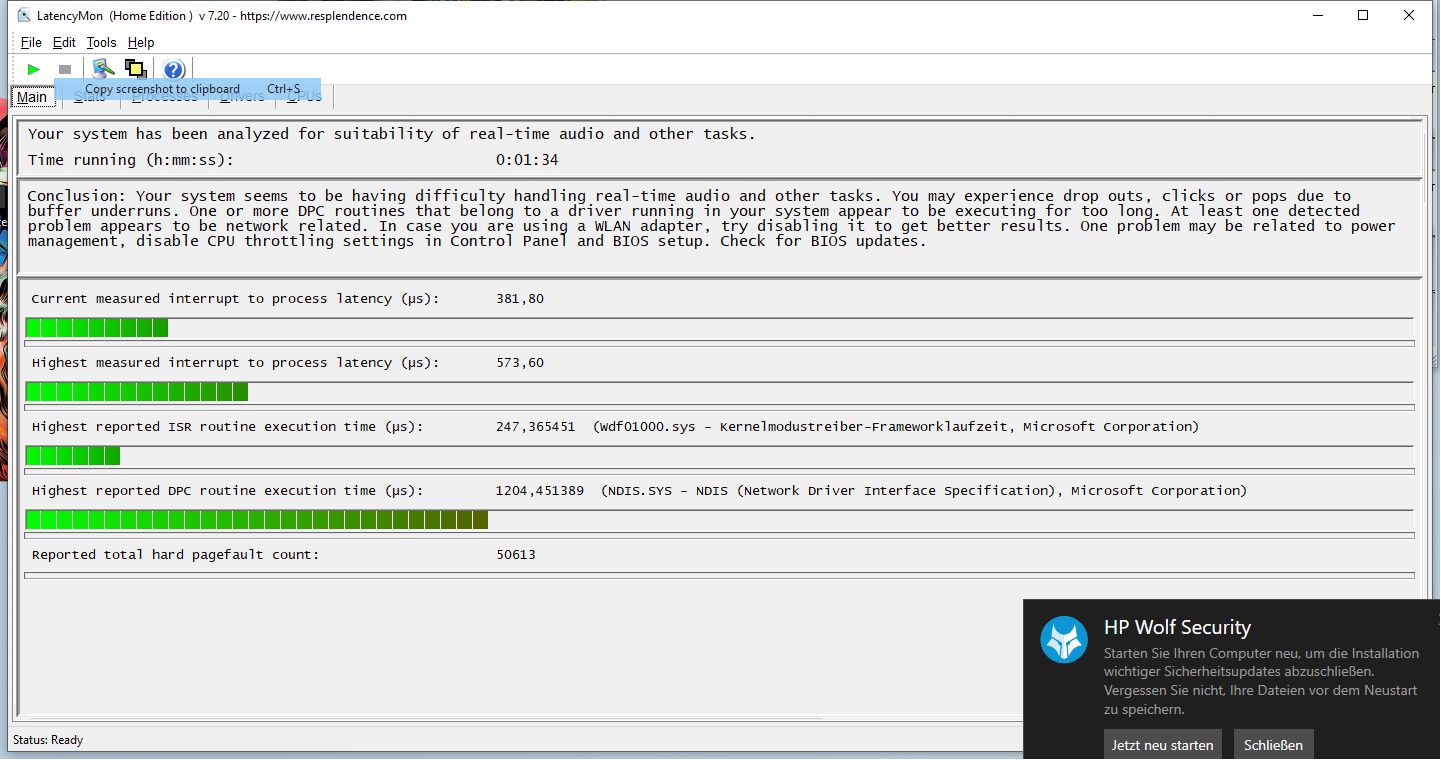
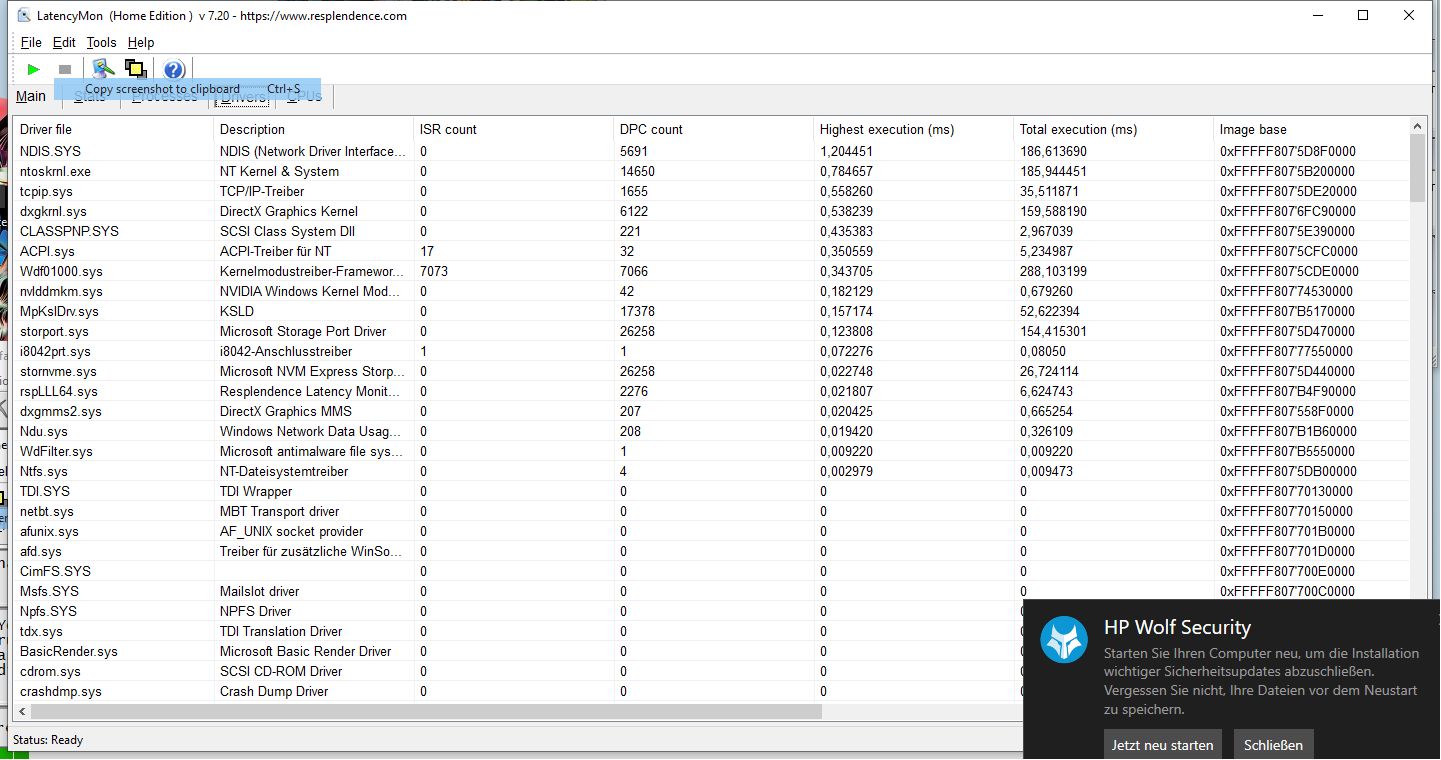
Con sólo 537,6 µs, la latencia DPC del ZBook Power 15 parece muy buena. Sin embargo, el análisis sigue mostrando que el driver de red causa algunos retrasos, por lo que el procesado de vídeo y audio en tiempo real sólo funcionará sin usar el Wi-Fi AX201 de Intel
Reproducir un vídeo 4K de YouTube causa una carga del 30% en la iGPU y del 12% en la CPU, pero seguimos notando algunos fotogramas caídos.
| DPC Latencies / LatencyMon - interrupt to process latency (max), Web, Youtube, Prime95 (ordenar por valor) | |
| HP ZBook Power 15 G8 313S5EA | |
| HP ZBook Fury 15 G8 | |
| HP ZBook Firefly 15 G8 2C9R7EA | |
| HP ZBook Studio 15 G8 | |
| Dell Precision 3000 3551 | |
| Lenovo ThinkPad P15v G2 21A9000XGE | |
* ... más pequeño es mejor
Solución de almacenamiento
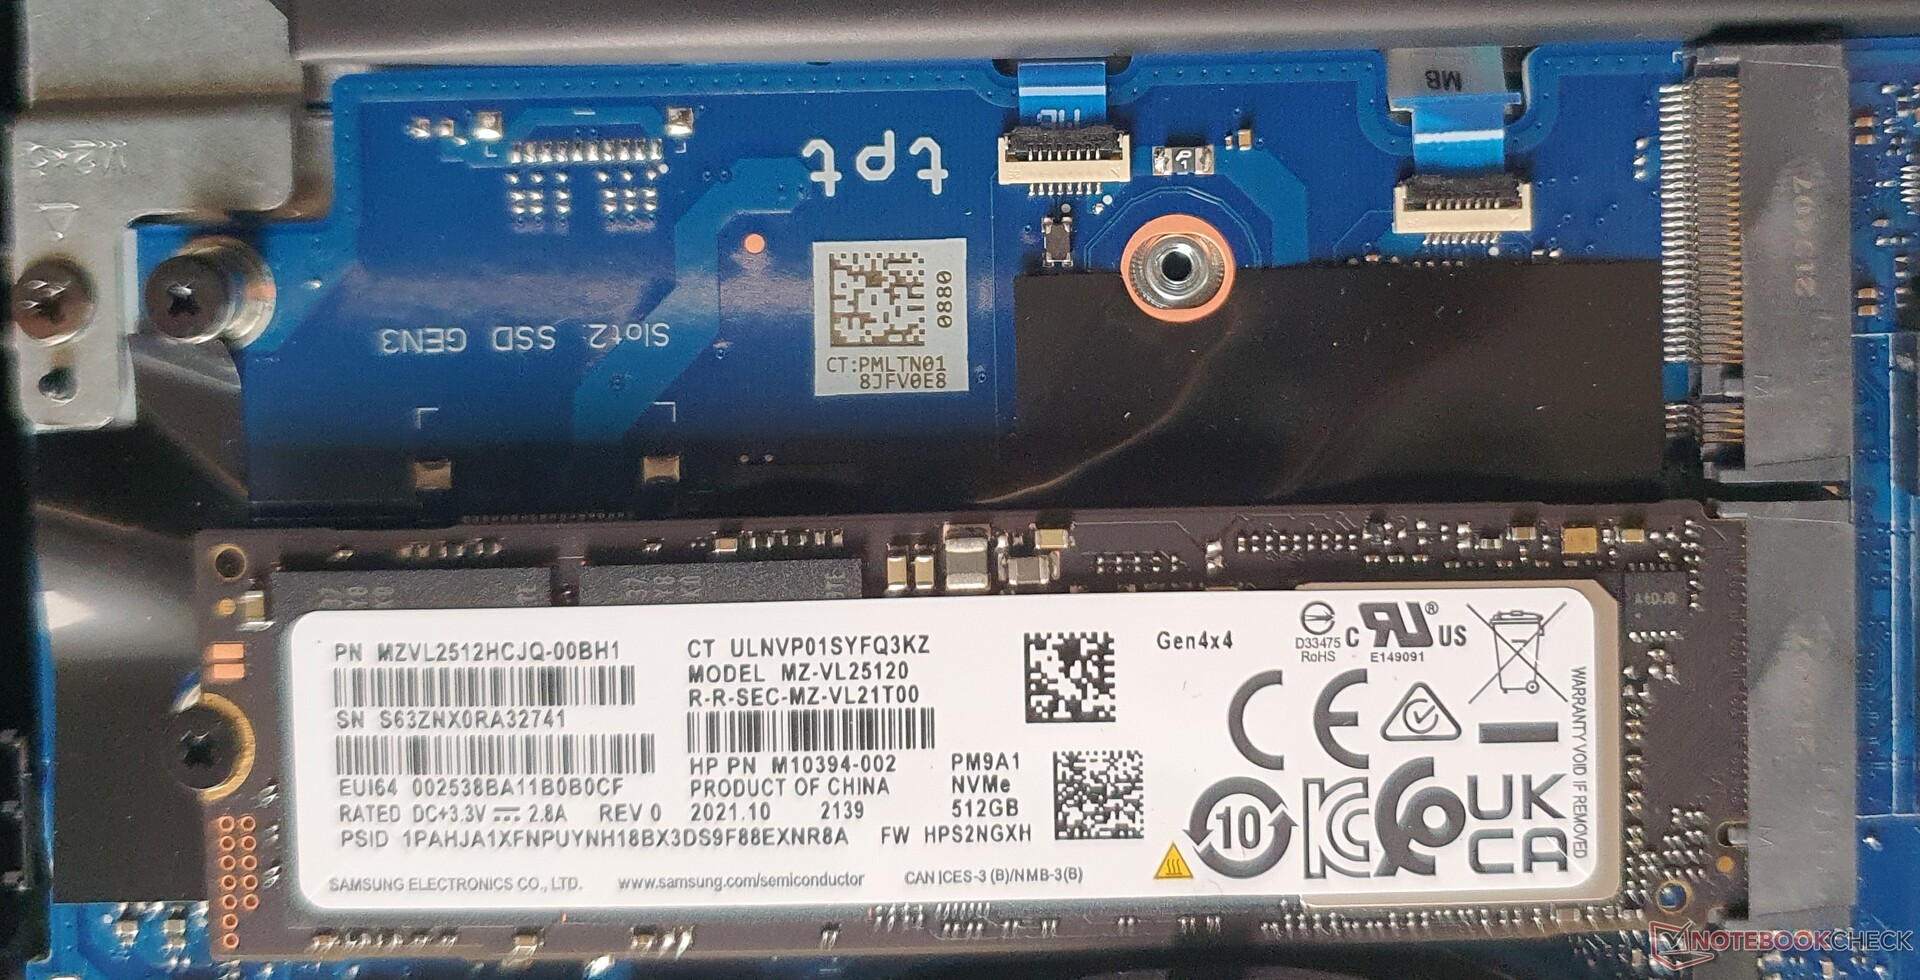
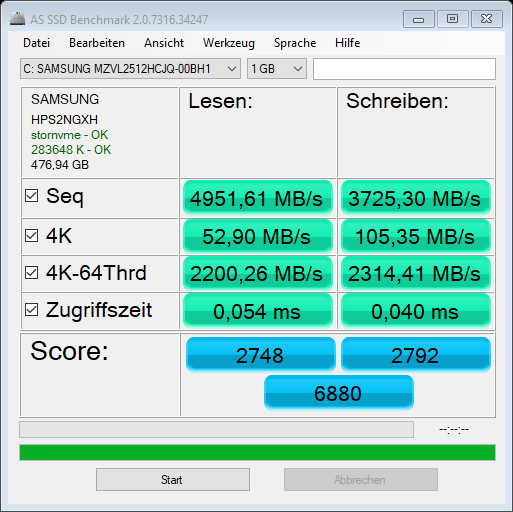
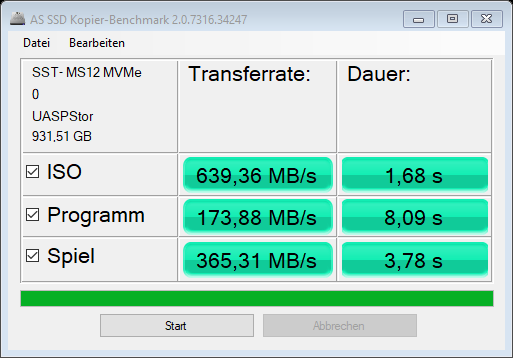
El Samsung PM9A1 ofrece espacio para 512 GB, de los cuales unos 418 GB quedan disponibles para el usuario en el estado de entrega. Gracias a PCIe Gen4x4, las velocidades, incluyendo los valores 4K y los tiempos de acceso, parecen muy buenos inicialmente. También hay disponible una segunda ranura (PCIe Gen3x4), y ambas están certificadas hasta 2 TB.
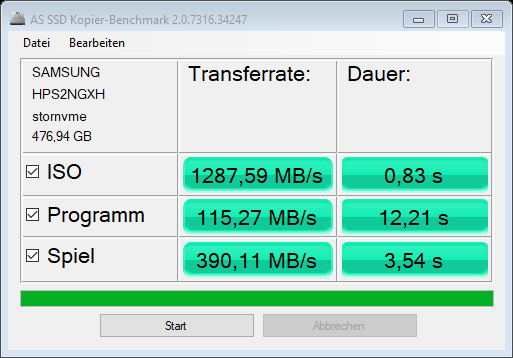
Sin embargo, al copiar un programa más grande, por ejemplo, el AS SSD muestra tasas de transferencia muy débiles de 115 MB/s en lugar de los 1074 MB/s delZBook Studio 15 G8. Incluso el asequible Dell Precision 3511 logra tasas de copia significativamente más altas. Nuestro SSD externo de 10 Gbps también copia los programas más rápido.
| HP ZBook Power 15 G8 313S5EA T600 Laptop GPU, i7-11800H, Samsung PM9A1 MZVL2512HCJQ | HP ZBook Fury 15 G8 RTX A5000 Laptop GPU, i9-11950H, Samsung PM981a MZVLB1T0HBLR | HP ZBook Studio 15 G8 GeForce RTX 3070 Laptop GPU, i9-11950H, Samsung PM981a MZVLB2T0HALB | HP ZBook Firefly 15 G8 2C9R7EA T500 Laptop GPU, i7-1165G7, Toshiba XG6 KXG60ZNV1T02 | Lenovo ThinkPad P15v G2 21A9000XGE T1200 Laptop GPU, i7-11800H, Toshiba XG6 KXG6AZNV512G | Dell Precision 3000 3551 Quadro P620, i9-10885H, Toshiba Kioxia XG6 KXG60PNV512G | |
|---|---|---|---|---|---|---|
| AS SSD | -35% | 64% | -26% | -9% | 24% | |
| Seq Read (MB/s) | 4951 | 2937 -41% | 2953 -40% | 2599 -48% | 2684 -46% | 1833 -63% |
| Seq Write (MB/s) | 3725 | 1688 -55% | 1691 -55% | 1305 -65% | 1352 -64% | 1283 -66% |
| 4K Read (MB/s) | 52.9 | 44.27 -16% | 43.98 -17% | 49.65 -6% | 43.68 -17% | 44.56 -16% |
| 4K Write (MB/s) | 105.35 | 105.8 0% | 105.4 0% | 128.1 22% | 105.56 0% | 112.4 7% |
| 4K-64 Read (MB/s) | 2200.26 | 873 -60% | 1065 -52% | 1157 -47% | 976.92 -56% | 1106 -50% |
| 4K-64 Write (MB/s) | 2314.41 | 1996 -14% | 1957 -15% | 1475 -36% | 1452.09 -37% | 1262 -45% |
| Access Time Read * (ms) | 0.054 | 0.048 11% | 0.04 26% | 0.057 -6% | 0.124 -130% | 0.084 -56% |
| Access Time Write * (ms) | 0.04 | 0.107 -168% | 0.105 -163% | 0.03 25% | 0.038 5% | 0.105 -163% |
| Score Read (Points) | 2748 | 1211 -56% | 1404 -49% | 1467 -47% | 1289 -53% | 1334 -51% |
| Score Write (Points) | 2792 | 2271 -19% | 2232 -20% | 1734 -38% | 1693 -39% | 1503 -46% |
| Score Total (Points) | 6880 | 4046 -41% | 4297 -38% | 3894 -43% | 3582 -48% | 3498 -49% |
| Copy ISO MB/s (MB/s) | 1287.6 | 901 -30% | 2474 92% | 1760.5 37% | 2940 128% | |
| Copy Program MB/s (MB/s) | 115.3 | 118.7 3% | 1074 831% | 355 208% | 733 536% | |
| Copy Game MB/s (MB/s) | 390.1 | 372 -5% | 1929 394% | 849 118% | 1442 270% |
* ... más pequeño es mejor
* ... más pequeño es mejor
Constant Performance Reading: DiskSpd Read Loop, Queue Depth 8
Tarjeta gráfica

ElNvidia T600utilizada aquí es la versión profesional de la GeForce GTX 1650 (no-Ti) con 4 GB de VRAM GDDR6 y un TGP de 25 vatios y boosts de hasta 1395 MHz
En muchos benchmarks, queda un ~15% por detrás de la Nvidia T1200delThinkPad P15v G2y entre un 30 y un 50% por delante del Nvidia T500 en elZBook Firefly 15 G8
En funcionamiento con batería, perderá aproximadamente un 20% de la potencia gráfica, lo que le permitirá seguir trabajando en tareas de la GPU en funcionamiento móvil.

| 3DMark Performance rating - Percent | |
| Media de la clase Workstation | |
| HP ZBook Fury 15 G8 -4! | |
| HP ZBook Studio 15 G8 -4! | |
| HP ZBook Power 15 G8 313S5EA | |
| Medio NVIDIA T600 Laptop GPU | |
| Lenovo ThinkPad P15v G2 21A9000XGE -3! | |
| Dell Precision 3000 3551 -3! | |
| HP ZBook Firefly 15 G8 2C9R7EA -4! | |
| 3DMark 06 - 1280x1024 Standard Score AA:0x AF:0x | |
| Media de la clase Workstation (53112 - 63693, n=3, últimos 2 años) | |
| HP ZBook Power 15 G8 313S5EA | |
| Medio NVIDIA T600 Laptop GPU (n=1) | |
| Lenovo ThinkPad P15v G2 21A9000XGE | |
| Dell Precision 3000 3551 | |
| 3DMark Vantage | |
| 1280x1024 P Result | |
| Media de la clase Workstation (71988 - 116321, n=3, últimos 2 años) | |
| HP ZBook Power 15 G8 313S5EA | |
| Medio NVIDIA T600 Laptop GPU (n=1) | |
| 1280x1024 P GPU no PhysX | |
| Media de la clase Workstation (66766 - 117151, n=2, últimos 2 años) | |
| HP ZBook Power 15 G8 313S5EA | |
| Medio NVIDIA T600 Laptop GPU (n=1) | |
| 1280x1024 P CPU no PhysX | |
| Media de la clase Workstation (94058 - 113900, n=2, últimos 2 años) | |
| HP ZBook Power 15 G8 313S5EA | |
| Medio NVIDIA T600 Laptop GPU (n=1) | |
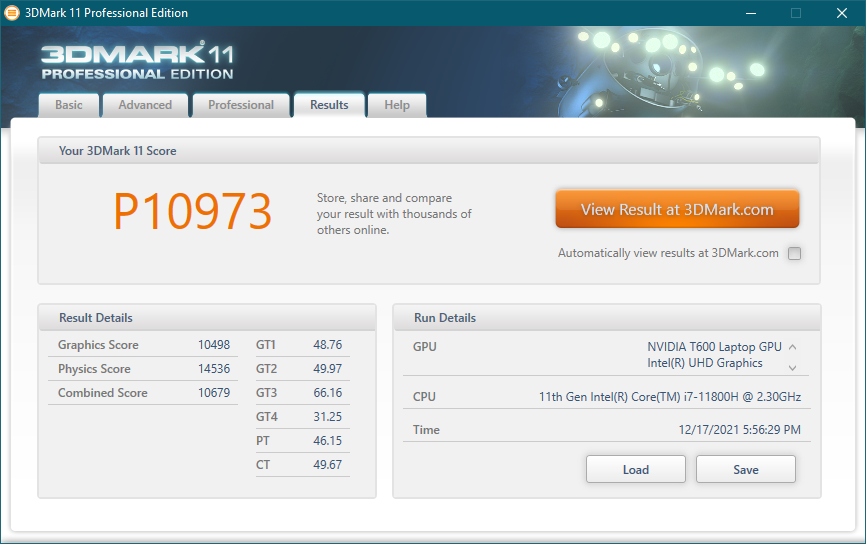
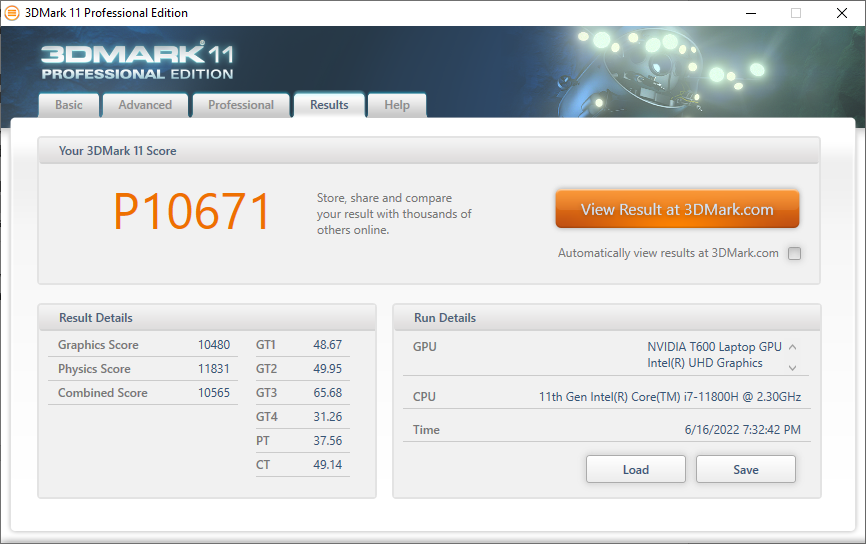
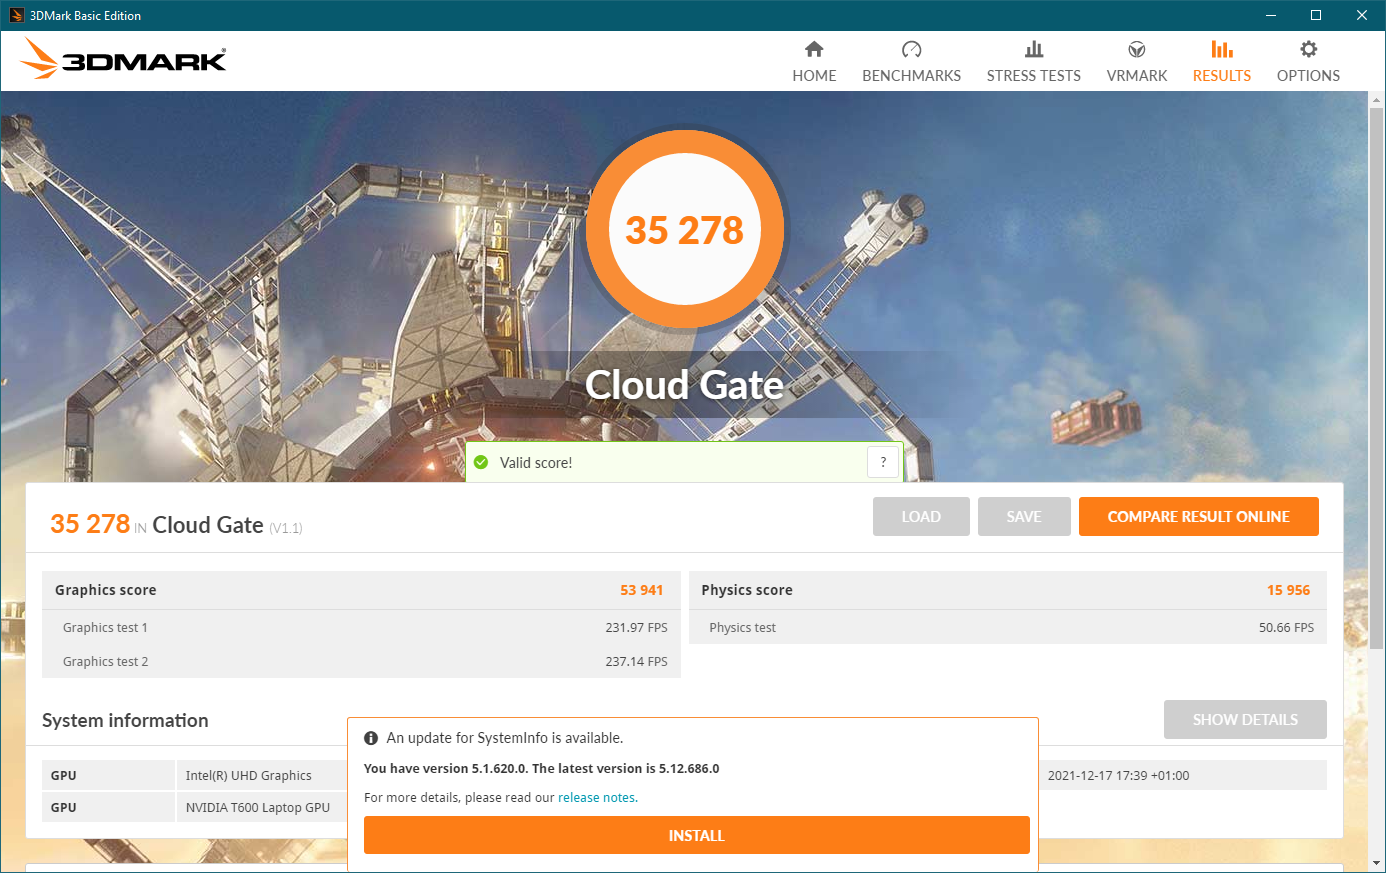
| 3DMark 06 Standard Score | 43438 puntos | |
| 3DMark Vantage P Result | 39112 puntos | |
| 3DMark 11 Performance | 10973 puntos | |
| 3DMark Ice Storm Standard Score | 76482 puntos | |
| 3DMark Cloud Gate Standard Score | 35278 puntos | |
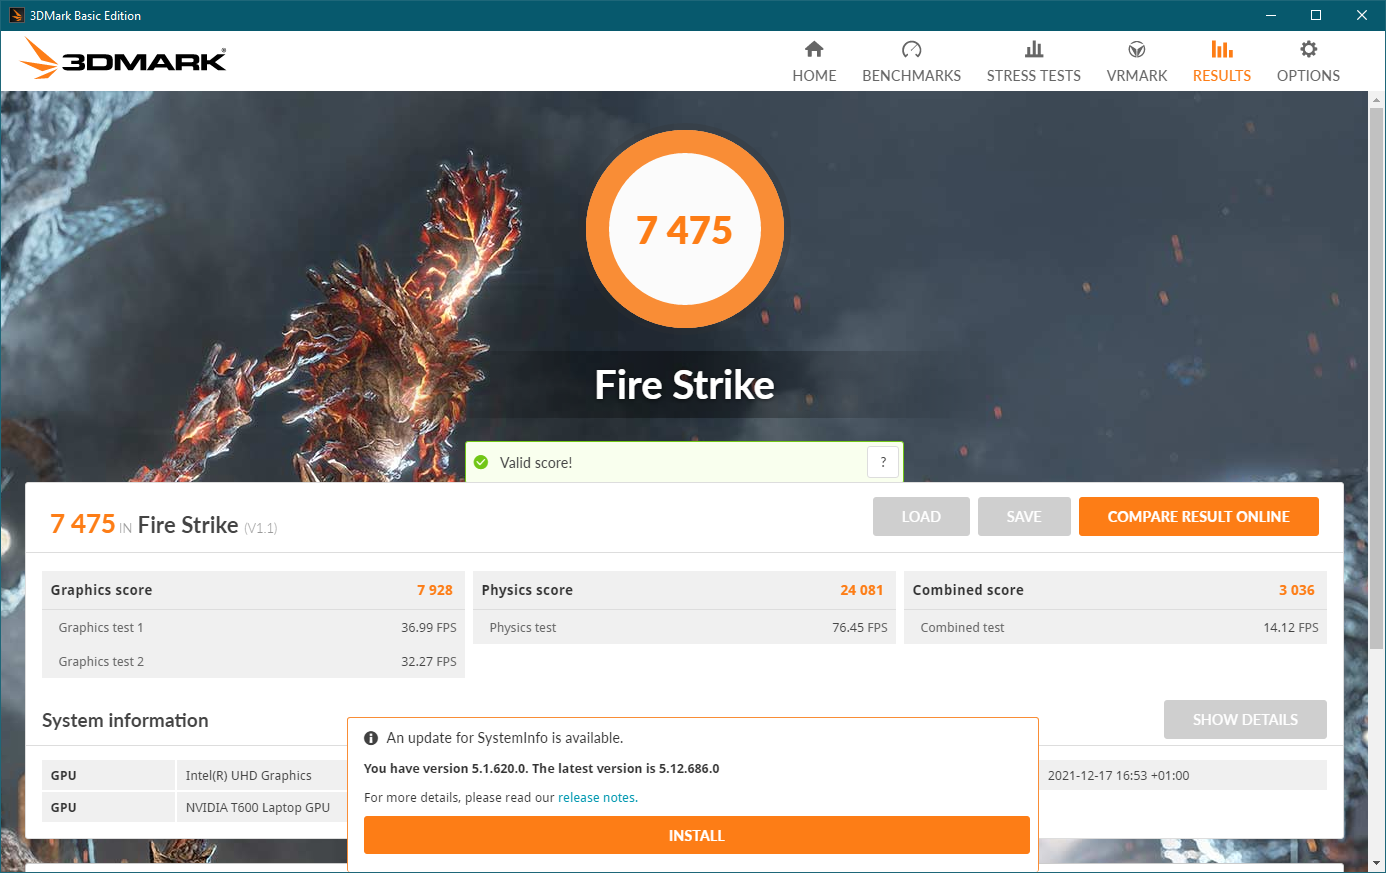
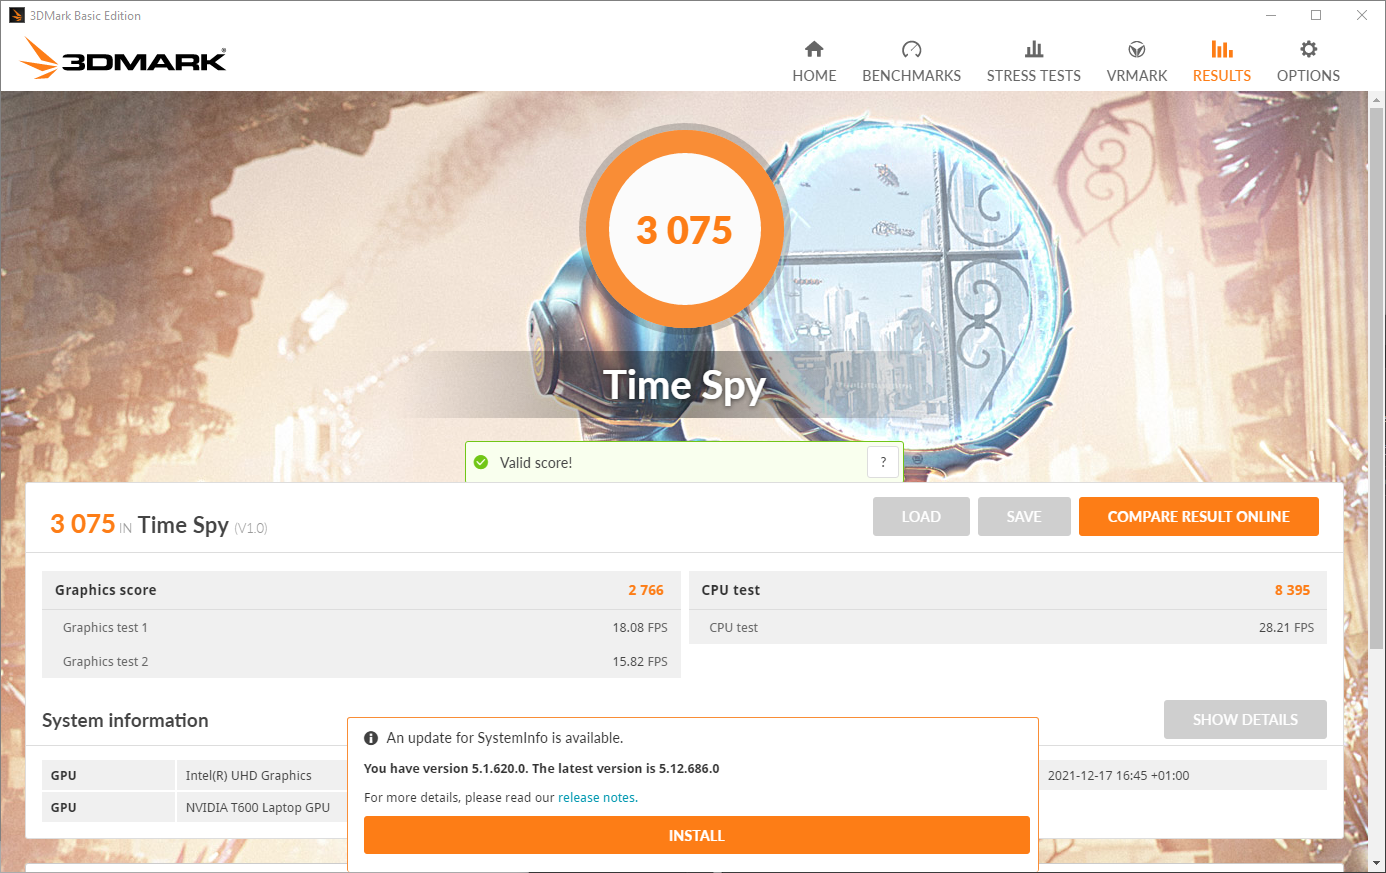
| 3DMark Fire Strike Score | 7475 puntos | |
| 3DMark Time Spy Score | 3075 puntos | |
ayuda | ||
Rendimiento de los juegos
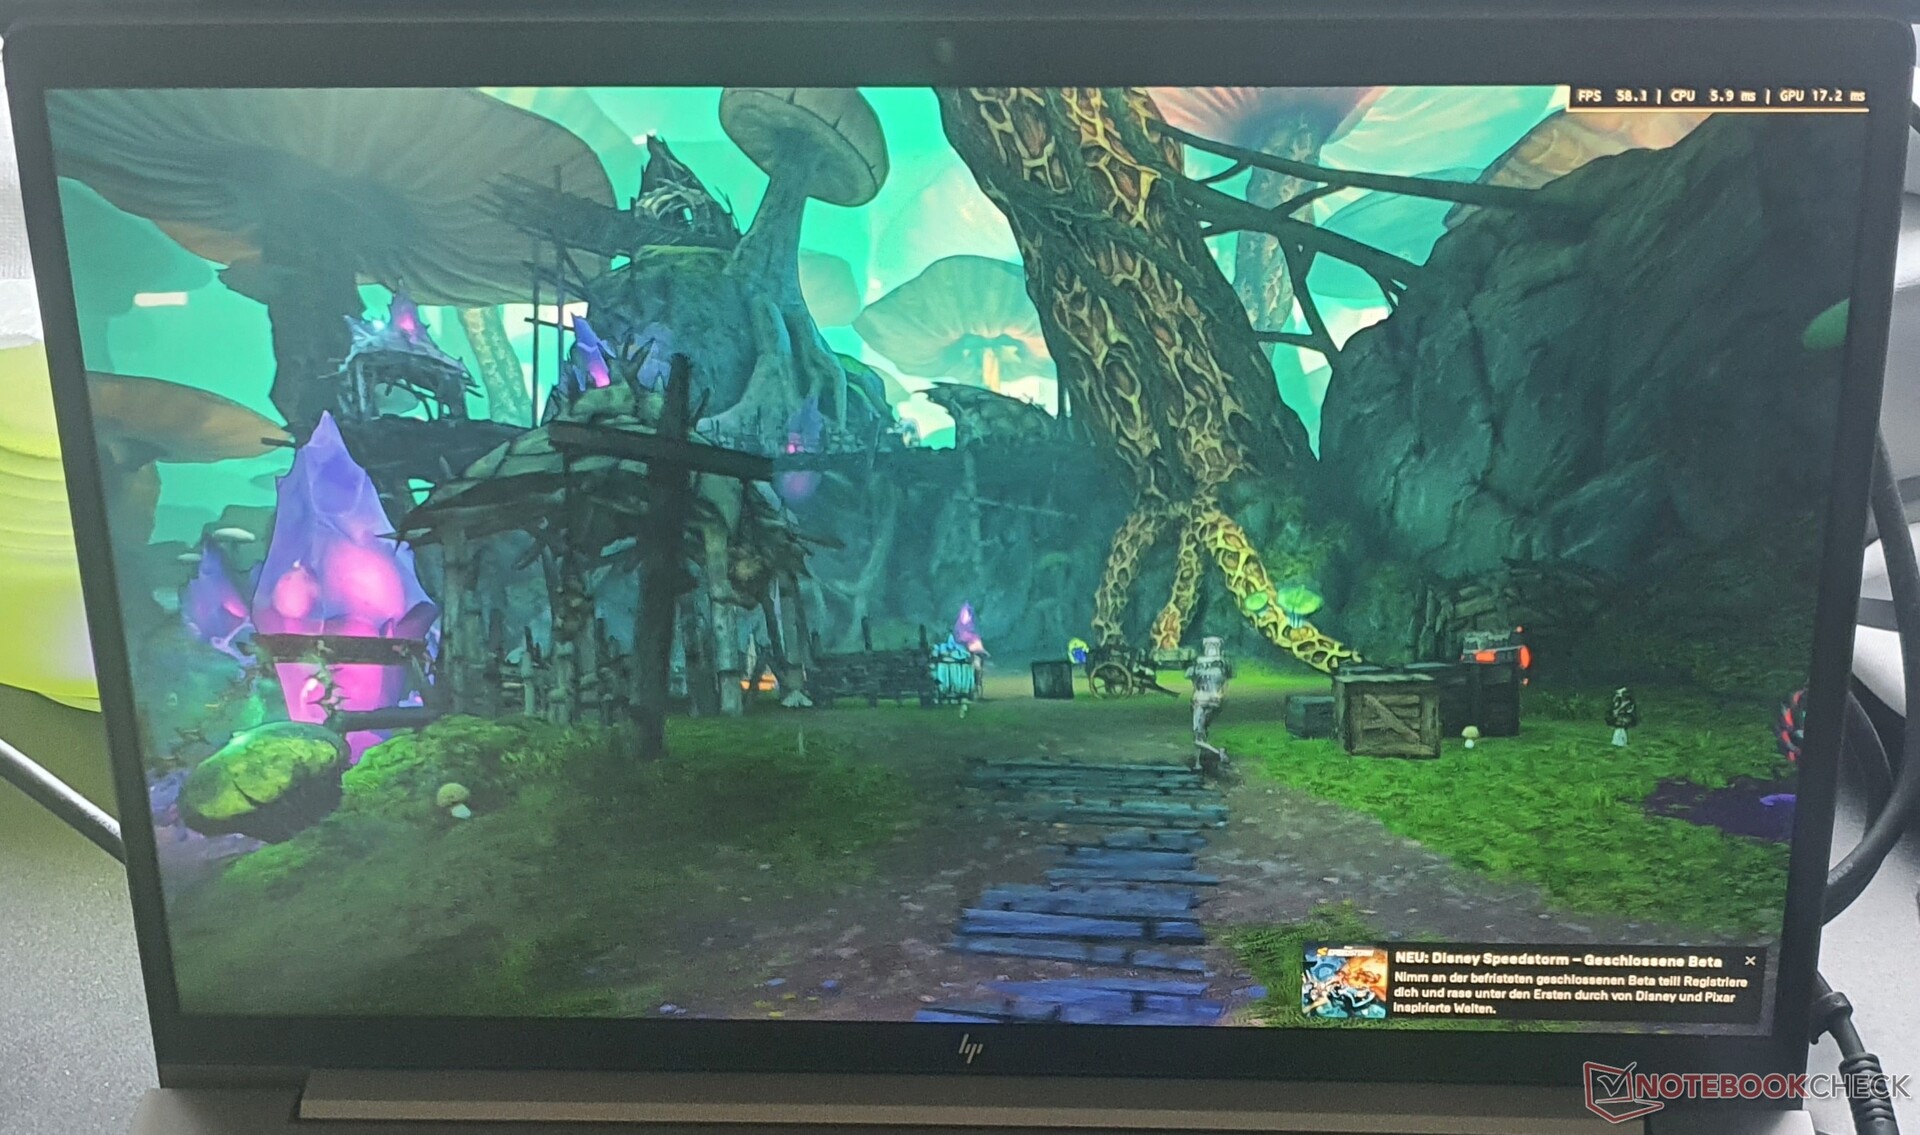
Durante los juegos, la Nvidia T600 es capaz de mantener su velocidad de reloj máxima. A menos de 60 °C, no se calienta especialmente. En los juegos modernos, el rendimiento es suficiente para detalles medios con resolución Full-HD. Sin embargo, el ZBook no está diseñado para jugar. El sistema consume unos 60 vatios en este escenario en general, y los 25 vatios van a la GPU.
Aunque el ThinkPad P15vsólo proporciona 10 vatios más para su dGPU, consume un total de 100 vatios en general durante los juegos, mientras que la Nvidia T1200ofrece sólo un ~15% más de fotogramas por segundo. ElZBook Firefly 15 con laNvidia T500 es un 40% más lento de media, pero sigue consumiendo los mismos 60 vatios en general durante los juegos. En la prueba de una hora de duración de The Witcher 3, no notamos ninguna caída de rendimiento.
The Witcher 3 FPS Chart
| The Witcher 3 | |
| 1366x768 Medium Graphics & Postprocessing | |
| HP ZBook Studio 15 G8 | |
| HP ZBook Fury 15 G8 | |
| HP ZBook Power 15 G8 313S5EA | |
| Medio NVIDIA T600 Laptop GPU (n=1) | |
| Dell Precision 3000 3551 | |
| 1920x1080 High Graphics & Postprocessing (Nvidia HairWorks Off) | |
| Media de la clase Workstation (n=1últimos 2 años) | |
| HP ZBook Studio 15 G8 | |
| HP ZBook Fury 15 G8 | |
| Lenovo ThinkPad P15v G2 21A9000XGE | |
| HP ZBook Power 15 G8 313S5EA | |
| Medio NVIDIA T600 Laptop GPU (n=1) | |
| Dell Precision 3000 3551 | |
| 1920x1080 Ultra Graphics & Postprocessing (HBAO+) | |
| Media de la clase Workstation (n=1últimos 2 años) | |
| HP ZBook Fury 15 G8 | |
| HP ZBook Studio 15 G8 | |
| Lenovo ThinkPad P15v G2 21A9000XGE | |
| HP ZBook Power 15 G8 313S5EA | |
| Medio NVIDIA T600 Laptop GPU (n=1) | |
| HP ZBook Firefly 15 G8 2C9R7EA | |
| Dell Precision 3000 3551 | |
| GTA V | |
| 1366x768 Normal/Off AF:4x | |
| Media de la clase Workstation (140.9 - 185.8, n=17, últimos 2 años) | |
| HP ZBook Fury 15 G8 | |
| Lenovo ThinkPad P15v G2 21A9000XGE | |
| HP ZBook Power 15 G8 313S5EA | |
| Medio NVIDIA T600 Laptop GPU (n=1) | |
| 1920x1080 High/On (Advanced Graphics Off) AA:2xMSAA + FX AF:8x | |
| Media de la clase Workstation (44.4 - 179.4, n=21, últimos 2 años) | |
| HP ZBook Fury 15 G8 | |
| Lenovo ThinkPad P15v G2 21A9000XGE | |
| HP ZBook Power 15 G8 313S5EA | |
| Medio NVIDIA T600 Laptop GPU (n=1) | |
| 1920x1080 Highest AA:4xMSAA + FX AF:16x | |
| Media de la clase Workstation (18.1 - 156.1, n=23, últimos 2 años) | |
| HP ZBook Fury 15 G8 | |
| Lenovo ThinkPad P15v G2 21A9000XGE | |
| HP ZBook Power 15 G8 313S5EA | |
| Medio NVIDIA T600 Laptop GPU (n=1) | |
| Shadow of the Tomb Raider | |
| 1280x720 Lowest Preset | |
| HP ZBook Fury 15 G8 | |
| HP ZBook Power 15 G8 313S5EA | |
| Medio NVIDIA T600 Laptop GPU (n=1) | |
| Lenovo ThinkPad P15v G2 21A9000XGE | |
| 1920x1080 Medium Preset | |
| HP ZBook Fury 15 G8 | |
| Lenovo ThinkPad P15v G2 21A9000XGE | |
| HP ZBook Power 15 G8 313S5EA | |
| Medio NVIDIA T600 Laptop GPU (n=1) | |
| 1920x1080 High Preset AA:SM | |
| HP ZBook Fury 15 G8 | |
| Lenovo ThinkPad P15v G2 21A9000XGE | |
| HP ZBook Power 15 G8 313S5EA | |
| Medio NVIDIA T600 Laptop GPU (n=1) | |
| Elden Ring | |
| 1920x1080 Medium Preset | |
| Lenovo ThinkPad P15v G2 21A9000XGE | |
| HP ZBook Power 15 G8 313S5EA | |
| Medio NVIDIA T600 Laptop GPU (n=1) | |
| 1920x1080 High Preset | |
| Lenovo ThinkPad P15v G2 21A9000XGE | |
| HP ZBook Power 15 G8 313S5EA | |
| Medio NVIDIA T600 Laptop GPU (n=1) | |
| 1920x1080 Maximum Preset | |
| Lenovo ThinkPad P15v G2 21A9000XGE | |
| HP ZBook Power 15 G8 313S5EA | |
| Medio NVIDIA T600 Laptop GPU (n=1) | |
| Resident Evil Village | |
| 1920x1080 Balanced Preset | |
| Lenovo ThinkPad P15v G2 21A9000XGE | |
| HP ZBook Power 15 G8 313S5EA | |
| Medio NVIDIA T600 Laptop GPU (n=1) | |
| 1920x1080 Prioritize Graphics Preset | |
| Lenovo ThinkPad P15v G2 21A9000XGE | |
| HP ZBook Power 15 G8 313S5EA | |
| Medio NVIDIA T600 Laptop GPU (n=1) | |
| 1920x1080 Max Preset | |
| Lenovo ThinkPad P15v G2 21A9000XGE | |
| HP ZBook Power 15 G8 313S5EA | |
| Medio NVIDIA T600 Laptop GPU (n=1) | |
| Vampire Bloodhunt | |
| 1920x1080 Medium Preset | |
| Lenovo ThinkPad P15v G2 21A9000XGE | |
| HP ZBook Power 15 G8 313S5EA | |
| Medio NVIDIA T600 Laptop GPU (n=1) | |
| 1920x1080 High Preset | |
| Lenovo ThinkPad P15v G2 21A9000XGE | |
| HP ZBook Power 15 G8 313S5EA | |
| Medio NVIDIA T600 Laptop GPU (n=1) | |
| 1920x1080 Ultra Preset | |
| Lenovo ThinkPad P15v G2 21A9000XGE | |
| HP ZBook Power 15 G8 313S5EA | |
| Medio NVIDIA T600 Laptop GPU (n=1) | |
| GRID Legends | |
| 1920x1080 Medium Preset | |
| Lenovo ThinkPad P15v G2 21A9000XGE | |
| HP ZBook Power 15 G8 313S5EA | |
| Medio NVIDIA T600 Laptop GPU (n=1) | |
| 1920x1080 High Preset | |
| Lenovo ThinkPad P15v G2 21A9000XGE | |
| HP ZBook Power 15 G8 313S5EA | |
| Medio NVIDIA T600 Laptop GPU (n=1) | |
| 1920x1080 Ultra Preset | |
| Lenovo ThinkPad P15v G2 21A9000XGE | |
| HP ZBook Power 15 G8 313S5EA | |
| Medio NVIDIA T600 Laptop GPU (n=1) | |
| Mafia Definitive Edition | |
| 1280x720 Low Preset | |
| Lenovo ThinkPad P15v G2 21A9000XGE | |
| HP ZBook Power 15 G8 313S5EA | |
| Medio NVIDIA T600 Laptop GPU (n=1) | |
| 1920x1080 Medium Preset | |
| Lenovo ThinkPad P15v G2 21A9000XGE | |
| HP ZBook Power 15 G8 313S5EA | |
| Medio NVIDIA T600 Laptop GPU (n=1) | |
| 1920x1080 High Preset | |
| Lenovo ThinkPad P15v G2 21A9000XGE | |
| HP ZBook Power 15 G8 313S5EA | |
| Medio NVIDIA T600 Laptop GPU (n=1) | |
| Elex 2 | |
| 1920x1080 Medium / On AA:FX AF:16x | |
| Lenovo ThinkPad P15v G2 21A9000XGE | |
| HP ZBook Power 15 G8 313S5EA | |
| Medio NVIDIA T600 Laptop GPU (n=1) | |
| 1920x1080 High / On AA:FX AF:16x | |
| Lenovo ThinkPad P15v G2 21A9000XGE | |
| HP ZBook Power 15 G8 313S5EA | |
| Medio NVIDIA T600 Laptop GPU (n=1) | |
| 1920x1080 Ultra / On AA:SM AF:16x | |
| Lenovo ThinkPad P15v G2 21A9000XGE | |
| HP ZBook Power 15 G8 313S5EA | |
| Medio NVIDIA T600 Laptop GPU (n=1) | |
| Farming Simulator 22 | |
| 1920x1080 Medium Preset | |
| Lenovo ThinkPad P15v G2 21A9000XGE | |
| HP ZBook Power 15 G8 313S5EA | |
| Medio NVIDIA T600 Laptop GPU (n=1) | |
| 1920x1080 High Preset | |
| Lenovo ThinkPad P15v G2 21A9000XGE | |
| HP ZBook Power 15 G8 313S5EA | |
| Medio NVIDIA T600 Laptop GPU (n=1) | |
| 1920x1080 Very High Preset | |
| Lenovo ThinkPad P15v G2 21A9000XGE | |
| HP ZBook Power 15 G8 313S5EA | |
| Medio NVIDIA T600 Laptop GPU (n=1) | |
| Ghostwire Tokyo | |
| 1920x1080 Medium Settings | |
| Lenovo ThinkPad P15v G2 21A9000XGE | |
| HP ZBook Power 15 G8 313S5EA | |
| Medio NVIDIA T600 Laptop GPU (n=1) | |
| 1920x1080 High Settings | |
| Lenovo ThinkPad P15v G2 21A9000XGE | |
| HP ZBook Power 15 G8 313S5EA | |
| Medio NVIDIA T600 Laptop GPU (n=1) | |
| 1920x1080 Highest Settings | |
| HP ZBook Power 15 G8 313S5EA | |
| Medio NVIDIA T600 Laptop GPU (n=1) | |
| Lenovo ThinkPad P15v G2 21A9000XGE | |
| Riders Republic | |
| 1920x1080 Medium Preset | |
| HP ZBook Power 15 G8 313S5EA | |
| Medio NVIDIA T600 Laptop GPU (n=1) | |
| Lenovo ThinkPad P15v G2 21A9000XGE | |
| 1920x1080 High Preset | |
| Lenovo ThinkPad P15v G2 21A9000XGE | |
| HP ZBook Power 15 G8 313S5EA | |
| Medio NVIDIA T600 Laptop GPU (n=1) | |
| 1920x1080 Ultra Preset | |
| Lenovo ThinkPad P15v G2 21A9000XGE | |
| HP ZBook Power 15 G8 313S5EA | |
| Medio NVIDIA T600 Laptop GPU (n=1) | |
| Dying Light 2 | |
| 1920x1080 Low Quality | |
| Lenovo ThinkPad P15v G2 21A9000XGE | |
| HP ZBook Power 15 G8 313S5EA | |
| Medio NVIDIA T600 Laptop GPU (n=1) | |
| 1920x1080 Medium Quality | |
| Lenovo ThinkPad P15v G2 21A9000XGE | |
| HP ZBook Power 15 G8 313S5EA | |
| Medio NVIDIA T600 Laptop GPU (n=1) | |
| 1920x1080 High Quality | |
| Lenovo ThinkPad P15v G2 21A9000XGE | |
| HP ZBook Power 15 G8 313S5EA | |
| Medio NVIDIA T600 Laptop GPU (n=1) | |
| Tiny Tina's Wonderlands | |
| 1920x1080 Medium Preset (DX12) | |
| Media de la clase Workstation (115.1 - 233, n=5, últimos 2 años) | |
| HP ZBook Power 15 G8 313S5EA | |
| Medio NVIDIA T600 Laptop GPU (n=1) | |
| 1920x1080 High Preset (DX12) | |
| Media de la clase Workstation (80 - 171.4, n=5, últimos 2 años) | |
| HP ZBook Power 15 G8 313S5EA | |
| Medio NVIDIA T600 Laptop GPU (n=1) | |
| 1920x1080 Badass Preset (DX12) | |
| Media de la clase Workstation (64.4 - 137.1, n=5, últimos 2 años) | |
| HP ZBook Power 15 G8 313S5EA | |
| Medio NVIDIA T600 Laptop GPU (n=1) | |
| Deathloop | |
| 1920x1080 Medium Preset | |
| HP ZBook Power 15 G8 313S5EA | |
| Medio NVIDIA T600 Laptop GPU (n=1) | |
| 1920x1080 High Preset | |
| HP ZBook Power 15 G8 313S5EA | |
| Medio NVIDIA T600 Laptop GPU (n=1) | |
| 1920x1080 Ultra Preset | |
| HP ZBook Power 15 G8 313S5EA | |
| Medio NVIDIA T600 Laptop GPU (n=1) | |
| Immortals Fenyx Rising | |
| 1920x1080 Medium Preset | |
| HP ZBook Fury 15 G8 | |
| HP ZBook Power 15 G8 313S5EA | |
| Medio NVIDIA T600 Laptop GPU (n=1) | |
| 1920x1080 High Preset | |
| HP ZBook Fury 15 G8 | |
| HP ZBook Power 15 G8 313S5EA | |
| Medio NVIDIA T600 Laptop GPU (n=1) | |
| 1920x1080 Very High Preset | |
| HP ZBook Fury 15 G8 | |
| HP ZBook Power 15 G8 313S5EA | |
| Medio NVIDIA T600 Laptop GPU (n=1) | |
| bajo | medio | alto | ultra | |
|---|---|---|---|---|
| GTA V (2015) | 142.6 | 137.6 | 82.3 | 44.1 |
| The Witcher 3 (2015) | 158.6 | 92.7 | 52.2 | 27.6 |
| Dota 2 Reborn (2015) | 149.4 | 127.6 | 115.8 | 107.1 |
| Final Fantasy XV Benchmark (2018) | 86 | 43.9 | 31 | |
| X-Plane 11.11 (2018) | 107.9 | 92.4 | 77 | |
| Far Cry 5 (2018) | 105 | 53 | 49 | 45 |
| Strange Brigade (2018) | 190.4 | 76.2 | 60.7 | 52.7 |
| Shadow of the Tomb Raider (2018) | 98 | 53 | 42 | 36 |
| Mafia Definitive Edition (2020) | 83.6 | 40.4 | 34.9 | |
| Immortals Fenyx Rising (2020) | 72 | 45 | 36 | 31 |
| Resident Evil Village (2021) | 113.6 | 58.6 | 52.1 | 44 |
| Deathloop (2021) | 68.9 | 34.4 | 28.4 | 25.2 |
| Riders Republic (2021) | 91 | 52 | 39 | 30 |
| Farming Simulator 22 (2021) | 175.4 | 87.5 | 63.5 | 53.9 |
| Dying Light 2 (2022) | 31.7 | 23 | 18.3 | |
| GRID Legends (2022) | 104.1 | 71 | 57.7 | 41.9 |
| Elden Ring (2022) | 52.4 | 45 | 39 | 29.9 |
| Elex 2 (2022) | 38.5 | 35.7 | 30.5 | 26.9 |
| Ghostwire Tokyo (2022) | 45.7 | 44.3 | 43.9 | 41.8 |
| Tiny Tina's Wonderlands (2022) | 57.5 | 32.8 | 48.3 | 27.2 |
| Vampire Bloodhunt (2022) | 119 | 64.5 | 61.8 | 60.1 |
Emisiones: La fría estación de trabajo ZBook funciona en silencio a veces
Emisiones acústicas
El probador sólo tiene las mediciones usando la antigua BIOS, que aún permitía una velocidad de ventilador significativamente mayor y resultó en un nivel de ruido de hasta 51db(A) en el escenario de carga. Sin embargo, con la BIOS v1.09, la IA de HP sólo permite una velocidad máxima del ventilador de unos 4300 upm, lo que podría ser una ventaja en entornos empresariales sensibles, no obstante.
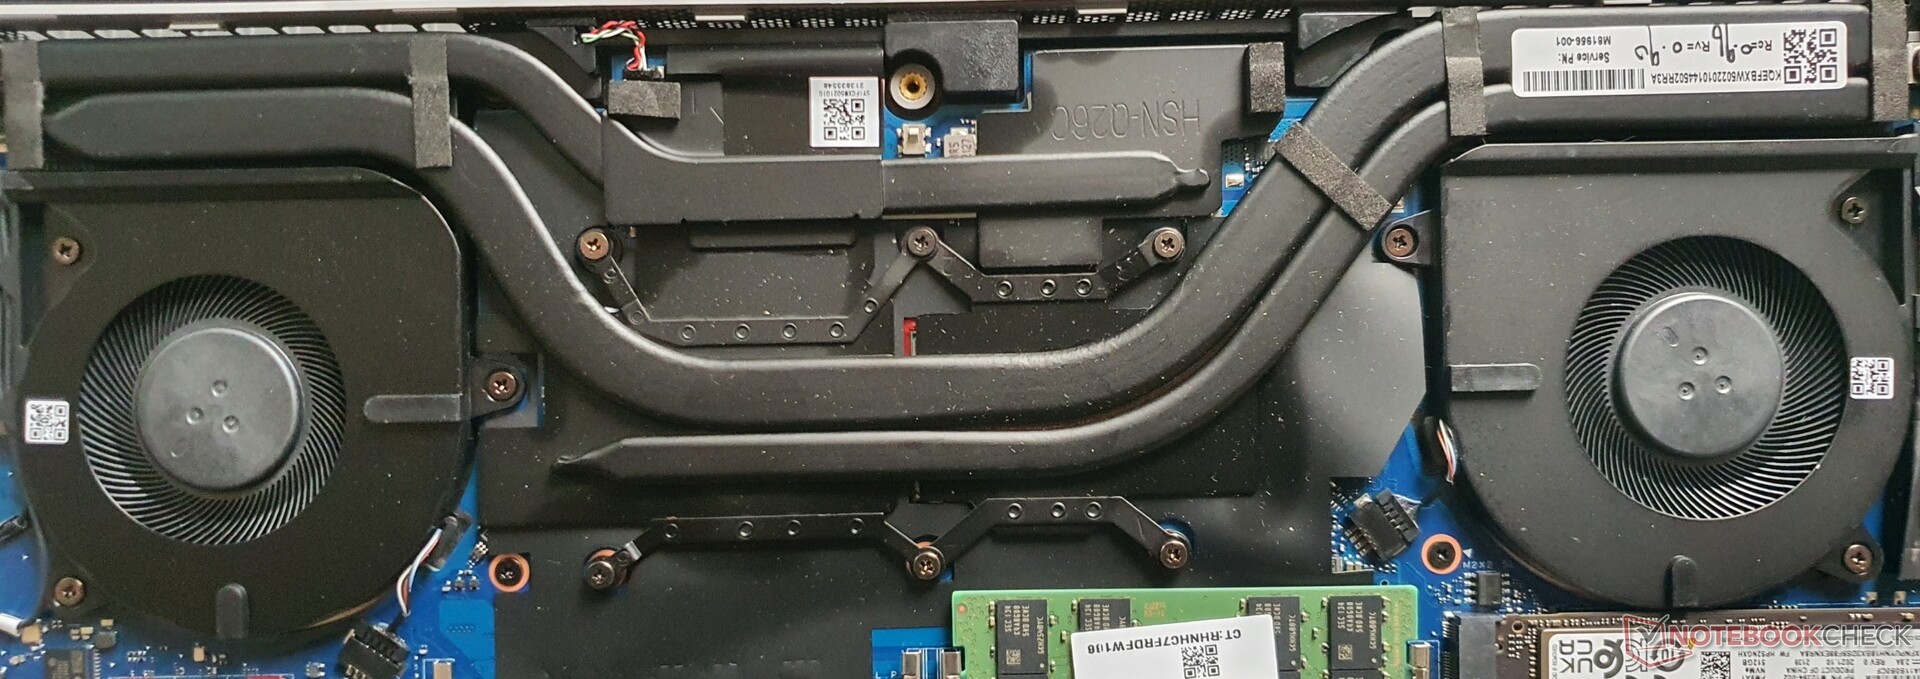
Con sus dos ventiladores y tres tubos de calor, la refrigeración debería ser capaz de disipar más calor que la del ThinkPad P15v G2, cuyos 75 vatios son enfriados con éxito por su único ventilador. Sin embargo, con la limitación de la IA, los ventiladores del HP ZBook enfrían un máximo de 65 a 80 vatios bajo carga combinada (CPU + GPU). Las rejillas de ventilación están en la parte inferior entre la pantalla y la carcasa, extrayendo el aire de la parte inferior de la carcasa, lo que hace que usarlo sobre el regazo no sea óptimo.
Durante la navegación regular por Internet, los ventiladores permanecen silenciosos, pero si estás acostumbrado a trabajar más rápido en la red, se encienden constantemente y de forma bastante ruidosa. Al menos, no hay un gemido de la bobina. Con componentes de potencia similar, el Lenovo ThinkPad P15v G2 es más silencioso en todos los escenarios, y el propio HP ZBook Fury también funciona de forma más silenciosa. Por otro lado, a los ventiladores del Dell Precision 3551 les gusta soplar mucho.
Ruido
| Ocioso |
| 25.54 / 25.54 / 25.54 dB(A) |
| Carga |
| 48.85 / 50.98 dB(A) |
 | ||
30 dB silencioso 40 dB(A) audible 50 dB(A) ruidosamente alto |
||
min: | ||
| HP ZBook Power 15 G8 313S5EA T600 Laptop GPU, i7-11800H, Samsung PM9A1 MZVL2512HCJQ | HP ZBook Fury 15 G8 RTX A5000 Laptop GPU, i9-11950H, Samsung PM981a MZVLB1T0HBLR | HP ZBook Studio 15 G8 GeForce RTX 3070 Laptop GPU, i9-11950H, Samsung PM981a MZVLB2T0HALB | HP ZBook Firefly 15 G8 2C9R7EA T500 Laptop GPU, i7-1165G7, Toshiba XG6 KXG60ZNV1T02 | Lenovo ThinkPad P15v G2 21A9000XGE T1200 Laptop GPU, i7-11800H, Toshiba XG6 KXG6AZNV512G | Dell Precision 3000 3551 Quadro P620, i9-10885H, Toshiba Kioxia XG6 KXG60PNV512G | |
|---|---|---|---|---|---|---|
| Noise | 9% | 3% | 14% | 9% | -1% | |
| apagado / medio ambiente * (dB) | 25.54 | 24.1 6% | 23.5 8% | 24.1 6% | 25.21 1% | 25.8 -1% |
| Idle Minimum * (dB) | 25.54 | 24.1 6% | 25.3 1% | 24.1 6% | 25.21 1% | 26.2 -3% |
| Idle Average * (dB) | 25.54 | 24.1 6% | 25.3 1% | 24.1 6% | 25.21 1% | 26.2 -3% |
| Idle Maximum * (dB) | 25.54 | 24.8 3% | 25.3 1% | 27.1 -6% | 25.21 1% | 26.2 -3% |
| Load Average * (dB) | 48.85 | 37.8 23% | 41.2 16% | 32.8 33% | 39.09 20% | 51.2 -5% |
| Witcher 3 ultra * (dB) | 46.58 | 44.2 5% | 49.4 -6% | 36.1 22% | 36.6 21% | 42.7 8% |
| Load Maximum * (dB) | 50.98 | 44.2 13% | 49.4 3% | 36.1 29% | 43.53 15% | 50.7 1% |
* ... más pequeño es mejor
Temperaturas
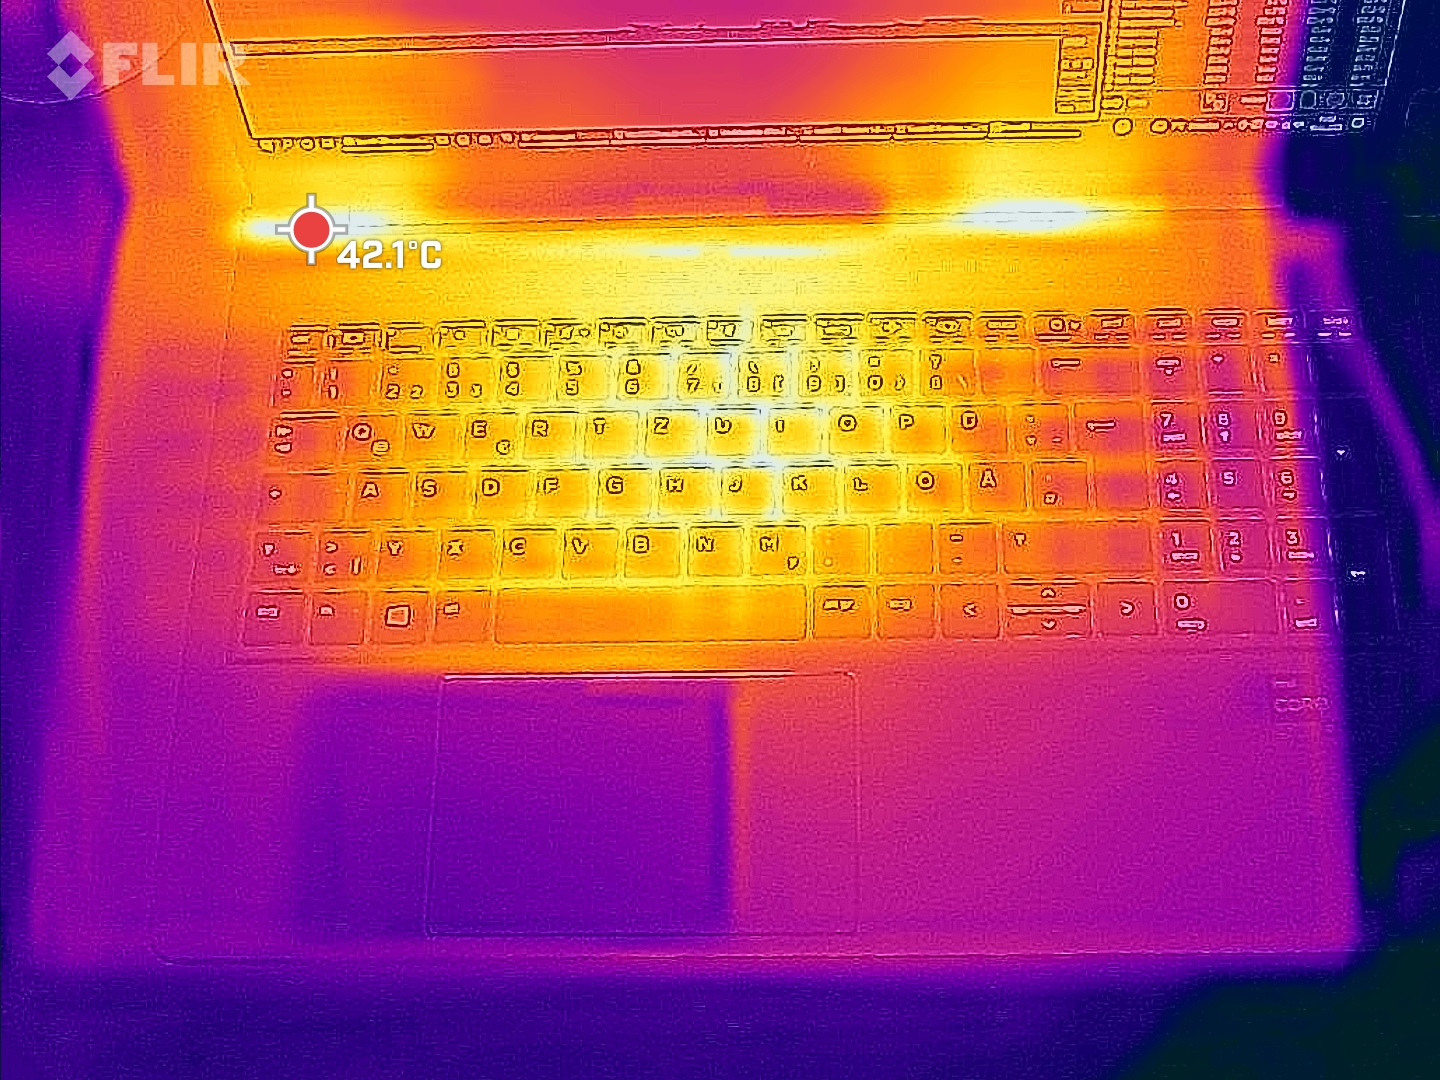
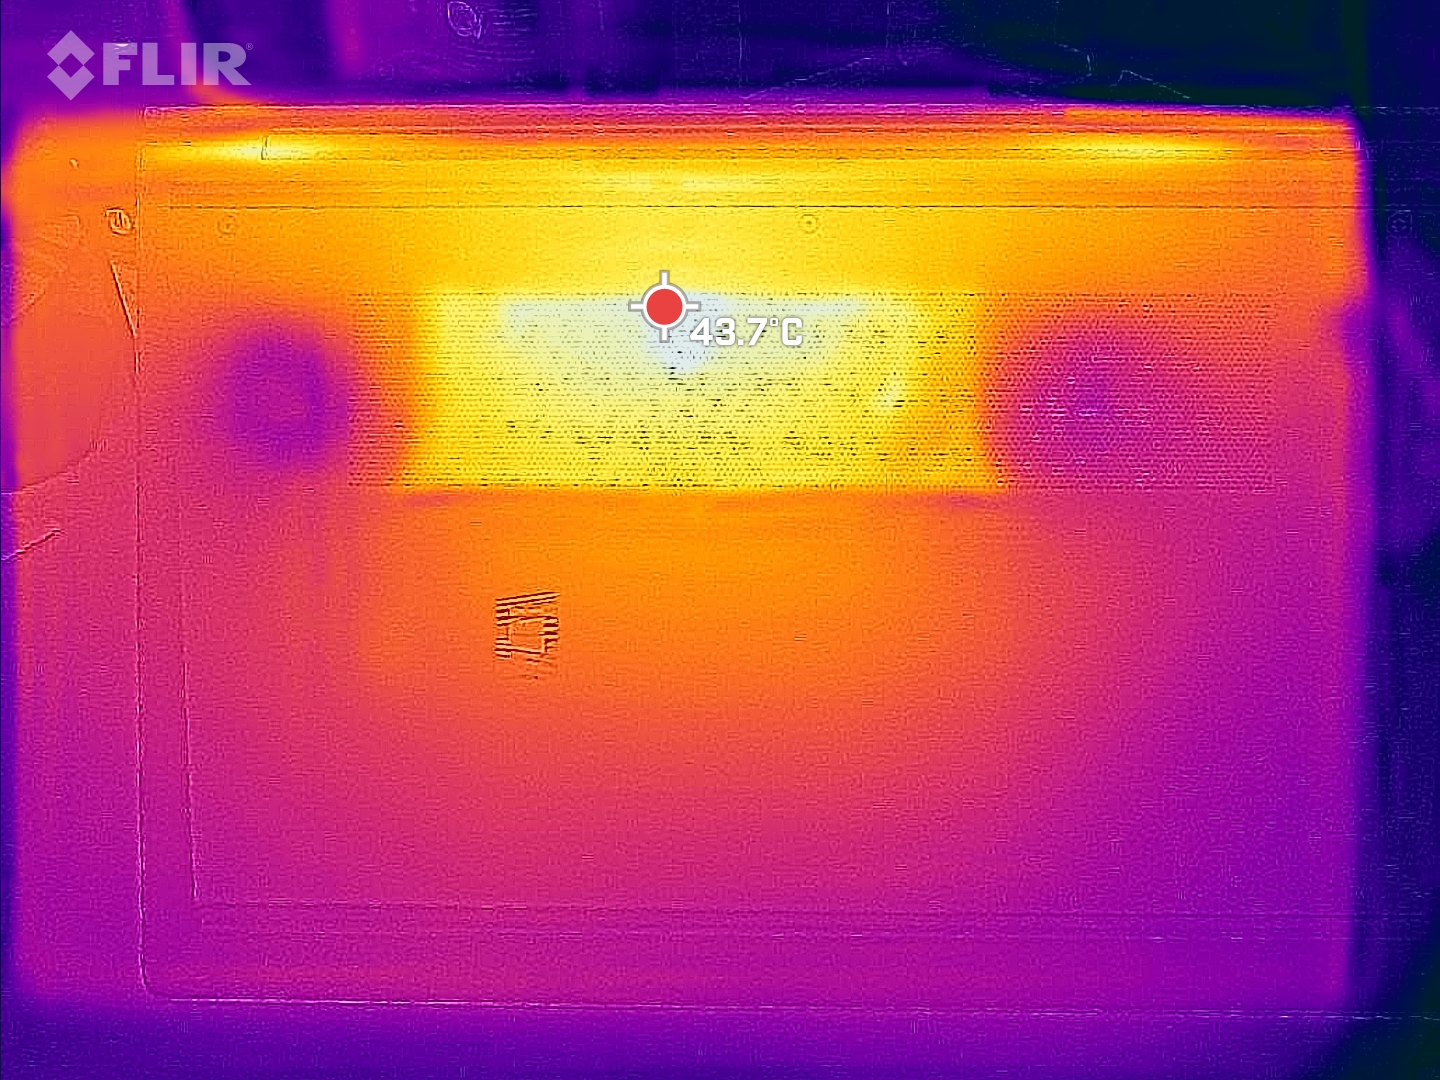
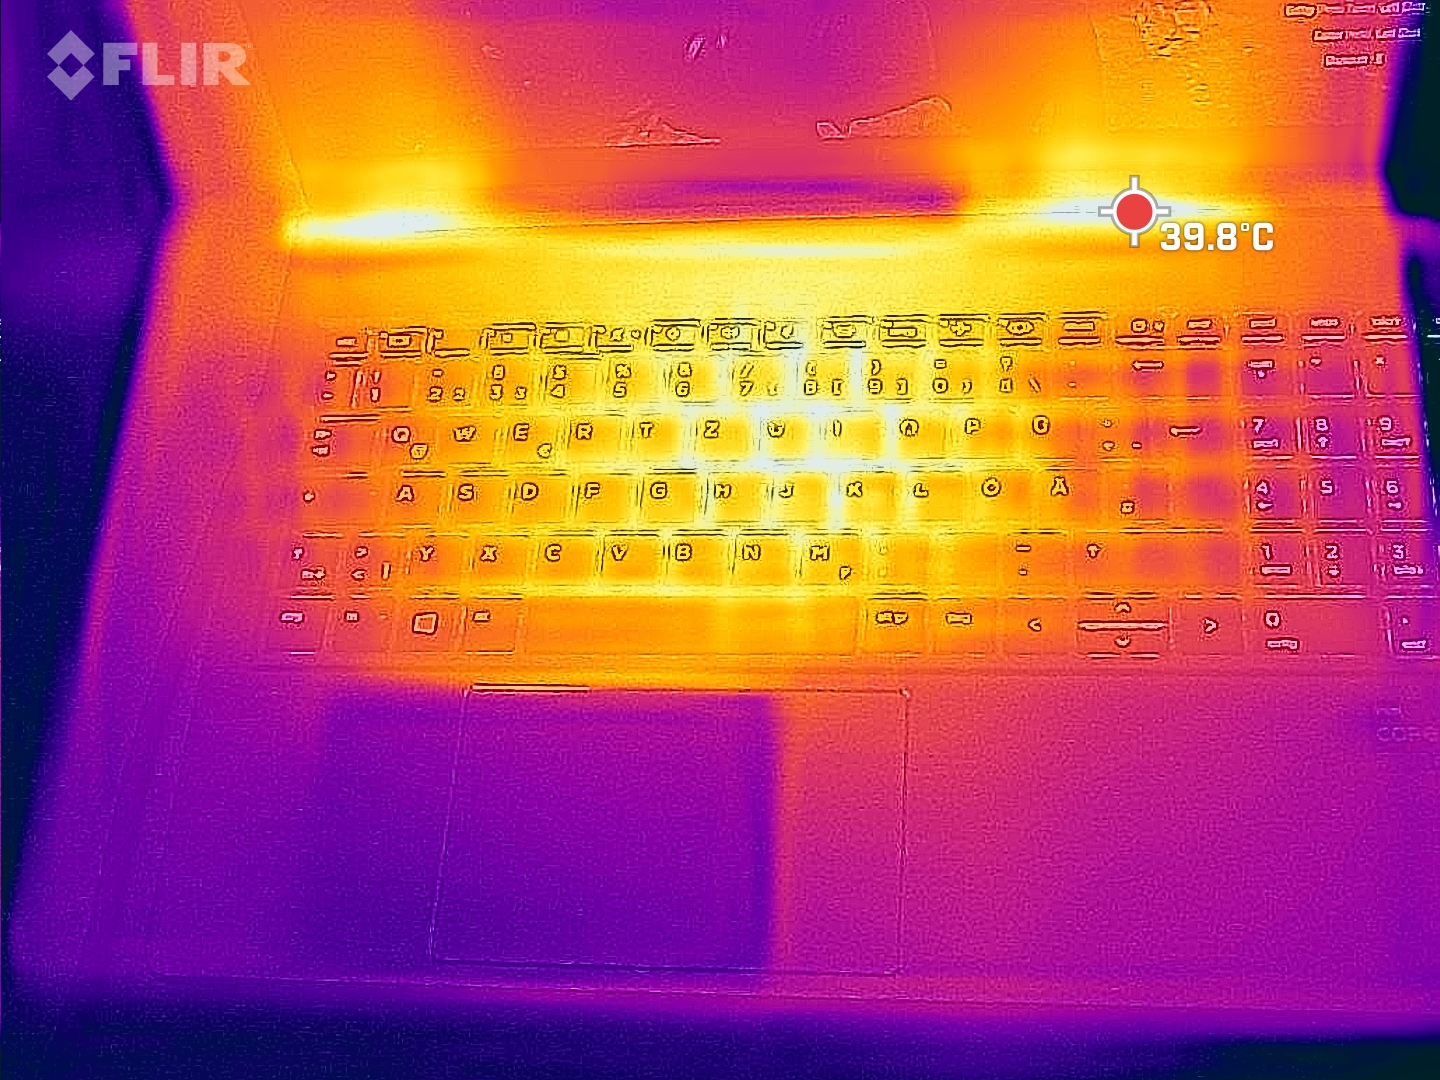
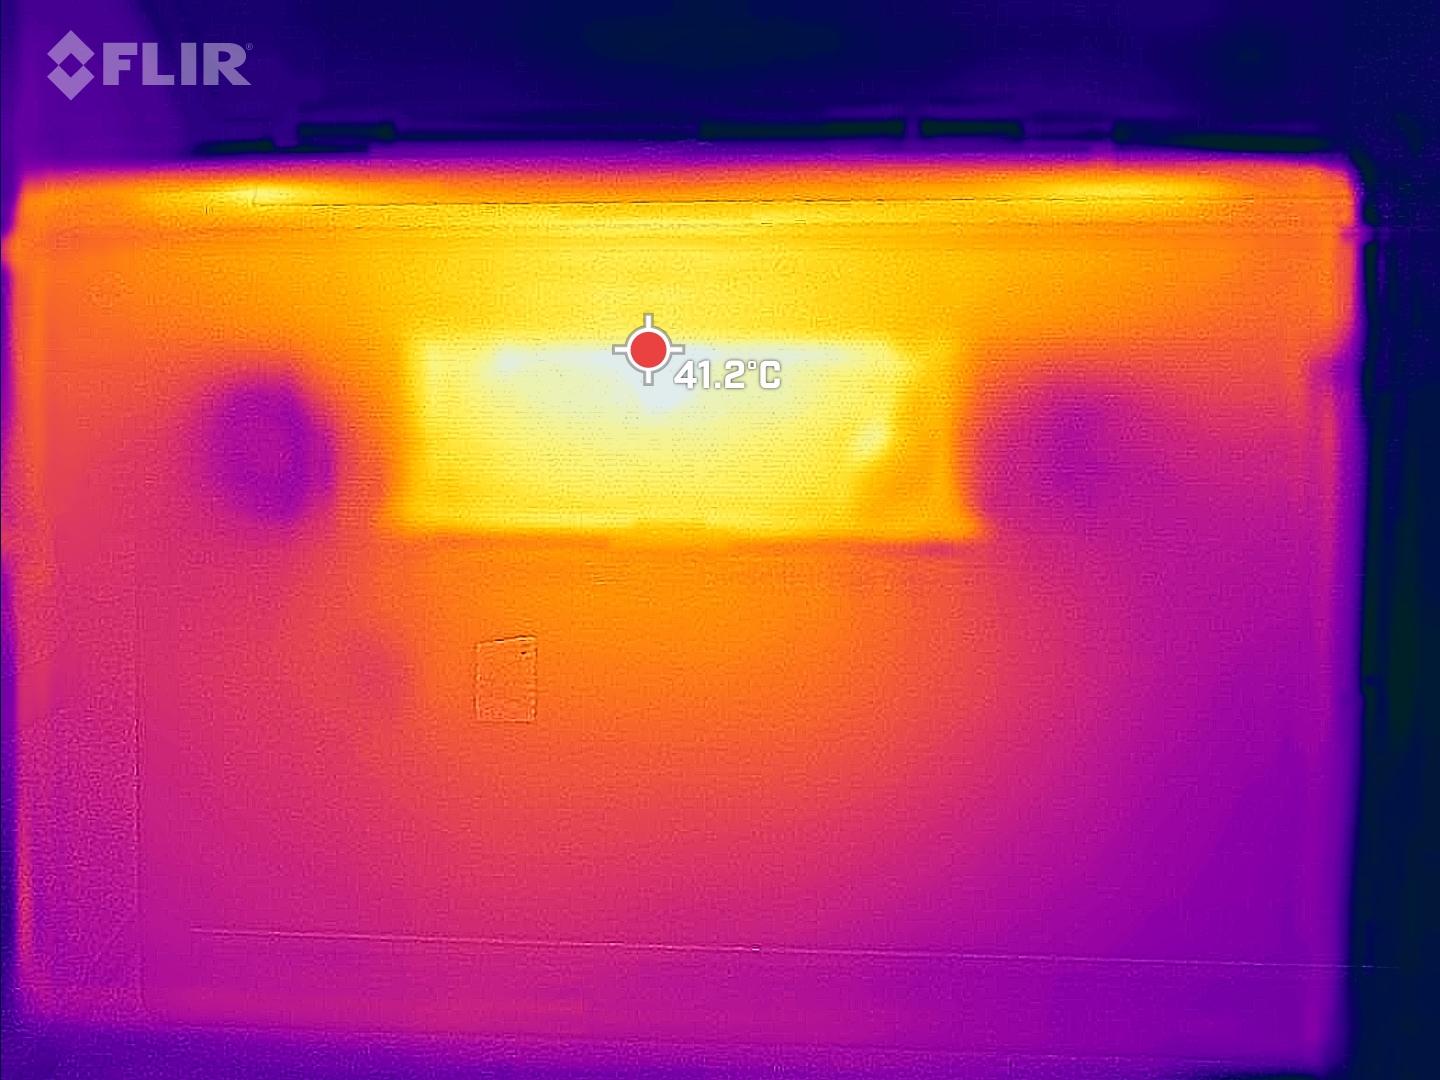
Los únicos puntos más calientes están en el centro sobre el teclado así como en el lugar correspondiente en el fondo de la carcasa, y eso sólo durante la prueba de estrés. Sin embargo, ya que los ventiladores no se aceleran tanto, estos puntos calientes son notables incluso durante el juego o mientras se renderiza, e incluso en el centro del teclado. Pero nunca se calientan de forma molesta.
(±) La temperatura máxima en la parte superior es de 41.4 °C / 107 F, frente a la media de 38.2 °C / 101 F, que oscila entre 22.2 y 69.8 °C para la clase Workstation.
(±) El fondo se calienta hasta un máximo de 41.5 °C / 107 F, frente a la media de 41.1 °C / 106 F
(+) En reposo, la temperatura media de la parte superior es de 22.9 °C / 73# F, frente a la media del dispositivo de 32 °C / 90 F.
(+) Jugando a The Witcher 3, la temperatura media de la parte superior es de 30.4 °C / 87 F, frente a la media del dispositivo de 32 °C / 90 F.
(+) El reposamanos y el panel táctil están a una temperatura inferior a la de la piel, con un máximo de 28.4 °C / 83.1 F y, por tanto, son fríos al tacto.
(±) La temperatura media de la zona del reposamanos de dispositivos similares fue de 27.8 °C / 82 F (-0.6 °C / -1.1 F).
| HP ZBook Power 15 G8 313S5EA Intel Core i7-11800H, NVIDIA T600 Laptop GPU | HP ZBook Fury 15 G8 Intel Core i9-11950H, NVIDIA RTX A5000 Laptop GPU | HP ZBook Studio 15 G8 Intel Core i9-11950H, NVIDIA GeForce RTX 3070 Laptop GPU | HP ZBook Firefly 15 G8 2C9R7EA Intel Core i7-1165G7, NVIDIA T500 Laptop GPU | Lenovo ThinkPad P15v G2 21A9000XGE Intel Core i7-11800H, NVIDIA T1200 Laptop GPU | Dell Precision 3000 3551 Intel Core i9-10885H, NVIDIA Quadro P620 | |
|---|---|---|---|---|---|---|
| Heat | -18% | -20% | -3% | -21% | -20% | |
| Maximum Upper Side * (°C) | 41.4 | 45.6 -10% | 49 -18% | 41.2 -0% | 53.8 -30% | 47 -14% |
| Maximum Bottom * (°C) | 41.5 | 57.6 -39% | 54.2 -31% | 47.2 -14% | 52.1 -26% | 54.6 -32% |
| Idle Upper Side * (°C) | 23.8 | 26 -9% | 26.2 -10% | 23.7 -0% | 27.6 -16% | 27.8 -17% |
| Idle Bottom * (°C) | 25 | 28.8 -15% | 30.2 -21% | 23.9 4% | 27.7 -11% | 29.2 -17% |
* ... más pequeño es mejor
Prueba de esfuerzo
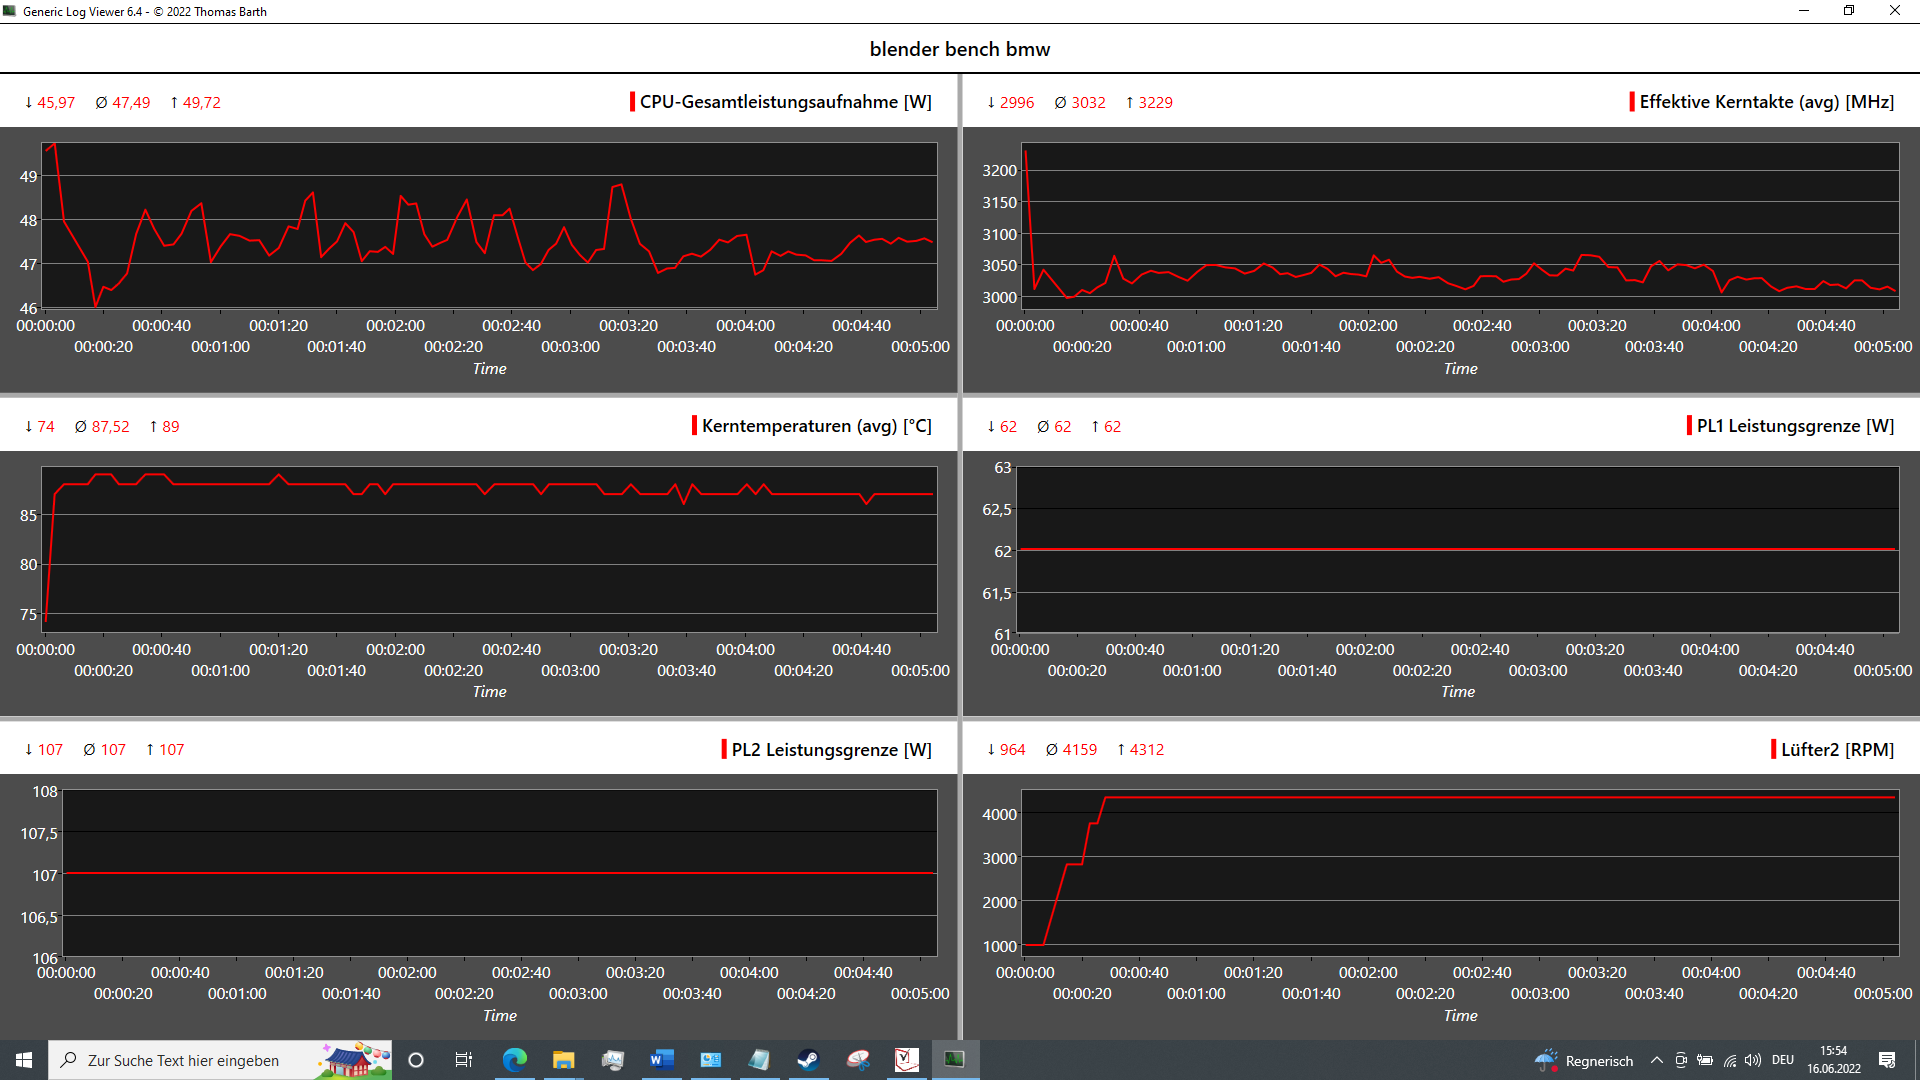
La CPU se beneficia de la actualización de la BIOS sólo durante la prueba de estrés. En el estrés combinado (Prime95 + FurMark), la CPU sigue funcionando a su velocidad de reloj básica (2,3 GHz), mientras que antes sólo lo hacía a 1,7 GHz. Por otro lado, a 1080 MHz, la velocidad de reloj de la GPU cae en 150 MHz. En el estrés puro de la CPU, se mantienen los 2,65 GHz con un consumo de energía de 50 vatios y una temperatura de 92 °C (198 °F)
Bajo carga gráfica pura, la GPU funciona a ~1100 MHz, lo que está significativamente por debajo de su velocidad boost de 1395 MHz. Sin embargo, la temperatura se mantiene en sólo 56 °C (133 °F), y sospechamos que se trata de otra inconsistencia de la IA.
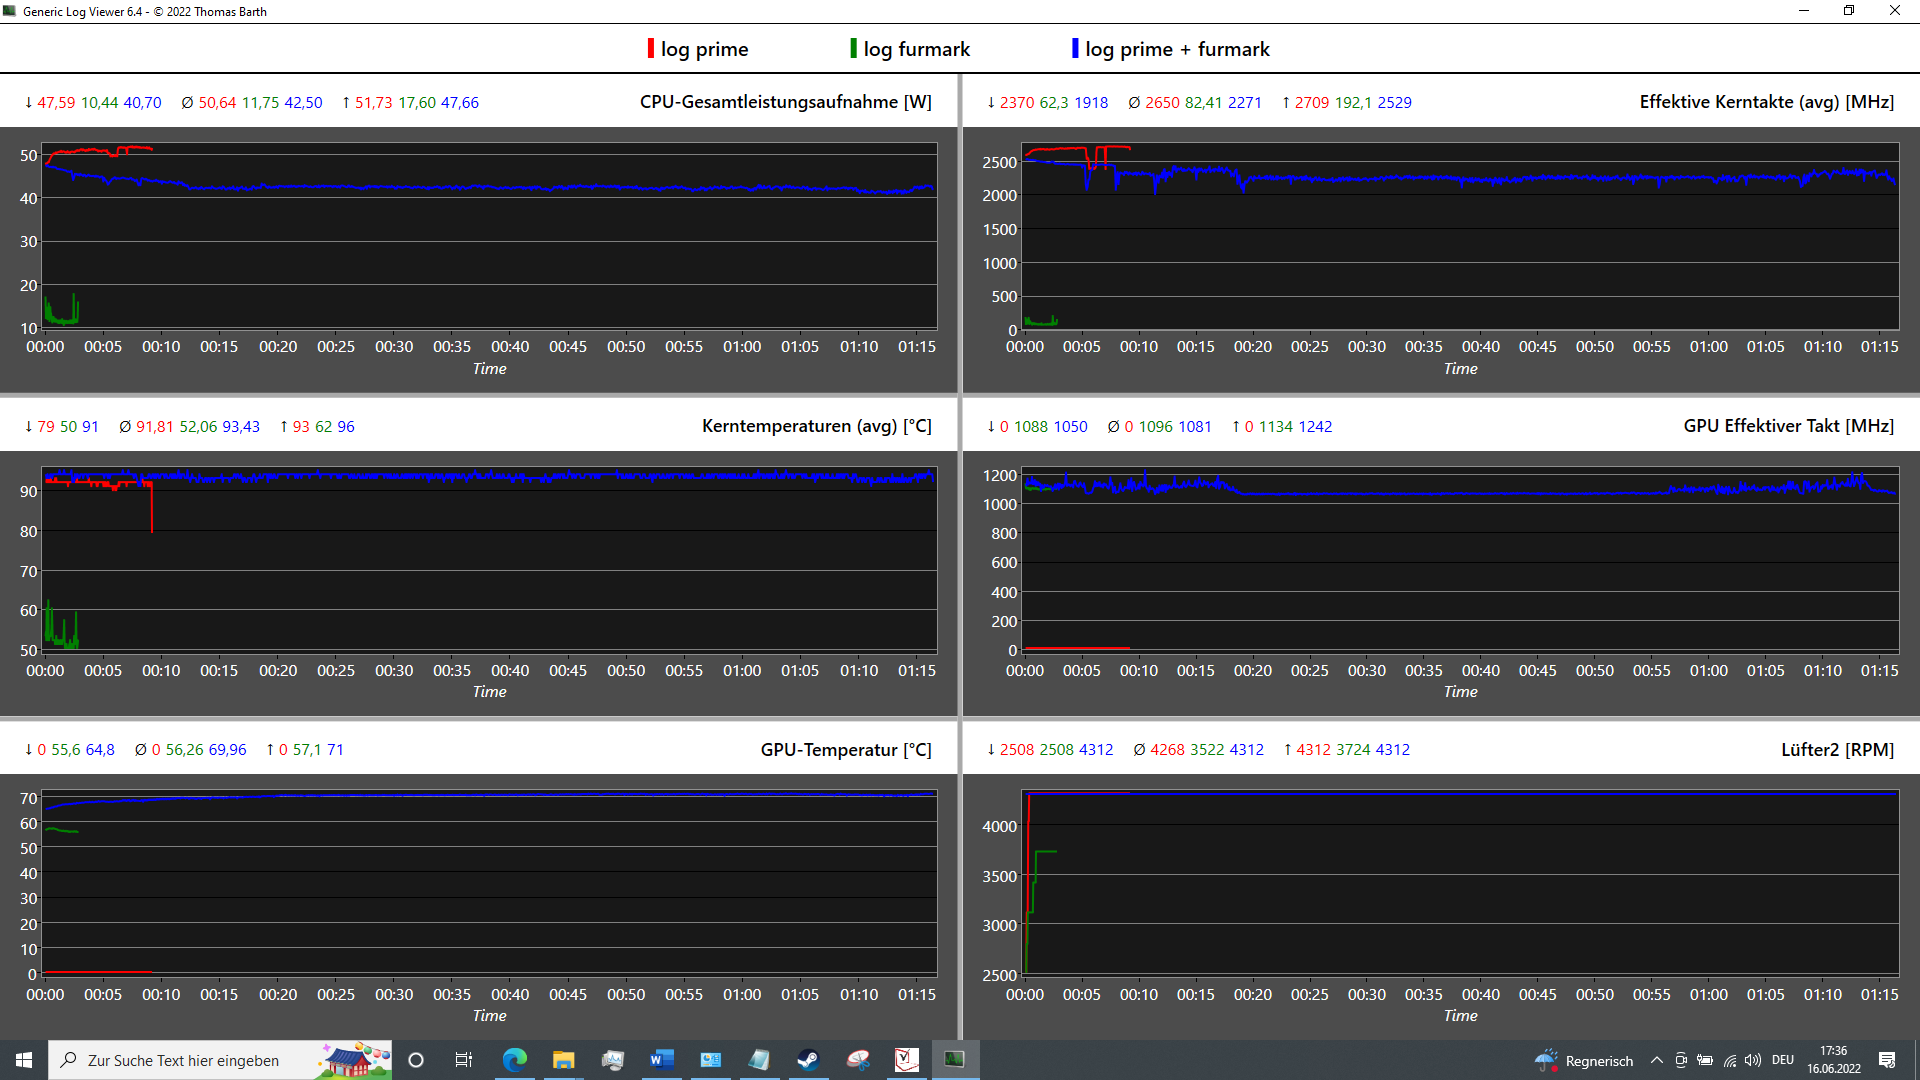
| Reloj dela CPU (GHz) | Reloj de la GPU (MHz) | Temperatura media dela CPU (°C) | Temperatura media de la GPU (°C) | |
| Sistema en reposo | 1,3 | 350 | 35 | 35 |
| Prime95 Stress | 2,65 | 350 | 91,8 | -- |
| Prime95+ FurMark Stress | 2,27 | 1081 | 93,4 | 56 |
| FurMark Stress | 1,3 | 1100 | 52 | 70 |
Altavoces
El sonido de los altavoces estéreo de 2 vatios que apuntan hacia arriba es bastante equilibrado, pero carecen de graves y tampoco son particularmente fuertes. El HP Fury 15 alberga un sistema de sonido significativamente más atractivo.
Aunque puede ser suficiente para las tareas de oficina, para disfrutar del multimedia, recomendamos utilizar la conexión de 3,5 mm o el Bluetooth para los periféricos de audio externos
HP ZBook Power 15 G8 313S5EA análisis de audio
(±) | la sonoridad del altavoz es media pero buena (72.3 dB)
Graves 100 - 315 Hz
(-) | casi sin bajos - de media 23.3% inferior a la mediana
(±) | la linealidad de los graves es media (11.8% delta a frecuencia anterior)
Medios 400 - 2000 Hz
(+) | medios equilibrados - a sólo 2.5% de la mediana
(+) | los medios son lineales (5.1% delta a la frecuencia anterior)
Altos 2 - 16 kHz
(+) | máximos equilibrados - a sólo 4.1% de la mediana
(+) | los máximos son lineales (3.1% delta a la frecuencia anterior)
Total 100 - 16.000 Hz
(±) | la linealidad del sonido global es media (21.4% de diferencia con la mediana)
En comparación con la misma clase
» 77% de todos los dispositivos probados de esta clase eran mejores, 6% similares, 18% peores
» El mejor tuvo un delta de 7%, la media fue 17%, el peor fue ###max##%
En comparación con todos los dispositivos probados
» 60% de todos los dispositivos probados eran mejores, 7% similares, 33% peores
» El mejor tuvo un delta de 4%, la media fue 23%, el peor fue ###max##%
Lenovo ThinkPad P15v G2 21A9000XGE análisis de audio
(-) | altavoces no muy altos (#70.7 dB)
Graves 100 - 315 Hz
(±) | lubina reducida - en promedio 13.4% inferior a la mediana
(±) | la linealidad de los graves es media (13.6% delta a frecuencia anterior)
Medios 400 - 2000 Hz
(+) | medios equilibrados - a sólo 4.7% de la mediana
(+) | los medios son lineales (6.2% delta a la frecuencia anterior)
Altos 2 - 16 kHz
(+) | máximos equilibrados - a sólo 3.2% de la mediana
(+) | los máximos son lineales (5.7% delta a la frecuencia anterior)
Total 100 - 16.000 Hz
(±) | la linealidad del sonido global es media (21.2% de diferencia con la mediana)
En comparación con la misma clase
» 76% de todos los dispositivos probados de esta clase eran mejores, 6% similares, 18% peores
» El mejor tuvo un delta de 7%, la media fue 17%, el peor fue ###max##%
En comparación con todos los dispositivos probados
» 59% de todos los dispositivos probados eran mejores, 7% similares, 34% peores
» El mejor tuvo un delta de 4%, la media fue 23%, el peor fue ###max##%
Gestión de la energía: El ZBook Power es tan eficiente como un ultrabook
Consumo de energía
Con una media de 6,32 vatios, los valores en reposo del ZBook Power 15 son tan buenos como los de los sistemas con una CPU de 15 vatios. ElZBook Furyy ZBook Powerconsumen casi tres veces más. Durante el modo de espera, el ZBook Power solo consume 0,95 vatios, por lo que no tendrás que recargarlo durante casi cuatro días cuando esté plegado. La fuente de alimentación de 150 vatios también es capaz de manejar los picos de carga de 110 vatios sin problemas y recargar el ZBook hasta el 80% en aproximadamente 1,5 horas.
| Off / Standby | |
| Ocioso | |
| Carga |
|
Clave:
min: | |
| HP ZBook Power 15 G8 313S5EA i7-11800H, T600 Laptop GPU, Samsung PM9A1 MZVL2512HCJQ, IPS LED, 1920x1080, 15.6" | HP ZBook Fury 15 G8 i9-11950H, RTX A5000 Laptop GPU, Samsung PM981a MZVLB1T0HBLR, IPS, 3840x2160, 15.6" | HP ZBook Studio 15 G8 i9-11950H, GeForce RTX 3070 Laptop GPU, Samsung PM981a MZVLB2T0HALB, OLED, 3840x2160, 15.6" | HP ZBook Firefly 15 G8 2C9R7EA i7-1165G7, T500 Laptop GPU, Toshiba XG6 KXG60ZNV1T02, IPS, 1920x1080, 15.6" | Lenovo ThinkPad P15v G2 21A9000XGE i7-11800H, T1200 Laptop GPU, Toshiba XG6 KXG6AZNV512G, IPS LED, 1920x1080, 15.6" | Dell Precision 3000 3551 i9-10885H, Quadro P620, Toshiba Kioxia XG6 KXG60PNV512G, IPS, 1920x1080, 15.6" | Medio NVIDIA T600 Laptop GPU | Media de la clase Workstation | |
|---|---|---|---|---|---|---|---|---|
| Power Consumption | -130% | -155% | 14% | -33% | -23% | 0% | -94% | |
| Idle Minimum * (Watt) | 4.17 | 8.3 -99% | 11 -164% | 3.3 21% | 5.96 -43% | 5.7 -37% | 4.17 ? -0% | 9.11 ? -118% |
| Idle Average * (Watt) | 6.32 | 19.9 -215% | 18.8 -197% | 5.6 11% | 8.37 -32% | 8.7 -38% | 6.32 ? -0% | 13.8 ? -118% |
| Idle Maximum * (Watt) | 7.1 | 21.8 -207% | 31.7 -346% | 8.7 -23% | 9.05 -27% | 9 -27% | 7.1 ? -0% | 17.9 ? -152% |
| Load Average * (Watt) | 80.41 | 110.9 -38% | 105.2 -31% | 64.4 20% | 91.82 -14% | 100.2 -25% | 80.4 ? -0% | 96 ? -19% |
| Witcher 3 ultra * (Watt) | 62.3 | 165 -165% | 148 -138% | 53 15% | 102 -64% | 56 10% | ||
| Load Maximum * (Watt) | 110.18 | 171.8 -56% | 171.8 -56% | 69 37% | 126.38 -15% | 133.2 -21% | 110.2 ? -0% | 180.3 ? -64% |
* ... más pequeño es mejor
Power Consumption The Witcher 3 / Stress Test
Power Consumption With External Monitor
Duración de la batería
Mientras navega por la web a 150 nits, el ZBook dura unas sorprendentes 12:19 horas. El ThinkPad P15v se queda significativamente atrás con sólo ~7,5 horas, mientras que Dell Precision 3551es capaz de superar la marca de las 13 horas. Con más de 2 horas bajo carga, el ZBook dura bastante, lo que también se debe en parte a su ralentización.
| HP ZBook Power 15 G8 313S5EA i7-11800H, T600 Laptop GPU, 83 Wh | HP ZBook Fury 15 G8 i9-11950H, RTX A5000 Laptop GPU, 94 Wh | HP ZBook Studio 15 G8 i9-11950H, GeForce RTX 3070 Laptop GPU, 83 Wh | HP ZBook Firefly 15 G8 2C9R7EA i7-1165G7, T500 Laptop GPU, 56 Wh | Lenovo ThinkPad P15v G2 21A9000XGE i7-11800H, T1200 Laptop GPU, 68 Wh | Dell Precision 3000 3551 i9-10885H, Quadro P620, 97 Wh | Media de la clase Workstation | |
|---|---|---|---|---|---|---|---|
| Duración de Batería | -50% | -26% | 15% | -26% | 11% | 4% | |
| Reader / Idle (h) | 14.9 | 12.9 -13% | 17.2 15% | 26.1 ? 75% | |||
| H.264 (h) | 10.1 | 15.3 51% | 8 -21% | 10.1 ? 0% | |||
| WiFi v1.3 (h) | 12.3 | 6.2 -50% | 6.2 -50% | 10.5 -15% | 7.5 -39% | 13.6 11% | 8.55 ? -30% |
| Load (h) | 2.1 | 1.8 -14% | 2.3 10% | 0.9 -57% | 1.441 ? -31% |
Pro
Contra
Veredicto: ZBook Power 15 asequible para creadores profesionales
A un precio de unos 1300 euros (~1324 dólares), el ZBook Power 15 G8 (Core i7, Nvidia T600, 8 GB / 256 GB) ofrece algunas claras ventajas de precio-rendimiento, al tiempo que mantiene muchas características de una estación de trabajo de gama alta. Los puntos fuertes del ZBook son los dispositivos de entrada, la duración de la batería, las características de seguridad, la capacidad de actualización, así como un buen rendimiento de estación de trabajo.
Aunque nuestra pantalla FHD probada no es del todo adecuada para el diseño de productos y Adobe, sigue ofreciendo buenos valores de brillo y contraste. El grupo objetivo de esta configuración consiste principalmente en estudiantes y profesionales del área de Autodesk SolidWorks, desarrollo de productos, arquitectura, construcción, ingeniería, diseño 2D y creación de realidad virtual.
Entre las desventajas está el desarrollo inconsistente del rendimiento, pero no podemos confirmar si esto se debe a la propia IA de HP. Además, hay que vivir sin procesadores Xeon junto con RAM ECC en esta estación de trabajo asequible. También carece de WWAN y de un lector de tarjetas SD y sólo ofrece un único puerto Thunderbolt 4. Y por último, la reproducción de sonido y la webcam son bastante pésimas.
"El HP ZBook Power 15 G8 es una estación de trabajo sólida para estudiantes, ingenieros y (semi)profesionales sin exigencias de gama alta. Por desgracia, el panel 4K opcional no amplía en absoluto el grupo objetivo a las tareas creativas, donde se requiere una alta precisión de color. Por lo demás, todos los demás aspectos básicos están a un gran nivel"
ElThinkPad P15v G2ofrece un rendimiento y dispositivos de entrada similares, también a un buen precio. Sin embargo, funciona de forma significativamente más silenciosa y ofrece un lector de tarjetas SD y, posiblemente, la opción de pantalla 4K con mayor precisión de color. Por otro lado, el ThinkPad no admite la carga por USB-C, y la duración de la batería es significativamente menor. Además, es más pesado y voluminoso El Dell Precision 3551 también es un campeón de la resistencia que no es mucho peor que el ZBook Power, excepto en términos de rendimiento bruto, siempre que lo equipes con la pantalla adecuada. Sin embargo, su sucesor debería ofrecer un mayor rendimiento.
Precio y disponibilidad
Una configuración de la estación de trabajo móvil HP ZBook Power G8 con un Core i7-11850H, 32 GB de RAM y 512 GB de SSD está actualmente disponible por ~$2400 en Amazon. La tienda online de HP https://www.hp.com/us-en/workstations/zbook-power-g8.html también ofrece muchas opciones configurables.
HP ZBook Power 15 G8 313S5EA
- 07/07/2022 v7 (old)
Marvin Gollor
Price comparison

