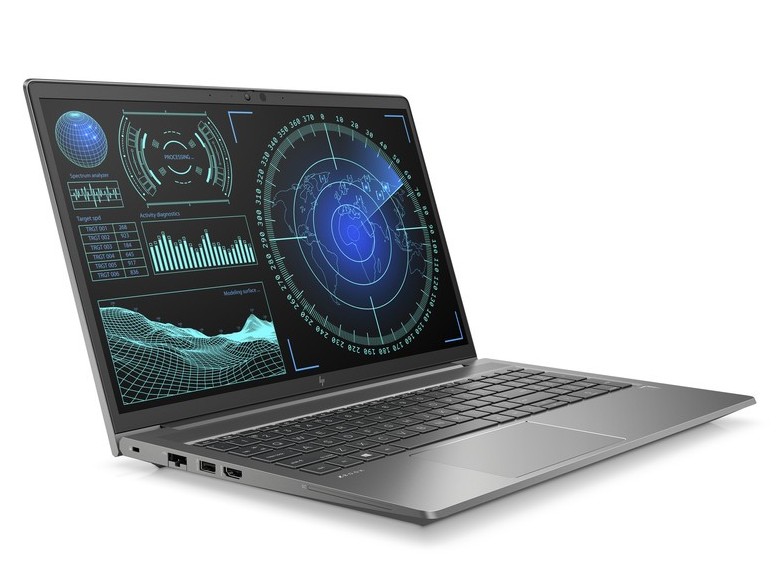
Análisis de la estación de trabajo HP ZBook Fury 15 G8: La Quadro RTX A5000 es una bestia
Mientras que el ZBook Fury 15 G7 representó una revisión masiva sobre el ZBook Fury 15 G6, el último ZBook Fury 15 G8 es una actualización relativamente menor en general. El nuevo modelo viene con CPUs Tiger Lake-H y GPUs Nvidia Ampere para reemplazar las opciones Comet Lake-H y Nvidia Turing del año pasado. Su pantalla también se ha actualizado de 4K 60 Hz a 4K 120 Hz para ser uno de los pocos portátiles de 15 pulgadas con esa opción de panel
Las referencias van desde la CPU Core i5-11500H con gráficos integrados y pantalla NTSC 1080p al 45% por unos 2000 dólares hasta la CPU Xeon W-11955M vPro con gráficos Quadro RTX A5000 y pantalla táctil brillante 4K UHD al 100% DCI-P3 por más de 6000 dólares. Nuestra unidad de prueba una configuración de gama alta con el Core i9-11950H, RTX A5000 y pantalla mate 4K120 por unos 5000 dólares
Los competidores en este espacio incluyen otras estaciones de trabajo tradicionales de 15,6 pulgadas como el Dell Precision 7550,Lenovo ThinkPad P15 Gen 2y la serie Serie Celsius de Fujitsu. Recomendamos consultar nuestro análisis existente sobre el ZBook Fury 15 G7 para más información sobre el chasis y sus características ya que el Fury 15 G8 utiliza el mismo esqueleto.
Más análisis de HP
potential competitors in comparison
Valoración | Fecha | Modelo | Peso | Altura | Tamaño | Resolución | Precio |
|---|---|---|---|---|---|---|---|
| 90.3 % v7 (old) | 10/2021 | HP ZBook Fury 15 G8 i9-11950H, RTX A5000 Laptop GPU | 2.5 kg | 25.9 mm | 15.60" | 3840x2160 | |
| 90.2 % v7 (old) | 01/2021 | HP ZBook Fury 15 G7 W-10885M, Quadro RTX 5000 Max-Q | 2.4 kg | 25.9 mm | 15.60" | 3840x2160 | |
| 88.3 % v7 (old) | 10/2021 | Dell Precision 5000 5560 i7-11850H, RTX A2000 Laptop GPU | 2 kg | 18 mm | 15.60" | 3840x2400 | |
| 87.8 % v7 (old) | 08/2021 | HP ZBook Studio 15 G8 i9-11950H, GeForce RTX 3070 Laptop GPU | 1.9 kg | 18 mm | 15.60" | 3840x2160 | |
| 85.3 % v7 (old) | 06/2021 | Lenovo ThinkPad P15s Gen2-20W6000GGE i7-1165G7, T500 Laptop GPU | 1.9 kg | 19.1 mm | 15.60" | 3840x2160 | |
| 82.7 % v7 (old) | 10/2020 | HP ZBook Firefly 15 G7 i7-10610U, Quadro P520 | 1.8 kg | 19.2 mm | 15.60" | 3840x2160 |
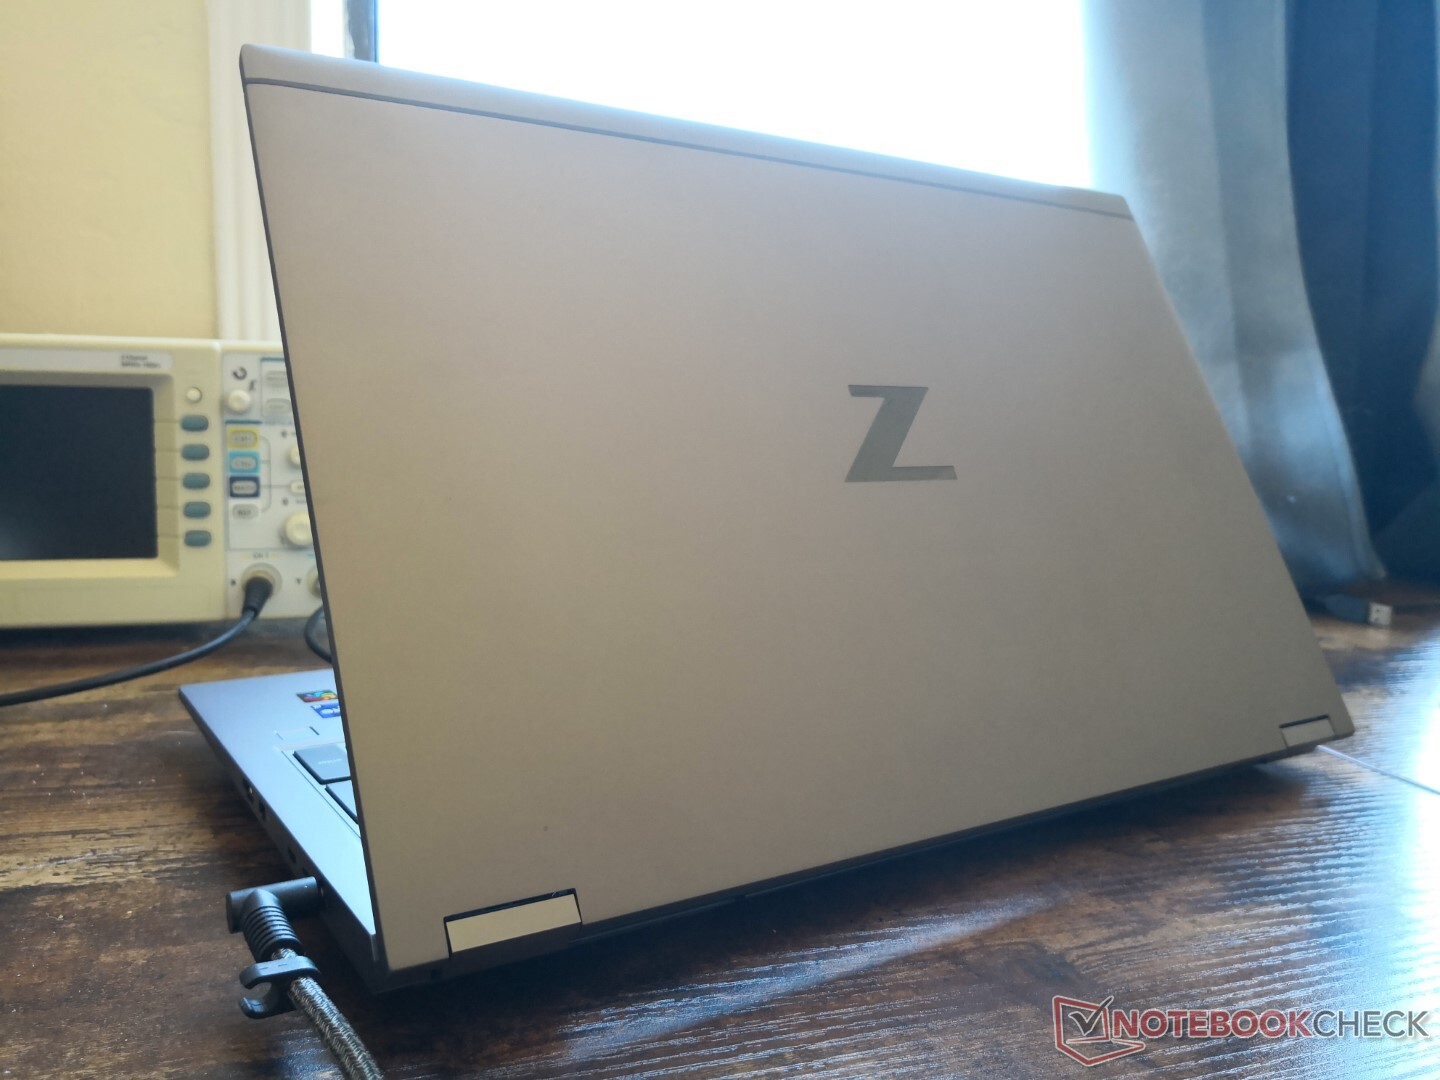
Caja - Idéntica a la ZBook Fury 15 G7
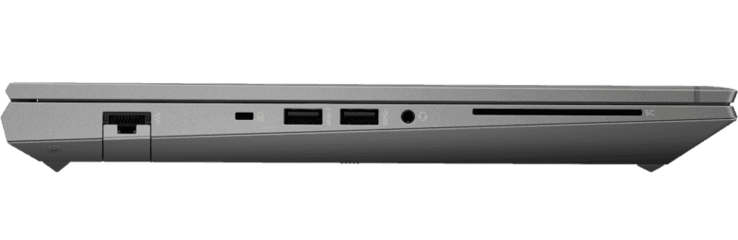
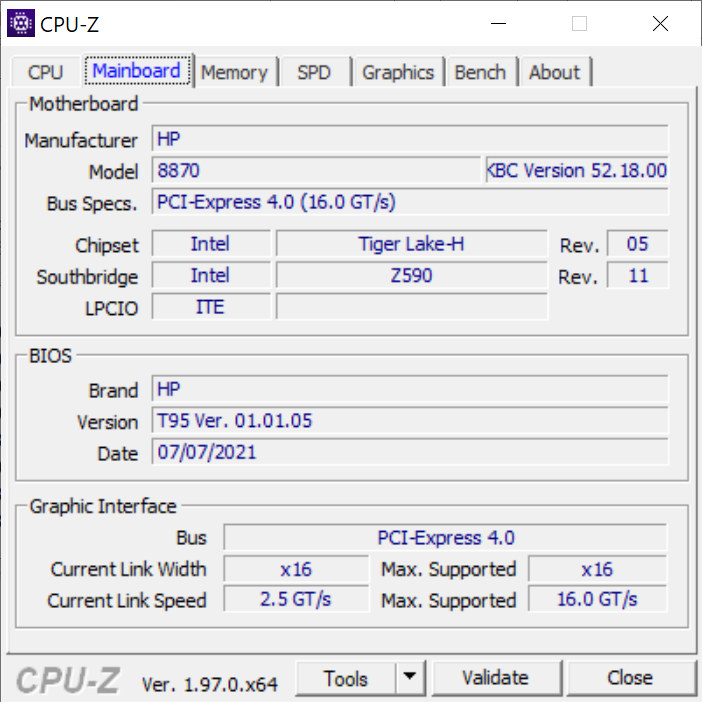
Conectividad
Se soporta Thunderbolt 4 en lugar de "sólo" Thunderbolt 3 en el Fury 15 G7. Por lo demás, los puertos siguen siendo idénticos año tras año.
Lector de tarjetas SD
| SD Card Reader | |
| average JPG Copy Test (av. of 3 runs) | |
| Dell Precision 5000 5560 (AV Pro V60) | |
| HP ZBook Fury 15 G7 (Toshiba Exceria Pro SDXC 64 GB UHS-II) | |
| HP ZBook Fury 15 G8 (AV Pro V60) | |
| HP ZBook Studio 15 G8 (AV Pro V60) | |
| Lenovo ThinkPad P15s Gen2-20W6000GGE (AV Pro V60) | |
| maximum AS SSD Seq Read Test (1GB) | |
| HP ZBook Fury 15 G7 (Toshiba Exceria Pro SDXC 64 GB UHS-II) | |
| Dell Precision 5000 5560 (AV Pro V60) | |
| Lenovo ThinkPad P15s Gen2-20W6000GGE (AV Pro V60) | |
| HP ZBook Studio 15 G8 (AV Pro V60) | |
| HP ZBook Fury 15 G8 (AV Pro V60) | |
Comunicación
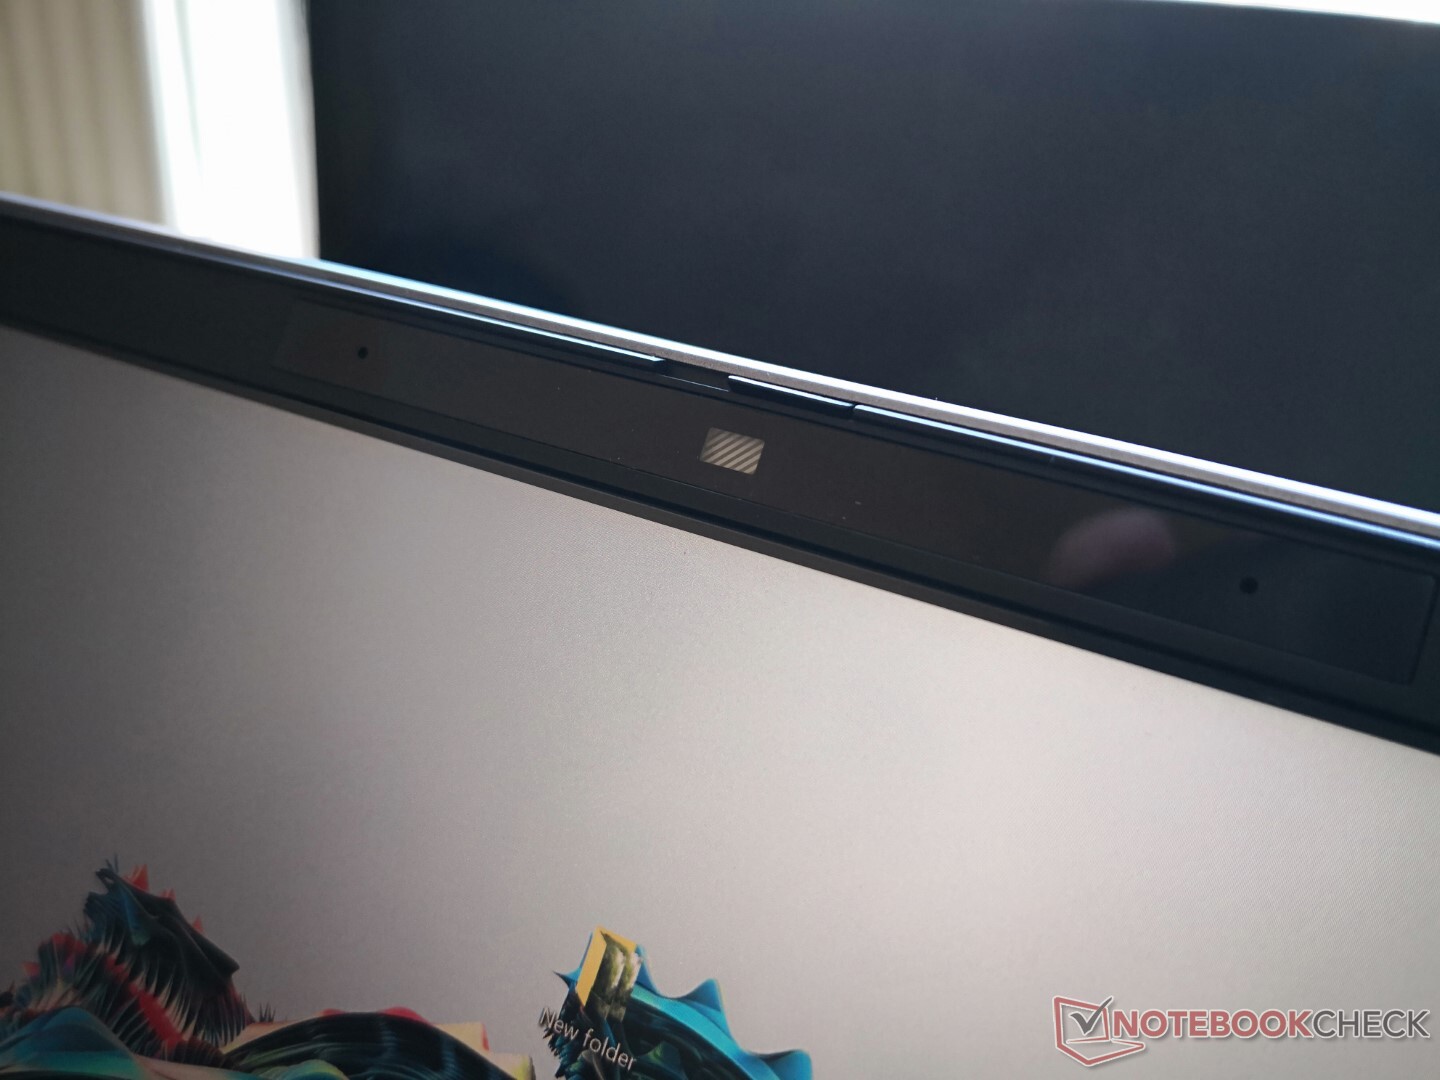
Webcam - Still 720p
La calidad de la cámara sigue siendo pobre, con sólo 720p. Algunos fabricantes como Razer han mejorado sus cámaras web integradas de 720p a 1080p.


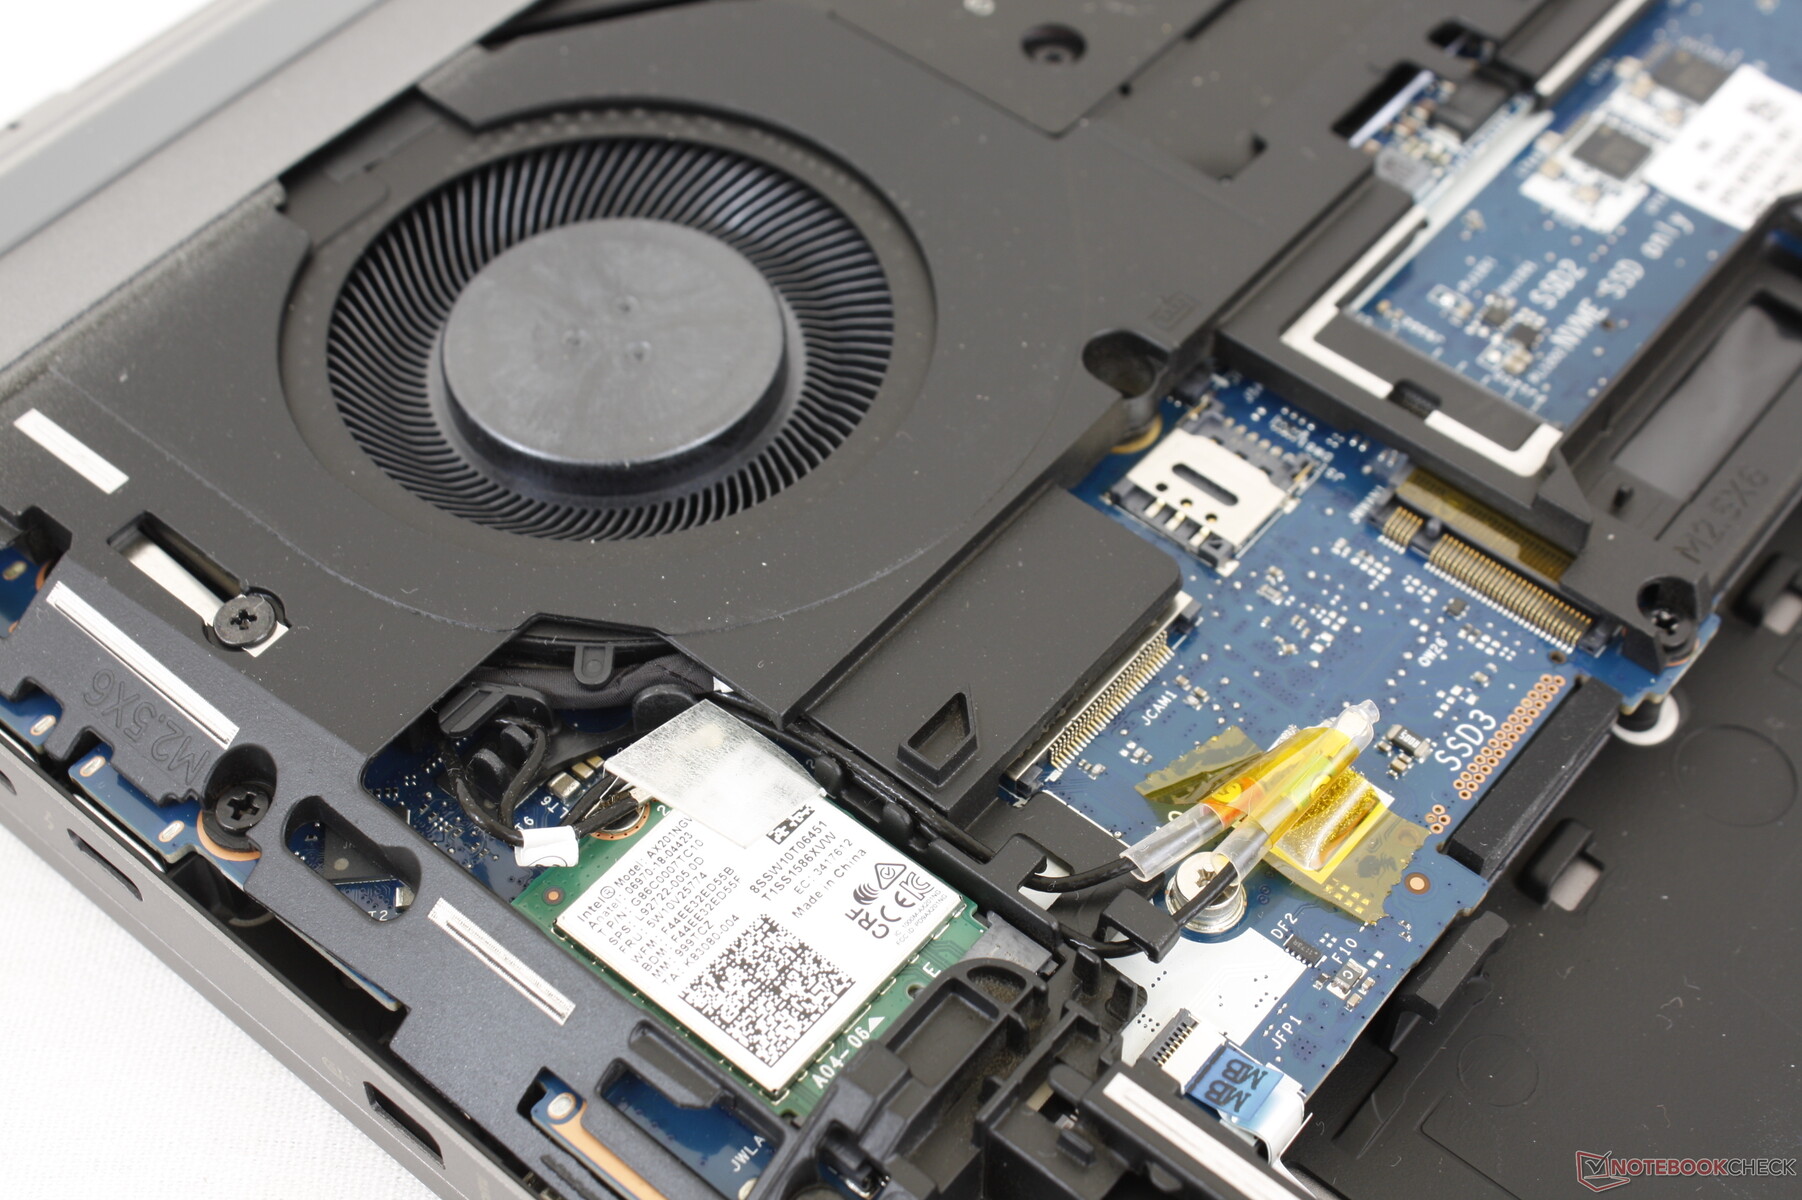
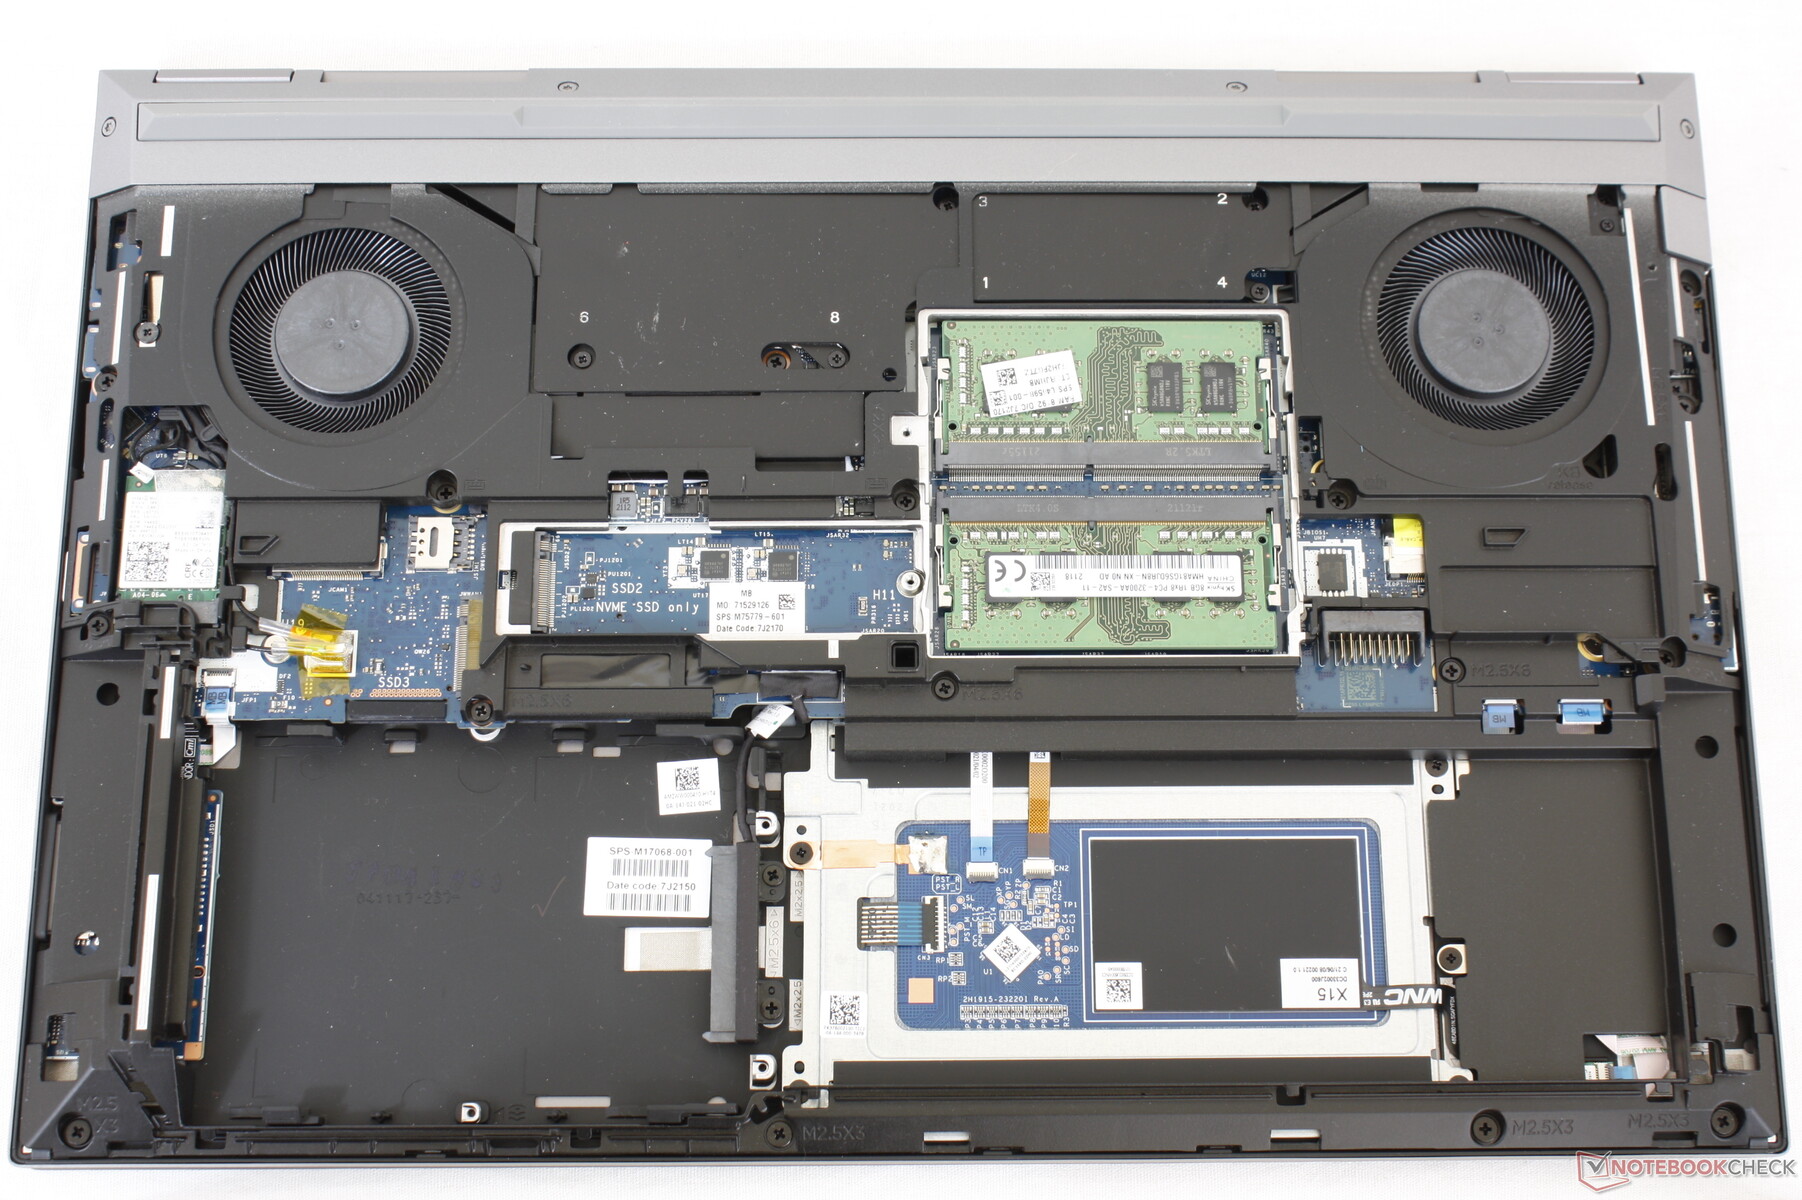
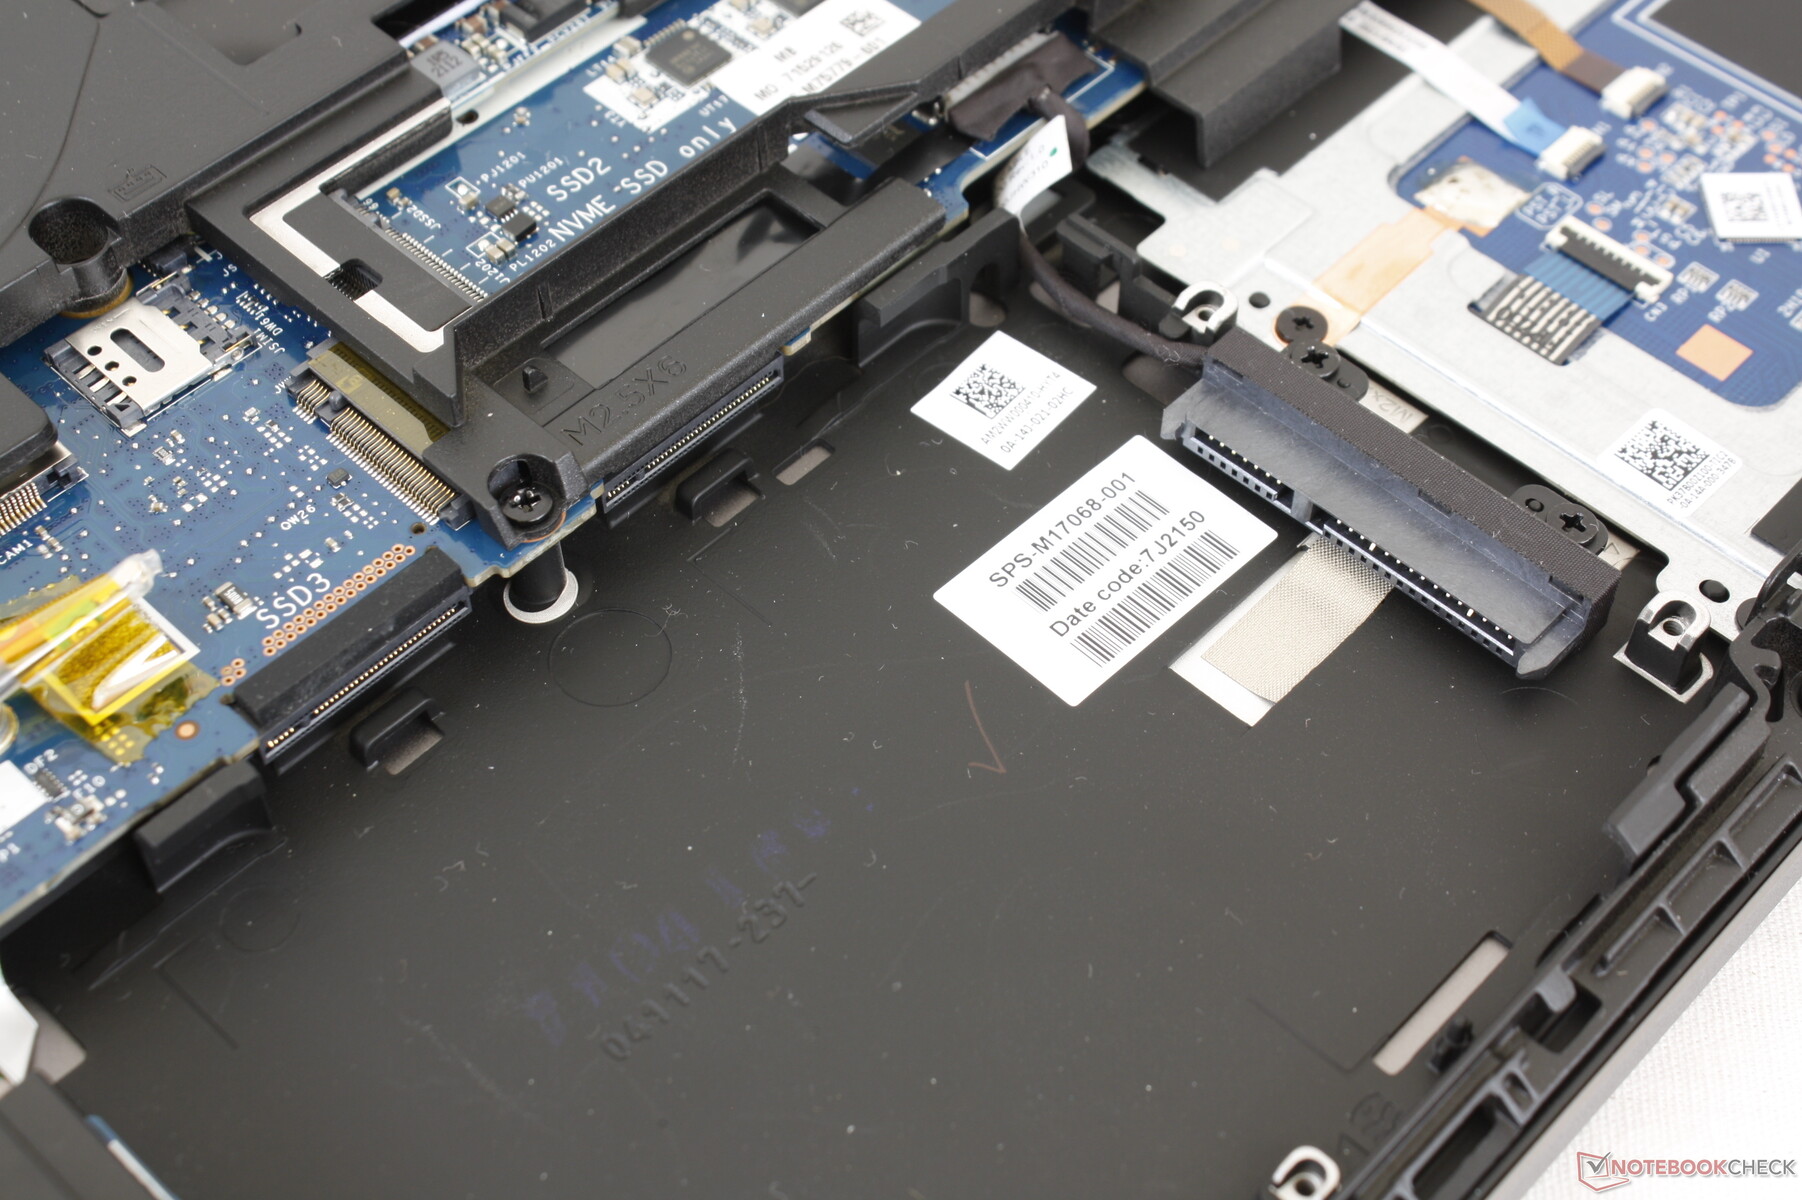
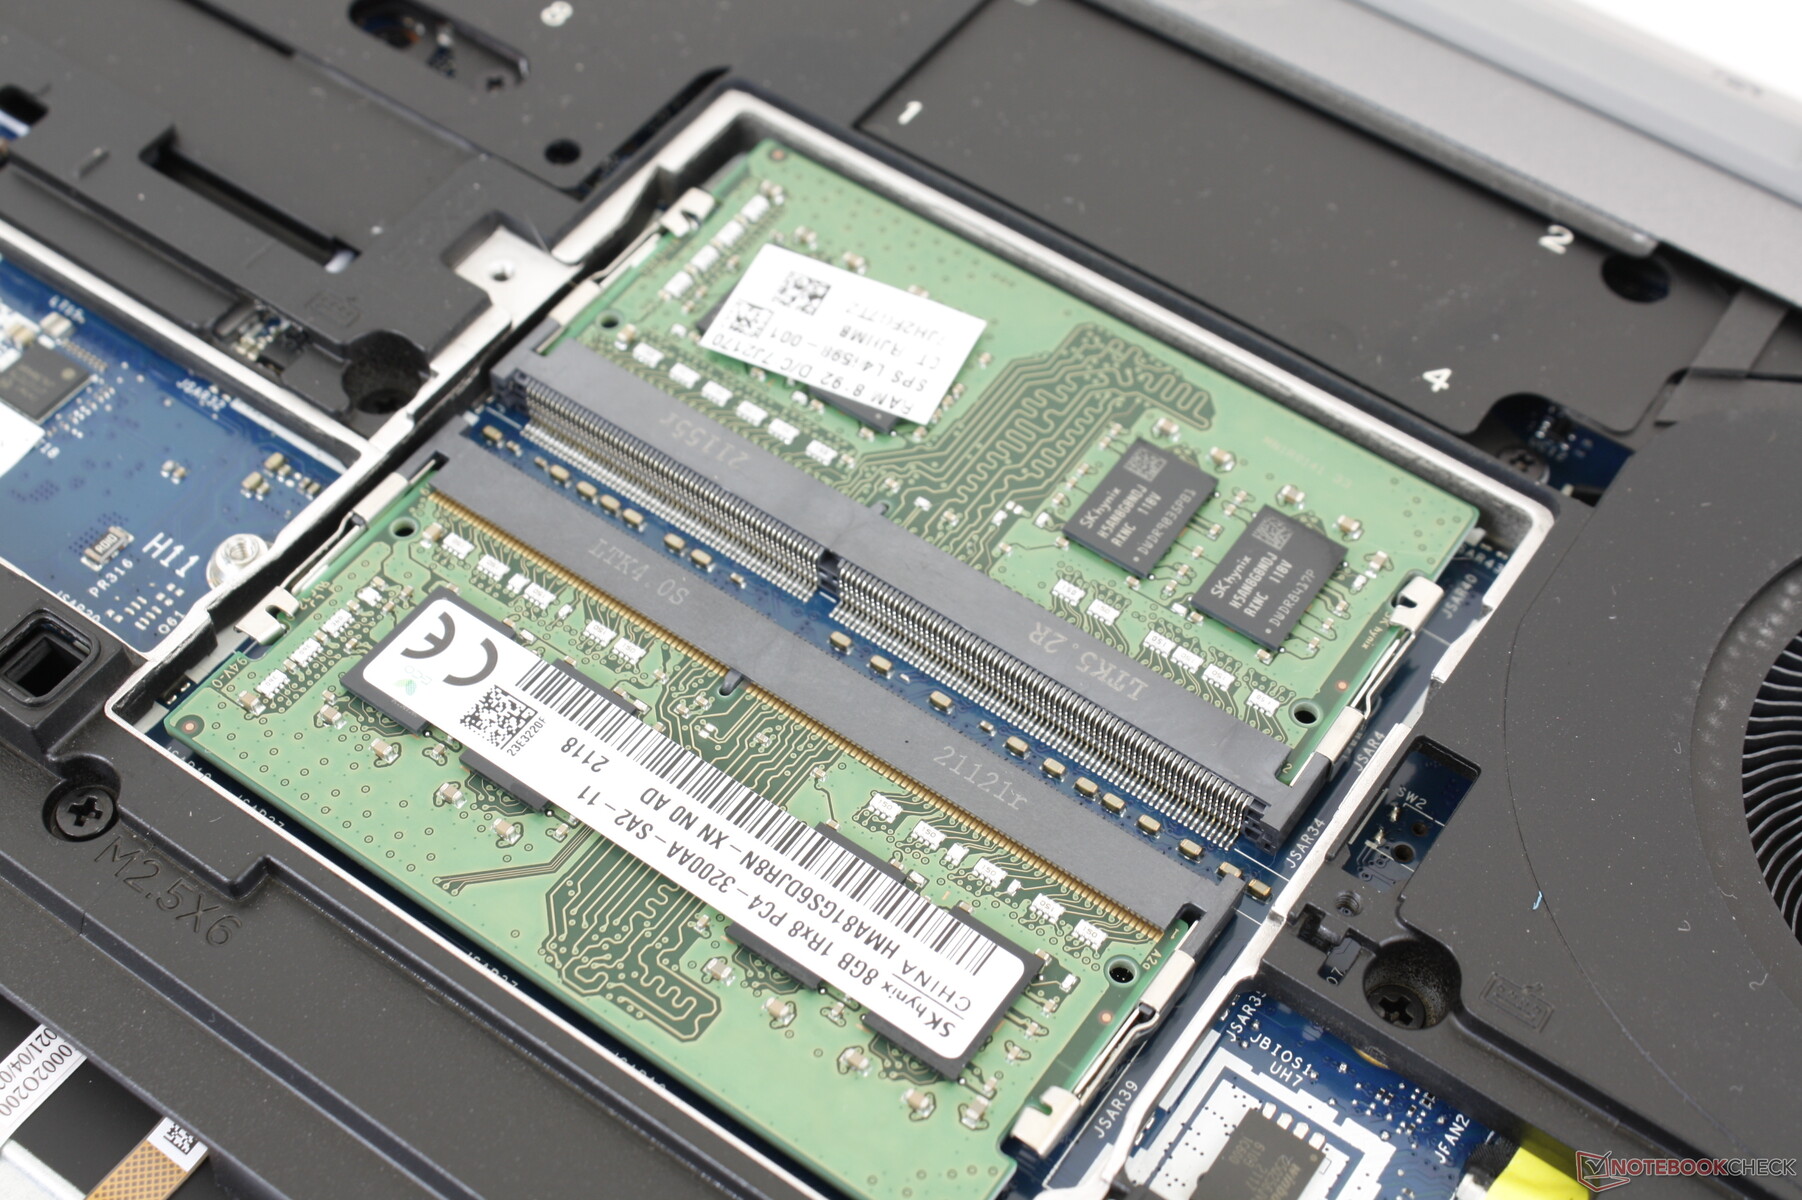
Mantenimiento - Tenga a mano un destornillador
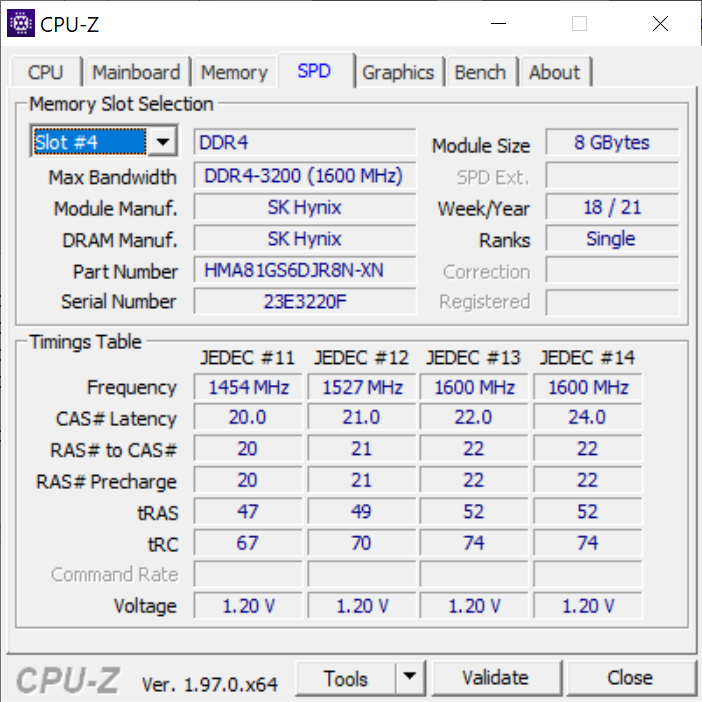
El panel inferior se desliza fácilmente, sin necesidad de herramientas o destornilladores. Sin embargo, una vez dentro, la mayoría de los componentes están debajo de placas metálicas que requieren un destornillador Philips para ser retiradas. La memoria RAM y los componentes de almacenamiento adicionales están en el otro lado de la placa base, por lo que no son tan fácilmente accesibles.
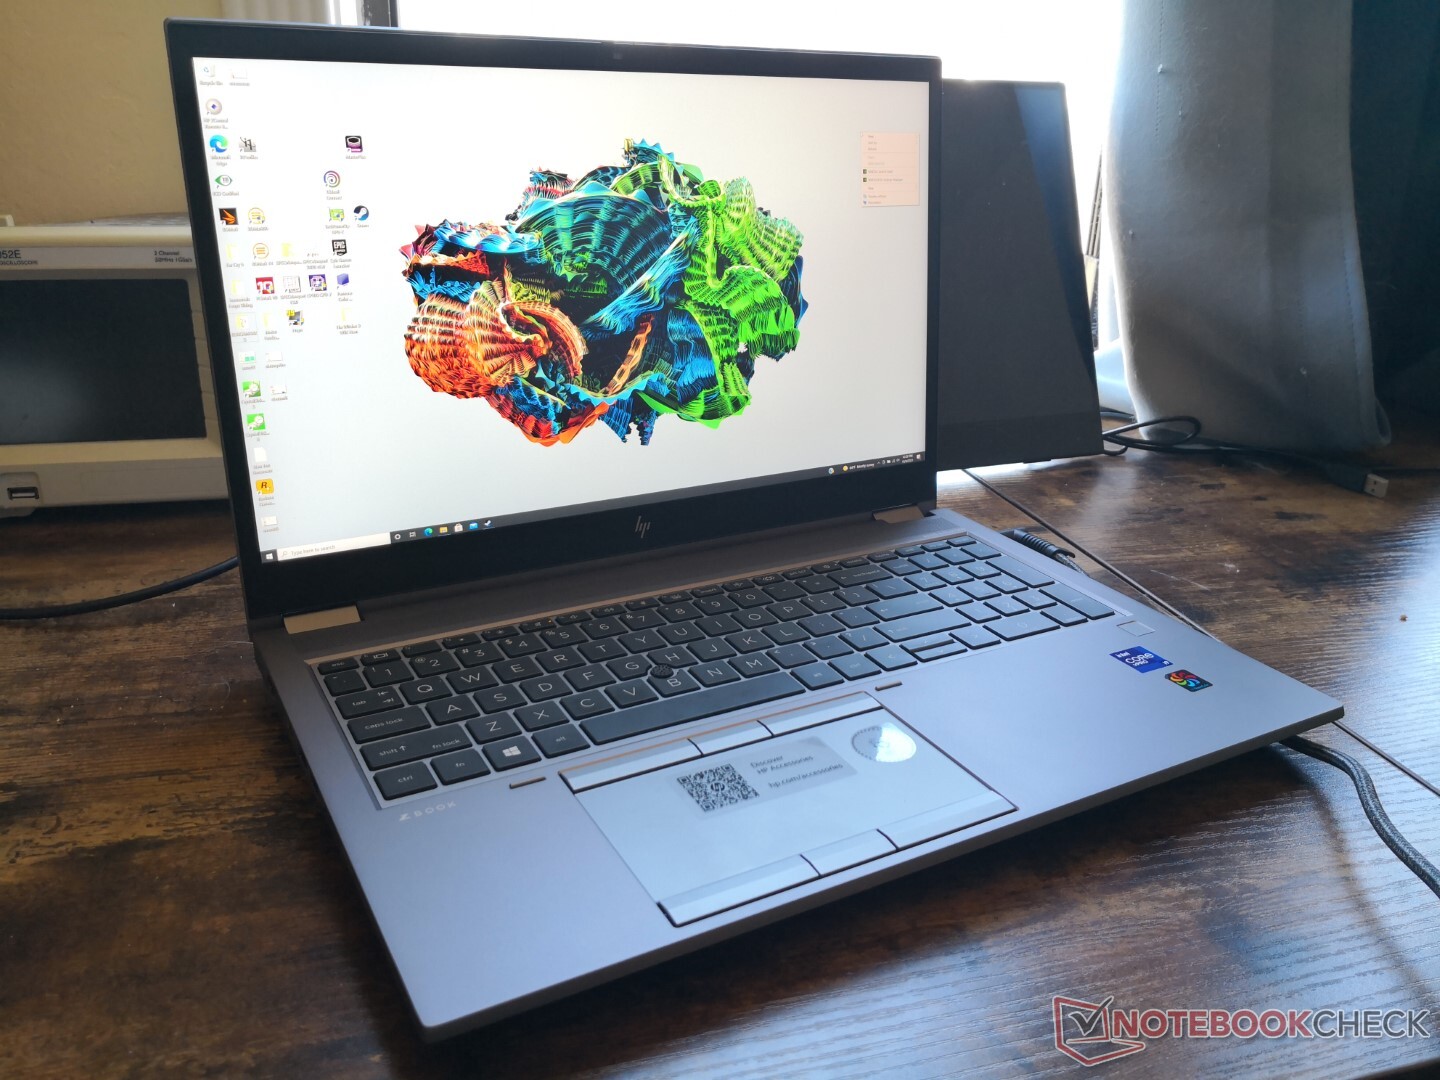
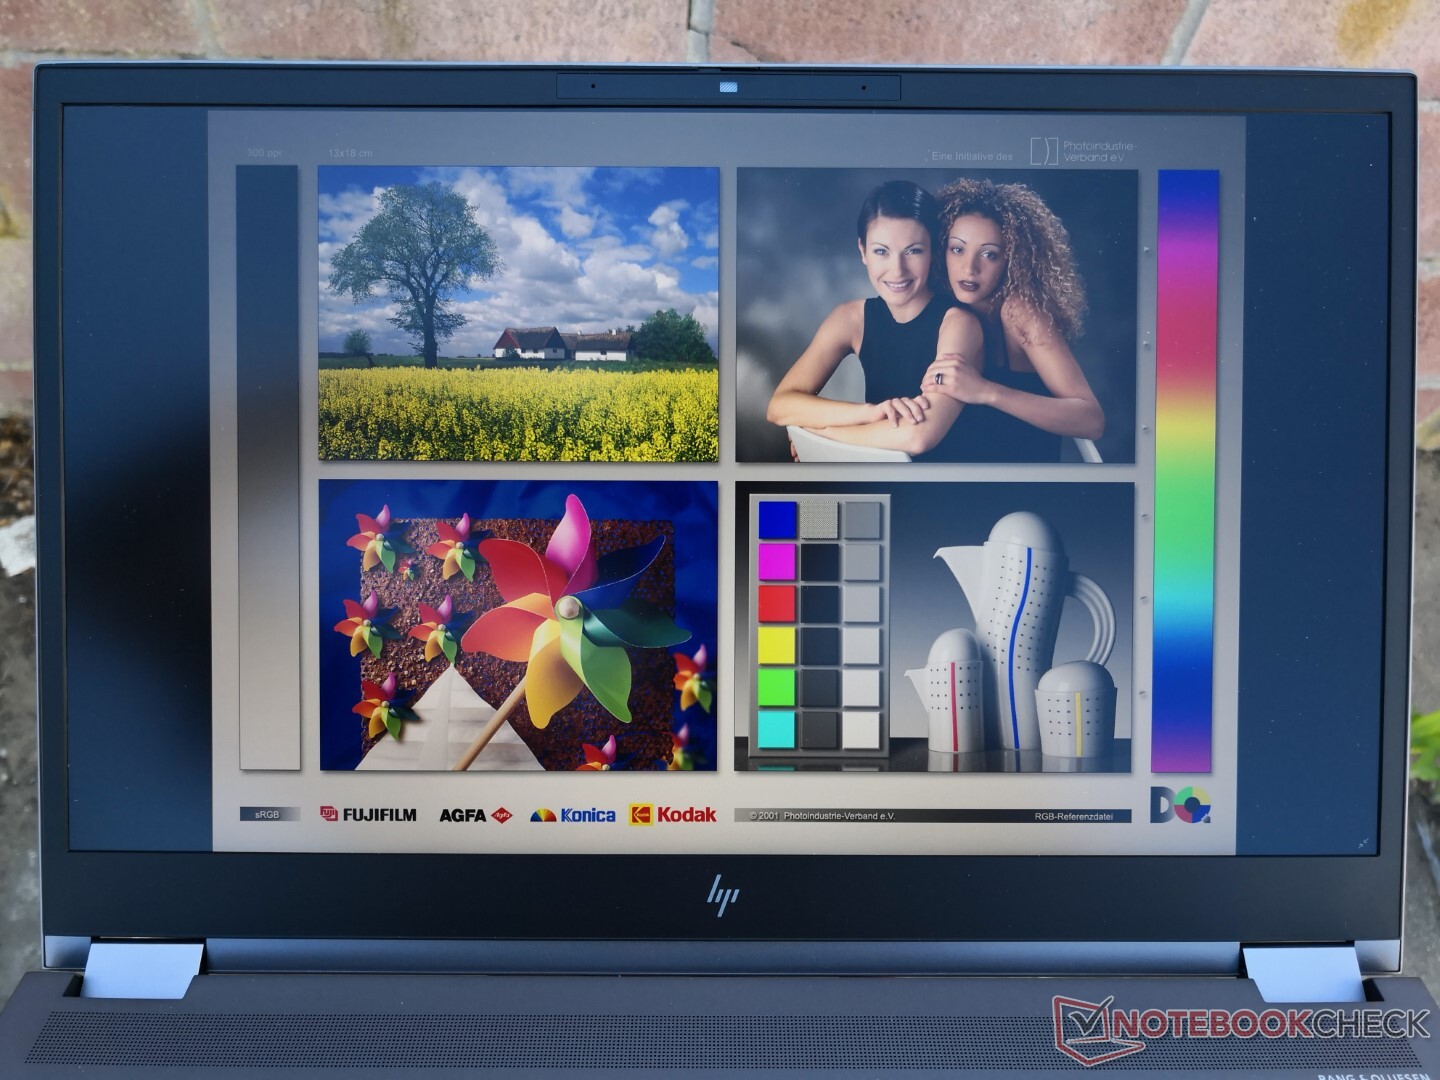
Pantalla: 120 Hz marcan la diferencia
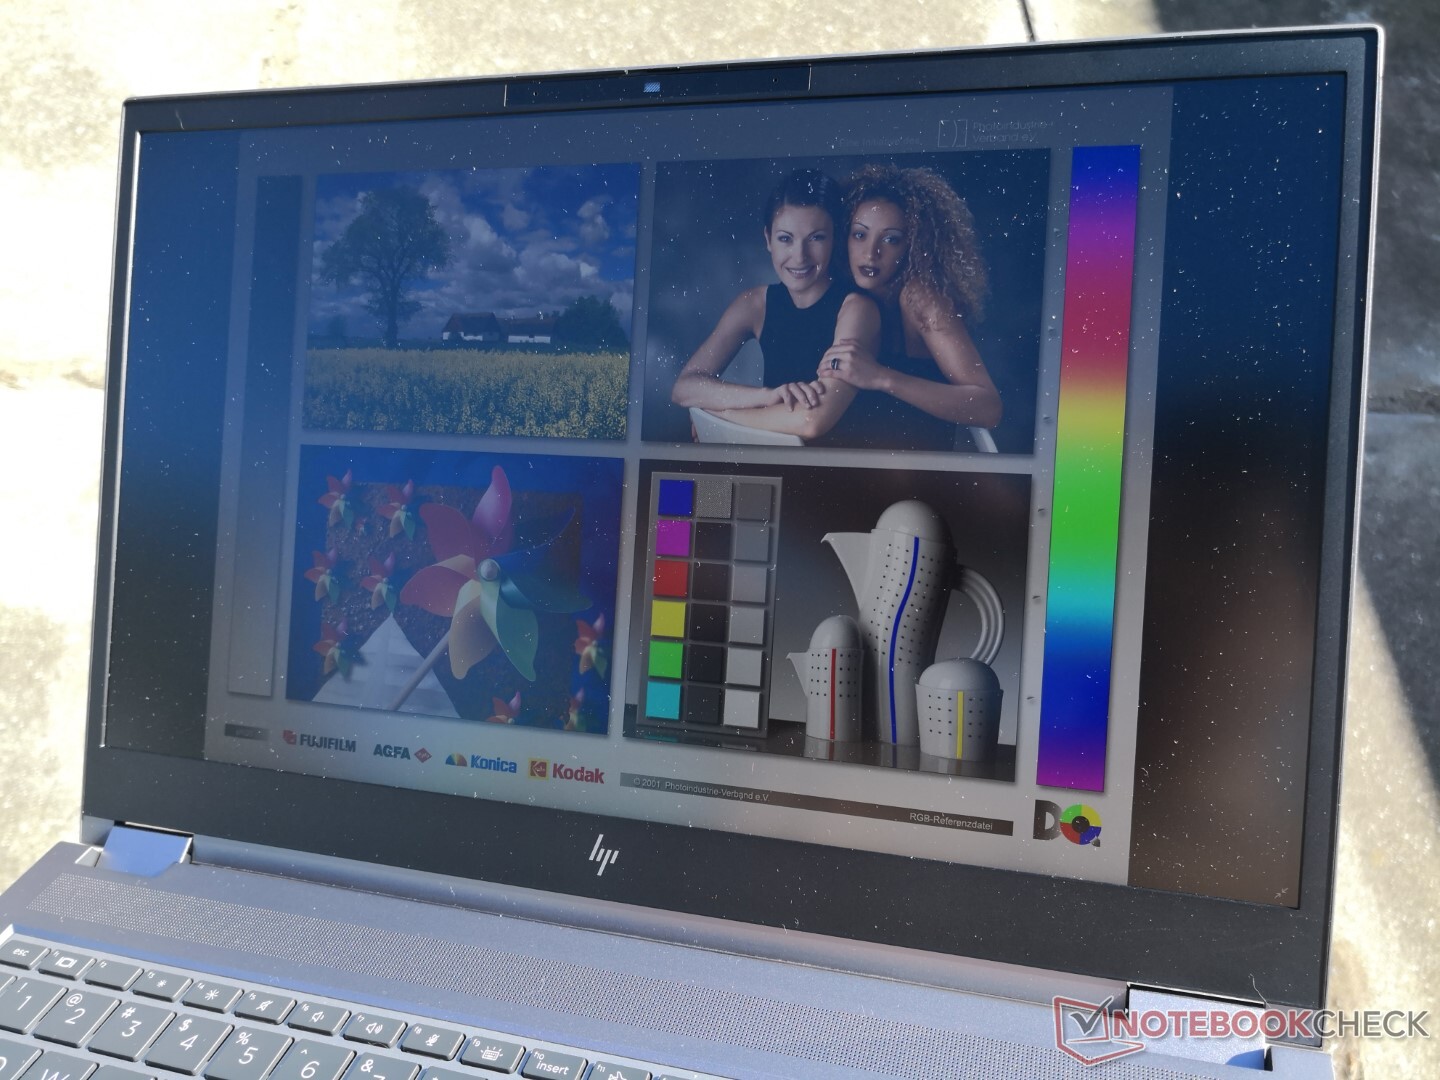
El nuevo panel 4K de 120 Hz del Fury 15 G8 es una mejora significativa con respecto al panel 4K de 60 Hz del Fury 15 G7 a pesar de tener la misma alta resolución nativa y amplia cobertura de color. Aparte de los beneficios obvios de pasar de 60 Hz a 120 Hz, el nuevo panel ofrece tiempos de respuesta en blanco y negro y gris mucho más rápidos, casi 4 veces, para un ghosting menos notable, especialmente cuando se trata de gráficos en movimiento rápido. Tanto el brillo como el contraste siguen siendo altos, con ~600:1 y >1000:1, respectivamente
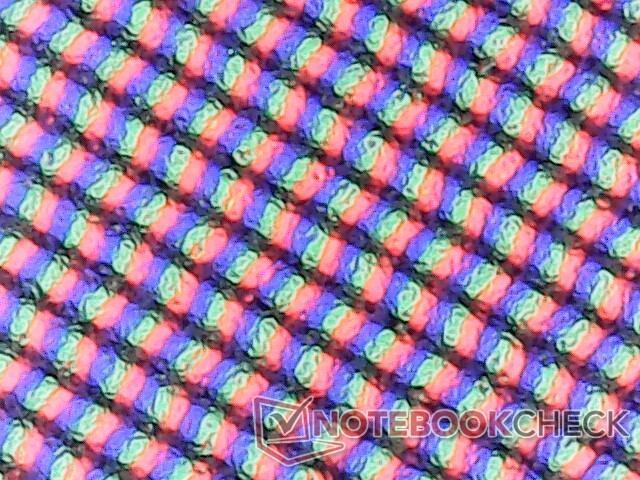
Quizá el mayor inconveniente del panel 4K es que sufre un poco de granulado debido a la superposición mate, por lo que los textos y las imágenes no parecen tan nítidos como podrían haber sido a pesar de los altísimos PPI. HP ofrece opciones brillantes para superar este inconveniente específico.
| |||||||||||||||||||||||||
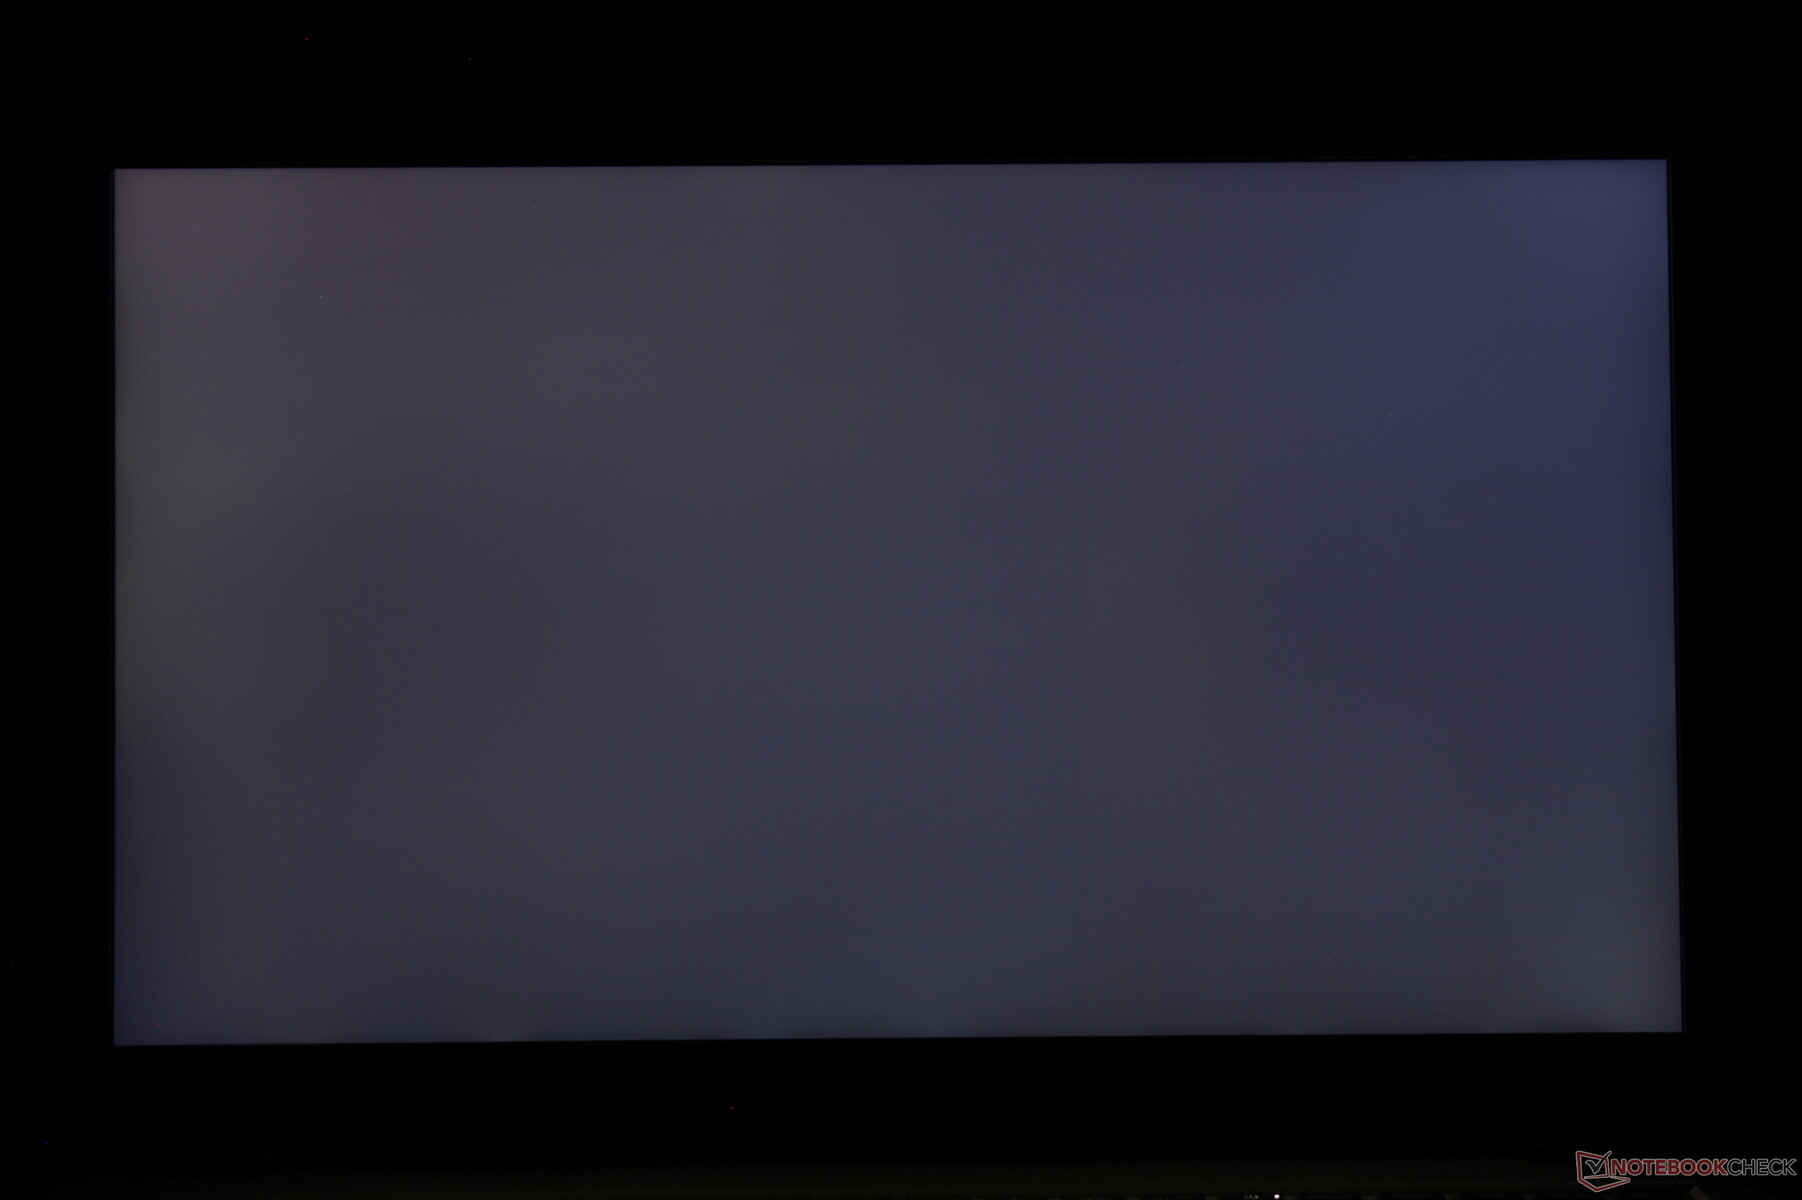
iluminación: 87 %
Brillo con batería: 626 cd/m²
Contraste: 1079:1 (Negro: 0.58 cd/m²)
ΔE ColorChecker Calman: 5.41 | ∀{0.5-29.43 Ø4.71}
calibrated: 0.6
ΔE Greyscale Calman: 6.2 | ∀{0.09-98 Ø4.96}
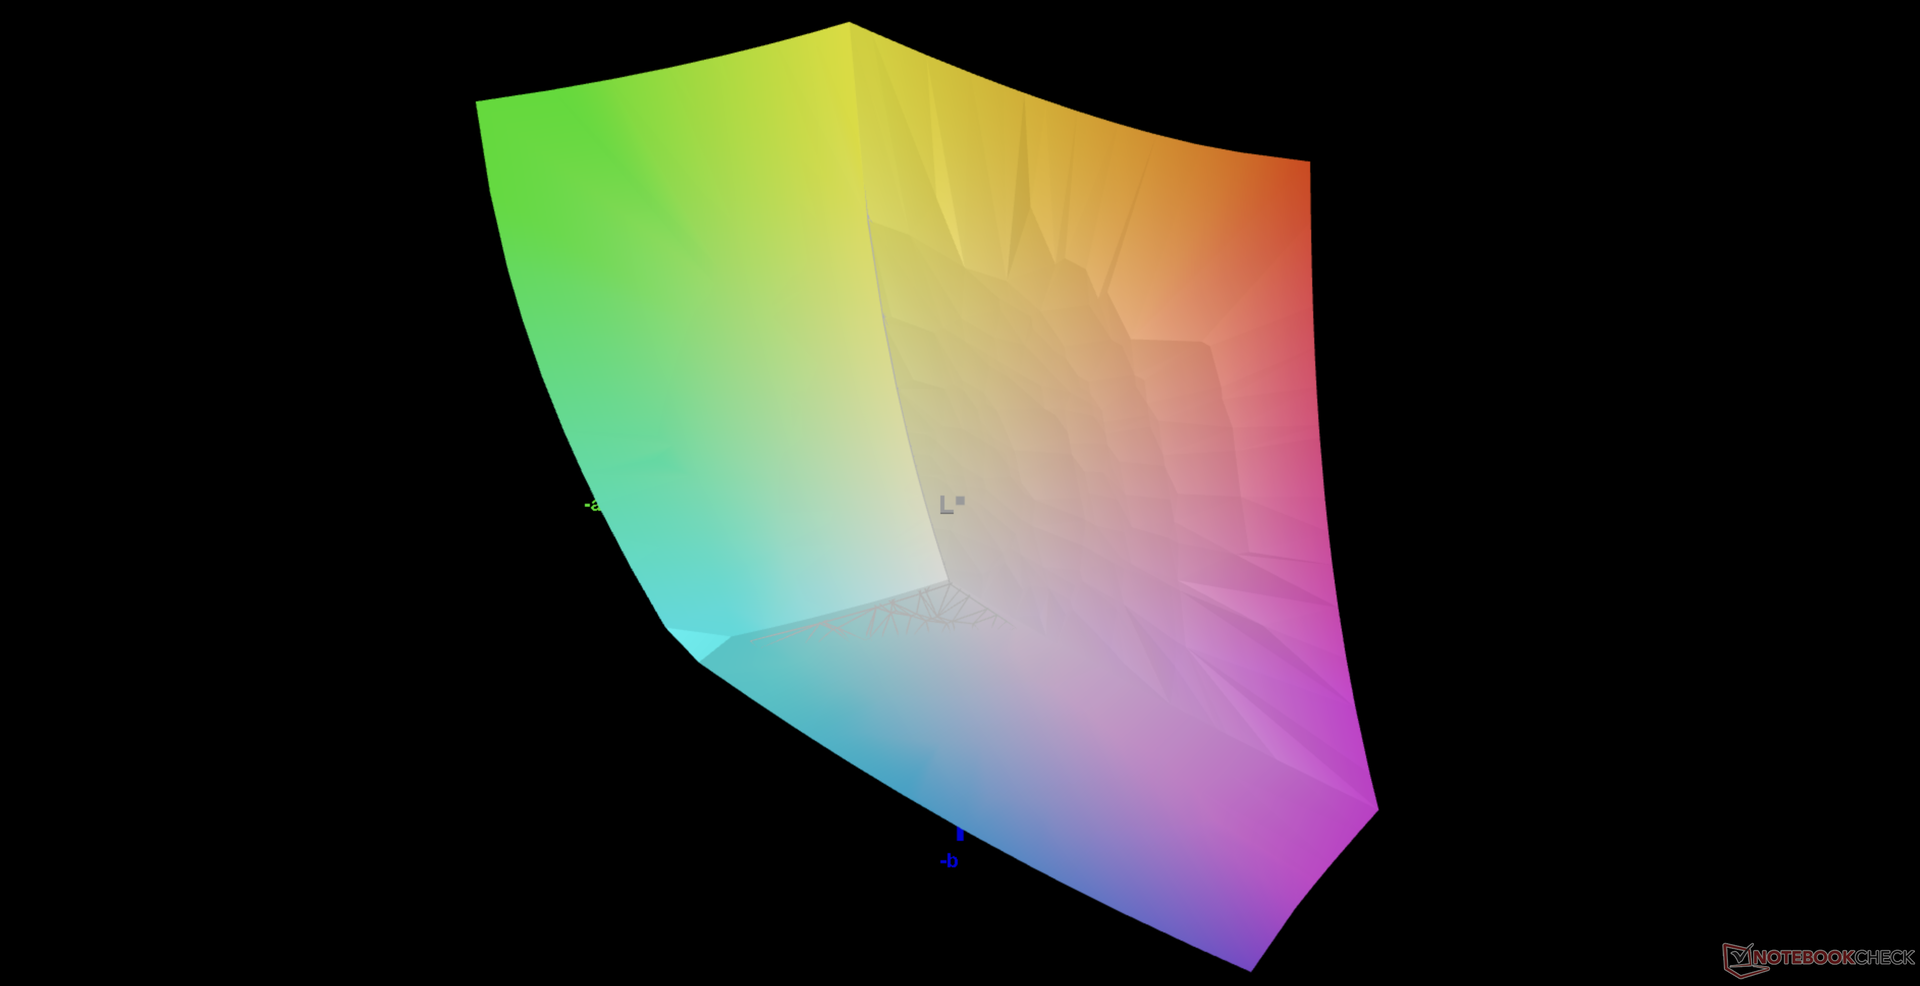
87.3% AdobeRGB 1998 (Argyll 3D)
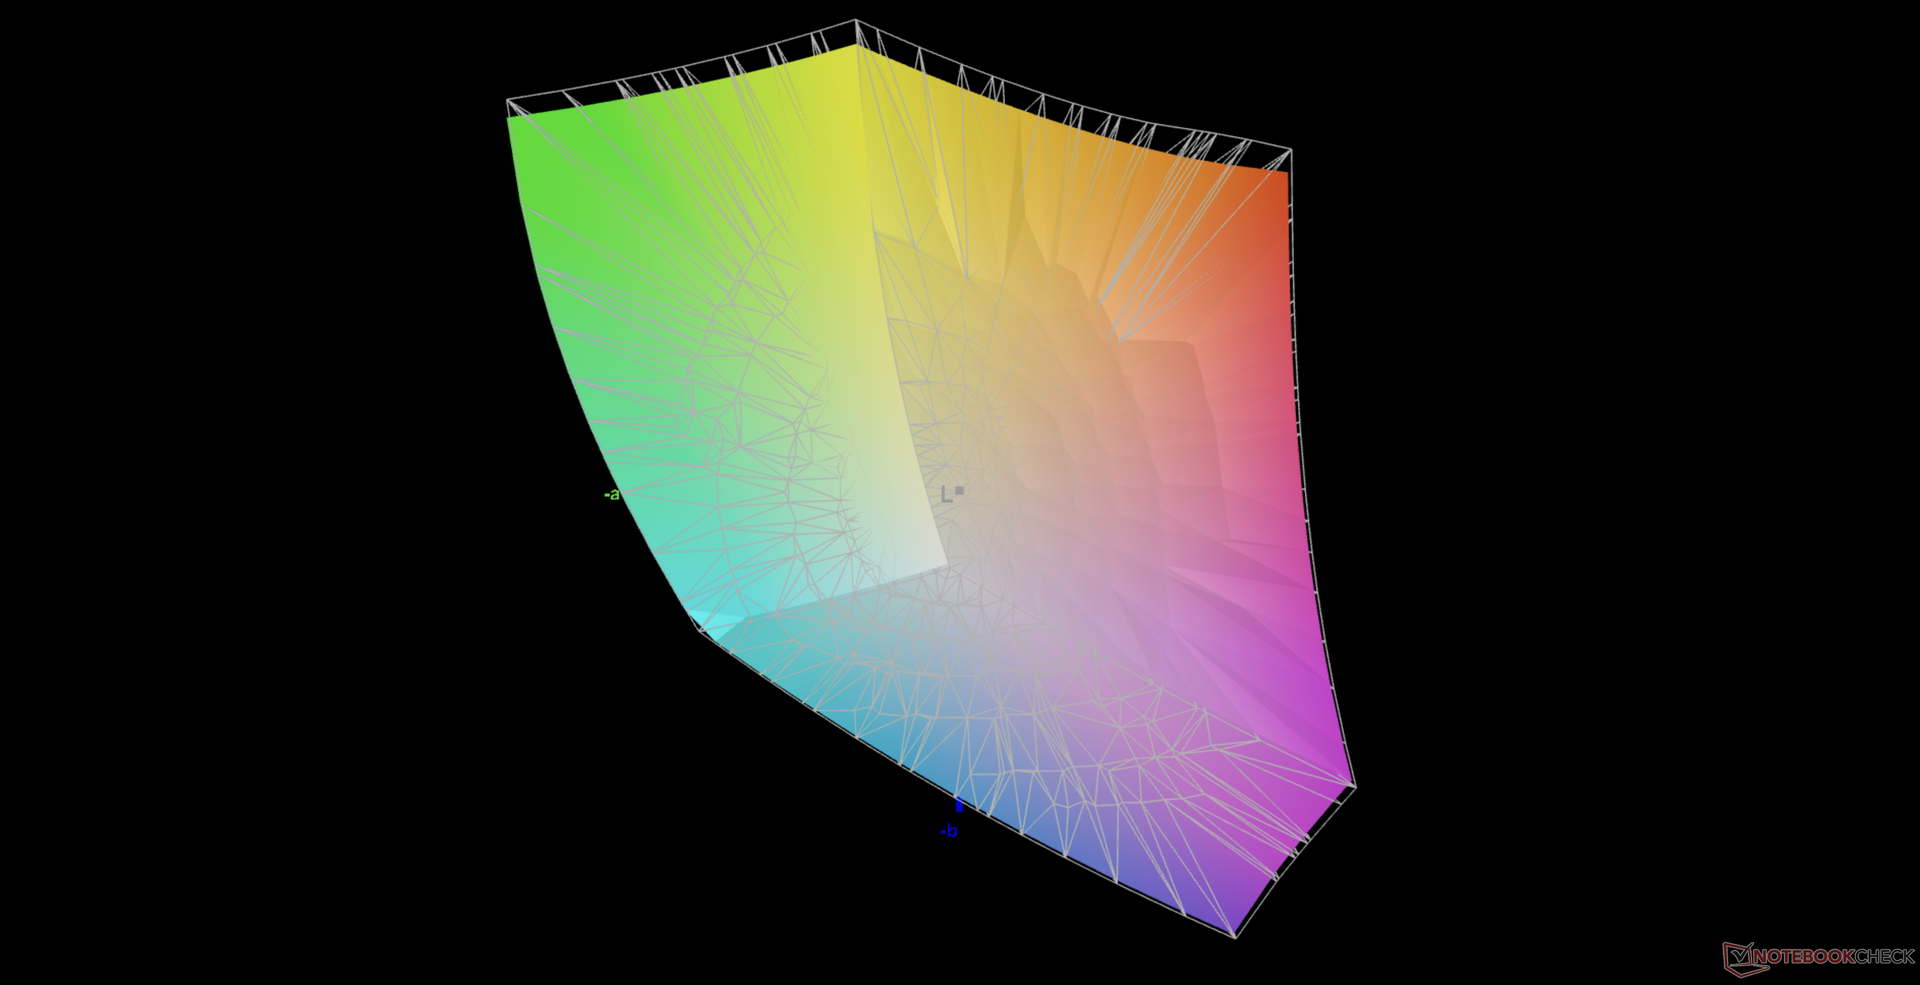
100% sRGB (Argyll 3D)
95.9% Display P3 (Argyll 3D)
Gamma: 2.66
CCT: 6101 K
| HP ZBook Fury 15 G8 BOE0969, IPS, 15.6", 3840x2160 | HP ZBook Fury 15 G7 LG Philips LGD0661, IPS, 15.6", 3840x2160 | Dell Precision 5000 5560 Sharp LQ156R1, IPS, 15.6", 3840x2400 | HP ZBook Studio 15 G8 SDC4145, OLED, 15.6", 3840x2160 | Lenovo ThinkPad P15s Gen2-20W6000GGE MNF601EA1-1, IPS LED, 15.6", 3840x2160 | HP ZBook Firefly 15 G7 LGD064F, IPS LED, 15.6", 3840x2160 | |
|---|---|---|---|---|---|---|
| Display | -1% | 5% | 4% | -0% | -17% | |
| Display P3 Coverage (%) | 95.9 | 95.6 0% | 94.9 -1% | 99.9 4% | 84.5 -12% | 68.8 -28% |
| sRGB Coverage (%) | 100 | 99.8 0% | 100 0% | 100 0% | 98.7 -1% | 97.7 -2% |
| AdobeRGB 1998 Coverage (%) | 87.3 | 84.5 -3% | 100 15% | 95.3 9% | 97.8 12% | 69.8 -20% |
| Response Times | -253% | -198% | 81% | -141% | -189% | |
| Response Time Grey 50% / Grey 80% * (ms) | 14.8 ? | 56 ? -278% | 47.2 ? -219% | 2.4 ? 84% | 40 ? -170% | 44 ? -197% |
| Response Time Black / White * (ms) | 11 ? | 36 ? -227% | 30.4 ? -176% | 2.4 ? 78% | 23.2 ? -111% | 30.8 ? -180% |
| PWM Frequency (Hz) | 240.4 ? | |||||
| Screen | -29% | 7% | -58% | 35% | 5% | |
| Brightness middle (cd/m²) | 626 | 672.8 7% | 501.5 -20% | 379.6 -39% | 604 -4% | 381 -39% |
| Brightness (cd/m²) | 589 | 674 14% | 467 -21% | 380 -35% | 609 3% | 382 -35% |
| Brightness Distribution (%) | 87 | 89 2% | 83 -5% | 95 9% | 91 5% | 92 6% |
| Black Level * (cd/m²) | 0.58 | 0.5 14% | 0.44 24% | 0.34 41% | 0.21 64% | |
| Contrast (:1) | 1079 | 1346 25% | 1140 6% | 1776 65% | 1814 68% | |
| Colorchecker dE 2000 * | 5.41 | 3.48 36% | 4.73 13% | 5.15 5% | 0.9 83% | 3 45% |
| Colorchecker dE 2000 max. * | 9.05 | 9.44 -4% | 8.45 7% | 7.79 14% | 2.6 71% | 5.2 43% |
| Colorchecker dE 2000 calibrated * | 0.6 | 3.03 -405% | 0.51 15% | 3.1 -417% | 0.8 -33% | 1.5 -150% |
| Greyscale dE 2000 * | 6.2 | 3.1 50% | 3.6 42% | 2.6 58% | 1.1 82% | 3.5 44% |
| Gamma | 2.66 83% | 2.04 108% | 2.08 106% | 1.99 111% | 2.15 102% | 2.26 97% |
| CCT | 6101 107% | 6380 102% | 6447 101% | 6166 105% | 6656 98% | 7254 90% |
| Color Space (Percent of AdobeRGB 1998) (%) | 75.2 | 84.5 | 64.3 | |||
| Color Space (Percent of sRGB) (%) | 100 | 98.6 | 97.5 | |||
| Media total (Programa/Opciones) | -94% /
-55% | -62% /
-23% | 9% /
-19% | -35% /
2% | -67% /
-27% |
* ... más pequeño es mejor
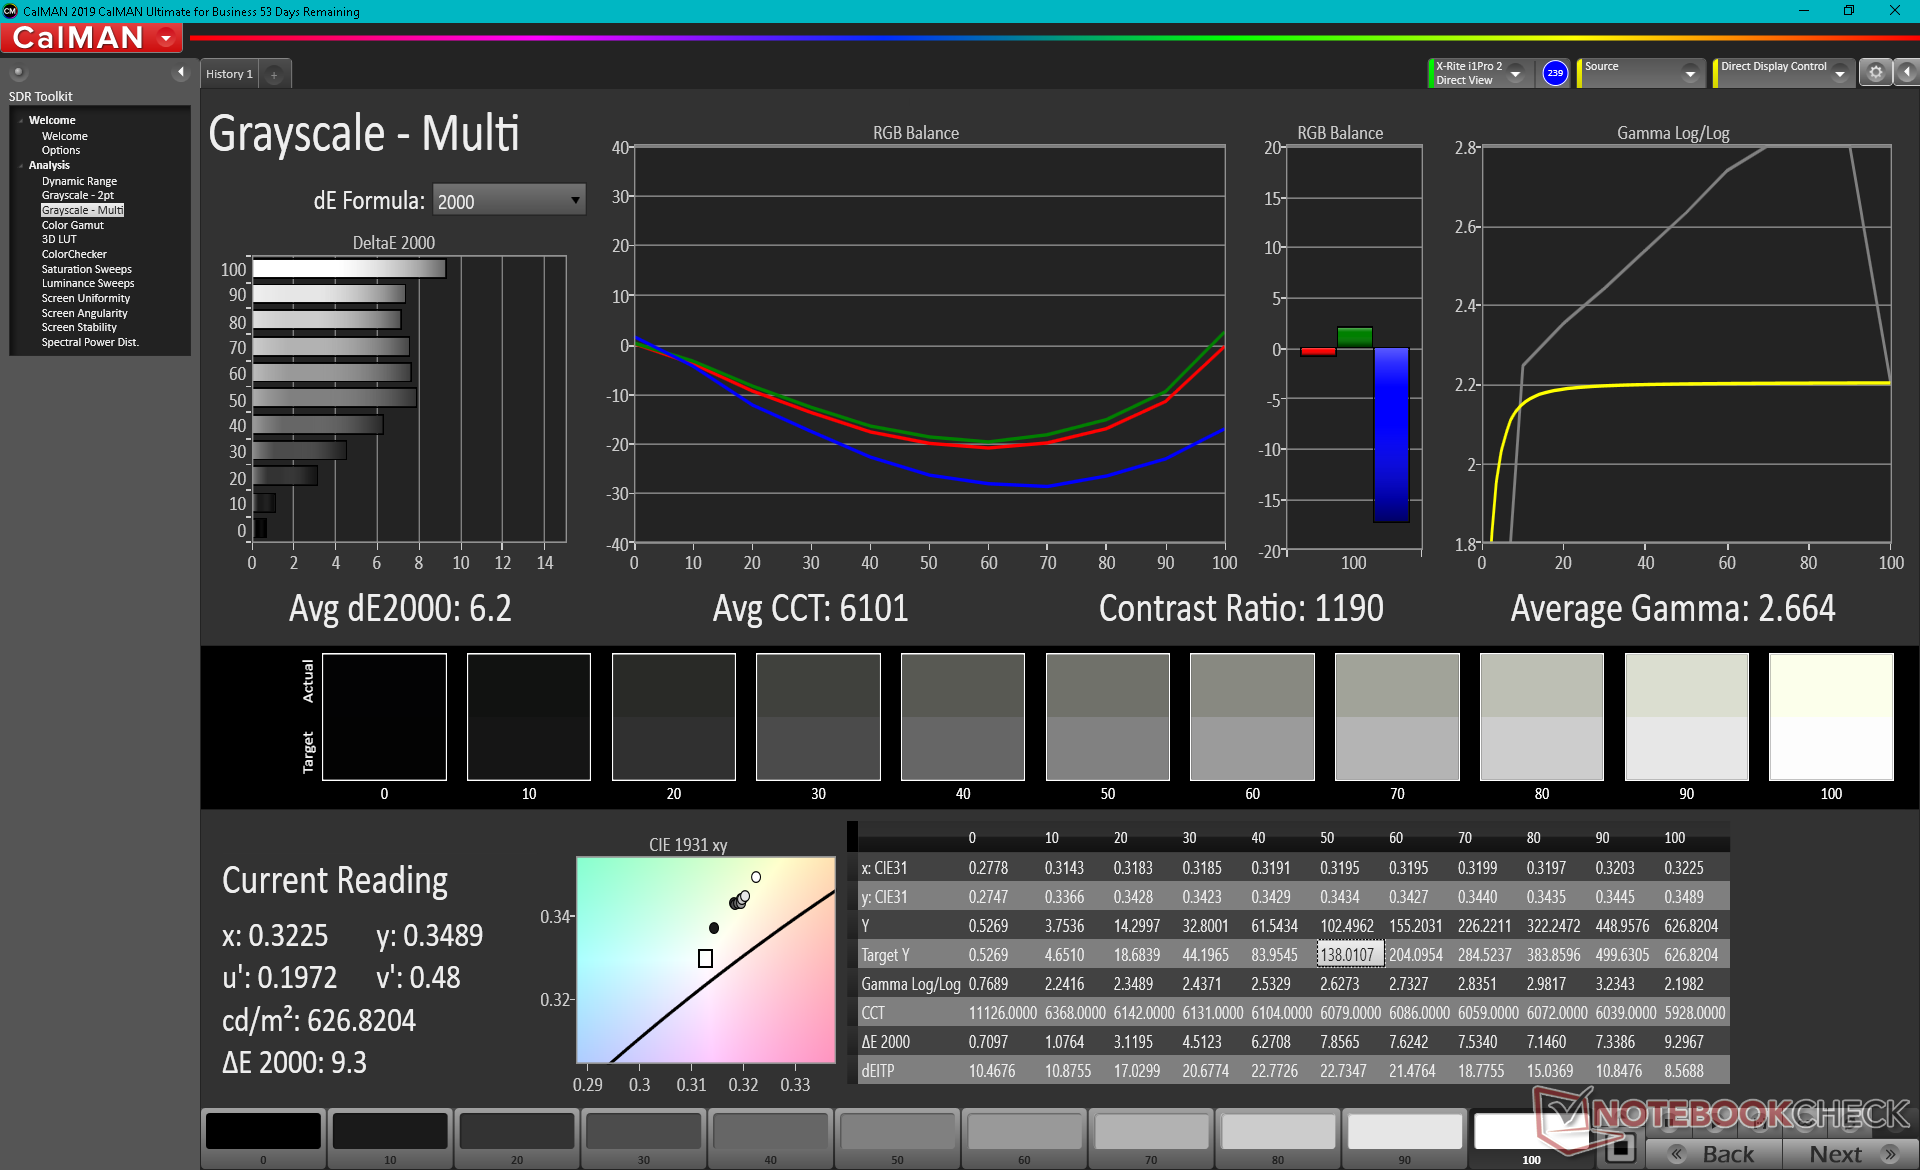
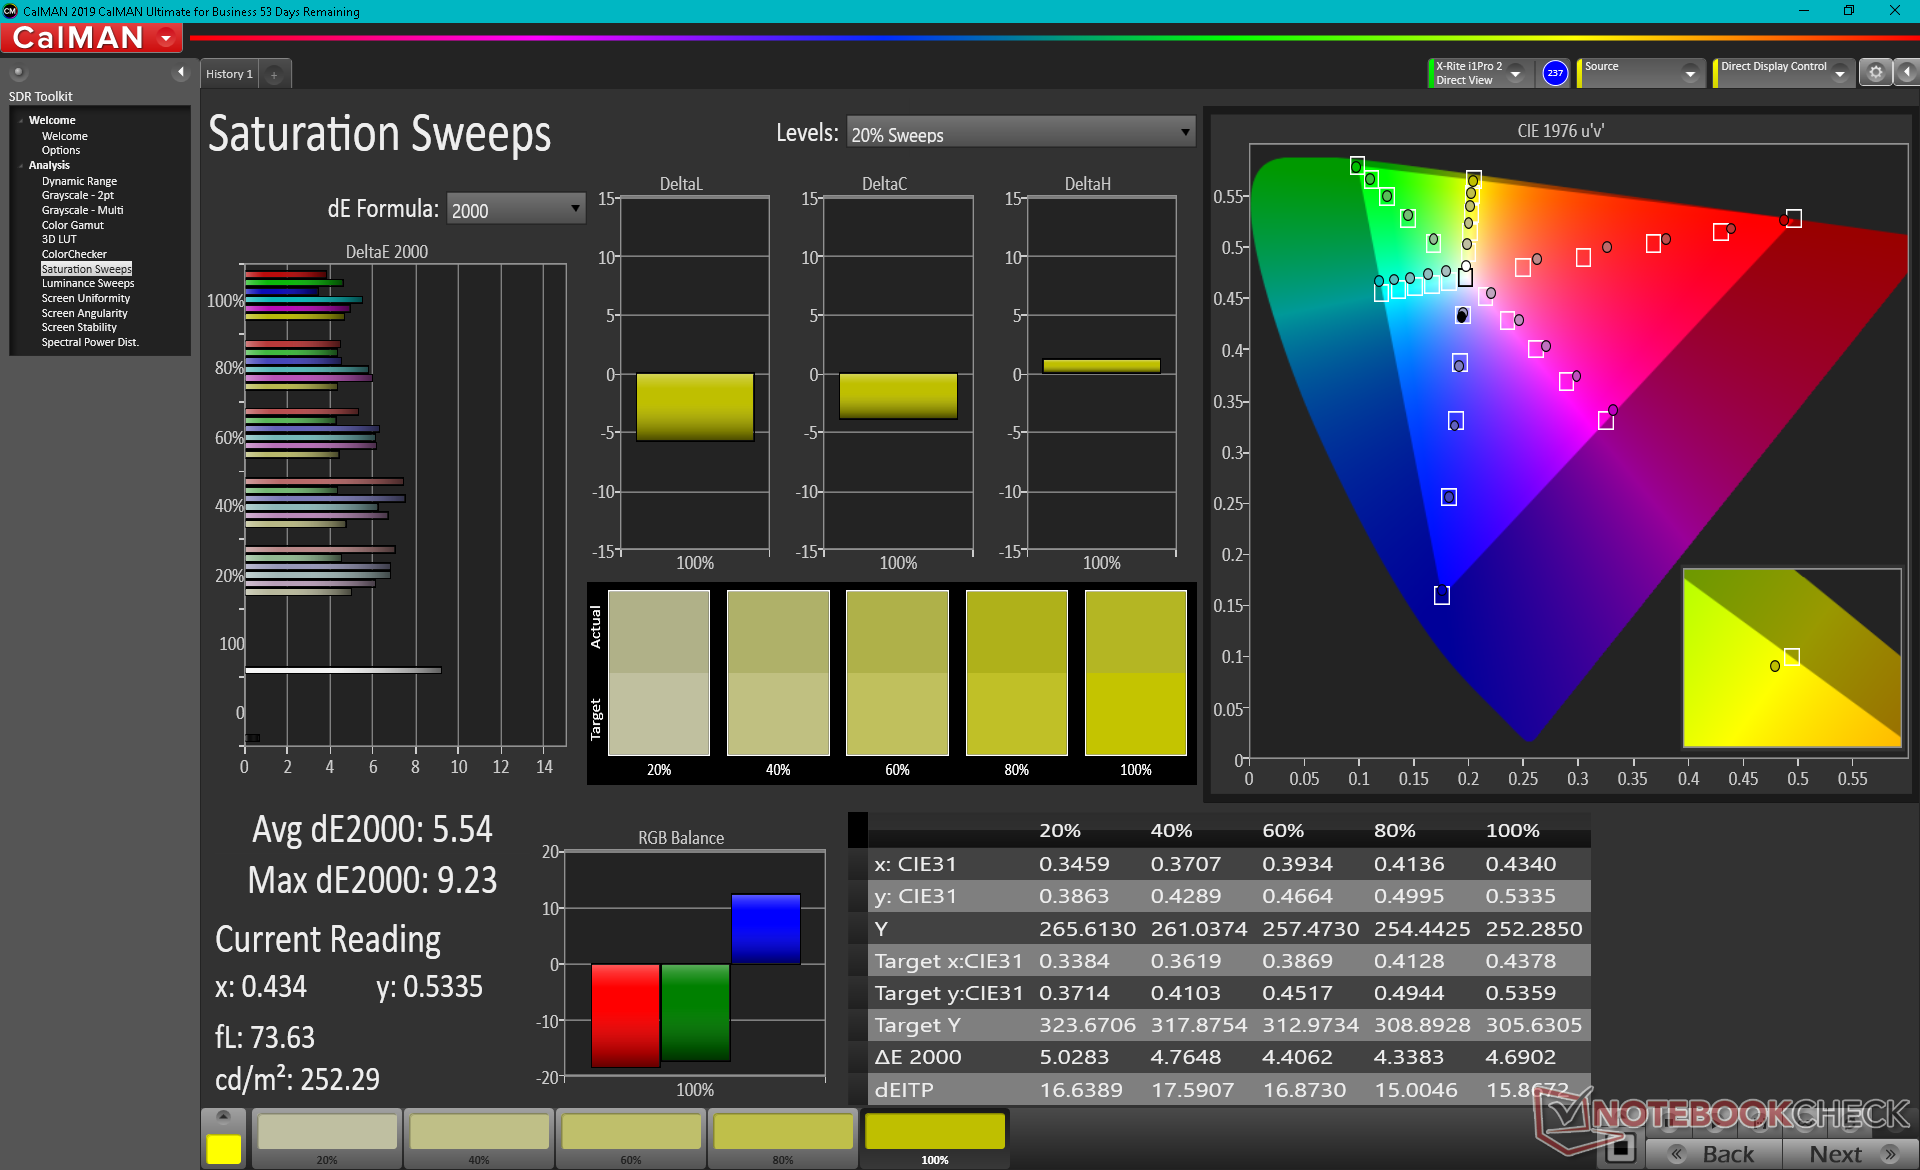
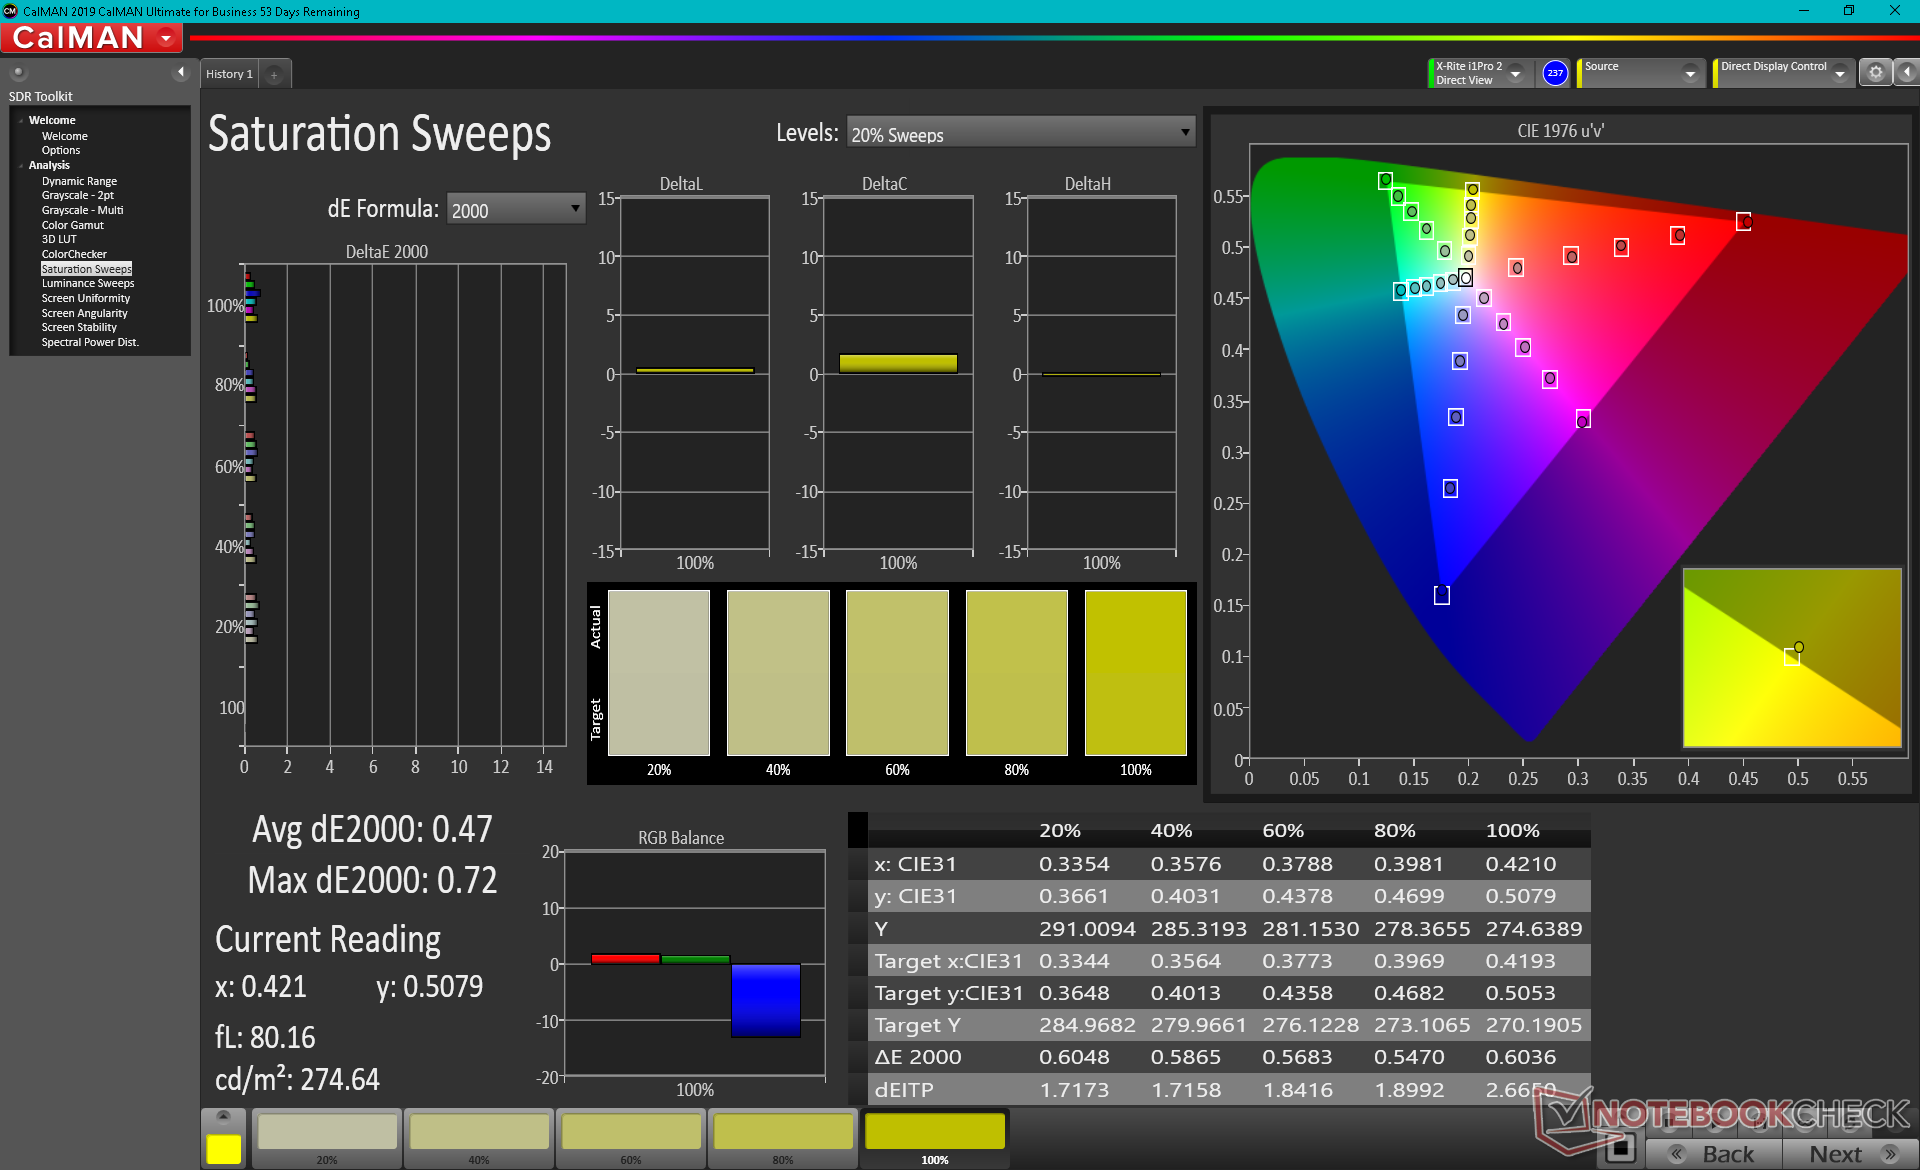
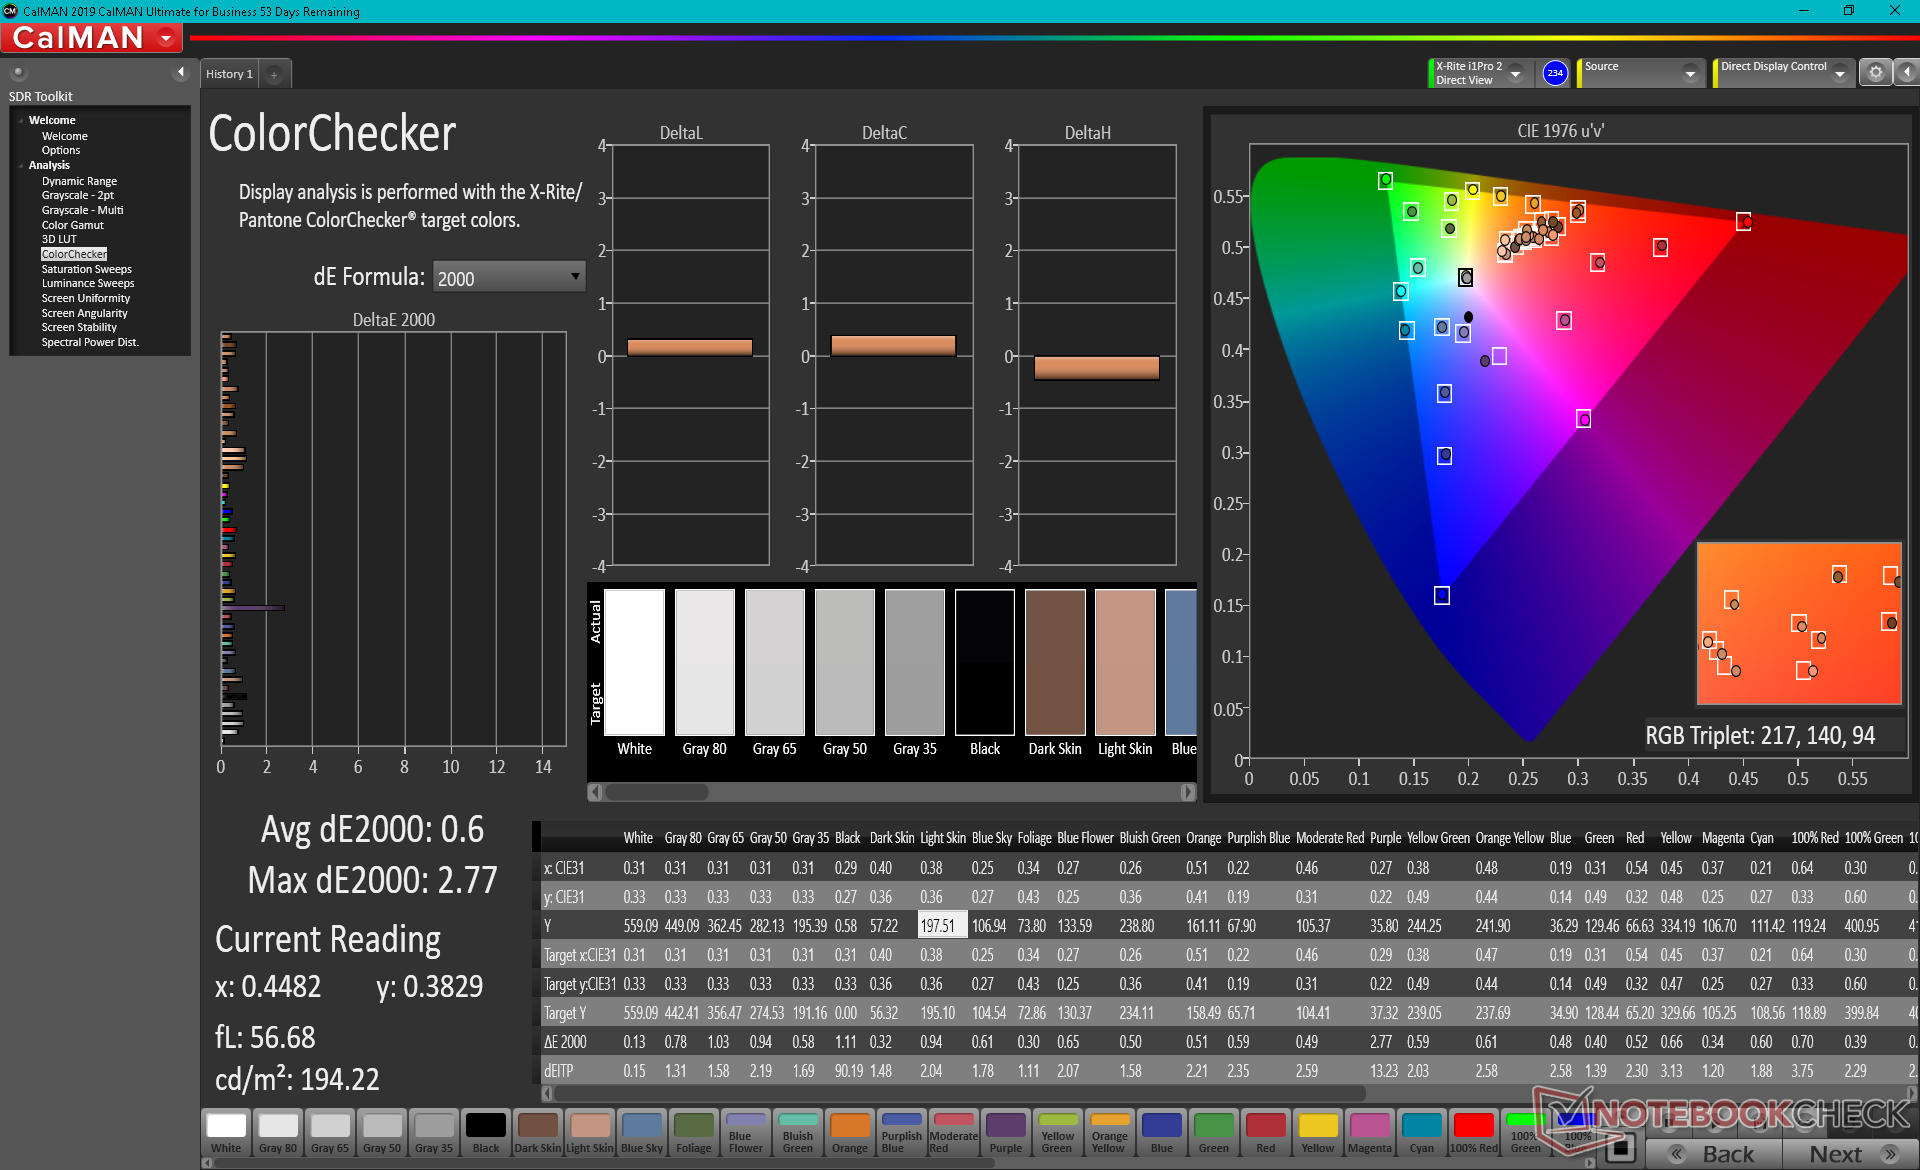
Nuestro colorímetro X-Rite muestra un 96% de cobertura DCI-P3 frente al 100% que afirma HP. Si se combinan los amplios colores con los rapidísimos tiempos de respuesta, se obtiene un panel 4K que funciona extraordinariamente bien tanto para la edición de gráficos profesionales como para las aplicaciones de juegos.
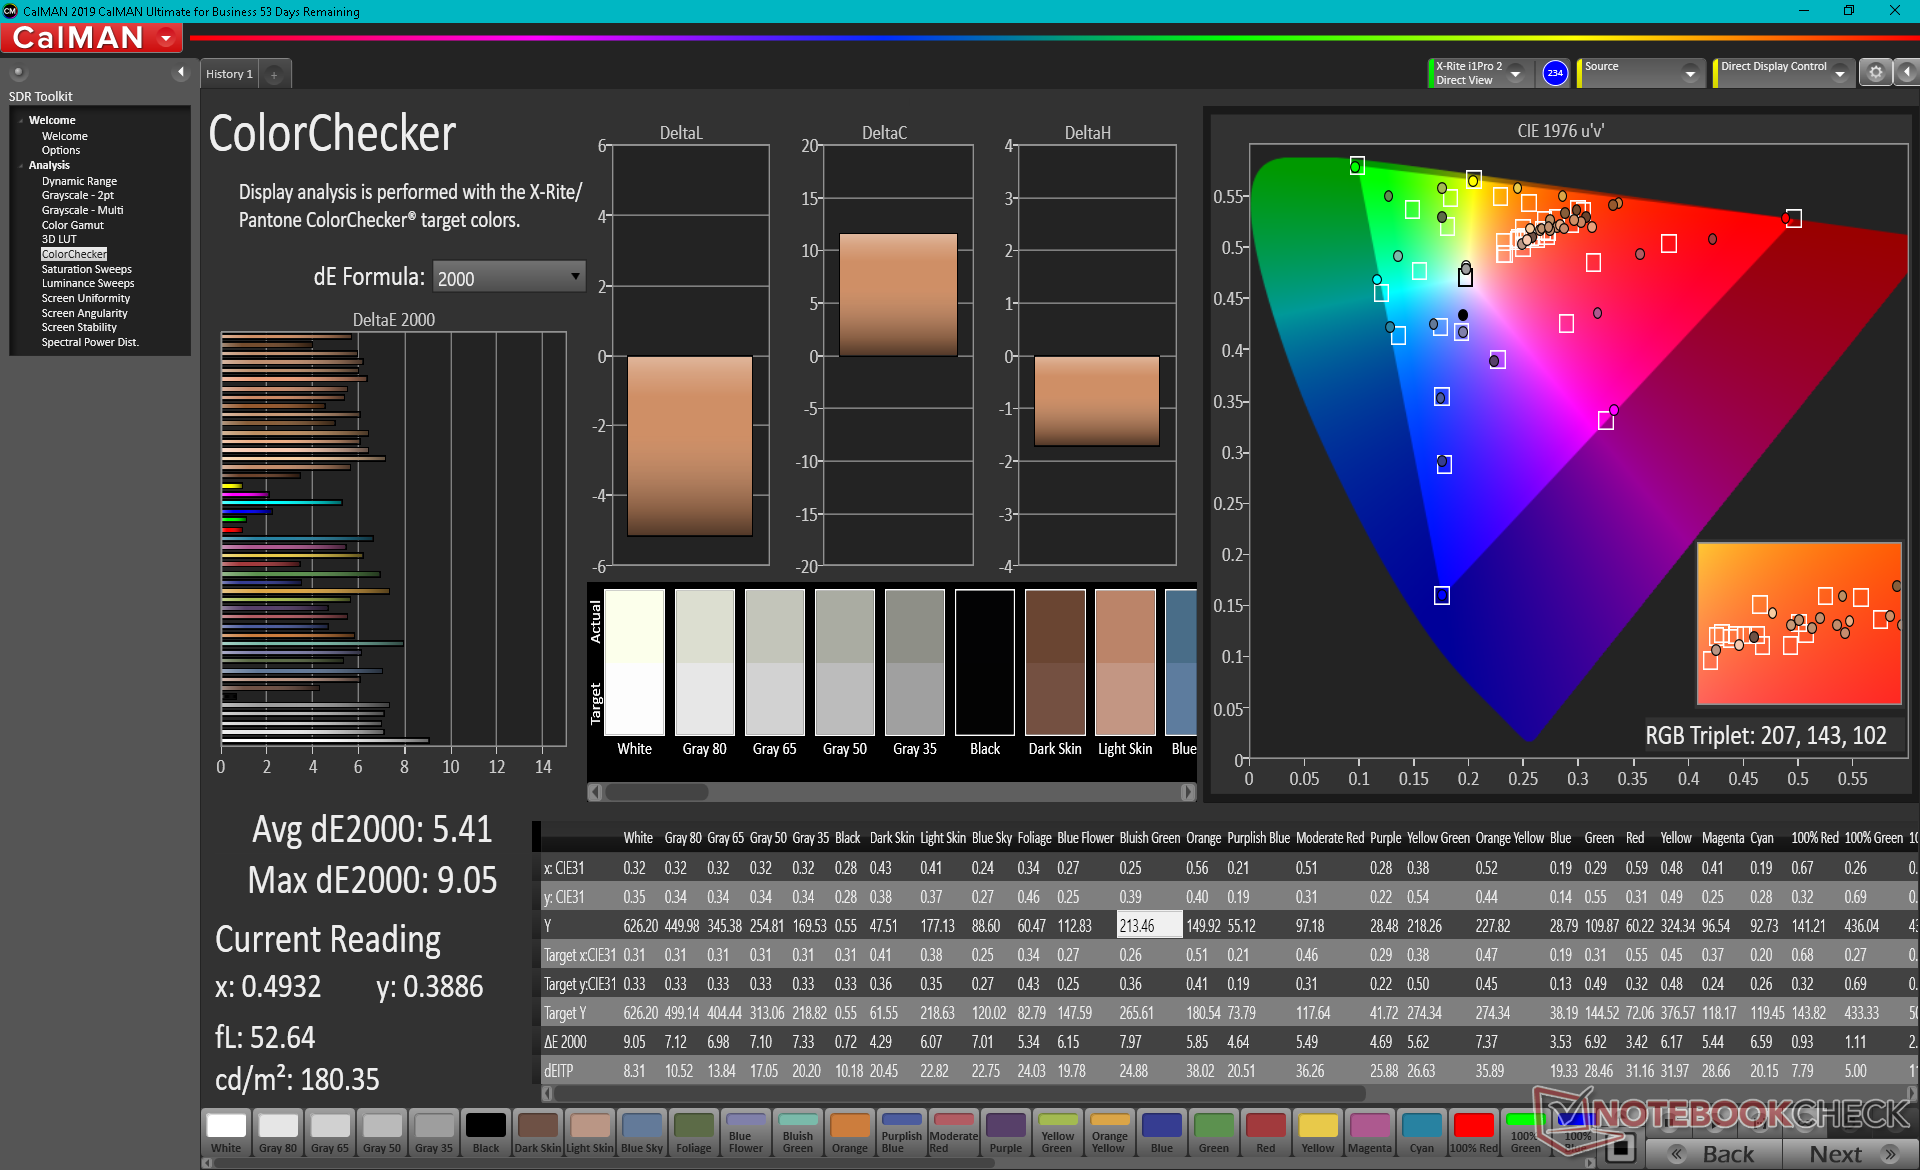
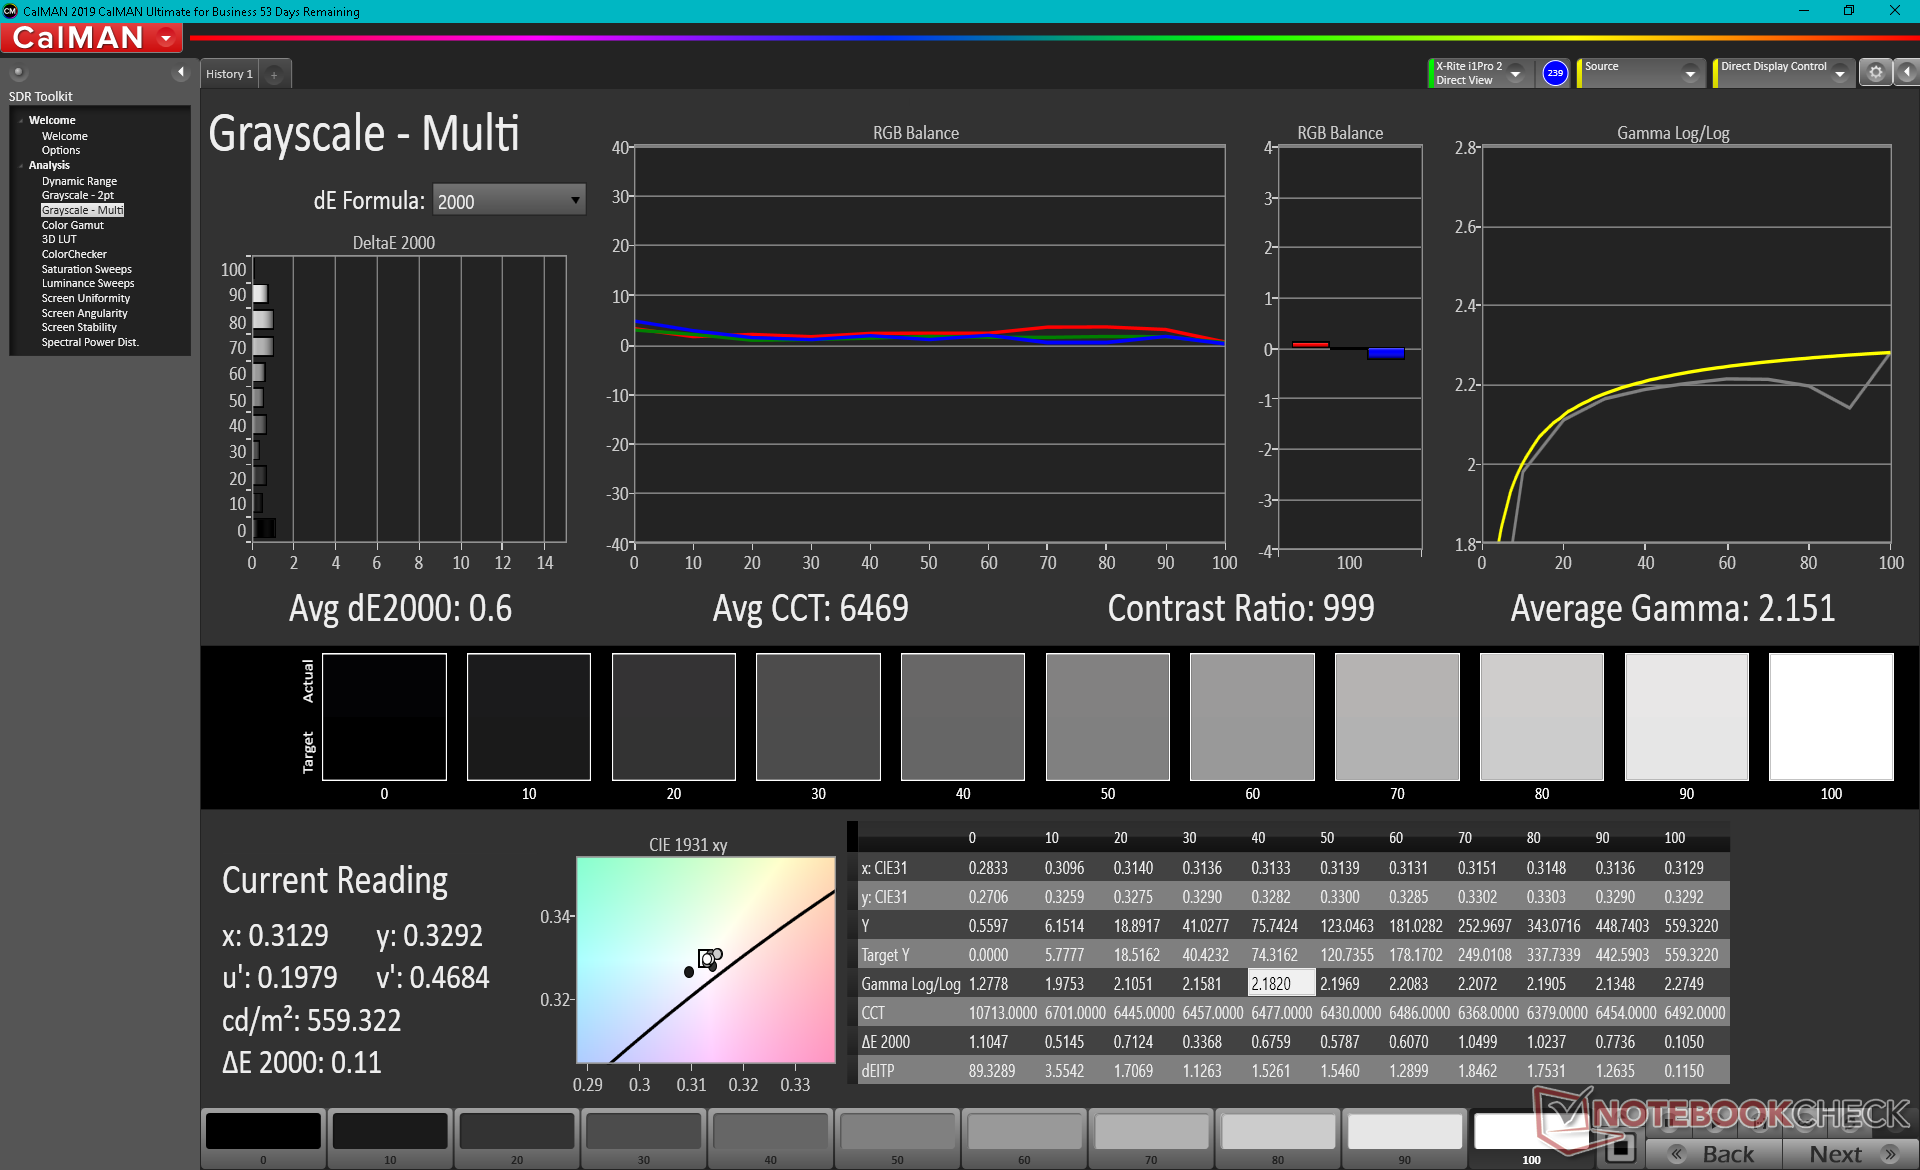
La pantalla podría haber sido mejor calibrada al sacarla de la caja con el estándar DCI-P3. Los valores medios de escala de grises y deltaE de color son de 6,2 y 5,41, respectivamente, con una temperatura de color demasiado cálida de 6100. Calibrar el panel nosotros mismos con un colorímetro X-Rite resuelve estas deficiencias.
Tiempos de respuesta del display
| ↔ Tiempo de respuesta de Negro a Blanco | ||
|---|---|---|
| 11 ms ... subida ↗ y bajada ↘ combinada | ↗ 7.6 ms subida | 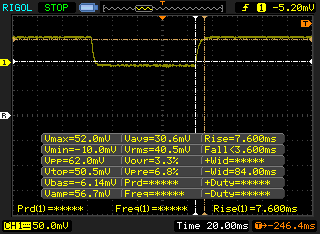 |
| ↘ 3.4 ms bajada | ||
| La pantalla mostró buenos tiempos de respuesta en nuestros tests pero podría ser demasiado lenta para los jugones competitivos. En comparación, todos los dispositivos de prueba van de ##min### (mínimo) a 240 (máximo) ms. » 30 % de todos los dispositivos son mejores. Esto quiere decir que el tiempo de respuesta medido es mejor que la media (19.8 ms) de todos los dispositivos testados. | ||
| ↔ Tiempo de respuesta 50% Gris a 80% Gris | ||
| 14.8 ms ... subida ↗ y bajada ↘ combinada | ↗ 7.6 ms subida | 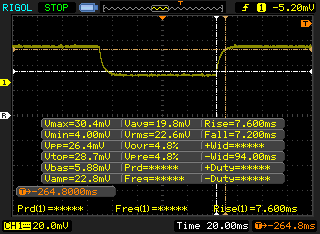 |
| ↘ 7.2 ms bajada | ||
| La pantalla mostró buenos tiempos de respuesta en nuestros tests pero podría ser demasiado lenta para los jugones competitivos. En comparación, todos los dispositivos de prueba van de ##min### (mínimo) a 636 (máximo) ms. » 29 % de todos los dispositivos son mejores. Esto quiere decir que el tiempo de respuesta medido es mejor que la media (31 ms) de todos los dispositivos testados. | ||
Parpadeo de Pantalla / PWM (Pulse-Width Modulation)
| Parpadeo de Pantalla / PWM no detectado | 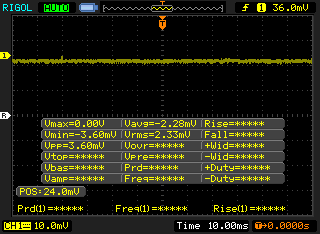 | ||
Comparación: 52 % de todos los dispositivos testados no usaron PWM para atenuar el display. Si se usó, medimos una media de 7754 (mínimo: 5 - máxmo: 343500) Hz. | |||
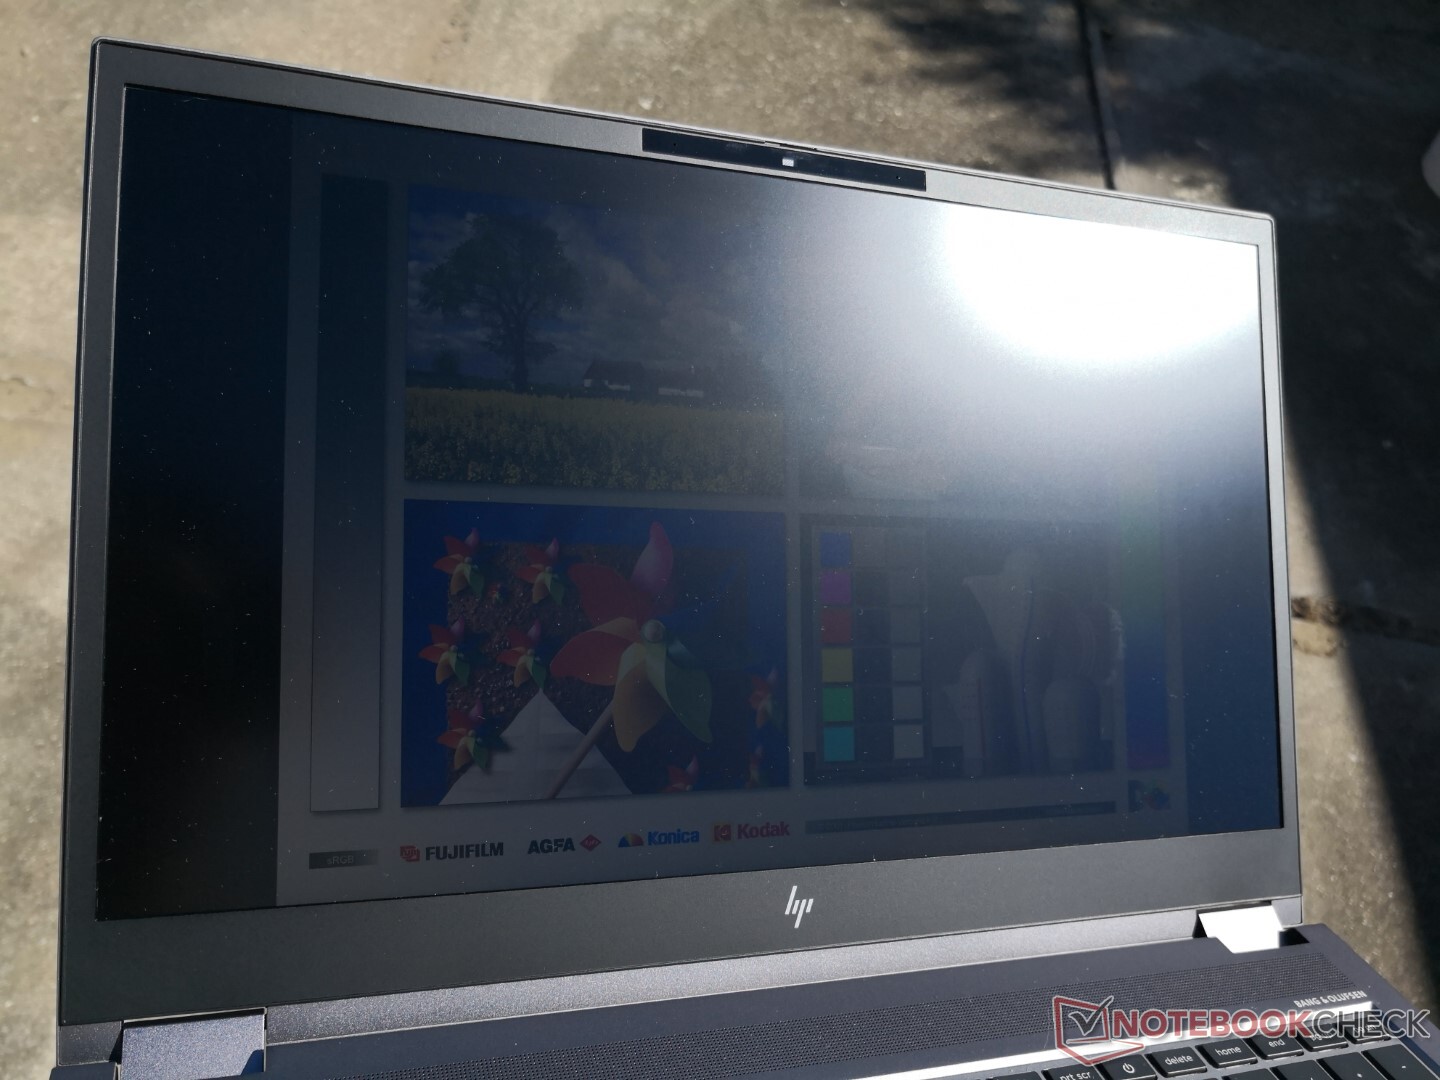
La visibilidad en exteriores es mejor que en muchas otras estaciones de trabajo gracias a la retroiluminación extra brillante de 600 nit. Incluso el propio HPZBook Studio 15 G8 o Firefly 15 G7 no se acercan a los 400 nits cada uno en sus respectivos ajustes de brillo máximo. No obstante, querrás escalar la fuente adecuadamente y trabajar a la sombra para maximizar la visibilidad.
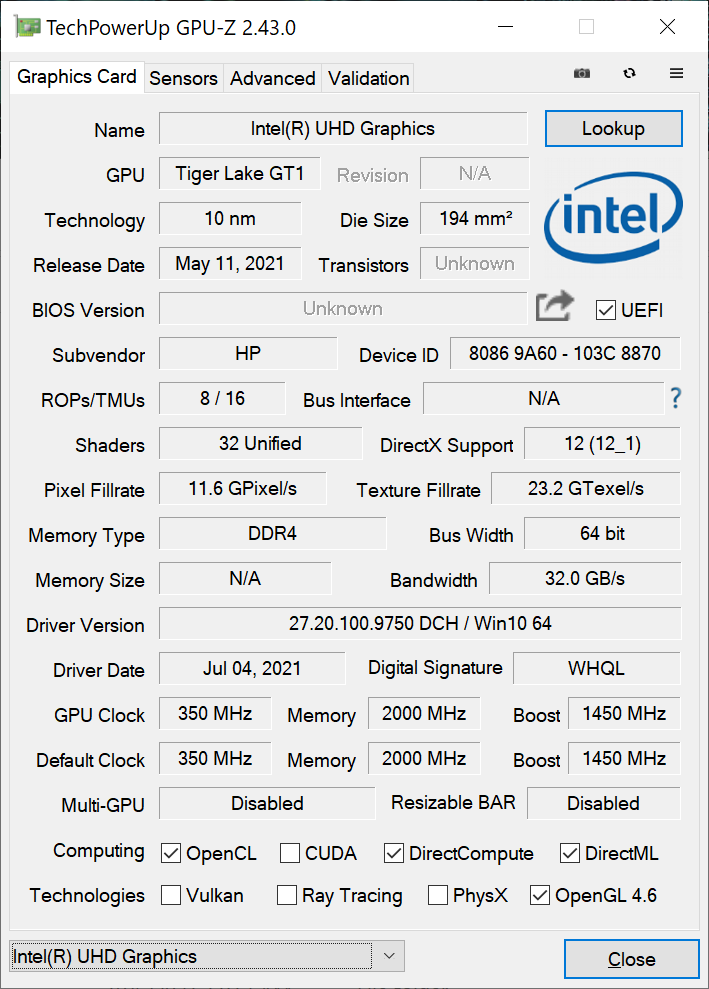
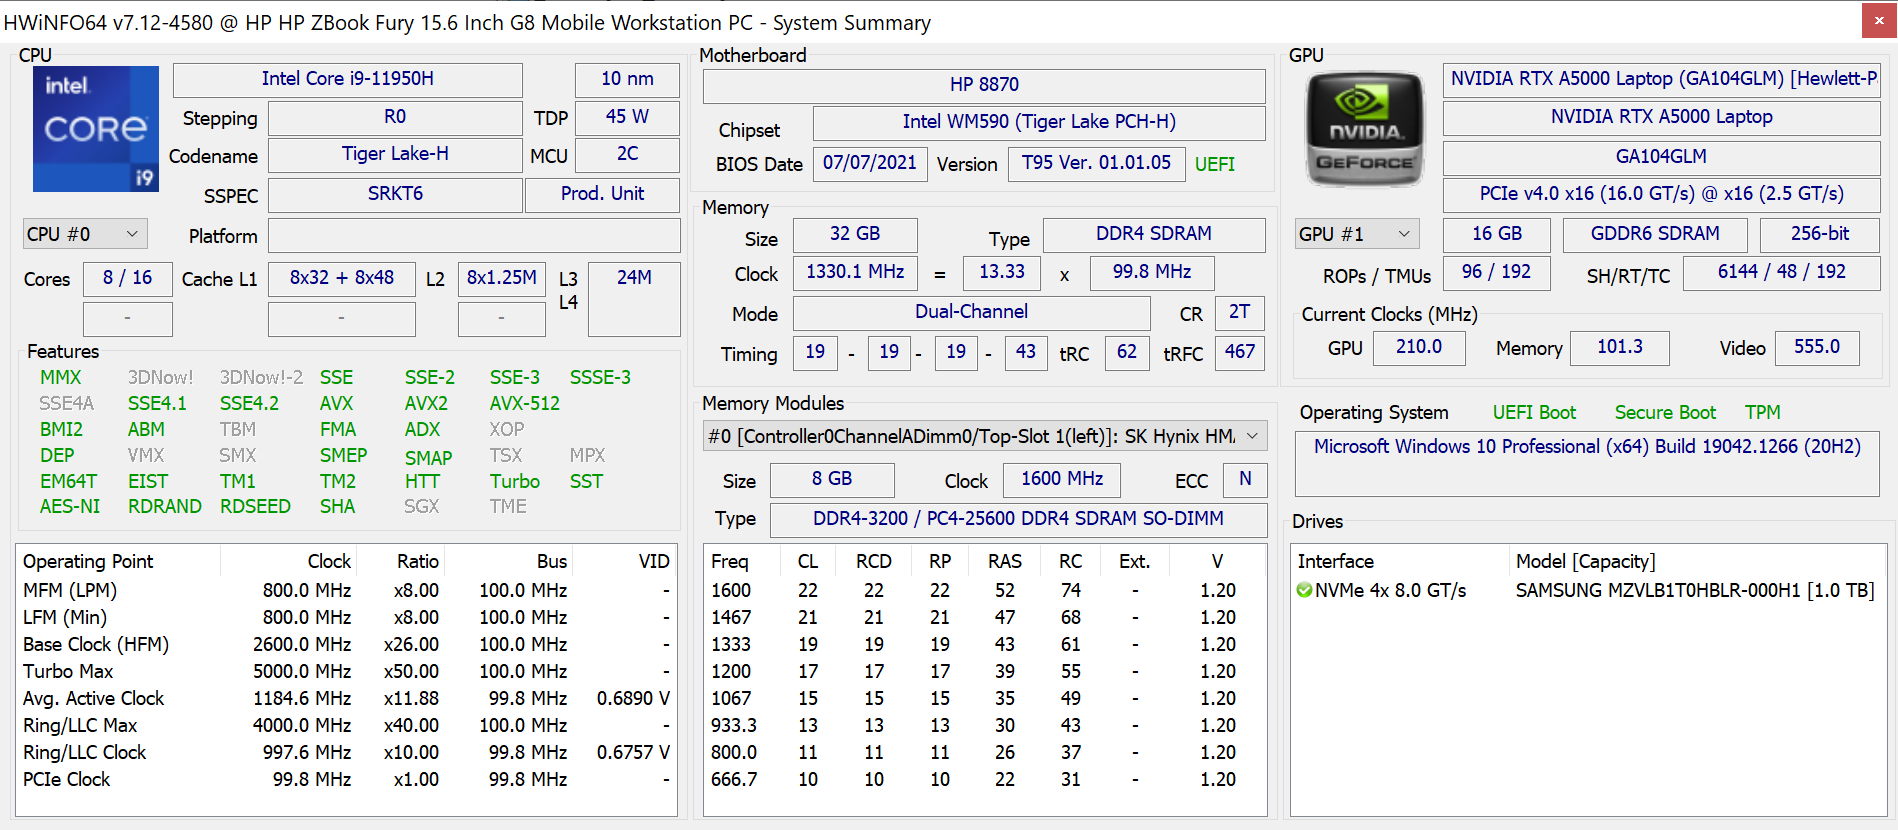
Rendimiento - Intel 11th Gen
Las opciones de CPU abarcan las CPUs Tiger Lake-H y las GPUs Nvidia T1200 y RTX serie A hasta la RTX A5000. También hay opciones de Xeon e incluso de Radeon Pro W6600M para una gama muy amplia de opciones configurables. Las opciones de gama alta, en particular, son algunos de los procesadores de clase estación de trabajo móvil más rápidos que se pueden encontrar en cualquier portátil
La barra redimensionable y el Dynamic Boost 2.0 son compatibles, mientras que Advanced Optimus y WhisperMode 2.0 no lo son. Lamentablemente, tampoco hay un interruptor de gráficos manual.
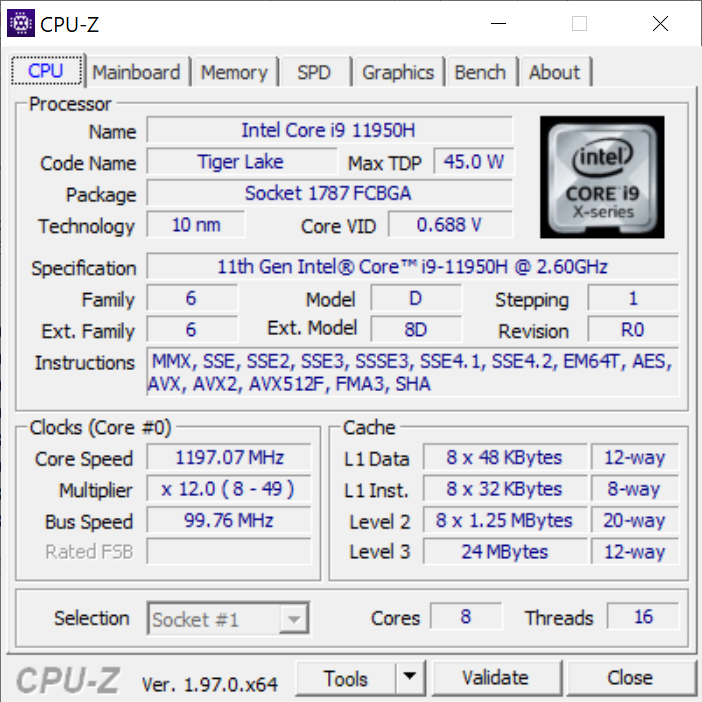
Procesador
El rendimiento de la CPU multihilo está unos pocos puntos porcentuales por debajo del Core i9-11900H que se encuentra en el competidor MSI WS66 lo que es de esperar por la integración de las características vPro El Core i9-11950H sin embargo, el rendimiento de un solo hilo sigue siendo excelente y está a la par con su homólogo no vPro. El rendimiento multihilo general es aproximadamente un 15 por ciento superior al del Xeon W-10885M del ZBook Fury 15 G7 del año pasado, pero sin soporte para RAM ECC, por supuesto.
Cinebench R15 Multi Loop
Cinebench R23: Multi Core | Single Core
Cinebench R15: CPU Multi 64Bit | CPU Single 64Bit
Blender: v2.79 BMW27 CPU
7-Zip 18.03: 7z b 4 -mmt1 | 7z b 4
Geekbench 5.5: Single-Core | Multi-Core
HWBOT x265 Benchmark v2.2: 4k Preset
LibreOffice : 20 Documents To PDF
R Benchmark 2.5: Overall mean
| Cinebench R23 / Multi Core | |
| Lenovo Legion 5 15ACH-82JU00C6GE-FL | |
| MSI GS76 Stealth 11UH | |
| Medio Intel Core i9-11950H (12048 - 13113, n=4) | |
| HP ZBook Fury 15 G8 | |
| Lenovo ThinkPad P15 G2-20YQ001JGE | |
| Dell Precision 5000 5560 | |
| Gigabyte Aero 15 OLED XC | |
| HP ZBook Fury 15 G7 | |
| Cinebench R23 / Single Core | |
| HP ZBook Fury 15 G8 | |
| Medio Intel Core i9-11950H (1569 - 1633, n=4) | |
| MSI GS76 Stealth 11UH | |
| Dell Precision 5000 5560 | |
| Lenovo ThinkPad P15 G2-20YQ001JGE | |
| Lenovo Legion 5 15ACH-82JU00C6GE-FL | |
| HP ZBook Fury 15 G7 | |
| Gigabyte Aero 15 OLED XC | |
| Geekbench 5.5 / Single-Core | |
| Medio Intel Core i9-11950H (1623 - 1702, n=3) | |
| MSI GS76 Stealth 11UH | |
| Lenovo ThinkPad P15 G2-20YQ001JGE | |
| Lenovo Legion 5 15ACH-82JU00C6GE-FL | |
| Acer Nitro 5 AN515-45-R05E | |
| HP ZBook Fury 15 G7 | |
| Dell Precision 5550 P91F | |
| Gigabyte Aero 15 OLED XC | |
| Geekbench 5.5 / Multi-Core | |
| MSI GS76 Stealth 11UH | |
| Lenovo ThinkPad P15 G2-20YQ001JGE | |
| Dell Precision 5550 P91F | |
| Medio Intel Core i9-11950H (7286 - 8152, n=3) | |
| Gigabyte Aero 15 OLED XC | |
| Lenovo Legion 5 15ACH-82JU00C6GE-FL | |
| HP ZBook Fury 15 G7 | |
| Acer Nitro 5 AN515-45-R05E | |
| HWBOT x265 Benchmark v2.2 / 4k Preset | |
| Lenovo Legion 5 15ACH-82JU00C6GE-FL | |
| MSI GS76 Stealth 11UH | |
| HP ZBook Fury 15 G8 | |
| Medio Intel Core i9-11950H (13.8 - 14.5, n=4) | |
| Lenovo ThinkPad P15 G2-20YQ001JGE | |
| Dell Precision 5000 5560 | |
| Gigabyte Aero 15 OLED XC | |
| Acer Nitro 5 AN515-45-R05E | |
| Dell Precision 5550 P91F | |
| HP ZBook Fury 15 G7 | |
| LibreOffice / 20 Documents To PDF | |
| Lenovo Legion 5 15ACH-82JU00C6GE-FL | |
| Gigabyte Aero 15 OLED XC | |
| HP ZBook Fury 15 G7 | |
| Acer Nitro 5 AN515-45-R05E | |
| HP ZBook Fury 15 G8 | |
| MSI GS76 Stealth 11UH | |
| Lenovo ThinkPad P15 G2-20YQ001JGE | |
| Medio Intel Core i9-11950H (38.6 - 53.2, n=4) | |
| Dell Precision 5000 5560 | |
| Dell Precision 5550 P91F | |
* ... más pequeño es mejor
Rendimiento del sistema
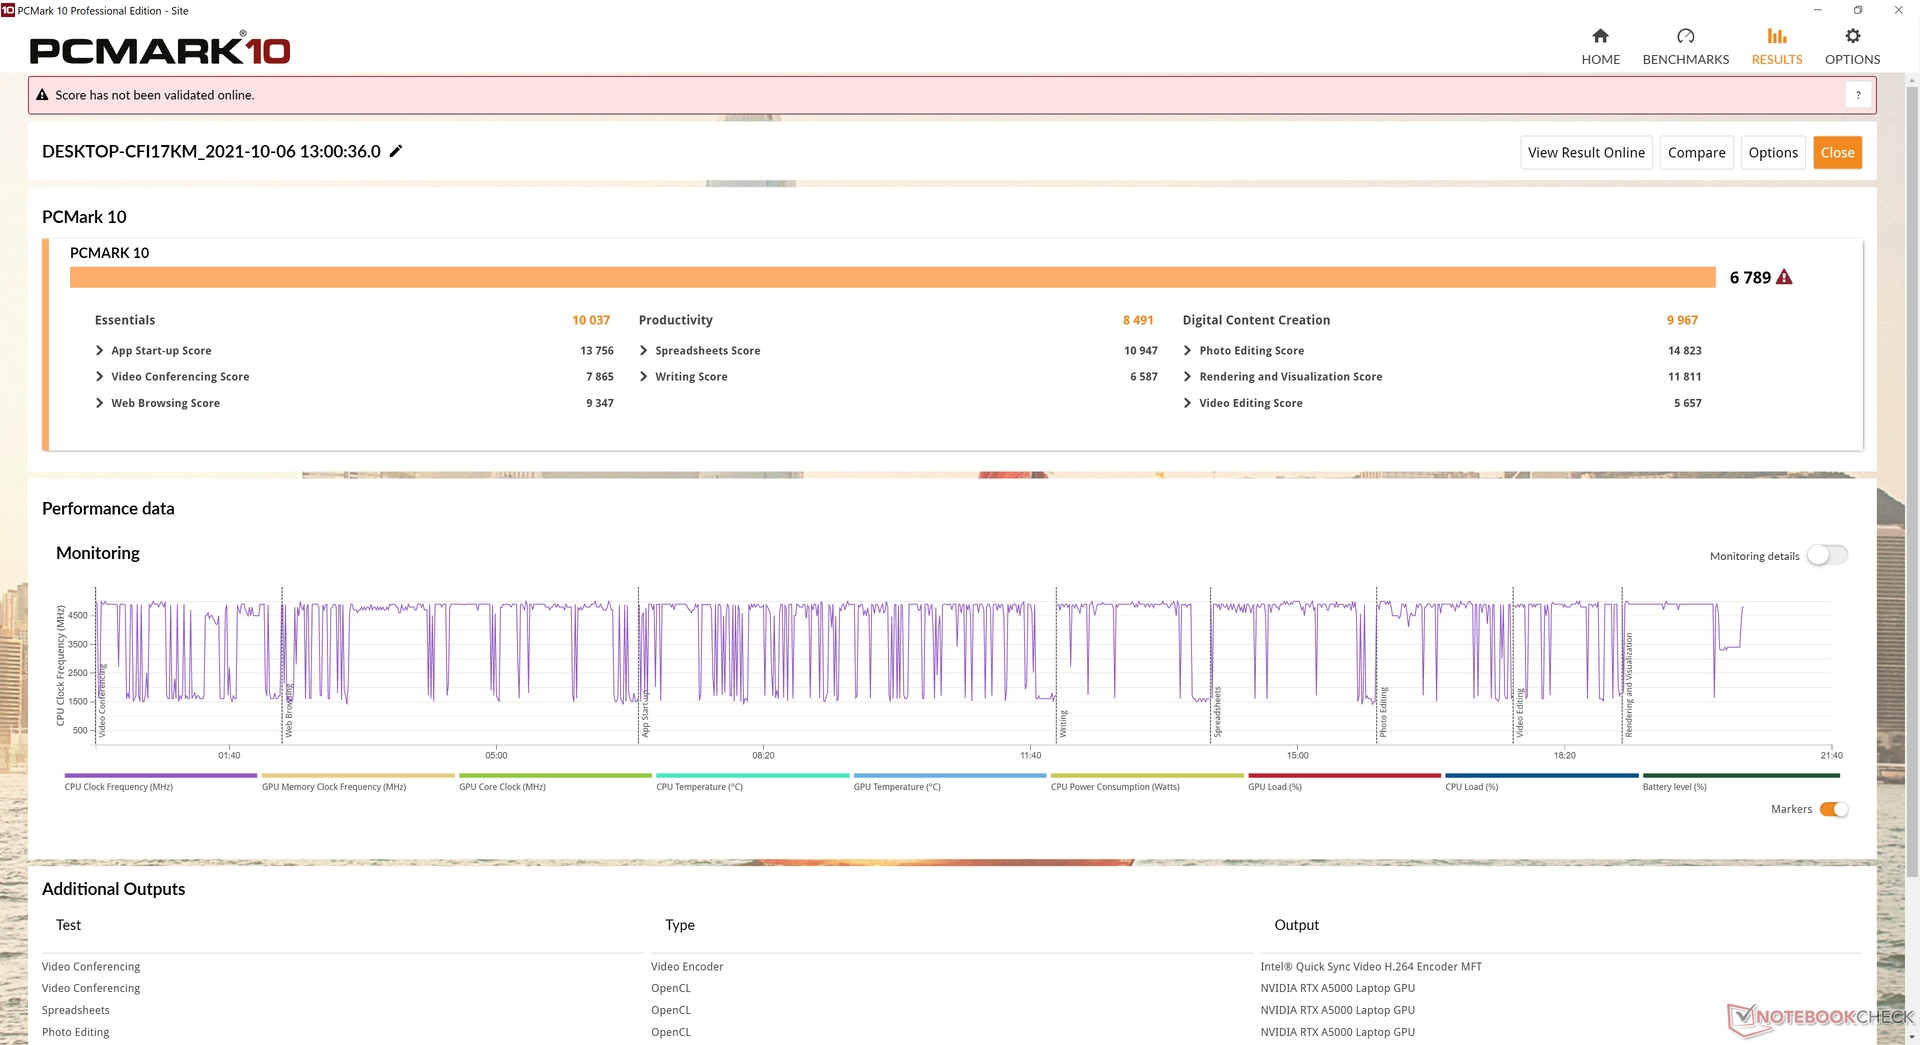
Las puntuaciones de PCMark son consistentemente más altas que las que registramos en la Fury 15 G7 mientras que son casi idénticas a las que registramos en la más gruesa Studio 15 G8 con gráficos RTX 3070.
| PCMark 10 / Score | |
| HP ZBook Fury 15 G8 | |
| Medio Intel Core i9-11950H, NVIDIA RTX A5000 Laptop GPU (n=1) | |
| HP ZBook Studio 15 G8 | |
| Dell Precision 5000 5560 | |
| HP ZBook Fury 15 G7 | |
| Lenovo ThinkPad P15s Gen2-20W6000GGE | |
| HP ZBook Firefly 15 G7 | |
| PCMark 10 / Essentials | |
| Dell Precision 5000 5560 | |
| HP ZBook Fury 15 G8 | |
| Medio Intel Core i9-11950H, NVIDIA RTX A5000 Laptop GPU (n=1) | |
| HP ZBook Studio 15 G8 | |
| Lenovo ThinkPad P15s Gen2-20W6000GGE | |
| HP ZBook Fury 15 G7 | |
| HP ZBook Firefly 15 G7 | |
| PCMark 10 / Productivity | |
| Lenovo ThinkPad P15s Gen2-20W6000GGE | |
| Dell Precision 5000 5560 | |
| HP ZBook Fury 15 G8 | |
| Medio Intel Core i9-11950H, NVIDIA RTX A5000 Laptop GPU (n=1) | |
| HP ZBook Studio 15 G8 | |
| HP ZBook Fury 15 G7 | |
| HP ZBook Firefly 15 G7 | |
| PCMark 10 / Digital Content Creation | |
| HP ZBook Fury 15 G8 | |
| Medio Intel Core i9-11950H, NVIDIA RTX A5000 Laptop GPU (n=1) | |
| HP ZBook Studio 15 G8 | |
| Dell Precision 5000 5560 | |
| HP ZBook Fury 15 G7 | |
| Lenovo ThinkPad P15s Gen2-20W6000GGE | |
| HP ZBook Firefly 15 G7 | |
| PCMark 10 Score | 6789 puntos | |
ayuda | ||
Latencia del CPD
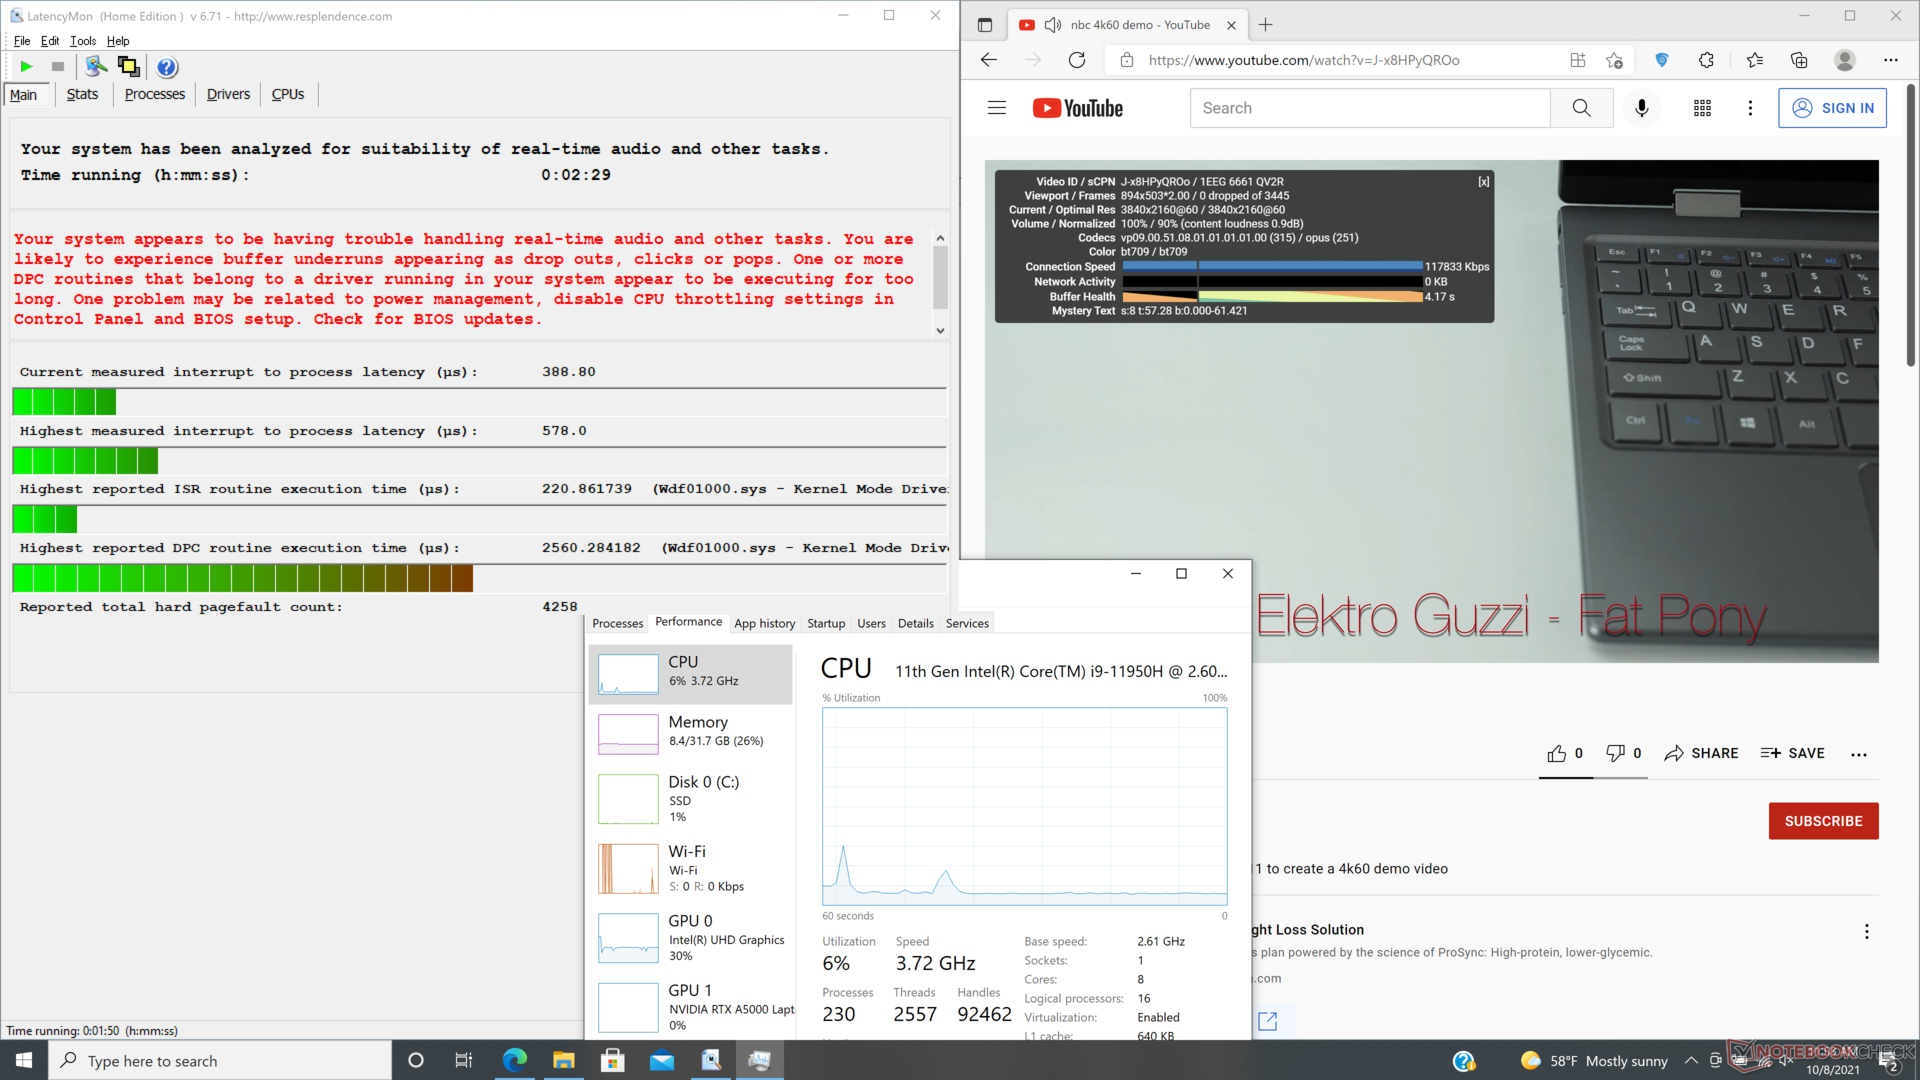
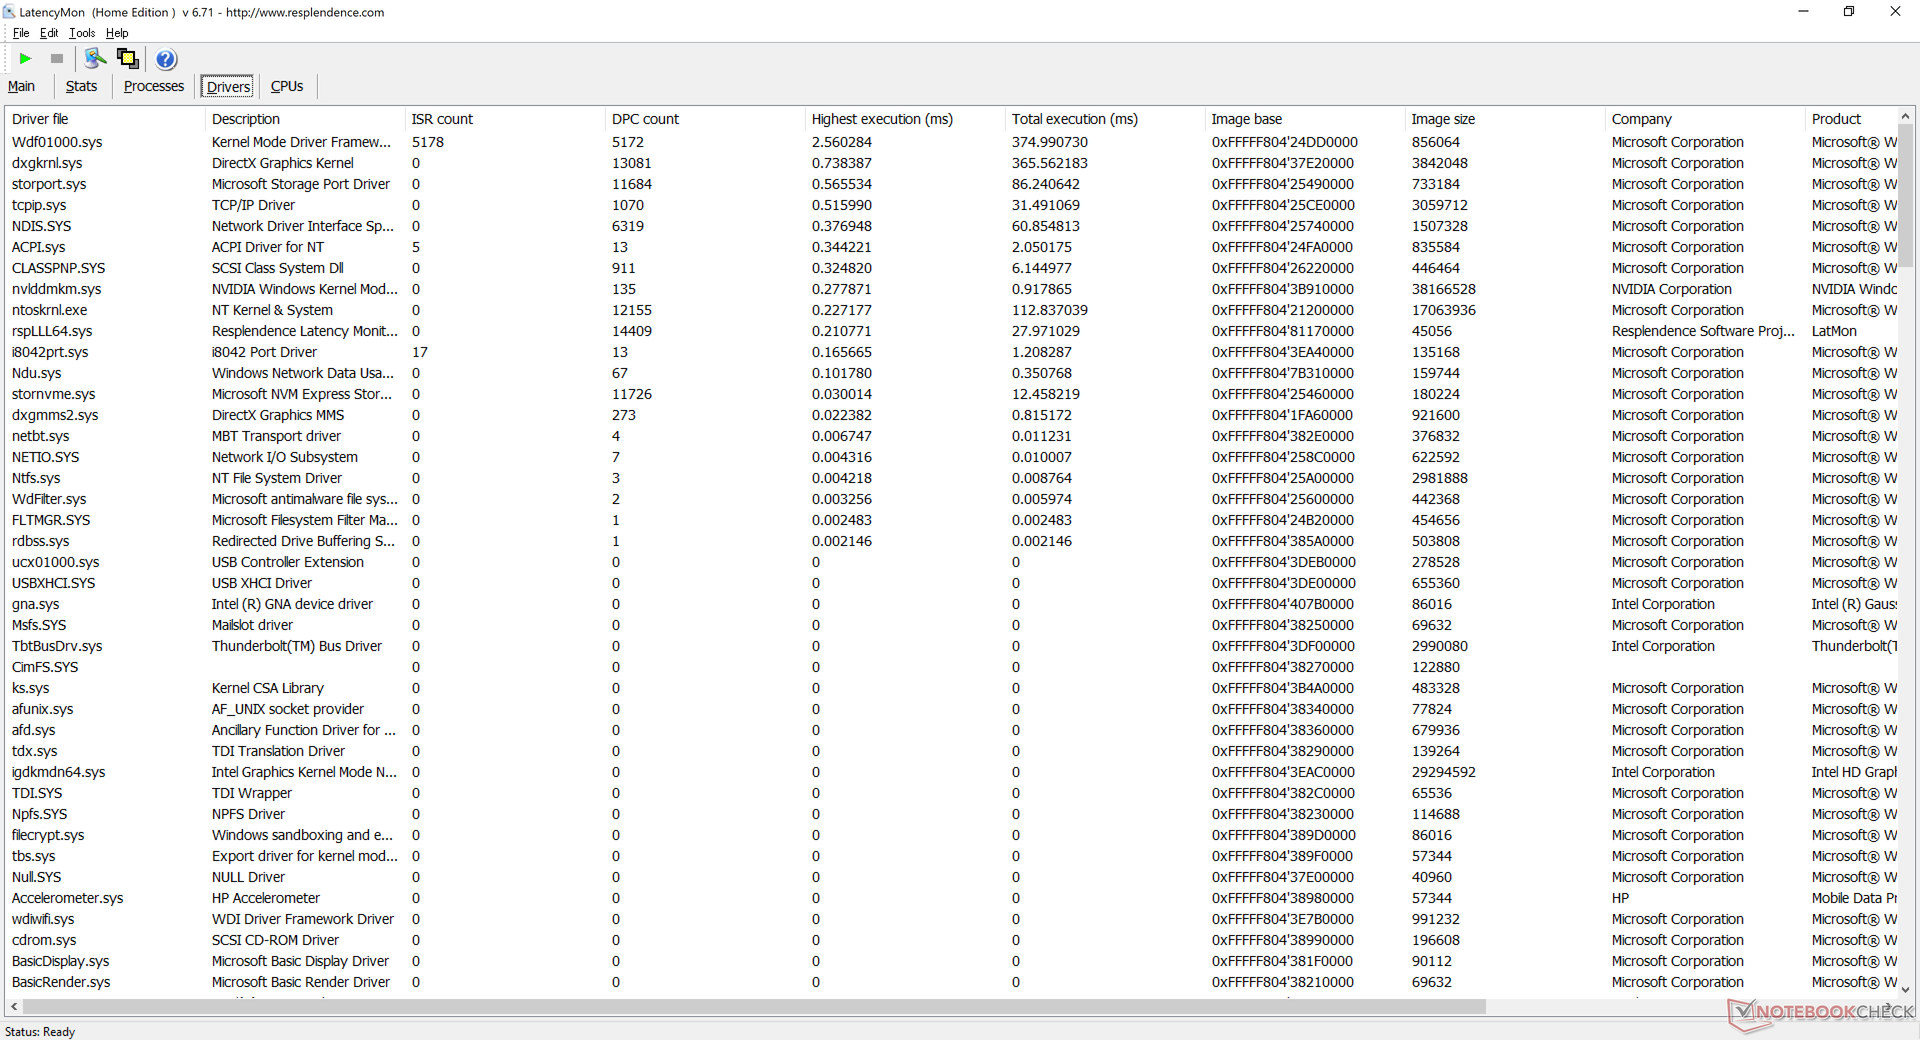
LatencyMon no revela grandes interrupciones de latencia al abrir varias pestañas del navegador en nuestra página de inicio o al ejecutar el estrés de Prime95. Los tiempos de rutina DPC, sin embargo, se disparan como lo que observamos en el Fury 15 G7 del año pasado. La reproducción de vídeo 4K a 60 FPS es por lo demás fluida y sin caídas de frames.
| DPC Latencies / LatencyMon - interrupt to process latency (max), Web, Youtube, Prime95 | |
| Lenovo ThinkPad P15s Gen2-20W6000GGE | |
| HP ZBook Firefly 15 G7 | |
| HP ZBook Fury 15 G7 | |
| HP ZBook Studio 15 G8 | |
| Dell Precision 5000 5560 | |
| HP ZBook Fury 15 G8 | |
* ... más pequeño es mejor
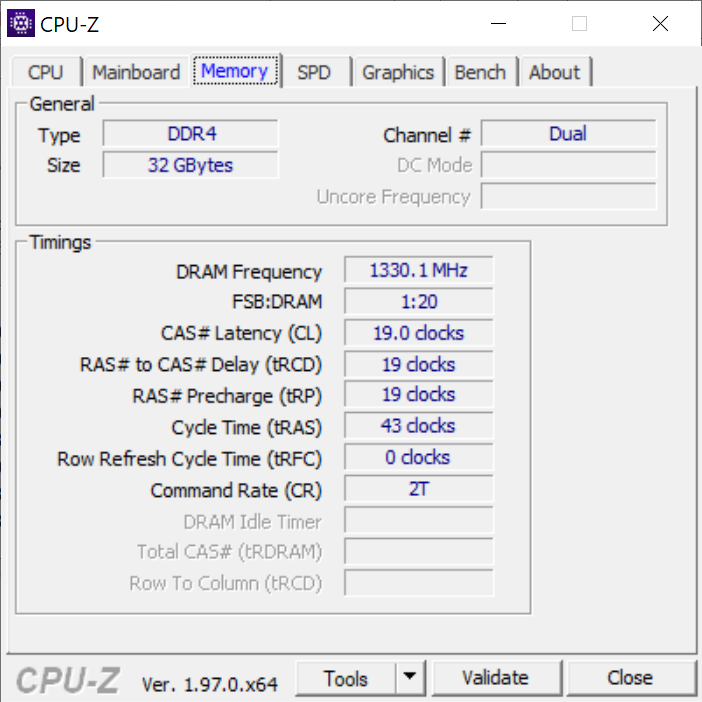
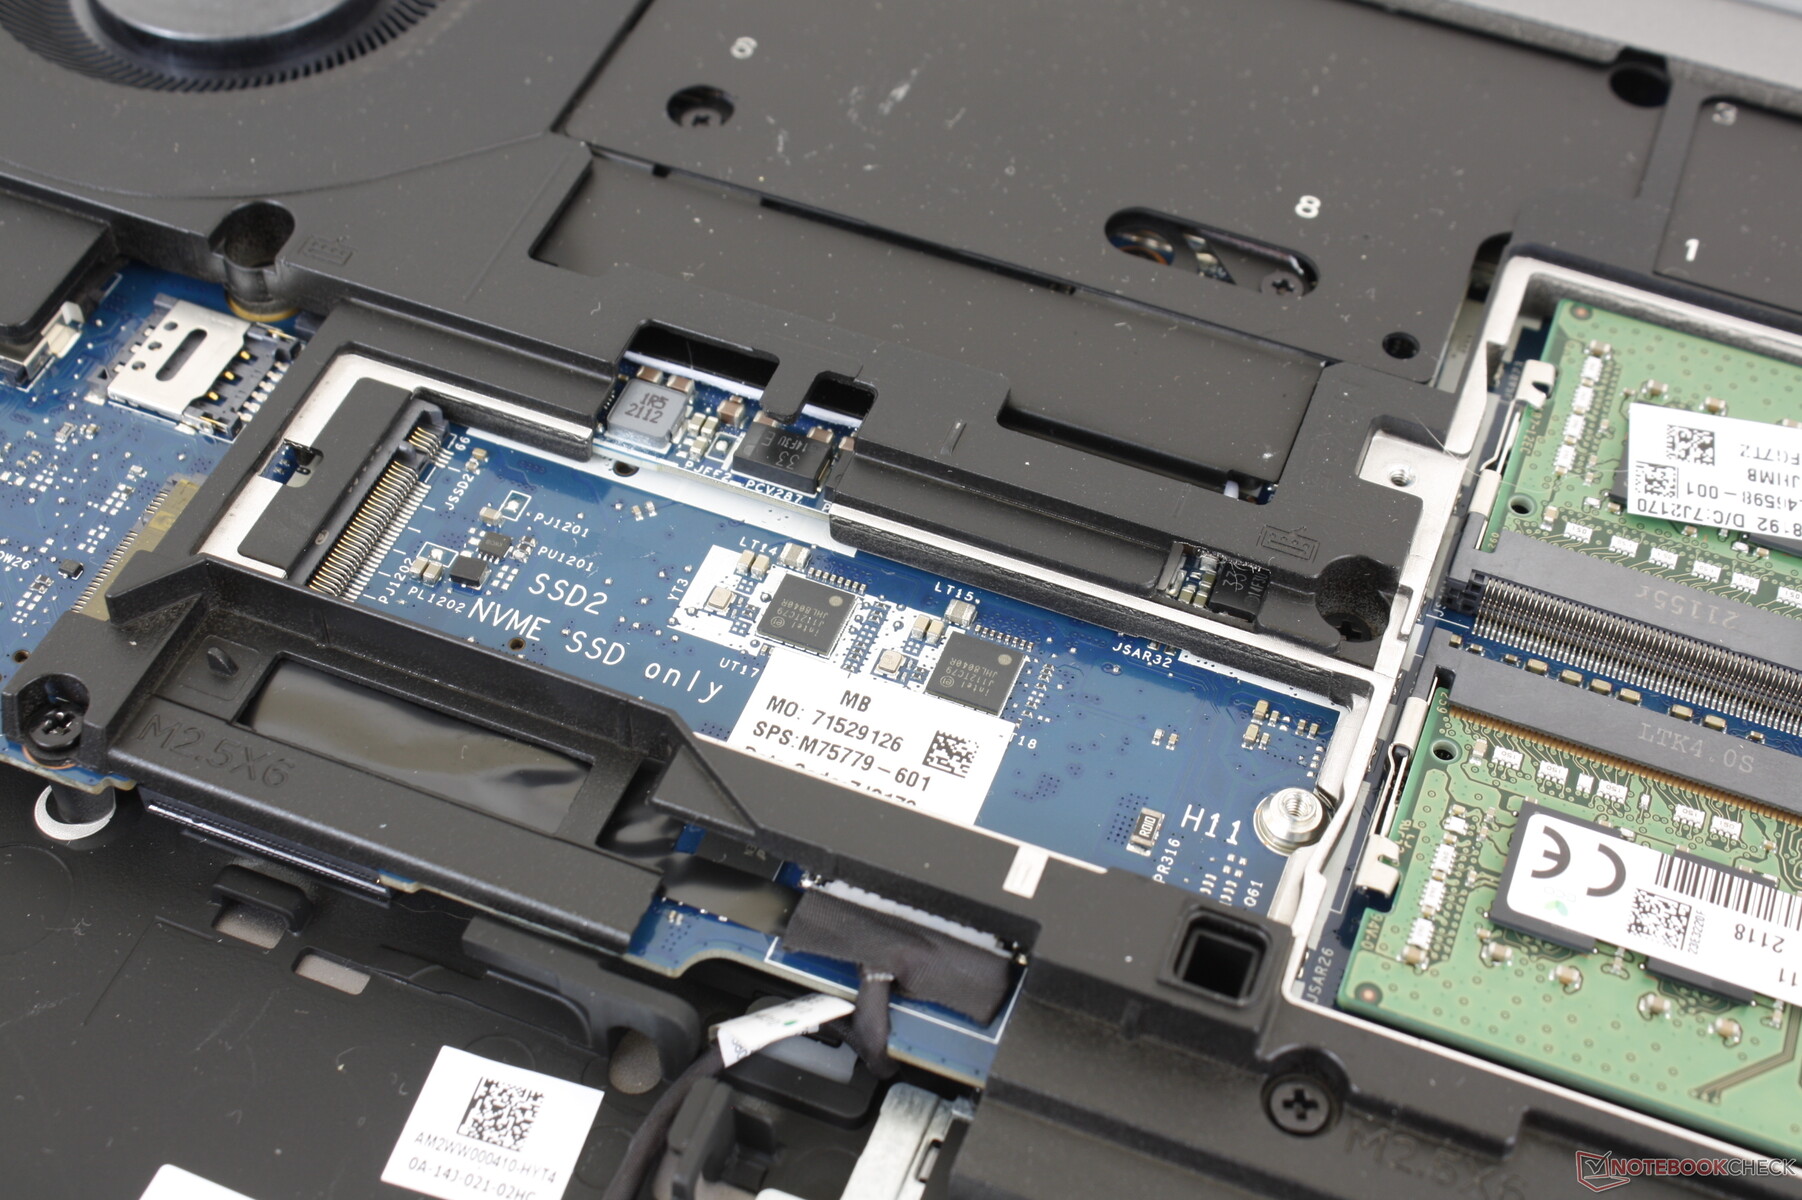
Dispositivos de almacenamiento: muchas opciones
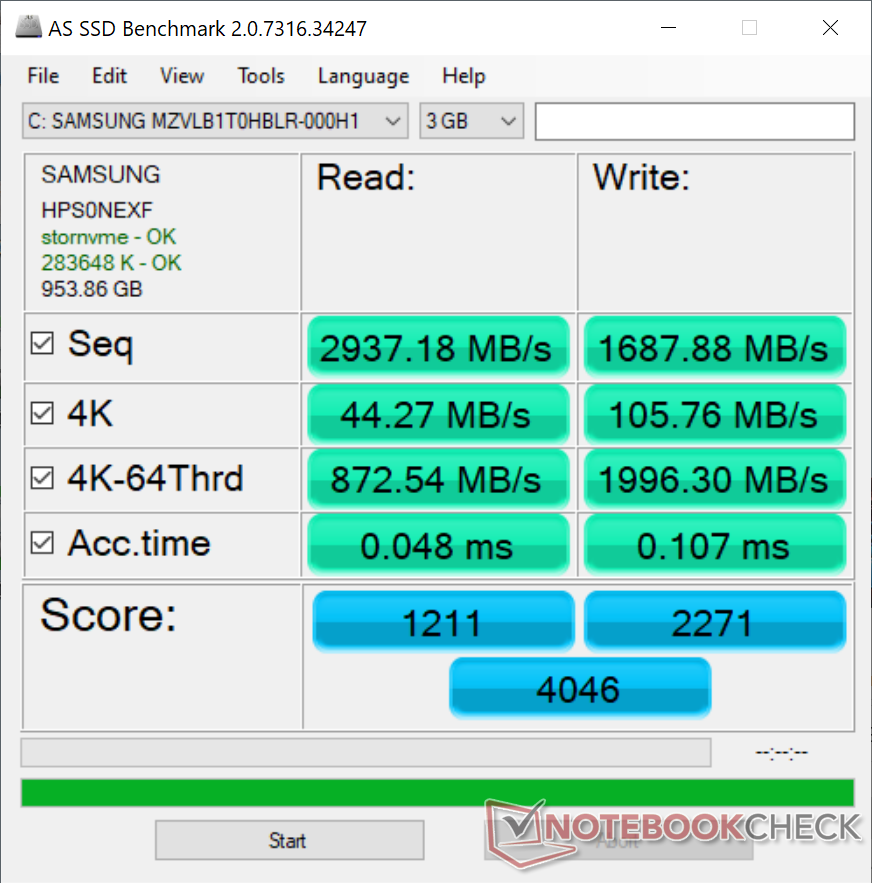
Nuestra unidad puede soportar hasta cuatro unidades de almacenamiento interno (2x M.2 2280, 1x M.2 2242, 1x 2.5-inch SATA III). Curiosamente, HP no ofrece ninguna opción PCIe4, ya que todas las unidades actuales vienen con SSDs PCIe3, como el conocido Samsung PM981a. Nos hemos puesto en contacto con HP para intentar confirmar si las velocidades PCIe4 NVMe son compatibles y actualizaremos esta página en consecuencia.
| HP ZBook Fury 15 G8 Samsung PM981a MZVLB1T0HBLR | HP ZBook Fury 15 G7 Samsung PM981a MZVLB1T0HBLR | Dell Precision 5000 5560 Samsung PM9A1 MZVL22T0HBLB | HP ZBook Studio 15 G8 Samsung PM981a MZVLB2T0HALB | Lenovo ThinkPad P15s Gen2-20W6000GGE WDC PC SN720 SDAQNTW-1T00 | HP ZBook Firefly 15 G7 Toshiba XG6 KXG60ZNV1T02 | |
|---|---|---|---|---|---|---|
| AS SSD | 24% | 93% | 104% | 19% | -1% | |
| Seq Read (MB/s) | 2937 | 2127 -28% | 5169 76% | 2953 1% | 2796 -5% | 2666 -9% |
| Seq Write (MB/s) | 1688 | 1296 -23% | 1986 18% | 1691 0% | 2525 50% | 1257 -26% |
| 4K Read (MB/s) | 44.27 | 54.8 24% | 78 76% | 43.98 -1% | 50.9 15% | 48.04 9% |
| 4K Write (MB/s) | 105.8 | 110.8 5% | 214.6 103% | 105.4 0% | 211.9 100% | 137.5 30% |
| 4K-64 Read (MB/s) | 873 | 1420 63% | 1232 41% | 1065 22% | 1505 72% | 977 12% |
| 4K-64 Write (MB/s) | 1996 | 2012 1% | 2719 36% | 1957 -2% | 949 -52% | 1142 -43% |
| Access Time Read * (ms) | 0.048 | 0.046 4% | 0.024 50% | 0.04 17% | 0.081 -69% | 0.053 -10% |
| Access Time Write * (ms) | 0.107 | 0.099 7% | 0.059 45% | 0.105 2% | 0.019 82% | 0.03 72% |
| Score Read (Points) | 1211 | 1687 39% | 1827 51% | 1404 16% | 1835 52% | 1292 7% |
| Score Write (Points) | 2271 | 2253 -1% | 3133 38% | 2232 -2% | 1413 -38% | 1406 -38% |
| Score Total (Points) | 4046 | 4770 18% | 5753 42% | 4297 6% | 4177 3% | 3297 -19% |
| Copy ISO MB/s (MB/s) | 901 | 2779 208% | 3201 255% | 2474 175% | ||
| Copy Program MB/s (MB/s) | 118.7 | 123.3 4% | 415.8 250% | 1074 805% | ||
| Copy Game MB/s (MB/s) | 372 | 440.8 18% | 1212 226% | 1929 419% | ||
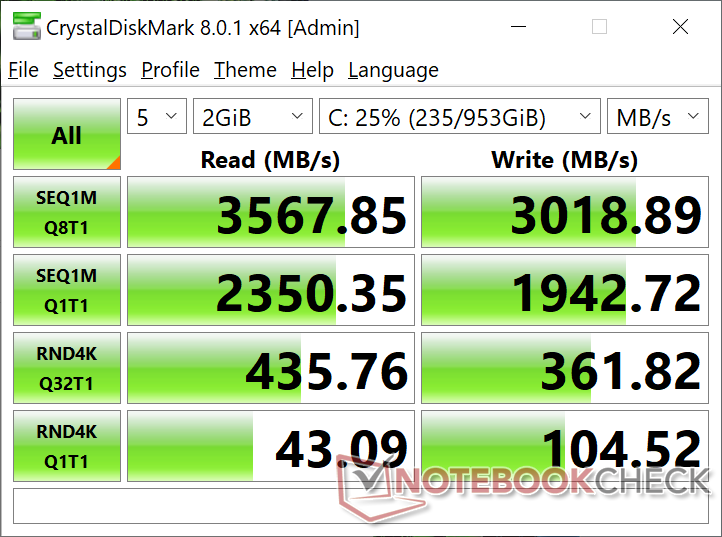
| CrystalDiskMark 5.2 / 6 | 10% | 54% | 7% | 31% | 7% | |
| Write 4K (MB/s) | 96.3 | 114.1 18% | 172.4 79% | 110.5 15% | 237.6 147% | 133.1 38% |
| Read 4K (MB/s) | 51.5 | 57.2 11% | 78.8 53% | 51.8 1% | 54.7 6% | 51.6 0% |
| Write Seq (MB/s) | 1942 | 2580 33% | 2991 54% | 2071 7% | 2603 34% | 1986 2% |
| Read Seq (MB/s) | 2504 | 2527 1% | 3351 34% | 2505 0% | 1889 -25% | 2208 -12% |
| Write 4K Q32T1 (MB/s) | 346.6 | 480.2 39% | 459.2 32% | 429.8 24% | 505 46% | 462.3 33% |
| Read 4K Q32T1 (MB/s) | 408 | 387.6 -5% | 484.3 19% | 418.3 3% | 606 49% | 400.2 -2% |
| Write Seq Q32T1 (MB/s) | 3019 | 2996 -1% | 4761 58% | 3060 1% | 2795 -7% | 3074 2% |
| Read Seq Q32T1 (MB/s) | 3514 | 2853 -19% | 7071 101% | 3539 1% | 3448 -2% | 3268 -7% |
| Media total (Programa/Opciones) | 17% /
19% | 74% /
79% | 56% /
69% | 25% /
24% | 3% /
2% |
* ... más pequeño es mejor

Disk Throttling: DiskSpd Read Loop, Queue Depth 8
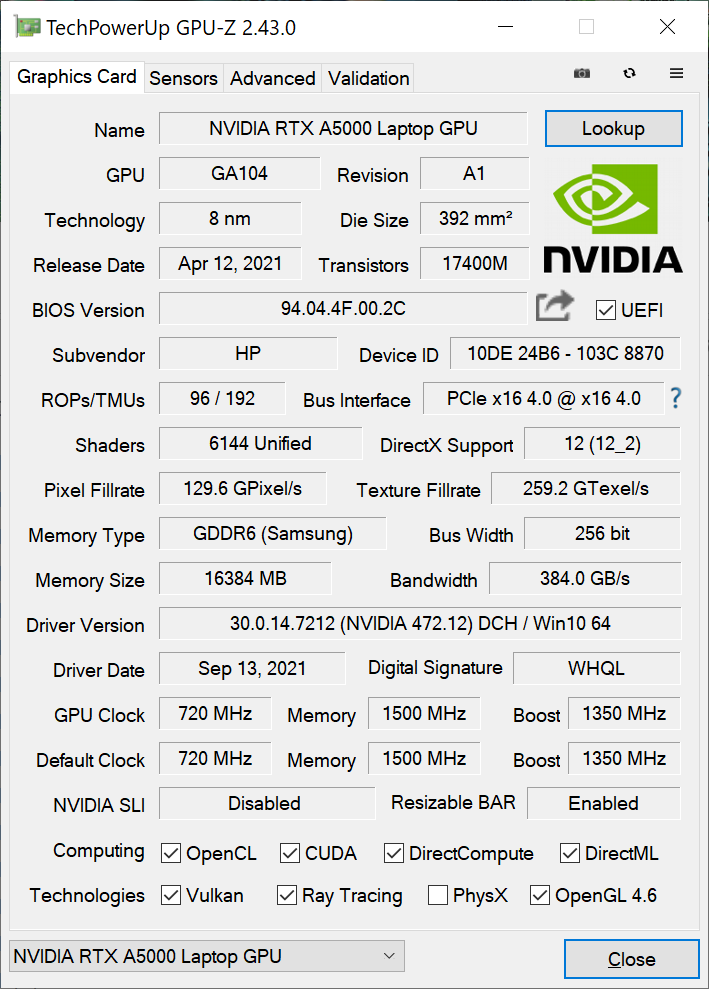
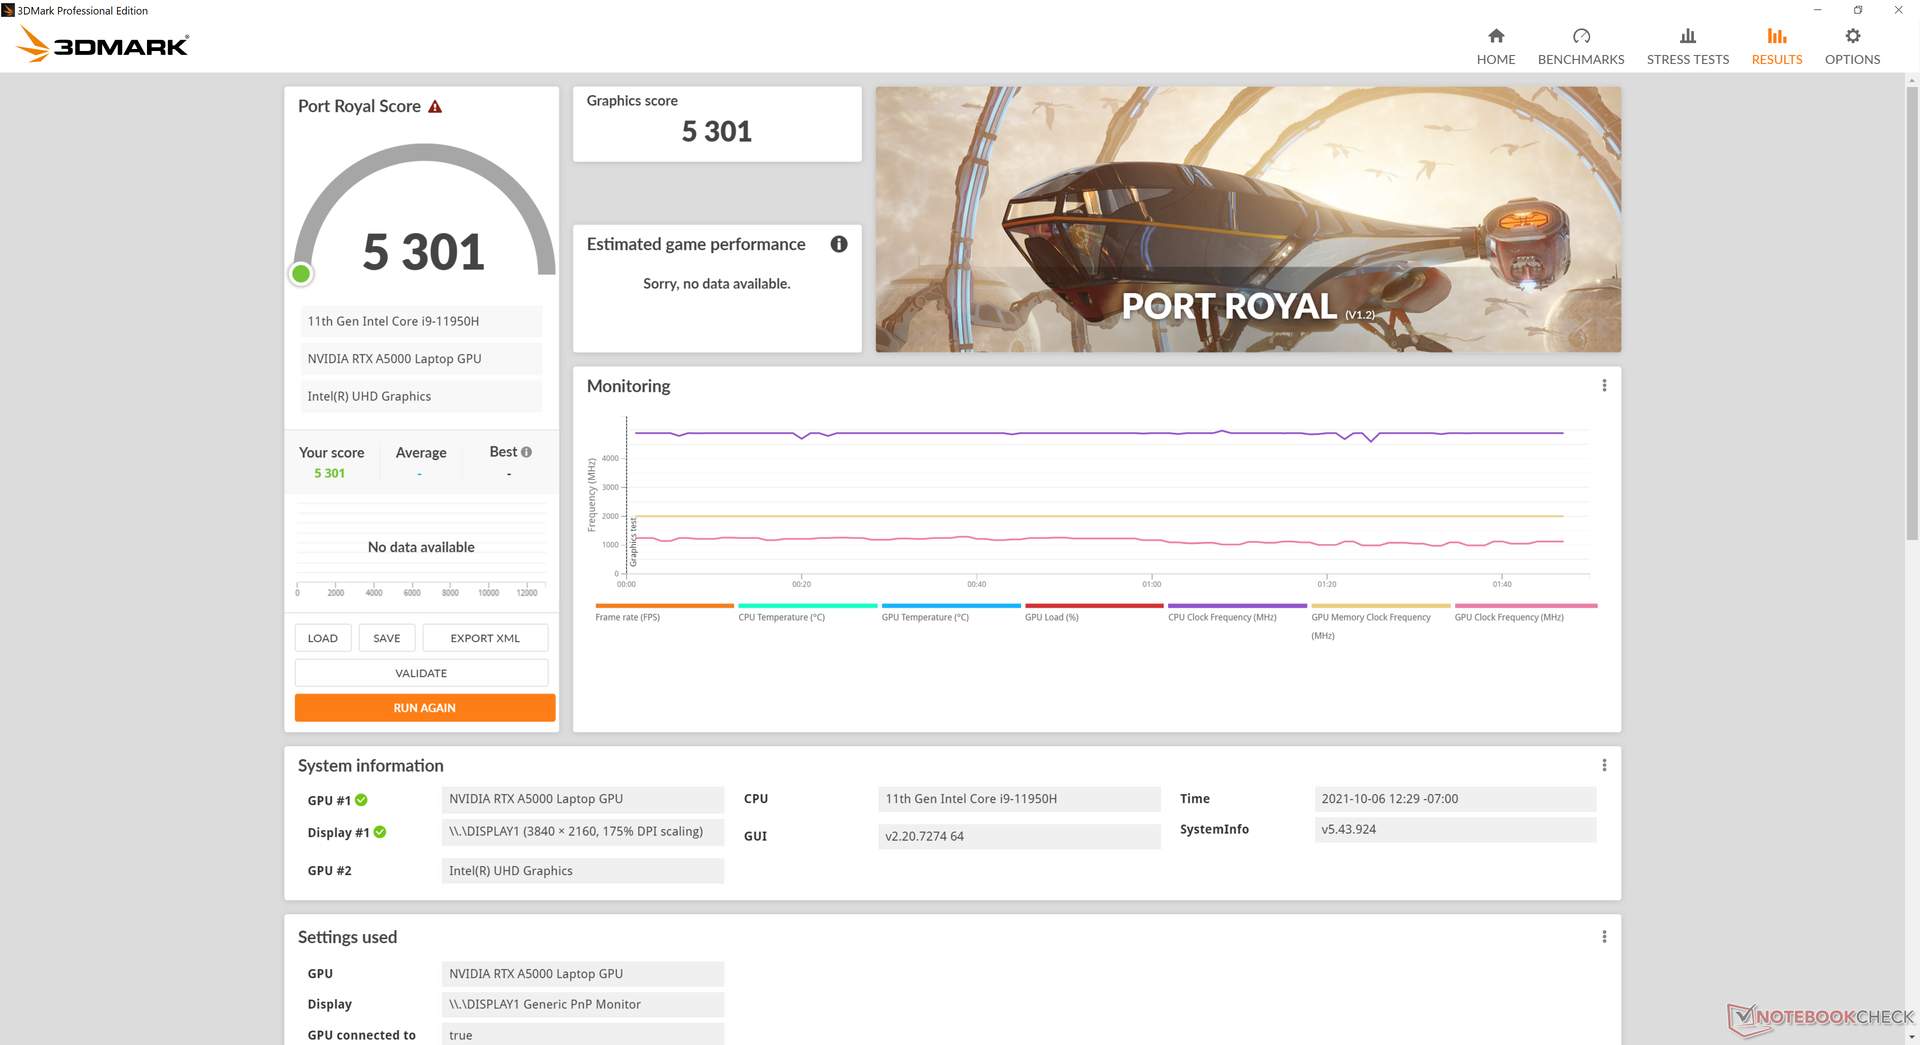
Rendimiento de la GPU: la potente Quadro RTX A5000
El rendimiento gráfico en bruto se sitúa entre la móvil GeForce RTX 3060 y rTX 3070 para móviles para ser entre un 10 y un 20 por ciento más rápido que la Quadro RTX 5000 Max-Q en la antigua Fury 15 G7. En algunos subcomparadores de SpecViewPerf se puede ver incluso una mejora del 40 al 50 por ciento
Aunque no está optimizado para los juegos, el sistema es capaz de superar incluso los títulos más exigentes a resolución QHD. El rendimiento general en juegos es similar al de la GeForce RTX 3060 para móviles en la mayoría de los casos.
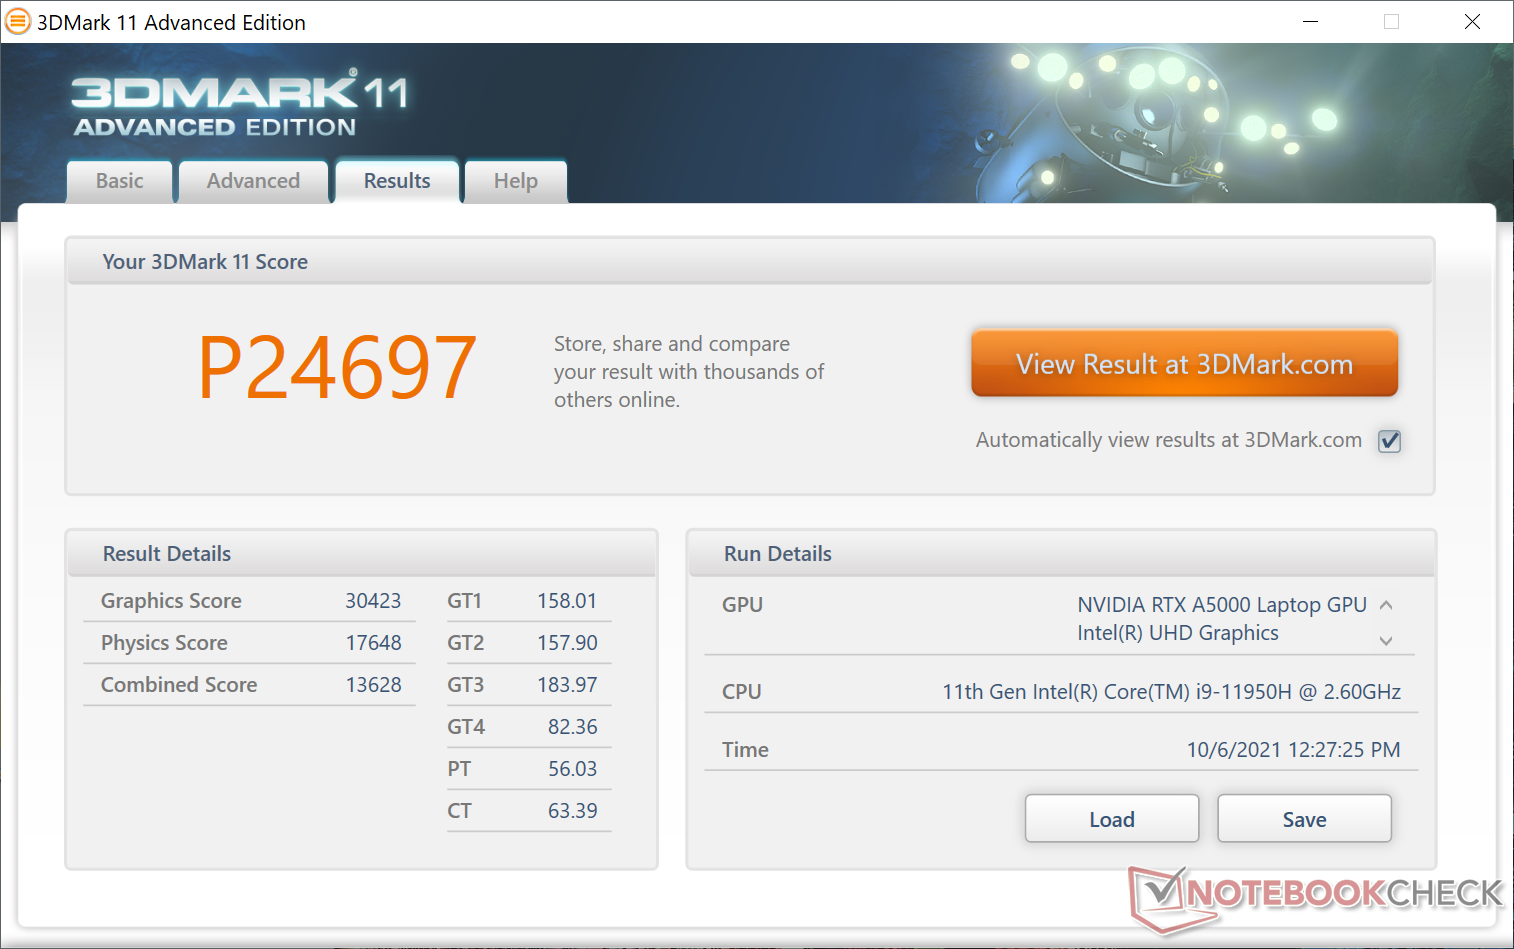
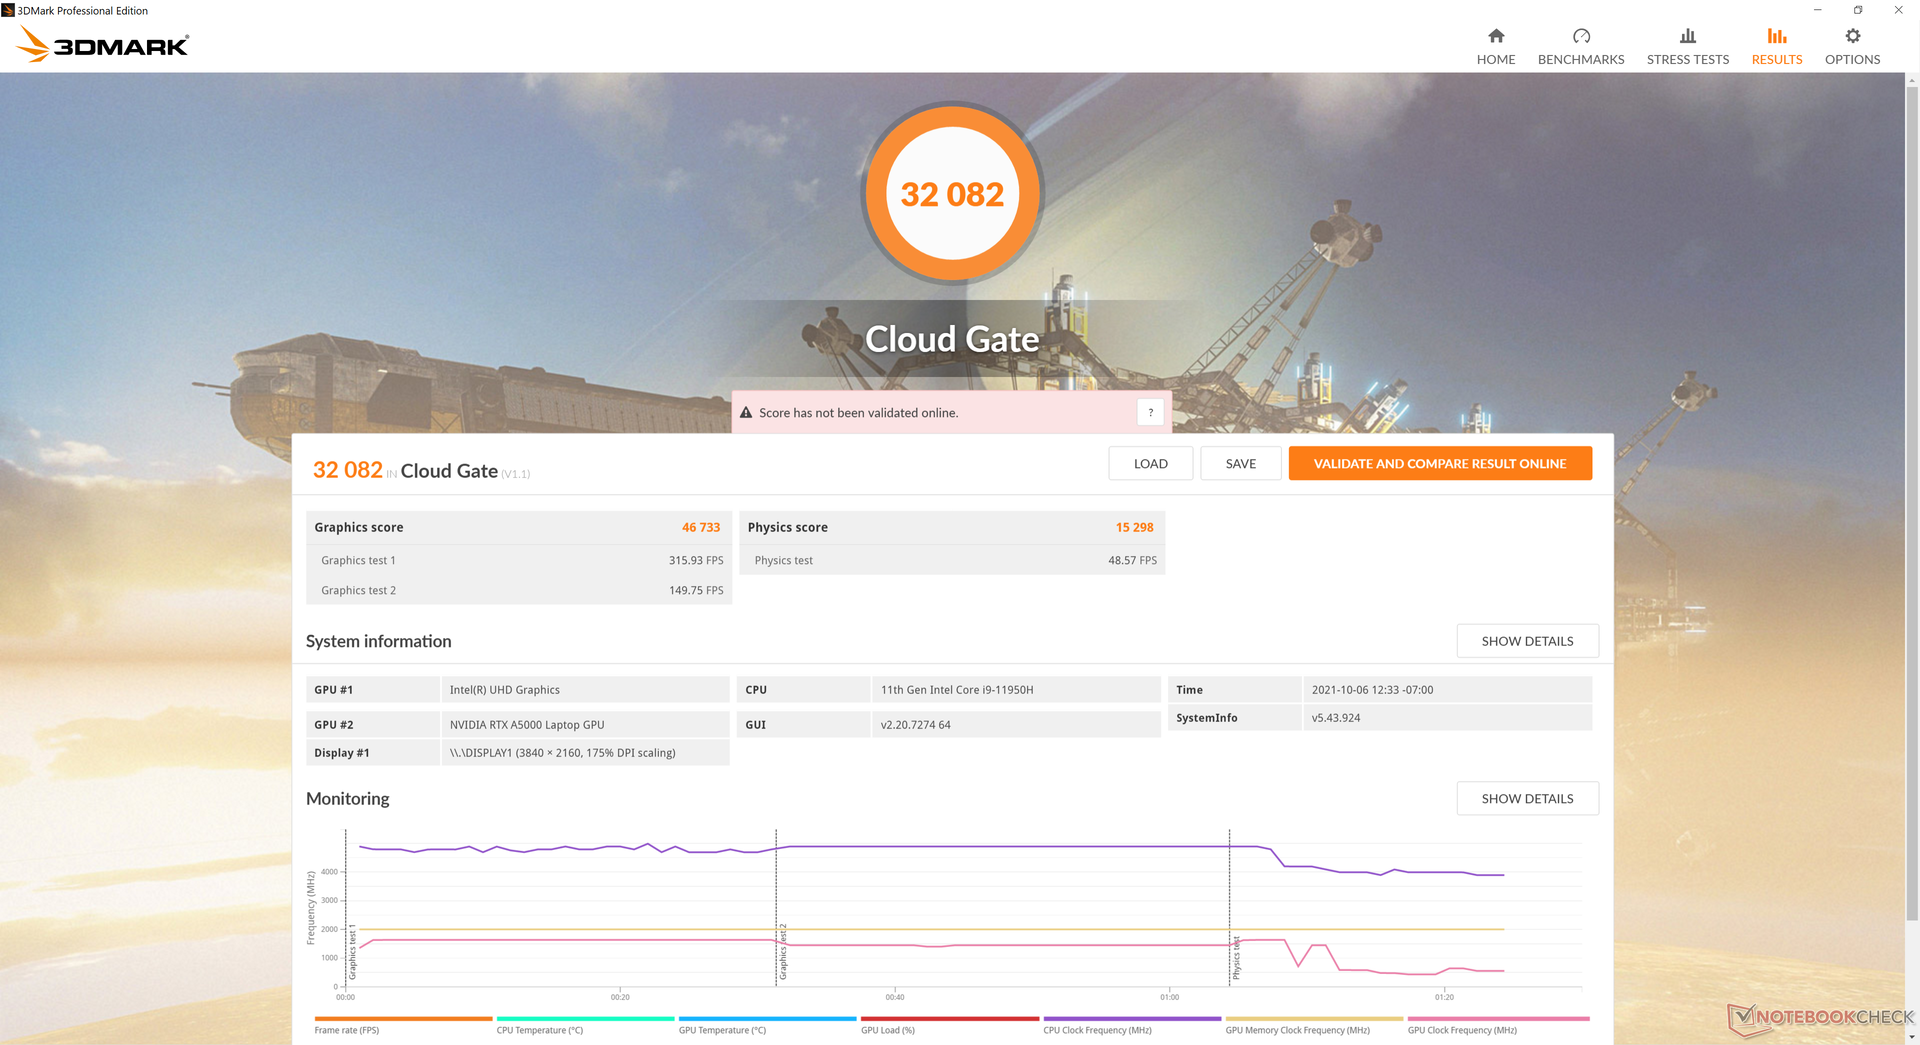
| 3DMark 11 Performance | 24697 puntos | |
| 3DMark Cloud Gate Standard Score | 32082 puntos | |
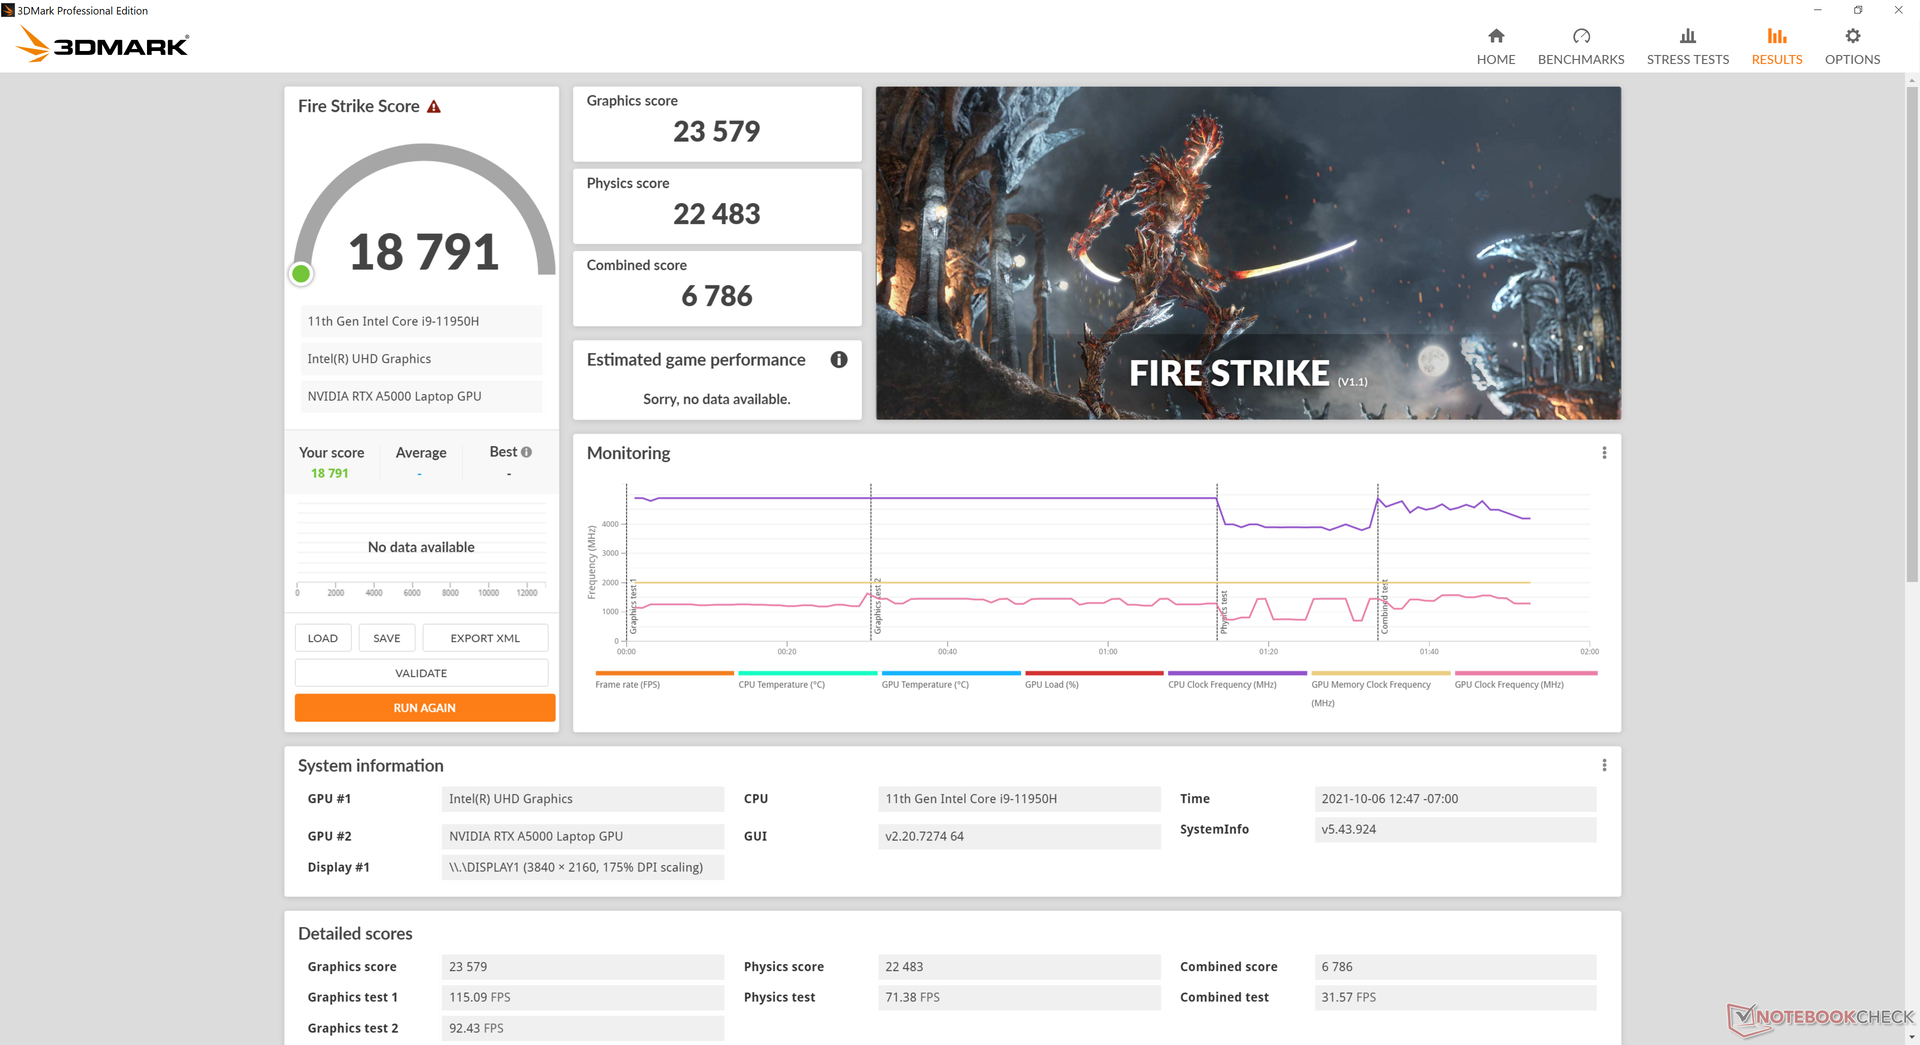
| 3DMark Fire Strike Score | 18791 puntos | |
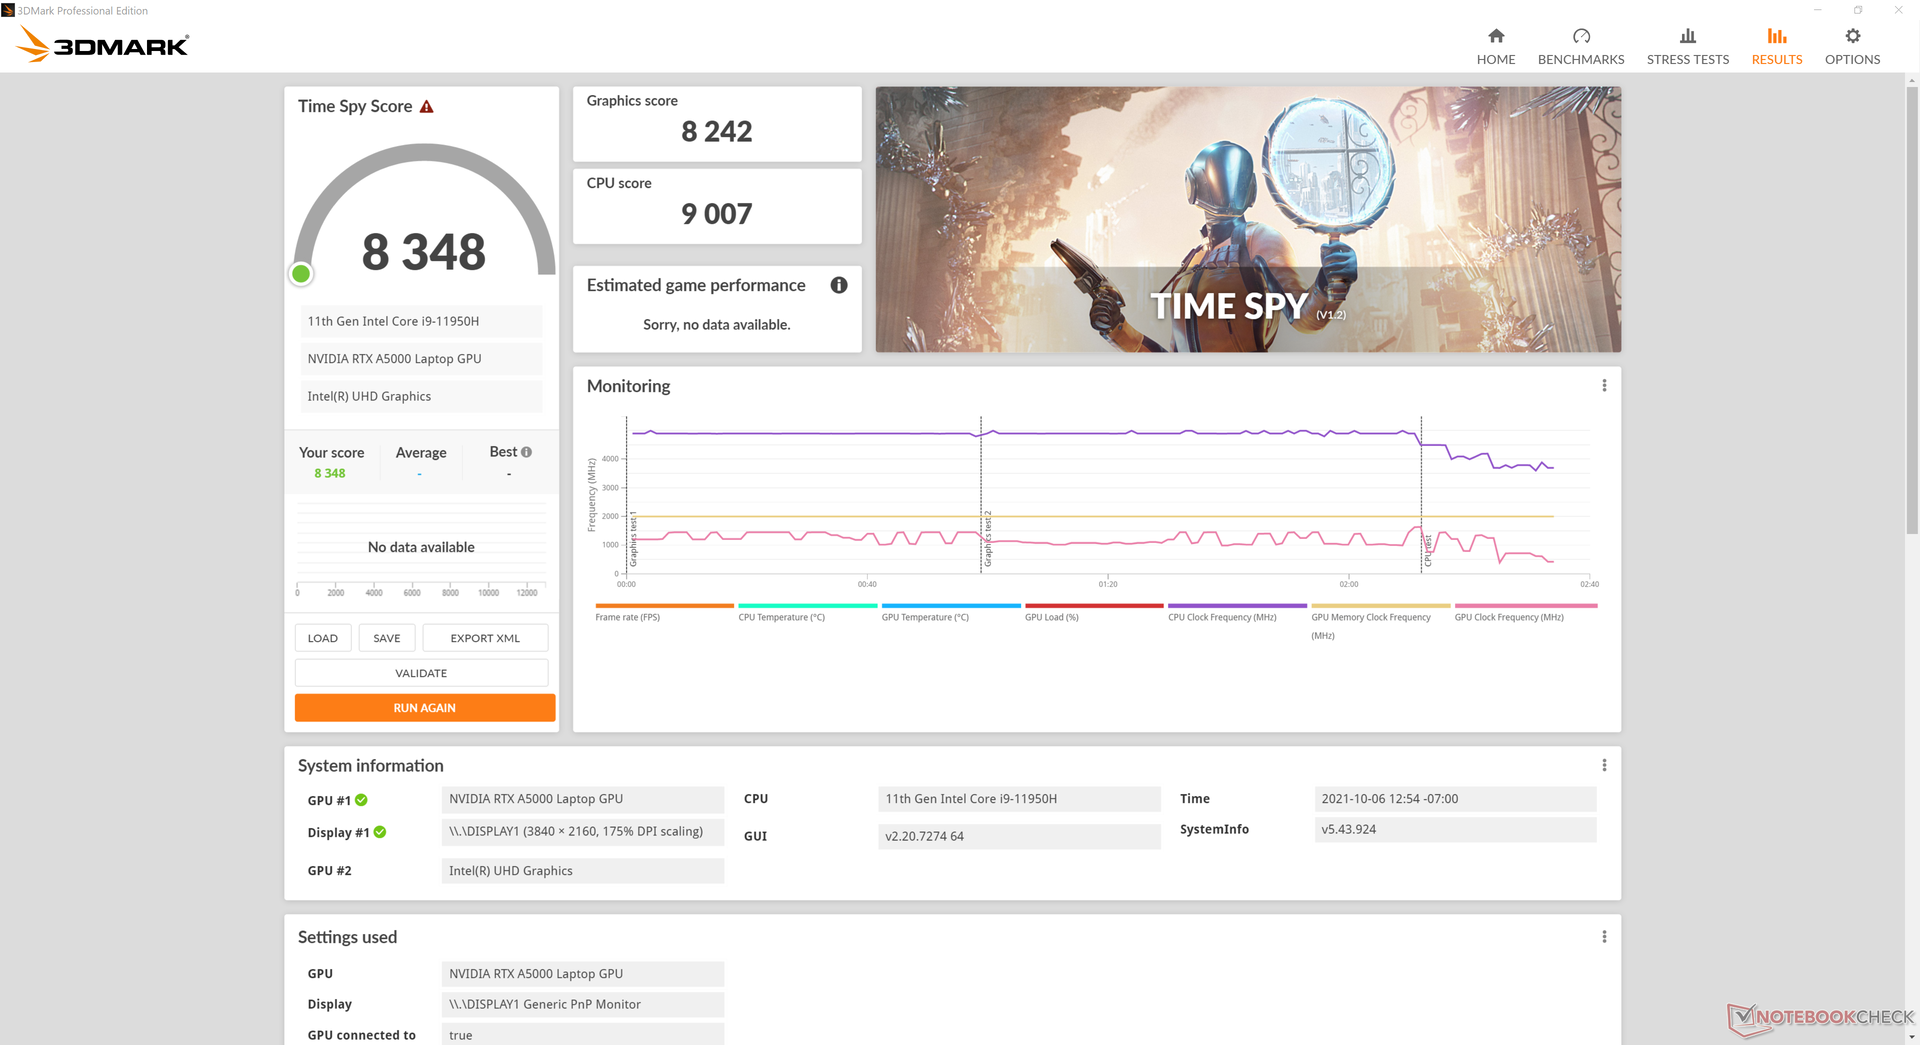
| 3DMark Time Spy Score | 8348 puntos | |
ayuda | ||
Witcher 3 FPS Chart
| bajo | medio | alto | ultra | QHD | 4K | |
|---|---|---|---|---|---|---|
| GTA V (2015) | 175 | 169 | 131 | 76.1 | 70.4 | 75.5 |
| The Witcher 3 (2015) | 335.1 | 227.4 | 149.5 | 81.7 | 57.5 | |
| Dota 2 Reborn (2015) | 164 | 148 | 140 | 131 | 95 | |
| Final Fantasy XV Benchmark (2018) | 155 | 110 | 81.1 | 62.6 | 35.4 | |
| X-Plane 11.11 (2018) | 108 | 90.8 | 76.5 | 48.6 | ||
| Far Cry 5 (2018) | 137 | 93 | 90 | 85 | 79 | 44 |
| Strange Brigade (2018) | 337 | 195 | 165 | 147 | 108 | 64 |
| Shadow of the Tomb Raider (2018) | 128 | 109 | 106 | 94 | 71 | 38 |
| Far Cry New Dawn (2019) | 105 | 85 | 78 | 71 | 62 | 43 |
| Metro Exodus (2019) | 154 | 94.8 | 74.5 | 59.8 | 46.3 | 28.5 |
| Borderlands 3 (2019) | 159.6 | 121.6 | 85.9 | 67.1 | 46.8 | 25.6 |
| Gears Tactics (2020) | 145.8 | 181.2 | 120.3 | 94.7 | 66.6 | 34.9 |
| Horizon Zero Dawn (2020) | 133 | 109 | 101 | 91 | 73 | 40 |
| Watch Dogs Legion (2020) | 69 | 64 | 60 | 45 | 43 | 26 |
| Dirt 5 (2020) | 178.1 | 115.2 | 91.7 | 74.8 | 59.5 | 39 |
| Assassin´s Creed Valhalla (2020) | 113 | 76 | 64 | 55 | 44 | 29 |
| Immortals Fenyx Rising (2020) | 123 | 90 | 84 | 80 | 59 | 38 |
| Hitman 3 (2021) | 206.6 | 147.3 | 138.1 | 125.8 | 87.1 | 47.1 |
| F1 2021 (2021) | 164 | 136 | 122 | 85 | 59 | 38 |
Emissions
Ruido del sistema
Los dos ventiladores de ~50 mm del Fury 15 G8 tienden a aumentar las RPM antes que en el Fury 15 G7 cuando se introducen cargas estresantes. Por ejemplo, somos capaces de registrar 37.8 dB(A) cuando ejecutamos la primera escena de 3DMark 06 comparado con los 31.7 dB(A) del modelo anterior. El ruido general del ventilador sigue siendo más silencioso que en el ZBook Studio 15 G8 pero mucho más fuerte que en el más lento ZBook Firefly 15 G7.
| HP ZBook Fury 15 G8 RTX A5000 Laptop GPU, i9-11950H, Samsung PM981a MZVLB1T0HBLR | HP ZBook Fury 15 G7 Quadro RTX 5000 Max-Q, W-10885M, Samsung PM981a MZVLB1T0HBLR | Dell Precision 5000 5560 RTX A2000 Laptop GPU, i7-11850H, Samsung PM9A1 MZVL22T0HBLB | HP ZBook Studio 15 G8 GeForce RTX 3070 Laptop GPU, i9-11950H, Samsung PM981a MZVLB2T0HALB | Lenovo ThinkPad P15s Gen2-20W6000GGE T500 Laptop GPU, i7-1165G7, WDC PC SN720 SDAQNTW-1T00 | HP ZBook Firefly 15 G7 Quadro P520, i7-10610U, Toshiba XG6 KXG60ZNV1T02 | |
|---|---|---|---|---|---|---|
| Noise | -5% | 8% | -6% | 2% | -3% | |
| apagado / medio ambiente * (dB) | 24.1 | 26.4 -10% | 23.4 3% | 23.5 2% | 24.3 -1% | 29.3 -22% |
| Idle Minimum * (dB) | 24.1 | 26.4 -10% | 23.6 2% | 25.3 -5% | 25.5 -6% | 29.3 -22% |
| Idle Average * (dB) | 24.1 | 26.4 -10% | 23.6 2% | 25.3 -5% | 25.5 -6% | 29.3 -22% |
| Idle Maximum * (dB) | 24.8 | 26.4 -6% | 23.6 5% | 25.3 -2% | 25.5 -3% | 30 -21% |
| Load Average * (dB) | 37.8 | 31.7 16% | 25.8 32% | 41.2 -9% | 35.65 6% | 32.8 13% |
| Witcher 3 ultra * (dB) | 44.2 | 47 -6% | 40.1 9% | 49.4 -12% | 32.8 26% | |
| Load Maximum * (dB) | 44.2 | 47 -6% | 41.4 6% | 49.4 -12% | 35.65 19% | 32.8 26% |
* ... más pequeño es mejor
Ruido
| Ocioso |
| 24.1 / 24.1 / 24.8 dB(A) |
| Carga |
| 37.8 / 44.2 dB(A) |
 | ||
30 dB silencioso 40 dB(A) audible 50 dB(A) ruidosamente alto |
||
min: | ||
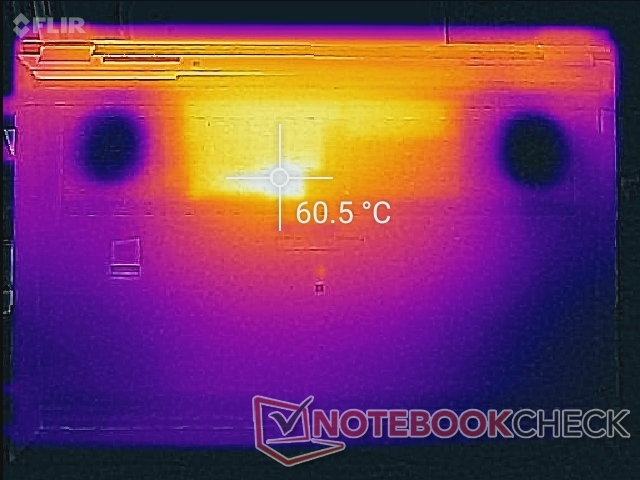
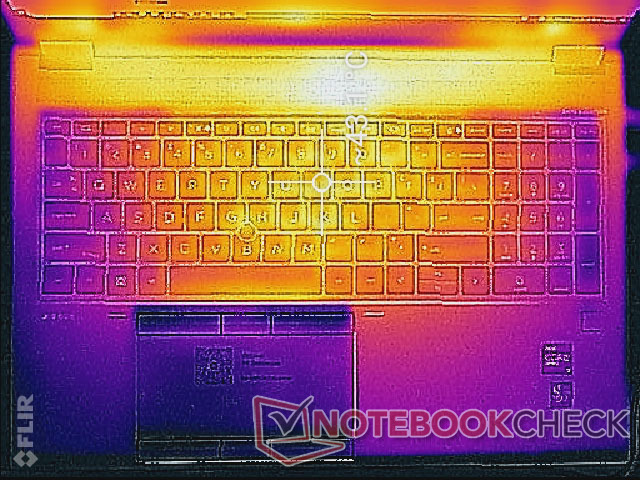
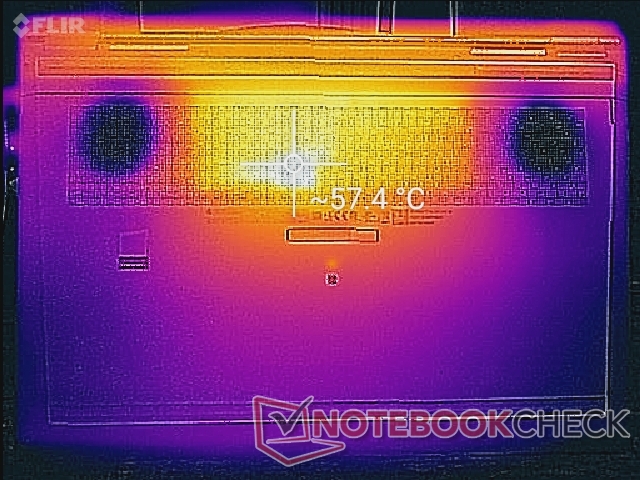
Temperatura - Refrigeración de la cámara de vapor
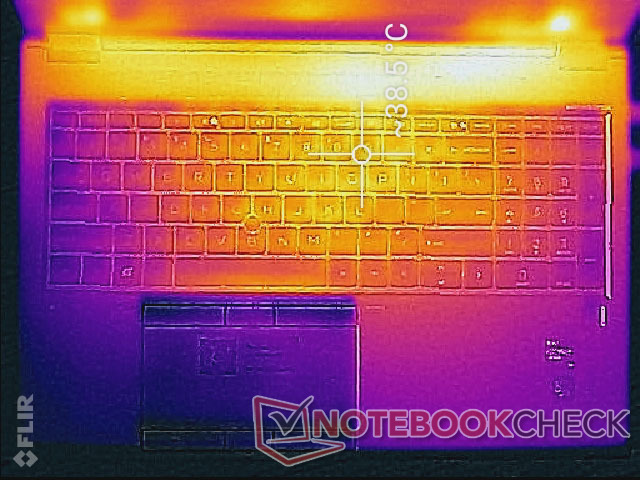
Las temperaturas superficiales pueden alcanzar hasta 43 C y 60 C en la parte superior e inferior, respectivamente, frente a los 49 C a 53 C de la Precision 7550 cuando se ejecutan cargas exigentes durante periodos prolongados. En otras palabras, el HP es más frío en la parte superior a expensas de una parte inferior más cálida, mientras que el Dell es más frío en la parte inferior a expensas de teclas más calientes.
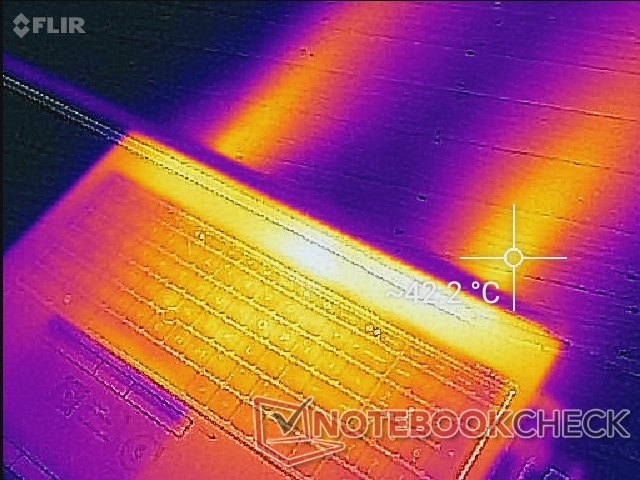
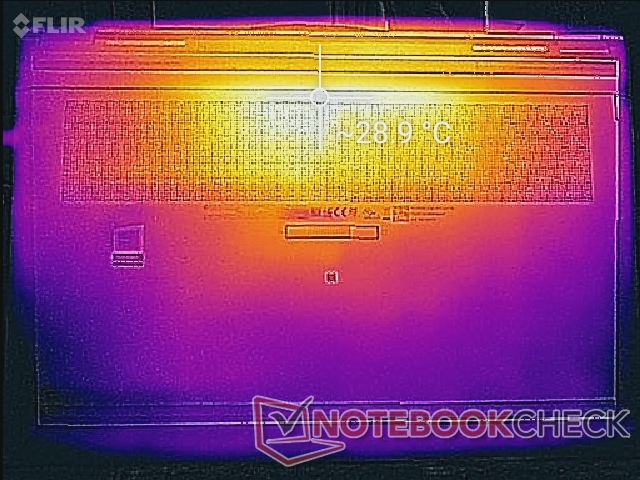
(-) La temperatura máxima en la parte superior es de 45.6 °C / 114 F, frente a la media de 38.2 °C / 101 F, que oscila entre 22.2 y 69.8 °C para la clase Workstation.
(-) El fondo se calienta hasta un máximo de 57.6 °C / 136 F, frente a la media de 41.1 °C / 106 F
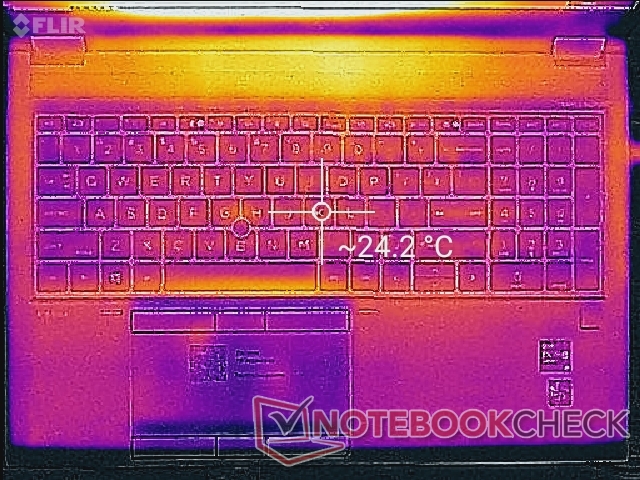
(+) En reposo, la temperatura media de la parte superior es de 24.4 °C / 76# F, frente a la media del dispositivo de 32 °C / 90 F.
(±) Jugando a The Witcher 3, la temperatura media de la parte superior es de 34 °C / 93 F, frente a la media del dispositivo de 32 °C / 90 F.
(+) Los reposamanos y el panel táctil alcanzan como máximo la temperatura de la piel (33 °C / 91.4 F) y, por tanto, no están calientes.
(-) La temperatura media de la zona del reposamanos de dispositivos similares fue de 27.8 °C / 82 F (-5.2 °C / -9.4 F).
Prueba de esfuerzo
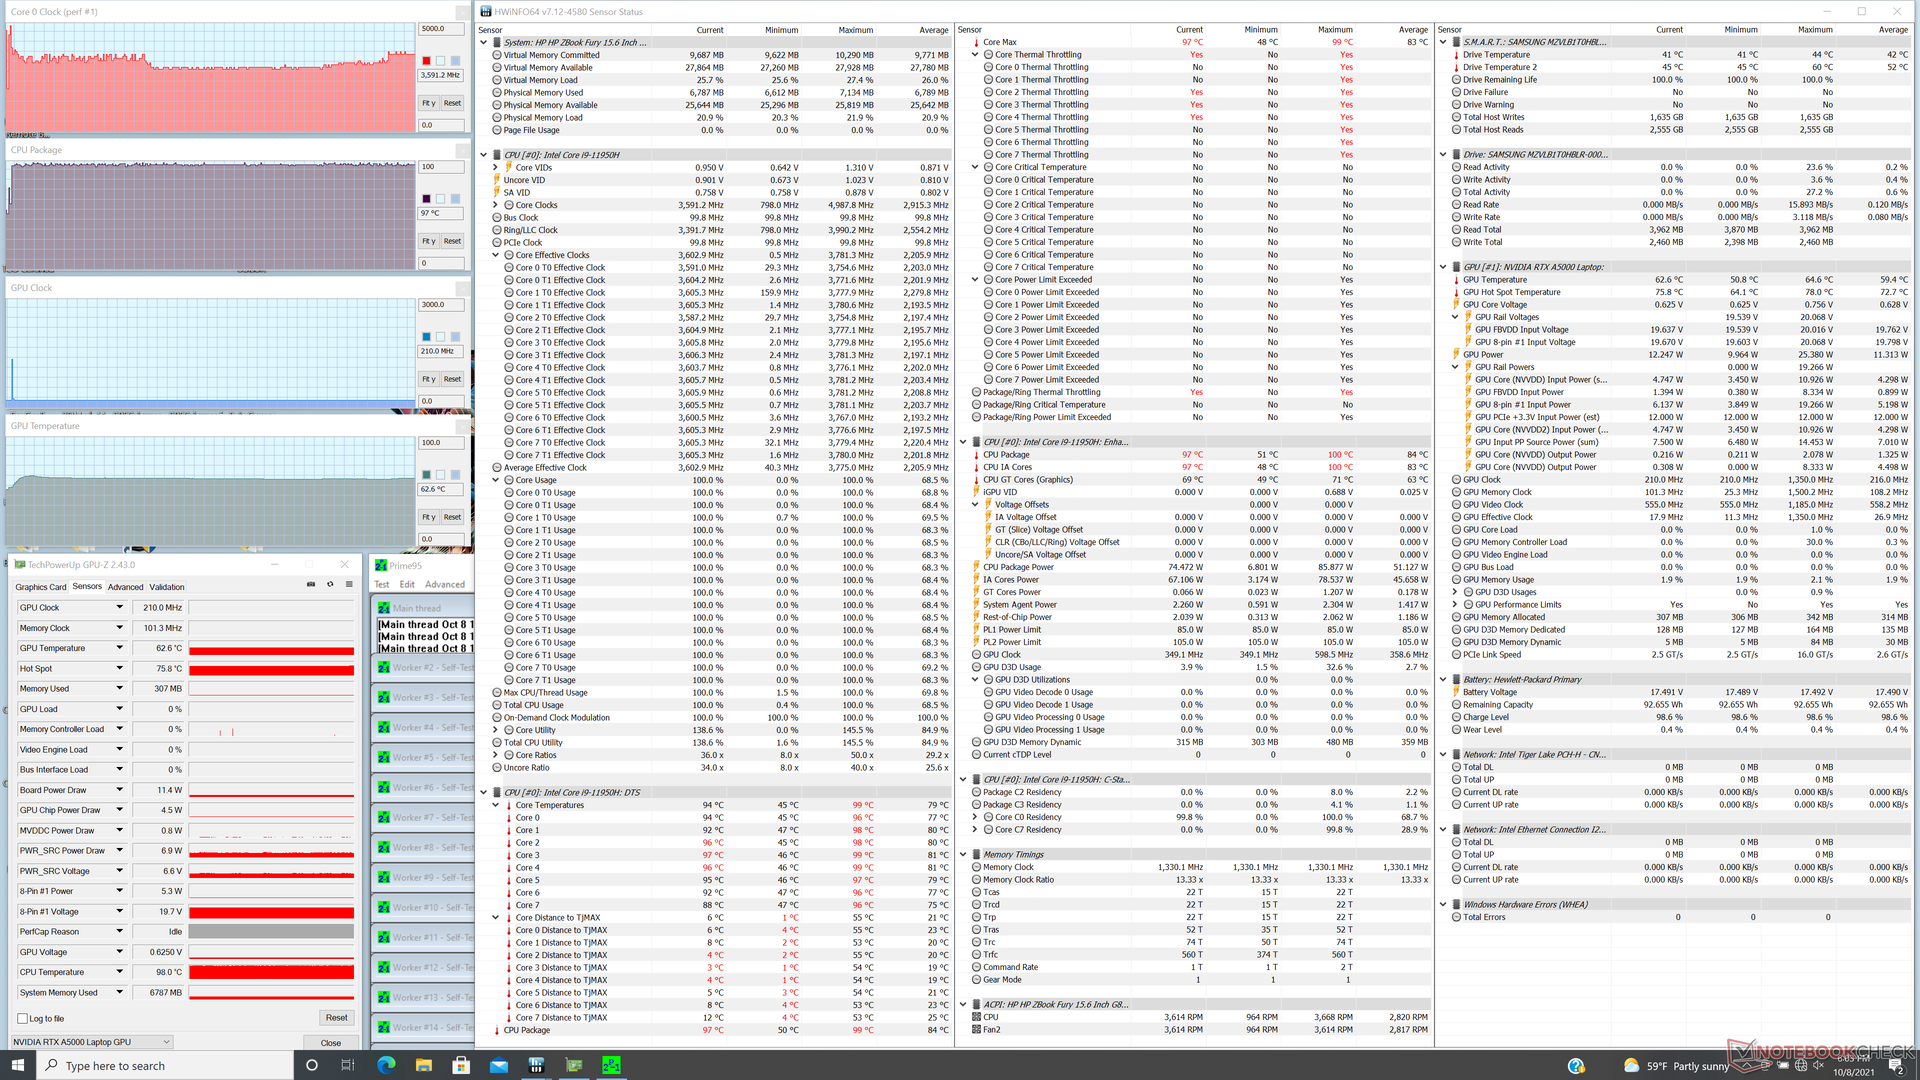
Cuando se estresa con Prime95, la CPU aumenta a 3,6 GHz durante el primer par de segundos hasta alcanzar una temperatura del núcleo de 96 C. A continuación, las velocidades de reloj se estabilizan en el rango de 3,0 a 3,5 GHz mientras se mantienen los 96 C. Los resultados son similares a los que observamos tanto en el Dell Precision 7550 como en el antiguo Fury 15 G7, lo que demuestra que estas estaciones de trabajo de alto rendimiento dan prioridad al rendimiento de la CPU, incluso si esto significa temperaturas del núcleo mucho más cálidas en general.
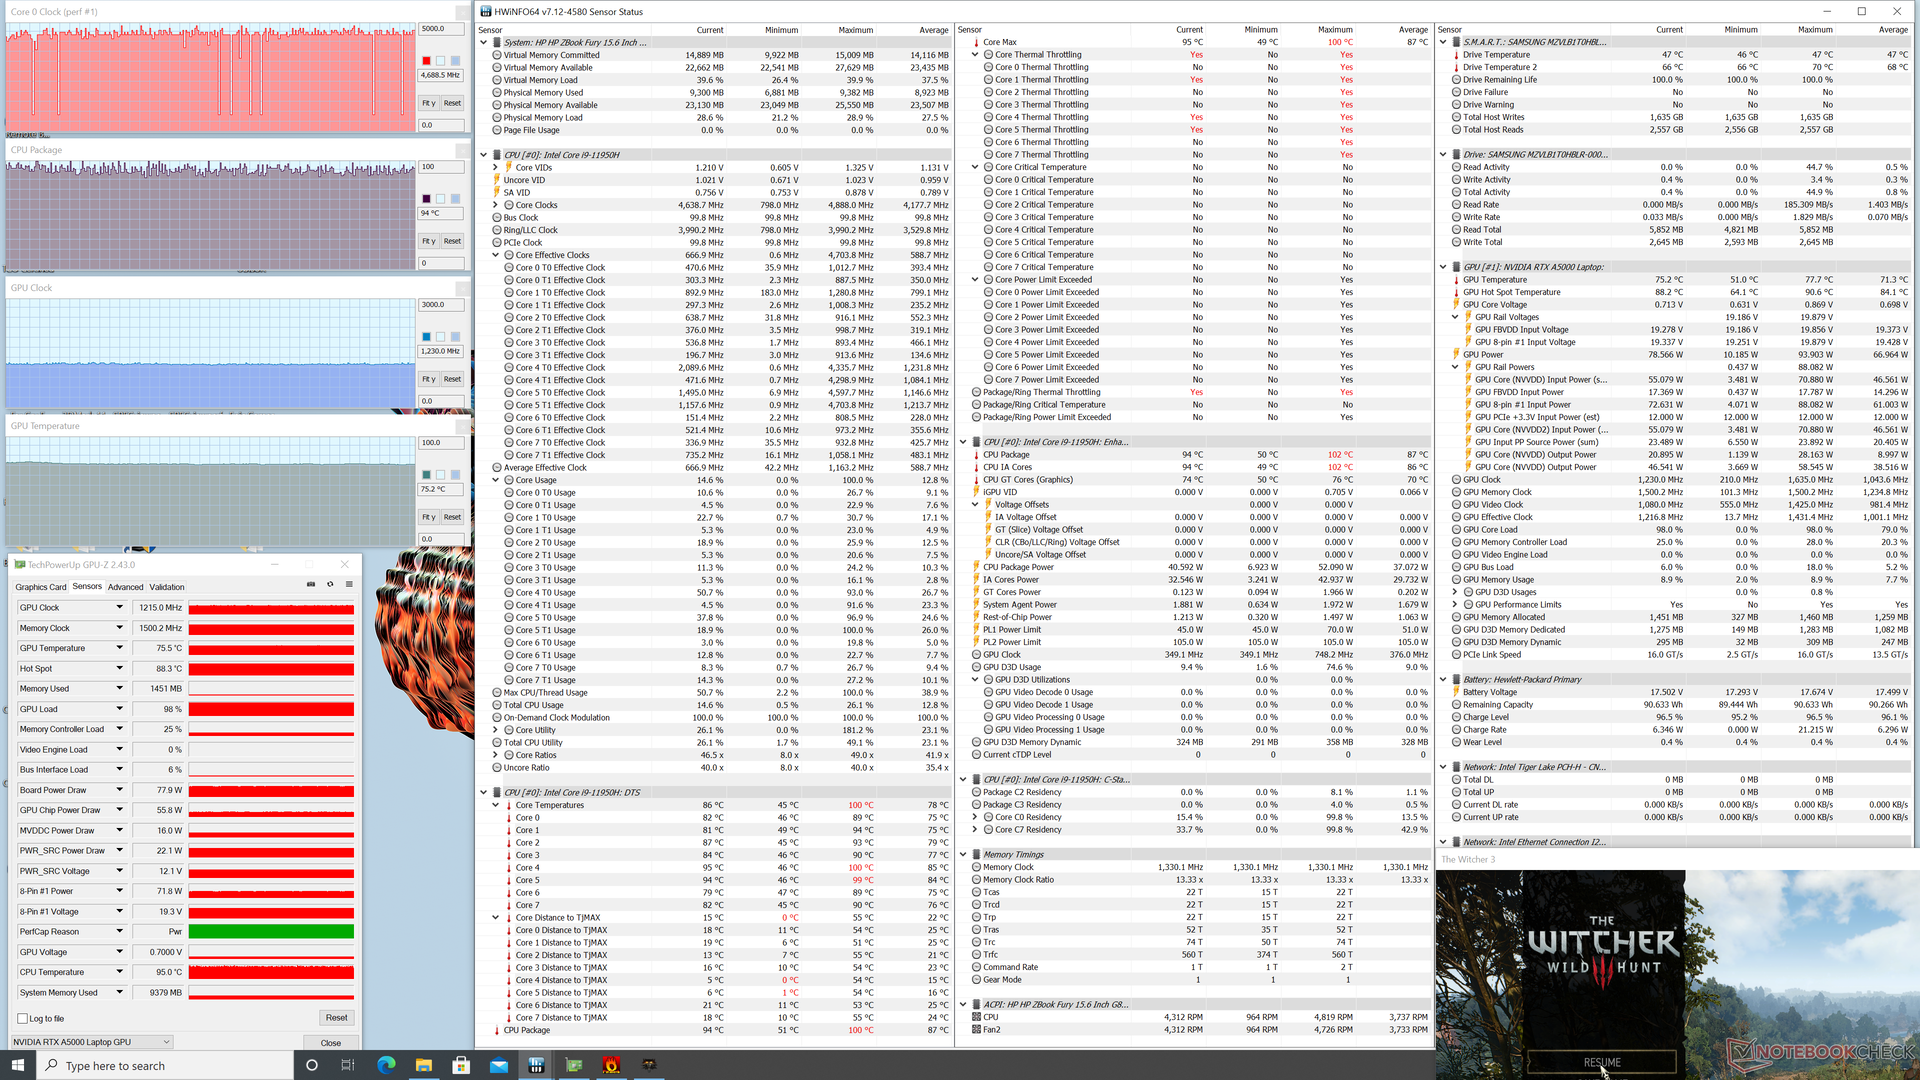
Cuando se ejecuta Witcher 3, las temperaturas de la CPU y la GPU se estabilizan en 94 C y 75 C, respectivamente, en comparación con los 85 C y 70 C de la Fury 15 G7. Por tanto, el aumento del rendimiento año tras año conlleva ligeros incrementos de las temperaturas. Los procesadores de nuestro Precision 7550 se estabilizarían a temperaturas más bajas con márgenes relativamente amplios de entre 10 y 20 C al ejecutar el mismo juego.
El consumo de energía de la placa de la GPU se estabilizaría en 78 W cuando se ejecutan cargas de juego en comparación con su objetivo de 90 W TGP. Conseguimos alcanzar un consumo de 93 W, aunque sólo durante un breve periodo de tiempo al inicio de la prueba.
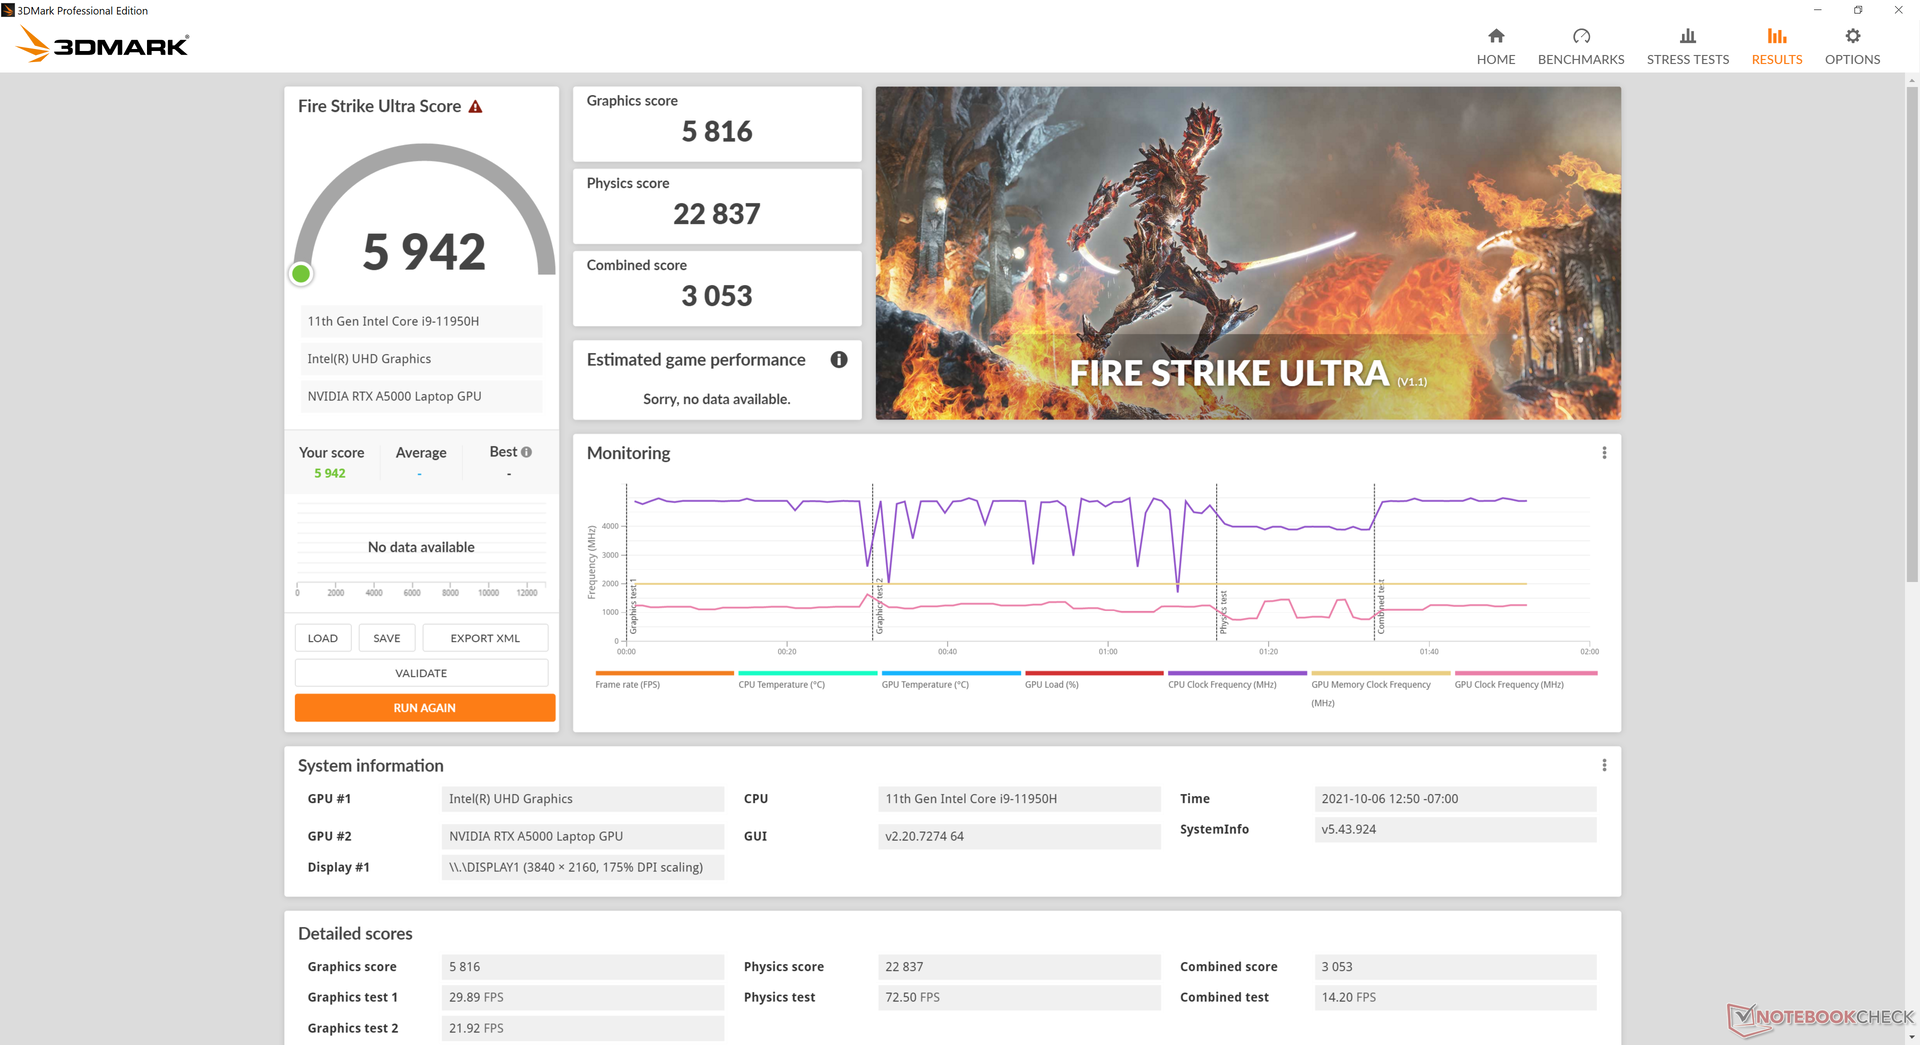
Funcionar con baterías limitará el rendimiento. Un test 3DMark Fire Strike en batería arrojaría unas puntuaciones de Física y Gráficos de 17779 y 6244 puntos, respectivamente, frente a los 22483 y 23579 puntos de la red eléctrica.
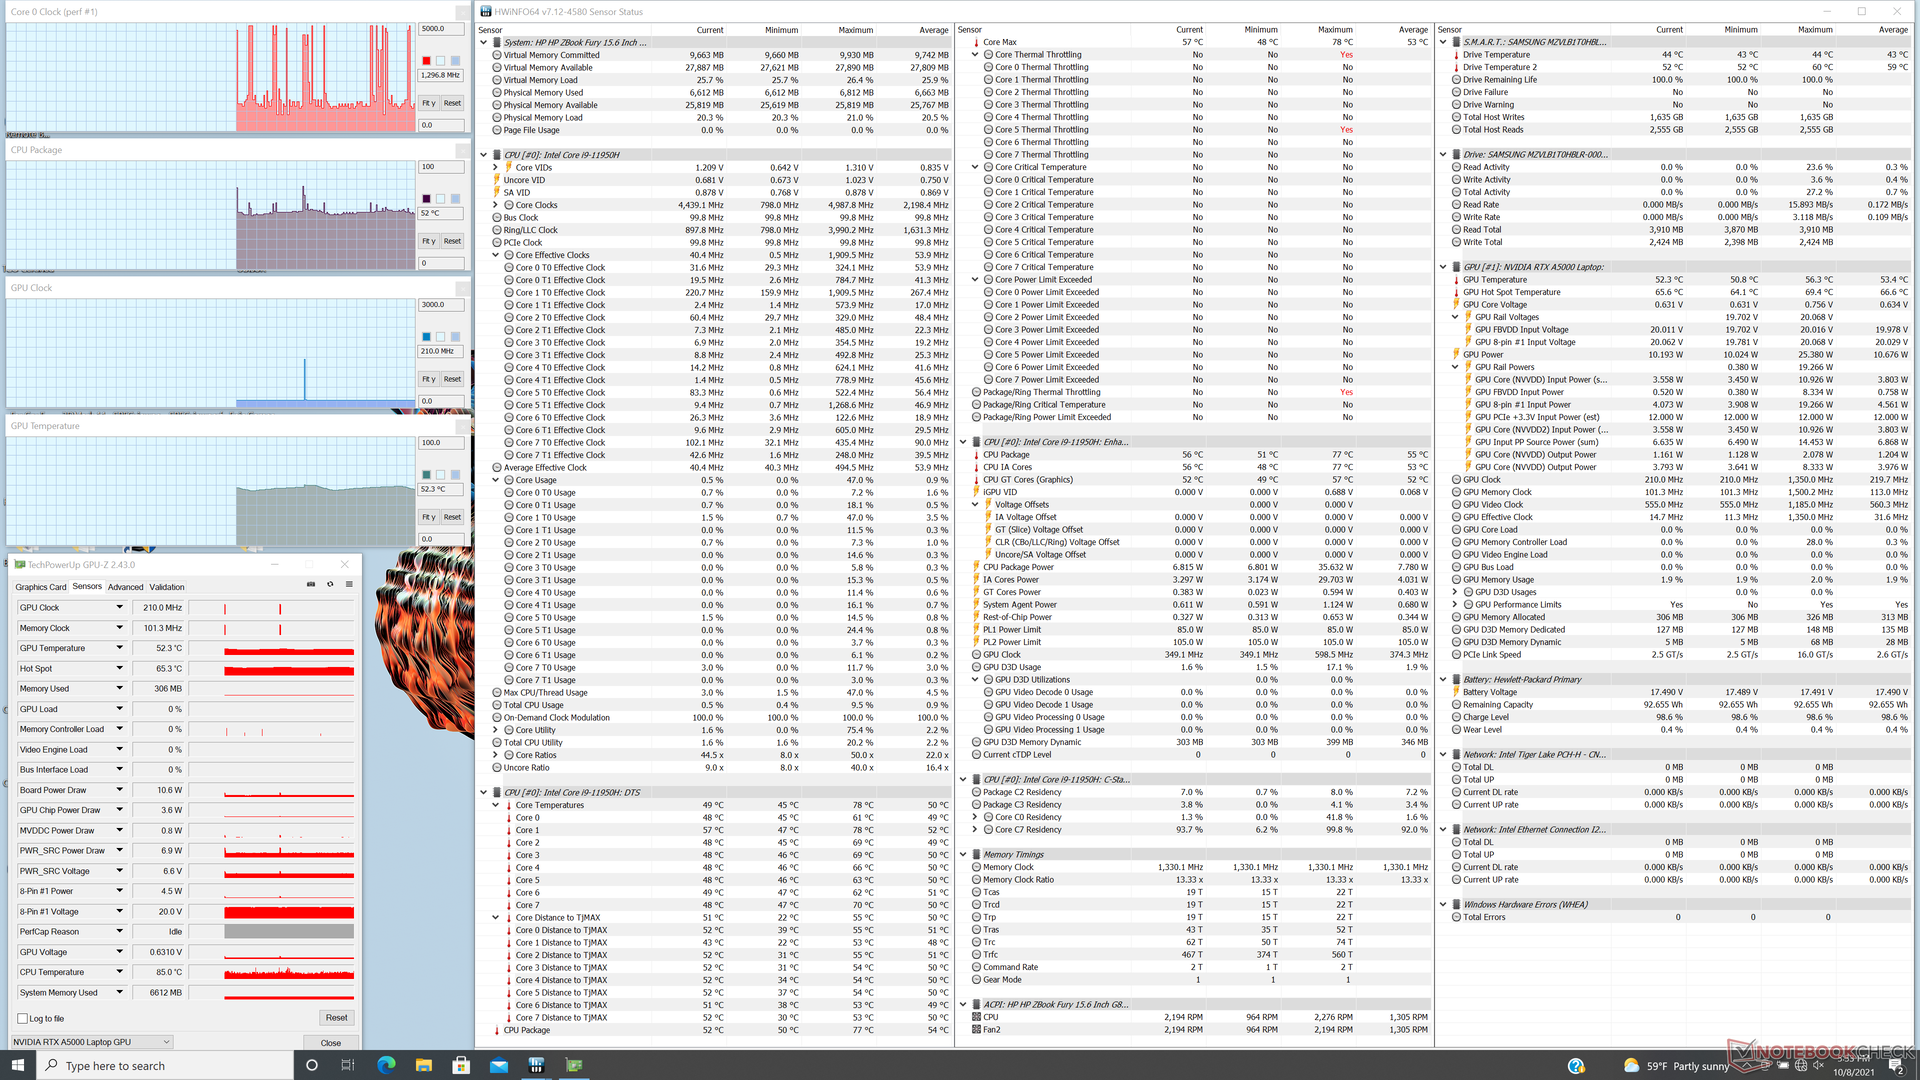
| Relojde la CPU(GHz) | Reloj dela GPU(MHz) | Temperatura media de la CPU (°C) | Temperaturamediade la GPU (°C) | |
| Sistema en reposo | 52 | 52 | ||
| EstrésPrime95 | 3,0 - 3,5 | -- | 97 | 63 |
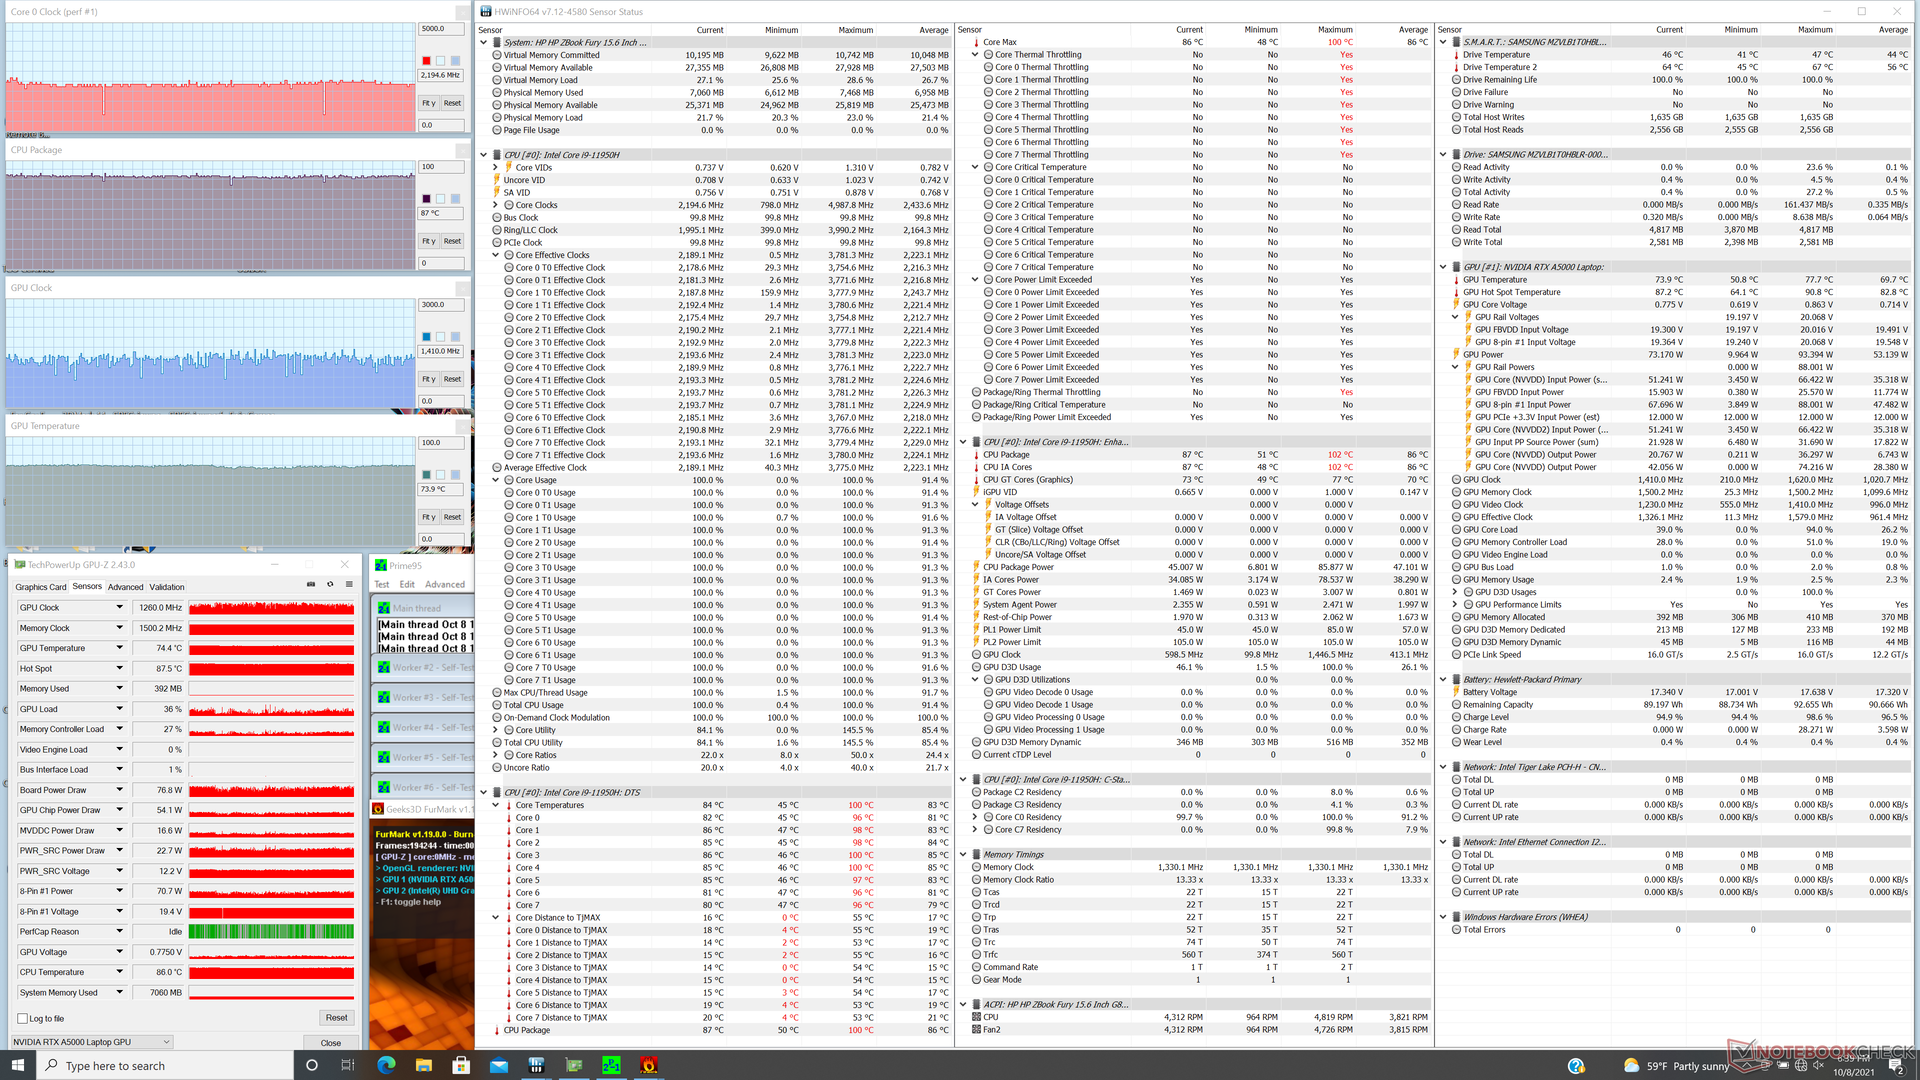
| Estrés de Prime95+ FurMark | 2,2 | ~1260 | 87 | 74 |
| Witcher 3 Stress | ~4.7 | 1215 | ~94 | 75 |
Altavoces

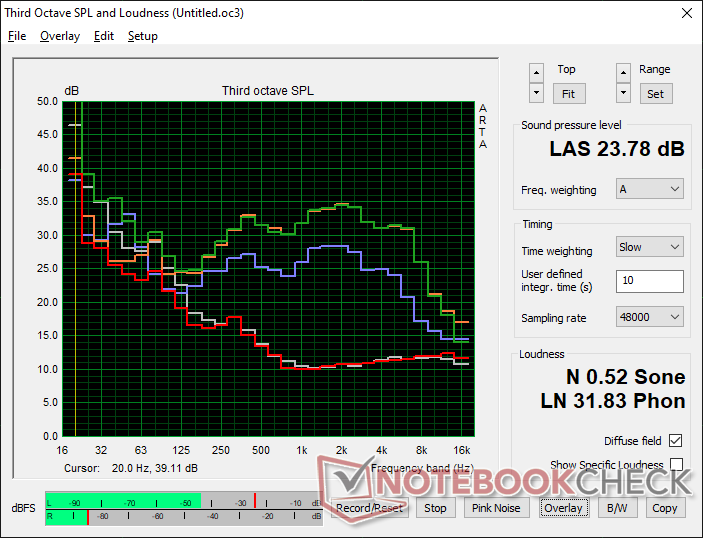
HP ZBook Fury 15 G8 análisis de audio
(±) | la sonoridad del altavoz es media pero buena (79.8 dB)
Graves 100 - 315 Hz
(±) | lubina reducida - en promedio 10.6% inferior a la mediana
(±) | la linealidad de los graves es media (8.8% delta a frecuencia anterior)
Medios 400 - 2000 Hz
(+) | medios equilibrados - a sólo 3.9% de la mediana
(+) | los medios son lineales (4.8% delta a la frecuencia anterior)
Altos 2 - 16 kHz
(+) | máximos equilibrados - a sólo 2.9% de la mediana
(+) | los máximos son lineales (5.3% delta a la frecuencia anterior)
Total 100 - 16.000 Hz
(+) | el sonido global es lineal (11.9% de diferencia con la mediana)
En comparación con la misma clase
» 17% de todos los dispositivos probados de esta clase eran mejores, 4% similares, 79% peores
» El mejor tuvo un delta de 7%, la media fue 17%, el peor fue ###max##%
En comparación con todos los dispositivos probados
» 9% de todos los dispositivos probados eran mejores, 2% similares, 89% peores
» El mejor tuvo un delta de 4%, la media fue 23%, el peor fue ###max##%
Apple MacBook 12 (Early 2016) 1.1 GHz análisis de audio
(+) | los altavoces pueden reproducir a un volumen relativamente alto (#83.6 dB)
Graves 100 - 315 Hz
(±) | lubina reducida - en promedio 11.3% inferior a la mediana
(±) | la linealidad de los graves es media (14.2% delta a frecuencia anterior)
Medios 400 - 2000 Hz
(+) | medios equilibrados - a sólo 2.4% de la mediana
(+) | los medios son lineales (5.5% delta a la frecuencia anterior)
Altos 2 - 16 kHz
(+) | máximos equilibrados - a sólo 2% de la mediana
(+) | los máximos son lineales (4.5% delta a la frecuencia anterior)
Total 100 - 16.000 Hz
(+) | el sonido global es lineal (10.2% de diferencia con la mediana)
En comparación con la misma clase
» 7% de todos los dispositivos probados de esta clase eran mejores, 2% similares, 90% peores
» El mejor tuvo un delta de 5%, la media fue 18%, el peor fue ###max##%
En comparación con todos los dispositivos probados
» 5% de todos los dispositivos probados eran mejores, 1% similares, 94% peores
» El mejor tuvo un delta de 4%, la media fue 23%, el peor fue ###max##%
Energy Management
Consumo de energía - Pantalla de alto consumo
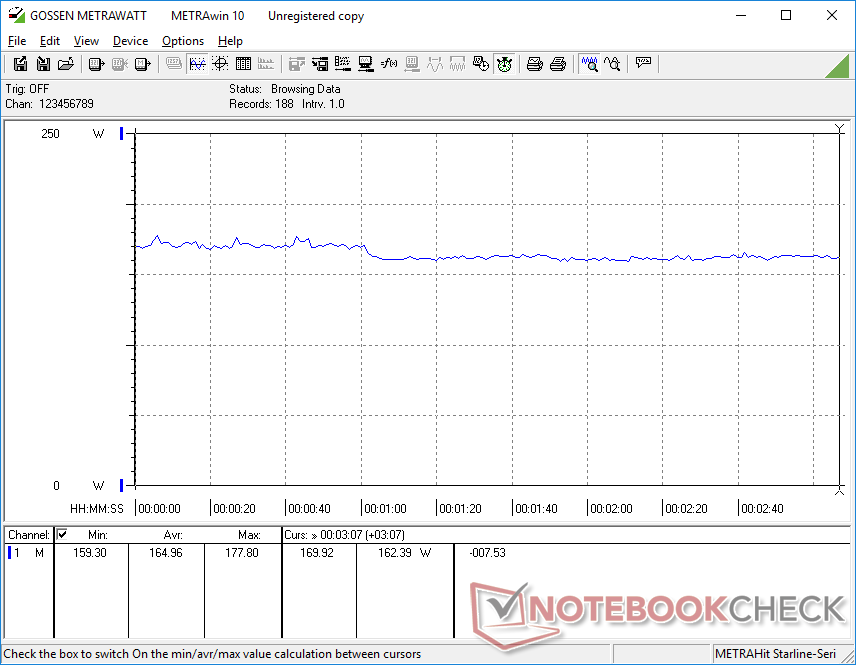
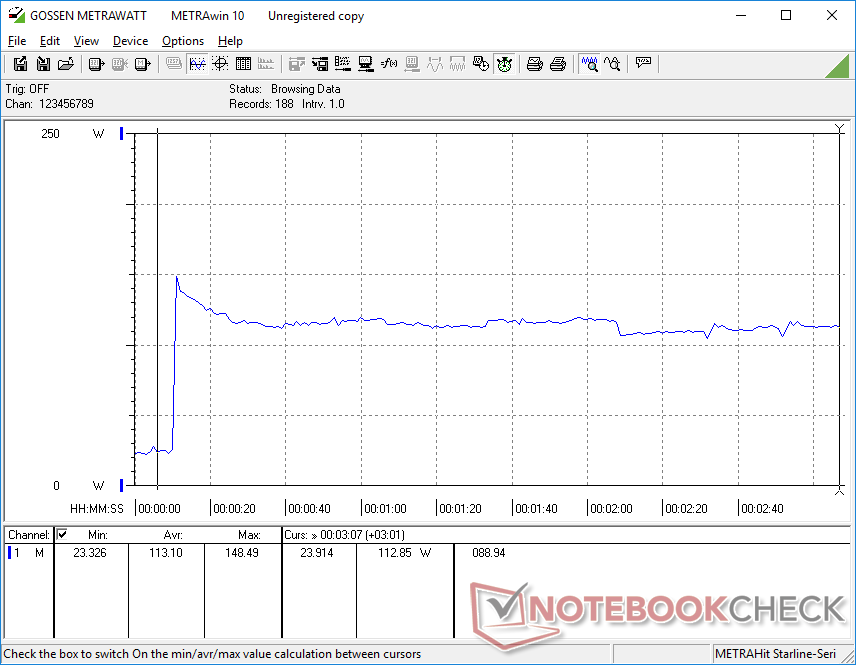
El sistema consume un poco más de energía que su predecesor inmediato, el Fury 15 G7, sobre todo cuando se somete a cargas de procesamiento bajas. Nuestra unidad se asentaba en rangos ligeramente superiores de 8 W a 20 W comparado con los 4 W a 14 W del modelo anterior. Por lo demás, el consumo de energía es muy parecido entre los dos modelos cuando se ejecutan cargas exigentes.
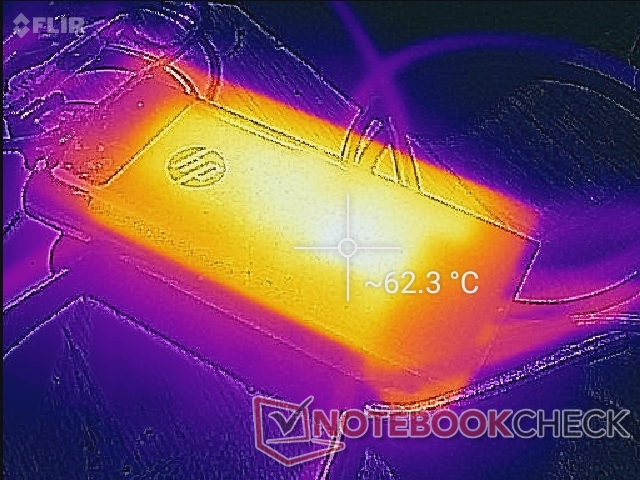
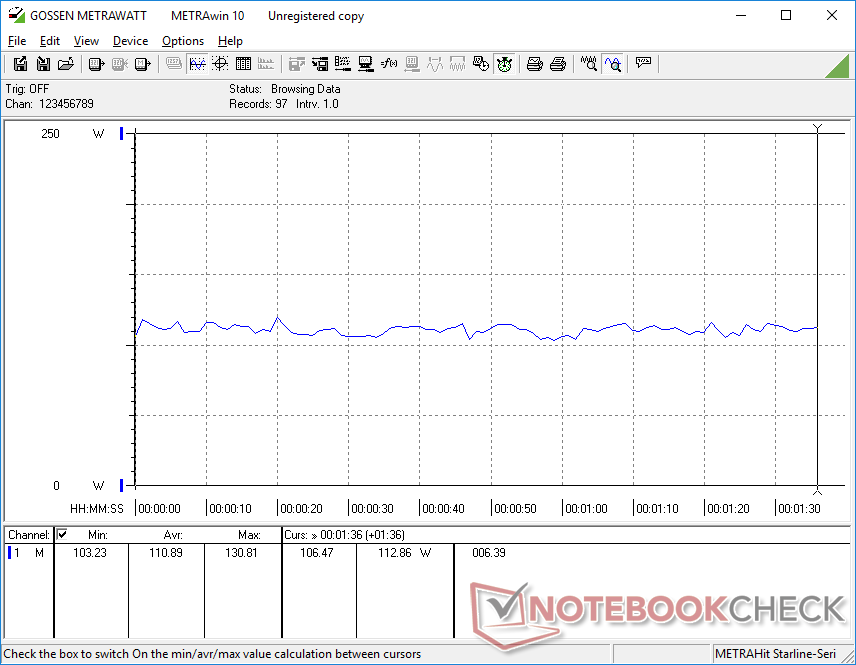
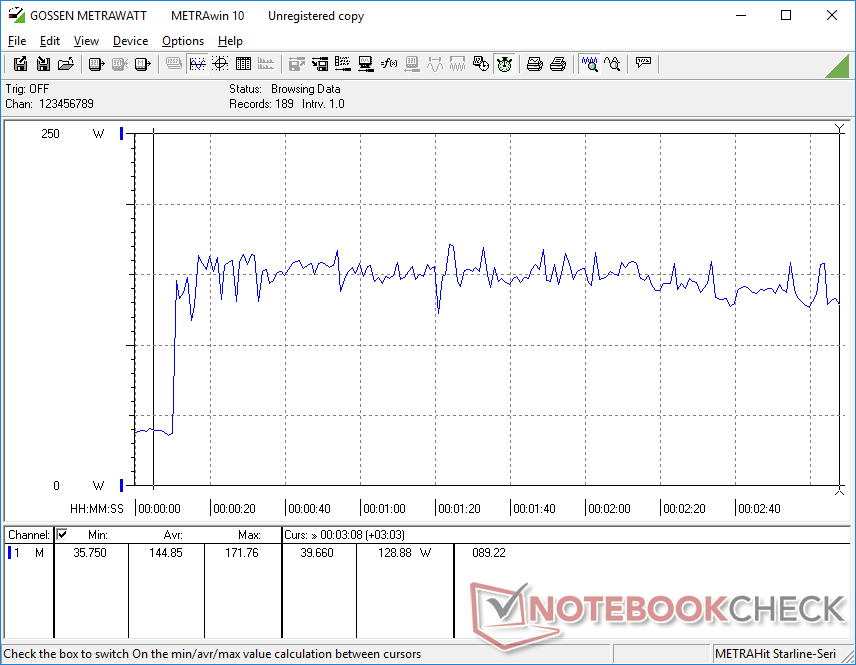
Ejecutar cargas extremas (Prime95+FurMark) haría que el consumo de energía se disparara hasta 172 W desde el adaptador de CA de 200 W de tamaño medio (~15,2 x 7,2 x 2,4 cm). El sistema continuará recargándose incluso cuando se ejecuten cargas elevadas, aunque a un ritmo más lento
Pasar del brillo mínimo al máximo consumiría unos 11 W más comparado con la mitad de la mayoría de Ultrabooks debido al panel extra-brillante de nuestro HP.
| Off / Standby | |
| Ocioso | |
| Carga |
|
Clave:
min: | |
| HP ZBook Fury 15 G8 i9-11950H, RTX A5000 Laptop GPU, Samsung PM981a MZVLB1T0HBLR, IPS, 3840x2160, 15.6" | HP ZBook Fury 15 G7 W-10885M, Quadro RTX 5000 Max-Q, Samsung PM981a MZVLB1T0HBLR, IPS, 3840x2160, 15.6" | Dell Precision 5000 5560 i7-11850H, RTX A2000 Laptop GPU, Samsung PM9A1 MZVL22T0HBLB, IPS, 3840x2400, 15.6" | HP ZBook Studio 15 G8 i9-11950H, GeForce RTX 3070 Laptop GPU, Samsung PM981a MZVLB2T0HALB, OLED, 3840x2160, 15.6" | Lenovo ThinkPad P15s Gen2-20W6000GGE i7-1165G7, T500 Laptop GPU, WDC PC SN720 SDAQNTW-1T00, IPS LED, 3840x2160, 15.6" | HP ZBook Firefly 15 G7 i7-10610U, Quadro P520, Toshiba XG6 KXG60ZNV1T02, IPS LED, 3840x2160, 15.6" | |
|---|---|---|---|---|---|---|
| Power Consumption | 11% | 22% | -10% | 49% | 59% | |
| Idle Minimum * (Watt) | 8.3 | 4.6 45% | 6.2 25% | 11 -33% | 5.8 30% | 3.5 58% |
| Idle Average * (Watt) | 19.9 | 13.6 32% | 13.9 30% | 18.8 6% | 13.3 33% | 6.7 66% |
| Idle Maximum * (Watt) | 21.8 | 21.5 1% | 23.8 -9% | 31.7 -45% | 15.6 28% | 9.6 56% |
| Load Average * (Watt) | 110.9 | 113.1 -2% | 95.7 14% | 105.2 5% | 43.2 61% | 60 46% |
| Witcher 3 ultra * (Watt) | 165 | 157.5 5% | 87 47% | 148 10% | 37.1 78% | 49.3 70% |
| Load Maximum * (Watt) | 171.8 | 199 -16% | 132.6 23% | 171.8 -0% | 67.3 61% | 68.6 60% |
* ... más pequeño es mejor
Power Consumption Witcher 3 / Stresstest
Duración de la batería
La duración de la WLAN es un par de horas más corta en el Fury 15 G8 en comparación con el Fury 15 G7, incluso cuando se establece el mismo perfil equilibrado, el brillo de la pantalla y la configuración de los gráficos integrados. Sospechamos que la mayor tasa de refresco nativa o la posible actividad automática en segundo plano pueden haber sido en parte responsables de la notablemente menor duración de la batería.
La carga desde el vacío hasta la capacidad total tarda unos 90 minutos. La mayoría de cargadores USB-C funcionarán también en el sistema siempre que la potencia sea lo bastante alta.
| HP ZBook Fury 15 G8 i9-11950H, RTX A5000 Laptop GPU, 94 Wh | HP ZBook Fury 15 G7 W-10885M, Quadro RTX 5000 Max-Q, 94 Wh | Dell Precision 5000 5560 i7-11850H, RTX A2000 Laptop GPU, 86 Wh | HP ZBook Studio 15 G8 i9-11950H, GeForce RTX 3070 Laptop GPU, 83 Wh | Lenovo ThinkPad P15s Gen2-20W6000GGE i7-1165G7, T500 Laptop GPU, 57 Wh | HP ZBook Firefly 15 G7 i7-10610U, Quadro P520, 53 Wh | |
|---|---|---|---|---|---|---|
| Duración de Batería | 39% | 2% | 0% | 24% | 47% | |
| WiFi v1.3 (h) | 6.2 | 8.6 39% | 6.3 2% | 6.2 0% | 7.7 24% | 9.1 47% |
| Reader / Idle (h) | 13.2 | 12 | 12.9 | |||
| Load (h) | 1.3 | 1.8 | 1.8 | 1.9 | 2 |
Pro
Contra
Veredicto - Actuación furiosa
El ZBook Fury 15 G8 exprime más rendimiento del mismo chasis Fury 15 G7 que ya conocemos. Los usuarios verán ganancias entre marginales y moderadas tanto de la CPU como de la GPU de última generación, manteniendo el mismo adaptador de CA y las mismas características físicas. No sería realista esperar un rediseño completo del Fury 15 G8 cuando el salto del Fury 15 G6 al Fury 15 G7 ya fue tan significativo para la serie. Los usuarios avanzados pueden considerar el Fury 15 G8 si las ganancias de rendimiento son relevantes para sus cargas de trabajo. Si no, el Fury 15 G7 puede ofrecer esencialmente la misma experiencia por menos.
La nueva opción de panel 4K de 120 Hz merece elogios, tal vez incluso más que las mejoras de procesador, ya que el movimiento más suave y la reducción de las imágenes fantasma son mucho más notables. Este es definitivamente un panel que nos encantaría ver en más portátiles fuera de la serie ZBook.
La serie Fury 15 en general sigue siendo una excelente alternativa a las estaciones de trabajo como el MSI WS66, Razer Blade Studio, ZBook Fireflyo Lenovo ThinkPad P1 que sacrifican características y opciones sólo por el aspecto más delgado y elegante.
Precio y disponibilidad
El ZBook Fury 15 G8 no está ampliamente disponible a través de los minoristas de terceros a partir de este escrito. Se puede encontrar al menos un SKU en Walmartpero los usuarios deberían comprar directamente a HP para obtener más opciones de configuración.
HP ZBook Fury 15 G8
- 10/13/2021 v7 (old)
Allen Ngo
Price comparison

