Análisis de la estación de trabajo Dell Precision 5560: El impulso de la Quadro RTX A2000

El Dell Precision 5560 es una actualización interna del Precision 5550 del año pasado. Ambos modelos se basan en el nuevo XPS 15 9500/9510 y, por tanto, todos los modelos llevan paneles 16:10 y otras características físicas similares. Por ello, recomendamos consultar nuestros análisis sobre el Precision 5550, XPS 15 9500o el XPS 15 9510 ya que muchos de nuestros comentarios siguen siendo válidos para el Precision 5560
En comparación con el Precision 5550, el Precision 5560 viene con CPUs de 11ª generación Tiger Lake-H y GPUs Nvidia Ampere para reemplazar las antiguas CPUs de 10ª generación Comet Lake-H y GPUs Turing, respectivamente. Las referencias van desde el Core i5-11500H básico con gráficos Quadro T1200, pantalla de 1200p y 8 GB de RAM por 2000 dólares hasta la CPU i9-11950H o Xeon W-11955M vPro con gráficos Quadro RTX A2000, pantalla táctil de 2400p y 64 GB de RAM ECC por más de 4000 dólares. Nuestra unidad de prueba específica es una configuración de gama media que se vende por poco más de 3.000 dólares
Los competidores en este espacio incluyen otras estaciones de trabajo móviles de 15,6 pulgadas como el HP ZBook Studio 15 G8,Asus ProArt StudioBook Pro 15,Lenovo ThinkPad P15 Gen 2, MSI WS66, oRazer Blade 15 Studio Edition. Existe una versión de 17 pulgadas de nuestro modelo llamada Precision 5750 basada en el XPS 17.
Más opiniones de Dell:
potential competitors in comparison
Valoración | Fecha | Modelo | Peso | Altura | Tamaño | Resolución | Precio |
|---|---|---|---|---|---|---|---|
| 88.3 % v7 (old) | 10/2021 | Dell Precision 5000 5560 i7-11850H, RTX A2000 Laptop GPU | 2 kg | 18 mm | 15.60" | 3840x2400 | |
| 87.2 % v7 (old) | 10/2021 | Lenovo ThinkPad P15 G2-20YQ001JGE i7-11800H, RTX A3000 Laptop GPU | 2.9 kg | 31.5 mm | 15.60" | 1920x1080 | |
| 87.8 % v7 (old) | 08/2021 | HP ZBook Studio 15 G8 i9-11950H, GeForce RTX 3070 Laptop GPU | 1.9 kg | 18 mm | 15.60" | 3840x2160 | |
| 83.1 % v7 (old) | 11/2020 | Asus ProArt StudioBook Pro 15 W500G5T i7-9750H, Quadro RTX 5000 Max-Q | 2 kg | 18.9 mm | 15.60" | 3840x2160 | |
| 87.8 % v7 (old) | 08/2020 | Dell Precision 7550 W-10885M, Quadro RTX 5000 Max-Q | 2.8 kg | 27.36 mm | 15.60" | 3840x2160 | |
| 86.3 % v7 (old) | 08/2020 | Dell Precision 5550 P91F i7-10875H, Quadro T2000 Max-Q | 2 kg | 18 mm | 15.60" | 3840x2400 | |
| 87 % v7 (old) | 08/2020 | Razer Blade 15 Studio Edition 2020 i7-10875H, Quadro RTX 5000 Max-Q | 2.2 kg | 13.98 mm | 15.60" | 3840x2160 |
Maletín - XPS profesional
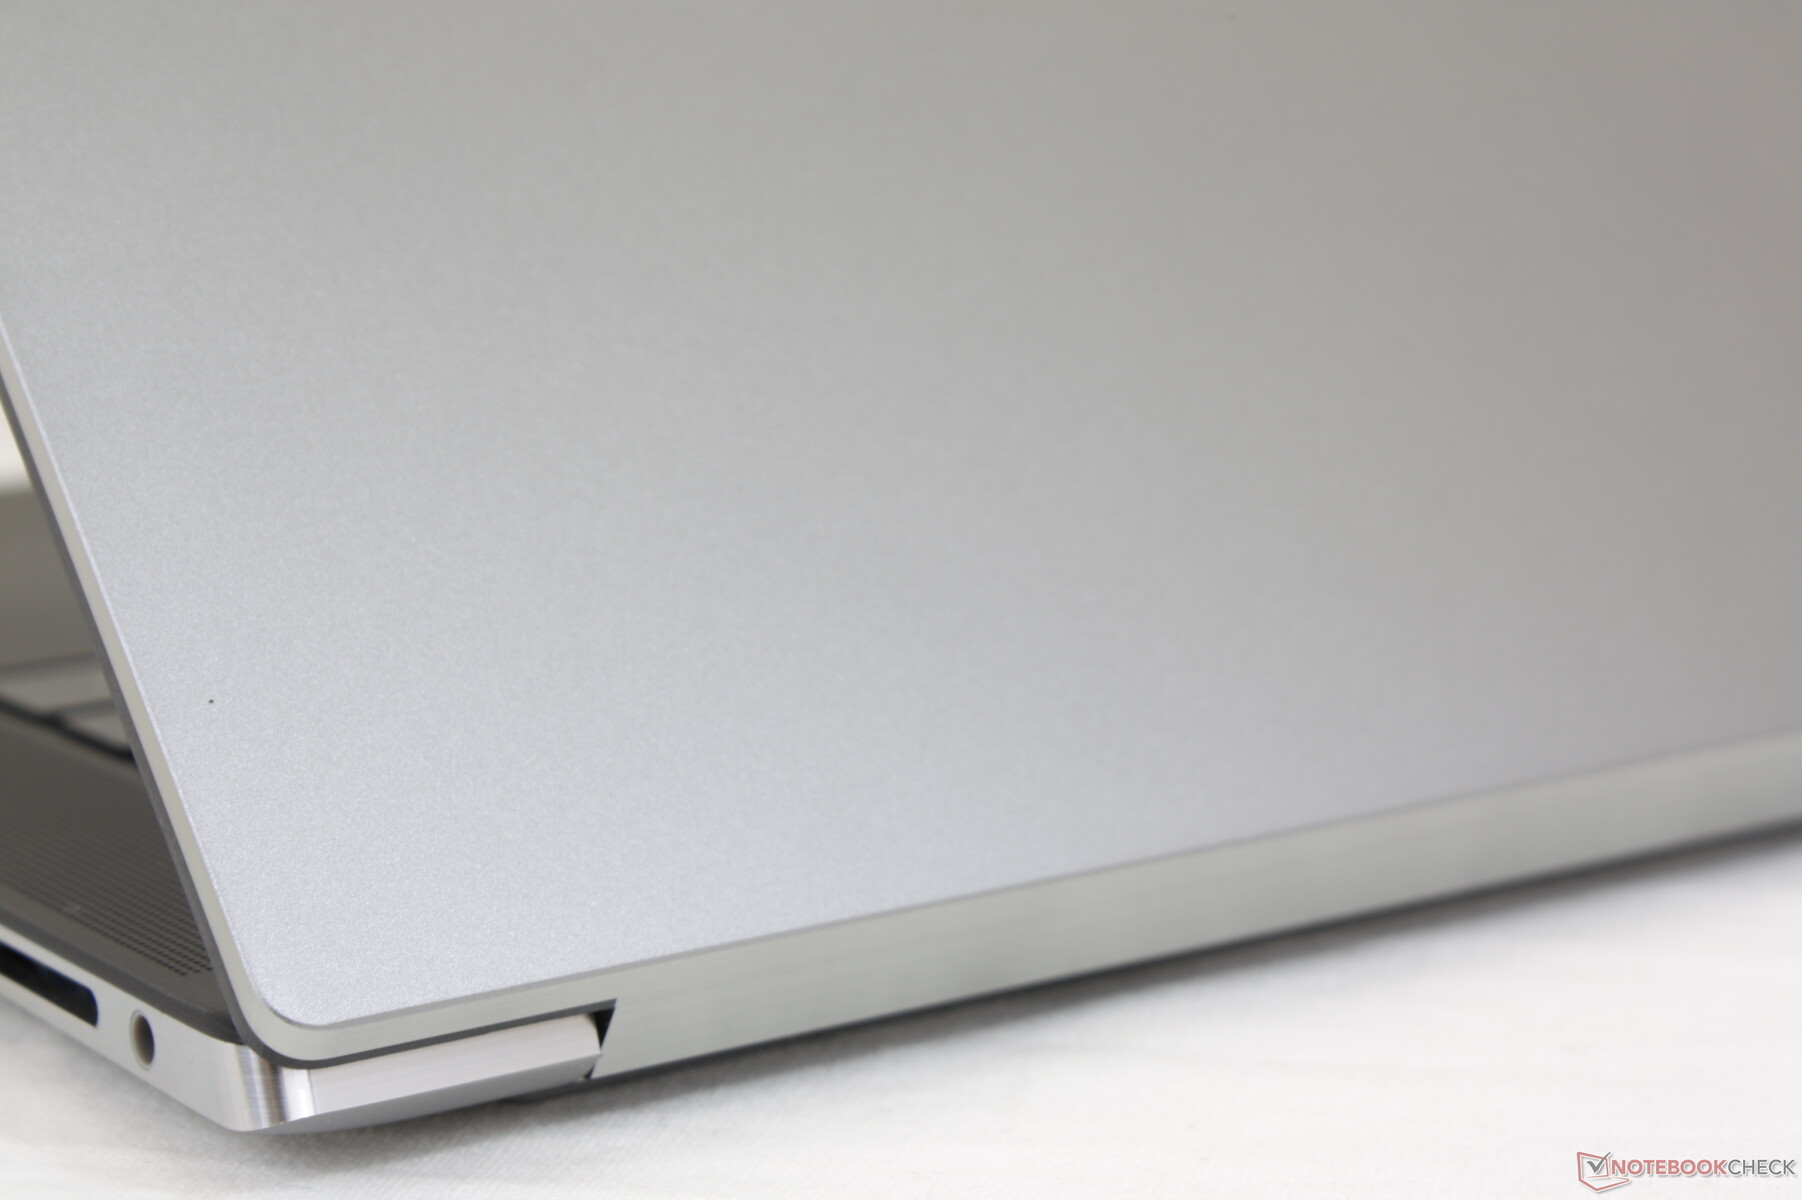
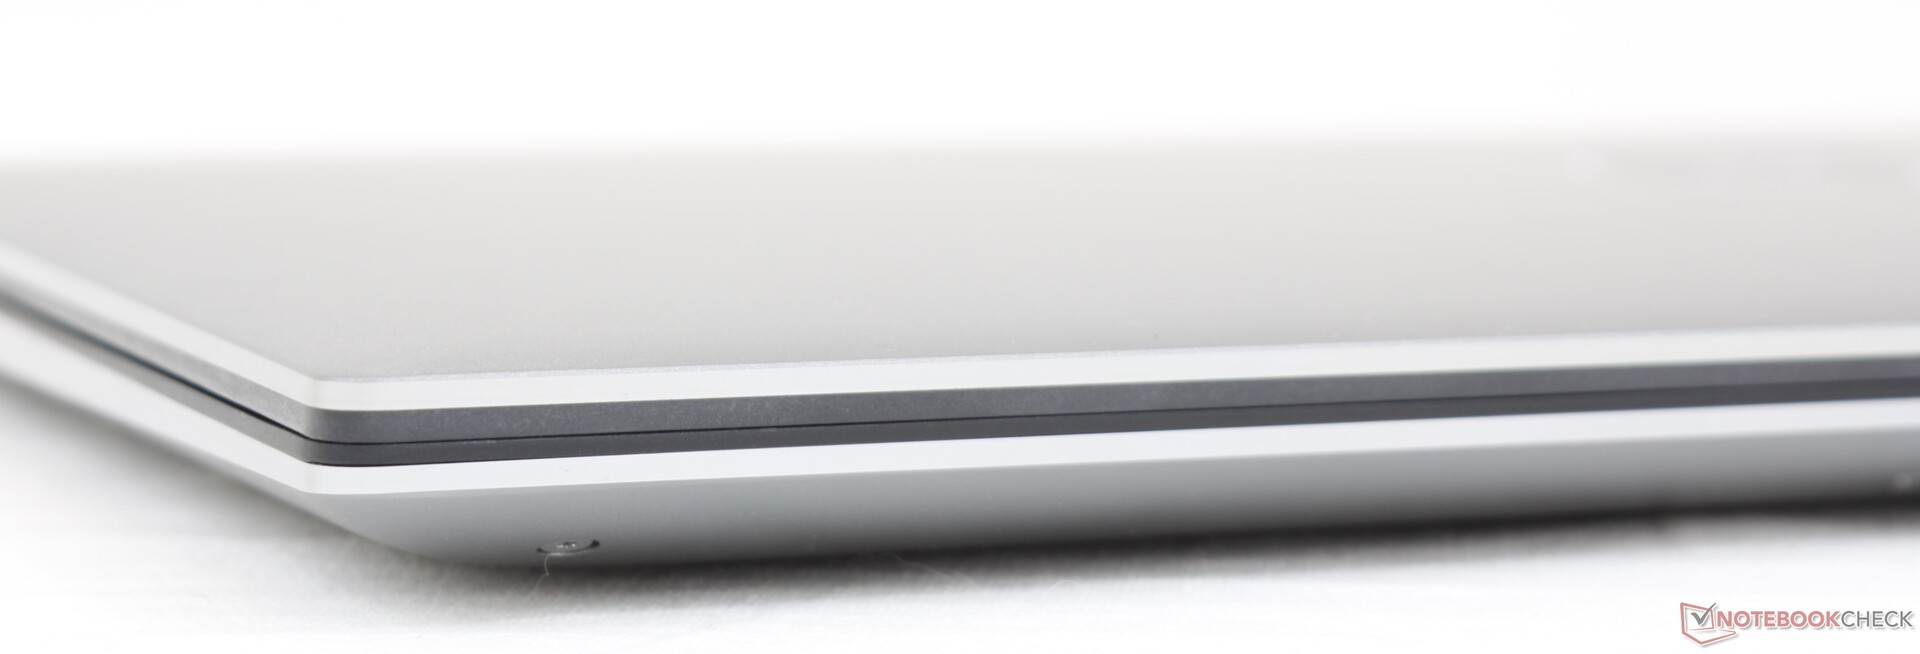
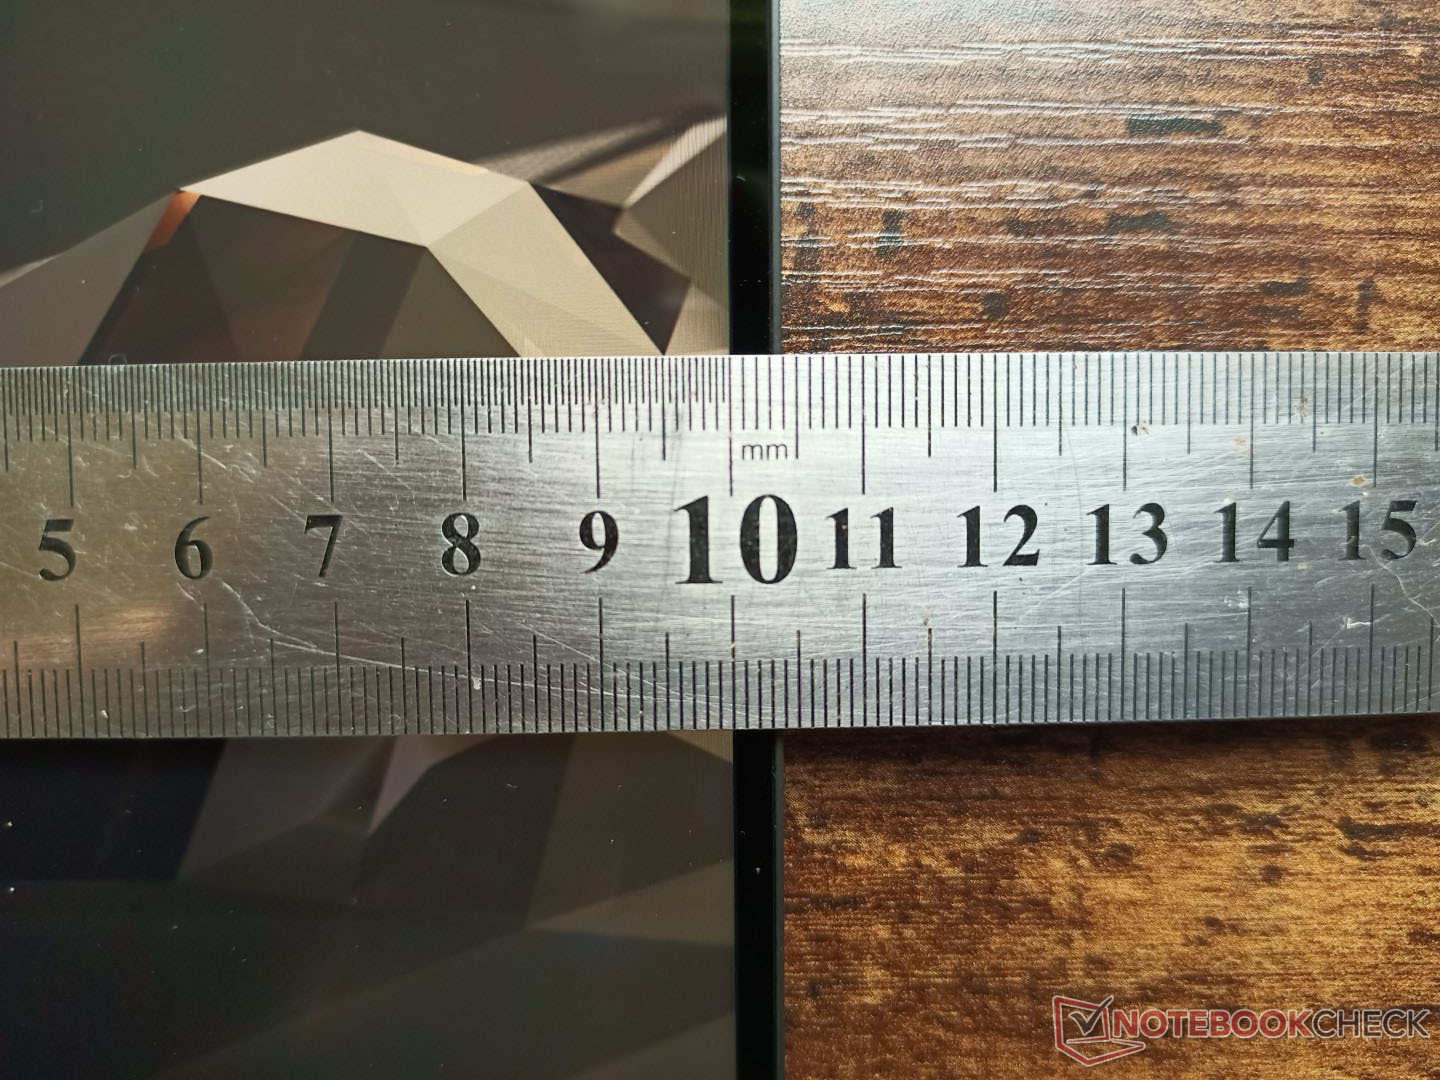
El chasis y las dimensiones son idénticos a los del XPS 15 9500 o 9510 con 18 x 344,72 x 230,14 mm. Sin embargo, la página oficial del producto de Dell afirma que el Precision 5560 es mucho más delgado con 11,64 mm desde su punto más grueso, lo cual es absolutamente falso. Sospechamos que Dell ha cambiado la forma de medir el grosor, lo que puede ser muy engañoso para los consumidores. Observamos una discrepancia de grosor similar
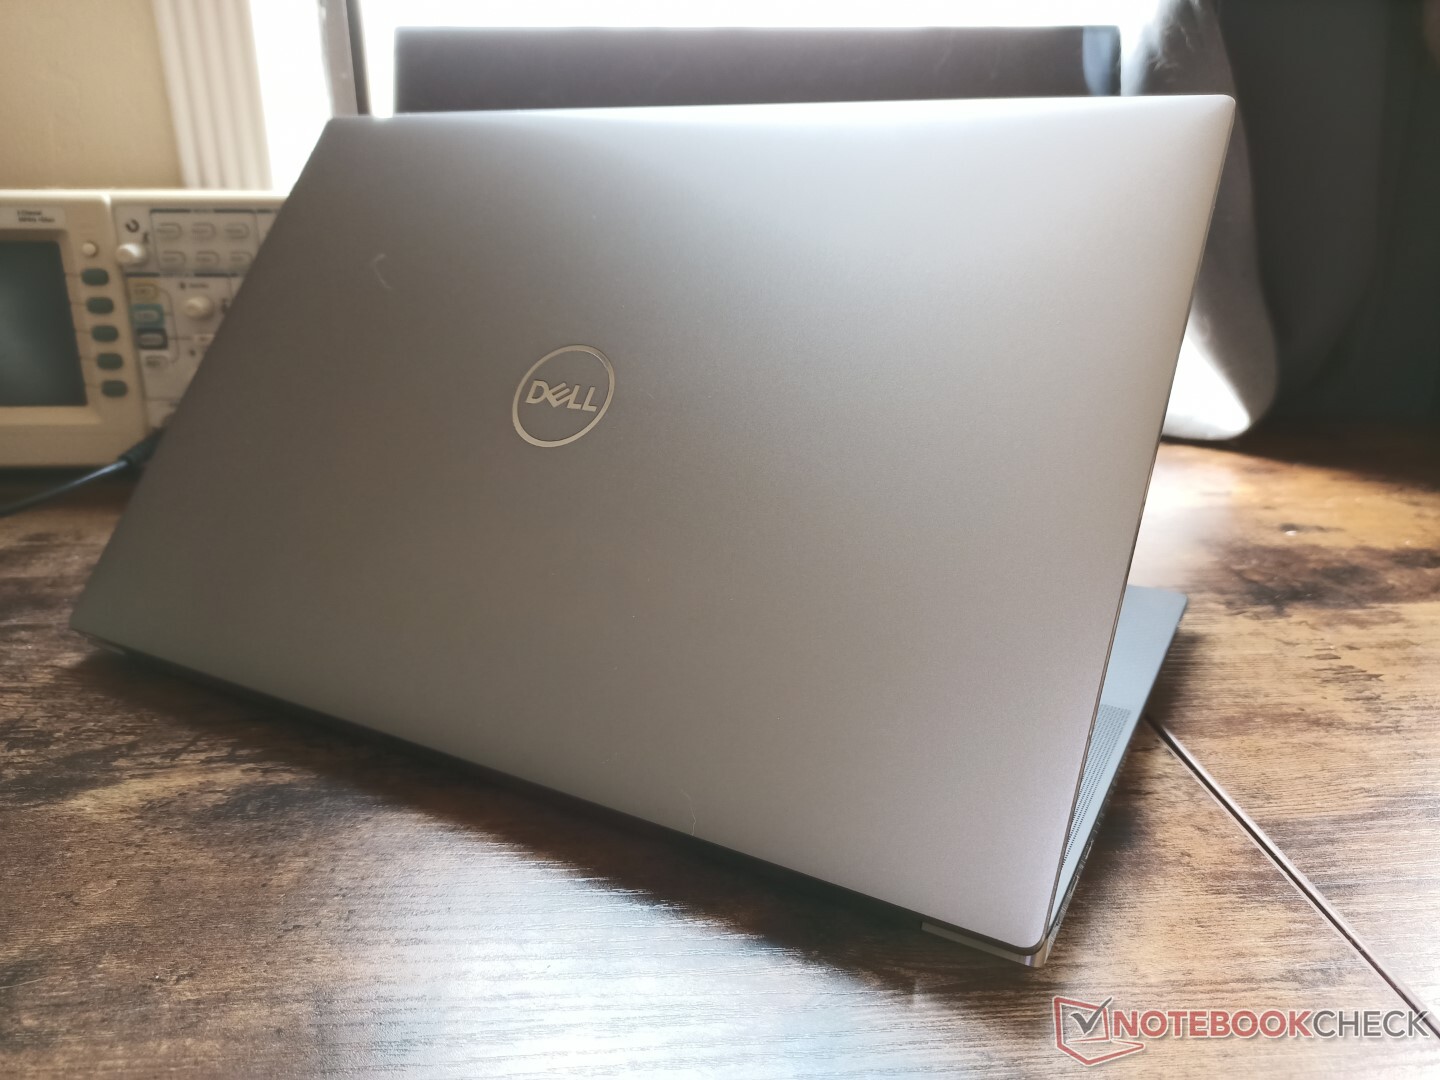
entre el idéntico XPS 13 7390 2-en-1 y el XPS 13 9310 2-en-1 también. </span> Como es habitual, la tapa exterior de aleación de magnesio tiene un tono de gris ligeramente más oscuro en comparación con el típico XPS 15 para ayudar a identificar visualmente la serie Precision 55x0 de la serie XPS 15.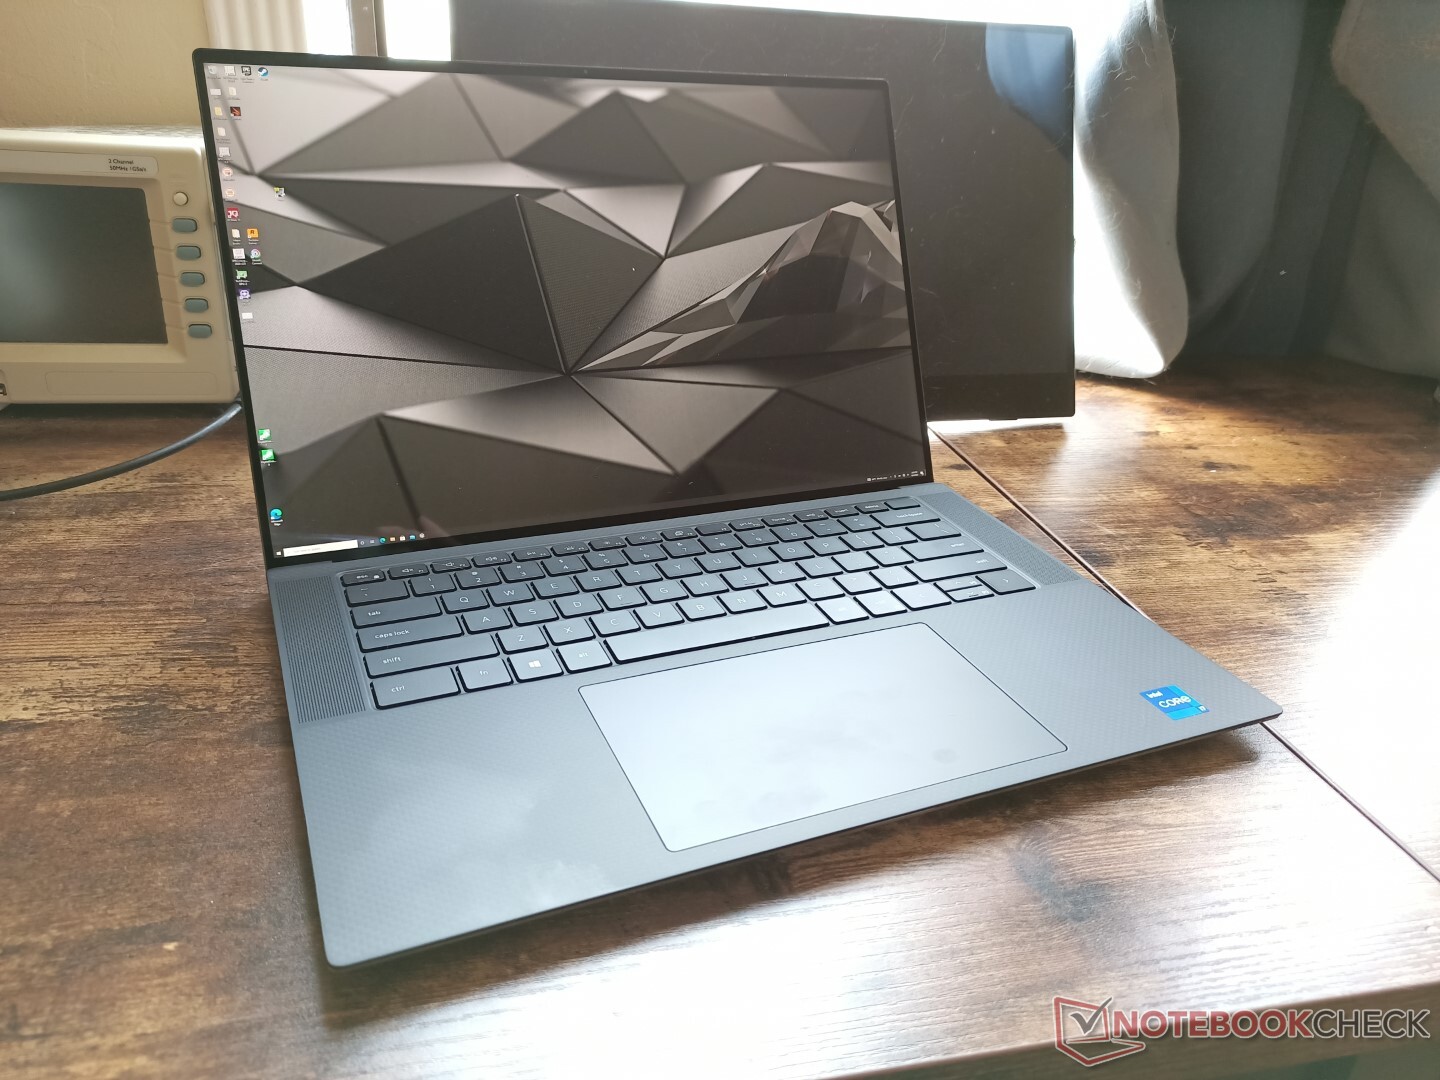
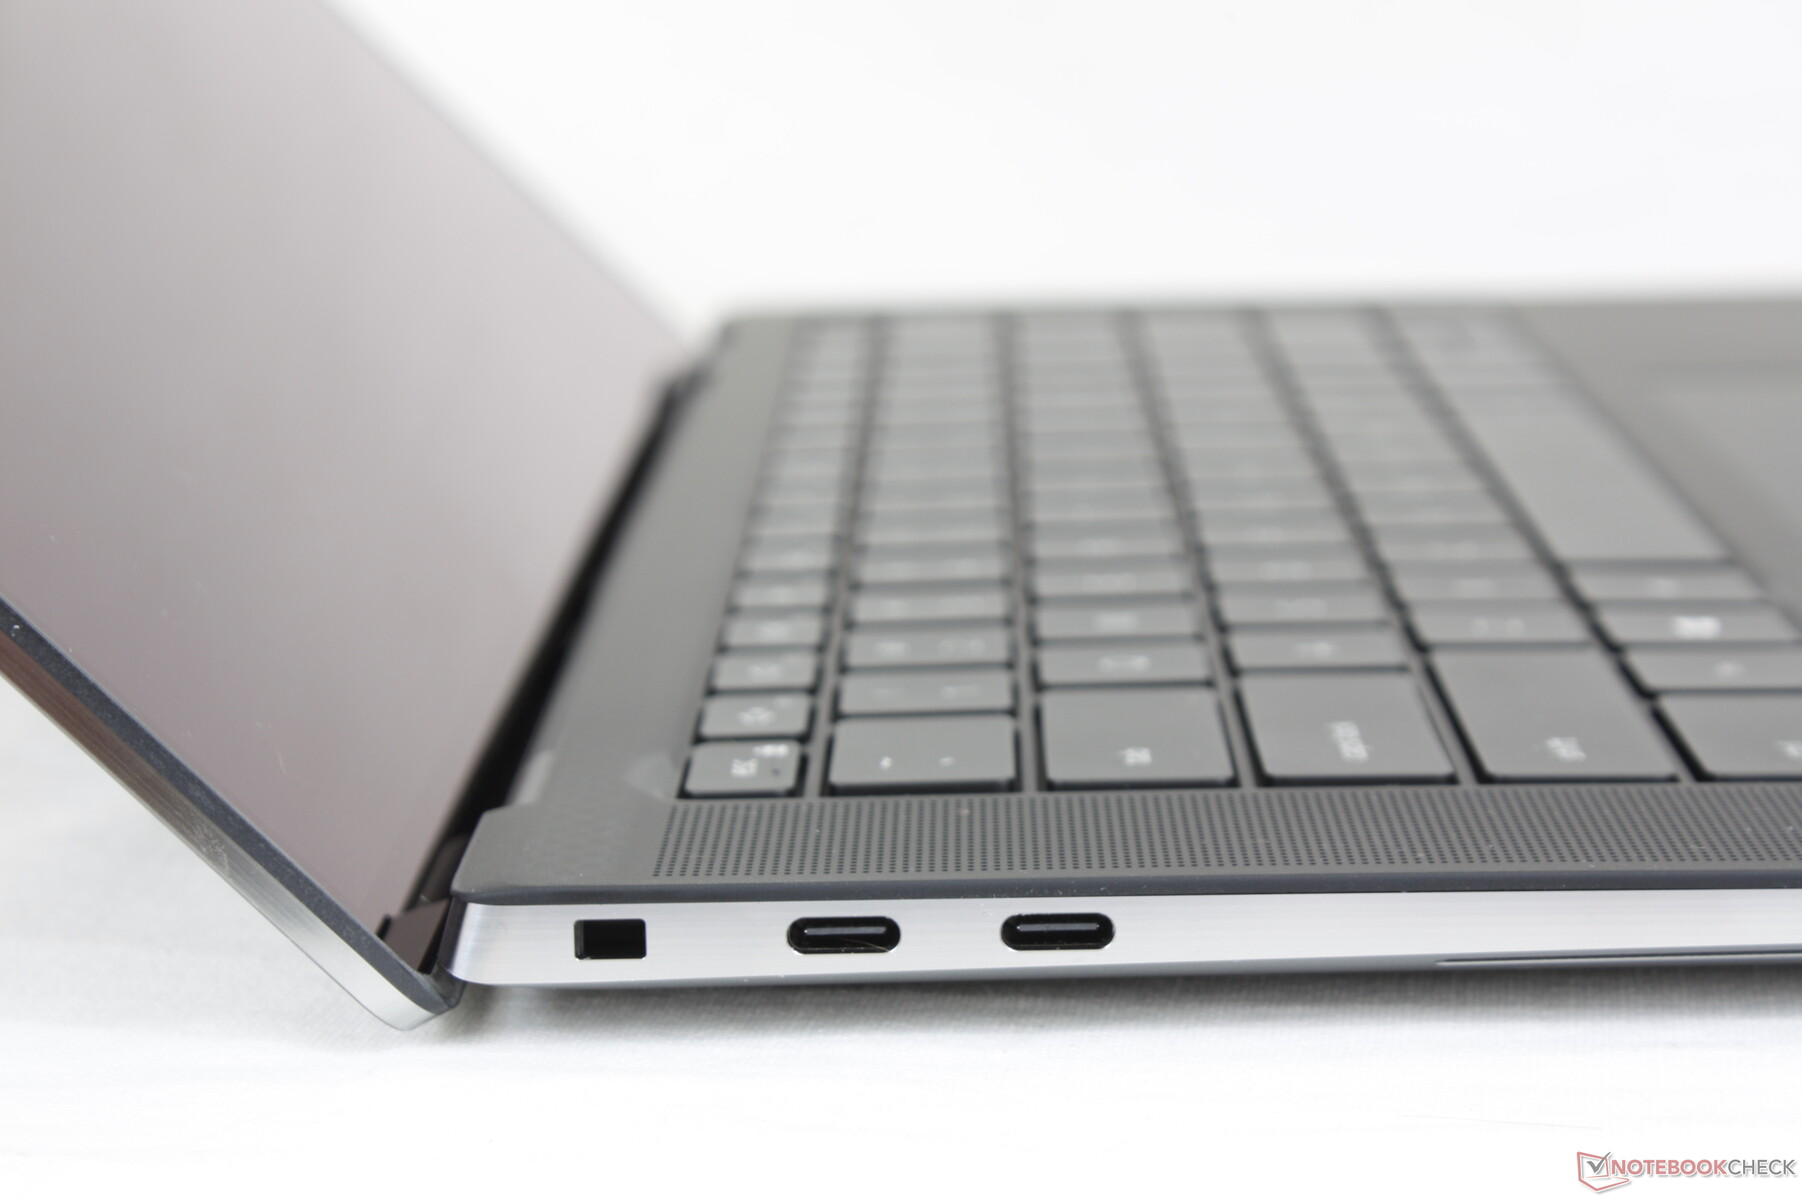
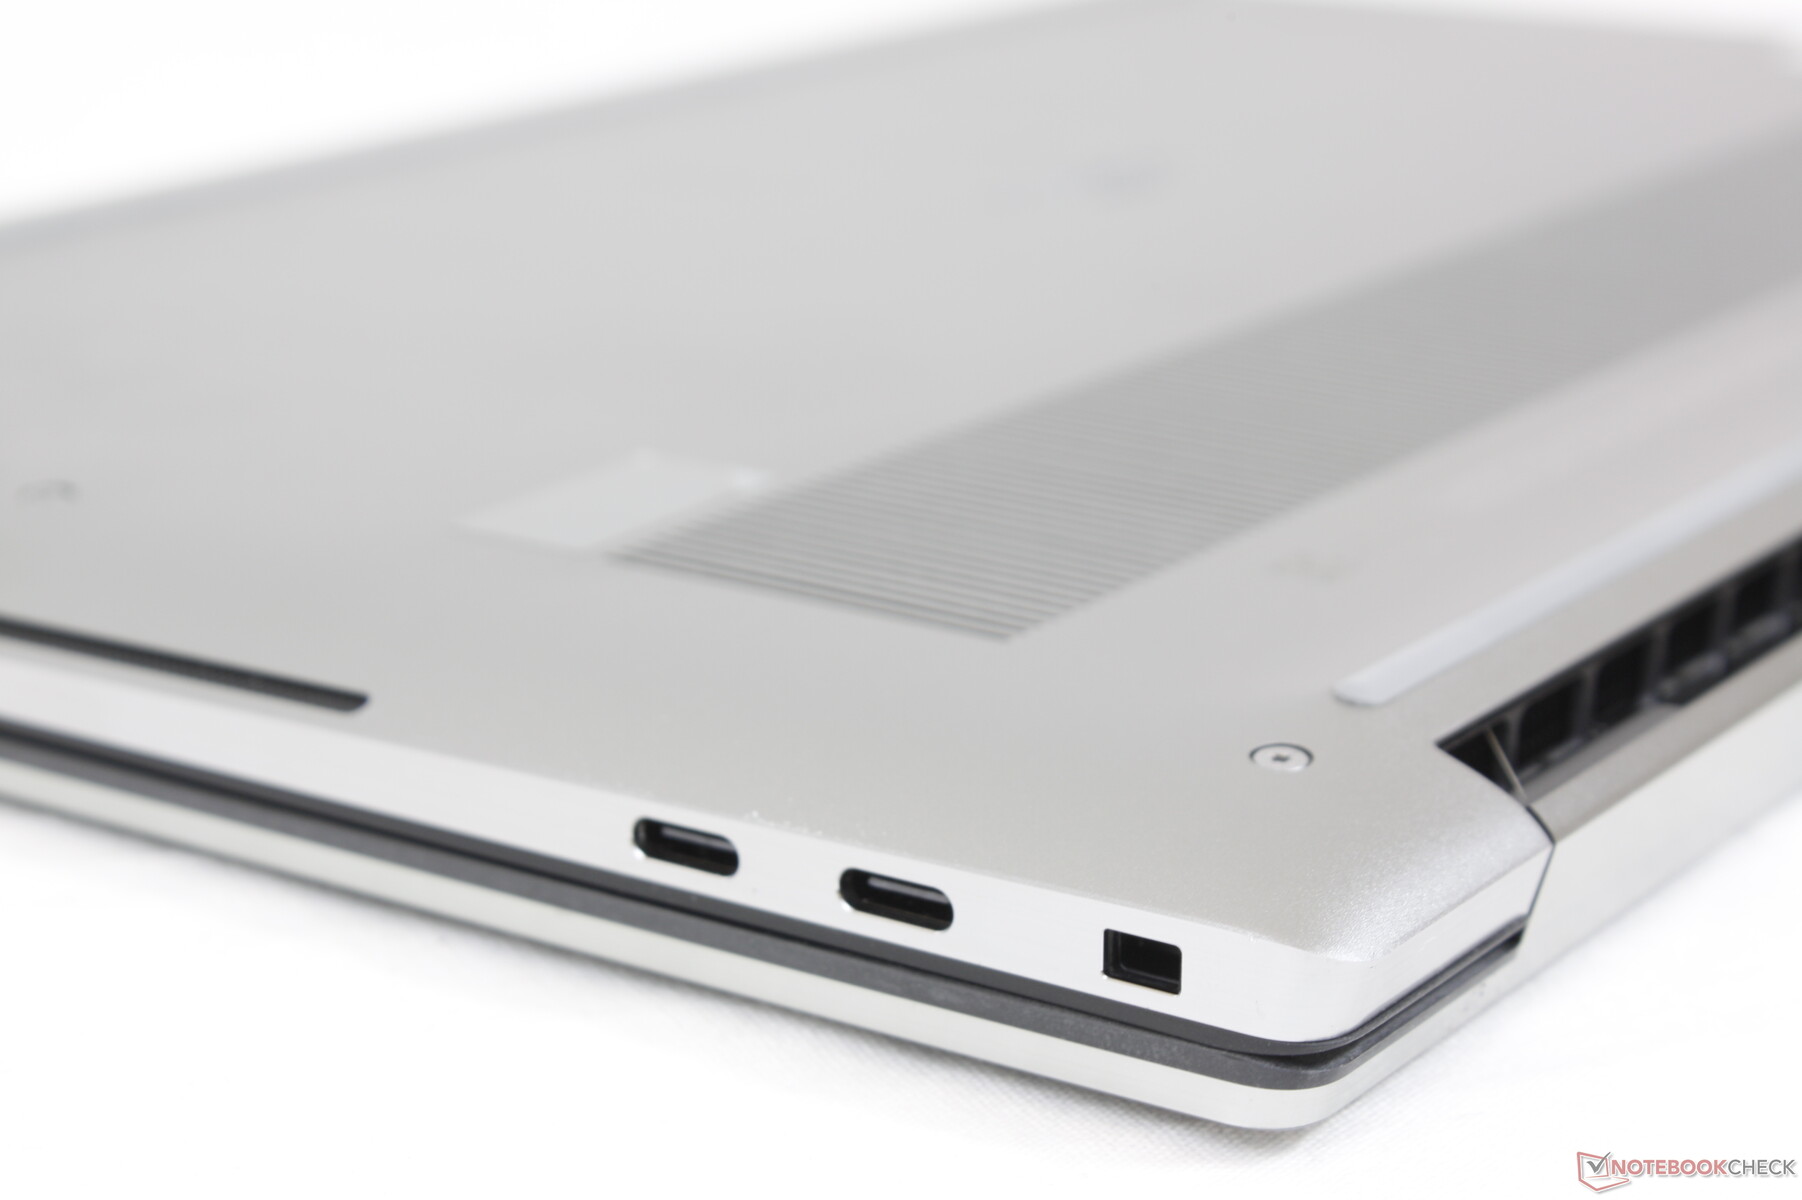
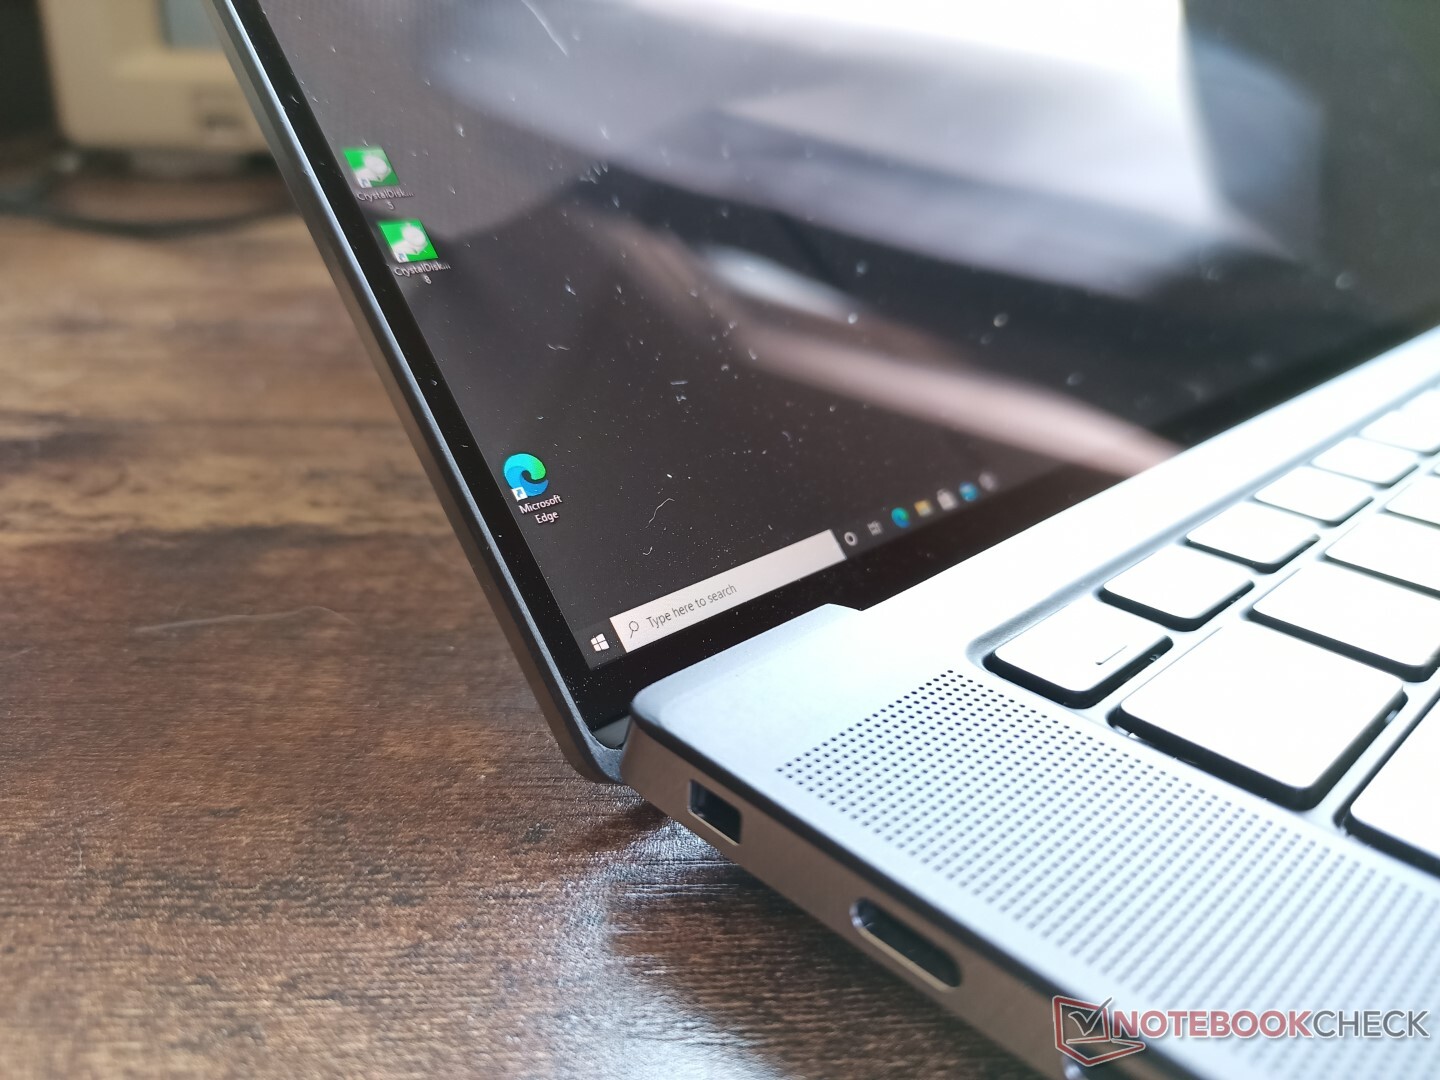
Conectividad - Thunderbolt 4 Ready to Go
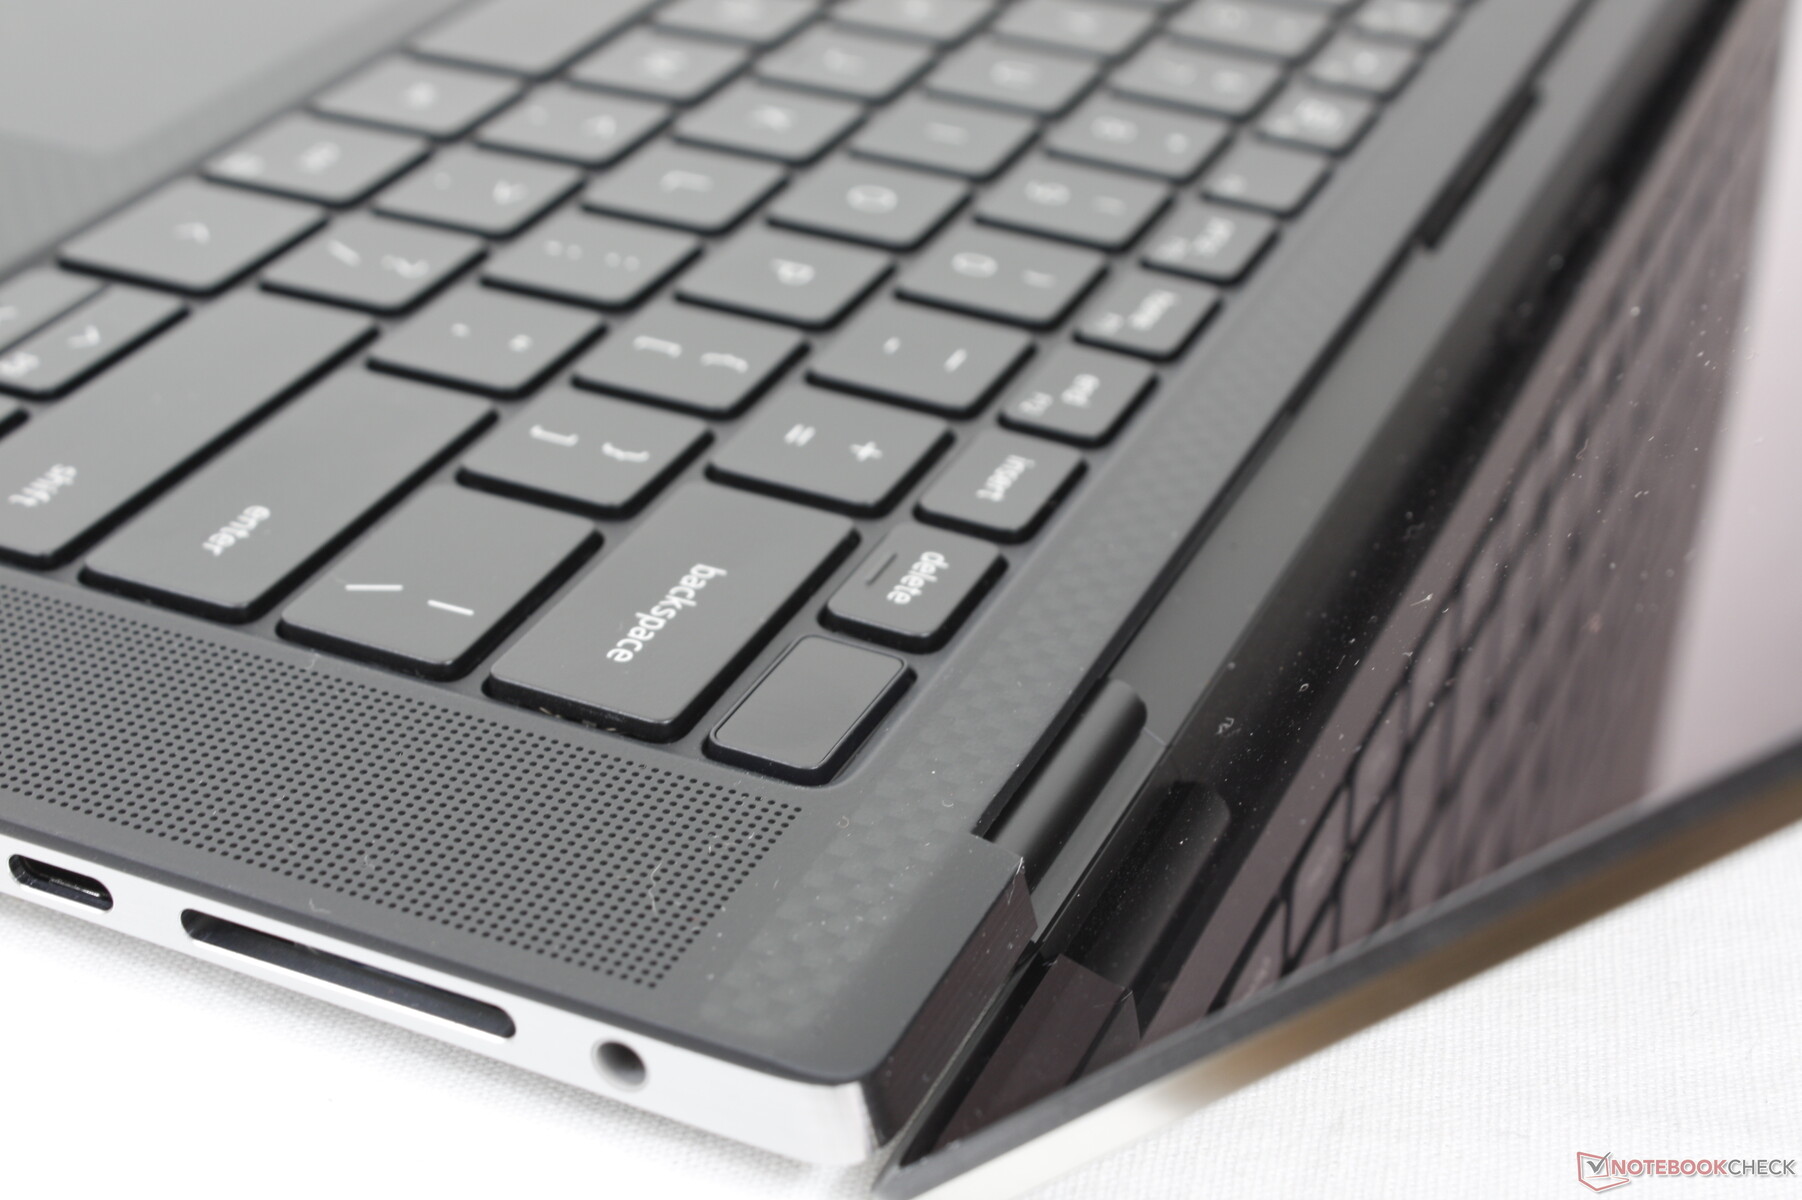
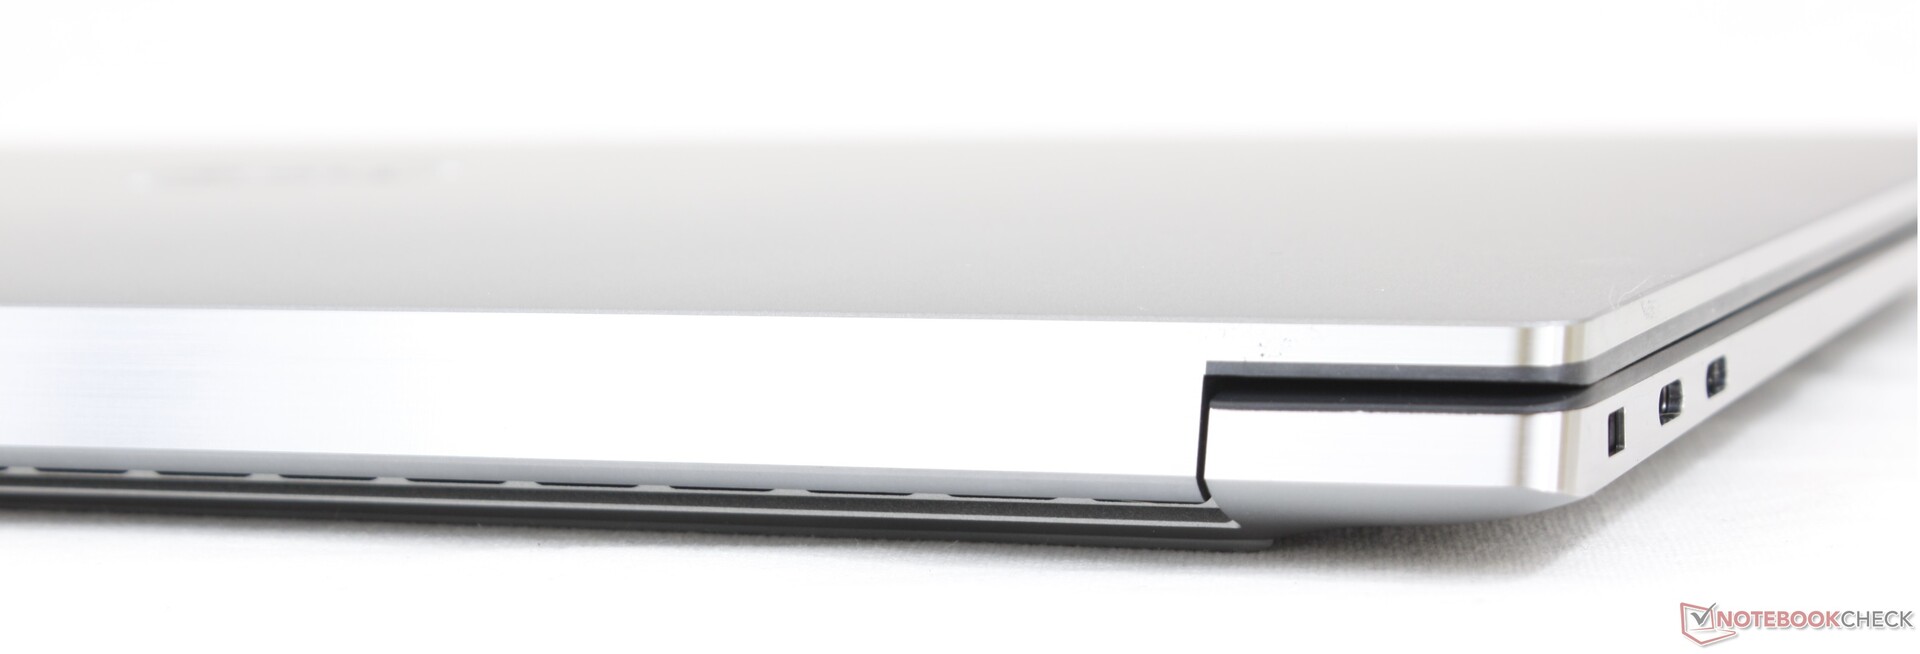
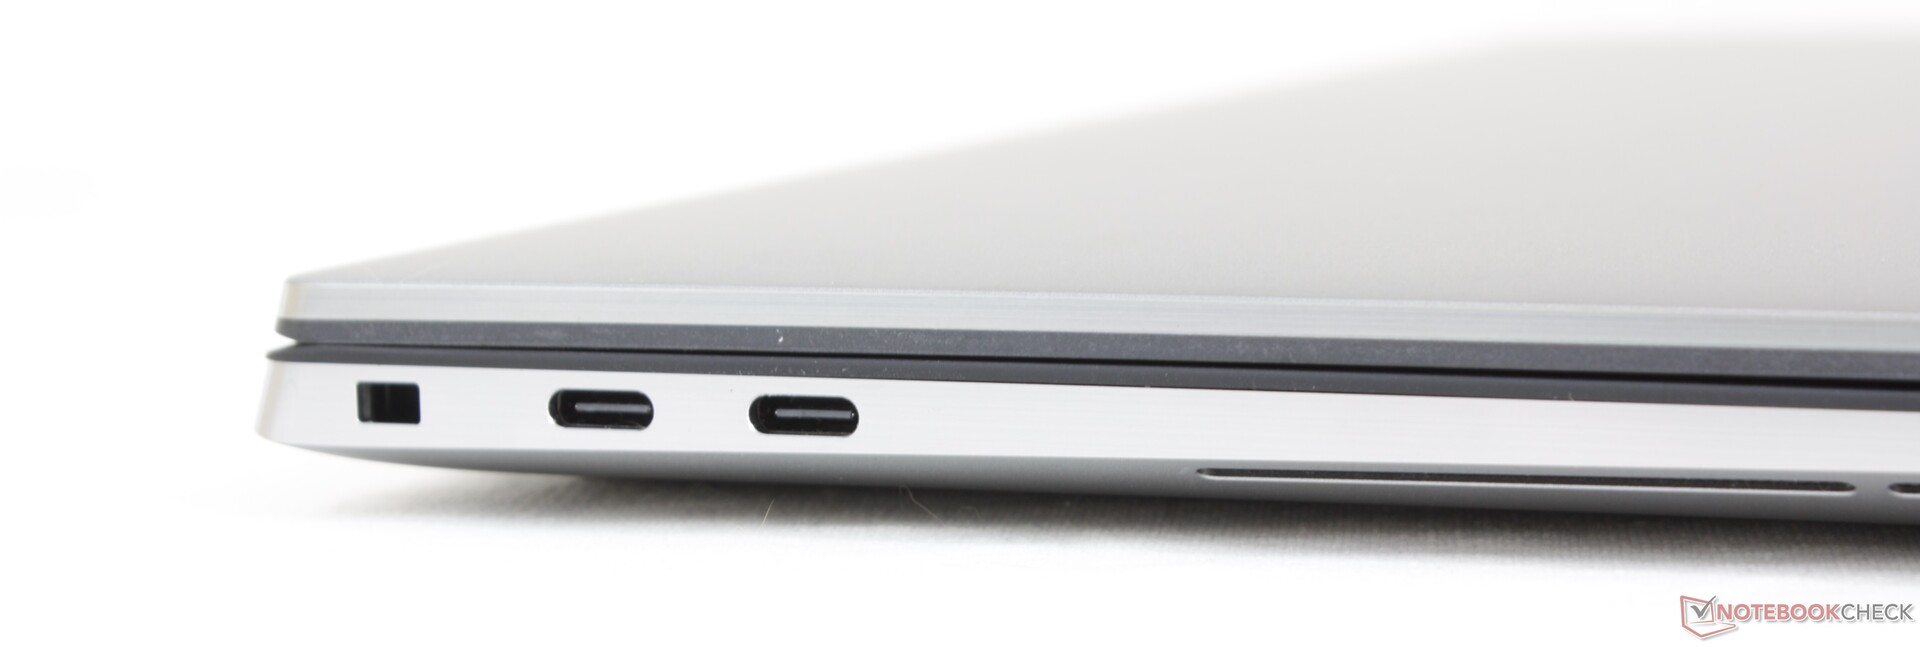
Las opciones de puerto incluyen sólo USB-C, así que prepárate para tener adaptadores allá donde vayas. Los tres puertos USB-C admiten DisplayPort y Power Delivery, pero sólo los dos puertos USB-C de la izquierda admiten dispositivos Thunderbolt. Estos dos puertos en particular han sido actualizados de Thunderbolt 3 en el Precision 5550 a Thunderbolt 4 en el Precision 5560.
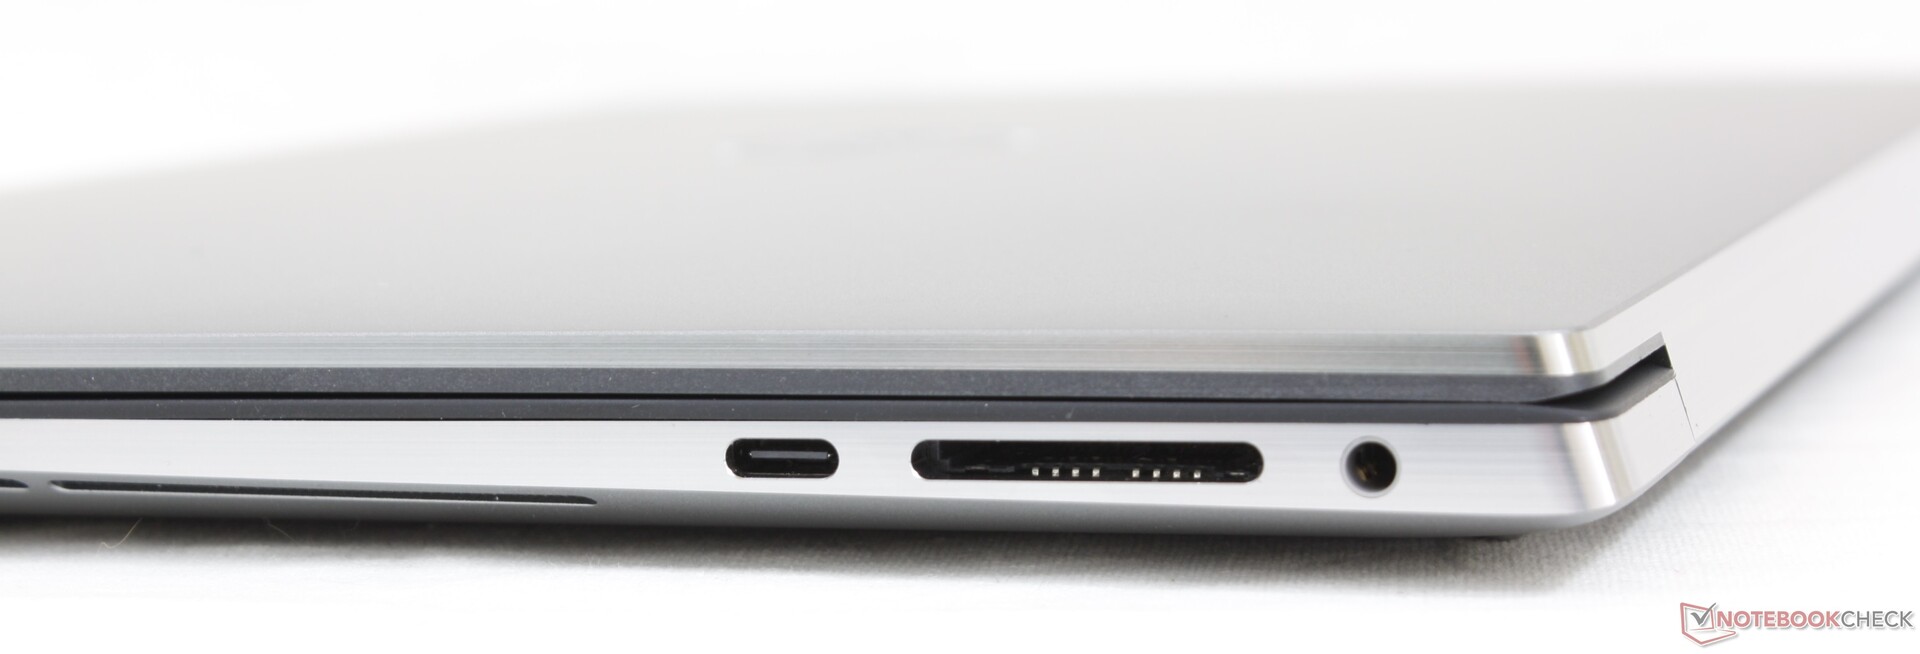
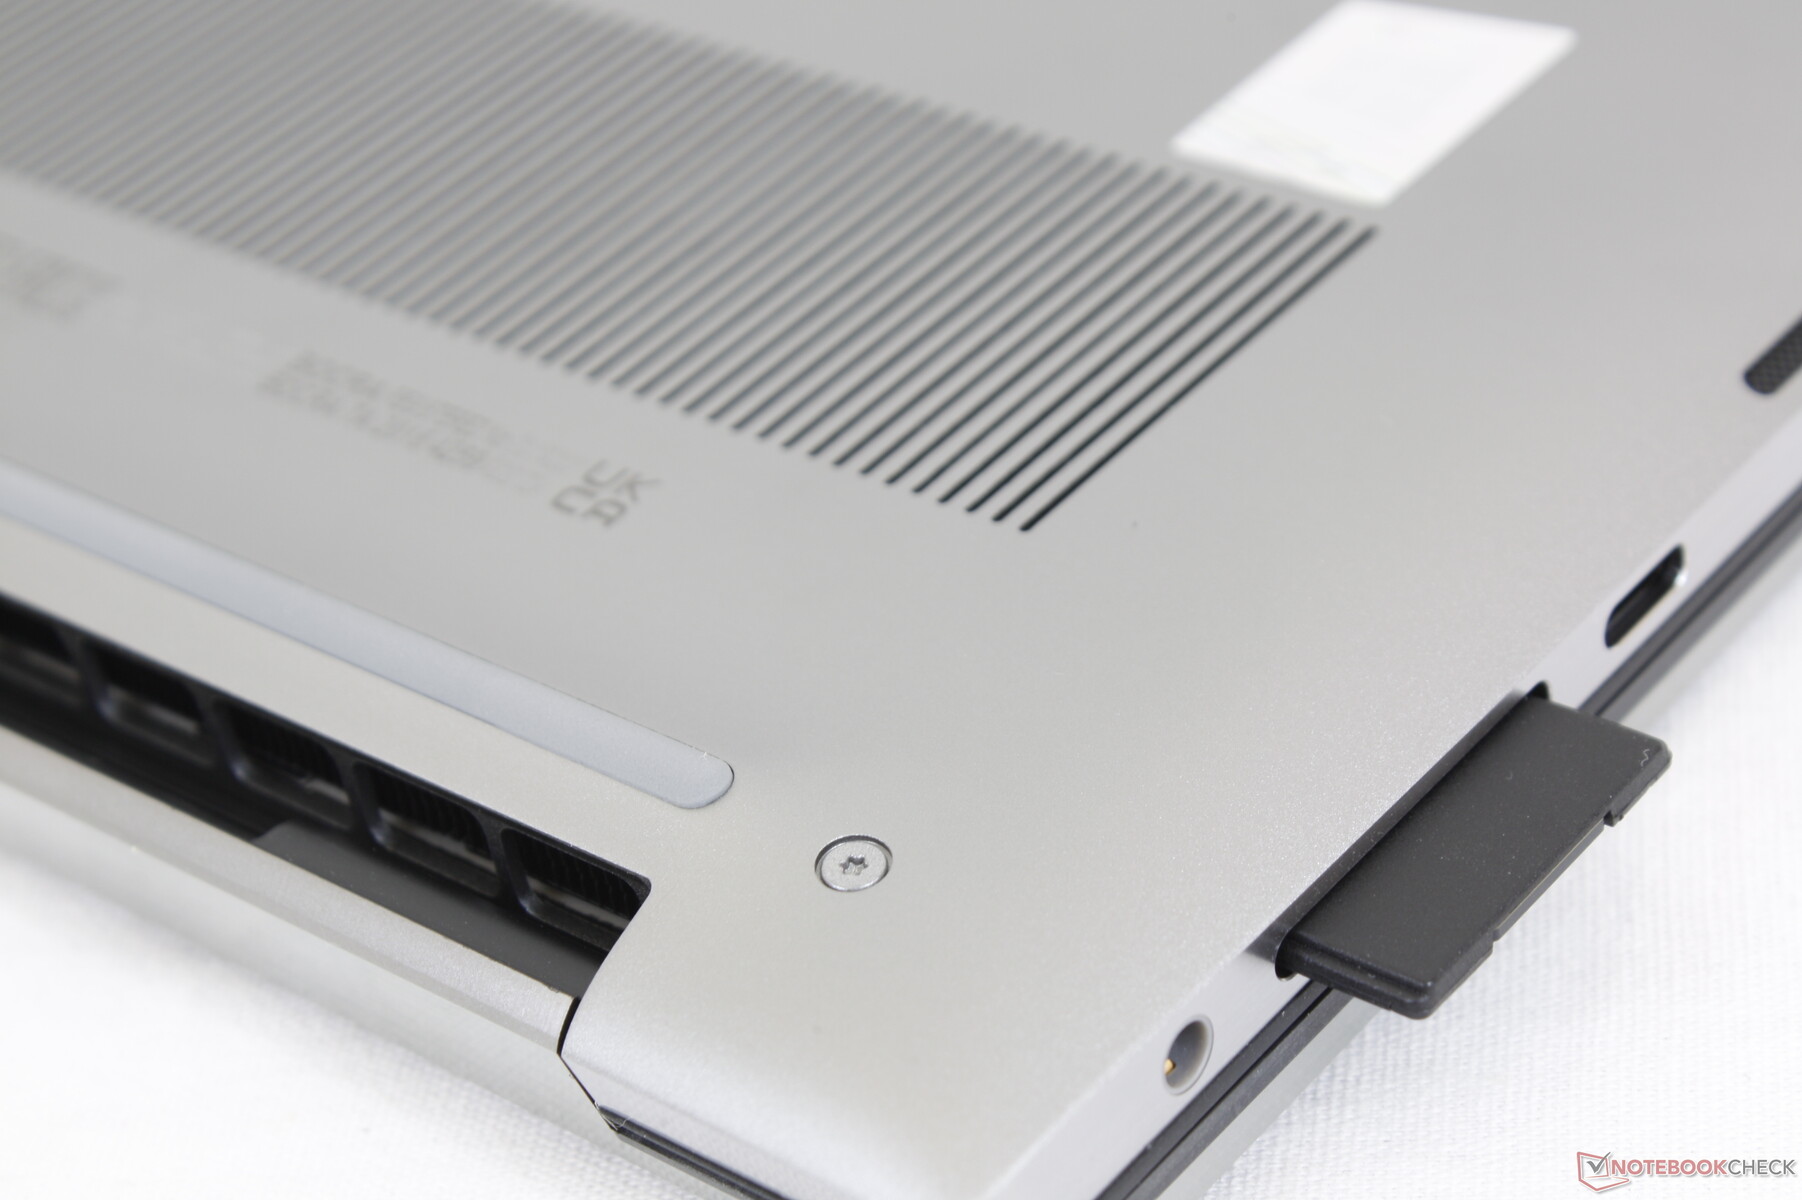
Lector de tarjetas SD
Las velocidades de transferencia son muy rápidas, acercándose a casi 200 MB/s en nuestra tarjeta de prueba UHS-II. La ranura no tiene resorte, por lo que la tarjeta SD sobresale del borde.
| SD Card Reader | |
| average JPG Copy Test (av. of 3 runs) | |
| Lenovo ThinkPad P15 G2-20YQ001JGE (AV Pro V60) | |
| Dell Precision 5000 5560 (AV Pro V60) | |
| Dell Precision 5550 P91F (Toshiba Exceria Pro SDXC 64 GB UHS-II) | |
| Dell Precision 7550 (Toshiba Exceria Pro SDXC 64 GB UHS-II) | |
| Razer Blade 15 Studio Edition 2020 (Toshiba Exceria Pro SDXC 64 GB UHS-II) | |
| HP ZBook Studio 15 G8 (AV Pro V60) | |
| maximum AS SSD Seq Read Test (1GB) | |
| Lenovo ThinkPad P15 G2-20YQ001JGE (AV Pro V60) | |
| Dell Precision 5000 5560 (AV Pro V60) | |
| Dell Precision 5550 P91F (Toshiba Exceria Pro SDXC 64 GB UHS-II) | |
| Dell Precision 7550 (Toshiba Exceria Pro SDXC 64 GB UHS-II) | |
| HP ZBook Studio 15 G8 (AV Pro V60) | |
Comunicación
Webcam - Todavía no hay obturador de privacidad


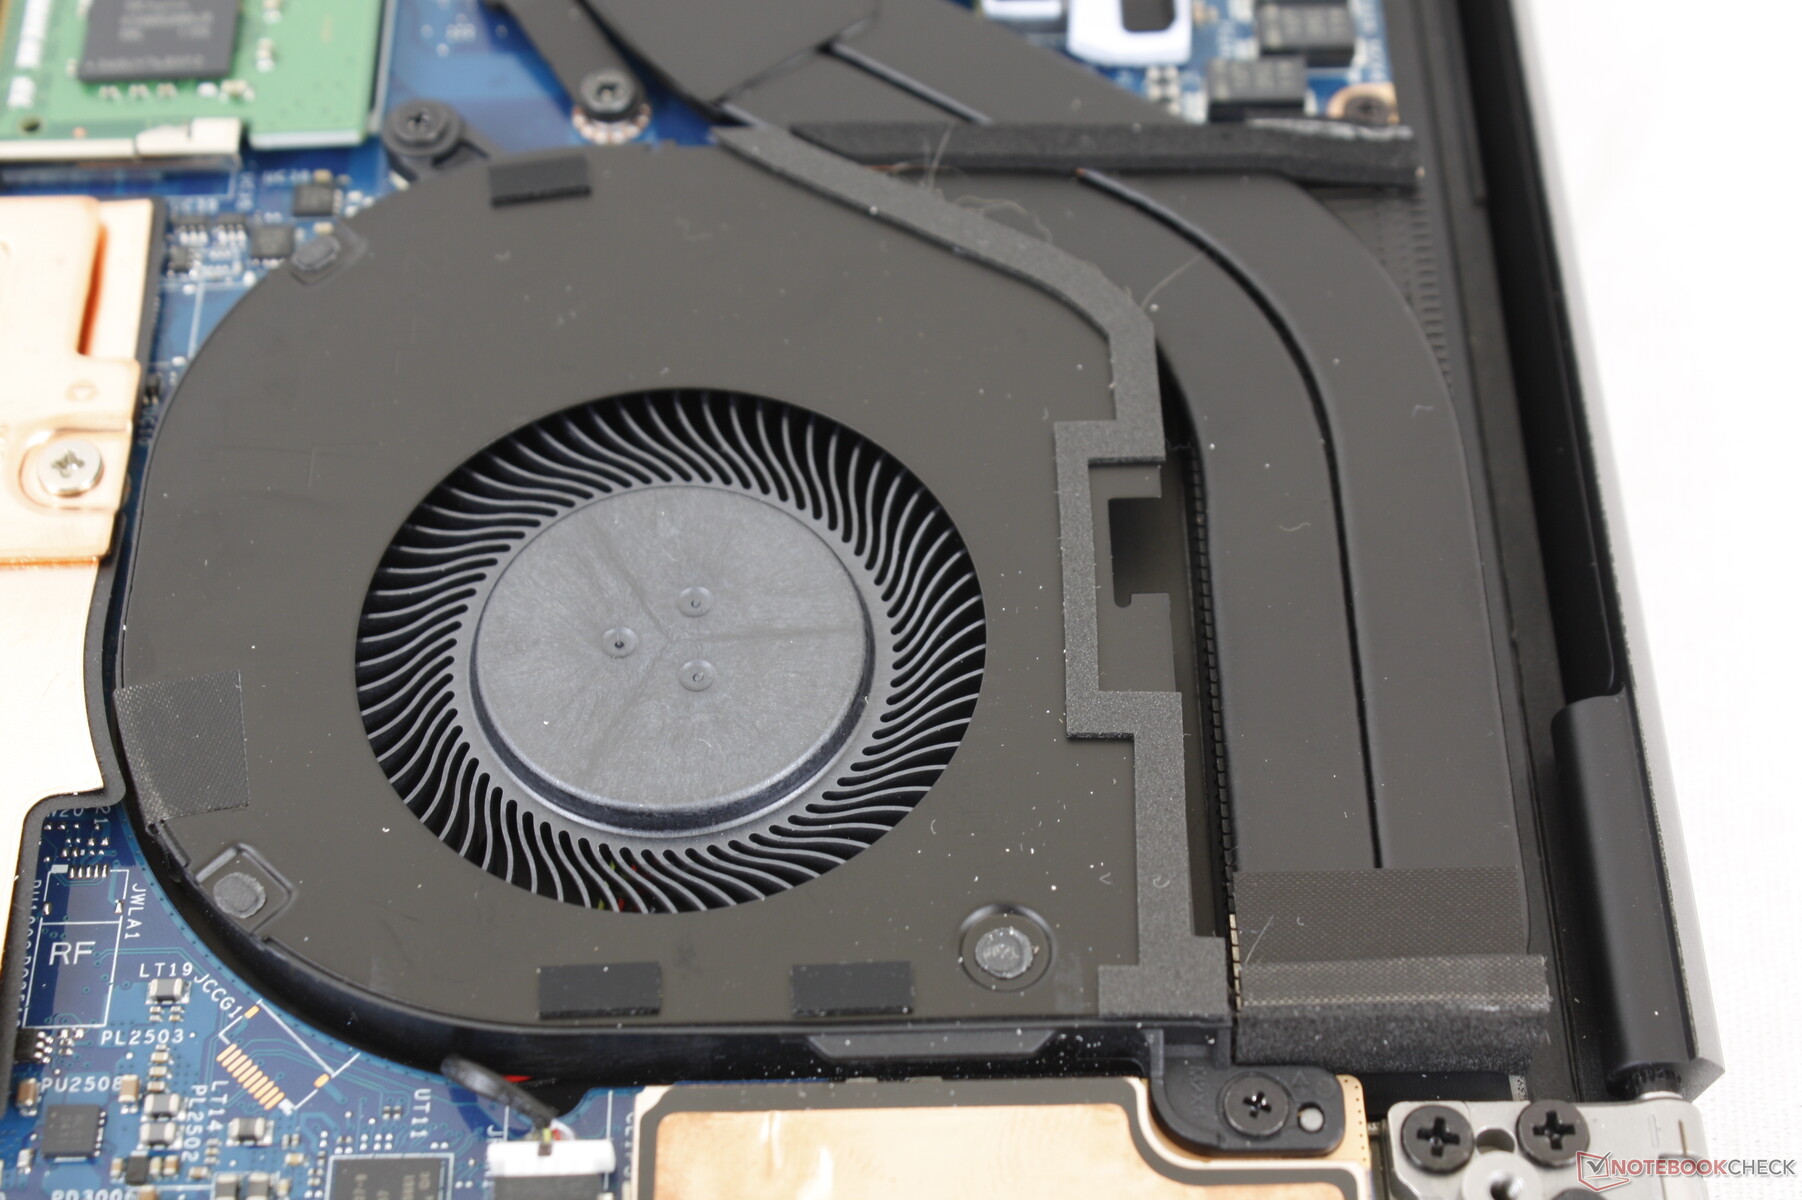
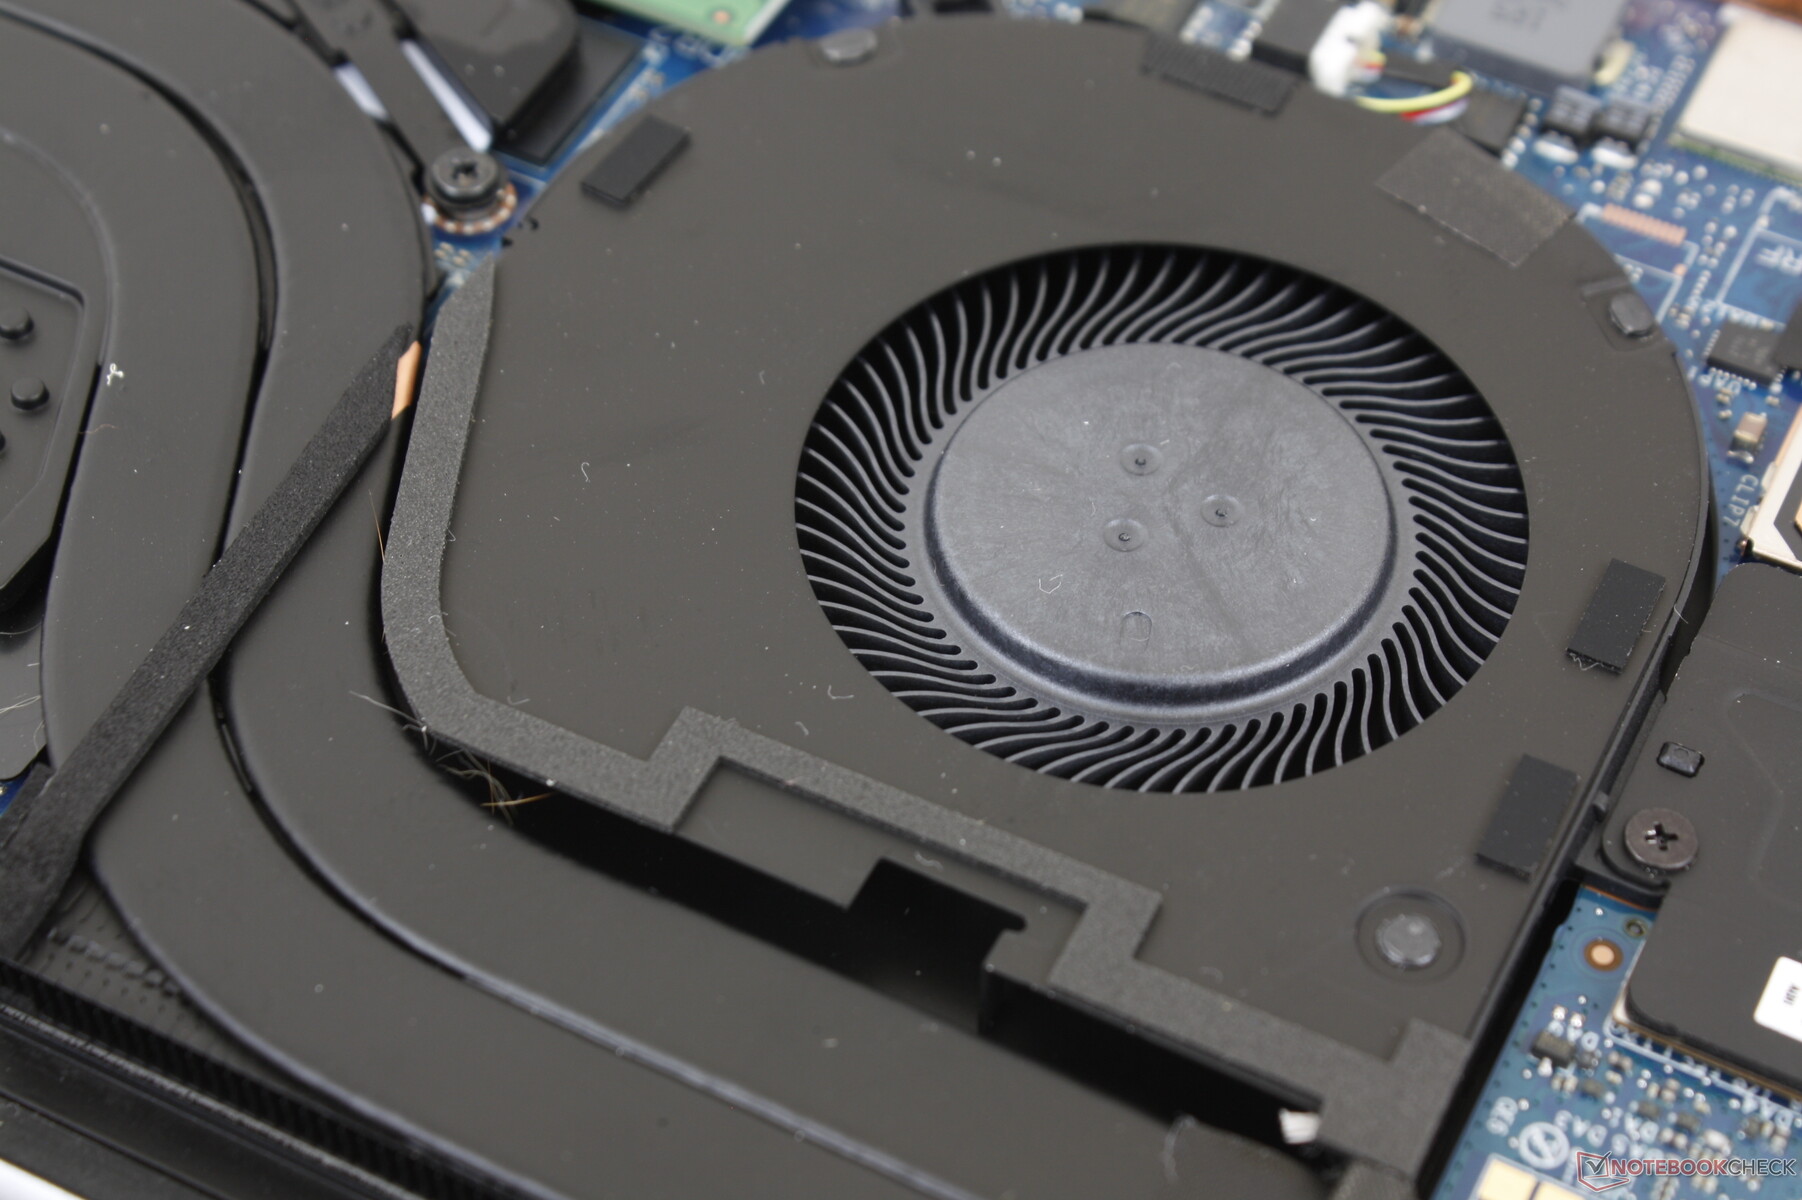
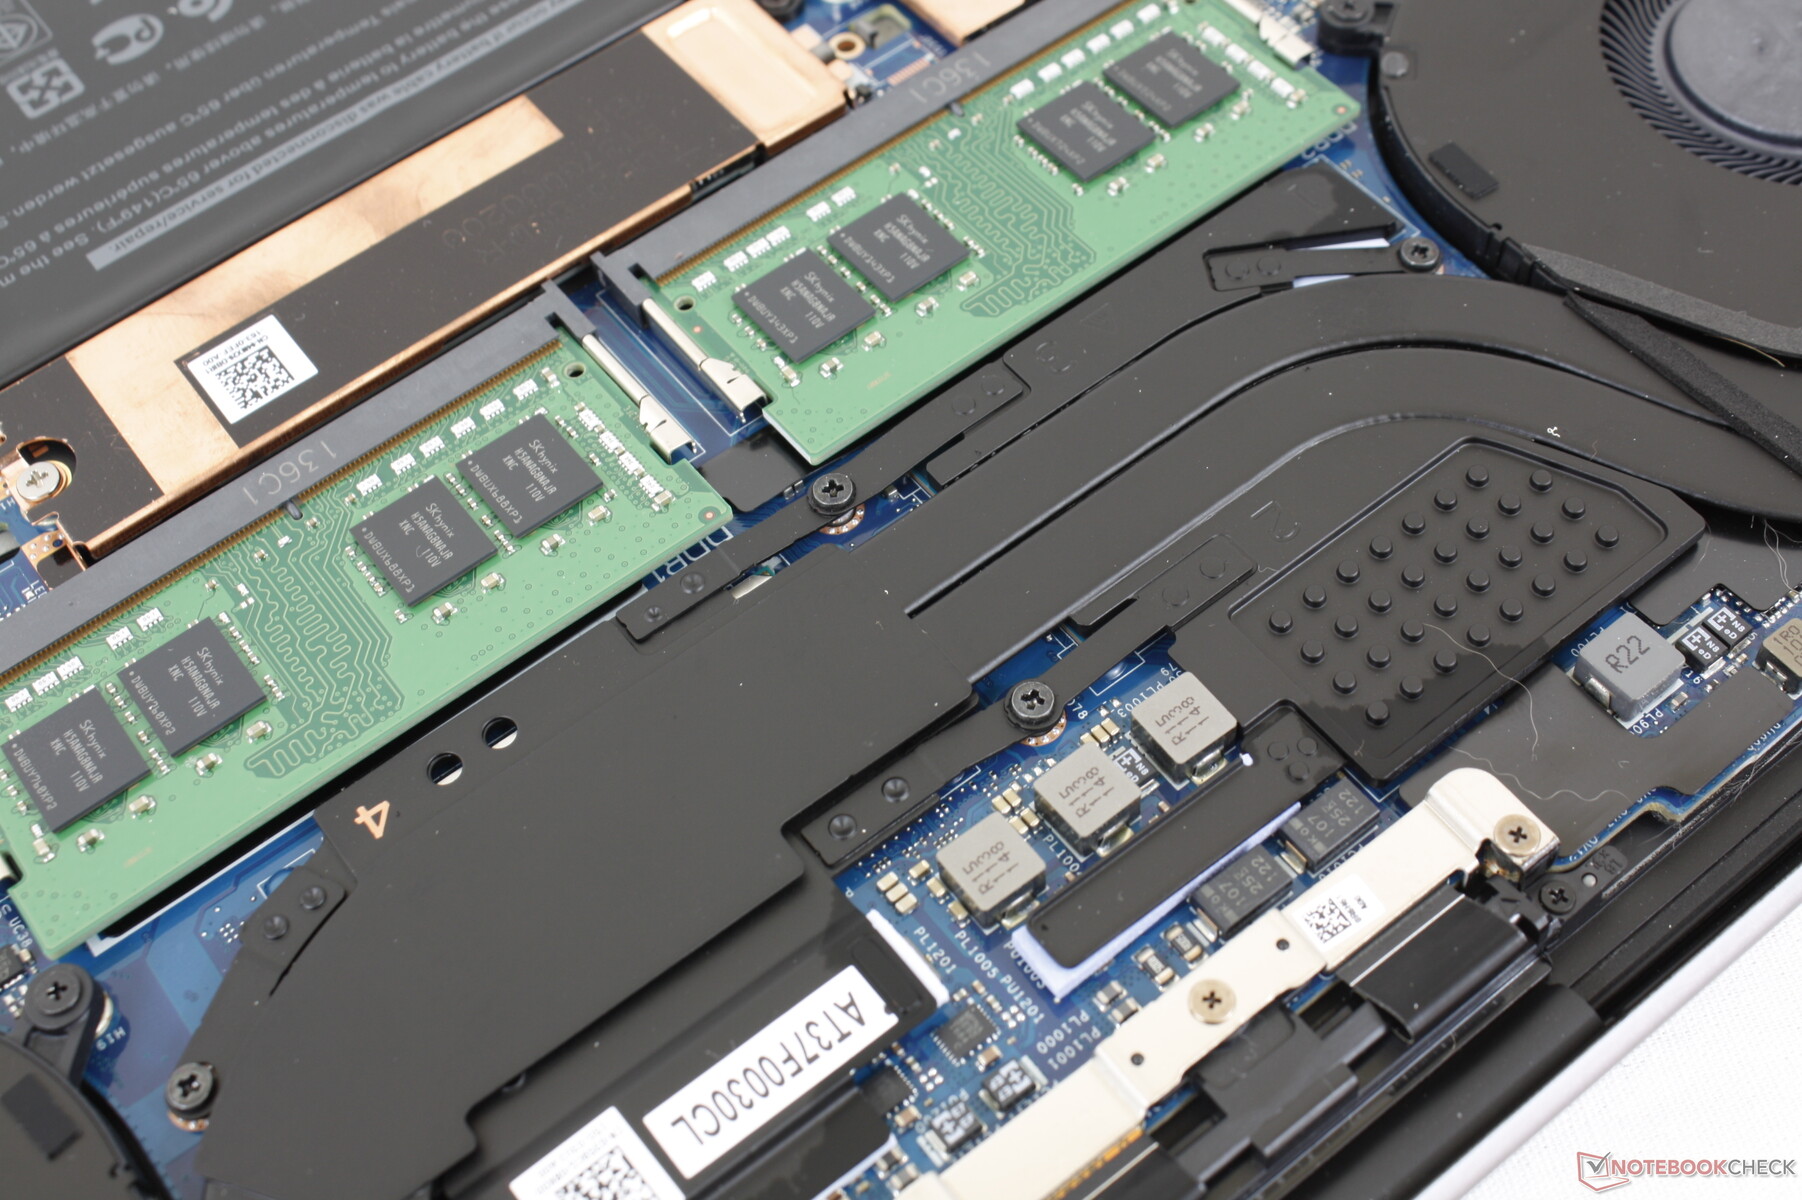
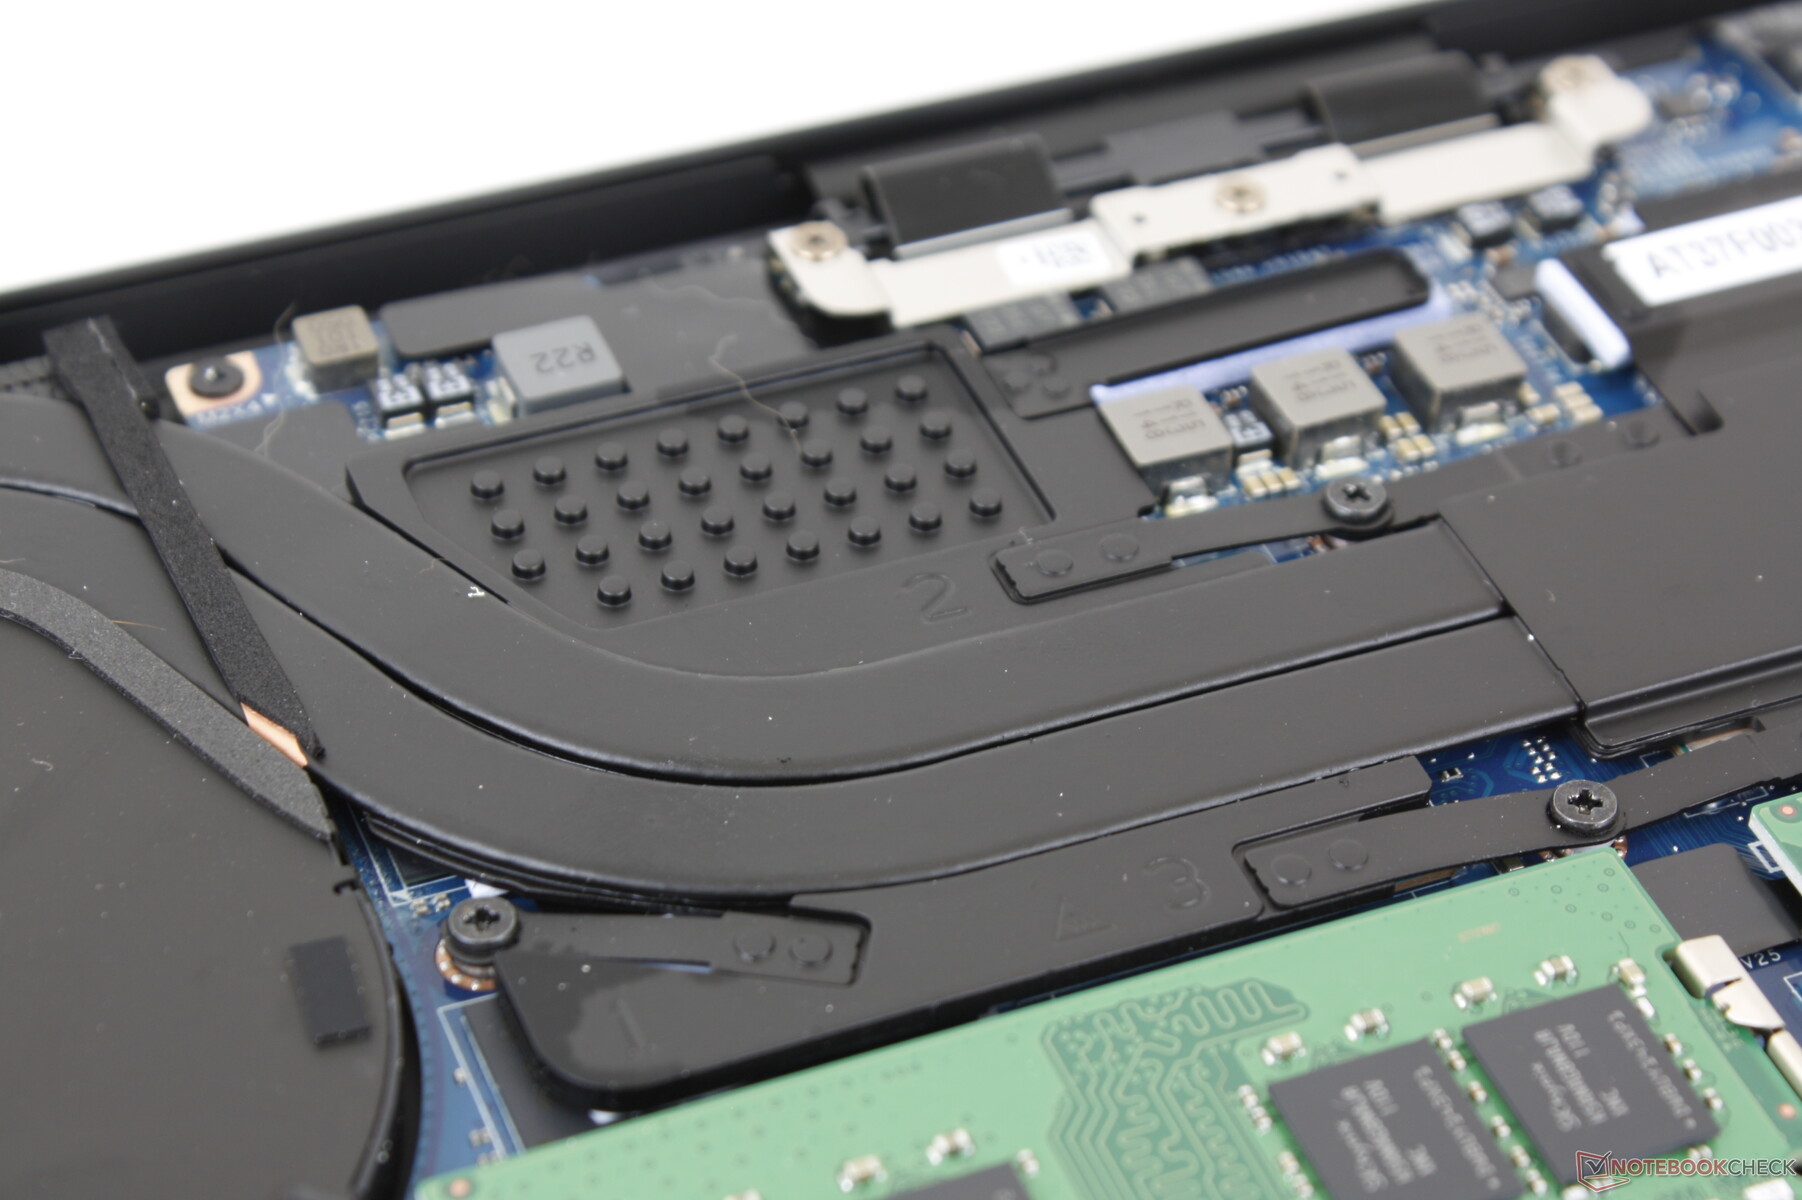
Mantenimiento
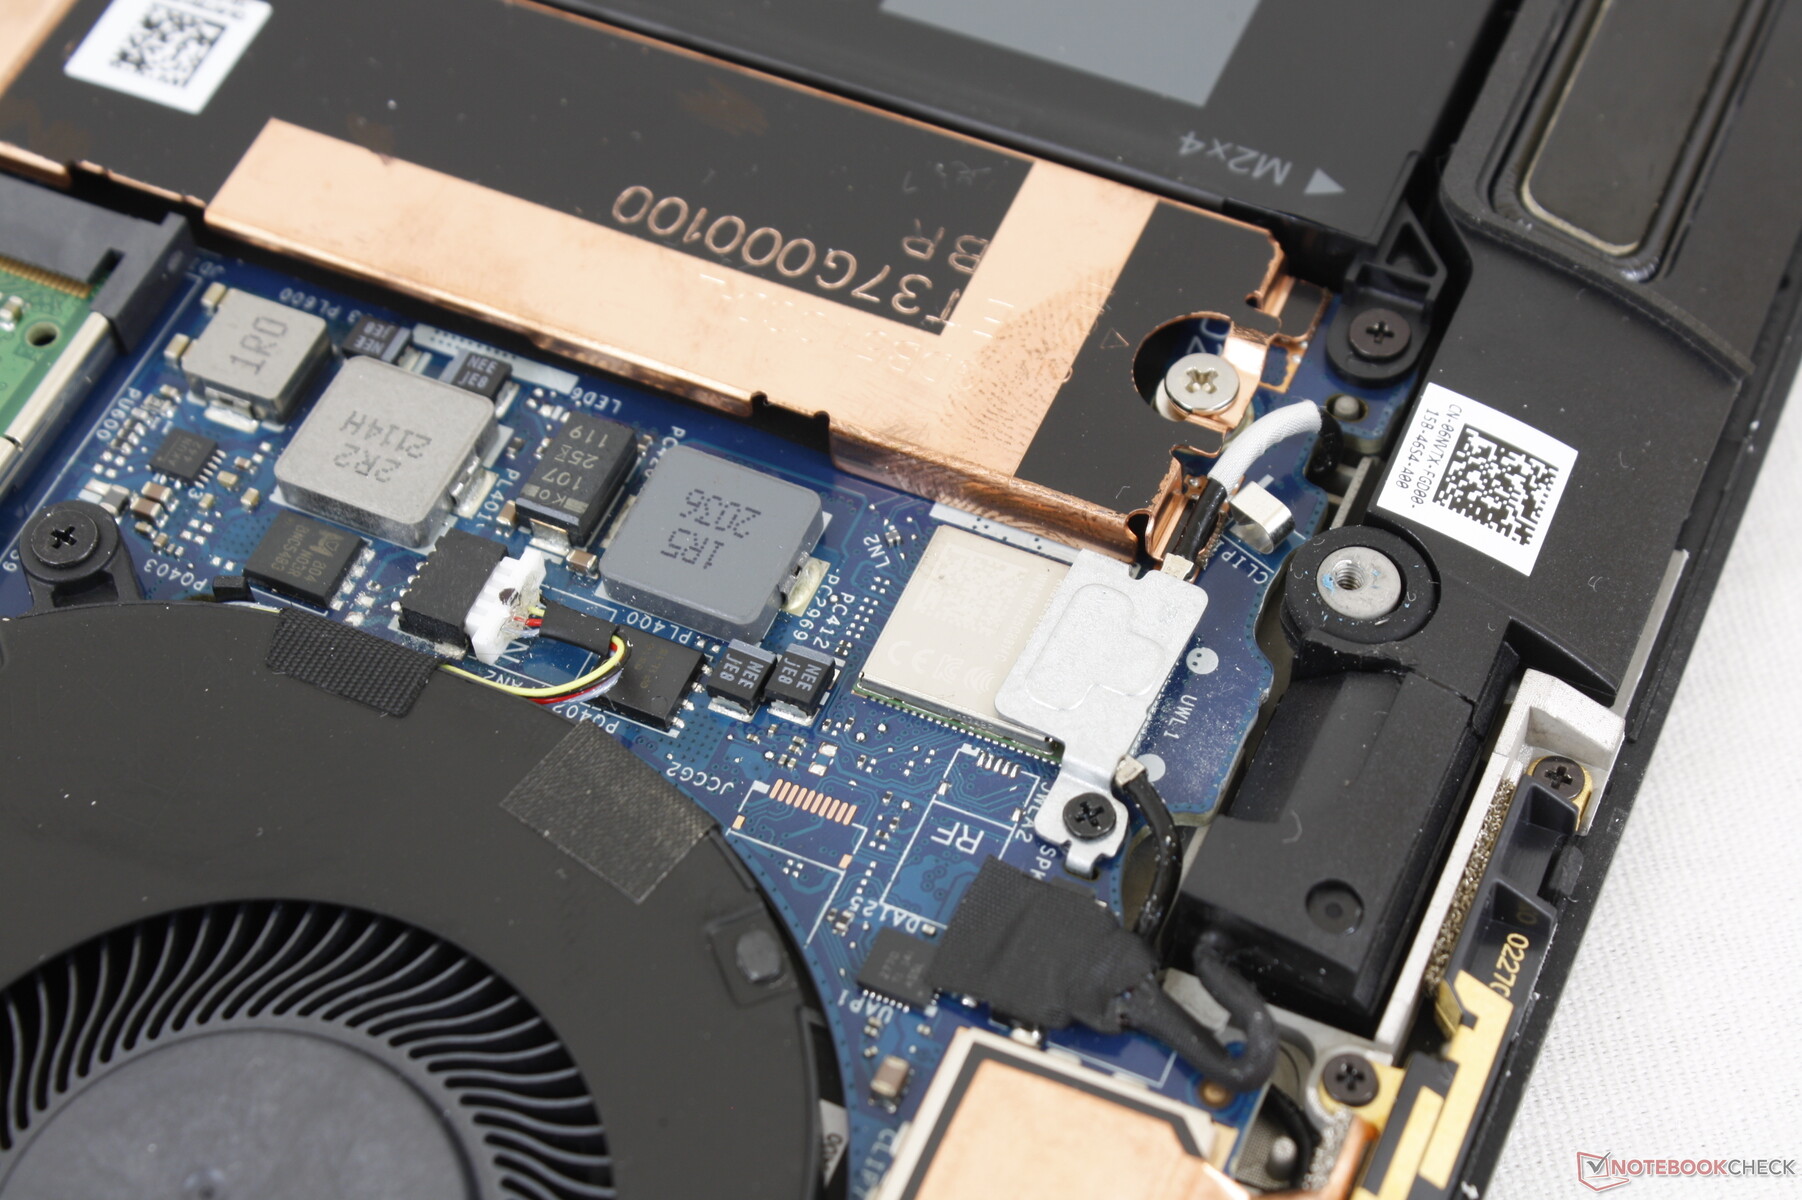
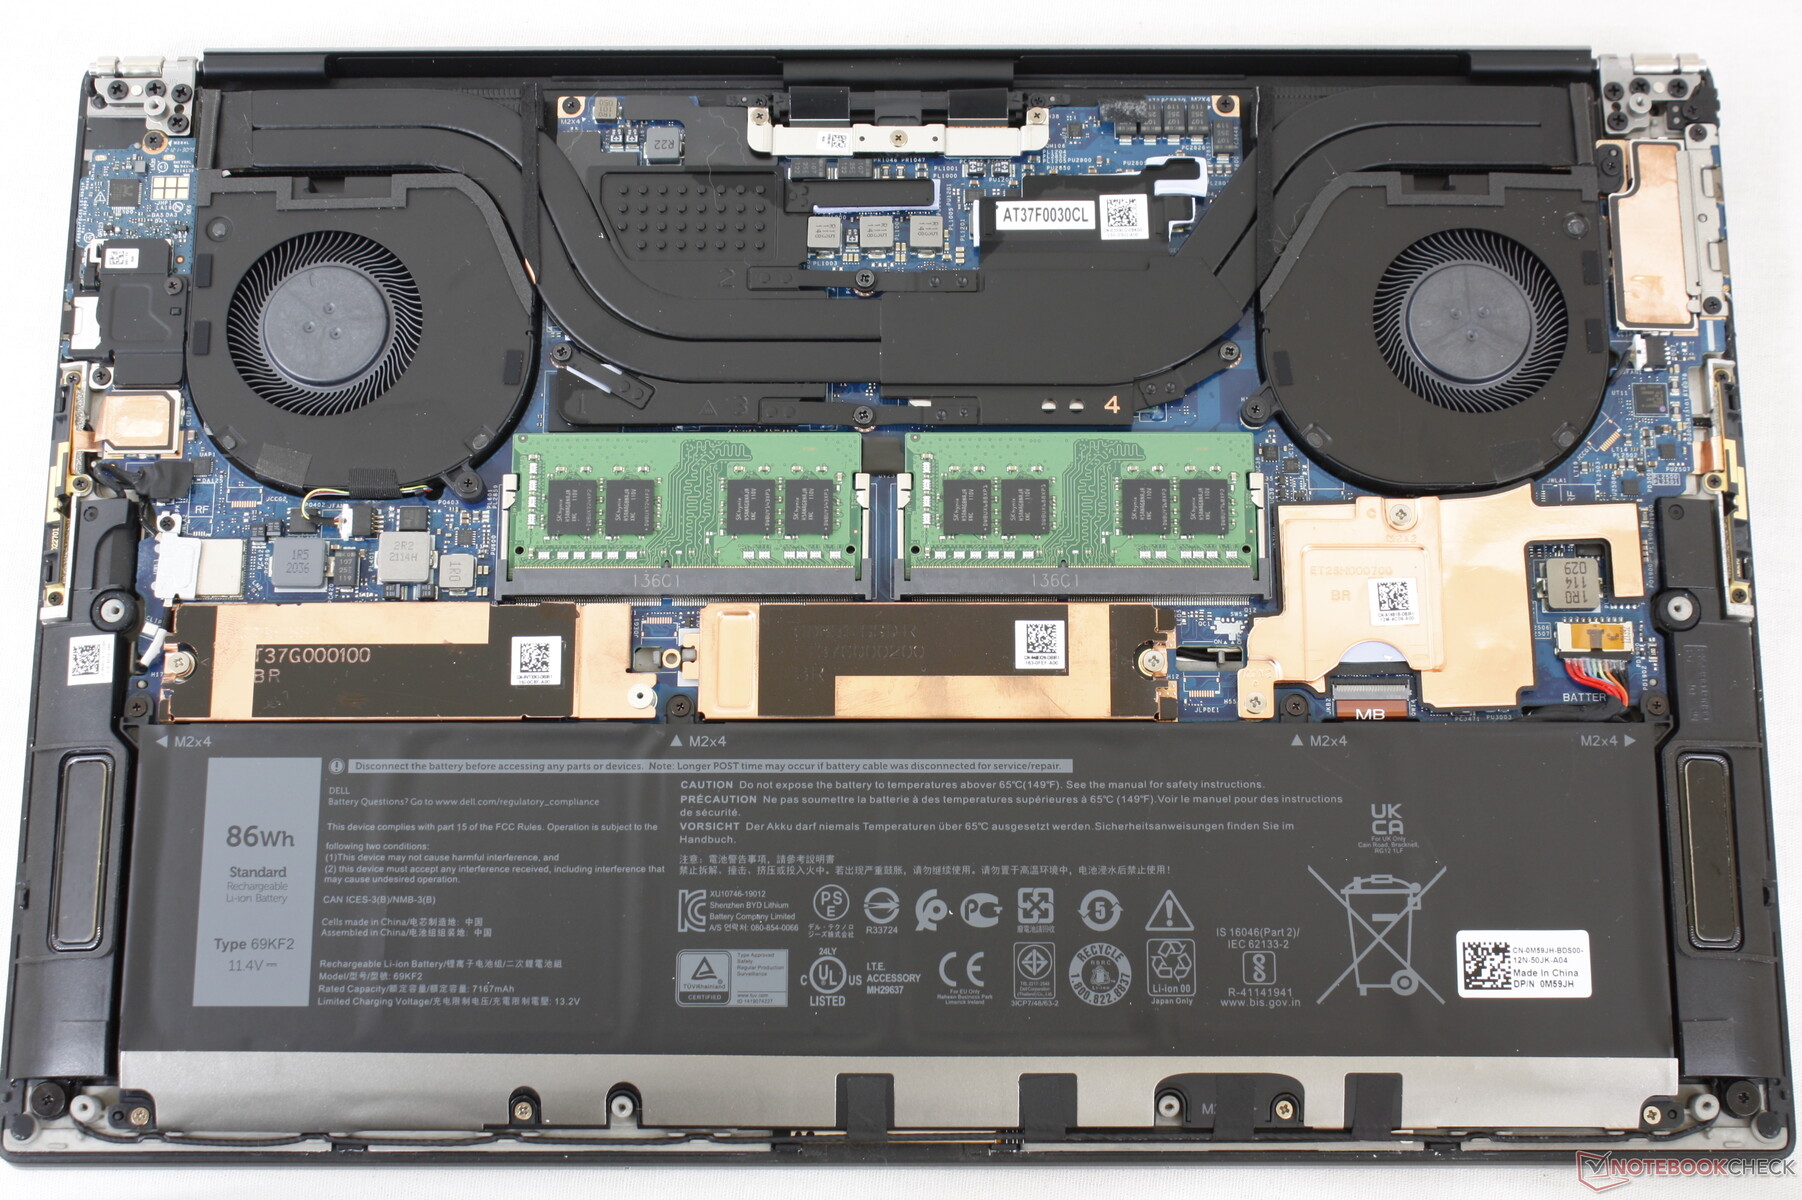
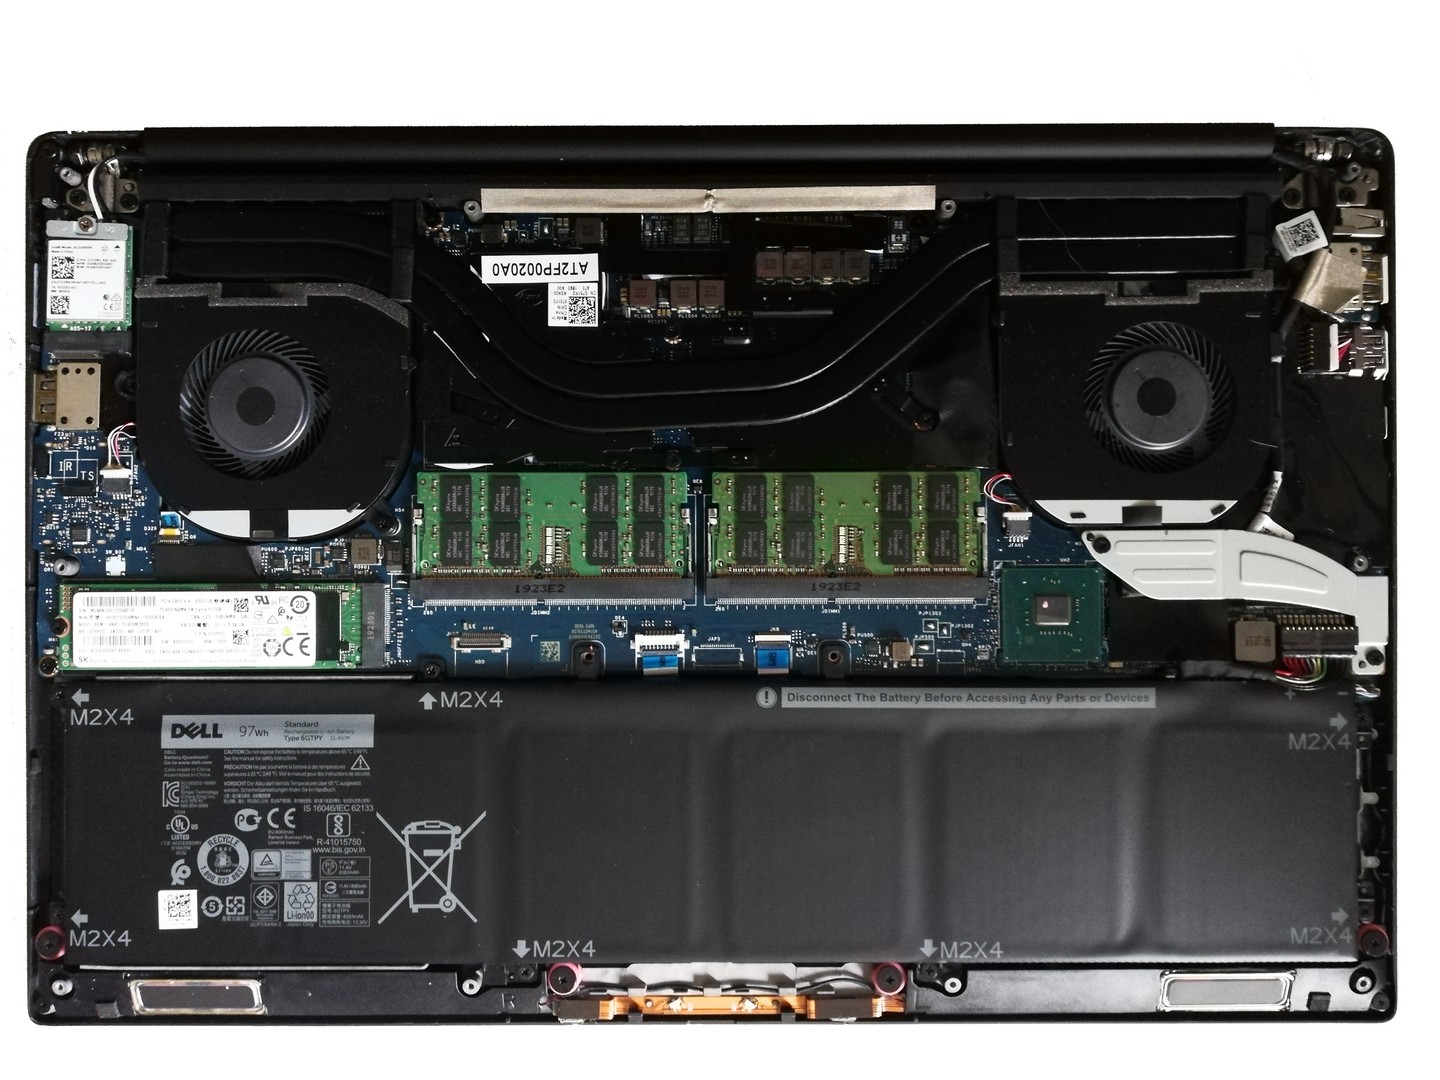
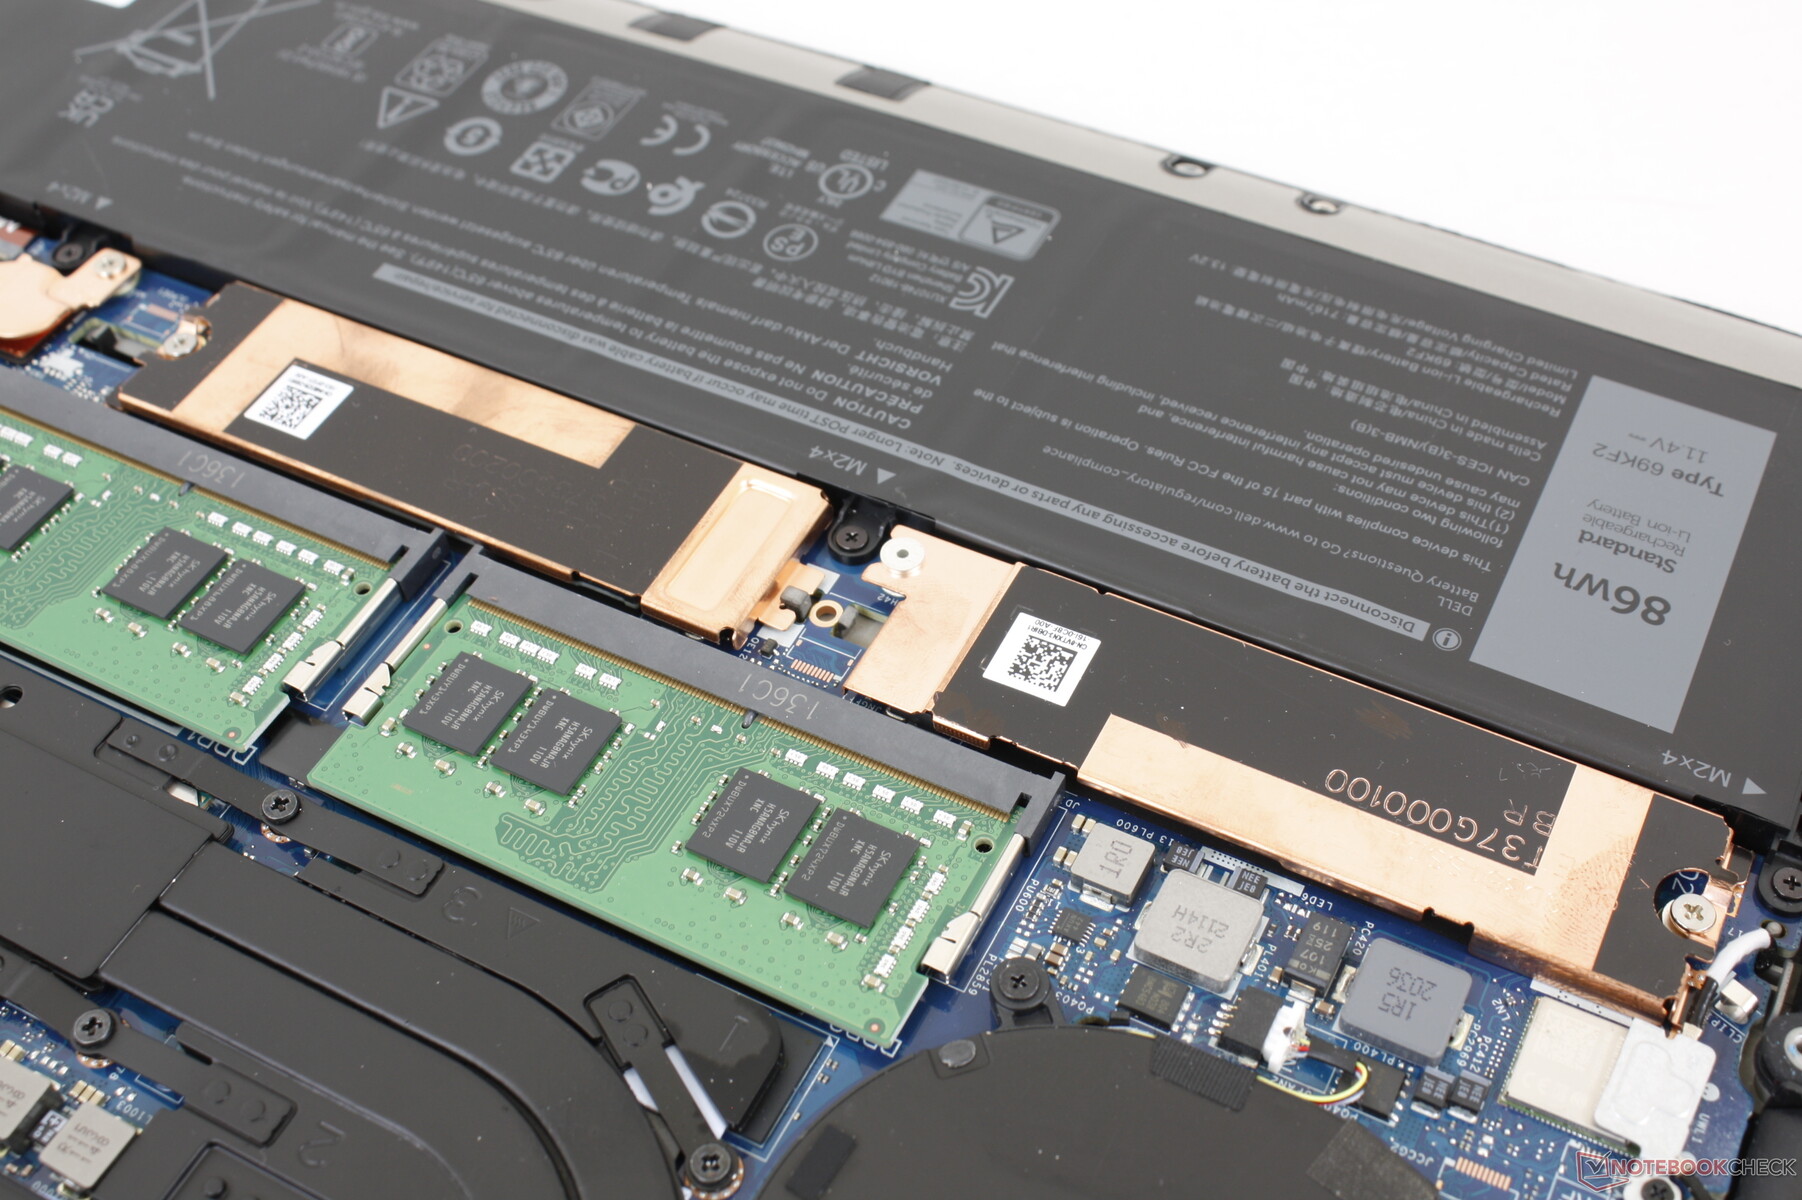
El panel inferior es más difícil de quitar en comparación con el antiguo diseño de Precision 5540. . Por lo demás, la disposición interna es esencialmente idéntica a la de Precision 5550.
Accesorios y garantía
La caja de venta incluye un práctico adaptador de USB-C a USB-A de tamaño completo y HDMI muy parecido al del XPS 15.
Decepcionantemente, la garantía base es de sólo un año en lugar de los dos o tres años de muchas otras estaciones de trabajo móviles. Los usuarios tendrían que cambiar a la serie Precision 7000 de gama alta para obtener una garantía básica más larga.
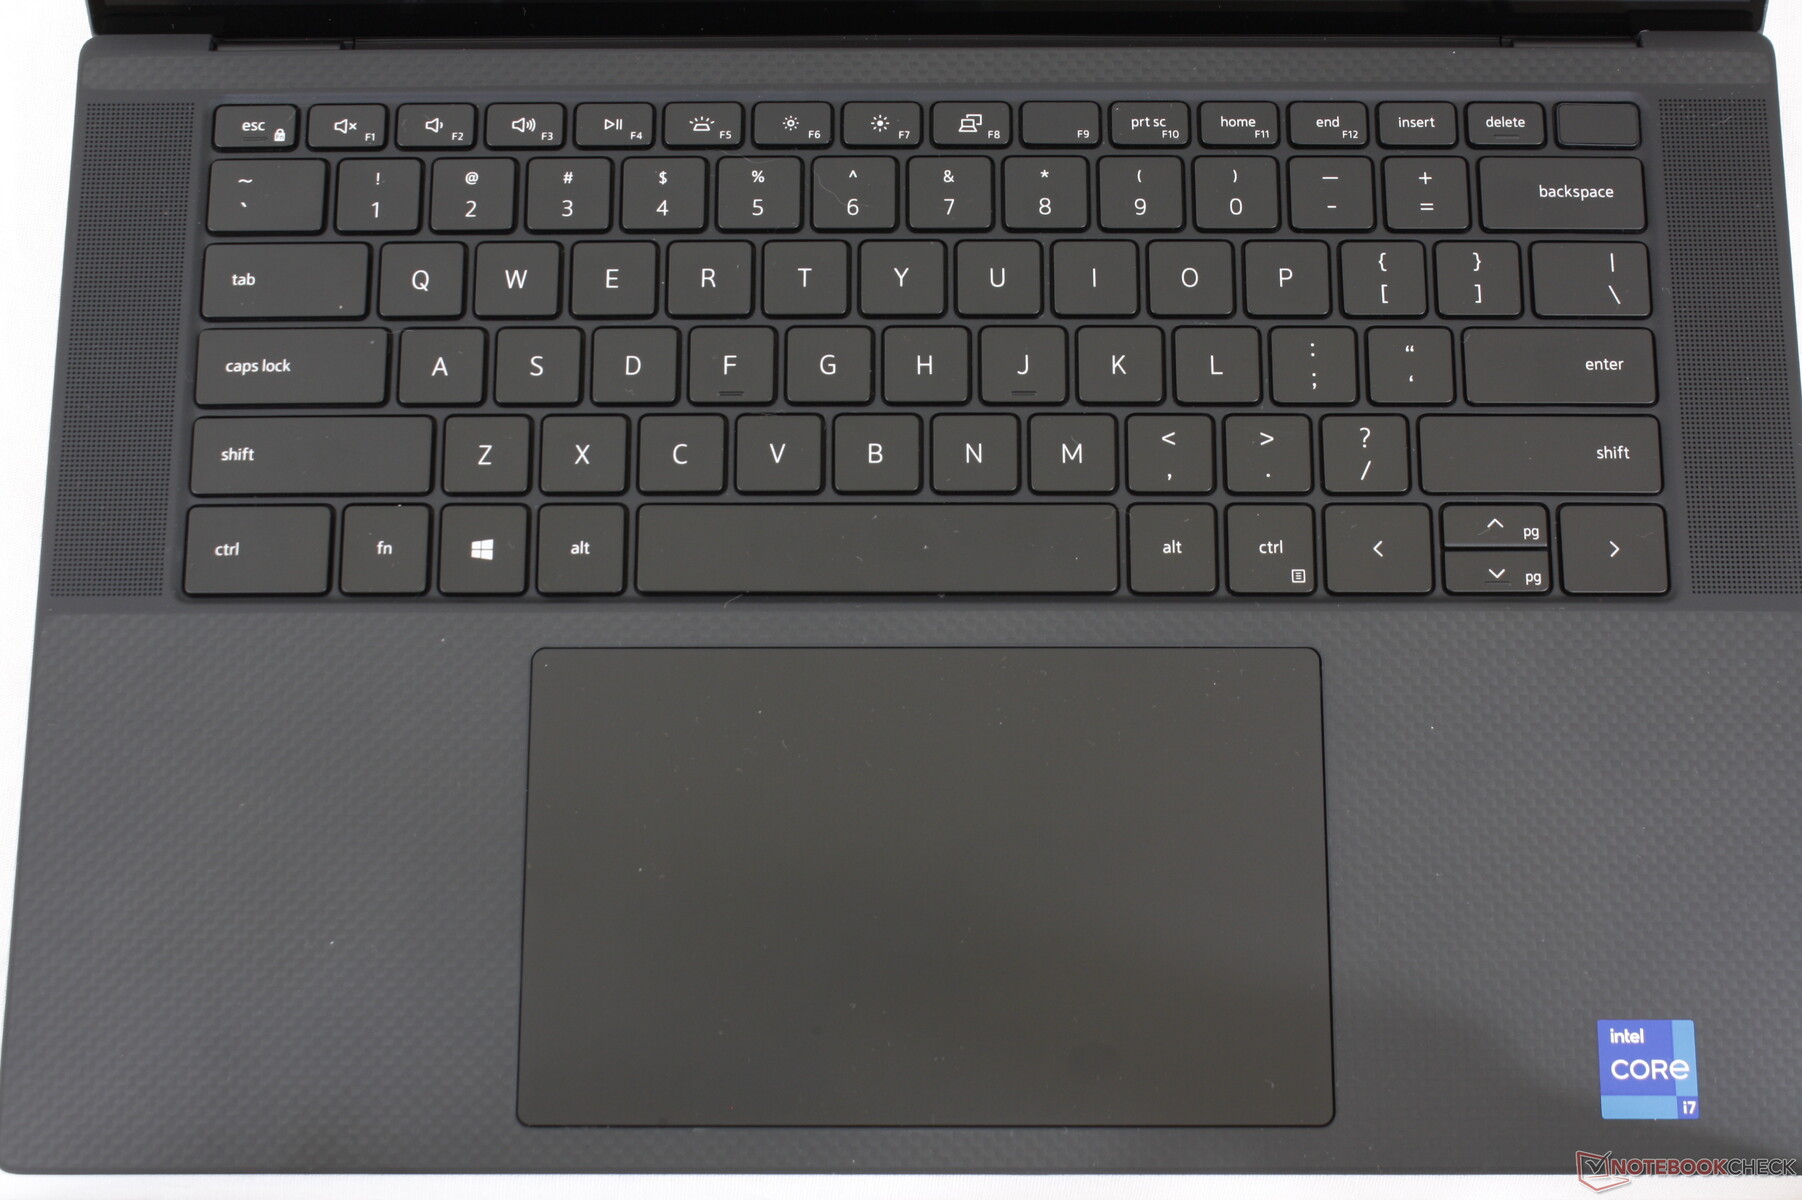
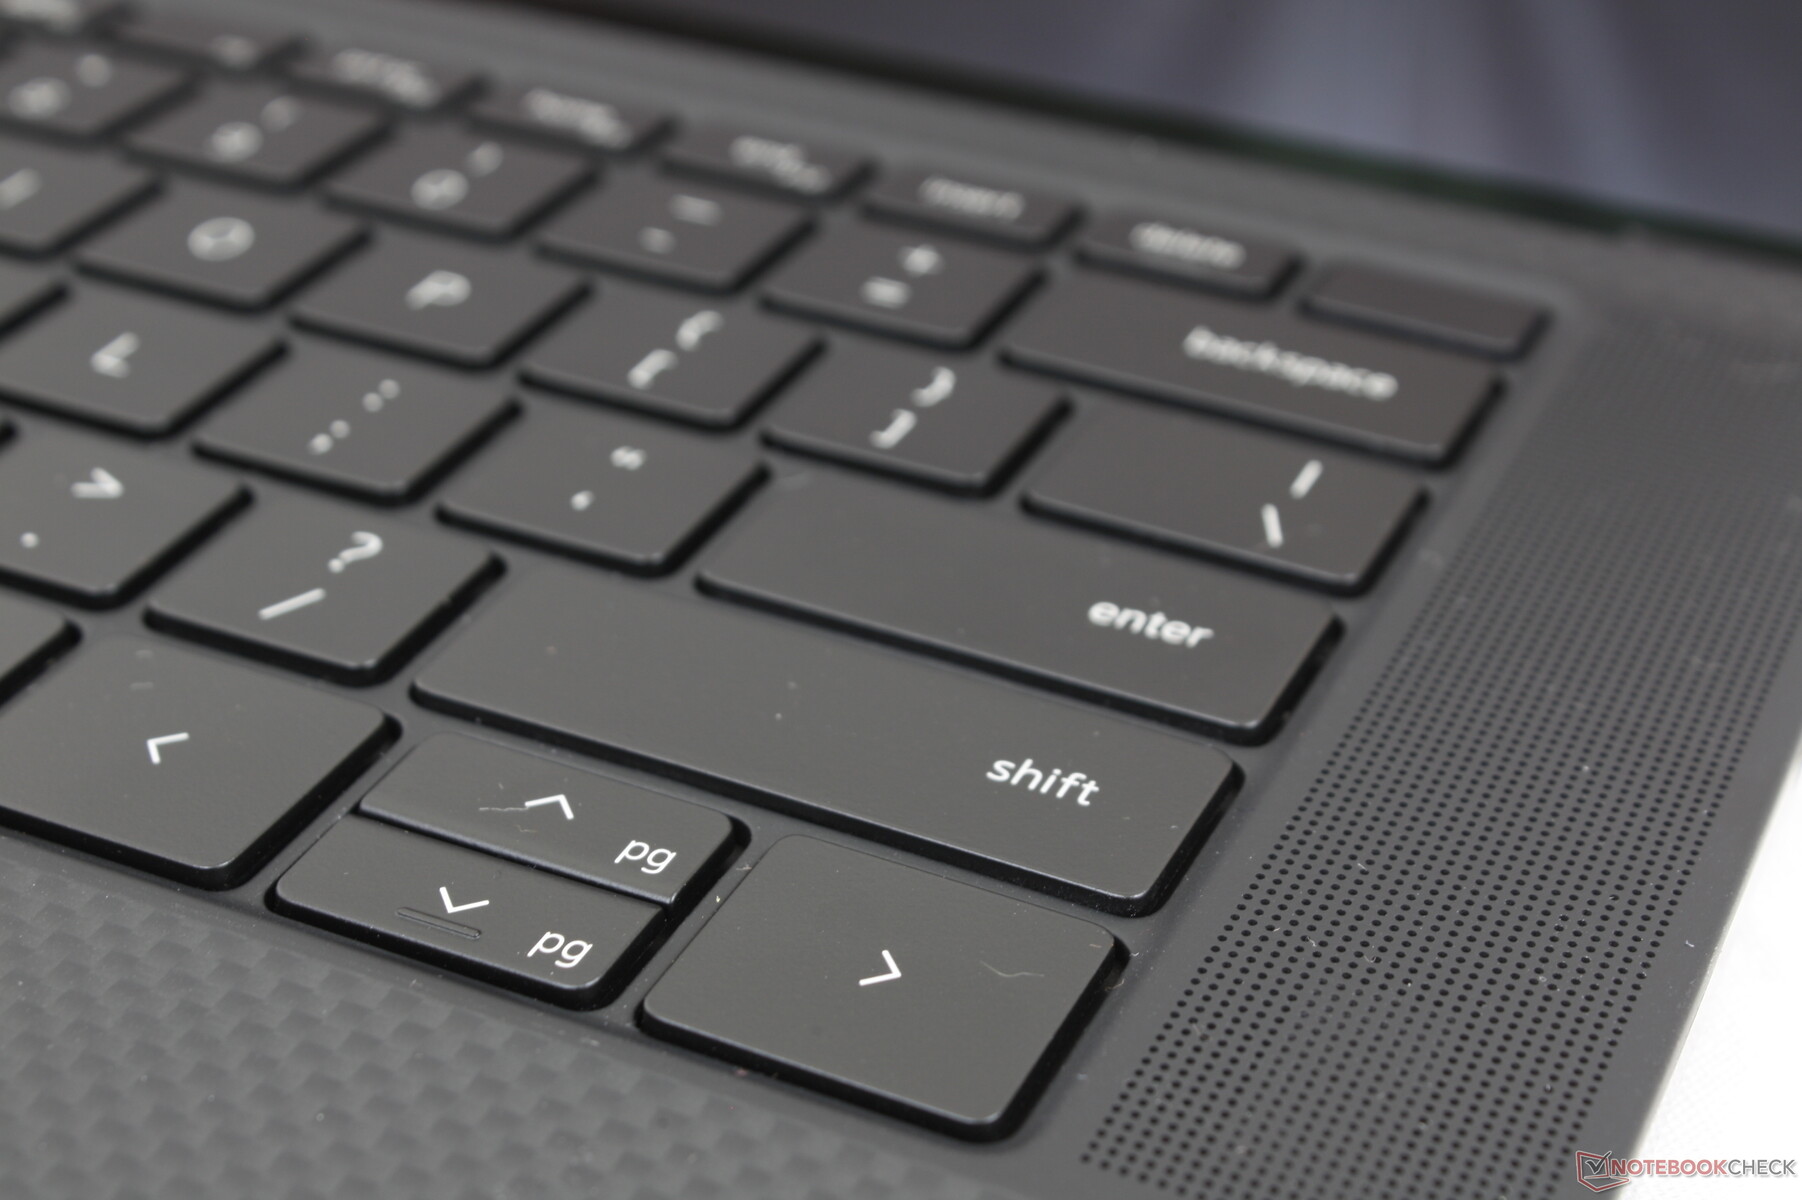
Dispositivos de entrada

Mostrar
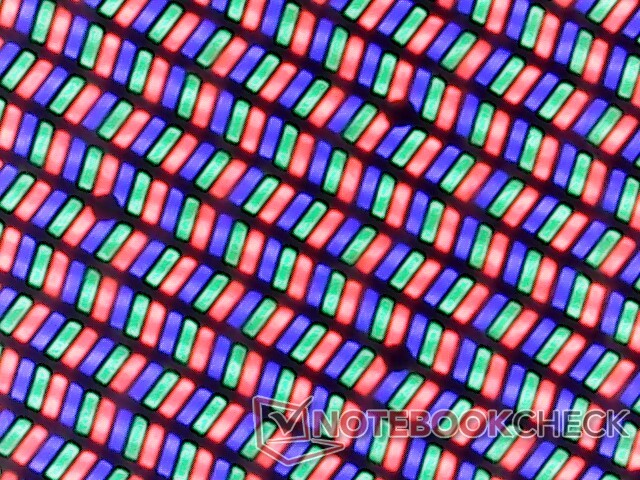
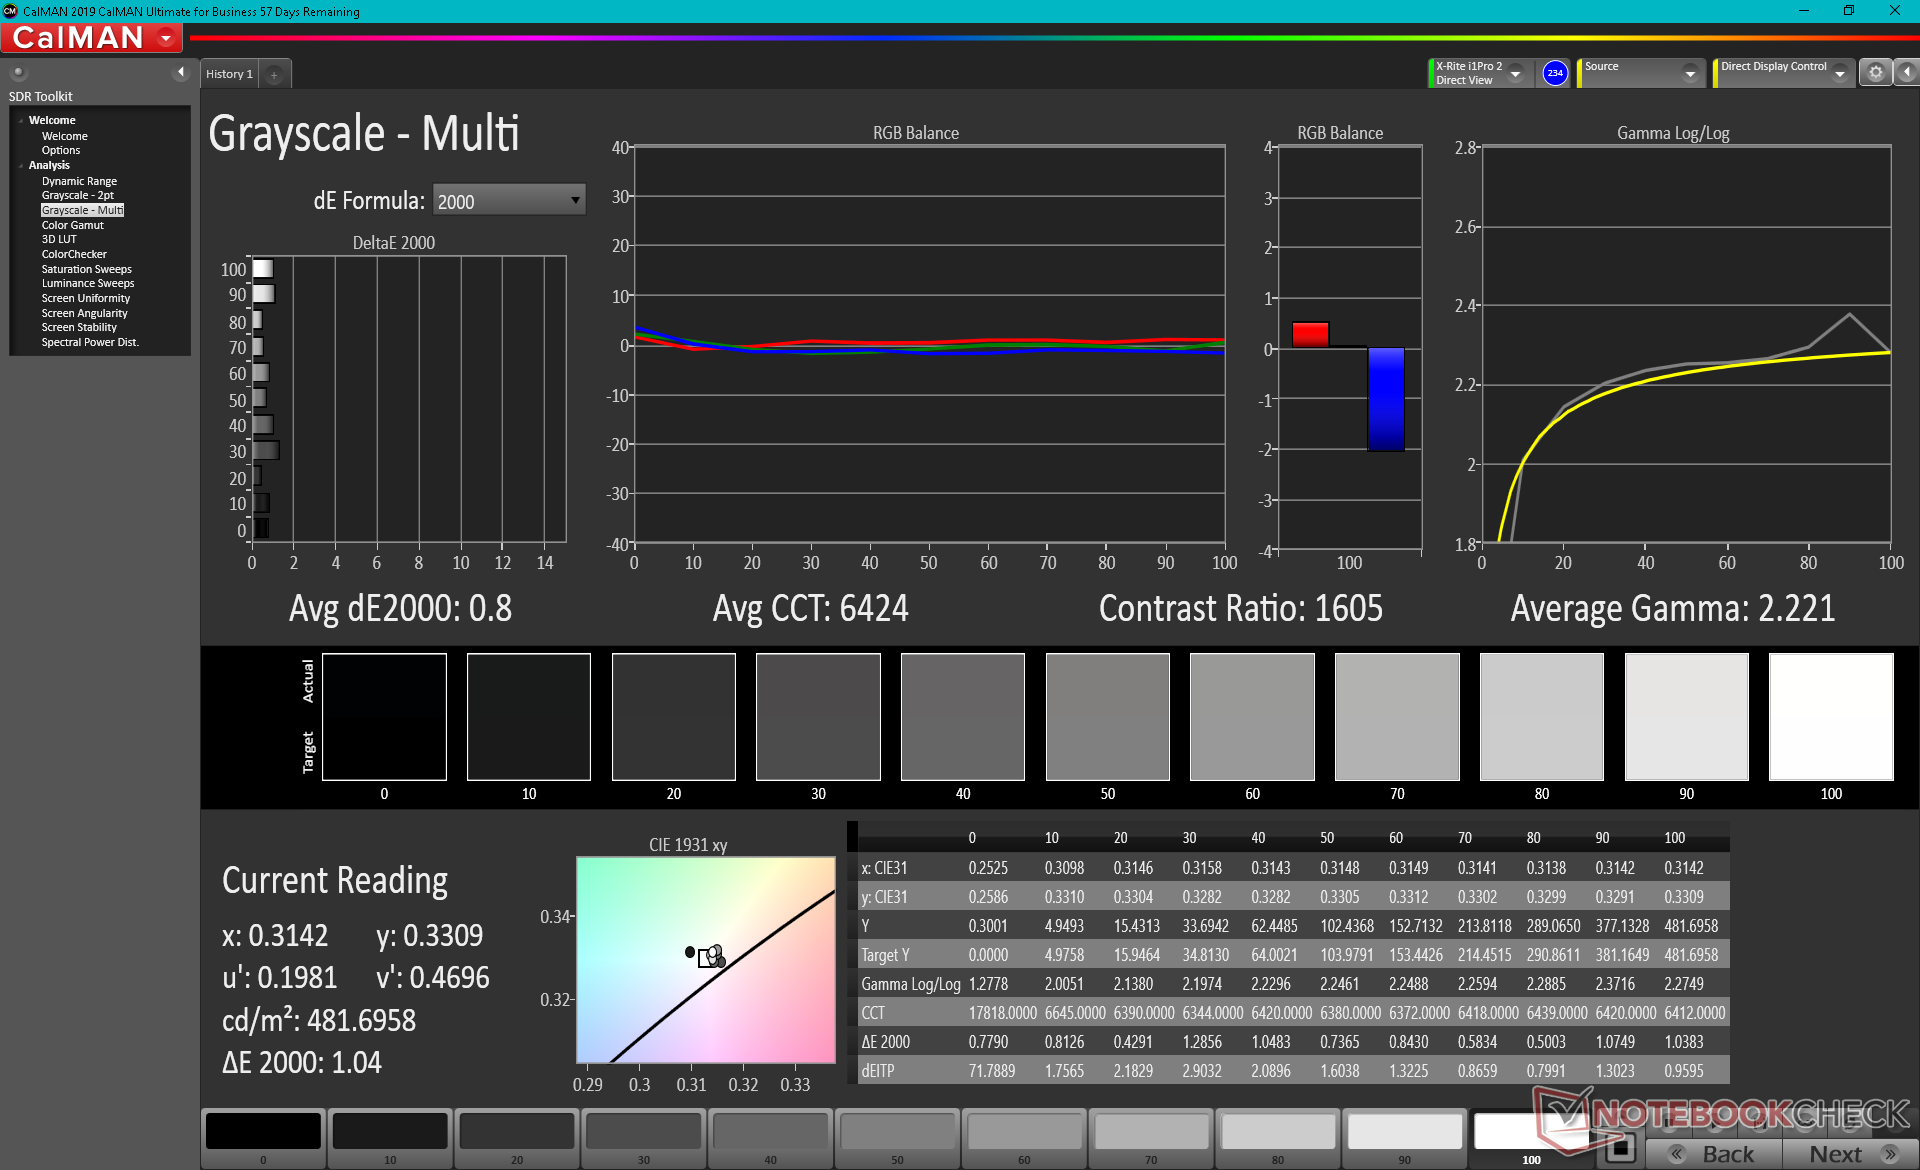
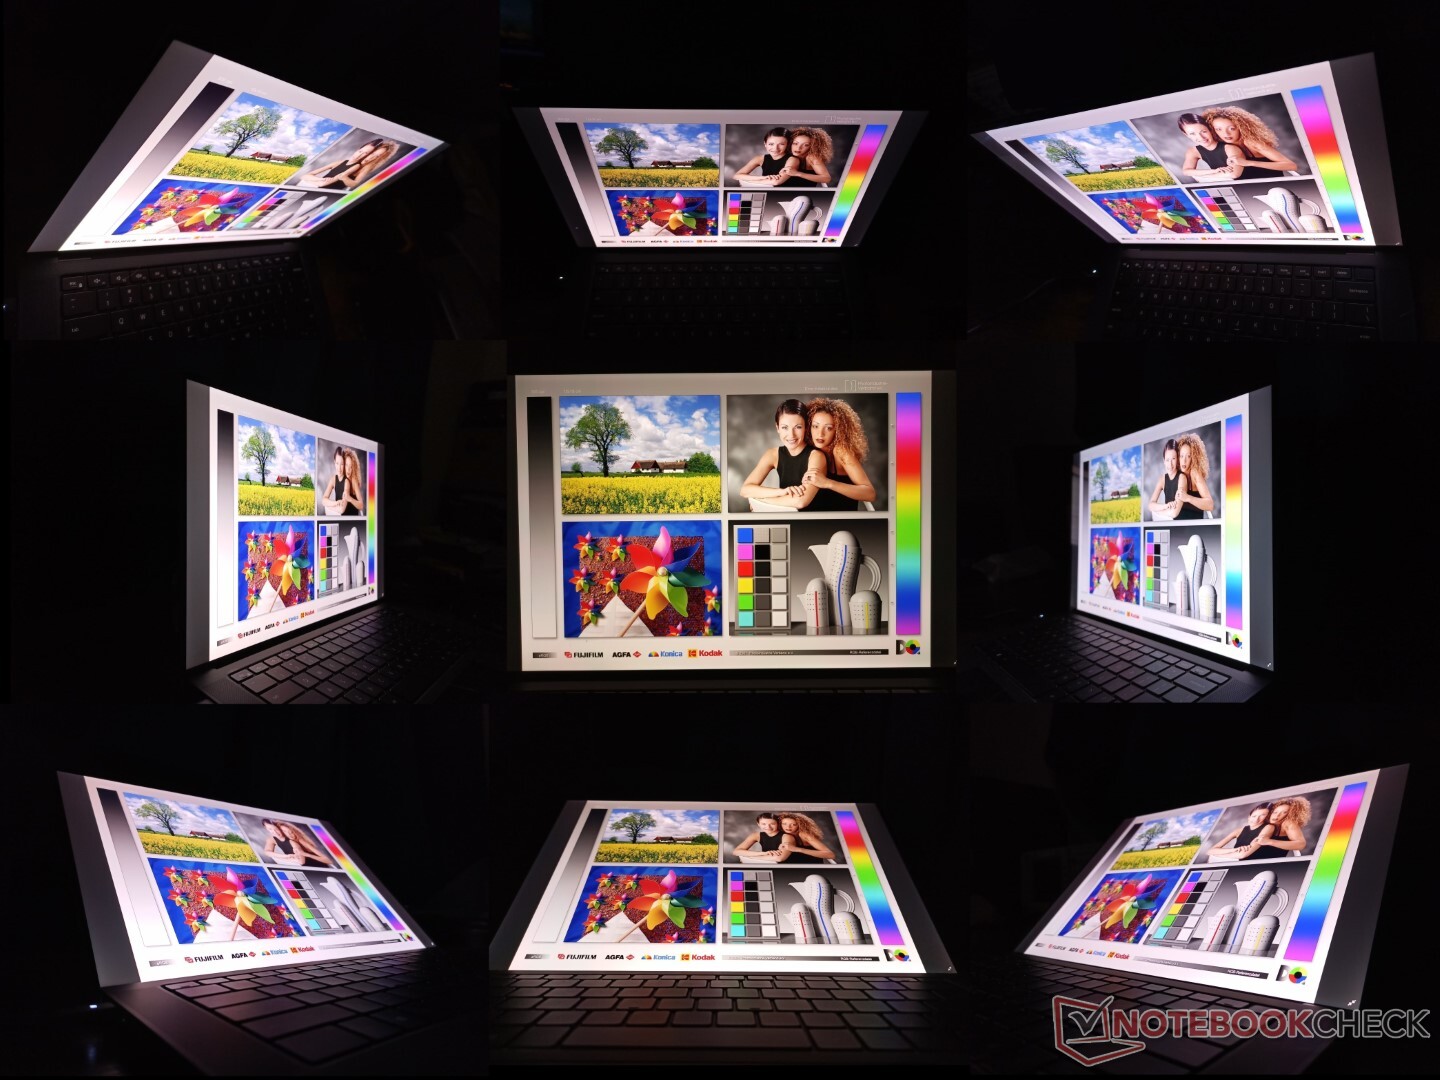
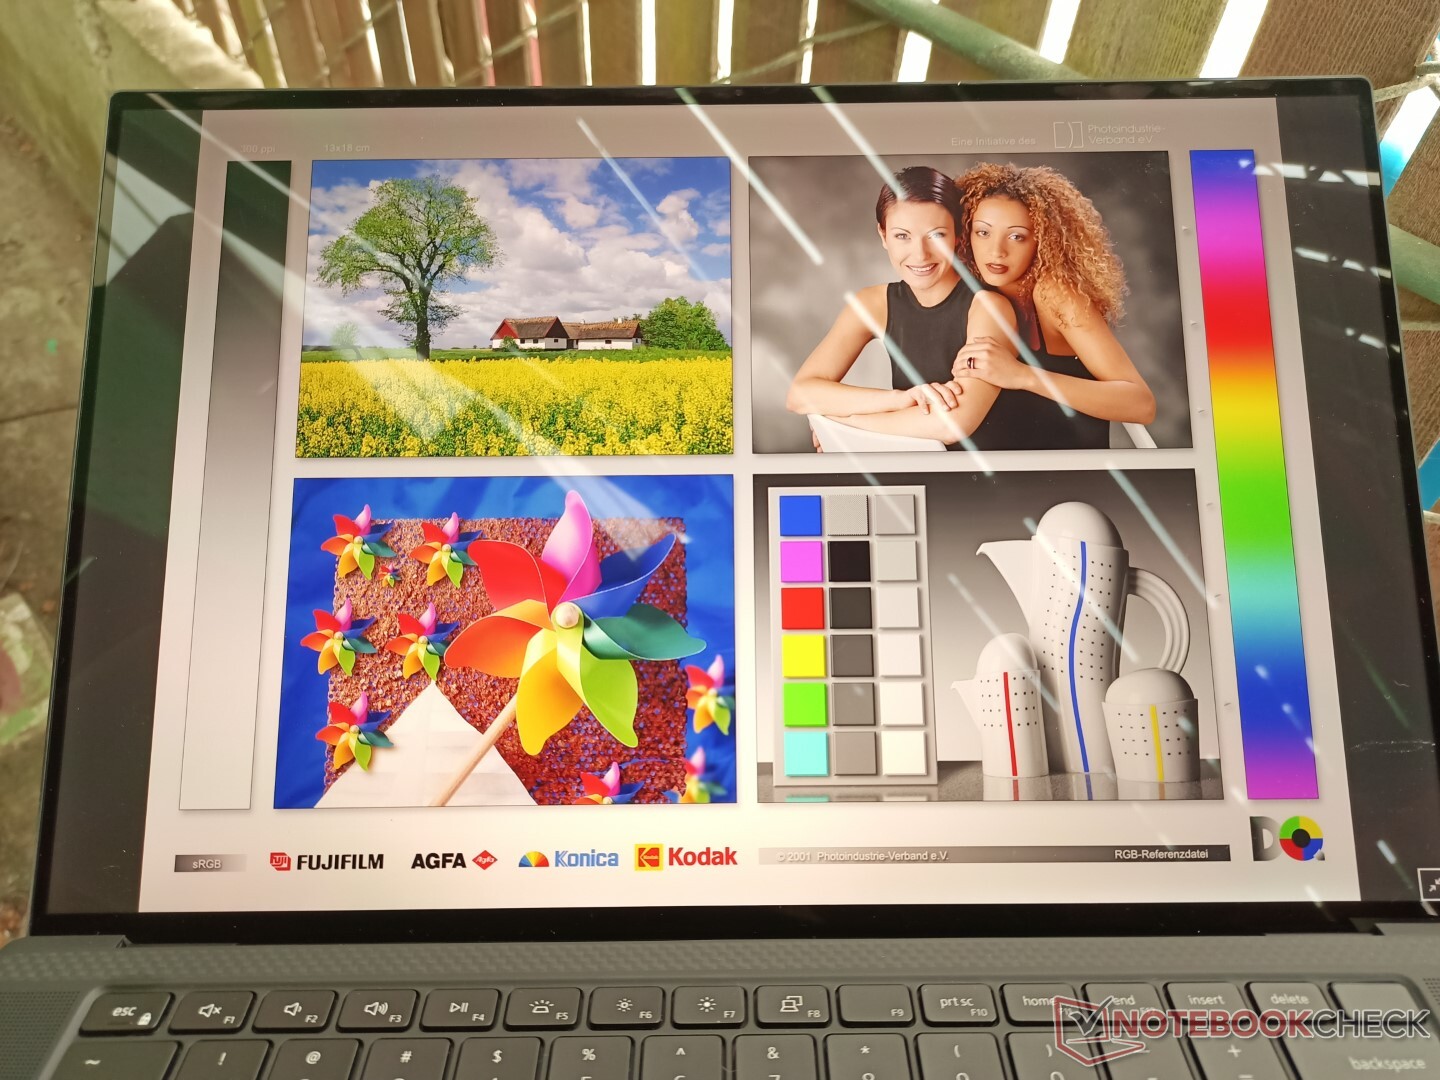
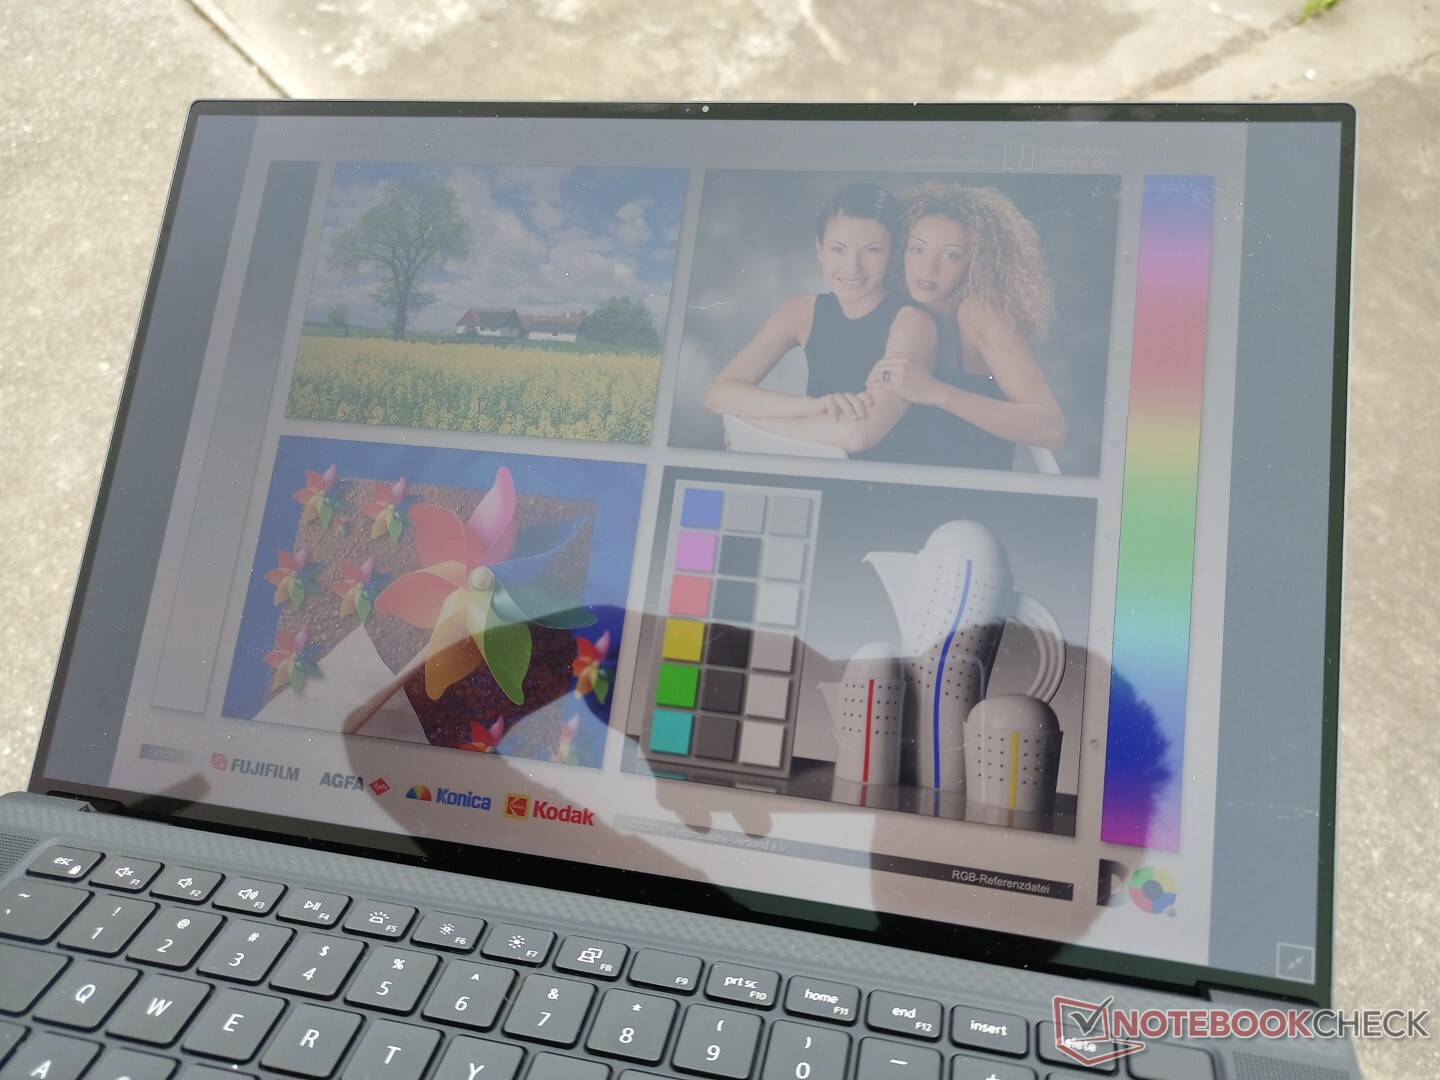
Dell sigue usando la misma pantalla táctil Sharp LQ156R1 en todos sus XPS 15 16:10 y Precision 5550/5560 4K, lo que está bien porque sigue siendo un panel de gama alta con cobertura AdobeRGB completa, alto ratio de contraste >1000:1, y retroiluminación brillante de ~500 nit. La experiencia de visualización es, por tanto, consistente entre los últimos modelos XPS 15 y Precision 55x0. Una pantalla menos mate de 1200p no táctil está disponible en algunos SKUs como en el XPS 15, pero el OLED se omite curiosamente en el Precision 5560
Los lentos tiempos de respuesta blanco-negro y gris-gris siguen siendo la principal desventaja, lo que significa que el ghosting es muy notable especialmente cuando se compara con OLED. Esto no será un gran problema para la mayoría de las aplicaciones de tipo CAD.
| |||||||||||||||||||||||||
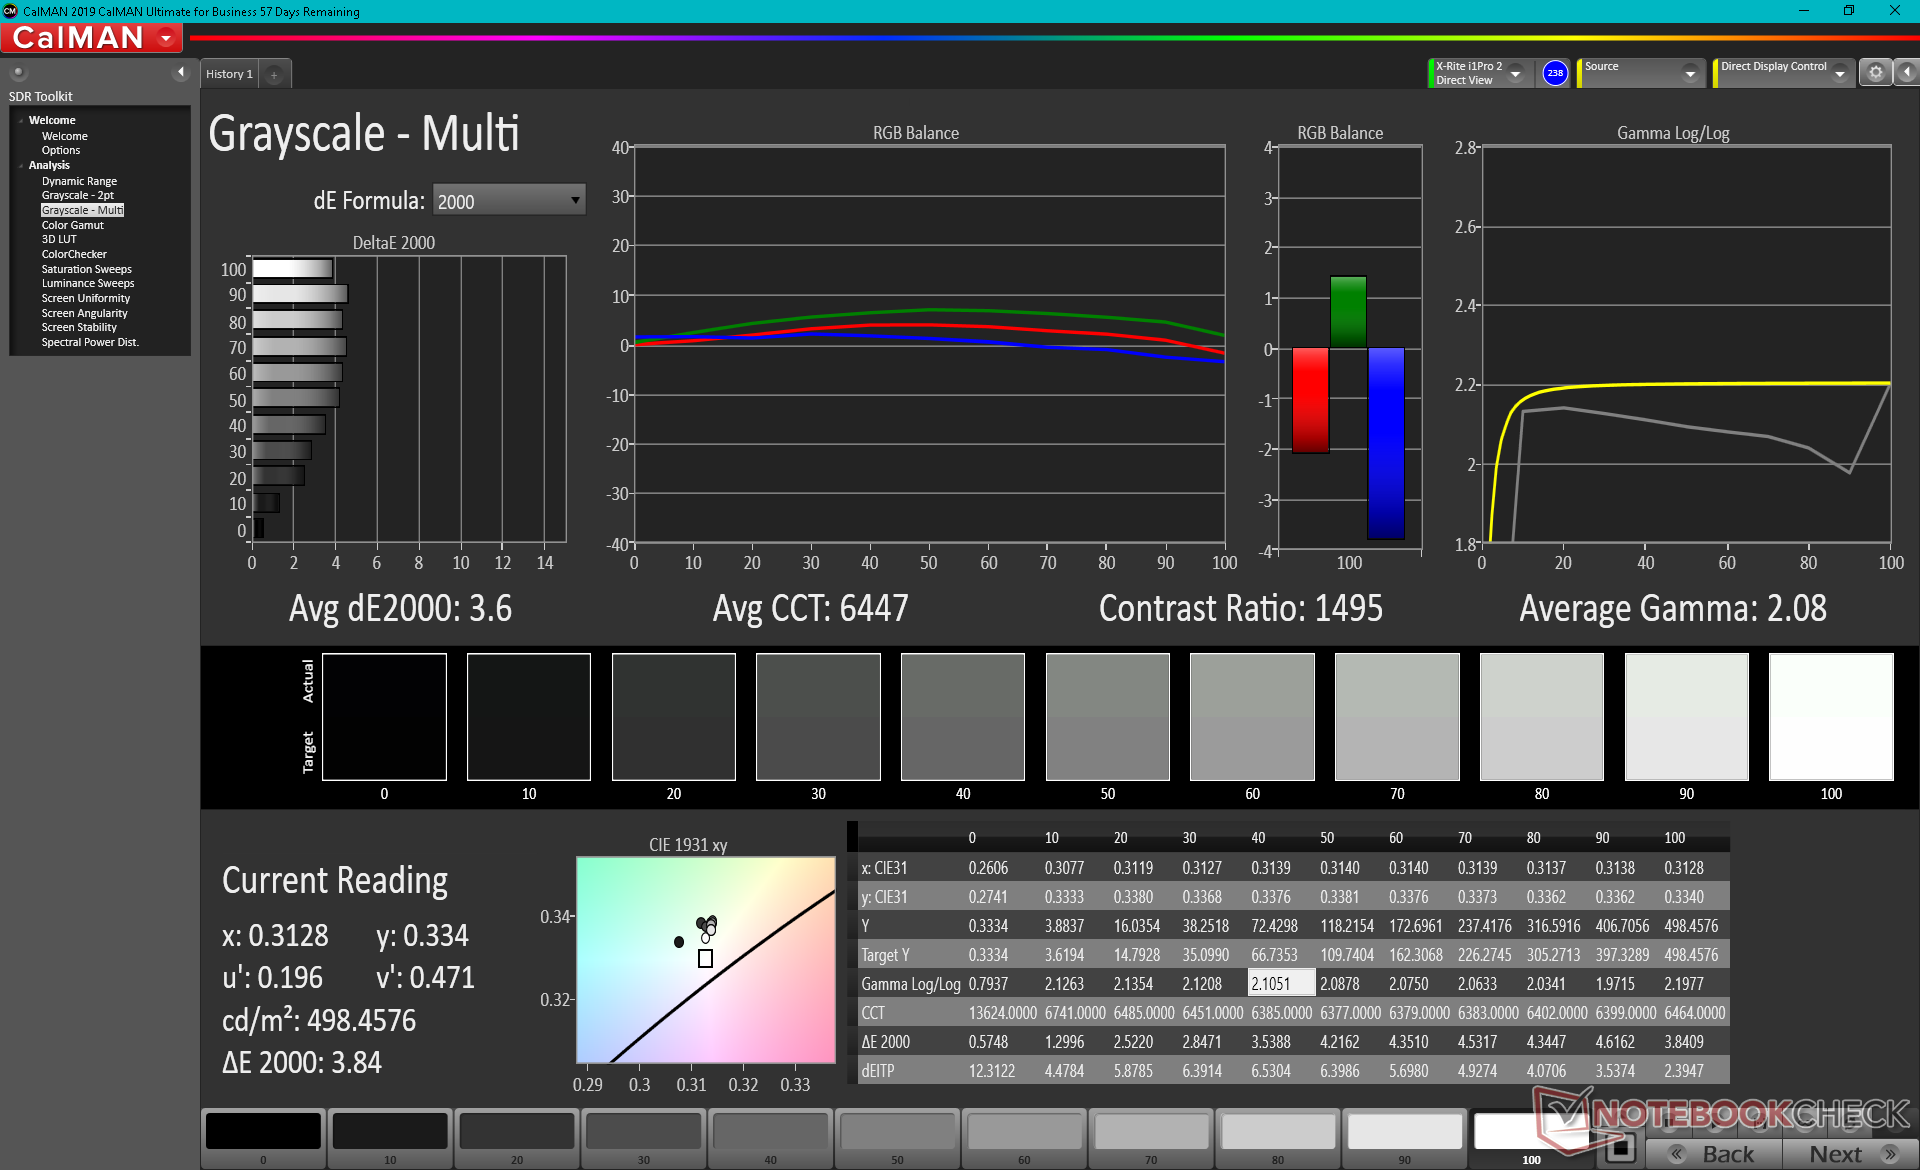
iluminación: 83 %
Brillo con batería: 501.5 cd/m²
Contraste: 1140:1 (Negro: 0.44 cd/m²)
ΔE ColorChecker Calman: 4.73 | ∀{0.5-29.43 Ø4.71}
calibrated: 0.51
ΔE Greyscale Calman: 3.6 | ∀{0.09-98 Ø4.96}
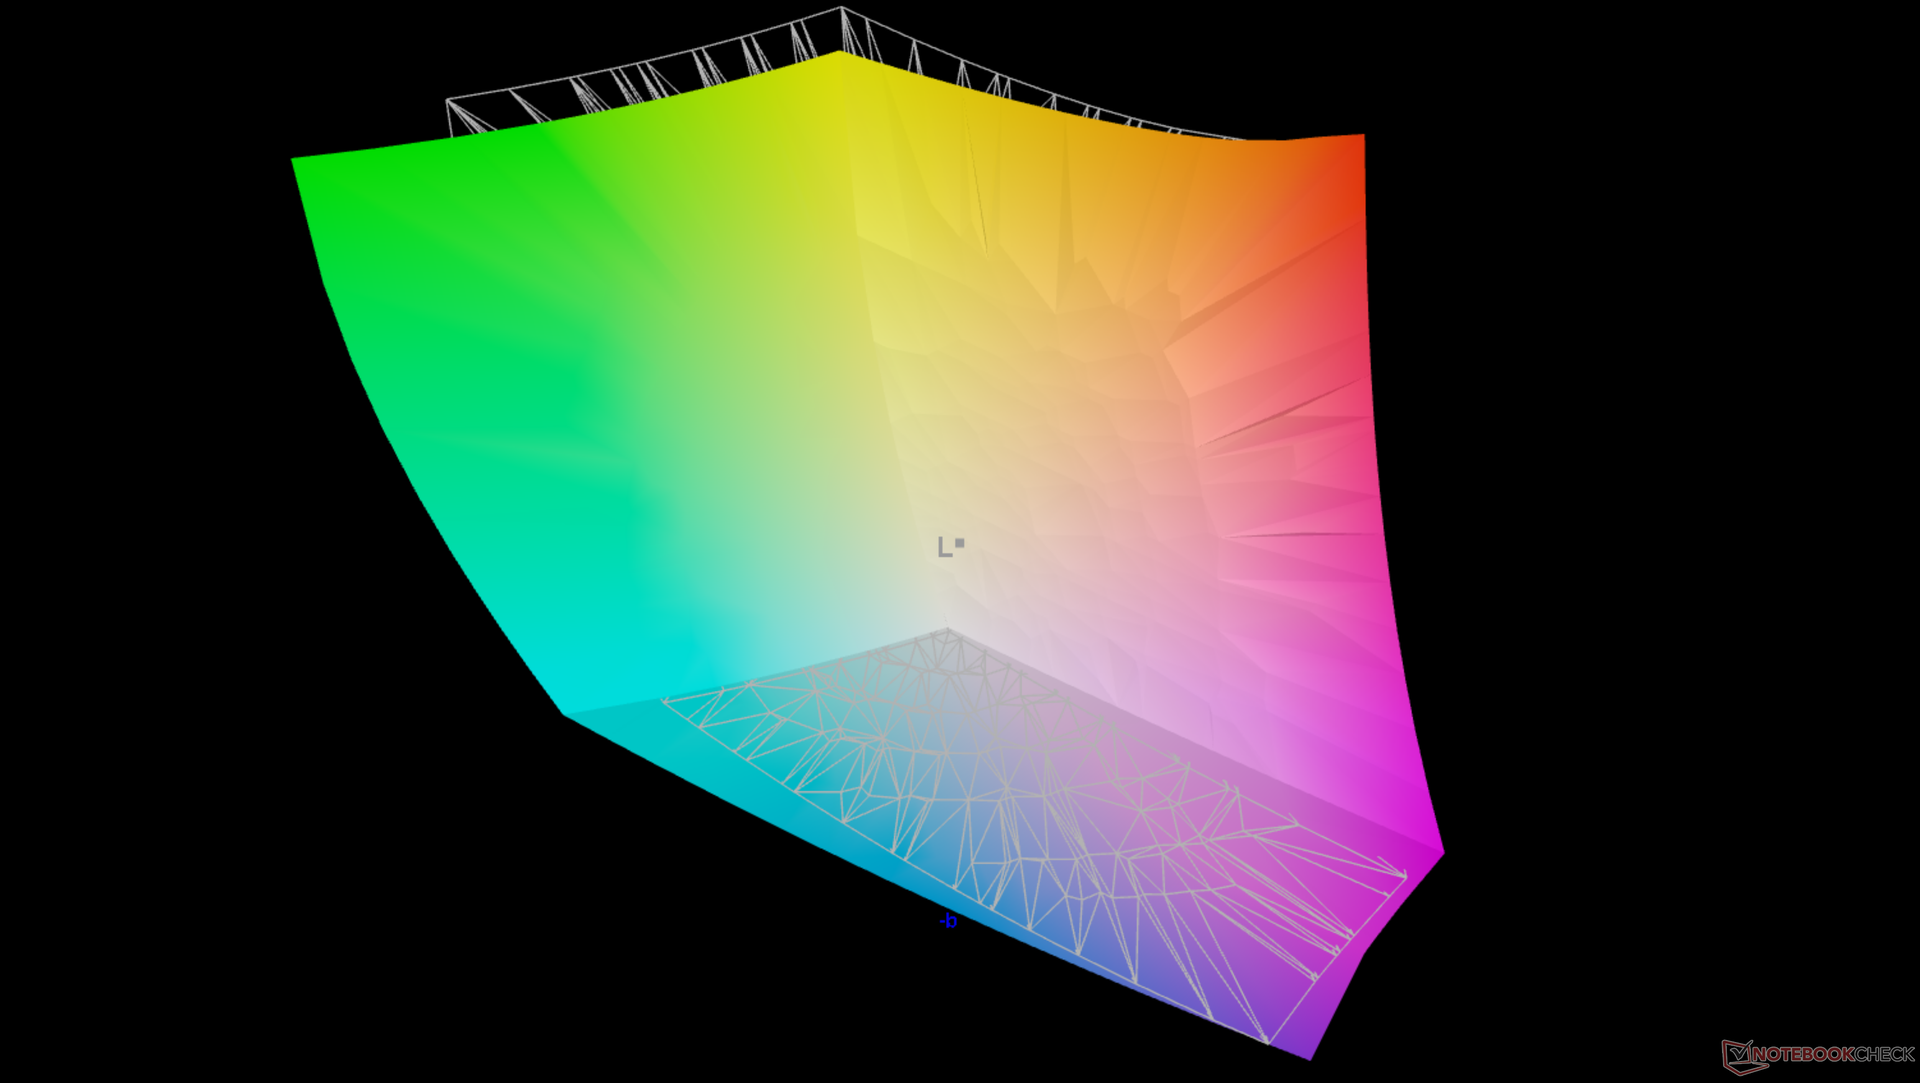
100% AdobeRGB 1998 (Argyll 3D)
100% sRGB (Argyll 3D)
94.9% Display P3 (Argyll 3D)
Gamma: 2.08
CCT: 6447 K
| Dell Precision 5000 5560 Sharp LQ156R1, IPS, 15.6", 3840x2400 | Lenovo ThinkPad P15 G2-20YQ001JGE N156HCE_GN1, IPS, 15.6", 1920x1080 | HP ZBook Studio 15 G8 SDC4145, OLED, 15.6", 3840x2160 | Asus ProArt StudioBook Pro 15 W500G5T AU Optronics B156ZAN03.1, IPS, 15.6", 3840x2160 | Dell Precision 7550 AU Optronics B156ZAN, IPS, 15.6", 3840x2160 | Dell Precision 5550 P91F Sharp LQ156R1, IPS, 15.6", 3840x2400 | Razer Blade 15 Studio Edition 2020 Samsung SDCA029, OLED, 15.6", 3840x2160 | |
|---|---|---|---|---|---|---|---|
| Display | -19% | 0% | -7% | -5% | -2% | 1% | |
| Display P3 Coverage (%) | 94.9 | 68.6 -28% | 99.9 5% | 82.1 -13% | 82.1 -13% | 89.9 -5% | 99.9 5% |
| sRGB Coverage (%) | 100 | 99.8 0% | 100 0% | 97.6 -2% | 99.6 0% | 100 0% | 100 0% |
| AdobeRGB 1998 Coverage (%) | 100 | 70.6 -29% | 95.3 -5% | 95 -5% | 96.8 -3% | 99.9 0% | 97.3 -3% |
| Response Times | 34% | 94% | -19% | -10% | -5% | 90% | |
| Response Time Grey 50% / Grey 80% * (ms) | 47.2 ? | 37.6 ? 20% | 2.4 ? 95% | 58 ? -23% | 51.2 ? -8% | 46 ? 3% | 4 ? 92% |
| Response Time Black / White * (ms) | 30.4 ? | 16 ? 47% | 2.4 ? 92% | 35 ? -15% | 34 ? -12% | 34 ? -12% | 4 ? 87% |
| PWM Frequency (Hz) | 26040 ? | 240.4 ? | |||||
| Screen | 9% | -73% | 10% | -68% | -79% | 140% | |
| Brightness middle (cd/m²) | 501.5 | 498 -1% | 379.6 -24% | 344 -31% | 473.5 -6% | 469.8 -6% | 380 -24% |
| Brightness (cd/m²) | 467 | 490 5% | 380 -19% | 335 -28% | 461 -1% | 464 -1% | 388 -17% |
| Brightness Distribution (%) | 83 | 95 14% | 95 14% | 93 12% | 90 8% | 85 2% | 93 12% |
| Black Level * (cd/m²) | 0.44 | 0.39 11% | 0.37 16% | 0.55 -25% | 0.42 5% | 0.018 96% | |
| Contrast (:1) | 1140 | 1277 12% | 930 -18% | 861 -24% | 1119 -2% | 21111 1752% | |
| Colorchecker dE 2000 * | 4.73 | 2.1 56% | 5.15 -9% | 1.76 63% | 4.8 -1% | 5.16 -9% | 5.47 -16% |
| Colorchecker dE 2000 max. * | 8.45 | 5.6 34% | 7.79 8% | 4.31 49% | 8.73 -3% | 9.33 -10% | 8.19 3% |
| Colorchecker dE 2000 calibrated * | 0.51 | 0.8 -57% | 3.1 -508% | 3.08 -504% | 3.75 -635% | 3.04 -496% | |
| Greyscale dE 2000 * | 3.6 | 3.4 6% | 2.6 28% | 3.12 13% | 5.6 -56% | 5.5 -53% | 5.3 -47% |
| Gamma | 2.08 106% | 2.32 95% | 1.99 111% | 2.2 100% | 2.34 94% | 2 110% | 2.15 102% |
| CCT | 6447 101% | 7162 91% | 6166 105% | 6563 99% | 7549 86% | 6198 105% | 6128 106% |
| Color Space (Percent of AdobeRGB 1998) (%) | 85 | 86.4 | 89.2 | 86 | |||
| Color Space (Percent of sRGB) (%) | 98 | 99.7 | 100 | 100 | |||
| Media total (Programa/Opciones) | 8% /
6% | 7% /
-27% | -5% /
1% | -28% /
-46% | -29% /
-52% | 77% /
103% |
* ... más pequeño es mejor
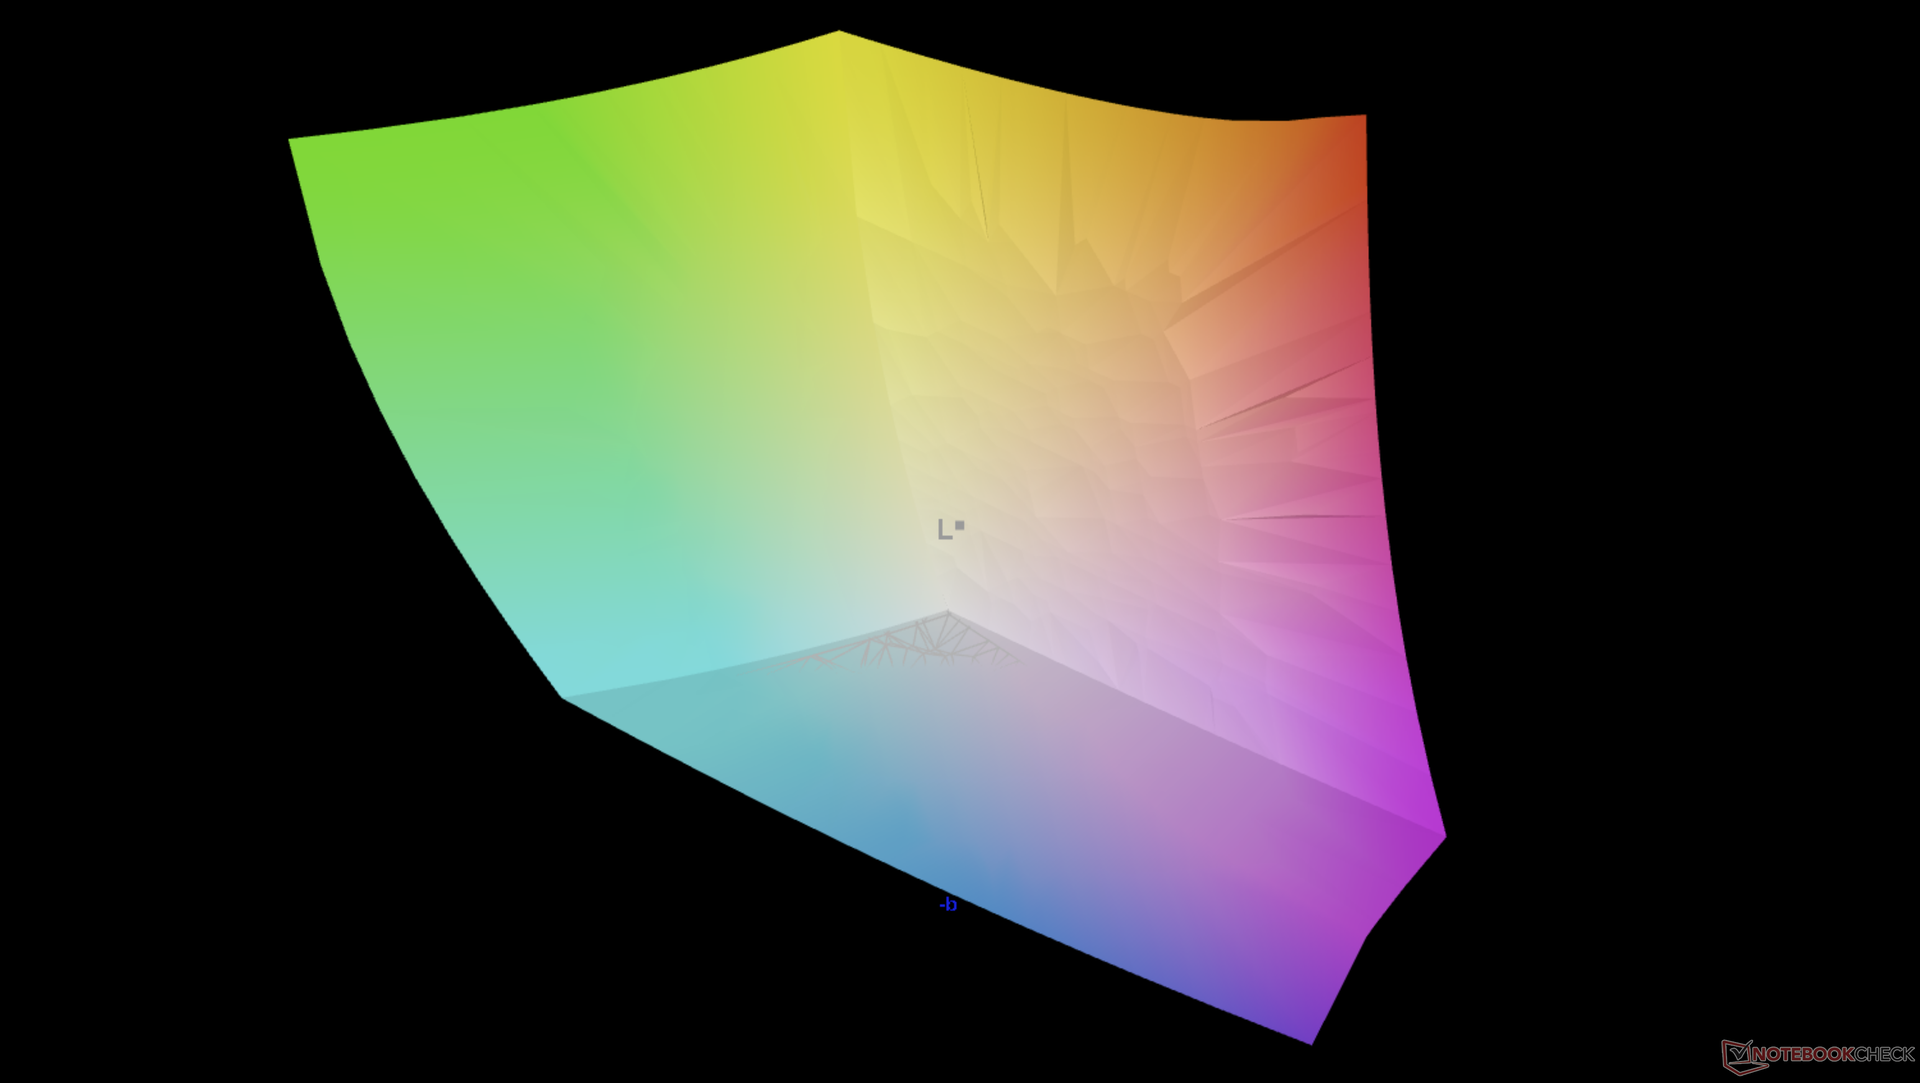
Los colores podrían haber sido mejor calibrados al sacarlos de la caja, ya que los valores medios de escala de grises y deltaE de color son sólo decentes, con 3,6 y 4,73, respectivamente. Podemos reducir ambos valores a menos de uno después de calibrarlos con nuestro colorímetro X-Rite.
Tiempos de respuesta del display
| ↔ Tiempo de respuesta de Negro a Blanco | ||
|---|---|---|
| 30.4 ms ... subida ↗ y bajada ↘ combinada | ↗ 16.4 ms subida | 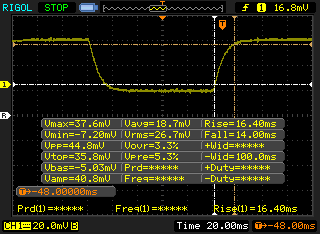 |
| ↘ 14 ms bajada | ||
| La pantalla mostró tiempos de respuesta lentos en nuestros tests y podría ser demasiado lenta para los jugones. En comparación, todos los dispositivos de prueba van de ##min### (mínimo) a 240 (máximo) ms. » 82 % de todos los dispositivos son mejores. Eso quiere decir que el tiempo de respuesta es peor que la media (19.8 ms) de todos los dispositivos testados. | ||
| ↔ Tiempo de respuesta 50% Gris a 80% Gris | ||
| 47.2 ms ... subida ↗ y bajada ↘ combinada | ↗ 25.2 ms subida | 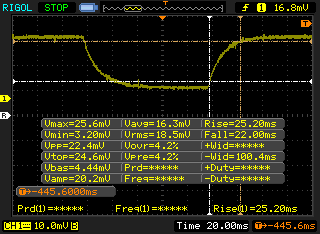 |
| ↘ 22 ms bajada | ||
| La pantalla mostró tiempos de respuesta lentos en nuestros tests y podría ser demasiado lenta para los jugones. En comparación, todos los dispositivos de prueba van de ##min### (mínimo) a 636 (máximo) ms. » 82 % de todos los dispositivos son mejores. Eso quiere decir que el tiempo de respuesta es peor que la media (31 ms) de todos los dispositivos testados. | ||
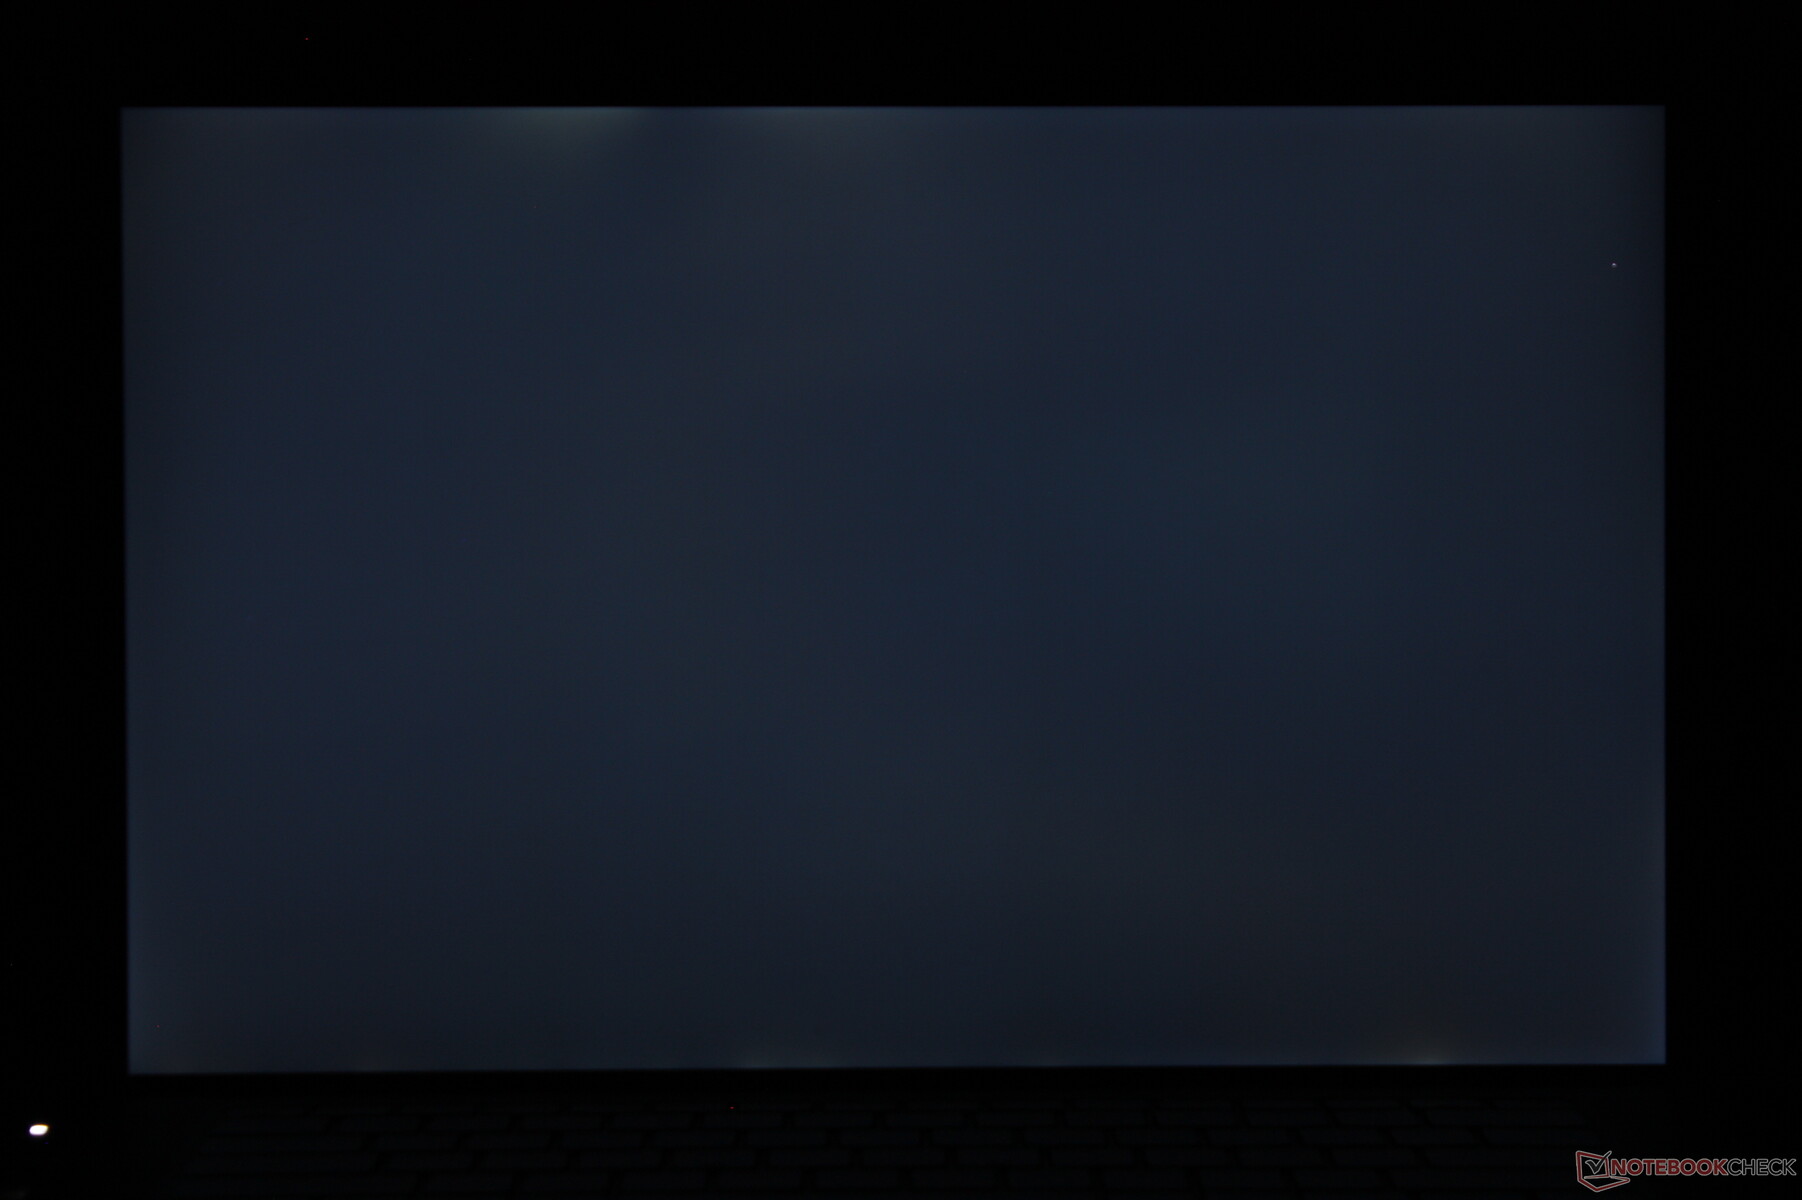
Parpadeo de Pantalla / PWM (Pulse-Width Modulation)
| Parpadeo de Pantalla / PWM no detectado | 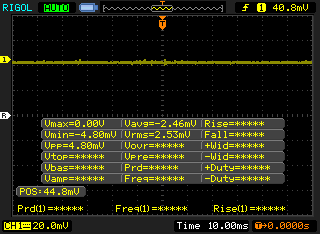 | ||
Comparación: 52 % de todos los dispositivos testados no usaron PWM para atenuar el display. Si se usó, medimos una media de 7754 (mínimo: 5 - máxmo: 343500) Hz. | |||
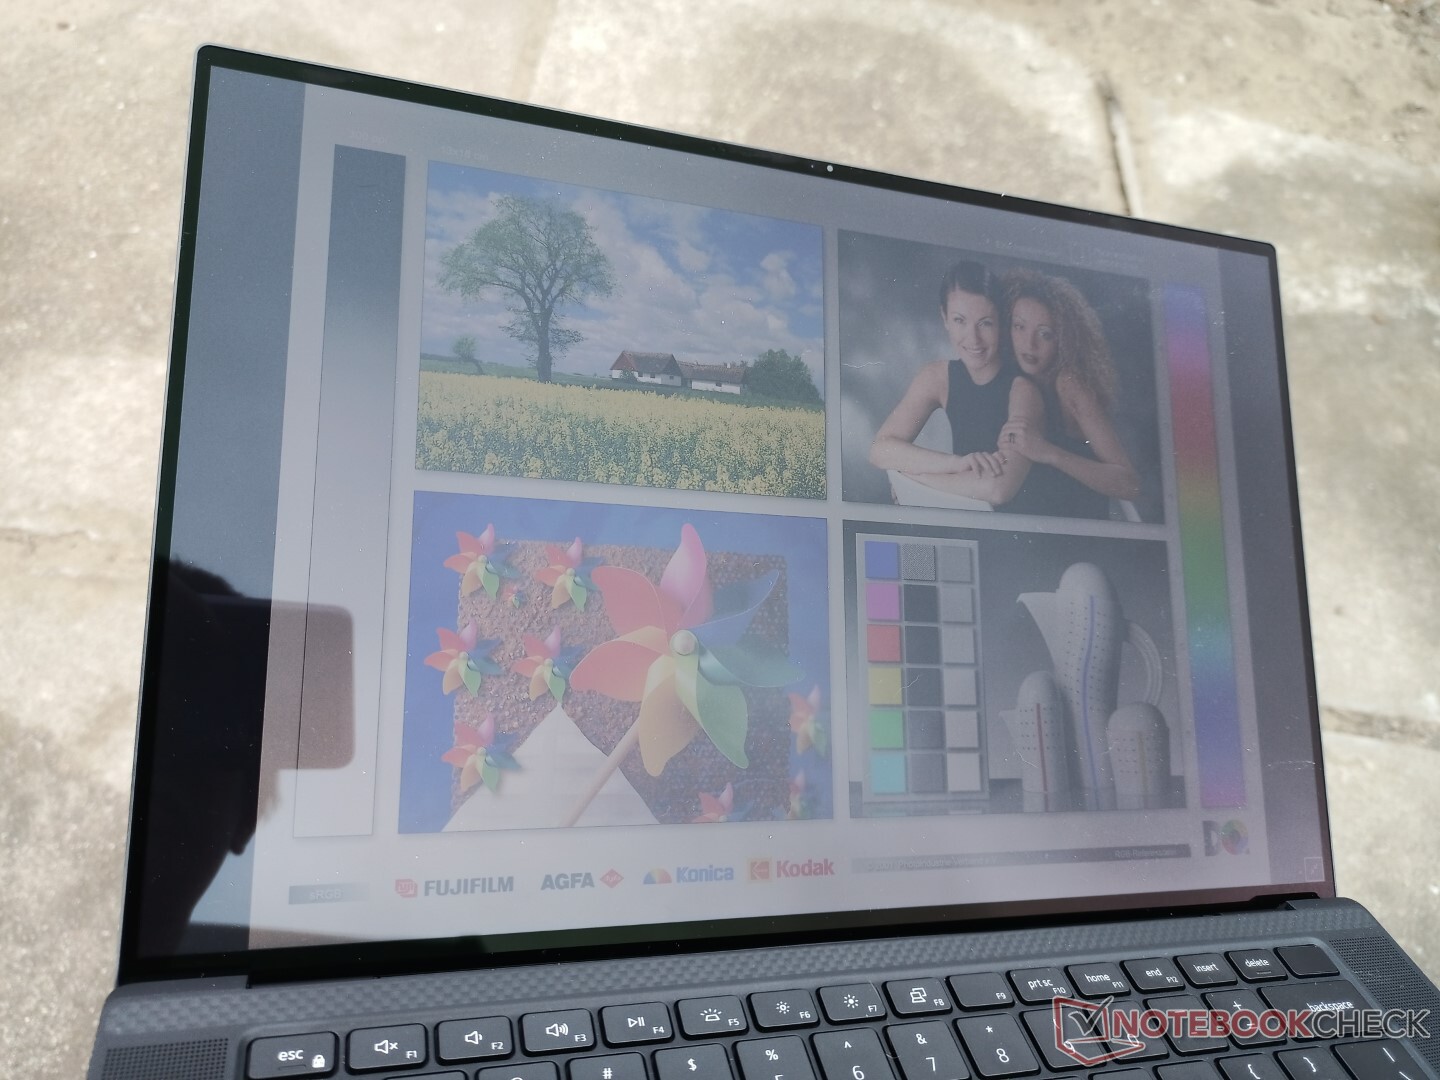
La visibilidad en exteriores es mejor que en el Razer Blade 15 Studio o el Asus ProArt debido a la luz de fondo más brillante de nuestro Precision 5560. Sin embargo, siempre habrá algo de resplandor en la pantalla brillante. Los usuarios pueden considerar la opción de pantalla mate de 1200p para reducir los reflejos.
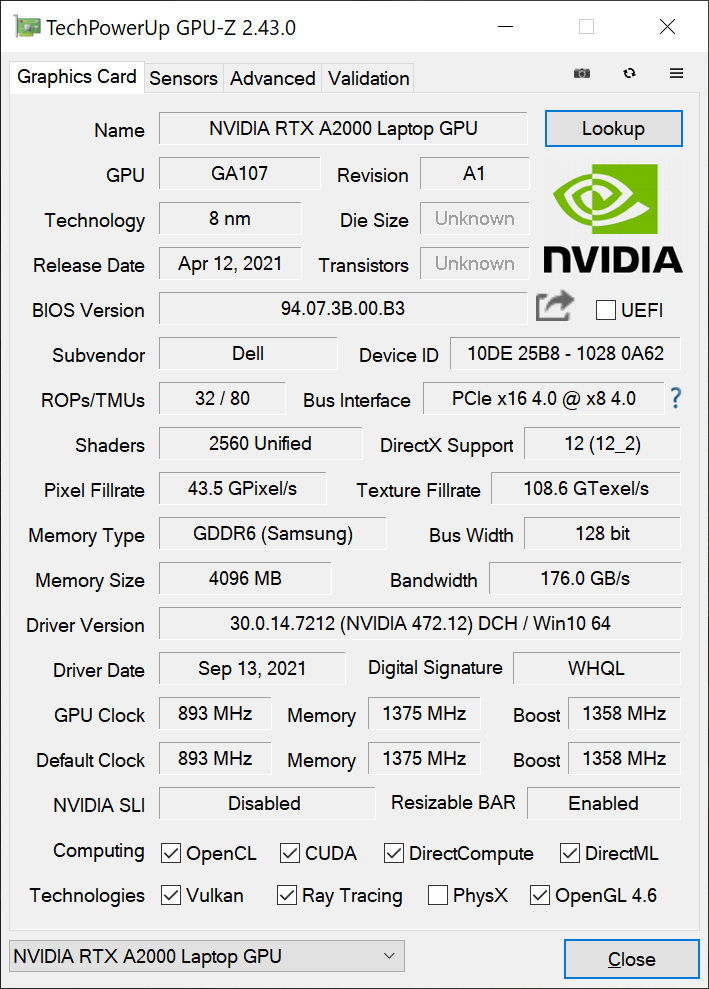
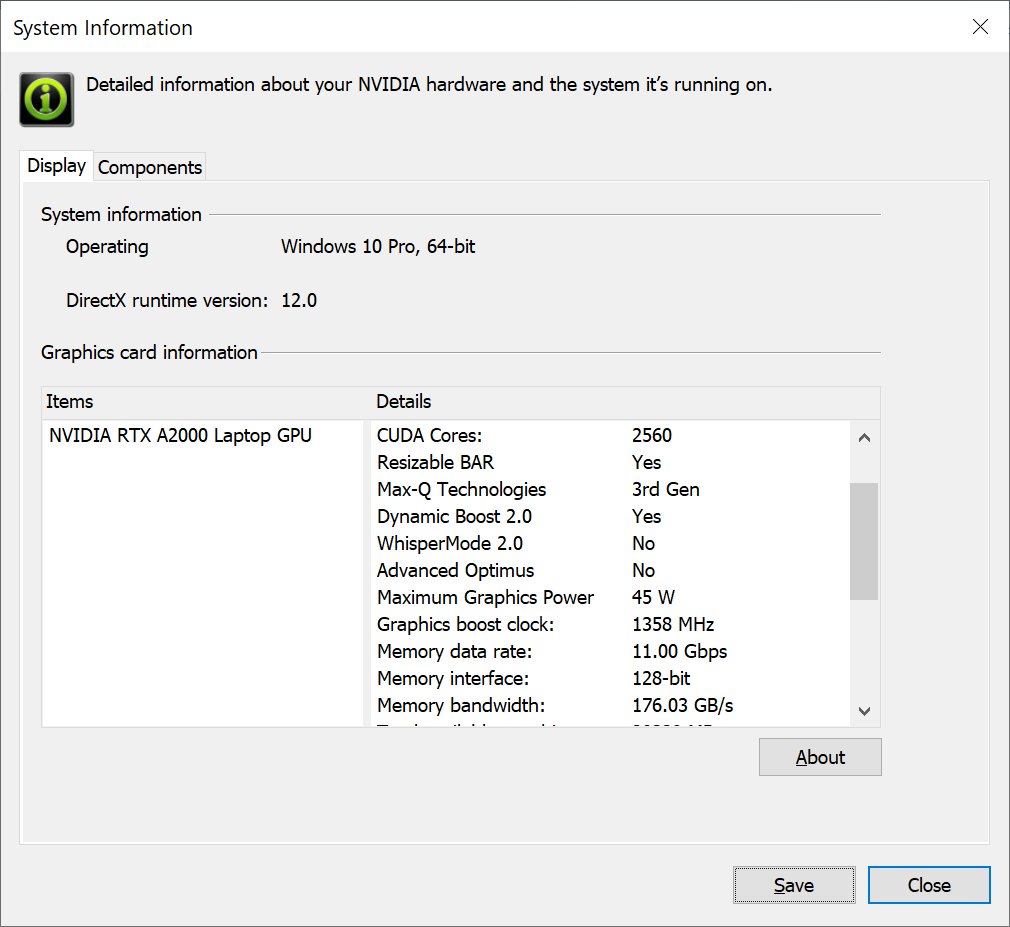
Rendimiento - Gráficos TGP Quadro RTX de 45 W
Dell ofrece tanto la versión no vPro (i5-11500H, i7-11800H) y vPro (i7-11850H, i9-11950H, Xeon W-11955M) Tiger Lake-H junto con las GPUs Nvidia Quadro (NVIDIA T1200, RTX A2000) para casi todas las configuraciones. Estas GPUs, las CPUs vPro y la RAM ECC opcional asociada son lo que separa al Precision 5560 de la serie XPS 15 de nivel de consumidor
La GPU Quadro RTX A2000 de nuestra unidad de pruebas soporta Resizable Bar y Dynamic Boost 2.0 pero sin soporte para Advanced Optimus o WhisperMode 2.0. Con sólo 45 W TGP, se trata técnicamente de una GPU Max-Q, aunque Max-Q no esté en el nombre. En comparación, la antigua Quadro T2000 Max-Q de la Precision 5550 tenía un consumo estimado de 40 W TGP
Nuestra unidad se configuró en el modo de Ultra Rendimiento a través del software Dell Power Manager antes de ejecutar nuestros benchmarks a continuación para obtener las puntuaciones más altas posibles.
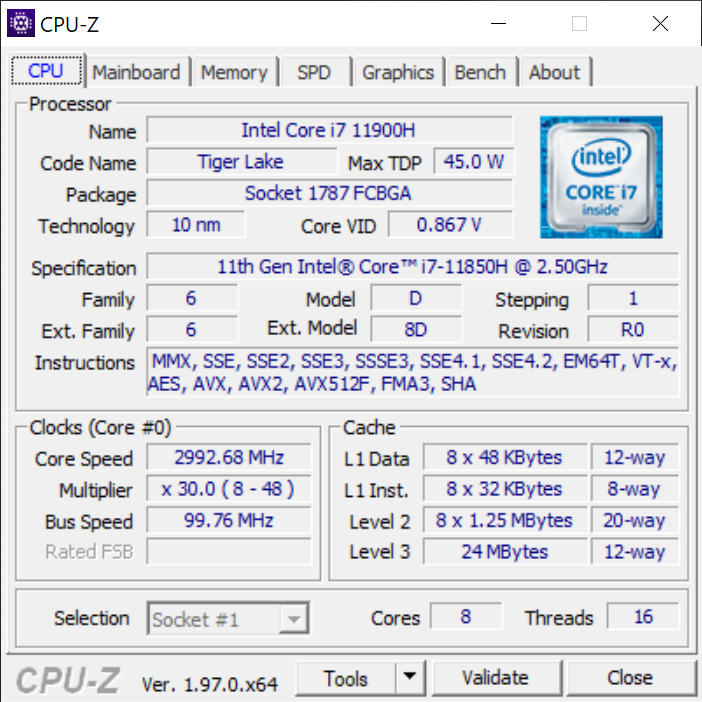
Procesador
El rendimiento multihilo general es aproximadamente un 15 por ciento más lento que el del Core i7-11800H, que es el precio a pagar por el soporte vPro integrado. Se espera que la actualización al Core i9-11950H aumente el rendimiento multihilo hasta un 20 por ciento según nuestra experiencia con el HP ZBook Studio 15 G8. Sin embargo, el rendimiento monohilo sigue siendo casi idéntico
La sostenibilidad del rendimiento es excelente, como muestran los resultados consistentes de CineBench R15 xT que aparecen a continuación.
Cinebench R15 Multi Loop
Cinebench R23: Multi Core | Single Core
Cinebench R15: CPU Multi 64Bit | CPU Single 64Bit
Blender: v2.79 BMW27 CPU
7-Zip 18.03: 7z b 4 -mmt1 | 7z b 4
Geekbench 5.5: Single-Core | Multi-Core
HWBOT x265 Benchmark v2.2: 4k Preset
LibreOffice : 20 Documents To PDF
R Benchmark 2.5: Overall mean
| Cinebench R23 / Multi Core | |
| Lenovo Legion 5 15ACH-82JU00C6GE-FL | |
| HP ZBook Studio 15 G8 | |
| Lenovo ThinkPad P15 G2-20YQ001JGE | |
| Medio Intel Core i7-11850H (9779 - 11935, n=2) | |
| HP ZBook Studio G7 | |
| Dell Precision 5000 5560 | |
| Lenovo ThinkPad P15 Gen1-20ST000DGE | |
| Lenovo ThinkPad P15s Gen2-20W6000GGE | |
| Cinebench R23 / Single Core | |
| HP ZBook Studio 15 G8 | |
| Medio Intel Core i7-11850H (1513 - 1552, n=2) | |
| Dell Precision 5000 5560 | |
| Lenovo ThinkPad P15 G2-20YQ001JGE | |
| Lenovo ThinkPad P15s Gen2-20W6000GGE | |
| Lenovo Legion 5 15ACH-82JU00C6GE-FL | |
| HP ZBook Studio G7 | |
| Lenovo ThinkPad P15 Gen1-20ST000DGE | |
Cinebench R23: Multi Core | Single Core
Cinebench R15: CPU Multi 64Bit | CPU Single 64Bit
Blender: v2.79 BMW27 CPU
7-Zip 18.03: 7z b 4 -mmt1 | 7z b 4
Geekbench 5.5: Single-Core | Multi-Core
HWBOT x265 Benchmark v2.2: 4k Preset
LibreOffice : 20 Documents To PDF
R Benchmark 2.5: Overall mean
* ... más pequeño es mejor
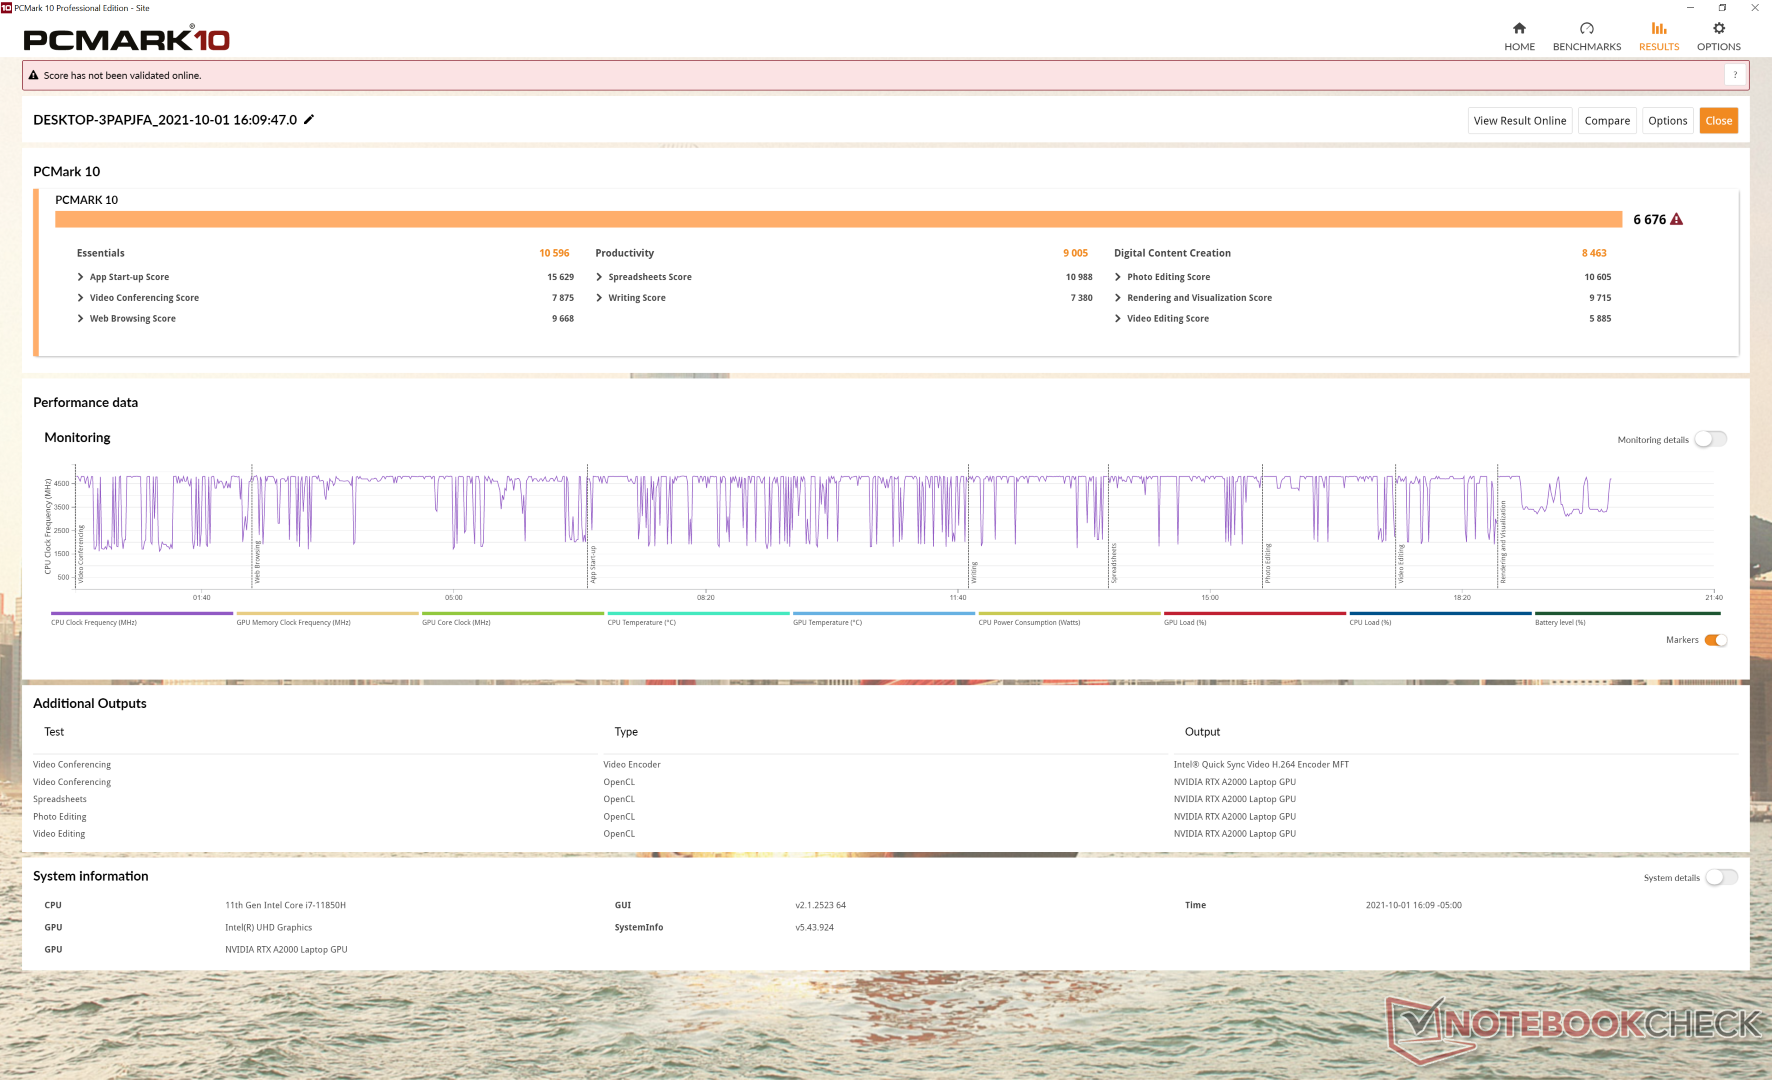
Rendimiento del sistema
Las puntuaciones de PCMark son sistemáticamente más altas que las de la Precision 5550, especialmente en la prueba de creación de contenidos digitales, en la que la RTX A2000 puede superar a la Quadro T2000 Max-Q.
| PCMark 10 / Score | |
| HP ZBook Studio 15 G8 | |
| Dell Precision 5000 5560 | |
| Medio Intel Core i7-11850H, NVIDIA RTX A2000 Laptop GPU (n=1) | |
| Lenovo ThinkPad P15 G2-20YQ001JGE | |
| Dell Precision 7550 | |
| Dell Precision 5550 P91F | |
| Razer Blade 15 Studio Edition 2020 | |
| Asus ProArt StudioBook Pro 15 W500G5T | |
| PCMark 10 / Essentials | |
| Dell Precision 5000 5560 | |
| Medio Intel Core i7-11850H, NVIDIA RTX A2000 Laptop GPU (n=1) | |
| Lenovo ThinkPad P15 G2-20YQ001JGE | |
| HP ZBook Studio 15 G8 | |
| Dell Precision 5550 P91F | |
| Dell Precision 7550 | |
| Razer Blade 15 Studio Edition 2020 | |
| Asus ProArt StudioBook Pro 15 W500G5T | |
| PCMark 10 / Productivity | |
| Dell Precision 5000 5560 | |
| Medio Intel Core i7-11850H, NVIDIA RTX A2000 Laptop GPU (n=1) | |
| HP ZBook Studio 15 G8 | |
| Lenovo ThinkPad P15 G2-20YQ001JGE | |
| Razer Blade 15 Studio Edition 2020 | |
| Dell Precision 7550 | |
| Dell Precision 5550 P91F | |
| Asus ProArt StudioBook Pro 15 W500G5T | |
| PCMark 10 / Digital Content Creation | |
| HP ZBook Studio 15 G8 | |
| Lenovo ThinkPad P15 G2-20YQ001JGE | |
| Dell Precision 5000 5560 | |
| Medio Intel Core i7-11850H, NVIDIA RTX A2000 Laptop GPU (n=1) | |
| Dell Precision 7550 | |
| Dell Precision 5550 P91F | |
| Asus ProArt StudioBook Pro 15 W500G5T | |
| Razer Blade 15 Studio Edition 2020 | |
| PCMark 10 Score | 6676 puntos | |
ayuda | ||
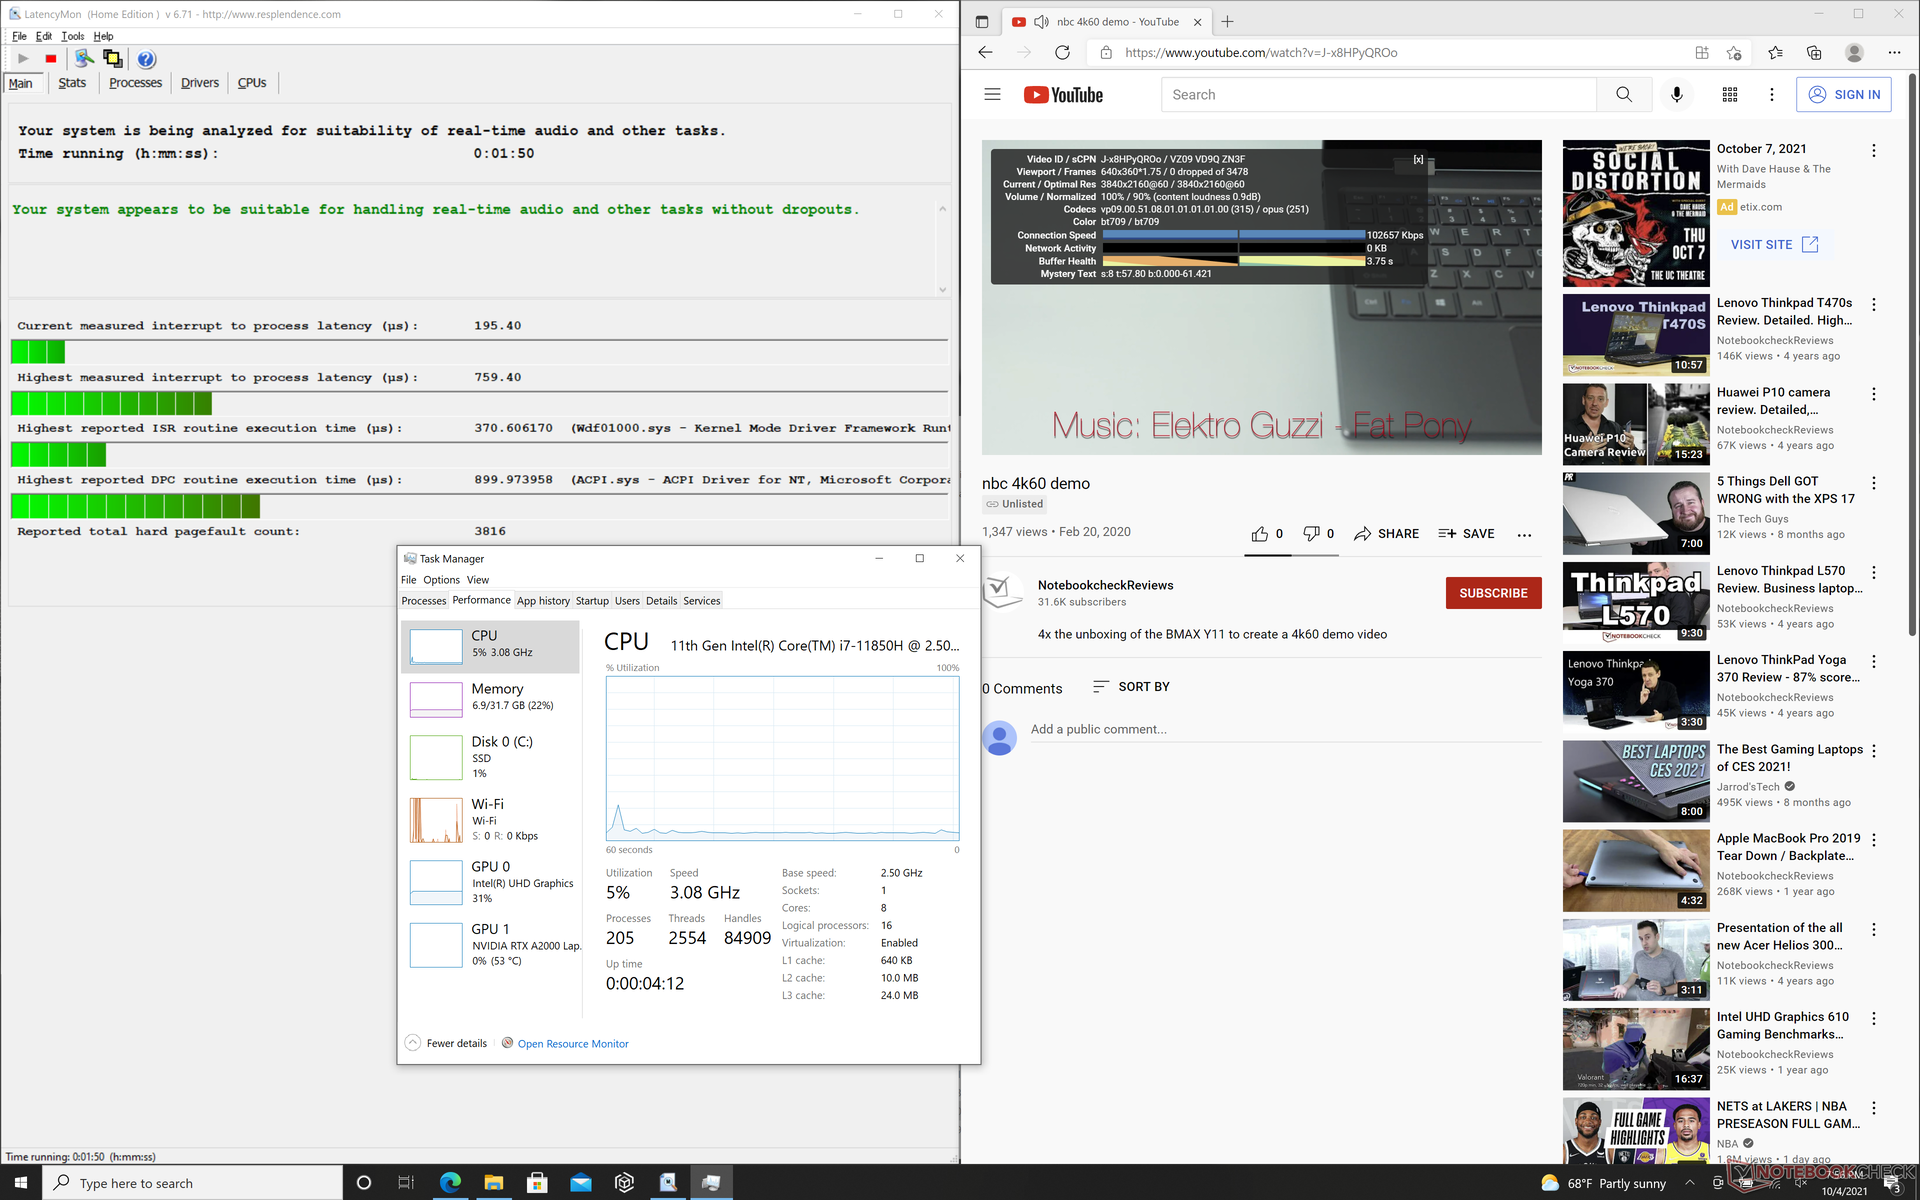
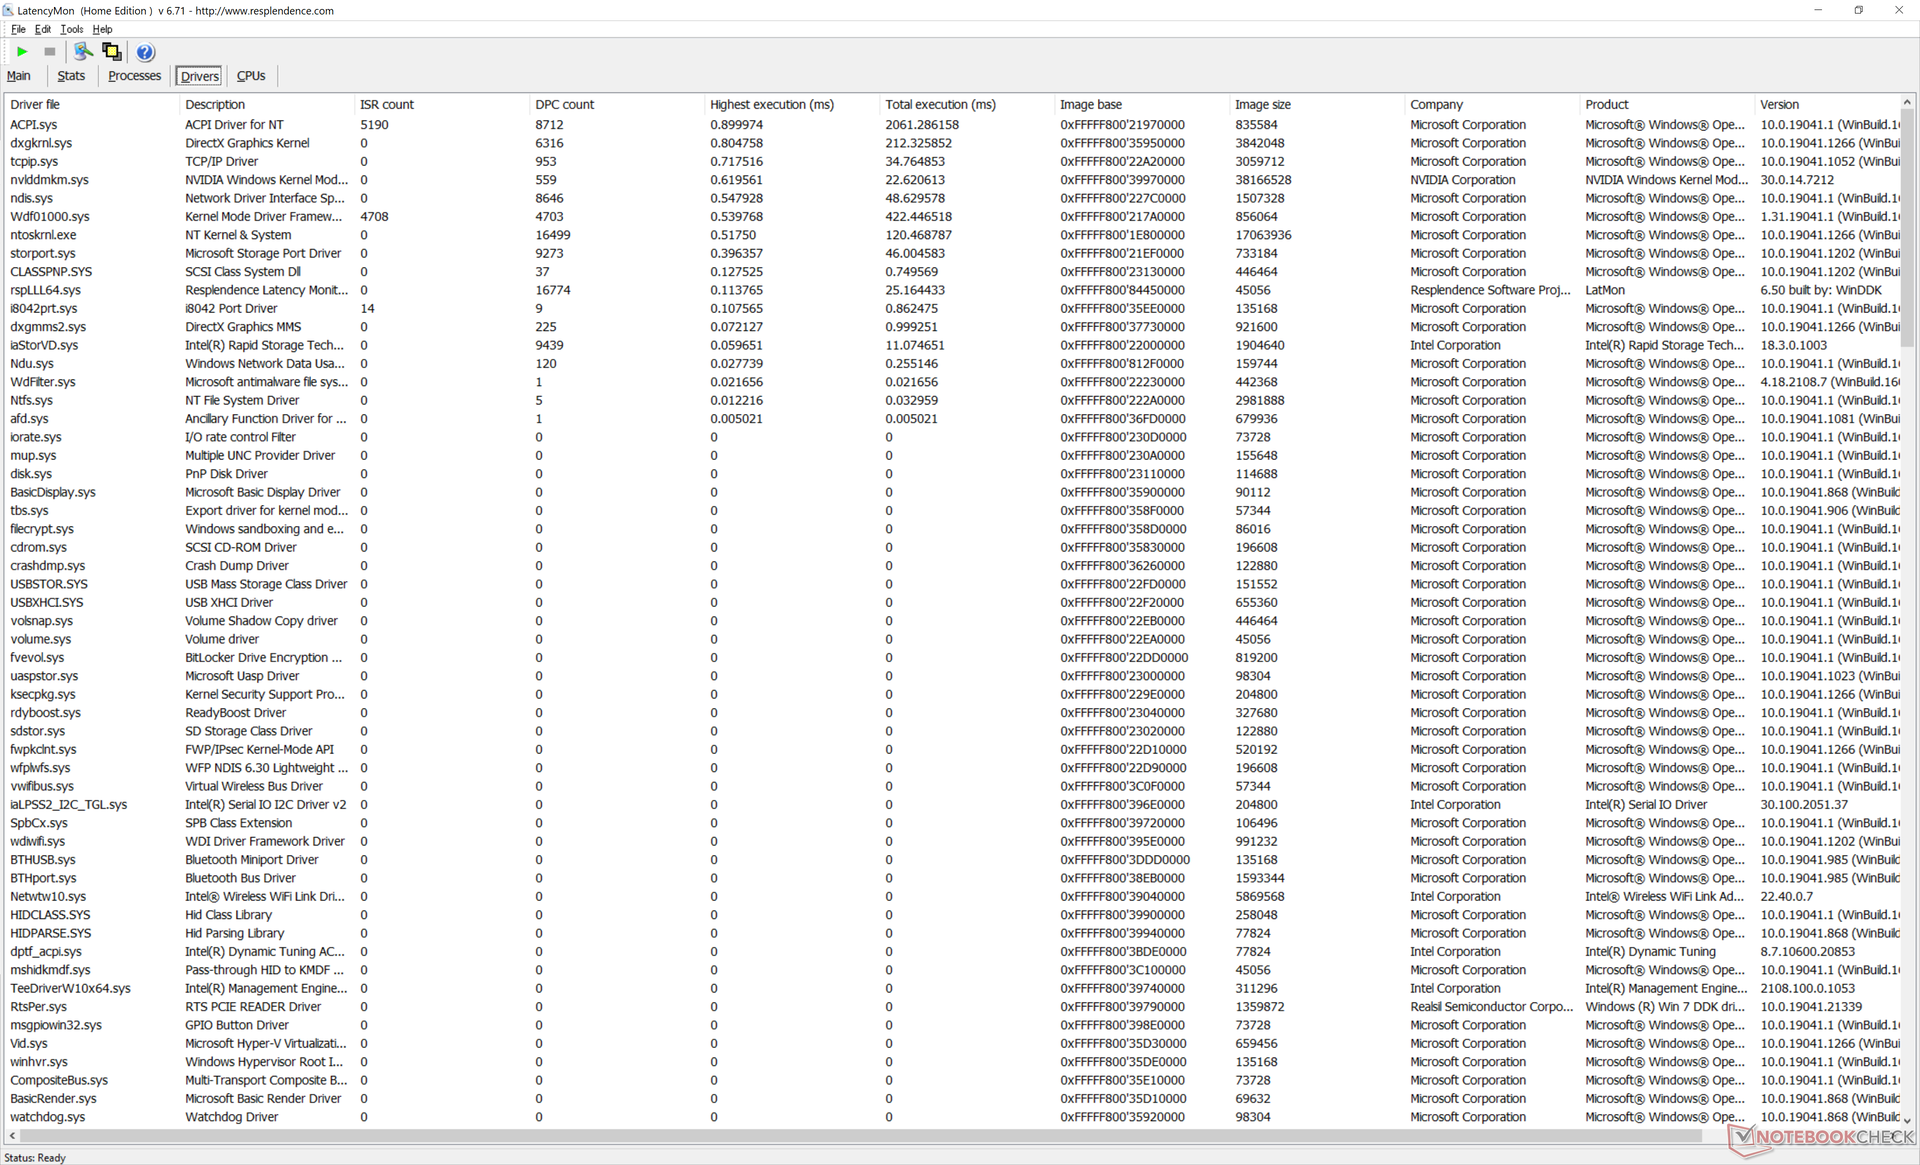
Latencia del CPD
LatencyMon no muestra problemas de latencia del CPD al abrir varias pestañas del navegador o al ejecutar Prime95. La reproducción de vídeo 4K a 60 FPS también es completamente fluida y sin pérdida de frames. No esperamos menos de cualquier estación de trabajo.
| DPC Latencies / LatencyMon - interrupt to process latency (max), Web, Youtube, Prime95 | |
| Dell Precision 7550 | |
| Lenovo ThinkPad P15 G2-20YQ001JGE | |
| Asus ProArt StudioBook Pro 15 W500G5T | |
| HP ZBook Studio 15 G8 | |
| Dell Precision 5000 5560 | |
| Razer Blade 15 Studio Edition 2020 | |
| Dell Precision 5550 P91F | |
* ... más pequeño es mejor
Dispositivos de almacenamiento
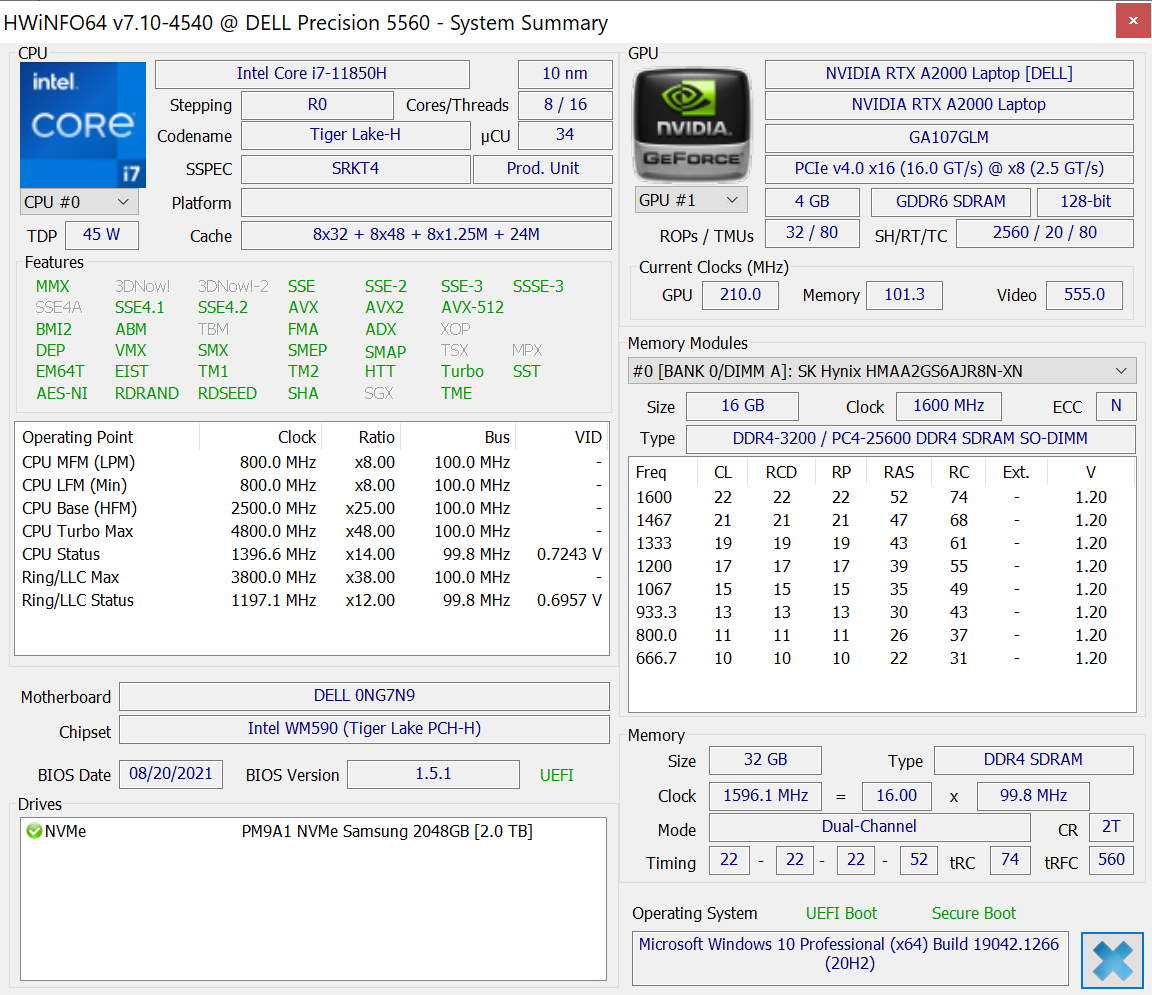
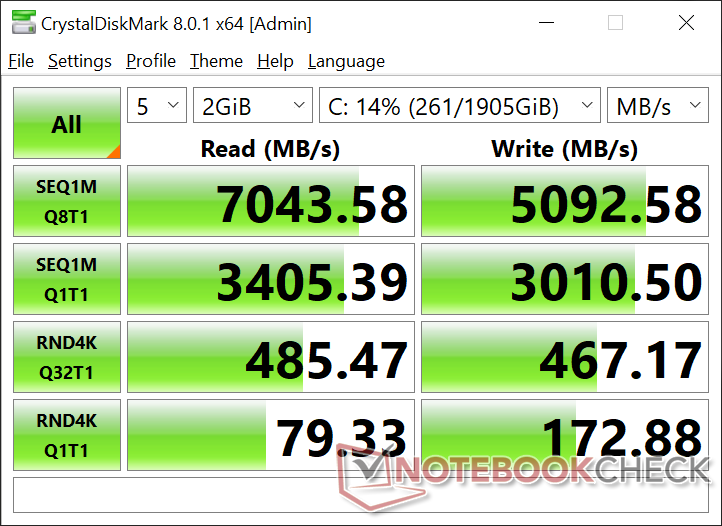
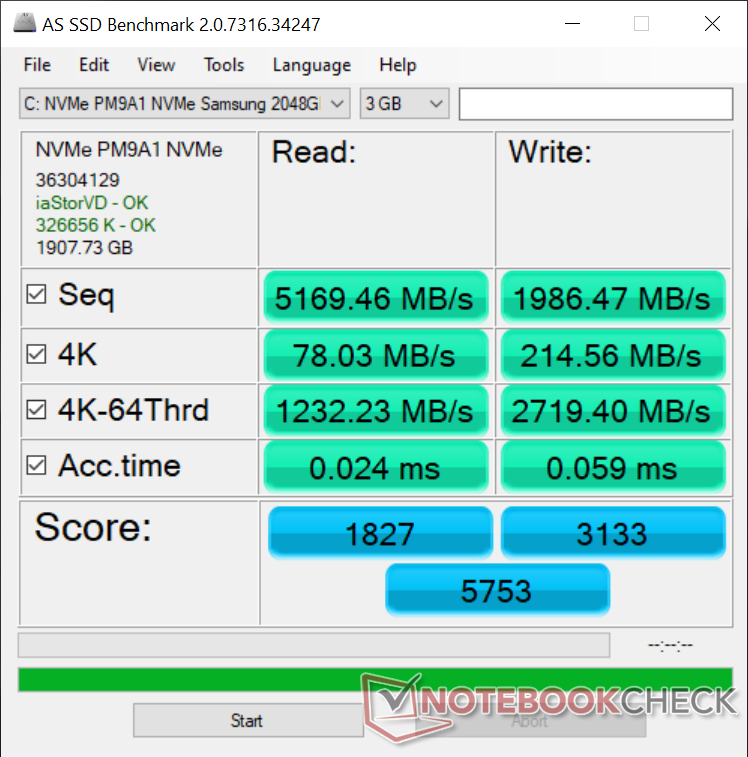
Dell nos ha confirmado que ambas bahías de almacenamiento M.2 admiten SSDs PCIe4 x4 en comparación con las PCIe3 del Precision 5550. Incluso el Alienware x17 R1 sólo puede soportar un SSD PCIe4 x4 a pesar de tener dos ranuras M.2 SSD. Nuestra unidad de prueba viene con un Samsung PM9A1 que es uno de los SSDs PCIe4 más rápidos a nivel de consumidor disponibles actualmente y, en consecuencia, es una enorme mejora de rendimiento respecto al SK Hynix PC601A del modelo del año pasado.
| Dell Precision 5000 5560 Samsung PM9A1 MZVL22T0HBLB | Lenovo ThinkPad P15 G2-20YQ001JGE Kioxia XG7 KXG7AZNV512G | HP ZBook Studio 15 G8 Samsung PM981a MZVLB2T0HALB | Asus ProArt StudioBook Pro 15 W500G5T Samsung SSD PM981 MZVLB1T0HALR | Dell Precision 7550 SK Hynix PC601A NVMe 1TB | Dell Precision 5550 P91F SK Hynix PC601A NVMe 1TB | Razer Blade 15 Studio Edition 2020 Samsung PM981a MZVLB1T0HBLR | |
|---|---|---|---|---|---|---|---|
| AS SSD | -8% | -16% | -16% | -42% | -142% | -33% | |
| Seq Read (MB/s) | 5169 | 5105 -1% | 2953 -43% | 2702 -48% | 2028 -61% | 2039 -61% | 1982 -62% |
| Seq Write (MB/s) | 1986 | 1815 -9% | 1691 -15% | 2348 18% | 1193 -40% | 1376 -31% | 2252 13% |
| 4K Read (MB/s) | 78 | 47.46 -39% | 43.98 -44% | 37.59 -52% | 42.31 -46% | 44.11 -43% | 47.13 -40% |
| 4K Write (MB/s) | 214.6 | 137.3 -36% | 105.4 -51% | 107.1 -50% | 105.5 -51% | 113.3 -47% | 88.2 -59% |
| 4K-64 Read (MB/s) | 1232 | 2112 71% | 1065 -14% | 1491 21% | 1128 -8% | 1094 -11% | 1481 20% |
| 4K-64 Write (MB/s) | 2719 | 1702 -37% | 1957 -28% | 1794 -34% | 1537 -43% | 1630 -40% | 1842 -32% |
| Access Time Read * (ms) | 0.024 | 0.065 -171% | 0.04 -67% | 0.046 -92% | 0.069 -188% | 0.059 -146% | 0.087 -262% |
| Access Time Write * (ms) | 0.059 | 0.03 49% | 0.105 -78% | 0.034 42% | 0.106 -80% | 0.99 -1578% | 0.04 32% |
| Score Read (Points) | 1827 | 2670 46% | 1404 -23% | 1798 -2% | 1373 -25% | 1342 -27% | 1726 -6% |
| Score Write (Points) | 3133 | 2021 -35% | 2232 -29% | 2136 -32% | 1762 -44% | 1881 -40% | 2155 -31% |
| Score Total (Points) | 5753 | 5885 2% | 4297 -25% | 4835 -16% | 3801 -34% | 3883 -33% | 4781 -17% |
| Copy ISO MB/s (MB/s) | 3201 | 2054 -36% | 2474 -23% | 2302 -28% | 1768 -45% | 2489 -22% | 1982 -38% |
| Copy Program MB/s (MB/s) | 415.8 | 714 72% | 1074 158% | 564 36% | 627 51% | 682 64% | 501 20% |
| Copy Game MB/s (MB/s) | 1212 | 1431 18% | 1929 59% | 1336 10% | 1477 22% | 1515 25% | 1140 -6% |
| CrystalDiskMark 5.2 / 6 | -9% | -29% | 38% | -35% | -36% | -26% | |
| Write 4K (MB/s) | 172.4 | 141.1 -18% | 110.5 -36% | 1107 542% | 121 -30% | 122.6 -29% | 132.9 -23% |
| Read 4K (MB/s) | 78.8 | 58.8 -25% | 51.8 -34% | 43.38 -45% | 42.16 -46% | 42.4 -46% | 46.73 -41% |
| Write Seq (MB/s) | 2991 | 3320 11% | 2071 -31% | 2387 -20% | 2150 -28% | 2167 -28% | 2214 -26% |
| Read Seq (MB/s) | 3351 | 2994 -11% | 2505 -25% | 2431 -27% | 1755 -48% | 1747 -48% | 2018 -40% |
| Write 4K Q32T1 (MB/s) | 459.2 | 626 36% | 429.8 -6% | 340.7 -26% | 395.3 -14% | 388.8 -15% | 478.9 4% |
| Read 4K Q32T1 (MB/s) | 484.3 | 401.8 -17% | 418.3 -14% | 397.8 -18% | 381.8 -21% | 367.3 -24% | 540 12% |
| Write Seq Q32T1 (MB/s) | 4761 | 3742 -21% | 3060 -36% | 2390 -50% | 2730 -43% | 2629 -45% | 2975 -38% |
| Read Seq Q32T1 (MB/s) | 7071 | 5097 -28% | 3539 -50% | 3502 -50% | 3468 -51% | 3460 -51% | 3195 -55% |
| Media total (Programa/Opciones) | -9% /
-8% | -23% /
-21% | 11% /
4% | -39% /
-40% | -89% /
-103% | -30% /
-31% |
* ... más pequeño es mejor

Disk Throttling: DiskSpd Read Loop, Queue Depth 8
Rendimiento de la GPU
El rendimiento gráfico bruto de la Quadro RTX A2000 se sitúa cómodamente entre la GeForce GTX 1650 Ti y GTX 1660 Ti o un 10 por ciento más lenta que la antigua Quadro RTX 3000 Max-Q. El aumento de rendimiento es más significativo, entre un 40 y un 50 por ciento, en comparación con la Quadro T2000 Max-Q en la Precision 5550. Laactualización a una Quadro RTX A3000, que no está disponible en la serie Precision 5560, puede suponer un aumento del rendimiento del 30 al 40 por ciento respecto a nuestra Quadro RTX A2000
Curiosamente, las puntuaciones de SpecViewPerf se acercan más de lo esperado entre nuestra RTX A2000 y la Quadro RTX 3000 Max-Q de última generación, a pesar de que la GPU Turing es más exigente en cuanto a potencia, lo que sugiere una mejor optimización en cargas de trabajo para nuestra GPU Ampere
Si se trata de juegos, el rendimiento será entre un 20 y un 30 por ciento más lento que el de la GTX 1660 Ti, ya que las GPUs Quadro no están optimizadas para juegos. Strange Brigade, por ejemplo, a veces se bloquea uno o dos minutos después de la prueba.
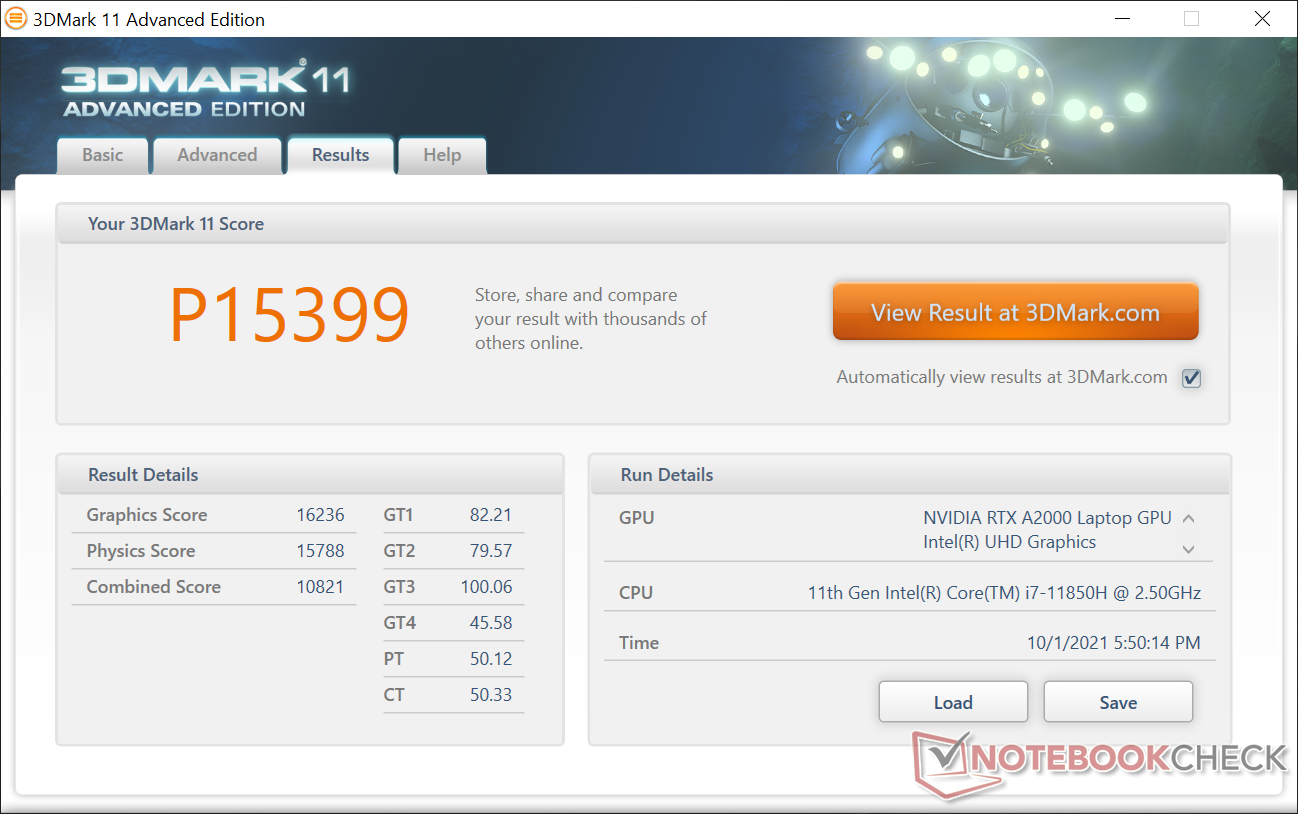
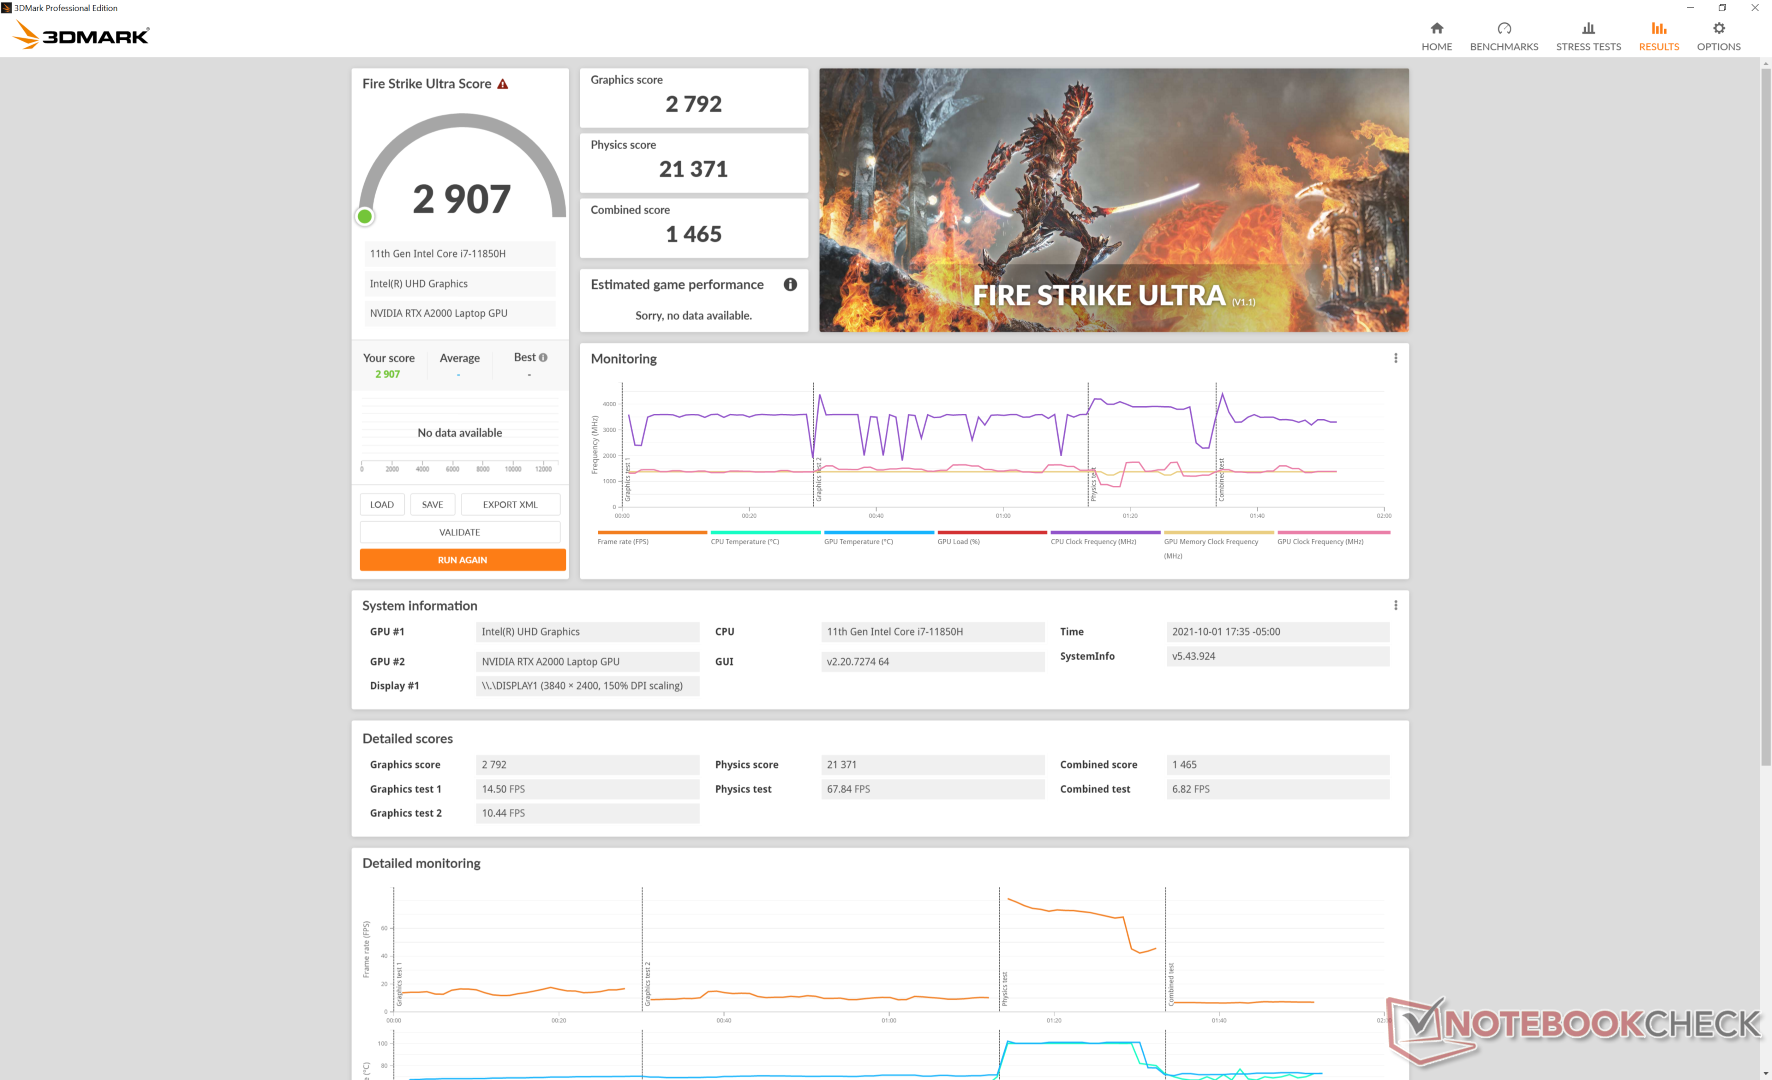
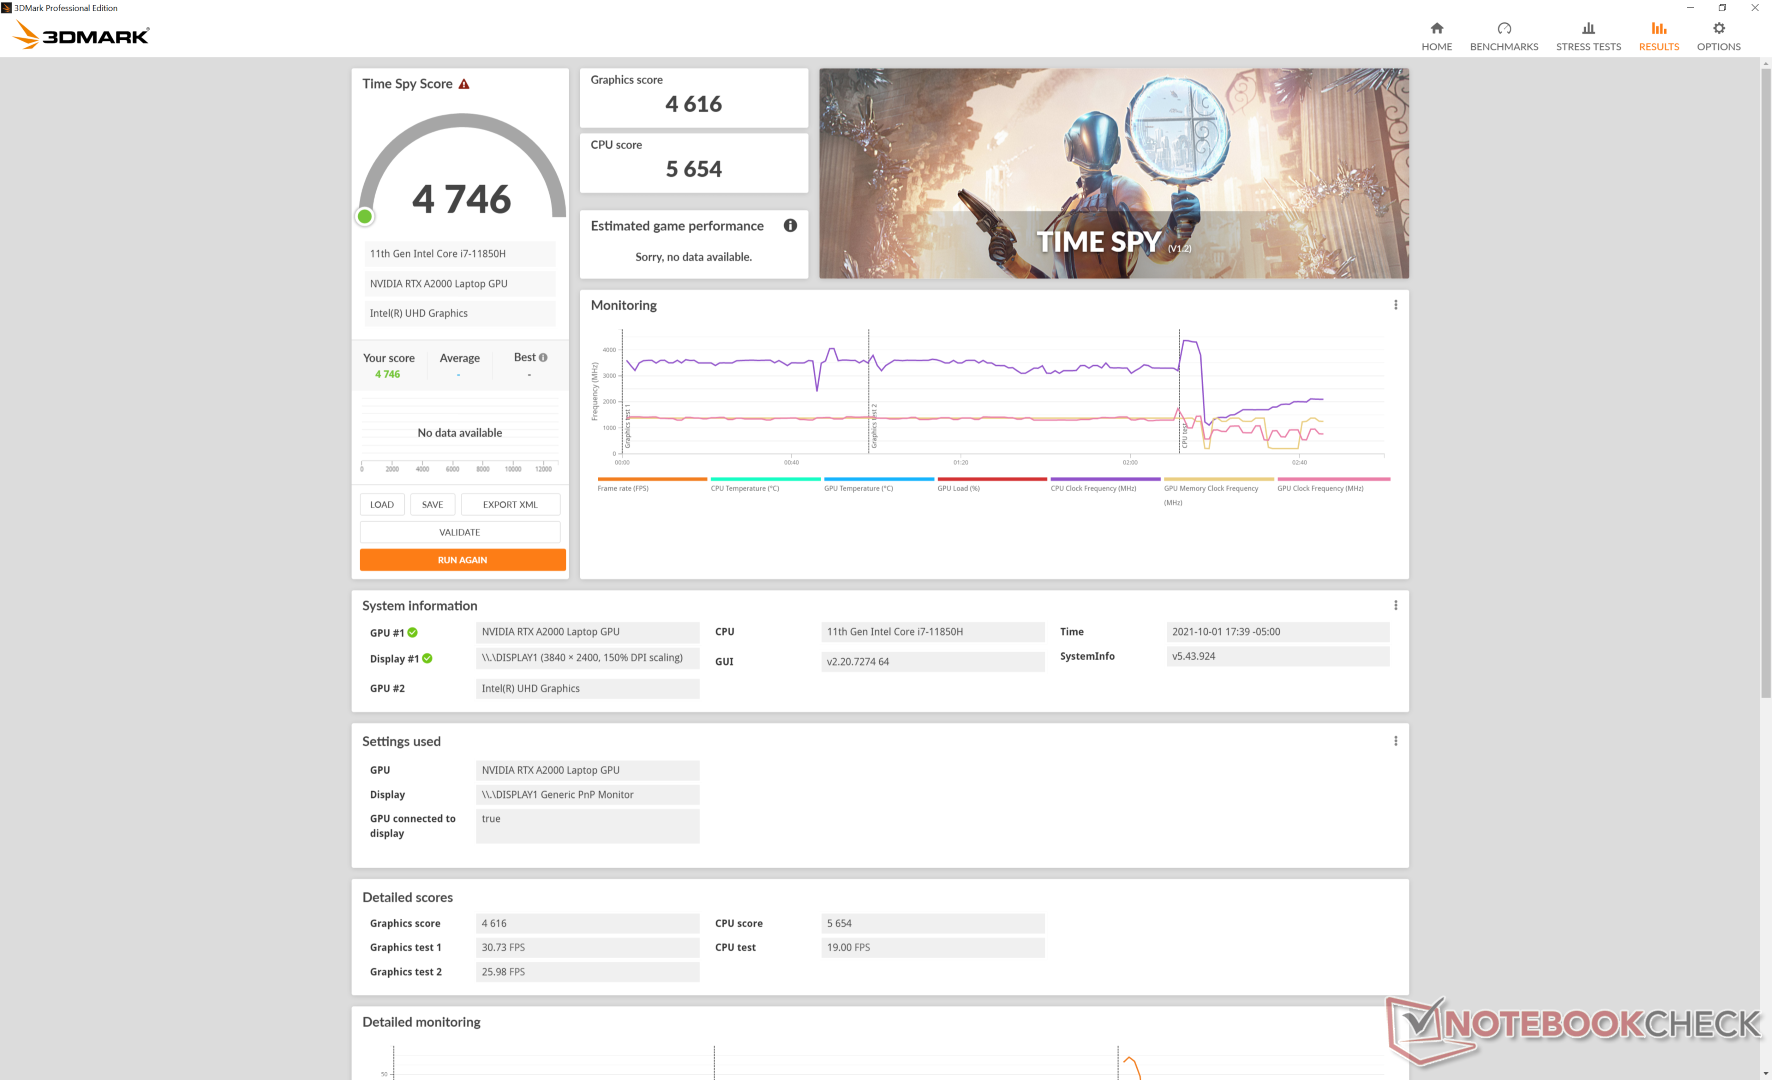
| 3DMark 11 Performance | 15399 puntos | |
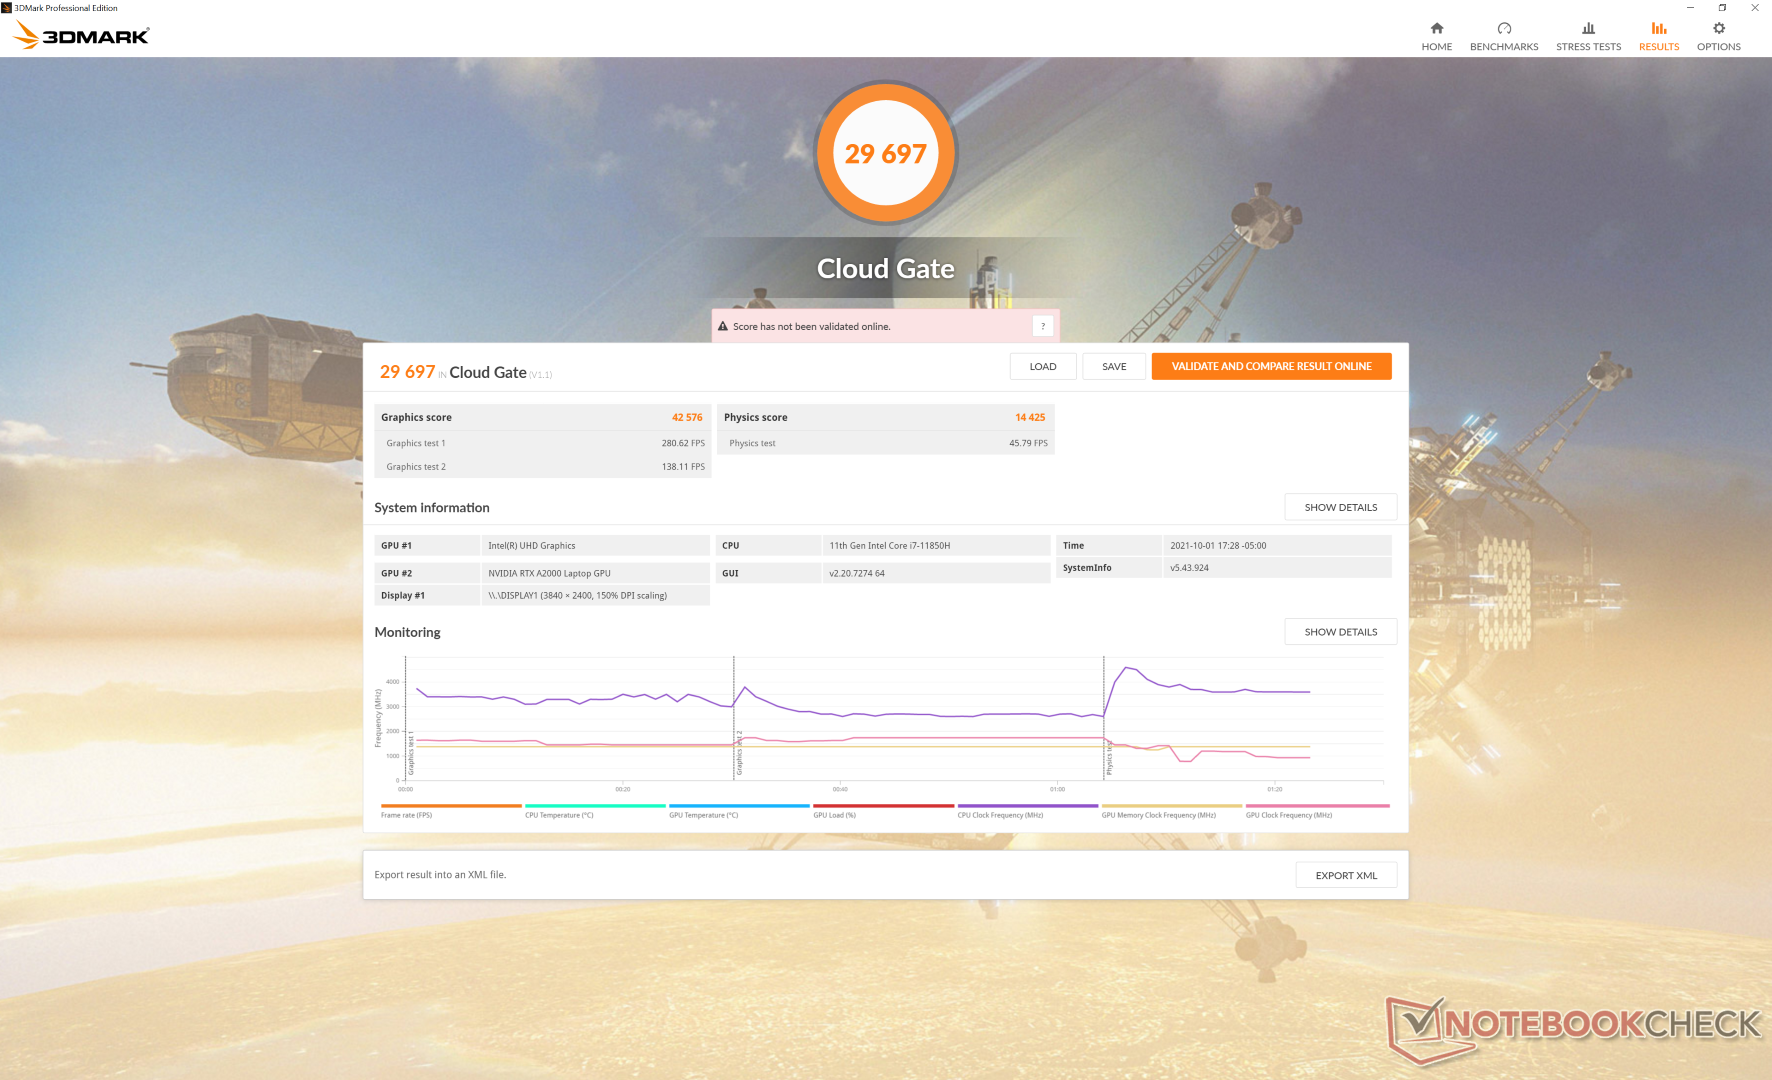
| 3DMark Cloud Gate Standard Score | 29697 puntos | |
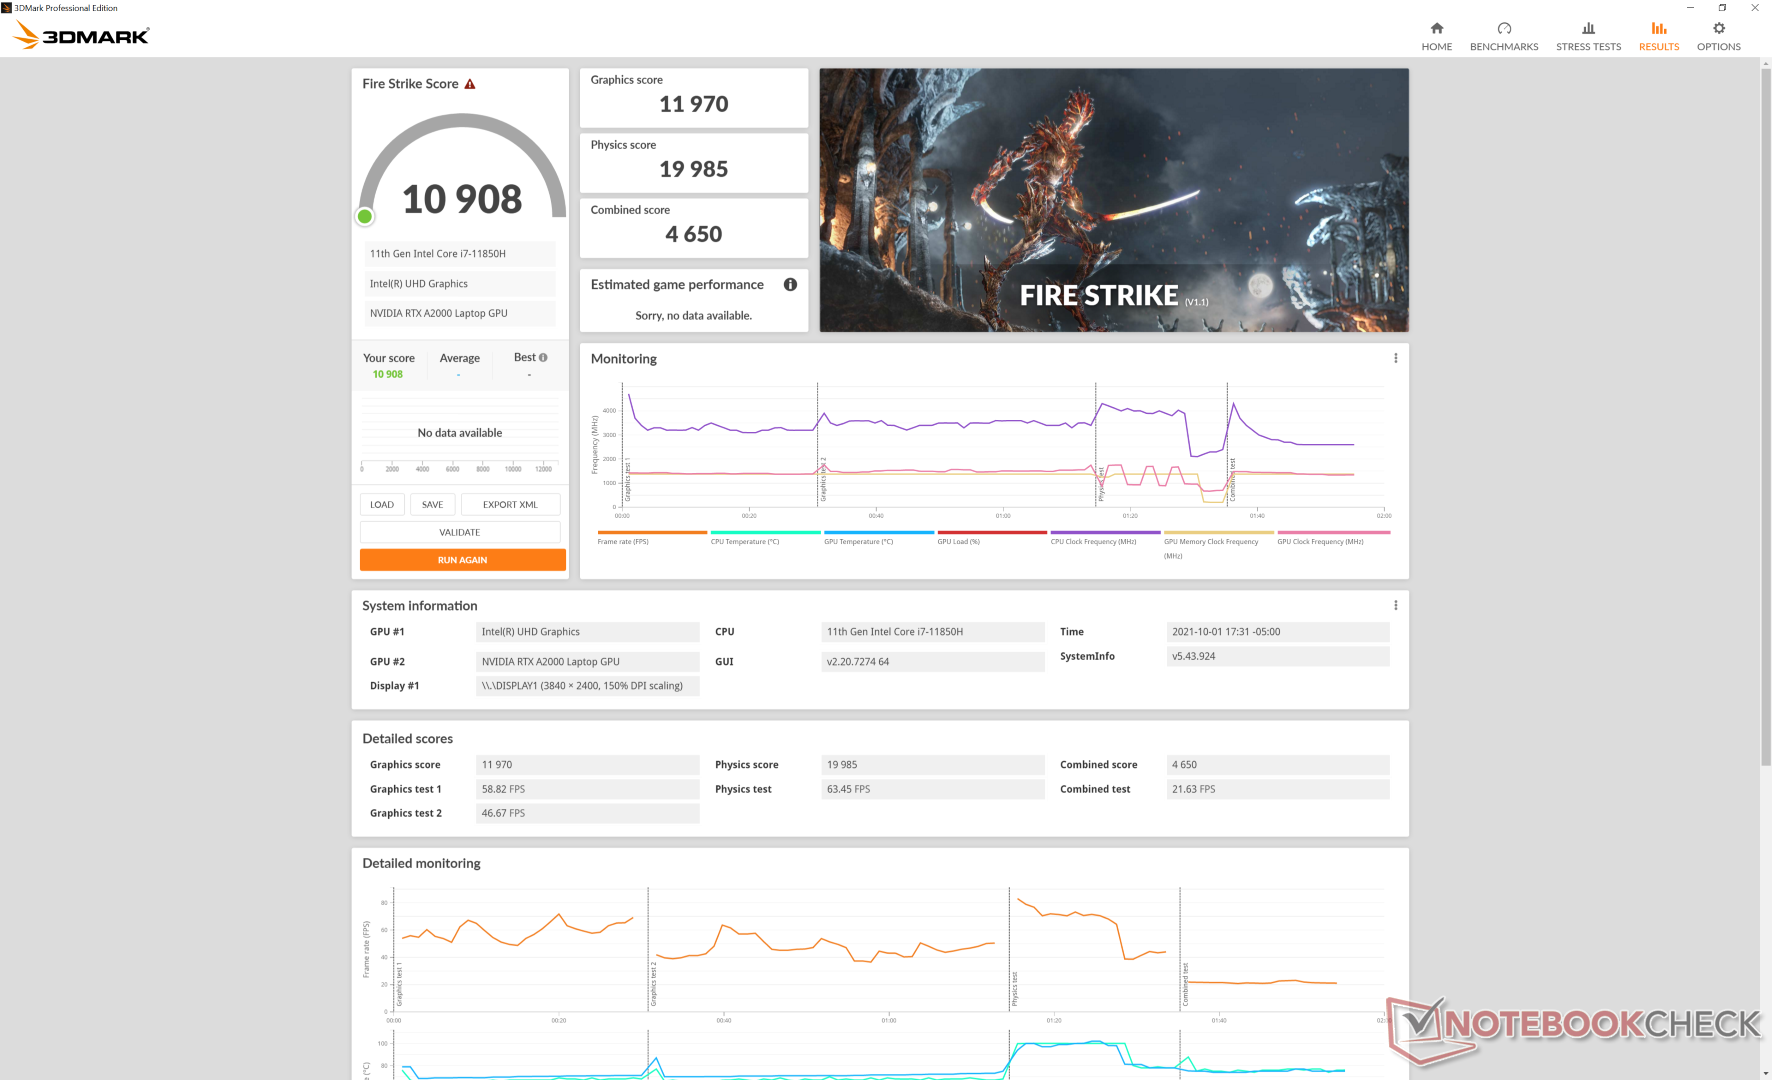
| 3DMark Fire Strike Score | 10908 puntos | |
| 3DMark Time Spy Score | 4746 puntos | |
ayuda | ||
Witcher 3 FPS Chart
| bajo | medio | alto | ultra | QHD | 4K | |
|---|---|---|---|---|---|---|
| GTA V (2015) | 179 | 170 | 112 | 57.8 | 42.9 | |
| The Witcher 3 (2015) | 259.8 | 151.9 | 92.4 | 50 | 33.1 | |
| Dota 2 Reborn (2015) | 173 | 155 | 130 | 119 | 62.9 | |
| Final Fantasy XV Benchmark (2018) | 86.9 | 63.2 | 46.6 | 34.4 | 19.3 | |
| X-Plane 11.11 (2018) | 112 | 89.2 | 75.1 | 45.3 | ||
| Far Cry 5 (2018) | 120 | 82 | 77 | 69 | 49 | |
| Strange Brigade (2018) | 251 | 60.4 | ||||
| Shadow of the Tomb Raider (2018) | 107 | 62 | 58 | 55 | 40 | 17 |
| Far Cry New Dawn (2019) | 106 | 72 | 71 | 59 | 49 | |
| Metro Exodus (2019) | 110.4 | 55.1 | 42.3 | 34.9 | 27 | |
| Borderlands 3 (2019) | 115.5 | 60.7 | 46.2 | 36 | ||
| Gears Tactics (2020) | 104.3 | 113.7 | 77.5 | 53.4 | 37.3 | |
| Horizon Zero Dawn (2020) | 81 | 60 | 55 | 49 | 41 | |
| Watch Dogs Legion (2020) | 86 | 62 | 51 | 29 | 20 | |
| Dirt 5 (2020) | 86.3 | 68 | 54.6 | 41.9 | 34 | |
| Assassin´s Creed Valhalla (2020) | 80 | 55 | 39 | 32 | 27 | |
| Immortals Fenyx Rising (2020) | 107 | 80 | 72 | 64 | 53 | |
| Hitman 3 (2021) | 166.6 | 83.4 | 78.6 | 73.9 | 48.4 | |
| F1 2021 (2021) | 114 | 120 | 104 | 37 | 24 |
Emissions
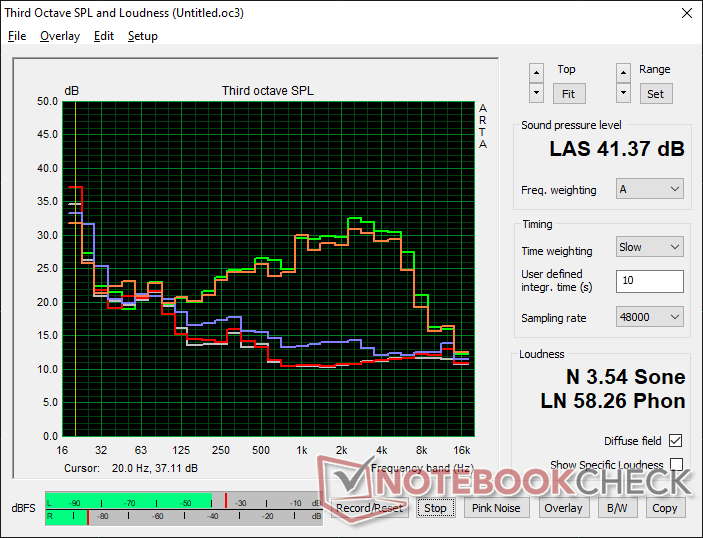
Ruido del sistema
Curiosamente, el ruido del ventilador es notablemente más silencioso que el observado en el Precision 5550. Mientras que el ruido del ventilador puede alcanzar más de 50 dB(A) en el Precision 5550, sólo hemos podido alcanzar hasta 41,4 dB(A) al máximo en nuestro Precision 5560 incluso cuando se le somete a las mismas condiciones de estrés. Este techo de ventilador más bajo en el modelo más nuevo se agradece y de hecho ayuda a que el sistema sea una de las estaciones de trabajo móviles ultradelgadas más silenciosas del mercado, pero esto viene a costa de temperaturas de núcleo más altas. Nuestra sección de pruebas de estrés muestra una diferencia de temperatura de la CPU de 16 C entre los dos portátiles cuando se ejecuta Prime95.
| Dell Precision 5000 5560 RTX A2000 Laptop GPU, i7-11850H, Samsung PM9A1 MZVL22T0HBLB | Lenovo ThinkPad P15 G2-20YQ001JGE RTX A3000 Laptop GPU, i7-11800H, Kioxia XG7 KXG7AZNV512G | HP ZBook Studio 15 G8 GeForce RTX 3070 Laptop GPU, i9-11950H, Samsung PM981a MZVLB2T0HALB | Asus ProArt StudioBook Pro 15 W500G5T Quadro RTX 5000 Max-Q, i7-9750H, Samsung SSD PM981 MZVLB1T0HALR | Dell Precision 7550 Quadro RTX 5000 Max-Q, W-10885M, SK Hynix PC601A NVMe 1TB | Dell Precision 5550 P91F Quadro T2000 Max-Q, i7-10875H, SK Hynix PC601A NVMe 1TB | Razer Blade 15 Studio Edition 2020 Quadro RTX 5000 Max-Q, i7-10875H, Samsung PM981a MZVLB1T0HBLR | |
|---|---|---|---|---|---|---|---|
| Noise | -25% | -18% | -26% | -27% | -17% | -28% | |
| apagado / medio ambiente * (dB) | 23.4 | 24.3 -4% | 23.5 -0% | 25.2 -8% | 25.8 -10% | 26.2 -12% | 30.1 -29% |
| Idle Minimum * (dB) | 23.6 | 24.3 -3% | 25.3 -7% | 27.9 -18% | 25.8 -9% | 26.2 -11% | 30.1 -28% |
| Idle Average * (dB) | 23.6 | 24.3 -3% | 25.3 -7% | 27.9 -18% | 25.8 -9% | 26.2 -11% | 30.1 -28% |
| Idle Maximum * (dB) | 23.6 | 28.6 -21% | 25.3 -7% | 27.9 -18% | 25.9 -10% | 26.2 -11% | 30.1 -28% |
| Load Average * (dB) | 25.8 | 47.5 -84% | 41.2 -60% | 47 -82% | 51.2 -98% | 39.2 -52% | 42.3 -64% |
| Witcher 3 ultra * (dB) | 40.1 | 49.4 -23% | 51.9 -29% | 39 3% | 48.2 -20% | ||
| Load Maximum * (dB) | 41.4 | 54.9 -33% | 49.4 -19% | 46.9 -13% | 51.9 -25% | 50.6 -22% | 42.1 -2% |
* ... más pequeño es mejor
Ruido
| Ocioso |
| 23.6 / 23.6 / 23.6 dB(A) |
| Carga |
| 25.8 / 41.4 dB(A) |
 | ||
30 dB silencioso 40 dB(A) audible 50 dB(A) ruidosamente alto |
||
min: | ||
Temperatura
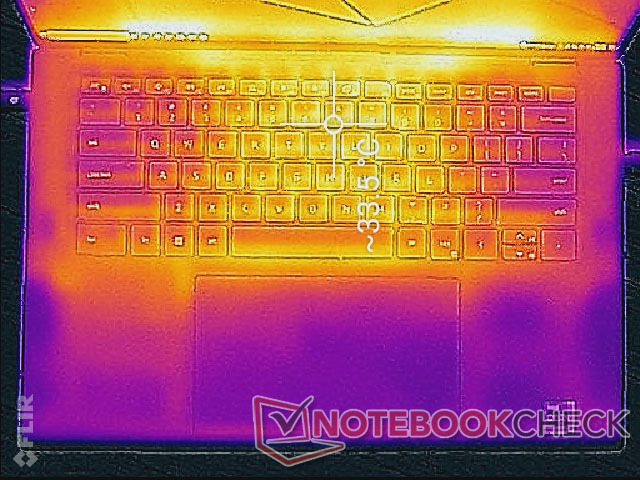
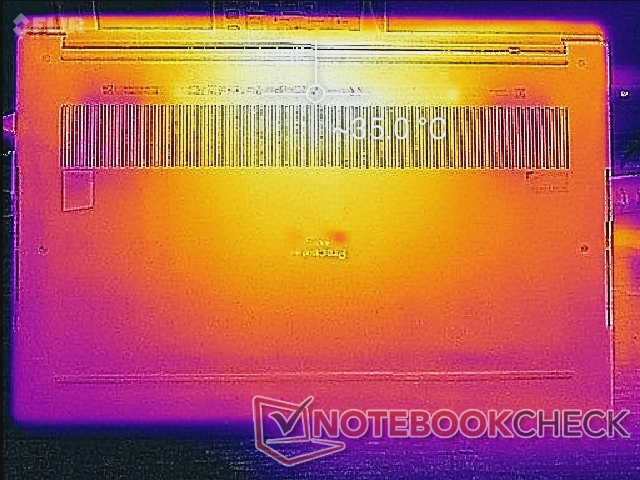
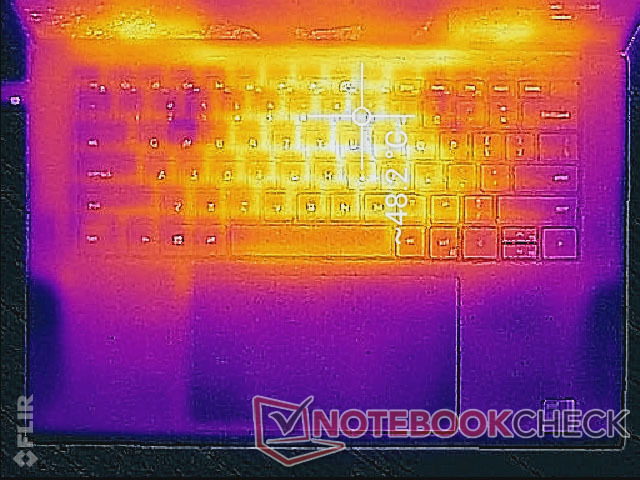
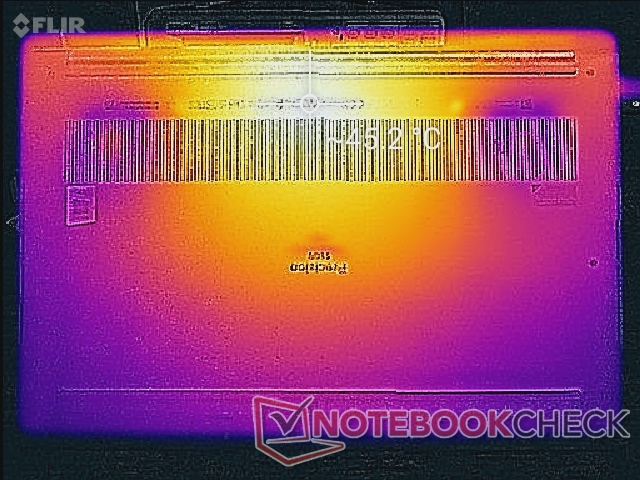
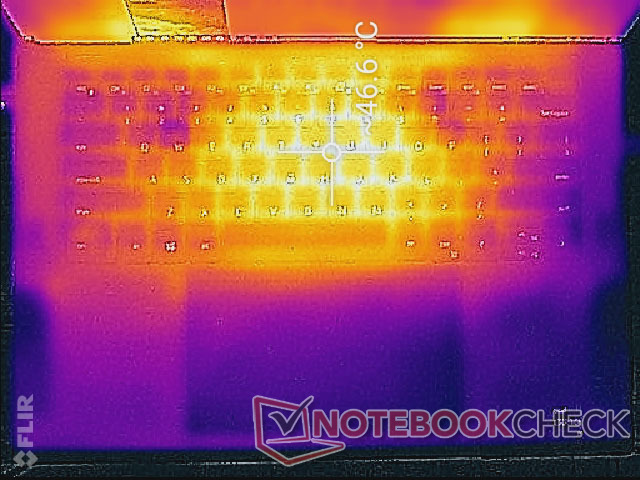
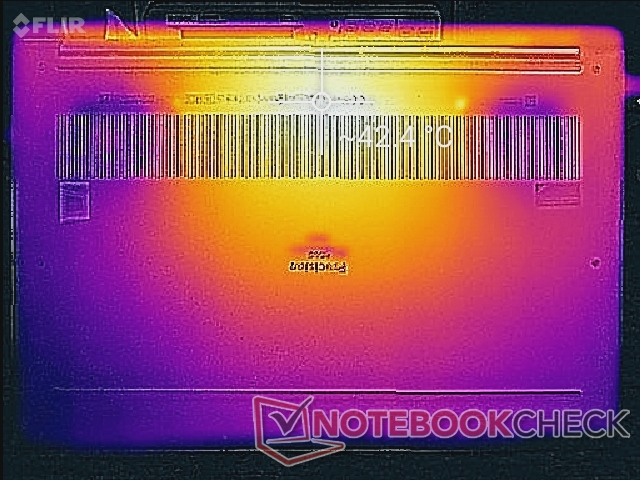
Las temperaturas superficiales bajo carga son similares a las que registramos en el Precision 5550 con puntos calientes que se acercan a los 49 C y 45 C en la parte superior e inferior, respectivamente. El desarrollo de la temperatura es en gran medida simétrico debido a la solución de refrigeración simétrica en su interior, por lo que el centro del teclado estará mucho más caliente que los reposamanos o los bordes. ElThinkPad P15 Gen 2 es una estación de trabajo móvil más potente que nuestro Precision 5560, pero sus puntos calientes pueden volverse mucho más calientes a más de 63 C como resultado.
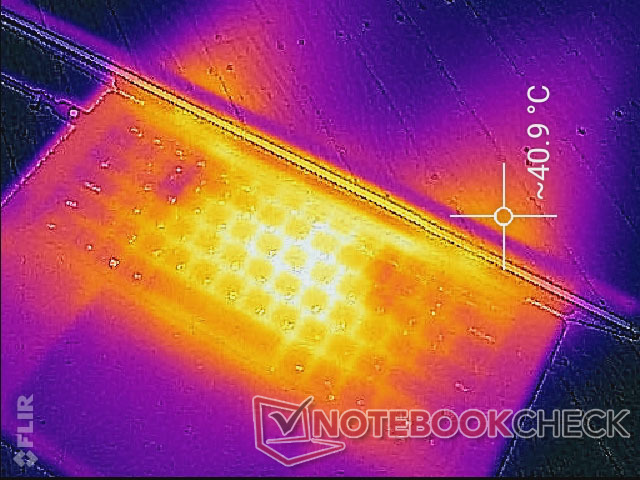
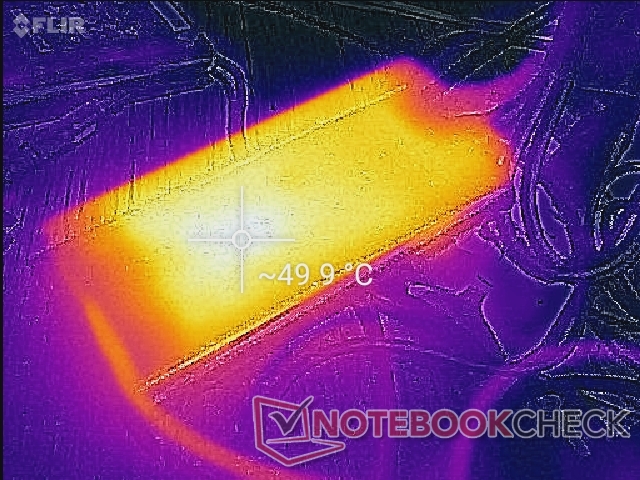
(-) La temperatura máxima en la parte superior es de 48.2 °C / 119 F, frente a la media de 38.2 °C / 101 F, que oscila entre 22.2 y 69.8 °C para la clase Workstation.
(±) El fondo se calienta hasta un máximo de 42.6 °C / 109 F, frente a la media de 41.1 °C / 106 F
(+) En reposo, la temperatura media de la parte superior es de 30.6 °C / 87# F, frente a la media del dispositivo de 32 °C / 90 F.
(±) Jugando a The Witcher 3, la temperatura media de la parte superior es de 35.4 °C / 96 F, frente a la media del dispositivo de 32 °C / 90 F.
(+) El reposamanos y el panel táctil están a una temperatura inferior a la de la piel, con un máximo de 30.8 °C / 87.4 F y, por tanto, son fríos al tacto.
(-) La temperatura media de la zona del reposamanos de dispositivos similares fue de 27.8 °C / 82 F (-3 °C / -5.4 F).
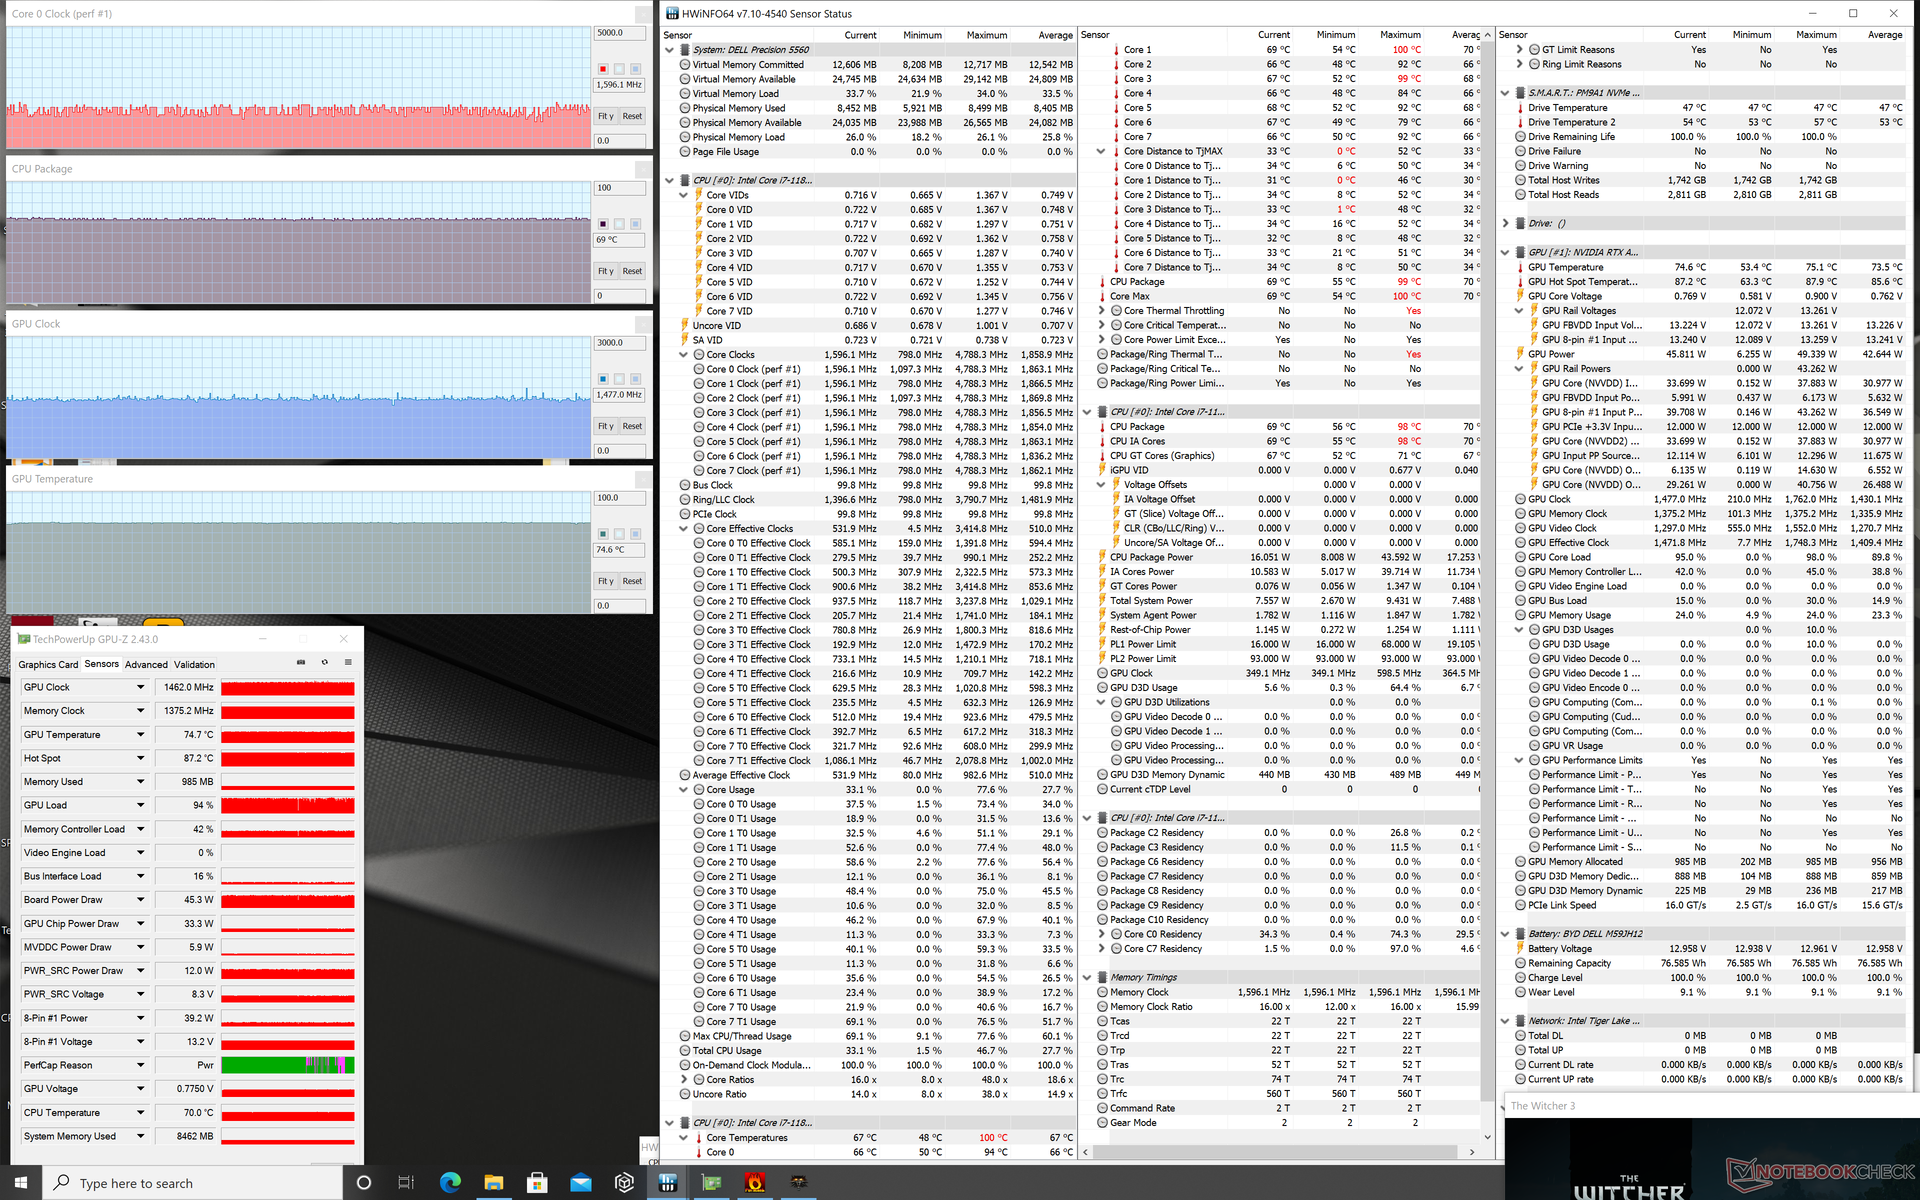
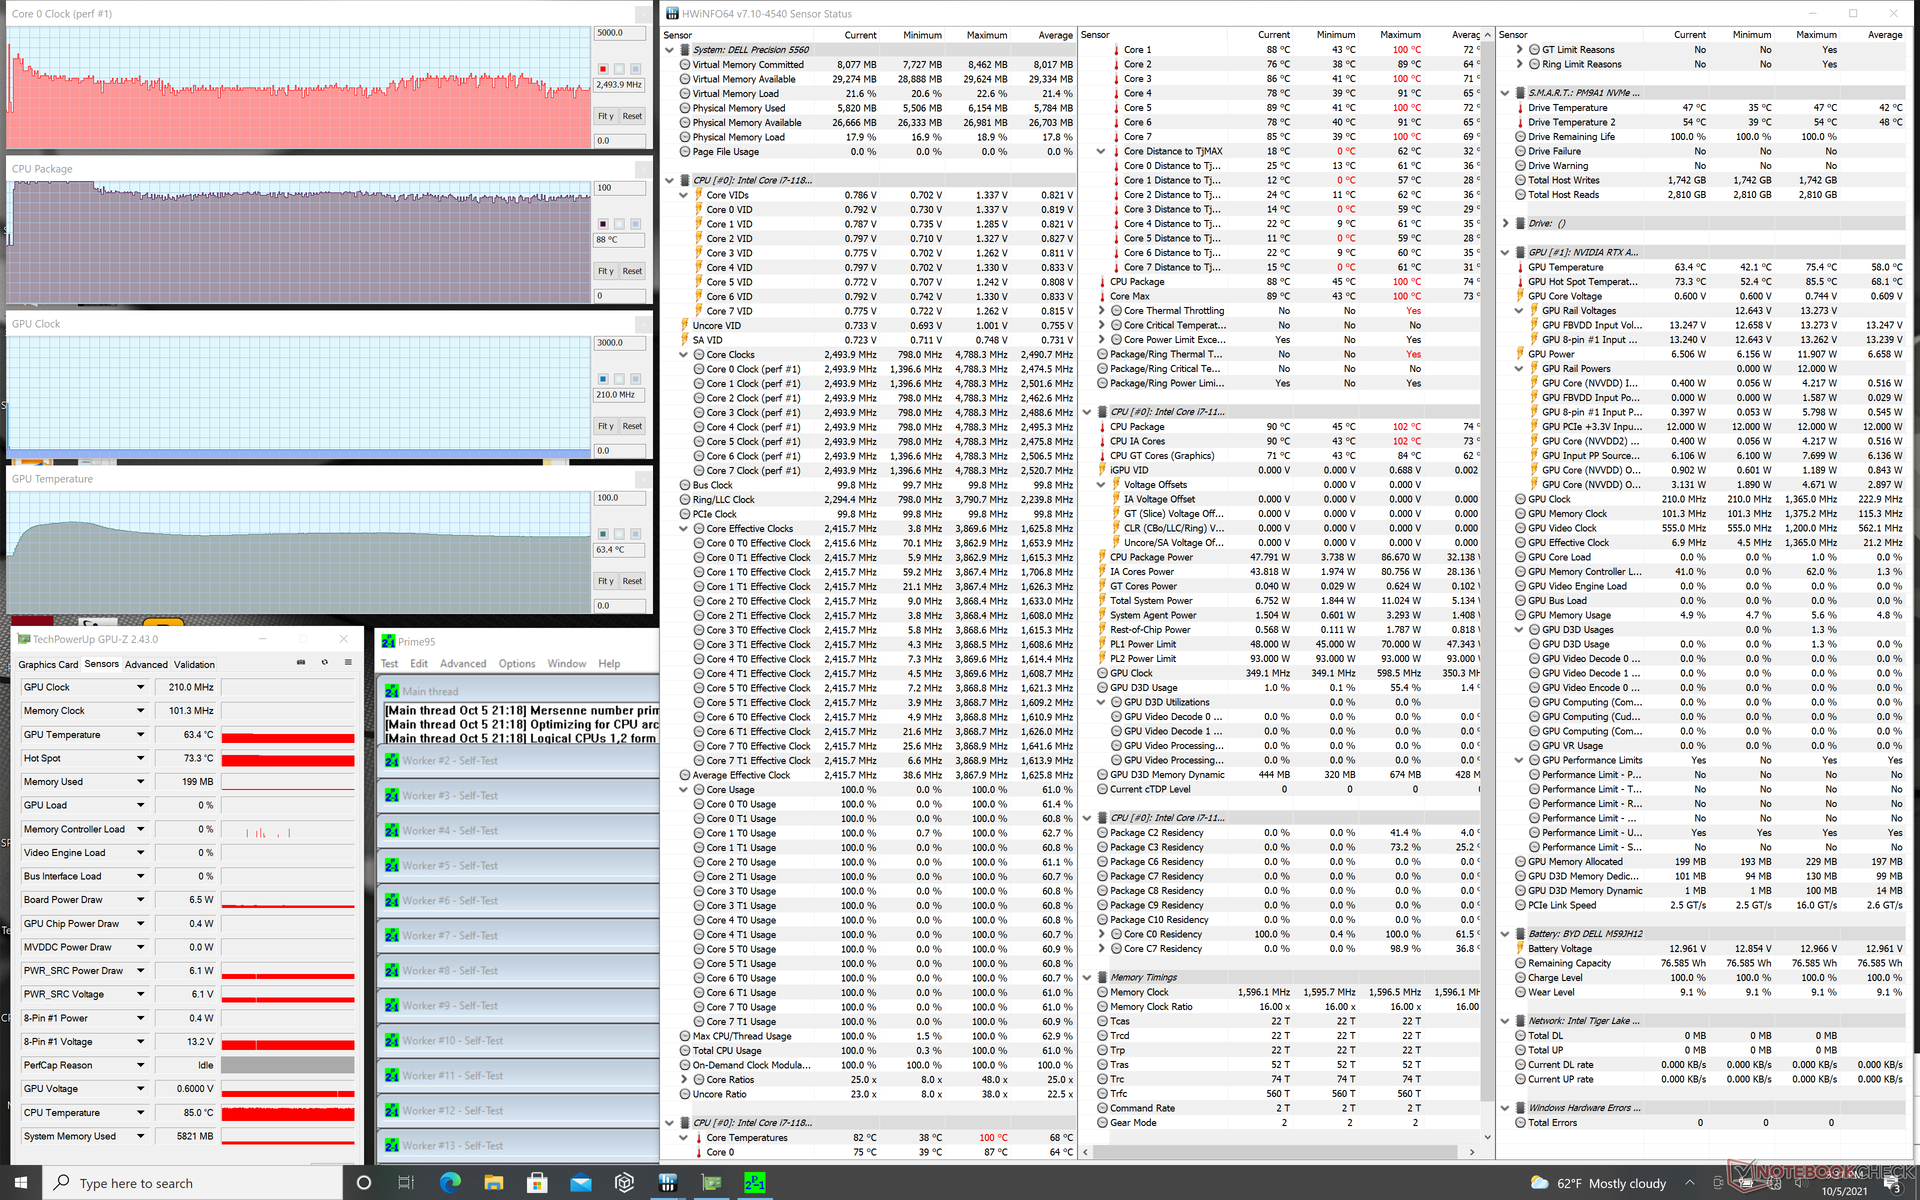
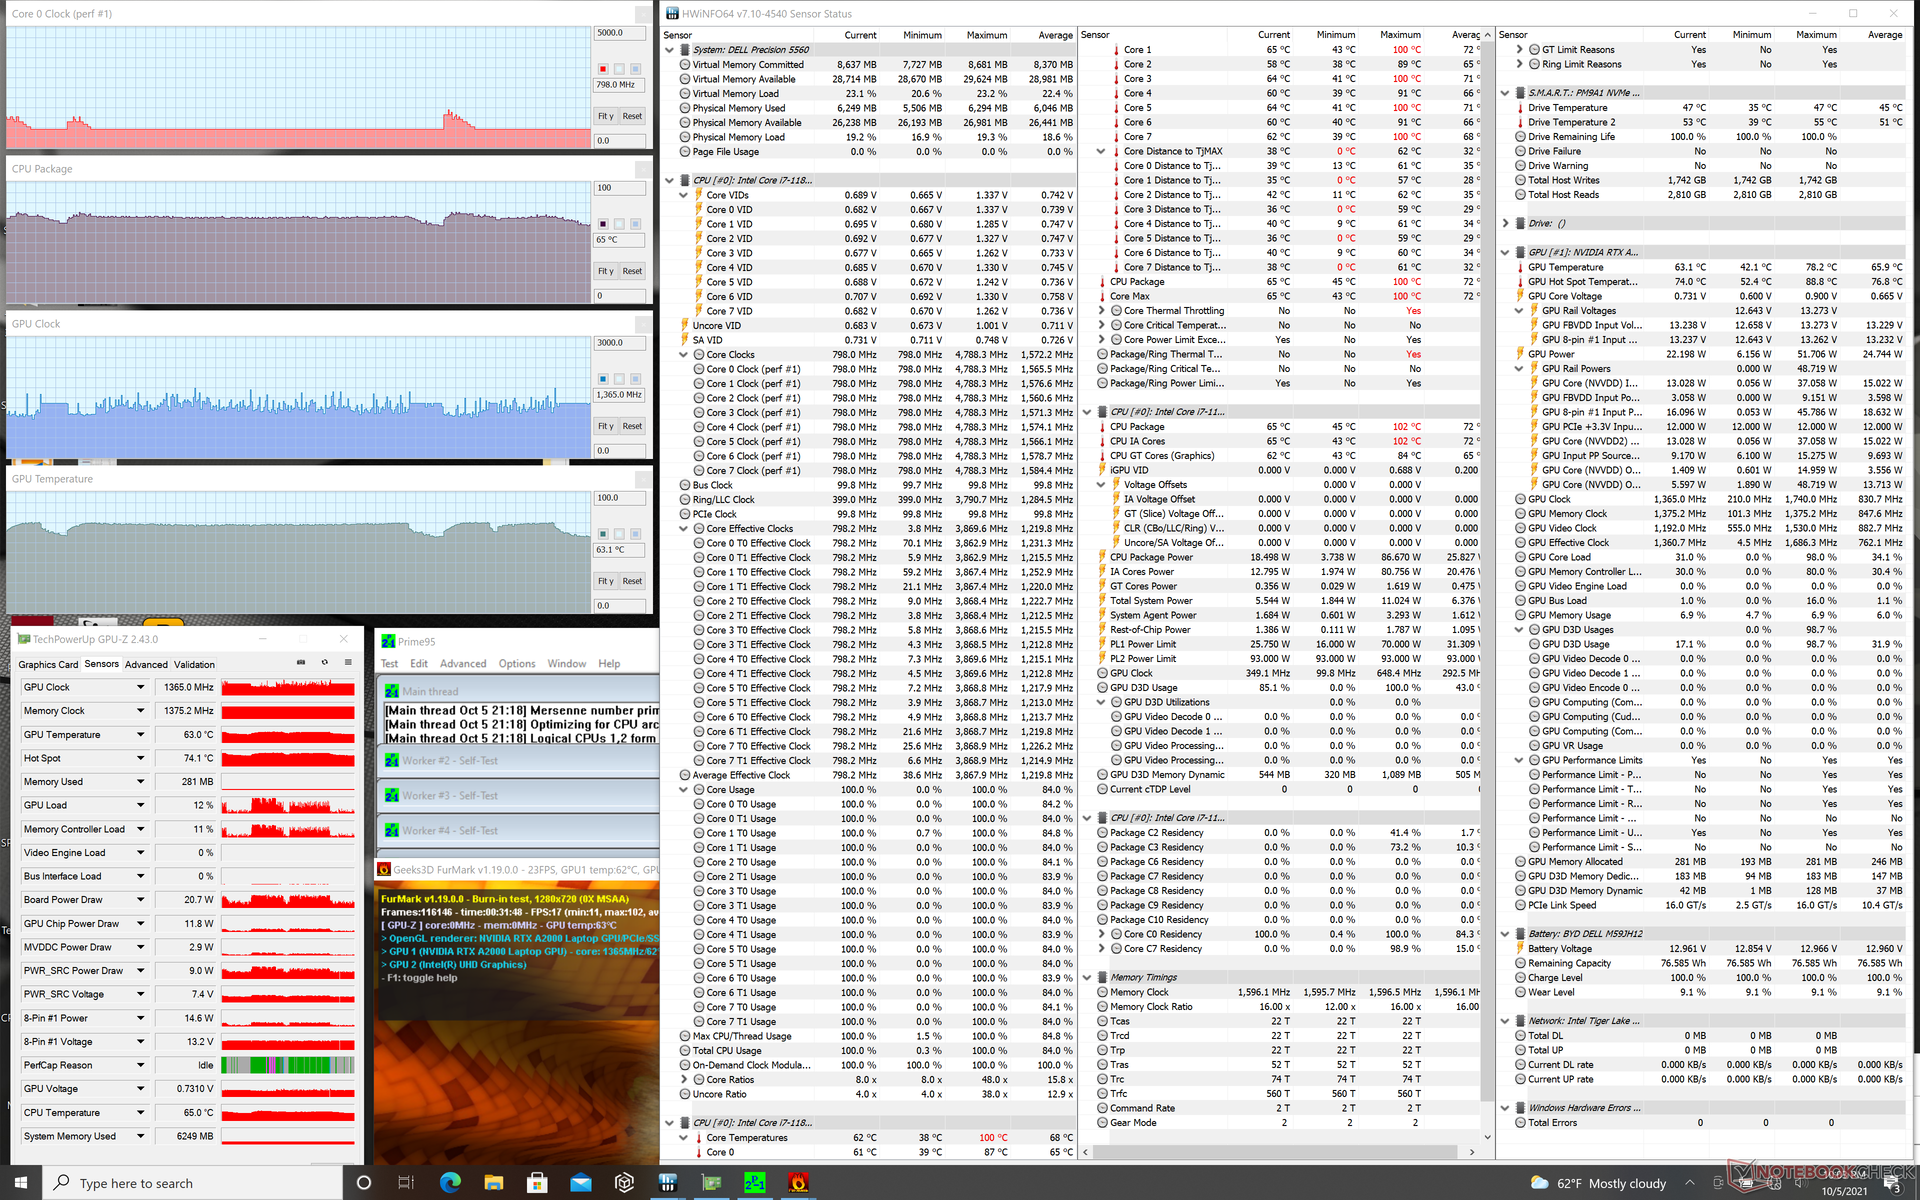
Prueba de esfuerzo
Cuando se ejecuta Prime95, la CPU se dispara a 3,8 GHz durante los primeros segundos antes de alcanzar una temperatura del núcleo de 100 C. La velocidad de reloj cae entonces al rango de 2,8 a 3,0 GHz durante el siguiente minuto más o menos antes de caer aún más al rango de 2,5 a 2,8 GHz. La temperatura del núcleo se estabilizaría finalmente en torno a los 90 C en comparación con los 98 C del HP ZBook Studio 15 G8 o los 74 C del Precision 5550
Cuando se ejecuta Witcher 3 para representar cargas estresantes, la CPU y la GPU se estabilizarían a 69 C y 75 C, respectivamente, en comparación con los 66 C y 67 C del Precision 5550. El consumo de energía de la GPU en tiempo real se estabiliza en 45 W, frente a los 40 W del Precision 5550, lo que puede explicar en parte la temperatura ligeramente superior de la GPU de nuestro Precision 5560
El uso de la batería afecta al rendimiento. Un test 3DMark 11 con baterías arrojaría unas puntuaciones de Física y Gráficos de 14330 y 12191 puntos, respectivamente, frente a los 15788 y 16236 puntos de la red eléctrica.
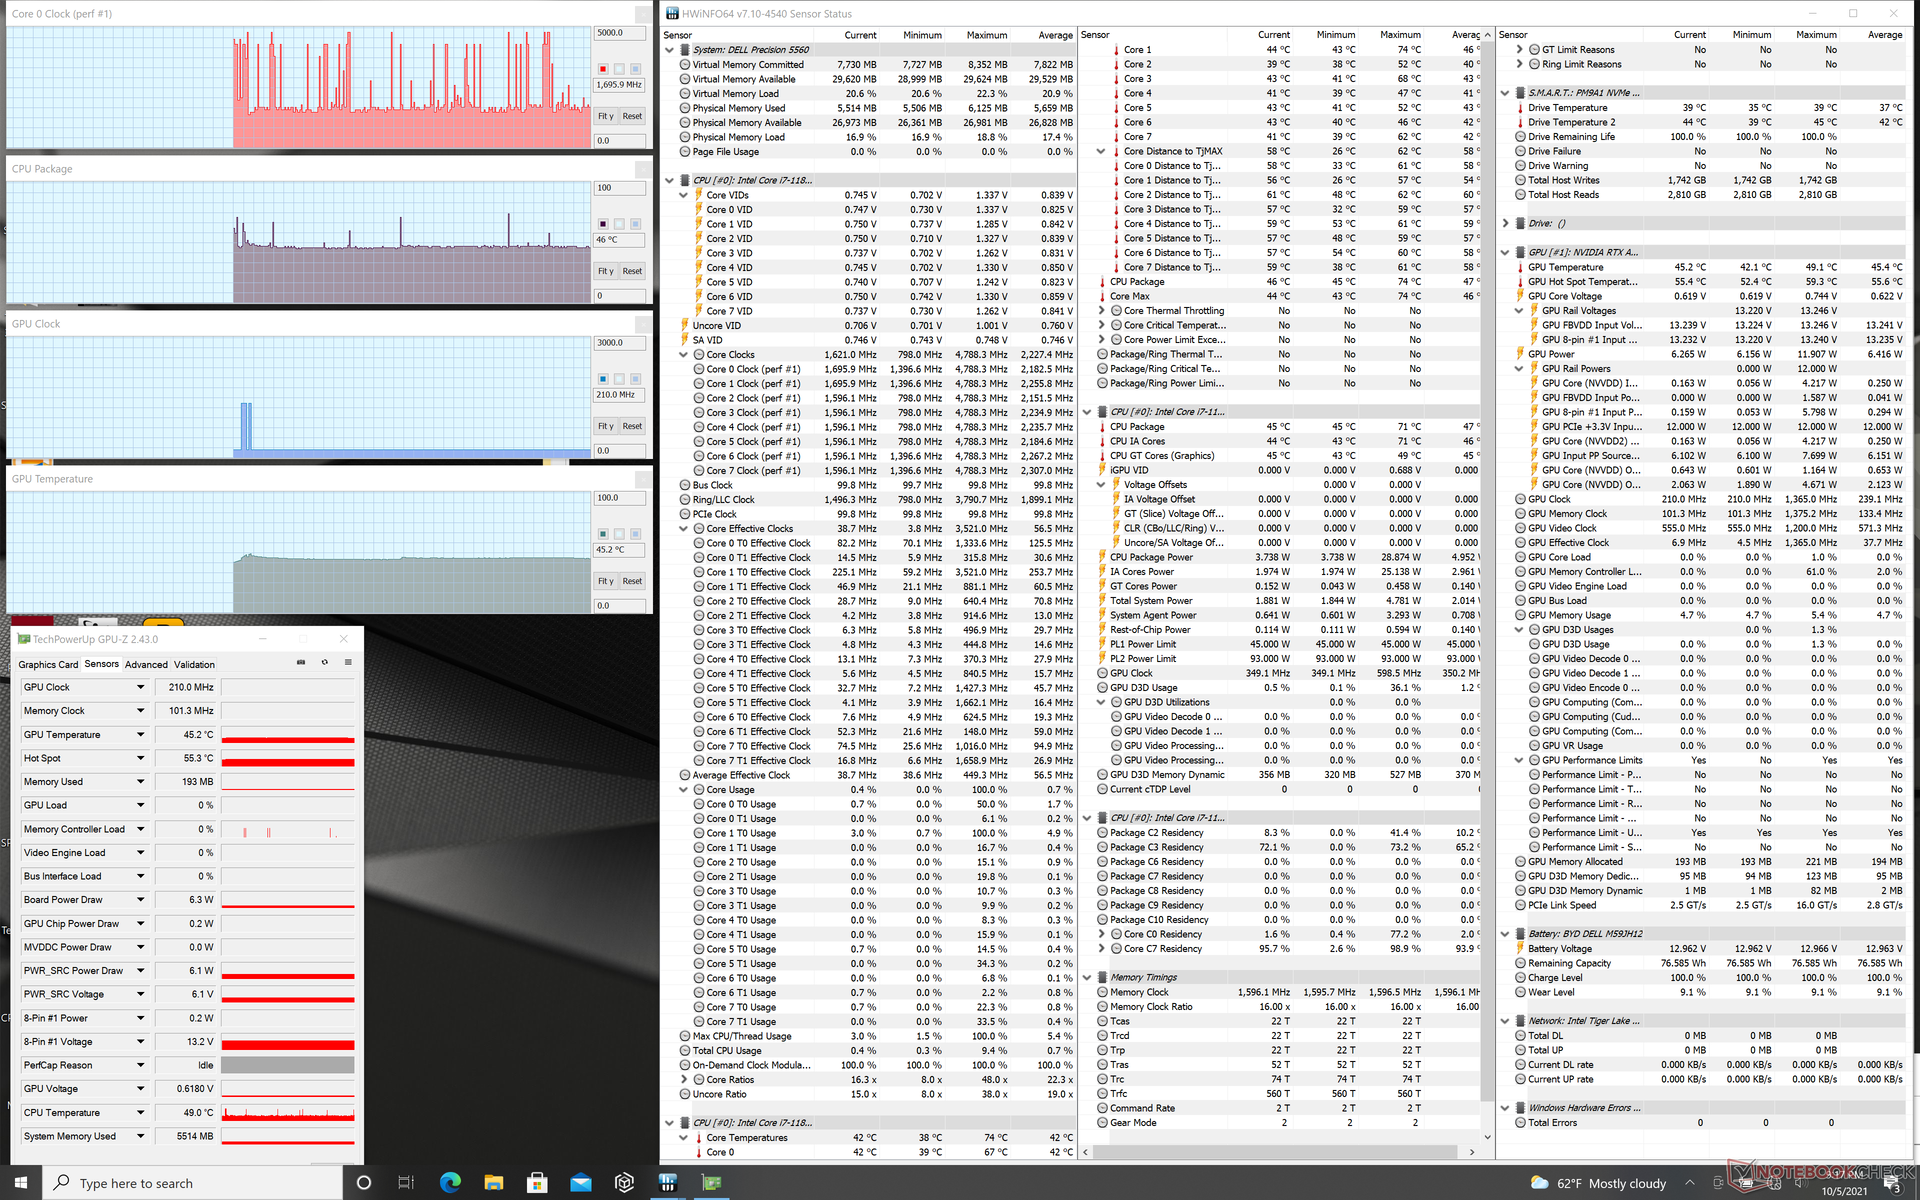
| Relojde la CPU(GHz) | Reloj dela GPU(MHz) | Temperatura media de la CPU (°C) | Temperaturamediade la GPU (°C) | |
| Sistema en reposo | 46 | 45 | ||
| EstrésPrime95 | 2,5 - 2,8 | -- | ~90 | 63 |
| Estrés Prime95+ FurMark | 0,8 - 1,4 | 1000 - 1400 | 64 - 75 | 63 - 75 |
| Witcher 3 Stress | ~1.6 | 1462 | 69 | 75 |
Altavoces

Dell Precision 5000 5560 análisis de audio
(±) | la sonoridad del altavoz es media pero buena (75.2 dB)
Graves 100 - 315 Hz
(±) | lubina reducida - en promedio 9.8% inferior a la mediana
(±) | la linealidad de los graves es media (8.8% delta a frecuencia anterior)
Medios 400 - 2000 Hz
(±) | medias más altas - de media 5.7% más altas que la mediana
(+) | los medios son lineales (3.7% delta a la frecuencia anterior)
Altos 2 - 16 kHz
(+) | máximos equilibrados - a sólo 2.7% de la mediana
(+) | los máximos son lineales (6.4% delta a la frecuencia anterior)
Total 100 - 16.000 Hz
(+) | el sonido global es lineal (14.8% de diferencia con la mediana)
En comparación con la misma clase
» 33% de todos los dispositivos probados de esta clase eran mejores, 6% similares, 61% peores
» El mejor tuvo un delta de 7%, la media fue 17%, el peor fue ###max##%
En comparación con todos los dispositivos probados
» 20% de todos los dispositivos probados eran mejores, 4% similares, 76% peores
» El mejor tuvo un delta de 4%, la media fue 23%, el peor fue ###max##%
Apple MacBook 12 (Early 2016) 1.1 GHz análisis de audio
(+) | los altavoces pueden reproducir a un volumen relativamente alto (#83.6 dB)
Graves 100 - 315 Hz
(±) | lubina reducida - en promedio 11.3% inferior a la mediana
(±) | la linealidad de los graves es media (14.2% delta a frecuencia anterior)
Medios 400 - 2000 Hz
(+) | medios equilibrados - a sólo 2.4% de la mediana
(+) | los medios son lineales (5.5% delta a la frecuencia anterior)
Altos 2 - 16 kHz
(+) | máximos equilibrados - a sólo 2% de la mediana
(+) | los máximos son lineales (4.5% delta a la frecuencia anterior)
Total 100 - 16.000 Hz
(+) | el sonido global es lineal (10.2% de diferencia con la mediana)
En comparación con la misma clase
» 7% de todos los dispositivos probados de esta clase eran mejores, 2% similares, 90% peores
» El mejor tuvo un delta de 5%, la media fue 18%, el peor fue ###max##%
En comparación con todos los dispositivos probados
» 5% de todos los dispositivos probados eran mejores, 1% similares, 94% peores
» El mejor tuvo un delta de 4%, la media fue 23%, el peor fue ###max##%
Energy Management
Consumo de energía
El consumo de energía es una mezcla. Con cargas bajas, nuestra unidad consume más energía que el Precision 5550 (de 6 a 24 W frente a 5 W a 19 W), lo que probablemente contribuya a los resultados de menor duración de la batería en nuestra siguiente sección. Por otro lado, el consumo de energía seguiría siendo casi el mismo que el de Precision 5550 cuando se ejecutan cargas más altas, como los juegos, a pesar de que nuestra CPU y GPU pueden ser hasta un 15% y un 50% más rápidas que el Core i7-10875H y la Quadro T2000 Max-Q, respectivamente. El rendimiento por vatio es, por tanto, mayor año tras año cuando se ejecutan aplicaciones exigentes.
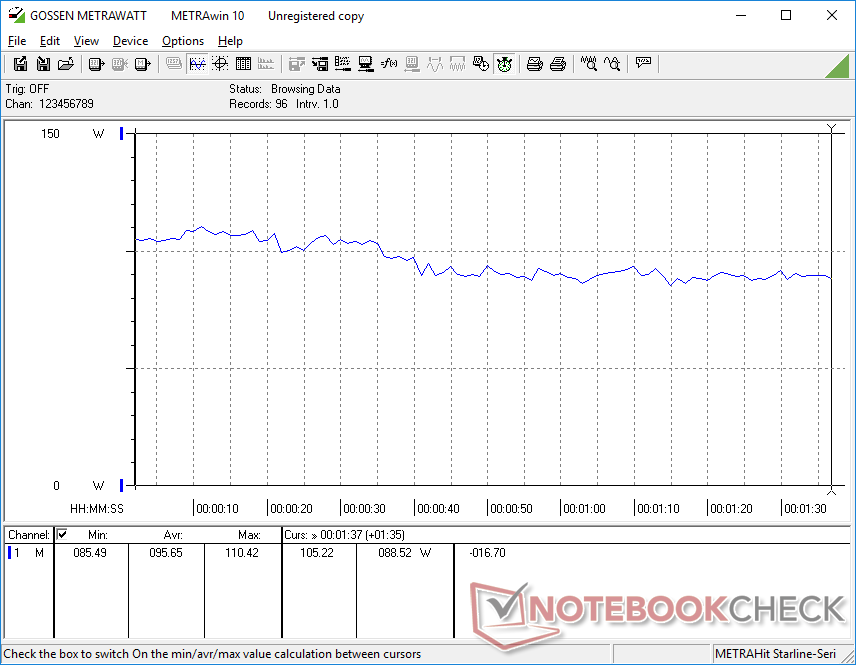
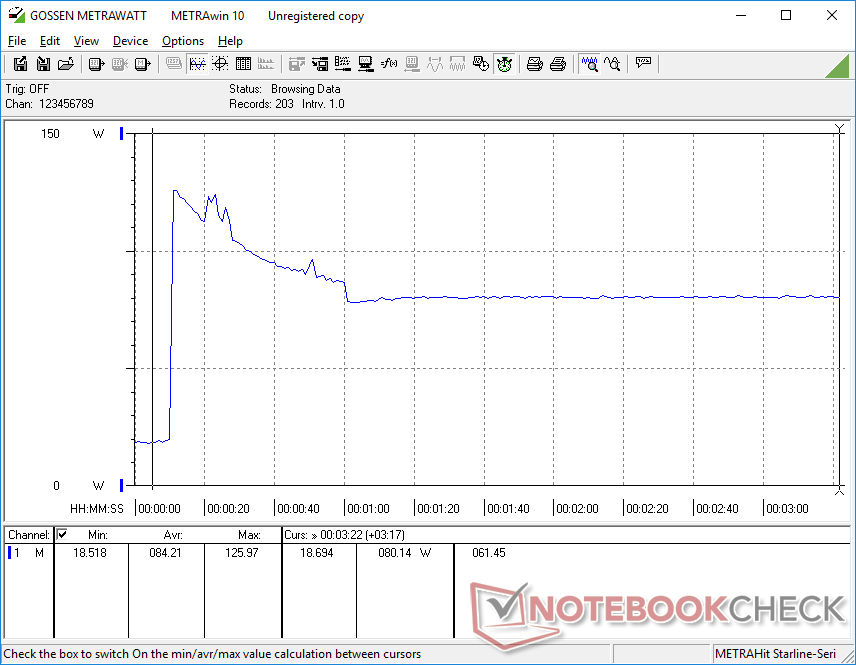
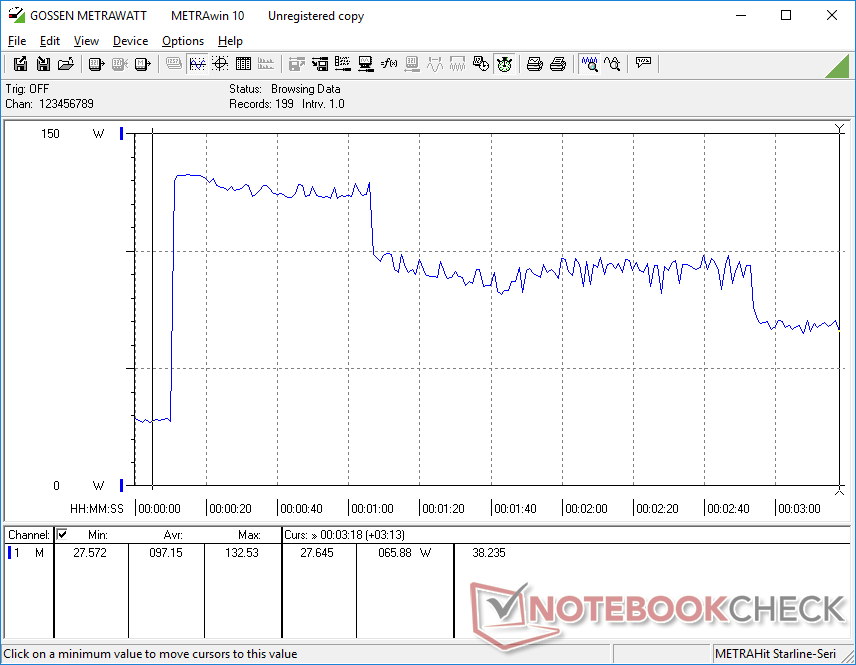
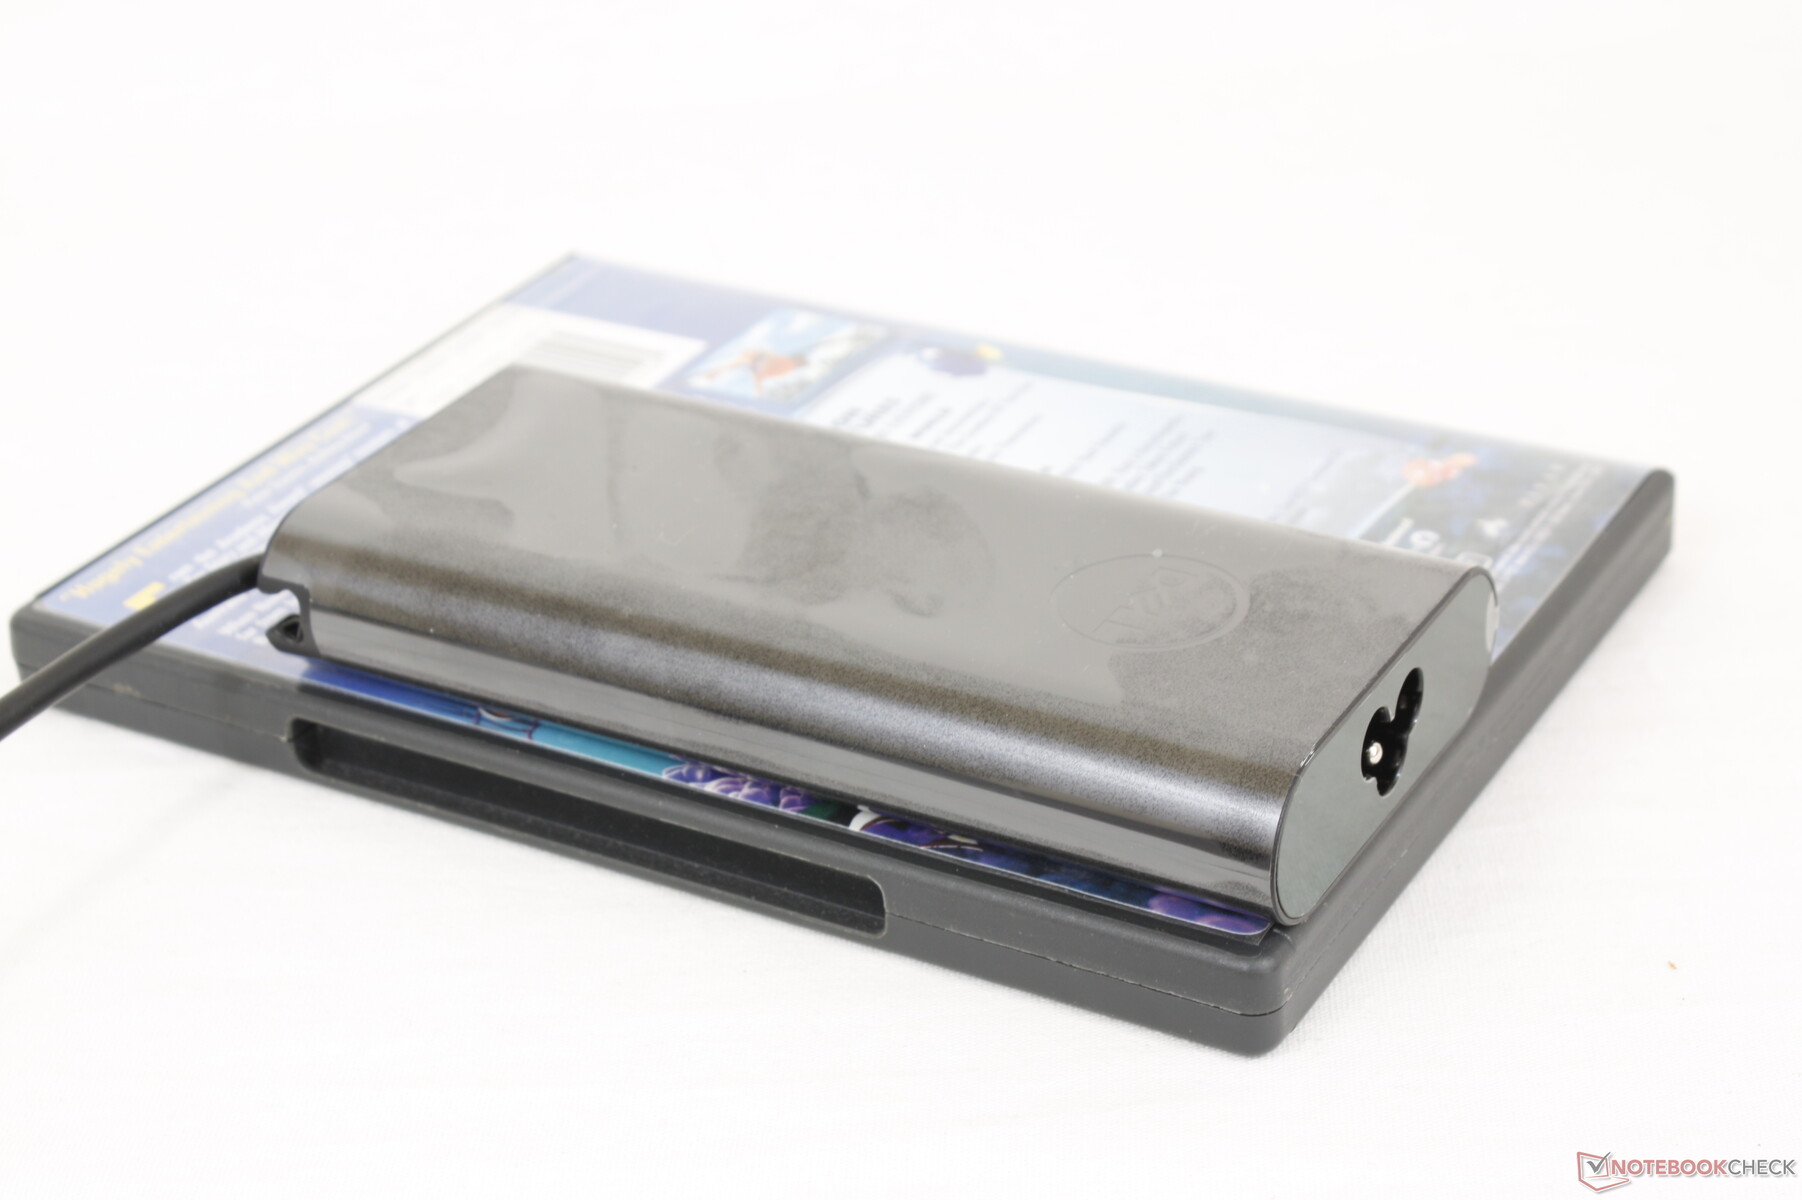
Podemos registrar un consumo máximo temporal de 133 W desde el pequeño (~14.3 x 6.5 x 2.2 cm) adaptador de CA USB-C de 130 W. El consumo cae con el tiempo, como muestran nuestros gráficos de abajo, debido a las limitaciones térmicas. La batería no se agota cuando se conecta a la red eléctrica, lo que no ocurre en algunos de los primeros modelos de Precision 5750.

| Off / Standby | |
| Ocioso | |
| Carga |
|
Clave:
min: | |
| Dell Precision 5000 5560 i7-11850H, RTX A2000 Laptop GPU, Samsung PM9A1 MZVL22T0HBLB, IPS, 3840x2400, 15.6" | Lenovo ThinkPad P15 G2-20YQ001JGE i7-11800H, RTX A3000 Laptop GPU, Kioxia XG7 KXG7AZNV512G, IPS, 1920x1080, 15.6" | HP ZBook Studio 15 G8 i9-11950H, GeForce RTX 3070 Laptop GPU, Samsung PM981a MZVLB2T0HALB, OLED, 3840x2160, 15.6" | Asus ProArt StudioBook Pro 15 W500G5T i7-9750H, Quadro RTX 5000 Max-Q, Samsung SSD PM981 MZVLB1T0HALR, IPS, 3840x2160, 15.6" | Dell Precision 7550 W-10885M, Quadro RTX 5000 Max-Q, SK Hynix PC601A NVMe 1TB, IPS, 3840x2160, 15.6" | Dell Precision 5550 P91F i7-10875H, Quadro T2000 Max-Q, SK Hynix PC601A NVMe 1TB, IPS, 3840x2400, 15.6" | Razer Blade 15 Studio Edition 2020 i7-10875H, Quadro RTX 5000 Max-Q, Samsung PM981a MZVLB1T0HBLR, OLED, 3840x2160, 15.6" | |
|---|---|---|---|---|---|---|---|
| Power Consumption | -11% | -43% | -30% | -38% | 7% | -44% | |
| Idle Minimum * (Watt) | 6.2 | 6.3 -2% | 11 -77% | 11.6 -87% | 8.2 -32% | 5.6 10% | 13.4 -116% |
| Idle Average * (Watt) | 13.9 | 10.7 23% | 18.8 -35% | 19 -37% | 16.8 -21% | 11.2 19% | 18 -29% |
| Idle Maximum * (Watt) | 23.8 | 11.6 51% | 31.7 -33% | 20.6 13% | 24.4 -3% | 18.4 23% | 26.1 -10% |
| Load Average * (Watt) | 95.7 | 99.3 -4% | 105.2 -10% | 102 -7% | 131 -37% | 114 -19% | 115 -20% |
| Witcher 3 ultra * (Watt) | 87 | 154 -77% | 148 -70% | 156.6 -80% | 76.7 12% | 145 -67% | |
| Load Maximum * (Watt) | 132.6 | 210 -58% | 171.8 -30% | 178 -34% | 201.8 -52% | 134.2 -1% | 165 -24% |
* ... más pequeño es mejor
Power Consumption Witcher 3 / Stresstest
Duración de la batería
Las duraciones son generalmente más cortas que las que registramos en el Precision 5550 del año pasado. El uso real de la WLAN sólo dura unas 6,5 horas comparado con las 9 horas del modelo anterior, incluso cuando ambos están configurados con idénticos perfiles de energía equilibrada con Optimus activo
La carga de vacío a plena capacidad tarda unas 2 horas. Apreciamos que el sistema pueda recargarse a través de cualquiera de sus tres puertos USB-C mientras que algunos portátiles sólo admiten la carga en un puerto USB-C. Este mismo cargador Dell también puede usarse para cargar portátiles XPS modernos.
| Dell Precision 5000 5560 i7-11850H, RTX A2000 Laptop GPU, 86 Wh | Lenovo ThinkPad P15 G2-20YQ001JGE i7-11800H, RTX A3000 Laptop GPU, 94 Wh | HP ZBook Studio 15 G8 i9-11950H, GeForce RTX 3070 Laptop GPU, 83 Wh | Asus ProArt StudioBook Pro 15 W500G5T i7-9750H, Quadro RTX 5000 Max-Q, 76 Wh | Dell Precision 7550 W-10885M, Quadro RTX 5000 Max-Q, 95 Wh | Dell Precision 5550 P91F i7-10875H, Quadro T2000 Max-Q, 86 Wh | Razer Blade 15 Studio Edition 2020 i7-10875H, Quadro RTX 5000 Max-Q, 80 Wh | |
|---|---|---|---|---|---|---|---|
| Duración de Batería | 15% | 2% | -25% | -3% | 36% | -9% | |
| Reader / Idle (h) | 12 | 12.9 8% | 11.1 -7% | 22.6 88% | 8.8 -27% | ||
| WiFi v1.3 (h) | 6.3 | 9.9 57% | 6.2 -2% | 4.7 -25% | 8.9 41% | 9 43% | 5.7 -10% |
| Load (h) | 1.8 | 1.3 -28% | 1.8 0% | 1 -44% | 1.4 -22% | 2 11% |
Pro
Contra
Veredicto - El mismo aspecto, gráficos mucho más rápidos
¿Por qué comprar el Precision 5560 cuando es visualmente idéntico al Precision 5550? El salto en la potencia de la GPU será la principal razón para considerar el modelo más nuevo sobre el anterior. La Quadro RTX A2000 de Nvidia va una generación por delante de la Quadro T2000 Max-Q para ofrecer un rendimiento de la GPU hasta un 50 por ciento más rápido con un coste mínimo en el consumo de energía, la duración de la batería, el peso, la temperatura de la superficie e incluso el ruido del ventilador. El aumento del rendimiento por vatio ayuda a que el sistema sea más rápido de lo que su perfil ultradelgado podría sugerir. Los usuarios también obtendrán un aumento del rendimiento de la CPU, aunque con márgenes mucho menores.
Un enorme aumento de la potencia de la GPU con respecto a la Precision 5550. Sin embargo, si la Quadro RTX A2000 no te interesa, quizá quieras considerar el modelo del año pasado, visualmente idéntico.
Por la razón que sea, nuestra Precision 5560 no puede alcanzar el mismo techo de ruido de ventilador máximo que experimentamos en la 5550. Esto podría haber sido a propósito por parte del fabricante en un intento de reducir el ruido del ventilador, pero afecta un poco a las temperaturas del núcleo.
Los usuarios que sepan que pueden beneficiarse del aumento de la potencia gráfica querrán prescindir de la Precision 5550 en favor de la 5560. Por lo demás, el 5550 puede ofrecer una experiencia de usuario idéntica en términos de características físicas y de pantalla. Competidores como el MSI WS66, Razer Blade 15 Studioo el Lenovo ThinkPad P15 G2 son ligeramente más gruesos pero llevan GPUs más rápidas de la Quadro RTX A3000 y superiores que no están disponibles en la serie Precision 5000.
Precio y disponibilidad
Dell Precision 5000 5560
- 10/06/2021 v7 (old)
Allen Ngo
Price comparison

