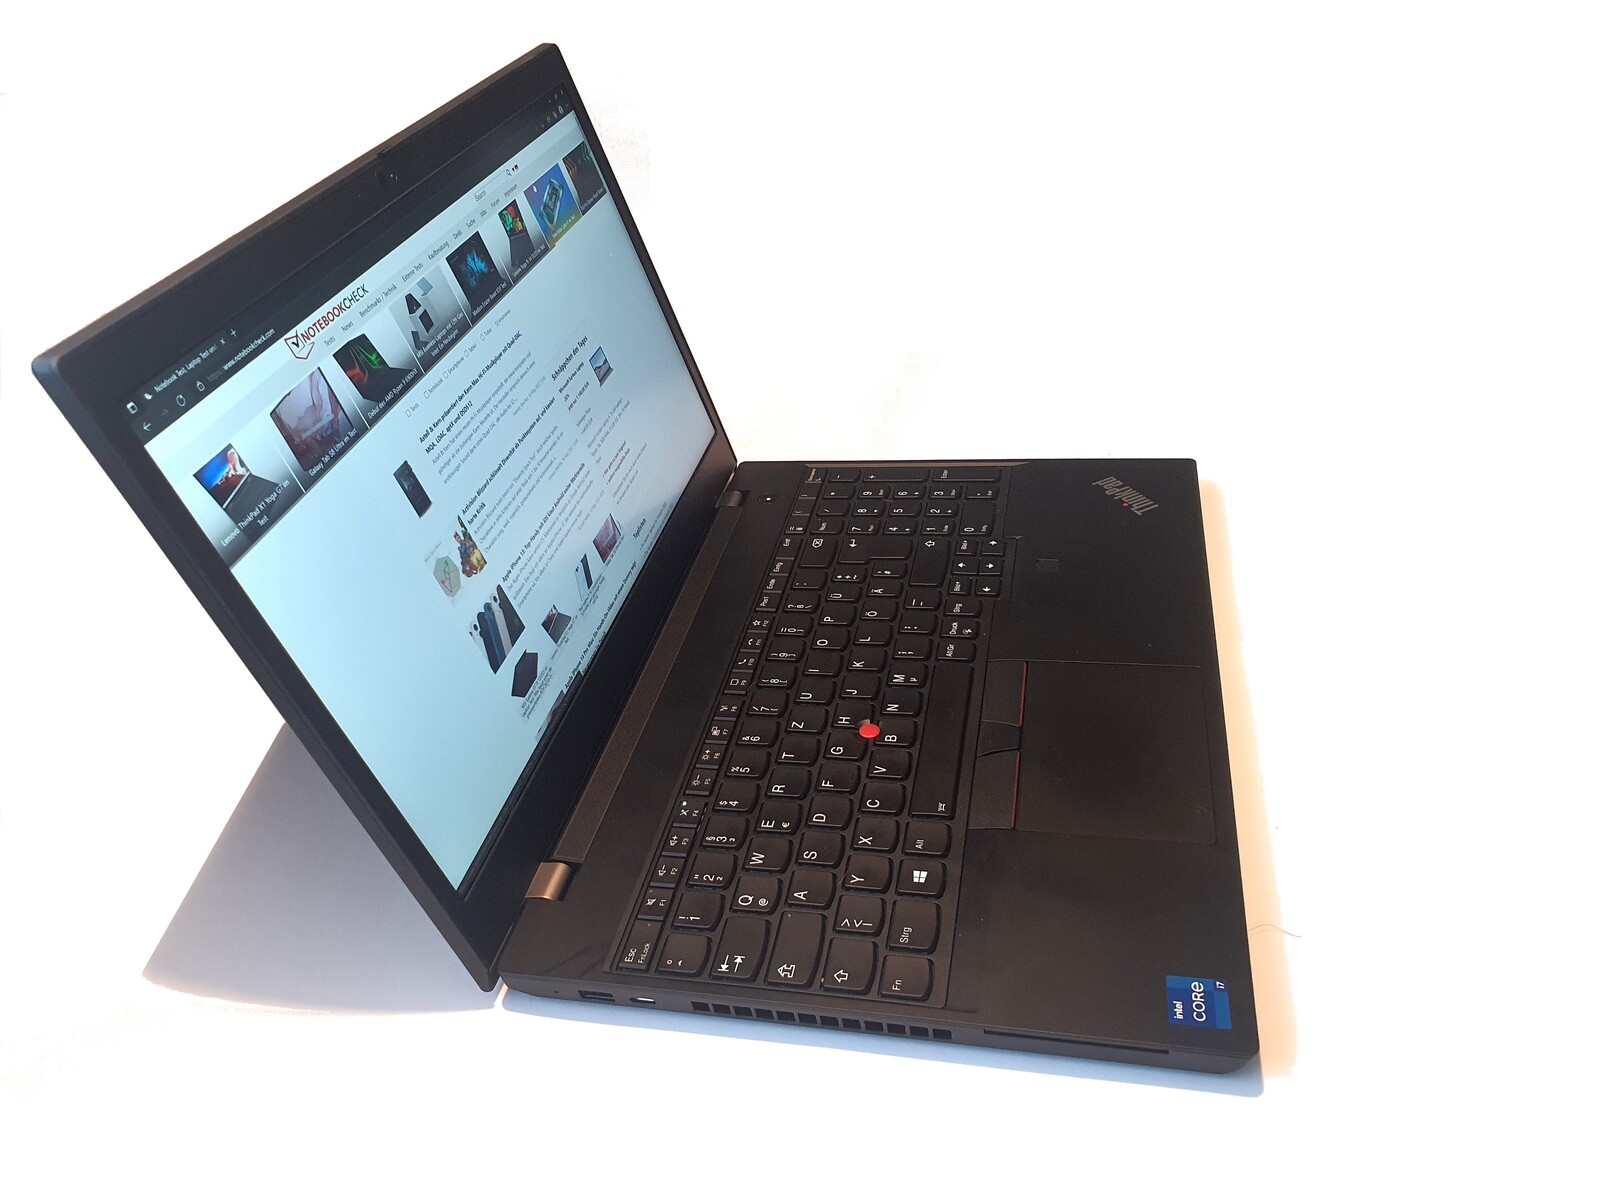
Análisis del portátil Lenovo ThinkPad P15v G2: Estación de trabajo empresarial asequible
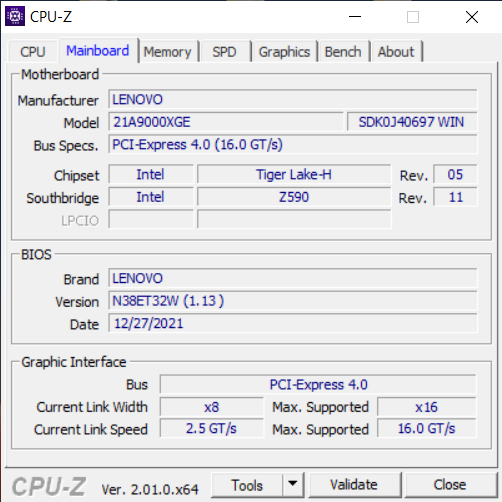
El Lenovo ThinkPad P15v Gen2 es una estación de trabajo de 15 pulgadas que se sitúa entre el ThinkPad P15s y P15 al igual que este último grupo, utiliza un procesador Intel Core i7-11800Hpero viene con la opción de una Nvidia GeForce RTX A2000 como la GPU más potente disponible para esta variante. El ThinkPad T15p Gen2 utiliza la más lenta Nvidia GeForce GTX 1650que está configurada como variante profesional (Nvidia T1200) en nuestro P15v G2.
Ambos dispositivos pueden equiparse con una pantalla 4K (600 nits), al igual que el T15p Gen1. El ThinkPad T15g, más voluminoso, por otro lado, es una variante de estación de trabajo del ThinkPad P15 que se ha desplazado en dirección a los juegos. Así, la serie P15v ofrece componentes potentes a un peso y precio no demasiado elevados (alrededor de 1.800 euros). Lenovo anuncia su estación de trabajo para personas creativas: si esta afirmación está justificada, particularmente en lo que respecta a la pantalla, se revelará en el siguiente análisis.
Nota para los lectores internacionales: El Lenovo ThinkPad P15v Gen2 también está disponible en otros países en varias configuraciones a varios precios (ver "Precio y Disponibilidad" al final de este análisis para ejemplos)
| Modelo | Área de aplicación |
|---|---|
| ThinkPad P15 | Estación de trabajo clásica |
| ThinkPad T15g | Estación de trabajo para juegos |
| ThinkPad P15s | Estación de trabajo Ultrabook |
| ThinkPad T15 | Negocio |
| ThinkPad P15v | Estación de trabajo básica |
| ThinkPad T15p | Rendimiento empresarial |
Posibles contendientes en la comparación
Valoración | Fecha | Modelo | Peso | Altura | Tamaño | Resolución | Precio |
|---|---|---|---|---|---|---|---|
| 86.2 % v7 (old) | 06/2022 | Lenovo ThinkPad P15v G2 21A9000XGE i7-11800H, T1200 Laptop GPU | 2.3 kg | 22.7 mm | 15.60" | 1920x1080 | |
| 87.2 % v7 (old) | 10/2021 | Lenovo ThinkPad P15 G2-20YQ001JGE i7-11800H, RTX A3000 Laptop GPU | 2.9 kg | 31.5 mm | 15.60" | 1920x1080 | |
| 86.3 % v7 (old) | 03/2021 | Lenovo ThinkPad T15g-20UR000GGE i7-10750H, GeForce RTX 2070 Super Max-Q | 2.8 kg | 31.45 mm | 15.60" | 1920x1080 | |
| 86.6 % v7 (old) | 02/2021 | Lenovo ThinkPad T15p-20TN0006GE i7-10750H, GeForce GTX 1050 Mobile | 2.2 kg | 22.7 mm | 15.60" | 3840x2160 | |
| 85.3 % v7 (old) | 06/2021 | Lenovo ThinkPad P15s Gen2-20W6000GGE i7-1165G7, T500 Laptop GPU | 1.9 kg | 19.1 mm | 15.60" | 3840x2160 | |
| 87.7 % v7 (old) | 07/2022 | HP ZBook Power 15 G8 313S5EA i7-11800H, T600 Laptop GPU | 2 kg | 22.8 mm | 15.60" | 1920x1080 | |
| 88.3 % v7 (old) | 10/2021 | Dell Precision 5000 5560 i7-11850H, RTX A2000 Laptop GPU | 2 kg | 18 mm | 15.60" | 3840x2400 |
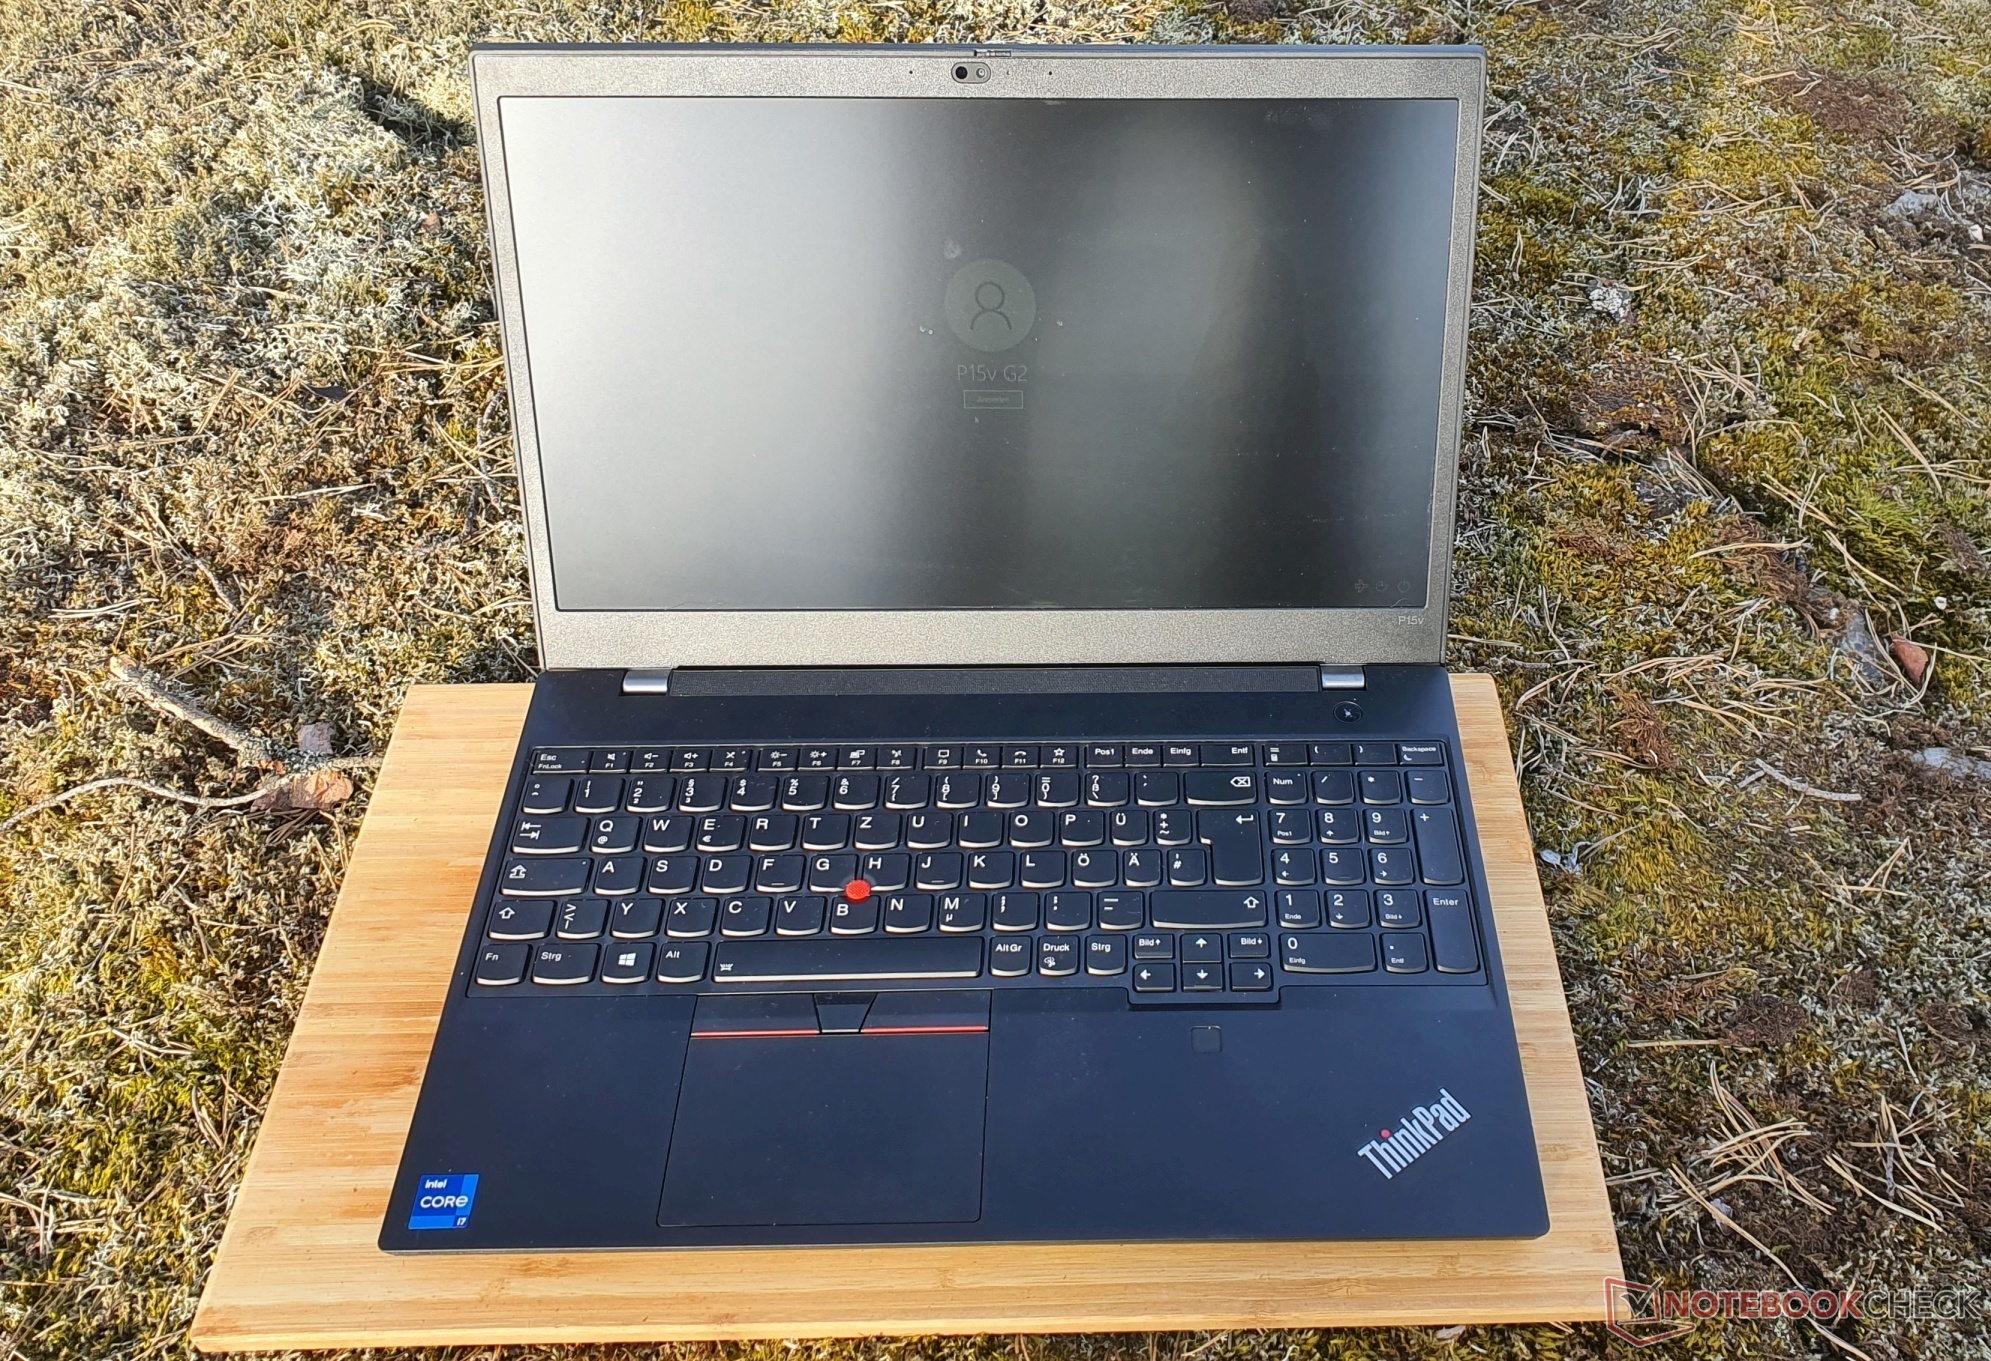
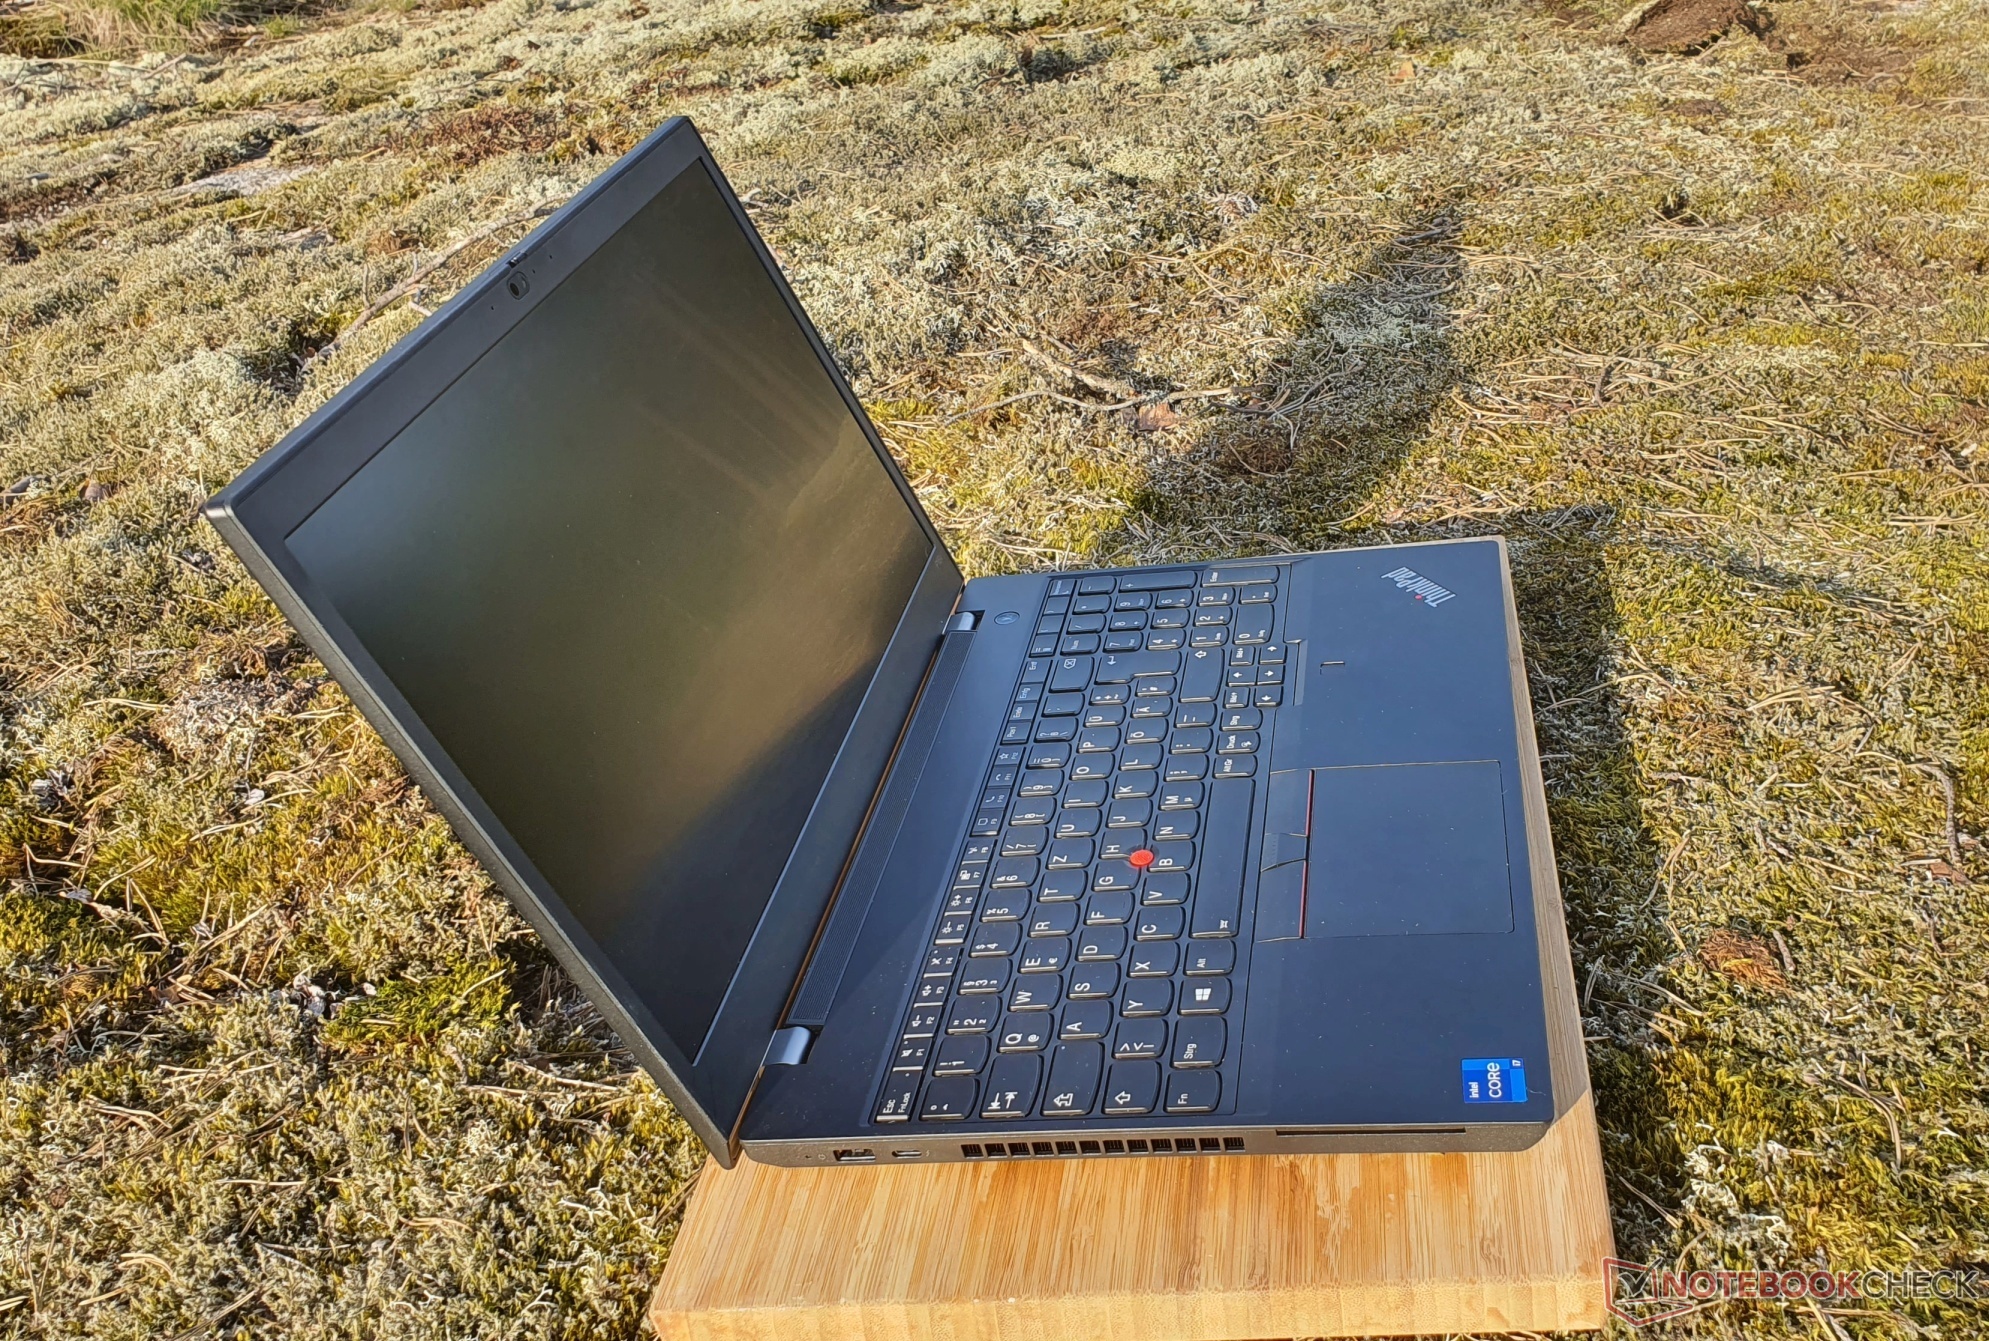
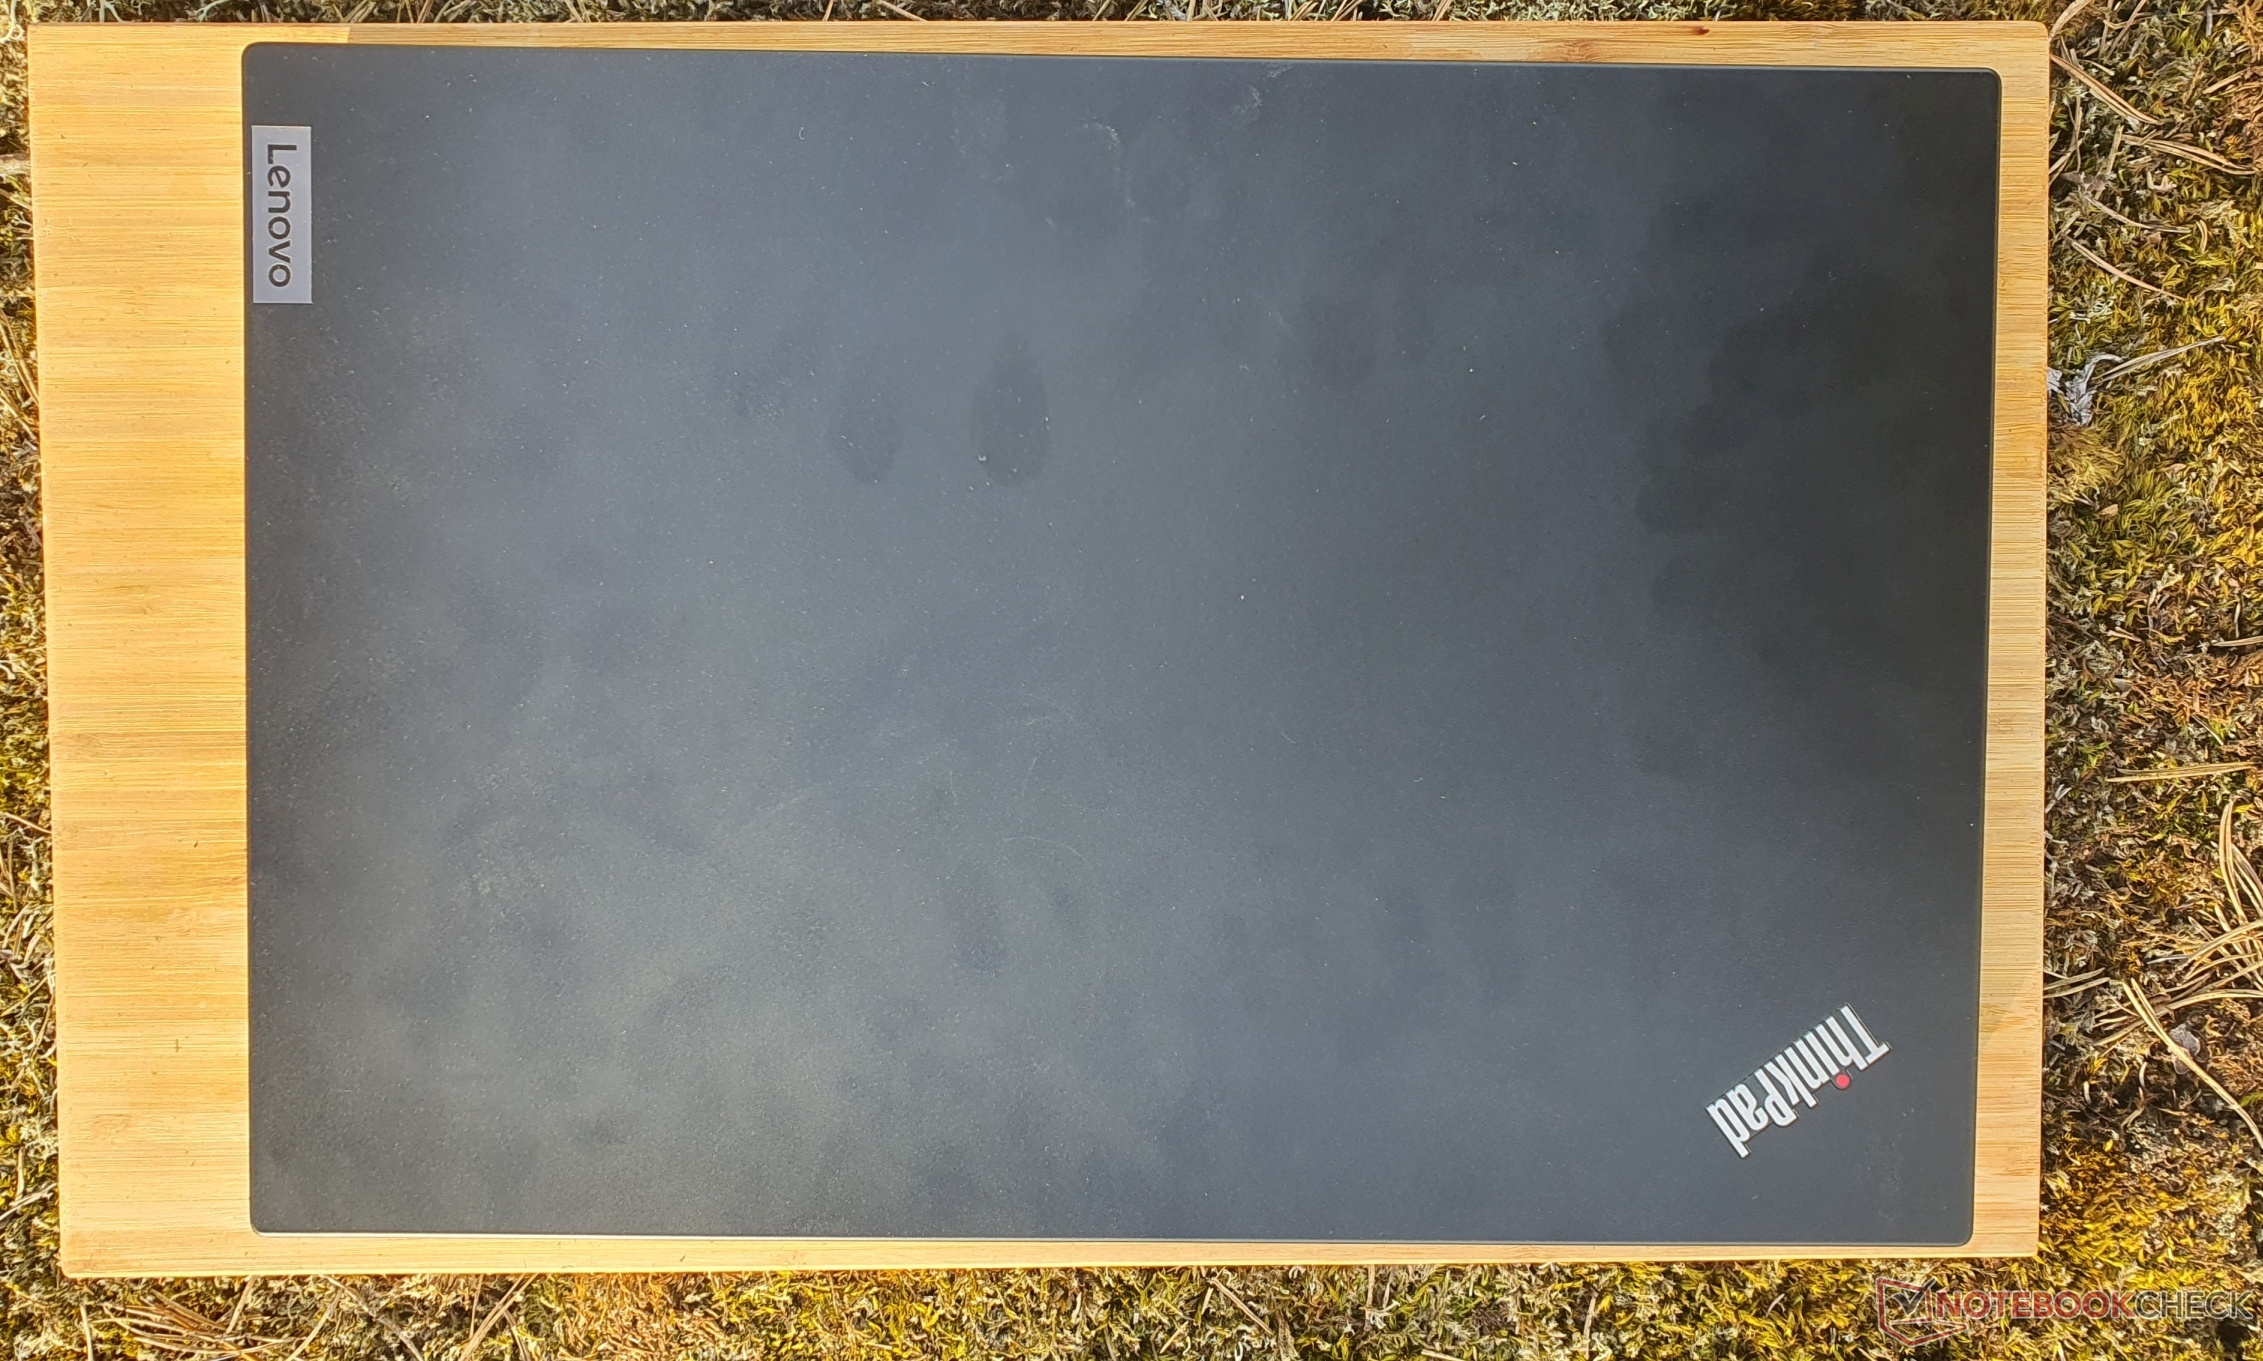
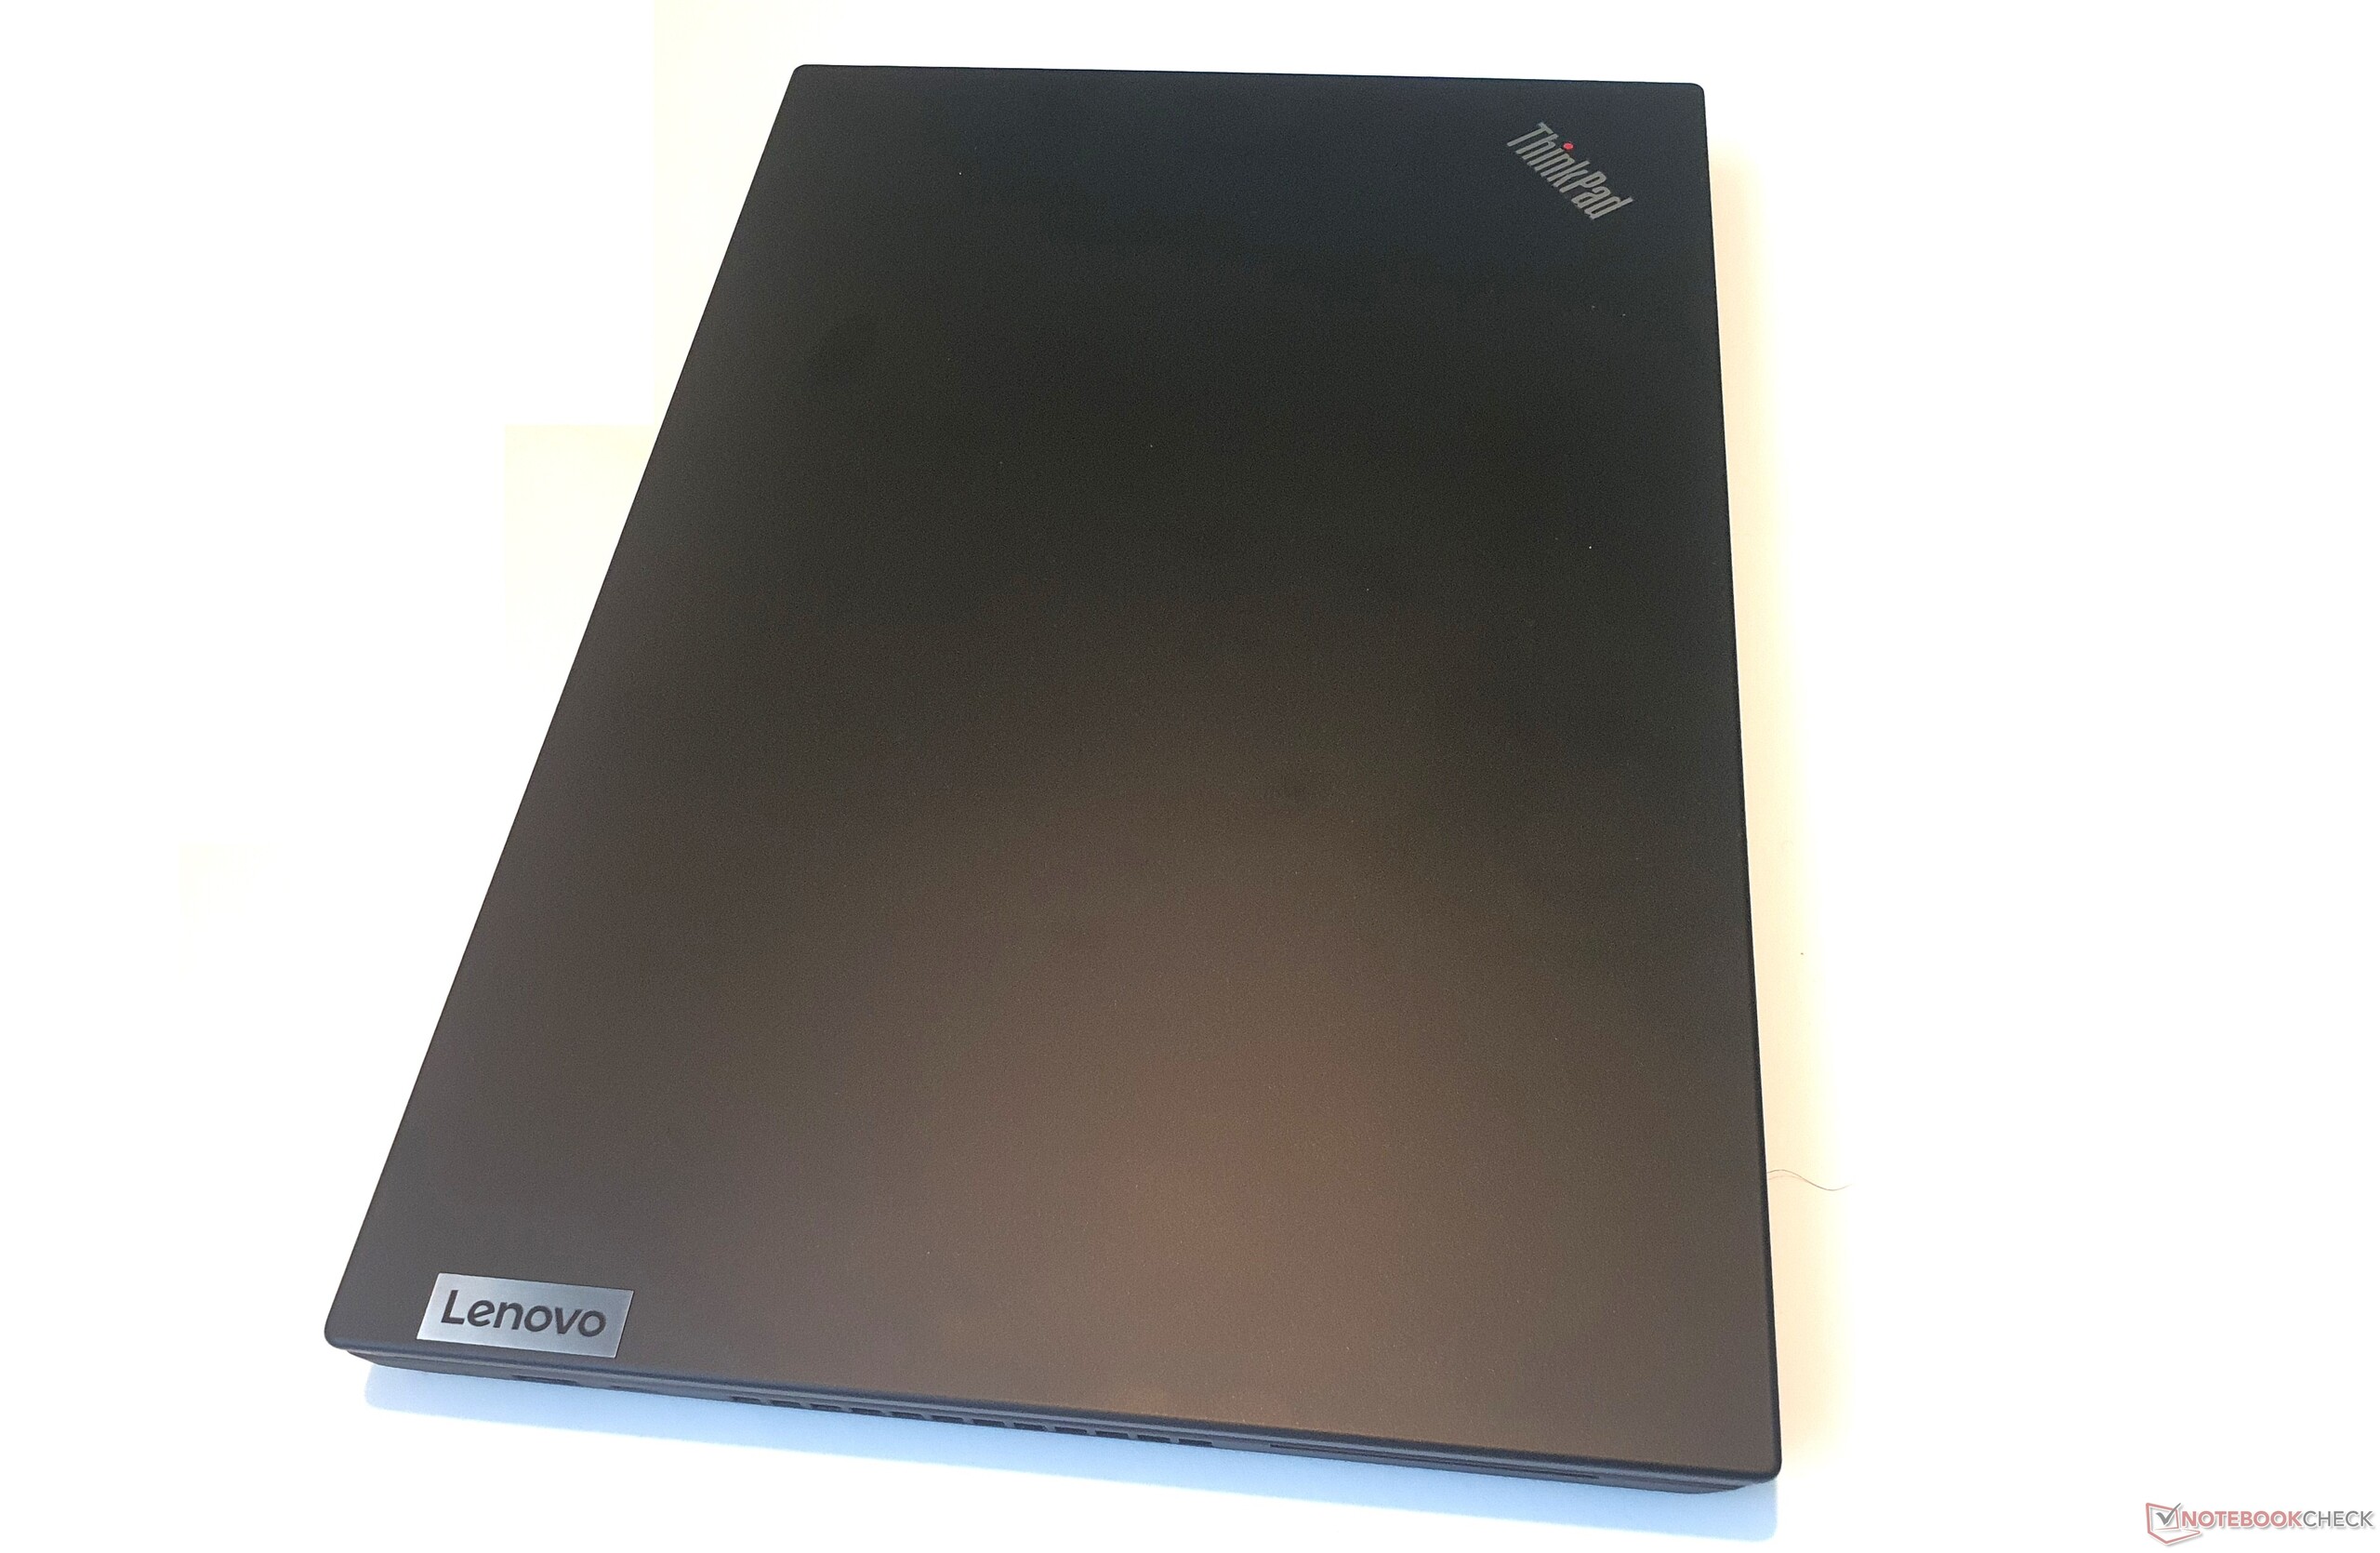
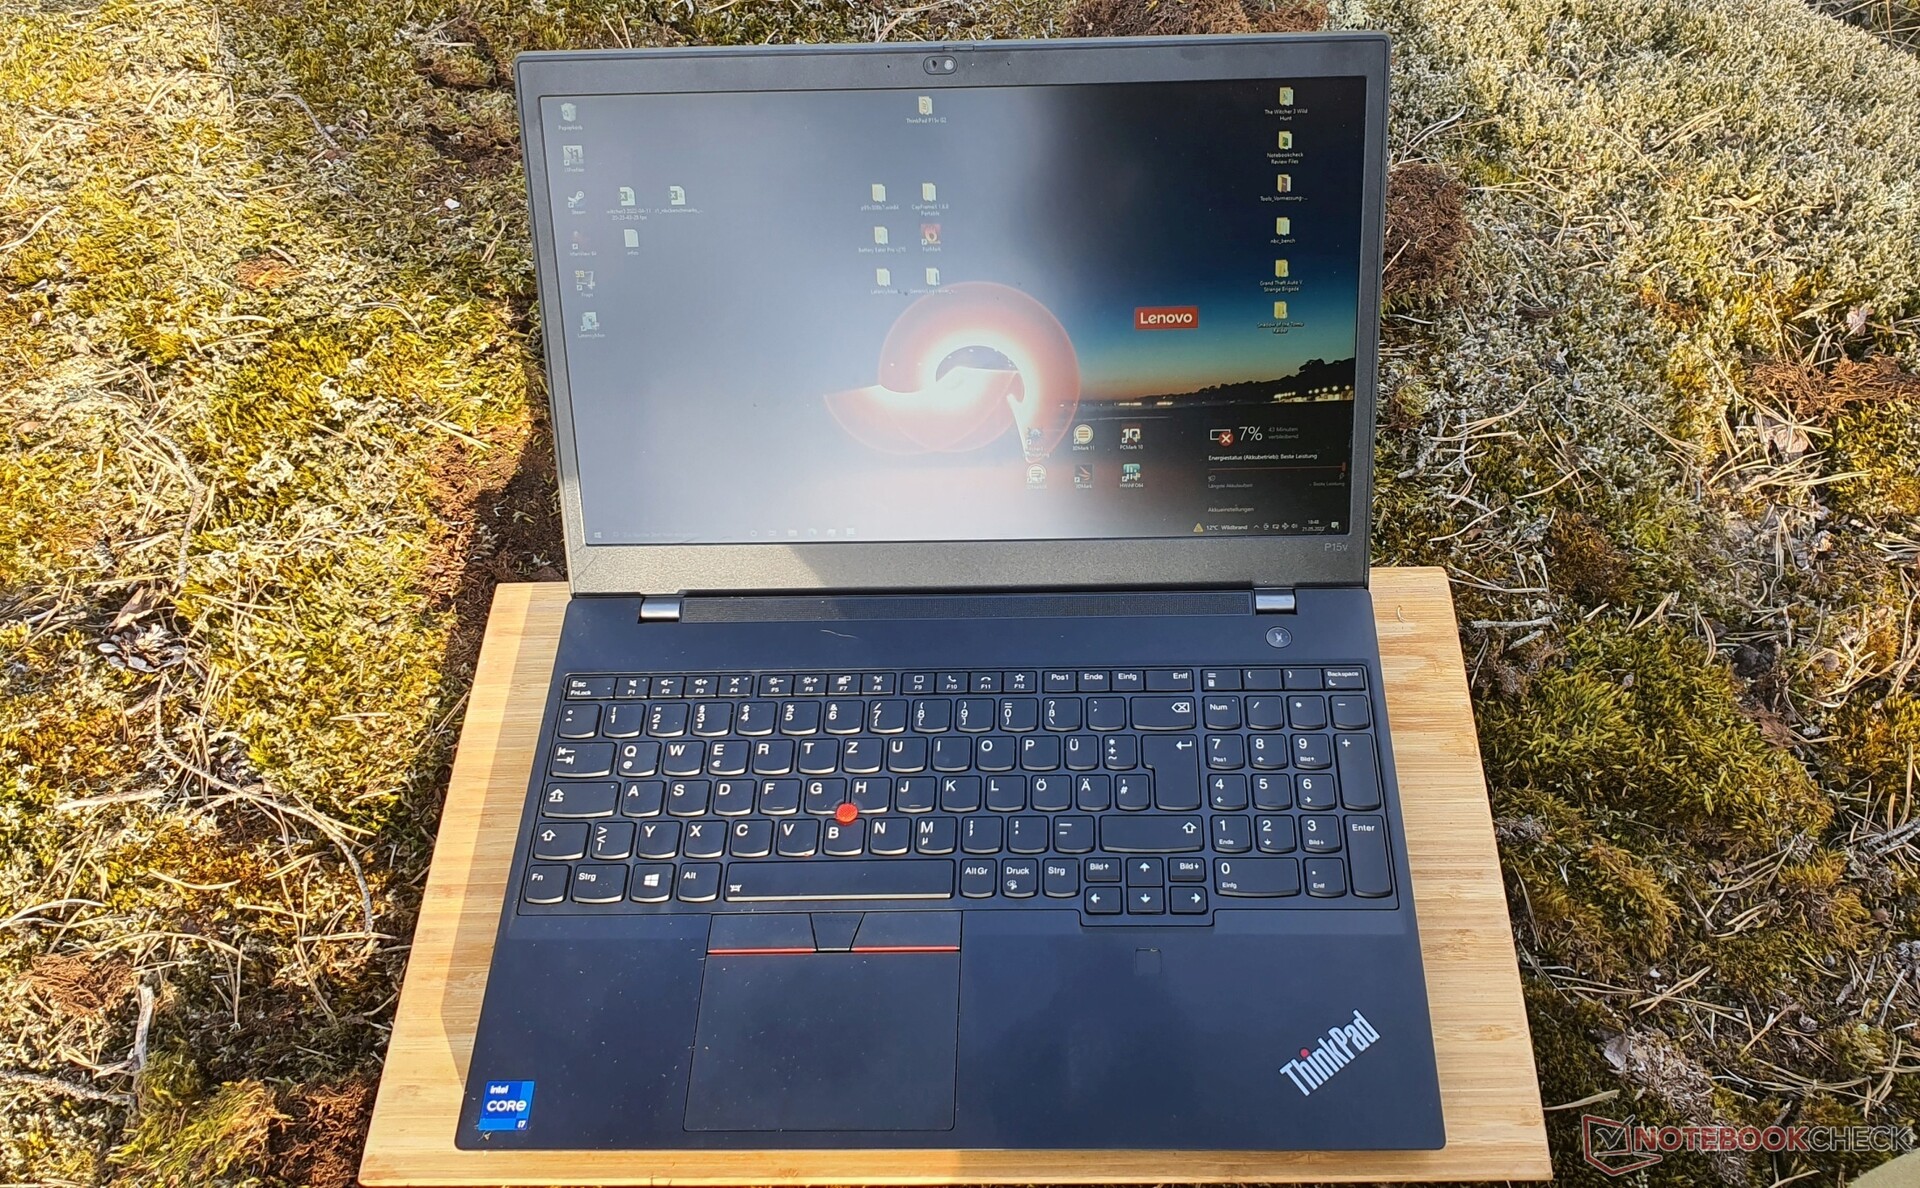
Caja: Plástico estable para el ThinkPad mate

La carcasa del ThinkPad P15v parece similar a la delThinkPad P15spero es más alta (unos 3,6 mm) y más pesada (360 gramos). La tapa también es considerablemente más gruesa, ofreciendo más resistencia a la torsión, pero todavía puede ser torcida notablemente.
La misma carcasa del ThinkPad T15p lo que significa que el plástico ABS es estable y mate, pero sin el refuerzo de fibra de vidrio de los P15. También faltan los revestimientos de goma agradables al tacto, lo que hace que la parte inferior sea muy áspera como se conoce de los ThinkPads económicos como elL15o el ThinkPad R500 del pasado lejano.
No hay defectos de fabricación, y la estabilidad es de alto nivel. La unidad de base reforzada con magnesio no puede torcerse ni por asomo, y la unidad del teclado sólo cede ligeramente en el centro cuando se aplica una presión específica. Las bisagras están muy tensas, pero aún así permiten la apertura con una sola mano hasta un ángulo de 180º. Por desgracia, el ThinkPad es un imán para las huellas dactilares.
Gracias a sus tarjetas gráficas más potentes y a sus sistemas de refrigeración más potentes, el ThinkPad P15 y T15g son portátiles de estación de trabajo significativamente más gruesos, con unos 31,5 mm, en comparación con el "delgado" y, por tanto, más ligero P15v, lo que supone una diferencia de peso de 600 gramos
Según el s-suffix (delgado), el ThinkPad P15s es aún más delgado y ligero.El Precision 5560 de Dellsigue siendo imbatible con su tamaño de portátil de 14 pulgadas, mientras que el ZBook Power 15 de HP tiene unas dimensiones similares al ThinkPad P15v, pero es casi 300 gramos más ligero, con 1,97 kg.
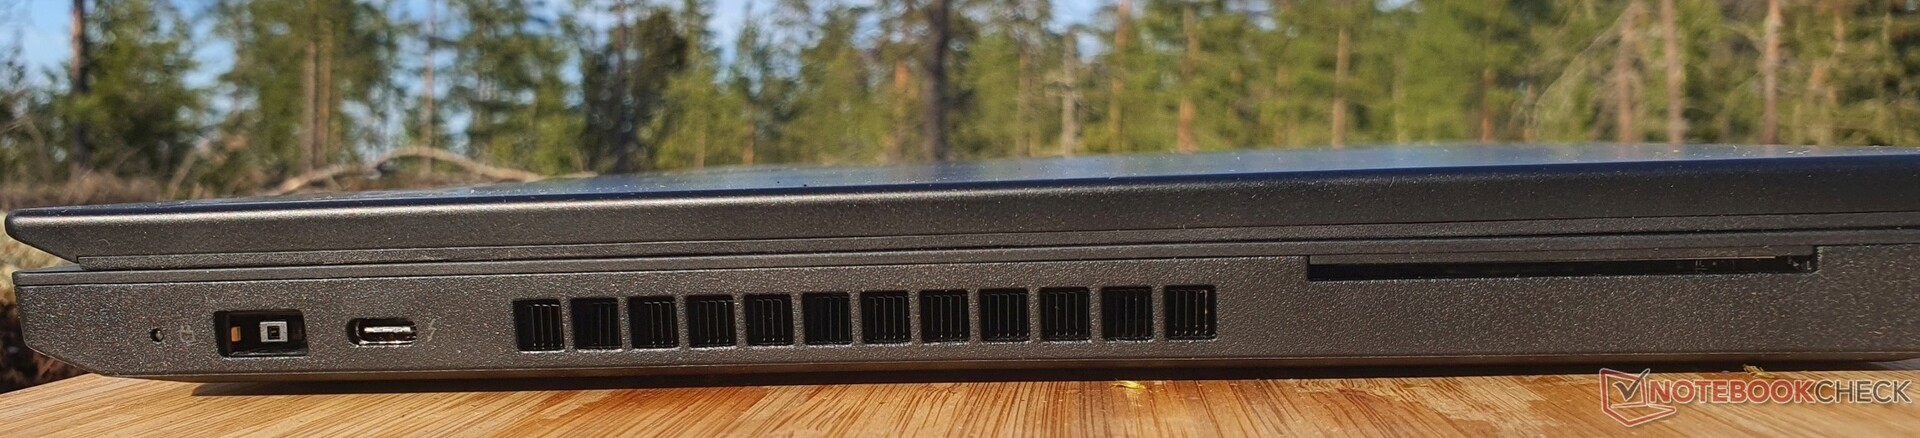
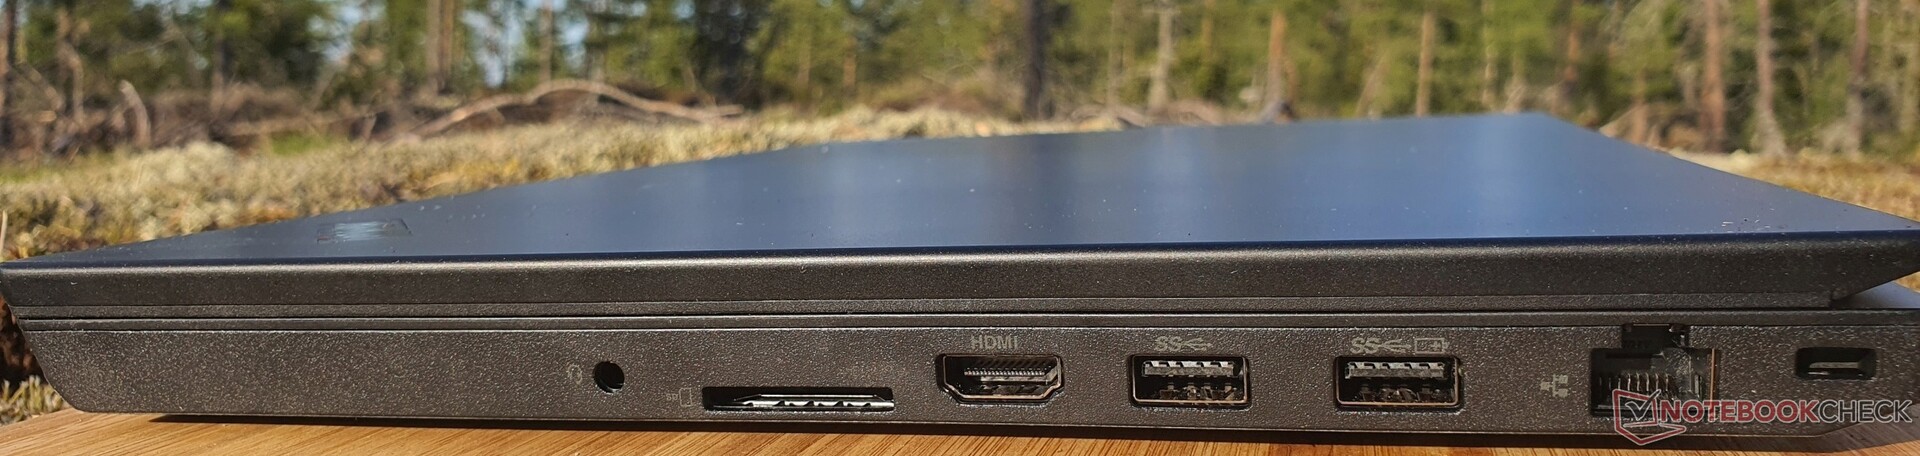
Conectividad: Lenovo con Wi-Fi 6 fijo y lector de tarjetas SD
El ThinkPad P15v G2 ofrece un montón de puertos: en el lado izquierdo está el puerto de carga propietario de punta fina y un puerto Thunderbolt 4, que por desgracia no admite carga. Además, hay un lector de tarjetas inteligentes y ranuras de ventilación, para que el calor residual no suponga un problema al usar un ratón en el lado derecho
Las características del lado derecho incluyen dos puertos USB-A 3.2 Gen1 (Always On), HDMI 2.0, GBit Ethernet y un lector de tarjetas SD de tamaño completo, que ya no se ofrecen en los ThinkPads puramente empresariales como los P15. Los modelos con WWAN tienen una ranura para tarjetas SIM en la parte posterior del dispositivo que actúa como ranura para tarjetas µSD si no se ha configurado la WWAN.
Lector de tarjetas SD
En lo que respecta a las velocidades de lectura de archivos de 1 GB, el ThinkPad P15v G2 se sitúa a la cabeza de su clase. En la prueba de copia, sin embargo, queda muy por detrás de los 200 MB/s del ThinkPad P15 y Dell Precision 5560 estaciones de trabajo con alrededor de 96 MB/s.
| SD Card Reader | |
| average JPG Copy Test (av. of 3 runs) | |
| Lenovo ThinkPad P15 G2-20YQ001JGE (AV Pro V60) | |
| Dell Precision 5000 5560 (AV Pro V60) | |
| Lenovo ThinkPad T15g-20UR000GGE (Toshiba Exceria Pro SDXC 64 GB UHS-II) | |
| Media de la clase Workstation (49.6 - 681, n=14, últimos 2 años) | |
| Lenovo ThinkPad P15v G2 21A9000XGE | |
| Lenovo ThinkPad T15p-20TN0006GE (Toshiba Exceria Pro SDXC 64 GB UHS-II) | |
| Lenovo ThinkPad P15s Gen2-20W6000GGE (AV Pro V60) | |
| maximum AS SSD Seq Read Test (1GB) | |
| Lenovo ThinkPad P15v G2 21A9000XGE | |
| Media de la clase Workstation (87.6 - 1455, n=14, últimos 2 años) | |
| Lenovo ThinkPad P15 G2-20YQ001JGE (AV Pro V60) | |
| Lenovo ThinkPad T15g-20UR000GGE (Toshiba Exceria Pro SDXC 64 GB UHS-II) | |
| Dell Precision 5000 5560 (AV Pro V60) | |
| Lenovo ThinkPad T15p-20TN0006GE (Toshiba Exceria Pro SDXC 64 GB UHS-II) | |
| Lenovo ThinkPad P15s Gen2-20W6000GGE (AV Pro V60) | |
Comunicación
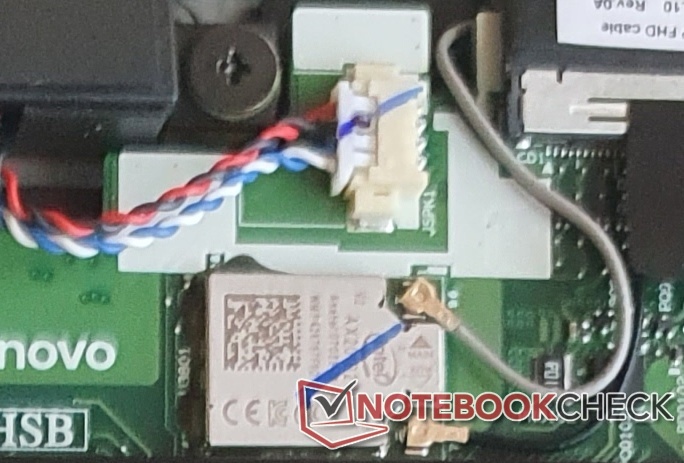
Se dispone de Ethernet RJ45 (1 GBit/s). También está el Wi-Fi 6 AX201 de Intel (instalado permanentemente), que permite al ThinkPad P15v G2 transferir datos de red diez veces más rápido que por cable, lo que está en el nivel alto de la competencia. Una ranura M.2 existente (y los correspondientes cables de antena) permite la instalación de una tarjeta WWAN, pero también se puede pedir preinstalada
Cámara web

Aunque la cámara sólo ofrece unos pésimos 720p, se pueden apreciar las cualidades del modelo.


Seguridad
Los portátiles puramente empresariales, como el ThinkPad P15v, ofrecen numerosas funciones de seguridad, como un lector de tarjetas inteligentes, un lector de huellas dactilares en el reposamanos, un bloqueo de seguridad Kensington, TPM 2.0 y una cámara de infrarrojos para Windows Hello con un ThinkShutter (obturador de cámara web) integrado.
Accesorios
Aparte del compacto adaptador de corriente de 135 vatios, no se incluye ningún accesorio al comprarlo. También se omite un puerto de acoplamiento explícito y faltan soluciones Thunderbolt debido a la imposibilidad de cargar por USB-C. Sólo se puede usar una variante de acoplamiento especial que combina el puerto de carga propietario con Thunderbolt: elThinkPad Thunderbolt 3 Workstation Dock Gen 2.
El embalaje de Lenovo no puede describirse realmente como respetuoso con el medio ambiente, aunque el embalaje y la caja sean muy sencillos.
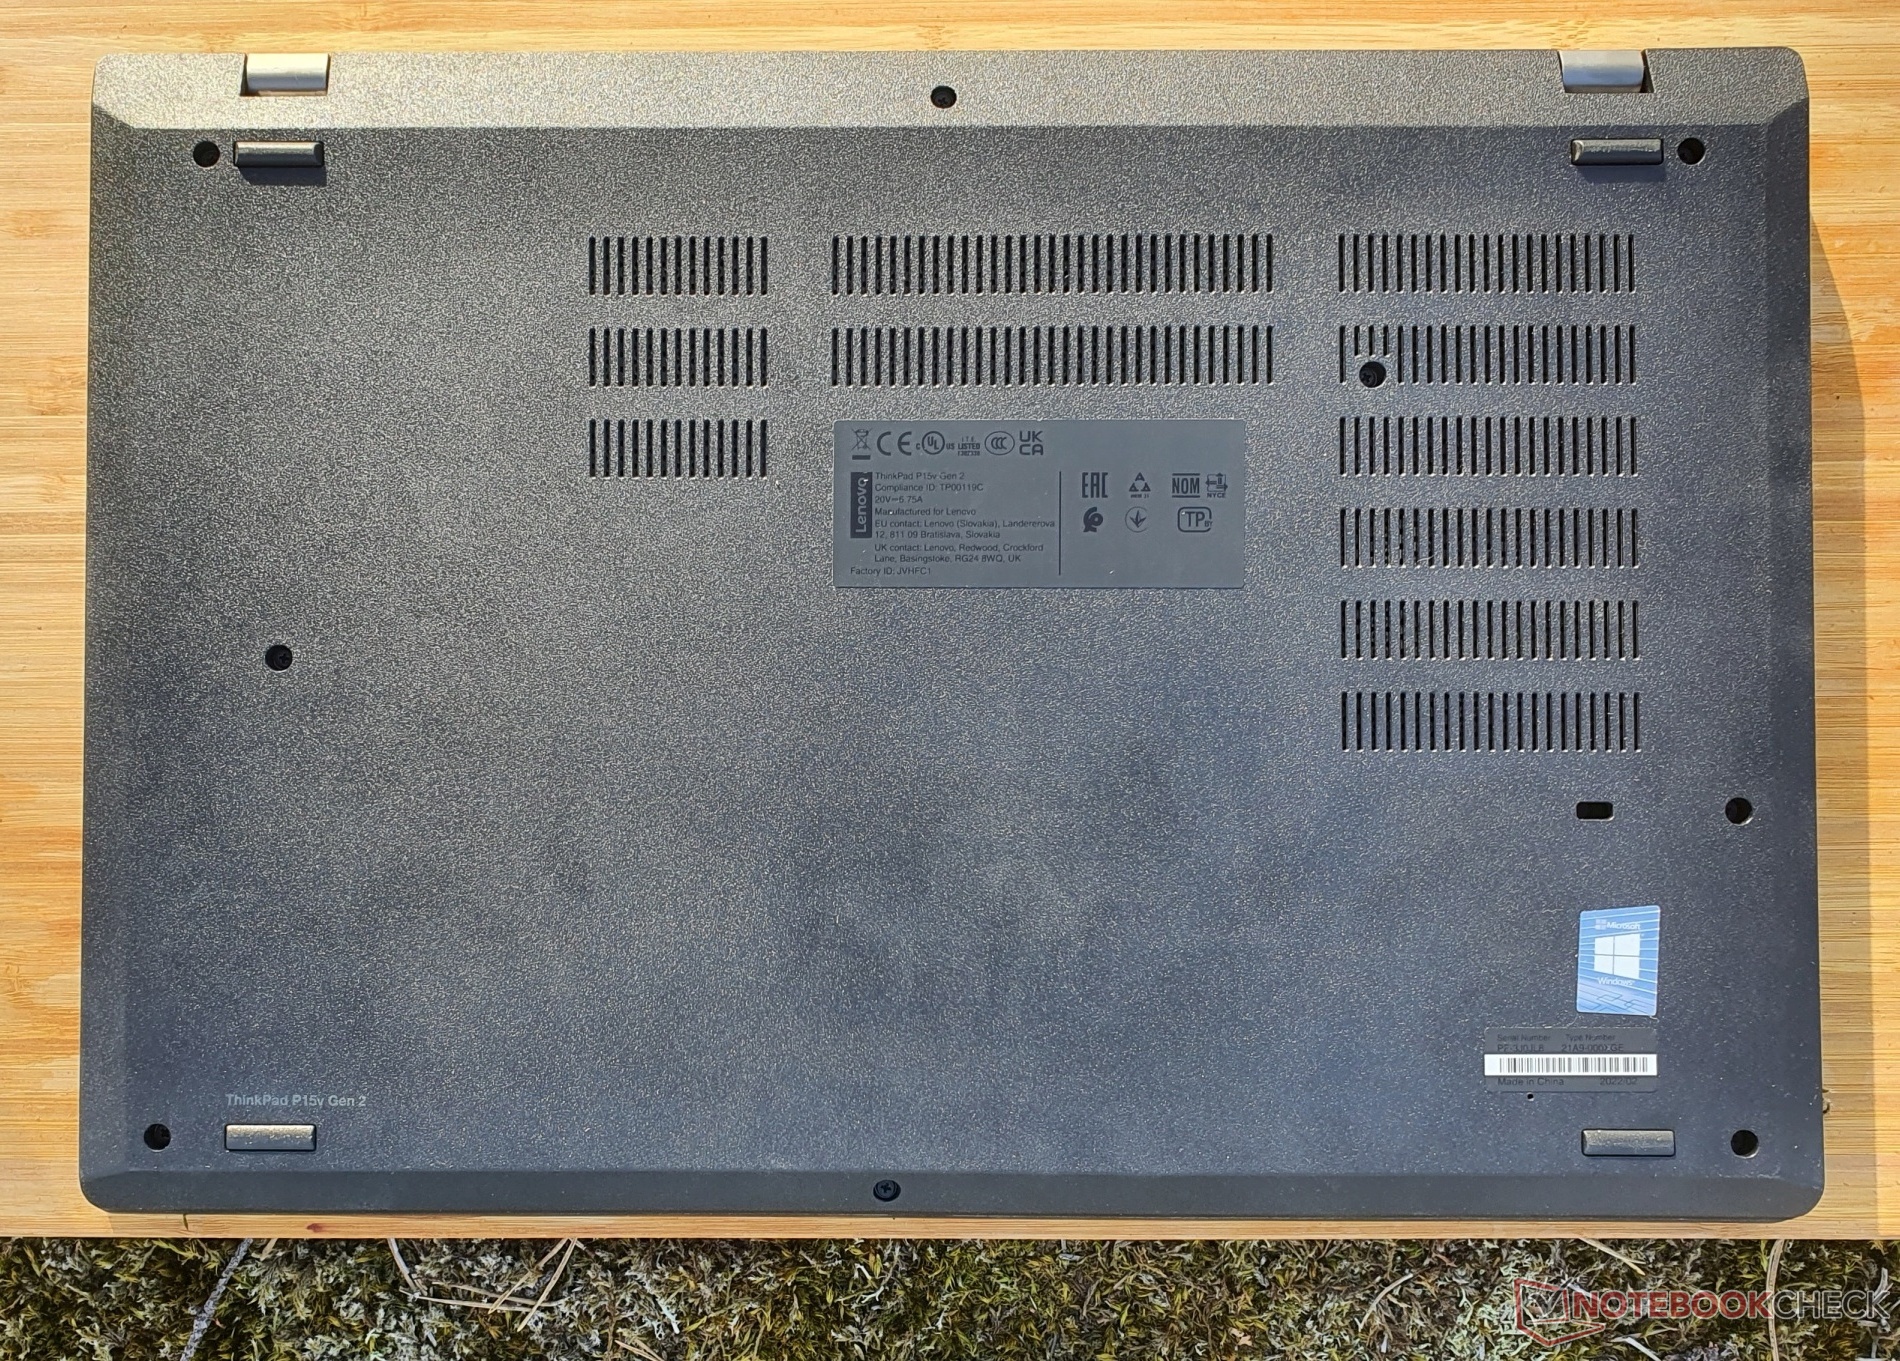
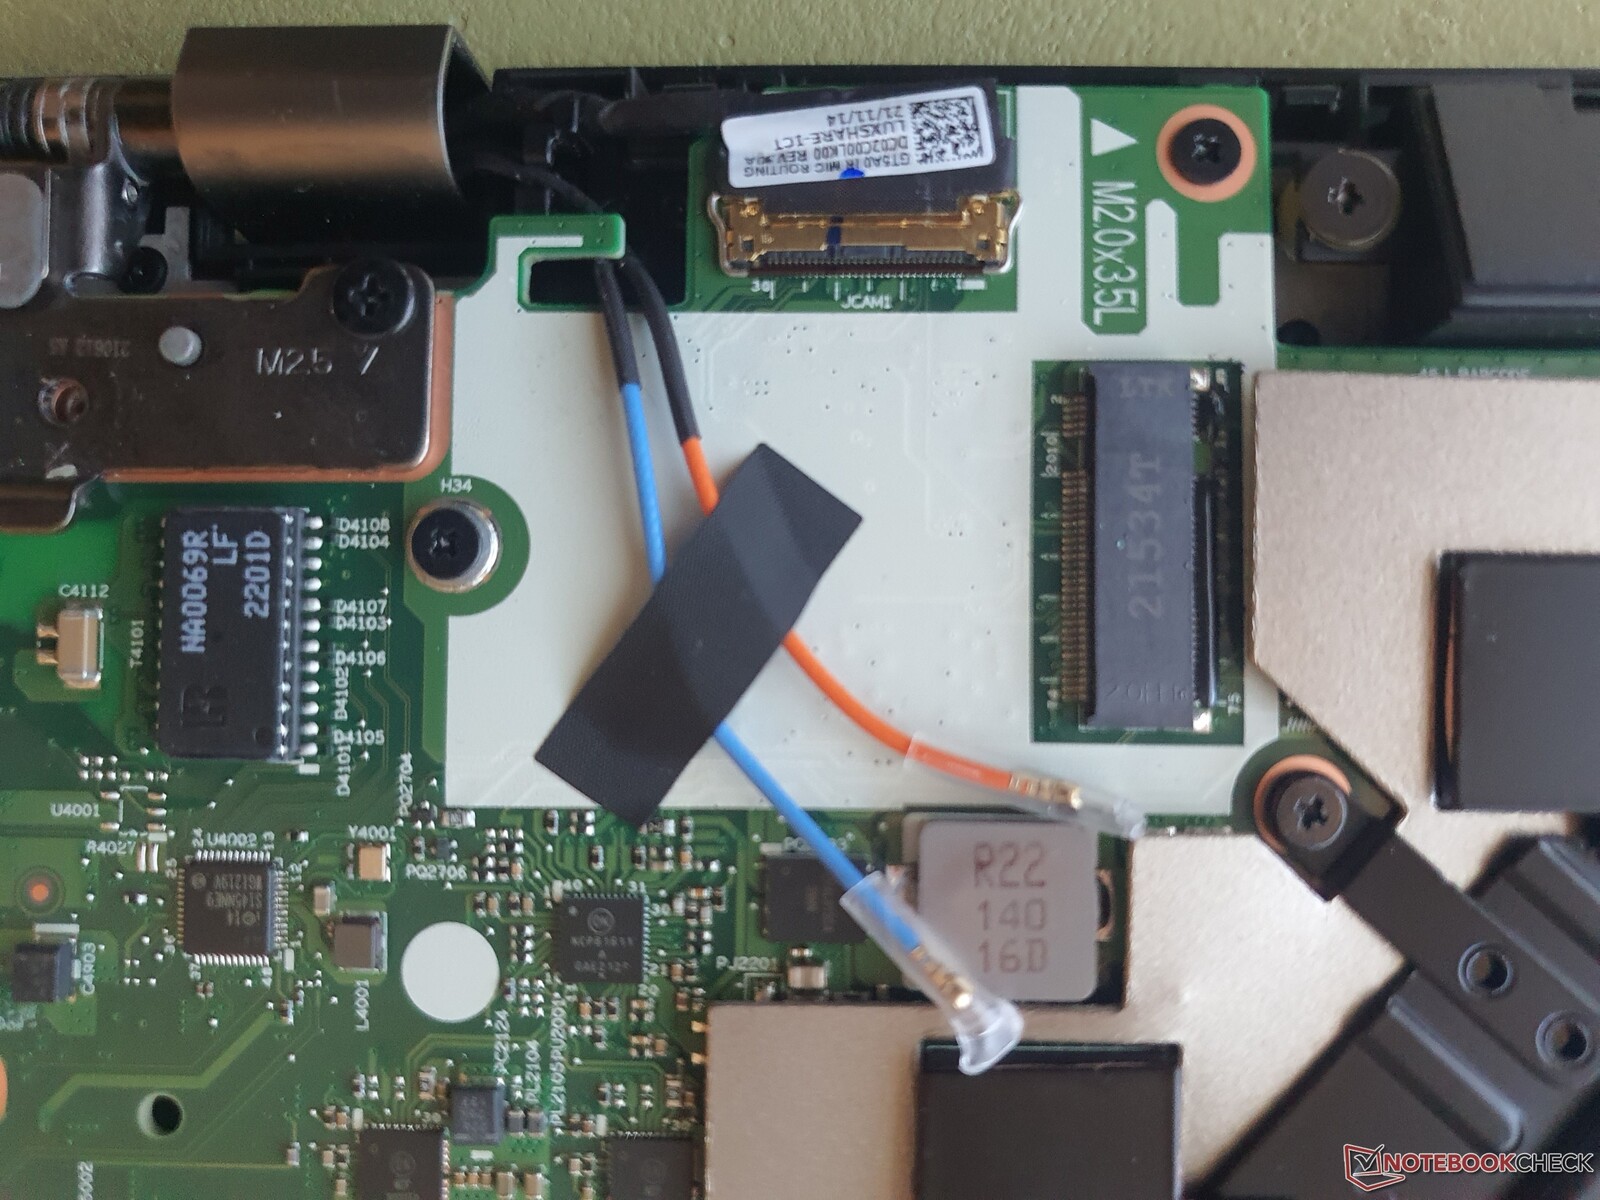
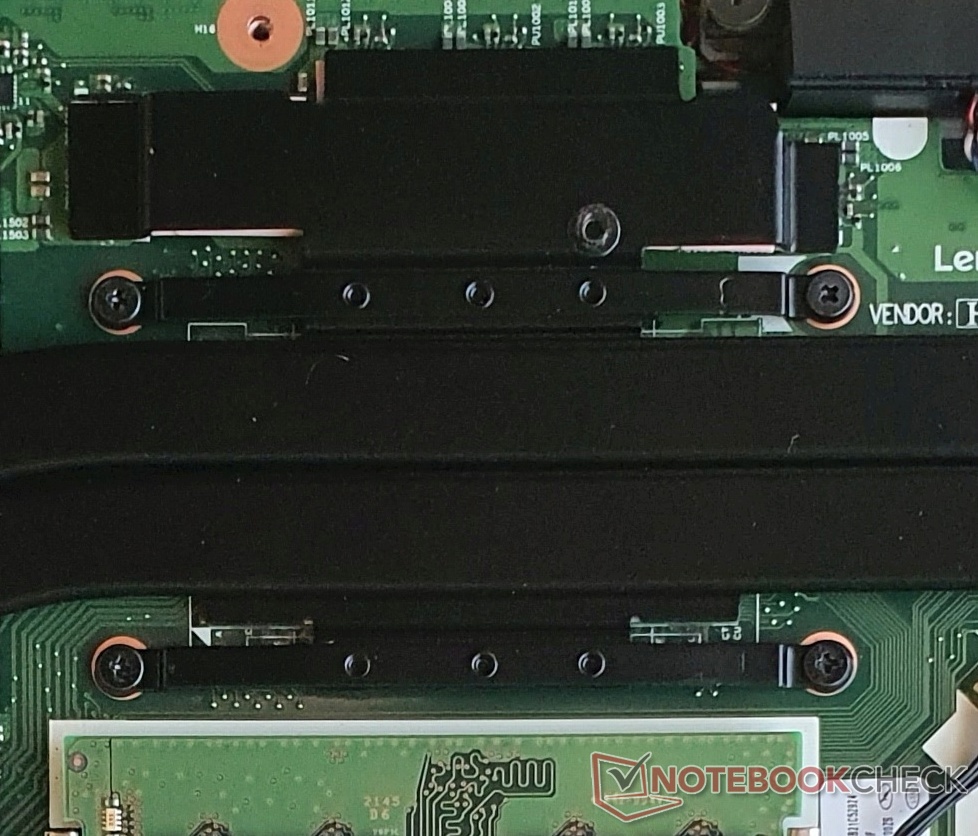
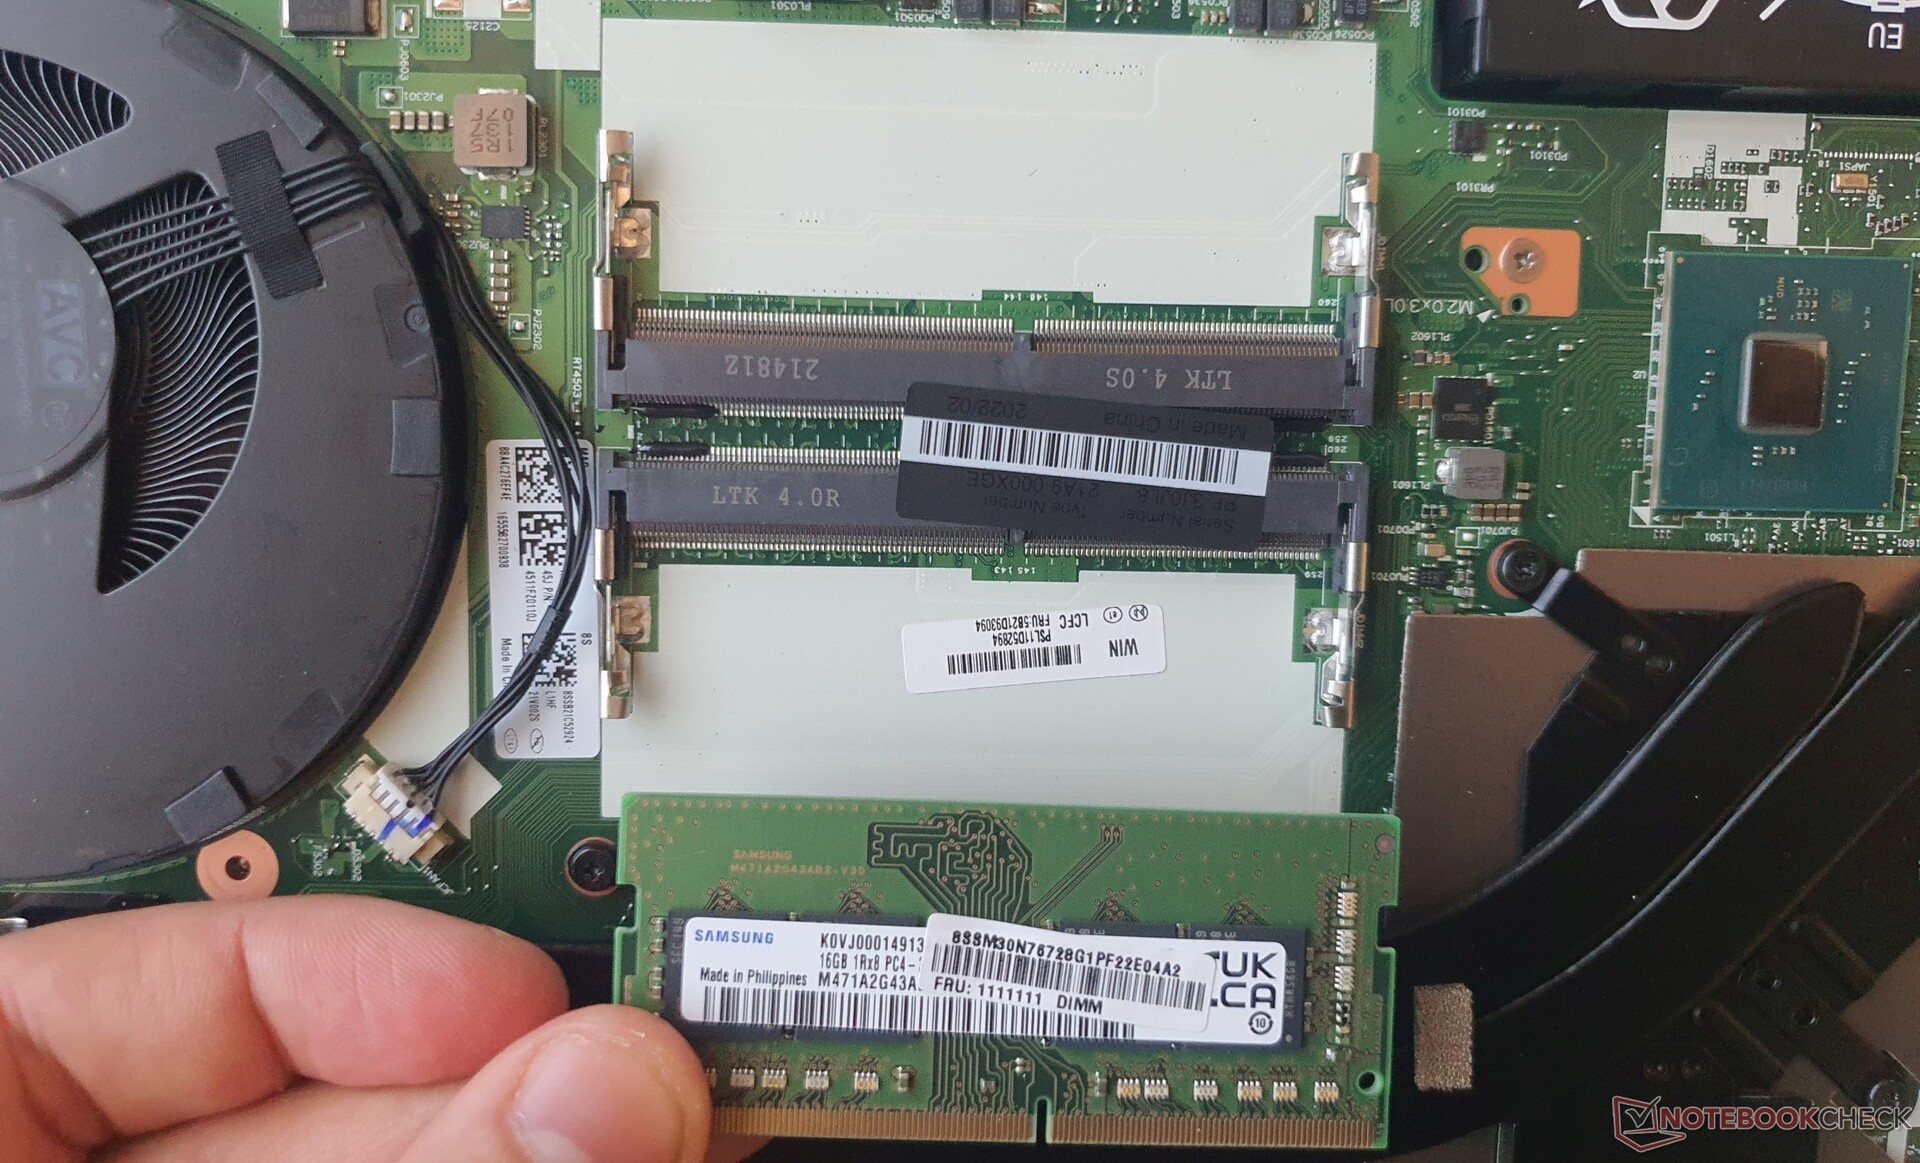
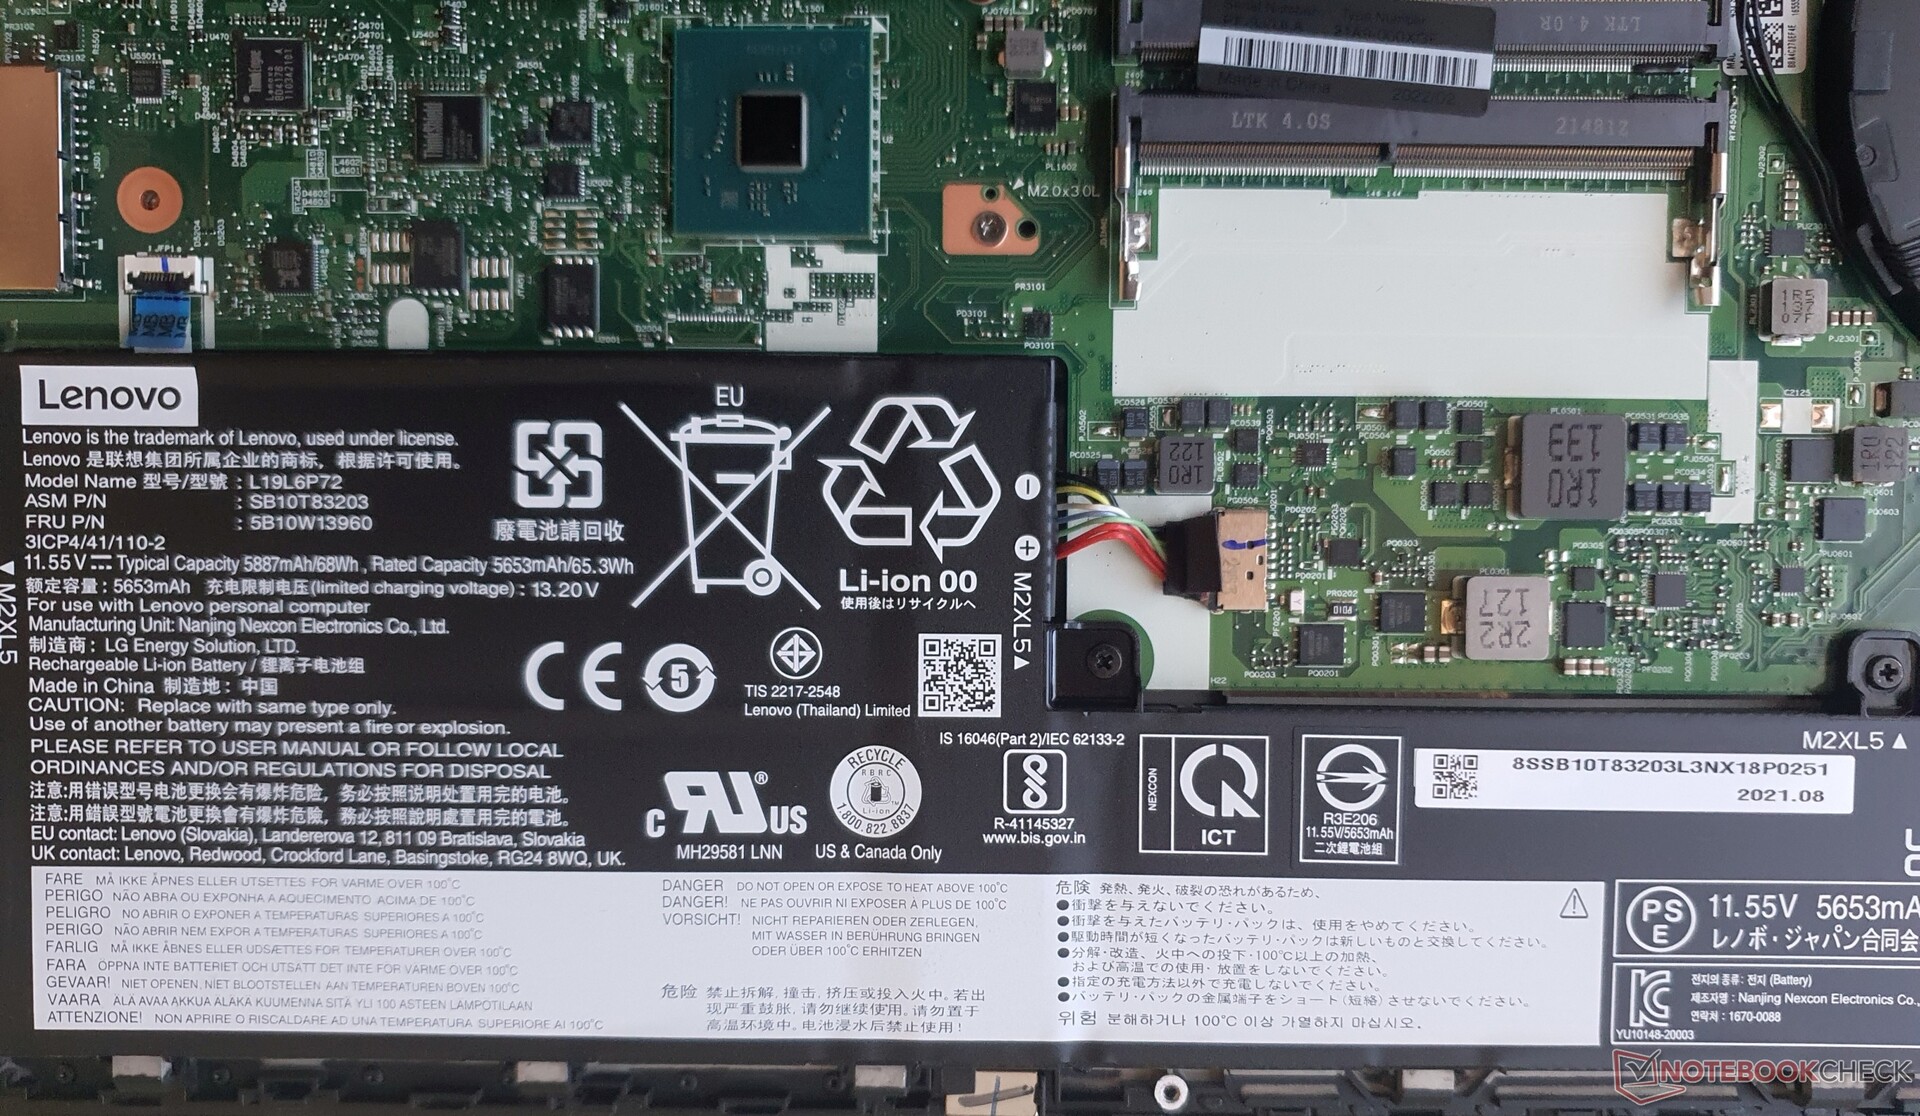
Mantenimiento
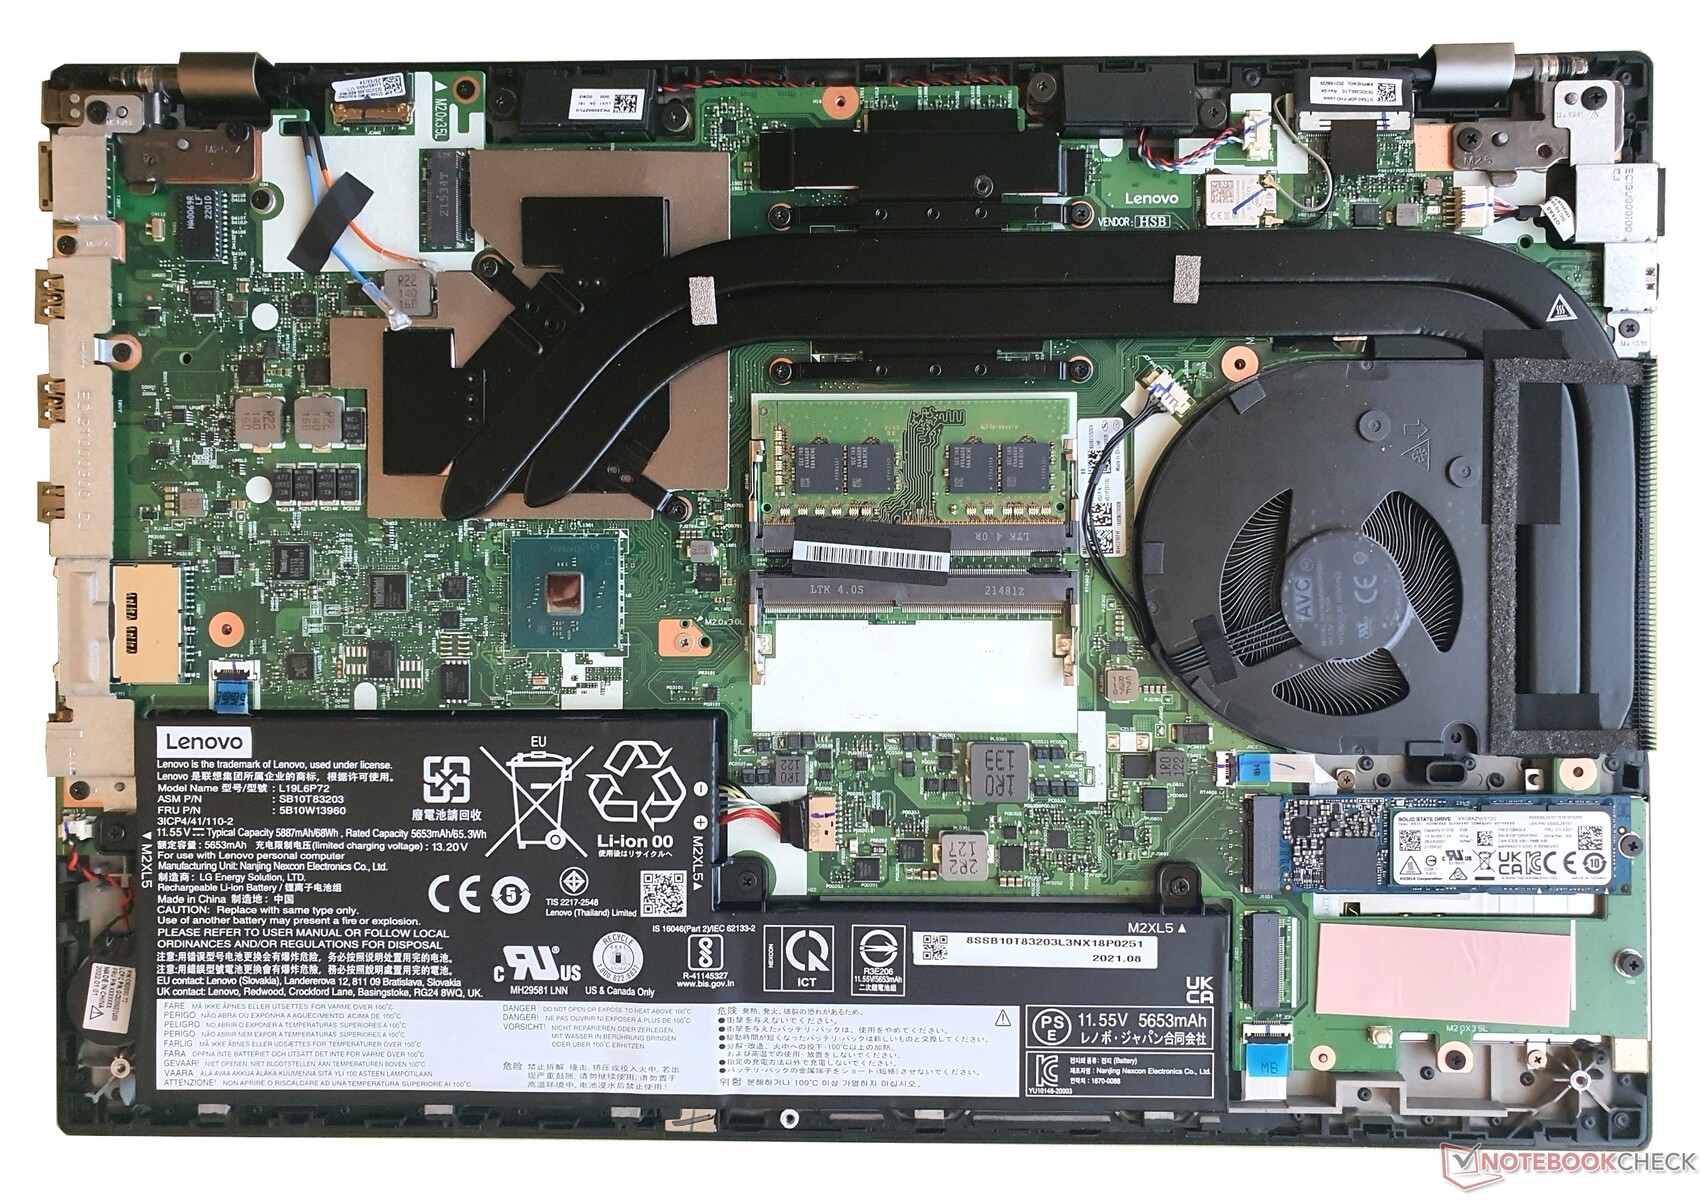
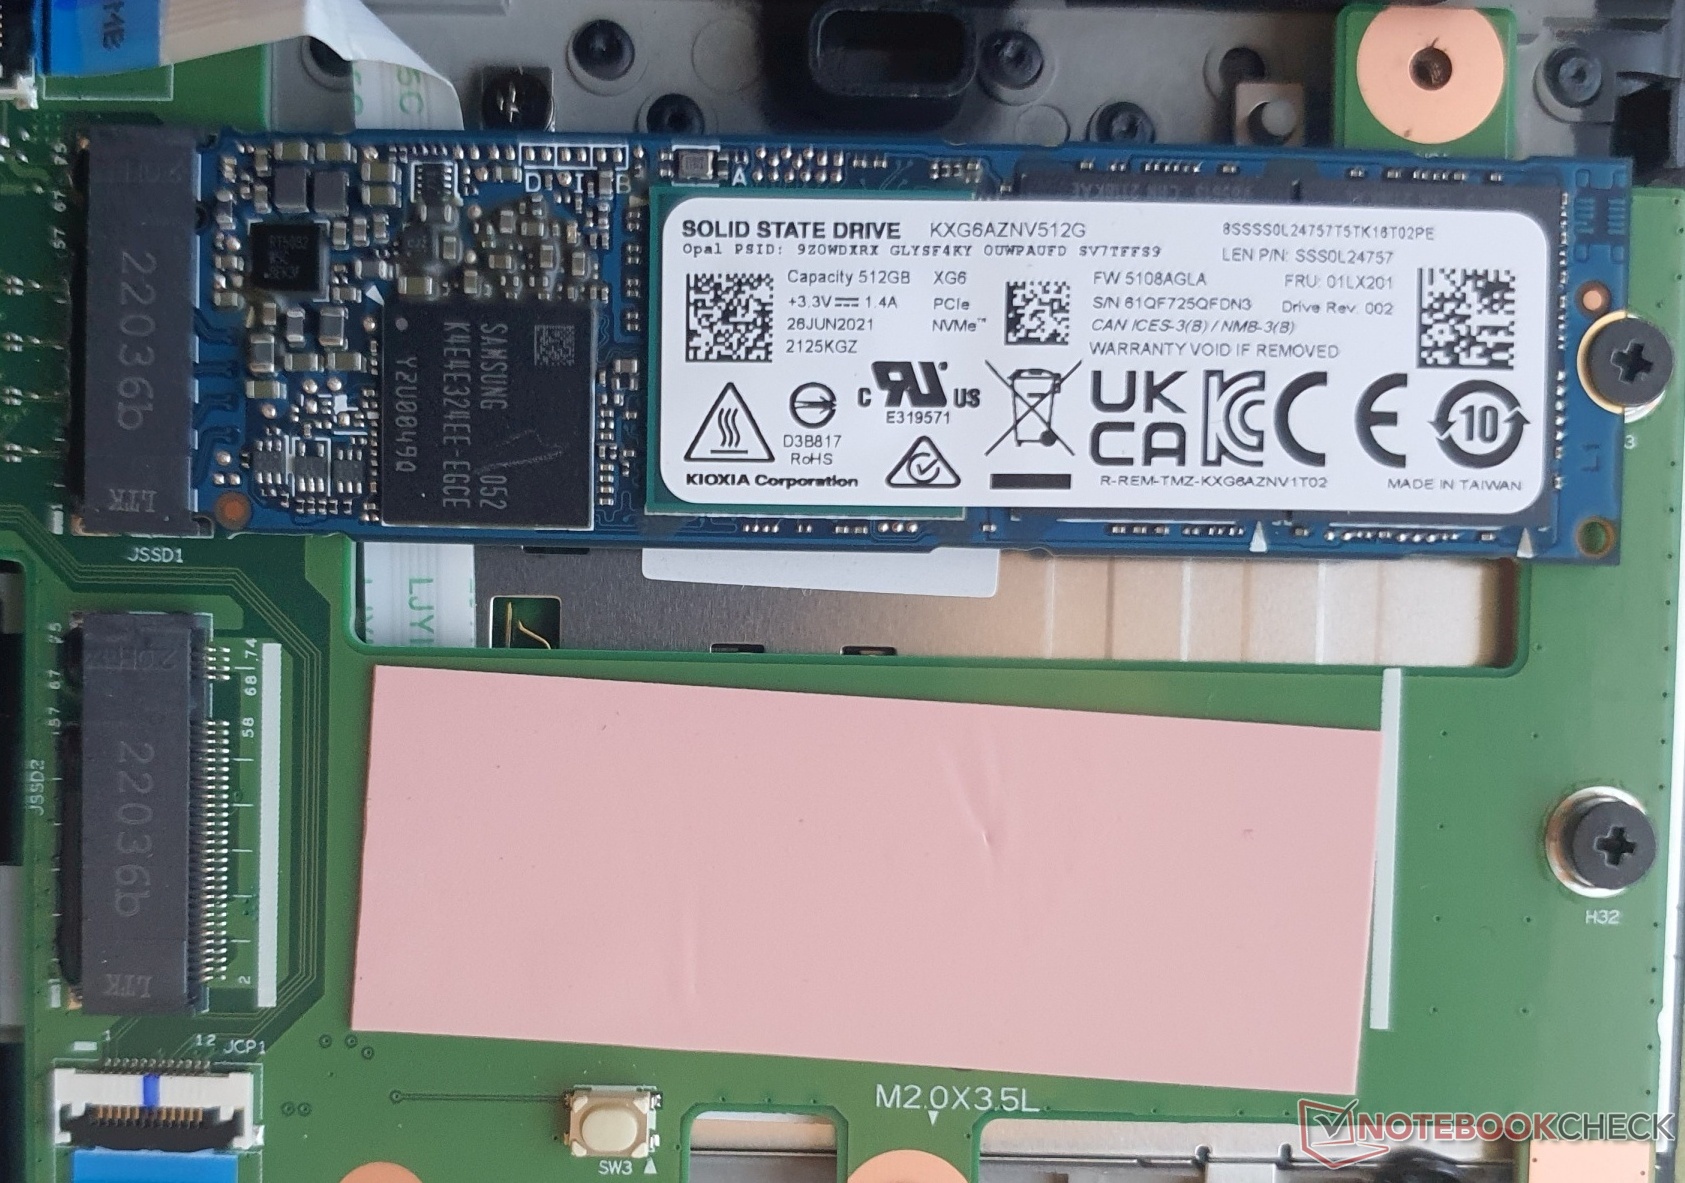
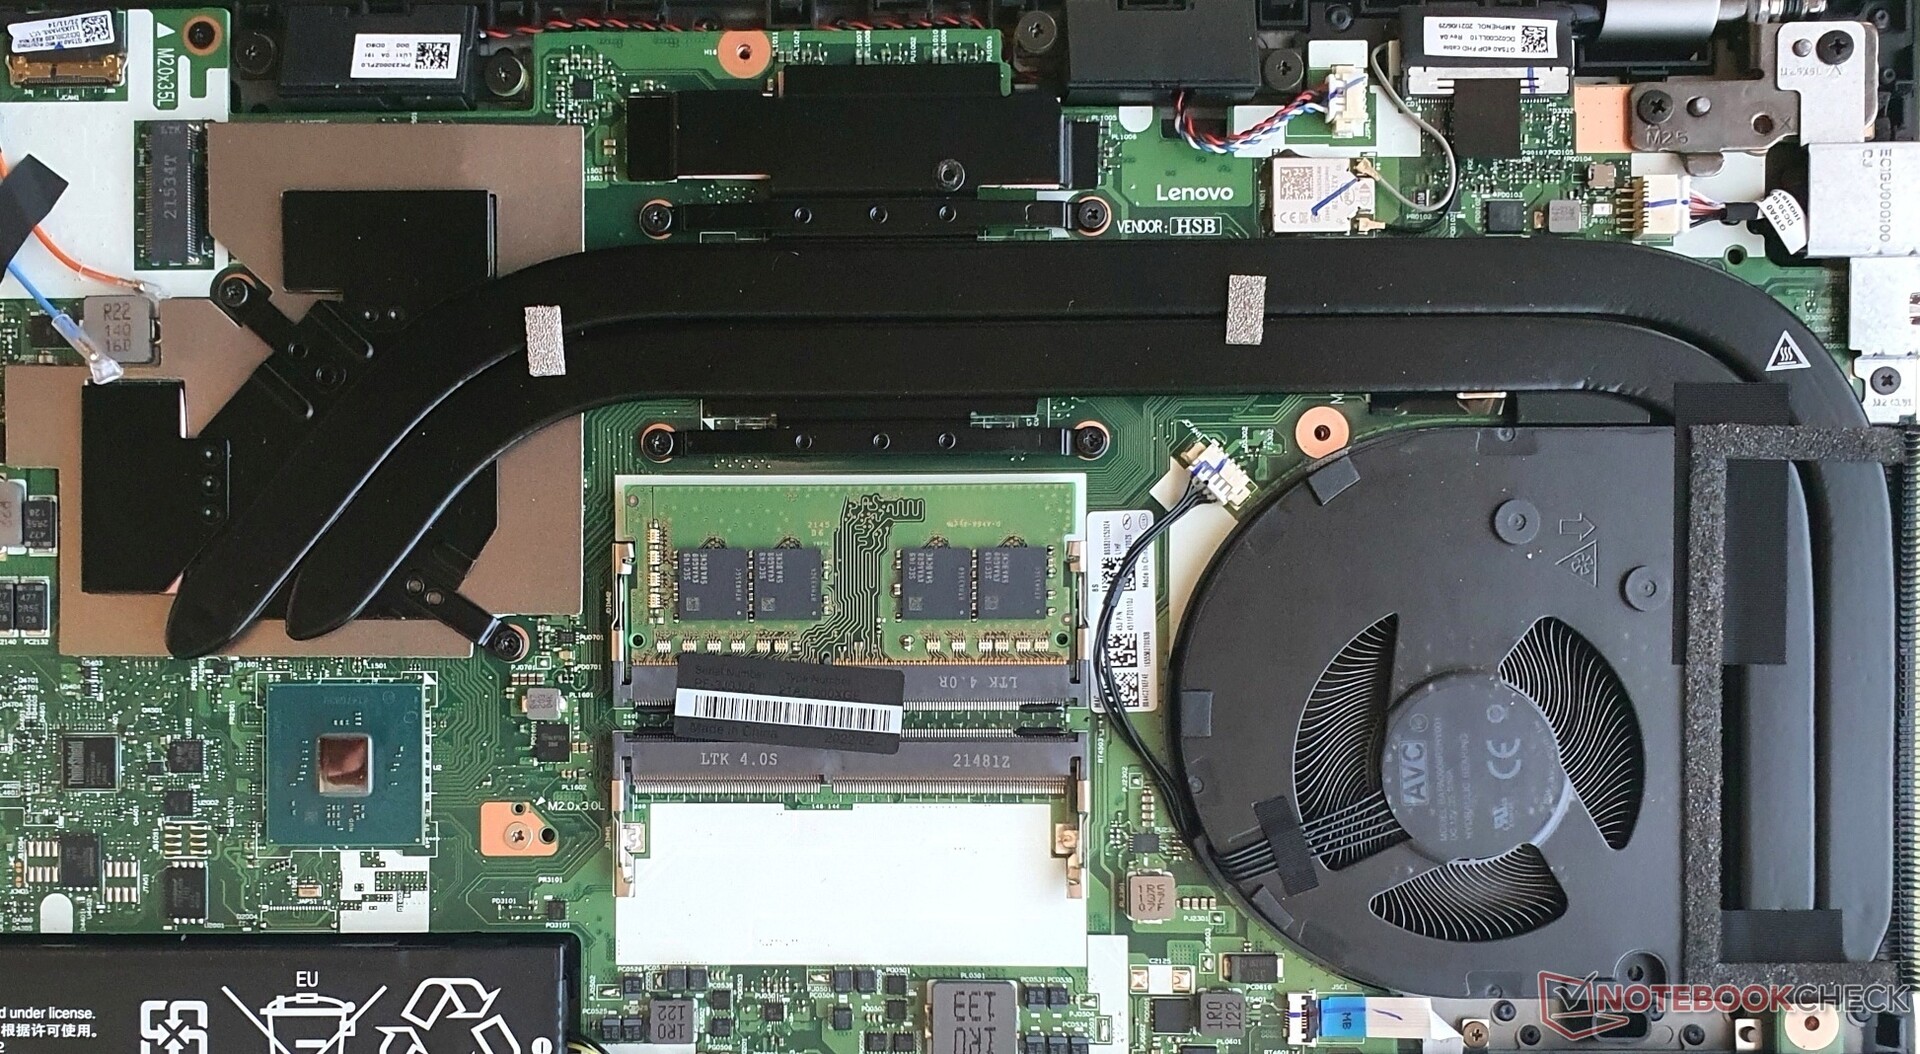
A pesar de varios clips de plástico, la placa base es bastante fácil de quitar. Los nueve tornillos se aflojan rápidamente, mientras que algunos de ellos permanecen pegados a la carcasa. Al abrirla, tienes que acceder a la RAM (1 ranura libre), la M.2-2280-SSD (1 ranura libre), el ventilador, que es reemplazable (incluyendo el tubo de calor), y la batería de 68 Wh, que también es reemplazable. El módulo WLAN está instalado de forma permanente
Otro aspecto útil es que el teclado puede sustituirse fácilmente si se desgasta o se estropea después de años de escribir.
Garantía
Como todos los ThinkPads de gama alta (serie T/X/P), Lenovo Alemania ofrece una garantía de tres años para el portátil P15v G2, que incluye recogida y devolución. Las reparaciones in situ también son posibles por un recargo, al igual que la protección contra daños accidentales, el soporte Premier o la ampliación de la garantía a 5 años.
Nota para los lectores internacionales: La política de garantía de Lenovo puede diferir de una región a otra, así que asegúrese de comprobar el sitio web de Lenovo (donde sea aplicable) para el país de compra
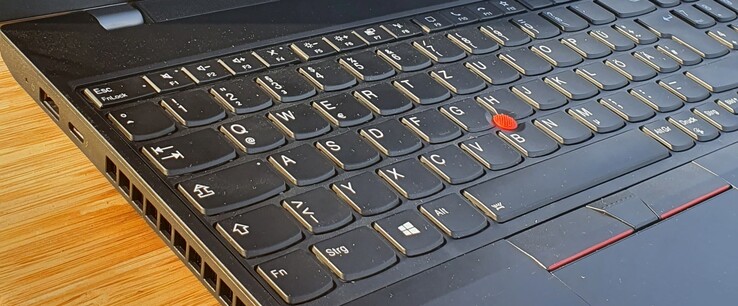
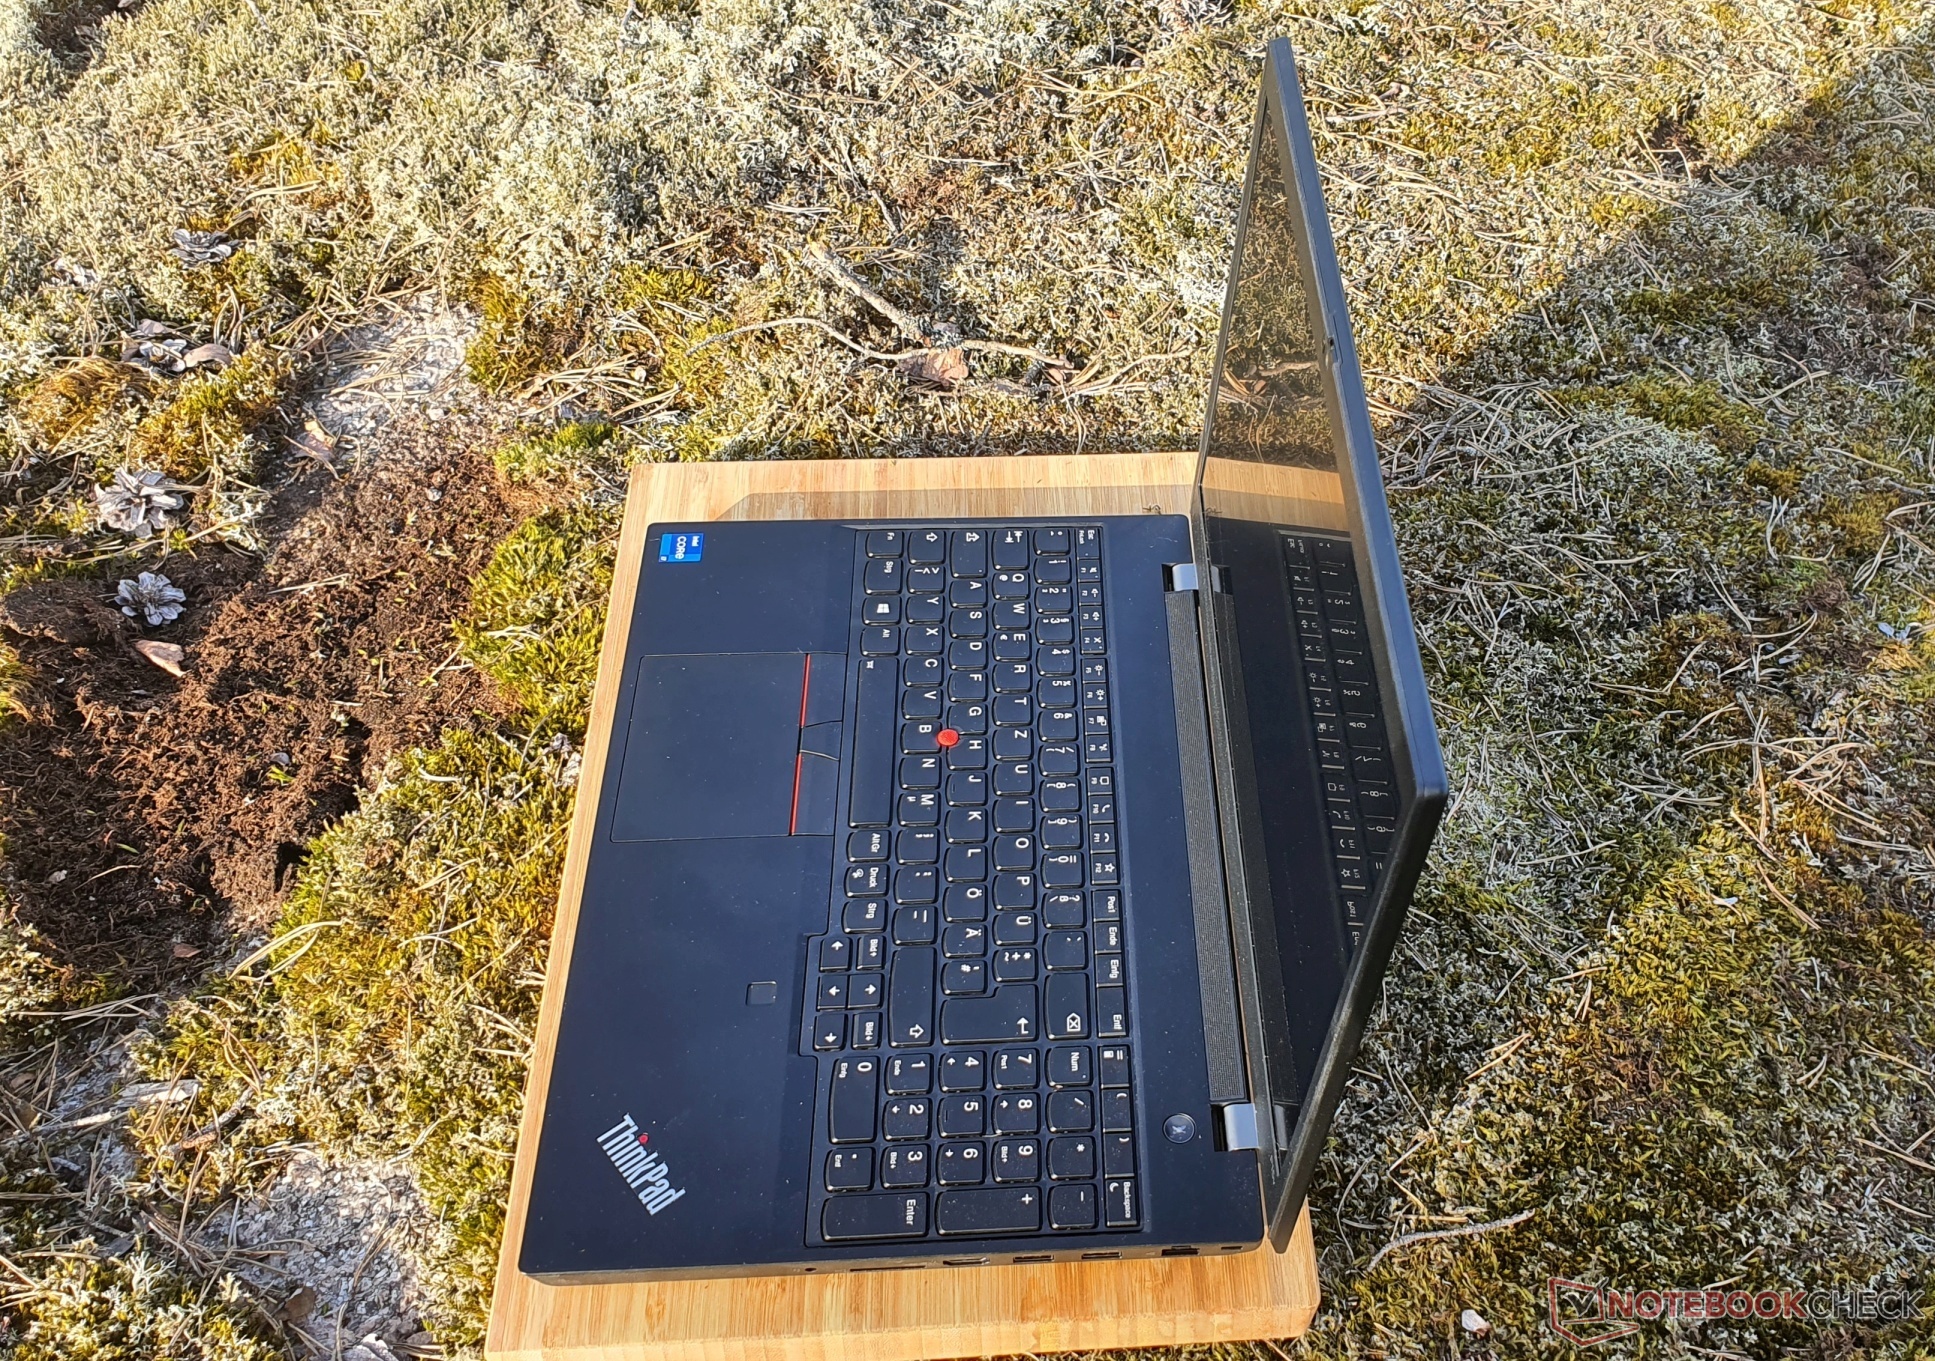
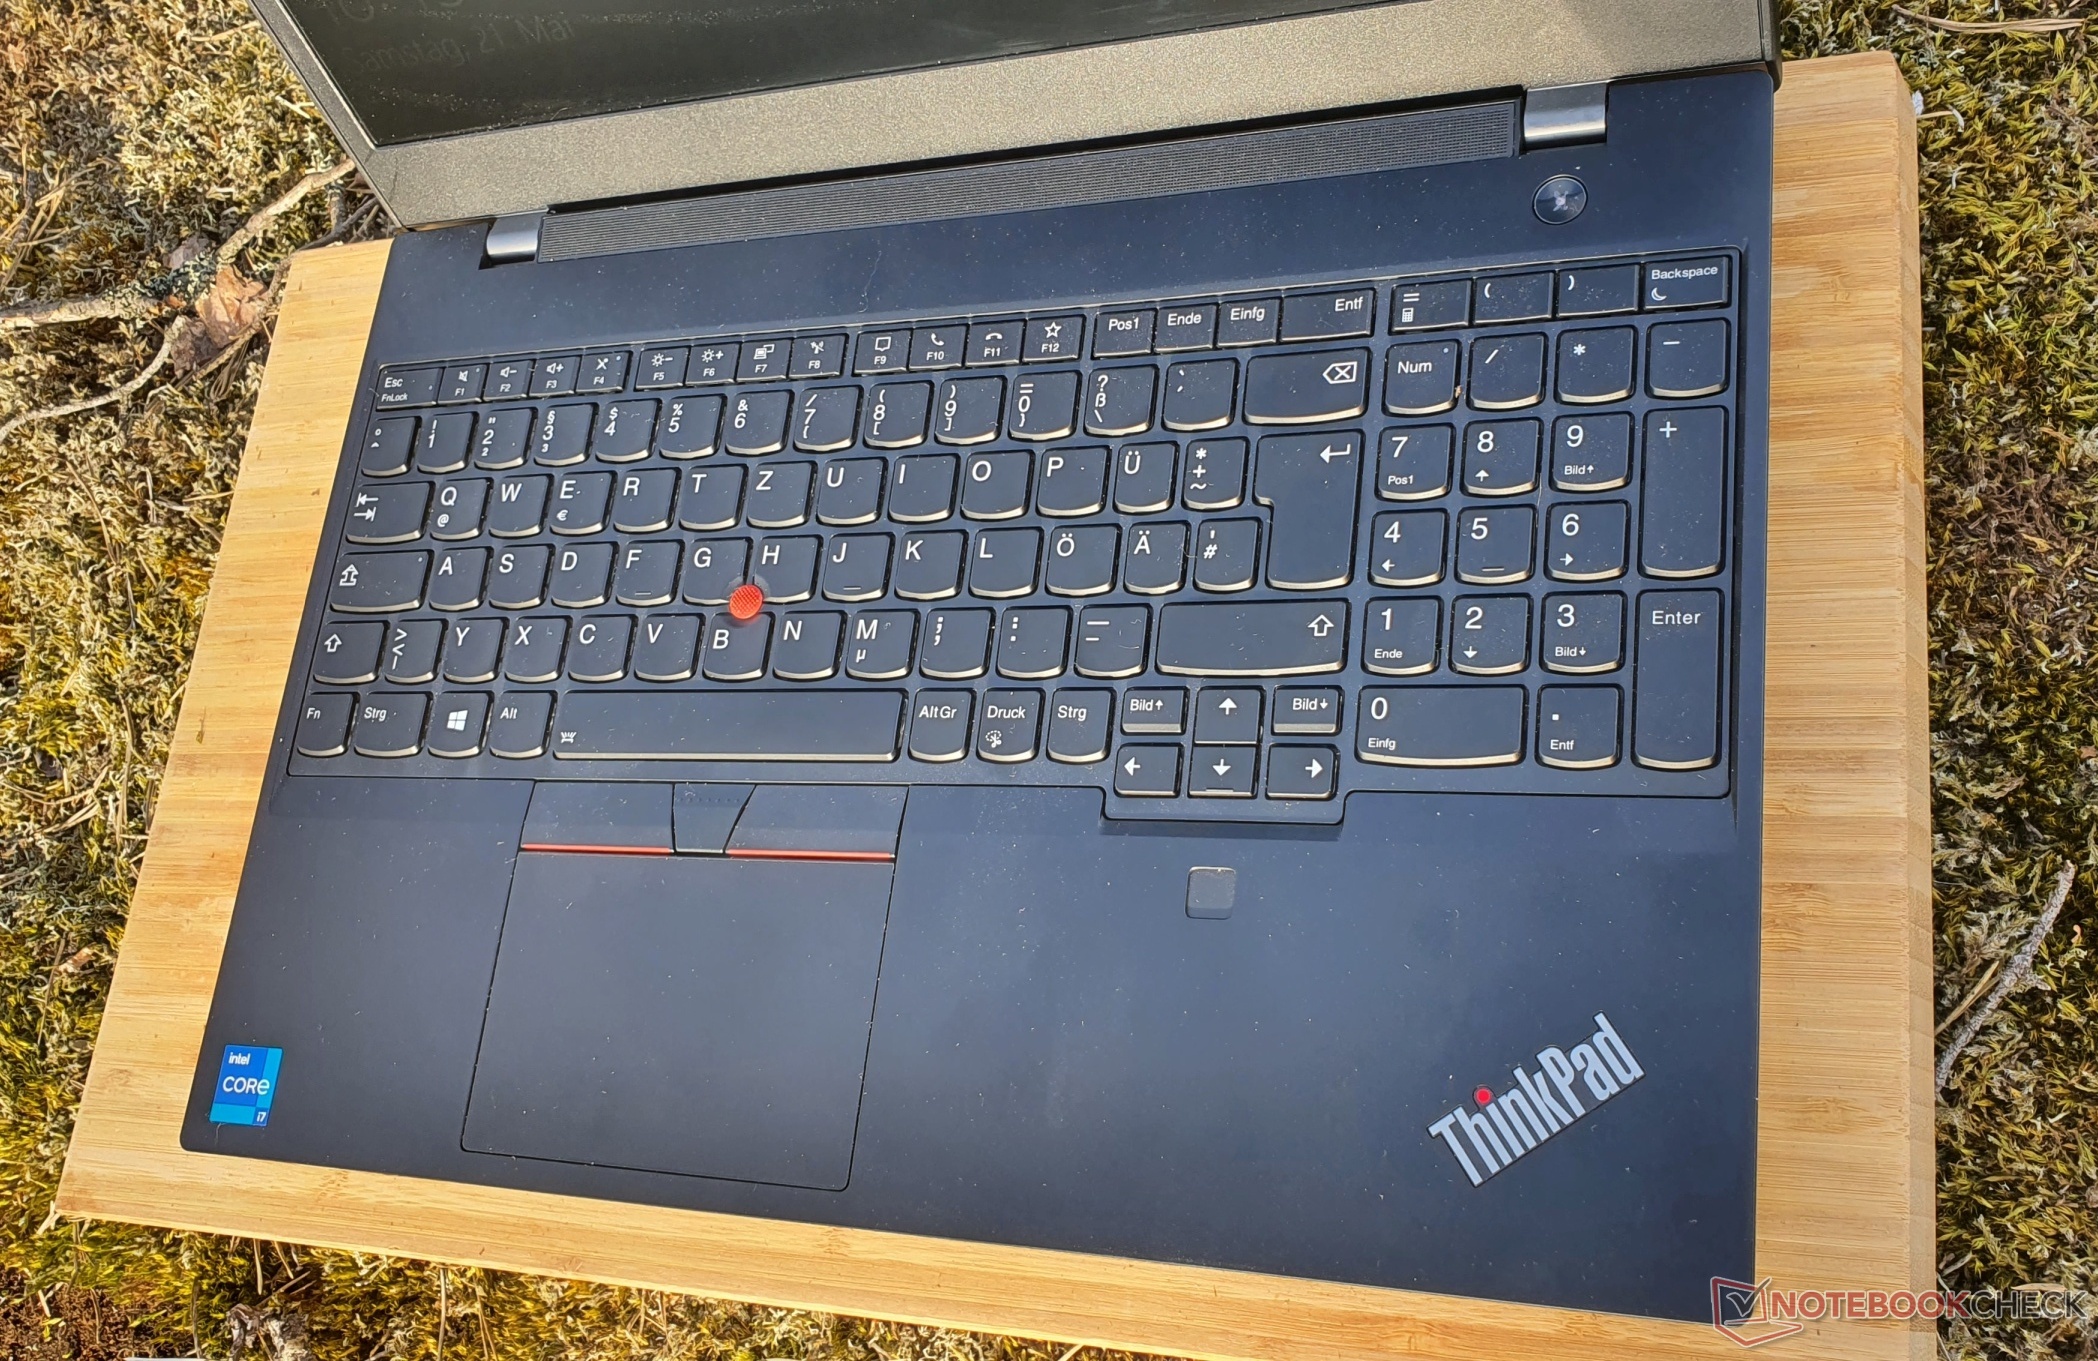
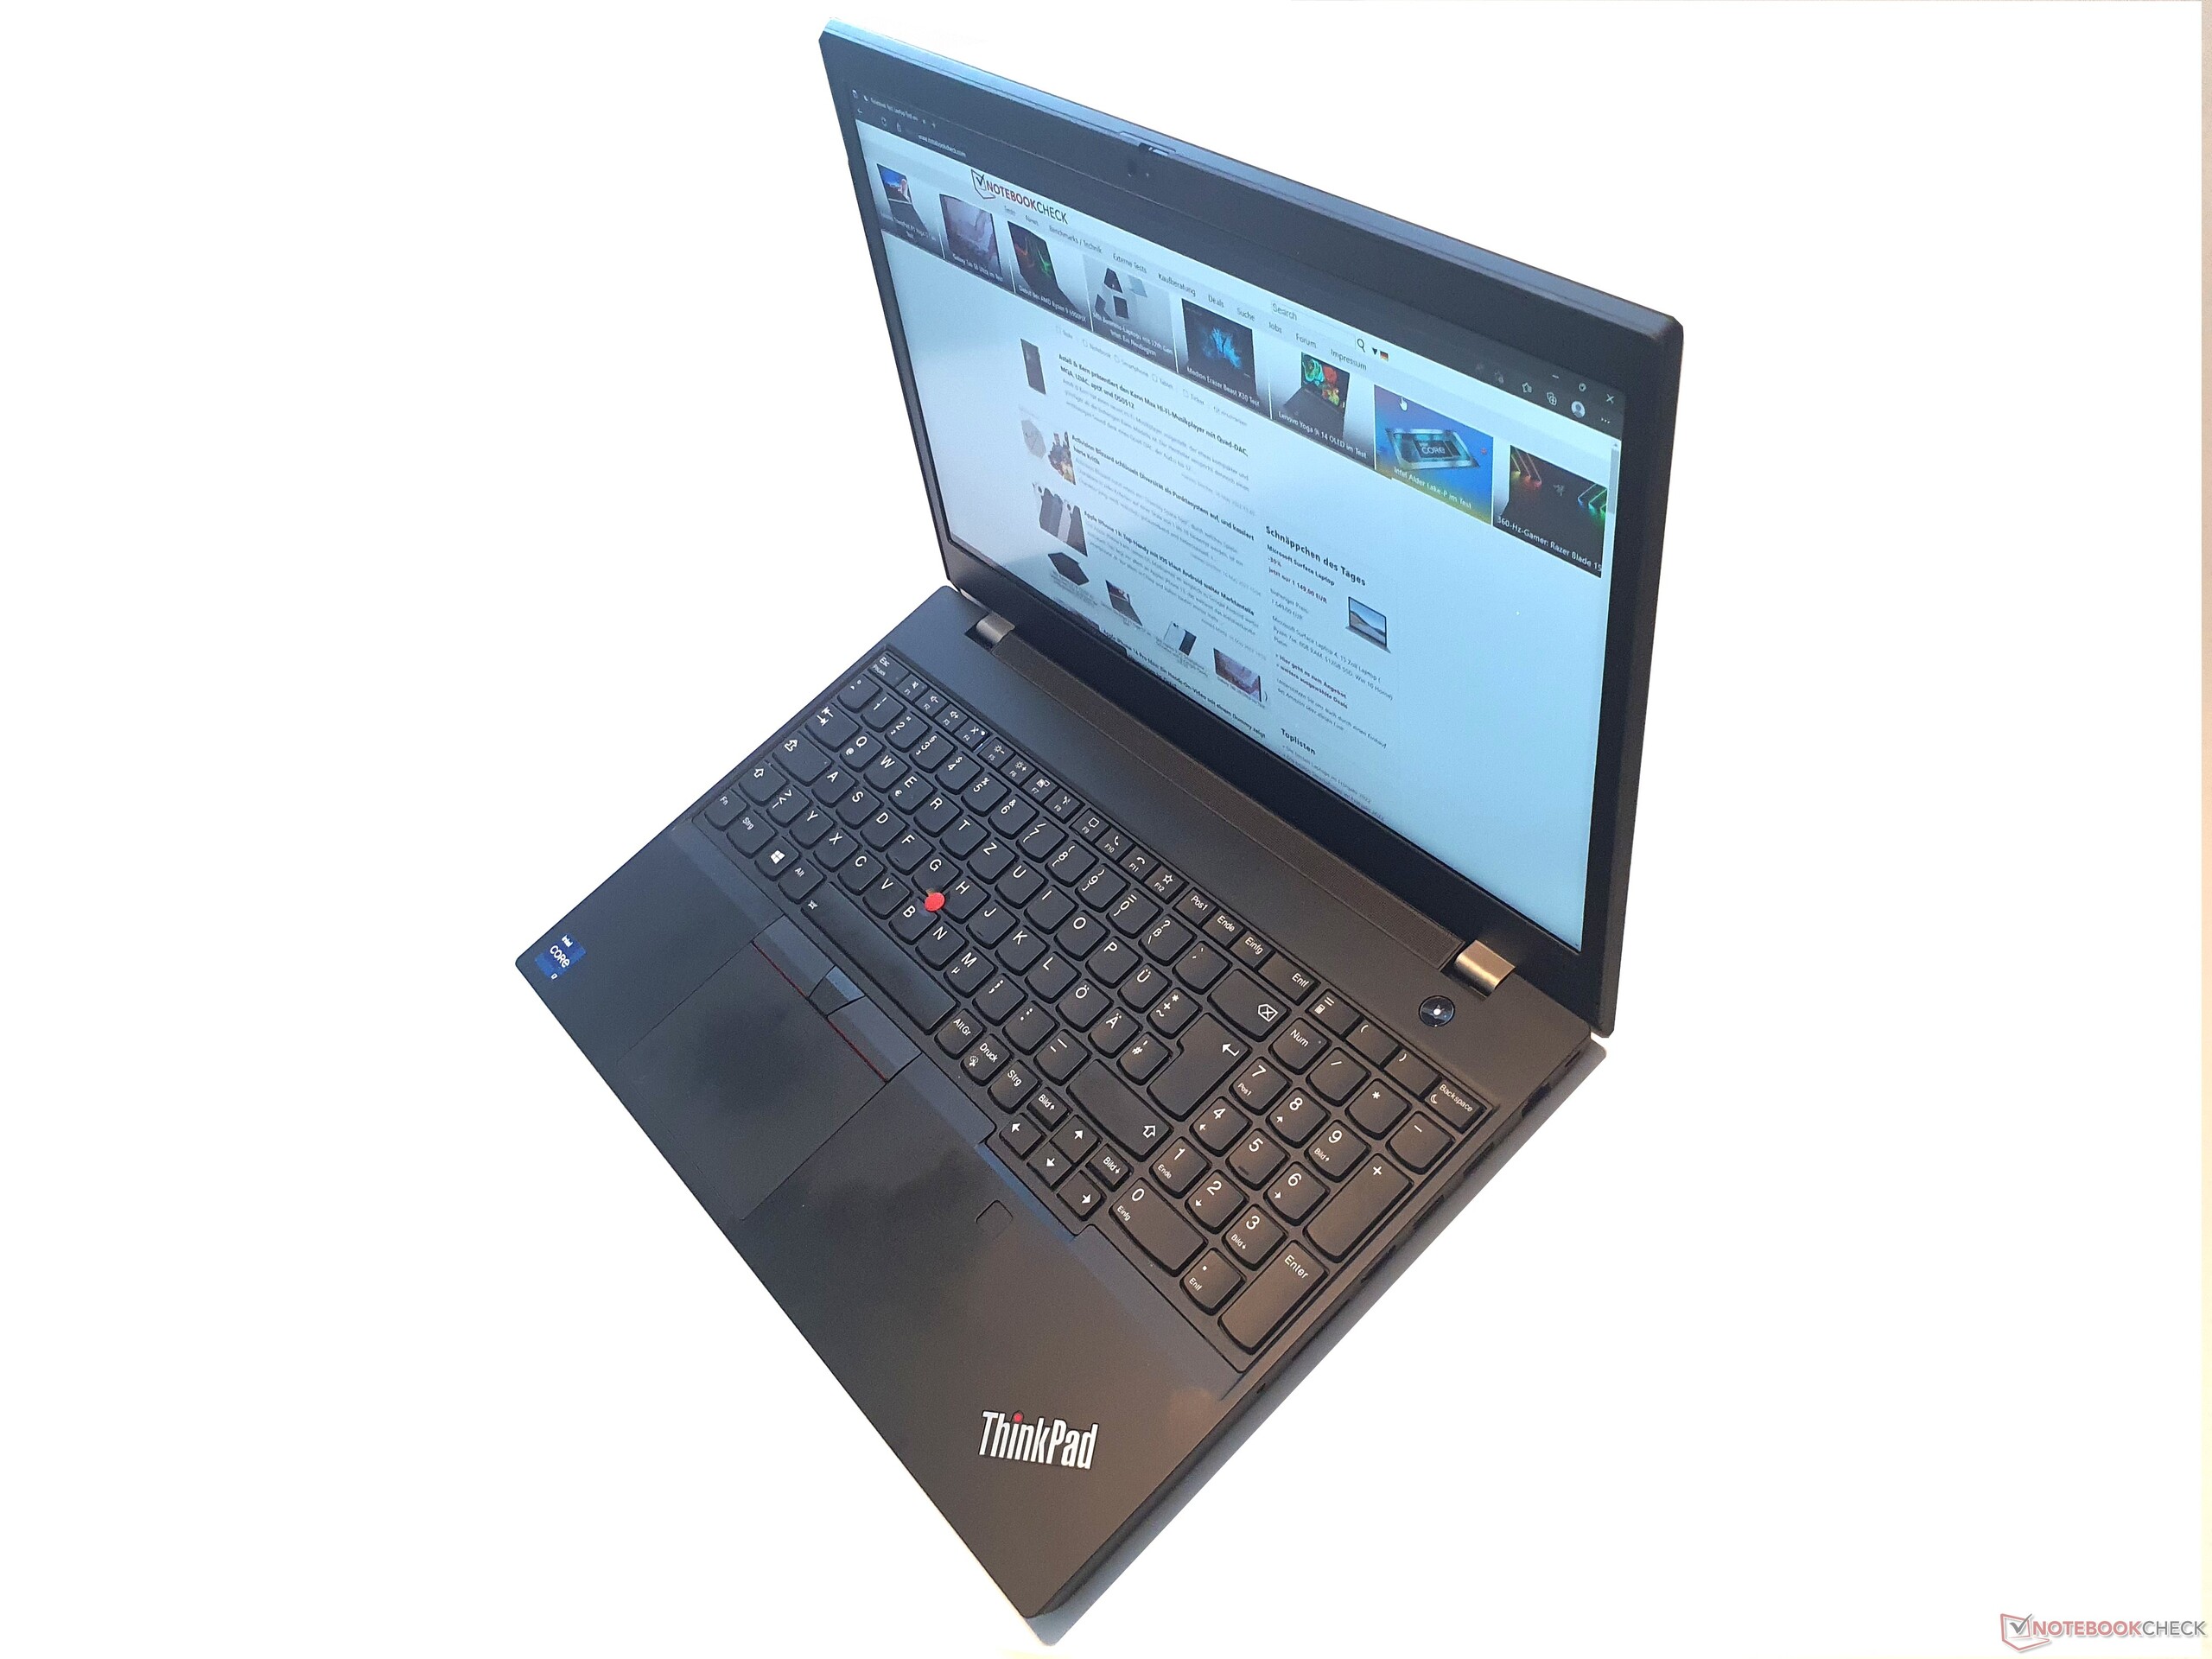
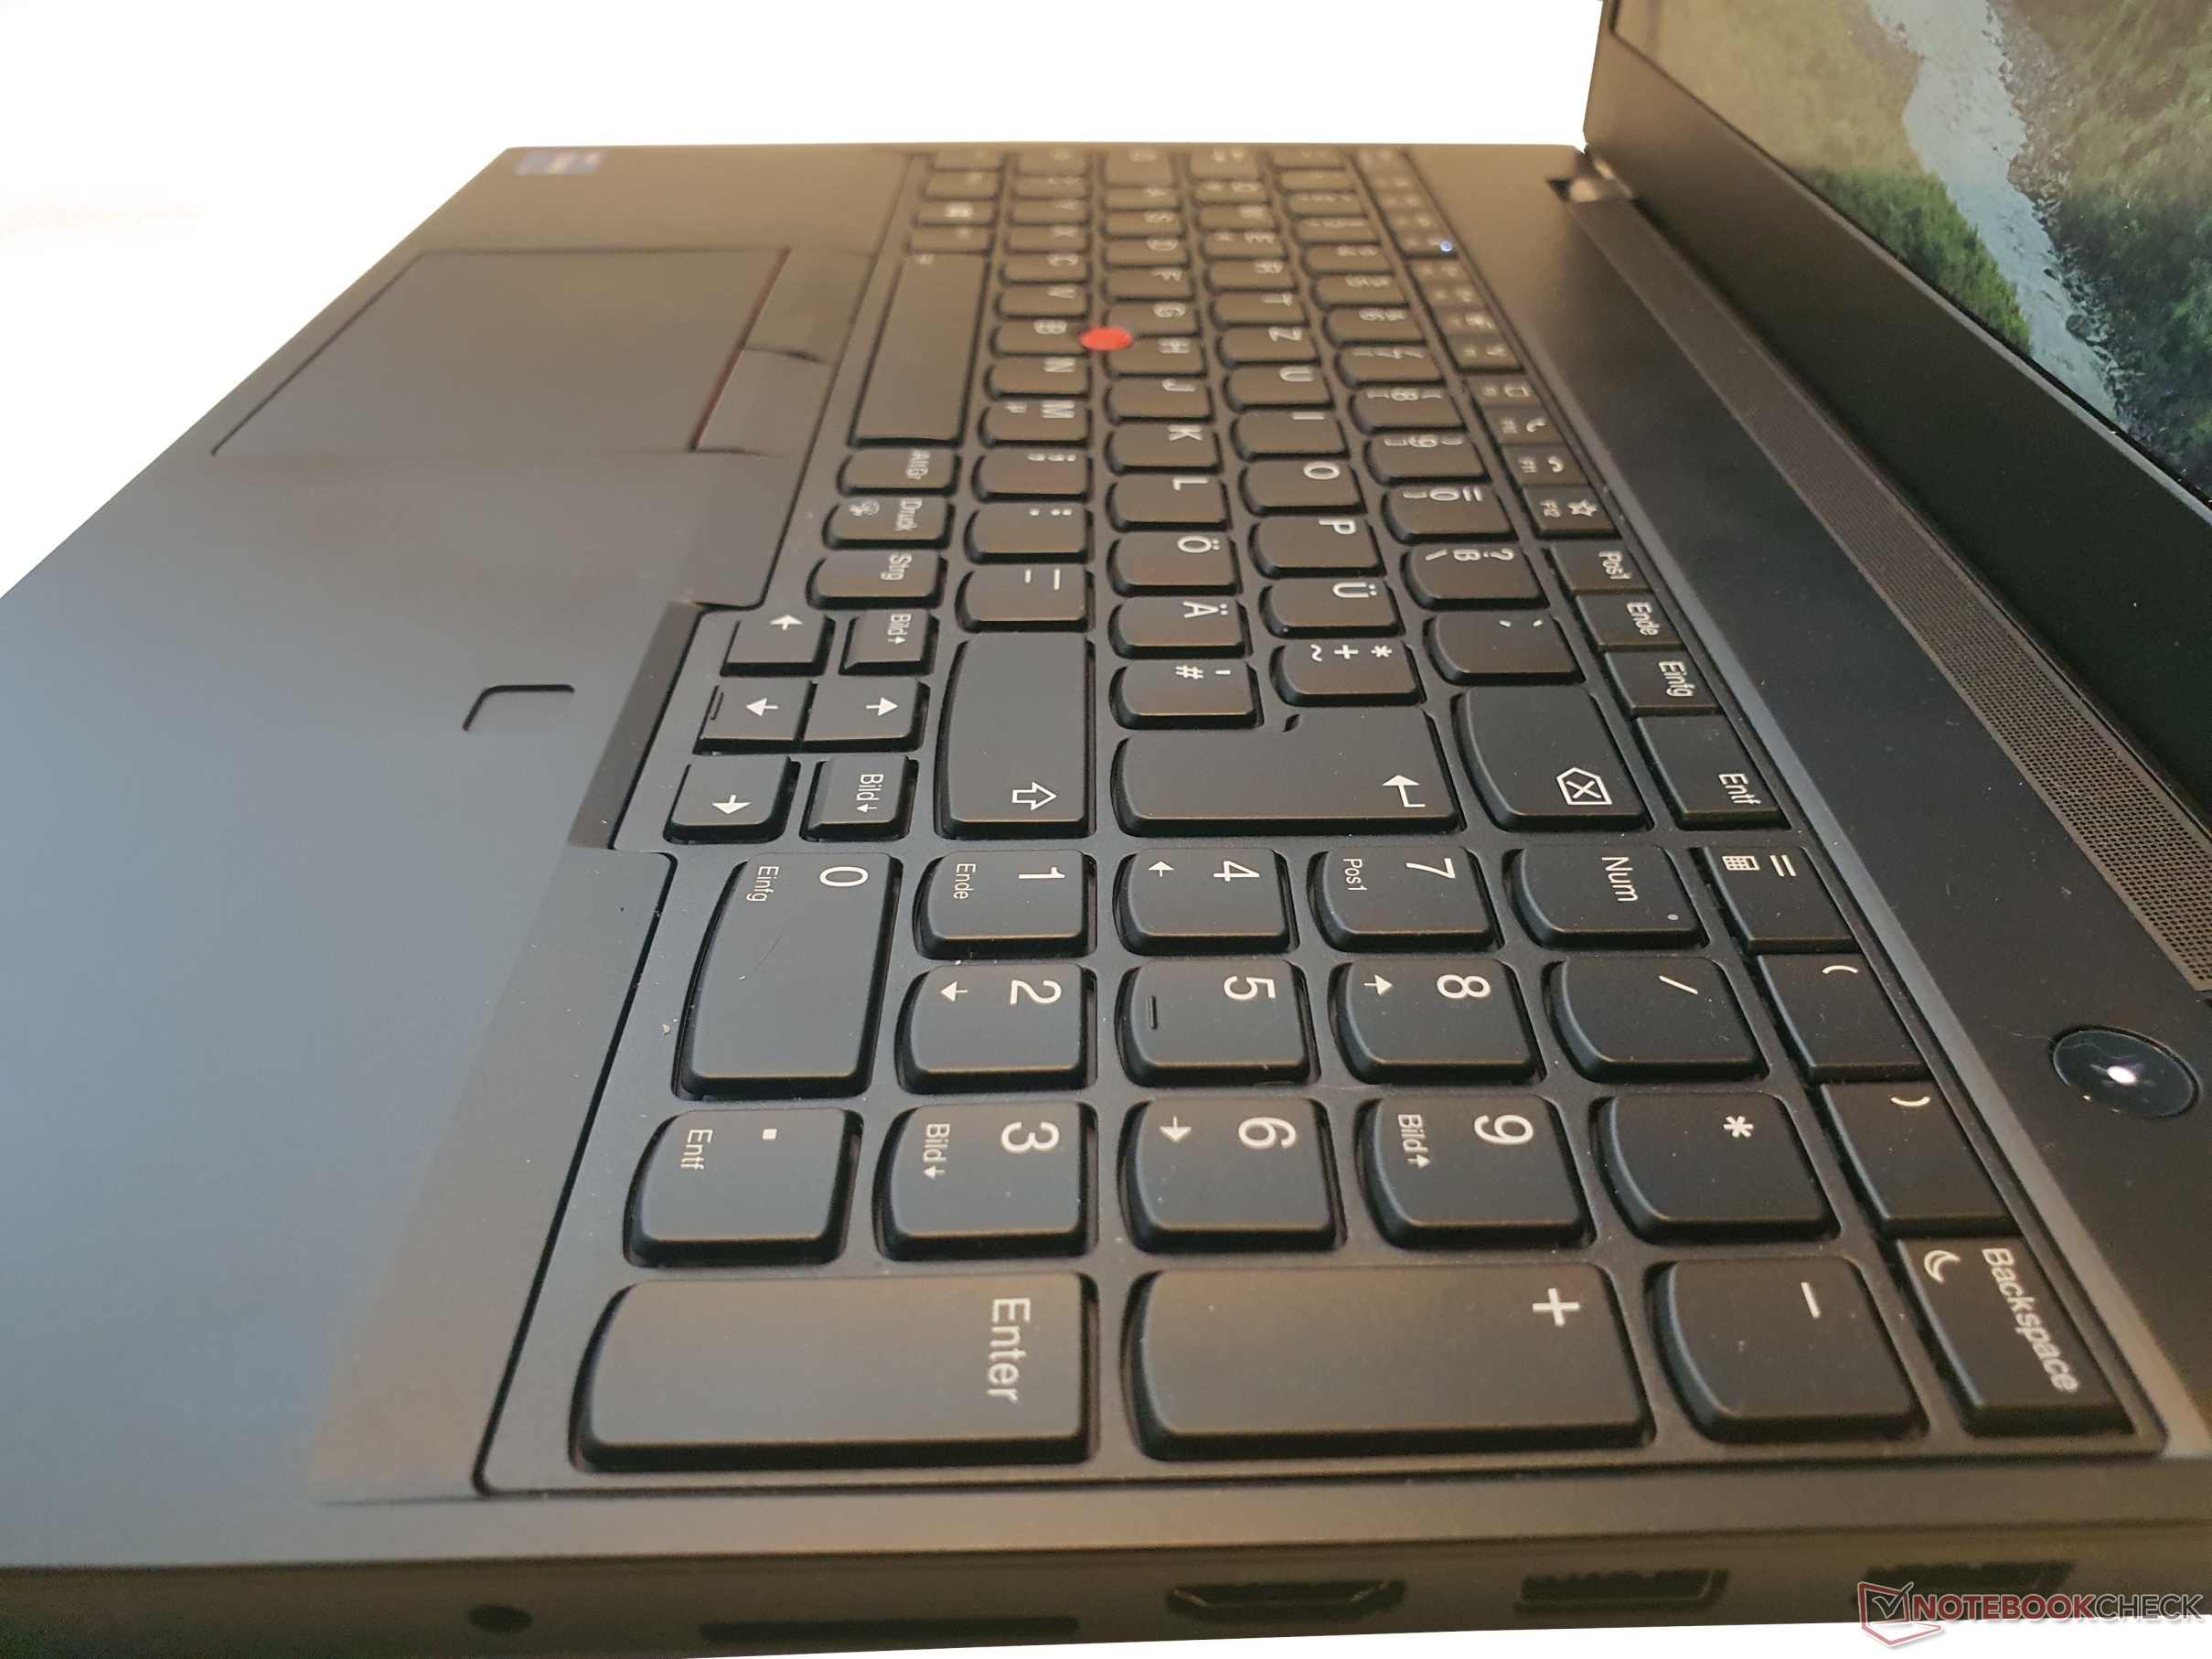
Dispositivos de entrada ThinkPad: Lenovo con un recorrido decente de 1,8 mm
Teclado
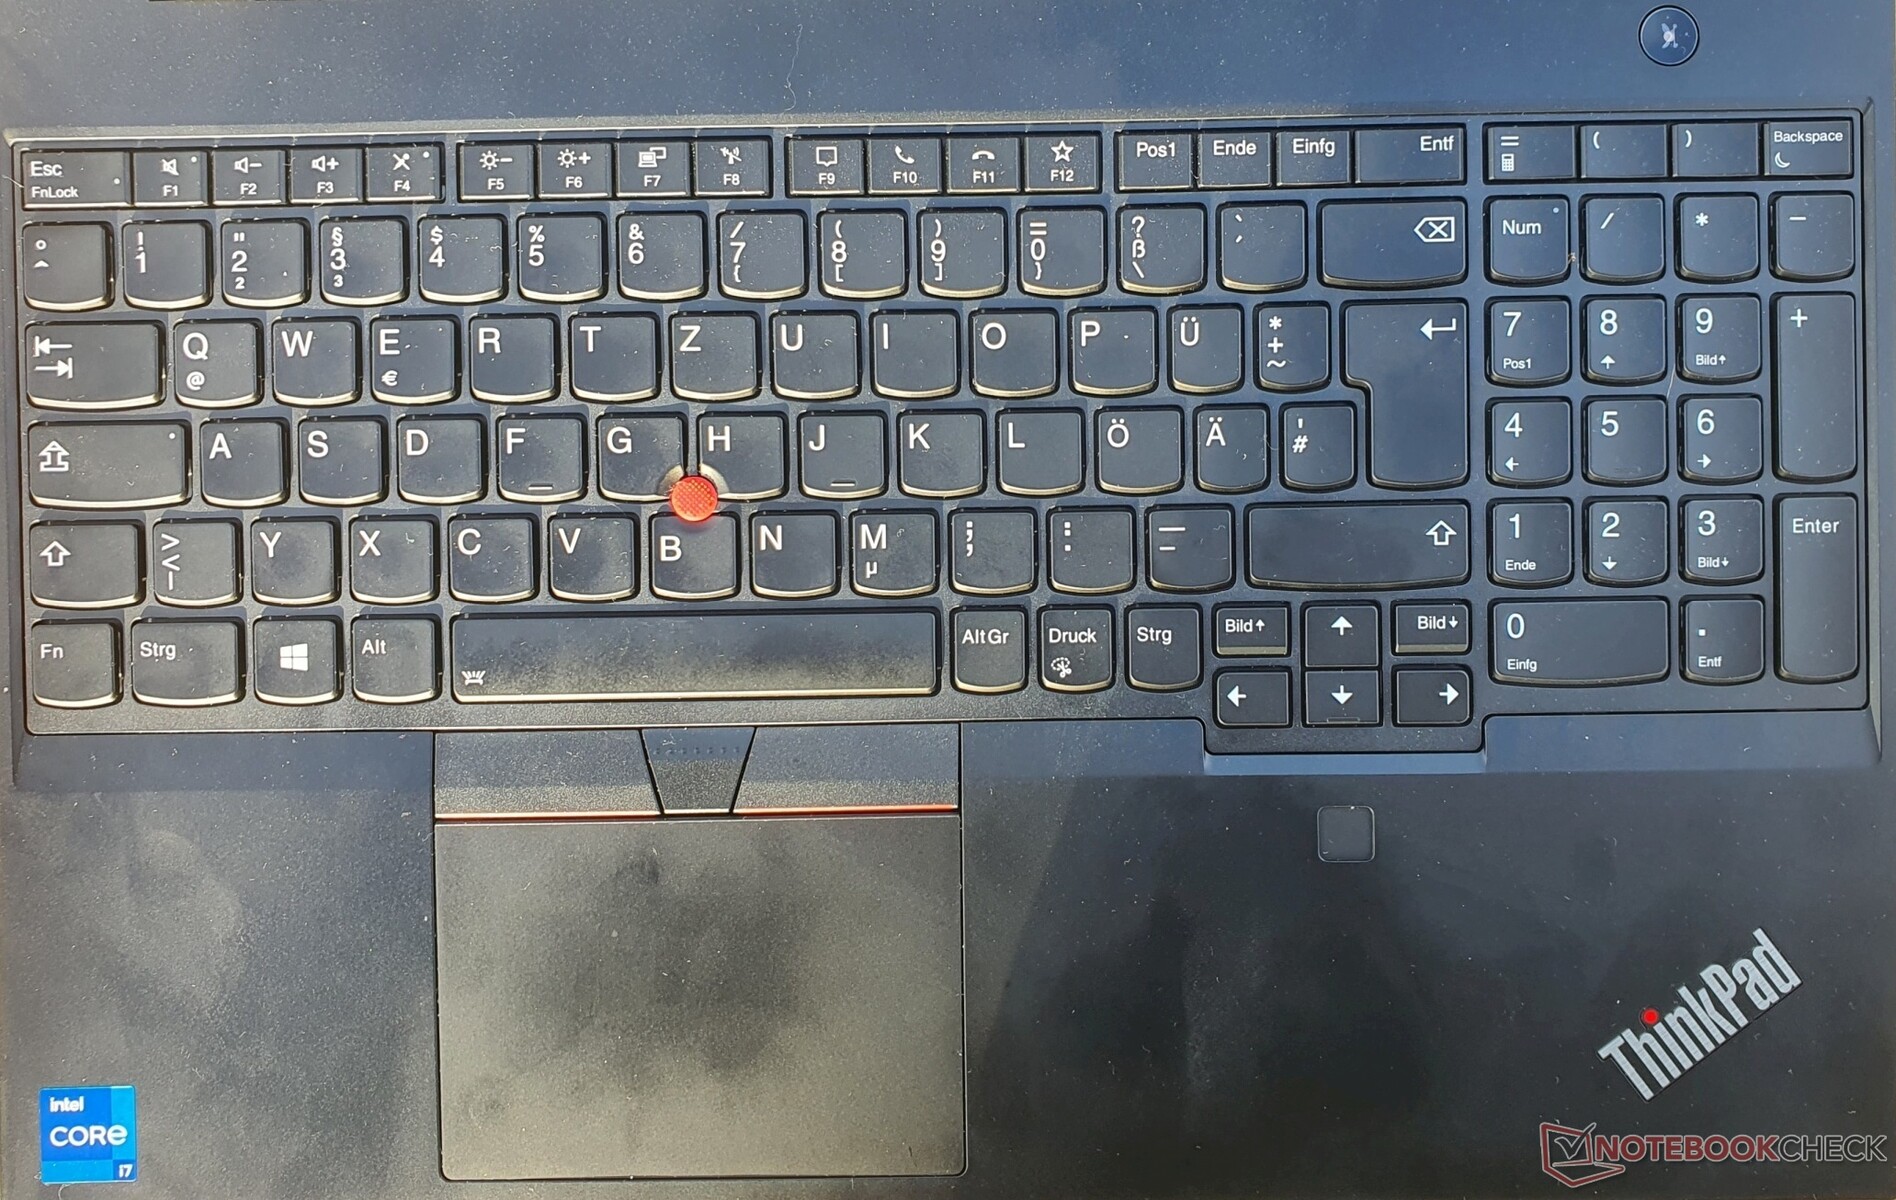
El teclado de Lenovo, resistente a las salpicaduras, es muy cómodo de usar con sus teclas de 15 x 15 mm y un recorrido de 1,8 mm. Esto ya se ha reducido a 1,5 mm en muchos ThinkPads. El punto de presión de las teclas lisas y ligeramente cóncavas es claramente perceptible y el recorrido muy satisfactorio. Por otro lado, el teclado del HP ZBook Power 15 tiene un punto de presión aún más nítido (en opinión del probador), pero un recorrido más corto. En caso de duda, pruebe los teclados antes de comprarlos.
En general, la distribución es muy buena, también gracias a la navegación dedicada y a las teclas de flecha bastante grandes. Sólo las cuatro teclas situadas a la izquierda del Enter y las de la fila superior son algo más pequeñas. También hay un teclado numérico, que puede simplificar la introducción de datos relacionados con el puesto de trabajo. Incluso bajo presión dirigida, el teclado no cede. La iluminación de fondo tiene dos niveles de ajuste.
Touchpad y TrackPoint
El panel táctil de tamaño medio mide 10 x 7 cm y tiene una superficie de Mylar suave con cualidades de deslizamiento decentes. Los botones de clic integrados tienen una caída completa y un punto de presión bien dosificado.
Con un poco de práctica, el TrackPoint y sus tres botones permiten controlar el cursor del ratón con mucha precisión y tiene la ventaja de que no hay que quitar la mano del teclado. El desplazamiento en combinación con el botón central también es útil.
Pantalla 4K opcional en el ThinkPad P15v G2

Lenovo ofrece un total de cuatro opciones de pantalla mate de 15,6 pulgadas en formato 16:9 para el ThinkPad P15v G2:
FHD (1920x1080) IPS, 300 nits, 45% NTSC.
FHD (1920x1080) IPS táctil, 300 nits, 45% sRGB
FHD (1920x1080) IPS, 300 nits, 100% sRGB
UHD (3840x2160) IPS, 600 Nits, 100% AdobeRGB, HDR400, X-Rite
Nuestro panel representa la variante básica y tiene una resolución de 1920x1080, por lo que el contenido se muestra con suficiente nitidez. El escalado, que puede ajustarse al 100%, también es ventajoso, ya que proporciona un contenido de aspecto aún más nítido y evita los problemas de escalado.
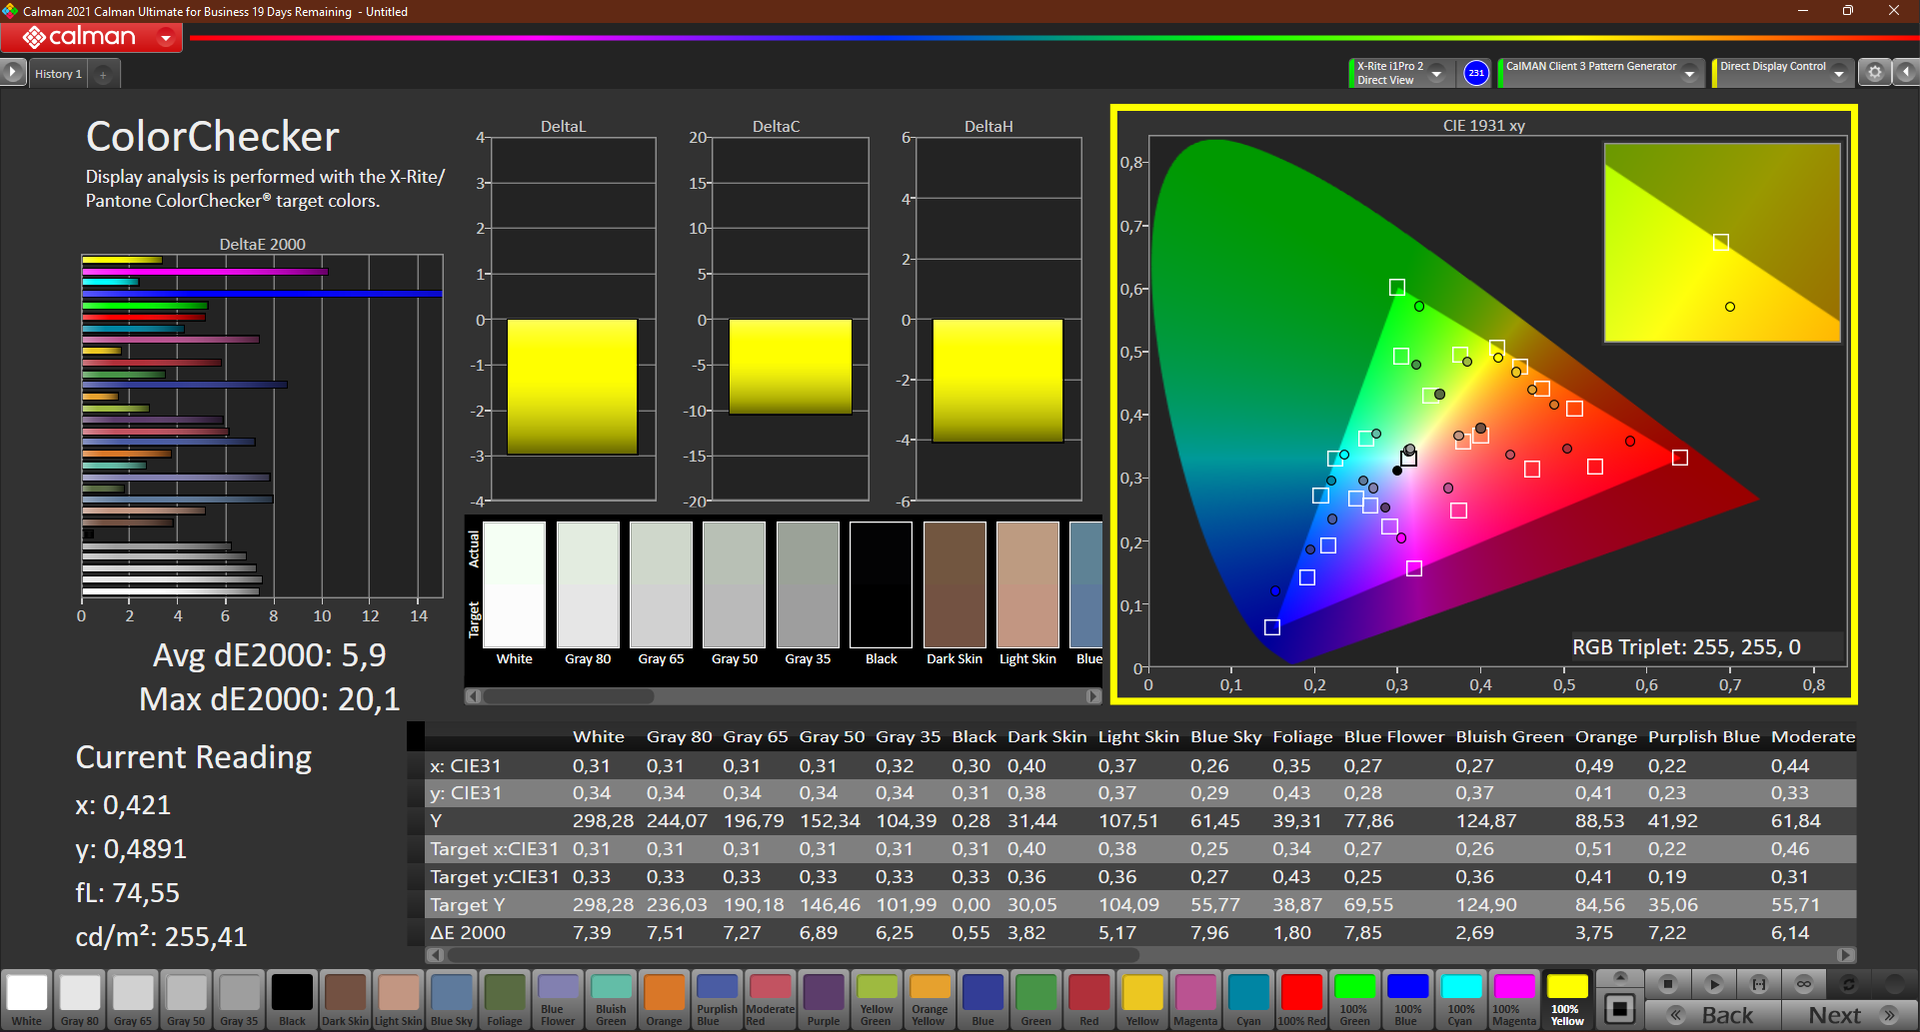
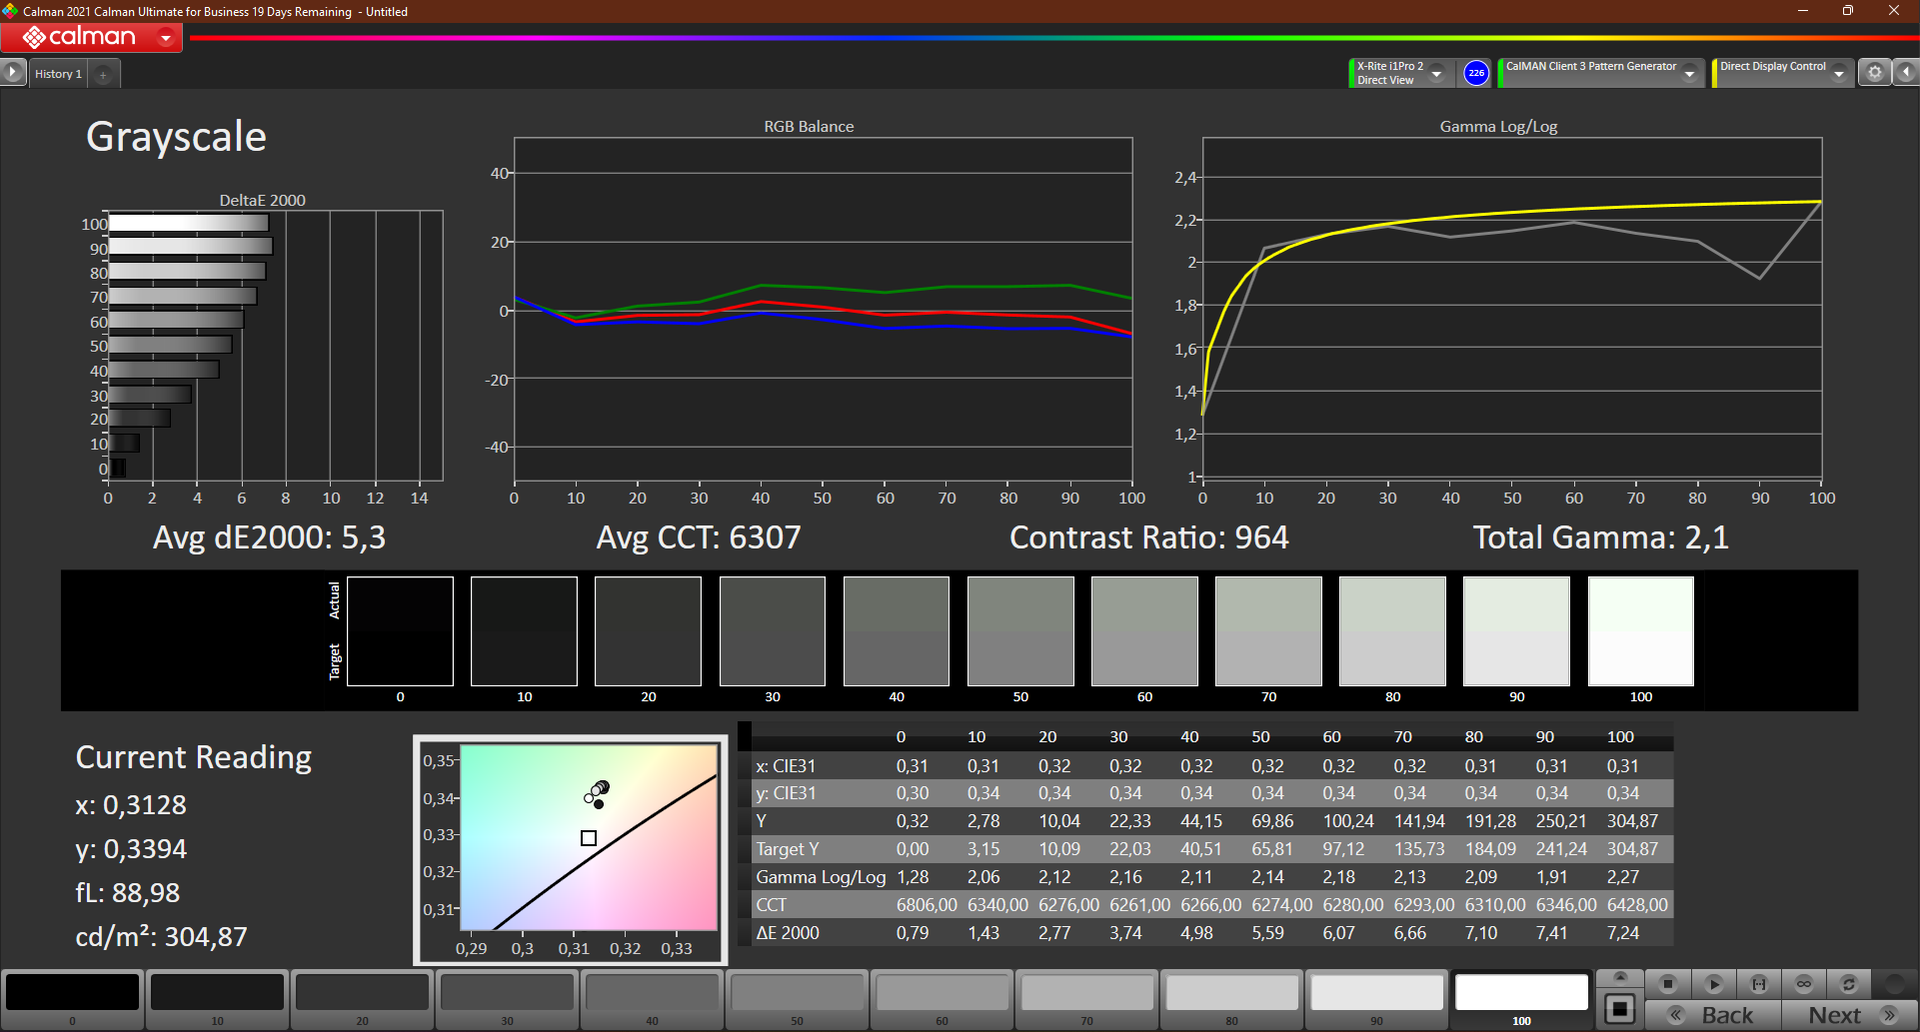
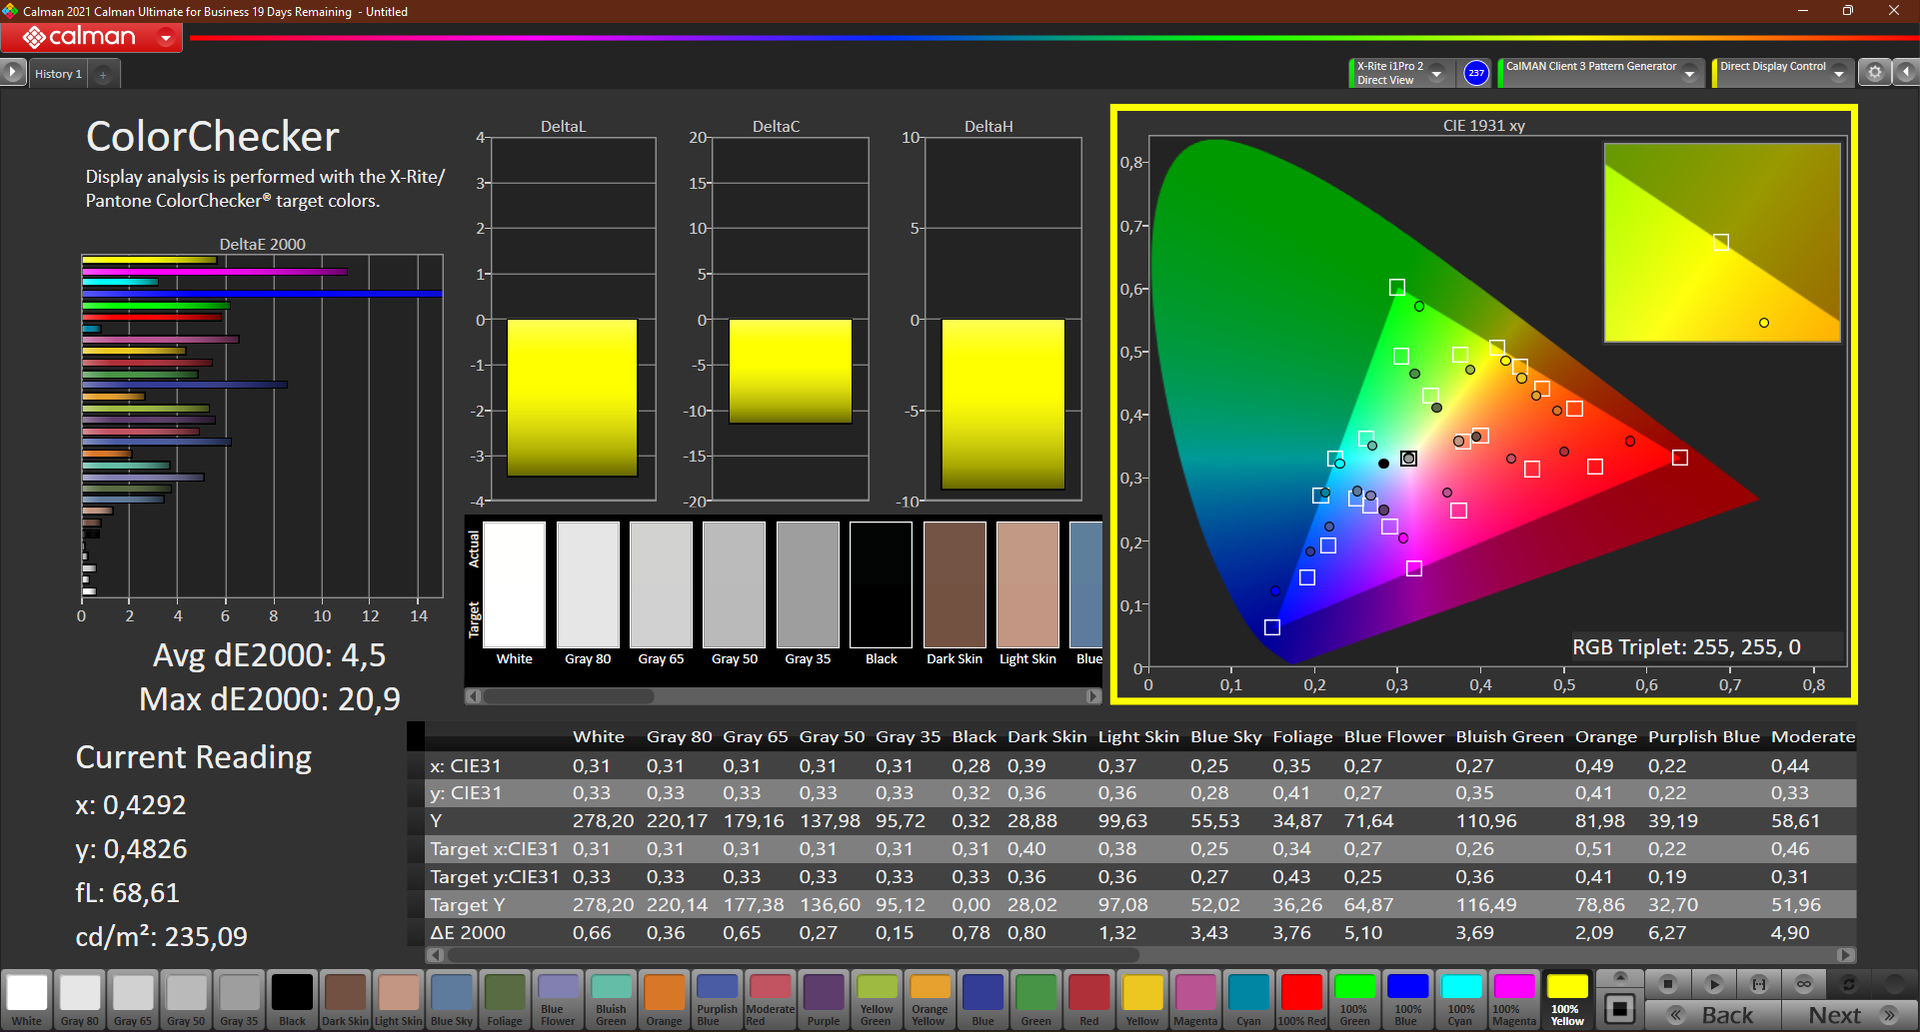
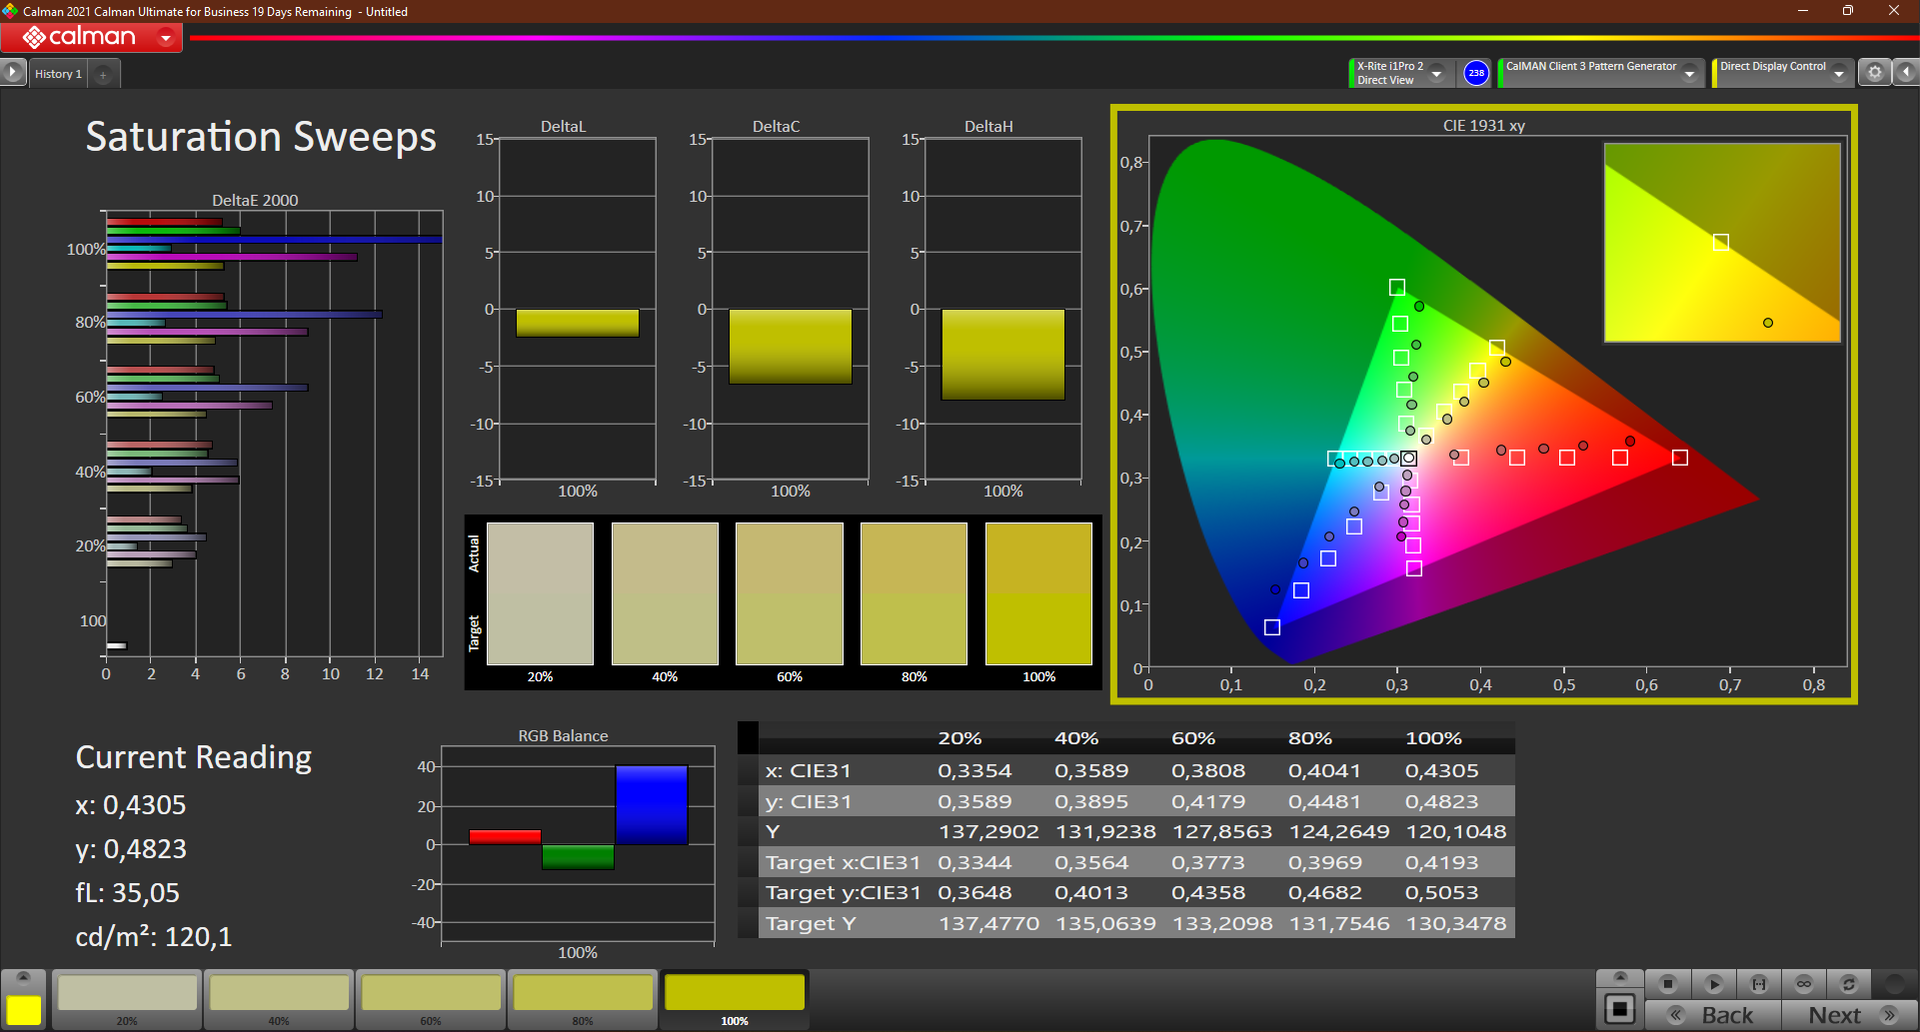
El brillo de unos 280 nits no es óptimo, pero sigue siendo aceptable en interiores. La relación de contraste de 953:1 está bien, así como el valor de negro de 0,32. La calibración da como resultado un negro más rico, y también pudimos reducir el valor de escala de grises DeltaE correspondiente de 5,3 a un buen 0,9. Sin embargo, el valor de color Delta E sigue siendo alto, de 4,5
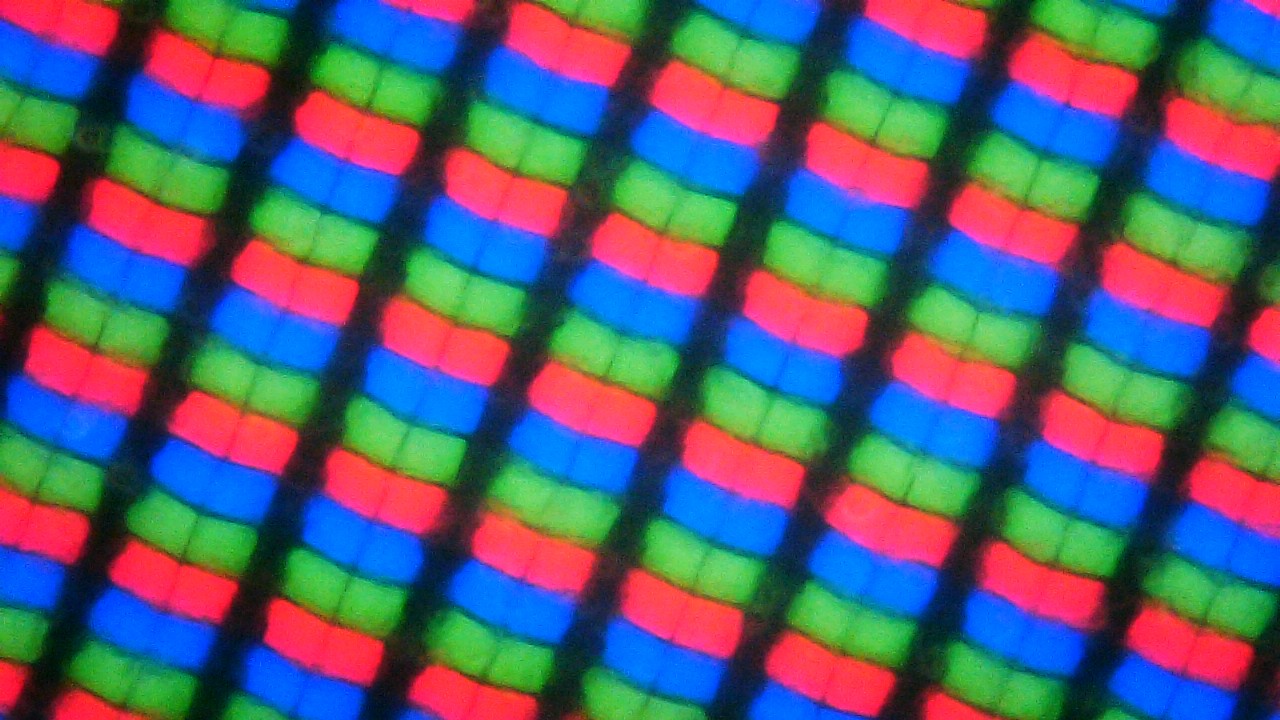
Subjetivamente, la calidad de la imagen es buena, sobre todo por los subpíxeles relativamente claros y el negro intenso. Pero el HP ZBook Power 15 y todos los demás dispositivos de la comparación ofrecen índices mucho mejores sobre el papel. Los tiempos de respuesta del panel son entre mediocres y lentos, por lo que no son óptimos para los juegos. No se detectó parpadeo PWM.
| |||||||||||||||||||||||||
iluminación: 88 %
Brillo con batería: 305 cd/m²
Contraste: 953:1 (Negro: 0.32 cd/m²)
ΔE ColorChecker Calman: 5.9 | ∀{0.5-29.43 Ø4.71}
calibrated: 4.5
ΔE Greyscale Calman: 5.3 | ∀{0.09-98 Ø4.96}
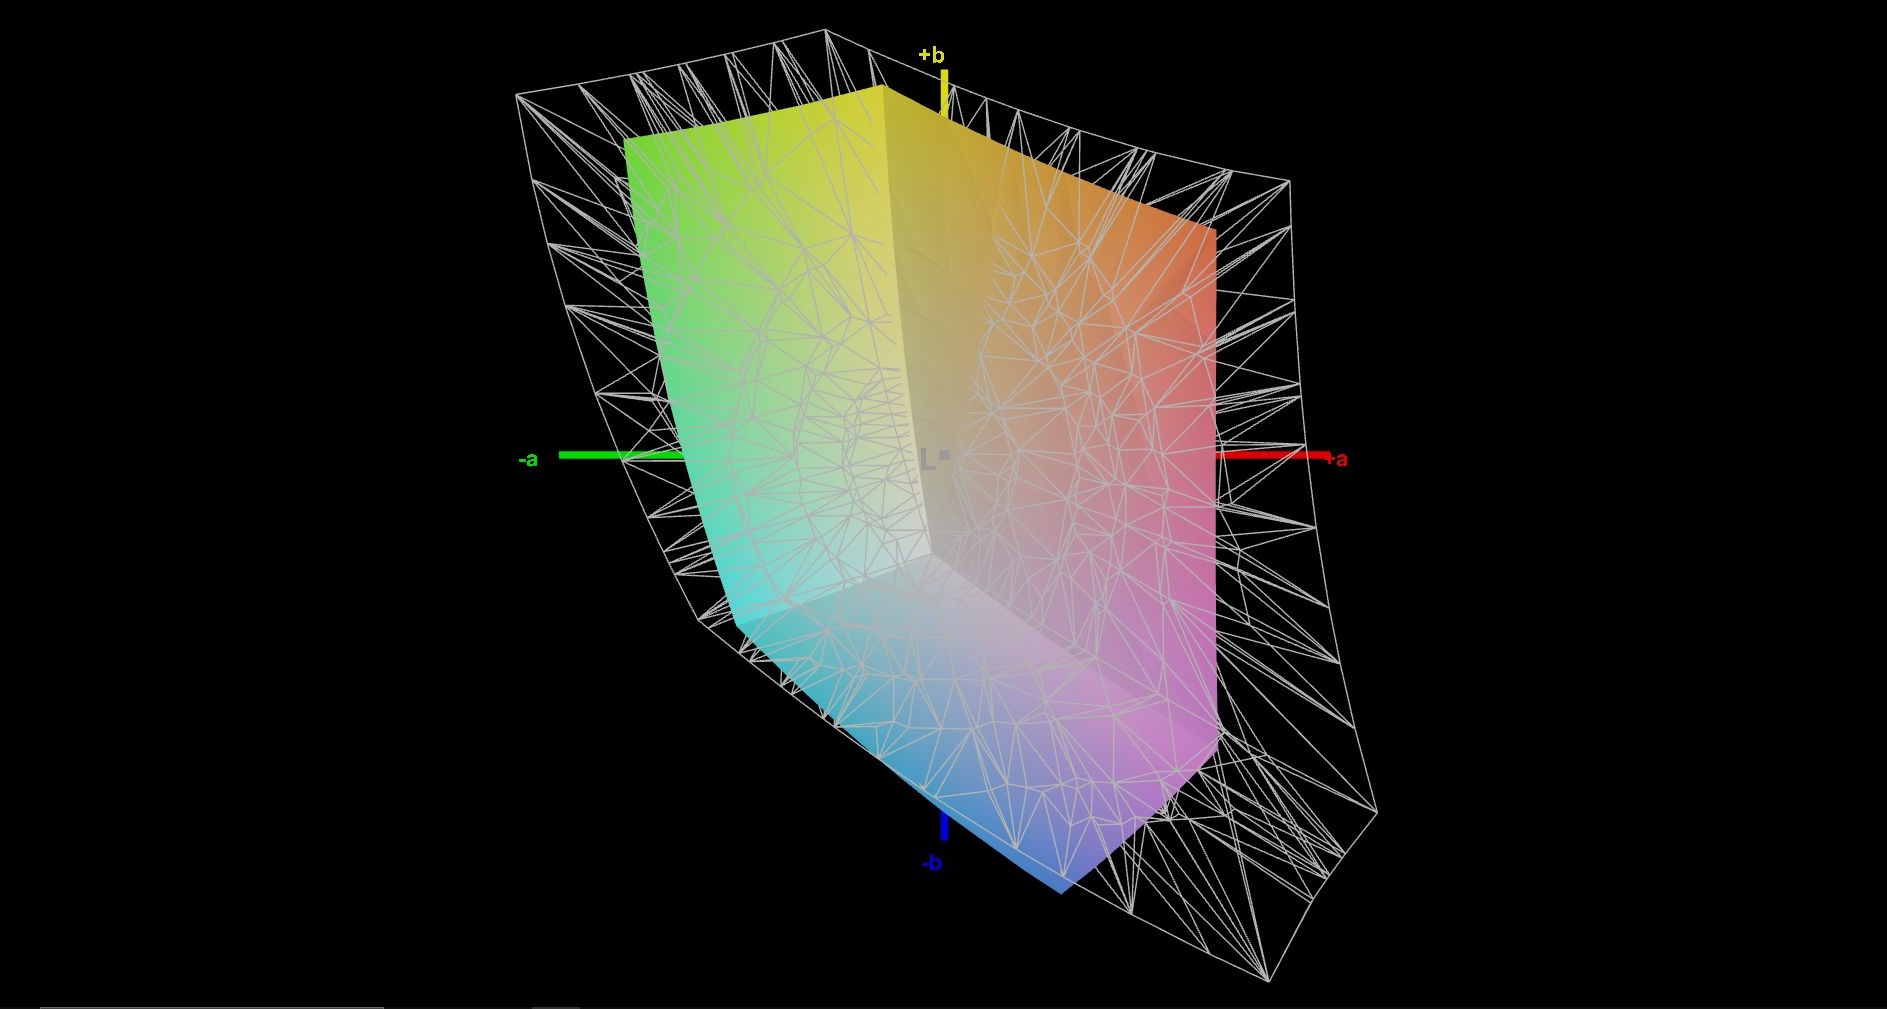
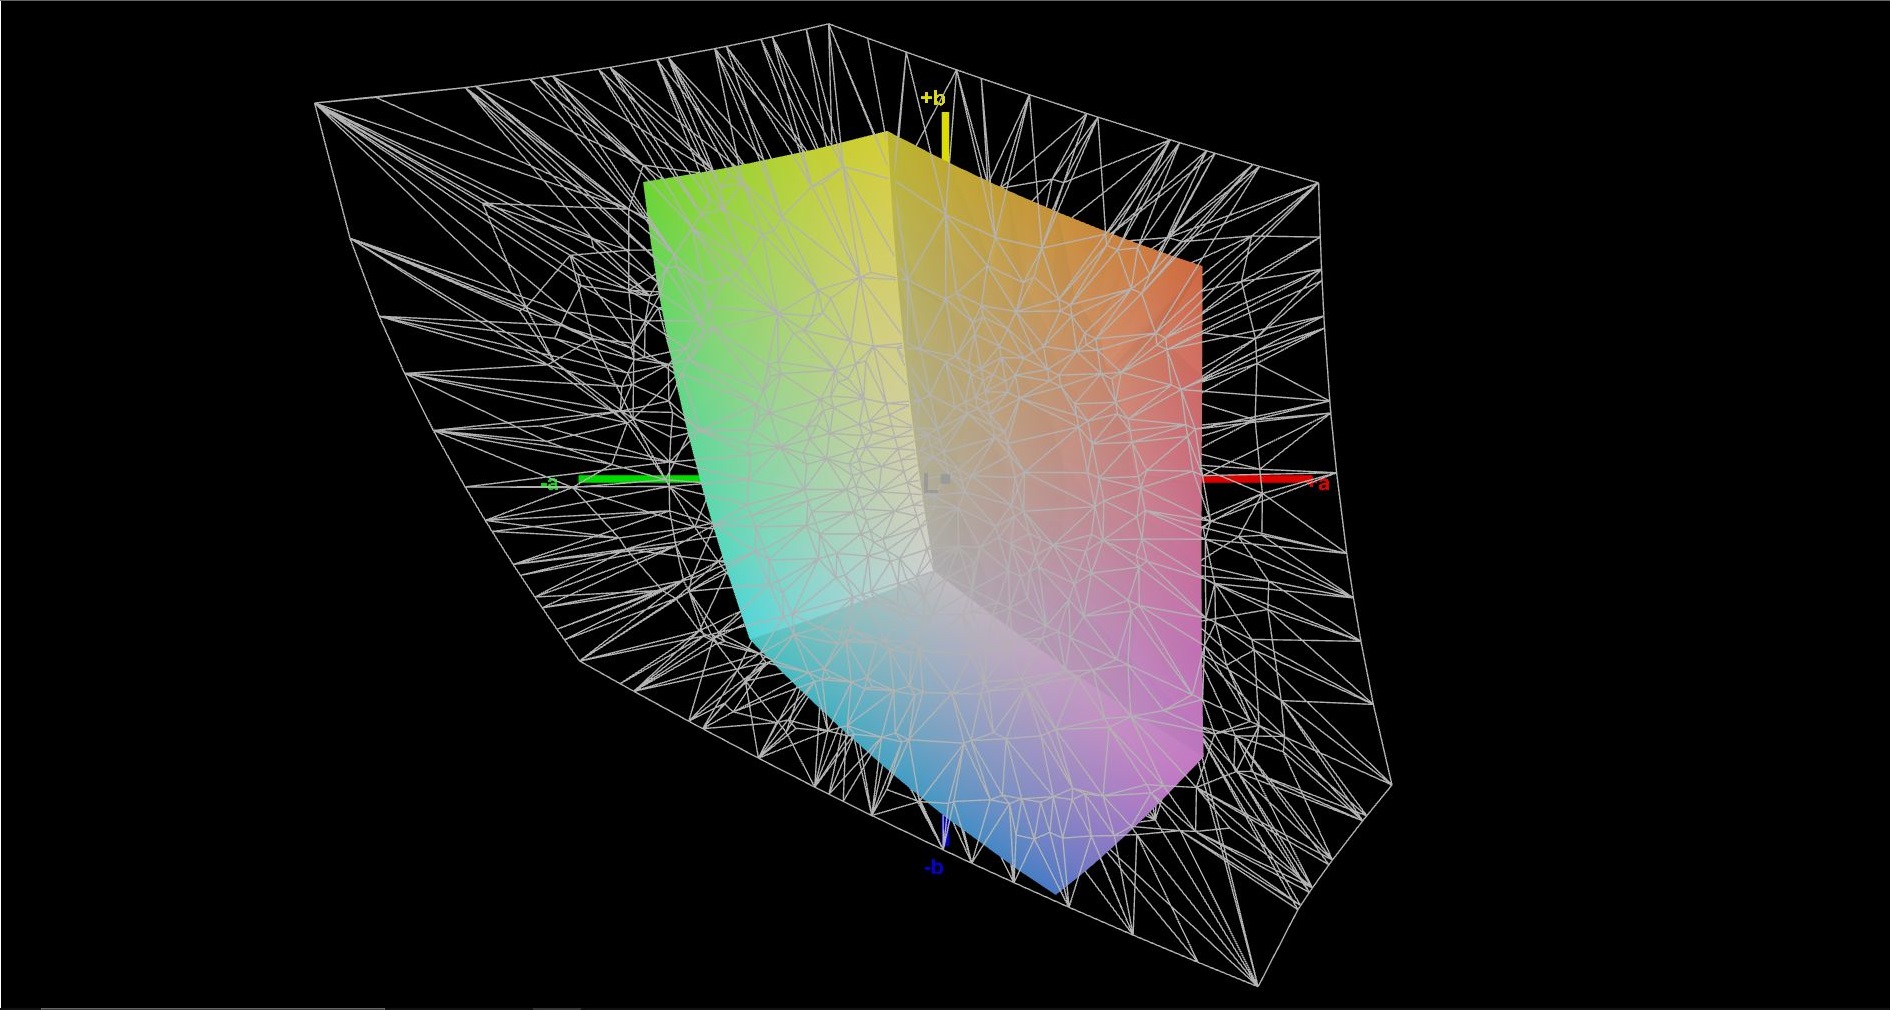
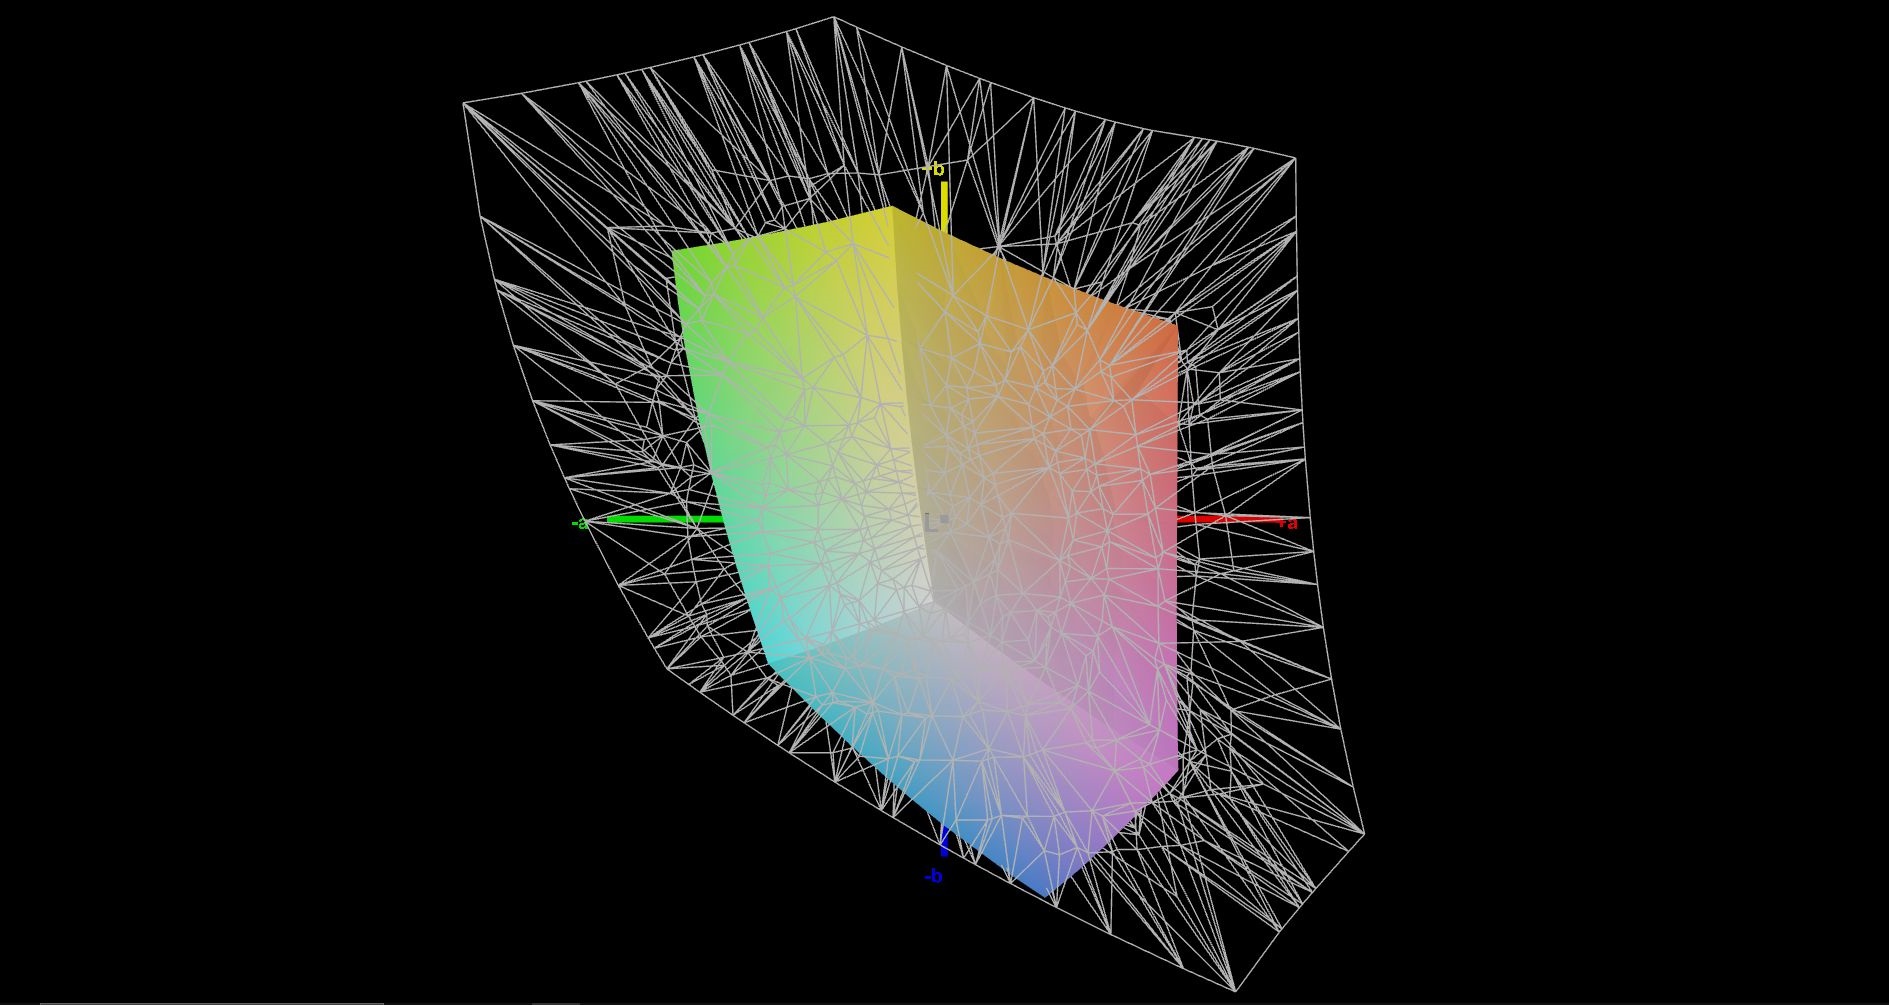
45.3% AdobeRGB 1998 (Argyll 3D)
65.1% sRGB (Argyll 3D)
43.7% Display P3 (Argyll 3D)
Gamma: 2.1
CCT: 6307 K
| Lenovo ThinkPad P15v G2 21A9000XGE N156HCA-EAC, IPS LED, 1920x1080, 15.6" | Lenovo ThinkPad P15 G2-20YQ001JGE N156HCE_GN1, IPS, 1920x1080, 15.6" | Lenovo ThinkPad T15g-20UR000GGE N156HCE-GN1, IPS, 1920x1080, 15.6" | Lenovo ThinkPad T15p-20TN0006GE MNF601EA1-1, IPS LED, 3840x2160, 15.6" | Lenovo ThinkPad P15s Gen2-20W6000GGE MNF601EA1-1, IPS LED, 3840x2160, 15.6" | HP ZBook Power 15 G8 313S5EA AUOA08B, IPS LED, 1920x1080, 15.6" | Dell Precision 5000 5560 Sharp LQ156R1, IPS, 3840x2400, 15.6" | |
|---|---|---|---|---|---|---|---|
| Display | 55% | 39% | 90% | 87% | 57% | 97% | |
| Display P3 Coverage (%) | 43.7 | 68.6 57% | 61.3 40% | 86.8 99% | 84.5 93% | 70.5 61% | 94.9 117% |
| sRGB Coverage (%) | 65.1 | 99.8 53% | 90.5 39% | 99.3 53% | 98.7 52% | 99 52% | 100 54% |
| AdobeRGB 1998 Coverage (%) | 45.3 | 70.6 56% | 62.3 38% | 98.5 117% | 97.8 116% | 71.3 57% | 100 121% |
| Response Times | 33% | 31% | 19% | 17% | -32% | -4% | |
| Response Time Grey 50% / Grey 80% * (ms) | 48 ? | 37.6 ? 22% | 38 ? 21% | 41.6 ? 13% | 40 ? 17% | 61 -27% | 47.2 ? 2% |
| Response Time Black / White * (ms) | 28 ? | 16 ? 43% | 16.8 ? 40% | 21.2 ? 24% | 23.2 ? 17% | 38 ? -36% | 30.4 ? -9% |
| PWM Frequency (Hz) | 26040 ? | 26040 ? | |||||
| Screen | 46% | 44% | 70% | 70% | 49% | 34% | |
| Brightness middle (cd/m²) | 305 | 498 63% | 504 65% | 595 95% | 604 98% | 393 29% | 501.5 64% |
| Brightness (cd/m²) | 281 | 490 74% | 476 69% | 594 111% | 609 117% | 385 37% | 467 66% |
| Brightness Distribution (%) | 88 | 95 8% | 90 2% | 94 7% | 91 3% | 78 -11% | 83 -6% |
| Black Level * (cd/m²) | 0.32 | 0.39 -22% | 0.34 -6% | 0.32 -0% | 0.34 -6% | 0.25 22% | 0.44 -38% |
| Contrast (:1) | 953 | 1277 34% | 1482 56% | 1859 95% | 1776 86% | 1572 65% | 1140 20% |
| Colorchecker dE 2000 * | 5.9 | 2.1 64% | 2.9 51% | 1.2 80% | 0.9 85% | 1.5 75% | 4.73 20% |
| Colorchecker dE 2000 max. * | 20.1 | 5.6 72% | 7.1 65% | 2.5 88% | 2.6 87% | 4.3 79% | 8.45 58% |
| Colorchecker dE 2000 calibrated * | 4.5 | 0.8 82% | 1.3 71% | 1 78% | 0.8 82% | 1.4 69% | 0.51 89% |
| Greyscale dE 2000 * | 5.3 | 3.4 36% | 4.3 19% | 1.4 74% | 1.1 79% | 1.3 75% | 3.6 32% |
| Gamma | 2.1 105% | 2.32 95% | 2.25 98% | 2.1 105% | 2.15 102% | 2.26 97% | 2.08 106% |
| CCT | 6307 103% | 7162 91% | 7265 89% | 6492 100% | 6656 98% | 6435 101% | 6447 101% |
| Color Space (Percent of AdobeRGB 1998) (%) | 57.7 | 85.3 | 84.5 | ||||
| Color Space (Percent of sRGB) (%) | 90.8 | 99.2 | 98.6 | ||||
| Media total (Programa/Opciones) | 45% /
46% | 38% /
41% | 60% /
67% | 58% /
66% | 25% /
39% | 42% /
42% |
* ... más pequeño es mejor
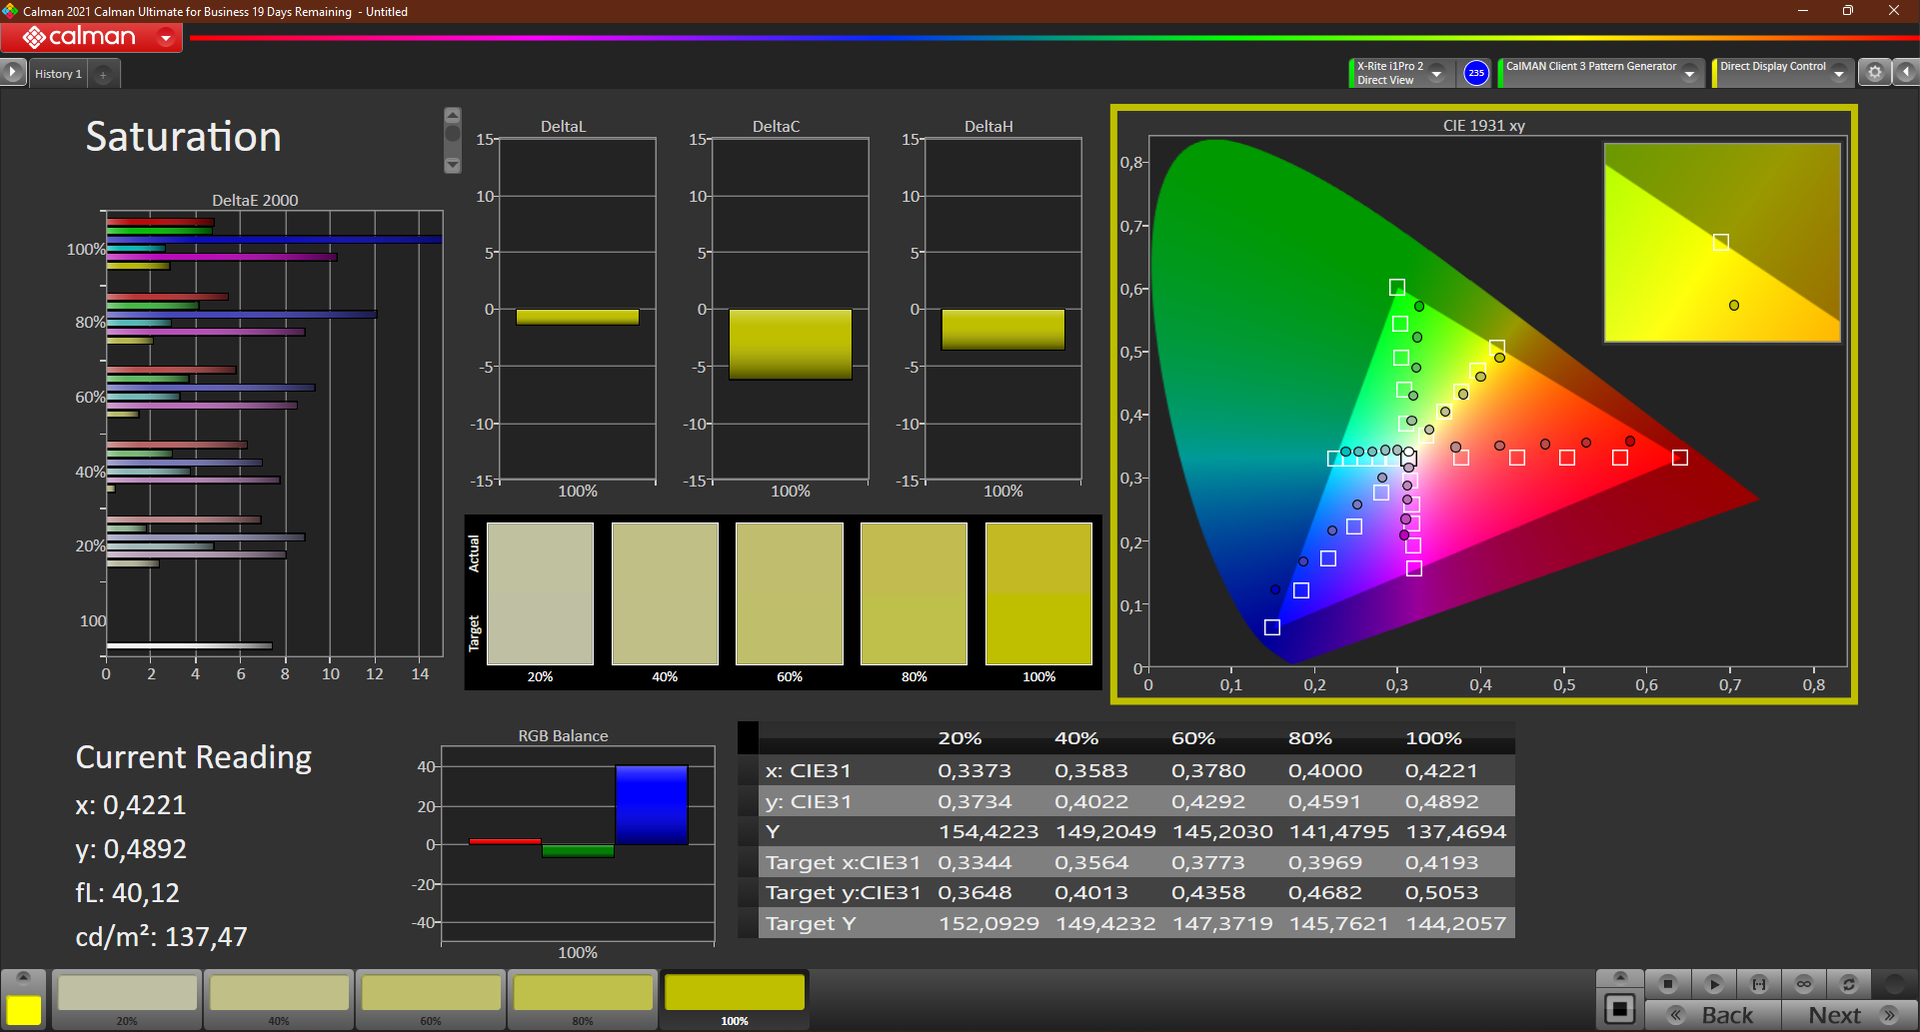
El espacio de color más pequeño que medimos (sRGB) se cubre con sólo un 65%. Si necesitas espacios de color más amplios, deberías usar otras opciones de pantalla, ya que nuestro modelo probado resulta inadecuado para la edición de imágenes ambiciosas.
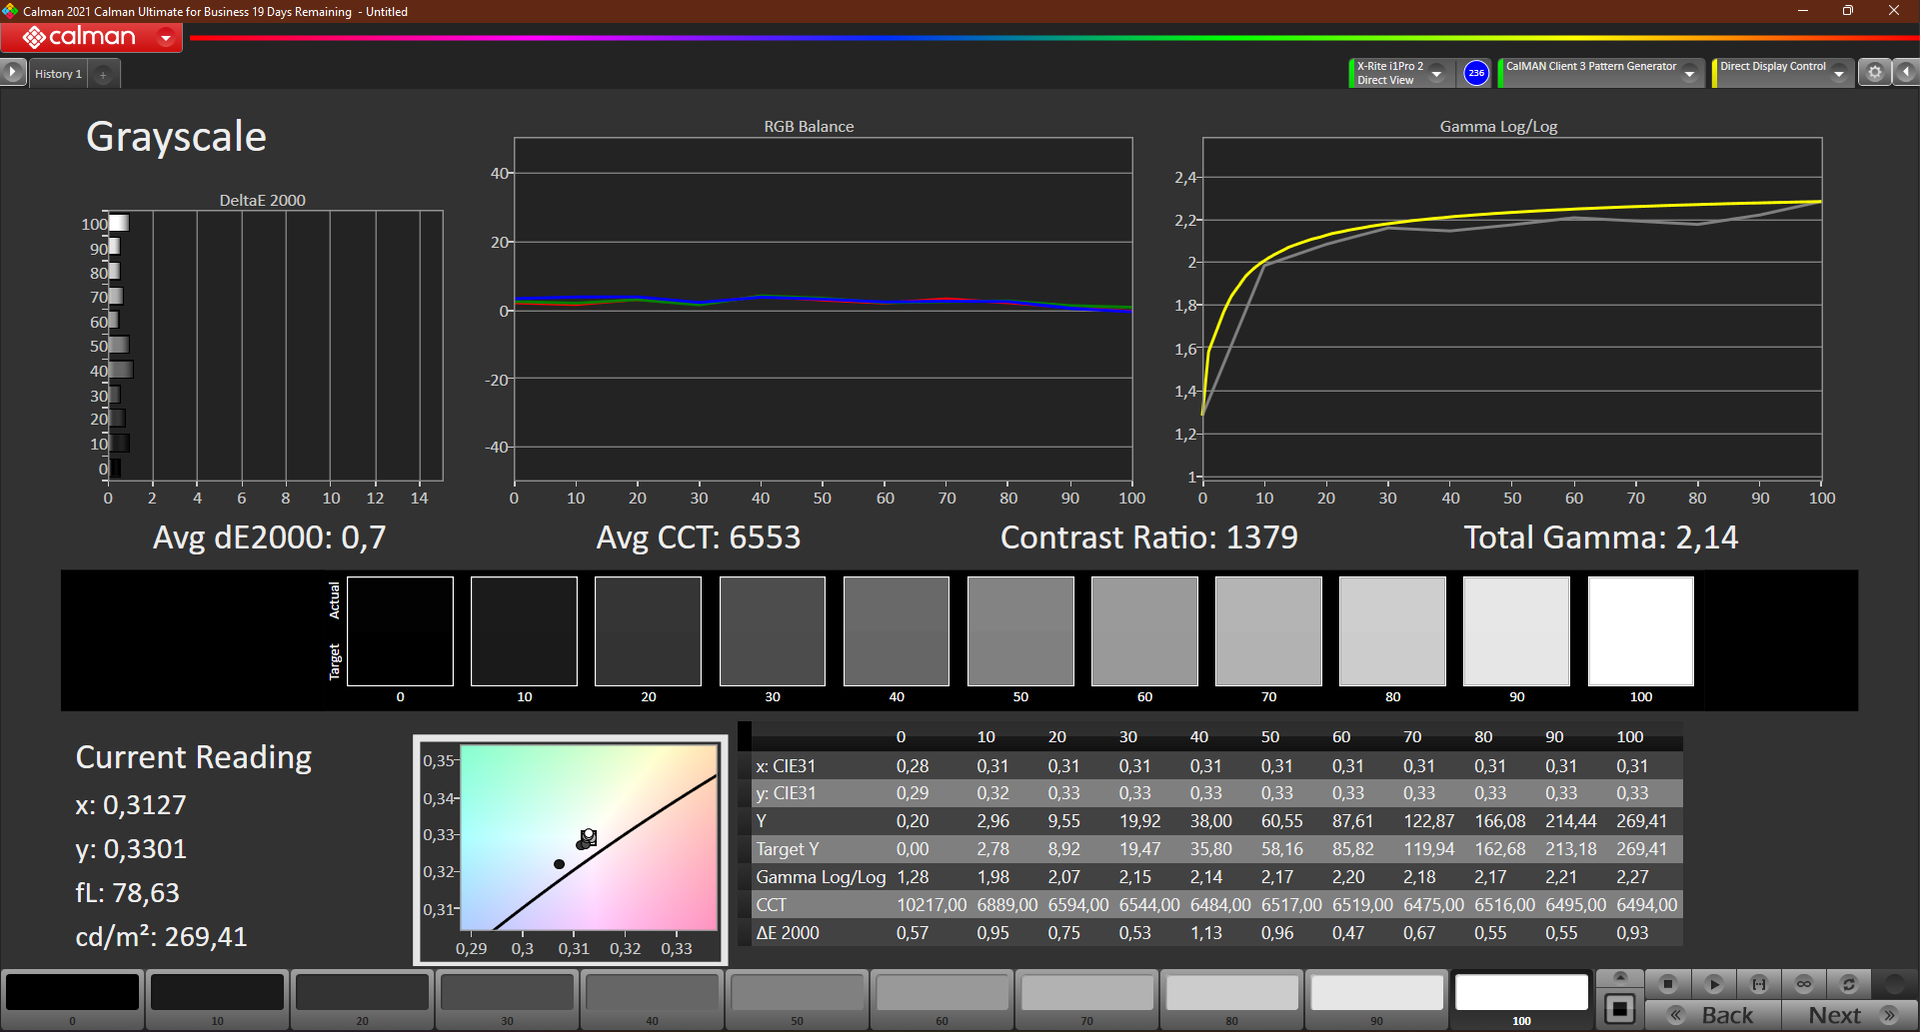
El balance RGB mejoró un poco tras la calibración con CalMan y el colorímetro X-Rite i1 Pro 2. El azul en particular se desvía significativamente con un valor DeltaE de ~15. La relación de contraste también aumentó un 45% hasta 1.379:1. Sin embargo, el brillo disminuyó en unos 20 nits debido al proceso. Como siempre, nuestro perfil de color ICC está disponible para su descarga junto al gráfico de iluminación.
Tiempos de respuesta del display
| ↔ Tiempo de respuesta de Negro a Blanco | ||
|---|---|---|
| 28 ms ... subida ↗ y bajada ↘ combinada | ↗ 17 ms subida | 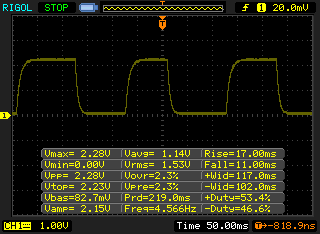 |
| ↘ 11 ms bajada | ||
| La pantalla mostró tiempos de respuesta relativamente lentos en nuestros tests pero podría ser demasiado lenta para los jugones. En comparación, todos los dispositivos de prueba van de ##min### (mínimo) a 240 (máximo) ms. » 71 % de todos los dispositivos son mejores. Eso quiere decir que el tiempo de respuesta es peor que la media (19.8 ms) de todos los dispositivos testados. | ||
| ↔ Tiempo de respuesta 50% Gris a 80% Gris | ||
| 48 ms ... subida ↗ y bajada ↘ combinada | ↗ 26 ms subida | 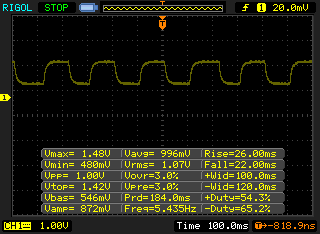 |
| ↘ 22 ms bajada | ||
| La pantalla mostró tiempos de respuesta lentos en nuestros tests y podría ser demasiado lenta para los jugones. En comparación, todos los dispositivos de prueba van de ##min### (mínimo) a 636 (máximo) ms. » 82 % de todos los dispositivos son mejores. Eso quiere decir que el tiempo de respuesta es peor que la media (31 ms) de todos los dispositivos testados. | ||
Parpadeo de Pantalla / PWM (Pulse-Width Modulation)
| Parpadeo de Pantalla / PWM no detectado | 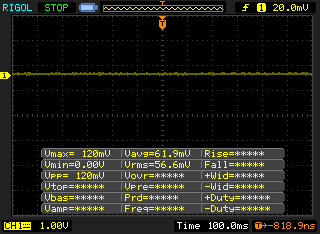 | ||
Comparación: 52 % de todos los dispositivos testados no usaron PWM para atenuar el display. Si se usó, medimos una media de 7757 (mínimo: 5 - máxmo: 343500) Hz. | |||
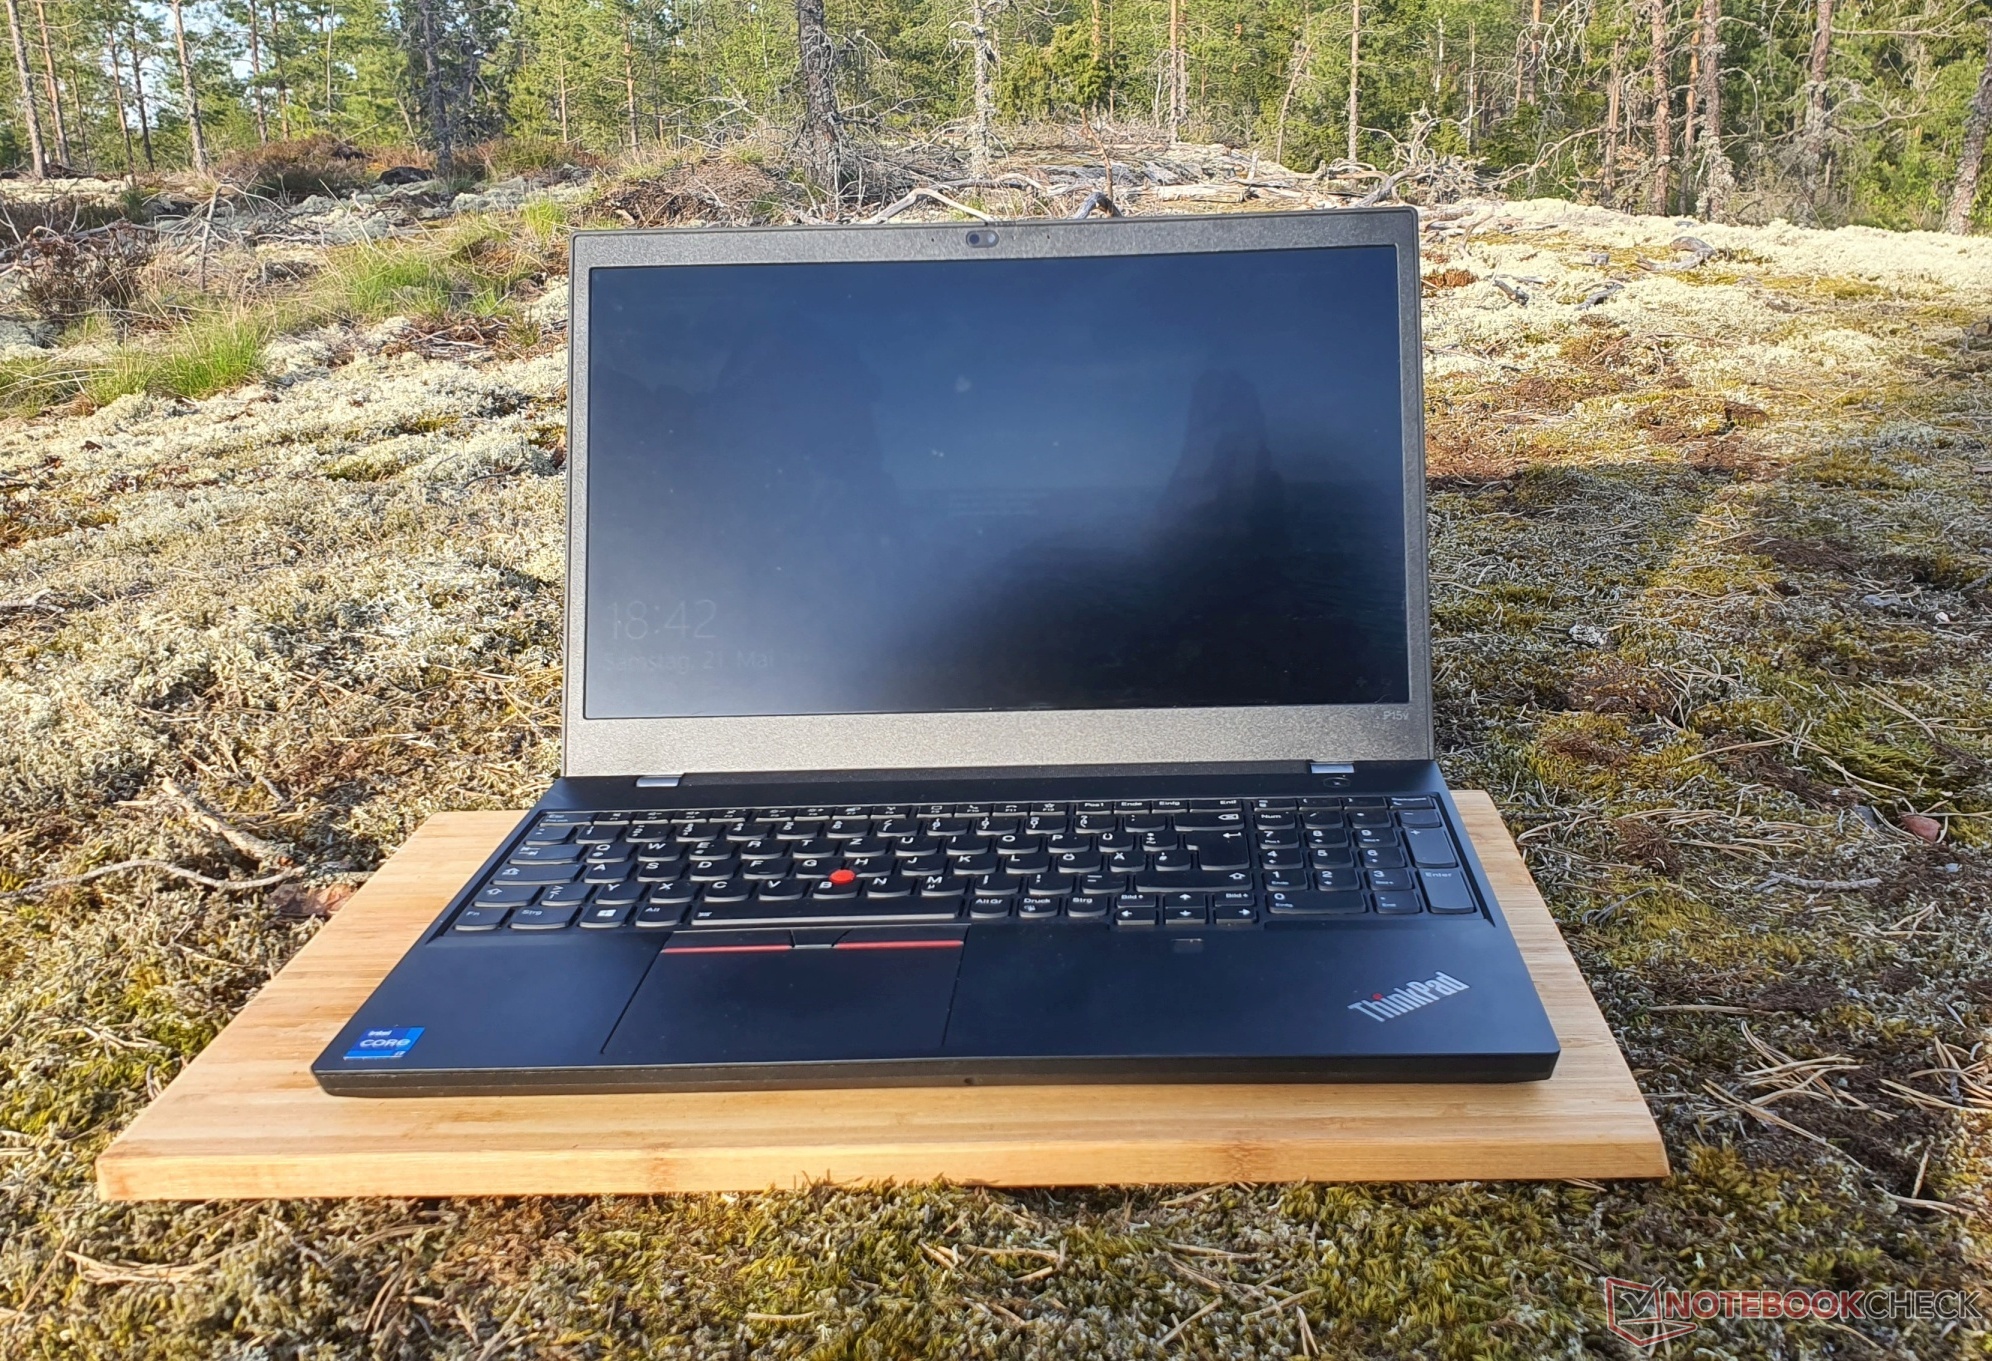
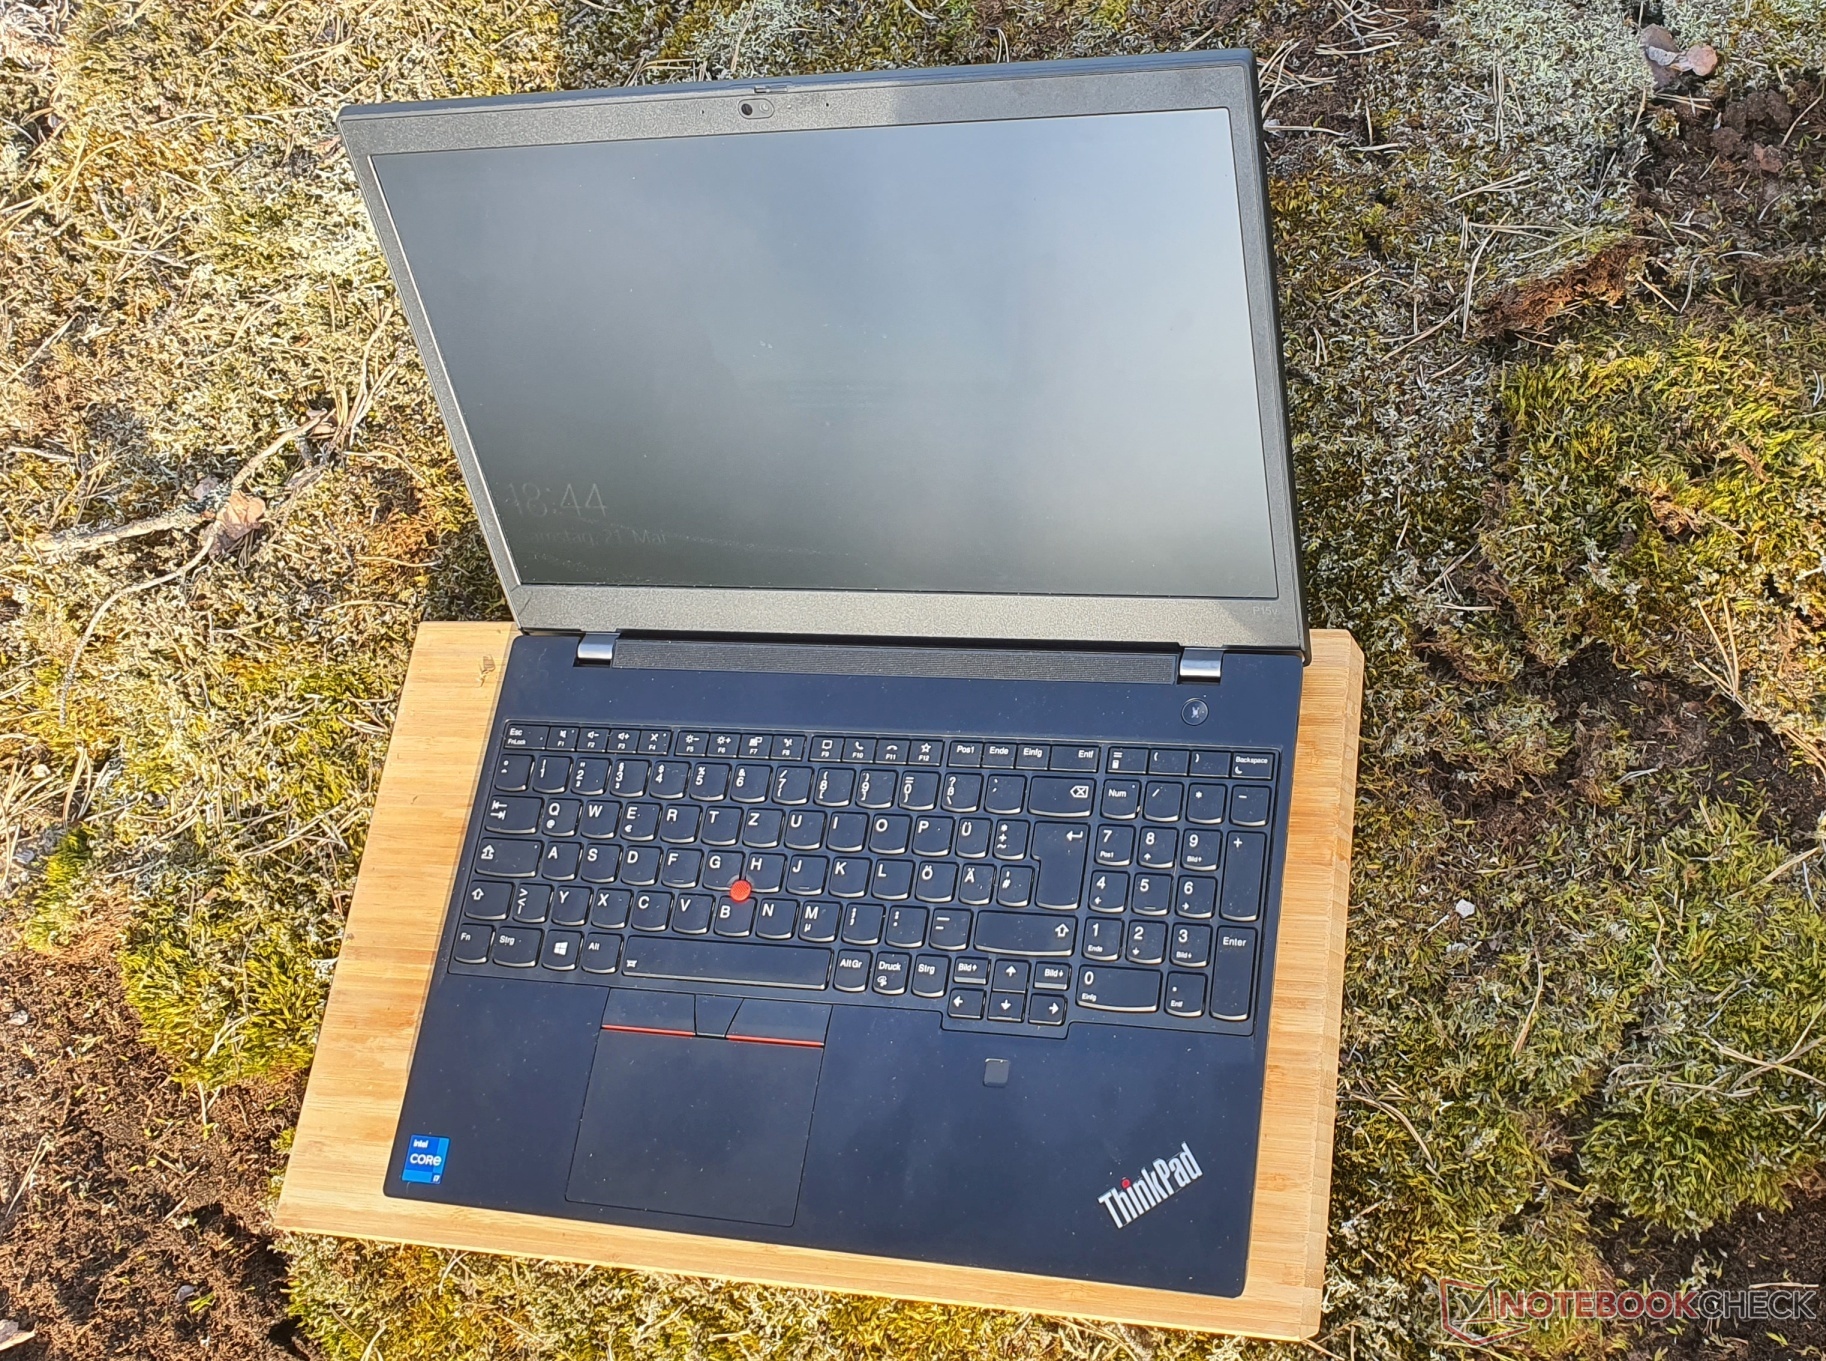
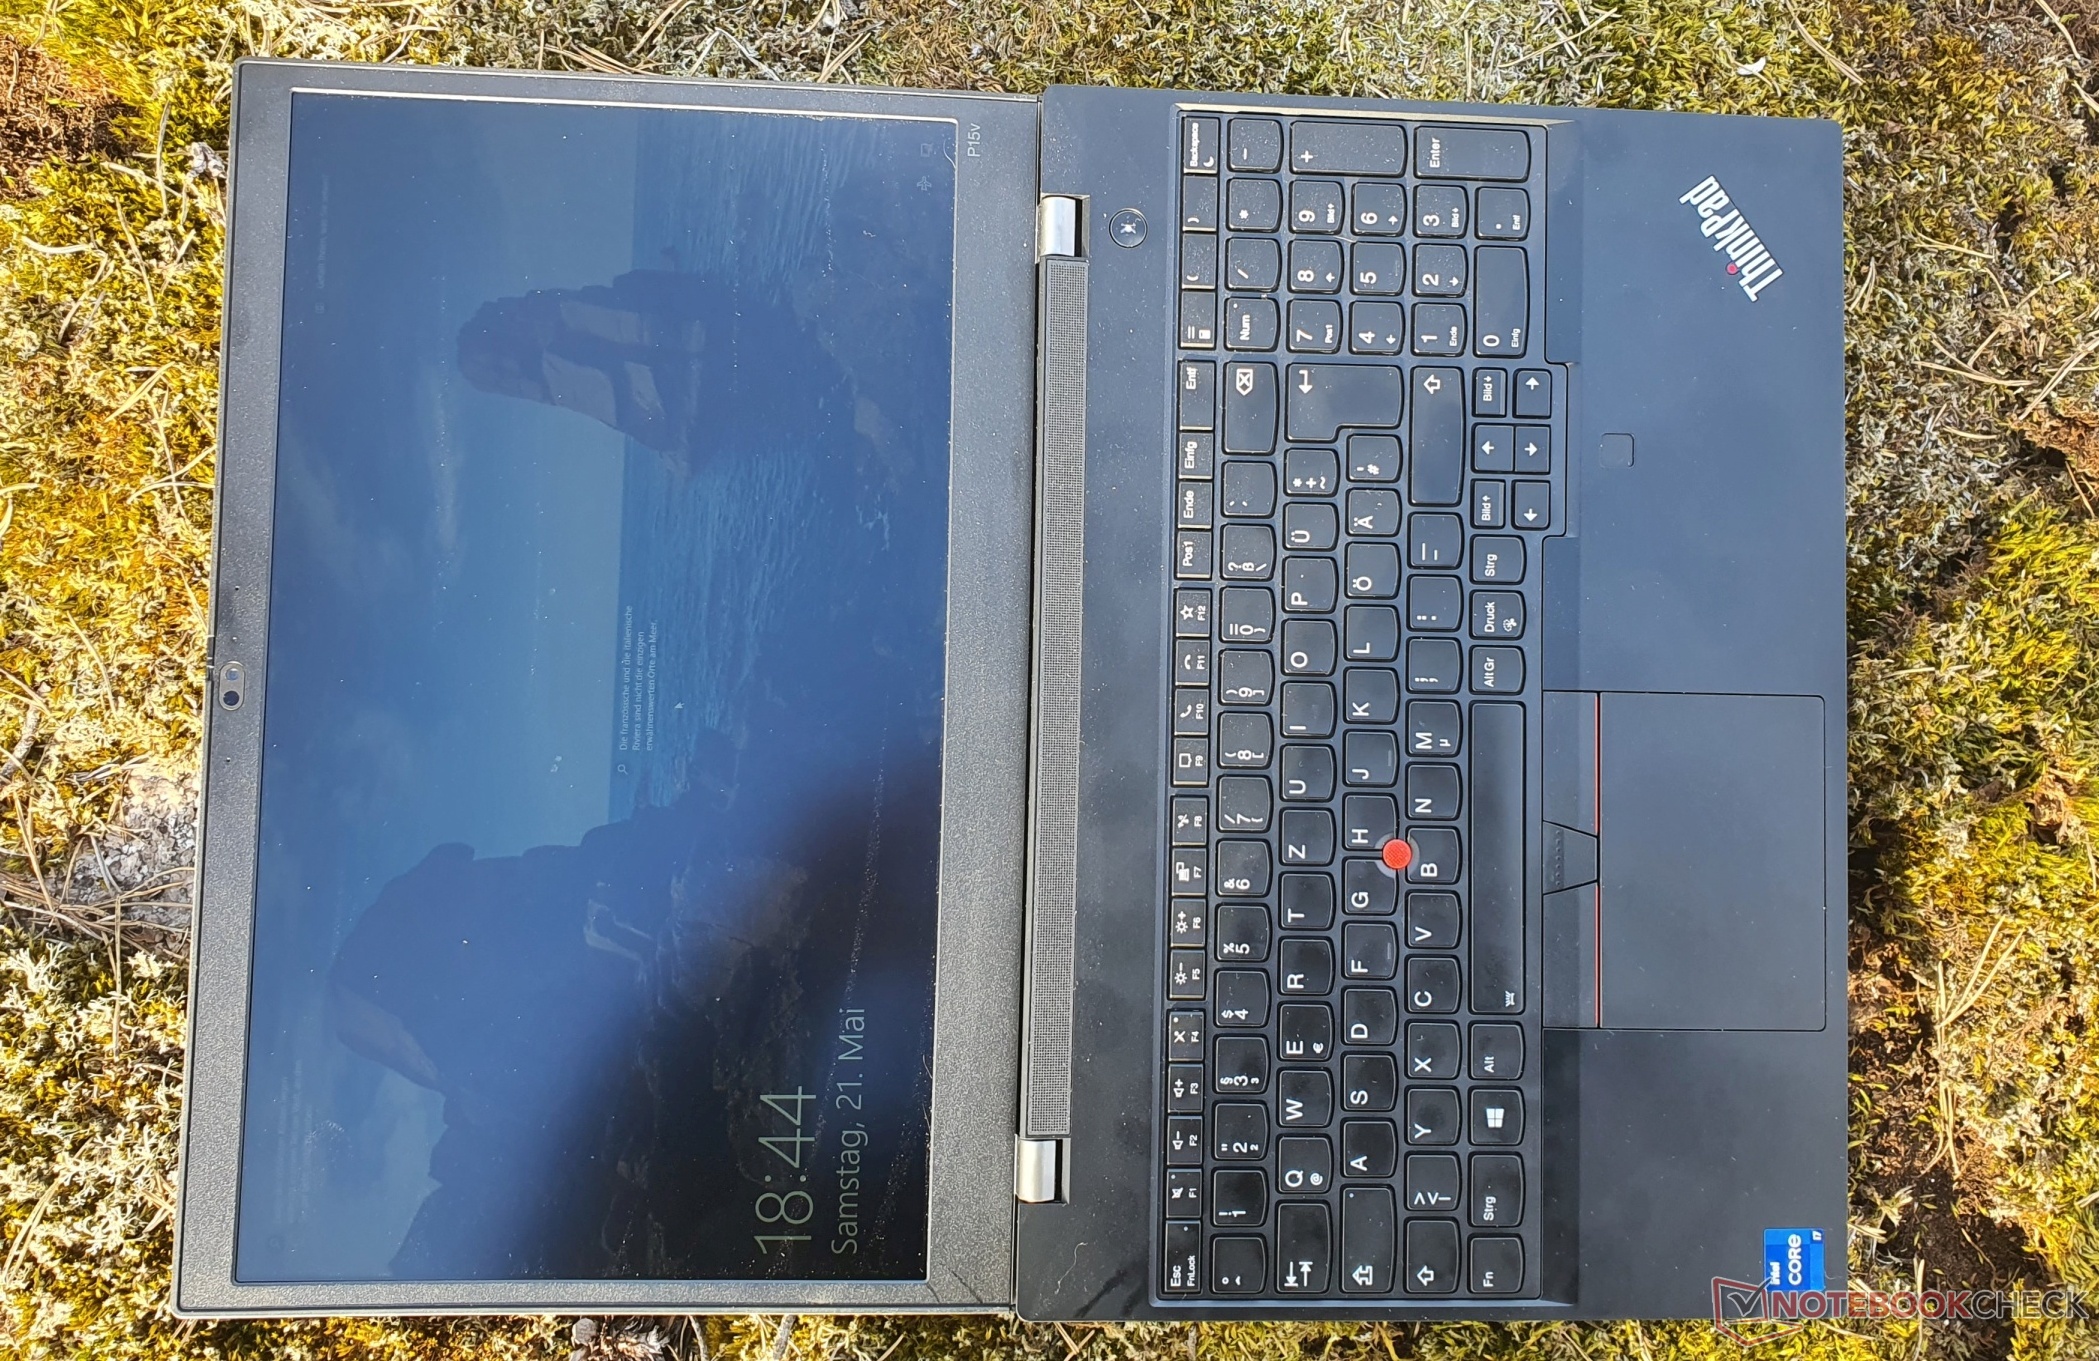
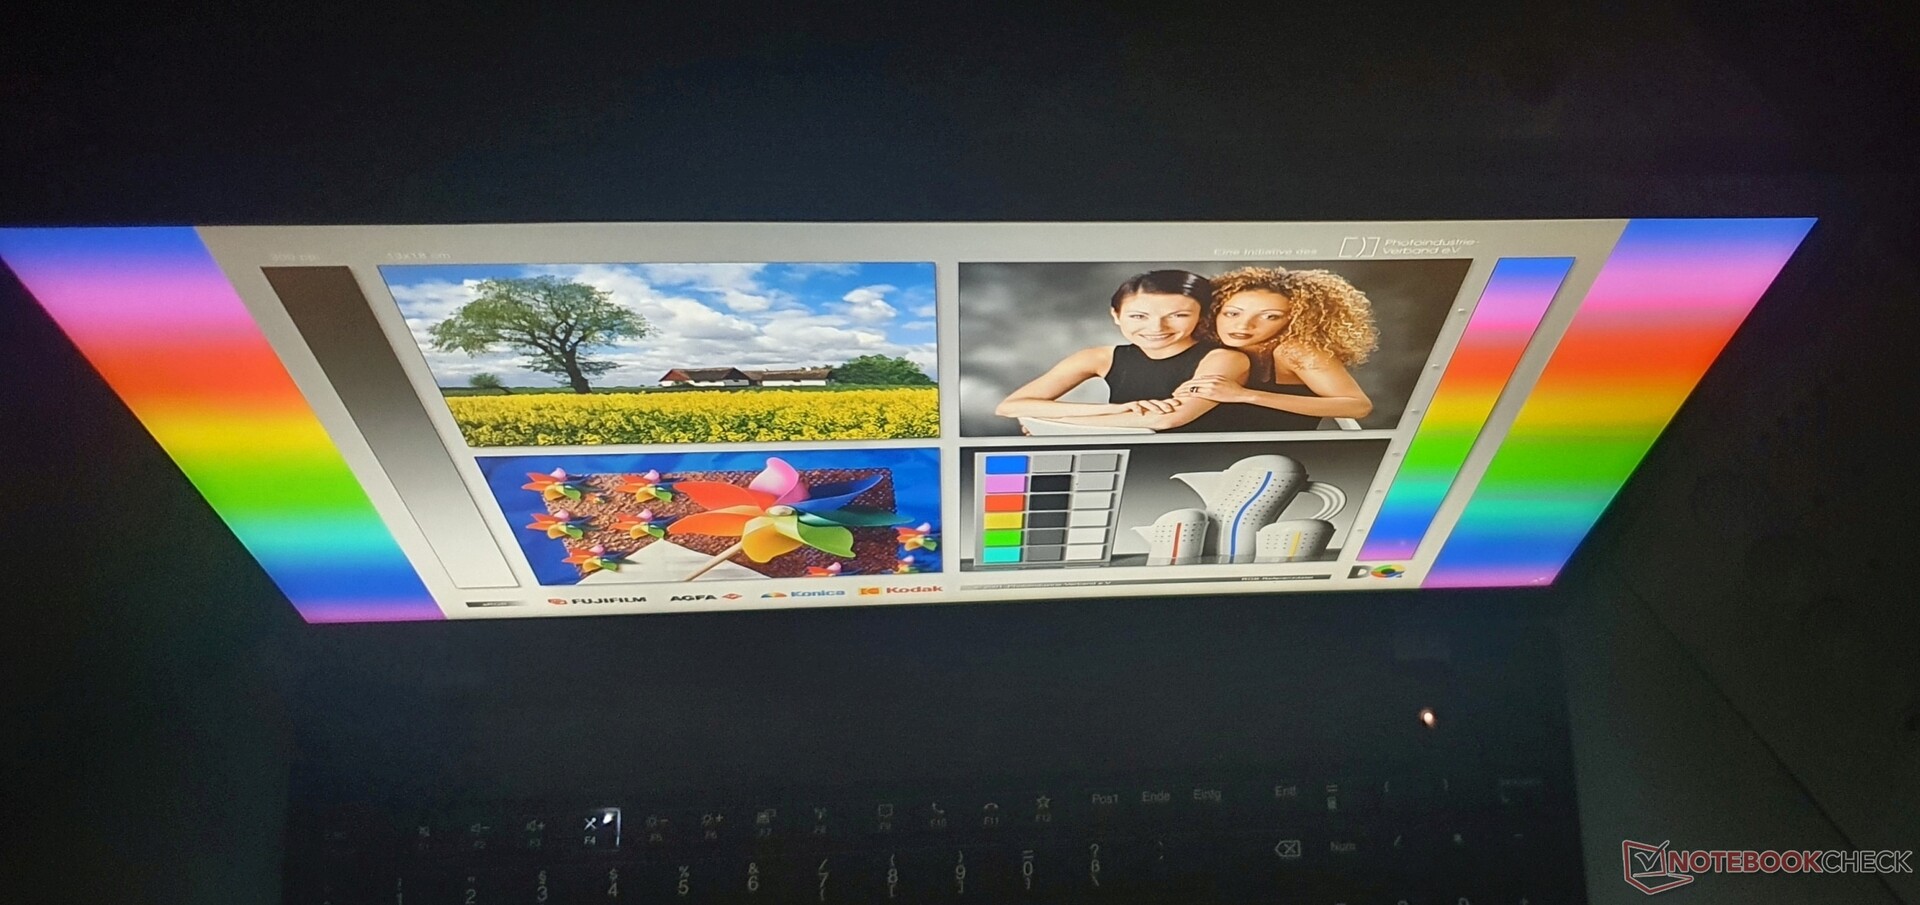
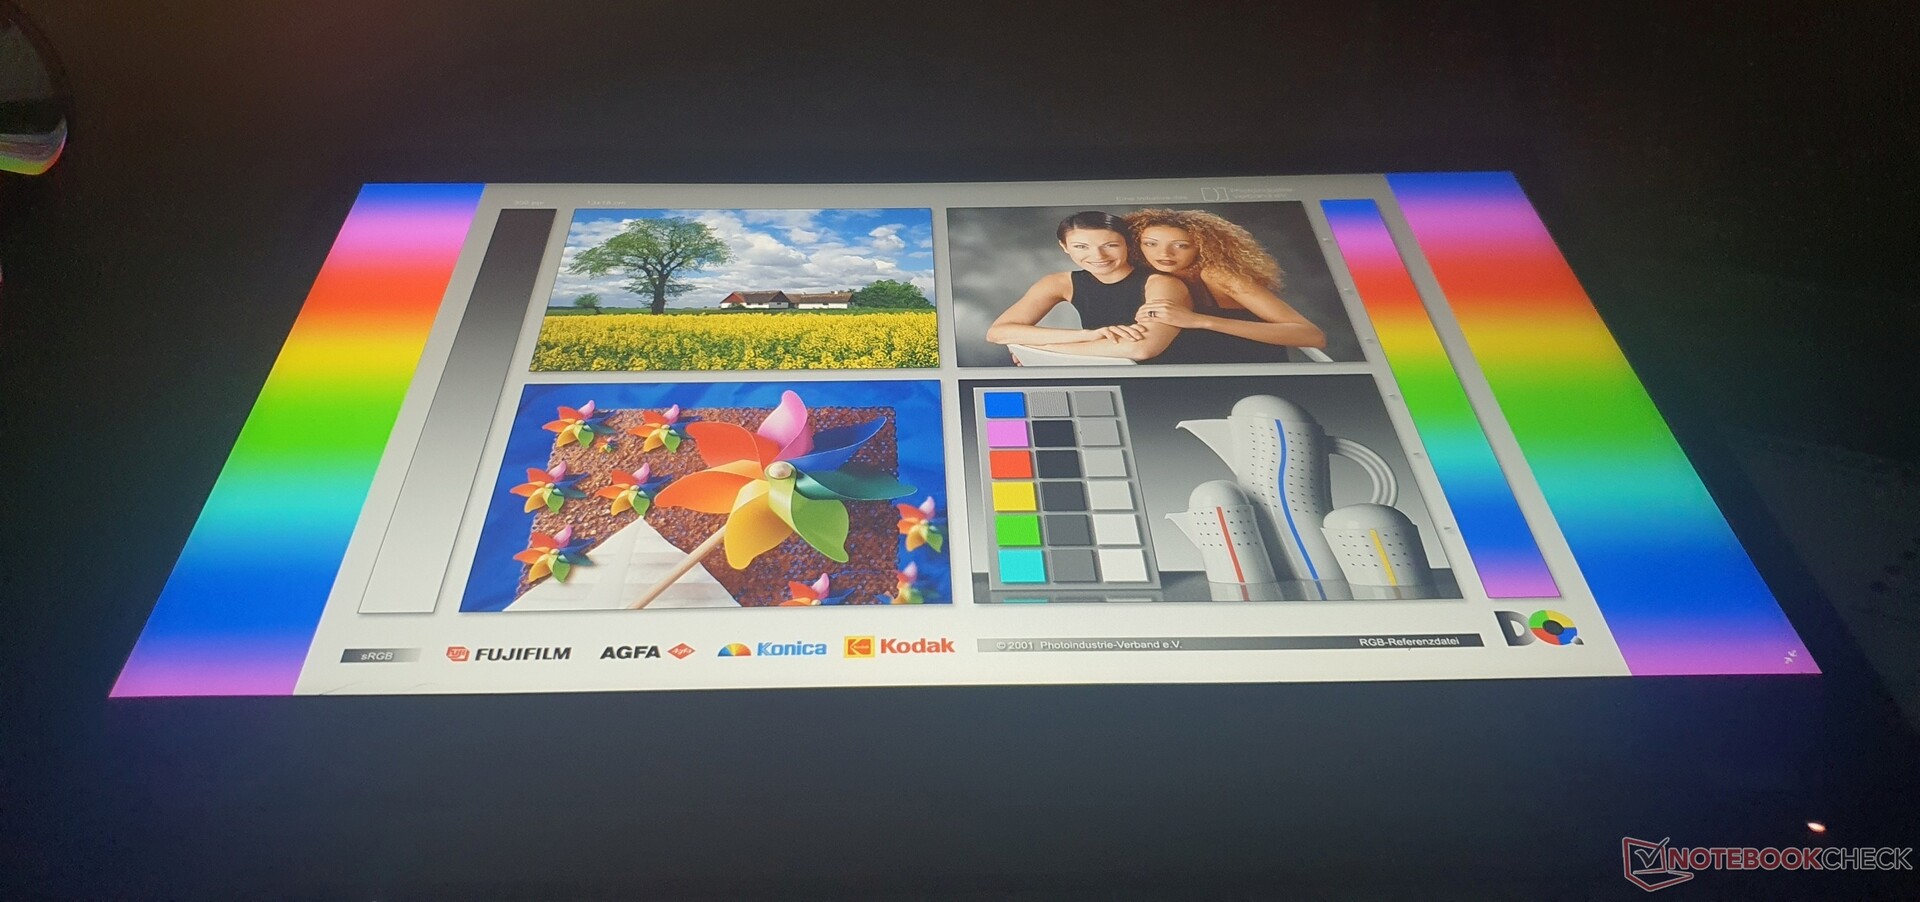
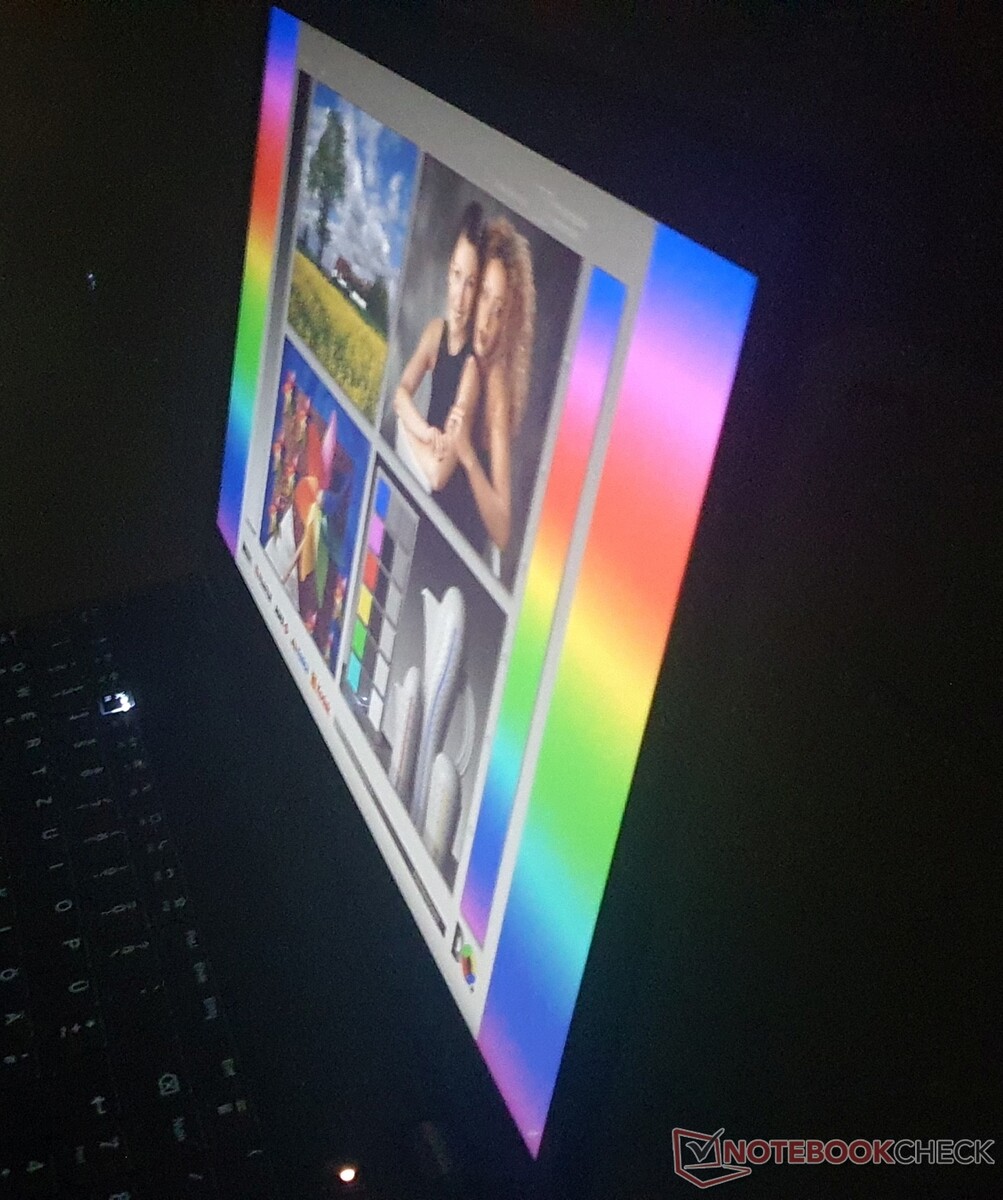
En exteriores, bajo el sol, la pantalla con sus 280 nits no es lo suficientemente brillante a pesar de la superficie mate. Pero el P15v puede usarse en la sombra
La legibilidad de la pantalla es muy buena hasta un ángulo de visión de aproximadamente 170°, lo que es típico de las IPS. Las OLED tienen un rendimiento aún mejor.
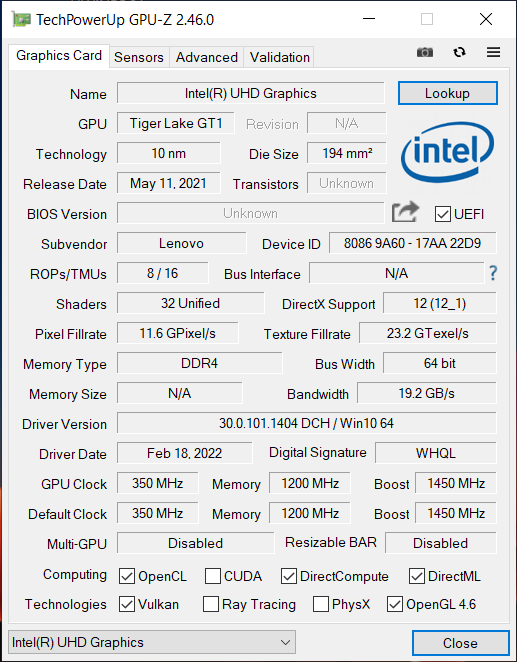
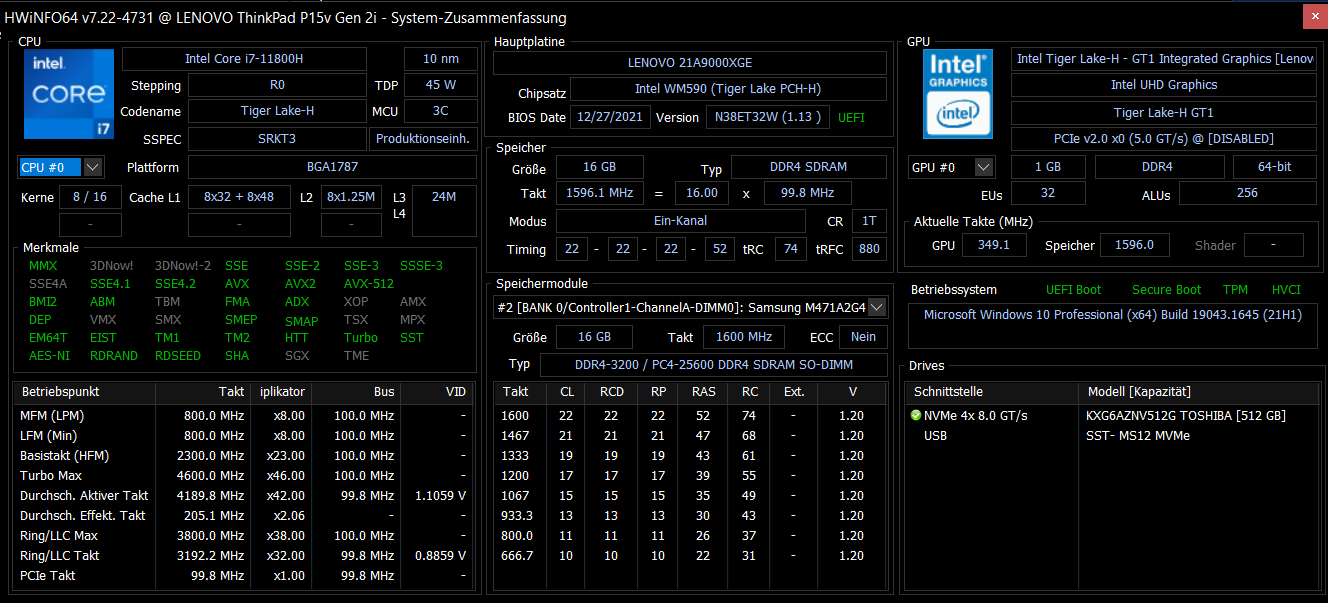
Rendimiento: ThinkPad P15v G2 mejor con Intel Core i9
Nuestro modelo de análisis viene con un Intel Tiger-LakeCore i7-11800H como alternativa, puedes optar por un Core Core i9-11950Hen cuanto a los gráficos, junto con la Intel Xe-iGPU (32/16 EUs), puedes elegir entre una Nvidia T600, T1200 (nuestro modelo) o una RTX A2000con certificaciones ISV. Las CPUs Xeon y la RAM ECC no están pensadas para lo que se supone que es una estación de trabajo barata.
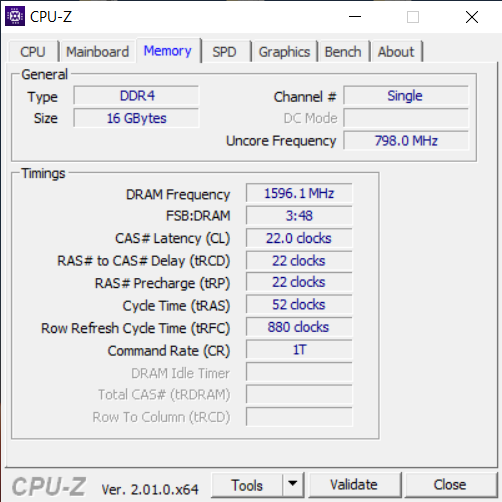
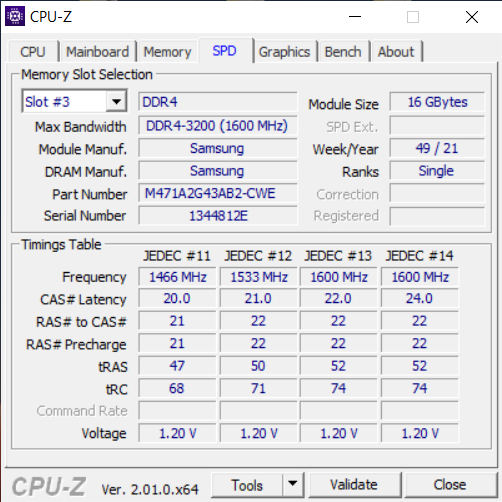
Dos módulos SODIMM albergan hasta 64 GB de RAM DDR4-3200, mientras que nuestro modelo está equipado con un módulo de 16 GB en modo monocanal. También hay dos ranuras PCIe 4.0 que permiten cada una un máximo de 2 TB de SSD NVMe en formato M.2 2280
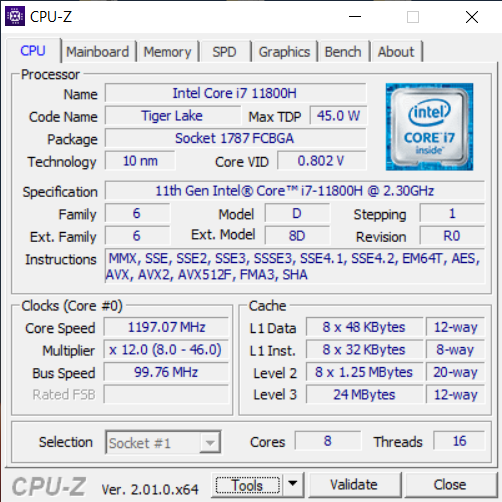

Procesador
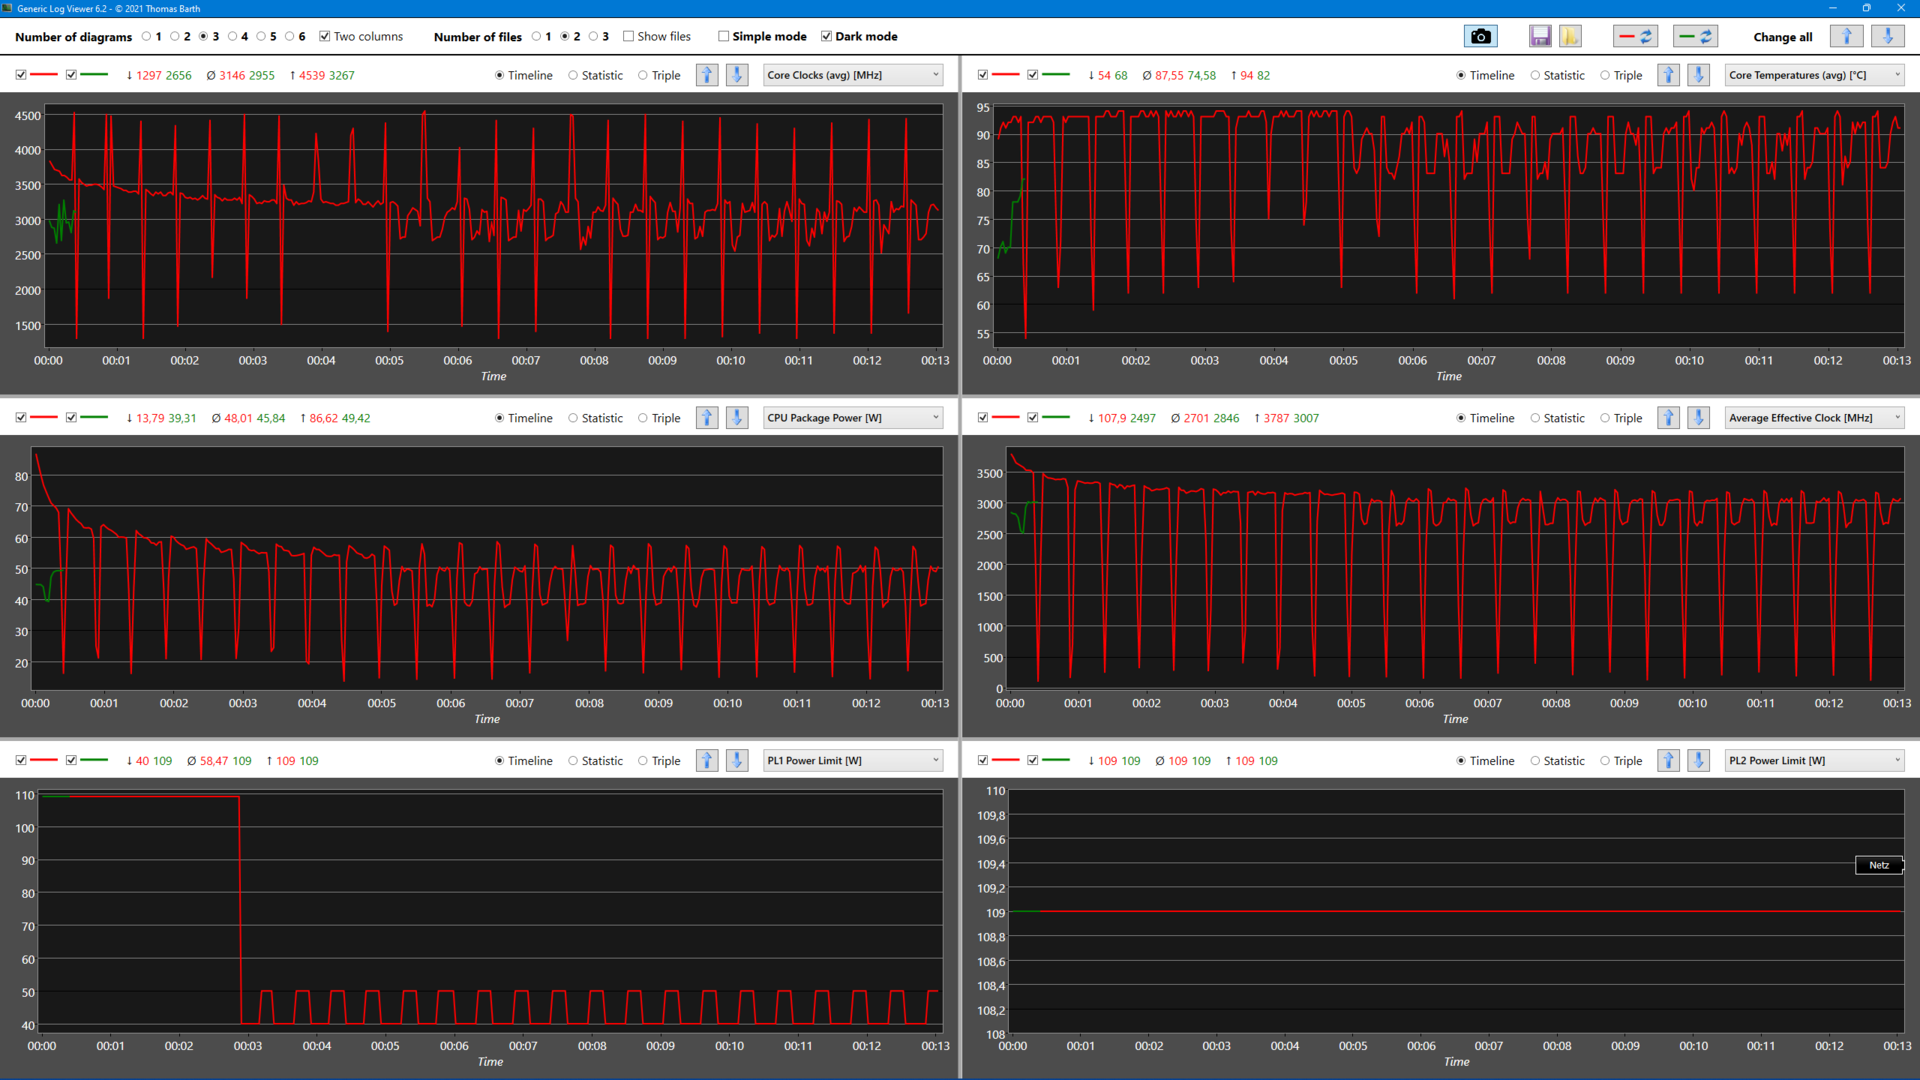
El Intel Core i7-11800Hpromete mucha potencia con sus ocho núcleos, pero la CPU no está configurada de forma óptima en el ThinkPad P15v G2 en la práctica. En el transcurso del bucle CB15, se alcanzan repetidamente los 4.6 GHz, mientras que la media es de 3.15 GHz. Después de 10 ejecuciones, sólo se alcanzan 1.400 puntos de forma consistente. El grueso ThinkPad P15 G2logra 1.768 puntos con la misma CPU.
Incluso el mucho más delgado ThinkPad P1 G3 del probador logra unos sostenidos ~1,700 puntos con el Core i9 de pregeneración. Bajo PL2 (inicial), se utilizan 87 de los 109 vatios, pero el problema surge de los 60 vatios (@4.6 GHz) empujados más allá de PL1 (50 vatios). Como resultado, la CPU alcanza regularmente la marca de 94 °C y está sujeta a un estrangulamiento térmico gradual.
En algunas aplicaciones se desperdicia un 25% del rendimiento. Una limitación manual del TDP a 50 o incluso 45 vatios a través de la herramienta "ThrottleStop" también lleva a un comportamiento fluctuante. Curiosamente, no hubo ralentización bajo un consumo constante de 50 vatios durante la prueba de estrés con Prime95. Una actualización de la BIOS no ayudó. Queda la duda de si esta caída de rendimiento puede remediarse con un Core i9 más flexible, y esta opción es cara. Como mínimo, el predecesor queda claramente superado aquí, pero el ZBook Power 15 de HP es un ~30% más rápido con el mismo Core i7.
La puntuación OpenCL relacionada con la estación de trabajo es sólo la mitad de buena que la del ThinkPad P15, principalmente debido a la GPU más débil. Esta discrepancia es aún más extrema en V-Ray 5 CUDA. En modo de batería, el rendimiento cae alrededor de un 20% (@45 vatios).
Cinebench R15 Multi Sustained Load
Cinebench R23: Multi Core | Single Core
Cinebench R20: CPU (Multi Core) | CPU (Single Core)
Cinebench R15: CPU Multi 64Bit | CPU Single 64Bit
Blender: v2.79 BMW27 CPU
7-Zip 18.03: 7z b 4 | 7z b 4 -mmt1
Geekbench 5.5: Multi-Core | Single-Core
HWBOT x265 Benchmark v2.2: 4k Preset
LibreOffice : 20 Documents To PDF
R Benchmark 2.5: Overall mean
V-Ray 5 Benchmark: GPU CUDA
Geekbench 5.5: OpenCL Score
SPECviewperf 13: Solidworks (sw-04) | Siemens NX (snx-03) | Showcase (showcase-02) | Medical (medical-02) | Maya (maya-05) | Energy (energy-02) | Creo (creo-02) | Catia (catia-05) | 3ds Max (3dsmax-06)
SPECviewperf 2020: 1920x1080 Solidworks (solidworks-05) | 1920x1080 Siemens NX (snx-04) | 1920x1080 Medical (medical-03) | 1920x1080 Maya (maya-06) | 1920x1080 Energy (energy-03) | 1920x1080 Creo (creo-03) | 1920x1080 CATIA (catia-06) | 1920x1080 3ds Max (3dsmax-07)
| CPU Performance rating | |
| Media de la clase Workstation | |
| Lenovo ThinkPad P15 G2-20YQ001JGE -1! | |
| Medio Intel Core i7-11800H | |
| Dell Precision 5000 5560 -4! | |
| Lenovo ThinkPad T15g-20UR000GGE -1! | |
| HP ZBook Power 15 G8 313S5EA | |
| Lenovo ThinkPad T15p-20TN0006GE -18! | |
| Lenovo ThinkPad P15v G2 21A9000XGE -1! | |
| Lenovo ThinkPad P15s Gen2-20W6000GGE -1! | |
| Cinebench R23 / Multi Core | |
| Media de la clase Workstation (14621 - 38520, n=23, últimos 2 años) | |
| HP ZBook Power 15 G8 313S5EA | |
| Medio Intel Core i7-11800H (6508 - 14088, n=48) | |
| Lenovo ThinkPad P15 G2-20YQ001JGE | |
| Lenovo ThinkPad P15v G2 21A9000XGE | |
| Dell Precision 5000 5560 | |
| Lenovo ThinkPad T15g-20UR000GGE | |
| Lenovo ThinkPad T15p-20TN0006GE | |
| Lenovo ThinkPad P15s Gen2-20W6000GGE | |
| Cinebench R23 / Single Core | |
| Media de la clase Workstation (1712 - 2228, n=23, últimos 2 años) | |
| HP ZBook Power 15 G8 313S5EA | |
| Dell Precision 5000 5560 | |
| Lenovo ThinkPad P15 G2-20YQ001JGE | |
| Medio Intel Core i7-11800H (1386 - 1522, n=45) | |
| Lenovo ThinkPad P15s Gen2-20W6000GGE | |
| Lenovo ThinkPad T15g-20UR000GGE | |
| Lenovo ThinkPad T15p-20TN0006GE | |
| Cinebench R20 / CPU (Multi Core) | |
| Media de la clase Workstation (5760 - 15043, n=23, últimos 2 años) | |
| Medio Intel Core i7-11800H (2498 - 5408, n=50) | |
| Lenovo ThinkPad P15 G2-20YQ001JGE | |
| HP ZBook Power 15 G8 313S5EA | |
| Dell Precision 5000 5560 | |
| Lenovo ThinkPad P15v G2 21A9000XGE | |
| Lenovo ThinkPad T15p-20TN0006GE | |
| Lenovo ThinkPad T15g-20UR000GGE | |
| Lenovo ThinkPad P15s Gen2-20W6000GGE | |
| Cinebench R20 / CPU (Single Core) | |
| Media de la clase Workstation (671 - 857, n=23, últimos 2 años) | |
| HP ZBook Power 15 G8 313S5EA | |
| Dell Precision 5000 5560 | |
| Lenovo ThinkPad P15 G2-20YQ001JGE | |
| Medio Intel Core i7-11800H (520 - 586, n=47) | |
| Lenovo ThinkPad P15v G2 21A9000XGE | |
| Lenovo ThinkPad P15s Gen2-20W6000GGE | |
| Lenovo ThinkPad T15g-20UR000GGE | |
| Lenovo ThinkPad T15p-20TN0006GE | |
| Cinebench R15 / CPU Multi 64Bit | |
| Media de la clase Workstation (2489 - 5810, n=23, últimos 2 años) | |
| HP ZBook Power 15 G8 313S5EA | |
| HP ZBook Power 15 G8 313S5EA | |
| Medio Intel Core i7-11800H (1342 - 2173, n=50) | |
| Lenovo ThinkPad P15 G2-20YQ001JGE | |
| Lenovo ThinkPad P15v G2 21A9000XGE | |
| Dell Precision 5000 5560 | |
| Lenovo ThinkPad T15g-20UR000GGE | |
| Lenovo ThinkPad T15p-20TN0006GE | |
| Lenovo ThinkPad P15s Gen2-20W6000GGE | |
| Cinebench R15 / CPU Single 64Bit | |
| Media de la clase Workstation (191.4 - 328, n=23, últimos 2 años) | |
| Dell Precision 5000 5560 | |
| HP ZBook Power 15 G8 313S5EA | |
| Lenovo ThinkPad P15 G2-20YQ001JGE | |
| Medio Intel Core i7-11800H (201 - 231, n=46) | |
| Lenovo ThinkPad P15v G2 21A9000XGE | |
| Lenovo ThinkPad P15s Gen2-20W6000GGE | |
| Lenovo ThinkPad T15g-20UR000GGE | |
| Lenovo ThinkPad T15p-20TN0006GE | |
| Blender / v2.79 BMW27 CPU | |
| Lenovo ThinkPad P15s Gen2-20W6000GGE | |
| Lenovo ThinkPad T15p-20TN0006GE | |
| Lenovo ThinkPad T15g-20UR000GGE | |
| Lenovo ThinkPad P15v G2 21A9000XGE | |
| Dell Precision 5000 5560 | |
| Medio Intel Core i7-11800H (217 - 454, n=46) | |
| Lenovo ThinkPad P15 G2-20YQ001JGE | |
| HP ZBook Power 15 G8 313S5EA | |
| Media de la clase Workstation (91 - 222, n=23, últimos 2 años) | |
| 7-Zip 18.03 / 7z b 4 | |
| Media de la clase Workstation (60489 - 116969, n=23, últimos 2 años) | |
| Lenovo ThinkPad P15 G2-20YQ001JGE | |
| HP ZBook Power 15 G8 313S5EA | |
| Medio Intel Core i7-11800H (33718 - 56758, n=46) | |
| Dell Precision 5000 5560 | |
| Lenovo ThinkPad P15v G2 21A9000XGE | |
| Lenovo ThinkPad T15g-20UR000GGE | |
| Lenovo ThinkPad T15p-20TN0006GE | |
| Lenovo ThinkPad P15s Gen2-20W6000GGE | |
| 7-Zip 18.03 / 7z b 4 -mmt1 | |
| Media de la clase Workstation (5126 - 6960, n=23, últimos 2 años) | |
| Dell Precision 5000 5560 | |
| HP ZBook Power 15 G8 313S5EA | |
| Medio Intel Core i7-11800H (5138 - 5732, n=46) | |
| Lenovo ThinkPad P15 G2-20YQ001JGE | |
| Lenovo ThinkPad P15s Gen2-20W6000GGE | |
| Lenovo ThinkPad T15g-20UR000GGE | |
| Lenovo ThinkPad P15v G2 21A9000XGE | |
| Lenovo ThinkPad T15p-20TN0006GE | |
| Geekbench 5.5 / Multi-Core | |
| Media de la clase Workstation (11542 - 25554, n=23, últimos 2 años) | |
| Lenovo ThinkPad P15 G2-20YQ001JGE | |
| Medio Intel Core i7-11800H (4655 - 9851, n=40) | |
| HP ZBook Power 15 G8 313S5EA | |
| Lenovo ThinkPad T15g-20UR000GGE | |
| Lenovo ThinkPad P15v G2 21A9000XGE | |
| Lenovo ThinkPad T15p-20TN0006GE | |
| Lenovo ThinkPad P15s Gen2-20W6000GGE | |
| Geekbench 5.5 / Single-Core | |
| Media de la clase Workstation (1783 - 2183, n=23, últimos 2 años) | |
| Lenovo ThinkPad P15 G2-20YQ001JGE | |
| Medio Intel Core i7-11800H (1429 - 1625, n=40) | |
| Lenovo ThinkPad P15s Gen2-20W6000GGE | |
| HP ZBook Power 15 G8 313S5EA | |
| Lenovo ThinkPad P15v G2 21A9000XGE | |
| Lenovo ThinkPad T15g-20UR000GGE | |
| Lenovo ThinkPad T15p-20TN0006GE | |
| HWBOT x265 Benchmark v2.2 / 4k Preset | |
| Media de la clase Workstation (17.8 - 40.5, n=23, últimos 2 años) | |
| Lenovo ThinkPad P15 G2-20YQ001JGE | |
| HP ZBook Power 15 G8 313S5EA | |
| Medio Intel Core i7-11800H (7.38 - 17.4, n=46) | |
| Dell Precision 5000 5560 | |
| Lenovo ThinkPad P15v G2 21A9000XGE | |
| Lenovo ThinkPad T15g-20UR000GGE | |
| Lenovo ThinkPad T15p-20TN0006GE | |
| Lenovo ThinkPad P15s Gen2-20W6000GGE | |
| LibreOffice / 20 Documents To PDF | |
| Lenovo ThinkPad P15v G2 21A9000XGE | |
| Lenovo ThinkPad P15 G2-20YQ001JGE | |
| Lenovo ThinkPad T15g-20UR000GGE | |
| Dell Precision 5000 5560 | |
| Media de la clase Workstation (37.1 - 74.7, n=23, últimos 2 años) | |
| Medio Intel Core i7-11800H (38.6 - 59.9, n=45) | |
| Lenovo ThinkPad P15s Gen2-20W6000GGE | |
| Lenovo ThinkPad T15p-20TN0006GE | |
| HP ZBook Power 15 G8 313S5EA | |
| R Benchmark 2.5 / Overall mean | |
| Lenovo ThinkPad T15p-20TN0006GE | |
| HP ZBook Power 15 G8 313S5EA | |
| Lenovo ThinkPad P15v G2 21A9000XGE | |
| Lenovo ThinkPad T15g-20UR000GGE | |
| Lenovo ThinkPad P15 G2-20YQ001JGE | |
| Medio Intel Core i7-11800H (0.548 - 0.615, n=46) | |
| Lenovo ThinkPad P15s Gen2-20W6000GGE | |
| Dell Precision 5000 5560 | |
| Media de la clase Workstation (0.3825 - 0.603, n=23, últimos 2 años) | |
| V-Ray 5 Benchmark / GPU CUDA | |
| Media de la clase Workstation (989 - 3239, n=9, últimos 2 años) | |
| Medio Intel Core i7-11800H (164 - 1238, n=16) | |
| Lenovo ThinkPad P15v G2 21A9000XGE | |
| HP ZBook Power 15 G8 313S5EA | |
| Geekbench 5.5 / OpenCL Score | |
| Media de la clase Workstation (33651 - 272866, n=23, últimos 2 años) | |
| Lenovo ThinkPad P15 G2-20YQ001JGE | |
| Lenovo ThinkPad T15g-20UR000GGE | |
| Medio Intel Core i7-11800H (8476 - 129333, n=46) | |
| Lenovo ThinkPad P15v G2 21A9000XGE | |
| HP ZBook Power 15 G8 313S5EA | |
| Lenovo ThinkPad P15s Gen2-20W6000GGE | |
| Lenovo ThinkPad T15p-20TN0006GE | |
| SPECviewperf 13 / Solidworks (sw-04) | |
| Media de la clase Workstation (147.5 - 230, n=10, últimos 2 años) | |
| Lenovo ThinkPad P15 G2-20YQ001JGE | |
| Dell Precision 5000 5560 | |
| Lenovo ThinkPad P15v G2 21A9000XGE | |
| Medio Intel Core i7-11800H (45.5 - 156.7, n=10) | |
| HP ZBook Power 15 G8 313S5EA | |
| Lenovo ThinkPad P15s Gen2-20W6000GGE | |
| Lenovo ThinkPad T15g-20UR000GGE | |
| SPECviewperf 13 / Siemens NX (snx-03) | |
| Media de la clase Workstation (331 - 879, n=10, últimos 2 años) | |
| Lenovo ThinkPad P15 G2-20YQ001JGE | |
| Dell Precision 5000 5560 | |
| Lenovo ThinkPad P15v G2 21A9000XGE | |
| HP ZBook Power 15 G8 313S5EA | |
| Medio Intel Core i7-11800H (5.45 - 250, n=10) | |
| Lenovo ThinkPad P15s Gen2-20W6000GGE | |
| Lenovo ThinkPad T15g-20UR000GGE | |
| SPECviewperf 13 / Showcase (showcase-02) | |
| Media de la clase Workstation (85.3 - 319, n=10, últimos 2 años) | |
| Lenovo ThinkPad T15g-20UR000GGE | |
| Lenovo ThinkPad P15 G2-20YQ001JGE | |
| Medio Intel Core i7-11800H (11.3 - 138, n=10) | |
| Dell Precision 5000 5560 | |
| Lenovo ThinkPad P15v G2 21A9000XGE | |
| HP ZBook Power 15 G8 313S5EA | |
| Lenovo ThinkPad P15s Gen2-20W6000GGE | |
| SPECviewperf 13 / Medical (medical-02) | |
| Media de la clase Workstation (169.9 - 363, n=10, últimos 2 años) | |
| Lenovo ThinkPad P15 G2-20YQ001JGE | |
| Dell Precision 5000 5560 | |
| Medio Intel Core i7-11800H (4.96 - 89.2, n=10) | |
| Lenovo ThinkPad P15v G2 21A9000XGE | |
| Lenovo ThinkPad T15g-20UR000GGE | |
| HP ZBook Power 15 G8 313S5EA | |
| Lenovo ThinkPad P15s Gen2-20W6000GGE | |
| SPECviewperf 13 / Maya (maya-05) | |
| Media de la clase Workstation (287 - 448, n=5, últimos 2 años) | |
| Lenovo ThinkPad P15 G2-20YQ001JGE | |
| Lenovo ThinkPad T15g-20UR000GGE | |
| Medio Intel Core i7-11800H (32 - 337, n=10) | |
| Dell Precision 5000 5560 | |
| Lenovo ThinkPad P15v G2 21A9000XGE | |
| HP ZBook Power 15 G8 313S5EA | |
| Lenovo ThinkPad P15s Gen2-20W6000GGE | |
| SPECviewperf 13 / Energy (energy-02) | |
| Media de la clase Workstation (49.5 - 174.7, n=10, últimos 2 años) | |
| Lenovo ThinkPad P15 G2-20YQ001JGE | |
| Dell Precision 5000 5560 | |
| Medio Intel Core i7-11800H (1.15 - 41.2, n=10) | |
| Lenovo ThinkPad T15g-20UR000GGE | |
| Lenovo ThinkPad P15v G2 21A9000XGE | |
| HP ZBook Power 15 G8 313S5EA | |
| Lenovo ThinkPad P15s Gen2-20W6000GGE | |
| SPECviewperf 13 / Creo (creo-02) | |
| Media de la clase Workstation (262 - 589, n=10, últimos 2 años) | |
| Lenovo ThinkPad P15 G2-20YQ001JGE | |
| Dell Precision 5000 5560 | |
| Lenovo ThinkPad T15g-20UR000GGE | |
| Medio Intel Core i7-11800H (22.5 - 225, n=10) | |
| Lenovo ThinkPad P15v G2 21A9000XGE | |
| HP ZBook Power 15 G8 313S5EA | |
| Lenovo ThinkPad P15s Gen2-20W6000GGE | |
| SPECviewperf 13 / Catia (catia-05) | |
| Media de la clase Workstation (301 - 552, n=10, últimos 2 años) | |
| Lenovo ThinkPad P15 G2-20YQ001JGE | |
| Dell Precision 5000 5560 | |
| Medio Intel Core i7-11800H (31.9 - 257, n=10) | |
| Lenovo ThinkPad P15v G2 21A9000XGE | |
| HP ZBook Power 15 G8 313S5EA | |
| Lenovo ThinkPad T15g-20UR000GGE | |
| Lenovo ThinkPad P15s Gen2-20W6000GGE | |
| SPECviewperf 13 / 3ds Max (3dsmax-06) | |
| Media de la clase Workstation (202 - 422, n=10, últimos 2 años) | |
| Lenovo ThinkPad P15 G2-20YQ001JGE | |
| Lenovo ThinkPad T15g-20UR000GGE | |
| Medio Intel Core i7-11800H (27.2 - 235, n=10) | |
| Dell Precision 5000 5560 | |
| Lenovo ThinkPad P15v G2 21A9000XGE | |
| HP ZBook Power 15 G8 313S5EA | |
| Lenovo ThinkPad P15s Gen2-20W6000GGE | |
| SPECviewperf 2020 / Solidworks (solidworks-05) | |
| Media de la clase Workstation (50.6 - 542, n=9, últimos 2 años) | |
| Lenovo ThinkPad T15g-20UR000GGE | |
| Lenovo ThinkPad P15 G2-20YQ001JGE | |
| Dell Precision 5000 5560 | |
| Medio Intel Core i7-11800H (73.4 - 147.9, n=6) | |
| Lenovo ThinkPad P15v G2 21A9000XGE | |
| HP ZBook Power 15 G8 313S5EA | |
| Lenovo ThinkPad P15s Gen2-20W6000GGE | |
| SPECviewperf 2020 / Siemens NX (snx-04) | |
| Media de la clase Workstation (22.3 - 903, n=23, últimos 2 años) | |
| Lenovo ThinkPad P15 G2-20YQ001JGE | |
| Dell Precision 5000 5560 | |
| Lenovo ThinkPad P15v G2 21A9000XGE | |
| Medio Intel Core i7-11800H (18.7 - 250, n=8) | |
| HP ZBook Power 15 G8 313S5EA | |
| Lenovo ThinkPad P15s Gen2-20W6000GGE | |
| Lenovo ThinkPad T15g-20UR000GGE | |
| SPECviewperf 2020 / Medical (medical-03) | |
| Media de la clase Workstation (28.8 - 227, n=23, últimos 2 años) | |
| Lenovo ThinkPad P15 G2-20YQ001JGE | |
| Dell Precision 5000 5560 | |
| Medio Intel Core i7-11800H (18.7 - 42.7, n=8) | |
| Lenovo ThinkPad T15g-20UR000GGE | |
| Lenovo ThinkPad P15v G2 21A9000XGE | |
| HP ZBook Power 15 G8 313S5EA | |
| Lenovo ThinkPad P15s Gen2-20W6000GGE | |
| SPECviewperf 2020 / Maya (maya-06) | |
| Media de la clase Workstation (117.8 - 724, n=22, últimos 2 años) | |
| Lenovo ThinkPad P15 G2-20YQ001JGE | |
| Lenovo ThinkPad T15g-20UR000GGE | |
| Dell Precision 5000 5560 | |
| Medio Intel Core i7-11800H (125 - 294, n=8) | |
| Lenovo ThinkPad P15v G2 21A9000XGE | |
| HP ZBook Power 15 G8 313S5EA | |
| Lenovo ThinkPad P15s Gen2-20W6000GGE | |
| SPECviewperf 2020 / Energy (energy-03) | |
| Media de la clase Workstation (17.3 - 176.7, n=23, últimos 2 años) | |
| Lenovo ThinkPad P15 G2-20YQ001JGE | |
| Dell Precision 5000 5560 | |
| Medio Intel Core i7-11800H (16 - 43.1, n=8) | |
| Lenovo ThinkPad T15g-20UR000GGE | |
| Lenovo ThinkPad P15v G2 21A9000XGE | |
| HP ZBook Power 15 G8 313S5EA | |
| Lenovo ThinkPad P15s Gen2-20W6000GGE | |
| SPECviewperf 2020 / Creo (creo-03) | |
| Media de la clase Workstation (49.2 - 261, n=23, últimos 2 años) | |
| Lenovo ThinkPad P15 G2-20YQ001JGE | |
| Dell Precision 5000 5560 | |
| Medio Intel Core i7-11800H (67.3 - 124.5, n=8) | |
| Lenovo ThinkPad T15g-20UR000GGE | |
| Lenovo ThinkPad P15v G2 21A9000XGE | |
| HP ZBook Power 15 G8 313S5EA | |
| Lenovo ThinkPad P15s Gen2-20W6000GGE | |
| SPECviewperf 2020 / CATIA (catia-06) | |
| Media de la clase Workstation (27.1 - 182.2, n=23, últimos 2 años) | |
| Lenovo ThinkPad P15 G2-20YQ001JGE | |
| Dell Precision 5000 5560 | |
| Medio Intel Core i7-11800H (33.1 - 80.5, n=8) | |
| Lenovo ThinkPad T15g-20UR000GGE | |
| Lenovo ThinkPad P15v G2 21A9000XGE | |
| HP ZBook Power 15 G8 313S5EA | |
| Lenovo ThinkPad P15s Gen2-20W6000GGE | |
| SPECviewperf 2020 / 3ds Max (3dsmax-07) | |
| Media de la clase Workstation (24.7 - 251, n=23, últimos 2 años) | |
| Lenovo ThinkPad T15g-20UR000GGE | |
| Lenovo ThinkPad P15 G2-20YQ001JGE | |
| Medio Intel Core i7-11800H (40.9 - 109.4, n=8) | |
| Dell Precision 5000 5560 | |
| Lenovo ThinkPad P15v G2 21A9000XGE | |
| HP ZBook Power 15 G8 313S5EA | |
| Lenovo ThinkPad P15s Gen2-20W6000GGE | |
* ... más pequeño es mejor
AIDA64: FP32 Ray-Trace | FPU Julia | CPU SHA3 | CPU Queen | FPU SinJulia | FPU Mandel | CPU AES | CPU ZLib | FP64 Ray-Trace | CPU PhotoWorxx
| Performance rating | |
| Media de la clase Workstation | |
| HP ZBook Power 15 G8 313S5EA | |
| Medio Intel Core i7-11800H | |
| Lenovo ThinkPad P15v G2 21A9000XGE | |
| Lenovo ThinkPad T15g-20UR000GGE | |
| Lenovo ThinkPad T15p-20TN0006GE | |
| Lenovo ThinkPad P15s Gen2-20W6000GGE | |
| AIDA64 / FP32 Ray-Trace | |
| Media de la clase Workstation (16730 - 61611, n=23, últimos 2 años) | |
| HP ZBook Power 15 G8 313S5EA | |
| Medio Intel Core i7-11800H (8772 - 15961, n=20) | |
| Lenovo ThinkPad P15v G2 21A9000XGE | |
| Lenovo ThinkPad T15g-20UR000GGE | |
| Lenovo ThinkPad T15p-20TN0006GE | |
| Lenovo ThinkPad P15s Gen2-20W6000GGE | |
| AIDA64 / FPU Julia | |
| Media de la clase Workstation (89597 - 186971, n=23, últimos 2 años) | |
| HP ZBook Power 15 G8 313S5EA | |
| Medio Intel Core i7-11800H (39404 - 65636, n=20) | |
| Lenovo ThinkPad P15v G2 21A9000XGE | |
| Lenovo ThinkPad T15g-20UR000GGE | |
| Lenovo ThinkPad T15p-20TN0006GE | |
| Lenovo ThinkPad P15s Gen2-20W6000GGE | |
| AIDA64 / CPU SHA3 | |
| Media de la clase Workstation (4178 - 8975, n=23, últimos 2 años) | |
| HP ZBook Power 15 G8 313S5EA | |
| Medio Intel Core i7-11800H (2599 - 4439, n=20) | |
| Lenovo ThinkPad P15v G2 21A9000XGE | |
| Lenovo ThinkPad T15g-20UR000GGE | |
| Lenovo ThinkPad T15p-20TN0006GE | |
| Lenovo ThinkPad P15s Gen2-20W6000GGE | |
| AIDA64 / CPU Queen | |
| Media de la clase Workstation (60778 - 144411, n=23, últimos 2 años) | |
| HP ZBook Power 15 G8 313S5EA | |
| Medio Intel Core i7-11800H (85233 - 91941, n=20) | |
| Lenovo ThinkPad P15v G2 21A9000XGE | |
| Lenovo ThinkPad T15p-20TN0006GE | |
| Lenovo ThinkPad T15g-20UR000GGE | |
| Lenovo ThinkPad P15s Gen2-20W6000GGE | |
| AIDA64 / FPU SinJulia | |
| Media de la clase Workstation (8165 - 29343, n=23, últimos 2 años) | |
| HP ZBook Power 15 G8 313S5EA | |
| Medio Intel Core i7-11800H (6420 - 9792, n=20) | |
| Lenovo ThinkPad P15v G2 21A9000XGE | |
| Lenovo ThinkPad T15p-20TN0006GE | |
| Lenovo ThinkPad T15g-20UR000GGE | |
| Lenovo ThinkPad P15s Gen2-20W6000GGE | |
| AIDA64 / FPU Mandel | |
| Media de la clase Workstation (44497 - 98153, n=23, últimos 2 años) | |
| HP ZBook Power 15 G8 313S5EA | |
| Medio Intel Core i7-11800H (23365 - 39464, n=20) | |
| Lenovo ThinkPad P15v G2 21A9000XGE | |
| Lenovo ThinkPad T15g-20UR000GGE | |
| Lenovo ThinkPad T15p-20TN0006GE | |
| Lenovo ThinkPad P15s Gen2-20W6000GGE | |
| AIDA64 / CPU AES | |
| Medio Intel Core i7-11800H (74617 - 149388, n=20) | |
| Media de la clase Workstation (73133 - 187841, n=23, últimos 2 años) | |
| HP ZBook Power 15 G8 313S5EA | |
| Lenovo ThinkPad P15v G2 21A9000XGE | |
| Lenovo ThinkPad P15s Gen2-20W6000GGE | |
| Lenovo ThinkPad T15p-20TN0006GE | |
| Lenovo ThinkPad T15g-20UR000GGE | |
| AIDA64 / CPU ZLib | |
| Media de la clase Workstation (929 - 2148, n=23, últimos 2 años) | |
| HP ZBook Power 15 G8 313S5EA | |
| Lenovo ThinkPad P15v G2 21A9000XGE | |
| Lenovo ThinkPad T15g-20UR000GGE | |
| Lenovo ThinkPad T15p-20TN0006GE | |
| Lenovo ThinkPad P15s Gen2-20W6000GGE | |
| Medio Intel Core i7-11800H (461 - 830, n=43) | |
| AIDA64 / FP64 Ray-Trace | |
| Media de la clase Workstation (8545 - 32891, n=23, últimos 2 años) | |
| HP ZBook Power 15 G8 313S5EA | |
| Medio Intel Core i7-11800H (4545 - 8717, n=21) | |
| Lenovo ThinkPad P15v G2 21A9000XGE | |
| Lenovo ThinkPad T15g-20UR000GGE | |
| Lenovo ThinkPad T15p-20TN0006GE | |
| Lenovo ThinkPad P15s Gen2-20W6000GGE | |
| AIDA64 / CPU PhotoWorxx | |
| Media de la clase Workstation (37151 - 93684, n=23, últimos 2 años) | |
| Lenovo ThinkPad P15s Gen2-20W6000GGE | |
| Lenovo ThinkPad T15g-20UR000GGE | |
| Medio Intel Core i7-11800H (11898 - 26757, n=21) | |
| HP ZBook Power 15 G8 313S5EA | |
| Lenovo ThinkPad T15p-20TN0006GE | |
| Lenovo ThinkPad P15v G2 21A9000XGE | |
Rendimiento del sistema
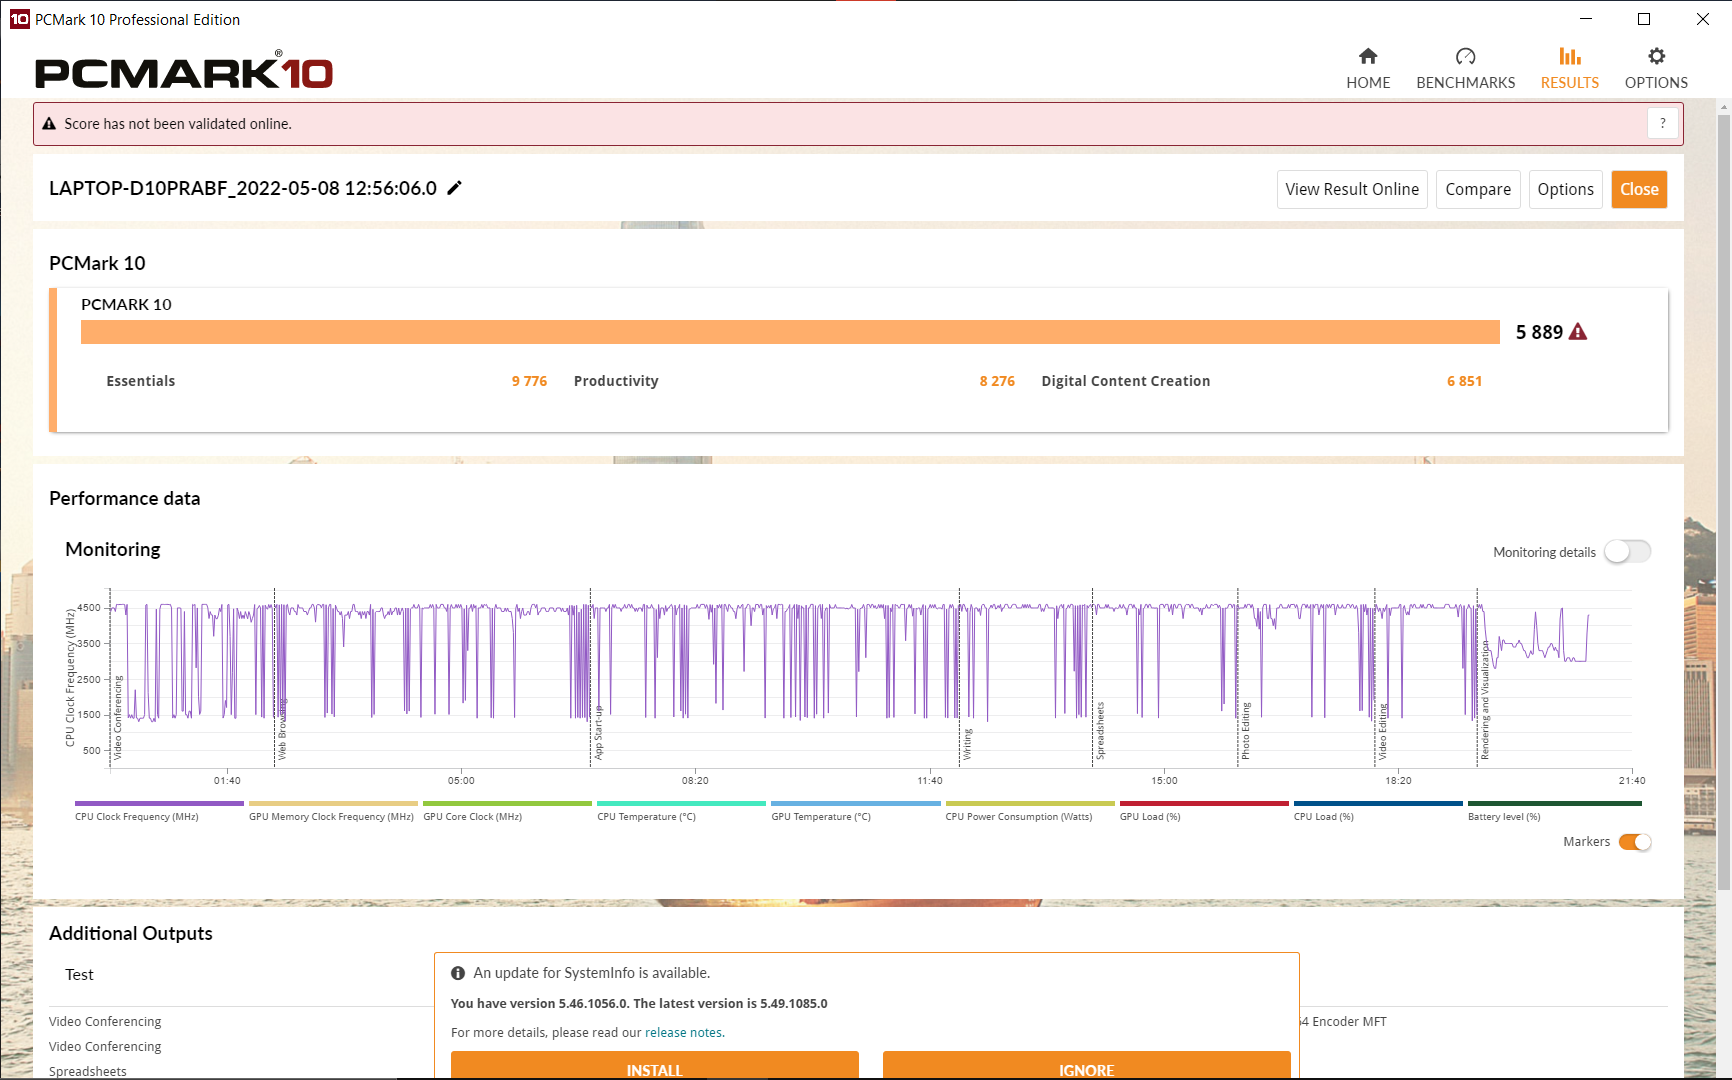
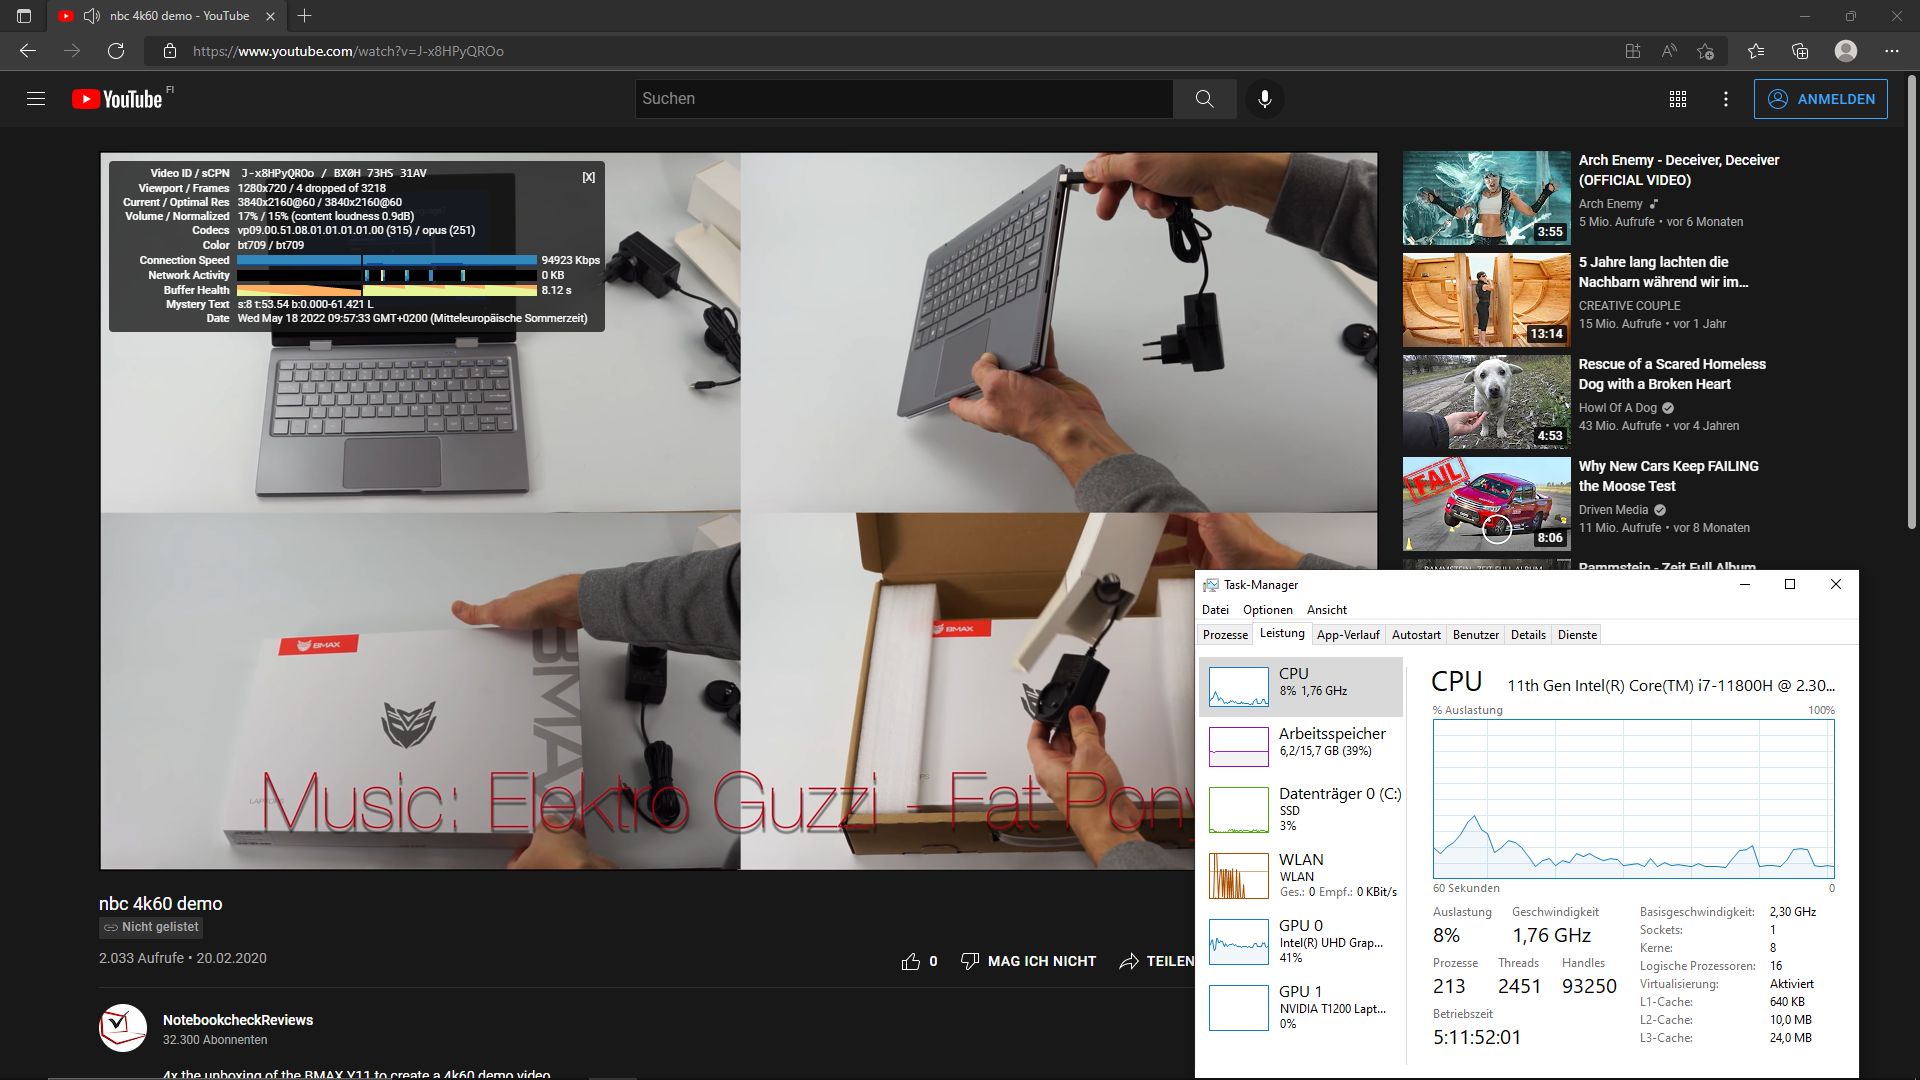
La navegación con múltiples pestañas mientras se reproduce un vídeo 4k de YouTube se ejecuta sin problemas.
Los resultados del benchmark están a buen nivel, lo que puede mejorarse aún más usando un segundo módulo de RAM (modo dual-channel).
CrossMark: Overall | Productivity | Creativity | Responsiveness
| PCMark 10 / Score | |
| Media de la clase Workstation (6563 - 10409, n=19, últimos 2 años) | |
| Dell Precision 5000 5560 | |
| Lenovo ThinkPad P15 G2-20YQ001JGE | |
| Lenovo ThinkPad T15g-20UR000GGE | |
| Medio Intel Core i7-11800H, NVIDIA T1200 Laptop GPU (5889 - 6147, n=3) | |
| Lenovo ThinkPad P15v G2 21A9000XGE | |
| Lenovo ThinkPad P15s Gen2-20W6000GGE | |
| Lenovo ThinkPad T15p-20TN0006GE | |
| HP ZBook Power 15 G8 313S5EA | |
| PCMark 10 / Essentials | |
| Dell Precision 5000 5560 | |
| Media de la clase Workstation (9622 - 11157, n=19, últimos 2 años) | |
| Lenovo ThinkPad P15 G2-20YQ001JGE | |
| Medio Intel Core i7-11800H, NVIDIA T1200 Laptop GPU (9776 - 9956, n=3) | |
| Lenovo ThinkPad P15v G2 21A9000XGE | |
| Lenovo ThinkPad P15s Gen2-20W6000GGE | |
| Lenovo ThinkPad T15g-20UR000GGE | |
| Lenovo ThinkPad T15p-20TN0006GE | |
| HP ZBook Power 15 G8 313S5EA | |
| PCMark 10 / Productivity | |
| Media de la clase Workstation (8789 - 20616, n=19, últimos 2 años) | |
| Lenovo ThinkPad P15s Gen2-20W6000GGE | |
| Dell Precision 5000 5560 | |
| Lenovo ThinkPad P15 G2-20YQ001JGE | |
| Medio Intel Core i7-11800H, NVIDIA T1200 Laptop GPU (8276 - 8445, n=3) | |
| Lenovo ThinkPad P15v G2 21A9000XGE | |
| Lenovo ThinkPad T15g-20UR000GGE | |
| HP ZBook Power 15 G8 313S5EA | |
| Lenovo ThinkPad T15p-20TN0006GE | |
| PCMark 10 / Digital Content Creation | |
| Media de la clase Workstation (8108 - 15631, n=19, últimos 2 años) | |
| Lenovo ThinkPad P15 G2-20YQ001JGE | |
| Dell Precision 5000 5560 | |
| Lenovo ThinkPad T15g-20UR000GGE | |
| Medio Intel Core i7-11800H, NVIDIA T1200 Laptop GPU (6851 - 7581, n=3) | |
| Lenovo ThinkPad P15v G2 21A9000XGE | |
| Lenovo ThinkPad T15p-20TN0006GE | |
| HP ZBook Power 15 G8 313S5EA | |
| Lenovo ThinkPad P15s Gen2-20W6000GGE | |
| CrossMark / Overall | |
| Media de la clase Workstation (1307 - 2267, n=22, últimos 2 años) | |
| HP ZBook Power 15 G8 313S5EA | |
| Medio Intel Core i7-11800H, NVIDIA T1200 Laptop GPU (1367 - 1526, n=2) | |
| Lenovo ThinkPad P15v G2 21A9000XGE | |
| CrossMark / Productivity | |
| Media de la clase Workstation (1130 - 2122, n=22, últimos 2 años) | |
| HP ZBook Power 15 G8 313S5EA | |
| Medio Intel Core i7-11800H, NVIDIA T1200 Laptop GPU (1389 - 1521, n=2) | |
| Lenovo ThinkPad P15v G2 21A9000XGE | |
| CrossMark / Creativity | |
| Media de la clase Workstation (1657 - 2725, n=22, últimos 2 años) | |
| HP ZBook Power 15 G8 313S5EA | |
| Medio Intel Core i7-11800H, NVIDIA T1200 Laptop GPU (1430 - 1606, n=2) | |
| Lenovo ThinkPad P15v G2 21A9000XGE | |
| CrossMark / Responsiveness | |
| Media de la clase Workstation (993 - 2096, n=22, últimos 2 años) | |
| Medio Intel Core i7-11800H, NVIDIA T1200 Laptop GPU (1137 - 1323, n=2) | |
| HP ZBook Power 15 G8 313S5EA | |
| Lenovo ThinkPad P15v G2 21A9000XGE | |
| PCMark 10 Score | 5889 puntos | |
ayuda | ||
| AIDA64 / Memory Copy | |
| Media de la clase Workstation (56003 - 164795, n=23, últimos 2 años) | |
| Lenovo ThinkPad P15s Gen2-20W6000GGE | |
| Medio Intel Core i7-11800H (24508 - 48144, n=21) | |
| Lenovo ThinkPad T15g-20UR000GGE | |
| HP ZBook Power 15 G8 313S5EA | |
| Lenovo ThinkPad P15v G2 21A9000XGE | |
| Lenovo ThinkPad T15p-20TN0006GE | |
| AIDA64 / Memory Read | |
| Media de la clase Workstation (55795 - 121563, n=23, últimos 2 años) | |
| Lenovo ThinkPad P15s Gen2-20W6000GGE | |
| Medio Intel Core i7-11800H (25882 - 50365, n=20) | |
| Lenovo ThinkPad T15g-20UR000GGE | |
| HP ZBook Power 15 G8 313S5EA | |
| Lenovo ThinkPad P15v G2 21A9000XGE | |
| Lenovo ThinkPad T15p-20TN0006GE | |
| AIDA64 / Memory Write | |
| Media de la clase Workstation (55663 - 214520, n=23, últimos 2 años) | |
| Lenovo ThinkPad P15s Gen2-20W6000GGE | |
| Lenovo ThinkPad T15g-20UR000GGE | |
| Medio Intel Core i7-11800H (22240 - 46214, n=20) | |
| HP ZBook Power 15 G8 313S5EA | |
| Lenovo ThinkPad P15v G2 21A9000XGE | |
| Lenovo ThinkPad T15p-20TN0006GE | |
| AIDA64 / Memory Latency | |
| Media de la clase Workstation (84.5 - 165.2, n=23, últimos 2 años) | |
| Lenovo ThinkPad P15v G2 21A9000XGE | |
| Lenovo ThinkPad P15s Gen2-20W6000GGE | |
| Lenovo ThinkPad T15p-20TN0006GE | |
| HP ZBook Power 15 G8 313S5EA | |
| Lenovo ThinkPad T15g-20UR000GGE | |
| Medio Intel Core i7-11800H (71.9 - 104.1, n=44) | |
* ... más pequeño es mejor
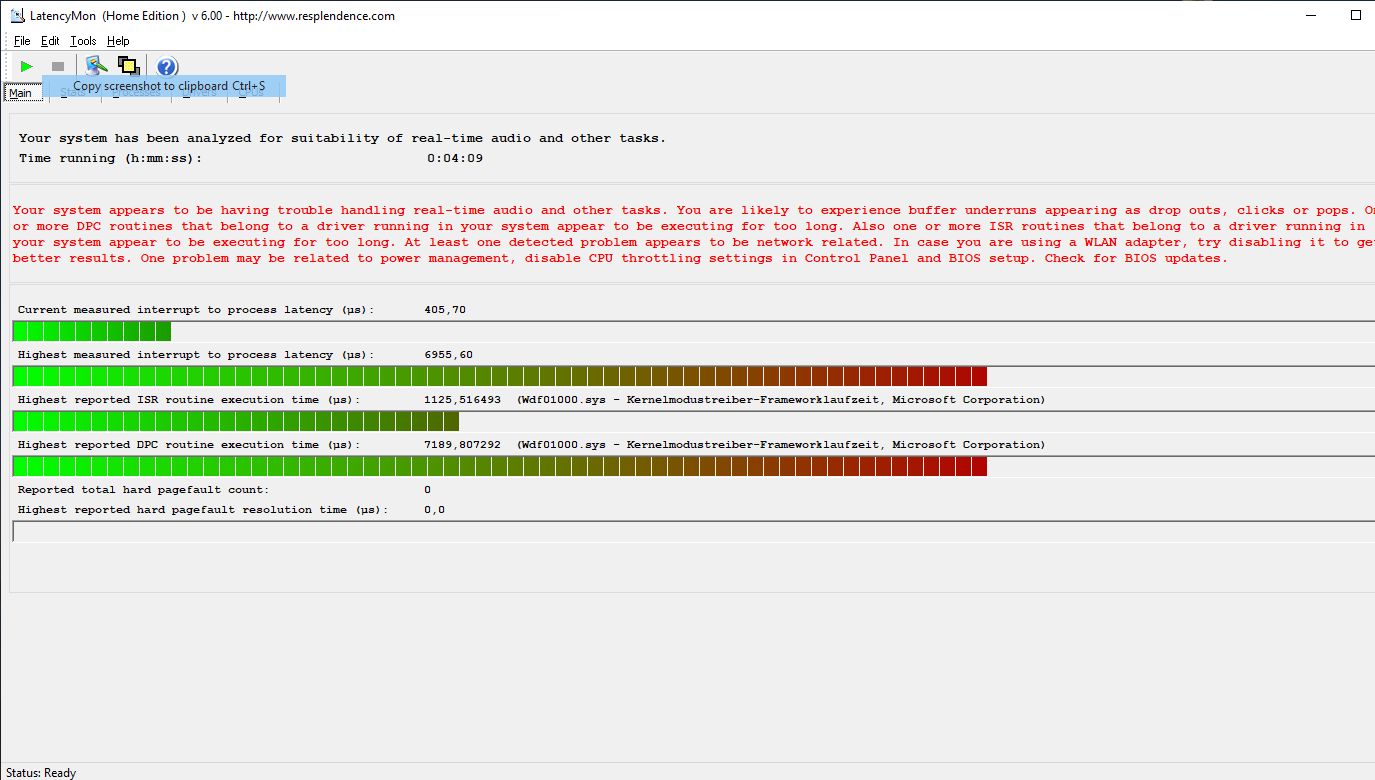
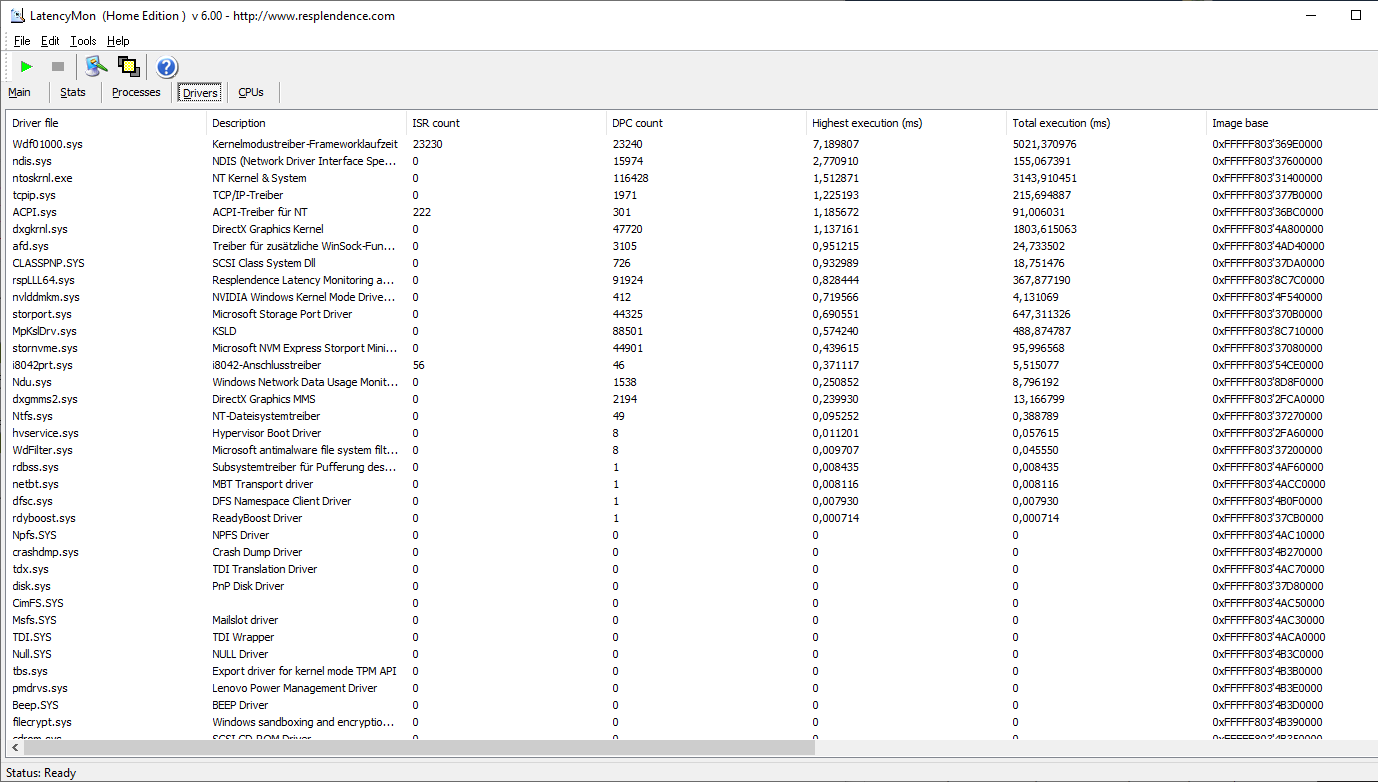
Latencias del CPD
Como el más grueso ThinkPad P15 G2las latencias del CPD resultaron ser pésimas con los últimos drivers y BIOS en el momento de las pruebas. Como a menudo, el módulo del kernel y los controladores de red son los responsables. El P15v G2 es, por tanto, inadecuado para el procesamiento de vídeo y audio en tiempo real El Precision 5560 de Dell le va mucho mejor en este aspecto.
| DPC Latencies / LatencyMon - interrupt to process latency (max), Web, Youtube, Prime95 | |
| Lenovo ThinkPad P15v G2 21A9000XGE | |
| Lenovo ThinkPad P15 G2-20YQ001JGE | |
| Lenovo ThinkPad P15s Gen2-20W6000GGE | |
| Lenovo ThinkPad T15g-20UR000GGE | |
| Lenovo ThinkPad T15p-20TN0006GE | |
| Dell Precision 5000 5560 | |
| HP ZBook Power 15 G8 313S5EA | |
* ... más pequeño es mejor
Dispositivos de almacenamiento
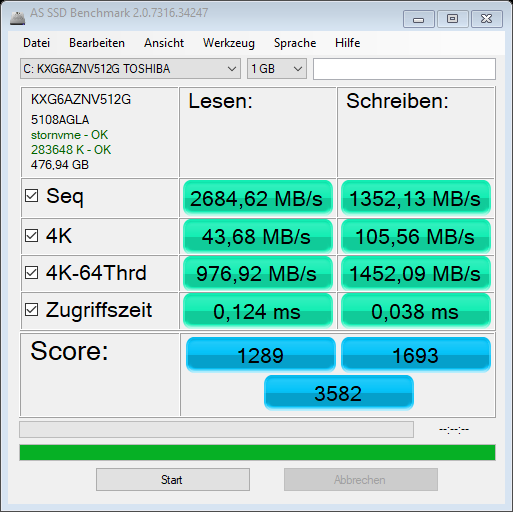
El SSD NVMe de Toshiba tiene una capacidad de 512 GB. La velocidad es la esperada para PCIe 3.0, pero no siempre es suficiente para una estación de trabajo.
Por otro lado, puedes ampliar hasta dos SSDs PCIe 4.0 más rápidos y también hacerlos funcionar en una configuración RAID (0.1). ZBook Power 15 G8 de HP, El Precision 5560 de Delly el ThinkPad P15 alcanzan aproximadamente el doble de velocidad.
| Lenovo ThinkPad P15v G2 21A9000XGE T1200 Laptop GPU, i7-11800H, Toshiba XG6 KXG6AZNV512G | Lenovo ThinkPad P15 G2-20YQ001JGE RTX A3000 Laptop GPU, i7-11800H, Kioxia XG7 KXG7AZNV512G | Lenovo ThinkPad T15g-20UR000GGE GeForce RTX 2070 Super Max-Q, i7-10750H, SK Hynix PC401 512GB M.2 (HFS512GD9TNG) | Lenovo ThinkPad T15p-20TN0006GE GeForce GTX 1050 Mobile, i7-10750H, WDC PC SN730 SDBQNTY-512GB | Lenovo ThinkPad P15s Gen2-20W6000GGE T500 Laptop GPU, i7-1165G7, WDC PC SN720 SDAQNTW-1T00 | Dell Precision 5000 5560 RTX A2000 Laptop GPU, i7-11850H, Samsung PM9A1 MZVL22T0HBLB | |
|---|---|---|---|---|---|---|
| AS SSD | 53% | 49% | 16% | 32% | 57% | |
| Seq Read (MB/s) | 2684 | 5105 90% | 2889 8% | 2505 -7% | 2796 4% | 5169 93% |
| Seq Write (MB/s) | 1352 | 1815 34% | 2424 79% | 1230 -9% | 2525 87% | 1986 47% |
| 4K Read (MB/s) | 43.68 | 47.46 9% | 55.6 27% | 42.4 -3% | 50.9 17% | 78 79% |
| 4K Write (MB/s) | 105.56 | 137.3 30% | 144.6 37% | 116.5 10% | 211.9 101% | 214.6 103% |
| 4K-64 Read (MB/s) | 976.92 | 2112 116% | 1569 61% | 1416 45% | 1505 54% | 1232 26% |
| 4K-64 Write (MB/s) | 1452.09 | 1702 17% | 1922 32% | 1809 25% | 949 -35% | 2719 87% |
| Access Time Read * (ms) | 0.124 | 0.065 48% | 0.07 44% | 0.109 12% | 0.081 35% | 0.024 81% |
| Access Time Write * (ms) | 0.038 | 0.03 21% | 0.026 32% | 0.032 16% | 0.019 50% | 0.059 -55% |
| Score Read (Points) | 1289 | 2670 107% | 1914 48% | 1708 33% | 1835 42% | 1827 42% |
| Score Write (Points) | 1693 | 2021 19% | 2309 36% | 2048 21% | 1413 -17% | 3133 85% |
| Score Total (Points) | 3582 | 5885 64% | 5185 45% | 4568 28% | 4177 17% | 5753 61% |
| Copy ISO MB/s (MB/s) | 1760.5 | 2054 17% | 2489 41% | 3201 82% | ||
| Copy Program MB/s (MB/s) | 355 | 714 101% | 728 105% | 415.8 17% | ||
| Copy Game MB/s (MB/s) | 849 | 1431 69% | 1670 97% | 1212 43% |
* ... más pequeño es mejor

* ... más pequeño es mejor
Sustained Read Performance: DiskSpd Read Loop, Queue Depth 8
Tarjeta gráfica
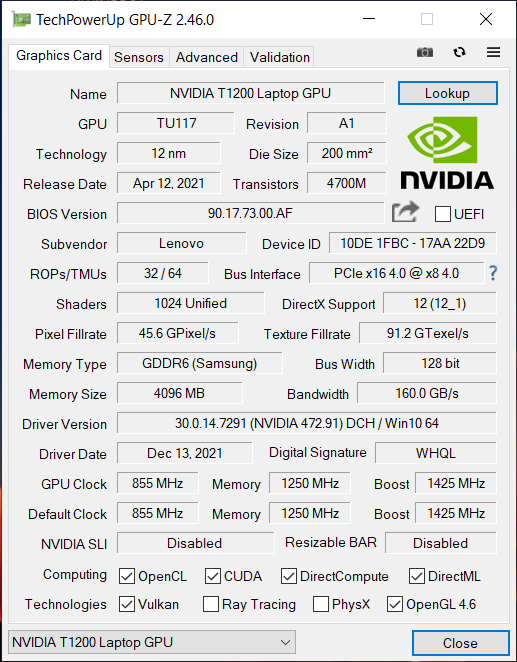
El Nvidia T1200es la variante profesional de la GeForce GTX 1650 Titiene 4 GB de VRAM GDDR6 y está potenciada hasta los 1.425 MHz. Es más del doble de rápida que la GeForce GTX 1050 de su predecesora y su modelo hermano en muchos benchmarks. La diferencia es aún mayor gracias a la tarjeta opcional RTX A2000.
En el modo de batería, el TGP de 40 W se reduce a 30 W y la velocidad del reloj cae en 250 MHz. El rendimiento cae un 15% como resultado. En este escenario, la CPU se trata de 7 vatios más del TDP compartido.
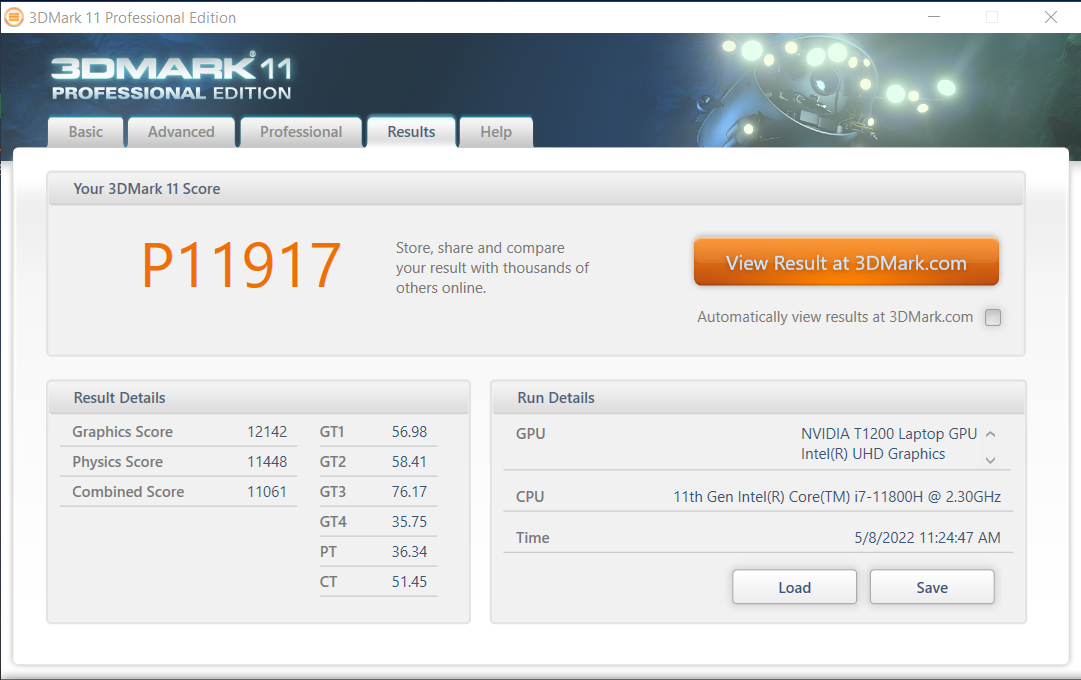
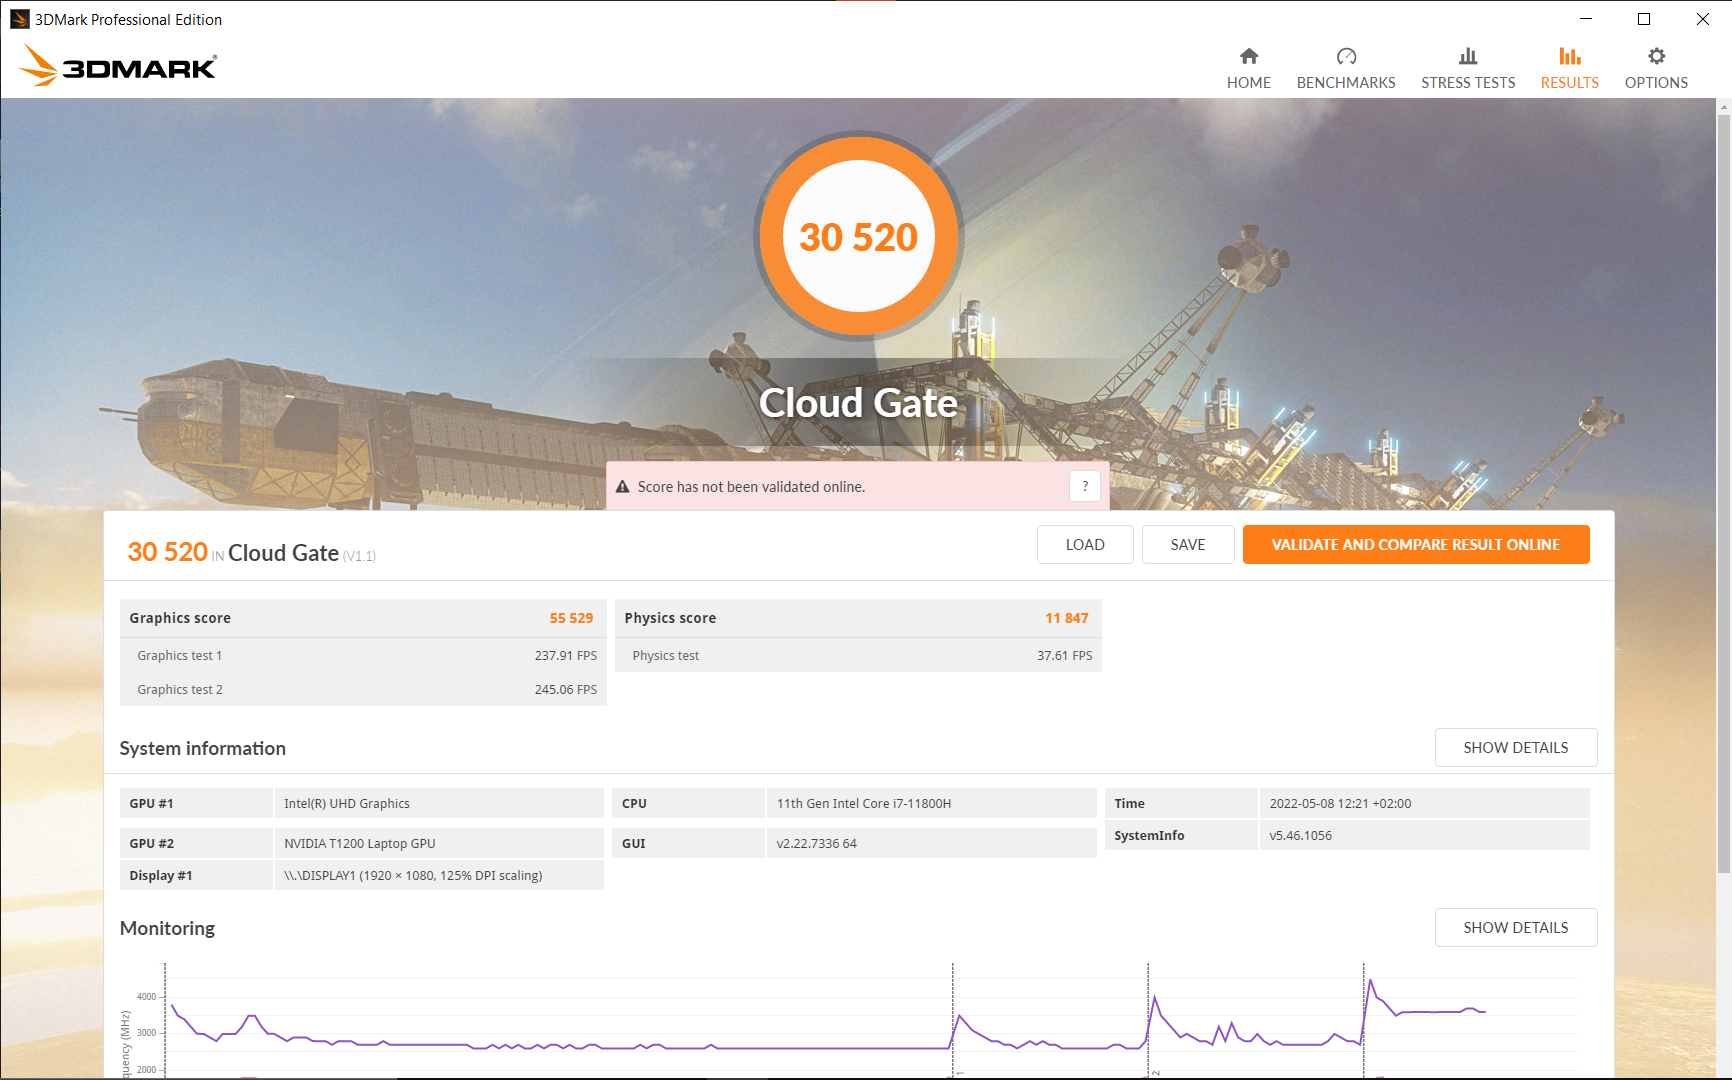
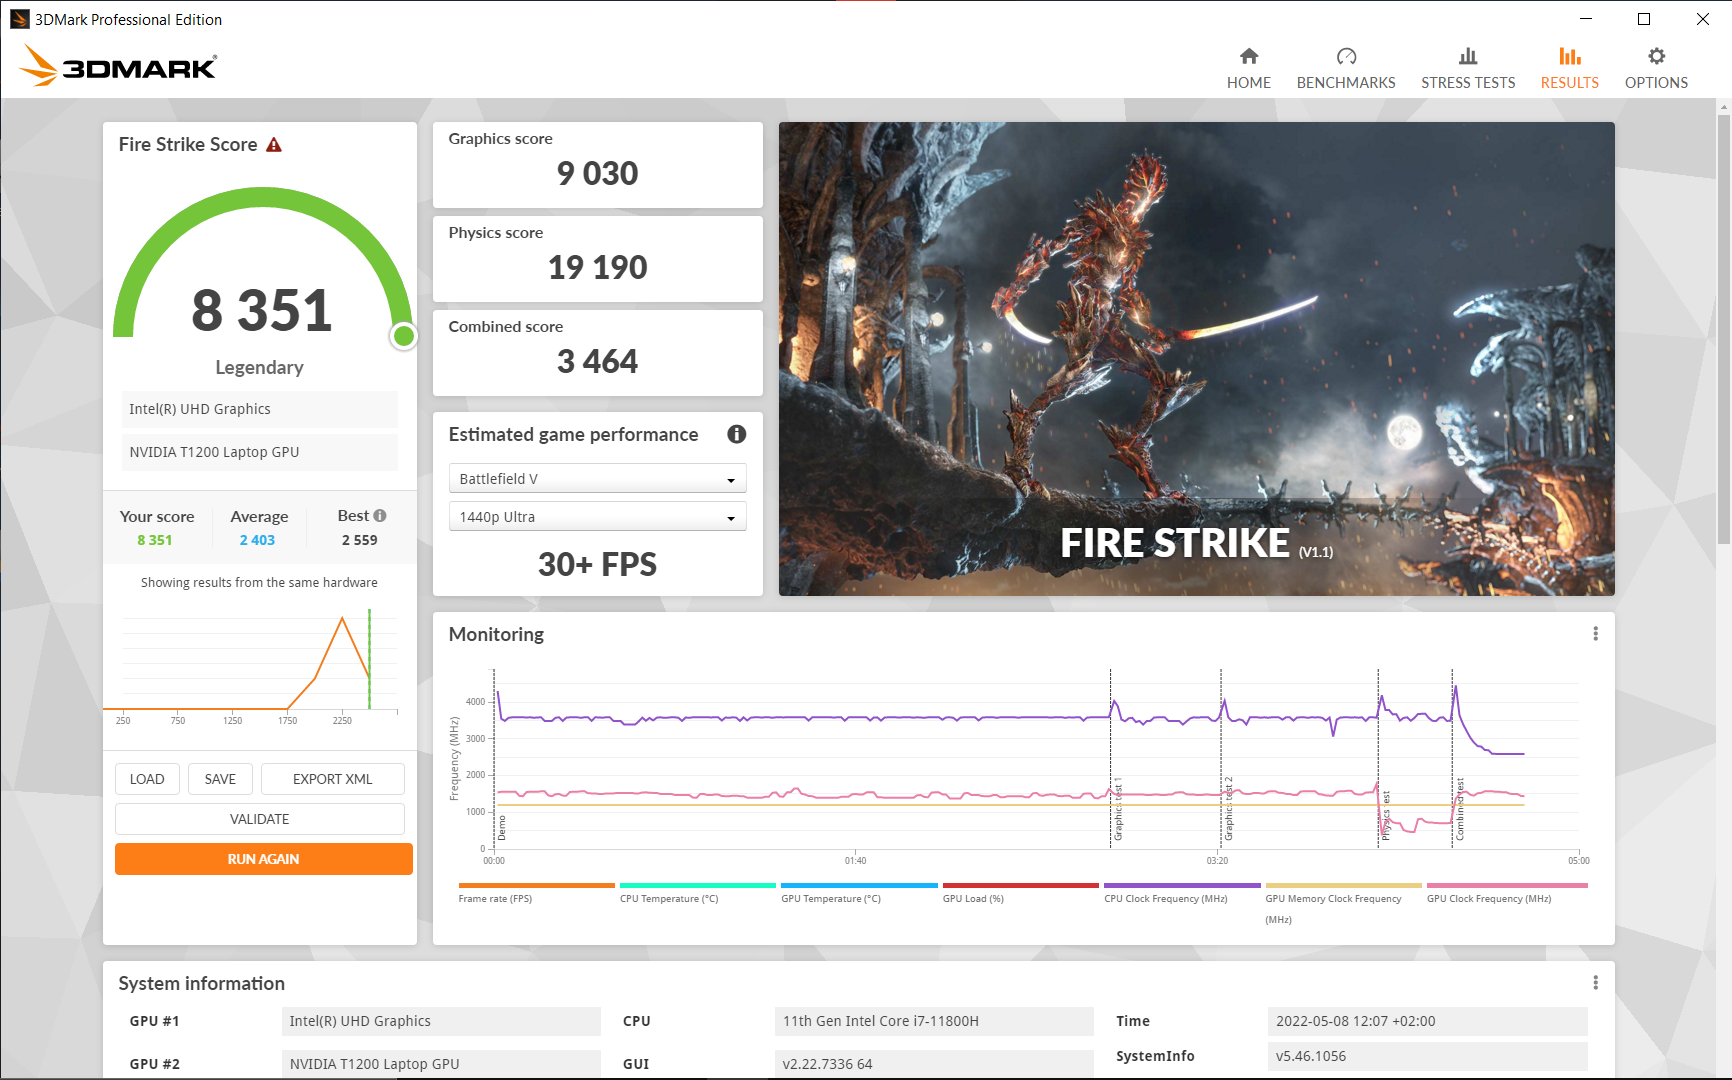
| 3DMark 06 Standard Score | 38139 puntos | |
| 3DMark 11 Performance | 11917 puntos | |
| 3DMark Cloud Gate Standard Score | 30520 puntos | |
| 3DMark Fire Strike Score | 8351 puntos | |
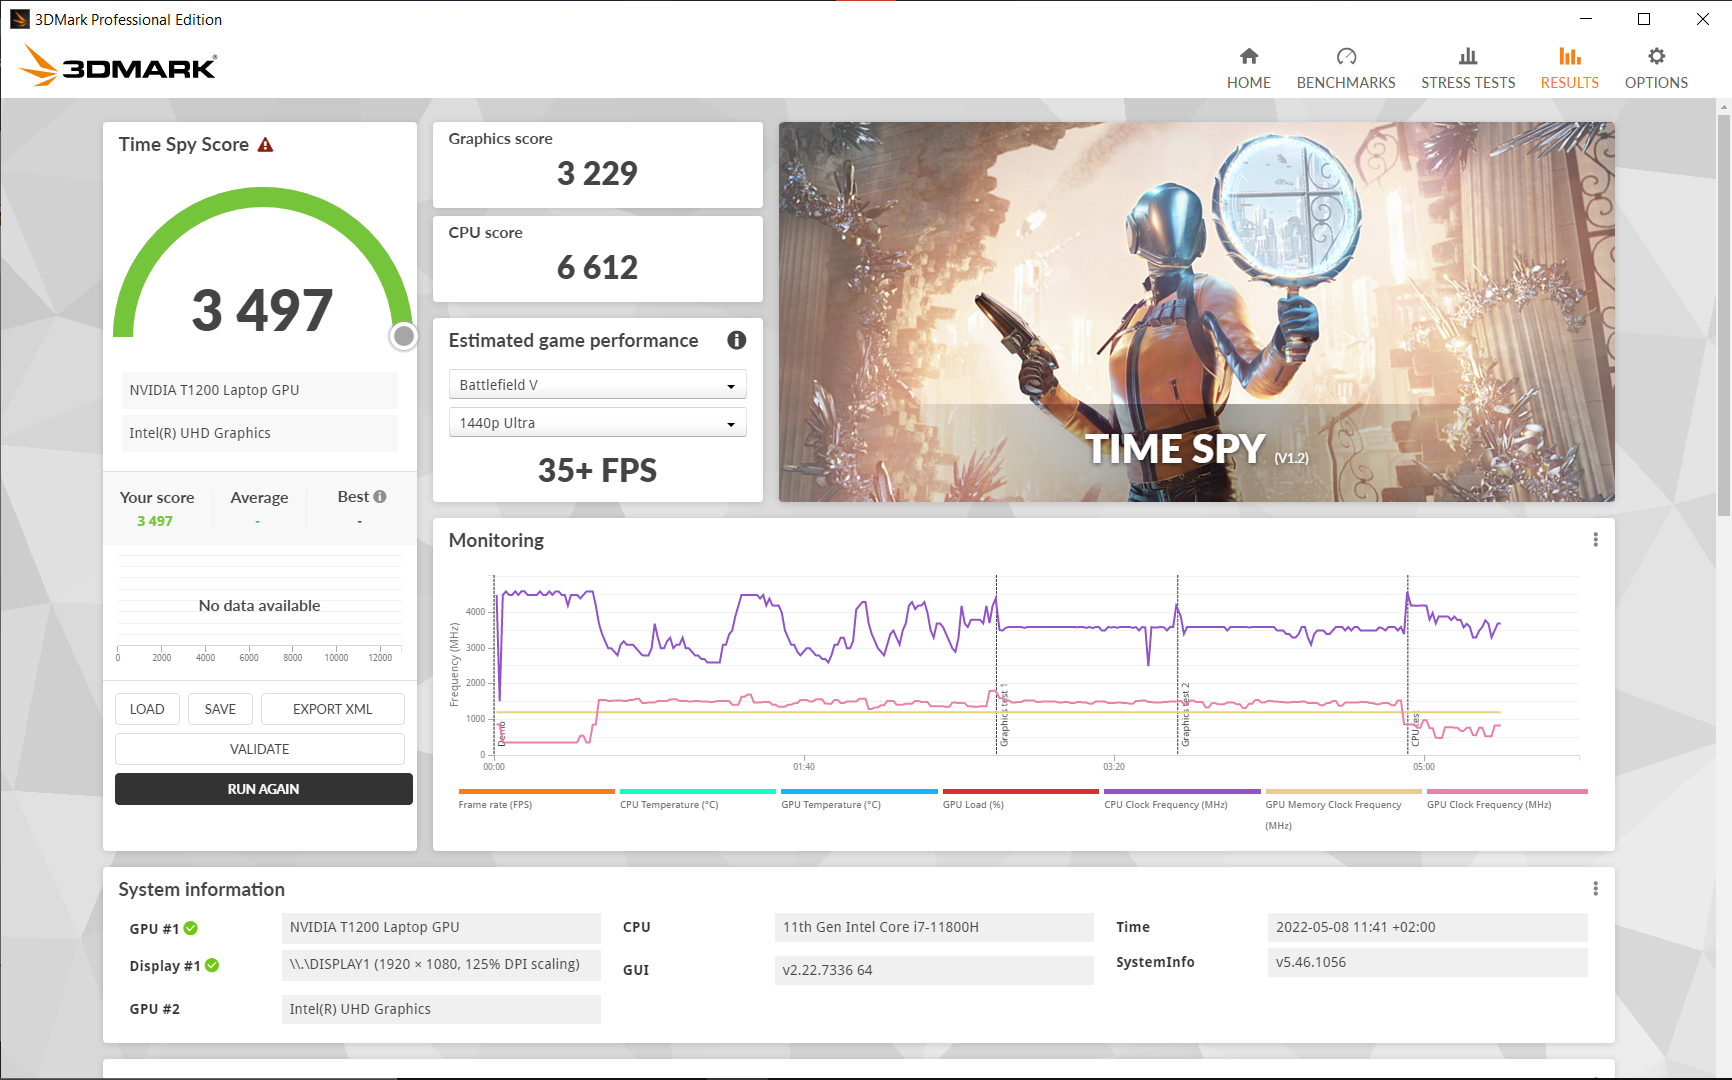
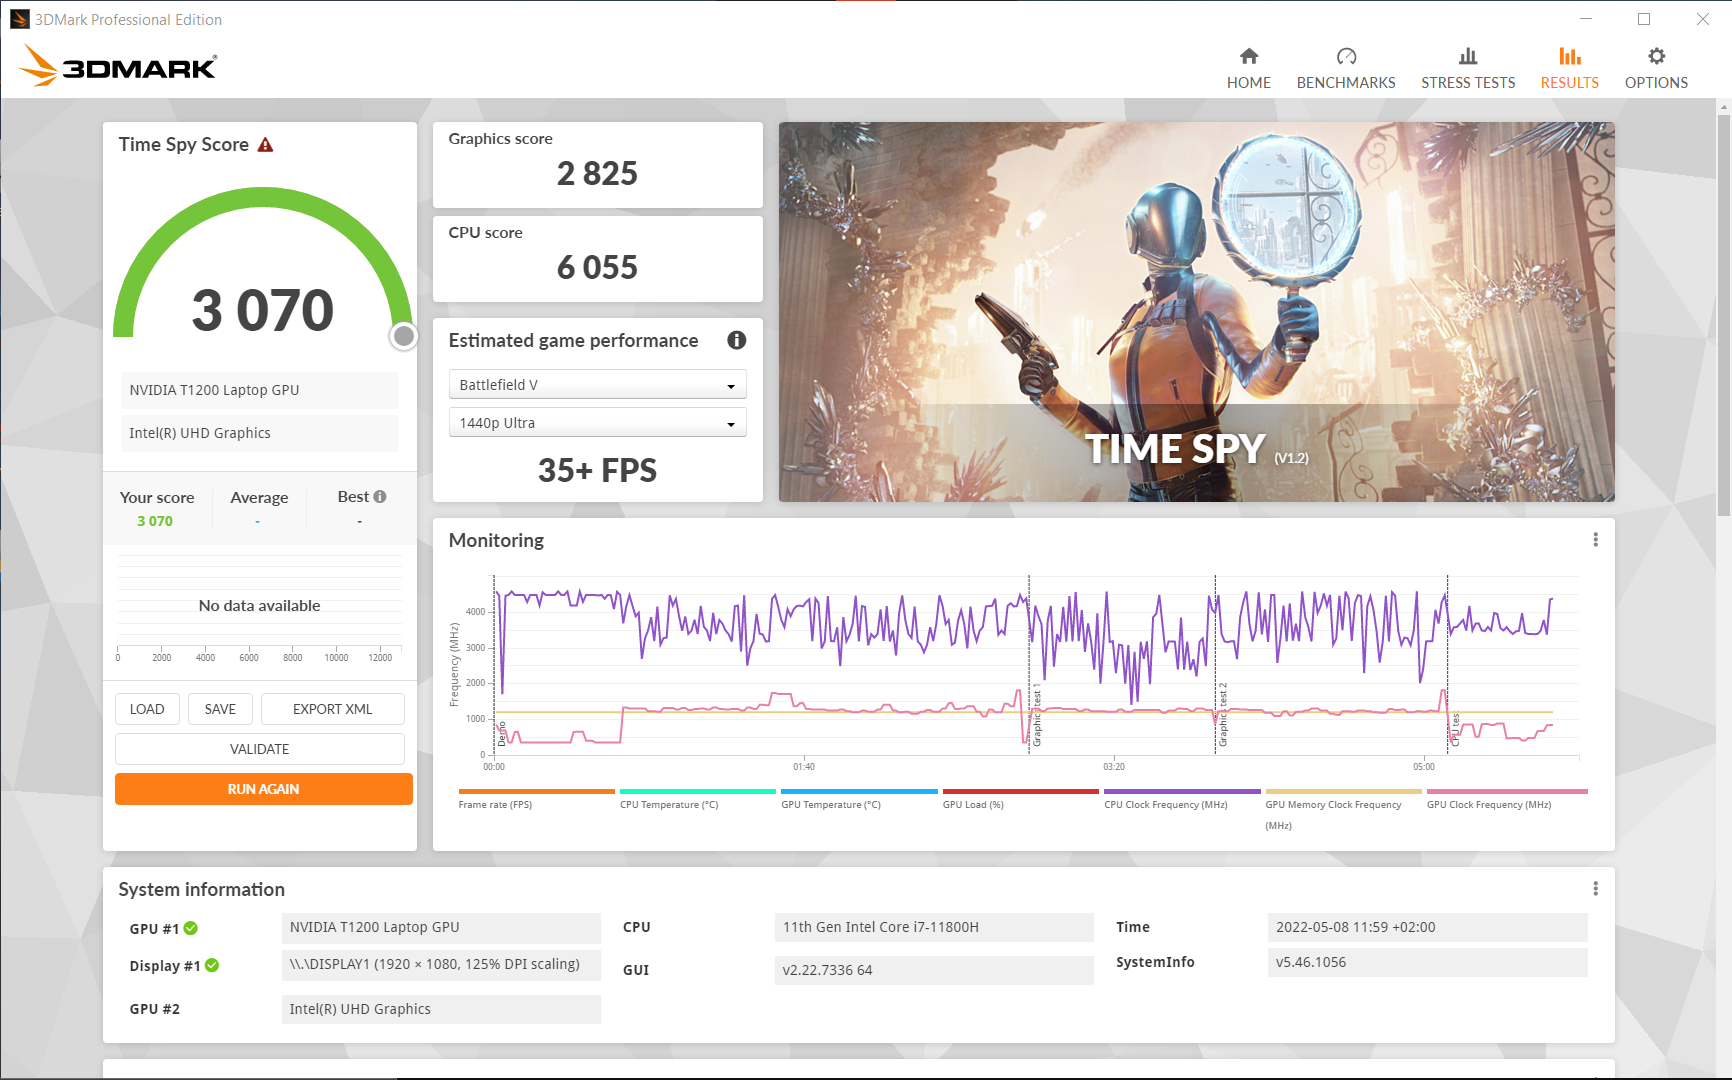
| 3DMark Time Spy Score | 3497 puntos | |
ayuda | ||
Rendimiento de los juegos
El Nvidia T1200 puede ejecutar juegos antiguos en detalles altos sin problemas. Los juegos nuevos se pueden ejecutar con detalles medios. No se observaron caídas de rendimiento durante la prueba de una hora en Witcher 3.
Witcher 3 FPS Chart
| bajo | medio | alto | ultra | |
|---|---|---|---|---|
| BioShock Infinite (2013) | 352.2 | 235.8 | 207.9 | 88.1 |
| GTA V (2015) | 169.9 | 158.5 | 89.7 | 48.5 |
| The Witcher 3 (2015) | 59 | 33.2 | ||
| Dota 2 Reborn (2015) | 133.3 | 116.5 | 107.8 | 100.4 |
| Final Fantasy XV Benchmark (2018) | 88 | 49.5 | 35 | |
| X-Plane 11.11 (2018) | 96.2 | 77.5 | 64.8 | |
| Far Cry 5 (2018) | 107 | 60 | 53 | 51 |
| Strange Brigade (2018) | 208 | 84 | 68.5 | 59.3 |
| Shadow of the Tomb Raider (2018) | 96 | 59 | 48 | 39 |
| Mafia Definitive Edition (2020) | 84 | 43.4 | 39.2 | |
| Resident Evil Village (2021) | 114.3 | 64.3 | 57.9 | 49.8 |
| Riders Republic (2021) | 93 | 50 | 41 | 40 |
| Farming Simulator 22 (2021) | 171.9 | 96.6 | 70.1 | 61.2 |
| Dying Light 2 (2022) | 36.1 | 25.7 | 21.2 | |
| GRID Legends (2022) | 103 | 73 | 61.7 | 45.7 |
| Elden Ring (2022) | 52.9 | 47 | 39.5 | 36.8 |
| Elex 2 (2022) | 43.1 | 39.3 | 34.2 | 29.6 |
| Ghostwire Tokyo (2022) | 50.7 | 47.3 | 44.6 | 41.2 |
| Vampire Bloodhunt (2022) | 121.8 | 72.9 | 69.9 | 69.5 |
Emisiones: El silencioso portátil de Lenovo con puntos de acceso
Ruido
El ventilador permanece silencioso en ralentí y también mientras se navega. Sólo bajo carga es el ThinkPad claramente audible con 39 dB. Medimos 43.5 dB en el test de estrés absoluto. El ventilador también se hace notar durante la navegación web intensiva, pero es cualquier cosa menos ruidoso. No se detectó ningún gemido en la bobina.
Todos los dispositivos de nuestro campo de comparación son generalmente más ruidosos, como el HP ZBook Power 15, que registra alrededor de un 10% más de ruido en escenarios de carga.
Ruido
| Ocioso |
| 25.21 / 25.21 / 25.21 dB(A) |
| Carga |
| 39.09 / 43.53 dB(A) |
 | ||
30 dB silencioso 40 dB(A) audible 50 dB(A) ruidosamente alto |
||
min: | ||
| Lenovo ThinkPad P15v G2 21A9000XGE T1200 Laptop GPU, i7-11800H, Toshiba XG6 KXG6AZNV512G | Lenovo ThinkPad P15 G2-20YQ001JGE RTX A3000 Laptop GPU, i7-11800H, Kioxia XG7 KXG7AZNV512G | Lenovo ThinkPad T15g-20UR000GGE GeForce RTX 2070 Super Max-Q, i7-10750H, SK Hynix PC401 512GB M.2 (HFS512GD9TNG) | Lenovo ThinkPad T15p-20TN0006GE GeForce GTX 1050 Mobile, i7-10750H, WDC PC SN730 SDBQNTY-512GB | Lenovo ThinkPad P15s Gen2-20W6000GGE T500 Laptop GPU, i7-1165G7, WDC PC SN720 SDAQNTW-1T00 | HP ZBook Power 15 G8 313S5EA T600 Laptop GPU, i7-11800H, Samsung PM9A1 MZVL2512HCJQ | Dell Precision 5000 5560 RTX A2000 Laptop GPU, i7-11850H, Samsung PM9A1 MZVL22T0HBLB | |
|---|---|---|---|---|---|---|---|
| Noise | -8% | -1% | -13% | 5% | -10% | 8% | |
| apagado / medio ambiente * (dB) | 25.21 | 24.3 4% | 24 5% | 29.3 -16% | 24.3 4% | 25.54 -1% | 23.4 7% |
| Idle Minimum * (dB) | 25.21 | 24.3 4% | 24 5% | 29.3 -16% | 25.5 -1% | 25.54 -1% | 23.6 6% |
| Idle Average * (dB) | 25.21 | 24.3 4% | 24 5% | 29.3 -16% | 25.5 -1% | 25.54 -1% | 23.6 6% |
| Idle Maximum * (dB) | 25.21 | 28.6 -13% | 24 5% | 30.6 -21% | 25.5 -1% | 25.54 -1% | 23.6 6% |
| Load Average * (dB) | 39.09 | 47.5 -22% | 36.1 8% | 42.7 -9% | 35.65 9% | 48.85 -25% | 25.8 34% |
| Witcher 3 ultra * (dB) | 36.6 | 46 -26% | 42.7 -17% | 46.58 -27% | 40.1 -10% | ||
| Load Maximum * (dB) | 43.53 | 54.9 -26% | 46 -6% | 42.7 2% | 35.65 18% | 50.98 -17% | 41.4 5% |
* ... más pequeño es mejor
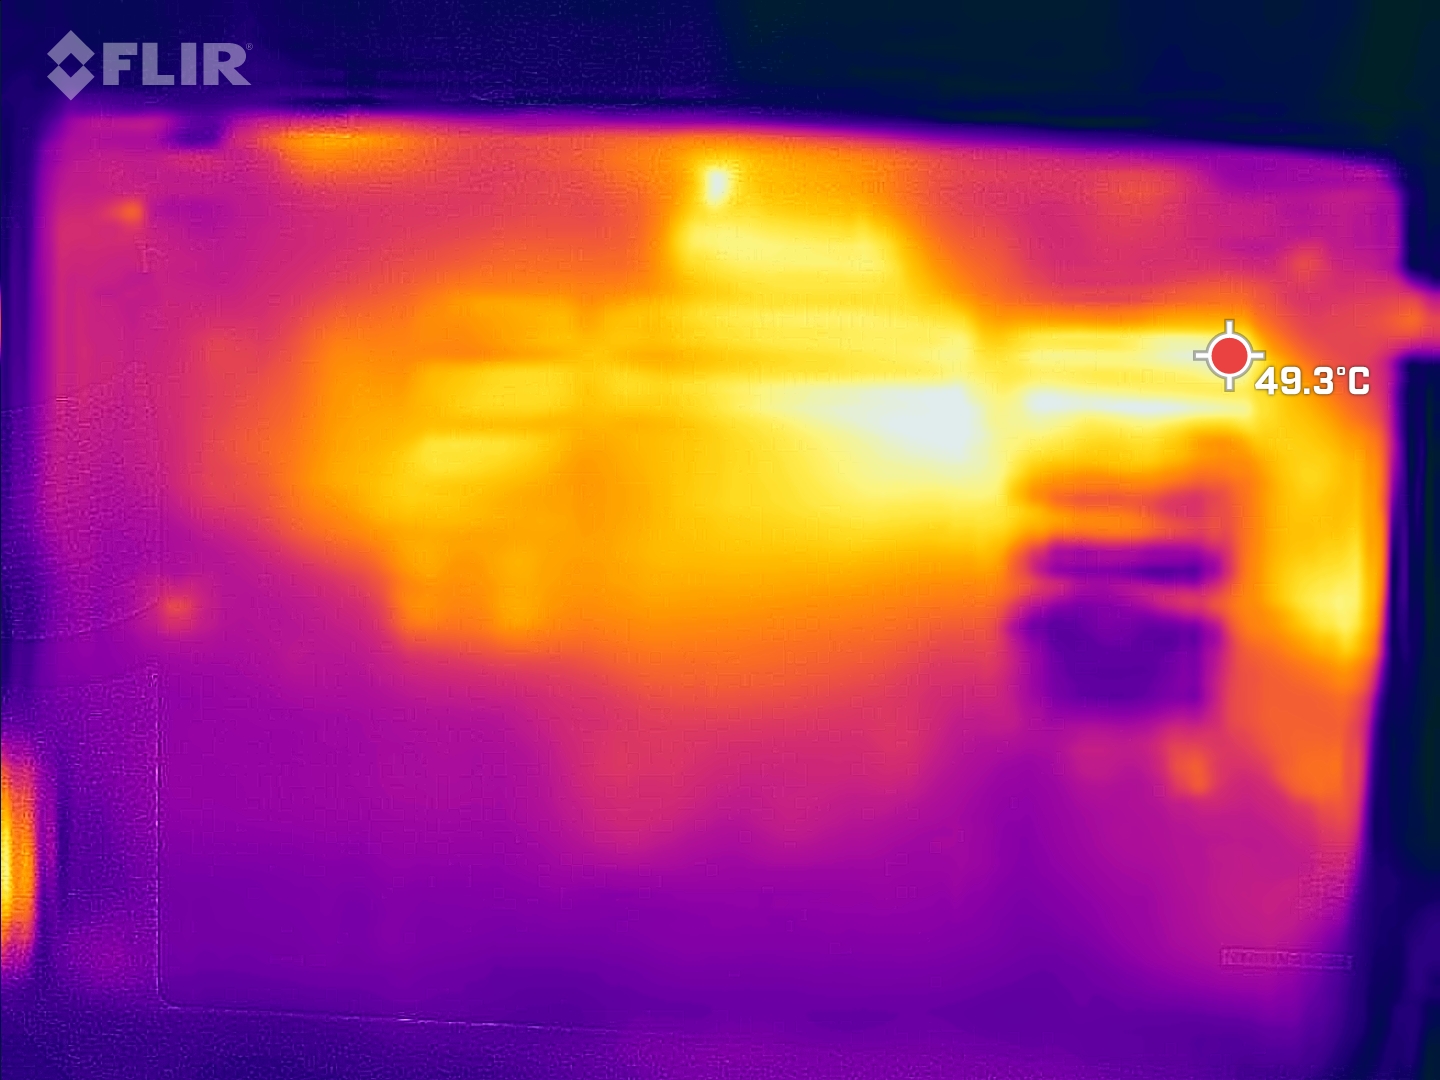
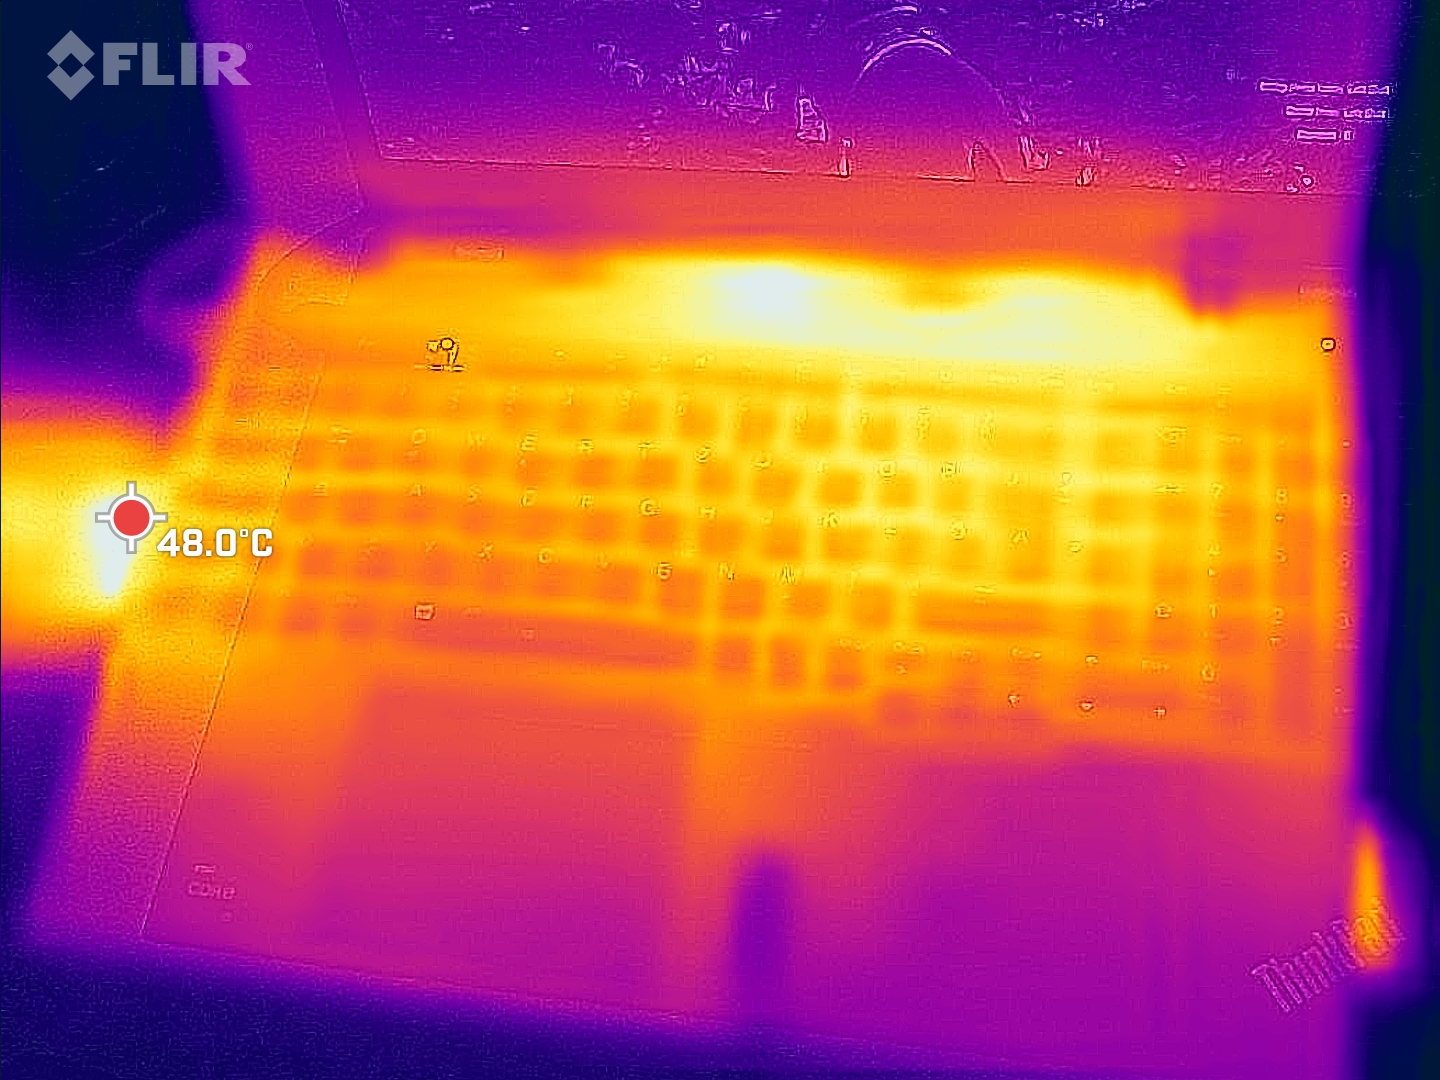
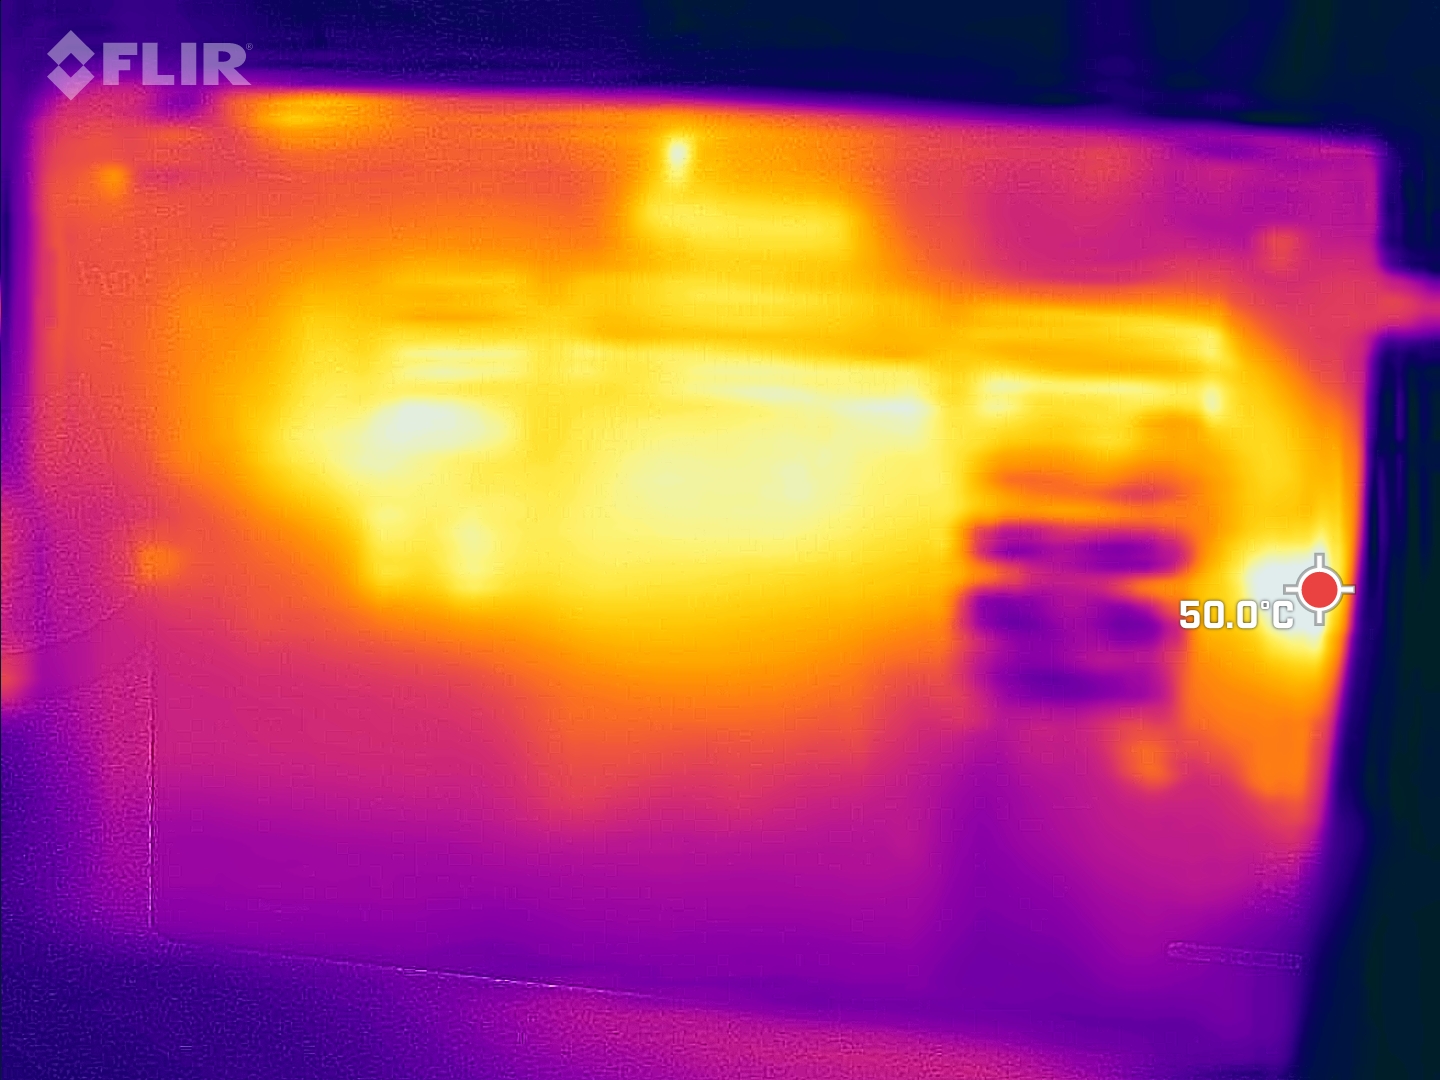
Temperatura
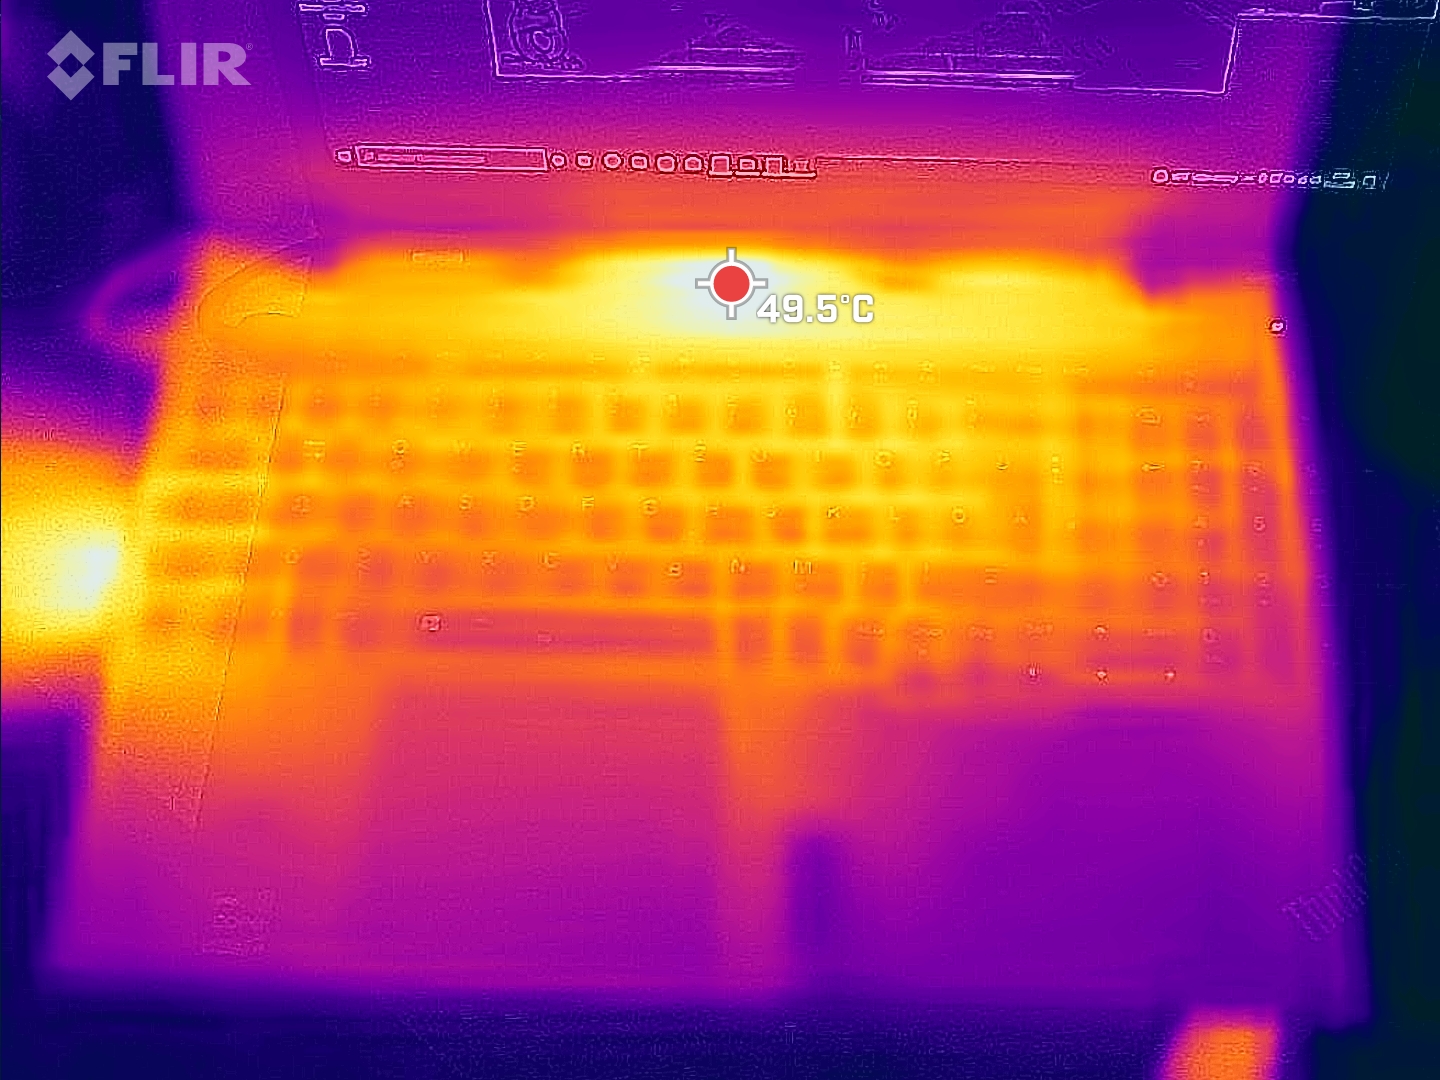
Bajo carga y también durante los juegos, el ThinkPad P15v se calienta mucho con 53.8 °C en el centro sobre el teclado. El ZBook Power 15 es significativamente más fresco con 41.5 °C, pero a costa de niveles de ruido significativamente mayores.
(-) La temperatura máxima en la parte superior es de 53.8 °C / 129 F, frente a la media de 38.2 °C / 101 F, que oscila entre 22.2 y 69.8 °C para la clase Workstation.
(-) El fondo se calienta hasta un máximo de 52.1 °C / 126 F, frente a la media de 41.1 °C / 106 F
(+) En reposo, la temperatura media de la parte superior es de 25.6 °C / 78# F, frente a la media del dispositivo de 32 °C / 90 F.
(-) Jugando a The Witcher 3, la temperatura media de la parte superior es de 41.4 °C / 107 F, frente a la media del dispositivo de 32 °C / 90 F.
(+) Los reposamanos y el panel táctil alcanzan como máximo la temperatura de la piel (35.6 °C / 96.1 F) y, por tanto, no están calientes.
(-) La temperatura media de la zona del reposamanos de dispositivos similares fue de 27.8 °C / 82 F (-7.8 °C / -14.1 F).
| Lenovo ThinkPad P15v G2 21A9000XGE Intel Core i7-11800H, NVIDIA T1200 Laptop GPU | Lenovo ThinkPad P15 G2-20YQ001JGE Intel Core i7-11800H, NVIDIA RTX A3000 Laptop GPU | Lenovo ThinkPad T15g-20UR000GGE Intel Core i7-10750H, NVIDIA GeForce RTX 2070 Super Max-Q | Lenovo ThinkPad T15p-20TN0006GE Intel Core i7-10750H, NVIDIA GeForce GTX 1050 Mobile | Lenovo ThinkPad P15s Gen2-20W6000GGE Intel Core i7-1165G7, NVIDIA T500 Laptop GPU | HP ZBook Power 15 G8 313S5EA Intel Core i7-11800H, NVIDIA T600 Laptop GPU | Dell Precision 5000 5560 Intel Core i7-11850H, NVIDIA RTX A2000 Laptop GPU | |
|---|---|---|---|---|---|---|---|
| Heat | -5% | -15% | 4% | 2% | 17% | -6% | |
| Maximum Upper Side * (°C) | 53.8 | 49.7 8% | 47.7 11% | 53.8 -0% | 42.8 20% | 41.4 23% | 48.2 10% |
| Maximum Bottom * (°C) | 52.1 | 63.2 -21% | 62.1 -19% | 56.6 -9% | 59.1 -13% | 41.5 20% | 42.6 18% |
| Idle Upper Side * (°C) | 27.6 | 27.1 2% | 31.3 -13% | 24.7 11% | 26.4 4% | 23.8 14% | 34.8 -26% |
| Idle Bottom * (°C) | 27.7 | 29.8 -8% | 38.8 -40% | 24.2 13% | 28.9 -4% | 25 10% | 35.2 -27% |
* ... más pequeño es mejor
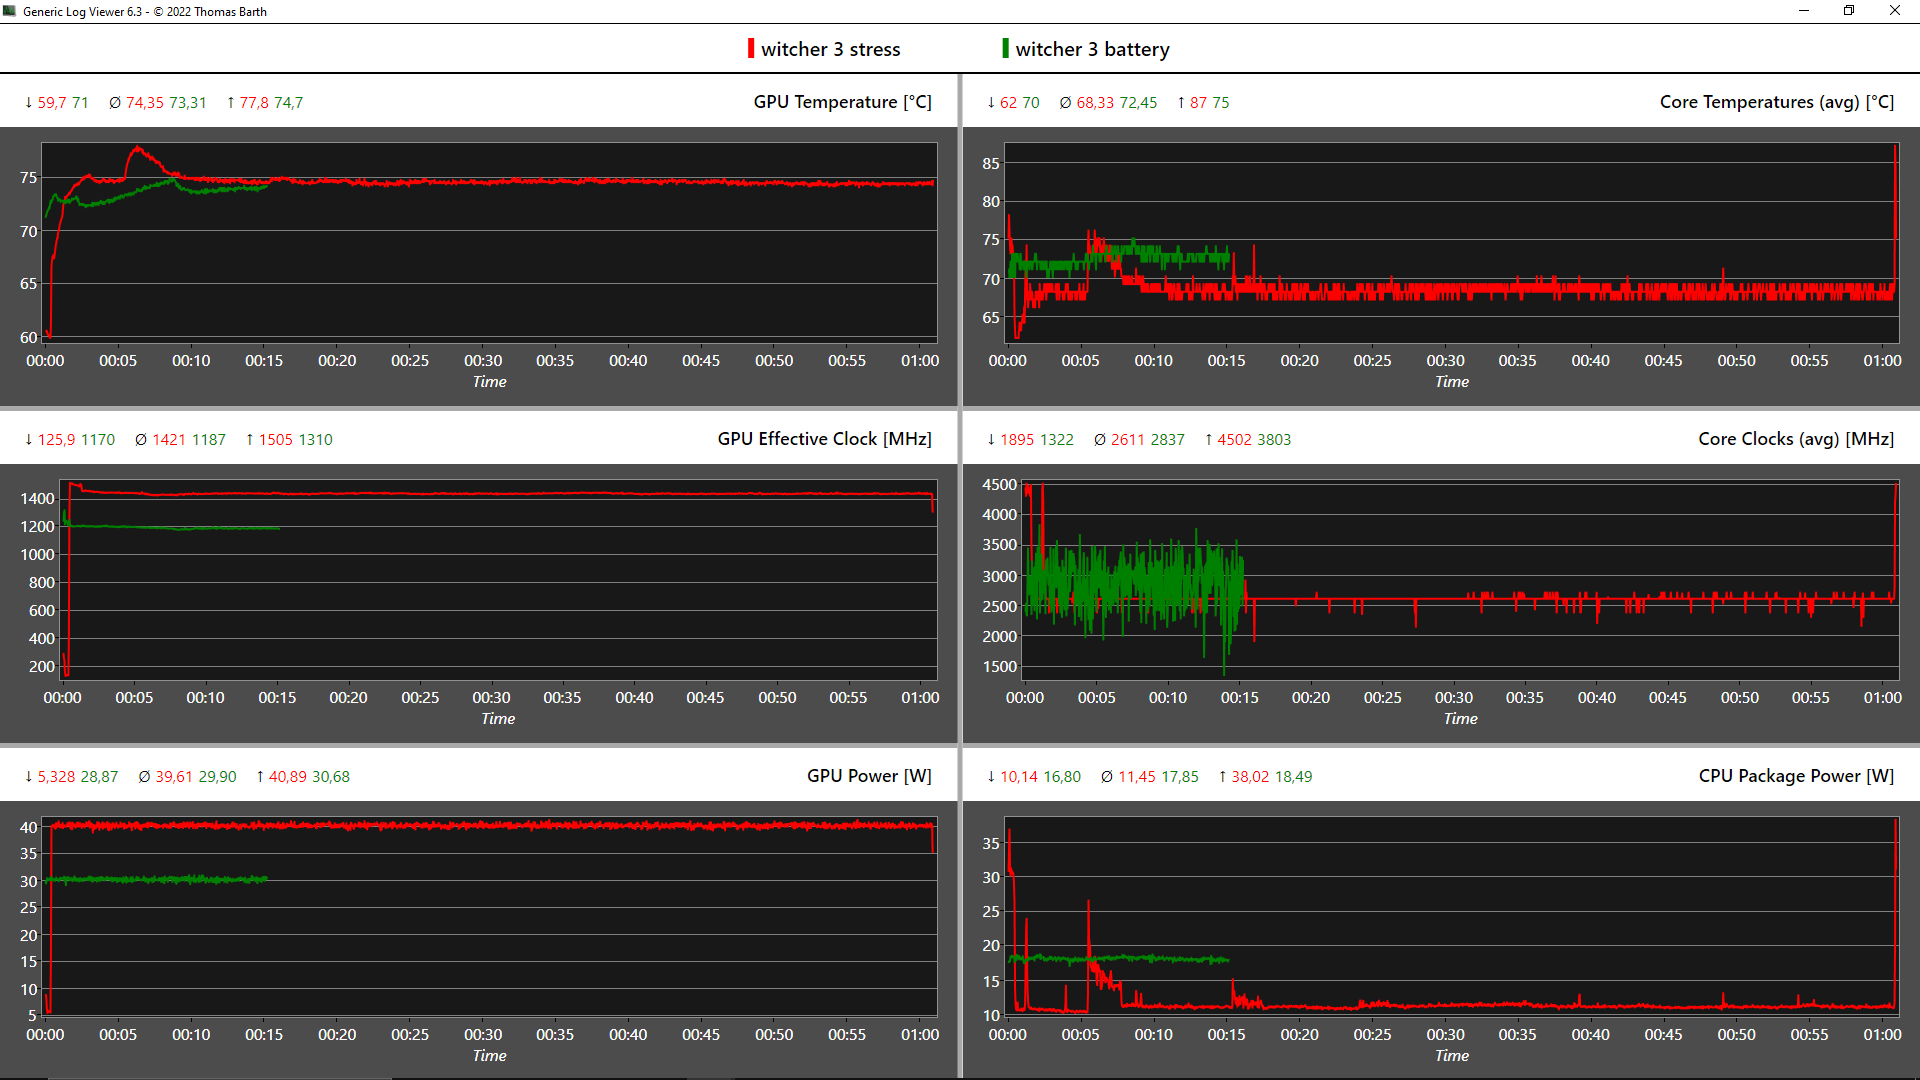
Prueba de esfuerzo
Tras una hora de pruebas de estrés combinadas (FurMark + Prime95), la CPU ronda los 2.15 GHz, que está sólo ligeramente por debajo del reloj base de 2.3 GHz. Las temperaturas alcanzan casi los 94 °C y el consumo es de 40 vatios, mientras que la GPU Nvidia consume sus 35 vatios especificados, pero no aprovecha plenamente su potencial de reloj a 986 MHz.
Bajo estrés puro de la GPU, la tarjeta gráfica extrae 40 vatios y así alcanza los 1.445 MHz completos a temperaturas no críticas. Bajo estrés de la CPU, el Core i7-11800H funciona a una frecuencia estable de 2,55 GHz, consume 50 vatios constantes y se calienta hasta 91,6 °C.
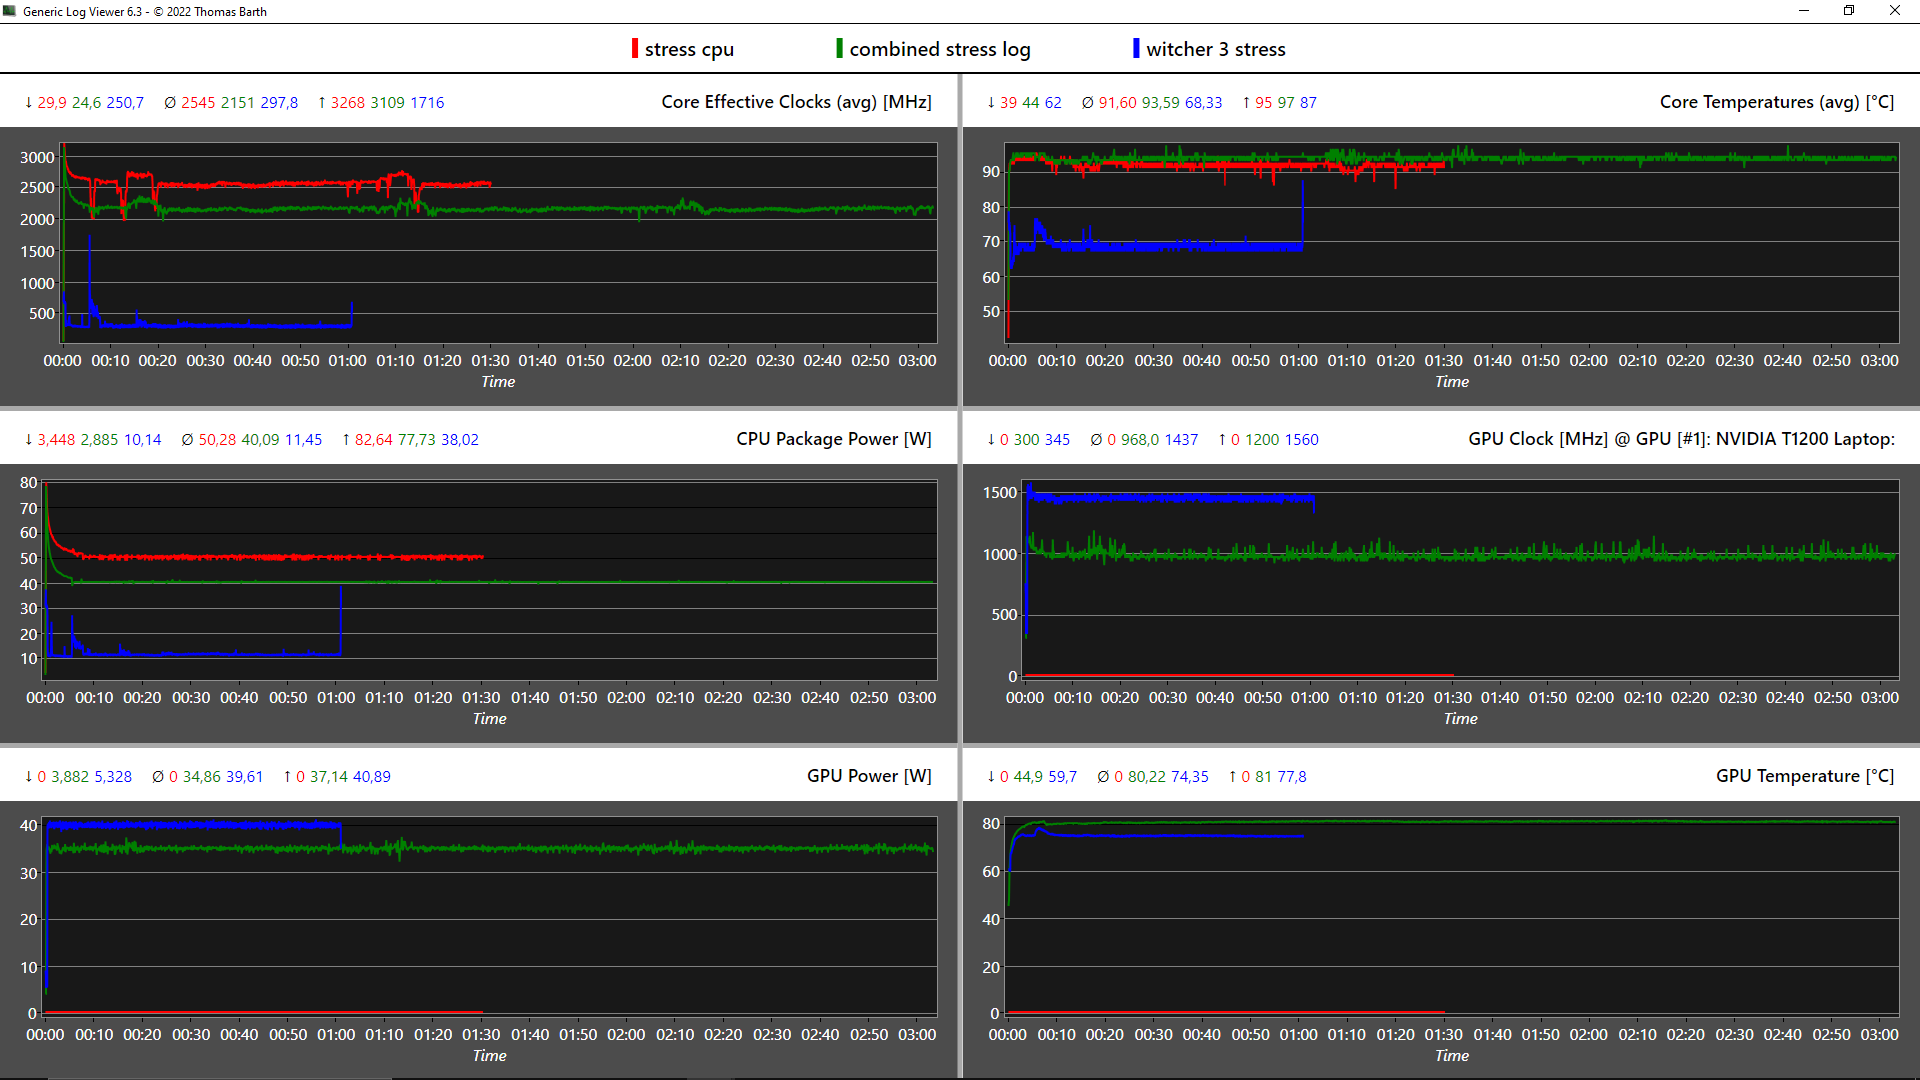
| Reloj dela CPU (GHz) | Reloj de la GPU (MHz) | Temperatura media dela CPU (°C) | Temperatura media de la GPU (°C) | |
| Sistema en reposo | 1,2 | 300 | 42 | 44,8 |
| Prime95Stress | 2,5 | 300 | 91,6 | 46,4 |
| Prime95+ FurMarkStress | 2,2 | 970 | 93,6 | 80,2 |
| Witcher 3 Stress | 0,3 | 1.445 | 68,3 | 74,4 |
Altavoces
Los altavoces de 2 vatios orientados hacia arriba no son especialmente potentes, pero el sonido es claro y los graves están presentes en cierta medida. En general, cumplen su función y superan a los altavoces de muchos otros portátiles de oficina
Lenovo ThinkPad P15v G2 21A9000XGE análisis de audio
(-) | altavoces no muy altos (#70.7 dB)
Graves 100 - 315 Hz
(±) | lubina reducida - en promedio 13.4% inferior a la mediana
(±) | la linealidad de los graves es media (13.6% delta a frecuencia anterior)
Medios 400 - 2000 Hz
(+) | medios equilibrados - a sólo 4.7% de la mediana
(+) | los medios son lineales (6.2% delta a la frecuencia anterior)
Altos 2 - 16 kHz
(+) | máximos equilibrados - a sólo 3.2% de la mediana
(+) | los máximos son lineales (5.7% delta a la frecuencia anterior)
Total 100 - 16.000 Hz
(±) | la linealidad del sonido global es media (21.2% de diferencia con la mediana)
En comparación con la misma clase
» 76% de todos los dispositivos probados de esta clase eran mejores, 6% similares, 18% peores
» El mejor tuvo un delta de 7%, la media fue 17%, el peor fue ###max##%
En comparación con todos los dispositivos probados
» 59% de todos los dispositivos probados eran mejores, 7% similares, 34% peores
» El mejor tuvo un delta de 4%, la media fue 23%, el peor fue ###max##%
HP ZBook Power 15 G8 313S5EA análisis de audio
(±) | la sonoridad del altavoz es media pero buena (72.3 dB)
Graves 100 - 315 Hz
(-) | casi sin bajos - de media 23.3% inferior a la mediana
(±) | la linealidad de los graves es media (11.8% delta a frecuencia anterior)
Medios 400 - 2000 Hz
(+) | medios equilibrados - a sólo 2.5% de la mediana
(+) | los medios son lineales (5.1% delta a la frecuencia anterior)
Altos 2 - 16 kHz
(+) | máximos equilibrados - a sólo 4.1% de la mediana
(+) | los máximos son lineales (3.1% delta a la frecuencia anterior)
Total 100 - 16.000 Hz
(±) | la linealidad del sonido global es media (21.4% de diferencia con la mediana)
En comparación con la misma clase
» 77% de todos los dispositivos probados de esta clase eran mejores, 6% similares, 18% peores
» El mejor tuvo un delta de 7%, la media fue 17%, el peor fue ###max##%
En comparación con todos los dispositivos probados
» 60% de todos los dispositivos probados eran mejores, 7% similares, 33% peores
» El mejor tuvo un delta de 4%, la media fue 23%, el peor fue ###max##%
Gestión de la energía: Media para el ThinkPad P15v
Consumo de energía
El consumo de 1,6 vatios en reposo sugiere que no es posible una duración de 2 días de funcionamiento. Por otro lado, los índices de inactividad son muy buenos para una estación de trabajo y sólo pueden ser superados por el ZBook Power 15.
Al principio de la prueba de estrés, se consumen 127 vatios y 108 vatios de forma continua. La fuente de alimentación de 135 W está por tanto suficientemente dimensionada y es capaz de absorber cualquier pico de carga. Una recarga completa del ThinkPad dura unos 90 minutos.
| Off / Standby | |
| Ocioso | |
| Carga |
|
Clave:
min: | |
| Lenovo ThinkPad P15v G2 21A9000XGE i7-11800H, T1200 Laptop GPU, Toshiba XG6 KXG6AZNV512G, IPS LED, 1920x1080, 15.6" | Lenovo ThinkPad P15 G2-20YQ001JGE i7-11800H, RTX A3000 Laptop GPU, Kioxia XG7 KXG7AZNV512G, IPS, 1920x1080, 15.6" | Lenovo ThinkPad T15g-20UR000GGE i7-10750H, GeForce RTX 2070 Super Max-Q, SK Hynix PC401 512GB M.2 (HFS512GD9TNG), IPS, 1920x1080, 15.6" | Lenovo ThinkPad T15p-20TN0006GE i7-10750H, GeForce GTX 1050 Mobile, WDC PC SN730 SDBQNTY-512GB, IPS LED, 3840x2160, 15.6" | Lenovo ThinkPad P15s Gen2-20W6000GGE i7-1165G7, T500 Laptop GPU, WDC PC SN720 SDAQNTW-1T00, IPS LED, 3840x2160, 15.6" | HP ZBook Power 15 G8 313S5EA i7-11800H, T600 Laptop GPU, Samsung PM9A1 MZVL2512HCJQ, IPS LED, 1920x1080, 15.6" | Dell Precision 5000 5560 i7-11850H, RTX A2000 Laptop GPU, Samsung PM9A1 MZVL22T0HBLB, IPS, 3840x2400, 15.6" | Medio NVIDIA T1200 Laptop GPU | Media de la clase Workstation | |
|---|---|---|---|---|---|---|---|---|---|
| Power Consumption | -31% | -36% | -20% | 6% | 23% | -38% | -23% | -53% | |
| Idle Minimum * (Watt) | 5.96 | 6.3 -6% | 5.8 3% | 6 -1% | 5.8 3% | 4.17 30% | 6.2 -4% | 7.85 ? -32% | 9.11 ? -53% |
| Idle Average * (Watt) | 8.37 | 10.7 -28% | 11.4 -36% | 12.8 -53% | 13.3 -59% | 6.32 24% | 13.9 -66% | 11.4 ? -36% | 13.8 ? -65% |
| Idle Maximum * (Watt) | 9.05 | 11.6 -28% | 13.9 -54% | 16.1 -78% | 15.6 -72% | 7.1 22% | 23.8 -163% | 12 ? -33% | 17.9 ? -98% |
| Load Average * (Watt) | 91.82 | 99.3 -8% | 93.2 -2% | 95.6 -4% | 43.2 53% | 80.41 12% | 95.7 -4% | 93.8 ? -2% | 96 ? -5% |
| Witcher 3 ultra * (Watt) | 102 | 154 -51% | 145 -42% | 84 18% | 37.1 64% | 62.3 39% | 87 15% | ||
| Load Maximum * (Watt) | 126.38 | 210 -66% | 234 -85% | 131.1 -4% | 67.3 47% | 110.18 13% | 132.6 -5% | 143.7 ? -14% | 180.3 ? -43% |
* ... más pequeño es mejor
Power Consumption Witcher 3 / Stresstest
Power Consumption Witcher 3 / Stress test (external monitor)
Duración de la batería
La batería de 68 Wh logra alimentar nuestra prueba Wi-Fi durante 7,5 horas, lo que corresponde a las propias afirmaciones de Lenovo. Otras estaciones de trabajo logran duraciones significativamente mayores con baterías más grandes.
El ZBook Power 15 de HP también dura bastante más en la navegación web con casi 12.5 horas El Dell Precision 5560con su pantalla 4K, registra unas escasas 6.5 horas.
| Lenovo ThinkPad P15v G2 21A9000XGE i7-11800H, T1200 Laptop GPU, 68 Wh | Lenovo ThinkPad P15 G2-20YQ001JGE i7-11800H, RTX A3000 Laptop GPU, 94 Wh | Lenovo ThinkPad T15g-20UR000GGE i7-10750H, GeForce RTX 2070 Super Max-Q, 94 Wh | Lenovo ThinkPad T15p-20TN0006GE i7-10750H, GeForce GTX 1050 Mobile, 68 Wh | Lenovo ThinkPad P15s Gen2-20W6000GGE i7-1165G7, T500 Laptop GPU, 57 Wh | HP ZBook Power 15 G8 313S5EA i7-11800H, T600 Laptop GPU, 83 Wh | Dell Precision 5000 5560 i7-11850H, RTX A2000 Laptop GPU, 86 Wh | Media de la clase Workstation | |
|---|---|---|---|---|---|---|---|---|
| Duración de Batería | 34% | 47% | 5% | 46% | 53% | 18% | 38% | |
| Reader / Idle (h) | 17.2 | 14.9 -13% | 12 -30% | 26.1 ? 52% | ||||
| H.264 (h) | 8 | 10 25% | 12.7 59% | 7.7 -4% | 9.9 24% | 10.1 26% | 10.1 ? 26% | |
| WiFi v1.3 (h) | 7.5 | 9.9 32% | 11.2 49% | 7.3 -3% | 7.7 3% | 12.3 64% | 6.3 -16% | 8.55 ? 14% |
| Load (h) | 0.9 | 1.3 44% | 1.2 33% | 1.1 22% | 1.9 111% | 2.1 133% | 1.8 100% | 1.441 ? 60% |
Pro
Contra
Veredicto: ¿El ThinkPad P15v G2 para creativos preocupados por el precio?

El ThinkPad P15v G2 logra el equilibrio entre portátil de empresa y estación de trabajo bastante bien, teniendo en cuenta que está dirigido a un grupo objetivo que puede prescindir de ciertas características de gama alta como CPUs Xeon, RAM ECC, el hardware más rápido y algunas otras cosas. Dicho esto, el rendimiento es en general bueno, aunque en algunos escenarios se aprecia una caída del 25%
La opción de la pantalla sólo será suficiente para los creativos y en el campo del CAD si se utiliza principalmente un monitor externo y para aquellos que tengan que hacer principalmente cálculos más complejos a un precio justo. El rendimiento gráfico es adecuado teniendo en cuenta el precio de menos de 2.000 euros, y los dispositivos de entrada están a un alto nivel. Hay algunos inconvenientes respecto a la pantalla algo oscura con poca cobertura del espacio de color. Afortunadamente, hay una opción 4K
La conectividad es amplia y el ThinkPad es fácilmente ampliable. En general, puntúa muy bien en general frente al más delgado ThinkPad P15s. La carcasa también es robusta, aunque otros ThinkPads tengan una tapa de pantalla reforzada. La cantidad de plástico puede ser desagradable para algunos en términos de sensación y apariencia. La duración de la batería no es la mejor, pero las emisiones están orientadas a la empresa y son muy buenas, excepto por algunos puntos de calor menores lejos del teclado y del reposamanos. El sistema de refrigeración se ha mantenido bastante simple en general a favor del precio. La carga por USB-C tampoco está disponible, y el módulo Wi-Fi está soldado. Pero se puede instalar WWAN a posteriori
El ThinkPad P15v G2 no necesita necesariamente un Core i9 y un display 4K para ser un sólido caballo de batalla. Aunque brilla principalmente por su razonable precio de entrada, sigue siendo un producto de nicho con limitaciones, especialmente en términos de pantalla y CPU.
Excluyendo el modelo hermano (T15p G2), hay dos alternativas directas en el mismo segmento de precios: El ZBook Power 15 de HP, que rinde constantemente a un alto nivel, tiene una pantalla mucho más brillante y mejor, un teclado bien diseñado, así como una duración de la batería mucho mejor, pero también es molestamente ruidoso. El Dell Precision 3651 pesa sólo 1.79 kg, ofrece un panel 4K y carga USB-C.
Precio y disponibilidad
El sitio web oficial de Lenovo ofrece el Lenovo ThinkPad P15v G2 en varias configuraciones y a varios precios, dependiendo del país de compra. Por ejemplo:
EE.UU, a partir de 1.391,42 USD
Reino Unido, a partir de 1.758,63 libras esterlinas
Canadáa partir de CAD$ 1.780,02
Australia, a partir de AUD$ 2.119,47
Nueva Zelandaa partir de NZ$ 4.699,00
Lenovo ThinkPad P15v G2 21A9000XGE
- 05/30/2022 v7 (old)
Marvin Gollor
Price comparison

