Análisis del portátil Intel Lenovo ThinkPad E14 G5: Core i7-1355U vs. Ryzen 7 7730U

Tras analizar recientemente la versión AMD del ThinkPad E14 G5, ahora estamos preparados para abordar la versión Intel del ThinkPad E14 G5. Ambas versiones comparten el mismo diseño de chasis, por lo que recomendamos consultar nuestro análisis sobre la versión AMD para conocer mejor las características físicas del modelo. No obstante, existen algunas diferencias internas entre ambos que mencionaremos en el análisis a continuación.
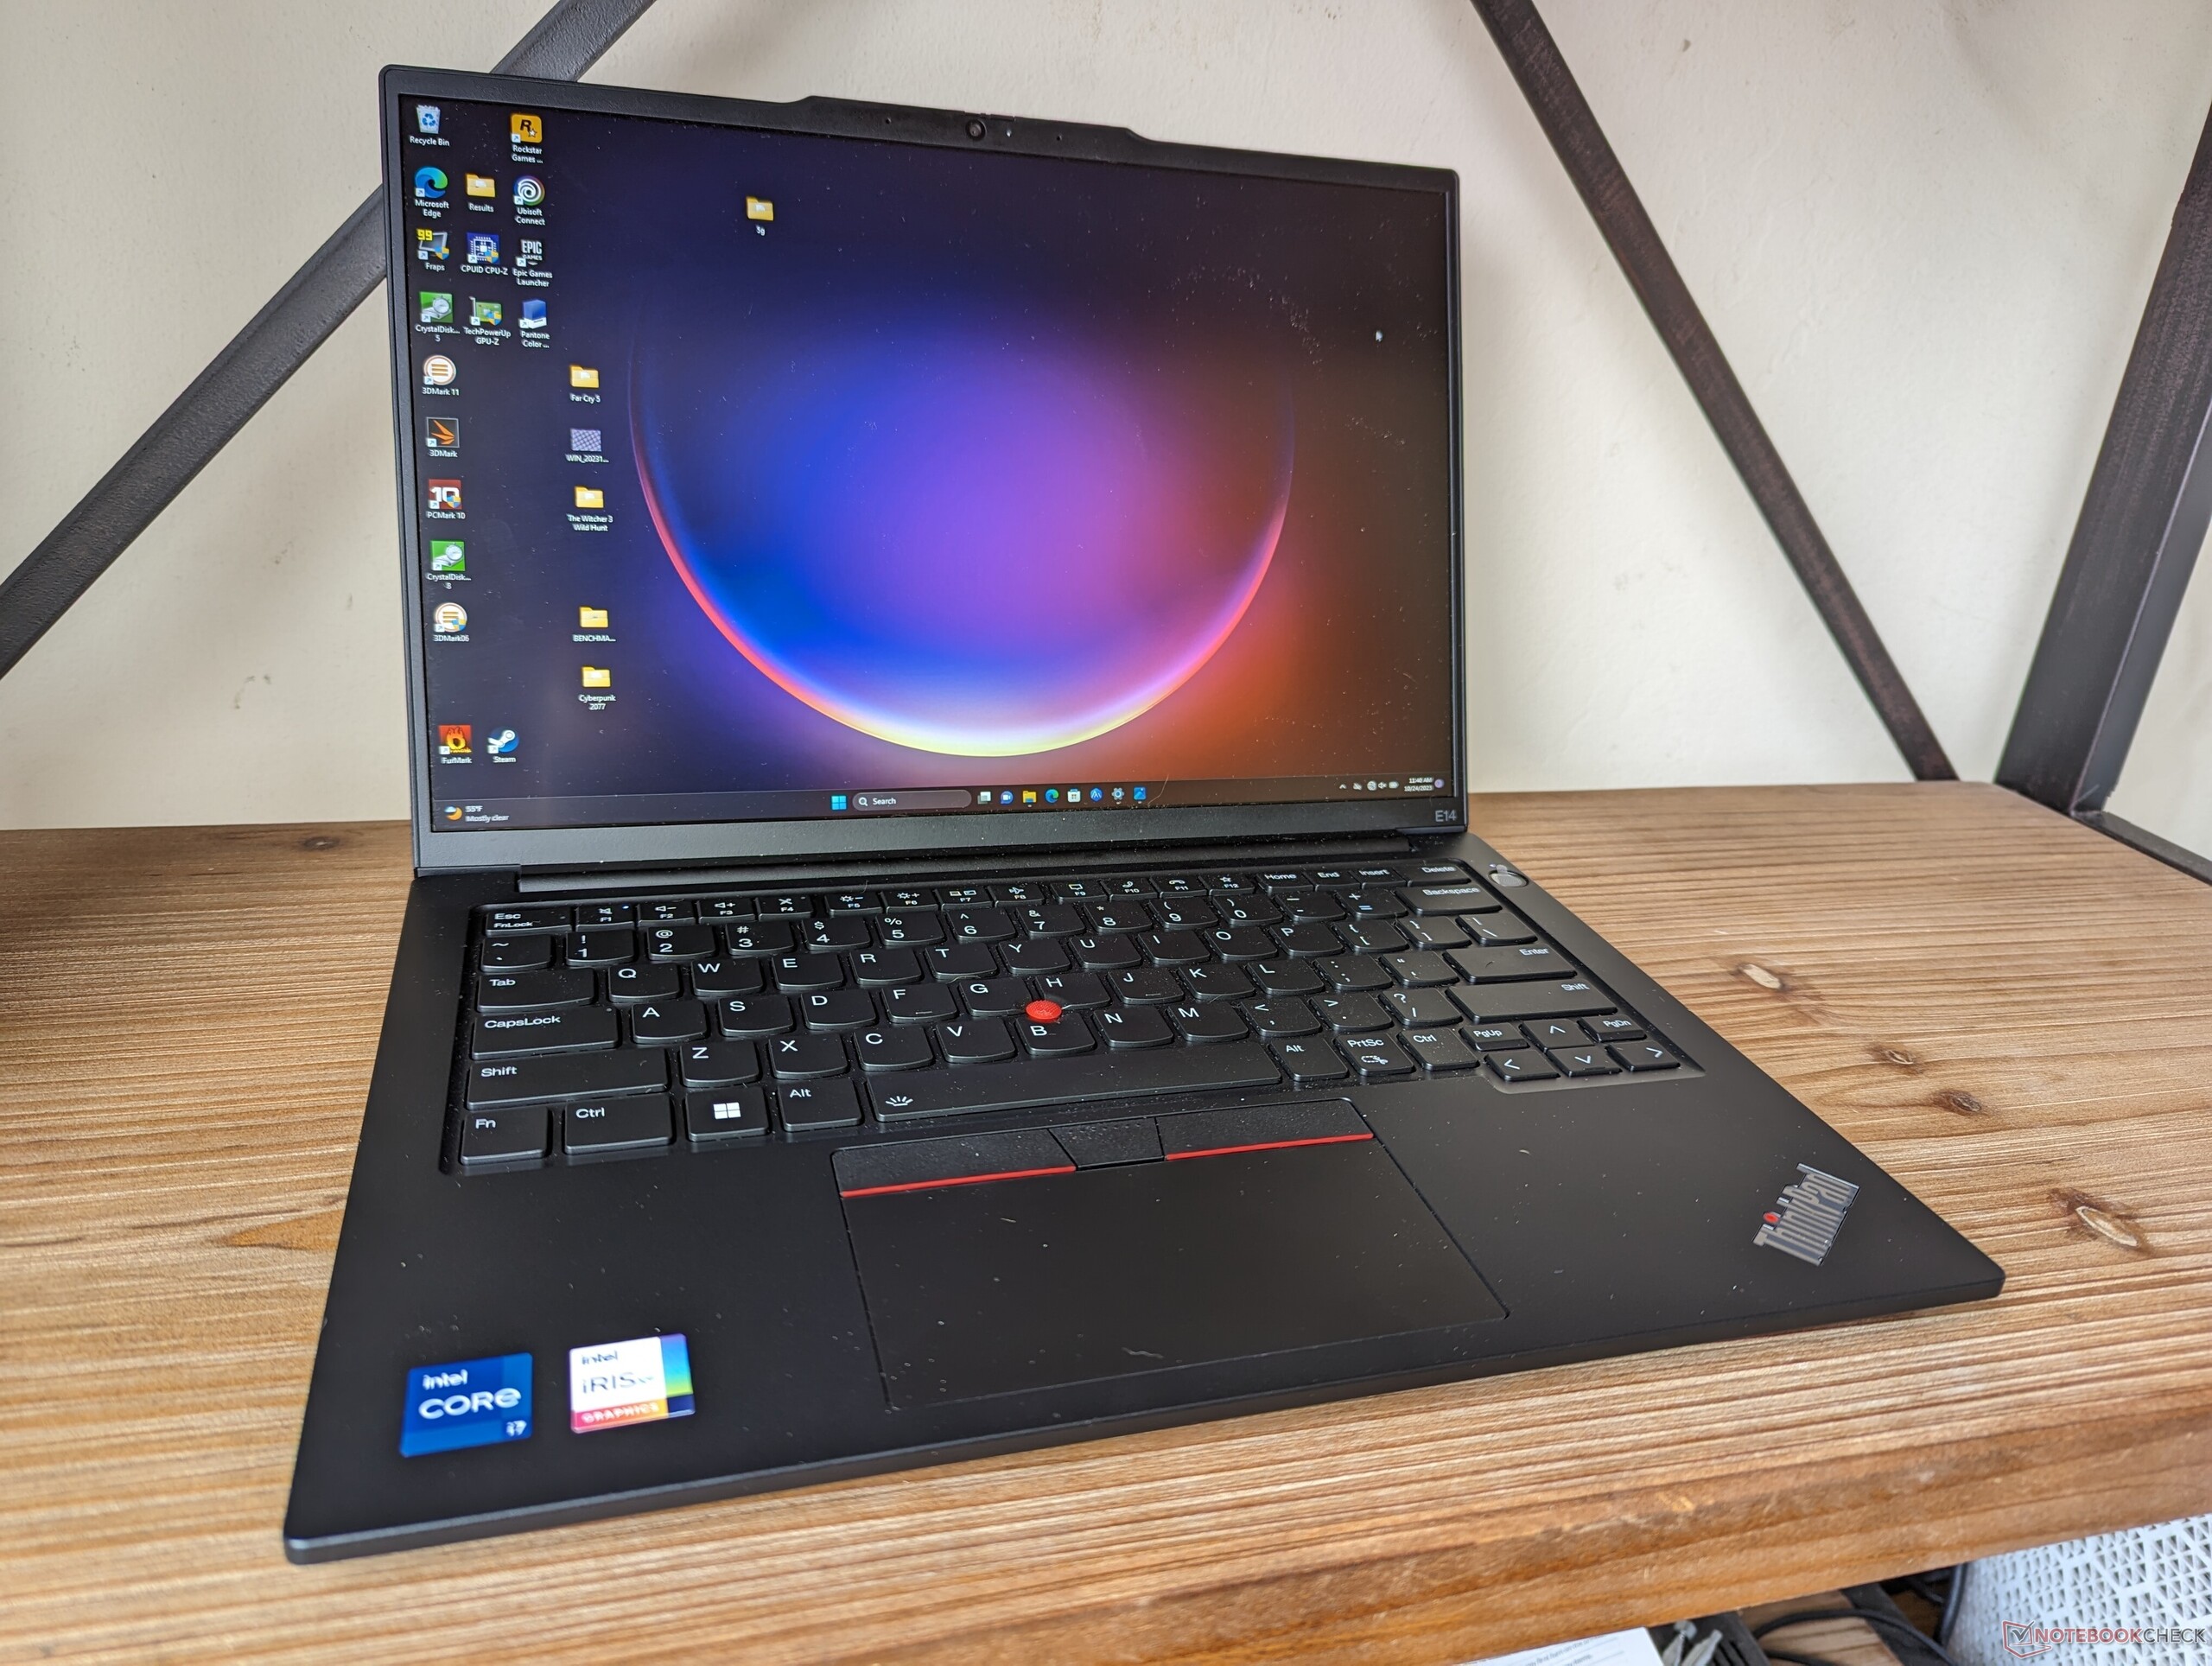
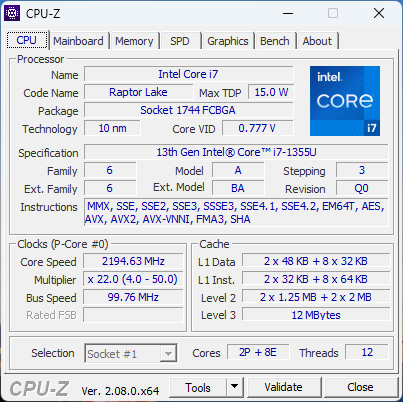
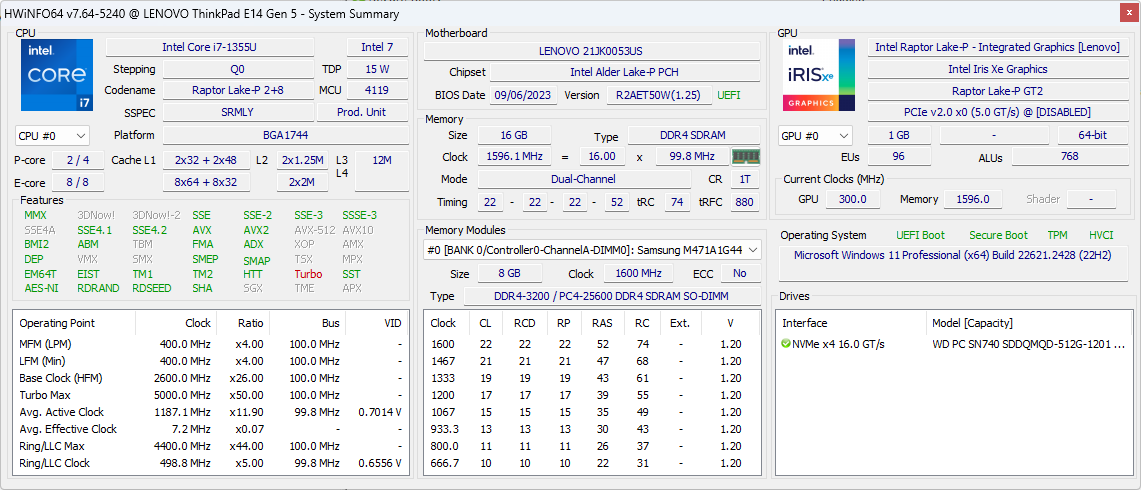
Nuestra unidad de prueba es una configuración Intel intermedia con la CPU Raptor Lake Core i7-1355U de 13ª generación y pantalla FHD+ de 1200p por aproximadamente 915 USD. Otras SKU parten del Core i3-1315U hasta el Core i7-13700H con gráficos GeForce MX550 opcionales y una pantalla IPS de mayor resolución de 2240 x 1400. La gama configurable es más amplia de lo esperado, especialmente para un subportátil de 14 pulgadas.
Entre las alternativas al ThinkPad E14 G5 se incluyen otros subportátiles empresariales de gama media alta como el HP EliteBook 845 o el Dell Latitude 7440.
Más opiniones sobre Lenovo:
Posibles contendientes en la comparación
Valoración | Fecha | Modelo | Peso | Altura | Tamaño | Resolución | Precio |
|---|---|---|---|---|---|---|---|
| 86 % v7 (old) | 10/2023 | Lenovo ThinkPad E14 G5 i7-1355U i7-1355U, Iris Xe G7 96EUs | 1.5 kg | 17.99 mm | 14.00" | 1920x1200 | |
| 88.3 % v7 (old) | 08/2023 | Lenovo ThinkPad E14 G5-21JSS05C00 R7 7730U, Vega 8 | 1.4 kg | 18 mm | 14.00" | 2240x1400 | |
| 90.1 % v7 (old) | 08/2023 | HP EliteBook 845 G10 818N0EA R9 PRO 7940HS, Radeon 780M | 1.5 kg | 17.9 mm | 14.00" | 2560x1600 | |
| 85.3 % v7 (old) | 06/2023 | Asus ZenBook 14 UM3402Y R7 7730U, Vega 8 | 1.4 kg | 16.9 mm | 14.00" | 2880x1800 | |
| 86.6 % v7 (old) | 10/2022 | LG Gram 14Z90Q i5-1240P, Iris Xe G7 80EUs | 980 g | 16.8 mm | 14.00" | 1920x1200 | |
| 90.3 % v7 (old) | 07/2023 | Dell Latitude 7440 i5-1345U, Iris Xe G7 80EUs | 1.2 kg | 17.95 mm | 14.00" | 2560x1600 |
Caso
Quizás la forma más fácil de distinguir entre las versiones Intel y AMD del ThinkPad E14 G5 es buscar el logotipo Thunderbolt en el borde izquierdo. Las versiones AMD carecen de compatibilidad tanto con Thunderbolt como con USB4, lo que da a las versiones Intel ventaja en lo que respecta a las capacidades de acoplamiento.
Comunicación
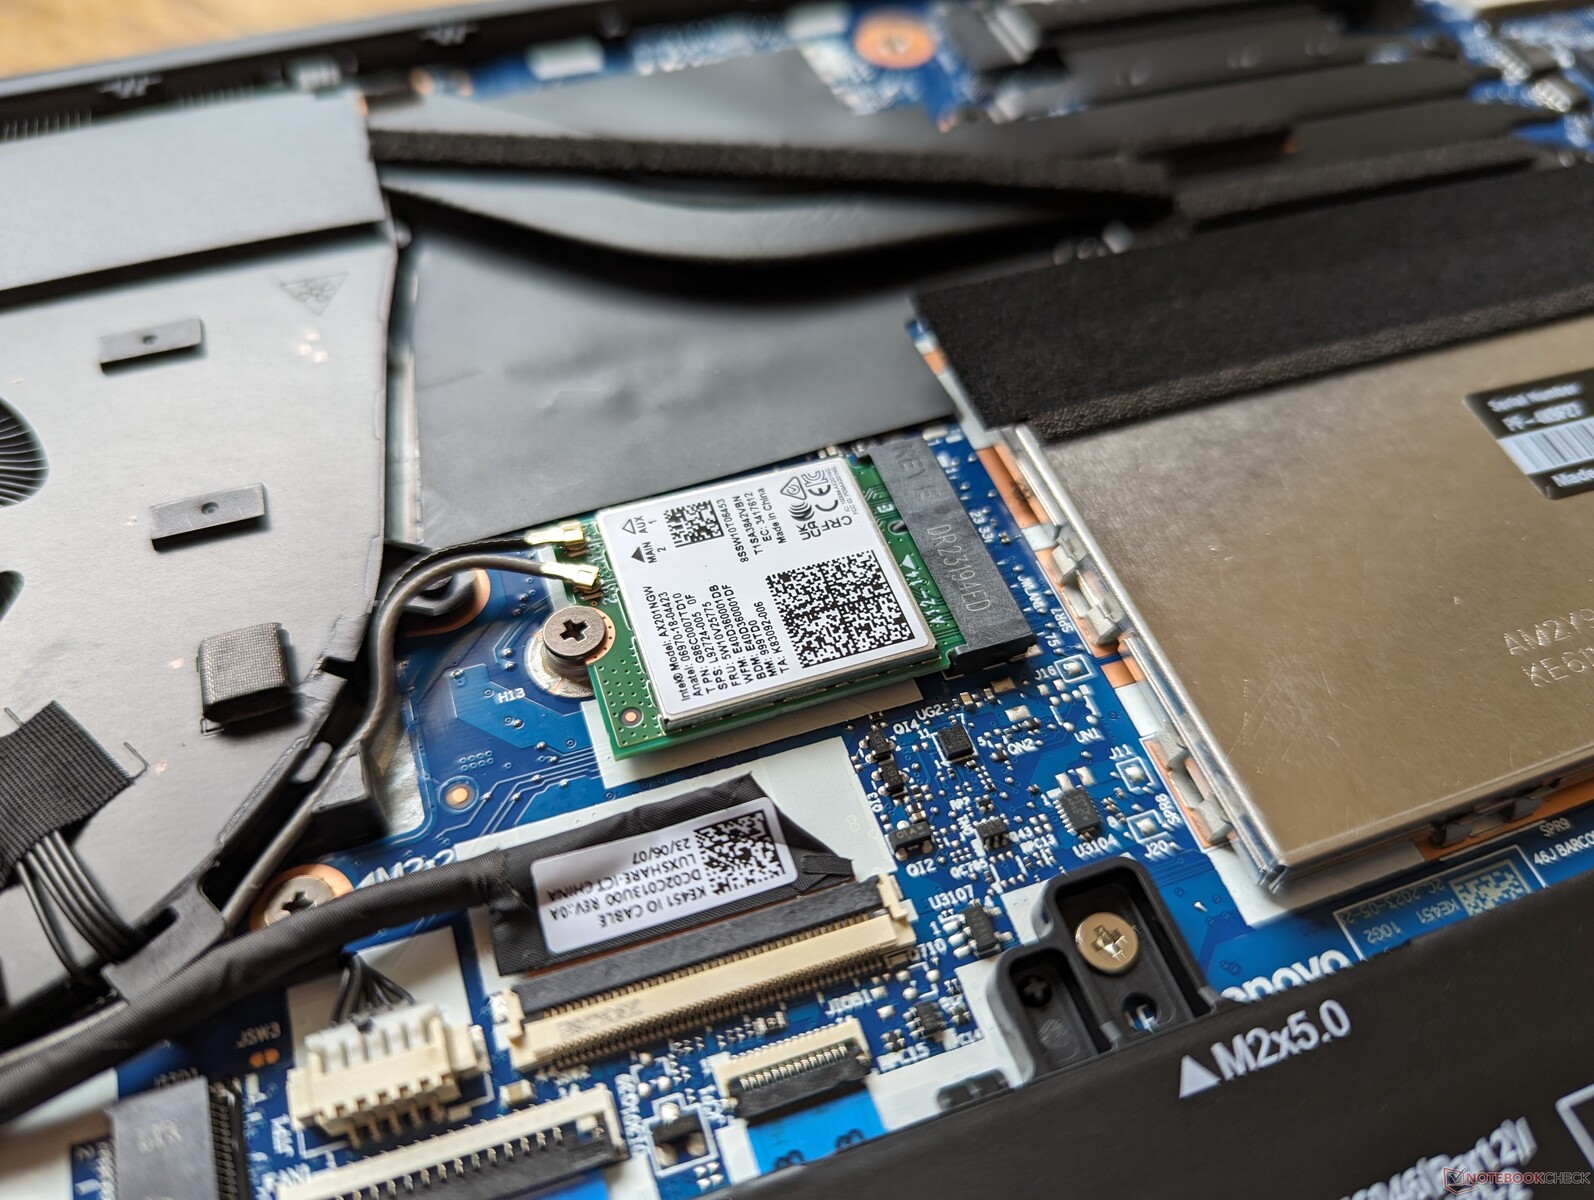
Se incluye un Intel AX201 para Wi-Fi 6 y compatibilidad con Bluetooth 5.1. El AX211, más caro, es opcional para los usuarios que deseen conectividad Wi-Fi 6E.
| Networking | |
| iperf3 transmit AXE11000 | |
| Lenovo ThinkPad E14 G5-21JSS05C00 | |
| Lenovo ThinkPad E14 G5 i7-1355U | |
| Dell Latitude 7440 | |
| Asus ZenBook 14 UM3402Y | |
| iperf3 receive AXE11000 | |
| Lenovo ThinkPad E14 G5-21JSS05C00 | |
| Lenovo ThinkPad E14 G5 i7-1355U | |
| Asus ZenBook 14 UM3402Y | |
| Dell Latitude 7440 | |
| iperf3 transmit AXE11000 6GHz | |
| HP EliteBook 845 G10 818N0EA | |
| Asus ZenBook 14 UM3402Y | |
| Dell Latitude 7440 | |
| iperf3 receive AXE11000 6GHz | |
| HP EliteBook 845 G10 818N0EA | |
| LG Gram 14Z90Q | |
| Asus ZenBook 14 UM3402Y | |
| Dell Latitude 7440 | |
Cámara web
Mientras que el obturador de privacidad viene de serie en todas las SKU, la resolución 1080p y el sensor de infrarrojos son opcionales. Es posible que las SKU de gama más baja se envíen con un sensor de 720p.


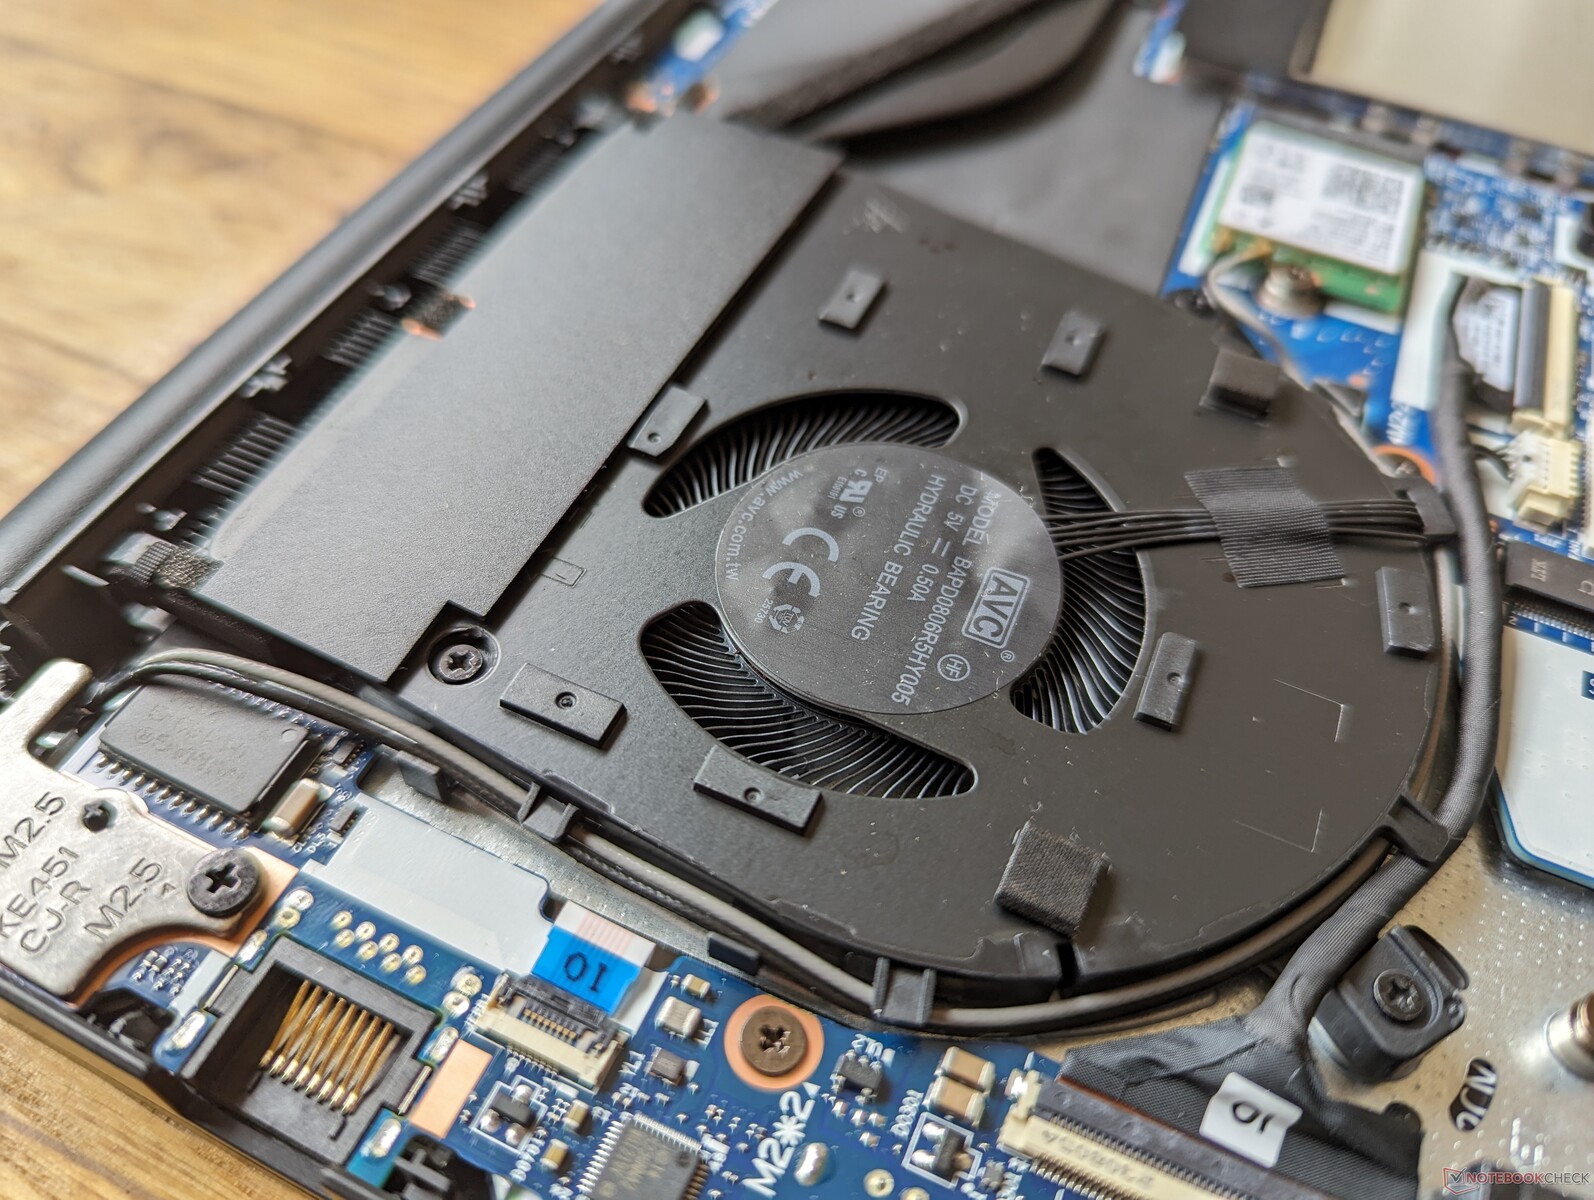
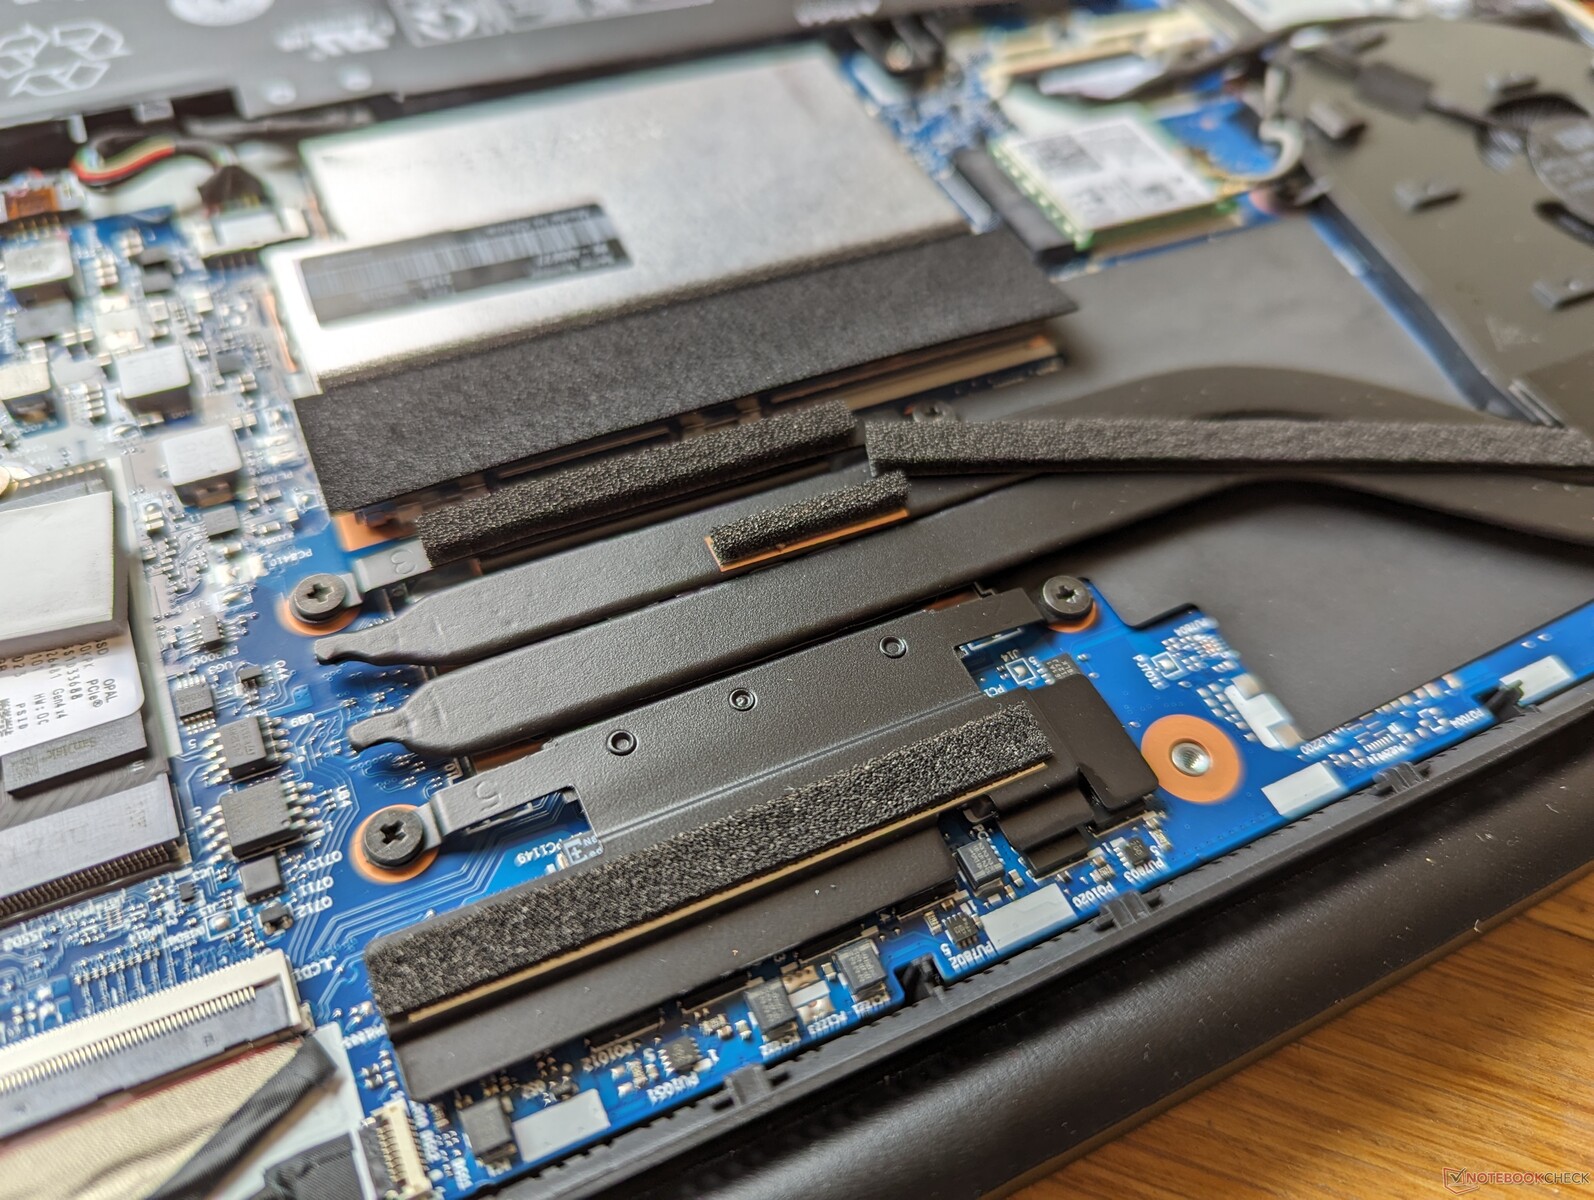
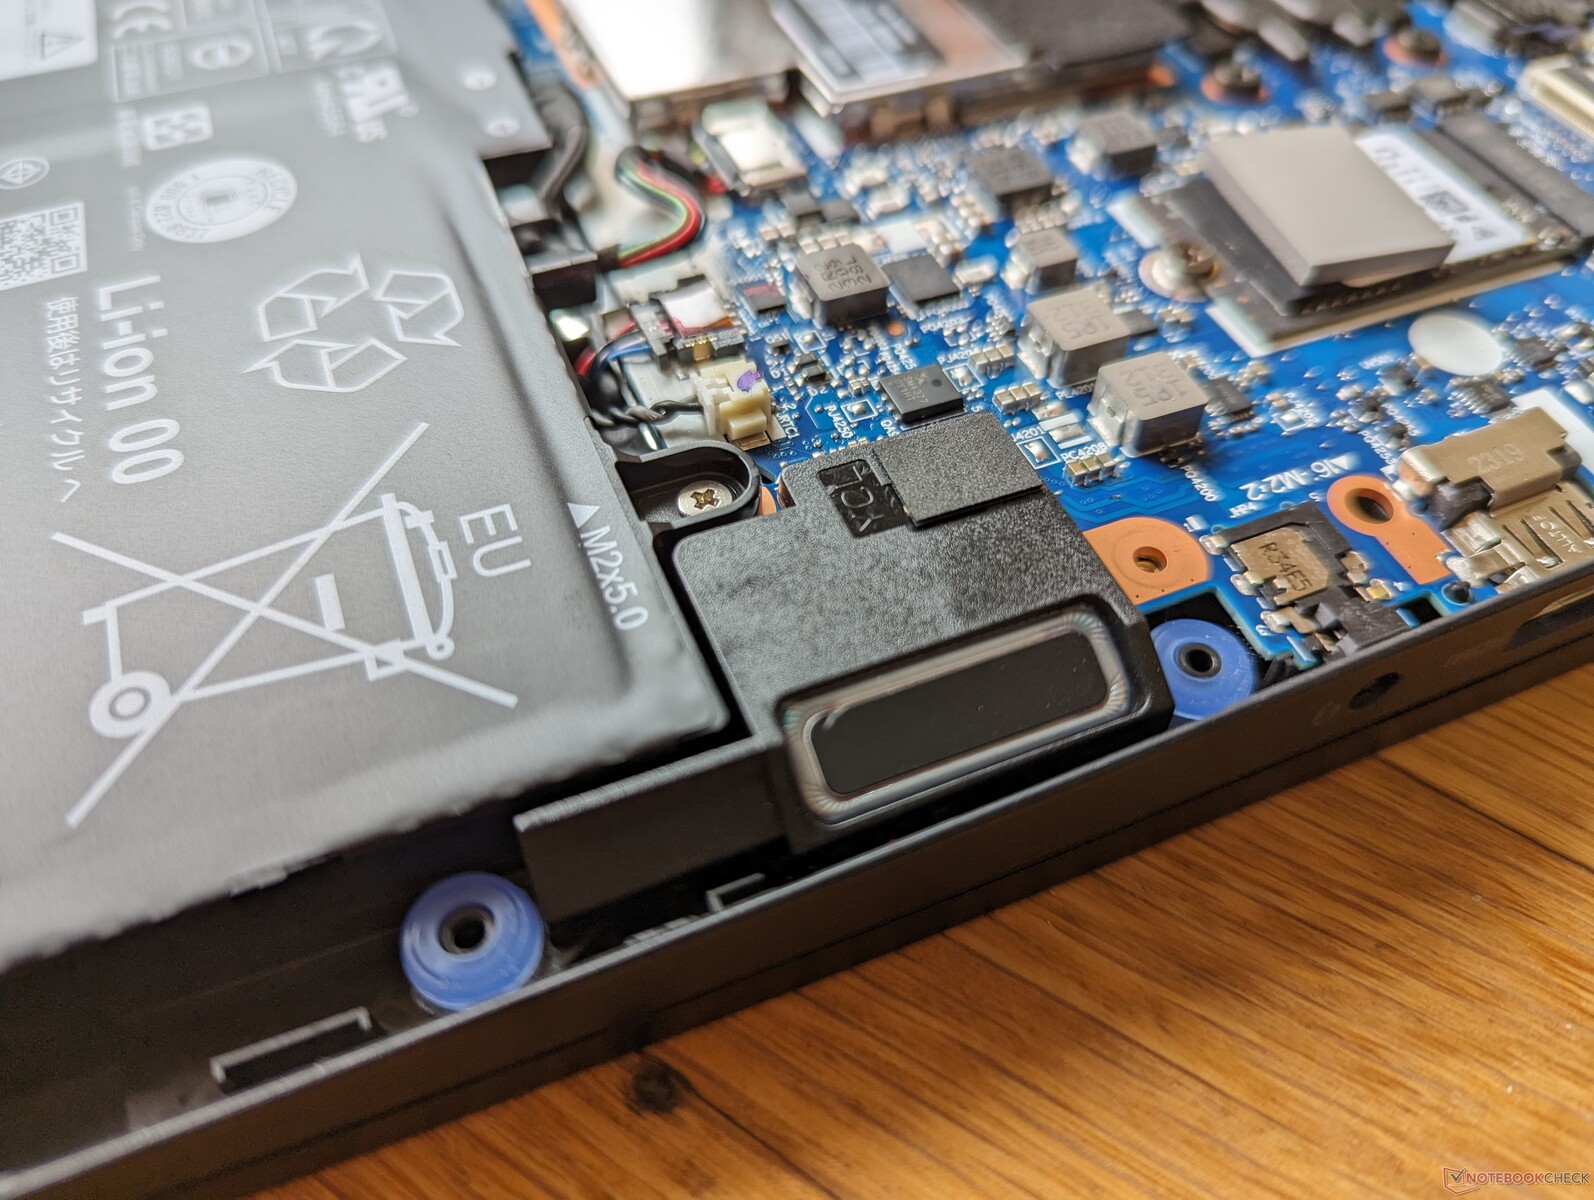
Mantenimiento
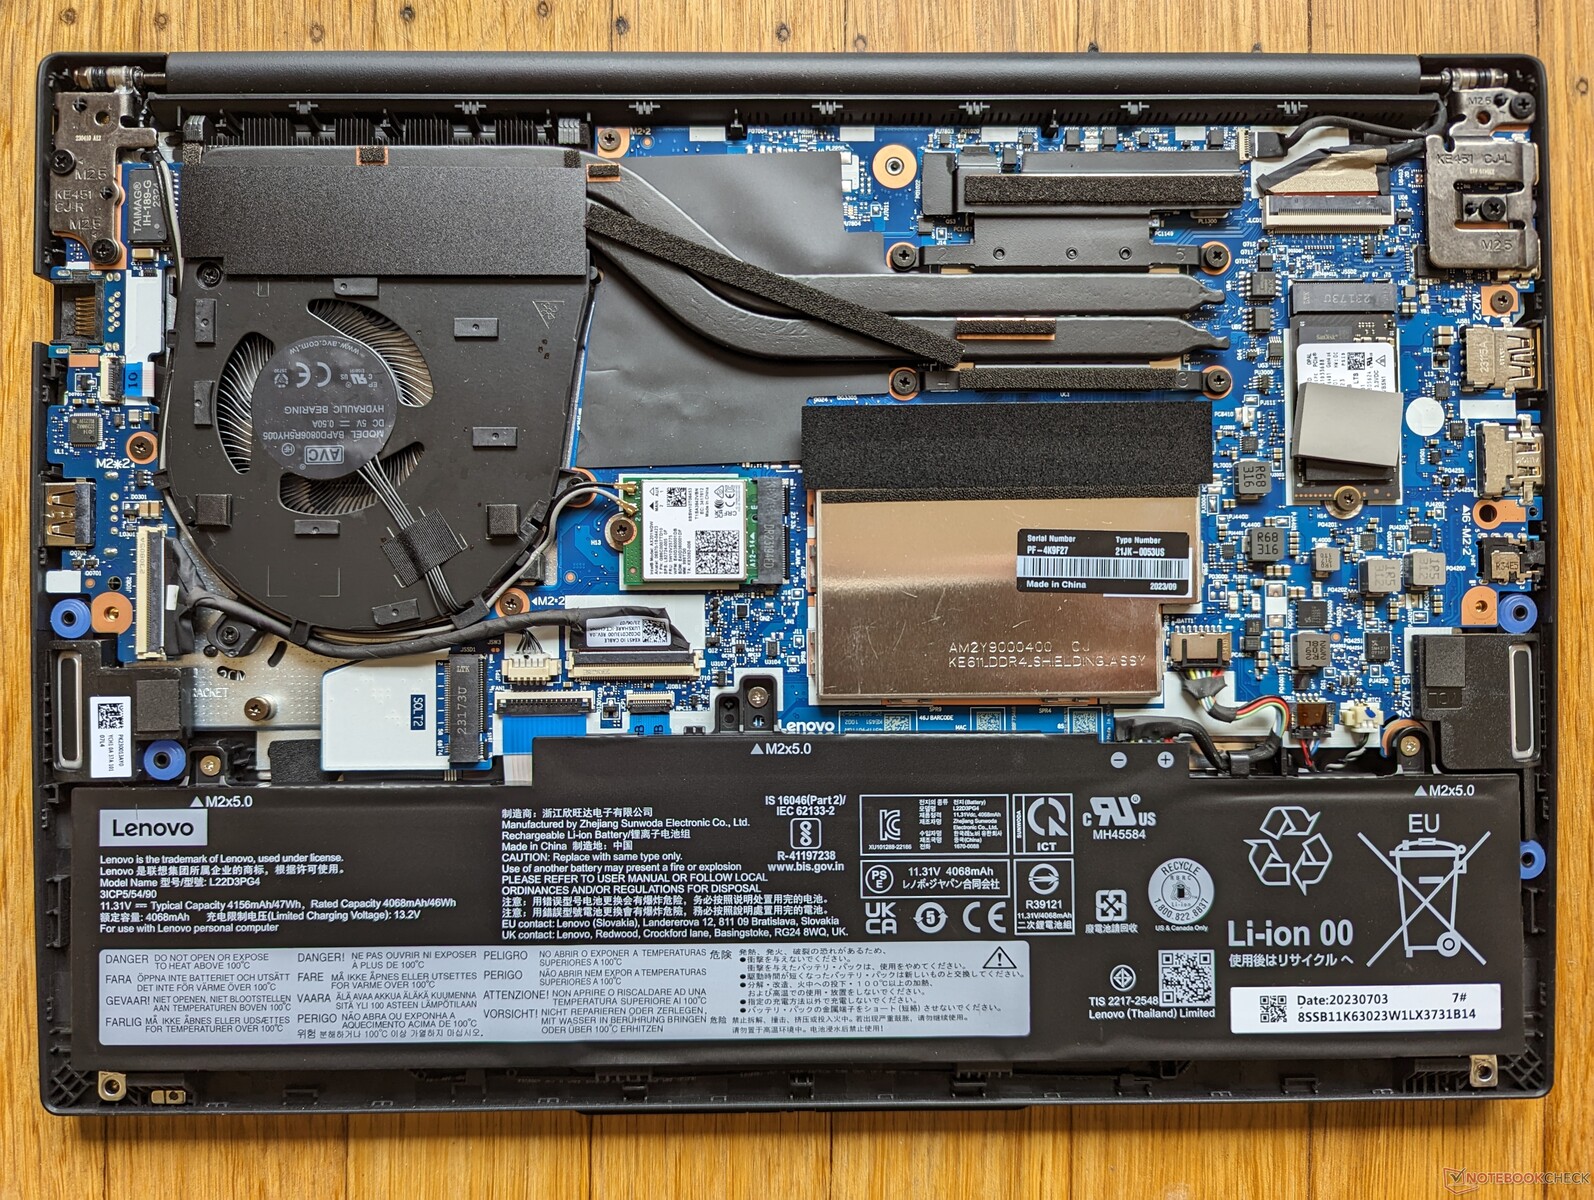
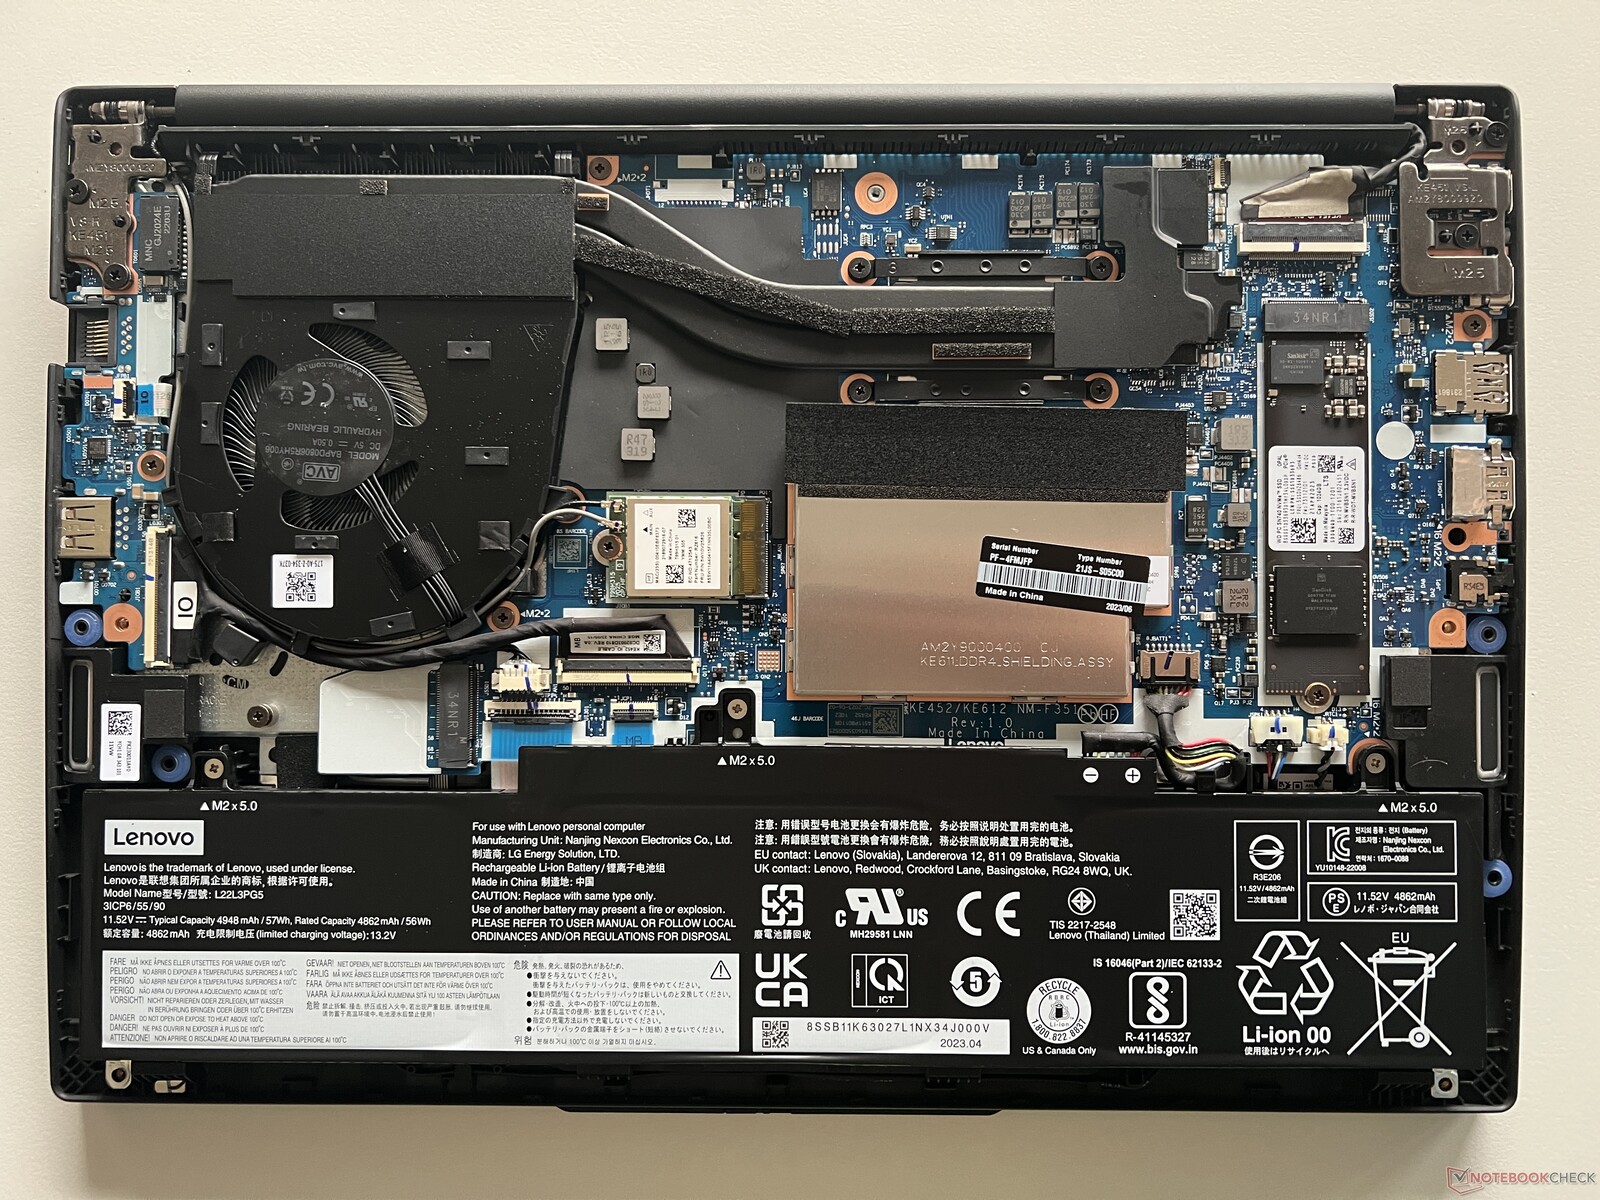
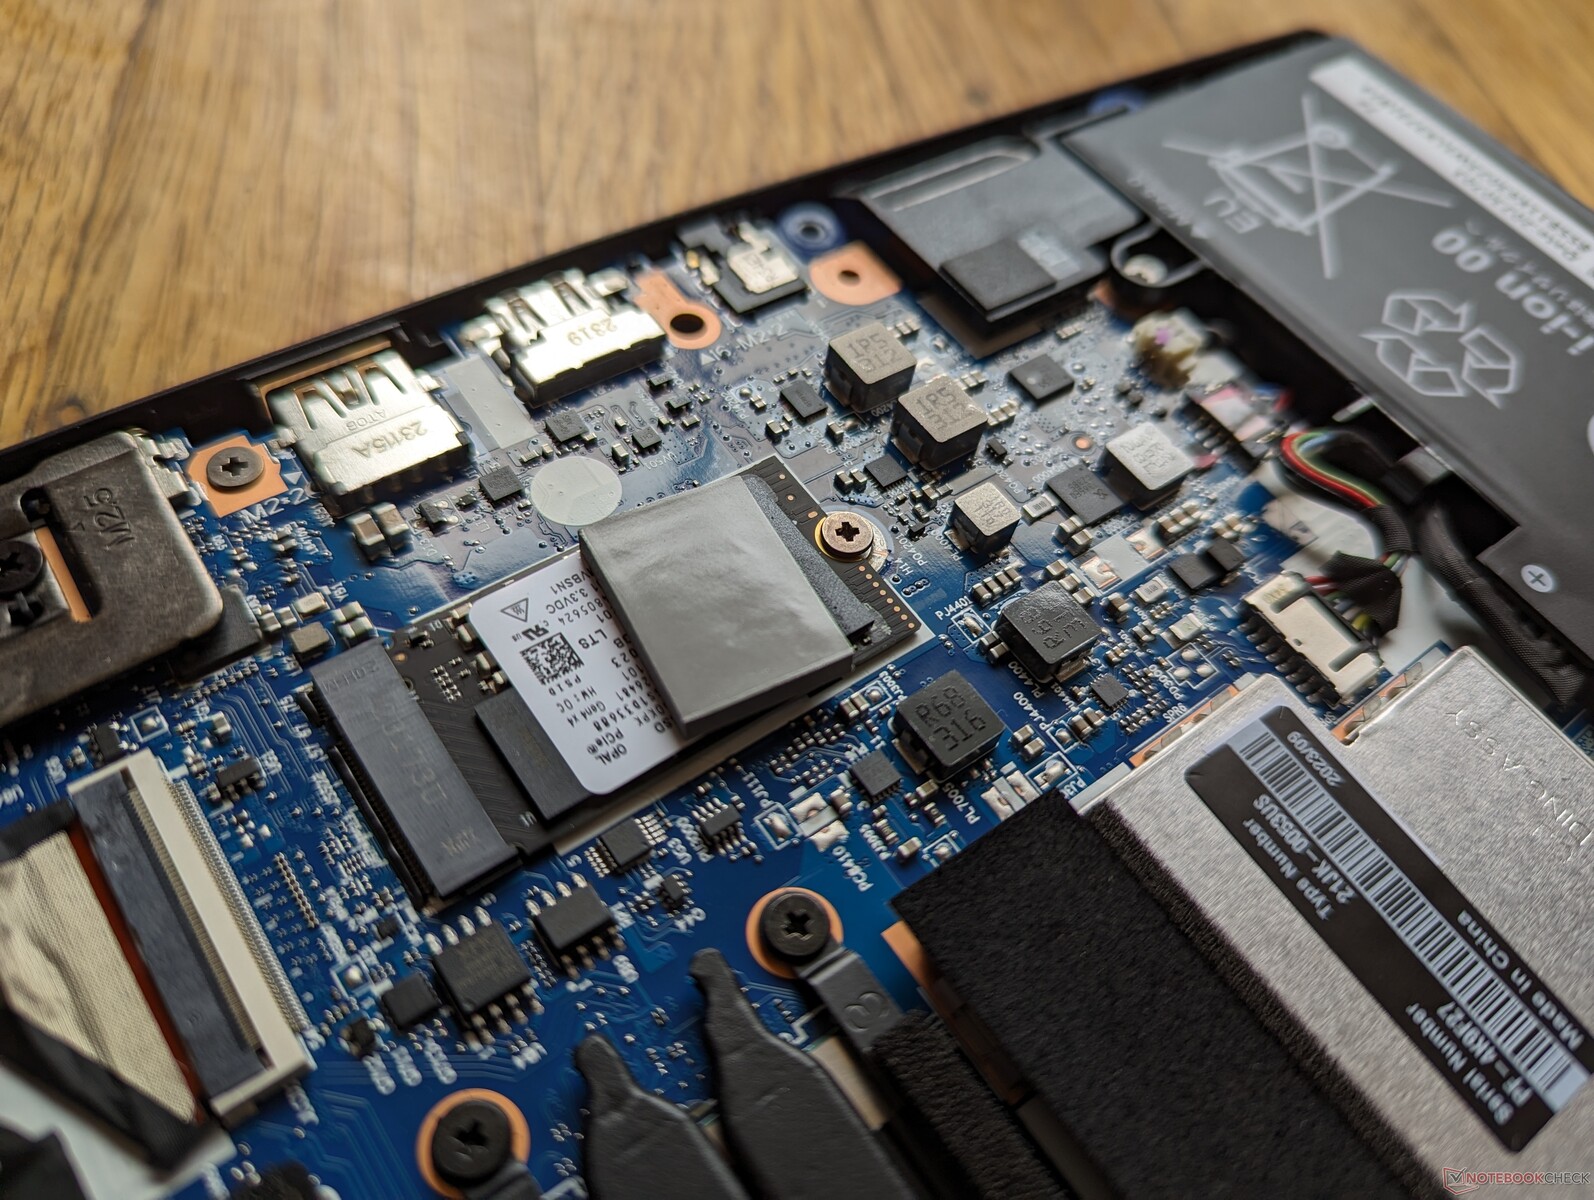
Una diferencia interesante entre las versiones Intel y AMD es que la versión Intel no admite unidades SSD M.2 2280 de longitud completa, como muestran las imágenes comparativas que aparecen a continuación. Aún se pueden instalar hasta dos unidades (PCIe4 x4 + PCIe3 x4), pero cada una debe tener una longitud máxima de 42 mm (2242).
Accesorios y garantía
No hay más extras en la caja que el adaptador de CA y la documentación. Se aplica una garantía limitada del fabricante de un año si se adquiere en EE.UU.
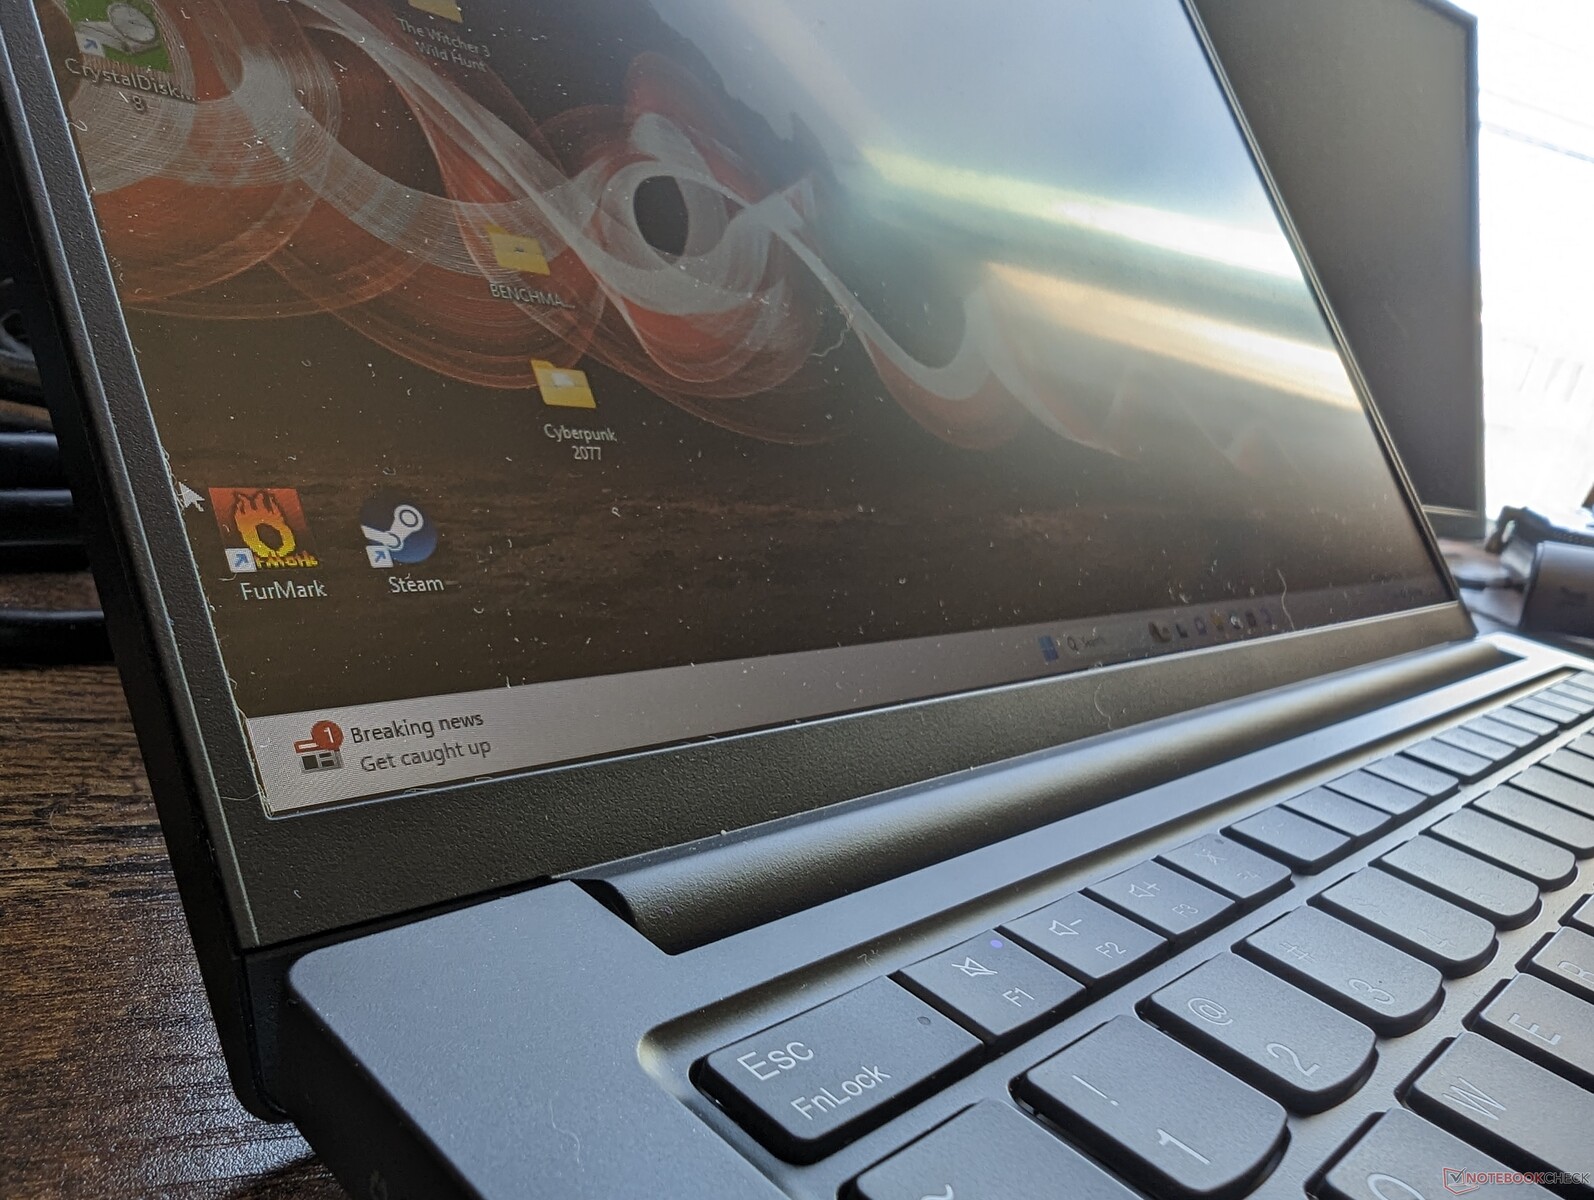
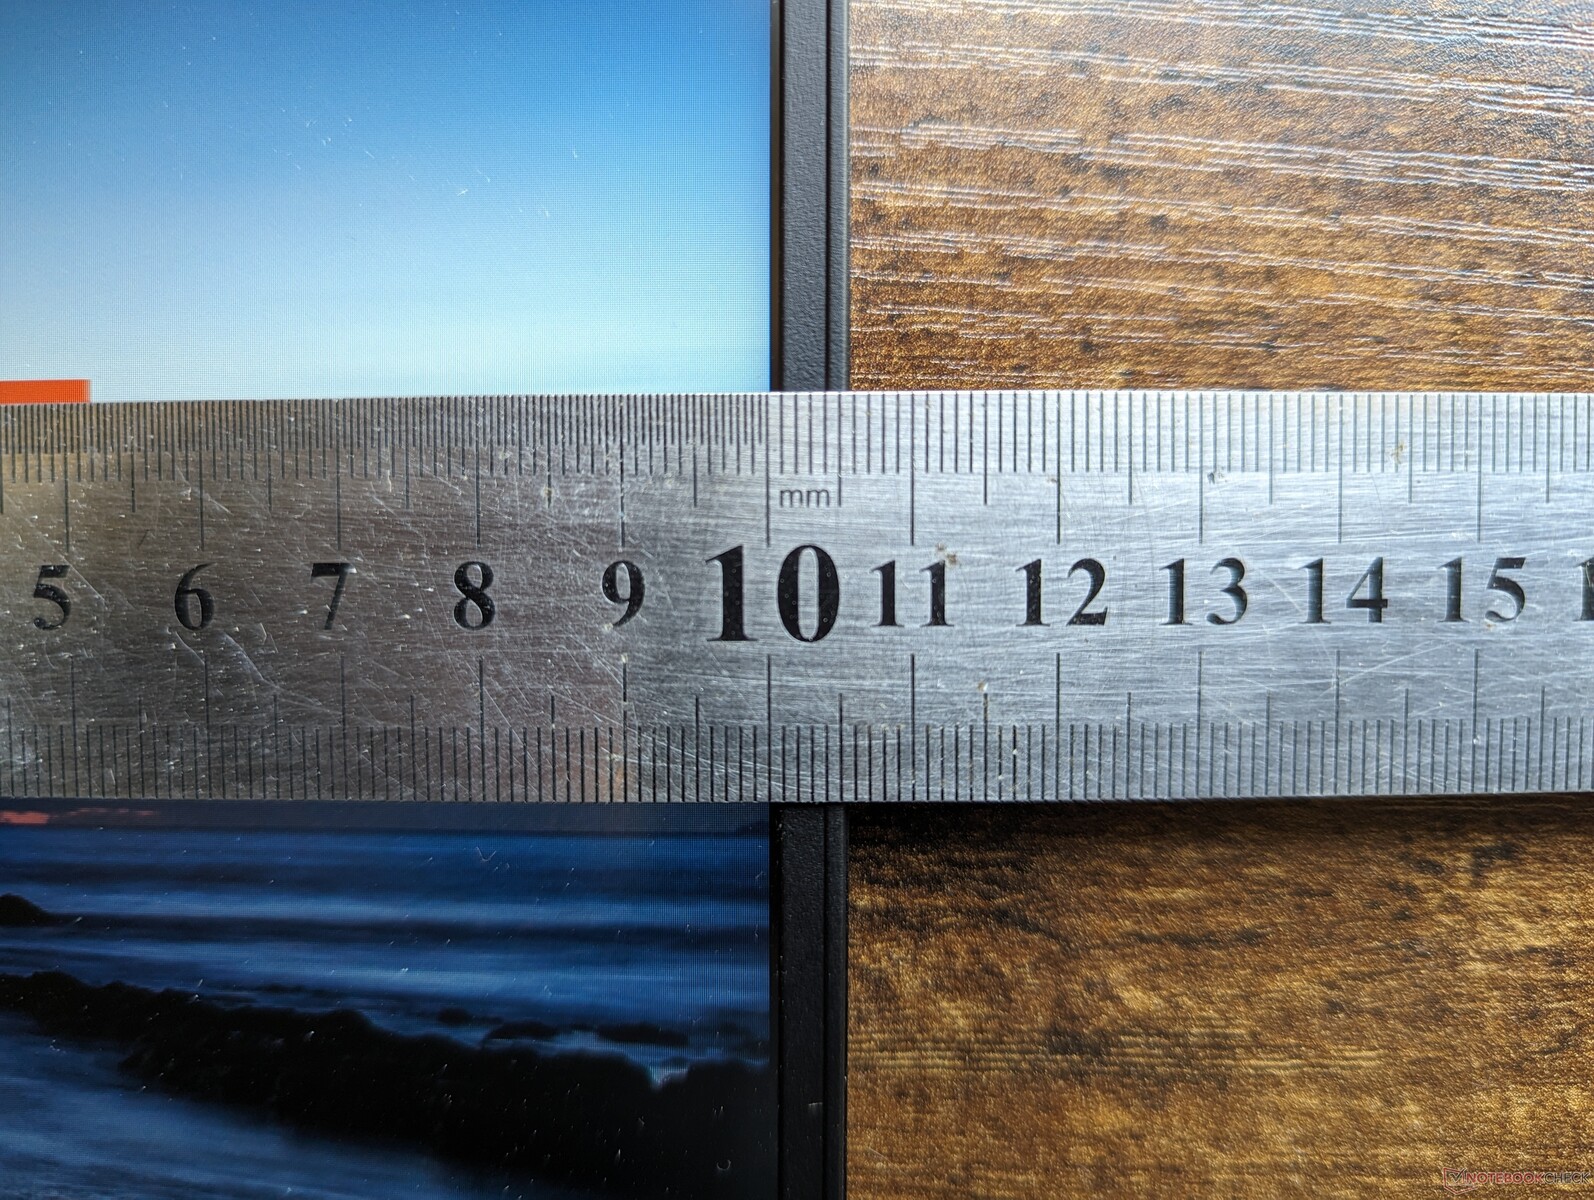
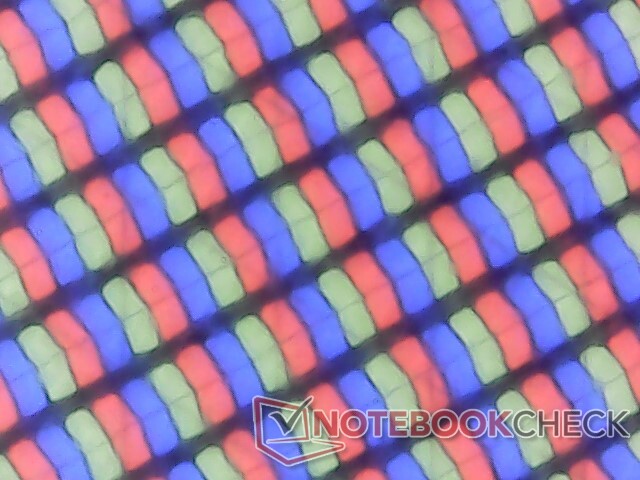
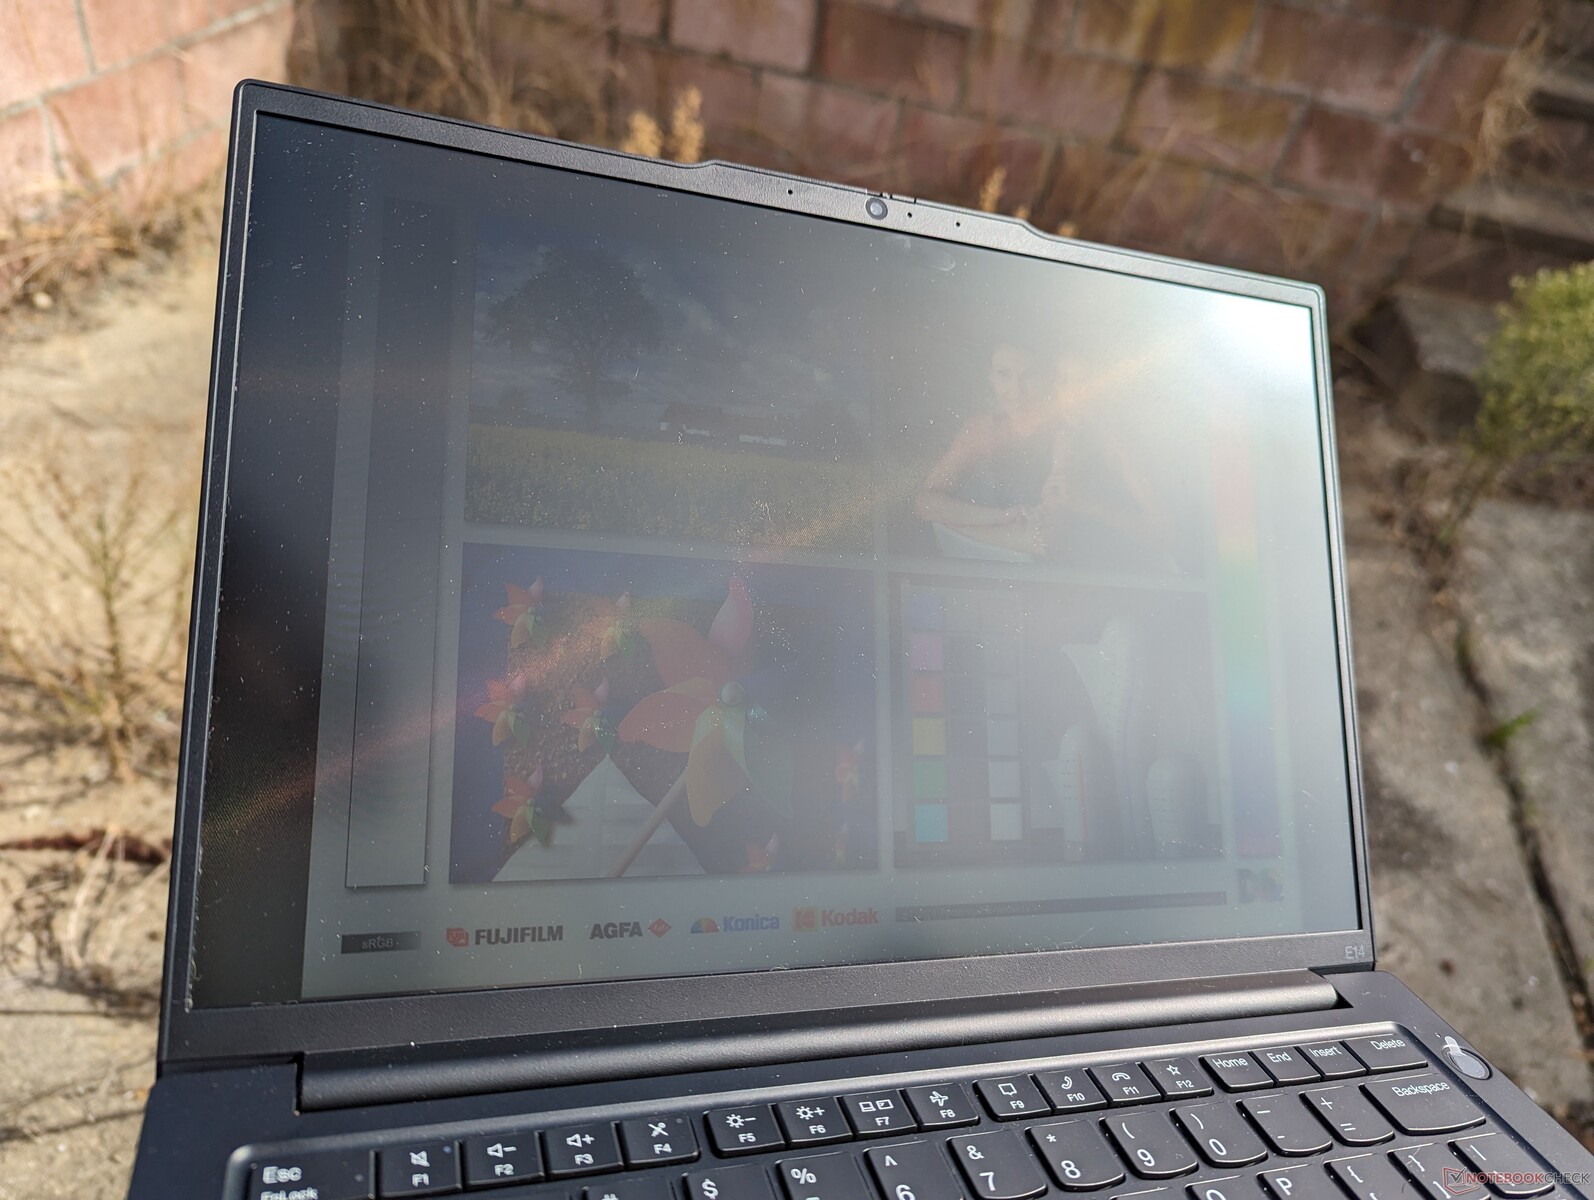
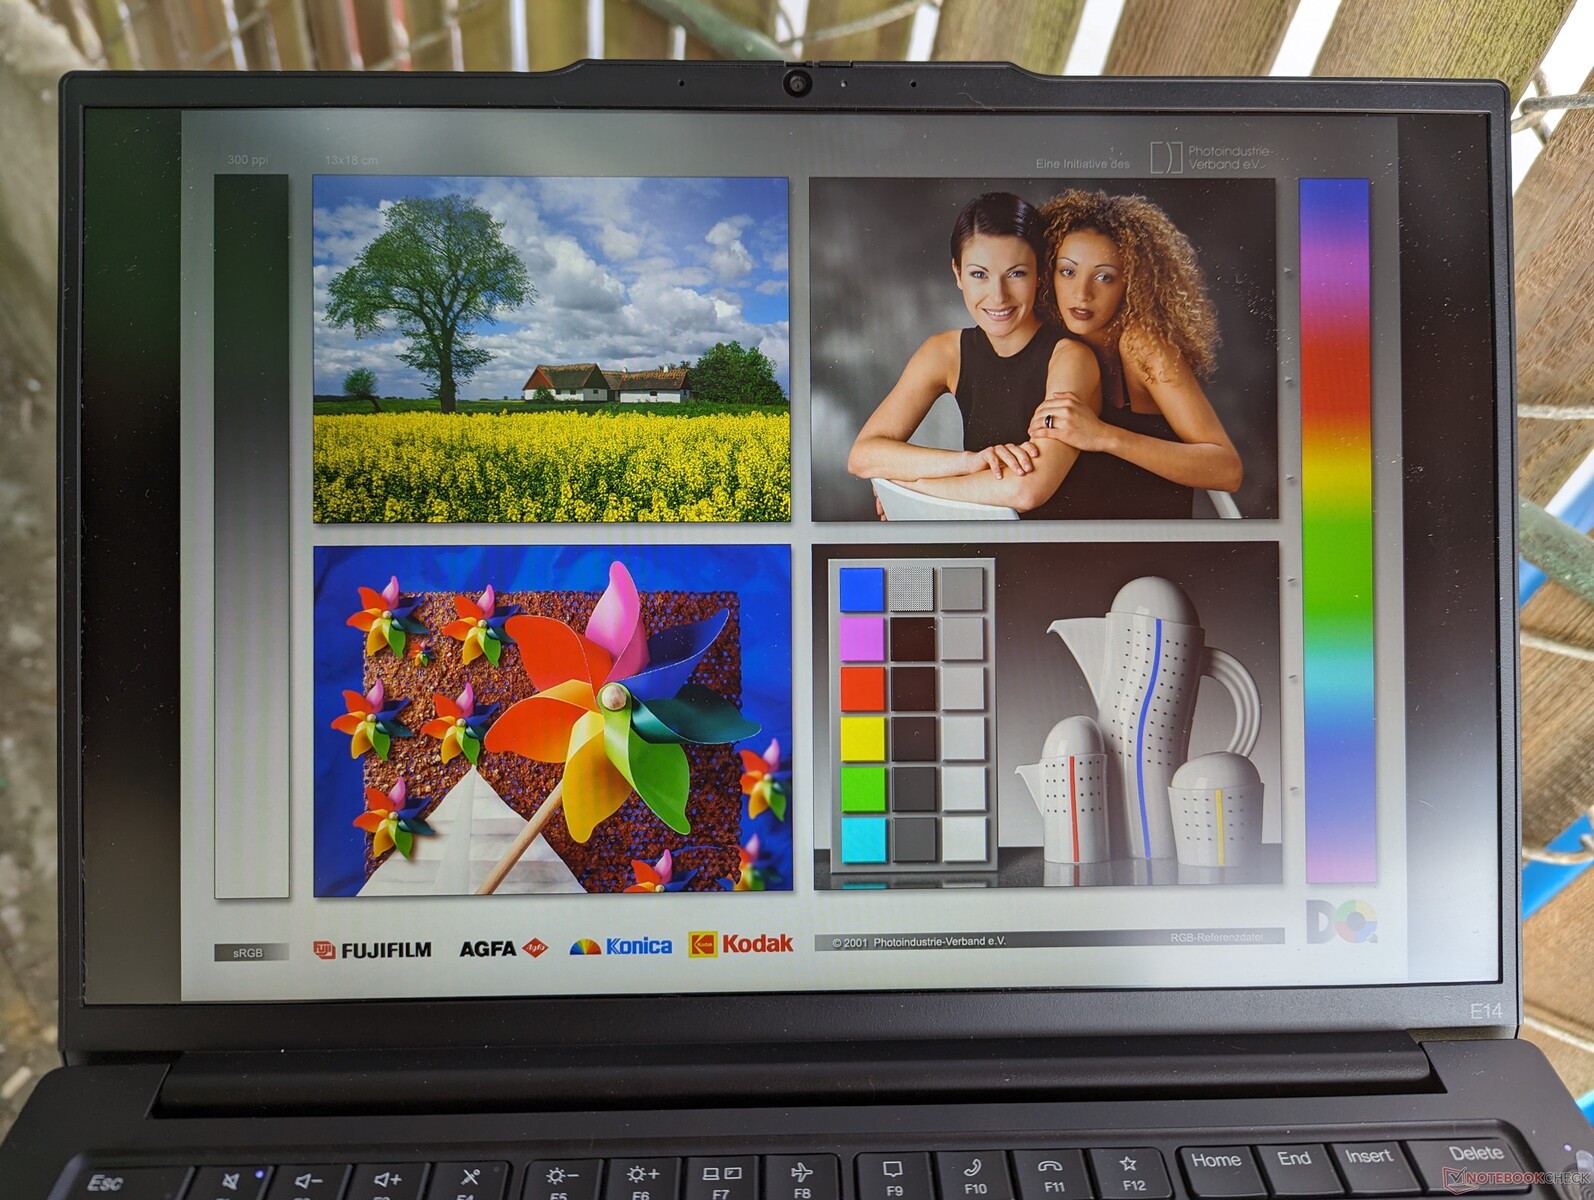
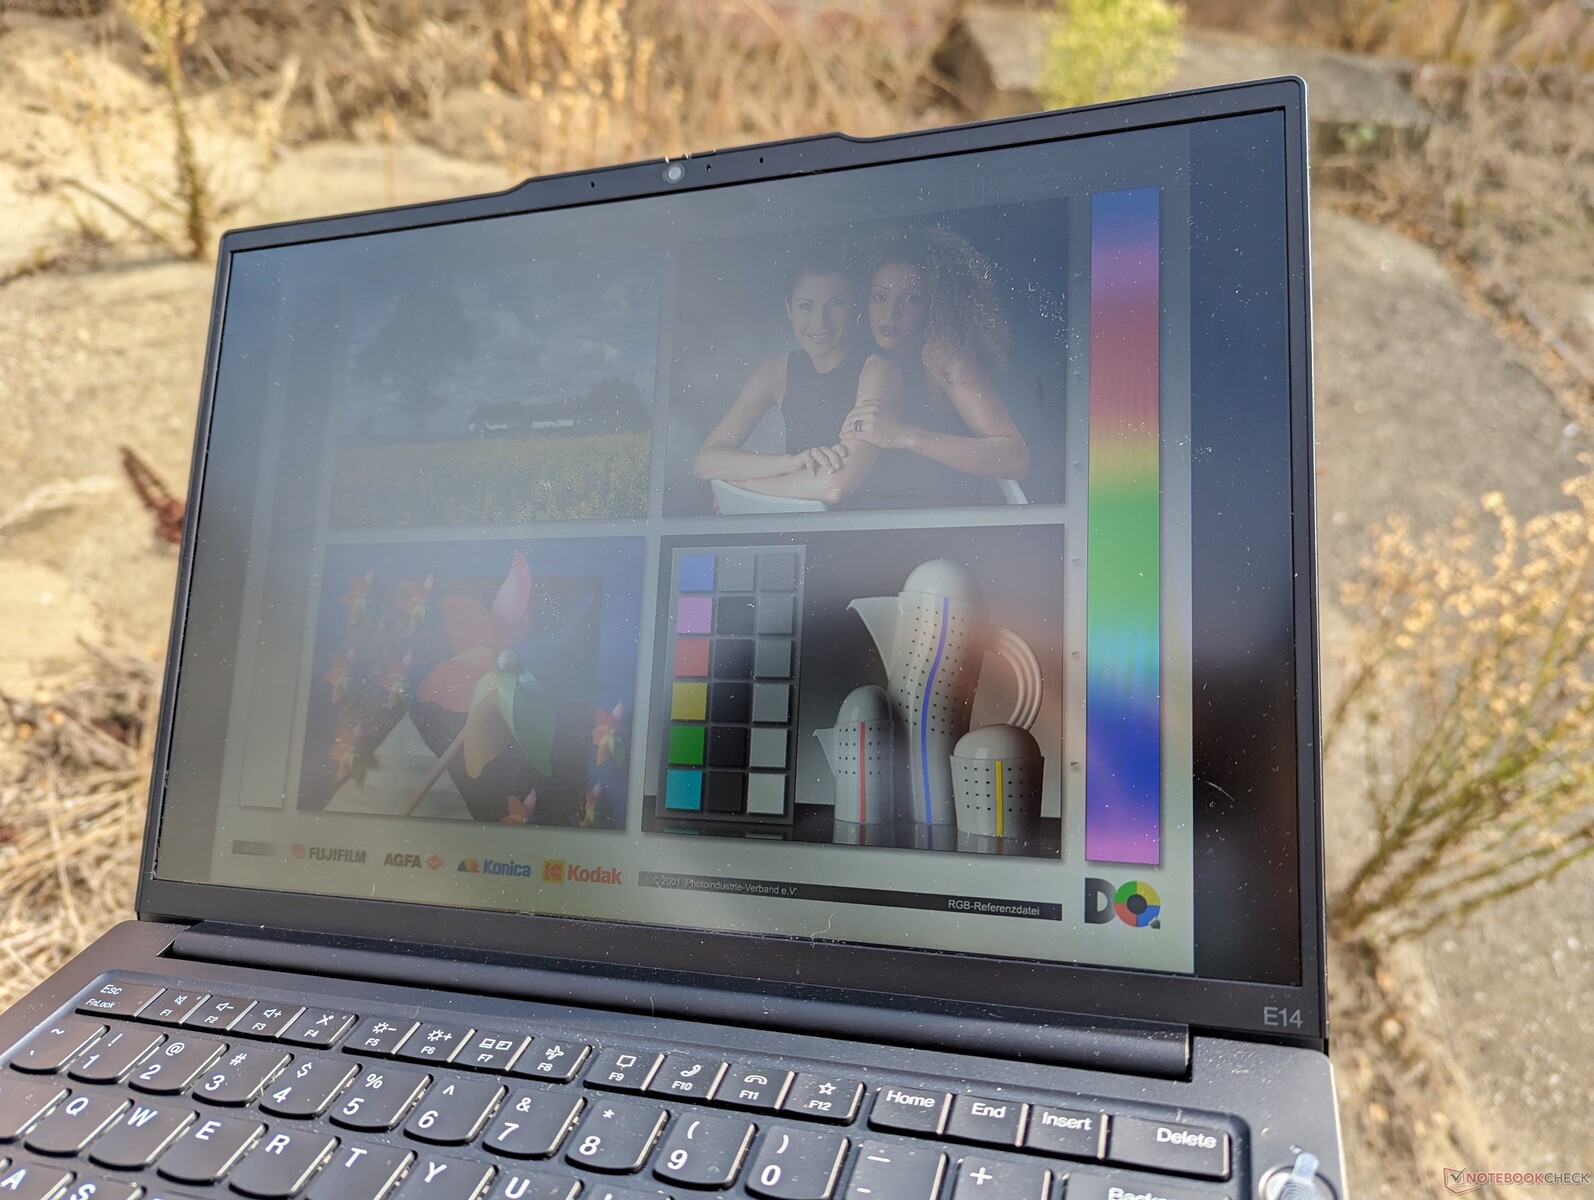
Mostrar
Dispone de tres opciones de visualización
- 1920 x 1200, IPS, 60% sRGB, 60 Hz, 300-nits, no táctil, mate
- 1920 x 1200, IPS, 60% sRGB, 60 Hz, 300-nits, táctil, mate
- 2240 x 1400, IPS, 100% sRGB, 60 Hz, 300-nits, no táctil, mate
Mientras que nuestra unidad AMD estaba configurada con el panel 1400p, nuestra unidad Intel viene con la opción en negrita en su lugar. Recomendamos el panel 1400p si sus cargas de trabajo exigen colores más precisos y una mayor relación de contraste. Por lo demás, otros atributos como el brillo y los tiempos de respuesta blanco-negro parecen ser consistentes entre todas las opciones.
| |||||||||||||||||||||||||
iluminación: 86 %
Brillo con batería: 352.3 cd/m²
Contraste: 1305:1 (Negro: 0.27 cd/m²)
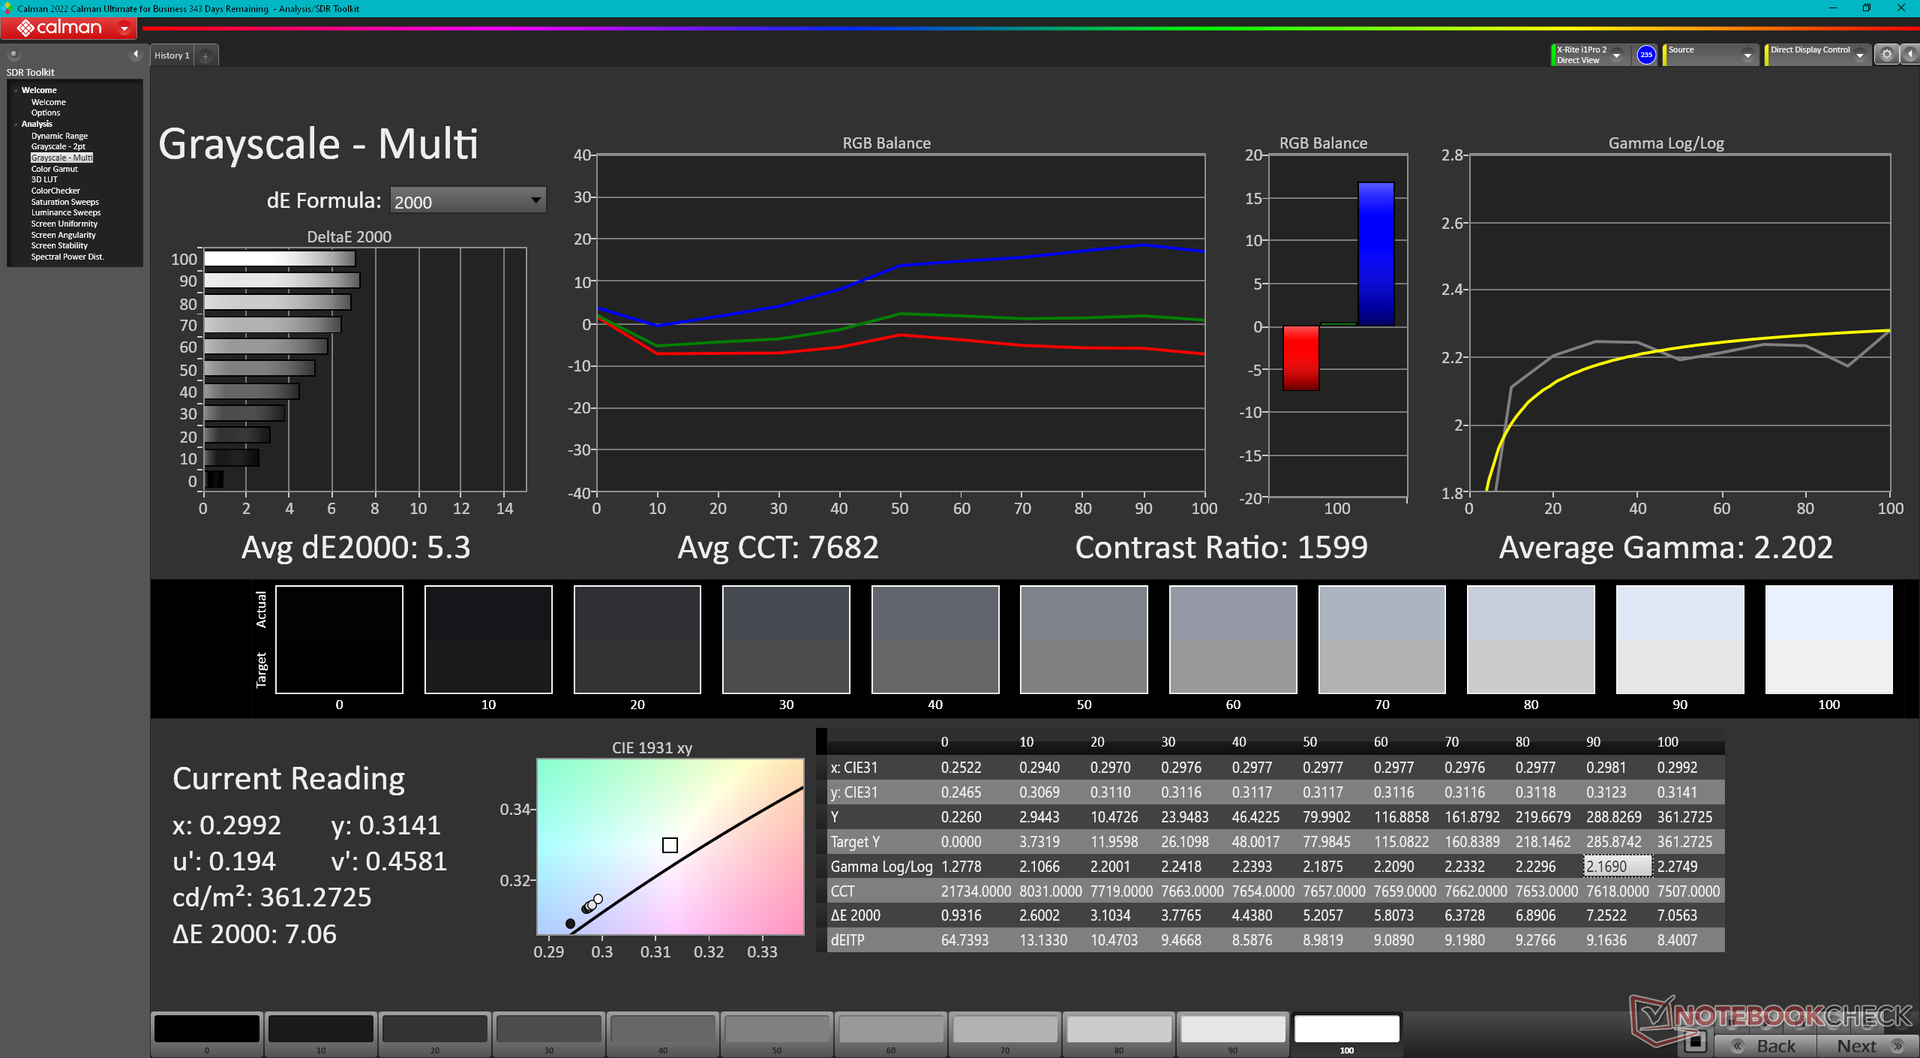
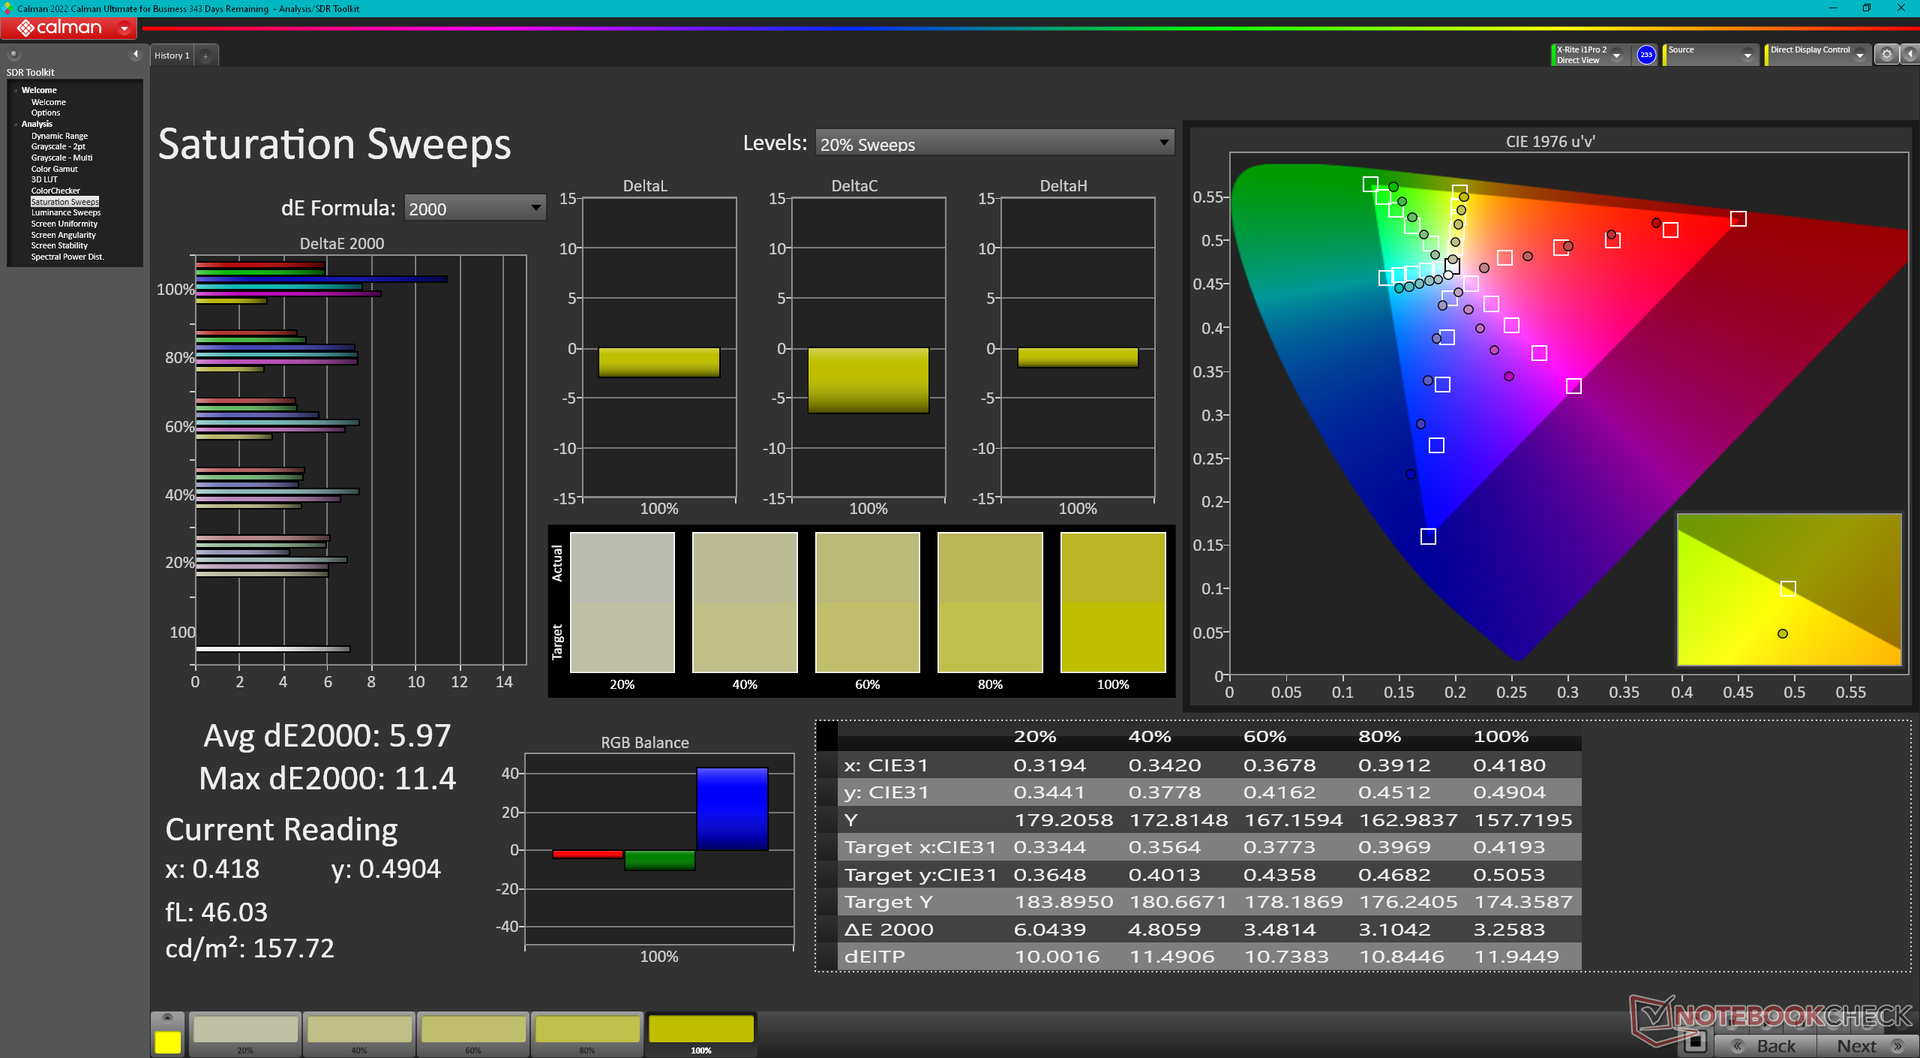
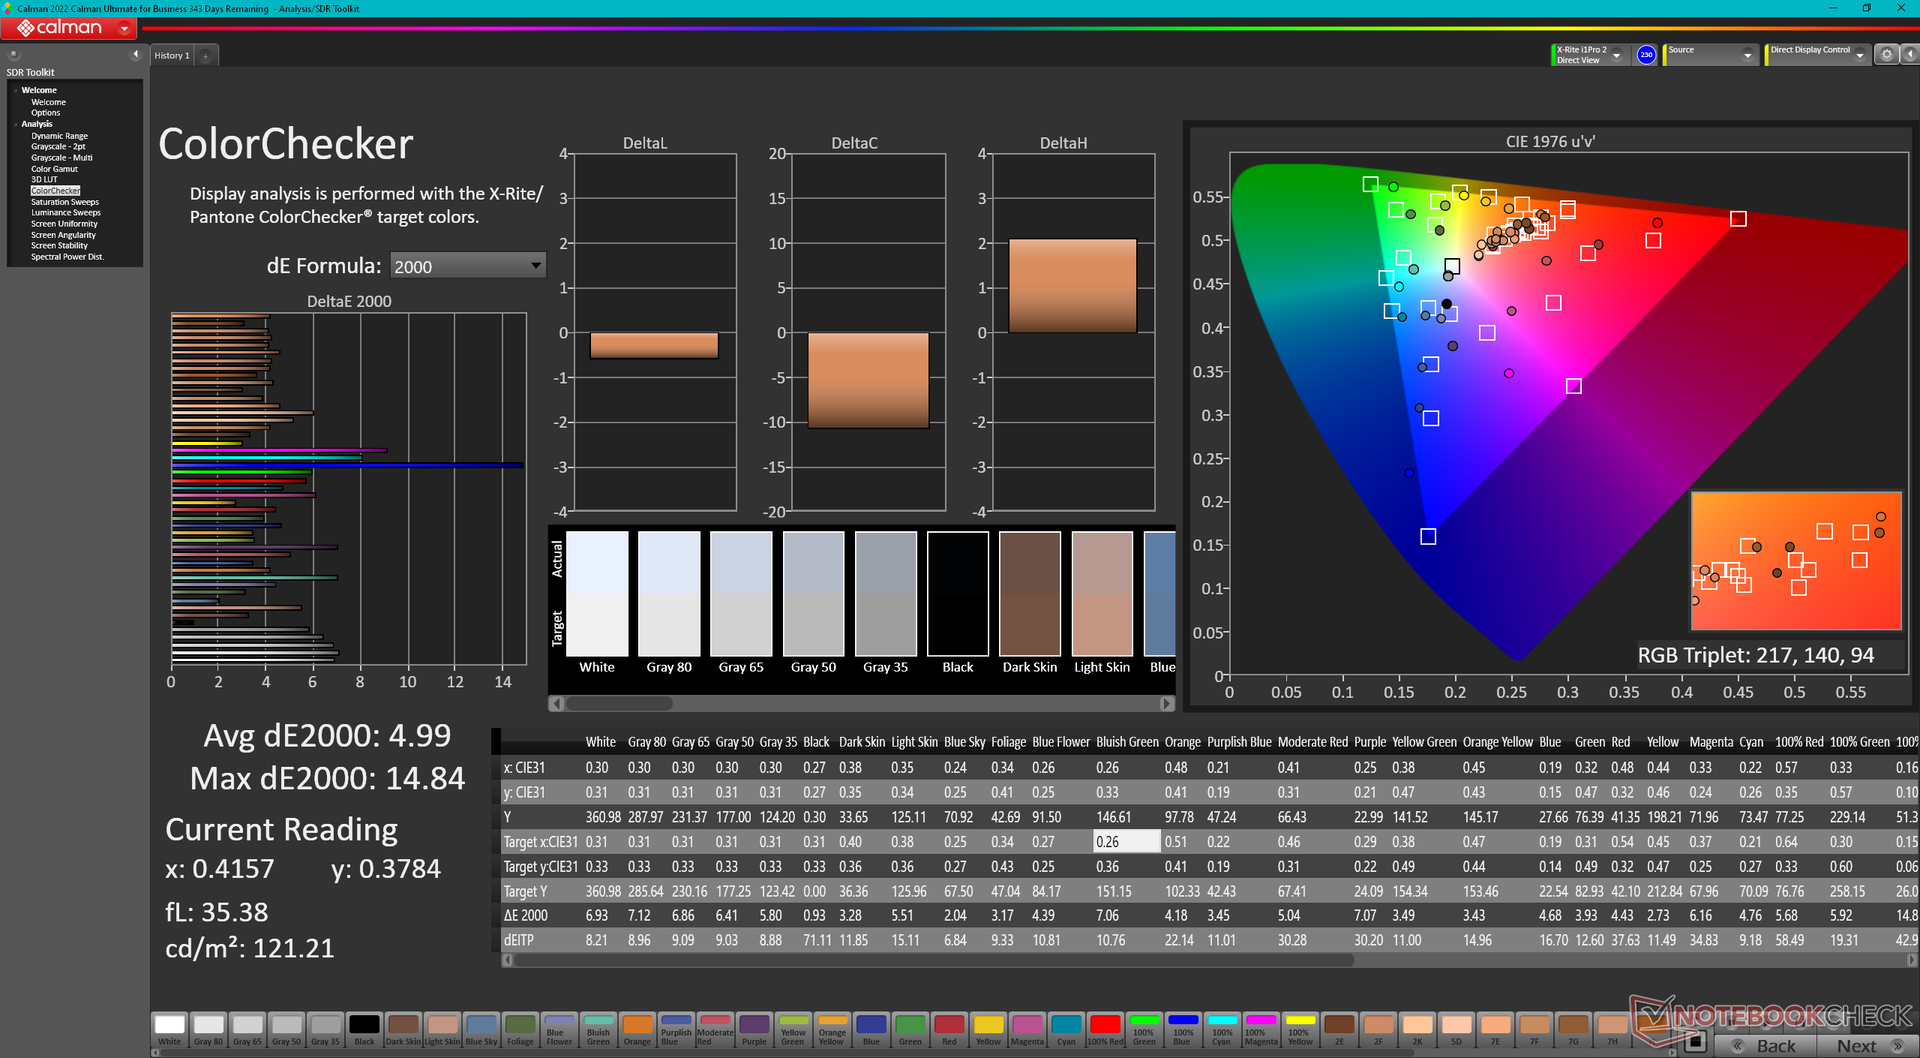
ΔE ColorChecker Calman: 4.99 | ∀{0.5-29.43 Ø4.71}
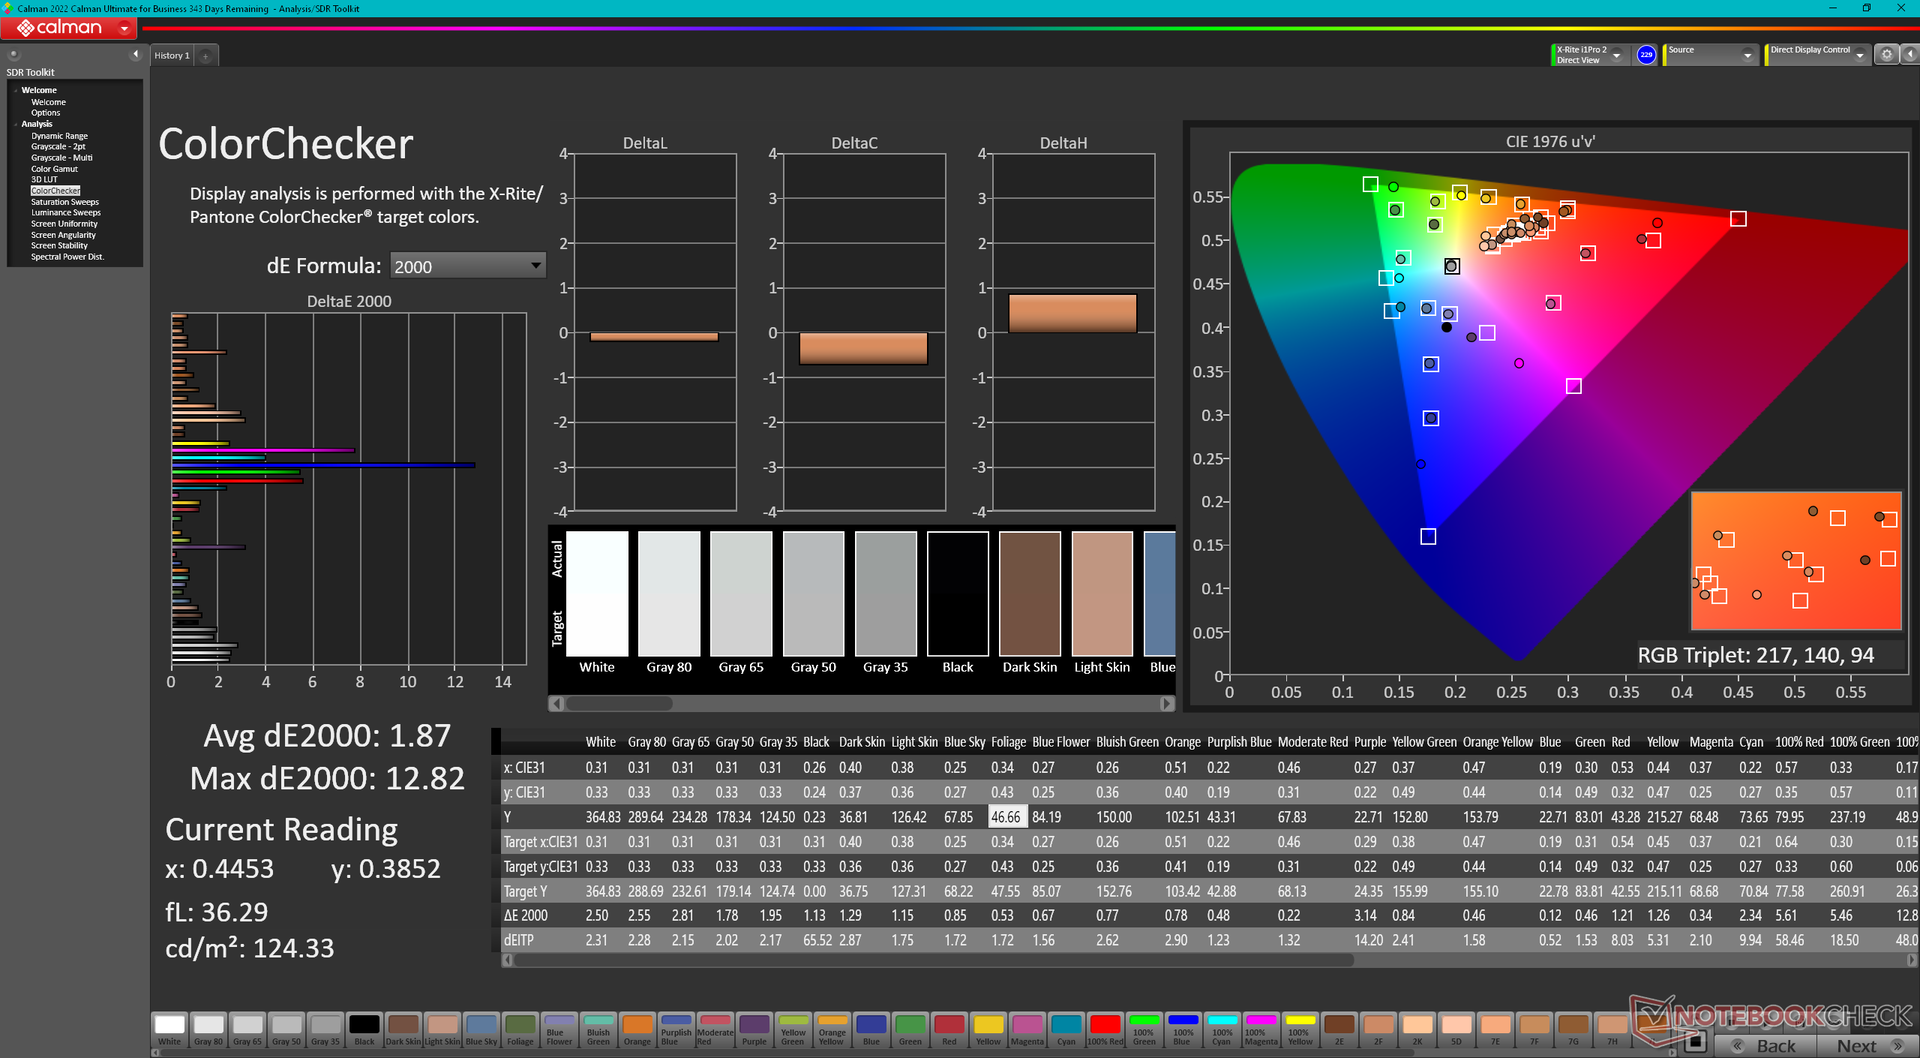
calibrated: 1.87
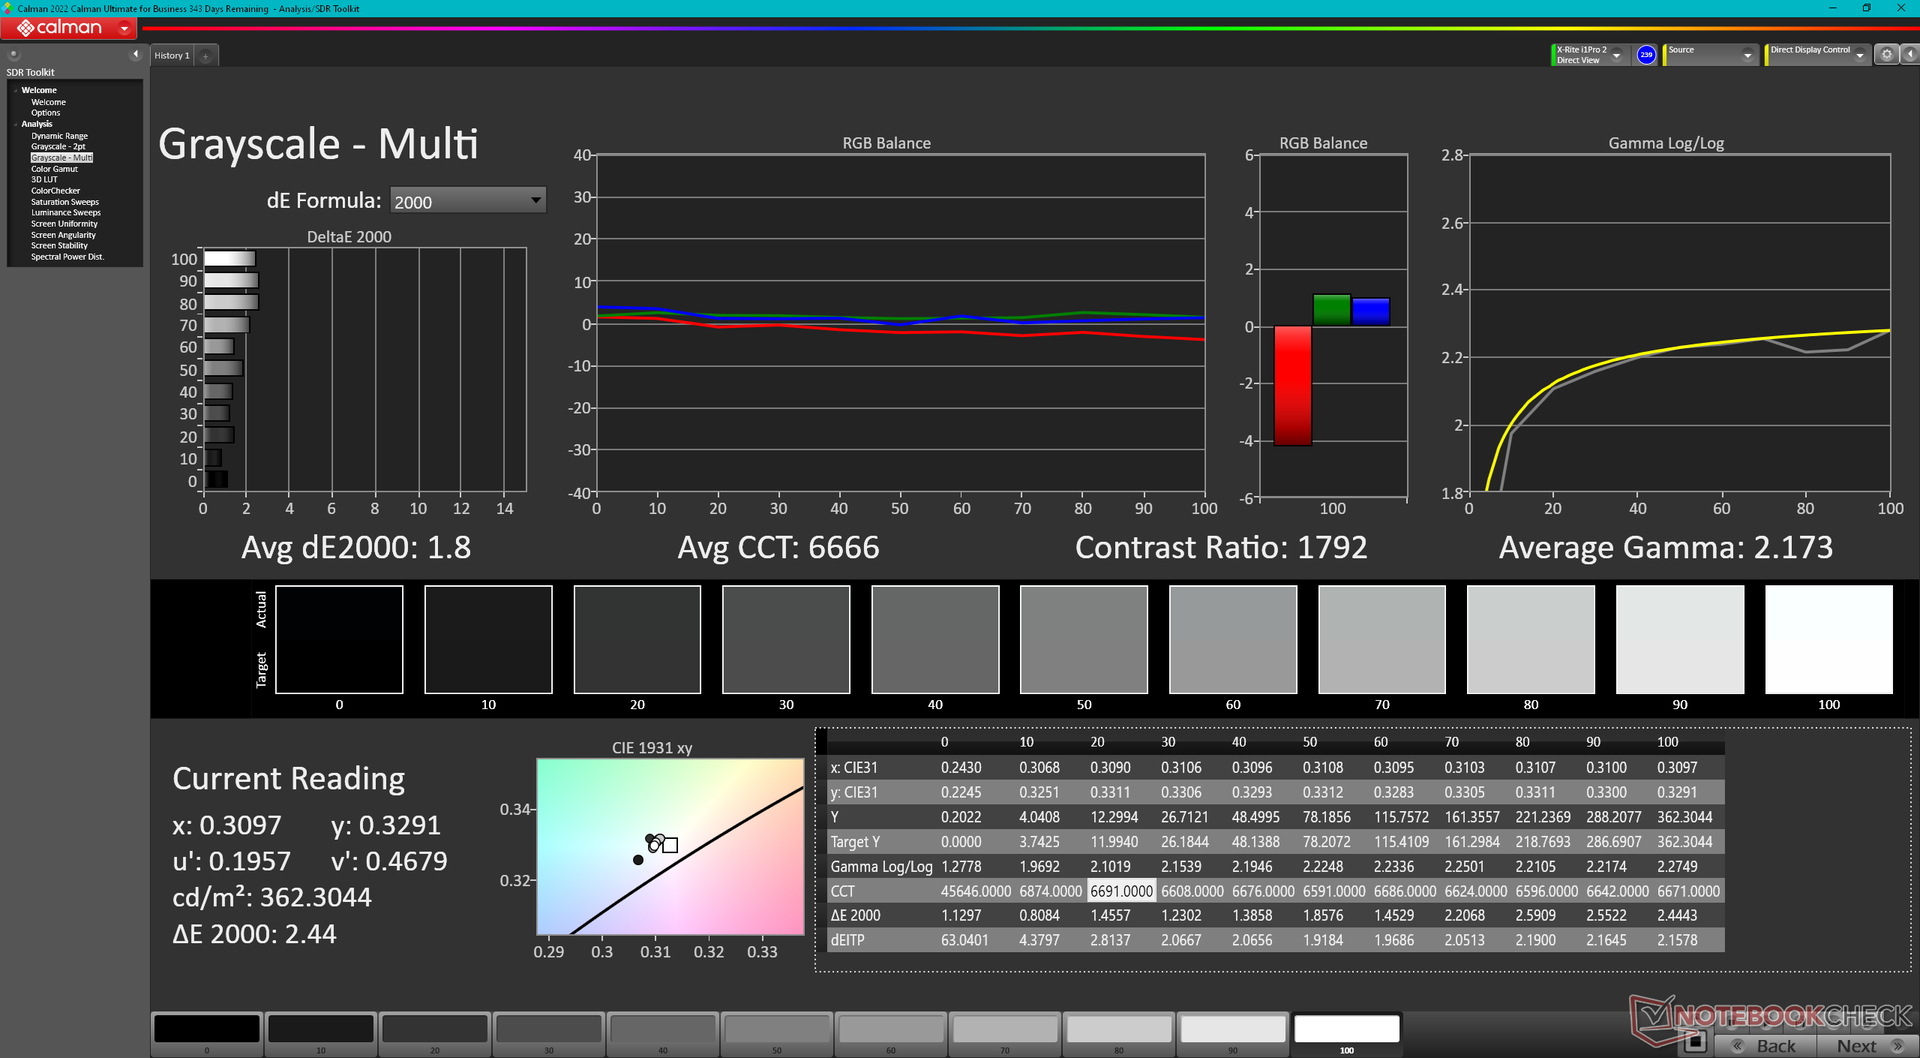
ΔE Greyscale Calman: 5.3 | ∀{0.09-98 Ø4.96}
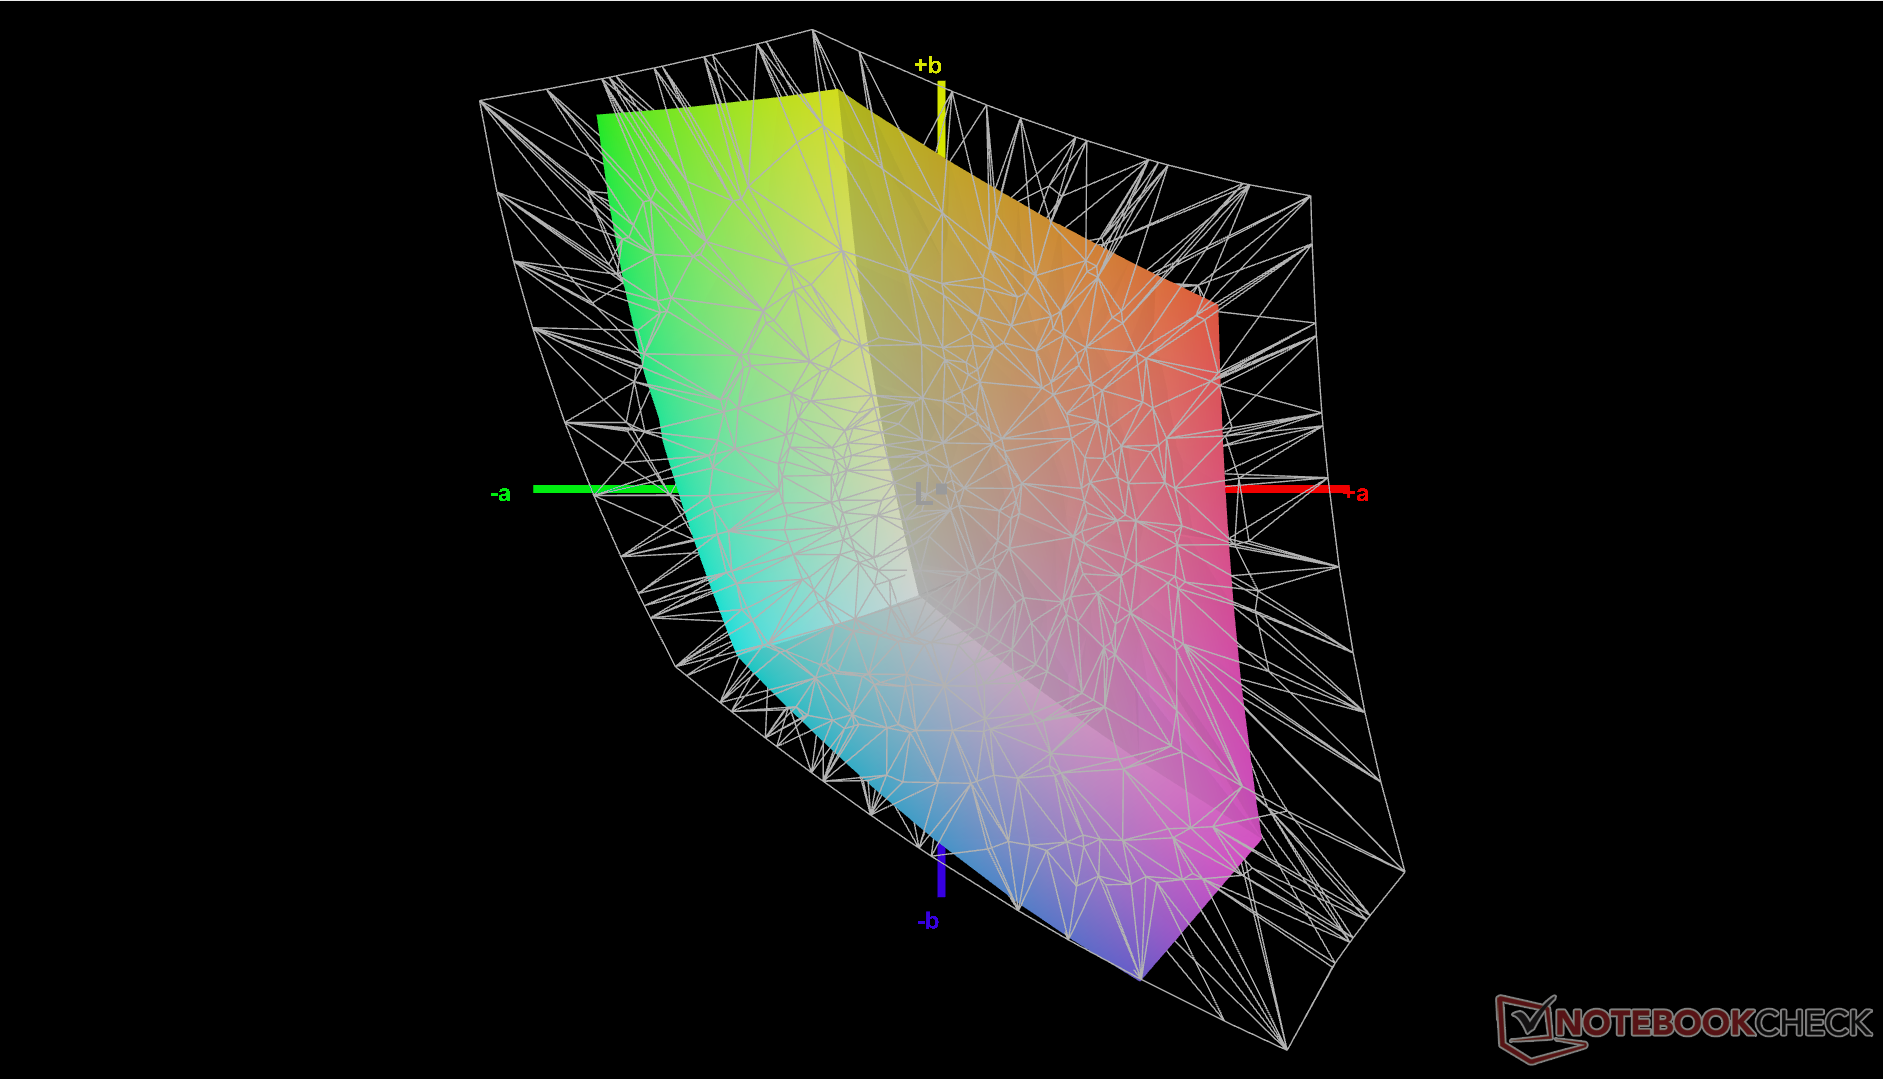
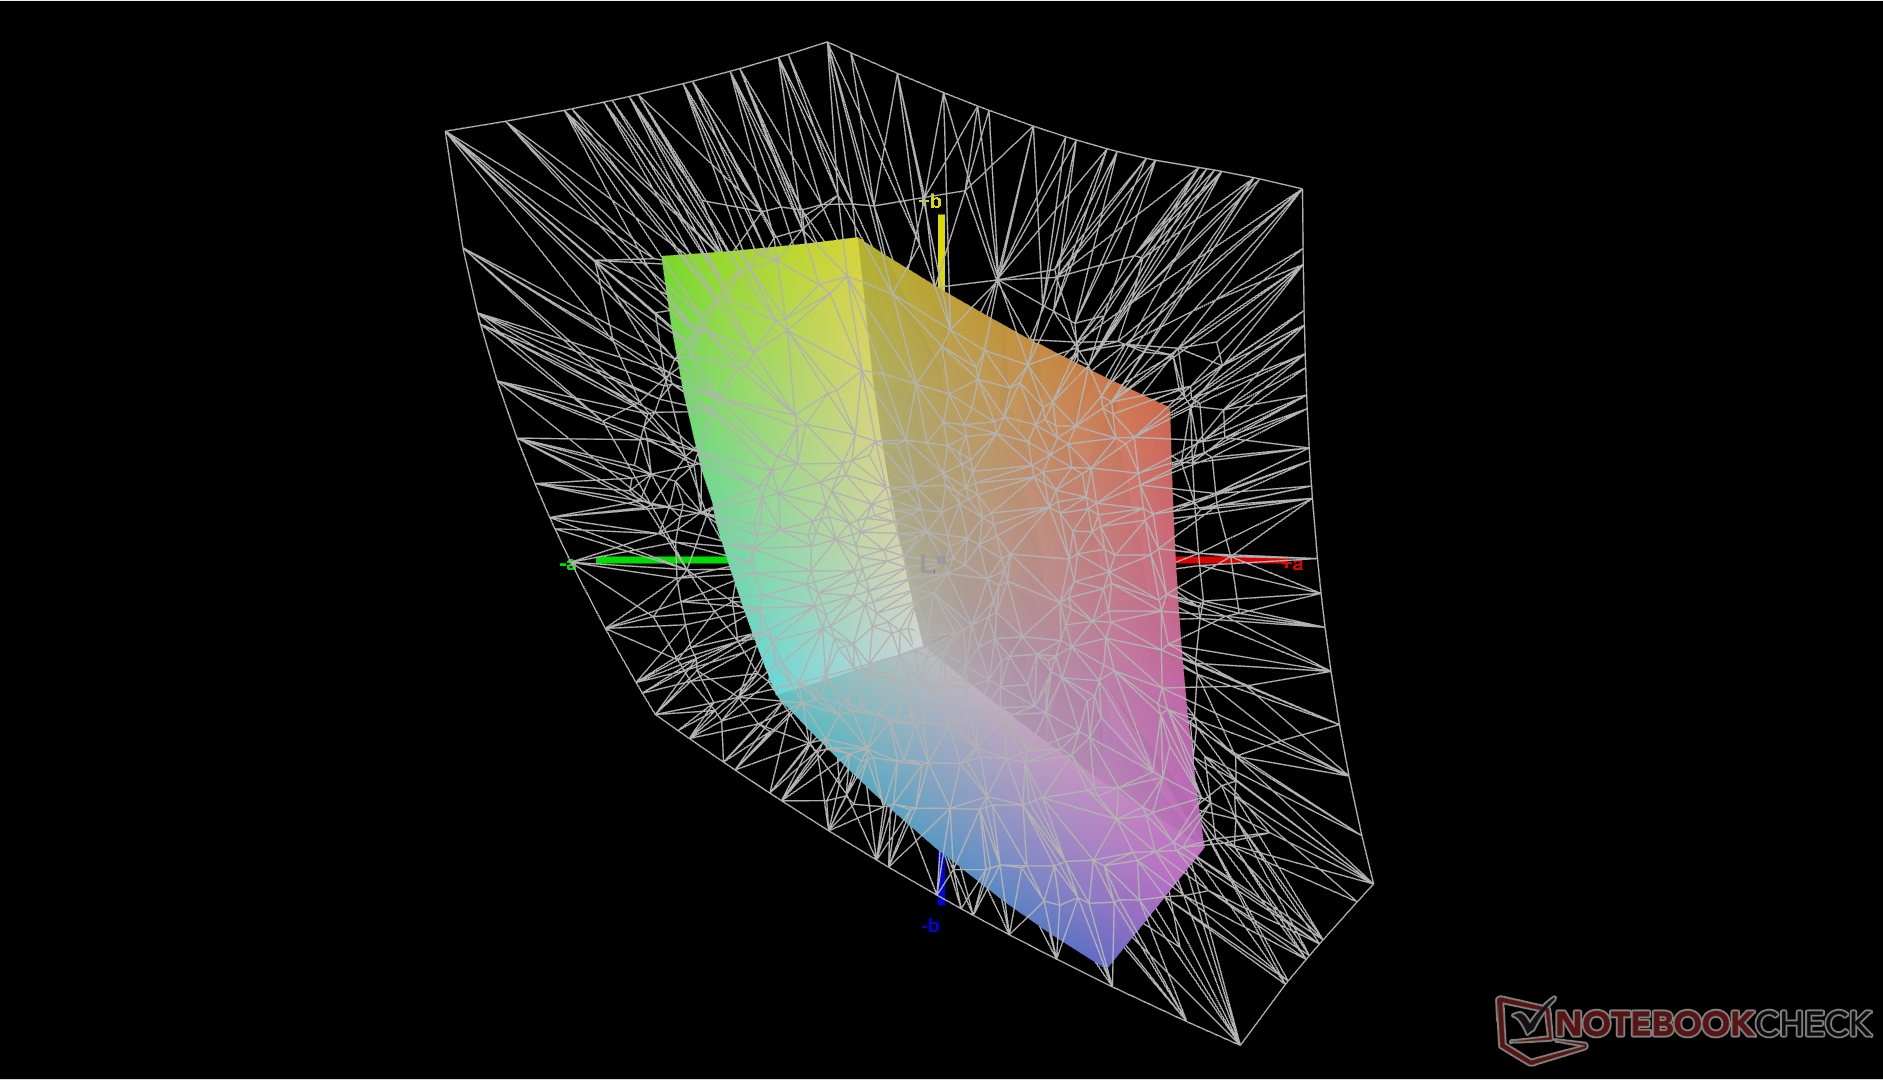
43.3% AdobeRGB 1998 (Argyll 3D)
63% sRGB (Argyll 3D)
41.9% Display P3 (Argyll 3D)
Gamma: 2.2
CCT: 7682 K
| Lenovo ThinkPad E14 G5 i7-1355U R140NW4D R5, IPS, 1920x1200, 14" | Lenovo ThinkPad E14 G5-21JSS05C00 M140NWHE R1, IPS, 2240x1400, 14" | HP EliteBook 845 G10 818N0EA AUO6DA8, IPS, 2560x1600, 14" | Asus ZenBook 14 UM3402Y Samsung ATNA40YK07-1, OLED, 2880x1800, 14" | LG Gram 14Z90Q LG LP140WU1-SPF1, IPS, 1920x1200, 14" | Dell Latitude 7440 AU Optronics B140QAX, IPS, 2560x1600, 14" | |
|---|---|---|---|---|---|---|
| Display | 61% | 97% | 108% | 97% | 72% | |
| Display P3 Coverage (%) | 41.9 | 69.3 65% | 98.3 135% | 99.9 138% | 98.4 135% | 75.4 80% |
| sRGB Coverage (%) | 63 | 97.6 55% | 99.8 58% | 100 59% | 99.9 59% | 99.9 59% |
| AdobeRGB 1998 Coverage (%) | 43.3 | 70.4 63% | 86.2 99% | 98.3 127% | 85.9 98% | 76.2 76% |
| Response Times | -9% | 60% | 94% | -40% | -70% | |
| Response Time Grey 50% / Grey 80% * (ms) | 30.7 ? | 36.3 ? -18% | 12.7 ? 59% | 1.19 ? 96% | 47.5 ? -55% | 56 ? -82% |
| Response Time Black / White * (ms) | 19.6 ? | 19.5 ? 1% | 7.9 ? 60% | 1.62 ? 92% | 24.5 ? -25% | 30.8 ? -57% |
| PWM Frequency (Hz) | 362.3 ? | |||||
| Screen | 33% | 38% | 41% | 14% | 22% | |
| Brightness middle (cd/m²) | 352.3 | 362 3% | 546 55% | 336.6 -4% | 341 -3% | 517.3 47% |
| Brightness (cd/m²) | 344 | 354 3% | 564 64% | 339 -1% | 305 -11% | 488 42% |
| Brightness Distribution (%) | 86 | 91 6% | 86 0% | 98 14% | 87 1% | 88 2% |
| Black Level * (cd/m²) | 0.27 | 0.18 33% | 0.38 -41% | 0.26 4% | 0.34 -26% | |
| Contrast (:1) | 1305 | 2011 54% | 1437 10% | 1312 1% | 1521 17% | |
| Colorchecker dE 2000 * | 4.99 | 2.6 48% | 1.3 74% | 0.84 83% | 3.11 38% | 3.3 34% |
| Colorchecker dE 2000 max. * | 14.84 | 3.7 75% | 5.3 64% | 3.1 79% | 8.29 44% | 7.81 47% |
| Colorchecker dE 2000 calibrated * | 1.87 | 1.1 41% | 1.2 36% | 0.83 56% | 1.02 45% | |
| Greyscale dE 2000 * | 5.3 | 3.3 38% | 1.1 79% | 1.4 74% | 5.3 -0% | 5.6 -6% |
| Gamma | 2.2 100% | 2.28 96% | 2.27 97% | 2.24 98% | 2.037 108% | 2.37 93% |
| CCT | 7682 85% | 6761 96% | 6463 101% | 6439 101% | 7571 86% | 6804 96% |
| Media total (Programa/Opciones) | 28% /
33% | 65% /
54% | 81% /
69% | 24% /
24% | 8% /
20% |
* ... más pequeño es mejor
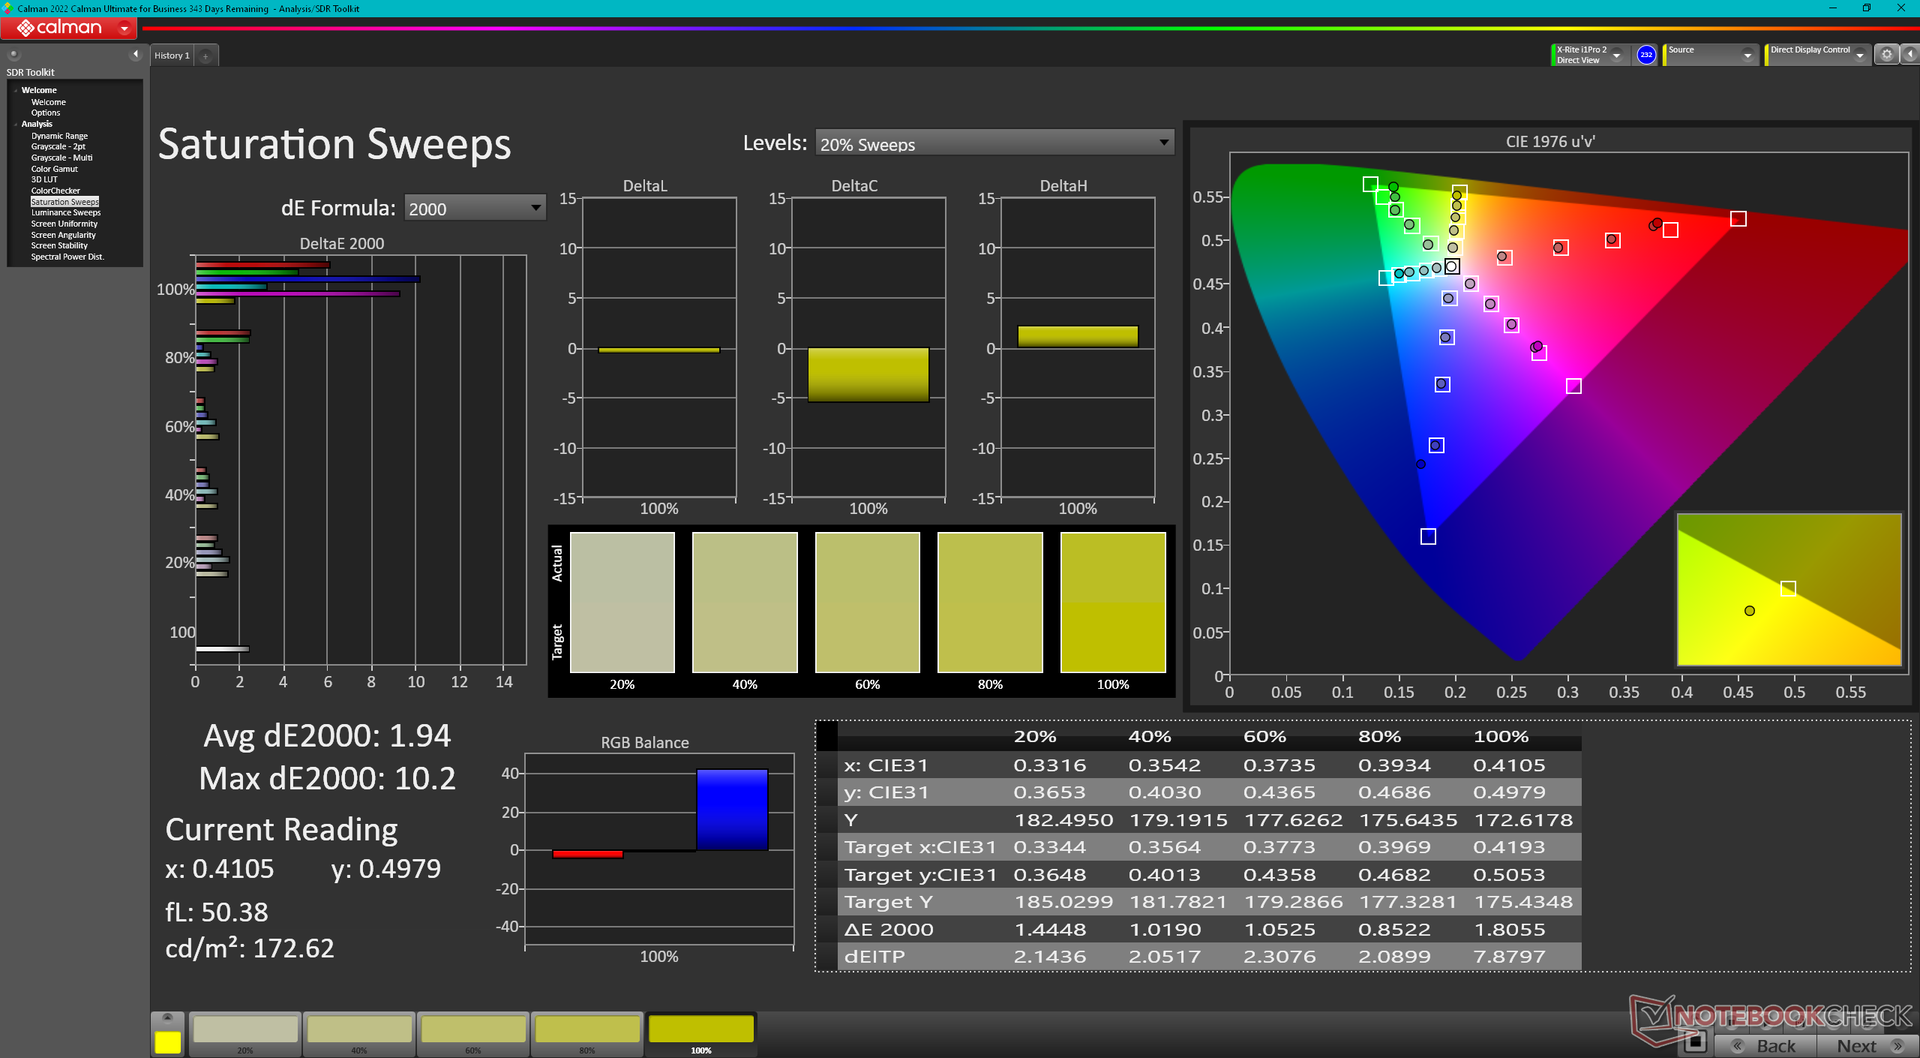
La pantalla no viene precalibrada. Calibrando el panel nosotros mismos con un colorímetro X-Rite mejoraríamos los valores medios de escala de grises y deltaE de color de 5,3 y 4,99 a sólo 1,8 y 1,87, respectivamente. Nuestro perfil ICM está disponible para su descarga gratuita más arriba.
Tiempos de respuesta del display
| ↔ Tiempo de respuesta de Negro a Blanco | ||
|---|---|---|
| 19.6 ms ... subida ↗ y bajada ↘ combinada | ↗ 9.8 ms subida | 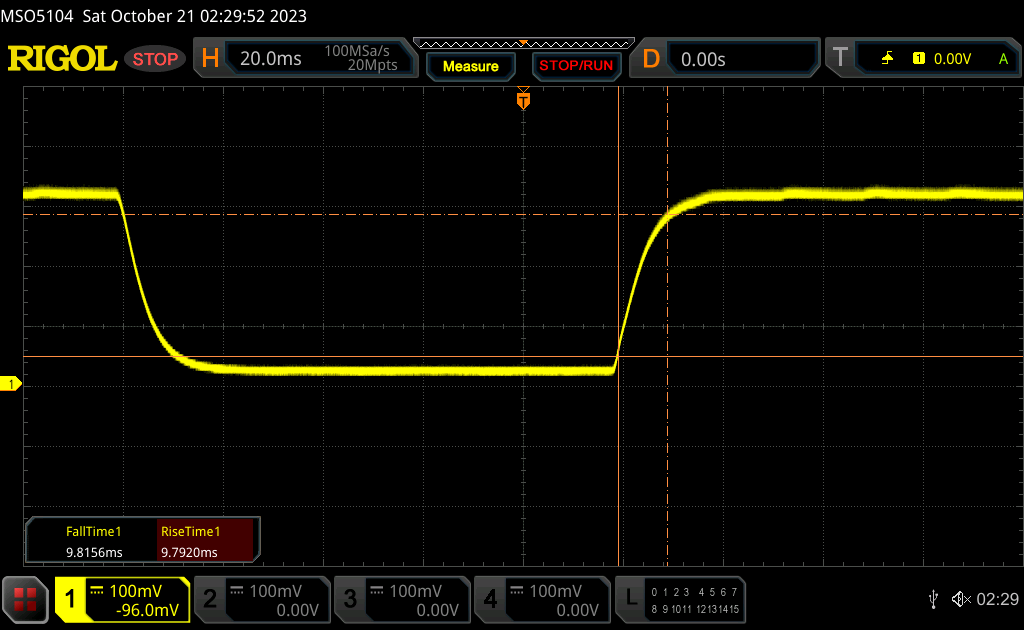 |
| ↘ 9.8 ms bajada | ||
| La pantalla mostró buenos tiempos de respuesta en nuestros tests pero podría ser demasiado lenta para los jugones competitivos. En comparación, todos los dispositivos de prueba van de ##min### (mínimo) a 240 (máximo) ms. » 43 % de todos los dispositivos son mejores. Eso quiere decir que el tiempo de respuesta es similar al dispositivo testado medio (19.8 ms). | ||
| ↔ Tiempo de respuesta 50% Gris a 80% Gris | ||
| 30.7 ms ... subida ↗ y bajada ↘ combinada | ↗ 14.7 ms subida | 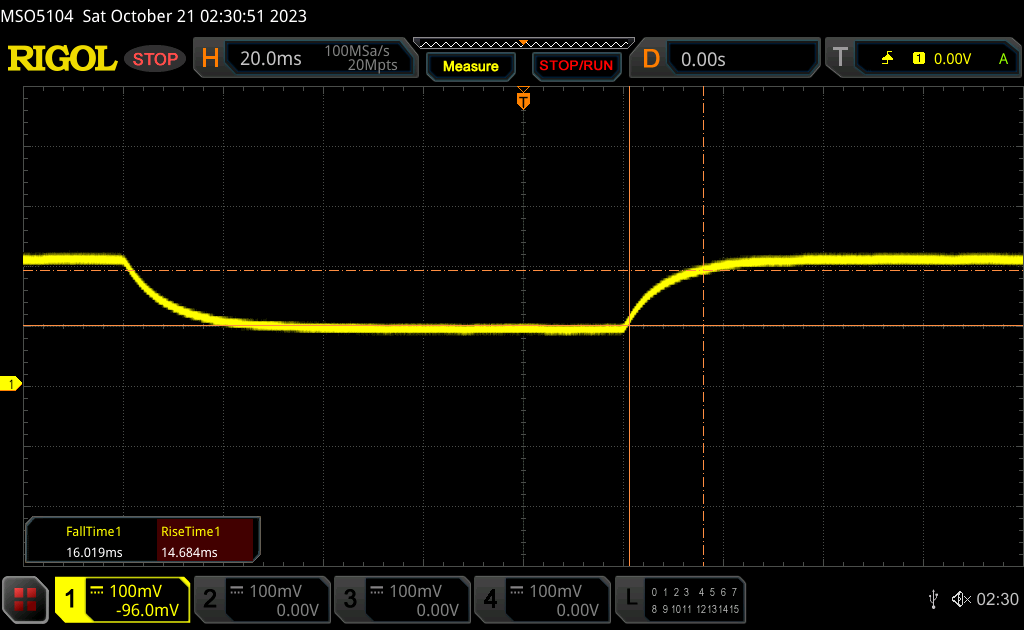 |
| ↘ 16 ms bajada | ||
| La pantalla mostró tiempos de respuesta lentos en nuestros tests y podría ser demasiado lenta para los jugones. En comparación, todos los dispositivos de prueba van de ##min### (mínimo) a 636 (máximo) ms. » 41 % de todos los dispositivos son mejores. Eso quiere decir que el tiempo de respuesta es similar al dispositivo testado medio (31 ms). | ||
Parpadeo de Pantalla / PWM (Pulse-Width Modulation)
| Parpadeo de Pantalla / PWM no detectado | 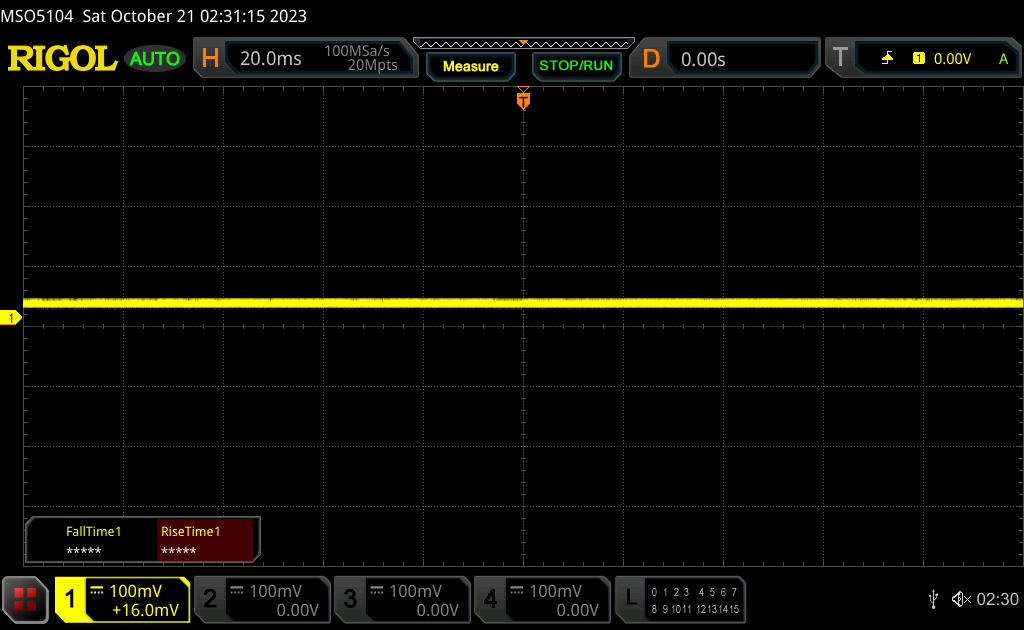 | ||
Comparación: 52 % de todos los dispositivos testados no usaron PWM para atenuar el display. Si se usó, medimos una media de 7747 (mínimo: 5 - máxmo: 343500) Hz. | |||

Rendimiento
Condiciones de prueba
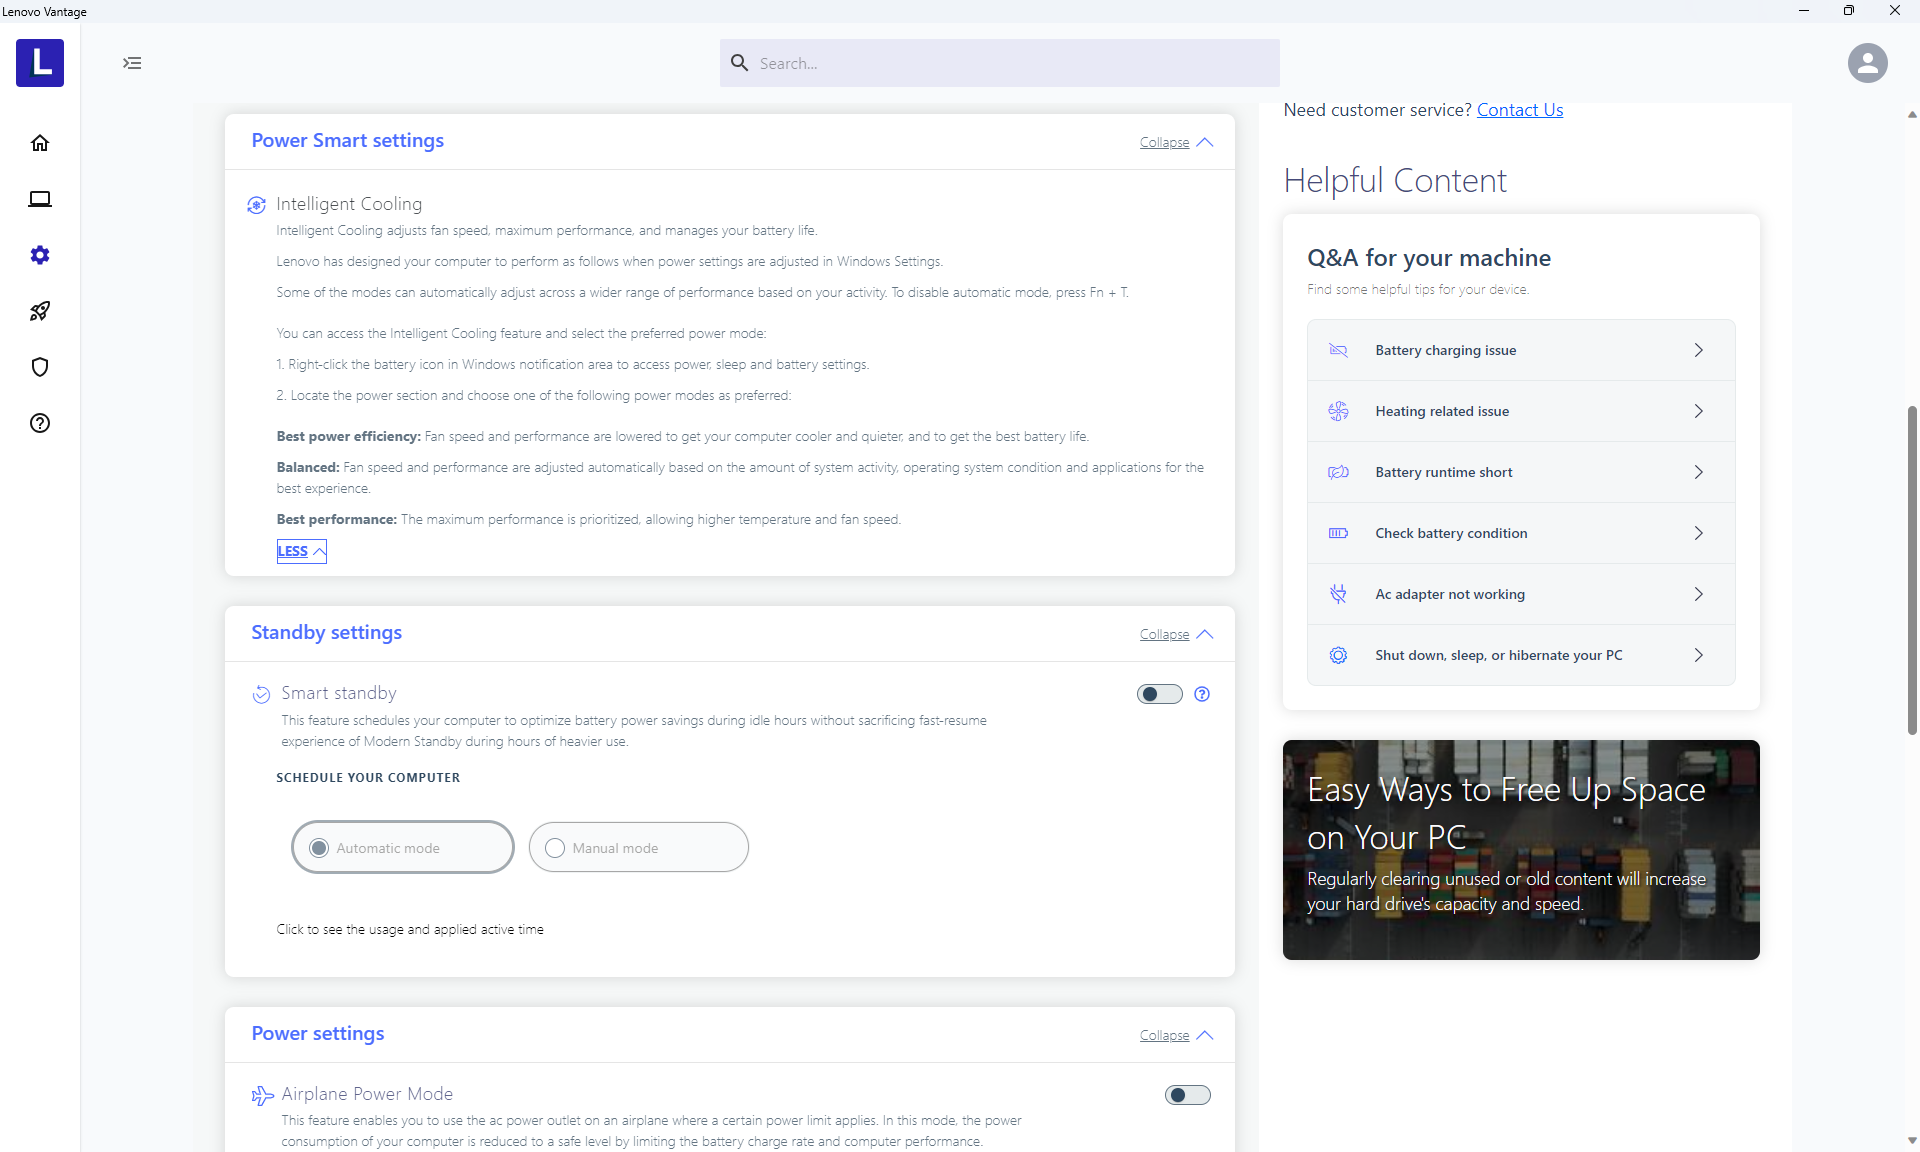
Pusimos Windows en modo Rendimiento antes de realizar las pruebas. Lenovo no incluye ningún perfil de energía especializado y en su lugar se basa en los perfiles de energía de Windows para reducir la confusión.

Procesador
El rendimiento del procesador es más débil de lo esperado, entre un 10 y un 15 por ciento más lento que el portátil medio de nuestra base de datos equipado con el mismo Core i7-1355U. El déficit puede atribuirse a la débil sostenibilidad Turbo Boost del sistema. Al ejecutar CineBench R15 xT en bucle, por ejemplo, la puntuación inicial de 1539 puntos caería hasta un 35-40 por ciento en el segundo bucle, como muestra el gráfico siguiente.
Cuando se compara con el Ryzen 7 7730U en el ThinkPad E14 G5 basado en AMD, nuestro Core i7-1355U ofrece un rendimiento de un solo subproceso entre un 25 y un 30 por ciento más rápido, pero un rendimiento de varios subprocesos entre un 25 y un 30 por ciento más lento una vez que se ha tenido en cuenta la ralentización.
Cinebench R15 Multi Loop
Cinebench R23: Multi Core | Single Core
Cinebench R20: CPU (Multi Core) | CPU (Single Core)
Cinebench R15: CPU Multi 64Bit | CPU Single 64Bit
Blender: v2.79 BMW27 CPU
7-Zip 18.03: 7z b 4 | 7z b 4 -mmt1
Geekbench 5.5: Multi-Core | Single-Core
HWBOT x265 Benchmark v2.2: 4k Preset
LibreOffice : 20 Documents To PDF
R Benchmark 2.5: Overall mean
* ... más pequeño es mejor
AIDA64: FP32 Ray-Trace | FPU Julia | CPU SHA3 | CPU Queen | FPU SinJulia | FPU Mandel | CPU AES | CPU ZLib | FP64 Ray-Trace | CPU PhotoWorxx
| Performance rating | |
| HP EliteBook 845 G10 818N0EA | |
| Asus ZenBook 14 UM3402Y | |
| Lenovo ThinkPad E14 G5-21JSS05C00 | |
| Dell Latitude 7440 | |
| Medio Intel Core i7-1355U | |
| Lenovo ThinkPad E14 G5 i7-1355U | |
| LG Gram 14Z90Q | |
| AIDA64 / FP32 Ray-Trace | |
| HP EliteBook 845 G10 818N0EA | |
| Asus ZenBook 14 UM3402Y | |
| Lenovo ThinkPad E14 G5-21JSS05C00 | |
| Dell Latitude 7440 | |
| Medio Intel Core i7-1355U (5673 - 8424, n=18) | |
| Lenovo ThinkPad E14 G5 i7-1355U | |
| LG Gram 14Z90Q | |
| AIDA64 / FPU Julia | |
| HP EliteBook 845 G10 818N0EA | |
| Asus ZenBook 14 UM3402Y | |
| Lenovo ThinkPad E14 G5-21JSS05C00 | |
| Dell Latitude 7440 | |
| Medio Intel Core i7-1355U (29580 - 42706, n=18) | |
| Lenovo ThinkPad E14 G5 i7-1355U | |
| LG Gram 14Z90Q | |
| AIDA64 / CPU SHA3 | |
| HP EliteBook 845 G10 818N0EA | |
| Asus ZenBook 14 UM3402Y | |
| Lenovo ThinkPad E14 G5-21JSS05C00 | |
| Dell Latitude 7440 | |
| Medio Intel Core i7-1355U (1529 - 2200, n=18) | |
| Lenovo ThinkPad E14 G5 i7-1355U | |
| LG Gram 14Z90Q | |
| AIDA64 / CPU Queen | |
| HP EliteBook 845 G10 818N0EA | |
| Asus ZenBook 14 UM3402Y | |
| Lenovo ThinkPad E14 G5-21JSS05C00 | |
| LG Gram 14Z90Q | |
| Lenovo ThinkPad E14 G5 i7-1355U | |
| Dell Latitude 7440 | |
| Medio Intel Core i7-1355U (21547 - 66907, n=18) | |
| AIDA64 / FPU SinJulia | |
| HP EliteBook 845 G10 818N0EA | |
| Asus ZenBook 14 UM3402Y | |
| Lenovo ThinkPad E14 G5-21JSS05C00 | |
| Dell Latitude 7440 | |
| Lenovo ThinkPad E14 G5 i7-1355U | |
| Medio Intel Core i7-1355U (4045 - 5426, n=18) | |
| LG Gram 14Z90Q | |
| AIDA64 / FPU Mandel | |
| HP EliteBook 845 G10 818N0EA | |
| Asus ZenBook 14 UM3402Y | |
| Lenovo ThinkPad E14 G5-21JSS05C00 | |
| Dell Latitude 7440 | |
| Medio Intel Core i7-1355U (14596 - 21627, n=18) | |
| Lenovo ThinkPad E14 G5 i7-1355U | |
| LG Gram 14Z90Q | |
| AIDA64 / CPU AES | |
| HP EliteBook 845 G10 818N0EA | |
| Asus ZenBook 14 UM3402Y | |
| Lenovo ThinkPad E14 G5-21JSS05C00 | |
| Dell Latitude 7440 | |
| Medio Intel Core i7-1355U (31432 - 75408, n=18) | |
| Lenovo ThinkPad E14 G5 i7-1355U | |
| LG Gram 14Z90Q | |
| AIDA64 / CPU ZLib | |
| HP EliteBook 845 G10 818N0EA | |
| Asus ZenBook 14 UM3402Y | |
| Lenovo ThinkPad E14 G5-21JSS05C00 | |
| Dell Latitude 7440 | |
| Medio Intel Core i7-1355U (454 - 684, n=18) | |
| Lenovo ThinkPad E14 G5 i7-1355U | |
| LG Gram 14Z90Q | |
| AIDA64 / FP64 Ray-Trace | |
| HP EliteBook 845 G10 818N0EA | |
| Asus ZenBook 14 UM3402Y | |
| Lenovo ThinkPad E14 G5-21JSS05C00 | |
| Dell Latitude 7440 | |
| Medio Intel Core i7-1355U (2991 - 4453, n=18) | |
| LG Gram 14Z90Q | |
| Lenovo ThinkPad E14 G5 i7-1355U | |
| AIDA64 / CPU PhotoWorxx | |
| Dell Latitude 7440 | |
| Medio Intel Core i7-1355U (21800 - 46154, n=18) | |
| HP EliteBook 845 G10 818N0EA | |
| LG Gram 14Z90Q | |
| Lenovo ThinkPad E14 G5 i7-1355U | |
| Asus ZenBook 14 UM3402Y | |
| Lenovo ThinkPad E14 G5-21JSS05C00 | |
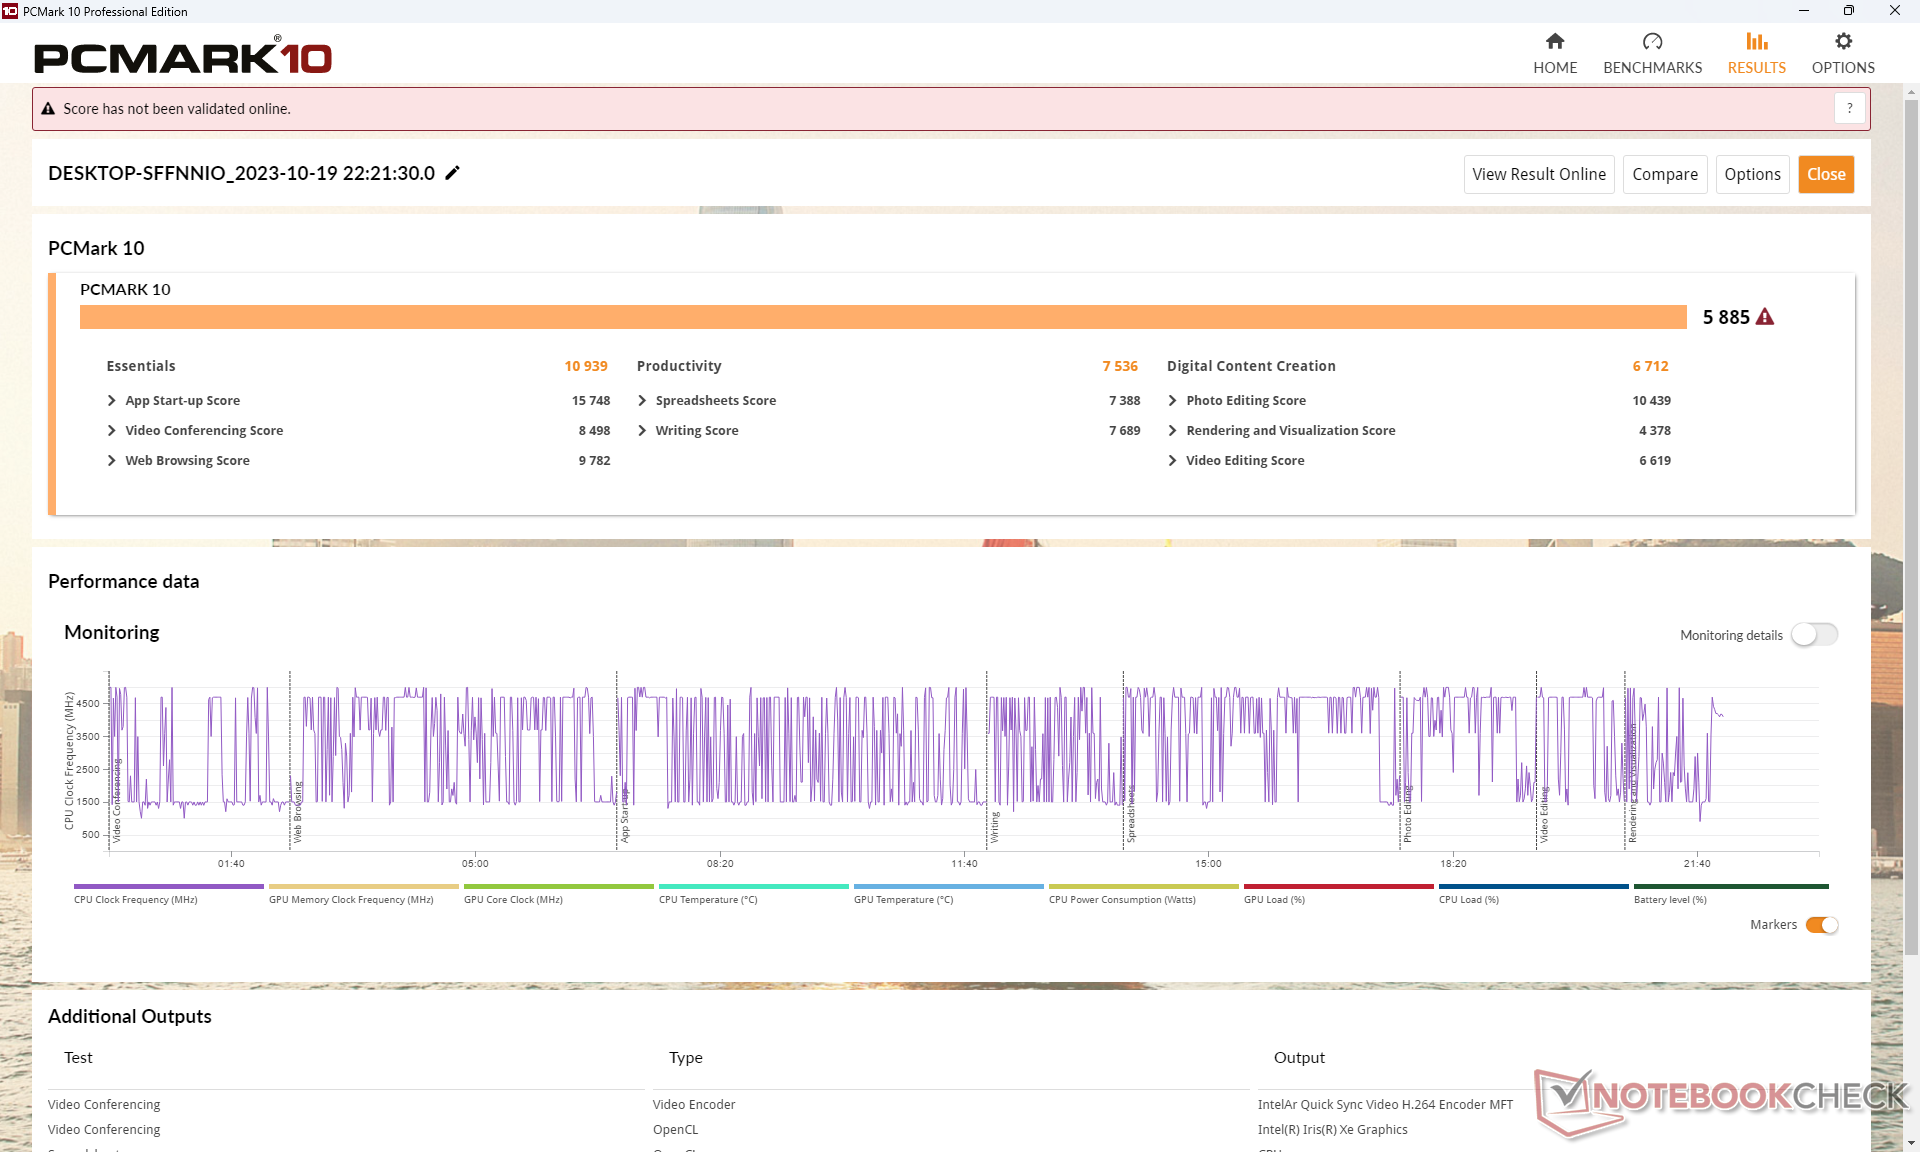
Rendimiento del sistema
Las puntuaciones de PCMark son generalmente inferiores a las de la configuración AMD, especialmente en la subprueba de Productividad, en la que el rendimiento multihilo es lo más importante.
CrossMark: Overall | Productivity | Creativity | Responsiveness
| PCMark 10 / Score | |
| HP EliteBook 845 G10 818N0EA | |
| Lenovo ThinkPad E14 G5-21JSS05C00 | |
| Asus ZenBook 14 UM3402Y | |
| Lenovo ThinkPad E14 G5 i7-1355U | |
| Medio Intel Core i7-1355U, Intel Iris Xe Graphics G7 96EUs (5455 - 5933, n=15) | |
| Dell Latitude 7440 | |
| LG Gram 14Z90Q | |
| PCMark 10 / Essentials | |
| Medio Intel Core i7-1355U, Intel Iris Xe Graphics G7 96EUs (10203 - 11822, n=15) | |
| Lenovo ThinkPad E14 G5 i7-1355U | |
| Dell Latitude 7440 | |
| Lenovo ThinkPad E14 G5-21JSS05C00 | |
| Asus ZenBook 14 UM3402Y | |
| HP EliteBook 845 G10 818N0EA | |
| LG Gram 14Z90Q | |
| PCMark 10 / Productivity | |
| Asus ZenBook 14 UM3402Y | |
| Lenovo ThinkPad E14 G5-21JSS05C00 | |
| HP EliteBook 845 G10 818N0EA | |
| Lenovo ThinkPad E14 G5 i7-1355U | |
| Medio Intel Core i7-1355U, Intel Iris Xe Graphics G7 96EUs (6763 - 7536, n=15) | |
| Dell Latitude 7440 | |
| LG Gram 14Z90Q | |
| PCMark 10 / Digital Content Creation | |
| HP EliteBook 845 G10 818N0EA | |
| Lenovo ThinkPad E14 G5 i7-1355U | |
| Medio Intel Core i7-1355U, Intel Iris Xe Graphics G7 96EUs (5723 - 6712, n=15) | |
| Lenovo ThinkPad E14 G5-21JSS05C00 | |
| Asus ZenBook 14 UM3402Y | |
| Dell Latitude 7440 | |
| LG Gram 14Z90Q | |
| CrossMark / Overall | |
| Medio Intel Core i7-1355U, Intel Iris Xe Graphics G7 96EUs (1478 - 1643, n=15) | |
| Lenovo ThinkPad E14 G5 i7-1355U | |
| HP EliteBook 845 G10 818N0EA | |
| Asus ZenBook 14 UM3402Y | |
| Lenovo ThinkPad E14 G5-21JSS05C00 | |
| CrossMark / Productivity | |
| Medio Intel Core i7-1355U, Intel Iris Xe Graphics G7 96EUs (1444 - 1665, n=15) | |
| Lenovo ThinkPad E14 G5 i7-1355U | |
| HP EliteBook 845 G10 818N0EA | |
| Asus ZenBook 14 UM3402Y | |
| Lenovo ThinkPad E14 G5-21JSS05C00 | |
| CrossMark / Creativity | |
| Medio Intel Core i7-1355U, Intel Iris Xe Graphics G7 96EUs (1563 - 1732, n=15) | |
| Lenovo ThinkPad E14 G5 i7-1355U | |
| HP EliteBook 845 G10 818N0EA | |
| Asus ZenBook 14 UM3402Y | |
| Lenovo ThinkPad E14 G5-21JSS05C00 | |
| CrossMark / Responsiveness | |
| Medio Intel Core i7-1355U, Intel Iris Xe Graphics G7 96EUs (1217 - 1681, n=15) | |
| Lenovo ThinkPad E14 G5 i7-1355U | |
| HP EliteBook 845 G10 818N0EA | |
| Asus ZenBook 14 UM3402Y | |
| Lenovo ThinkPad E14 G5-21JSS05C00 | |
| PCMark 10 Score | 5885 puntos | |
ayuda | ||
| AIDA64 / Memory Copy | |
| Dell Latitude 7440 | |
| Medio Intel Core i7-1355U (35017 - 71600, n=18) | |
| LG Gram 14Z90Q | |
| Asus ZenBook 14 UM3402Y | |
| Lenovo ThinkPad E14 G5 i7-1355U | |
| HP EliteBook 845 G10 818N0EA | |
| Lenovo ThinkPad E14 G5-21JSS05C00 | |
| AIDA64 / Memory Read | |
| LG Gram 14Z90Q | |
| Medio Intel Core i7-1355U (38551 - 73377, n=18) | |
| Dell Latitude 7440 | |
| Asus ZenBook 14 UM3402Y | |
| Lenovo ThinkPad E14 G5-21JSS05C00 | |
| Lenovo ThinkPad E14 G5 i7-1355U | |
| HP EliteBook 845 G10 818N0EA | |
| AIDA64 / Memory Write | |
| Dell Latitude 7440 | |
| Medio Intel Core i7-1355U (35910 - 93342, n=18) | |
| LG Gram 14Z90Q | |
| Lenovo ThinkPad E14 G5 i7-1355U | |
| Asus ZenBook 14 UM3402Y | |
| HP EliteBook 845 G10 818N0EA | |
| Lenovo ThinkPad E14 G5-21JSS05C00 | |
| AIDA64 / Memory Latency | |
| LG Gram 14Z90Q | |
| Medio Intel Core i7-1355U (72.2 - 346, n=18) | |
| Asus ZenBook 14 UM3402Y | |
| HP EliteBook 845 G10 818N0EA | |
| Dell Latitude 7440 | |
| Lenovo ThinkPad E14 G5-21JSS05C00 | |
| Lenovo ThinkPad E14 G5 i7-1355U | |
* ... más pequeño es mejor
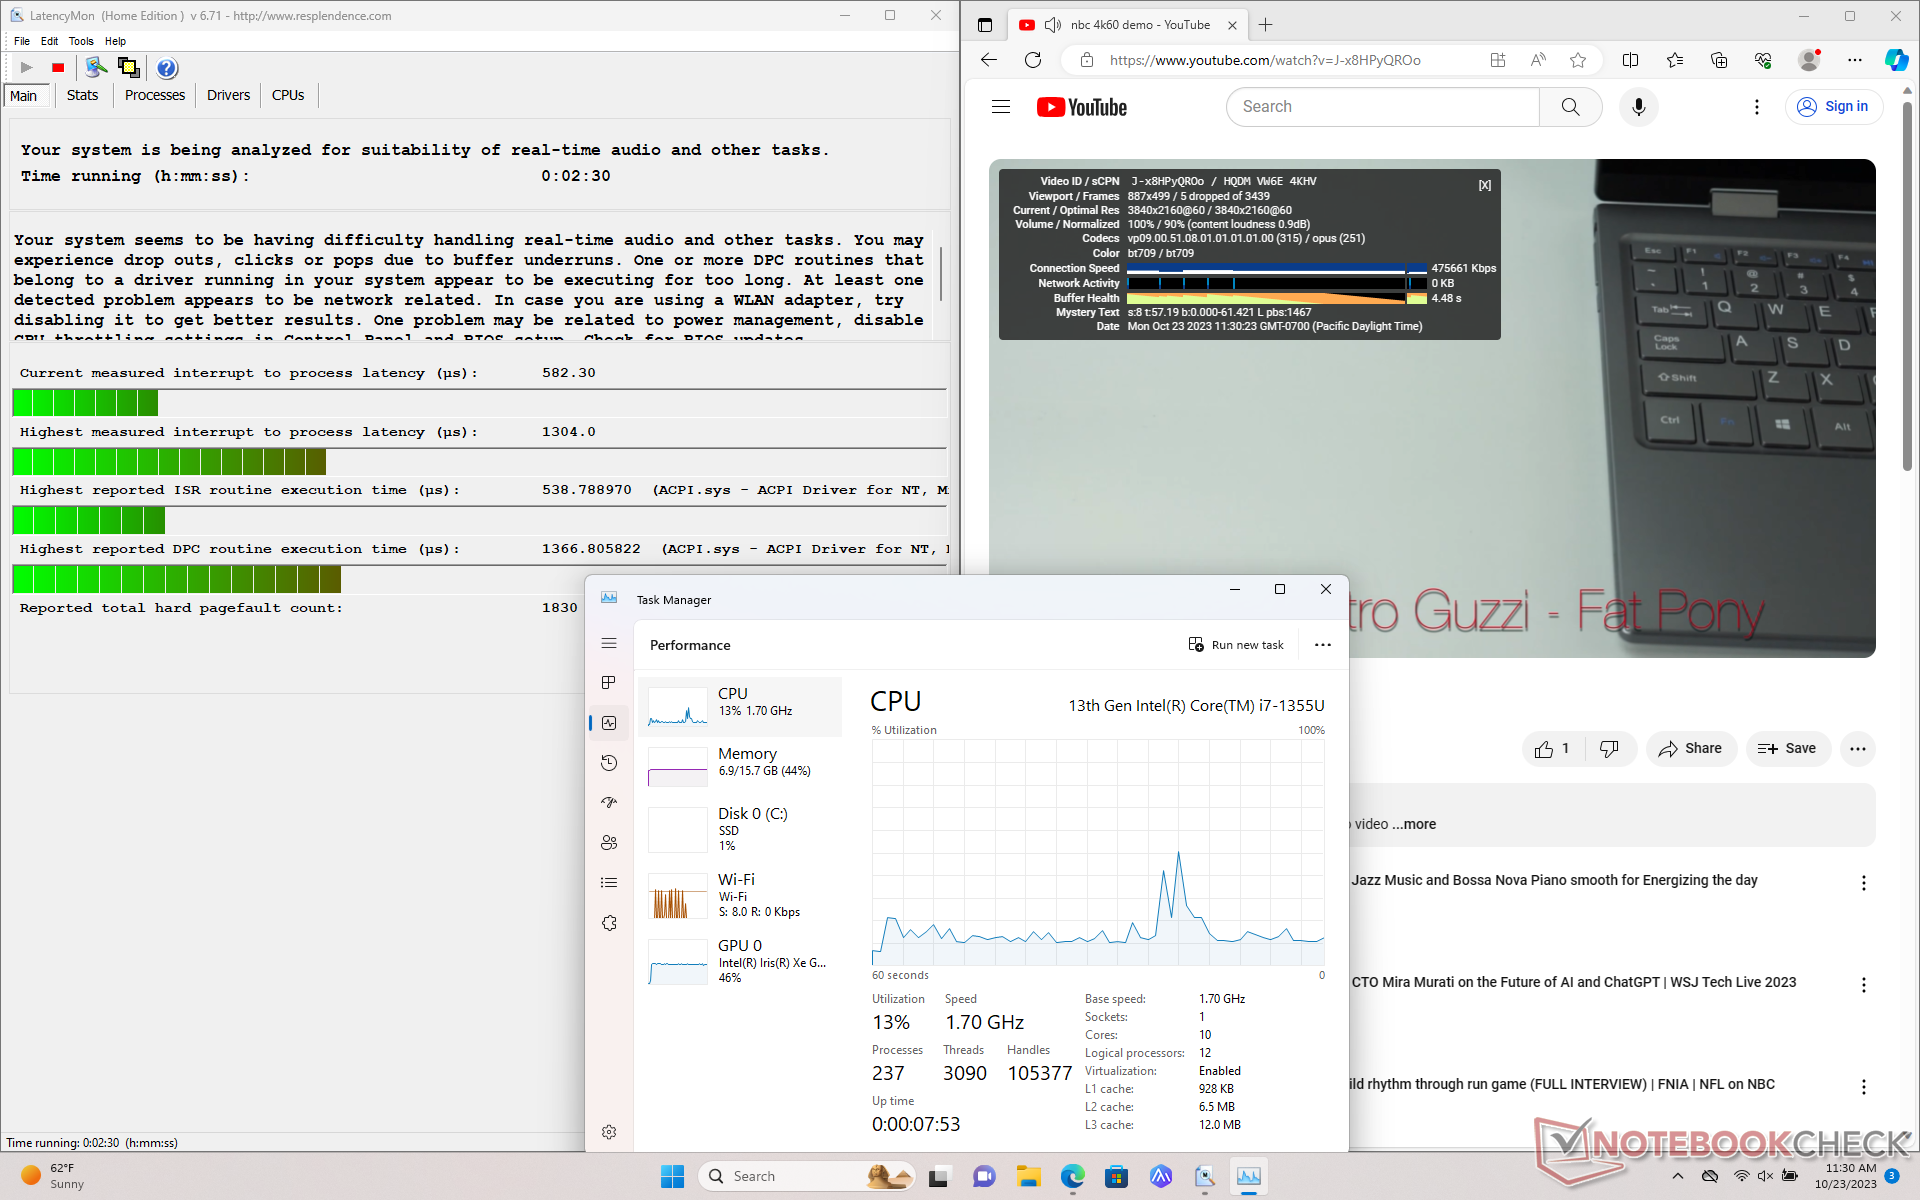
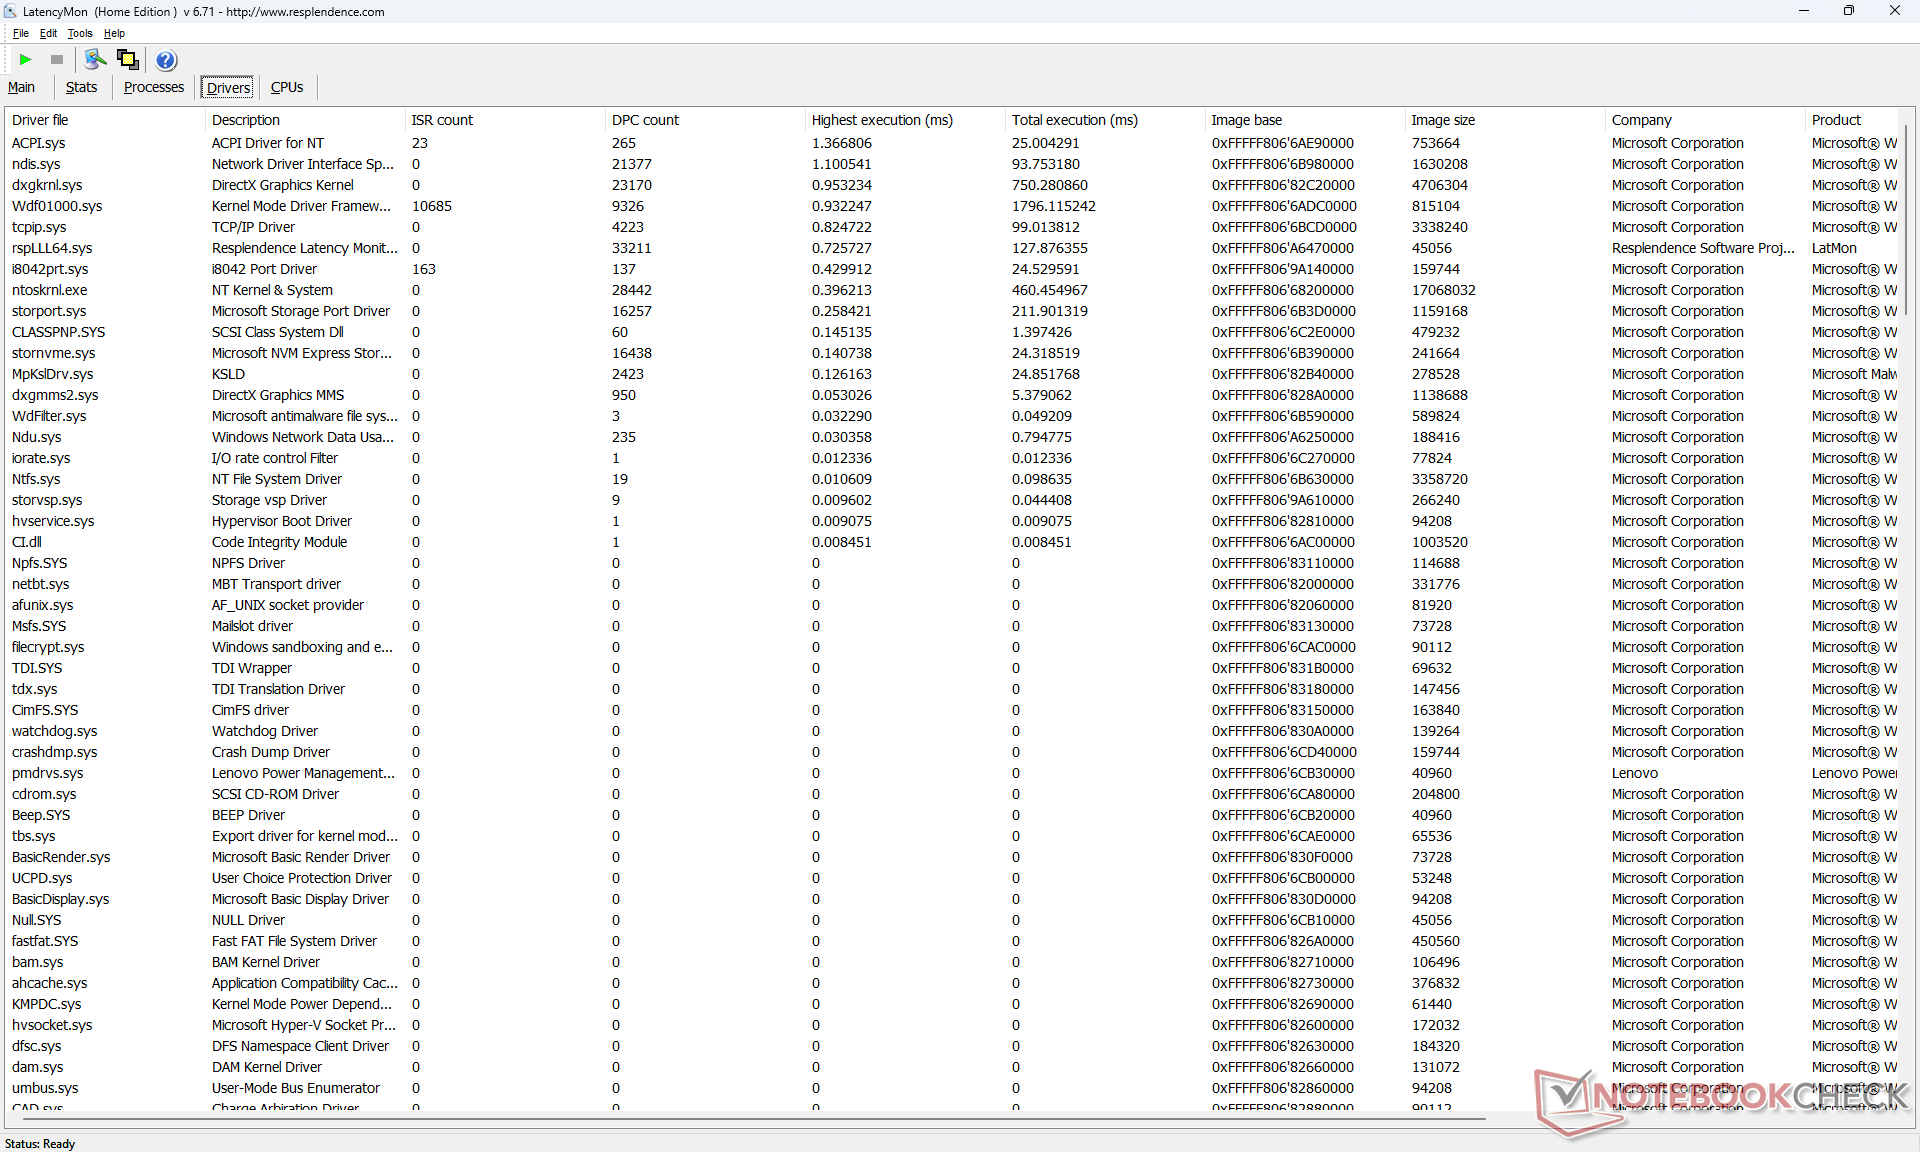
Latencia del CPD
LatencyMon muestra problemas de CPD al abrir varias pestañas del navegador de nuestra página principal. la reproducción de vídeo 4K a 60 FPS también presenta imperfecciones, con 5 fotogramas caídos registrados durante un periodo de 60 segundos.
| DPC Latencies / LatencyMon - interrupt to process latency (max), Web, Youtube, Prime95 | |
| Asus ZenBook 14 UM3402Y | |
| Lenovo ThinkPad E14 G5-21JSS05C00 | |
| Lenovo ThinkPad E14 G5 i7-1355U | |
| Dell Latitude 7440 | |
| LG Gram 14Z90Q | |
| HP EliteBook 845 G10 818N0EA | |
* ... más pequeño es mejor
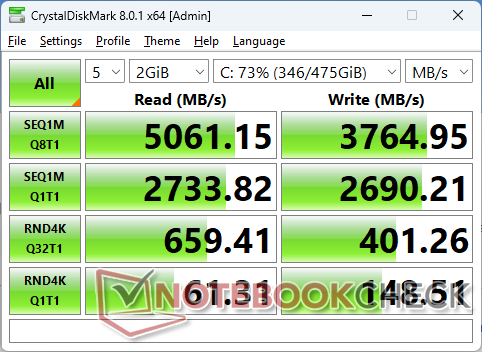
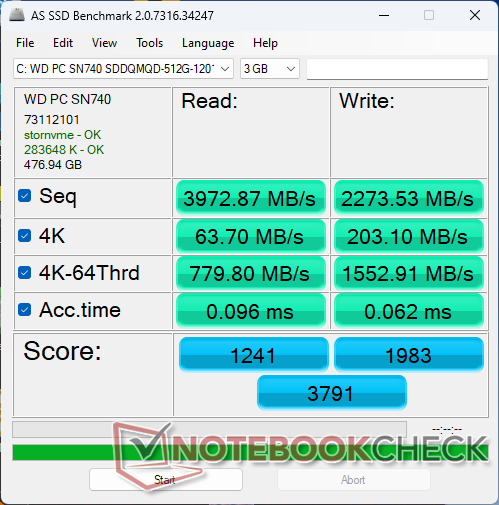
Dispositivos de almacenamiento
Nuestra unidad viene con la versión de 42 mm delWD PC SN740 mientras que la configuración AMD viene con la WD PC SN740 de 80 mm. Esta unidad SSD NVMe PCIe4 x4 de gama media ofrece velocidades de lectura de hasta 5000 MB/s, pero solo durante un par de minutos antes de que se produzca el estrangulamiento, como muestra el gráfico siguiente.

| Drive Performance rating - Percent | |
| LG Gram 14Z90Q | |
| HP EliteBook 845 G10 818N0EA | |
| Lenovo ThinkPad E14 G5 i7-1355U | |
| Dell Latitude 7440 | |
| Lenovo ThinkPad E14 G5-21JSS05C00 | |
| Asus ZenBook 14 UM3402Y | |
* ... más pequeño es mejor
Disk Throttling: DiskSpd Read Loop, Queue Depth 8
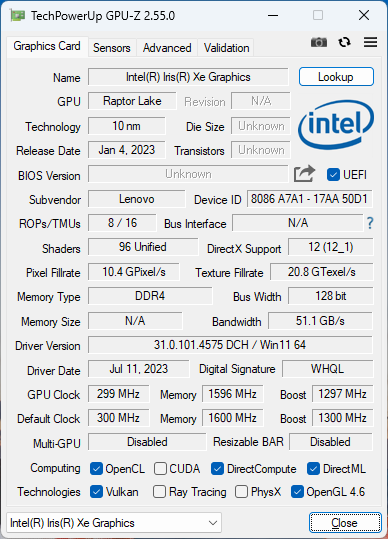
Rendimiento de la GPU
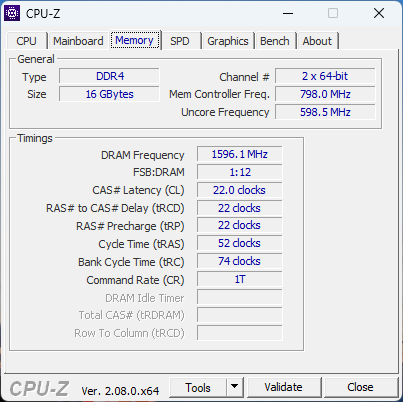
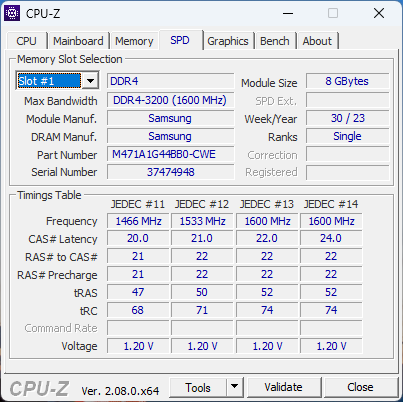
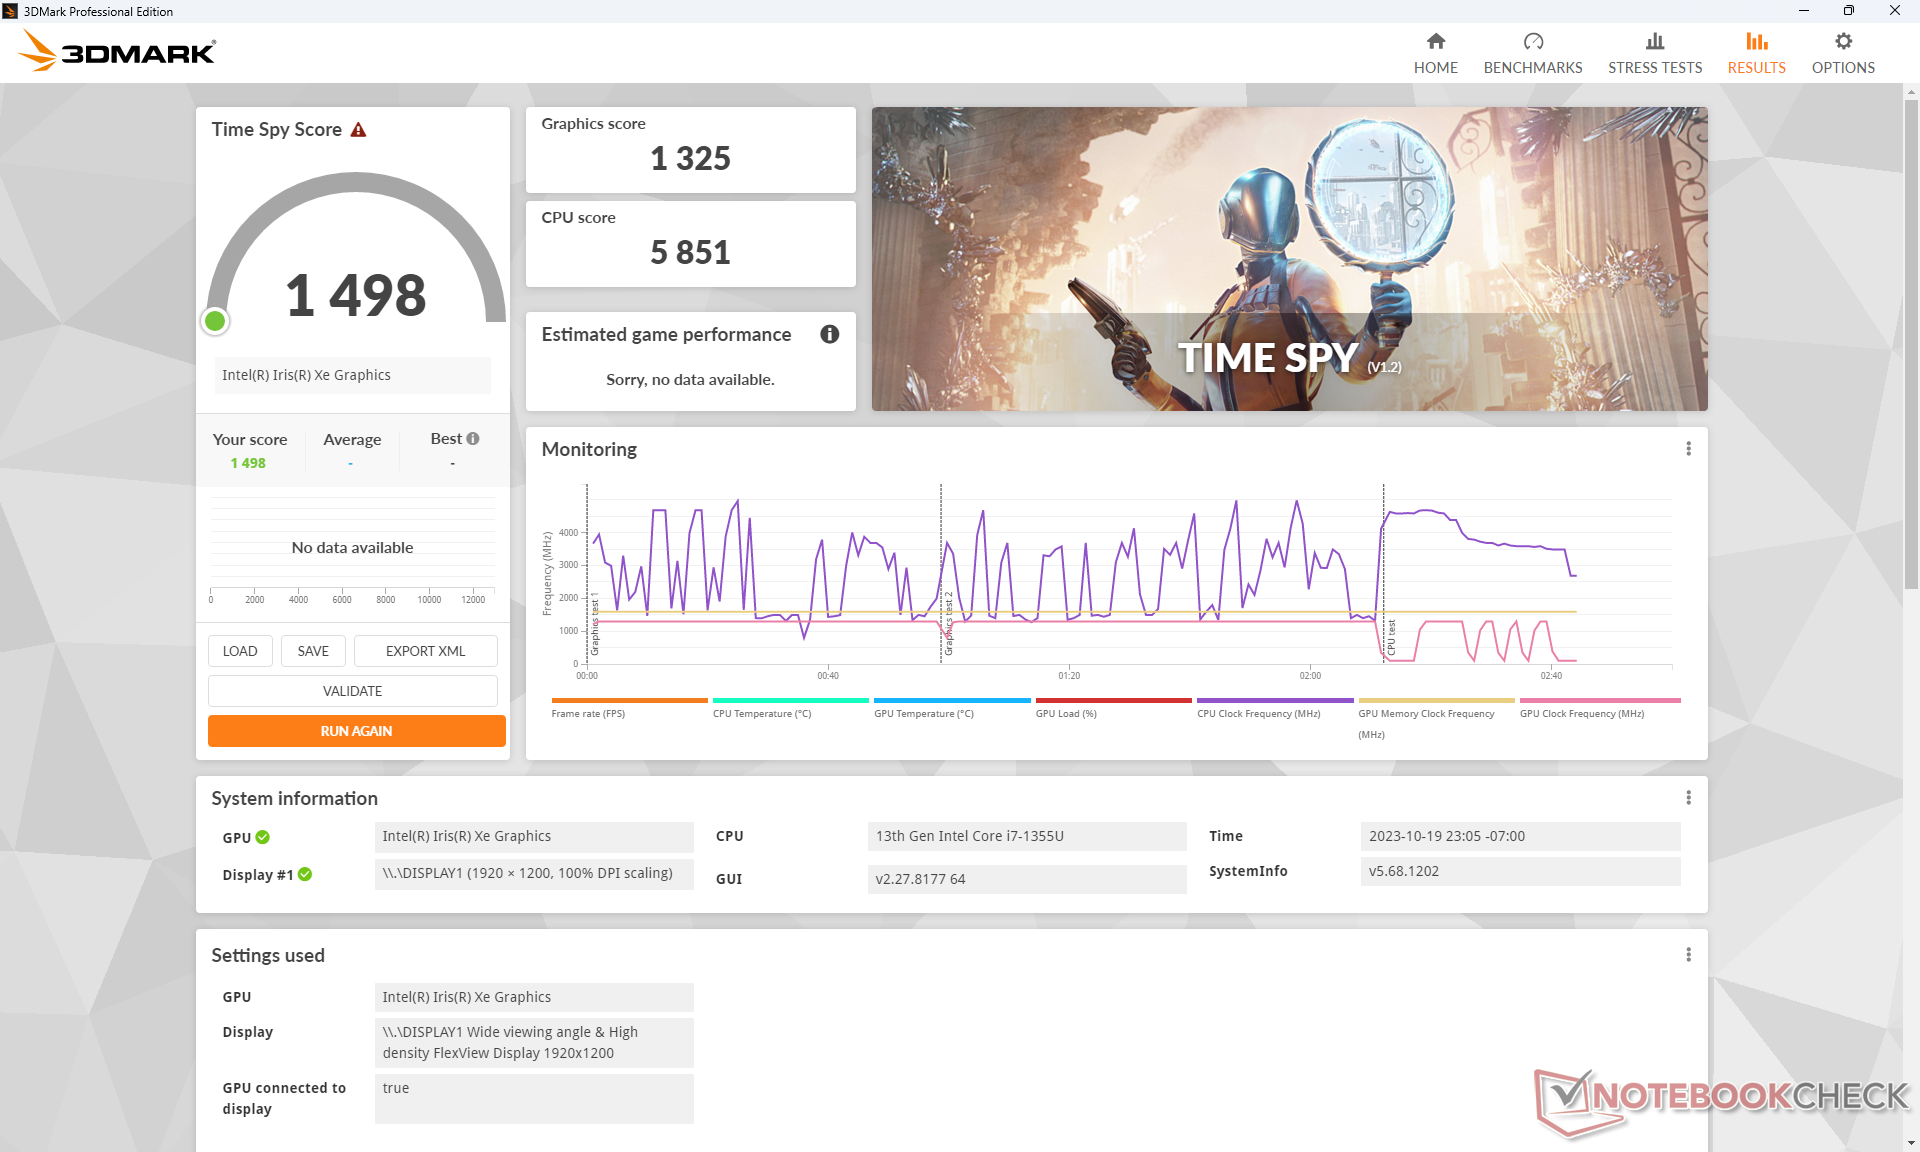
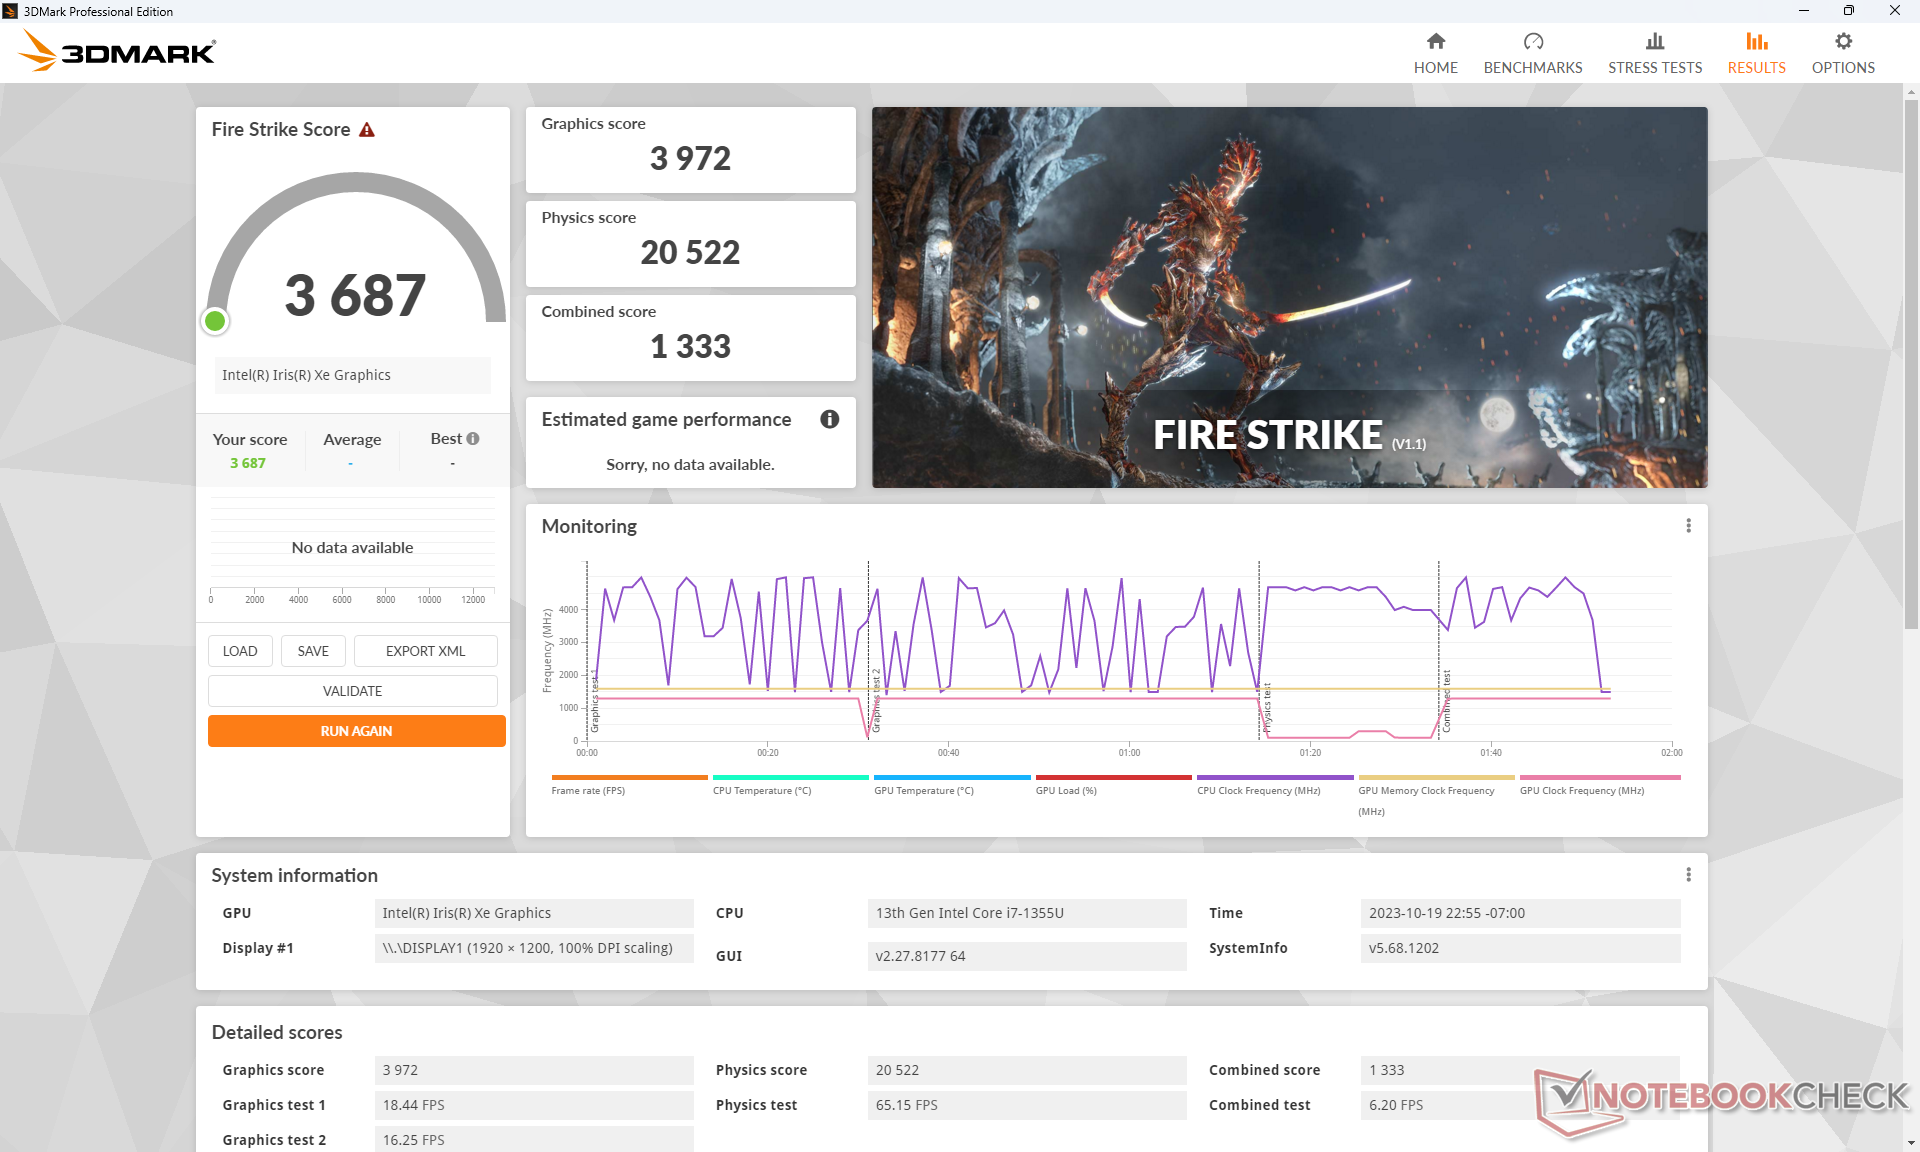
La memoria RAM es más lenta que la media, sólo DDR4-3200, lo que repercute negativamente en el rendimiento de los gráficos integrados. Nuestro Iris Xe 96 UE es entre un 10 y un 15 por ciento más lenta que la media de los portátiles de nuestra base de datos con la misma GPU debido a la ralentización de la CPU y a la lentitud de la RAM. El rendimiento general es aproximadamente el mismo que el de la RX Vega 8 en la versión Ryzen 7 7730U como resultado.
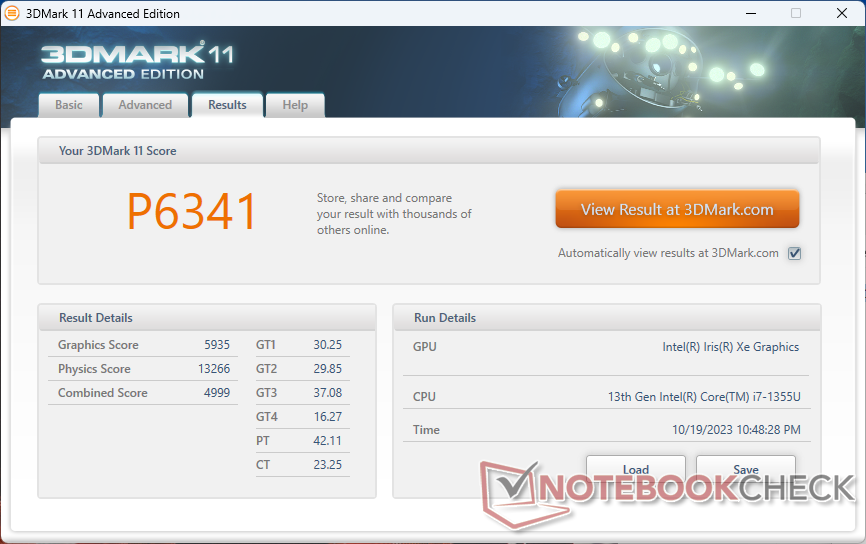
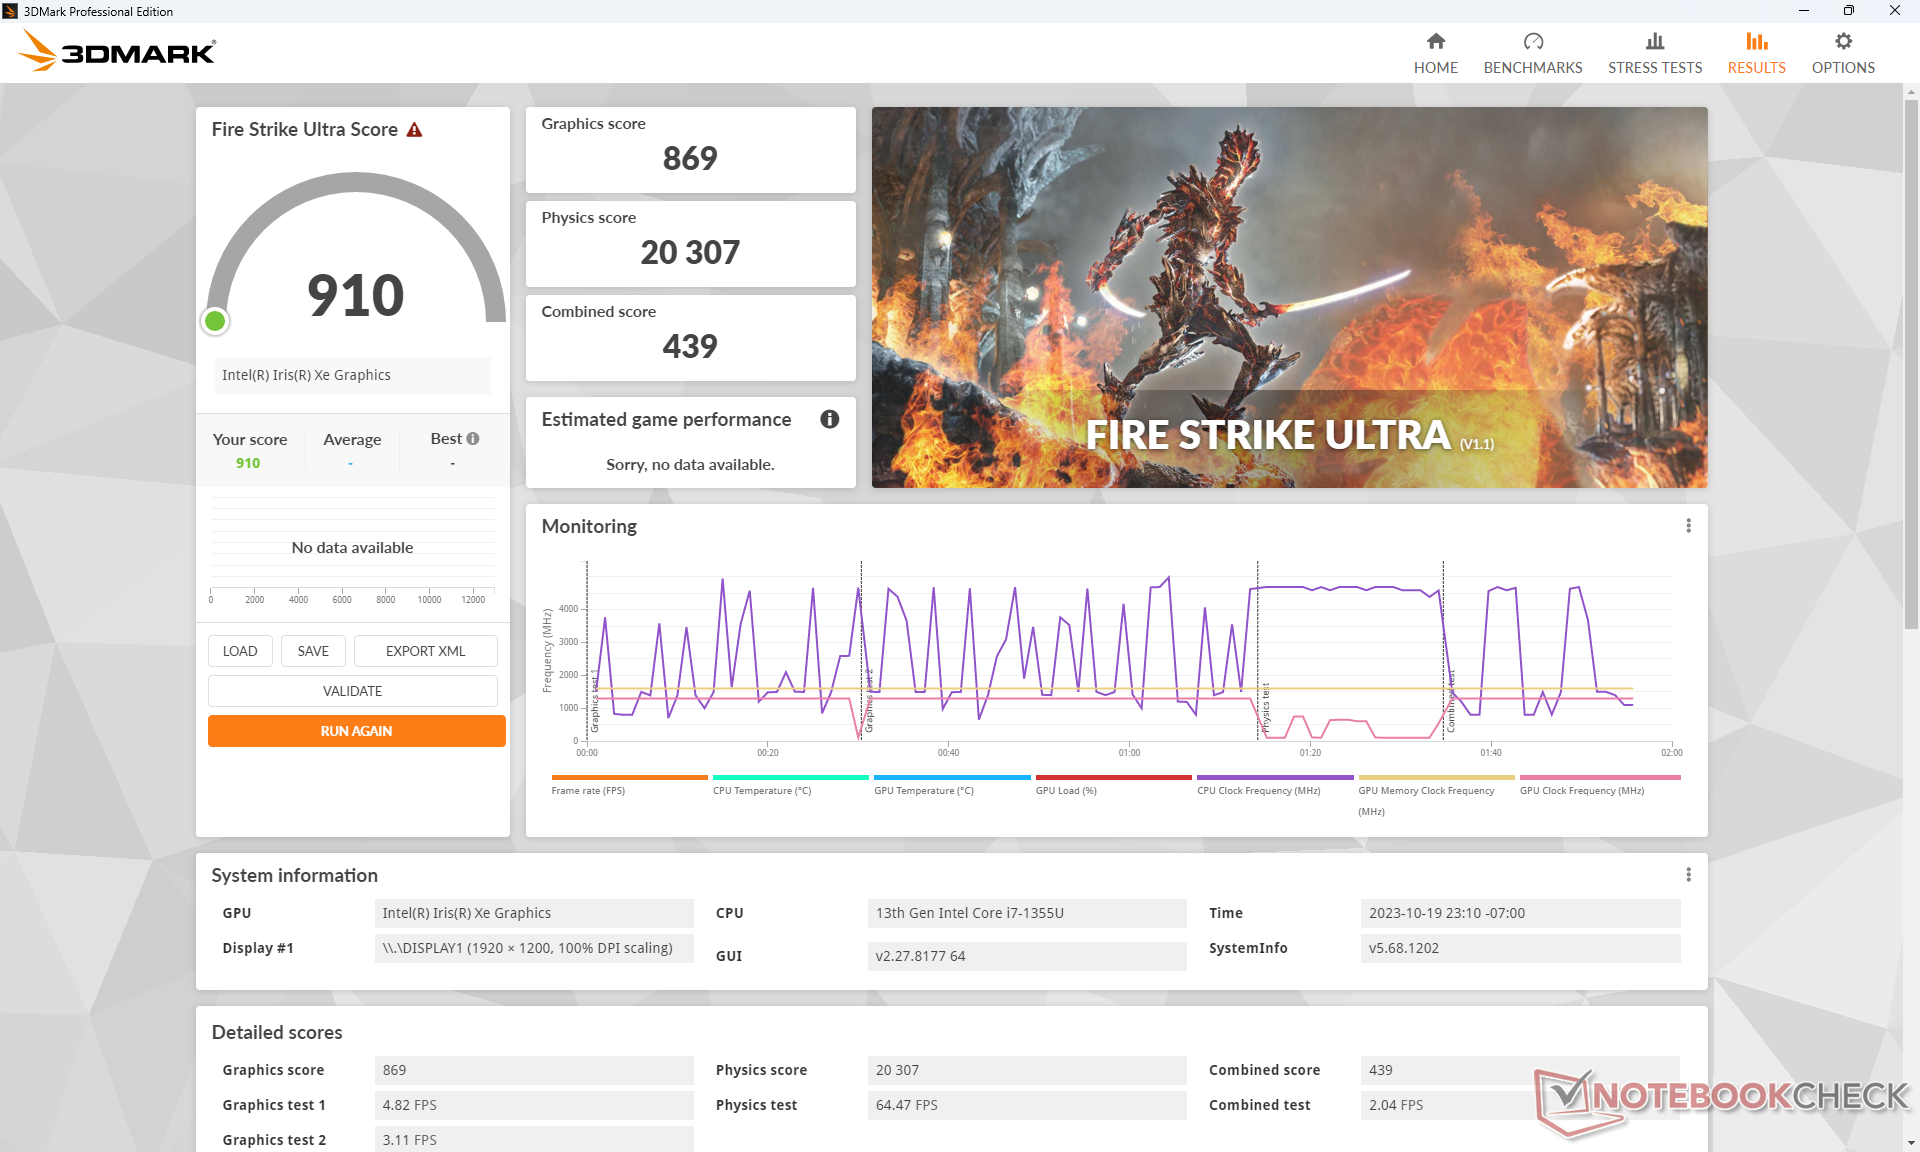
| 3DMark 11 Performance | 6341 puntos | |
| 3DMark Fire Strike Score | 3687 puntos | |
| 3DMark Time Spy Score | 1498 puntos | |
ayuda | ||
* ... más pequeño es mejor
| Tiny Tina's Wonderlands | |
| 1280x720 Lowest Preset (DX12) | |
| Dell Inspiron 14 7435 2-in-1 | |
| Medio Intel Iris Xe Graphics G7 96EUs (25.9 - 67.3, n=32) | |
| Lenovo ThinkPad E14 G5 i7-1355U | |
| 1920x1080 Low Preset (DX12) | |
| Medio Intel Iris Xe Graphics G7 96EUs (22.3 - 53, n=32) | |
| Dell Inspiron 14 7435 2-in-1 | |
| Dell Latitude 7440 | |
| Lenovo ThinkPad E14 G5 i7-1355U | |
| HP Envy 14-eb0252ng | |
| 1920x1080 Medium Preset (DX12) | |
| Medio Intel Iris Xe Graphics G7 96EUs (17 - 40.1, n=30) | |
| Dell Latitude 7440 | |
| Lenovo ThinkPad E14 G5 i7-1355U | |
| HP Envy 14-eb0252ng | |
| 1920x1080 High Preset (DX12) | |
| Medio Intel Iris Xe Graphics G7 96EUs (10.6 - 24.1, n=29) | |
| Dell Latitude 7440 | |
| Lenovo ThinkPad E14 G5 i7-1355U | |
| HP Envy 14-eb0252ng | |
| 1920x1080 Badass Preset (DX12) | |
| Medio Intel Iris Xe Graphics G7 96EUs (8.4 - 18.4, n=26) | |
| Dell Latitude 7440 | |
| Lenovo ThinkPad E14 G5 i7-1355U | |
Witcher 3 FPS Chart
| bajo | medio | alto | ultra | |
|---|---|---|---|---|
| GTA V (2015) | 85.2 | 67 | 13.7 | 5.57 |
| The Witcher 3 (2015) | 74.9 | 48.9 | 24.1 | 12.1 |
| Dota 2 Reborn (2015) | 104.5 | 77.3 | 51.5 | 47.3 |
| Final Fantasy XV Benchmark (2018) | 34.3 | 18.1 | 13.1 | |
| X-Plane 11.11 (2018) | 34.2 | 28.2 | 25.6 | |
| Far Cry 5 (2018) | 40 | 20 | 19 | 18 |
| Strange Brigade (2018) | 74.5 | 28.4 | 24.2 | 19.3 |
| Cyberpunk 2077 1.6 (2022) | 13 | |||
| Tiny Tina's Wonderlands (2022) | 23.8 | 17 | 10.6 | 9.1 |
| F1 22 (2022) | 35.3 | 32.3 | 23.6 | 18.3 |
Emisiones
Ruido del sistema
El ruido del ventilador entre las versiones AMD e Intel no es muy diferente. Las cargas altas, como los juegos, alcanzarían máximos similares de poco más de 40 dB(A) en cada versión, mientras que seguiría produciéndose una ligera pulsación del ventilador durante cargas más bajas, como la navegación o el streaming. Por lo demás, el ventilador es fácil de ignorar cuando se ejecutan cargas bajas o medias.
Ruido
| Ocioso |
| 23.2 / 23.2 / 23.2 dB(A) |
| Carga |
| 36 / 41 dB(A) |
 | ||
30 dB silencioso 40 dB(A) audible 50 dB(A) ruidosamente alto |
||
min: | ||
| Lenovo ThinkPad E14 G5 i7-1355U Iris Xe G7 96EUs, i7-1355U, WD PC SN740 512GB SDDQMQD-512G | Lenovo ThinkPad E14 G5-21JSS05C00 Vega 8, R7 7730U, WD PC SN740 SDDPNQD-1T00 | HP EliteBook 845 G10 818N0EA Radeon 780M, R9 PRO 7940HS, SK hynix PC801 HFS001TEJ9X101N | Asus ZenBook 14 UM3402Y Vega 8, R7 7730U, Micron 2400 MTFDKBA512QFM | LG Gram 14Z90Q Iris Xe G7 80EUs, i5-1240P, Samsung PM9A1 MZVL2512HCJQ | Dell Latitude 7440 Iris Xe G7 80EUs, i5-1345U, Samsung MZ9L4512HBLU-00BMV | |
|---|---|---|---|---|---|---|
| Noise | -1% | -7% | -7% | -5% | 9% | |
| apagado / medio ambiente * (dB) | 23.2 | 24.4 -5% | 25.3 -9% | 22.6 3% | 25 -8% | 22.8 2% |
| Idle Minimum * (dB) | 23.2 | 24.4 -5% | 25.3 -9% | 22.6 3% | 26 -12% | 22.8 2% |
| Idle Average * (dB) | 23.2 | 24.4 -5% | 25.3 -9% | 22.6 3% | 27 -16% | 22.8 2% |
| Idle Maximum * (dB) | 23.2 | 25.7 -11% | 25.3 -9% | 22.6 3% | 28 -21% | 22.8 2% |
| Load Average * (dB) | 36 | 31.8 12% | 34.4 4% | 40.7 -13% | 35 3% | 26.3 27% |
| Witcher 3 ultra * (dB) | 38.5 | 36.7 5% | 43.4 -13% | 46.6 -21% | 36 6% | 30 22% |
| Load Maximum * (dB) | 41 | 41.2 -0% | 43.4 -6% | 52.5 -28% | 36 12% | 38.3 7% |
* ... más pequeño es mejor
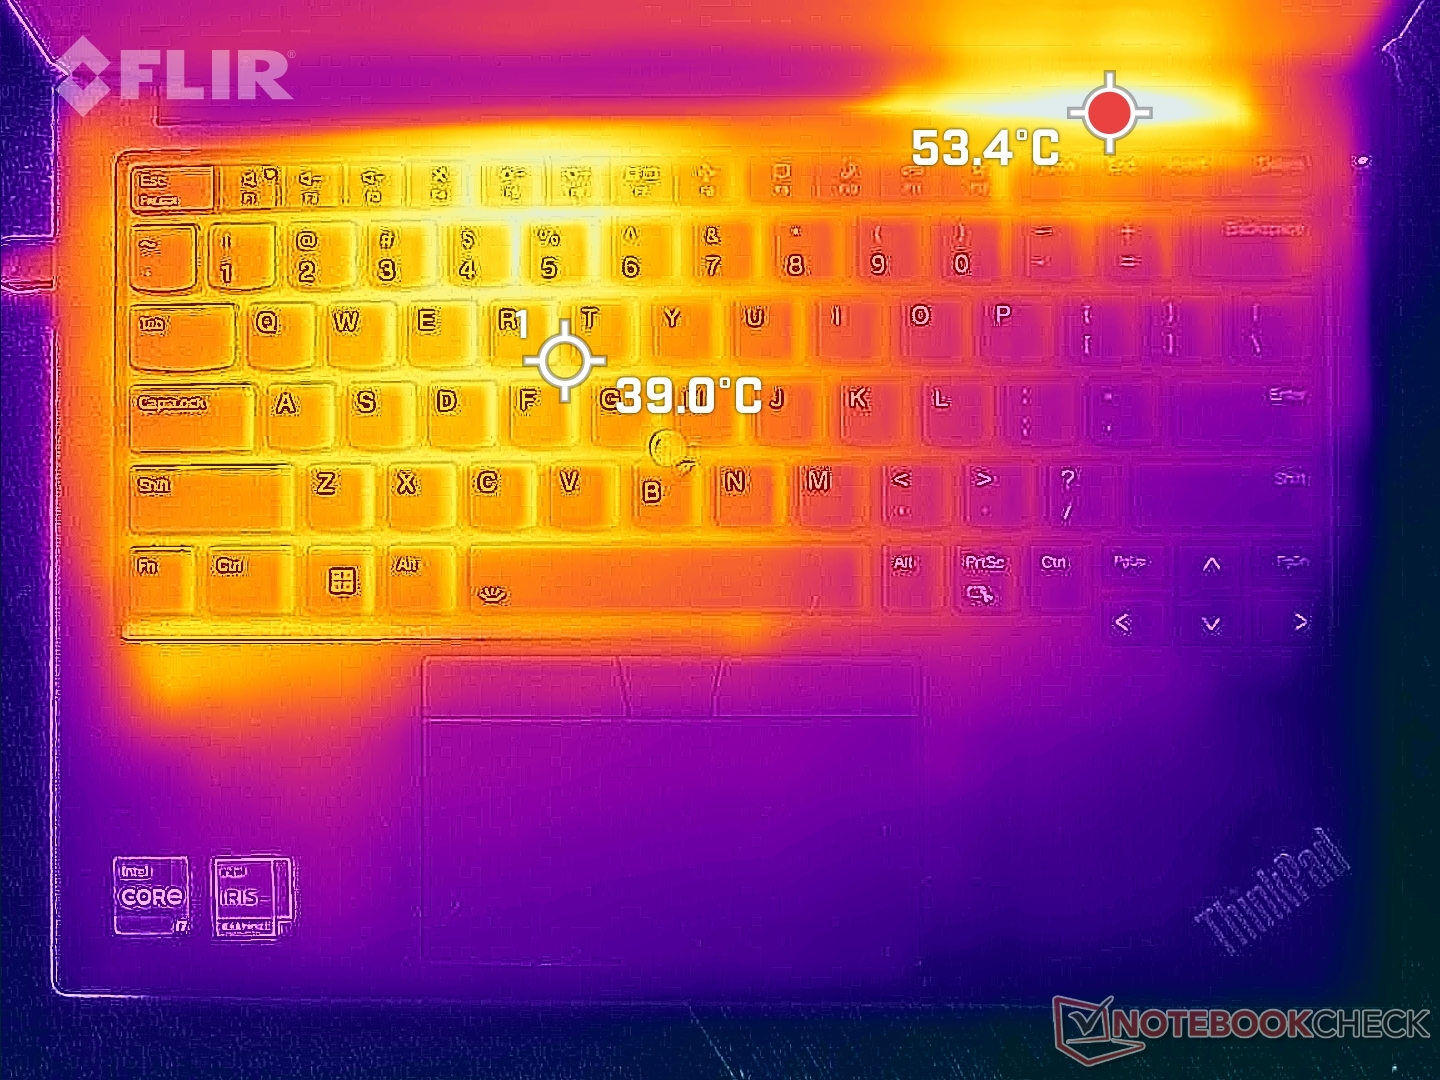
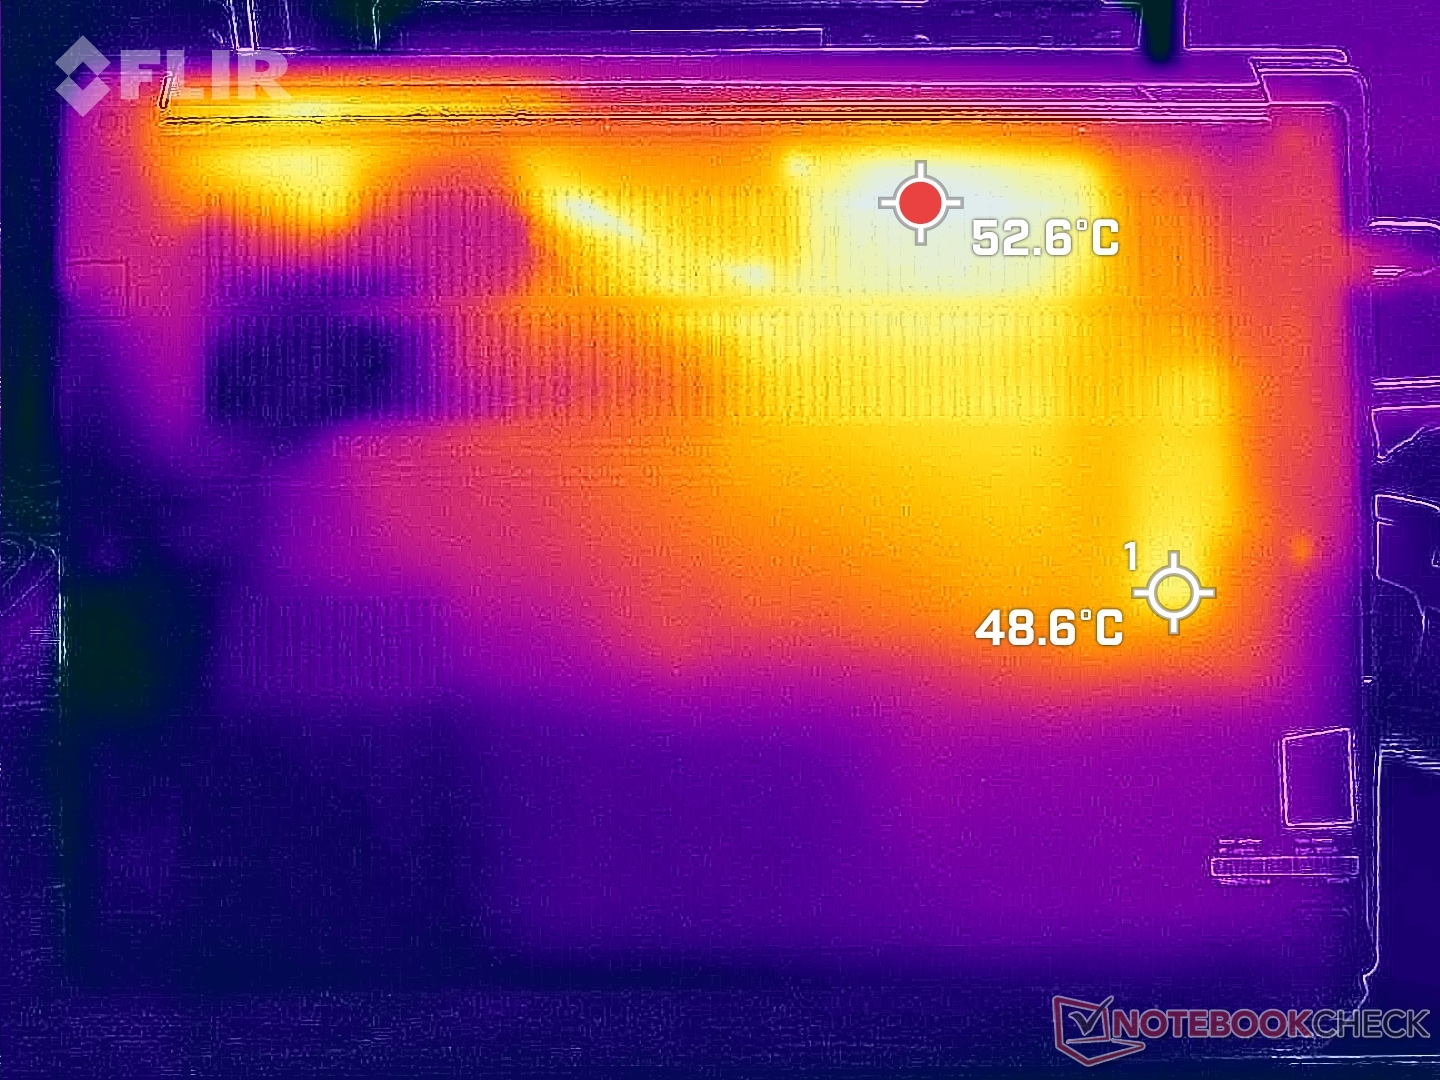
Temperatura
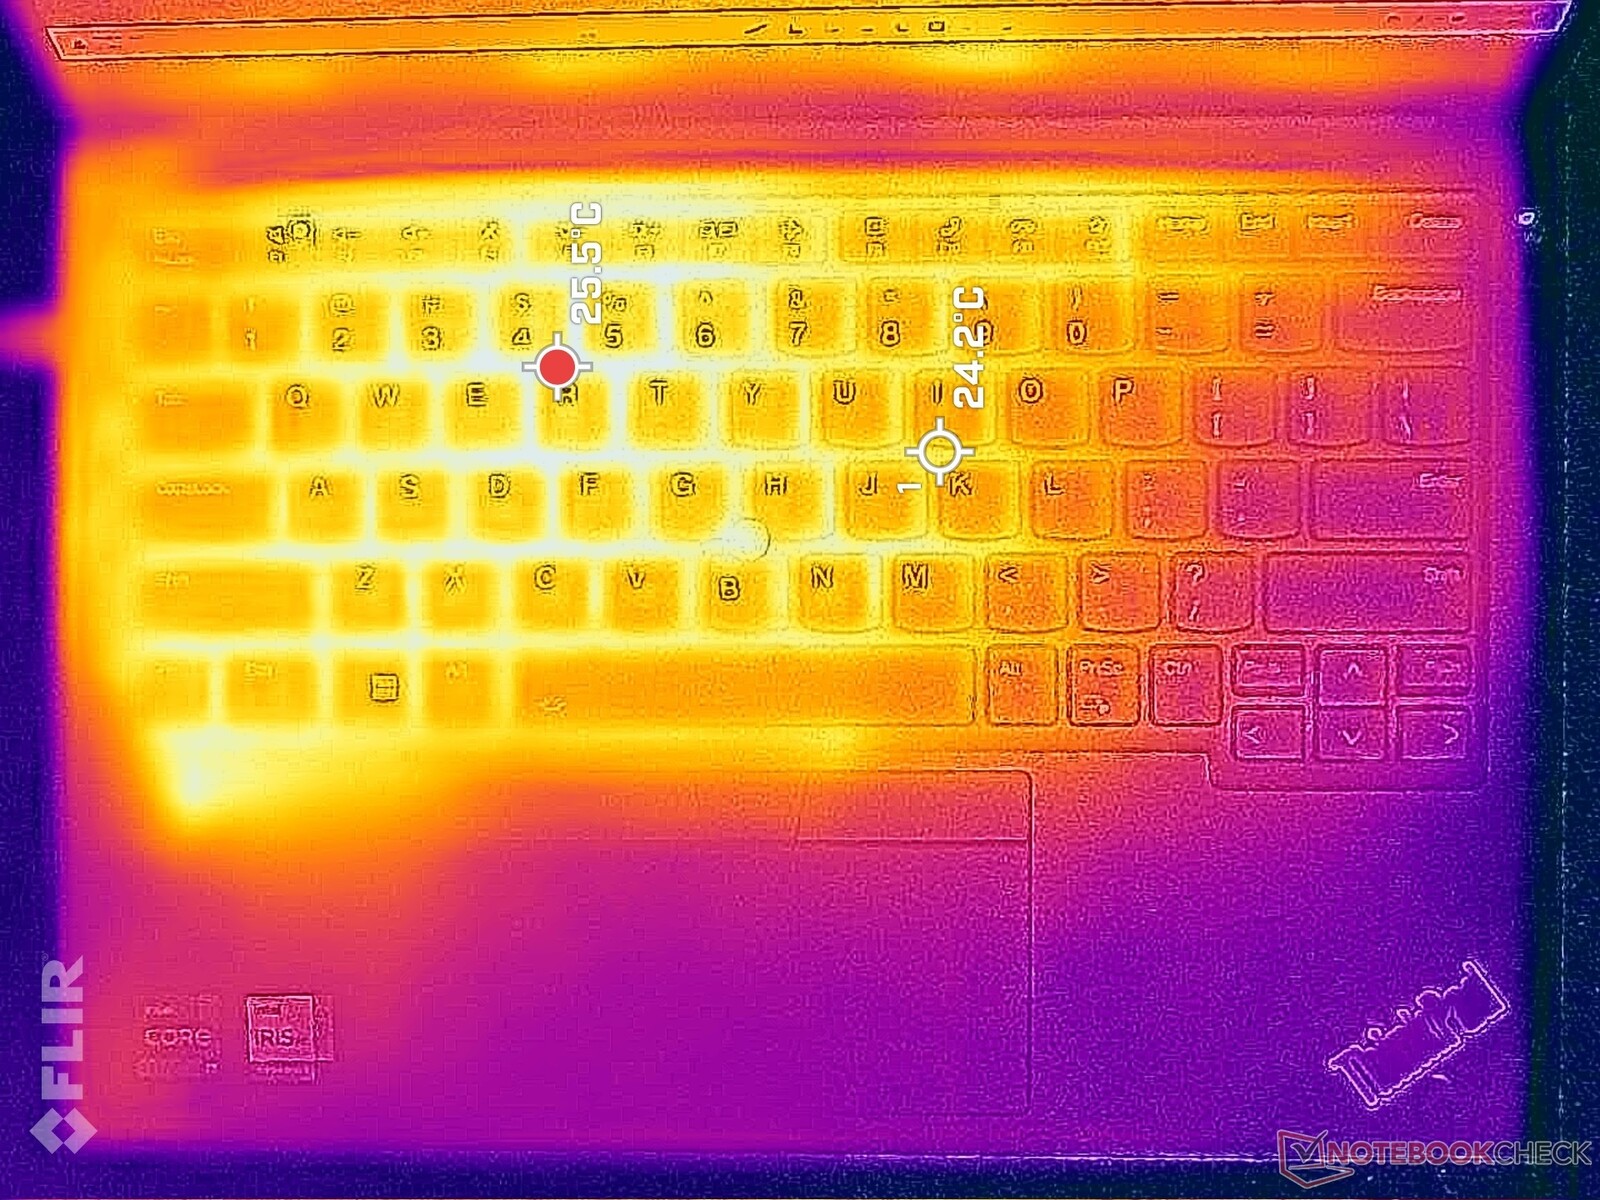
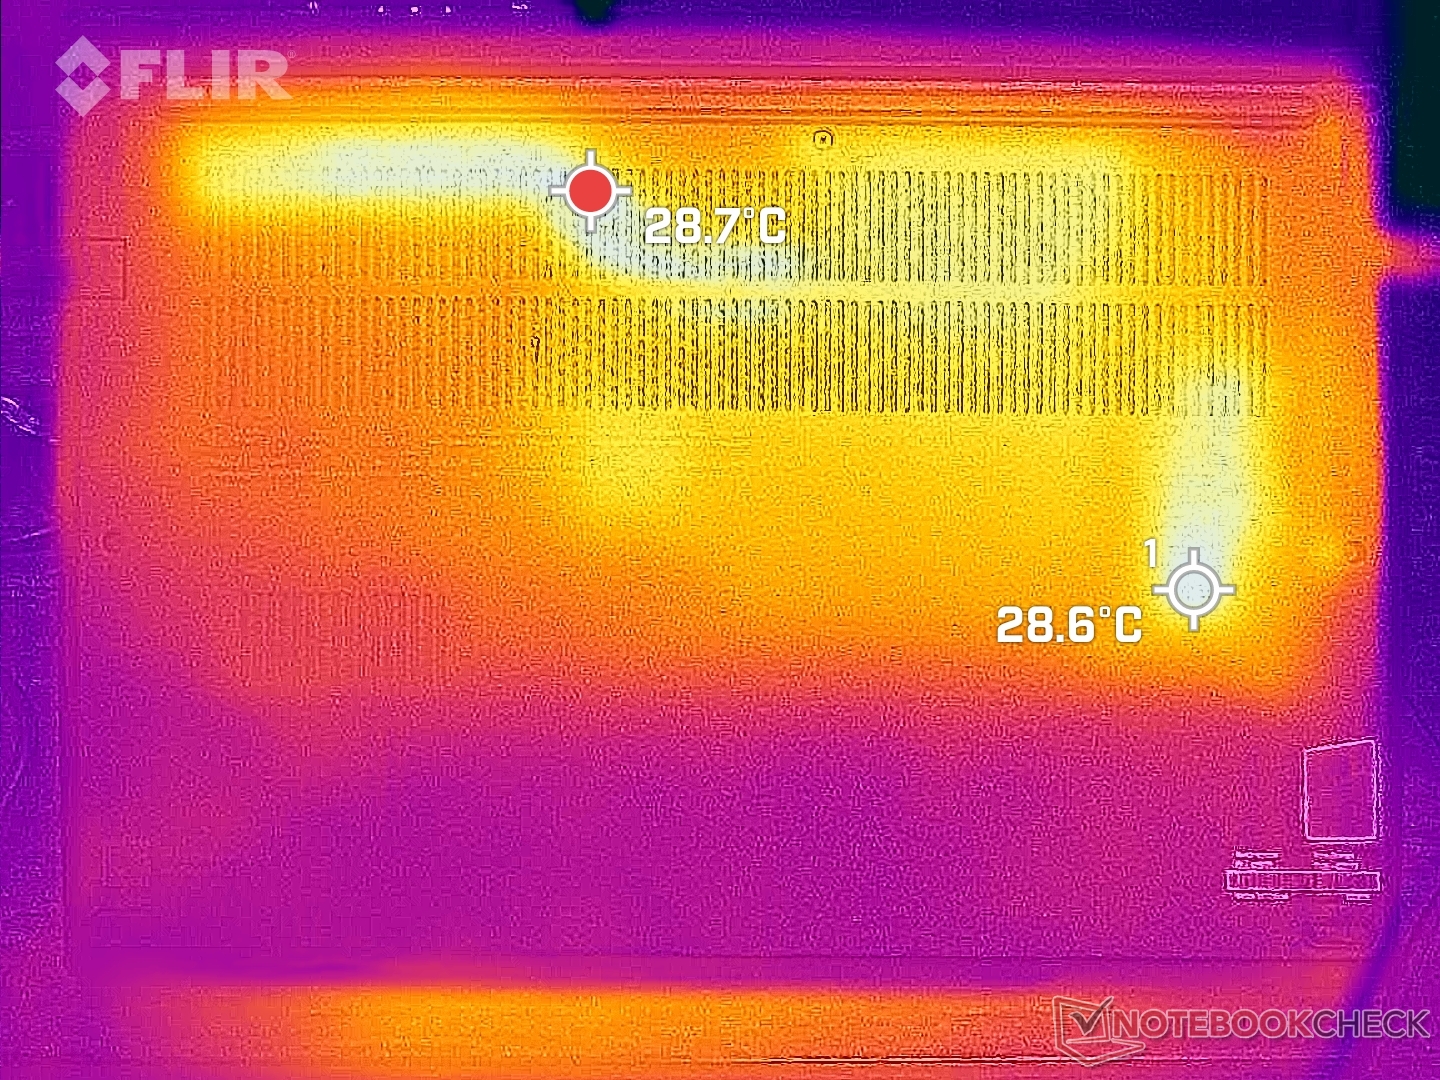
Las temperaturas superficiales son más cálidas en la mitad izquierda del chasis y cerca de las rejillas de ventilación traseras. Los puntos calientes en las superficies del teclado y la parte inferior pueden alcanzar hasta 41 C y 54 C, respectivamente, similar a lo que registramos en la configuración AMD.
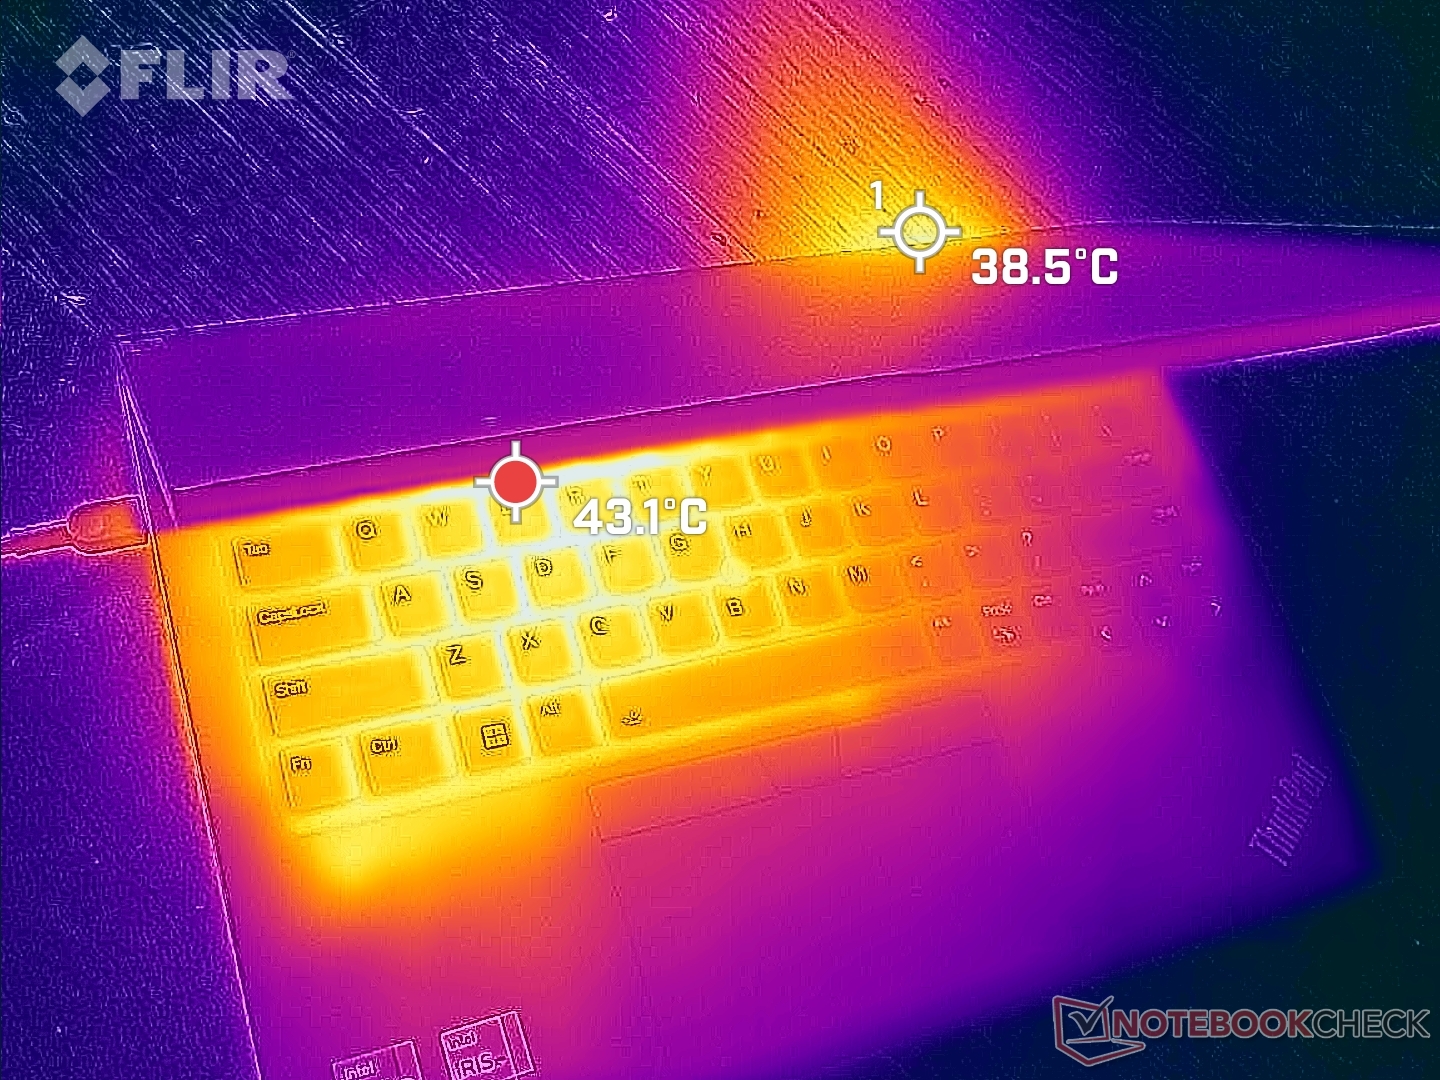
(-) La temperatura máxima en la parte superior es de 45.4 °C / 114 F, frente a la media de 34.3 °C / 94 F, que oscila entre 21.2 y 62.5 °C para la clase Office.
(-) El fondo se calienta hasta un máximo de 50.8 °C / 123 F, frente a la media de 36.8 °C / 98 F
(+) En reposo, la temperatura media de la parte superior es de 28.8 °C / 84# F, frente a la media del dispositivo de 29.5 °C / 85 F.
(+) El reposamanos y el panel táctil están a una temperatura inferior a la de la piel, con un máximo de 29.8 °C / 85.6 F y, por tanto, son fríos al tacto.
(-) La temperatura media de la zona del reposamanos de dispositivos similares fue de 27.5 °C / 81.5 F (-2.3 °C / -4.1 F).
| Lenovo ThinkPad E14 G5 i7-1355U Intel Core i7-1355U, Intel Iris Xe Graphics G7 96EUs | Lenovo ThinkPad E14 G5-21JSS05C00 AMD Ryzen 7 7730U, AMD Radeon RX Vega 8 (Ryzen 4000/5000) | HP EliteBook 845 G10 818N0EA AMD Ryzen 9 PRO 7940HS, AMD Radeon 780M | Asus ZenBook 14 UM3402Y AMD Ryzen 7 7730U, AMD Radeon RX Vega 8 (Ryzen 4000/5000) | LG Gram 14Z90Q Intel Core i5-1240P, Intel Iris Xe Graphics G7 80EUs | Dell Latitude 7440 Intel Core i5-1345U, Intel Iris Xe Graphics G7 80EUs | |
|---|---|---|---|---|---|---|
| Heat | 8% | 7% | 10% | 11% | 14% | |
| Maximum Upper Side * (°C) | 45.4 | 42.6 6% | 45.6 -0% | 39.4 13% | 43 5% | 39 14% |
| Maximum Bottom * (°C) | 50.8 | 55.3 -9% | 51.9 -2% | 43.2 15% | 45 11% | 40.6 20% |
| Idle Upper Side * (°C) | 30.2 | 25.8 15% | 26.5 12% | 28.6 5% | 27 11% | 28 7% |
| Idle Bottom * (°C) | 33.4 | 27.4 18% | 27 19% | 30.6 8% | 28 16% | 28.8 14% |
* ... más pequeño es mejor
Prueba de estrés
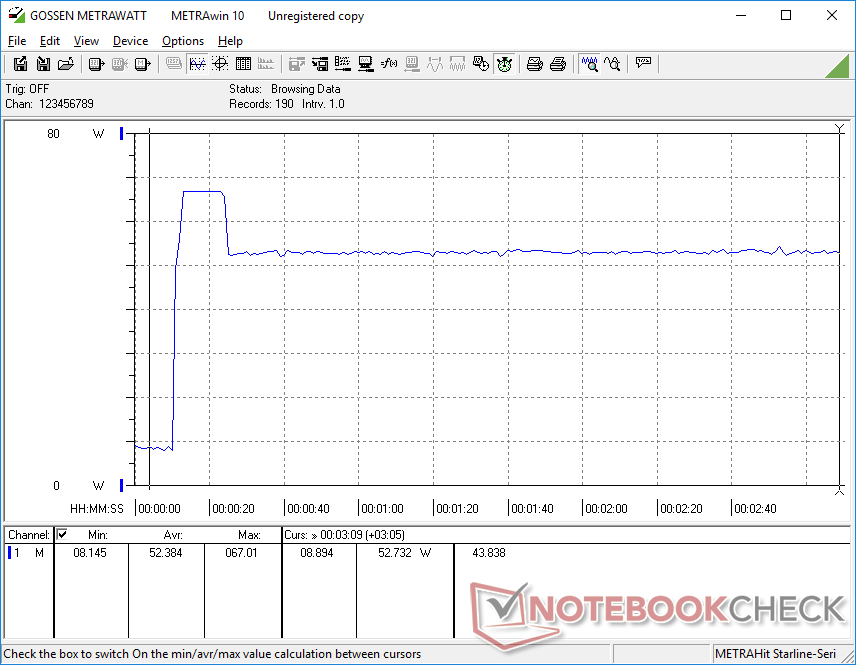
La velocidad de reloj de la CPU y el consumo de energía de la placa al iniciar el estrés Prime95 se dispararían a 4 GHz y 52 W, respectivamente, con una duración de unos 30 segundos y una temperatura del núcleo de 97 C. A continuación, el procesador realizaría ciclos entre 1,6 GHz y 3,9 GHz y entre 14 W y 43 W a partir de entonces con el fin de mantener temperaturas del núcleo más frescas, como se muestra en la captura de pantalla siguiente. El rango de estrangulamiento de la velocidad de reloj es muy amplio, lo que explica los resultados de CineBench más lentos de lo esperado mencionados anteriormente y las cifras de consumo energético tan dispares de la siguiente sección.
La temperatura del núcleo rondaría los 80 C cuando se ejecutan cargas estresantes en comparación con algo menos de 70 C en el Dell Latitude 7440.
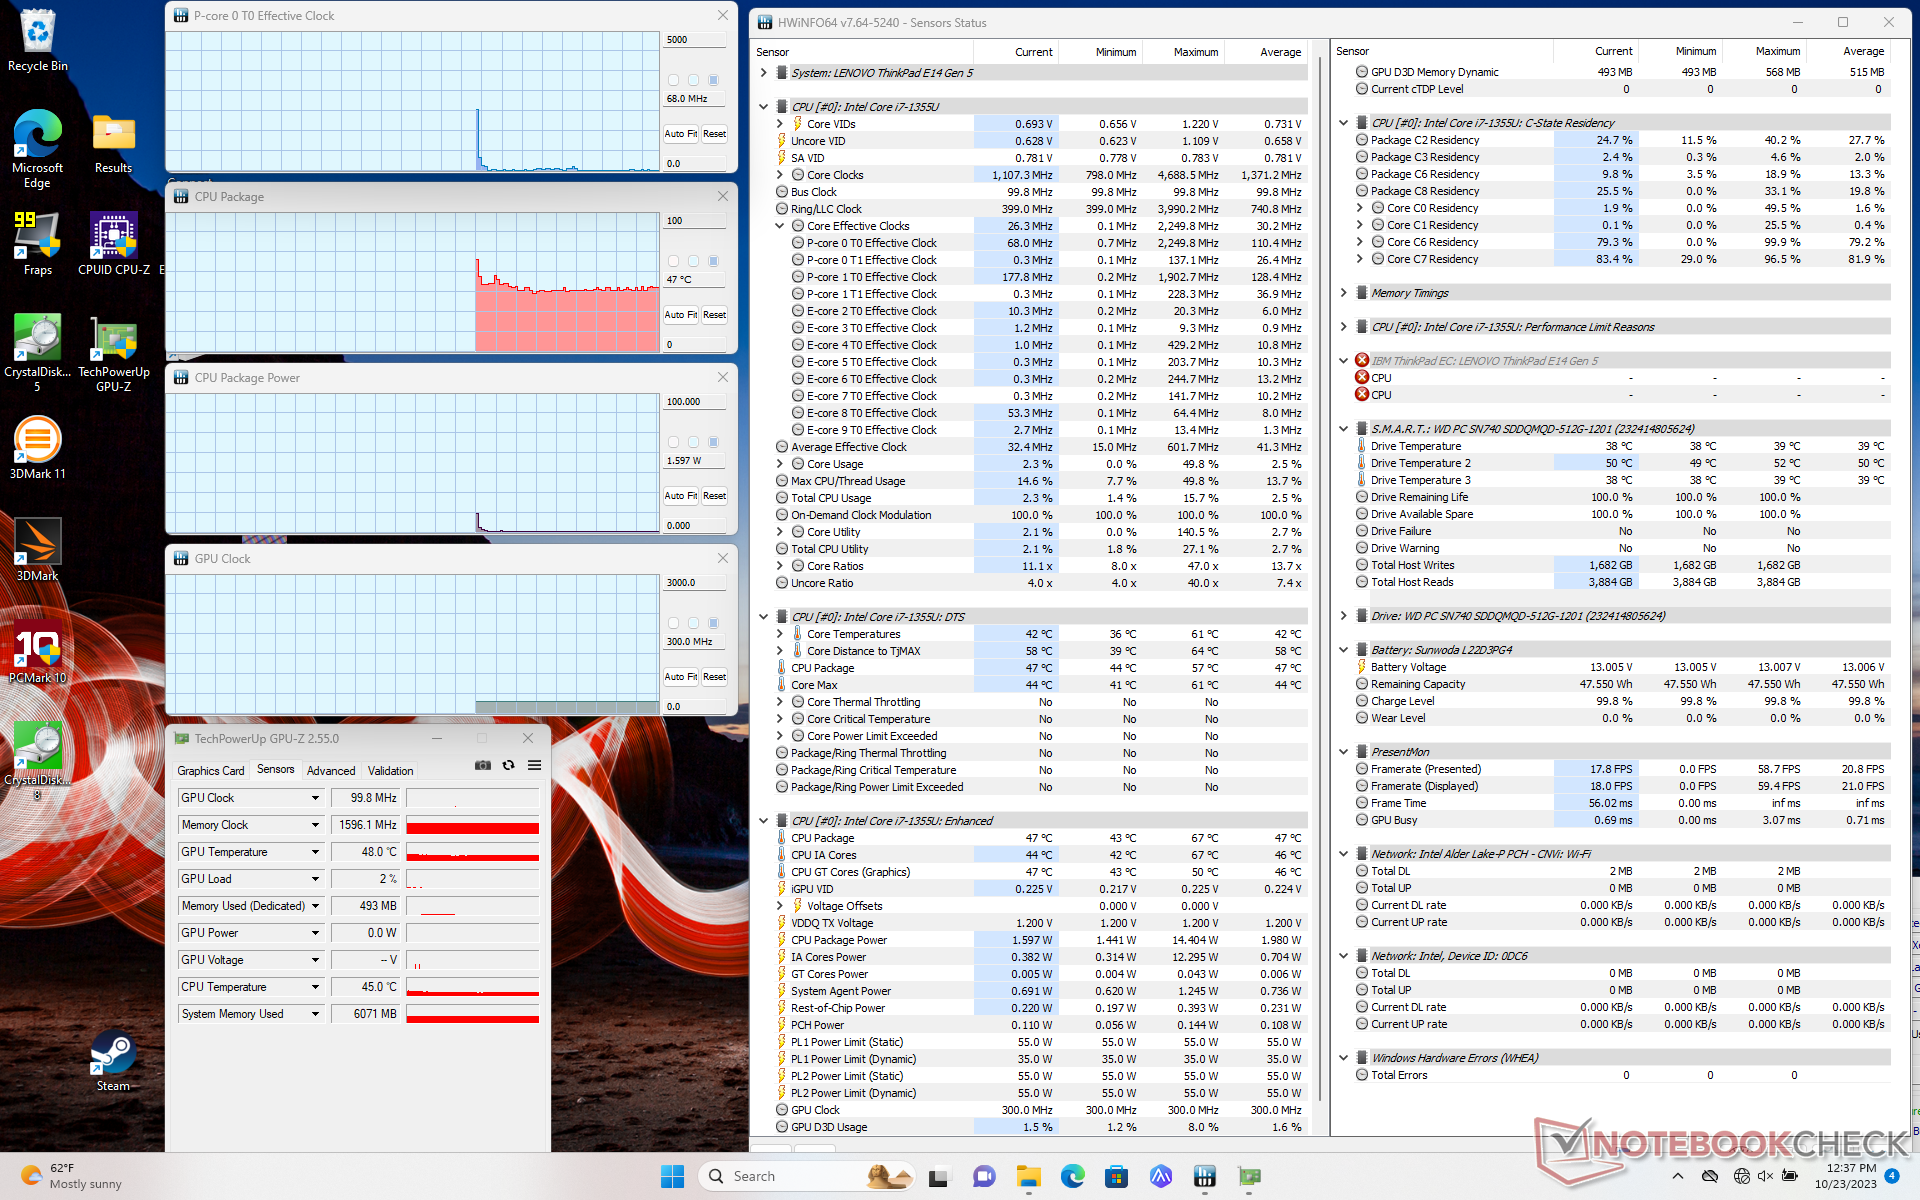
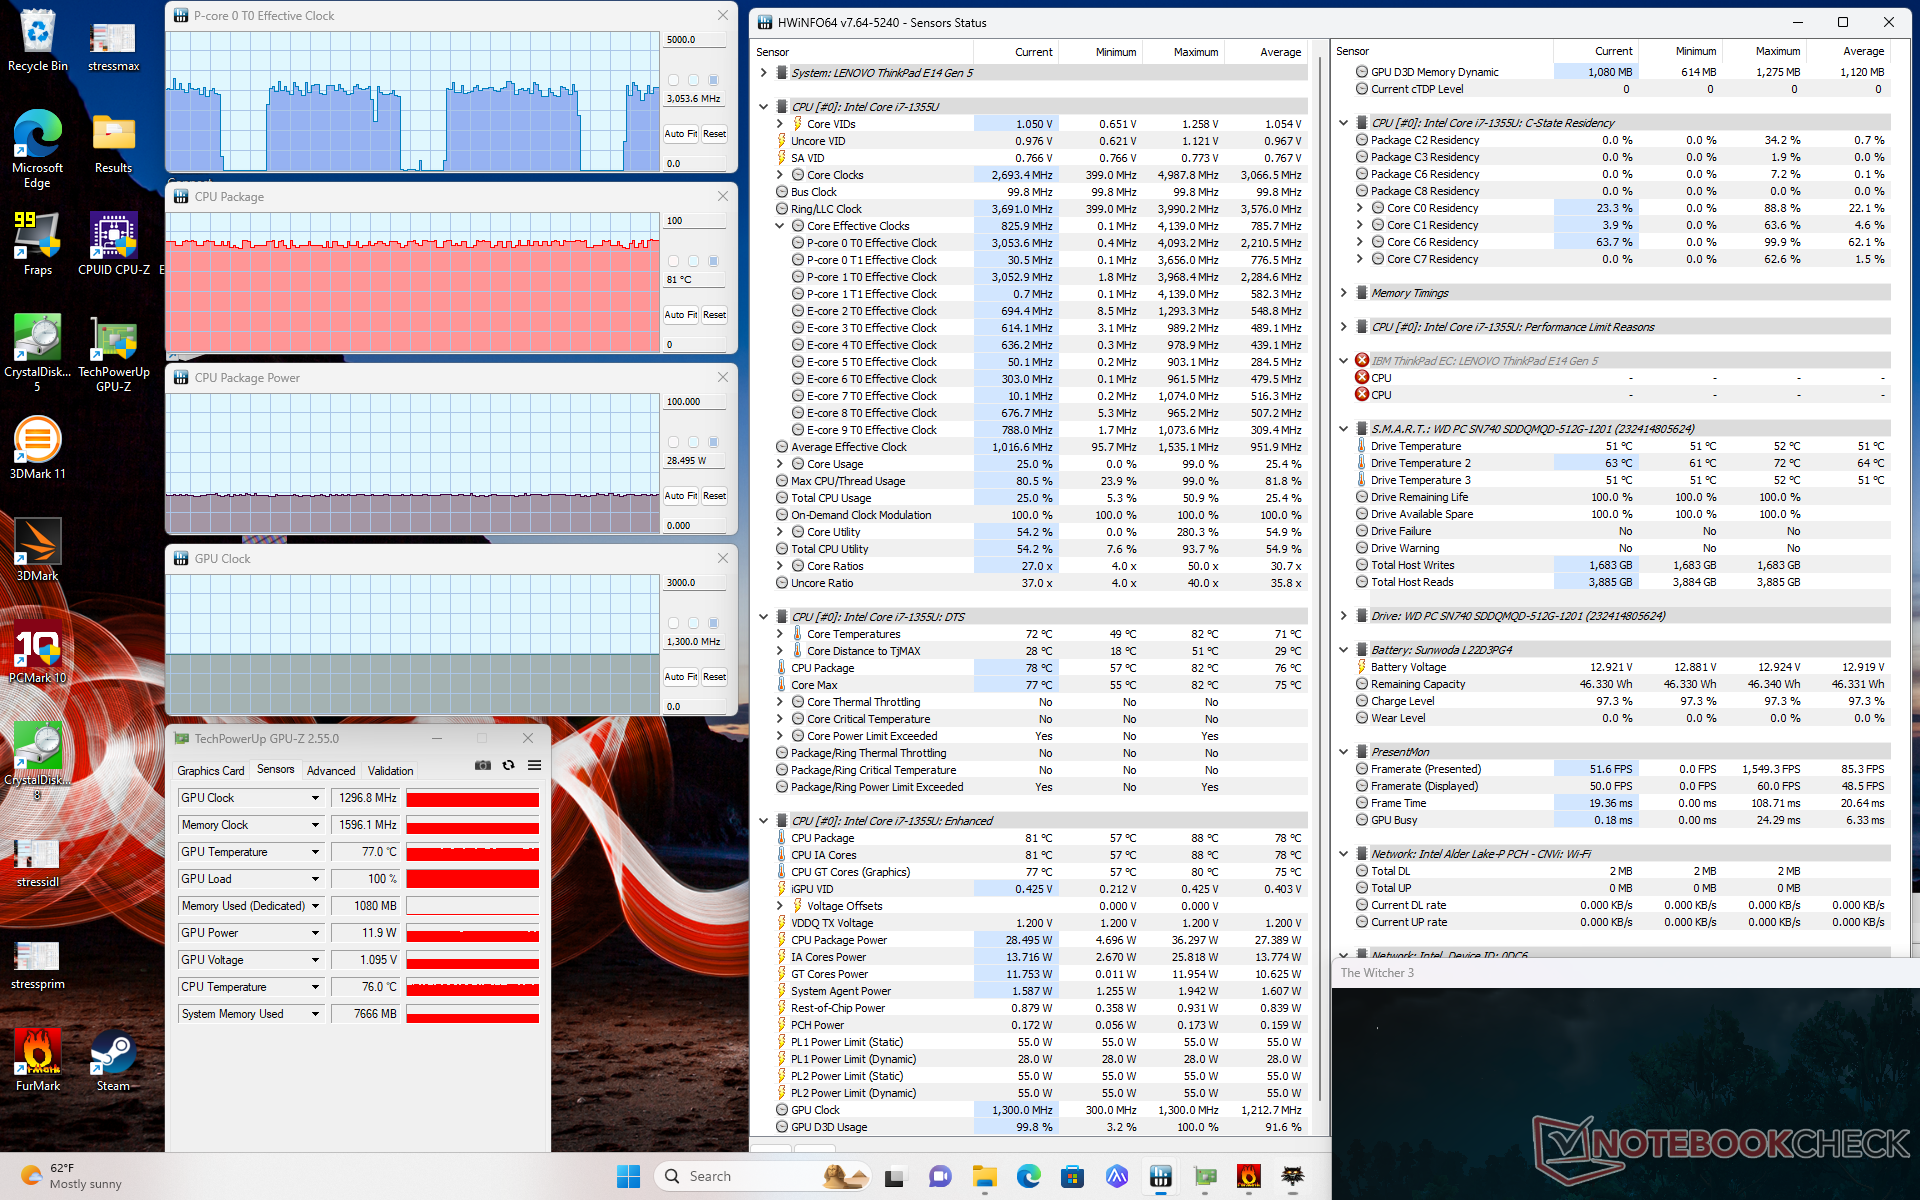
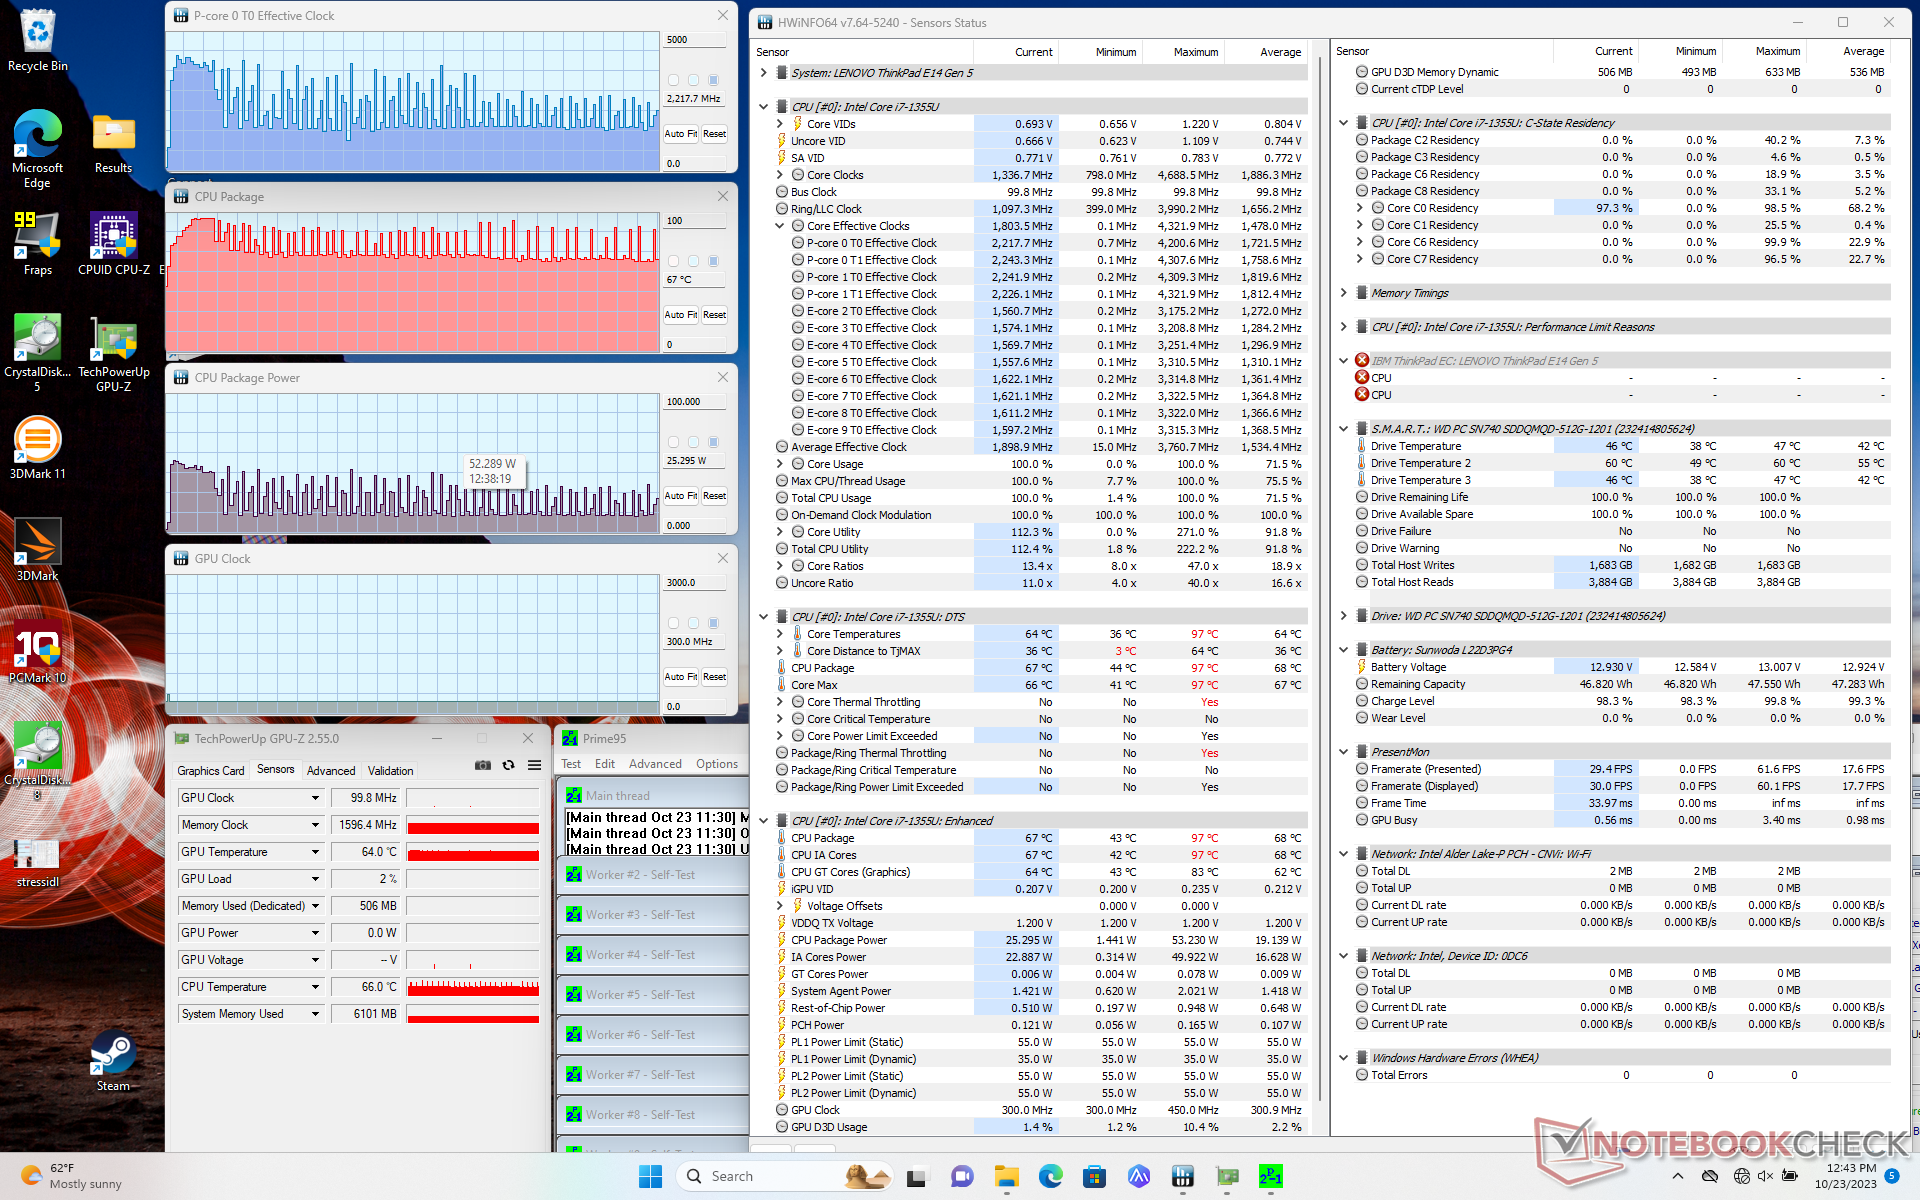
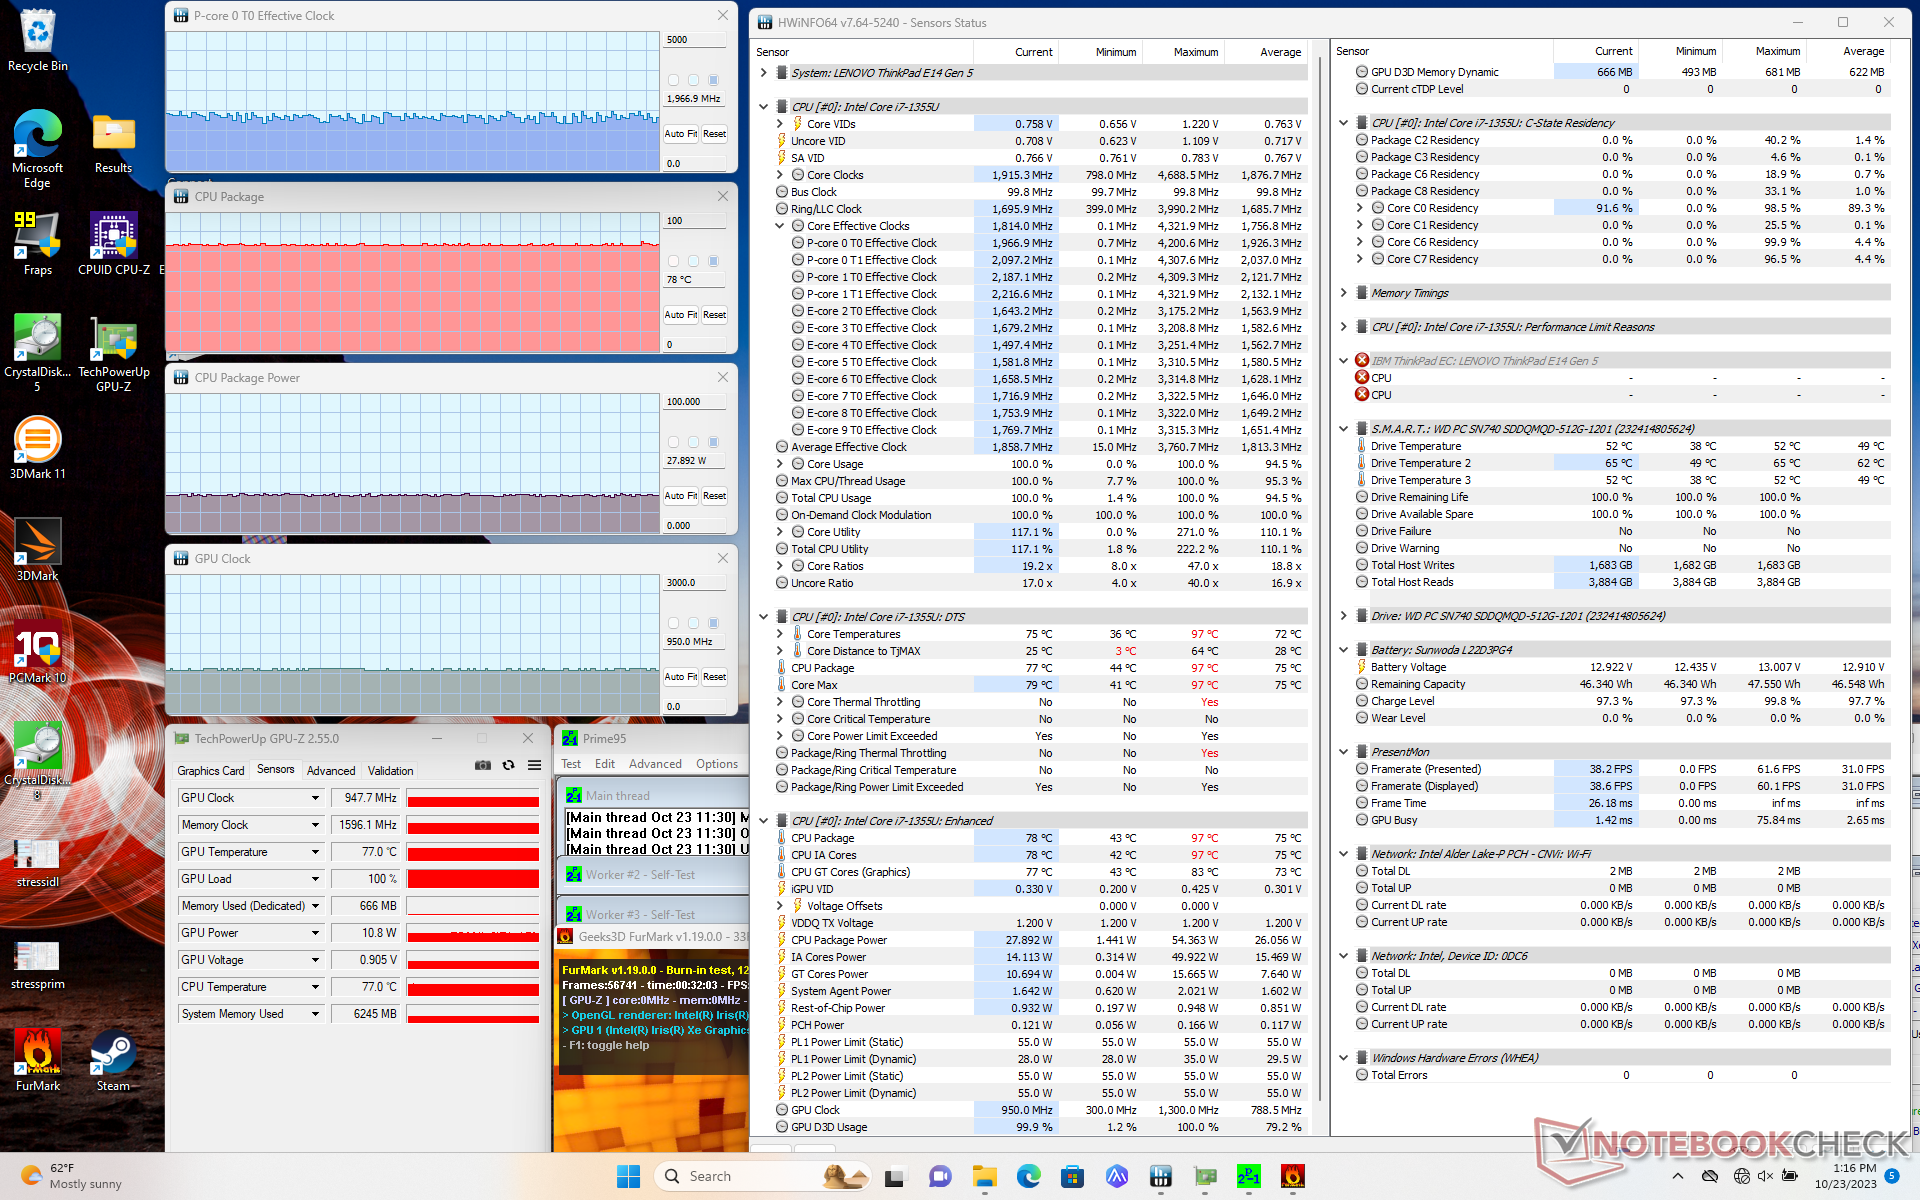
| Reloj dela CPU (GHz) | Reloj de la GPU (MHz) | Temperatura media de la CPU (°C) | |
| Sistema en reposo | -- | -- | 47 |
| Prime95 Stress | 1,6 - 3,9 | -- | 70 - 90 |
| Prime95+ FurMark Estrés | ~2.0 | 950 | 78 |
| Witcher 3 Estrés | ~3.0 | 1300 | 81 |
Altavoces
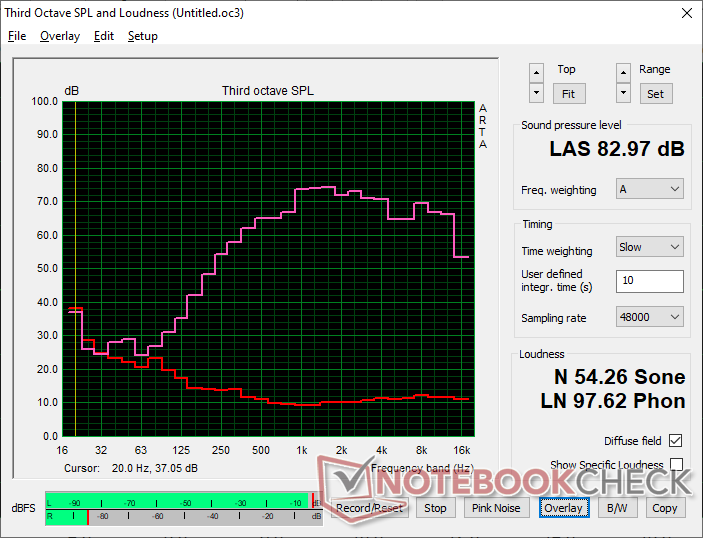
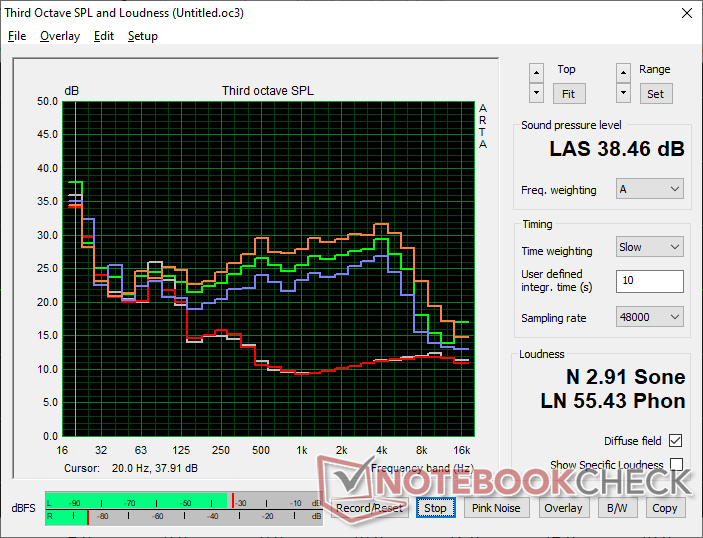
Lenovo ThinkPad E14 G5 i7-1355U análisis de audio
(+) | los altavoces pueden reproducir a un volumen relativamente alto (#83 dB)
Graves 100 - 315 Hz
(-) | casi sin bajos - de media 20.3% inferior a la mediana
(±) | la linealidad de los graves es media (9.6% delta a frecuencia anterior)
Medios 400 - 2000 Hz
(+) | medios equilibrados - a sólo 4.8% de la mediana
(+) | los medios son lineales (4.3% delta a la frecuencia anterior)
Altos 2 - 16 kHz
(+) | máximos equilibrados - a sólo 3.7% de la mediana
(+) | los máximos son lineales (4.4% delta a la frecuencia anterior)
Total 100 - 16.000 Hz
(±) | la linealidad del sonido global es media (16.9% de diferencia con la mediana)
En comparación con la misma clase
» 23% de todos los dispositivos probados de esta clase eran mejores, 7% similares, 70% peores
» El mejor tuvo un delta de 7%, la media fue 21%, el peor fue ###max##%
En comparación con todos los dispositivos probados
» 30% de todos los dispositivos probados eran mejores, 8% similares, 62% peores
» El mejor tuvo un delta de 4%, la media fue 23%, el peor fue ###max##%
Apple MacBook Pro 16 2021 M1 Pro análisis de audio
(+) | los altavoces pueden reproducir a un volumen relativamente alto (#84.7 dB)
Graves 100 - 315 Hz
(+) | buen bajo - sólo 3.8% lejos de la mediana
(+) | el bajo es lineal (5.2% delta a la frecuencia anterior)
Medios 400 - 2000 Hz
(+) | medios equilibrados - a sólo 1.3% de la mediana
(+) | los medios son lineales (2.1% delta a la frecuencia anterior)
Altos 2 - 16 kHz
(+) | máximos equilibrados - a sólo 1.9% de la mediana
(+) | los máximos son lineales (2.7% delta a la frecuencia anterior)
Total 100 - 16.000 Hz
(+) | el sonido global es lineal (4.6% de diferencia con la mediana)
En comparación con la misma clase
» 0% de todos los dispositivos probados de esta clase eran mejores, 0% similares, 100% peores
» El mejor tuvo un delta de 5%, la media fue 17%, el peor fue ###max##%
En comparación con todos los dispositivos probados
» 0% de todos los dispositivos probados eran mejores, 0% similares, 100% peores
» El mejor tuvo un delta de 4%, la media fue 23%, el peor fue ###max##%
Gestión de la energía
Consumo de energía
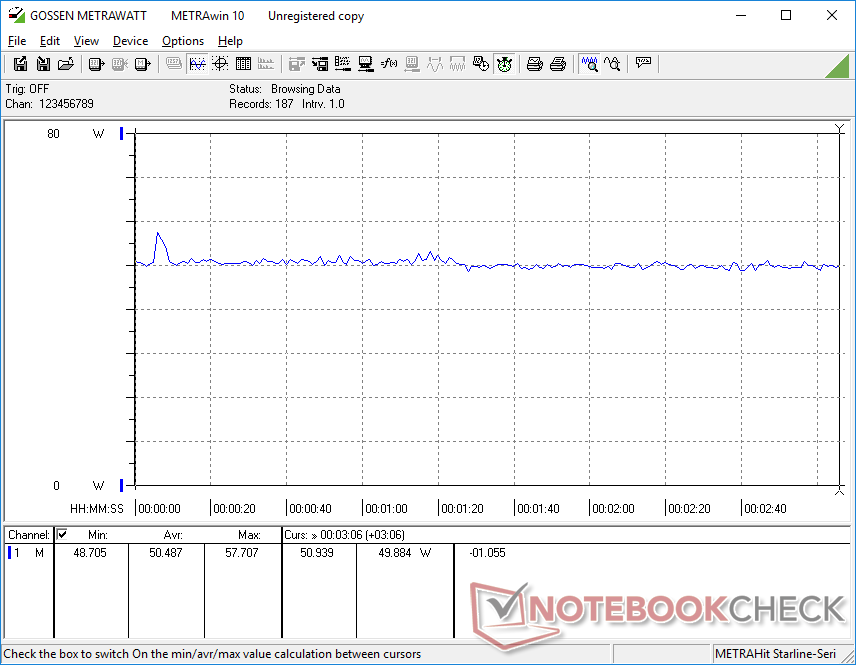
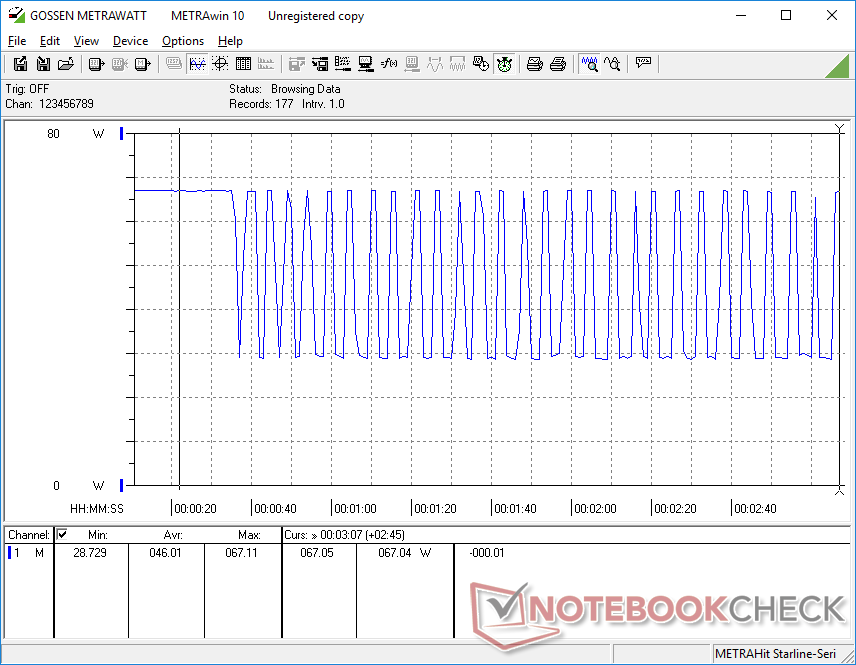
El comportamiento del consumo de energía refleja el pronunciado comportamiento de estrangulamiento de la CPU mencionado anteriormente. Al ejecutar Prime95, por ejemplo, el consumo oscilaba entre 29 W y 67 W, mientras que la misma prueba exacta en el AMD ThinkPad E14 G5 arrojaba una tasa más estable de 47 W.
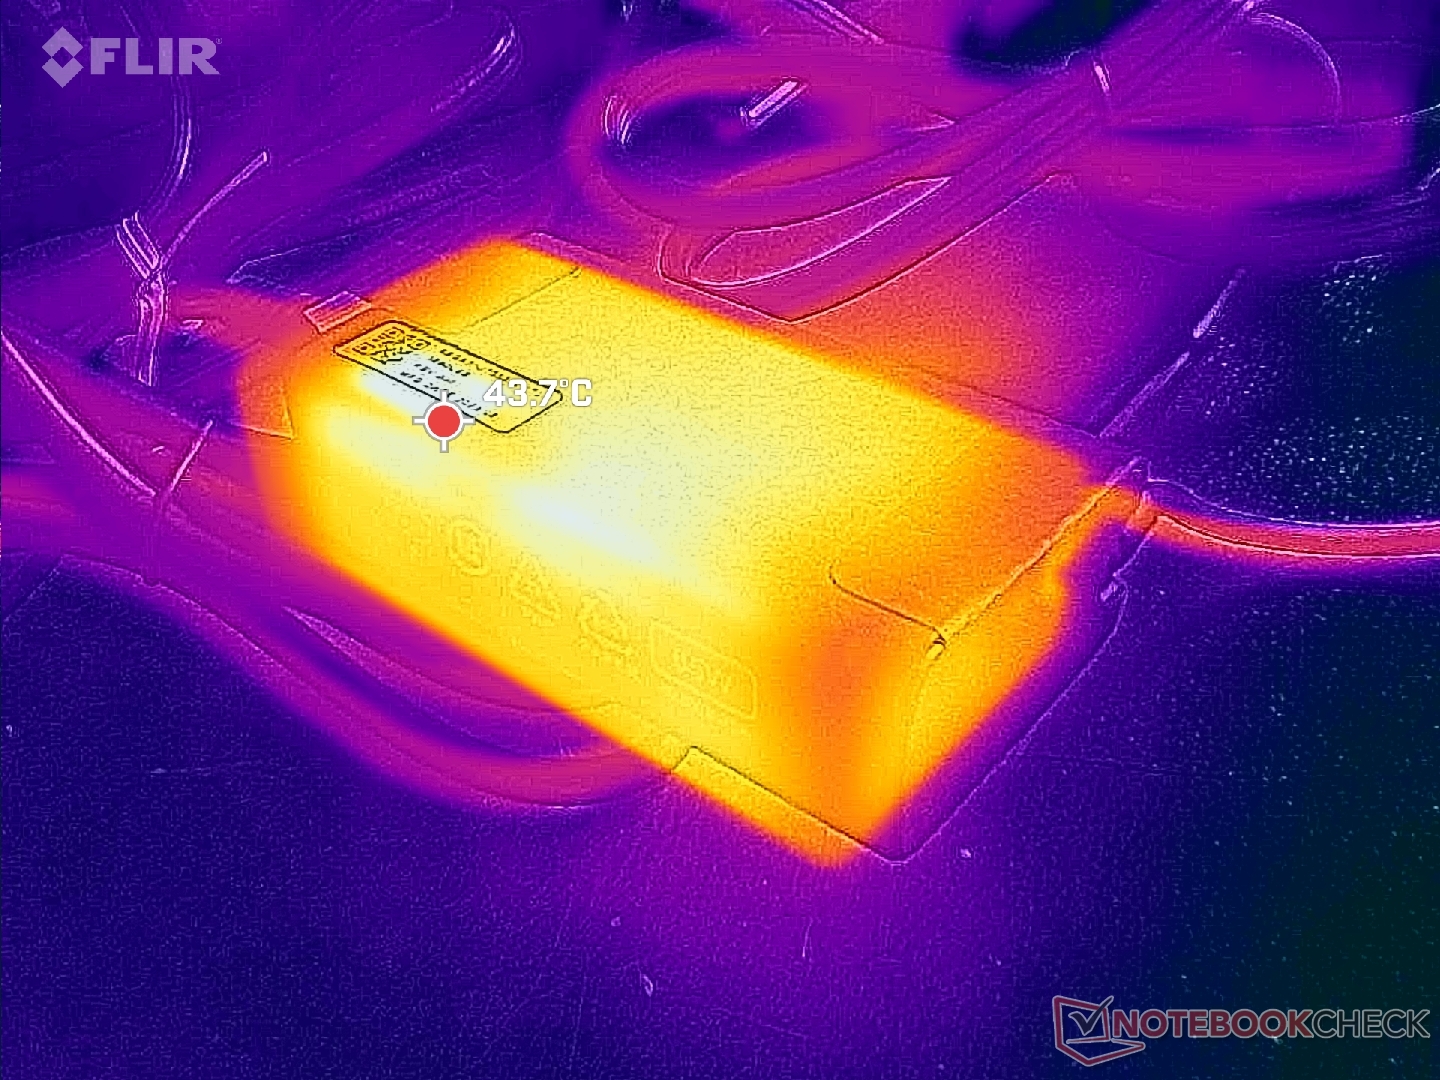
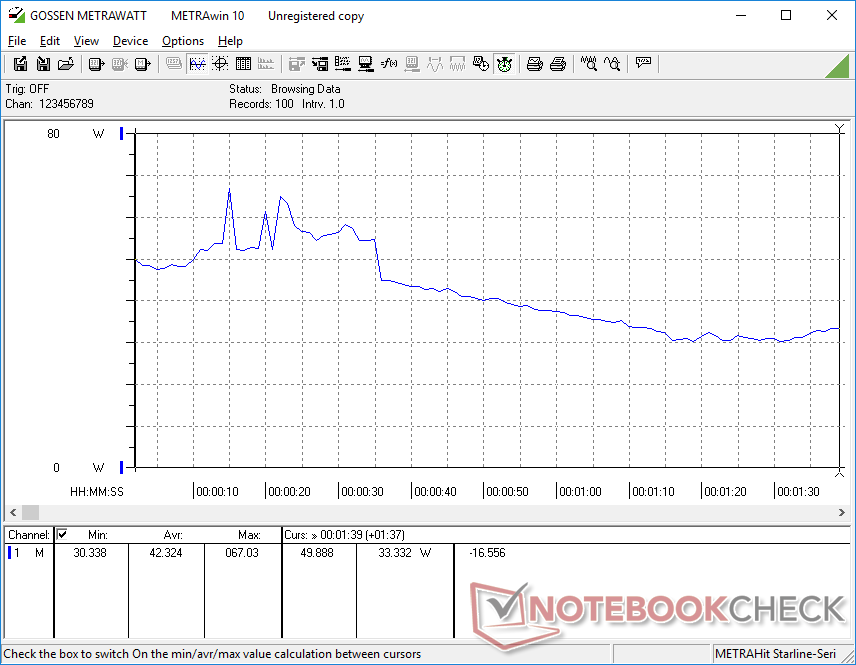
El consumo puede llegar a 67 W desde el pequeño (9 x 4,7 x 2,7 cm) adaptador de CA USB-C de 65 W cuando la CPU está al 100% de utilización. Por lo tanto, el sistema Intel consume más energía que el sistema AMD cuando Turbo Boost está al máximo, como cuando se realizan varias tareas o se inician aplicaciones. Esto también puede observarse al iniciar el benchmark CineBench R15 xT, como muestra el gráfico comparativo que aparece a continuación. Por lo demás, el consumo es prácticamente el mismo entre las dos versiones cuando está en reposo en el escritorio o cuando ejecuta cargas menos exigentes.
| Off / Standby | |
| Ocioso | |
| Carga |
|
Clave:
min: | |
| Lenovo ThinkPad E14 G5 i7-1355U i7-1355U, Iris Xe G7 96EUs, WD PC SN740 512GB SDDQMQD-512G, IPS, 1920x1200, 14" | Lenovo ThinkPad E14 G5-21JSS05C00 R7 7730U, Vega 8, WD PC SN740 SDDPNQD-1T00, IPS, 2240x1400, 14" | HP EliteBook 845 G10 818N0EA R9 PRO 7940HS, Radeon 780M, SK hynix PC801 HFS001TEJ9X101N, IPS, 2560x1600, 14" | Asus ZenBook 14 UM3402Y R7 7730U, Vega 8, Micron 2400 MTFDKBA512QFM, OLED, 2880x1800, 14" | LG Gram 14Z90Q i5-1240P, Iris Xe G7 80EUs, Samsung PM9A1 MZVL2512HCJQ, IPS, 1920x1200, 14" | Dell Latitude 7440 i5-1345U, Iris Xe G7 80EUs, Samsung MZ9L4512HBLU-00BMV, IPS, 2560x1600, 14" | |
|---|---|---|---|---|---|---|
| Power Consumption | -3% | -33% | -42% | -0% | -5% | |
| Idle Minimum * (Watt) | 3.6 | 3.3 8% | 4.3 -19% | 7.9 -119% | 3 17% | 4.5 -25% |
| Idle Average * (Watt) | 6.9 | 7.6 -10% | 10.1 -46% | 8.8 -28% | 6 13% | 6.5 6% |
| Idle Maximum * (Watt) | 7 | 8.9 -27% | 11.2 -60% | 14.7 -110% | 12 -71% | 7.3 -4% |
| Load Average * (Watt) | 42.3 | 47.3 -12% | 64.4 -52% | 46.9 -11% | 40 5% | 52.5 -24% |
| Witcher 3 ultra * (Watt) | 50.5 | 45.1 11% | 59.4 -18% | 44.9 11% | 36.5 28% | 46.2 9% |
| Load Maximum * (Watt) | 67 | 57.8 14% | 66.7 -0% | 65.2 3% | 63 6% | 63 6% |
* ... más pequeño es mejor
Power Consumption Witcher 3 / Stresstest
Power Consumption external Monitor
Duración de las pilas
La batería es más pequeña para algunas configuraciones Intel en comparación con nuestra configuración AMD (47 Wh frente a 57 Wh), por lo que los usuarios deben esperar tiempos de ejecución más cortos si se configuran con la opción más pequeña. Somos capaces de navegar por la web durante unas 5,5 horas antes del apagado automático en comparación con las casi 10 horas de la versión AMD.
Por lo demás, la carga desde vacío a plena capacidad es muy rápida con poco más de una hora con el adaptador de CA incluido. La carga rápida está activada por defecto.
| Lenovo ThinkPad E14 G5 i7-1355U i7-1355U, Iris Xe G7 96EUs, 47 Wh | Lenovo ThinkPad E14 G5-21JSS05C00 R7 7730U, Vega 8, 57 Wh | HP EliteBook 845 G10 818N0EA R9 PRO 7940HS, Radeon 780M, 51 Wh | Asus ZenBook 14 UM3402Y R7 7730U, Vega 8, 75 Wh | LG Gram 14Z90Q i5-1240P, Iris Xe G7 80EUs, 72 Wh | Dell Latitude 7440 i5-1345U, Iris Xe G7 80EUs, 57 Wh | |
|---|---|---|---|---|---|---|
| Duración de Batería | 80% | 44% | 120% | 116% | 136% | |
| WiFi v1.3 (h) | 5.5 | 9.9 80% | 7.9 44% | 12.1 120% | 11.9 116% | 13 136% |
| H.264 (h) | 10.8 | 9.3 | ||||
| Load (h) | 1.2 | 0.9 | 3.4 | 2.8 | 2.7 | |
| Reader / Idle (h) | 18.5 | 28.9 | 23.8 |
Pro
Contra
Veredicto - Buena pero más difícil de recomendar que la versión AMD Ryzen 7

Nuestra unidad Intel configurada con la CPU Core i7, 16 GB de RAM, pantalla táctil 1200p y SSD de 512 GB se vende por unos 915 USD, frente a los 865 USD de la versión Ryzen 7 con la misma RAM, pantalla táctil y SSD. Optar por la versión AMD le proporcionará un rendimiento multihilo más rápido, una mayor duración de la batería y la compatibilidad adecuada con la SSD M.2 2280, mientras que la versión Intel le proporcionará un rendimiento monohilo más rápido y compatibilidad con Thunderbolt. Otros aspectos como el rendimiento gráfico, la temperatura de la superficie y el ruido del ventilador son por lo demás muy similares entre las dos versiones. Por lo tanto, a menos que realmente valore el rendimiento de un solo subproceso y Thunderbolt, la versión AMD es más fácil de recomendar que la versión Intel para la mayoría de los compradores interesados.
El ThinkPad E14 G5 basado en Intel muestra un comportamiento de ralentización más pronunciado que su alternativa Ryzen 7 menos costosa.
Faltan algunas funciones auxiliares centradas en la empresa como WAN y Smart Card, pero eso es por diseño ya que se supone que la serie ThinkPad E es una alternativa más asequible a la gama alta y mucho más cara ThinkPad serie T o Serie X.
Precio y disponibilidad
Amazon está enviando ahora el ThinkPad E14 Gen 5 como se revisó por $915 USD. Lenovo también está envi ando el mismo modelo pero con RAM adicional por poco más de $1030.
Lenovo ThinkPad E14 G5 i7-1355U
- 10/26/2023 v7 (old)
Allen Ngo
Transparencia
La selección de los dispositivos que se van a reseñar corre a cargo de nuestro equipo editorial. La muestra de prueba fue proporcionada al autor en calidad de préstamo por el fabricante o el minorista a los efectos de esta reseña. El prestamista no tuvo ninguna influencia en esta reseña, ni el fabricante recibió una copia de la misma antes de su publicación. No había ninguna obligación de publicar esta reseña. Como empresa de medios independiente, Notebookcheck no está sujeta a la autoridad de fabricantes, minoristas o editores.
Así es como prueba Notebookcheck
Cada año, Notebookcheck revisa de forma independiente cientos de portátiles y smartphones utilizando procedimientos estandarizados para asegurar que todos los resultados son comparables. Hemos desarrollado continuamente nuestros métodos de prueba durante unos 20 años y hemos establecido los estándares de la industria en el proceso. En nuestros laboratorios de pruebas, técnicos y editores experimentados utilizan equipos de medición de alta calidad. Estas pruebas implican un proceso de validación en varias fases. Nuestro complejo sistema de clasificación se basa en cientos de mediciones y puntos de referencia bien fundamentados, lo que mantiene la objetividad.Price comparison

