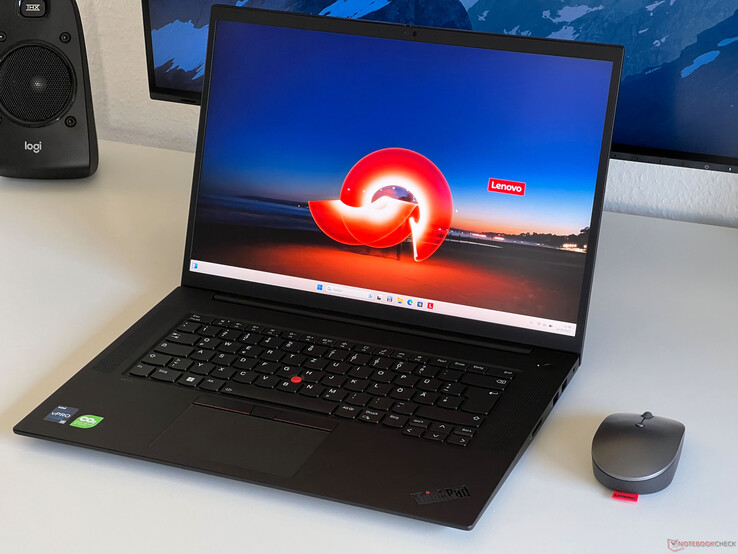
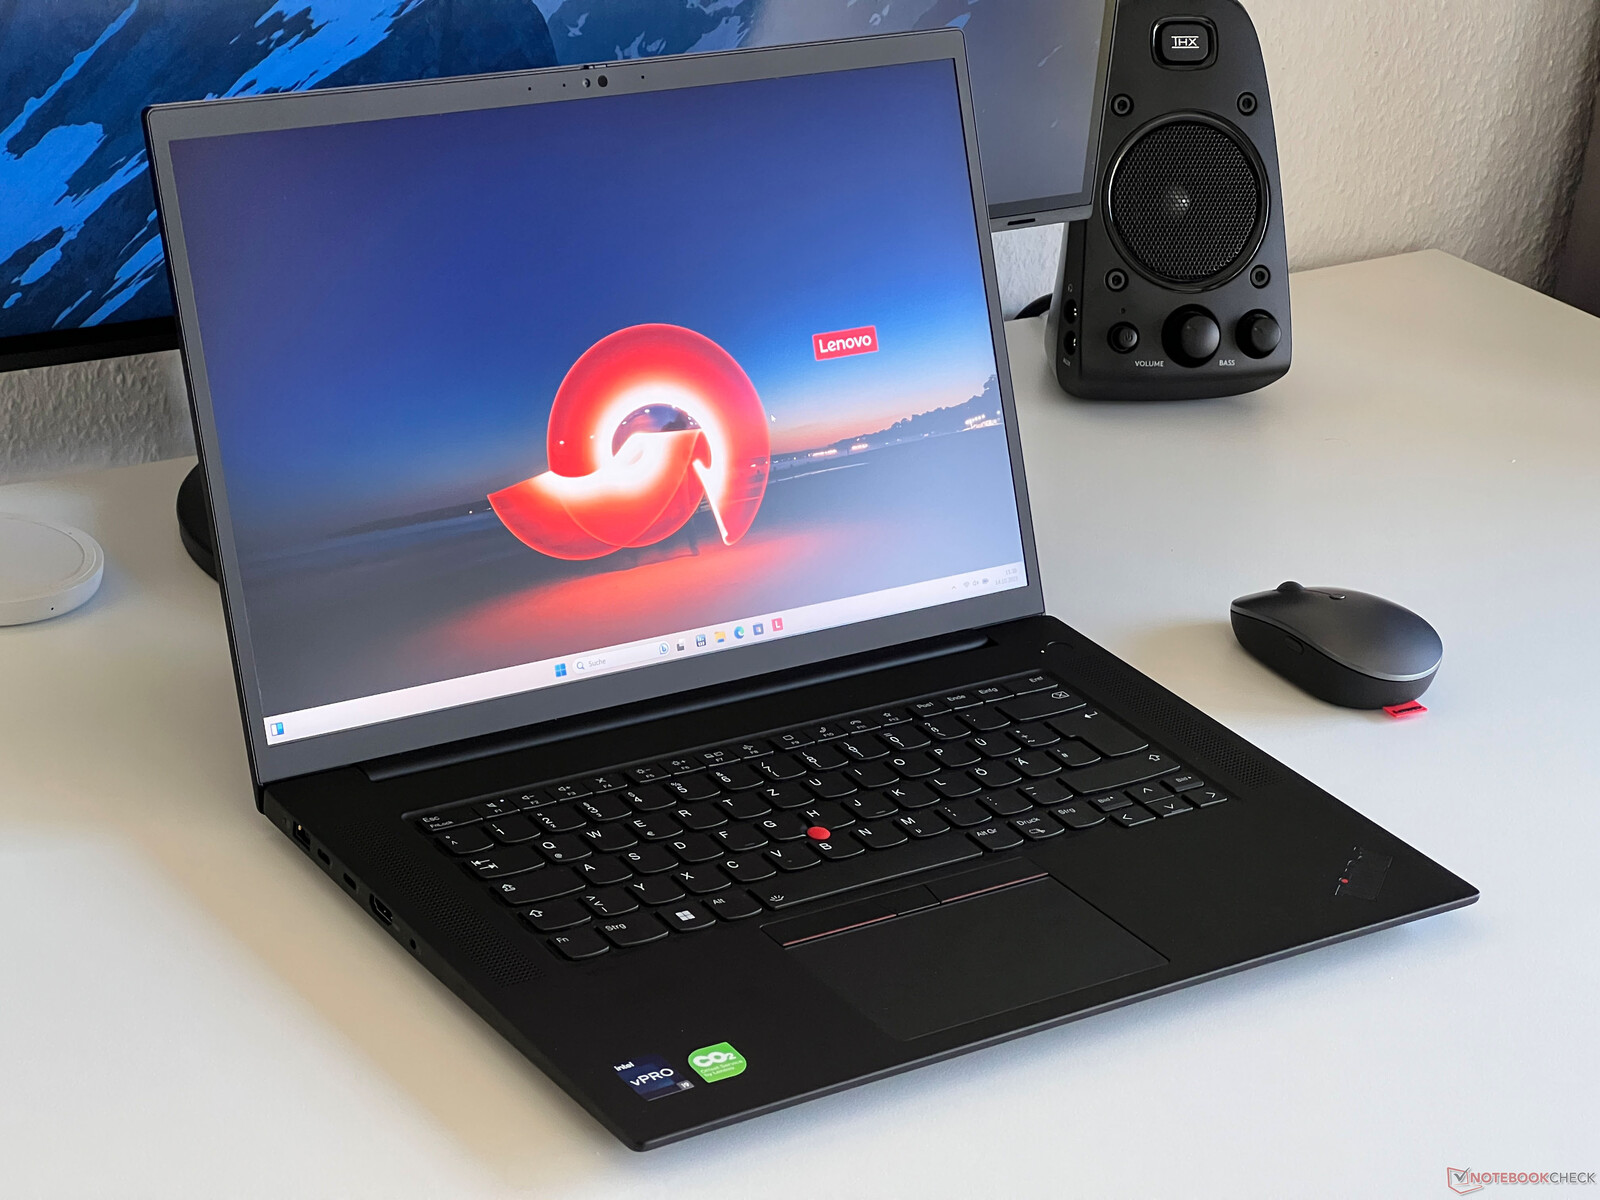
Análisis del portátil Lenovo ThinkPad P1 G6: la estación de trabajo móvil sustituye al ThinkPad X1 Extreme
Durante años, Lenovo tuvo dos grandes modelos de 16 pulgadas en su línea: el Lenovo ThinkPad X1 Extreme y su estación de trabajo de idéntica construcción, el ThinkPad P1. Ahora, la cartera se ha racionalizado, y el nuevo ThinkPad P1 Gen 6 asume ambos papeles de inmediato. No hay sucesor del ThinkPad X1 Extreme Gen 5 del año pasado. El nuevo ThinkPad P1 Gen 6 está disponible tanto con GPU de consumo GeForce como con adaptadores gráficos de nivel profesional, lo que ofrece versatilidad a la hora de elegir. Cabe destacar que el diseño de la carcasa permanece prácticamente inalterado y que se siguen ofreciendo dos modelos básicos. Dependiendo de la tarjeta gráfica elegida, se utiliza una refrigeración convencional o una cámara de vapor (para GeForce RTX 4060/RTX 3500 Ada).
La gama de componentes del ThinkPad P1 Gen 6 es amplia. Siempre utiliza las CPU Raptor-Lake de 45 vatios más recientes de Intel, y las opciones de tarjeta gráfica van desde la RTX 1000 Ada hasta la RTX 5000 Ada (o GeForce RTX 4060, 4080 o 4090). Esta gran variedad se traduce en variaciones considerables en los precios. El modelo base, equipado con Core i7-13700H, 32 GB de RAM y RTX 1000 Ada, parte actualmente de unos 2850 dólares. Sin embargo, los precios pueden superar fácilmente los 6.350 USD para las configuraciones de gama más alta con Core i9, RTX 5000 Ada, 96 GB de RAM y pantalla OLED.
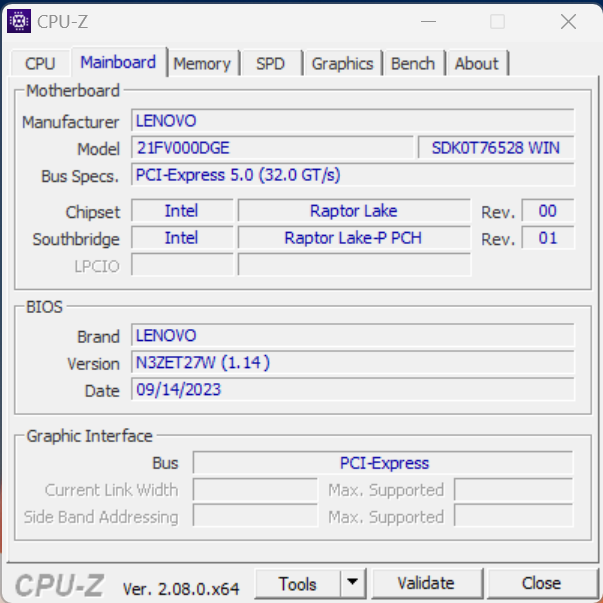
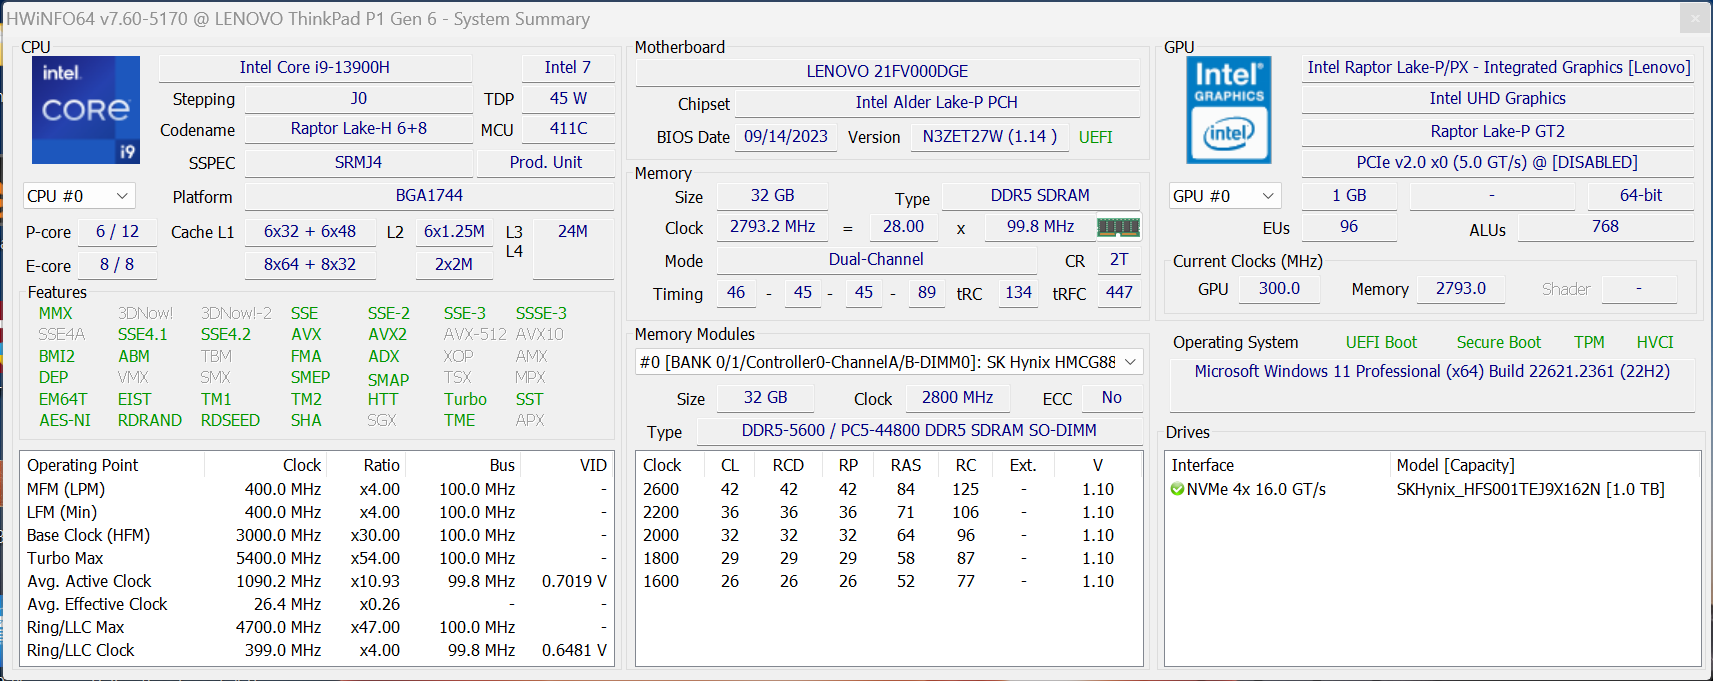
Nuestro dispositivo de prueba, identificado con el número de producto 21FV000DGE, tiene actualmente un precio de unos ~3.400 USD. Cuenta con el Core i9-13900HrTX 2000 Ada, 32 GB de RAM y una unidad SSD de 1 TB. Además, también incluye el panel IPS WQHD opcional con una frecuencia de actualización de 165 Hz. Aquellos con acceso al programa Campus de Lenovo pueden conseguir este modelo por aproximadamente 3.000 USD.
Posibles contendientes en la comparación
Valoración | Fecha | Modelo | Peso | Altura | Tamaño | Resolución | Precio |
|---|---|---|---|---|---|---|---|
| 91.7 % v7 (old) | 10/2023 | Lenovo ThinkPad P1 G6-21FV000DGE i9-13900H, RTX 2000 Ada Generation Laptop | 1.9 kg | 17.5 mm | 16.00" | 2560x1600 | |
| 89 % v7 (old) | 08/2023 | Dell Precision 5000 5680 i9-13900H, RTX 5000 Ada Generation Laptop | 2.3 kg | 22.17 mm | 16.00" | 3840x2400 | |
| 88.8 % v7 (old) | 05/2023 | Samsung Galaxy Book3 Ultra 16, i9-13900H RTX 4070 i9-13900H, GeForce RTX 4070 Laptop GPU | 1.8 kg | 16.8 mm | 16.00" | 2880x1800 | |
| 90.1 % v7 (old) | 11/2022 | HP ZBook Studio 16 G9 62U04EA i7-12800H, RTX A2000 Laptop GPU | 1.8 kg | 19 mm | 16.00" | 3840x2400 | |
| 84.3 % v7 (old) | 11/2022 | MSI CreatorPro Z16P B12UKST i7-12700H, RTX A3000 Laptop GPU | 2.4 kg | 19 mm | 16.00" | 2560x1600 | |
| 88.6 % v7 (old) | 07/2023 | Schenker VISION 16 Pro (M23) i7-13700H, GeForce RTX 4070 Laptop GPU | 1.6 kg | 17.1 mm | 16.00" | 2560x1600 |
Caja - La estabilidad la proporcionan la fibra de carbono y el magnesio
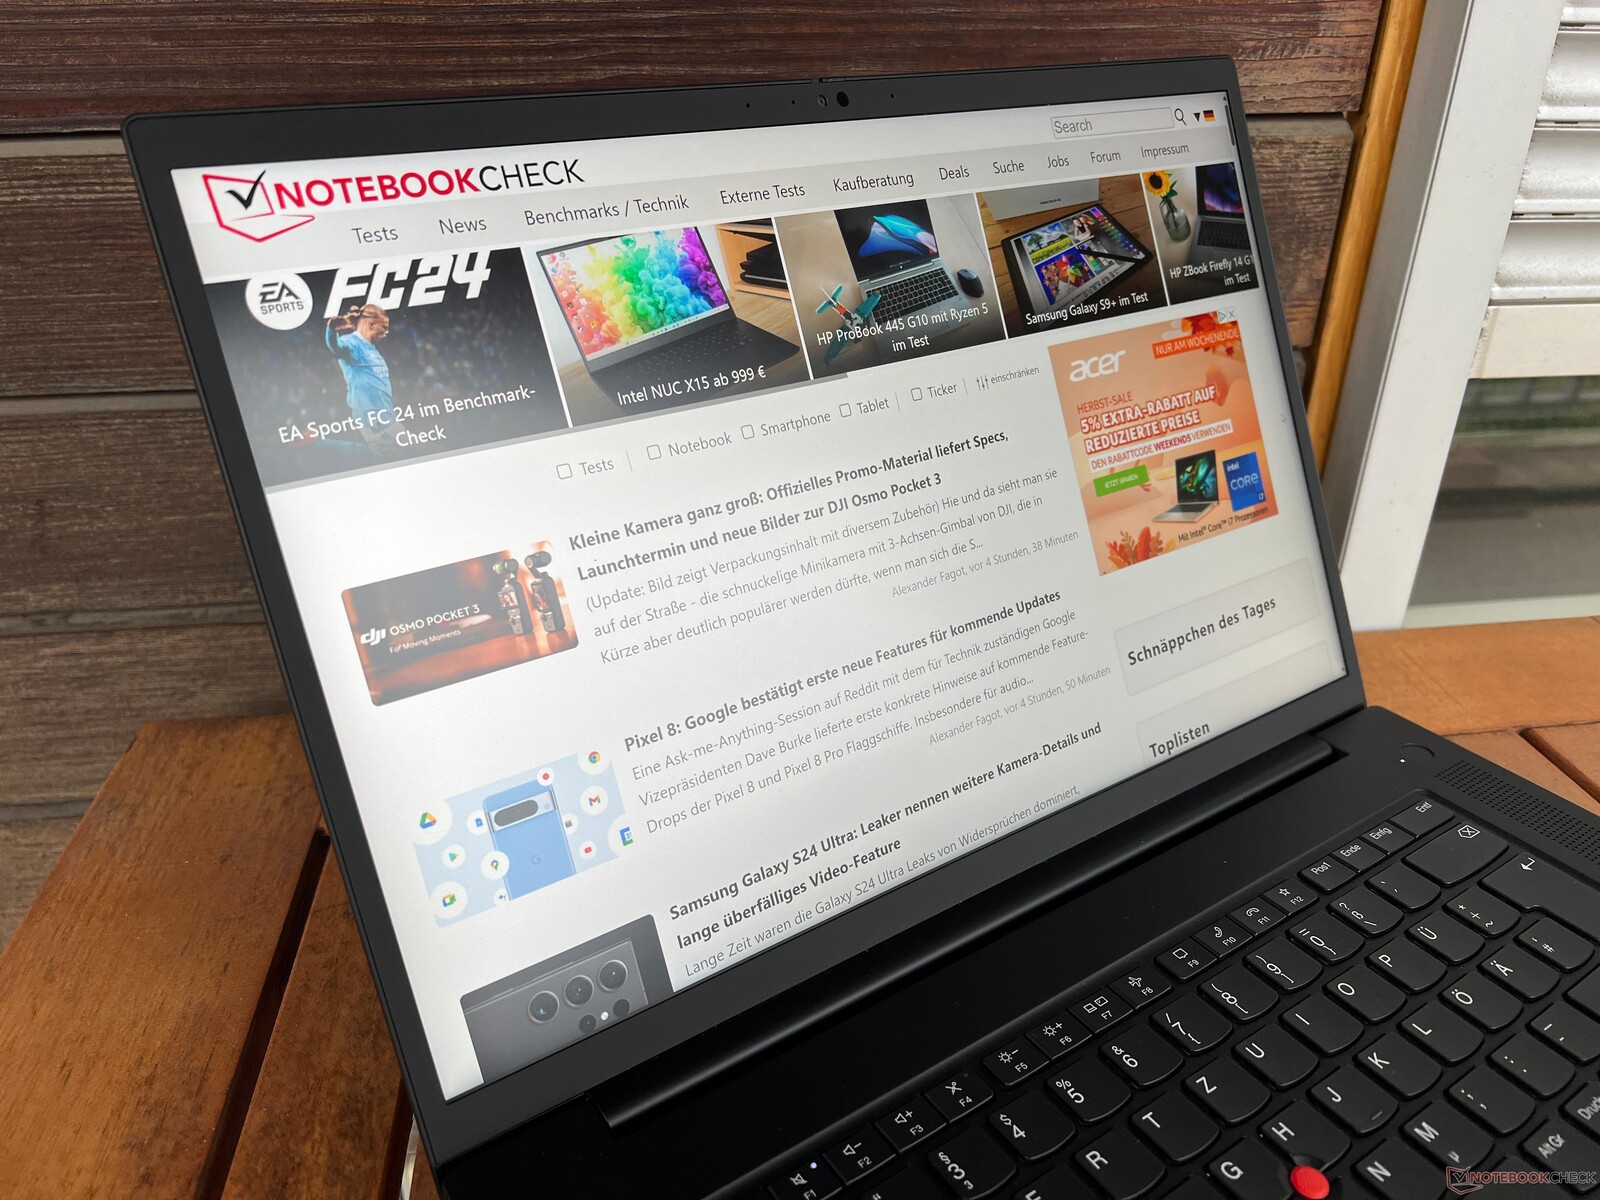
Lenovo conserva el conocido diseño para el ThinkPad P1 Gen 6, manteniendo la coherencia con sus predecesores, las generaciones G4 y G5. El diseño negro puede percibirse como simple o poco emocionante, dependiendo de las perspectivas individuales. No obstante, la identidad distintiva del ThinkPad sigue siendo inconfundible. Los modelos con pantalla OLED siguen mostrando una tapa de pantalla con un patrón de fibra de carbono, aunque se trata de un diseño impreso en lugar de fibra de carbono real. En general, el diseño mantiene un aspecto contemporáneo, pero las superficies lisas son susceptibles de acumular suciedad y grasa con el tiempo, lo que requiere una limpieza regular.
La construcción combina fibra de carbono y magnesio, lo que garantiza una estabilidad excepcional. Tanto la unidad base como la tapa de la pantalla son robustas, sin torsiones ni puntos de presión perceptibles. No hay problemas de distorsiones de la imagen ni ruidos chirriantes. Las dos bisagras (con un ángulo máximo de apertura de 180 grados) permiten abrir la tapa con una sola mano, manteniendo la tensión suficiente para evitar cualquier rebote perceptible.
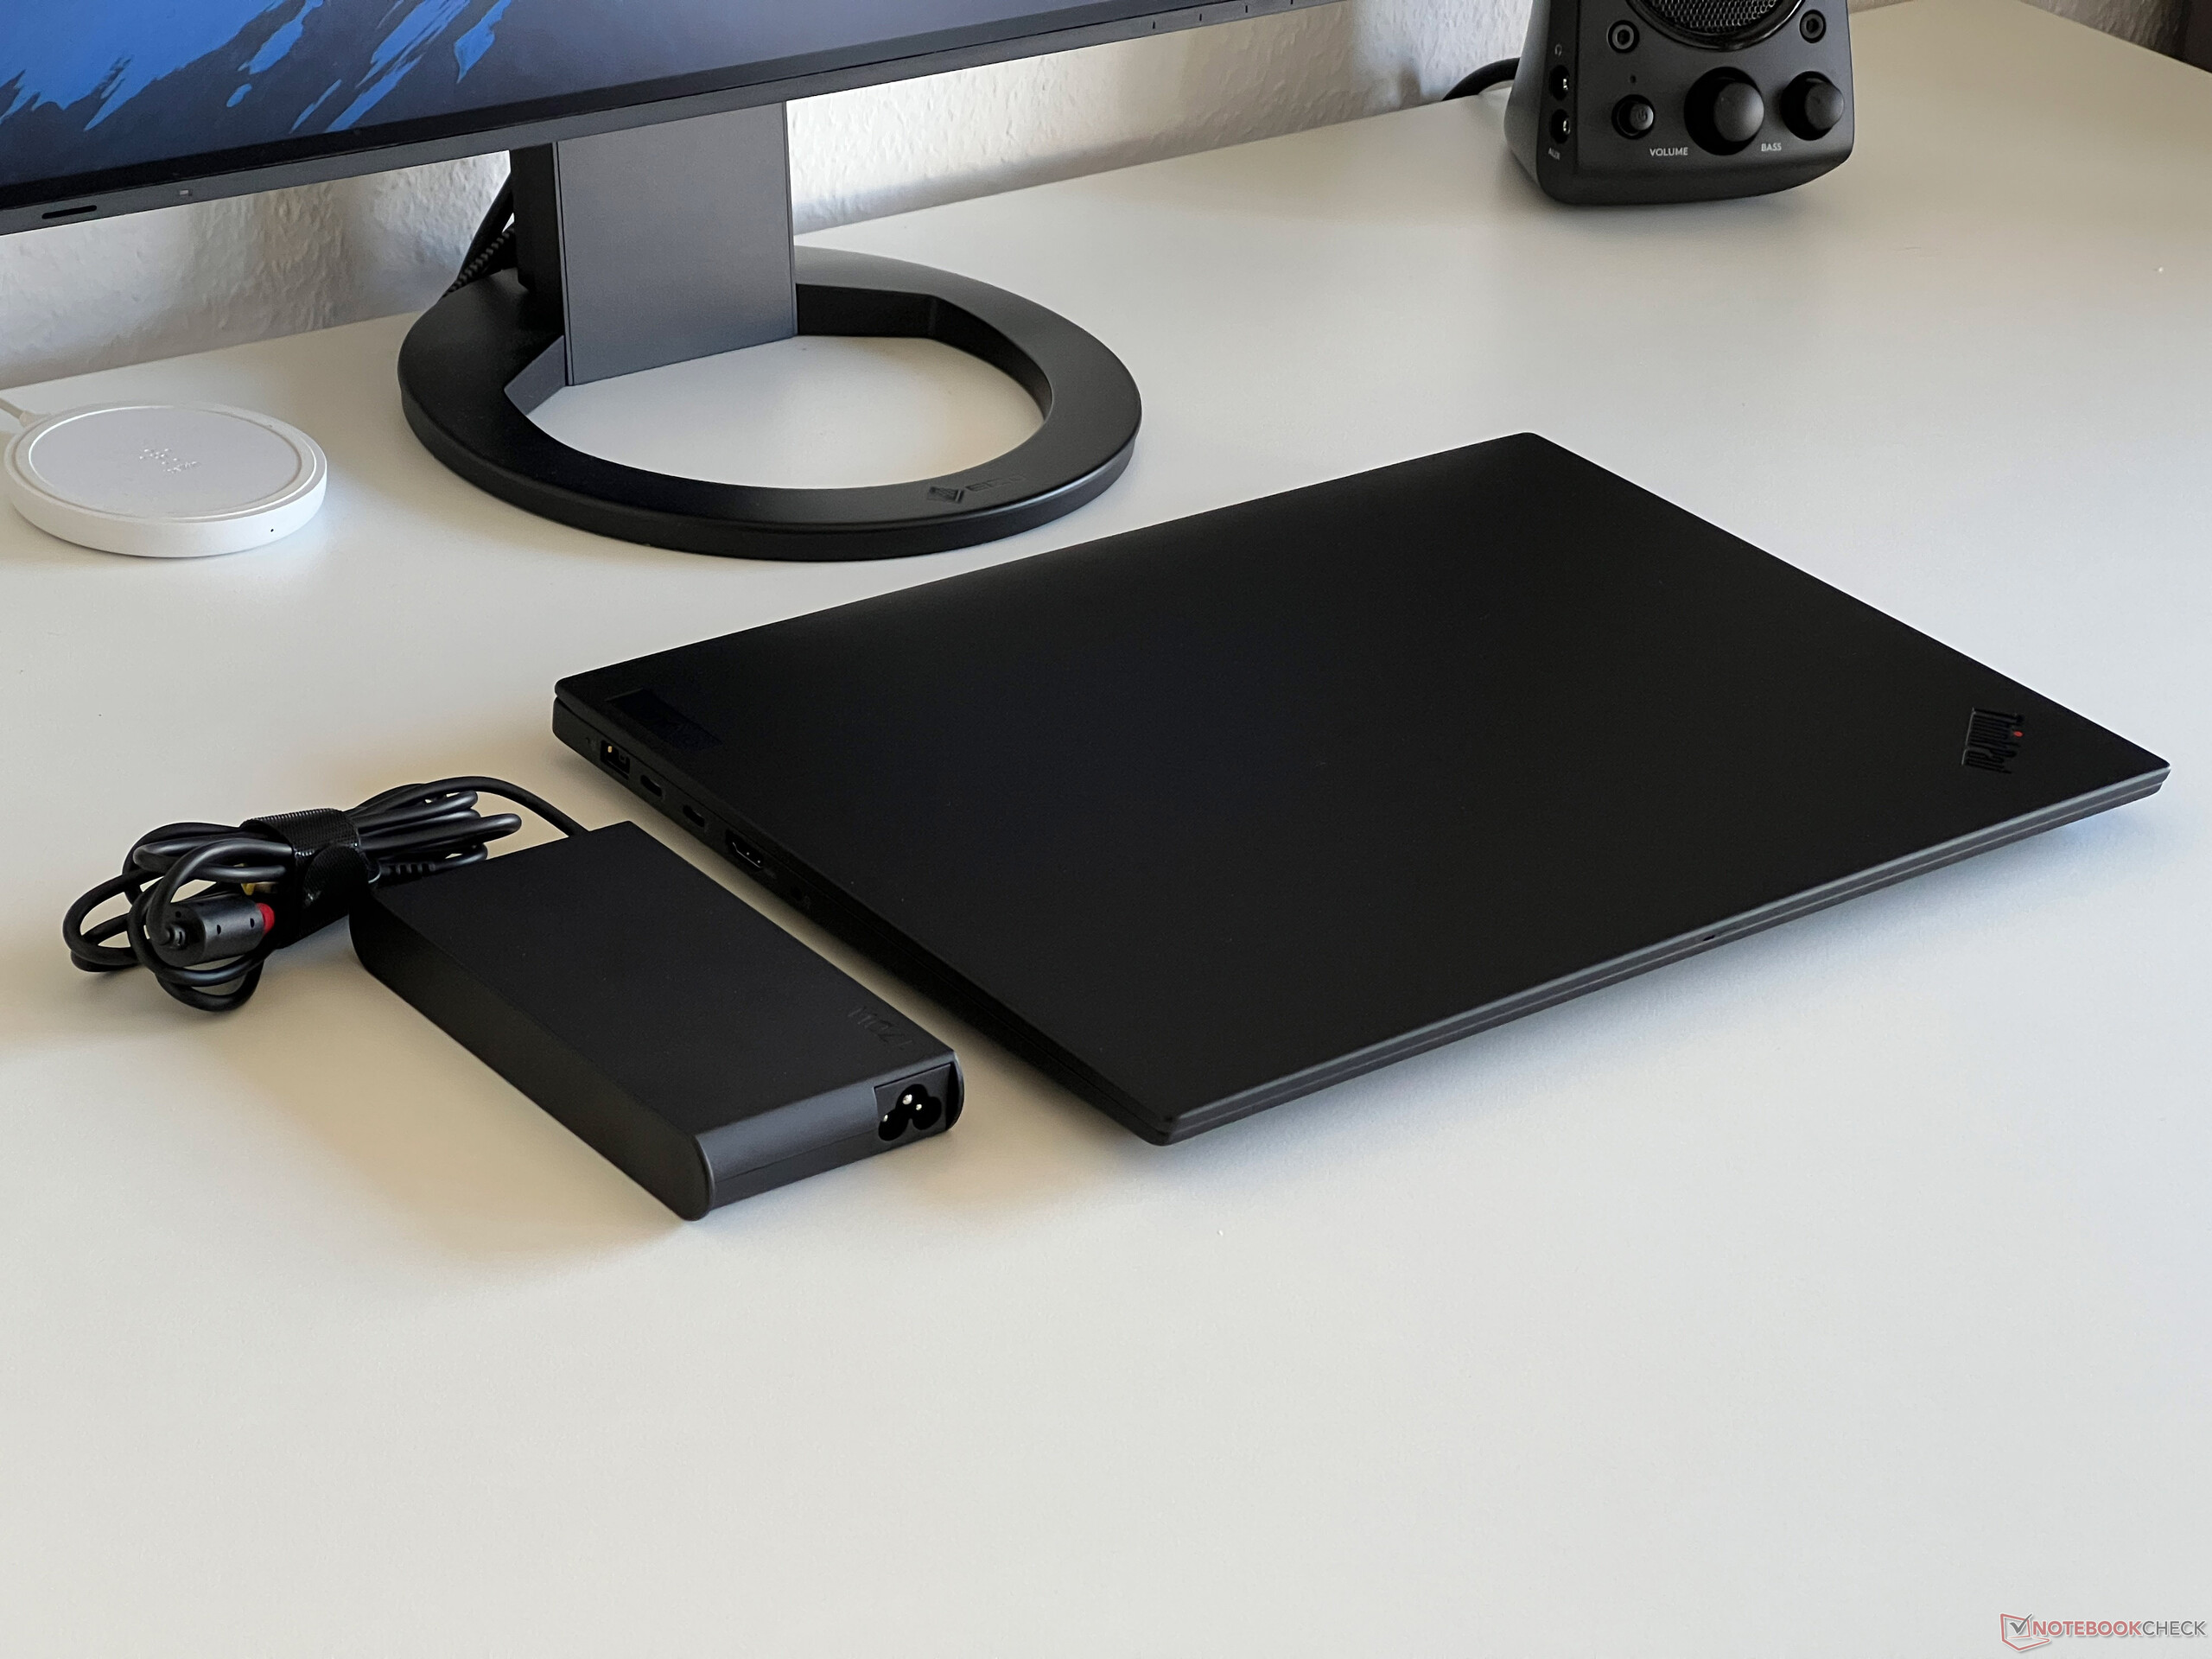
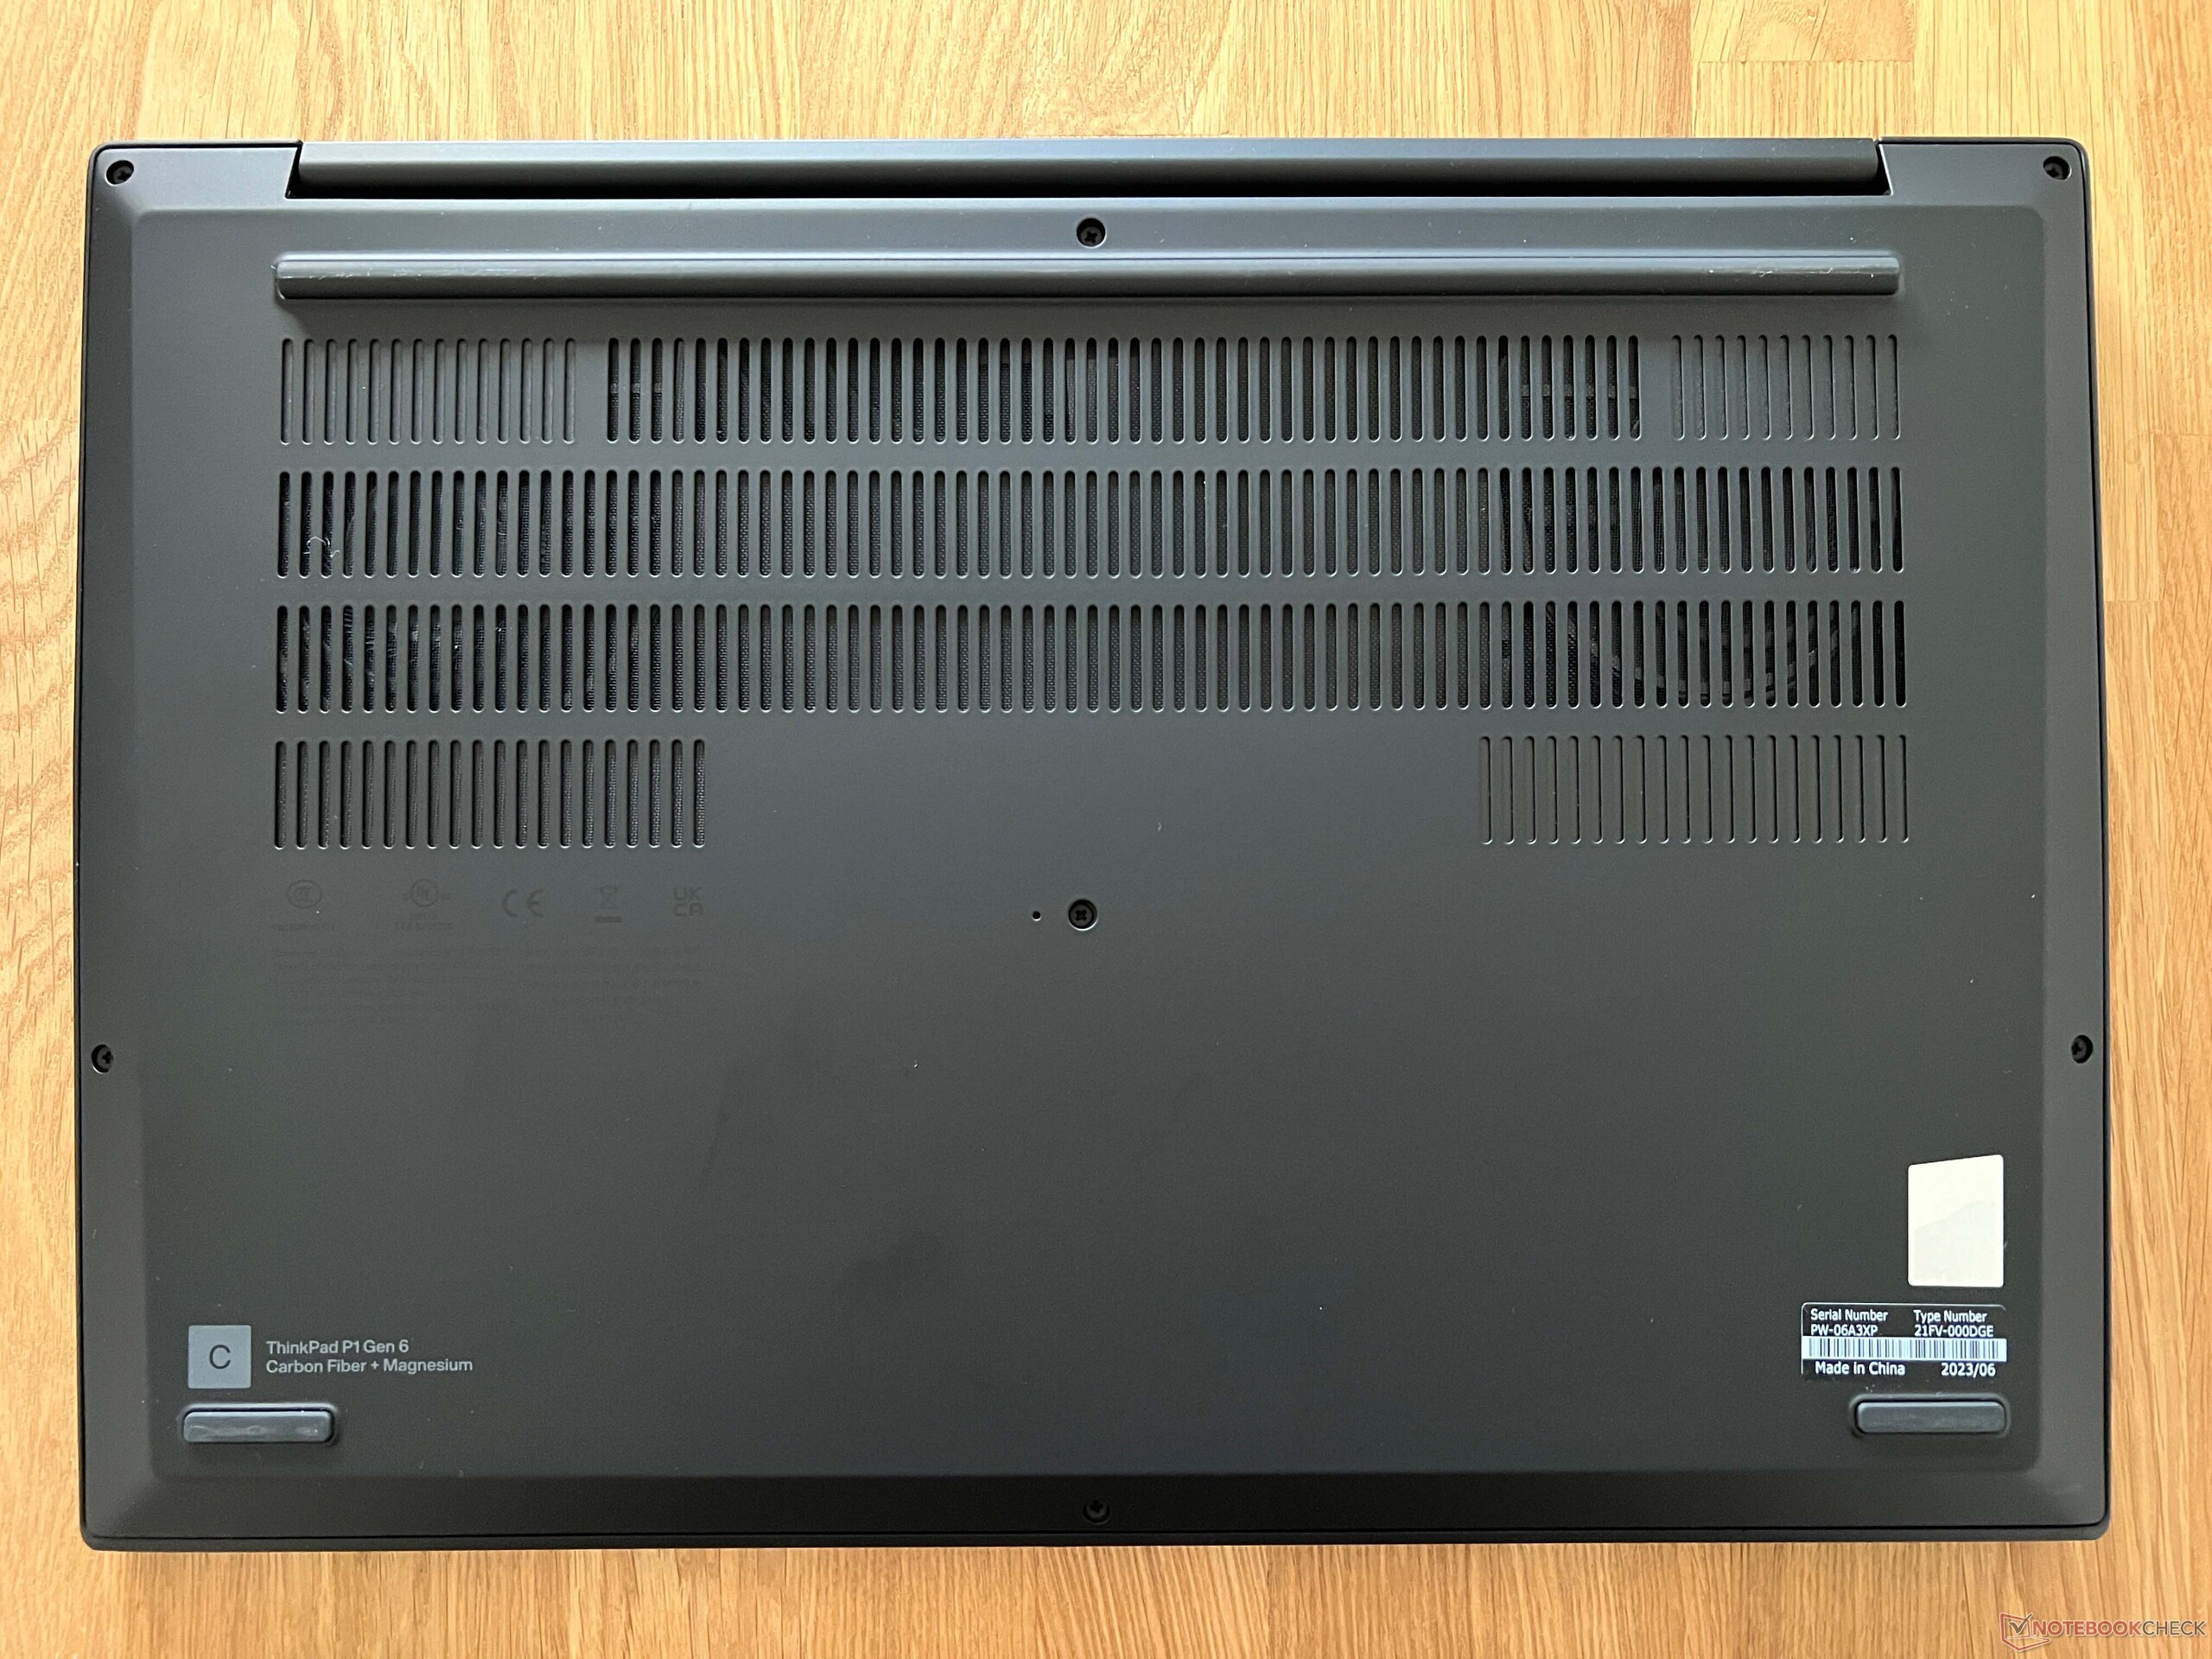
Los aparatos comparables tienen una huella similar, pero son significativamente más pesados. El ThinkPad P1 Gen 6 es una de las variantes más ligeras, pesa poco menos de 4,19 lbs y sólo le supera el Schenker Vision 16. La fuente de alimentación de 170 vatios añade 1,23 lbs adicionales al peso total.
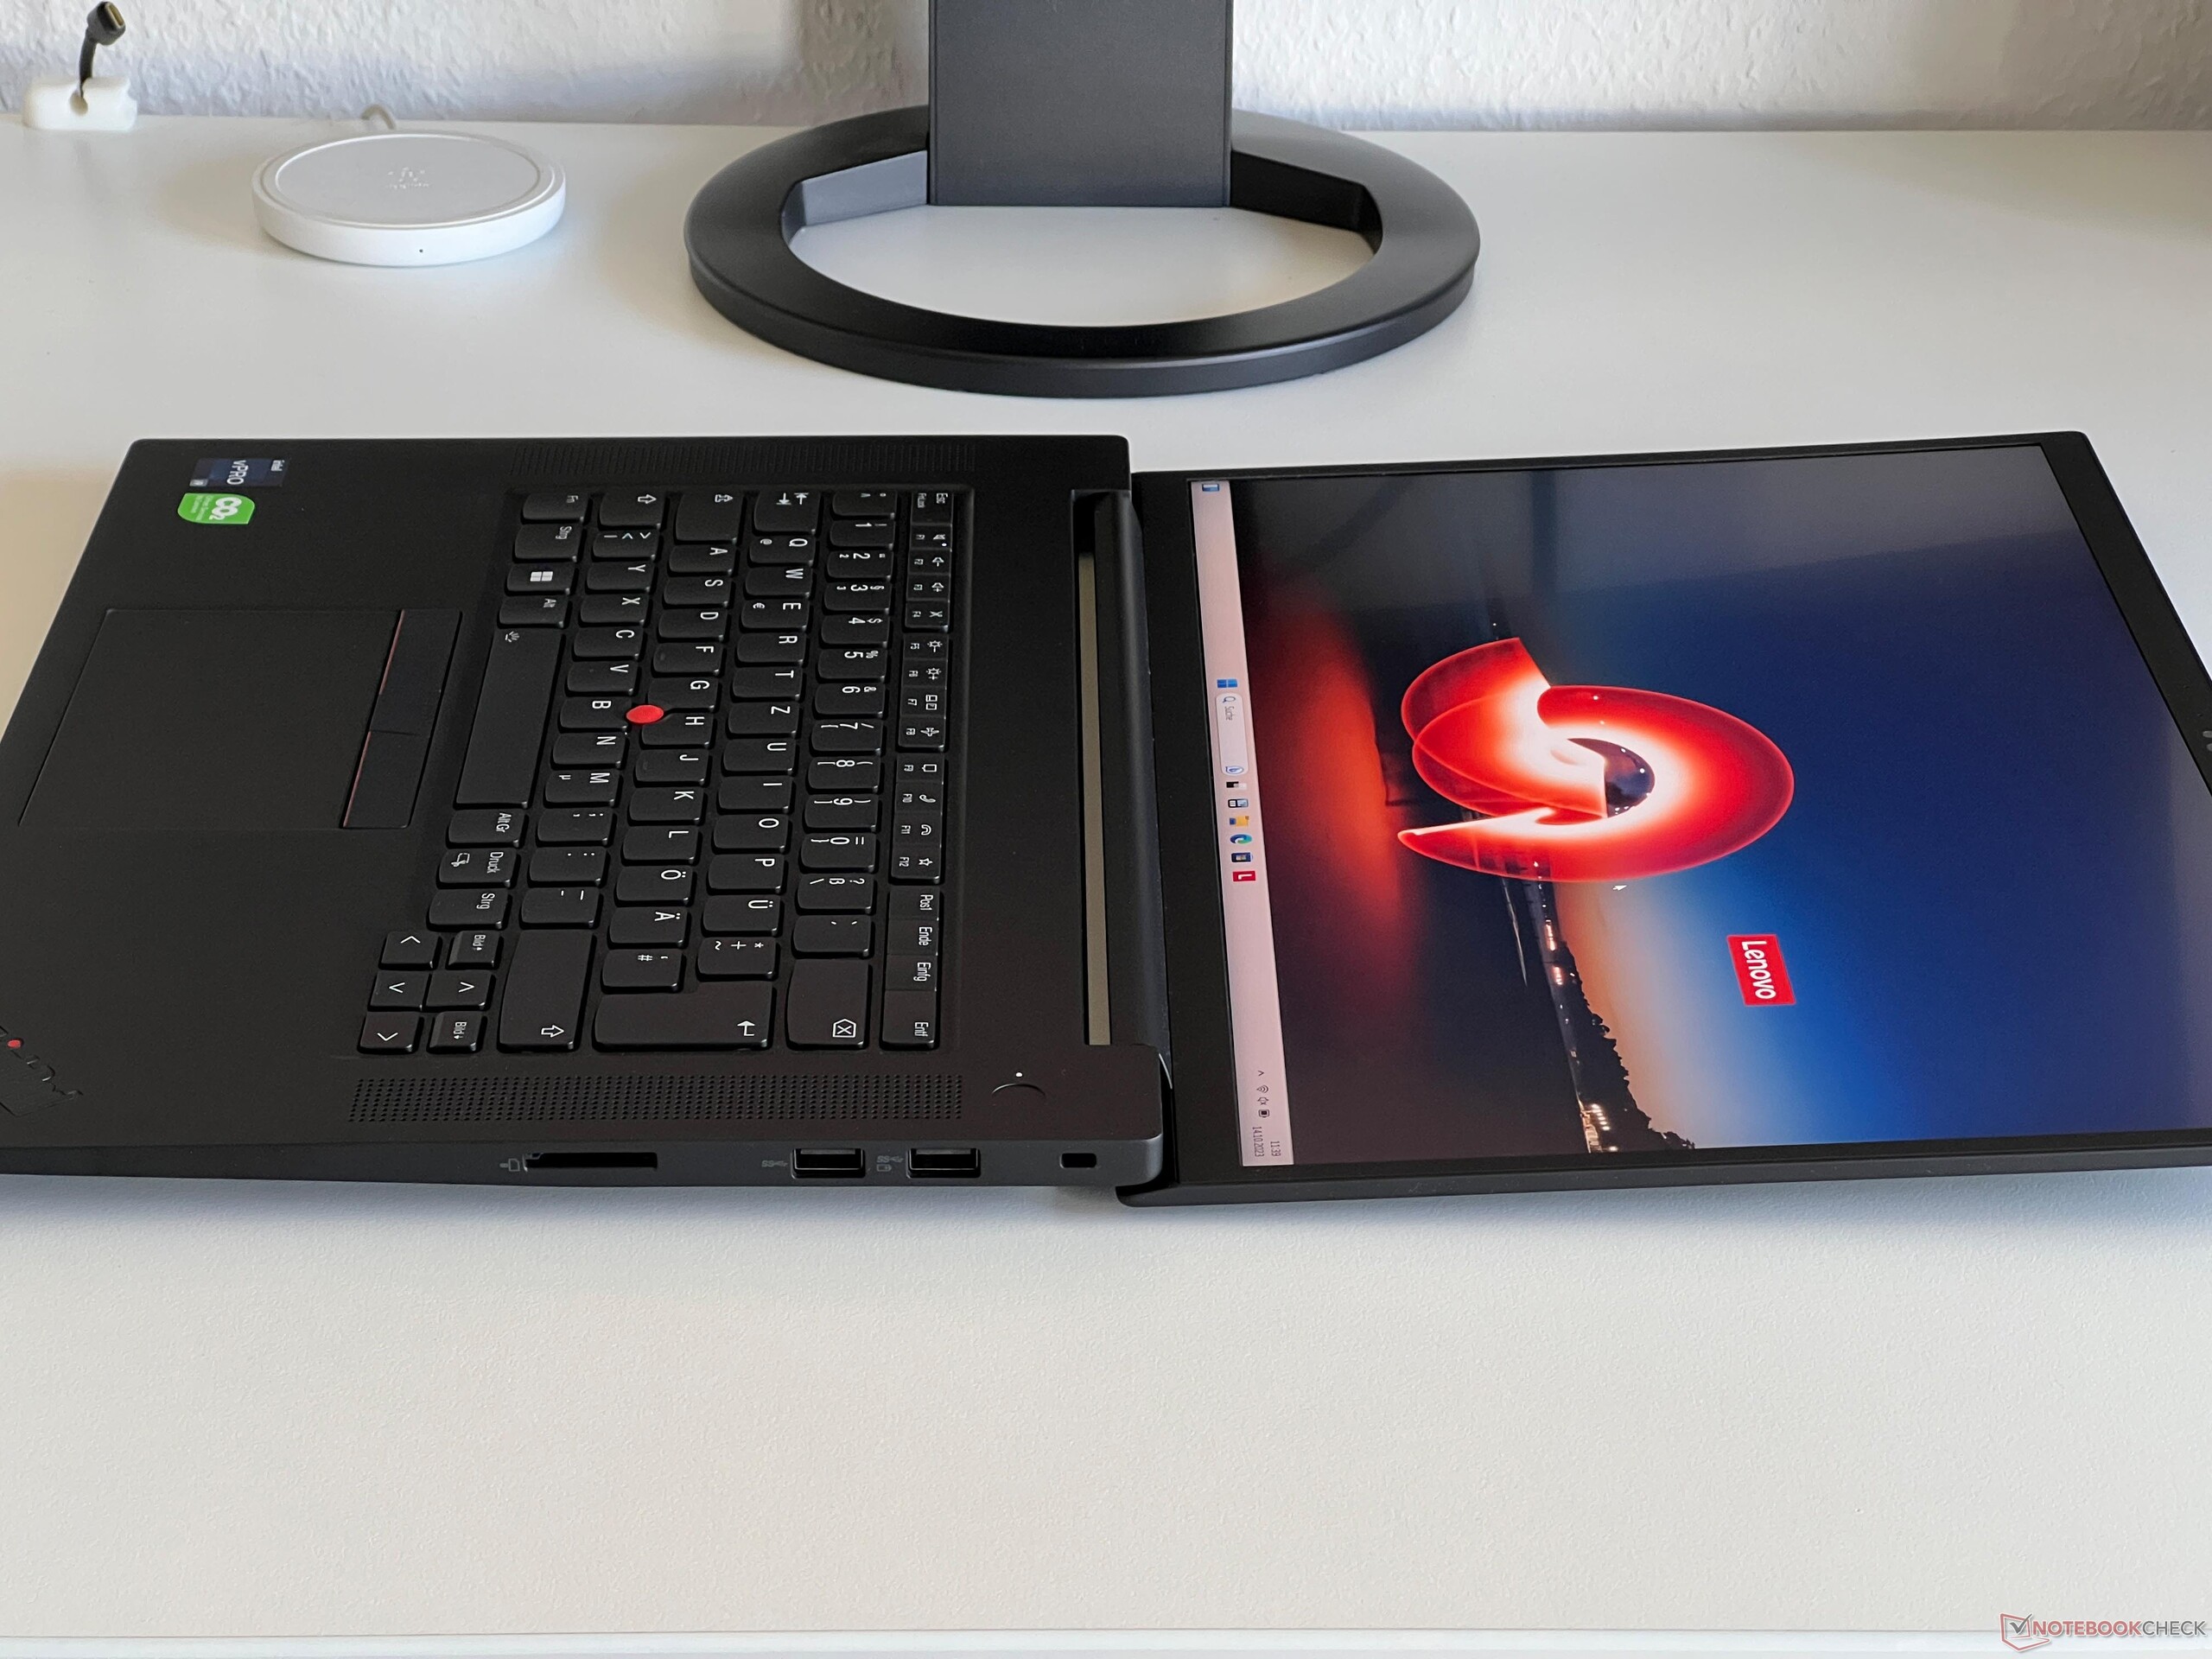
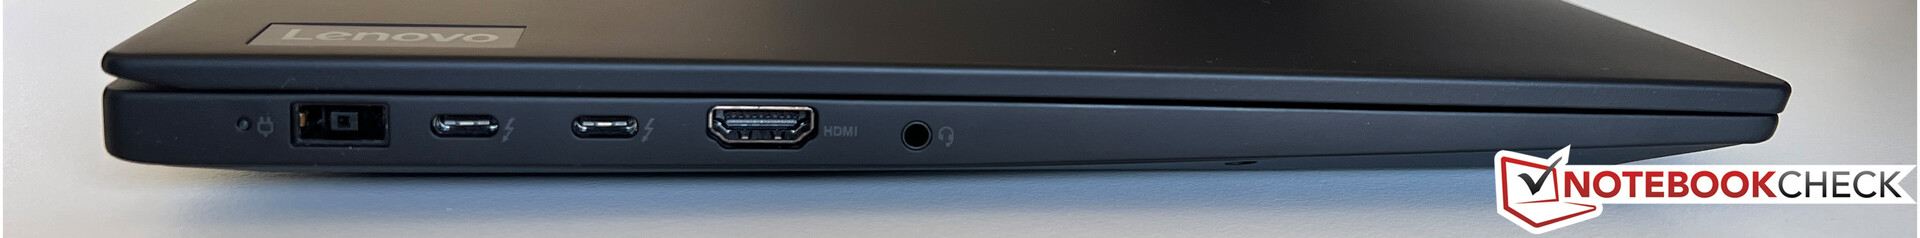
Conectividad - Thunderbolt y Wi-Fi 6E
No ha habido cambios en los puertos y todos los estándares esenciales siguen estando disponibles. Además, los dos puertos USB-C con Thunderbolt 4 pueden utilizarse para cargar, suministrando un mínimo de 90 vatios de potencia.
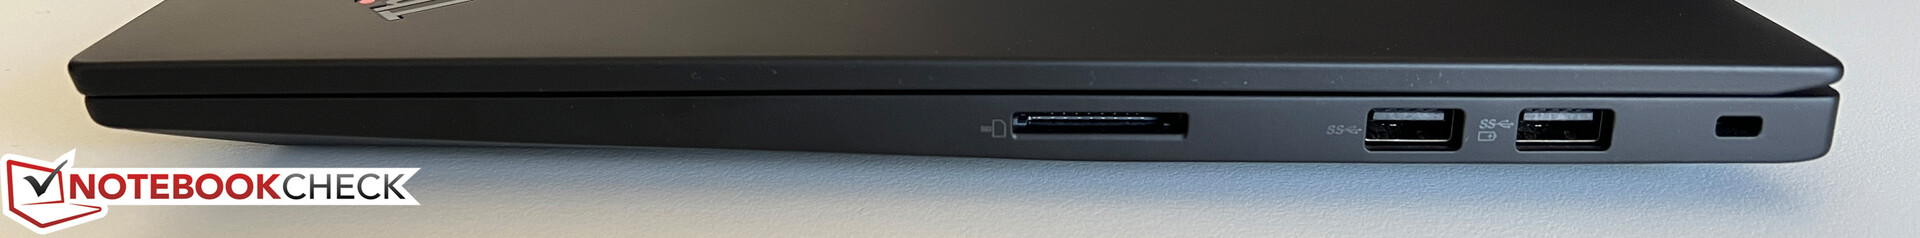
Lector de tarjetas SD
El lector de tarjetas adecuado sólo proporciona velocidades de transferencia medias. Las tasas de transferencia son de aproximadamente 80 MB/s cuando se combina con nuestra tarjeta de referencia (Angelbird AV Pro V60).
Comunicación
No hay cambios en cuanto al módulo WLAN; se sigue utilizando la tarjeta Intel AX211, compatible con las modernas redes de 6 GHz. Las velocidades de transferencia son excelentes y, durante nuestras pruebas, no encontramos ningún problema de conexión. Aunque no hay puerto Ethernet, se puede añadir a través de un adaptador USB-C compatible. En el interior de la carcasa, hay una ranura M.2-2242 para un módulo WWAN; sin embargo, las antenas necesarias no están preinstaladas, lo que impide realizar retroinstalaciones para la conectividad WWAN.
| Networking | |
| Lenovo ThinkPad P1 G6-21FV000DGE | |
| iperf3 transmit AXE11000 | |
| iperf3 receive AXE11000 | |
| Dell Precision 5000 5680 | |
| iperf3 transmit AXE11000 | |
| iperf3 receive AXE11000 | |
| iperf3 transmit AXE11000 6GHz | |
| iperf3 receive AXE11000 6GHz | |
| Samsung Galaxy Book3 Ultra 16, i9-13900H RTX 4070 | |
| iperf3 transmit AXE11000 | |
| iperf3 receive AXE11000 | |
| iperf3 transmit AXE11000 6GHz | |
| iperf3 receive AXE11000 6GHz | |
| HP ZBook Studio 16 G9 62U04EA | |
| iperf3 transmit AXE11000 6GHz | |
| iperf3 receive AXE11000 6GHz | |
| MSI CreatorPro Z16P B12UKST | |
| iperf3 transmit AXE11000 6GHz | |
| iperf3 receive AXE11000 6GHz | |
| Schenker VISION 16 Pro (M23) | |
| iperf3 transmit AXE11000 | |
| iperf3 receive AXE11000 | |
| Lenovo ThinkPad X1 Extreme G5-21DE003RGE | |
| iperf3 transmit AXE11000 6GHz | |
| iperf3 receive AXE11000 6GHz | |
Cámara web
La cámara de 1080p toma fotos decentes en buenas condiciones de iluminación y cuenta con un obturador mecánico. Además, dispone de una cámara IR para el reconocimiento facial a través de Windows Hello.


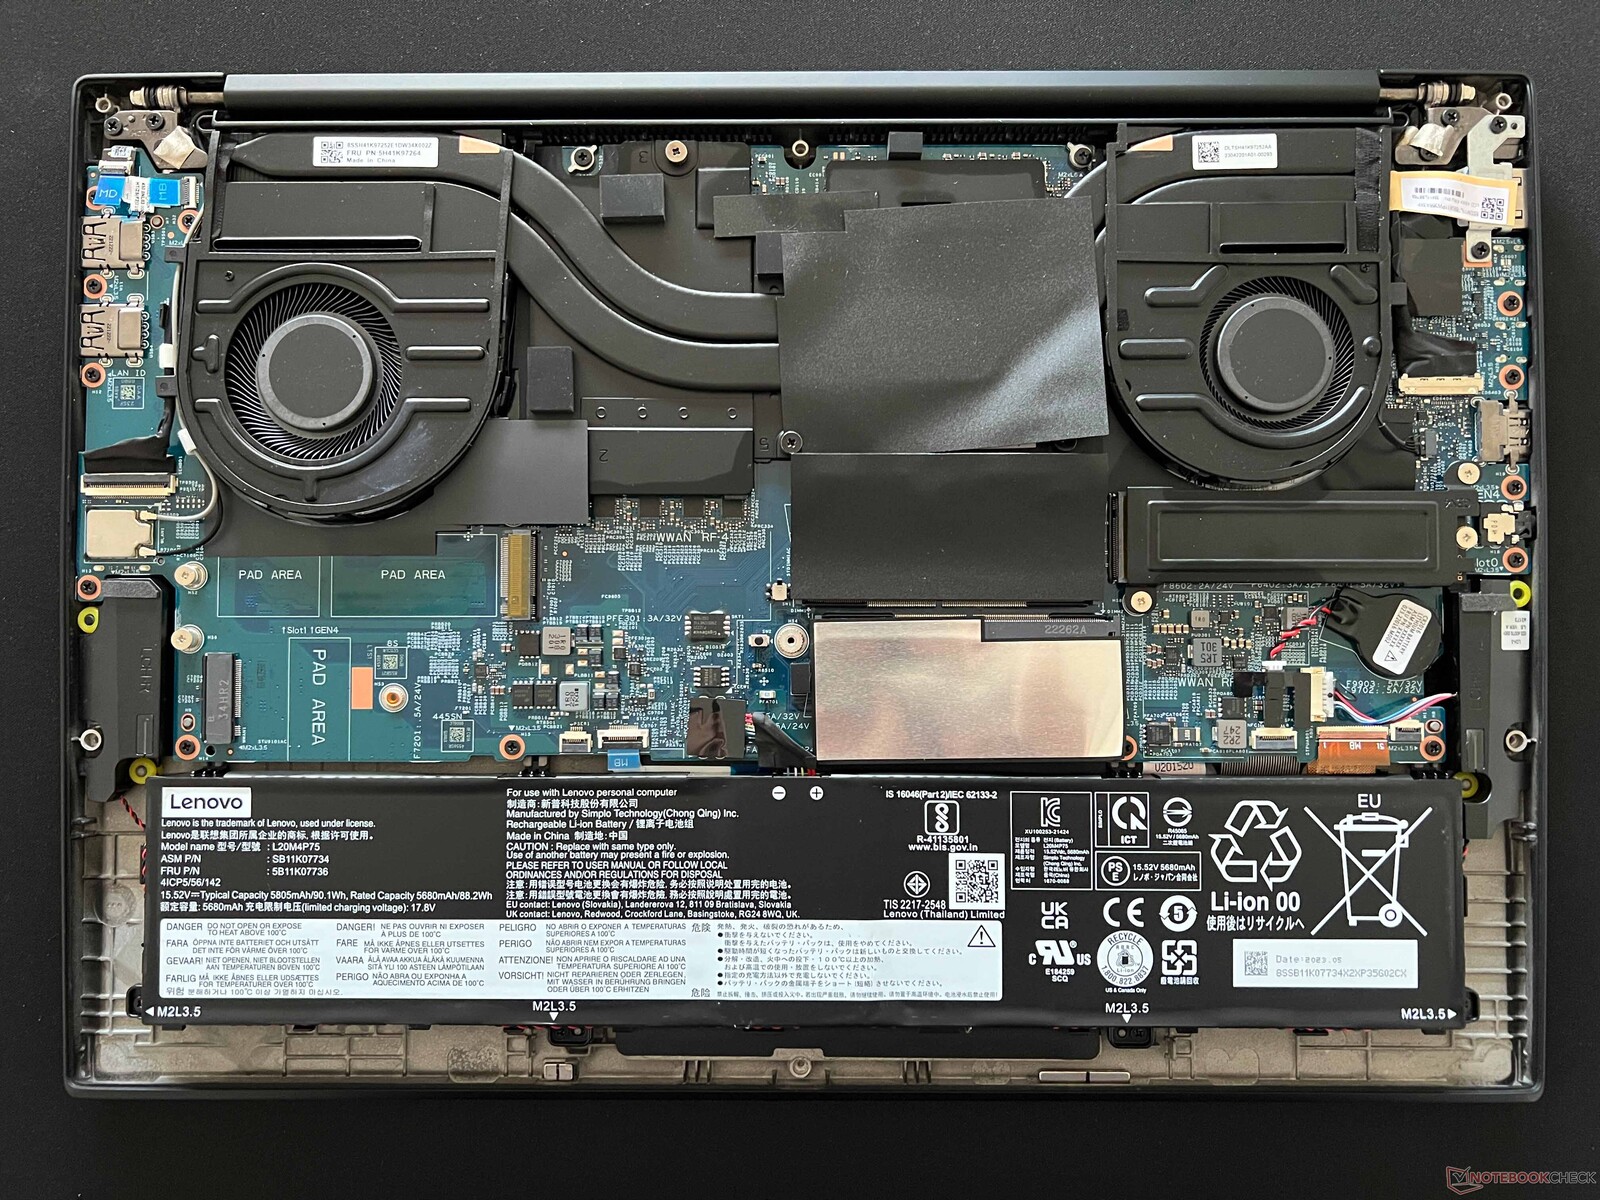
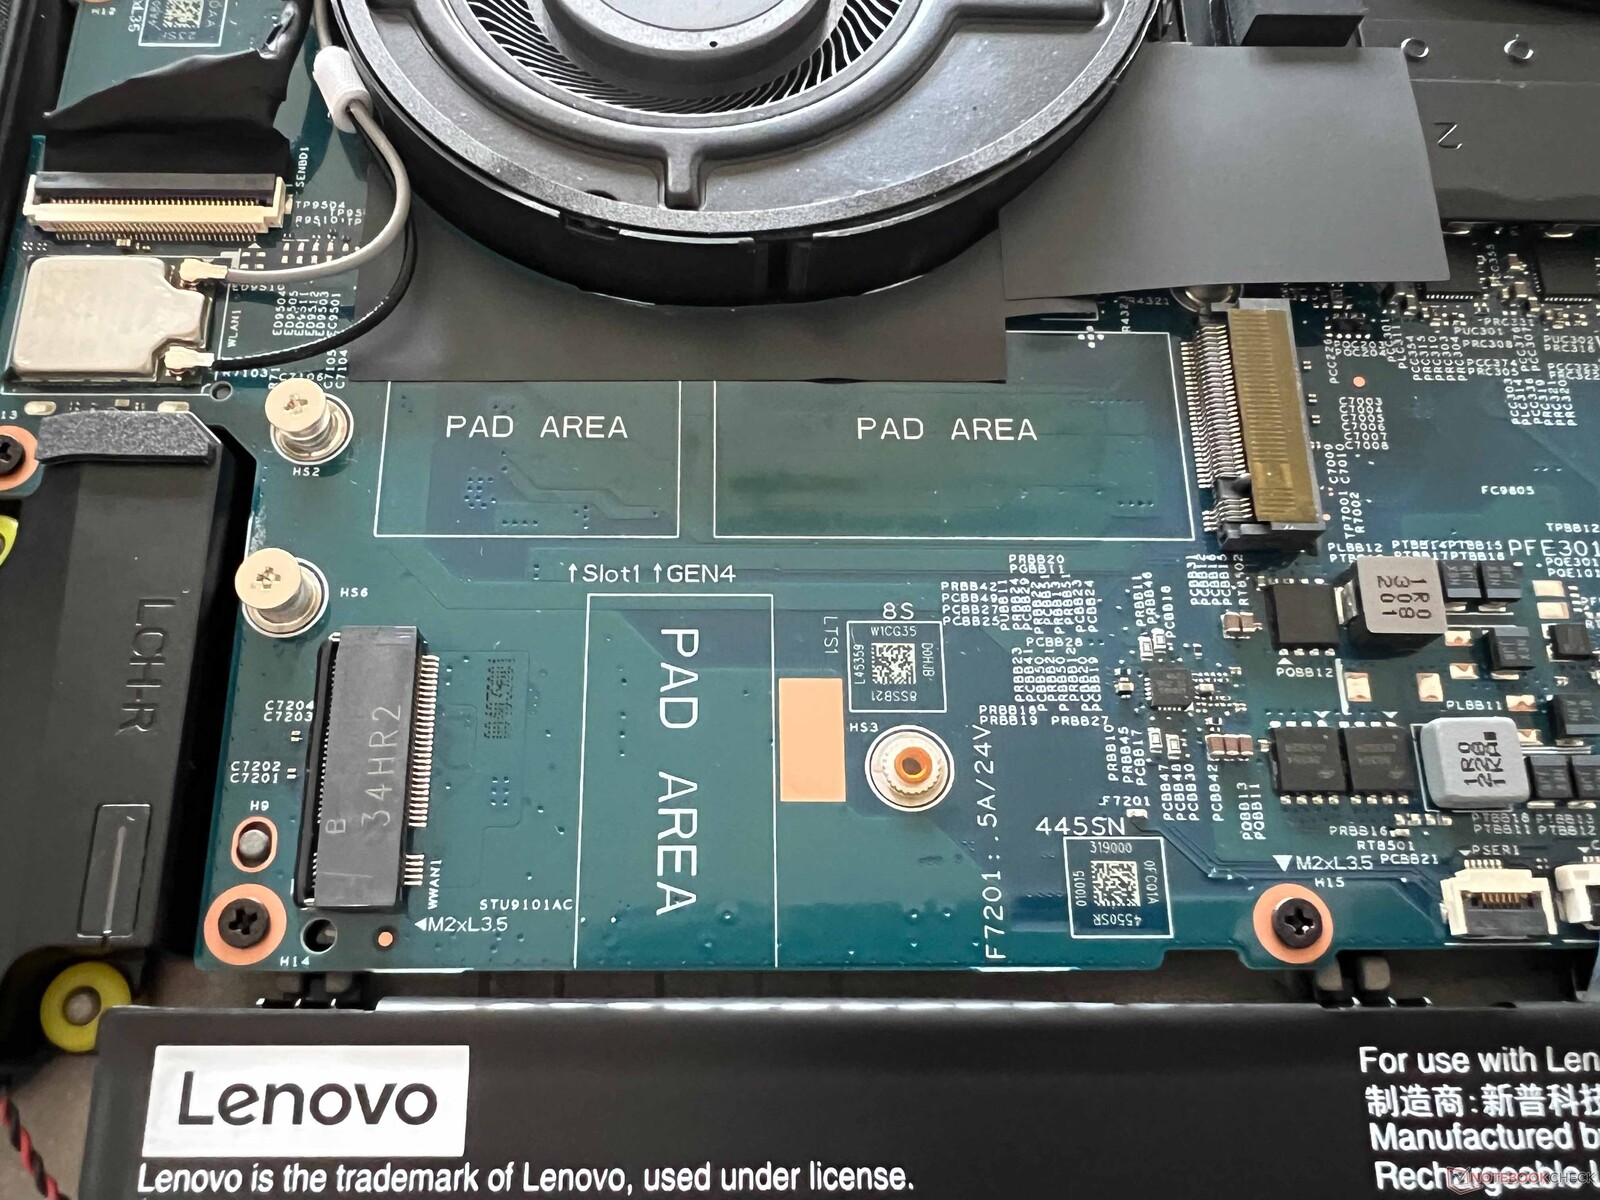
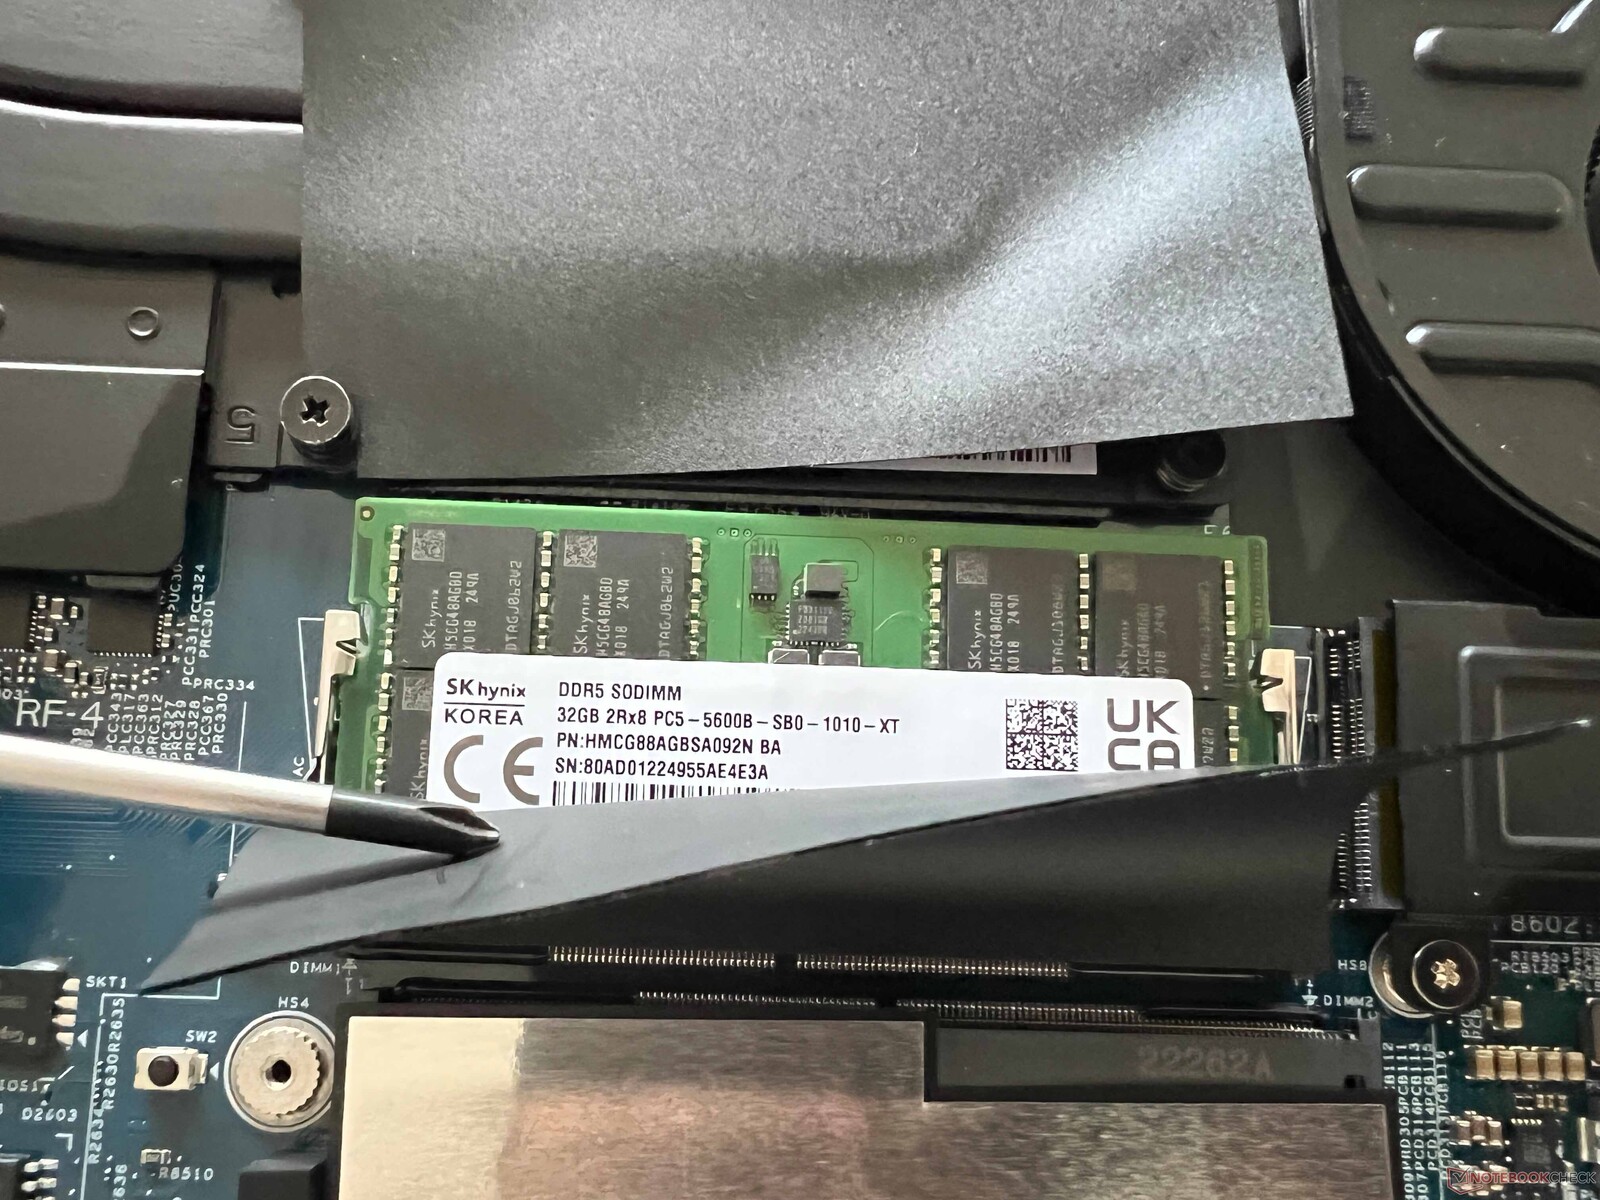
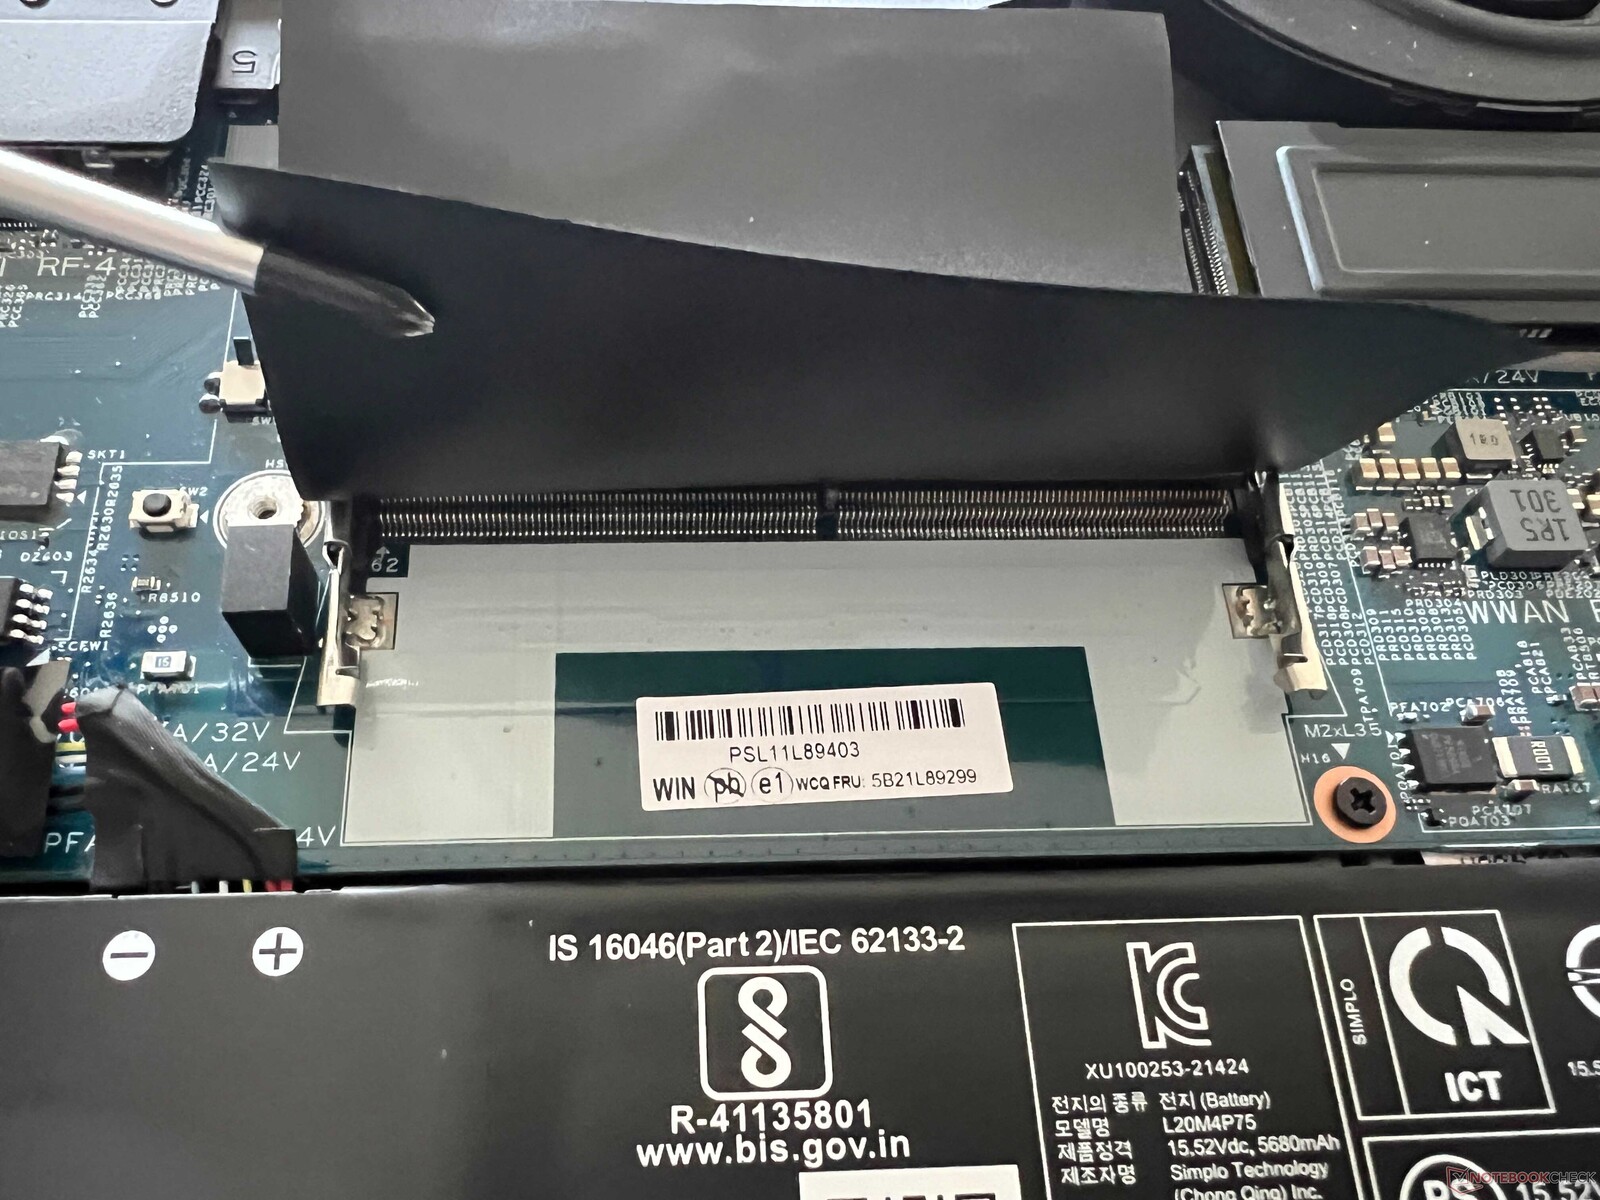
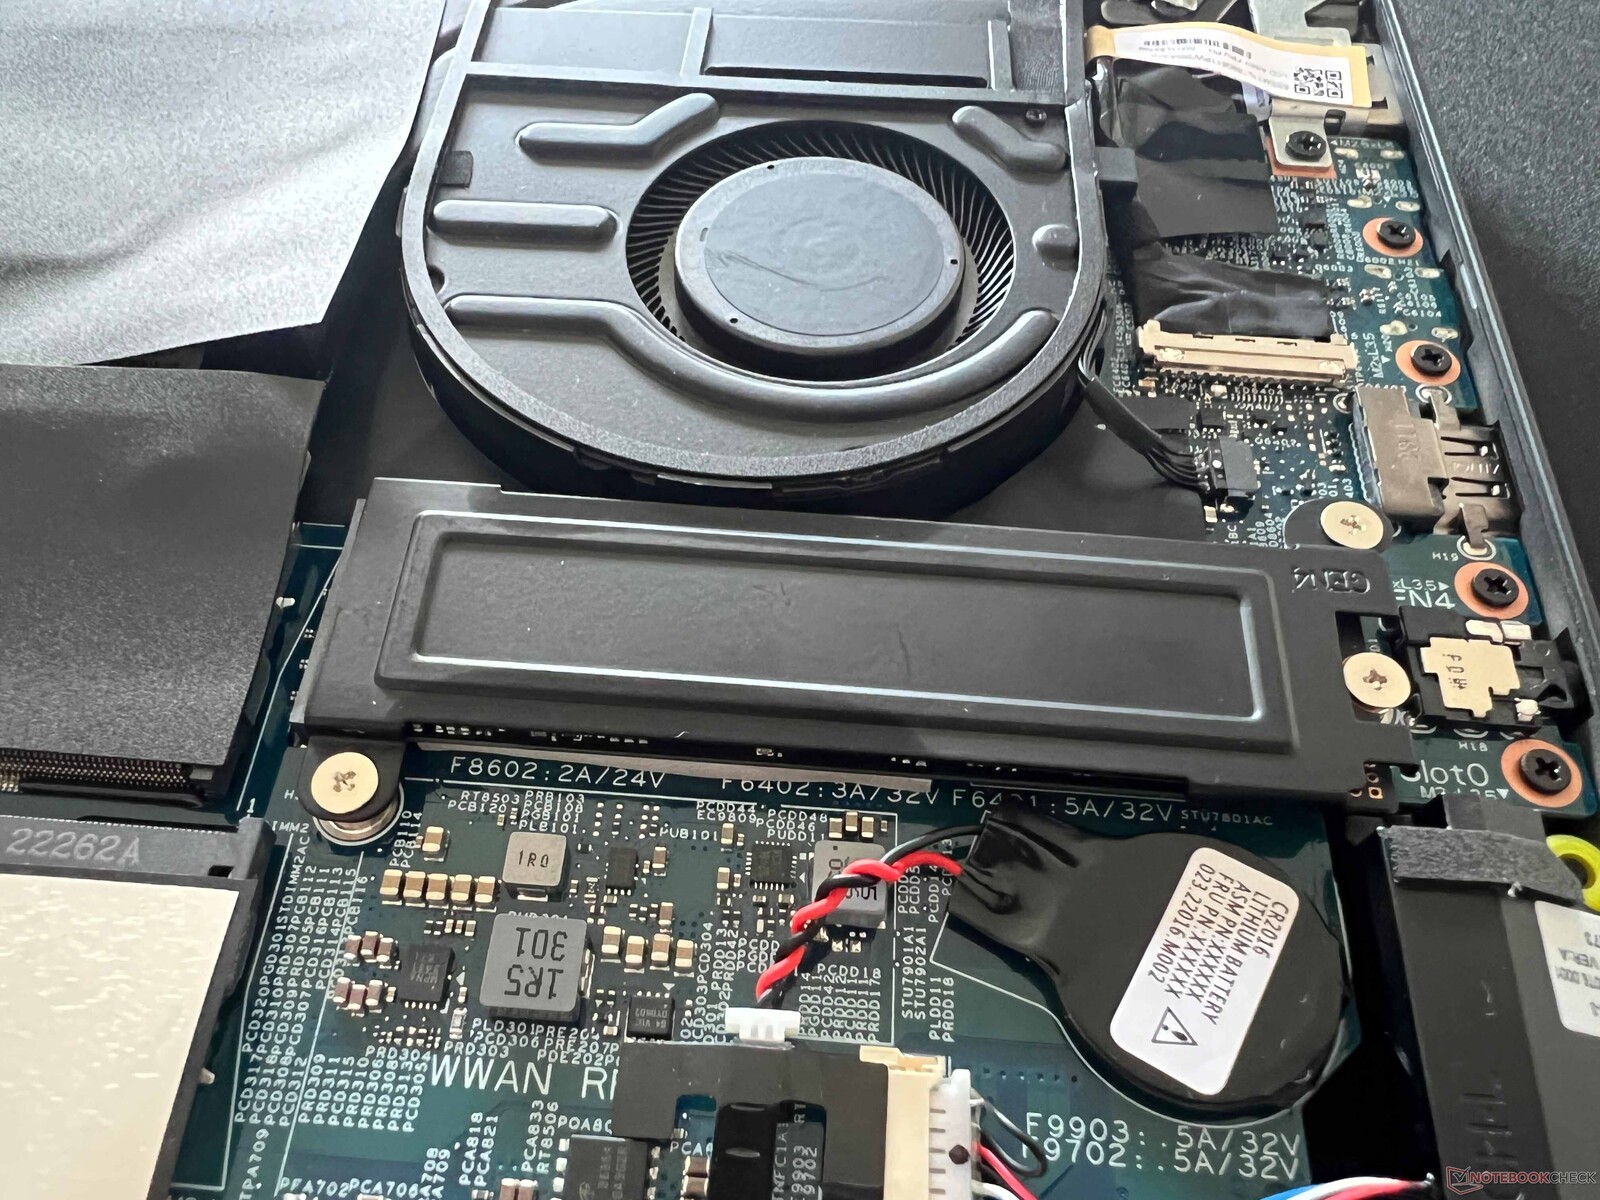
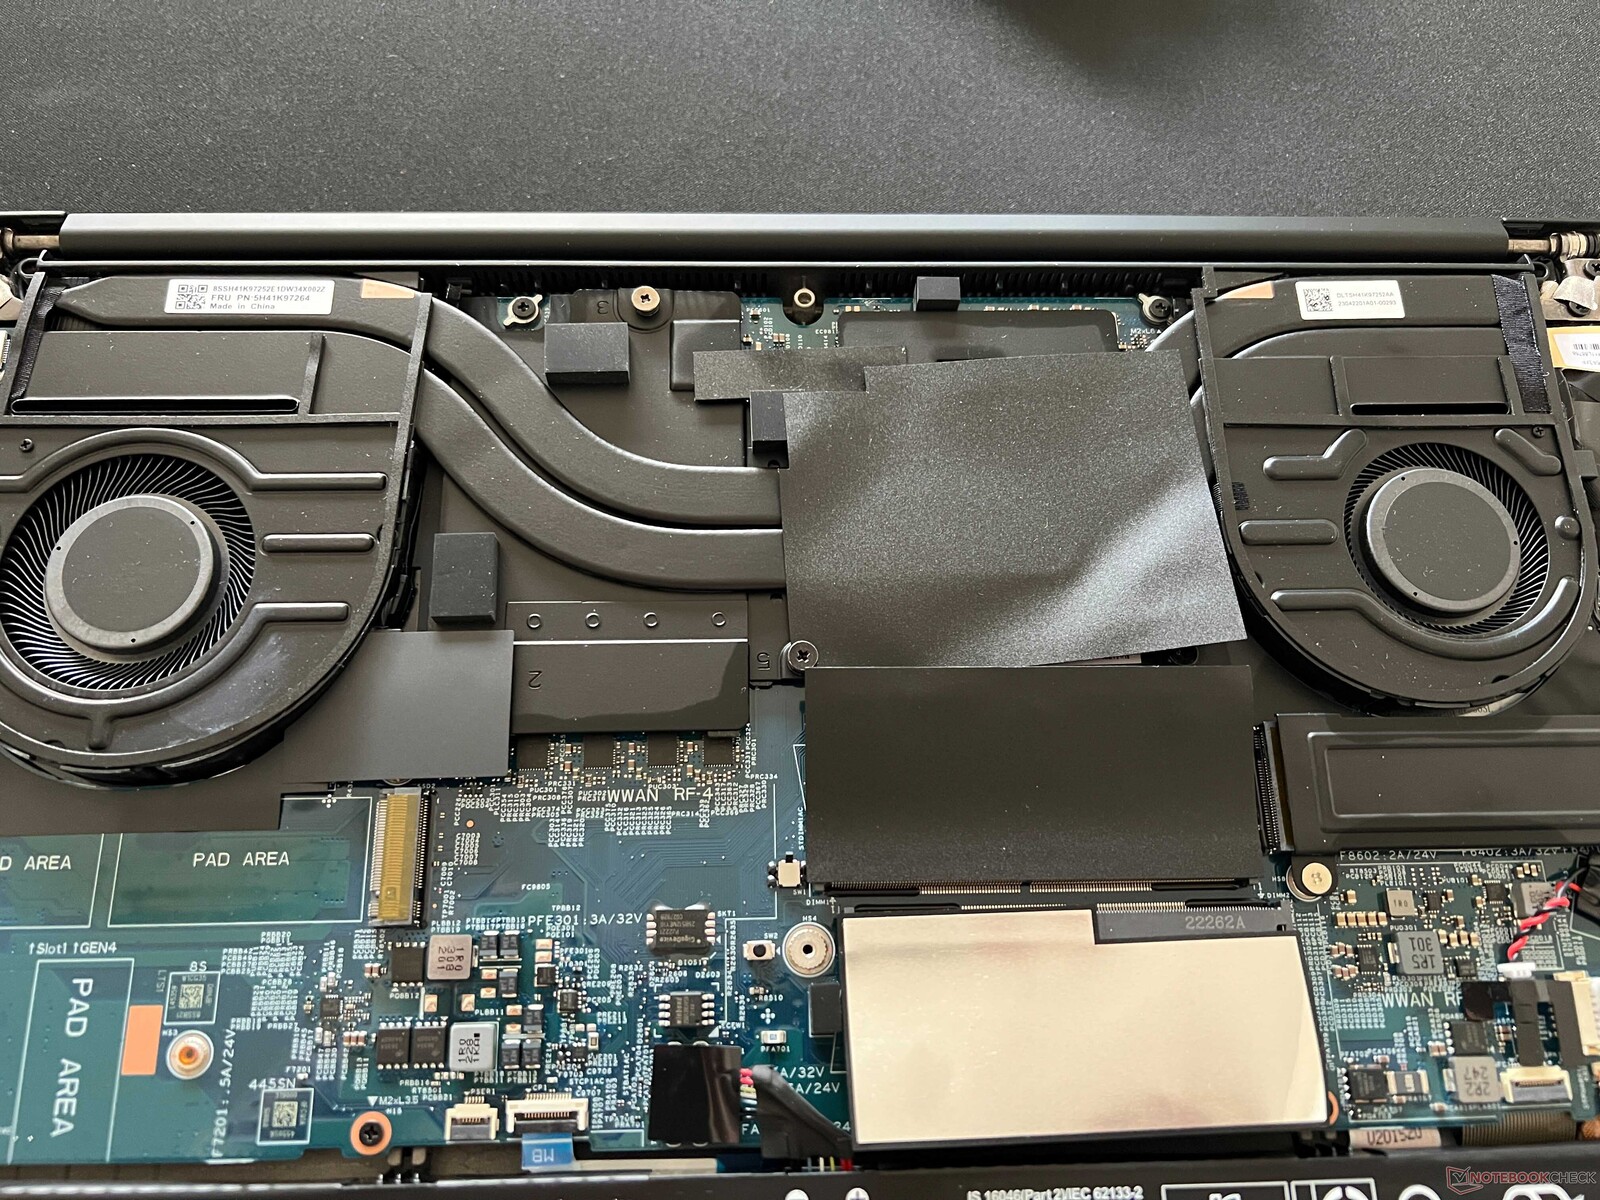
Mantenimiento
La cubierta inferior de la carcasa puede retirarse fácilmente. Nuestro dispositivo de pruebas dispone de refrigeración convencional con aletas de refrigeración, lo que permite dos ranuras para unidades SSD M.2-2280. Además, hay dos ranuras SODIMM para módulos RAM, pero el módulo WLAN no se puede intercambiar.
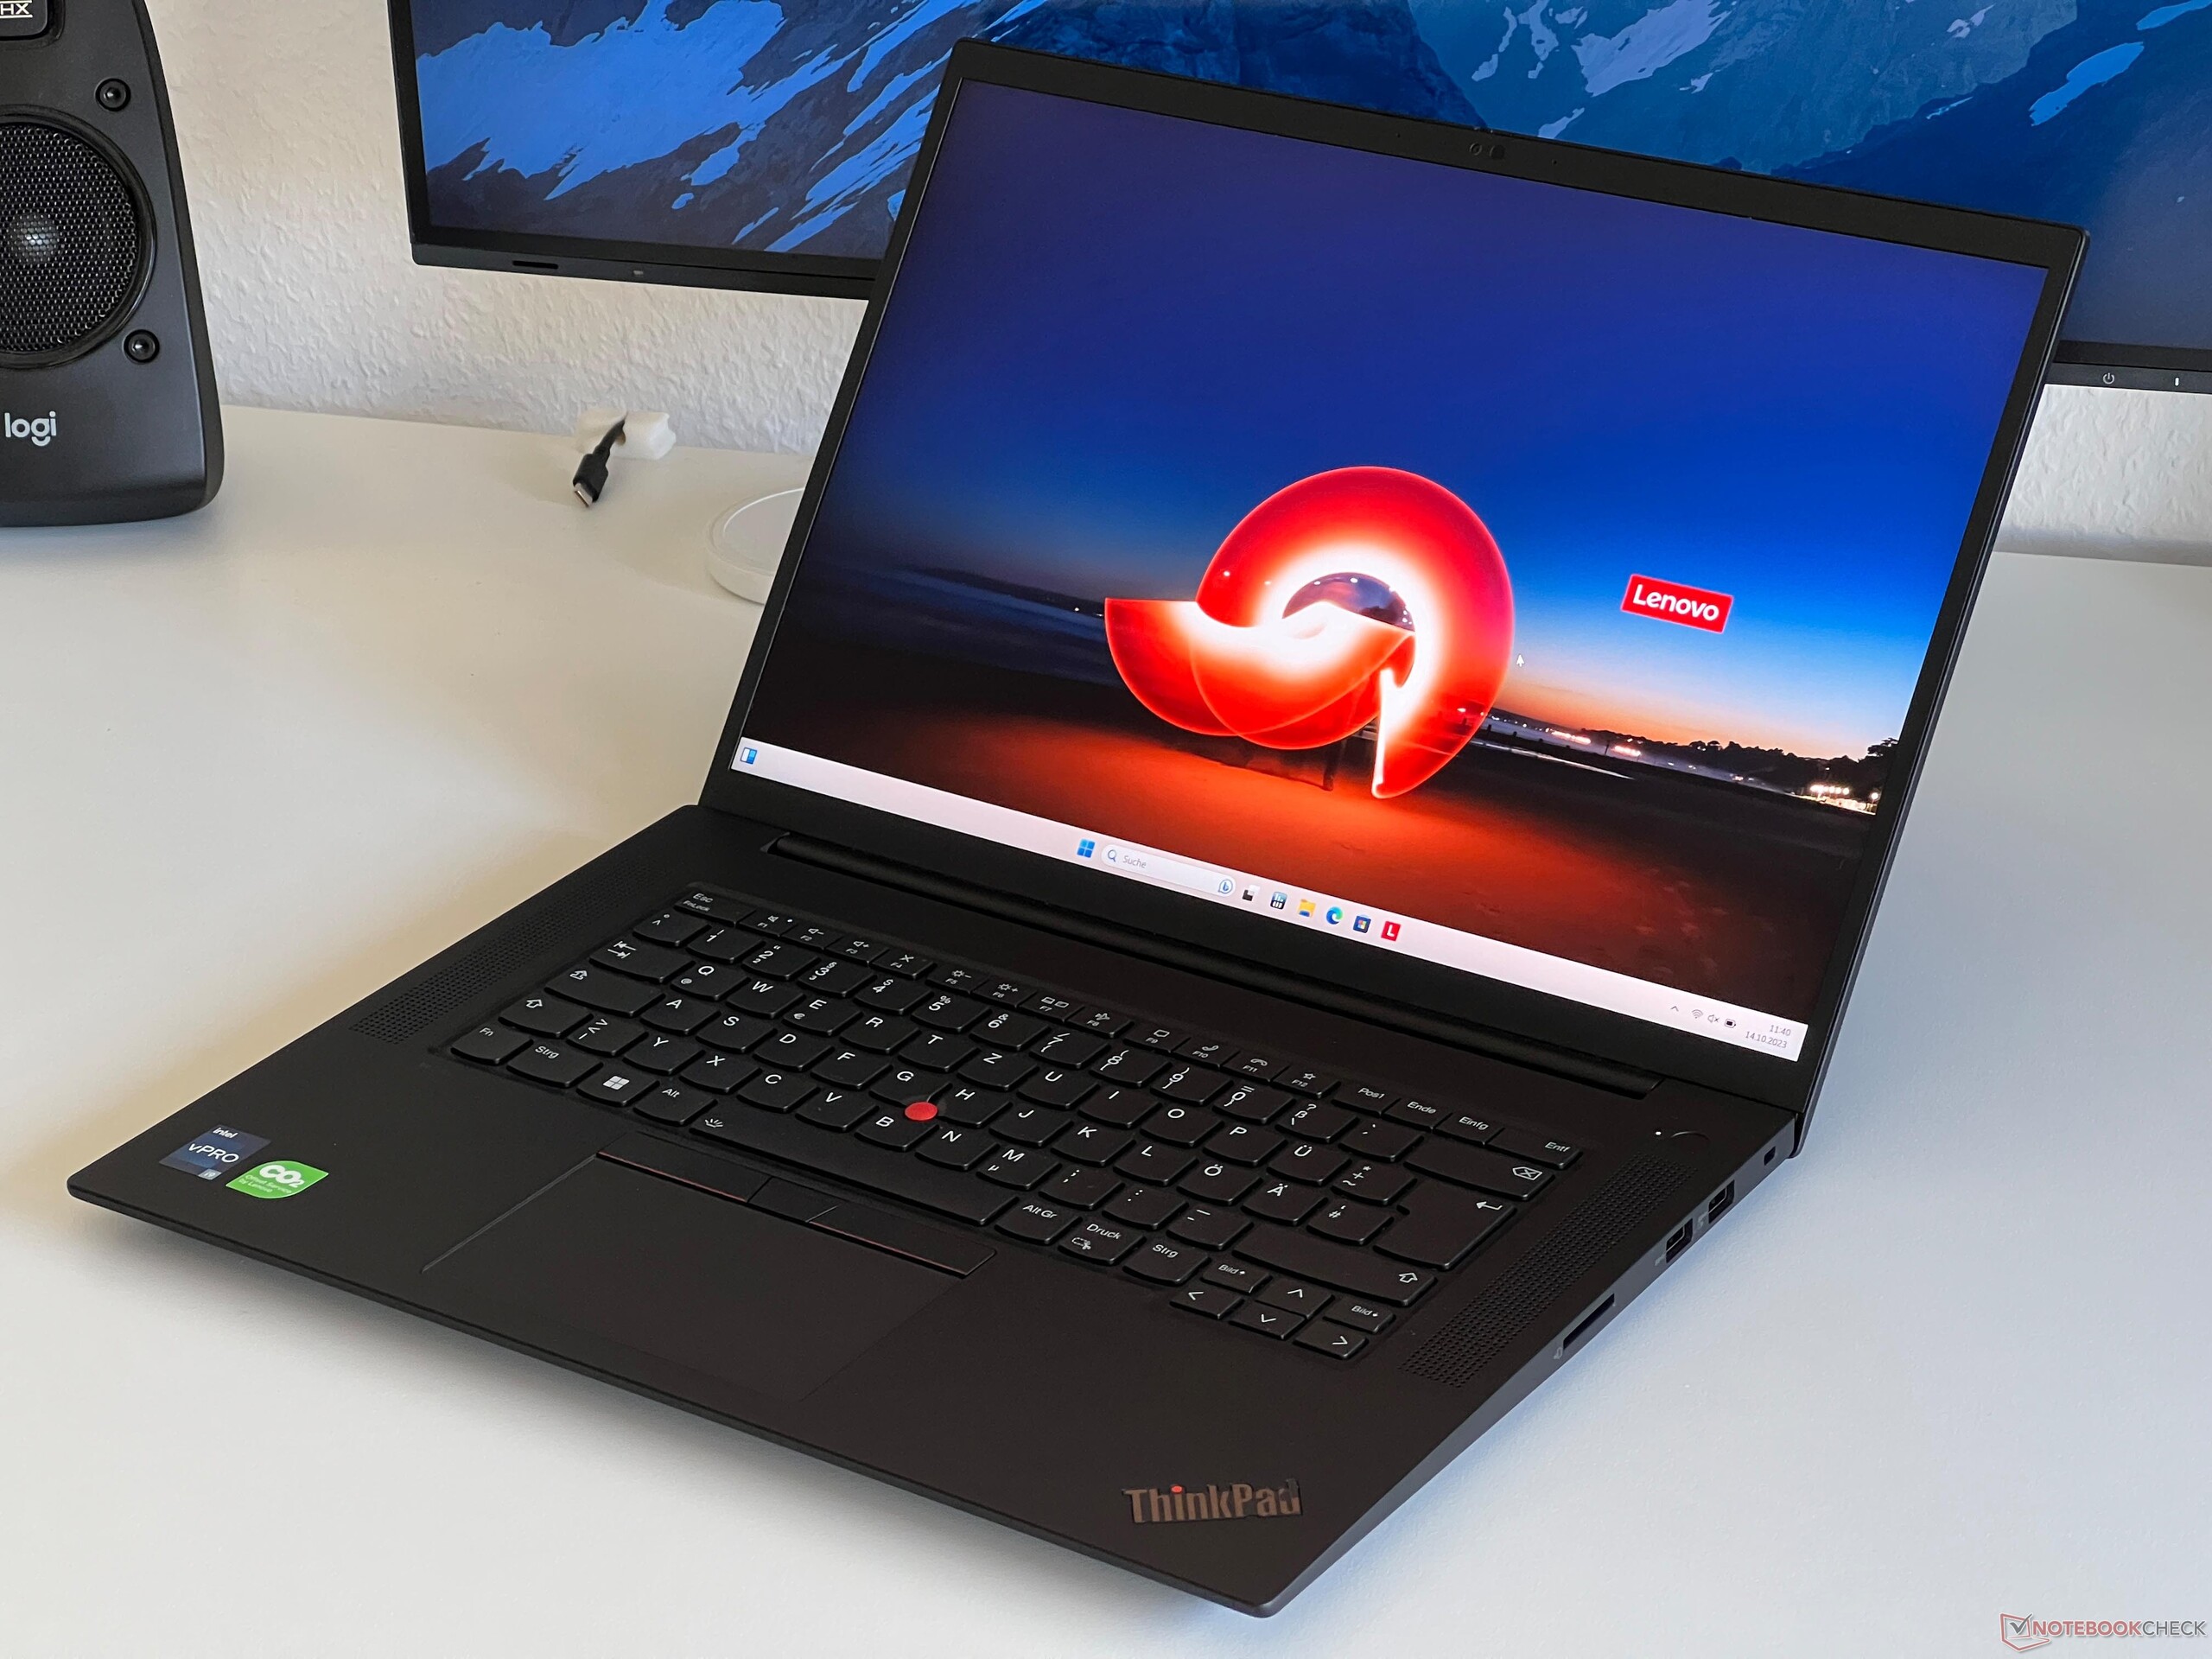
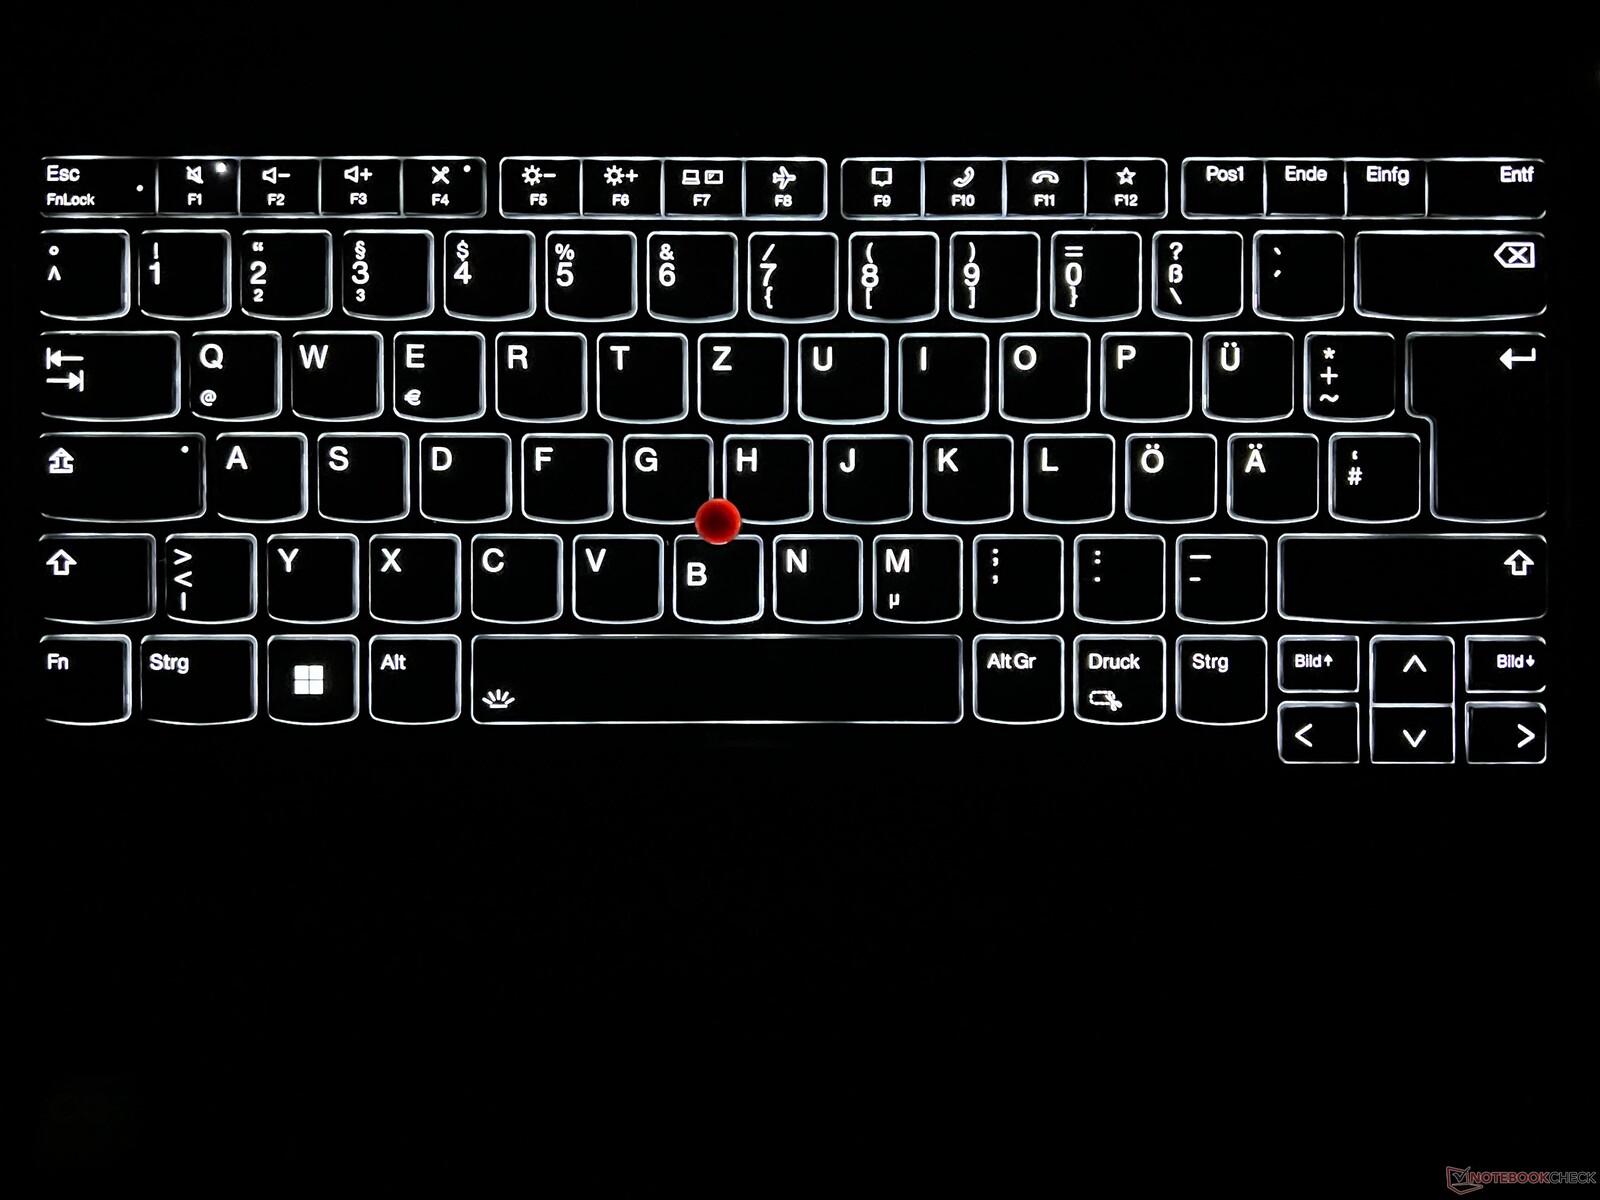
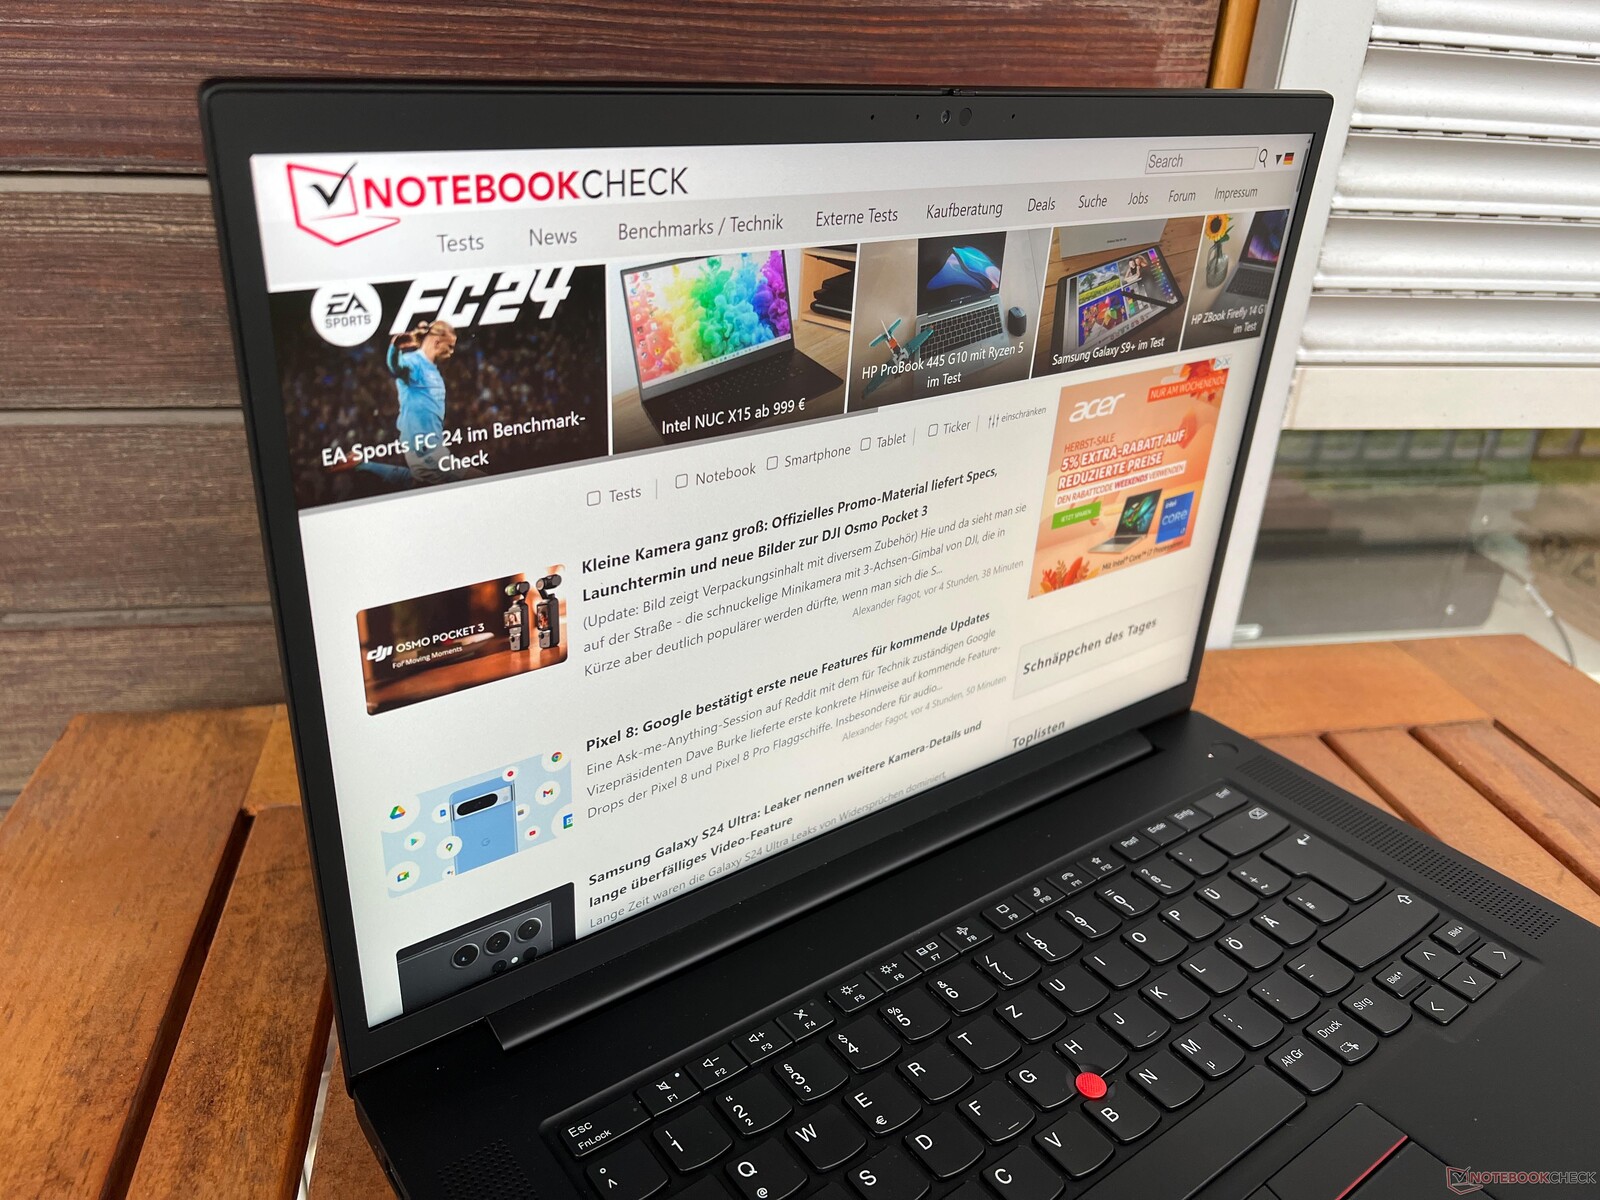
Dispositivos de entrada - Carrera de 1,5 mm
Lenovo ha estado utilizando un teclado con un recorrido de 0,06 pulgadas para el ThinkPad P1 durante los dos últimos años, sin cambios en el modelo actual. Aunque el teclado proporciona una experiencia de escritura cómoda, permitiendo escribir textos extensos sin problemas, ya no alcanza la calidad de los modelos anteriores. En este sentido, no hay ventajas significativas sobre los competidores. La retroiluminación blanca de dos niveles resulta beneficiosa en condiciones de poca luz, aunque carece de activación automática mediante un sensor.
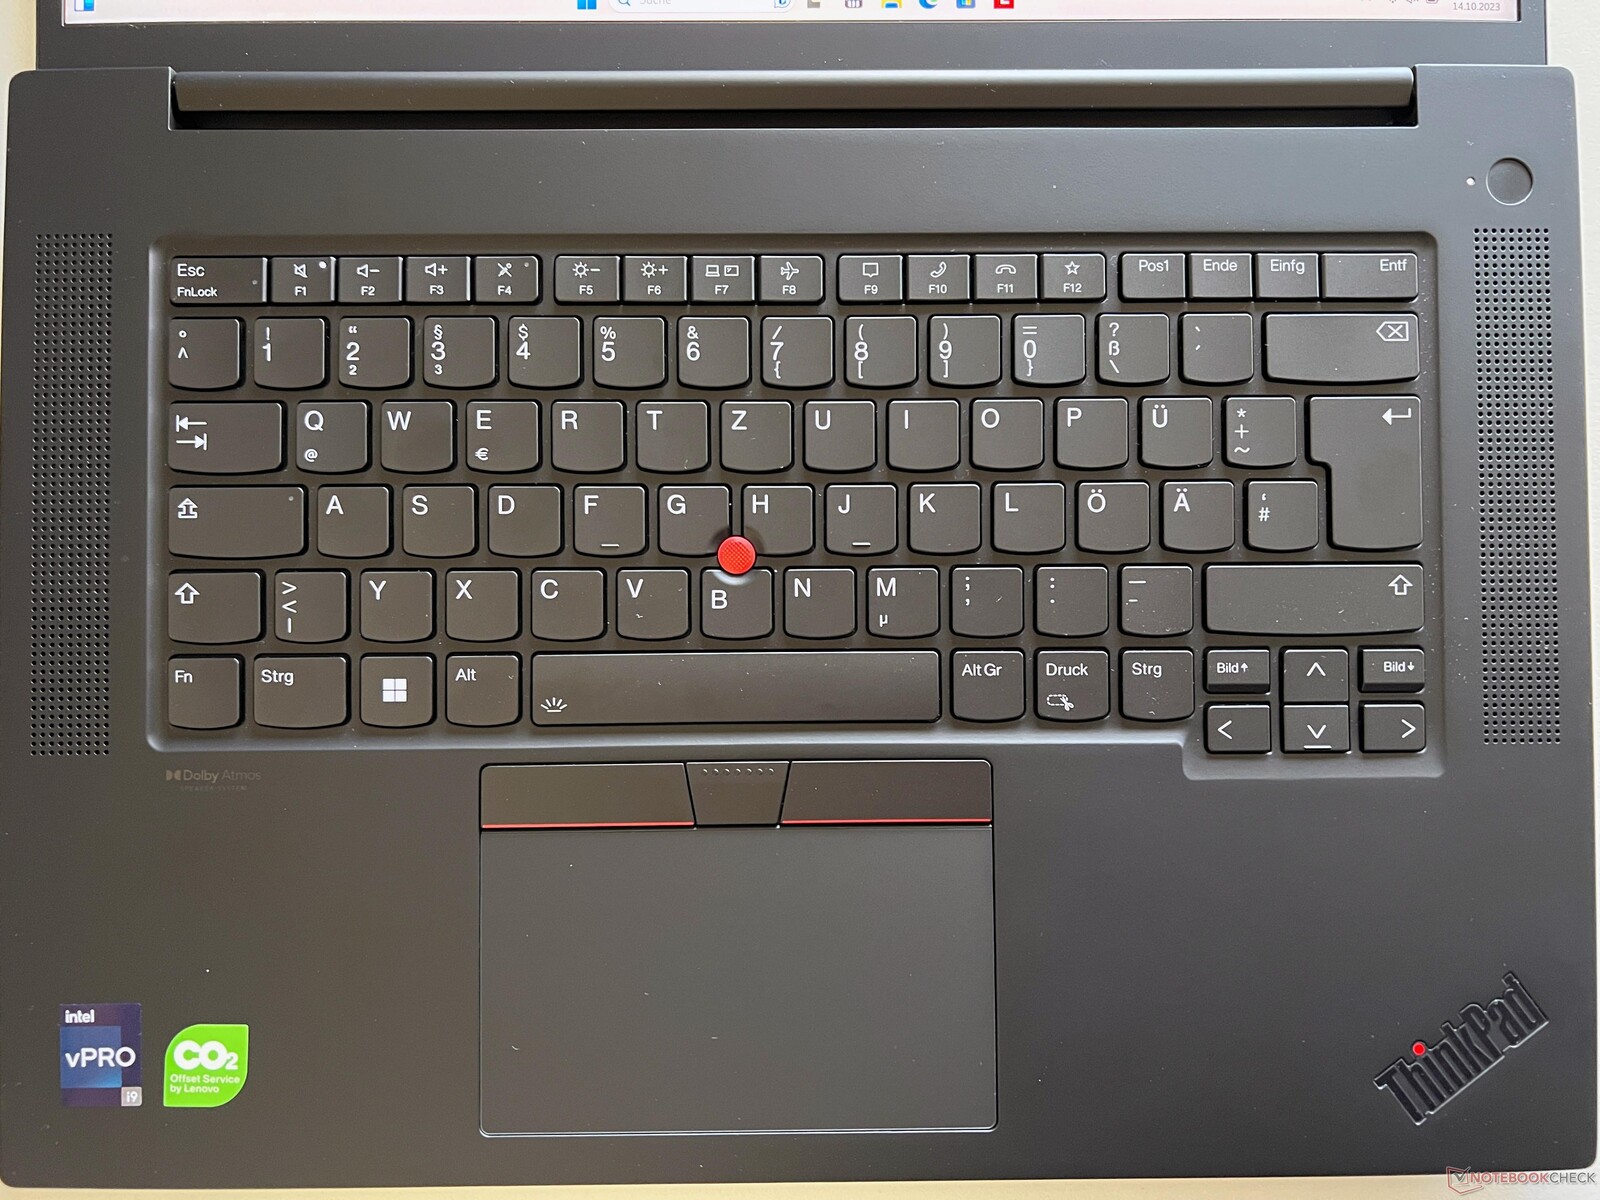
El ClickPad proporciona excelentes propiedades de deslizamiento y un mecanismo de alta calidad, ofreciendo ruidos de clic silenciosos y suaves. Además, para el control del ratón, dispone del TrackPoint y de botones dedicados. Las teclas planas ofrecen una experiencia de escritura buena y silenciosa, funcionando sin problemas; aunque las teclas de nuestro dispositivo de prueba parecen algo ruidosas.
Pantalla - Panel IPS mate con 165 Hz y 500 cd/m²
Lenovo introdujo la pantalla opcional de 165 Hz con resolución WQHD en la generación G5 del año pasado, pero sólo ahora podemos probarla. La configuración estándar incluye un panel Full HD mate con un brillo de 300 cd/m². Además, existe la opción de una pantalla OLED 4K con cobertura P3 completa. Cabe destacar que el modelo IPS 4K con cobertura AdobeRGB, que probamos en el ThinkPad X1 Extremeno está disponible en esta versión.
La pantalla IPS opcional de nuestra unidad de análisis destaca por su excelente calidad de imagen subjetiva. Los colores aparecen vibrantes y los movimientos son increíblemente suaves gracias a la alta frecuencia de actualización, lo que hace que todo el contenido sea excepcionalmente nítido. Incluso en las zonas brillantes, no hay grano, y la pantalla no muestra ningún problema de parpadeo PWM. Además, los tiempos de respuesta son impresionantemente rápidos, y no se aprecian efectos fantasma. A altos niveles de brillo, se aprecian ligeros halos sobre un fondo oscuro, pero no es un problema significativo en el uso práctico.
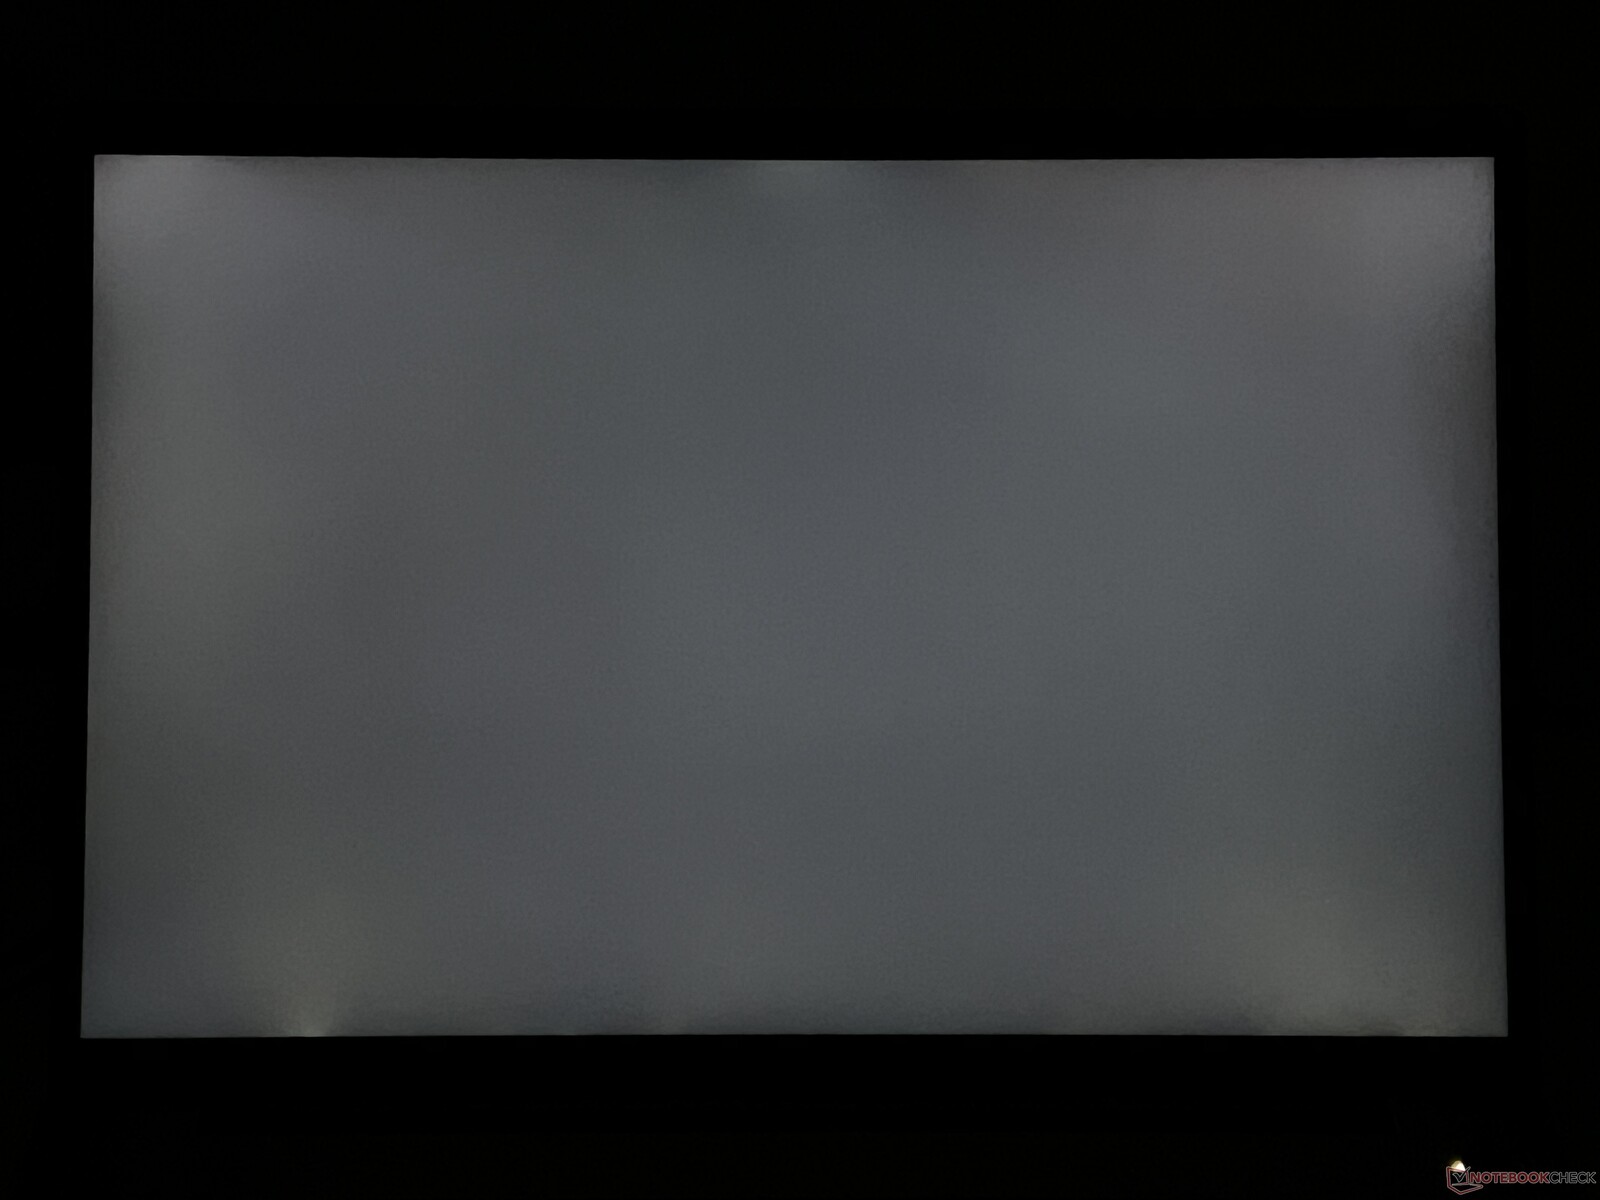
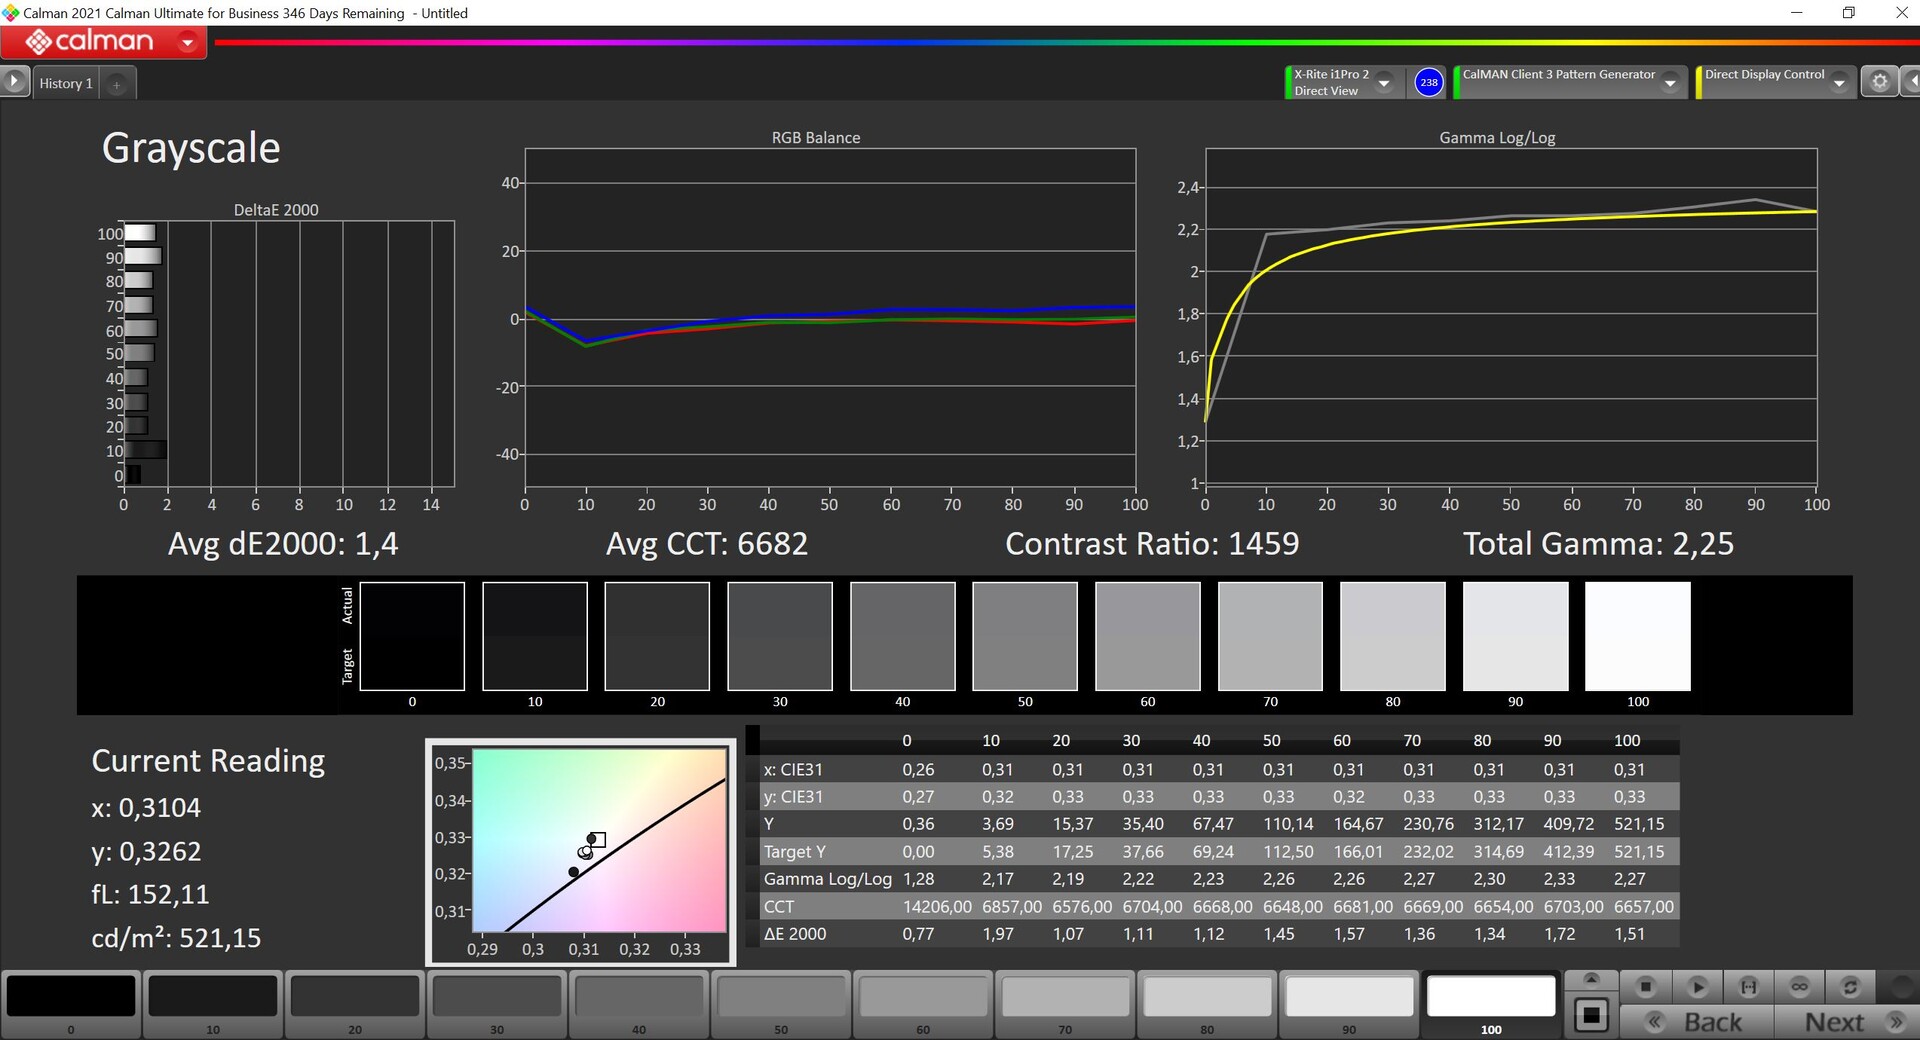
Lenovo afirma un brillo de 500 cd/m², una cifra que podemos confirmar, al menos en el centro de la pantalla. El brillo medio de nuestra muestra de revisión mide algo menos de 485 cd/m², lo que representa una mejora sustancial con respecto al panel estándar. El valor de negro (0,36 cd/m²) se ve algo afectado por el alto brillo. No obstante, la relación de contraste máxima sigue superando los 1400:1.
| |||||||||||||||||||||||||
iluminación: 89 %
Brillo con batería: 520 cd/m²
Contraste: 1447:1 (Negro: 0.36 cd/m²)
ΔE ColorChecker Calman: 1.2 | ∀{0.5-29.43 Ø4.72}
calibrated: 1
ΔE Greyscale Calman: 1.4 | ∀{0.09-98 Ø4.97}
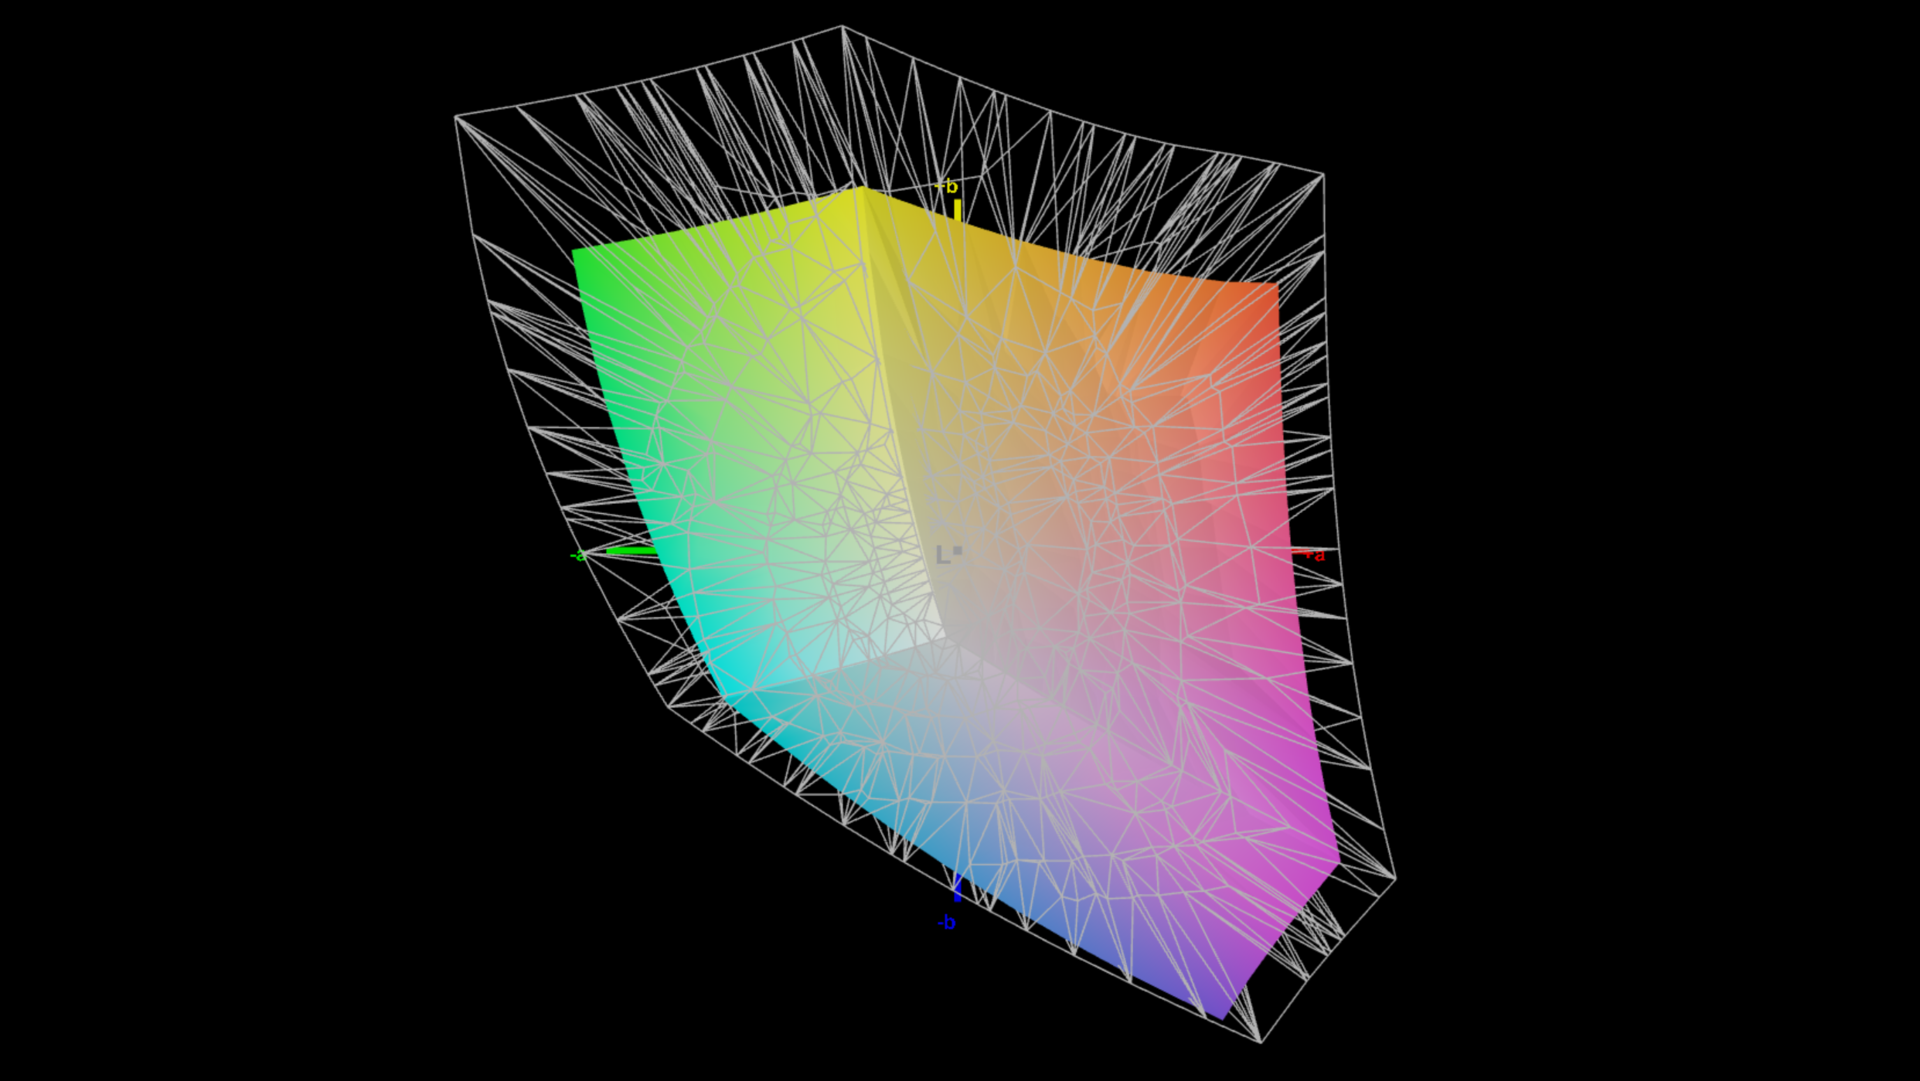
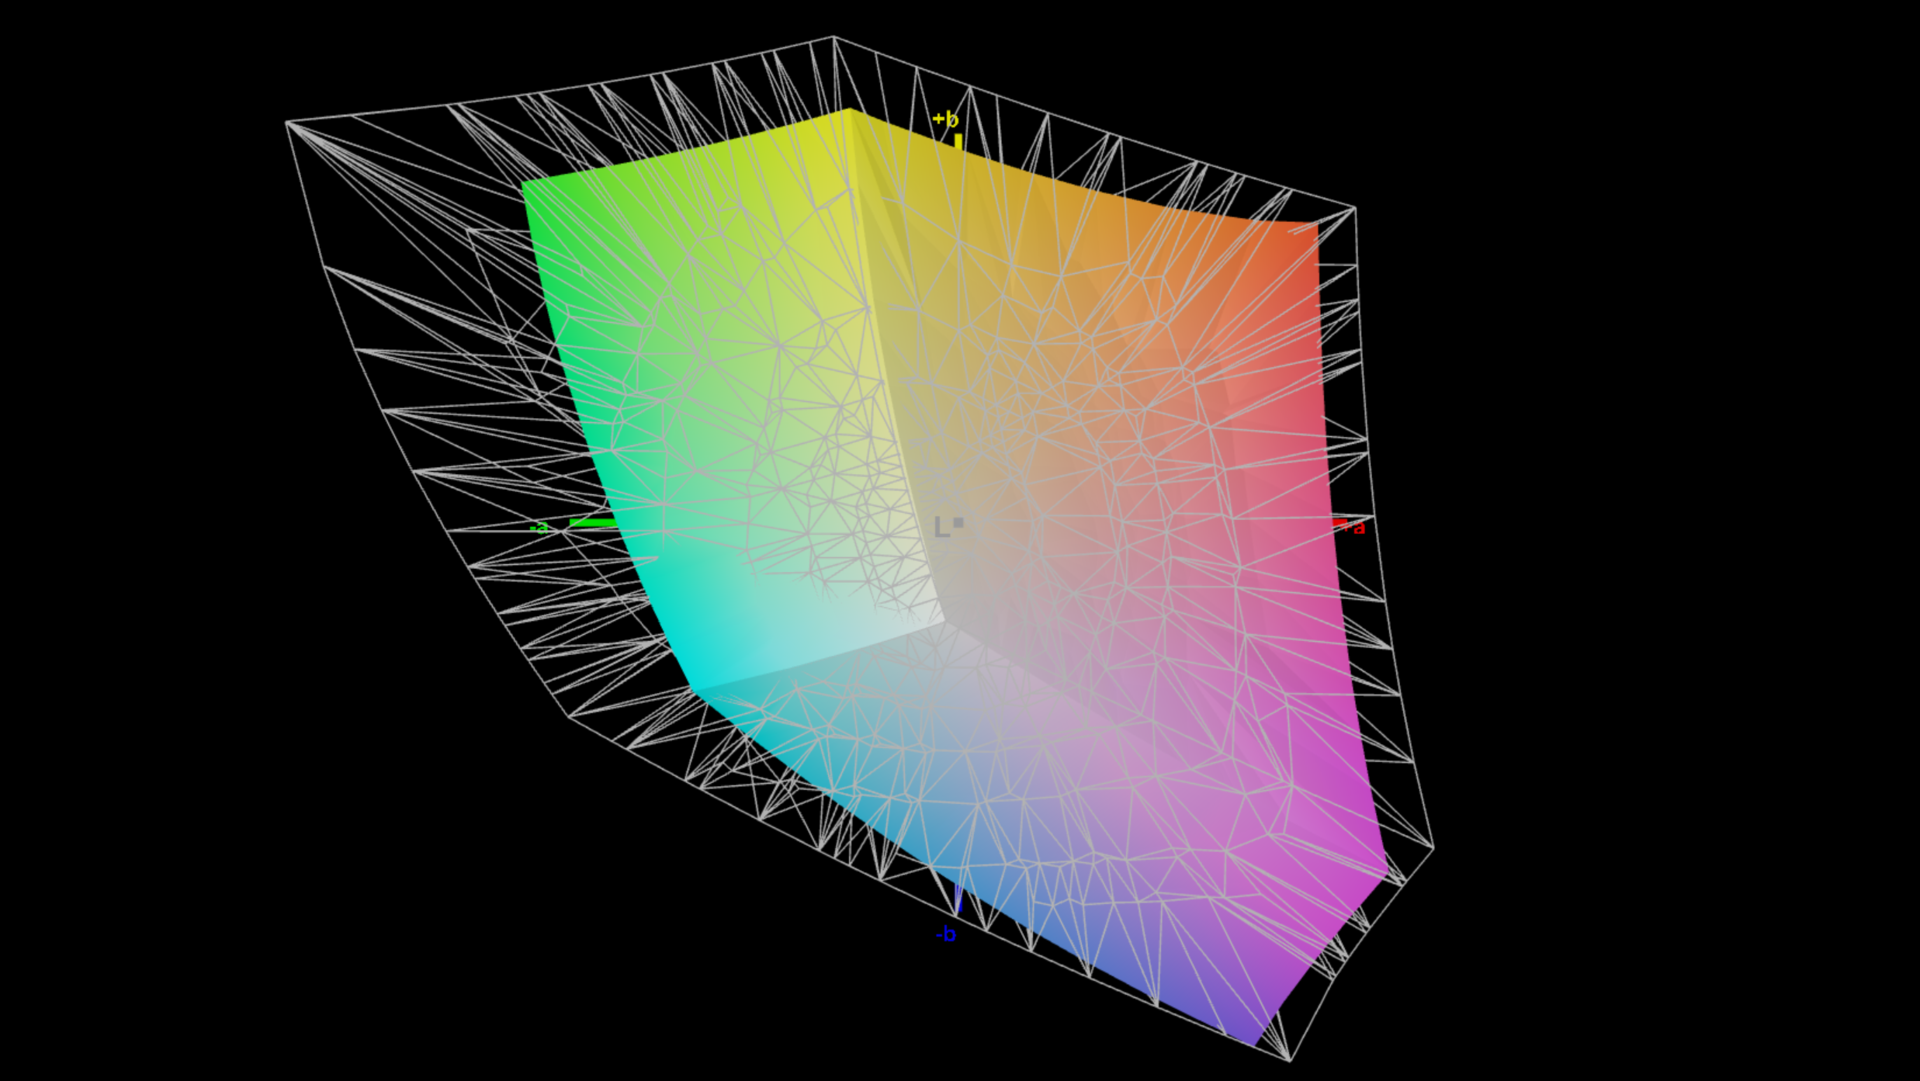
70.2% AdobeRGB 1998 (Argyll 3D)
97.5% sRGB (Argyll 3D)
68.1% Display P3 (Argyll 3D)
Gamma: 2.25
CCT: 6682 K
| Lenovo ThinkPad P1 G6-21FV000DGE NE160QDM-NY1, IPS, 2560x1600, 16" | Dell Precision 5000 5680 Samsung 160YV03, OLED, 3840x2400, 16" | Samsung Galaxy Book3 Ultra 16, i9-13900H RTX 4070 Samsung SDC4185 ATNA60CL03-0, OLED / AMOLED, 2880x1800, 16" | HP ZBook Studio 16 G9 62U04EA BOE0A52, IPS, 3840x2400, 16" | MSI CreatorPro Z16P B12UKST B160QAN02.N, IPS, 2560x1600, 16" | Schenker VISION 16 Pro (M23) NE160QDM-NZ1, IPS, 2560x1600, 16" | Lenovo ThinkPad X1 Extreme G5-21DE003RGE LP160UQ1-SPB1, IPS, 3840x2400, 16" | |
|---|---|---|---|---|---|---|---|
| Display | 30% | 27% | 23% | 23% | 1% | 22% | |
| Display P3 Coverage (%) | 68.1 | 99.9 47% | 95.3 40% | 97.5 43% | 97.6 43% | 68.8 1% | 84.6 24% |
| sRGB Coverage (%) | 97.5 | 100 3% | 99.1 2% | 99.9 2% | 99.9 2% | 98.8 1% | 99.2 2% |
| AdobeRGB 1998 Coverage (%) | 70.2 | 97.5 39% | 97.4 39% | 86.3 23% | 87.4 25% | 70 0% | 97.7 39% |
| Response Times | 85% | 82% | 12% | 15% | 8% | -168% | |
| Response Time Grey 50% / Grey 80% * (ms) | 13.7 ? | 1.68 ? 88% | 2 ? 85% | 15.3 ? -12% | 12.8 ? 7% | 13.7 ? -0% | 46 ? -236% |
| Response Time Black / White * (ms) | 9.6 ? | 1.77 ? 82% | 2 ? 79% | 6.1 ? 36% | 7.4 ? 23% | 8.1 ? 16% | 19.2 ? -100% |
| PWM Frequency (Hz) | 60 ? | 250 ? | |||||
| Screen | -79% | -51% | 0% | -10% | -74% | -29% | |
| Brightness middle (cd/m²) | 521 | 345.7 -34% | 403 -23% | 554 6% | 407 -22% | 384 -26% | 476 -9% |
| Brightness (cd/m²) | 484 | 349 -28% | 408 -16% | 516 7% | 388 -20% | 371 -23% | 470 -3% |
| Brightness Distribution (%) | 89 | 98 10% | 98 10% | 84 -6% | 88 -1% | 88 -1% | 90 1% |
| Black Level * (cd/m²) | 0.36 | 0.47 -31% | 0.36 -0% | 0.3 17% | 0.35 3% | ||
| Contrast (:1) | 1447 | 1179 -19% | 1131 -22% | 1280 -12% | 1360 -6% | ||
| Colorchecker dE 2000 * | 1.2 | 3.59 -199% | 2.63 -119% | 1 17% | 1.3 -8% | 3.4 -183% | 1.9 -58% |
| Colorchecker dE 2000 max. * | 2.5 | 7.02 -181% | 4.07 -63% | 2.4 4% | 2.5 -0% | 9.2 -268% | 4.7 -88% |
| Colorchecker dE 2000 calibrated * | 1 | 0.99 1% | 0.6 40% | 0.7 30% | 1.3 -30% | 1.3 -30% | |
| Greyscale dE 2000 * | 1.4 | 3.1 -121% | 2.69 -92% | 1.6 -14% | 2.1 -50% | 3.4 -143% | 2.4 -71% |
| Gamma | 2.25 98% | 2.13 103% | 2.48 89% | 2.29 96% | 2.26 97% | 2.16 102% | 2.24 98% |
| CCT | 6682 97% | 6448 101% | 6907 94% | 6458 101% | 6437 101% | 7462 87% | 6377 102% |
| Media total (Programa/Opciones) | 12% /
-24% | 19% /
-5% | 12% /
7% | 9% /
1% | -22% /
-47% | -58% /
-38% |
* ... más pequeño es mejor
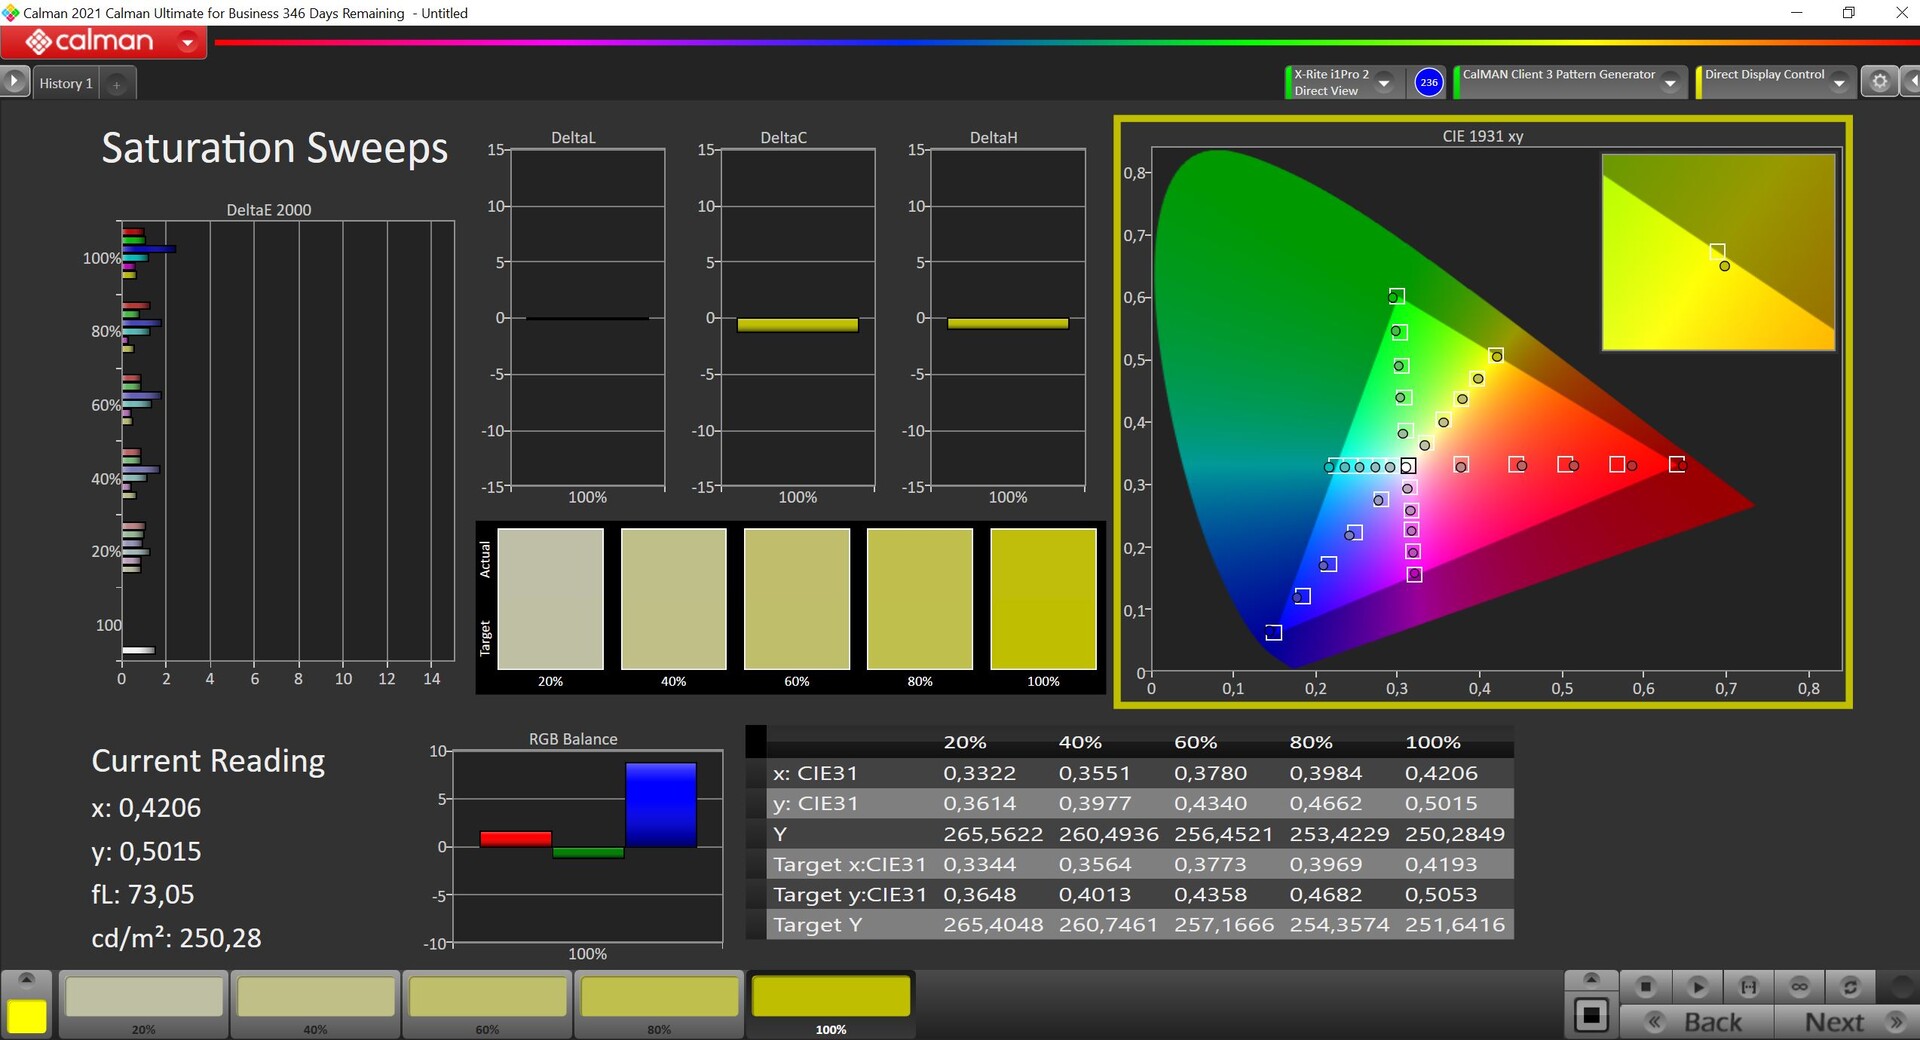
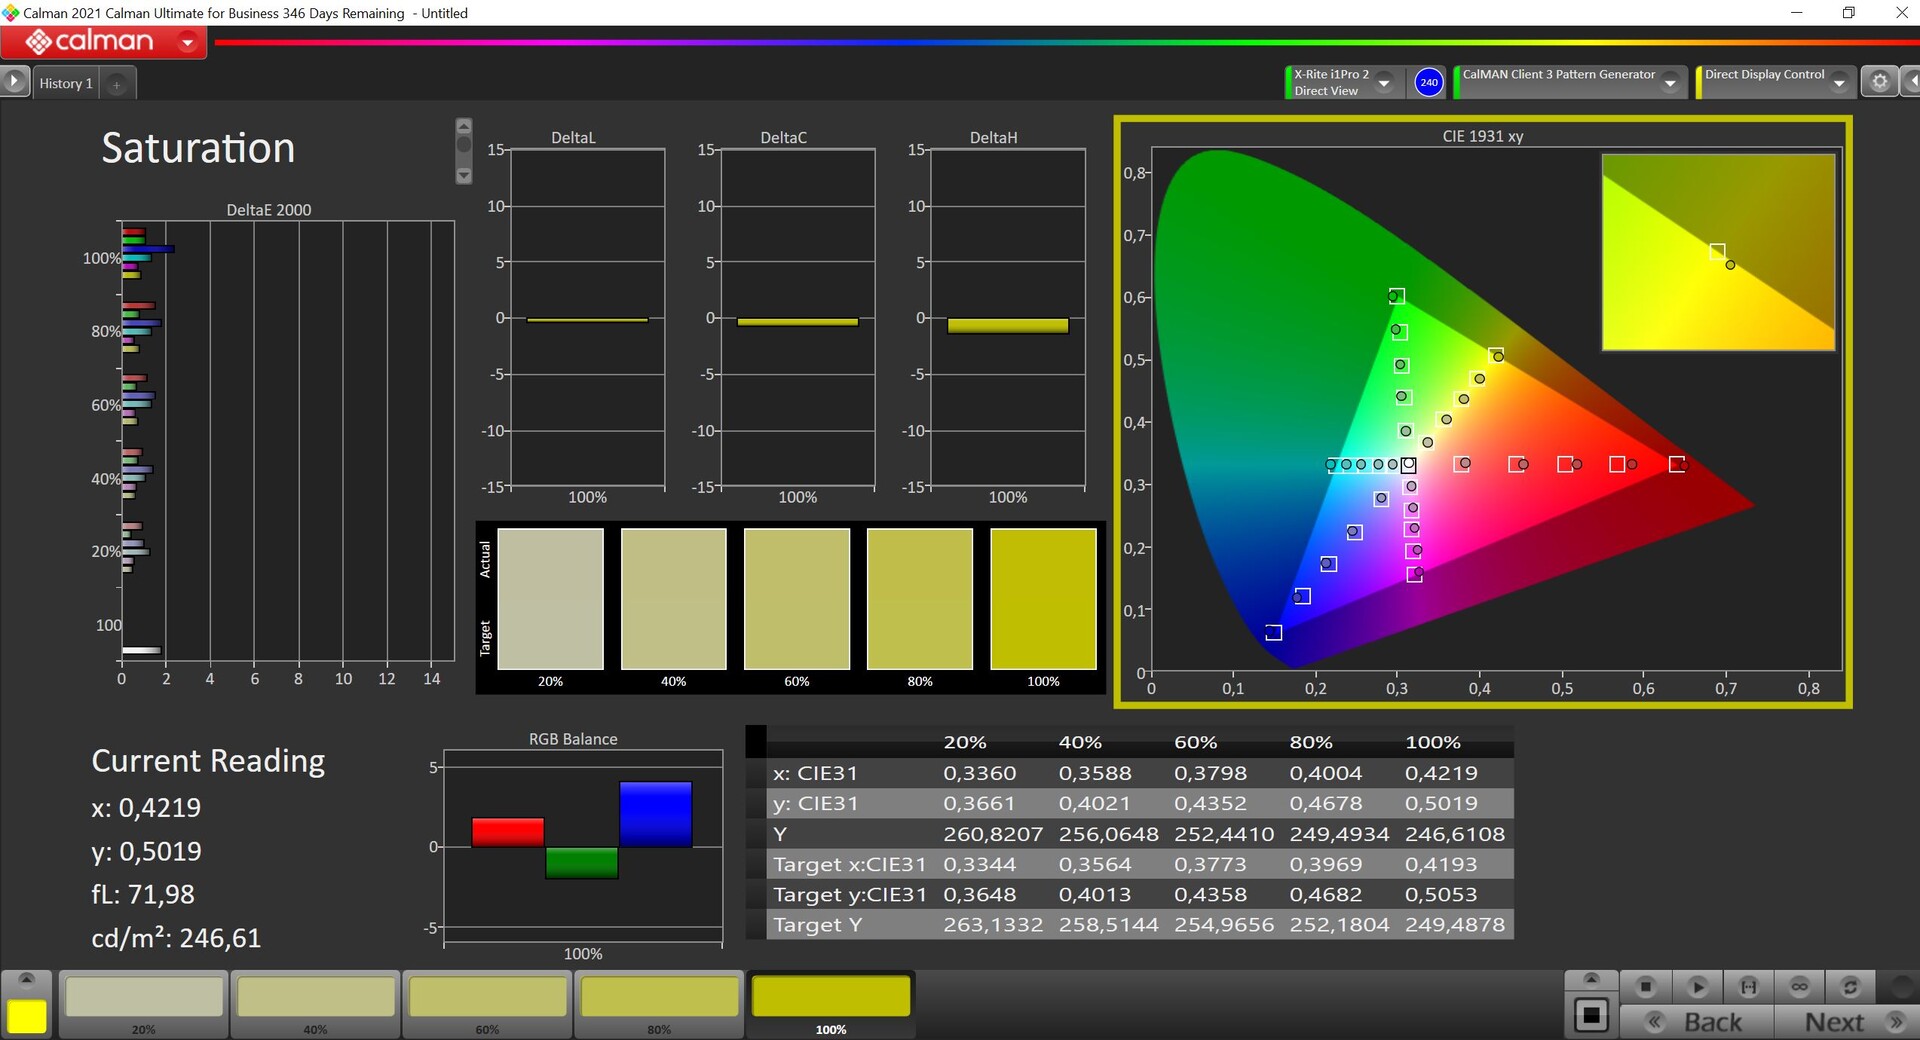
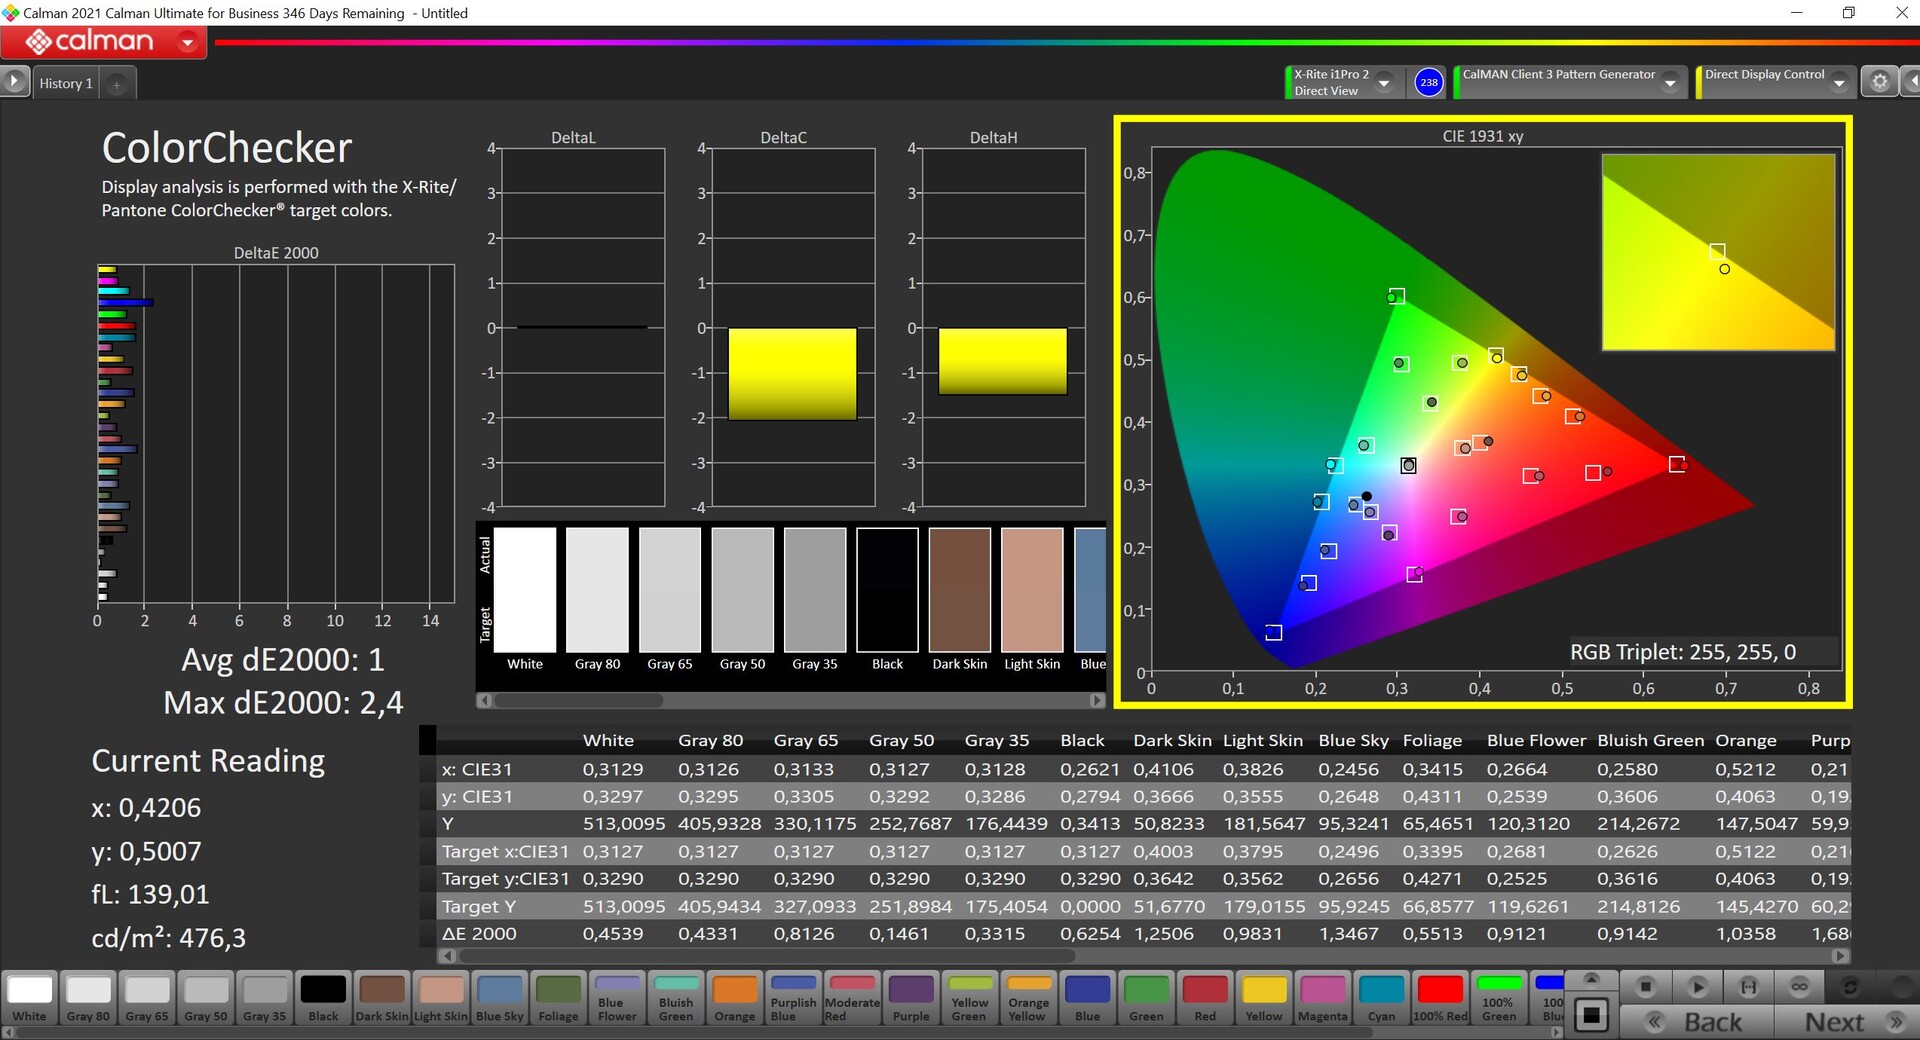
Todas las pantallas ThinkPad P1 Gen 6 vienen calibradas de fábrica y los clientes pueden elegir entre varios perfiles de color. El perfil predeterminado presenta unos valores excelentes, tal y como muestra nuestro análisis con el software profesional CalMAN. Estos valores ya son muy impresionantes, sin desviaciones DeltaE-2000 superiores a 3 ni en la escala de grises ni en los colores. El único inconveniente menor es la temperatura del color en la escala de grises, que podría ser un poco más cálida. Se trata de un problema insignificante, y no es necesario que los usuarios realicen ninguna calibración adicional. Pudimos minimizar ligeramente las discrepancias de color y acercar la temperatura del color al valor óptimo utilizando nuestra propia calibración (el perfil correspondiente se puede descargar gratuitamente más arriba).


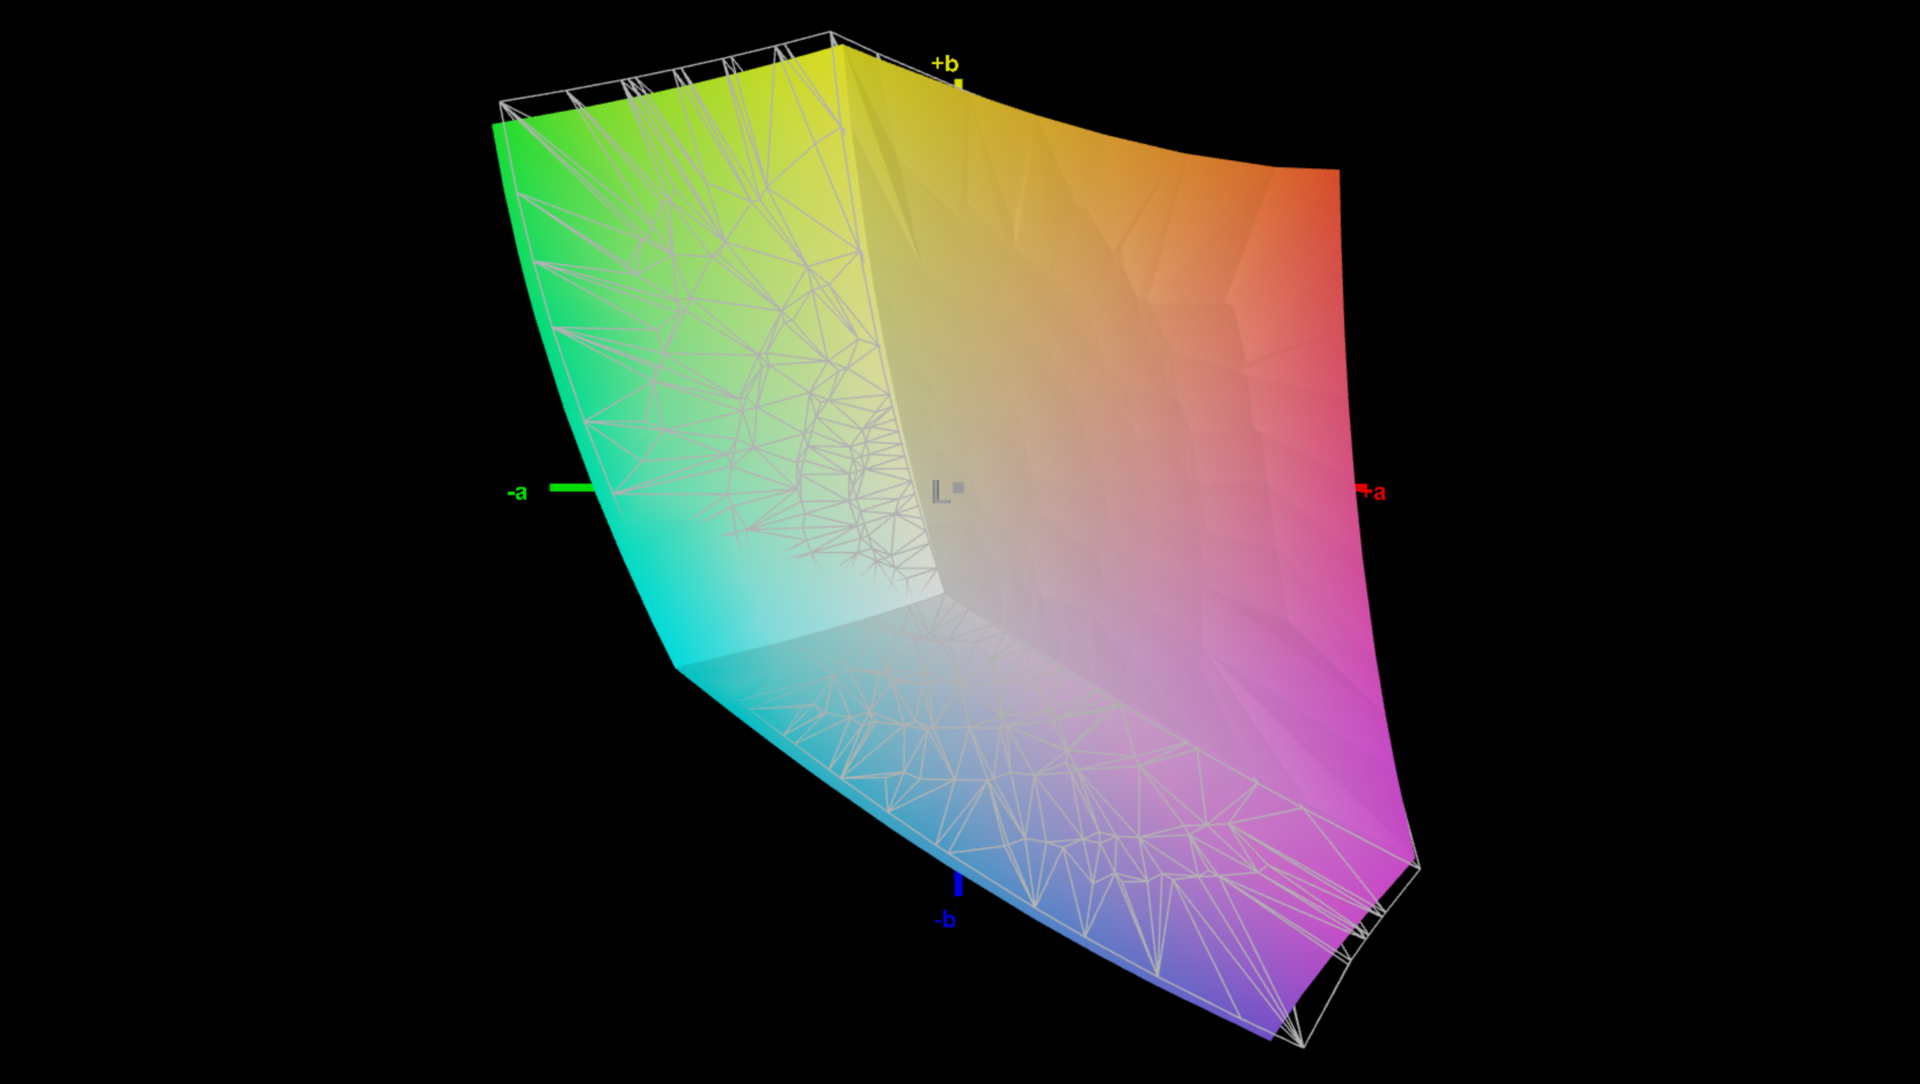
La pantalla cubre totalmente el espacio de color sRGB más pequeño, que es adecuado para muchas aplicaciones. Si necesita el espacio de color más amplio P3, tendrá que utilizar el panel OLED, pero normalmente recomendamos el panel de 165 Hz debido a las desventajas del OLED, como el PWM y el mayor consumo de energía.
Tiempos de respuesta del display
| ↔ Tiempo de respuesta de Negro a Blanco | ||
|---|---|---|
| 9.6 ms ... subida ↗ y bajada ↘ combinada | ↗ 4.8 ms subida | 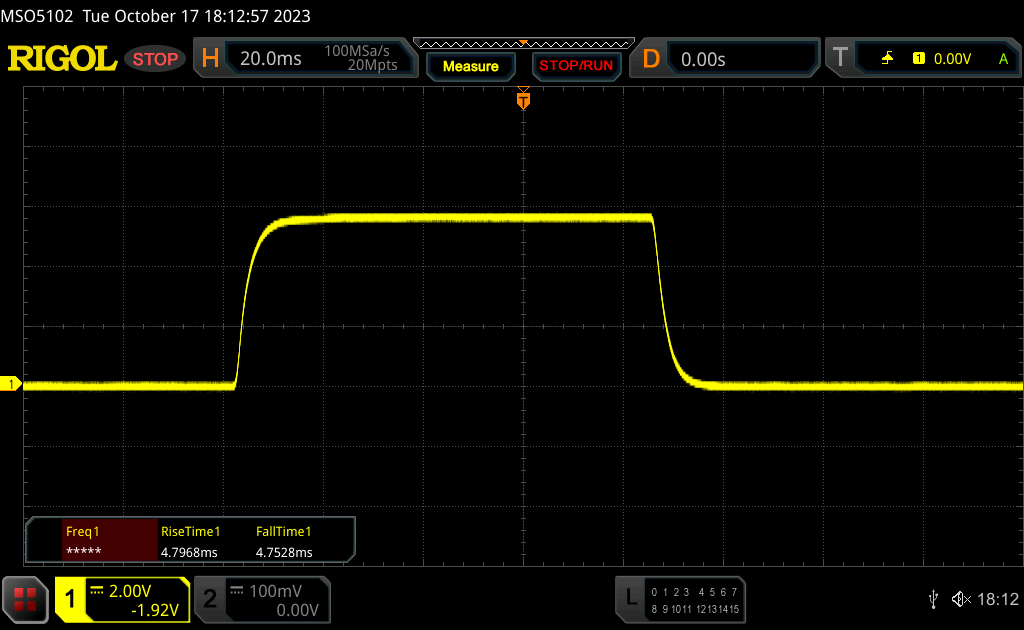 |
| ↘ 4.8 ms bajada | ||
| La pantalla mostró tiempos de respuesta rápidos en nuestros tests y debería ser adecuada para juegos. En comparación, todos los dispositivos de prueba van de ##min### (mínimo) a 240 (máximo) ms. » 26 % de todos los dispositivos son mejores. Esto quiere decir que el tiempo de respuesta medido es mejor que la media (19.8 ms) de todos los dispositivos testados. | ||
| ↔ Tiempo de respuesta 50% Gris a 80% Gris | ||
| 13.7 ms ... subida ↗ y bajada ↘ combinada | ↗ 6.7 ms subida | 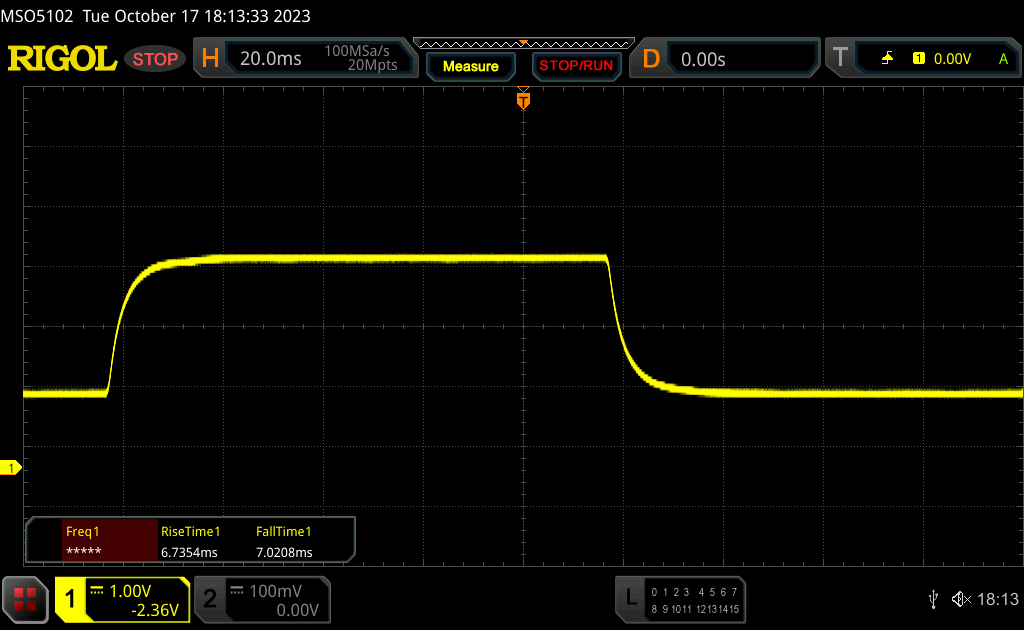 |
| ↘ 7 ms bajada | ||
| La pantalla mostró buenos tiempos de respuesta en nuestros tests pero podría ser demasiado lenta para los jugones competitivos. En comparación, todos los dispositivos de prueba van de ##min### (mínimo) a 636 (máximo) ms. » 27 % de todos los dispositivos son mejores. Esto quiere decir que el tiempo de respuesta medido es mejor que la media (31 ms) de todos los dispositivos testados. | ||
Parpadeo de Pantalla / PWM (Pulse-Width Modulation)
| Parpadeo de Pantalla / PWM no detectado | 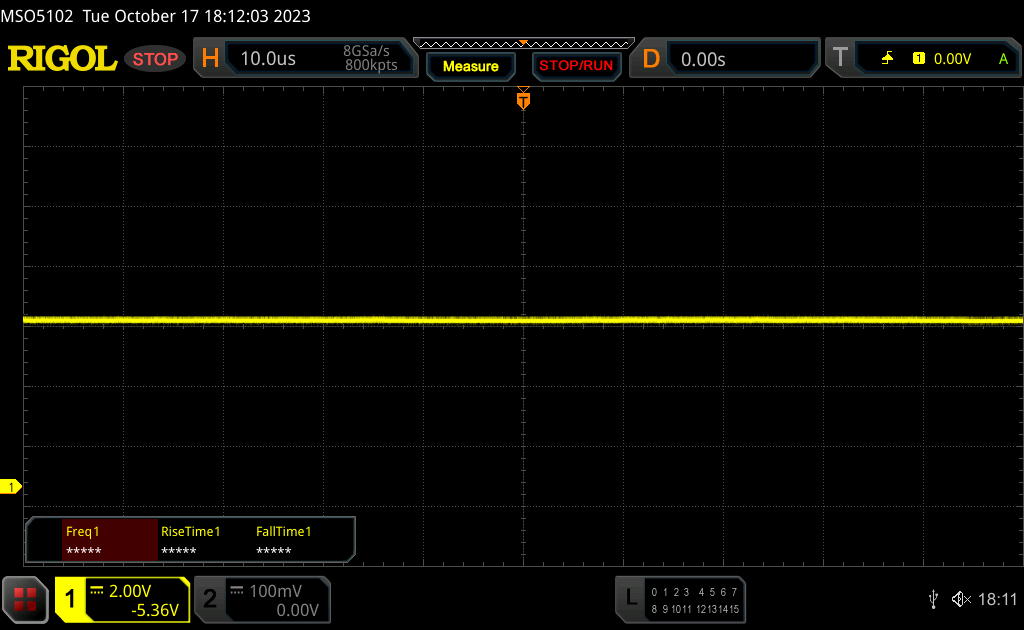 | ||
Comparación: 52 % de todos los dispositivos testados no usaron PWM para atenuar el display. Si se usó, medimos una media de 7781 (mínimo: 5 - máxmo: 343500) Hz. | |||
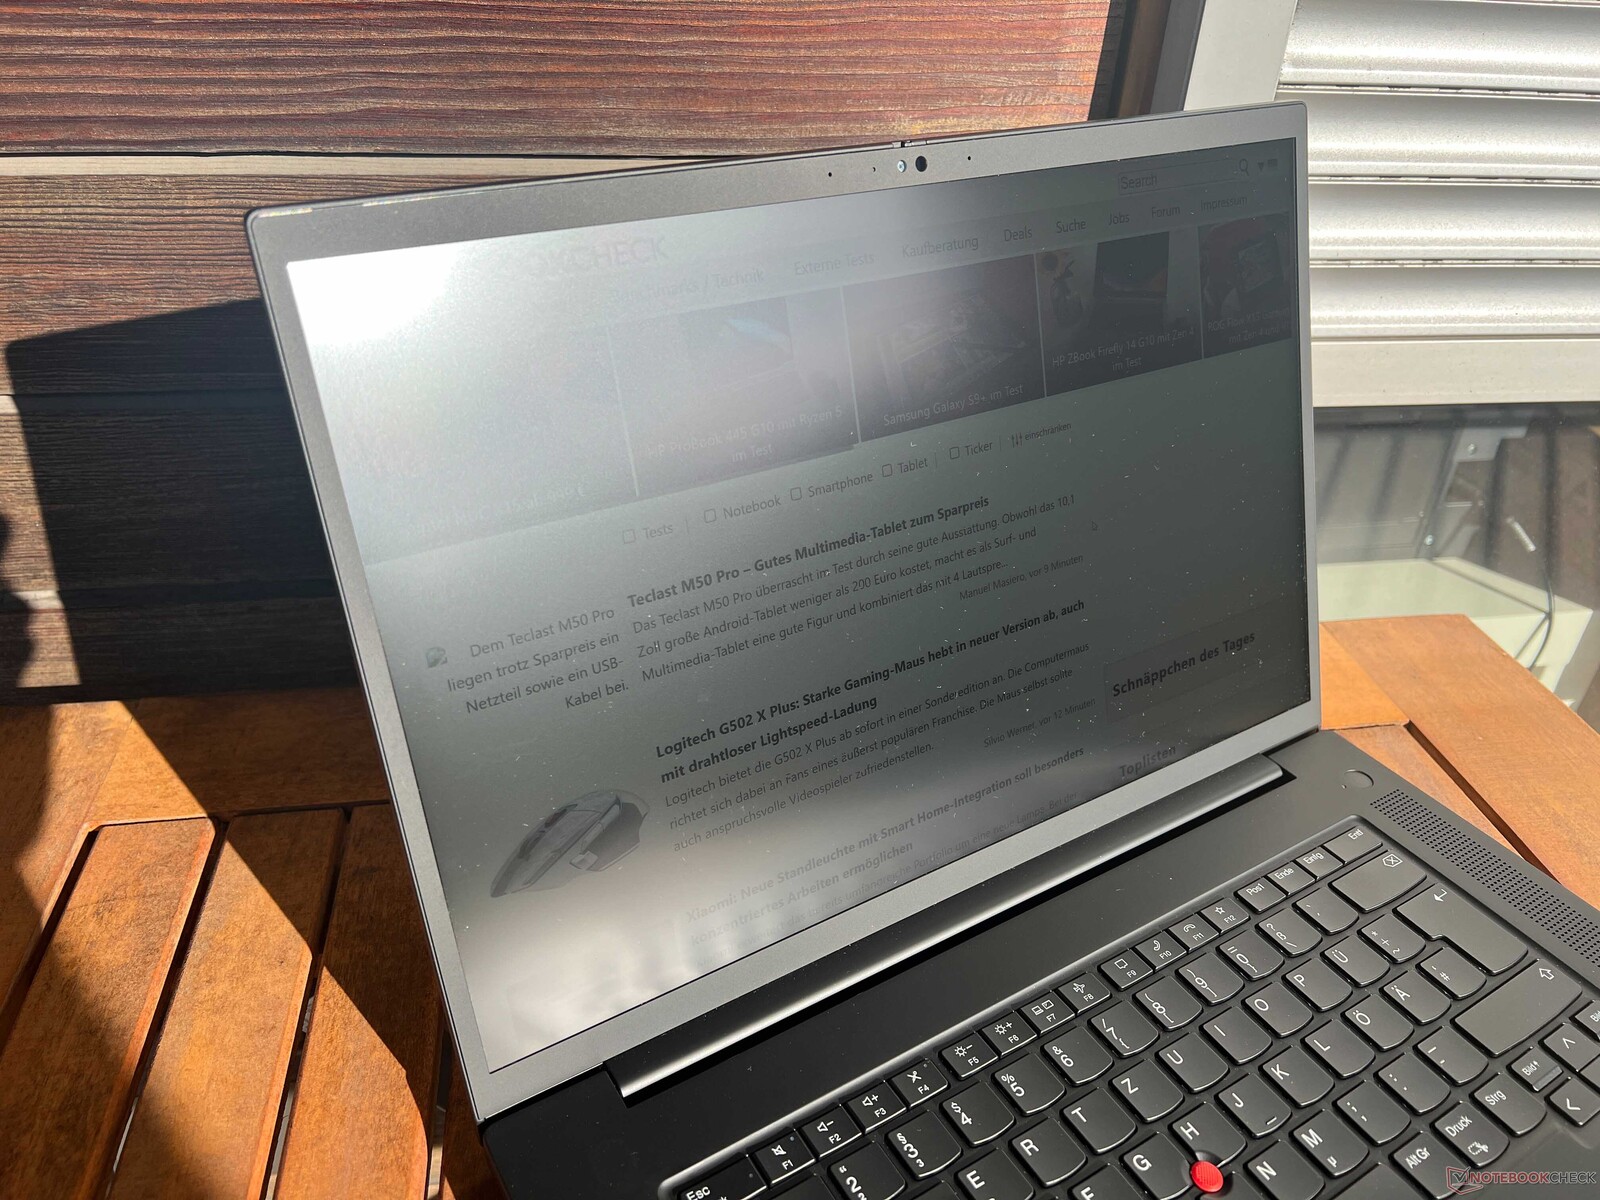
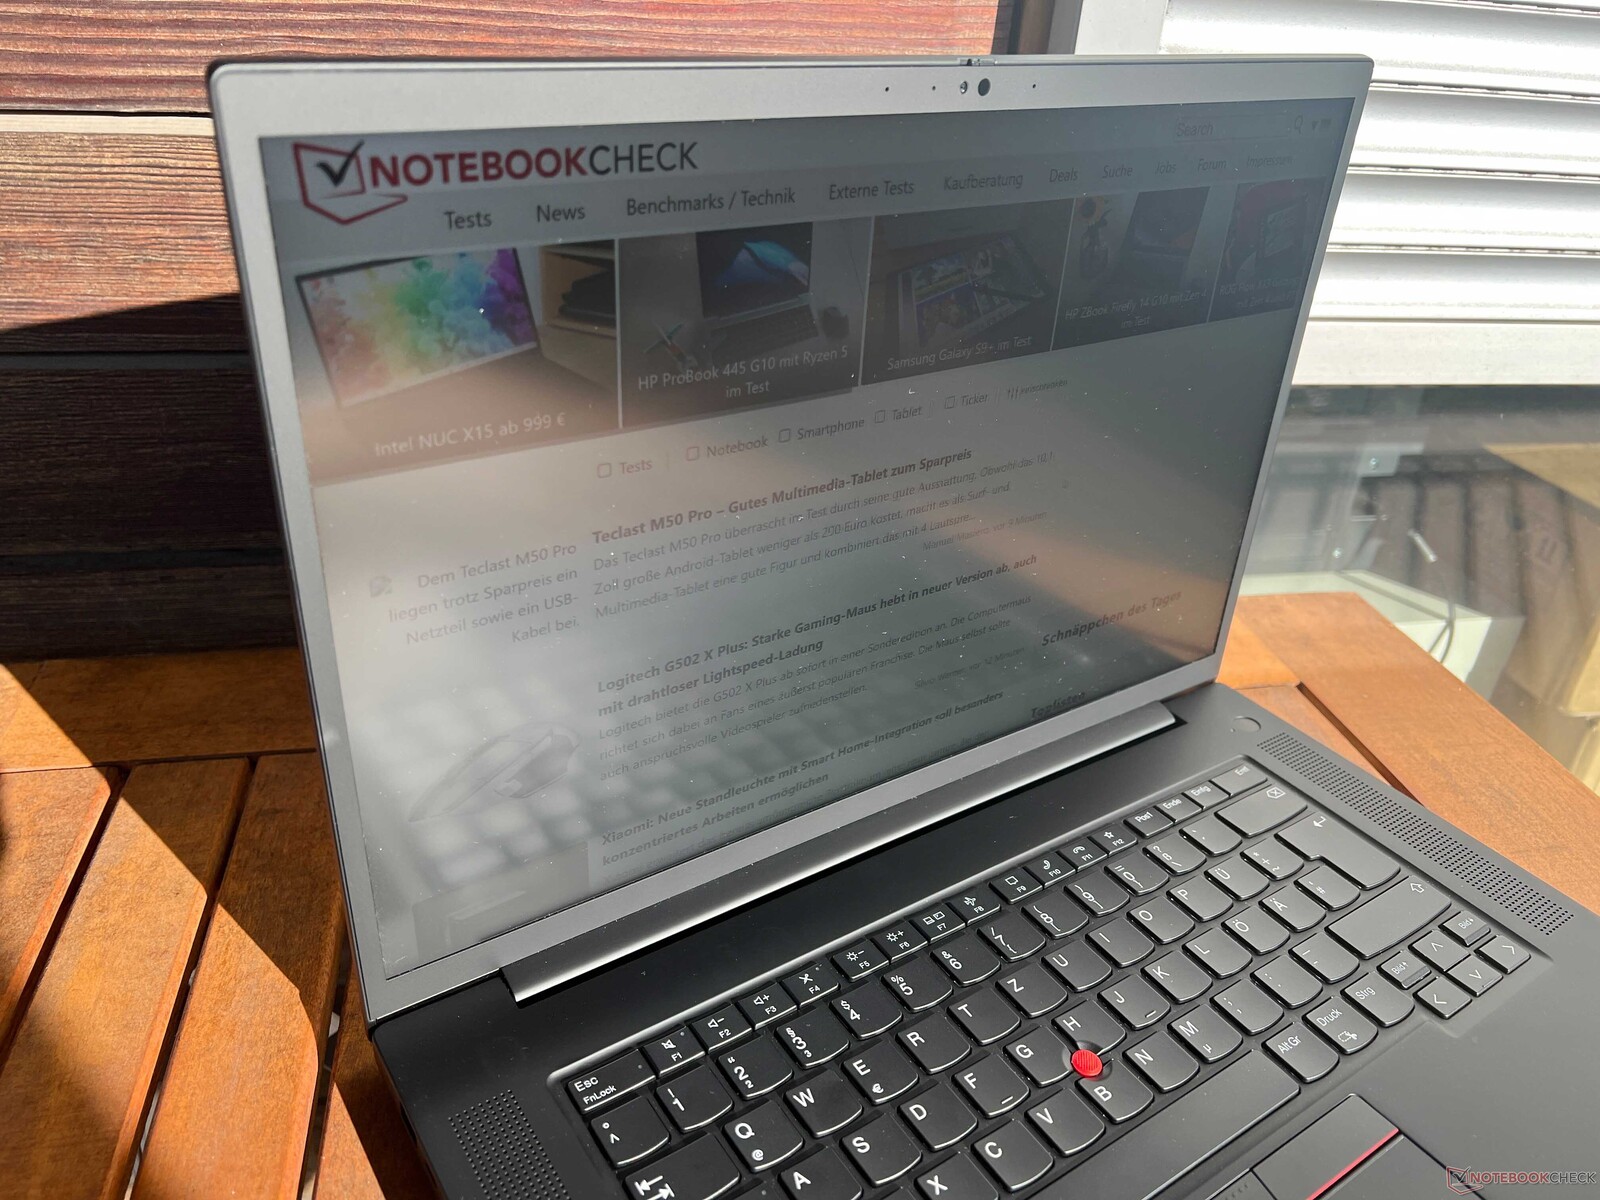
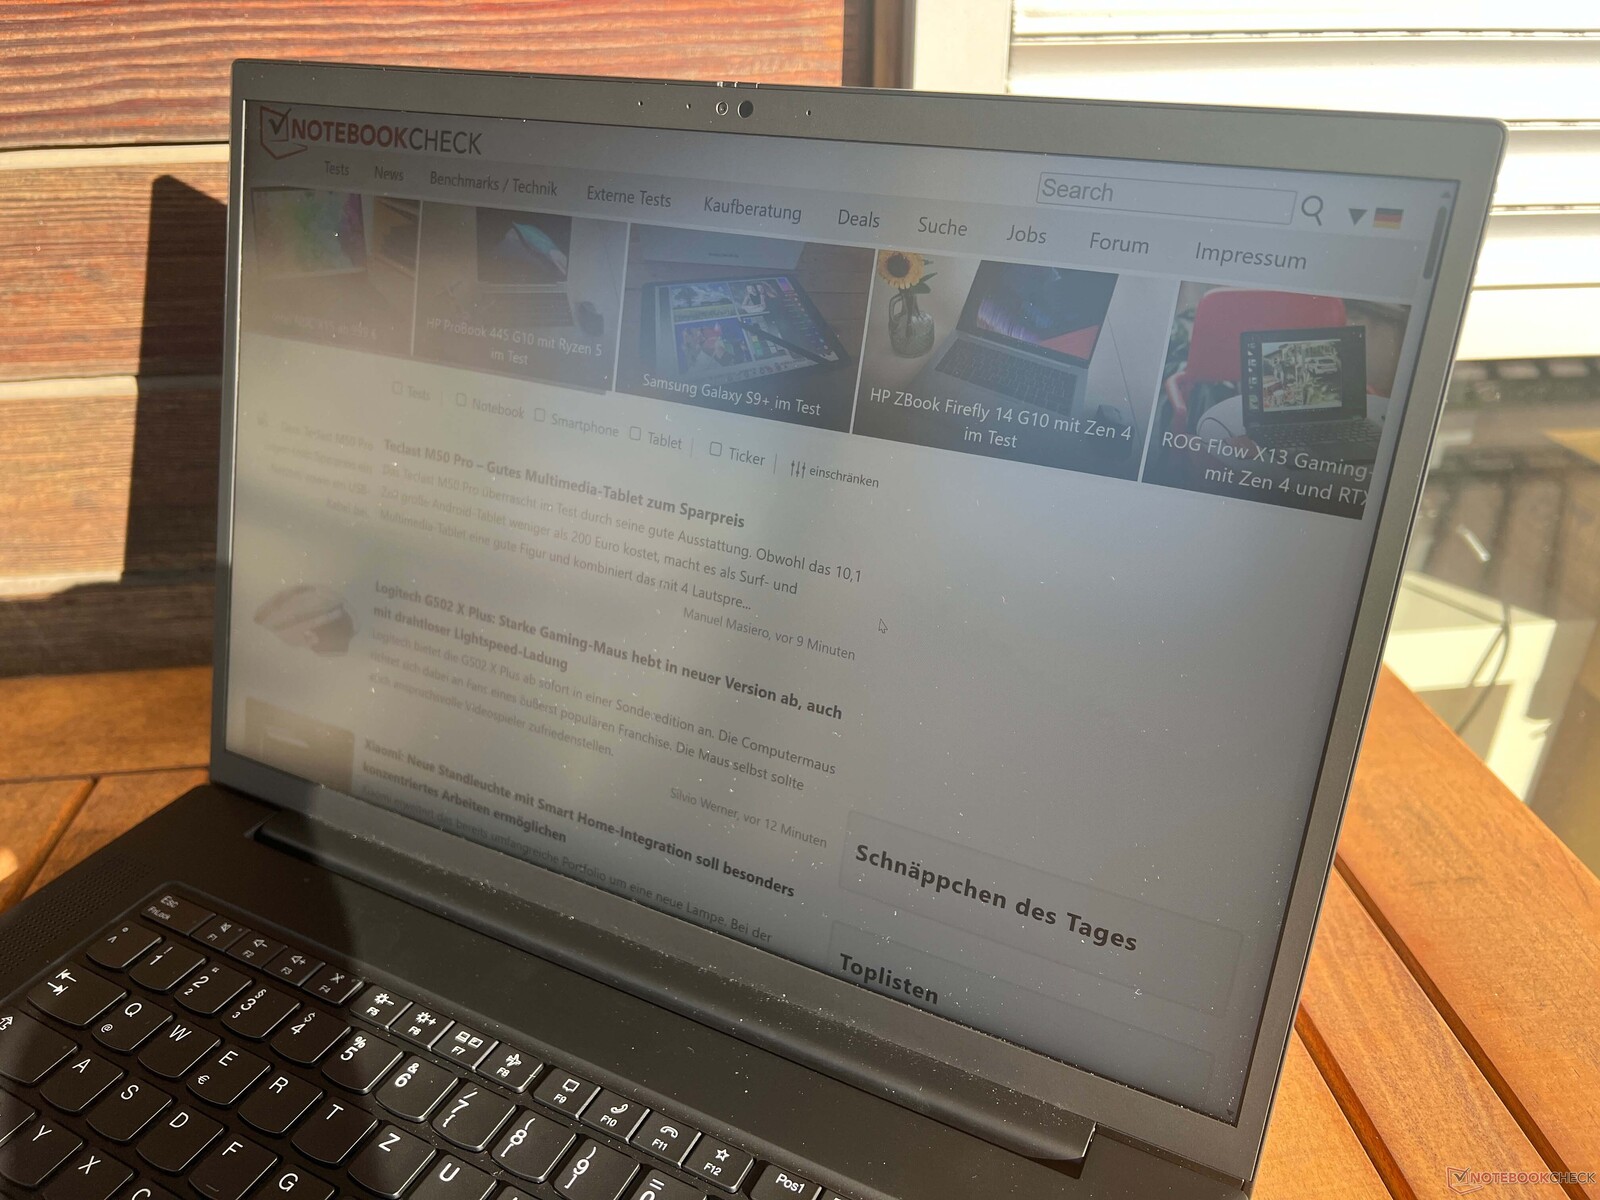
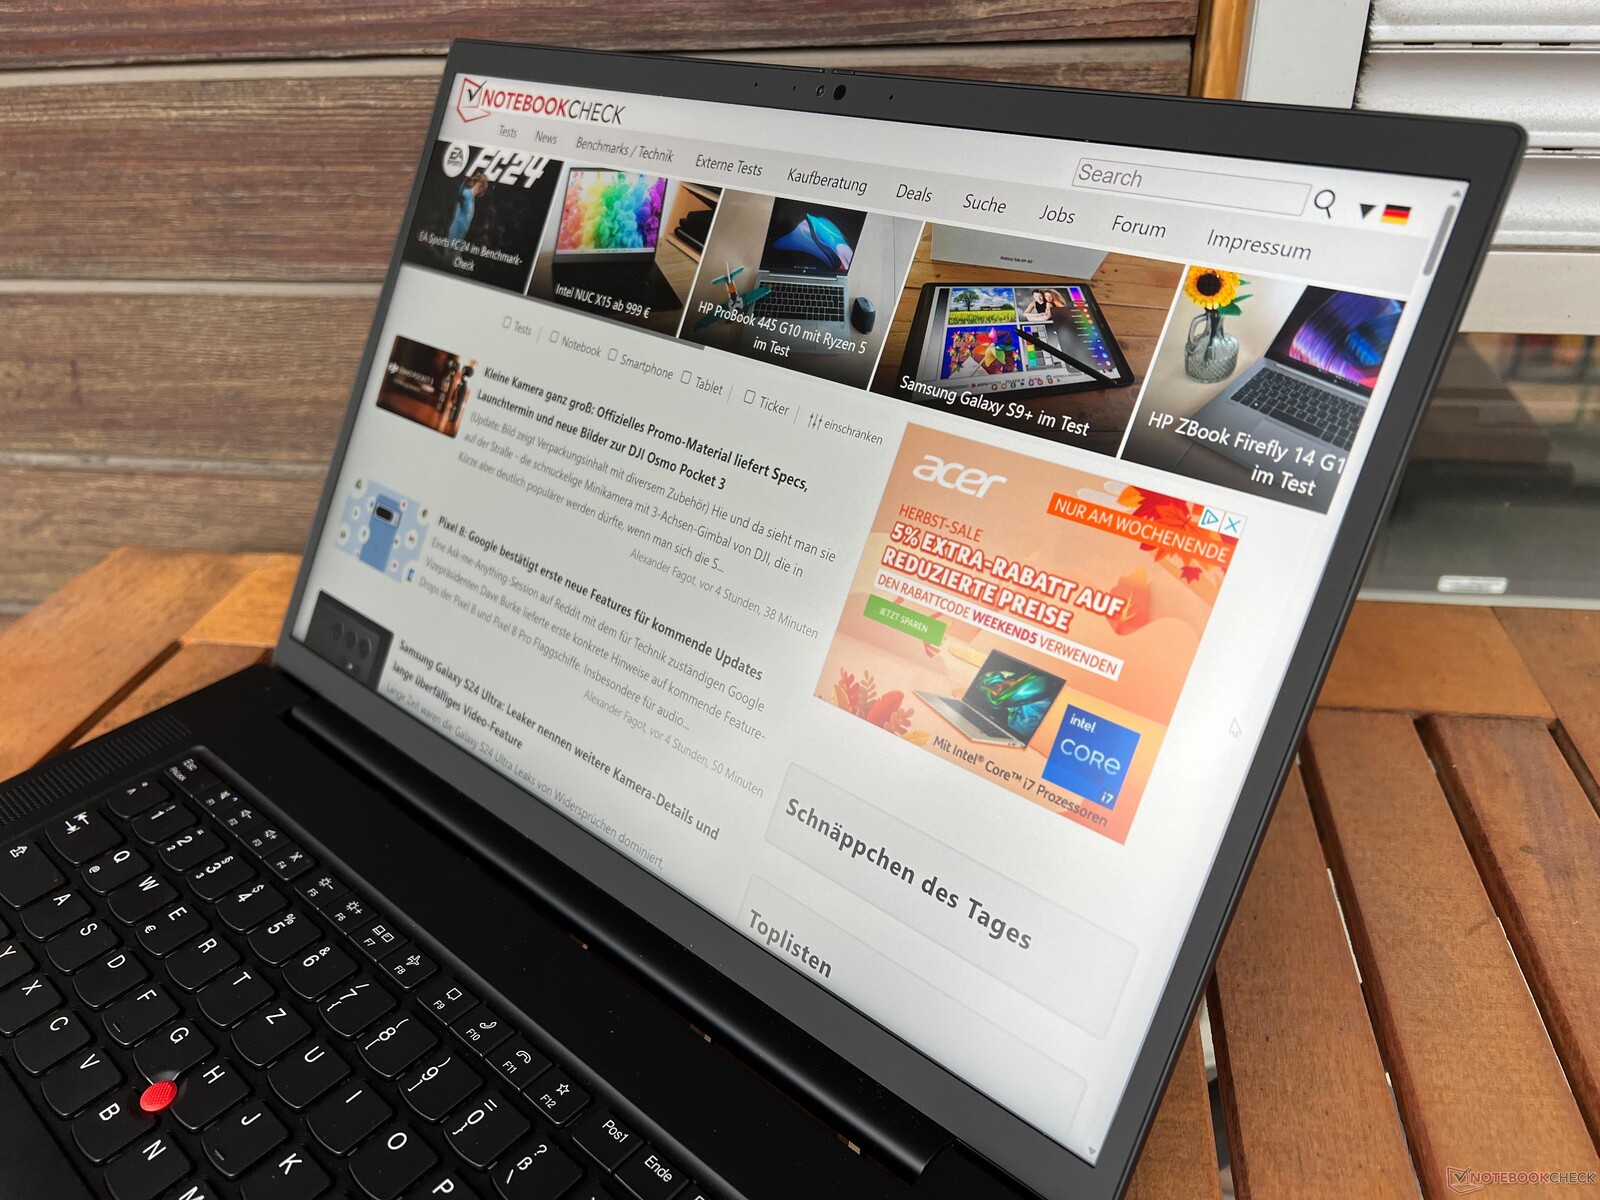
La pantalla mate es utilizable en exteriores, aunque se vuelve difícil bajo la luz directa del sol. El panel IPS ofrece una excelente estabilidad del ángulo de visión.

Rendimiento - Raptor Lake y Ada Lovelace
Condiciones de prueba
Lenovo lleva bastante tiempo sin utilizar perfiles de energía independientes en los modelos ThinkPad. Los ajustes de Smart Cooling están directamente vinculados a los perfiles de energía estándar de Windows. Para los siguientes puntos de referencia y mediciones, hemos utilizado el perfil de mejor rendimiento como configuración predeterminada.
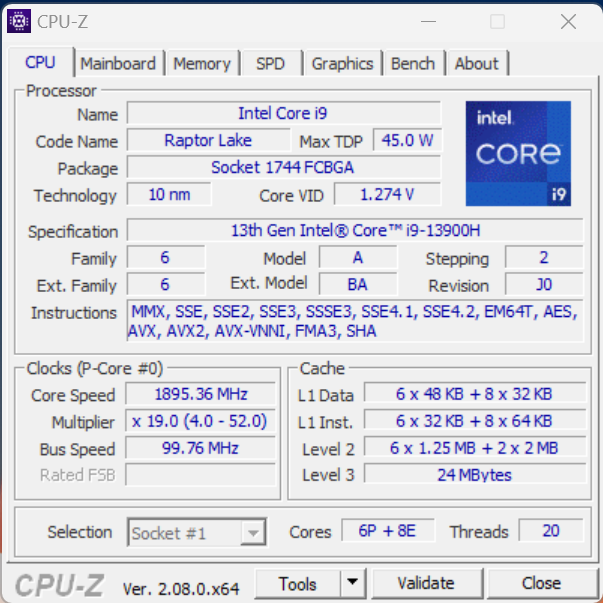
Procesador - Core i7-13900H
El Intel Core i9-13900H de la generación Raptor-Lake tiene 6 núcleos de alto rendimiento y 8 de eficiencia y puede manejar hasta 20 hilos. Tiene velocidades de reloj máximas significativamente más altas que el Core i7-13700H y soporta capacidades vPro. Aunque se produjeron cambios menores en nuestra prueba de bucle Cinebench, la CPU de nuestro ThinkPad P1 Gen 6 puede consumir hasta 96 vatios de forma temporal y aproximadamente 84 vatios de forma continua. En general, las puntuaciones de un solo núcleo son buenas, pero el rendimiento multinúcleo tiene más potencial. Es concebible que las CPU con la cámara de vapor proporcionen un mejor rendimiento. Cuando funciona con pilas, la CPU está limitada a 57 vatios de consumo máximo, lo que se traduce en un rendimiento multinúcleo aproximadamente un 25% inferior. Encontrará más pruebas de rendimiento de la CPU en nuestrasección técnica.
Cinebench R15 Multi Loop
Cinebench R23: Multi Core | Single Core
Cinebench R20: CPU (Multi Core) | CPU (Single Core)
Cinebench R15: CPU Multi 64Bit | CPU Single 64Bit
Blender: v2.79 BMW27 CPU
7-Zip 18.03: 7z b 4 | 7z b 4 -mmt1
Geekbench 5.5: Multi-Core | Single-Core
HWBOT x265 Benchmark v2.2: 4k Preset
LibreOffice : 20 Documents To PDF
R Benchmark 2.5: Overall mean
| CPU Performance rating | |
| Media de la clase Workstation | |
| Dell Precision 5000 5680 | |
| Lenovo ThinkPad P1 G6-21FV000DGE | |
| HP ZBook Studio 16 G9 62U04EA | |
| Lenovo ThinkPad X1 Extreme G5-21DE003RGE | |
| Medio Intel Core i9-13900H | |
| MSI CreatorPro Z16P B12UKST | |
| Schenker VISION 16 Pro (M23) | |
| Samsung Galaxy Book3 Ultra 16, i9-13900H RTX 4070 | |
| Cinebench R23 / Multi Core | |
| Media de la clase Workstation (14055 - 38520, n=25, últimos 2 años) | |
| Dell Precision 5000 5680 | |
| Lenovo ThinkPad P1 G6-21FV000DGE | |
| Lenovo ThinkPad X1 Extreme G5-21DE003RGE | |
| MSI CreatorPro Z16P B12UKST | |
| Medio Intel Core i9-13900H (11997 - 20385, n=28) | |
| HP ZBook Studio 16 G9 62U04EA | |
| Schenker VISION 16 Pro (M23) | |
| Samsung Galaxy Book3 Ultra 16, i9-13900H RTX 4070 | |
| Cinebench R23 / Single Core | |
| Lenovo ThinkPad P1 G6-21FV000DGE | |
| Dell Precision 5000 5680 | |
| Media de la clase Workstation (1712 - 2228, n=25, últimos 2 años) | |
| Medio Intel Core i9-13900H (1297 - 2054, n=26) | |
| Schenker VISION 16 Pro (M23) | |
| HP ZBook Studio 16 G9 62U04EA | |
| Lenovo ThinkPad X1 Extreme G5-21DE003RGE | |
| MSI CreatorPro Z16P B12UKST | |
| Samsung Galaxy Book3 Ultra 16, i9-13900H RTX 4070 | |
| Cinebench R20 / CPU (Multi Core) | |
| Media de la clase Workstation (5471 - 15043, n=25, últimos 2 años) | |
| Dell Precision 5000 5680 | |
| Lenovo ThinkPad P1 G6-21FV000DGE | |
| Lenovo ThinkPad X1 Extreme G5-21DE003RGE | |
| MSI CreatorPro Z16P B12UKST | |
| Medio Intel Core i9-13900H (4935 - 7716, n=25) | |
| HP ZBook Studio 16 G9 62U04EA | |
| Schenker VISION 16 Pro (M23) | |
| Samsung Galaxy Book3 Ultra 16, i9-13900H RTX 4070 | |
| Cinebench R20 / CPU (Single Core) | |
| Lenovo ThinkPad P1 G6-21FV000DGE | |
| Dell Precision 5000 5680 | |
| Media de la clase Workstation (671 - 857, n=25, últimos 2 años) | |
| Schenker VISION 16 Pro (M23) | |
| Medio Intel Core i9-13900H (428 - 792, n=25) | |
| HP ZBook Studio 16 G9 62U04EA | |
| Lenovo ThinkPad X1 Extreme G5-21DE003RGE | |
| MSI CreatorPro Z16P B12UKST | |
| Samsung Galaxy Book3 Ultra 16, i9-13900H RTX 4070 | |
| Cinebench R15 / CPU Multi 64Bit | |
| Media de la clase Workstation (2489 - 5810, n=25, últimos 2 años) | |
| Lenovo ThinkPad X1 Extreme G5-21DE003RGE | |
| Medio Intel Core i9-13900H (2061 - 3100, n=26) | |
| Lenovo ThinkPad P1 G6-21FV000DGE | |
| HP ZBook Studio 16 G9 62U04EA | |
| Dell Precision 5000 5680 | |
| Schenker VISION 16 Pro (M23) | |
| MSI CreatorPro Z16P B12UKST | |
| Samsung Galaxy Book3 Ultra 16, i9-13900H RTX 4070 | |
| Cinebench R15 / CPU Single 64Bit | |
| Media de la clase Workstation (191.4 - 328, n=25, últimos 2 años) | |
| Dell Precision 5000 5680 | |
| Lenovo ThinkPad P1 G6-21FV000DGE | |
| Schenker VISION 16 Pro (M23) | |
| HP ZBook Studio 16 G9 62U04EA | |
| Medio Intel Core i9-13900H (211 - 297, n=26) | |
| Lenovo ThinkPad X1 Extreme G5-21DE003RGE | |
| MSI CreatorPro Z16P B12UKST | |
| Samsung Galaxy Book3 Ultra 16, i9-13900H RTX 4070 | |
| Blender / v2.79 BMW27 CPU | |
| Samsung Galaxy Book3 Ultra 16, i9-13900H RTX 4070 | |
| Schenker VISION 16 Pro (M23) | |
| Medio Intel Core i9-13900H (166 - 268, n=24) | |
| MSI CreatorPro Z16P B12UKST | |
| Dell Precision 5000 5680 | |
| Lenovo ThinkPad P1 G6-21FV000DGE | |
| HP ZBook Studio 16 G9 62U04EA | |
| Lenovo ThinkPad X1 Extreme G5-21DE003RGE | |
| Media de la clase Workstation (91 - 261, n=25, últimos 2 años) | |
| 7-Zip 18.03 / 7z b 4 | |
| Media de la clase Workstation (54741 - 116969, n=25, últimos 2 años) | |
| Lenovo ThinkPad P1 G6-21FV000DGE | |
| Dell Precision 5000 5680 | |
| HP ZBook Studio 16 G9 62U04EA | |
| MSI CreatorPro Z16P B12UKST | |
| Medio Intel Core i9-13900H (45045 - 79032, n=25) | |
| Lenovo ThinkPad X1 Extreme G5-21DE003RGE | |
| Schenker VISION 16 Pro (M23) | |
| Samsung Galaxy Book3 Ultra 16, i9-13900H RTX 4070 | |
| 7-Zip 18.03 / 7z b 4 -mmt1 | |
| Lenovo ThinkPad P1 G6-21FV000DGE | |
| Schenker VISION 16 Pro (M23) | |
| Dell Precision 5000 5680 | |
| Media de la clase Workstation (5126 - 6960, n=25, últimos 2 años) | |
| Medio Intel Core i9-13900H (3665 - 6600, n=25) | |
| HP ZBook Studio 16 G9 62U04EA | |
| Lenovo ThinkPad X1 Extreme G5-21DE003RGE | |
| MSI CreatorPro Z16P B12UKST | |
| Samsung Galaxy Book3 Ultra 16, i9-13900H RTX 4070 | |
| Geekbench 5.5 / Multi-Core | |
| Media de la clase Workstation (11542 - 25554, n=25, últimos 2 años) | |
| Dell Precision 5000 5680 | |
| HP ZBook Studio 16 G9 62U04EA | |
| Medio Intel Core i9-13900H (9094 - 15410, n=26) | |
| MSI CreatorPro Z16P B12UKST | |
| Schenker VISION 16 Pro (M23) | |
| Lenovo ThinkPad X1 Extreme G5-21DE003RGE | |
| Lenovo ThinkPad P1 G6-21FV000DGE | |
| Samsung Galaxy Book3 Ultra 16, i9-13900H RTX 4070 | |
| Geekbench 5.5 / Single-Core | |
| Dell Precision 5000 5680 | |
| Media de la clase Workstation (1781 - 2183, n=25, últimos 2 años) | |
| Lenovo ThinkPad P1 G6-21FV000DGE | |
| Medio Intel Core i9-13900H (1140 - 2043, n=26) | |
| Schenker VISION 16 Pro (M23) | |
| HP ZBook Studio 16 G9 62U04EA | |
| Lenovo ThinkPad X1 Extreme G5-21DE003RGE | |
| MSI CreatorPro Z16P B12UKST | |
| Samsung Galaxy Book3 Ultra 16, i9-13900H RTX 4070 | |
| HWBOT x265 Benchmark v2.2 / 4k Preset | |
| Media de la clase Workstation (14.4 - 40.5, n=25, últimos 2 años) | |
| Dell Precision 5000 5680 | |
| HP ZBook Studio 16 G9 62U04EA | |
| MSI CreatorPro Z16P B12UKST | |
| Lenovo ThinkPad P1 G6-21FV000DGE | |
| Medio Intel Core i9-13900H (14.1 - 22.3, n=25) | |
| Lenovo ThinkPad X1 Extreme G5-21DE003RGE | |
| Schenker VISION 16 Pro (M23) | |
| Samsung Galaxy Book3 Ultra 16, i9-13900H RTX 4070 | |
| LibreOffice / 20 Documents To PDF | |
| Samsung Galaxy Book3 Ultra 16, i9-13900H RTX 4070 | |
| Media de la clase Workstation (37.1 - 74.7, n=25, últimos 2 años) | |
| Schenker VISION 16 Pro (M23) | |
| Medio Intel Core i9-13900H (34.4 - 82.8, n=25) | |
| Lenovo ThinkPad P1 G6-21FV000DGE | |
| HP ZBook Studio 16 G9 62U04EA | |
| Lenovo ThinkPad X1 Extreme G5-21DE003RGE | |
| Dell Precision 5000 5680 | |
| MSI CreatorPro Z16P B12UKST | |
| R Benchmark 2.5 / Overall mean | |
| Samsung Galaxy Book3 Ultra 16, i9-13900H RTX 4070 | |
| Lenovo ThinkPad X1 Extreme G5-21DE003RGE | |
| MSI CreatorPro Z16P B12UKST | |
| Medio Intel Core i9-13900H (0.4052 - 0.723, n=25) | |
| HP ZBook Studio 16 G9 62U04EA | |
| Media de la clase Workstation (0.3825 - 0.603, n=25, últimos 2 años) | |
| Schenker VISION 16 Pro (M23) | |
| Lenovo ThinkPad P1 G6-21FV000DGE | |
| Dell Precision 5000 5680 | |
* ... más pequeño es mejor
AIDA64: FP32 Ray-Trace | FPU Julia | CPU SHA3 | CPU Queen | FPU SinJulia | FPU Mandel | CPU AES | CPU ZLib | FP64 Ray-Trace | CPU PhotoWorxx
| Performance rating | |
| Media de la clase Workstation | |
| MSI CreatorPro Z16P B12UKST | |
| Dell Precision 5000 5680 | |
| Lenovo ThinkPad P1 G6-21FV000DGE | |
| Medio Intel Core i9-13900H | |
| HP ZBook Studio 16 G9 62U04EA | |
| Lenovo ThinkPad X1 Extreme G5-21DE003RGE | |
| Schenker VISION 16 Pro (M23) | |
| Samsung Galaxy Book3 Ultra 16, i9-13900H RTX 4070 | |
| AIDA64 / FP32 Ray-Trace | |
| Media de la clase Workstation (10658 - 61611, n=25, últimos 2 años) | |
| Lenovo ThinkPad P1 G6-21FV000DGE | |
| Lenovo ThinkPad X1 Extreme G5-21DE003RGE | |
| Dell Precision 5000 5680 | |
| HP ZBook Studio 16 G9 62U04EA | |
| Medio Intel Core i9-13900H (6788 - 19557, n=25) | |
| Samsung Galaxy Book3 Ultra 16, i9-13900H RTX 4070 | |
| MSI CreatorPro Z16P B12UKST | |
| Schenker VISION 16 Pro (M23) | |
| AIDA64 / FPU Julia | |
| Media de la clase Workstation (56664 - 186971, n=25, últimos 2 años) | |
| Lenovo ThinkPad P1 G6-21FV000DGE | |
| Lenovo ThinkPad X1 Extreme G5-21DE003RGE | |
| HP ZBook Studio 16 G9 62U04EA | |
| Dell Precision 5000 5680 | |
| Medio Intel Core i9-13900H (22551 - 95579, n=25) | |
| MSI CreatorPro Z16P B12UKST | |
| Schenker VISION 16 Pro (M23) | |
| Samsung Galaxy Book3 Ultra 16, i9-13900H RTX 4070 | |
| AIDA64 / CPU SHA3 | |
| Media de la clase Workstation (2608 - 8975, n=25, últimos 2 años) | |
| Lenovo ThinkPad X1 Extreme G5-21DE003RGE | |
| Lenovo ThinkPad P1 G6-21FV000DGE | |
| HP ZBook Studio 16 G9 62U04EA | |
| MSI CreatorPro Z16P B12UKST | |
| Medio Intel Core i9-13900H (2491 - 4270, n=25) | |
| Dell Precision 5000 5680 | |
| Samsung Galaxy Book3 Ultra 16, i9-13900H RTX 4070 | |
| Schenker VISION 16 Pro (M23) | |
| AIDA64 / CPU Queen | |
| Dell Precision 5000 5680 | |
| Lenovo ThinkPad P1 G6-21FV000DGE | |
| HP ZBook Studio 16 G9 62U04EA | |
| Media de la clase Workstation (60778 - 144411, n=25, últimos 2 años) | |
| Medio Intel Core i9-13900H (65121 - 120936, n=25) | |
| Lenovo ThinkPad X1 Extreme G5-21DE003RGE | |
| MSI CreatorPro Z16P B12UKST | |
| Schenker VISION 16 Pro (M23) | |
| Samsung Galaxy Book3 Ultra 16, i9-13900H RTX 4070 | |
| AIDA64 / FPU SinJulia | |
| Media de la clase Workstation (8165 - 29343, n=25, últimos 2 años) | |
| Lenovo ThinkPad P1 G6-21FV000DGE | |
| Dell Precision 5000 5680 | |
| Lenovo ThinkPad X1 Extreme G5-21DE003RGE | |
| Medio Intel Core i9-13900H (6108 - 11631, n=25) | |
| HP ZBook Studio 16 G9 62U04EA | |
| MSI CreatorPro Z16P B12UKST | |
| Schenker VISION 16 Pro (M23) | |
| Samsung Galaxy Book3 Ultra 16, i9-13900H RTX 4070 | |
| AIDA64 / FPU Mandel | |
| Media de la clase Workstation (27301 - 98153, n=25, últimos 2 años) | |
| Lenovo ThinkPad P1 G6-21FV000DGE | |
| Lenovo ThinkPad X1 Extreme G5-21DE003RGE | |
| Dell Precision 5000 5680 | |
| HP ZBook Studio 16 G9 62U04EA | |
| Medio Intel Core i9-13900H (11283 - 48474, n=25) | |
| Samsung Galaxy Book3 Ultra 16, i9-13900H RTX 4070 | |
| MSI CreatorPro Z16P B12UKST | |
| Schenker VISION 16 Pro (M23) | |
| AIDA64 / CPU AES | |
| MSI CreatorPro Z16P B12UKST | |
| Media de la clase Workstation (56077 - 187841, n=25, últimos 2 años) | |
| Medio Intel Core i9-13900H (3691 - 149377, n=25) | |
| Lenovo ThinkPad X1 Extreme G5-21DE003RGE | |
| Lenovo ThinkPad P1 G6-21FV000DGE | |
| HP ZBook Studio 16 G9 62U04EA | |
| Dell Precision 5000 5680 | |
| Schenker VISION 16 Pro (M23) | |
| Samsung Galaxy Book3 Ultra 16, i9-13900H RTX 4070 | |
| AIDA64 / CPU ZLib | |
| Media de la clase Workstation (742 - 2148, n=25, últimos 2 años) | |
| Lenovo ThinkPad P1 G6-21FV000DGE | |
| Lenovo ThinkPad X1 Extreme G5-21DE003RGE | |
| HP ZBook Studio 16 G9 62U04EA | |
| Medio Intel Core i9-13900H (789 - 1254, n=25) | |
| MSI CreatorPro Z16P B12UKST | |
| Dell Precision 5000 5680 | |
| Samsung Galaxy Book3 Ultra 16, i9-13900H RTX 4070 | |
| Schenker VISION 16 Pro (M23) | |
| AIDA64 / FP64 Ray-Trace | |
| Media de la clase Workstation (5580 - 32891, n=25, últimos 2 años) | |
| Lenovo ThinkPad P1 G6-21FV000DGE | |
| Lenovo ThinkPad X1 Extreme G5-21DE003RGE | |
| HP ZBook Studio 16 G9 62U04EA | |
| Dell Precision 5000 5680 | |
| Medio Intel Core i9-13900H (3655 - 10716, n=25) | |
| MSI CreatorPro Z16P B12UKST | |
| Schenker VISION 16 Pro (M23) | |
| Samsung Galaxy Book3 Ultra 16, i9-13900H RTX 4070 | |
| AIDA64 / CPU PhotoWorxx | |
| Media de la clase Workstation (37151 - 93684, n=25, últimos 2 años) | |
| Samsung Galaxy Book3 Ultra 16, i9-13900H RTX 4070 | |
| Dell Precision 5000 5680 | |
| Schenker VISION 16 Pro (M23) | |
| MSI CreatorPro Z16P B12UKST | |
| Medio Intel Core i9-13900H (10871 - 50488, n=25) | |
| HP ZBook Studio 16 G9 62U04EA | |
| Lenovo ThinkPad P1 G6-21FV000DGE | |
| Lenovo ThinkPad X1 Extreme G5-21DE003RGE | |
Rendimiento del sistema
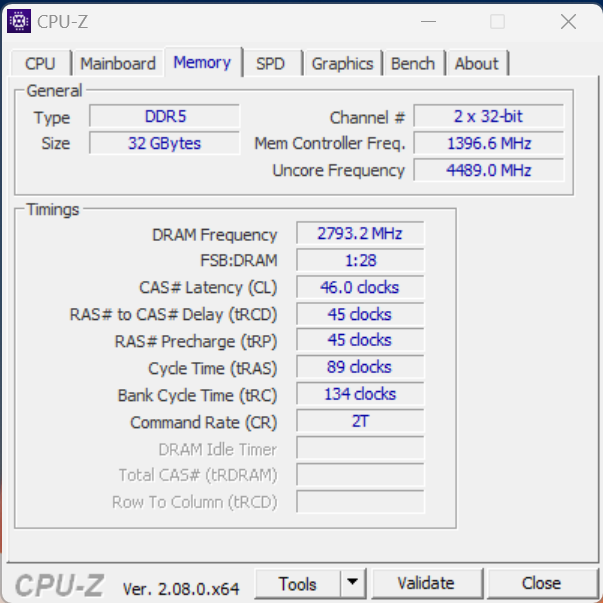
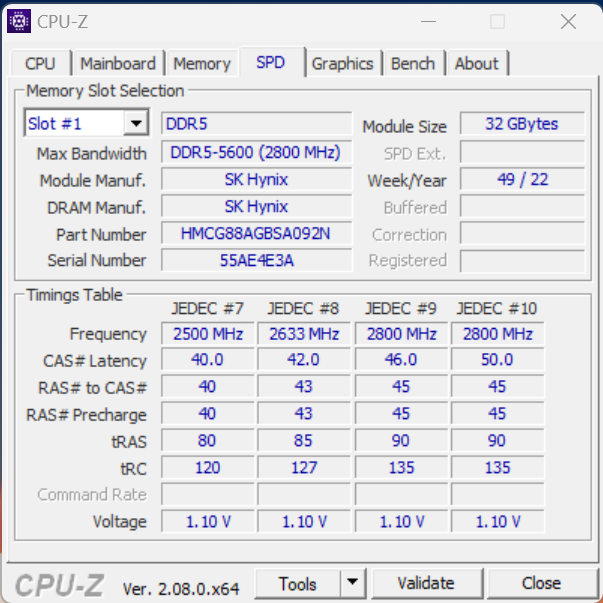
El rendimiento del sistema del ThinkPad P1 Gen 6 es sobresaliente, un hecho respaldado tanto por los puntos de referencia sintéticos como por nuestra evaluación subjetiva del rendimiento. Como era de esperar, los puntos de referencia de RAM son ligeramente inferiores debido a la configuración de un solo canal de la memoria, en comparación con los modelos con RAM de doble canal. A lo largo de la prueba, no hubo problemas de congelación o tartamudeo.
CrossMark: Overall | Productivity | Creativity | Responsiveness
| PCMark 10 / Score | |
| Dell Precision 5000 5680 | |
| Media de la clase Workstation (6436 - 10409, n=21, últimos 2 años) | |
| Lenovo ThinkPad P1 G6-21FV000DGE | |
| Medio Intel Core i9-13900H, NVIDIA RTX 2000 Ada Generation Laptop (n=1) | |
| Schenker VISION 16 Pro (M23) | |
| Lenovo ThinkPad X1 Extreme G5-21DE003RGE | |
| MSI CreatorPro Z16P B12UKST | |
| HP ZBook Studio 16 G9 62U04EA | |
| Samsung Galaxy Book3 Ultra 16, i9-13900H RTX 4070 | |
| PCMark 10 / Essentials | |
| Dell Precision 5000 5680 | |
| Lenovo ThinkPad P1 G6-21FV000DGE | |
| Medio Intel Core i9-13900H, NVIDIA RTX 2000 Ada Generation Laptop (n=1) | |
| Schenker VISION 16 Pro (M23) | |
| MSI CreatorPro Z16P B12UKST | |
| Lenovo ThinkPad X1 Extreme G5-21DE003RGE | |
| Media de la clase Workstation (9622 - 11157, n=21, últimos 2 años) | |
| HP ZBook Studio 16 G9 62U04EA | |
| Samsung Galaxy Book3 Ultra 16, i9-13900H RTX 4070 | |
| PCMark 10 / Productivity | |
| Media de la clase Workstation (8789 - 20616, n=21, últimos 2 años) | |
| Dell Precision 5000 5680 | |
| Lenovo ThinkPad P1 G6-21FV000DGE | |
| Medio Intel Core i9-13900H, NVIDIA RTX 2000 Ada Generation Laptop (n=1) | |
| Schenker VISION 16 Pro (M23) | |
| Lenovo ThinkPad X1 Extreme G5-21DE003RGE | |
| MSI CreatorPro Z16P B12UKST | |
| Samsung Galaxy Book3 Ultra 16, i9-13900H RTX 4070 | |
| HP ZBook Studio 16 G9 62U04EA | |
| PCMark 10 / Digital Content Creation | |
| Dell Precision 5000 5680 | |
| Media de la clase Workstation (7744 - 15631, n=21, últimos 2 años) | |
| Schenker VISION 16 Pro (M23) | |
| Lenovo ThinkPad P1 G6-21FV000DGE | |
| Medio Intel Core i9-13900H, NVIDIA RTX 2000 Ada Generation Laptop (n=1) | |
| Lenovo ThinkPad X1 Extreme G5-21DE003RGE | |
| MSI CreatorPro Z16P B12UKST | |
| HP ZBook Studio 16 G9 62U04EA | |
| Samsung Galaxy Book3 Ultra 16, i9-13900H RTX 4070 | |
| CrossMark / Overall | |
| MSI CreatorPro Z16P B12UKST | |
| Dell Precision 5000 5680 | |
| Media de la clase Workstation (1307 - 2267, n=24, últimos 2 años) | |
| Schenker VISION 16 Pro (M23) | |
| Lenovo ThinkPad P1 G6-21FV000DGE | |
| Medio Intel Core i9-13900H, NVIDIA RTX 2000 Ada Generation Laptop (n=1) | |
| HP ZBook Studio 16 G9 62U04EA | |
| Lenovo ThinkPad X1 Extreme G5-21DE003RGE | |
| Samsung Galaxy Book3 Ultra 16, i9-13900H RTX 4070 | |
| CrossMark / Productivity | |
| MSI CreatorPro Z16P B12UKST | |
| Schenker VISION 16 Pro (M23) | |
| Dell Precision 5000 5680 | |
| Lenovo ThinkPad P1 G6-21FV000DGE | |
| Medio Intel Core i9-13900H, NVIDIA RTX 2000 Ada Generation Laptop (n=1) | |
| Media de la clase Workstation (1130 - 2122, n=24, últimos 2 años) | |
| HP ZBook Studio 16 G9 62U04EA | |
| Lenovo ThinkPad X1 Extreme G5-21DE003RGE | |
| Samsung Galaxy Book3 Ultra 16, i9-13900H RTX 4070 | |
| CrossMark / Creativity | |
| Dell Precision 5000 5680 | |
| Media de la clase Workstation (1657 - 2725, n=24, últimos 2 años) | |
| HP ZBook Studio 16 G9 62U04EA | |
| MSI CreatorPro Z16P B12UKST | |
| Lenovo ThinkPad P1 G6-21FV000DGE | |
| Medio Intel Core i9-13900H, NVIDIA RTX 2000 Ada Generation Laptop (n=1) | |
| Schenker VISION 16 Pro (M23) | |
| Lenovo ThinkPad X1 Extreme G5-21DE003RGE | |
| Samsung Galaxy Book3 Ultra 16, i9-13900H RTX 4070 | |
| CrossMark / Responsiveness | |
| MSI CreatorPro Z16P B12UKST | |
| Schenker VISION 16 Pro (M23) | |
| Lenovo ThinkPad P1 G6-21FV000DGE | |
| Medio Intel Core i9-13900H, NVIDIA RTX 2000 Ada Generation Laptop (n=1) | |
| Media de la clase Workstation (993 - 2096, n=24, últimos 2 años) | |
| Dell Precision 5000 5680 | |
| HP ZBook Studio 16 G9 62U04EA | |
| Lenovo ThinkPad X1 Extreme G5-21DE003RGE | |
| Samsung Galaxy Book3 Ultra 16, i9-13900H RTX 4070 | |
| PCMark 10 Score | 7522 puntos | |
ayuda | ||
| AIDA64 / Memory Copy | |
| Media de la clase Workstation (56003 - 164795, n=25, últimos 2 años) | |
| Dell Precision 5000 5680 | |
| Samsung Galaxy Book3 Ultra 16, i9-13900H RTX 4070 | |
| Schenker VISION 16 Pro (M23) | |
| MSI CreatorPro Z16P B12UKST | |
| HP ZBook Studio 16 G9 62U04EA | |
| Medio Intel Core i9-13900H (37448 - 74486, n=25) | |
| Lenovo ThinkPad P1 G6-21FV000DGE | |
| Lenovo ThinkPad X1 Extreme G5-21DE003RGE | |
| AIDA64 / Memory Read | |
| Media de la clase Workstation (55795 - 121563, n=25, últimos 2 años) | |
| Schenker VISION 16 Pro (M23) | |
| Samsung Galaxy Book3 Ultra 16, i9-13900H RTX 4070 | |
| Dell Precision 5000 5680 | |
| MSI CreatorPro Z16P B12UKST | |
| HP ZBook Studio 16 G9 62U04EA | |
| Medio Intel Core i9-13900H (41599 - 75433, n=25) | |
| Lenovo ThinkPad P1 G6-21FV000DGE | |
| Lenovo ThinkPad X1 Extreme G5-21DE003RGE | |
| AIDA64 / Memory Write | |
| Samsung Galaxy Book3 Ultra 16, i9-13900H RTX 4070 | |
| Media de la clase Workstation (55663 - 214520, n=25, últimos 2 años) | |
| Dell Precision 5000 5680 | |
| Schenker VISION 16 Pro (M23) | |
| MSI CreatorPro Z16P B12UKST | |
| Medio Intel Core i9-13900H (36152 - 88505, n=25) | |
| HP ZBook Studio 16 G9 62U04EA | |
| Lenovo ThinkPad P1 G6-21FV000DGE | |
| Lenovo ThinkPad X1 Extreme G5-21DE003RGE | |
| AIDA64 / Memory Latency | |
| Media de la clase Workstation (84.5 - 165.2, n=25, últimos 2 años) | |
| Samsung Galaxy Book3 Ultra 16, i9-13900H RTX 4070 | |
| MSI CreatorPro Z16P B12UKST | |
| Dell Precision 5000 5680 | |
| HP ZBook Studio 16 G9 62U04EA | |
| Medio Intel Core i9-13900H (75.8 - 102.3, n=25) | |
| Lenovo ThinkPad X1 Extreme G5-21DE003RGE | |
| Schenker VISION 16 Pro (M23) | |
| Lenovo ThinkPad P1 G6-21FV000DGE | |
* ... más pequeño es mejor
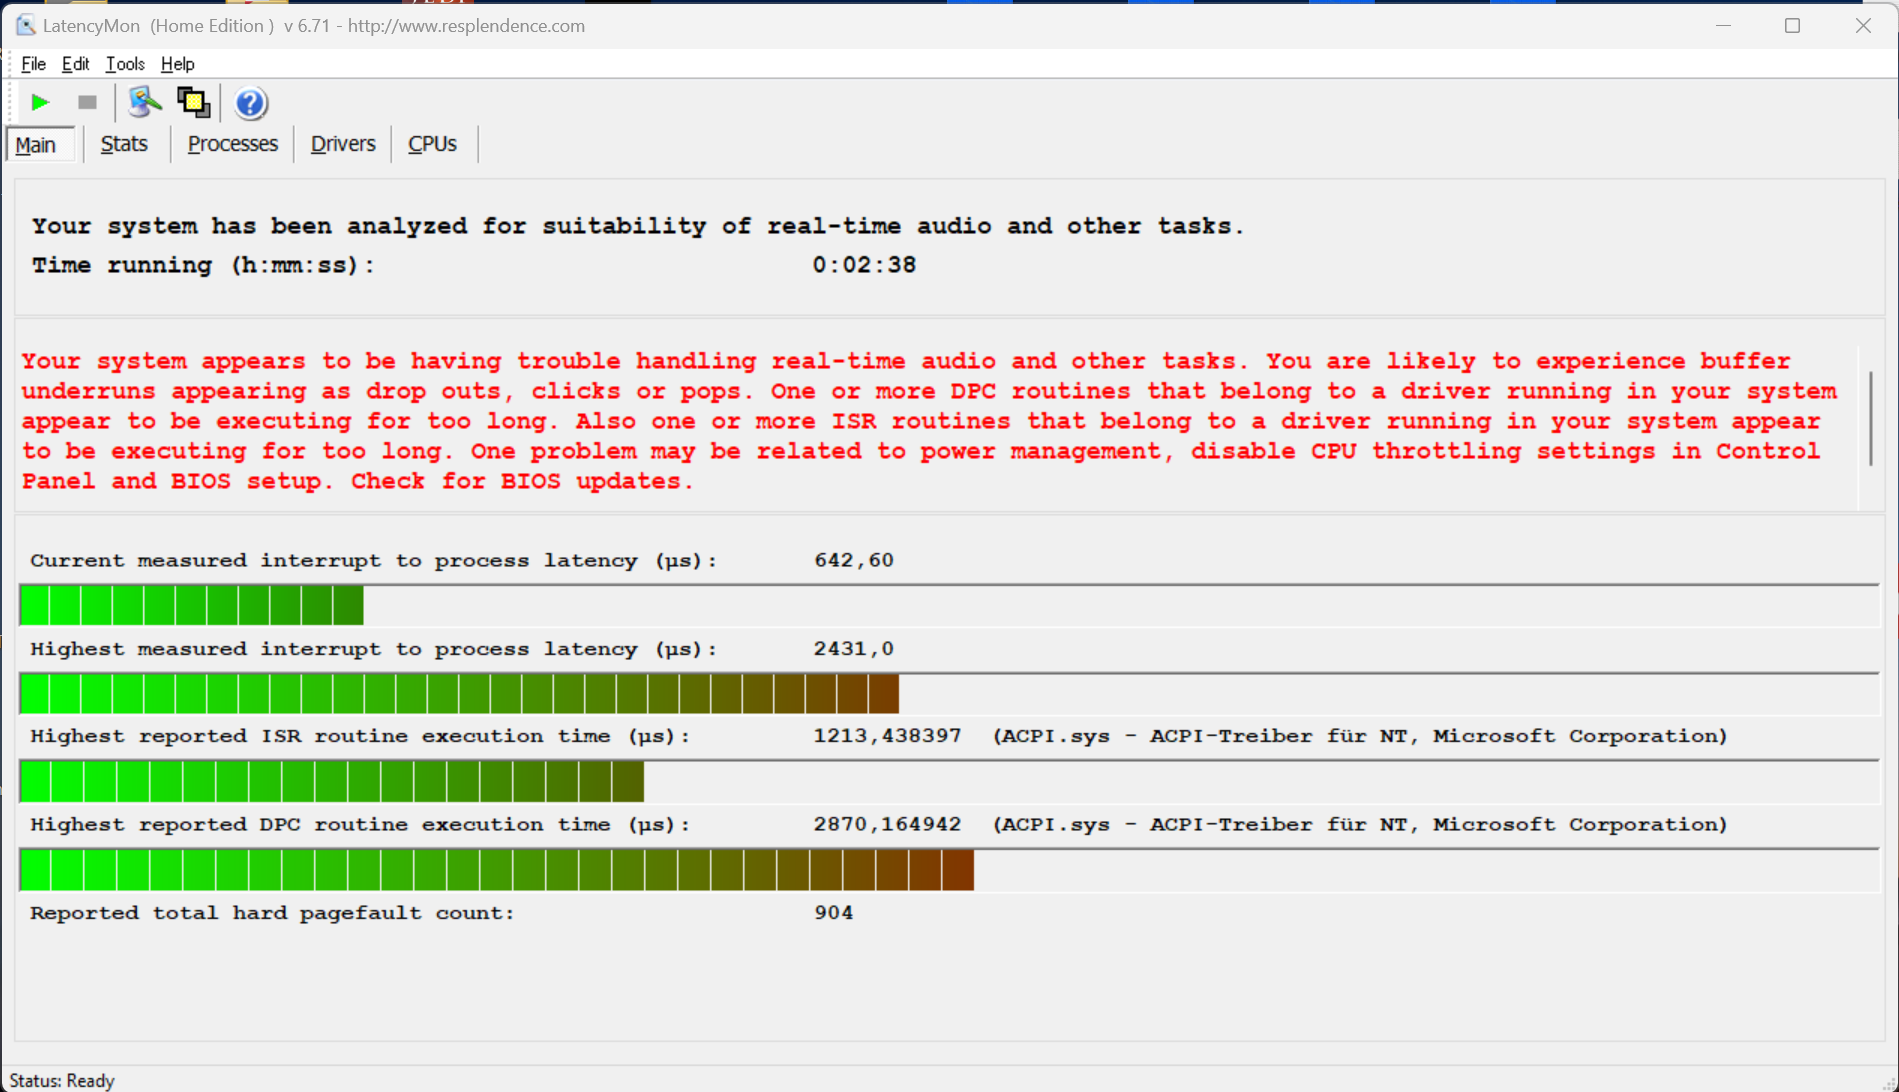
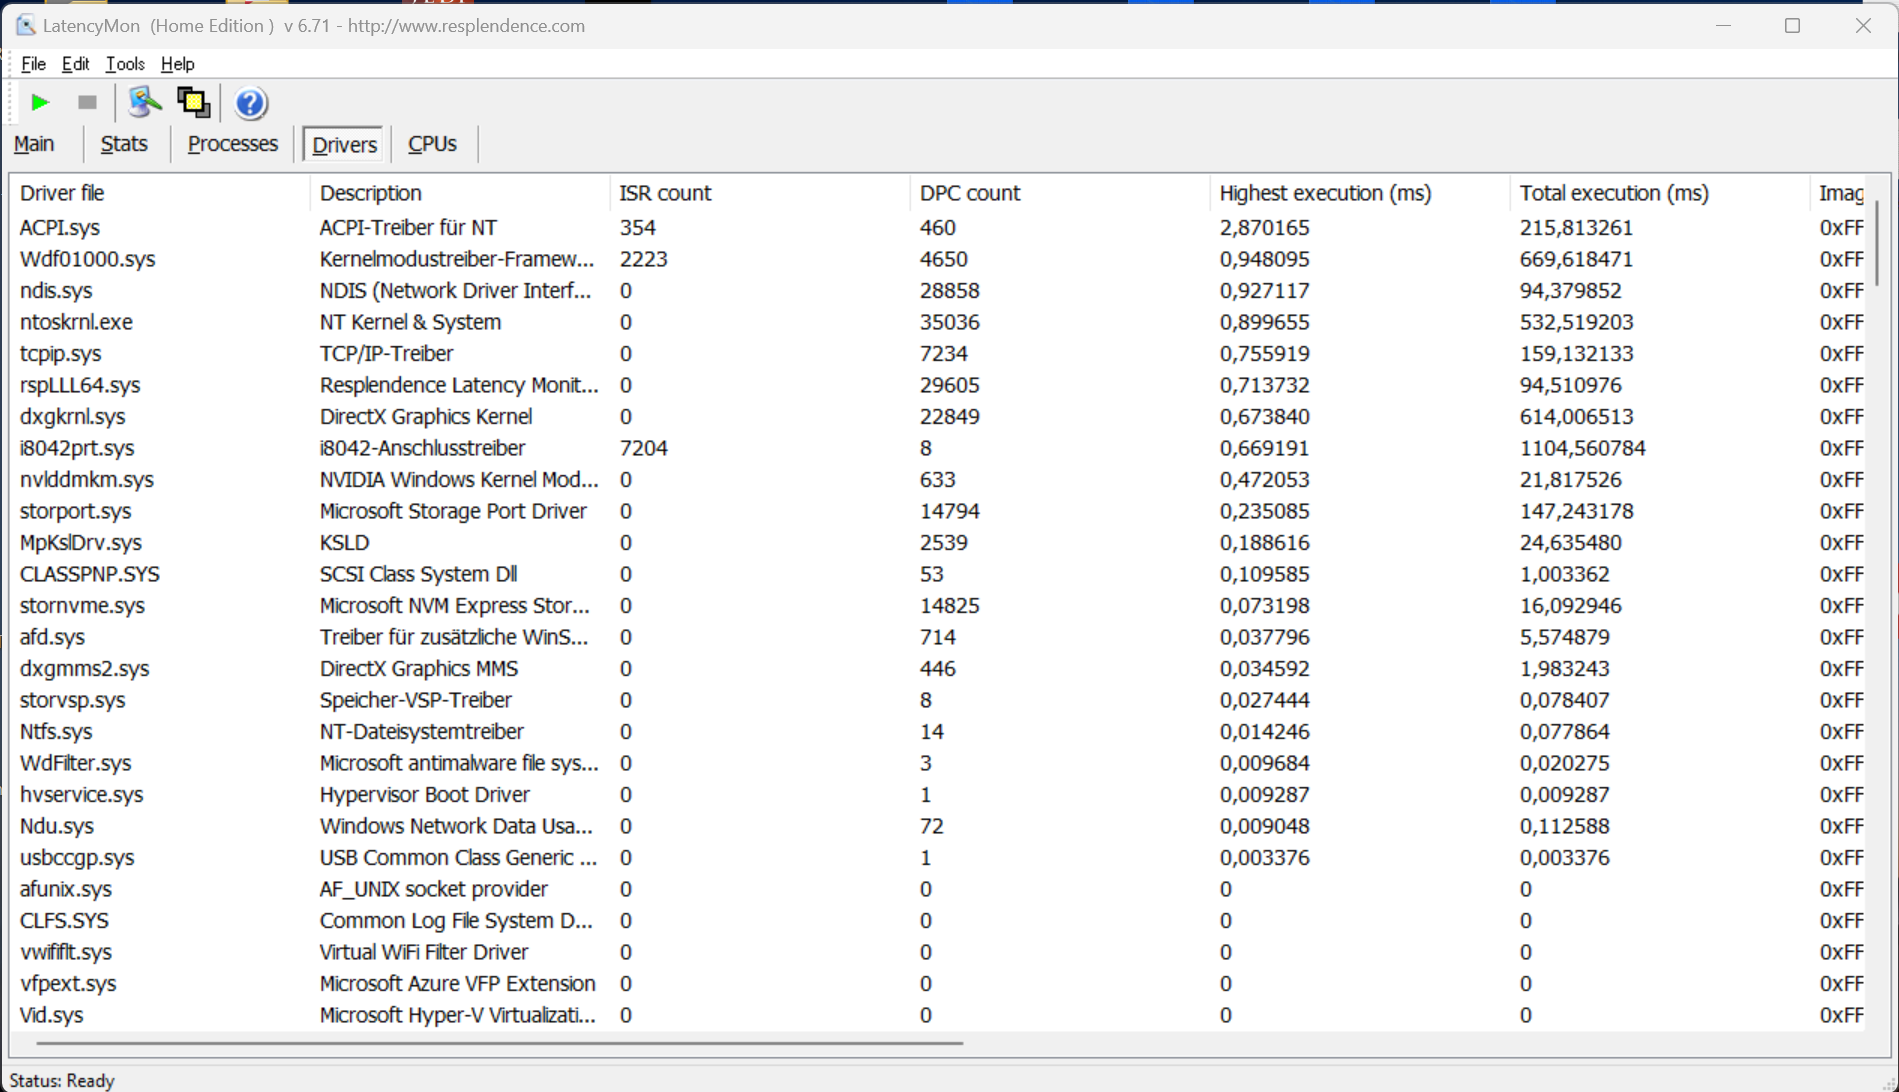
Latencia del CPD
Nuestro dispositivo de prueba mostró dificultades en las aplicaciones de audio en tiempo real con la versión actual de la BIOS (1.14) en nuestra prueba de latencia estandarizada, que incluía navegación web, streaming 4K de YouTube y carga de la CPU. Durante la reproducción de vídeo, sin embargo, no se perdieron fotogramas.
| DPC Latencies / LatencyMon - interrupt to process latency (max), Web, Youtube, Prime95 | |
| Samsung Galaxy Book3 Ultra 16, i9-13900H RTX 4070 | |
| Lenovo ThinkPad P1 G6-21FV000DGE | |
| Dell Precision 5000 5680 | |
| Lenovo ThinkPad X1 Extreme G5-21DE003RGE | |
| HP ZBook Studio 16 G9 62U04EA | |
| Schenker VISION 16 Pro (M23) | |
| MSI CreatorPro Z16P B12UKST | |
* ... más pequeño es mejor
Dispositivos de almacenamiento
Las configuraciones P1 G6 con refrigeración convencional disponen de dos ranuras PCIe 4.0 rápidas. Nuestro dispositivo de pruebas está equipado con el SK Hynix PC711 de 1 TB, que proporciona 897 GB de RAM libre tras la primera configuración. La unidad SSD PCIe 4.0 tiene unas tasas de transferencia excepcionales, alcanzando más de 7 GB/s en el rendimiento máximo. Lenovo también añade una placa metálica a la SSD para proporcionar un rendimiento consistente incluso bajo un uso constante. Hay más puntos de referencia de SSD accesibles aquí.

* ... más pequeño es mejor
Continuous power read: DiskSpd Read Loop, Queue Depth 8
Tarjeta gráfica - RTX 2000 Ada
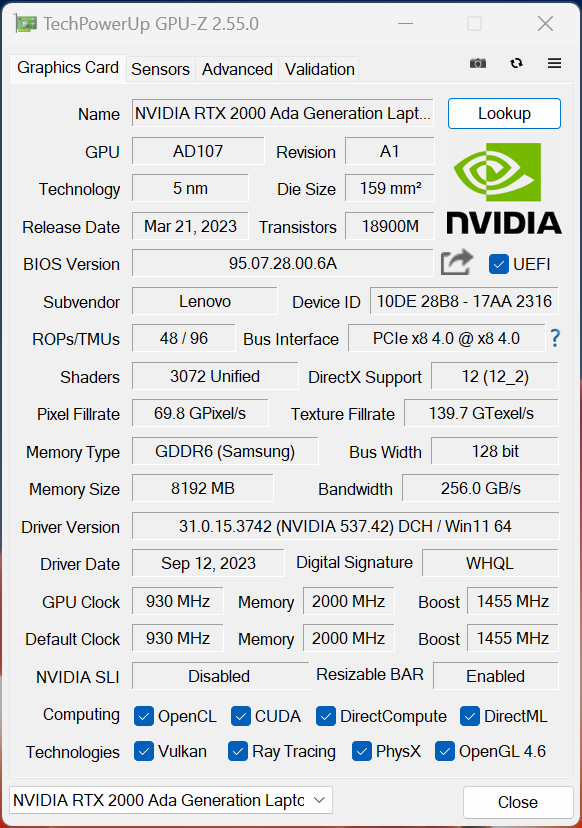
Lenovo incluye ahora las nuevas GPU Ada Lovelace de Nvidia. Además de los modelos GeForce Portátil RTX 4060, Portátil RTX 4080y Portátil RTX 4090 (cada uno con una variante de 80 vatios, según consta en la hoja de especificaciones), también ofrece nuevos modelos profesionales como la RTX 1000 Ada (65 vatios), RTX 2000 Ada (65 vatios), RTX 3500 Ada, RTX 4000 Aday el buque insignia RTX 5000 Ada (80 vatios TGP).
Sorprendentemente, la RTX 2000 Ada de nuestra muestra de revisión se basa en el portátil GeForce RTX 4060, y Lenovo ha optado por una refrigeración convencional. Como resultado, funciona a "sólo" 65 vatios (incluidos 15 vatios de Dynamic Boost). En las pruebas 3DMark, la RTX 2000 Ada supera en algunos puntos porcentuales a la GeForce RTX 4060 del portátil ROG Flow Z13 de Asus, donde la GPU también puede consumir 65 vatios (incluidos 15 vatios de Dynamic Boost). En términos de rendimiento puro, la GPU representa un avance significativo, superando a la antigua RTX A3000 y a la RTX 3060 del anterior portátil ThinkPad X1 Extreme. Además, la ventaja sobre la antigua RTX A2000 es de casi el 70%.
En las pruebas de rendimiento profesionales, la RTX 2000 Ada supera sistemáticamente a la antigua
RTX A3000y, a menudo, deja atrás a la versión de 50 vatios de la RTX 3000 Ada en el más compacto Dell Precision 5480.El rendimiento constante de la GPU incluso en condiciones de estrés sostenido es una gran ventaja. Cuando se alimenta con una batería, la RTX 2000 Ada está limitada a un uso máximo de 45 vatios, lo que se traduce en un rendimiento gráfico aproximadamente un 15% inferior (7.107 puntos en Time Spy Graphics). Aquí encontrará más pruebas de rendimiento de la GPU.
| 3DMark 06 Standard Score | 53707 puntos | |
| 3DMark Vantage P Result | 37844 puntos | |
| 3DMark 11 Performance | 27558 puntos | |
| 3DMark Fire Strike Score | 19987 puntos | |
| 3DMark Time Spy Score | 8849 puntos | |
ayuda | ||
| Geekbench 6.7 - GPU OpenCL | |
| HP ZBook Fury 16 G10 | |
| Dell Precision 5000 5680 | |
| Dell Precision 5480 | |
| Lenovo ThinkPad P1 G6-21FV000DGE | |
| Blender / v3.3 Classroom OPTIX/RTX | |
| HP ZBook Studio 16 G9 62U04EA | |
| Lenovo ThinkPad X1 Extreme G5-21DE003RGE | |
| MSI CreatorPro Z16P B12UKST | |
| Lenovo ThinkPad P1 G6-21FV000DGE | |
| Medio NVIDIA RTX 2000 Ada Generation Laptop (25 - 31, n=4) | |
| Samsung Galaxy Book3 Ultra 16, i9-13900H RTX 4070 | |
| Media de la clase Workstation (10 - 95, n=19, últimos 2 años) | |
| Schenker VISION 16 Pro (M23) | |
| Dell Precision 5000 5680 | |
| Blender / v3.3 Classroom CUDA | |
| HP ZBook Studio 16 G9 62U04EA | |
| Medio NVIDIA RTX 2000 Ada Generation Laptop (51 - 155, n=4) | |
| Lenovo ThinkPad X1 Extreme G5-21DE003RGE | |
| MSI CreatorPro Z16P B12UKST | |
| Lenovo ThinkPad P1 G6-21FV000DGE | |
| Samsung Galaxy Book3 Ultra 16, i9-13900H RTX 4070 | |
| Media de la clase Workstation (16 - 142, n=19, últimos 2 años) | |
| Schenker VISION 16 Pro (M23) | |
| Dell Precision 5000 5680 | |
| Blender / v3.3 Classroom CPU | |
| Samsung Galaxy Book3 Ultra 16, i9-13900H RTX 4070 | |
| Schenker VISION 16 Pro (M23) | |
| Dell Precision 5000 5680 | |
| MSI CreatorPro Z16P B12UKST | |
| HP ZBook Studio 16 G9 62U04EA | |
| Lenovo ThinkPad P1 G6-21FV000DGE | |
| Lenovo ThinkPad X1 Extreme G5-21DE003RGE | |
| Medio NVIDIA RTX 2000 Ada Generation Laptop (291 - 347, n=4) | |
| Media de la clase Workstation (148 - 464, n=25, últimos 2 años) | |
* ... más pequeño es mejor
Rendimiento en juegos
No encontramos ningún problema con el controlador profesional durante nuestros benchmarks de juegos, y el rendimiento se alinea con el de un GeForce Portátil RTX 4060 con tasas de TGP comparables. En consecuencia, juegos actuales como Star Wars Jedi Survivor, Assassins' Creed Mirage o Cyberpunk pueden jugarse sin problemas con los ajustes máximos y una resolución de 1080p. Para obtener una resolución WQHD nativa, es posible que los usuarios tengan que recurrir a métodos de reescalado como el DLSS de Nvidia. Es importante destacar que el rendimiento se mantiene estable incluso durante sesiones de juego prolongadas.
| Far Cry 6 | |
| 1920x1080 High Graphics Quality AA:T | |
| Lenovo ThinkPad P1 G6-21FV000DGE | |
| Medio NVIDIA RTX 2000 Ada Generation Laptop (n=1) | |
| Media de la clase Workstation (n=1últimos 2 años) | |
| 1920x1080 Ultra Graphics Quality + HD Textures AA:T | |
| Lenovo ThinkPad P1 G6-21FV000DGE | |
| Medio NVIDIA RTX 2000 Ada Generation Laptop (n=1) | |
| Star Wars Jedi Survivor | |
| 1920x1080 High Preset | |
| Schenker VISION 16 Pro (M23) | |
| Lenovo ThinkPad P1 G6-21FV000DGE | |
| Medio NVIDIA RTX 2000 Ada Generation Laptop (n=1) | |
| 1920x1080 Epic Preset | |
| Schenker VISION 16 Pro (M23) | |
| Lenovo ThinkPad P1 G6-21FV000DGE | |
| Medio NVIDIA RTX 2000 Ada Generation Laptop (n=1) | |
| Hogwarts Legacy | |
| 1920x1080 High Preset AA:High T | |
| Lenovo ThinkPad P1 G6-21FV000DGE | |
| Medio NVIDIA RTX 2000 Ada Generation Laptop (n=1) | |
| Samsung Galaxy Book3 Ultra 16, i9-13900H RTX 4070 | |
| 1920x1080 Ultra Preset AA:High T | |
| Lenovo ThinkPad P1 G6-21FV000DGE | |
| Medio NVIDIA RTX 2000 Ada Generation Laptop (n=1) | |
| Samsung Galaxy Book3 Ultra 16, i9-13900H RTX 4070 | |
| F1 23 | |
| 1920x1080 High Preset AA:T AF:16x | |
| Medio NVIDIA RTX 2000 Ada Generation Laptop (142.1 - 147, n=2) | |
| Lenovo ThinkPad P1 G6-21FV000DGE | |
| Media de la clase Workstation (n=1últimos 2 años) | |
| 1920x1080 Ultra High Preset AA:T AF:16x | |
| Medio NVIDIA RTX 2000 Ada Generation Laptop (44.4 - 49.2, n=2) | |
| Lenovo ThinkPad P1 G6-21FV000DGE | |
| Media de la clase Workstation (n=1últimos 2 años) | |
Witcher 3 FPS chart
| bajo | medio | alto | ultra | QHD | |
|---|---|---|---|---|---|
| GTA V (2015) | 173 | 101.6 | 74.6 | ||
| The Witcher 3 (2015) | 390 | 261 | 164 | 79.6 | 65 |
| Dota 2 Reborn (2015) | 178.4 | 153.1 | 143.9 | 133.4 | |
| Final Fantasy XV Benchmark (2018) | 111.2 | 83.5 | 63.7 | ||
| X-Plane 11.11 (2018) | 149.2 | 131.6 | 108.9 | ||
| Far Cry 5 (2018) | 175 | 130 | 120 | 113 | 81 |
| Strange Brigade (2018) | 459 | 228 | 182.5 | 158.2 | 107.5 |
| F1 2021 (2021) | 353 | 230 | 186.6 | 99.2 | 74.9 |
| Far Cry 6 (2021) | 157 | 121 | 104 | 87 | 63 |
| Cyberpunk 2077 1.6 (2022) | 101 | 81 | 72 | 65 | 41 |
| F1 22 (2022) | 213 | 193.2 | 138.5 | 52.8 | 34.2 |
| Hogwarts Legacy (2023) | 101 | 80 | 64 | 53 | 38 |
| Star Wars Jedi Survivor (2023) | 49 | 45 | 42 | 40 | 27 |
| F1 23 (2023) | 202 | 192.1 | 142.1 | 44.4 | 27.6 |
| Assassin's Creed Mirage (2023) | 113 | 103 | 97 | 76 | 58 |
Emisiones: el ThinkPad suele permanecer silencioso en el uso diario
Ruido del sistema
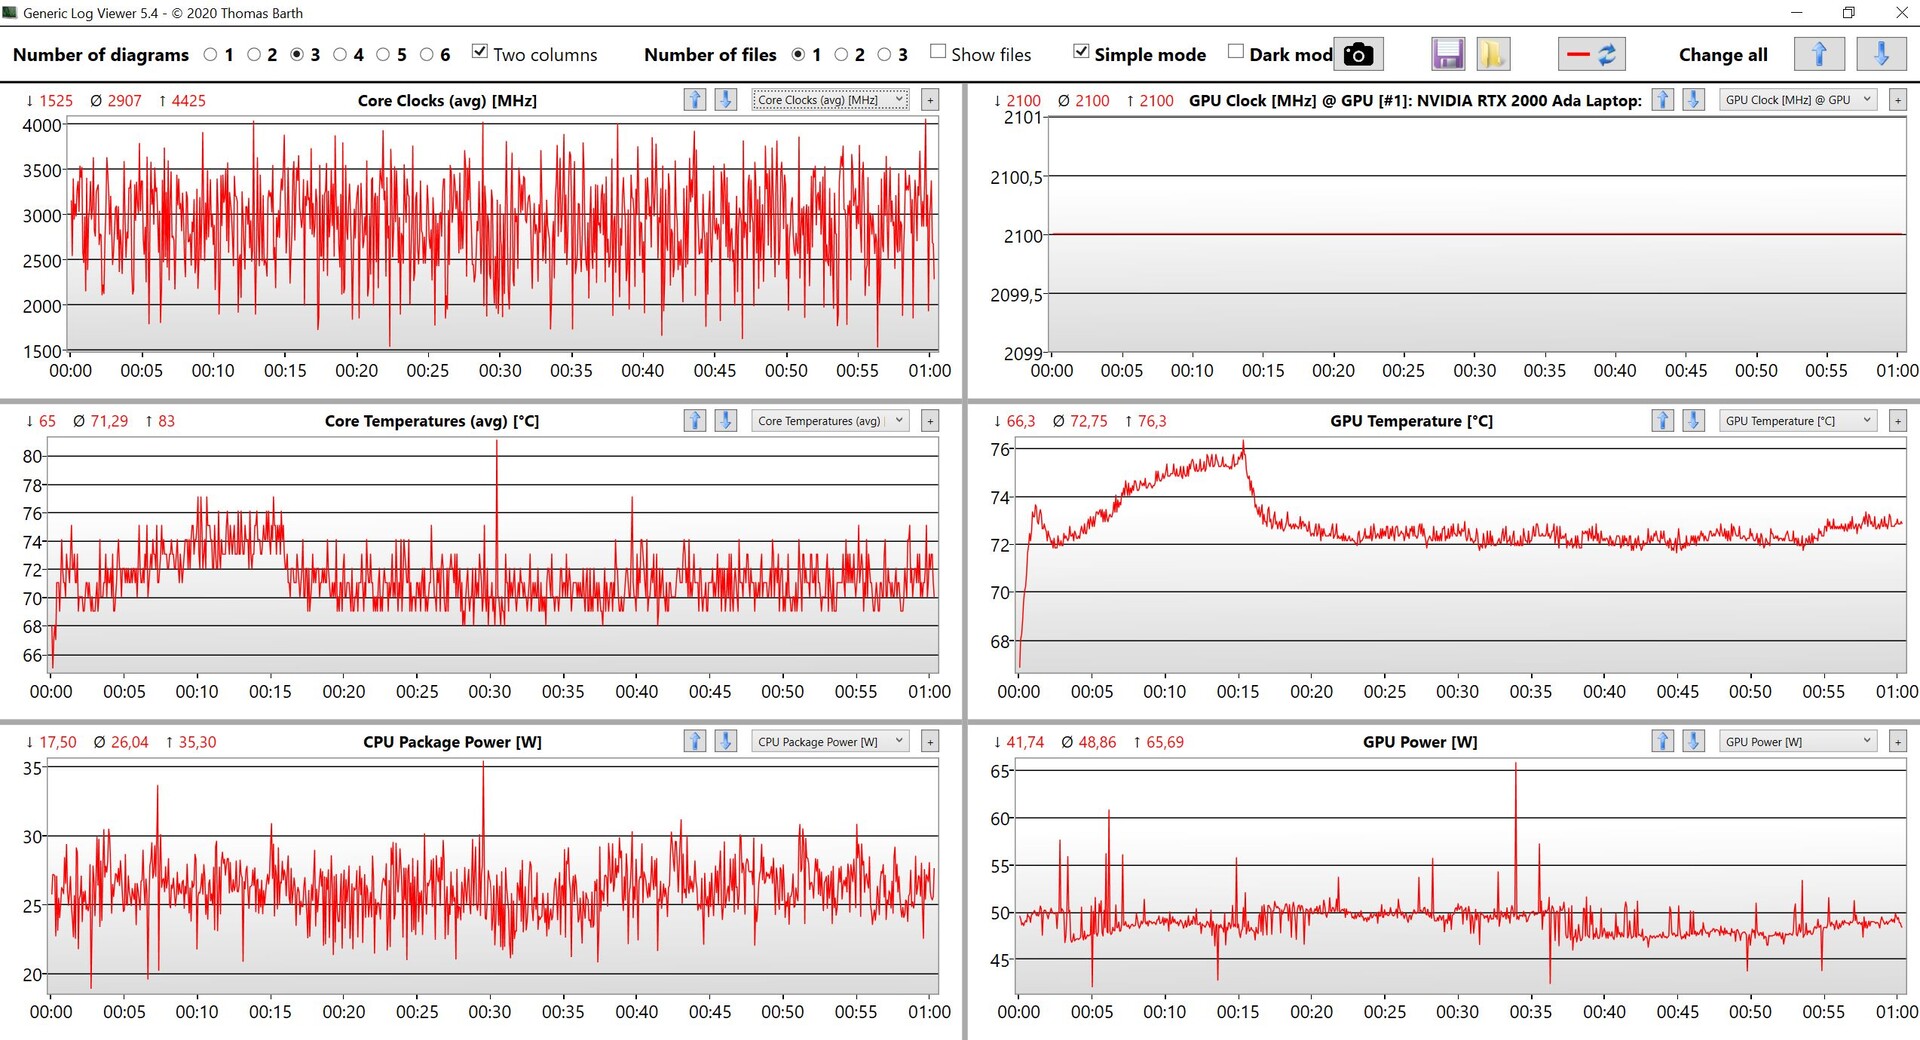
Durante las tareas básicas, los dos ventiladores del ThinkPad suelen permanecer completamente inactivos. Sólo se hacen audibles cuando se activa el procesador o la tarjeta gráfica dedicada. Cabe destacar que, cuando se activan, los ventiladores funcionan a alta velocidad de forma instantánea sin una acumulación gradual. En escenarios de juego, medimos niveles de ruido que oscilaban aproximadamente entre 41 y 48 dB(A), siendo 48 dB(A) el volumen máximo de los ventiladores durante las pruebas de estrés. En los dos modos de rendimiento más eficientes, el nivel de ruido alcanza un máximo de 40,7 dB(A). Cabe destacar que no se detectaron otros ruidos electrónicos en nuestro dispositivo de prueba.
Ruido
| Ocioso |
| 24.5 / 24.5 / 24.5 dB(A) |
| Carga |
| 48 / 48 dB(A) |
 | ||
30 dB silencioso 40 dB(A) audible 50 dB(A) ruidosamente alto |
||
min: | ||
| Lenovo ThinkPad P1 G6-21FV000DGE RTX 2000 Ada Generation Laptop, i9-13900H, SK Hynix PC711 1TB HFS001TDE9X084N | Dell Precision 5000 5680 RTX 5000 Ada Generation Laptop, i9-13900H, 2x SK hynix PC801 HFS512GEJ9X101N RAID 0 | Samsung Galaxy Book3 Ultra 16, i9-13900H RTX 4070 GeForce RTX 4070 Laptop GPU, i9-13900H, Samsung PM9A1 MZVL21T0HCLR | HP ZBook Studio 16 G9 62U04EA RTX A2000 Laptop GPU, i7-12800H, Micron 3400 1TB MTFDKBA1T0TFH | MSI CreatorPro Z16P B12UKST RTX A3000 Laptop GPU, i7-12700H, Samsung PM9A1 MZVL21T0HCLR | Schenker VISION 16 Pro (M23) GeForce RTX 4070 Laptop GPU, i7-13700H, Samsung 990 Pro 1 TB | Lenovo ThinkPad X1 Extreme G5-21DE003RGE GeForce RTX 3060 Laptop GPU, i7-12700H, Micron 3400 1TB MTFDKBA1T0TFH | |
|---|---|---|---|---|---|---|---|
| Noise | 2% | -4% | -2% | -4% | -13% | 3% | |
| apagado / medio ambiente * (dB) | 24.5 | 22.8 7% | 25.2 -3% | 24 2% | 24.1 2% | 25.9 -6% | 23.2 5% |
| Idle Minimum * (dB) | 24.5 | 23 6% | 25.2 -3% | 24 2% | 27.1 -11% | 25.9 -6% | 23.2 5% |
| Idle Average * (dB) | 24.5 | 23 6% | 25.2 -3% | 27.7 -13% | 27.1 -11% | 25.9 -6% | 23.2 5% |
| Idle Maximum * (dB) | 24.5 | 23 6% | 31.3 -28% | 27.7 -13% | 27.1 -11% | 32 -31% | 23.2 5% |
| Load Average * (dB) | 48 | 37.2 22% | 38.8 19% | 39.8 17% | 42.9 11% | 47.2 2% | 45.5 5% |
| Witcher 3 ultra * (dB) | 40.7 | 51 -25% | 44.3 -9% | 44 -8% | 53.1 -30% | 45.5 -12% | |
| Load Maximum * (dB) | 48 | 51 -6% | 51.2 -7% | 47.7 1% | 47 2% | 53.1 -11% | 45.5 5% |
* ... más pequeño es mejor
Temperatura
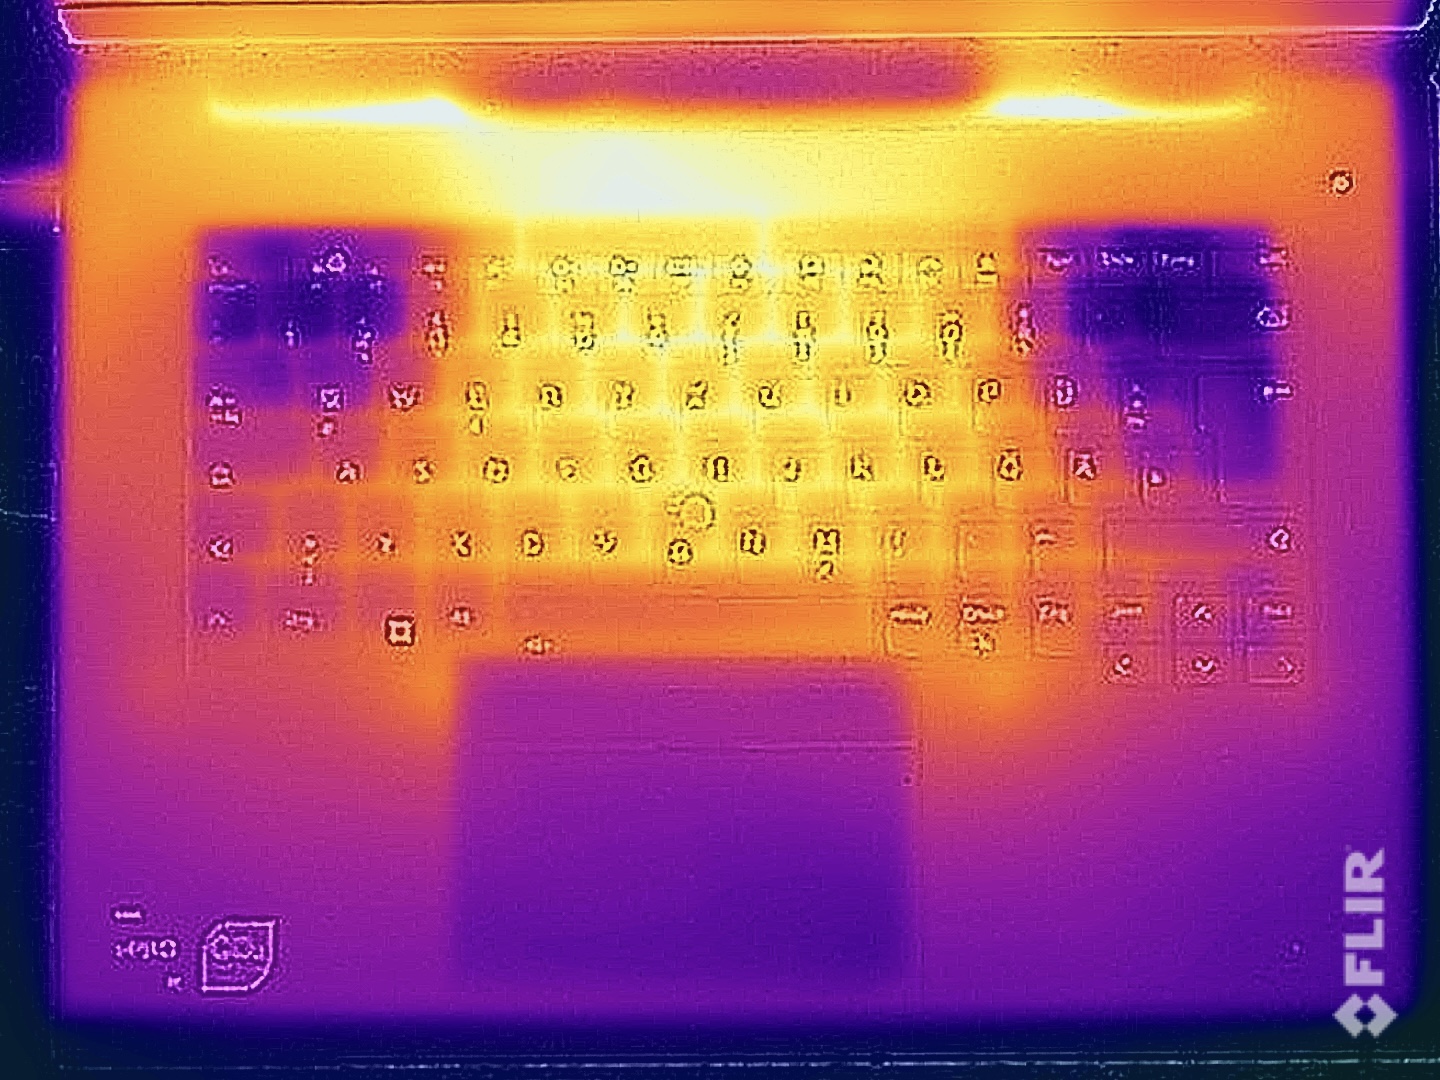
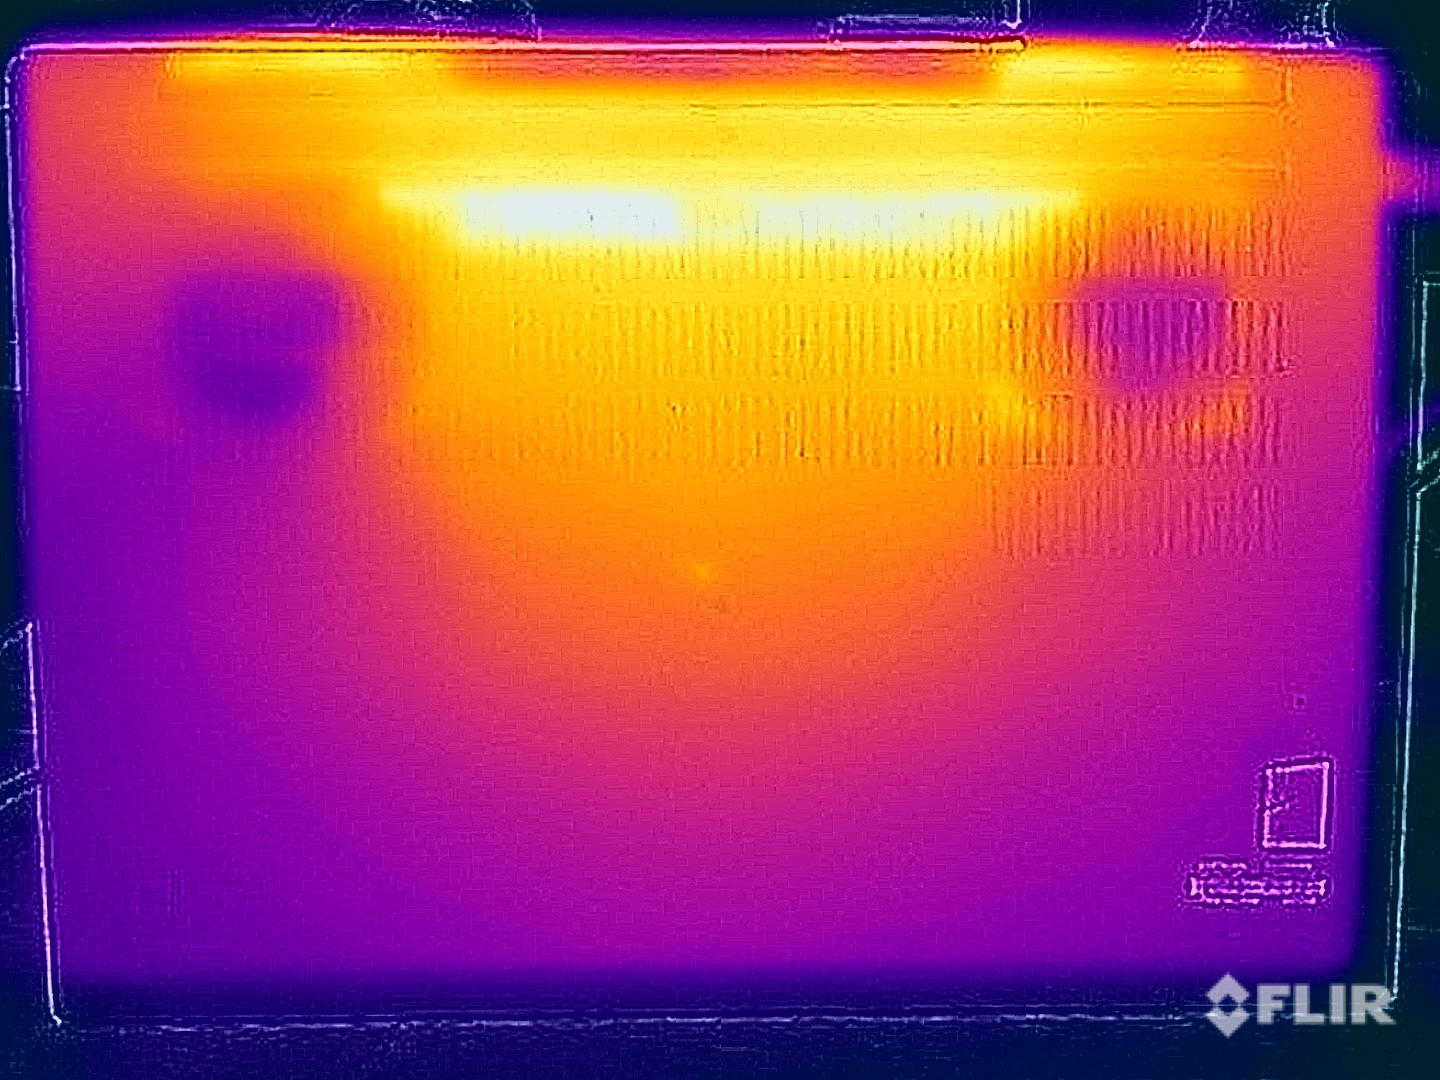
Las temperaturas de la superficie permanecen completamente seguras durante tareas sencillas, y la carcasa apenas se calienta. Similar al modelo anteriorbajo una carga pesada, las temperaturas superan los 50°C en la parte inferior. Es aconsejable no colocar el dispositivo sobre los muslos durante esos periodos, aunque dado su tamaño, este escenario es poco probable. La zona del teclado también puede alcanzar temperaturas de hasta 47 °C, aunque registramos temperaturas incluso superiores en el modelo predecesor. Teclear bajo carga (o mientras se juega) puede provocar el calentamiento de los dedos, pero no hay molestias significativas.
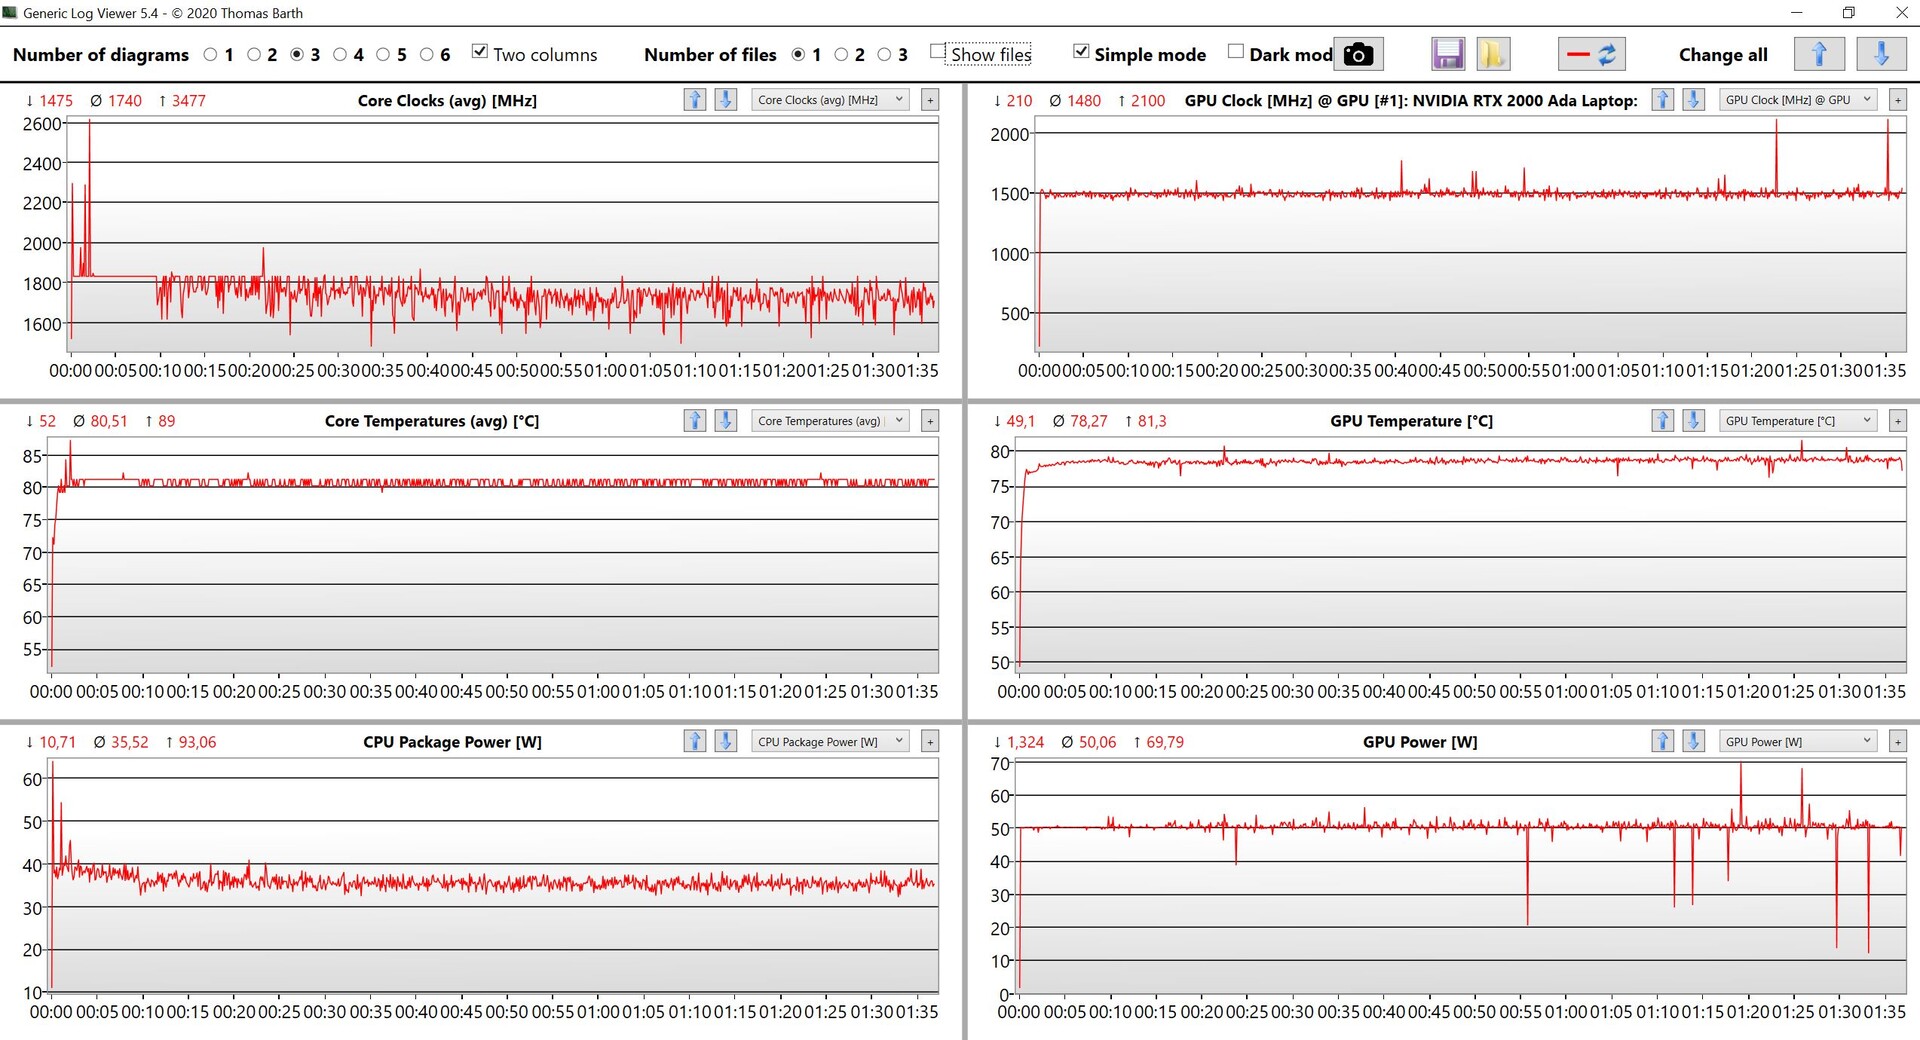
Durante la prueba de estrés, la tarjeta gráfica dedicada funciona a los 50 vatios especificados, mientras que el procesador se estabiliza en torno a los 35 vatios. El sistema puede soportar una carga total de refrigeración de 85 vatios de forma continua. A modo de comparación, la generación G5 con la cámara de vapor manejaba unos 100 vatios en total (60 vatios para la GPU y 40 vatios para la CPU).
(-) La temperatura máxima en la parte superior es de 47.1 °C / 117 F, frente a la media de 38.2 °C / 101 F, que oscila entre 22.2 y 69.8 °C para la clase Workstation.
(-) El fondo se calienta hasta un máximo de 56.5 °C / 134 F, frente a la media de 41.1 °C / 106 F
(+) En reposo, la temperatura media de la parte superior es de 26.4 °C / 80# F, frente a la media del dispositivo de 32 °C / 90 F.
(-) Jugando a The Witcher 3, la temperatura media de la parte superior es de 39.1 °C / 102 F, frente a la media del dispositivo de 32 °C / 90 F.
(+) Los reposamanos y el panel táctil alcanzan como máximo la temperatura de la piel (35.1 °C / 95.2 F) y, por tanto, no están calientes.
(-) La temperatura media de la zona del reposamanos de dispositivos similares fue de 27.8 °C / 82 F (-7.3 °C / -13.2 F).
| Lenovo ThinkPad P1 G6-21FV000DGE Intel Core i9-13900H, NVIDIA RTX 2000 Ada Generation Laptop | Dell Precision 5000 5680 Intel Core i9-13900H, NVIDIA RTX 5000 Ada Generation Laptop | Samsung Galaxy Book3 Ultra 16, i9-13900H RTX 4070 Intel Core i9-13900H, NVIDIA GeForce RTX 4070 Laptop GPU | HP ZBook Studio 16 G9 62U04EA Intel Core i7-12800H, NVIDIA RTX A2000 Laptop GPU | MSI CreatorPro Z16P B12UKST Intel Core i7-12700H, NVIDIA RTX A3000 Laptop GPU | Schenker VISION 16 Pro (M23) Intel Core i7-13700H, NVIDIA GeForce RTX 4070 Laptop GPU | Lenovo ThinkPad X1 Extreme G5-21DE003RGE Intel Core i7-12700H, NVIDIA GeForce RTX 3060 Laptop GPU | |
|---|---|---|---|---|---|---|---|
| Heat | -3% | -6% | 3% | -6% | 4% | -1% | |
| Maximum Upper Side * (°C) | 47.1 | 50.2 -7% | 45.9 3% | 38.7 18% | 56.3 -20% | 46.7 1% | 52 -10% |
| Maximum Bottom * (°C) | 56.5 | 32 43% | 50.9 10% | 53.4 5% | 68.3 -21% | 54.1 4% | 56.4 -0% |
| Idle Upper Side * (°C) | 28.1 | 37.4 -33% | 31.6 -12% | 27.3 3% | 25.2 10% | 26.5 6% | 26.4 6% |
| Idle Bottom * (°C) | 27.6 | 31.2 -13% | 34.2 -24% | 31.6 -14% | 25.9 6% | 26.8 3% | 27.2 1% |
* ... más pequeño es mejor
Altavoces
Las características de los altavoces siguen siendo similares a las del modelo antiguo, y el volumen máximo de casi 82 dB(A) también es comparable. El P1 G6 actual rinde ligeramente mejor en nuestras mediciones, posiblemente debido a las optimizaciones del software. Recomendamos encarecidamente activar la aplicación Dolby precargada para disfrutar de una experiencia de audio mejorada. Aunque los altavoces estéreo ofrecen un buen rendimiento general, los rivales con más altavoces siguen manteniendo una ventaja en este aspecto.
Lenovo ThinkPad P1 G6-21FV000DGE análisis de audio
(±) | la sonoridad del altavoz es media pero buena (81.8 dB)
Graves 100 - 315 Hz
(±) | lubina reducida - en promedio 8.9% inferior a la mediana
(±) | la linealidad de los graves es media (12.3% delta a frecuencia anterior)
Medios 400 - 2000 Hz
(+) | medios equilibrados - a sólo 4.7% de la mediana
(+) | los medios son lineales (3.5% delta a la frecuencia anterior)
Altos 2 - 16 kHz
(+) | máximos equilibrados - a sólo 4.1% de la mediana
(+) | los máximos son lineales (6.1% delta a la frecuencia anterior)
Total 100 - 16.000 Hz
(+) | el sonido global es lineal (12.2% de diferencia con la mediana)
En comparación con la misma clase
» 18% de todos los dispositivos probados de esta clase eran mejores, 3% similares, 79% peores
» El mejor tuvo un delta de 7%, la media fue 17%, el peor fue ###max##%
En comparación con todos los dispositivos probados
» 10% de todos los dispositivos probados eran mejores, 2% similares, 88% peores
» El mejor tuvo un delta de 4%, la media fue 24%, el peor fue ###max##%
MSI CreatorPro Z16P B12UKST análisis de audio
(+) | los altavoces pueden reproducir a un volumen relativamente alto (#83.3 dB)
Graves 100 - 315 Hz
(-) | casi sin bajos - de media 18.7% inferior a la mediana
(±) | la linealidad de los graves es media (7% delta a frecuencia anterior)
Medios 400 - 2000 Hz
(+) | medios equilibrados - a sólo 3% de la mediana
(+) | los medios son lineales (6.8% delta a la frecuencia anterior)
Altos 2 - 16 kHz
(+) | máximos equilibrados - a sólo 4.6% de la mediana
(+) | los máximos son lineales (6.4% delta a la frecuencia anterior)
Total 100 - 16.000 Hz
(±) | la linealidad del sonido global es media (15.2% de diferencia con la mediana)
En comparación con la misma clase
» 33% de todos los dispositivos probados de esta clase eran mejores, 10% similares, 57% peores
» El mejor tuvo un delta de 7%, la media fue 17%, el peor fue ###max##%
En comparación con todos los dispositivos probados
» 21% de todos los dispositivos probados eran mejores, 4% similares, 74% peores
» El mejor tuvo un delta de 4%, la media fue 24%, el peor fue ###max##%
Gestión de la energía - Buena resistencia con el panel IPS
Consumo de energía
El ThinkPad P1 G6 con el panel WQHD demuestra una eficiencia significativamente mayor en comparación con el antiguo ThinkPad X1 Extreme con el panel 4K. La experiencia sugiere que la pantalla OLED 4K opcional también requerirá bastante más energía. El consumo máximo en reposo a 165 Hz es de 15,3 vatios, y puede ahorrar aproximadamente 1,5 vatios en modo de 60 Hz. El portátil sigue siendo bastante eficiente bajo carga; durante los juegos, medimos poco más de 100 vatios. En el predecesor, seguía siendo de unos 130 vatios a pesar del menor rendimiento. Aunque medimos brevemente un máximo de 165 vatios al comienzo de la prueba de estrés, se estabilizó rápidamente en torno a los 110 vatios. La fuente de alimentación de 170 vatios incluida es más que suficiente para estos requisitos de potencia.
| Off / Standby | |
| Ocioso | |
| Carga |
|
Clave:
min: | |
| Lenovo ThinkPad P1 G6-21FV000DGE i9-13900H, RTX 2000 Ada Generation Laptop, SK Hynix PC711 1TB HFS001TDE9X084N, IPS, 2560x1600, 16" | Dell Precision 5000 5680 i9-13900H, RTX 5000 Ada Generation Laptop, 2x SK hynix PC801 HFS512GEJ9X101N RAID 0, OLED, 3840x2400, 16" | Samsung Galaxy Book3 Ultra 16, i9-13900H RTX 4070 i9-13900H, GeForce RTX 4070 Laptop GPU, Samsung PM9A1 MZVL21T0HCLR, OLED / AMOLED, 2880x1800, 16" | HP ZBook Studio 16 G9 62U04EA i7-12800H, RTX A2000 Laptop GPU, Micron 3400 1TB MTFDKBA1T0TFH, IPS, 3840x2400, 16" | MSI CreatorPro Z16P B12UKST i7-12700H, RTX A3000 Laptop GPU, Samsung PM9A1 MZVL21T0HCLR, IPS, 2560x1600, 16" | Schenker VISION 16 Pro (M23) i7-13700H, GeForce RTX 4070 Laptop GPU, Samsung 990 Pro 1 TB, IPS, 2560x1600, 16" | Lenovo ThinkPad X1 Extreme G5-21DE003RGE i7-12700H, GeForce RTX 3060 Laptop GPU, Micron 3400 1TB MTFDKBA1T0TFH, IPS, 3840x2400, 16" | Medio NVIDIA RTX 2000 Ada Generation Laptop | Media de la clase Workstation | |
|---|---|---|---|---|---|---|---|---|---|
| Power Consumption | -14% | 29% | -12% | -21% | -0% | -43% | 9% | -5% | |
| Idle Minimum * (Watt) | 8.3 | 8 4% | 4.3 48% | 7.2 13% | 10.8 -30% | 8.6 -4% | 11.8 -42% | 6.88 ? 17% | 8.94 ? -8% |
| Idle Average * (Watt) | 14.5 | 10.4 28% | 4.6 68% | 18.1 -25% | 16.3 -12% | 12 17% | 22.4 -54% | 12.1 ? 17% | 13.8 ? 5% |
| Idle Maximum * (Watt) | 15.3 | 30.5 -99% | 11.4 25% | 18.5 -21% | 16.9 -10% | 12.4 19% | 23.1 -51% | 14.5 ? 5% | 17.5 ? -14% |
| Load Average * (Watt) | 91.8 | 75.4 18% | 97 -6% | 112.8 -23% | 111.7 -22% | 80 13% | 138 -50% | 86.9 ? 5% | 95 ? -3% |
| Witcher 3 ultra * (Watt) | 104.7 | 134 -28% | 100.9 4% | 106.7 -2% | 152.1 -45% | 147.7 -41% | 129.9 -24% | ||
| Load Maximum * (Watt) | 164.5 | 175 -6% | 107 35% | 186 -13% | 177.4 -8% | 173.1 -5% | 225.6 -37% | 161.1 ? 2% | 175.2 ? -7% |
* ... más pequeño es mejor
Power consumption Witcher 3 / stress test
Power consumption with external monitor
Duración de las pilas
La batería conserva su capacidad de 90 vatios-hora, lo que permite una excelente autonomía, especialmente en el modo de 60 Hz. Durante nuestra prueba WLAN, el ThinkPad P1 G6 alcanza aproximadamente 9,5 horas a 150 cd/m² (equivalente al 63% del brillo máximo en el dispositivo de prueba) y 6 horas y 43 minutos a brillo máximo. Teniendo en cuenta el gran tamaño de la pantalla y el alto brillo de casi 500 cd/m², estos resultados son bastante impresionantes. Dura casi 11 horas durante la prueba de vídeo (también a 150 cd/m2), pero los tiempos de ejecución son más cortos en el modo de 165 Hz, como se ve en la tabla siguiente:
| Modo | Prueba WLAN (150 cd/m²) | Prueba WLAN brillo máx. | Prueba de vídeo (150 cd/m²) |
|---|---|---|---|
| 60 Hz | 567 minutos | 403 minutos | 674 minutos |
| 165 Hz | 500 minutos | 370 minutos | 548 minutos |
Con un uso intensivo, la batería puede agotarse en poco más de una hora, y tarda aproximadamente 100 minutos en recargarse por completo cuando se enciende el aparato. Alrededor del 45% de carga está disponible tras algo menos de 20 minutos, y el 80% se alcanza tras 50 minutos.
| Lenovo ThinkPad P1 G6-21FV000DGE i9-13900H, RTX 2000 Ada Generation Laptop, 90 Wh | Dell Precision 5000 5680 i9-13900H, RTX 5000 Ada Generation Laptop, 98 Wh | Samsung Galaxy Book3 Ultra 16, i9-13900H RTX 4070 i9-13900H, GeForce RTX 4070 Laptop GPU, 76 Wh | HP ZBook Studio 16 G9 62U04EA i7-12800H, RTX A2000 Laptop GPU, 86 Wh | MSI CreatorPro Z16P B12UKST i7-12700H, RTX A3000 Laptop GPU, 90 Wh | Schenker VISION 16 Pro (M23) i7-13700H, GeForce RTX 4070 Laptop GPU, 80 Wh | Lenovo ThinkPad X1 Extreme G5-21DE003RGE i7-12700H, GeForce RTX 3060 Laptop GPU, 90 Wh | Media de la clase Workstation | |
|---|---|---|---|---|---|---|---|---|
| Duración de Batería | 30% | -18% | -19% | -39% | -10% | -3% | 2% | |
| H.264 (h) | 11.2 | 9 -20% | 8.5 -24% | 7.8 -30% | 7.3 -35% | 9.51 ? -15% | ||
| WiFi v1.3 (h) | 9.5 | 9.9 4% | 8 -16% | 6.3 -34% | 5.8 -39% | 7.8 -18% | 6.7 -29% | 8.53 ? -10% |
| Load (h) | 1.1 | 1.7 55% | 0.9 -18% | 1.1 0% | 1.3 18% | 1.7 55% | 1.429 ? 30% |
Pro
Contra
Veredicto - Muy buena estación de trabajo móvil

El nuevo ThinkPad P1 G6 cumple las expectativas al mantener el diseño de la carcasa sin cambios y ofrecer dos tipos diferentes de refrigeración (clásica con tubos de calor o cámara de vapor) en función de la tarjeta gráfica dedicada. La discontinuación del ThinkPad X1 Extreme es únicamente una decisión de marketing, ya que ambos modelos eran idénticos. Junto a las GPU Nvidia profesionales, Lenovo también ofrece variantes de consumo, aunque las opciones se limitan en cierto modo a la Portátil RTX 4060, portátil 4080y 4090 Portátil.
En cuanto al rendimiento del procesador, la potencia general es excelente, destacando el Core i9 en las pruebas de un solo núcleo. Además, se sospecha que los modelos más potentes con refrigeración por cámara de vapor podrían ofrecer un rendimiento de la CPU ligeramente superior. La nueva RTX 2000 Ada destaca como una mejora significativa, ya que ofrece un rendimiento gráfico superior a pesar de su relativamente baja clasificación TGP de 65 vatios. Supera a la antigua RTX A3000 e incluso a la GeForce RTX 3060 portátil. Aunque la GPU es similar a la del portátil GeForce RTX 4060, funciona a 80 vatios en el ThinkPad P1 G6 con una refrigeración por cámara de vapor más robusta. La diferenciación de Lenovo en este sentido no está del todo clara.
El ThinkPad P1 G6 destaca como estación de trabajo móvil, priorizando la movilidad sobre el rendimiento bruto. Las GPU Nvidia Ada ofrecen un rendimiento impresionante, y la pantalla IPS opcional con 500 nits de brillo y una frecuencia de actualización de 165 Hz es muy recomendable, especialmente si no necesita un espacio de color ampliado.
Aunque la pantalla rinde excepcionalmente bien, su punto débil reside en la cobertura del espacio de color, limitada al pequeño estándar sRGB. Todos los demás aspectos de la pantalla son excelentes, lo que la convierte en la opción preferida frente al modelo OLED opcional. El único argumento a favor de la pantalla OLED es su mayor cobertura del espacio de color. Es una pena que Lenovo ya no ofrezca la pantalla IPS 4K con espacio de color Adobe RGB.
El ThinkPad P1 G6 es un dispositivo bien desarrollado sin grandes defectos. Las mejoras podrían incluir un lector de tarjetas más rápido, la vuelta a los antiguos teclados con un recorrido de 0,07 pulgadas y el enrutamiento previo de las antenas para los módulos WWAN. Además, optimizar el comportamiento del ventilador mejoraría la experiencia general del usuario. El nivel de ruido del dispositivo alcanza un máximo de 48 dB(A) bajo carga, lo que lo hace relativamente ruidoso. En comparación, la refrigeración por cámara de vapor del predecesor era más silenciosa.
Precio y disponibilidad
Nuestra muestra de revisión del ThinkPad P1 G6 puede encargarse en Amazon por ~3.000 USD. El P1 G6 también puede configurarse en la tienda en línea de Lenovo.
Lenovo ThinkPad P1 G6-21FV000DGE
- 10/19/2023 v7 (old)
Andreas Osthoff
Transparencia
La selección de los dispositivos que se van a reseñar corre a cargo de nuestro equipo editorial. La muestra de prueba fue proporcionada al autor en calidad de préstamo por el fabricante o el minorista a los efectos de esta reseña. El prestamista no tuvo ninguna influencia en esta reseña, ni el fabricante recibió una copia de la misma antes de su publicación. No había ninguna obligación de publicar esta reseña. Como empresa de medios independiente, Notebookcheck no está sujeta a la autoridad de fabricantes, minoristas o editores.
Así es como prueba Notebookcheck
Cada año, Notebookcheck revisa de forma independiente cientos de portátiles y smartphones utilizando procedimientos estandarizados para asegurar que todos los resultados son comparables. Hemos desarrollado continuamente nuestros métodos de prueba durante unos 20 años y hemos establecido los estándares de la industria en el proceso. En nuestros laboratorios de pruebas, técnicos y editores experimentados utilizan equipos de medición de alta calidad. Estas pruebas implican un proceso de validación en varias fases. Nuestro complejo sistema de clasificación se basa en cientos de mediciones y puntos de referencia bien fundamentados, lo que mantiene la objetividad.Price comparison

