Legion análisis del 9i Gen 8 16IRX8: El portátil para juegos más ambicioso de Lenovo hasta la fecha

Presentado hace apenas unas semanas en IFA 2023, la nueva Legion 9i 16 es el modelo de gama más alta Legion disponible, superando a la serie Legion 5 de gama media y a la serie Legion 7 de gama media-alta. Es el primer producto Legion 9 en varios años tras el mediocre Legion Y920 de 2017. El último modelo destaca por su pantalla mini-LED y sus térmicas de refrigeración líquida integradas.
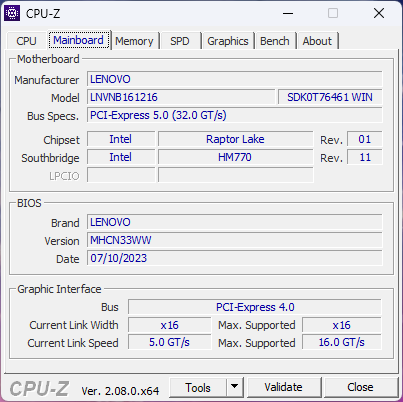
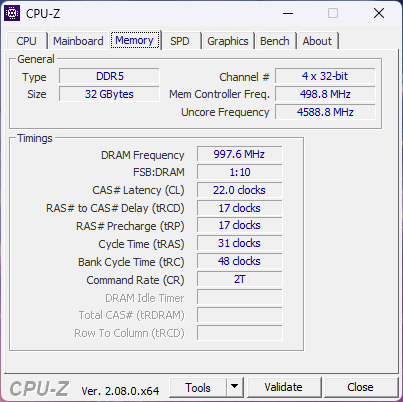
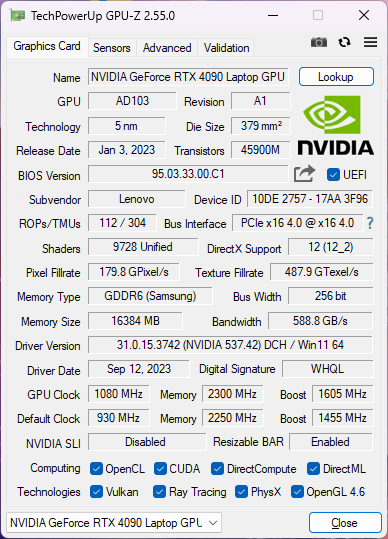
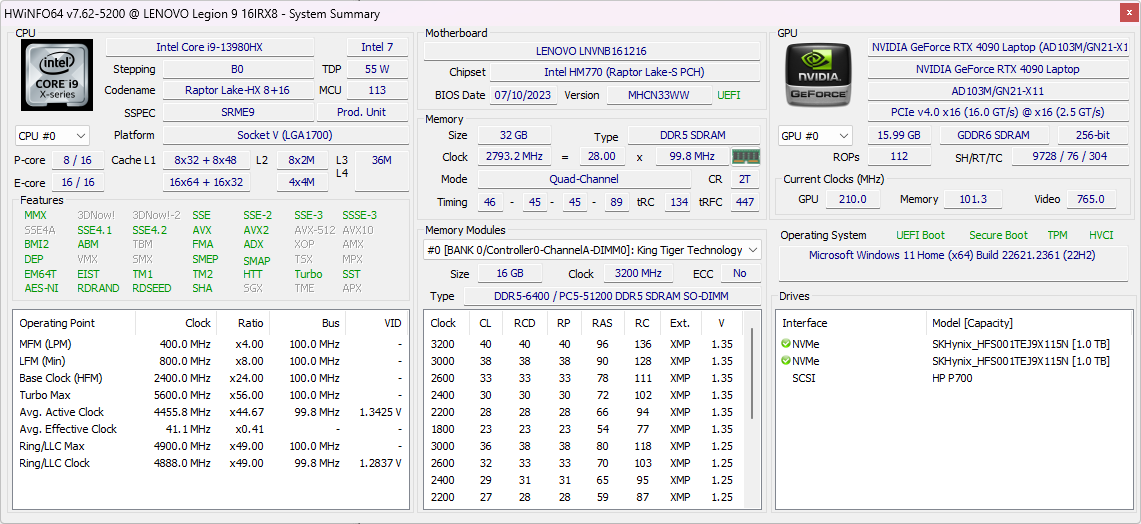
Nuestra unidad de análisis se ha configurado con todo y el fregadero de la cocina para incluir una CPU Core i9-13980HX de 13ª generación, una GPU GeForce RTX 4090 de 175 W, una SSD NVMe PCIe4 x4 de 1 TB en RAID 0 y una pantalla mini-LED de 3,2K (3200 x 2000) a 165 Hz con colores DCI-P3 por poco menos de 4000 USD al por menor. Por el momento, todas las opciones se entregan con la misma CPU Core i9 y la pantalla mini-LED, mientras que sólo la GPU puede configurarse hasta la RTX 4080.
Las alternativas al Legion 9i 16 incluyen otros portátiles para juegos de 16 pulgadas como el Razer Blade 16, Asus ROG Strix G16, HP Omen Transcend 16y el Alienware x16 R1.
Más reseñas de Lenovo:
Posibles contendientes en la comparación
Valoración | Fecha | Modelo | Peso | Altura | Tamaño | Resolución | Precio |
|---|---|---|---|---|---|---|---|
| 90.2 % v7 (old) | 10/2023 | Lenovo Legion 9 16IRX8 i9-13980HX, GeForce RTX 4090 Laptop GPU | 2.6 kg | 22.7 mm | 16.00" | 3200x2000 | |
| 87.7 % v7 (old) | 08/2023 | Lenovo Legion Slim 5 16APH8 R7 7840HS, GeForce RTX 4060 Laptop GPU | 2.4 kg | 25.2 mm | 16.00" | 2560x1600 | |
| 89.8 % v7 (old) | 03/2023 | Razer Blade 16 Early 2023 RTX 4090 i9-13950HX, GeForce RTX 4090 Laptop GPU | 2.5 kg | 21.99 mm | 16.00" | 3840x2400 | |
| 88.4 % v7 (old) | 03/2023 | Asus ROG Strix G16 G614JZ i9-13980HX, GeForce RTX 4080 Laptop GPU | 2.4 kg | 30.4 mm | 16.00" | 2560x1600 | |
| 87.9 % v7 (old) | 08/2023 | HP Omen Transcend 16 i9-13900HX, GeForce RTX 4070 Laptop GPU | 2.3 kg | 19.8 mm | 16.00" | 2560x1600 | |
| 88.4 % v7 (old) | 06/2023 | Alienware x16 R1 i9-13900HK, GeForce RTX 4080 Laptop GPU | 2.6 kg | 18.57 mm | 16.00" | 2560x1600 |
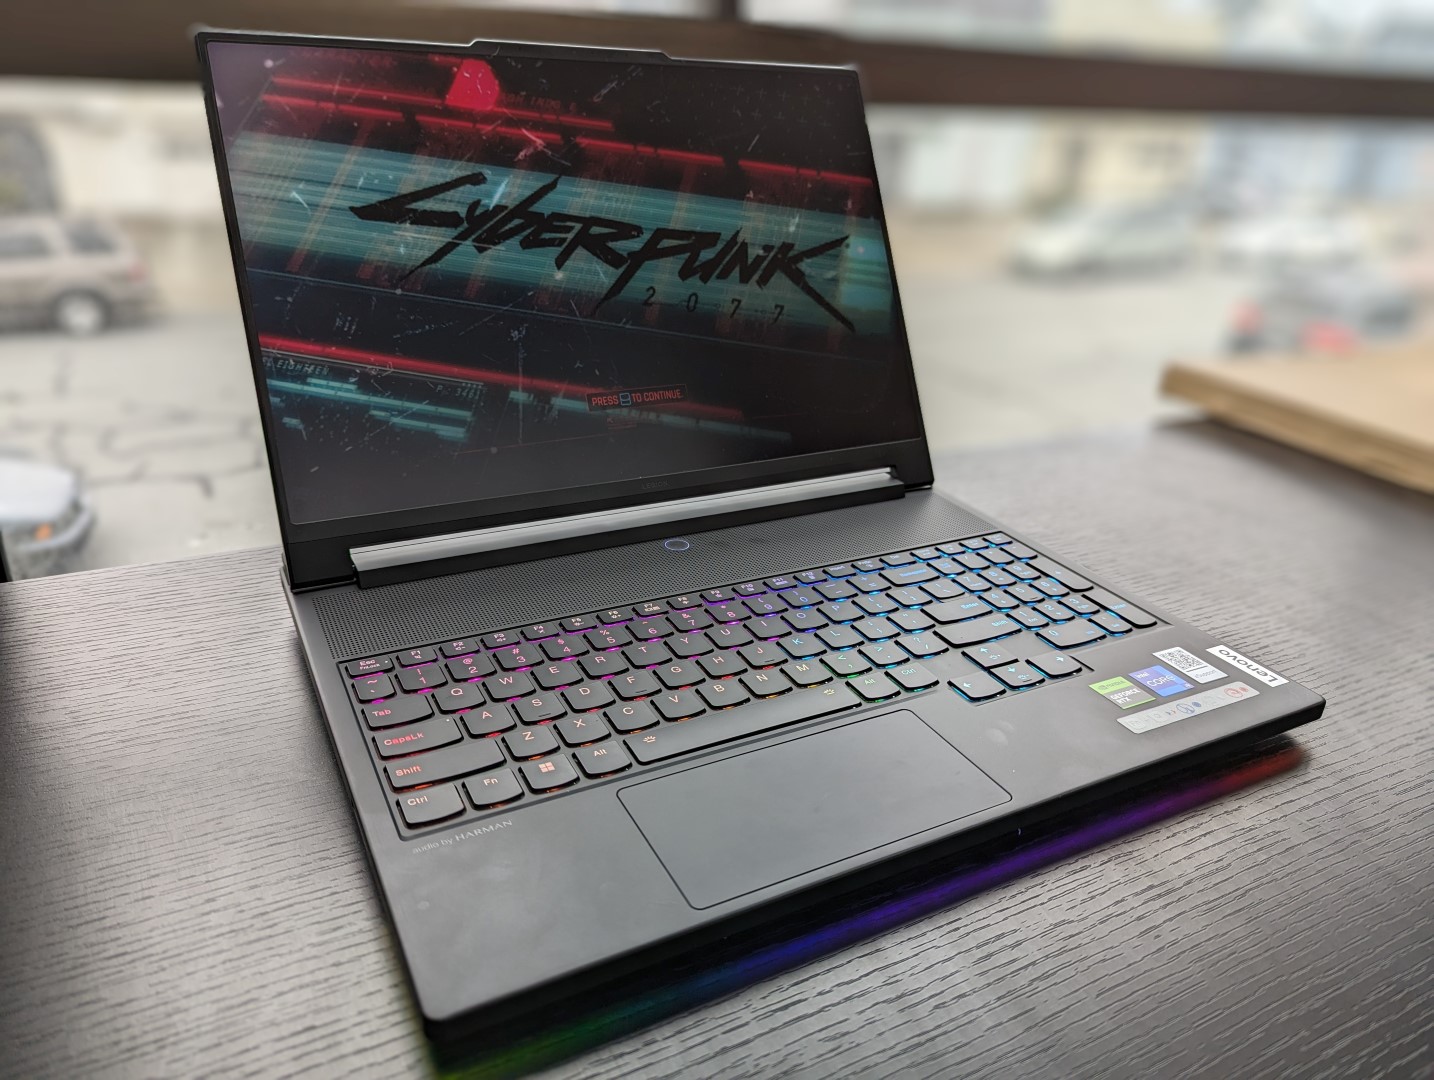
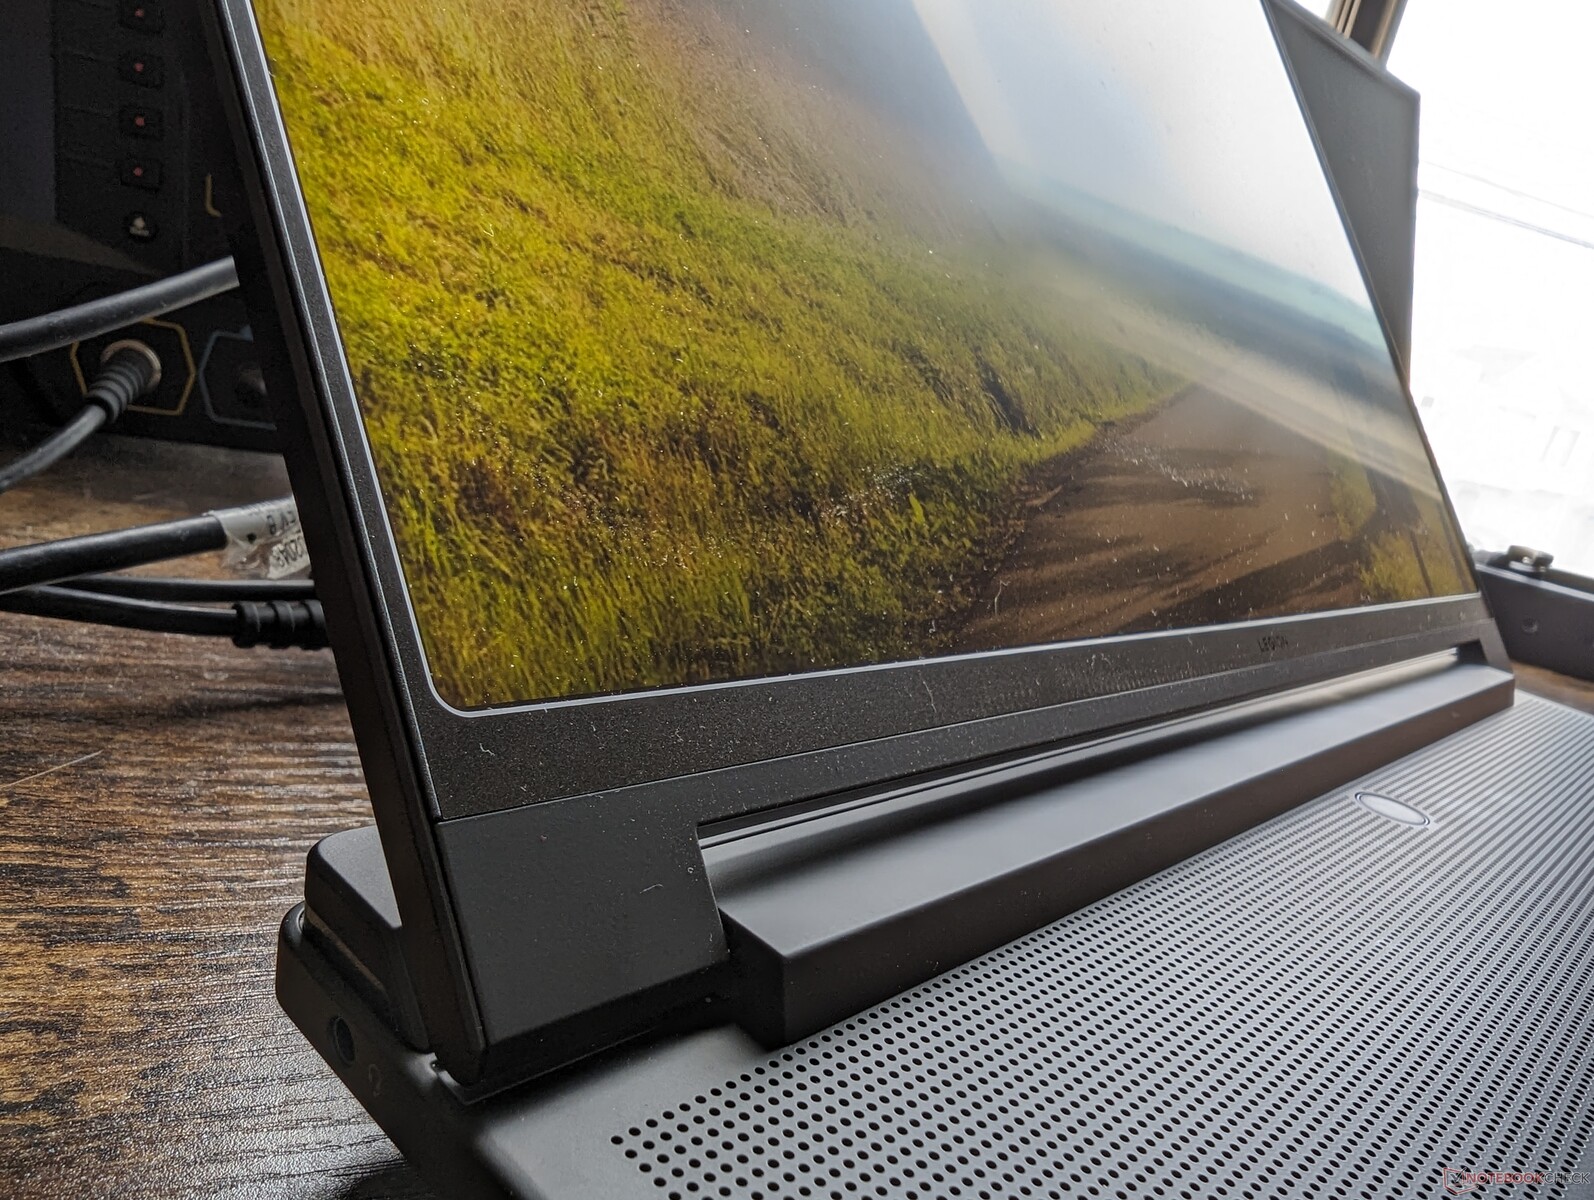
Caso - Un diseño evolucionado Legion
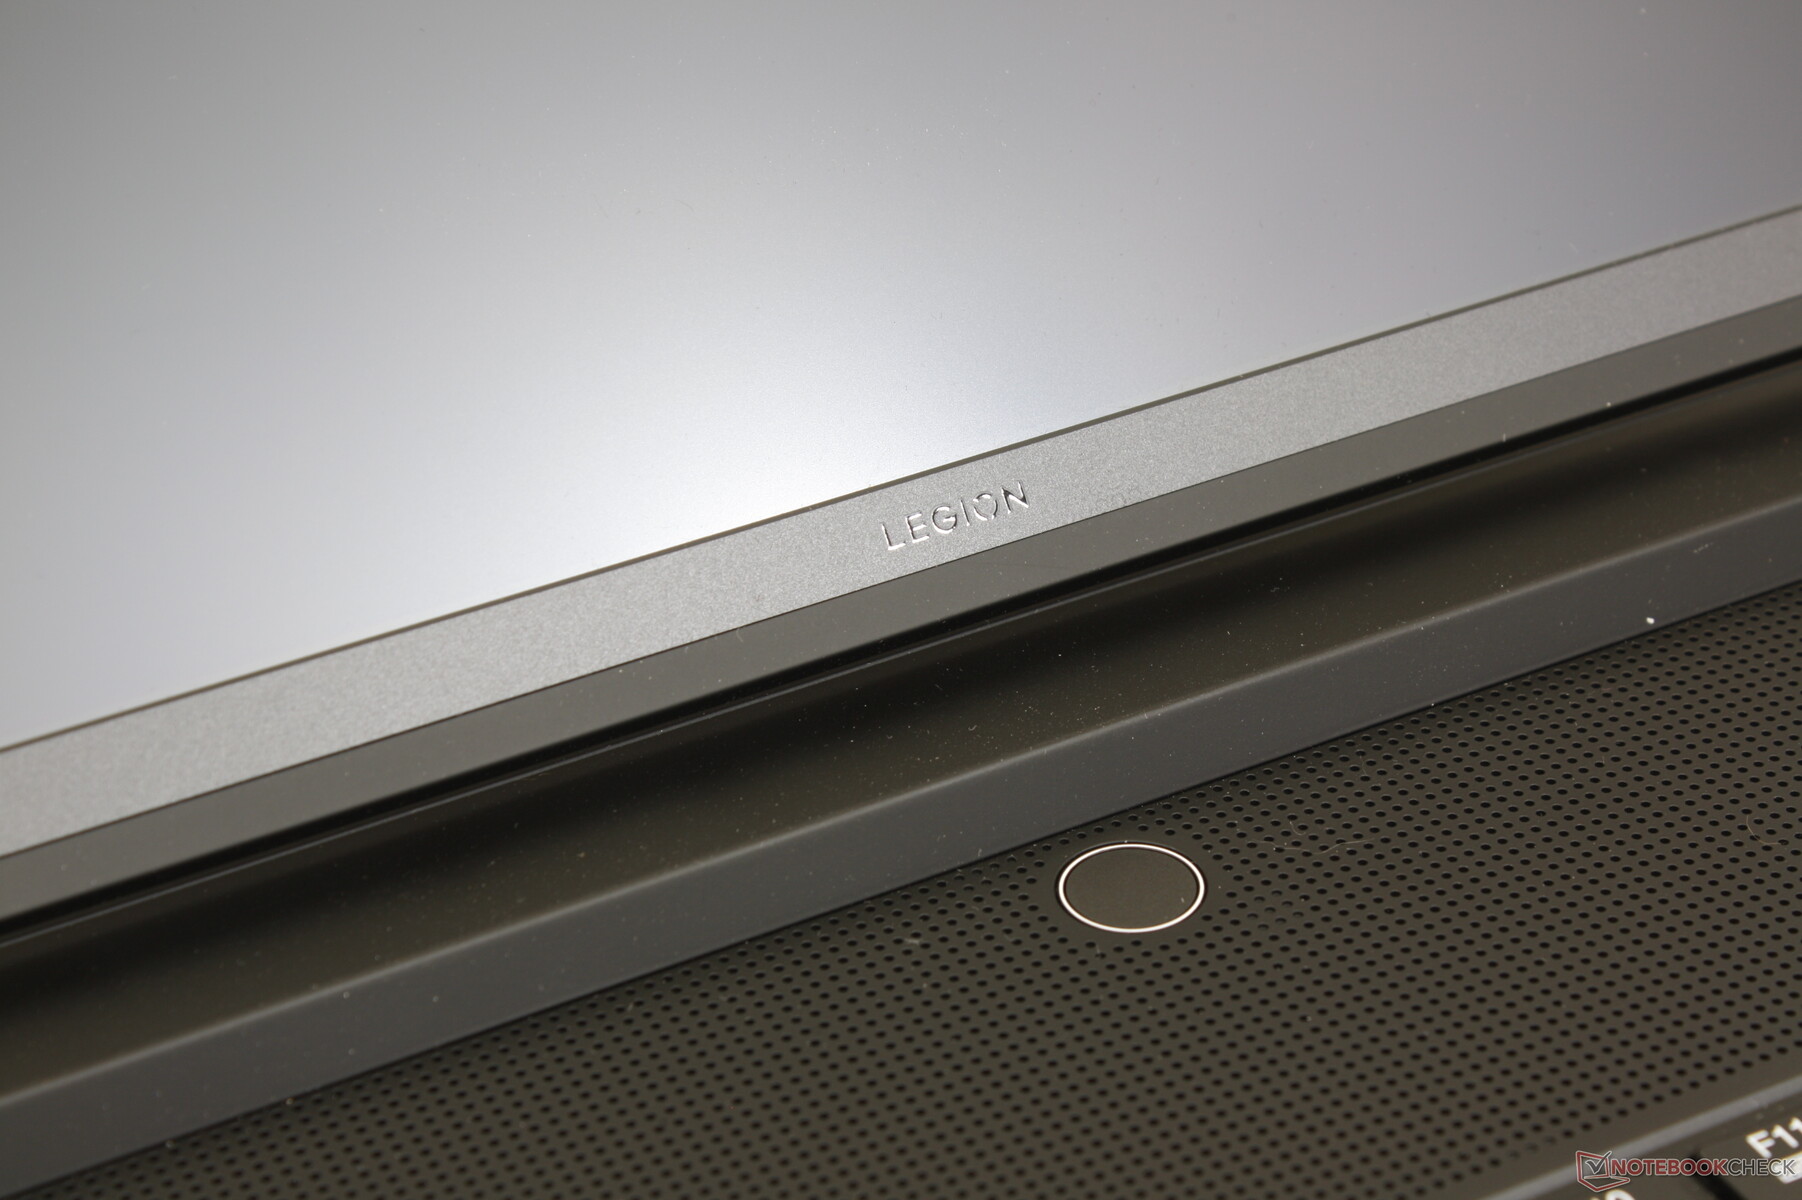
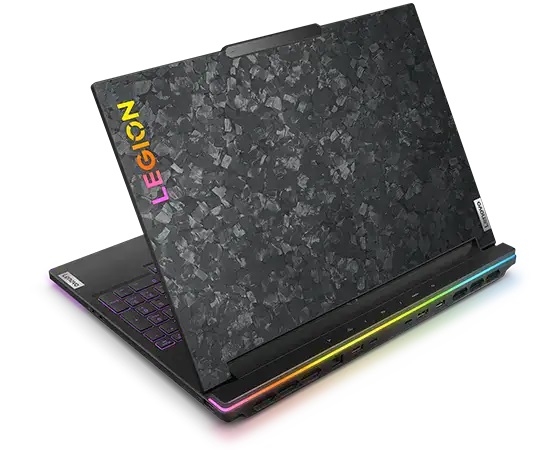
El Legion 9i 16 utiliza materiales de magnesio mate similares a los del Legion serie 7, pero son visualmente muy diferentes. En primer lugar, el teclado se ha desplazado hacia delante para estar más cerca del usuario, de forma similar al Asus Zephyrus S GX531 con el fin de dejar espacio para más rejillas de ventilación y una solución de refrigeración más grande. En segundo lugar, un exclusivo patrón envolvente de carbono alrededor de la tapa exterior ayuda a reducir la acumulación de huellas dactilares al tiempo que contribuye a la estética gamer. Y por último, la parte trasera que sobresale se ha engrosado para acomodar mejor todos los cambios internos y el hardware más exigente.
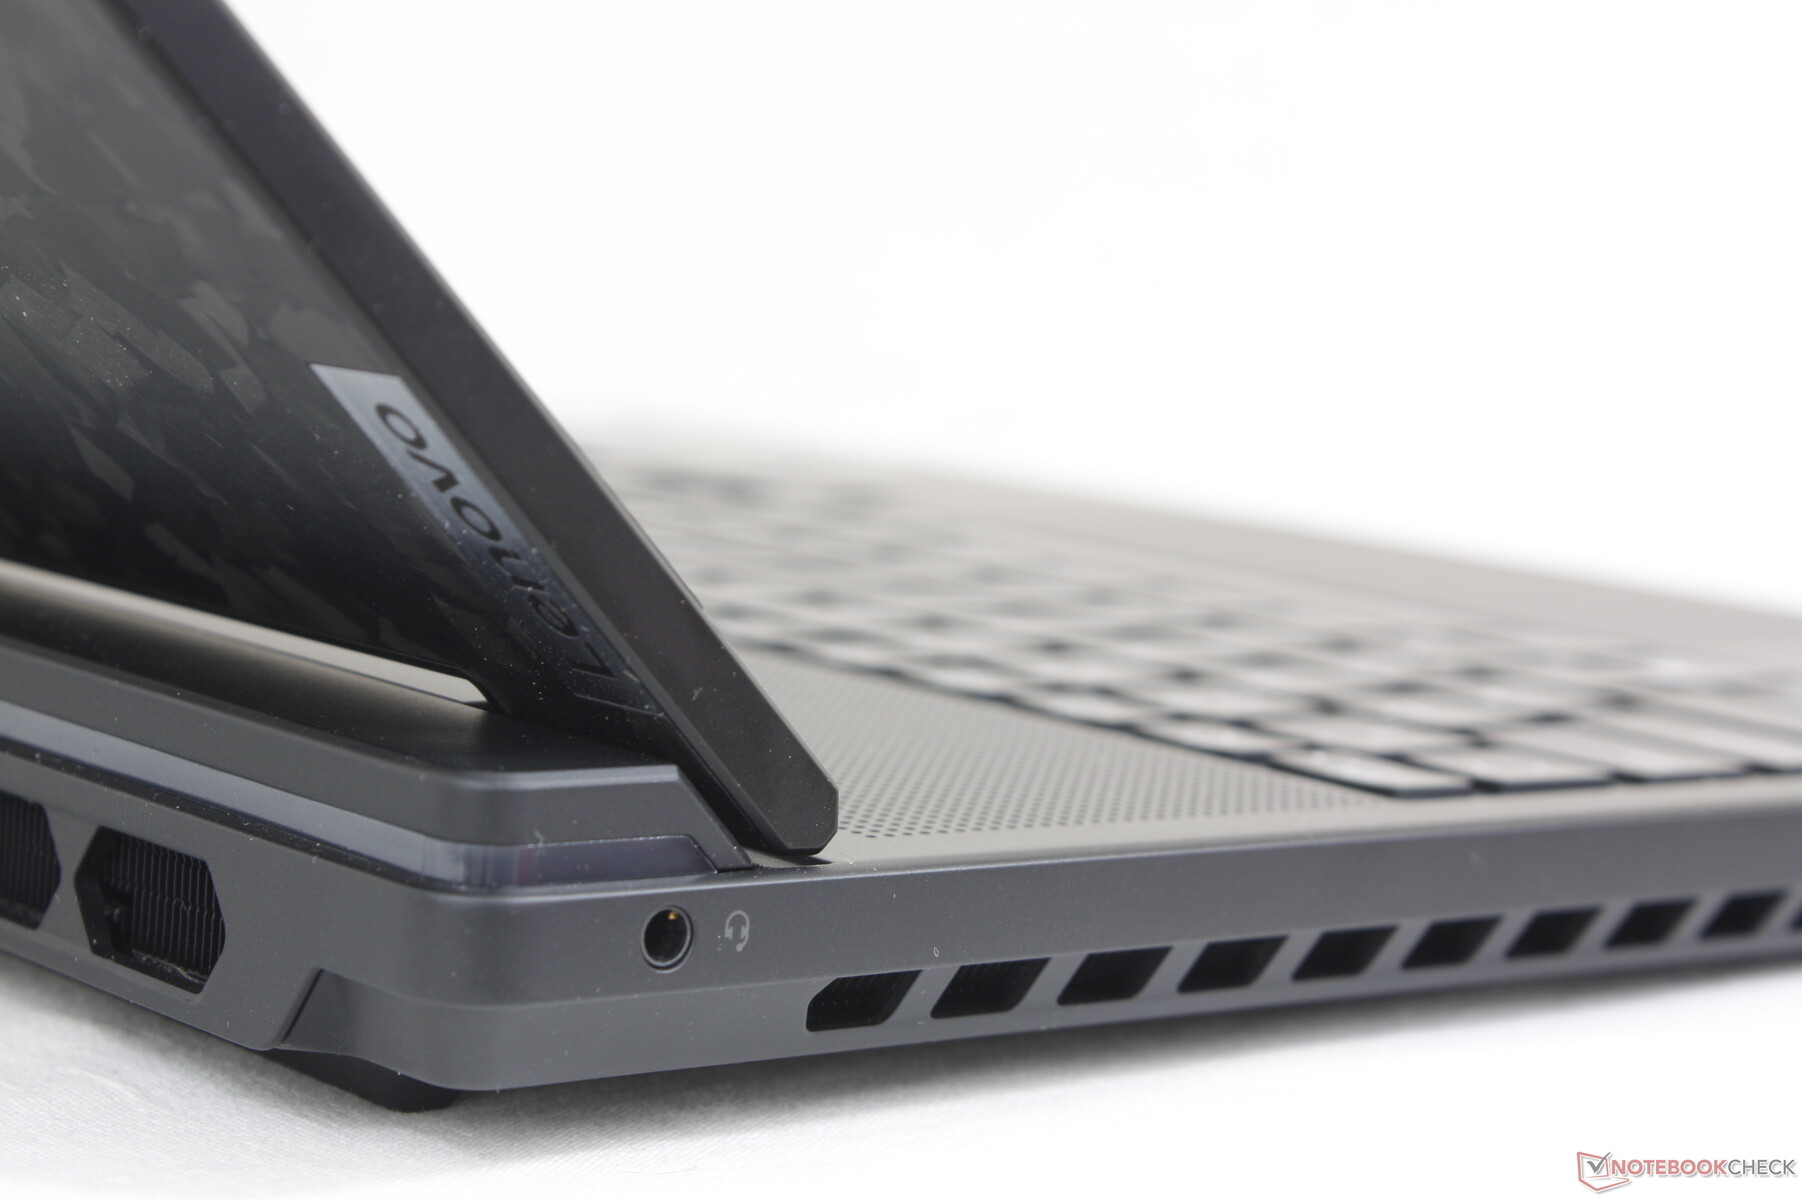
La calidad del chasis es excelente, con sólo un poco de cesión al intentar girar la tapa o presionar el centro del teclado o los reposamuñecas. No se siente ni mejor ni peor que el
Legion 7 16 o el Alienware x16 R1 en términos de rigidez, especialmente porque todos pesan más o menos lo mismo. Sin embargo, las bisagras siguen siendo relativamente pequeñas en comparación con las bisagras mucho más grandes de la Serie Asus Strix o el recienteMSI Raider GE68. Puede que sean satisfactorias cuando son nuevas, pero sólo el tiempo dirá lo bien que le irán a largo plazo.
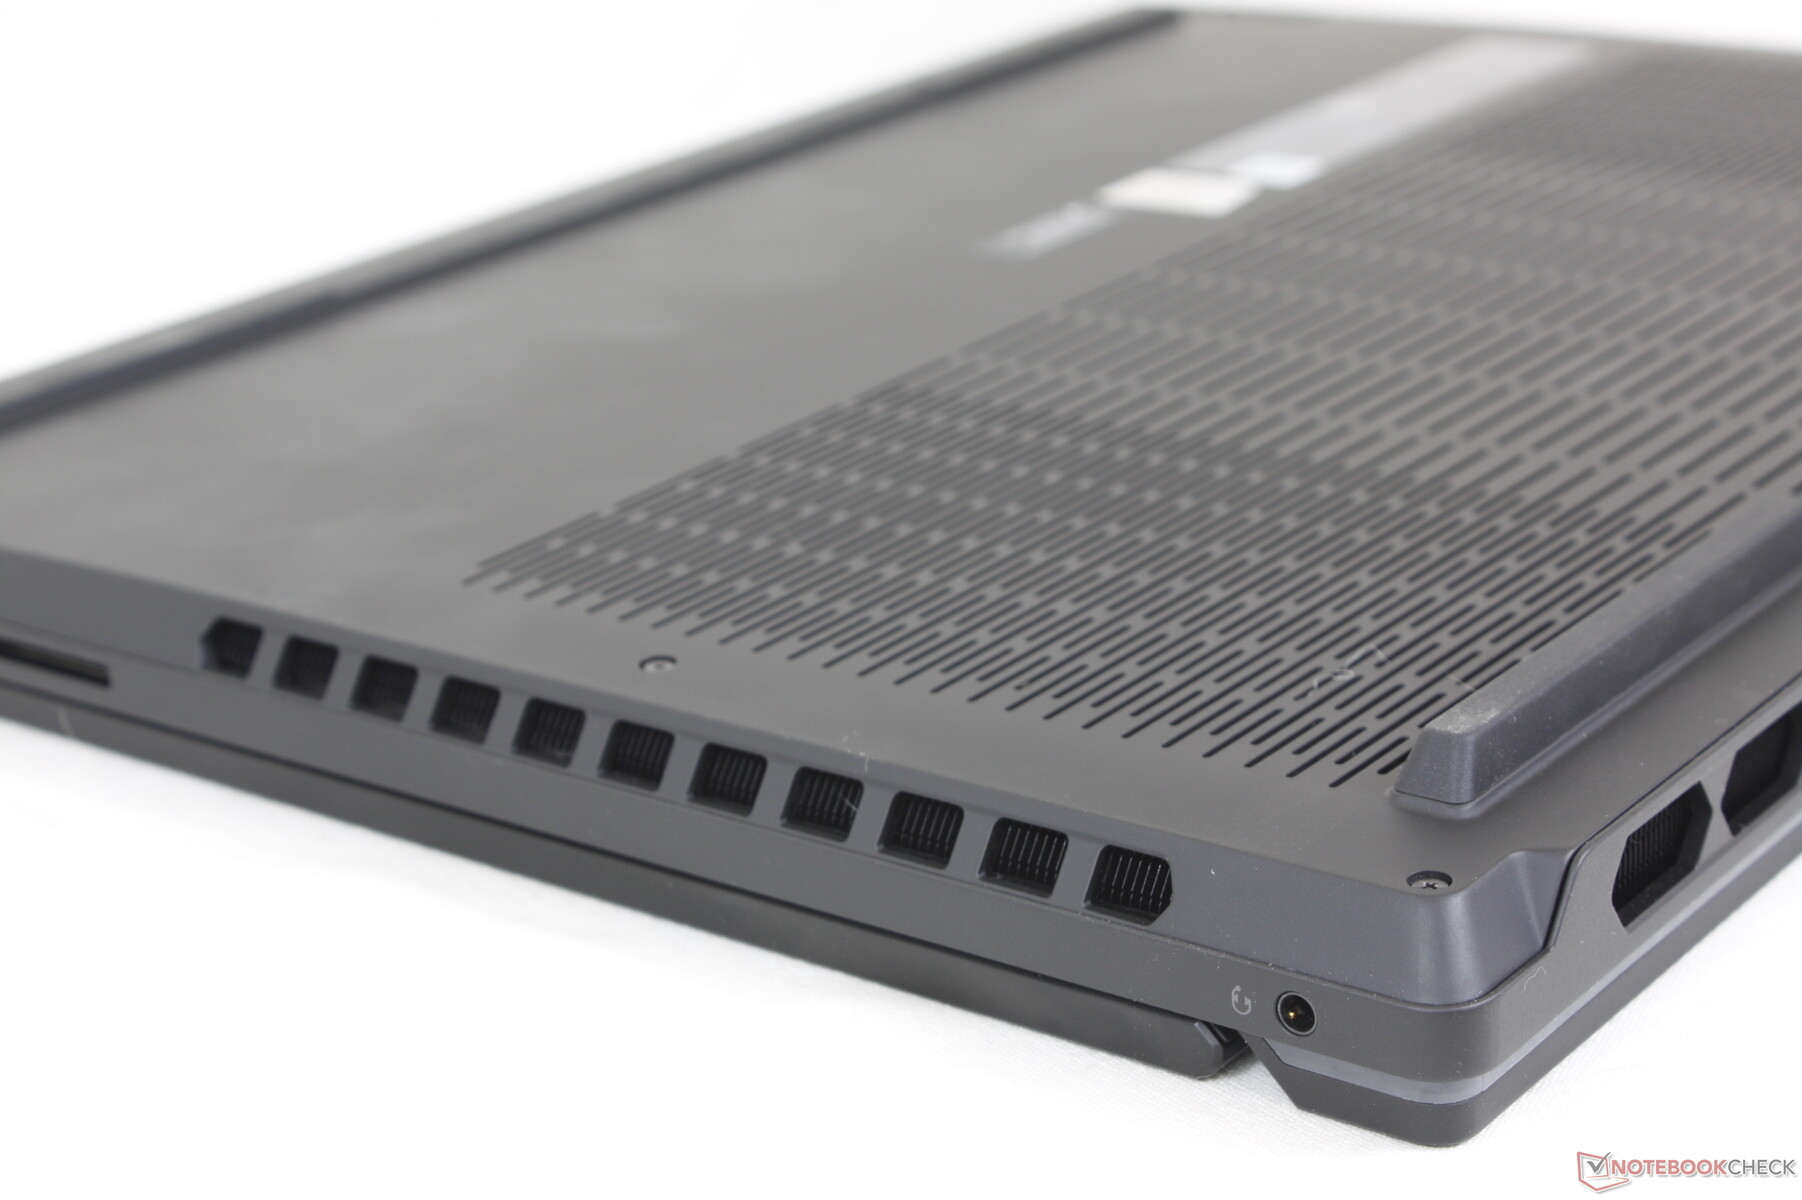
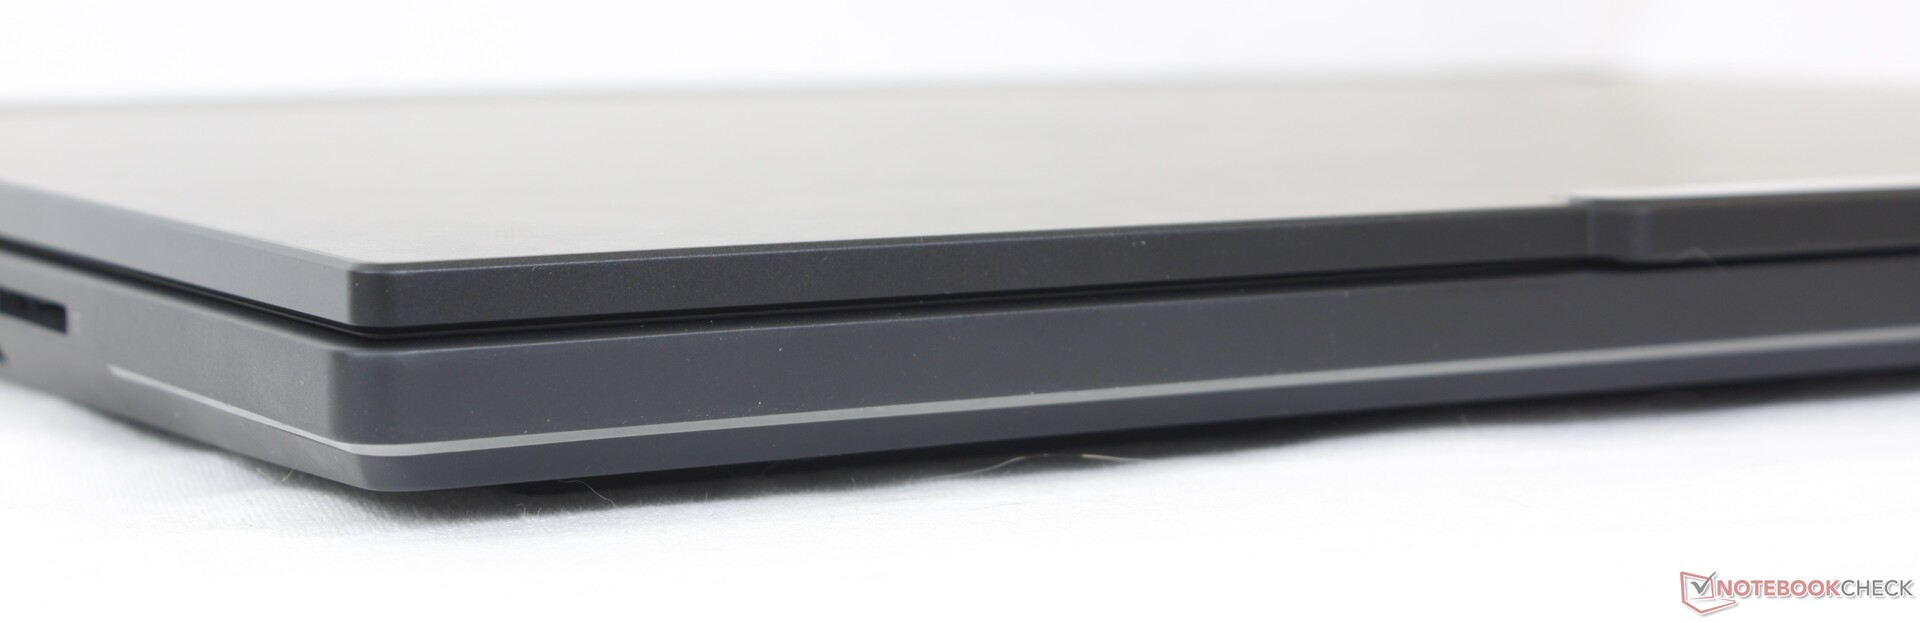
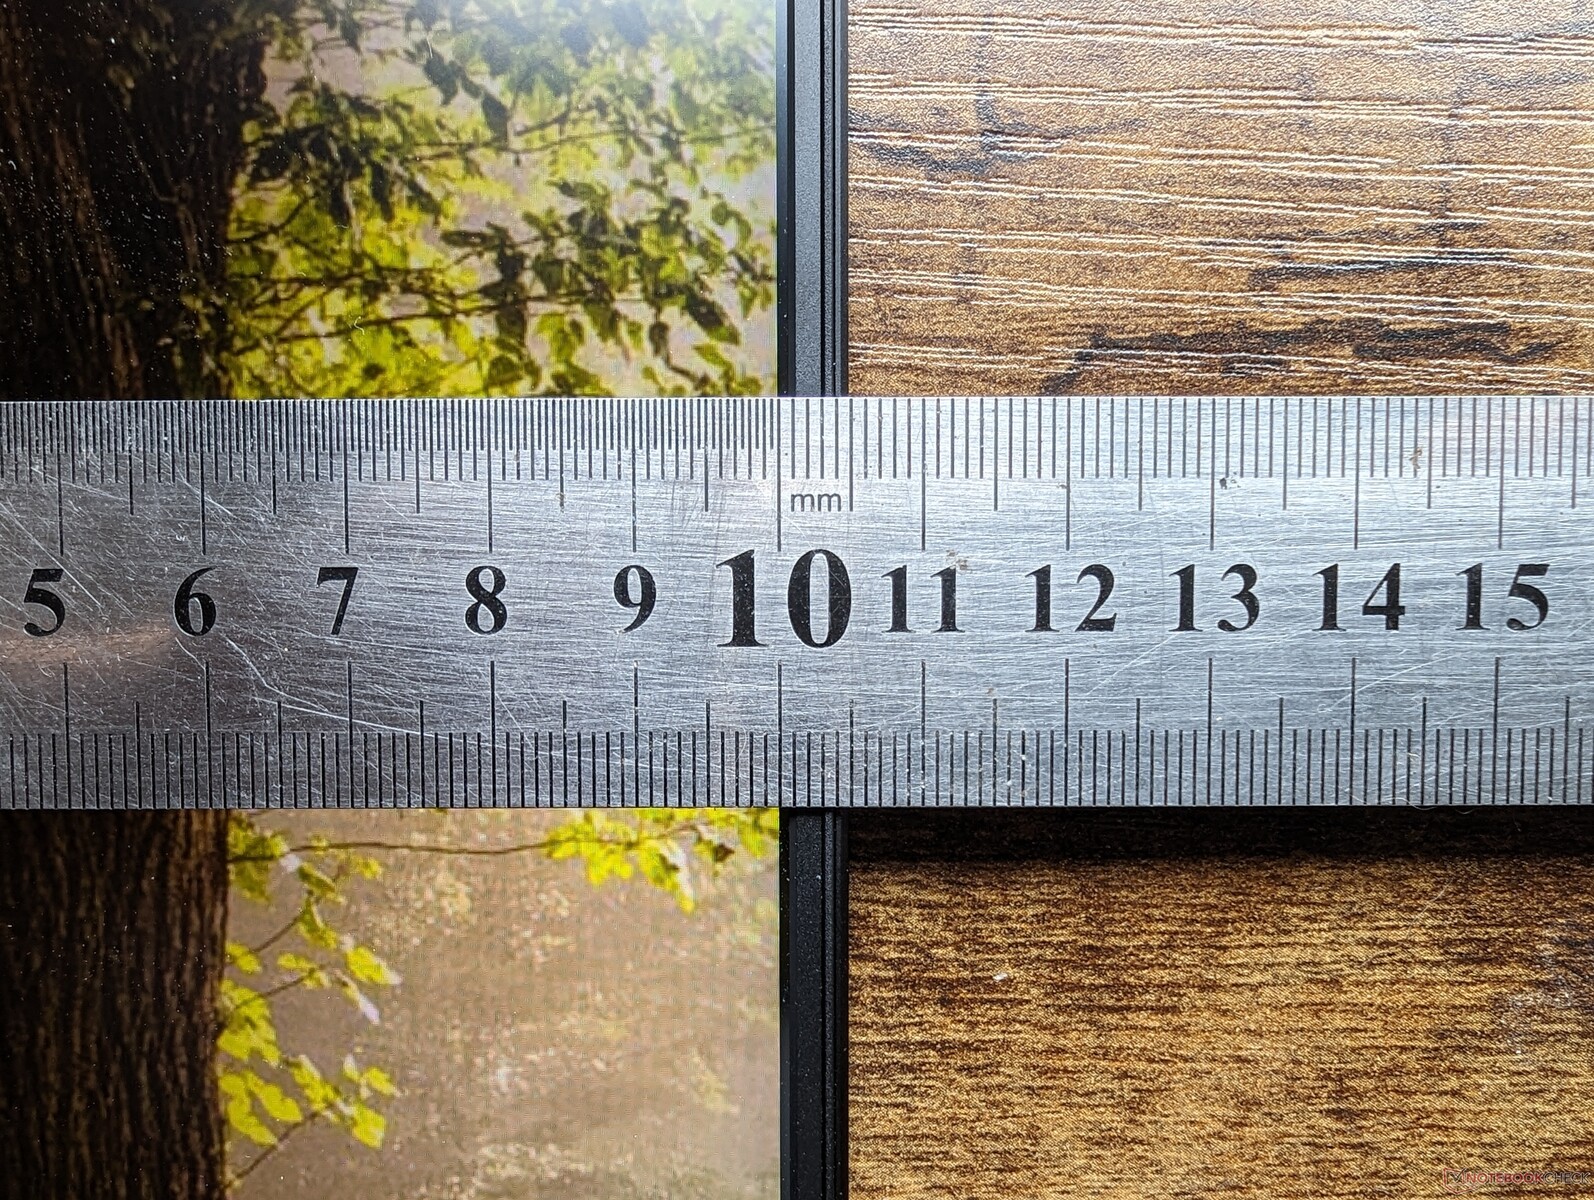
La parte trasera ampliada y los exigentes componentes internos Core i9/RTX 4090 han dado lugar a un chasis más grande y grueso que el Legion 7 16. Las diferencias son notables ya que el Legion 9i 16 es más grande que muchos otros portátiles para juegos de 16 pulgadas como el ROG Strix G16, Blade 16o el Omen Transcend 16. En este sentido, el alto rendimiento y las funciones avanzadas se producen a costa de la portabilidad.
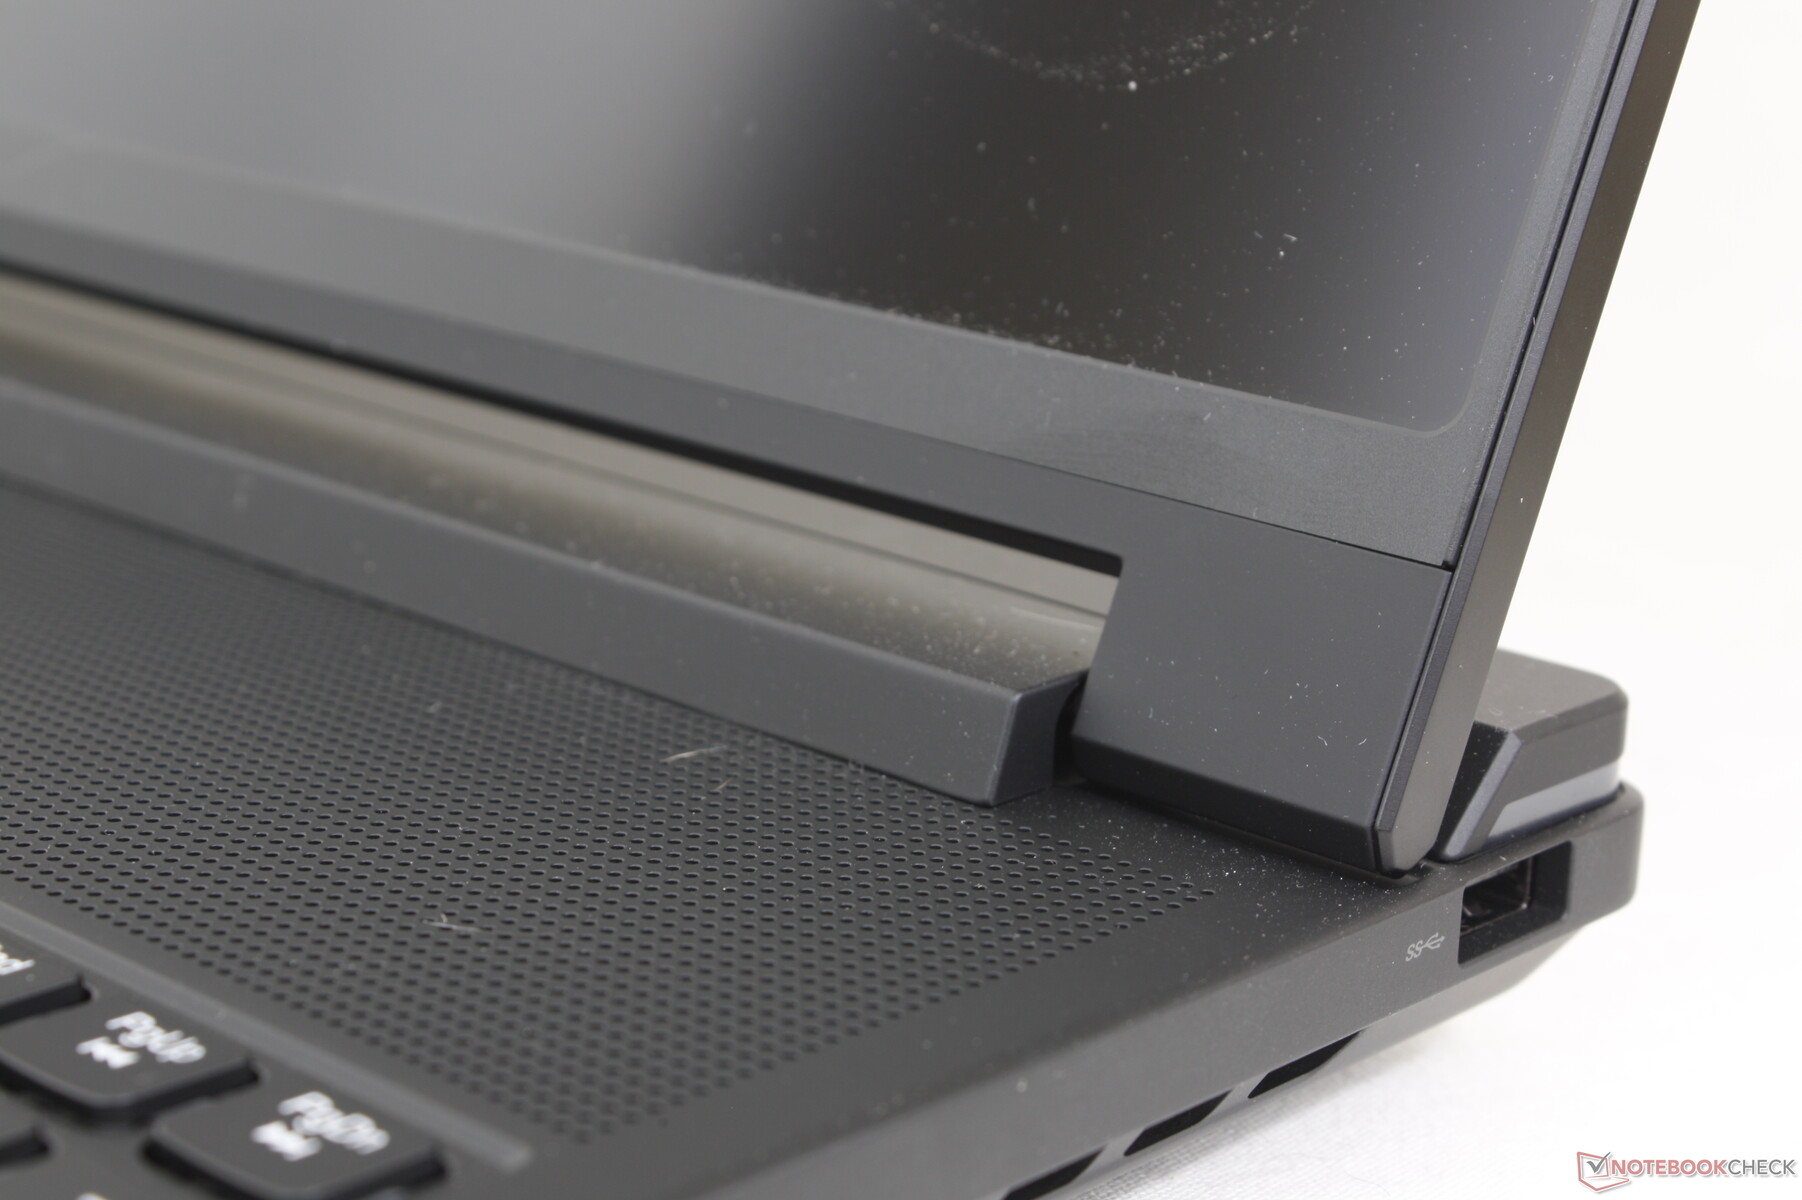
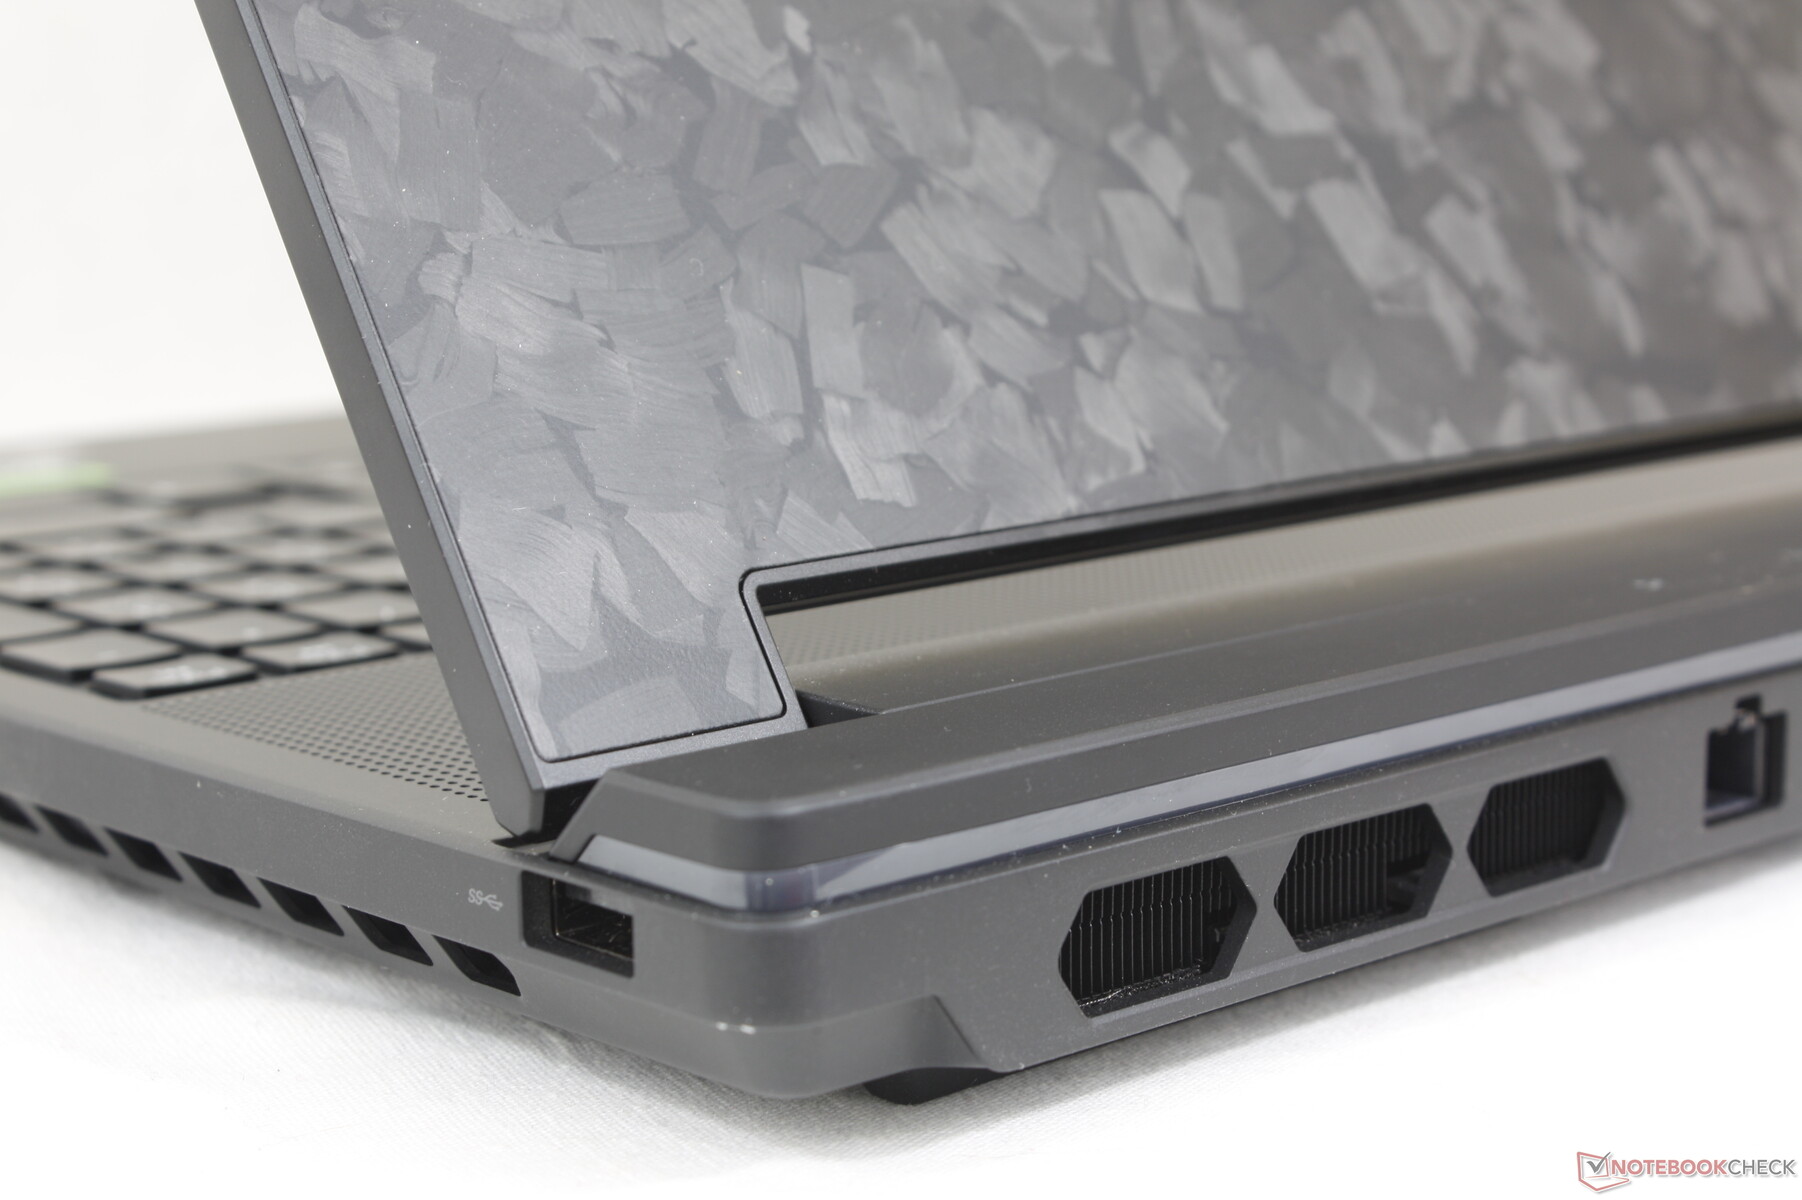
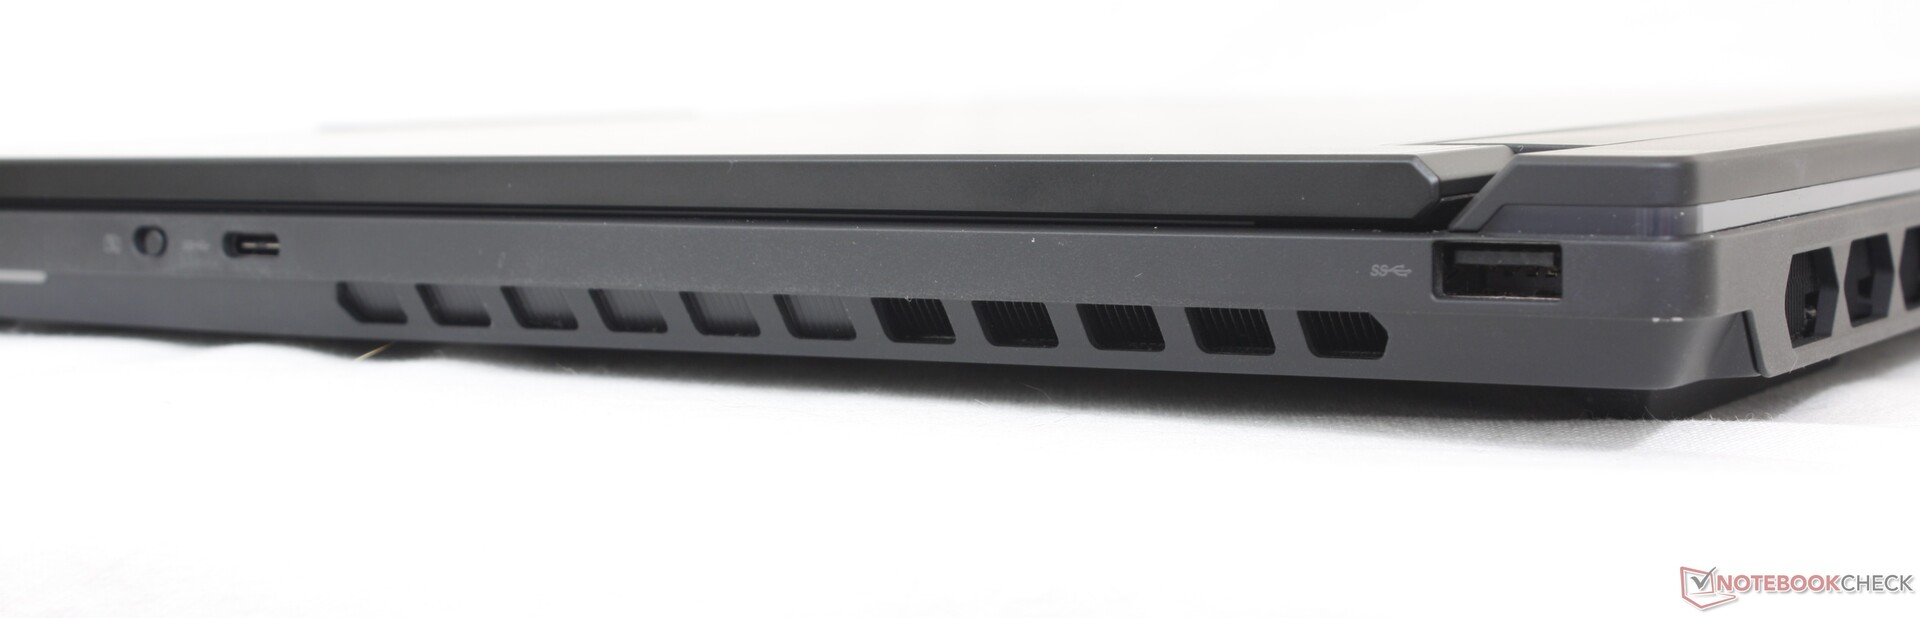
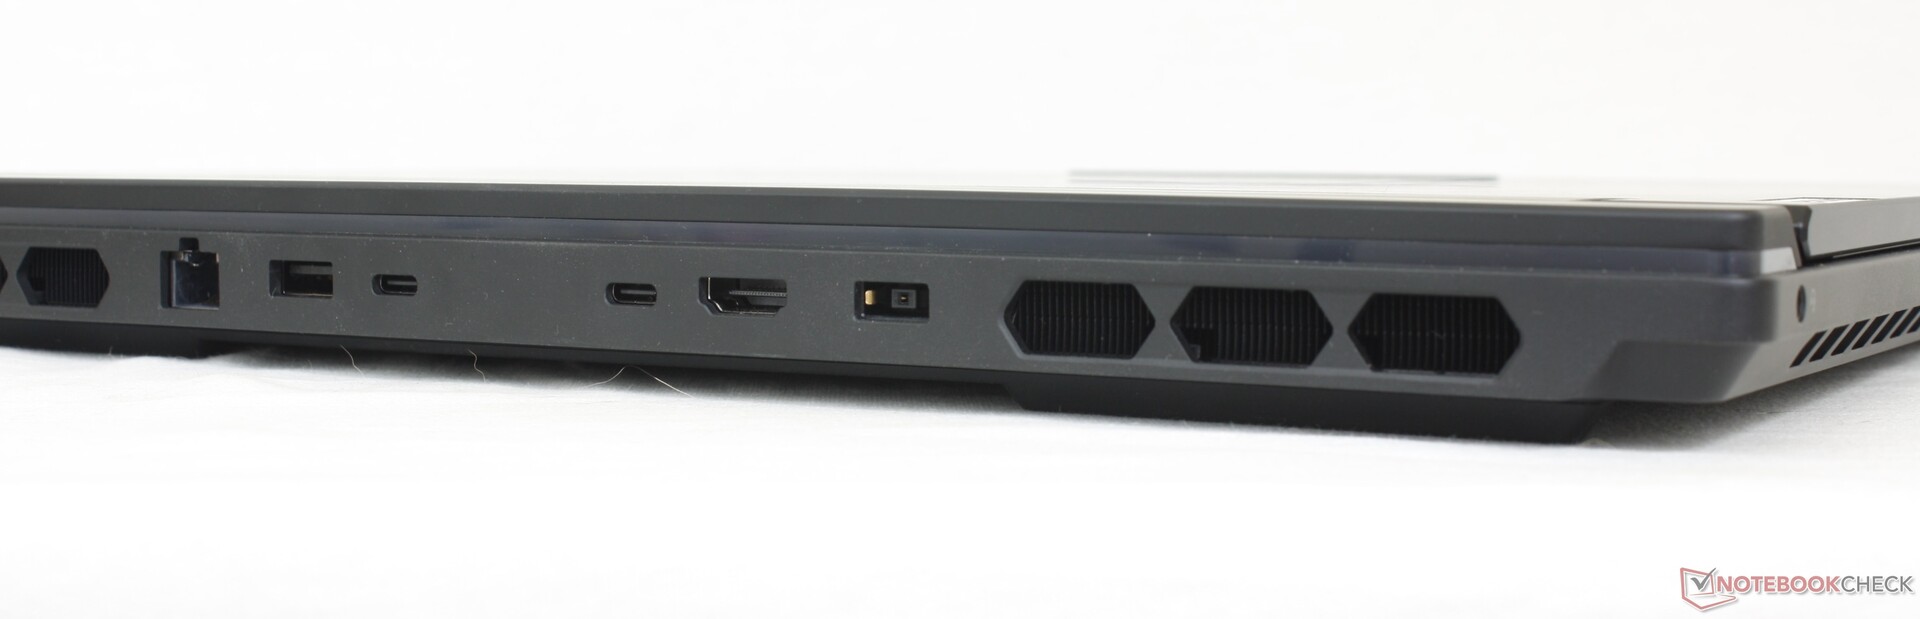
Conectividad: mucho donde elegir
Las opciones de puertos son abundantes con la mayoría de ellos situados a lo largo de la parte trasera en lugar de los laterales. Sin embargo, a diferencia de los puertos traseros del Alienware X16 R1, los puertos del Lenovo están etiquetados individualmente con indicadores LED para facilitar el acceso.
Sólo los dos puertos USB-C traseros se pueden utilizar para monitores externos o para recargar el portátil a través de Power Delivery. El tercer puerto USB-C a lo largo del borde derecho es sólo para datos y para cargar dispositivos externos.
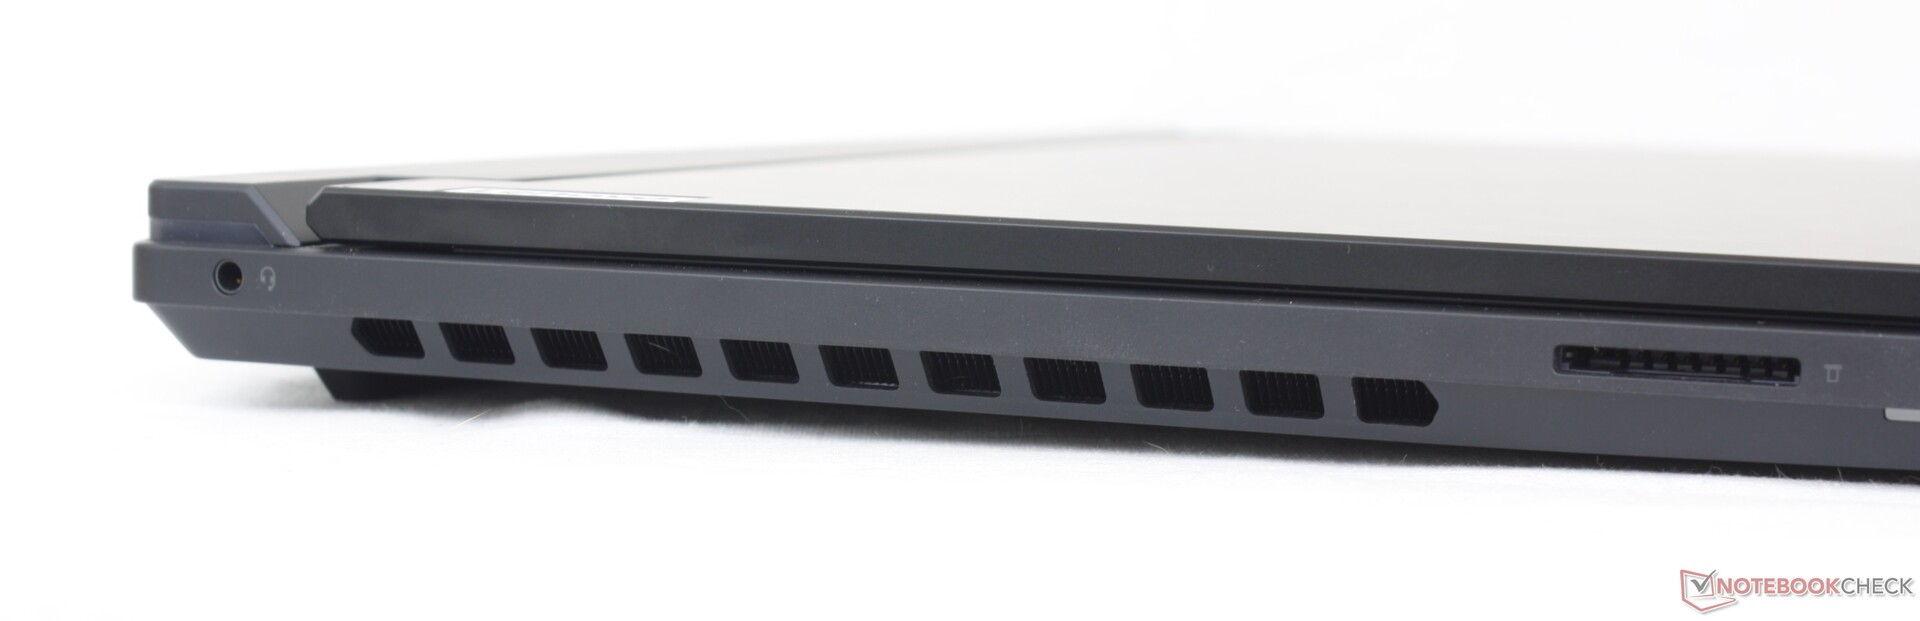
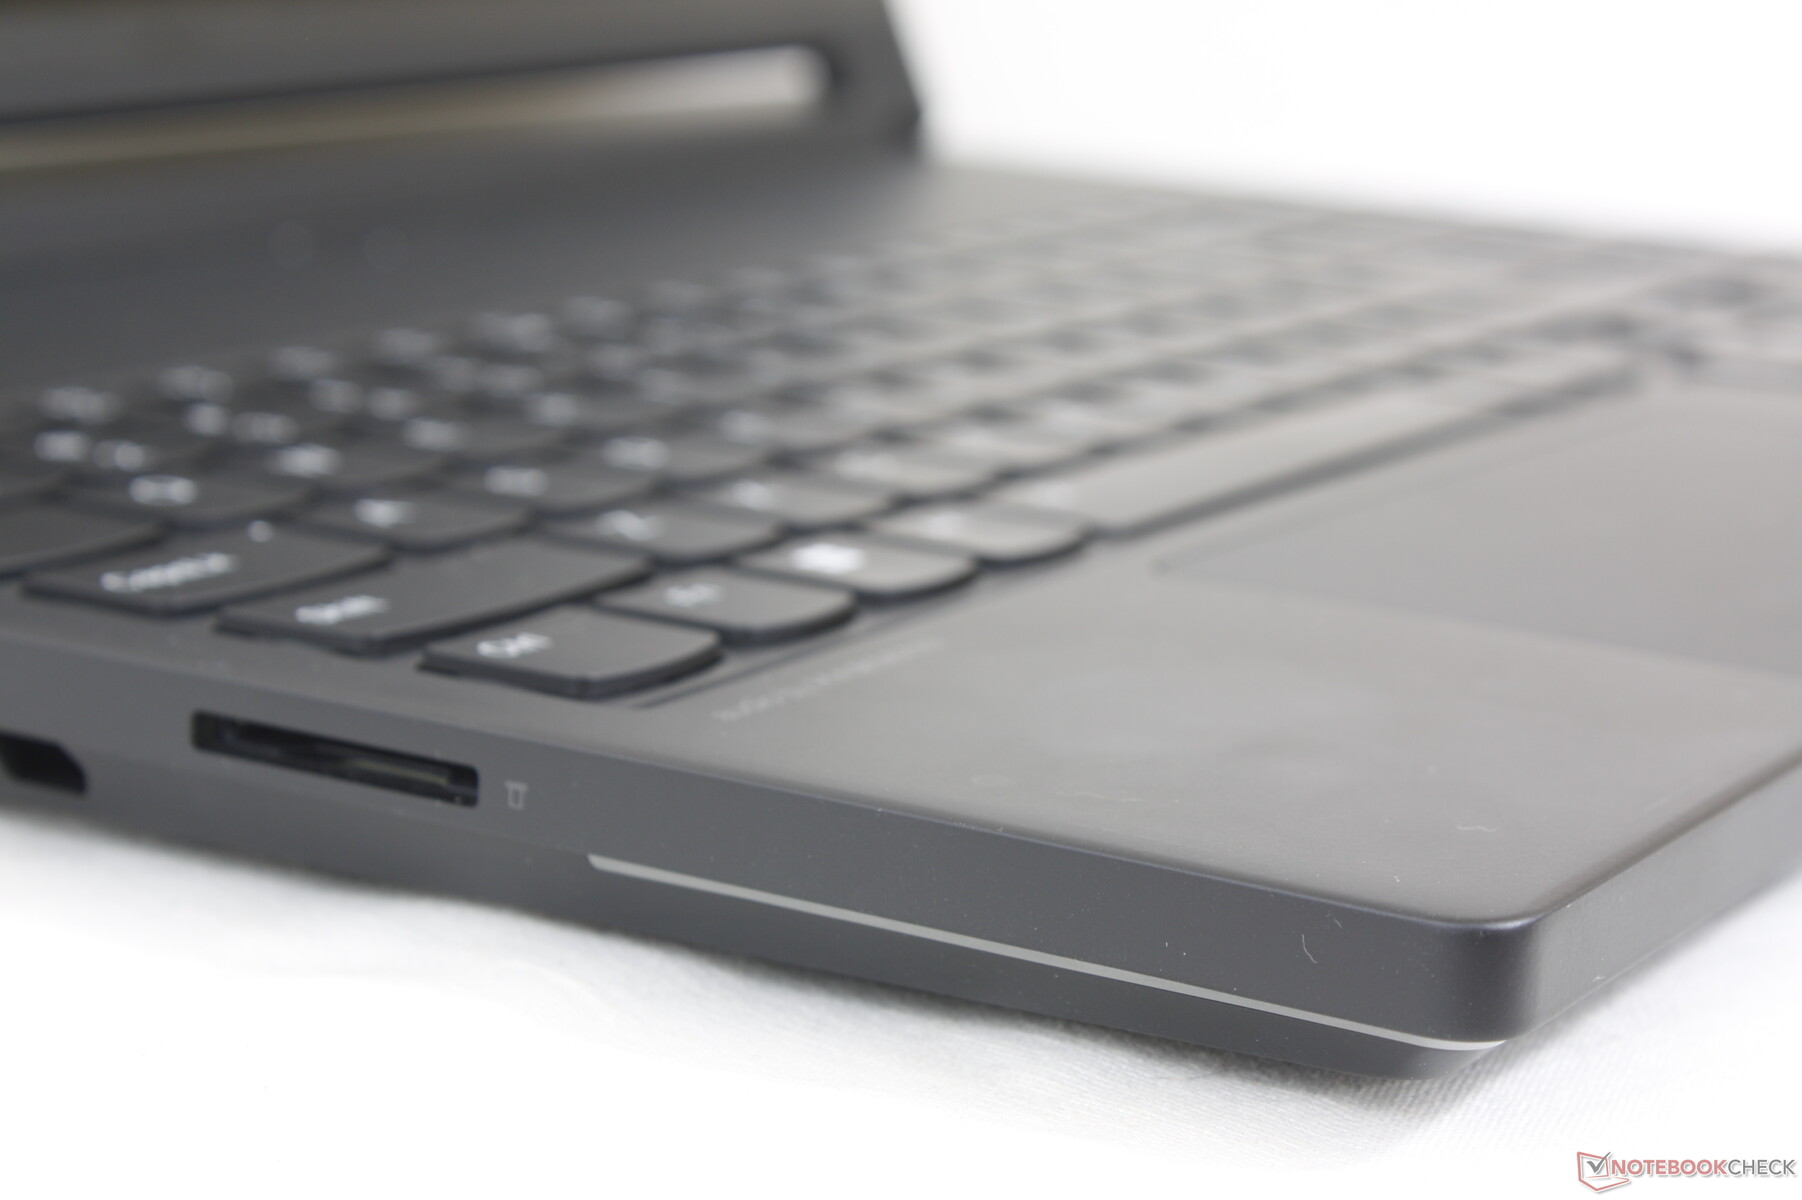
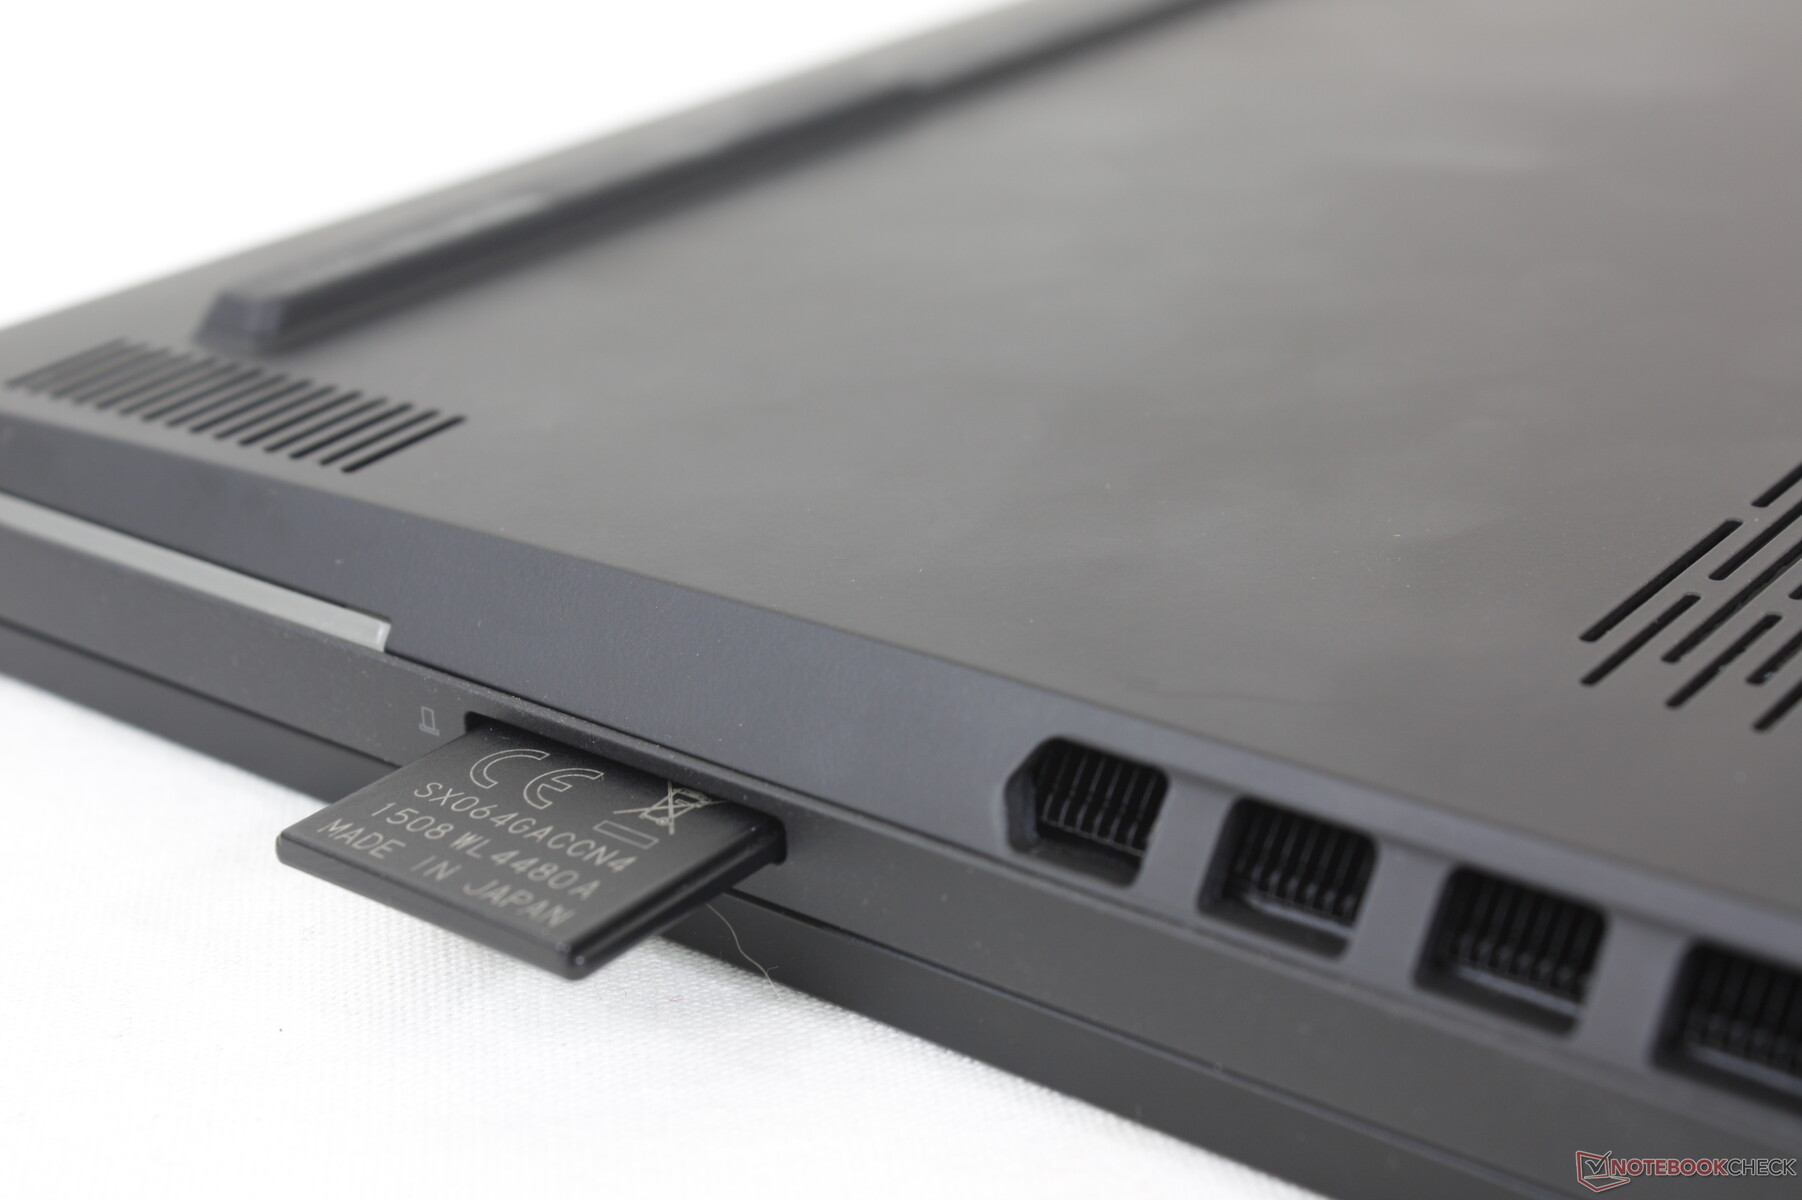
Lector de tarjetas SD
El lector SD integrado es una intención para atraer a los creadores de contenidos tanto como a los jugadores hardcore a la Legion 9i. Sin embargo, las tasas de transferencia no son tan buenas, con menos de la mitad de velocidad que el lector SD delRazer Blade 16.
| SD Card Reader | |
| average JPG Copy Test (av. of 3 runs) | |
| Razer Blade 16 Early 2023 RTX 4090 (Angelbird AV PRO 128 GB V60) | |
| Lenovo Legion 9 16IRX8 (Toshiba Exceria Pro SDXC 64 GB UHS-II) | |
| Alienware x16 R1 (AV PRO microSD 128 GB V60) | |
| Lenovo Legion Slim 5 16APH8 (PNY EliteX-Pro60 V60 256 GB) | |
| maximum AS SSD Seq Read Test (1GB) | |
| Alienware x16 R1 (AV PRO microSD 128 GB V60) | |
| Razer Blade 16 Early 2023 RTX 4090 (Angelbird AV PRO 128 GB V60) | |
| Lenovo Legion 9 16IRX8 (Toshiba Exceria Pro SDXC 64 GB UHS-II) | |
| Lenovo Legion Slim 5 16APH8 (PNY EliteX-Pro60 V60 256 GB) | |
Comunicación
El Killer AX1675i viene de serie que es la marca de juegos para el AX211 regular. Soporta Wi-Fi 6E y Bluetooth 5.3 y no experimentamos ningún problema de conectividad cuando lo emparejamos a nuestra red Asus AXE11000 de 6 GHz.
Cámara web
La cámara web de 2 MP es estándar para la categoría de portátiles para juegos. Aunque hay un interruptor de apagado de cámara integrado, no hay sensor de infrarrojos.

")
")
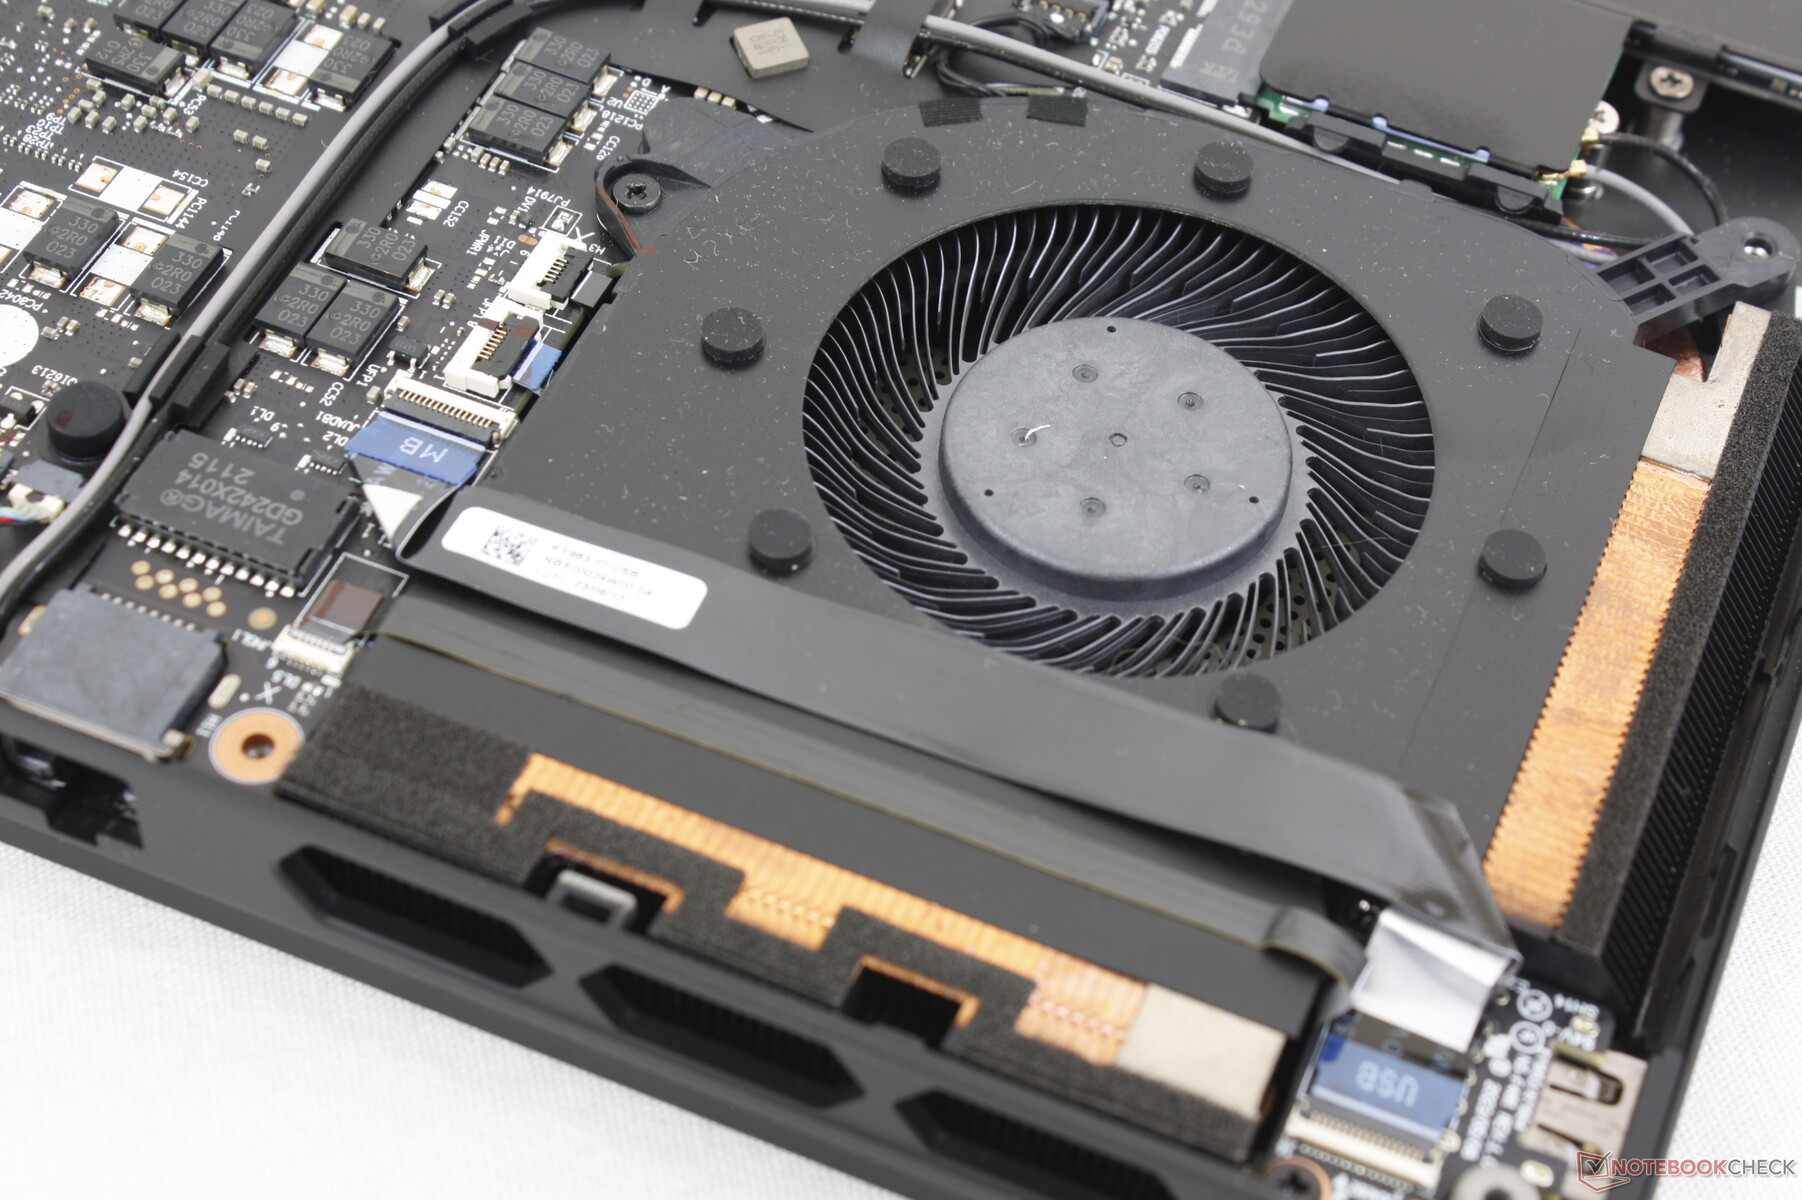
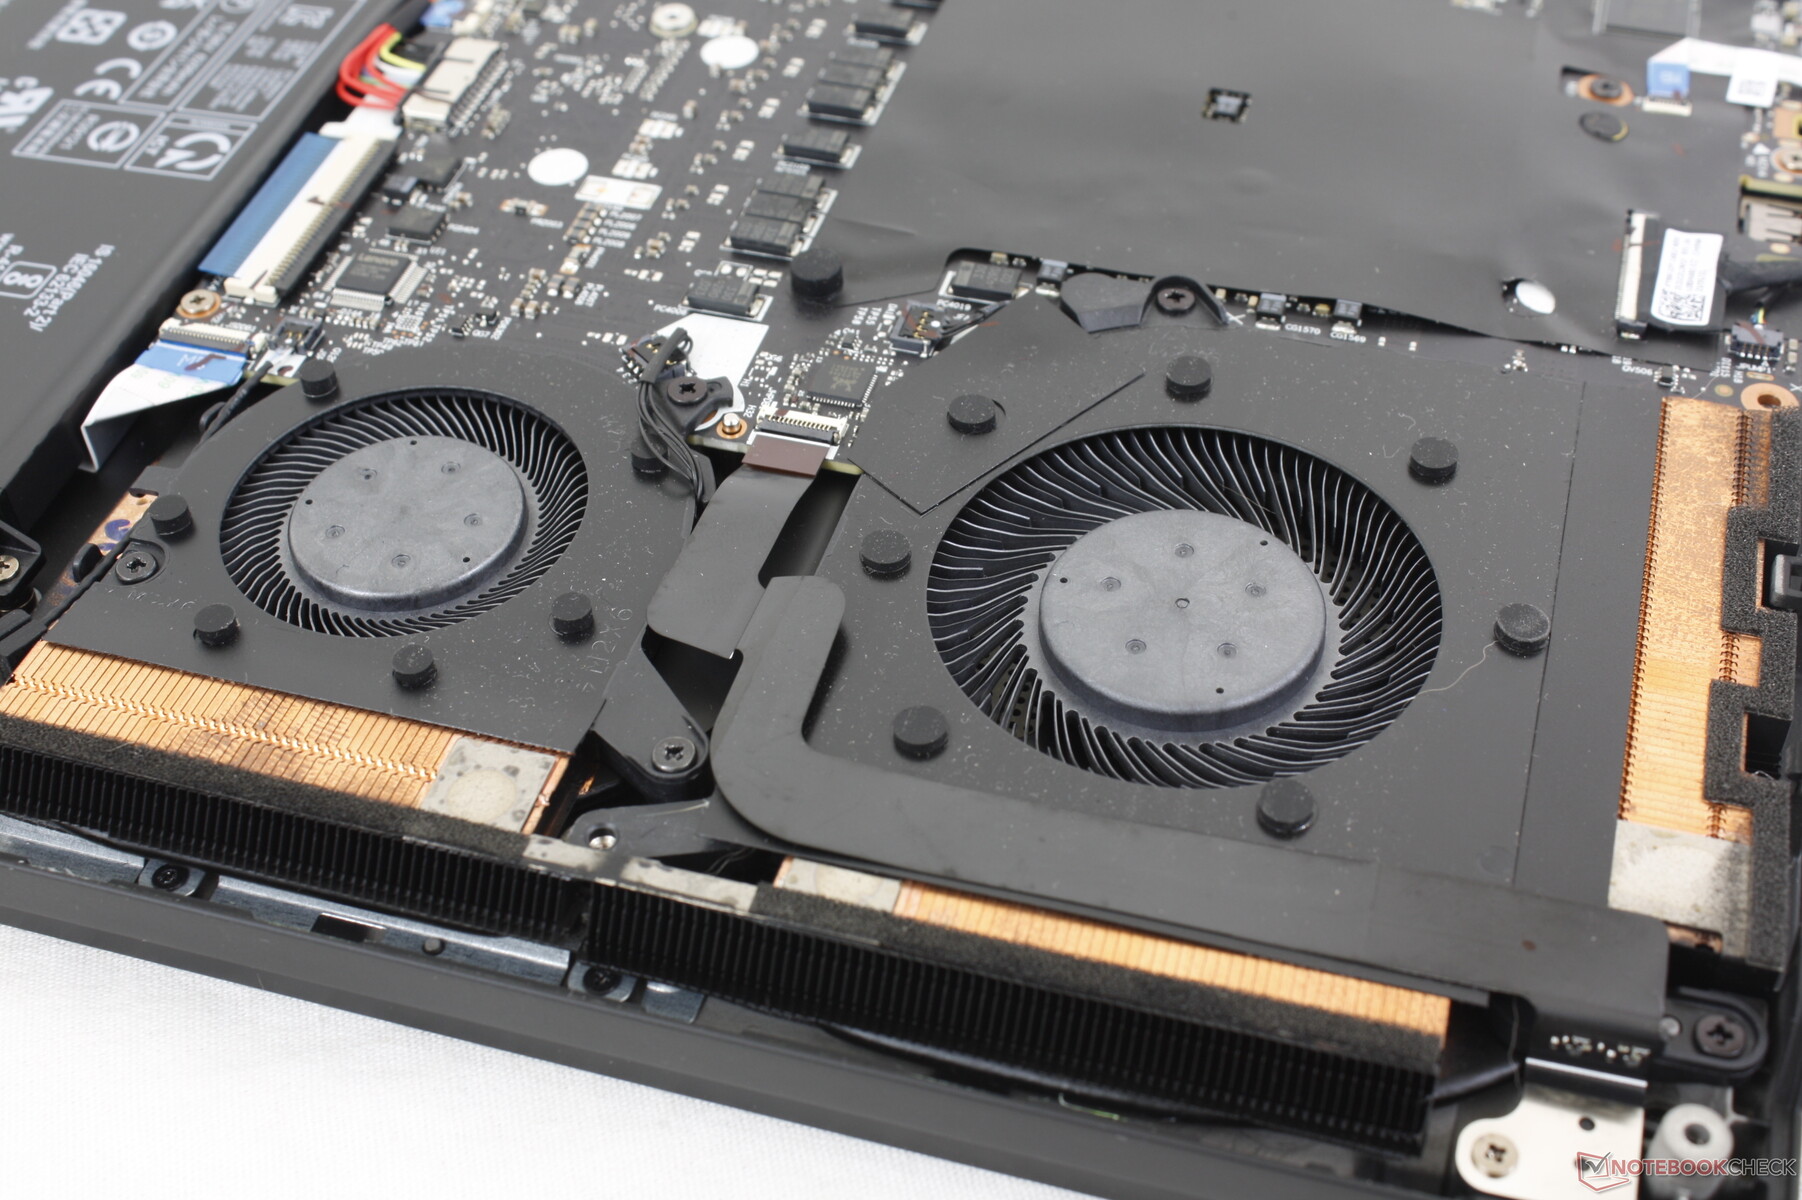
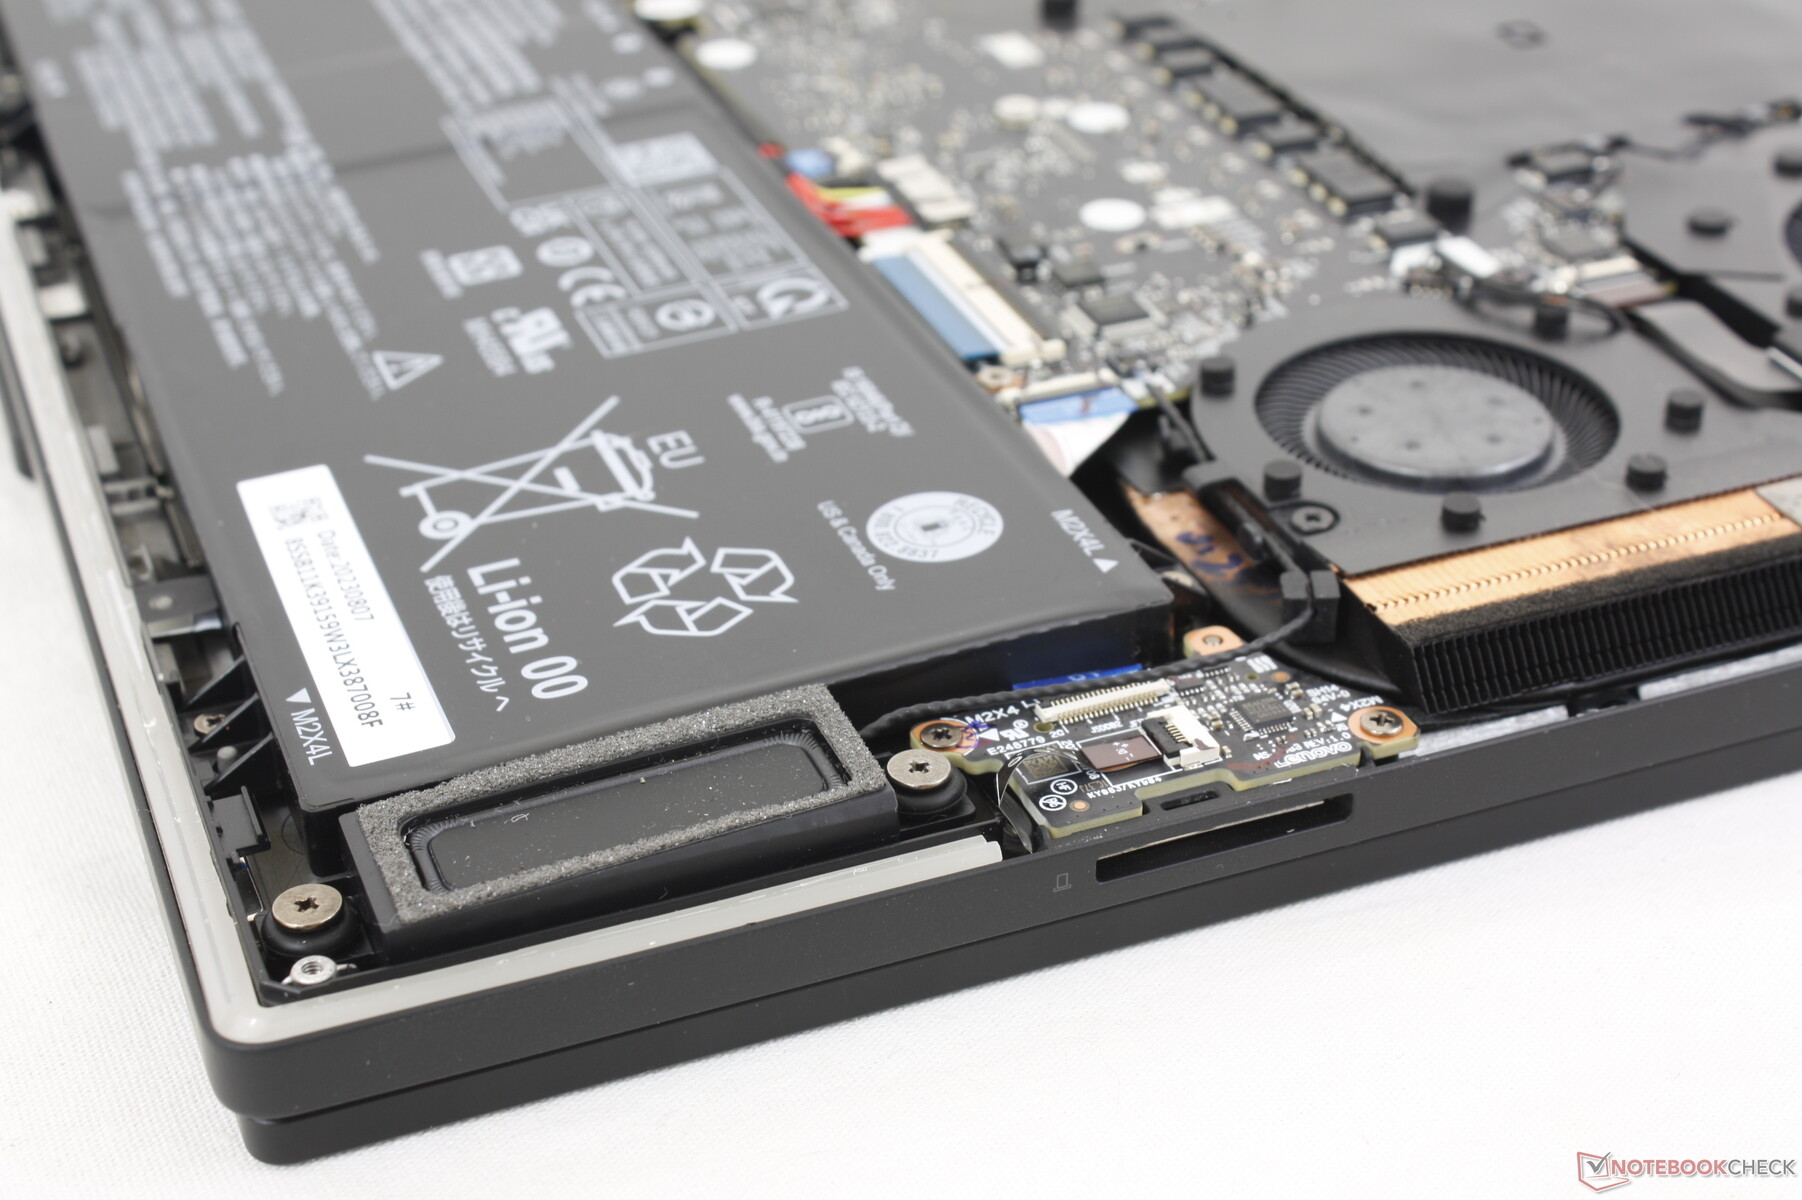
Mantenimiento
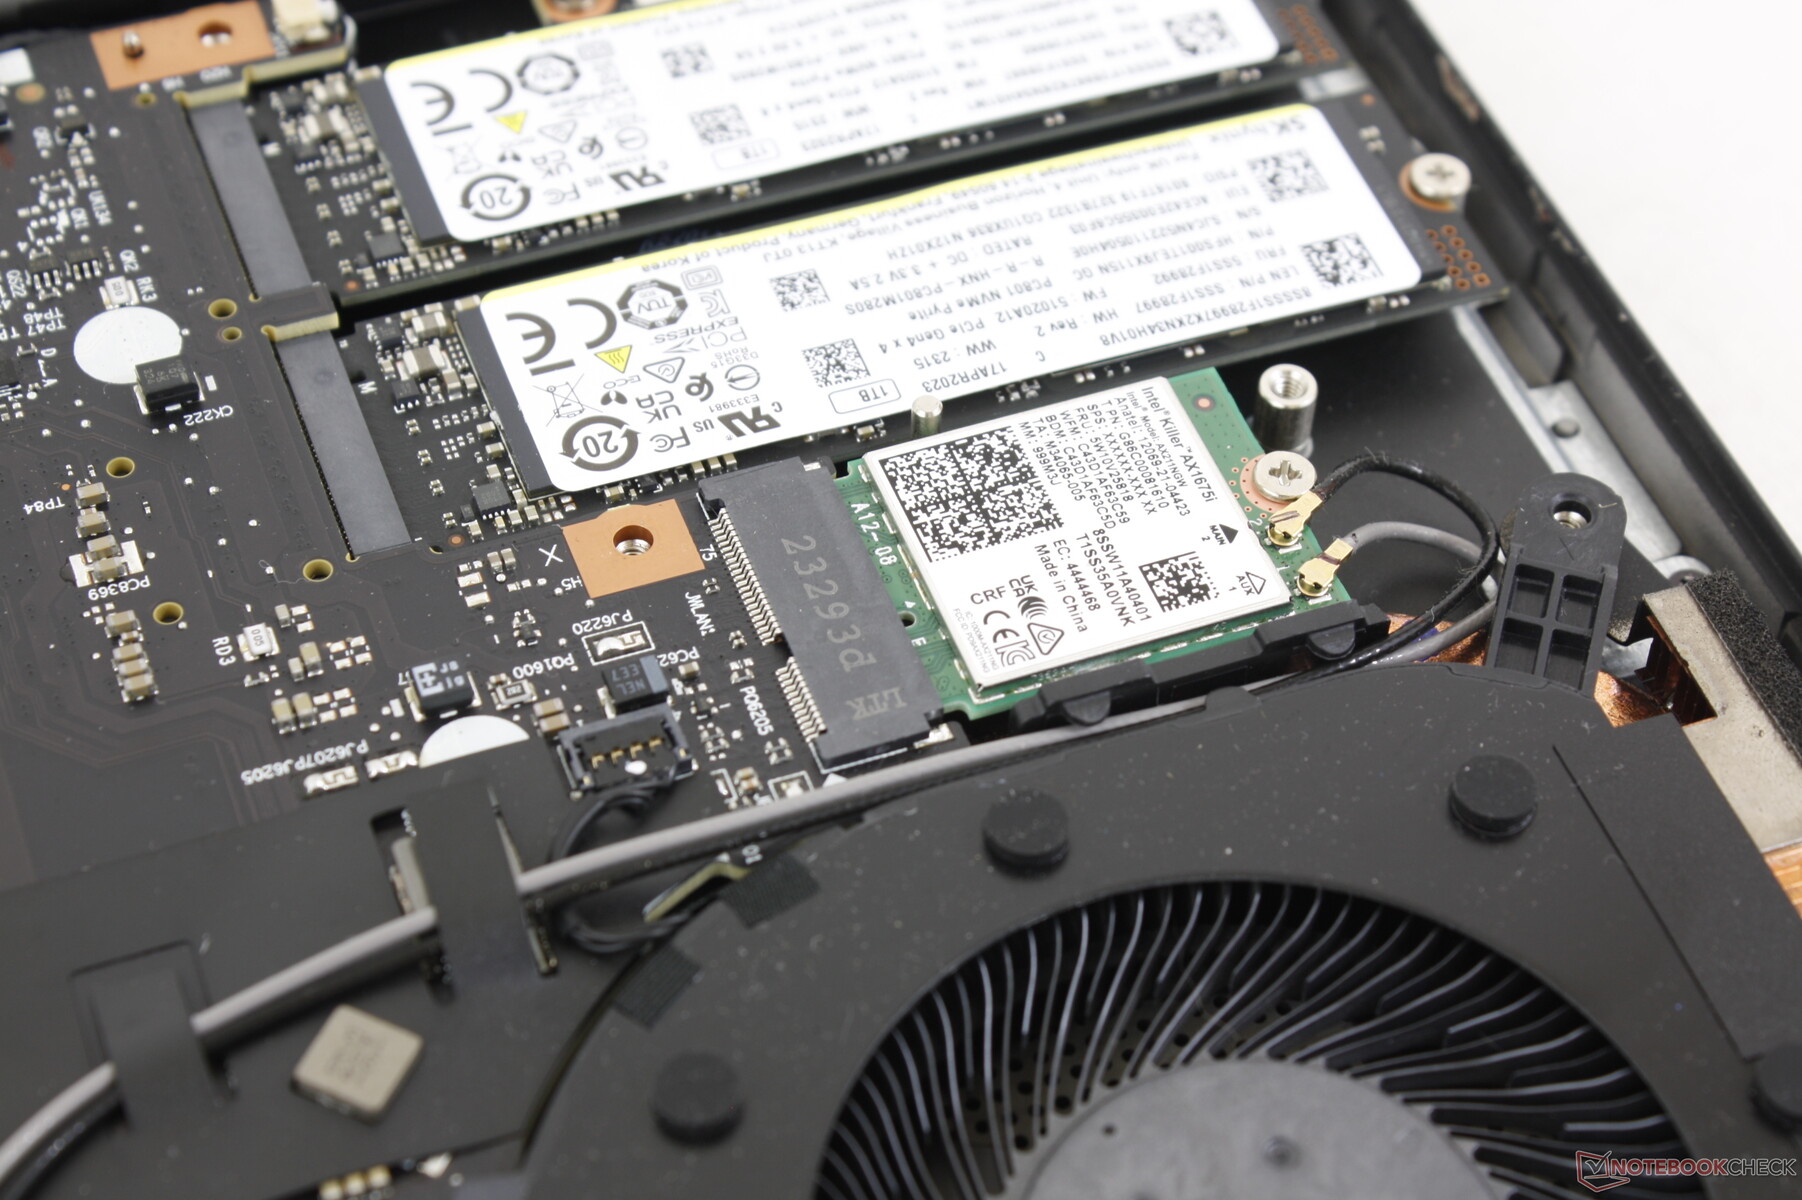
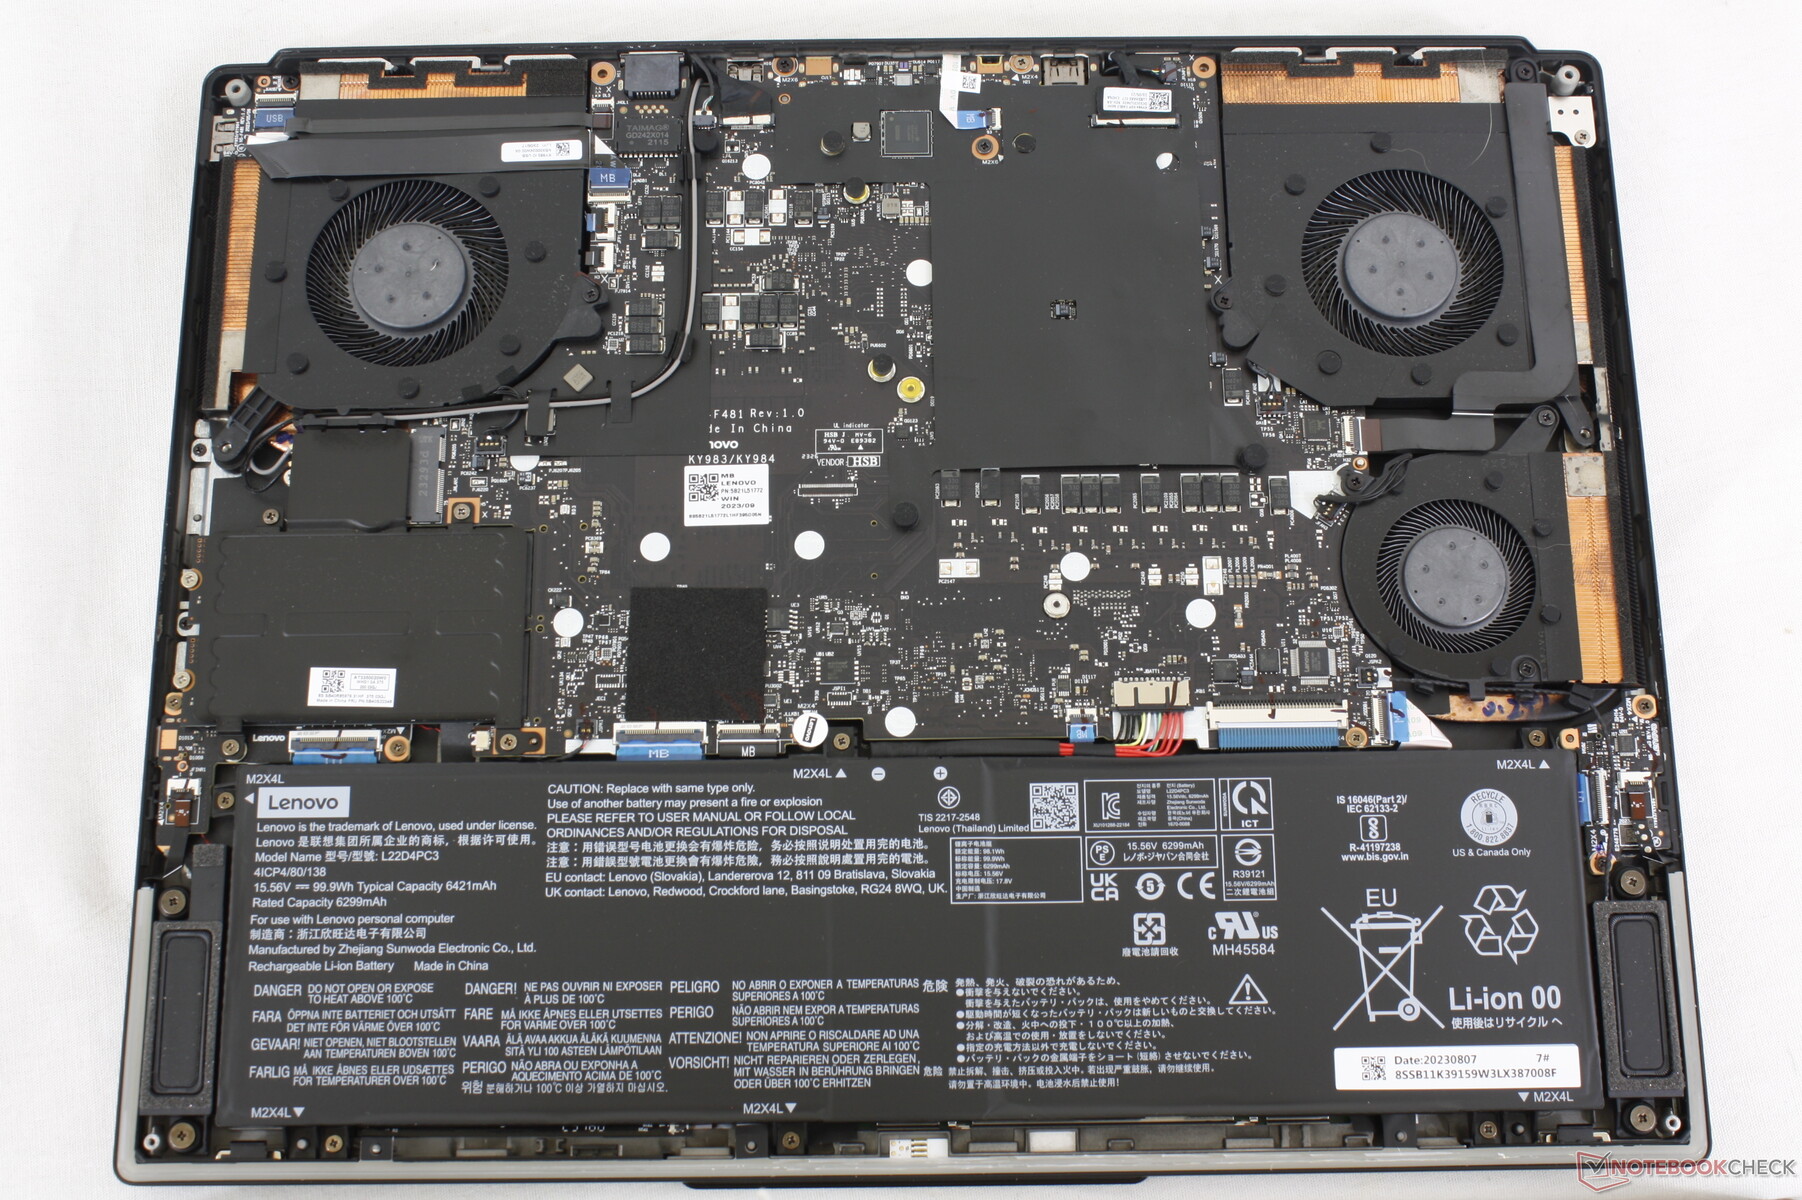
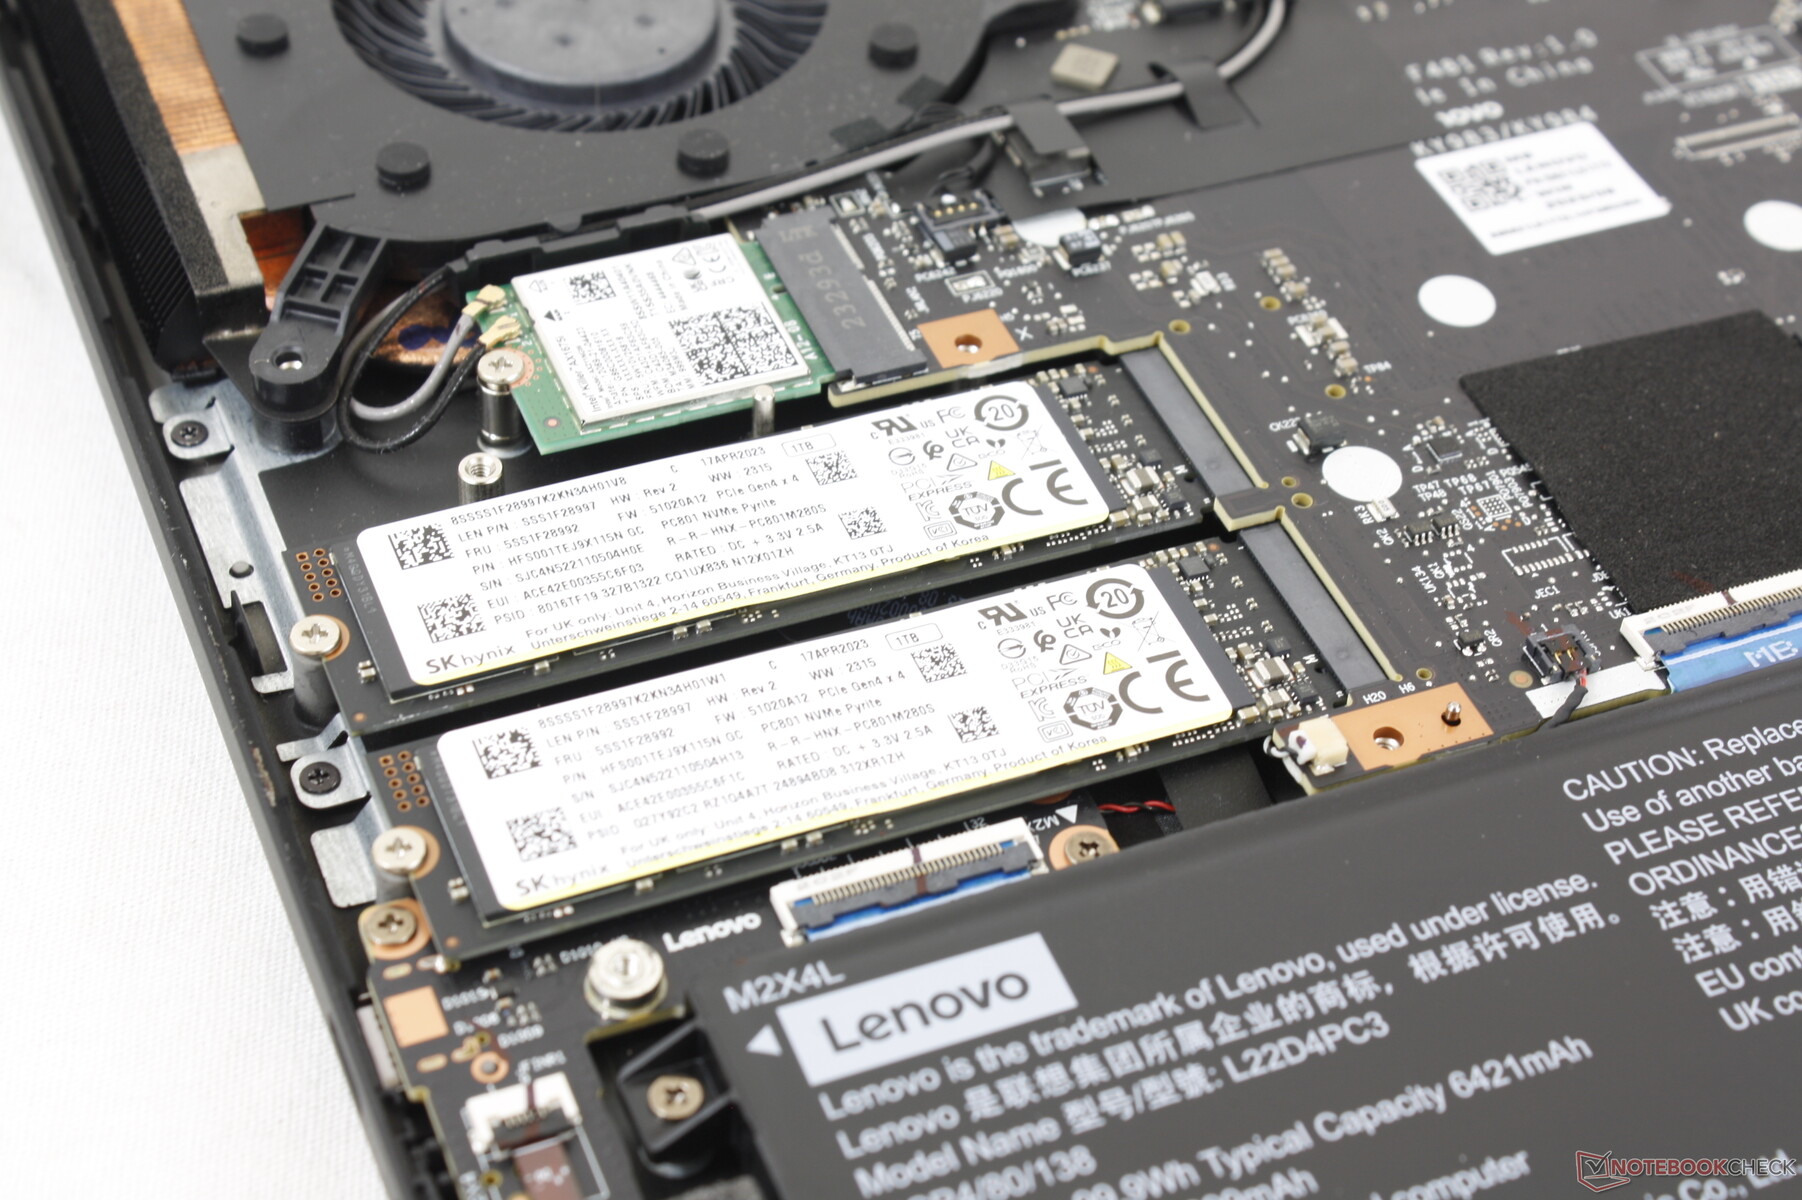
El panel inferior está asegurado por 8 tornillos Phillips que permiten desmontarlo con relativa facilidad. A diferencia de la mayoría de portátiles, la placa base del Legion 9 16 está al revés, por lo que es necesario desmontarla más a fondo para acceder a los módulos RAM de la solución de refrigeración. Al menos las dos ranuras M.2 2280 SSD son fácilmente accesibles.
Accesorios y garantía
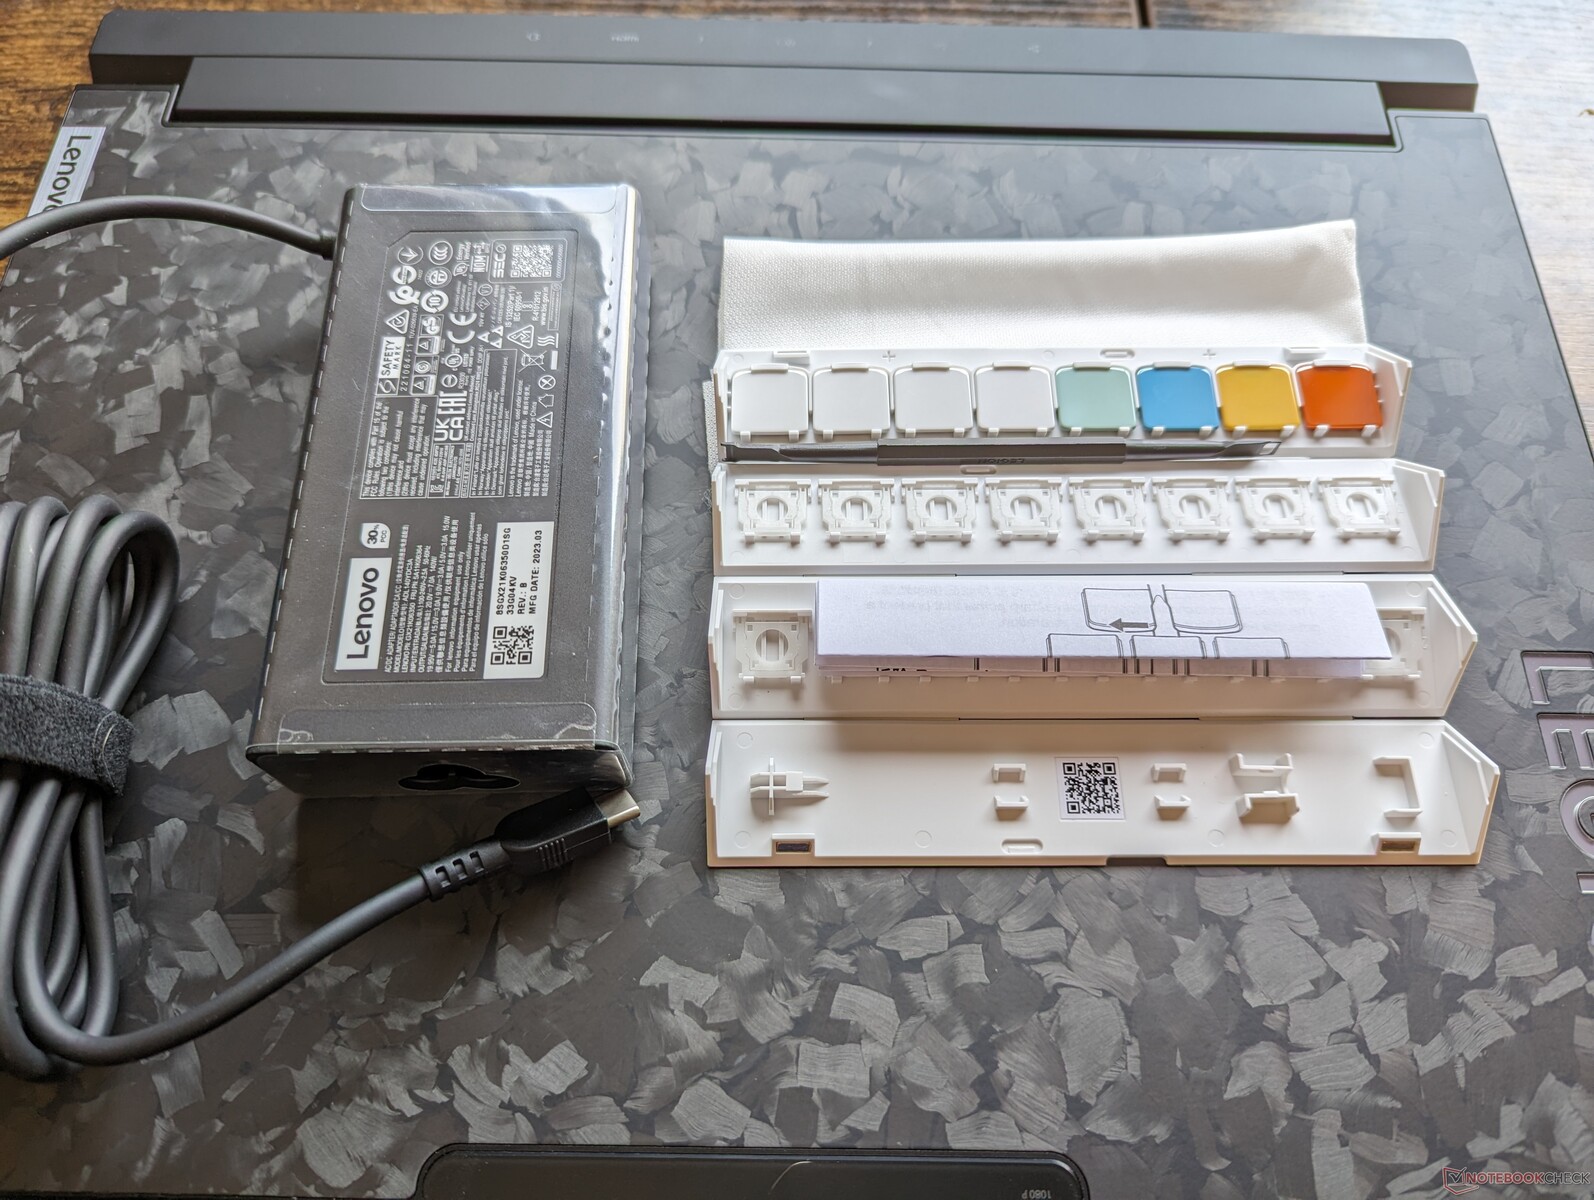
Además del habitual adaptador de CA propietario y la documentación, la caja de venta al público también incluye un adaptador universal USB-C de 140 W muy práctico que puede utilizarse para cargar este portátil y la mayoría de los demás dispositivos USB-C y 8 teclas.
Se aplica la garantía limitada estándar del fabricante de un año si se adquiere en EE.UU.
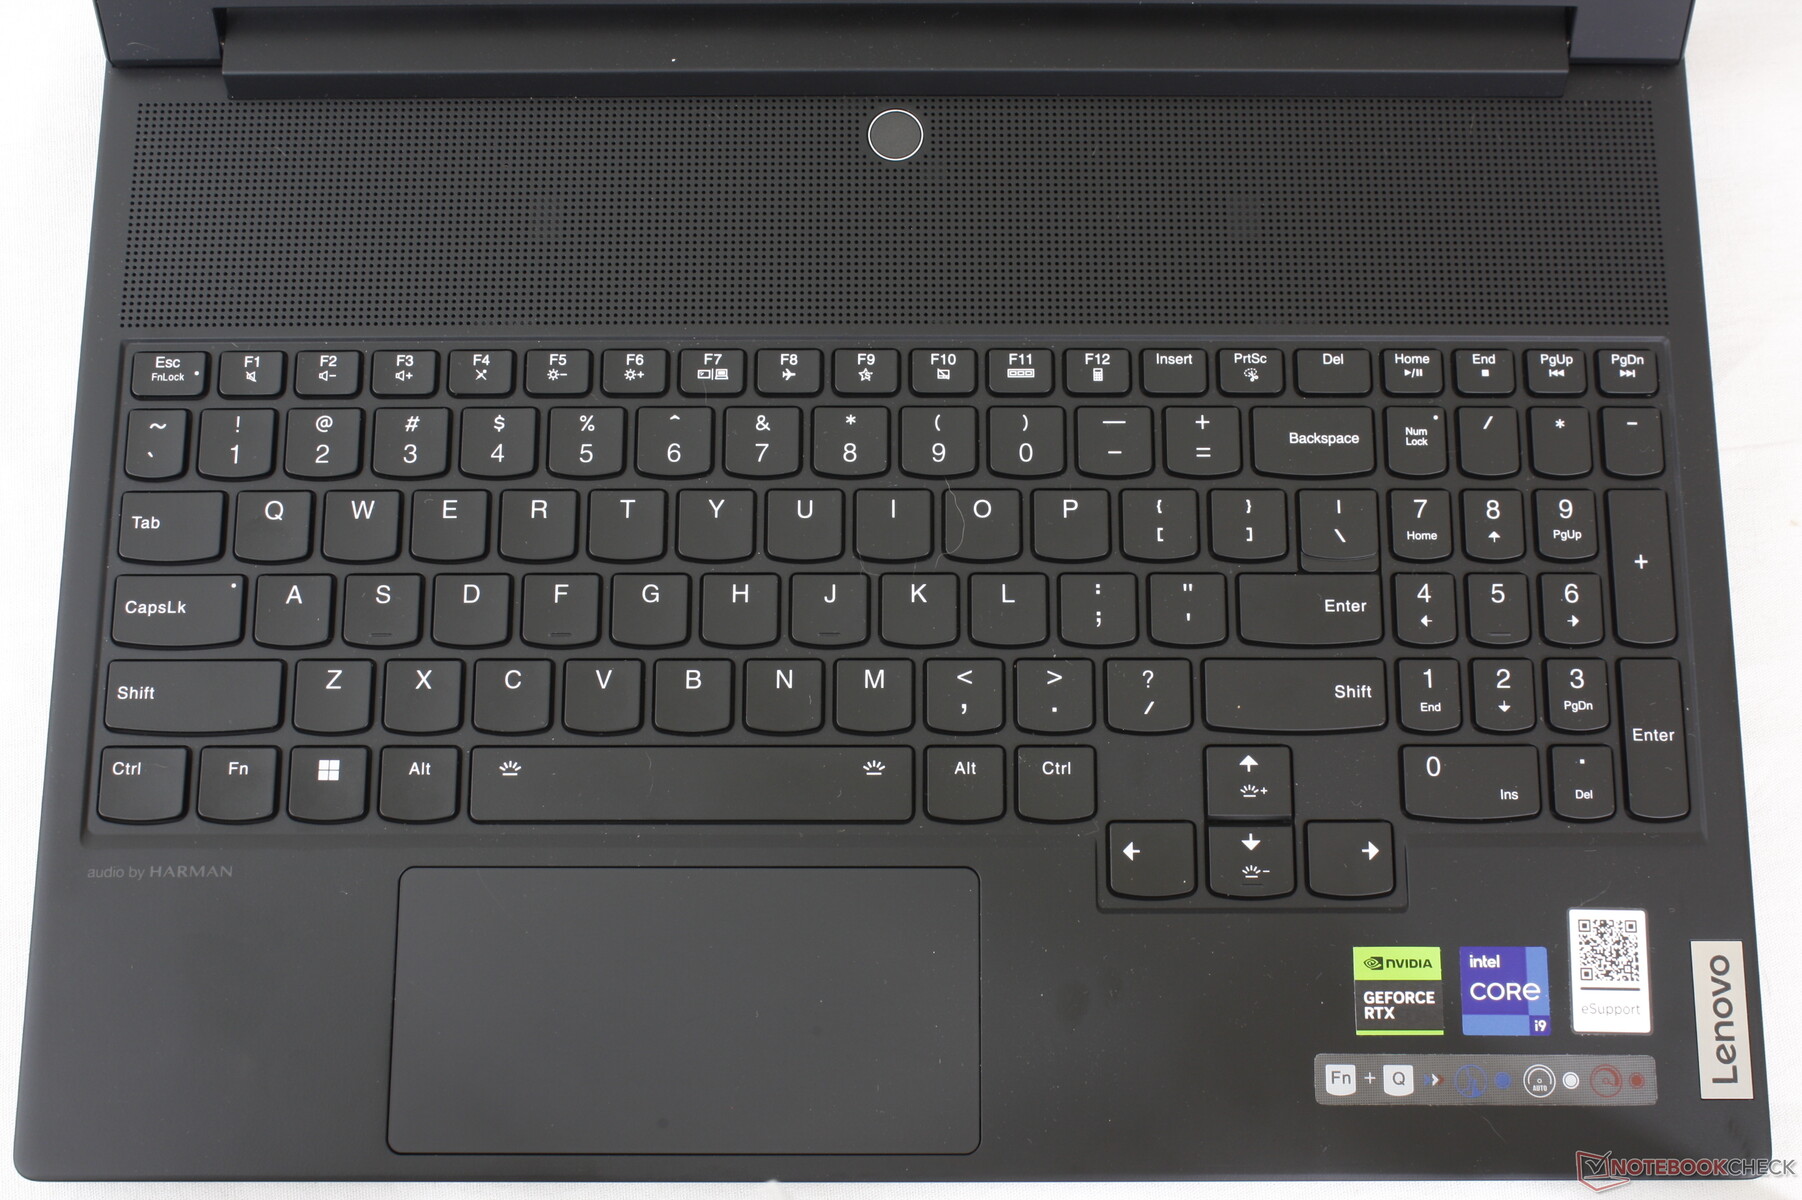
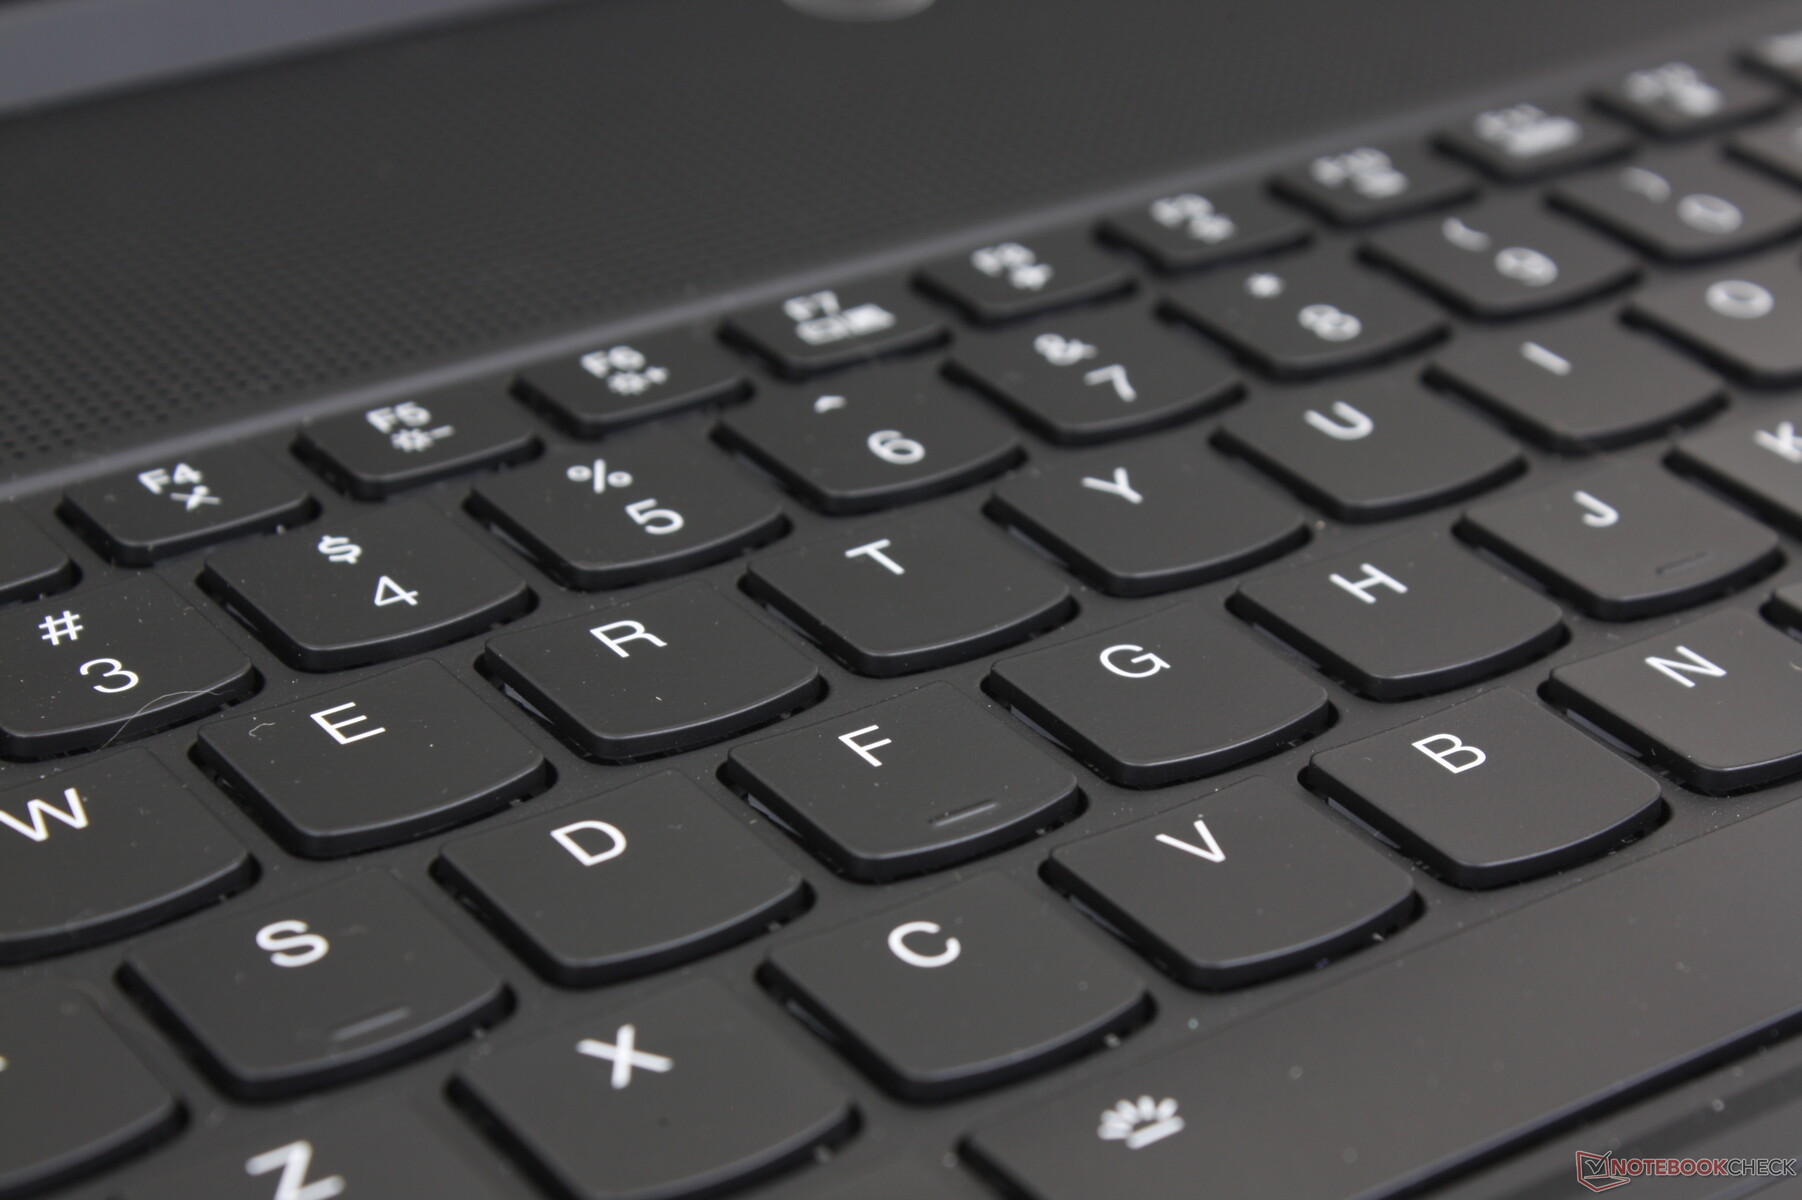
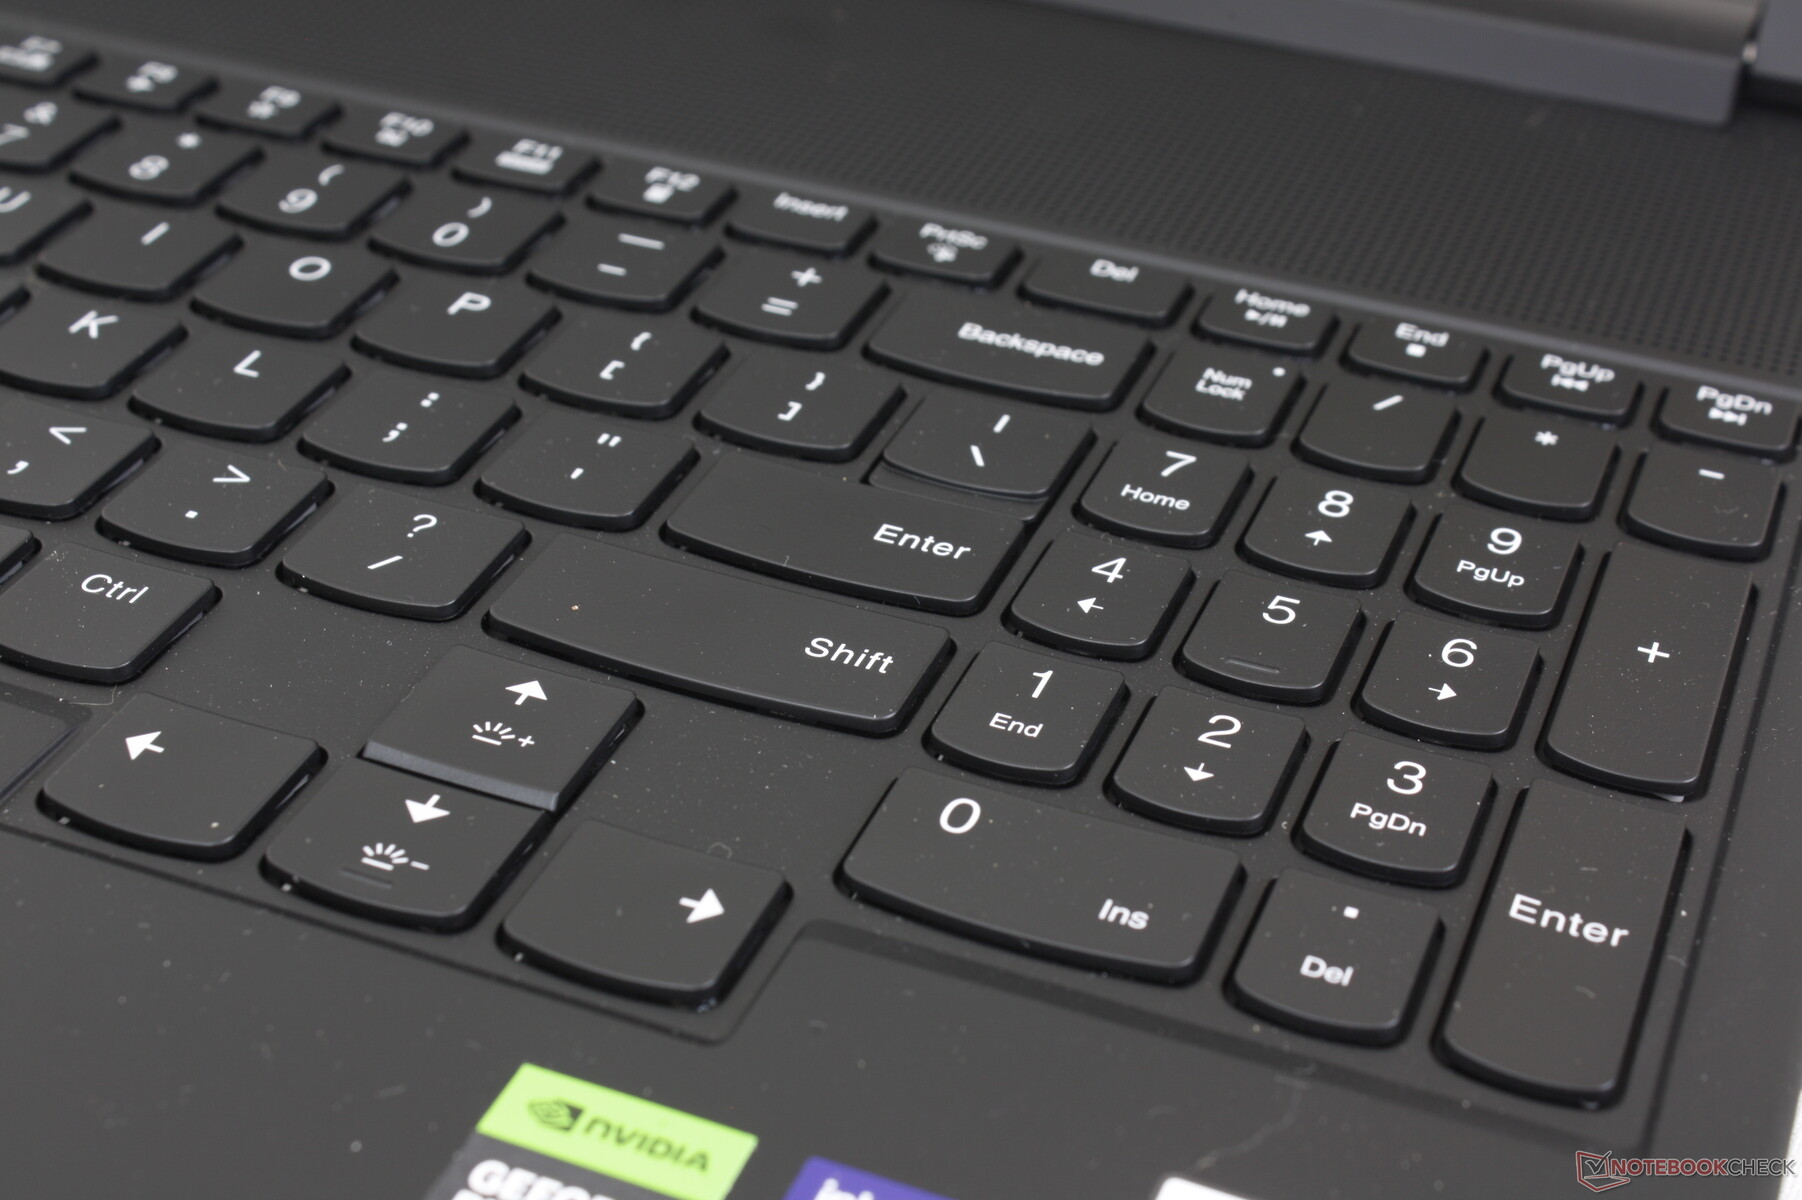
Dispositivos de entrada - Teclado cómodo con teclado estrecho
Teclado
El teclado TrueStrike ofrece un recorrido de tecla de 1,5 mm para ser ligeramente más profundo que las teclas de la mayoría de los Ultrabooks. La respuesta es sorprendentemente nítida y cómoda para unas teclas basadas en membrana, lo que demuestra que no necesita interruptores mecánicos de lujo para una buena experiencia de mecanografía. Las teclas firmes son más ruidosas que las del Blade 16 o el Asus Zephyrus M16 pero definitivamente no tan cliqueantes como las teclas mecánicas de modelos como el Schenker XMG Neo 15 o el Alienware m18.
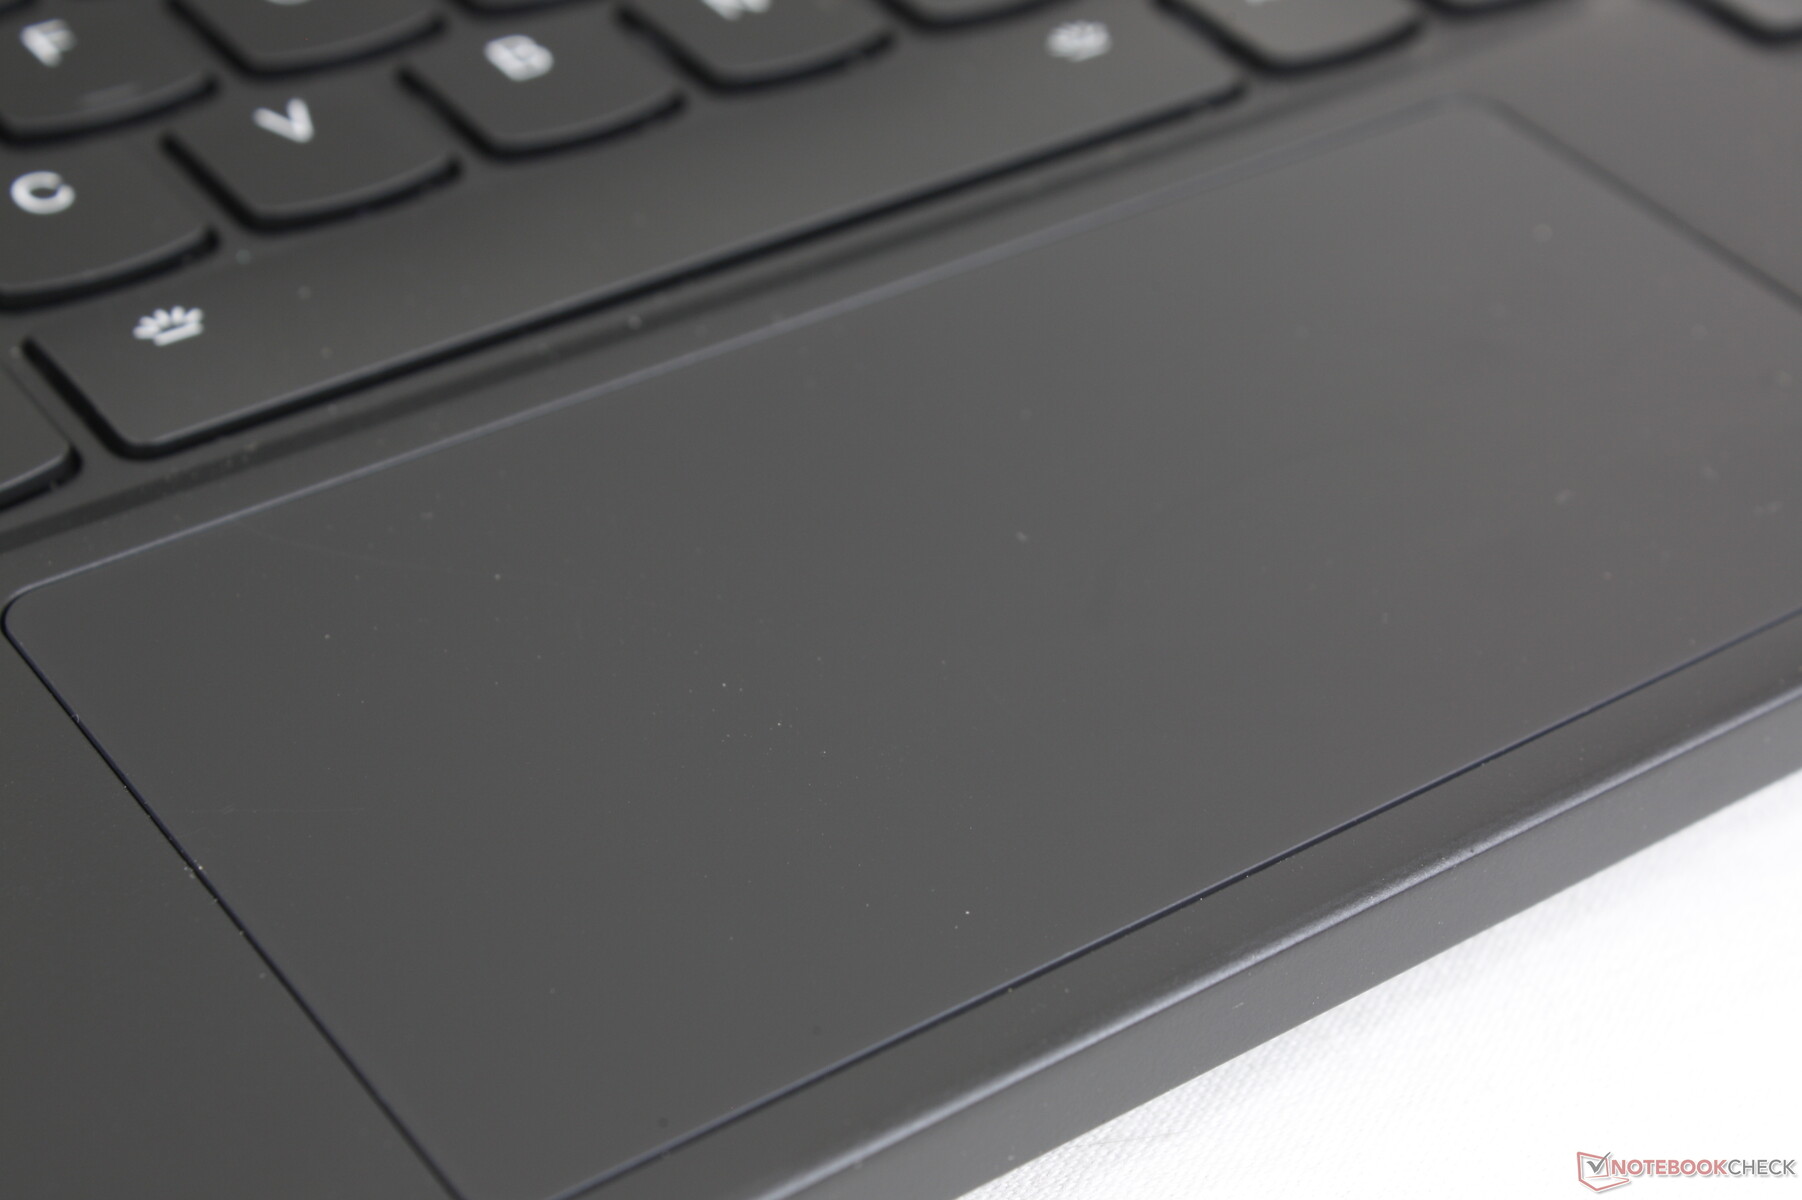
Panel táctil
El tamaño del clickpad se ha reducido a sólo (12 x 5,9 cm) debido a la colocación del teclado. Los movimientos verticales del cursor en la alta pantalla 16:10 se sienten estrechos como resultado, especialmente en comparación con los portátiles para juegos con clickpads mucho más grandes como el Razer Blade 16lenovo apuesta por que los jugadores utilicen sus propios ratones USB o Bluetooth para la gran mayoría de los escenarios.
Por lo demás, el deslizamiento y el clic son suaves y con un clic satisfactorio a pesar de la pequeña superficie. Sin embargo, los movimientos del cursor se congelaban ocasionalmente en nuestra unidad al utilizar el clickpad mientras que el mismo problema no ocurría al utilizar un ratón externo. Le recomendamos que compruebe el clickpad al comprarlo para asegurarse de que no tiene ningún defecto.
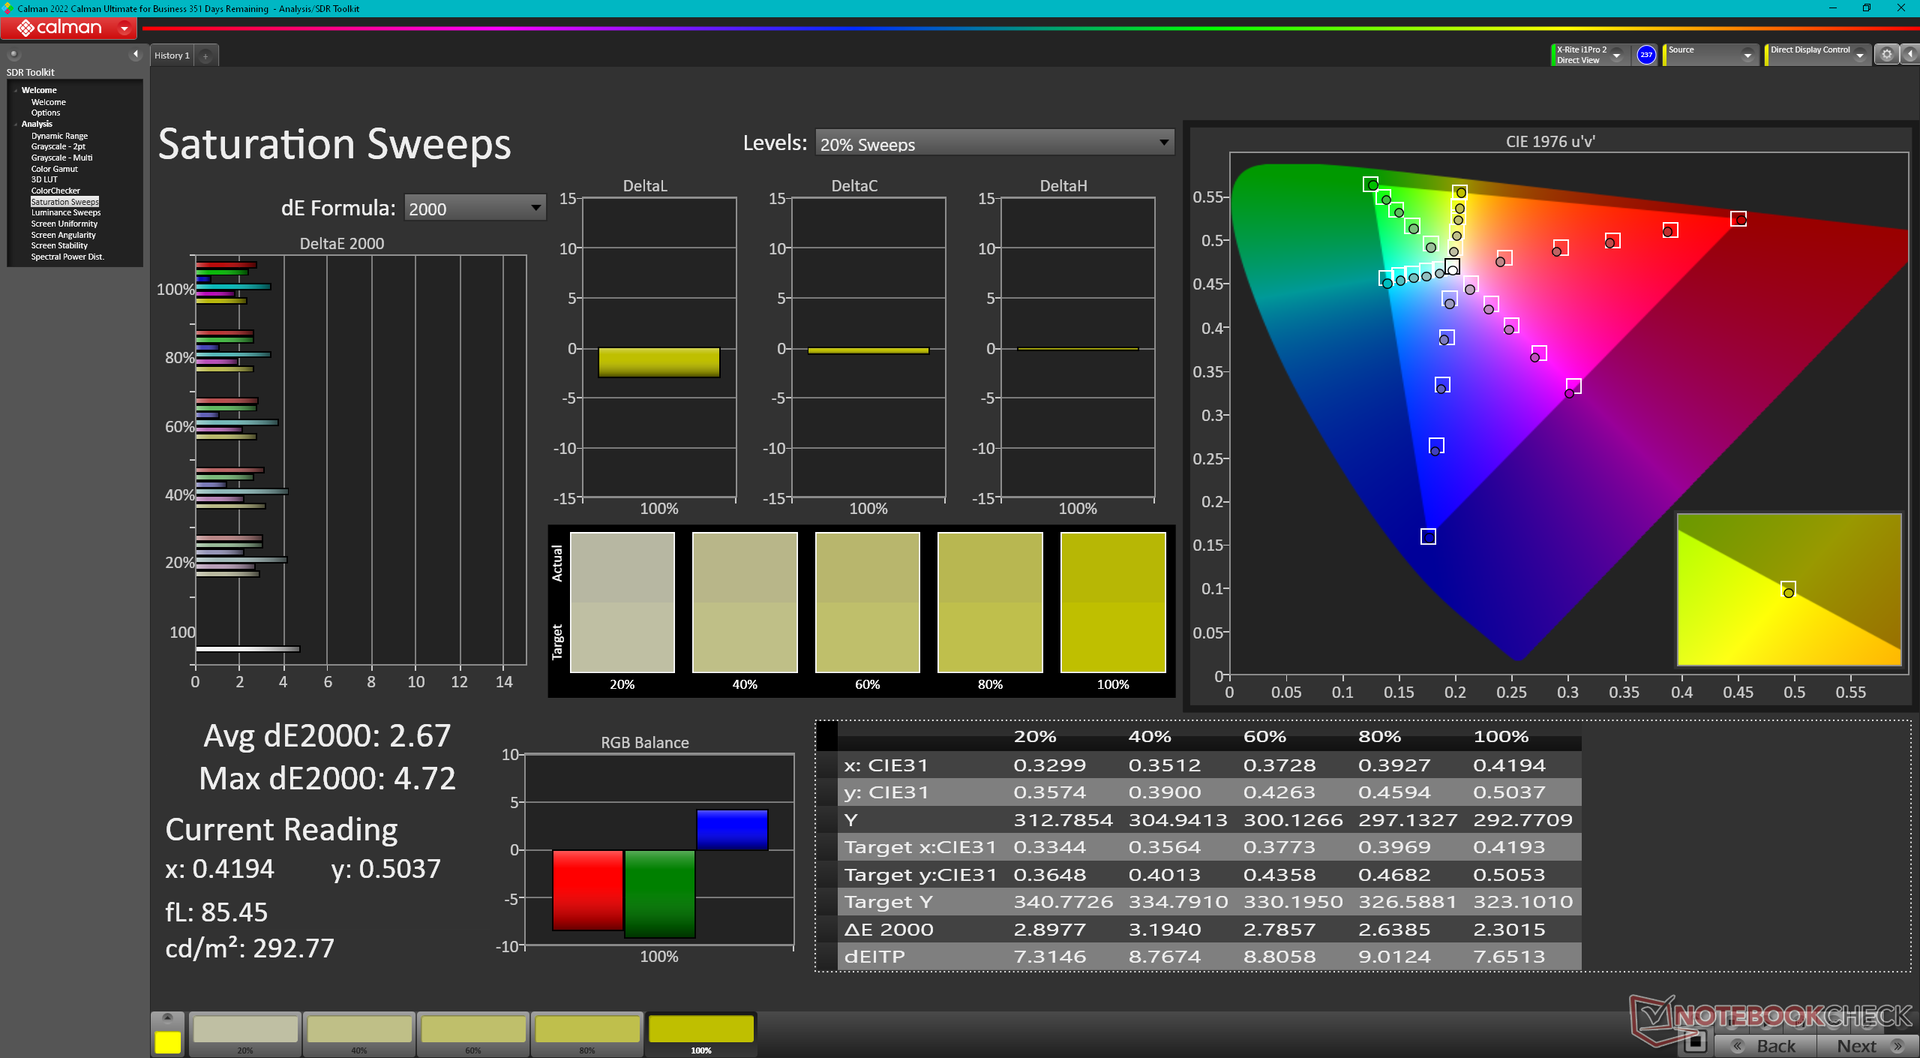
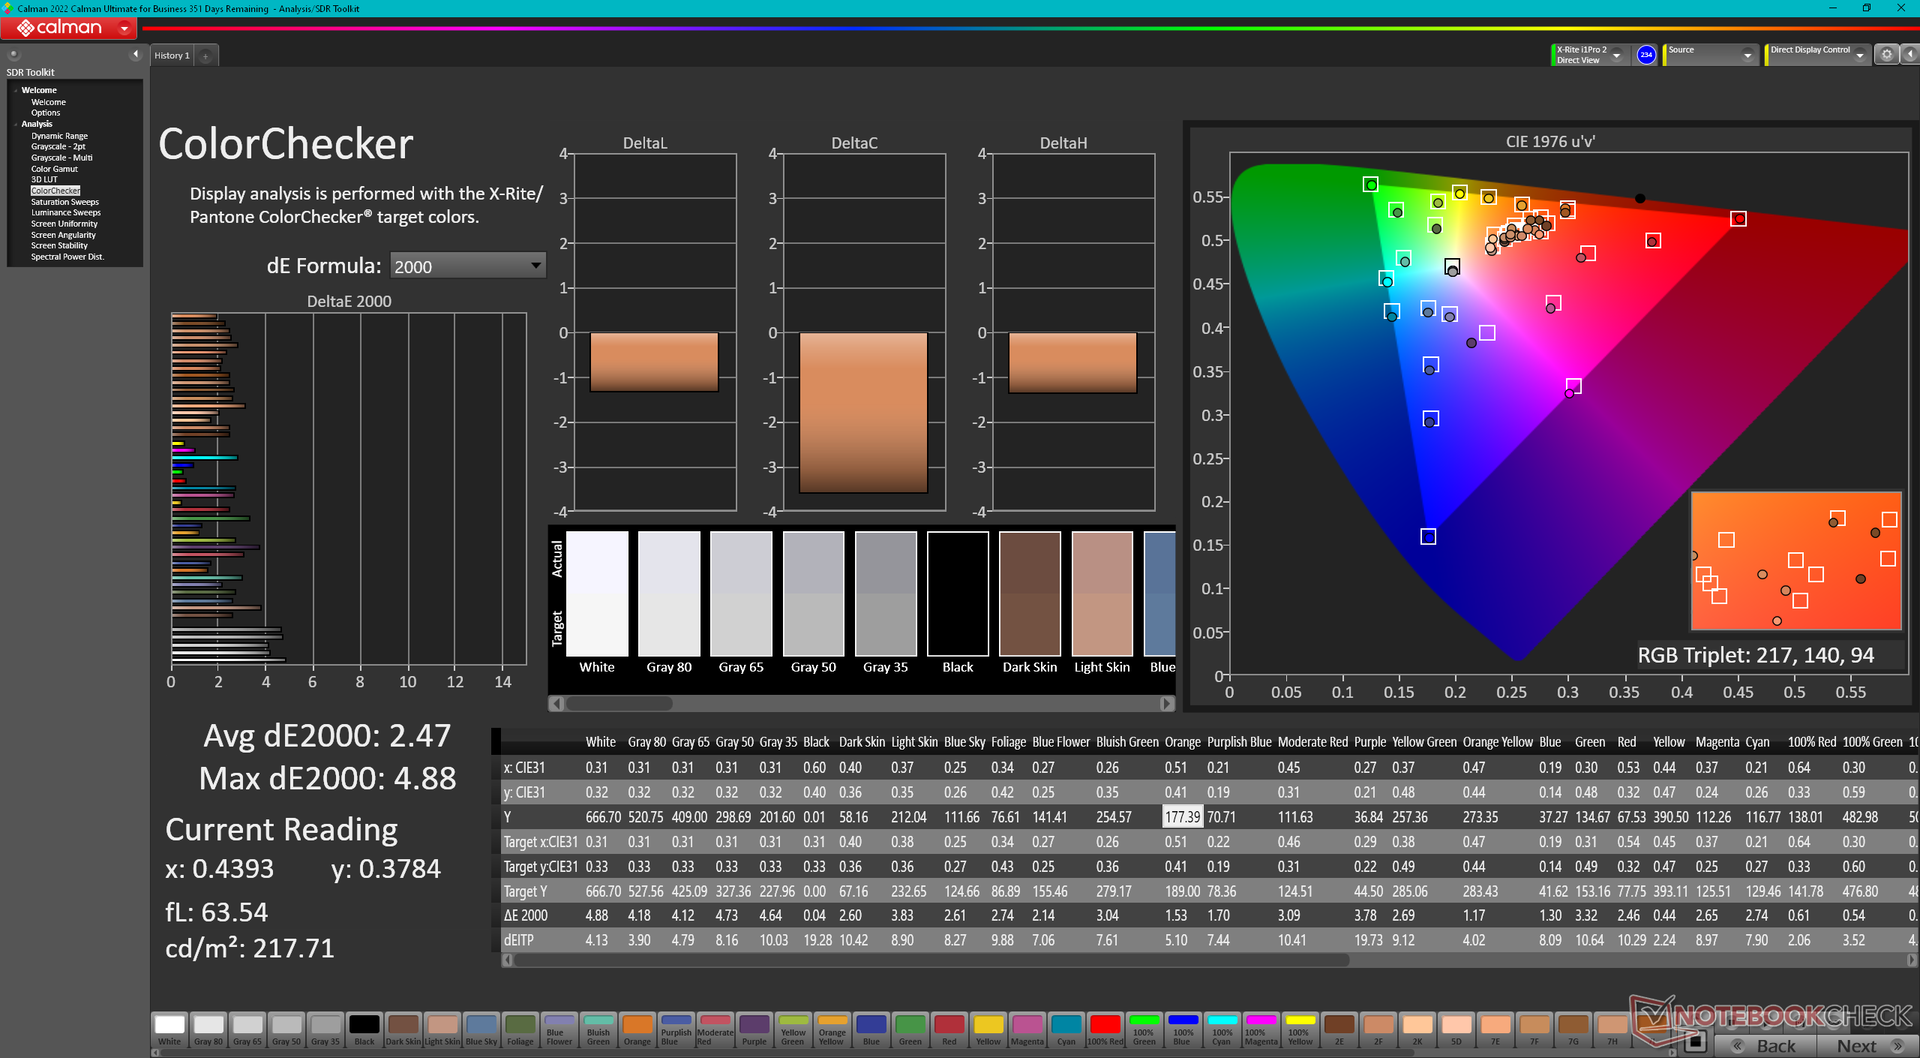
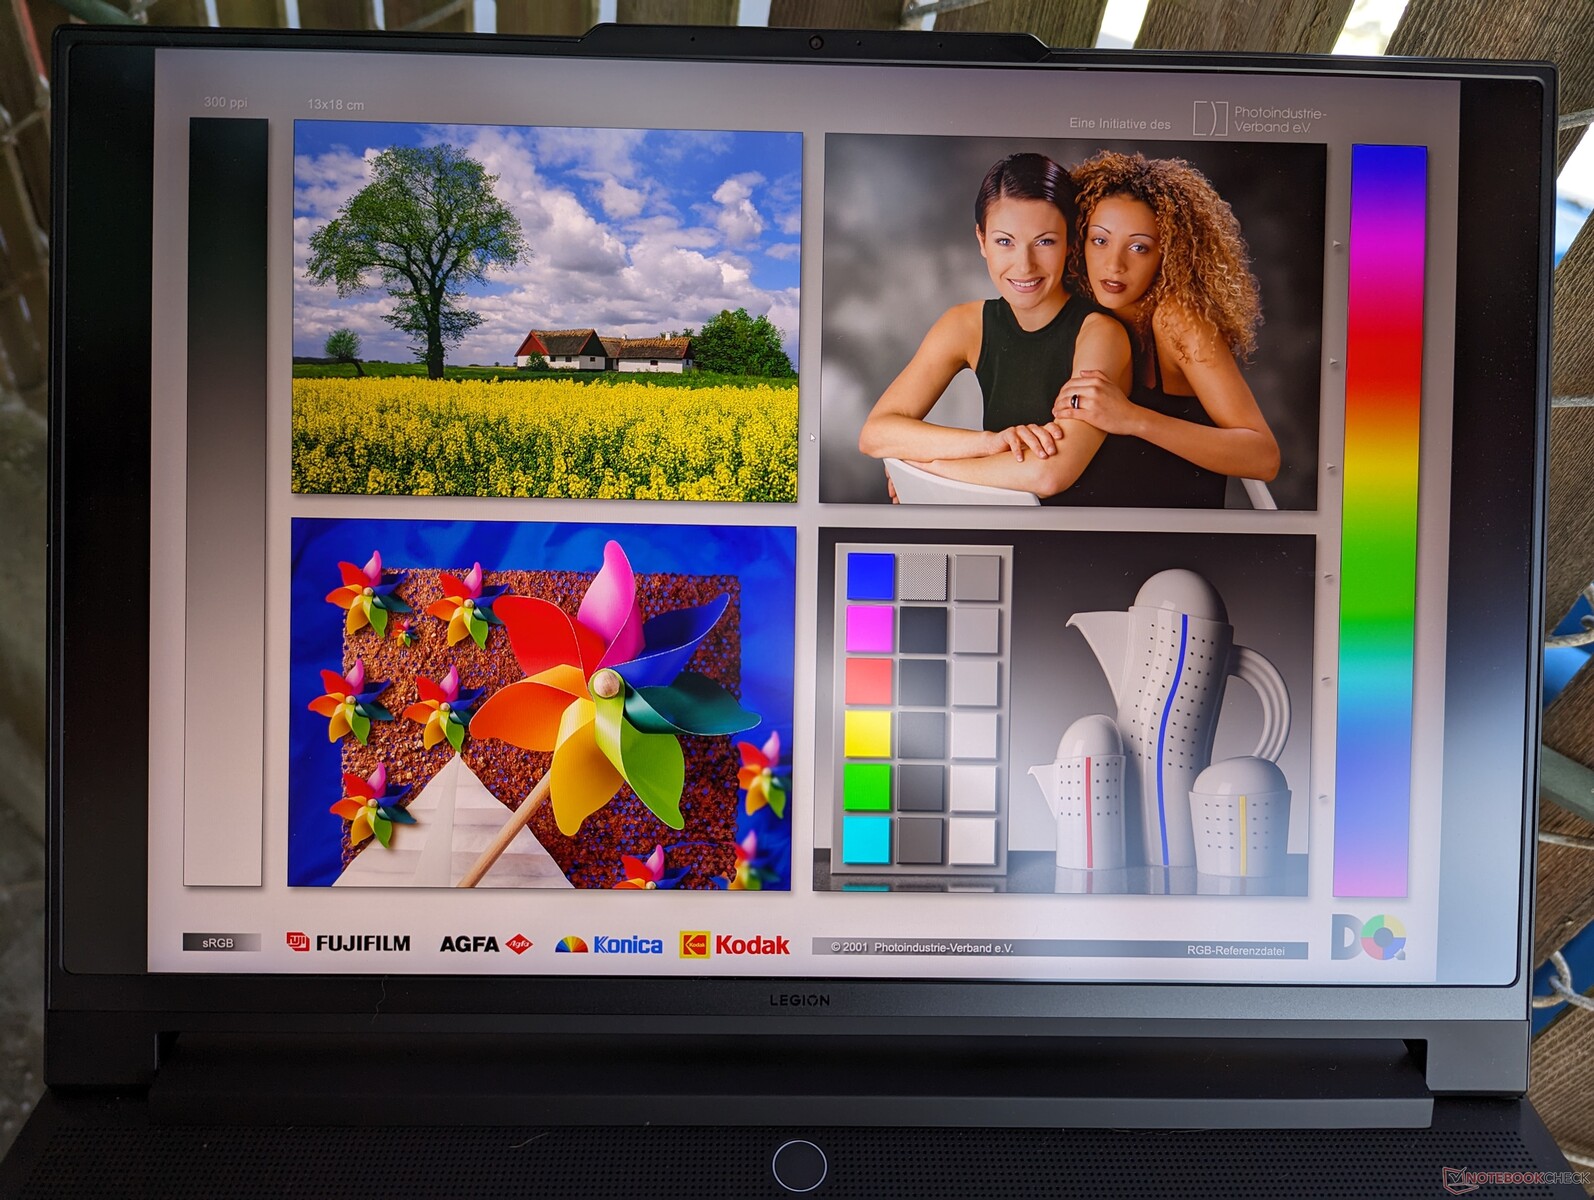
Pantalla - La atracción principal

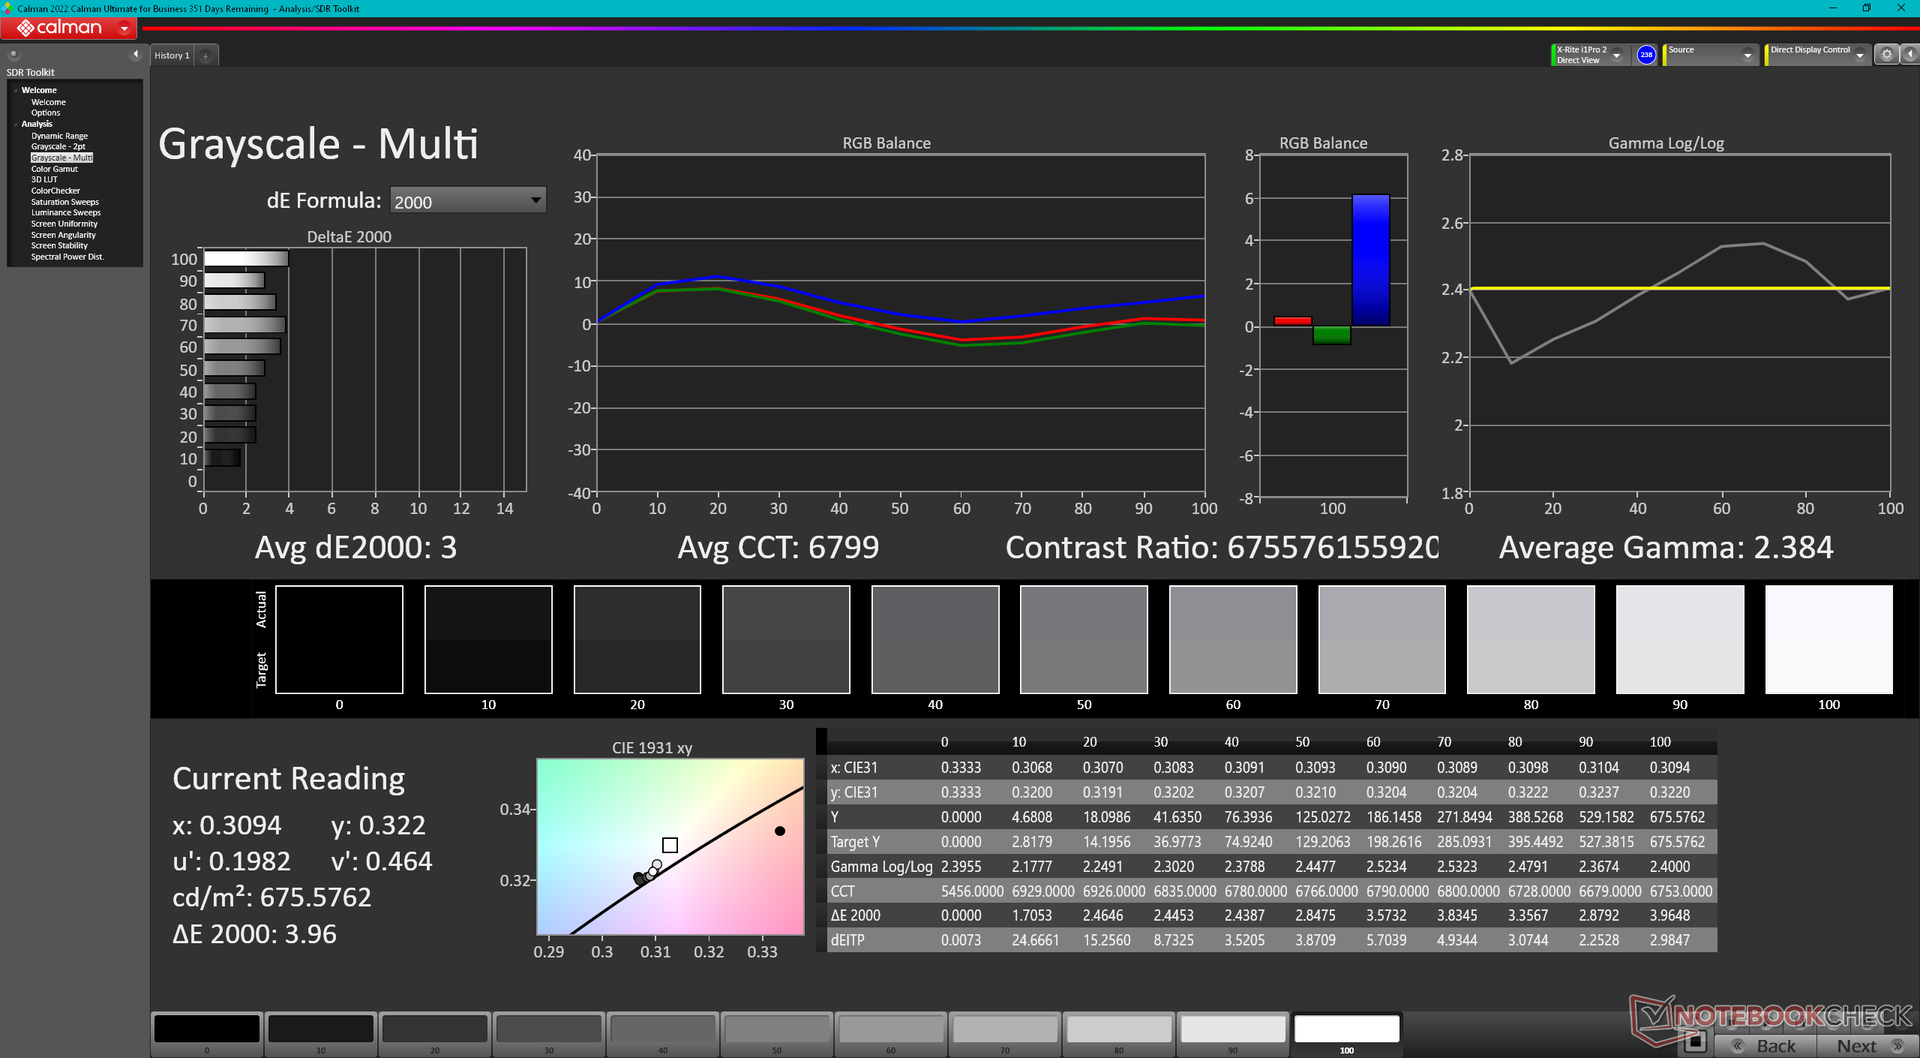
En comparación con las tradicionales IPS y OLED, la mini-LED ofrece niveles de negro superiores a las primeras e incluso niveles de brillo máximo superiores a las segundas para una mejor compatibilidad general con HDR. En este caso, Lenovo anuncia un brillo máximo de 1200 nits para la compatibilidad con HDR1000, lo que es raro de ver en pantallas de portátiles. Hemos podido confirmar un brillo máximo en el mundo real de 1025 nits cuando el modo HDR está activado o de 675 nits cuando se muestra contenido SDR. En comparación, la mayoría de los paneles IPS y OLED de los portátiles para juegos suelen oscilar entre 300 y 500 nits. Por tanto, siempre que sea posible querrá reproducir contenidos en modo HDR para aprovechar mejor las ventajas del mini-LED.
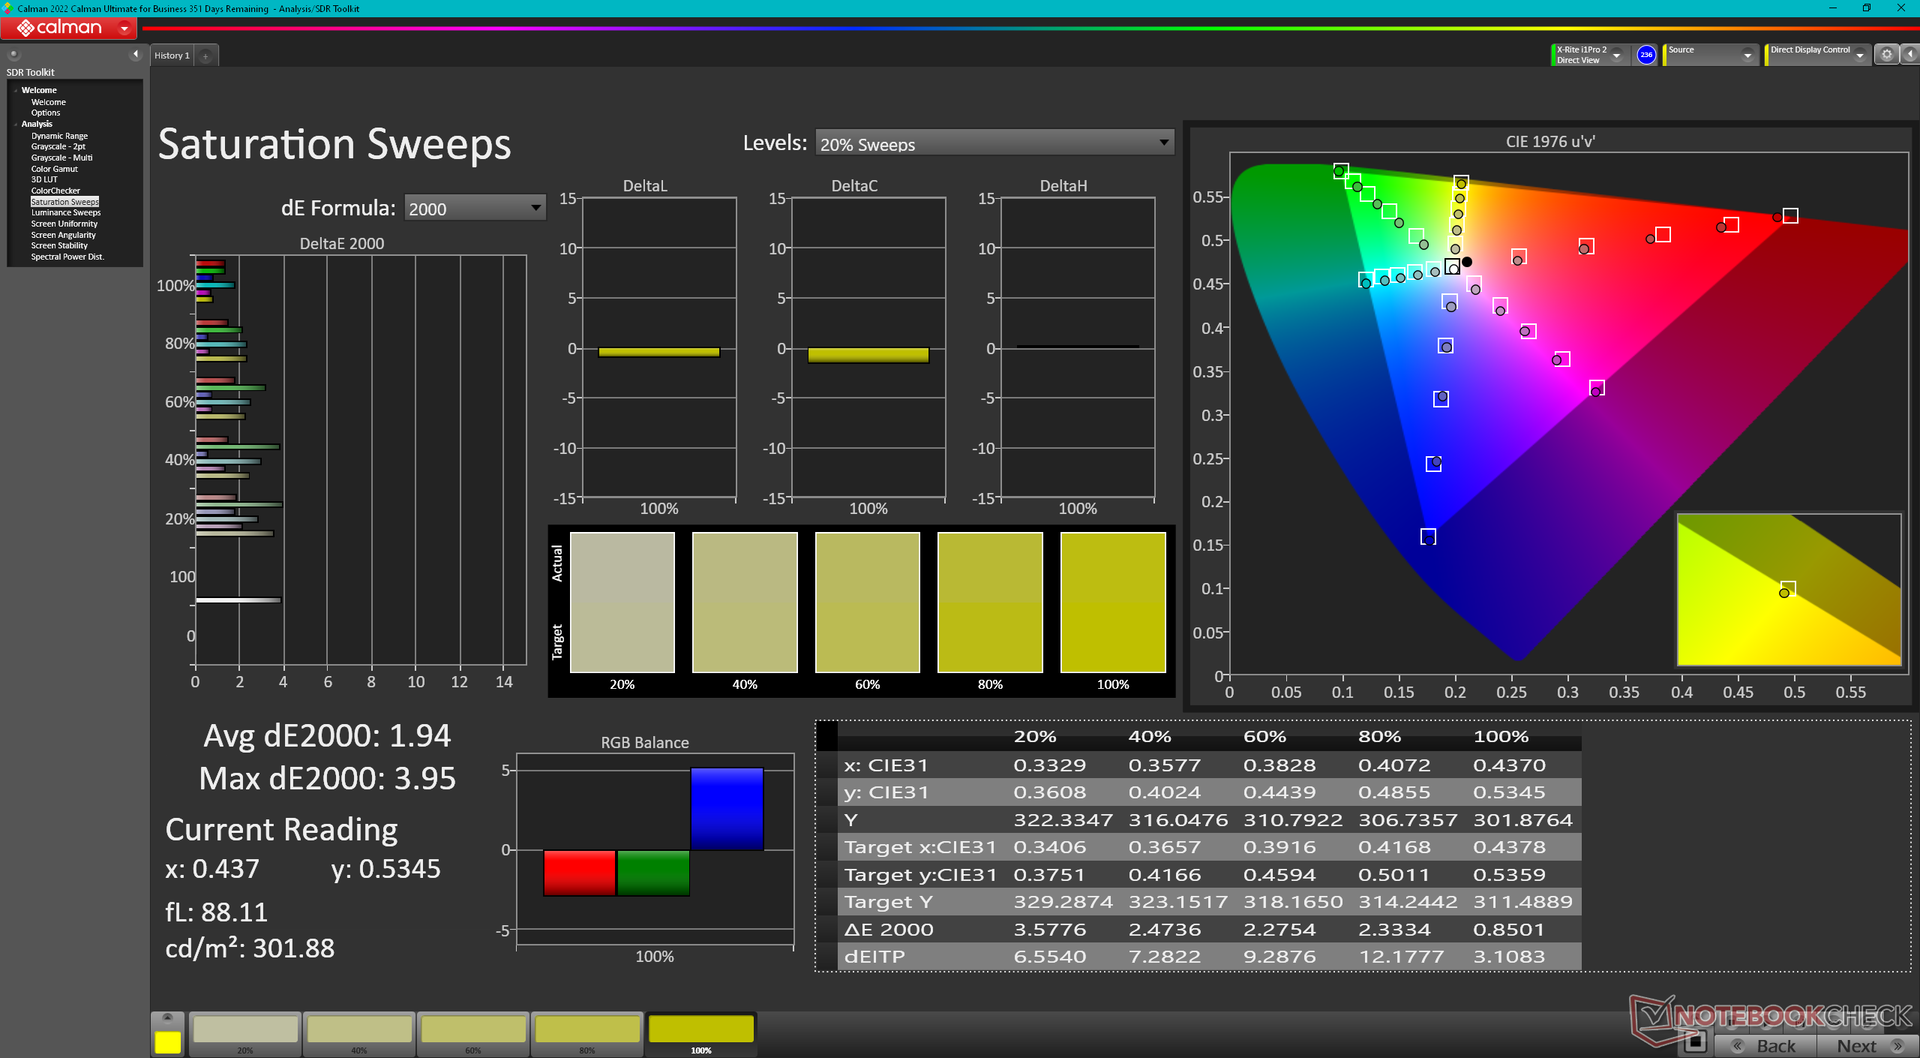
Aparte de los altísimos niveles de brillo, el panel también cuenta con G-Sync, colores DCI-P3 completos, frecuencia de refresco de 165 Hz y tiempos de respuesta rápidos para ser apto tanto para la creación de contenidos como para los juegos.
| |||||||||||||||||||||||||
iluminación: 96 %
Brillo con batería: 674.9 cd/m²
Contraste: 16873:1 (Negro: 0.04 cd/m²)
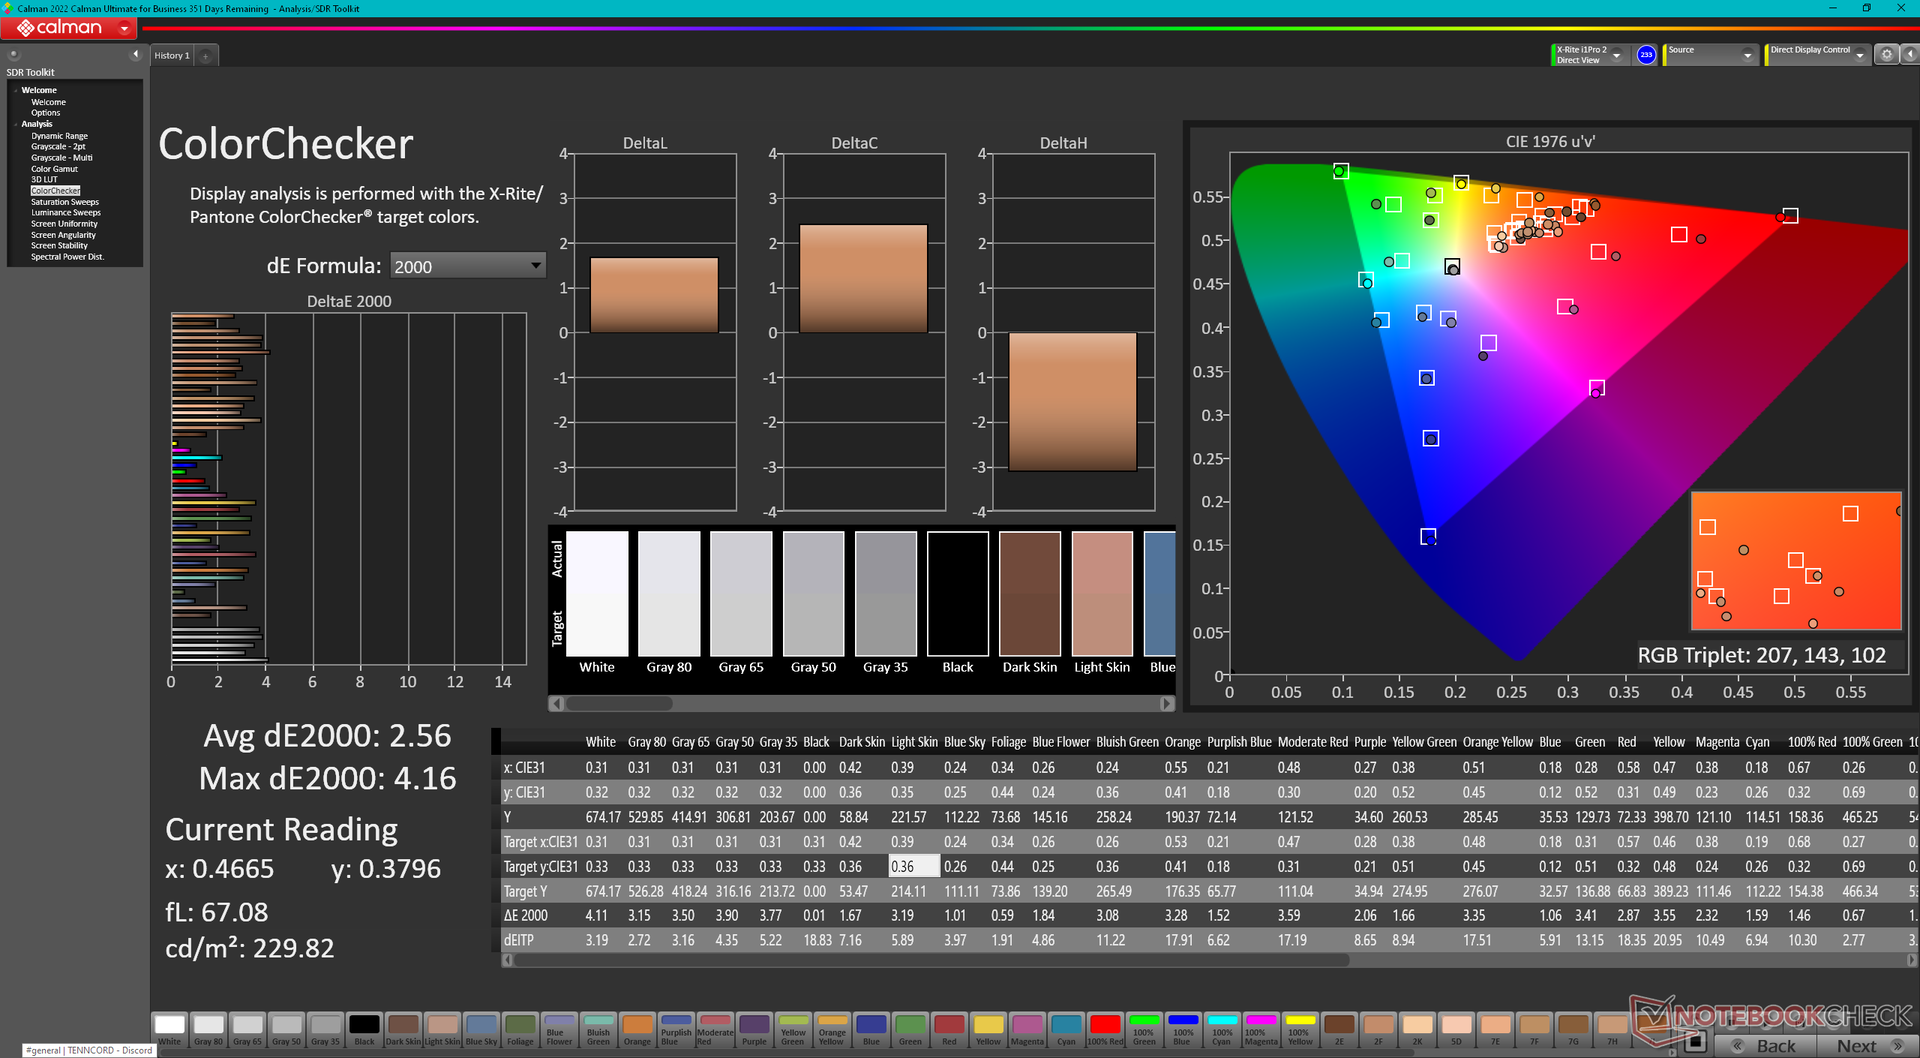
ΔE ColorChecker Calman: 2.56 | ∀{0.5-29.43 Ø4.73}
calibrated: 2.47
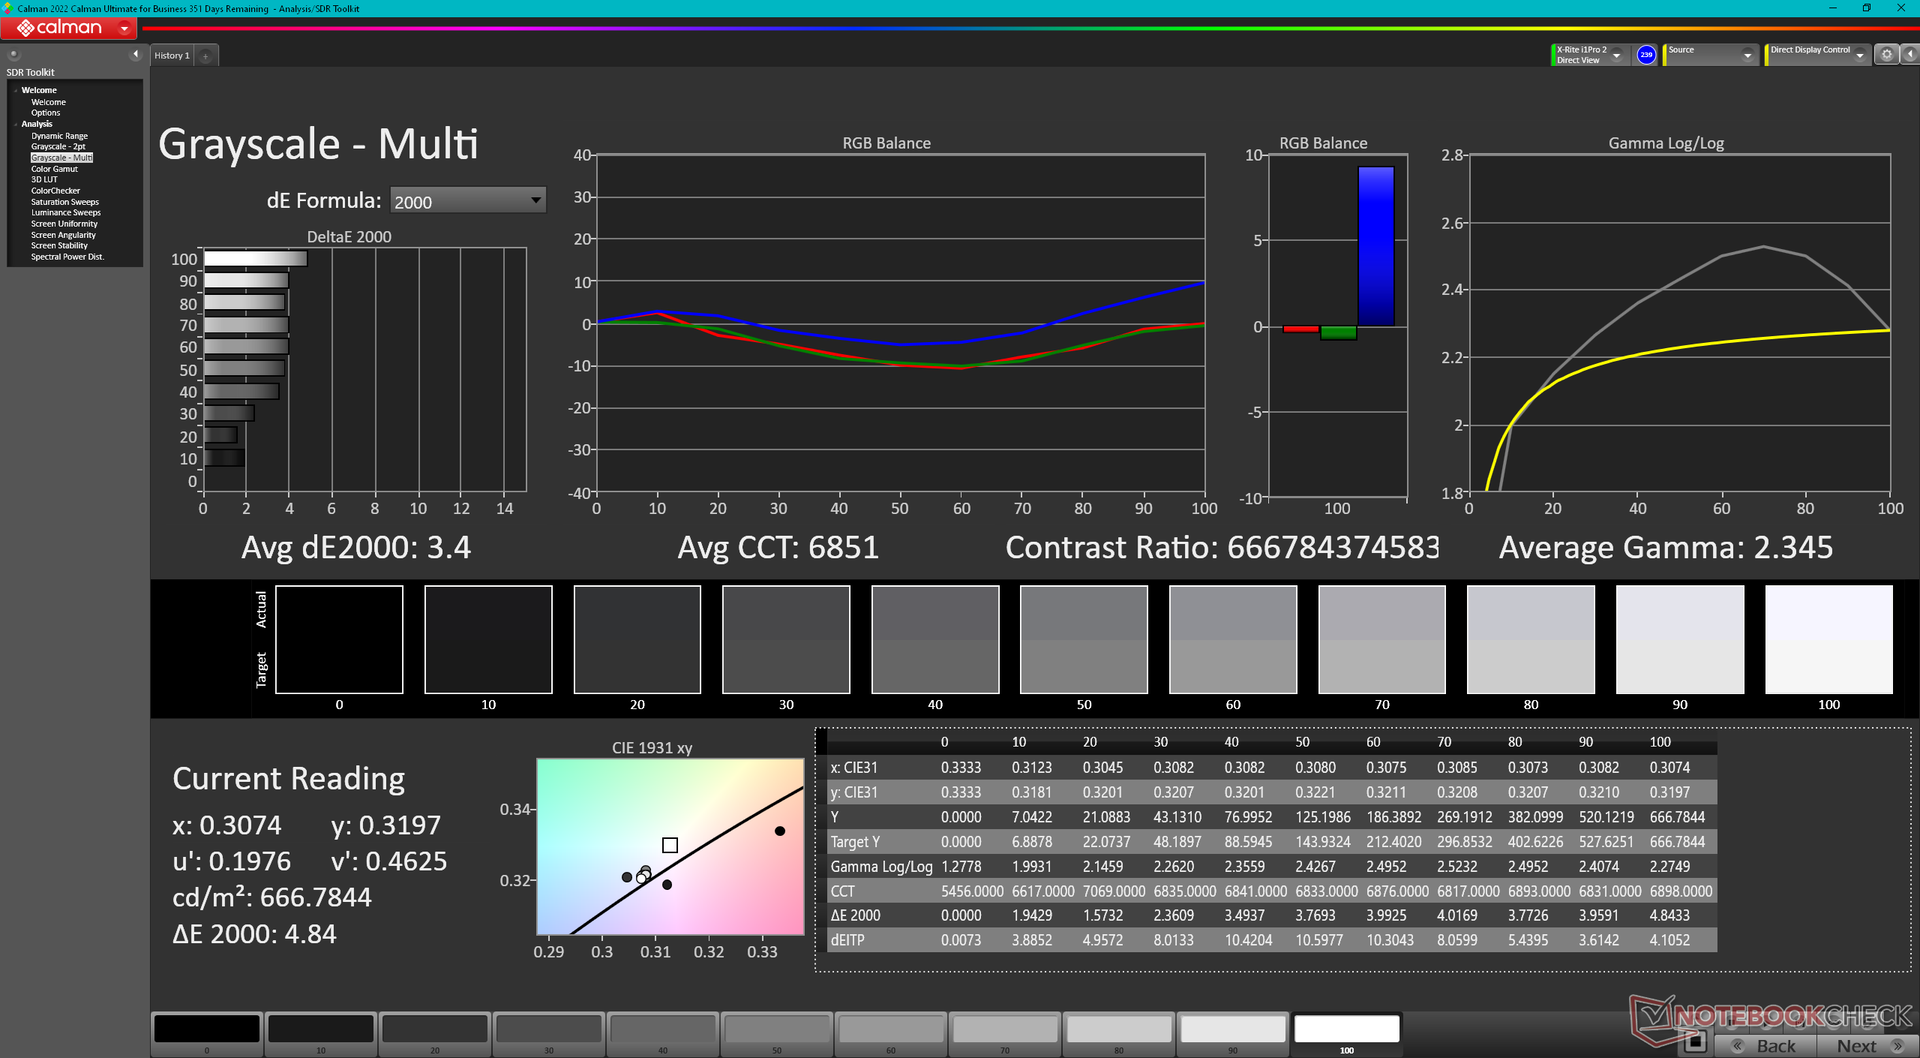
ΔE Greyscale Calman: 3 | ∀{0.09-98 Ø4.97}
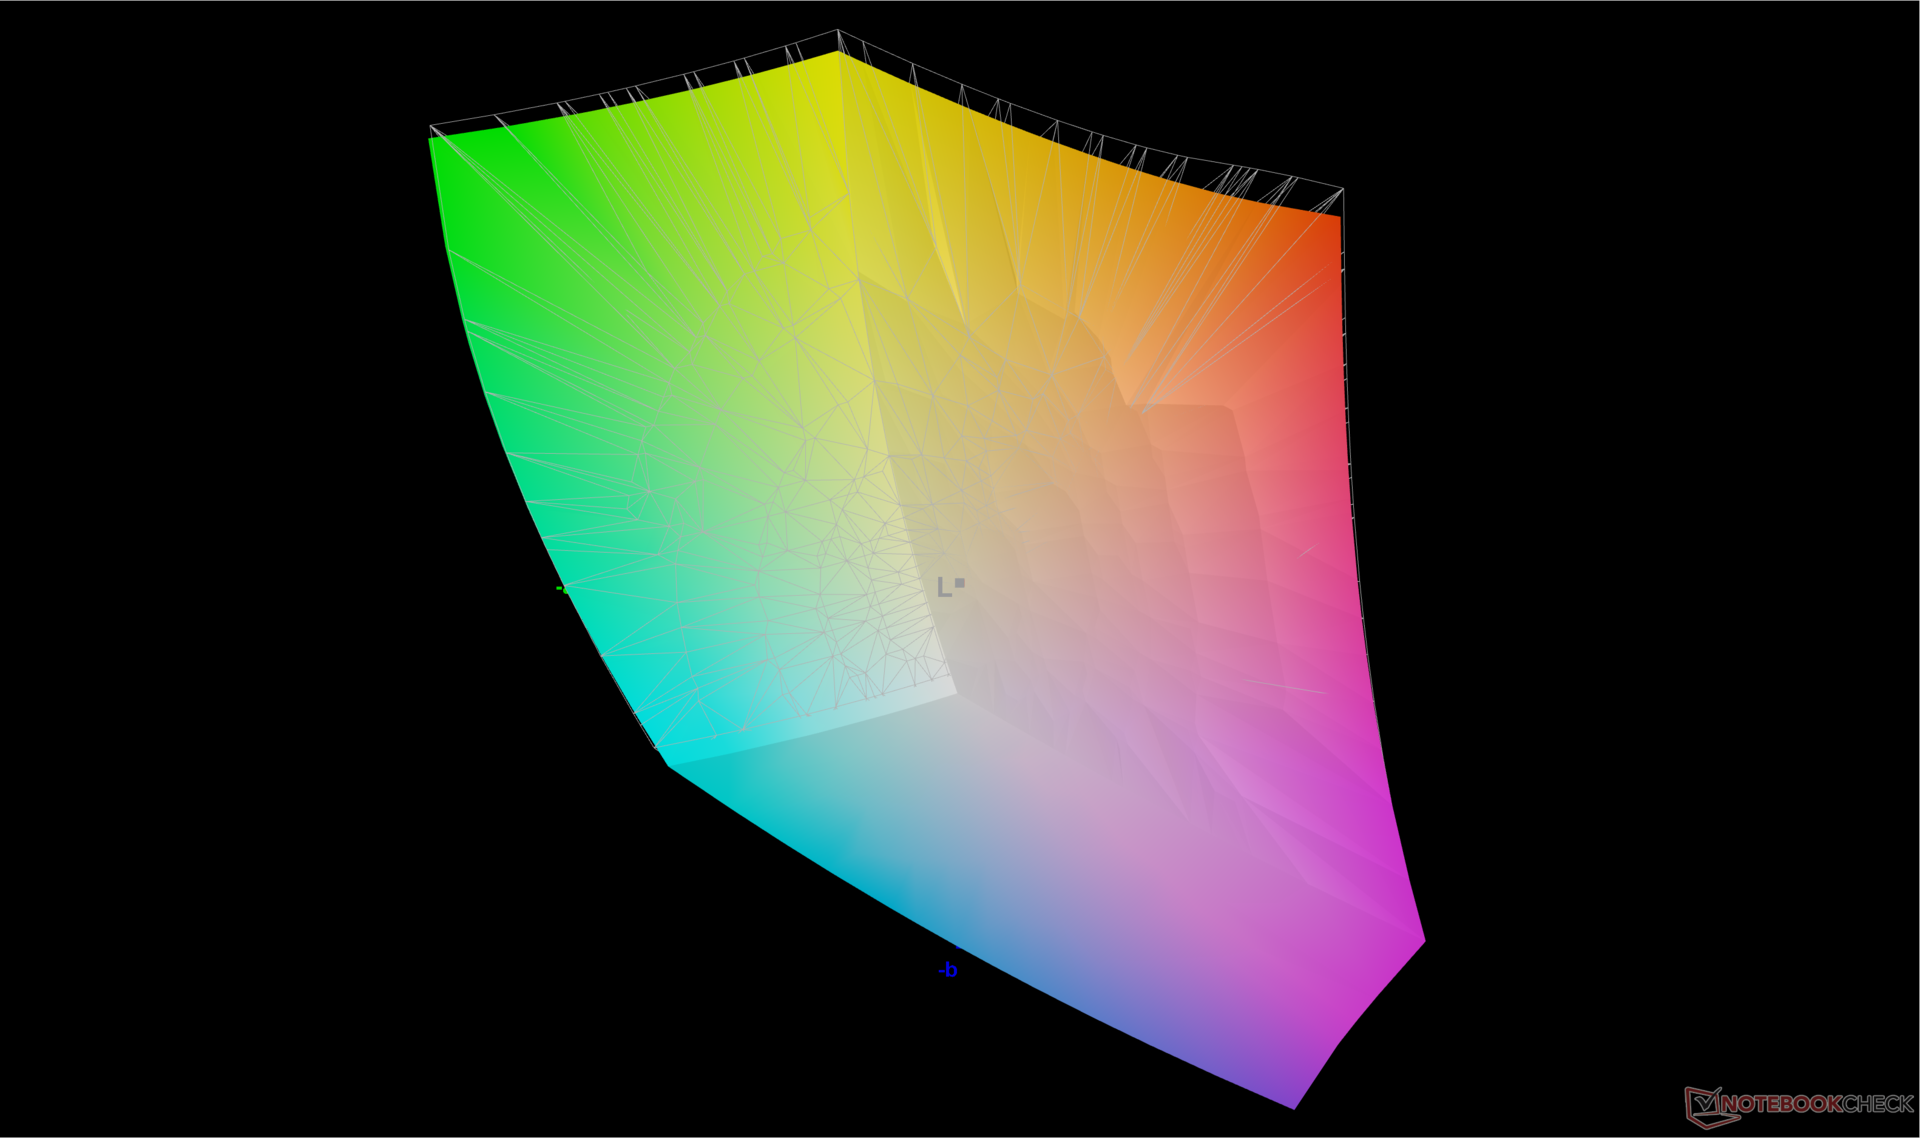
87% AdobeRGB 1998 (Argyll 3D)
99.9% sRGB (Argyll 3D)
97.2% Display P3 (Argyll 3D)
Gamma: 2.38
CCT: 6799 K
| Lenovo Legion 9 16IRX8 CSOT T3 MNG007ZA2-2, Mini-LED, 3200x2000, 16" | Lenovo Legion Slim 5 16APH8 BOE NJ NE160QDM-NYC, IPS, 2560x1600, 16" | Razer Blade 16 Early 2023 RTX 4090 AUO B160ZAN01.U, mini-LED, 3840x2400, 16" | Asus ROG Strix G16 G614JZ TL160ADMP03-0, IPS, 2560x1600, 16" | HP Omen Transcend 16 AUOA3A6, Mini-LED, 2560x1600, 16" | Alienware x16 R1 BOE NE16NZ4, IPS, 2560x1600, 16" | |
|---|---|---|---|---|---|---|
| Display | -16% | 2% | -1% | 1% | 1% | |
| Display P3 Coverage (%) | 97.2 | 69.3 -29% | 99.9 3% | 97 0% | 99.2 2% | 99.2 2% |
| sRGB Coverage (%) | 99.9 | 100 0% | 100 0% | 99.9 0% | 100 0% | 100 0% |
| AdobeRGB 1998 Coverage (%) | 87 | 70 -20% | 90.9 4% | 84.9 -2% | 87.6 1% | 88.6 2% |
| Response Times | 27% | -206% | 53% | -121% | 37% | |
| Response Time Grey 50% / Grey 80% * (ms) | 13.3 ? | 10.7 ? 20% | 10.2 ? 23% | 5.1 ? 62% | 26.4 ? -98% | 5.1 ? 62% |
| Response Time Black / White * (ms) | 11.6 ? | 7.8 ? 33% | 62.04 ? -435% | 6.6 ? 43% | 28.2 ? -143% | 10.3 ? 11% |
| PWM Frequency (Hz) | 4742 | 2420 ? | 3506 ? | |||
| Screen | -109% | 62% | -111% | -26% | -73% | |
| Brightness middle (cd/m²) | 674.9 | 371.6 -45% | 730 8% | 470 -30% | 791.1 17% | 302.2 -55% |
| Brightness (cd/m²) | 682 | 343 -50% | 729 7% | 459 -33% | 800 17% | 285 -58% |
| Brightness Distribution (%) | 96 | 84 -12% | 94 -2% | 93 -3% | 95 -1% | 89 -7% |
| Black Level * (cd/m²) | 0.04 | 0.44 -1000% | 0.0045 89% | 0.42 -950% | 0.04 -0% | 0.26 -550% |
| Contrast (:1) | 16873 | 845 -95% | 162222 861% | 1119 -93% | 19778 17% | 1162 -93% |
| Colorchecker dE 2000 * | 2.56 | 1.52 41% | 5.65 -121% | 1.86 27% | 4.37 -71% | 1.63 36% |
| Colorchecker dE 2000 max. * | 4.16 | 2.68 36% | 10.11 -143% | 3.87 7% | 10.39 -150% | 4.13 1% |
| Colorchecker dE 2000 calibrated * | 2.47 | 0.33 87% | 1.85 25% | 0.93 62% | 1.04 58% | 1.17 53% |
| Greyscale dE 2000 * | 3 | 1.2 60% | 8.1 -170% | 2.7 10% | 6.5 -117% | 2.5 17% |
| Gamma | 2.38 92% | 2.1 105% | 1.98 111% | 2.246 98% | 2.28 96% | 2.23 99% |
| CCT | 6799 96% | 6503 100% | 5874 111% | 6711 97% | 6000 108% | 6590 99% |
| Media total (Programa/Opciones) | -33% /
-70% | -47% /
11% | -20% /
-64% | -49% /
-33% | -12% /
-41% |
* ... más pequeño es mejor
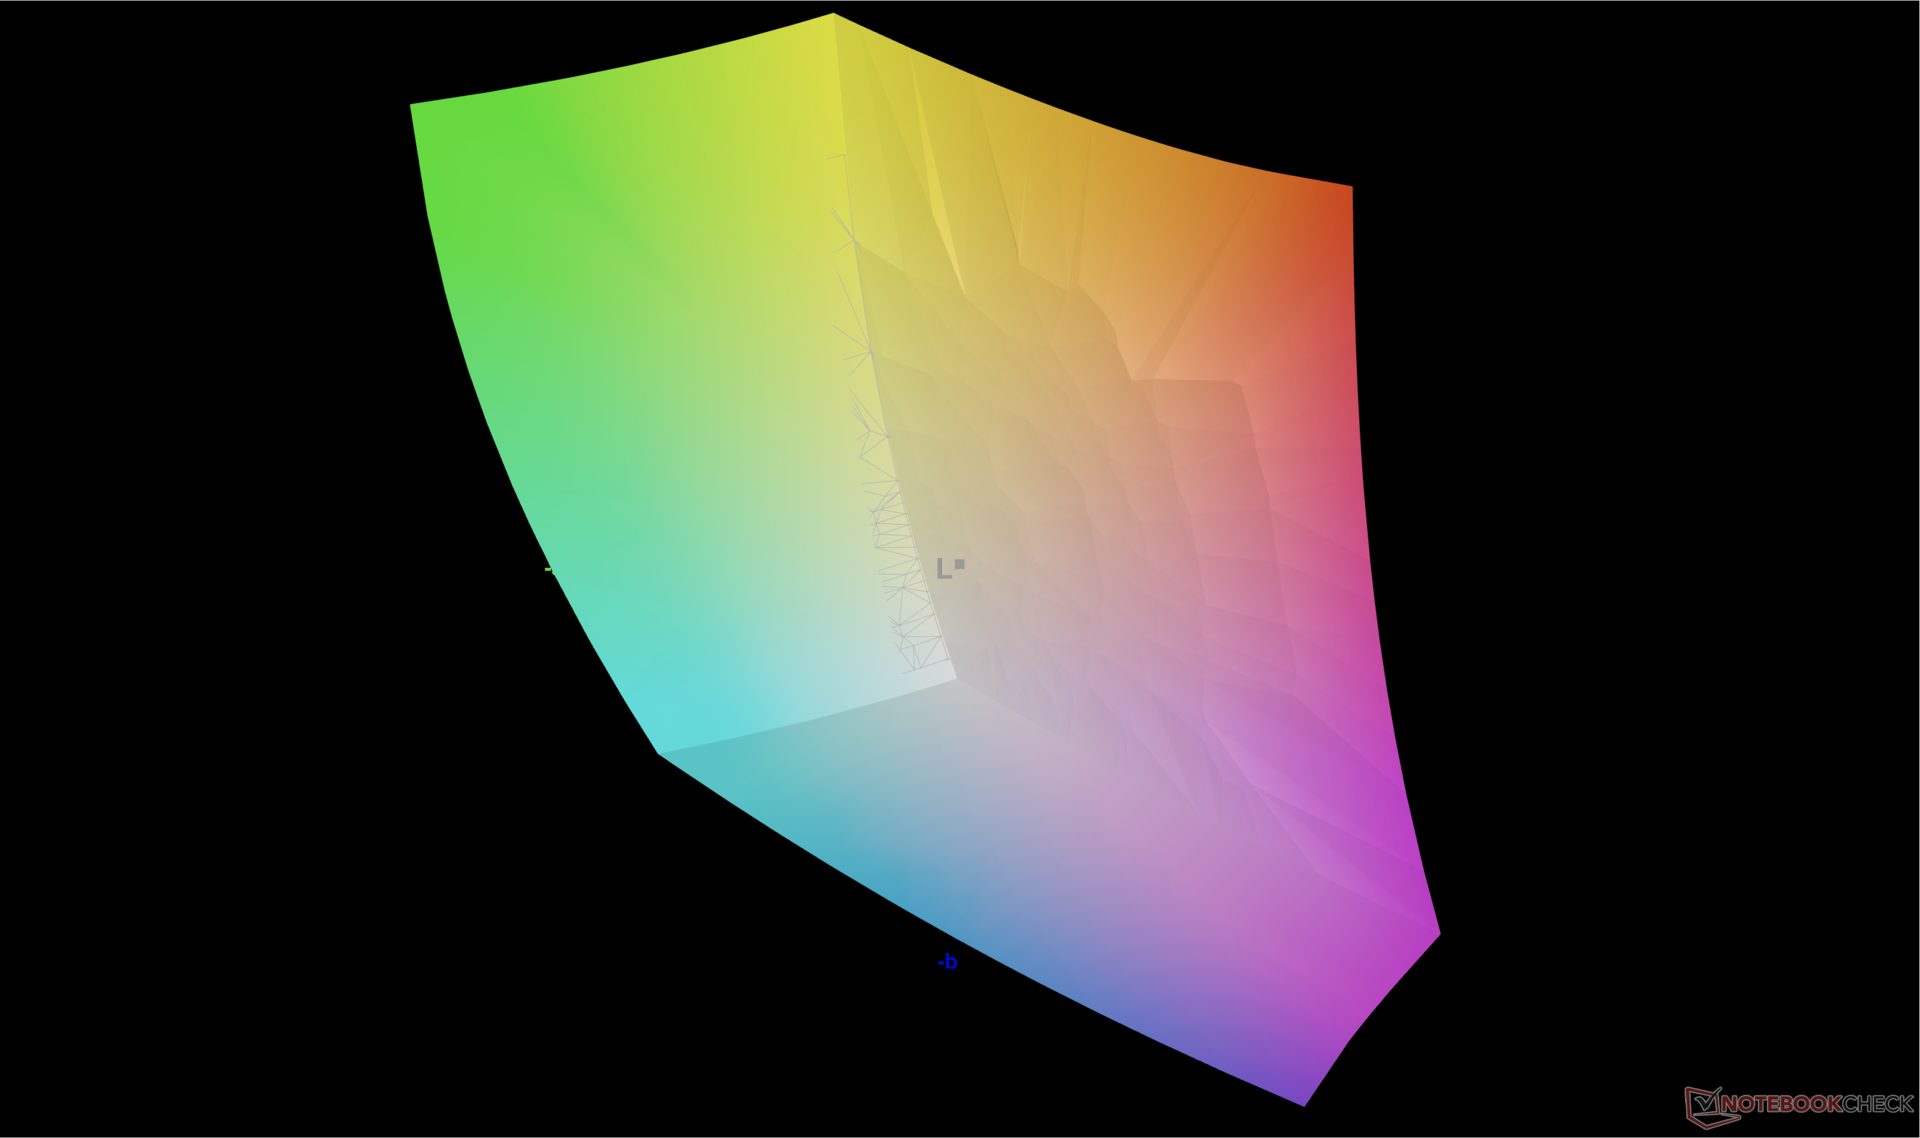
La pantalla viene bien calibrada de fábrica respecto a la norma P3, con unos valores DeltaE medios en escala de grises y color de sólo 3 y 2,56, respectivamente.
Tiempos de respuesta del display
| ↔ Tiempo de respuesta de Negro a Blanco | ||
|---|---|---|
| 11.6 ms ... subida ↗ y bajada ↘ combinada | ↗ 5.1 ms subida | 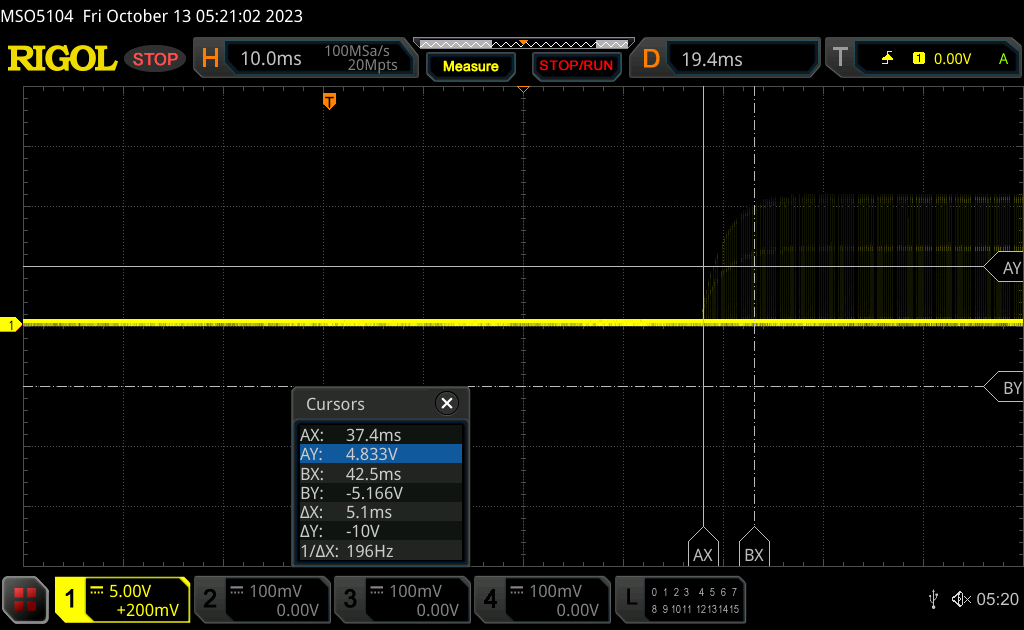 |
| ↘ 6.5 ms bajada | ||
| La pantalla mostró buenos tiempos de respuesta en nuestros tests pero podría ser demasiado lenta para los jugones competitivos. En comparación, todos los dispositivos de prueba van de ##min### (mínimo) a 240 (máximo) ms. » 31 % de todos los dispositivos son mejores. Esto quiere decir que el tiempo de respuesta medido es mejor que la media (19.9 ms) de todos los dispositivos testados. | ||
| ↔ Tiempo de respuesta 50% Gris a 80% Gris | ||
| 13.3 ms ... subida ↗ y bajada ↘ combinada | ↗ 5.7 ms subida | 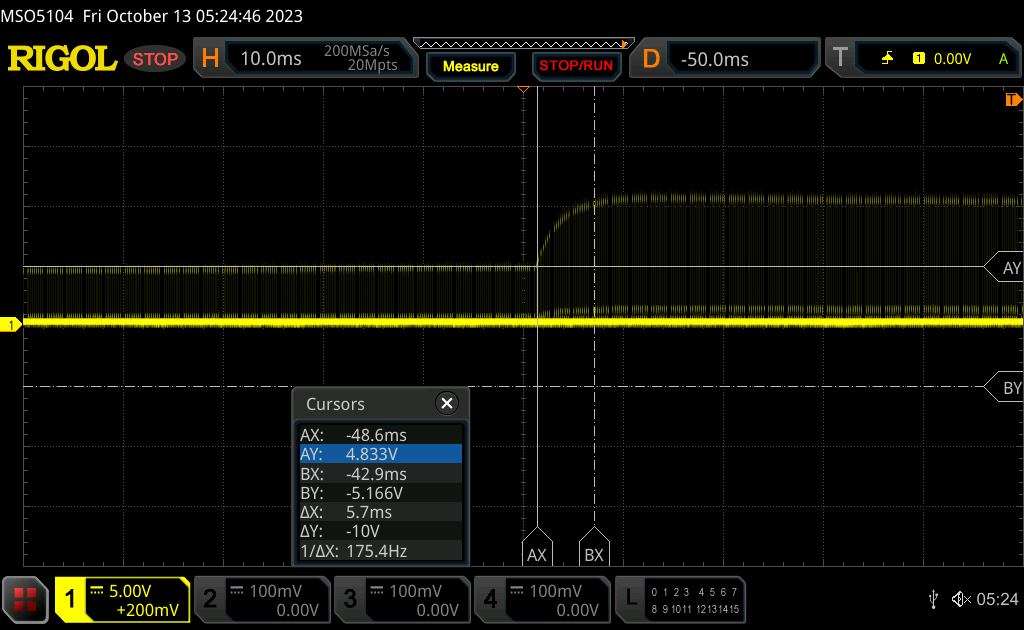 |
| ↘ 7.6 ms bajada | ||
| La pantalla mostró buenos tiempos de respuesta en nuestros tests pero podría ser demasiado lenta para los jugones competitivos. En comparación, todos los dispositivos de prueba van de ##min### (mínimo) a 636 (máximo) ms. » 27 % de todos los dispositivos son mejores. Esto quiere decir que el tiempo de respuesta medido es mejor que la media (31.1 ms) de todos los dispositivos testados. | ||
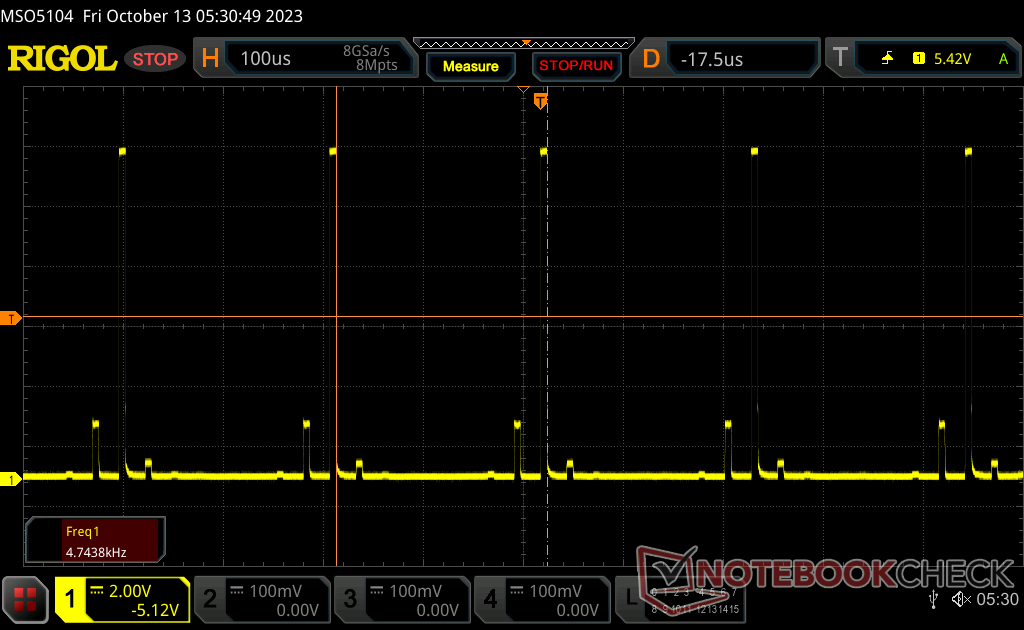
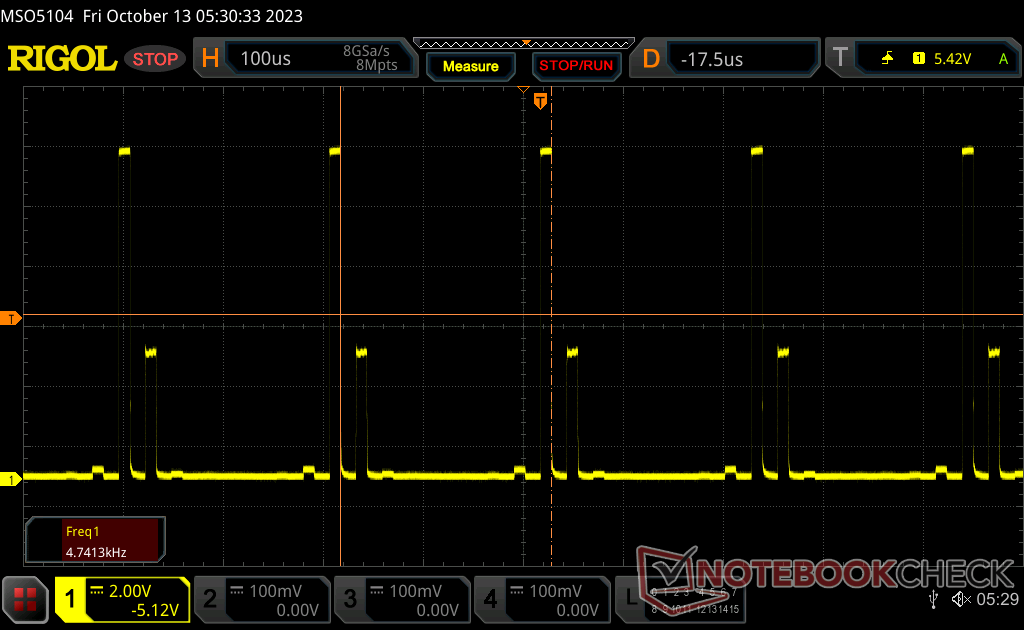
Parpadeo de Pantalla / PWM (Pulse-Width Modulation)
| Parpadeo de Pantalla / PWM detectado | 4742 Hz | 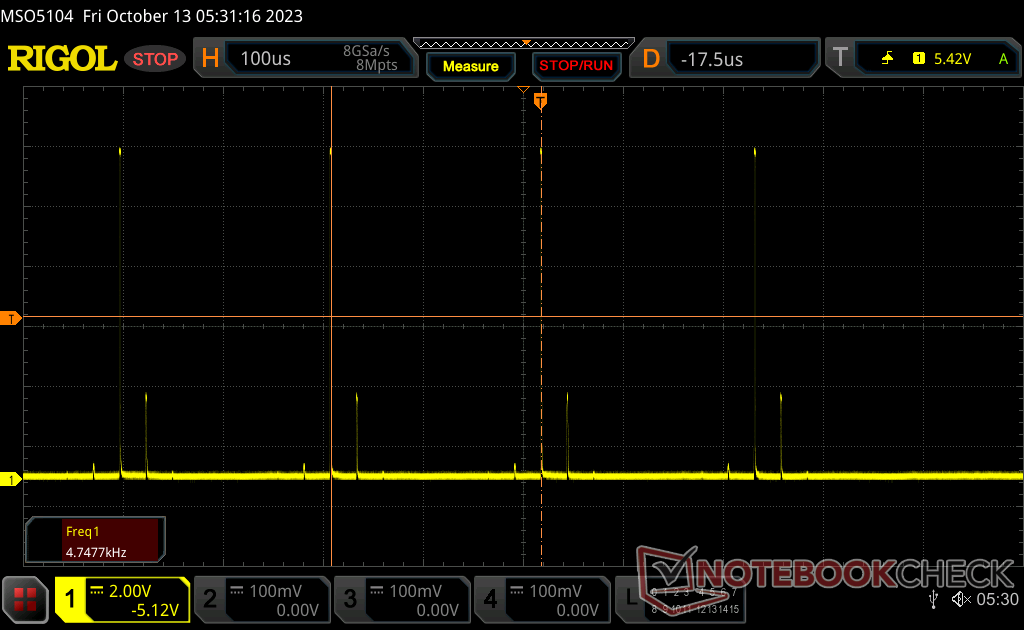 | |
La retroiluminación del display parpadea a 4742 Hz (seguramente usa PWM - Pulse-Width Modulation) . La frecuencia de 4742 Hz es bastante alta, por lo que la mayoría de gente sensible al parpadeo no debería ver parpadeo o tener fatiga visual. Comparación: 52 % de todos los dispositivos testados no usaron PWM para atenuar el display. Si se usó, medimos una media de 7798 (mínimo: 5 - máxmo: 343500) Hz. | |||
El parpadeo está presente en todos los niveles de brillo a una frecuencia constante de 4752 Hz.


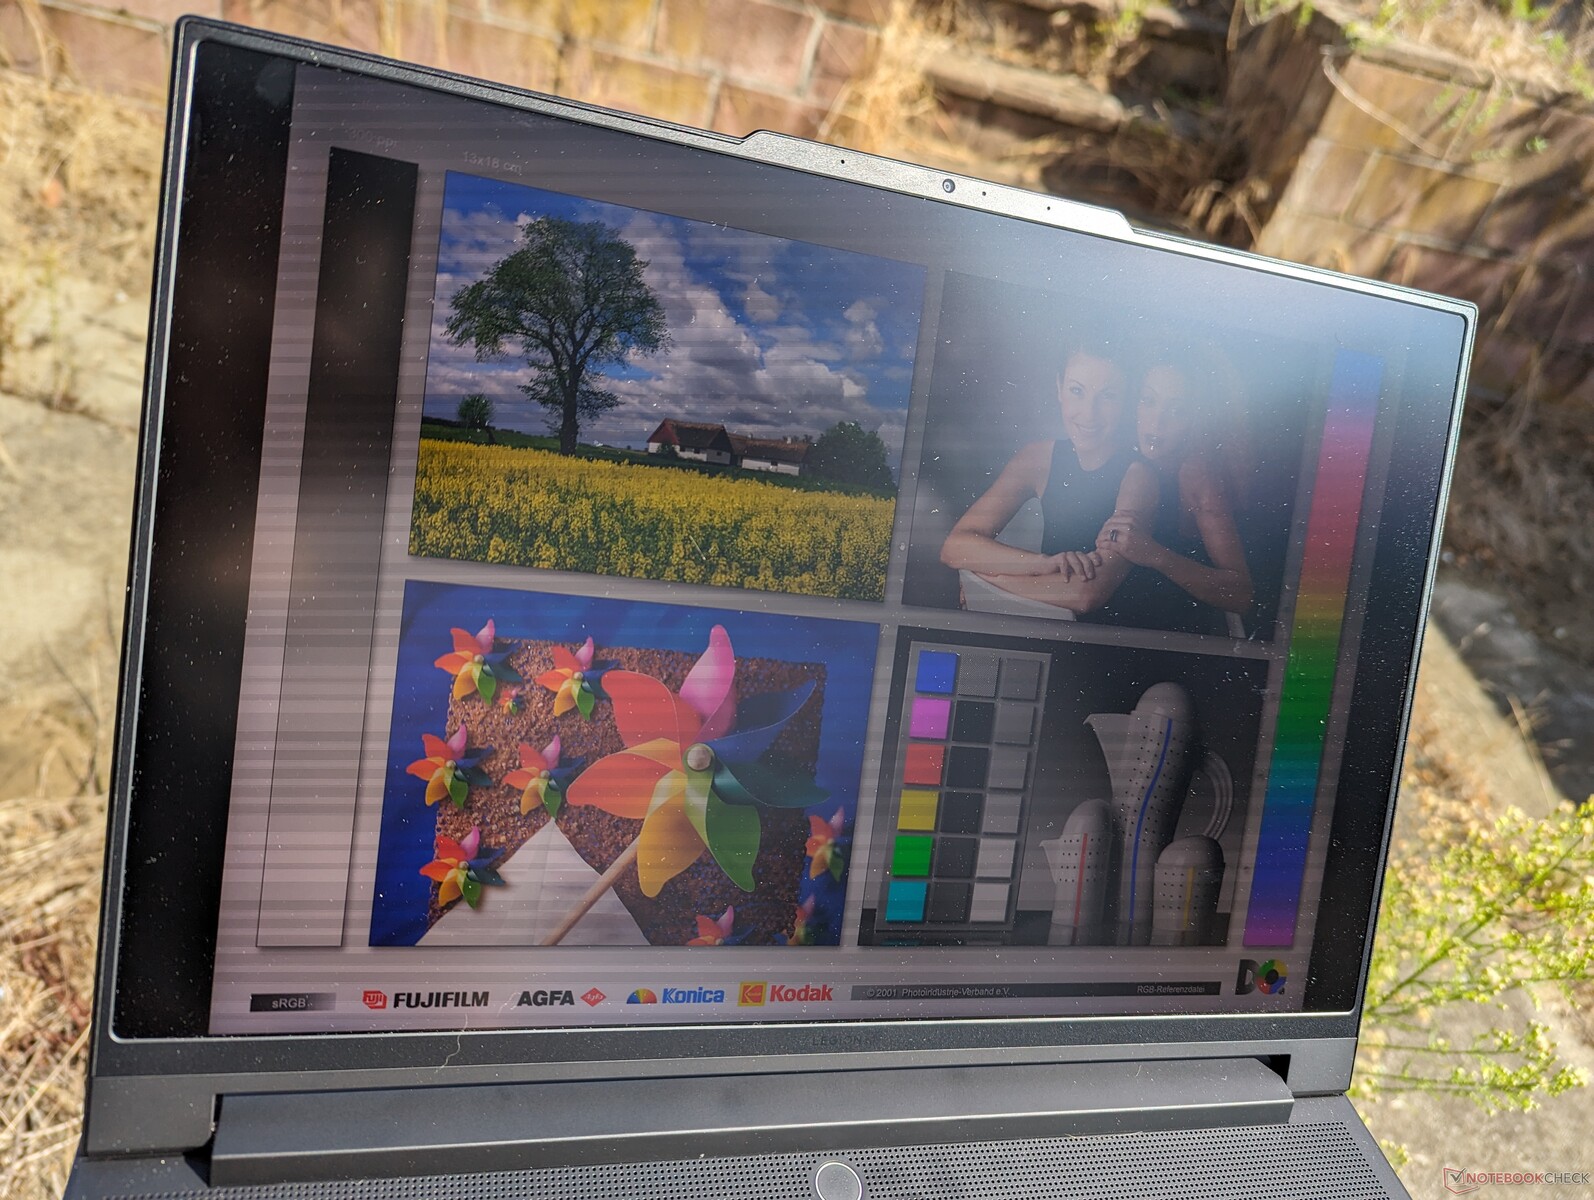
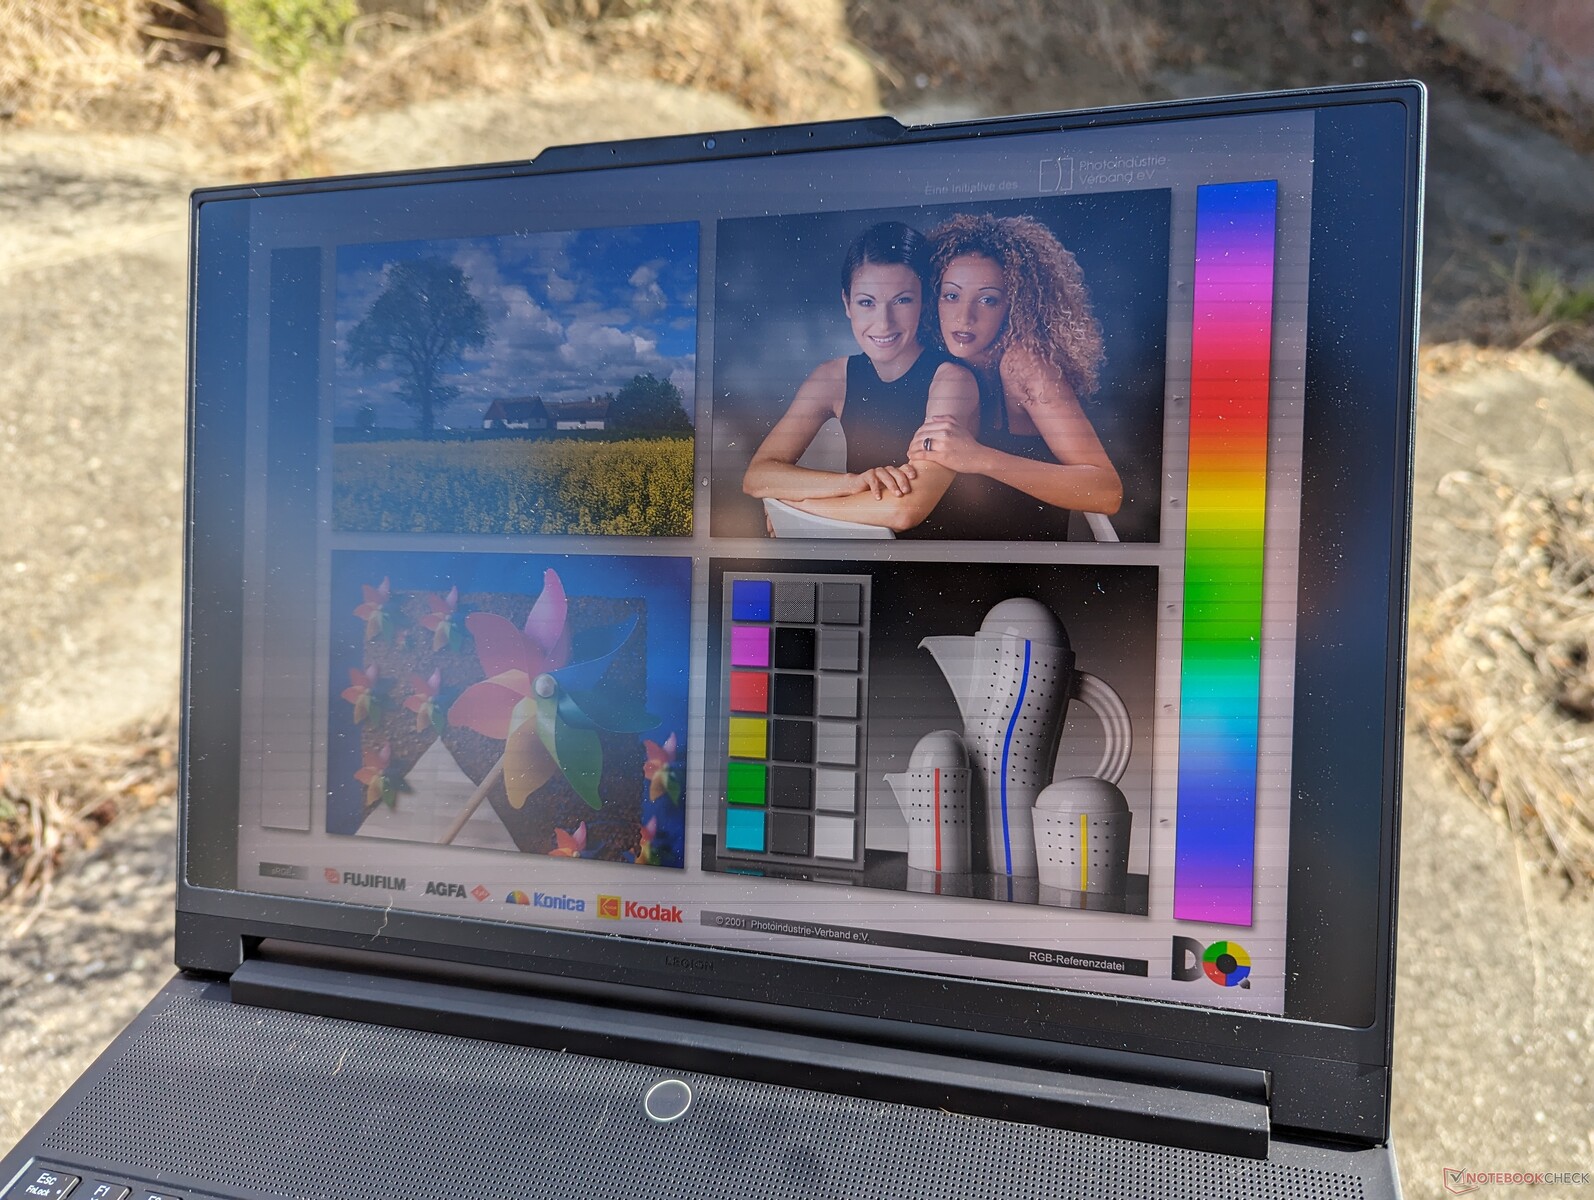
La visibilidad en exteriores es excelente para un portátil de juegos gracias al ya mencionado alto brillo máximo del mini-LED. No obstante, el elevado peso y la corta duración de la batería siguen limitando el portátil a escenarios mayoritariamente de interior.
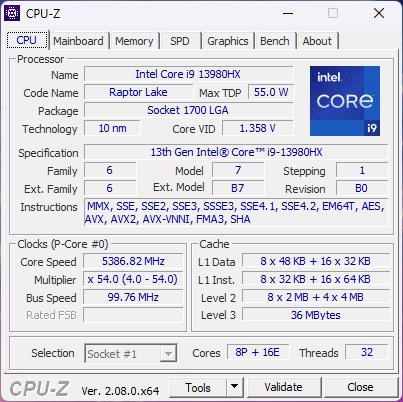
Rendimiento - No se admiten Core i7
Condiciones de prueba
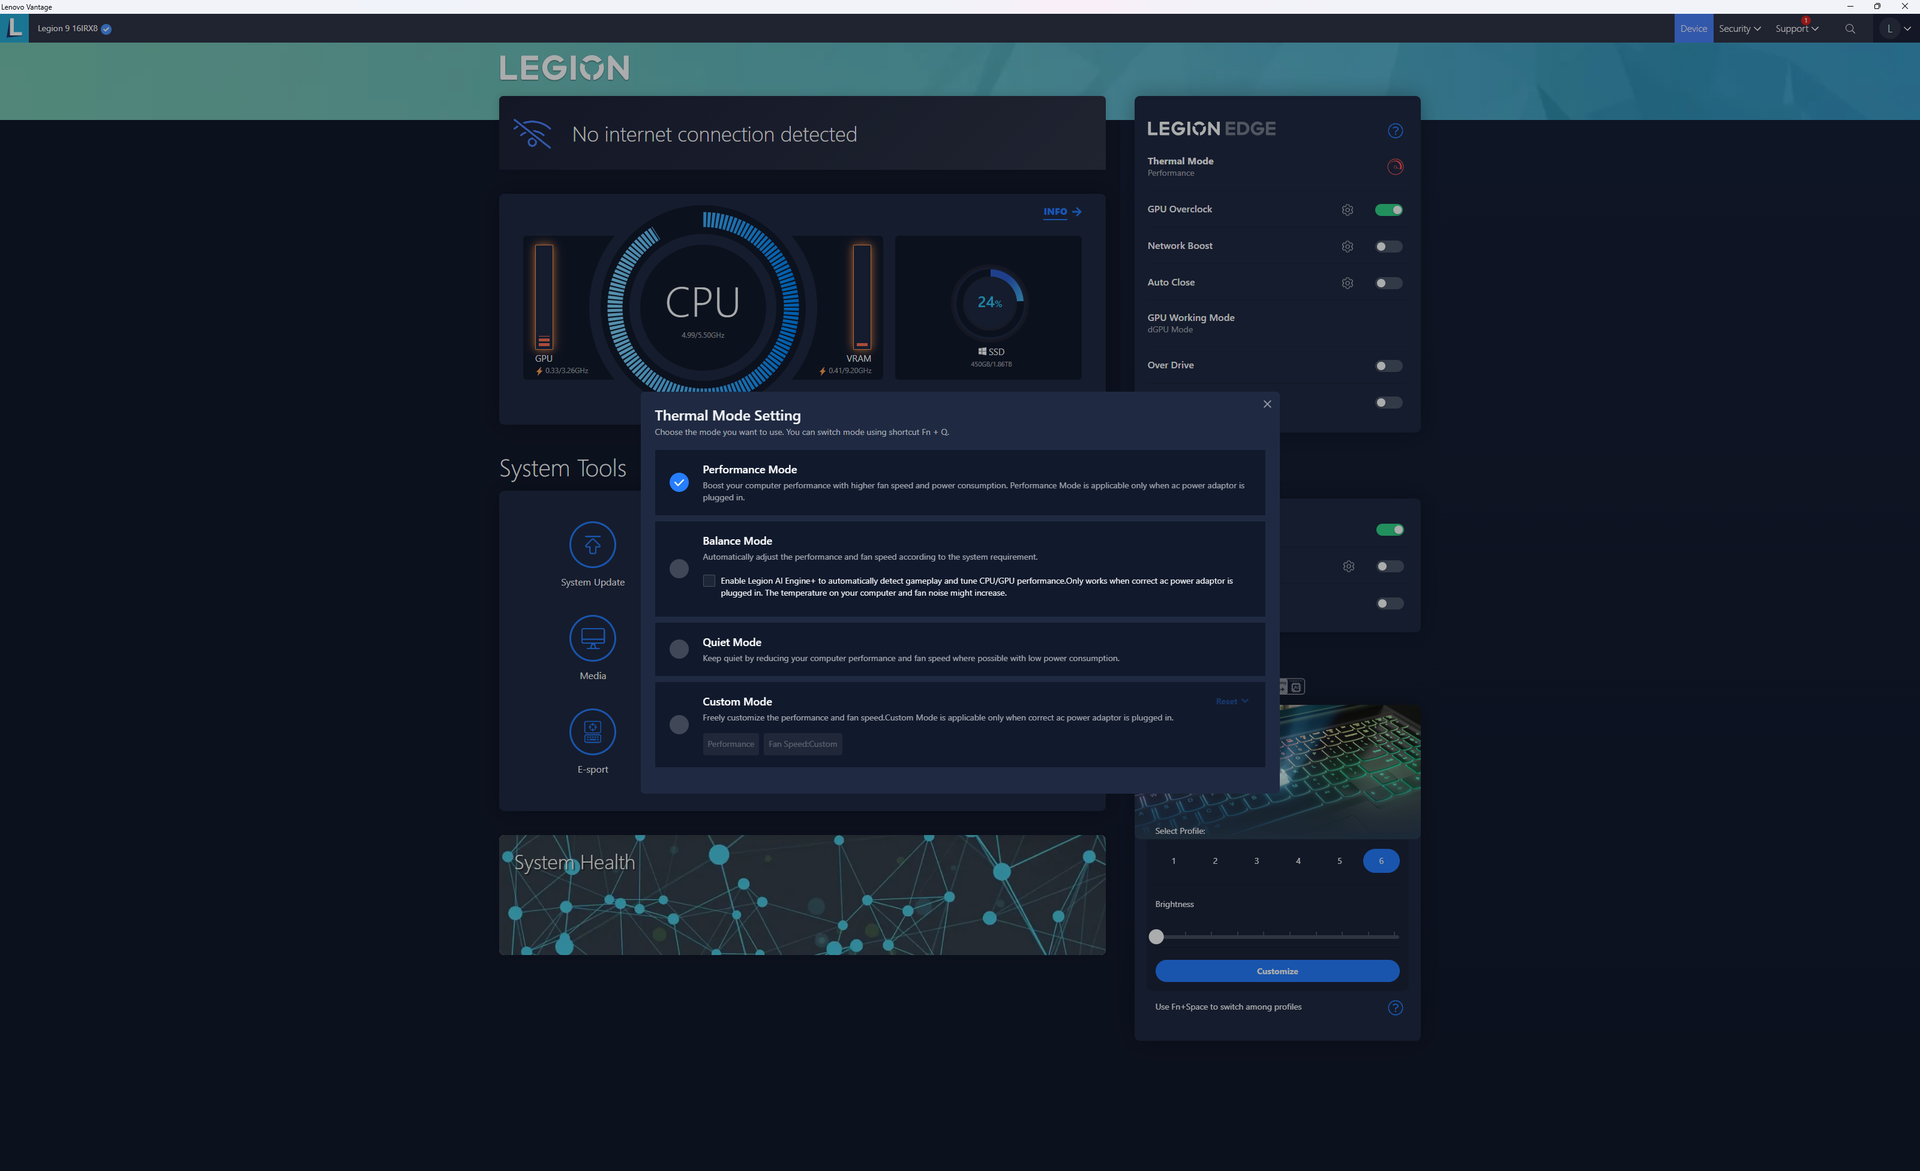
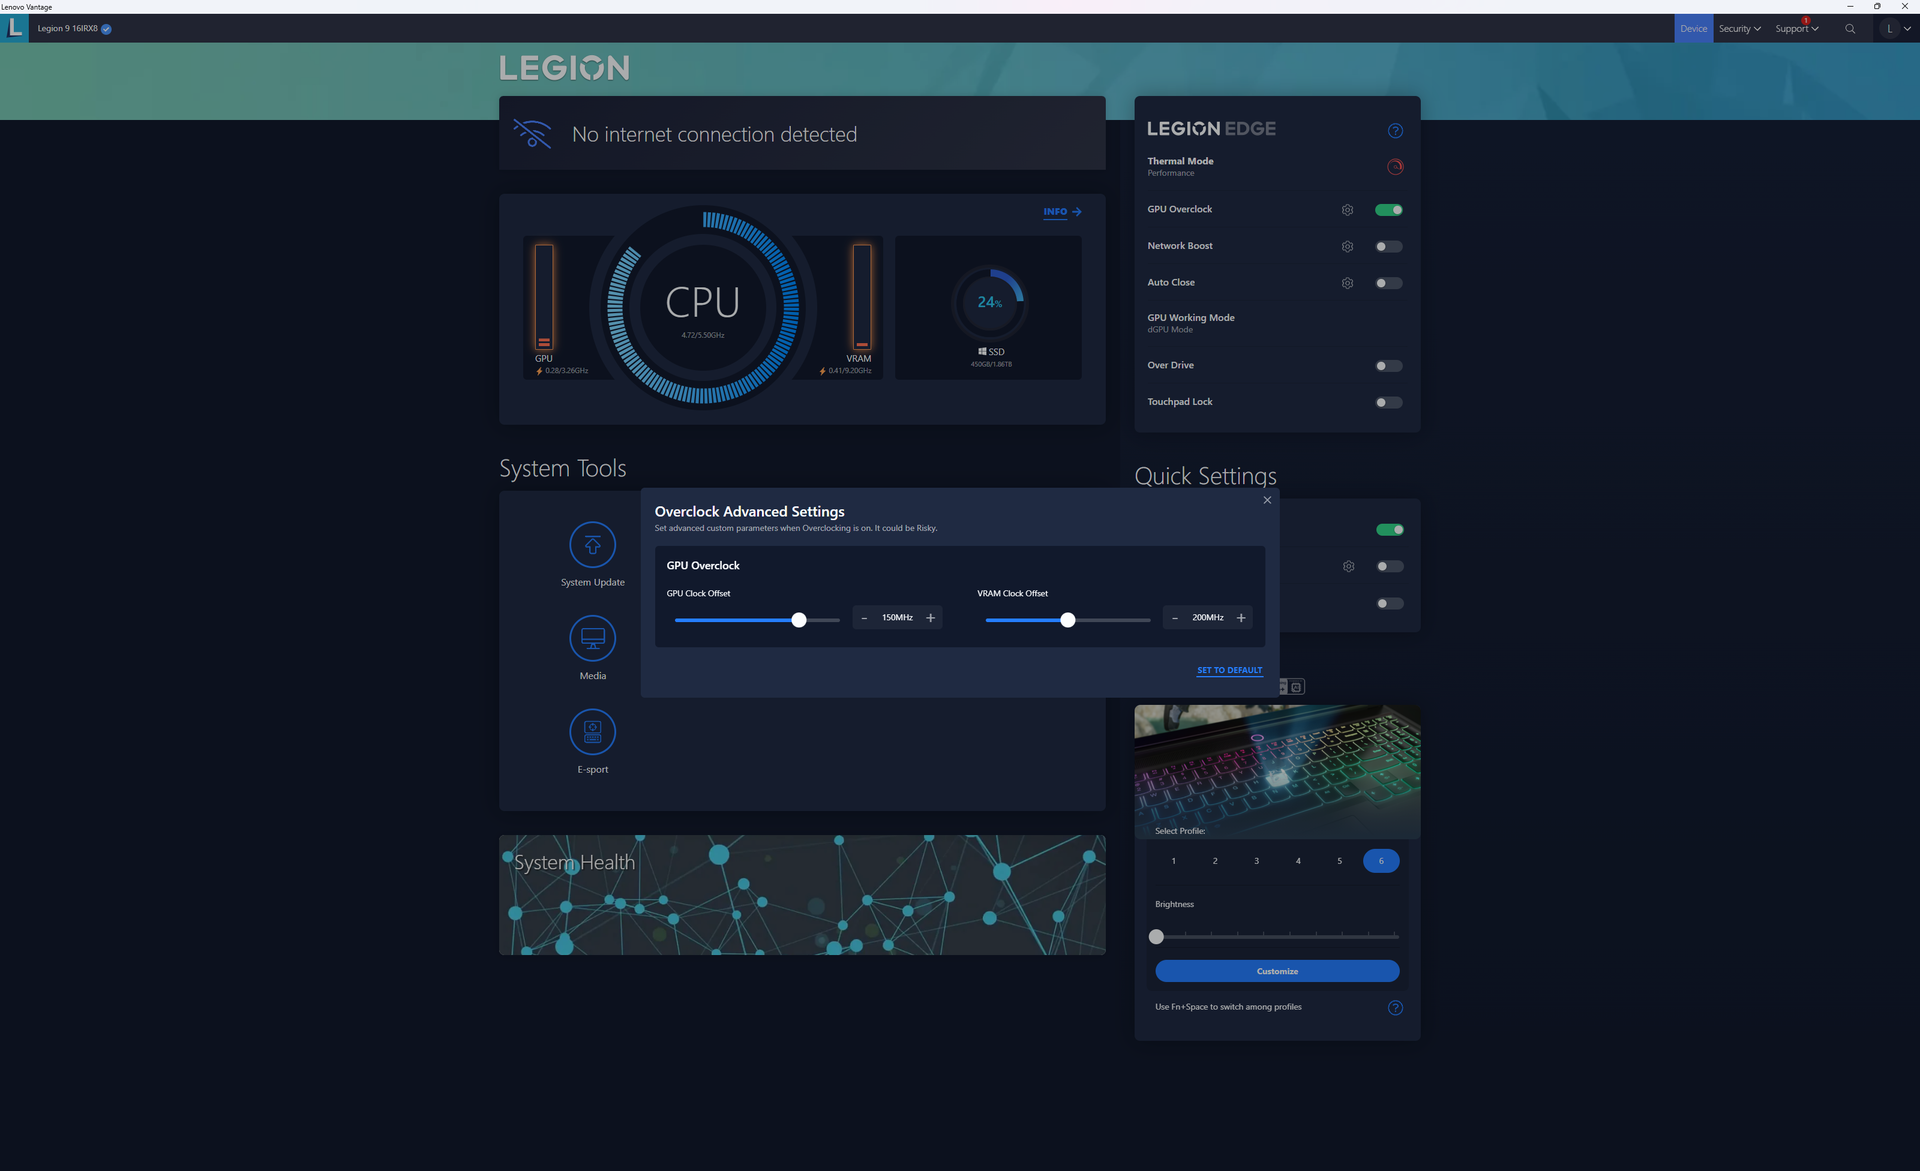
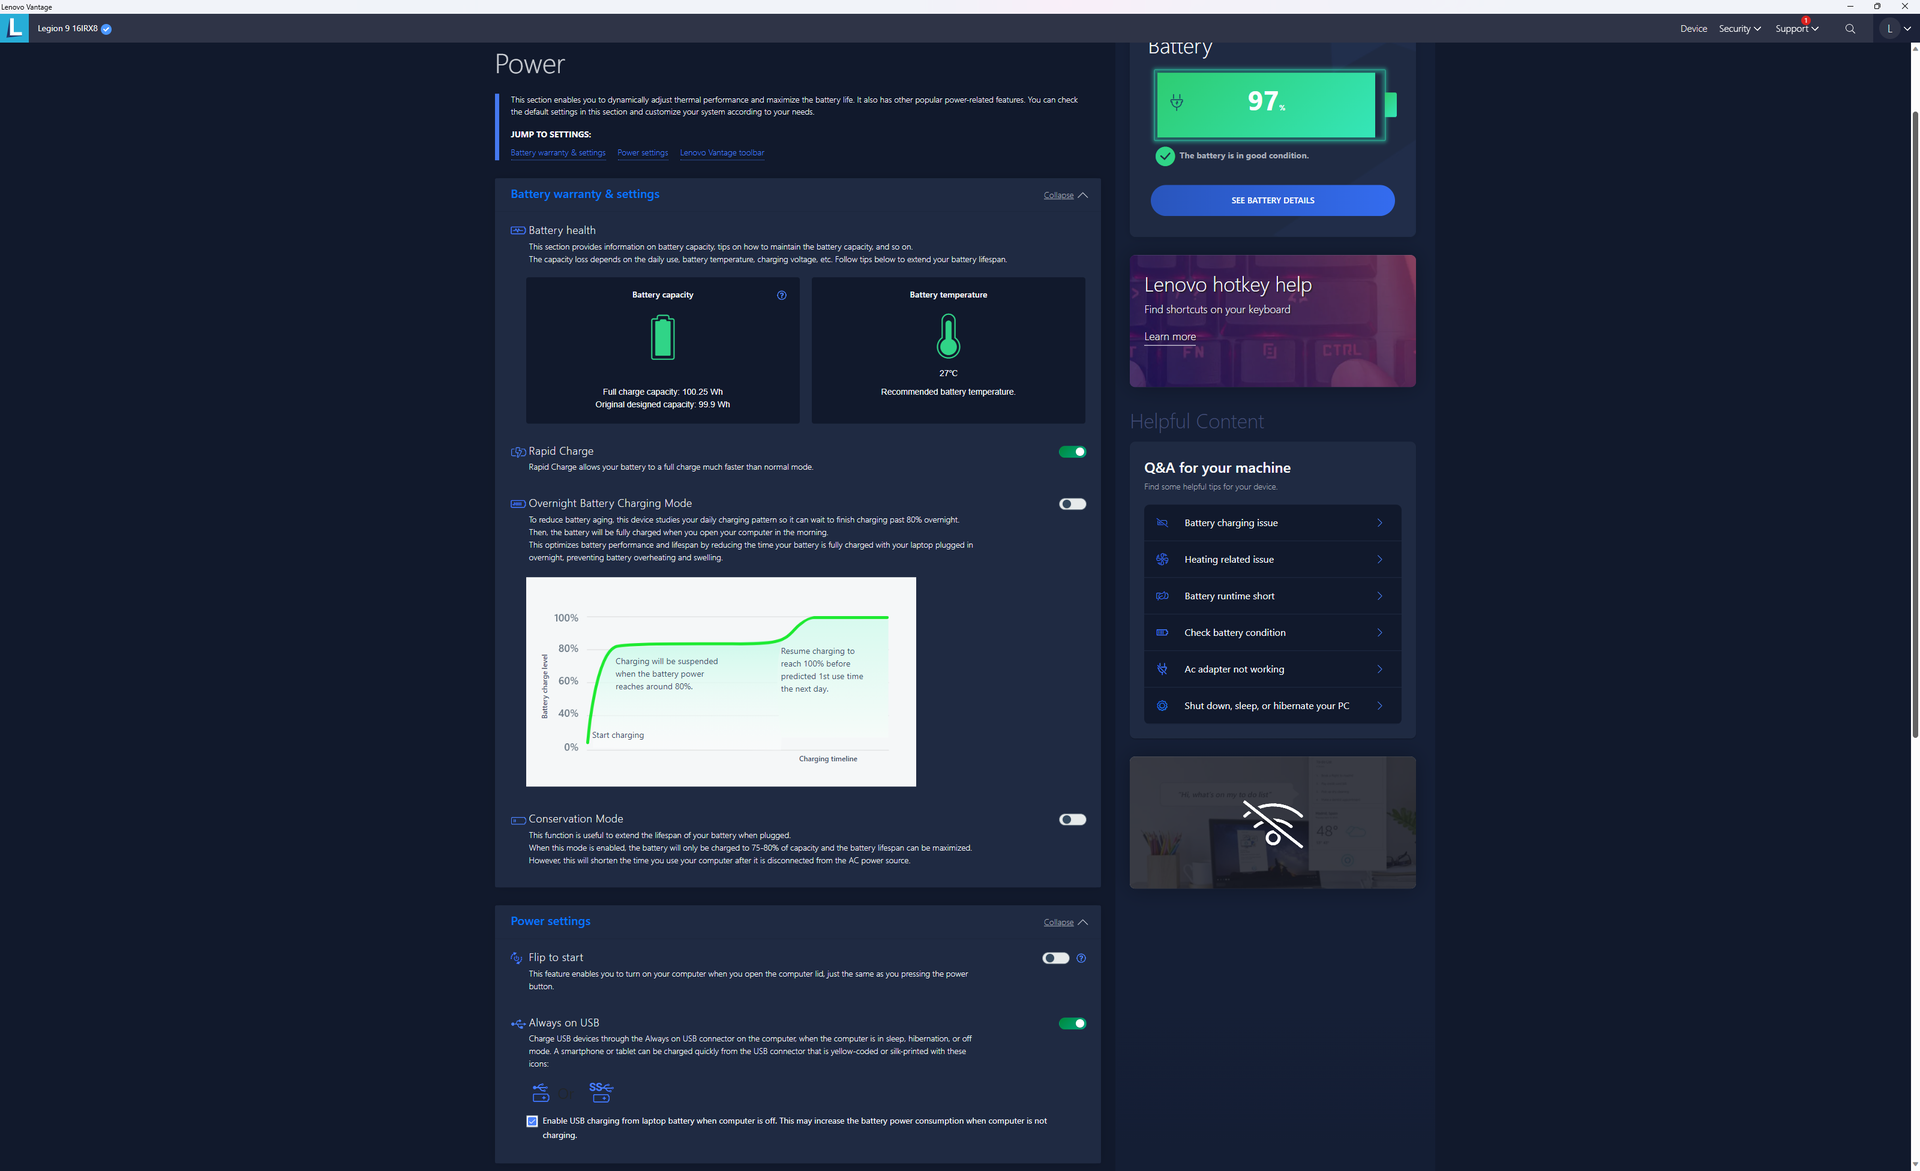
Configuramos nuestra unidad en modo Rendimiento y modo dGPU a través de Lenovo Vantage antes de ejecutar los puntos de referencia que se muestran a continuación. El overclock de la GPU también está activado por defecto a +150 MHz en la GPU y +200 MHz en la VRAM, al igual que en otros modelos de gama alta de Legion. Se recomienda que los propietarios se familiaricen con Vantage para ajustar los perfiles de energía y otros ajustes auxiliares.
Advanced Optimus, MUX y G-Sync son compatibles a diferencia de los recientes Legion Slim 5 14.
Procesador
El rendimiento de la CPU es excelente, con resultados entre un 80 y un 90 por ciento más rápidos en cargas de trabajo multihilo que el Core i7-13700H. El Core i9-13980HX es una de las CPU móviles más rápidas de Intel en este momento, pero sigue estando por detrás del competidorRyzen 9 7945HX en la mayoría de los puntos de referencia multihilo en aproximadamente un 10 por ciento.
El rendimiento es sólo un 5 por ciento más rápido que el Core i9-13950HX basándonos en nuestro tiempo con el Razer Blade 16 2023. Desafortunadamente, Lenovo no ofrece ninguna otra opción de CPU aparte del Core i9-13980HX para aquellos que hubieran querido ahorrarse unos cientos de dólares.
Cinebench R15 Multi Loop
Cinebench R23: Multi Core | Single Core
Cinebench R20: CPU (Multi Core) | CPU (Single Core)
Cinebench R15: CPU Multi 64Bit | CPU Single 64Bit
Blender: v2.79 BMW27 CPU
7-Zip 18.03: 7z b 4 | 7z b 4 -mmt1
Geekbench 5.5: Multi-Core | Single-Core
HWBOT x265 Benchmark v2.2: 4k Preset
LibreOffice : 20 Documents To PDF
R Benchmark 2.5: Overall mean
* ... más pequeño es mejor
AIDA64: FP32 Ray-Trace | FPU Julia | CPU SHA3 | CPU Queen | FPU SinJulia | FPU Mandel | CPU AES | CPU ZLib | FP64 Ray-Trace | CPU PhotoWorxx
| Performance rating | |
| Lenovo Legion 9 16IRX8 | |
| Medio Intel Core i9-13980HX | |
| Asus ROG Strix G16 G614JZ | |
| HP Omen Transcend 16 | |
| Razer Blade 16 Early 2023 RTX 4090 | |
| Lenovo Legion Slim 5 16APH8 | |
| Alienware x16 R1 | |
| AIDA64 / FP32 Ray-Trace | |
| Lenovo Legion Slim 5 16APH8 | |
| Asus ROG Strix G16 G614JZ | |
| Lenovo Legion 9 16IRX8 | |
| Medio Intel Core i9-13980HX (21332 - 29553, n=9) | |
| HP Omen Transcend 16 | |
| Alienware x16 R1 | |
| Razer Blade 16 Early 2023 RTX 4090 | |
| AIDA64 / FPU Julia | |
| Lenovo Legion 9 16IRX8 | |
| Medio Intel Core i9-13980HX (108001 - 148168, n=9) | |
| Asus ROG Strix G16 G614JZ | |
| Lenovo Legion Slim 5 16APH8 | |
| HP Omen Transcend 16 | |
| Razer Blade 16 Early 2023 RTX 4090 | |
| Alienware x16 R1 | |
| AIDA64 / CPU SHA3 | |
| Lenovo Legion 9 16IRX8 | |
| Asus ROG Strix G16 G614JZ | |
| Medio Intel Core i9-13980HX (5264 - 7142, n=9) | |
| Razer Blade 16 Early 2023 RTX 4090 | |
| HP Omen Transcend 16 | |
| Lenovo Legion Slim 5 16APH8 | |
| Alienware x16 R1 | |
| AIDA64 / CPU Queen | |
| Asus ROG Strix G16 G614JZ | |
| Medio Intel Core i9-13980HX (126758 - 143409, n=9) | |
| Razer Blade 16 Early 2023 RTX 4090 | |
| Lenovo Legion 9 16IRX8 | |
| HP Omen Transcend 16 | |
| Lenovo Legion Slim 5 16APH8 | |
| Alienware x16 R1 | |
| AIDA64 / FPU SinJulia | |
| Asus ROG Strix G16 G614JZ | |
| Medio Intel Core i9-13980HX (13785 - 17117, n=9) | |
| Lenovo Legion 9 16IRX8 | |
| Lenovo Legion Slim 5 16APH8 | |
| HP Omen Transcend 16 | |
| Razer Blade 16 Early 2023 RTX 4090 | |
| Alienware x16 R1 | |
| AIDA64 / FPU Mandel | |
| Lenovo Legion 9 16IRX8 | |
| Medio Intel Core i9-13980HX (53398 - 73758, n=9) | |
| Asus ROG Strix G16 G614JZ | |
| Lenovo Legion Slim 5 16APH8 | |
| HP Omen Transcend 16 | |
| Razer Blade 16 Early 2023 RTX 4090 | |
| Alienware x16 R1 | |
| AIDA64 / CPU AES | |
| Razer Blade 16 Early 2023 RTX 4090 | |
| Asus ROG Strix G16 G614JZ | |
| Lenovo Legion 9 16IRX8 | |
| Medio Intel Core i9-13980HX (105169 - 136520, n=9) | |
| HP Omen Transcend 16 | |
| Alienware x16 R1 | |
| Lenovo Legion Slim 5 16APH8 | |
| AIDA64 / CPU ZLib | |
| Lenovo Legion 9 16IRX8 | |
| Asus ROG Strix G16 G614JZ | |
| Medio Intel Core i9-13980HX (1513 - 2039, n=9) | |
| Razer Blade 16 Early 2023 RTX 4090 | |
| HP Omen Transcend 16 | |
| Alienware x16 R1 | |
| Lenovo Legion Slim 5 16APH8 | |
| AIDA64 / FP64 Ray-Trace | |
| Lenovo Legion Slim 5 16APH8 | |
| Lenovo Legion 9 16IRX8 | |
| Asus ROG Strix G16 G614JZ | |
| Medio Intel Core i9-13980HX (11431 - 16325, n=9) | |
| HP Omen Transcend 16 | |
| Alienware x16 R1 | |
| Razer Blade 16 Early 2023 RTX 4090 | |
| AIDA64 / CPU PhotoWorxx | |
| Razer Blade 16 Early 2023 RTX 4090 | |
| Lenovo Legion 9 16IRX8 | |
| HP Omen Transcend 16 | |
| Alienware x16 R1 | |
| Medio Intel Core i9-13980HX (37069 - 52949, n=9) | |
| Asus ROG Strix G16 G614JZ | |
| Lenovo Legion Slim 5 16APH8 | |
Rendimiento del sistema
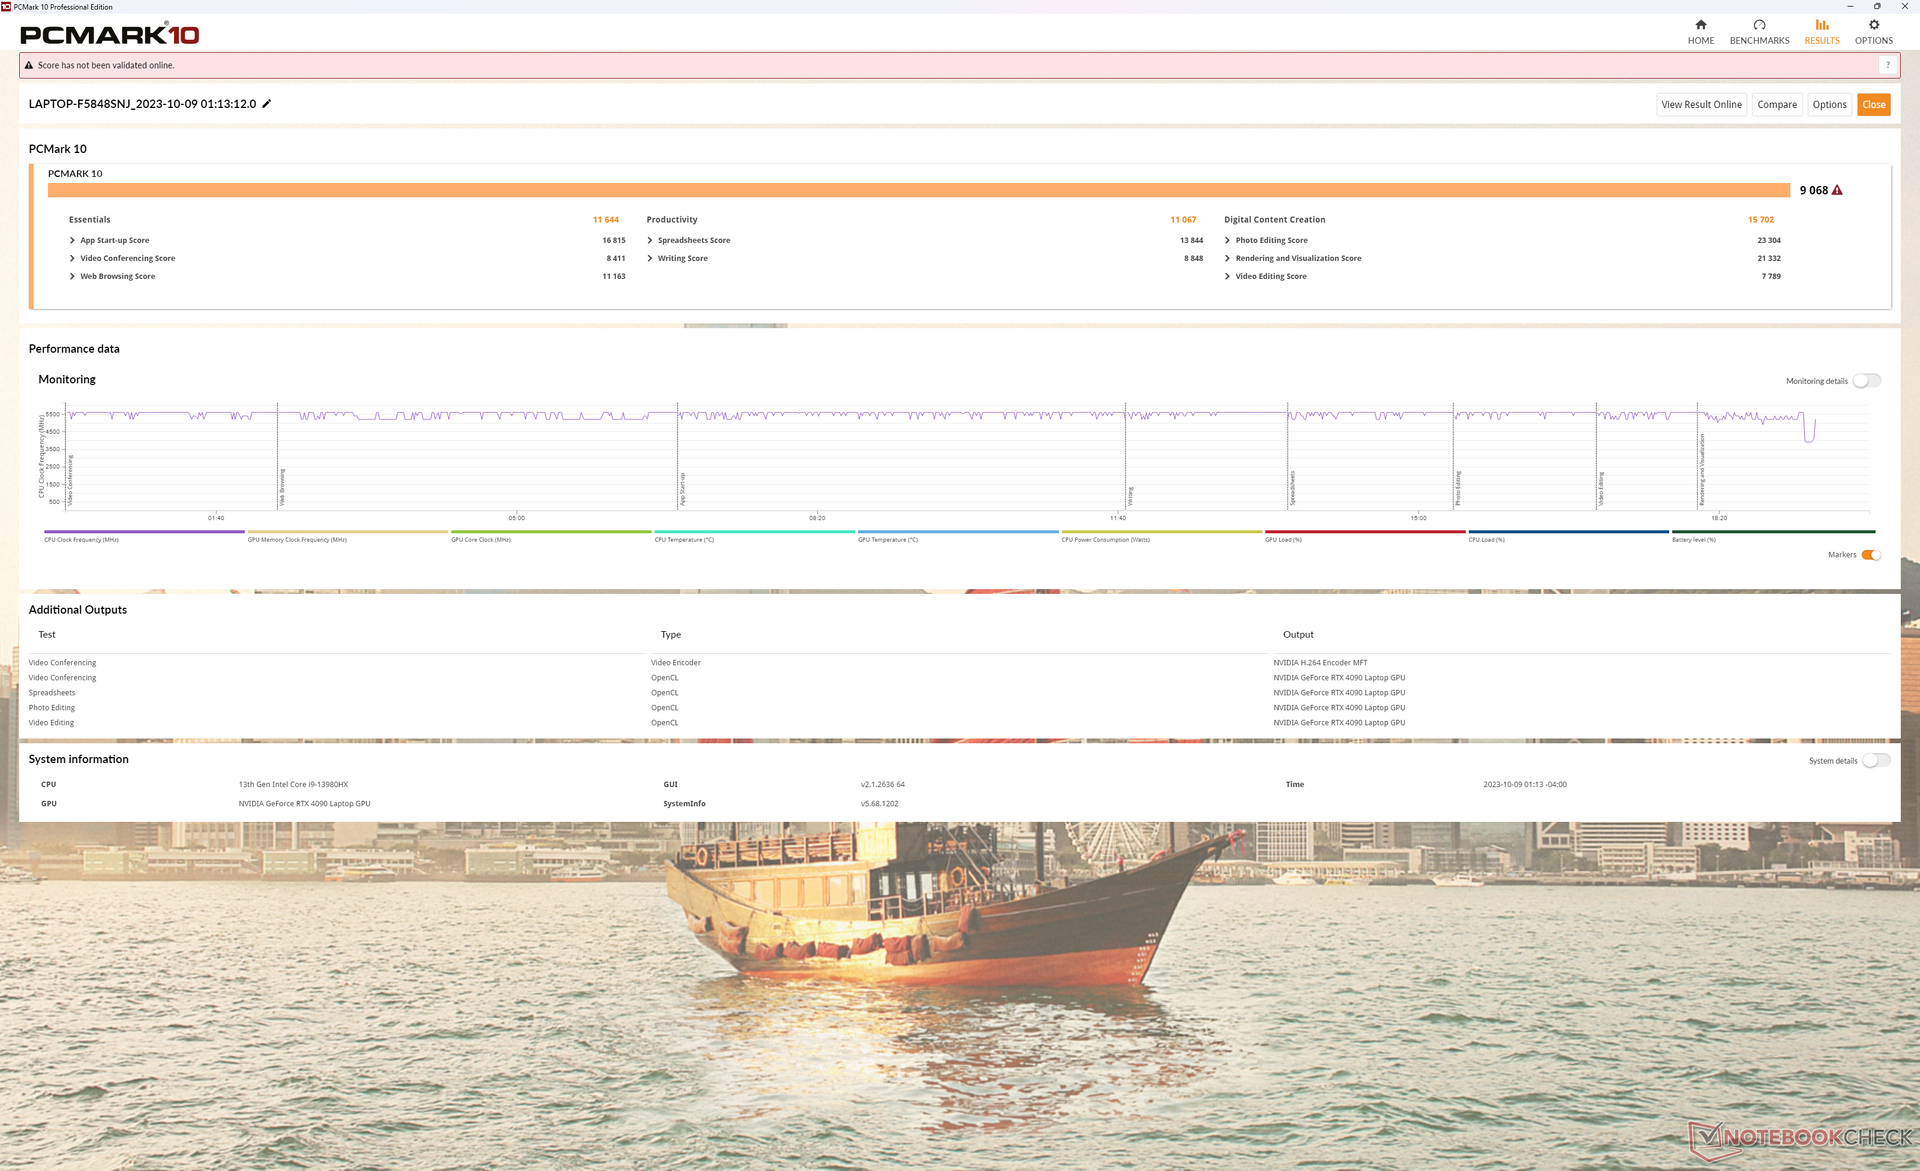
Las puntuaciones en PCMark son de las más altas de cualquier portátil para juegos, independientemente de su tamaño, debido en gran parte a la CPU Core HX de 13ª generación, la GPU RTX 4090 y, especialmente, la configuración RAID 0 PCIe4 x4. No obstante, seguimos experimentando problemas al despertar del sueño en los que la pantalla a veces permanecía en blanco y "congelada" durante periodos de tiempo inusualmente largos. Sospechamos que esto podría deberse a la forma en que el modelo hace malabarismos entre los distintos modos de GPU.
CrossMark: Overall | Productivity | Creativity | Responsiveness
| PCMark 10 / Score | |
| Lenovo Legion 9 16IRX8 | |
| Medio Intel Core i9-13980HX, NVIDIA GeForce RTX 4090 Laptop GPU (8650 - 9068, n=4) | |
| Alienware x16 R1 | |
| HP Omen Transcend 16 | |
| Lenovo Legion Slim 5 16APH8 | |
| Razer Blade 16 Early 2023 RTX 4090 | |
| Asus ROG Strix G16 G614JZ | |
| PCMark 10 / Essentials | |
| Asus ROG Strix G16 G614JZ | |
| Lenovo Legion 9 16IRX8 | |
| Medio Intel Core i9-13980HX, NVIDIA GeForce RTX 4090 Laptop GPU (11215 - 11644, n=3) | |
| HP Omen Transcend 16 | |
| Lenovo Legion Slim 5 16APH8 | |
| Alienware x16 R1 | |
| Razer Blade 16 Early 2023 RTX 4090 | |
| PCMark 10 / Productivity | |
| Lenovo Legion 9 16IRX8 | |
| Medio Intel Core i9-13980HX, NVIDIA GeForce RTX 4090 Laptop GPU (10125 - 11067, n=3) | |
| Lenovo Legion Slim 5 16APH8 | |
| Alienware x16 R1 | |
| HP Omen Transcend 16 | |
| Razer Blade 16 Early 2023 RTX 4090 | |
| Asus ROG Strix G16 G614JZ | |
| PCMark 10 / Digital Content Creation | |
| Lenovo Legion 9 16IRX8 | |
| Medio Intel Core i9-13980HX, NVIDIA GeForce RTX 4090 Laptop GPU (15052 - 16012, n=3) | |
| Alienware x16 R1 | |
| HP Omen Transcend 16 | |
| Razer Blade 16 Early 2023 RTX 4090 | |
| Lenovo Legion Slim 5 16APH8 | |
| Asus ROG Strix G16 G614JZ | |
| CrossMark / Overall | |
| Asus ROG Strix G16 G614JZ | |
| Medio Intel Core i9-13980HX, NVIDIA GeForce RTX 4090 Laptop GPU (1935 - 2176, n=4) | |
| Razer Blade 16 Early 2023 RTX 4090 | |
| HP Omen Transcend 16 | |
| Alienware x16 R1 | |
| Lenovo Legion 9 16IRX8 | |
| Lenovo Legion Slim 5 16APH8 | |
| CrossMark / Productivity | |
| Asus ROG Strix G16 G614JZ | |
| Razer Blade 16 Early 2023 RTX 4090 | |
| Medio Intel Core i9-13980HX, NVIDIA GeForce RTX 4090 Laptop GPU (1764 - 2005, n=4) | |
| Alienware x16 R1 | |
| HP Omen Transcend 16 | |
| Lenovo Legion 9 16IRX8 | |
| Lenovo Legion Slim 5 16APH8 | |
| CrossMark / Creativity | |
| Asus ROG Strix G16 G614JZ | |
| Medio Intel Core i9-13980HX, NVIDIA GeForce RTX 4090 Laptop GPU (2267 - 2469, n=4) | |
| HP Omen Transcend 16 | |
| Lenovo Legion 9 16IRX8 | |
| Razer Blade 16 Early 2023 RTX 4090 | |
| Alienware x16 R1 | |
| Lenovo Legion Slim 5 16APH8 | |
| CrossMark / Responsiveness | |
| Asus ROG Strix G16 G614JZ | |
| Alienware x16 R1 | |
| Razer Blade 16 Early 2023 RTX 4090 | |
| Medio Intel Core i9-13980HX, NVIDIA GeForce RTX 4090 Laptop GPU (1556 - 1904, n=4) | |
| Lenovo Legion 9 16IRX8 | |
| HP Omen Transcend 16 | |
| Lenovo Legion Slim 5 16APH8 | |
| PCMark 10 Score | 9068 puntos | |
ayuda | ||
| AIDA64 / Memory Copy | |
| Razer Blade 16 Early 2023 RTX 4090 | |
| Lenovo Legion 9 16IRX8 | |
| HP Omen Transcend 16 | |
| Alienware x16 R1 | |
| Medio Intel Core i9-13980HX (62189 - 80776, n=9) | |
| Lenovo Legion Slim 5 16APH8 | |
| Asus ROG Strix G16 G614JZ | |
| AIDA64 / Memory Read | |
| Lenovo Legion 9 16IRX8 | |
| Razer Blade 16 Early 2023 RTX 4090 | |
| HP Omen Transcend 16 | |
| Medio Intel Core i9-13980HX (62624 - 89096, n=9) | |
| Asus ROG Strix G16 G614JZ | |
| Alienware x16 R1 | |
| Lenovo Legion Slim 5 16APH8 | |
| AIDA64 / Memory Write | |
| Alienware x16 R1 | |
| Lenovo Legion Slim 5 16APH8 | |
| Razer Blade 16 Early 2023 RTX 4090 | |
| Lenovo Legion 9 16IRX8 | |
| HP Omen Transcend 16 | |
| Medio Intel Core i9-13980HX (59912 - 79917, n=9) | |
| Asus ROG Strix G16 G614JZ | |
| AIDA64 / Memory Latency | |
| Alienware x16 R1 | |
| Lenovo Legion Slim 5 16APH8 | |
| HP Omen Transcend 16 | |
| Asus ROG Strix G16 G614JZ | |
| Medio Intel Core i9-13980HX (79.4 - 93.2, n=9) | |
| Razer Blade 16 Early 2023 RTX 4090 | |
| Lenovo Legion 9 16IRX8 | |
* ... más pequeño es mejor
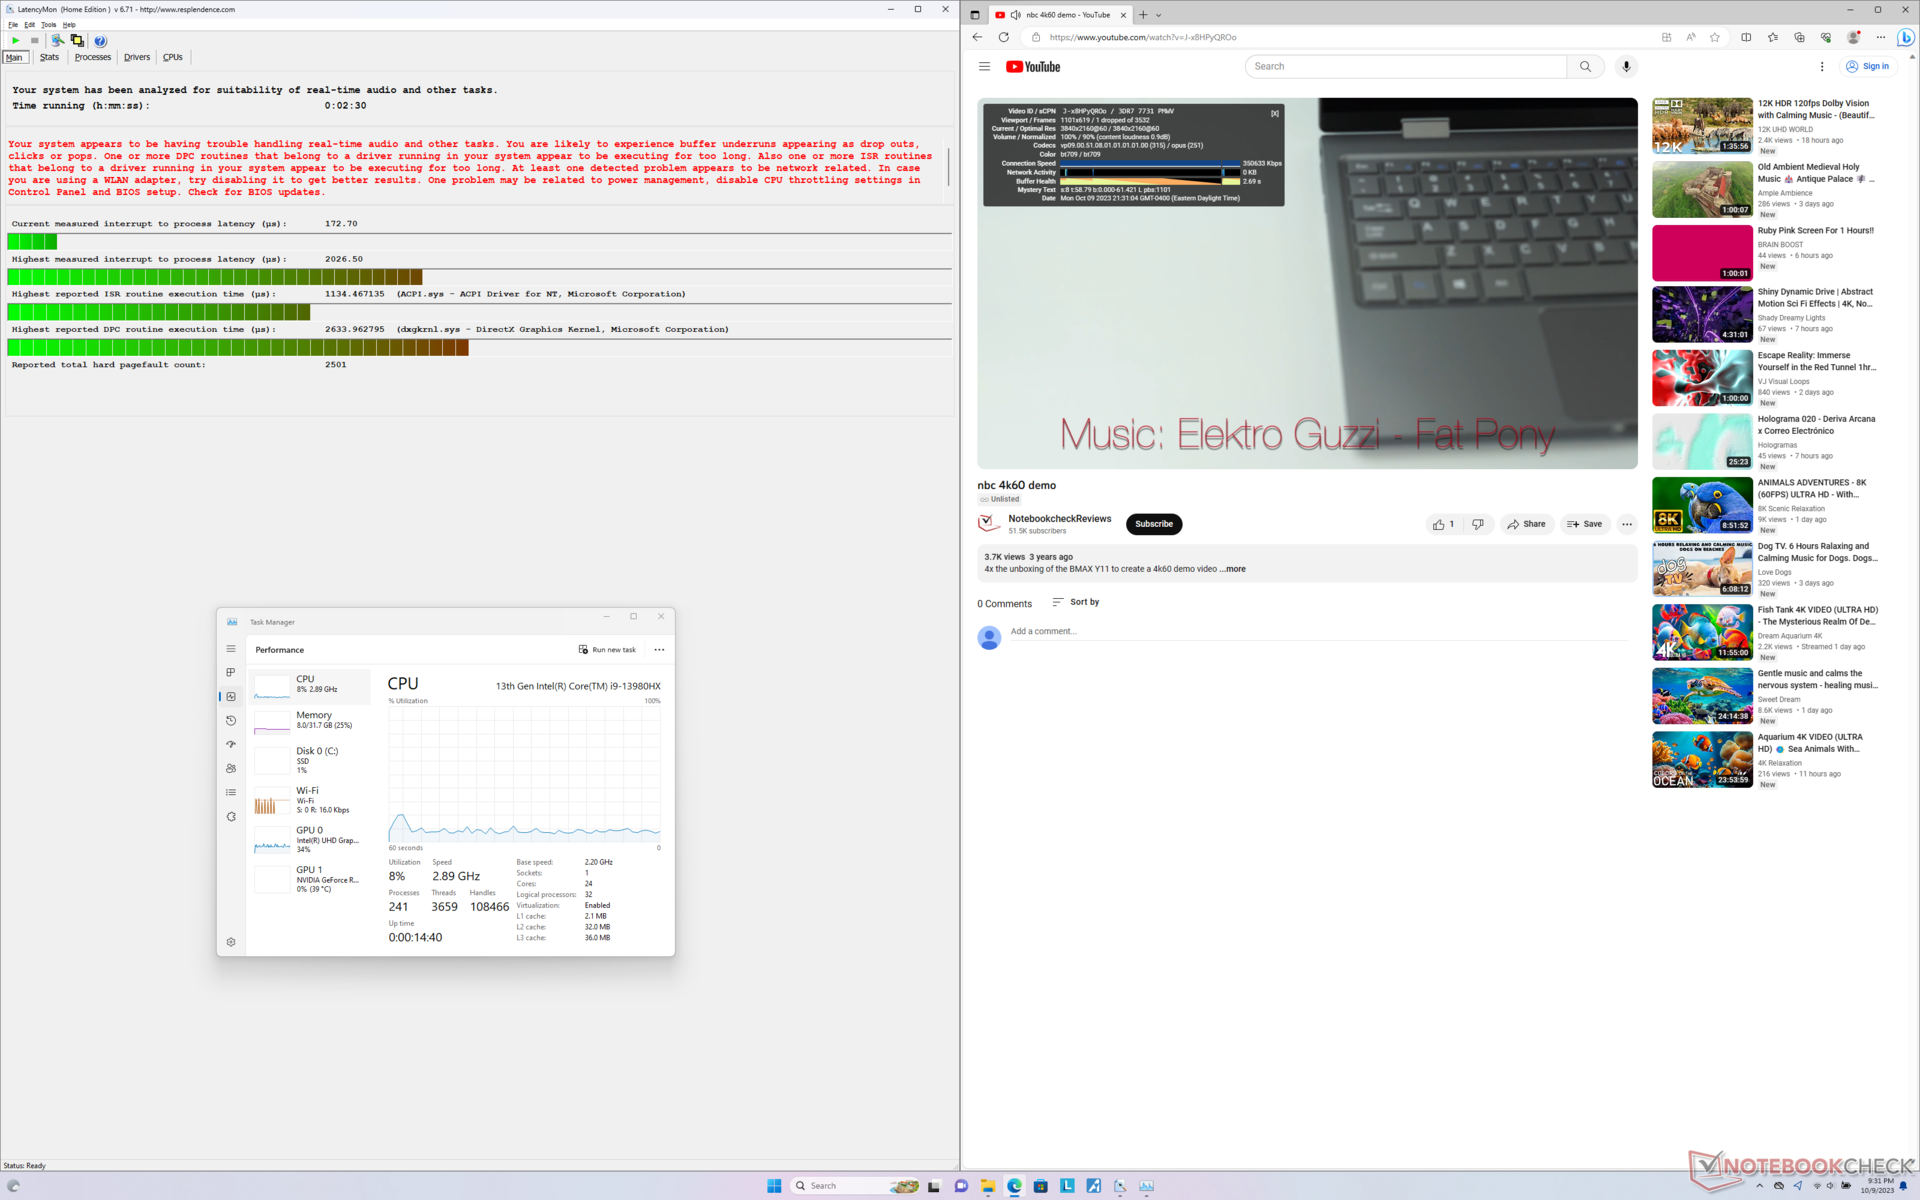
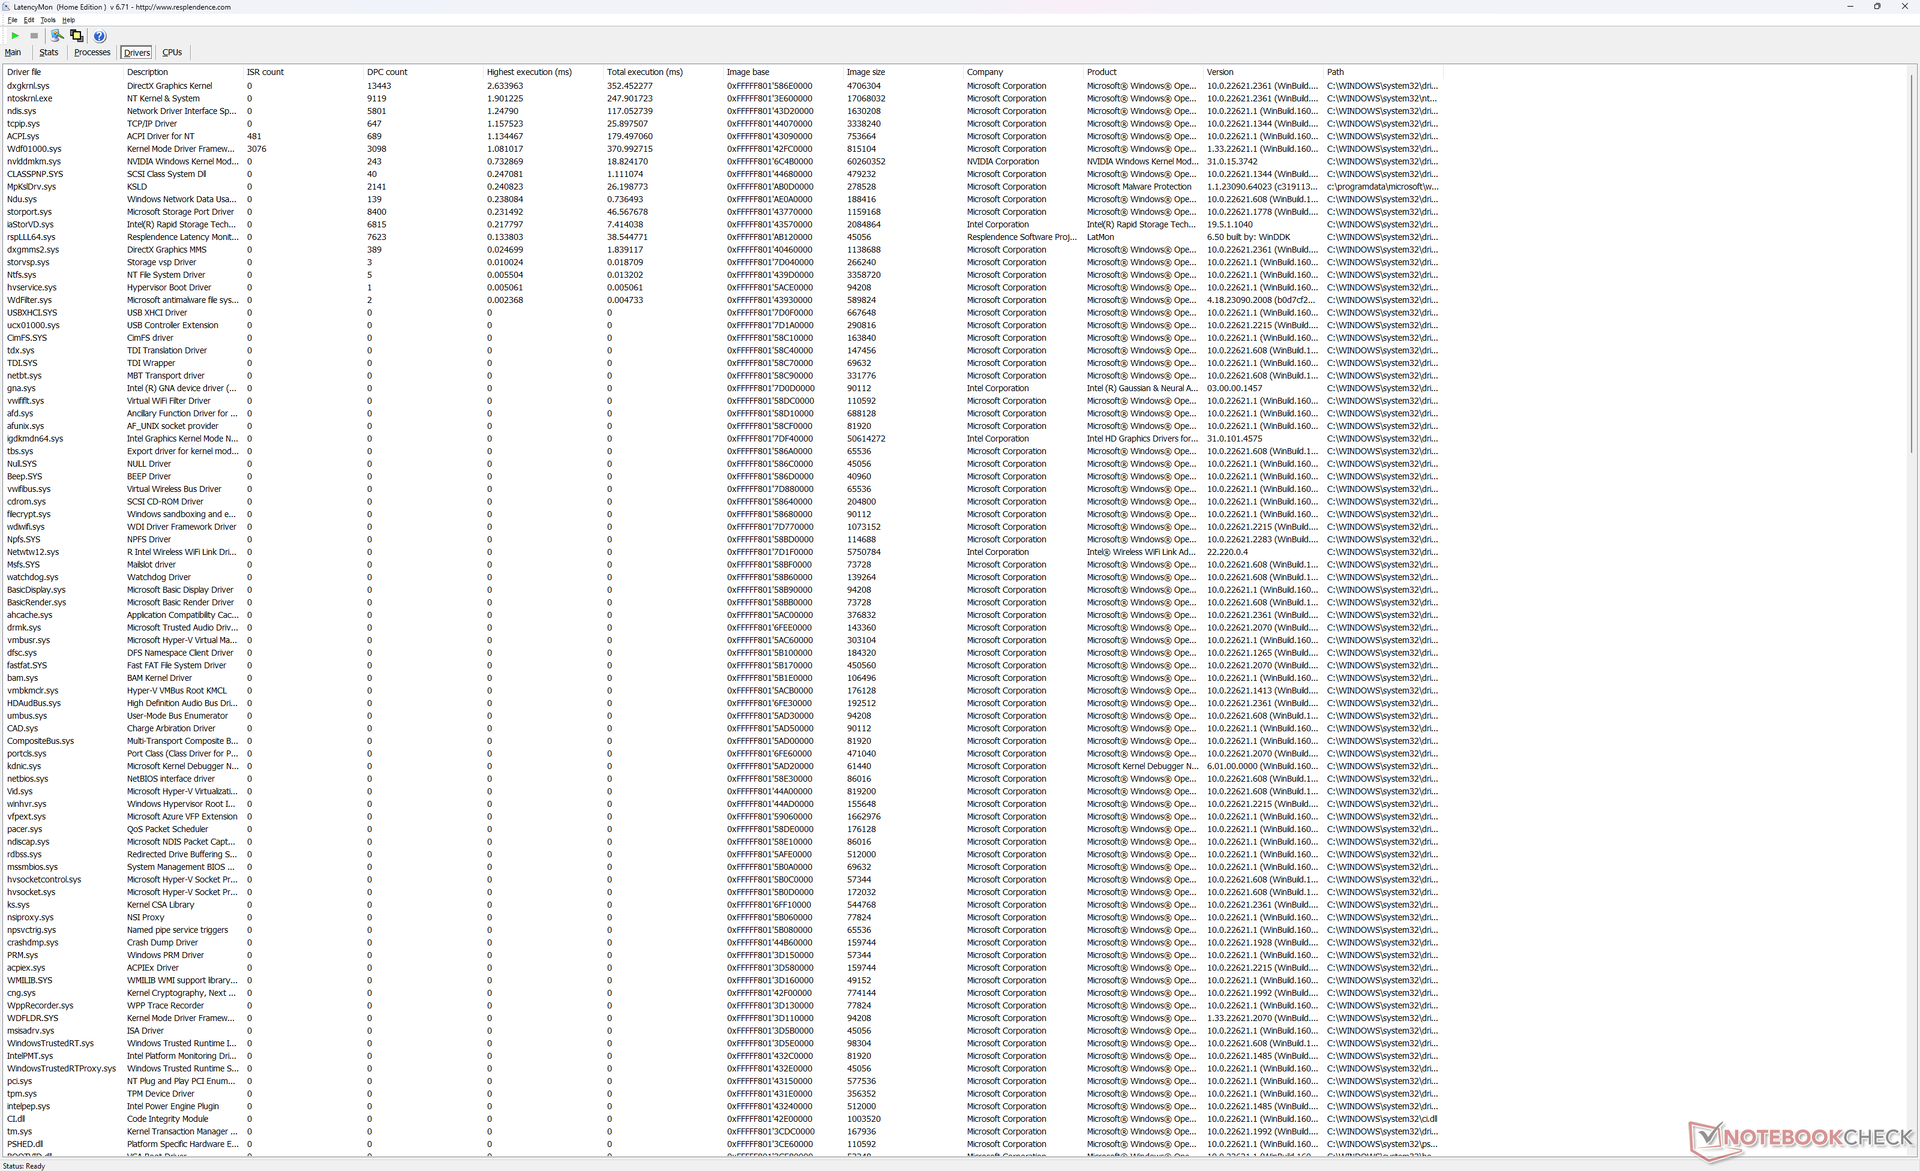
Latencia del CPD
LatencyMon revela problemas de CPD al abrir varias pestañas del navegador de nuestra página principal. la reproducción de vídeo 4K a 60 FPS es casi perfecta, con un solo fotograma caído registrado durante un intervalo de un minuto.
| DPC Latencies / LatencyMon - interrupt to process latency (max), Web, Youtube, Prime95 | |
| Razer Blade 16 Early 2023 RTX 4090 | |
| Razer Blade 16 Early 2023 RTX 4090 | |
| Asus ROG Strix G16 G614JZ | |
| Lenovo Legion 9 16IRX8 | |
| HP Omen Transcend 16 | |
| Alienware x16 R1 | |
| Lenovo Legion Slim 5 16APH8 | |
* ... más pequeño es mejor
Dispositivos de almacenamiento
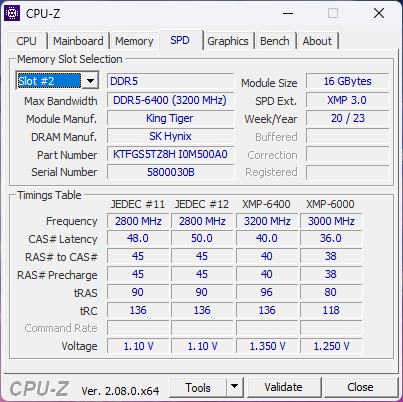
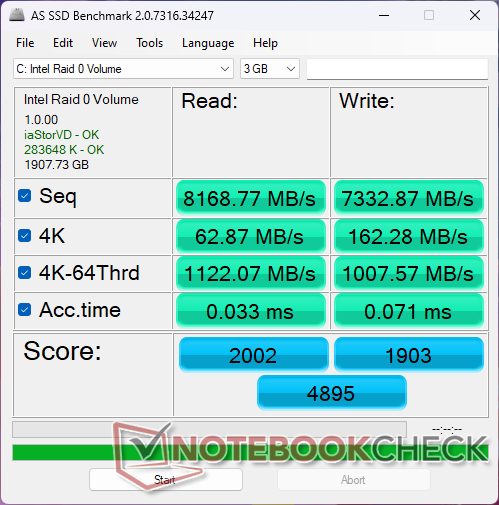
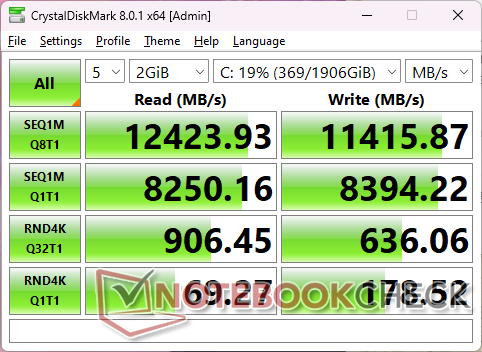
Nuestra unidad viene configurada con dos SK hynix HFS001TEJ9X115N PCIe4 x4 NVMe SSD en configuración RAID 0 para velocidades de lectura y escritura secuenciales increíblemente rápidas de hasta 12000 MB/s y 11000 MB/s, respectivamente. Desafortunadamente, las unidades son propensas al estrangulamiento cuando funcionan a velocidades tan altas durante periodos prolongados. Los resultados de nuestra prueba en bucle DiskSpd que se muestran a continuación muestran que las velocidades de lectura de una de las unidades caen a unos 4600 MB/s después de unos 4 minutos.

| Drive Performance rating - Percent | |
| Alienware x16 R1 | |
| Lenovo Legion 9 16IRX8 | |
| Razer Blade 16 Early 2023 RTX 4090 | |
| Asus ROG Strix G16 G614JZ | |
| HP Omen Transcend 16 | |
| Lenovo Legion Slim 5 16APH8 | |
* ... más pequeño es mejor
Disk Throttling: DiskSpd Read Loop, Queue Depth 8
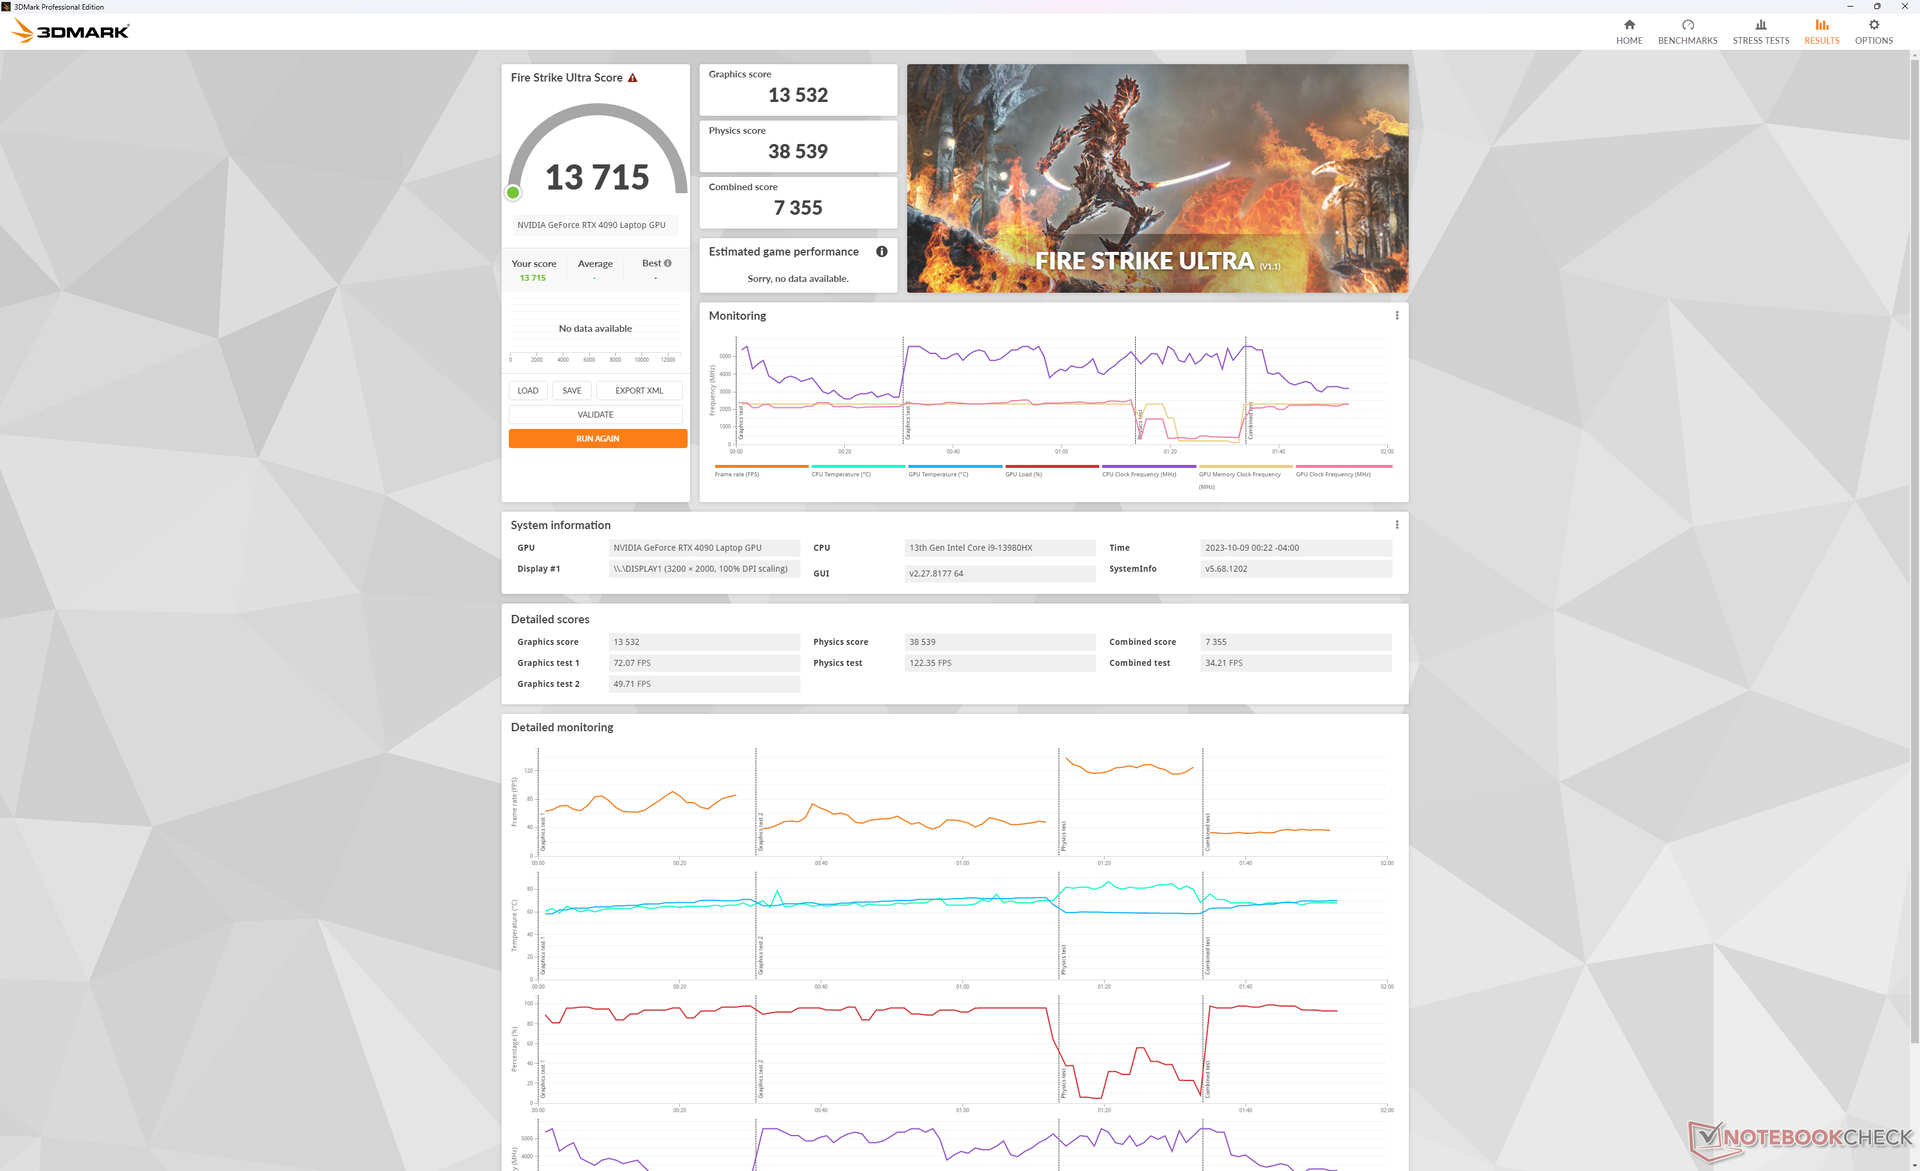
Rendimiento de la GPU - Gráficos TGP de 175 W
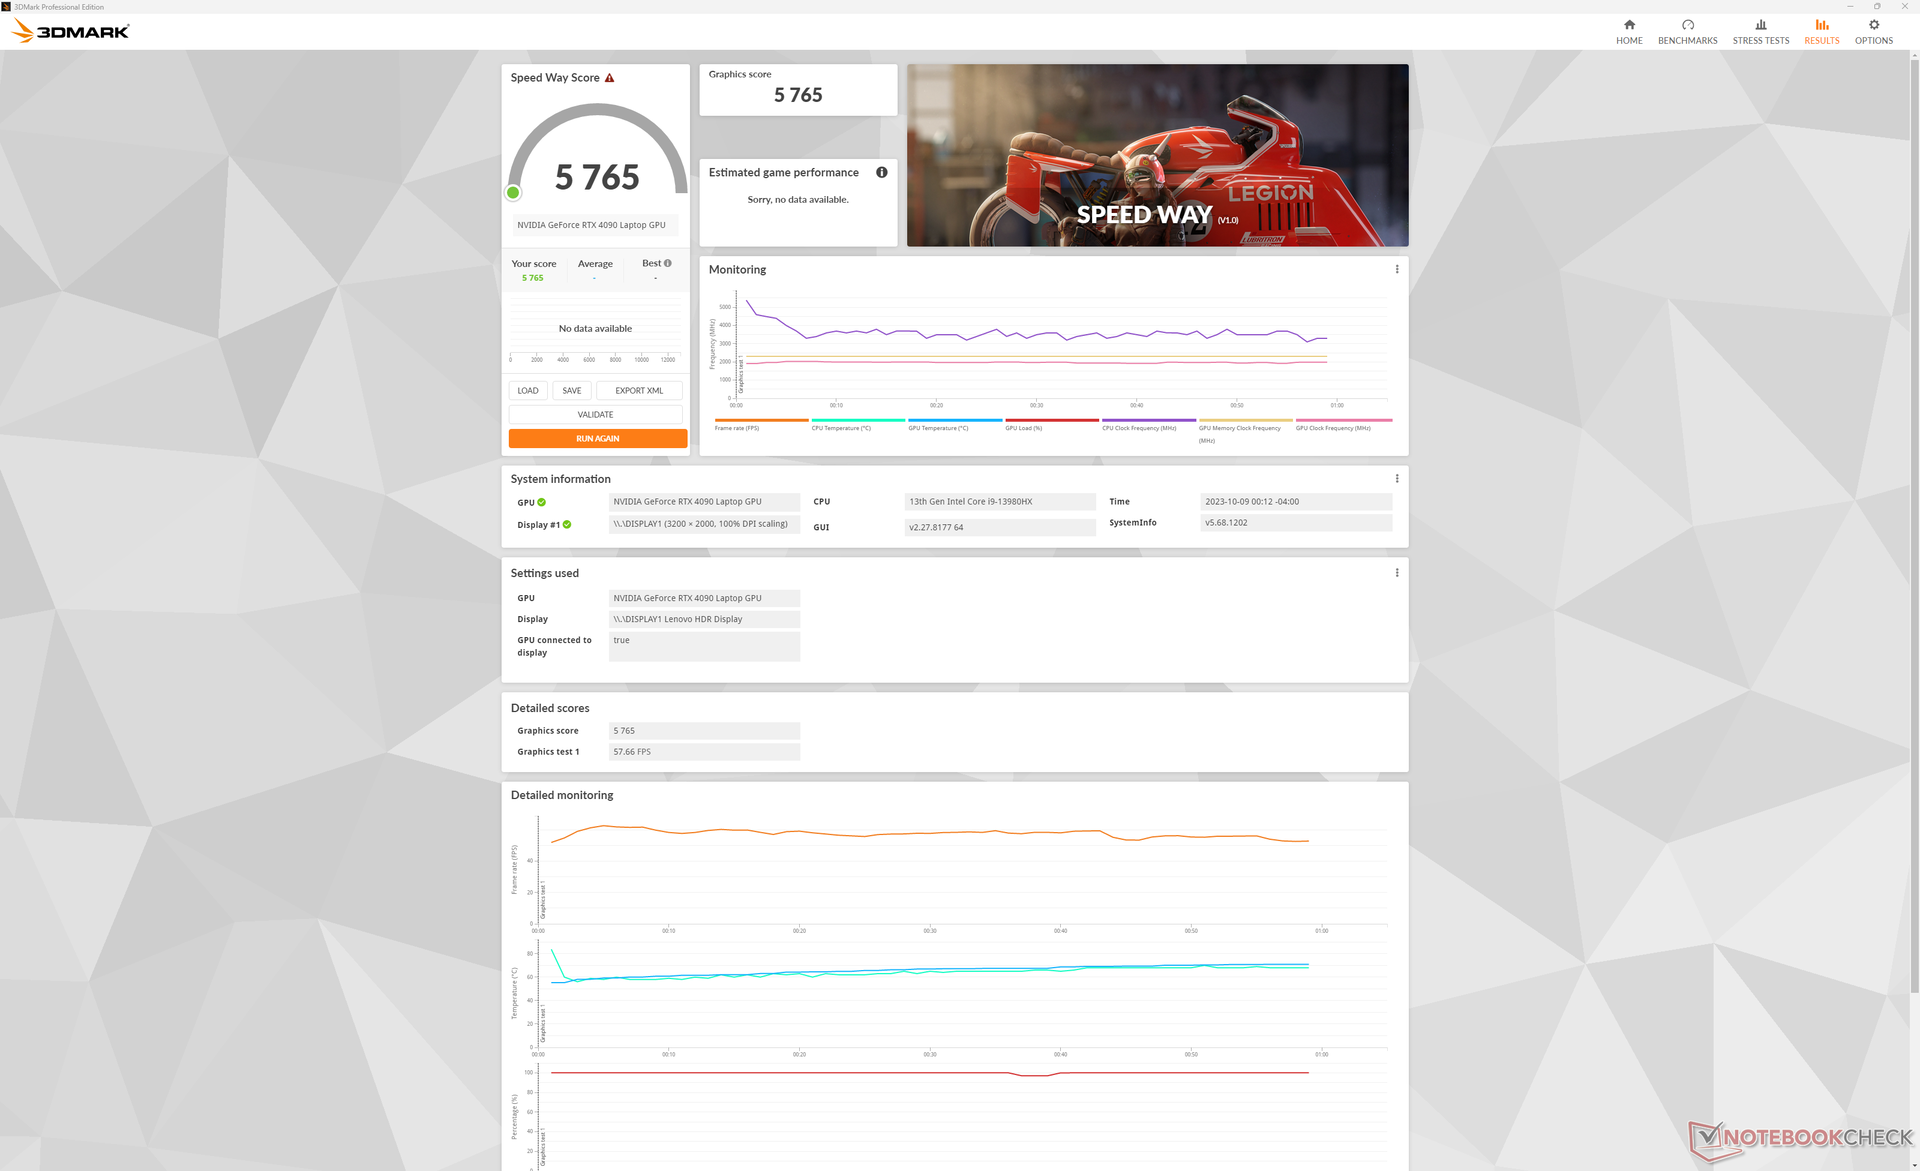
Nuestros 175 W GeForce RTX 4090 portátil rinde a sólo 1 ó 2 puntos porcentuales del portátil medio de nuestra base de datos con la misma GPU. Los resultados son impresionantes teniendo en cuenta lo grandes que pueden ser algunos portátiles RTX 4090 como elMSI Raider GE78 HX 13VI.
Si miramos el panorama general, la RTX 4090 portátil es aproximadamente un 40 por ciento más lenta que una "adecuada" rTX 4090 de sobremesa. De hecho, sólo ofrece modestas ventajas de apenas un 5 a un 10 por ciento sobre la rTX 4080 móvil configuración.
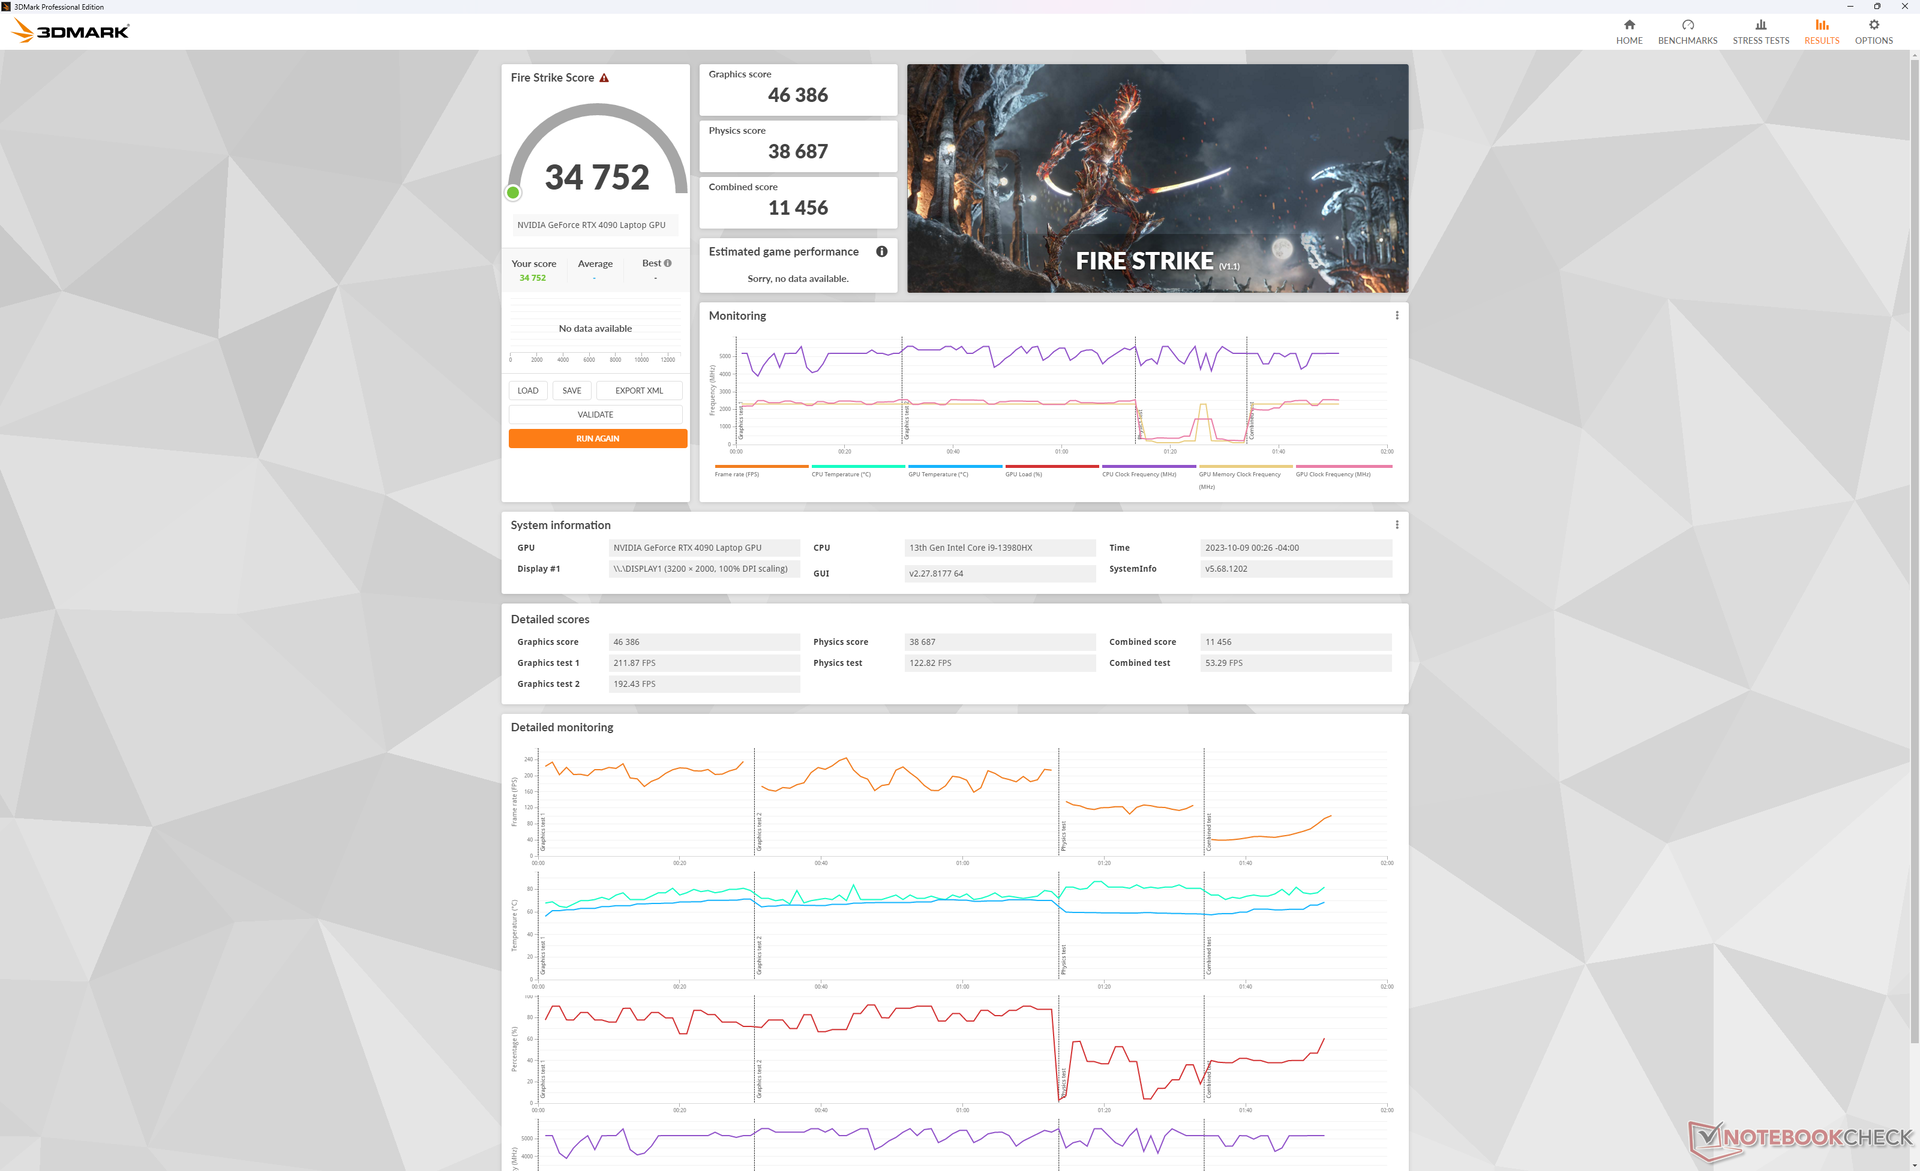
Si se ejecuta en el perfil de potencia Equilibrado con el overclocking desactivado, se reduciría el rendimiento gráfico en aproximadamente un 17 por ciento, según nuestra tabla de resultados de Fire Strike que aparece a continuación.
| Perfil de potencia | Puntuación gráfica | Puntuación física | Puntuación combinada |
| Modo Rendimiento | 46386 | 38687 | 11456 |
| Modo equilibrado (con el overclock de la GPU desactivado) | 38285 (-17%) | 39020 (-0%) | 12715 (-0%) |
| Batería | 22176 (-52%) | 21072 (-46%) | 6306 (-45%) |
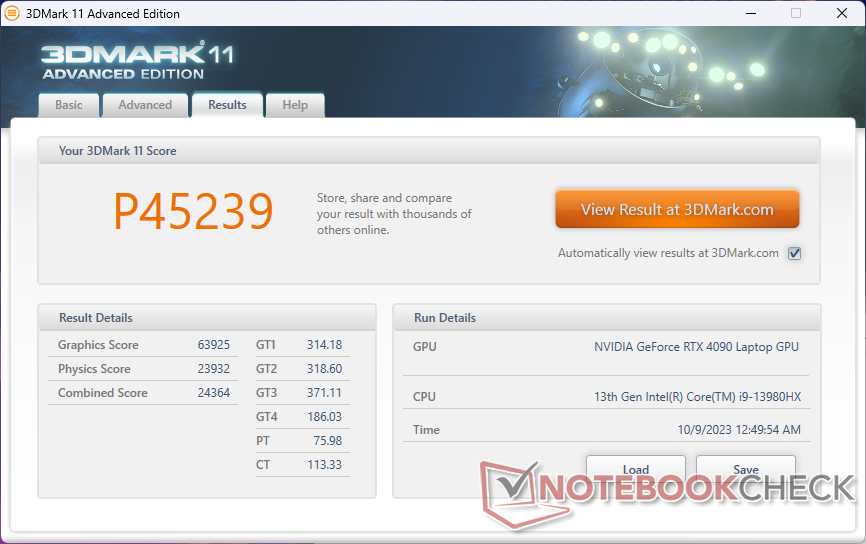
| 3DMark 11 Performance | 45239 puntos | |
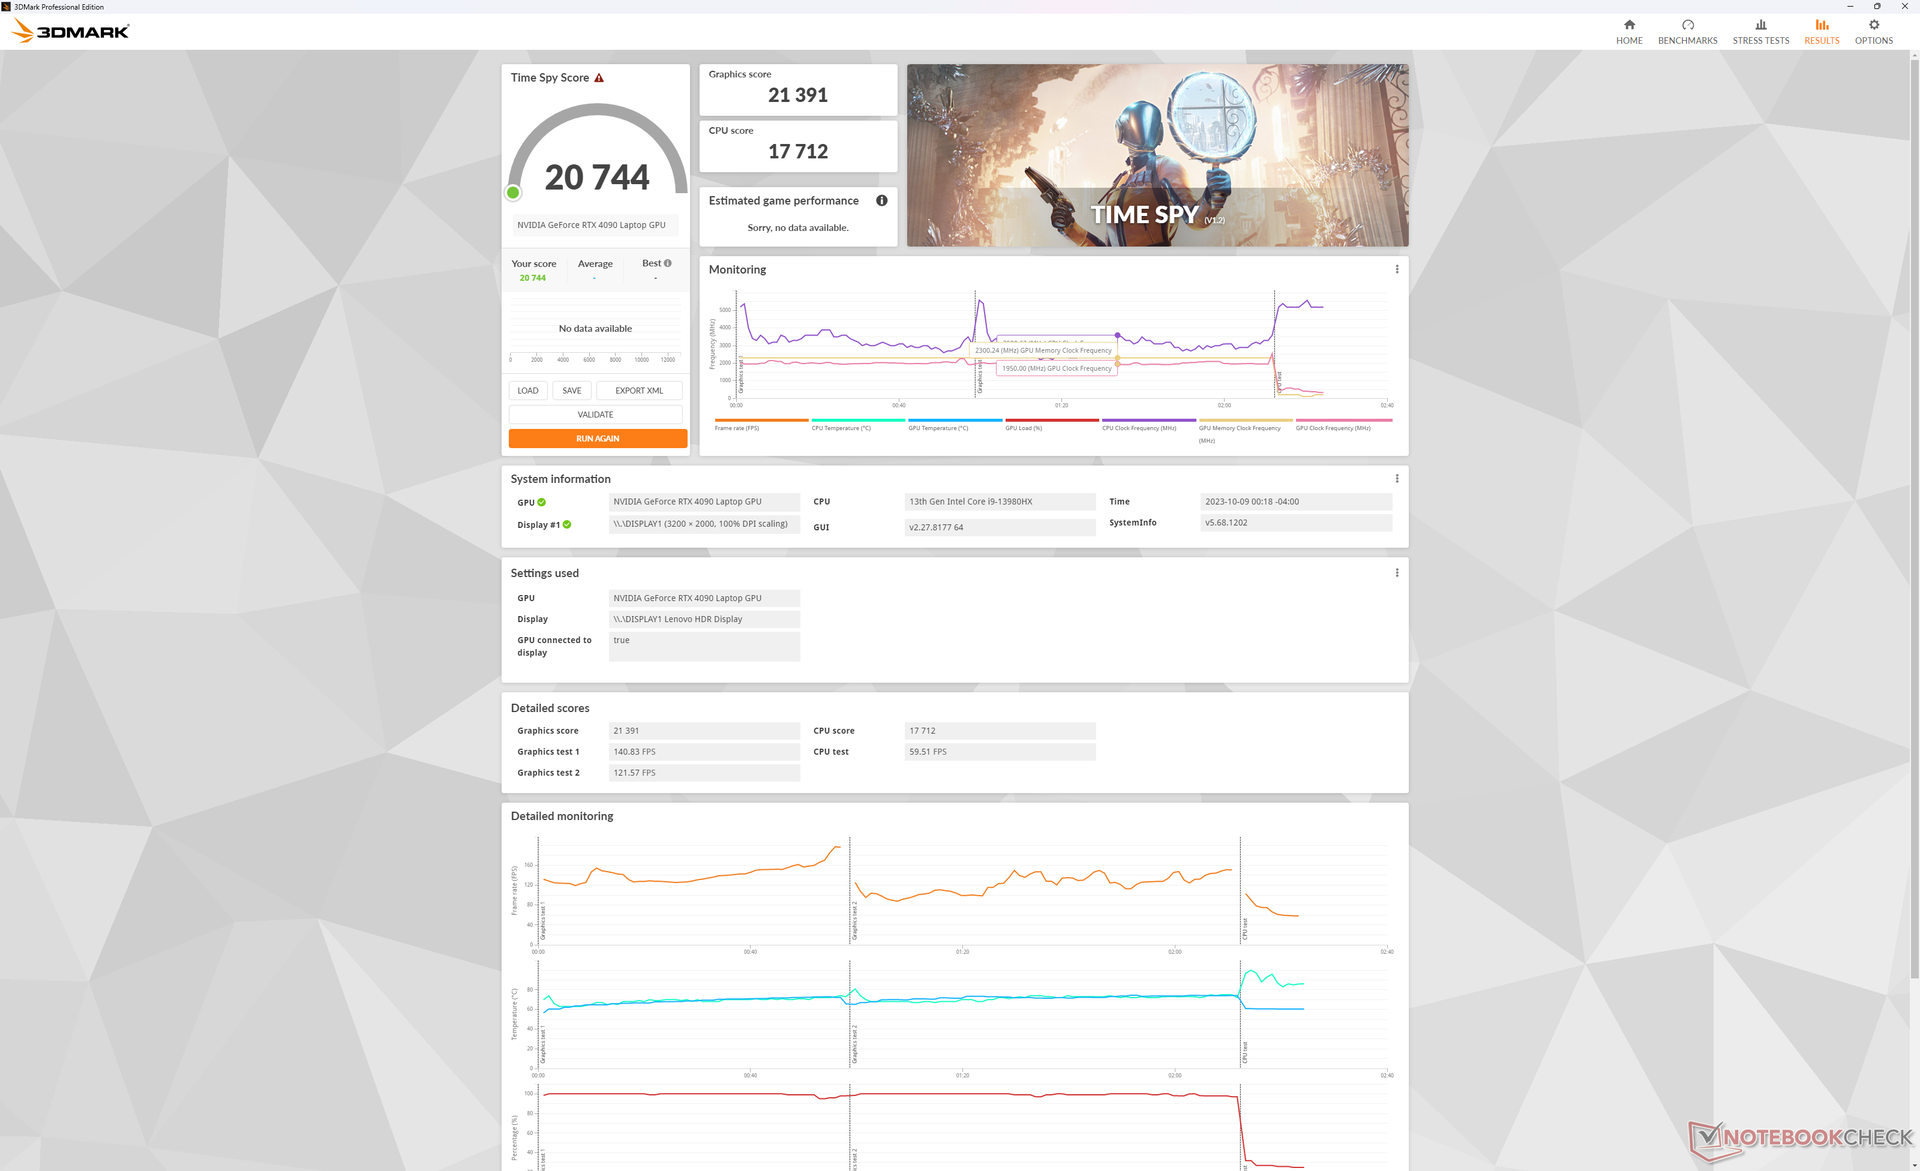
| 3DMark Fire Strike Score | 34752 puntos | |
| 3DMark Time Spy Score | 20744 puntos | |
ayuda | ||
* ... más pequeño es mejor
Rendimiento en juegos
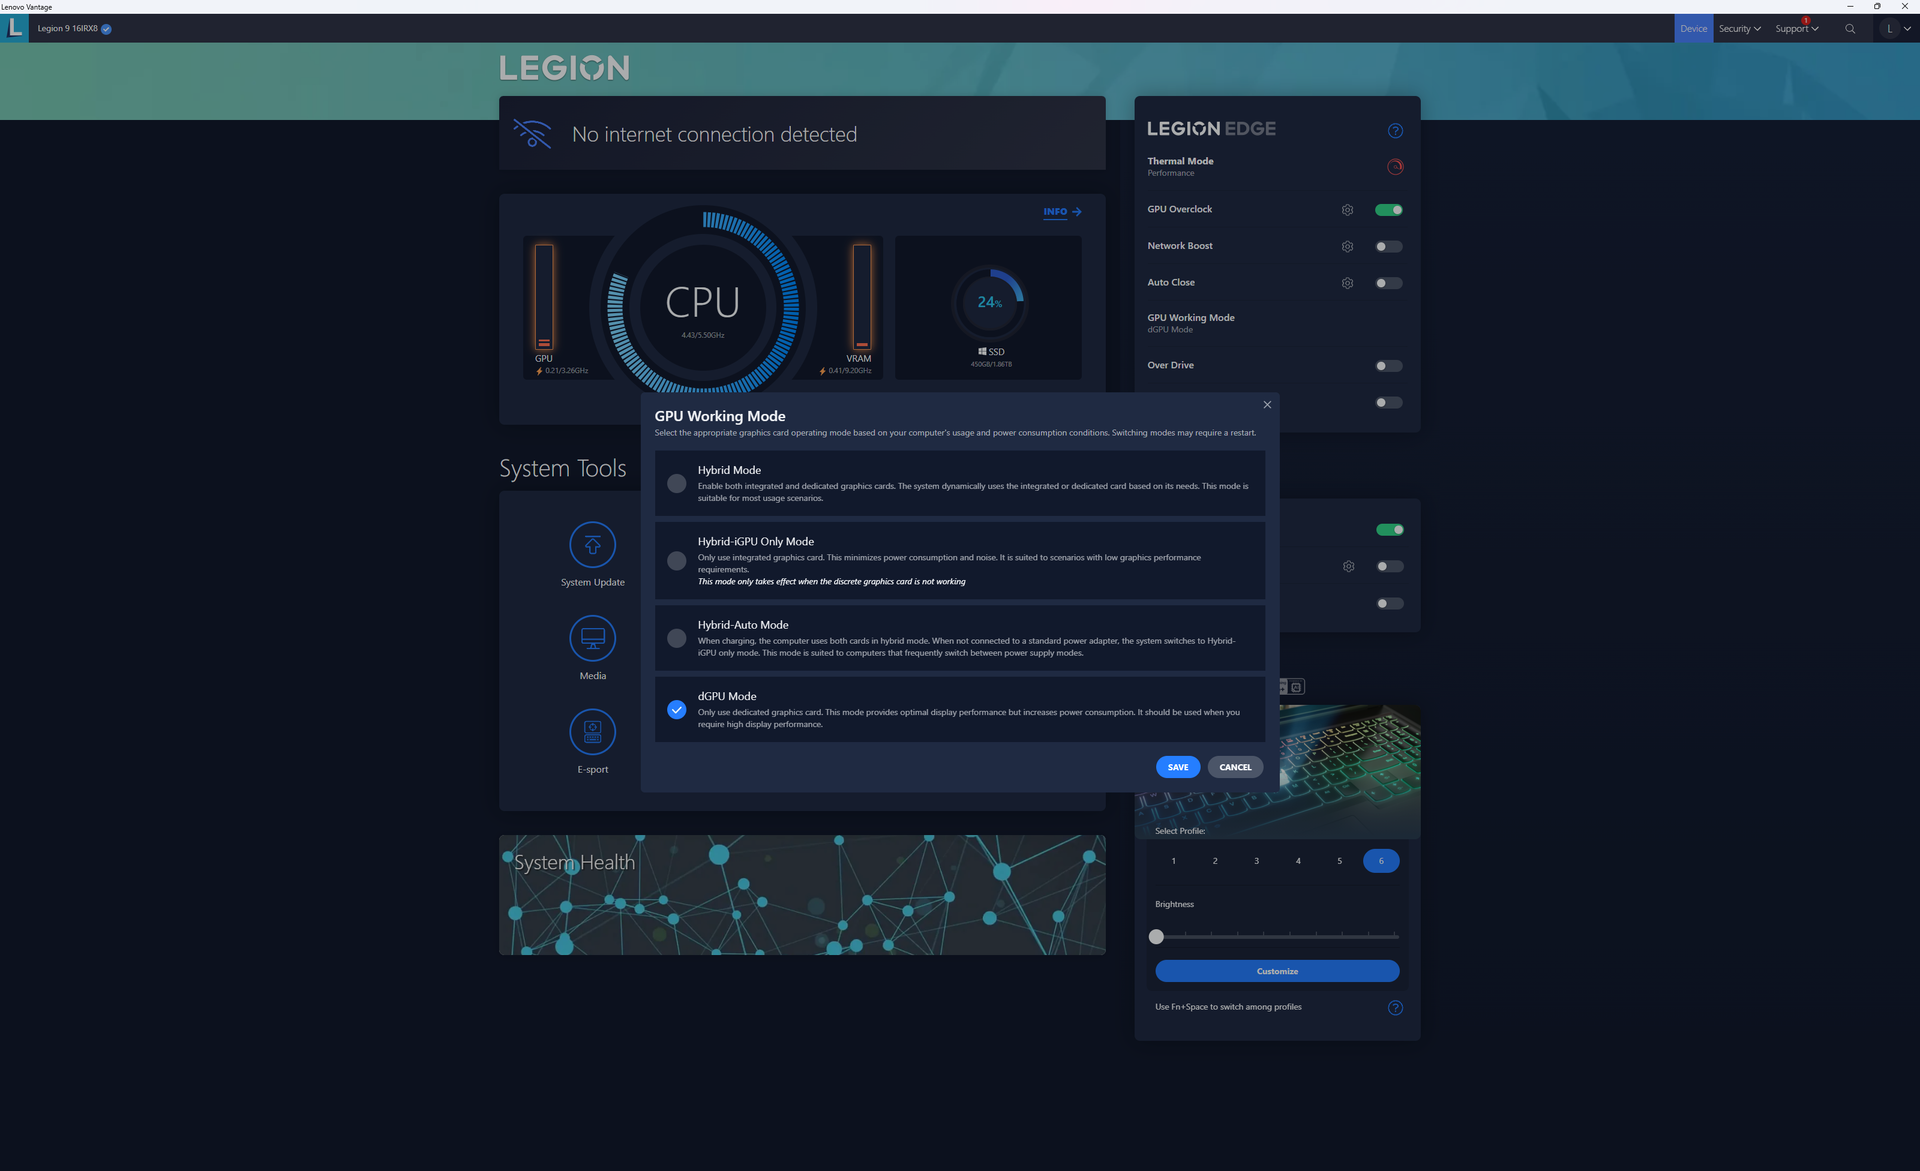
Todos los juegos se ejecutan muy bien en QHD o superior, incluidos títulos exigentes como Cyberpunk 2077 o Ratchet and Clank. Tenga en cuenta que G-Sync sólo se puede activar si se establece en el modo dGPU, ya que de lo contrario se desactiva si está en los modos de gráficos híbridos o integrados.
| Ratchet & Clank Rift Apart | |
| 1920x1080 Low Preset | |
| Lenovo Legion 9 16IRX8 | |
| Medio NVIDIA GeForce RTX 4090 Laptop GPU (n=1) | |
| MSI Raider GE68HX 13VF | |
| 1920x1080 Medium Preset AA:T | |
| Medio NVIDIA GeForce RTX 4090 Laptop GPU (155.6 - 161.8, n=2) | |
| Lenovo Legion 9 16IRX8 | |
| MSI Raider GE68HX 13VF | |
| 1920x1080 High Preset AA:T | |
| Medio NVIDIA GeForce RTX 4090 Laptop GPU (135.4 - 136.6, n=2) | |
| Lenovo Legion 9 16IRX8 | |
| MSI Raider GE68HX 13VF | |
| 1920x1080 Very High Preset AA:T | |
| Medio NVIDIA GeForce RTX 4090 Laptop GPU (111.1 - 115.4, n=2) | |
| Lenovo Legion 9 16IRX8 | |
| MSI Raider GE68HX 13VF | |
| 2560x1440 Very High Preset AA:T | |
| Medio NVIDIA GeForce RTX 4090 Laptop GPU (98.7 - 107.1, n=2) | |
| Lenovo Legion 9 16IRX8 | |
Witcher 3 FPS Chart
| bajo | medio | alto | ultra | QHD | |
|---|---|---|---|---|---|
| GTA V (2015) | 187.1 | 186.3 | 184.8 | 150.7 | 145.3 |
| The Witcher 3 (2015) | 671.8 | 569 | 408.2 | 208.7 | 165 |
| Dota 2 Reborn (2015) | 244 | 217 | 208 | 193.1 | |
| Final Fantasy XV Benchmark (2018) | 231 | 207 | 181.3 | 158.4 | |
| X-Plane 11.11 (2018) | 214 | 185.9 | 140.1 | ||
| Far Cry 5 (2018) | 195 | 176 | 167 | 158 | 157 |
| Strange Brigade (2018) | 487 | 409 | 390 | 387 | 312 |
| Cyberpunk 2077 1.6 (2022) | 146.9 | 142.9 | 129.5 | 131.4 | 98.8 |
| Tiny Tina's Wonderlands (2022) | 377.6 | 290.4 | 226.2 | 186.4 | 137.8 |
| F1 22 (2022) | 336 | 333 | 286 | 130.8 | 90.9 |
| Ratchet & Clank Rift Apart (2023) | 163.4 | 155.6 | 135.4 | 111.1 | 98.7 |
| Cyberpunk 2077 (2023) | 131.22 | 89.55 | |||
| Alan Wake 2 (2023) | 121.1 | 83.7 | |||
| Avatar Frontiers of Pandora (2023) | 100 | 69 |
Emisiones
Ruido del sistema
Los ventiladores casi nunca están en reposo, por lo que siempre debe esperarse algo de ruido. Tienden a rondar los 30,4 dB(A) frente a un fondo silencioso de 23,7 dB(A) cuando está sometido a las cargas más comunes como la navegación web o la transmisión de vídeo, incluso cuando está configurado en modo silencioso. Este rango es típico de la mayoría de portátiles para juegos en condiciones similares, pero el Legion 9i 16 no pulsa con tanta frecuencia siempre que se ejecute en modo iGPU equilibrado o inferior.
El ruido del ventilador aumenta significativamente hasta los 52,2 dB(A) cuando se juega en modo Rendimiento, que es el rango esperado para los portátiles de juego de gama alta. El ruido bajaría ligeramente a 49,5 dB(A) si se juega en modo Equilibrado, pero hay que tener en cuenta el déficit gráfico del 17% en comparación con el modo Rendimiento, como se ha indicado anteriormente. Se recomiendan auriculares para jugar en cualquiera de los dos casos.
Ruido
| Ocioso |
| 24 / 24 / 30.4 dB(A) |
| Carga |
| 30.4 / 54.9 dB(A) |
 | ||
30 dB silencioso 40 dB(A) audible 50 dB(A) ruidosamente alto |
||
min: | ||
| Lenovo Legion 9 16IRX8 GeForce RTX 4090 Laptop GPU, i9-13980HX, 2x SK Hynix HFS001TEJ9X115N (RAID 0) | Lenovo Legion Slim 5 16APH8 GeForce RTX 4060 Laptop GPU, R7 7840HS, SK hynix PC801 HFS512GEJ9X115N | Razer Blade 16 Early 2023 RTX 4090 GeForce RTX 4090 Laptop GPU, i9-13950HX, SSSTC CA6-8D1024 | Asus ROG Strix G16 G614JZ GeForce RTX 4080 Laptop GPU, i9-13980HX, WD PC SN560 SDDPNQE-1T00 | HP Omen Transcend 16 GeForce RTX 4070 Laptop GPU, i9-13900HX, SK hynix PC801 HFS002TEJ9X101N | Alienware x16 R1 GeForce RTX 4080 Laptop GPU, i9-13900HK, SK hynix PC801 HFS001TEJ9X101N | |
|---|---|---|---|---|---|---|
| Noise | 1% | 3% | -11% | -13% | -1% | |
| apagado / medio ambiente * (dB) | 23.7 | 22.9 3% | 20.84 12% | 25 -5% | 22.9 3% | 22.7 4% |
| Idle Minimum * (dB) | 24 | 23.1 4% | 23.65 1% | 26 -8% | 29.1 -21% | 23.1 4% |
| Idle Average * (dB) | 24 | 23.1 4% | 23.65 1% | 28 -17% | 29.1 -21% | 25.8 -8% |
| Idle Maximum * (dB) | 30.4 | 27.7 9% | 23.65 22% | 30 1% | 29.1 4% | 25.8 15% |
| Load Average * (dB) | 30.4 | 33.3 -10% | 43.35 -43% | 48 -58% | 45.7 -50% | 39.3 -29% |
| Witcher 3 ultra * (dB) | 52.2 | 54 -3% | 46.7 11% | 49 6% | 54.3 -4% | 49.9 4% |
| Load Maximum * (dB) | 54.9 | 54 2% | 46.72 15% | 52 5% | 54.3 1% | 54.8 -0% |
* ... más pequeño es mejor
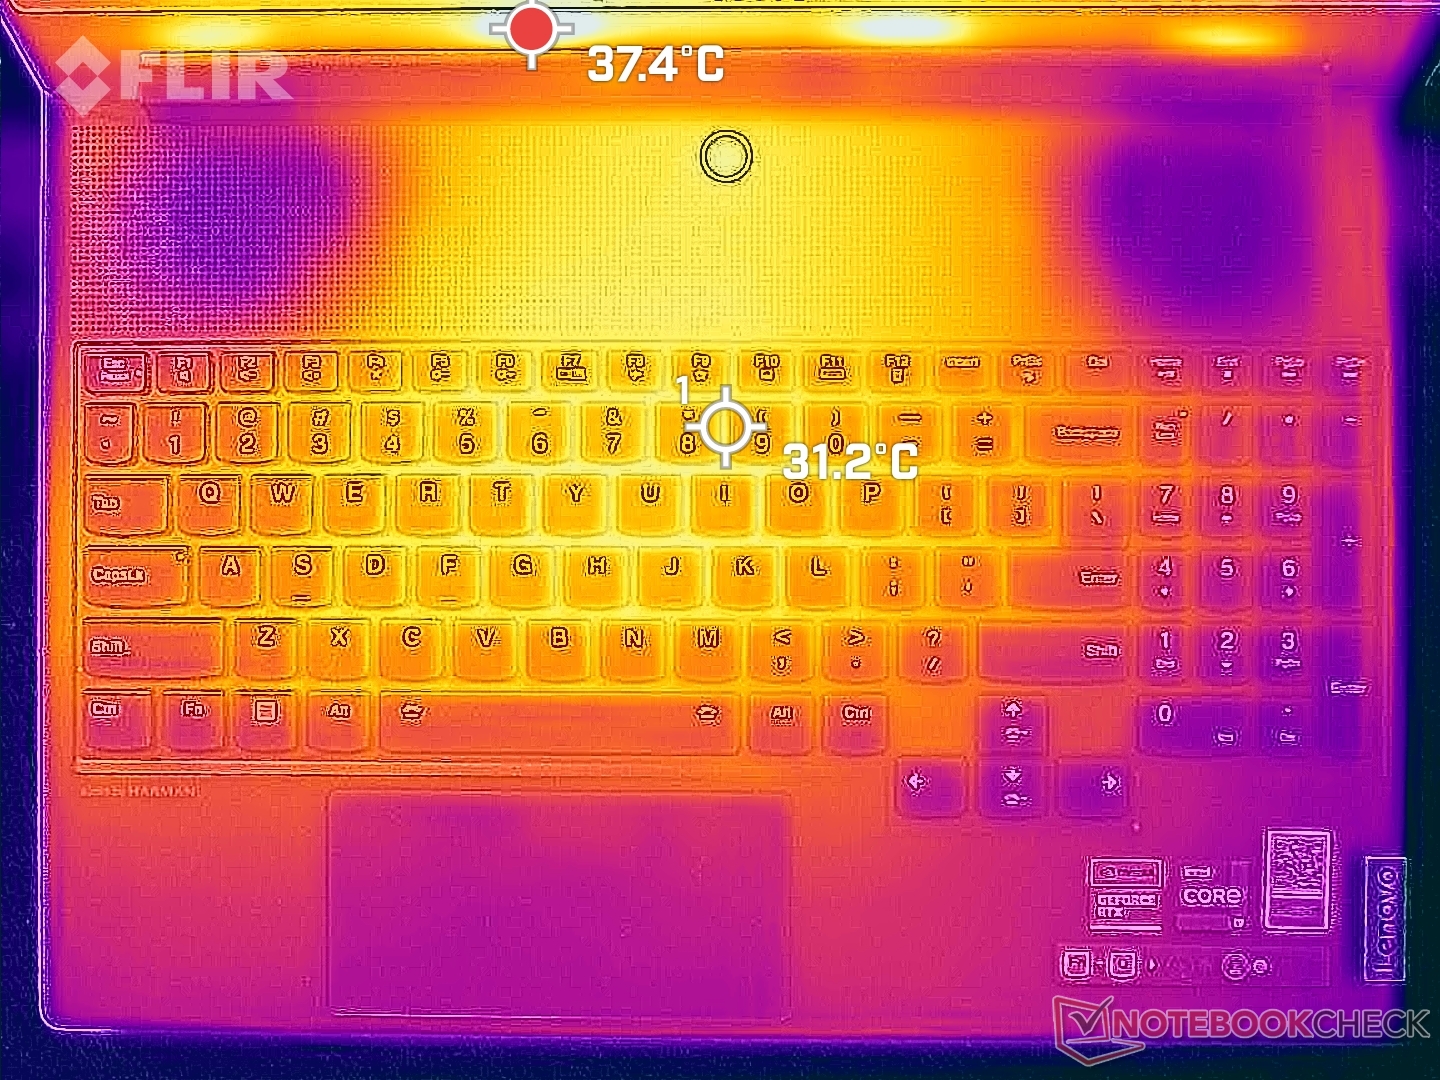
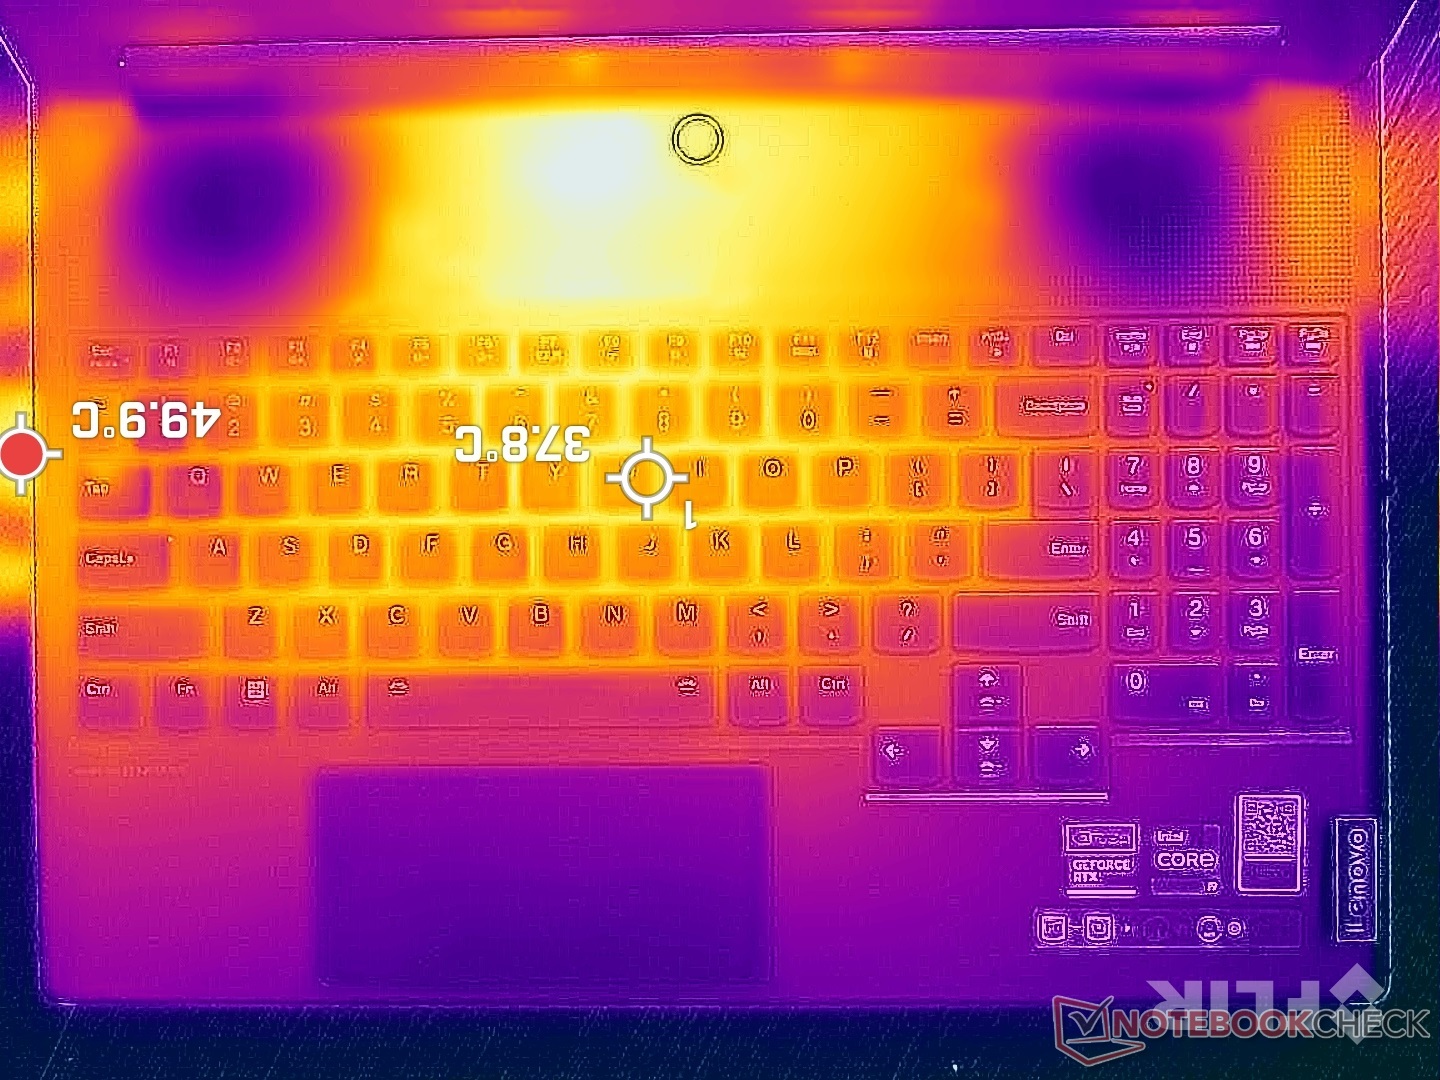
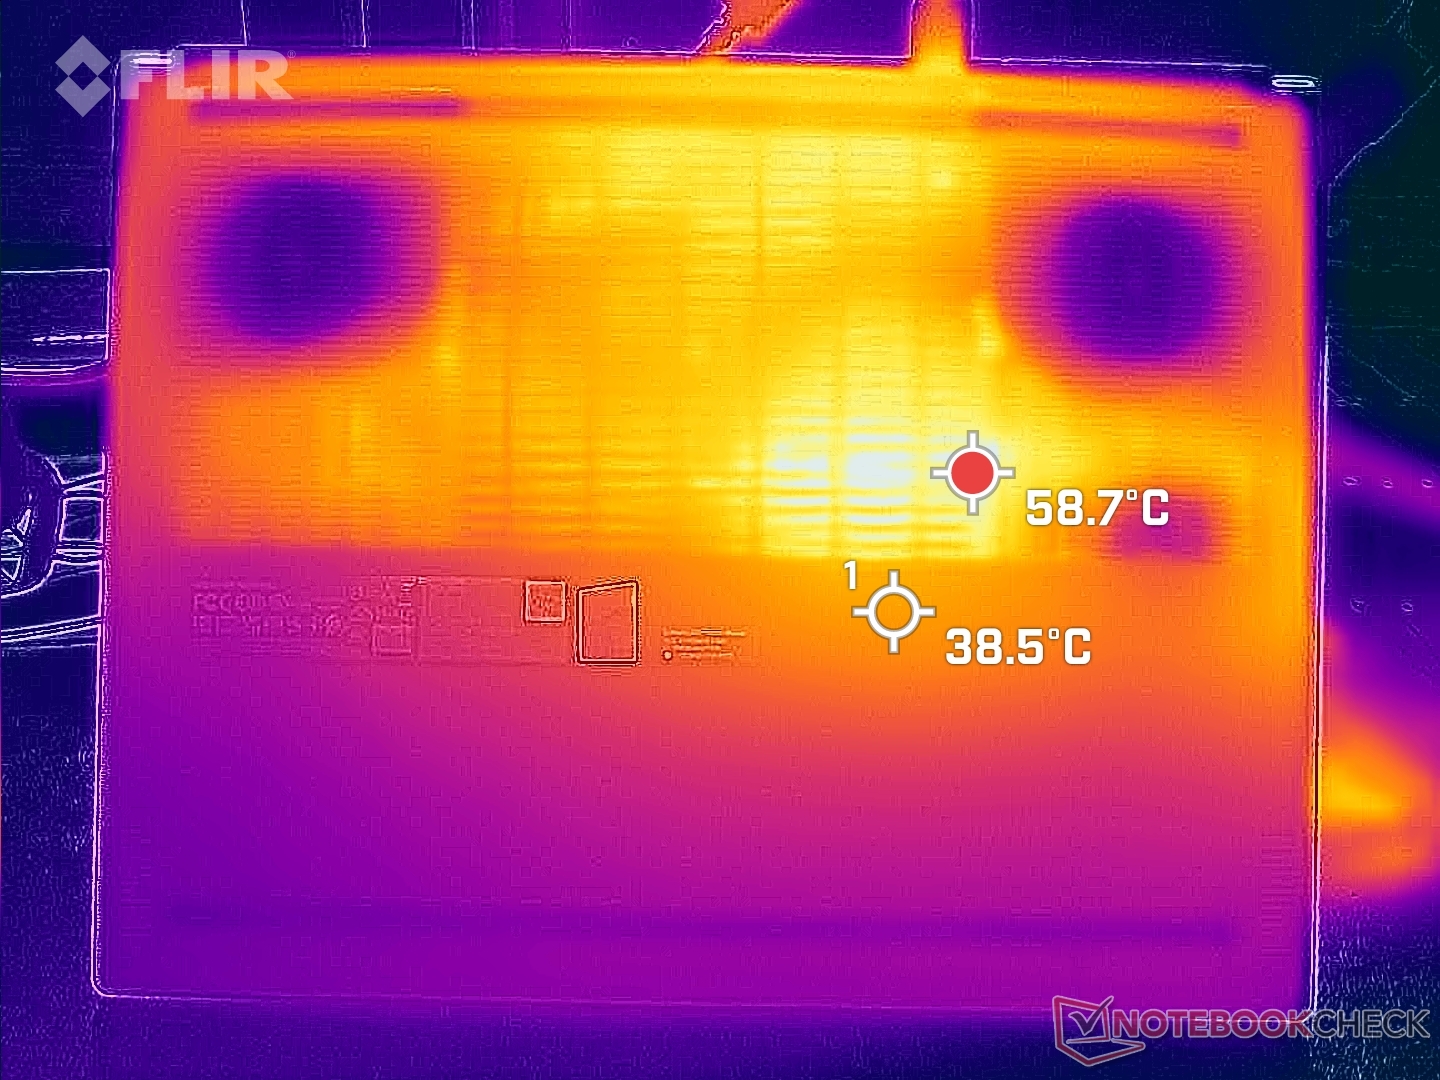
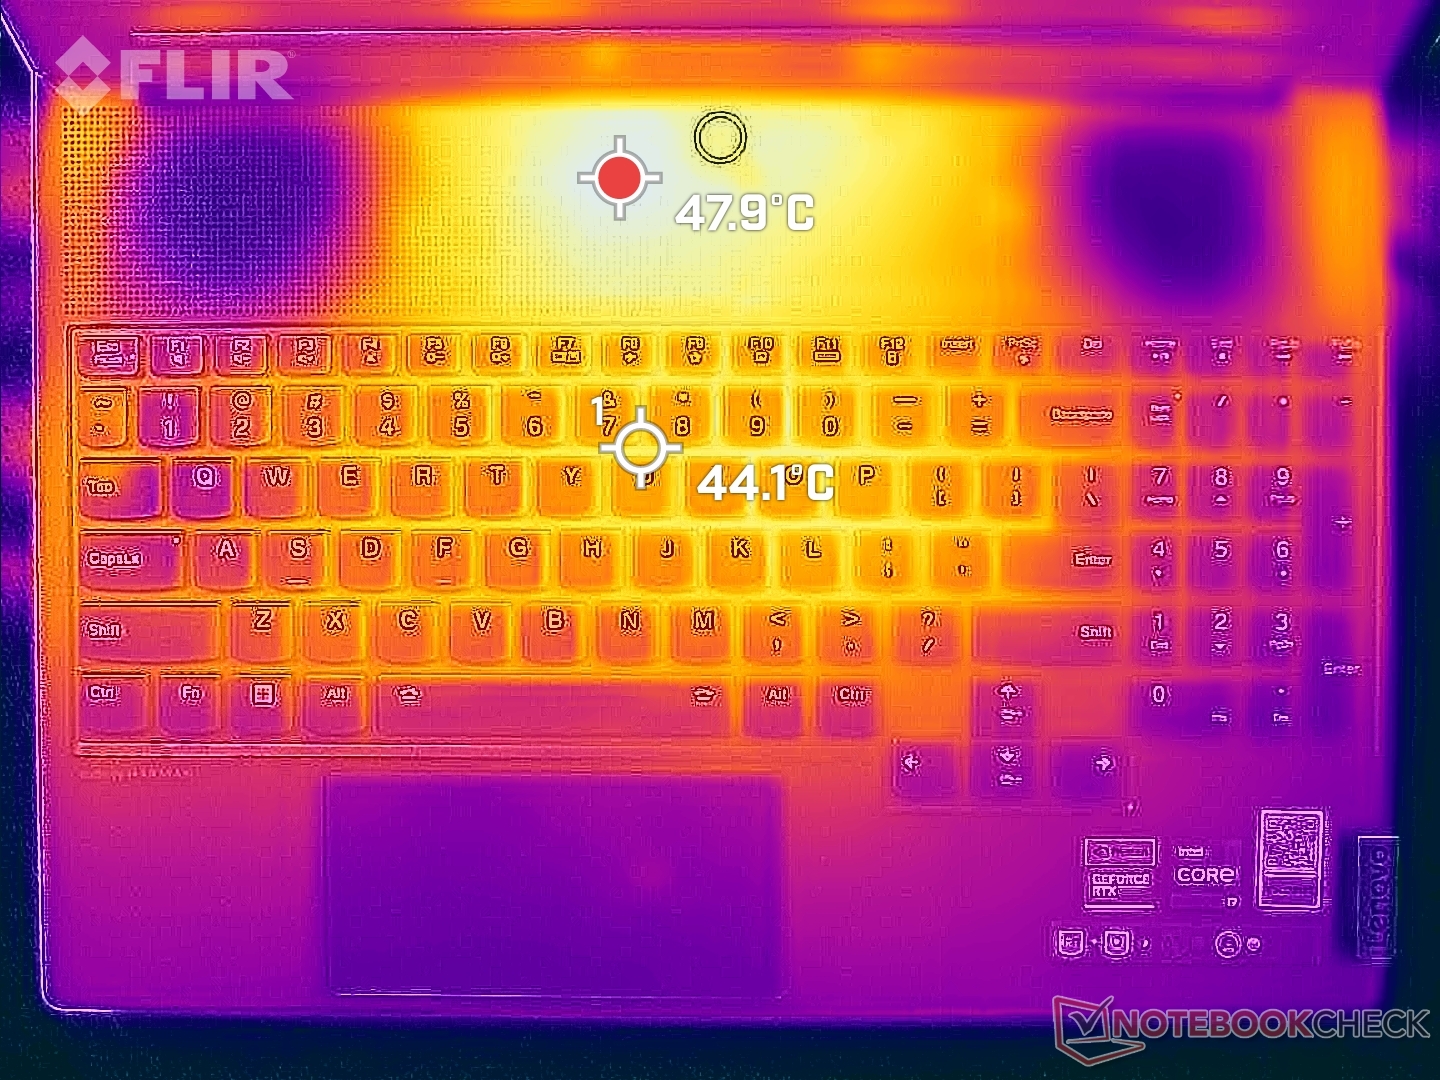
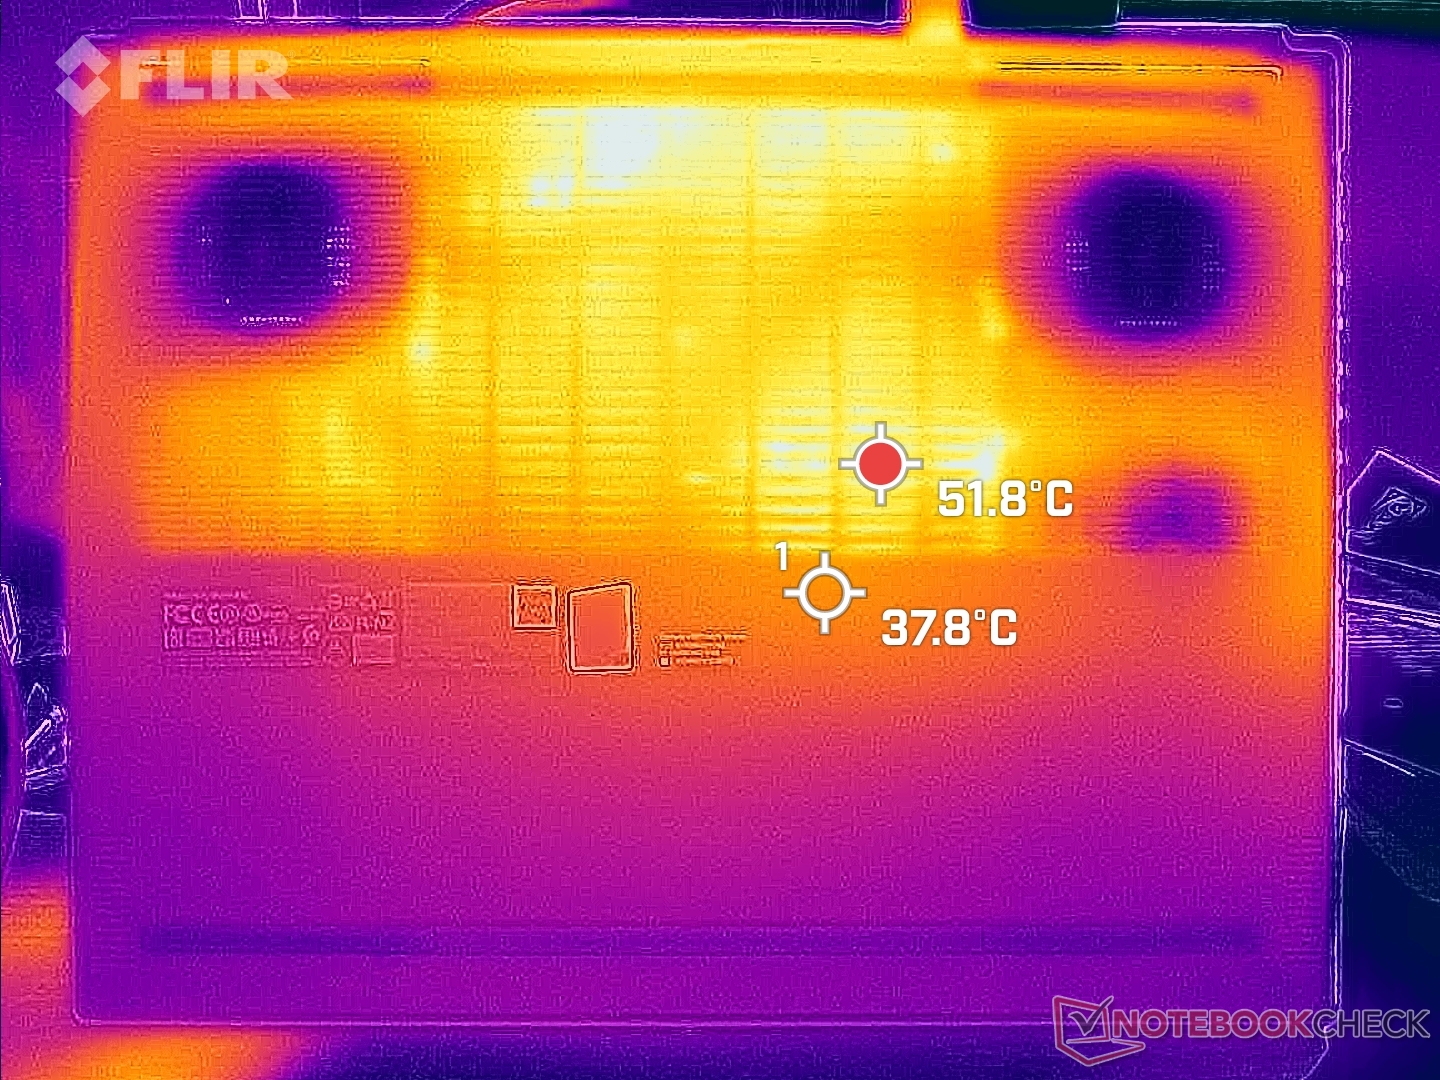
Temperatura
Las temperaturas de la superficie son bastante cálidas a pesar de los térmicos avanzados. Al jugar, las teclas WASD y el centro del teclado pueden estar tan calientes como 42 C y 46 C, respectivamente, lo que es ligeramente más caliente que lo que observamos en el Alienware x16 R1. Muchos otros portátiles para juegos, como el Razer Blade 16, extraen aire fresco de las teclas WASD para mantener fría esa parte del teclado y poder jugar más cómodamente, pero este no es el caso de nuestro diseño Legion 9 16, como muestran los mapas de temperatura que aparecen a continuación.
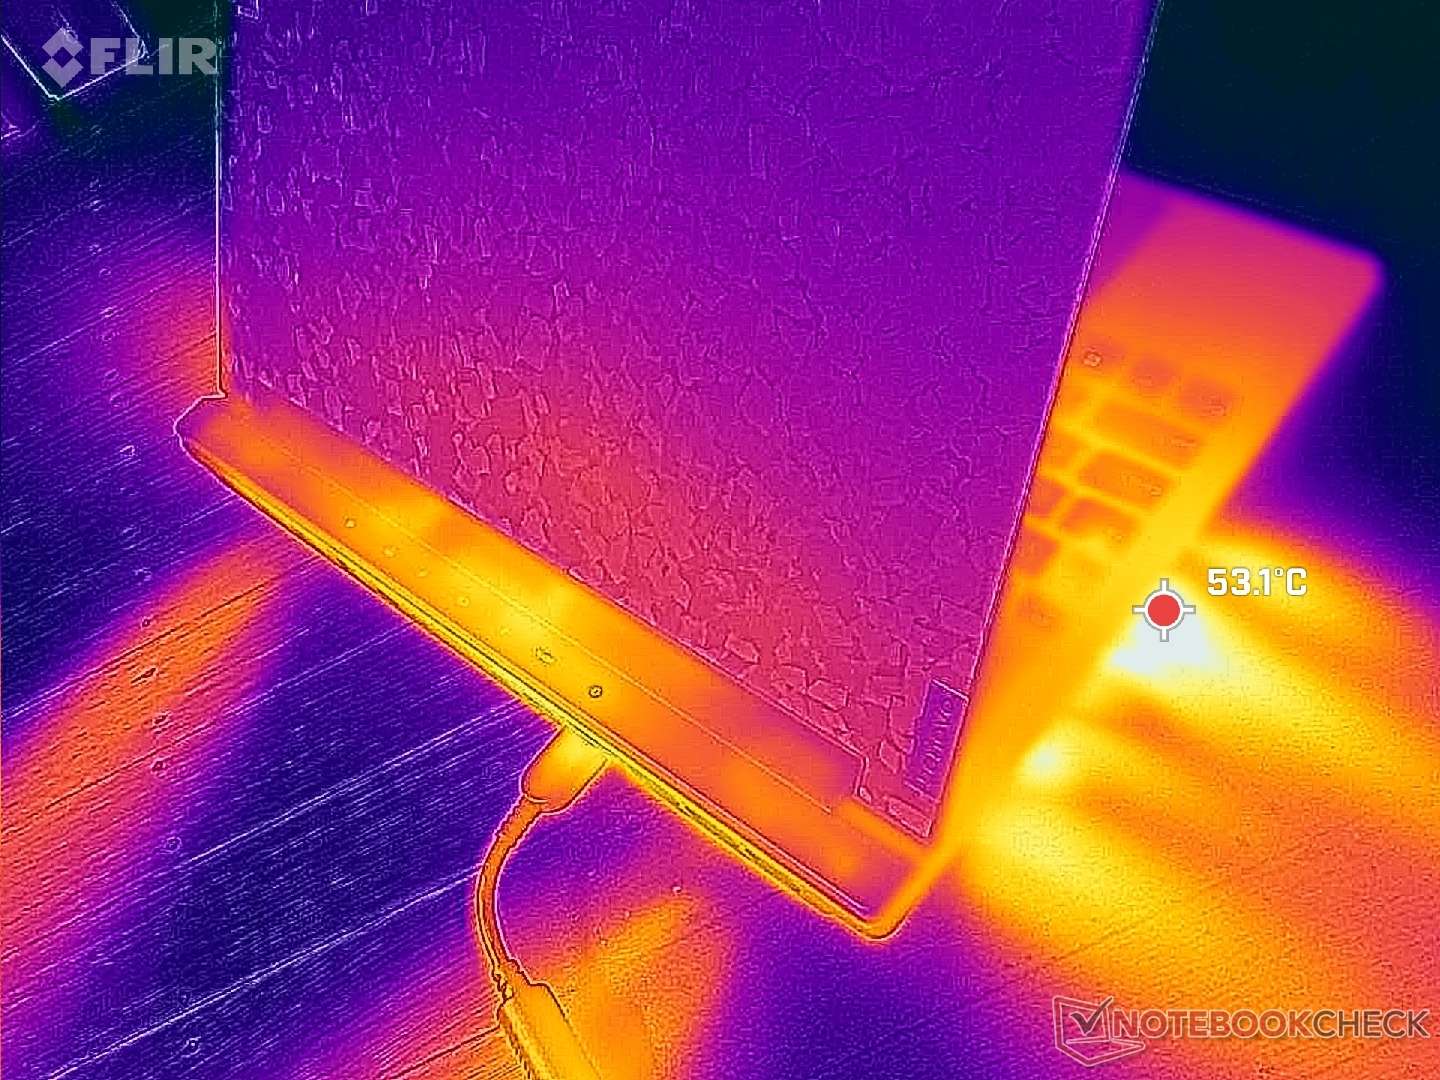
(-) La temperatura máxima en la parte superior es de 49.6 °C / 121 F, frente a la media de 40.4 °C / 105 F, que oscila entre 21.2 y 68.8 °C para la clase Gaming.
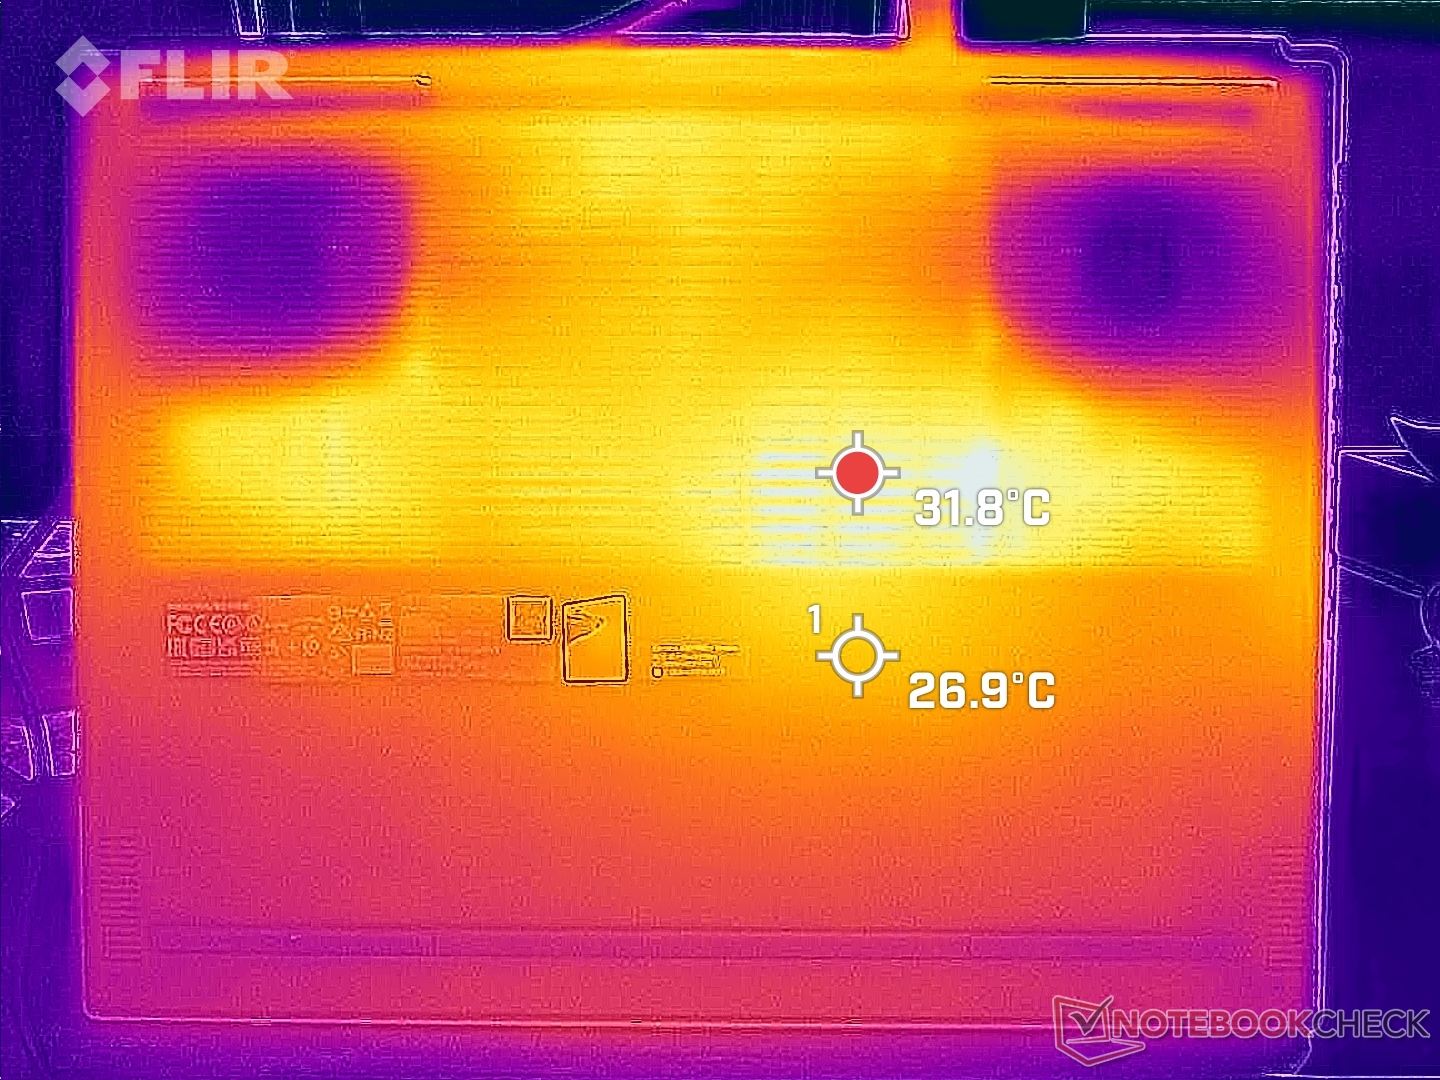
(-) El fondo se calienta hasta un máximo de 48.6 °C / 119 F, frente a la media de 43.2 °C / 110 F
(+) En reposo, la temperatura media de la parte superior es de 30 °C / 86# F, frente a la media del dispositivo de 33.9 °C / 93 F.
(-) Jugando a The Witcher 3, la temperatura media de la parte superior es de 38.1 °C / 101 F, frente a la media del dispositivo de 33.9 °C / 93 F.
(+) Los reposamanos y el panel táctil alcanzan como máximo la temperatura de la piel (33.6 °C / 92.5 F) y, por tanto, no están calientes.
(-) La temperatura media de la zona del reposamanos de dispositivos similares fue de 28.8 °C / 83.8 F (-4.8 °C / -8.7 F).
| Lenovo Legion 9 16IRX8 Intel Core i9-13980HX, NVIDIA GeForce RTX 4090 Laptop GPU | Lenovo Legion Slim 5 16APH8 AMD Ryzen 7 7840HS, NVIDIA GeForce RTX 4060 Laptop GPU | Razer Blade 16 Early 2023 RTX 4090 Intel Core i9-13950HX, NVIDIA GeForce RTX 4090 Laptop GPU | Asus ROG Strix G16 G614JZ Intel Core i9-13980HX, NVIDIA GeForce RTX 4080 Laptop GPU | HP Omen Transcend 16 Intel Core i9-13900HX, NVIDIA GeForce RTX 4070 Laptop GPU | Alienware x16 R1 Intel Core i9-13900HK, NVIDIA GeForce RTX 4080 Laptop GPU | |
|---|---|---|---|---|---|---|
| Heat | 18% | 2% | -1% | 5% | -2% | |
| Maximum Upper Side * (°C) | 49.6 | 40.6 18% | 52 -5% | 54 -9% | 47.4 4% | 47.2 5% |
| Maximum Bottom * (°C) | 48.6 | 42 14% | 47.6 2% | 55 -13% | 54.4 -12% | 47.8 2% |
| Idle Upper Side * (°C) | 33.2 | 27.8 16% | 33 1% | 29 13% | 28.4 14% | 36.8 -11% |
| Idle Bottom * (°C) | 34.2 | 26.6 22% | 30.6 11% | 33 4% | 29.2 15% | 35.8 -5% |
* ... más pequeño es mejor
Prueba de estrés
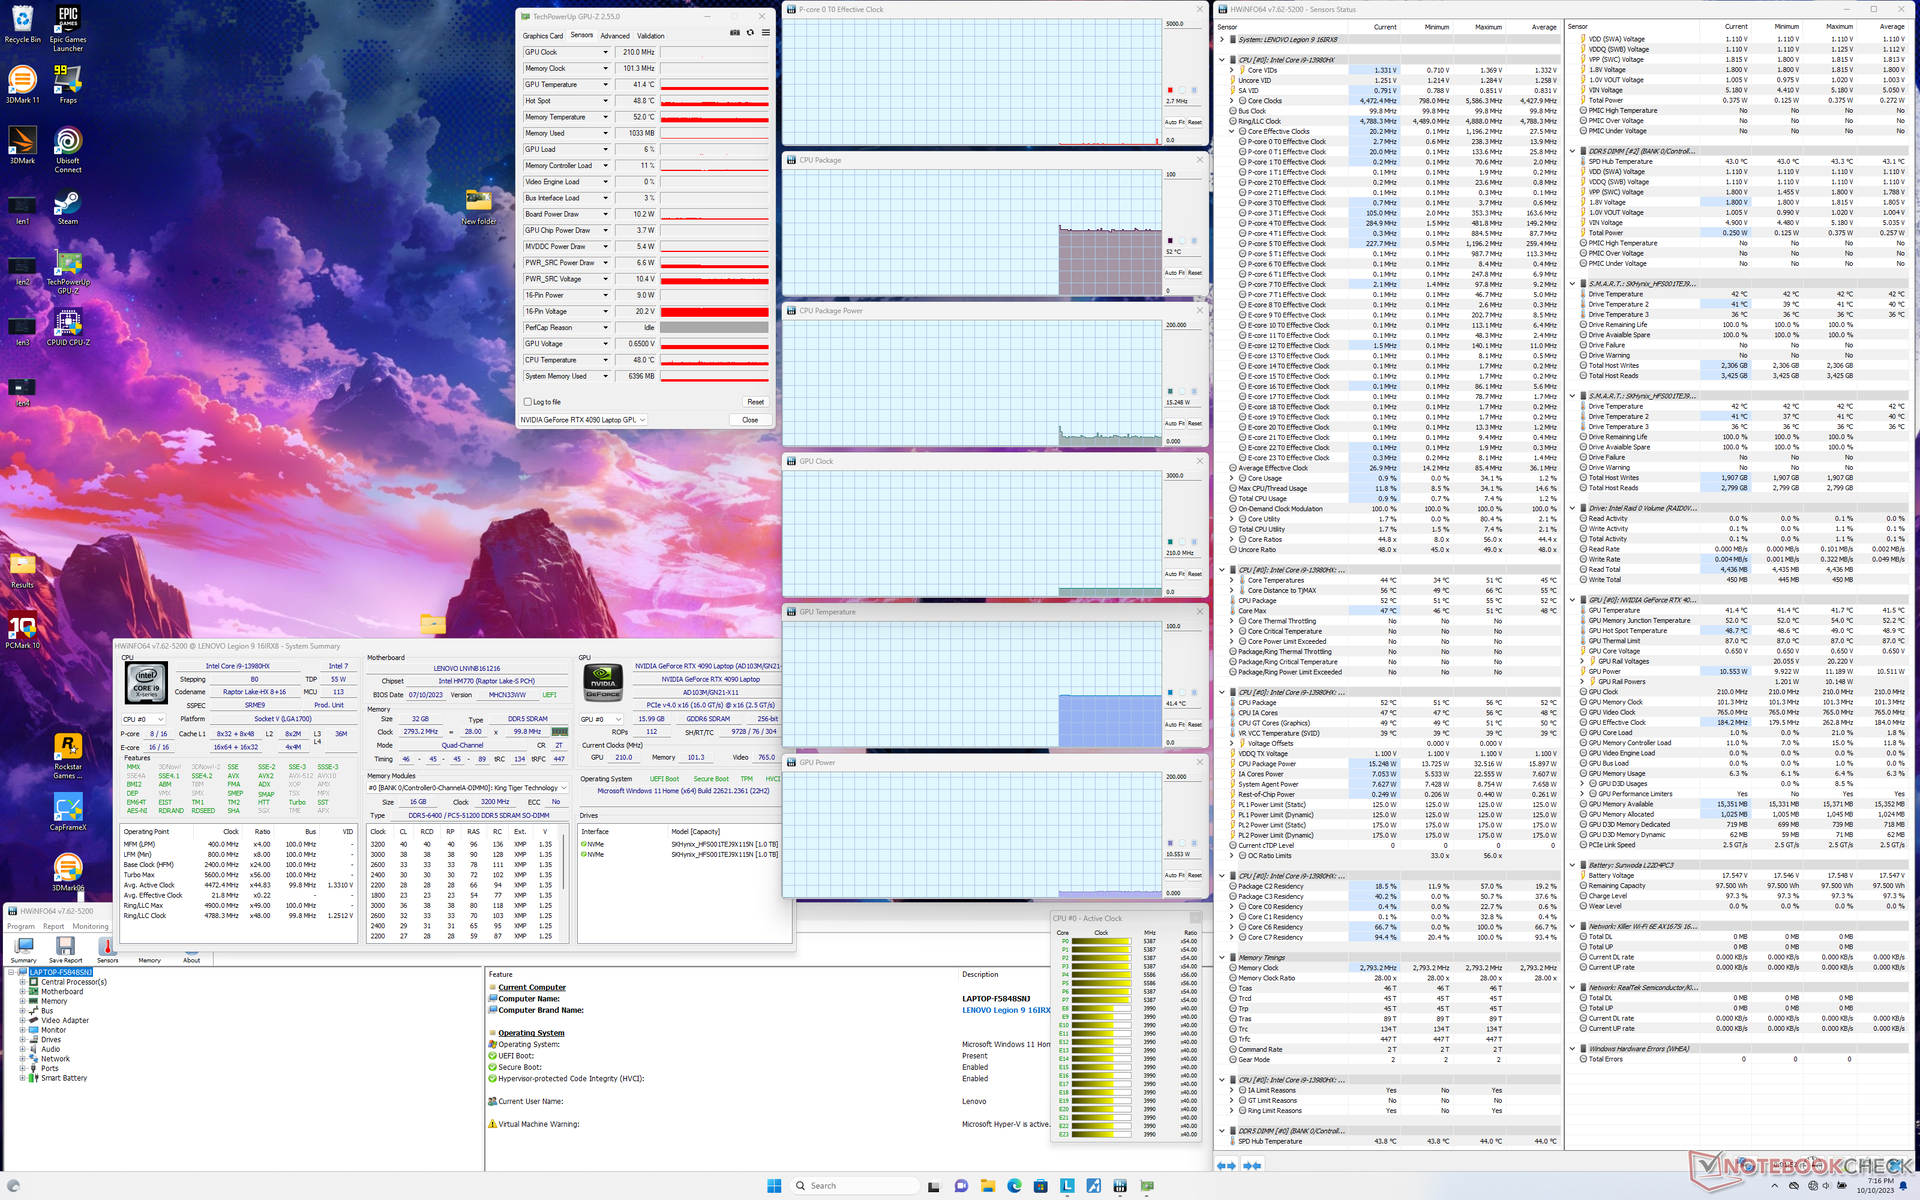
Las velocidades de reloj de la CPU y el consumo de energía de la placa al iniciar el estrés Prime95 se dispararían a 3,6 GHz y 138 W, respectivamente, antes de caer y estabilizarse en 3,0 GHz y 125 W después de aproximadamente un minuto en la prueba. La temperatura del núcleo se estabilizaría en 83 C en comparación con los 100 C del Alienware m18 R1 equipado exactamente con el mismo Core i9-13980HX.
El rendimiento de la GPU depende en gran medida del perfil de potencia seleccionado, como se mencionó anteriormente en la sección Rendimiento de la GPU. Cuando se ejecuta Witcher 3 en modo Rendimiento, por ejemplo, la GPU Nvidia se estabilizaría en 2265 MHz y 160 W en comparación con sólo 1650 MHz y 104 W cuando está en modo Equilibrado con GPU Overclock desactivado. La temperatura de la GPU se estabilizaría en 78 C en comparación con los 71 C de la Blade 16 con la misma GPU RTX 4090.
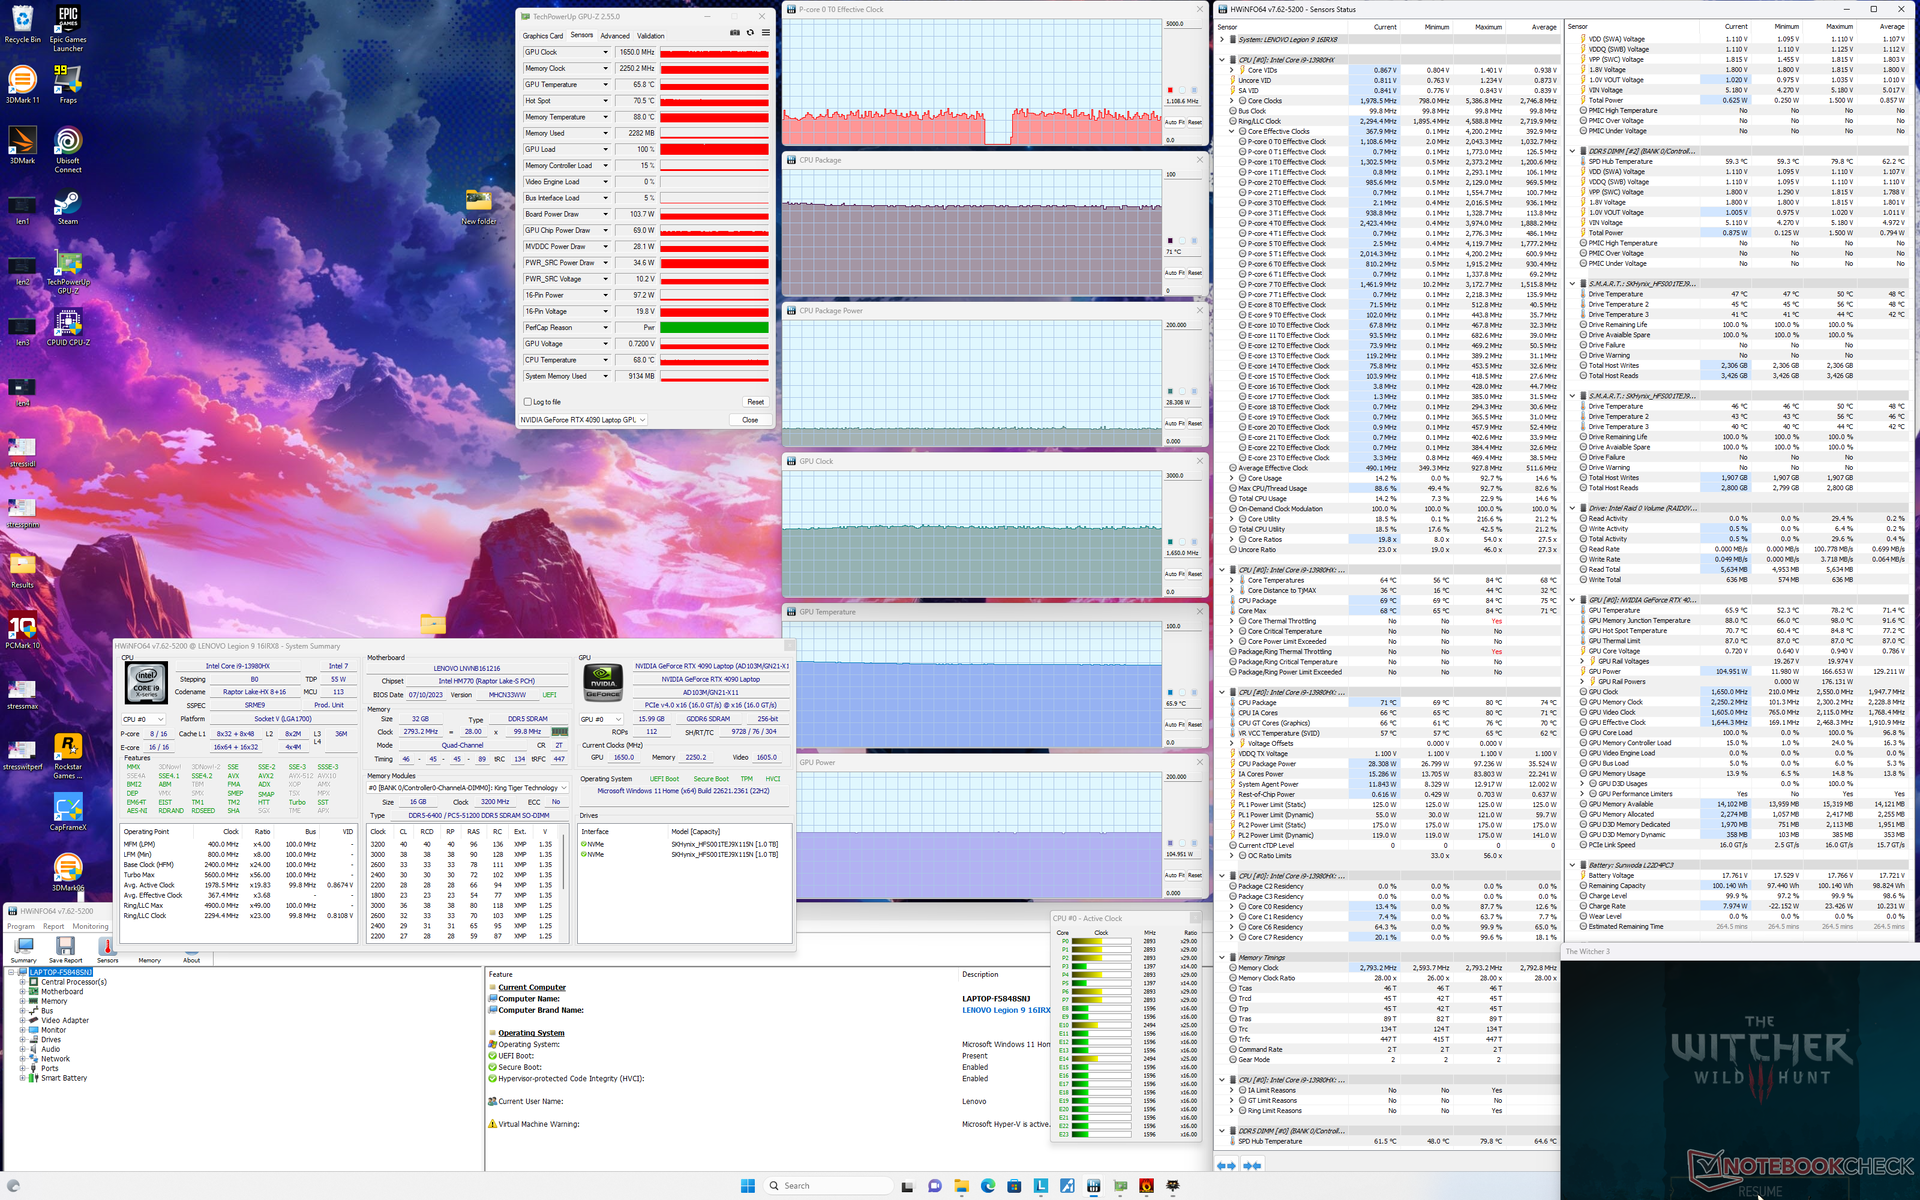
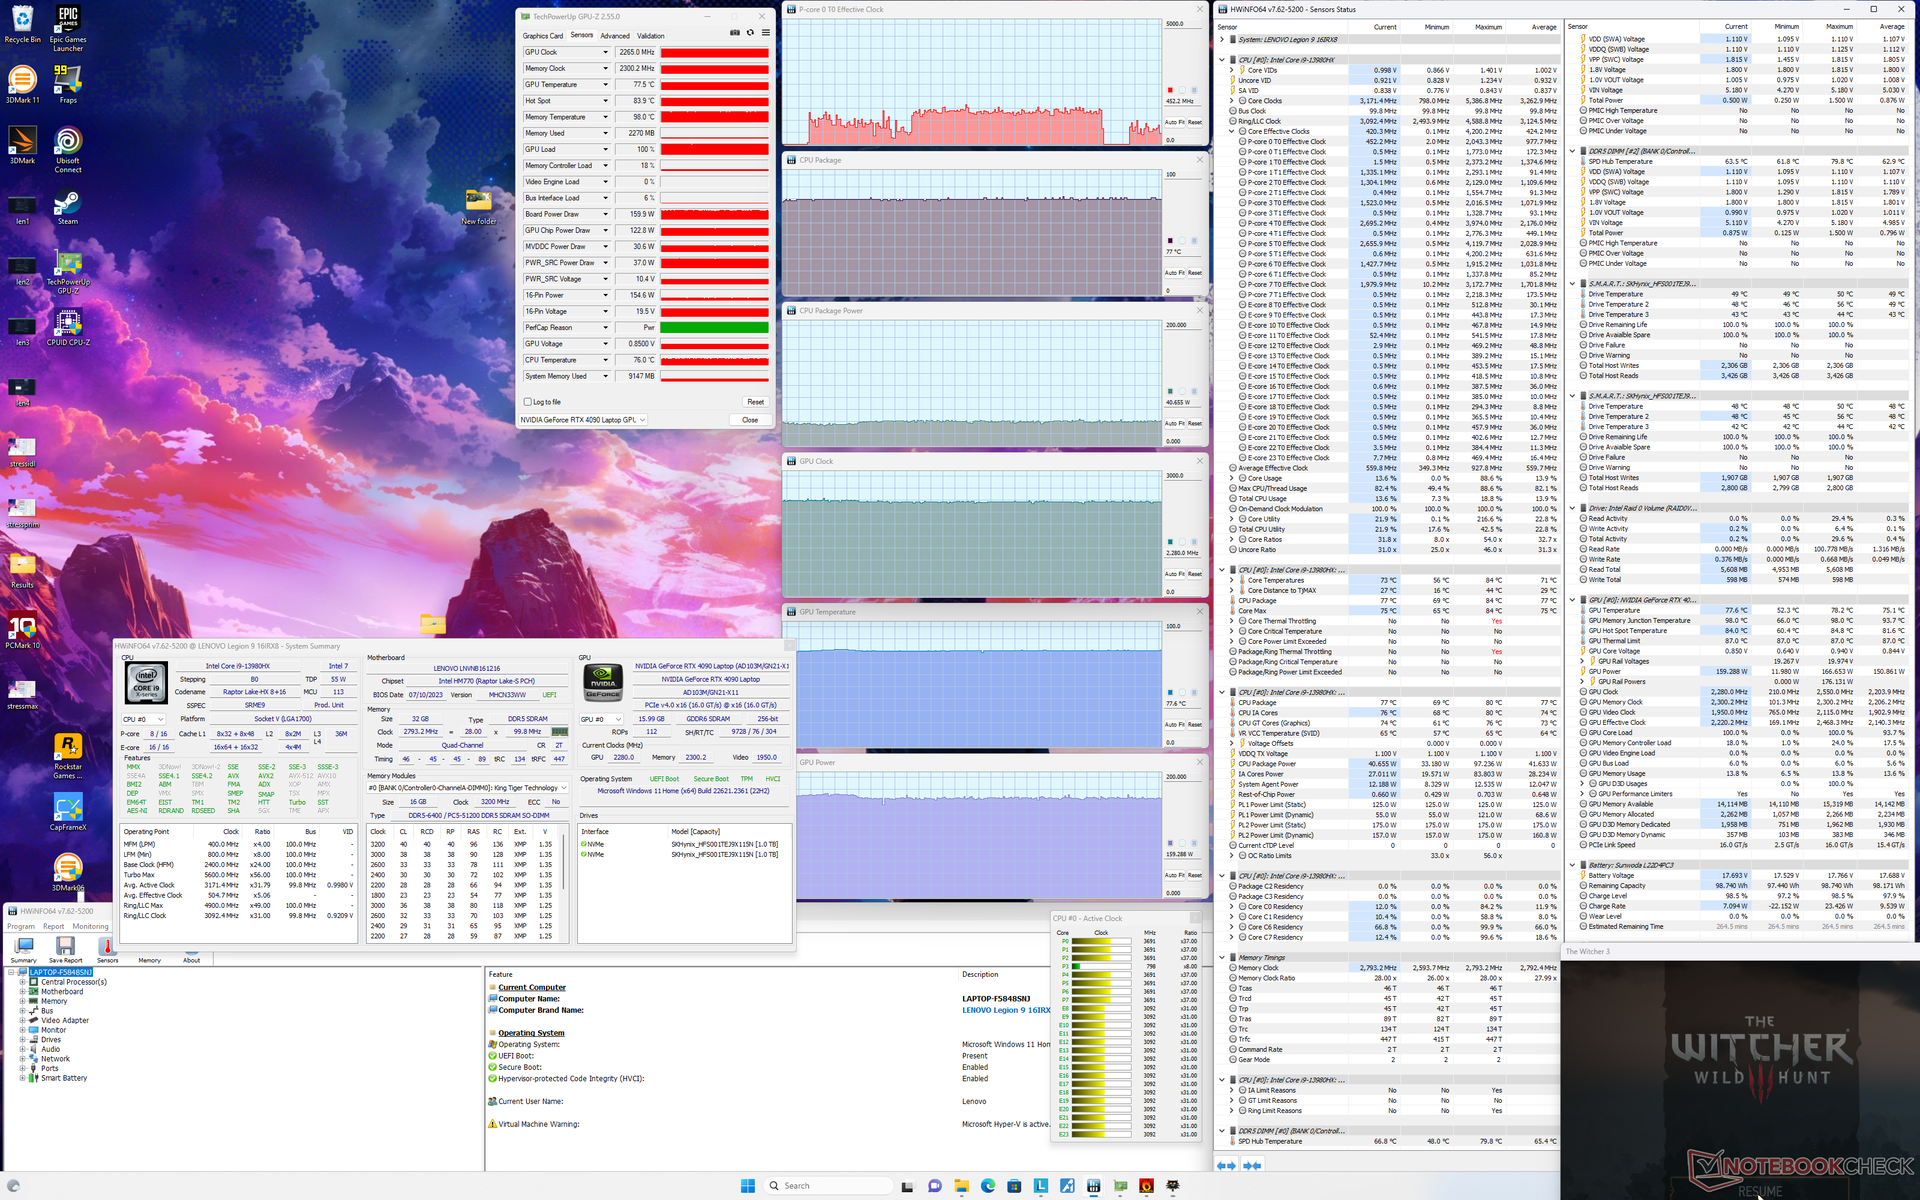
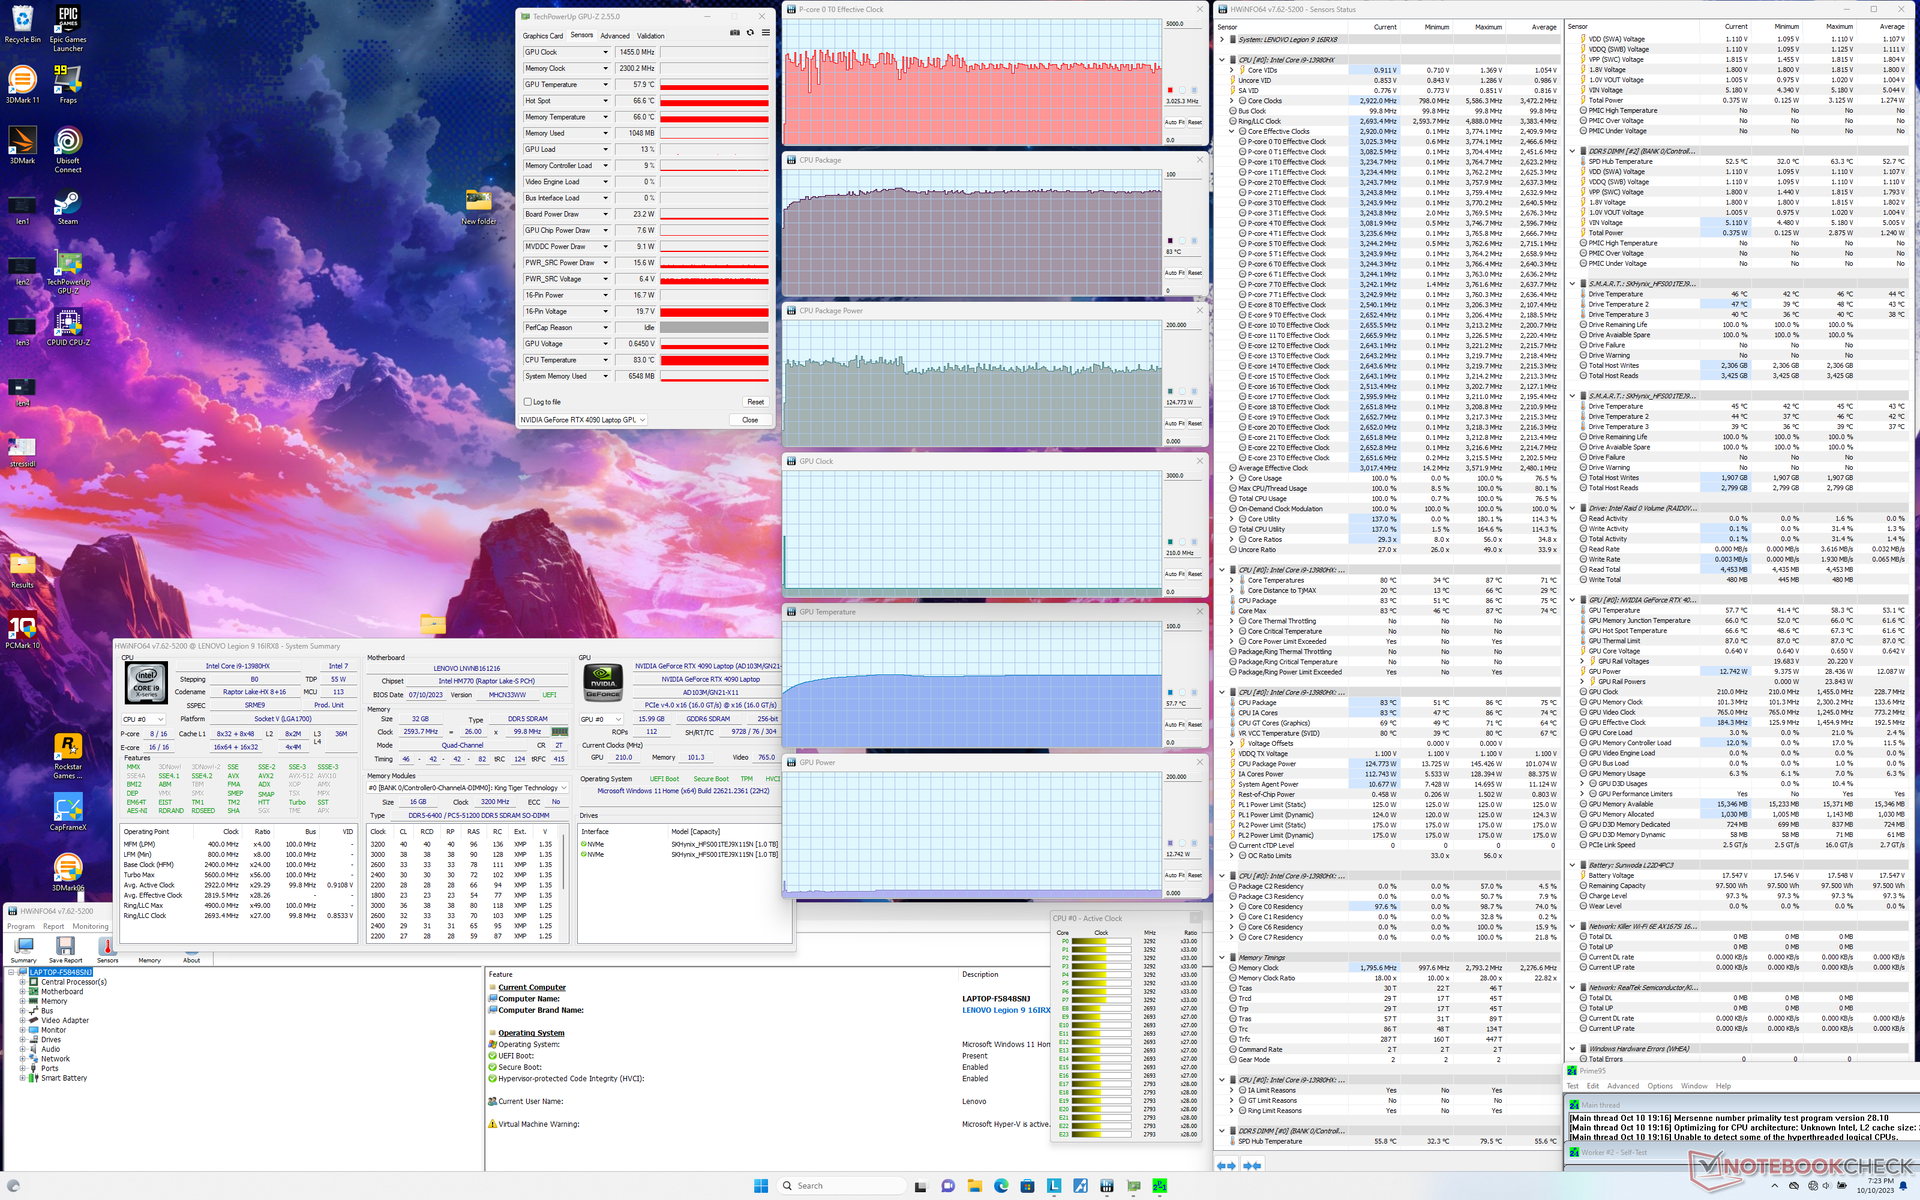
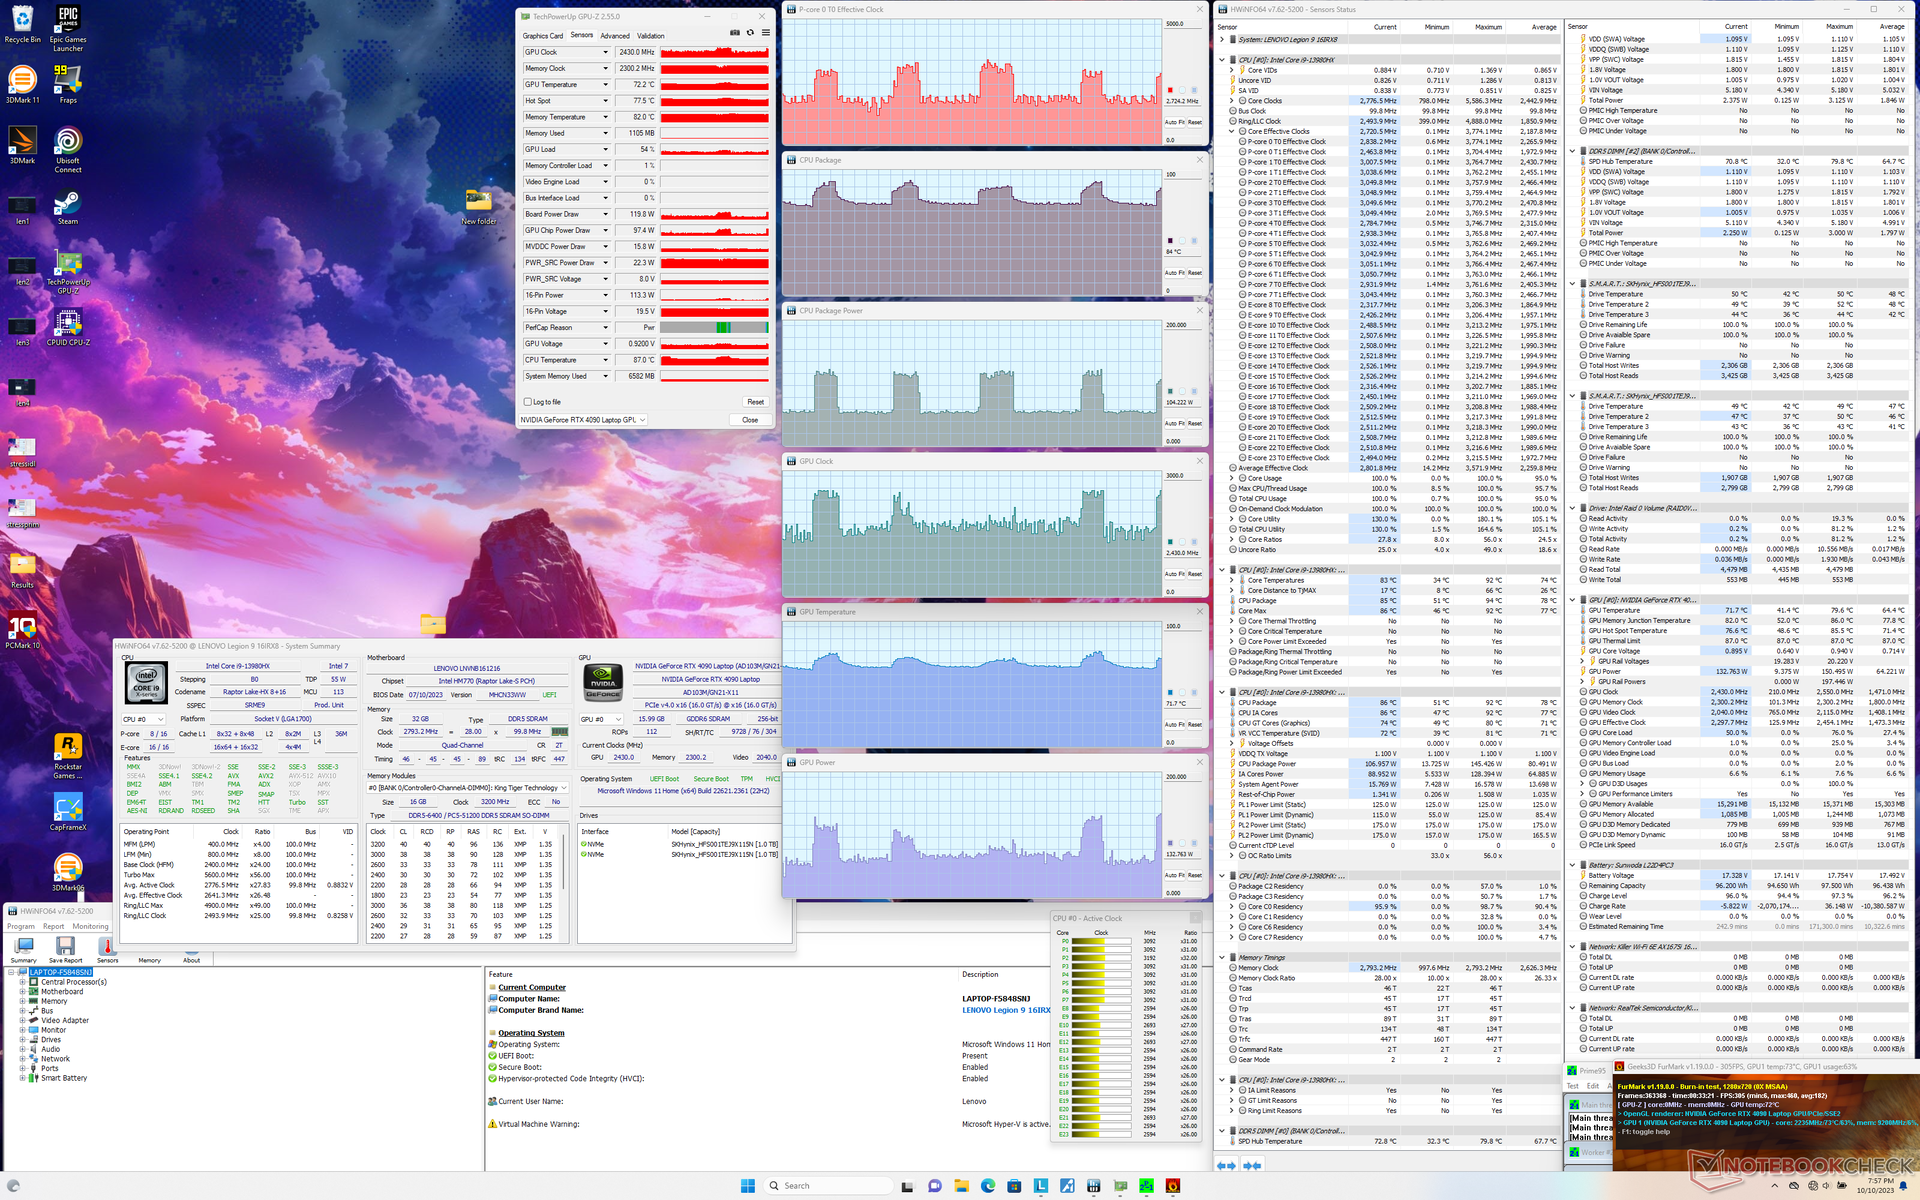
| Reloj dela CPU (GHz) | Reloj de la GPU (MHz) | Temperatura media dela CPU (°C) | Temperatura media de la GPU (°C) | |
| Sistema en reposo | -- | -- | 52 | 41 |
| Prime95 Stress | 3.0 | -- | 83 | 58 |
| Estrés Prime95+ FurMark | 1,6 - 3,4 | 1365 - 2535 | 74 - 86 | 72 - 78 |
| Witcher 3 Estrés (modoequilibrado con GPU Overclock desactivado) | ~1,1 | 1650 | 71 | 66 |
| Witcher 3 Estrés (modoRendimiento) | ~1.1 | 2265 | 77 | 78 |
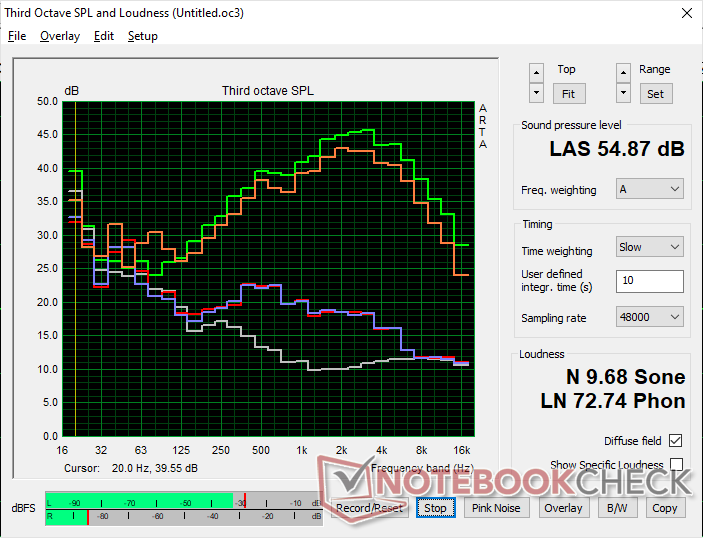
Altavoces
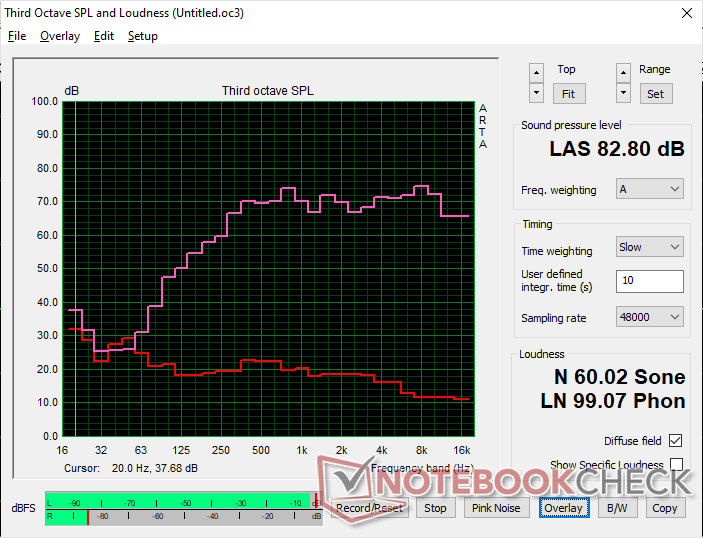
Lenovo Legion 9 16IRX8 análisis de audio
(+) | los altavoces pueden reproducir a un volumen relativamente alto (#82.8 dB)
Graves 100 - 315 Hz
(±) | lubina reducida - en promedio 13.5% inferior a la mediana
(±) | la linealidad de los graves es media (9% delta a frecuencia anterior)
Medios 400 - 2000 Hz
(+) | medios equilibrados - a sólo 1.5% de la mediana
(+) | los medios son lineales (5.7% delta a la frecuencia anterior)
Altos 2 - 16 kHz
(+) | máximos equilibrados - a sólo 2.4% de la mediana
(+) | los máximos son lineales (3.7% delta a la frecuencia anterior)
Total 100 - 16.000 Hz
(+) | el sonido global es lineal (11% de diferencia con la mediana)
En comparación con la misma clase
» 7% de todos los dispositivos probados de esta clase eran mejores, 3% similares, 89% peores
» El mejor tuvo un delta de 6%, la media fue 18%, el peor fue ###max##%
En comparación con todos los dispositivos probados
» 6% de todos los dispositivos probados eran mejores, 2% similares, 92% peores
» El mejor tuvo un delta de 4%, la media fue 24%, el peor fue ###max##%
Apple MacBook Pro 16 2021 M1 Pro análisis de audio
(+) | los altavoces pueden reproducir a un volumen relativamente alto (#84.7 dB)
Graves 100 - 315 Hz
(+) | buen bajo - sólo 3.8% lejos de la mediana
(+) | el bajo es lineal (5.2% delta a la frecuencia anterior)
Medios 400 - 2000 Hz
(+) | medios equilibrados - a sólo 1.3% de la mediana
(+) | los medios son lineales (2.1% delta a la frecuencia anterior)
Altos 2 - 16 kHz
(+) | máximos equilibrados - a sólo 1.9% de la mediana
(+) | los máximos son lineales (2.7% delta a la frecuencia anterior)
Total 100 - 16.000 Hz
(+) | el sonido global es lineal (4.6% de diferencia con la mediana)
En comparación con la misma clase
» 0% de todos los dispositivos probados de esta clase eran mejores, 0% similares, 100% peores
» El mejor tuvo un delta de 5%, la media fue 17%, el peor fue ###max##%
En comparación con todos los dispositivos probados
» 0% de todos los dispositivos probados eran mejores, 0% similares, 100% peores
» El mejor tuvo un delta de 4%, la media fue 24%, el peor fue ###max##%
Gestión de la energía
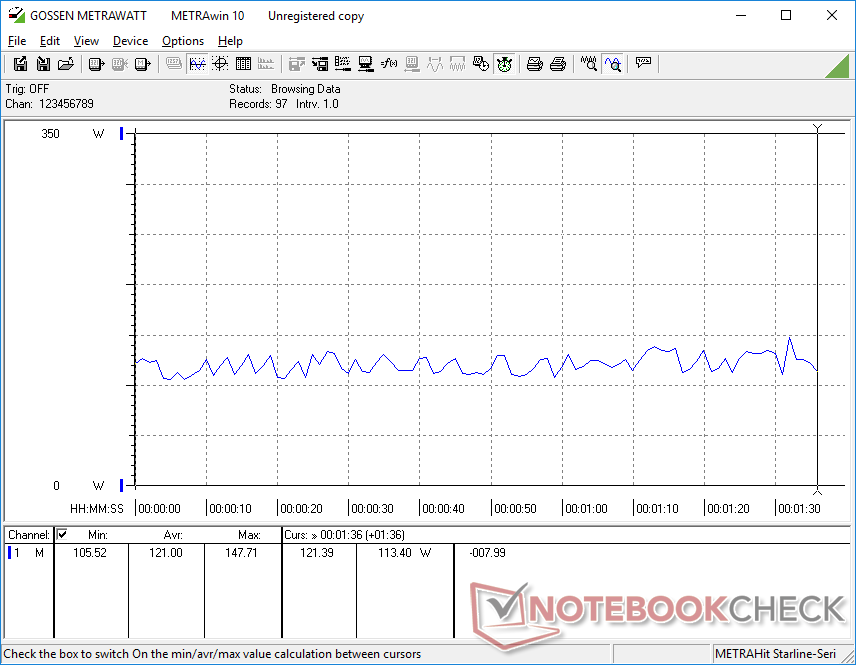
Consumo de energía
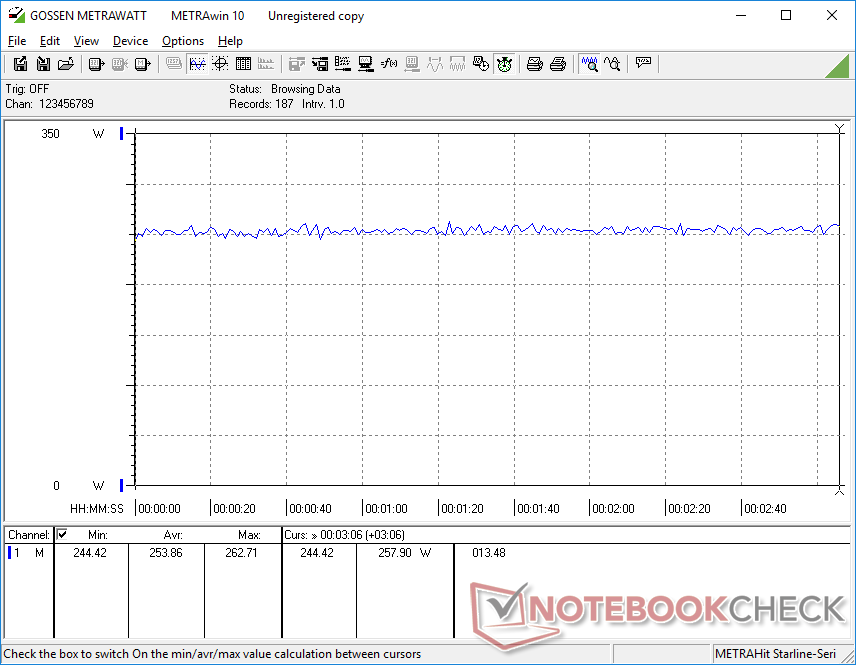
El consumo de energía es muy elevado sea cual sea el ajuste de potencia. Funcionando al ralentí en el escritorio en el modo iGPU de ahorro de energía y en el ajuste de brillo mínimo seguiría demandando 32 W en comparación con sólo 9 W a 10 W en el Legion Slim 5 16 o Asus ROG Strix G16 cada uno con paneles IPS. El consumo también depende no sólo del brillo, sino también del color, al igual que con un panel OLED. Una pantalla totalmente blanca en nuestro Legion 9i 16, por ejemplo, demandaría unos 13 W más que una pantalla totalmente negra incluso estando en el ajuste de brillo máximo para ambos colores. En comparación, los paneles IPS demandarían como mucho unos pocos vatios sin importar el color.
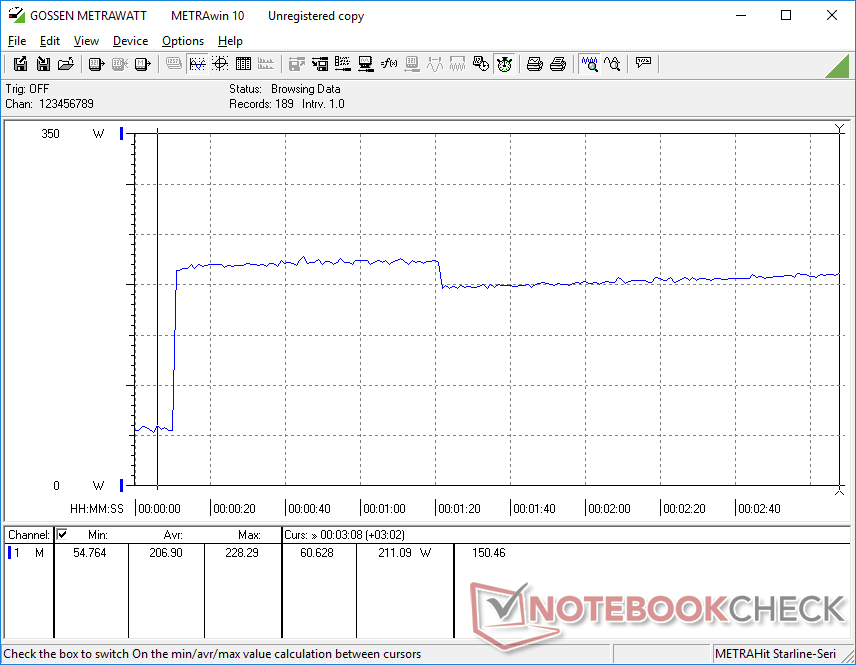
Ejecutando Prime95 en un monitor externo muestra niveles de consumo muy similares entre nuestra unidad Lenovo y el Asus ROG Strix Scar 17 alimentado por el Ryzen 9 7945HX de la competencia como muestran los gráficos comparativos de abajo. No obstante, el rendimiento por vatio sigue estando a favor de AMD, ya que el Ryzen 9 7945HX supera a nuestro Core i9-13980HX en cargas de trabajo multihilo a pesar de sus similares demandas de energía.
El consumo cuando se juega es ligeramente superior en alrededor de un 10 por ciento en comparación con el Asus ROG Strix Scar 17 SE con la RTX 3080 Ti más antigua. Sin embargo, el aumento del 40 al 75 por ciento en el rendimiento gráfico con nuestra RTX 4090 compensa con creces el menor aumento en el consumo. El altísimo rendimiento por vatio de la serie Lovelace de Ada para portátiles es impresionante e insuperable en estos momentos.
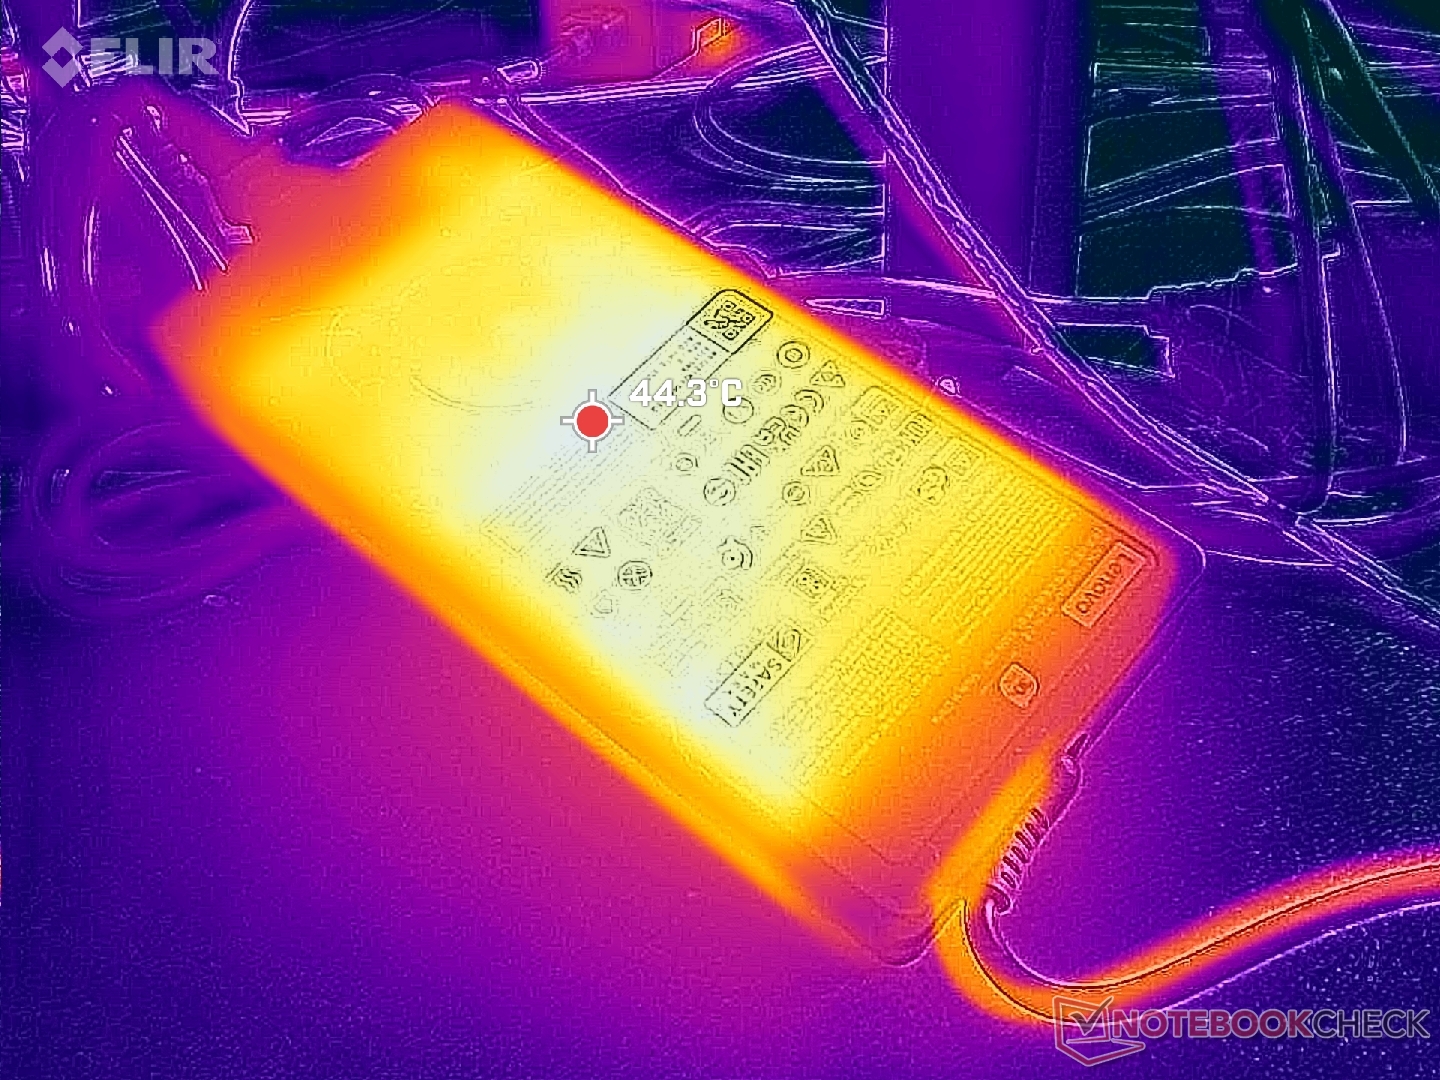
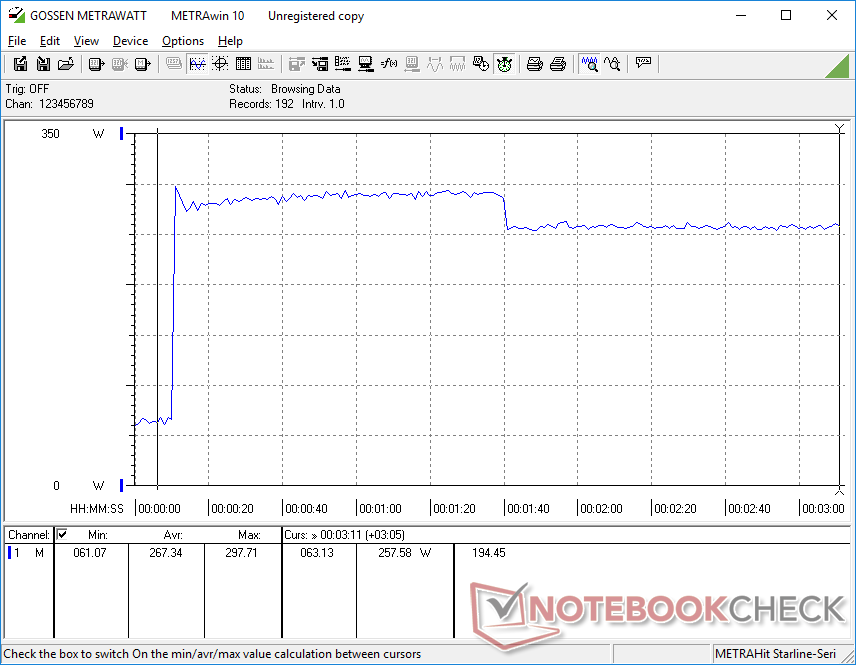
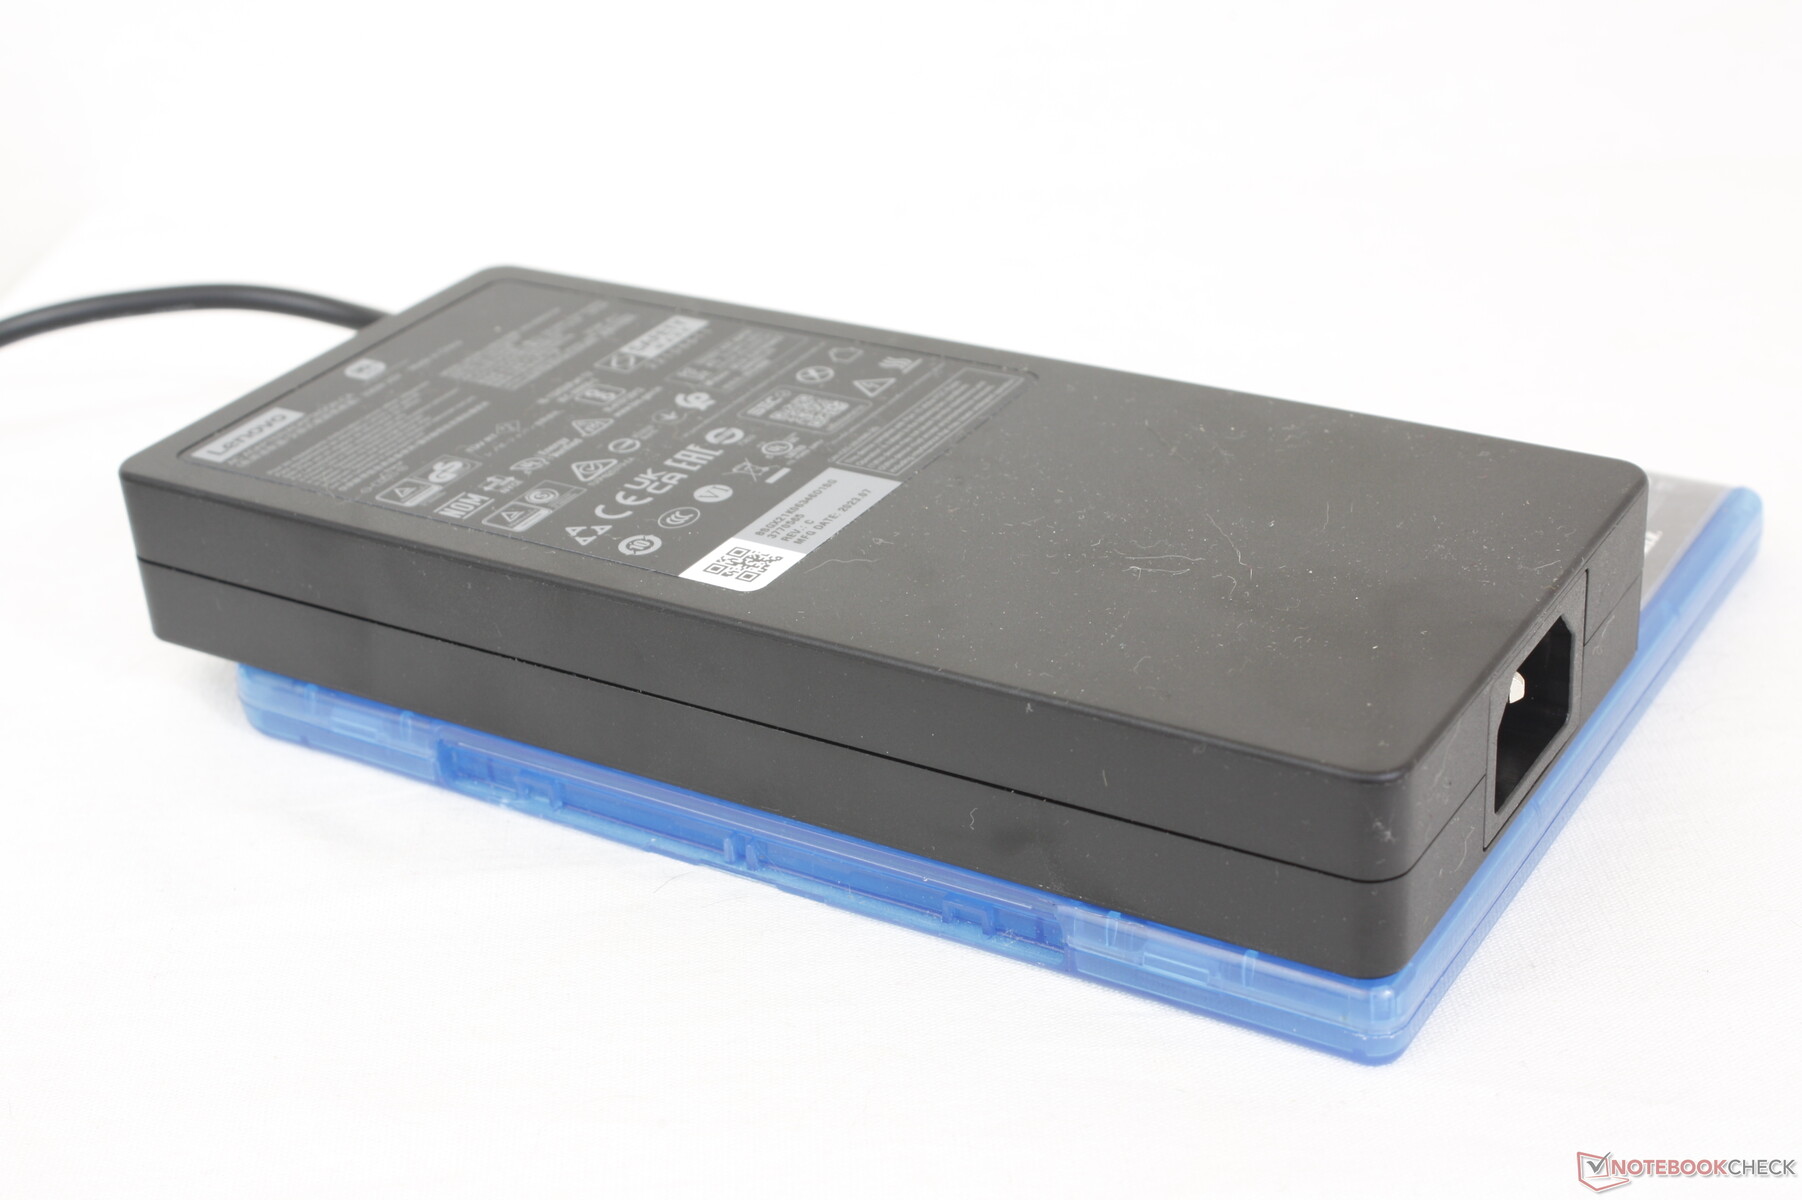
Hemos podido medir un consumo máximo de 298 W del adaptador de CA de 330 W de tamaño mediano (18,5 x 2,6 x8,3 cm) cuando tanto la CPU como la GPU están cada una al 100% de utilización. Esta tasa es sólo temporal debido a las limitaciones térmicas.
| Off / Standby | |
| Ocioso | |
| Carga |
|
Clave:
min: | |
| Lenovo Legion 9 16IRX8 i9-13980HX, GeForce RTX 4090 Laptop GPU, 2x SK Hynix HFS001TEJ9X115N (RAID 0), Mini-LED, 3200x2000, 16" | Lenovo Legion Slim 5 16APH8 R7 7840HS, GeForce RTX 4060 Laptop GPU, SK hynix PC801 HFS512GEJ9X115N, IPS, 2560x1600, 16" | Razer Blade 16 Early 2023 RTX 4090 i9-13950HX, GeForce RTX 4090 Laptop GPU, SSSTC CA6-8D1024, mini-LED, 3840x2400, 16" | Asus ROG Strix G16 G614JZ i9-13980HX, GeForce RTX 4080 Laptop GPU, WD PC SN560 SDDPNQE-1T00, IPS, 2560x1600, 16" | HP Omen Transcend 16 i9-13900HX, GeForce RTX 4070 Laptop GPU, SK hynix PC801 HFS002TEJ9X101N, Mini-LED, 2560x1600, 16" | Alienware x16 R1 i9-13900HK, GeForce RTX 4080 Laptop GPU, SK hynix PC801 HFS001TEJ9X101N, IPS, 2560x1600, 16" | |
|---|---|---|---|---|---|---|
| Power Consumption | 53% | 9% | 28% | 18% | 12% | |
| Idle Minimum * (Watt) | 32.3 | 9.4 71% | 27.5 15% | 10 69% | 19.2 41% | 25.2 22% |
| Idle Average * (Watt) | 42.6 | 15.5 64% | 34.4 19% | 16 62% | 22.7 47% | 29.9 30% |
| Idle Maximum * (Watt) | 57.9 | 24.4 58% | 35.4 39% | 27 53% | 55.4 4% | 49.8 14% |
| Load Average * (Watt) | 121 | 74.1 39% | 147.8 -22% | 129 -7% | 128.4 -6% | 105.4 13% |
| Witcher 3 ultra * (Watt) | 254 | 112.9 56% | 256 -1% | 247 3% | 206 19% | 263 -4% |
| Load Maximum * (Watt) | 297.7 | 206.5 31% | 286.7 4% | 342 -15% | 292 2% | 313.8 -5% |
* ... más pequeño es mejor
Power Consumption Witcher 3 / Stresstest
Power Consumption external Monitor
Duración de las pilas
Los tiempos de ejecución son pobres, lo que se correlaciona con nuestros elevados números de consumo de energía anteriores. Sólo pudimos navegar por Internet durante 160 minutos, incluso con el modo iGPU equilibrado. Otros portátiles mini-LED, como el HP Omen Transcend 16también muestran tiempos de ejecución muy cortos a pesar de sus grandes paquetes de baterías de más de 90 Wh.
La carga es al menos muy rápida, de aproximadamente una hora cuando la carga rápida de Lenovo está activada, en comparación con los 90 minutos o más de la mayoría de los demás portátiles para juegos. Los adaptadores USB-C de terceros también pueden cargar el sistema aunque a un ritmo más lento y con una compatibilidad no garantizada.
| Lenovo Legion 9 16IRX8 i9-13980HX, GeForce RTX 4090 Laptop GPU, 99.9 Wh | Lenovo Legion Slim 5 16APH8 R7 7840HS, GeForce RTX 4060 Laptop GPU, 80 Wh | Razer Blade 16 Early 2023 RTX 4090 i9-13950HX, GeForce RTX 4090 Laptop GPU, 95.2 Wh | Asus ROG Strix G16 G614JZ i9-13980HX, GeForce RTX 4080 Laptop GPU, 90 Wh | HP Omen Transcend 16 i9-13900HX, GeForce RTX 4070 Laptop GPU, 97 Wh | Alienware x16 R1 i9-13900HK, GeForce RTX 4080 Laptop GPU, 90 Wh | |
|---|---|---|---|---|---|---|
| Duración de Batería | 86% | 78% | 135% | 23% | -9% | |
| Reader / Idle (h) | 6.7 | 11.7 75% | 6.3 -6% | 7.3 9% | ||
| WiFi v1.3 (h) | 2.7 | 7.1 163% | 5.8 115% | 9.7 259% | 4.2 56% | 2.5 -7% |
| Load (h) | 1 | 1.2 20% | 1.4 40% | 1.1 10% | 1.2 20% | 0.7 -30% |
| H.264 (h) | 8.4 | |||||
| Witcher 3 ultra (h) | 1.6 |
Pro
Contra
Veredicto - El mejor Legion que el dinero puede comprar
Si está en el mercado por una CPU Core i9, una GPU RTX 4090 y una pantalla mini-LED, entonces el Legion 9i 16 merece absolutamente la pena tenerlo en cuenta. Cuando se compara con otros portátiles de juego mini-LED como el HP Omen Transcend 16, Razer Blade 16o el Asus Zephyrus M16, el Lenovo ofrece gráficos más rápidos que el HP, precios más bajos que el Razer y una resolución nativa superior a la del Asus. Clava tanto las especificaciones como el diseño físico para ser un saludable paso adelante respecto a la ya excelente Legion Serie Pro 7.
Todas las mejoras han conducido naturalmente a un chasis más grande y pesado. Si desea las características de CPU y pantalla del Lenovo pero en un factor de forma más portátil, entonces el Blade 16, más caro, podría merecer la pena. La refrigeración líquida integrada suena interesante sobre el papel, pero no parece haber conseguido un diseño más ligero, silencioso o incluso más fresco. Espere que el Lenovo funcione tan ruidosamente como la mayoría de los otros portátiles para juegos de la misma categoría de tamaño.
El Legion 9i 16 tiene todas las especificaciones de lujo y un nuevo aspecto que los entusiastas pueden apreciar siempre que pueda pasar por alto la corta duración de la batería y el chasis relativamente grande.
Tendrá que querer realmente mini-LED si quiere el Legion 9 16 ya que no ofrece otras opciones de pantalla para bien o para mal. Mini-LED está en su mejor momento cuando el HDR está activado para explotar su brillo máximo de 1000 nits. De lo contrario, el panel es muy exigente con la batería sin otras ventajas importantes sobre paneles menos caros como IPS u OLED.
Precio y disponibilidad
Lenovo ya está comercializando su modelo Legion 9i Gen 8 a partir de 3420 USD si está configurado con la GeForce RTX 4080 hasta 4000 USD si está totalmente configurado con la RTX 4090 y almacenamiento adicional.
Lenovo Legion 9 16IRX8
- 10/15/2023 v7 (old)
Allen Ngo
Transparencia
La selección de los dispositivos que se van a reseñar corre a cargo de nuestro equipo editorial. La muestra de prueba fue proporcionada al autor en calidad de préstamo por el fabricante o el minorista a los efectos de esta reseña. El prestamista no tuvo ninguna influencia en esta reseña, ni el fabricante recibió una copia de la misma antes de su publicación. No había ninguna obligación de publicar esta reseña. Como empresa de medios independiente, Notebookcheck no está sujeta a la autoridad de fabricantes, minoristas o editores.
Así es como prueba Notebookcheck
Cada año, Notebookcheck revisa de forma independiente cientos de portátiles y smartphones utilizando procedimientos estandarizados para asegurar que todos los resultados son comparables. Hemos desarrollado continuamente nuestros métodos de prueba durante unos 20 años y hemos establecido los estándares de la industria en el proceso. En nuestros laboratorios de pruebas, técnicos y editores experimentados utilizan equipos de medición de alta calidad. Estas pruebas implican un proceso de validación en varias fases. Nuestro complejo sistema de clasificación se basa en cientos de mediciones y puntos de referencia bien fundamentados, lo que mantiene la objetividad.Price comparison

