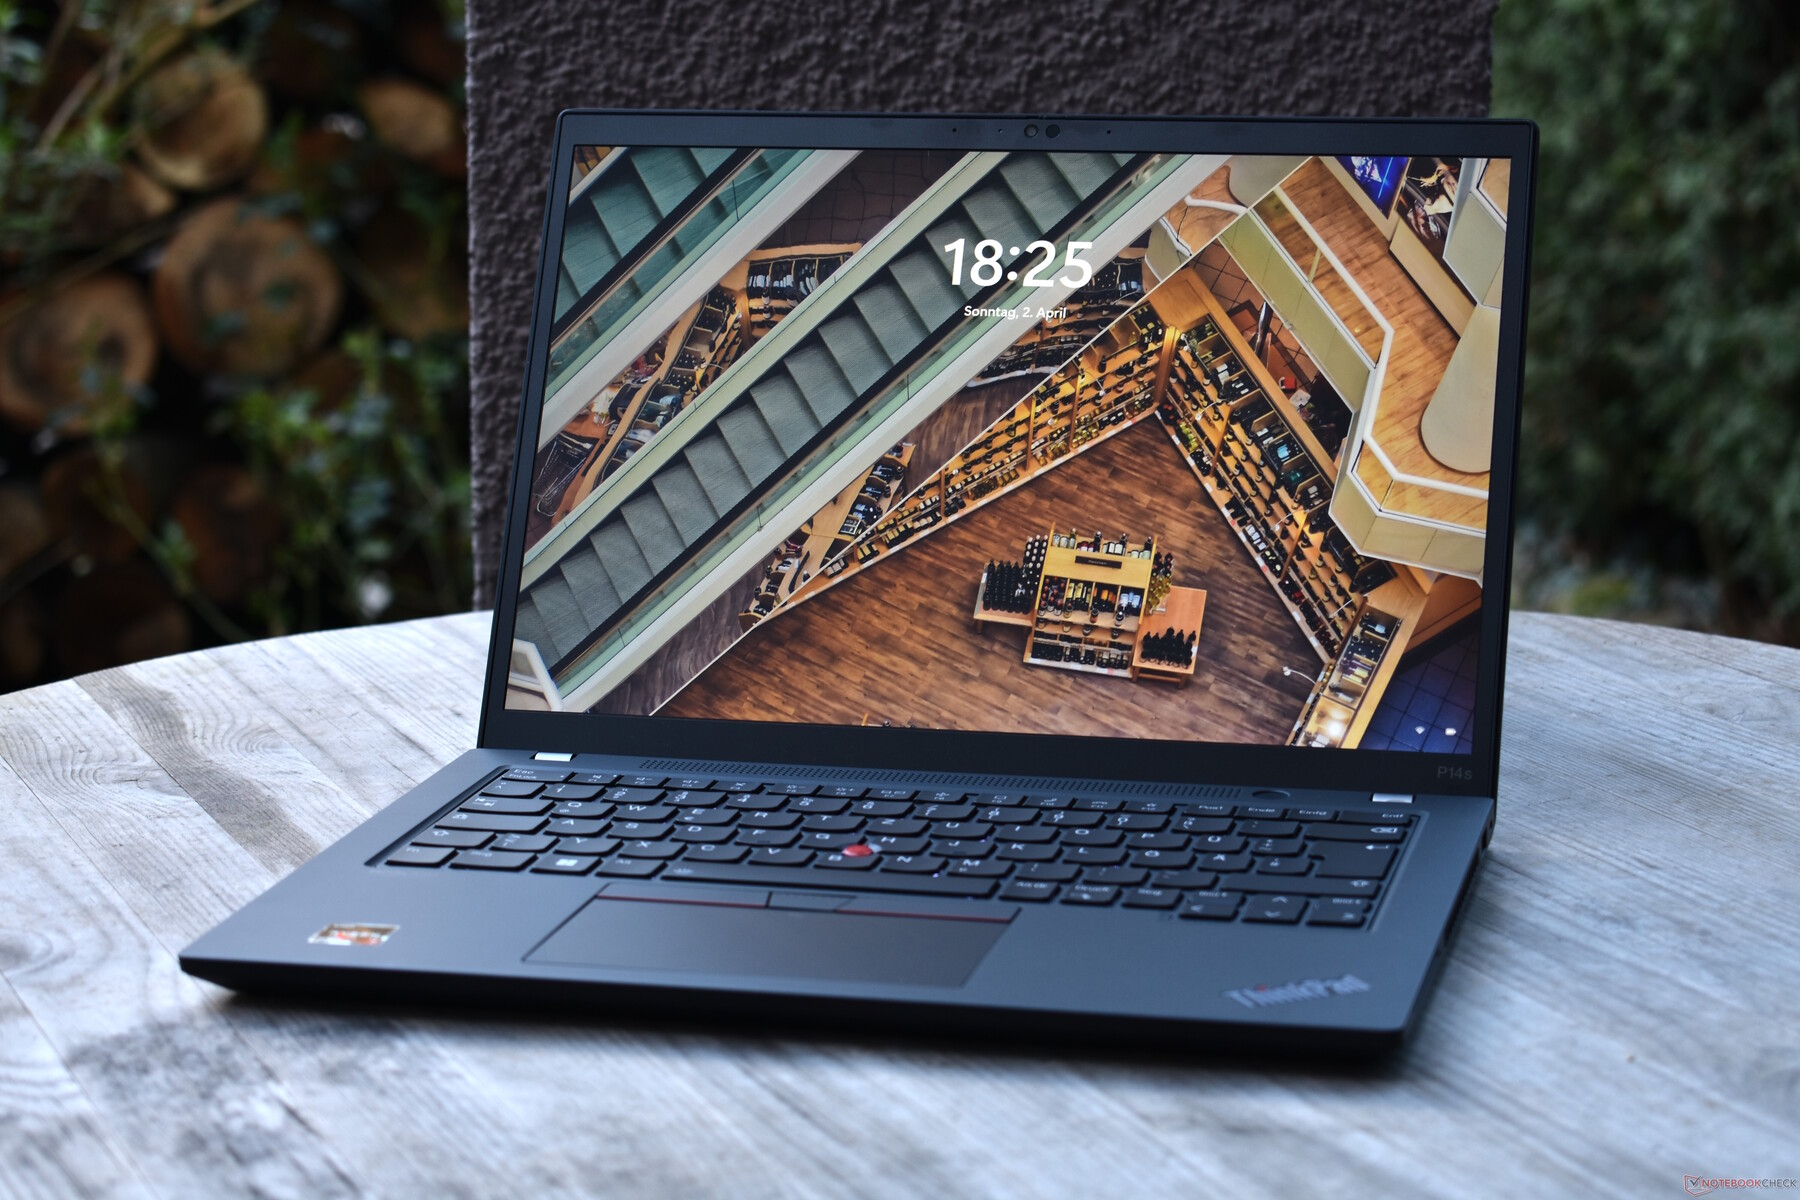
Análisis del portátil Lenovo ThinkPad P14s G3 AMD: Estación de trabajo ligera sin dGPU
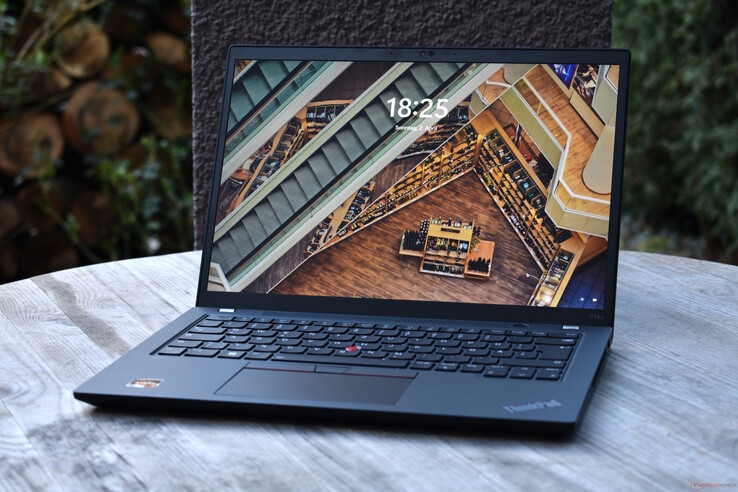
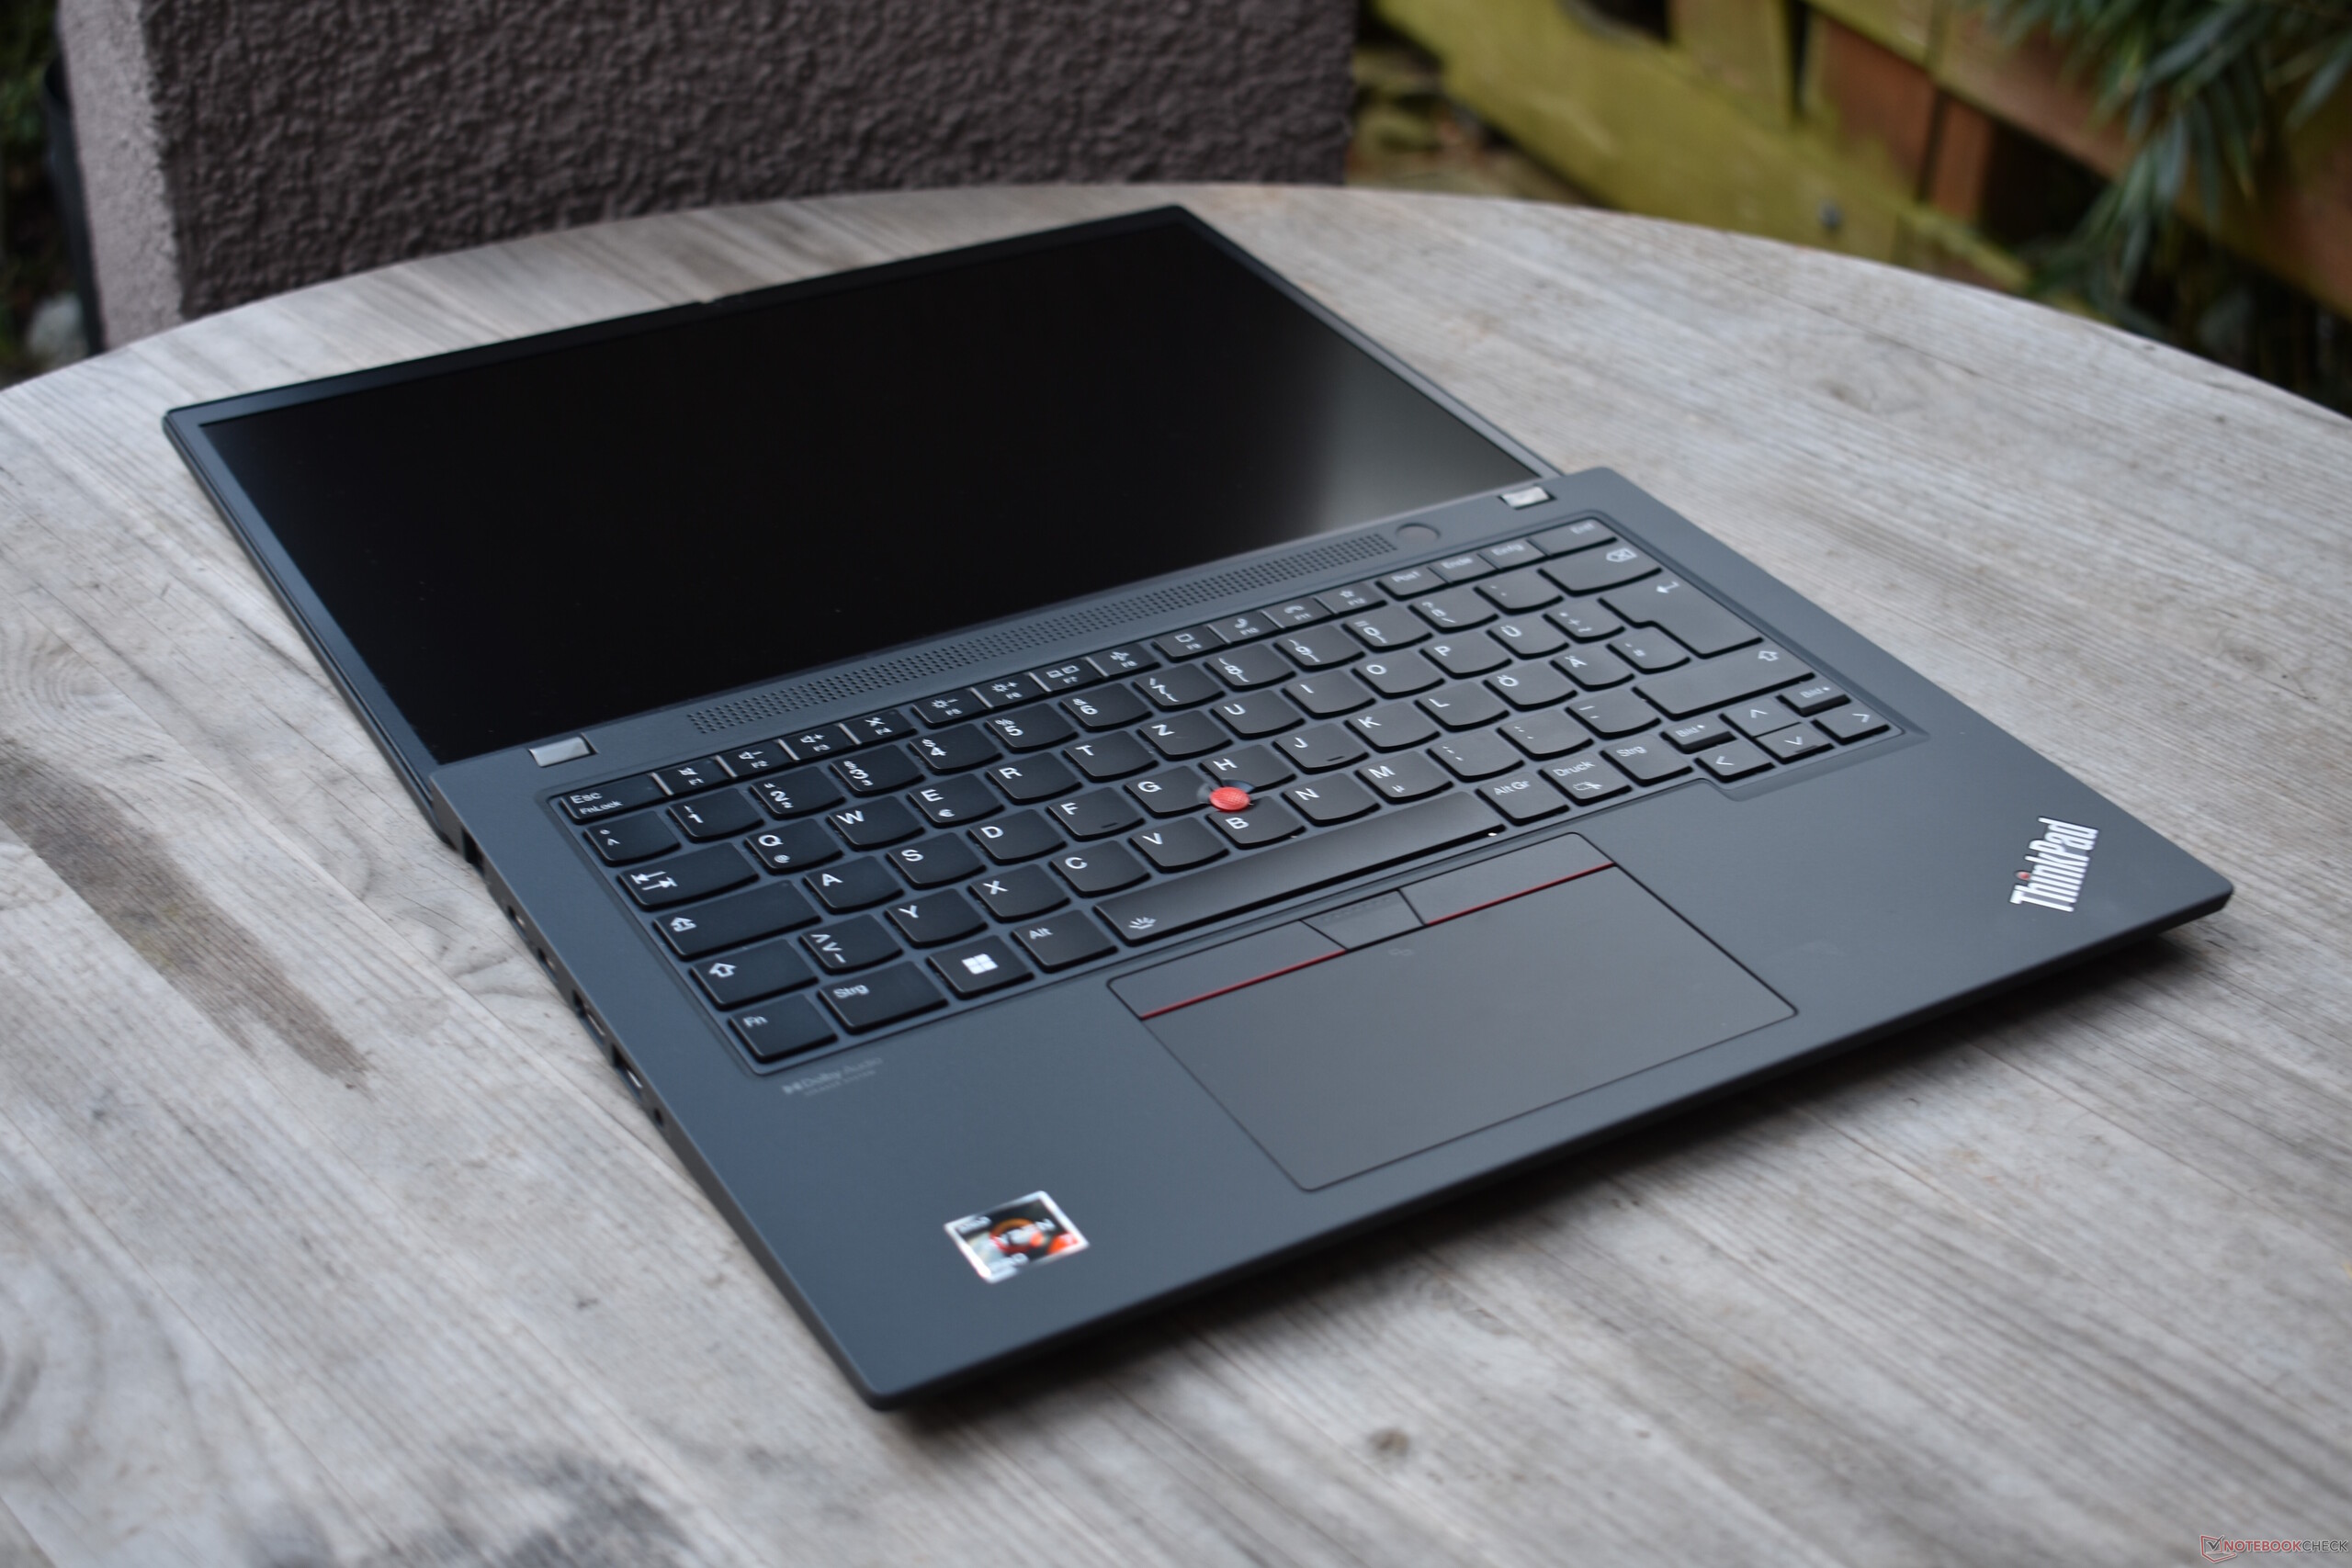
Las estaciones de trabajo móviles suelen tener pantallas relativamente grandes, de 15 pulgadas o más, mientras que las de 14 pulgadas son bastante raras. El Lenovo ThinkPad P14s G3 es uno de estos últimos modelos. Puede que esta serie de productos no sea nueva, pero las variantes AMD del P14s son bastante nuevas en comparación. Hoy vamos a probar uno.
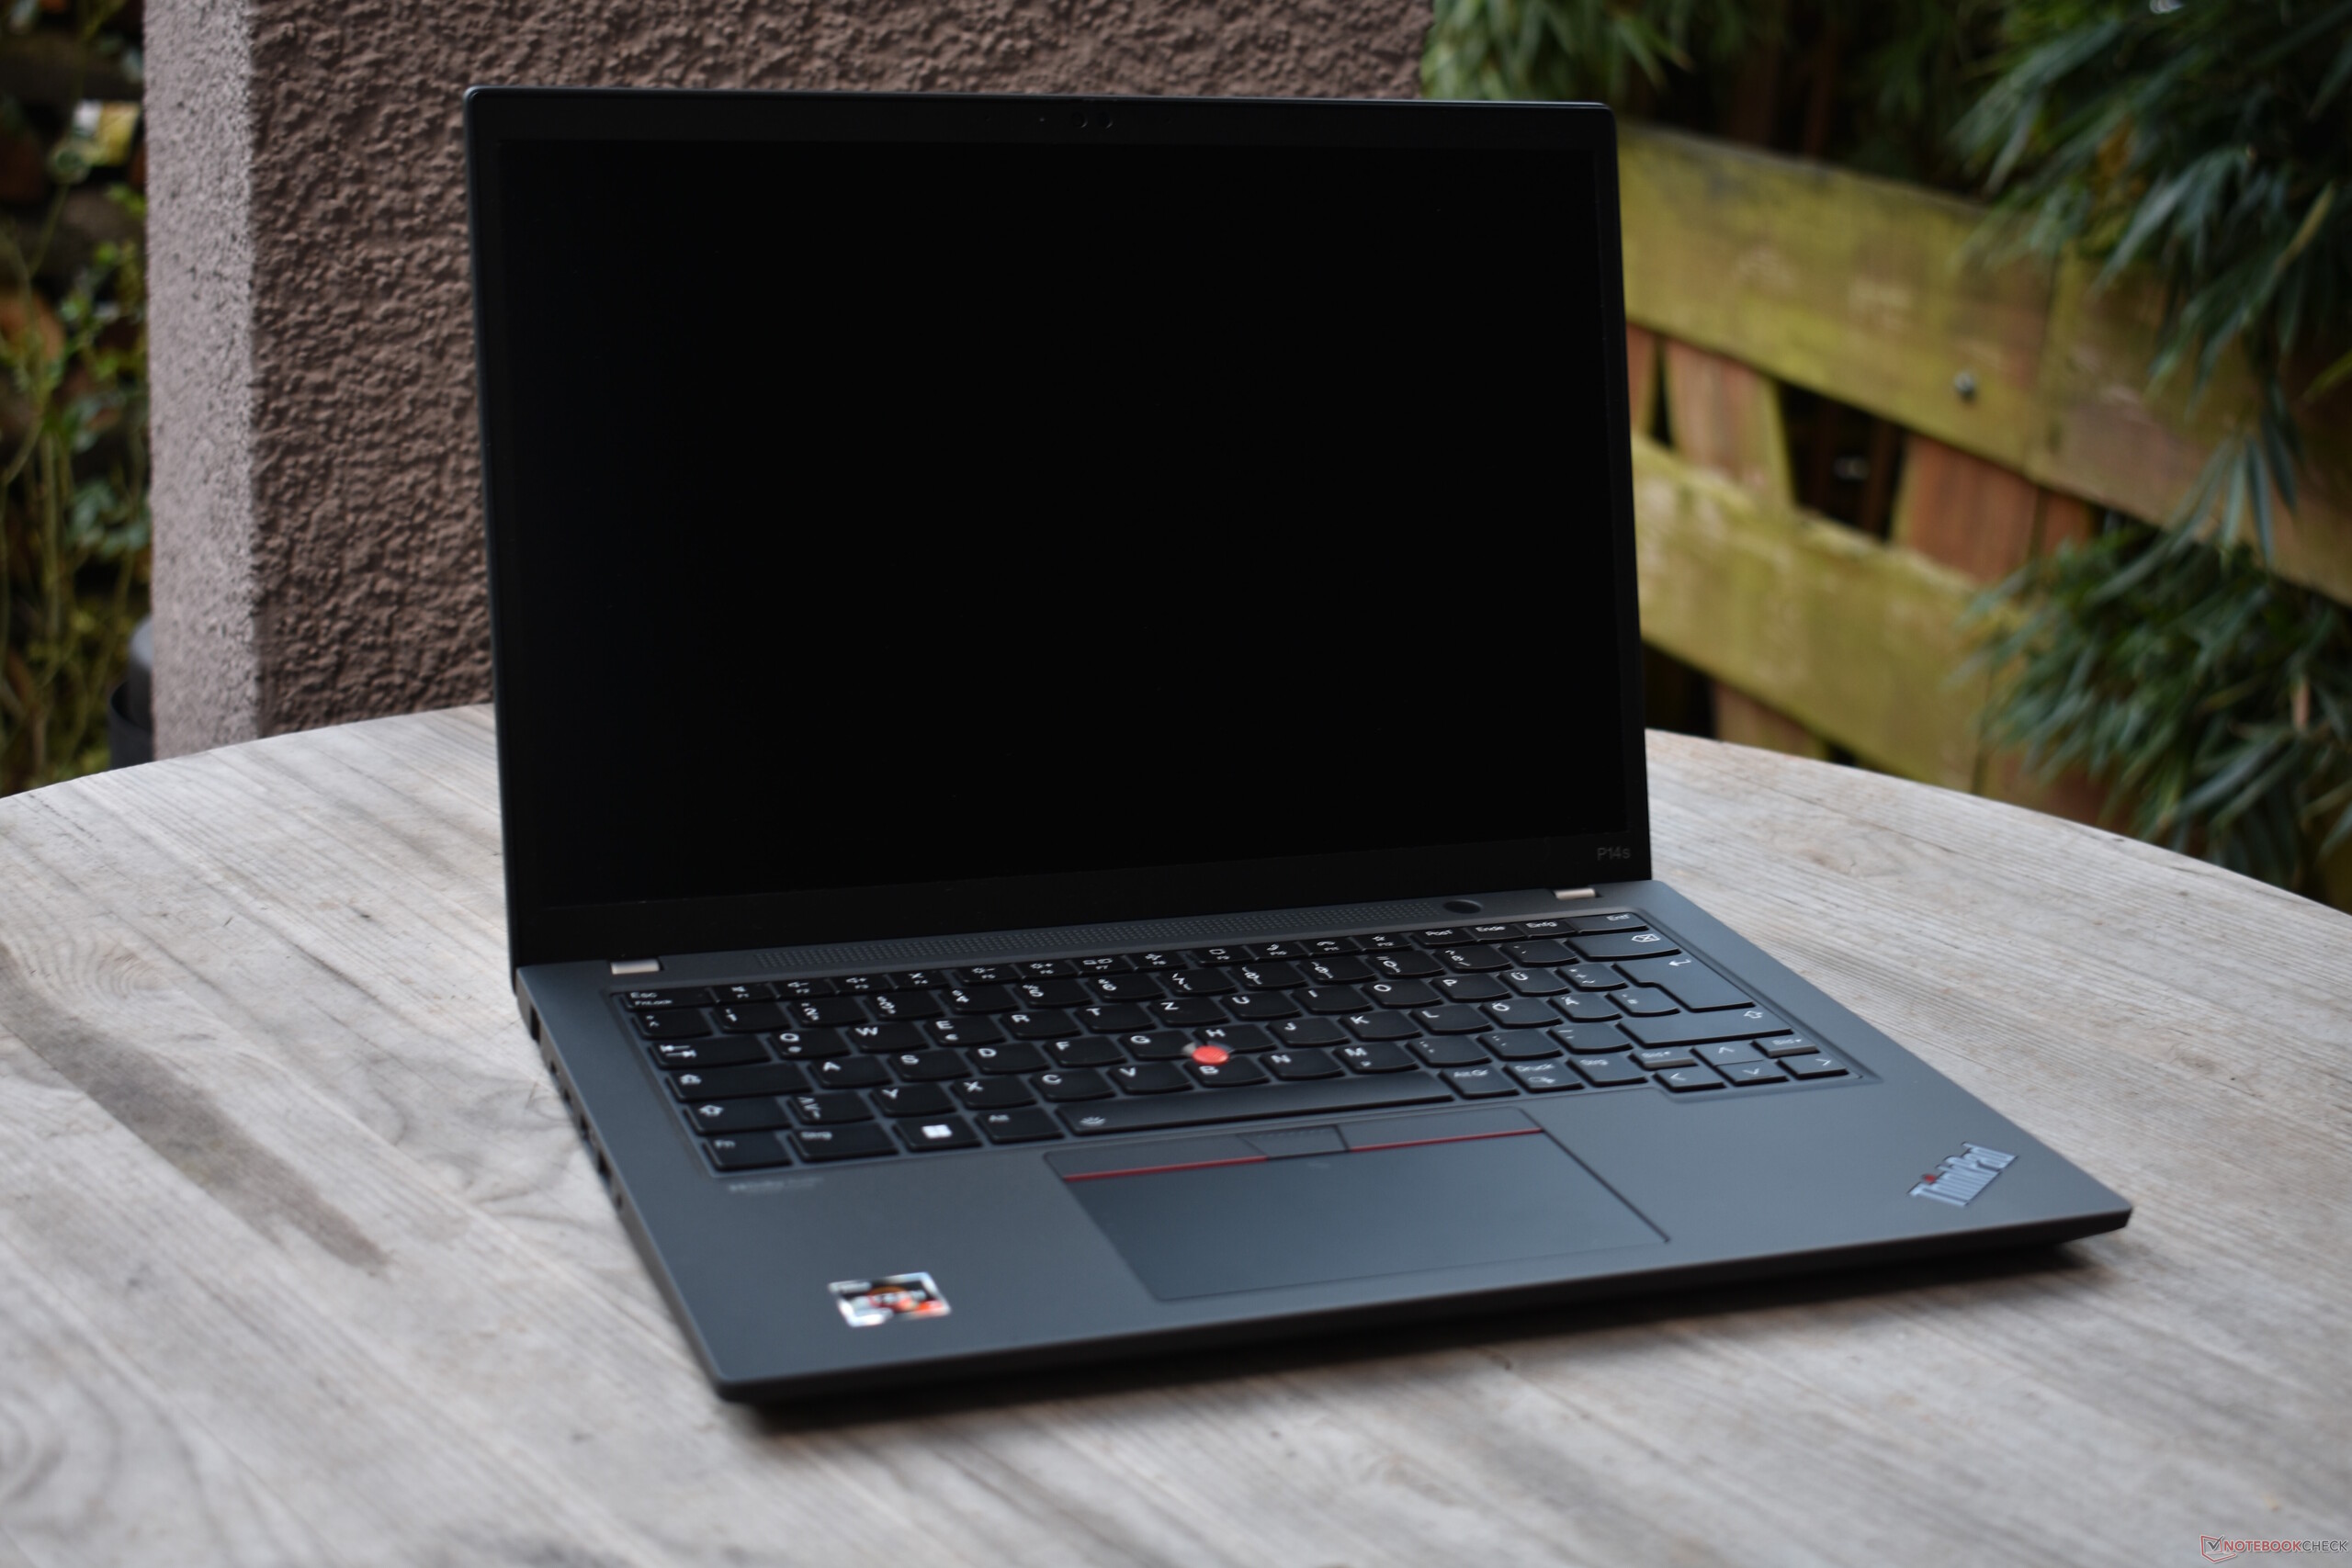
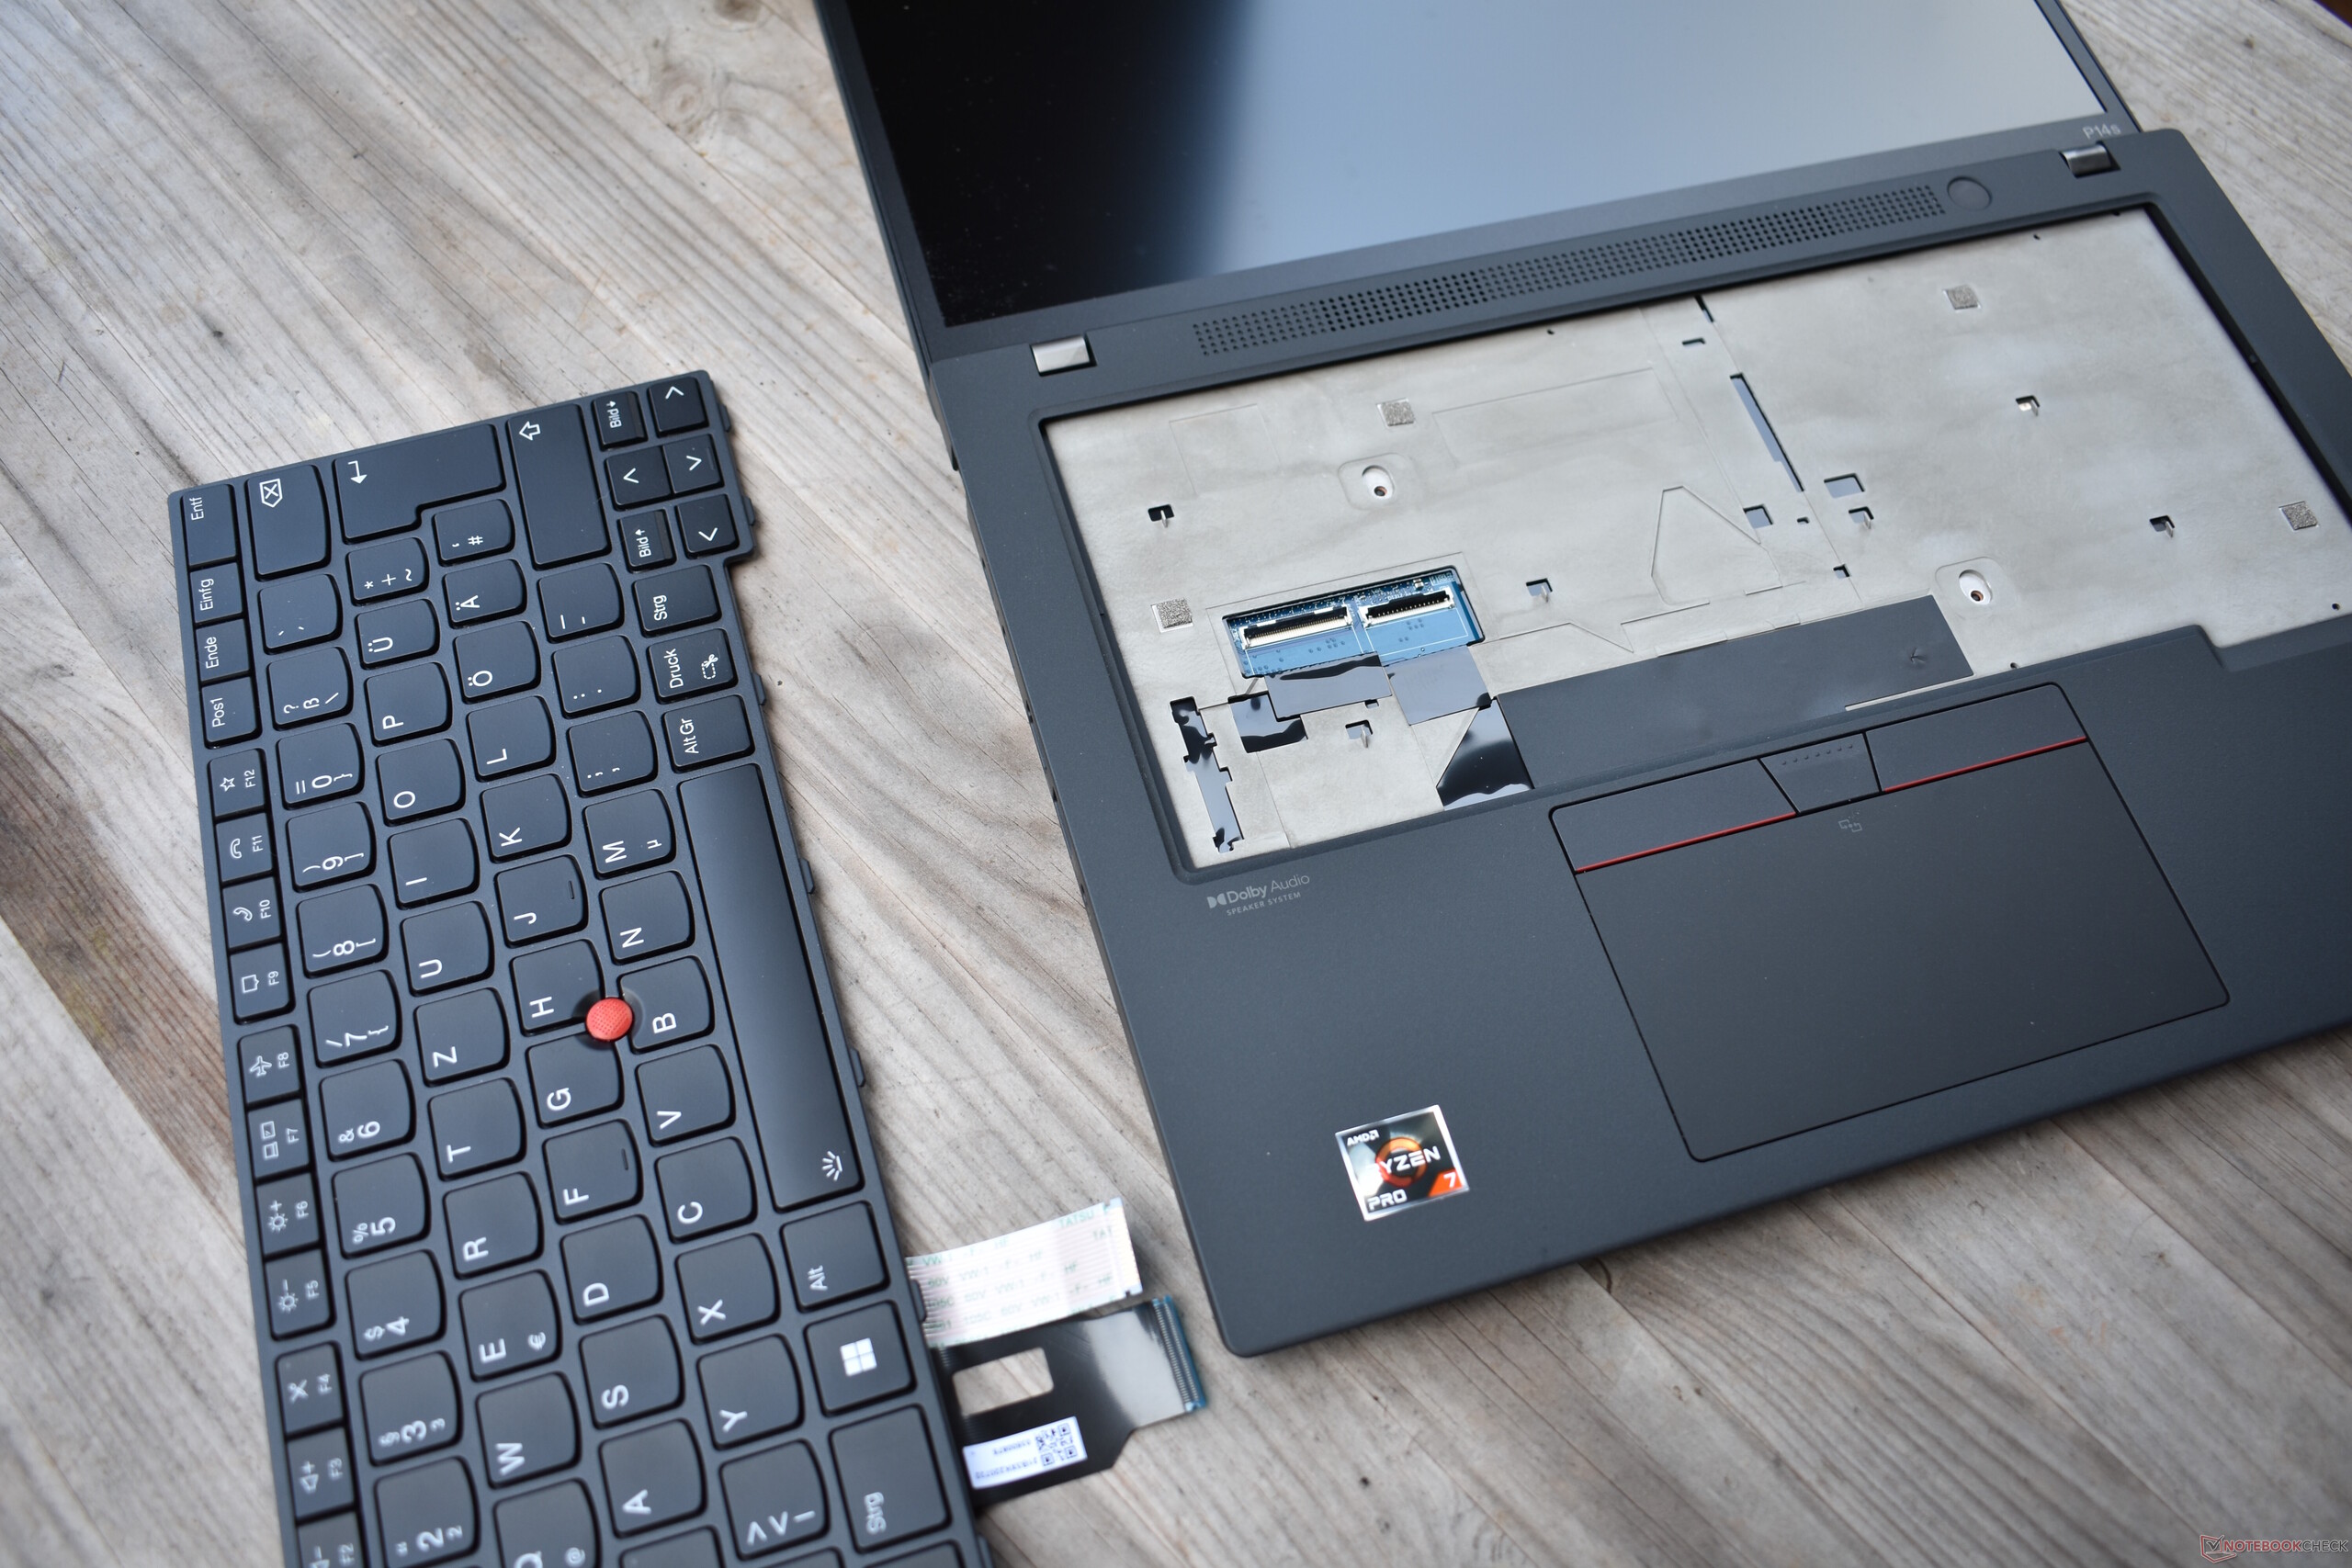
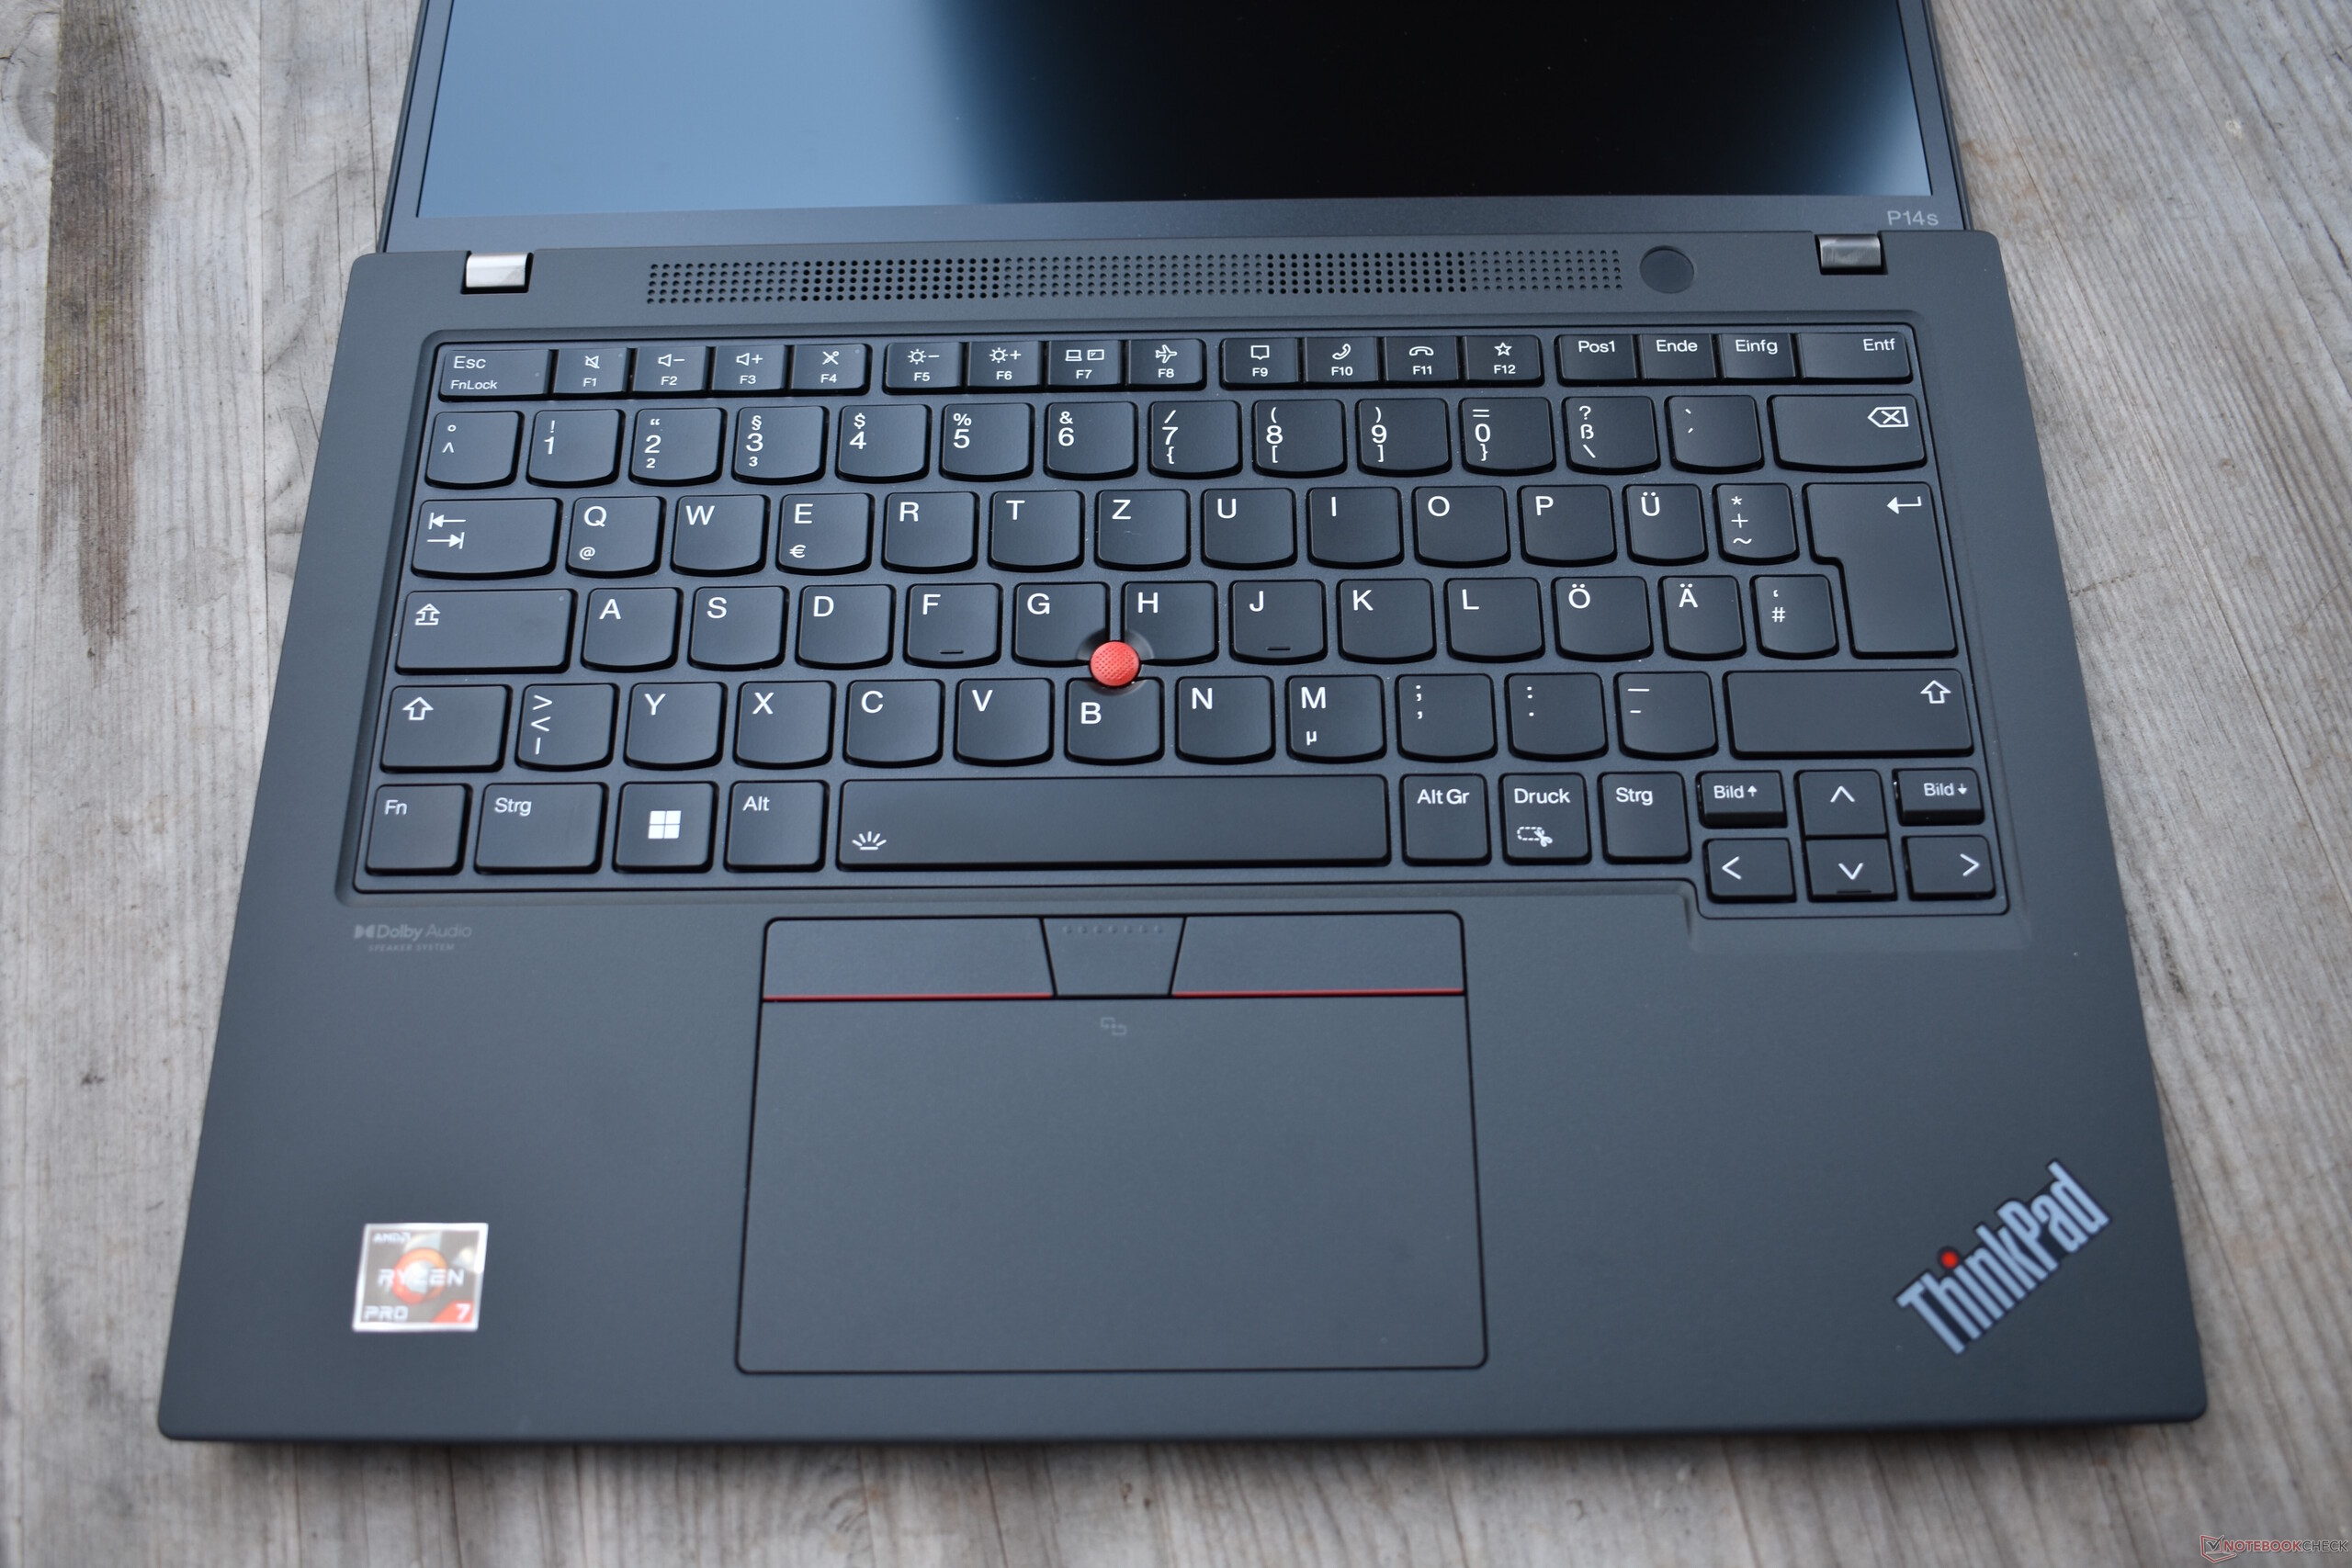
El ThinkPad P14s es un modelo hermano del ThinkPad T14 de Lenovo. Externamente, ambos tienen exactamente el mismo aspecto, lo que significa que puedes consultar nuestro análisis delThinkPad T14 Gen 3 de Lenovo si estás interesado en leer sobre su diseño, características y dispositivos de entrada.
Posibles contendientes en la comparación
Valoración | Fecha | Modelo | Peso | Altura | Tamaño | Resolución | Precio |
|---|---|---|---|---|---|---|---|
| 86.9 % v7 (old) | 04/2023 | Lenovo ThinkPad P14s G3 AMD 21J6S05000 R7 PRO 6850U, Radeon 680M | 1.5 kg | 17.9 mm | 14.00" | 1920x1200 | |
| 85.1 % v7 (old) | 06/2021 | Lenovo ThinkPad P14s Gen2-20VX000GGE i7-1185G7, T500 Laptop GPU | 1.5 kg | 18 mm | 14.00" | 1920x1080 | |
| 88.8 % v7 (old) | 09/2022 | Lenovo ThinkPad T14 G3-21CF004NGE R7 PRO 6850U, Radeon 680M | 1.4 kg | 17.9 mm | 14.00" | 1920x1200 | |
| 87.6 % v7 (old) | 09/2022 | Dell Precision 5000 5470 i9-12900H, RTX A1000 Laptop GPU | 1.6 kg | 18.95 mm | 14.00" | 2560x1600 | |
| 83.6 % v7 (old) | 10/2022 | HP ZBook Firefly 14 G9-6B8A2EA i7-1265U, T550 Laptop GPU | 1.5 kg | 19.9 mm | 14.00" | 1920x1200 |
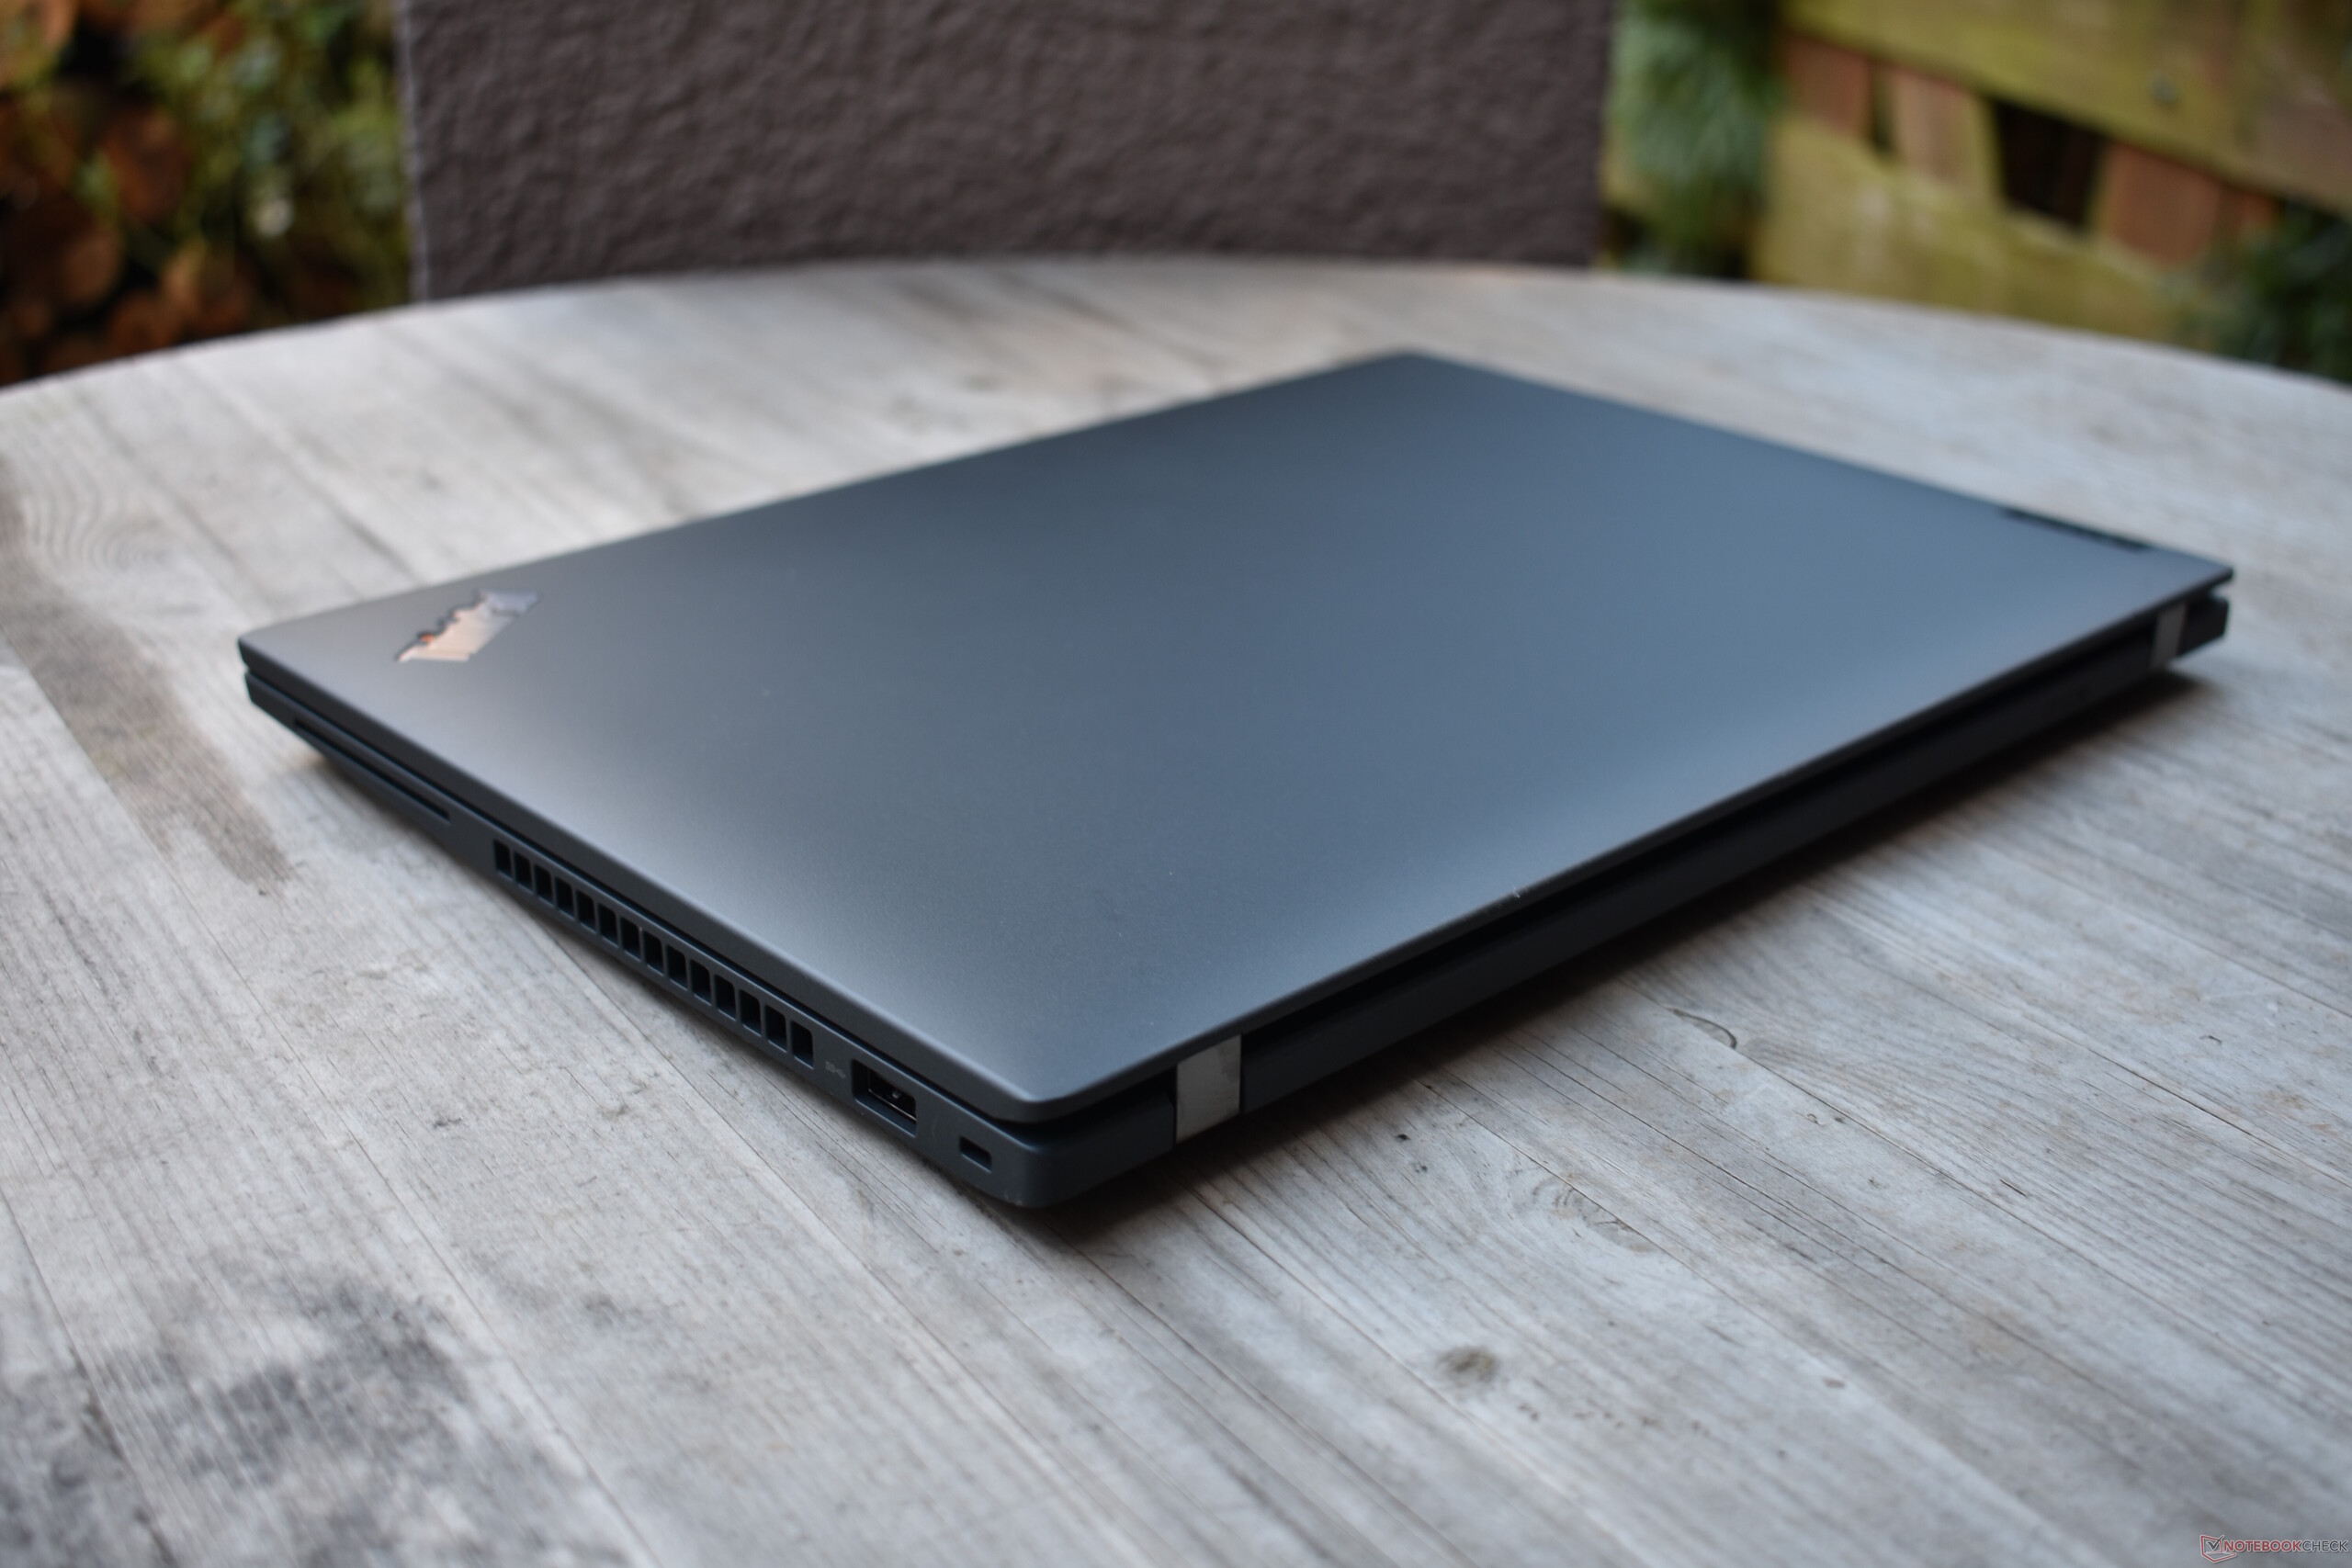
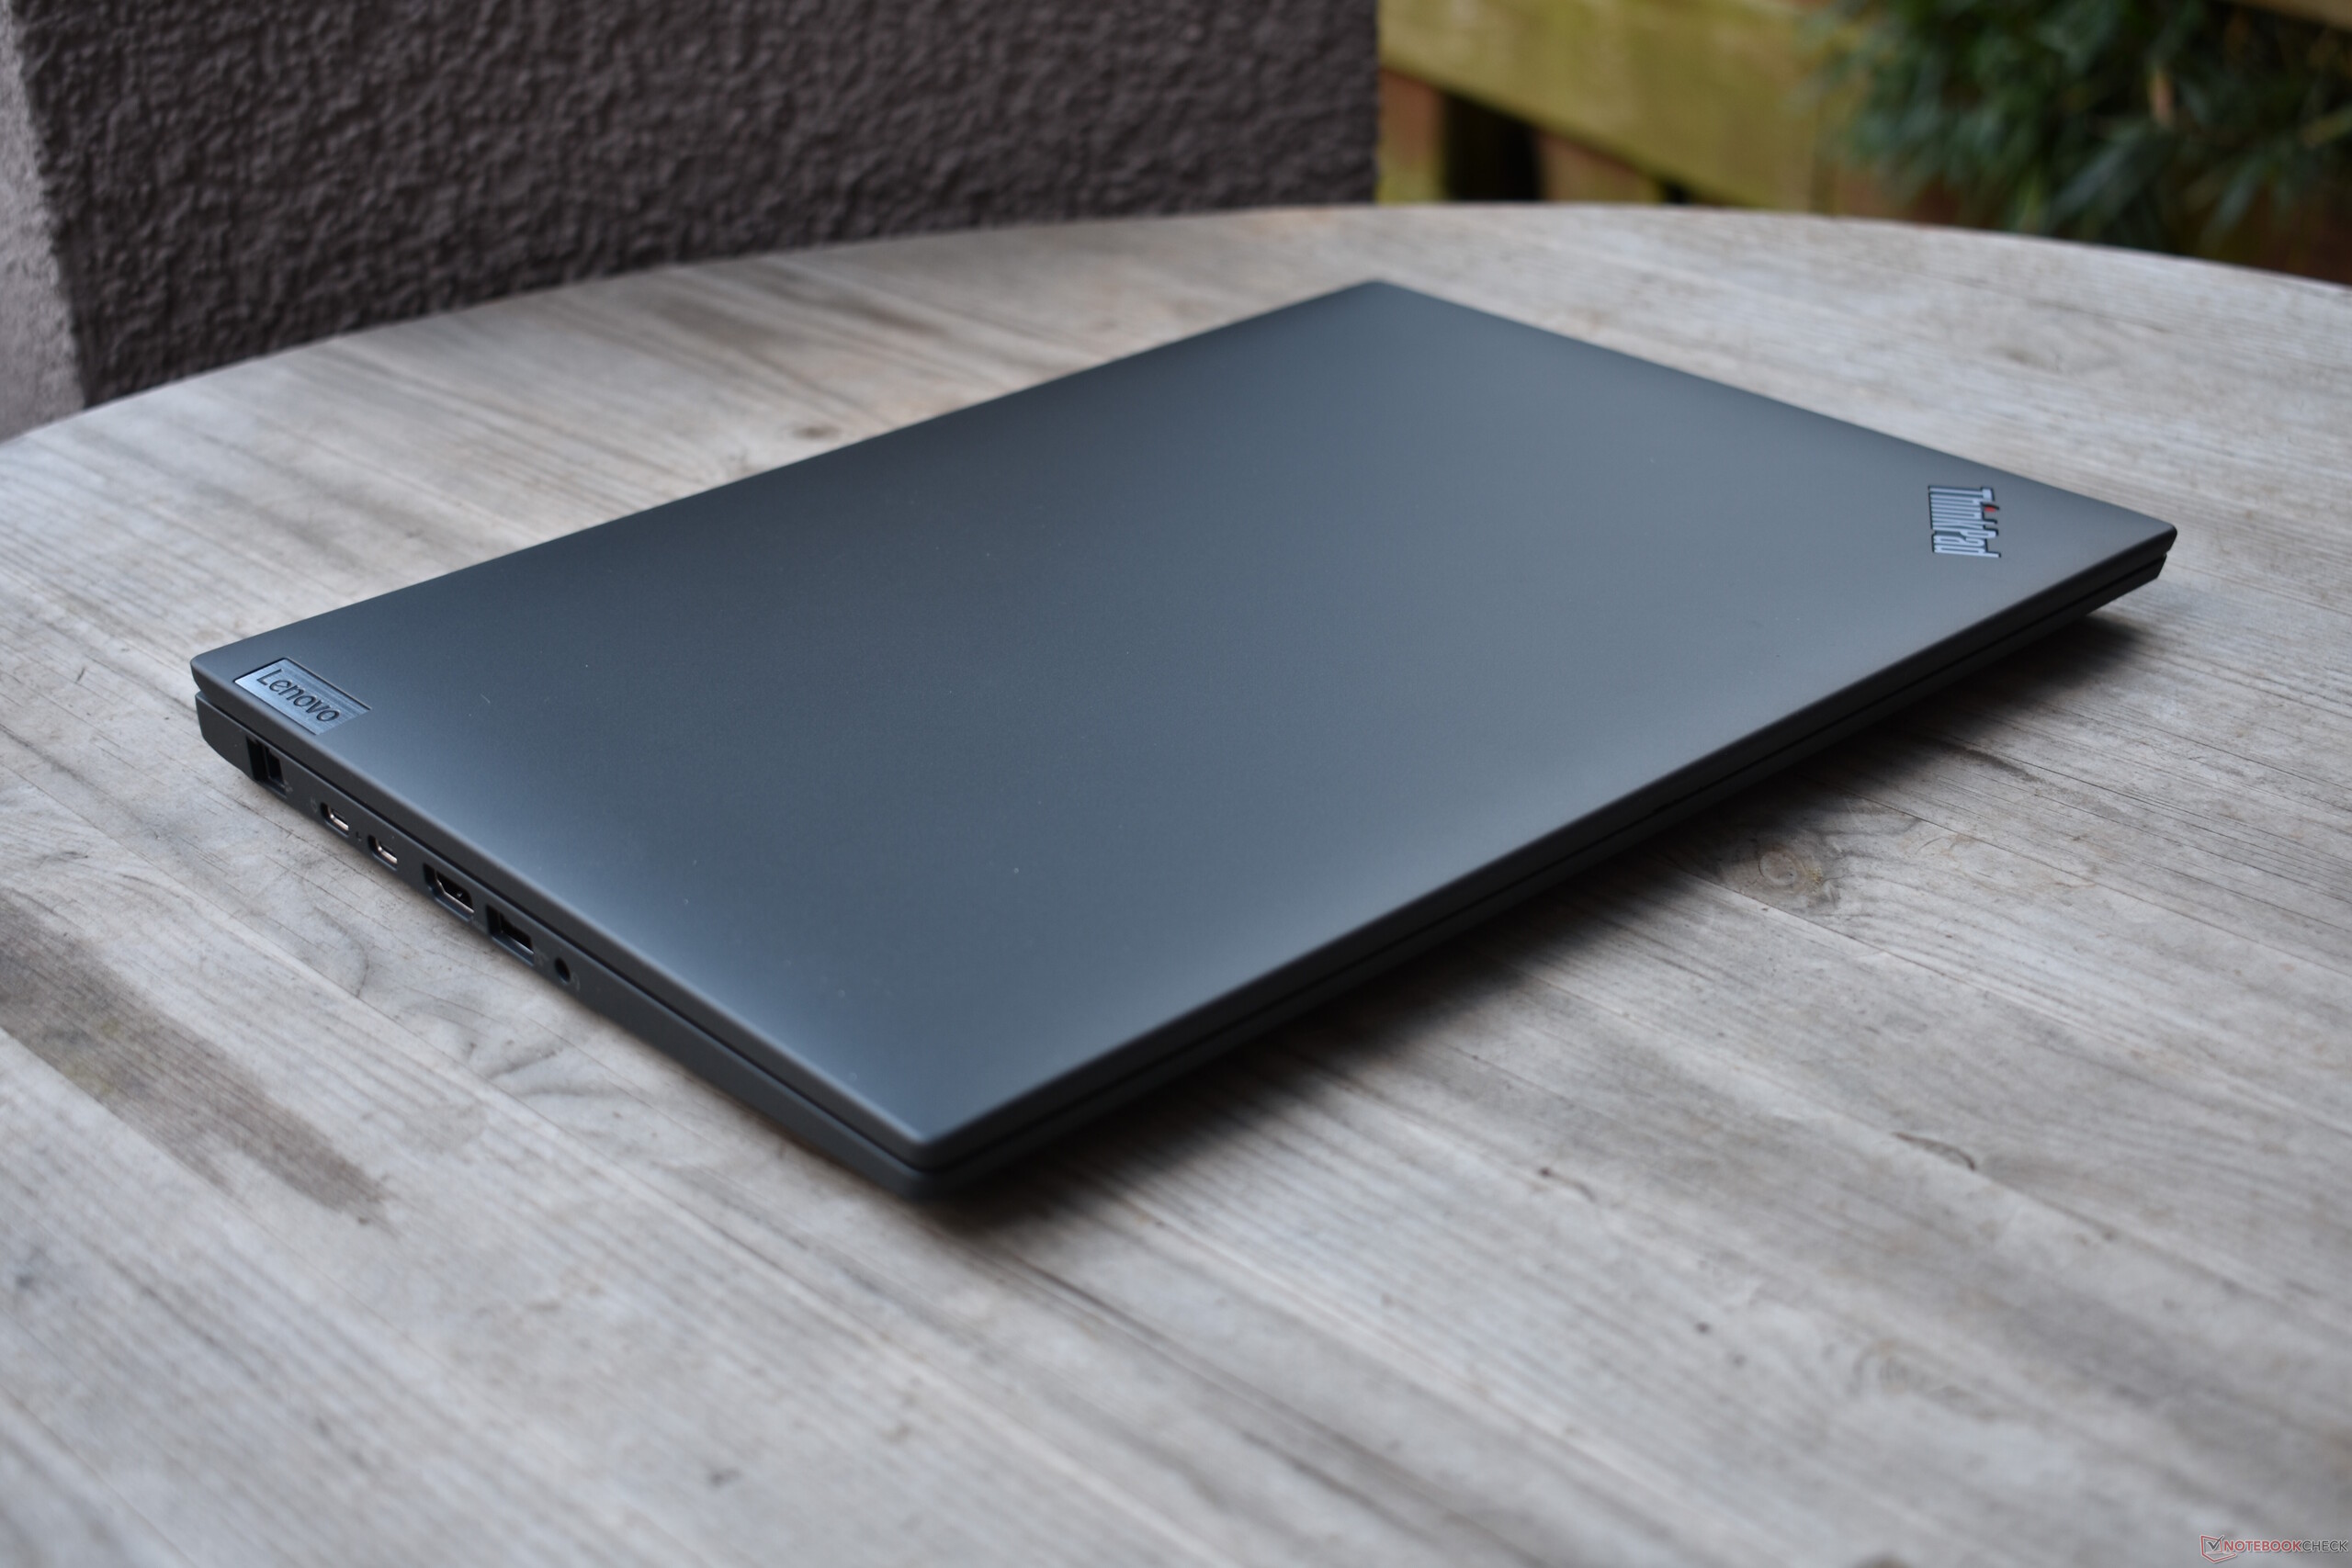
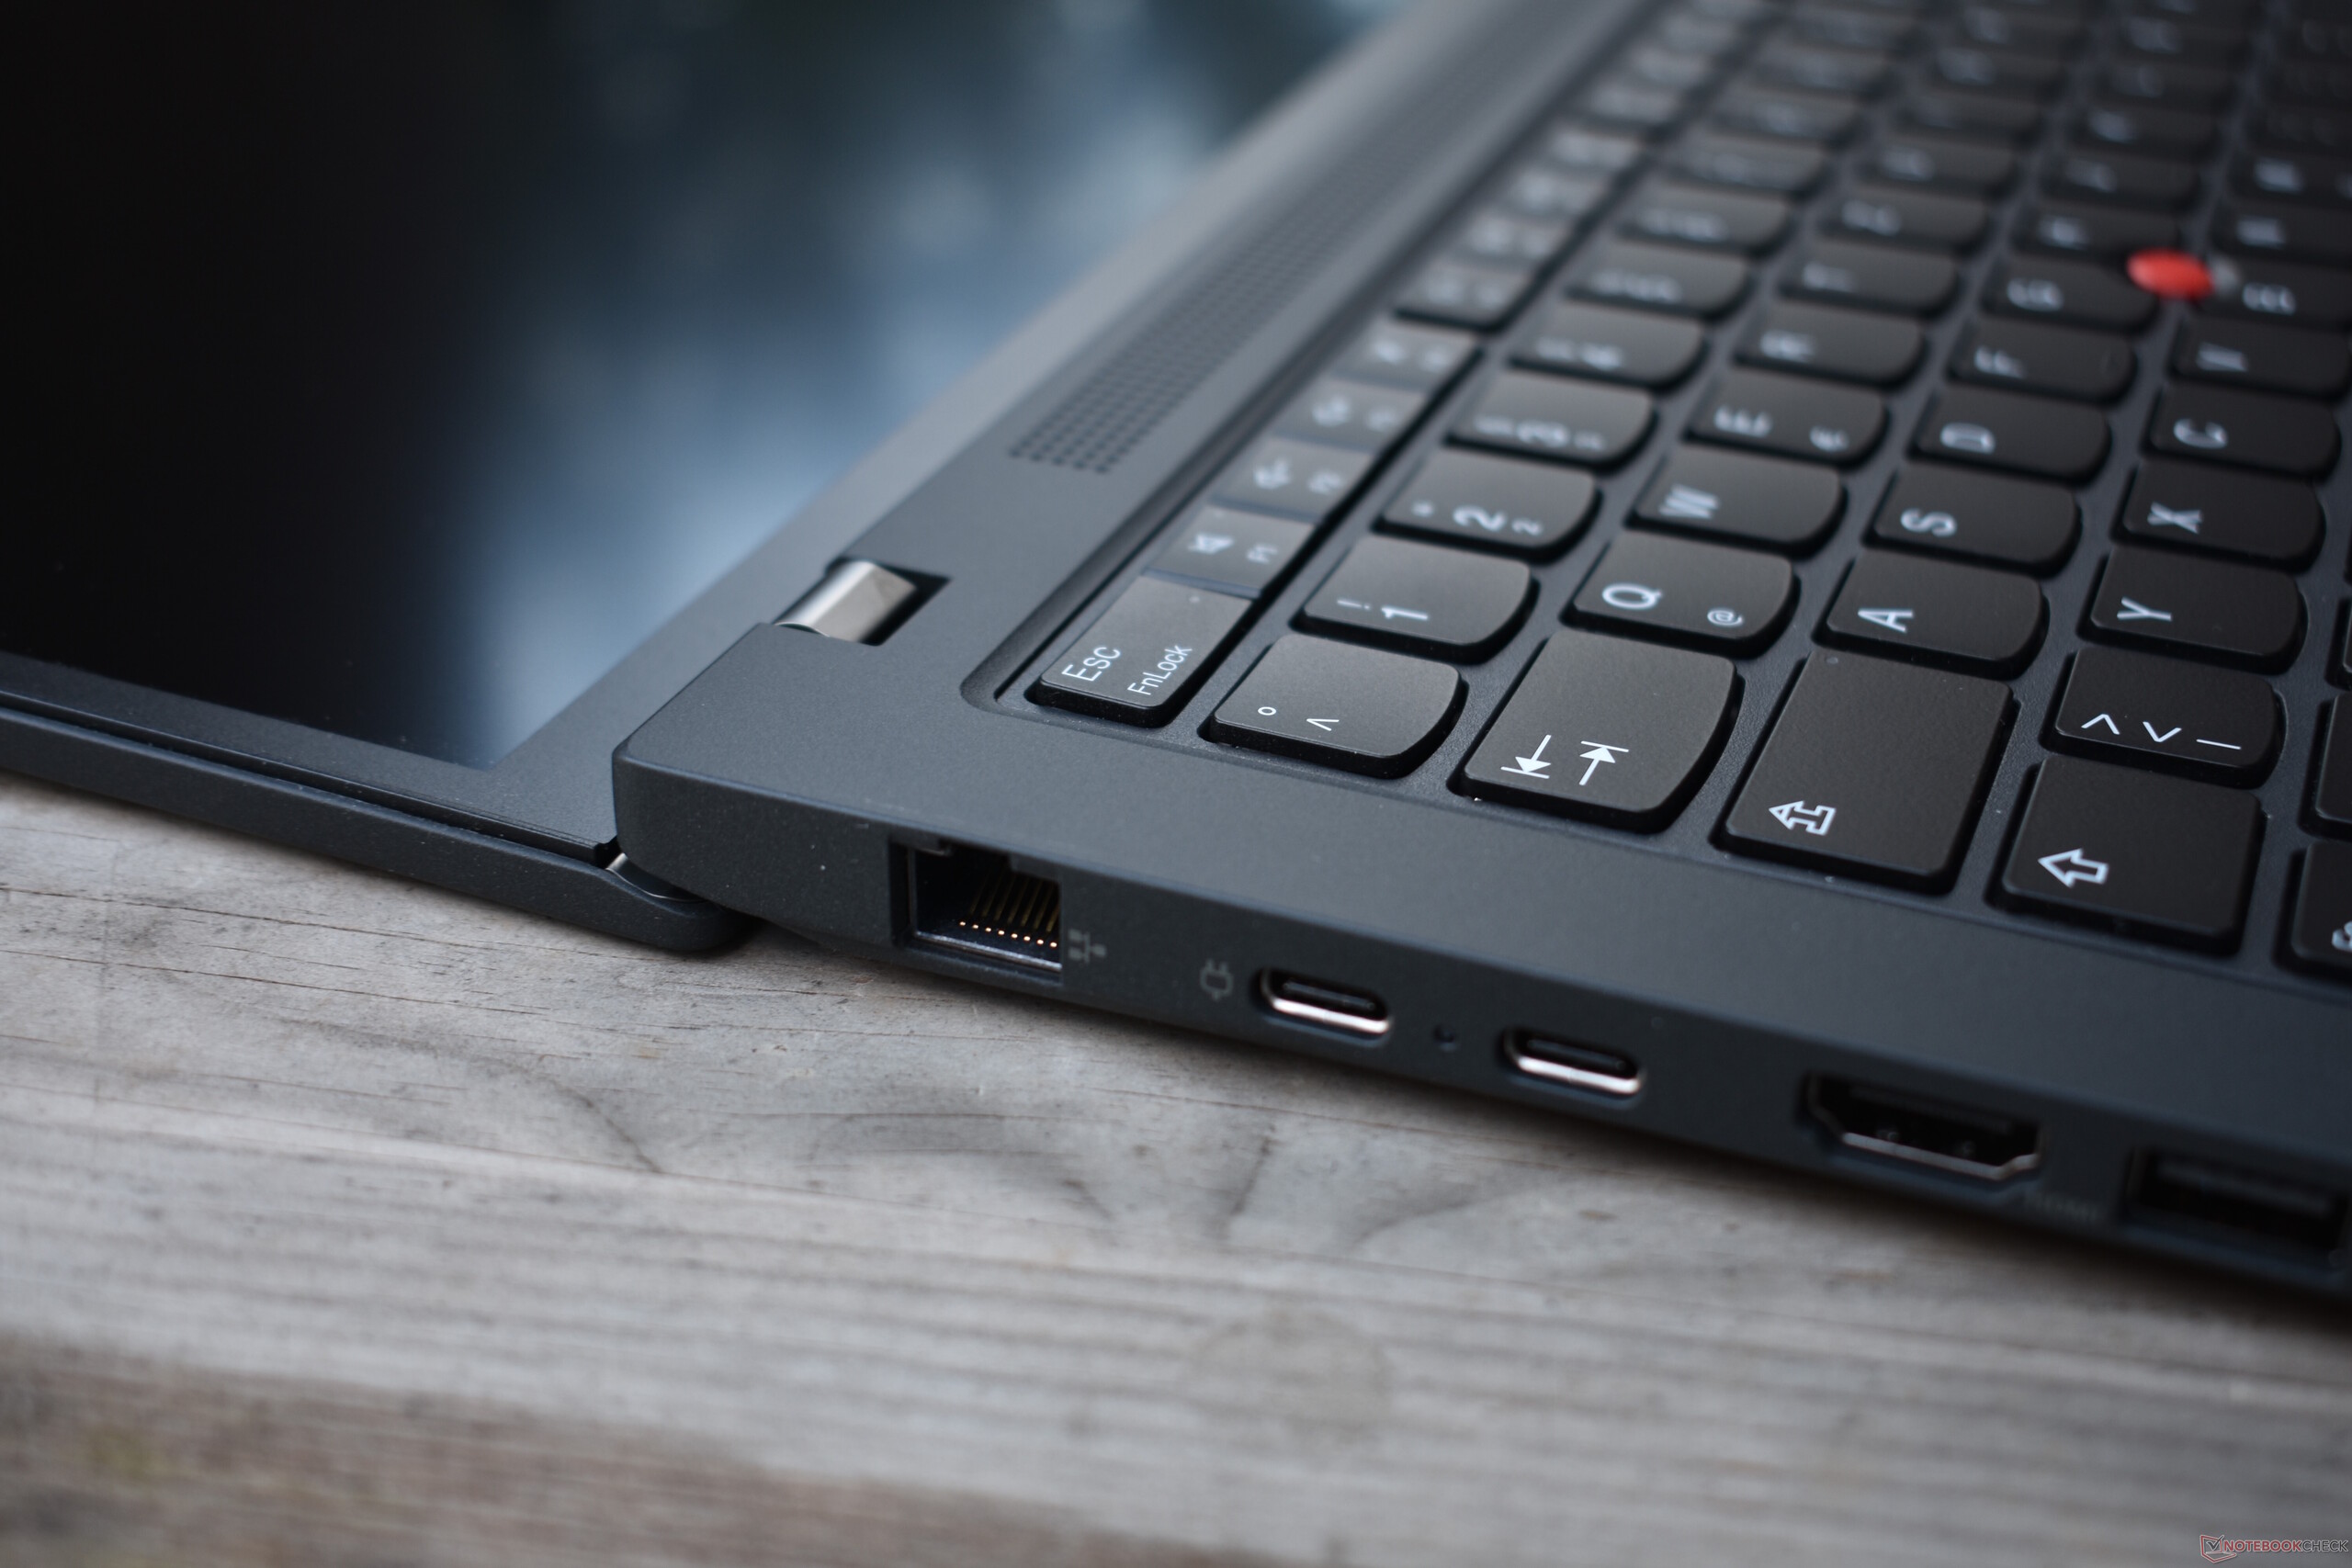
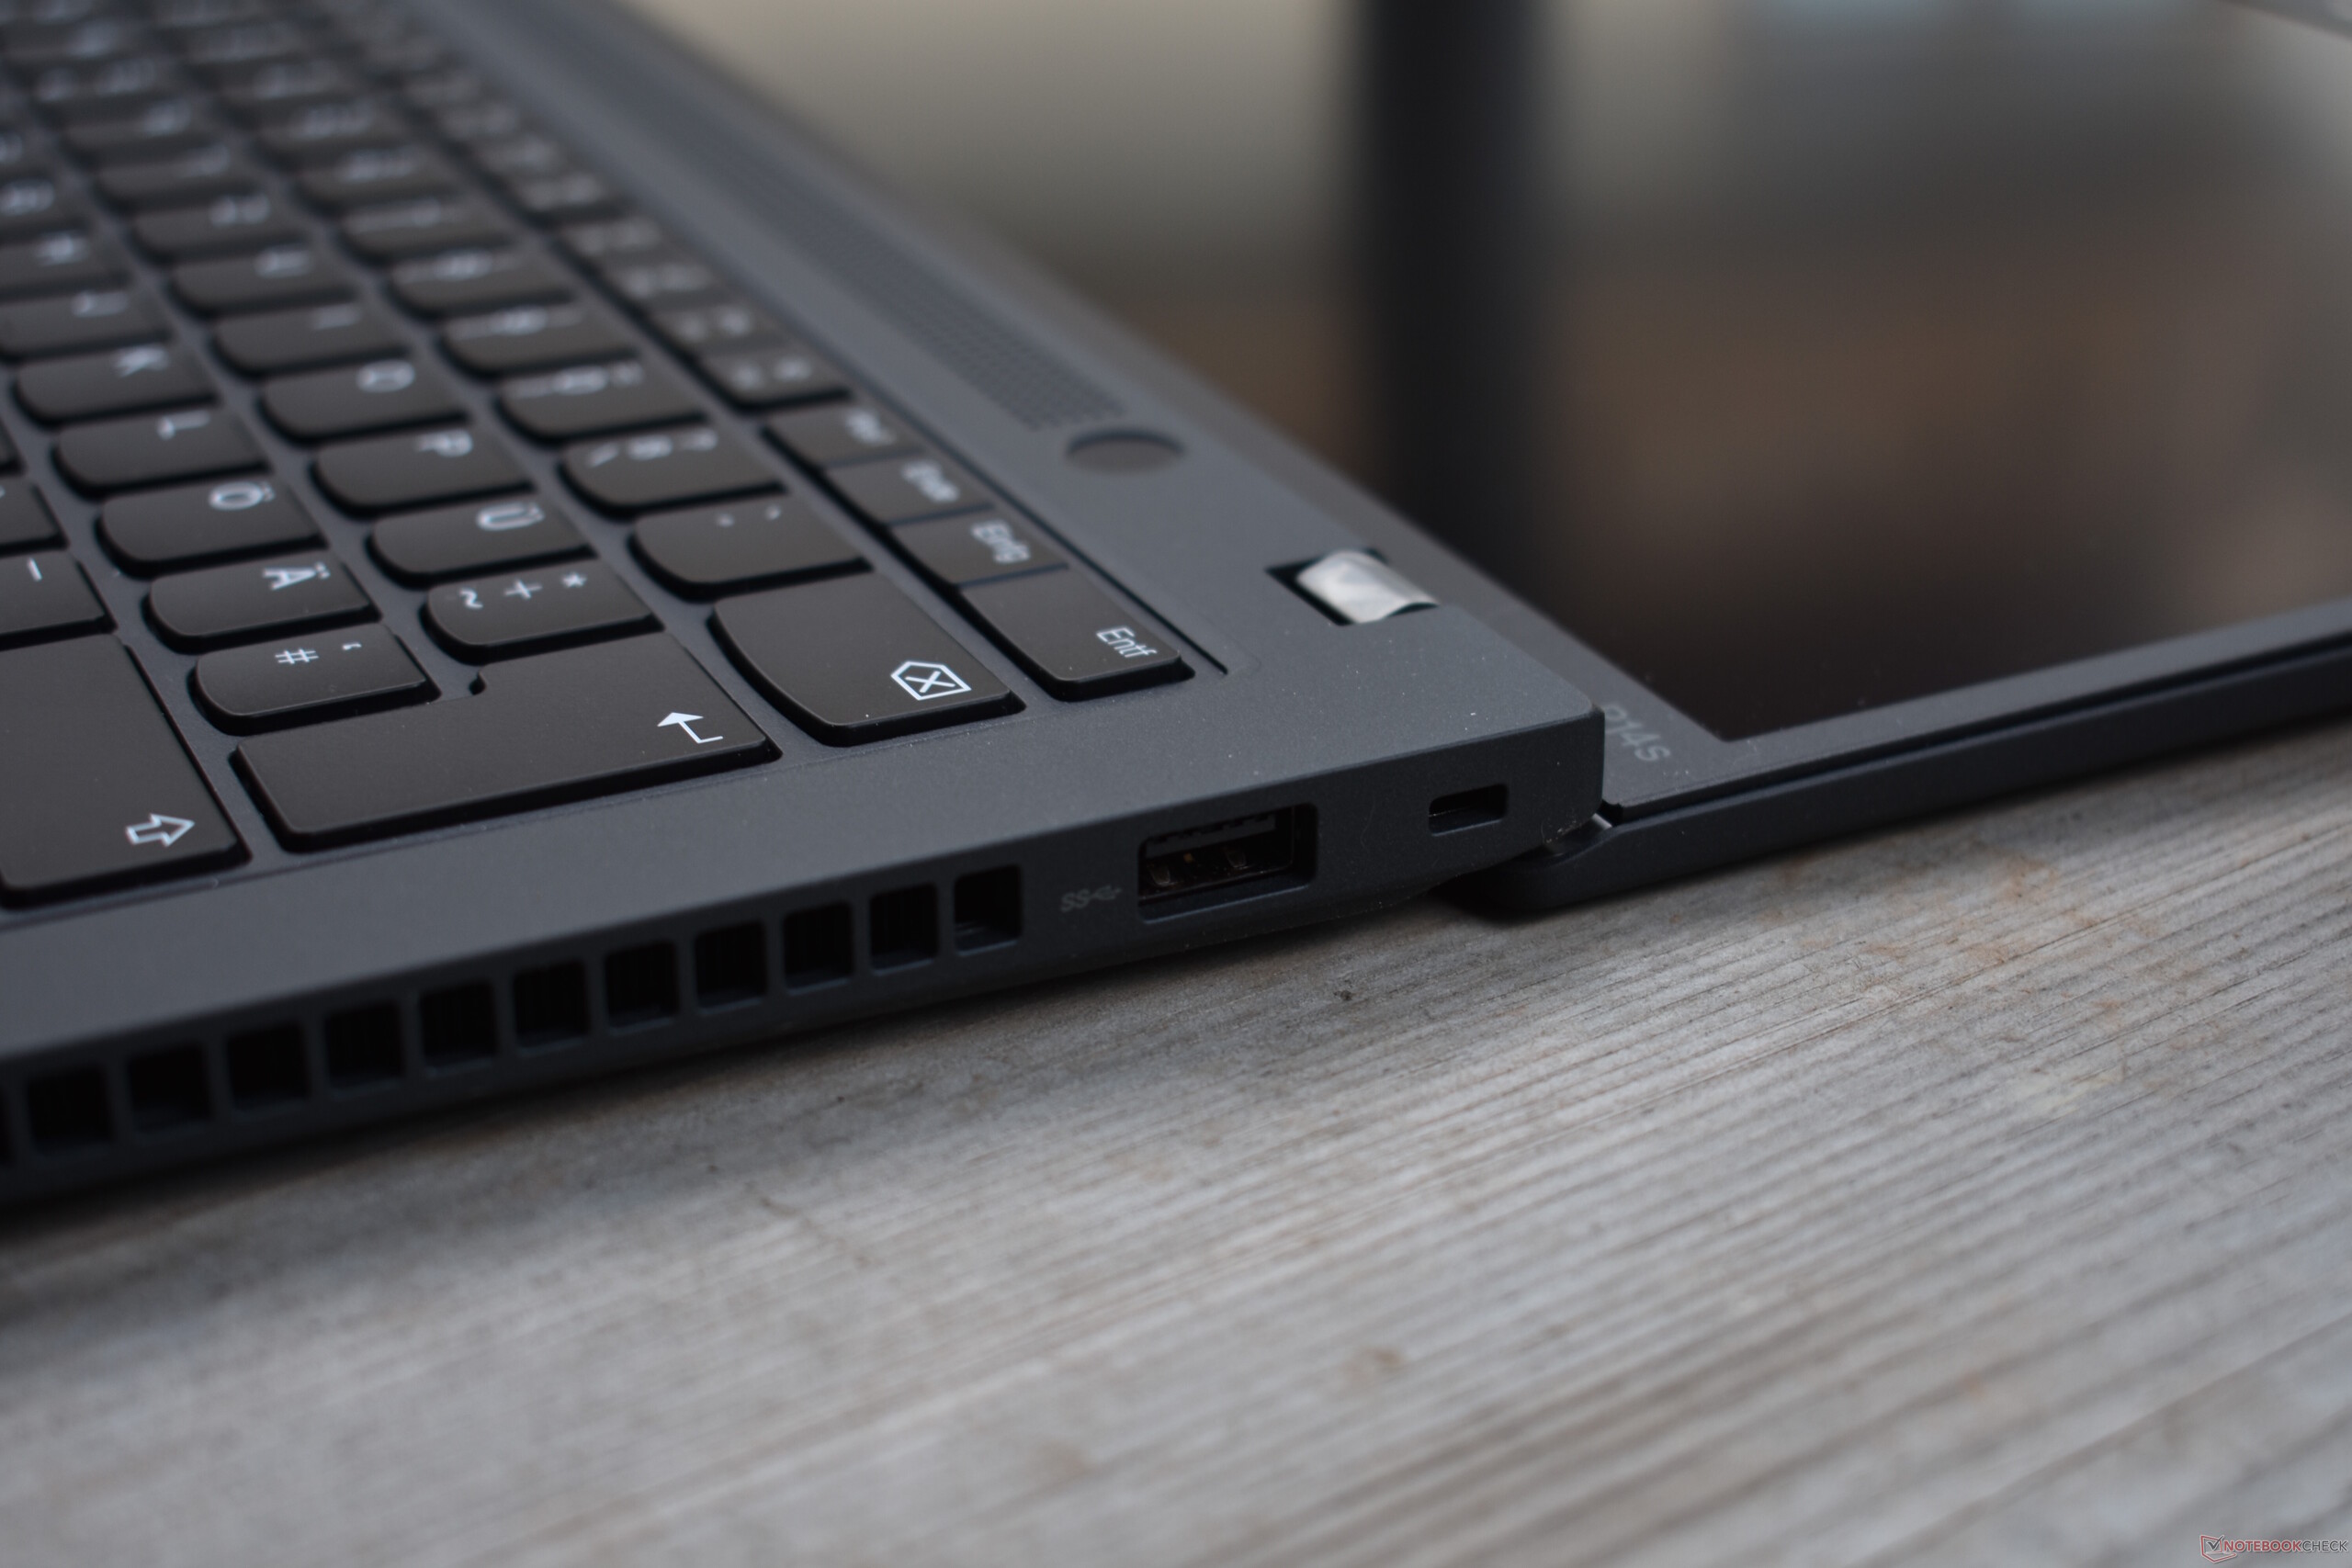
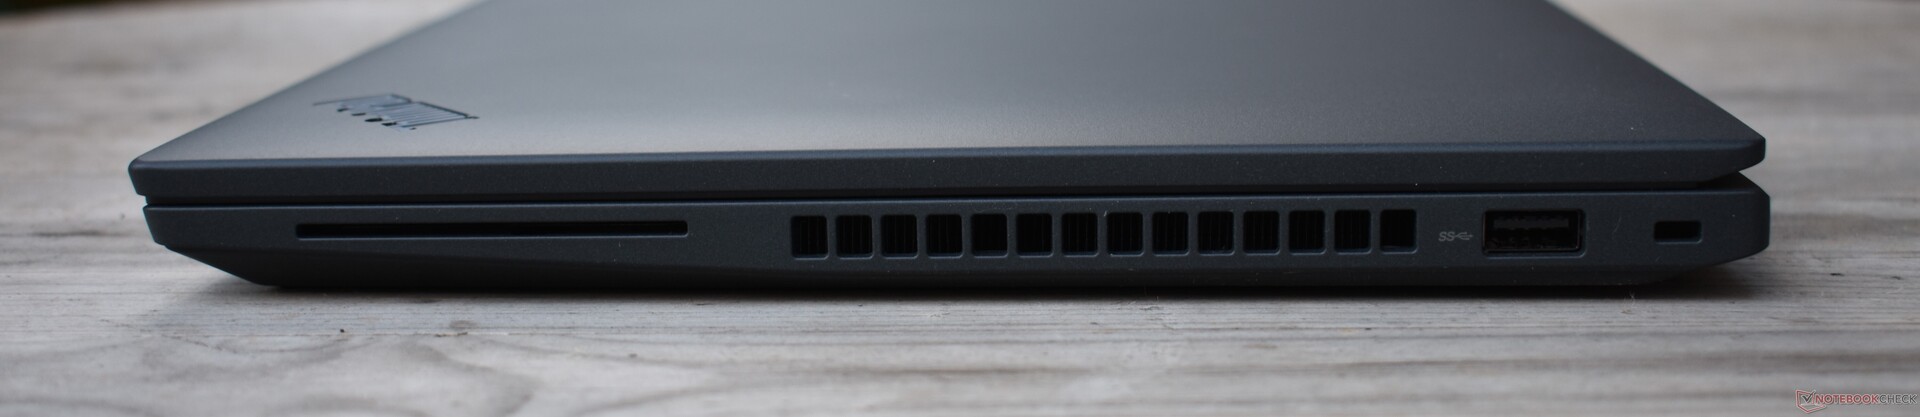
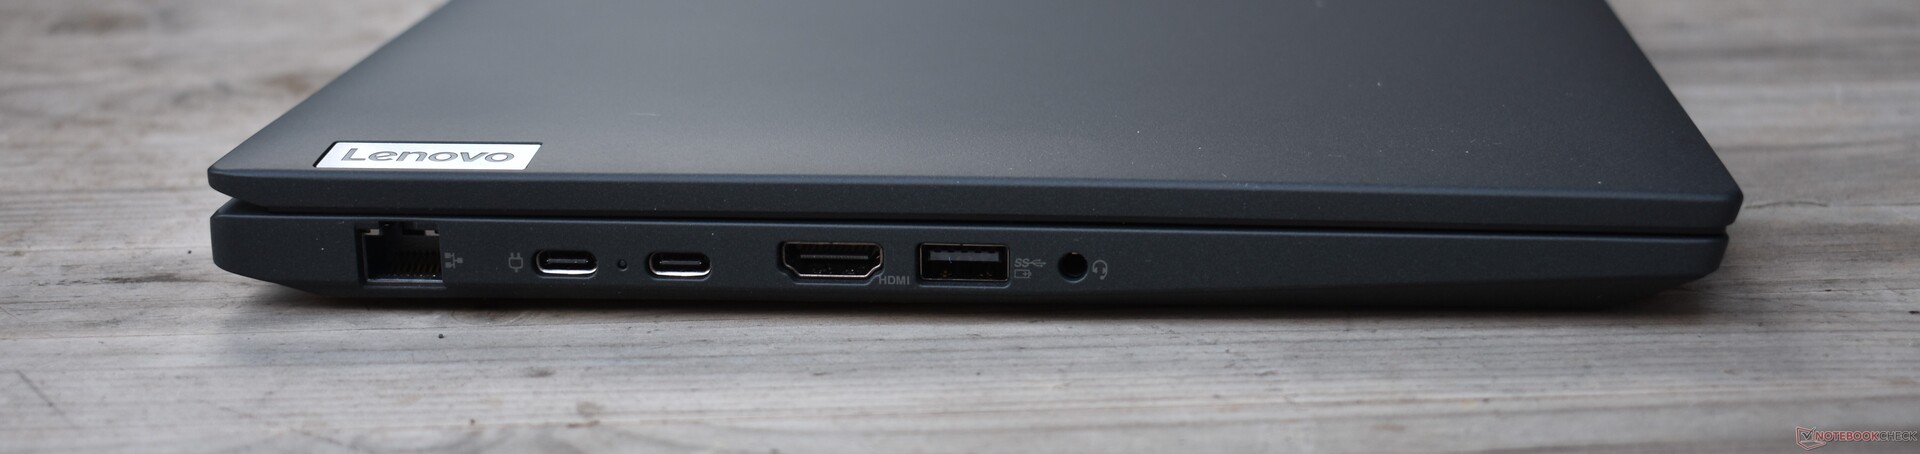
Puertos
Sus amplias opciones de conectividad son idénticas a las del ThinkPad T14 Gen 3. Su falta de USB4 y, en consecuencia, Thunderbolt, es decepcionante. A cambio, el Lenovo ThinkPad P14s G3 trae Ethernet RJ45 - las estaciones de trabajo de 14" de Dell y HP no tienen este puerto. Sin embargo, lo ideal sería incluir una ranura para tarjetas SD o al menos microSD en este tipo de portátiles.
Conectividad
Como todos los ThinkPads AMD actuales, el Lenovo ThinkPad P14s Gen 3 confía en una solución Wi-Fi de Qualcomm. Esto puede lograr altas tasas de transferencia, pero la conexión no fue muy estable al enviar datos.


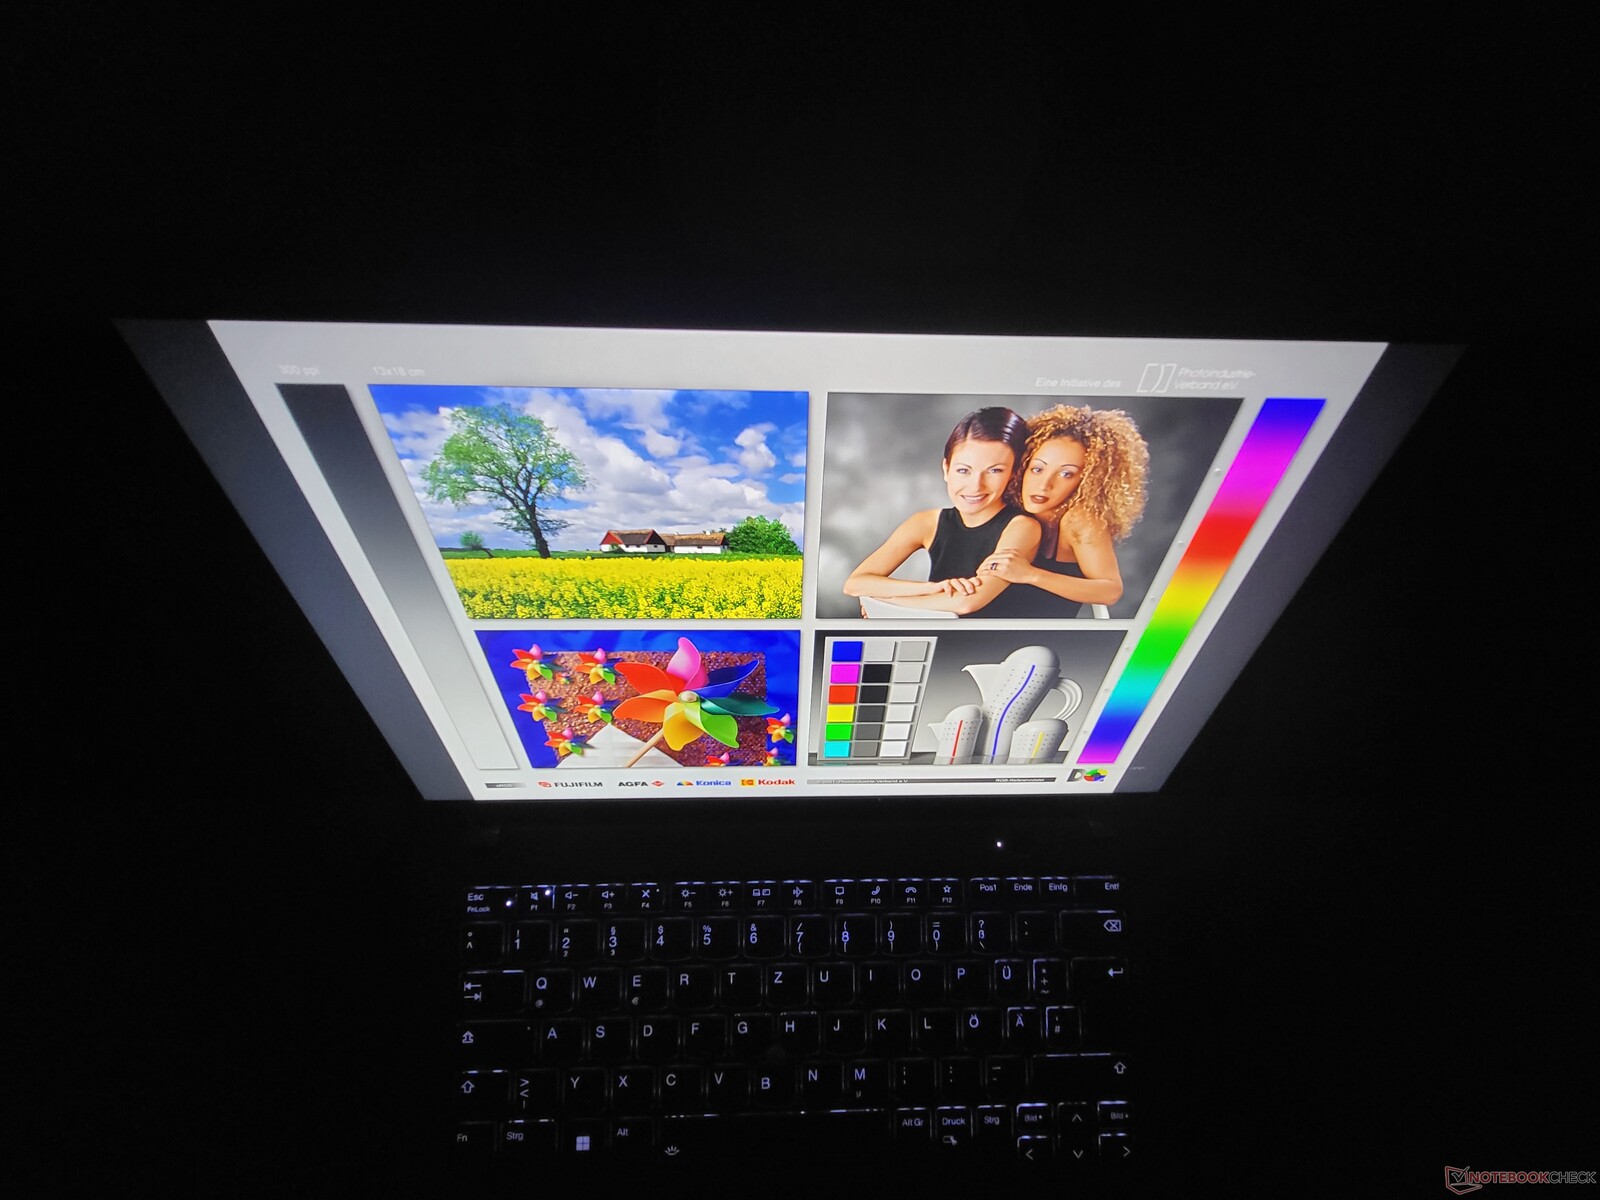
Pantalla: El panel mate de bajo consumo del ThinkPad
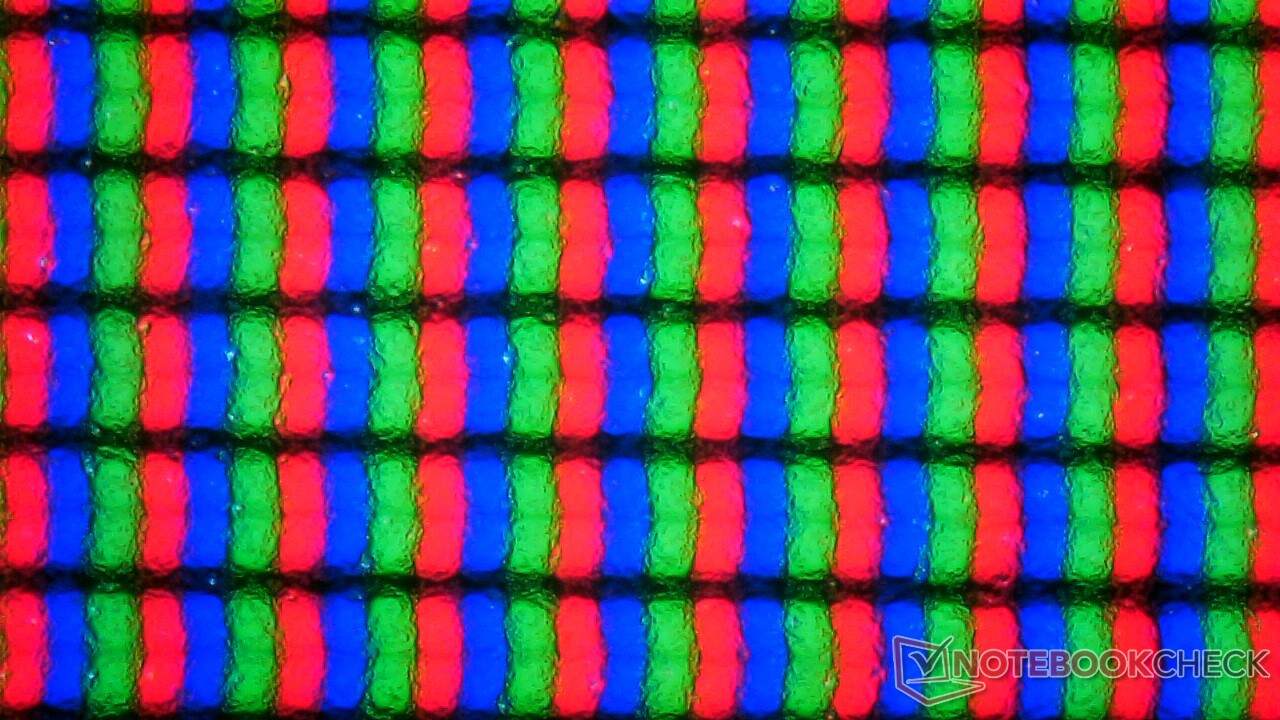
Como suele ocurrir con los portátiles ThinkPad de Lenovo y los portátiles de empresa en general, el ThinkPad P14s Gen 3 también tiene varias opciones de pantalla. Las características que todas estas pantallas tienen en común: Su diagonal de 14 pulgadas, su formato 16:10 así como su tecnología IPS-LCD:
- WUXGA (1.920 x 1.200), 300 cd/m², 45 % NTSC, antirreflejos
- WUXGA (1.920 x 1.200), 400 cd/m², 100 % sRGB, antirreflejos, bajo consumo
- WUXGA (1.920 x 1.200), 300 cd/m², 45 % NTSC, antirreflejos, On-Cell-Multitouch
- WQUXGA (3.840 x 2.400), 500 cd/m², 100 % DCI-P3, Antirreflejos, On-Cell-Multitouch
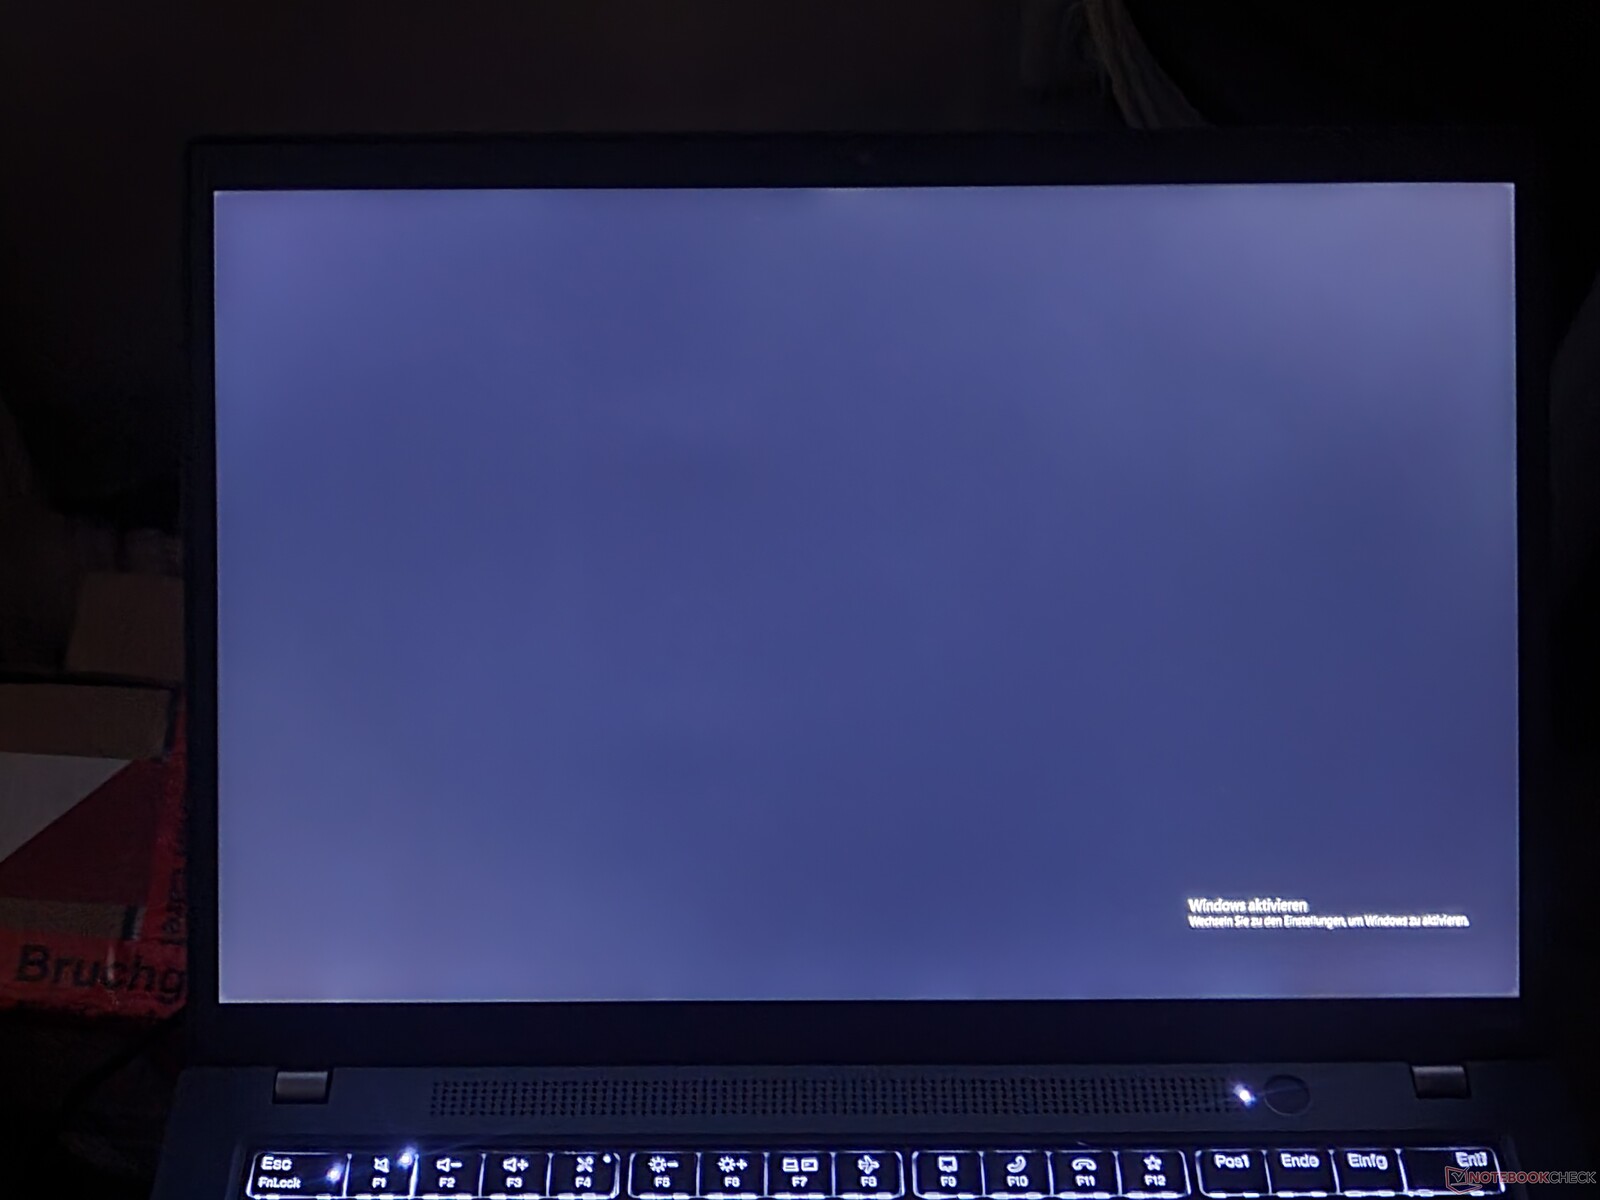
Ya probamos la pantalla de bajo consumo de LG en el ThinkPad T14 Gen 3. Superó el valor de brillo declarado de 400 cd/m² - su brillo medio fue de 422 cd/m². Este no es el único panel que Lenovo comercializa como "pantalla de bajo consumo" - en el ThinkPad T14s Gen 3, por ejemplo, probamos un panel CSOT que ofrecía un brillo ligeramente inferior. Esta "lotería de pantallas" también es el caso del ThinkPad P14s G3.
| |||||||||||||||||||||||||
iluminación: 85 %
Brillo con batería: 448 cd/m²
Contraste: 1948:1 (Negro: 0.23 cd/m²)
ΔE ColorChecker Calman: 2.5 | ∀{0.5-29.43 Ø4.71}
calibrated: 1.3
ΔE Greyscale Calman: 2.9 | ∀{0.09-98 Ø4.96}
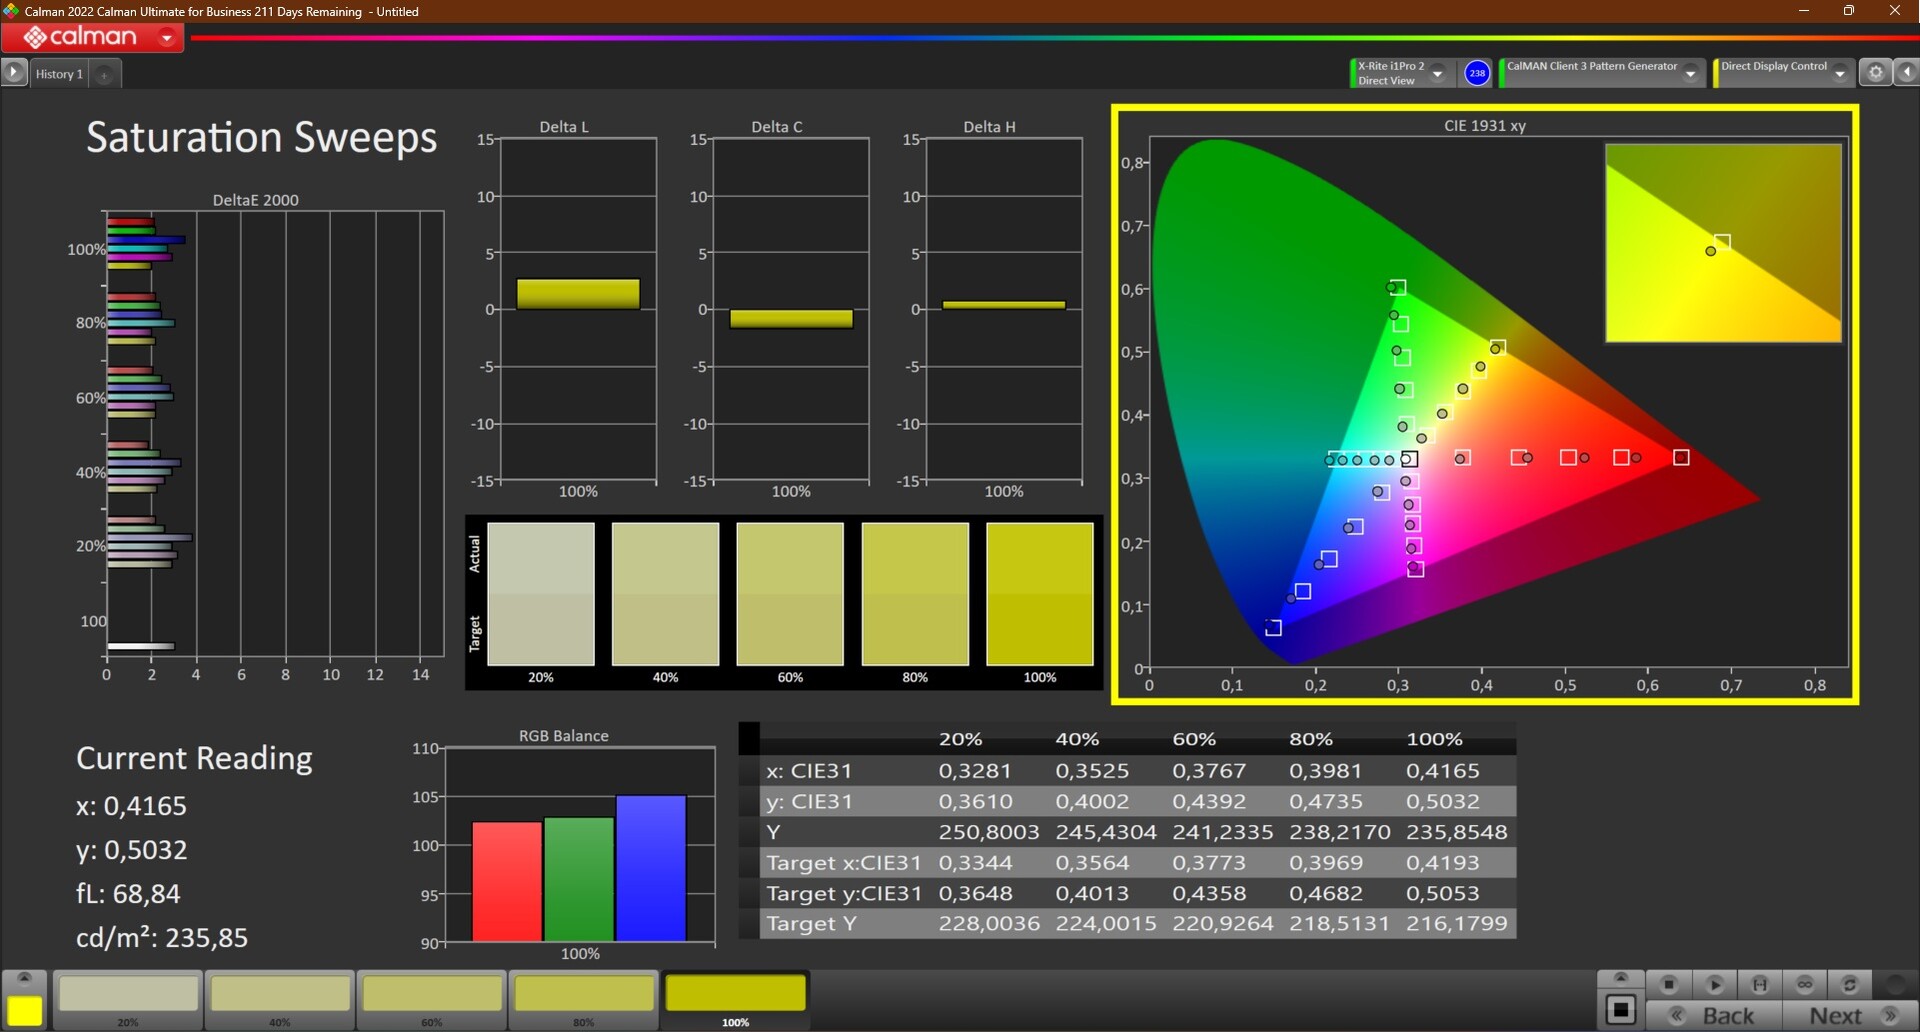
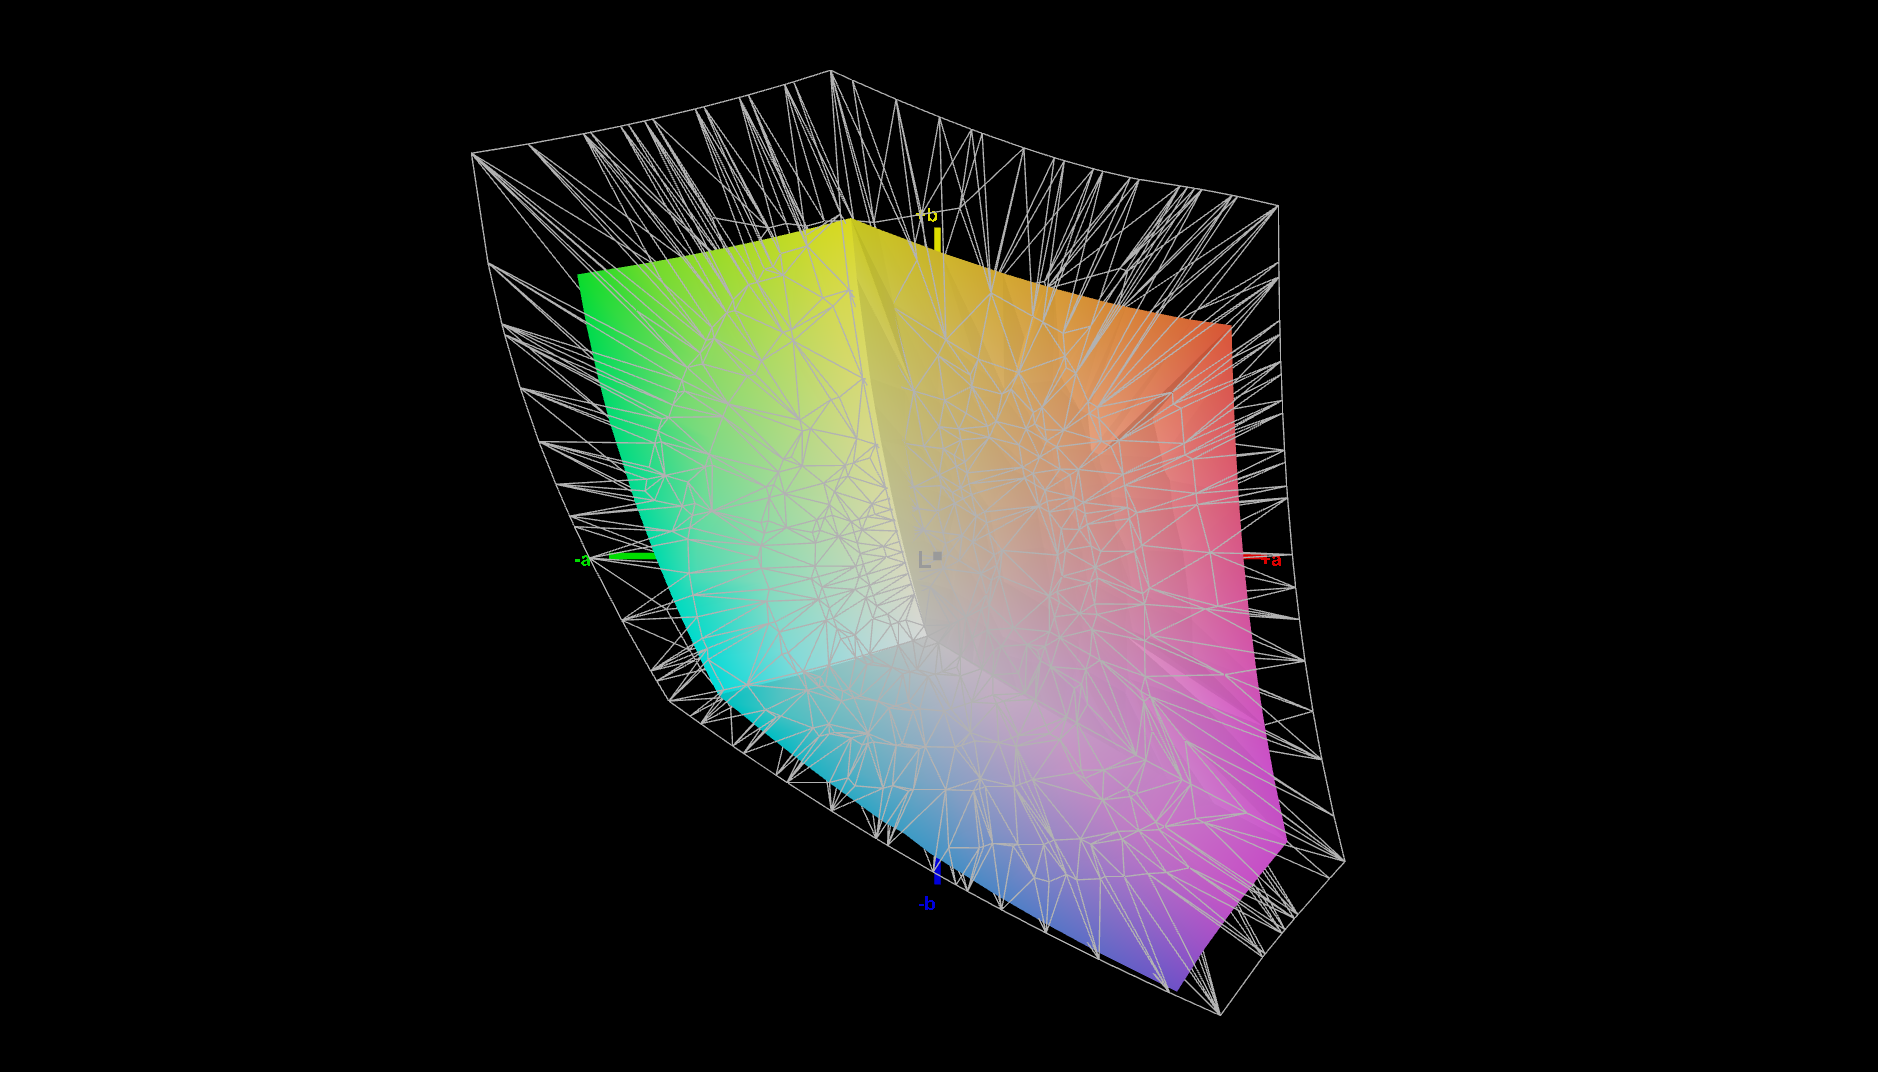
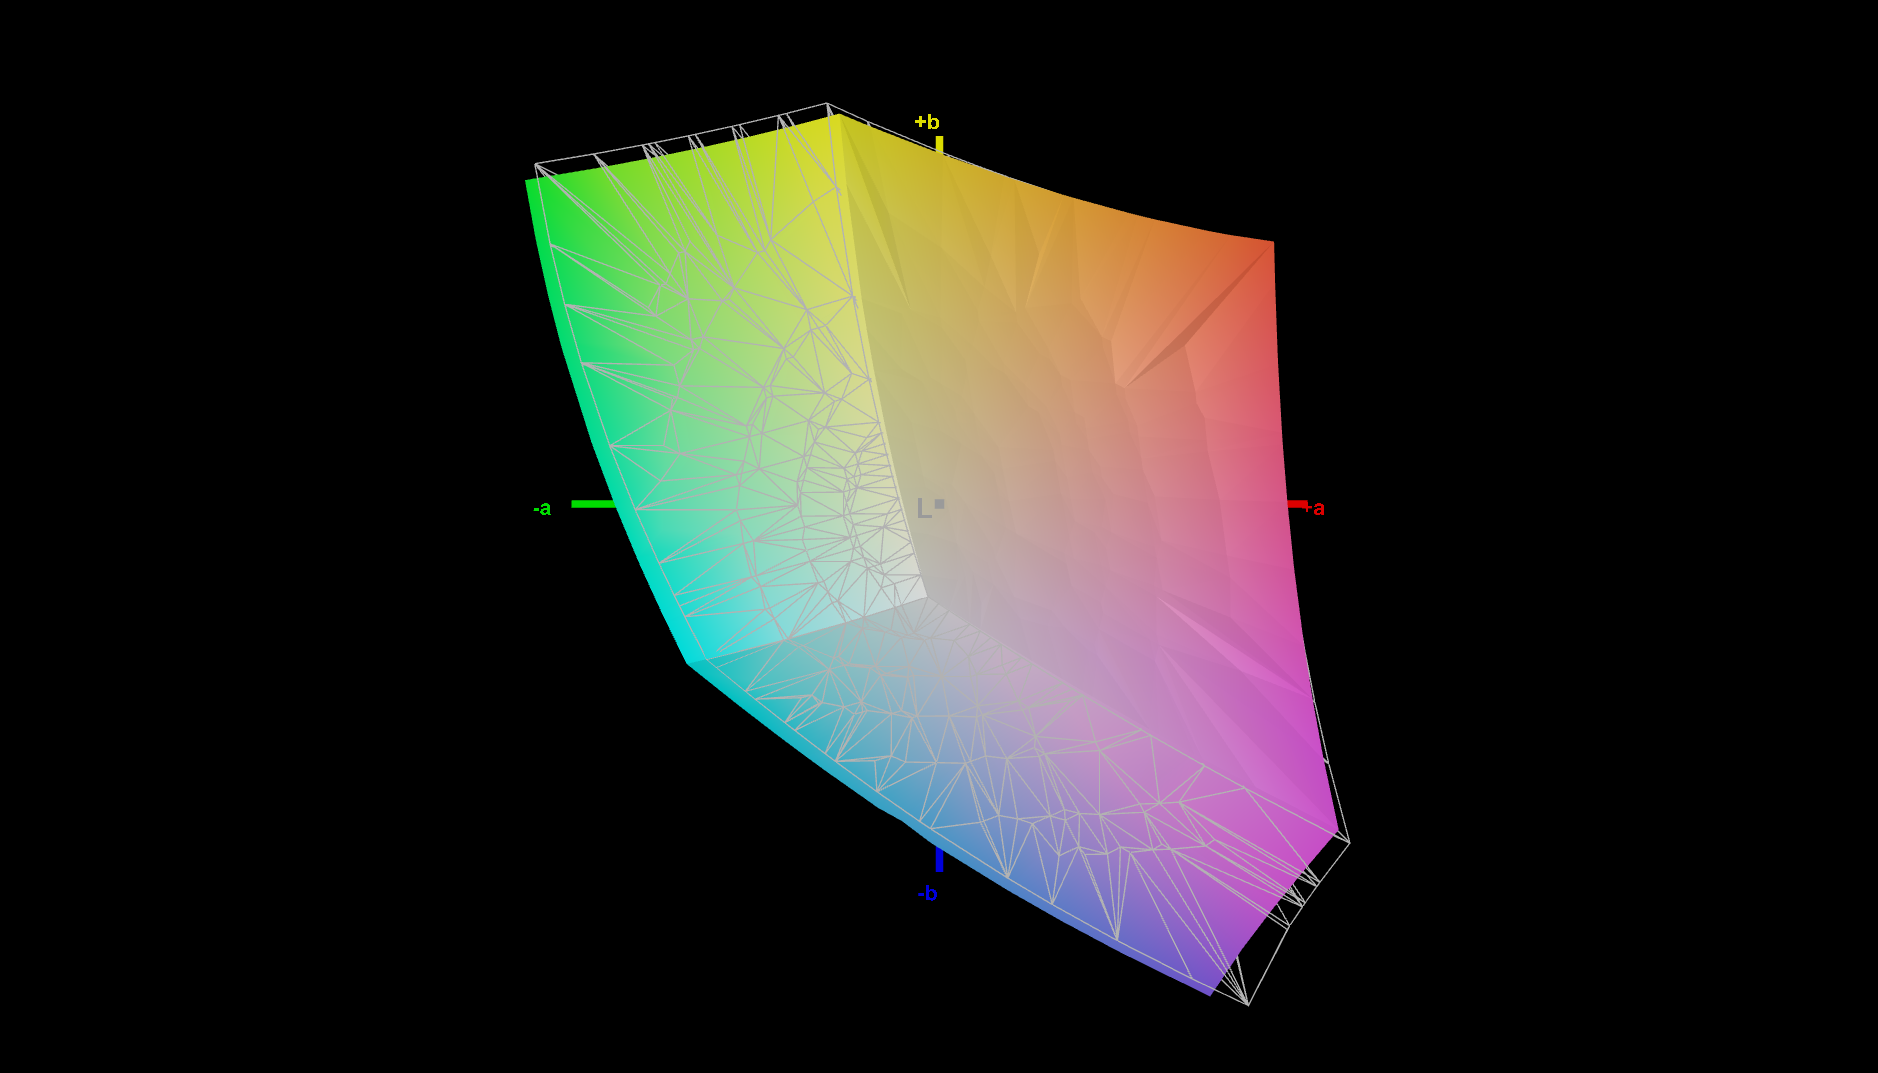
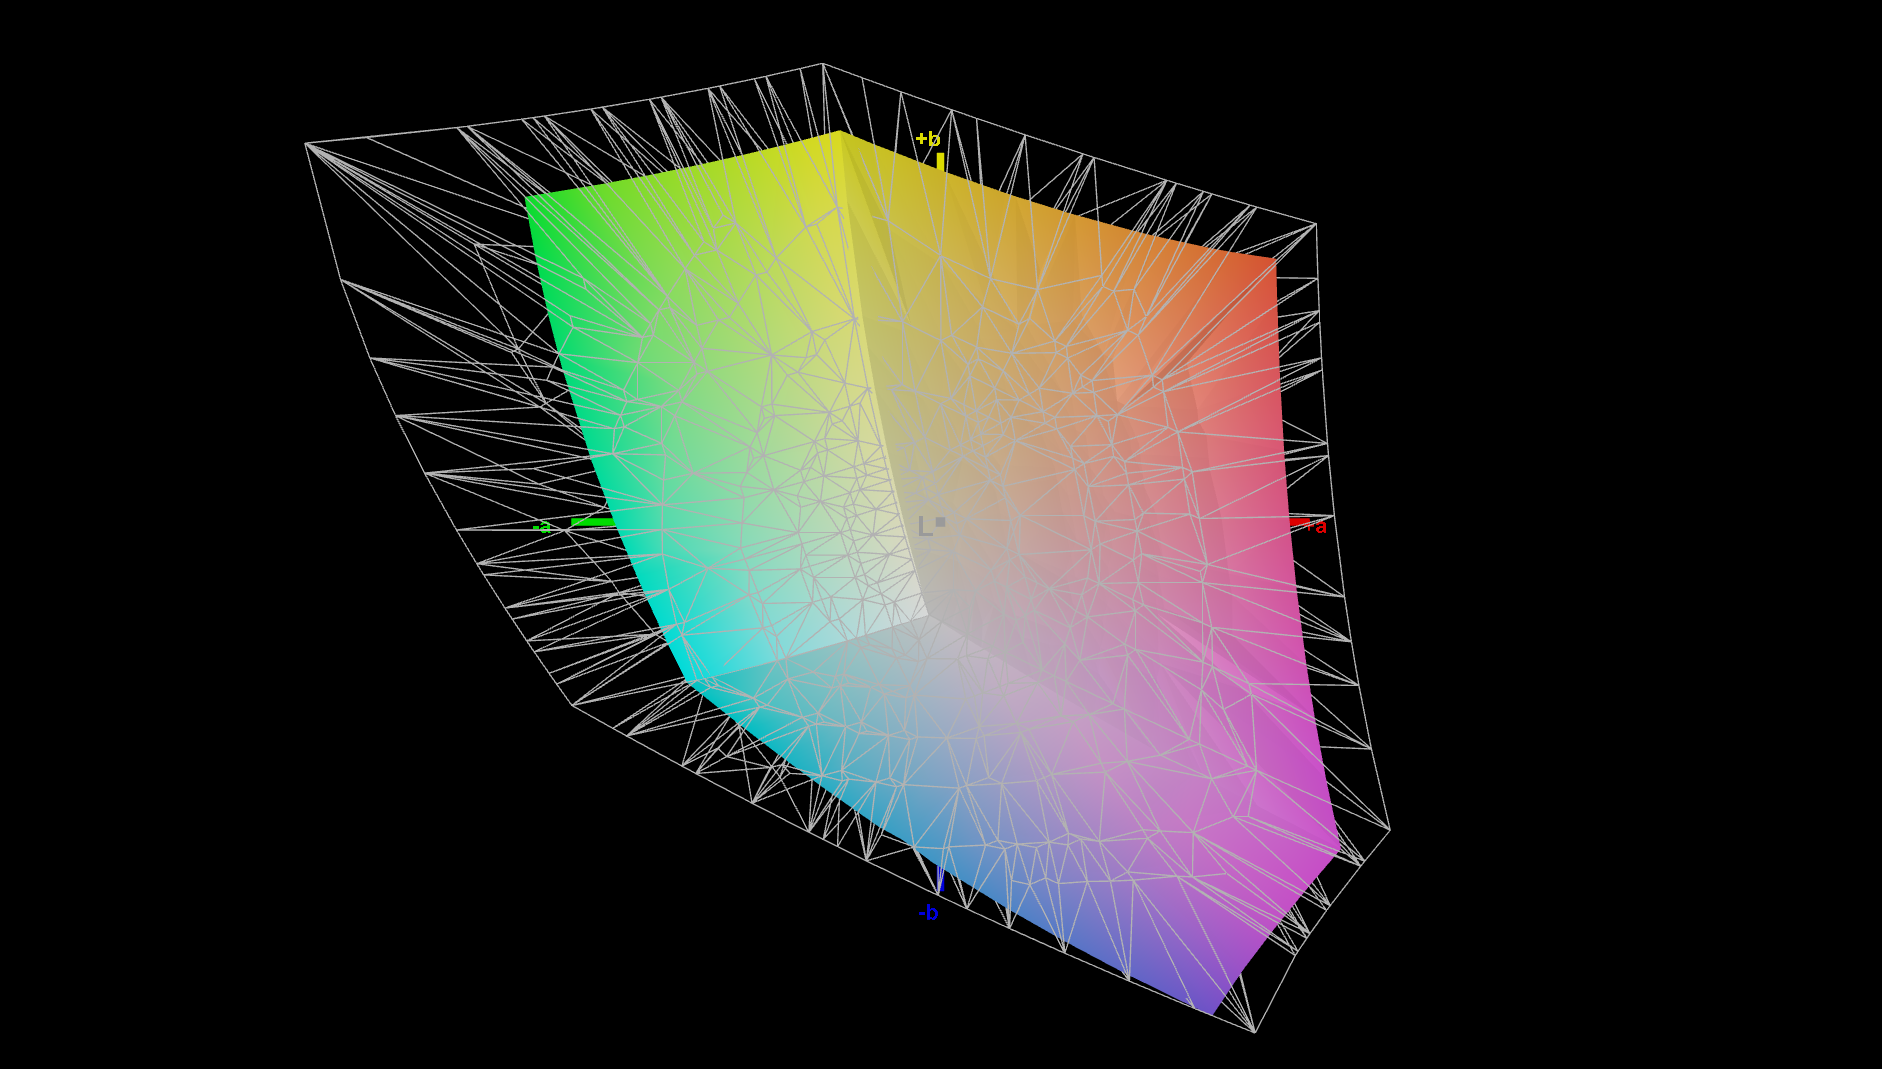
68.2% AdobeRGB 1998 (Argyll 3D)
94.3% sRGB (Argyll 3D)
65.9% Display P3 (Argyll 3D)
Gamma: 2.03
CCT: 6840 K
| Lenovo ThinkPad P14s G3 AMD 21J6S05000 LP140WU1-SPB2, IPS LED, 1920x1200, 14" | Lenovo ThinkPad P14s Gen2-20VX000GGE B140HAN05.7, IPS, 1920x1080, 14" | Lenovo ThinkPad T14 G3-21CF004NGE LP140WU1-SPB2, IPS, 1920x1200, 14" | Dell Precision 5000 5470 AU Optronics B140QAN, IPS, 2560x1600, 14" | HP ZBook Firefly 14 G9-6B8A2EA CMN1435, IPS, 1920x1200, 14" | Lenovo ThinkPad T14s G3 21CQ002LGE MNE007JA1-1, LTPS IPS LED, 1920x1200, 14" | |
|---|---|---|---|---|---|---|
| Display | -0% | 4% | 14% | 5% | 5% | |
| Display P3 Coverage (%) | 65.9 | 65.4 -1% | 69.2 5% | 79.3 20% | 69.6 6% | 69.4 5% |
| sRGB Coverage (%) | 94.3 | 96.6 2% | 97.4 3% | 100 6% | 99.9 6% | 99.8 6% |
| AdobeRGB 1998 Coverage (%) | 68.2 | 66.5 -2% | 71.5 5% | 78.7 15% | 71.1 4% | 71.4 5% |
| Response Times | -54% | -1% | -43% | -37% | -1% | |
| Response Time Grey 50% / Grey 80% * (ms) | 33.5 ? | 58.8 ? -76% | 41.4 ? -24% | 52.4 ? -56% | 56.3 ? -68% | 36.3 ? -8% |
| Response Time Black / White * (ms) | 24.9 ? | 32.8 ? -32% | 19.2 ? 23% | 32.4 ? -30% | 26.2 ? -5% | 23.1 ? 7% |
| PWM Frequency (Hz) | ||||||
| Screen | -24% | 1% | -2% | -15% | 13% | |
| Brightness middle (cd/m²) | 448 | 350 -22% | 451 1% | 537 20% | 432 -4% | 396 -12% |
| Brightness (cd/m²) | 422 | 348 -18% | 435 3% | 518 23% | 407 -4% | 379 -10% |
| Brightness Distribution (%) | 85 | 94 11% | 94 11% | 94 11% | 91 7% | 92 8% |
| Black Level * (cd/m²) | 0.23 | 0.14 39% | 0.21 9% | 0.33 -43% | 0.28 -22% | 0.26 -13% |
| Contrast (:1) | 1948 | 2500 28% | 2148 10% | 1627 -16% | 1543 -21% | 1523 -22% |
| Colorchecker dE 2000 * | 2.5 | 4.3 -72% | 2.4 4% | 2.97 -19% | 3.1 -24% | 1.3 48% |
| Colorchecker dE 2000 max. * | 3.7 | 6.7 -81% | 4.1 -11% | 5.33 -44% | 5.6 -51% | 2.7 27% |
| Colorchecker dE 2000 calibrated * | 1.3 | 1.5 -15% | 1.3 -0% | 0.88 32% | 0.8 38% | 0.7 46% |
| Greyscale dE 2000 * | 2.9 | 5.3 -83% | 3.3 -14% | 2.4 17% | 4.5 -55% | 1.6 45% |
| Gamma | 2.03 108% | 2.42 91% | 2.13 103% | 2.06 107% | 2 110% | 2.14 103% |
| CCT | 6840 95% | 7631 85% | 6848 95% | 6668 97% | 6528 100% | 6554 99% |
| Color Space (Percent of AdobeRGB 1998) (%) | 61.1 | |||||
| Color Space (Percent of sRGB) (%) | 96.4 | |||||
| Media total (Programa/Opciones) | -26% /
-23% | 1% /
2% | -10% /
-5% | -16% /
-14% | 6% /
9% |
* ... más pequeño es mejor
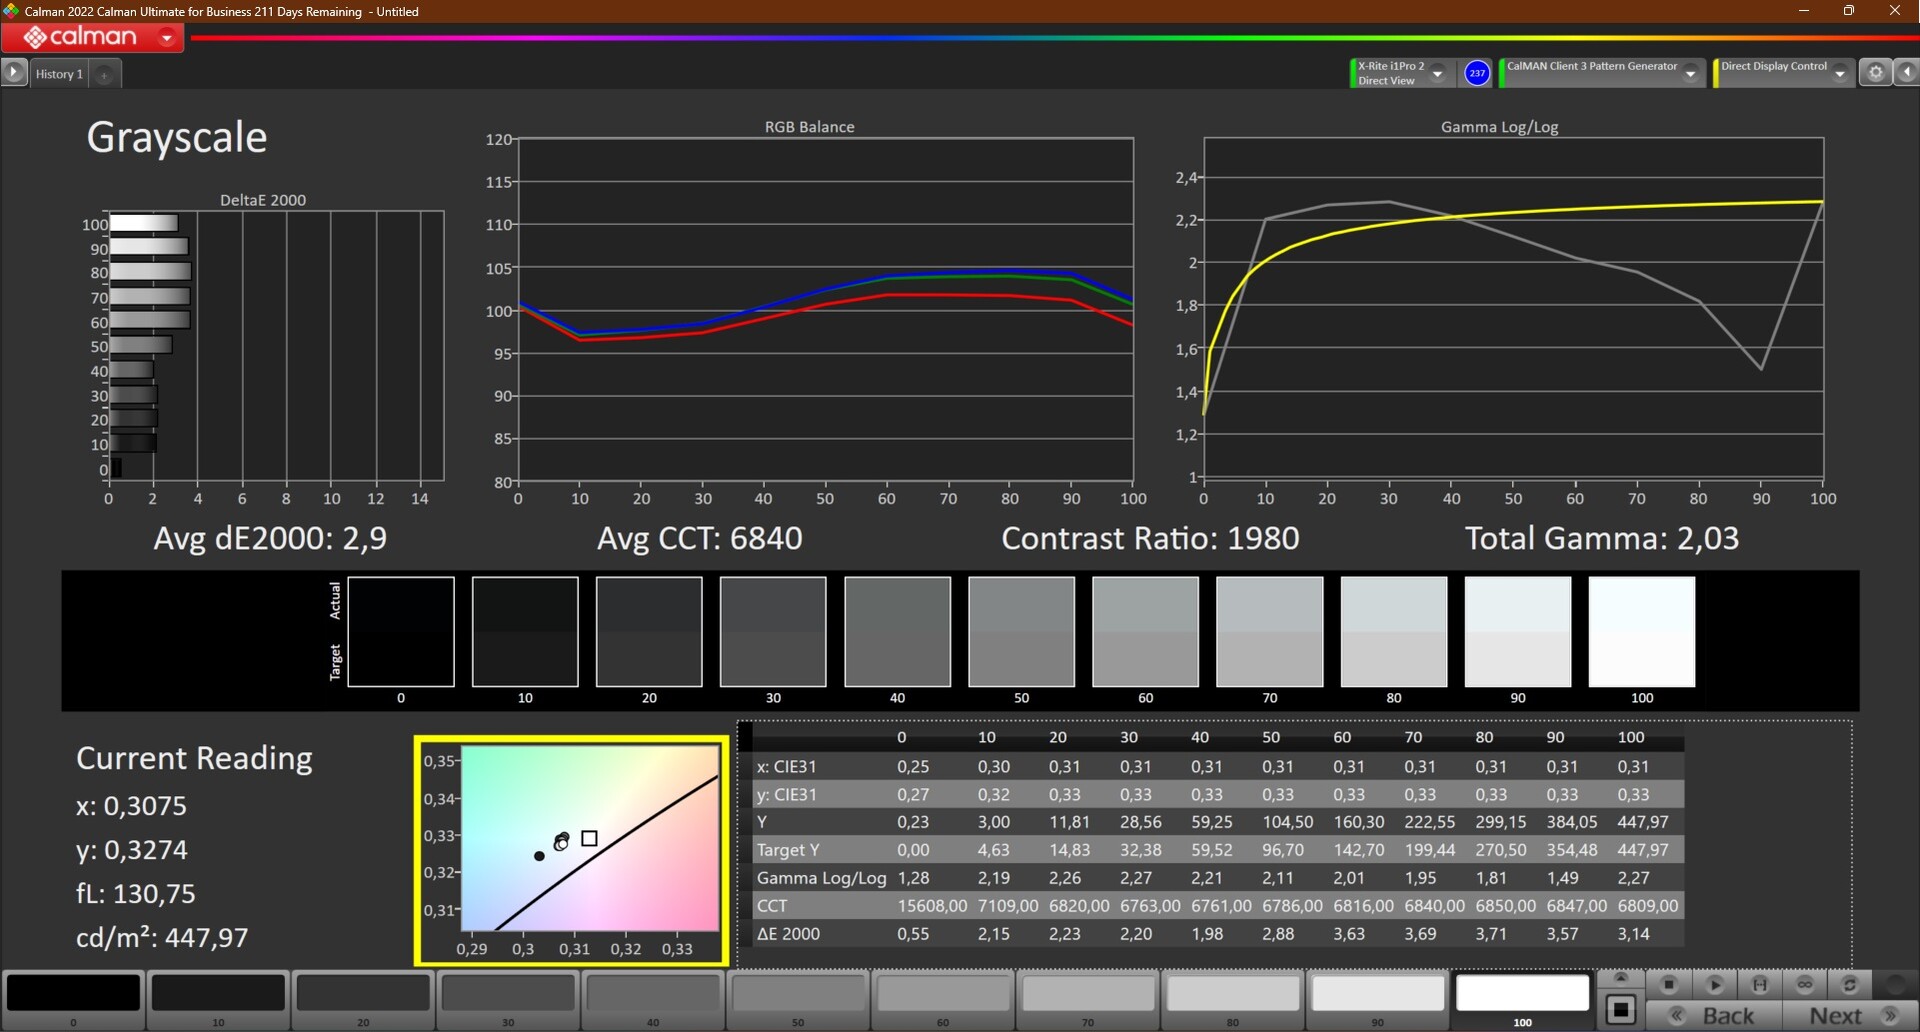
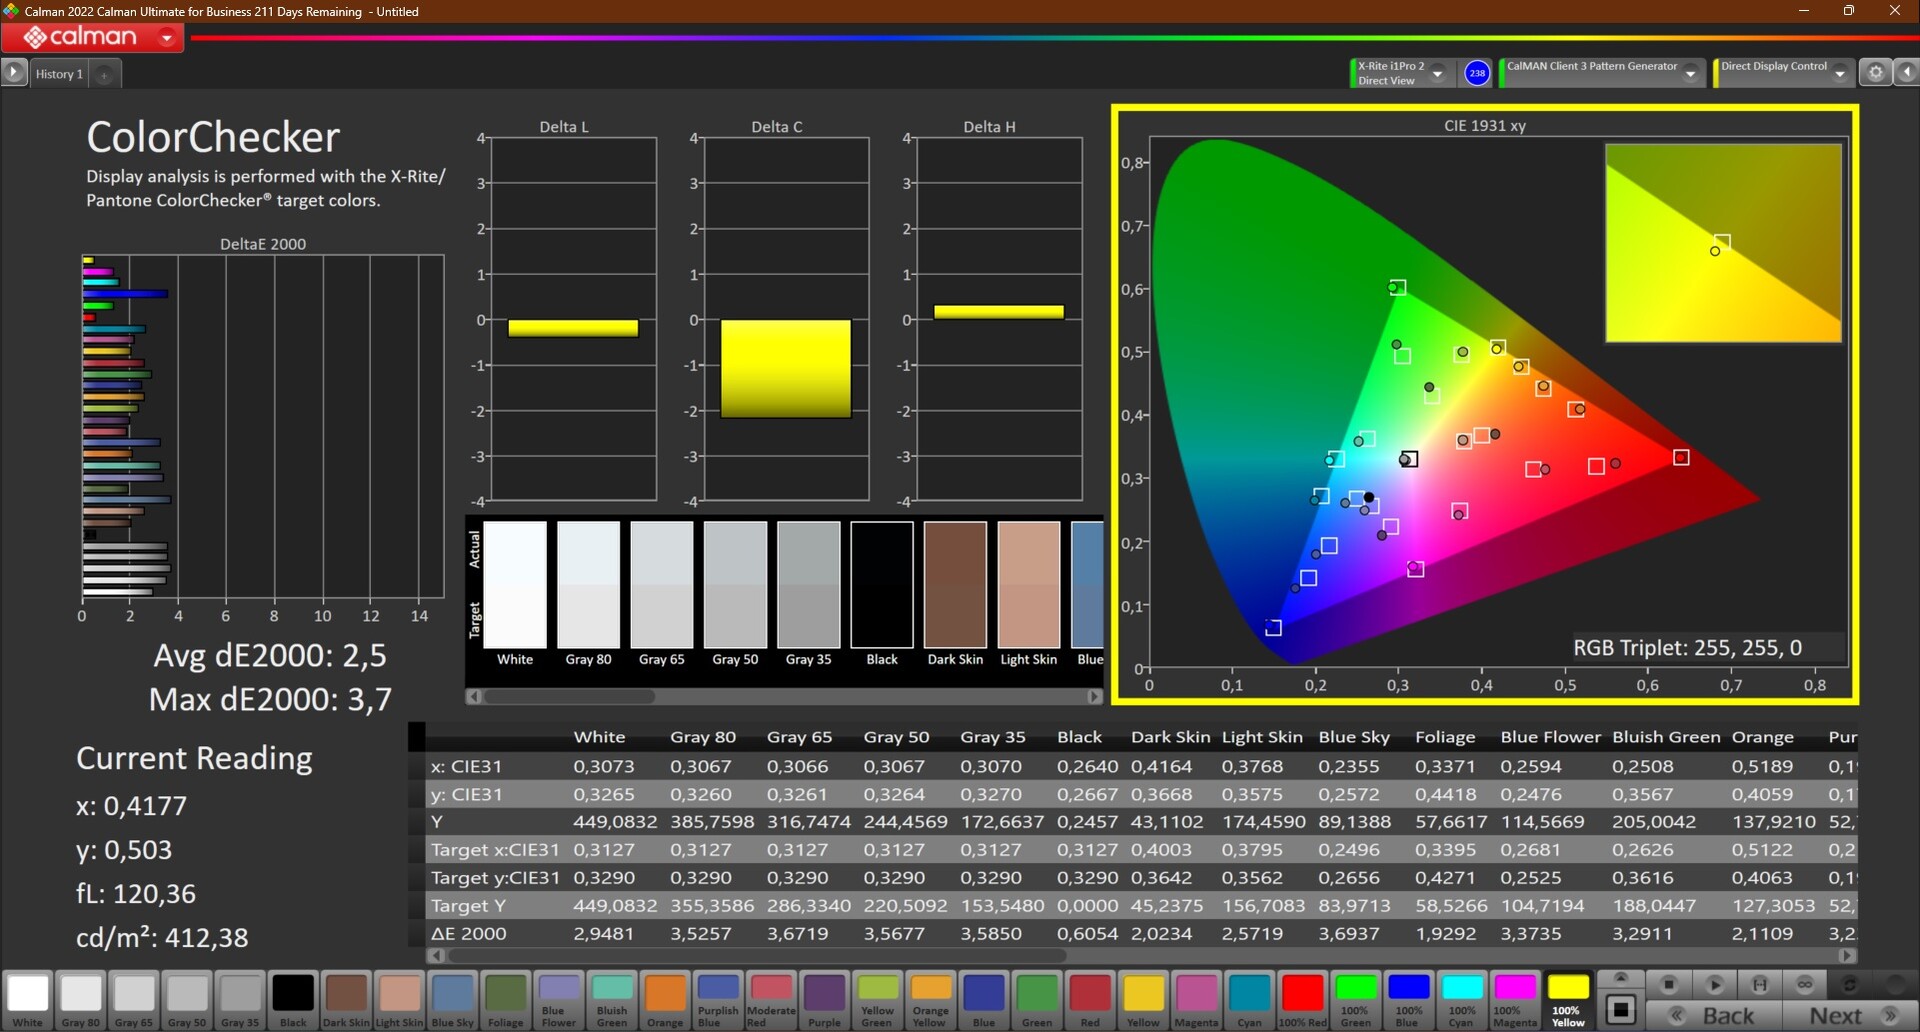
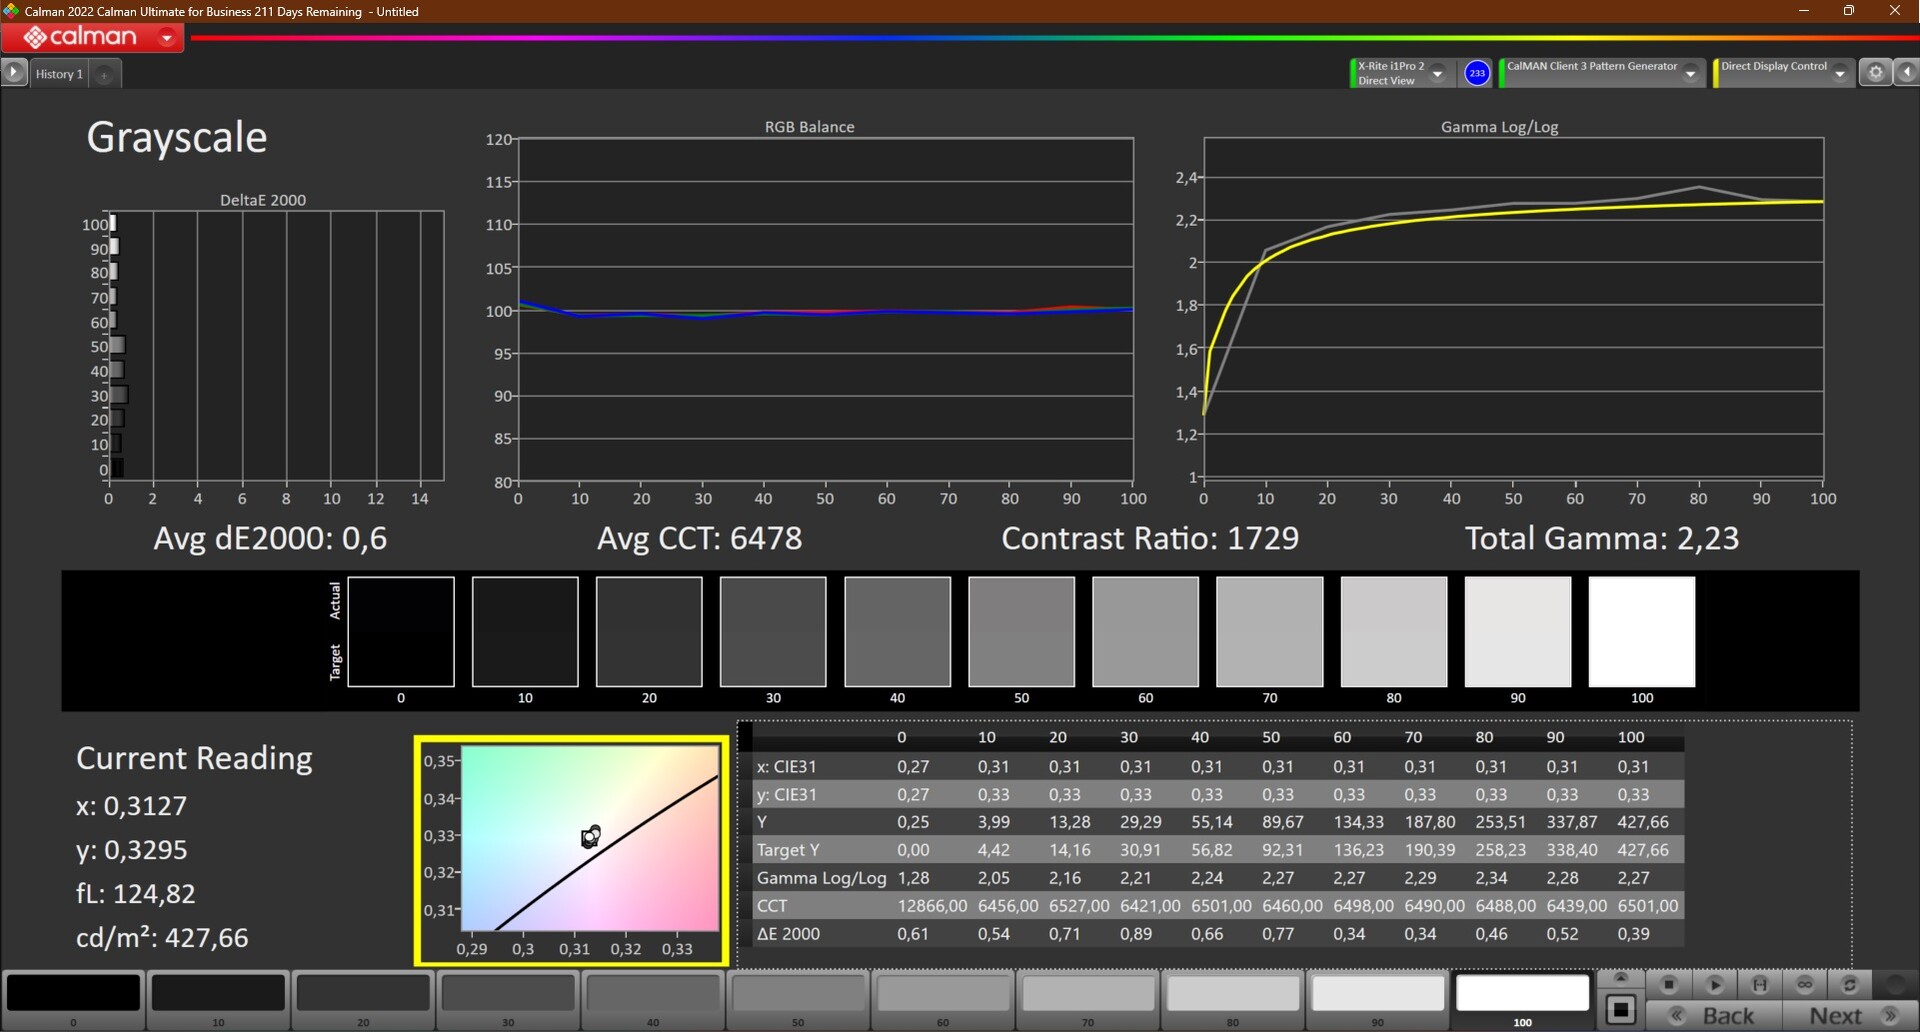
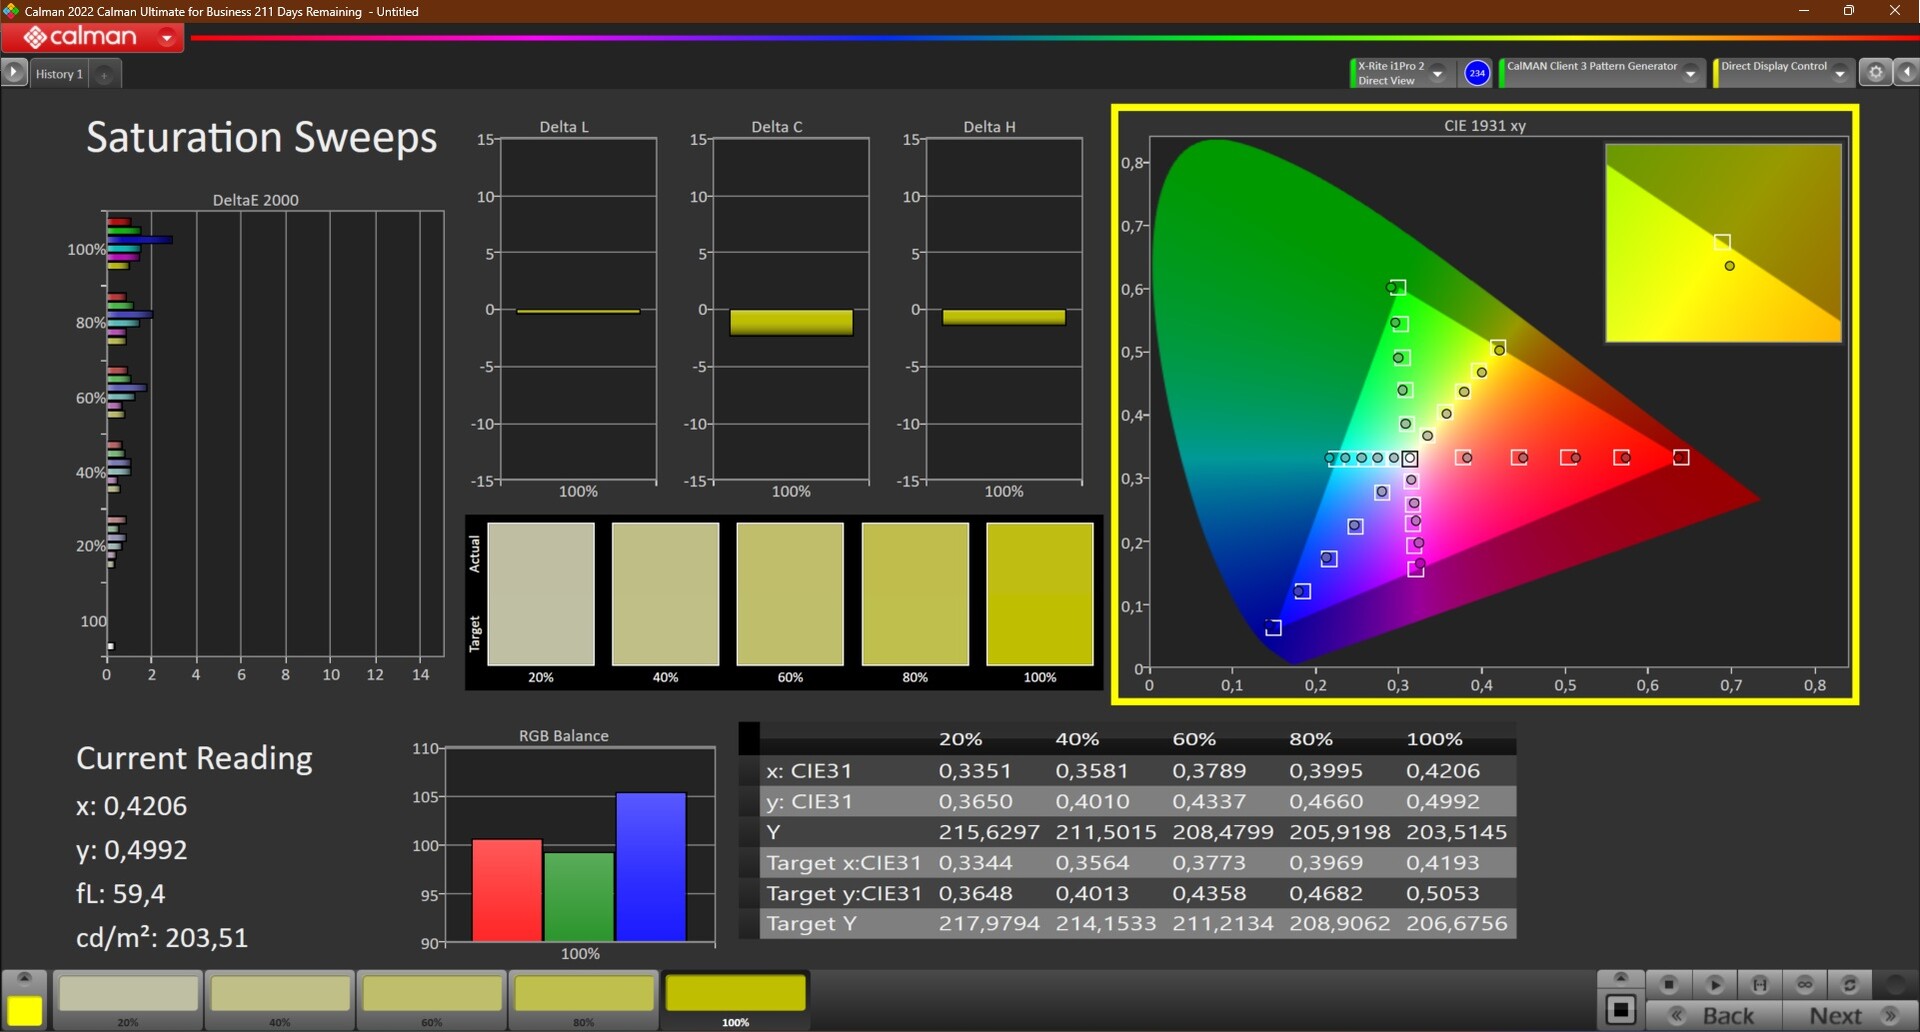
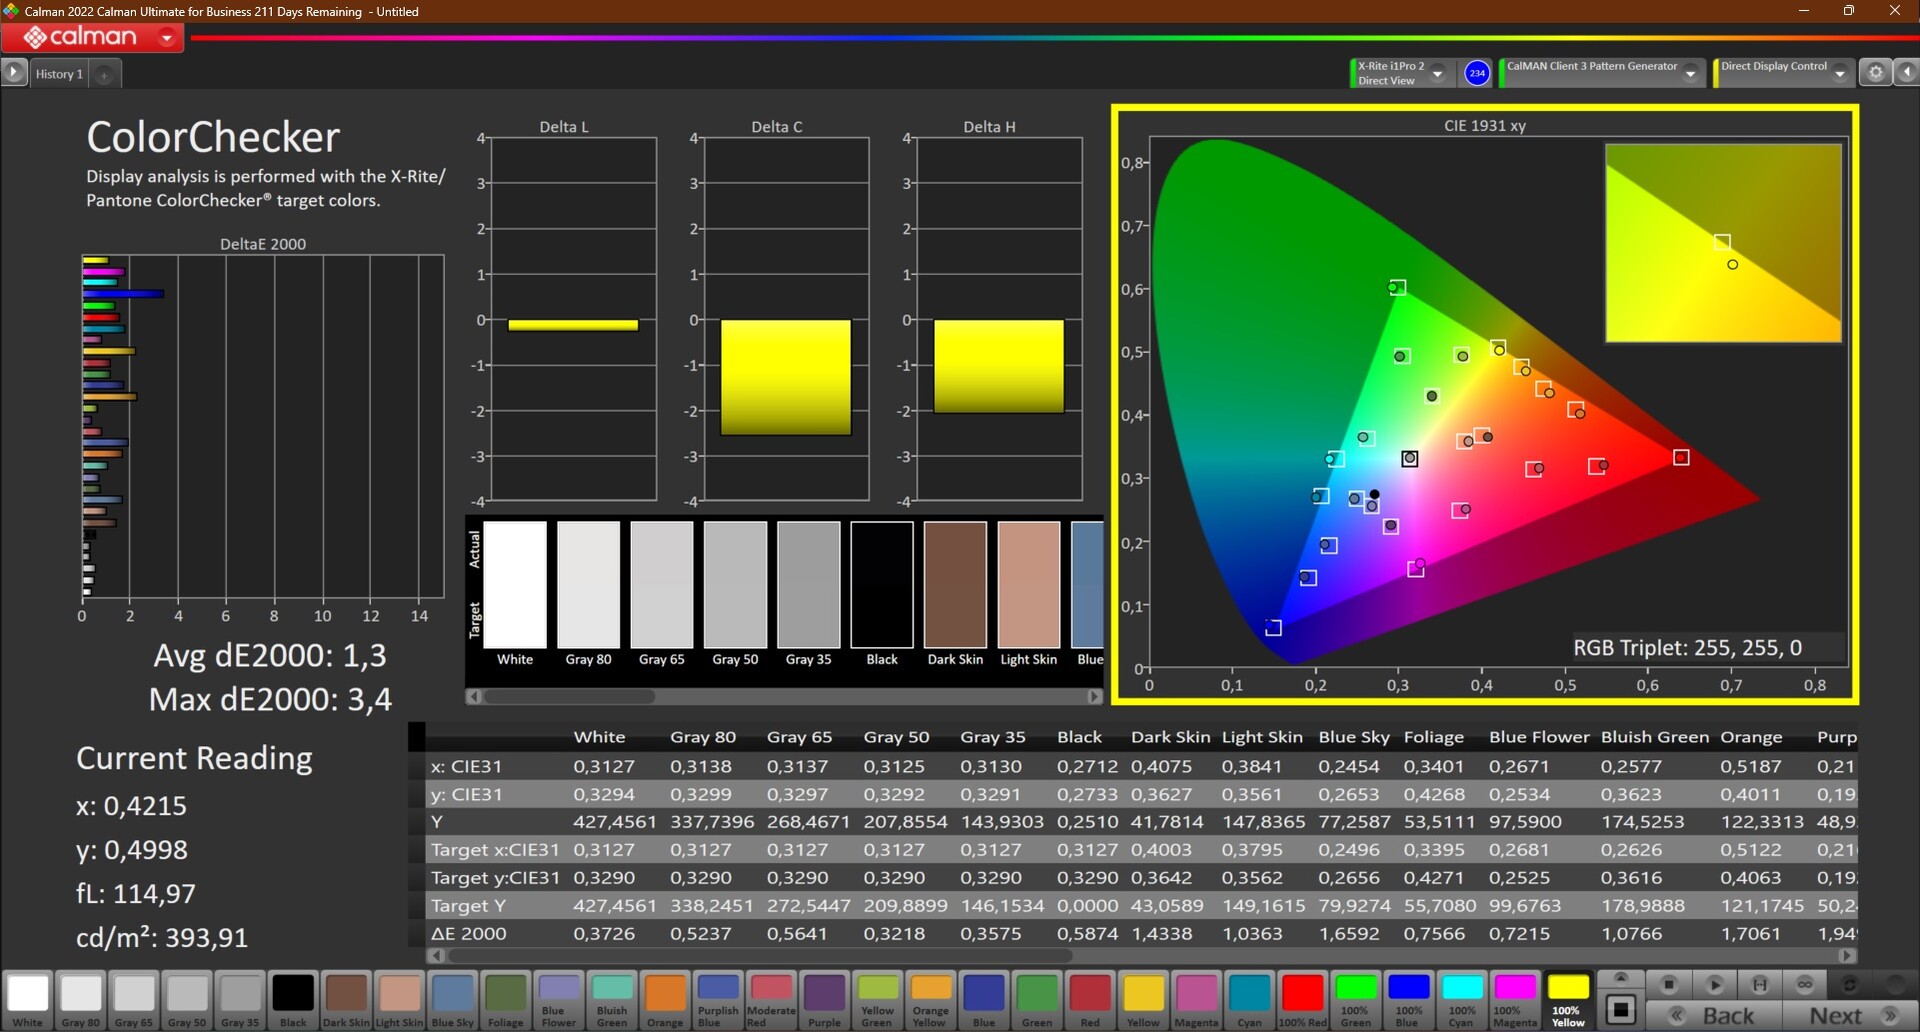
Los colores de la pantalla eran un poco fríos nada más sacarla de la caja, lo que medimos utilizando el software Calman y el colorímetro X-Rite i1Pro 2. Una calibración con el i1Profiler pudo corregir este desequilibrio cromático. Como siempre, el perfil correspondiente está disponible para su descarga gratuita en el recuadro gris con los valores medidos. El valor deltaE--Colorchecker alcanzó un muy buen 1,3 en el estado calibrado.
La pantalla LG no fue capaz de alcanzar el valor anunciado de 100% sRGB: Con 94.3%, el objetivo se perdió por poco. En consecuencia, el panel del Lenovo ThinkPad P14s Gen 3 no puede recomendarse para la edición de imágenes. Los usuarios que quieran hacerlo estarían mejor con la pantalla WQUXGA.
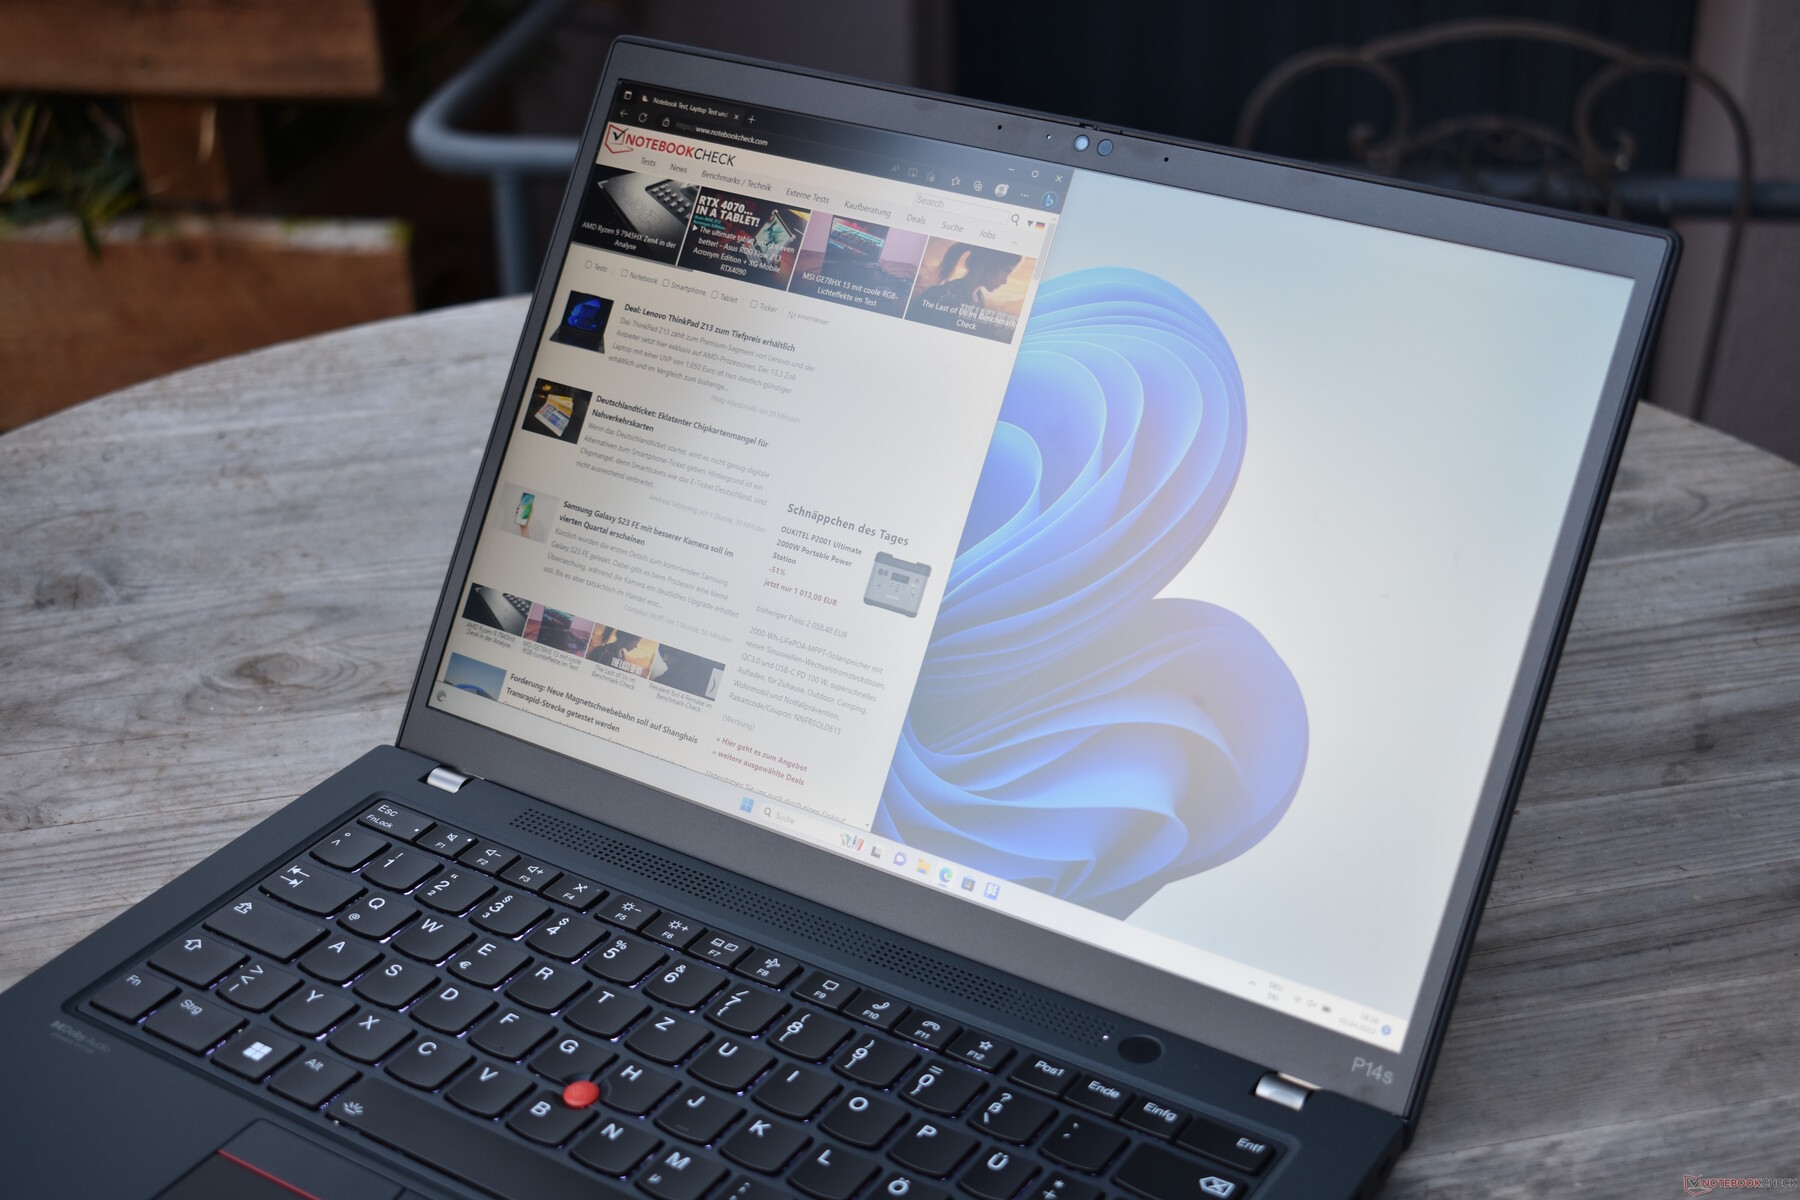
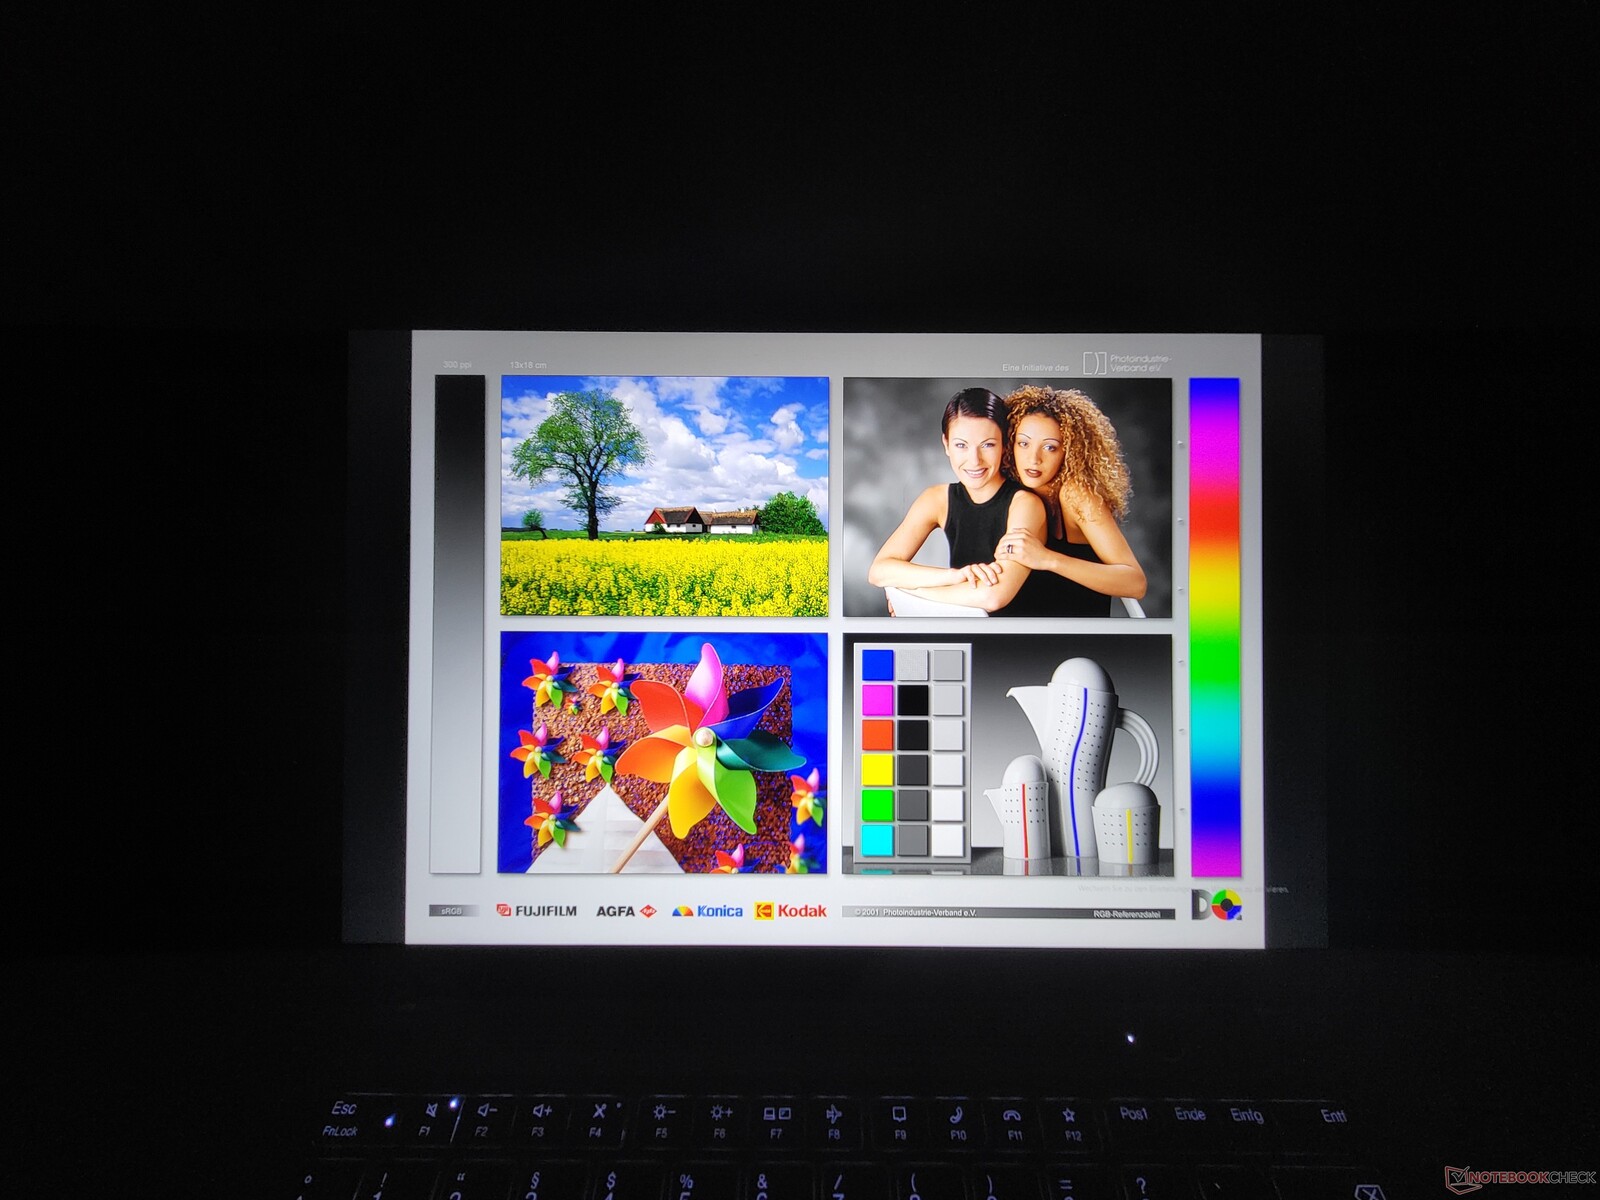
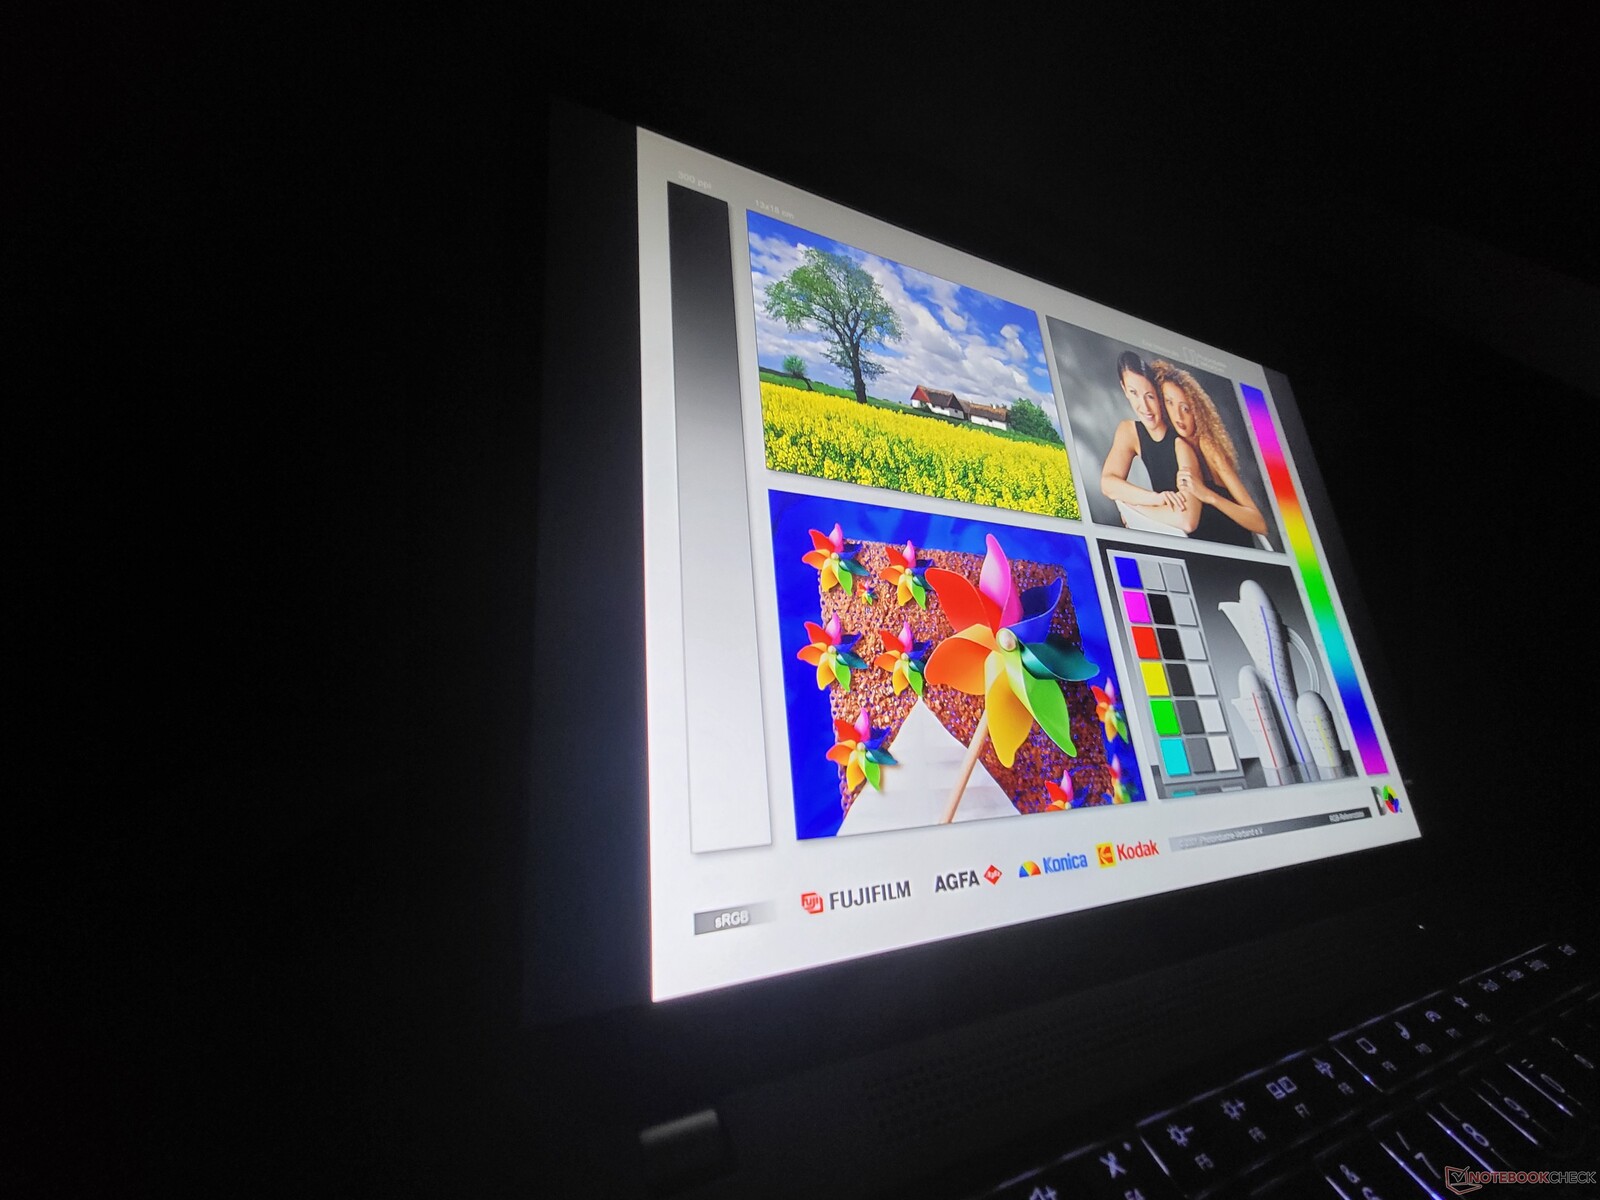
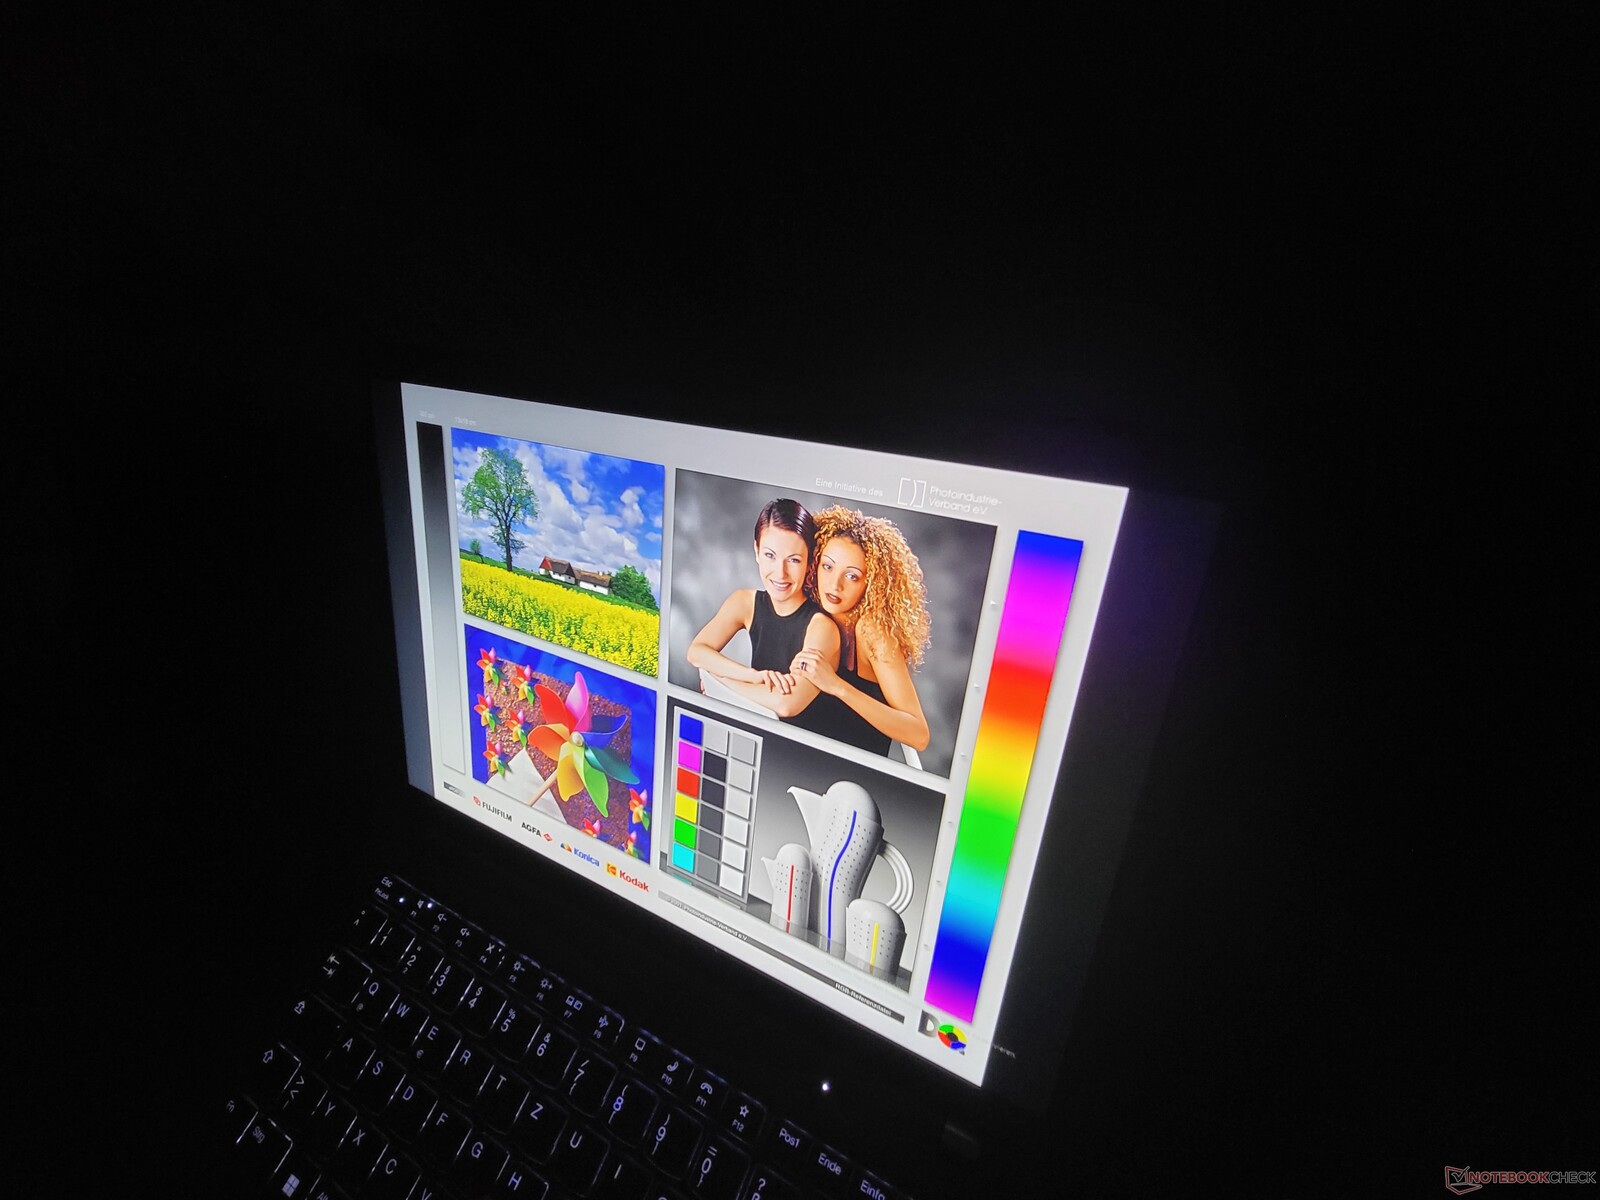
El portátil ThinkPad rindió aceptablemente en exteriores, lo que podría atribuirse a la combinación del buen brillo de la pantalla y su superficie mate (denominada antirreflejos por Lenovo).
Tiempos de respuesta del display
| ↔ Tiempo de respuesta de Negro a Blanco | ||
|---|---|---|
| 24.9 ms ... subida ↗ y bajada ↘ combinada | ↗ 11.6 ms subida | 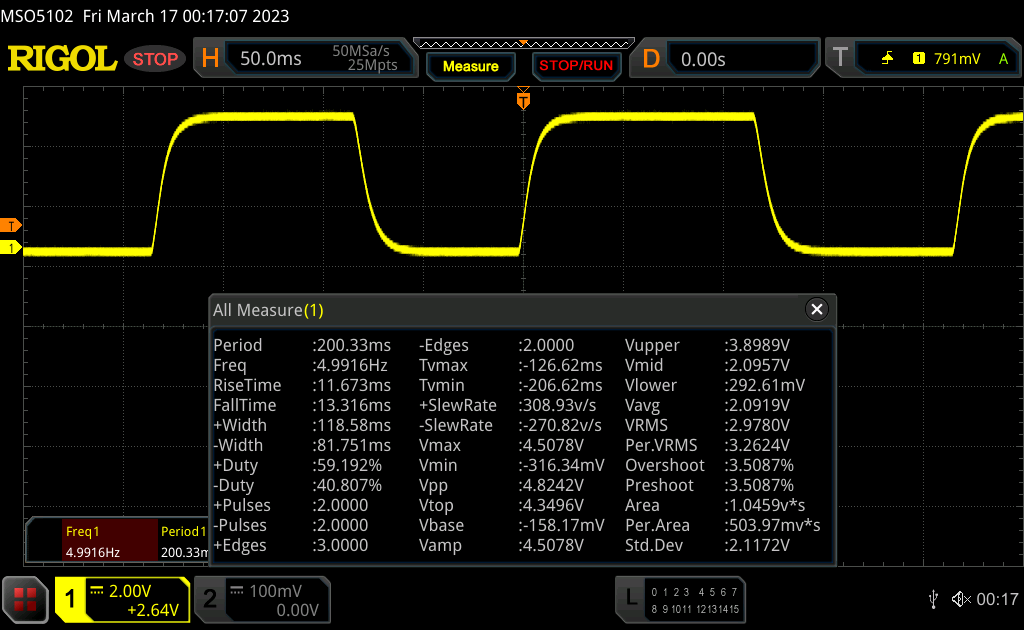 |
| ↘ 13.3 ms bajada | ||
| La pantalla mostró buenos tiempos de respuesta en nuestros tests pero podría ser demasiado lenta para los jugones competitivos. En comparación, todos los dispositivos de prueba van de ##min### (mínimo) a 240 (máximo) ms. » 59 % de todos los dispositivos son mejores. Eso quiere decir que el tiempo de respuesta es peor que la media (19.8 ms) de todos los dispositivos testados. | ||
| ↔ Tiempo de respuesta 50% Gris a 80% Gris | ||
| 33.5 ms ... subida ↗ y bajada ↘ combinada | ↗ 14.9 ms subida | 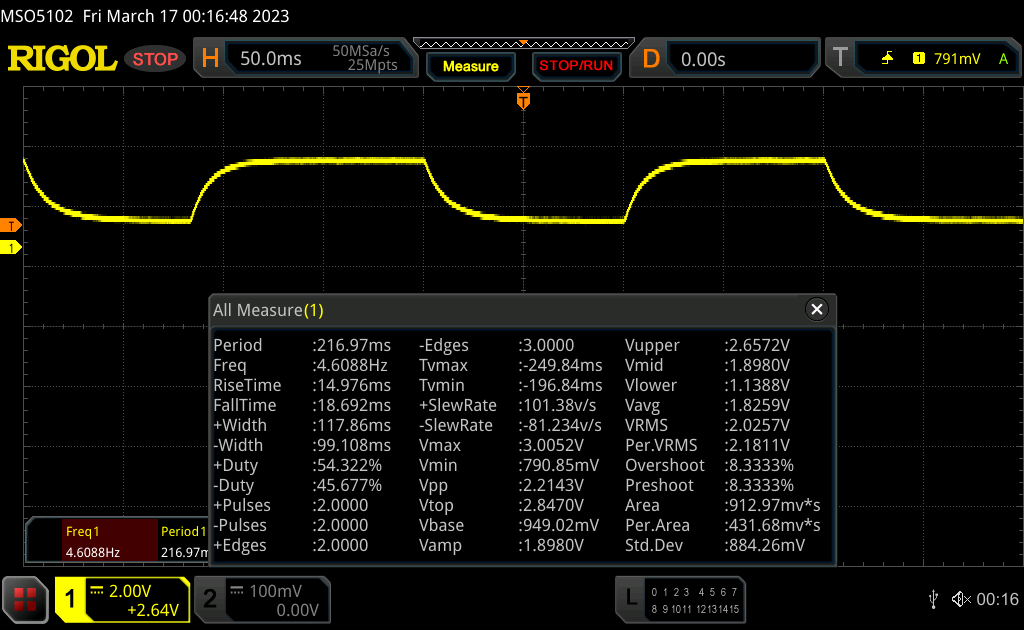 |
| ↘ 18.6 ms bajada | ||
| La pantalla mostró tiempos de respuesta lentos en nuestros tests y podría ser demasiado lenta para los jugones. En comparación, todos los dispositivos de prueba van de ##min### (mínimo) a 636 (máximo) ms. » 46 % de todos los dispositivos son mejores. Eso quiere decir que el tiempo de respuesta es similar al dispositivo testado medio (31 ms). | ||
Parpadeo de Pantalla / PWM (Pulse-Width Modulation)
| Parpadeo de Pantalla / PWM no detectado | 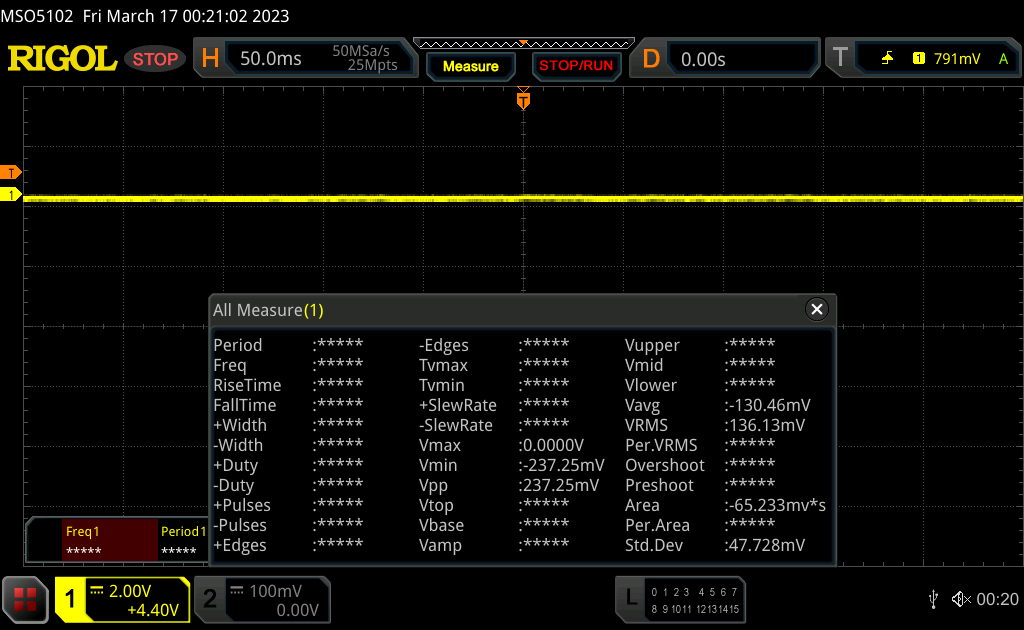 | ||
Comparación: 52 % de todos los dispositivos testados no usaron PWM para atenuar el display. Si se usó, medimos una media de 7754 (mínimo: 5 - máxmo: 343500) Hz. | |||
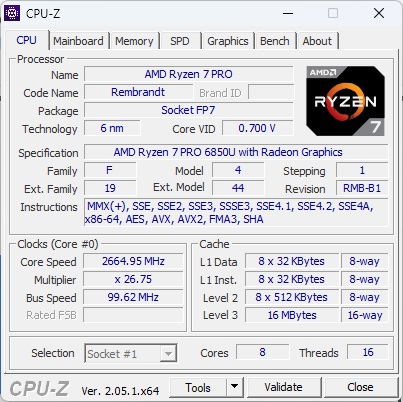
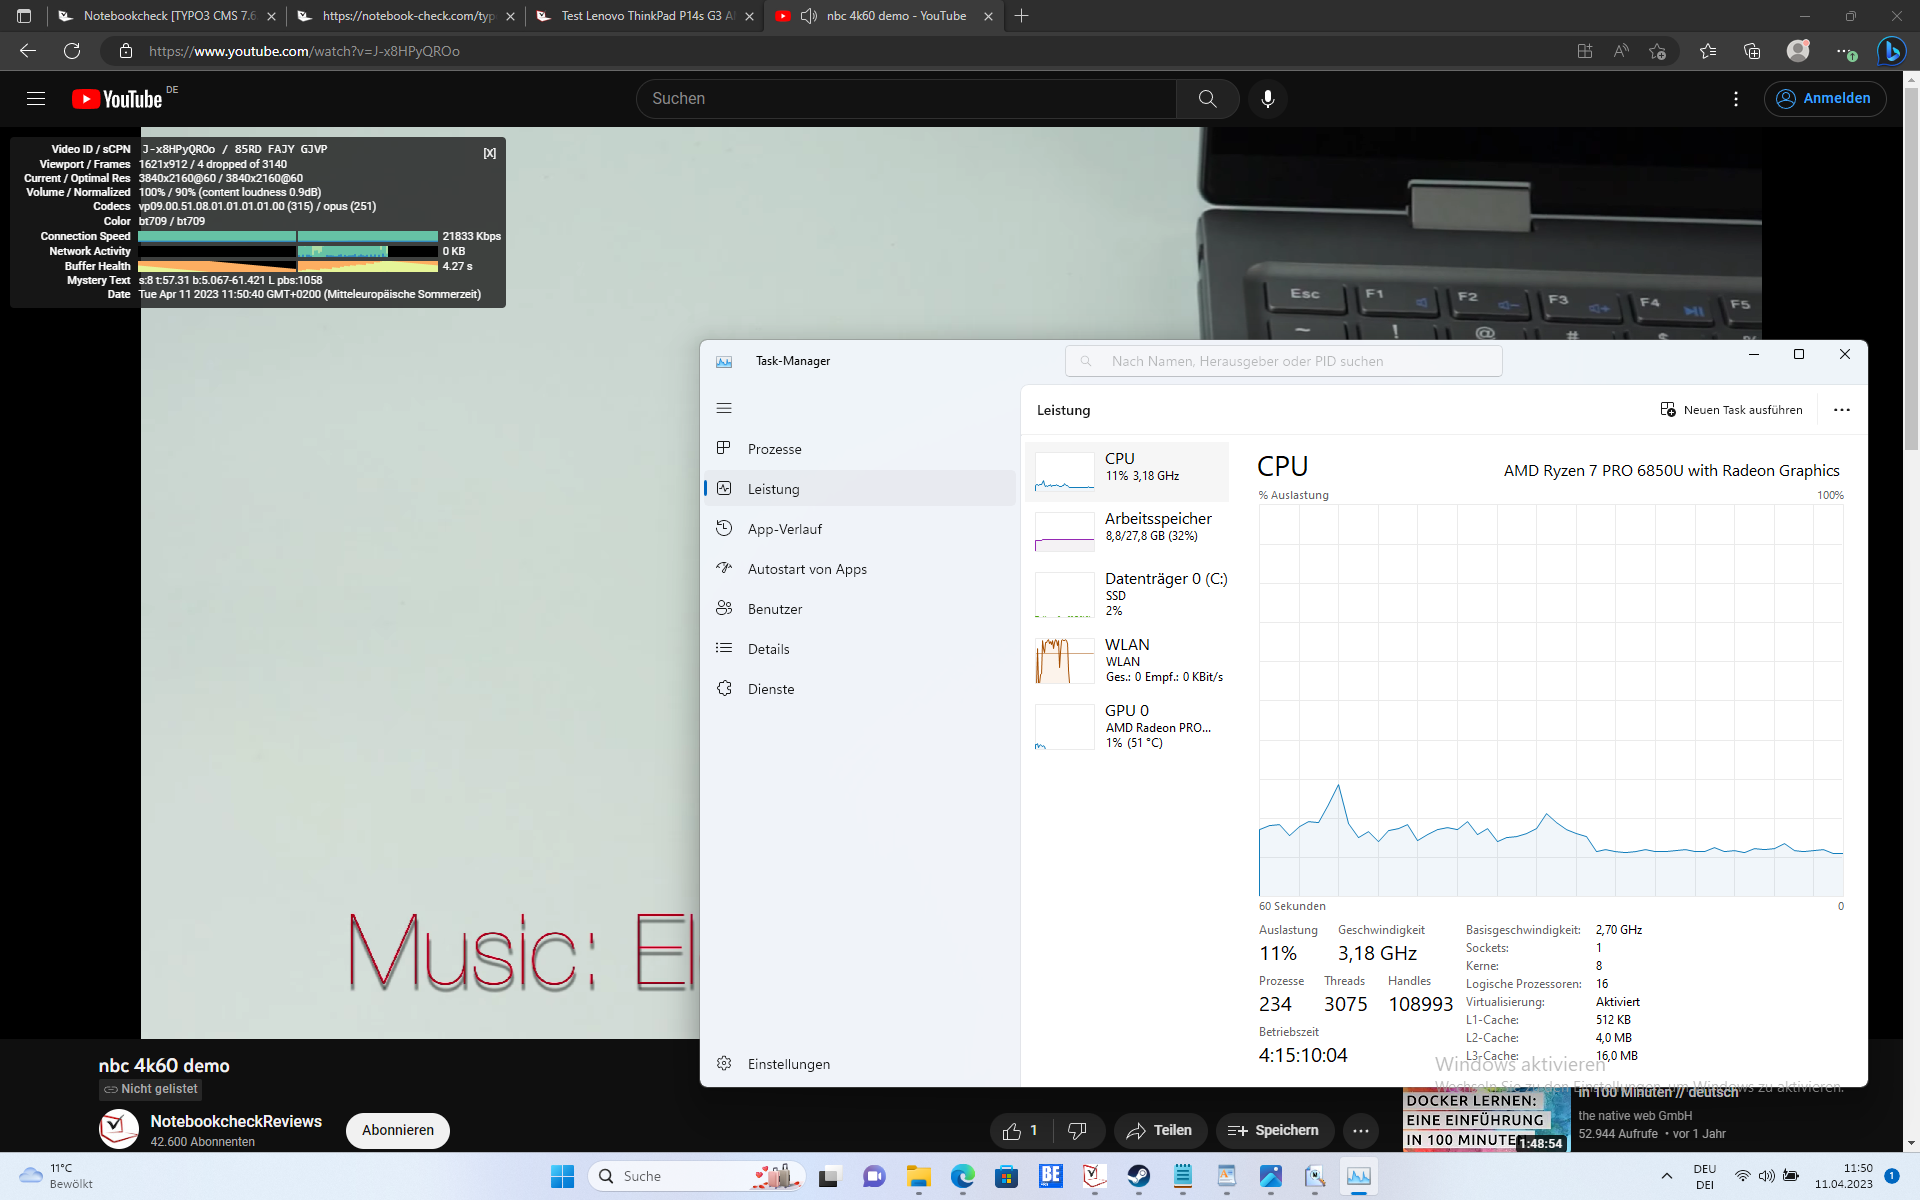
Rendimiento: AMD Ryzen 6000U con un gran rendimiento
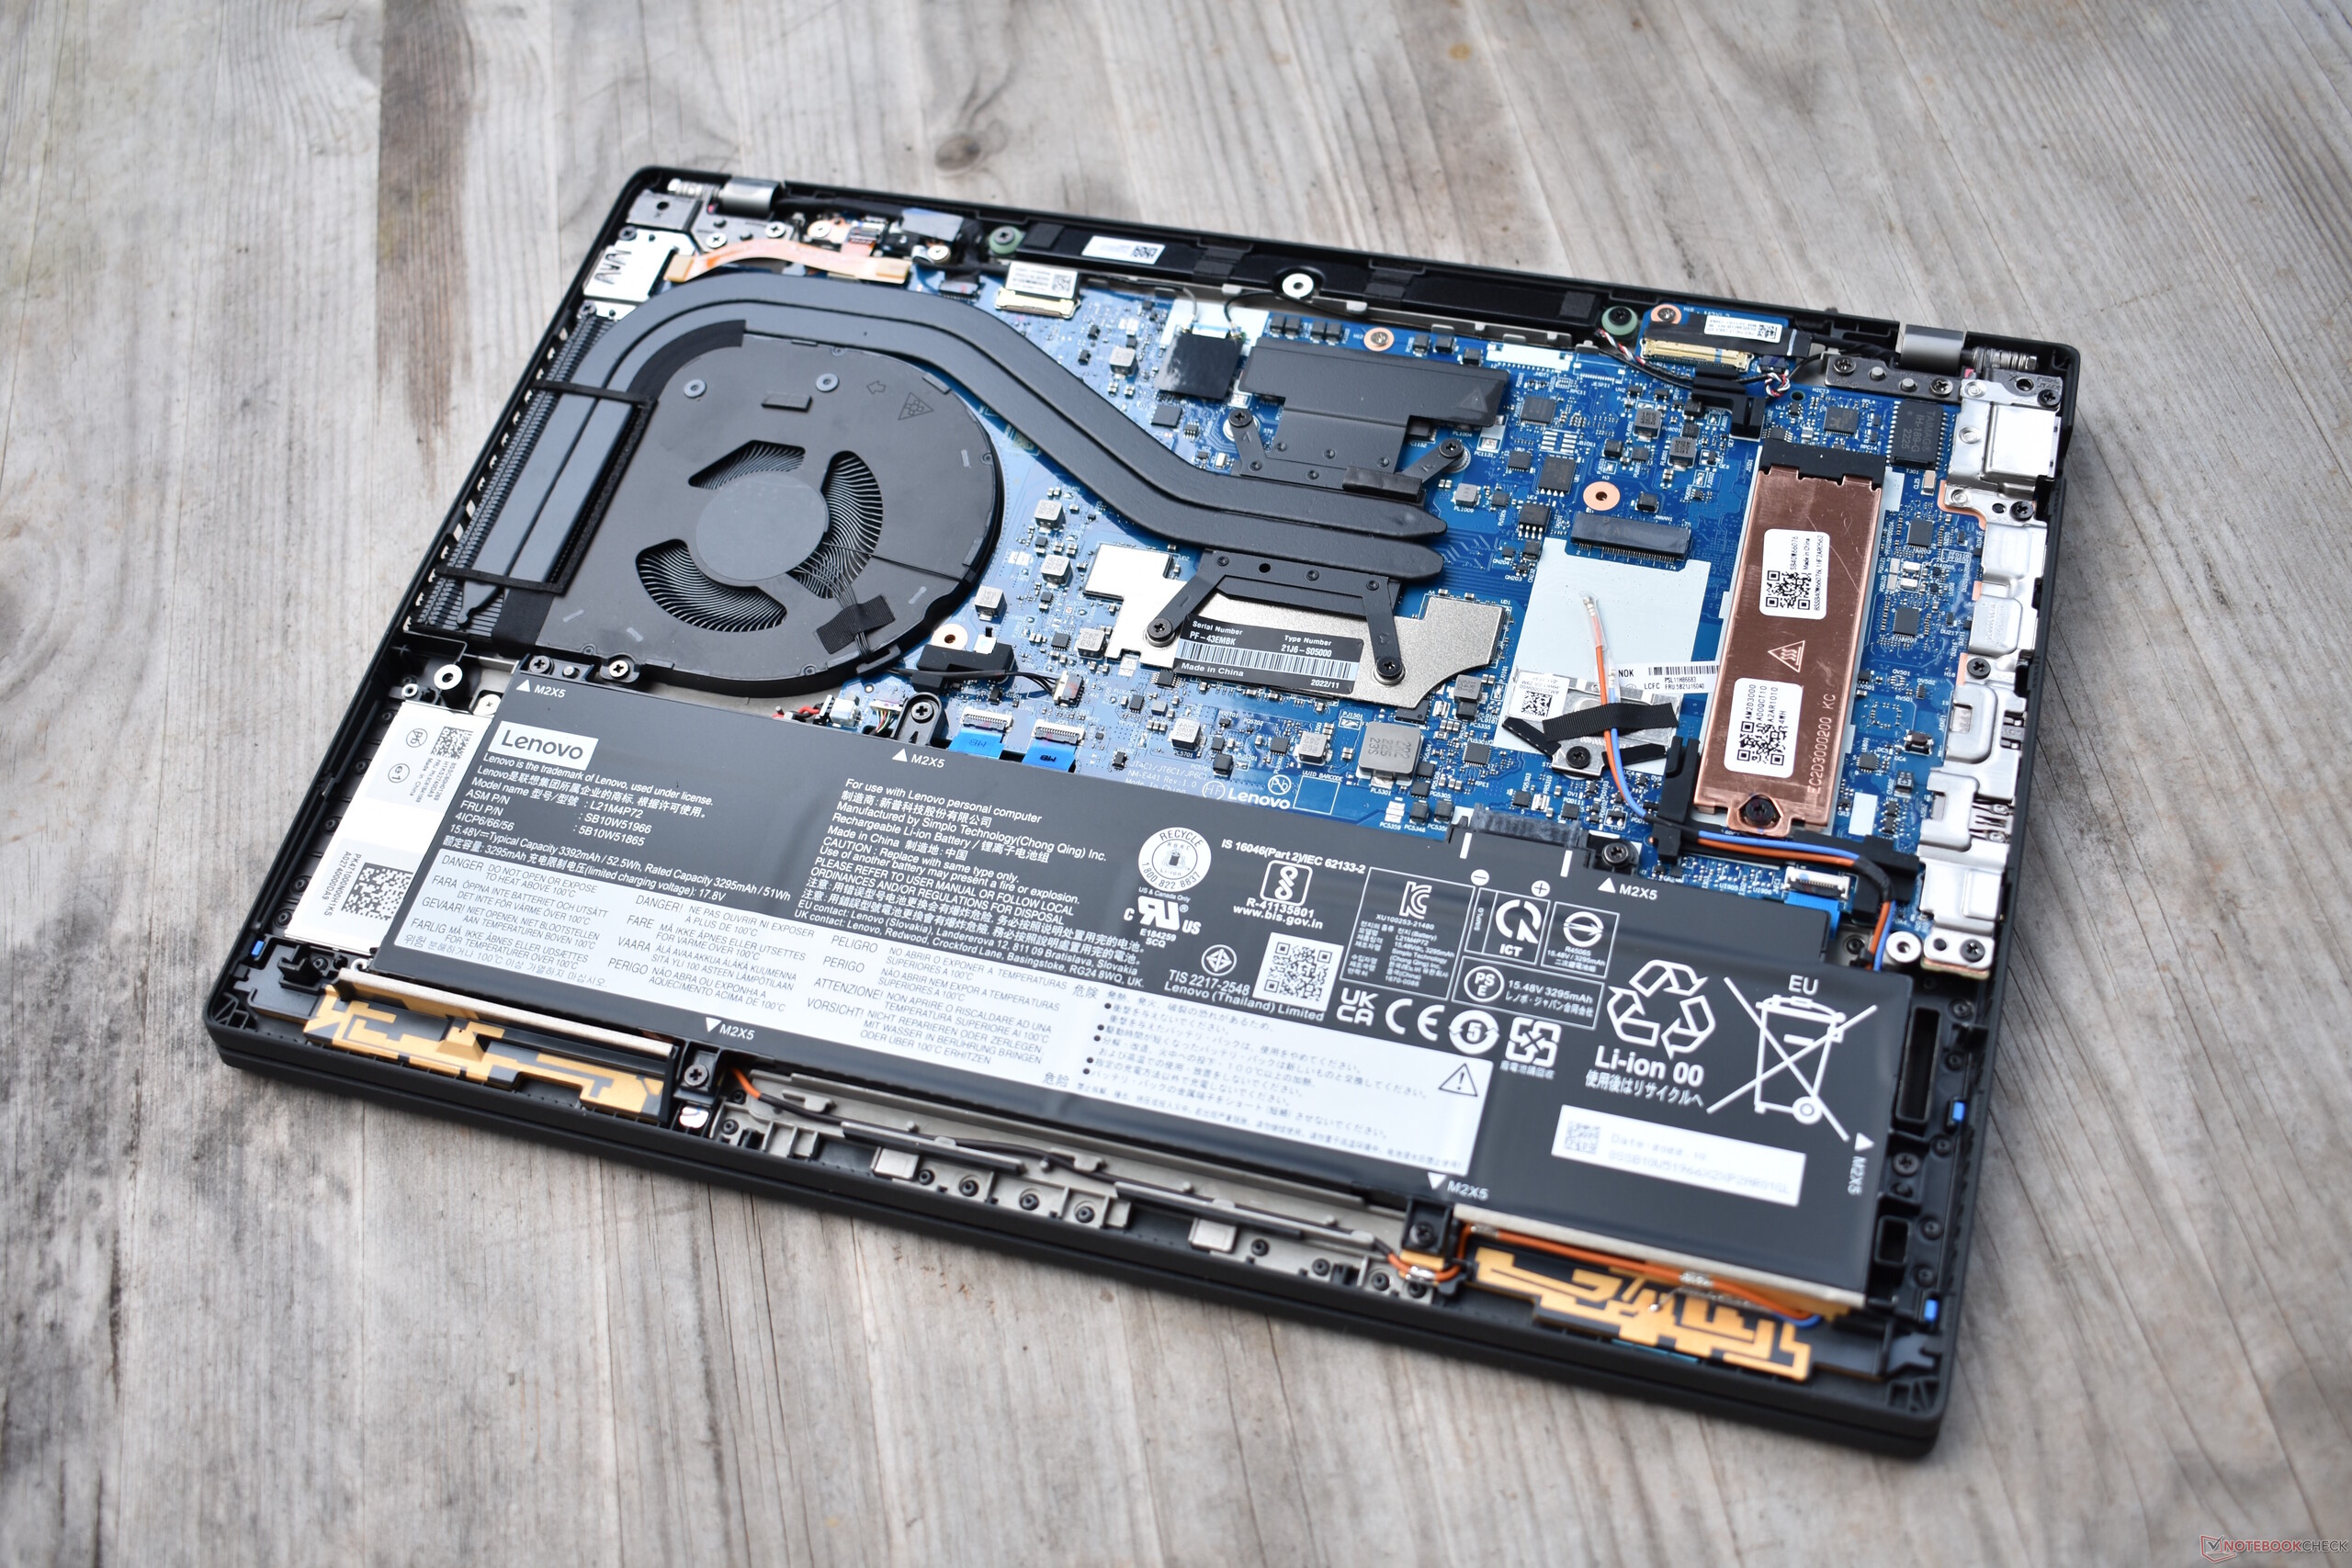
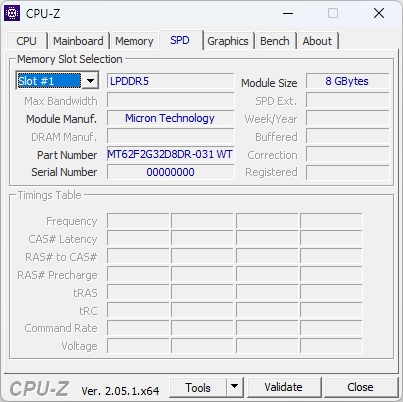
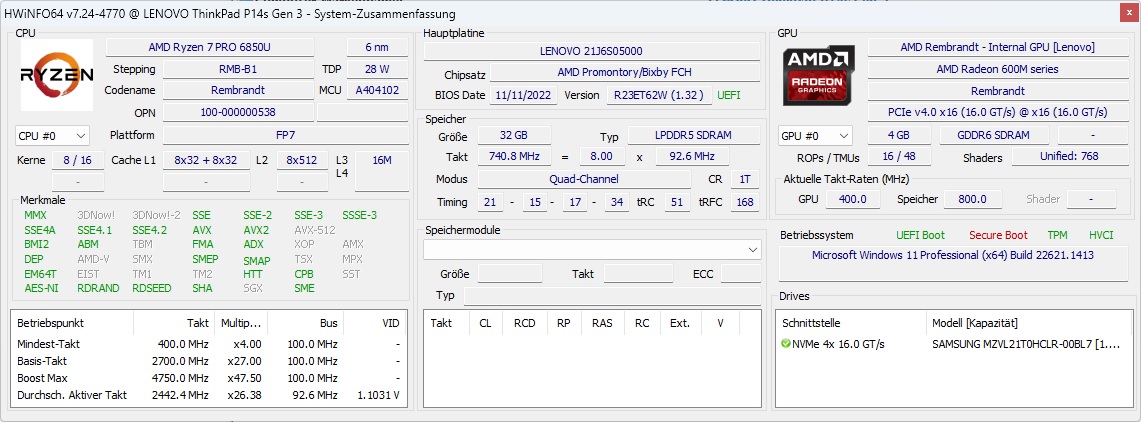
El Lenovo ThinkPad P14s Gen 3 viene en varias configuraciones diferentes. Todos usan CPUs Ryzen de AMD, con el Ryzen 5 Pro 6650U y elRyzen 7 Pro 6850U entre los que elegir. El Ryzen 5 incorpora la AMD Radeon 660My el Ryzen 7 tiene la más potente Radeon 680M. La RAM suele estar soldada en la versión AMD de los P14, y Lenovo ofrece 16 o 32 GB de LPDDR5-6400. Un único SSD M.2-2280 hace las veces de almacenamiento; de fábrica, Lenovo instala un máximo de 2 TB.
Condiciones de ensayo
En sus portátiles ThinkPad, Lenovo ha entrelazado sus perfiles de energía internos con el control de energía de Windows. Así, se pueden seleccionar tres perfiles diferentes que afectan al rendimiento en la aplicación de configuración de Windows:
- Mejor ahorro de energía: 30 vatios (límite de energía a corto plazo) / 25 vatios (límite de energía a largo plazo).
- Equilibrado: 36 vatios (límite de potencia a corto plazo) / 31 vatios (límite de potencia a largo plazo)
- Mejor potencia: 40 vatios (límite de potencia a corto plazo) / 31 vatios (límite de potencia a largo plazo)
Procesador
EnAMD Ryzen 7 Pro 6850U es el procesador "U" más rápido de la serie Ryzen 6000 (aparte del 6860Zque solo está disponible en el ThinkPad Z13). Como U-CPU, está optimizado para un consumo de 15 a 25 vatios. Sus ocho núcleos con 16 hilos funcionan entre 2,7 y 4,7 GHz. Puedes consultar nuestra Lista de pruebas de CPU para comparaciones más extensas con otros procesadores.
Comparado con el ThinkPad T14 G3 con la misma CPU, sus límites de potencia son un poco más altos. Esto se pudo observar en el bucle multinúcleo Cinebench R15, por ejemplo, donde el ThinkPad P14s puntuó mejor que el T14. Sin embargo, la diferencia no fue grande. Al compararlo con sus competidores, su rendimiento CPU es respetable. El ThinkPad P14s Gen 3 es significativamente más rápido que elZBook Firefly 14 G9 y no muy por detrás del Dell Precision 5470a pesar de su CPU H45 nominalmente superior. Sólo en términos de rendimiento mononúcleo tienen ventaja los modelos Intel.
La CPU también rinde con éxito sólo con batería.
Cinebench R15 multi continuous test
Cinebench R23: Multi Core | Single Core
Cinebench R20: CPU (Multi Core) | CPU (Single Core)
Cinebench R15: CPU Multi 64Bit | CPU Single 64Bit
Blender: v2.79 BMW27 CPU
7-Zip 18.03: 7z b 4 | 7z b 4 -mmt1
Geekbench 5.5: Multi-Core | Single-Core
HWBOT x265 Benchmark v2.2: 4k Preset
LibreOffice : 20 Documents To PDF
R Benchmark 2.5: Overall mean
| CPU Performance rating | |
| Media de la clase Workstation | |
| Dell Precision 5000 5470 | |
| Lenovo ThinkPad T14 G3-21CF004NGE | |
| Medio AMD Ryzen 7 PRO 6850U | |
| HP ZBook Firefly 14 G9-6B8A2EA | |
| Lenovo ThinkPad P14s G3 AMD 21J6S05000 | |
| Lenovo ThinkPad P14s Gen2-20VX000GGE | |
| Cinebench R23 / Multi Core | |
| Media de la clase Workstation (14621 - 38520, n=23, últimos 2 años) | |
| Dell Precision 5000 5470 | |
| Lenovo ThinkPad P14s G3 AMD 21J6S05000 | |
| Medio AMD Ryzen 7 PRO 6850U (9923 - 12945, n=7) | |
| Lenovo ThinkPad T14 G3-21CF004NGE | |
| HP ZBook Firefly 14 G9-6B8A2EA | |
| Lenovo ThinkPad P14s Gen2-20VX000GGE | |
| Cinebench R23 / Single Core | |
| Media de la clase Workstation (1712 - 2228, n=23, últimos 2 años) | |
| Dell Precision 5000 5470 | |
| HP ZBook Firefly 14 G9-6B8A2EA | |
| Lenovo ThinkPad P14s G3 AMD 21J6S05000 | |
| Medio AMD Ryzen 7 PRO 6850U (1409 - 1536, n=7) | |
| Lenovo ThinkPad P14s Gen2-20VX000GGE | |
| Lenovo ThinkPad T14 G3-21CF004NGE | |
| Cinebench R20 / CPU (Multi Core) | |
| Media de la clase Workstation (5760 - 15043, n=23, últimos 2 años) | |
| Dell Precision 5000 5470 | |
| Lenovo ThinkPad P14s G3 AMD 21J6S05000 | |
| Medio AMD Ryzen 7 PRO 6850U (3784 - 5022, n=7) | |
| Lenovo ThinkPad T14 G3-21CF004NGE | |
| HP ZBook Firefly 14 G9-6B8A2EA | |
| Lenovo ThinkPad P14s Gen2-20VX000GGE | |
| Cinebench R20 / CPU (Single Core) | |
| Media de la clase Workstation (671 - 857, n=23, últimos 2 años) | |
| Dell Precision 5000 5470 | |
| HP ZBook Firefly 14 G9-6B8A2EA | |
| Lenovo ThinkPad P14s G3 AMD 21J6S05000 | |
| Medio AMD Ryzen 7 PRO 6850U (587 - 596, n=7) | |
| Lenovo ThinkPad T14 G3-21CF004NGE | |
| Lenovo ThinkPad P14s Gen2-20VX000GGE | |
| Cinebench R15 / CPU Multi 64Bit | |
| Media de la clase Workstation (2489 - 5810, n=23, últimos 2 años) | |
| Dell Precision 5000 5470 | |
| Lenovo ThinkPad P14s G3 AMD 21J6S05000 | |
| Medio AMD Ryzen 7 PRO 6850U (1652 - 2092, n=7) | |
| Lenovo ThinkPad T14 G3-21CF004NGE | |
| HP ZBook Firefly 14 G9-6B8A2EA | |
| Lenovo ThinkPad P14s Gen2-20VX000GGE | |
| Cinebench R15 / CPU Single 64Bit | |
| Media de la clase Workstation (191.4 - 328, n=23, últimos 2 años) | |
| HP ZBook Firefly 14 G9-6B8A2EA | |
| Dell Precision 5000 5470 | |
| Lenovo ThinkPad P14s G3 AMD 21J6S05000 | |
| Lenovo ThinkPad T14 G3-21CF004NGE | |
| Medio AMD Ryzen 7 PRO 6850U (228 - 244, n=7) | |
| Lenovo ThinkPad P14s Gen2-20VX000GGE | |
| Blender / v2.79 BMW27 CPU | |
| Lenovo ThinkPad P14s Gen2-20VX000GGE | |
| HP ZBook Firefly 14 G9-6B8A2EA | |
| Lenovo ThinkPad T14 G3-21CF004NGE | |
| Lenovo ThinkPad P14s G3 AMD 21J6S05000 | |
| Medio AMD Ryzen 7 PRO 6850U (241 - 307, n=7) | |
| Dell Precision 5000 5470 | |
| Media de la clase Workstation (91 - 222, n=23, últimos 2 años) | |
| 7-Zip 18.03 / 7z b 4 | |
| Media de la clase Workstation (60489 - 116969, n=23, últimos 2 años) | |
| Dell Precision 5000 5470 | |
| Lenovo ThinkPad T14 G3-21CF004NGE | |
| Medio AMD Ryzen 7 PRO 6850U (44011 - 59045, n=7) | |
| Lenovo ThinkPad P14s G3 AMD 21J6S05000 | |
| HP ZBook Firefly 14 G9-6B8A2EA | |
| Lenovo ThinkPad P14s Gen2-20VX000GGE | |
| 7-Zip 18.03 / 7z b 4 -mmt1 | |
| Media de la clase Workstation (5126 - 6960, n=23, últimos 2 años) | |
| HP ZBook Firefly 14 G9-6B8A2EA | |
| Lenovo ThinkPad P14s Gen2-20VX000GGE | |
| Dell Precision 5000 5470 | |
| Medio AMD Ryzen 7 PRO 6850U (5057 - 5662, n=7) | |
| Lenovo ThinkPad T14 G3-21CF004NGE | |
| Lenovo ThinkPad P14s G3 AMD 21J6S05000 | |
| Geekbench 5.5 / Multi-Core | |
| Media de la clase Workstation (11542 - 25554, n=23, últimos 2 años) | |
| Dell Precision 5000 5470 | |
| HP ZBook Firefly 14 G9-6B8A2EA | |
| Lenovo ThinkPad P14s G3 AMD 21J6S05000 | |
| Medio AMD Ryzen 7 PRO 6850U (7044 - 9241, n=7) | |
| Lenovo ThinkPad T14 G3-21CF004NGE | |
| Lenovo ThinkPad P14s Gen2-20VX000GGE | |
| Geekbench 5.5 / Single-Core | |
| Media de la clase Workstation (1783 - 2183, n=23, últimos 2 años) | |
| Dell Precision 5000 5470 | |
| HP ZBook Firefly 14 G9-6B8A2EA | |
| Lenovo ThinkPad P14s Gen2-20VX000GGE | |
| Lenovo ThinkPad T14 G3-21CF004NGE | |
| Lenovo ThinkPad P14s G3 AMD 21J6S05000 | |
| Medio AMD Ryzen 7 PRO 6850U (1433 - 1533, n=7) | |
| HWBOT x265 Benchmark v2.2 / 4k Preset | |
| Media de la clase Workstation (17.8 - 40.5, n=23, últimos 2 años) | |
| Dell Precision 5000 5470 | |
| Lenovo ThinkPad T14 G3-21CF004NGE | |
| Lenovo ThinkPad P14s G3 AMD 21J6S05000 | |
| Medio AMD Ryzen 7 PRO 6850U (11.7 - 16.3, n=7) | |
| HP ZBook Firefly 14 G9-6B8A2EA | |
| Lenovo ThinkPad P14s Gen2-20VX000GGE | |
| LibreOffice / 20 Documents To PDF | |
| Lenovo ThinkPad P14s G3 AMD 21J6S05000 | |
| Medio AMD Ryzen 7 PRO 6850U (46.3 - 74, n=7) | |
| Lenovo ThinkPad T14 G3-21CF004NGE | |
| Media de la clase Workstation (37.1 - 74.7, n=23, últimos 2 años) | |
| Dell Precision 5000 5470 | |
| HP ZBook Firefly 14 G9-6B8A2EA | |
| Lenovo ThinkPad P14s Gen2-20VX000GGE | |
| R Benchmark 2.5 / Overall mean | |
| Lenovo ThinkPad P14s Gen2-20VX000GGE | |
| Lenovo ThinkPad P14s G3 AMD 21J6S05000 | |
| Lenovo ThinkPad T14 G3-21CF004NGE | |
| Medio AMD Ryzen 7 PRO 6850U (0.4932 - 0.544, n=7) | |
| HP ZBook Firefly 14 G9-6B8A2EA | |
| Dell Precision 5000 5470 | |
| Media de la clase Workstation (0.3825 - 0.603, n=23, últimos 2 años) | |
* ... más pequeño es mejor
AIDA64: FP32 Ray-Trace | FPU Julia | CPU SHA3 | CPU Queen | FPU SinJulia | FPU Mandel | CPU AES | CPU ZLib | FP64 Ray-Trace | CPU PhotoWorxx
| Performance rating | |
| Media de la clase Workstation | |
| Medio AMD Ryzen 7 PRO 6850U | |
| Lenovo ThinkPad P14s G3 AMD 21J6S05000 | |
| Dell Precision 5000 5470 | |
| Lenovo ThinkPad T14 G3-21CF004NGE | |
| HP ZBook Firefly 14 G9-6B8A2EA | |
| AIDA64 / FP32 Ray-Trace | |
| Media de la clase Workstation (16730 - 61611, n=23, últimos 2 años) | |
| Dell Precision 5000 5470 | |
| Medio AMD Ryzen 7 PRO 6850U (11272 - 14704, n=8) | |
| Lenovo ThinkPad P14s G3 AMD 21J6S05000 | |
| Lenovo ThinkPad T14 G3-21CF004NGE | |
| HP ZBook Firefly 14 G9-6B8A2EA | |
| AIDA64 / FPU Julia | |
| Media de la clase Workstation (89597 - 186971, n=23, últimos 2 años) | |
| Medio AMD Ryzen 7 PRO 6850U (72242 - 92957, n=8) | |
| Lenovo ThinkPad P14s G3 AMD 21J6S05000 | |
| Lenovo ThinkPad T14 G3-21CF004NGE | |
| Dell Precision 5000 5470 | |
| HP ZBook Firefly 14 G9-6B8A2EA | |
| AIDA64 / CPU SHA3 | |
| Media de la clase Workstation (4178 - 8975, n=23, últimos 2 años) | |
| Dell Precision 5000 5470 | |
| Medio AMD Ryzen 7 PRO 6850U (2419 - 3104, n=8) | |
| Lenovo ThinkPad P14s G3 AMD 21J6S05000 | |
| Lenovo ThinkPad T14 G3-21CF004NGE | |
| HP ZBook Firefly 14 G9-6B8A2EA | |
| AIDA64 / CPU Queen | |
| Dell Precision 5000 5470 | |
| Media de la clase Workstation (60778 - 144411, n=23, últimos 2 años) | |
| Lenovo ThinkPad P14s G3 AMD 21J6S05000 | |
| Medio AMD Ryzen 7 PRO 6850U (86644 - 96912, n=7) | |
| Lenovo ThinkPad T14 G3-21CF004NGE | |
| HP ZBook Firefly 14 G9-6B8A2EA | |
| AIDA64 / FPU SinJulia | |
| Media de la clase Workstation (8165 - 29343, n=23, últimos 2 años) | |
| Lenovo ThinkPad P14s G3 AMD 21J6S05000 | |
| Medio AMD Ryzen 7 PRO 6850U (10917 - 12571, n=8) | |
| Lenovo ThinkPad T14 G3-21CF004NGE | |
| Dell Precision 5000 5470 | |
| HP ZBook Firefly 14 G9-6B8A2EA | |
| AIDA64 / FPU Mandel | |
| Media de la clase Workstation (44497 - 98153, n=23, últimos 2 años) | |
| Medio AMD Ryzen 7 PRO 6850U (39609 - 51296, n=8) | |
| Lenovo ThinkPad P14s G3 AMD 21J6S05000 | |
| Lenovo ThinkPad T14 G3-21CF004NGE | |
| Dell Precision 5000 5470 | |
| HP ZBook Firefly 14 G9-6B8A2EA | |
| AIDA64 / CPU AES | |
| Media de la clase Workstation (73133 - 187841, n=23, últimos 2 años) | |
| Medio AMD Ryzen 7 PRO 6850U (45568 - 60867, n=8) | |
| Lenovo ThinkPad T14 G3-21CF004NGE | |
| Lenovo ThinkPad P14s G3 AMD 21J6S05000 | |
| HP ZBook Firefly 14 G9-6B8A2EA | |
| Dell Precision 5000 5470 | |
| AIDA64 / CPU ZLib | |
| Media de la clase Workstation (929 - 2148, n=23, últimos 2 años) | |
| Lenovo ThinkPad P14s G3 AMD 21J6S05000 | |
| Medio AMD Ryzen 7 PRO 6850U (641 - 805, n=8) | |
| Lenovo ThinkPad T14 G3-21CF004NGE | |
| HP ZBook Firefly 14 G9-6B8A2EA | |
| Dell Precision 5000 5470 | |
| AIDA64 / FP64 Ray-Trace | |
| Media de la clase Workstation (8545 - 32891, n=23, últimos 2 años) | |
| Dell Precision 5000 5470 | |
| Medio AMD Ryzen 7 PRO 6850U (5967 - 7821, n=8) | |
| Lenovo ThinkPad P14s G3 AMD 21J6S05000 | |
| Lenovo ThinkPad T14 G3-21CF004NGE | |
| HP ZBook Firefly 14 G9-6B8A2EA | |
| AIDA64 / CPU PhotoWorxx | |
| Media de la clase Workstation (37151 - 93684, n=23, últimos 2 años) | |
| Dell Precision 5000 5470 | |
| HP ZBook Firefly 14 G9-6B8A2EA | |
| Medio AMD Ryzen 7 PRO 6850U (19707 - 27840, n=8) | |
| Lenovo ThinkPad T14 G3-21CF004NGE | |
| Lenovo ThinkPad P14s G3 AMD 21J6S05000 | |
Rendimiento del sistema
El rendimiento de su sistema fue ligeramente peor que el de sus rivales directos, pero esto no es tan perceptible en el uso diario. Una característica típica de los sistemas AMD actuales es su peor rendimiento de memoria en comparación con los modelos Intel.
CrossMark: Overall | Productivity | Creativity | Responsiveness
| PCMark 10 / Score | |
| Media de la clase Workstation (6563 - 10409, n=19, últimos 2 años) | |
| Dell Precision 5000 5470 | |
| HP ZBook Firefly 14 G9-6B8A2EA | |
| Medio AMD Ryzen 7 PRO 6850U, AMD Radeon 680M (5873 - 6311, n=7) | |
| Lenovo ThinkPad T14 G3-21CF004NGE | |
| Lenovo ThinkPad P14s G3 AMD 21J6S05000 | |
| Lenovo ThinkPad P14s Gen2-20VX000GGE | |
| PCMark 10 / Essentials | |
| Dell Precision 5000 5470 | |
| Media de la clase Workstation (9622 - 11157, n=19, últimos 2 años) | |
| HP ZBook Firefly 14 G9-6B8A2EA | |
| Lenovo ThinkPad T14 G3-21CF004NGE | |
| Medio AMD Ryzen 7 PRO 6850U, AMD Radeon 680M (9151 - 10263, n=7) | |
| Lenovo ThinkPad P14s Gen2-20VX000GGE | |
| Lenovo ThinkPad P14s G3 AMD 21J6S05000 | |
| PCMark 10 / Productivity | |
| Media de la clase Workstation (8789 - 20616, n=19, últimos 2 años) | |
| HP ZBook Firefly 14 G9-6B8A2EA | |
| Lenovo ThinkPad P14s Gen2-20VX000GGE | |
| Medio AMD Ryzen 7 PRO 6850U, AMD Radeon 680M (8435 - 8891, n=7) | |
| Lenovo ThinkPad T14 G3-21CF004NGE | |
| Dell Precision 5000 5470 | |
| Lenovo ThinkPad P14s G3 AMD 21J6S05000 | |
| PCMark 10 / Digital Content Creation | |
| Media de la clase Workstation (8108 - 15631, n=19, últimos 2 años) | |
| Dell Precision 5000 5470 | |
| Lenovo ThinkPad P14s G3 AMD 21J6S05000 | |
| Medio AMD Ryzen 7 PRO 6850U, AMD Radeon 680M (6796 - 8422, n=7) | |
| Lenovo ThinkPad T14 G3-21CF004NGE | |
| HP ZBook Firefly 14 G9-6B8A2EA | |
| Lenovo ThinkPad P14s Gen2-20VX000GGE | |
| CrossMark / Overall | |
| Media de la clase Workstation (1307 - 2267, n=22, últimos 2 años) | |
| Dell Precision 5000 5470 | |
| HP ZBook Firefly 14 G9-6B8A2EA | |
| Lenovo ThinkPad T14 G3-21CF004NGE | |
| Medio AMD Ryzen 7 PRO 6850U, AMD Radeon 680M (1154 - 1442, n=7) | |
| Lenovo ThinkPad P14s G3 AMD 21J6S05000 | |
| CrossMark / Productivity | |
| Media de la clase Workstation (1130 - 2122, n=22, últimos 2 años) | |
| Dell Precision 5000 5470 | |
| HP ZBook Firefly 14 G9-6B8A2EA | |
| Lenovo ThinkPad T14 G3-21CF004NGE | |
| Medio AMD Ryzen 7 PRO 6850U, AMD Radeon 680M (1188 - 1444, n=7) | |
| Lenovo ThinkPad P14s G3 AMD 21J6S05000 | |
| CrossMark / Creativity | |
| Media de la clase Workstation (1657 - 2725, n=22, últimos 2 años) | |
| Dell Precision 5000 5470 | |
| HP ZBook Firefly 14 G9-6B8A2EA | |
| Lenovo ThinkPad T14 G3-21CF004NGE | |
| Medio AMD Ryzen 7 PRO 6850U, AMD Radeon 680M (1180 - 1523, n=7) | |
| Lenovo ThinkPad P14s G3 AMD 21J6S05000 | |
| CrossMark / Responsiveness | |
| Media de la clase Workstation (993 - 2096, n=22, últimos 2 años) | |
| Dell Precision 5000 5470 | |
| HP ZBook Firefly 14 G9-6B8A2EA | |
| Lenovo ThinkPad T14 G3-21CF004NGE | |
| Medio AMD Ryzen 7 PRO 6850U, AMD Radeon 680M (990 - 1282, n=7) | |
| Lenovo ThinkPad P14s G3 AMD 21J6S05000 | |
| PCMark 10 Score | 5953 puntos | |
ayuda | ||
| AIDA64 / Memory Copy | |
| Media de la clase Workstation (56003 - 164795, n=23, últimos 2 años) | |
| Dell Precision 5000 5470 | |
| HP ZBook Firefly 14 G9-6B8A2EA | |
| Lenovo ThinkPad T14 G3-21CF004NGE | |
| Lenovo ThinkPad P14s G3 AMD 21J6S05000 | |
| Medio AMD Ryzen 7 PRO 6850U (31003 - 48605, n=8) | |
| AIDA64 / Memory Read | |
| Media de la clase Workstation (55795 - 121563, n=23, últimos 2 años) | |
| Dell Precision 5000 5470 | |
| HP ZBook Firefly 14 G9-6B8A2EA | |
| Medio AMD Ryzen 7 PRO 6850U (34682 - 45912, n=8) | |
| Lenovo ThinkPad T14 G3-21CF004NGE | |
| Lenovo ThinkPad P14s G3 AMD 21J6S05000 | |
| AIDA64 / Memory Write | |
| Media de la clase Workstation (55663 - 214520, n=23, últimos 2 años) | |
| HP ZBook Firefly 14 G9-6B8A2EA | |
| Dell Precision 5000 5470 | |
| Lenovo ThinkPad P14s G3 AMD 21J6S05000 | |
| Lenovo ThinkPad T14 G3-21CF004NGE | |
| Medio AMD Ryzen 7 PRO 6850U (34532 - 51096, n=8) | |
| AIDA64 / Memory Latency | |
| Media de la clase Workstation (84.5 - 165.2, n=23, últimos 2 años) | |
| Lenovo ThinkPad P14s G3 AMD 21J6S05000 | |
| Lenovo ThinkPad T14 G3-21CF004NGE | |
| Dell Precision 5000 5470 | |
| Medio AMD Ryzen 7 PRO 6850U (86.1 - 135.3, n=8) | |
| HP ZBook Firefly 14 G9-6B8A2EA | |
* ... más pequeño es mejor
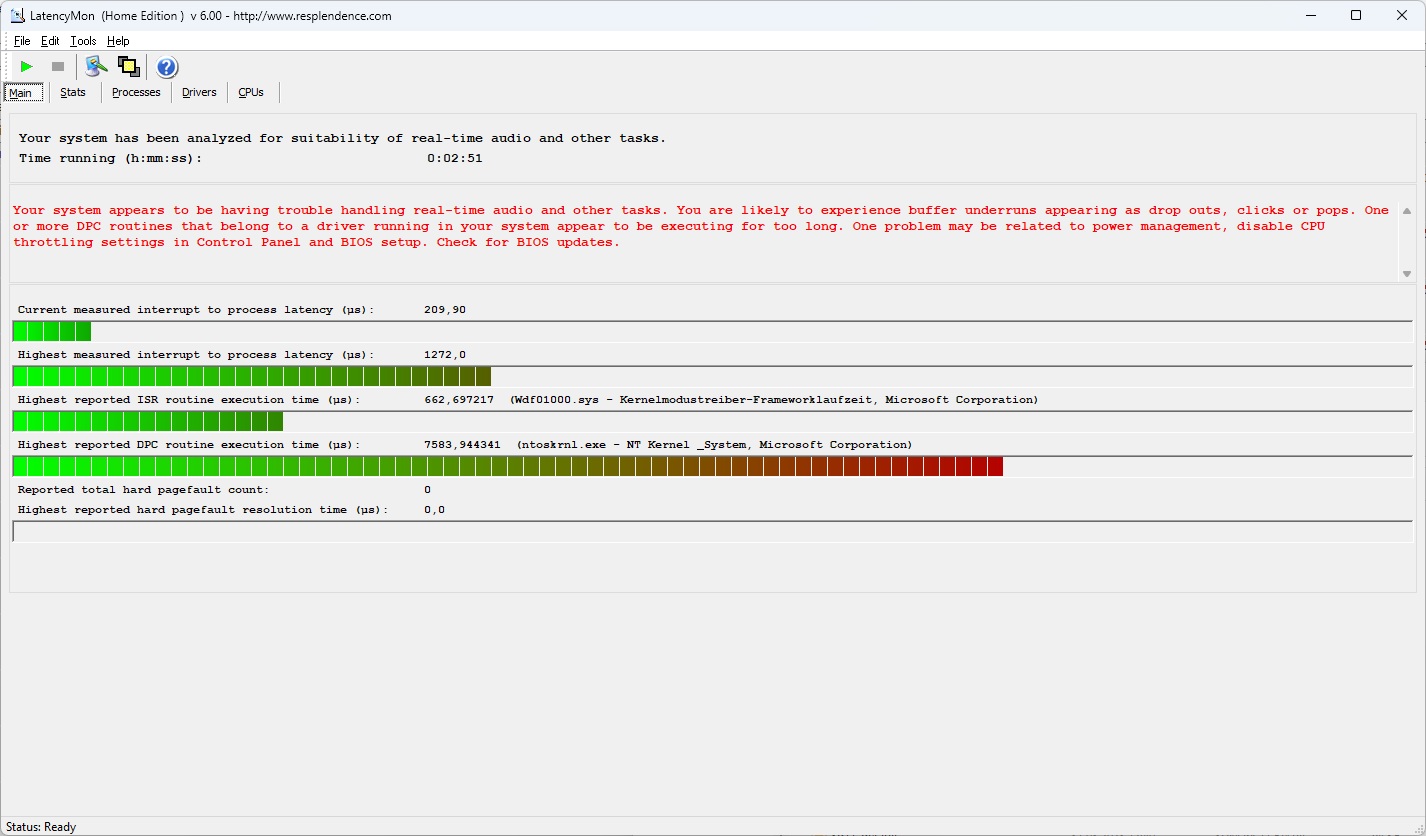
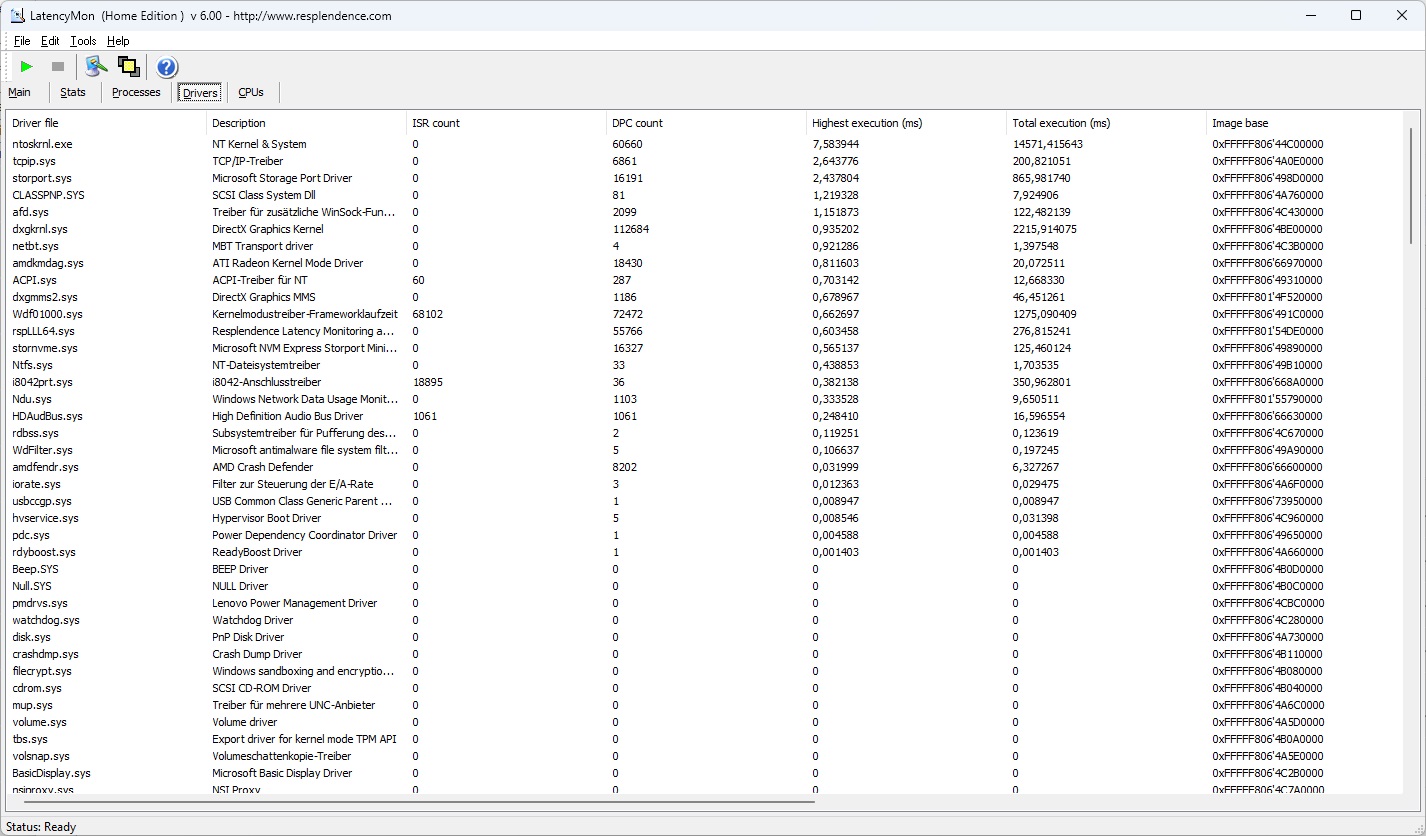
Latencia del CPD
El ThinkPad P14s Gen 3 tiene problemas con las latencias del CPD en la configuración presentada. Esto podría deberse a un problema de drivers, y bien podría resolverse en una futura actualización software.
| DPC Latencies / LatencyMon - interrupt to process latency (max), Web, Youtube, Prime95 | |
| Dell Precision 5000 5470 | |
| Lenovo ThinkPad P14s G3 AMD 21J6S05000 | |
| Lenovo ThinkPad P14s Gen2-20VX000GGE | |
| HP ZBook Firefly 14 G9-6B8A2EA | |
| Lenovo ThinkPad T14 G3-21CF004NGE | |
* ... más pequeño es mejor
Dispositivos de almacenamiento
El Samsung PM9A1 del Lenovo ThinkPad P14s G3 ofrece un alto rendimiento, típico de una SSD PCIe 4.0. El SSD M.2-2280 de una cara también funciona muy rápido bajo carga continua y sin ralentización.

* ... más pequeño es mejor
Reading continuous performance: DiskSpd Read Loop, Queue Depth 8
Tarjeta gráfica
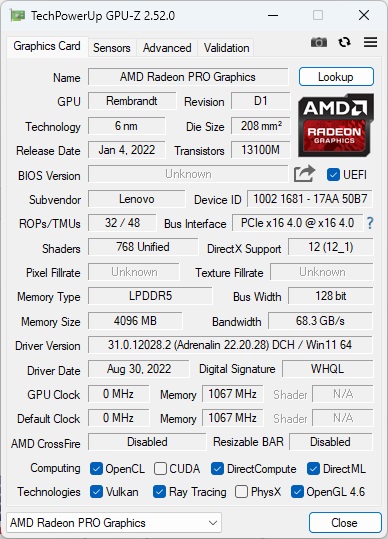
Un rasgo distintivo de las estaciones de trabajo móviles es que, a diferencia de los portátiles de oficina, sus gráficos rinden bien en CAD y otras tareas que requieren un uso intensivo de la GPU. Para ello se suele instalar una GPU dedicada. Sin embargo, Lenovo ha decidido no poner una en el ThinkPad P14s Gen 3. En su lugar, el portátil Lenovo confía exclusivamente en la integrada AMD Radeon 680M.
El resultado es un rendimiento GPU débil para una estación de trabajo - muy por debajo de la media. Para ser justos, sin embargo, laNvidia T550 delZBook Firefly 14 no es realmente mejor. Sólo la Nvidia RTX A1000 del DellPrecision 5470 empieza a mostrar un rendimiento significativamente mejor. Una cosa debe quedar clara si estás pensando en comprar el P14: Es un modelo básico absoluto que renuncia al rendimiento GPU en nombre de la movilidad.
Para jugar, el P14s G3 es tan adecuado como el resto de portátiles AMD actuales con una Radeon 680M: Muchos juegos se ejecutan con bastante fluidez en Full HD - pero con ajustes de detalle reducidos.
Como con el procesador, no notamos ninguna limitación de GPU en modo batería.
| 3DMark Performance rating - Percent | |
| Media de la clase Workstation | |
| Dell Precision 5000 5470 | |
| Lenovo ThinkPad P14s G3 AMD 21J6S05000 | |
| Lenovo ThinkPad T14 G3-21CF004NGE | |
| Medio AMD Radeon 680M | |
| HP ZBook Firefly 14 G9-6B8A2EA -1! | |
| Lenovo ThinkPad P14s Gen2-20VX000GGE | |
| 3DMark 11 - 1280x720 Performance GPU | |
| Media de la clase Workstation (12535 - 69594, n=23, últimos 2 años) | |
| Dell Precision 5000 5470 | |
| Lenovo ThinkPad P14s G3 AMD 21J6S05000 | |
| Lenovo ThinkPad T14 G3-21CF004NGE | |
| Medio AMD Radeon 680M (6858 - 11755, n=39) | |
| HP ZBook Firefly 14 G9-6B8A2EA | |
| Lenovo ThinkPad P14s Gen2-20VX000GGE | |
| 3DMark | |
| 1280x720 Cloud Gate Standard Graphics | |
| Media de la clase Workstation (58392 - 152418, n=14, últimos 2 años) | |
| Dell Precision 5000 5470 | |
| Lenovo ThinkPad T14 G3-21CF004NGE | |
| Lenovo ThinkPad P14s G3 AMD 21J6S05000 | |
| Medio AMD Radeon 680M (24634 - 50120, n=31) | |
| Lenovo ThinkPad P14s Gen2-20VX000GGE | |
| 1920x1080 Fire Strike Graphics | |
| Media de la clase Workstation (8293 - 52560, n=23, últimos 2 años) | |
| Dell Precision 5000 5470 | |
| Lenovo ThinkPad P14s G3 AMD 21J6S05000 | |
| Lenovo ThinkPad T14 G3-21CF004NGE | |
| Medio AMD Radeon 680M (3791 - 7706, n=41) | |
| HP ZBook Firefly 14 G9-6B8A2EA | |
| Lenovo ThinkPad P14s Gen2-20VX000GGE | |
| 2560x1440 Time Spy Graphics | |
| Media de la clase Workstation (2725 - 24806, n=23, últimos 2 años) | |
| Dell Precision 5000 5470 | |
| Lenovo ThinkPad P14s G3 AMD 21J6S05000 | |
| Lenovo ThinkPad T14 G3-21CF004NGE | |
| HP ZBook Firefly 14 G9-6B8A2EA | |
| Medio AMD Radeon 680M (1359 - 2607, n=41) | |
| Lenovo ThinkPad P14s Gen2-20VX000GGE | |
| SPECviewperf Performance rating - Percent | |
| Media de la clase Workstation | |
| Dell Precision 5000 5470 | |
| HP ZBook Firefly 14 G9-6B8A2EA | |
| Lenovo ThinkPad P14s G3 AMD 21J6S05000 | |
| Medio AMD Radeon 680M | |
| Lenovo ThinkPad T14 G3-21CF004NGE | |
| Lenovo ThinkPad P14s Gen2-20VX000GGE -1! | |
| 3DMark 11 Performance | 10377 puntos | |
| 3DMark Cloud Gate Standard Score | 30226 puntos | |
| 3DMark Fire Strike Score | 6722 puntos | |
| 3DMark Time Spy Score | 2724 puntos | |
ayuda | ||
| Blender | |
| v3.3 Classroom HIP/AMD | |
| Medio AMD Radeon 680M (270 - 555, n=34) | |
| Lenovo ThinkPad T14 G3-21CF004NGE | |
| Lenovo ThinkPad P14s G3 AMD 21J6S05000 | |
| Lenovo ThinkPad P14s G3 AMD 21J6S05000 | |
| v3.3 Classroom OPTIX/RTX | |
| HP ZBook Firefly 14 G9-6B8A2EA | |
| Dell Precision 5000 5470 | |
| Media de la clase Workstation (10 - 43, n=17, últimos 2 años) | |
| v3.3 Classroom CUDA | |
| HP ZBook Firefly 14 G9-6B8A2EA | |
| Dell Precision 5000 5470 | |
| Media de la clase Workstation (16 - 74, n=17, últimos 2 años) | |
| v3.3 Classroom CPU | |
| HP ZBook Firefly 14 G9-6B8A2EA | |
| Lenovo ThinkPad T14 G3-21CF004NGE | |
| Medio AMD Radeon 680M (389 - 980, n=37) | |
| Lenovo ThinkPad P14s G3 AMD 21J6S05000 | |
| Dell Precision 5000 5470 | |
| Media de la clase Workstation (148 - 364, n=23, últimos 2 años) | |
* ... más pequeño es mejor
| Performance rating - Percent | |
| Media de la clase Workstation | |
| Dell Precision 5000 5470 | |
| HP ZBook Firefly 14 G9-6B8A2EA | |
| Lenovo ThinkPad T14 G3-21CF004NGE | |
| Lenovo ThinkPad P14s G3 AMD 21J6S05000 | |
| Lenovo ThinkPad P14s Gen2-20VX000GGE | |
| The Witcher 3 - 1920x1080 Ultra Graphics & Postprocessing (HBAO+) | |
| Media de la clase Workstation (n=1últimos 2 años) | |
| Dell Precision 5000 5470 | |
| Lenovo ThinkPad P14s G3 AMD 21J6S05000 | |
| Lenovo ThinkPad T14 G3-21CF004NGE | |
| HP ZBook Firefly 14 G9-6B8A2EA | |
| Lenovo ThinkPad P14s Gen2-20VX000GGE | |
| GTA V - 1920x1080 Highest AA:4xMSAA + FX AF:16x | |
| Media de la clase Workstation (18.1 - 156.1, n=23, últimos 2 años) | |
| Dell Precision 5000 5470 | |
| HP ZBook Firefly 14 G9-6B8A2EA | |
| Lenovo ThinkPad P14s G3 AMD 21J6S05000 | |
| Lenovo ThinkPad T14 G3-21CF004NGE | |
| Lenovo ThinkPad P14s Gen2-20VX000GGE | |
| Final Fantasy XV Benchmark - 1920x1080 High Quality | |
| Media de la clase Workstation (26.4 - 197.6, n=23, últimos 2 años) | |
| Dell Precision 5000 5470 | |
| Lenovo ThinkPad P14s G3 AMD 21J6S05000 | |
| Lenovo ThinkPad T14 G3-21CF004NGE | |
| HP ZBook Firefly 14 G9-6B8A2EA | |
| Lenovo ThinkPad P14s Gen2-20VX000GGE | |
| Strange Brigade - 1920x1080 ultra AA:ultra AF:16 | |
| Media de la clase Workstation (93.2 - 418, n=17, últimos 2 años) | |
| Dell Precision 5000 5470 | |
| Lenovo ThinkPad T14 G3-21CF004NGE | |
| HP ZBook Firefly 14 G9-6B8A2EA | |
| Lenovo ThinkPad P14s G3 AMD 21J6S05000 | |
| Lenovo ThinkPad P14s Gen2-20VX000GGE | |
| Dota 2 Reborn - 1920x1080 ultra (3/3) best looking | |
| Dell Precision 5000 5470 | |
| Media de la clase Workstation (50.7 - 178.4, n=23, últimos 2 años) | |
| HP ZBook Firefly 14 G9-6B8A2EA | |
| Lenovo ThinkPad P14s Gen2-20VX000GGE | |
| Lenovo ThinkPad T14 G3-21CF004NGE | |
| Lenovo ThinkPad P14s G3 AMD 21J6S05000 | |
| X-Plane 11.11 - 1920x1080 high (fps_test=3) | |
| Media de la clase Workstation (30.5 - 139.7, n=23, últimos 2 años) | |
| Dell Precision 5000 5470 | |
| HP ZBook Firefly 14 G9-6B8A2EA | |
| Lenovo ThinkPad P14s Gen2-20VX000GGE | |
| Lenovo ThinkPad T14 G3-21CF004NGE | |
| Lenovo ThinkPad P14s G3 AMD 21J6S05000 | |
Witcher 3 fps diagram
| bajo | medio | alto | ultra | |
|---|---|---|---|---|
| GTA V (2015) | 123.2 | 110.2 | 47.6 | 23.8 |
| The Witcher 3 (2015) | 111.1 | 42.6 | 26.8 | |
| Dota 2 Reborn (2015) | 90.2 | 84.7 | 67.4 | 57.8 |
| Final Fantasy XV Benchmark (2018) | 61.3 | 36.1 | 25.4 | |
| X-Plane 11.11 (2018) | 52 | 39.3 | 31.9 | |
| Far Cry 5 (2018) | 60 | 38 | 35 | 33 |
| Strange Brigade (2018) | 106.8 | 49.1 | 39.9 | 34.1 |
| F1 22 (2022) | 53.1 | 49.1 | 35.4 | 8.32 |
Emisiones: Un poco más ruidoso que el ThinkPad T14 G3 AMD
Emisiones sonoras
Comparado con el ThinkPad T14 Gen 3, el ThinkPad P14s Gen 3 tuvo la tendencia a ser un poco más ruidoso - especialmente en la Witcher 3 prueba. Aunque sus niveles de ruido máximos fueron comparables. Sus competidores Dell y HP tienen sistemas de refrigeración activa mucho más ruidosos.
No pudimos notar ningún ruido de bobina en el P14s G3 - sin embargo, observamos una especie de crujido silencioso, que probablemente fuera sólo el SSD.
Ruido
| Ocioso |
| 22.9 / 22.9 / 22.9 dB(A) |
| Carga |
| 30.8 / 39.5 dB(A) |
 | ||
30 dB silencioso 40 dB(A) audible 50 dB(A) ruidosamente alto |
||
min: | ||
| Lenovo ThinkPad P14s G3 AMD 21J6S05000 Radeon 680M, R7 PRO 6850U, Samsung PM9A1 MZVL21T0HCLR | Lenovo ThinkPad P14s Gen2-20VX000GGE T500 Laptop GPU, i7-1185G7, Toshiba XG6 KXG6AZNV1T02 | Lenovo ThinkPad T14 G3-21CF004NGE Radeon 680M, R7 PRO 6850U, Kioxia BG5 KBG5AZNV512G | Dell Precision 5000 5470 RTX A1000 Laptop GPU, i9-12900H, Samsung PM9A1 MZVL21T0HCLR | HP ZBook Firefly 14 G9-6B8A2EA T550 Laptop GPU, i7-1265U, Micron 3400 1TB MTFDKBA1T0TFH | |
|---|---|---|---|---|---|
| Noise | -9% | -3% | -16% | -9% | |
| apagado / medio ambiente * (dB) | 22.9 | 24.6 -7% | 24.2 -6% | 23 -0% | 23.6 -3% |
| Idle Minimum * (dB) | 22.9 | 24.6 -7% | 24.2 -6% | 23.3 -2% | 23.6 -3% |
| Idle Average * (dB) | 22.9 | 24.6 -7% | 24.2 -6% | 23.3 -2% | 23.6 -3% |
| Idle Maximum * (dB) | 22.9 | 24.6 -7% | 25.8 -13% | 23.3 -2% | 23.6 -3% |
| Load Average * (dB) | 30.8 | 38.9 -26% | 32.2 -5% | 48.5 -57% | 42.5 -38% |
| Witcher 3 ultra * (dB) | 39.4 | 34.1 13% | 48.6 -23% | 42.5 -8% | |
| Load Maximum * (dB) | 39.5 | 38.9 2% | 38.8 2% | 50.4 -28% | 42.5 -8% |
* ... más pequeño es mejor
Temperatura
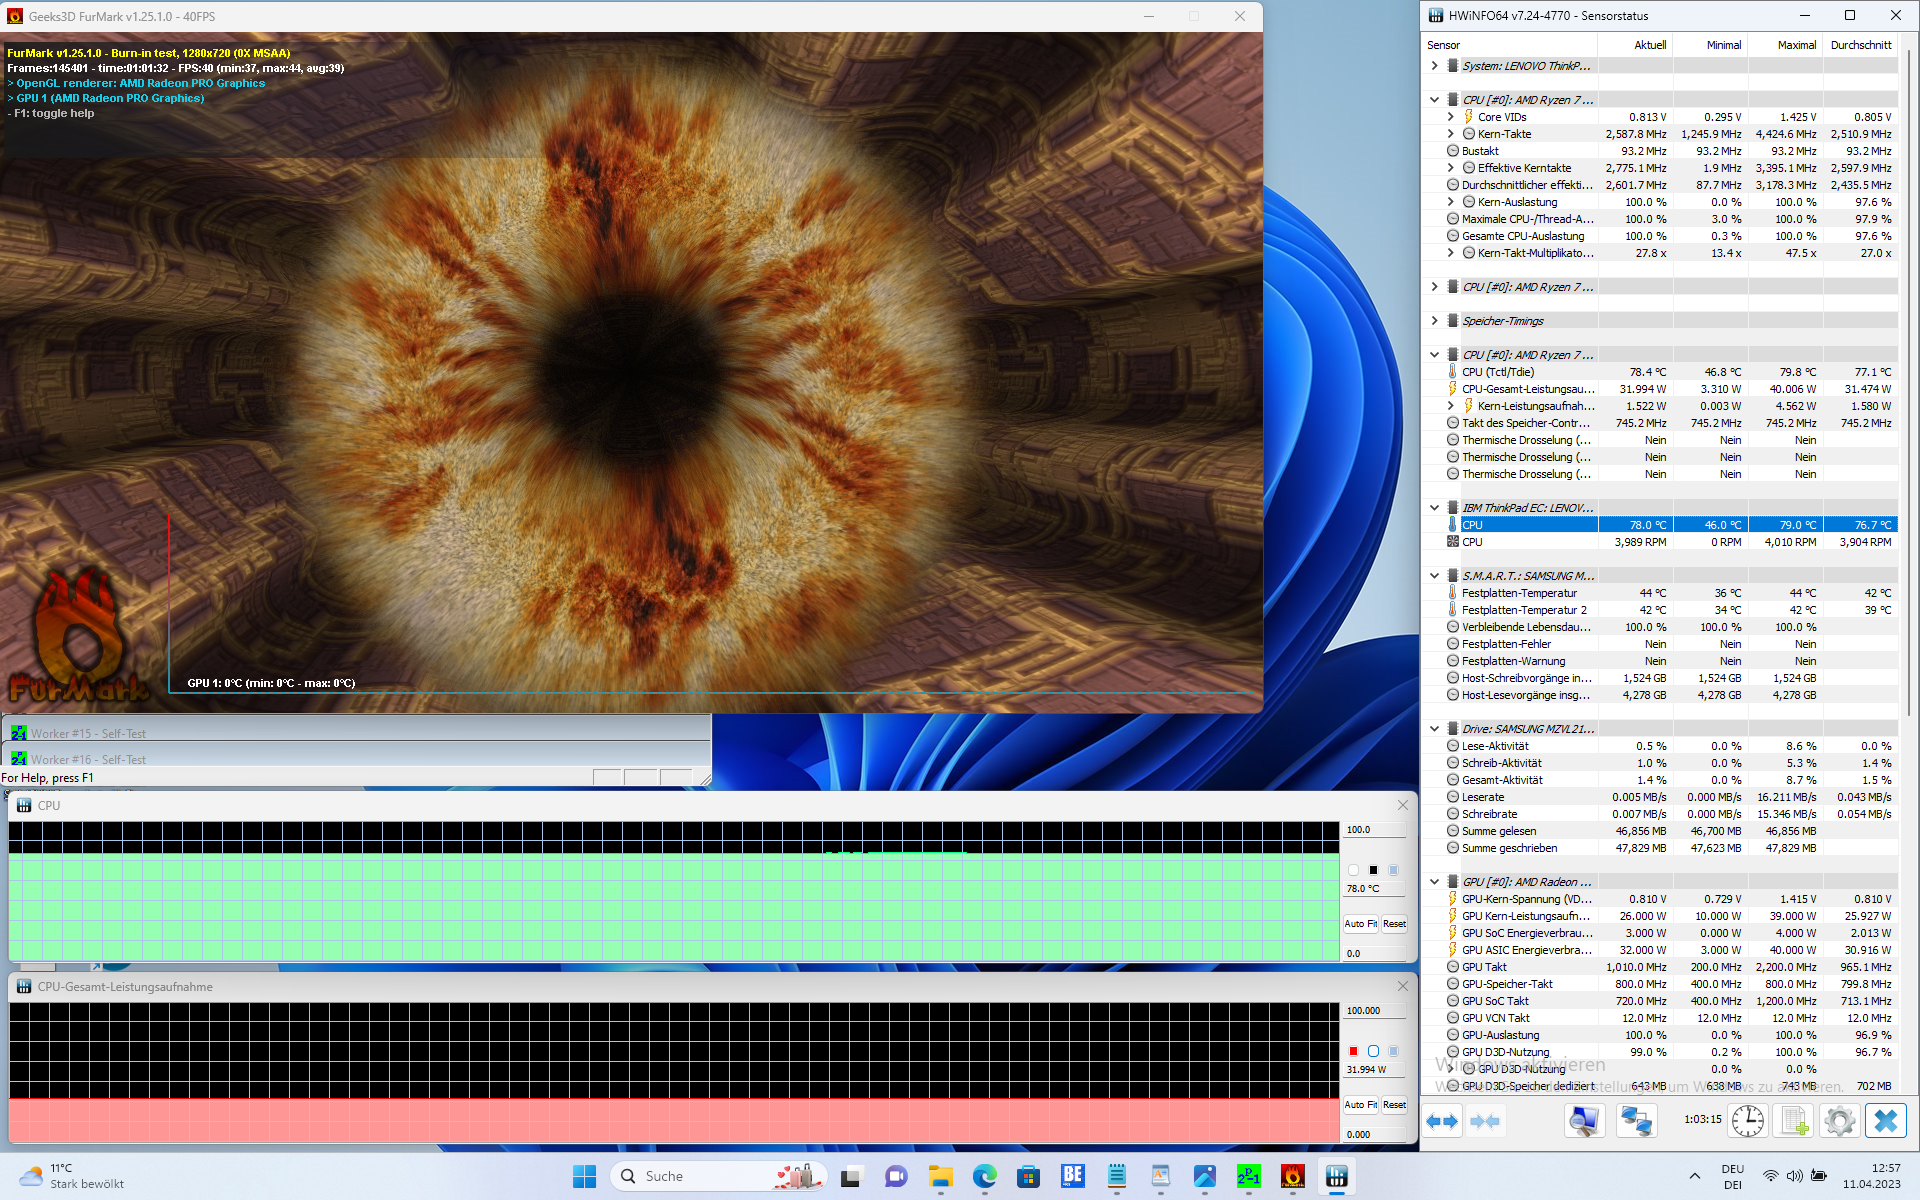
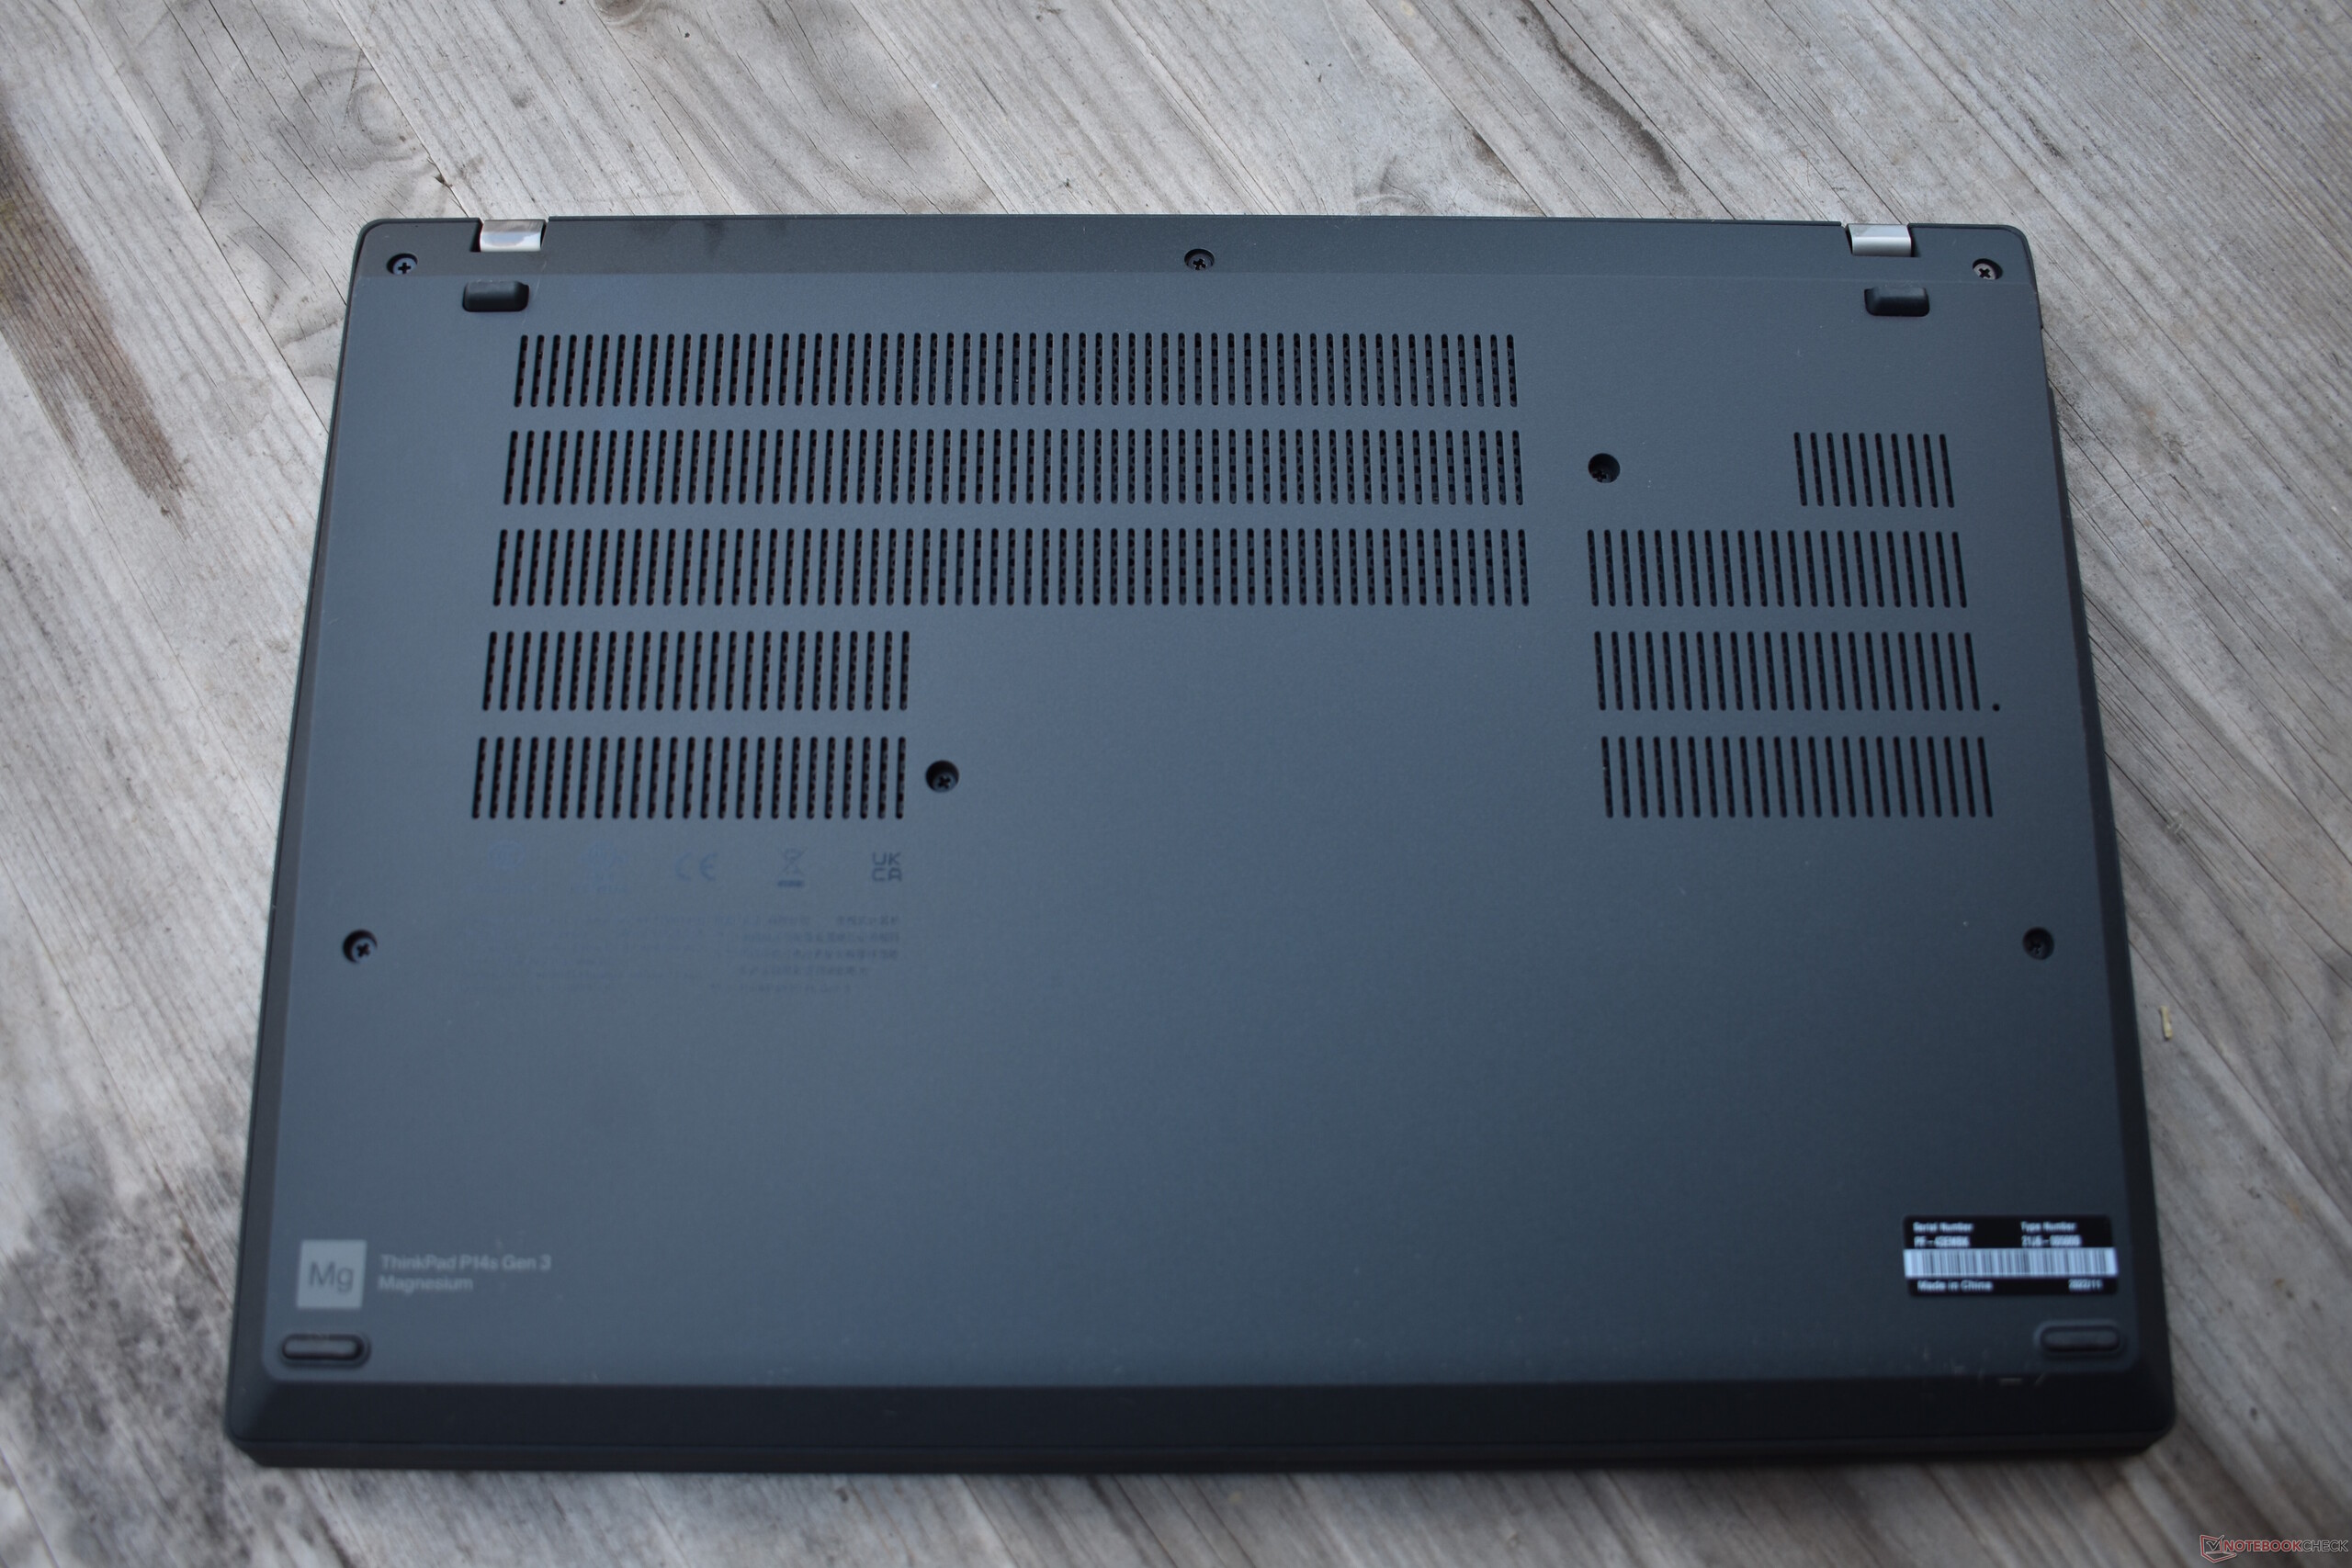
El AMD P14s G3 es un portátil relativamente fresco. El predecesor P14s Gen 2 basado en Intel en particular se calentaba mucho más. Medimos un máximo de 43.1 grados Celsius en el P14s, que también está por debajo de la temperatura máxima del T14 Gen 3 AMD - presumiblemente debido a su ventilador algo más activo.
No hubo absolutamente ninguna ralentización en la prueba de estrés, su procesador fue capaz de mantener su rendimiento estable.
(±) La temperatura máxima en la parte superior es de 42.7 °C / 109 F, frente a la media de 38.2 °C / 101 F, que oscila entre 22.2 y 69.8 °C para la clase Workstation.
(±) El fondo se calienta hasta un máximo de 43.1 °C / 110 F, frente a la media de 41.1 °C / 106 F
(+) En reposo, la temperatura media de la parte superior es de 24.6 °C / 76# F, frente a la media del dispositivo de 32 °C / 90 F.
(±) Jugando a The Witcher 3, la temperatura media de la parte superior es de 32.3 °C / 90 F, frente a la media del dispositivo de 32 °C / 90 F.
(+) El reposamanos y el panel táctil están a una temperatura inferior a la de la piel, con un máximo de 26.8 °C / 80.2 F y, por tanto, son fríos al tacto.
(±) La temperatura media de la zona del reposamanos de dispositivos similares fue de 27.8 °C / 82 F (+1 °C / 1.8 F).
| Lenovo ThinkPad P14s G3 AMD 21J6S05000 AMD Ryzen 7 PRO 6850U, AMD Radeon 680M | Lenovo ThinkPad P14s Gen2-20VX000GGE Intel Core i7-1185G7, NVIDIA T500 Laptop GPU | Lenovo ThinkPad T14 G3-21CF004NGE AMD Ryzen 7 PRO 6850U, AMD Radeon 680M | Dell Precision 5000 5470 Intel Core i9-12900H, NVIDIA RTX A1000 Laptop GPU | HP ZBook Firefly 14 G9-6B8A2EA Intel Core i7-1265U, NVIDIA T550 Laptop GPU | |
|---|---|---|---|---|---|
| Heat | -16% | -6% | -11% | -3% | |
| Maximum Upper Side * (°C) | 42.7 | 52.4 -23% | 48.2 -13% | 41.8 2% | 41.2 4% |
| Maximum Bottom * (°C) | 43.1 | 63.7 -48% | 52.8 -23% | 36 16% | 47.9 -11% |
| Idle Upper Side * (°C) | 25.7 | 24.6 4% | 24.4 5% | 34.6 -35% | 26.5 -3% |
| Idle Bottom * (°C) | 26.4 | 26 2% | 24.5 7% | 33.6 -27% | 27 -2% |
* ... más pequeño es mejor
Altavoces
Los altavoces del ThinkPad P14s Gen 3, situados sobre el teclado, no son particularmente buenos. Son demasiado silenciosos y no tienen suficiente volumen. Se recomienda una solución externa para escuchar música.
Lenovo ThinkPad P14s G3 AMD 21J6S05000 análisis de audio
(-) | altavoces no muy altos (#69.6 dB)
Graves 100 - 315 Hz
(-) | casi sin bajos - de media 20.4% inferior a la mediana
(-) | los graves no son lineales (15.1% delta a la frecuencia anterior)
Medios 400 - 2000 Hz
(+) | medios equilibrados - a sólo 1.6% de la mediana
(+) | los medios son lineales (5.8% delta a la frecuencia anterior)
Altos 2 - 16 kHz
(+) | máximos equilibrados - a sólo 2% de la mediana
(+) | los máximos son lineales (6.1% delta a la frecuencia anterior)
Total 100 - 16.000 Hz
(±) | la linealidad del sonido global es media (18.7% de diferencia con la mediana)
En comparación con la misma clase
» 63% de todos los dispositivos probados de esta clase eran mejores, 8% similares, 29% peores
» El mejor tuvo un delta de 7%, la media fue 17%, el peor fue ###max##%
En comparación con todos los dispositivos probados
» 43% de todos los dispositivos probados eran mejores, 8% similares, 49% peores
» El mejor tuvo un delta de 4%, la media fue 23%, el peor fue ###max##%
HP ZBook Firefly 14 G9-6B8A2EA análisis de audio
(+) | los altavoces pueden reproducir a un volumen relativamente alto (#84.5 dB)
Graves 100 - 315 Hz
(-) | casi sin bajos - de media 19.6% inferior a la mediana
(±) | la linealidad de los graves es media (13% delta a frecuencia anterior)
Medios 400 - 2000 Hz
(+) | medios equilibrados - a sólo 2.5% de la mediana
(+) | los medios son lineales (3.5% delta a la frecuencia anterior)
Altos 2 - 16 kHz
(+) | máximos equilibrados - a sólo 1.9% de la mediana
(+) | los máximos son lineales (3.2% delta a la frecuencia anterior)
Total 100 - 16.000 Hz
(+) | el sonido global es lineal (12.7% de diferencia con la mediana)
En comparación con la misma clase
» 21% de todos los dispositivos probados de esta clase eran mejores, 4% similares, 74% peores
» El mejor tuvo un delta de 7%, la media fue 17%, el peor fue ###max##%
En comparación con todos los dispositivos probados
» 12% de todos los dispositivos probados eran mejores, 3% similares, 86% peores
» El mejor tuvo un delta de 4%, la media fue 23%, el peor fue ###max##%
Gestión de la energía: La eficiencia de AMD mejora la autonomía
Consumo de energía
Su consumo de energía es muy similar al del ThinkPad T14 G3, con la diferencia de que el ThinkPad P14s G3 consume un poco más bajo carga. Sin embargo, su consumo sigue siendo tan bajo que una fuente de alimentación de 65 vatios es más que suficiente. No es el caso de sus competidores Dell y HP.
| Off / Standby | |
| Ocioso | |
| Carga |
|
Clave:
min: | |
| Lenovo ThinkPad P14s G3 AMD 21J6S05000 R7 PRO 6850U, Radeon 680M, Samsung PM9A1 MZVL21T0HCLR, IPS LED, 1920x1200, 14" | Lenovo ThinkPad P14s Gen2-20VX000GGE i7-1185G7, T500 Laptop GPU, Toshiba XG6 KXG6AZNV1T02, IPS, 1920x1080, 14" | Lenovo ThinkPad T14 G3-21CF004NGE R7 PRO 6850U, Radeon 680M, Kioxia BG5 KBG5AZNV512G, IPS, 1920x1200, 14" | Dell Precision 5000 5470 i9-12900H, RTX A1000 Laptop GPU, Samsung PM9A1 MZVL21T0HCLR, IPS, 2560x1600, 14" | HP ZBook Firefly 14 G9-6B8A2EA i7-1265U, T550 Laptop GPU, Micron 3400 1TB MTFDKBA1T0TFH, IPS, 1920x1200, 14" | Medio AMD Radeon 680M | Media de la clase Workstation | |
|---|---|---|---|---|---|---|---|
| Power Consumption | -34% | 9% | -110% | -19% | -72% | -187% | |
| Idle Minimum * (Watt) | 2.6 | 4.5 -73% | 2.4 8% | 4.3 -65% | 4.2 -62% | 6.93 ? -167% | 9.11 ? -250% |
| Idle Average * (Watt) | 5 | 7.1 -42% | 5.3 -6% | 8.9 -78% | 6.5 -30% | 8.98 ? -80% | 13.8 ? -176% |
| Idle Maximum * (Watt) | 5.6 | 9.7 -73% | 5.6 -0% | 18.9 -238% | 7.2 -29% | 10.5 ? -88% | 17.9 ? -220% |
| Load Average * (Watt) | 49.7 | 37.8 24% | 39.7 20% | 94 -89% | 47.7 4% | 53.5 ? -8% | 96 ? -93% |
| Witcher 3 ultra * (Watt) | 50.6 | 42.8 15% | 83.2 -64% | 42.9 15% | |||
| Load Maximum * (Watt) | 61.1 | 64.7 -6% | 50.6 17% | 137.5 -125% | 68.2 -12% | 70.5 ? -15% | 180.3 ? -195% |
* ... más pequeño es mejor
Power consumption Witcher 3 / stress test
Power consumption with external monitor
Duración de la batería
Como el ThinkPad T14 Gen 3 de Lenovo, el ThinkPad P14s G3 logra sacar mucho de su batería de 52.5 vatios-hora. Doce horas en la prueba Wi-Fi (150 cd/m²) son un resultado respetable. Incluso con el brillo de pantalla al máximo, el portátil ThinkPad aguantó casi diez horas en el test Wi-Fi. Sus rivales basados en Intel de Dell y HP sólo pueden soñar con eso.
| Lenovo ThinkPad P14s G3 AMD 21J6S05000 R7 PRO 6850U, Radeon 680M, 52.5 Wh | Lenovo ThinkPad P14s Gen2-20VX000GGE i7-1185G7, T500 Laptop GPU, 50 Wh | Lenovo ThinkPad T14 G3-21CF004NGE R7 PRO 6850U, Radeon 680M, 52.5 Wh | Dell Precision 5000 5470 i9-12900H, RTX A1000 Laptop GPU, 72 Wh | HP ZBook Firefly 14 G9-6B8A2EA i7-1265U, T550 Laptop GPU, 51 Wh | Media de la clase Workstation | |
|---|---|---|---|---|---|---|
| Duración de Batería | -25% | 20% | -11% | -28% | -5% | |
| H.264 (h) | 12 | 16.4 37% | 10.1 ? -16% | |||
| WiFi v1.3 (h) | 12.2 | 9.2 -25% | 12.9 6% | 9.6 -21% | 8.8 -28% | 8.55 ? -30% |
| Load (h) | 1.1 | 1.3 18% | 1.1 0% | 1.441 ? 31% |
Pro
Contra
Veredicto: El Lenovo ThinkPad P14s G3 AMD es una excelente estación de trabajo básica

Una estación de trabajo móvil que renderice elaborados proyectos CAD durante horas o que pueda usarse para el desarrollo de juegos - esto es exactamente lo que no es el Lenovo ThinkPad P14s Gen 3 AMD. Se trata más bien de un modelo básico que ofrece principalmente un buen rendimiento de CPU, pero que queda muy por detrás de los portátiles de estación de trabajo más grandes en términos de rendimiento de GPU. El portátil Lenovo compensa este menor rendimiento con una muy buena movilidad.
Esto también debería dejar claro que no está pensado para sustituir a "grandes" estaciones de trabajo como el ThinkPad P16. Es una variante del ThinkPad T14 G3, un portátil de oficina que también se comercializa para clientes de estaciones de trabajo. Lógicamente, comparte puntos fuertes y débiles similares con el ThinkPad T14 G3 AMD. La ausencia de ranura para tarjetas SD es uno de esos puntos débiles, al igual que el estándar USB4 no soportado. La RAM soldada es aún más molesta en un dispositivo de estación de trabajo, y el teclado no está al mismo nivel que el del P14s Gen 2aunque sigue siendo muy bueno. Su presencia de Ethernet y su teclado fácilmente reemplazable también son aspectos positivos.
Buen rendimiento de CPU y duración de batería, bajo rendimiento de GPU para una estación de trabajo: El Lenovo ThinkPad P14s Gen 3 AMD
El Lenovo ThinkPad P14s Gen 3 AMD es una excelente estación de trabajo móvil para tareas que requieran el rendimiento de la CPU. Sus principales competidores son el HP ZBook Firefly 14 G9que ofrece Thunderbolt pero tiene peor rendimiento multinúcleo y menos duración de batería con el procesador Intel más ineficiente. Otra alternativa es el Dell Precision 5470que se caracteriza principalmente por su rendimiento de GPU significativamente mejor - pero hace grandes sacrificios en términos de puertos (aparte de la presencia de Thunderbolt y un lector de tarjetas SD).
Precio y disponibilidad
El modelo que probamos con Ryzen 7, pantalla WUXGA, 32 GB de RAM y SSD de 1 TB con el número de modelo 21J6S05000 es un modelo especial que solo está disponible en el programa Campus de Lenovo para compradores elegibles. Cuesta alrededor de 1.640 dólares y viene sin sistema operativo. Para el resto de clientes, este modelo con Windows 11 Pro(21J5002FGE) está disponible por unos 1.900 dólares. Amazon tiene en oferta el ThinkPad P14s Gen 3 AMD con pantalla WQUXGA de mayor resolución por unos 1.661 dólares.
Lenovo ThinkPad P14s G3 AMD 21J6S05000
- 04/17/2023 v7 (old)
Benjamin Herzig
Transparencia
La selección de los dispositivos que se van a reseñar corre a cargo de nuestro equipo editorial. La muestra de prueba fue proporcionada al autor en calidad de préstamo por el fabricante o el minorista a los efectos de esta reseña. El prestamista no tuvo ninguna influencia en esta reseña, ni el fabricante recibió una copia de la misma antes de su publicación. No había ninguna obligación de publicar esta reseña. Como empresa de medios independiente, Notebookcheck no está sujeta a la autoridad de fabricantes, minoristas o editores.
Así es como prueba Notebookcheck
Cada año, Notebookcheck revisa de forma independiente cientos de portátiles y smartphones utilizando procedimientos estandarizados para asegurar que todos los resultados son comparables. Hemos desarrollado continuamente nuestros métodos de prueba durante unos 20 años y hemos establecido los estándares de la industria en el proceso. En nuestros laboratorios de pruebas, técnicos y editores experimentados utilizan equipos de medición de alta calidad. Estas pruebas implican un proceso de validación en varias fases. Nuestro complejo sistema de clasificación se basa en cientos de mediciones y puntos de referencia bien fundamentados, lo que mantiene la objetividad.Price comparison

