Análisis de la estación de trabajo Lenovo ThinkPad P16 G1 RTX A5500: Más rápida que la Dell Precision 7670
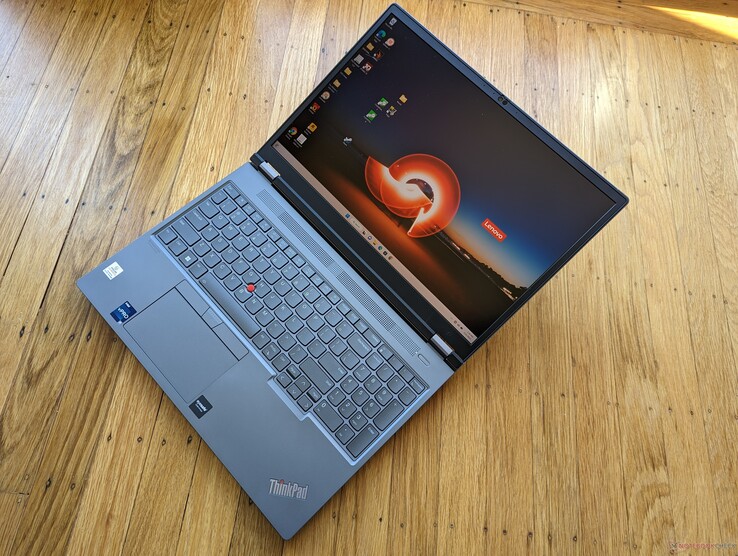
El ThinkPad P16 G1 es una nueva generación de estaciones de trabajo ThinkPad de 16 pulgadas diseñada para superar a la actual serie ThinkPad P1 de 16 pulgadas Lenovo ThinkPad P1 G4 Laptop Review: BIOS update provides more CPU performance . Lleva algunas de las CPU móviles y GPU de estación de trabajo más rápidas disponibles actualmente, hasta el Core i9-12950HX y RTX A5500, respectivamente, para ser una de las estaciones de trabajo móviles más rápidas del mercado. Nuestra unidad configurada se vende por unos 9.000 dólares. Por supuesto, SKUs de gama inferior con gráficos UHD integrados más lentos o el Intel ARC Pro A30M también están disponibles con precios de salida de $3400 en su lugar.
El modelo compite directamente con otras estaciones de trabajo móviles de gama alta y algunos portátiles Nvidia Studio como el Dell Precision 7670, Asus ProArt StudioBook Pro 16, MSI CreatorPro Z16P, o el HP ZBook Studio 16 G9. Consulte nuestro análisis completo de la configuración ThinkPad P16 G1 RTX A2000 para obtener más información sobre el chasis y otras características físicas del modelo. Este análisis se centrará en lo que los usuarios pueden esperar del ThinkPad P16 G1 en términos de rendimiento si se configura con las opciones de CPU y GPU de gama más alta.
Más análisis de Lenovo:
Posibles contendientes en la comparación
Valoración | Fecha | Modelo | Peso | Altura | Tamaño | Resolución | Precio |
|---|---|---|---|---|---|---|---|
| 91 % v7 (old) | 02/2023 | Lenovo ThinkPad P16 G1 RTX A5500 i9-12950HX, RTX A5500 Laptop GPU | 3 kg | 30.23 mm | 16.00" | 3840x2400 | |
v (old) | 12/2021 | Asus ProArt StudioBook 16 W7600H5A-2BL2 W-11955M, RTX A5000 Laptop GPU | 2.4 kg | 21.4 mm | 16.00" | 3840x2400 | |
| 89.1 % v7 (old) | 12/2022 | Dell Precision 7000 7670 Performance i9-12950HX, RTX A5500 Laptop GPU | 2.8 kg | 25.95 mm | 16.00" | 3840x2400 | |
| 88.2 % v7 (old) | 02/2023 | Lenovo ThinkPad P16 G1 21D6001DMB i7-12850HX, RTX A2000 Laptop GPU | 3 kg | 30.23 mm | 16.00" | 2560x1600 | |
| 84.3 % v7 (old) | 11/2022 | MSI CreatorPro Z16P B12UKST i7-12700H, RTX A3000 Laptop GPU | 2.4 kg | 19 mm | 16.00" | 2560x1600 | |
| 90.1 % v7 (old) | 11/2022 | HP ZBook Studio 16 G9 62U04EA i7-12800H, RTX A2000 Laptop GPU | 1.8 kg | 19 mm | 16.00" | 3840x2400 |
Caso
Lector de tarjetas SD
El lector de tarjetas integrado ofrece una velocidad de transferencia media. Pasar 1 GB de imágenes de nuestra tarjeta de prueba UHS-II al escritorio lleva unos 14 segundos, frente a menos de la mitad en el Precision 7670. Para una estación de trabajo móvil de gama alta como nuestro ThinkPad P1, esperábamos un poco más.
| SD Card Reader | |
| average JPG Copy Test (av. of 3 runs) | |
| Dell Precision 7000 7670 Performance (Toshiba Exceria Pro SDXC 64 GB UHS-II) | |
| MSI CreatorPro Z16P B12UKST (AV Pro V60) | |
| Lenovo ThinkPad P16 G1 RTX A5500 (Toshiba Exceria Pro SDXC 64 GB UHS-II) | |
| HP ZBook Studio 16 G9 62U04EA (Angelbird AV PRO V60) | |
| Asus ProArt StudioBook 16 W7600H5A-2BL2 (AV Pro SD microSD 128 GB V60) | |
| Lenovo ThinkPad P16 G1 21D6001DMB (AV Pro V60) | |
| maximum AS SSD Seq Read Test (1GB) | |
| Dell Precision 7000 7670 Performance (Toshiba Exceria Pro SDXC 64 GB UHS-II) | |
| Asus ProArt StudioBook 16 W7600H5A-2BL2 (AV Pro SD microSD 128 GB V60) | |
| MSI CreatorPro Z16P B12UKST (AV Pro V60) | |
| Lenovo ThinkPad P16 G1 RTX A5500 (Toshiba Exceria Pro SDXC 64 GB UHS-II) | |
| HP ZBook Studio 16 G9 62U04EA (Angelbird AV PRO V60) | |
| Lenovo ThinkPad P16 G1 21D6001DMB (AV Pro V60) | |
Comunicación
| Networking | |
| iperf3 transmit AX12 | |
| Asus ProArt StudioBook 16 W7600H5A-2BL2 | |
| iperf3 receive AX12 | |
| Asus ProArt StudioBook 16 W7600H5A-2BL2 | |
| iperf3 receive AXE11000 6GHz | |
| MSI CreatorPro Z16P B12UKST | |
| HP ZBook Studio 16 G9 62U04EA | |
| Dell Precision 7000 7670 Performance | |
| Lenovo ThinkPad P16 G1 RTX A5500 | |
| iperf3 receive AXE11000 | |
| Lenovo ThinkPad P16 G1 21D6001DMB | |
| Lenovo ThinkPad P16 G1 RTX A5500 | |
| Dell Precision 7000 7670 Performance | |
| iperf3 transmit AXE11000 | |
| Lenovo ThinkPad P16 G1 RTX A5500 | |
| Lenovo ThinkPad P16 G1 21D6001DMB | |
| Dell Precision 7000 7670 Performance | |
| iperf3 transmit AXE11000 6GHz | |
| MSI CreatorPro Z16P B12UKST | |
| HP ZBook Studio 16 G9 62U04EA | |
| Lenovo ThinkPad P16 G1 RTX A5500 | |
| Dell Precision 7000 7670 Performance | |
Cámara web


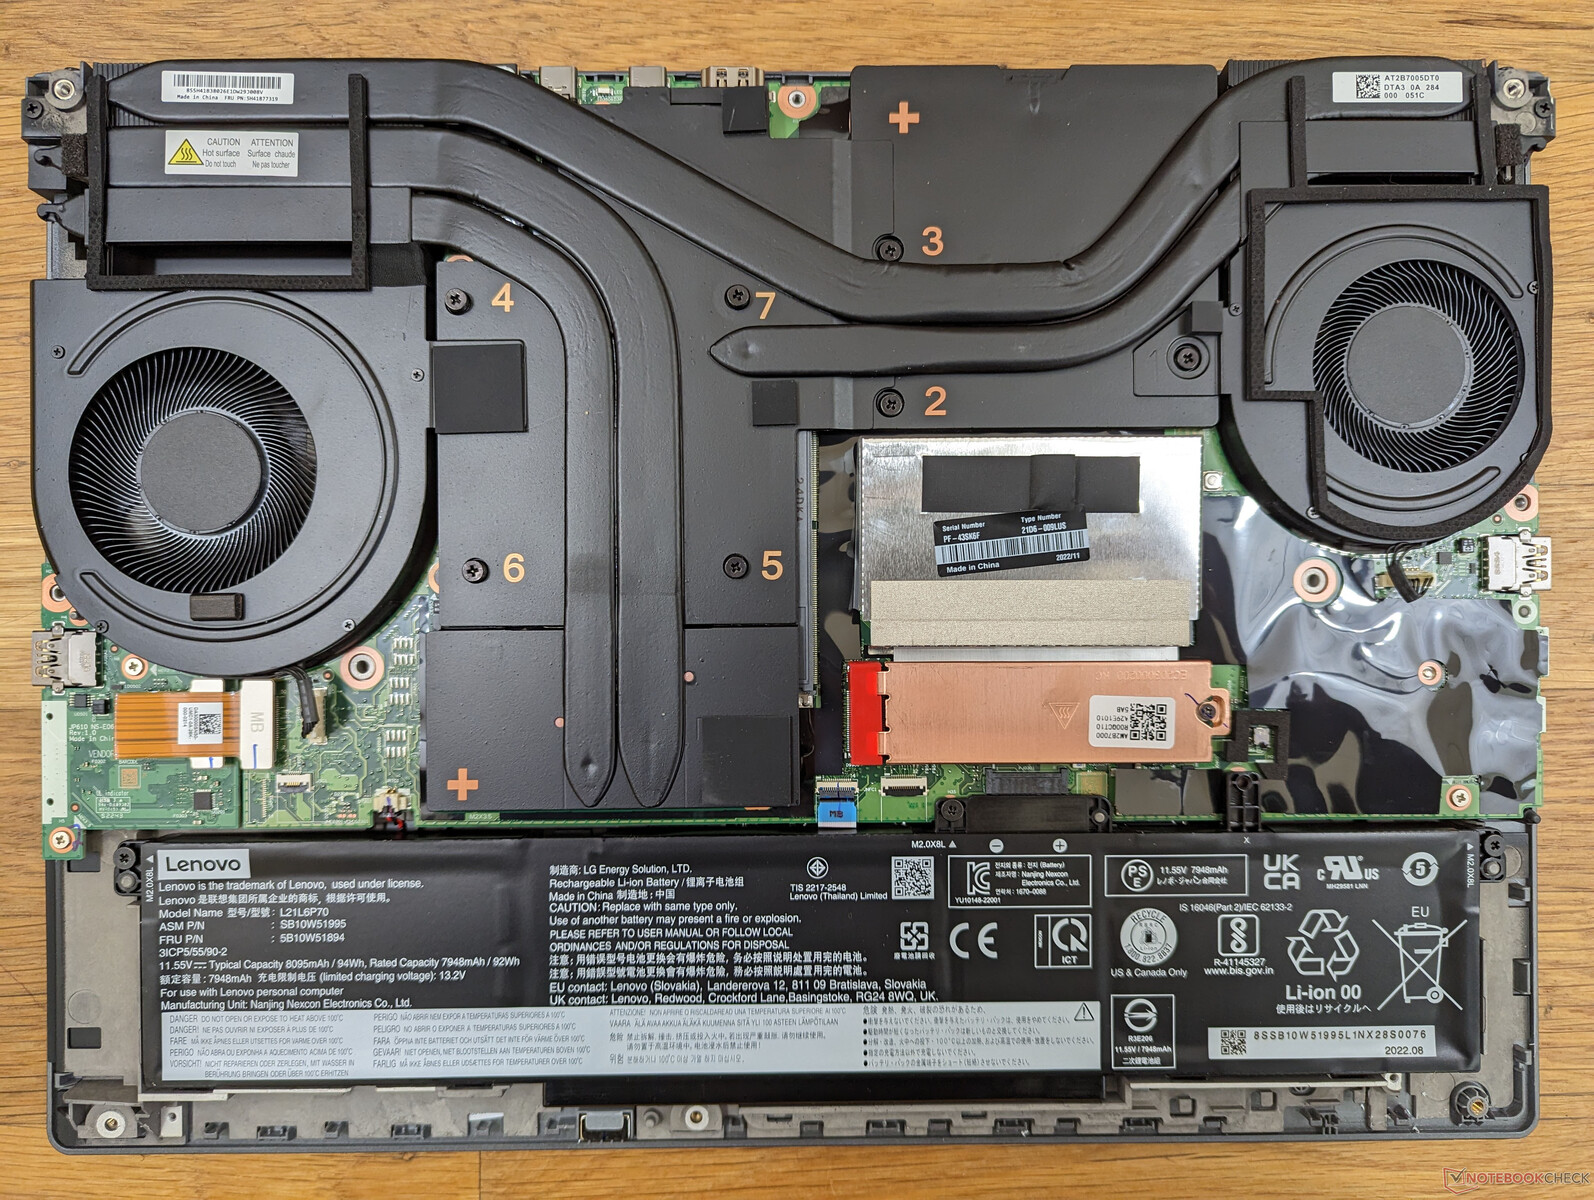
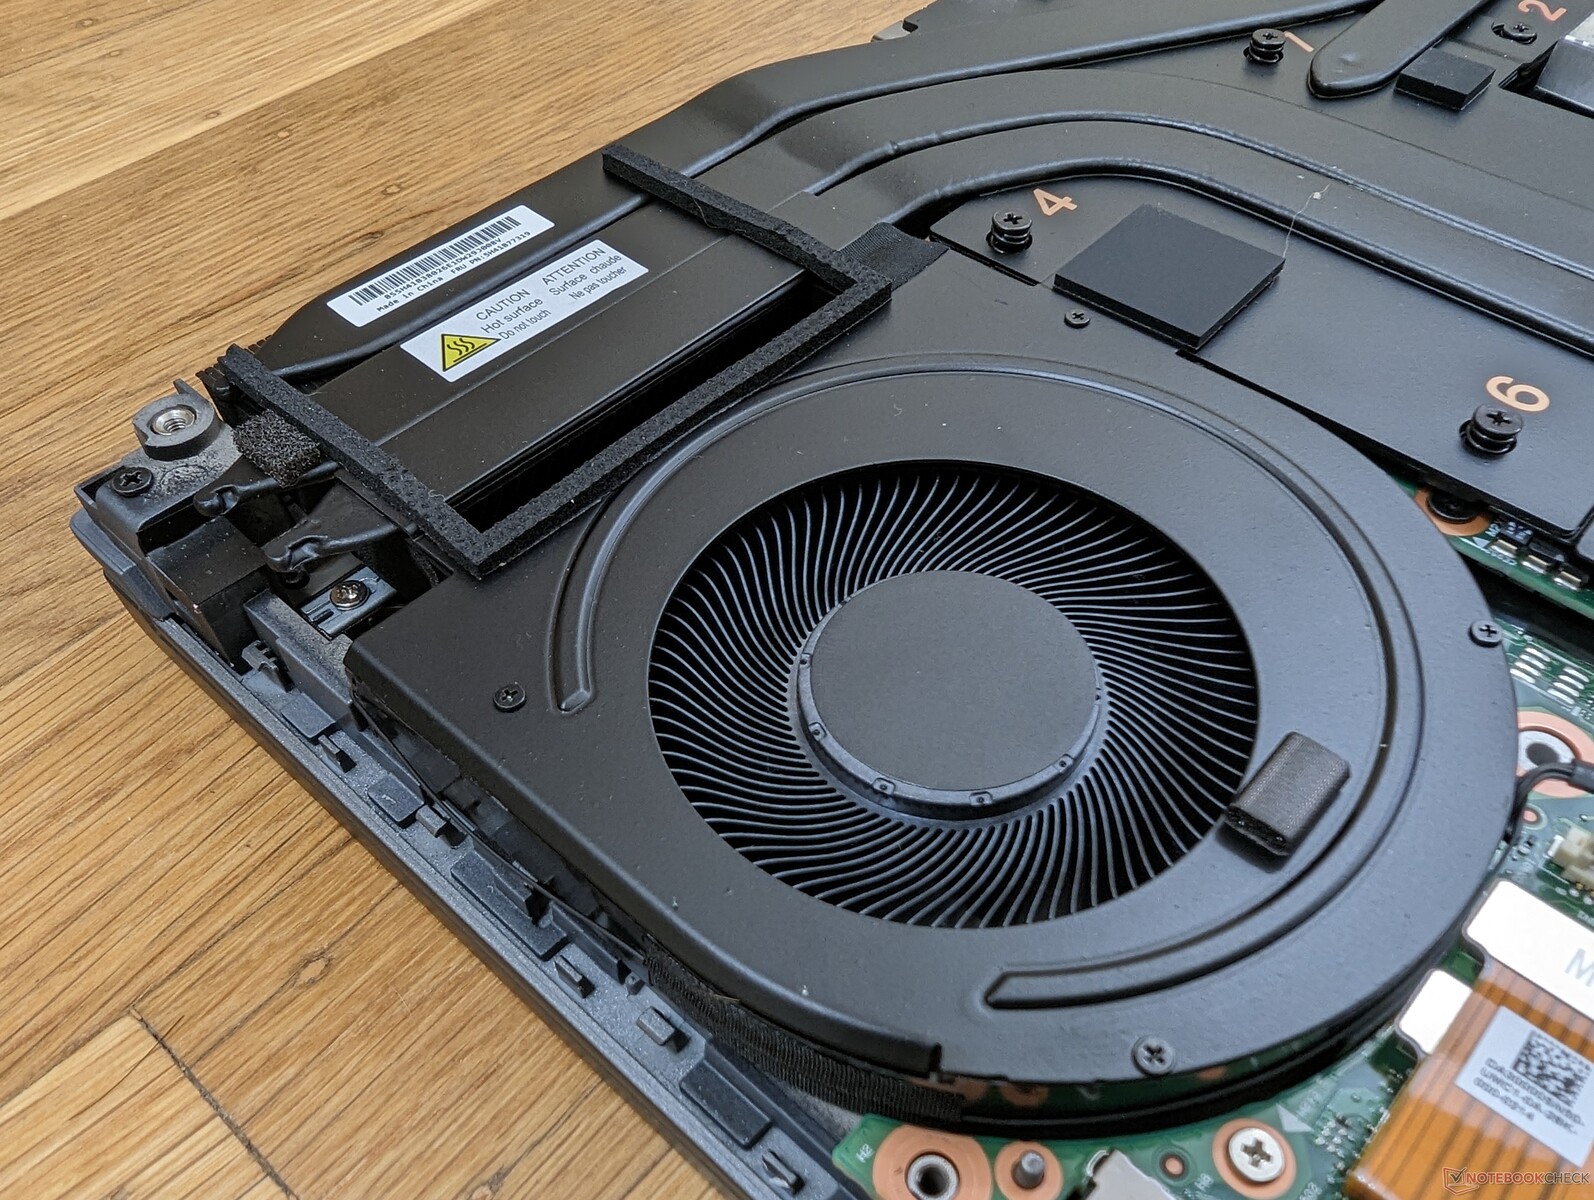
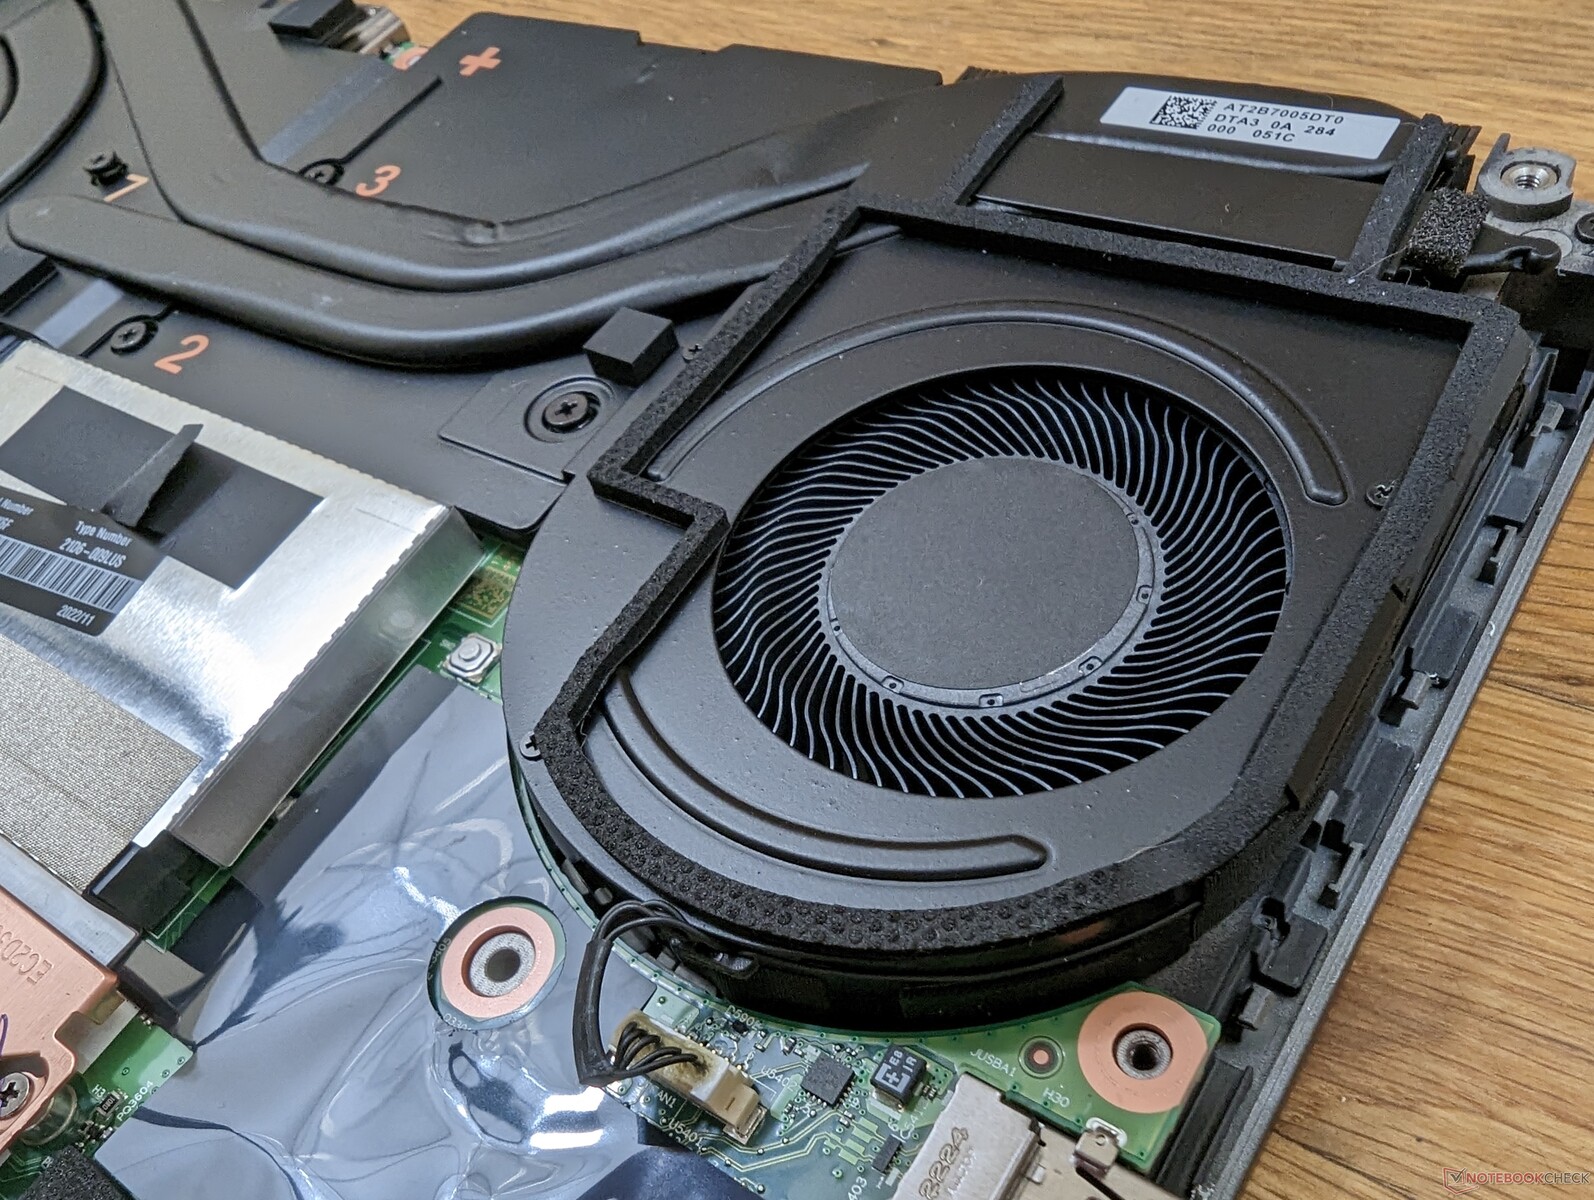
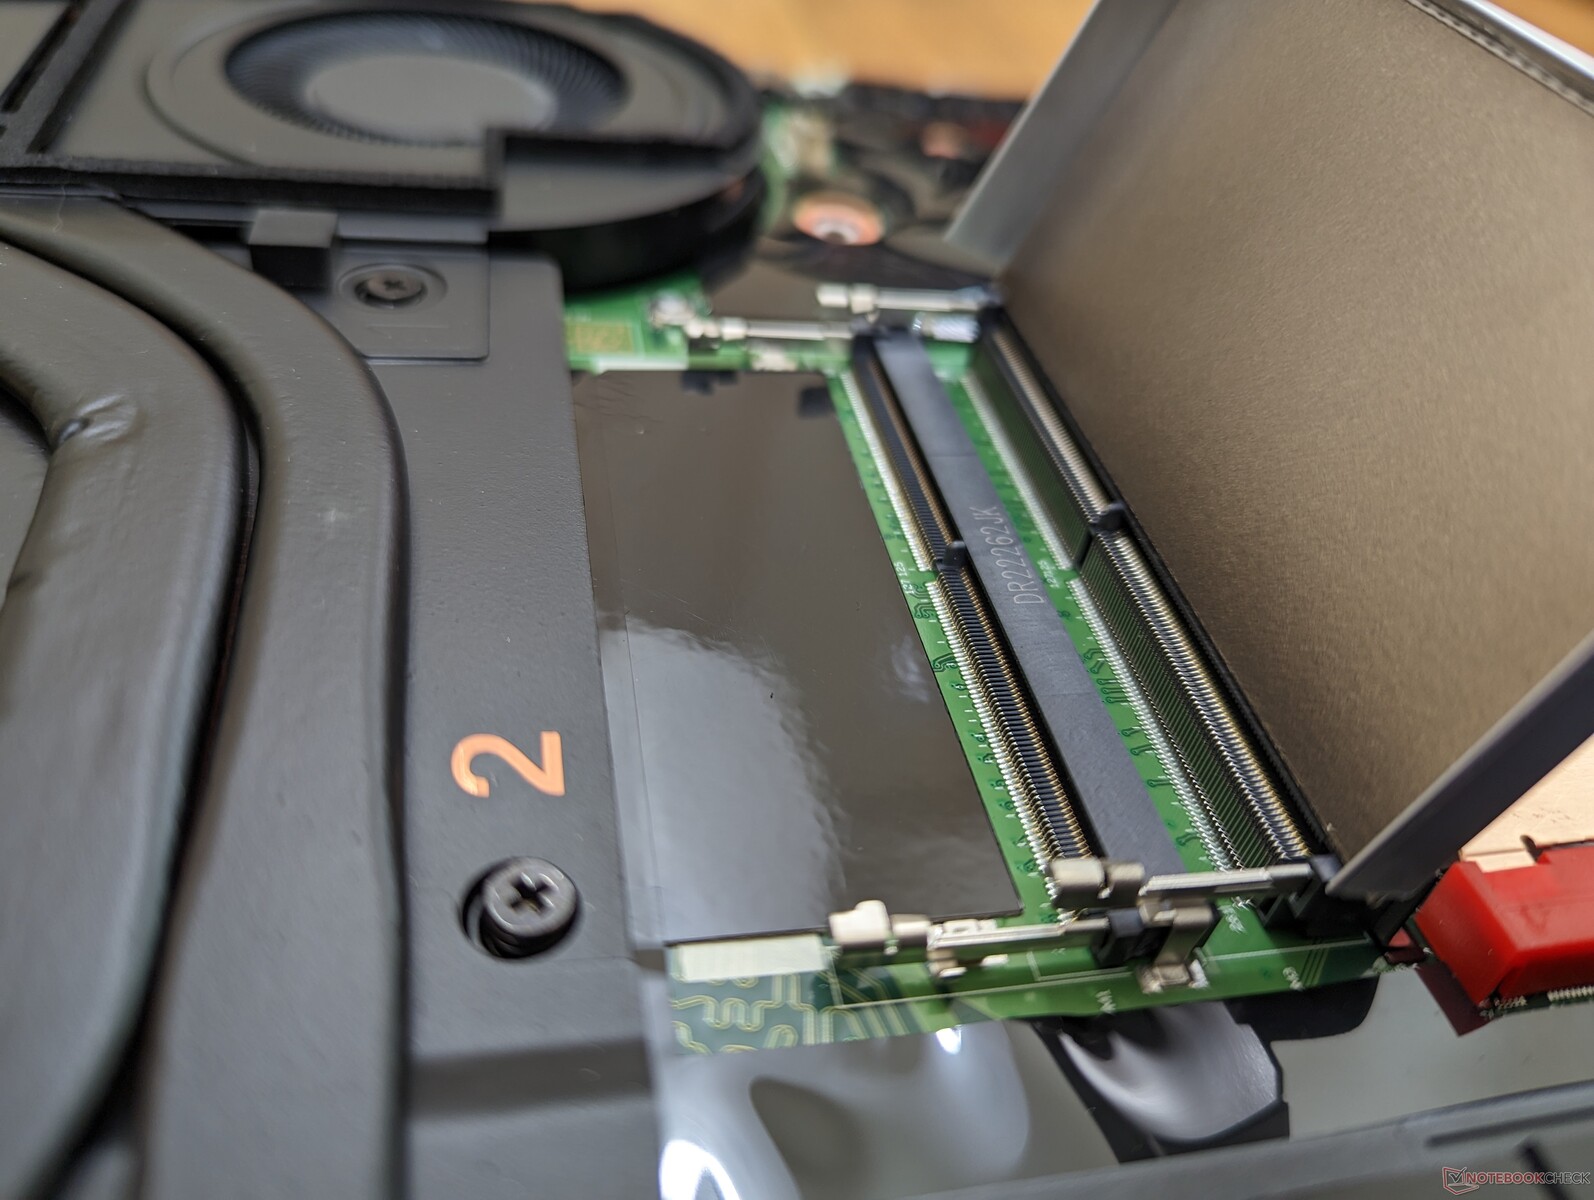
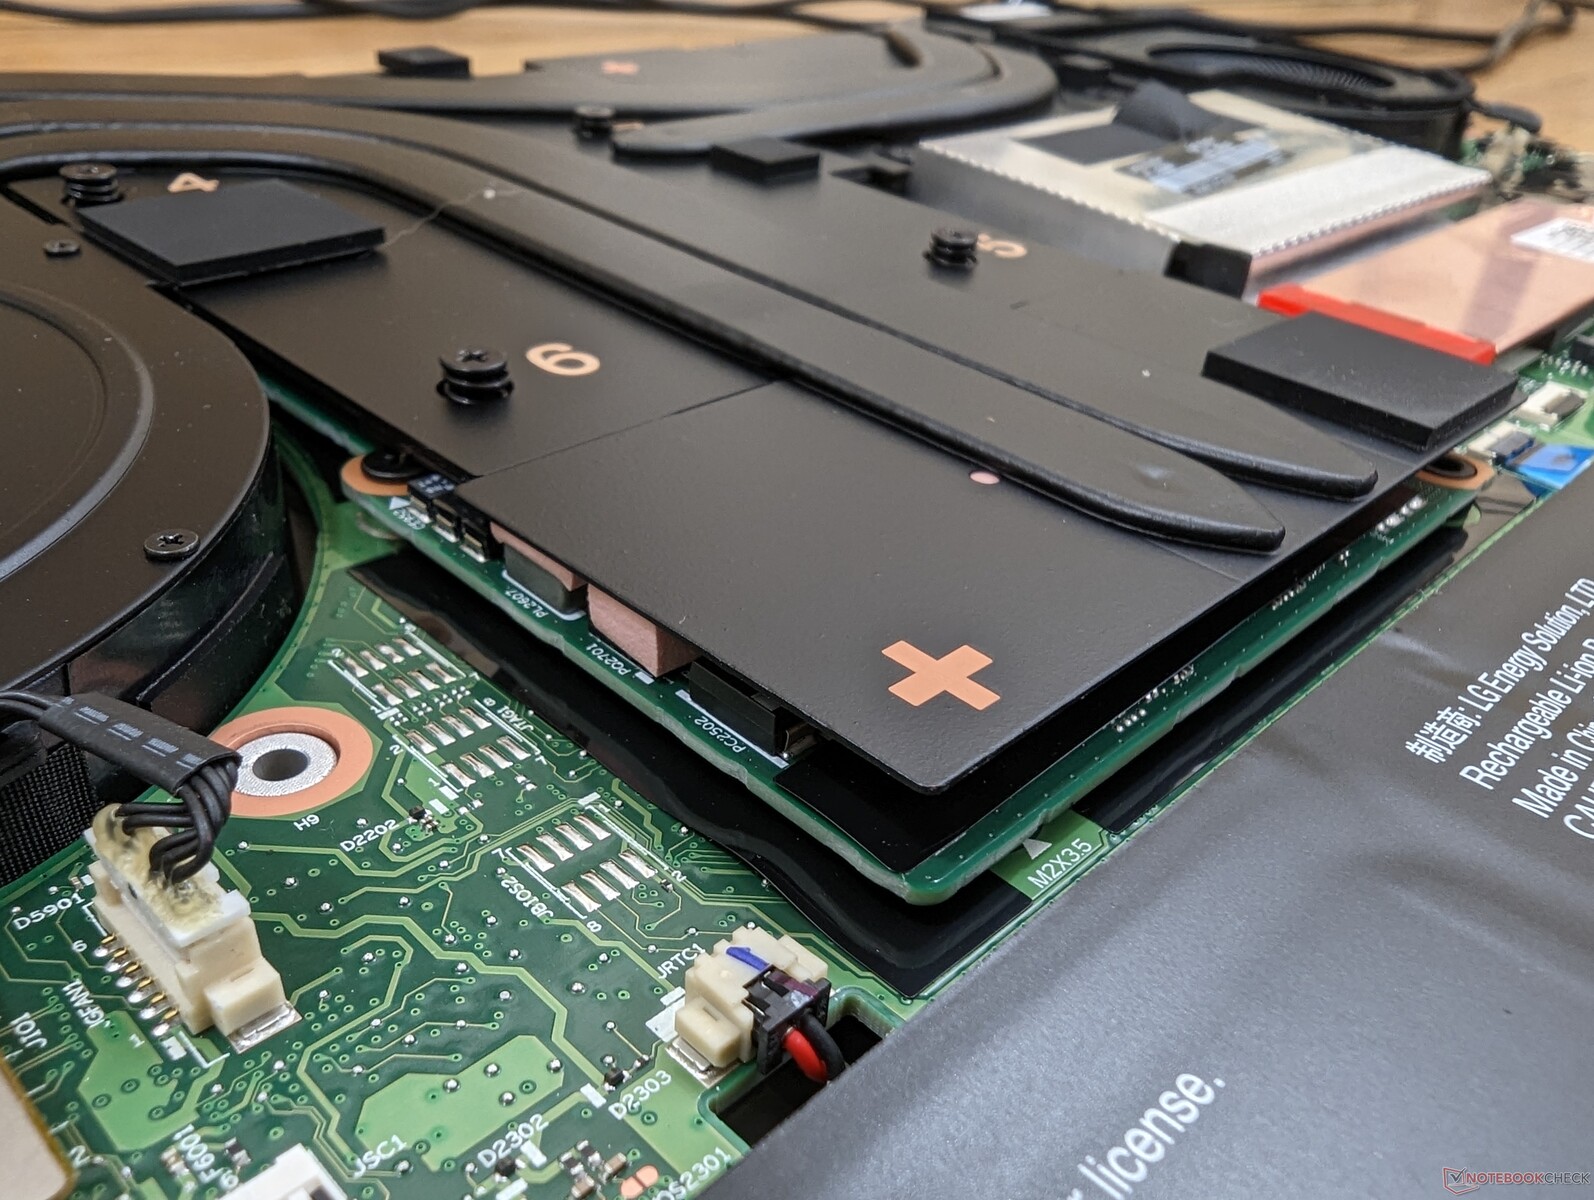
Mantenimiento
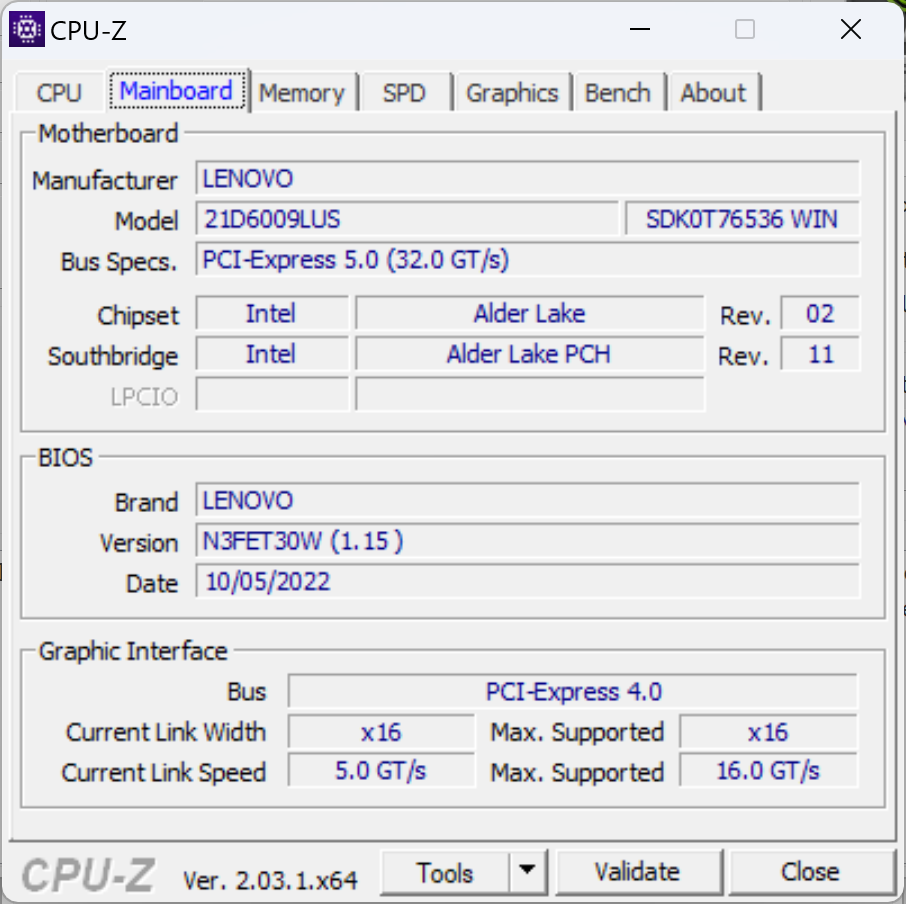
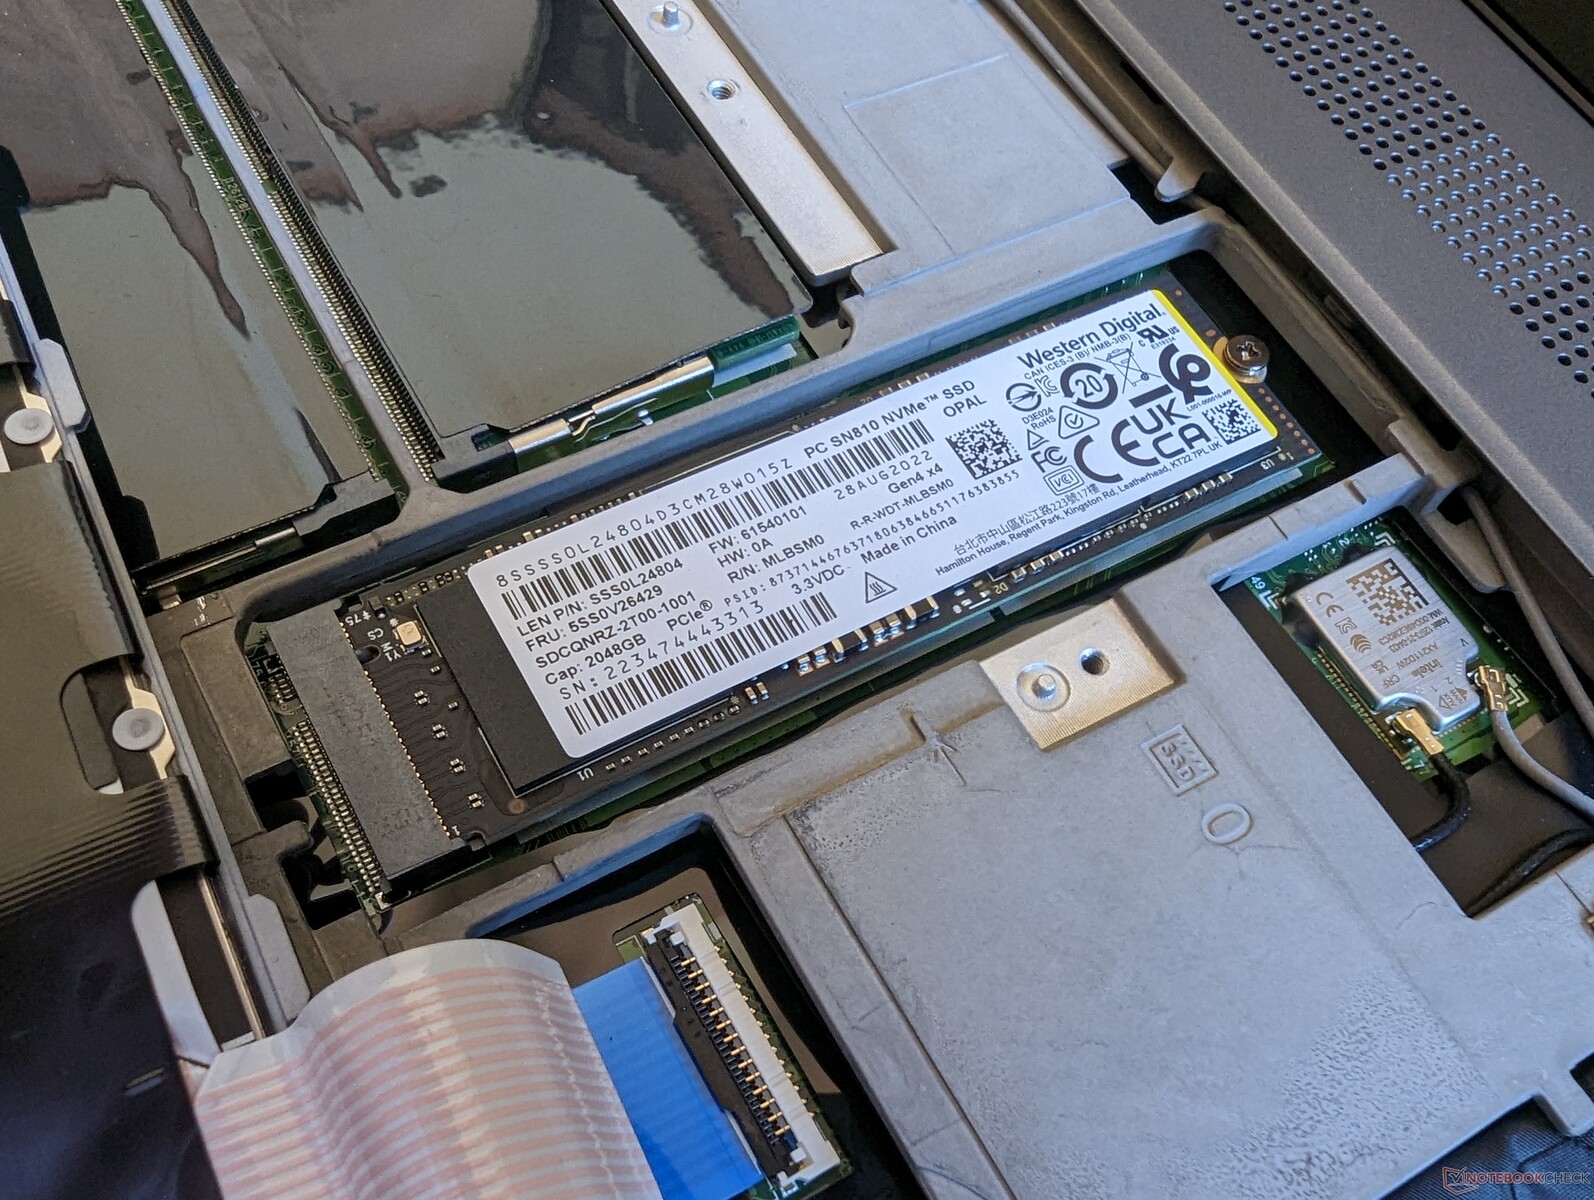
El panel inferior está asegurado por 12 tornillos Philips. Hay que quitar el teclado para acceder al módulo WAN, a la ranura SSD M.2 primaria y a dos de las cuatro ranuras SODIMM. Lenovo tiene un manual de mantenimiento oficial https://download.lenovo.com/pccbbs/mobiles_pdf/p16_gen1_hmm_en.pdf para los usuarios finales a seguir.
Curiosamente, el ThinkPad P16 G1 es uno de los pocos portátiles que se comercializan con una GPU extraíble. Cambiar la tarjeta gráfica de un portátil no se recomienda normalmente, excepto para fines de mantenimiento o sustitución.
Accesorios y garantía
No hay extras en la caja, salvo el adaptador de CA y la documentación.
Se aplica una garantía limitada de un año, mientras que el Dell Precision 7670 viene con tres años de serie. Sin embargo, Lenovo ofrece servicio in situ durante el año de duración si es necesario.
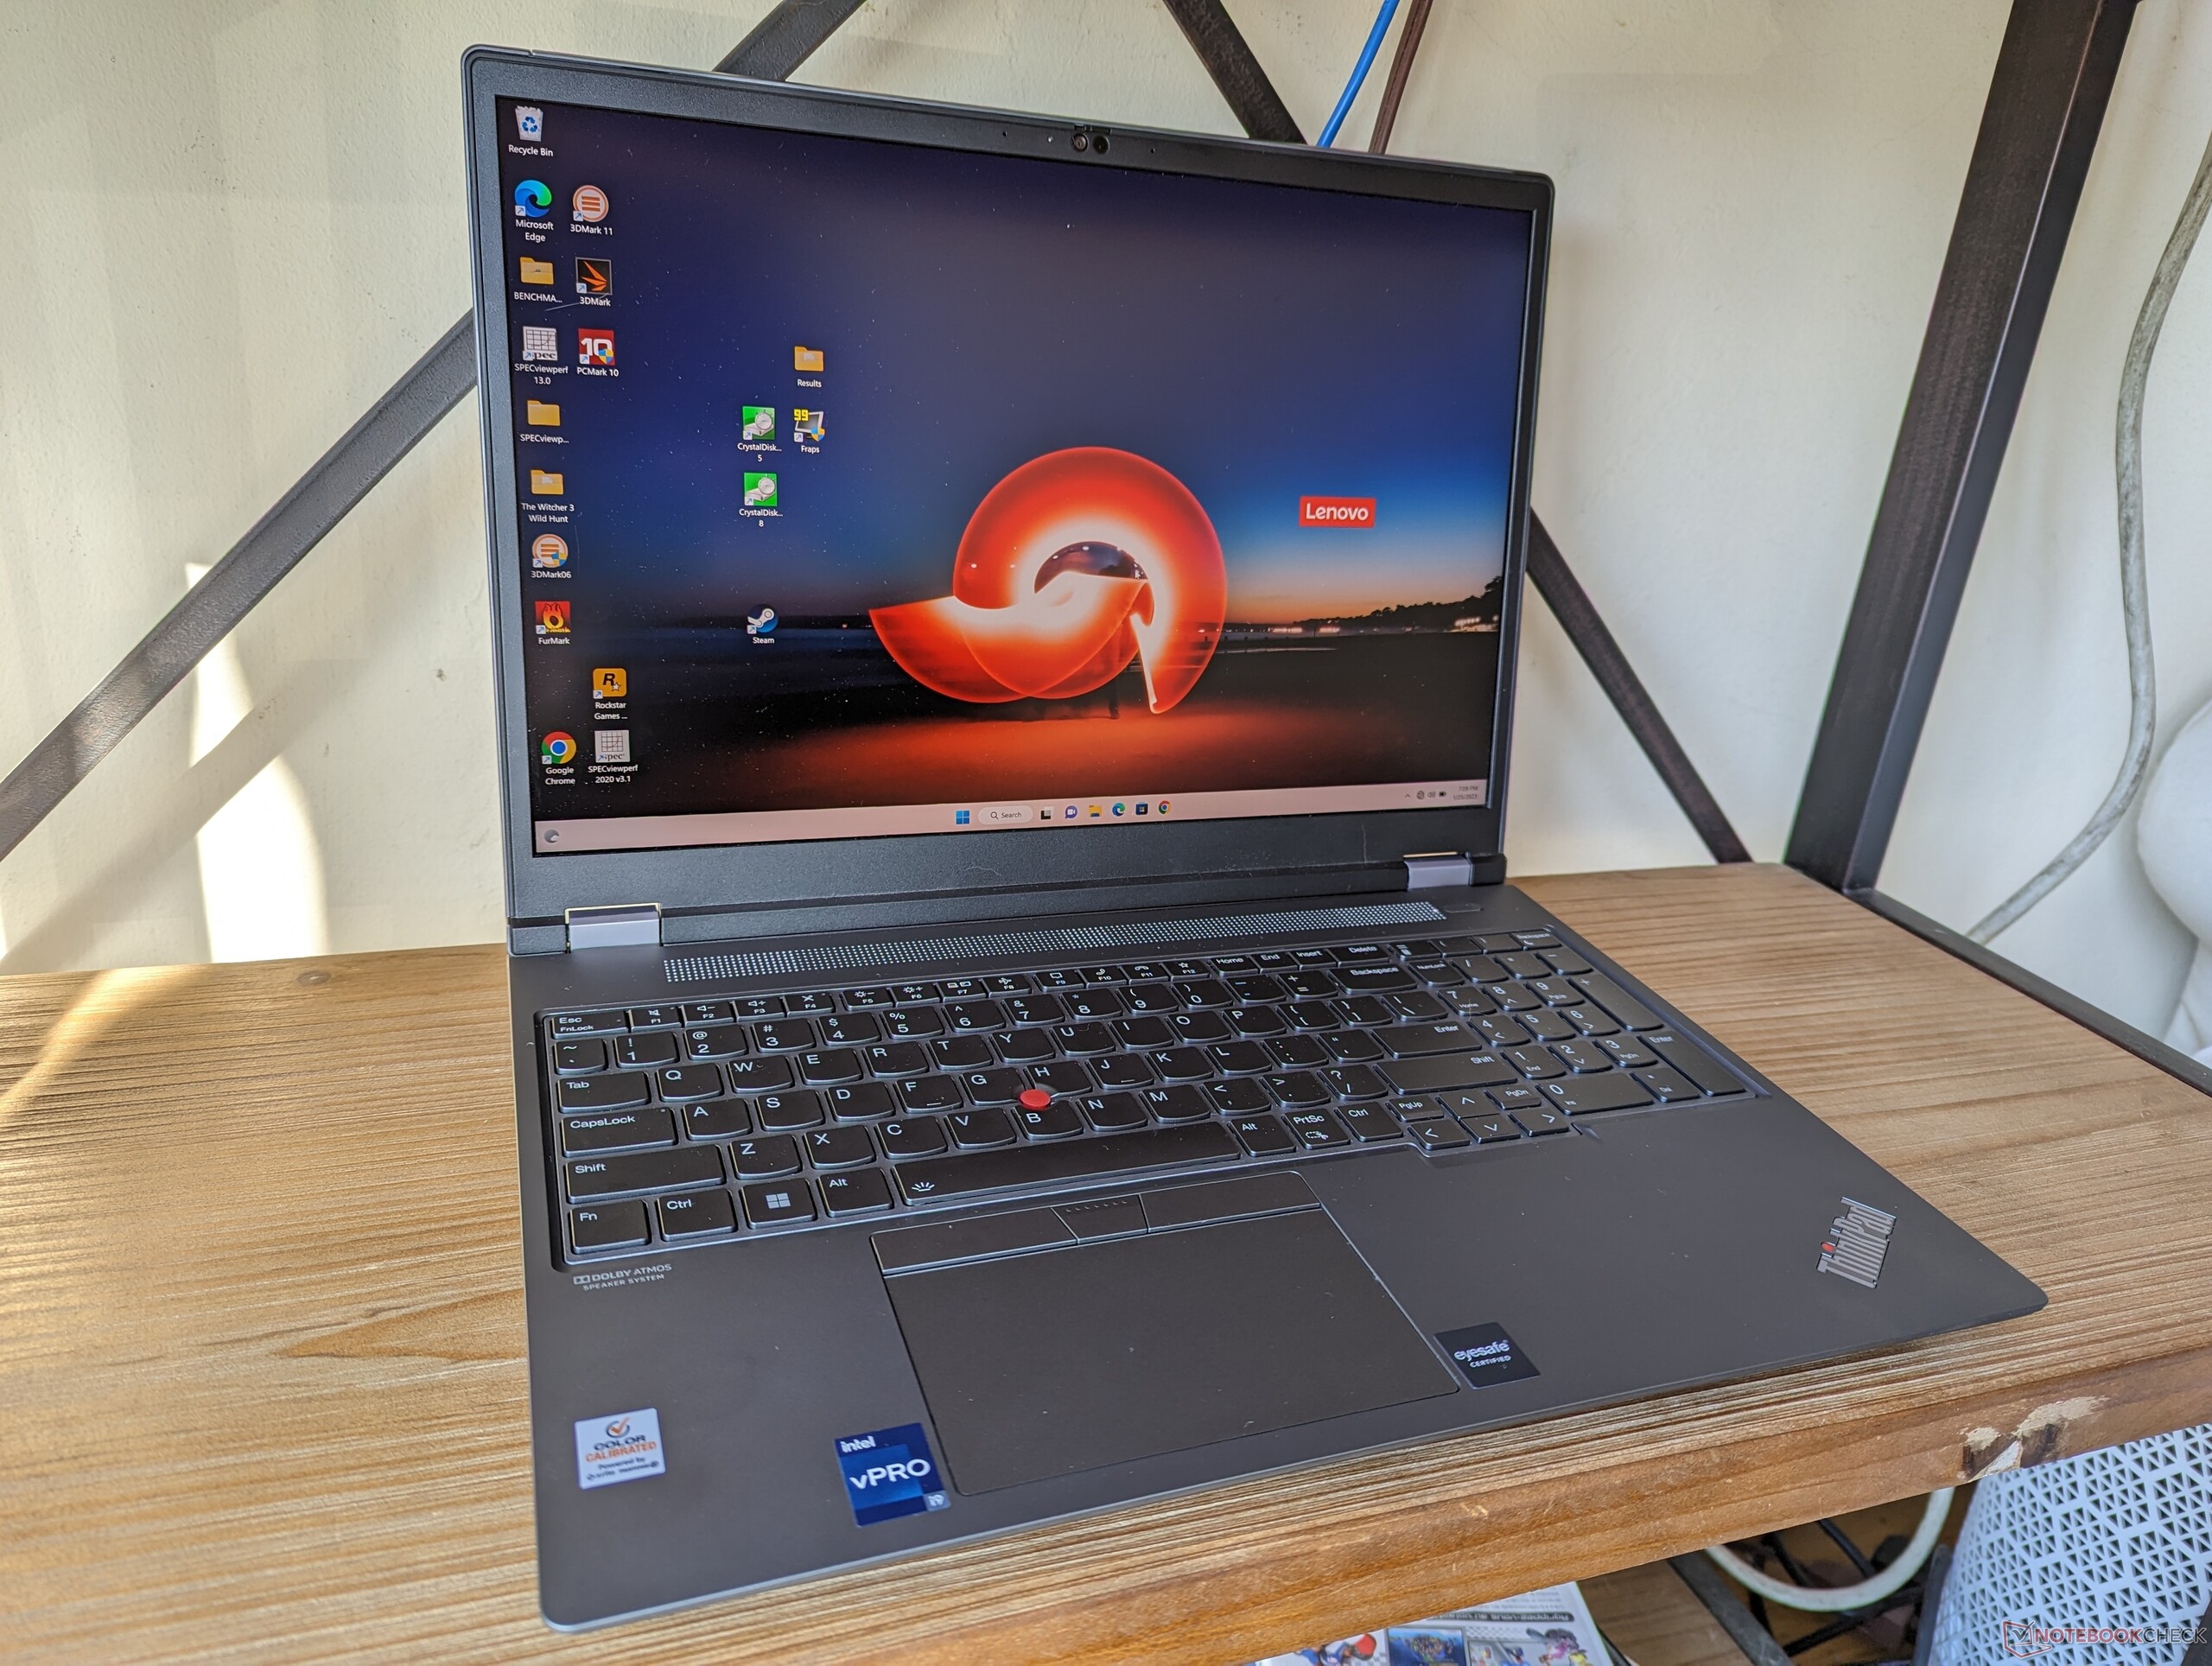
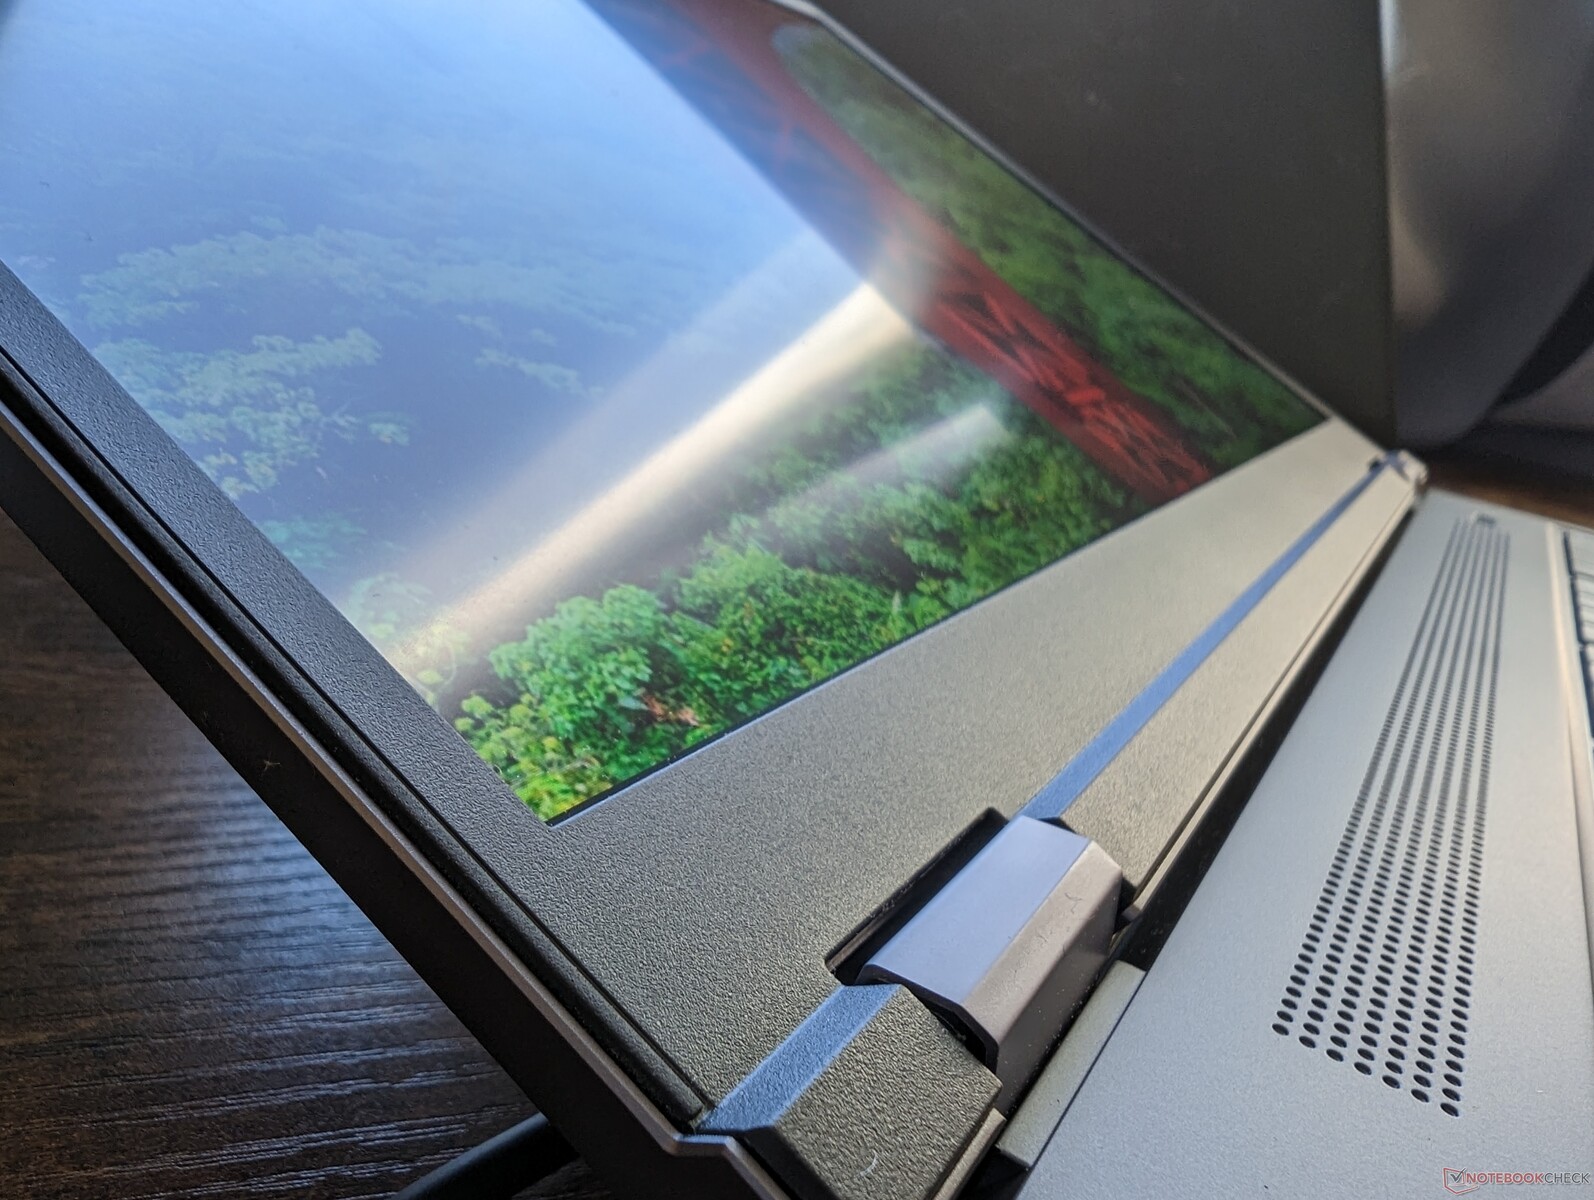
Mostrar
Lenovo ofrece cuatro opciones diferentes de pantalla de 60 Hz, todas ellas calibradas en fábrica con Pantone y atenuación DC. Nuestras mediciones a continuación reflejan sólo la opción en negrita, mientras que nuestra segunda unidad con la GPU RTX A2000 viene equipada con la opción 1600p.
- 1920 x 1200, no táctil, IPS, 300 nits, mate, 100% sRGB
- 2560 x 1600, no táctil, IPS, 400 nits, mate, 100% sRGB
- 3840 x 2400, no táctil, IPS, 600 nits, mate, 100% AdobeRGB
- 3840 x 2400, táctil, OLED, 400 nits, brillante, 100% DCI-P3
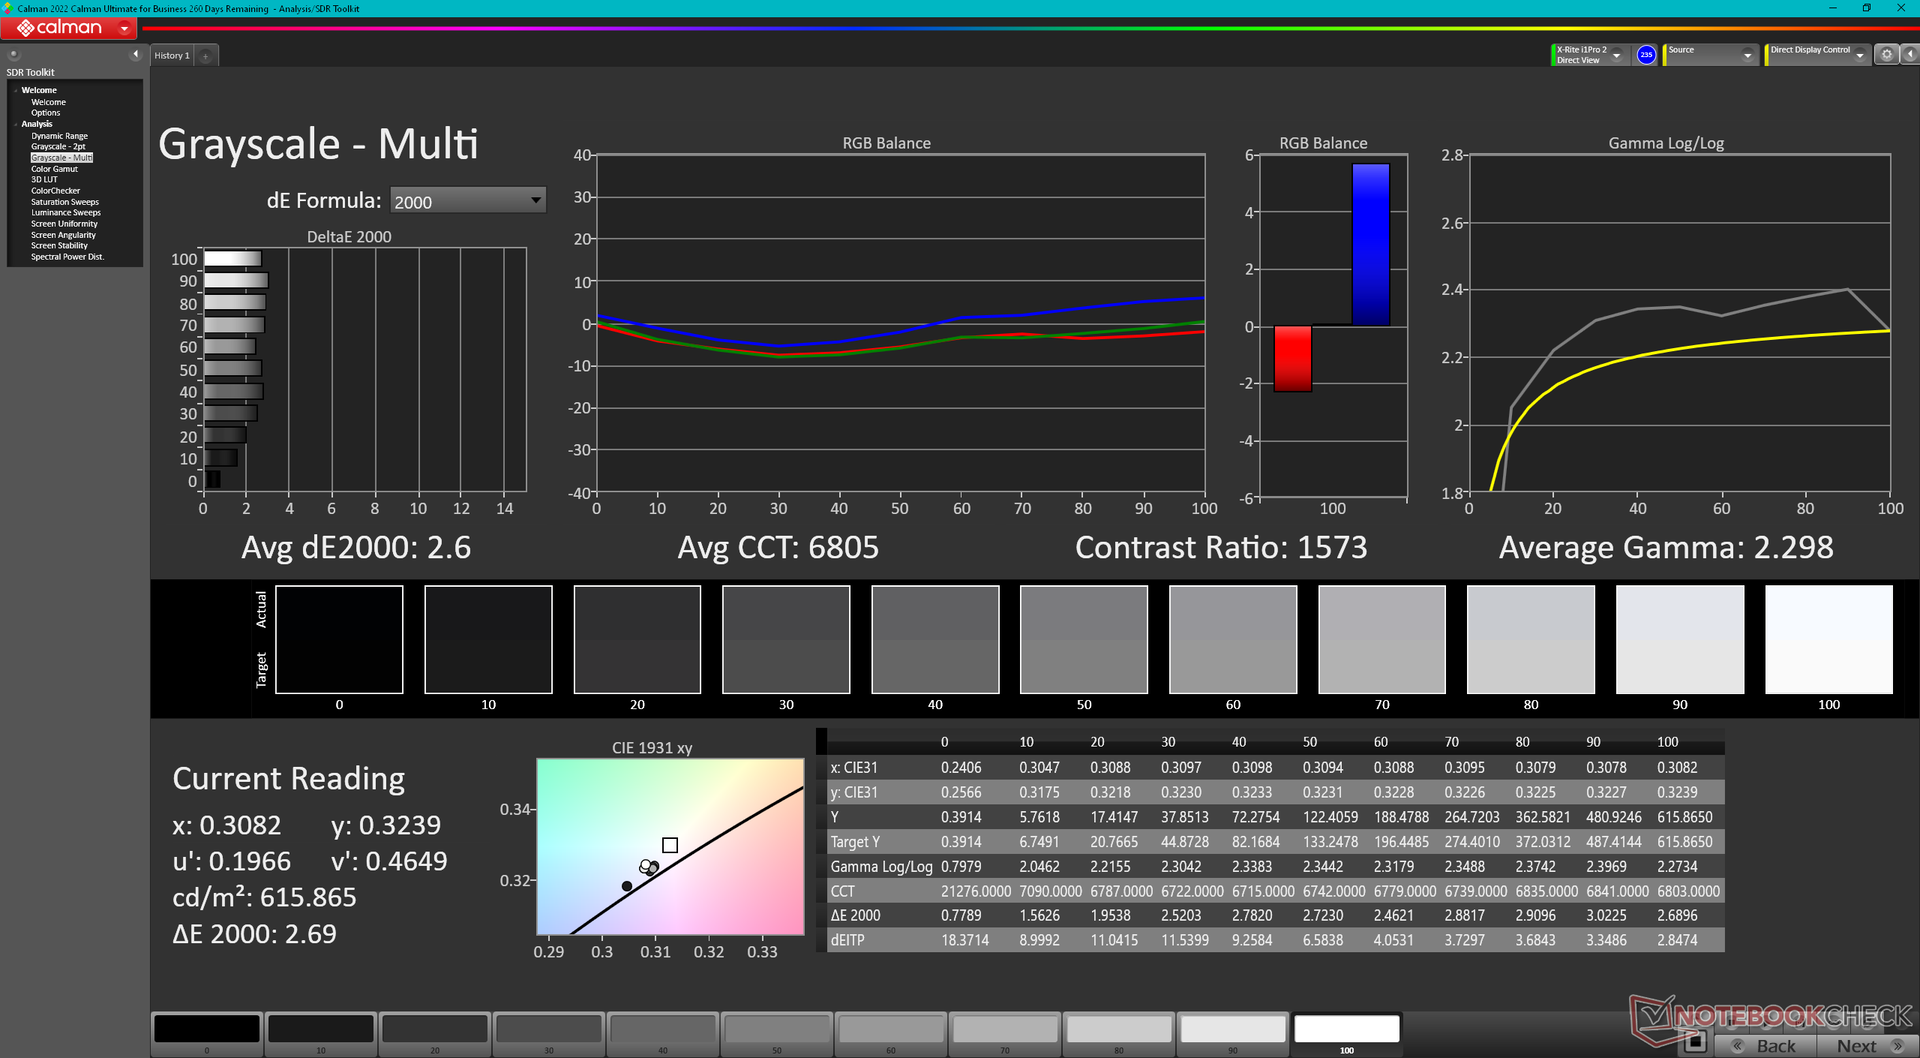
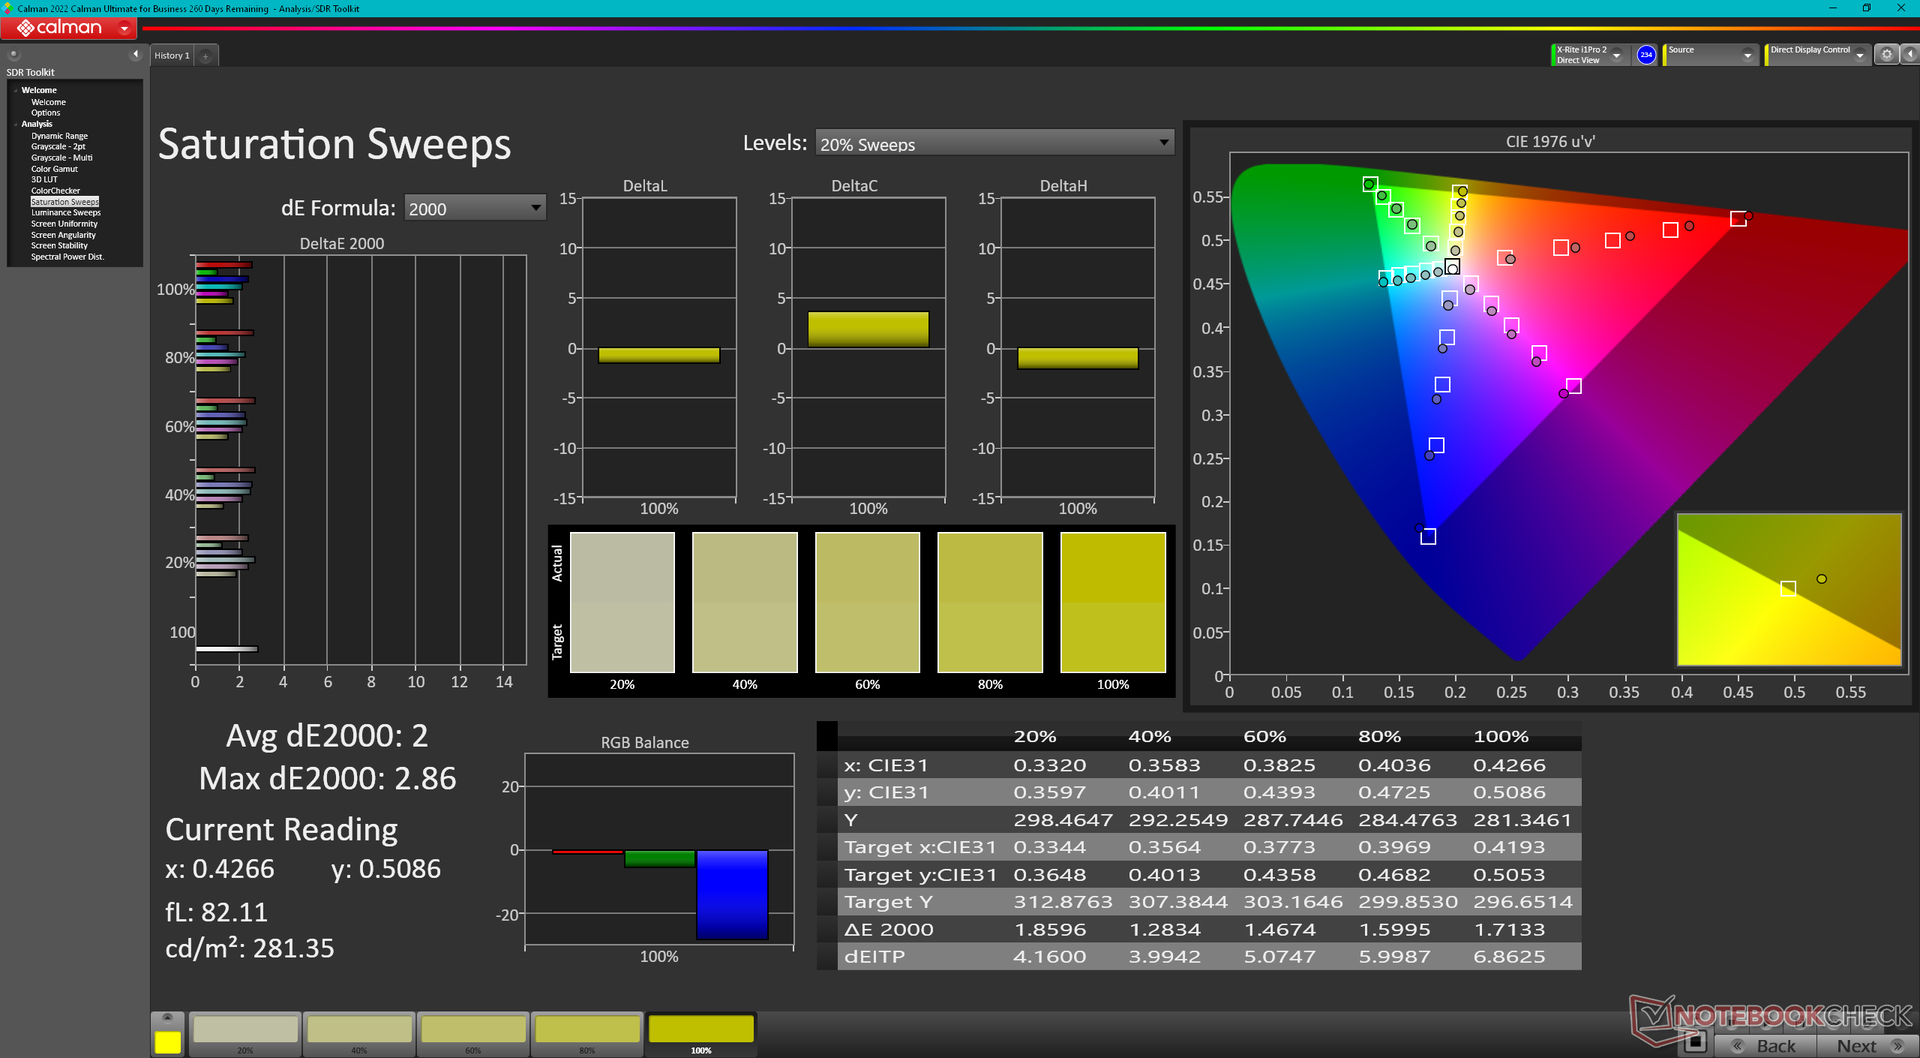
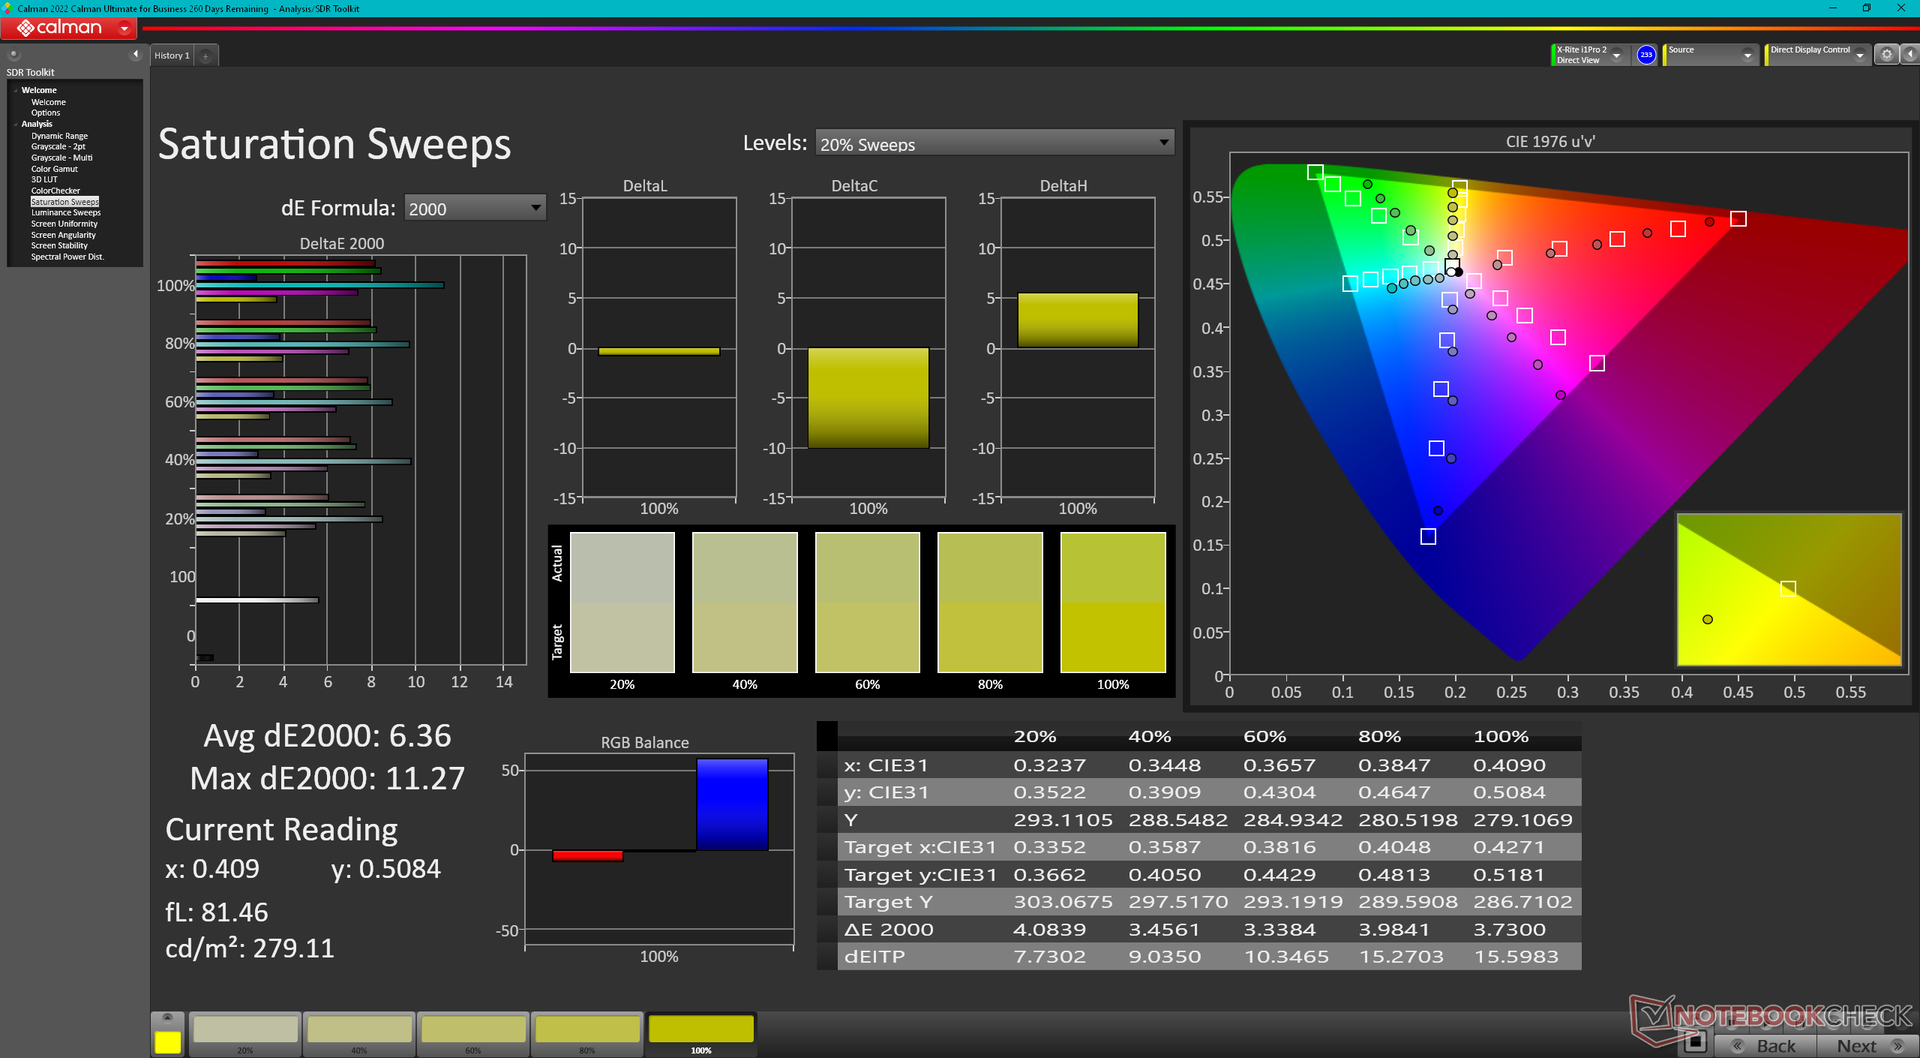
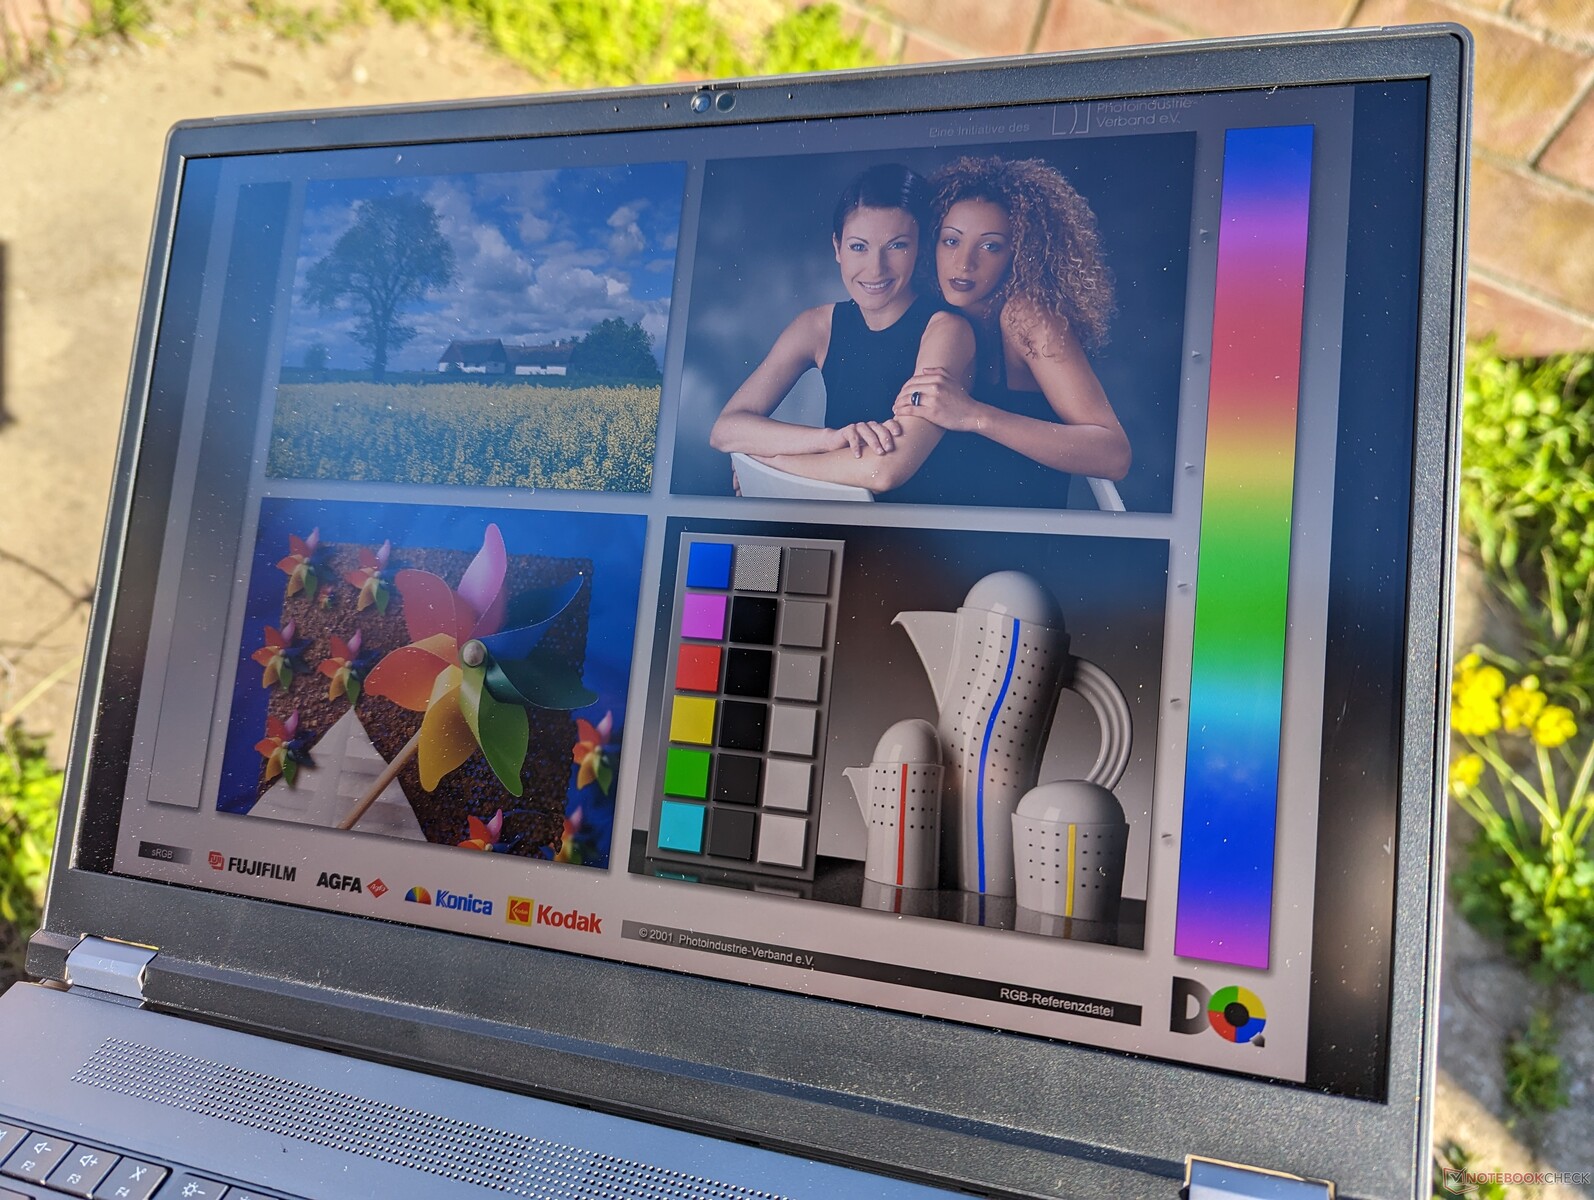
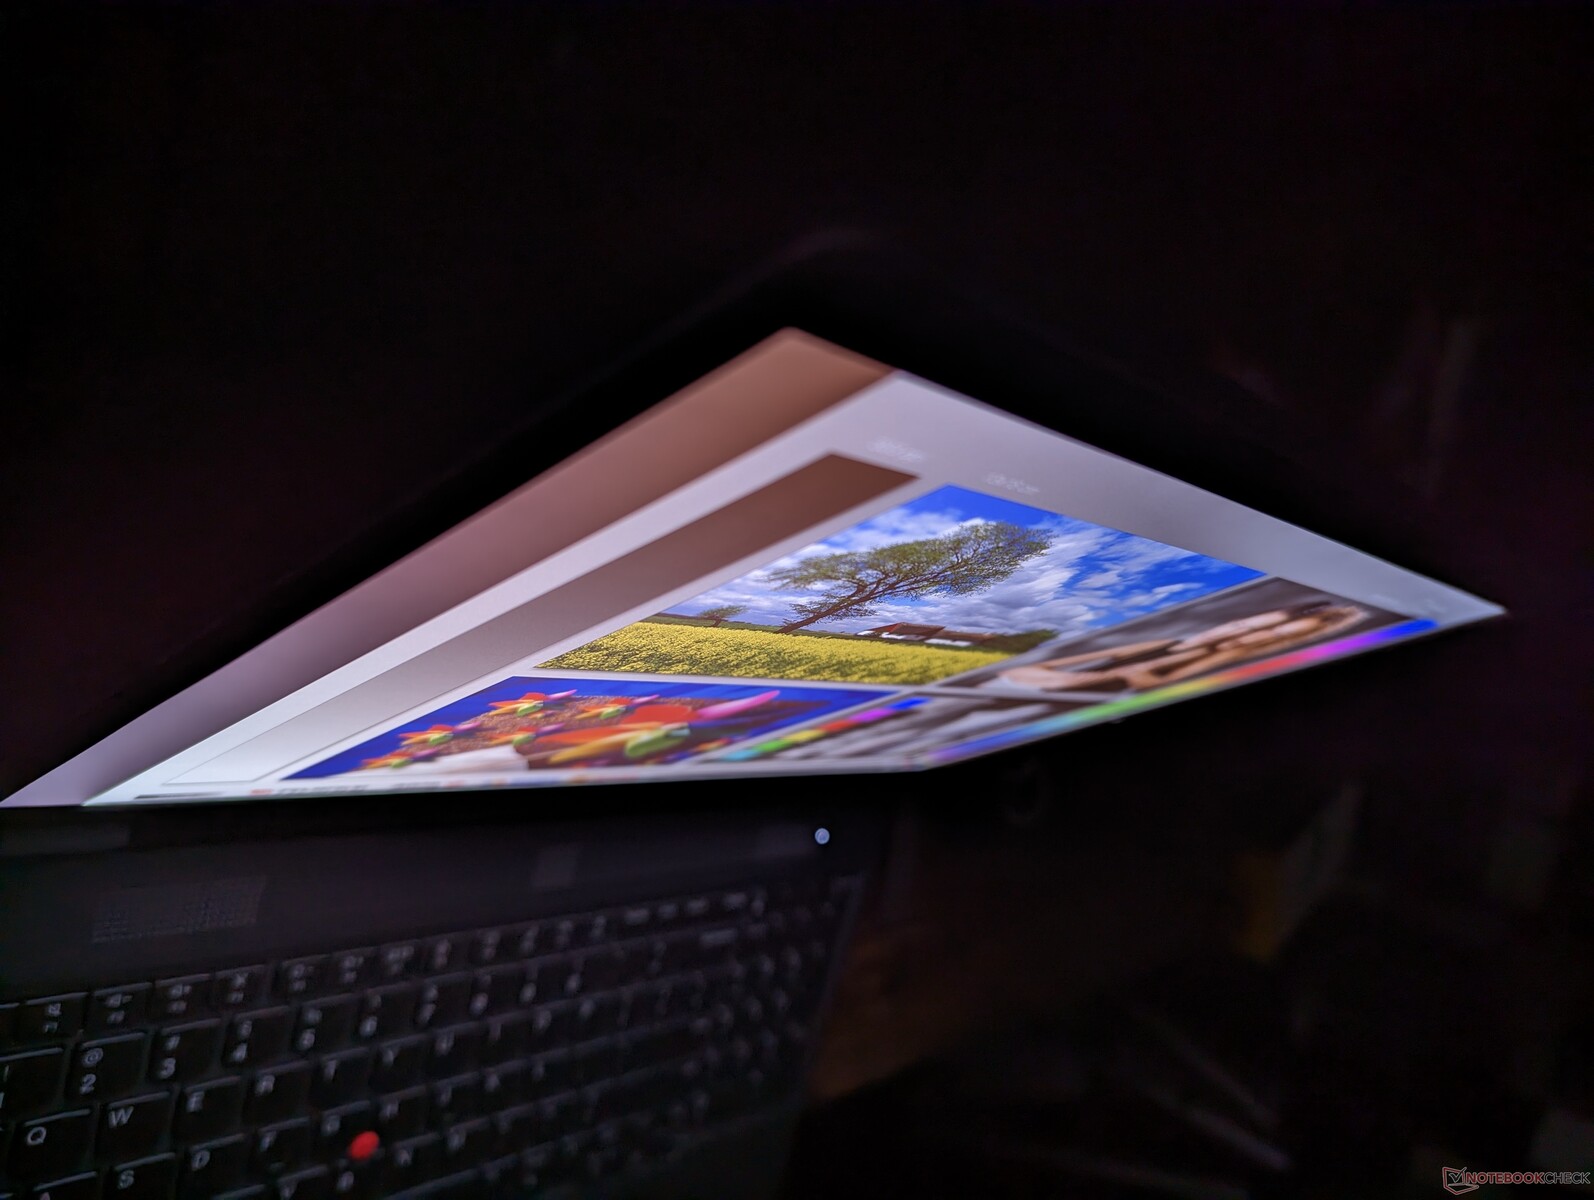
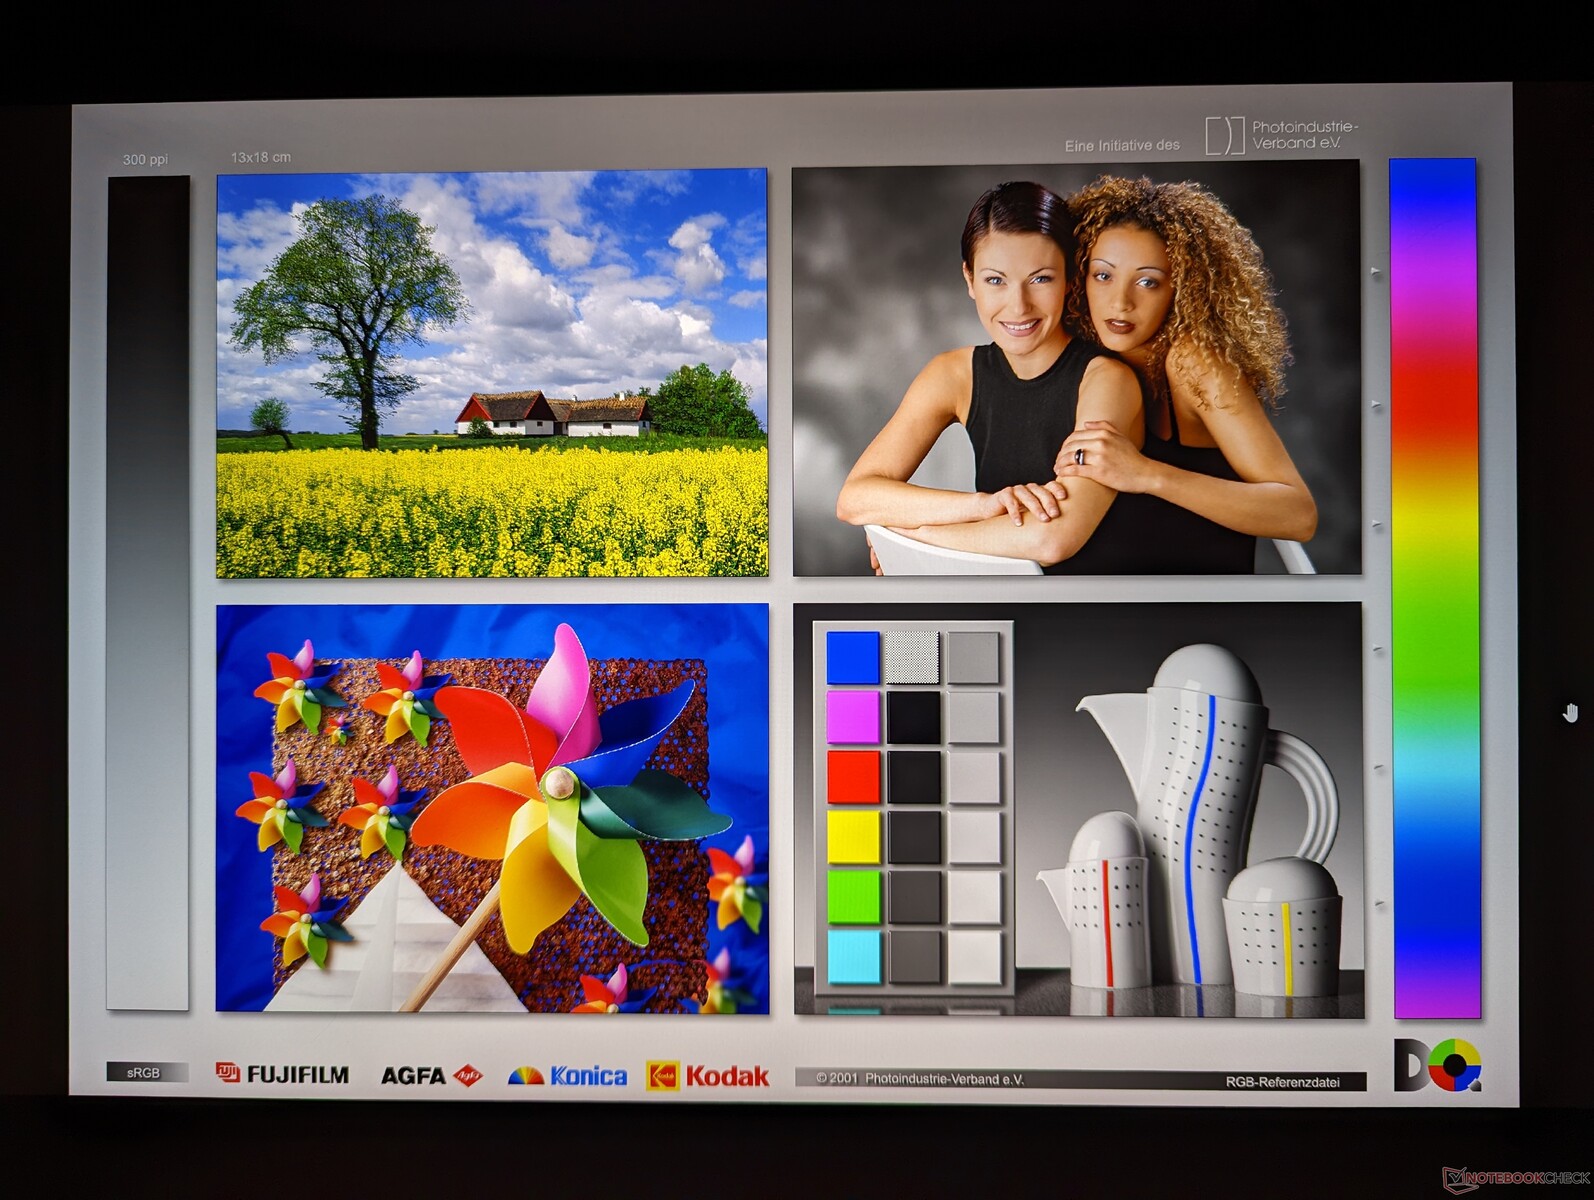
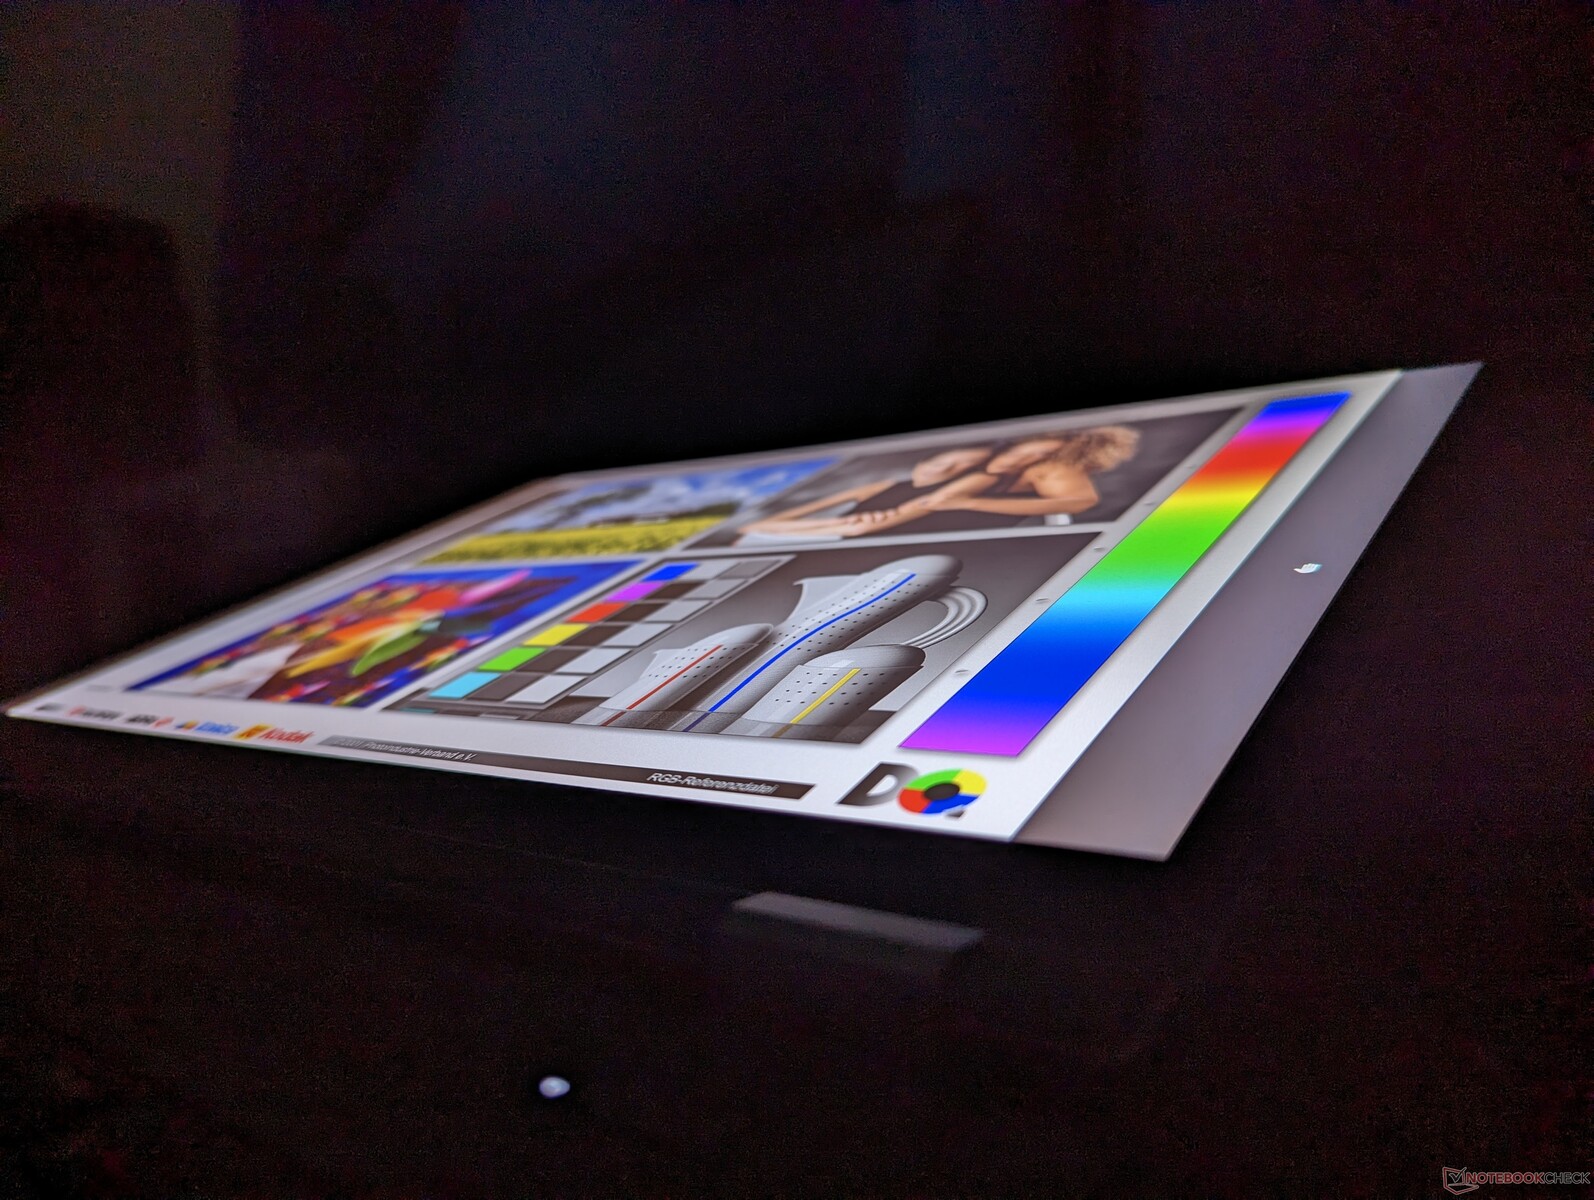
Nuestras mediciones independientes pueden confirmar la cobertura AdobeRGB completa y el brillo de 600 nits. La distribución del brillo, sin embargo, es sólo media a pesar del objetivo de 600 nits. El cuadrante superior izquierdo de nuestra pantalla, por ejemplo, es un 29% más brillante que el cuadrante inferior derecho (642 nits frente a 497 nits). Optar por el panel OLED mejoraría la distribución del brillo, pero esperábamos algo mejor de nuestro panel IPS teniendo en cuenta el precio del ThinkPad P1 G1.
Vale la pena señalar que Lenovo utiliza el mismo panel IPS LP160UQ1-SPB1 en el ThinkPad P1 G1 para sus otros modelos ThinkPad de 16 pulgadas, incluyendo elThinkPad P1 G4 yThinkPad X1 Extreme G4.


| |||||||||||||||||||||||||
iluminación: 77 %
Brillo con batería: 601.9 cd/m²
Contraste: 1281:1 (Negro: 0.47 cd/m²)
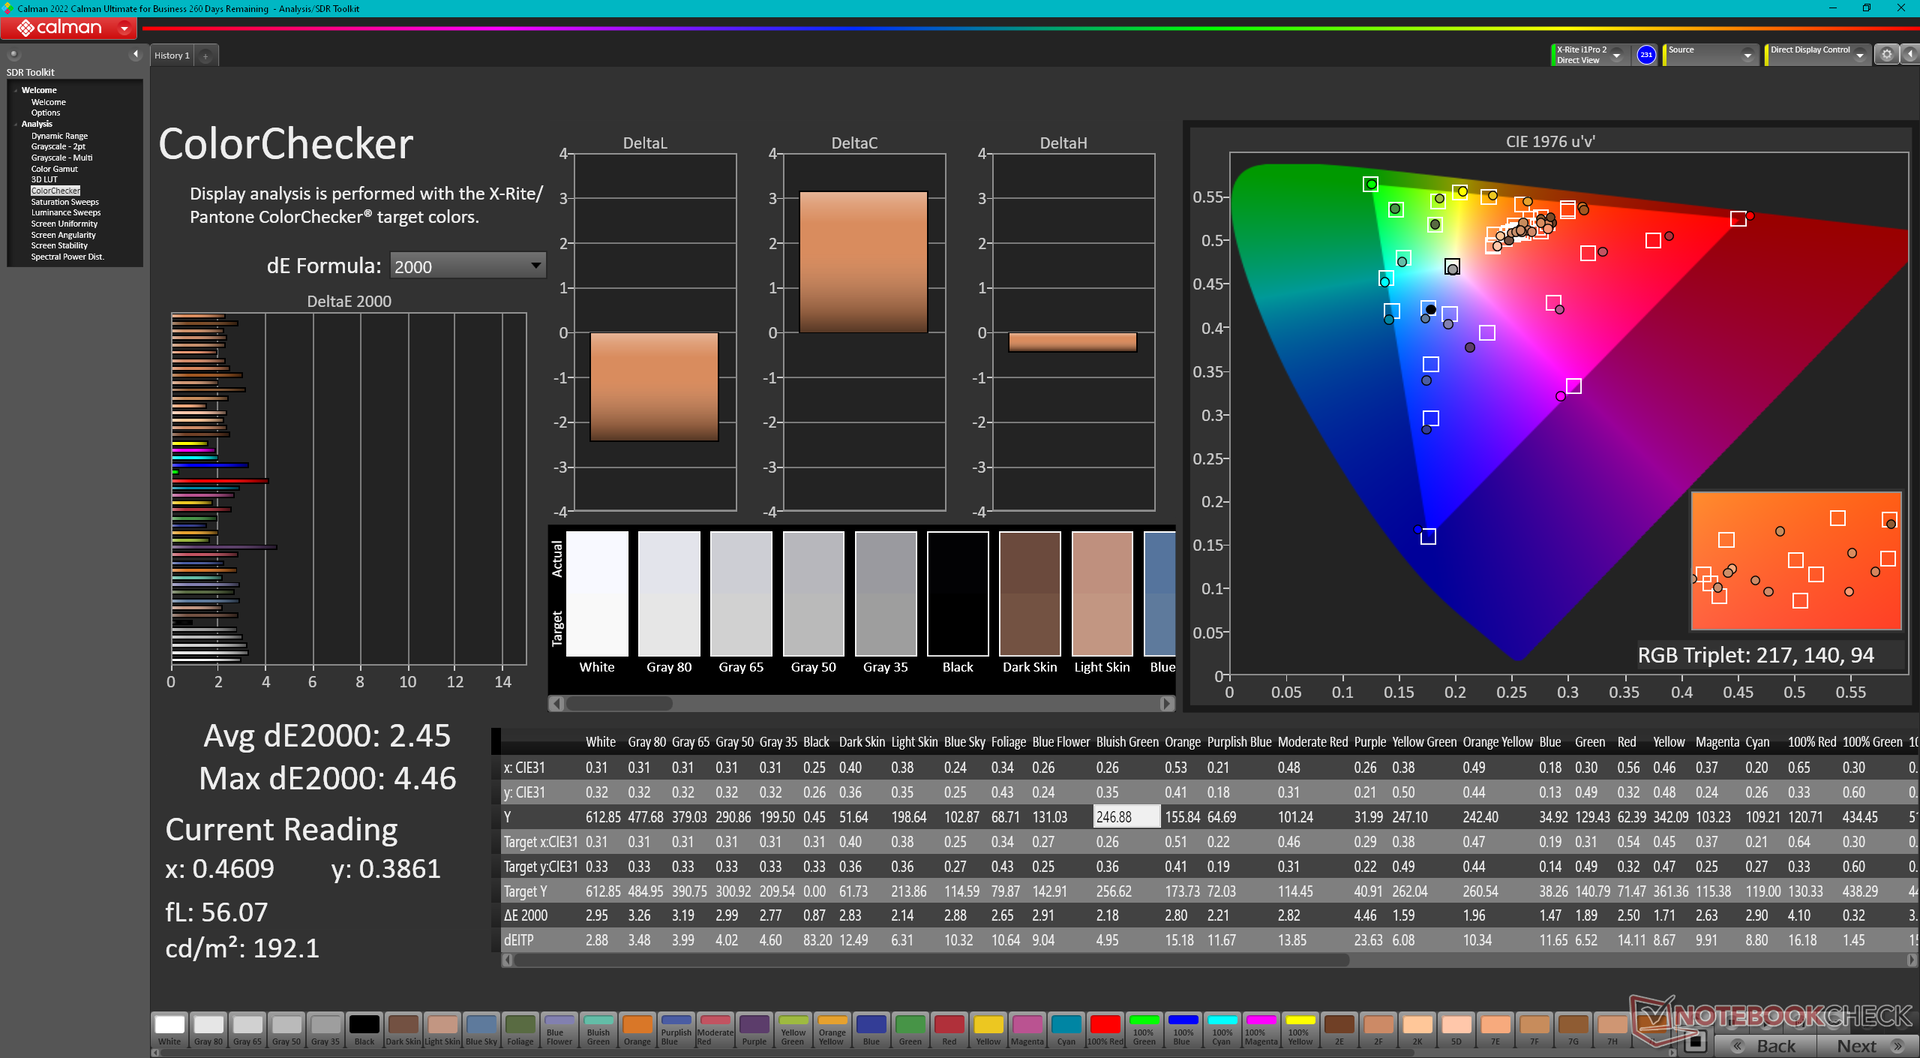
ΔE ColorChecker Calman: 2.45 | ∀{0.5-29.43 Ø4.71}
ΔE Greyscale Calman: 2.6 | ∀{0.09-98 Ø4.96}
95.9% AdobeRGB 1998 (Argyll 3D)
98.9% sRGB (Argyll 3D)
82.9% Display P3 (Argyll 3D)
Gamma: 2.3
CCT: 6805 K
| Lenovo ThinkPad P16 G1 RTX A5500 LP160UQ1-SPB1, IPS, 3840x2400, 16" | Asus ProArt StudioBook 16 W7600H5A-2BL2 ATNA60YV02-0, OLED, 3840x2400, 16" | Dell Precision 7000 7670 Performance Samsung 160YV03, OLED, 3840x2400, 16" | Lenovo ThinkPad P16 G1 21D6001DMB NE160QDM-N63 , IPS LED, 2560x1600, 16" | MSI CreatorPro Z16P B12UKST B160QAN02.N, IPS, 2560x1600, 16" | HP ZBook Studio 16 G9 62U04EA BOE0A52, IPS, 3840x2400, 16" | |
|---|---|---|---|---|---|---|
| Display | 8% | 8% | -12% | 3% | 3% | |
| Display P3 Coverage (%) | 82.9 | 99.9 21% | 99.9 21% | 71.5 -14% | 97.6 18% | 97.5 18% |
| sRGB Coverage (%) | 98.9 | 100 1% | 100 1% | 100 1% | 99.9 1% | 99.9 1% |
| AdobeRGB 1998 Coverage (%) | 95.9 | 98.6 3% | 98.1 2% | 73.3 -24% | 87.4 -9% | 86.3 -10% |
| Response Times | 96% | 96% | 23% | 76% | 75% | |
| Response Time Grey 50% / Grey 80% * (ms) | 45.6 ? | 2 ? 96% | 1.84 ? 96% | 37.7 ? 17% | 12.8 ? 72% | 15.3 ? 66% |
| Response Time Black / White * (ms) | 36.8 ? | 2 ? 95% | 1.92 ? 95% | 26.3 ? 29% | 7.4 ? 80% | 6.1 ? 83% |
| PWM Frequency (Hz) | 240 ? | 59.52 ? | ||||
| Screen | -2% | -36% | -4% | 9% | 16% | |
| Brightness middle (cd/m²) | 601.9 | 353 -41% | 325.2 -46% | 424 -30% | 407 -32% | 554 -8% |
| Brightness (cd/m²) | 569 | 360 -37% | 328 -42% | 398 -30% | 388 -32% | 516 -9% |
| Brightness Distribution (%) | 77 | 96 25% | 97 26% | 90 17% | 88 14% | 84 9% |
| Black Level * (cd/m²) | 0.47 | 0.24 49% | 0.36 23% | 0.47 -0% | ||
| Contrast (:1) | 1281 | 1767 38% | 1131 -12% | 1179 -8% | ||
| Colorchecker dE 2000 * | 2.45 | 2.45 -0% | 4.59 -87% | 2.6 -6% | 1.3 47% | 1 59% |
| Colorchecker dE 2000 max. * | 4.46 | 3.75 16% | 7.65 -72% | 4.9 -10% | 2.5 44% | 2.4 46% |
| Greyscale dE 2000 * | 2.6 | 1.88 28% | 2.5 4% | 4.1 -58% | 2.1 19% | 1.6 38% |
| Gamma | 2.3 96% | 2.31 95% | 2.1 105% | 2.13 103% | 2.26 97% | 2.29 96% |
| CCT | 6805 96% | 6441 101% | 6541 99% | 7252 90% | 6437 101% | 6458 101% |
| Colorchecker dE 2000 calibrated * | 2.77 | 0.8 | 0.7 | 0.6 | ||
| Media total (Programa/Opciones) | 34% /
19% | 23% /
-0% | 2% /
-2% | 29% /
18% | 31% /
22% |
* ... más pequeño es mejor
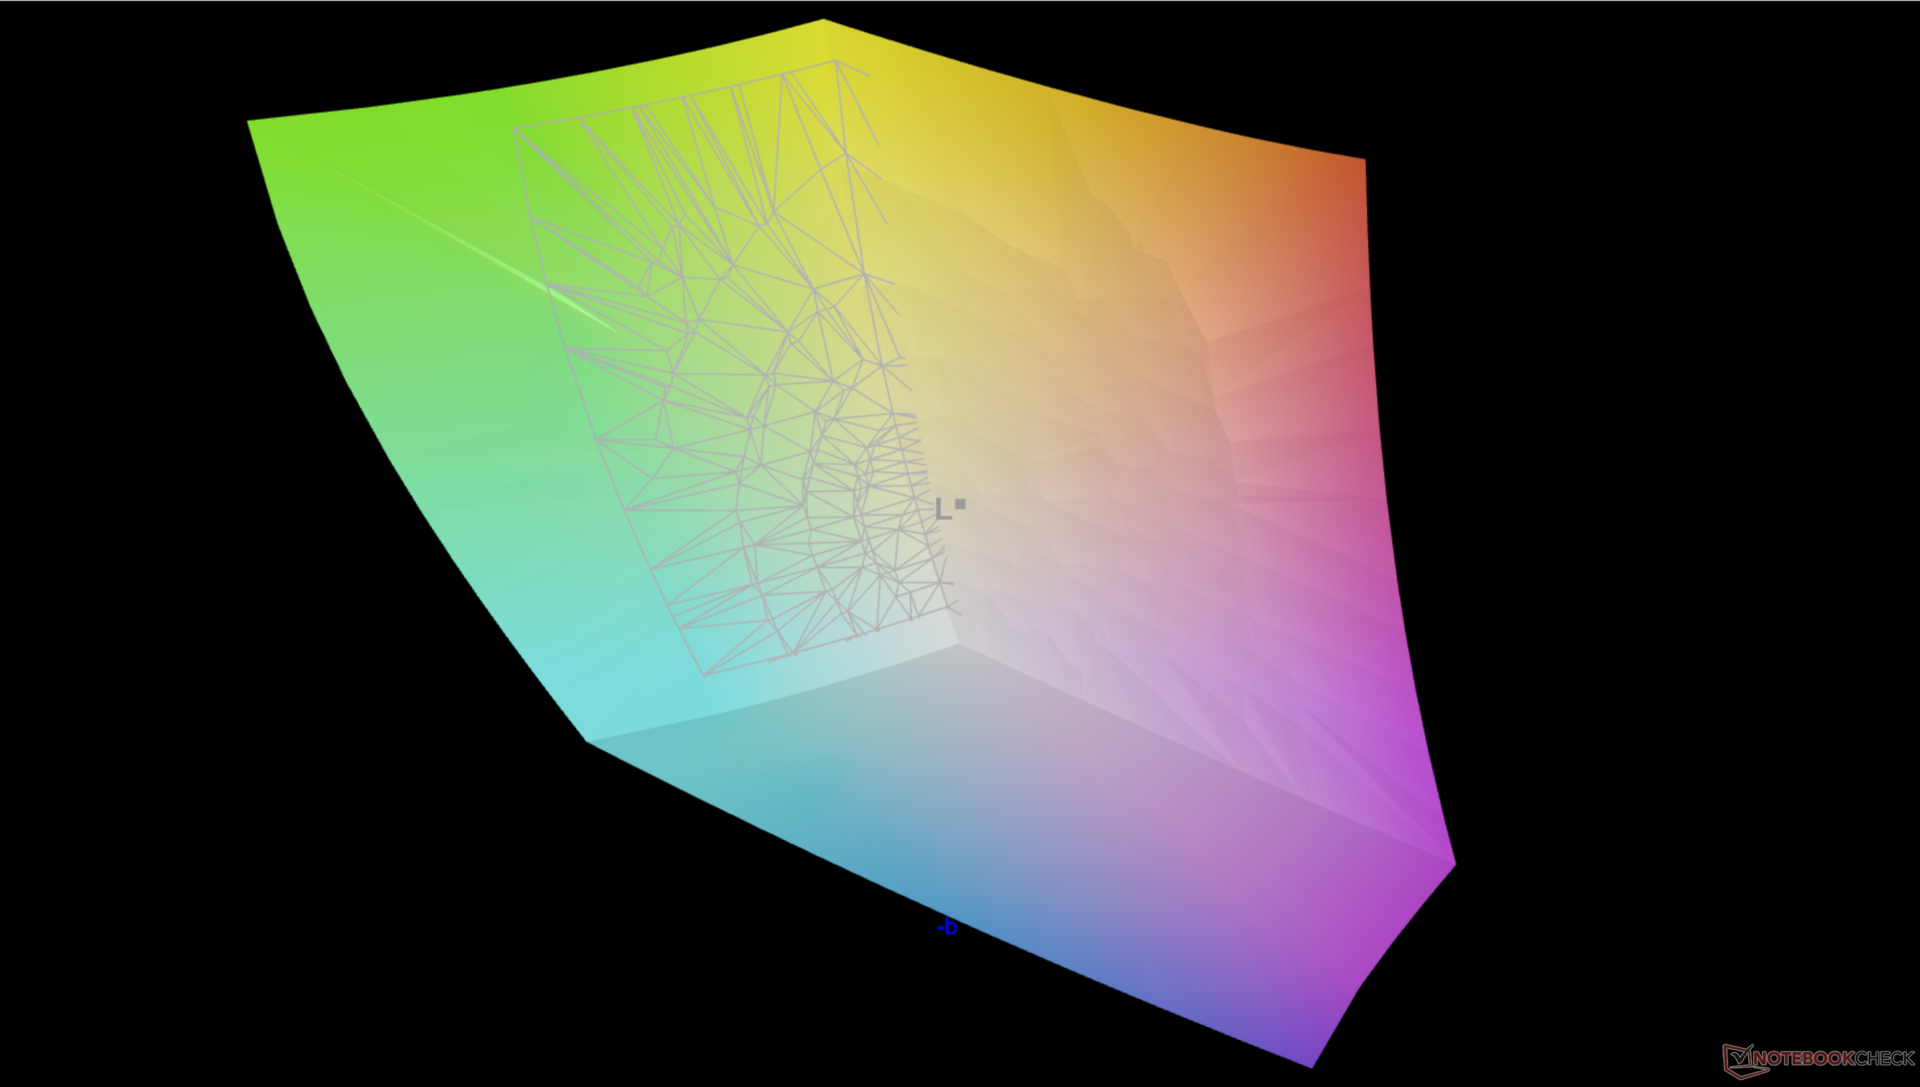
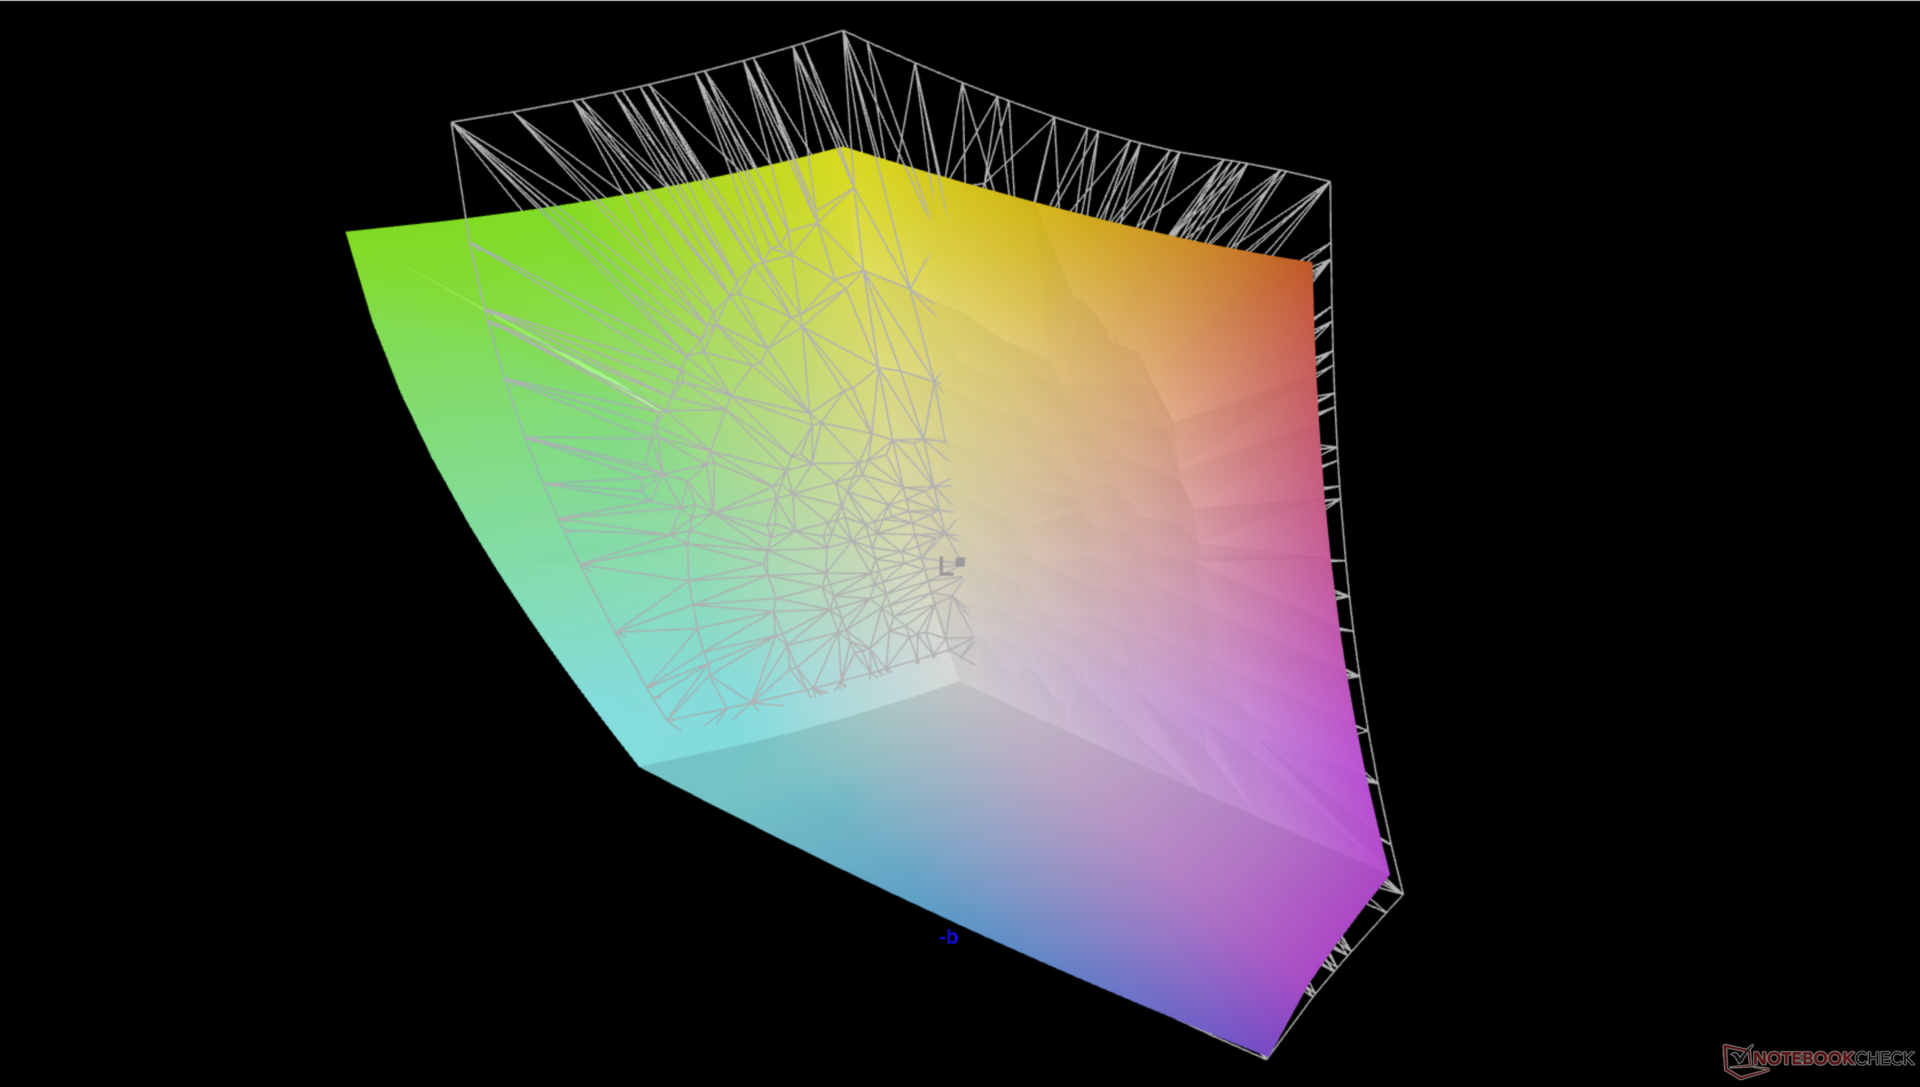
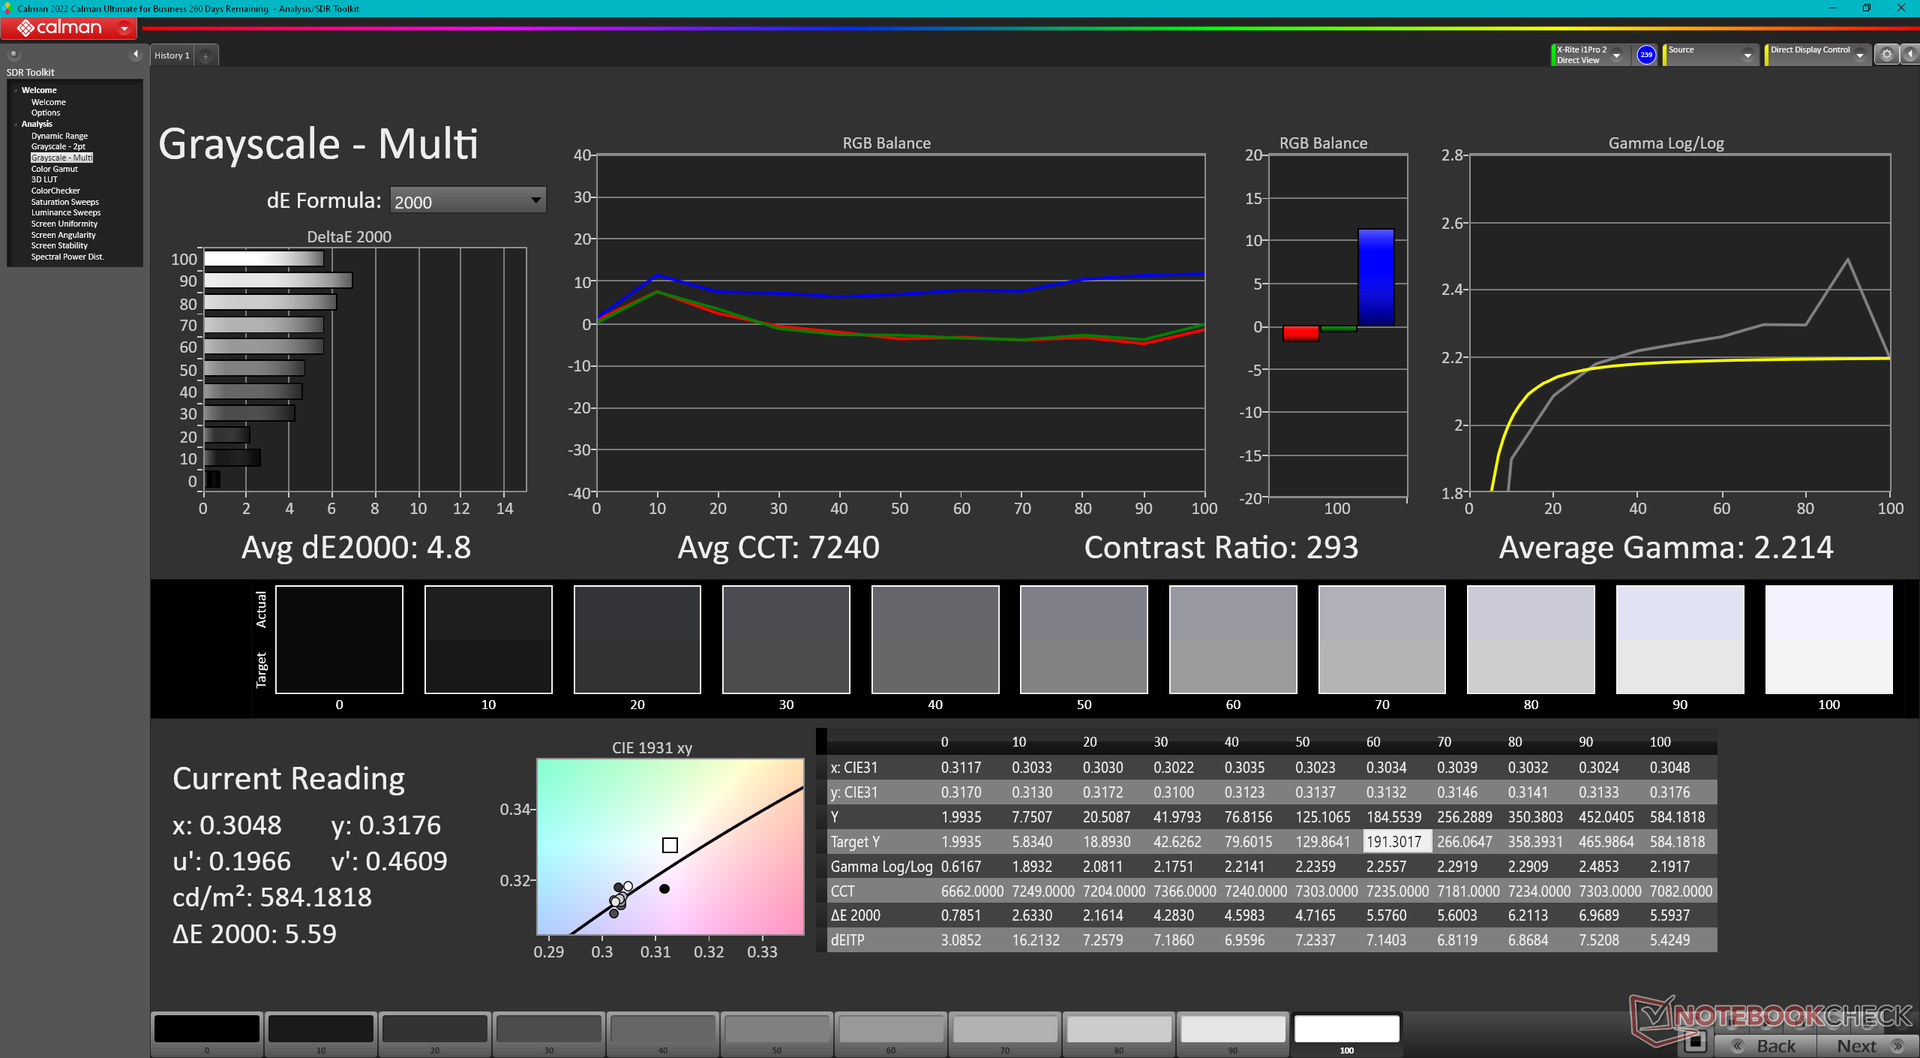
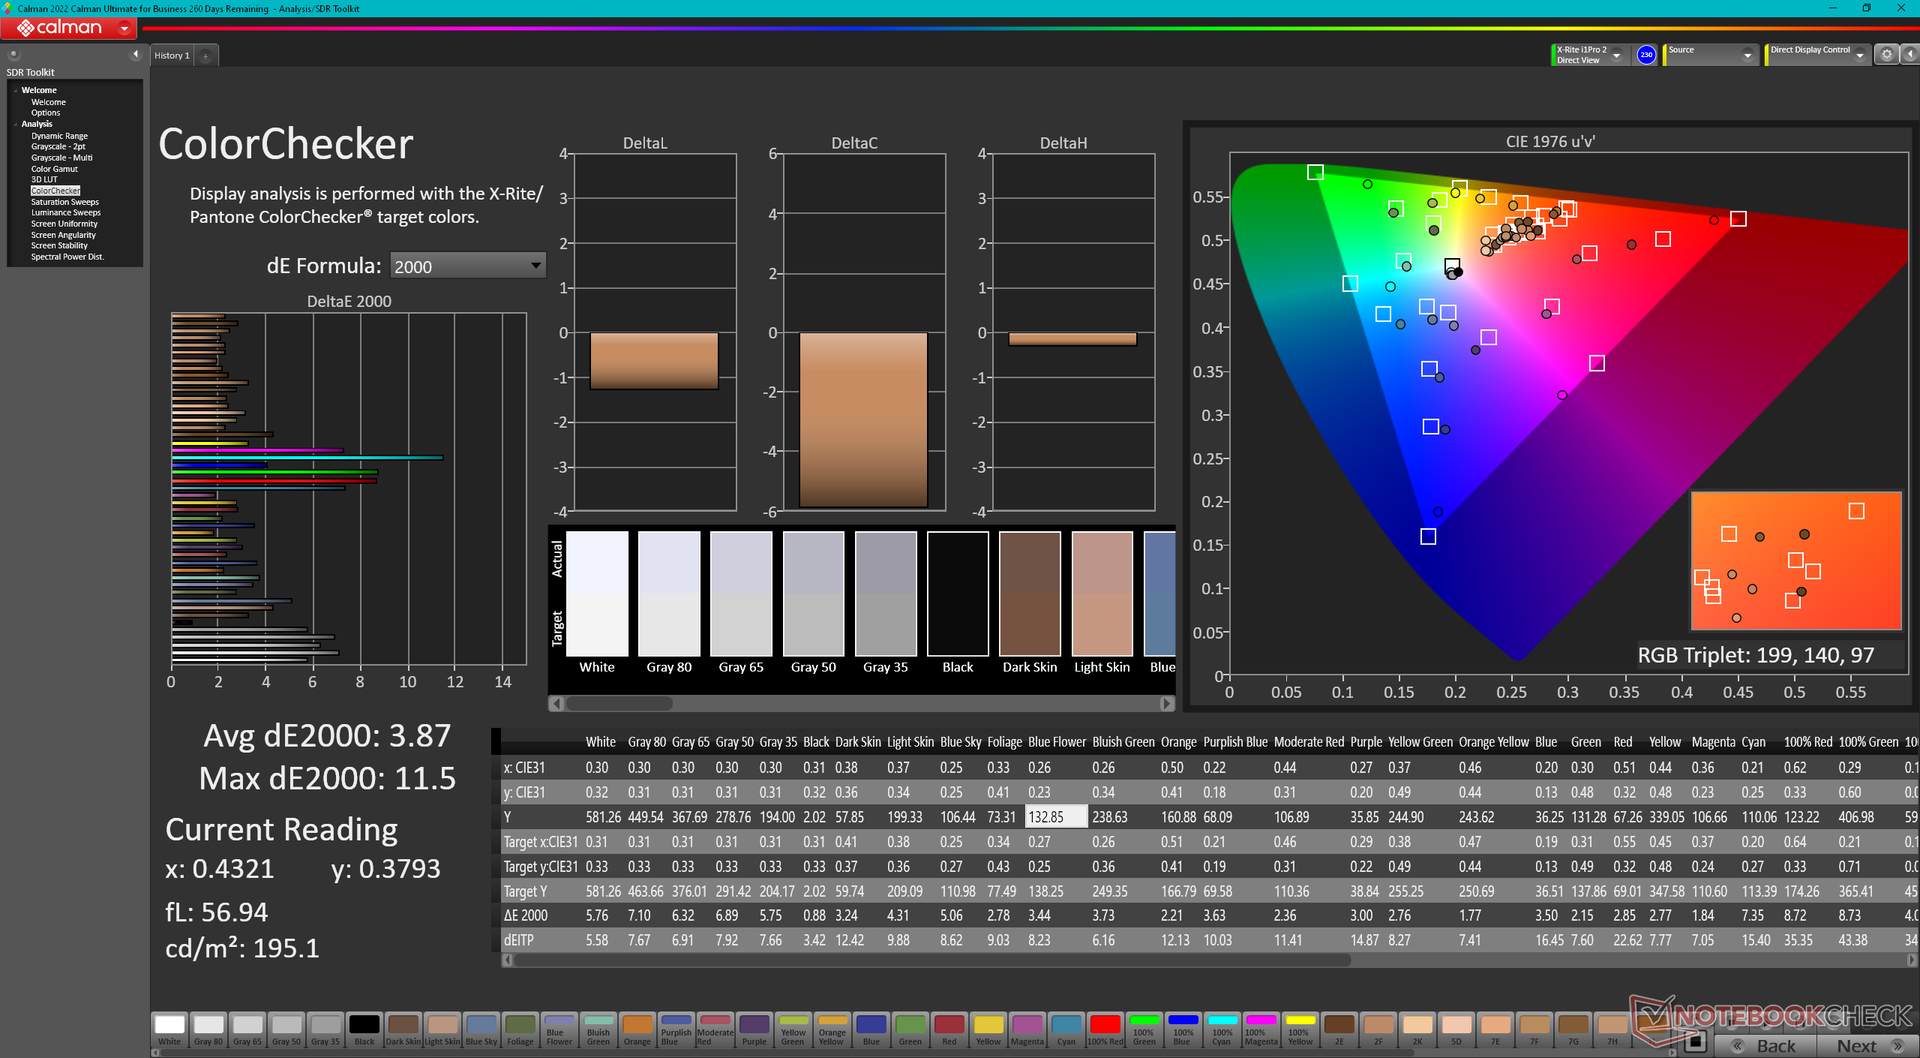
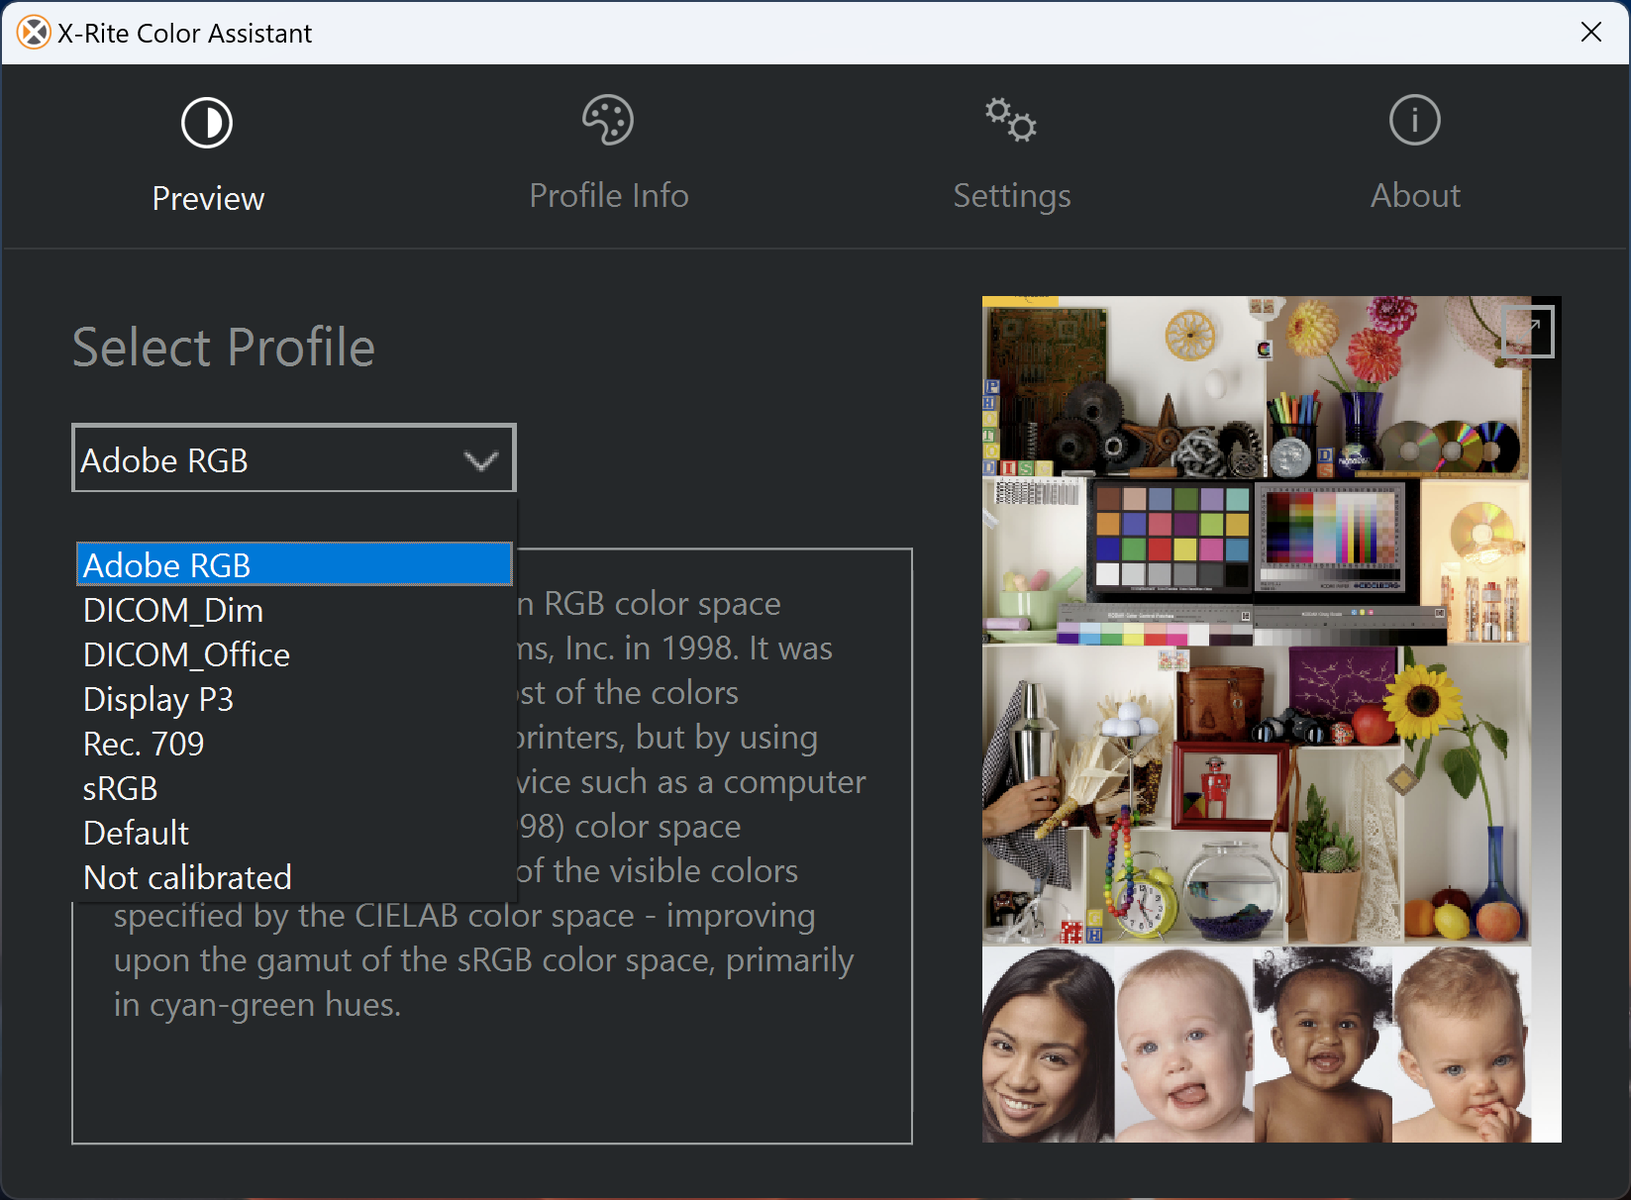
El perfil de color se puede cambiar mediante el software X-Rite Color Assistant preinstalado. De momento parece tener fallos, ya que los colores no son tan precisos como deberían al sacarlo de la caja, a pesar de la cobertura AdobeRGB completa de nuestro panel. Cuando se establece en modo sRGB, por ejemplo, la escala de grises promedio y los valores deltaE de color serían sólo 2,6 y 2,45, respectivamente, en comparación con 4,8 y 3,87 cuando se establece en modo AdobeRGB.
Tiempos de respuesta del display
| ↔ Tiempo de respuesta de Negro a Blanco | ||
|---|---|---|
| 36.8 ms ... subida ↗ y bajada ↘ combinada | ↗ 19.6 ms subida | 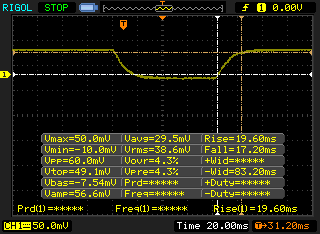 |
| ↘ 17.2 ms bajada | ||
| La pantalla mostró tiempos de respuesta lentos en nuestros tests y podría ser demasiado lenta para los jugones. En comparación, todos los dispositivos de prueba van de ##min### (mínimo) a 240 (máximo) ms. » 95 % de todos los dispositivos son mejores. Eso quiere decir que el tiempo de respuesta es peor que la media (19.8 ms) de todos los dispositivos testados. | ||
| ↔ Tiempo de respuesta 50% Gris a 80% Gris | ||
| 45.6 ms ... subida ↗ y bajada ↘ combinada | ↗ 21.2 ms subida | 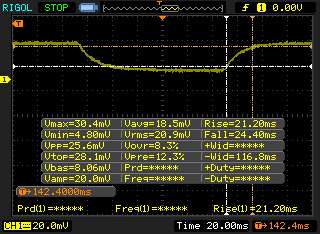 |
| ↘ 24.4 ms bajada | ||
| La pantalla mostró tiempos de respuesta lentos en nuestros tests y podría ser demasiado lenta para los jugones. En comparación, todos los dispositivos de prueba van de ##min### (mínimo) a 636 (máximo) ms. » 78 % de todos los dispositivos son mejores. Eso quiere decir que el tiempo de respuesta es peor que la media (31 ms) de todos los dispositivos testados. | ||
Parpadeo de Pantalla / PWM (Pulse-Width Modulation)
| Parpadeo de Pantalla / PWM no detectado | 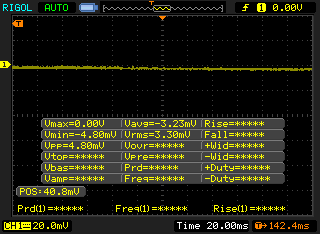 | ||
Comparación: 52 % de todos los dispositivos testados no usaron PWM para atenuar el display. Si se usó, medimos una media de 7754 (mínimo: 5 - máxmo: 343500) Hz. | |||
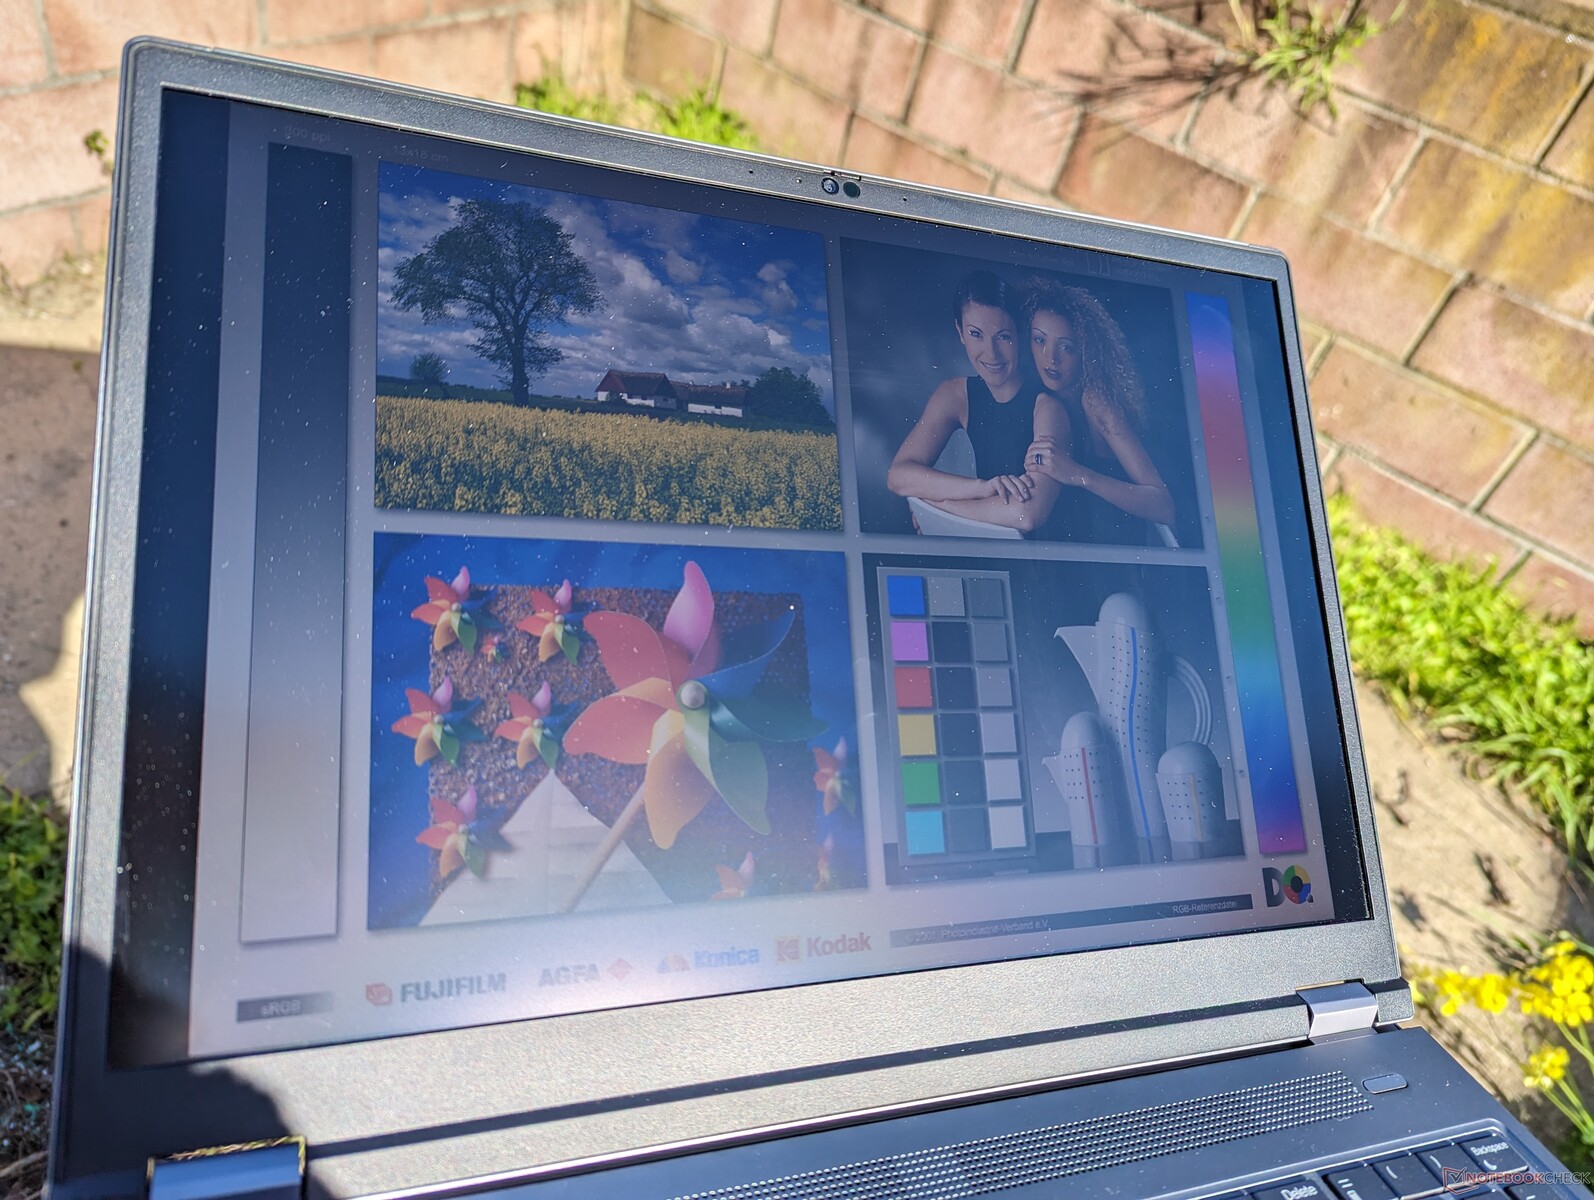
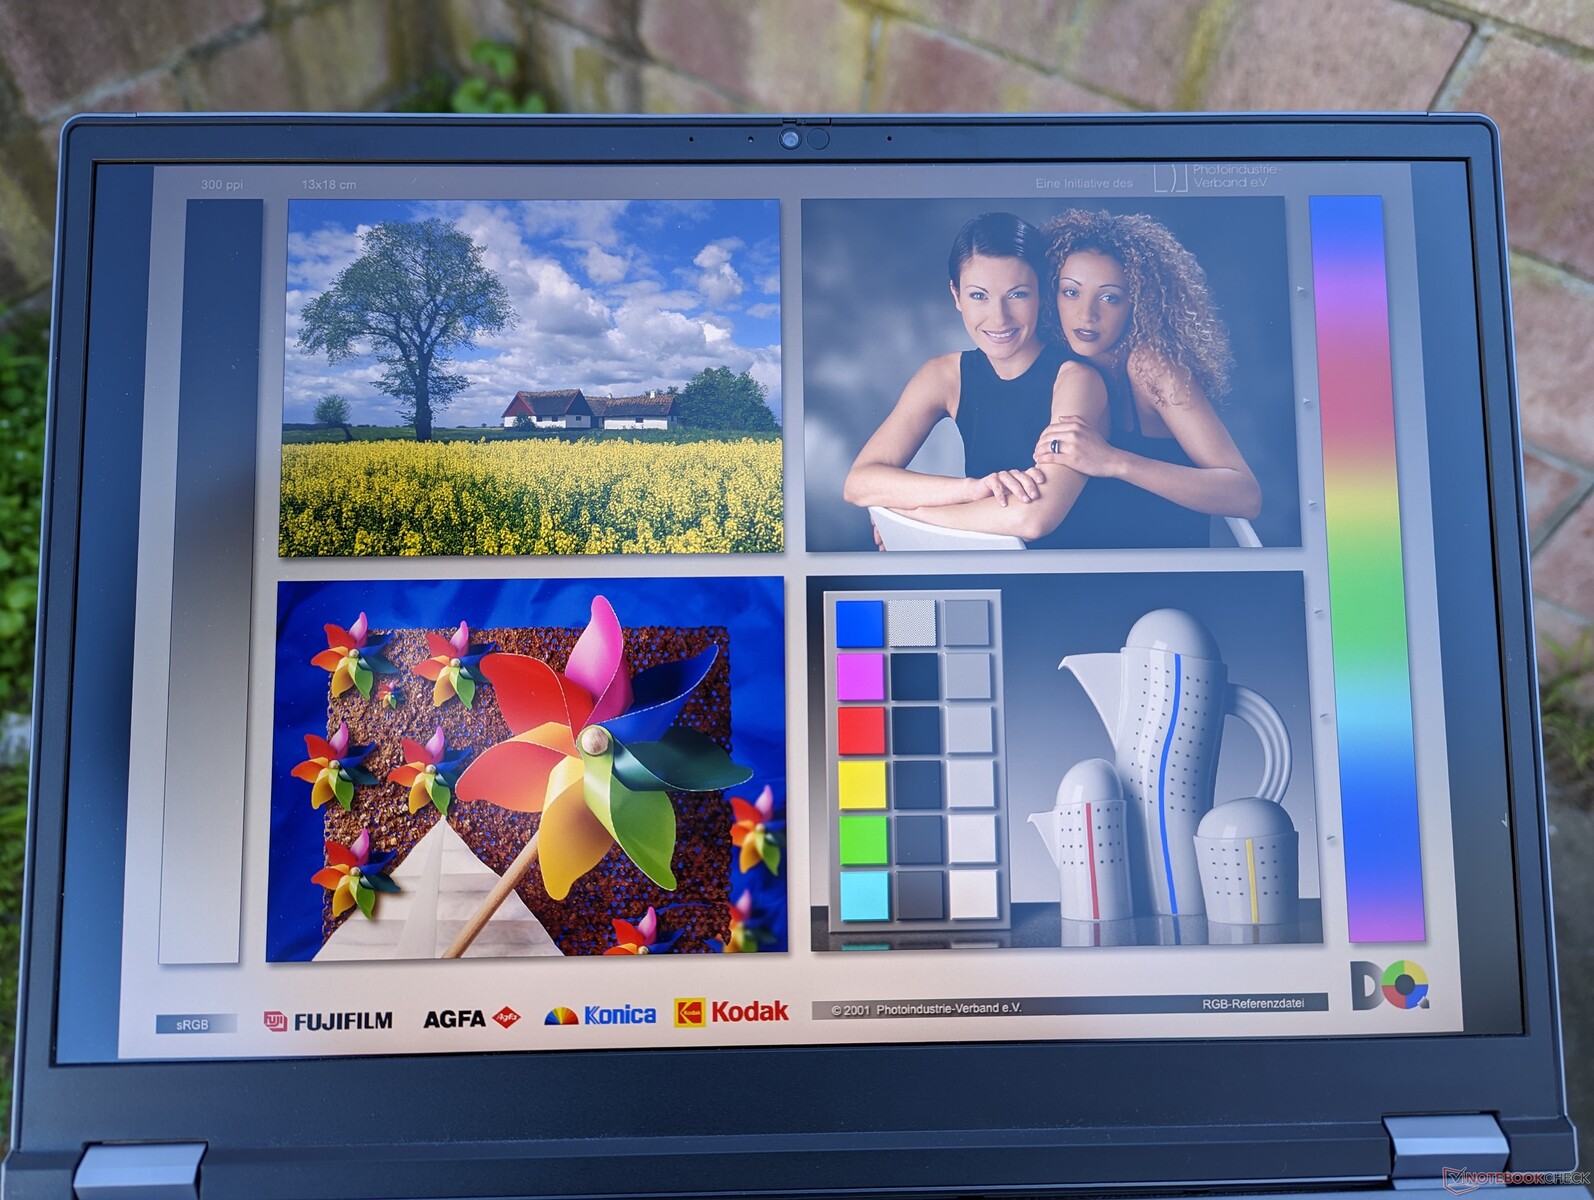
La visibilidad en exteriores es decente, ya que la pantalla es más brillante que en la mayoría de los portátiles, en los que el rango de 300 a 400 nit es más habitual. No obstante, se recomienda trabajar a la sombra siempre que sea posible, ya que la luz solar directa degrada la calidad de la imagen y los colores.
Rendimiento
Condiciones de ensayo
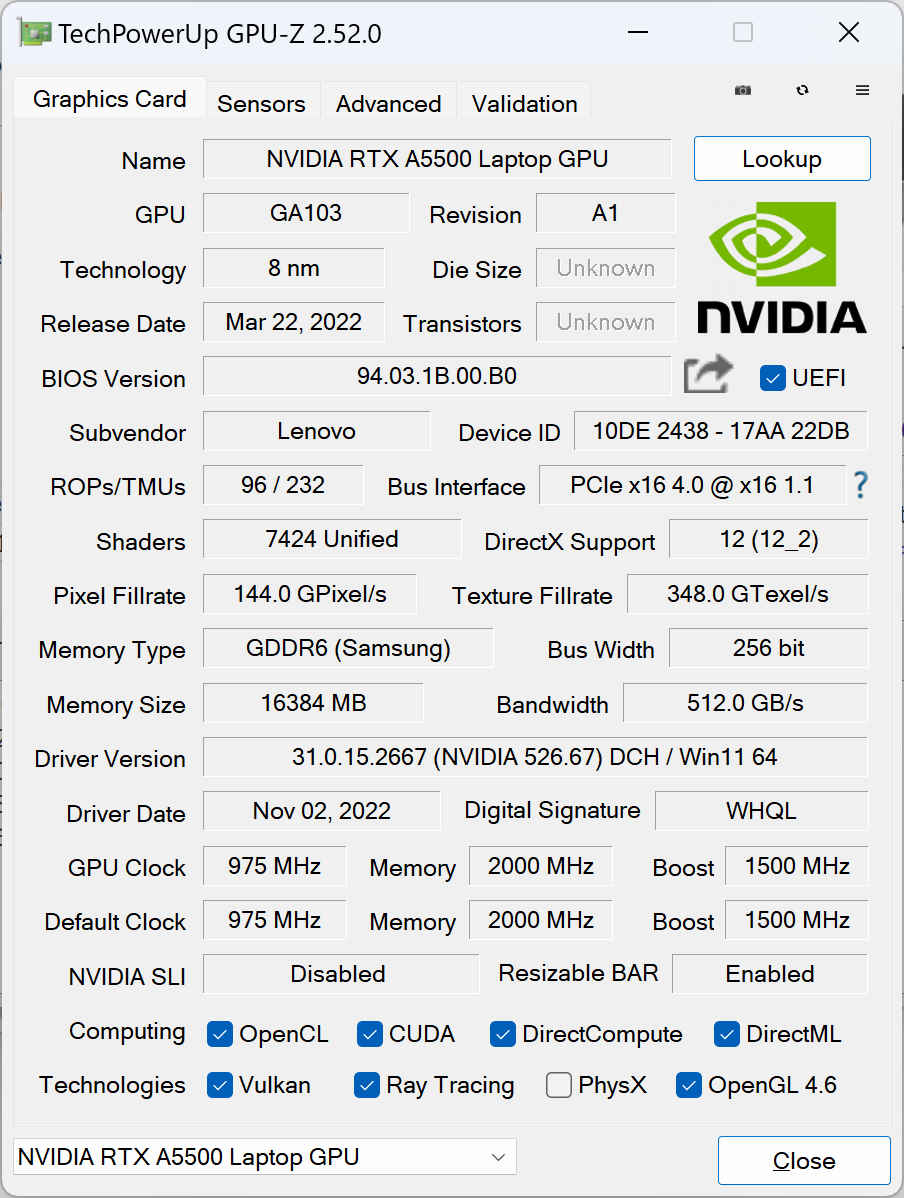
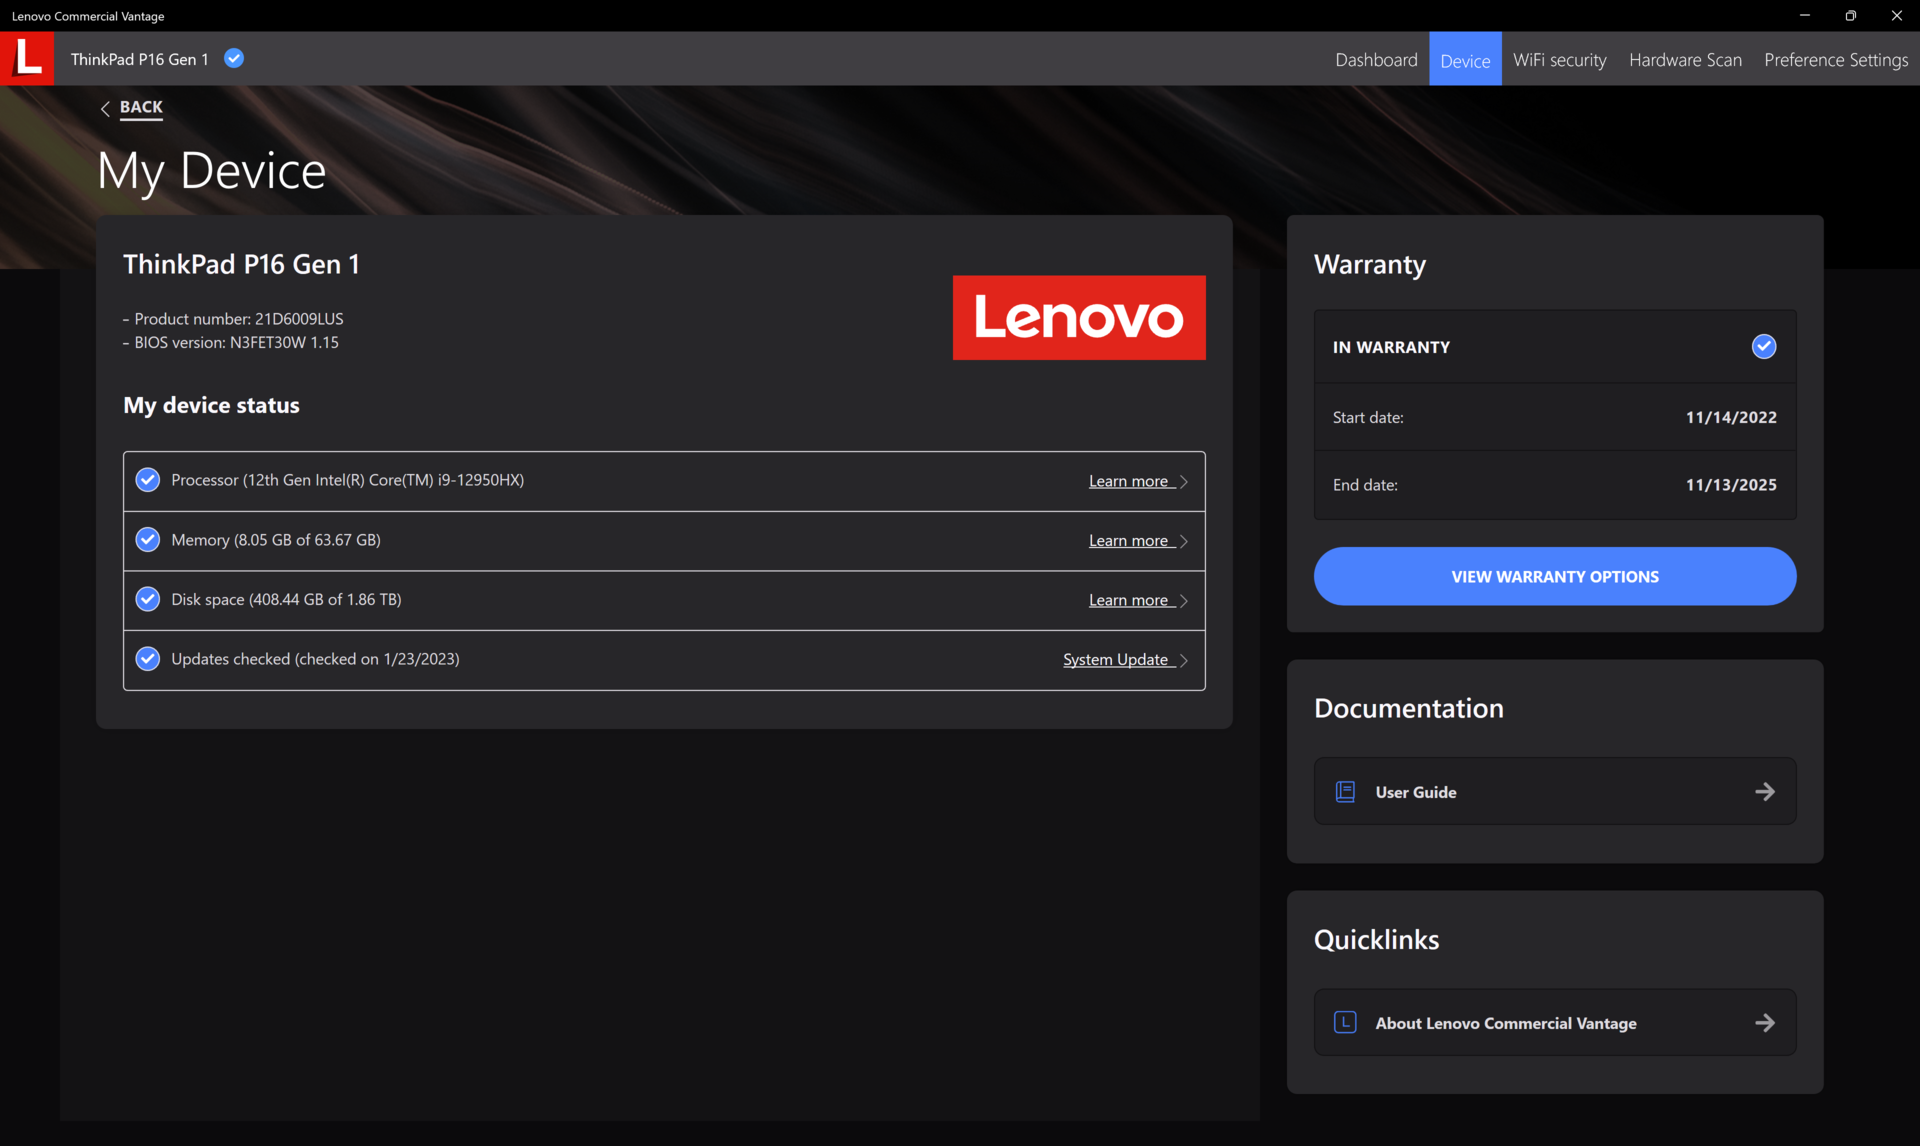
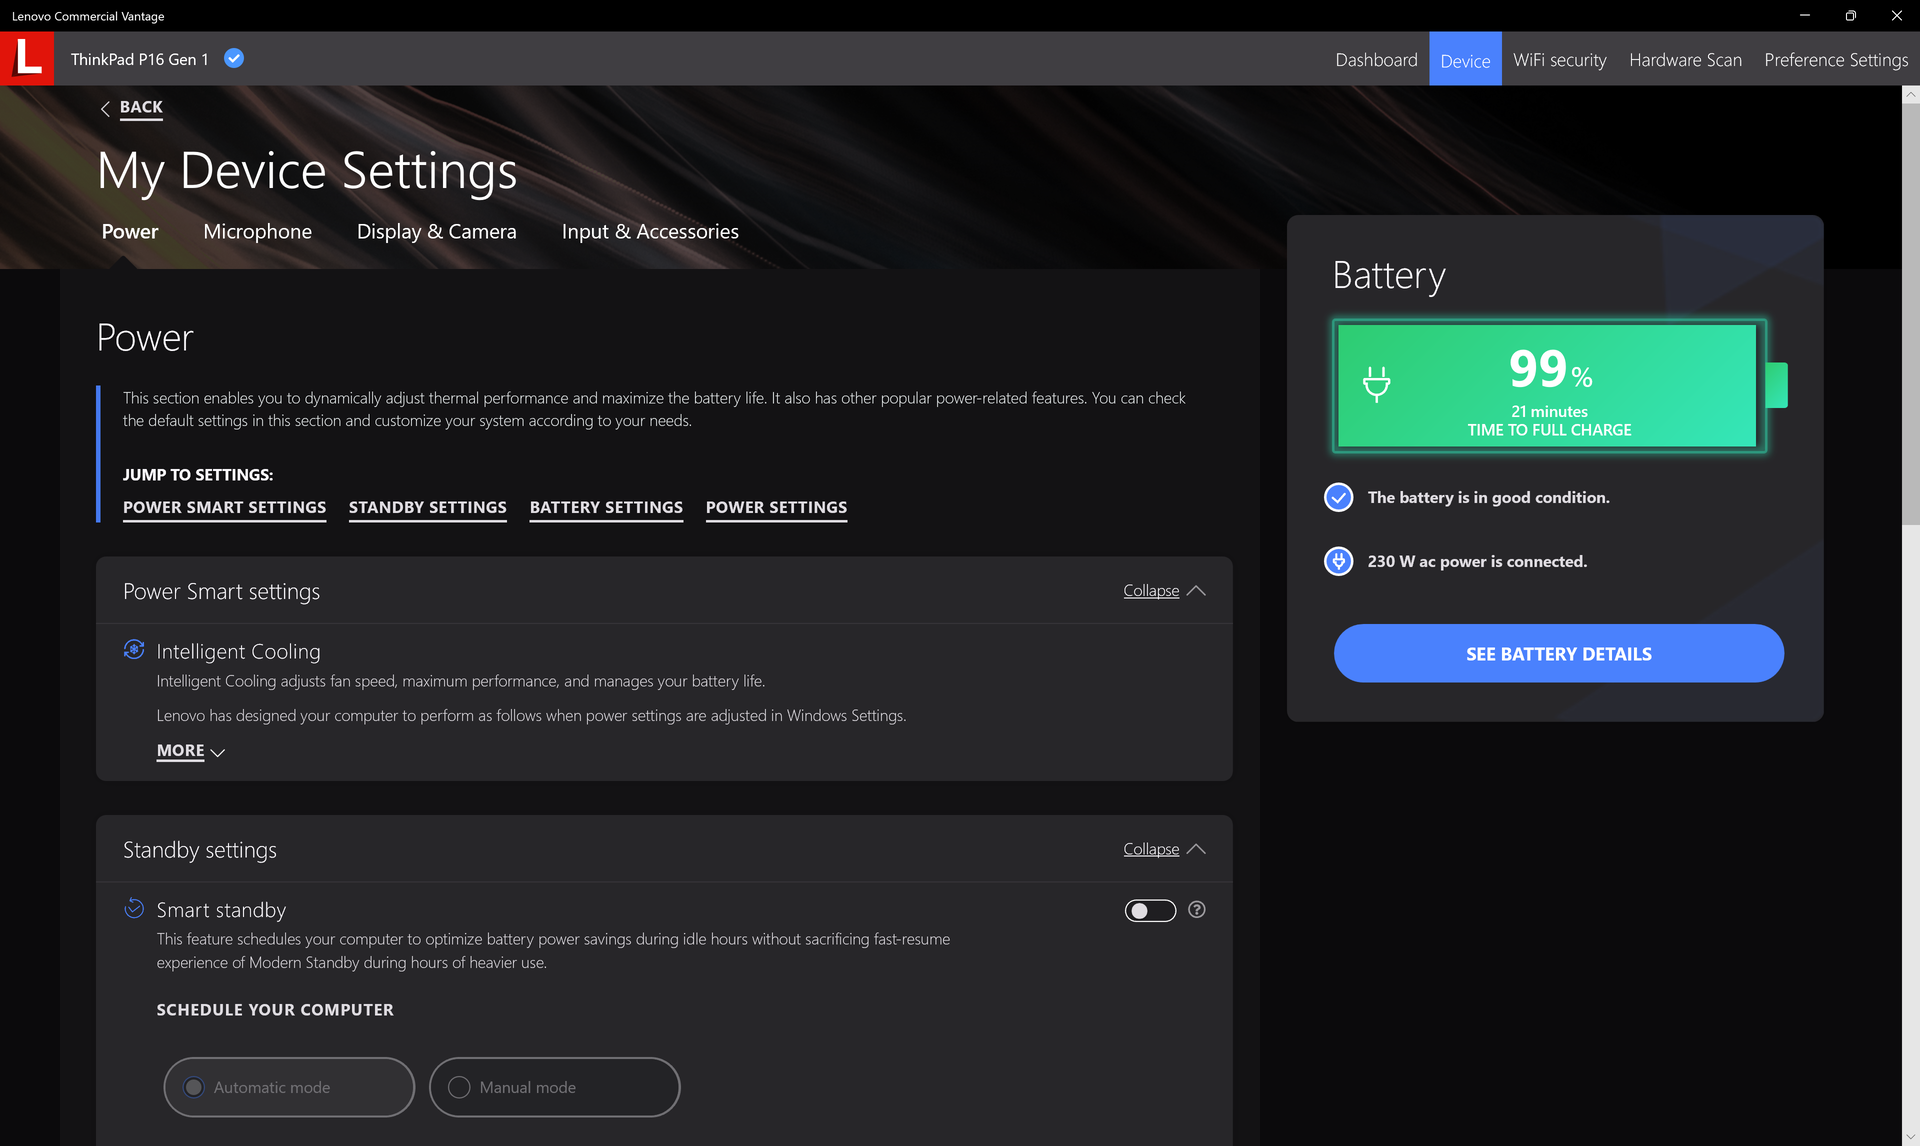
Configuramos nuestra unidad en modo Rendimiento y modo dGPU a través de Windows y el panel de control de Nvidia, respectivamente, antes de ejecutar cualquier prueba de rendimiento a continuación. Se recomienda que los usuarios se familiaricen con el software preinstalado Lenovo Vantage, ya que es el eje central para las actualizaciones de BIOS específicas de Lenovo, características, estado de la garantía y más.
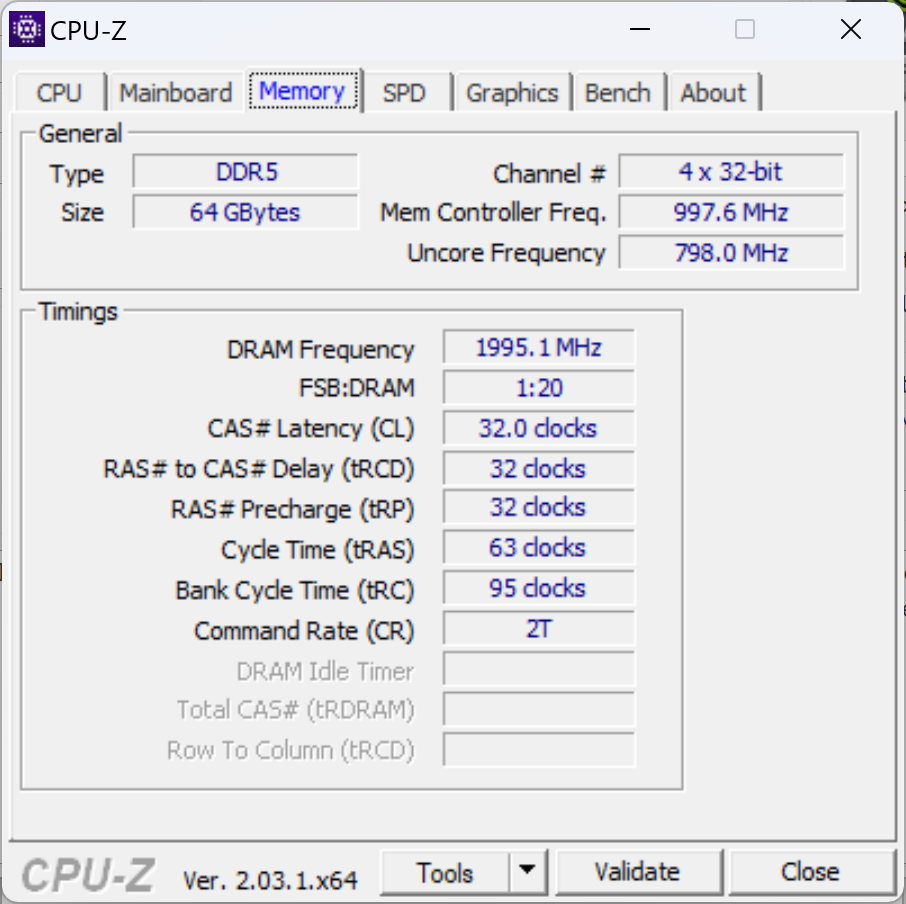
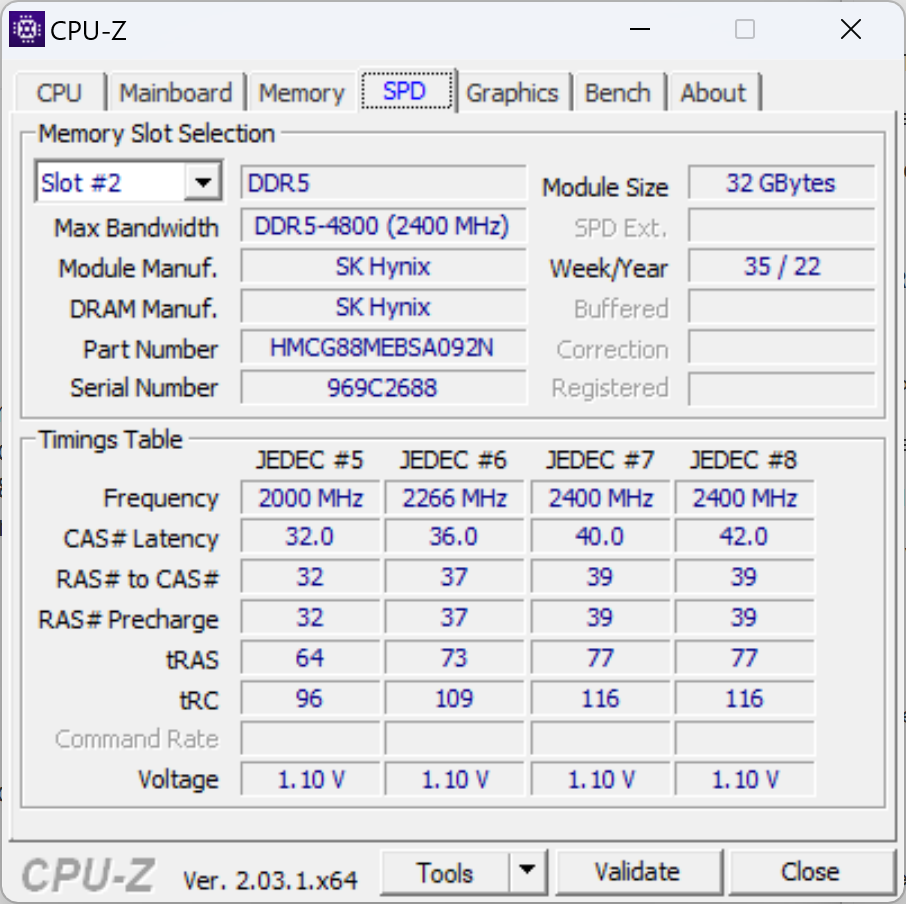
No hay opciones de CPU Xeon, por lo que la RAM ECC no es compatible. Sin embargo, el estado ECC para la GPU se puede activar o desactivar a través del panel de control de Nvidia.
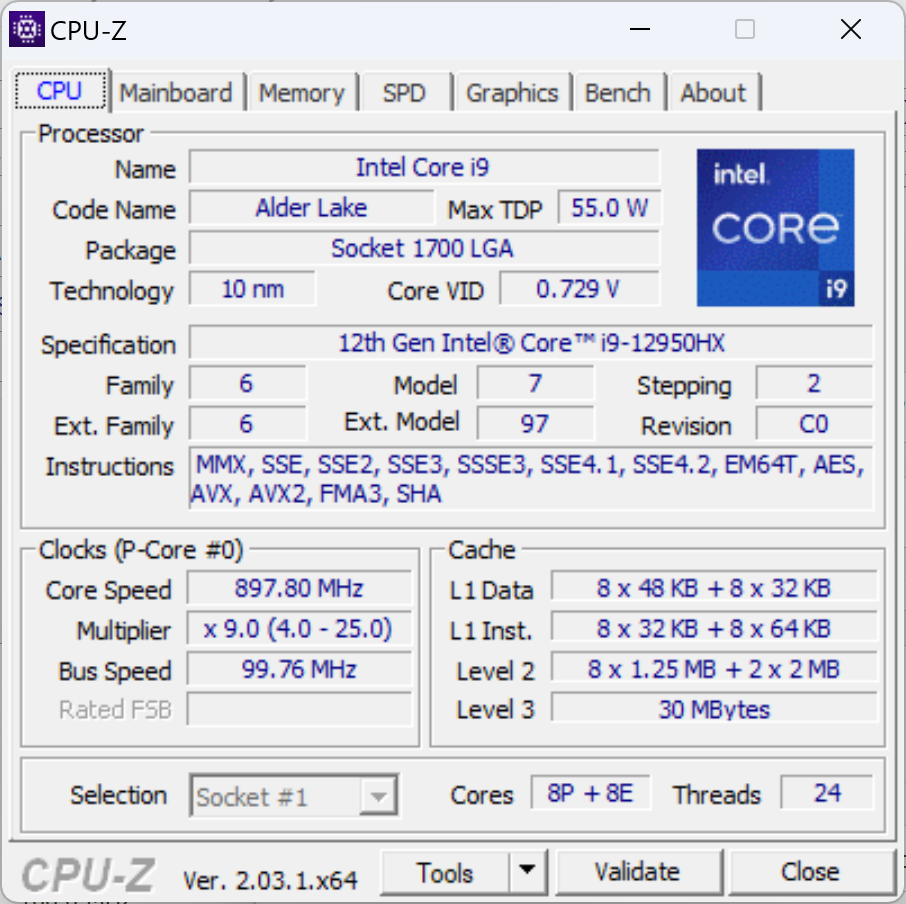
Procesador
El rendimiento multihilo en bruto es un 10% más rápido que el del Core i9-12900H del competidor MSI CreatorPro Z16P. La actualización desde elCore i7-12850HX a nuestra configuración Core i9-12950HX aumentará el rendimiento en un 15%. Tal vez lo más notable sea que el Precision 7670 es aproximadamente entre un 15 y un 20 por ciento más lento a pesar de que viene con la misma CPU Core i9-12950HX que nuestro Lenovo.
La sostenibilidad de Turbo Boost es buena pero no perfecta. Al ejecutar CineBench R15 xT en un bucle, por ejemplo, la puntuación original de 3141 puntos caería a ~2830 puntos con el tiempo para una caída de rendimiento del 10 por ciento.
Cinebench R15 Multi Loop
Cinebench R23: Multi Core | Single Core
Cinebench R20: CPU (Multi Core) | CPU (Single Core)
Cinebench R15: CPU Multi 64Bit | CPU Single 64Bit
Blender: v2.79 BMW27 CPU
7-Zip 18.03: 7z b 4 | 7z b 4 -mmt1
Geekbench 5.5: Multi-Core | Single-Core
HWBOT x265 Benchmark v2.2: 4k Preset
LibreOffice : 20 Documents To PDF
R Benchmark 2.5: Overall mean
* ... más pequeño es mejor
AIDA64: FP32 Ray-Trace | FPU Julia | CPU SHA3 | CPU Queen | FPU SinJulia | FPU Mandel | CPU AES | CPU ZLib | FP64 Ray-Trace | CPU PhotoWorxx
| Performance rating | |
| Medio Intel Core i9-12950HX | |
| Lenovo ThinkPad P16 G1 RTX A5500 | |
| Lenovo ThinkPad P16 G1 21D6001DMB | |
| MSI CreatorPro Z16P B12UKST | |
| HP ZBook Studio 16 G9 62U04EA | |
| Dell Precision 7000 7670 Performance | |
| Asus ProArt StudioBook 16 W7600H5A-2BL2 -9! | |
| AIDA64 / FP32 Ray-Trace | |
| Lenovo ThinkPad P16 G1 RTX A5500 | |
| Medio Intel Core i9-12950HX (15499 - 22868, n=7) | |
| Lenovo ThinkPad P16 G1 21D6001DMB | |
| Dell Precision 7000 7670 Performance | |
| HP ZBook Studio 16 G9 62U04EA | |
| MSI CreatorPro Z16P B12UKST | |
| AIDA64 / FPU Julia | |
| Lenovo ThinkPad P16 G1 RTX A5500 | |
| Medio Intel Core i9-12950HX (77846 - 115907, n=7) | |
| Lenovo ThinkPad P16 G1 21D6001DMB | |
| HP ZBook Studio 16 G9 62U04EA | |
| Dell Precision 7000 7670 Performance | |
| MSI CreatorPro Z16P B12UKST | |
| AIDA64 / CPU SHA3 | |
| Lenovo ThinkPad P16 G1 RTX A5500 | |
| Medio Intel Core i9-12950HX (3426 - 5069, n=7) | |
| Lenovo ThinkPad P16 G1 21D6001DMB | |
| HP ZBook Studio 16 G9 62U04EA | |
| MSI CreatorPro Z16P B12UKST | |
| Dell Precision 7000 7670 Performance | |
| AIDA64 / CPU Queen | |
| HP ZBook Studio 16 G9 62U04EA | |
| Medio Intel Core i9-12950HX (102752 - 104726, n=7) | |
| Lenovo ThinkPad P16 G1 RTX A5500 | |
| Dell Precision 7000 7670 Performance | |
| MSI CreatorPro Z16P B12UKST | |
| Lenovo ThinkPad P16 G1 21D6001DMB | |
| AIDA64 / FPU SinJulia | |
| Lenovo ThinkPad P16 G1 RTX A5500 | |
| Medio Intel Core i9-12950HX (10134 - 12823, n=7) | |
| Lenovo ThinkPad P16 G1 21D6001DMB | |
| Dell Precision 7000 7670 Performance | |
| HP ZBook Studio 16 G9 62U04EA | |
| MSI CreatorPro Z16P B12UKST | |
| AIDA64 / FPU Mandel | |
| Lenovo ThinkPad P16 G1 RTX A5500 | |
| Medio Intel Core i9-12950HX (37146 - 57340, n=7) | |
| Lenovo ThinkPad P16 G1 21D6001DMB | |
| HP ZBook Studio 16 G9 62U04EA | |
| Dell Precision 7000 7670 Performance | |
| MSI CreatorPro Z16P B12UKST | |
| AIDA64 / CPU AES | |
| MSI CreatorPro Z16P B12UKST | |
| Medio Intel Core i9-12950HX (72599 - 181128, n=7) | |
| Lenovo ThinkPad P16 G1 RTX A5500 | |
| Lenovo ThinkPad P16 G1 21D6001DMB | |
| HP ZBook Studio 16 G9 62U04EA | |
| Dell Precision 7000 7670 Performance | |
| AIDA64 / FP64 Ray-Trace | |
| Lenovo ThinkPad P16 G1 RTX A5500 | |
| Medio Intel Core i9-12950HX (8455 - 12432, n=7) | |
| Lenovo ThinkPad P16 G1 21D6001DMB | |
| HP ZBook Studio 16 G9 62U04EA | |
| Dell Precision 7000 7670 Performance | |
| MSI CreatorPro Z16P B12UKST | |
| AIDA64 / CPU PhotoWorxx | |
| MSI CreatorPro Z16P B12UKST | |
| Dell Precision 7000 7670 Performance | |
| Medio Intel Core i9-12950HX (35479 - 42655, n=7) | |
| Lenovo ThinkPad P16 G1 RTX A5500 | |
| HP ZBook Studio 16 G9 62U04EA | |
| Lenovo ThinkPad P16 G1 21D6001DMB | |
Rendimiento del sistema
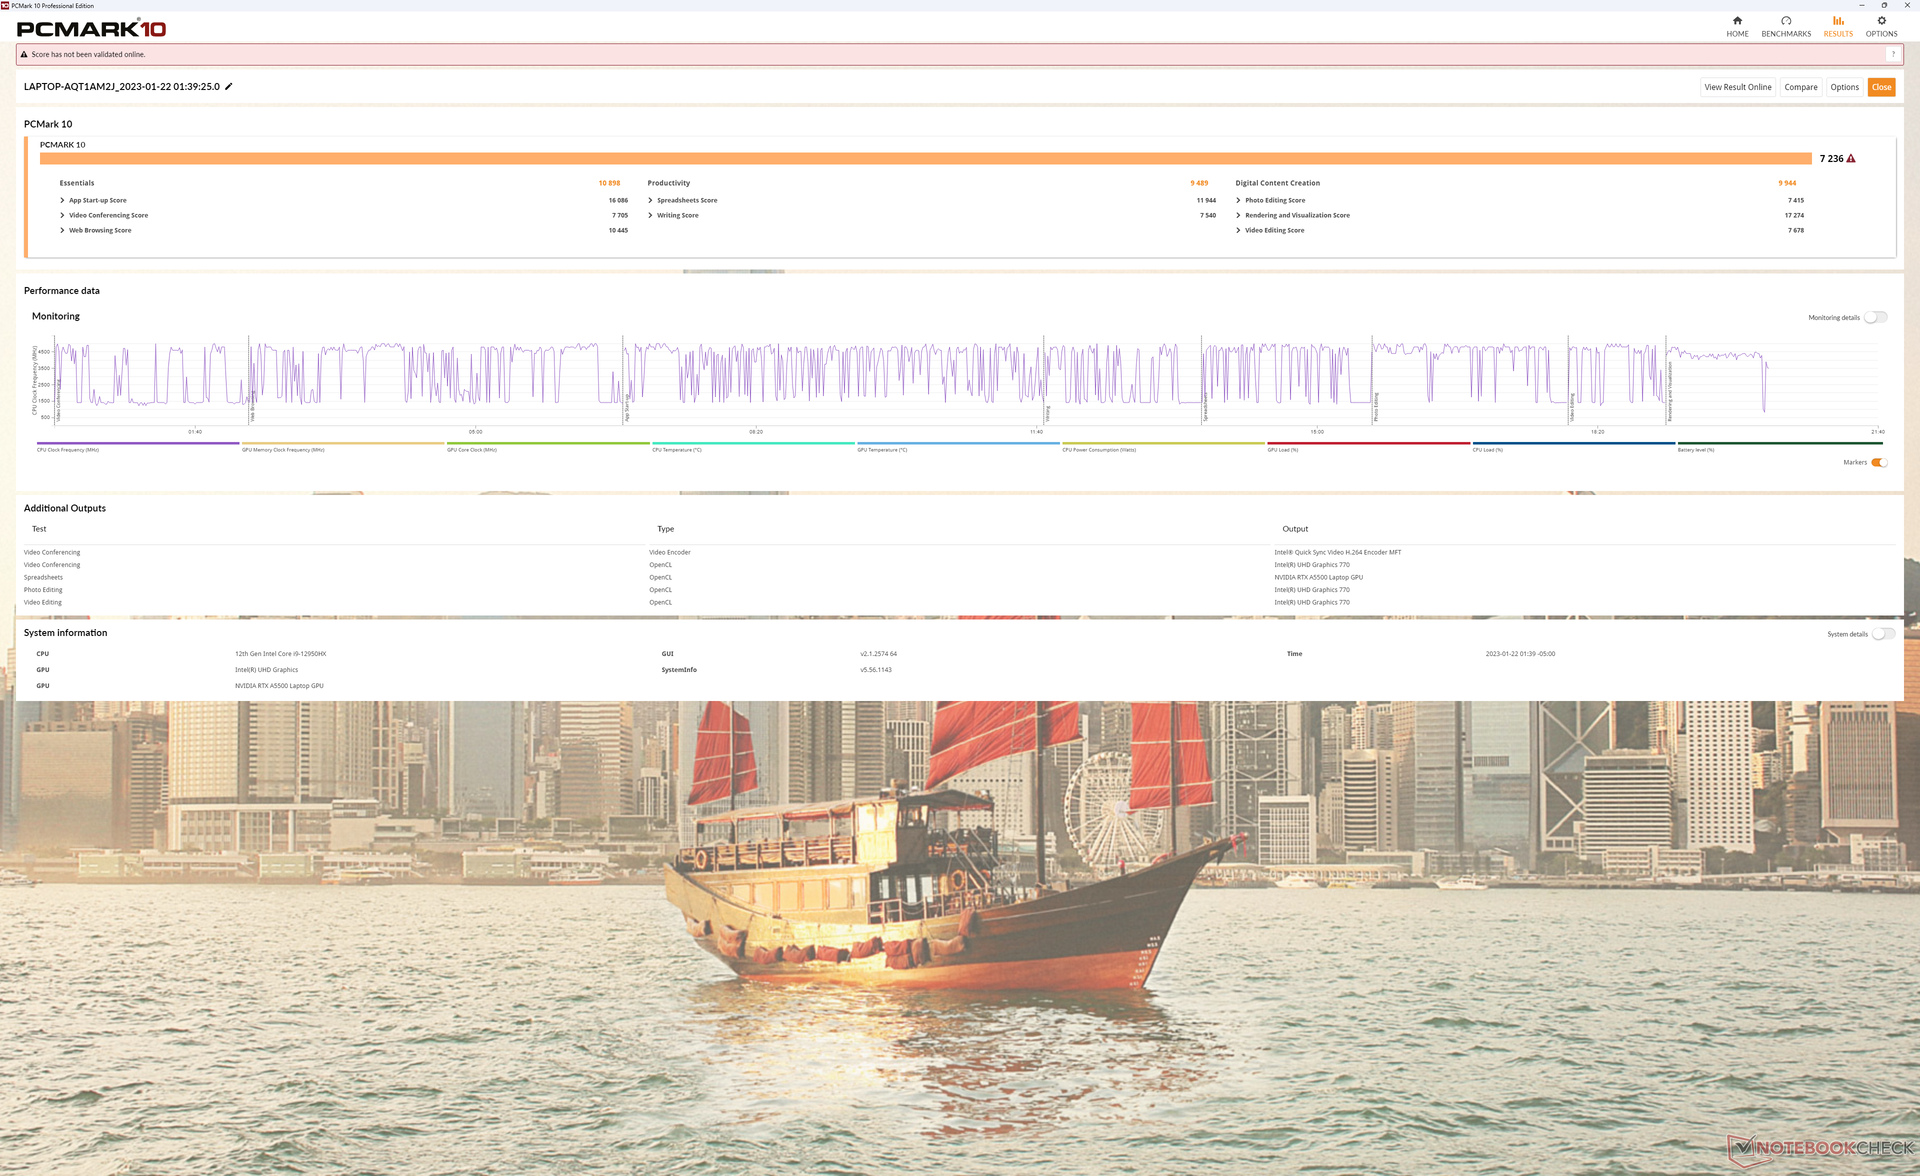
Las puntuaciones PCMark son de las más altas que hemos visto en una estación de trabajo portátil. Nuestro sistema supera incluso al Dell Precision 7670 que incluye las mismas opciones de CPU y GPU que el ThinkPad P16 G1.
CrossMark: Overall | Productivity | Creativity | Responsiveness
| PCMark 10 / Score | |
| Lenovo ThinkPad P16 G1 RTX A5500 | |
| MSI CreatorPro Z16P B12UKST | |
| Medio Intel Core i9-12950HX, NVIDIA RTX A5500 Laptop GPU (6883 - 7236, n=3) | |
| Asus ProArt StudioBook 16 W7600H5A-2BL2 | |
| Dell Precision 7000 7670 Performance | |
| HP ZBook Studio 16 G9 62U04EA | |
| Lenovo ThinkPad P16 G1 21D6001DMB | |
| PCMark 10 / Essentials | |
| Dell Precision 7000 7670 Performance | |
| Medio Intel Core i9-12950HX, NVIDIA RTX A5500 Laptop GPU (10898 - 11465, n=3) | |
| Lenovo ThinkPad P16 G1 RTX A5500 | |
| MSI CreatorPro Z16P B12UKST | |
| Asus ProArt StudioBook 16 W7600H5A-2BL2 | |
| Lenovo ThinkPad P16 G1 21D6001DMB | |
| HP ZBook Studio 16 G9 62U04EA | |
| PCMark 10 / Productivity | |
| Lenovo ThinkPad P16 G1 RTX A5500 | |
| MSI CreatorPro Z16P B12UKST | |
| Lenovo ThinkPad P16 G1 21D6001DMB | |
| Asus ProArt StudioBook 16 W7600H5A-2BL2 | |
| Medio Intel Core i9-12950HX, NVIDIA RTX A5500 Laptop GPU (8054 - 9489, n=3) | |
| Dell Precision 7000 7670 Performance | |
| HP ZBook Studio 16 G9 62U04EA | |
| PCMark 10 / Digital Content Creation | |
| Asus ProArt StudioBook 16 W7600H5A-2BL2 | |
| Lenovo ThinkPad P16 G1 RTX A5500 | |
| MSI CreatorPro Z16P B12UKST | |
| Dell Precision 7000 7670 Performance | |
| Medio Intel Core i9-12950HX, NVIDIA RTX A5500 Laptop GPU (9155 - 9944, n=3) | |
| HP ZBook Studio 16 G9 62U04EA | |
| Lenovo ThinkPad P16 G1 21D6001DMB | |
| CrossMark / Overall | |
| MSI CreatorPro Z16P B12UKST | |
| Lenovo ThinkPad P16 G1 RTX A5500 | |
| Medio Intel Core i9-12950HX, NVIDIA RTX A5500 Laptop GPU (1801 - 1889, n=3) | |
| HP ZBook Studio 16 G9 62U04EA | |
| Dell Precision 7000 7670 Performance | |
| Lenovo ThinkPad P16 G1 21D6001DMB | |
| CrossMark / Productivity | |
| MSI CreatorPro Z16P B12UKST | |
| Lenovo ThinkPad P16 G1 RTX A5500 | |
| Medio Intel Core i9-12950HX, NVIDIA RTX A5500 Laptop GPU (1684 - 1785, n=3) | |
| HP ZBook Studio 16 G9 62U04EA | |
| Dell Precision 7000 7670 Performance | |
| Lenovo ThinkPad P16 G1 21D6001DMB | |
| CrossMark / Creativity | |
| Lenovo ThinkPad P16 G1 RTX A5500 | |
| Medio Intel Core i9-12950HX, NVIDIA RTX A5500 Laptop GPU (2042 - 2192, n=3) | |
| HP ZBook Studio 16 G9 62U04EA | |
| MSI CreatorPro Z16P B12UKST | |
| Dell Precision 7000 7670 Performance | |
| Lenovo ThinkPad P16 G1 21D6001DMB | |
| CrossMark / Responsiveness | |
| MSI CreatorPro Z16P B12UKST | |
| HP ZBook Studio 16 G9 62U04EA | |
| Medio Intel Core i9-12950HX, NVIDIA RTX A5500 Laptop GPU (1501 - 1585, n=3) | |
| Dell Precision 7000 7670 Performance | |
| Lenovo ThinkPad P16 G1 RTX A5500 | |
| Lenovo ThinkPad P16 G1 21D6001DMB | |
| PCMark 10 Score | 7236 puntos | |
ayuda | ||
| AIDA64 / Memory Copy | |
| Dell Precision 7000 7670 Performance | |
| Medio Intel Core i9-12950HX (59731 - 64732, n=7) | |
| Lenovo ThinkPad P16 G1 RTX A5500 | |
| MSI CreatorPro Z16P B12UKST | |
| HP ZBook Studio 16 G9 62U04EA | |
| Lenovo ThinkPad P16 G1 21D6001DMB | |
| AIDA64 / Memory Read | |
| Dell Precision 7000 7670 Performance | |
| Medio Intel Core i9-12950HX (59744 - 70359, n=7) | |
| MSI CreatorPro Z16P B12UKST | |
| HP ZBook Studio 16 G9 62U04EA | |
| Lenovo ThinkPad P16 G1 RTX A5500 | |
| Lenovo ThinkPad P16 G1 21D6001DMB | |
| AIDA64 / Memory Write | |
| MSI CreatorPro Z16P B12UKST | |
| Dell Precision 7000 7670 Performance | |
| HP ZBook Studio 16 G9 62U04EA | |
| Medio Intel Core i9-12950HX (57750 - 67899, n=7) | |
| Lenovo ThinkPad P16 G1 RTX A5500 | |
| Lenovo ThinkPad P16 G1 21D6001DMB | |
* ... más pequeño es mejor
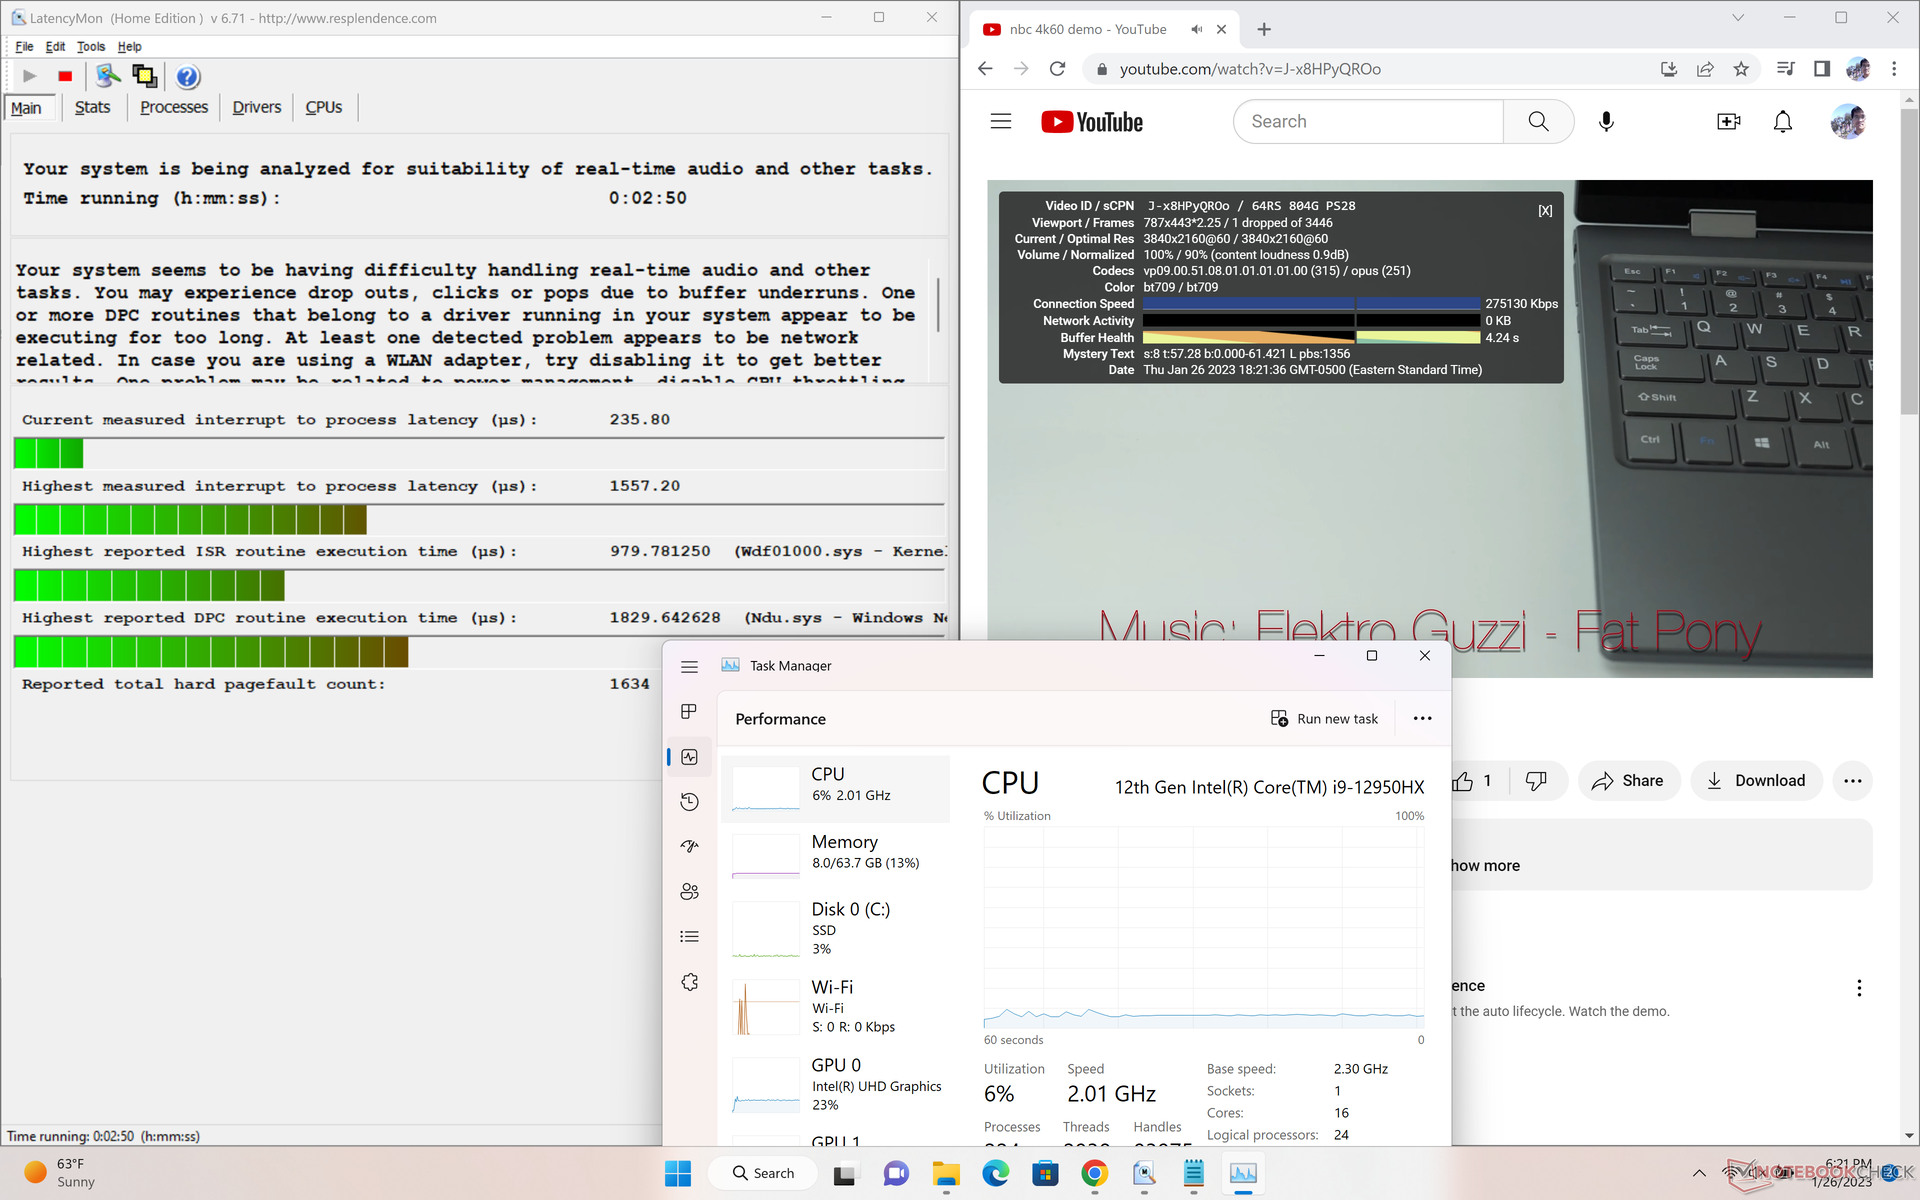
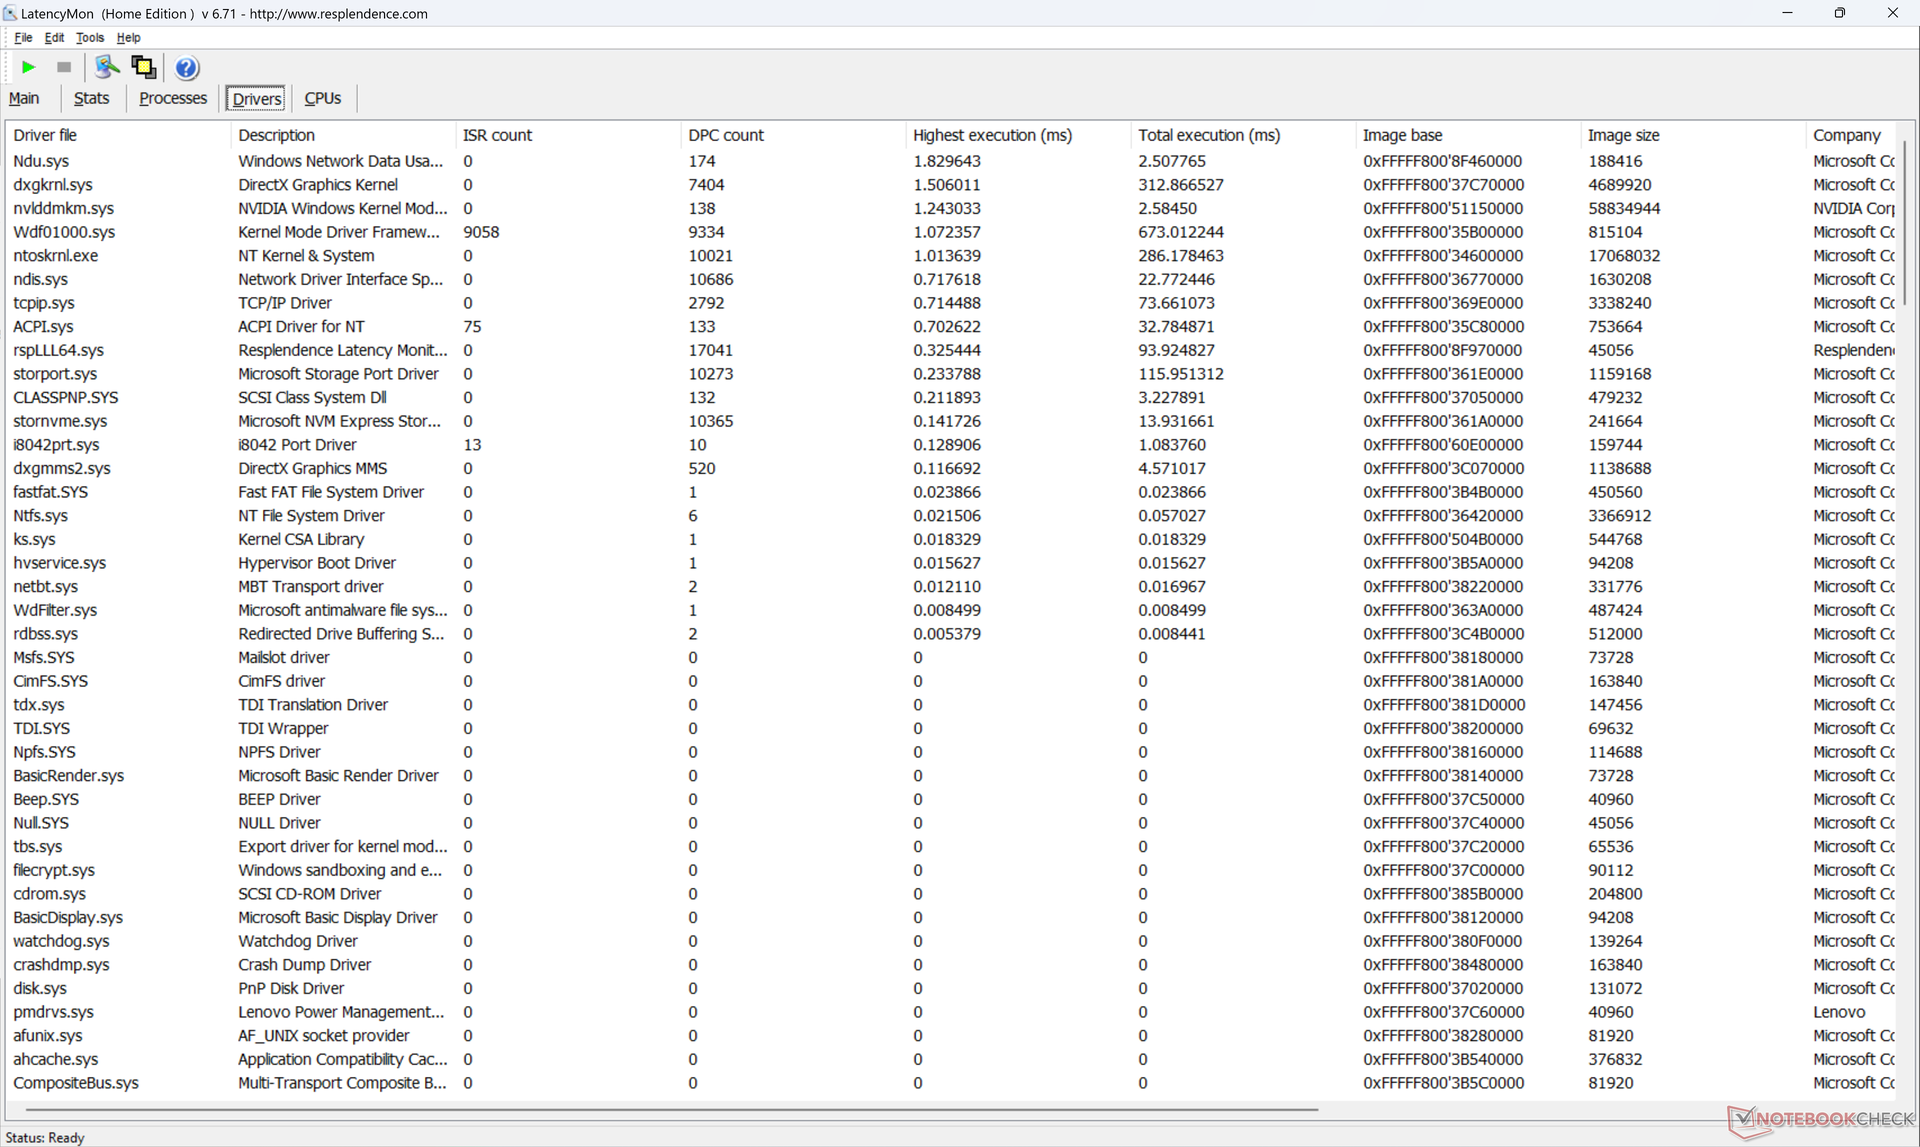
Latencia del CPD
LatencyMon revela problemas menores de CPD al abrir múltiples pestañas de navegador de nuestra página de inicio, lo que es decepcionante para una estación de trabajo. la reproducción de vídeo 4K a 60 FPS es por lo demás excelente, con un único fotograma caído durante nuestro vídeo de pruebas.
| DPC Latencies / LatencyMon - interrupt to process latency (max), Web, Youtube, Prime95 | |
| Dell Precision 7000 7670 Performance | |
| Lenovo ThinkPad P16 G1 RTX A5500 | |
| Asus ProArt StudioBook 16 W7600H5A-2BL2 | |
| Lenovo ThinkPad P16 G1 21D6001DMB | |
| HP ZBook Studio 16 G9 62U04EA | |
| MSI CreatorPro Z16P B12UKST | |
* ... más pequeño es mejor
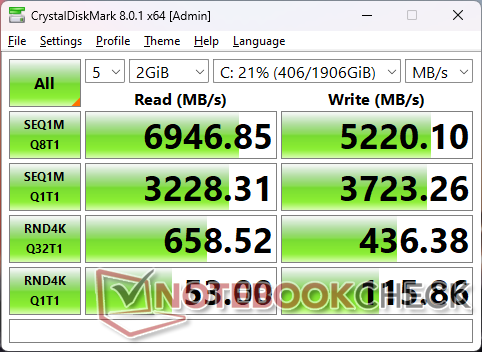
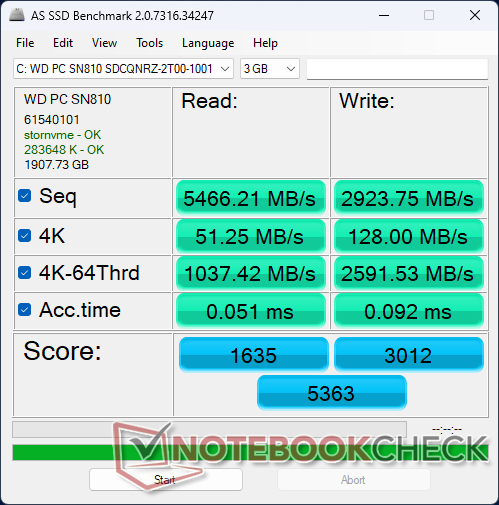
Dispositivos de almacenamiento
Mientras que nuestra configuración A2000 incluye una unidad SSD Micron 3400, nuestra configuración A5500 incluye una unidad SSD WD SN810 OPAL WD SN810 OPAL SSD. Las tasas de lectura y escritura secuencial son comparables entre los dos, pero nuestra unidad WD parece tener problemas para mantener las tasas de transferencia máximas después de unos 5 minutos de estrés, como se muestra en nuestro gráfico de comparación a continuación.

* ... más pequeño es mejor
Disk Throttling: DiskSpd Read Loop, Queue Depth 8
Rendimiento de la GPU
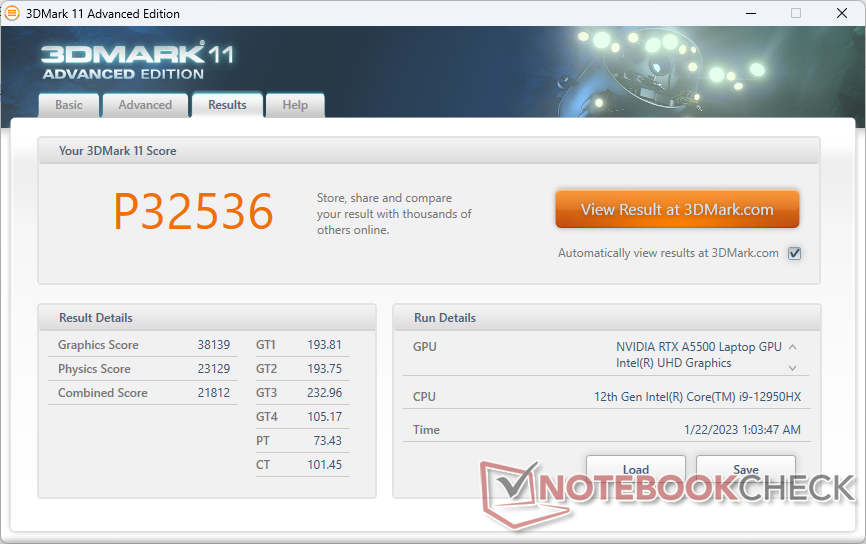
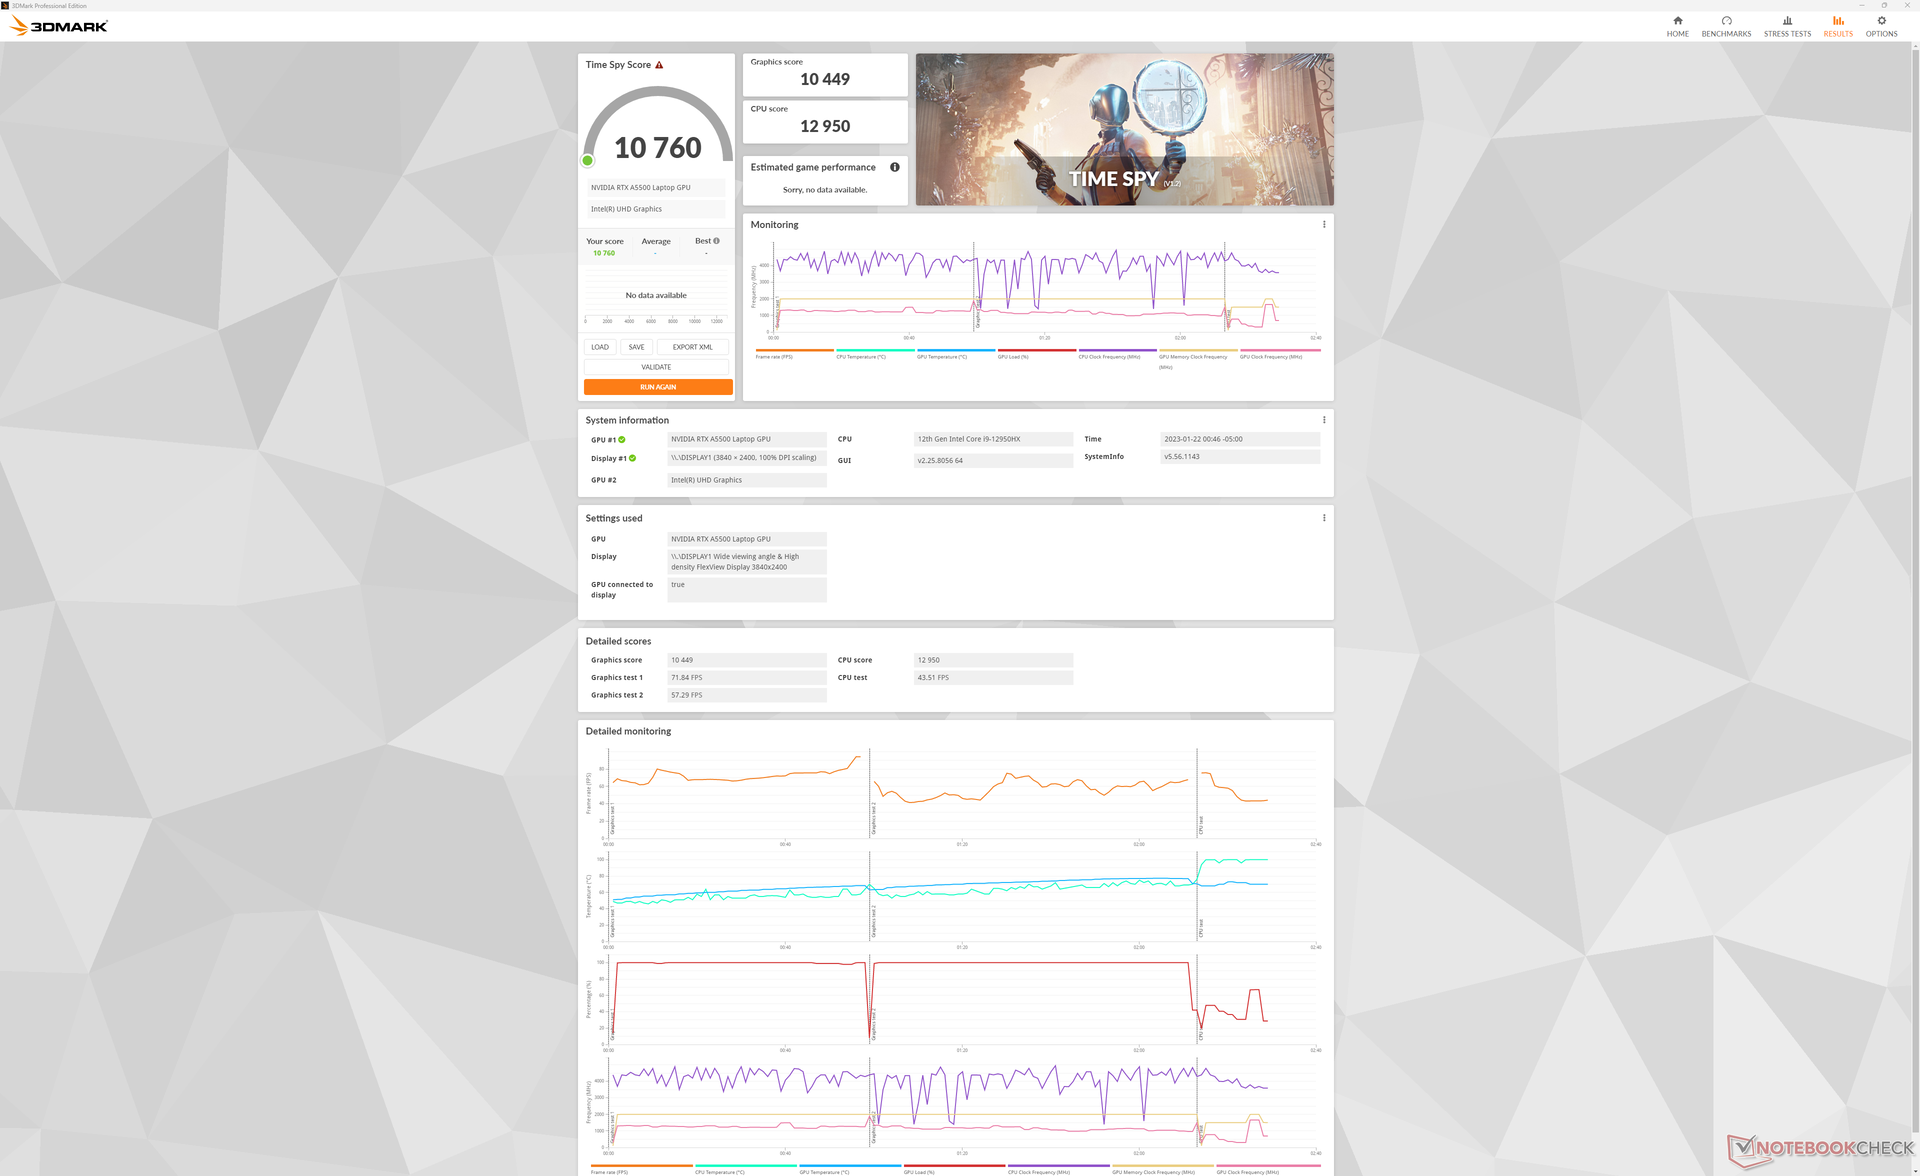
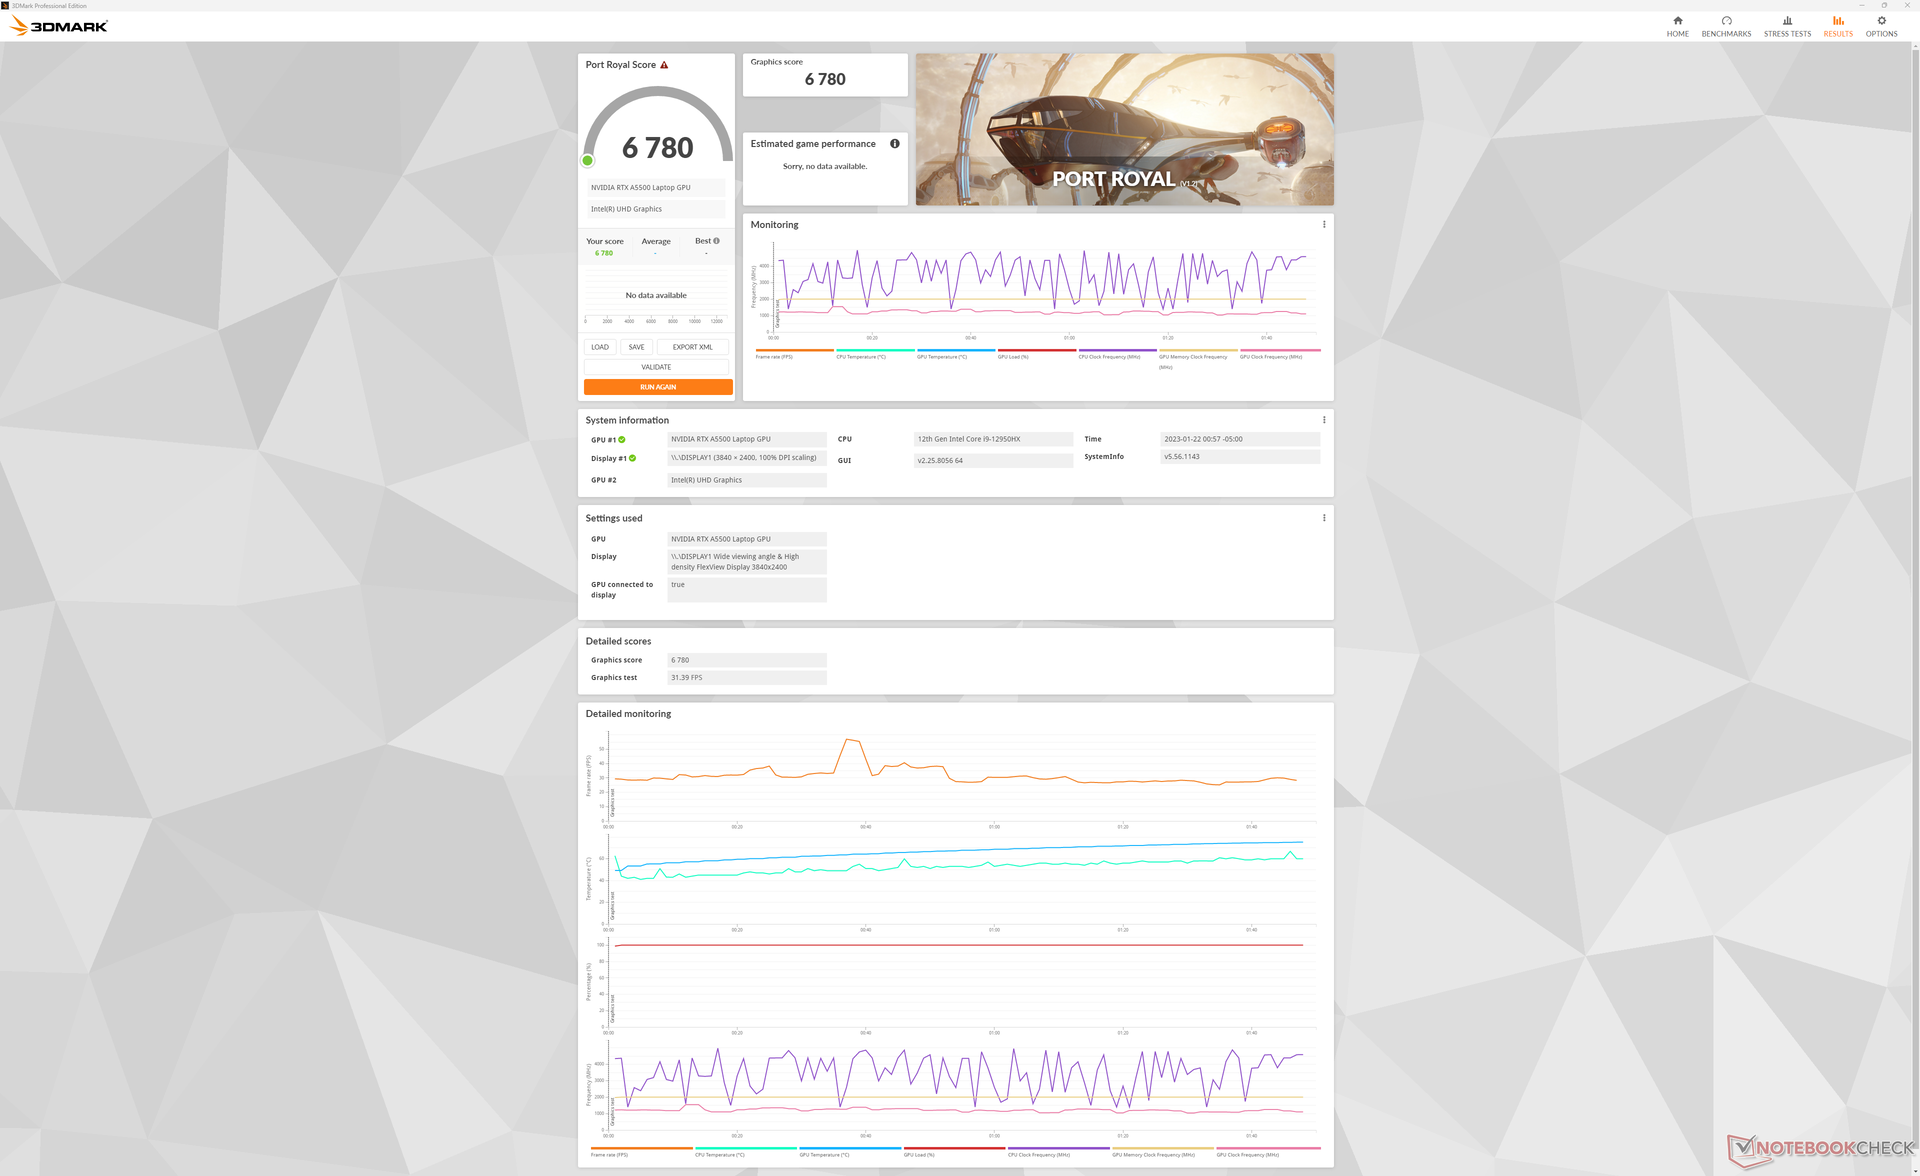
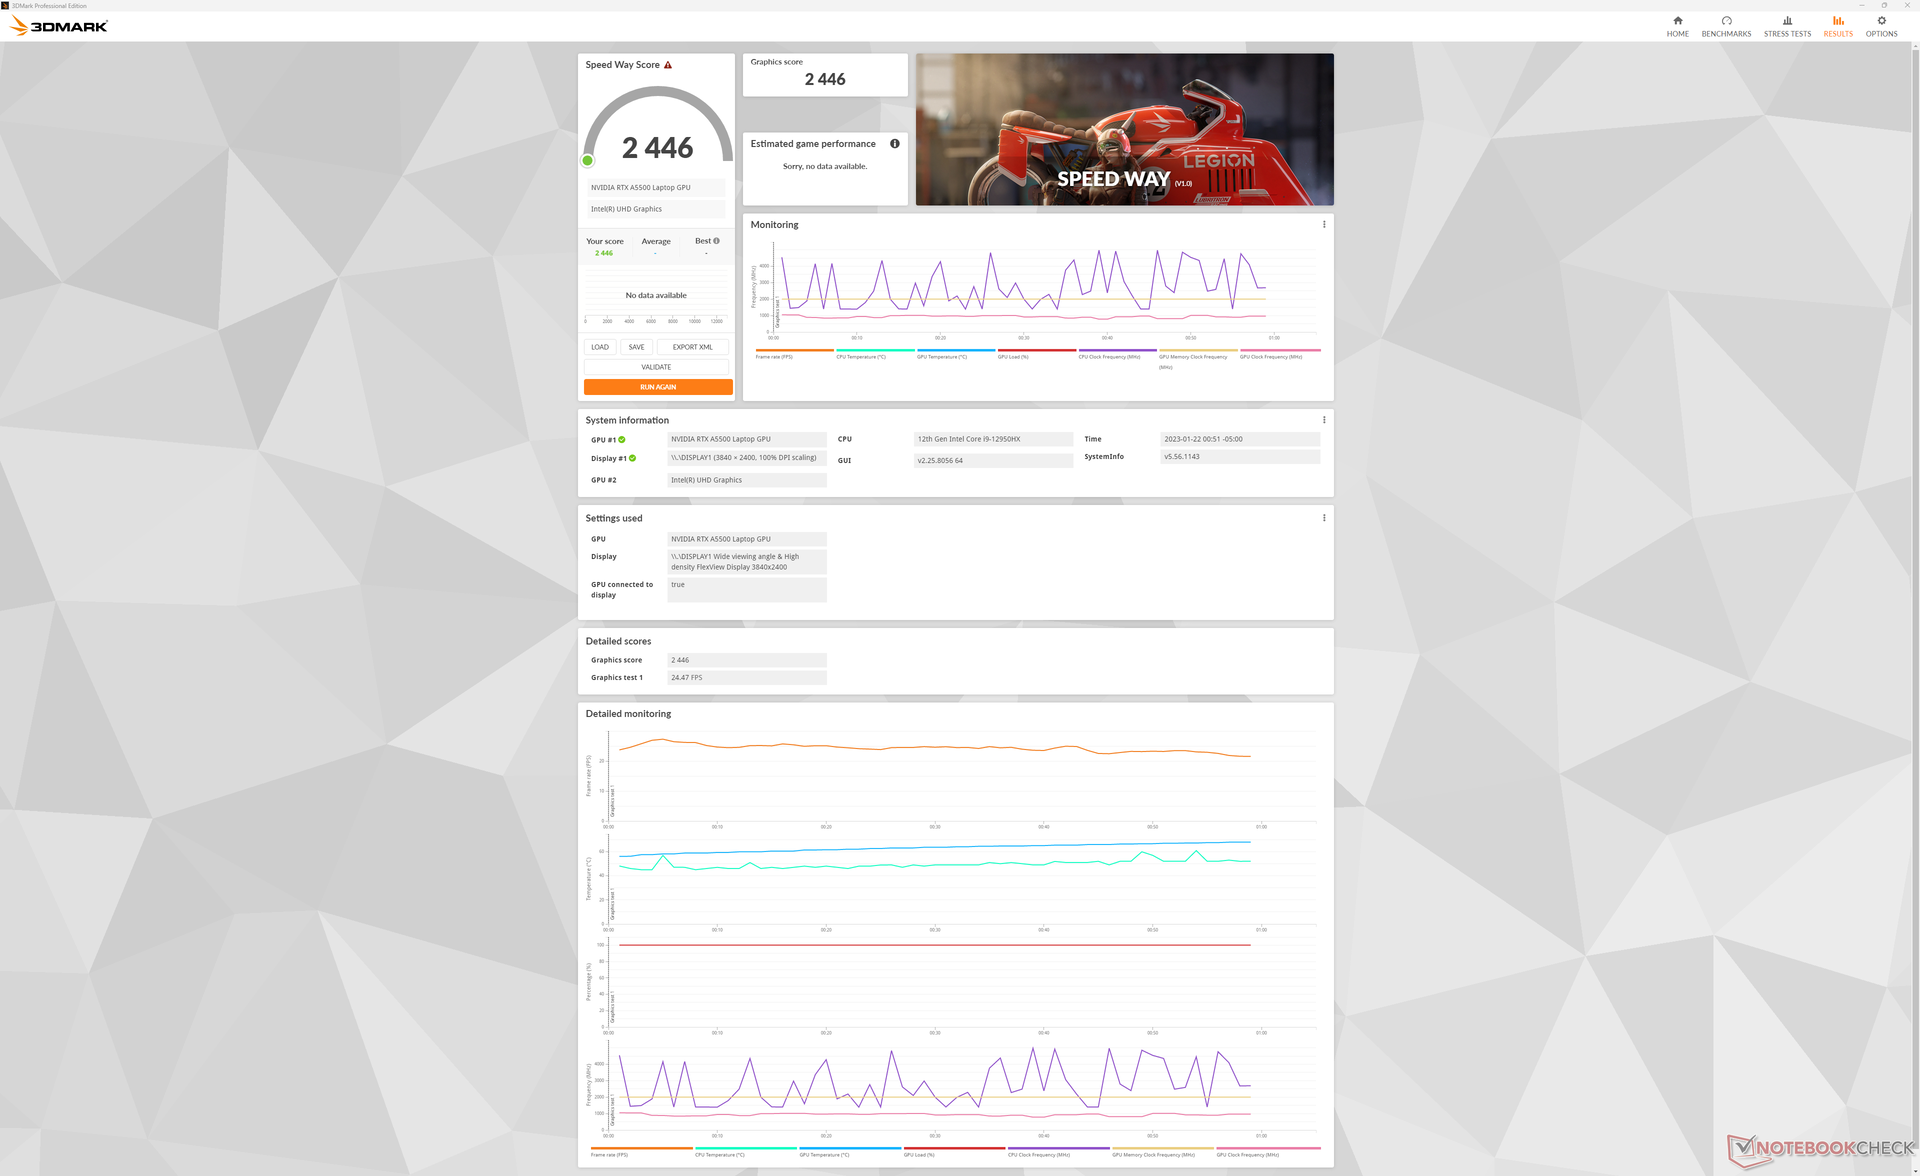
La RTX A5500 de nuestro Lenovo rinde aproximadamente un 10% más rápido que la misma GPU de la Precision 7670 de la competencia. Y eso a pesar de que, según el panel de control de Nvidia, la GPU del Dell tiene una potencia nominal de 135 W TGP frente a los 130 W TGP de nuestro Lenovo. Pasando a la gama baja RTX A2000 Reducirá el rendimiento gráfico entre un 50 y un 65 por ciento.
| 3DMark Performance rating - Percent | |
| Lenovo Legion 7 16IAX7-82TD004SGE -34! | |
| Lenovo ThinkPad P16 G1 RTX A5500 | |
| Dell Precision 7000 7670 Performance -1! | |
| Medio NVIDIA RTX A5500 Laptop GPU | |
| Asus ProArt StudioBook 16 W7600H5A-2BL2 -19! | |
| MSI WE76 11UM-456 -9! | |
| HP ZBook Fury 15 G8 -1! | |
| MSI CreatorPro Z16P B12UKST -17! | |
| HP ZBook Studio 15 G8 -17! | |
| HP ZBook Studio G7 -17! | |
| HP ZBook Studio 16 G9 62U04EA -9! | |
| Dell Precision 5000 5470 -9! | |
| Lenovo ThinkPad P16 G1 21D6001DMB -17! | |
| 3DMark 11 Performance | 32536 puntos | |
| 3DMark Cloud Gate Standard Score | 54323 puntos | |
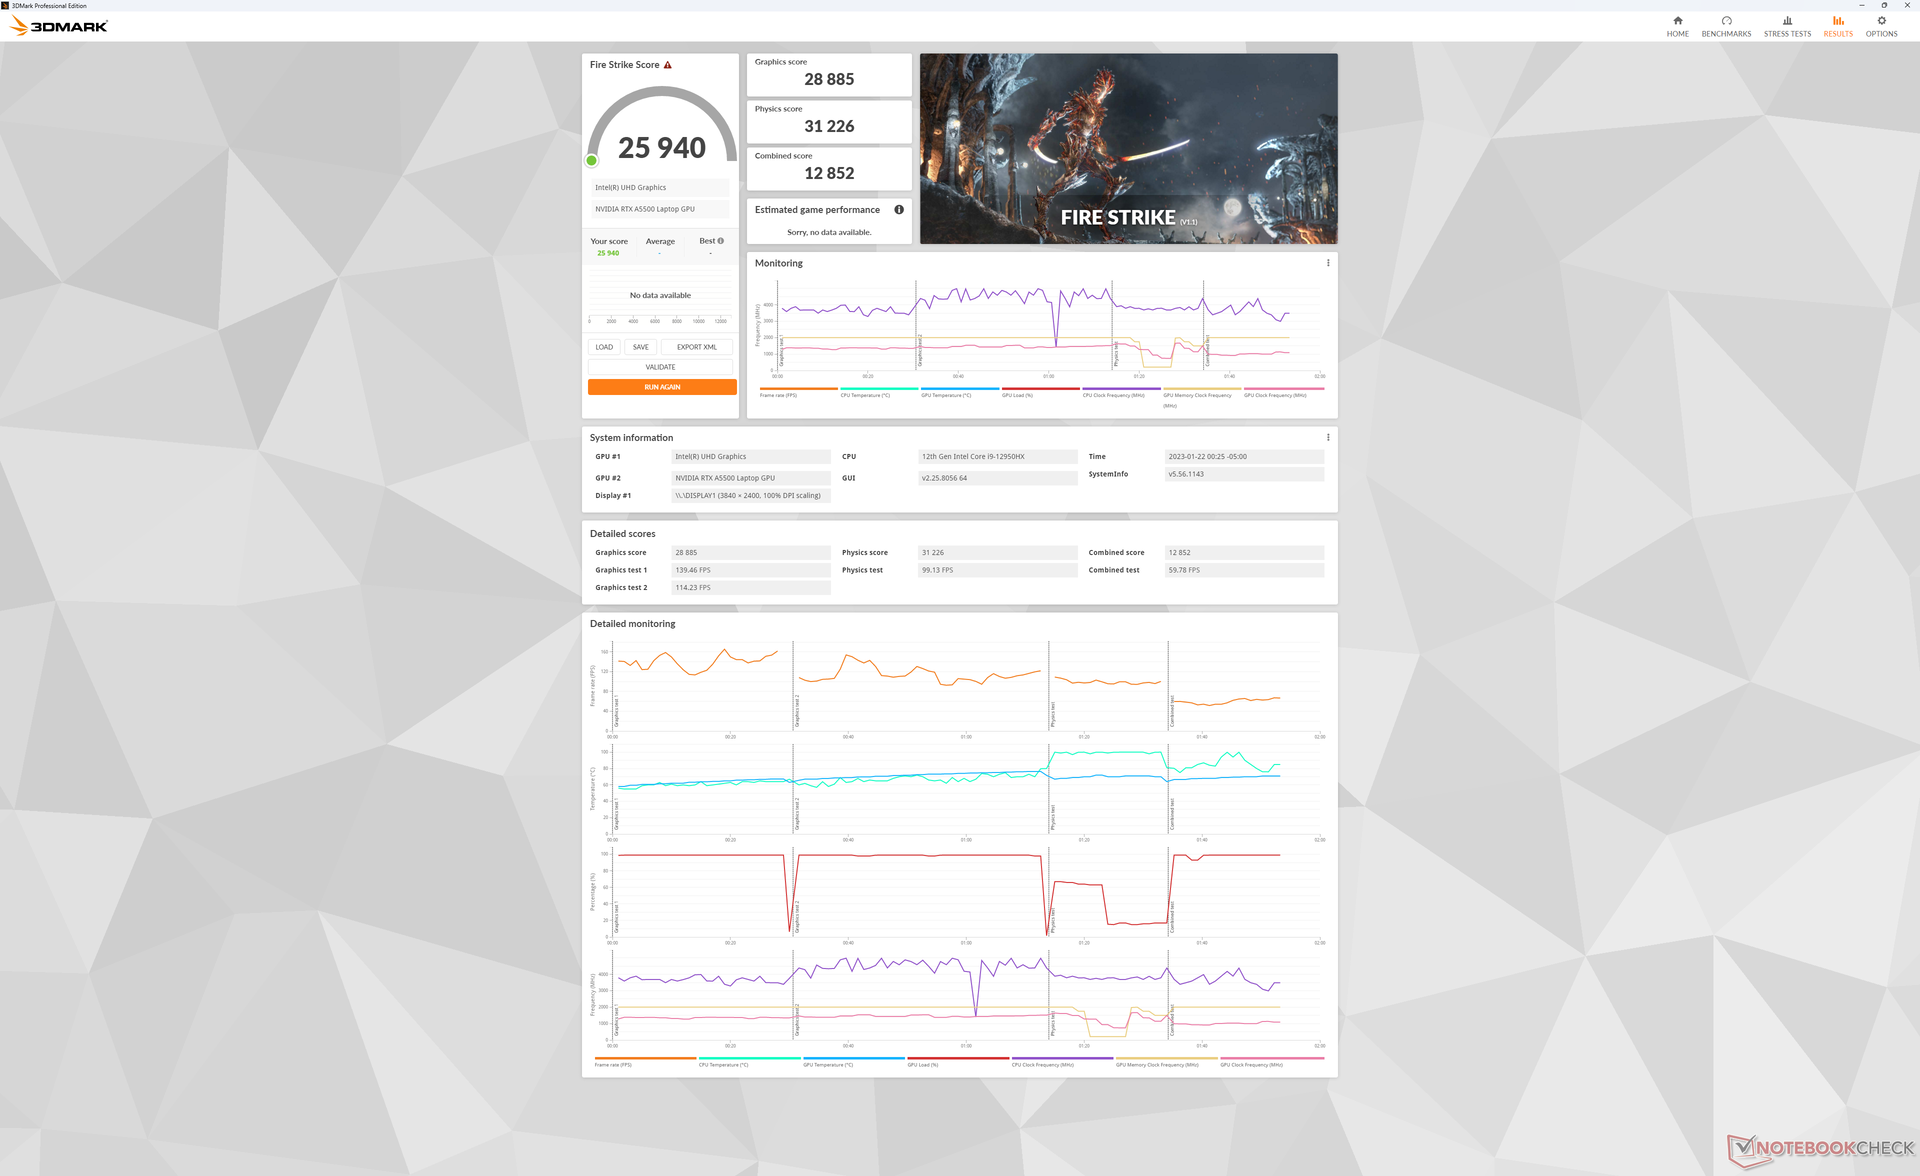
| 3DMark Fire Strike Score | 25940 puntos | |
| 3DMark Time Spy Score | 10760 puntos | |
ayuda | ||
* ... más pequeño es mejor
Witcher 3 FPS Chart
| bajo | medio | alto | ultra | QHD | 4K | |
|---|---|---|---|---|---|---|
| GTA V (2015) | 185.9 | 183.4 | 177.7 | 124.4 | 103.5 | |
| The Witcher 3 (2015) | 489.4 | 329.9 | 211.8 | 110.4 | 63.7 | |
| Dota 2 Reborn (2015) | 194.3 | 174.5 | 166.1 | 156.3 | 132.8 | |
| Final Fantasy XV Benchmark (2018) | 212 | 142.5 | 113.1 | 83.5 | 45.4 | |
| X-Plane 11.11 (2018) | 155.8 | 137.6 | 108.8 | 93.7 | ||
| Strange Brigade (2018) | 442 | 264 | 223 | 197.7 | 138.6 | |
| Cyberpunk 2077 1.6 (2022) | 132.3 | 117.7 | 96.1 | 80.7 | 47 | 20.4 |
Emisiones
Ruido del sistema
En el modo equilibrado por defecto, los ventiladores permanecen silenciosos durante más tiempo del esperado a pesar de los procesadores de alto rendimiento que llevan dentro. Al ejecutar 3DMark 06, por ejemplo, el ruido de los ventiladores alcanzaba los 28 dB(A) al final de la primera escena de la prueba. Hicieron falta varias ejecuciones antes de que los ventiladores alcanzaran unas revoluciones más altas, de hasta 40 dB(A).
El ruido del ventilador cuando se ejecutan cargas más exigentes en el modo Rendimiento alcanzaría un máximo de 50 dB(A) para ser notablemente más ruidoso que las estaciones de trabajo de la competencia, incluyendo la Precision 7670, como se muestra en la siguiente tabla. Por supuesto, estas alternativas también son más lentas que nuestra configuración Lenovo.
Ruido
| Ocioso |
| 23.1 / 23.1 / 23.1 dB(A) |
| Carga |
| 28.9 / 51.4 dB(A) |
 | ||
30 dB silencioso 40 dB(A) audible 50 dB(A) ruidosamente alto |
||
min: | ||
| Lenovo ThinkPad P16 G1 RTX A5500 RTX A5500 Laptop GPU, i9-12950HX, WDC PC SN810 2TB | Asus ProArt StudioBook 16 W7600H5A-2BL2 RTX A5000 Laptop GPU, W-11955M, 2x Micron 2300 2TB MTFDHBA2T0TDV (RAID 0) | Dell Precision 7000 7670 Performance RTX A5500 Laptop GPU, i9-12950HX | Lenovo ThinkPad P16 G1 21D6001DMB RTX A2000 Laptop GPU, i7-12850HX, Micron 3400 1TB MTFDKBA1T0TFH | MSI CreatorPro Z16P B12UKST RTX A3000 Laptop GPU, i7-12700H, Samsung PM9A1 MZVL21T0HCLR | HP ZBook Studio 16 G9 62U04EA RTX A2000 Laptop GPU, i7-12800H, Micron 3400 1TB MTFDKBA1T0TFH | |
|---|---|---|---|---|---|---|
| Noise | -14% | -16% | -6% | -11% | -9% | |
| apagado / medio ambiente * (dB) | 23.1 | 26 -13% | 23.9 -3% | 23.2 -0% | 24.1 -4% | 24 -4% |
| Idle Minimum * (dB) | 23.1 | 26 -13% | 24 -4% | 23.2 -0% | 27.1 -17% | 24 -4% |
| Idle Average * (dB) | 23.1 | 26 -13% | 24 -4% | 23.2 -0% | 27.1 -17% | 27.7 -20% |
| Idle Maximum * (dB) | 23.1 | 26.5 -15% | 38 -65% | 23.2 -0% | 27.1 -17% | 27.7 -20% |
| Load Average * (dB) | 28.9 | 42 -45% | 46.3 -60% | 47.8 -65% | 42.9 -48% | 39.8 -38% |
| Witcher 3 ultra * (dB) | 51.6 | 41.9 19% | 34.1 34% | 44 15% | 44.3 14% | |
| Load Maximum * (dB) | 51.4 | 43 16% | 47.9 7% | 56.3 -10% | 47 9% | 47.7 7% |
* ... más pequeño es mejor
Temperatura
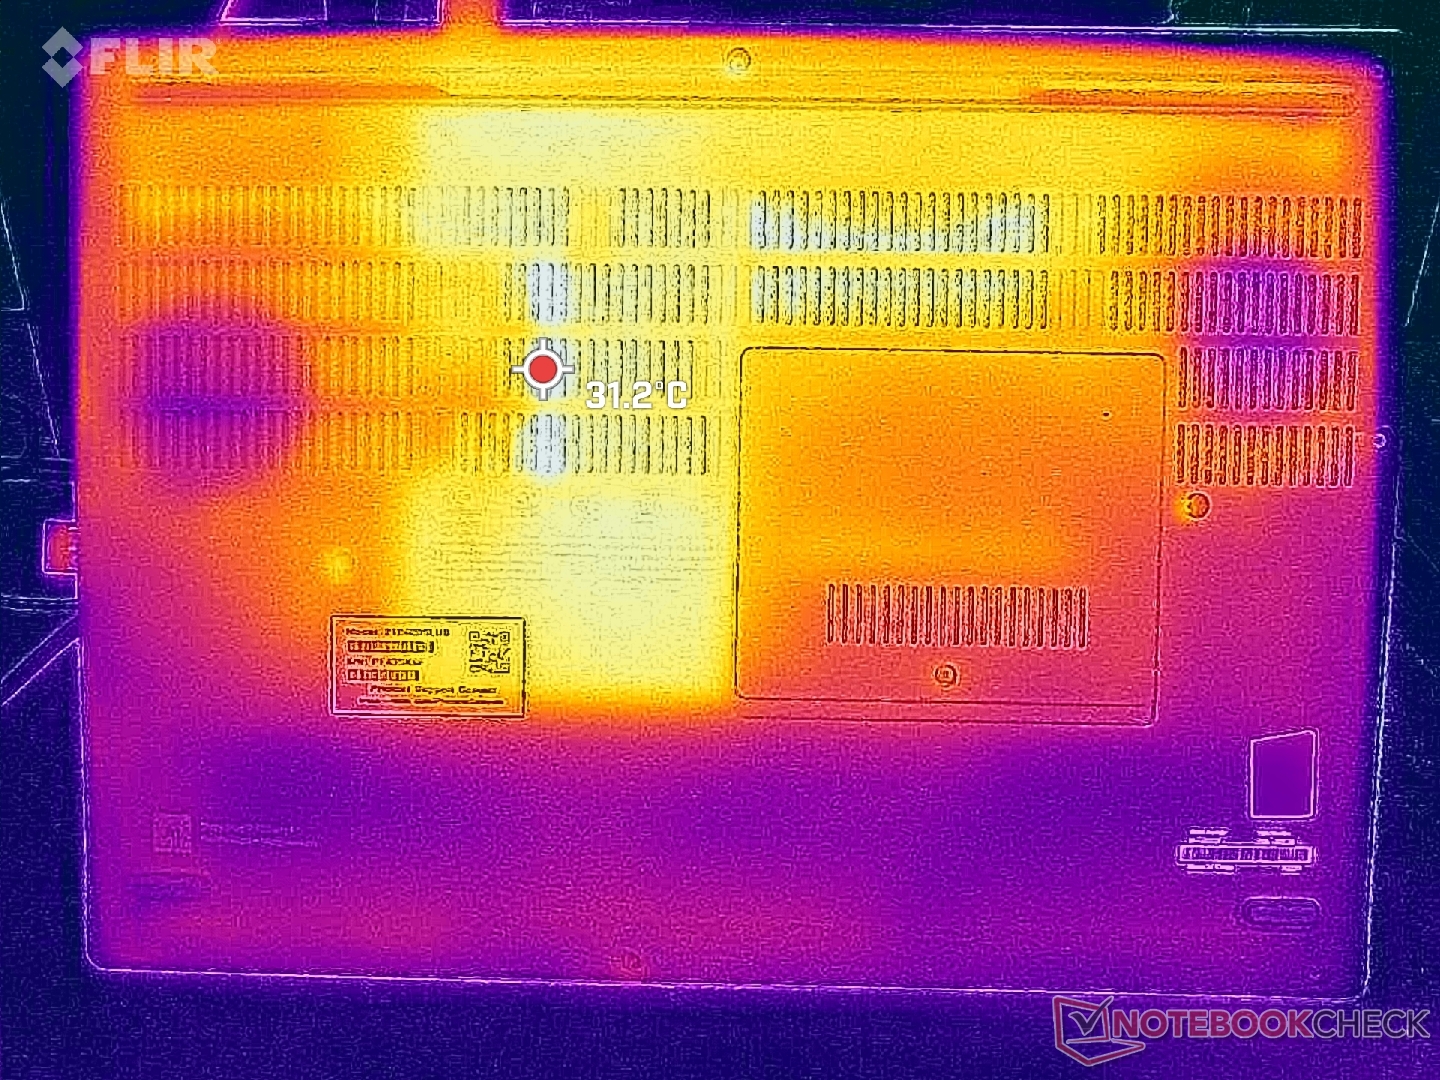
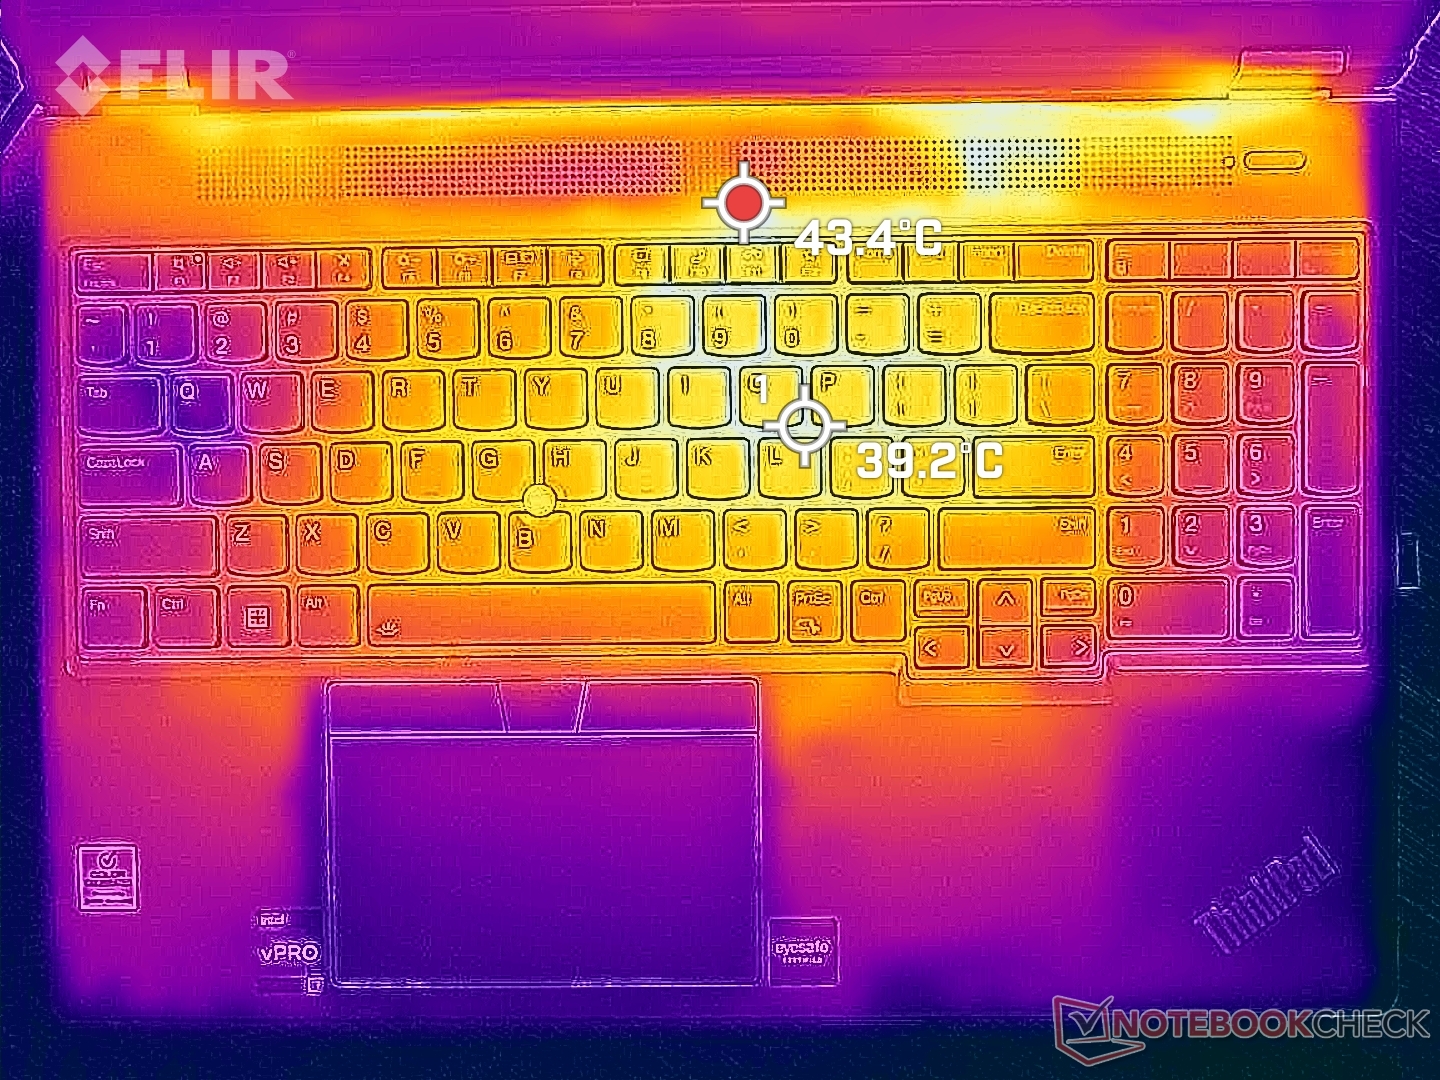
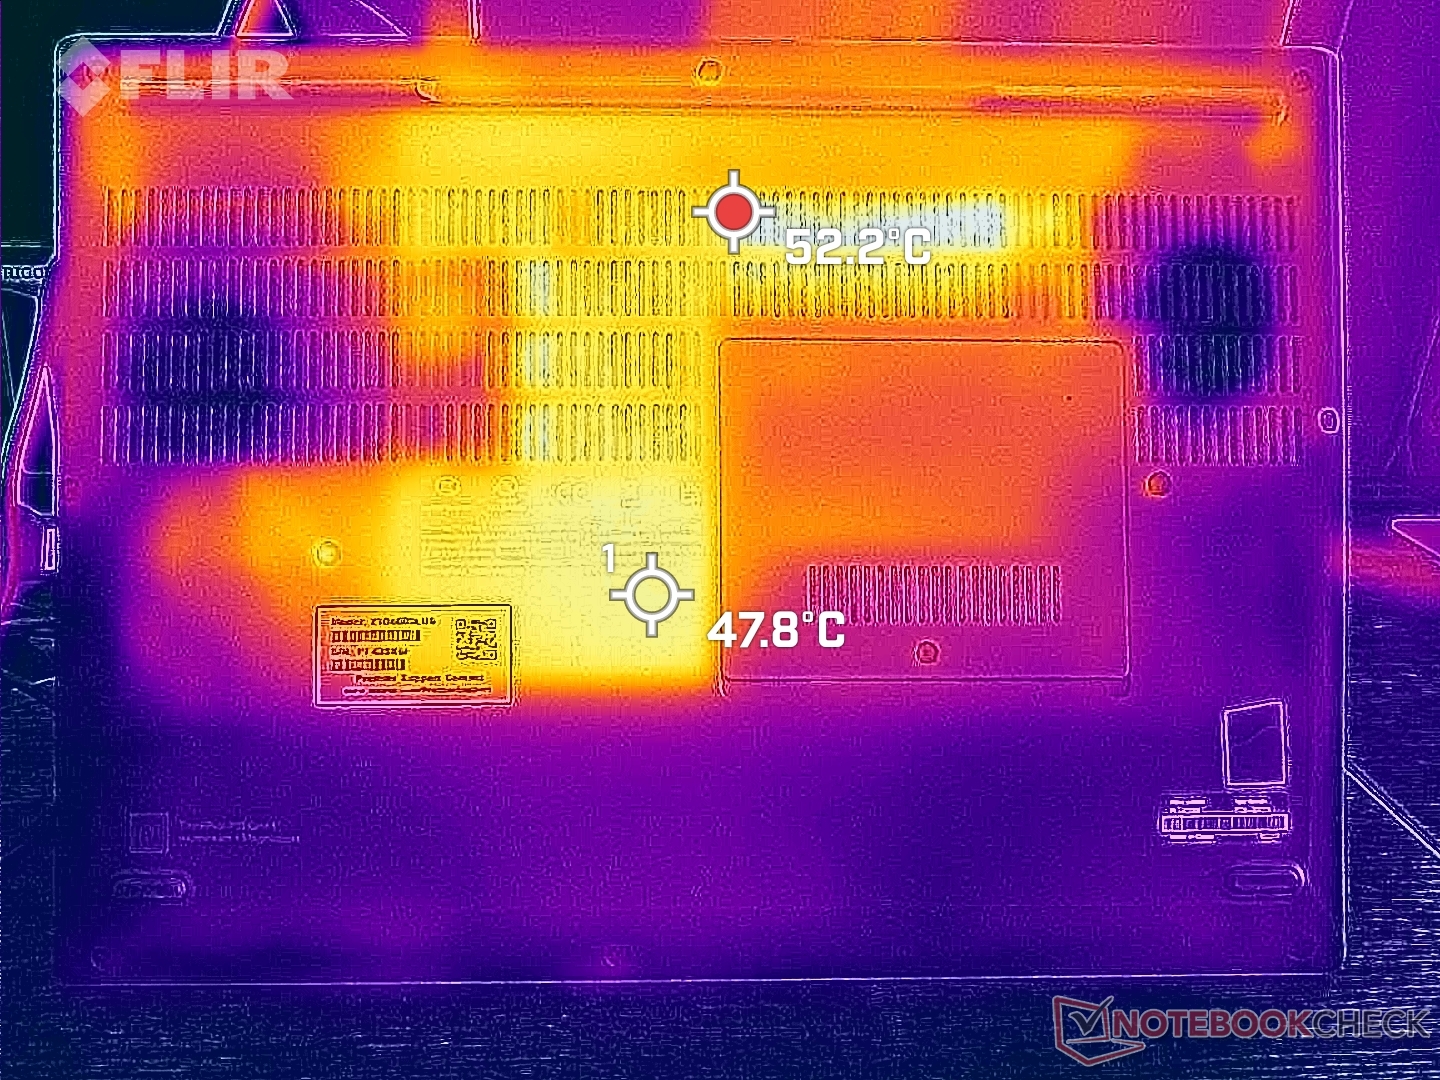
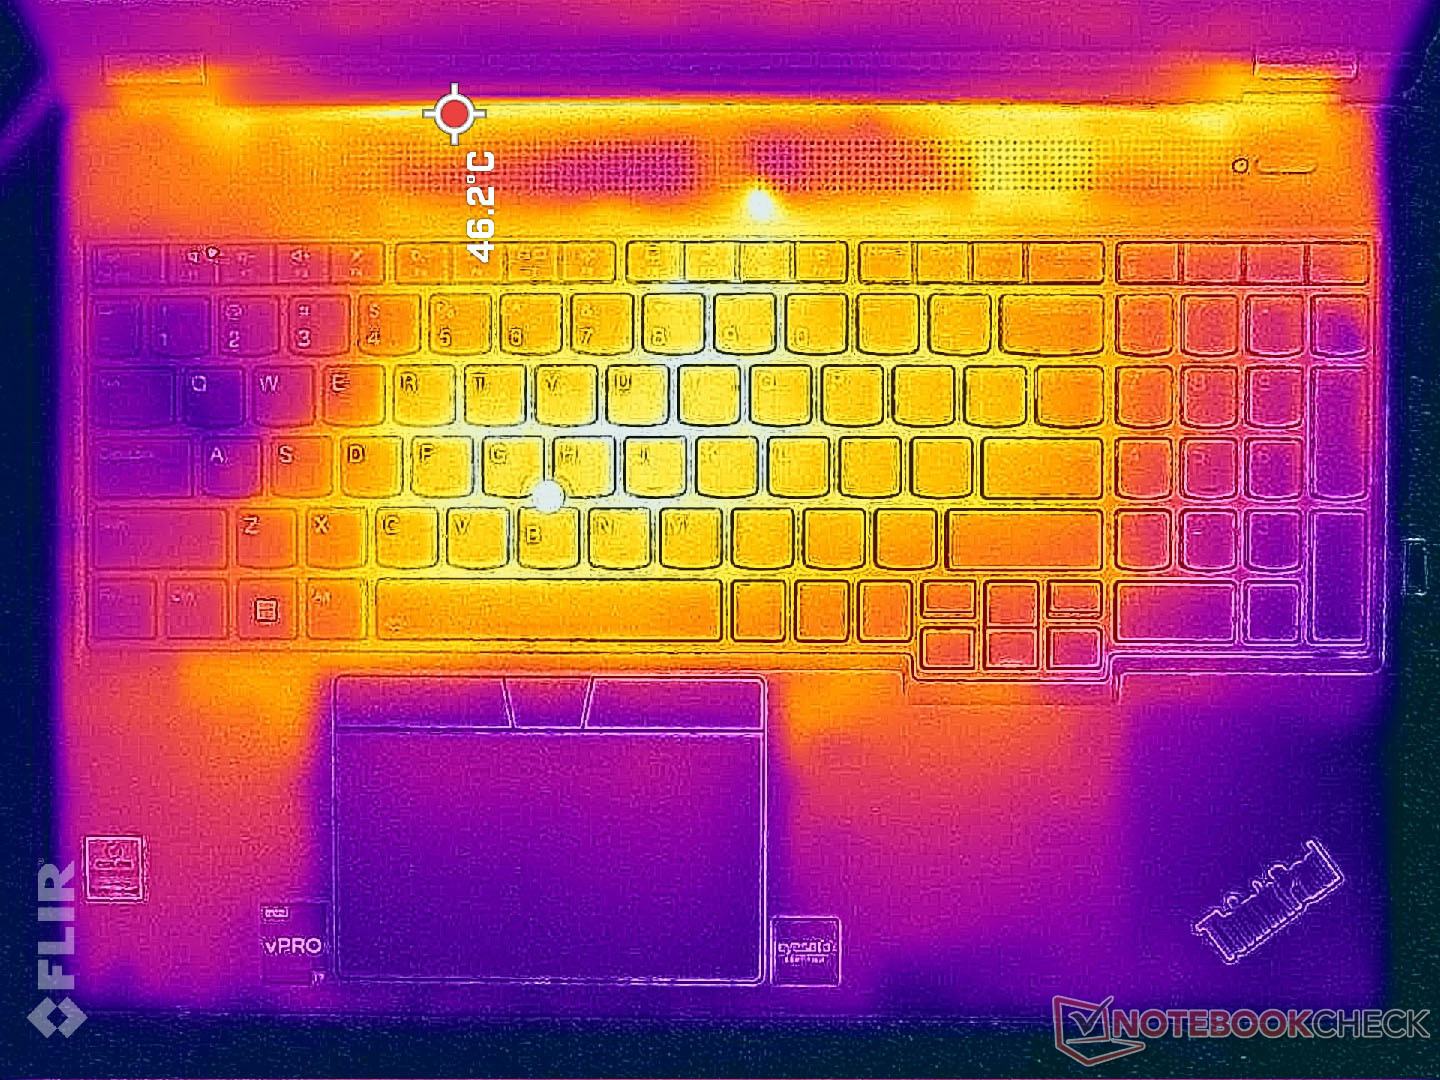
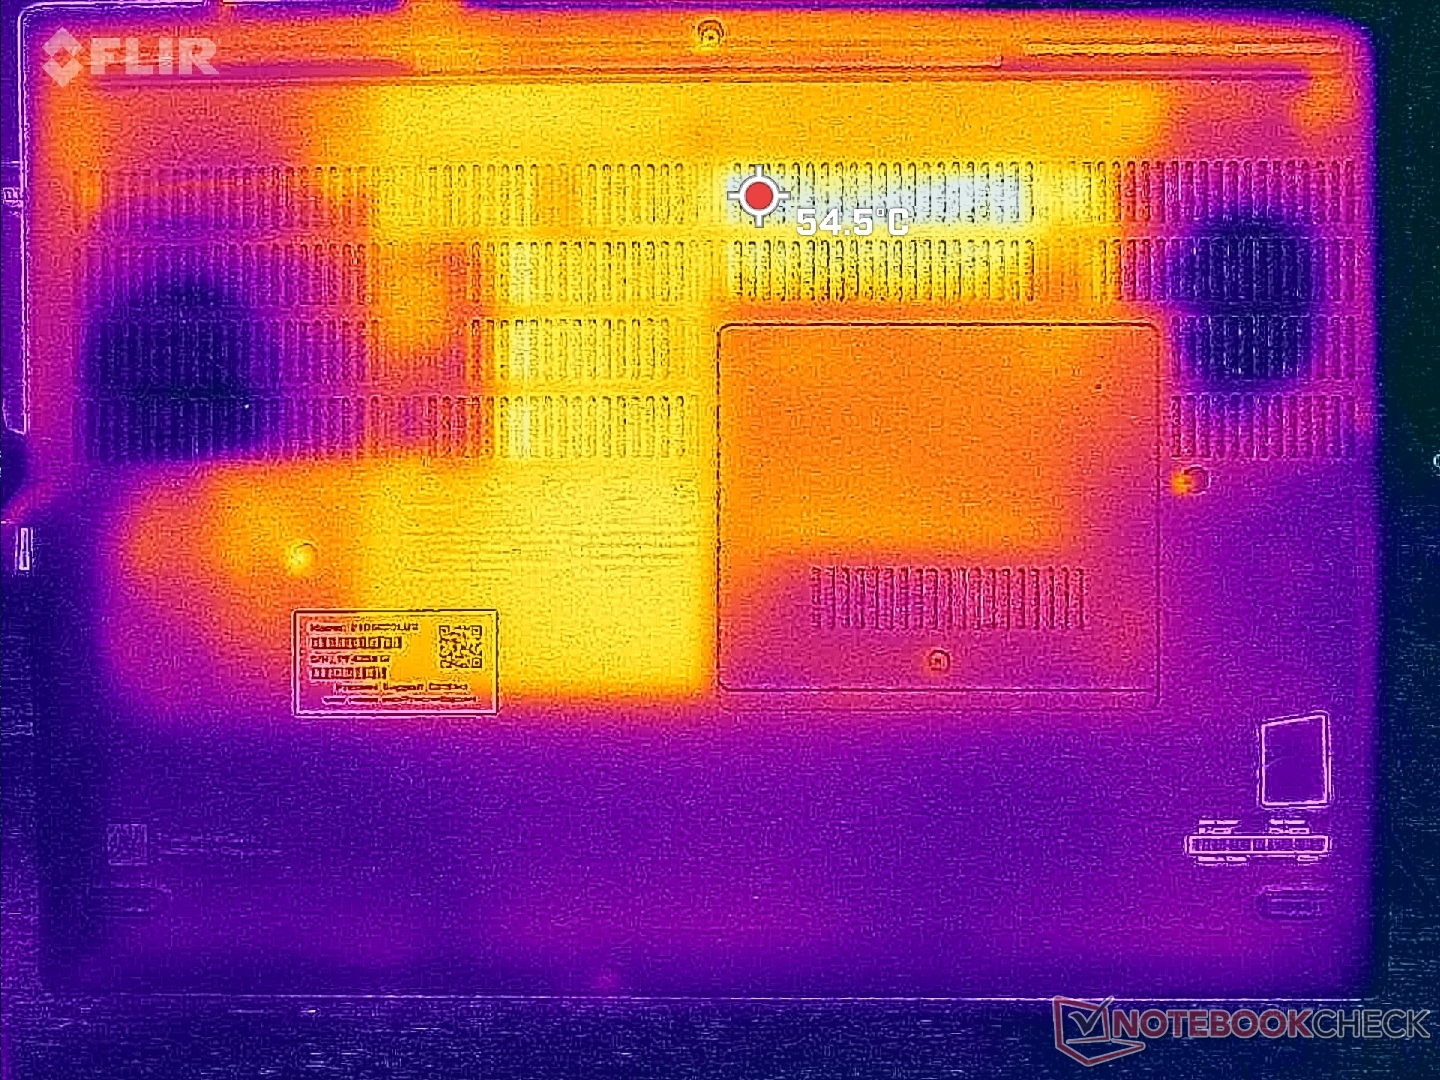
Las temperaturas superficiales son más cálidas de lo esperado incluso en reposo sobre el escritorio sin aplicaciones en ejecución. La parte inferior, por ejemplo, puede alcanzar los 37ºC comparado con los 31ºC del Precision 7670. Si se ejecutan cargas más altas, estos mismos puntos calientes del Lenovo pueden alcanzar los 49 C o más, mientras que el centro del teclado puede llegar a los 40 C. Las temperaturas de la piel pueden resultar incómodas si el portátil está sobre el regazo en lugar de sobre una mesa.
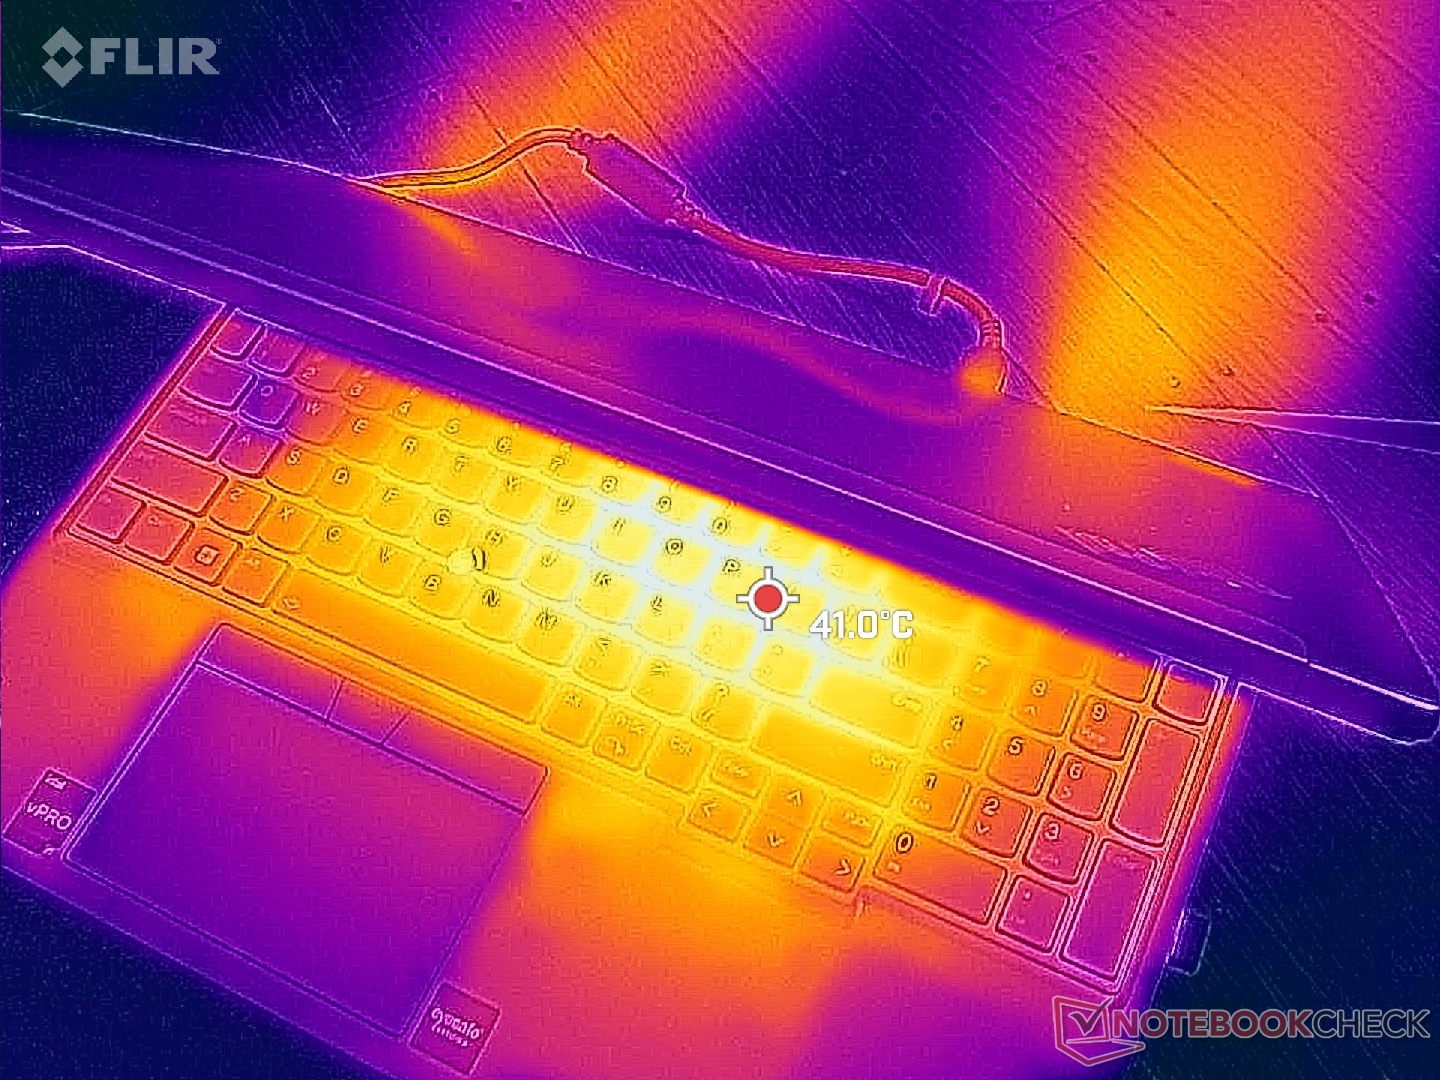
(±) La temperatura máxima en la parte superior es de 44.8 °C / 113 F, frente a la media de 38.2 °C / 101 F, que oscila entre 22.2 y 69.8 °C para la clase Workstation.
(-) El fondo se calienta hasta un máximo de 49.8 °C / 122 F, frente a la media de 41.1 °C / 106 F
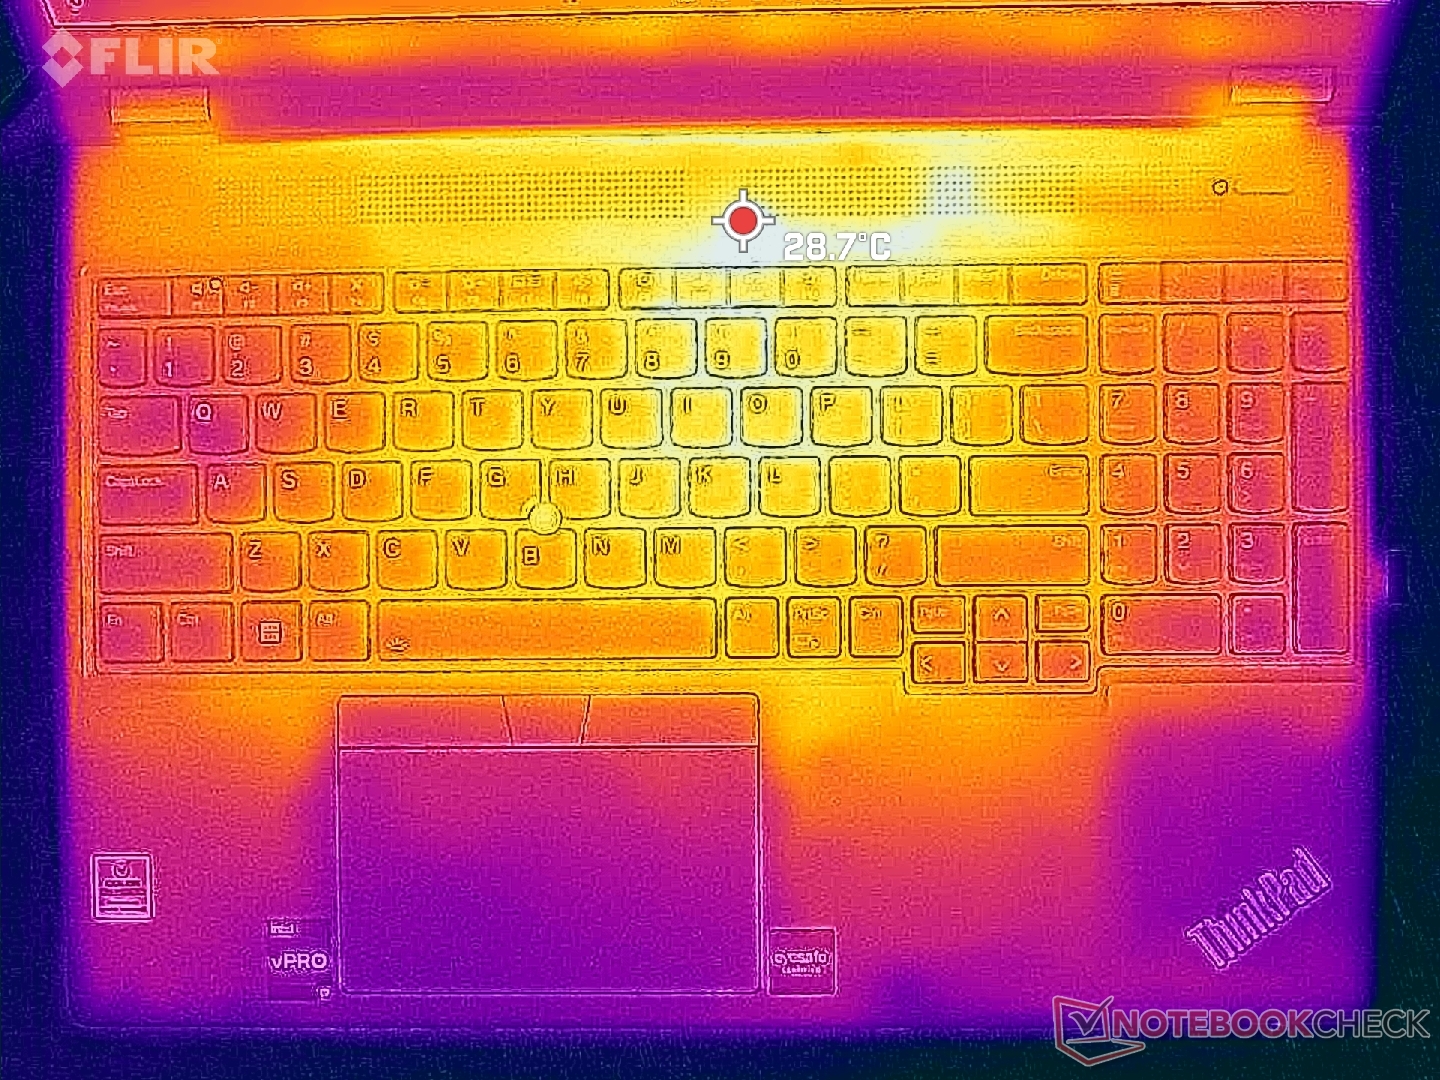
(+) En reposo, la temperatura media de la parte superior es de 28.6 °C / 83# F, frente a la media del dispositivo de 32 °C / 90 F.
(±) Jugando a The Witcher 3, la temperatura media de la parte superior es de 36.4 °C / 98 F, frente a la media del dispositivo de 32 °C / 90 F.
(+) Los reposamanos y el panel táctil alcanzan como máximo la temperatura de la piel (32.4 °C / 90.3 F) y, por tanto, no están calientes.
(-) La temperatura media de la zona del reposamanos de dispositivos similares fue de 27.8 °C / 82 F (-4.6 °C / -8.3 F).
| Lenovo ThinkPad P16 G1 RTX A5500 Intel Core i9-12950HX, NVIDIA RTX A5500 Laptop GPU | Asus ProArt StudioBook 16 W7600H5A-2BL2 Intel Xeon W-11955M, NVIDIA RTX A5000 Laptop GPU | Dell Precision 7000 7670 Performance Intel Core i9-12950HX, NVIDIA RTX A5500 Laptop GPU | Lenovo ThinkPad P16 G1 21D6001DMB Intel Core i7-12850HX, NVIDIA RTX A2000 Laptop GPU | MSI CreatorPro Z16P B12UKST Intel Core i7-12700H, NVIDIA RTX A3000 Laptop GPU | HP ZBook Studio 16 G9 62U04EA Intel Core i7-12800H, NVIDIA RTX A2000 Laptop GPU | |
|---|---|---|---|---|---|---|
| Heat | -1% | -3% | 17% | -3% | 9% | |
| Maximum Upper Side * (°C) | 44.8 | 45.7 -2% | 53 -18% | 43.1 4% | 56.3 -26% | 38.7 14% |
| Maximum Bottom * (°C) | 49.8 | 48.3 3% | 43.2 13% | 39.9 20% | 68.3 -37% | 53.4 -7% |
| Idle Upper Side * (°C) | 30.6 | 35.3 -15% | 36.8 -20% | 26 15% | 25.2 18% | 27.3 11% |
| Idle Bottom * (°C) | 38.6 | 34.4 11% | 33.8 12% | 27.6 28% | 25.9 33% | 31.6 18% |
* ... más pequeño es mejor
Prueba de resistencia
El sistema se pone definitivamente a prueba cuando los procesadores están sometidos a una carga pesada. Cuando se ejecuta Prime95, por ejemplo, las frecuencias de reloj de la CPU y el consumo de la placa aumentan a 4,1 GHz y 135 W, respectivamente. Por desgracia, la temperatura del núcleo se disparaba hasta los 100 C casi de inmediato, por lo que las frecuencias de reloj caían rápidamente para evitar temperaturas aún más elevadas. Al final, el procesador se estabilizó en 3 GHz, 82 W y 100 C, lo que significa que está llegando al límite de la solución de refrigeración del ThinkPad P16 G1. Repitiendo esta prueba en el Precision 7670 equipado con el mismo procesador resultaría en una velocidad de reloj estable más lenta de 2,3 GHz y una temperatura del núcleo más fría de 78 C.
Cuando se ejecuta Witcher 3 para representar cargas elevadas, la velocidad de reloj de la GPU, el reloj de la memoria y la temperatura se estabilizarían en 1477 MHz, 2000 MHz y 78 C, respectivamente, en comparación con los 1417 MHz, 1750 MHz y 82 C del Precision 7670 en condiciones similares. El consumo de la placa también sería mayor en nuestro Lenovo con 129 W frente a los 100 W del Dell, lo que explicaría las ventajas de rendimiento de la GPU mencionadas anteriormente.
Funcionar con batería limita el rendimiento. Un test Fire Strike a pilas arrojaría unas puntuaciones de Física y Gráficos de 18903 y 12395 puntos, respectivamente, comparados con los 31226 y 28885 puntos de la red eléctrica.
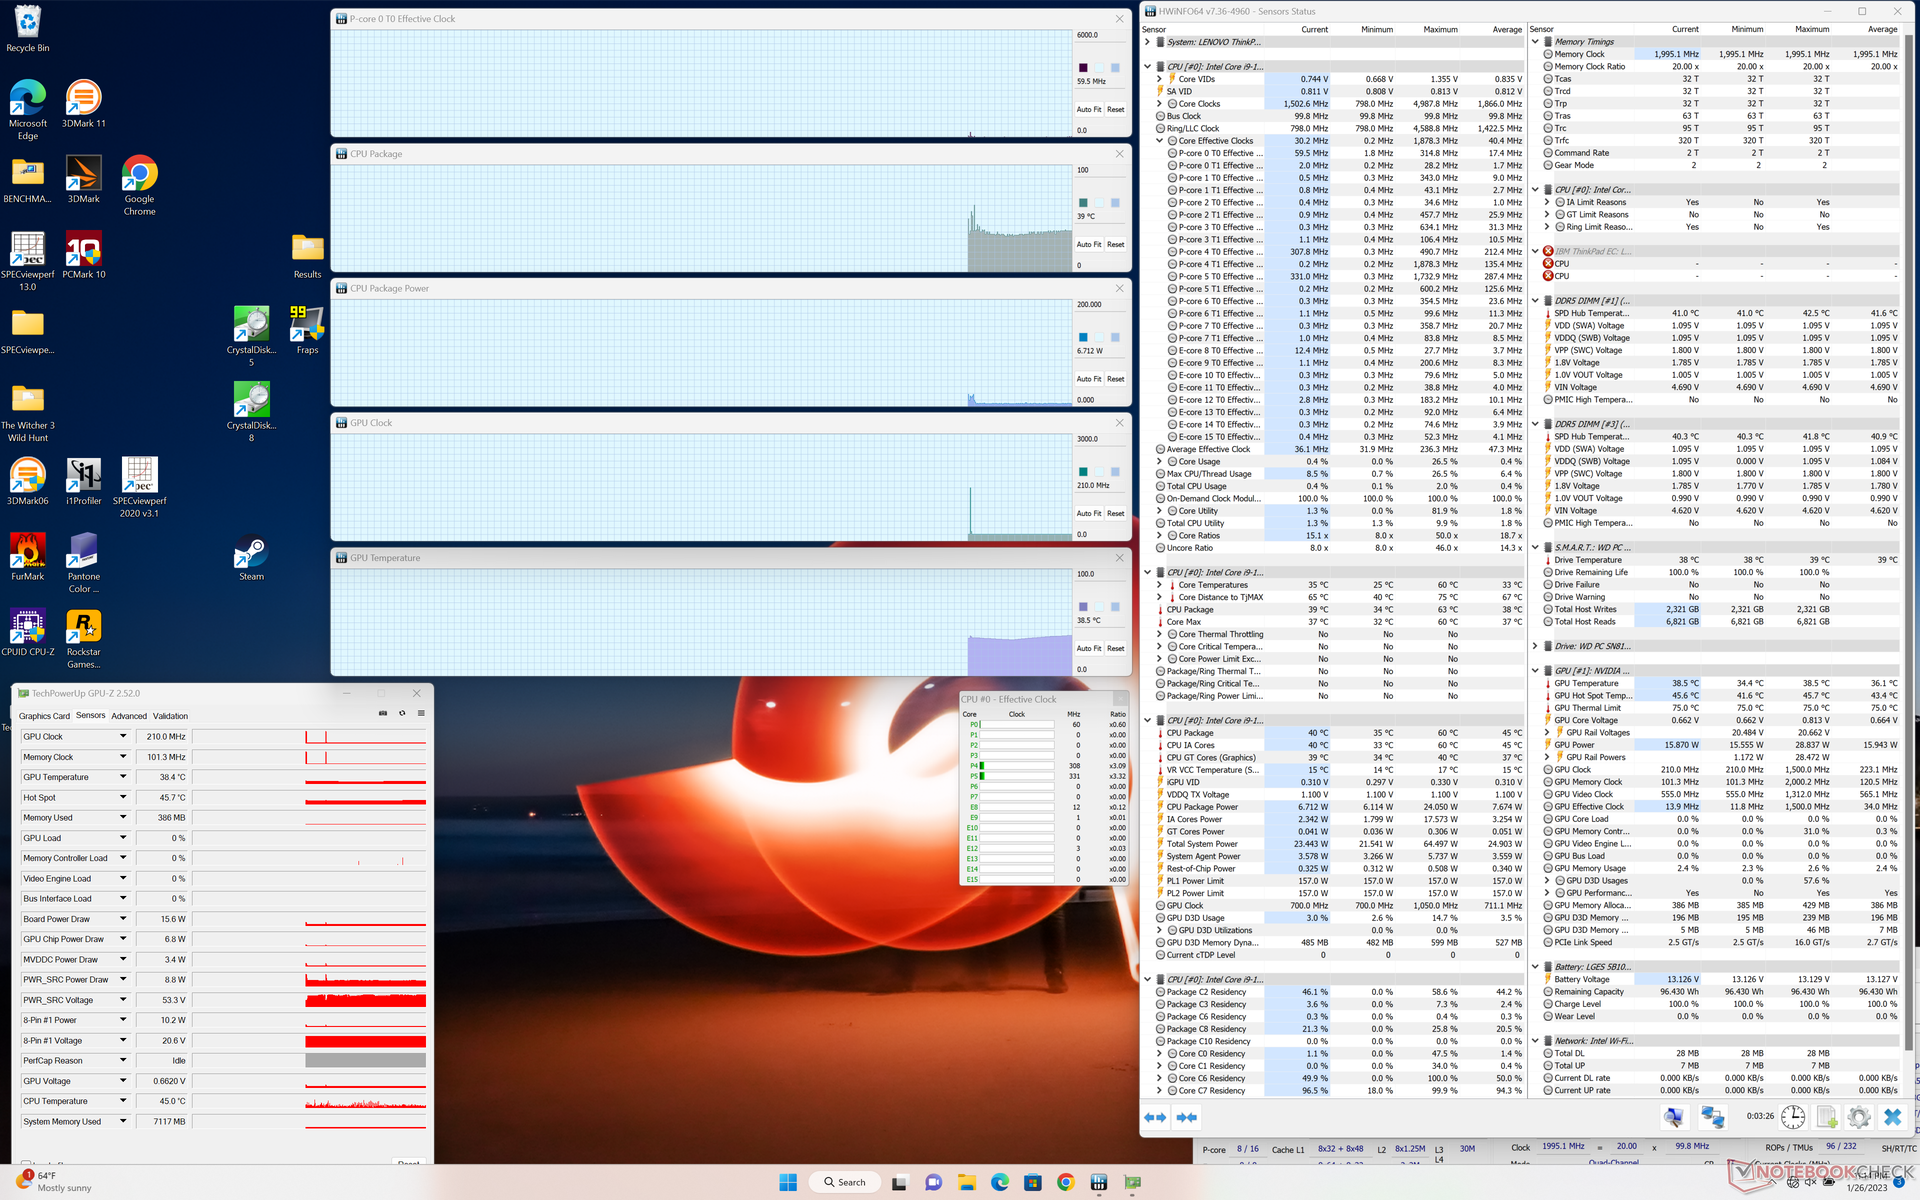
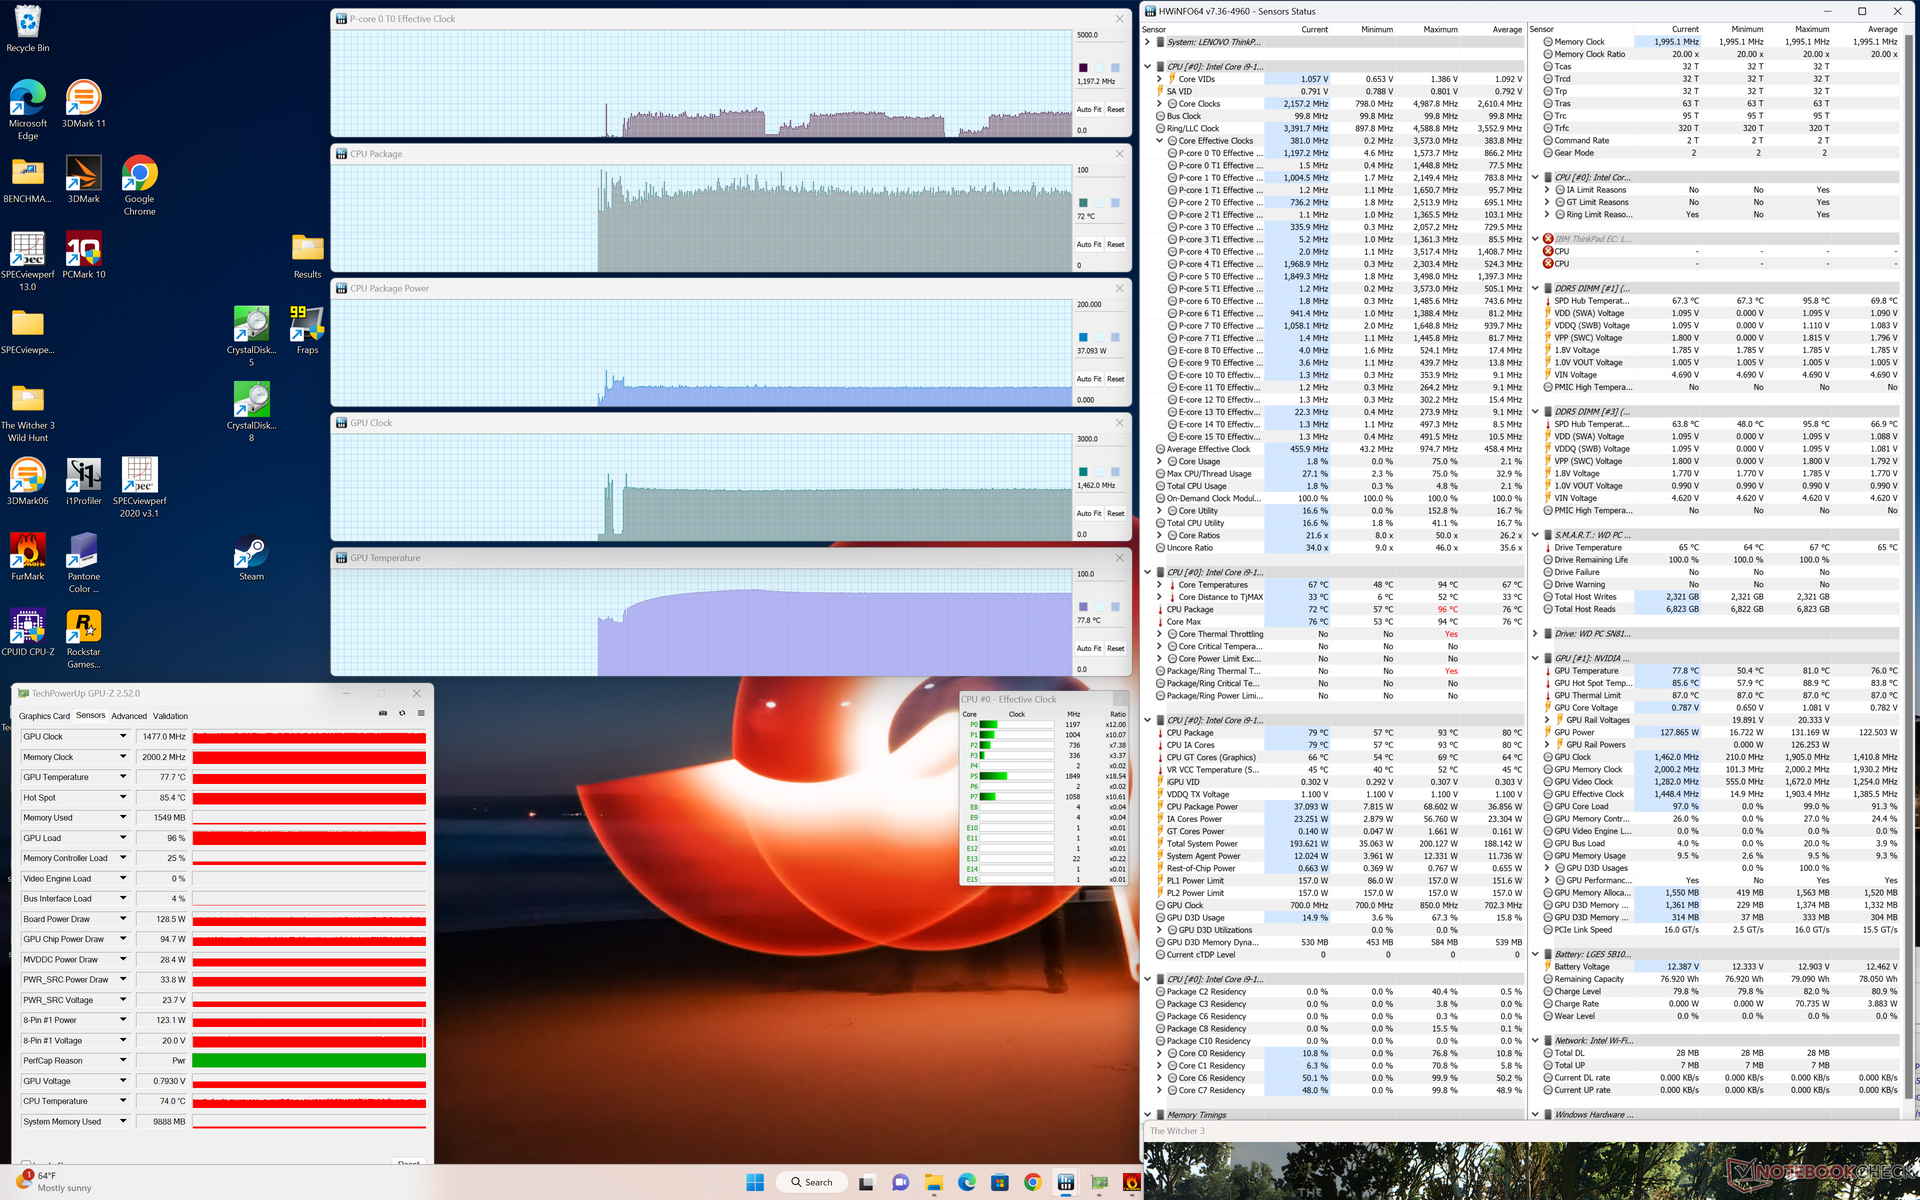
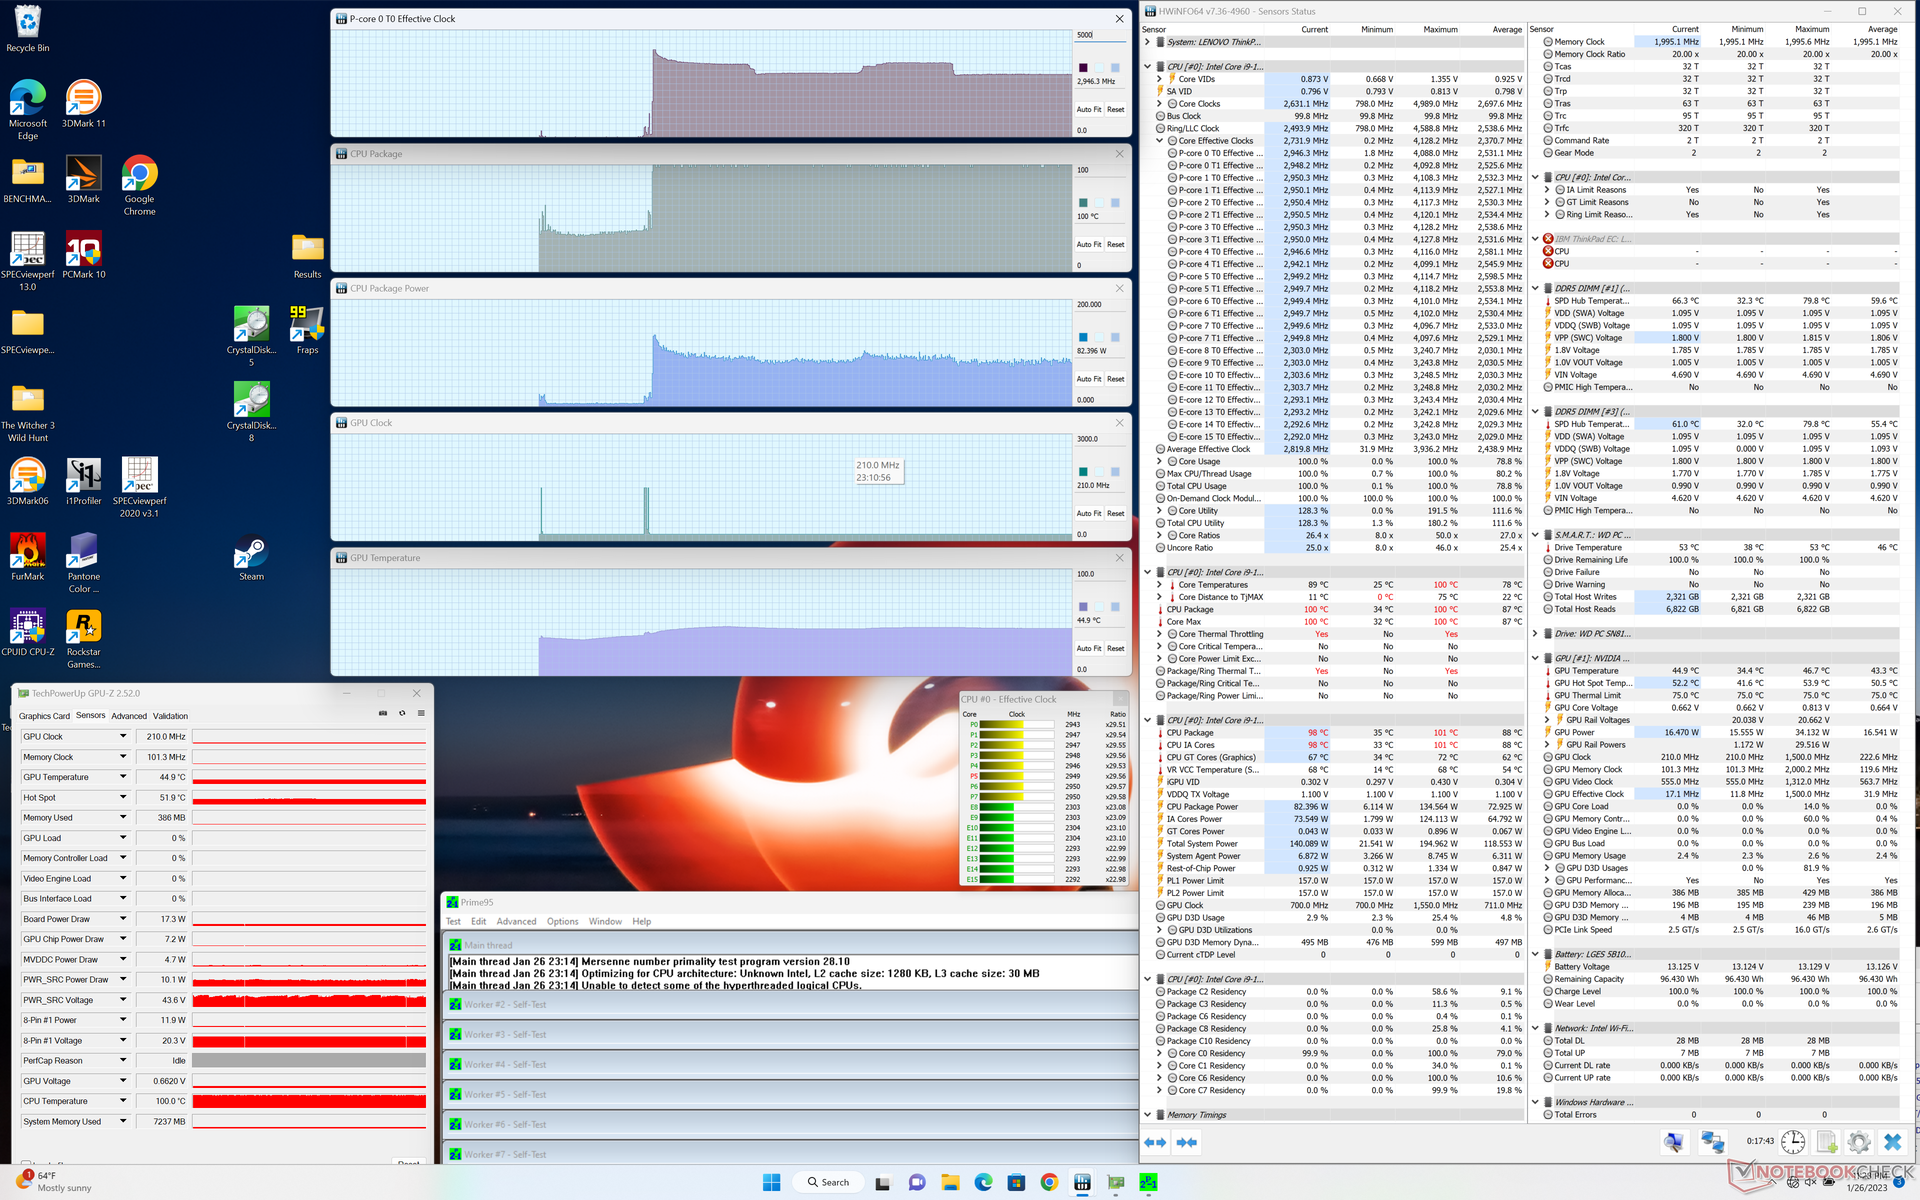
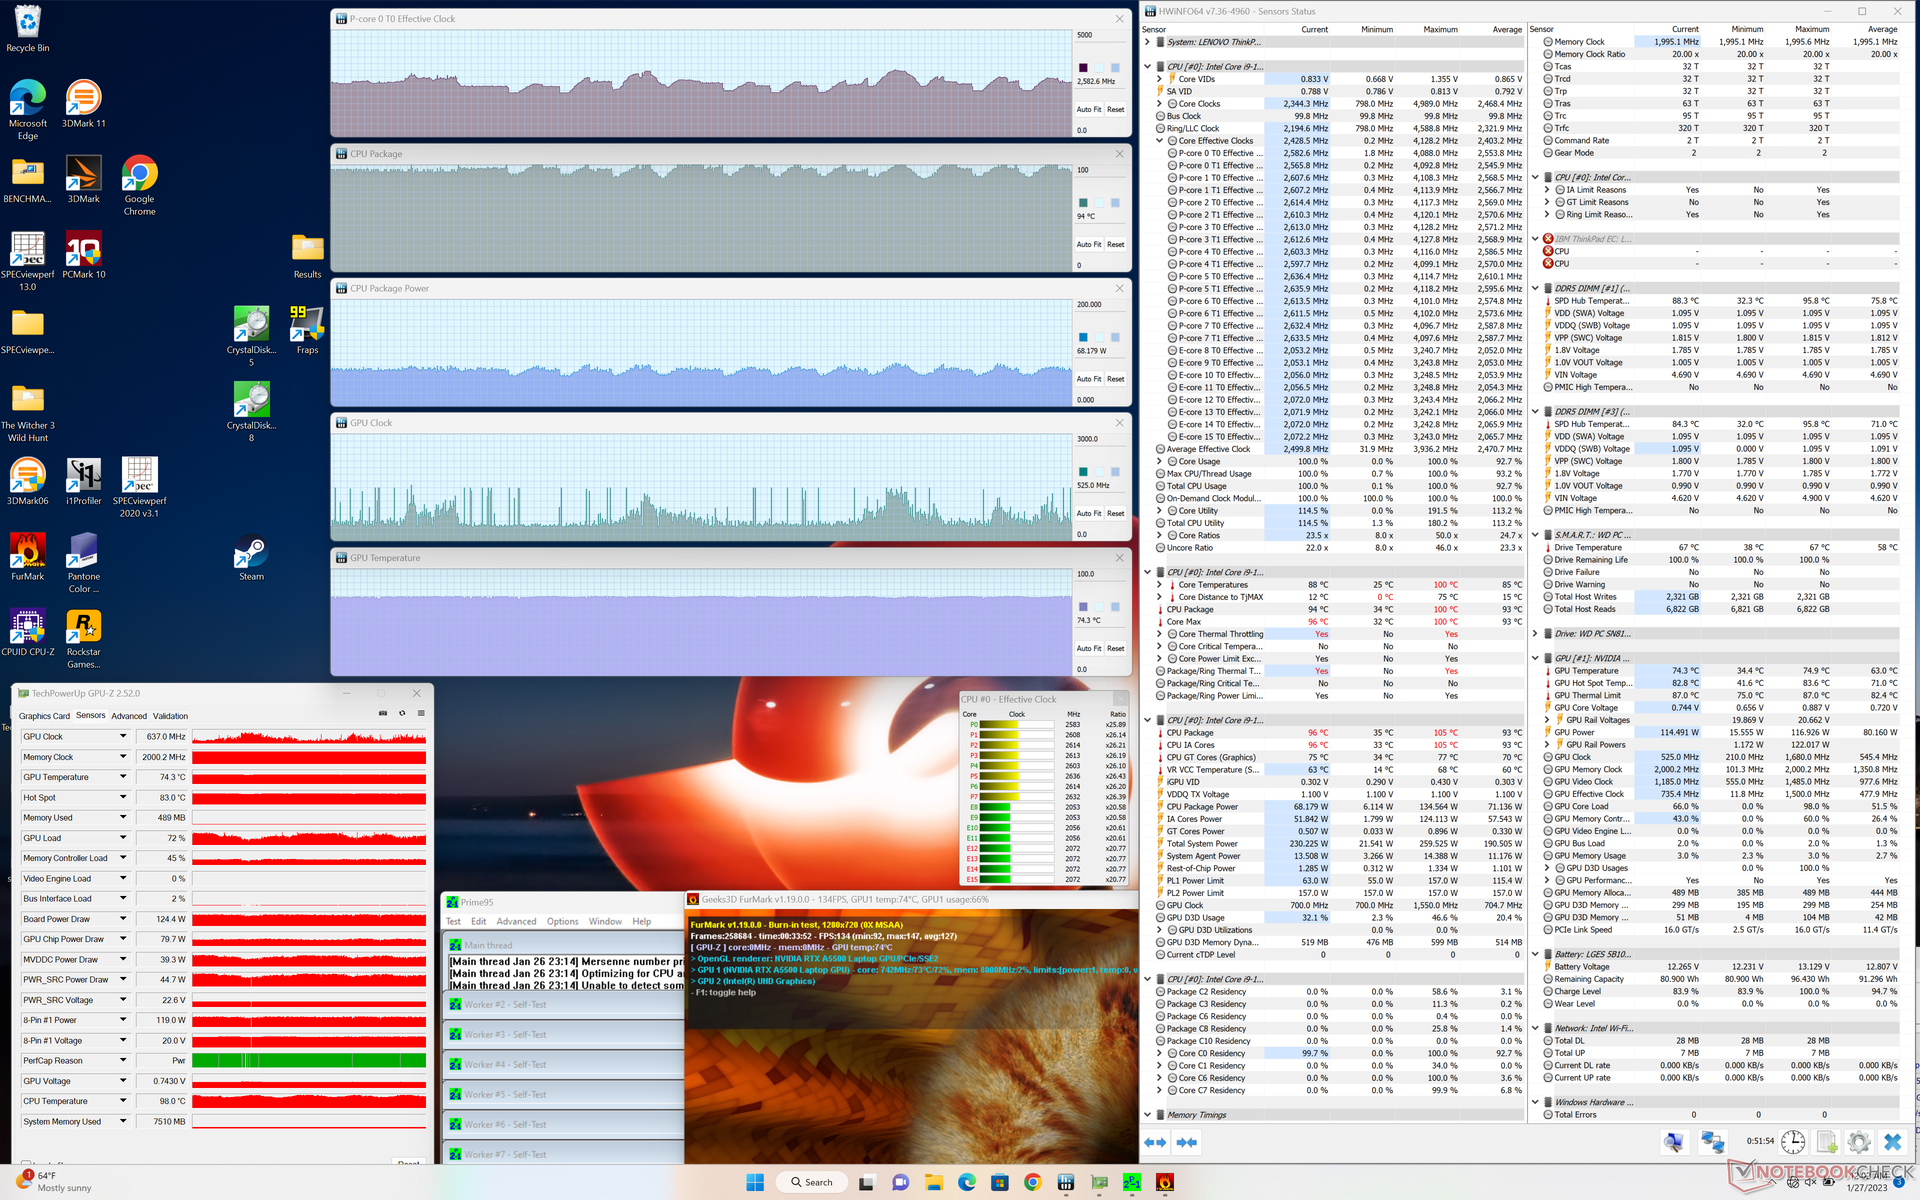
| RelojCPU (GHz) | Reloj GPU (MHz) | Temperatura mediaCPU (°C) | Temperatura media GPU (°C) | |
| Sistema en reposo | -- | -- | 39 | 39 |
| Prime95 Stress | 3.0 | -- | 100 | 45 |
| Prime95+ FurMark Stress | 2,1 - 2,8 | ~500 - 1550 | 88 - 100 | 75 |
| Witcher 3 Tensión | ~1,2 | 1477 | 72 | 78 |
Altavoces
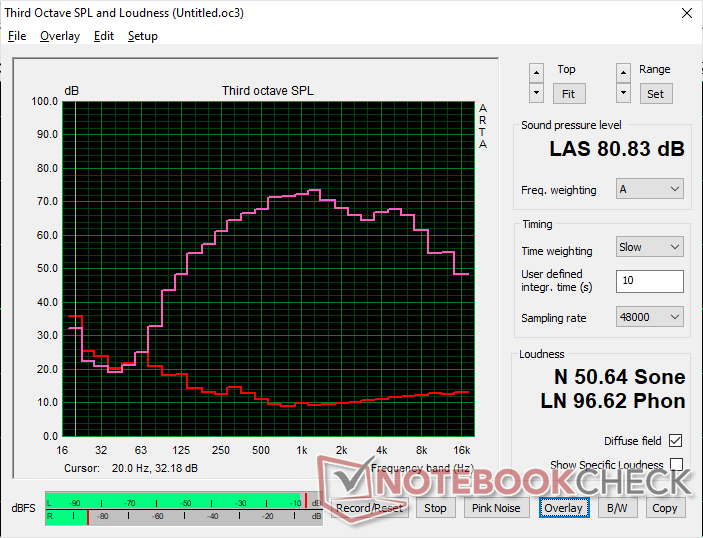
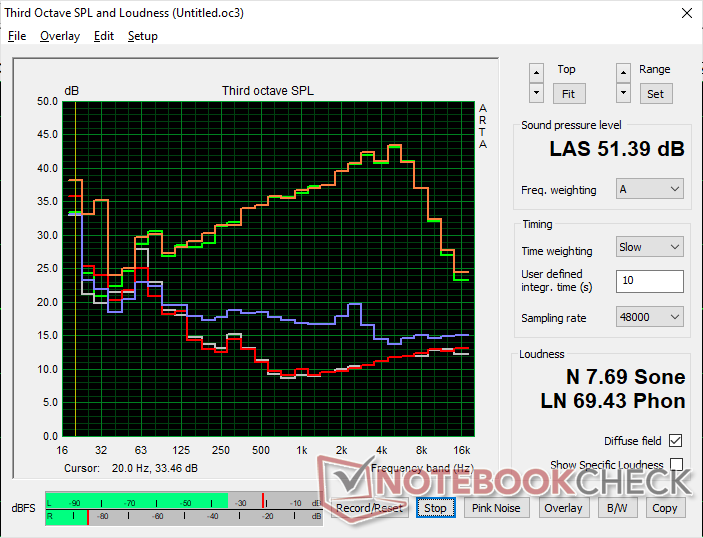
Lenovo ThinkPad P16 G1 RTX A5500 análisis de audio
(±) | la sonoridad del altavoz es media pero buena (80.8 dB)
Graves 100 - 315 Hz
(±) | lubina reducida - en promedio 11.1% inferior a la mediana
(±) | la linealidad de los graves es media (9.7% delta a frecuencia anterior)
Medios 400 - 2000 Hz
(+) | medios equilibrados - a sólo 4.1% de la mediana
(+) | los medios son lineales (3.3% delta a la frecuencia anterior)
Altos 2 - 16 kHz
(+) | máximos equilibrados - a sólo 2.9% de la mediana
(+) | los máximos son lineales (5.2% delta a la frecuencia anterior)
Total 100 - 16.000 Hz
(+) | el sonido global es lineal (13.2% de diferencia con la mediana)
En comparación con la misma clase
» 23% de todos los dispositivos probados de esta clase eran mejores, 6% similares, 71% peores
» El mejor tuvo un delta de 7%, la media fue 17%, el peor fue ###max##%
En comparación con todos los dispositivos probados
» 13% de todos los dispositivos probados eran mejores, 3% similares, 84% peores
» El mejor tuvo un delta de 4%, la media fue 23%, el peor fue ###max##%
Apple MacBook Pro 16 2021 M1 Pro análisis de audio
(+) | los altavoces pueden reproducir a un volumen relativamente alto (#84.7 dB)
Graves 100 - 315 Hz
(+) | buen bajo - sólo 3.8% lejos de la mediana
(+) | el bajo es lineal (5.2% delta a la frecuencia anterior)
Medios 400 - 2000 Hz
(+) | medios equilibrados - a sólo 1.3% de la mediana
(+) | los medios son lineales (2.1% delta a la frecuencia anterior)
Altos 2 - 16 kHz
(+) | máximos equilibrados - a sólo 1.9% de la mediana
(+) | los máximos son lineales (2.7% delta a la frecuencia anterior)
Total 100 - 16.000 Hz
(+) | el sonido global es lineal (4.6% de diferencia con la mediana)
En comparación con la misma clase
» 0% de todos los dispositivos probados de esta clase eran mejores, 0% similares, 100% peores
» El mejor tuvo un delta de 5%, la media fue 17%, el peor fue ###max##%
En comparación con todos los dispositivos probados
» 0% de todos los dispositivos probados eran mejores, 0% similares, 100% peores
» El mejor tuvo un delta de 4%, la media fue 23%, el peor fue ###max##%
Gestión de la energía
Consumo de energía
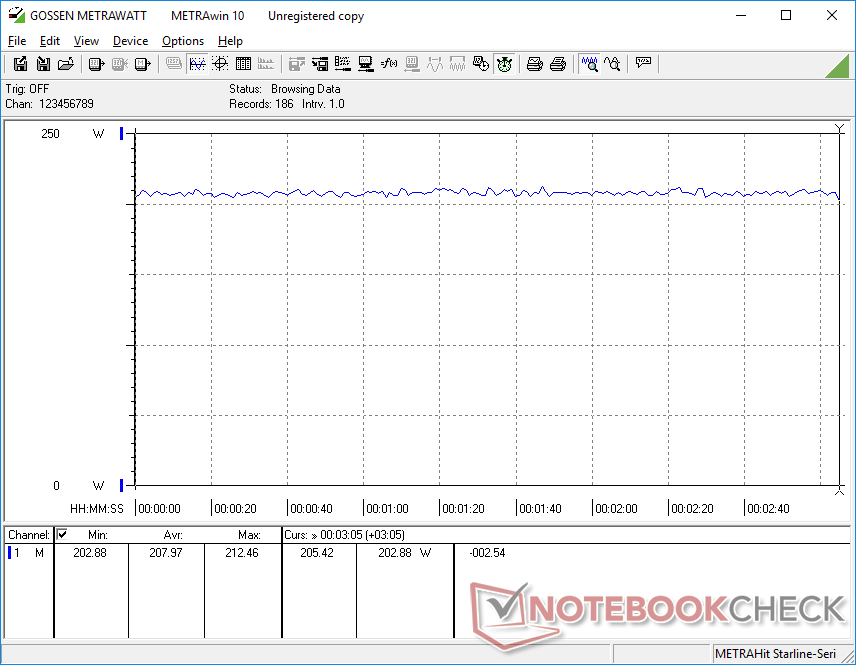
El consumo de energía en reposo es inferior al del Precision 7670 en varios vatios, probablemente debido al panel OLED más exigente de este último. Con cargas más altas como Witcher 3sin embargo, el consumo es notablemente superior en el Lenovo que en el Dell (208 W frente a 159 W). El mayor consumo de energía coincide con el mayor rendimiento de CPU y GPU sobre el modelo Dell de la competencia, como muestran nuestras pruebas anteriores.
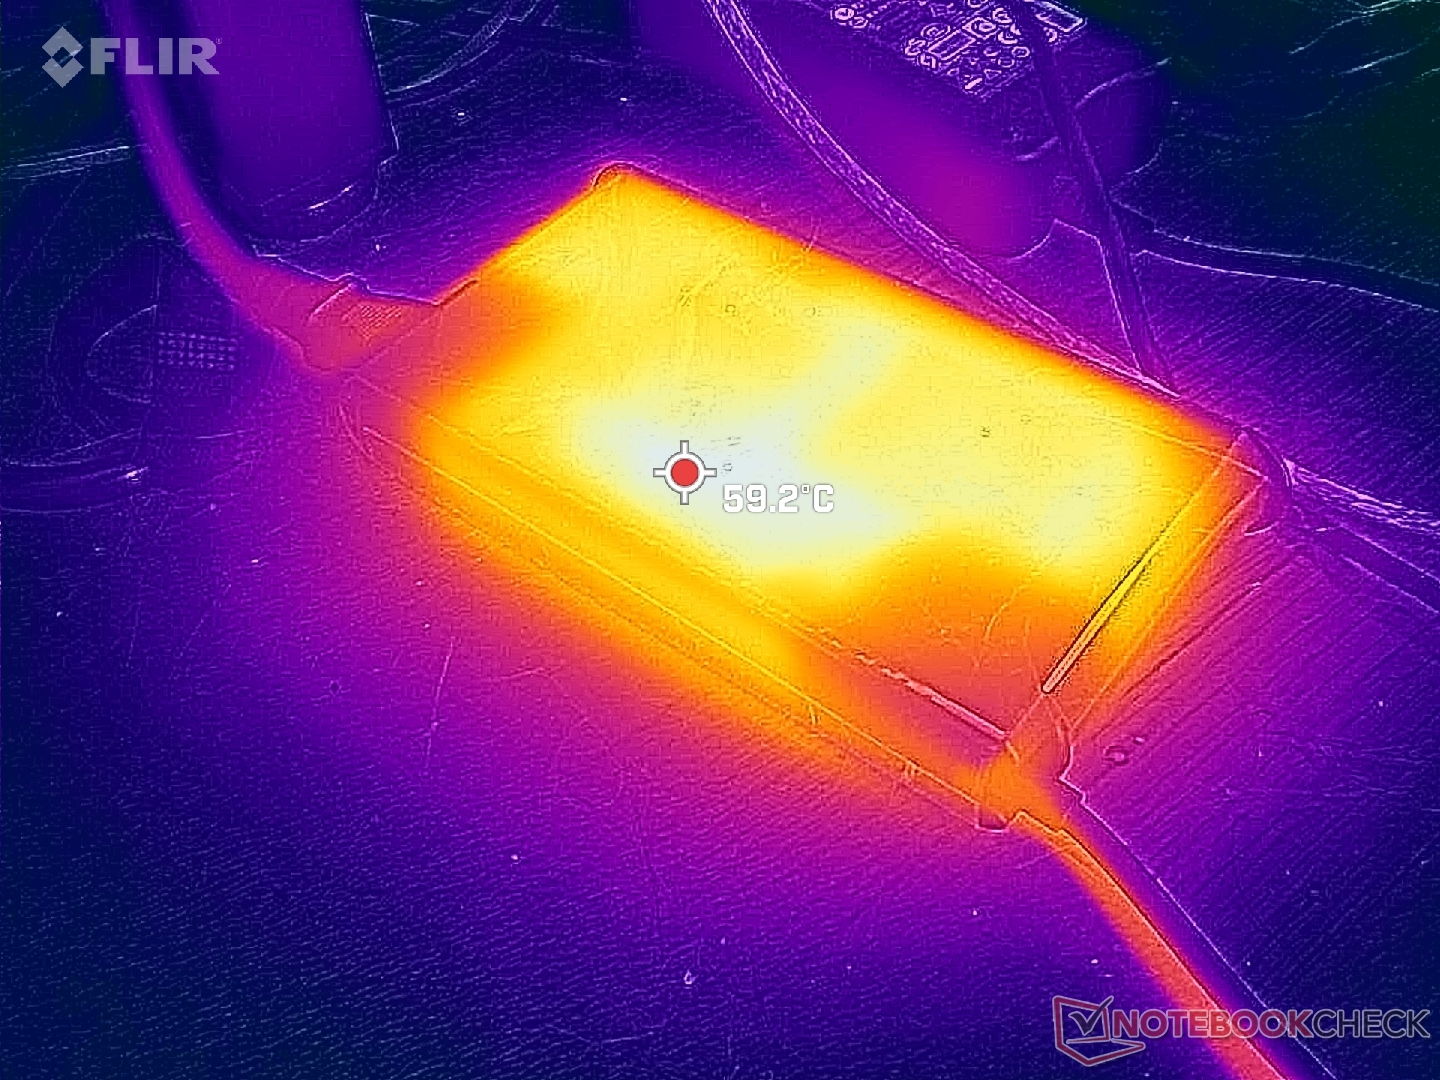
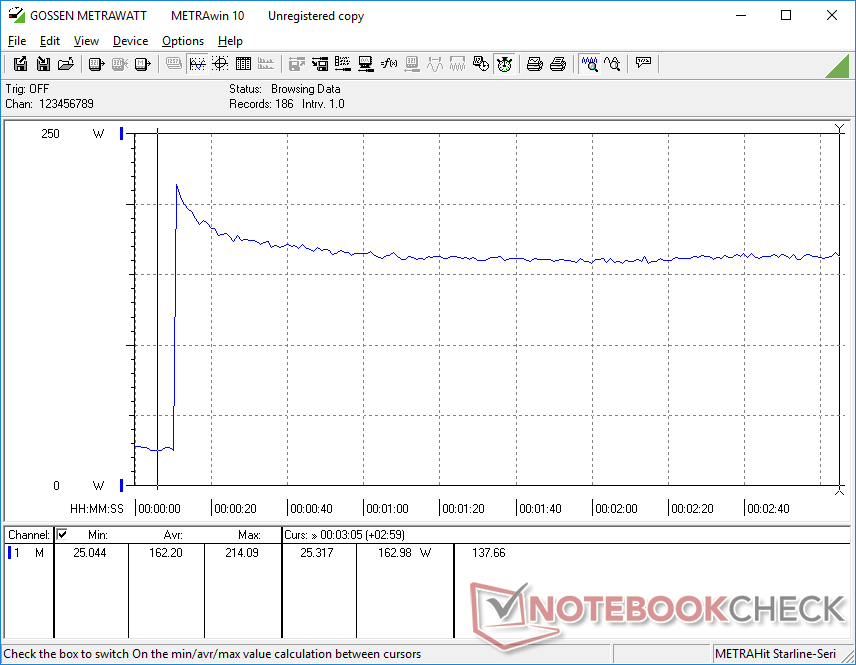
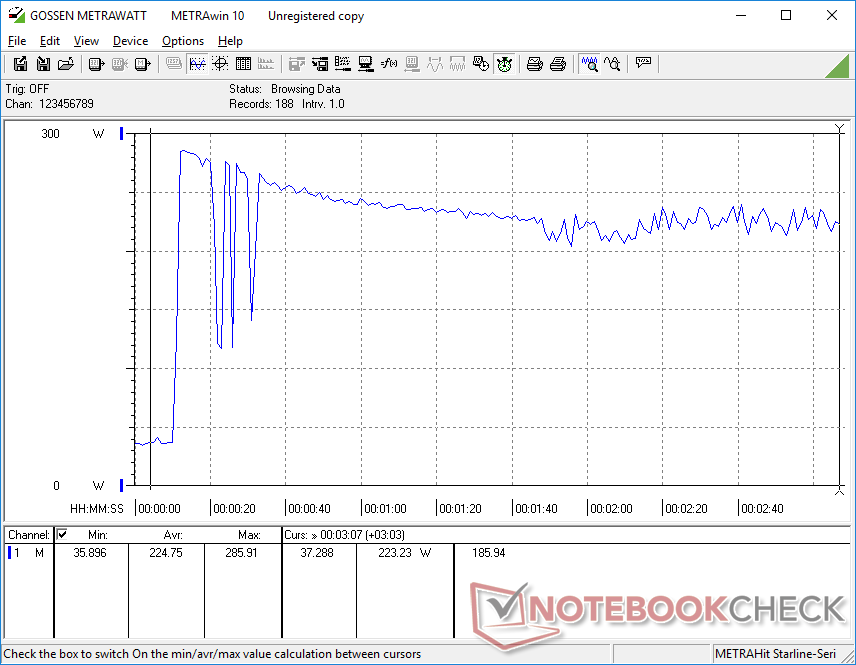
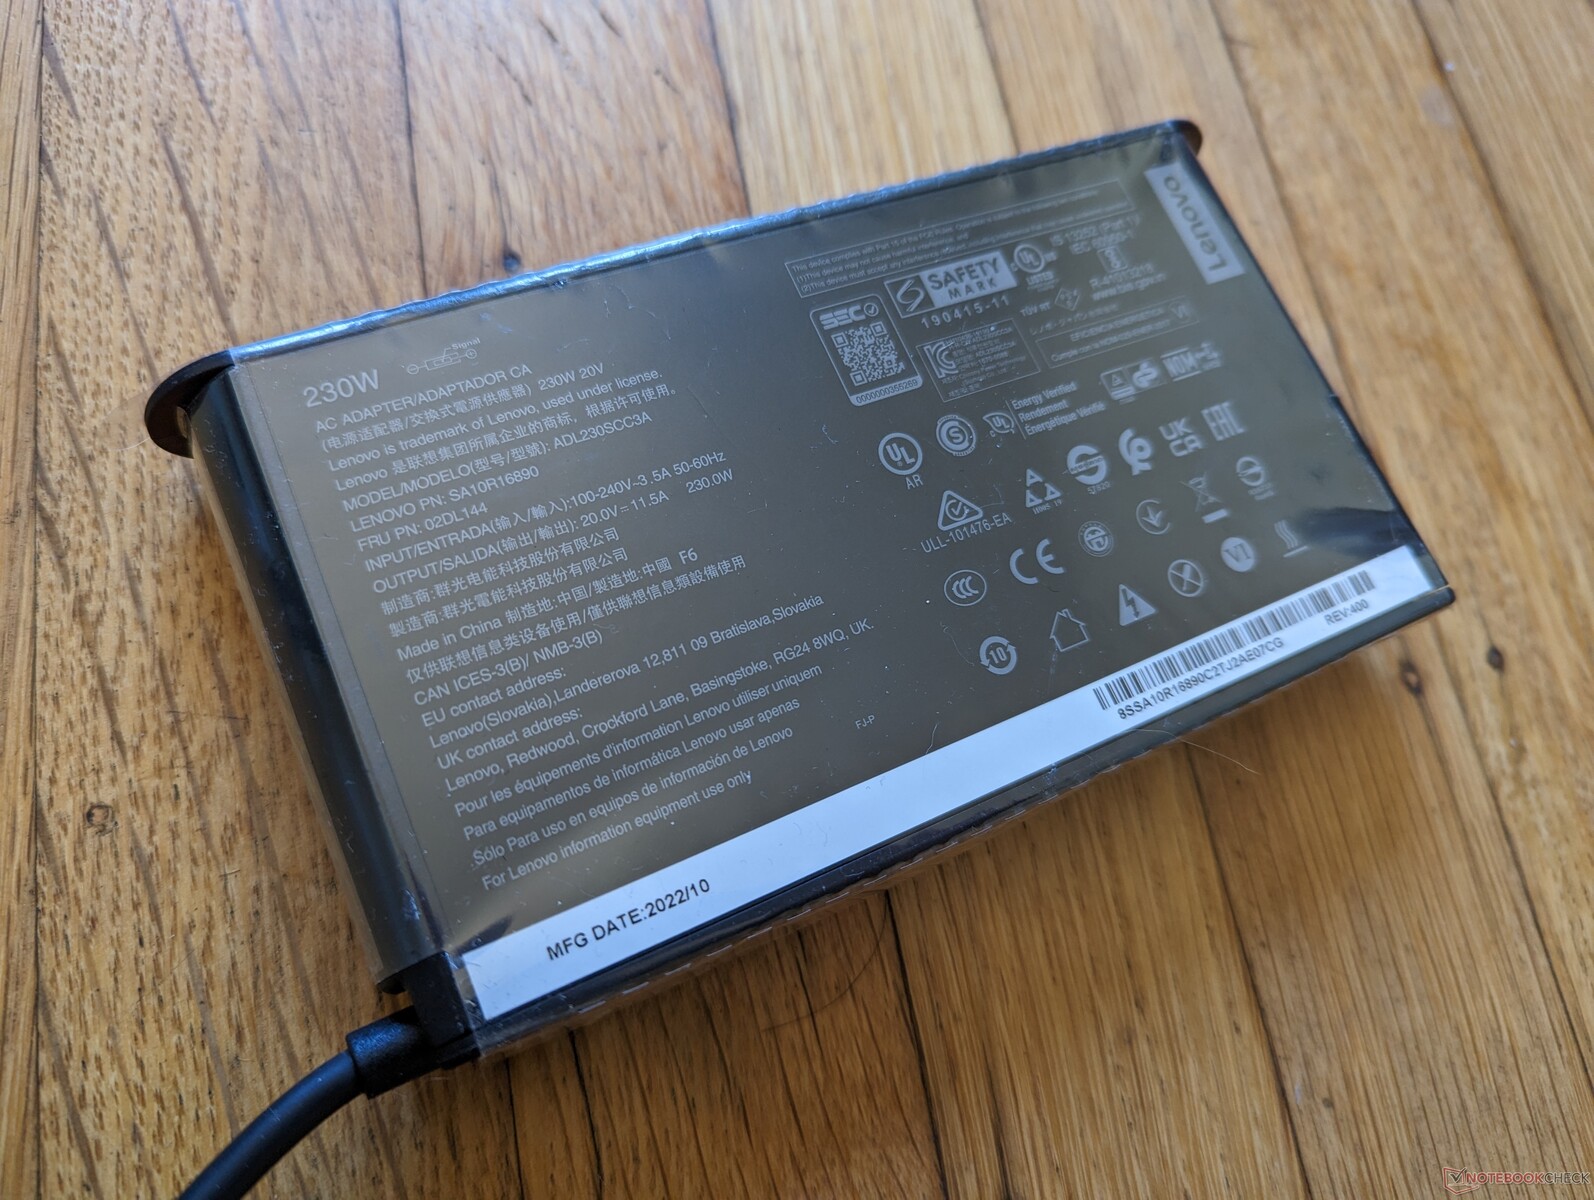
Aunque los usuarios avanzados pueden apreciar el rendimiento extra, nuestro Lenovo a plena carga es significativamente más exigente que la mayoría de estaciones de trabajo móviles. De hecho, el adaptador de CA de 230 W y tamaño medio (~15 x 8,6 x 2,6 cm) puede no ser suficiente para alimentar la máquina cuando la CPU y la GPU están a alta utilización. Podemos medir un consumo máximo temporal de 286 W del adaptador de 230 W antes de que caiga y se estabilice en unos 223 W. Por tanto, cabe esperar que la tasa de carga de la batería se ralentice o incluso se vuelva negativa cuando se ejecuten cargas exigentes. Por ejemplo Witcher 3 durante 90 minutos seguidos, por ejemplo, observamos que el nivel de la batería bajaba del 100% al 87%. Un comportamiento similar se observó en el xPS 17 o Precision 5750. Es una pena que Lenovo no ofrezca opciones de adaptador de CA superiores a 230 W en la caja.
Configurarlo con la RTX A2000 de gama baja reduciría el consumo a la mitad. En este caso, el adaptador de CA de 230 W sería suficiente.
| Off / Standby | |
| Ocioso | |
| Carga |
|
Clave:
min: | |
| Lenovo ThinkPad P16 G1 RTX A5500 i9-12950HX, RTX A5500 Laptop GPU, WDC PC SN810 2TB, IPS, 3840x2400, 16" | Asus ProArt StudioBook 16 W7600H5A-2BL2 W-11955M, RTX A5000 Laptop GPU, 2x Micron 2300 2TB MTFDHBA2T0TDV (RAID 0), OLED, 3840x2400, 16" | Dell Precision 7000 7670 Performance i9-12950HX, RTX A5500 Laptop GPU, , OLED, 3840x2400, 16" | Lenovo ThinkPad P16 G1 21D6001DMB i7-12850HX, RTX A2000 Laptop GPU, Micron 3400 1TB MTFDKBA1T0TFH, IPS LED, 2560x1600, 16" | MSI CreatorPro Z16P B12UKST i7-12700H, RTX A3000 Laptop GPU, Samsung PM9A1 MZVL21T0HCLR, IPS, 2560x1600, 16" | HP ZBook Studio 16 G9 62U04EA i7-12800H, RTX A2000 Laptop GPU, Micron 3400 1TB MTFDKBA1T0TFH, IPS, 3840x2400, 16" | |
|---|---|---|---|---|---|---|
| Power Consumption | 14% | -35% | 45% | 19% | 28% | |
| Idle Minimum * (Watt) | 7.5 | 12.4 -65% | 16.4 -119% | 5.1 32% | 10.8 -44% | 7.2 4% |
| Idle Average * (Watt) | 20.1 | 16.5 18% | 35.9 -79% | 9.2 54% | 16.3 19% | 18.1 10% |
| Idle Maximum * (Watt) | 40 | 25 37% | 47 -18% | 9.9 75% | 16.9 58% | 18.5 54% |
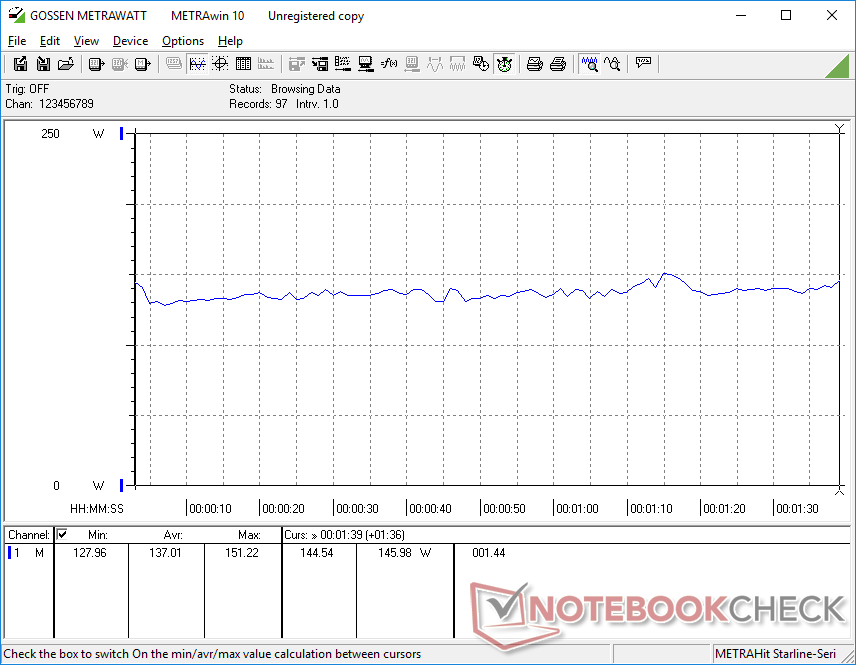
| Load Average * (Watt) | 137 | 132 4% | 147.1 -7% | 124.1 9% | 111.7 18% | 112.8 18% |
| Witcher 3 ultra * (Watt) | 208 | 132 37% | 158.8 24% | 87.7 58% | 152.1 27% | 106.7 49% |
| Load Maximum * (Watt) | 285.9 | 134 53% | 311 -9% | 168.9 41% | 177.4 38% | 186 35% |
* ... más pequeño es mejor
Power Consumption Witcher 3 / Stresstest
Power Consumption external Monitor
Duración de la batería
La autonomía es varias horas inferior a la de nuestra RTX A2000 SKU de menor potencia, con un total de algo menos de 6 horas si se configura con el perfil de energía equilibrado.
La carga de vacío a lleno tarda unas 2 horas. Sin embargo, el tiempo de carga estimado por Lenovo no es tan exacto, ya que Vantage puede mostrar un tiempo de hasta 4 horas al principio antes de recalibrarse automáticamente. Hay que tener en cuenta que la velocidad de carga se ralentizará significativamente si se ejecutan aplicaciones exigentes como las mencionadas anteriormente.
El sistema no se puede recargar a través de USB-C.
| Lenovo ThinkPad P16 G1 RTX A5500 i9-12950HX, RTX A5500 Laptop GPU, 94 Wh | Asus ProArt StudioBook 16 W7600H5A-2BL2 W-11955M, RTX A5000 Laptop GPU, 90 Wh | Dell Precision 7000 7670 Performance i9-12950HX, RTX A5500 Laptop GPU, 93 Wh | Lenovo ThinkPad P16 G1 21D6001DMB i7-12850HX, RTX A2000 Laptop GPU, 94 Wh | MSI CreatorPro Z16P B12UKST i7-12700H, RTX A3000 Laptop GPU, 90 Wh | HP ZBook Studio 16 G9 62U04EA i7-12800H, RTX A2000 Laptop GPU, 86 Wh | |
|---|---|---|---|---|---|---|
| Duración de Batería | -14% | -19% | 62% | 0% | 9% | |
| WiFi v1.3 (h) | 5.8 | 5 -14% | 4.7 -19% | 9.4 62% | 5.8 0% | 6.3 9% |
| H.264 (h) | 1.8 | 8.5 | ||||
| Witcher 3 ultra (h) | 1.6 | |||||
| Load (h) | 1.8 | 1.1 |
Pro
Contra
Veredicto - El adaptador de CA de 230 W no es suficiente
Desde una perspectiva puramente de rendimiento, el ThinkPad P16 G1 es una de las estaciones de trabajo móviles más rápidas disponibles actualmente, independientemente del tamaño de la pantalla. Su CPU Core i9-12950HX y su GPU RTX A5500 superan ligera pero consistentemente a la GPU Precision 7670 aunque el modelo Dell viene con opciones de procesador similares.
Hay dos defectos clave que esperamos que Lenovo pueda resolver en futuras iteraciones. En primer lugar, las temperaturas de la CPU son muy superiores a la media cuando se ejecutan cargas exigentes. Las altas temperaturas no son inesperadas, por supuesto, pero llegar a los 100 C es demasiado cuando la misma CPU en el modelo Dell apenas llega a los 80 C en condiciones similares. La alta temperatura es quizás el precio a pagar por un rendimiento ligeramente superior.
En segundo lugar, el adaptador de CA de 230 W está sudando la gota gorda intentando alimentar una CPU de más de 100 W y una GPU de 130 W. La lucha se observa cuando se ejecuta una CPU exigente. La lucha es observable cuando se ejecutan cargas exigentes, ya que la tasa de carga del sistema se ralentiza significativamente o incluso empieza a agotar la batería en ciertos escenarios. Cuando somos capaces de medir un consumo máximo de 285 W con un adaptador de CA de sólo 230 W, está claro que hay un cuello de botella. Un adaptador de CA mayor de 280 W o 330 W habría sido más apropiado dado nuestro nivel de configuración.
El ThinkPad P16 Gen 1 maximiza el rendimiento incluso si implica un mayor consumo de energía y temperaturas de núcleo más altas. El adaptador de CA de 230 W puede ser demasiado conservador, sin embargo, dados los muy exigentes procesadores de nuestra configuración de gama alta.
No obstante, el alto rendimiento general del sistema es innegable a pesar de las altas temperaturas y el insuficiente bloque de alimentación de 230 W. Asegúrate de salir de cualquier aplicación exigente para obtener velocidades de carga decentes.
Precio y disponibilidad
El ThinkPad P16 G1 ya está a la venta en Best Buy y Amazon en niveles de configuración más bajos a partir de $2570 o $3850 USD, respectivamente. Recomendamos comprar directamente a Lenovo, ya que tiene las opciones más configurables en stock.
Lenovo ThinkPad P16 G1 RTX A5500
- 02/06/2023 v7 (old)
Allen Ngo
Transparencia
La selección de los dispositivos que se van a reseñar corre a cargo de nuestro equipo editorial. La muestra de prueba fue proporcionada al autor en calidad de préstamo por el fabricante o el minorista a los efectos de esta reseña. El prestamista no tuvo ninguna influencia en esta reseña, ni el fabricante recibió una copia de la misma antes de su publicación. No había ninguna obligación de publicar esta reseña. Como empresa de medios independiente, Notebookcheck no está sujeta a la autoridad de fabricantes, minoristas o editores.
Así es como prueba Notebookcheck
Cada año, Notebookcheck revisa de forma independiente cientos de portátiles y smartphones utilizando procedimientos estandarizados para asegurar que todos los resultados son comparables. Hemos desarrollado continuamente nuestros métodos de prueba durante unos 20 años y hemos establecido los estándares de la industria en el proceso. En nuestros laboratorios de pruebas, técnicos y editores experimentados utilizan equipos de medición de alta calidad. Estas pruebas implican un proceso de validación en varias fases. Nuestro complejo sistema de clasificación se basa en cientos de mediciones y puntos de referencia bien fundamentados, lo que mantiene la objetividad.Price comparison

