Análises de portátiles con NVIDIA GeForce GTX 1650 Ti Mobile tarjeta gráfica
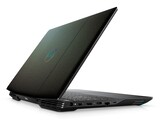
Revisión del portátil Dell G5 15 5500: Un aspirante de rango medio decepcionado por una pantalla inferior
La nueva variante del G5 15 5500 de Dell tiene como objetivo atraer al jugador de gama media. Con un Core i5-10300H, una GTX 1650 Ti y una pantalla de 120 Hz, el G5 15 5500 tiene lo básico. Sin embargo, por el precio de venta de ₹87,990 (US$1,195), el G5 15 5500 es más económico, especialmente con la pantalla. ¿Puede el Dell G5 15 5500 compensar estos déficits en el frente del rendimiento? Averigüémoslo.
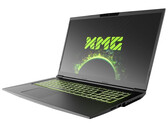
Intel Core i5-10300H, NVIDIA GeForce GTX 1650 Ti Mobile, 15.6", 2.3 kgSchenker XMG Core 17 (Tongfang GK7MRFR) en revisión: Un portátil de gama media para juegos sin sofocos
El hardware del Schenker XMG Core 17 lleva todos los juegos de ordenador modernos sin problemas a la pantalla de 17,3 pulgadas (Full HD, IPS, 144 Hz). El portátil también obtiene puntos con un desarrollo de calor moderado, desarrollo de bajo ruido en el uso diario, y espacio para dos SSD.
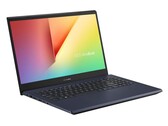
Intel Core i7-10750H, NVIDIA GeForce GTX 1650 Ti Mobile, 17.3", 2.5 kgReview del portátil Asus VivoBook 15 K571LI: Híbrido multimedia para juegos
Es la versión más potente del VivoBook 15 que puedes conseguir por el momento, pero eso no significa necesariamente que sea la mejor. Este portátil alimentado por la GeForce GTX se ve afectado por la duración media de la batería y los colores.
Intel Core i7-10750H, NVIDIA GeForce GTX 1650 Ti Mobile, 15.6", 2.1 kgReview del portátil HP Pavilion Gaming 16: Portátil de 16 pulgadas de bajo precio con una GPU GeForce
Aunque HP ya tiene muchos buenos portátiles para juegos en su serie Omen, el fabricante también ofrece portátiles para juegos de bajo precio en su serie Pavilion. El sistema sorprende con un buen nivel de rendimiento y tiempos de funcionamiento de la batería utilizables.
Intel Core i5-10300H, NVIDIA GeForce GTX 1650 Ti Mobile, 16.1", 2.2 kgReview del portátil Asus ROG Strix G15 G512LI: 1000 dólares por una GeForce GTX 1650 Ti Graphics es demasiado
Los portátiles que funcionan con gráficos GeForce RTX 2060 hoy en día empiezan a venderse por unos 1.000 a 1.200 dólares, pero el ROG Strix G15 G512LI de Asus viene con la más lenta GTX 1650 Ti por casi el mismo precio. ¿A dónde va todo ese dinero?
Intel Core i7-10750H, NVIDIA GeForce GTX 1650 Ti Mobile, 15.6", 2.3 kgAcer Nitro 5 AN515-44-R5FT: AMD Ryzen 5 4600H, 15.60", 2.2 kg
análise » Review del portátil Acer Nitro 5 AN515-44: AMD saliendo con Nvidia
Dell XPS 15 9500 Core i7 4K UHD: Intel Core i7-10875H, 15.60", 2 kg
análise » Review del portátil Dell XPS 15 9500 Core i7 GeForce GTX 1650 Ti: No hay ninguna tontería del Core i9
HP Pavilion 16-a0002ns: Intel Core i7-10750H, 16.10", 2.4 kg
análise externo » HP Pavilion 16-a0002ns
Asus TUF Gaming F17 FX706LI-ES53: Intel Core i5-10300H, 17.30", 2.6 kg
análise externo » Asus TUF Gaming F17 FX706LI-ES53
HP Pavilion Gaming 16-a0040ns: Intel Core i7-10870H, 16.10", 2.4 kg
análise externo » HP Pavilion Gaming 16-a0040ns
HP Pavilion Gaming 16-a0024ns: Intel Core i7-10750H, 16.10", 2.4 kg
análise externo » HP Pavilion Gaming 16-a0024ns
LG UltraPC 15U70P-P.AAS8U1: Intel Core i7-1165G7, 15.60", 1.9 kg
análise externo » LG UltraPC 15U70P-P.AAS8U1
Acer Aspire 7 A715-75G-76NG: Intel Core i7-10750H, 15.60", 2.2 kg
análise externo » Acer Aspire 7 A715-75G-76NG
HP Pavilion Gaming 15-ec1028ns: AMD Ryzen 7 4800H, 15.60", 2 kg
análise externo » HP Pavilion Gaming 15-ec1028ns
MSI Summit E14 A11SCST-069NE: Intel Core i7-1185G7, 14.00", 1.3 kg
análise externo » MSI Summit E14 A11SCST-069NE
HP Pavilion Gaming 16-a0046ns: Intel Core i5-10300H, 16.10", 2.4 kg
análise externo » HP Pavilion Gaming 16-a0046ns
HP Pavilion Gaming 16-a0010ns: Intel Core i7-10750H, 16.10", 2.4 kg
análise externo » HP Pavilion Gaming 16-a0010ns
Asus ROG Zephyrus G14 GA401II-HE092T: AMD Ryzen 7 4800HS, 14.00", 1.7 kg
análise externo » Asus ROG Zephyrus G14 GA401II-HE092T
HP Pavilion Gaming 15-ec1013ns: AMD Ryzen 7 4800H, 15.60", 2 kg
análise externo » HP Pavilion Gaming 15-ec1013ns
Haier GG1500A, i5-10200H GTX 1650 Ti: Intel Core i5-10200H, 15.60", 1.9 kg
análise externo » Haier GG1500A, i5-10200H GTX 1650 Ti
Acer Aspire 7 A715-75G-57H8: Intel Core i5-9300H, 15.60", 2.2 kg
análise externo » Acer Aspire 7 A715-75G-57H8
Hyperbook NV4, i7-1165G7 GTX 1650 Ti: Intel Core i7-1165G7, 14.00", 1.4 kg
análise externo » Hyperbook NV4, i7-1165G7 GTX 1650 Ti
Asus ROG Zephyrus G14 GA401II-HE004: AMD Ryzen 7 4800HS, 14.00", 1.6 kg
análise externo » Asus ROG Zephyrus G14 GA401II-HE004
HP Pavilion 16-a0003ns: Intel Core i7-10750H, 16.10", 2.4 kg
análise externo » HP Pavilion 16-a0003ns
Lenovo IdeaPad Gaming 3 15ARH05-82EY003NGE: AMD Ryzen 5 4600H, 15.60", 2.2 kg
análise externo » Lenovo IdeaPad Gaming 3 15ARH05-82EY003NGE
Asus TUF Gaming F17 FX706LI-HX177T: Intel Core i7-10870H, 17.30", 2.6 kg
análise externo » Asus TUF Gaming F17 FX706LI-HX177T
Dell XPS 15 9500-NCFMG: Intel Core i7-10750H, 15.60", 2.1 kg
análise externo » Dell XPS 15 9500-NCFMG
Acer Nitro 5 AN515-55-59KS: Intel Core i5-10300H, 15.60", 2.3 kg
análise externo » Acer Nitro 5 AN515-55-59KS
HP Pavilion Gaming 16-a0044ns: Intel Core i5-10300H, 16.10", 2.5 kg
análise externo » HP Pavilion Gaming 16-a0044ns
Dell Vostro 15 7500, i7-10750H GTX 1650 Ti: Intel Core i7-10750H, 15.60", 1.9 kg
análise externo » Dell Vostro 15 7500, i7-10750H GTX 1650 Ti
Acer Nitro 5 AN515-44-R7LD: AMD Ryzen 5 4600H, 15.60", 2.4 kg
análise externo » Acer Nitro 5 AN515-44-R7LD
Dell G3 15 3500-H5JDG: Intel Core i5-10300H, 15.60", 2.6 kg
análise externo » Dell G3 15 3500-H5JDG
Asus TUF Gaming F15 FX506LI-HN109: Intel Core i7-10870H, 15.60", 2.3 kg
análise externo » Asus TUF Gaming A15 FX506LI-HN109
Dell XPS 17 9700, i7-10750H GTX 1650Ti: Intel Core i7-10750H, 17.30", 2.5 kg
análise externo » Dell XPS 17 9700, i7-10750H GTX 1650Ti
Acer Nitro 5 AN515-44-R3N9: AMD Ryzen 5 4600H, 15.60", 2.4 kg
análise externo » Acer Nitro 5 AN515-44-R3N9
Asus TUF Gaming F15 FX506LI-HN109T: Intel Core i7-10750H, 15.60", 2.3 kg
análise externo » Asus TUF Gaming A15 FX506LI-HN109T
Dell XPS 15 9500-XHR6F: Intel Core i9-10885H, 15.60", 2.1 kg
análise externo » Dell XPS 15 9500-XHR6F
Acer ConceptD 3 Ezel CC314-72G-79WQ: Intel Core i7-10750H, 14.00", 1.9 kg
análise externo » Acer ConceptD 3 Ezel CC314-72G-79WQ
HP Pavilion Gaming 16-a0021ns: Intel Core i7-10750H, 16.10", 2.4 kg
análise externo » HP Pavilion Gaming 16-a0021ns
Lenovo Legion Slim 7i-82BC002FGE: Intel Core i5-10300H, 15.60", 1.9 kg
análise externo » Lenovo Legion Slim 7i-82BC002FGE
Acer ConceptD 3 Ezel CC315-72G-73DF: Intel Core i7-10750H, 15.60", 2.2 kg
análise externo » Acer ConceptD 3 Ezel CC315-72G-73DF
Lenovo Yoga 9 15IMH5-82DE000WGE: Intel Core i7-10750H, 15.60", 2 kg
análise externo » Lenovo Yoga 9 15IMH5-82DE000WGE
Acer Nitro 5 AN515-44-R6TE: AMD Ryzen 5 4600H, 15.60", 2.4 kg
análise externo » Acer Nitro 5 AN515-44-R6TE
Asus TUF Gaming A15 FA506II-BQ029: AMD Ryzen 7 4800H, 15.60", 2.3 kg
análise externo » Asus TUF A15 FA506II-BQ029
Asus TUF A17 FA706II-AU741: AMD Ryzen 7 4800H, 17.30", 2.6 kg
análise externo » Asus TUF A17 FA706II-AU741
Acer Nitro 5 AN515-44-R5FT: AMD Ryzen 5 4600H, 15.60", 2.2 kg
análise externo » Acer Nitro 5 AN515-44-R5FT
Xiaomi Redmi G, i5-10300H 1650Ti: Intel Core i5-10300H, 16.10", 2.5 kg
análise externo » Xiaomi Redmi G, i5-10300H 1650Ti
HP Pavilion Gaming 15-ec1158ng: AMD Ryzen 5 4600H, 15.60", 2.3 kg
análise externo » HP Pavilion Gaming 15-ec1158ng
Acer Predator Helios 300 PH315-53-5507: Intel Core i5-10300H, 15.60", 2.3 kg
análise externo » Acer Predator Helios 300 PH315-53-5507
HP Pavilion Gaming 16-a0007ns: Intel Core i7-10750H, 15.60", 2.4 kg
análise externo » HP Pavilion Gaming 16-a0007ns
HP Pavilion Gaming 16-a0027ns: Intel Core i7-10750H, 16.10", 2.4 kg
análise externo » HP Pavilion Gaming 16-a0027ns
Lenovo IdeaPad Creator 5 15IMH05-82D4003GGE: Intel Core i7-10750H, 15.60", 2.2 kg
análise externo » Lenovo IdeaPad Creator 5 15IMH05-82D4003GGE
Dell XPS 15 9500-XXFY5: Intel Core i7-10750H, 15.60", 2.1 kg
análise externo » Dell XPS 15 9500-XXFY5
HP Omen 15-en0261ng: AMD Ryzen 7 4800H, 15.60", 2.4 kg
análise externo » HP Omen 15-en0261ng
Dell G5 15 5500 i7-10750H, 1650 Ti: Intel Core i7-10750H, 15.60", 2.4 kg
análise externo » Dell G5 15 5500 i7-10750H, 1650 Ti
HP Omen 15-en0001ns: AMD Ryzen 7 4800H, 15.60", 2.4 kg
análise externo » HP Omen 15-en0001ns
HP Envy 15-ep0003ns: Intel Core i5-10300H, 15.60", 2.1 kg
análise externo » HP Envy 15-ep0003ns
Lenovo Ideapad Creator 5 15IMH05, i5-10300H GTX 1650 Ti: Intel Core i5-10300H, 15.60", 2.2 kg
análise externo » Lenovo Ideapad Creator 5 15IMH05, i5-10300H GTX 1650 Ti
Xiaomi Redmi G Gaming i7-10750H GTX 1650Ti: Intel Core i7-10750H, 16.10", 2.5 kg
análise externo » Xiaomi Redmi G Gaming i7-10750H GTX 1650Ti
Schenker XMG Core 15-M20hdw: AMD Ryzen 7 4800H, 15.60", 1.9 kg
análise externo » Schenker XMG Core 15-M20hdw
Asus TUF Gaming A15 FA506II-BQ150: AMD Ryzen 7 4800H, 15.60", 2.3 kg
análise externo » Asus TUF Gaming A15 FA506II-BQ150
MSI GF75 Thin 10SCSR-015NE: Intel Core i7-10750H, 17.30", 2.2 kg
análise externo » MSI GF75 Thin 10SCSR-015NE
Acer Nitro 5 AN515-55-52HQ: Intel Core i5-10300H, 15.60", 2.3 kg
análise externo » Acer Nitro 5 AN515-55-52HQ
HP Pavilion Gaming 15-ec1012ns: AMD Ryzen 7 4800H, 15.60", 2 kg
análise externo » HP Pavilion Gaming 15-ec1012ns
Dell G5 15 5500-9T6CF: Intel Core i5-10300H, 15.60", 2.4 kg
análise externo » Dell G5 15 5500-9T6CF
Acer Predator Triton 300 PT315-52, i5-10300H GTX 1650 Ti: Intel Core i5-10300H, 15.60", 2.3 kg
análise externo » Acer Predator Triton 300 PT315-52, i5-10300H GTX 1650 Ti
HP Omen 15t-ek000: Intel Core i5-10300H, 15.60", 2.4 kg
análise externo » HP Omen 15t-ek000
Acer Aspire 7 A715-75G: Intel Core i7-9750H, 15.60", 2.2 kg
análise externo » Acer Aspire 7 A715-75G
Asus ROG Strix G15 G512LI: Intel Core i7-10750H, 15.60", 2.3 kg
análise externo » Asus ROG Strix G15 G512LI
Acer Nitro 5 AN515-55-751H: Intel Core i7-10750H, 15.60", 2.3 kg
análise externo » Acer Nitro 5 AN515-55-751H
Lenovo Legion 5 15ARH05-82B5007CMH: AMD Ryzen 7 4800H, 15.60", 2.3 kg
análise externo » Lenovo Legion 5 15ARH05-82B5007CMH
Lenovo Legion 5 15ARH05-82B500C5GE: AMD Ryzen 5 4600H, 15.60", 2.3 kg
análise externo » Lenovo Legion 5 15ARH05-82B500C5GE
Lenovo Legion 5i: Intel Core i7-10750H, 15.60", 2.3 kg
análise externo » Lenovo Legion 5i
Dell XPS 15 9500-BNX9508: unknown, 15.60", 2 kg
análise externo » Dell XPS 15 9500-BNX9508
Acer Aspire Nitro 5 AN515-44: AMD Ryzen 7 4800H, 15.60", 2.4 kg
análise externo » Acer Aspire Nitro 5 AN515-44
Asus Zephyrus G14 GA401II-HE046T: AMD Ryzen 7 4800HS, 14.00", 1.6 kg
análise externo » Asus Zephyrus G14 GA401II-HE046T
Lenovo IdeaPad Gaming 3i 15IMH05-81Y400F6GE: Intel Core i7-10750H, 15.60", 2.2 kg
análise externo » Lenovo IdeaPad Gaming 3i 15IMH05-81Y400F6GE
MSI GL75 10SCSR-003XPL: Intel Core i5-10300H, 17.30", 2.5 kg
análise externo » MSI GL75 10SCSR-003XPL
Asus TUF Gaming A15 FA506II-BQ018: AMD Ryzen 5 4600H, 15.60", 2.3 kg
análise externo » Asus TUF Gaming A15 FA506II-BQ018
Asus TUF Gaming F15 FX506II-R75TB6B: AMD Ryzen 7 4800H, 15.60", 2.3 kg
análise externo » Asus TUF Gaming A15 FX506II-R75TB6B
Asus TUF Gaming A15 FA506II-BQ027T: AMD Ryzen 7 4800H, 15.60", 2.3 kg
análise externo » Asus TUF Gaming A15 FA506II-BQ027T
Asus TUF Gaming A15 FA506II-HN188: AMD Ryzen 5 4600H, 15.60", 2.3 kg
análise externo » Asus TUF A15 FA506II-HN188
Acer Nitro 5 AN515-55-52DV: Intel Core i5-10300H, 15.60", 2.3 kg
análise externo » Acer Nitro 5 AN515-55-52DV
Dell XPS 15 9500 Core i7 4K UHD: Intel Core i7-10875H, 15.60", 2 kg
análise externo » Dell XPS 15 9500 Core i7 4K UHD
Asus TUF Gaming A17 FA706II-H7356: AMD Ryzen 7 4800H, 17.30", 2.6 kg
análise externo » Asus TUF Gaming A17 FA706II-H7356
Asus Zephyrus G14 GA401II-025T: AMD Ryzen 5 4600HS, 14.00", 1.6 kg
análise externo » Asus Zephyrus G14 GA401II-025T
Asus TUF Gaming A17 FA706II-AU077T: AMD Ryzen 7 4800H, 17.30", 2.6 kg
análise externo » Asus TUF Gaming A17 FA706II-AU077T
Dell Inspiron 15 7590-92P5C: Intel Core i7-9750H, 15.60", 1.8 kg
análise externo » Dell Inspiron 15 7590-92P5C
Schenker XMG Core 17 Comet Lake: Intel Core i7-10750H, 17.30", 2.5 kg
» El Schenker XMG Core 17 (2020) ofrece tres salidas de video y espacio para dos SSDs
Asus VivoBook 15 K571LI-PB71: Intel Core i7-10750H, 15.60", 2.1 kg
» Evita estos monitores Panda LM156LF IPS cuando compres tu próximo portátil para juegos.
Asus ROG Strix G15 G512LI: Intel Core i7-10750H, 15.60", 2.3 kg
» Las opciones móviles de la Nvidia GeForce se están disparando fuera de control. Saltee la GeForce GTX 1650 Ti y vaya por la superior GTX 1660 Ti en su lugar