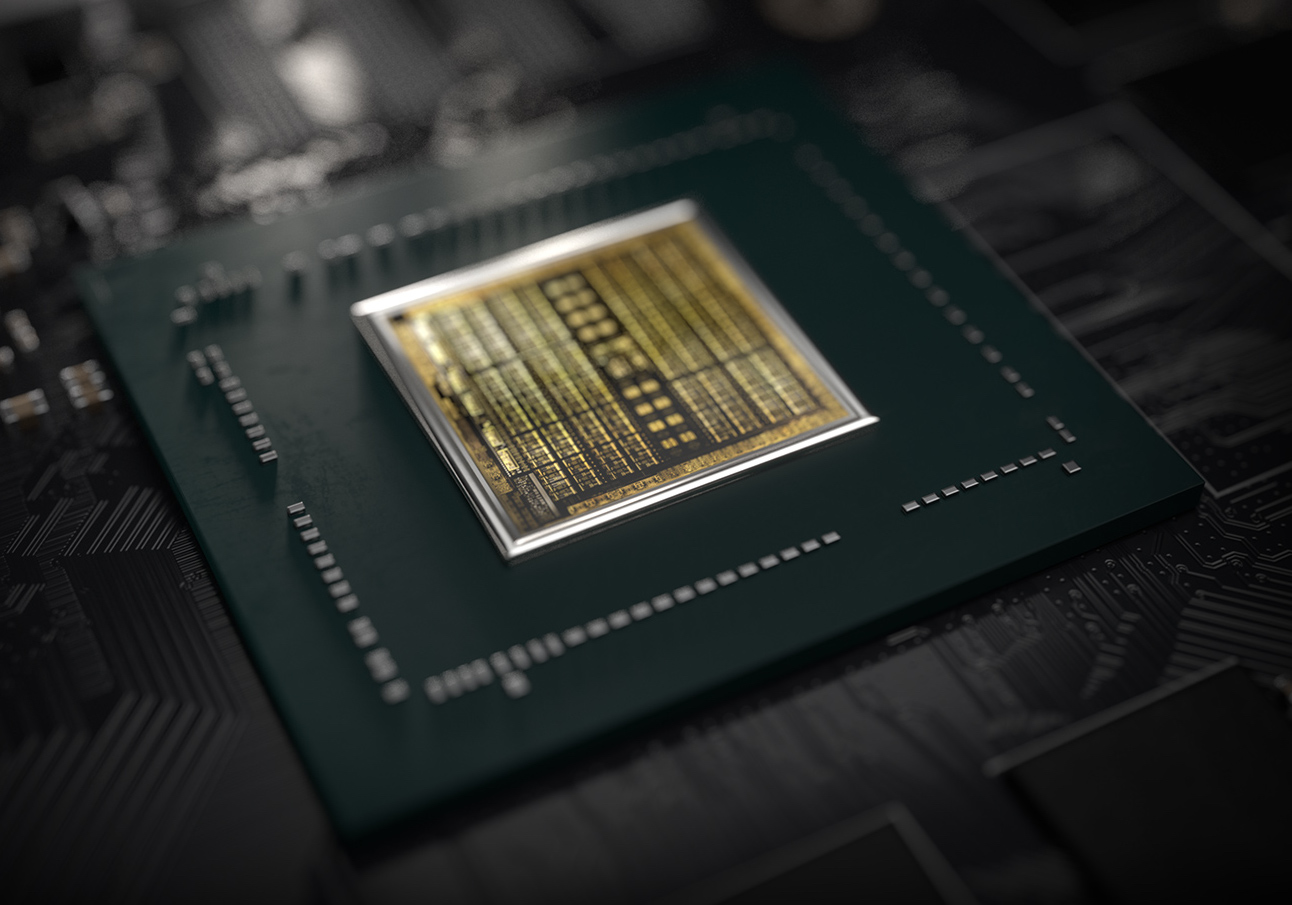
Análises de portátiles con NVIDIA GeForce GTX 1650 Mobile tarjeta gráfica
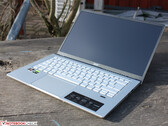
Análisis del Acer Swift X SFX14 con GTX 1650: El portátil Swift Ryzen
El portátil de 14 pulgadas de Acer tiene las características de un ultrabook para juegos. Aunque la gráfica Turing 2020 no es lo último y lo mejor, ofrece una potencia de juego moderada junto con el Ryzen 5000 en una carcasa de 19 mm de grosor. La calidad de construcción es sólida y la pantalla sorprendentemente buena.
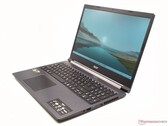
AMD Ryzen 5 5500U, NVIDIA GeForce GTX 1650 Mobile, 14", 1.4 kgAnálisis del portátil multimedia Acer Aspire 7 A715-42G: Un todoterreno disfrazado con potencial para juegos
La pantalla de 15,6 pulgadas no sólo ofrece suficiente potencia para la oficina e Internet, sino que también se esfuerza por conseguir una velocidad de fotogramas nítida. El portátil multimedia transfiere sin problemas muchos juegos modernos a la pantalla.
AMD Ryzen 5 5500U, NVIDIA GeForce GTX 1650 Mobile, 15.6", 2.2 kgAnálisis del Lenovo IdeaPad 5 Pro 16ACH: Portátil Ryzen 5000 con una gran pantalla LCD de 120 Hz
El Lenovo IdeaPad 5 Pro 16ACH podría ser el resultado de la combinación de las tendencias hacia las pantallas 16:10 y los procesadores AMD. El portátil multimedia destaca con su gran pantalla LCD de alta resolución de 120 Hz en un formato menos ancho y con sus rápidas CPUs Ryzen 5000H.
AMD Ryzen 7 5800H, NVIDIA GeForce GTX 1650 Mobile, 16", 2 kgAnálisis del Lenovo Yoga Creator 7 15IMH05: Dolby Vision, muy buena duración de la batería y tres años de garantía
El delgado y compacto Lenovo Yoga Creator 7 ofrece mucho rendimiento informático y un nivel de equipamiento muy completo. A esto se suma una muy buena duración de la batería y una garantía de tres años.
Intel Core i7-10750H, NVIDIA GeForce GTX 1650 Mobile, 15.6", 1.8 kgVista previa de Acer Nitro 5 en 15 y 17 pulgadas: Ryzen 5000H para jugadores
Ryzen 5000H acelera y supera a muchas máquinas de juego con un chip Intel. Sin embargo, la configuración con una pantalla sensible y opciones de almacenamiento masivo también es atractiva. Probamos dos modelos de preproducción.
AMD Ryzen 5 5600H, NVIDIA GeForce GTX 1650 Mobile, 15.6", 2.3 kgSchenker XMG Core 14: Intel Core i5-1135G7, 14.00", 1.4 kg
análise » Revisión del portátil Schenker XMG Core 14 (Clevo NV40MB): bebé jugador
Lenovo Legion 5 17IMH05: Intel Core i5-10300H, 17.30", 2.9 kg
análise » Review del portátil Lenovo Legion 5 17IMH: La batería no morirá
LG Ultra 17U70N: Intel Core i5-10210U, 17.00", 2 kg
análise » Como un Dell XPS 17, pero peor: Review del portátil LG Ultra 17
HP Pavilion Gaming 15-ec1206ng: AMD Ryzen 5 4600H, 15.60", 2.1 kg
análise » Review del HP Pavilion Gaming 15: El portátil para juegos económico ofrece una larga duración de la batería
Nexoc GH5 515IG: Intel Core i5-10300H, 15.60", 2.1 kg
análise » Nexoc GH5 515IG (Clevo NH50DB): El portátil para juegos de nivel básico ofrece espacio para tres unidades de almacenamiento
Lenovo IdeaPad Gaming 3i 15IMH05: Intel Core i5-10300H, 15.60", 2.2 kg
análise » Review de Lenovo IdeaPad Gaming 3i 15IMH05: Core i5 a todo gas
MSI GF75 Thin 10SCXR: Intel Core i5-10300H, 17.30", 2.2 kg
análise » Debut del Core i5 Comet Lake-H de la 10ª generación: Review del portátil MSI GF75 Thin 10SCXR
Lenovo ThinkPad X1 Extreme 2019 20QV000WGE: Intel Core i7-9750H, 15.60", 1.7 kg
análise » Review del portátil Lenovo ThinkPad X1 Extreme 2019: La segunda generación de la principal computadora portátil multimedia de Lenovo ha empeorado.
Dell G5 15 5590-PCNJJ: Intel Core i5-9300H, 15.60", 2.7 kg
análise » Review del portátil Dell G5 15 5590: El rey del precio/rendimiento y el niño problemático
Dell G3 3590: Intel Core i5-9300H, 15.60", 2.5 kg
análise » Review del portátil Dell G3 15 3590: Económico con actualizaciones sencillas
Lenovo IdeaPad L340-15IRH 81LK00BMGE: Intel Core i5-9300H, 15.60", 2.1 kg
análise » Review del portátil Lenovo IdeaPad L340 para juegos: Stiff ClickPad afecta a la diversión de los juegos
Acer Aspire 7 A715-74G-50U5: Intel Core i5-9300H, 15.60", 2.4 kg
análise » Review del portátil Aspire 7 A715: El gigante de la actualización de Acer con potencial de juego y larga duración de la batería
Lenovo Ideapad L340-17IRH 81LL001YGE: Intel Core i5-9300H, 17.30", 2.5 kg
análise » Review de Lenovo IdeaPad L340-17IRH: El completo portátil de gama media para juegos no puede alcanzar todo su potencial de rendimiento.
Dell XPS 15 7590 9980HK GTX 1650: Intel Core i9-9980HK, 15.60", 2 kg
análise » El poder es abrumador: Review de los portátiles Dell XPS 15 7590 Core i9 y GeForce GTX 1650 OLED
HP Omen 15-dc1020ng: Intel Core i5-9300H, 15.60", 2.3 kg
análise » Review de HP Omen 15: un juego asequible para principiantes con una duración decente de la batería
MSI GF75 Thin 9SC: Intel Core i7-9750H, 17.30", 2.3 kg
análise » La delgadez está de moda: Review del portátil MSI GF75 Thin 9SC
Asus TUF FX505DT-EB73: AMD Ryzen 7 3750H, 15.60", 2.2 kg
análise » No se requiere información de Intel: Review del portátil Asus TUF FX505DT con Ryzen 7 y GeForce GTX 1650
Asus TUF FX705DT-AU068T: AMD Ryzen 5 3550H, 17.30", 2.7 kg
análise » Review del Asus TUF Gaming FX705DT (Ryzen 5 3550H, GTX 1650, SSD, FHD)
Acer Aspire Nitro 5 AN515-54-53Z2: Intel Core i5-9300H, 15.60", 2.2 kg
análise » Review del Acer Nitro 5 (Core i5-9300H, GeForce GTX 1650)
Acer Nitro 5 AN515-57, GTX 1650: Intel Core i5-11400H, 15.60", 2.3 kg
análise externo » Acer Nitro 5 AN515-57, GTX 1650
Lenovo IdeaPad 5 Pro 16ACH6-82L500VKMH: AMD Ryzen 7 5800H, 16.00", 1.9 kg
análise externo » Lenovo IdeaPad 5 Pro 16ACH6-82L500VKMH
Acer Aspire 7 A715-76G: Intel Core i5-12450H, 15.60", 2.1 kg
análise externo » Acer Aspire 7 A715-76G
HP Victus 15-fa0031dx: Intel Core i5-12450H, 15.60", 2.3 kg
análise externo » HP Victus 15-fa0031dx
Asus TUF Gaming F15 FX506LHB-HN324: Intel Core i5-10300H, 15.60", 2.3 kg
análise externo » Asus TUF Gaming F15 FX506LHB-HN324
HP Victus 16-d0019ns: Intel Core i5-11400H, 16.10", 2.5 kg
análise externo » HP Victus 16-d0019ns
HP Victus 16-e0085ns: AMD Ryzen 5 5600H, 16.10", 2.5 kg
análise externo » HP Victus 16-e0085ns
HP Victus 15-fb0152ng: AMD Ryzen 5 5600H, 16.00", 2.3 kg
análise externo » HP Victus 15-fb0152ng
MSI GF63 Thin 11SC: Intel Core i5-11400H, 15.60", 1.9 kg
análise externo » MSI GF63 Thin 11SC
Lenovo IdeaPad Gaming 3 15IHU6-82K1019DSP: Intel Core i5-11320H, 15.60", 2.3 kg
análise externo » Lenovo IdeaPad Gaming 3 15IHU6-82K1019DSP
HP Victus 15-fa0038nf: Intel Core i5-12450H, 15.60", 2.3 kg
análise externo » HP Victus 15-fa0038nf
Lenovo IdeaPad Gaming 3 15ACH6-82K201SRSP: AMD Ryzen 5 5600H, 15.60", 2.3 kg
análise externo » Lenovo IdeaPad Gaming 3 15ACH6-82K201SRSP
MSI Prestige 14 A12SC-086CA: Intel Core i7-1280P, 14.00", 1.6 kg
análise externo » MSI Prestige 14 A12SC-086CA
HP Victus 15t-fa000: Intel Core i5-12450H, 15.60", 2.3 kg
análise externo » HP Victus 15t-fa000
Lenovo IdeaPad Gaming 3 15ACH6-82K201HEMH: AMD Ryzen 5 5600H, 15.60", 2.3 kg
análise externo » Lenovo IdeaPad Gaming 3 15ACH6-82K201HEMH
Asus TUF Gaming F15 FX506LH-AS51: Intel Core i5-10300H, 15.60", 2.3 kg
análise externo » Asus TUF Gaming F15 FX506LH-AS51
Acer Nitro 5 AN515-55-72P7: Intel Core i7-10750H, 15.60", 2.5 kg
análise externo » Acer Nitro 5 AN515-55-72P7
Lenovo IdeaPad 5 Pro 16ACH: AMD Ryzen 7 5800H, 16.00", 2 kg
análise externo » Lenovo IdeaPad 5 Pro 16ACH
Acer Nitro 5 AN515-56-54DF: Intel Core i5-11300H, 15.60", 2.3 kg
análise externo » Acer Nitro 5 AN515-56-54DF
Acer Nitro 5 AN515-56-51V8: Intel Core i5-11300H, 15.60", 2.3 kg
análise externo » Acer Nitro 5 AN515-56-51V8
HP Victus 16-e0040ns: AMD Ryzen 5 5600H, 16.10", 2.5 kg
análise externo » HP Victus 16-e0040ns
Lenovo IdeaPad Gaming 3 15ACH6-82K201DHMH: AMD Ryzen 5 5600H, 15.60", 2.3 kg
análise externo » Lenovo IdeaPad Gaming 3 15ACH6-82K201DHMH
Lenovo ThinkBook 15p G2 ITH-21B1001LUS: Intel Core i7-11800H, 15.60", 1.9 kg
análise externo » Lenovo ThinkBook 15p G2 ITH-21B1001LUS
HP Victus 16-e0010ns: AMD Ryzen 5 5600H, 16.10", 2.5 kg
análise externo » HP Victus 16-e0010ns
Lenovo IdeaPad Gaming 3 15ACH6-82K200UTUS: AMD Ryzen 5 5600H, 15.60", 2.3 kg
análise externo » Lenovo IdeaPad Gaming 3 15ACH6-82K200UTUS
Dell G15 5510-8R03T: Intel Core i5-10200H, 15.60", 2.7 kg
análise externo » Dell G15 5510-8R03T
Asus Vivobook Pro 14 K3400, i5-11300H GTX 1650: Intel Core i5-11300H, 14.00", 1.4 kg
análise externo » Asus Vivobook Pro 14 K3400, i5-11300H GTX 1650
HP Pavilion Gaming 15-ec2004ns: AMD Ryzen 7 5800H, 15.60", 2 kg
análise externo » HP Pavilion Gaming 15-ec2004ns
HP Pavilion Gaming 15-ec2047AX: AMD Ryzen 5 5600H, 15.60", 2 kg
análise externo » HP Pavilion Gaming 15-ec2047AX
HP Pavilion Gaming 15-ec2005ns: AMD Ryzen 5 5600H, 15.60", 2 kg
análise externo » HP Pavilion Gaming 15-ec2005ns
Asus ROG Strix G513IC-HN004: AMD Ryzen 7 4800H, 15.60", 2.3 kg
análise externo » Asus ROG Strix G513IC-HN004
MSI GF75 Thin 10SCXR: Intel Core i5-10300H, 17.30", 2.2 kg
análise externo » MSI GF75 Thin 10SCXR
HP Pavilion Gaming 15-ec2002ns: AMD Ryzen 5 5600H, 15.60", 2 kg
análise externo » HP Pavilion Gaming 15-ec2002ns
Acer Aspire 7 A715-42G-R1DD: AMD Ryzen 5 5500U, 15.60", 2.2 kg
análise externo » Acer Aspire 7 A715-42G-R1DD
Lenovo IdeaPad Gaming 3 15ACH6-82K20015US: AMD Ryzen 5 5600H, 15.60", 2.3 kg
análise externo » Lenovo IdeaPad Gaming 3 15ACH6-82K20015US
HP Pavilion Gaming 15-ec2009ns: AMD Ryzen 5 5600H, 15.60", 2 kg
análise externo » HP Pavilion Gaming 15-ec2009ns
Acer Swift X SFX14-41G-R9KC: AMD Ryzen 5 5500U, 14.00", 1.5 kg
análise externo » Acer Swift X SFX14-41G-R9KC
Lenovo IdeaPad Gaming 3 15IMH05-81Y400YFSP: Intel Core i7-10750H, 15.60", 2.2 kg
análise externo » Lenovo IdeaPad Gaming 3 15IMH05-81Y400YFSP
HP Victus 16-e0004ns: AMD Ryzen 5 5600H, 16.10", 2.5 kg
análise externo » HP Victus 16-e0004ns
HP Pavilion Gaming 15-ec2007ns: AMD Ryzen 5 5600H, 15.60", 2 kg
análise externo » HP Pavilion Gaming 15-ec2007ns
Acer Nitro 5 AN515-55-56F5: Intel Core i5-10300H, 15.60", 2.3 kg
análise externo » Acer Nitro 5 AN515-55-56F5
Acer Nitro 5 AN515-55-72GW: Intel Core i7-10750H, 15.60", 2.3 kg
análise externo » Acer Nitro 5 AN515-55-72GW
HP Pavilion Gaming 15-ec2008ns: AMD Ryzen 5 5600H, 15.60", 2 kg
análise externo » HP Pavilion Gaming 15-ec2008ns
Lenovo IdeaPad Gaming 3 15ARH05-82EY00RDSP: AMD Ryzen 5 4600H, 15.60", 2.2 kg
análise externo » Lenovo IdeaPad Gaming 3 15ARH05-82EY00RDSP
Asus TUF Gaming F15 FX506LH-HN129: Intel Core i7-10875H, 15.60", 2.3 kg
análise externo » Asus TUF Gaming F15 FX506LH-HN129
HP Pavilion Gaming 15z-ec200: AMD Ryzen 5 5600H, 15.60", 2.3 kg
análise externo » HP Pavilion Gaming 15z-ec200
HP Pavilion Gaming 15-ec2025ns: AMD Ryzen 7 5800H, 15.60", 2.3 kg
análise externo » HP Pavilion Gaming 15-ec2025ns
Asus ROG Strix G15 G513IH-HN008: AMD Ryzen 7 4800H, 15.60", 2.1 kg
análise externo » Asus ROG Strix G15 G513IH-HN008
Lenovo Legion 5 17ACH6-82K0000RMH: AMD Ryzen 5 5600H, 17.30", 3 kg
análise externo » Lenovo Legion 5 17ACH6-82K0000RMH
Lenovo IdeaPad Gaming 3 15ARH05-82EY00RESP: AMD Ryzen 7 4800H, 15.60", 2.2 kg
análise externo » Lenovo IdeaPad Gaming 3 15ARH05-82EY00RESP
Asus TUF Gaming F15 FX506LH-HN042T: Intel Core i5-10300H, 15.60", 2.3 kg
análise externo » Asus TUF Gaming F15 FX506LH-HN042T
Acer Swift X SFX14-41G-R2DS: AMD Ryzen 7 5700U, 14.00", 1.5 kg
análise externo » Acer Swift X SFX14-41G-R2DS
Lenovo Ideapad L340-17IRH 81LL001YGE: Intel Core i5-9300H, 17.30", 2.5 kg
análise externo » Lenovo Ideapad L340-17IRH 81LL001YGE
Lenovo Ideapad L340 17IRH-81LL003BMH: Intel Core i7-9750H, 17.30", 2.8 kg
análise externo » Lenovo Ideapad L340 17IRH-81LL003BMH
HP Pavilion Gaming 15-ec2253ng: AMD Ryzen 5 5600H, 15.60", 2.3 kg
análise externo » HP Pavilion Gaming 15-ec2253ng
Acer Aspire 7 A715-42G-R9LH: AMD Ryzen 7 5700U, 15.60", 2.2 kg
análise externo » Acer Aspire 7 A715-42G-R9LH
HP Pavilion Gaming 15-ec1073dx: AMD Ryzen 5 4600H, 15.60", 2 kg
análise externo » HP Pavilion Gaming 15-ec1073dx
Dell Vostro 15 7500-0323: Intel Core i7-10750H, 15.60", 1.9 kg
análise externo » Dell Vostro 15 7500-0323
Medion Erazer Crawler E10: Intel Core i5-10300H, 15.60", 2.2 kg
análise externo » Medion Erazer Crawler E10
Acer Nitro 5 AN515-56-75HR: Intel Core i7-11370H, 15.60", 2.3 kg
análise externo » Acer Nitro 5 AN515-56-75HR
Asus ROG Flow X13 GV301QH-K5228T: AMD Ryzen 9 5980HS, 13.40", 1.3 kg
análise externo » Asus ROG Flow X13 GV301QH-K5228T
Acer Nitro 5 AN515-56-58CQ: Intel Core i5-11300H, 15.60", 2.3 kg
análise externo » Acer Nitro 5 AN515-56-58CQ
Asus TUF FX505DT-HN540: AMD Ryzen 7 3750H, 15.60", 2.2 kg
análise externo » Asus TUF FX505DT-HN540
Asus ROG Flow X13 GV301QH-K5232T: AMD Ryzen 9 5980HS, 13.40", 1.3 kg
análise externo » Asus ROG Flow X13 GV301QH-K5232T
Lenovo IdeaPad Gaming 3 15ARH05-82EY00CQSP: AMD Ryzen 7 4800H, 15.60", 2.2 kg
análise externo » Lenovo IdeaPad Gaming 3 15ARH05-82EY00CQSP
Acer Nitro 5 AN515-43-R6BW: AMD Ryzen 5 3550H, 15.60", 2.3 kg
análise externo » Acer Nitro 5 AN515-43-R6BW
Acer Aspire 7 A715-42G-R0XB: AMD Ryzen 5 5500U, 15.60", 2.2 kg
análise externo » Acer Aspire 7 A715-42G-R0XB
Lenovo IdeaPad 3 15IMH05-81Y400DWMH: Intel Core i5-10300H, 15.60", 2.2 kg
análise externo » Lenovo IdeaPad 3 15IMH05-81Y400DWMH
Acer Aspire Nitro 5 AN517-53-51FQ: Intel Core i5-11300H, 17.30", 2.7 kg
análise externo » Acer Aspire Nitro 5 AN517-53-51FQ
LG Ultra 17U70N-J.AA78B: Intel Core i7-10510U, 17.30"
análise externo » LG Ultra 17U70N-J.AA78B
Lenovo IdeaPad 3 15ARH05-82EY00CNSP: AMD Ryzen 7 4800H, 15.60", 2.2 kg
análise externo » Lenovo IdeaPad 3 15ARH05-82EY00CNSP
HP Pavilion 15-ec1155nd: AMD Ryzen 5 4600H, 15.60", 2 kg
análise externo » HP Pavilion 15-ec1155nd
Acer Nitro 5 AN515-44-R8QT: AMD Ryzen 5 4600H, 15.60", 2.4 kg
análise externo » Acer Nitro 5 AN515-44-R8QT
Asus TUF Gaming F15 FX506LH-BQ116: Intel Core i7-10870H, 15.60", 2.3 kg
análise externo » Asus TUF Gaming F15 FX506LH-BQ116
HP Gaming Pavilion 15-ec1005ns: AMD Ryzen 5 4600H, 15.60", 2 kg
análise externo » HP Gaming Pavilion 15-ec1005ns
Lenovo IdeaPad 3 15ARH05-82EY00BSMH: AMD Ryzen 7 4800H, 15.60", 2.2 kg
análise externo » Lenovo IdeaPad 3 15ARH05-82EY00BSMH
Lenovo Yoga Creator 7 15IMH05 82DS000VGE: Intel Core i7-10750H, 15.60", 1.8 kg
análise externo » Lenovo Yoga Creator 7 15IMH05-82DS000VGE
Asus TUF Gaming A15 FA506IH-AS53: AMD Ryzen 5 4600H, 15.60", 2.3 kg
análise externo » Asus TUF Gaming A15 FA506IH-AS53
Acer ConceptD 3 CN314-72G-744X: Intel Core i7-10750H, 14.00", 1.5 kg
análise externo » Acer ConceptD 3 CN314-72G-744X
Lenovo Ideapad Creator 5 15IMH05-82D4003UCK: Intel Core i5-10300H, 15.60", 2.2 kg
análise externo » Lenovo Ideapad Creator 5 15IMH05-82D4003UCK
HP Pavilion Gaming 16-a0031ns: Intel Core i5-10300H, 16.10", 2.4 kg
análise externo » HP Pavilion Gaming 16-a0031ns
Acer Aspire Nitro 5 AN515-44-R329: AMD Ryzen 5 4600H, 15.60", 2.4 kg
análise externo » Acer Aspire Nitro 5 AN515-44-R329
Acer Aspire 7 A715-75G-59MG: Intel Core i5-10300H, 15.60", 2.2 kg
análise externo » Acer Aspire 7 A715-75G-59MG
Lenovo Legion 5 17IMH05: Intel Core i5-10300H, 17.30", 2.9 kg
análise externo » Lenovo Legion 5 17IMH05
Asus TUF Gaming A15 FA506IH-BQ027T: AMD Ryzen 7 4800H, 15.60", 2.3 kg
análise externo » Asus TUF Gaming A15 FA506IH-BQ027T
Acer Nitro 5 AN515-44-R99Q: AMD Ryzen 5 4600H, 15.60", 2.4 kg
análise externo » Acer Nitro 5 AN515-44-R99Q
Lenovo Yoga Slim 7 15IMH05-82AB003CUK: Intel Core i7-10750H, 15.60", 1.8 kg
análise externo » Lenovo Yoga Slim 7 15IMH05-82AB003CUK
LG Ultra 17U70N-R.AAS8U1: Intel Core i7-10510U, 17.00", 2 kg
análise externo » LG Ultra 17U70N-R.AAS8U1
HP Pavilion Gaming 15-dk1041tx: Intel Core i7-10750H, 15.60", 2.3 kg
análise externo » HP Pavilion Gaming 15-dk1041tx
HP Pavilion Gaming 16-a0006ns: Intel Core i5-10300H, 15.60", 2.4 kg
análise externo » HP Pavilion Gaming 16-a0006ns
Lenovo Legion 5 15IMH05-82AU00B1SP: Intel Core i7-10750H, 15.60", 2.3 kg
análise externo » Lenovo Legion 5 15IMH05-82AU00B1SP
Asus TUF Gaming F15 FX506LH-BQ030: Intel Core i7-10750H, 15.60", 2.3 kg
análise externo » Asus TUF FX506LH-BQ030
Asus TUF Gaming F15 FX506LH-BQ034: Intel Core i5-10300H, 15.60", 2.3 kg
análise externo » Asus TUF FX506LH-BQ034
Lenovo Legion Y7000SE: Intel Core i5-9300HF, 15.60"
análise externo » Lenovo Legion Y7000SE
HP Pavilion Gaming 16-a0022ns: Intel Core i5-10300H, 16.10", 2.4 kg
análise externo » HP Pavilion Gaming 16-a0022ns
Asus TUF FX505DT-BQ613T: AMD Ryzen 7 3750H, 15.60", 2.2 kg
análise externo » Asus TUF FX505DT-BQ613T
Lenovo Yoga Slim 7 15IMH05-82AB002WMH: Intel Core i5-10300H, 15.60", 1.8 kg
análise externo » Lenovo Yoga Slim 7 15IMH05-82AB002WMH
Acer Nitro 5 AN515-44-R4P7: AMD Ryzen 7 4800H, 15.60", 2.4 kg
análise externo » Acer Nitro 5 AN515-44-R4P7
MSI GF63 Thin 10SCXR-042XES: Intel Core i7-10750H, 15.60", 1.9 kg
análise externo » MSI GF63 Thin 10SCXR-042XES
Lenovo Legion 5 15ARH05-82B500D3SP: AMD Ryzen 7 4800H, 15.60", 2.3 kg
análise externo » Lenovo Legion 5 15ARH05-82B500D3SP
Asus TUF FX505GT-BQ108: Intel Core i5-9300H, 15.60", 2.2 kg
análise externo » Asus TUF FX505GT-BQ108
HP Pavilion Gaming 16-a0000ns: Intel Core i5-10300H, 16.10", 2.4 kg
análise externo » HP Pavilion Gaming 16-a0000ns
HP Pavilion Gaming 15-ec1009ns: AMD Ryzen 5 4600H, 15.60", 2 kg
análise externo » HP Pavilion Gaming 15-ec1009ns
Asus F571GT-AL311T: Intel Core i7-9750H, 15.60", 1.8 kg
análise externo » Asus F571GT-AL311T
Acer Nitro 5 AN515-44-R55M: AMD Ryzen 5 4600H, 15.60", 2.4 kg
análise externo » Acer Nitro 5 AN515-44-R55M
Lenovo IdeaPad S540-15IWL-81SW002AGE: Intel Core i7-8565U, 15.60", 1.8 kg
análise externo » Lenovo IdeaPad S540-15IWL-81SW002AGE
HP Gaming Pavilion 15-dk0025ns: Intel Core i5-9300H, 15.60", 2.2 kg
análise externo » HP Gaming Pavilion 15-dk0025ns
Acer Nitro 5 AN515-55-598S: Intel Core i5-10300H, 15.60", 2.3 kg
análise externo » Acer Nitro 5 AN515-55-598S
MSI GF63 Thin 10SCXR-405XES: Intel Core i7-10750H, 15.60", 1.9 kg
análise externo » MSI GF63 Thin 10SCXR-405XES
Dell G3 15 3500-3KJ99: Intel Core i5-10300H, 15.60", 2.6 kg
análise externo » Dell G3 15 3500-3KJ99
Lenovo IdeaPad Gaming 3i 15IMH05: Intel Core i5-10300H, 15.60", 2.2 kg
análise externo » Lenovo IdeaPad Gaming 3i 15IMH05
Acer Nitro 5 AN515-55-7075: Intel Core i7-10750H, 15.60", 2.3 kg
análise externo » Acer Nitro 5 AN515-55-7075
Acer Aspire 7 A715-41G-R8MJ: AMD Ryzen 5 3550H, 15.60", 2.2 kg
análise externo » Acer Aspire 7 A715-41G-R8MJ
HP Omen 15-dc1049ns: Intel Core i5-9300H, 15.60", 2.3 kg
análise externo » HP Omen 15-dc1049ns
Lenovo Legion Y540-15IRH-PG0: Intel Core i7-9750H, 15.60", 1.3 kg
análise externo » Lenovo Legion Y540-15IRH-PG0
Lenovo Legion 5 15IMH05-82AU004YVN: Intel Core i7-10750H, 15.60", 2.4 kg
análise externo » Lenovo Legion 5 15IMH05-82AU004YVN
Acer Nitro 5 AN517-52-7995: Intel Core i7-10750H, 17.30", 2.2 kg
análise externo » Acer Nitro 5 AN517-52-7995
Lenovo IdeaPad Gaming 3i 15-81Y400NESB: Intel Core i7-10750H, 15.60", 2.2 kg
análise externo » Lenovo IdeaPad Gaming 3i 15-81Y400NESB
Acer Aspire 7 A715-41G-R5LR: AMD Ryzen 5 3550H, 15.60", 2.4 kg
análise externo » Acer Aspire 7 A715-41G-R5LR
HP Pavilion Gaming 15-ec1011ns: AMD Ryzen 5 4600H, 15.60", 2 kg
análise externo » HP Pavilion Gaming 15-ec1011ns
Asus TUF FX505DT-BQ600: AMD Ryzen 7 3750H, 15.60", 2.2 kg
análise externo » Asus TUF FX505DT-BQ600
HP Gaming Pavilion 15-dk0031ns: Intel Core i7-9750H, 15.60", 2.3 kg
análise externo » HP Gaming Pavilion 15-dk0031ns
Asus X571GT-BQ597: Intel Core i5-8300H, 15.60", 2 kg
análise externo » Asus X571GT-BQ597
Lenovo Legion 5 15ARH05-82B500CFGE: AMD Ryzen 7 4800H, 15.60", 2.3 kg
análise externo » Lenovo Legion 5 15ARH05-82B500CFGE
Asus TUF FX505DT-BQ208: AMD Ryzen 7 3750H, 15.60", 2.2 kg
análise externo » Asus TUF FX505DT-BQ208
Acer Nitro 5 AN515-55-53YW: Intel Core i5-10300H, 15.60", 2.3 kg
análise externo » Acer Nitro 5 AN515-55-53YW
Acer Aspire 7 A715-41G-R3J5: AMD Ryzen 7 3750H, 15.60", 2.4 kg
análise externo » Acer Aspire 7 A715-41G-R3J5
Acer Aspire 7 A715-74G-77AW: Intel Core i7-9750H, 15.60", 2.4 kg
análise externo » Acer Aspire 7 A715-74G-77AW
Asus ROG Strix G531GT-BQ165: Intel Core i7-9750H, 15.60", 2.4 kg
análise externo » Asus ROG Strix G531GT-BQ165
MSI Prestige 14 A10SC-067XES: Intel Core i7-10710U, 14.00", 1.3 kg
análise externo » MSI Prestige 14 A10SC-067XES
Acer ConceptD 3 CN315-71-76MR: Intel Core i7-9750H, 15.60", 2.4 kg
análise externo » Acer ConceptD 3 CN315-71-76MR
Asus TUF FX505DT-BQ051: AMD Ryzen 5 3550H, 15.60", 2.2 kg
análise externo » Asus TUF FX505DT-BQ051
HP Gaming Pavilion 15-dk0026ns: Intel Core i7-9750H, 15.60", 2.2 kg
análise externo » HP Gaming Pavilion 15-dk0026ns
Acer Nitro 5 AN515-43-R84P: AMD Ryzen 5 3550H, 15.60"
análise externo » Acer Nitro 5 AN515-43-R84P
HP Pavilion Gaming 15-ec0014nl: AMD Ryzen 7 3750H, 15.60", 2.3 kg
análise externo » HP Pavilion Gaming 15-ec0014nl
Asus TUF FX505GT-BQ025: Intel Core i5-9300H, 15.60", 2.2 kg
análise externo » Asus TUF FX505GT-BQ025
MSI Prestige 14 A10SC-096NE: Intel Core i7-10710U, 14.00", 1.3 kg
análise externo » MSI Prestige 14 A10SC-096NE
Acer Nitro 5 AN517-51-55ML: Intel Core i5-9300H, 17.30", 2.7 kg
análise externo » Acer Nitro 5 AN517-51-55ML
Lenovo Ideapad L340-15IRH-81LK00CDSP: Intel Core i7-9750H, 15.60", 2.2 kg
análise externo » Lenovo Ideapad L340-15IRH-81LK00CDSP
Acer Aspire Nitro 5 AN515-54-7793: Intel Core i7-9750H, 15.60", 2.5 kg
análise externo » Acer Aspire Nitro 5 AN515-54-7793
HP Pavilion Gaming 15-dk0002ns: Intel Core i5-9300H, 15.60", 2.3 kg
análise externo » HP Pavilion Gaming 15-dk0002ns
Asus TUF FX505GT-BQ028: Intel Core i7-9750H, 15.60", 2.2 kg
análise externo » Asus TUF FX505GT-BQ028
MSI Prestige 15 A10SC-007ES: Intel Core i7-10710U, 15.60", 1.7 kg
análise externo » MSI Prestige 15 A10SC-007ES
Asus TUF FX505DT-BQ121: AMD Ryzen 7 3750H, 15.60", 2.2 kg
análise externo » Asus TUF FX505DT-BQ121
MSI GF75 Thin 9SC-277XES: Intel Core i7-9750H, 17.30", 2.2 kg
análise externo » MSI GF75 Thin 9SC-277XES
HP Pavilion Gaming 15-ec0003ns: AMD Ryzen 7 3750H, 15.60", 2.3 kg
análise externo » HP Pavilion Gaming 15-ec0003ns
MSI Prestige 14 A10SC-012ES: Intel Core i7-10710U, 14.00", 1.3 kg
análise externo » MSI Prestige 14 A10SC-012ES
HP Omen 15-dc1010nr: Intel Core i7-9750H, 15.60", 2.6 kg
análise externo » HP Omen 15-dc1010nr
Acer Aspire Nitro 5 AN517-51-76MG: Intel Core i7-9750H, 15.60", 2.5 kg
análise externo » Acer Aspire Nitro 5 AN517-51-76MG
Samsung Odyssey 2 NP850XBD-XG1BR: Intel Core i5-9300H, 15.60", 2.4 kg
análise externo » Samsung Odyssey 2 NP850XBD-XG1BR
HP Pavilion 15-BC520NS: Intel Core i7-9750H, 15.60", 2.2 kg
análise externo » HP Pavilion 15-BC520NS
Acer Aspire Nitro 7 AN715-51-76XG: Intel Core i7-8750H, 15.60", 2.5 kg
análise externo » Acer Aspire Nitro 7 AN715-51-76XG
Acer Predator Triton 300 PT315-51-58BG: Intel Core i5-9300H, 15.60", 2.5 kg
análise externo » Acer Predator Triton 300 PT315-51-58BG
Lenovo Legion Y540-15IRH-81SY00A2SP: Intel Core i5-9300H, 15.60", 2.3 kg
análise externo » Lenovo Legion Y540-15IRH-81SY00A2SP
Asus TUF FX505GT-BQ024: Intel Core i7-9750H, 15.60", 2.2 kg
análise externo » Asus TUF FX505GT-BQ024
HP Pavilion 15-bc521ns: Intel Core i5-9300H, 15.60", 2.1 kg
análise externo » HP Pavilion 15-bc521ns
Dell G3 15 3590-GN3R591AU: Intel Core i7-9750H, 15.60", 2.7 kg
análise externo » Dell G3 15 3590-GN3R591AU
Acer Nitro 5 AN515-54-749V: Intel Core i7-9750H, 15.60", 2.5 kg
análise externo » Acer Nitro 5 AN515-54-749V
Dell G3 3590: Intel Core i5-9300H, 15.60", 2.5 kg
análise externo » Dell G3 3590
Acer Predator Triton 300 PT315-51-7815: Intel Core i7-9750H, 15.60", 2.3 kg
análise externo » Acer Predator Triton 300 PT315-51-7815
HP Gaming Pavilion 15-dk0046nr: Intel Core i7-9750H, 15.60", 2.3 kg
análise externo » HP Gaming Pavilion 15-dk0046nr
MSI GL65 9SC-004: Intel Core i5-9300H, 15.60", 2.3 kg
análise externo » MSI GL65 9SC-004
MSI GF63 9SC-621: Intel Core i5-9300H, 15.60", 1.9 kg
análise externo » MSI GF63 9SC-621
Lenovo IdeaPad L340-15IRH 81LK00BMGE: Intel Core i5-9300H, 15.60", 2.1 kg
análise externo » Lenovo IdeaPad L340-15IRH 81LK00BMGE
Acer Aspire 7 A715-74G-743J: Intel Core i7-9750H, 15.60", 2.4 kg
análise externo » Acer Aspire 7 A715-74G-743J
MSI GF75 Thin 9SC-061XES: Intel Core i7-9750H, 17.30", 2.2 kg
análise externo » MSI GF75 Thin 9SC-061XES
Acer Nitro 5 AN517-51-77B8: Intel Core i7-9750H, 17.30", 2.7 kg
análise externo » Acer Nitro 5 AN517-51-77B8
HP Gaming Pavilion 17-cd0222ng: Intel Core i5-9300H, 17.30", 2.8 kg
análise externo » HP Gaming Pavilion 17-cd0222ng
Asus ROG Strix G531GT-BQ012 : Intel Core i7-9750H, 15.60", 2.4 kg
análise externo » Asus ROG Strix G531GT-BQ012
Acer Aspire 7 A715-74G-53YM: Intel Core i5-9300H, 15.60", 2.4 kg
análise externo » Acer Aspire 7 A715-74G-53YM
Asus Strix G G531GT-BI7N6: Intel Core i7-9750H, 15.60", 2.4 kg
análise externo » Asus Strix G G531GT-BI7N6
Acer Nitro 5 AN517-51-56YW: Intel Core i5-9300H, 17.30", 2.7 kg
análise externo » Acer Nitro 5 AN517-51-56YW
Acer Predator Triton 300-15: Intel Core i7-9750H, 15.60", 2.3 kg
análise externo » Acer Predator Triton 300-15
Lenovo Legion Y540-15IRH-81SY00A6SP: Intel Core i7-9750H, 15.60", 2.3 kg
análise externo » Lenovo Legion Y540-15IRH-81SY00A6SP
Dell XPS 15 7590-K6XWV: Intel Core i7-9750H, 15.60", 2 kg
análise externo » Dell XPS 15 7590-K6XWV
Acer Nitro 5 AN517-51-70U7: Intel Core i7-9750H, 17.30", 2.7 kg
análise externo » Acer Nitro 5 AN517-51-70U7
Lenovo Ideapad L340-15IRH-81LK0093MB: Intel Core i7-9750H, 15.60", 2.2 kg
análise externo » Lenovo Ideapad L340-15IRH-81LK0093MB
Dell G3 15 3590-cn35917: Intel Core i5-9300H, 15.60", 2.4 kg
análise externo » Dell G3 15 3590-cn35917
HP Pavilion 15-dk0042tx: Intel Core i7-9750H, 15.60", 2.3 kg
análise externo » HP Pavilion 15-dk0042tx
Lenovo Legion Y545-15-81T20005US: Intel Core i7-9750H, 15.60", 2.3 kg
análise externo » Lenovo Legion Y545-15-81T20005US
Asus ROG Strix G531GT-BQ020: Intel Core i7-9750H, 15.60", 2.4 kg
análise externo » Asus ROG Strix G531GT-BQ020
Acer Nitro 7 AN715-51-752B: Intel Core i7-9750H, 15.60", 2.7 kg
análise externo » Acer Nitro 7 AN715-51-752B
Lenovo Legion Y540 15-IRH-81SY001KSB: Intel Core i7-9750H, 15.60", 2.3 kg
análise externo » Lenovo Legion Y540 15-IRH-81SY001KSB
Acer Nitro 5 AN515-54-73KT: Intel Core i7-9750H, 15.60", 2.7 kg
análise externo » Acer Nitro 5 AN515-54-73KT
Asus ROG Strix G531GT-BQ005: Intel Core i5-9300H, 15.60", 2.4 kg
análise externo » Asus ROG Strix G531GT-BQ005
MSI PS63 Modern 8SC-054ES: Intel Core i7-8565U, 15.60", 1.6 kg
análise externo » MSI PS63 Modern 8SC-054ES
Asus Strix G531GT-BI7N6: Intel Core i7-9750H, 15.60", 2.4 kg
análise externo » Asus Strix G531GT-BI7N6
Asus TUF FX705DT-AU028T: AMD Ryzen 7 3750H, 17.30", 2.6 kg
análise externo » Asus TUF FX705DT-AU028T
Dell G5 15 5590-PCNJJ: Intel Core i5-9300H, 15.60", 2.7 kg
análise externo » Dell G5 15 5590-PCNJJ
Dell XPS 15 7590 9980HK GTX 1650: Intel Core i9-9980HK, 15.60", 2 kg
análise externo » Dell XPS 15 7590 9980HK GTX 1650
Asus TUF FX505DT-EB73: AMD Ryzen 7 3750H, 15.60", 2.2 kg
análise externo » Asus TUF FX505DT-EB73
Dell XPS 15 7590: Intel Core i9-9980HK, 15.60", 2 kg
análise externo » Dell XPS 15 7590
Acer Aspire Nitro 5 AN515-54-72J1: Intel Core i7-9750H, 15.60", 2.3 kg
análise externo » Acer Aspire Nitro 5 AN515-54-72J1
MSI GF63 Thin 9SC-047XES: Intel Core i7-9750H, 15.60", 1.9 kg
análise externo » MSI GF63 Thin 9SC-047XES
Lenovo Ideapad L340-17IRH-81LL001YGE: Intel Core i5-9300H, 17.30", 2.5 kg
análise externo » Lenovo Ideapad L340-17IRH-81LL001YGE
Lenovo Ideapad L340-15IRH-81LK0001UK: Intel Core i5-9300H, 15.60", 2.2 kg
análise externo » Lenovo Ideapad L340-15IRH-81LK0001UK
Acer Aspire Nitro 5 AN515-54-53Z2: Intel Core i5-9300H, 15.60", 2.2 kg
análise externo » Acer Aspire Nitro 5 AN515-54-53Z2
Acer Aspire Nitro 7 AN715-51: Intel Core i7-8750H, 15.60", 2.2 kg
análise externo » Acer Aspire Nitro 7 AN715-51
Lenovo IdeaPad Gaming 3i 15IMH05: Intel Core i5-10300H, 15.60", 2.2 kg
» El Lenovo IdeaPad Gaming 3i 15IMH05 explota al máximo su CPU y GPU