Análisis del portátil Asus ROG Strix Scar 15 G533ZW: potencia para juegos a 1440p y 240 Hz con Alder Lake Core i9 y RTX 3070 Ti de 150 W
La serie ROG Strix de Asus es una de las líneas de portátiles para juegos más esperadas a principios de cada año. El ROG Strix Scar 15 (2022) fue anunciado durante el CES 2022 con actualizaciones a Intel Alder Lake-H y opciones gráficas hasta la GPU Nvidia GeForce RTX 3080 Ti para portátiles. Asus sigue manteniendo la nomenclatura G533 en 2022 pero ha hecho algunos cambios en la marca.
Mientras que Asus cambió completamente a las ofertas de la serie AMD Ryzen 5000 con el ROG Strix Scar 15 en 2021, la compañía ha bifurcado la línea de productos en ofertas distintas de Intel Alder Lake y AMD Ryzen 6000.
En el formato de 15,6 pulgadas, tenemos ofertas como nuestra unidad de prueba actual, el ROG Strix Scar 15 G533ZW. En el lado de AMD, Asus deja caer la marca "Scar" (junto con el diseño de la firma y Keystone) con la serie Strix G15 G513 siendo alimentado por opciones de CPU hasta un Ryzen 9 6900HX y hasta una GPU de 150 WGPU RTX 3080 para portátiles.
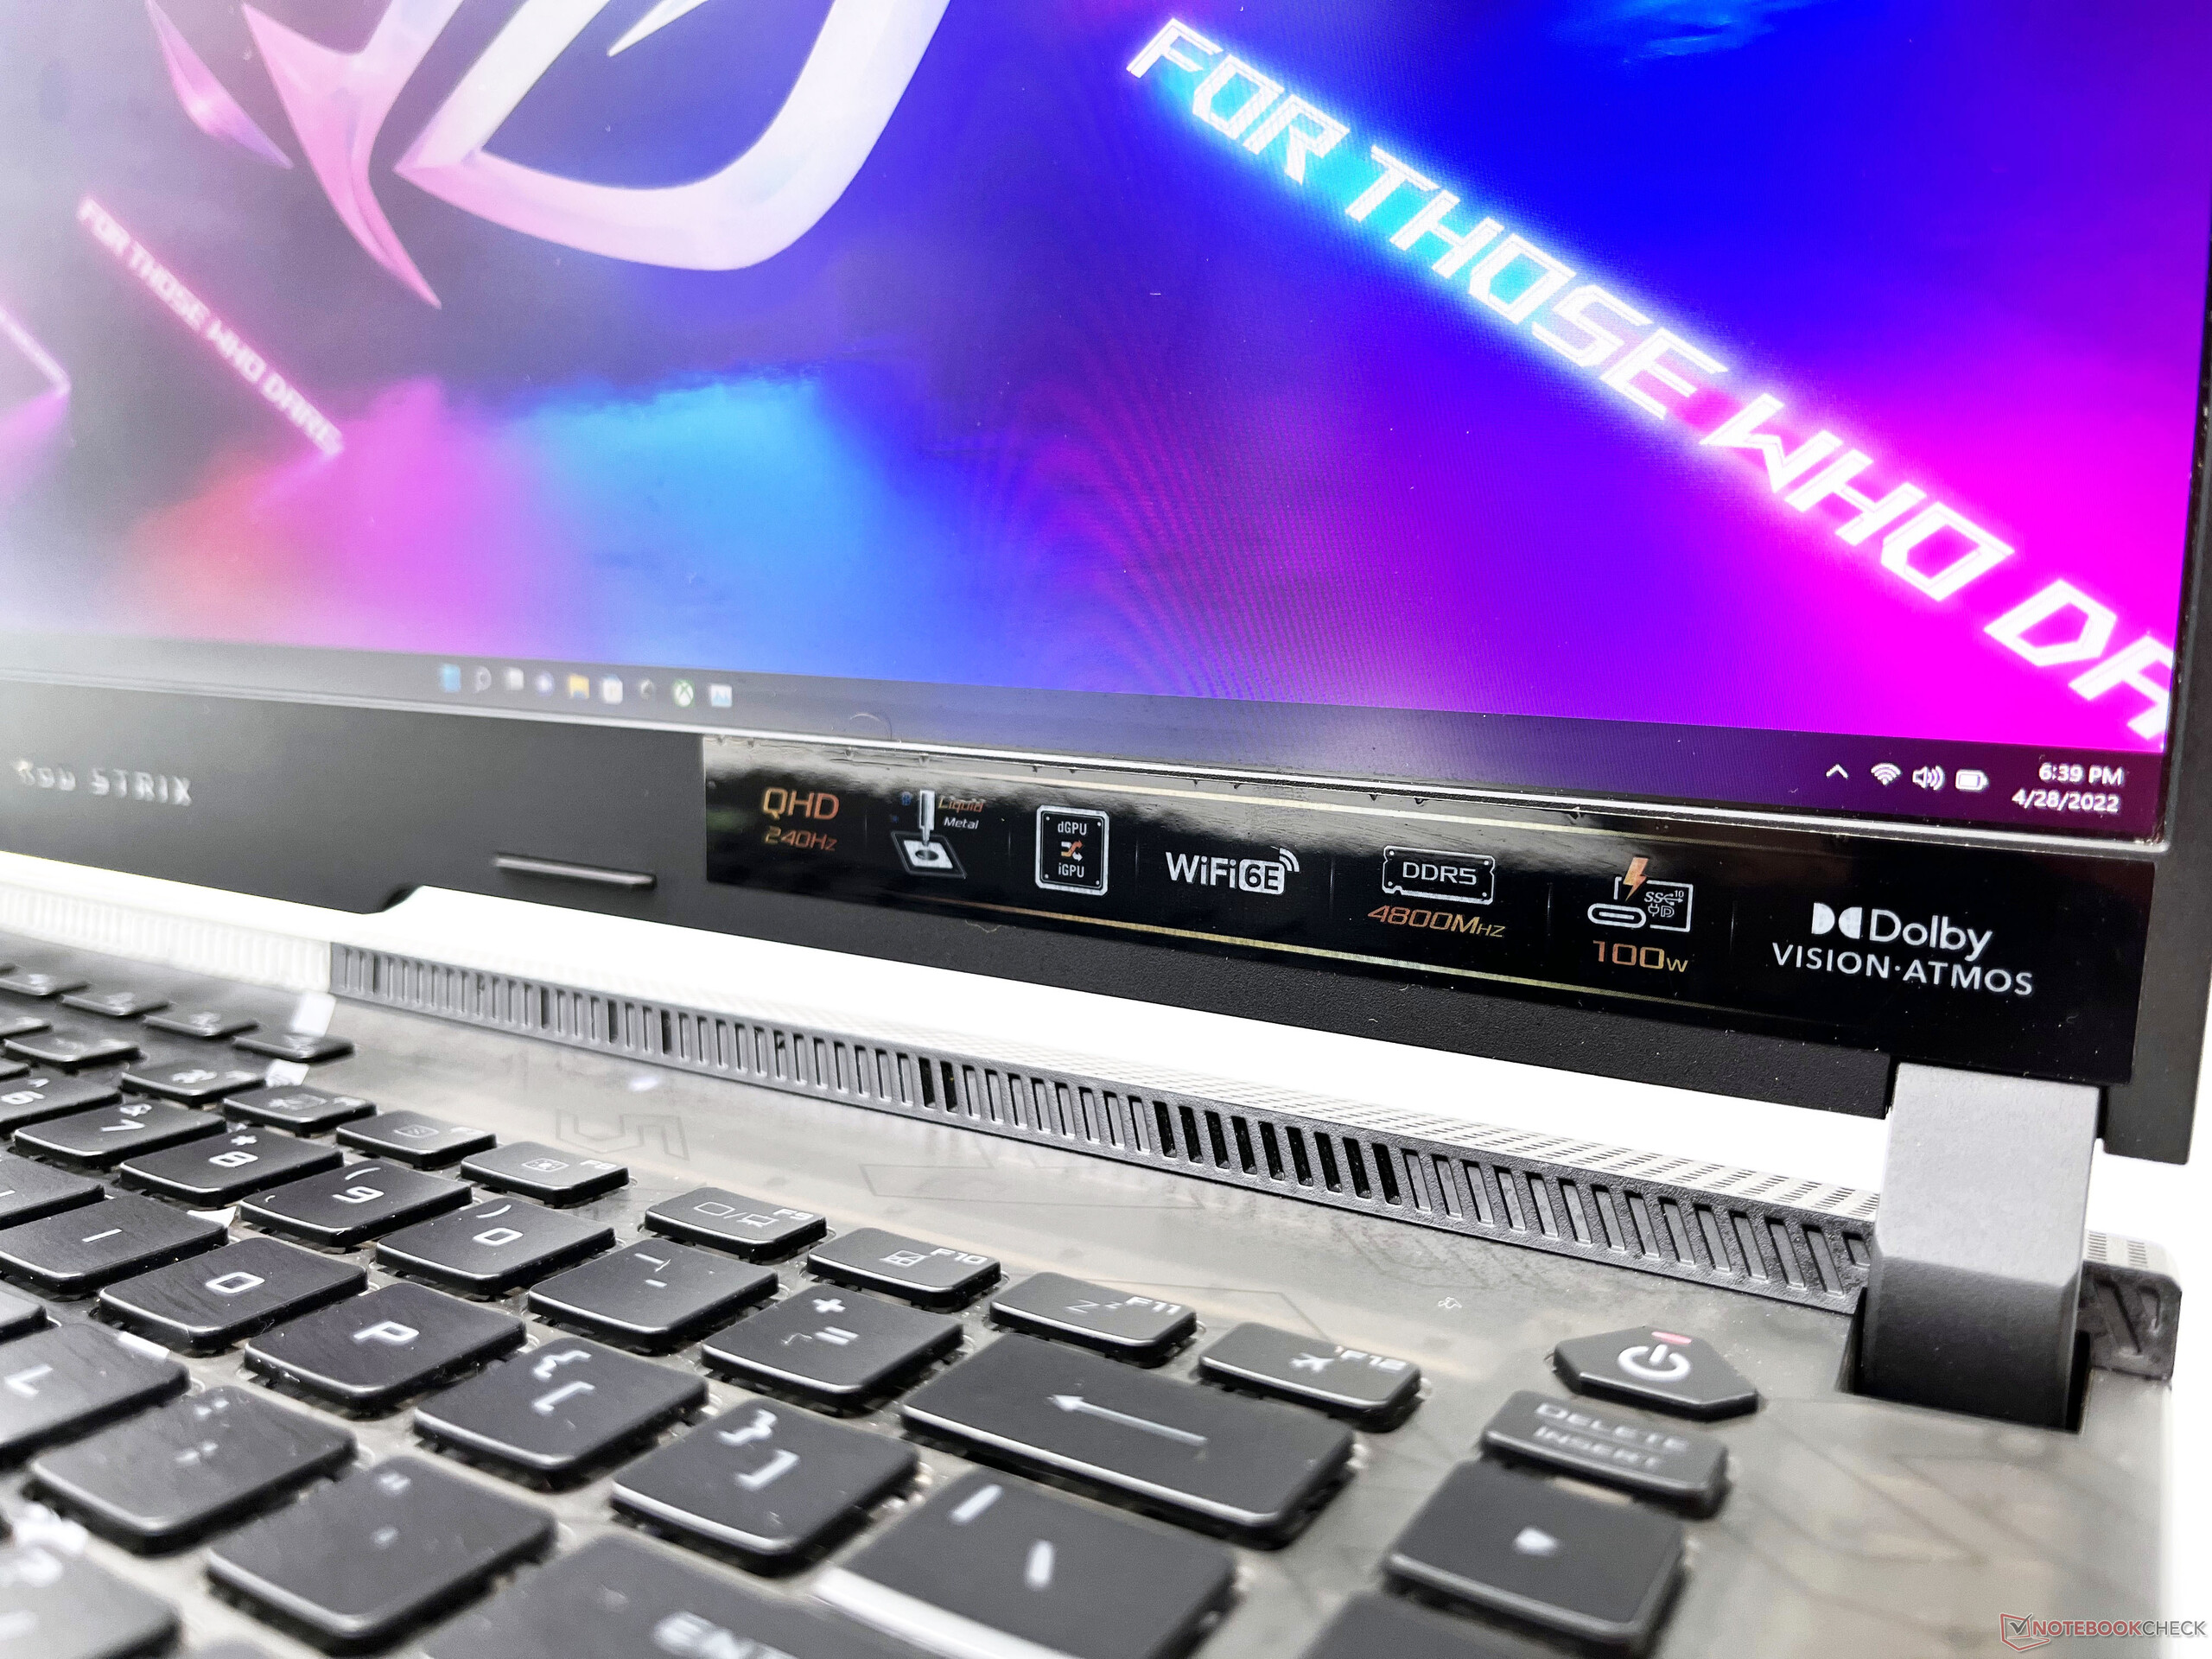
El ROG Strix Scar 15 G533ZW (2022) introduce algunas características nuevas y atractivas en la línea. Todos los portátiles ROG 2022 vienen ahora con un interruptor MUX que se puede activar dentro de Armory Crate. También podemos ver opciones de pantalla hasta paneles WQHD de 240 Hz, memoria DDR5-4800, SSDs PCIe Gen 4, puertos USB más rápidos, LAN 2.5G y Wi-Fi 6E.
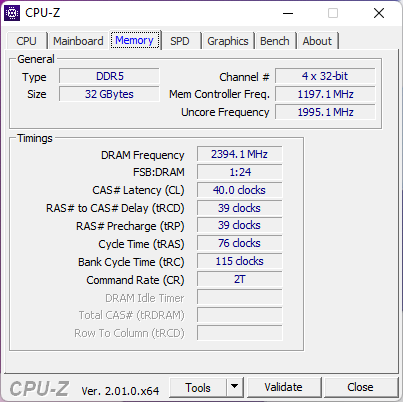
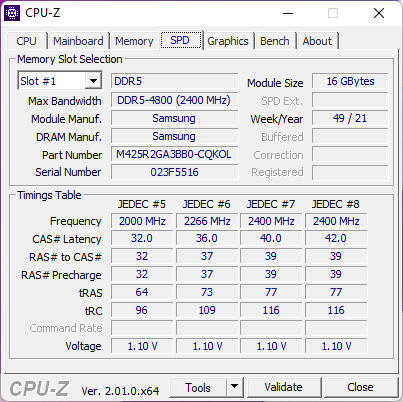
Nuestro dispositivo ROG Strix Scar 15 G533ZW de prueba está alimentado por elCore i9-12900Hy una GPU de 150 WGPU RTX 3070 Ti para portátiles. Hay 32 GB de RAM DDR5-4800 a bordo junto con un SSD NVMe Gen 4 de 2 TB. Esta configuración le costará ₹2.64.990 (3.419 dólares).
En este análisis, probamos el ROG Strix Scar 15 G533ZW y vemos si las nuevas actualizaciones merecen tu consideración.
Posibles contendientes en la comparación
Valoración | Fecha | Modelo | Peso | Altura | Tamaño | Resolución | Precio |
|---|---|---|---|---|---|---|---|
| 86.3 % v7 (old) | 06/2022 | Asus ROG Strix Scar 15 G533ZW-LN106WS i9-12900H, GeForce RTX 3070 Ti Laptop GPU | 2.3 kg | 27.2 mm | 15.60" | 2560x1440 | |
| 80.7 % v7 (old) | 04/2022 | MSI Pulse GL66 12UEK i9-12900H, GeForce RTX 3060 Laptop GPU | 2.3 kg | 25 mm | 15.60" | 1920x1080 | |
| 84.7 % v7 (old) | 03/2022 | Gigabyte Aero 16 YE5 i9-12900HK, GeForce RTX 3080 Ti Laptop GPU | 2.3 kg | 22.4 mm | 16.00" | 3840x2400 | |
| 86.9 % v7 (old) | 03/2022 | MSI Vector GP66 12UGS i9-12900H, GeForce RTX 3070 Ti Laptop GPU | 2.3 kg | 23.4 mm | 15.60" | 1920x1080 | |
| 87.4 % v7 (old) | 06/2022 | MSI Raider GE66 12UHS i9-12900HK, GeForce RTX 3080 Ti Laptop GPU | 2.4 kg | 23.4 mm | 15.60" | 3840x2160 | |
| 85.5 % v7 (old) | 05/2022 | HP Omen 16-b1090ng i7-12700H, GeForce RTX 3070 Ti Laptop GPU | 2.3 kg | 23 mm | 16.10" | 2560x1440 | |
| 88 % v7 (old) | 03/2022 | Lenovo Legion 5 Pro 16 G7 i7 RTX 3070Ti i7-12700H, GeForce RTX 3070 Ti Laptop GPU | 2.6 kg | 26.6 mm | 16.00" | 2560x1600 | |
| 89.4 % v7 (old) | 05/2022 | Razer Blade 14 Ryzen 9 6900HX R9 6900HX, GeForce RTX 3070 Ti Laptop GPU | 1.8 kg | 16.8 mm | 14.00" | 2560x1440 | |
| 86.7 % v7 (old) | 03/2022 | Asus ROG Zephyrus G14 GA402RK R9 6900HS, Radeon RX 6800S | 1.7 kg | 19.5 mm | 14.00" | 2560x1600 | |
| 89.1 % v7 (old) | 03/2022 | Razer Blade 15 2022 i7-12800H, GeForce RTX 3080 Ti Laptop GPU | 2.1 kg | 16.99 mm | 15.60" | 2560x1440 |
Caso: Sin cambios respecto al año pasado
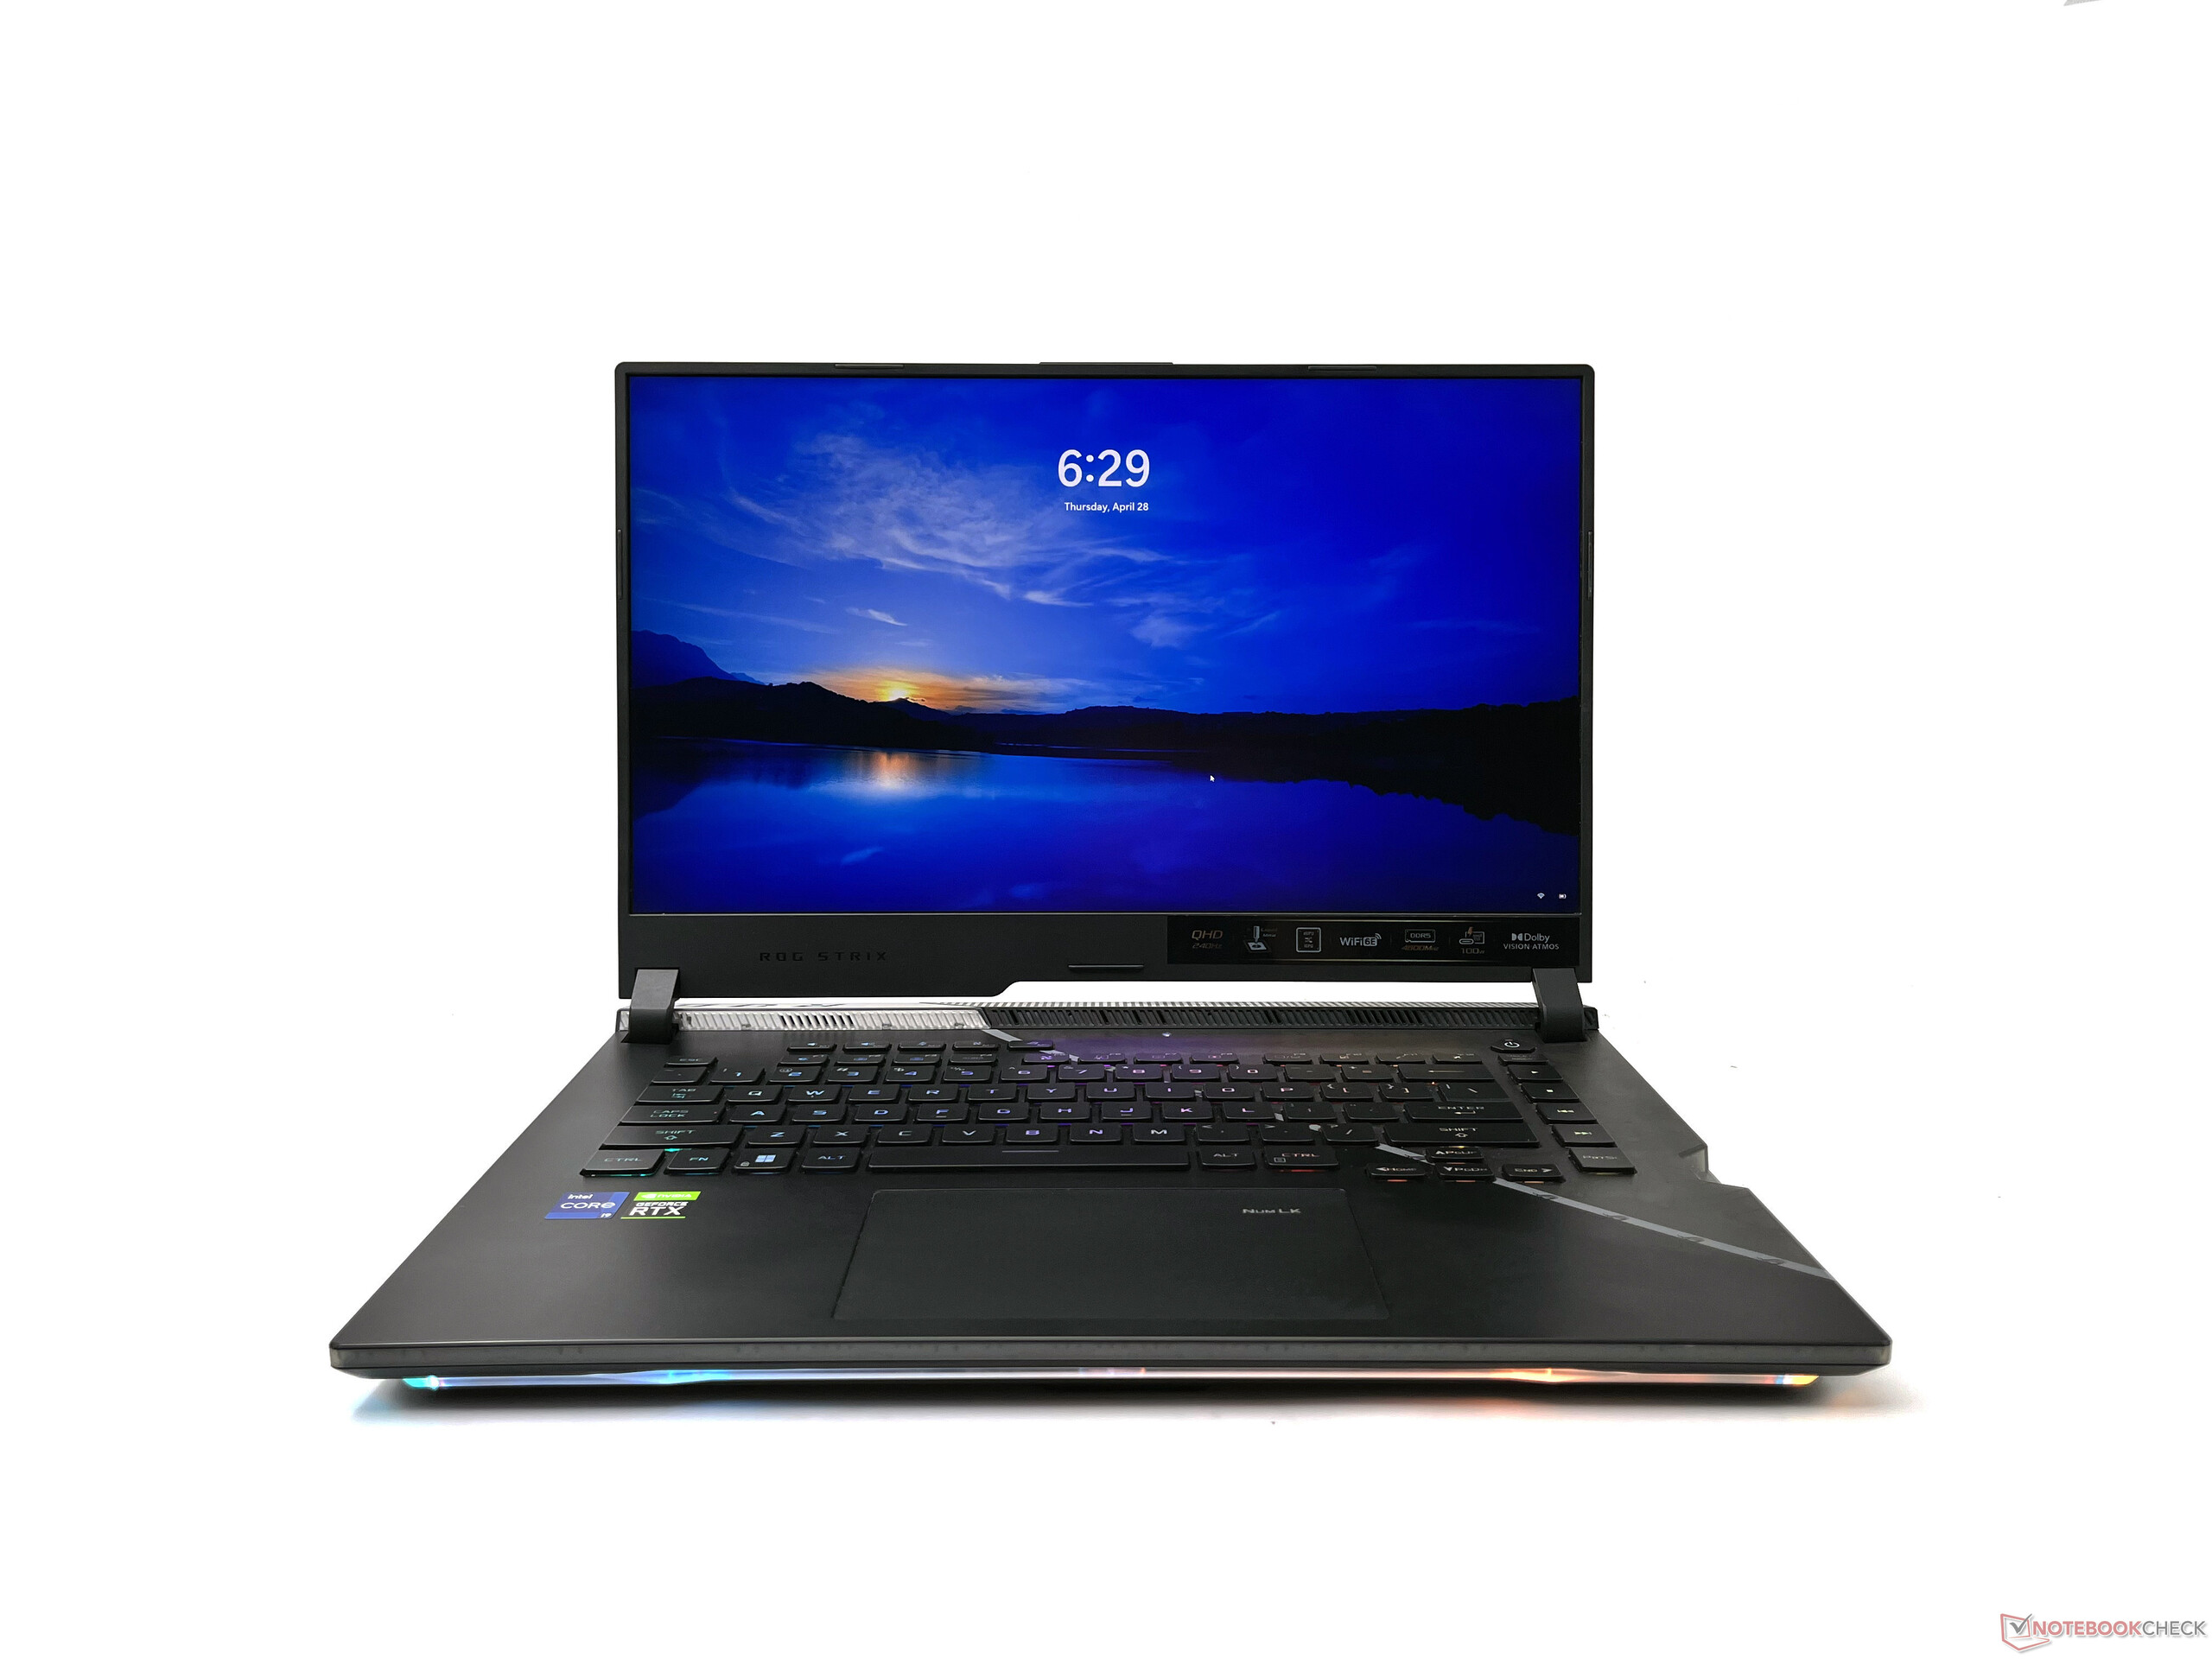
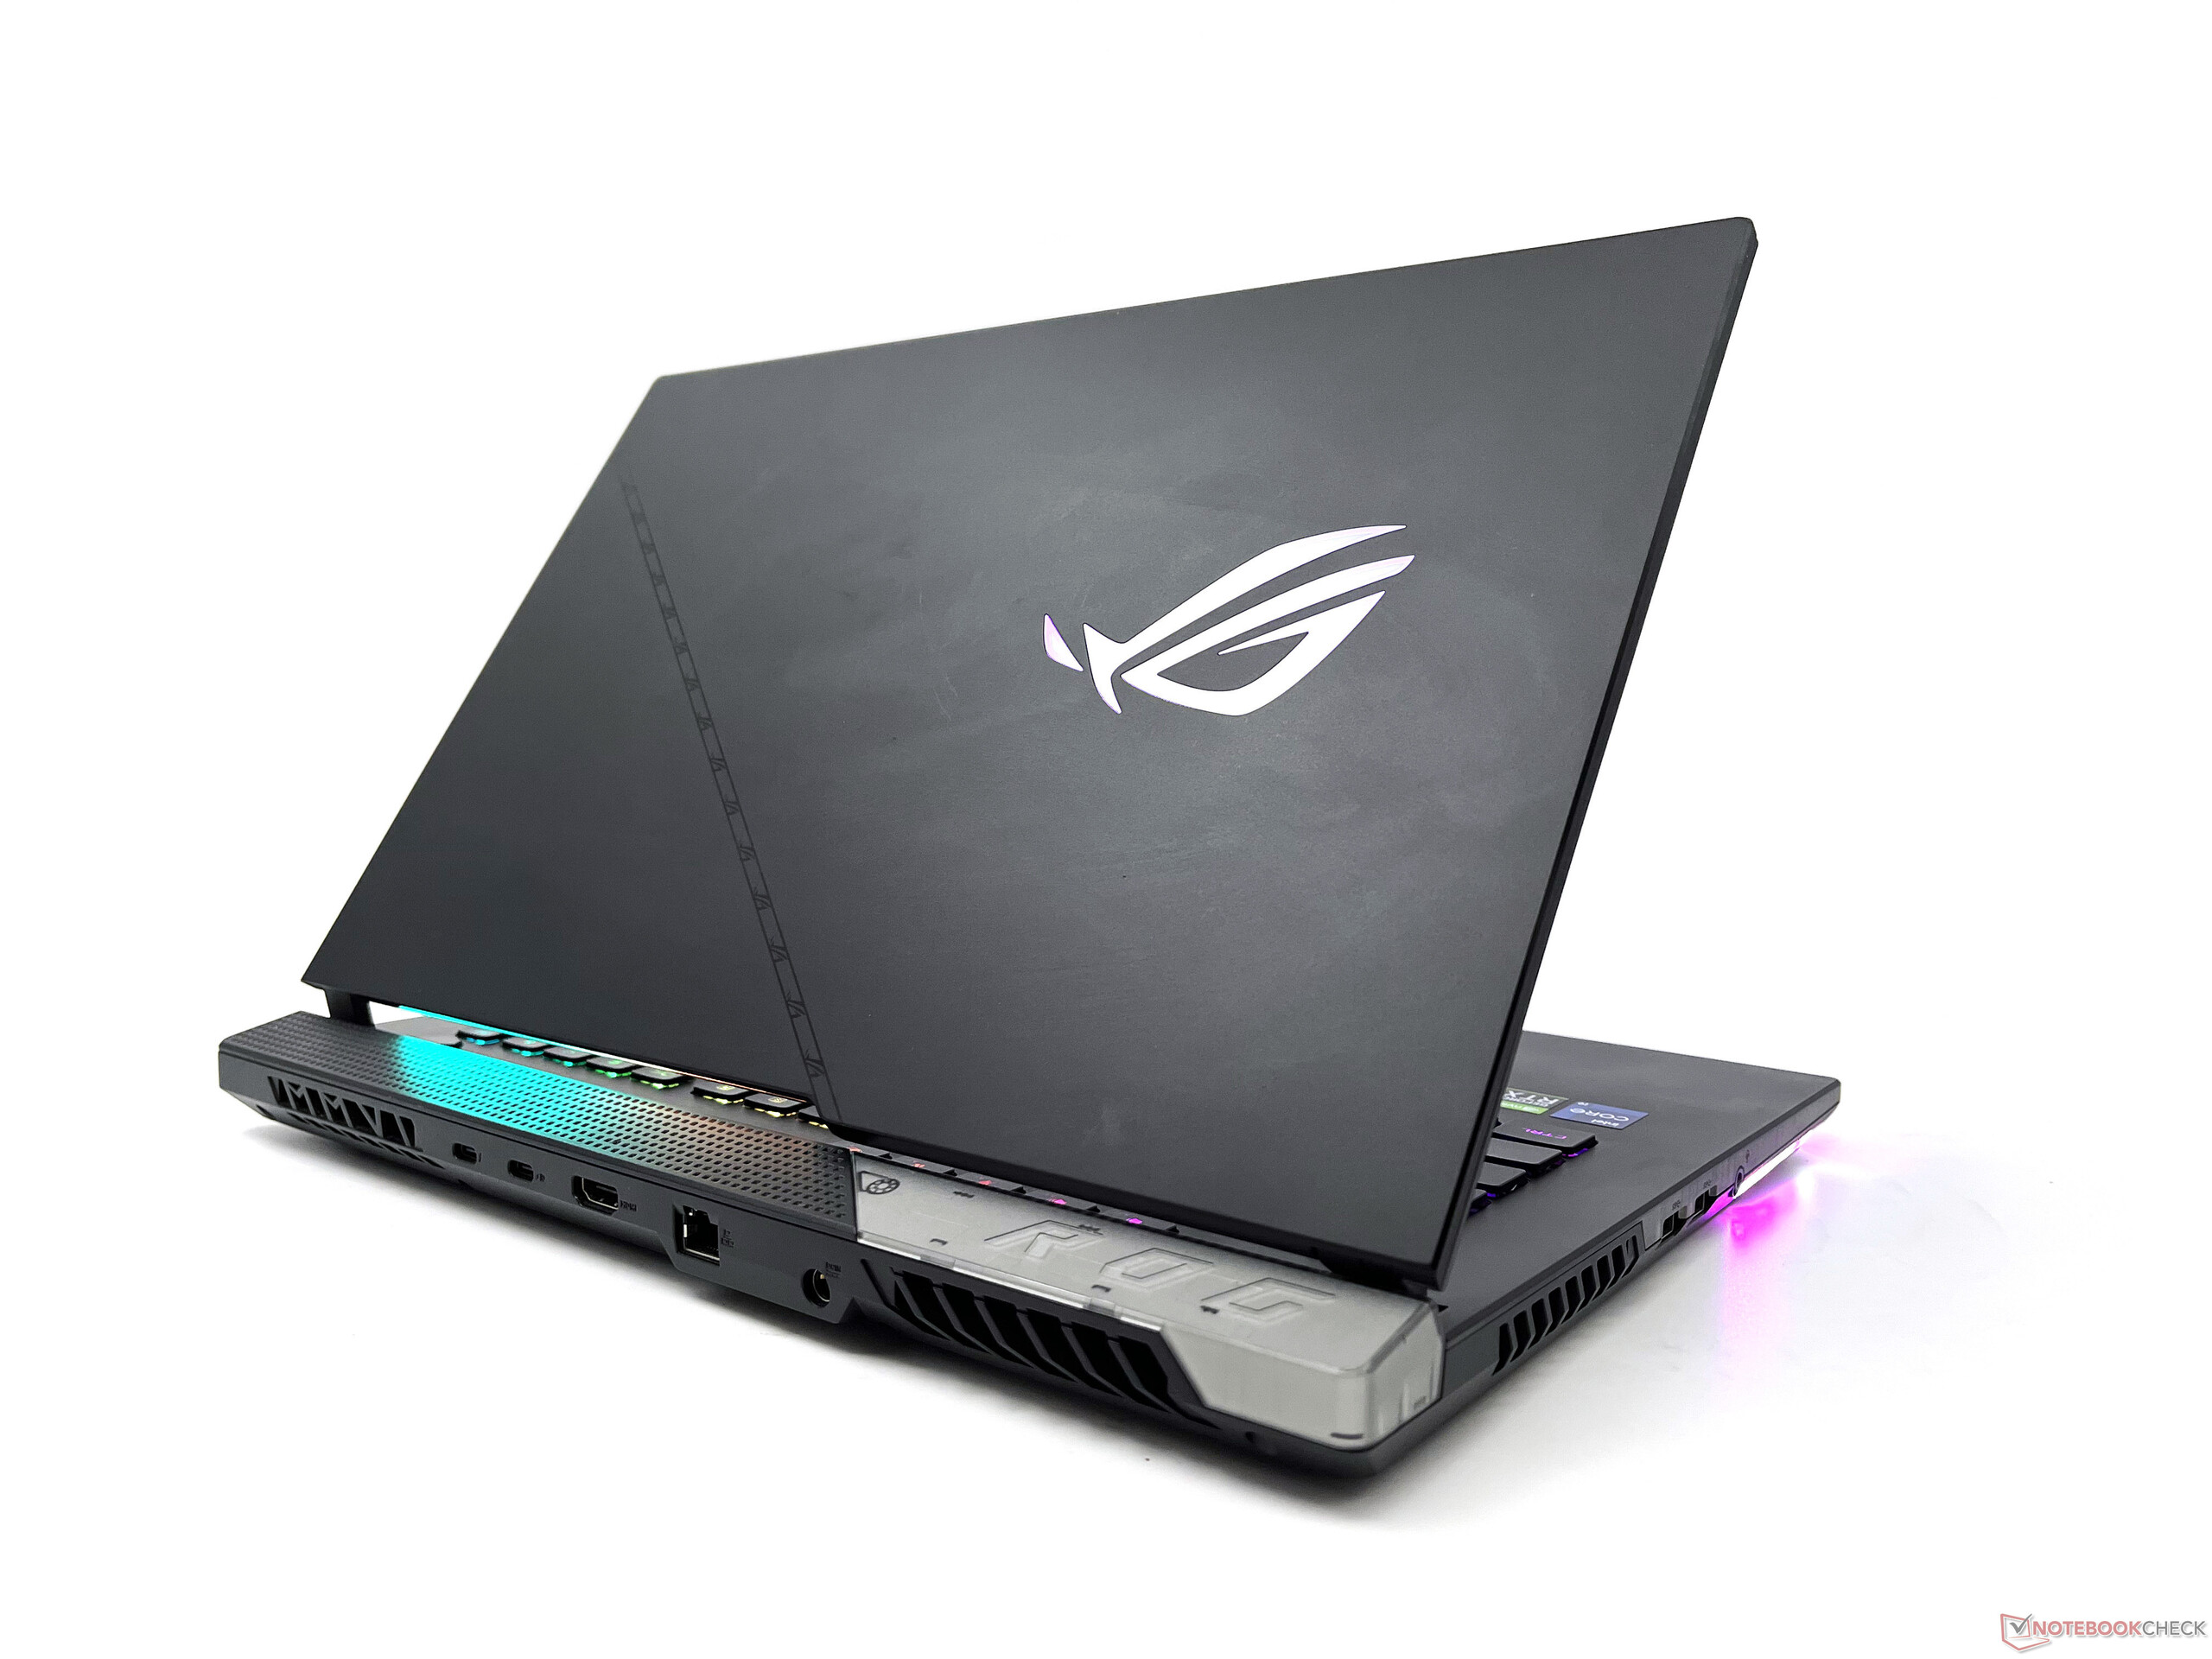
El ROG Strix Scar 15 G533ZW es prácticamente indistinguible del modelo del año pasado en términos de diseño, dimensiones y peso. El cuerpo principal está hecho principalmente de plástico - no parece barato ni pegajoso, pero puede reunir rápidamente bastantes huellas y manchas.
La cubierta del teclado se flexiona un poco si se presiona con fuerza, pero nada preocupante en particular. El borde derecho de la cubierta del teclado es translúcido en el estilo característico de Scar, lo que permite echar un vistazo a las entrañas.
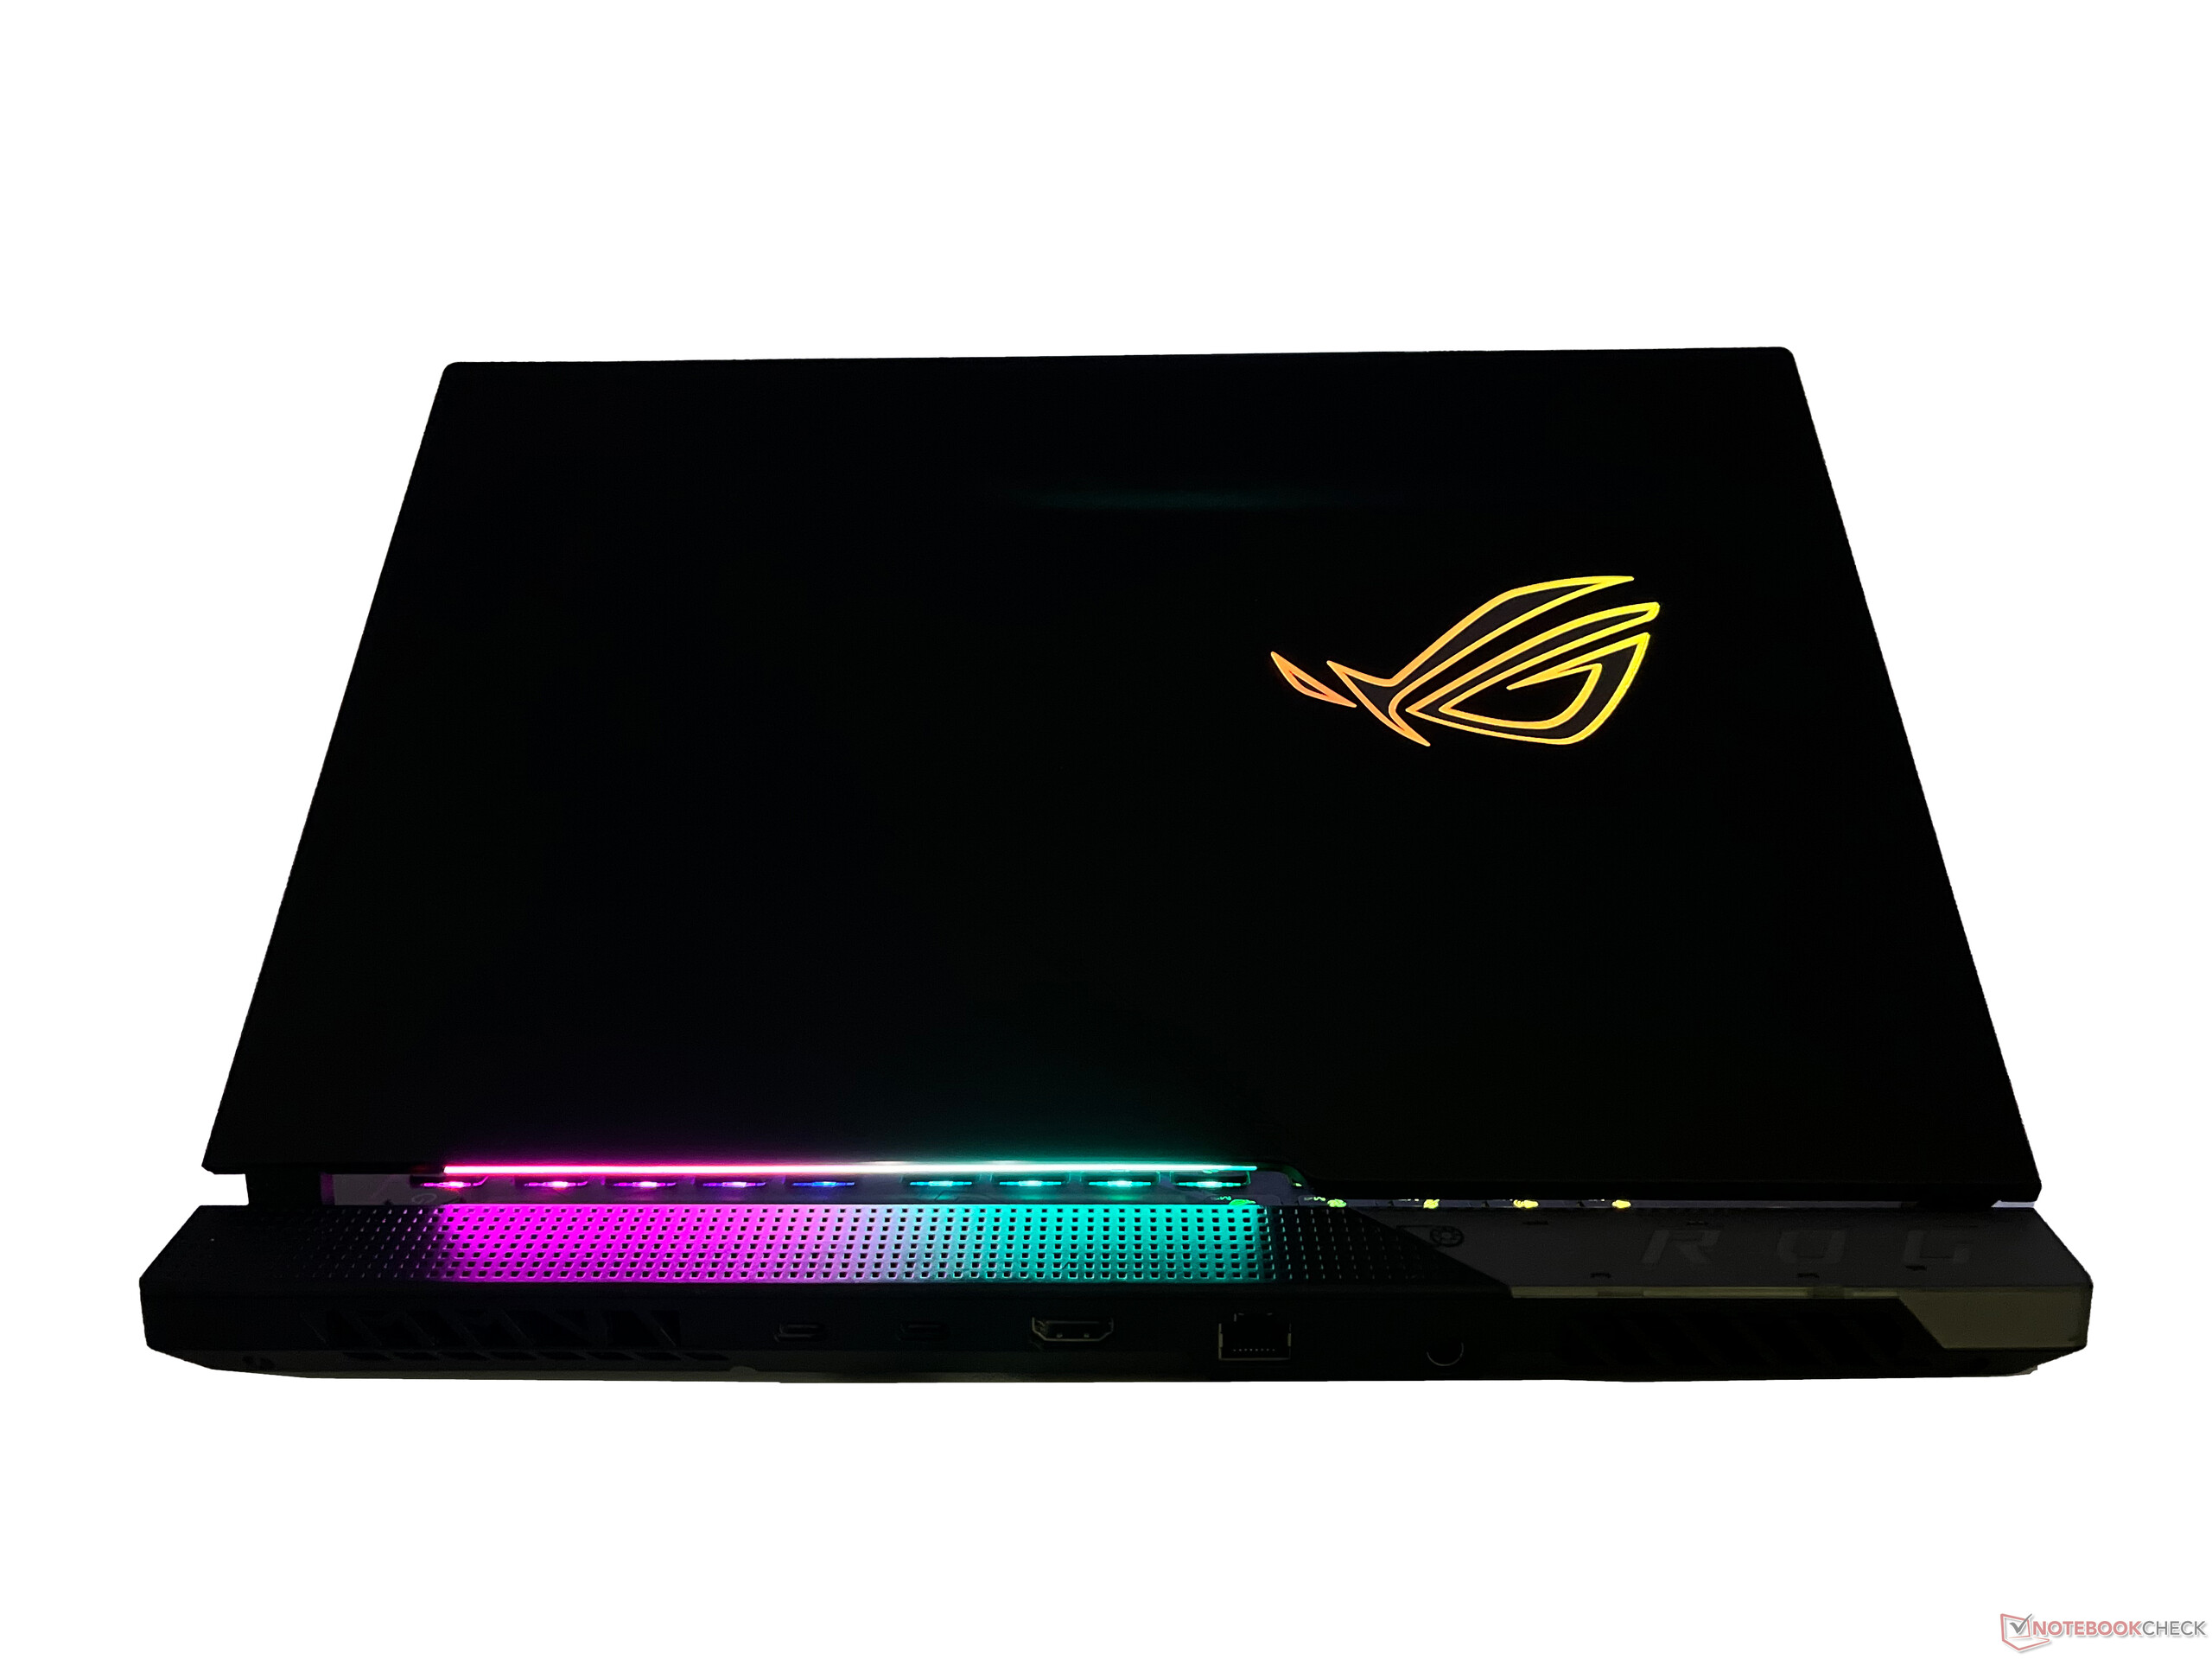
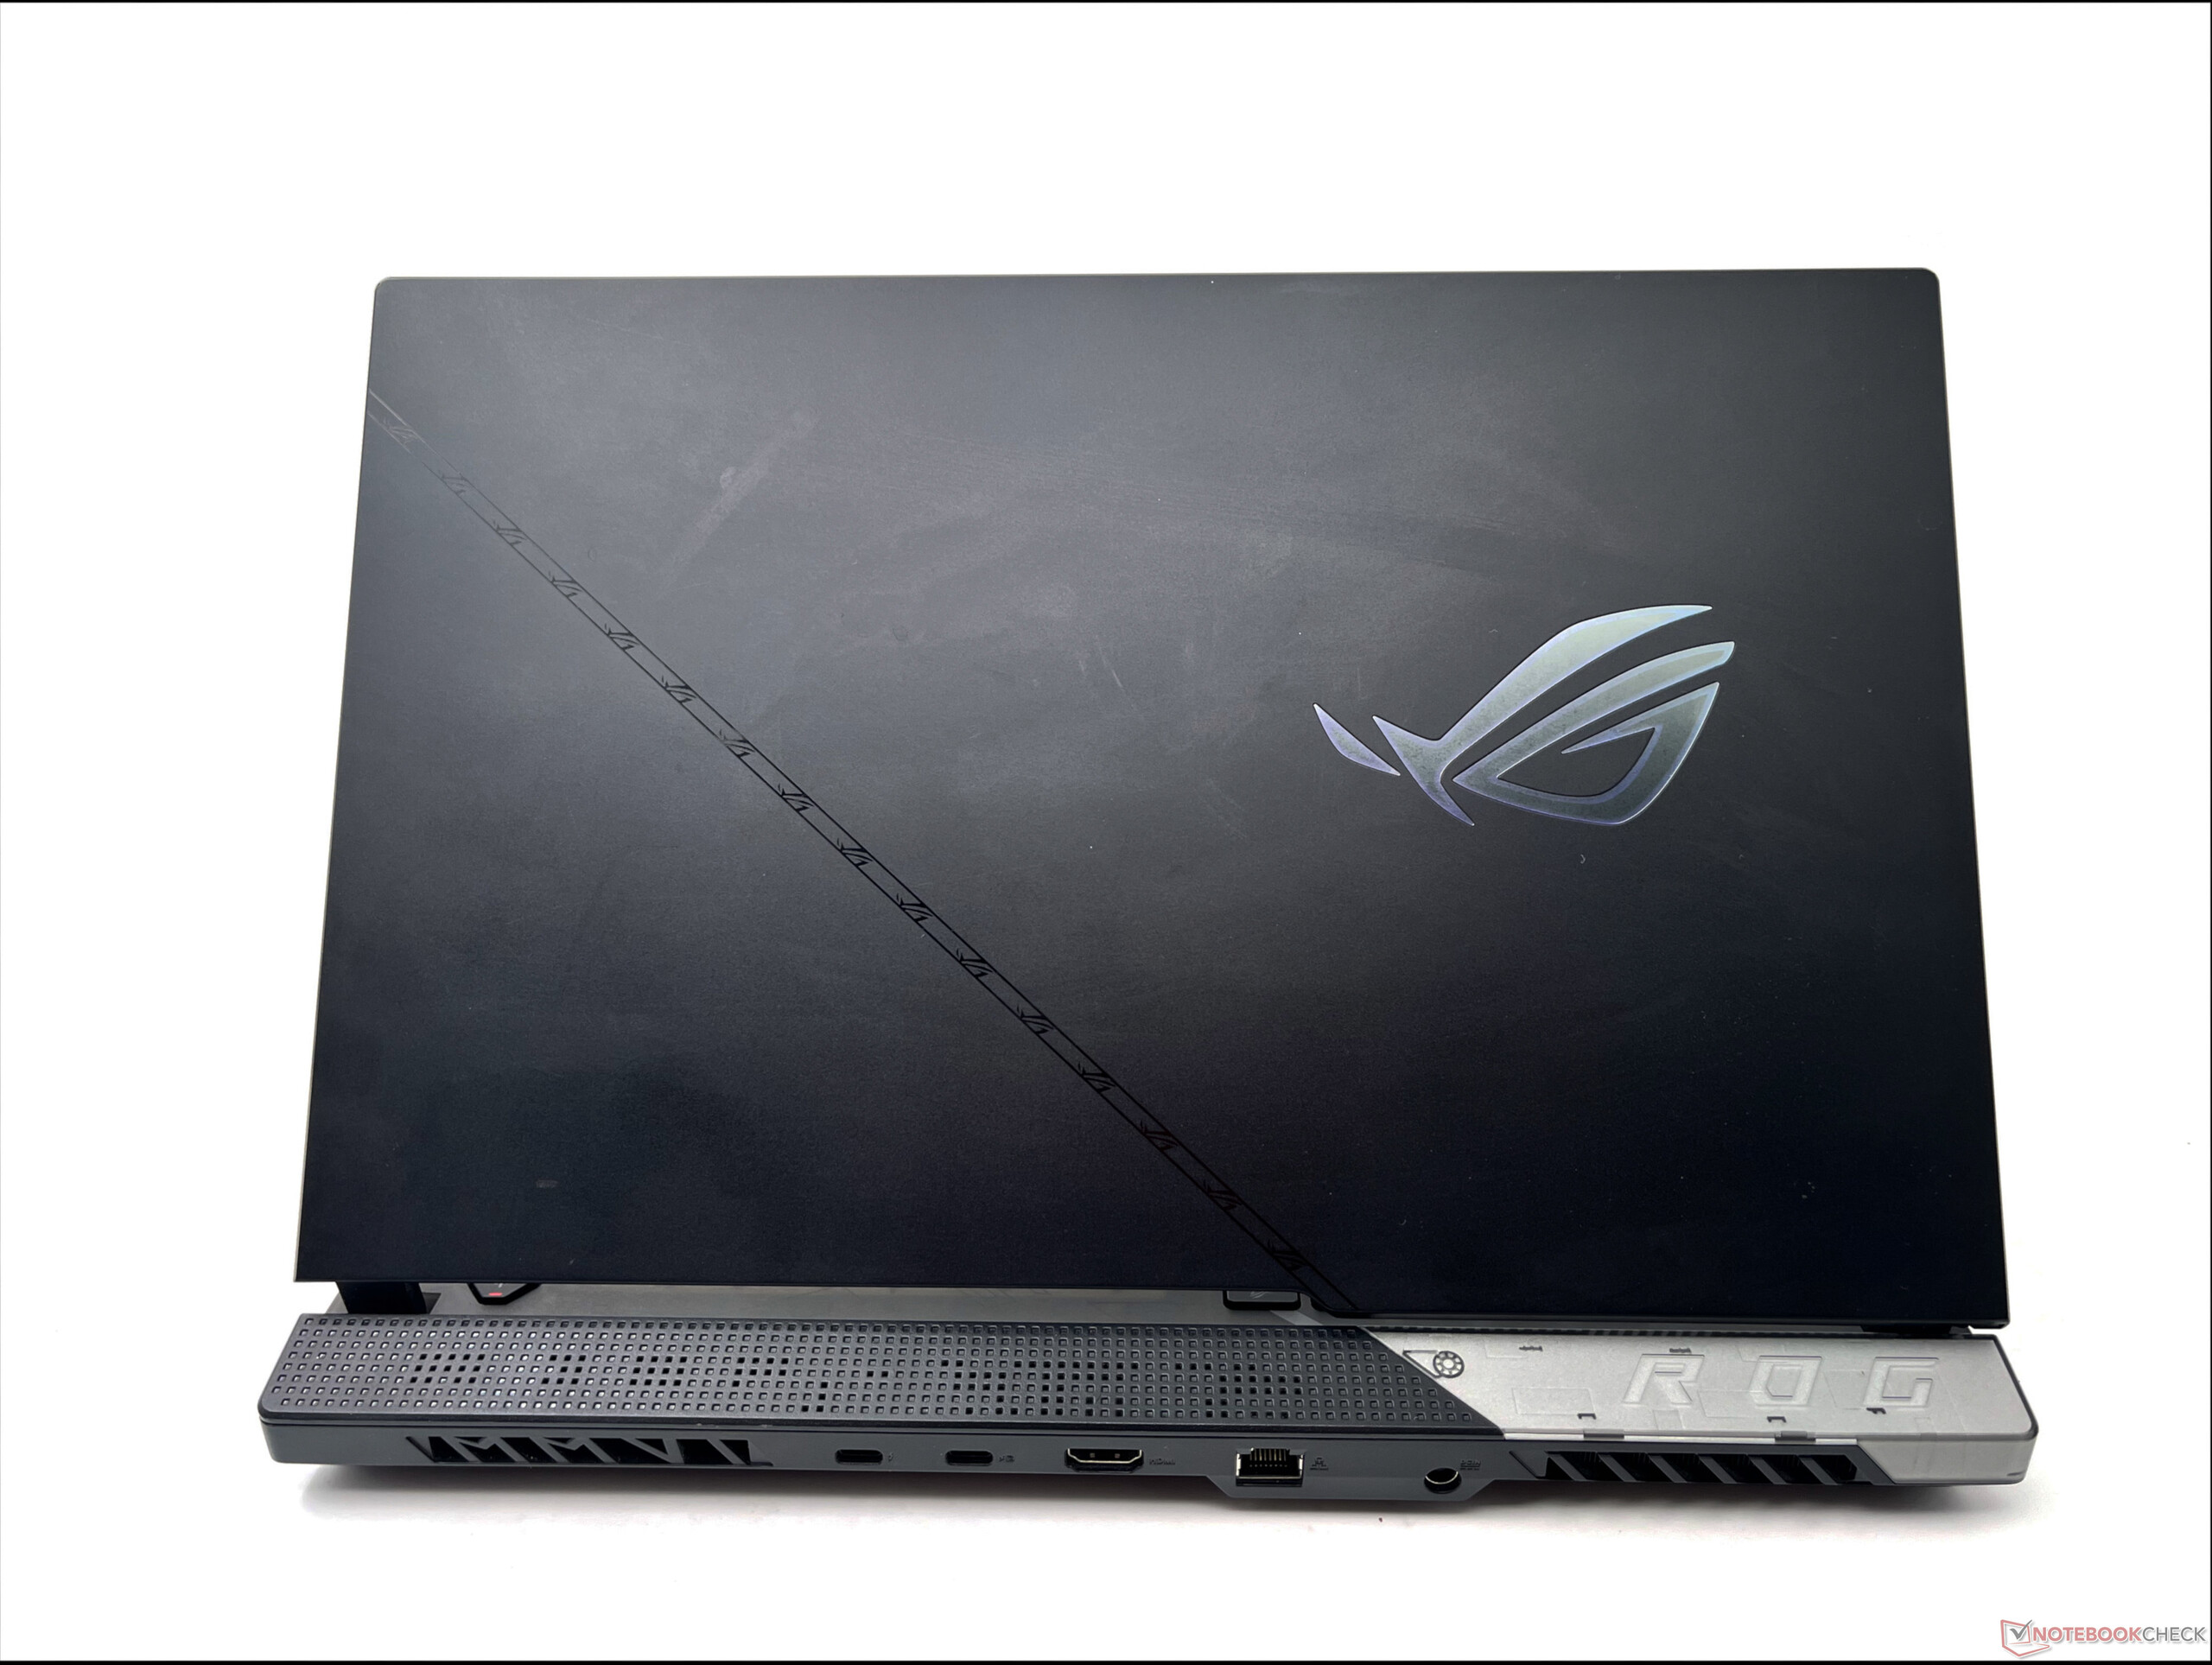
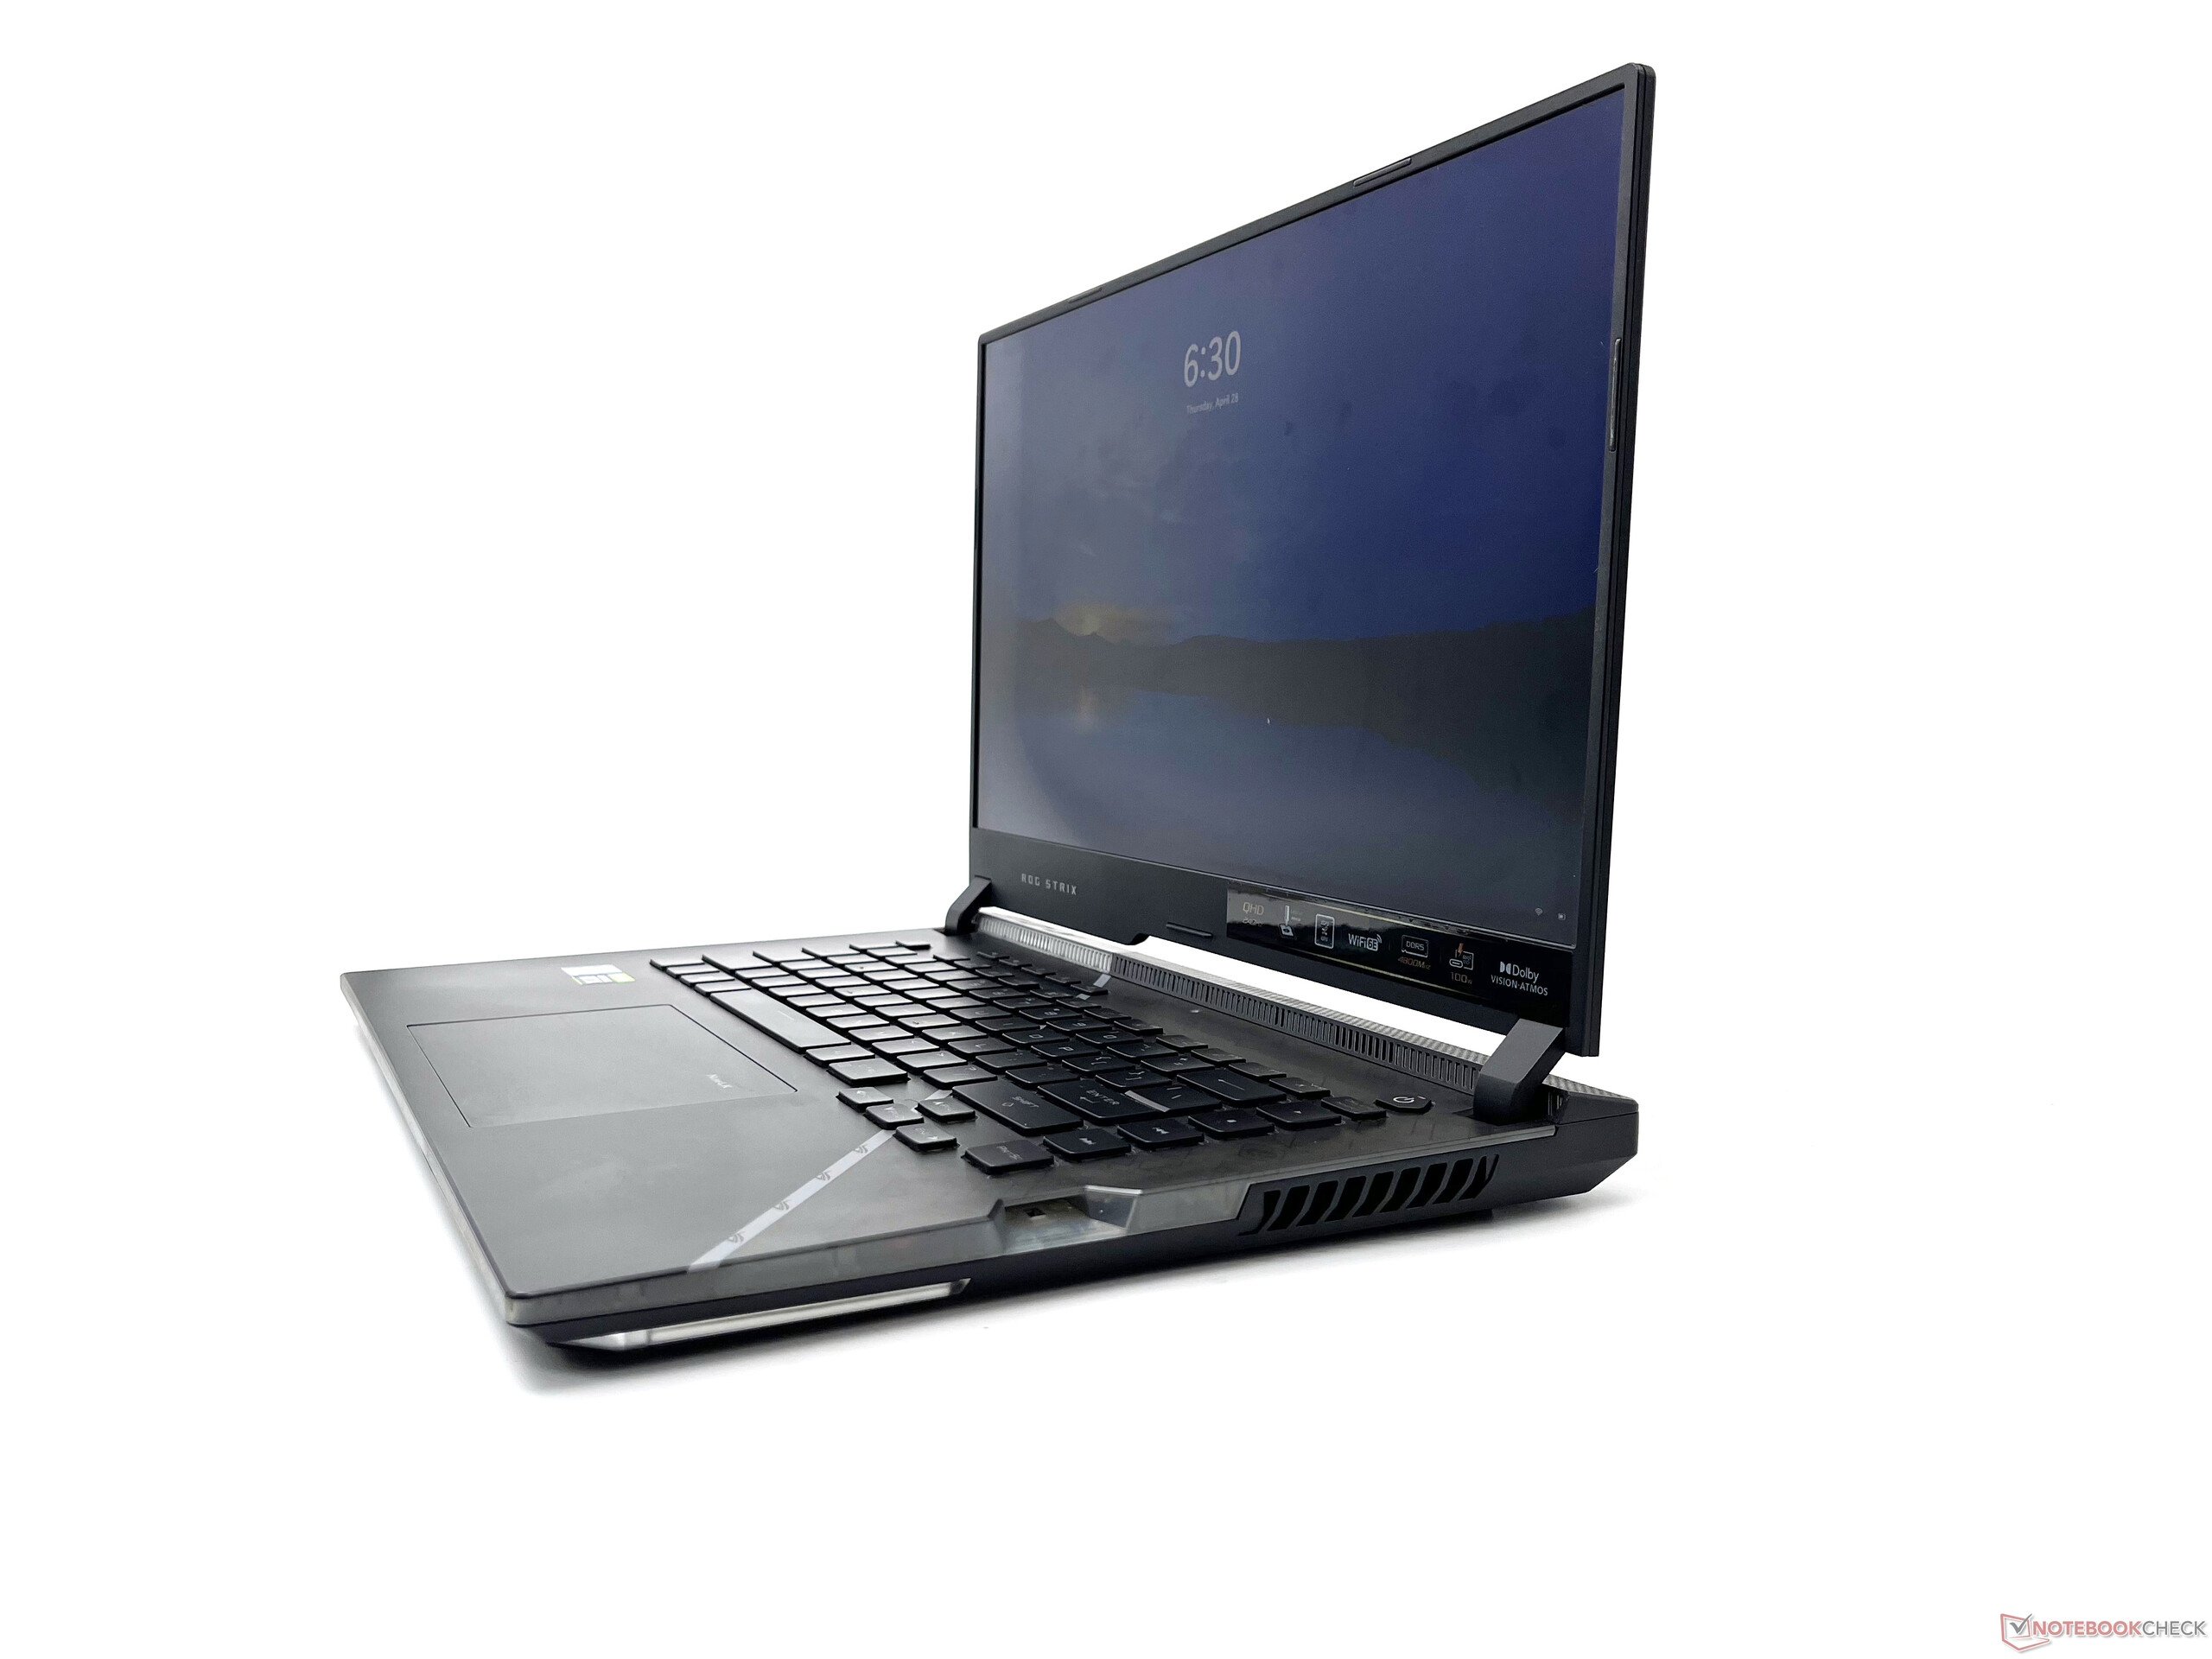
La cubierta de la tapa es de aluminio y se puede abrir con un dedo, pero se flexiona demasiado para nuestro gusto. La parte posterior de la tapa lleva el logotipo de ROG, cuyo contorno recibe un poco de amor RGB. También hay LEDs en la base de la pantalla para añadir algo de brillo. La tapa sólo se puede abrir hasta unos 130º, lo que puede ser un poco molesto cuando se utiliza el dispositivo en el regazo.
La base está recubierta de goma para un agarre firme. También se ofrecen algunas posibilidades de personalización en forma de tapas ROG Armor; en la caja vienen un par de ellas, pero puedes imprimirlas en 3D si lo deseas.
En general, la calidad de construcción del Asus ROG Strix Scar 15 G533ZW es robusta en su mayor parte, salvo por cierta flexibilidad en el teclado y la tapa.
Conectividad: Thunderbolt 4 y Wi-Fi 6E a bordo
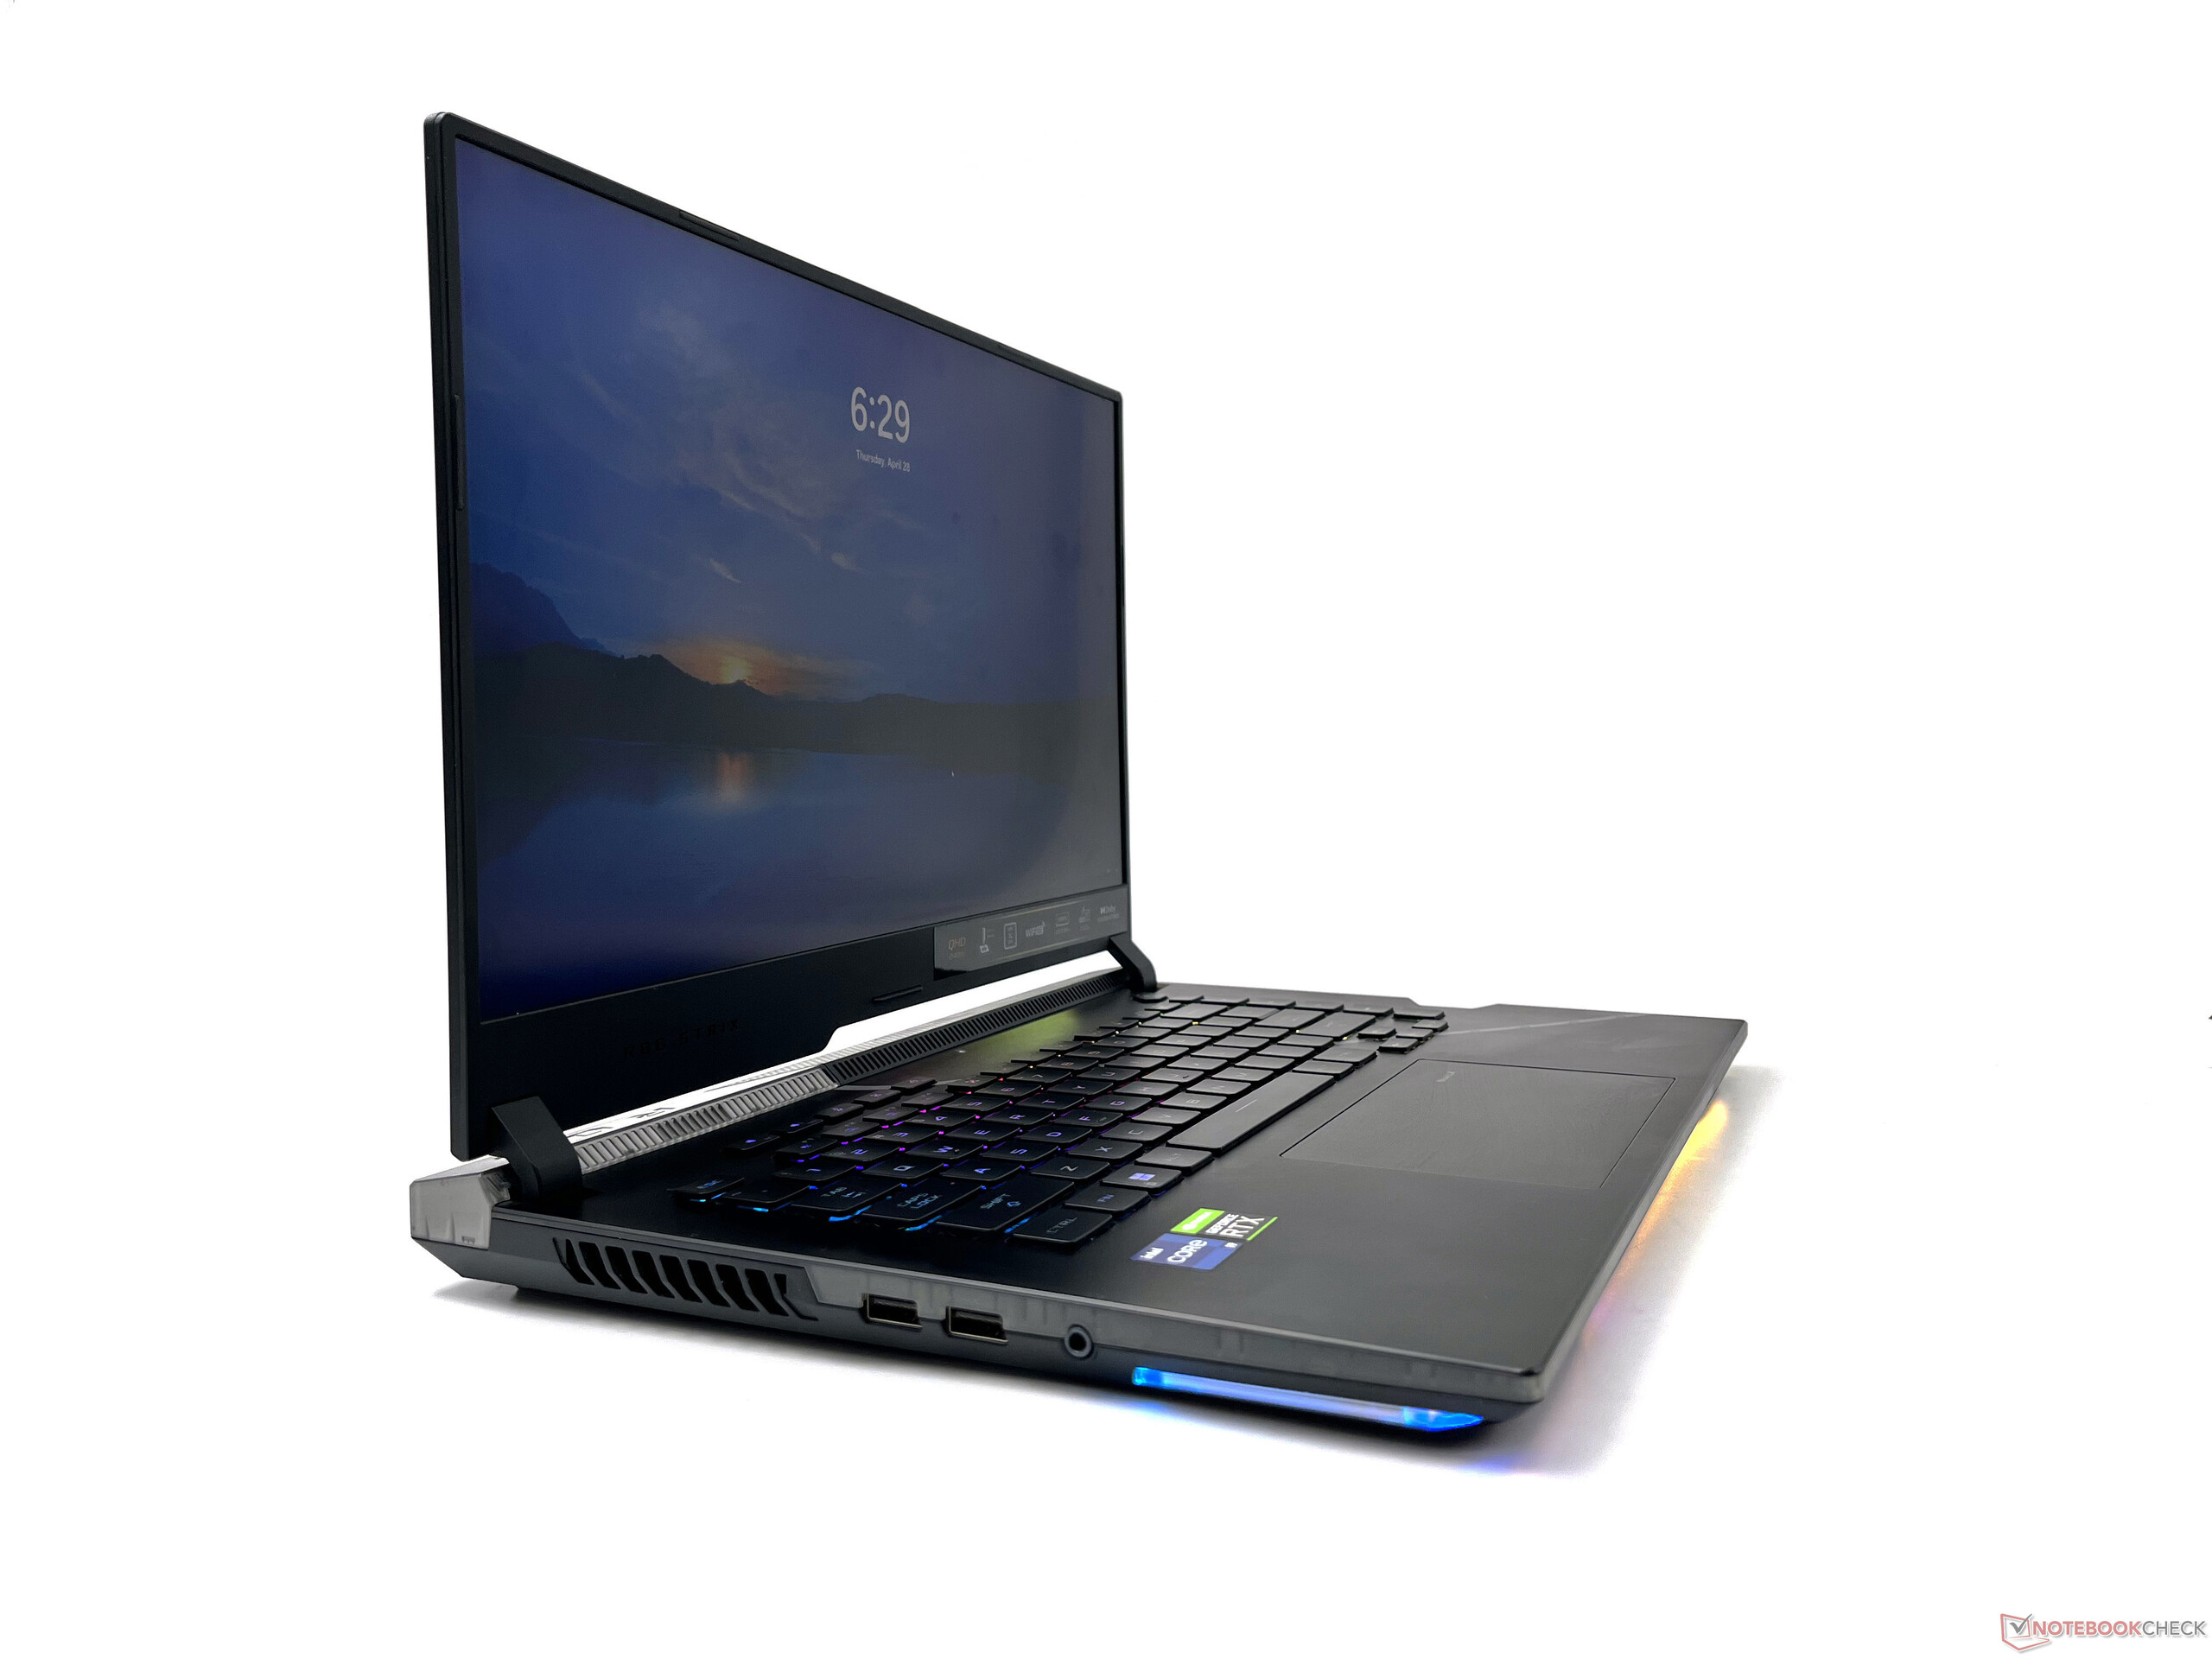
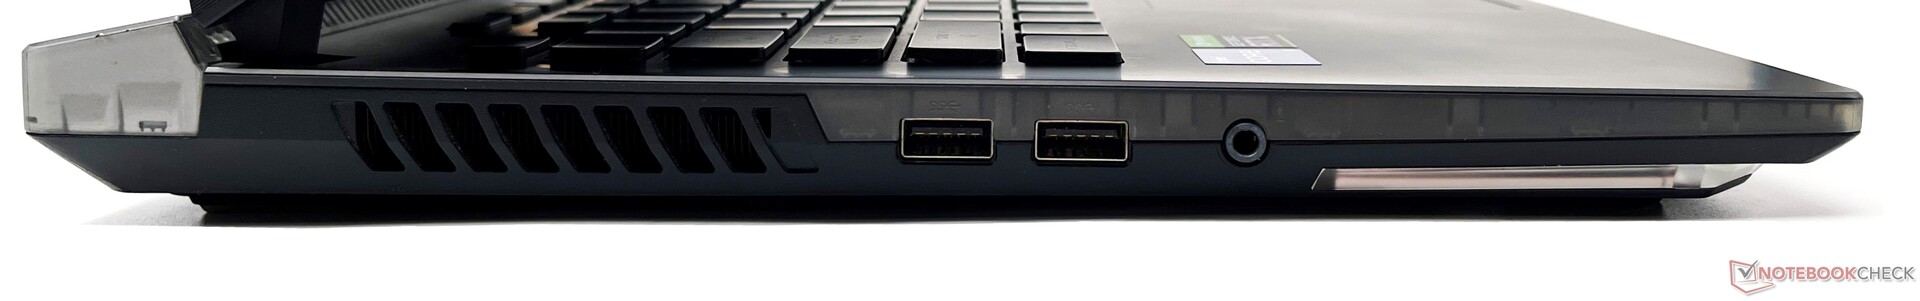
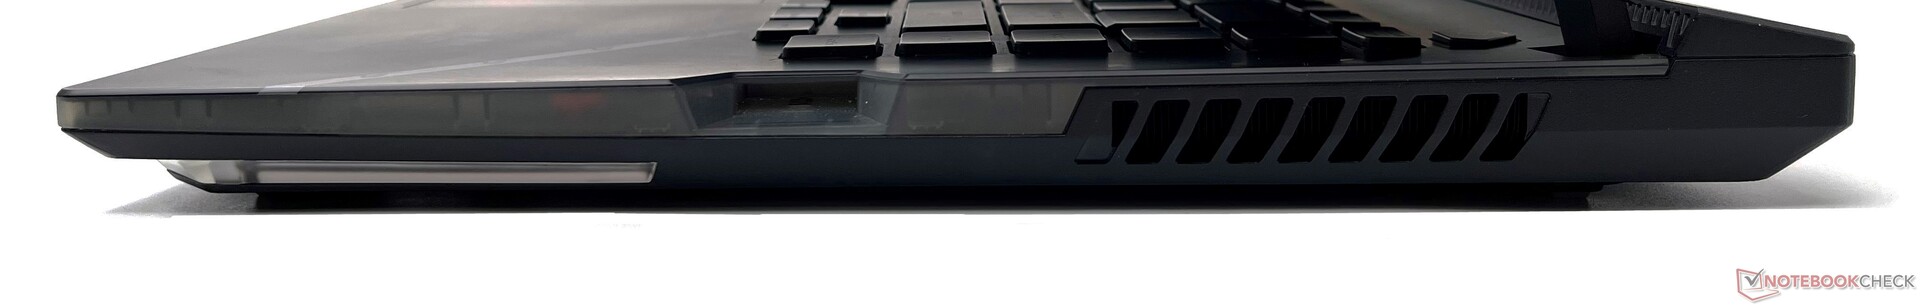
El ROG Strix Scar 15 G533 cubre lo esencial en cuanto a E/S. A la izquierda, hay dos USB 3.2 Gen 1 Tipo-A y un conector de audio combinado, mientras que la derecha solo tiene una ranura para el ROG Keystone 2. La Keystone 2 es una llave NFC que funciona con la aplicación Armory Crate para aplicar varios perfiles de rendimiento y RGB y también para desbloquear una unidad Shadow oculta.
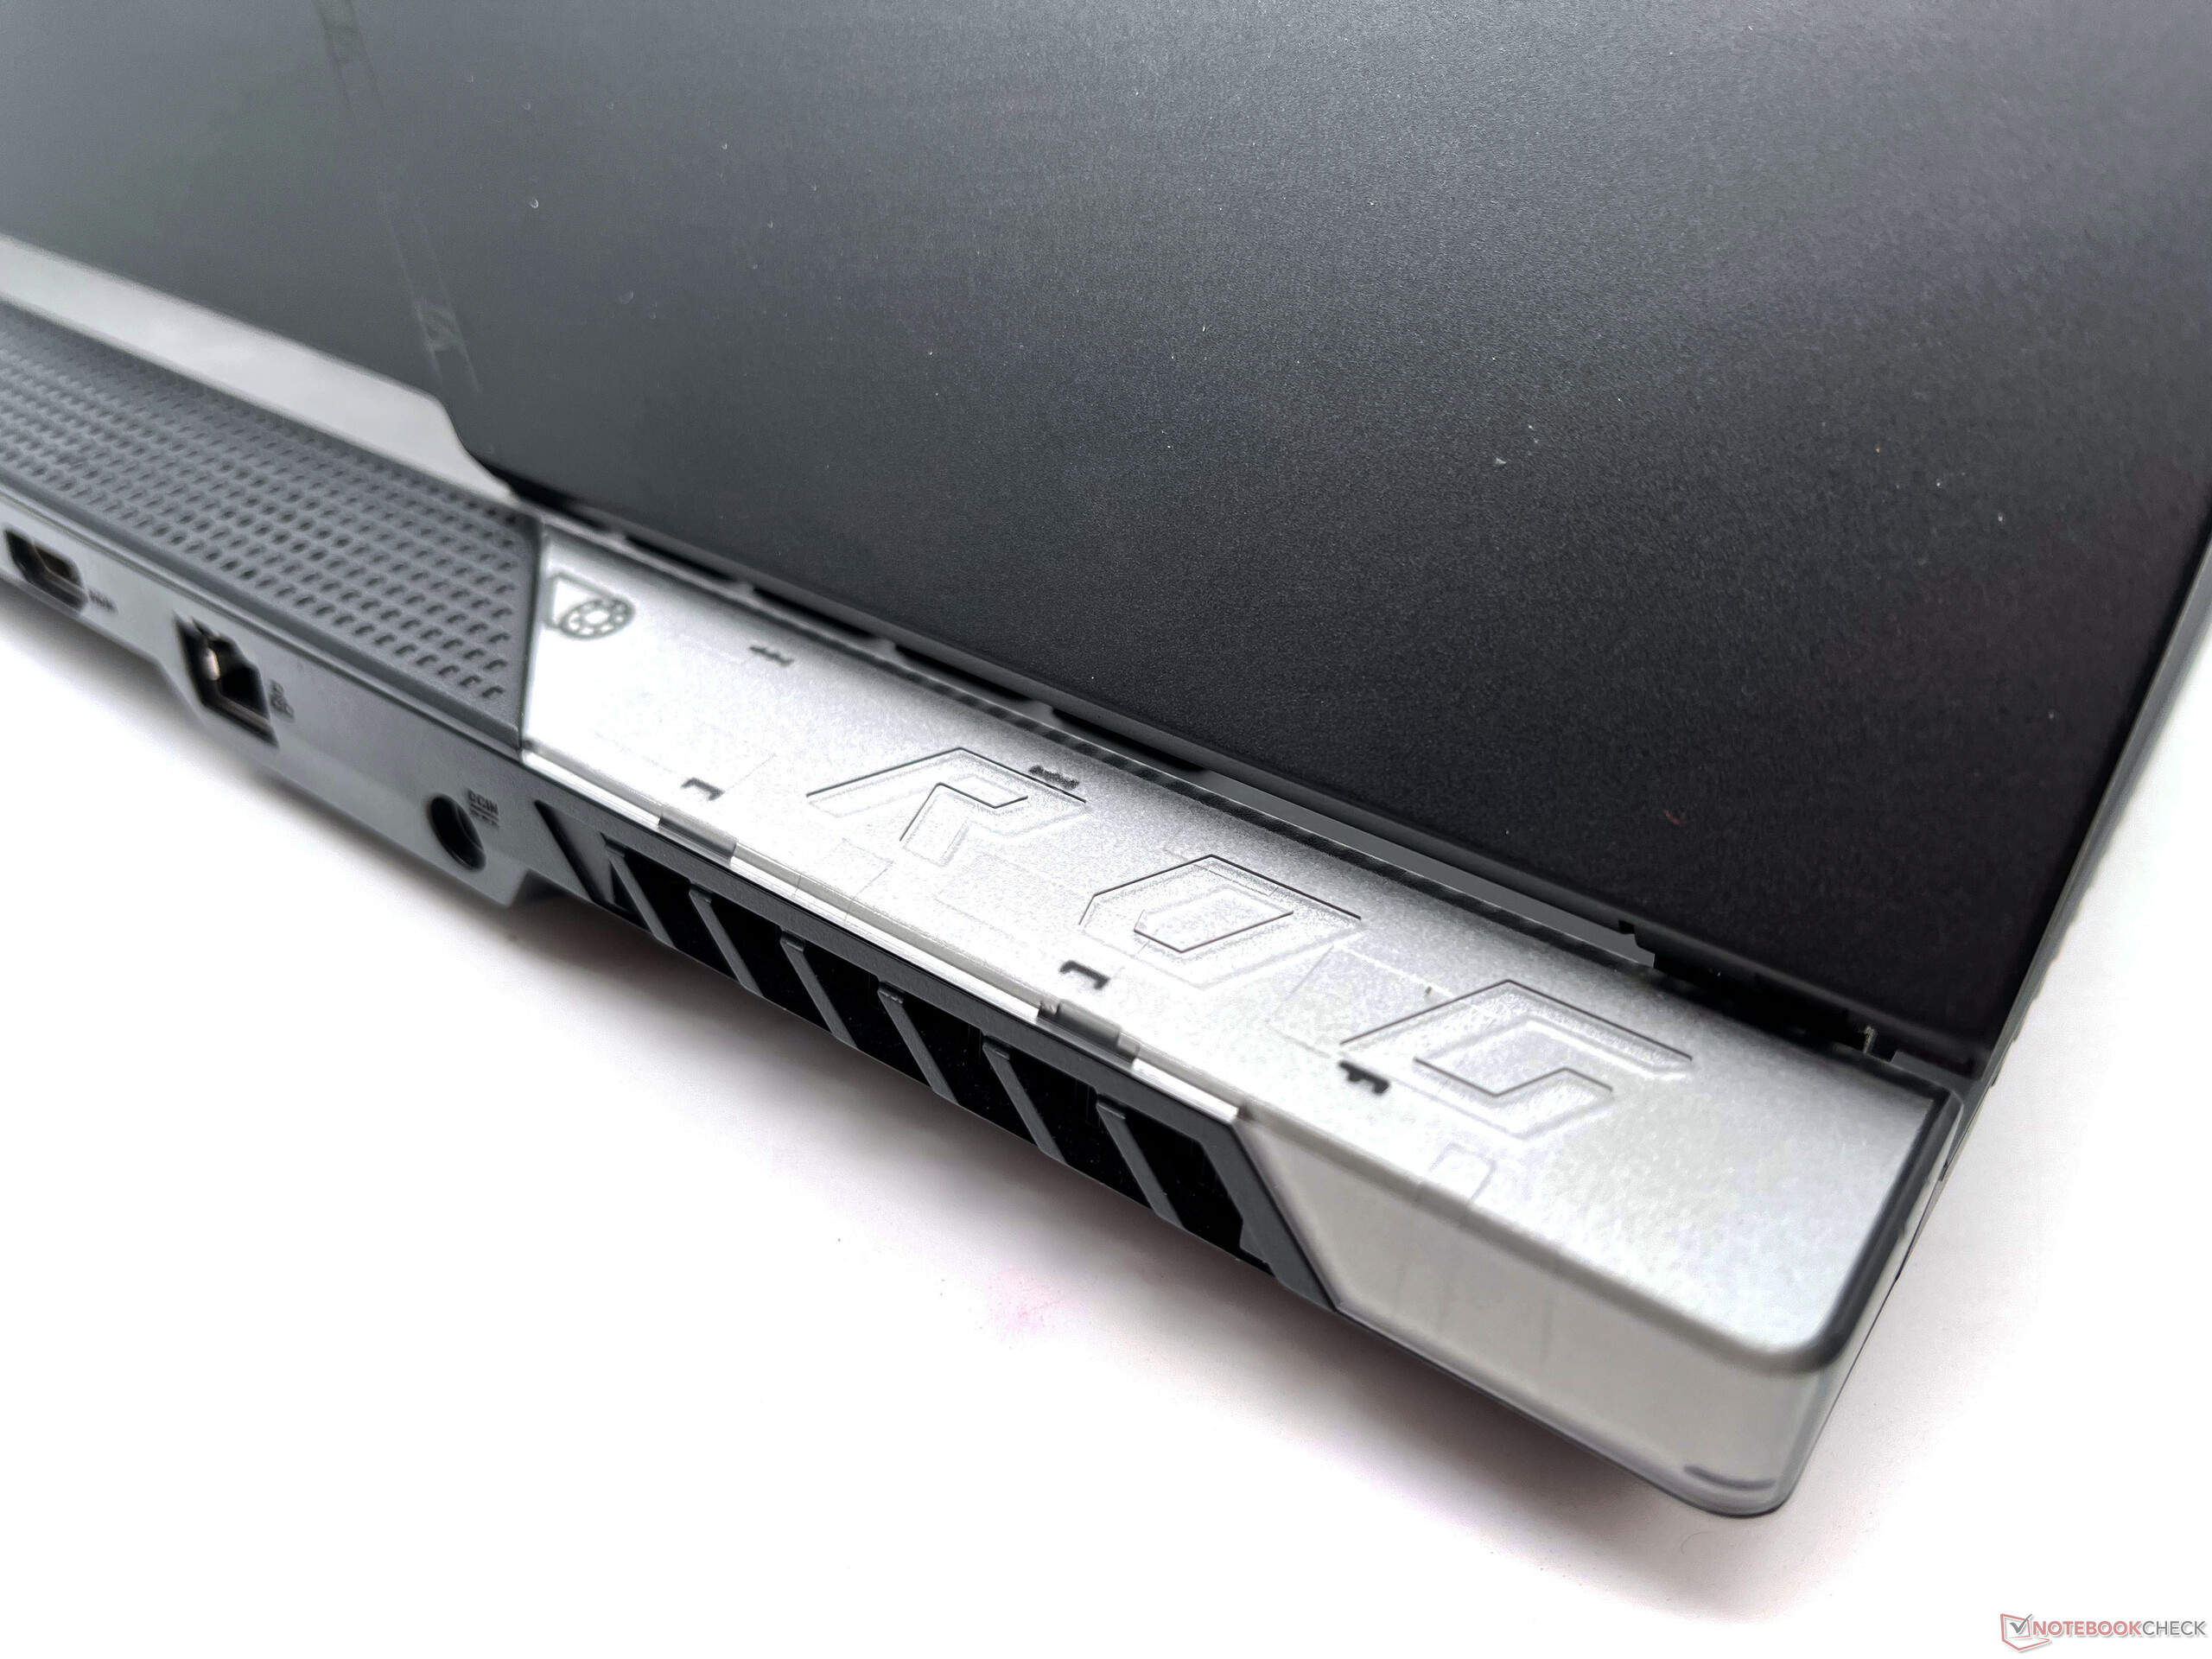
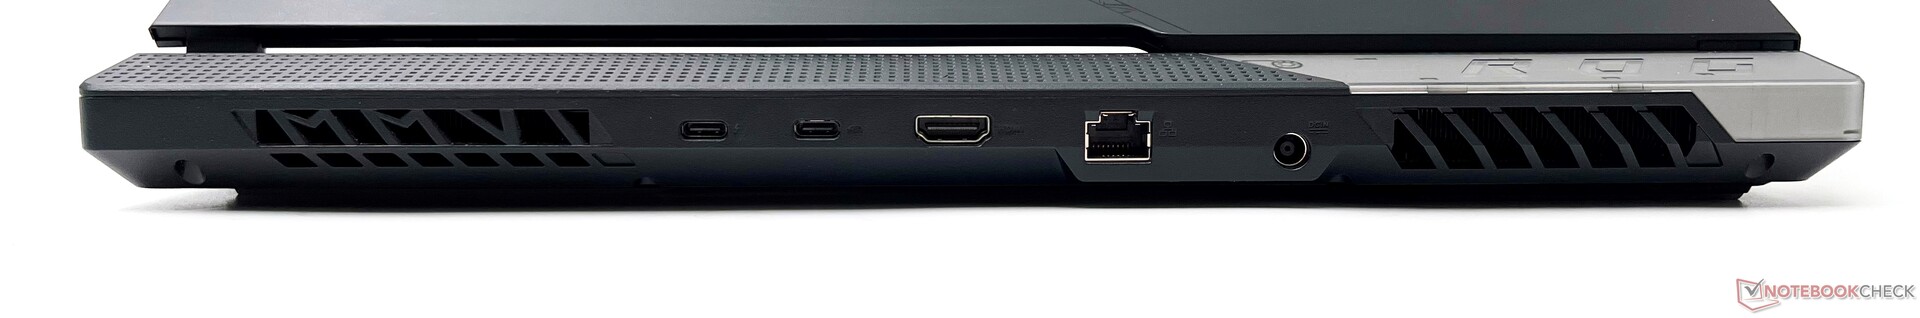
La mayoría de los puertos se encuentran hacia la parte trasera. Estos incluyen un puerto Thunderbolt 4, un USB 3.2 Gen2 Tipo-C que soporta DisplayPort-out y Power Delivery, HDMI 2.1-out, un puerto Ethernet 2.5G, y DC power-in.
La ubicación de los puertos es conveniente y no dificulta los movimientos de un ratón externo. Por desgracia, el Scar 15 no ofrece una ranura para tarjetas SD ni una ranura de bloqueo Kensington.
Comunicación
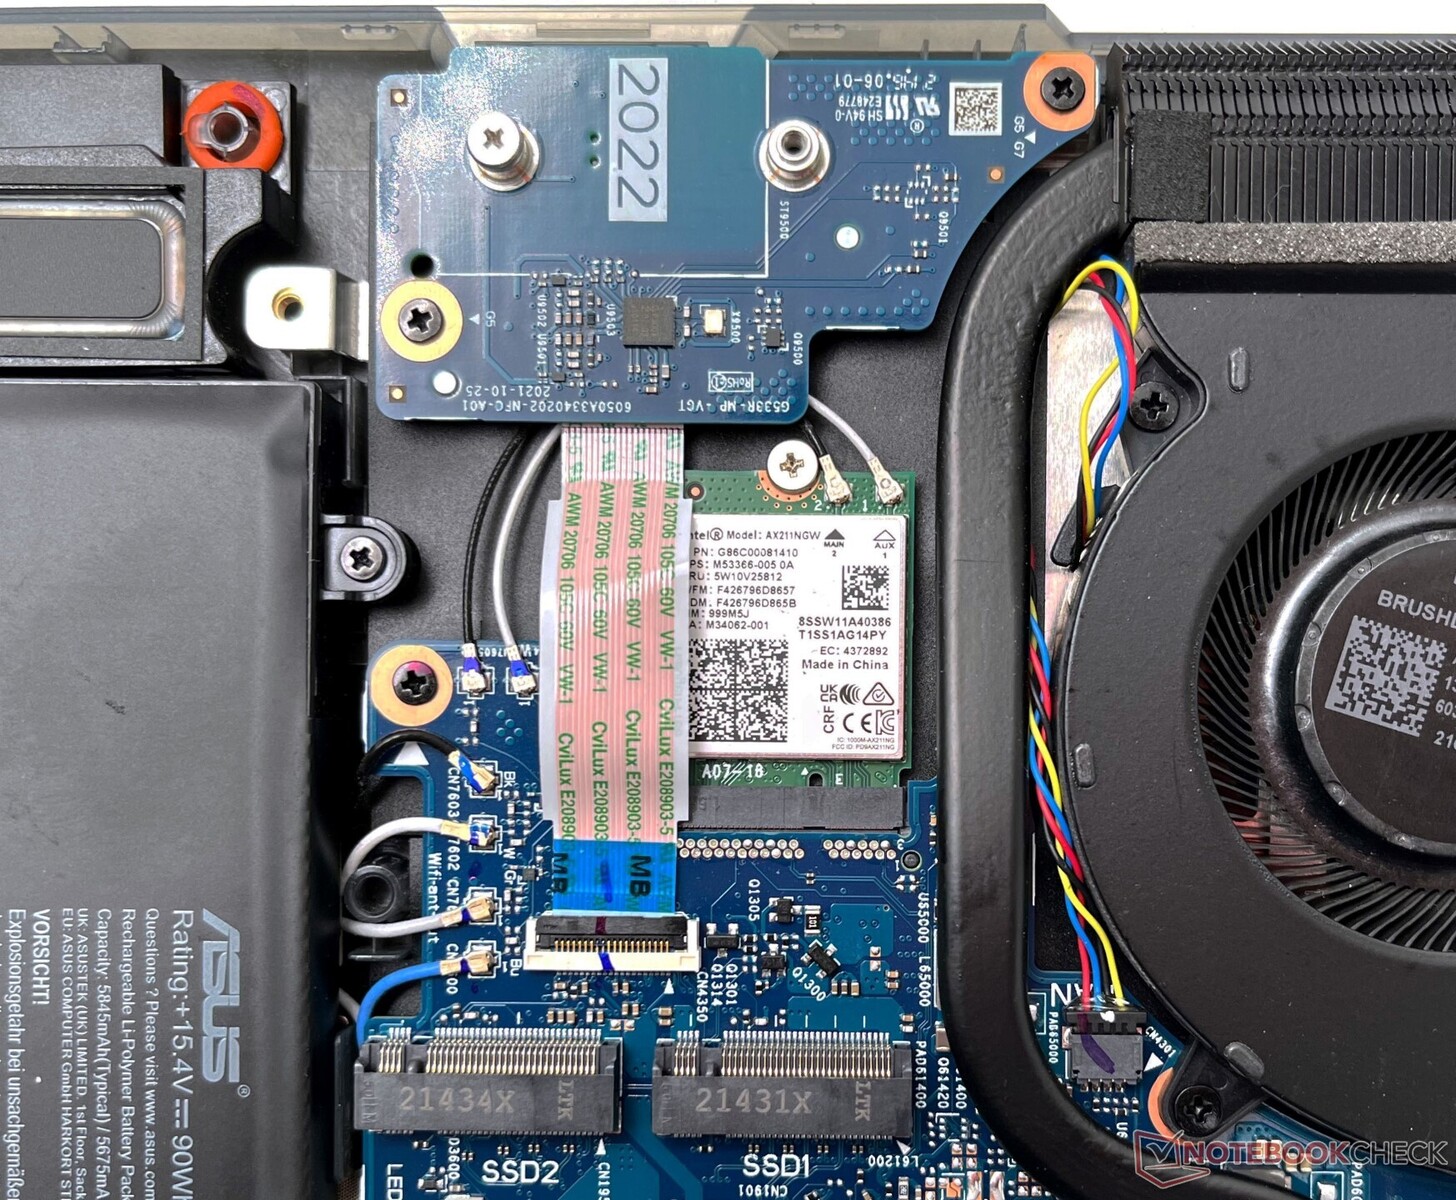
El ROG Strix Scar 15 ofrece conectividad Wi-Fi 6E a través de la tarjeta Intel Wi-Fi 6E AX211. Ya hemos visto envarios portátilescon el chipset AX211, pero es probable que el ROG Strix Scar 15 sea el primer portátil que se lance en la India con soporte para el nuevo estándar inalámbrico.
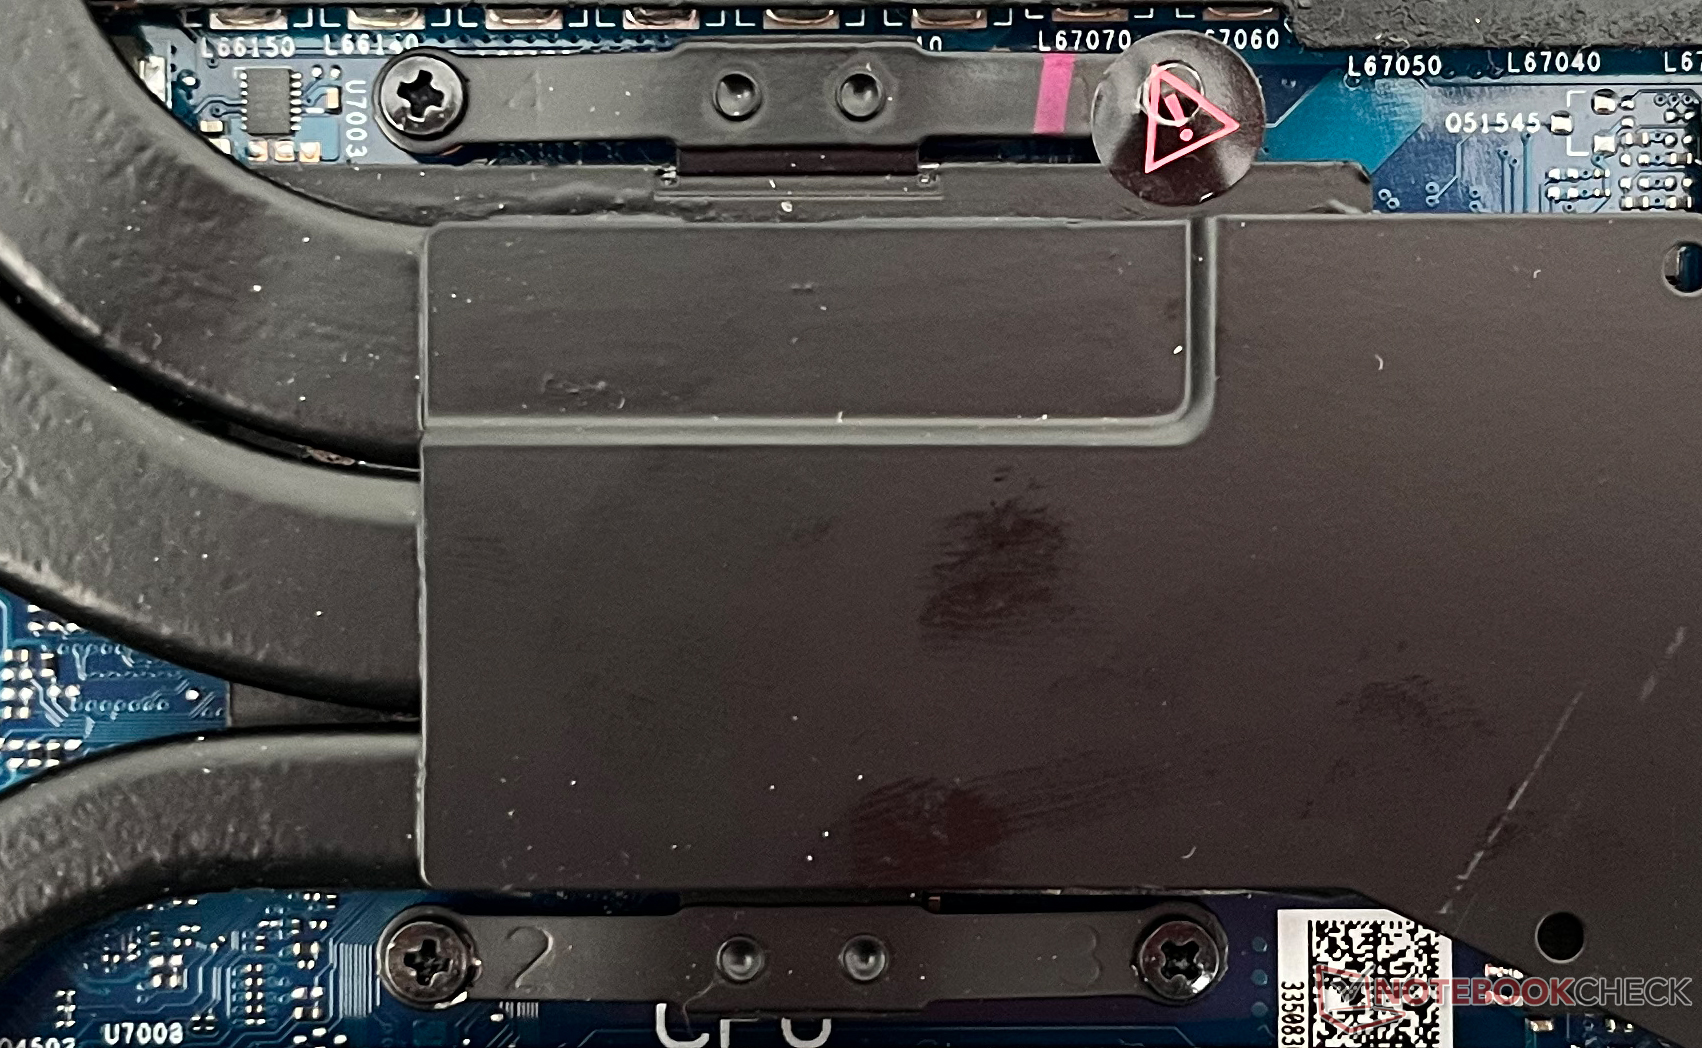
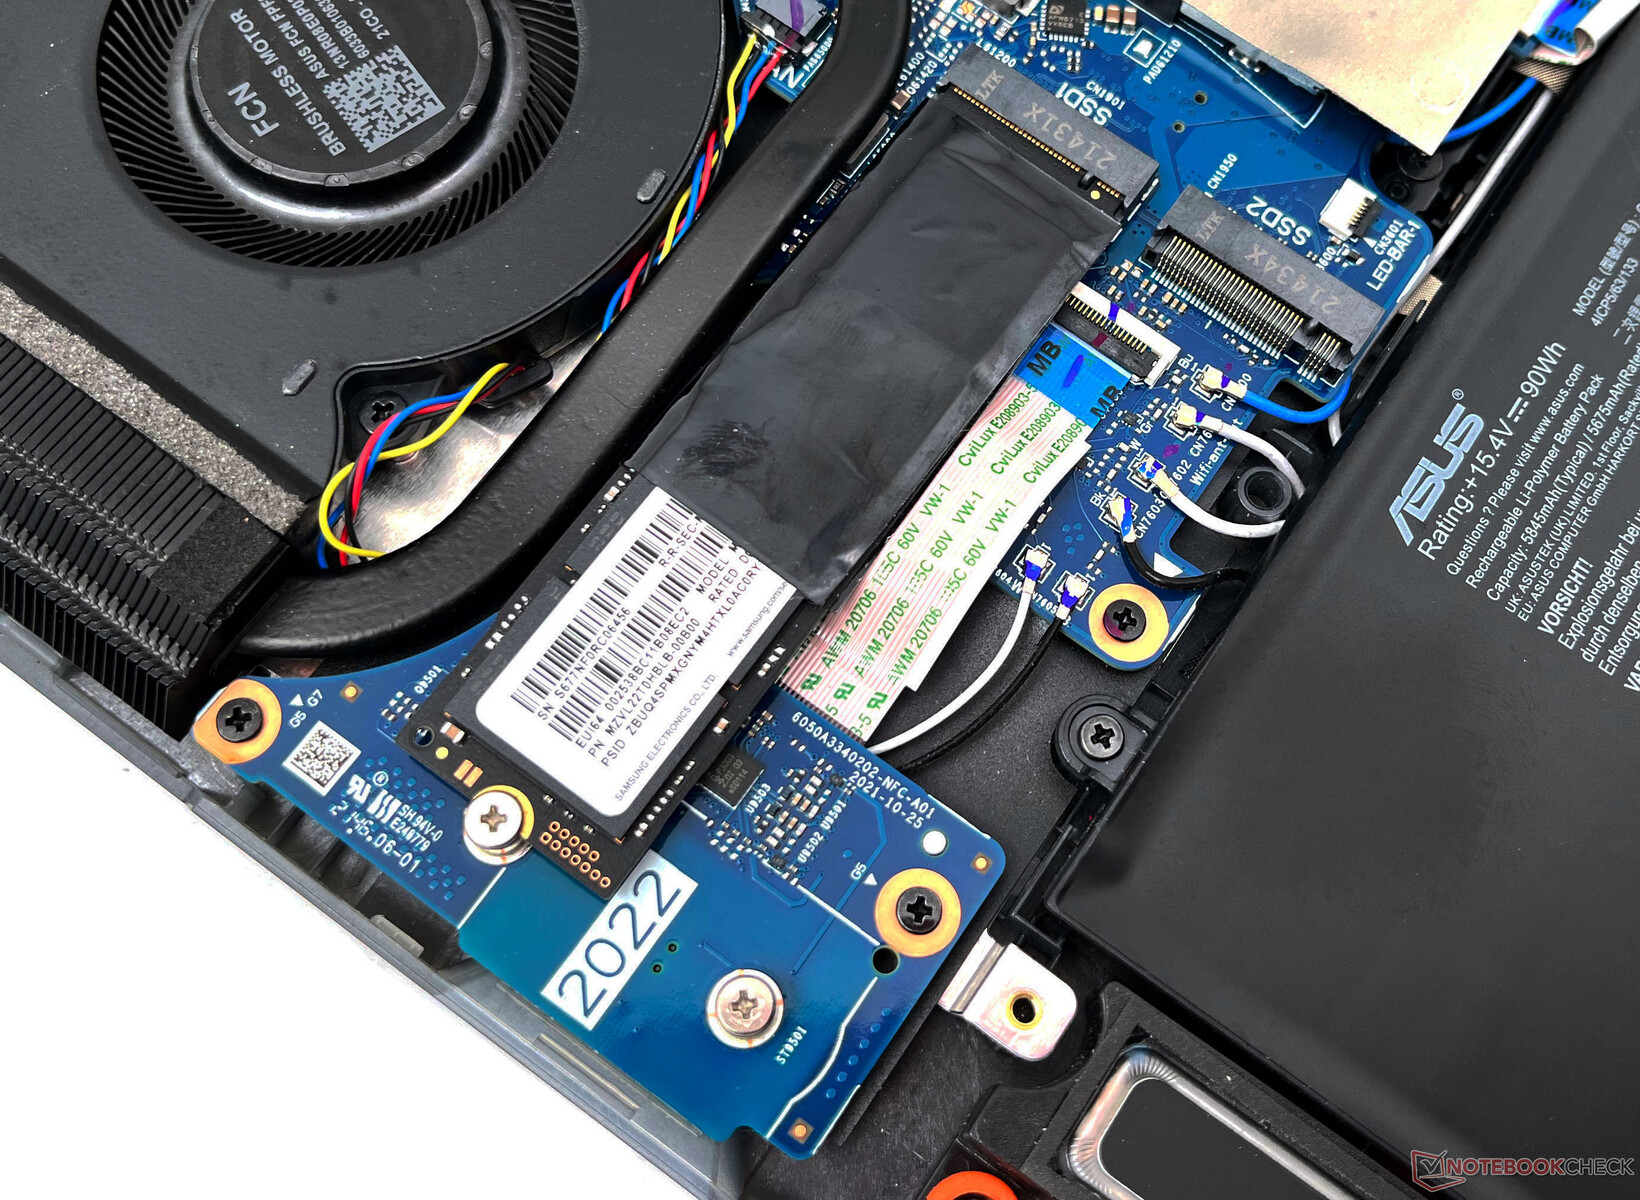
La tarjeta Wi-Fi del Scar 15 se puede cambiar si es necesario, pero no somos muy fans de su colocación. La tarjeta WLAN está escondida debajo de la unidad SSD M.2 principal y hay que quitar la unidad para acceder a ella para actualizarla o sustituirla. También hay que tener cuidado con el cable de datos que sale del PCB Keystone y que pasa directamente por encima de la tarjeta.
En consecuencia, hemos probado el rendimiento de Wi-Fi 5 GHz y Wi-Fi 6E con nuestro router de referencia Asus ROG Rapture GT-AXE11000 a una distancia de 1 m del dispositivo en línea de visión clara. Nuestro dispositivo de prueba muestra hasta un 6% más de velocidad media de recepción con 6E en la prueba de recepción y un rendimiento medio similar al de 5 GHz en la prueba de transmisión. La banda 6E también permite valores máximos de recepción más altos, cercanos a los 2 Gbit/s.
Observamos que la opción de 6 GHz tarda un poco en estar disponible para conectarse después de arrancar de nuevo en Windows. No se observaron grandes caídas de rendimiento durante las pruebas.
Cámara web
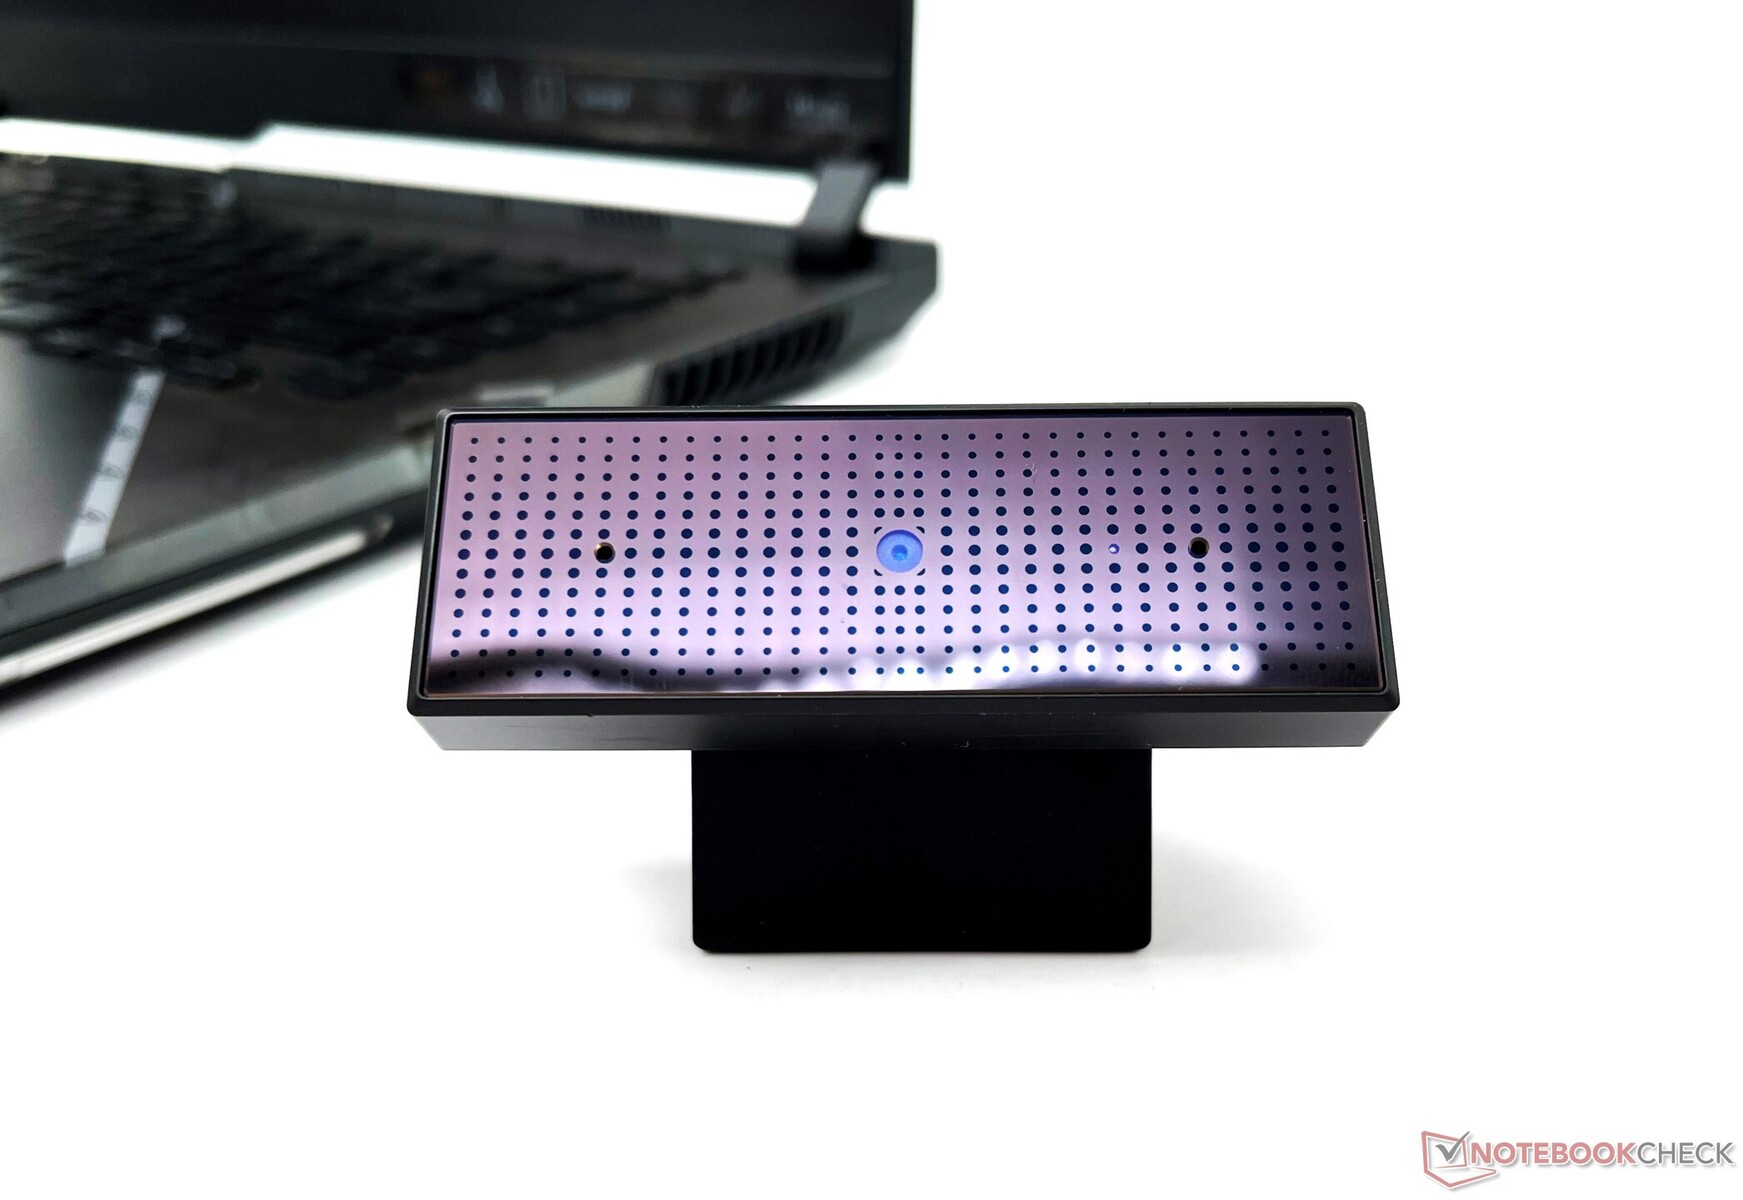
El ROG Strix Scar 15 no tiene webcam. Sin embargo, nuestra unidad de análisis venía con una webcam externa ROG Eye 1080p 60 fps con micrófonos duales beamforming integrados. La webcam puede usarse en el escritorio o montarse en el bisel superior del Scar 15.
La calidad de imagen de la ROG Eye es bastante utilizable en su mayor parte. La cámara ROG Eye muestra una precisión de color Delta E media de 15,12 con nuestro ColorChecker Passport en una habitación bien iluminada, con los valores Delta E más bajos vistos en los parches blancos y negros.
El gráfico de prueba muestra detalles decentes, pero hay una falta de nitidez y claridad en la imagen. La webcam ROG Eye te costará unos ₹5.800 (~US$75 o menos) si la compras por separado.


Seguridad
Dado que el ROG Strix Scar 15 está orientado al público gaming, Asus ha escatimado en características de seguridad como un lector de huellas dactilares o una cámara IR. Sin embargo, hay un módulo TPM 2.0 presente.
Accesorios
La caja contiene el adaptador de corriente y la documentación habitual. También incluye la llave ROG Keystone 2 y dos tapas ROG Armor reemplazables. Nuestra unidad se envió con la webcam externa ROG Eye, pero algunas unidades de venta pueden no ofrecerse con una dependiendo del SKU y la región.
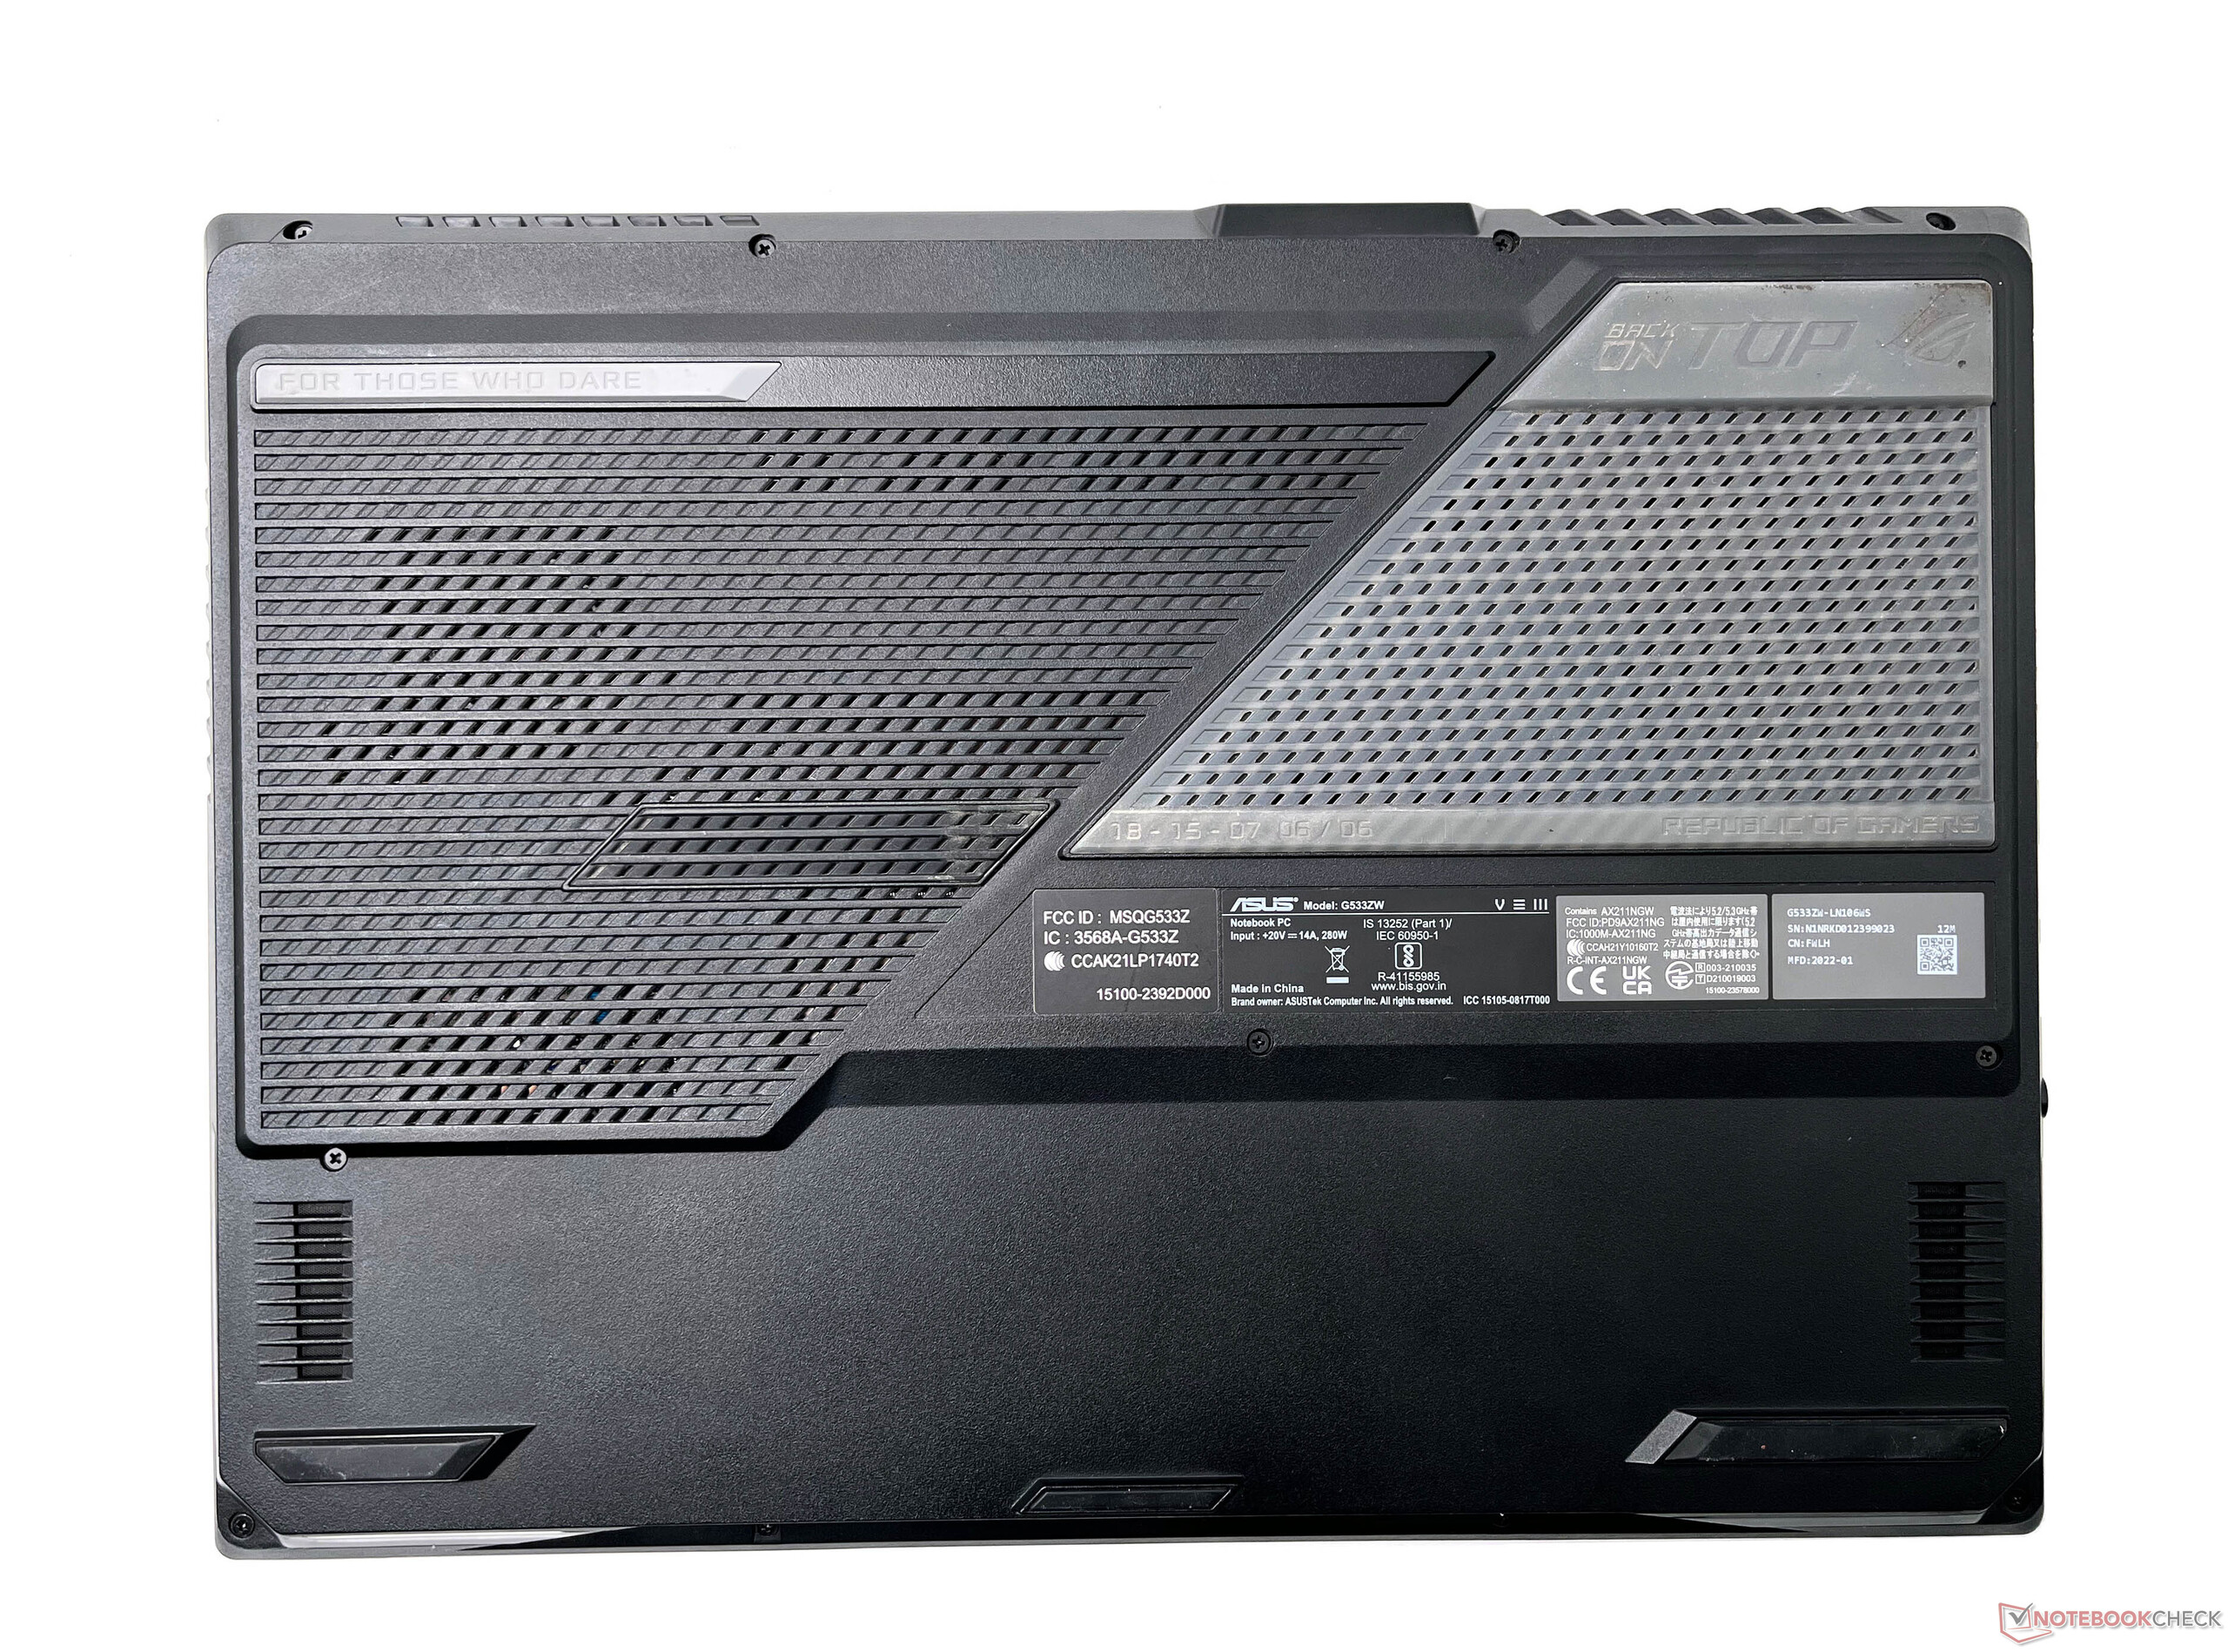
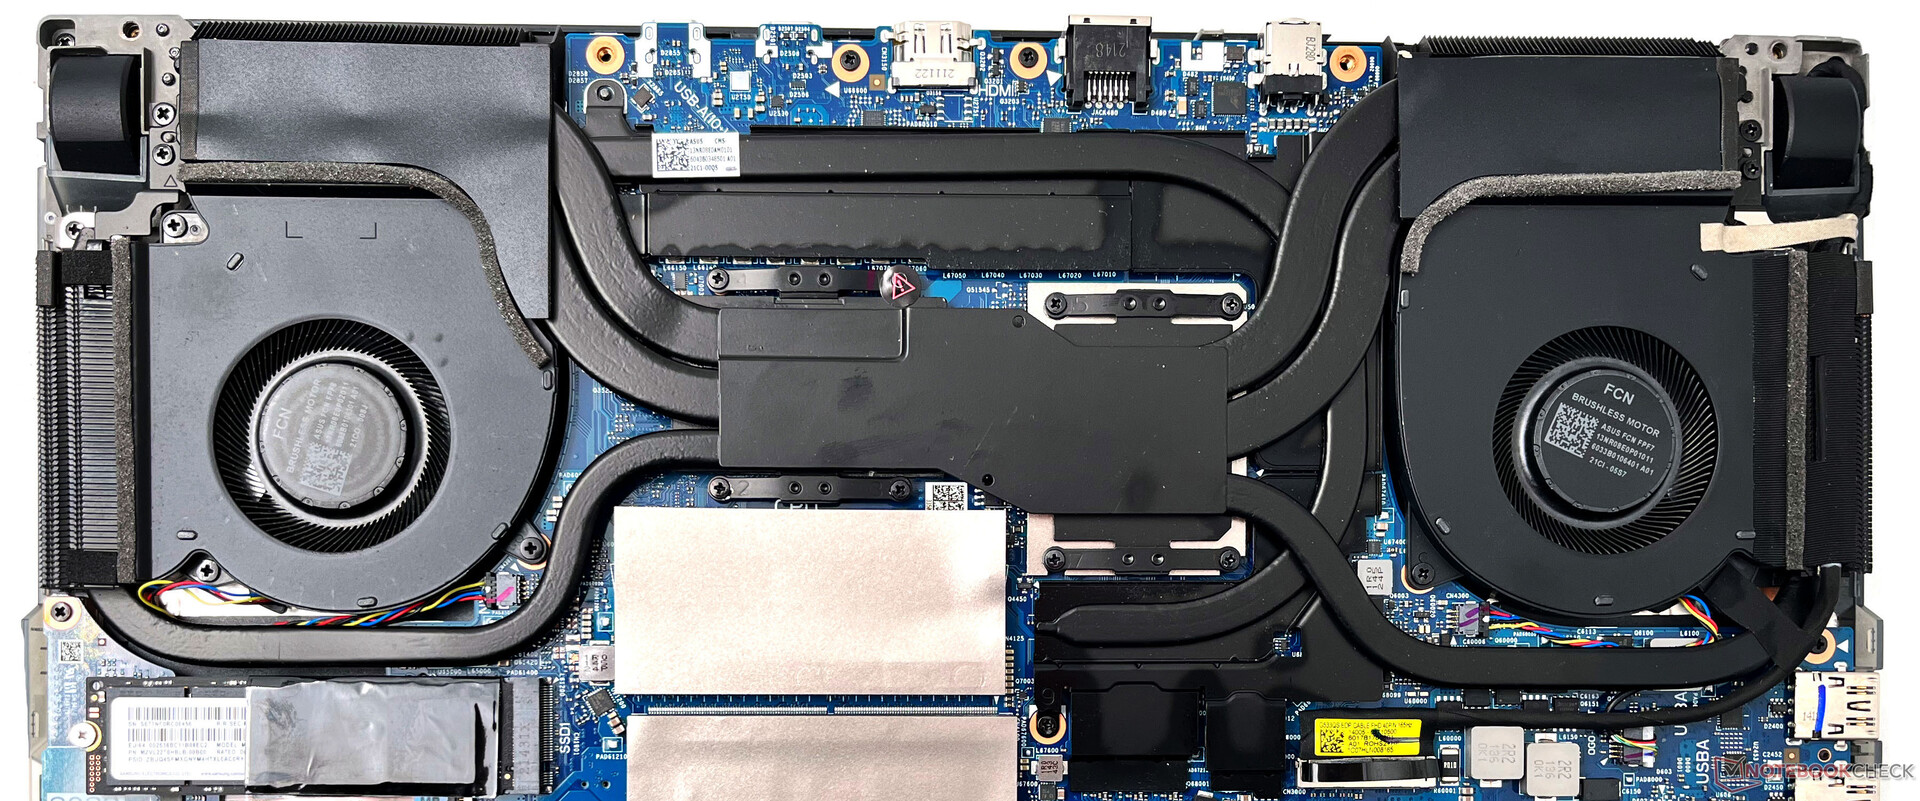
Mantenimiento
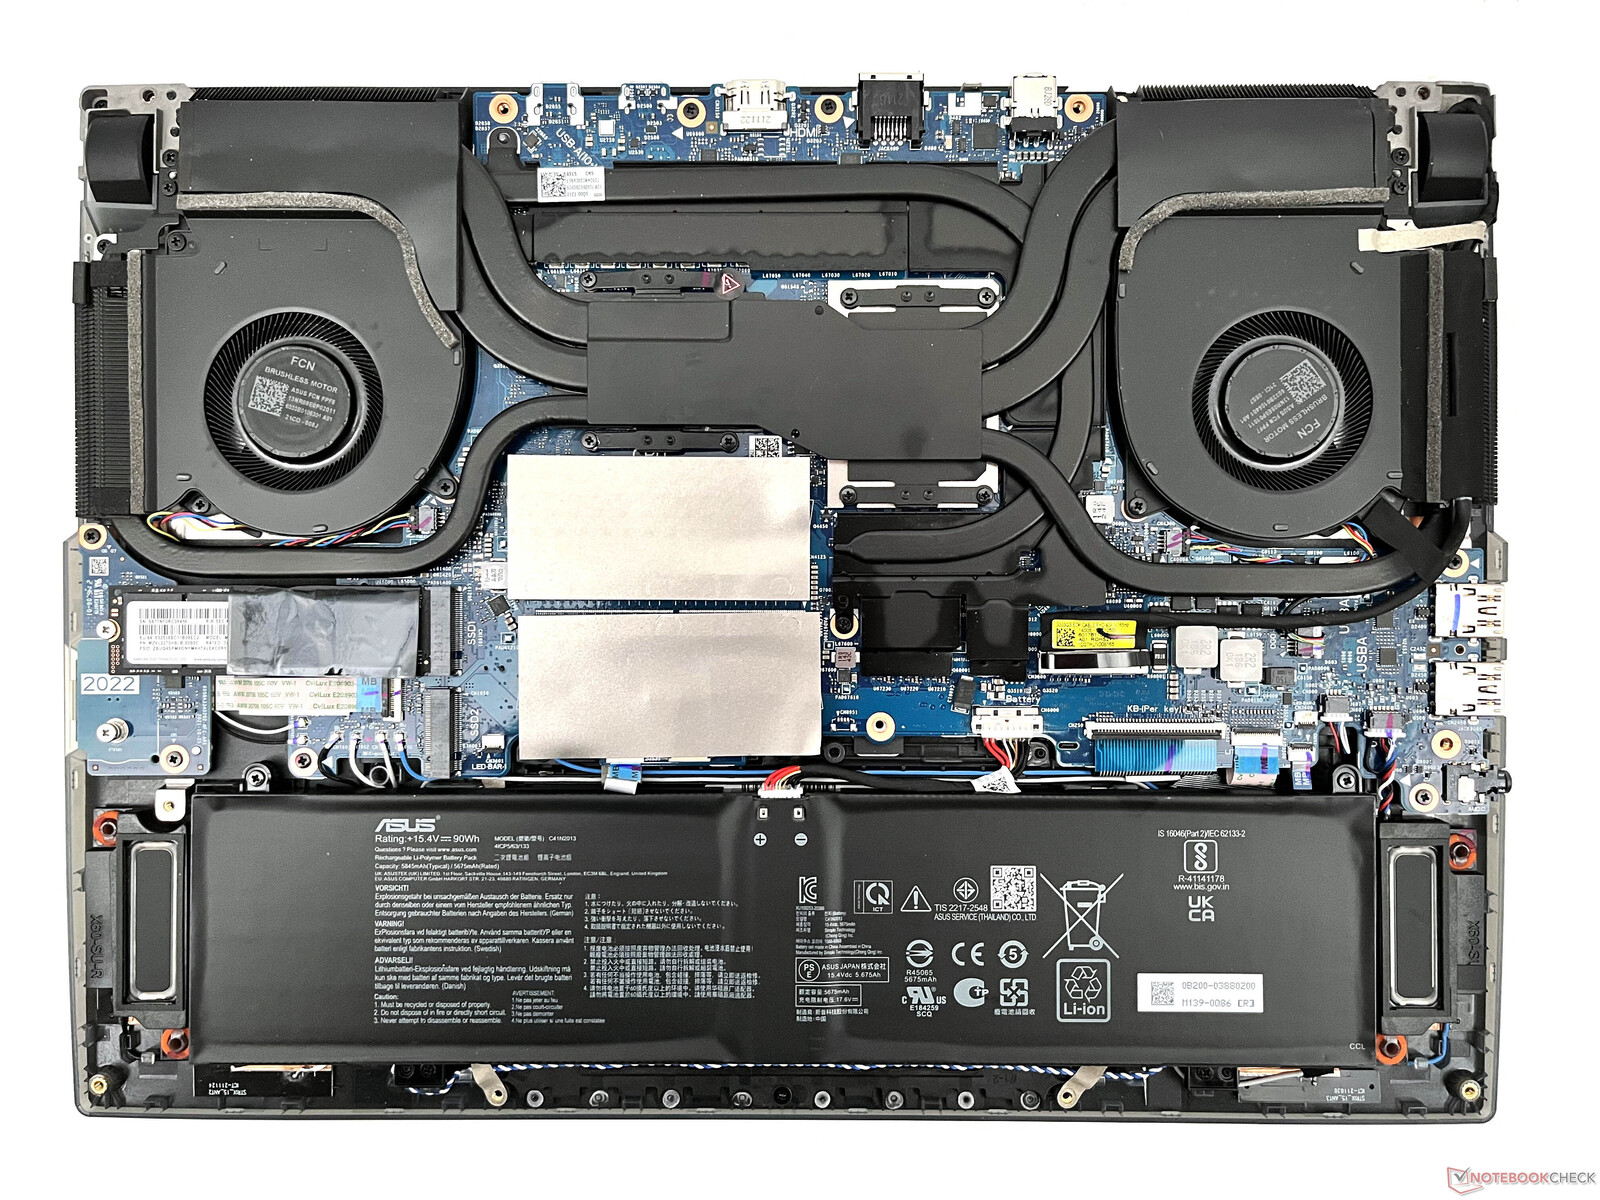
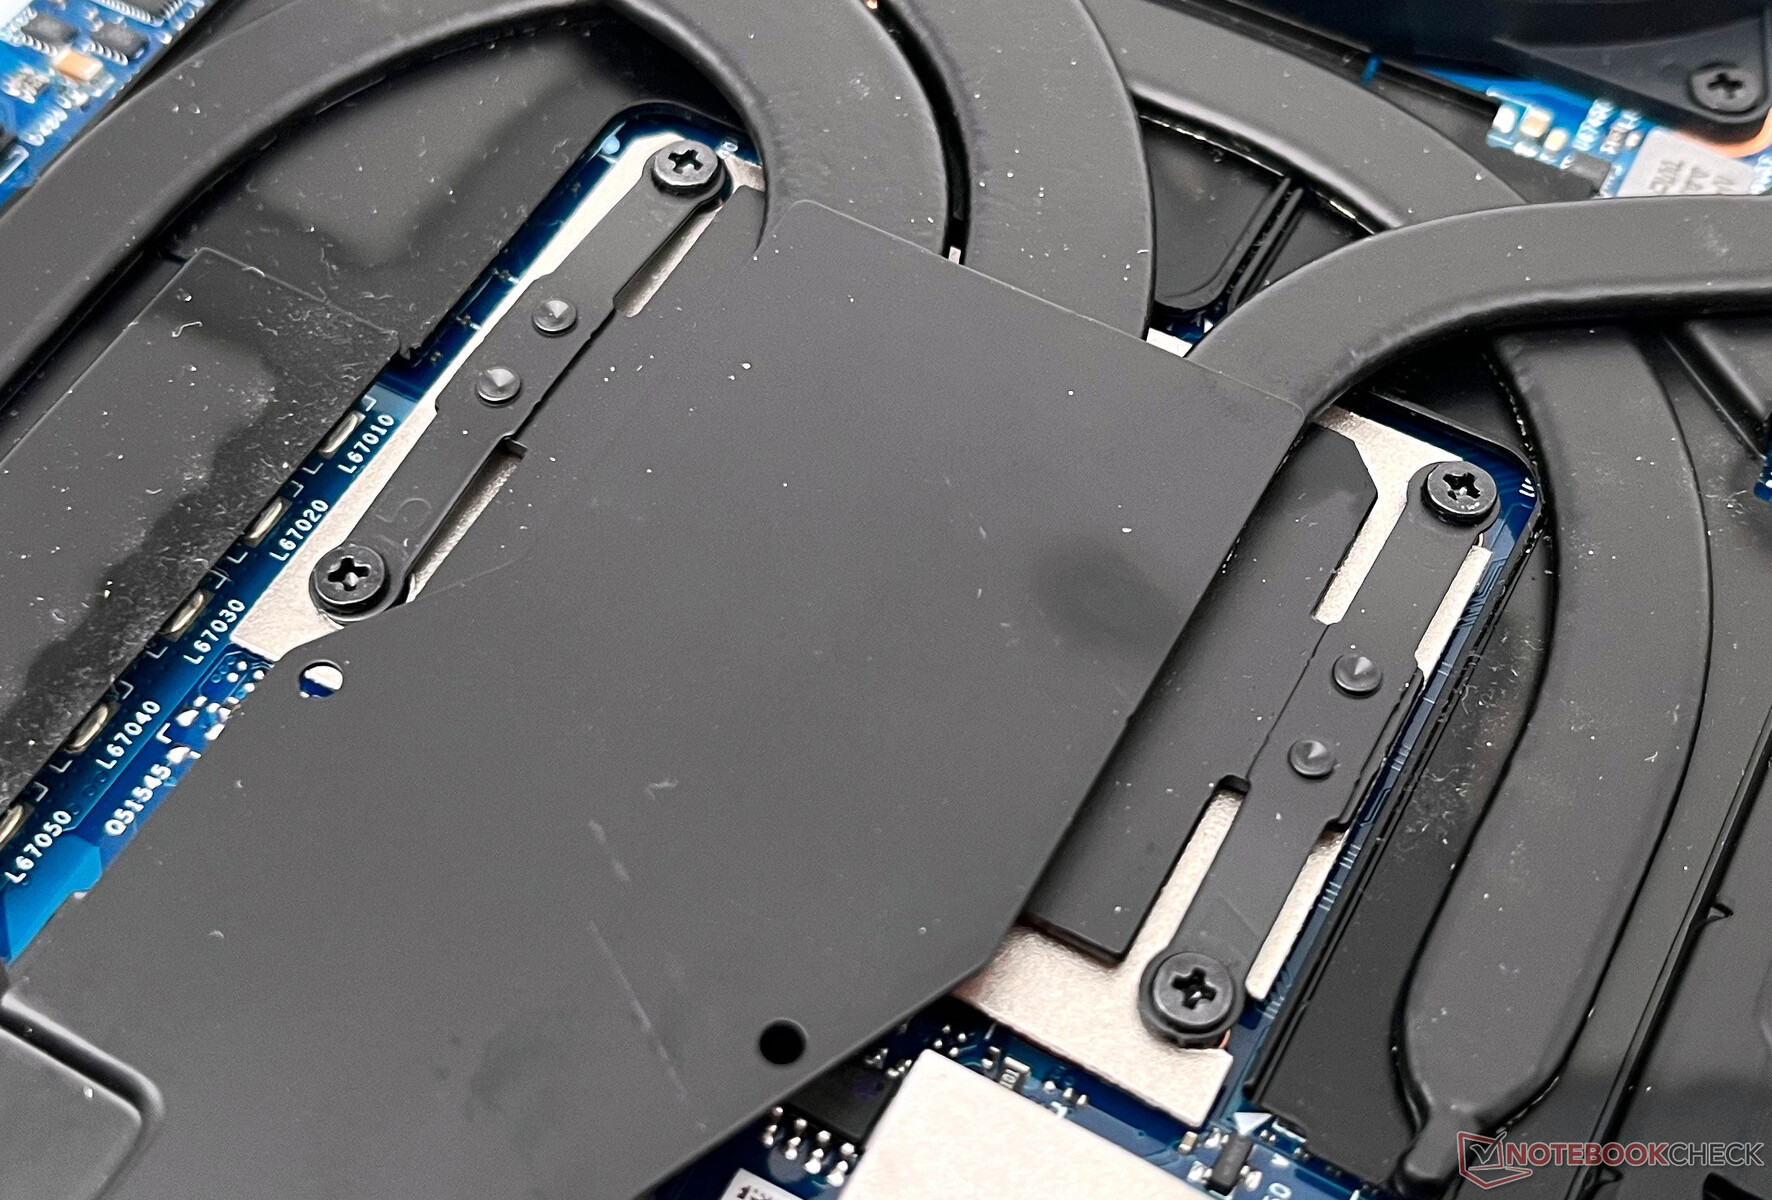
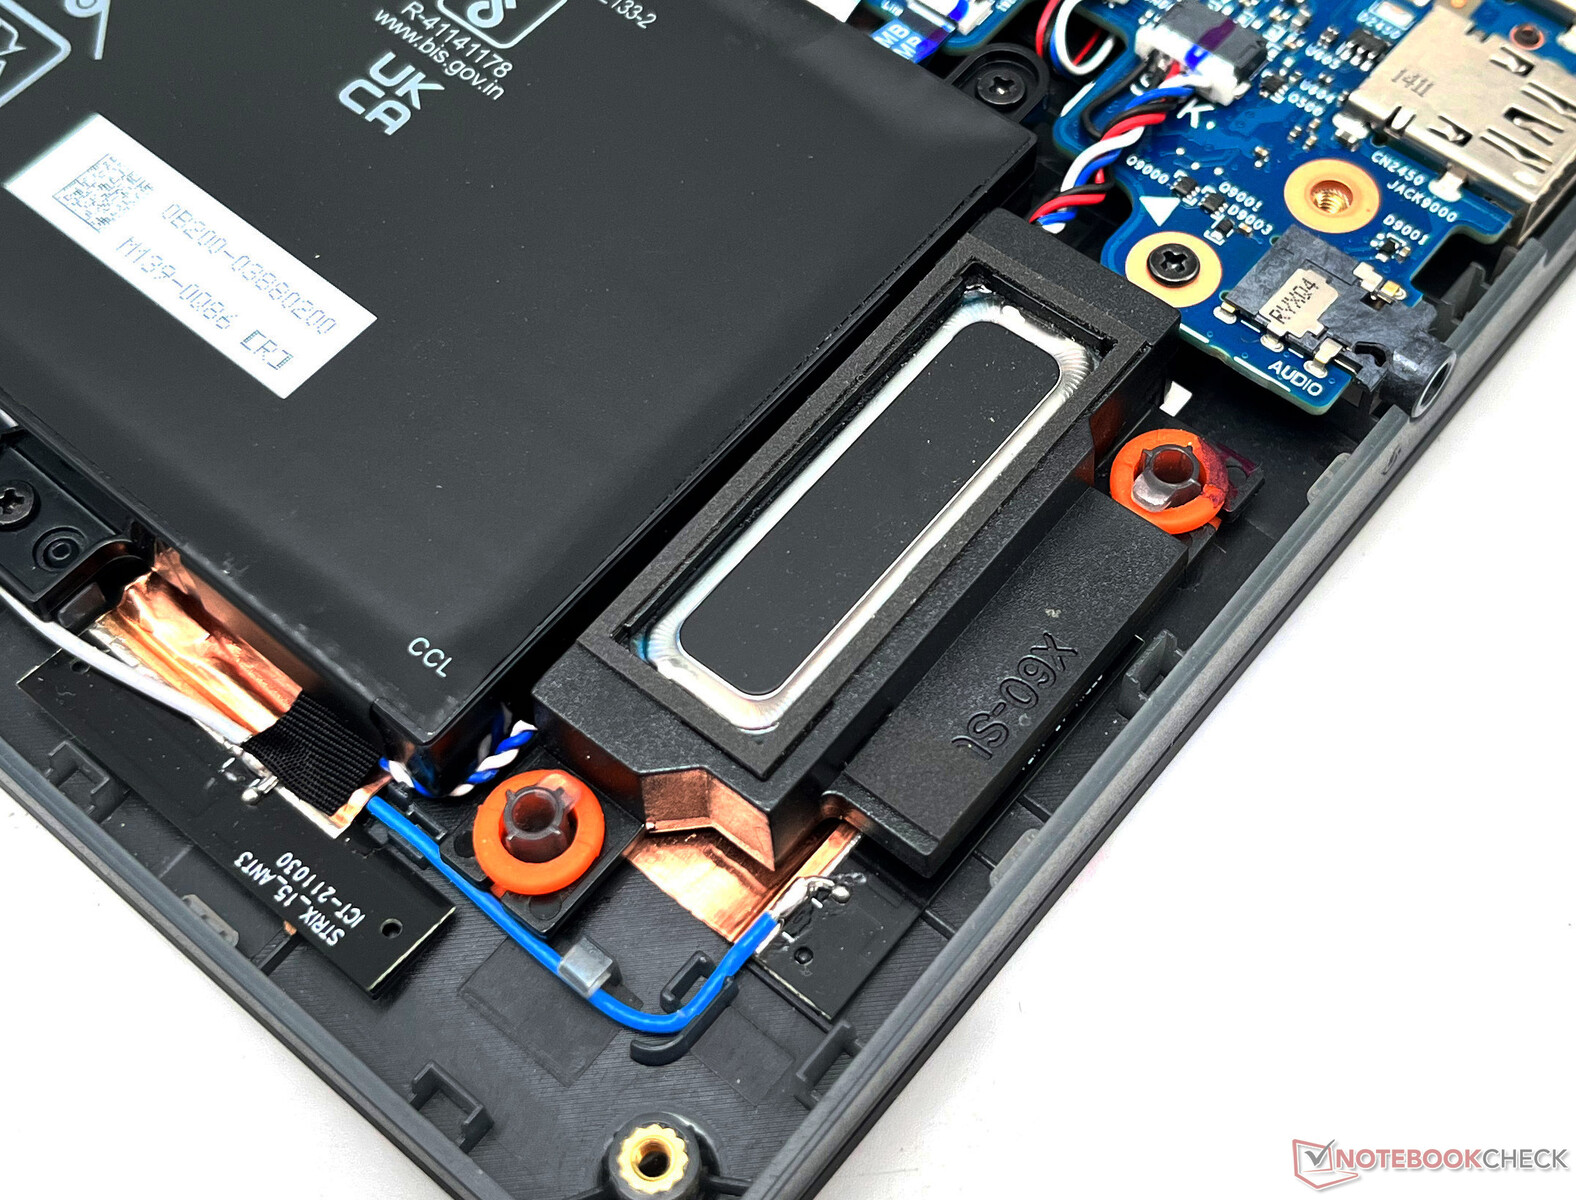
El panel inferior puede abrirse fácilmente tras retirar los 10 tornillos PH0. Sin embargo, hay que tener cuidado aquí, ya que hay cables de cinta frágiles que van desde el panel inferior a la placa base. Estos cables controlan la barra de luz RGB en el borde frontal del panel inferior.
Tener la barra RGB del chasis en este lugar no es una buena idea, en nuestra opinión, ya que complica el acceso a las partes internas debido a los finos cables que pueden romperse si no se tiene cuidado al desprender el panel inferior. Los LEDs deberían haber sido parte del propio chasis principal, idealmente como el MSI GE76 Raider, por ejemplo.
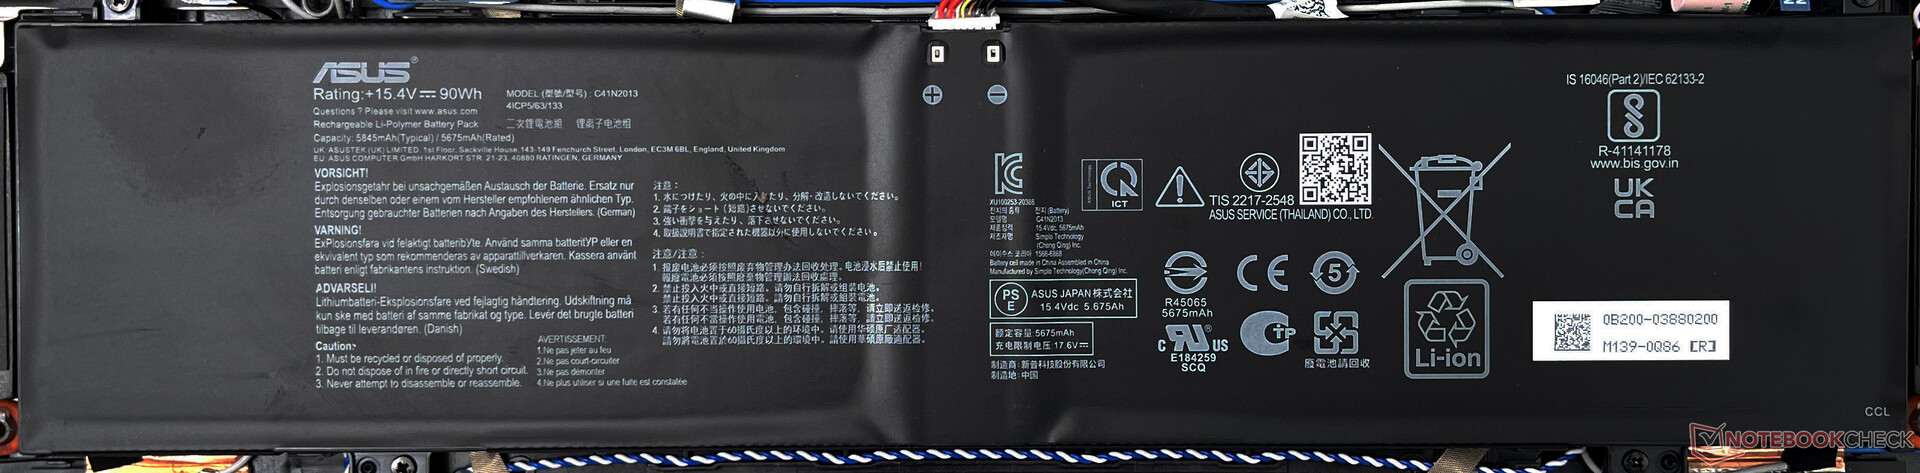
Las entrañas no presentan ninguna sorpresa en particular. Tienes SO-DIMMs intercambiables, SSDs M.2, y tarjeta WLAN, una gran batería de 90 Whr, y un sistema de refrigeración de ocho tubos de calor con doble ventilador.
Garantía
Asus ofrece una garantía estándar de un año para el ROG Strix Scar 15 en la India. Las extensiones de garantía adicionales de Premium Care se pueden adquirir a través de la aplicación MyAsus o en una tienda Asus.
Los compradores indios pueden aprovechar las ofertas de Back to School para extensiones de garantía de dos y tres años y protección contra daños accidentales en varias carteras de portátiles Asus, incluida la serie ROG, en los 15 días siguientes a la compra.
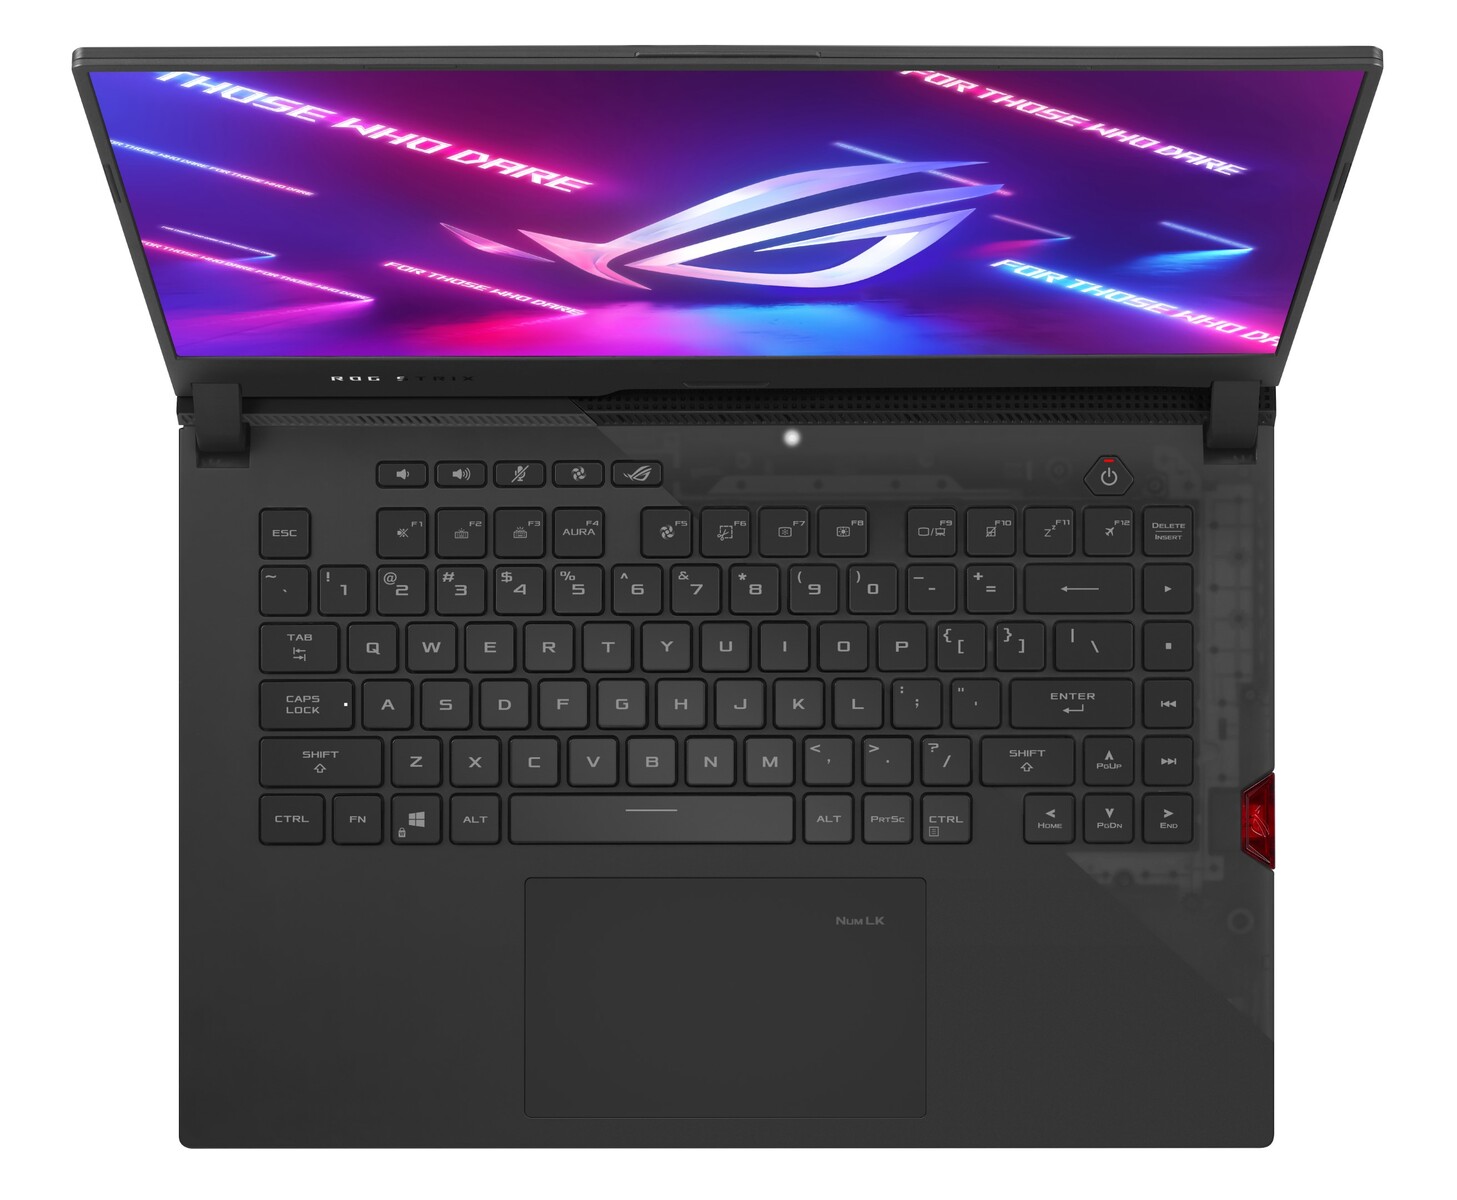
Dispositivos de entrada: Volver a los interruptores de membrana
Teclado
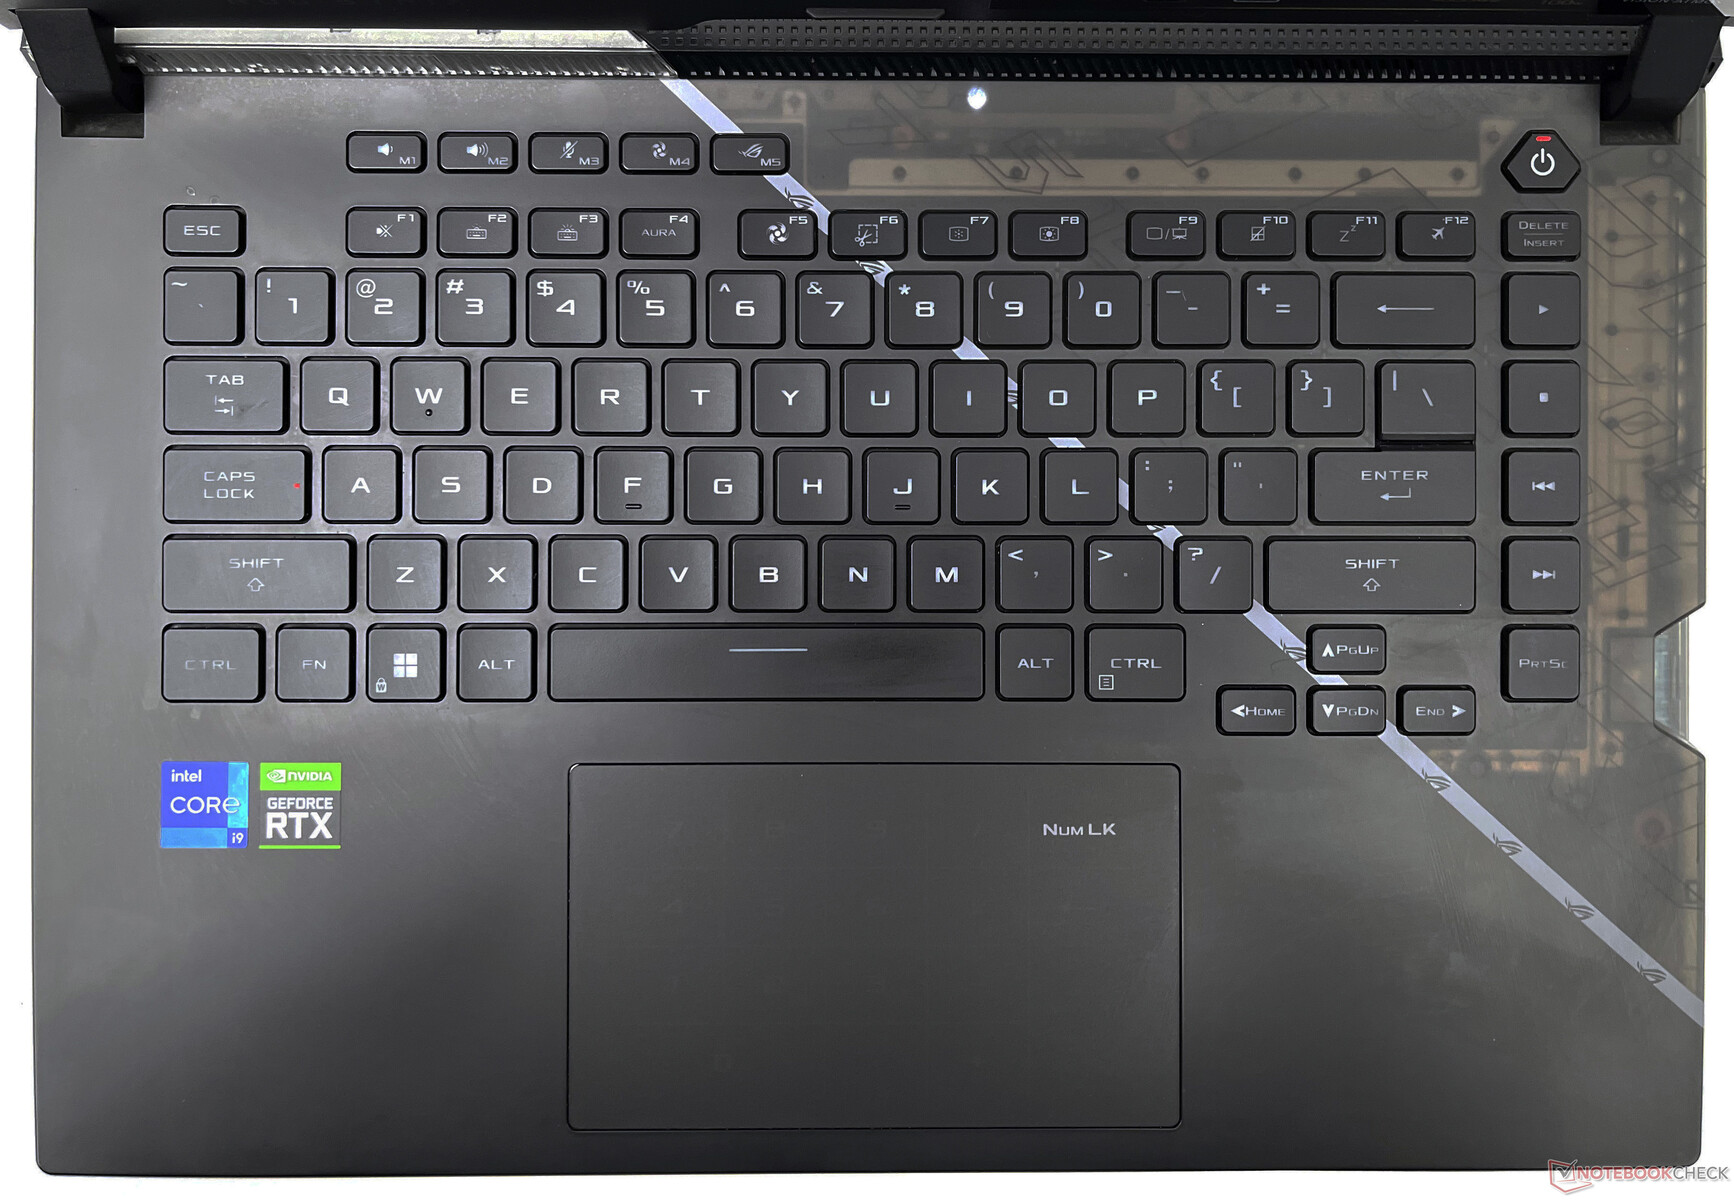
La cubierta mate del teclado es un imán para las manchas y la grasa a pesar de las afirmaciones de Asus de lo contrario. El2021 ROG Strix Scar 15contaba con interruptores opto-mecánicos, pero Asus ha vuelto al clásico interruptor de cúpula de membrana para el Scar 15 de este año. Para compensar, Asus usa lo que llama ROG Overstroke, que registra la pulsación de una tecla en un momento anterior del recorrido. Las teclas están adecuadamente espaciadas y el tecleo, en general, es bastante cómodo con un tacto decente
La fila superior tiene atajos rápidos para el volumen, el silencio del micrófono, la velocidad del ventilador y la aplicación Armory Crate. Estas teclas también se pueden asignar a atajos y macros personalizados a través de Armory Crate. Las teclas de dirección son más pequeñas de lo que nos gustaría, pero cumplen su función. Asus dice que hay pequeñas rejillas de ventilación alrededor de las teclas WASD para que entre aire en el chasis y evitar el calentamiento del teclado.
El brillo RGB es más que adecuado para disfrutar de varios efectos de iluminación a través de Aura Sync. Todas las teclas se pueden iluminar individualmente, pero a Asus le gusta mantener las letras F1-F12 en la oscuridad por alguna razón.
Teclado táctil
El touchpad de 13 cm x 7,5 cm es espacioso y ofrece un deslizamiento suave. Sin embargo, los clics son poco profundos y algo ruidosos para nuestro gusto. Los jugadores estarían mejor con un ratón adecuado.
En el touchpad hay un interruptor de toque suave para un teclado numérico digital, que sólo brilla en blanco.
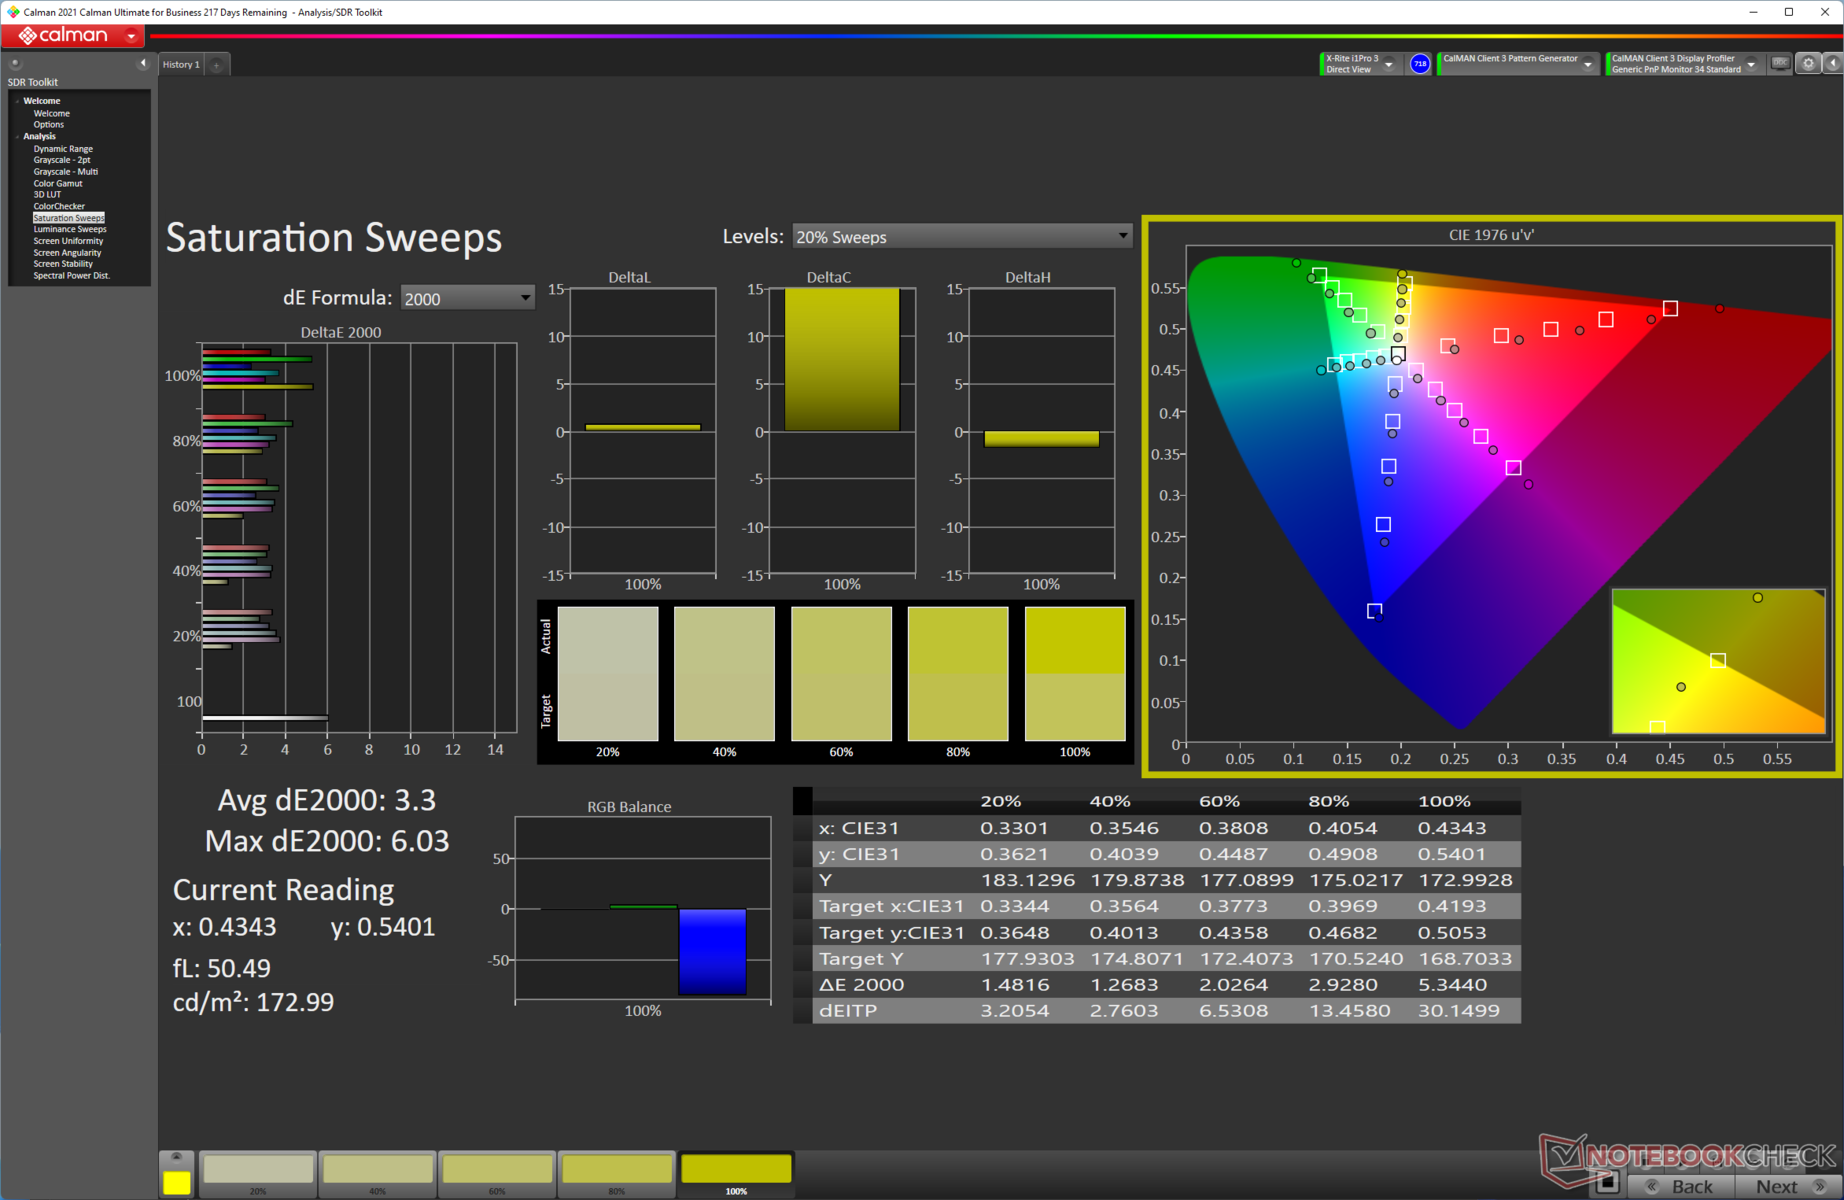
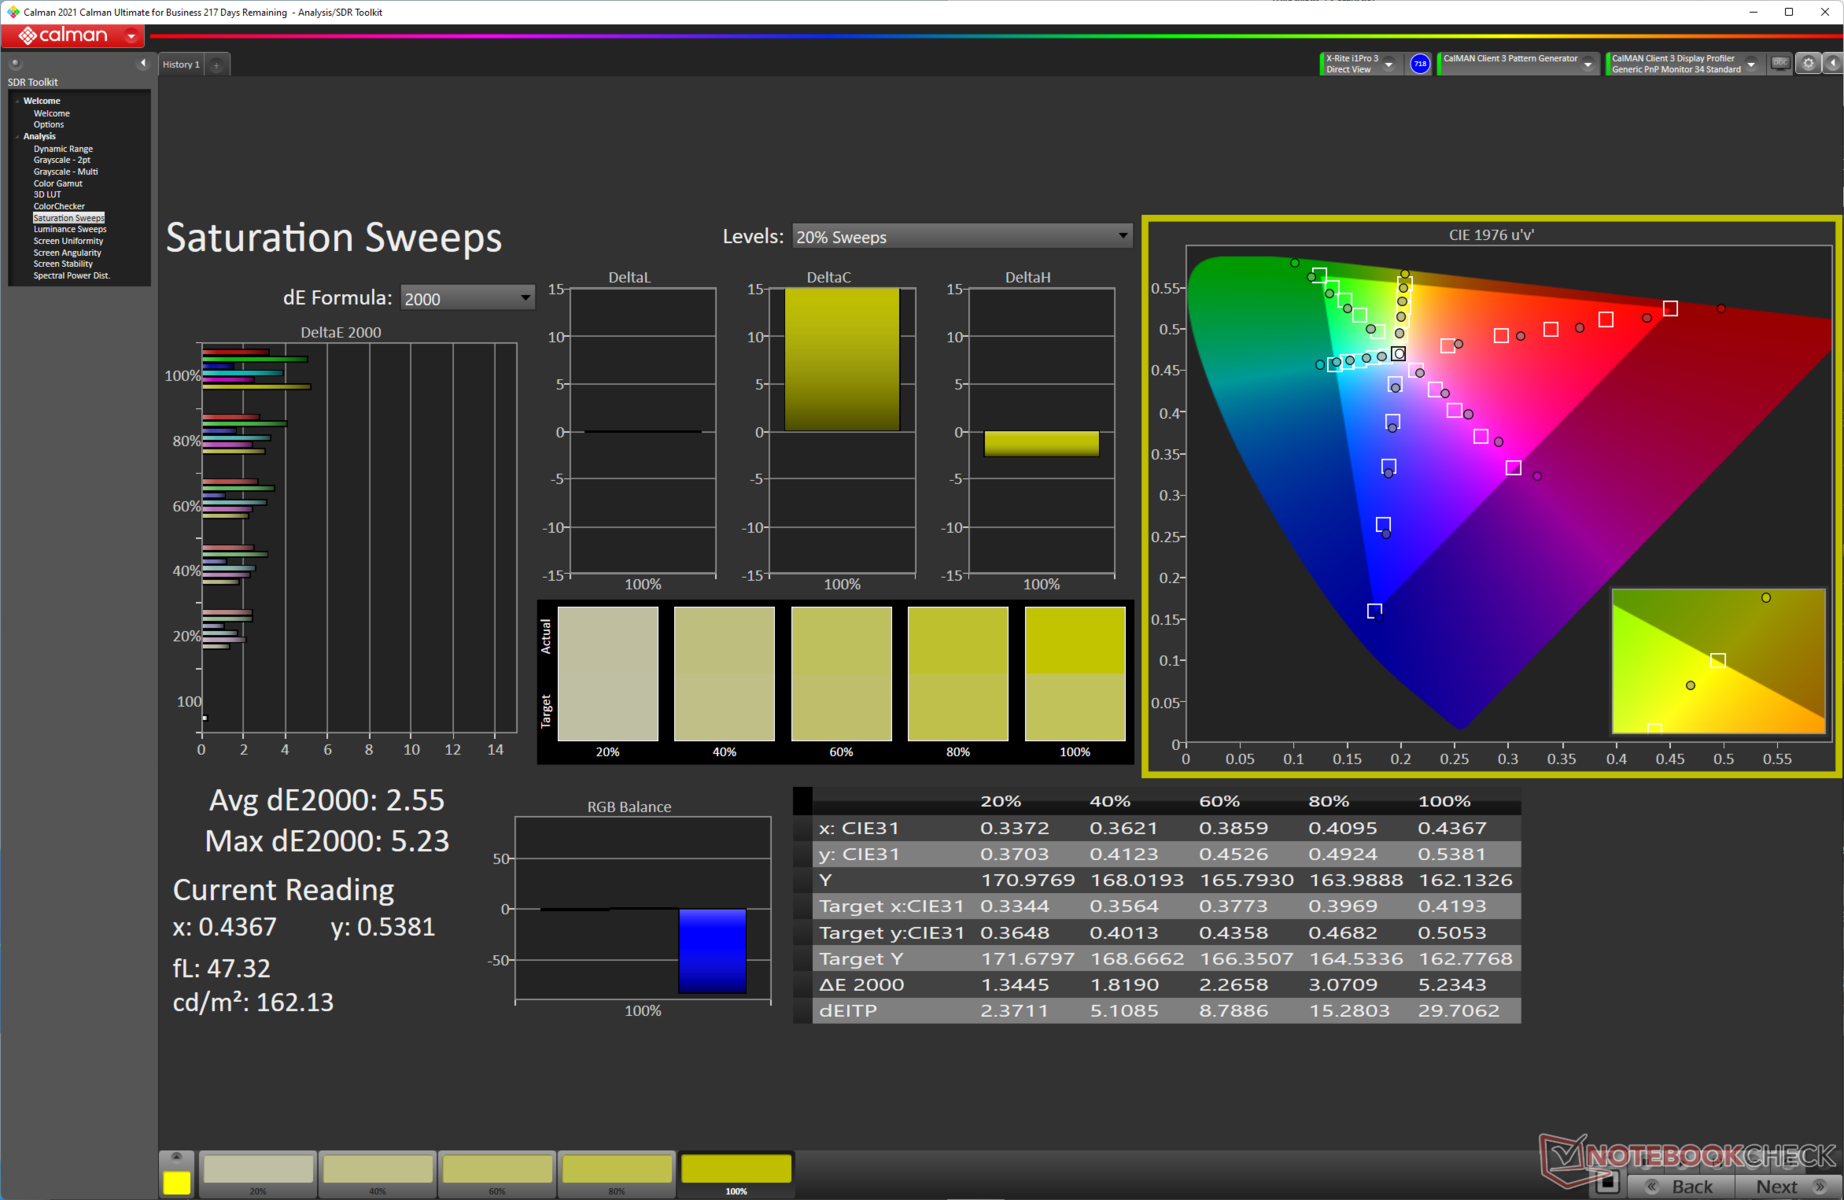
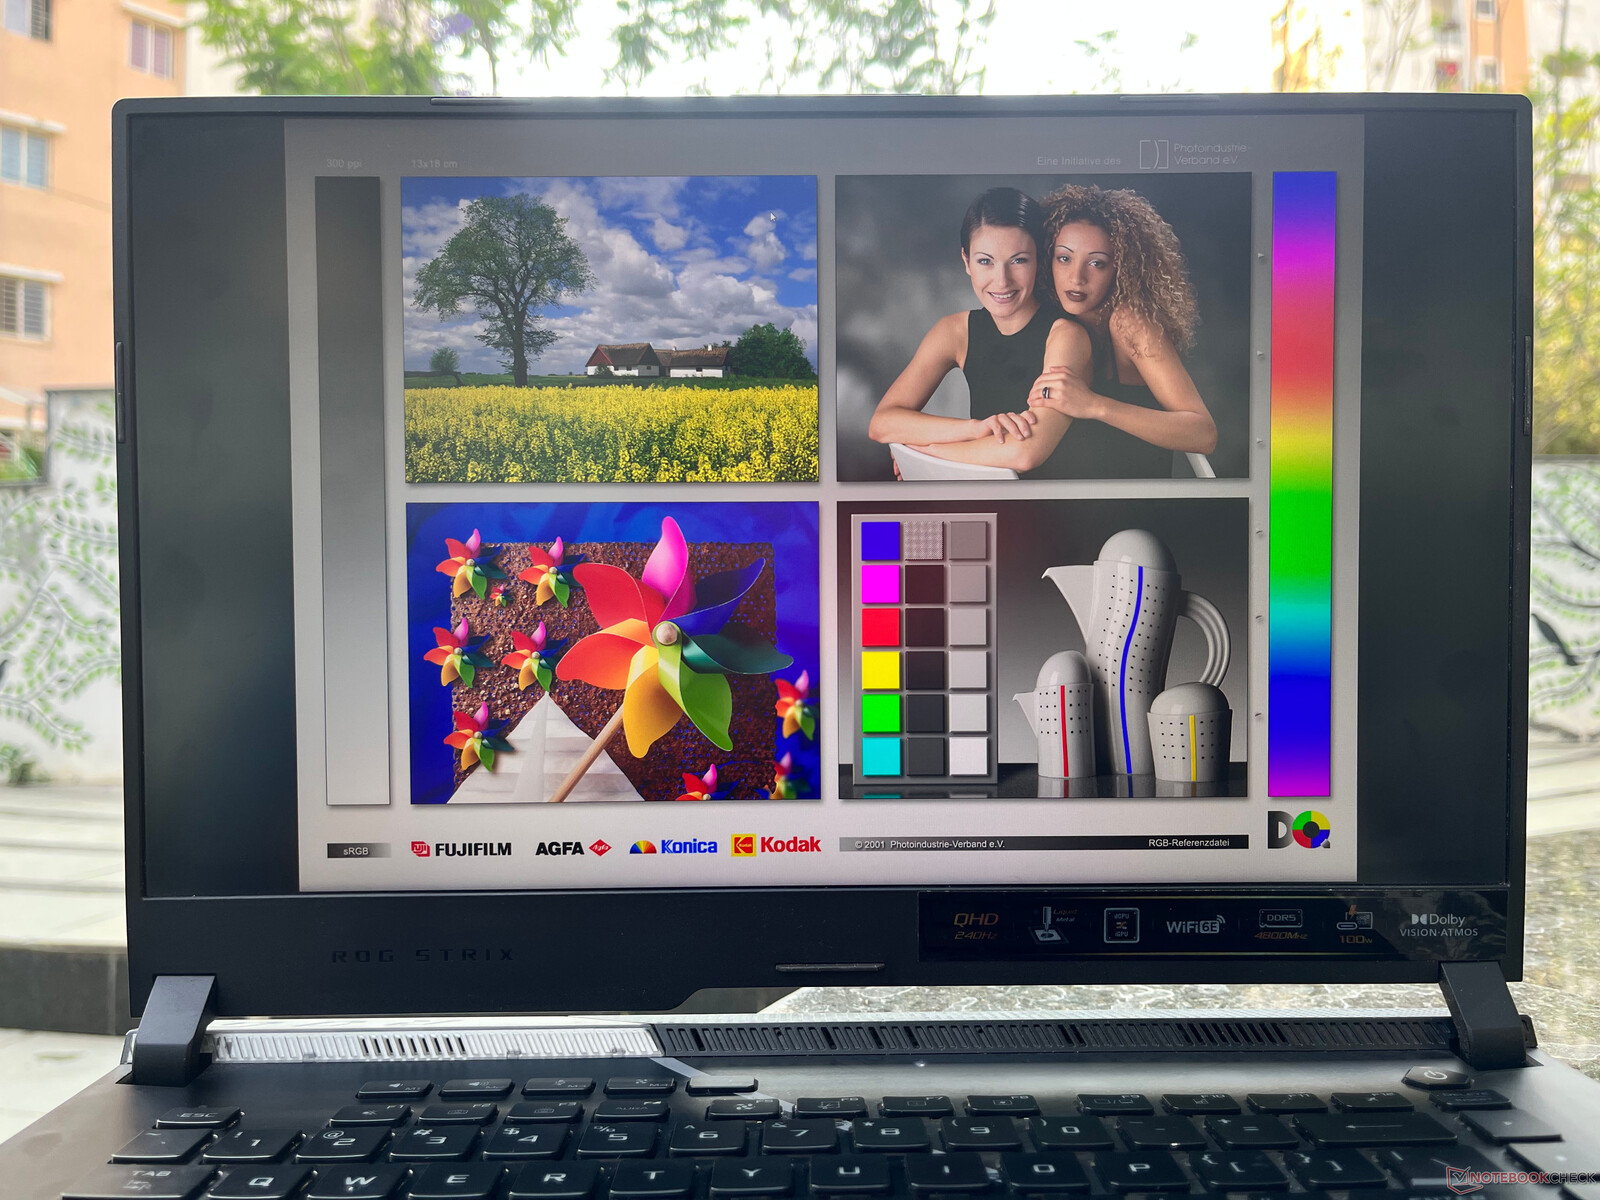
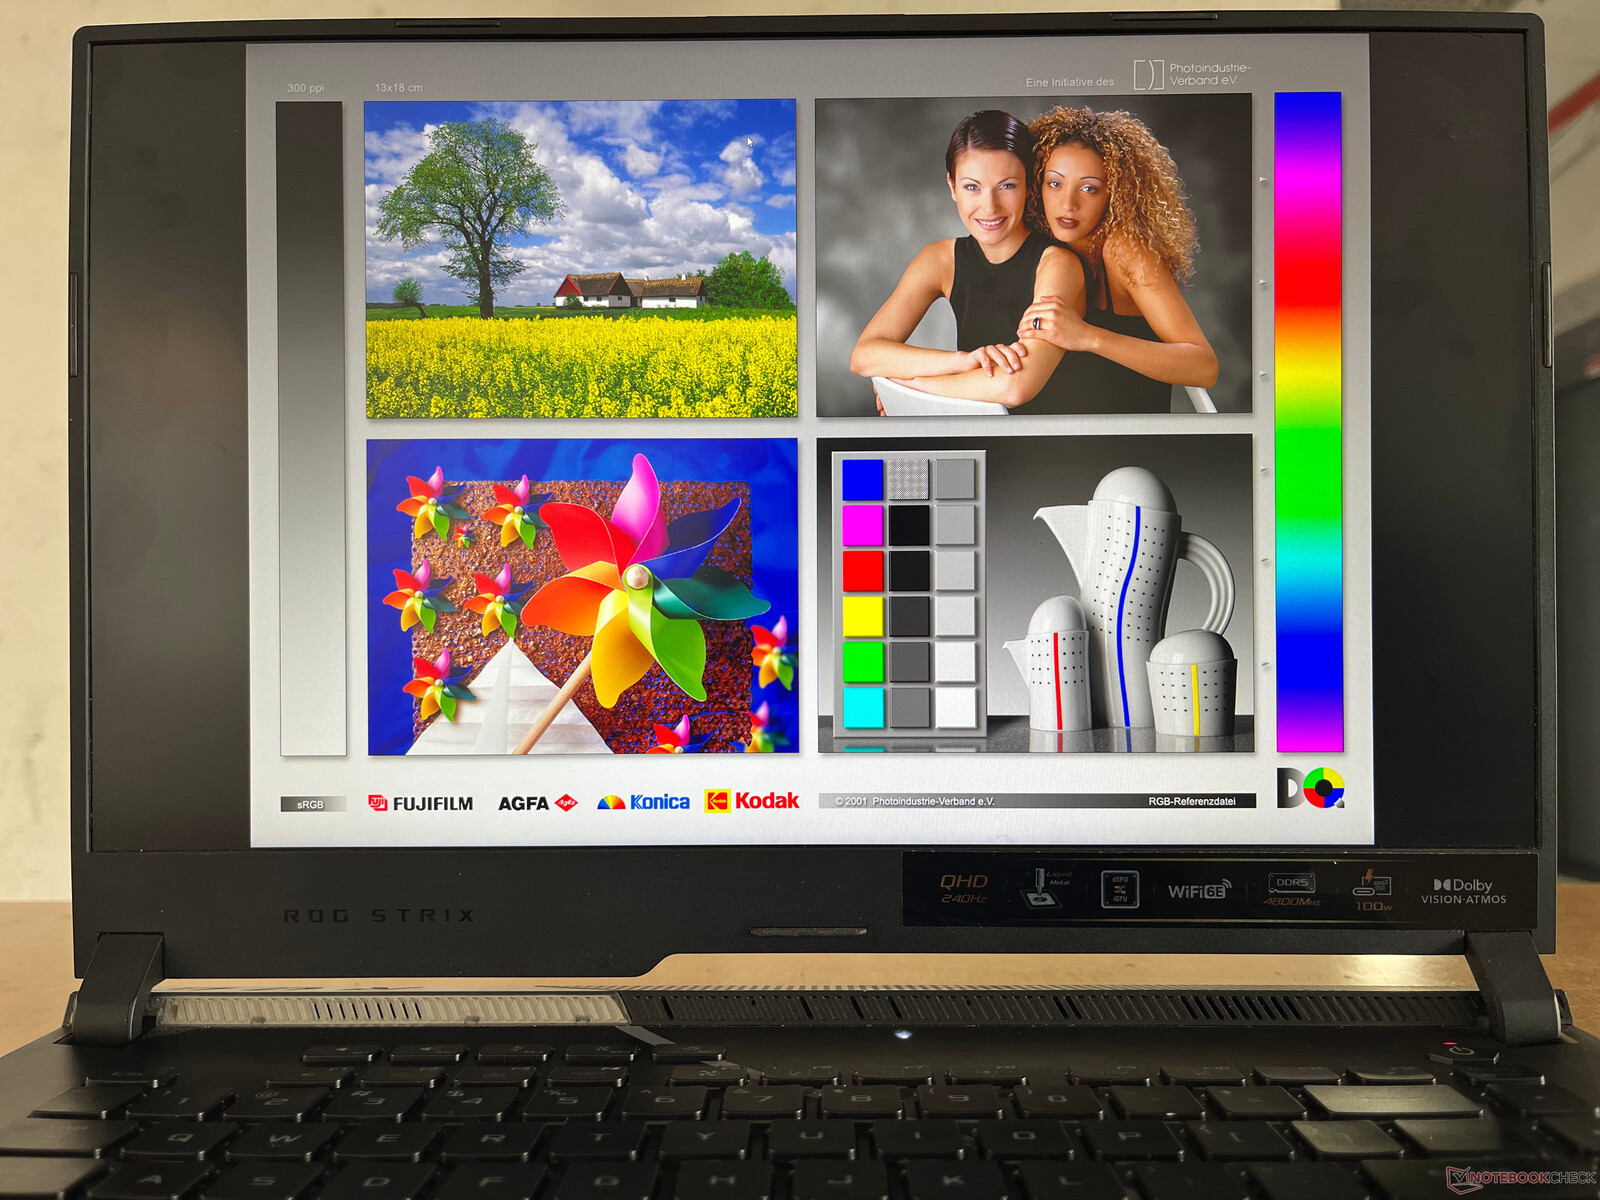
Pantalla: Dolby Vision con una relación de contraste pobre pero con tiempos de respuesta mejorados
Asus utiliza esencialmente el mismo panel QHD IPS BOE del año pasado en el nuevo Scar 15, pero con una ligera revisión en el número de modelo y una tasa de refresco de 240 Hz en todas las SKU de 15 y 17 pulgadas.
La pantalla del Scar 15 soporta Dolby Vision HDR y Adaptive Sync. Usamos el perfil "Bright" por defecto en la configuración de Dolby Vision para las mediciones posteriores.
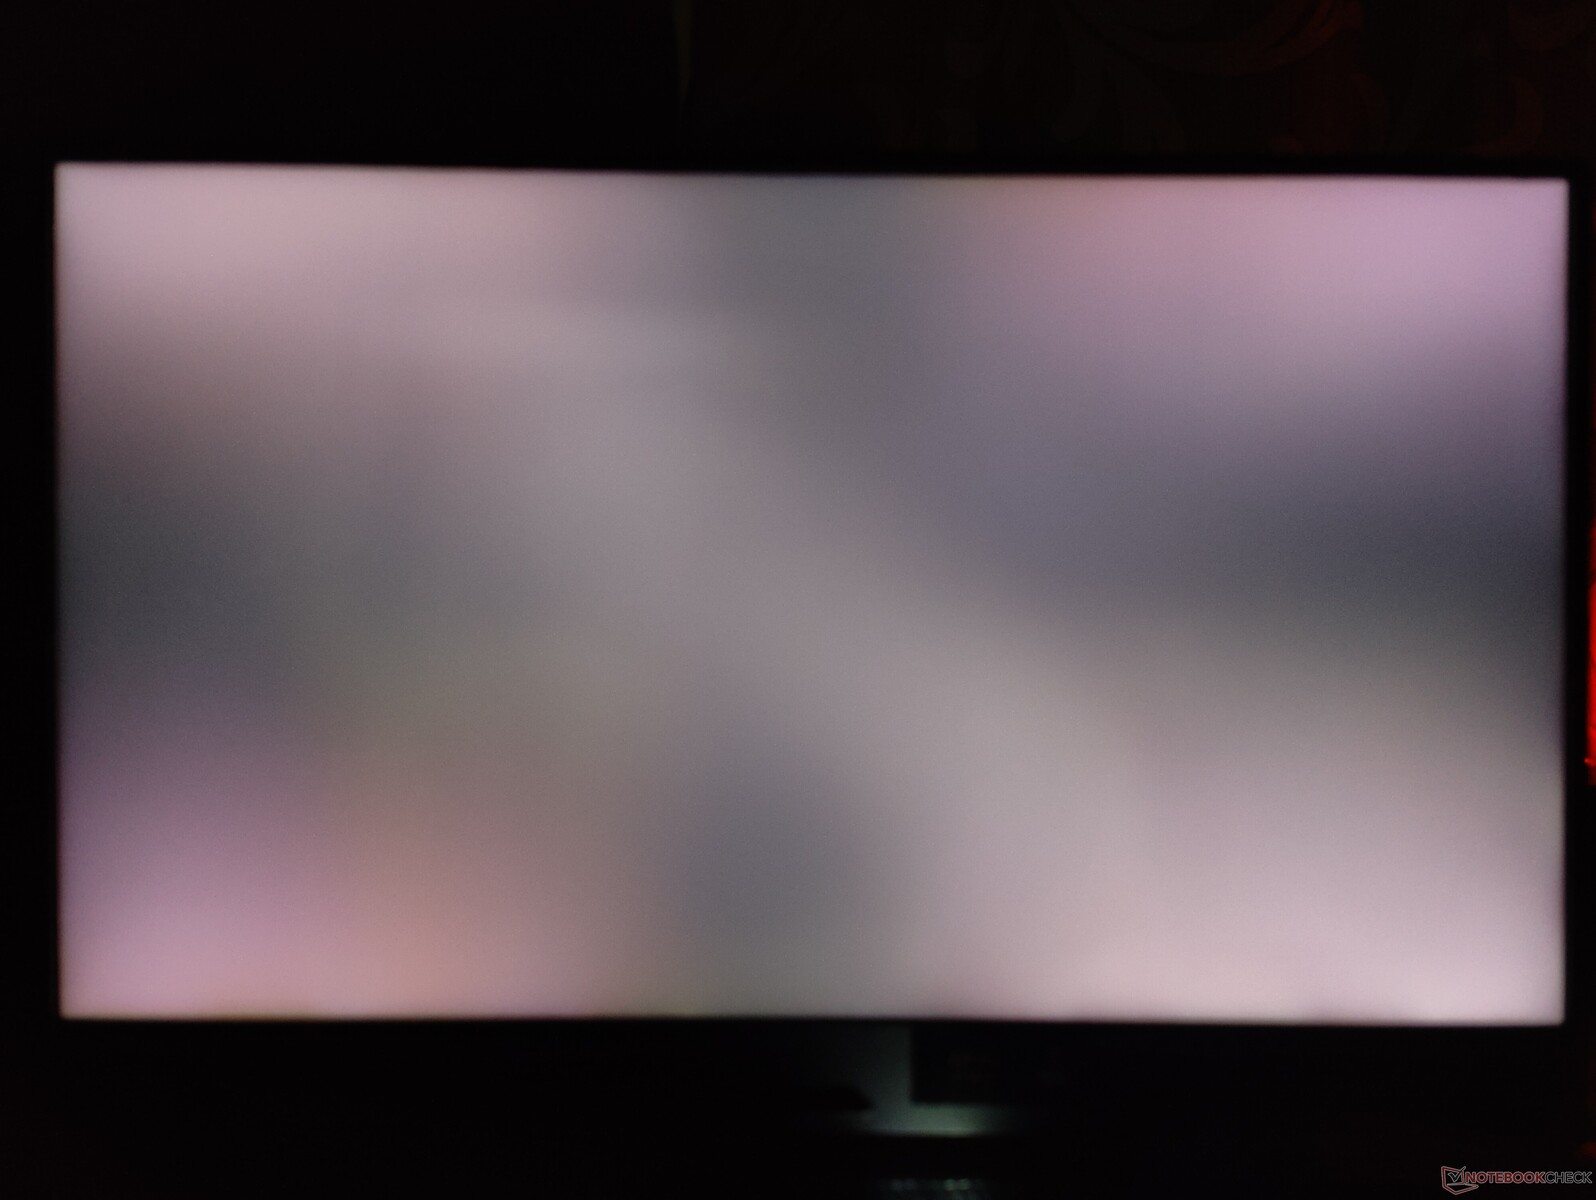
La disposición de los subpixeles parece un poco borrosa debido al revestimiento mate. Observamos un significativo sangrado de la luz de fondo en exposiciones largas.
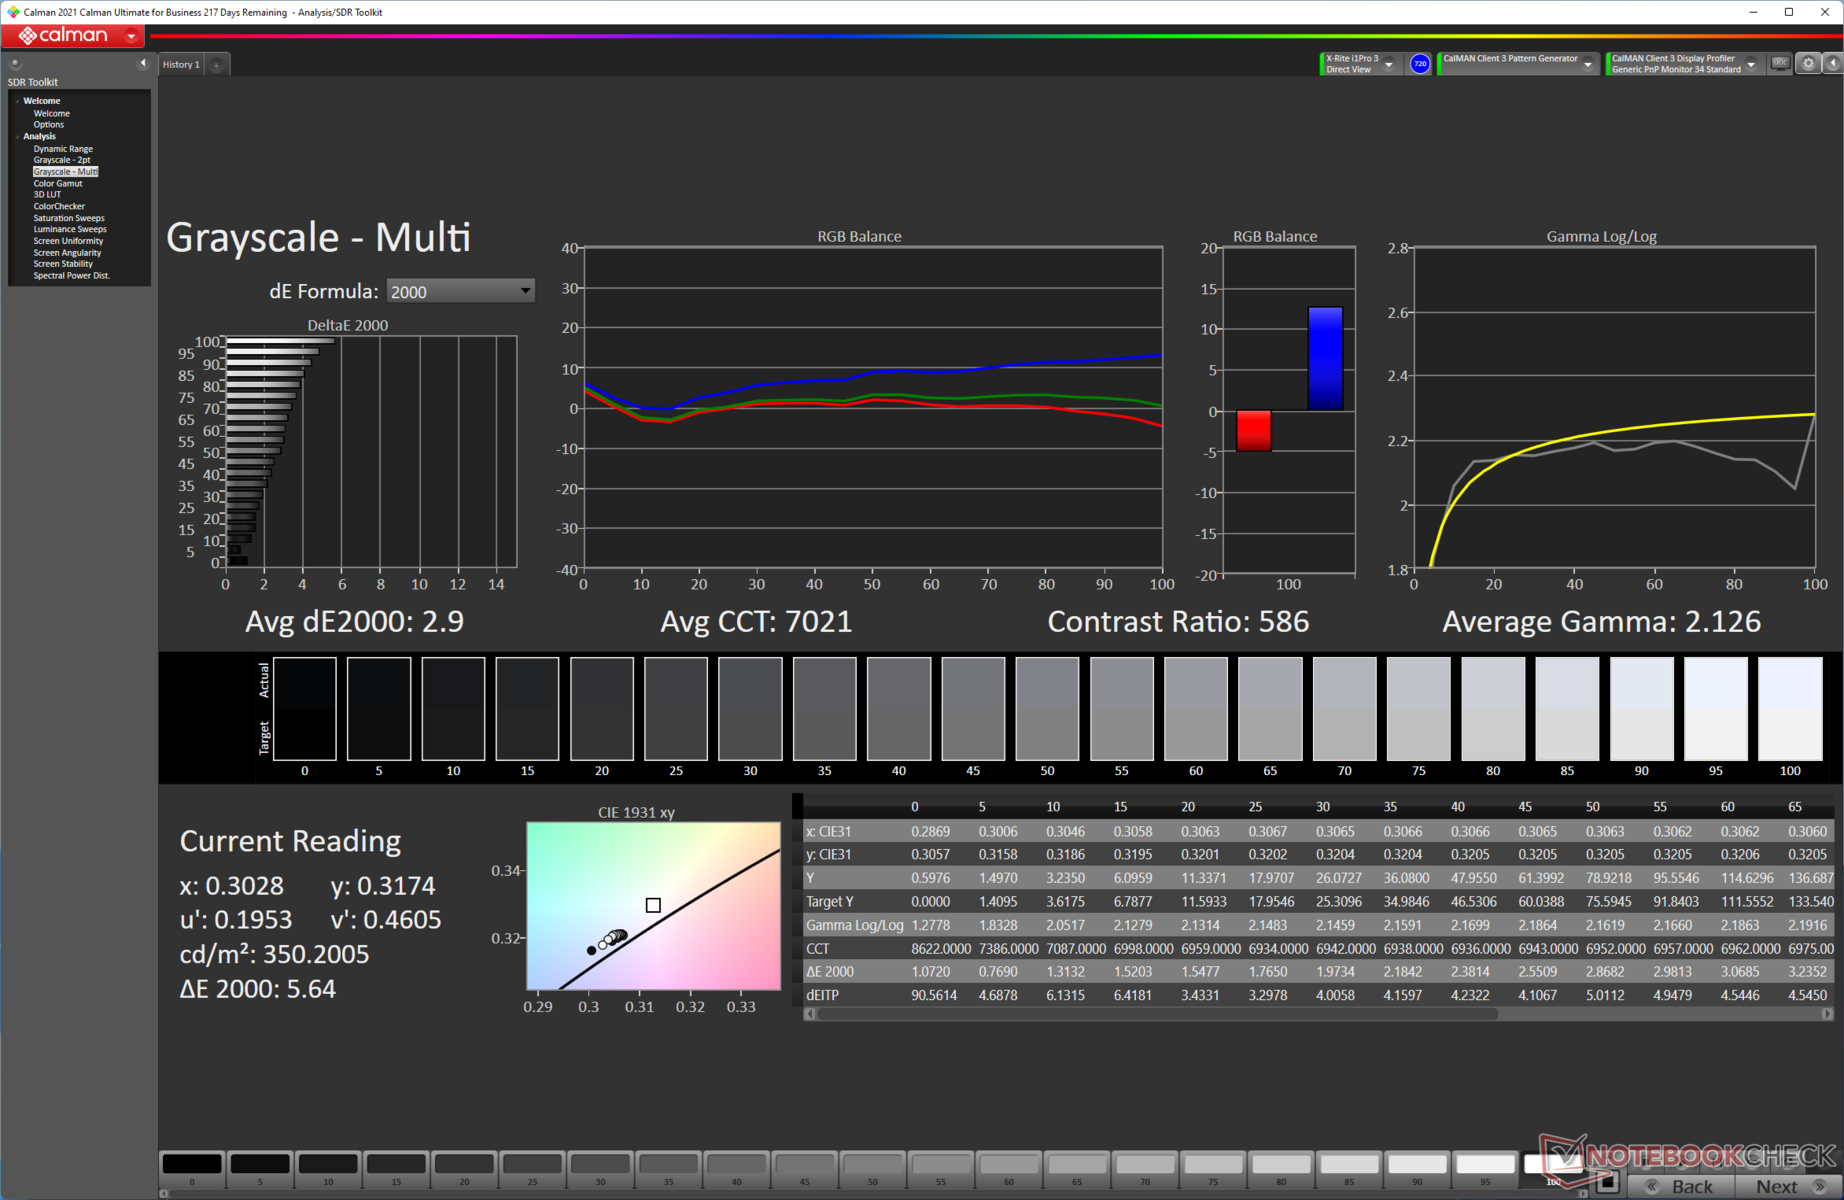
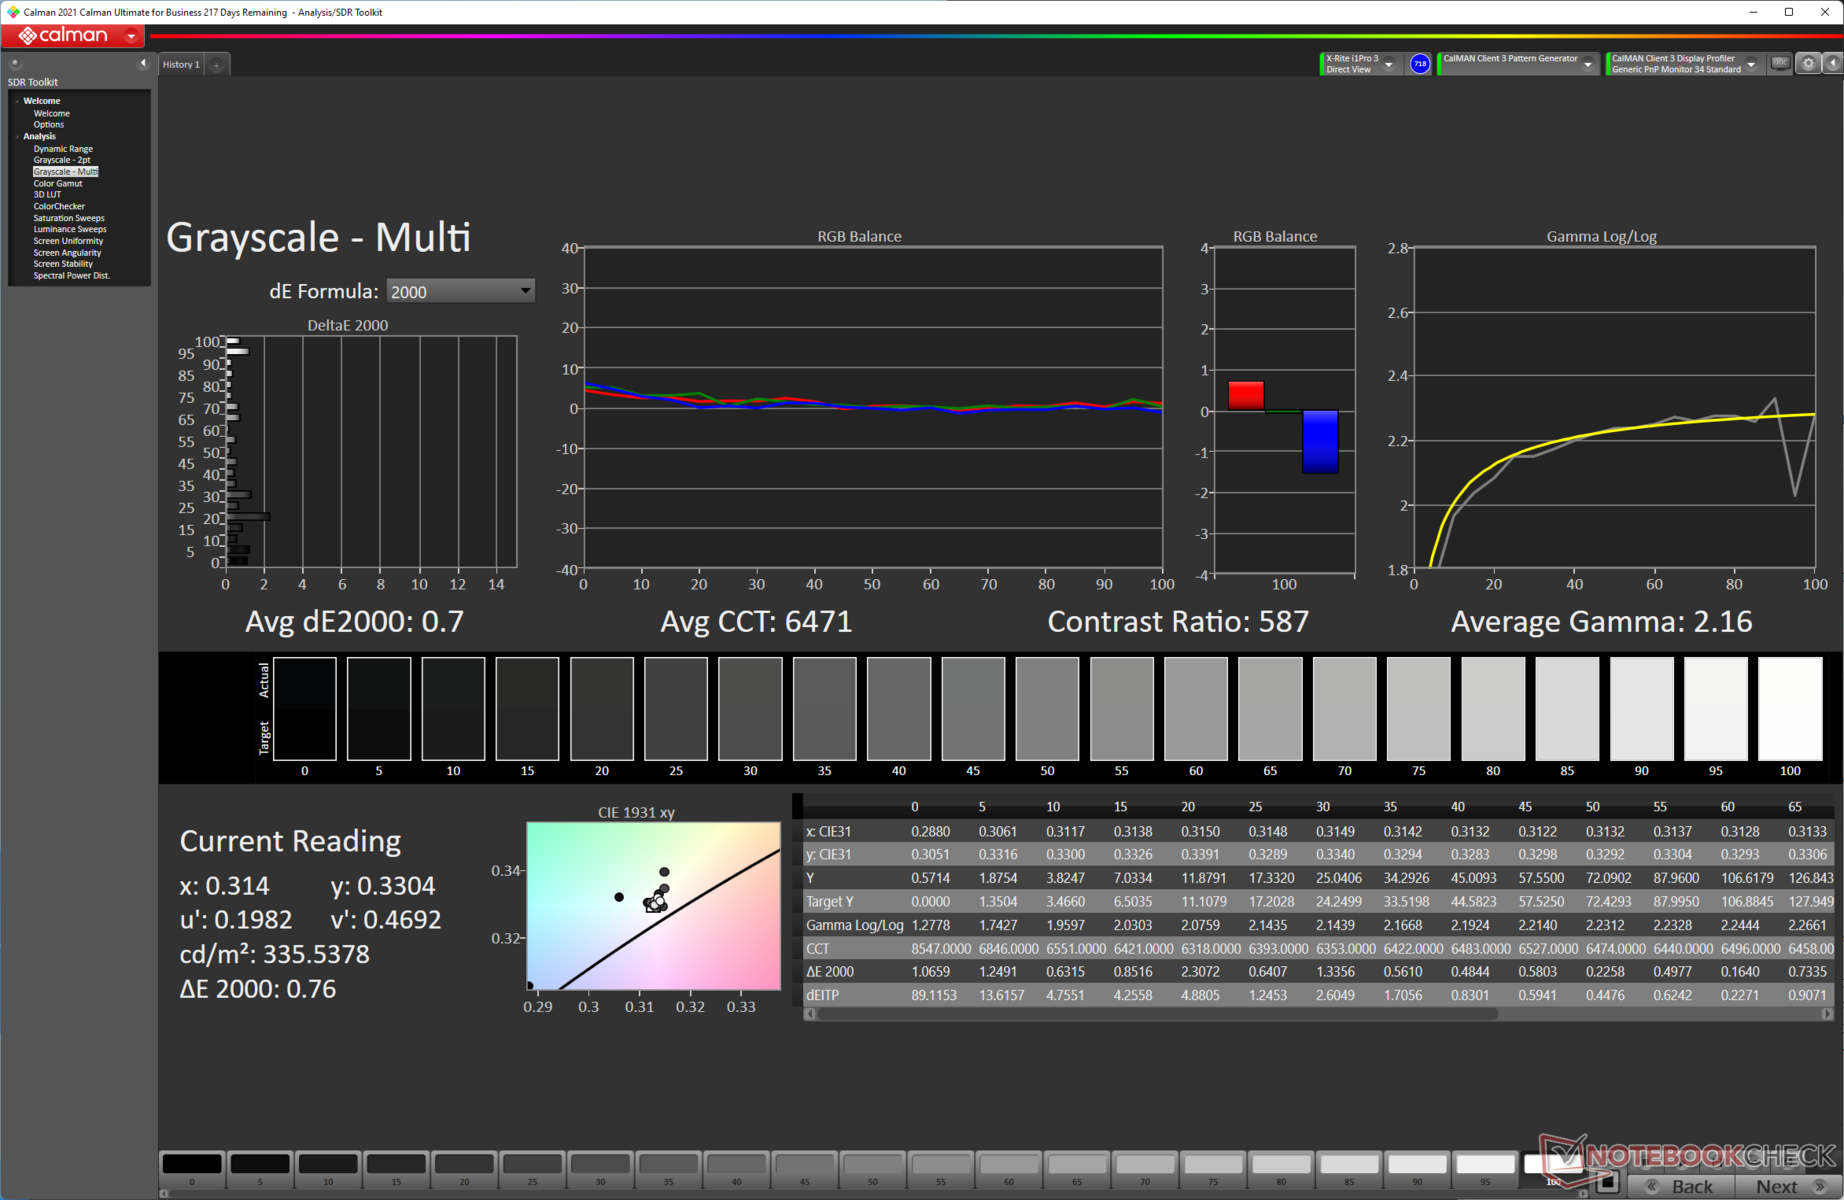
La distribución del brillo es decente con un 91%. Sin embargo, el panel sufre de un pobre ratio de contraste de sólo 586:1. La experiencia visual subjetiva general sigue siendo bastante buena para un panel IPS.

| |||||||||||||||||||||||||
iluminación: 91 %
Brillo con batería: 346 cd/m²
Contraste: 586:1 (Negro: 0.59 cd/m²)
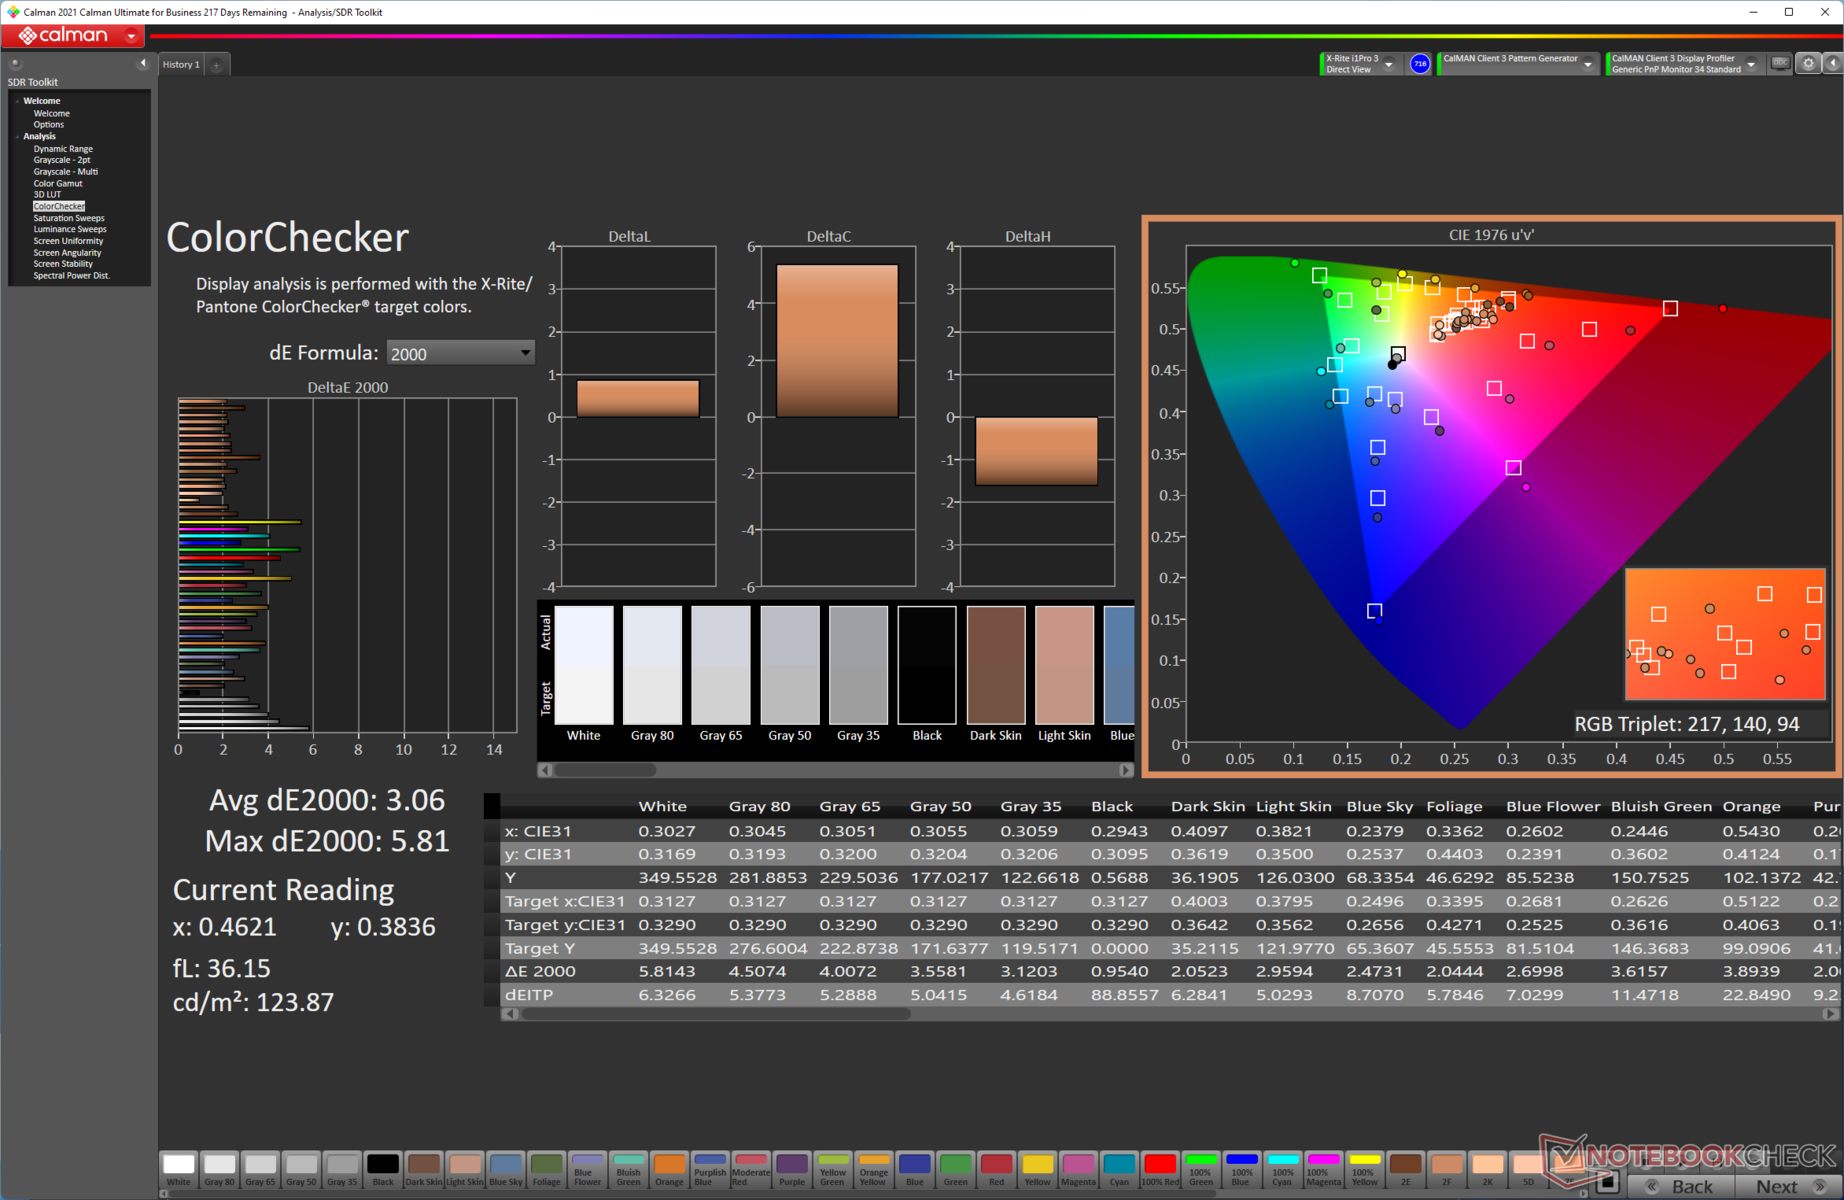
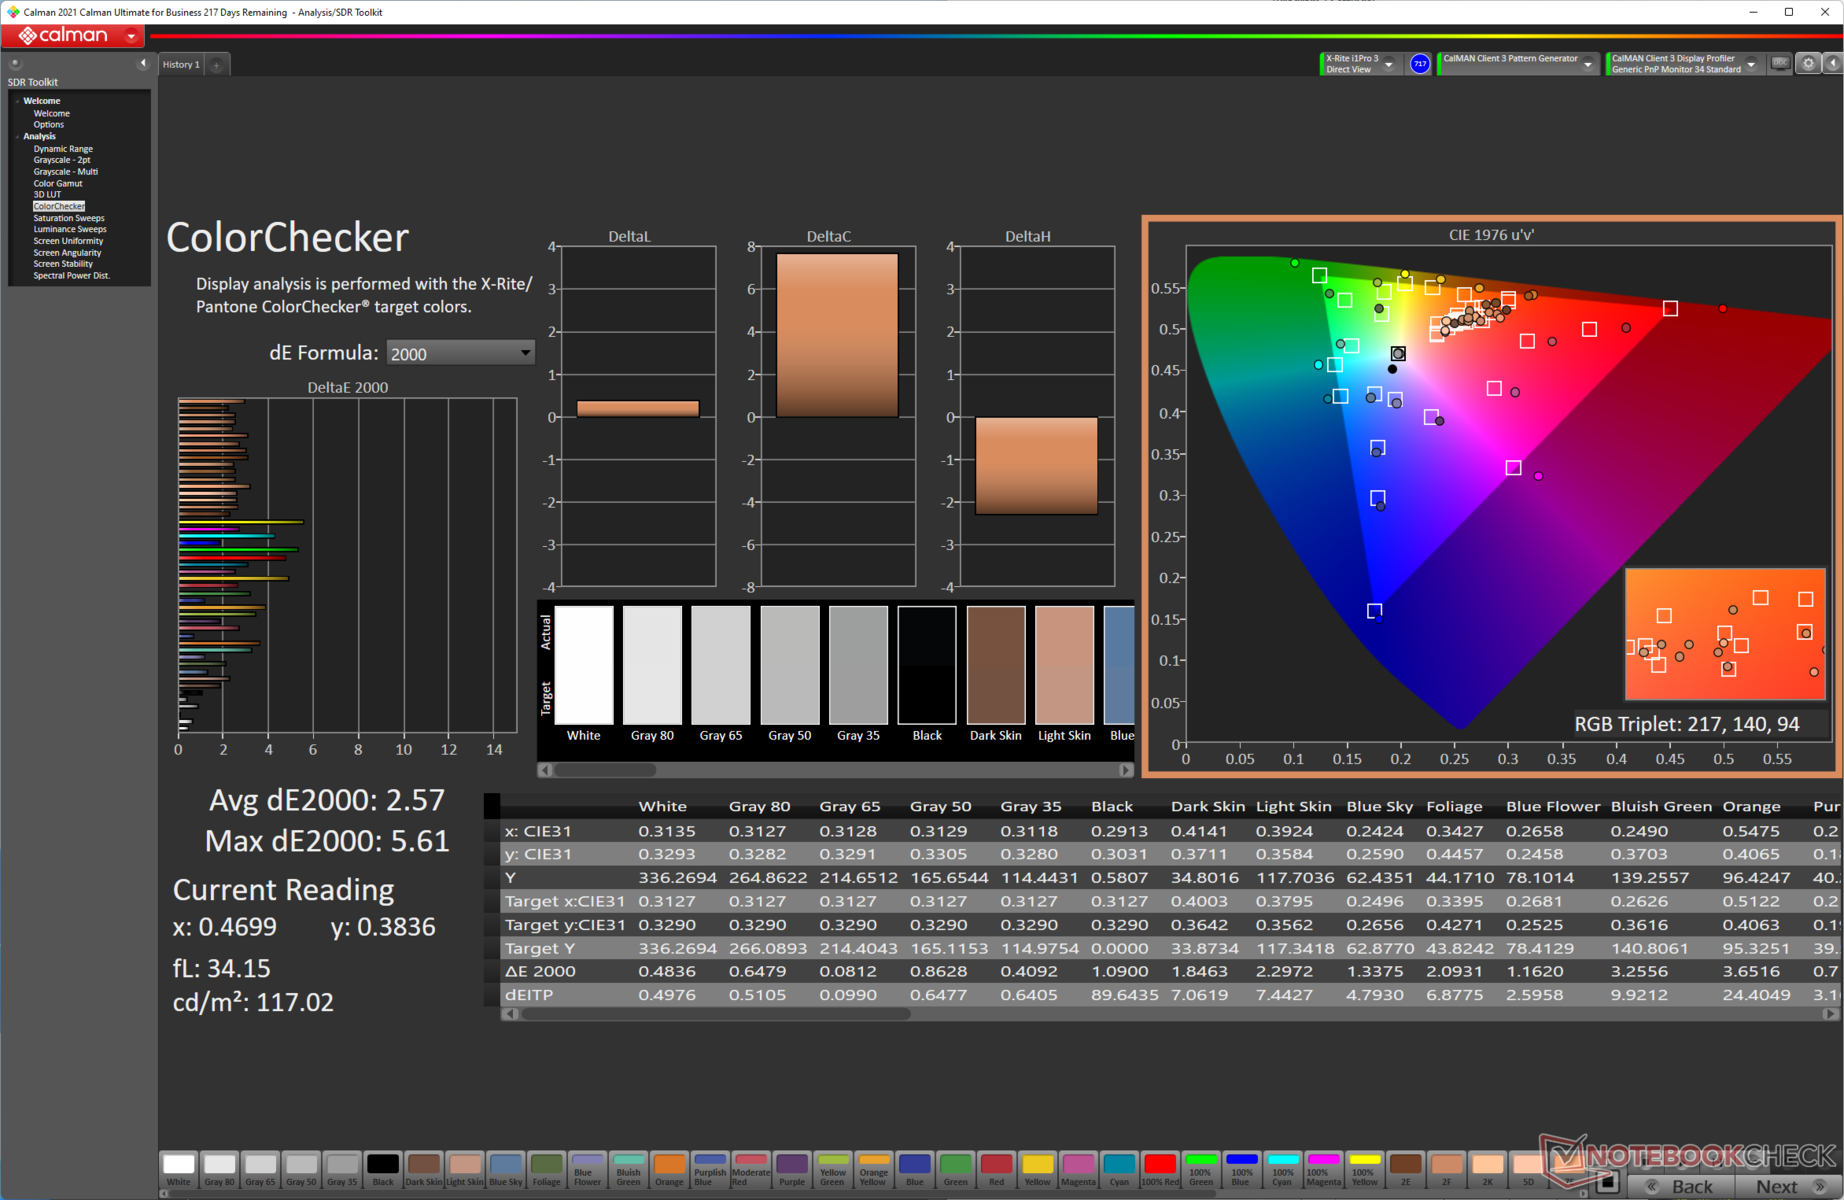
ΔE ColorChecker Calman: 3.06 | ∀{0.5-29.43 Ø4.71}
calibrated: 2.57
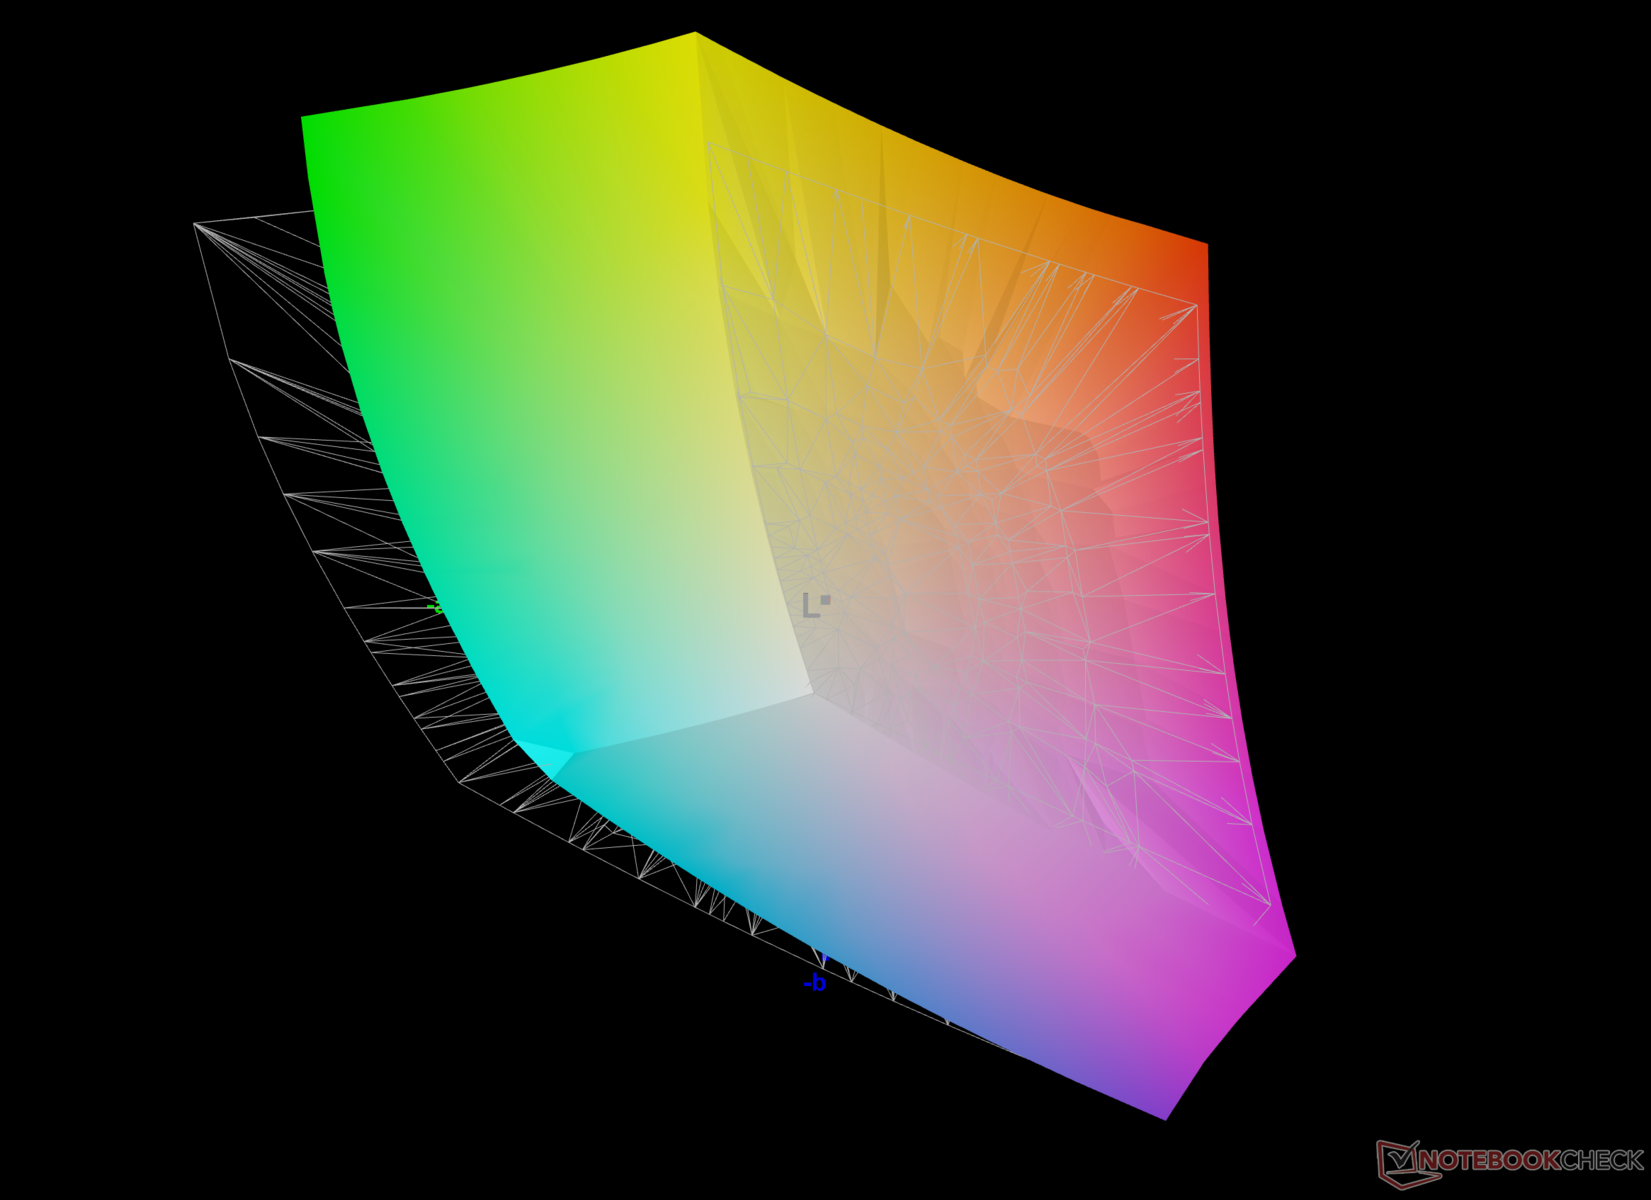
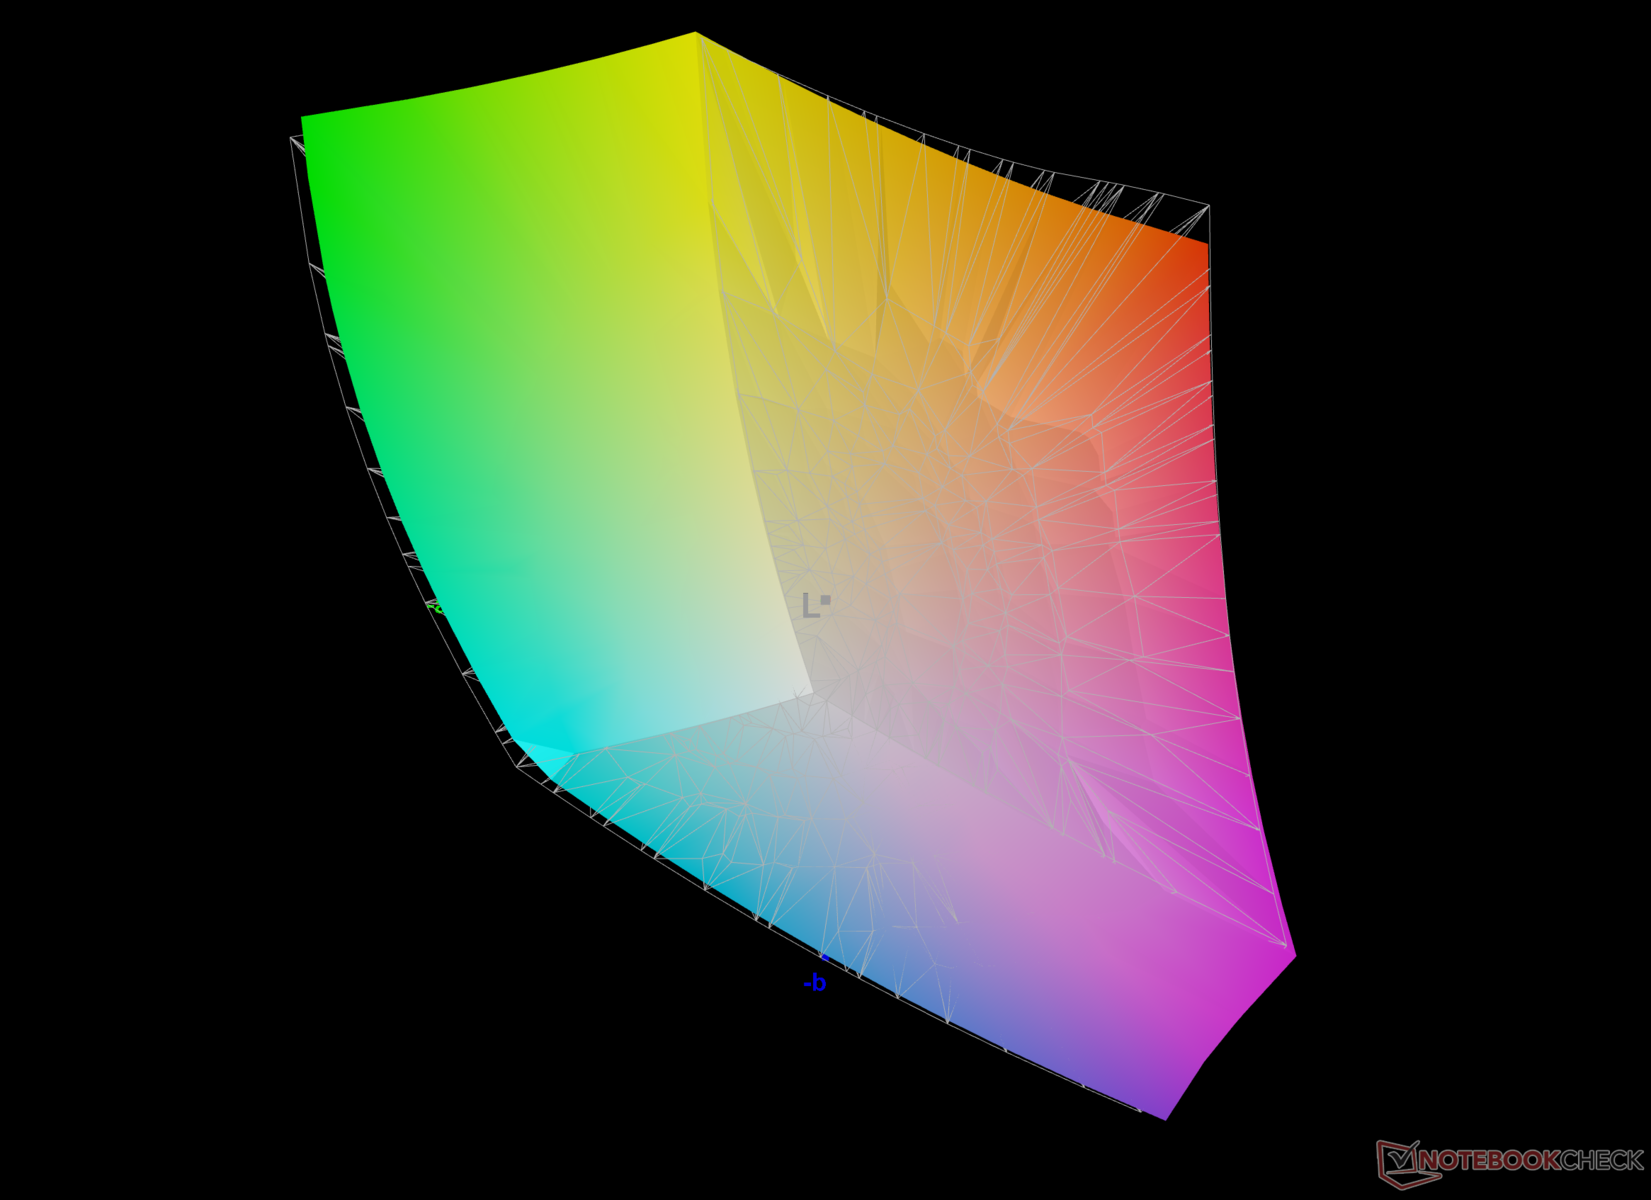
84.5% AdobeRGB 1998 (Argyll 3D)
99.9% sRGB (Argyll 3D)
96.2% Display P3 (Argyll 3D)
Gamma: 2.12
CCT: 7021 K
| Asus ROG Strix Scar 15 G533ZW BOE CQ NE156QHM-NZ2, IPS-level, 2560x1440, 15.6" | MSI Pulse GL66 12UEK AU Optronics B156HAN08.4 (AUOAF90), IPS, 1920x1080, 15.6" | MSI Vector GP66 12UGS BOE NE156FHM-NZ3, IPS, 1920x1080, 15.6" | MSI Raider GE66 12UHS AUO51EB, IPS, 3840x2160, 15.6" | HP Omen 16-b1090ng BOE09E5, IPS, 2560x1440, 16.1" | Lenovo Legion 5 Pro 16 G7 i7 RTX 3070Ti NE160QDM-NY1, IPS, 2560x1600, 16" | Razer Blade 15 2022 Sharp LQ156T1JW03, IPS, 2560x1440, 15.6" | |
|---|---|---|---|---|---|---|---|
| Display | -51% | -14% | -2% | -14% | -16% | 2% | |
| Display P3 Coverage (%) | 96.2 | 39 -59% | 70.1 -27% | 80.4 -16% | 71 -26% | 68.7 -29% | 99.1 3% |
| sRGB Coverage (%) | 99.9 | 58.4 -42% | 99.5 0% | 98.4 -2% | 97.9 -2% | 97.6 -2% | 99.9 0% |
| AdobeRGB 1998 Coverage (%) | 84.5 | 40.3 -52% | 72.1 -15% | 94.7 12% | 73.3 -13% | 70.9 -16% | 86.8 3% |
| Response Times | -334% | -1% | -105% | -55% | -63% | -69% | |
| Response Time Grey 50% / Grey 80% * (ms) | 7.86 ? 4.21 ? | 38.8 ? -394% | 5.8 ? 26% | 18.8 ? -139% | 14.5 ? -84% | 17.6 ? -124% | 14.4 ? -83% |
| Response Time Black / White * (ms) | 7.5 ? | 28 ? -273% | 9.6 ? -28% | 12.8 ? -71% | 9.4 ? -25% | 7.6 ? -1% | 11.6 ? -55% |
| PWM Frequency (Hz) | |||||||
| Screen | 28% | 24% | 21% | 12% | 43% | 17% | |
| Brightness middle (cd/m²) | 346 | 248 -28% | 353.1 2% | 351 1% | 335 -3% | 502 45% | 286 -17% |
| Brightness (cd/m²) | 329 | 245 -26% | 325 -1% | 347 5% | 319 -3% | 491 49% | 271 -18% |
| Brightness Distribution (%) | 91 | 86 -5% | 85 -7% | 90 -1% | 90 -1% | 91 0% | 89 -2% |
| Black Level * (cd/m²) | 0.59 | 0.13 78% | 0.38 36% | 0.35 41% | 0.28 53% | 0.37 37% | 0.25 58% |
| Contrast (:1) | 586 | 1908 226% | 929 59% | 1003 71% | 1196 104% | 1357 132% | 1144 95% |
| Colorchecker dE 2000 * | 3.06 | 3.14 -3% | 2.24 27% | 2.54 17% | 4.38 -43% | 2.7 12% | 2.74 10% |
| Colorchecker dE 2000 max. * | 5.81 | 5.82 -0% | 5 14% | 8.36 -44% | 9.48 -63% | 4.5 23% | 5.21 10% |
| Colorchecker dE 2000 calibrated * | 2.57 | 3.14 -22% | 1.02 60% | 0.67 74% | 1.33 48% | 1.4 46% | 2.52 2% |
| Gamma | 2.12 104% | 2.49 88% | 2.24 98% | 2.089 105% | 2.103 105% | 2.44 90% | 2.2 100% |
| CCT | 7021 93% | 6468 100% | 6864 95% | 7036 92% | 6244 104% | 6326 103% | 6408 101% |
| Greyscale dE 2000 * | 1.2 | 4 | 4.1 | 7 | 2.7 | 1.1 | |
| Media total (Programa/Opciones) | -119% /
-46% | 3% /
11% | -29% /
-4% | -19% /
-4% | -12% /
13% | -17% /
0% |
* ... más pequeño es mejor
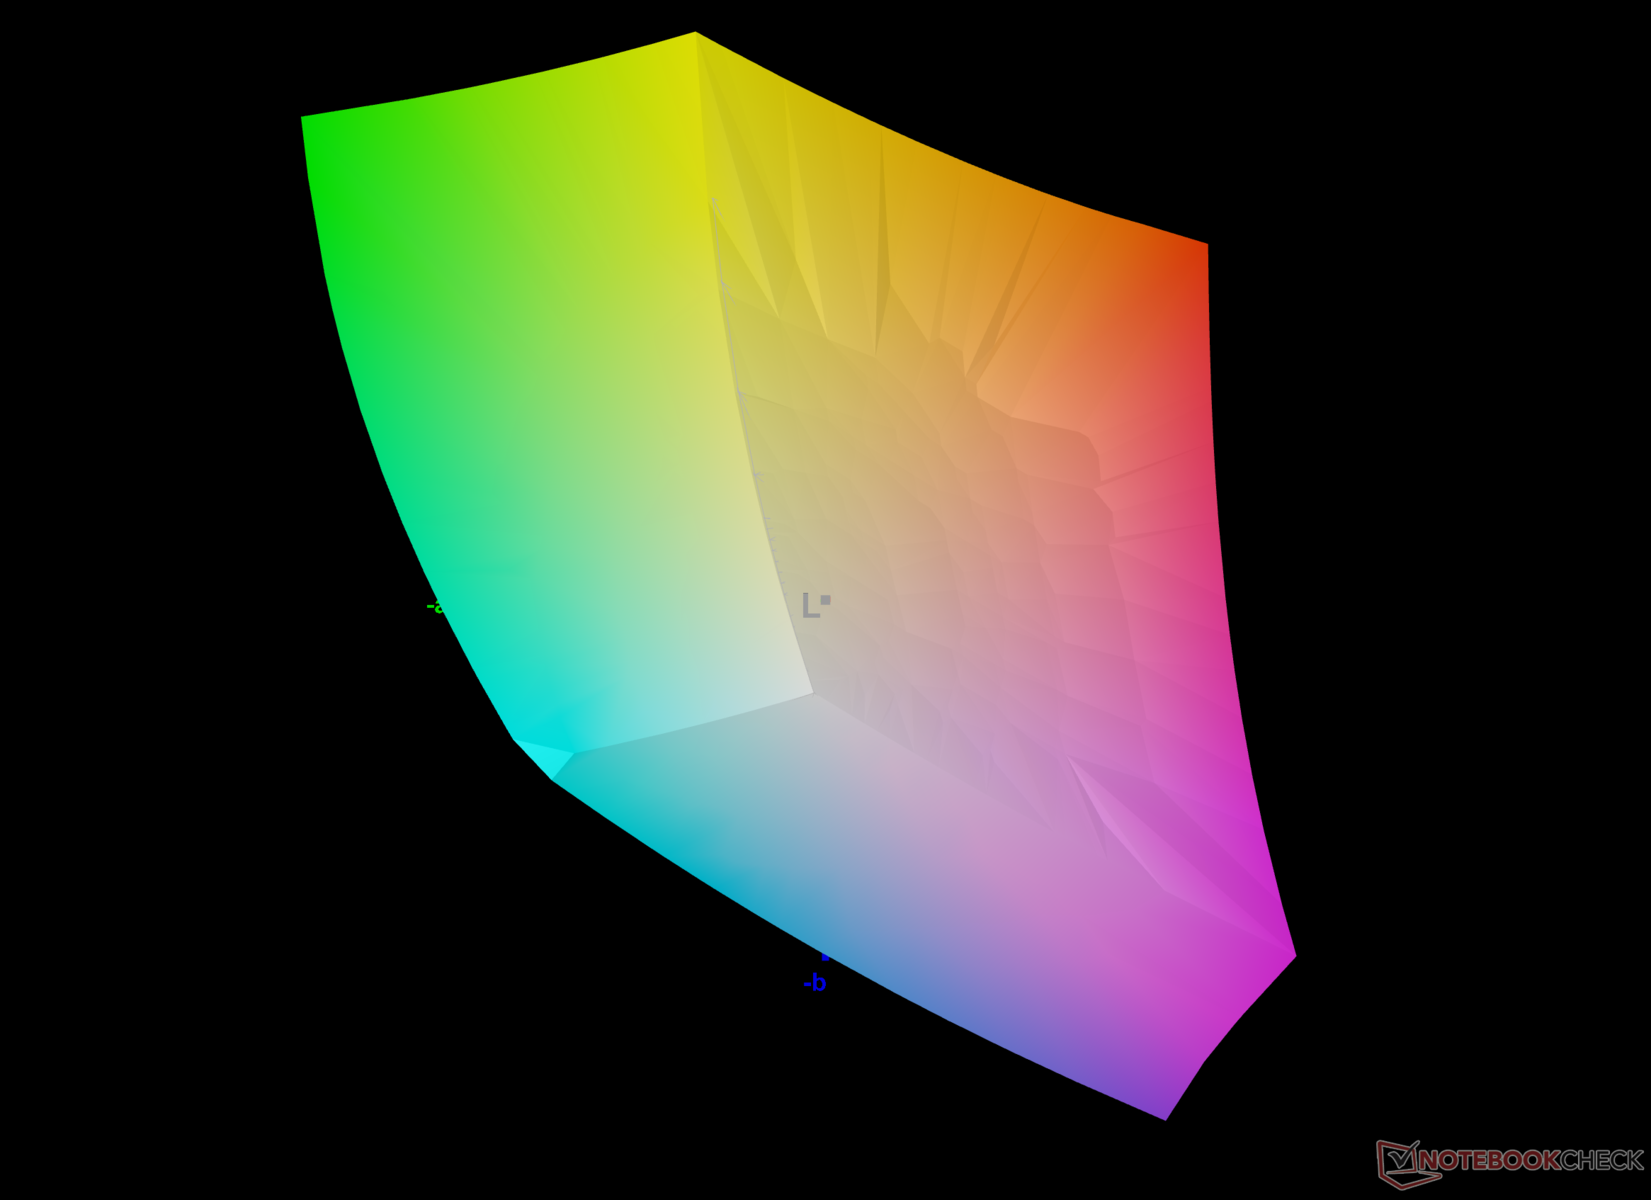
La pantalla del ROG Strix Scar 15 rinde muy bien para un portátil de juegos en lo que respecta a la cobertura de la gama de colores. El panel cubre todo el espectro sRGB y casi todo el DCI-P3. La cobertura de AdobeRGB también es buena, con casi un 85%, lo que hace que la pantalla del Scar 15 sea bastante adecuada para los flujos de trabajo de edición de fotos y vídeos profesionales.
Nuestra rutina de calibración ayuda a reducir aún más el Delta E medio de la escala de grises a 0,7 y el Delta E de ColorChecker a 2,57. Las mayores desviaciones se observan en las partes roja y azul del espectro de color.
Nuestro archivo ICC calibrado puede descargarse en el enlace anterior.
El panel BOE CQ NE156QHM-NZ2 parece ofrecer tiempos de respuesta muy mejorados que la variante del año pasado, lo que debería complacer a los jugadores. Medimos un tiempo de respuesta combinado de 100% negro a 100% blanco de 7,5 ms y un tiempo de respuesta combinado de 50% gris a 80% gris de 4,21 ms.
Asus activa el modo overdrive por defecto, lo que se refleja en la señal de "cuerno" que se ve en los datos del 50% de gris al 80% de gris. La sobremarcha del panel se puede desactivar en la app Armory Crate. Esto aumenta los tiempos de respuesta de gris a gris a 7,86 ms.
No observamos ningún parpadeo del PWM o de la pantalla en todos los niveles de brillo, por lo que el uso a largo plazo de esta pantalla no debería causar ninguna fatiga ocular.
Para más información, consulte nuestro artículo "Por qué la modulación por ancho de pulsos (PWM) es un dolor de cabeza", y también consulte nuestra Tabla de clasificación PWM para comparar la frecuencia PWM de todos los dispositivos analizados.
Tiempos de respuesta del display
| ↔ Tiempo de respuesta de Negro a Blanco | ||
|---|---|---|
| 7.5 ms ... subida ↗ y bajada ↘ combinada | ↗ 3.89 ms subida | 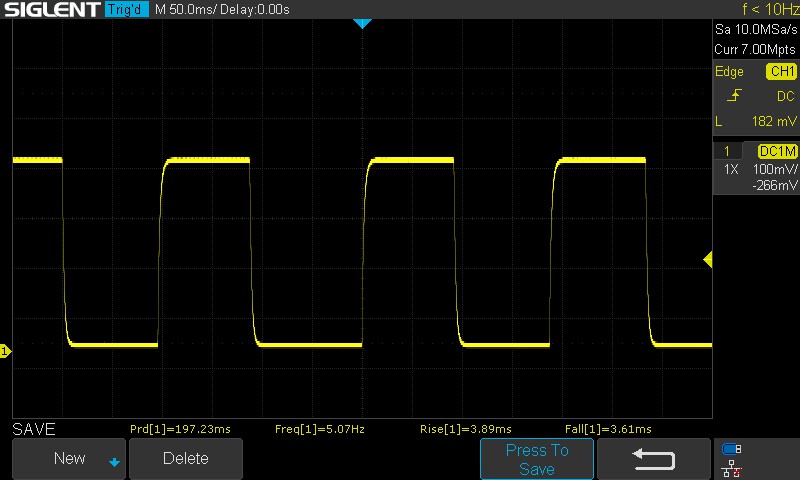 |
| ↘ 3.61 ms bajada | ||
| La pantalla mostró tiempos de respuesta muy rápidos en nuestros tests y debería ser adecuada para juegos frenéticos. En comparación, todos los dispositivos de prueba van de ##min### (mínimo) a 240 (máximo) ms. » 22 % de todos los dispositivos son mejores. Esto quiere decir que el tiempo de respuesta medido es mejor que la media (19.8 ms) de todos los dispositivos testados. | ||
| ↔ Tiempo de respuesta 50% Gris a 80% Gris | ||
| 4.21 ms ... subida ↗ y bajada ↘ combinada | ↗ 1.98 ms subida | 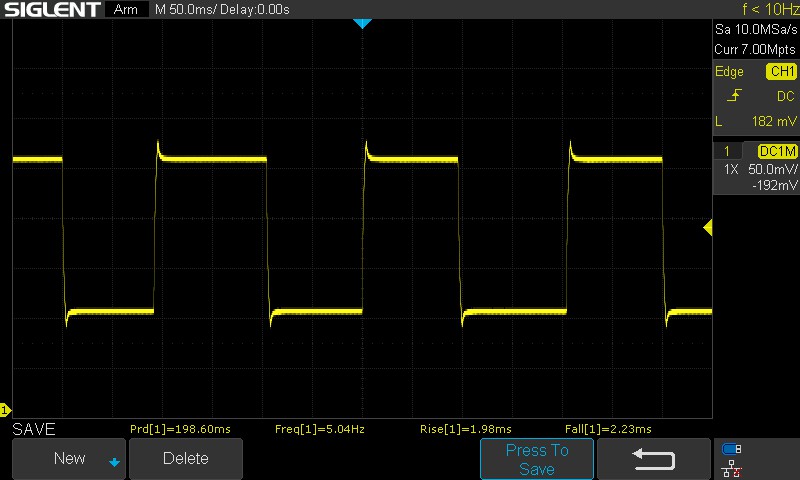 |
| ↘ 2.23 ms bajada | ||
| La pantalla mostró tiempos de respuesta muy rápidos en nuestros tests y debería ser adecuada para juegos frenéticos. En comparación, todos los dispositivos de prueba van de ##min### (mínimo) a 636 (máximo) ms. » 16 % de todos los dispositivos son mejores. Esto quiere decir que el tiempo de respuesta medido es mejor que la media (31 ms) de todos los dispositivos testados. | ||
| ↔ Tiempo de respuesta 50% Gris a 80% Gris | ||
| 7.86 ms ... subida ↗ y bajada ↘ combinada | ↗ 4.02 ms subida | 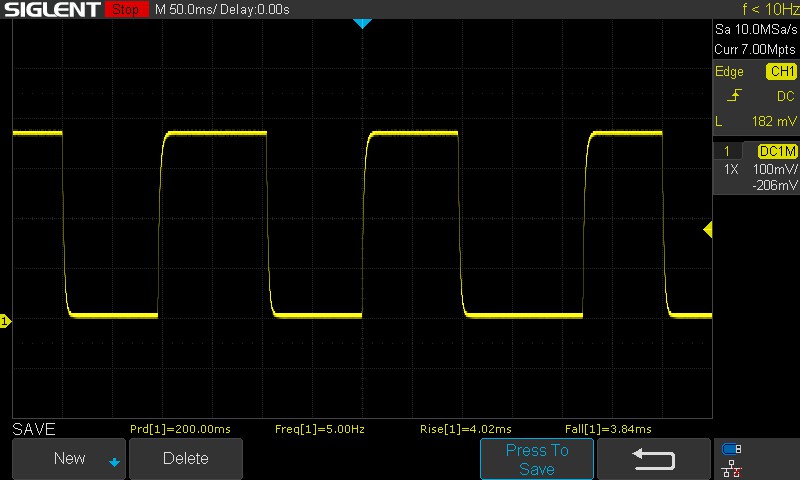 |
| ↘ 3.84 ms bajada | ||
| La pantalla mostró tiempos de respuesta muy rápidos en nuestros tests y debería ser adecuada para juegos frenéticos. En comparación, todos los dispositivos de prueba van de ##min### (mínimo) a 636 (máximo) ms. » 21 % de todos los dispositivos son mejores. Esto quiere decir que el tiempo de respuesta medido es mejor que la media (31 ms) de todos los dispositivos testados. | ||
Parpadeo de Pantalla / PWM (Pulse-Width Modulation)
| Parpadeo de Pantalla / PWM no detectado | 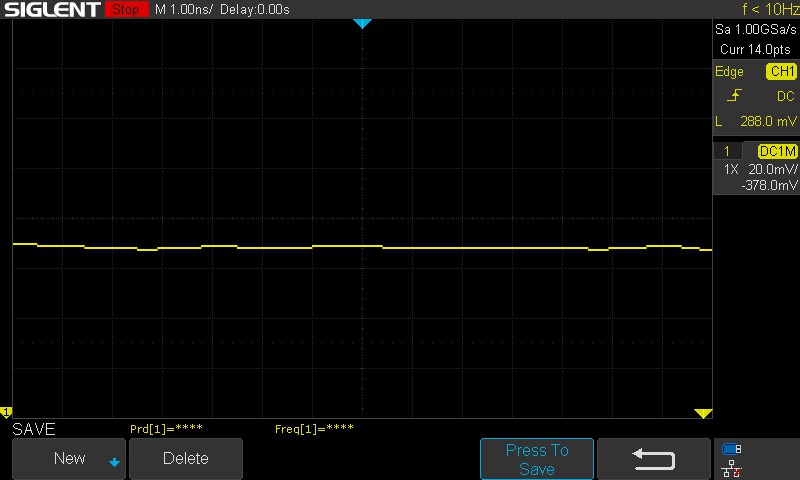 | ||
Comparación: 52 % de todos los dispositivos testados no usaron PWM para atenuar el display. Si se usó, medimos una media de 7754 (mínimo: 5 - máxmo: 343500) Hz. | |||
La visualización en exteriores es decente siempre que no incida la luz del sol en la pantalla. Los ángulos de visión son amplios, pero observamos pérdida de brillo e información de color cuando se ve desde ángulos extremos.

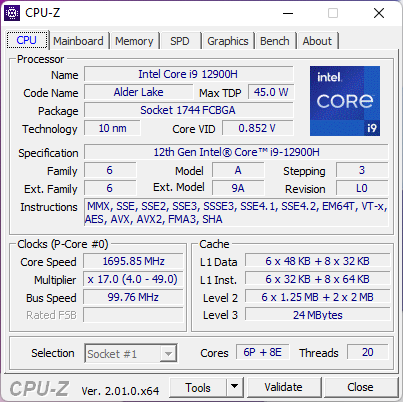
Rendimiento: El Core i9-12900H se convierte en alas con 135 W
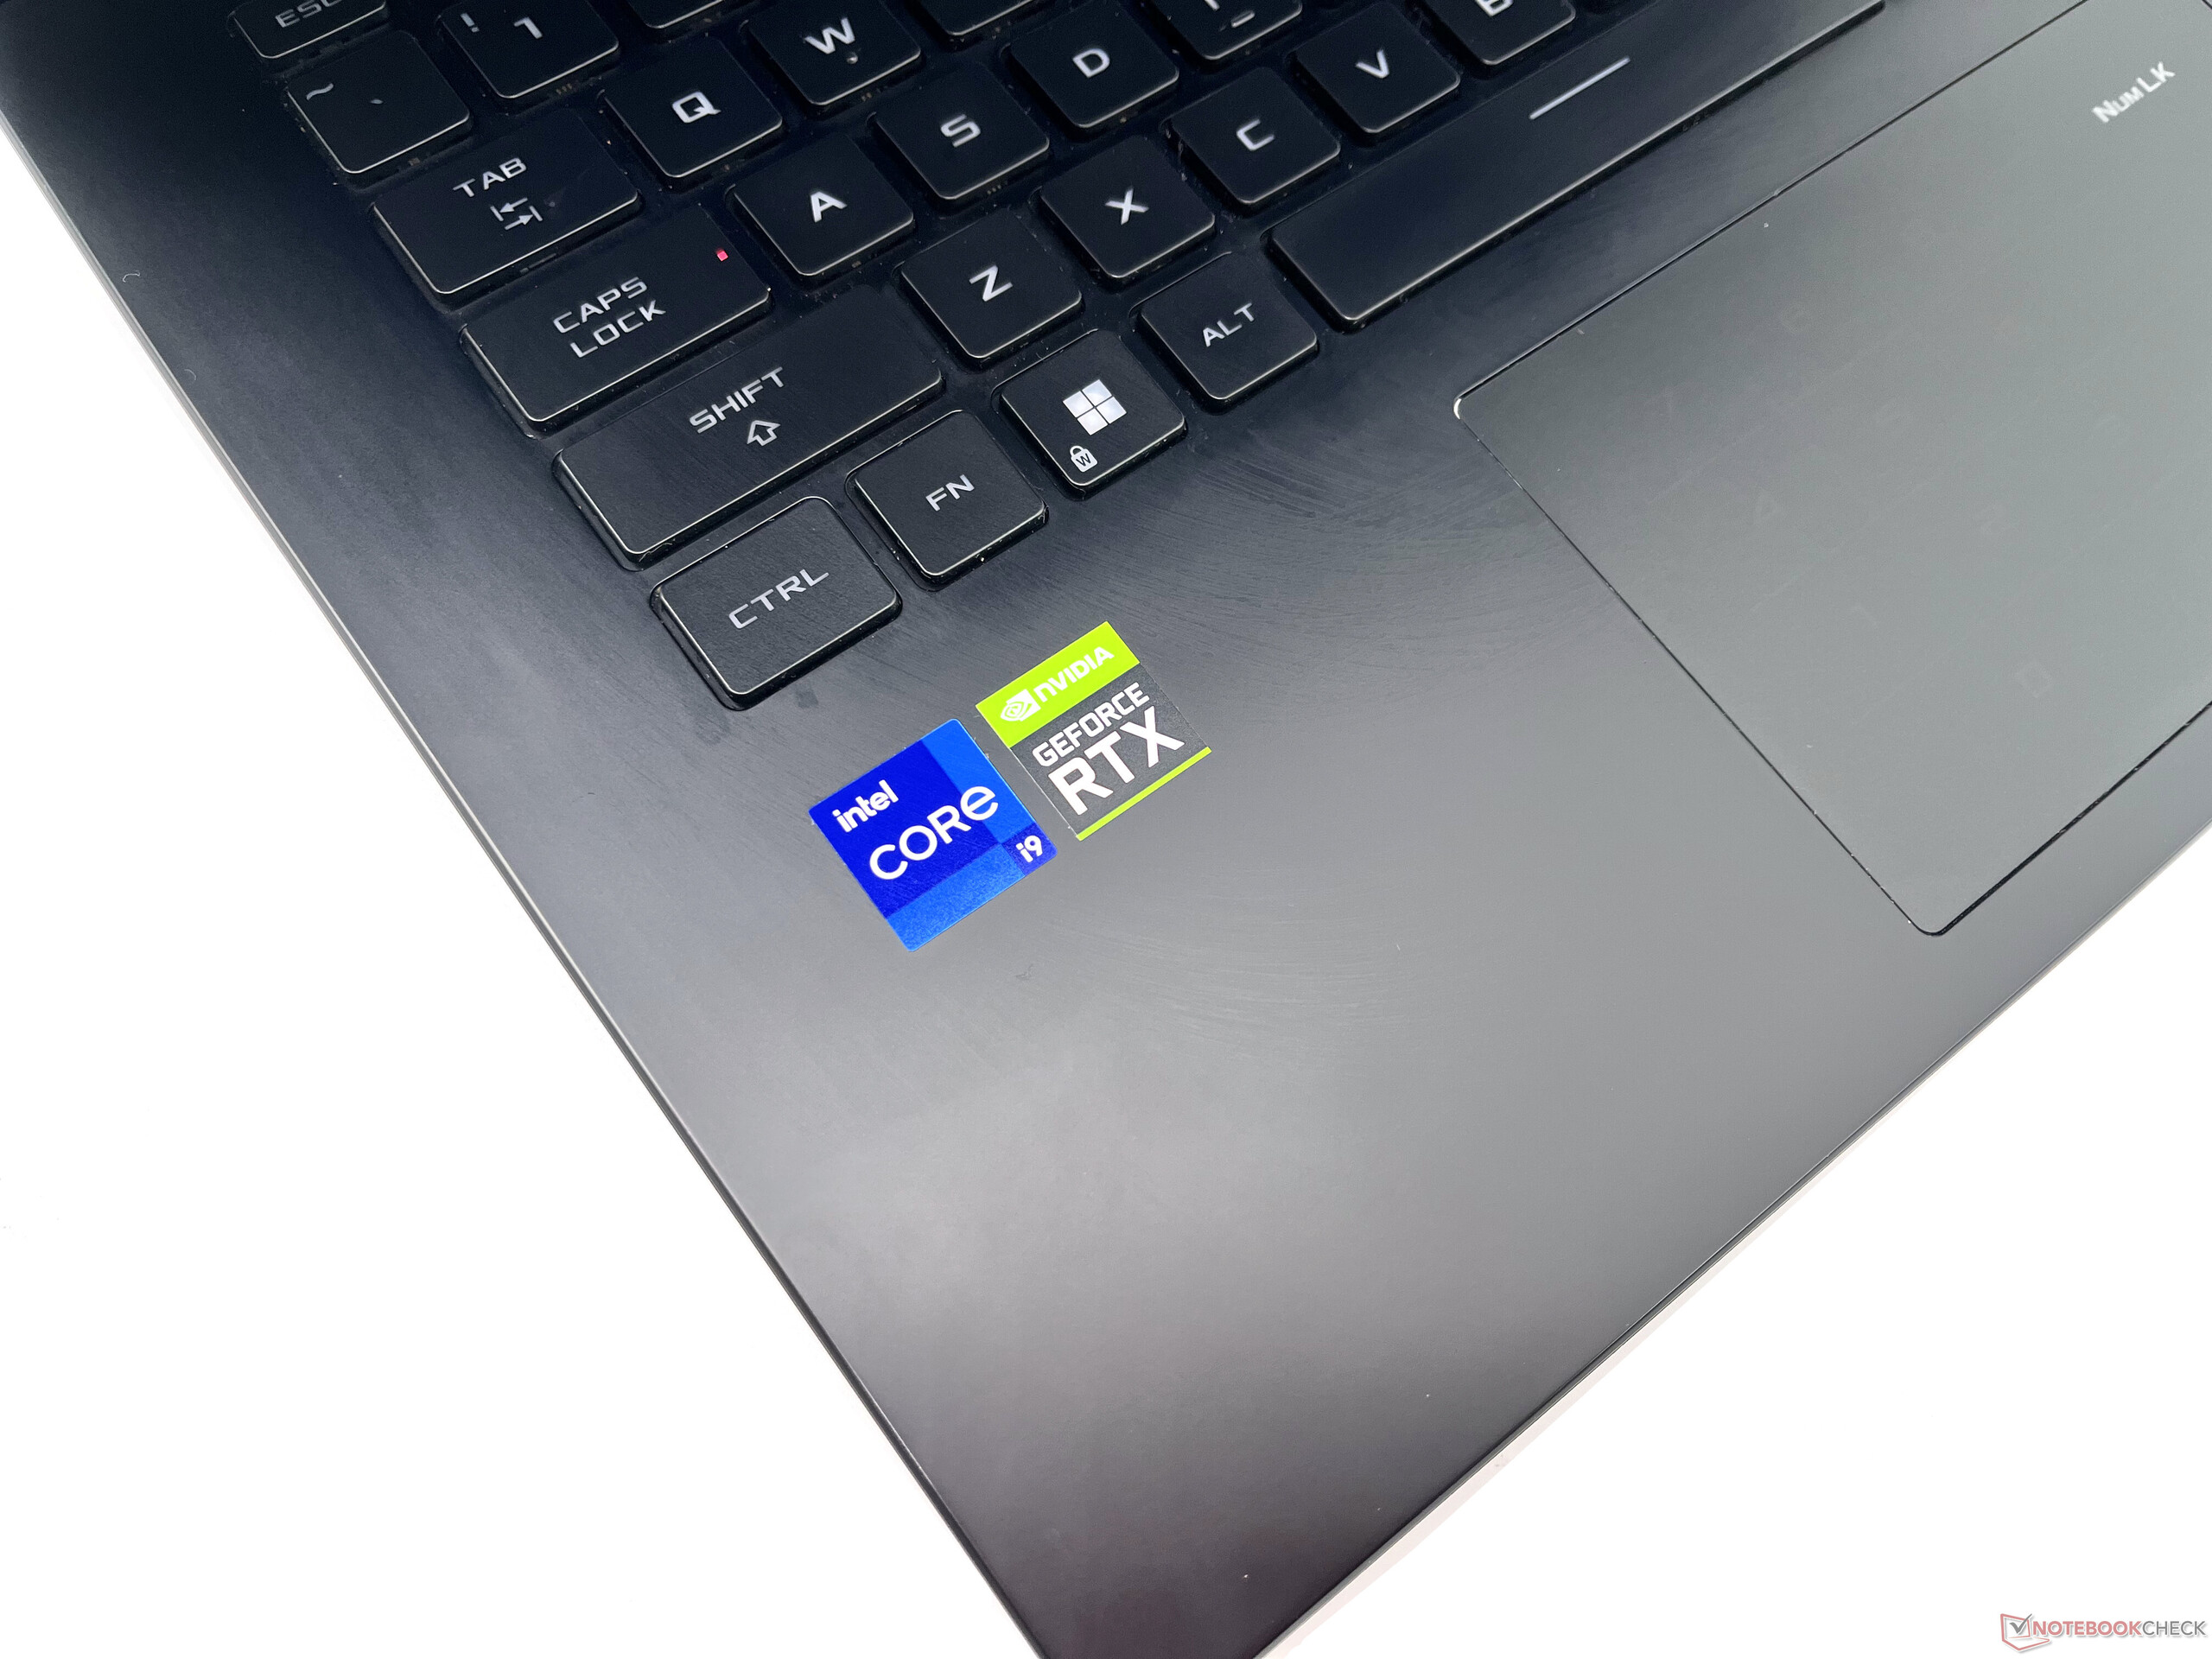
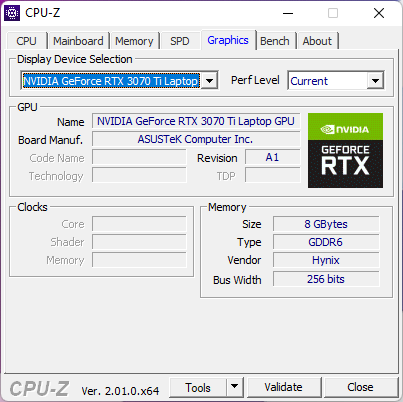
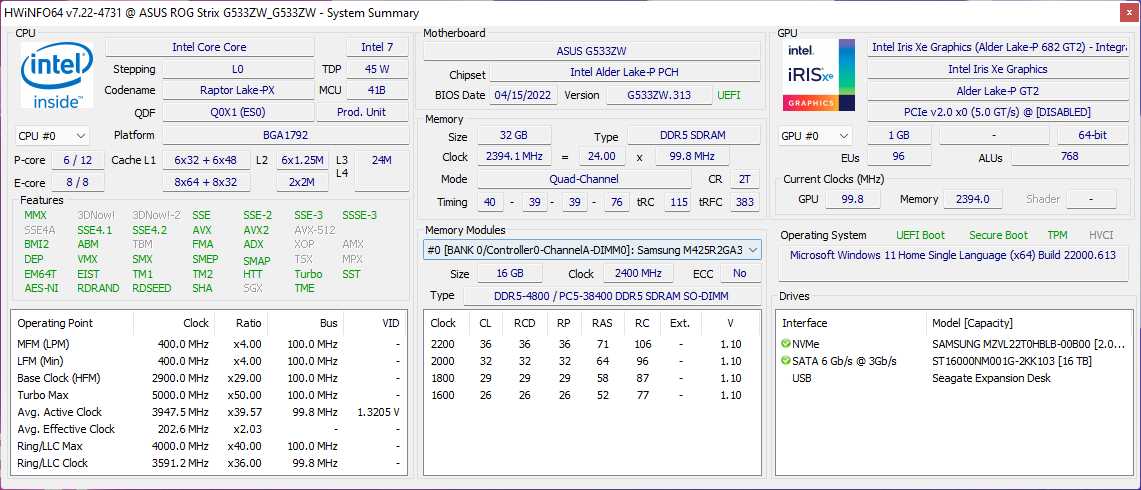
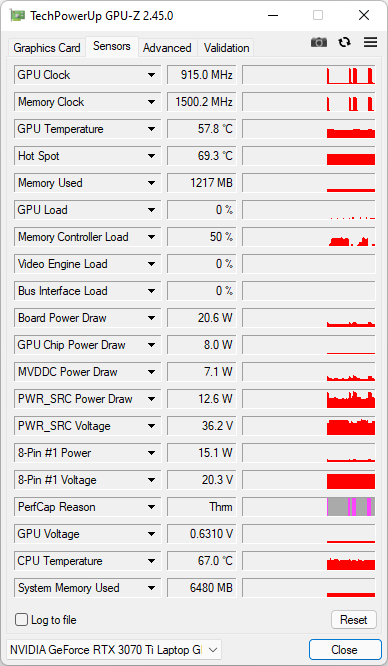
Asus ha equipado nuestra unidad ROG Strix Scar 15 de prueba con un Intel Core i9-12900H Y una GPU NvidiaGPU Nvidia GeForce RTX 3070 Ti para portátiles.
Aparentemente, el Core i9-12900H con un material de interfaz térmica (TIM) de metal líquido es la opción de procesador de facto en todos los SKU 2022 Scar 15, al menos en la India. Las opciones de GPU, sin embargo, van desde los 140 WRTX 3060 a la de 150 WRTX 3080 Ti.
Condiciones de la prueba
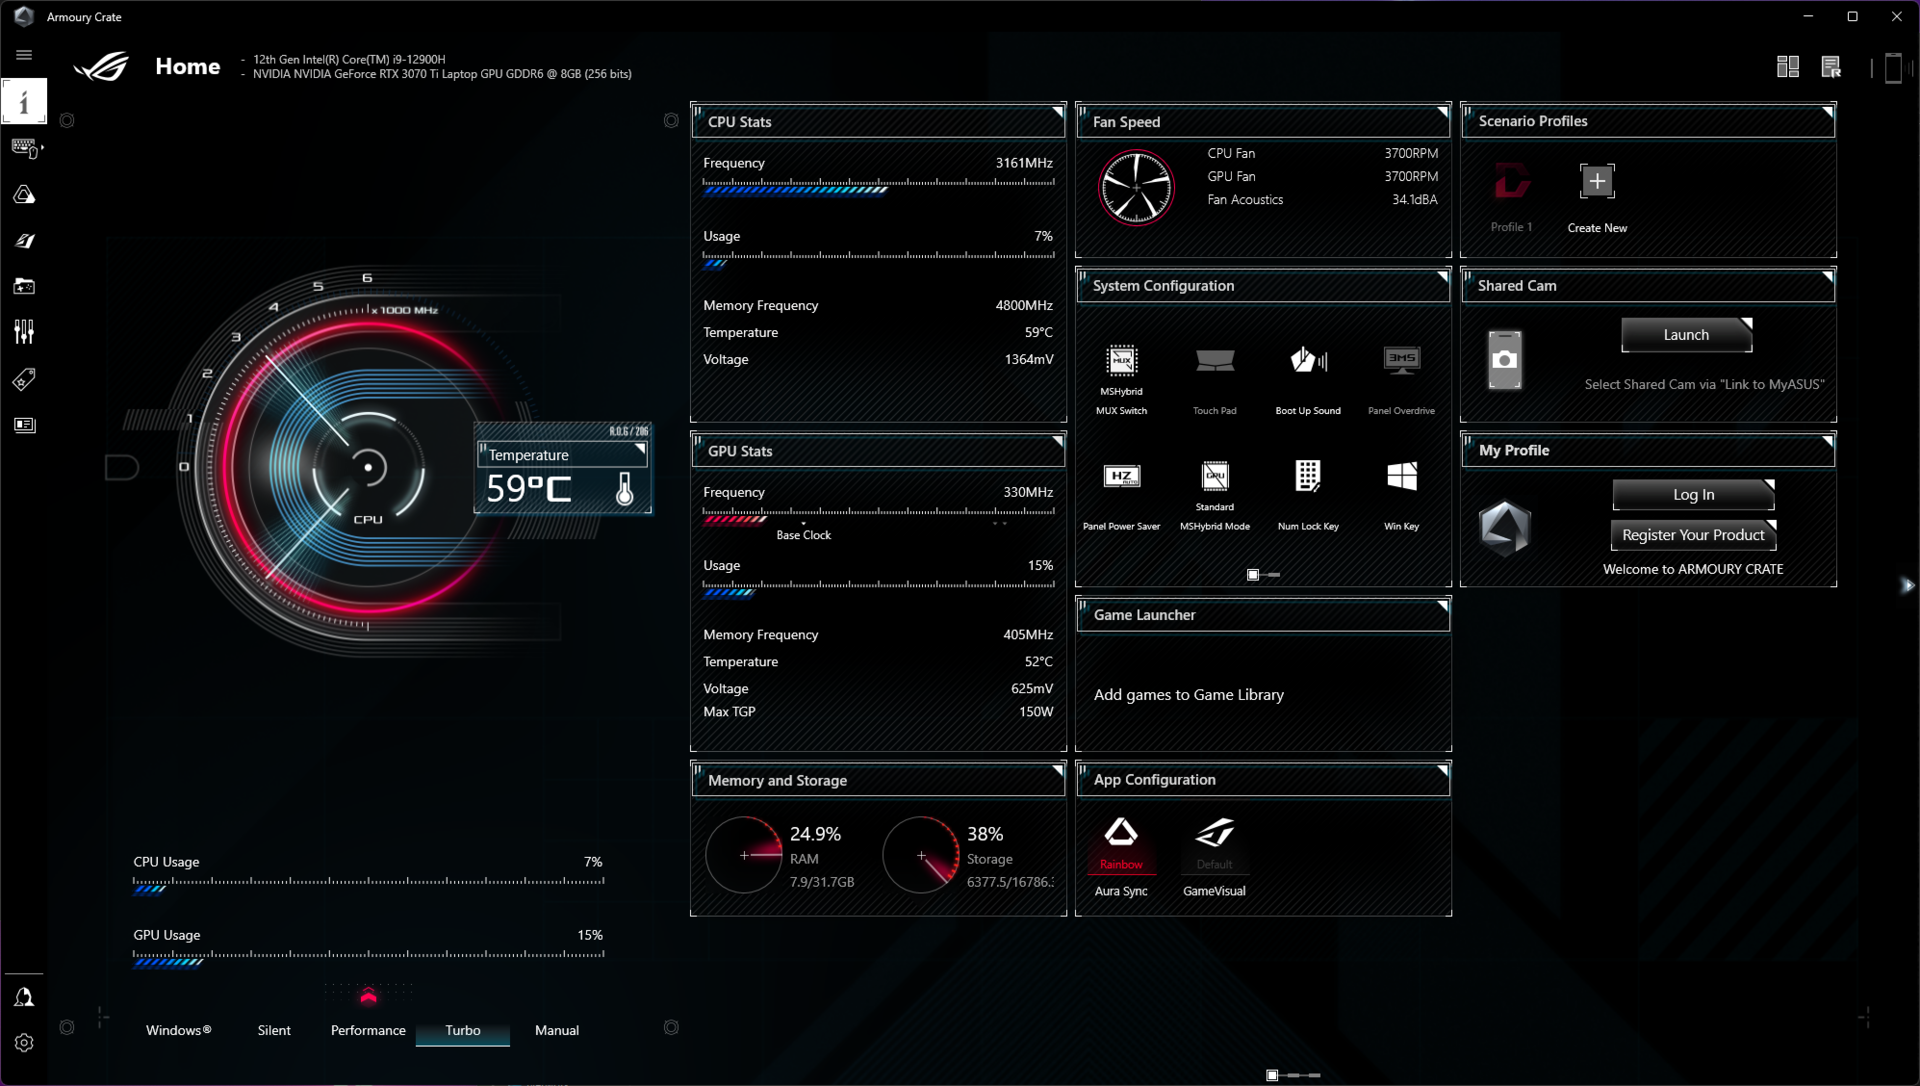
La aplicación Armory Crate permite seleccionar uno de los tres modos de rendimiento principales: Silencioso, Rendimiento y Turbo. También puedes ajustar la configuración del reloj y el ventilador manualmente en el modo Manual o simplemente dejar que los perfiles de energía de Windows se hagan cargo con el modo Windows.
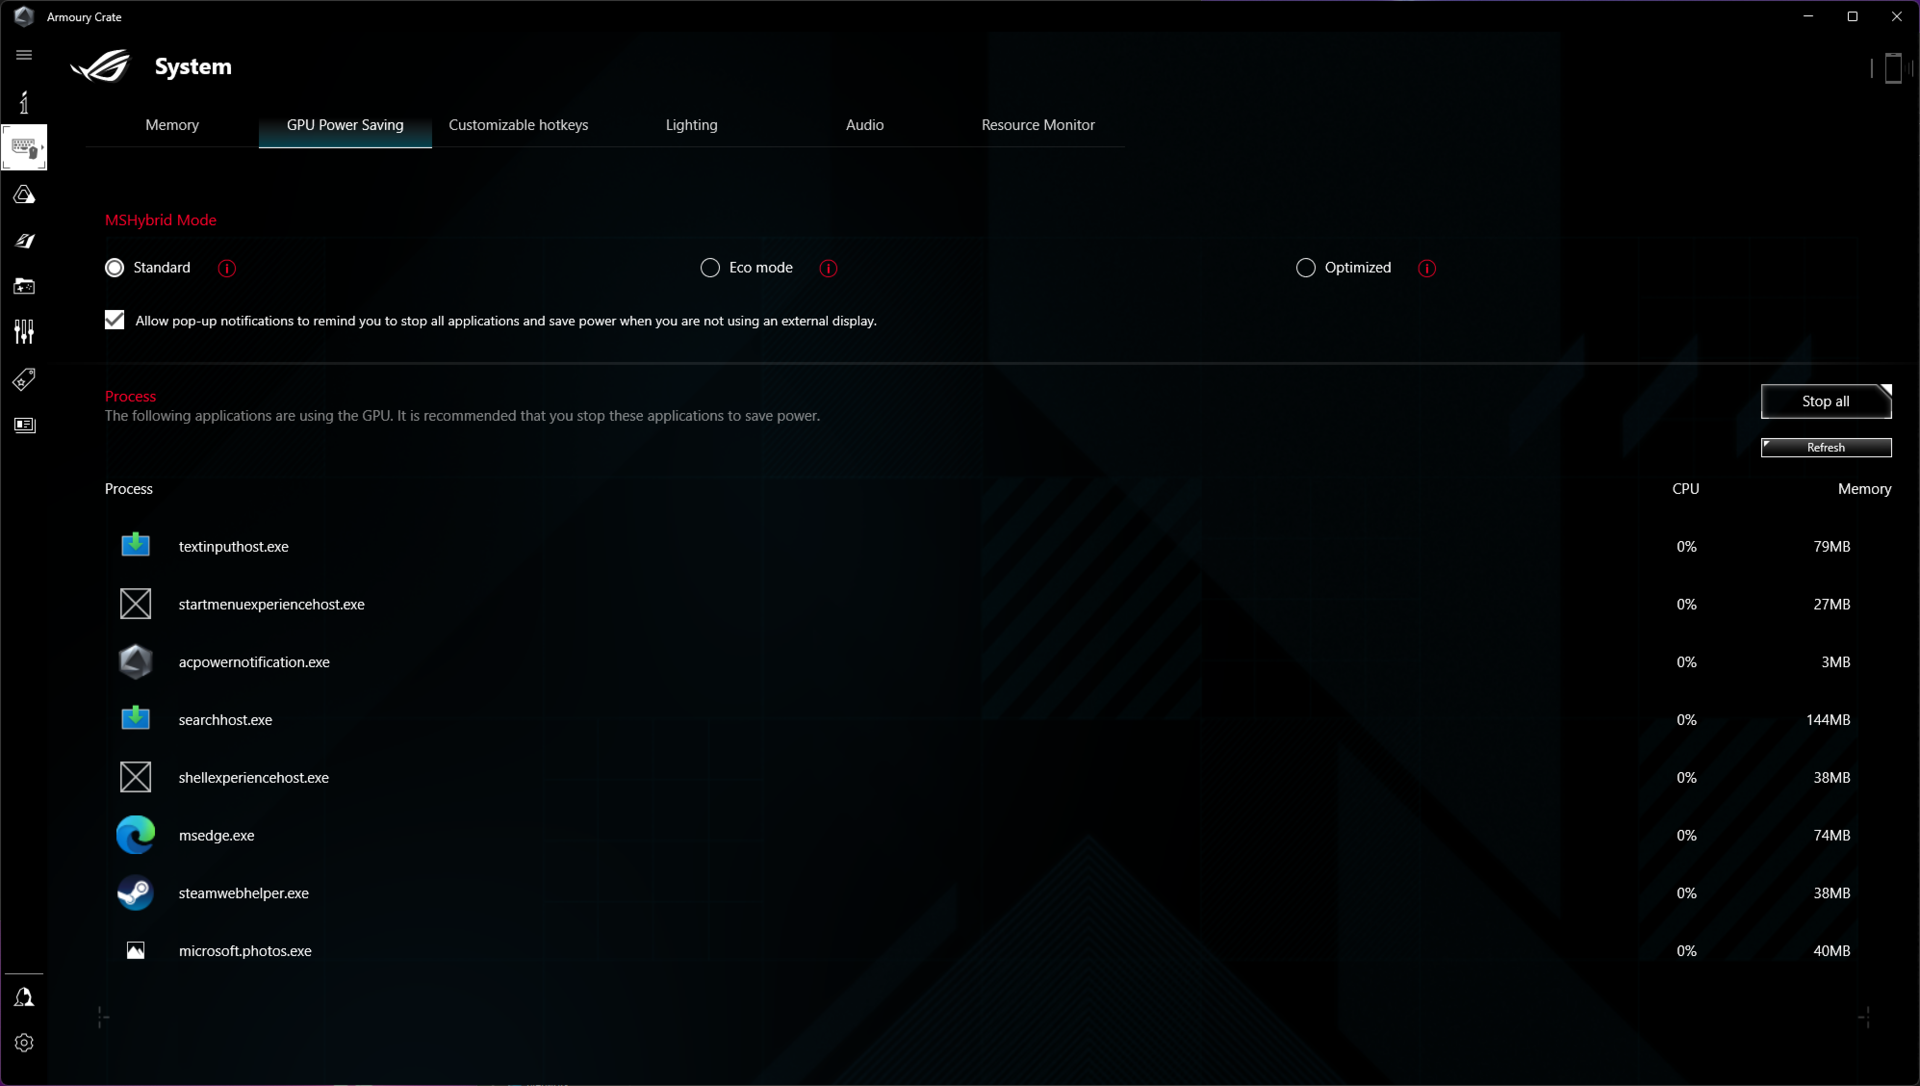
Para la GPU, Asus permite elegir entre el modo MSHybrid por defecto y un modo MUX. El interruptor MUX permite enrutar la señal de la dGPU directamente a la pantalla interna sin pasar por la iGPU. Esto puede suponer una ligera ventaja de rendimiento, que veremos en la sección de rendimiento de la GPU. Sin embargo, a efectos de comparación, hemos utilizado el modo MSHybrid estándar, ya que es la configuración por defecto.
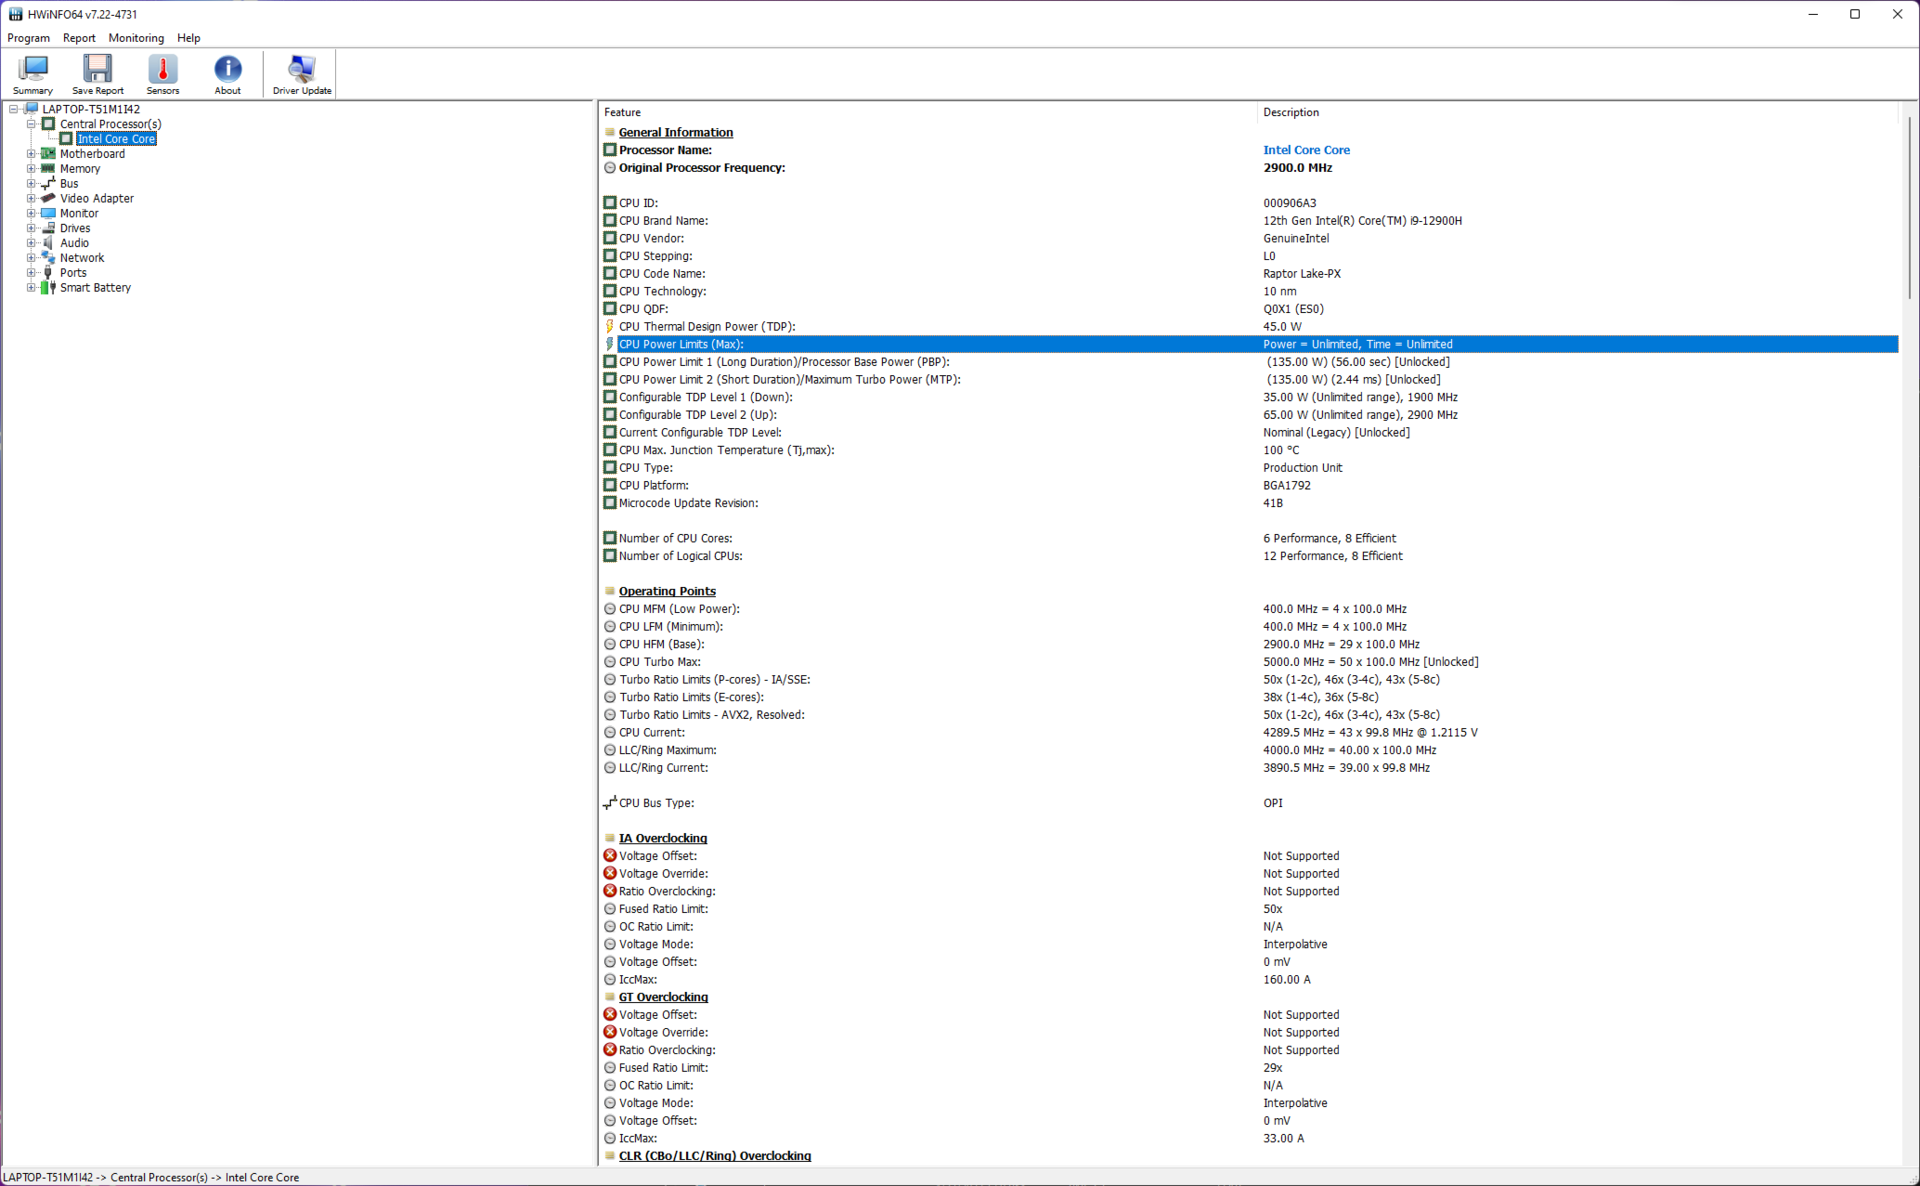
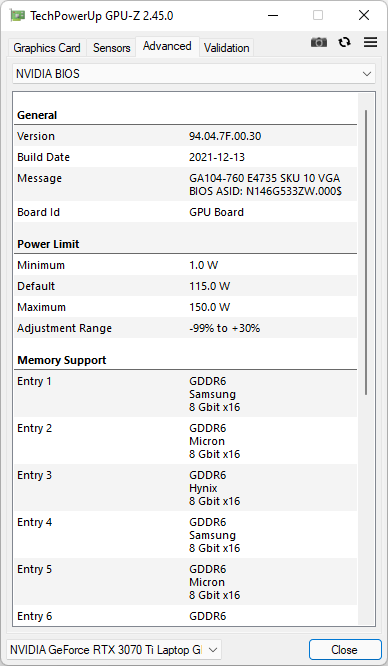
La tabla siguiente ilustra cómo cambian los valores PL1 y PL2 con cada perfil de potencia elegido. Recomendamos usar el perfil Turbo para cargas de trabajo pesadas y juegos si los niveles de ruido del ventilador no son un problema.
| Modo de rendimiento | PL1 / Tau | PL2 / Tau |
|---|---|---|
| Silencioso | 45 W / 56 s | 70 W / 2,44 ms |
| Rendimiento | 80 W / 56 s | 90 W / 2,44 ms |
| Turbo | 135 W / 56 s | 135 W / 2.44 ms |
Para nuestras pruebas, elegimos el modo Turbo, ya que permite al Core i9-12900H sacar todo su potencial con un PL1/PL2 de 135 W desbloqueado. Los datos comparativos entre los distintos modos de rendimiento se ofrecen siempre que sea posible.
Procesador
El Core i9-12900H es una pieza Alder Lake de 12ª generación con 14 núcleos (6P+8E) y 20 hilos. La implementación por parte de Asus de un robusto sistema de refrigeración asegura que el Core i9-12900H pueda ofrecer un rendimiento sostenido sin mucha ralentización en la prueba de bucle multinúcleo Cinebench R15.
Curiosamente, observamos que el Core i7-12700H en la prueba Lenovo Legion 5i Pro 16 G7 para ofrecer un rendimiento multinúcleo ligeramente superior en todo el tablero. Sin embargo, el Core i9-12900H tiene la ventaja en las cargas mononúcleo.
Cinebench R15 Multi Loop
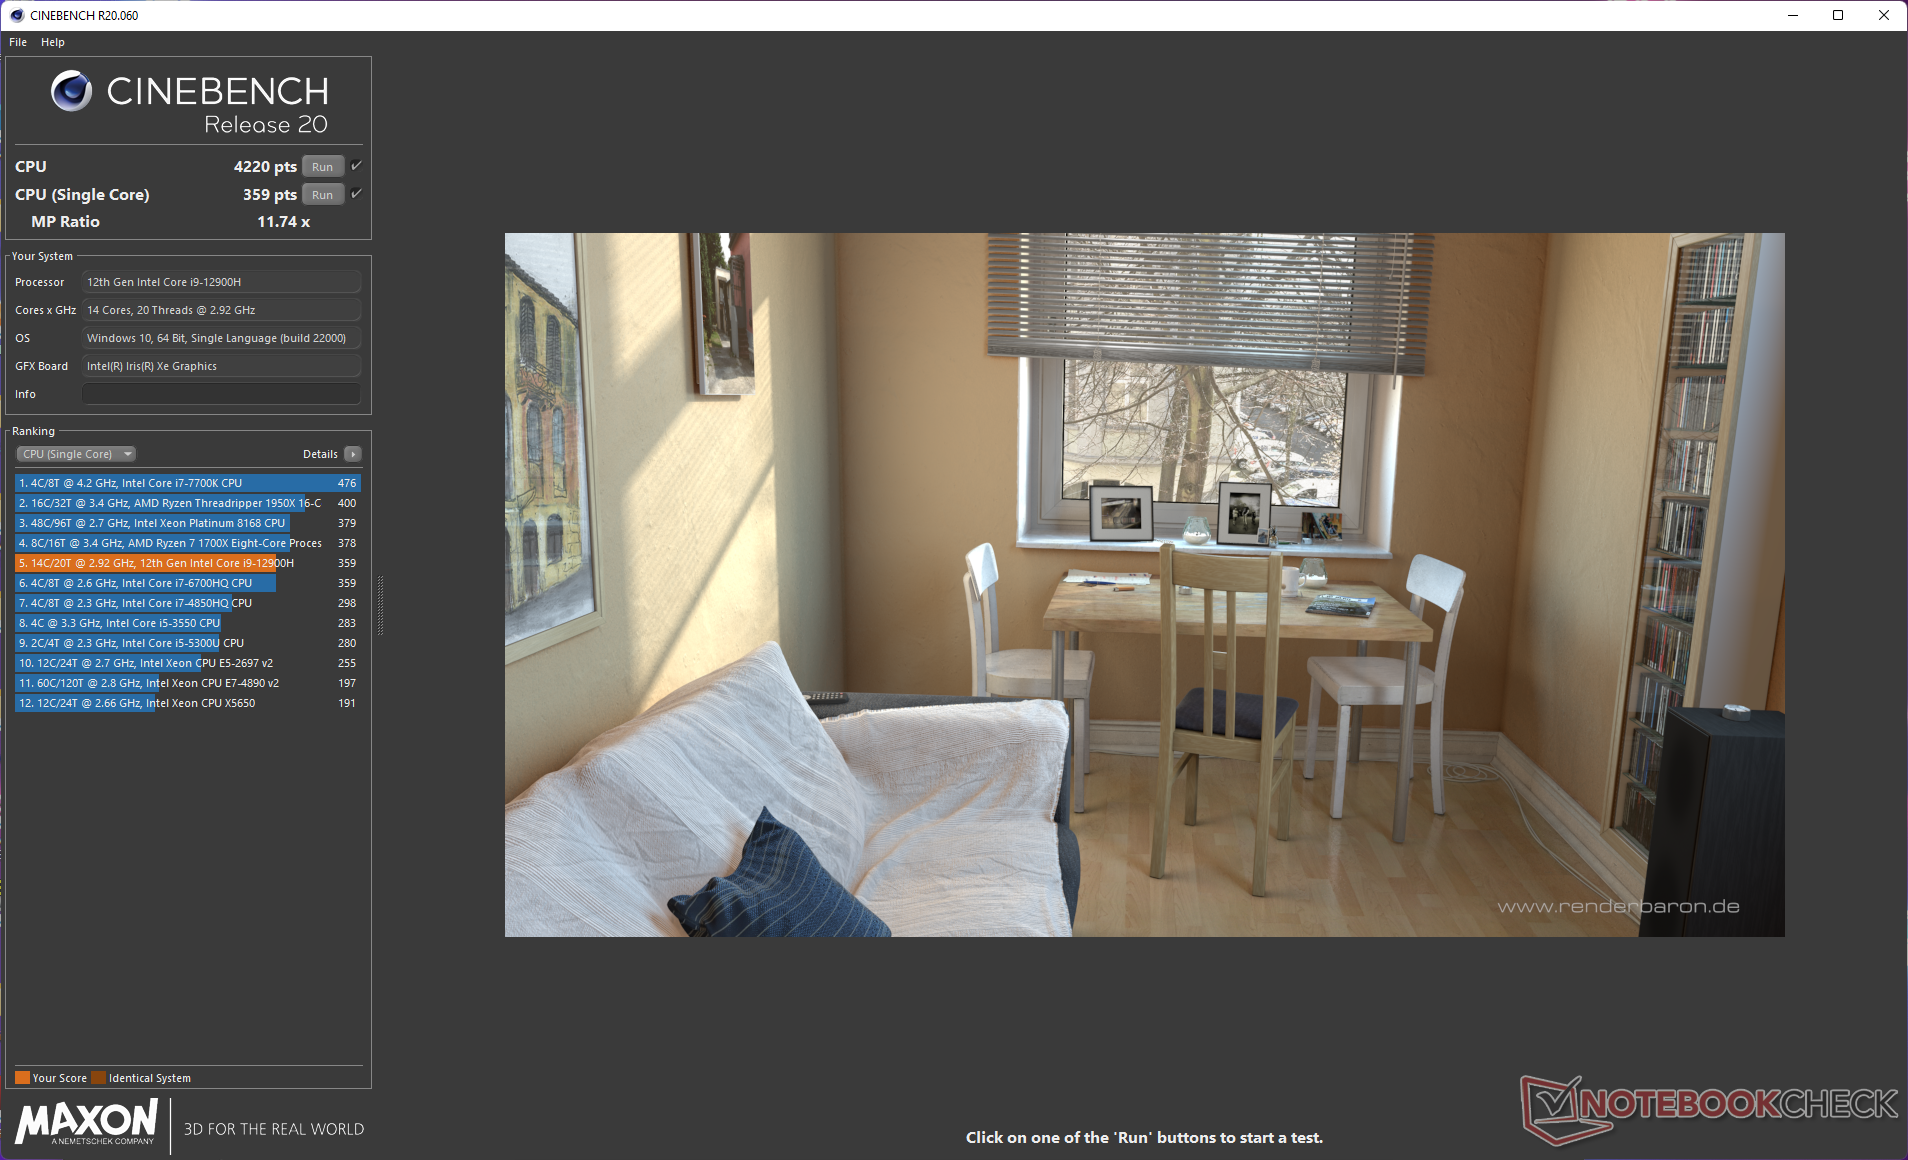
El Core i9-12900H también parece tener una ligera ventaja sobre el Core i9-12900HK en el MSI Raider GE66 12UHS, pero empata con el chip Alder Lake sin multiplicador del Gigabyte Aero 16 YE5 en las pruebas Cinebench de un solo núcleo.
En batería, el ROG Strix Scar 15 cambia al plan de energía Silent. Esto resulta en una enorme reducción del 40% en el rendimiento multi-core y una caída del 50% en los números single-core en Cinebench R20.
Cinebench R23: Multi Core | Single Core
Cinebench R20: CPU (Multi Core) | CPU (Single Core)
Cinebench R15: CPU Multi 64Bit | CPU Single 64Bit
Blender: v2.79 BMW27 CPU
7-Zip 18.03: 7z b 4 | 7z b 4 -mmt1
Geekbench 5.5: Multi-Core | Single-Core
HWBOT x265 Benchmark v2.2: 4k Preset
LibreOffice : 20 Documents To PDF
R Benchmark 2.5: Overall mean
| CPU Performance rating | |
| Media de la clase Gaming | |
| Asus ROG Strix Scar 15 G533ZW-LN106WS | |
| Gigabyte Aero 16 YE5 | |
| Lenovo Legion 5 Pro 16 G7 i7 RTX 3070Ti | |
| MSI Pulse GL66 12UEK | |
| MSI Raider GE66 12UHS | |
| MSI Vector GP66 12UGS | |
| HP Omen 16-b1090ng | |
| Medio Intel Core i9-12900H | |
| Razer Blade 15 2022 | |
| Razer Blade 14 Ryzen 9 6900HX | |
| Asus ROG Zephyrus G14 GA402RK | |
| Cinebench R23 / Multi Core | |
| Media de la clase Gaming (10488 - 42661, n=107, últimos 2 años) | |
| Lenovo Legion 5 Pro 16 G7 i7 RTX 3070Ti | |
| Asus ROG Strix Scar 15 G533ZW-LN106WS | |
| Gigabyte Aero 16 YE5 | |
| MSI Pulse GL66 12UEK | |
| MSI Vector GP66 12UGS | |
| MSI Raider GE66 12UHS | |
| HP Omen 16-b1090ng | |
| Medio Intel Core i9-12900H (7359 - 19648, n=28) | |
| Razer Blade 15 2022 | |
| Razer Blade 14 Ryzen 9 6900HX | |
| Asus ROG Zephyrus G14 GA402RK | |
| Cinebench R23 / Single Core | |
| Media de la clase Gaming (1166 - 2415, n=107, últimos 2 años) | |
| Gigabyte Aero 16 YE5 | |
| Asus ROG Strix Scar 15 G533ZW-LN106WS | |
| MSI Pulse GL66 12UEK | |
| MSI Vector GP66 12UGS | |
| MSI Raider GE66 12UHS | |
| Medio Intel Core i9-12900H (1634 - 1930, n=28) | |
| Lenovo Legion 5 Pro 16 G7 i7 RTX 3070Ti | |
| HP Omen 16-b1090ng | |
| Razer Blade 15 2022 | |
| Asus ROG Zephyrus G14 GA402RK | |
| Razer Blade 14 Ryzen 9 6900HX | |
| Cinebench R20 / CPU (Multi Core) | |
| Media de la clase Gaming (4029 - 16433, n=106, últimos 2 años) | |
| Lenovo Legion 5 Pro 16 G7 i7 RTX 3070Ti | |
| Asus ROG Strix Scar 15 G533ZW-LN106WS | |
| Gigabyte Aero 16 YE5 | |
| MSI Pulse GL66 12UEK | |
| MSI Vector GP66 12UGS | |
| MSI Raider GE66 12UHS | |
| HP Omen 16-b1090ng | |
| Razer Blade 15 2022 | |
| Medio Intel Core i9-12900H (2681 - 7471, n=28) | |
| Razer Blade 14 Ryzen 9 6900HX | |
| Asus ROG Zephyrus G14 GA402RK | |
| Cinebench R20 / CPU (Single Core) | |
| Media de la clase Gaming (442 - 913, n=106, últimos 2 años) | |
| MSI Pulse GL66 12UEK | |
| MSI Vector GP66 12UGS | |
| Asus ROG Strix Scar 15 G533ZW-LN106WS | |
| MSI Raider GE66 12UHS | |
| Medio Intel Core i9-12900H (624 - 738, n=28) | |
| Lenovo Legion 5 Pro 16 G7 i7 RTX 3070Ti | |
| HP Omen 16-b1090ng | |
| Razer Blade 15 2022 | |
| Gigabyte Aero 16 YE5 | |
| Asus ROG Zephyrus G14 GA402RK | |
| Razer Blade 14 Ryzen 9 6900HX | |
| Cinebench R15 / CPU Multi 64Bit | |
| Media de la clase Gaming (1578 - 6330, n=105, últimos 2 años) | |
| Asus ROG Strix Scar 15 G533ZW-LN106WS | |
| Lenovo Legion 5 Pro 16 G7 i7 RTX 3070Ti | |
| HP Omen 16-b1090ng | |
| Gigabyte Aero 16 YE5 | |
| MSI Pulse GL66 12UEK | |
| MSI Raider GE66 12UHS | |
| Medio Intel Core i9-12900H (1395 - 3077, n=28) | |
| MSI Vector GP66 12UGS | |
| Razer Blade 14 Ryzen 9 6900HX | |
| Razer Blade 15 2022 | |
| Asus ROG Zephyrus G14 GA402RK | |
| Cinebench R15 / CPU Single 64Bit | |
| Media de la clase Gaming (188.8 - 350, n=106, últimos 2 años) | |
| Gigabyte Aero 16 YE5 | |
| MSI Pulse GL66 12UEK | |
| Asus ROG Strix Scar 15 G533ZW-LN106WS | |
| MSI Vector GP66 12UGS | |
| MSI Raider GE66 12UHS | |
| Lenovo Legion 5 Pro 16 G7 i7 RTX 3070Ti | |
| Medio Intel Core i9-12900H (235 - 277, n=29) | |
| HP Omen 16-b1090ng | |
| Razer Blade 15 2022 | |
| Asus ROG Zephyrus G14 GA402RK | |
| Razer Blade 14 Ryzen 9 6900HX | |
| Blender / v2.79 BMW27 CPU | |
| Asus ROG Zephyrus G14 GA402RK | |
| Medio Intel Core i9-12900H (160 - 451, n=28) | |
| Razer Blade 15 2022 | |
| Razer Blade 14 Ryzen 9 6900HX | |
| Gigabyte Aero 16 YE5 | |
| MSI Vector GP66 12UGS | |
| MSI Raider GE66 12UHS | |
| MSI Pulse GL66 12UEK | |
| HP Omen 16-b1090ng | |
| Asus ROG Strix Scar 15 G533ZW-LN106WS | |
| Lenovo Legion 5 Pro 16 G7 i7 RTX 3070Ti | |
| Media de la clase Gaming (79 - 330, n=104, últimos 2 años) | |
| 7-Zip 18.03 / 7z b 4 -mmt1 | |
| Media de la clase Gaming (4199 - 7436, n=105, últimos 2 años) | |
| Gigabyte Aero 16 YE5 | |
| MSI Vector GP66 12UGS | |
| MSI Pulse GL66 12UEK | |
| MSI Raider GE66 12UHS | |
| Asus ROG Strix Scar 15 G533ZW-LN106WS | |
| HP Omen 16-b1090ng | |
| Asus ROG Zephyrus G14 GA402RK | |
| Medio Intel Core i9-12900H (5302 - 6289, n=28) | |
| Razer Blade 14 Ryzen 9 6900HX | |
| Lenovo Legion 5 Pro 16 G7 i7 RTX 3070Ti | |
| Razer Blade 15 2022 | |
| Geekbench 5.5 / Multi-Core | |
| Media de la clase Gaming (6460 - 28263, n=105, últimos 2 años) | |
| Asus ROG Strix Scar 15 G533ZW-LN106WS | |
| Gigabyte Aero 16 YE5 | |
| MSI Raider GE66 12UHS | |
| HP Omen 16-b1090ng | |
| Lenovo Legion 5 Pro 16 G7 i7 RTX 3070Ti | |
| Razer Blade 15 2022 | |
| MSI Vector GP66 12UGS | |
| Medio Intel Core i9-12900H (8519 - 14376, n=31) | |
| MSI Pulse GL66 12UEK | |
| Asus ROG Zephyrus G14 GA402RK | |
| Razer Blade 14 Ryzen 9 6900HX | |
| Geekbench 5.5 / Single-Core | |
| Media de la clase Gaming (986 - 2474, n=105, últimos 2 años) | |
| MSI Vector GP66 12UGS | |
| Gigabyte Aero 16 YE5 | |
| MSI Raider GE66 12UHS | |
| Asus ROG Strix Scar 15 G533ZW-LN106WS | |
| MSI Pulse GL66 12UEK | |
| HP Omen 16-b1090ng | |
| Medio Intel Core i9-12900H (1631 - 1897, n=31) | |
| Razer Blade 15 2022 | |
| Lenovo Legion 5 Pro 16 G7 i7 RTX 3070Ti | |
| Asus ROG Zephyrus G14 GA402RK | |
| Razer Blade 14 Ryzen 9 6900HX | |
| HWBOT x265 Benchmark v2.2 / 4k Preset | |
| Media de la clase Gaming (11.5 - 44.4, n=105, últimos 2 años) | |
| Lenovo Legion 5 Pro 16 G7 i7 RTX 3070Ti | |
| Asus ROG Strix Scar 15 G533ZW-LN106WS | |
| HP Omen 16-b1090ng | |
| MSI Vector GP66 12UGS | |
| MSI Pulse GL66 12UEK | |
| MSI Raider GE66 12UHS | |
| Gigabyte Aero 16 YE5 | |
| Razer Blade 14 Ryzen 9 6900HX | |
| Razer Blade 15 2022 | |
| Medio Intel Core i9-12900H (8.05 - 22.5, n=28) | |
| Asus ROG Zephyrus G14 GA402RK | |
| LibreOffice / 20 Documents To PDF | |
| Razer Blade 15 2022 | |
| Razer Blade 14 Ryzen 9 6900HX | |
| Media de la clase Gaming (33.2 - 88.8, n=105, últimos 2 años) | |
| Asus ROG Zephyrus G14 GA402RK | |
| Medio Intel Core i9-12900H (36.8 - 59.8, n=28) | |
| Lenovo Legion 5 Pro 16 G7 i7 RTX 3070Ti | |
| MSI Pulse GL66 12UEK | |
| HP Omen 16-b1090ng | |
| MSI Vector GP66 12UGS | |
| Asus ROG Strix Scar 15 G533ZW-LN106WS | |
| Gigabyte Aero 16 YE5 | |
| MSI Raider GE66 12UHS | |
| R Benchmark 2.5 / Overall mean | |
| Razer Blade 14 Ryzen 9 6900HX | |
| Asus ROG Zephyrus G14 GA402RK | |
| Razer Blade 15 2022 | |
| Medio Intel Core i9-12900H (0.4218 - 0.506, n=28) | |
| Lenovo Legion 5 Pro 16 G7 i7 RTX 3070Ti | |
| HP Omen 16-b1090ng | |
| MSI Raider GE66 12UHS | |
| Asus ROG Strix Scar 15 G533ZW-LN106WS | |
| Media de la clase Gaming (0.3439 - 0.759, n=106, últimos 2 años) | |
| MSI Pulse GL66 12UEK | |
| MSI Vector GP66 12UGS | |
| Gigabyte Aero 16 YE5 | |
* ... más pequeño es mejor
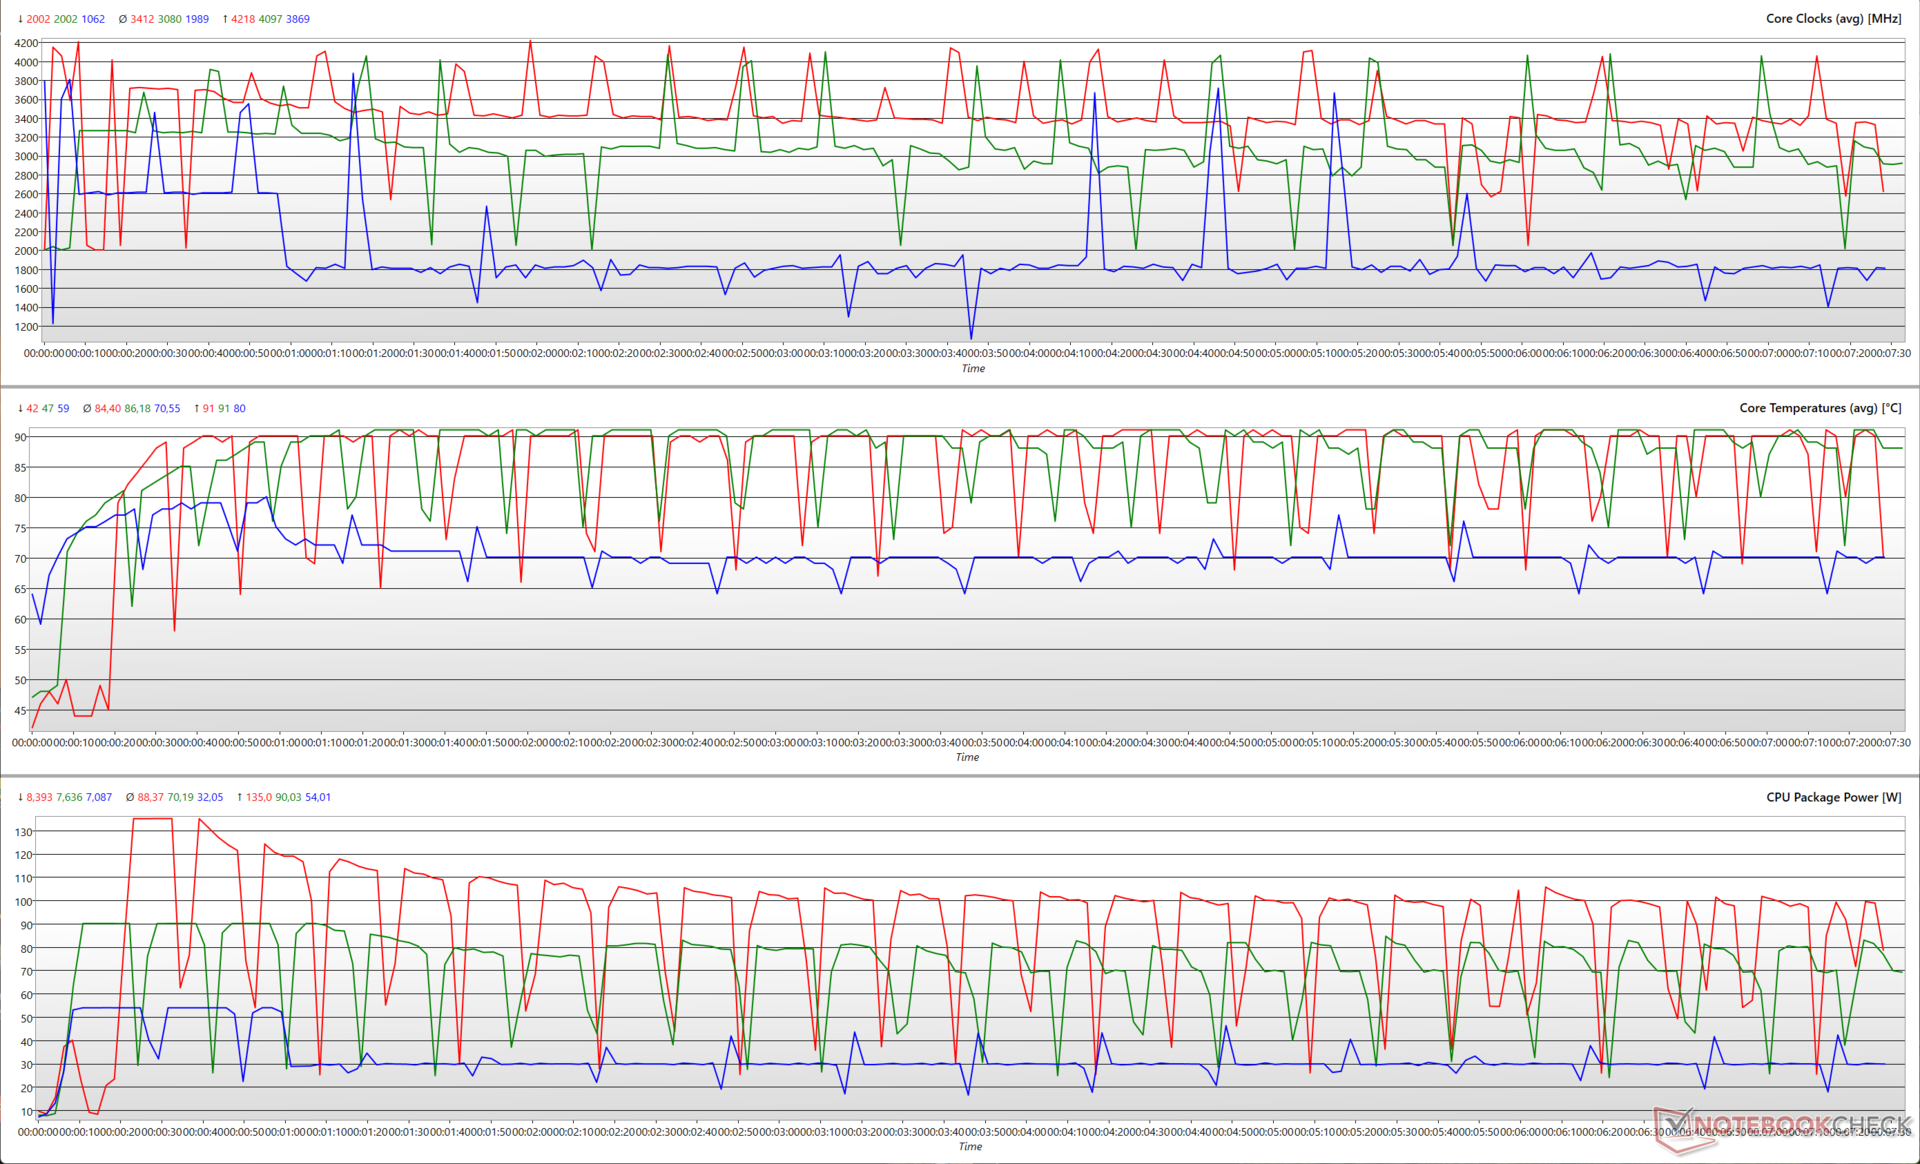
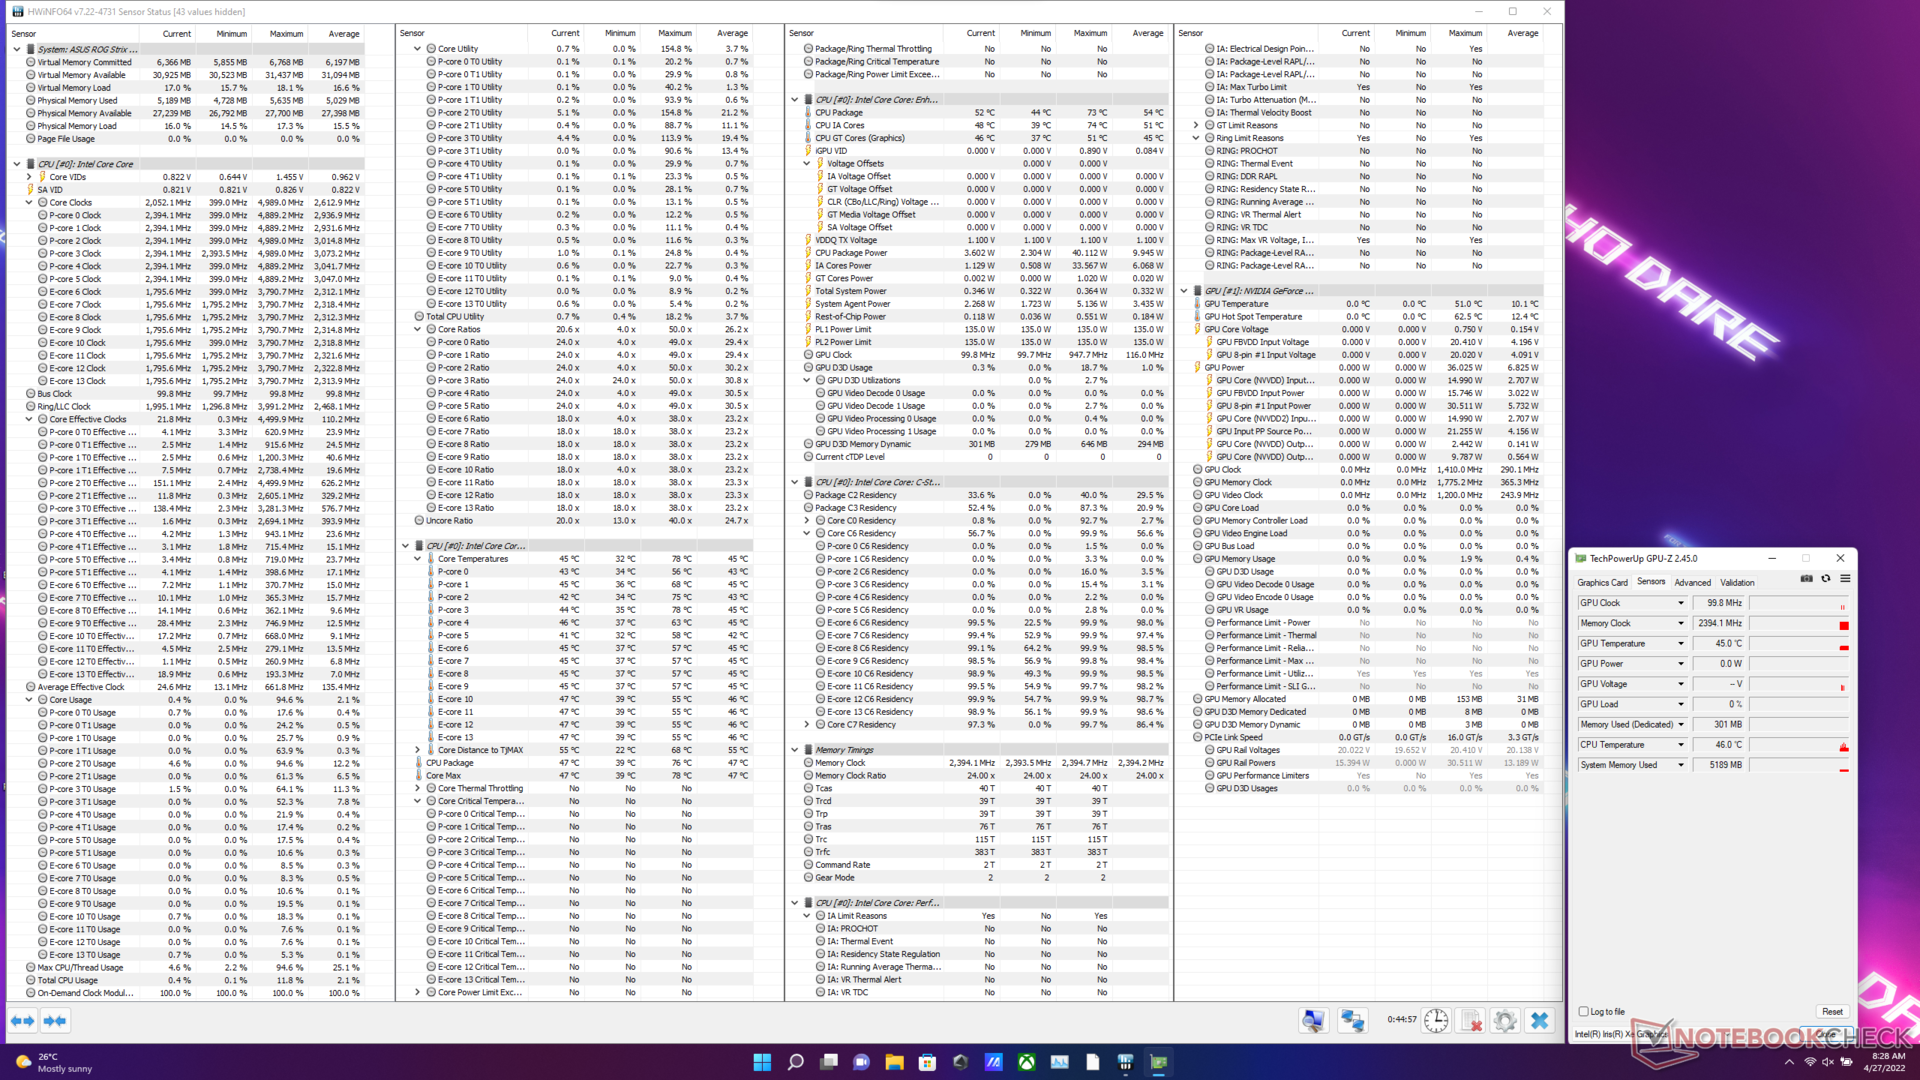
El siguiente gráfico ilustra cómo varían los diferentes parámetros de la CPU durante un bucle multinúcleo de Cinebench R15 en cada uno de los modos de rendimiento. El Turbo permite al Core i9-12900H usar 135 W, pero esto no dura más de 10 segundos. La CPU acaba estableciéndose en ~100 W durante la mayor parte del bucle. Durante este proceso, las temperaturas medias del núcleo alcanzan los 90 °C mientras que los relojes llegan a entre 4.1 GHz y 4.2 GHz.
En el modo de rendimiento se consumen inicialmente 90 W de potencia del paquete, pero se estabilizan en 80 W a partir del sexto bucle. Las temperaturas de los núcleos también alcanzan los 90 °C, pero el procesador puede alcanzar los 4 GHz+ sólo en algunos intervalos.
El modo silencioso empieza cerca de los 60 W, pero se asienta cerca de la marca de los 30 W. Como era de esperar, esto da lugar a frecuencias de CPU más bajas, normalmente cerca de la marca de 2 GHz, con picos ocasionales hasta la marca de 3,5 GHz. Las temperaturas en este modo son bastante bajas, 70 °C.
AIDA64: FP32 Ray-Trace | FPU Julia | CPU SHA3 | CPU Queen | FPU SinJulia | FPU Mandel | CPU AES | CPU ZLib | FP64 Ray-Trace | CPU PhotoWorxx
| Performance rating | |
| Media de la clase Gaming | |
| Razer Blade 14 Ryzen 9 6900HX | |
| Asus ROG Zephyrus G14 GA402RK | |
| Asus ROG Strix Scar 15 G533ZW-LN106WS | |
| Lenovo Legion 5 Pro 16 G7 i7 RTX 3070Ti | |
| Medio Intel Core i9-12900H | |
| MSI Raider GE66 12UHS | |
| Gigabyte Aero 16 YE5 | |
| MSI Pulse GL66 12UEK | |
| MSI Vector GP66 12UGS | |
| HP Omen 16-b1090ng | |
| Razer Blade 15 2022 | |
| AIDA64 / FP32 Ray-Trace | |
| Media de la clase Gaming (10227 - 85542, n=105, últimos 2 años) | |
| Razer Blade 14 Ryzen 9 6900HX | |
| Asus ROG Zephyrus G14 GA402RK | |
| Medio Intel Core i9-12900H (4074 - 18289, n=29) | |
| Asus ROG Strix Scar 15 G533ZW-LN106WS | |
| Lenovo Legion 5 Pro 16 G7 i7 RTX 3070Ti | |
| MSI Pulse GL66 12UEK | |
| MSI Raider GE66 12UHS | |
| MSI Vector GP66 12UGS | |
| Gigabyte Aero 16 YE5 | |
| Razer Blade 15 2022 | |
| HP Omen 16-b1090ng | |
| AIDA64 / FPU SinJulia | |
| Media de la clase Gaming (4424 - 33636, n=105, últimos 2 años) | |
| Razer Blade 14 Ryzen 9 6900HX | |
| Asus ROG Zephyrus G14 GA402RK | |
| Asus ROG Strix Scar 15 G533ZW-LN106WS | |
| Lenovo Legion 5 Pro 16 G7 i7 RTX 3070Ti | |
| MSI Pulse GL66 12UEK | |
| MSI Vector GP66 12UGS | |
| Gigabyte Aero 16 YE5 | |
| MSI Raider GE66 12UHS | |
| HP Omen 16-b1090ng | |
| Razer Blade 15 2022 | |
| Medio Intel Core i9-12900H (5709 - 10410, n=29) | |
| AIDA64 / FP64 Ray-Trace | |
| Media de la clase Gaming (5509 - 45446, n=105, últimos 2 años) | |
| Razer Blade 14 Ryzen 9 6900HX | |
| Asus ROG Zephyrus G14 GA402RK | |
| Medio Intel Core i9-12900H (2235 - 10511, n=29) | |
| Lenovo Legion 5 Pro 16 G7 i7 RTX 3070Ti | |
| Asus ROG Strix Scar 15 G533ZW-LN106WS | |
| MSI Pulse GL66 12UEK | |
| MSI Raider GE66 12UHS | |
| MSI Vector GP66 12UGS | |
| Gigabyte Aero 16 YE5 | |
| HP Omen 16-b1090ng | |
| Razer Blade 15 2022 | |
| AIDA64 / CPU PhotoWorxx | |
| Media de la clase Gaming (12271 - 89891, n=105, últimos 2 años) | |
| Razer Blade 15 2022 | |
| HP Omen 16-b1090ng | |
| MSI Raider GE66 12UHS | |
| Asus ROG Strix Scar 15 G533ZW-LN106WS | |
| Gigabyte Aero 16 YE5 | |
| Medio Intel Core i9-12900H (20960 - 48269, n=30) | |
| Lenovo Legion 5 Pro 16 G7 i7 RTX 3070Ti | |
| Asus ROG Zephyrus G14 GA402RK | |
| Razer Blade 14 Ryzen 9 6900HX | |
| MSI Vector GP66 12UGS | |
| MSI Pulse GL66 12UEK | |
Consulte nuestra página web dedicada al Intel Core i9-12900H para ver más pruebas de rendimiento y comparaciones.
Rendimiento del sistema
El rendimiento del sistema está en las líneas esperadas y a la par con dispositivos de configuración similar. No hemos notado ningún contratiempo en tareas de productividad general o de navegación web.
CrossMark: Overall | Productivity | Creativity | Responsiveness
| PCMark 10 / Score | |
| Media de la clase Gaming (5828 - 12414, n=93, últimos 2 años) | |
| MSI Raider GE66 12UHS | |
| MSI Vector GP66 12UGS | |
| Asus ROG Strix Scar 15 G533ZW-LN106WS | |
| Gigabyte Aero 16 YE5 | |
| Asus ROG Zephyrus G14 GA402RK | |
| Medio Intel Core i9-12900H, NVIDIA GeForce RTX 3070 Ti Laptop GPU (7087 - 8072, n=6) | |
| Razer Blade 15 2022 | |
| Lenovo Legion 5 Pro 16 G7 i7 RTX 3070Ti | |
| Razer Blade 14 Ryzen 9 6900HX | |
| HP Omen 16-b1090ng | |
| MSI Pulse GL66 12UEK | |
| PCMark 10 / Essentials | |
| MSI Raider GE66 12UHS | |
| Gigabyte Aero 16 YE5 | |
| MSI Vector GP66 12UGS | |
| Razer Blade 14 Ryzen 9 6900HX | |
| Asus ROG Zephyrus G14 GA402RK | |
| Medio Intel Core i9-12900H, NVIDIA GeForce RTX 3070 Ti Laptop GPU (10266 - 11663, n=6) | |
| Razer Blade 15 2022 | |
| Asus ROG Strix Scar 15 G533ZW-LN106WS | |
| Media de la clase Gaming (8810 - 11935, n=97, últimos 2 años) | |
| MSI Pulse GL66 12UEK | |
| HP Omen 16-b1090ng | |
| Lenovo Legion 5 Pro 16 G7 i7 RTX 3070Ti | |
| PCMark 10 / Productivity | |
| Media de la clase Gaming (6845 - 25323, n=95, últimos 2 años) | |
| Asus ROG Strix Scar 15 G533ZW-LN106WS | |
| MSI Raider GE66 12UHS | |
| Medio Intel Core i9-12900H, NVIDIA GeForce RTX 3070 Ti Laptop GPU (9402 - 10742, n=6) | |
| MSI Vector GP66 12UGS | |
| Gigabyte Aero 16 YE5 | |
| Lenovo Legion 5 Pro 16 G7 i7 RTX 3070Ti | |
| Asus ROG Zephyrus G14 GA402RK | |
| MSI Pulse GL66 12UEK | |
| Razer Blade 15 2022 | |
| HP Omen 16-b1090ng | |
| Razer Blade 14 Ryzen 9 6900HX | |
| PCMark 10 / Digital Content Creation | |
| Media de la clase Gaming (7602 - 19954, n=95, últimos 2 años) | |
| MSI Raider GE66 12UHS | |
| MSI Vector GP66 12UGS | |
| Razer Blade 15 2022 | |
| Asus ROG Strix Scar 15 G533ZW-LN106WS | |
| Lenovo Legion 5 Pro 16 G7 i7 RTX 3070Ti | |
| Gigabyte Aero 16 YE5 | |
| Asus ROG Zephyrus G14 GA402RK | |
| Medio Intel Core i9-12900H, NVIDIA GeForce RTX 3070 Ti Laptop GPU (10009 - 12541, n=6) | |
| HP Omen 16-b1090ng | |
| Razer Blade 14 Ryzen 9 6900HX | |
| MSI Pulse GL66 12UEK | |
| CrossMark / Overall | |
| Gigabyte Aero 16 YE5 | |
| MSI Pulse GL66 12UEK | |
| Asus ROG Strix Scar 15 G533ZW-LN106WS | |
| Media de la clase Gaming (1366 - 2409, n=94, últimos 2 años) | |
| Lenovo Legion 5 Pro 16 G7 i7 RTX 3070Ti | |
| Medio Intel Core i9-12900H, NVIDIA GeForce RTX 3070 Ti Laptop GPU (1664 - 2044, n=6) | |
| CrossMark / Productivity | |
| MSI Pulse GL66 12UEK | |
| Gigabyte Aero 16 YE5 | |
| Asus ROG Strix Scar 15 G533ZW-LN106WS | |
| Lenovo Legion 5 Pro 16 G7 i7 RTX 3070Ti | |
| Media de la clase Gaming (1386 - 2254, n=94, últimos 2 años) | |
| Medio Intel Core i9-12900H, NVIDIA GeForce RTX 3070 Ti Laptop GPU (1591 - 1968, n=6) | |
| CrossMark / Creativity | |
| Media de la clase Gaming (1343 - 2786, n=94, últimos 2 años) | |
| Gigabyte Aero 16 YE5 | |
| Asus ROG Strix Scar 15 G533ZW-LN106WS | |
| MSI Pulse GL66 12UEK | |
| Lenovo Legion 5 Pro 16 G7 i7 RTX 3070Ti | |
| Medio Intel Core i9-12900H, NVIDIA GeForce RTX 3070 Ti Laptop GPU (1797 - 2148, n=6) | |
| CrossMark / Responsiveness | |
| MSI Pulse GL66 12UEK | |
| Gigabyte Aero 16 YE5 | |
| Asus ROG Strix Scar 15 G533ZW-LN106WS | |
| Lenovo Legion 5 Pro 16 G7 i7 RTX 3070Ti | |
| Medio Intel Core i9-12900H, NVIDIA GeForce RTX 3070 Ti Laptop GPU (1514 - 2069, n=6) | |
| Media de la clase Gaming (1226 - 2334, n=94, últimos 2 años) | |
| PCMark 8 Home Score Accelerated v2 | 6245 puntos | |
| PCMark 8 Work Score Accelerated v2 | 6416 puntos | |
| PCMark 10 Score | 7904 puntos | |
ayuda | ||
| AIDA64 / Memory Write | |
| Media de la clase Gaming (22297 - 135096, n=105, últimos 2 años) | |
| Razer Blade 15 2022 | |
| MSI Raider GE66 12UHS | |
| Asus ROG Strix Scar 15 G533ZW-LN106WS | |
| HP Omen 16-b1090ng | |
| Gigabyte Aero 16 YE5 | |
| Medio Intel Core i9-12900H (32276 - 67858, n=29) | |
| Lenovo Legion 5 Pro 16 G7 i7 RTX 3070Ti | |
| Asus ROG Zephyrus G14 GA402RK | |
| Razer Blade 14 Ryzen 9 6900HX | |
| MSI Pulse GL66 12UEK | |
| MSI Vector GP66 12UGS | |
| AIDA64 / Memory Latency | |
| Media de la clase Gaming (75.3 - 259, n=105, últimos 2 años) | |
| Asus ROG Strix Scar 15 G533ZW-LN106WS | |
| Lenovo Legion 5 Pro 16 G7 i7 RTX 3070Ti | |
| MSI Raider GE66 12UHS | |
| MSI Pulse GL66 12UEK | |
| MSI Vector GP66 12UGS | |
| HP Omen 16-b1090ng | |
| Gigabyte Aero 16 YE5 | |
| Medio Intel Core i9-12900H (74.7 - 118.1, n=28) | |
| Razer Blade 14 Ryzen 9 6900HX | |
| Asus ROG Zephyrus G14 GA402RK | |
| Razer Blade 15 2022 | |
* ... más pequeño es mejor
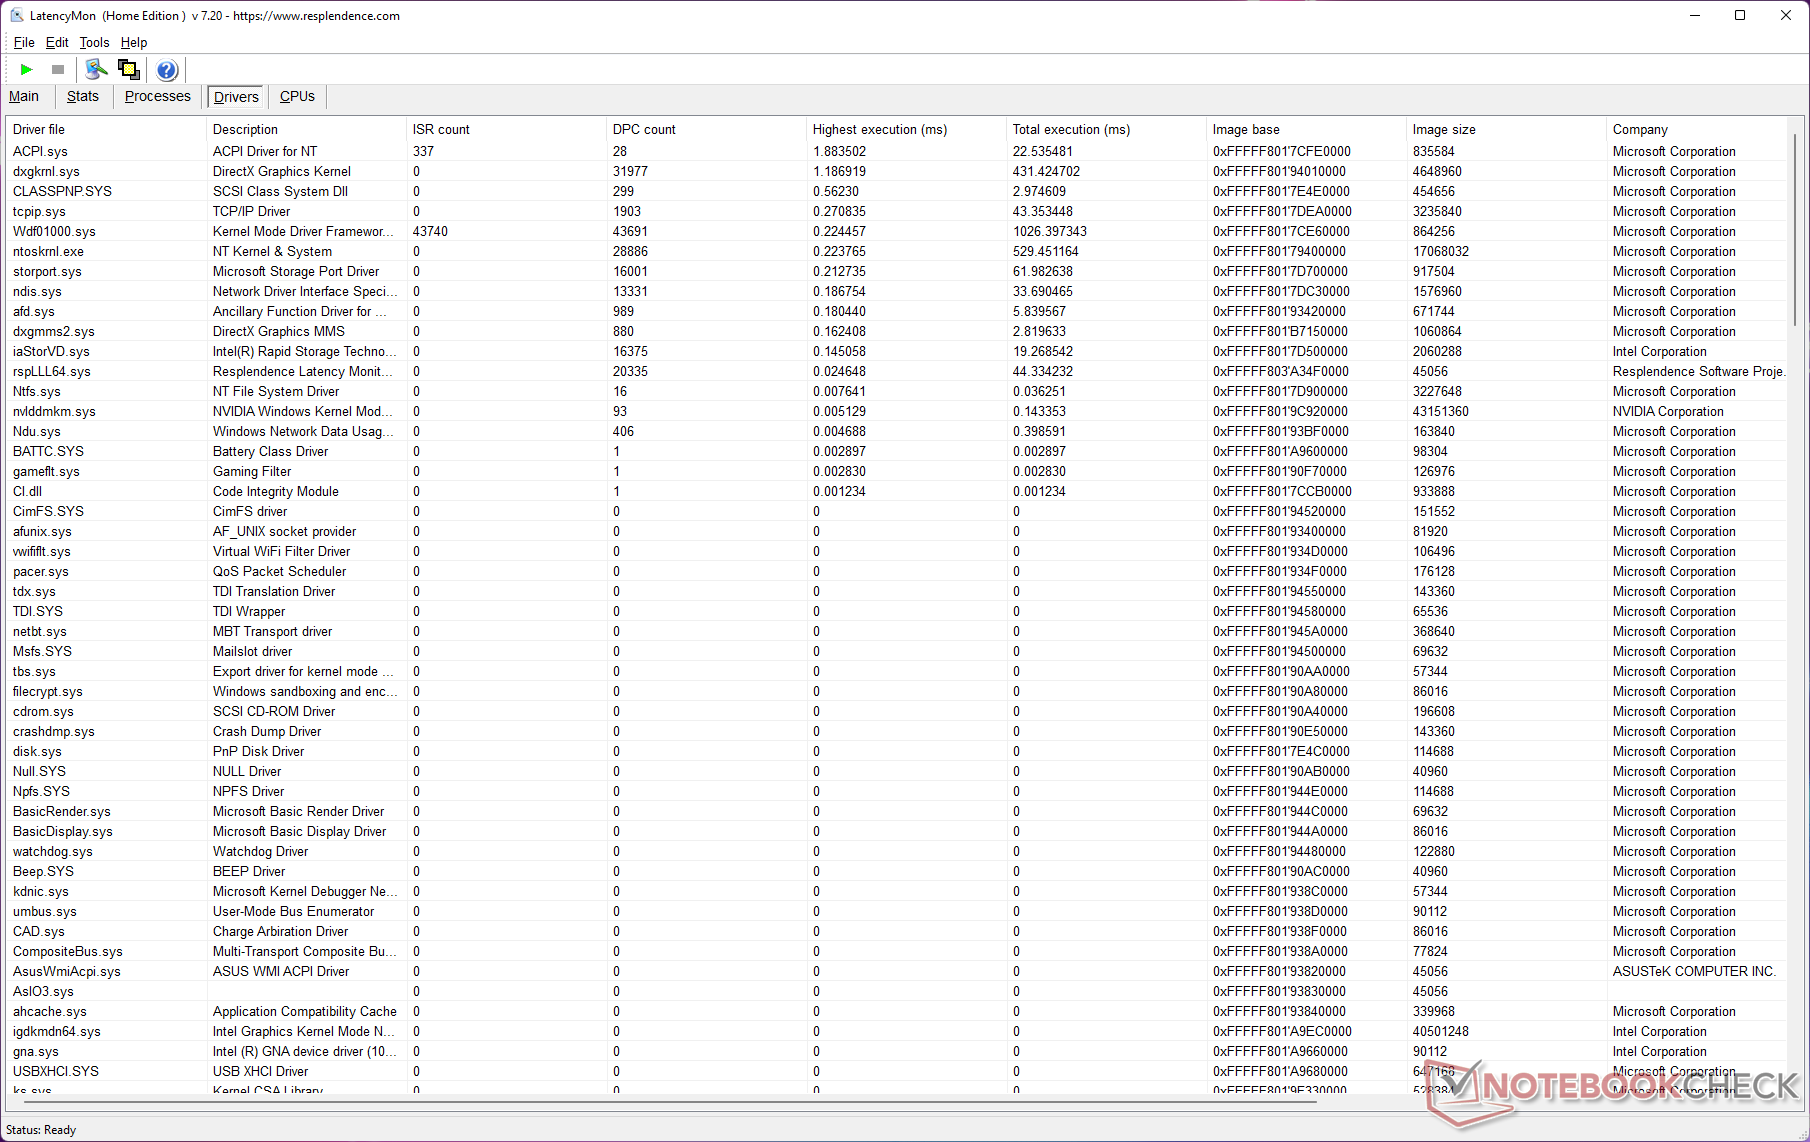
Latencia del CPD
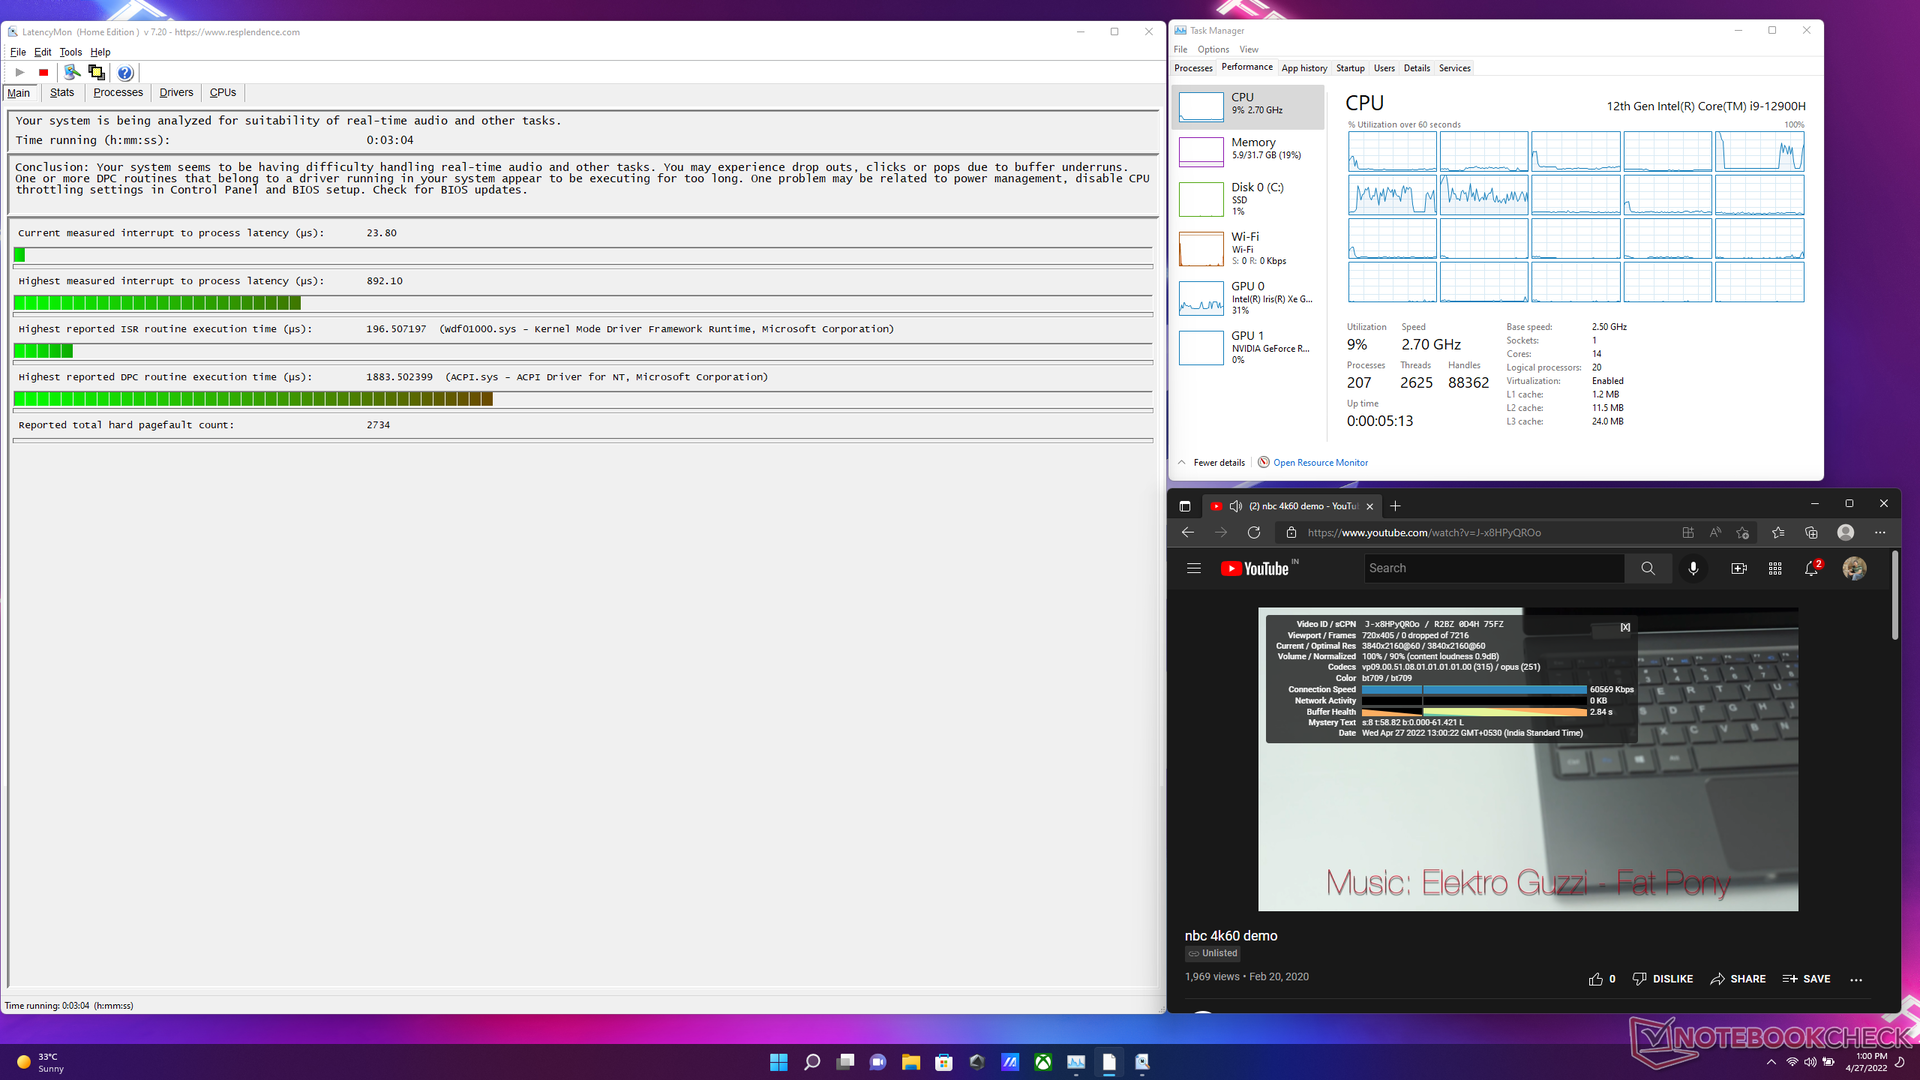
La latencia DPC medida de la Scar 15 es menor que la de la mayoría de sus competidores. Dicho esto, es posible que se encuentre con problemas potenciales cuando se trata de flujos de trabajo de audio y vídeo en tiempo real. El componente de gestión de energía de Windows, ACPI.sys, parece ser la razón de la alta latencia DPC observada.
| DPC Latencies / LatencyMon - interrupt to process latency (max), Web, Youtube, Prime95 | |
| MSI Raider GE66 12UHS | |
| Asus ROG Zephyrus G14 GA402RK | |
| MSI Vector GP66 12UGS | |
| Razer Blade 15 2022 | |
| Razer Blade 14 Ryzen 9 6900HX | |
| MSI Pulse GL66 12UEK | |
| Asus ROG Strix Scar 15 G533ZW-LN106WS | |
| Lenovo Legion 5 Pro 16 G7 i7 RTX 3070Ti | |
| HP Omen 16-b1090ng | |
| Gigabyte Aero 16 YE5 | |
* ... más pequeño es mejor
Nuestro dedicado Clasificación de la latencia del CPD ofrece más comparaciones de latencia entre los dispositivos analizados.
Dispositivos de almacenamiento
Nuestra unidad ROG Strix Scar 15 venía con un SSD NVMe Samsung PM9A1 de 2 TB. Su rendimiento en las pruebas es comparable al de otros portátiles equipados con PM9A1.
Sin embargo, la unidad se ralentiza significativamente tras el sexto bucle en lecturas sostenidas de DiskSpd con una profundidad de cola de 8, ya que no hay solución térmica ni en la unidad ni en el panel inferior.
No hay posibilidad de instalar unidades SATA de 2,5 pulgadas. No obstante, Asus ofrece una ranura M.2 secundaria para añadir otra expansión de almacenamiento NVMe.

| Asus ROG Strix Scar 15 G533ZW Samsung PM9A1 MZVL22T0HBLB | MSI Pulse GL66 12UEK Micron 2450 512GB MTFDKBA512TFK | Gigabyte Aero 16 YE5 Phison ESR01TBMFCT | MSI Vector GP66 12UGS | MSI Raider GE66 12UHS Samsung PM9A1 MZVL22T0HBLB | HP Omen 16-b1090ng WDC PC SN810 1TB | Lenovo Legion 5 Pro 16 G7 i7 RTX 3070Ti Samsung PM9A1 MZVL21T0HCLR | Razer Blade 14 Ryzen 9 6900HX Samsung PM9A1 MZVL21T0HCLR | Asus ROG Zephyrus G14 GA402RK Micron 2450 1TB MTFDKBK1T0TFK | Razer Blade 15 2022 SSSTC CA6-8D1024 | Medio Samsung PM9A1 MZVL22T0HBLB | Media de la clase Gaming | |
|---|---|---|---|---|---|---|---|---|---|---|---|---|
| Drive Performance rating | ||||||||||||
| Percent (pt) | 87.6 | 60.6 -31% | 89.4 2% | 62.8 -28% | 85.2 -3% | 67.3 -23% | 89.8 3% | 85.1 -3% | 64.2 -27% | 78.8 -10% | 76.2 -13% | 71.9 -18% |
| DiskSpd | -21% | 9% | -20% | 1% | -16% | 11% | 4% | -27% | -3% | -6% | -11% | |
| seq read (MB/s) | 2397 | 2038 -15% | 3819 59% | 2119 -12% | 3813 59% | 3928 64% | 4486 87% | 4352 82% | 2262 -6% | 4119 72% | 3903 ? 63% | 3556 ? 48% |
| seq write (MB/s) | 4488 | 3275 -27% | 4457 -1% | 3405 -24% | 3838 -14% | 4033 -10% | 4368 -3% | 4240 -6% | 3454 -23% | 4167 -7% | 4101 ? -9% | 3957 ? -12% |
| seq q8 t1 read (MB/s) | 7006 | 3613 -48% | 7028 0% | 3563 -49% | 5358 -24% | 6867 -2% | 6637 -5% | 6670 -5% | 3563 -49% | 6921 -1% | 7079 ? 1% | 7552 ? 8% |
| seq q8 t1 write (MB/s) | 5263 | 3351 -36% | 5004 -5% | 3448 -34% | 4951 -6% | 5412 3% | 4940 -6% | 4995 -5% | 3455 -34% | 4740 -10% | 5439 ? 3% | 5961 ? 13% |
| 4k q1 t1 read (MB/s) | 86.8 | 71.5 -18% | 88.7 2% | 69.5 -20% | 88.3 2% | 77.1 -11% | 97.4 12% | 79.8 -8% | 62.4 -28% | 79.6 -8% | 77.3 ? -11% | 70.3 ? -19% |
| 4k q1 t1 write (MB/s) | 294 | 421 43% | 373 27% | 408 39% | 273 -7% | 205 -30% | 274 -7% | 196.8 -33% | 249 -15% | 256 -13% | 212 ? -28% | 195.9 ? -33% |
| 4k q32 t16 read (MB/s) | 3975 | 1550 -61% | 3555 -11% | 1844 -54% | 4068 2% | 1528 -62% | 4158 5% | 4174 5% | 1841 -54% | 3184 -20% | 2860 ? -28% | 2264 ? -43% |
| 4k q32 t16 write (MB/s) | 3509 | 3249 -7% | 3612 3% | 3354 -4% | 3478 -1% | 585 -83% | 3544 1% | 3559 1% | 3364 -4% | 2141 -39% | 2177 ? -38% | 1832 ? -48% |
| AS SSD | -116% | -6% | -242% | -6% | -29% | -0% | -37% | -116% | -33% | -28% | -42% | |
| Score Total (Points) | 9031 | 4693 -48% | 9380 4% | 6130 -32% | 8959 -1% | 5985 -34% | 9094 1% | 9147 1% | 7568 -16% | 7659 -15% | 7177 ? -21% | 6872 ? -24% |
| Score Read (Points) | 3378 | 1878 -44% | 3634 8% | 2008 -41% | 3341 -1% | 1994 -41% | 3380 0% | 3439 2% | 2722 -19% | 3431 2% | 2615 ? -23% | 2248 ? -33% |
| Score Write (Points) | 3999 | 1837 -54% | 3991 0% | 3087 -23% | 3977 -1% | 3093 -23% | 4043 1% | 4026 1% | 3451 -14% | 2563 -36% | 3292 ? -18% | 3547 ? -11% |
| Seq Read (MB/s) | 5563.48 | 3127 -44% | 5588 0% | 3080 -45% | 5098.97 -8% | 5396.69 -3% | 5036 -9% | 5482.07 -1% | 3209 -42% | 5750 3% | 5454 ? -2% | 5591 ? 0% |
| Seq Write (MB/s) | 4045.87 | 2977 -26% | 3267 -19% | 2997 -26% | 3667.77 -9% | 2667.04 -34% | 3784 -6% | 4007.19 -1% | 3131 -23% | 4073 1% | 3968 ? -2% | 3972 ? -2% |
| 4K Read (MB/s) | 81.3 | 95.9 18% | 109.4 35% | 70 -14% | 84.06 3% | 73.81 -9% | 88.1 8% | 73.78 -9% | 77.7 -4% | 67.2 -17% | 72 ? -11% | 71.1 ? -13% |
| 4K Write (MB/s) | 248.96 | 363.5 46% | 321.6 29% | 352 41% | 244.47 -2% | 247.26 -1% | 240.4 -3% | 174.19 -30% | 218.3 -12% | 221.3 -11% | 195.9 ? -21% | 215 ? -14% |
| 4K-64 Read (MB/s) | 2740.24 | 1469 -46% | 2966 8% | 1630 -41% | 2747.2 0% | 1380.56 -50% | 2788 2% | 2816.7 3% | 2323 -15% | 2789 2% | 1998 ? -27% | 1618 ? -41% |
| 4K-64 Write (MB/s) | 3345.62 | 1175 -65% | 3342 0% | 2435 -27% | 3365.94 1% | 2579.14 -23% | 3424 2% | 3450.87 3% | 2920 -13% | 1934 -42% | 2700 ? -19% | 2935 ? -12% |
| Access Time Read * (ms) | 0.022 | 0.051 -132% | 0.056 -155% | 0.033 -50% | 0.032 -45% | 0.045 -105% | 0.02 9% | 0.035 -59% | 0.065 -195% | 0.023 -5% | 0.03461 ? -57% | 0.06364 ? -189% |
| Access Time Write * (ms) | 0.017 | 0.167 -882% | 0.012 29% | 0.425 -2400% | 0.018 -6% | 0.016 6% | 0.018 -6% | 0.07 -312% | 0.174 -924% | 0.058 -241% | 0.03473 ? -104% | 0.03794 ? -123% |
| Media total (Programa/Opciones) | -56% /
-74% | 2% /
1% | -97% /
-142% | -3% /
-3% | -23% /
-24% | 5% /
4% | -12% /
-19% | -57% /
-76% | -15% /
-20% | -16% /
-18% | -24% /
-28% |
* ... más pequeño es mejor
Disk Throttling: DiskSpd Read Loop, Queue Depth 8
Consulte nuestros Comparaciones de SSD y HDD para ver más comparaciones de dispositivos de almacenamiento.
Rendimiento de la GPU
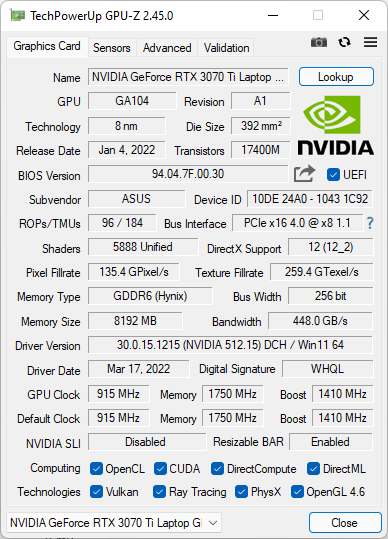
Nuestra unidad ROG Strix Scar 15 cuenta con una GPU Nvidia GeForce RTX 3070 Ti para portátiles con una potencia gráfica total (TGP) de 150 W (125 W + 25 W Dynamic Boost)
El rendimiento general en 3DMark está a la par con una Radeon RX 6800S en el Asus ROG Zephyrus G14. El rendimiento en 3DMark Fire Strike Graphics y 3DMark Time Spy Graphics se queda atrás en un 5% y un 12%, respectivamente, en comparación con laGPU RTX 3080 Ti para portátiles en el MSI Raider GE66 12UHS.
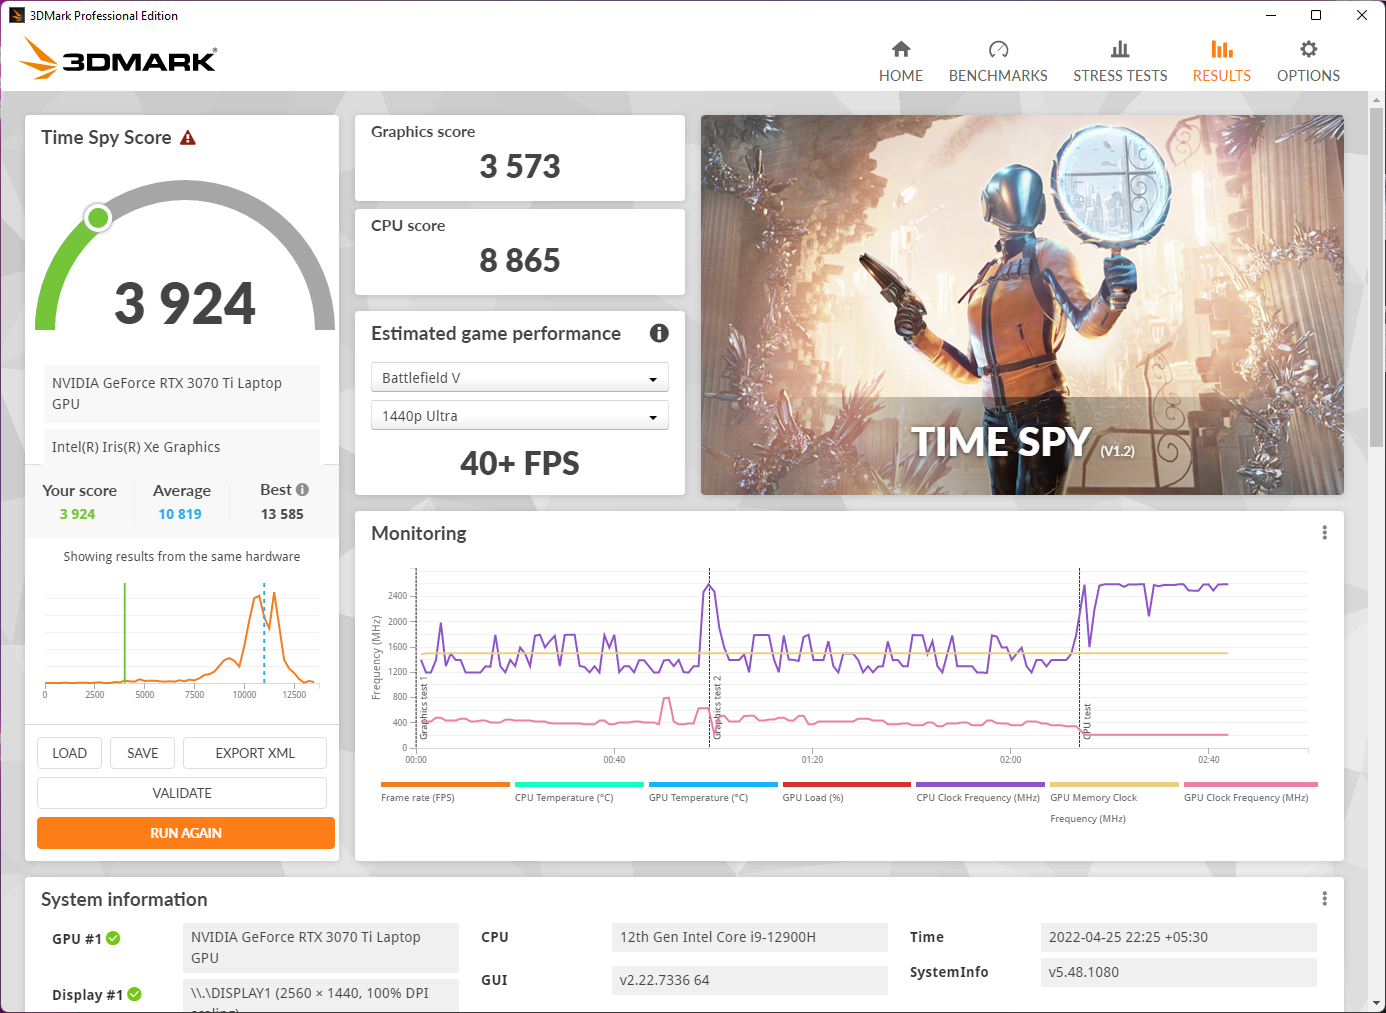
El rendimiento de la GPU se lleva una gran paliza con la batería. Observamos una reducción del 68% en la puntuación gráfica de Time Spy. El portátil cambia automáticamente al modo de rendimiento silencioso y la tasa de refresco de la pantalla se reduce de 240 Hz a 60 Hz al desconectar el adaptador de corriente. Según 3DMark, las bajas puntuaciones en batería aún se correlacionan con un rendimiento equivalente a 40+ fps en un título como
a 1440p Ultra.Como se ha mencionado antes, Asus permite usar un interruptor MUX a través de Armory Crate para puentear la iGPU. Asus afirma que el beneficio de rendimiento es de hasta un 9% al hacerlo, pero su kilometraje variará dependiendo del juego o la carga gráfica.
La siguiente tabla muestra una comparación entre los modos MSHybrid estándar y MUX en las pruebas gráficas 3DMark Time Spy y Fire Strike. Aunque vemos una ligera ventaja, la diferencia está bien dentro del margen de error para ser considerada significativa.
No obstante, el interruptor MUX dedicado es una buena característica que puede resultar útil en los juegos del mundo real, sobre todo para aumentar los fotogramas a 1080p.
| prueba 3DMark | Estándar MSHybrid | MUX Switch |
|---|---|---|
| Fire Strike Puntuación | 24123 | 25390 (+1,1%) |
| Fire Strike Gráficos | 29292 | 29811 (+1,77%) |
| Fire Strike Física | 30624 | 30101 (-1,70%) |
| Time Spy Puntuación | 11481 | 11724 (+2,11%) |
| Time Spy Gráficos | 11197 | 11374 (+1,58%) |
| Time Spy CPU | 13413 | 14204 (+5,9%) |
| 3DMark 11 Performance | 34211 puntos | |
| 3DMark Ice Storm Standard Score | 118774 puntos | |
| 3DMark Cloud Gate Standard Score | 58464 puntos | |
| 3DMark Fire Strike Score | 24123 puntos | |
| 3DMark Fire Strike Extreme Score | 13949 puntos | |
| 3DMark Time Spy Score | 11481 puntos | |
ayuda | ||
Rendimiento de los juegos
El rendimiento en los juegos probados está en la línea esperada. La GPU RTX 3070 Ti para portátiles es bastante capaz de jugar a 4K en una pantalla externa al menos con ajustes altos, si no en Ultra. Los juegos QHD son totalmente posibles con todos los detalles al máximo. El trazado de rayos se ve afectado en comparación con la GPU RTX 3080 Ti para portátiles, pero deberían poder conseguirse fotogramas jugables con DLSS en los títulos compatibles.
| The Witcher 3 | |
| 1920x1080 Ultra Graphics & Postprocessing (HBAO+) | |
| Media de la clase Gaming (104.7 - 240, n=7, últimos 2 años) | |
| MSI Vector GP66 12UGS | |
| Asus ROG Strix Scar 15 G533ZW-LN106WS | |
| MSI Raider GE66 12UHS | |
| Razer Blade 15 2022 | |
| Lenovo Legion 5 Pro 16 G7 i7 RTX 3070Ti | |
| Medio NVIDIA GeForce RTX 3070 Ti Laptop GPU (76.8 - 124.1, n=39) | |
| HP Omen 16-b1090ng | |
| Razer Blade 14 Ryzen 9 6900HX | |
| Asus ROG Zephyrus G14 GA402RK | |
| Gigabyte Aero 16 YE5 | |
| MSI Pulse GL66 12UEK | |
| 3840x2160 High Graphics & Postprocessing (Nvidia HairWorks Off) | |
| Media de la clase Gaming (114 - 170.9, n=4, últimos 2 años) | |
| Asus ROG Strix Scar 15 G533ZW-LN106WS | |
| MSI Raider GE66 12UHS | |
| Medio NVIDIA GeForce RTX 3070 Ti Laptop GPU (73.2 - 78, n=2) | |
| Gigabyte Aero 16 YE5 | |
| 3840x2160 Ultra Graphics & Postprocessing (HBAO+) | |
| Media de la clase Gaming (112.4 - 114.8, n=2, últimos 2 años) | |
| Asus ROG Strix Scar 15 G533ZW-LN106WS | |
| Medio NVIDIA GeForce RTX 3070 Ti Laptop GPU (48.4 - 52.3, n=2) | |
| Gigabyte Aero 16 YE5 | |
| F1 2021 | |
| 1920x1080 Ultra High Preset + Raytracing AA:T AF:16x | |
| MSI Raider GE66 12UHS | |
| Asus ROG Strix Scar 15 G533ZW-LN106WS | |
| Lenovo Legion 5 Pro 16 G7 i7 RTX 3070Ti | |
| Asus ROG Zephyrus G14 GA402RK | |
| Medio NVIDIA GeForce RTX 3070 Ti Laptop GPU (67.3 - 134.2, n=13) | |
| Gigabyte Aero 16 YE5 | |
| 2560x1440 Ultra High Preset + Raytracing AA:T AF:16x | |
| Lenovo Legion 5 Pro 16 G7 i7 RTX 3070Ti | |
| Asus ROG Strix Scar 15 G533ZW-LN106WS | |
| Gigabyte Aero 16 YE5 | |
| Medio NVIDIA GeForce RTX 3070 Ti Laptop GPU (47.5 - 99.2, n=11) | |
| Asus ROG Zephyrus G14 GA402RK | |
| 3840x2160 Ultra High Preset + Raytracing AA:T AF:16x | |
| Asus ROG Strix Scar 15 G533ZW-LN106WS | |
| Medio NVIDIA GeForce RTX 3070 Ti Laptop GPU (47 - 56.8, n=3) | |
| Gigabyte Aero 16 YE5 | |
| Asus ROG Zephyrus G14 GA402RK | |
| Assassin´s Creed Valhalla | |
| 1920x1080 Ultra High Preset | |
| Asus ROG Zephyrus G14 GA402RK | |
| MSI Raider GE66 12UHS | |
| Asus ROG Strix Scar 15 G533ZW-LN106WS | |
| Medio NVIDIA GeForce RTX 3070 Ti Laptop GPU (73 - 80, n=4) | |
| 2560x1440 Ultra High Preset | |
| MSI Raider GE66 12UHS | |
| Asus ROG Zephyrus G14 GA402RK | |
| Asus ROG Strix Scar 15 G533ZW-LN106WS | |
| Medio NVIDIA GeForce RTX 3070 Ti Laptop GPU (56 - 62, n=3) | |
| 3840x2160 Ultra High Preset | |
| MSI Raider GE66 12UHS | |
| Asus ROG Strix Scar 15 G533ZW-LN106WS | |
| Medio NVIDIA GeForce RTX 3070 Ti Laptop GPU (35 - 37, n=2) | |
| Asus ROG Zephyrus G14 GA402RK | |
La tabla de FPS de Witcher 3
Velocidades de fotogramas enEl Witcher 3 prueba de esfuerzo a 1080p Ultra rondan entre 103 y 113 fps y parecen relativamente estables en su mayor parte.
| bajo | medio | alto | ultra | QHD | 4K | |
|---|---|---|---|---|---|---|
| GTA V (2015) | 182.7 | 184.5 | 172.2 | 123.9 | 101.9 | 98 |
| The Witcher 3 (2015) | 441 | 251 | 209 | 111 | 78 | |
| Dota 2 Reborn (2015) | 187 | 173.3 | 164.8 | 158.4 | 130.2 | |
| Final Fantasy XV Benchmark (2018) | 202 | 129.7 | 95.7 | 72.2 | 43.9 | |
| Far Cry 5 (2018) | 160 | 143 | 138 | 130 | 107 | 61 |
| Strange Brigade (2018) | 519 | 274 | 235 | 196.2 | 148.5 | 87.9 |
| Assassin´s Creed Valhalla (2020) | 160 | 111 | 94 | 80 | 62 | 37 |
| F1 2021 (2021) | 405 | 317 | 238 | 134.2 | 98.4 | 56.8 |
| Cyberpunk 2077 1.6 (2022) | 140.3 | 114.6 | 89.5 | 76 | 46 | 24.6 |
Echa un vistazo a la GPU Nvidia GeForce RTX 3070 Ti para portátiles y de juegos para obtener más información y comparaciones de rendimiento.
Emisiones: rTX 3070 Ti de 150 W a costa de un elevado ruido de ventilador
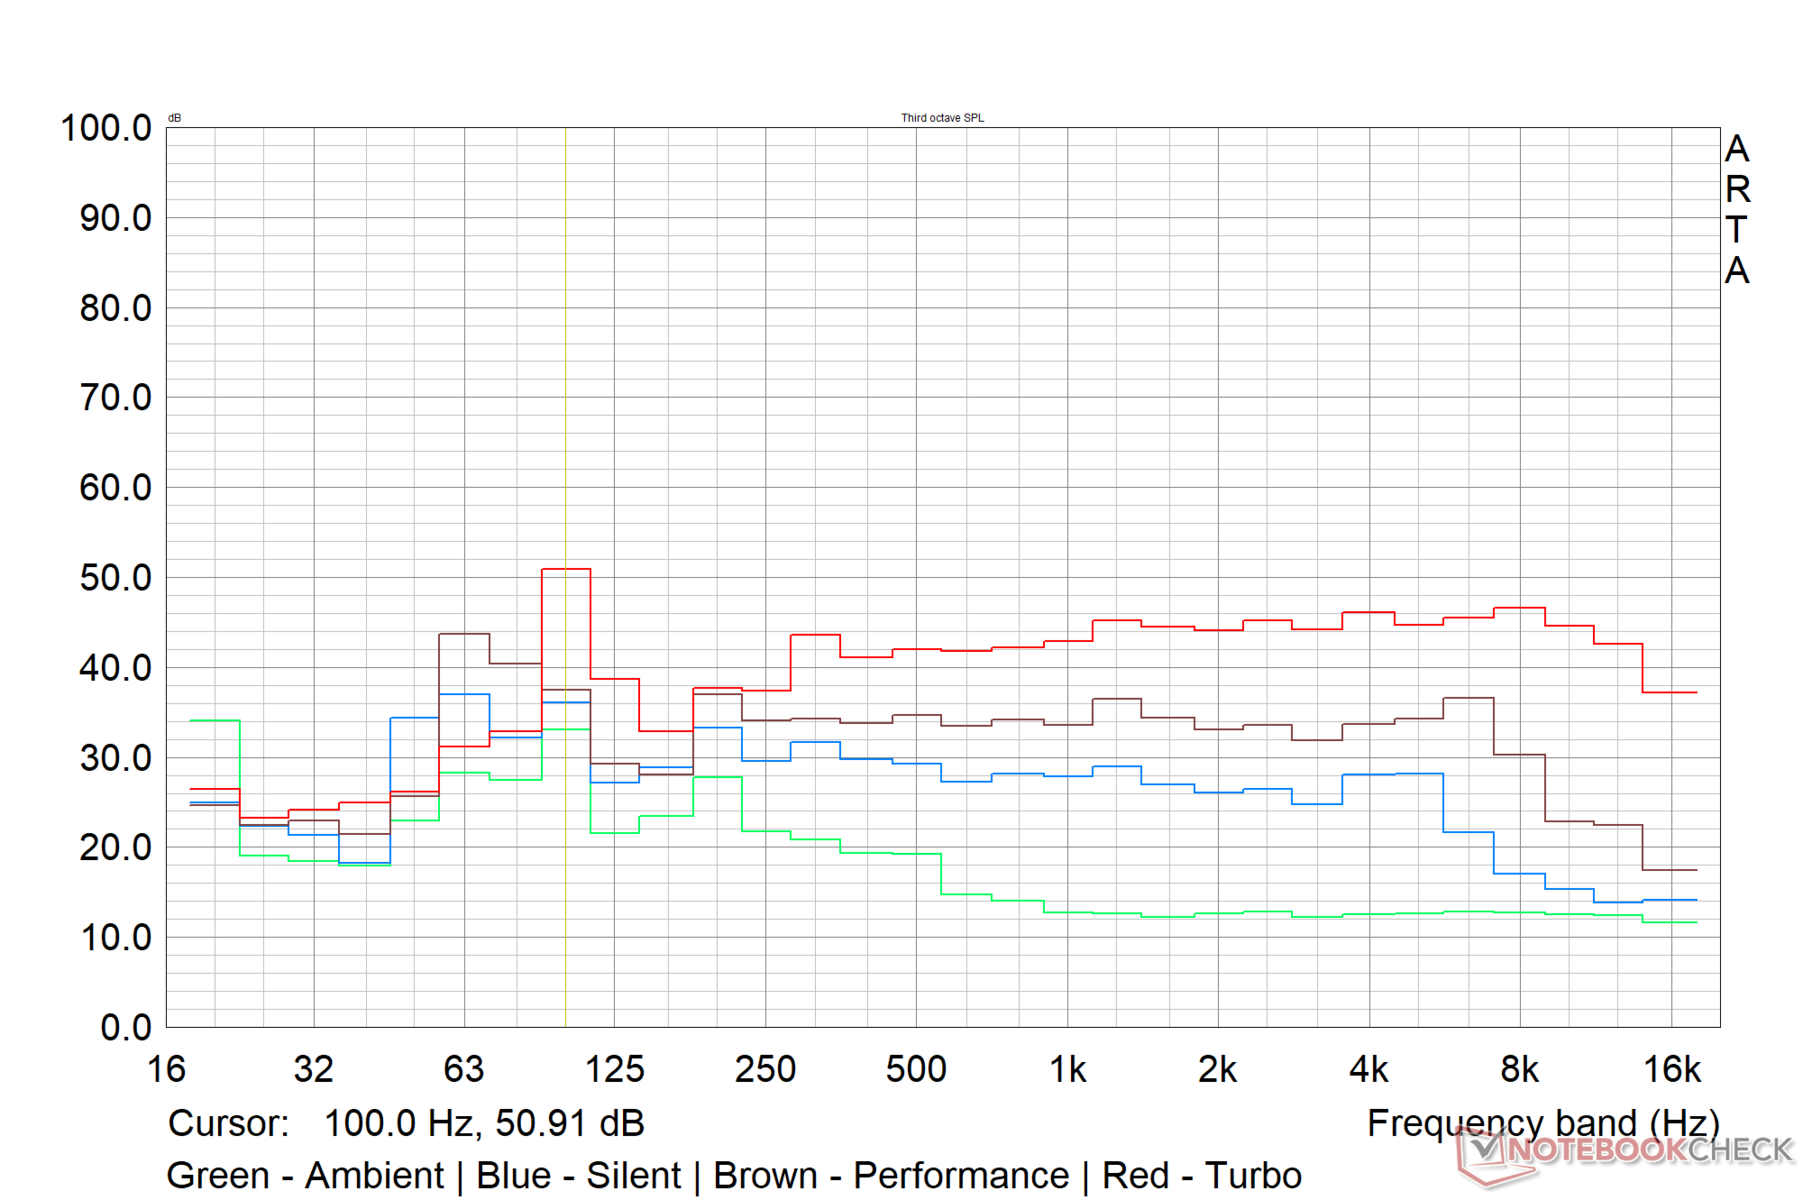
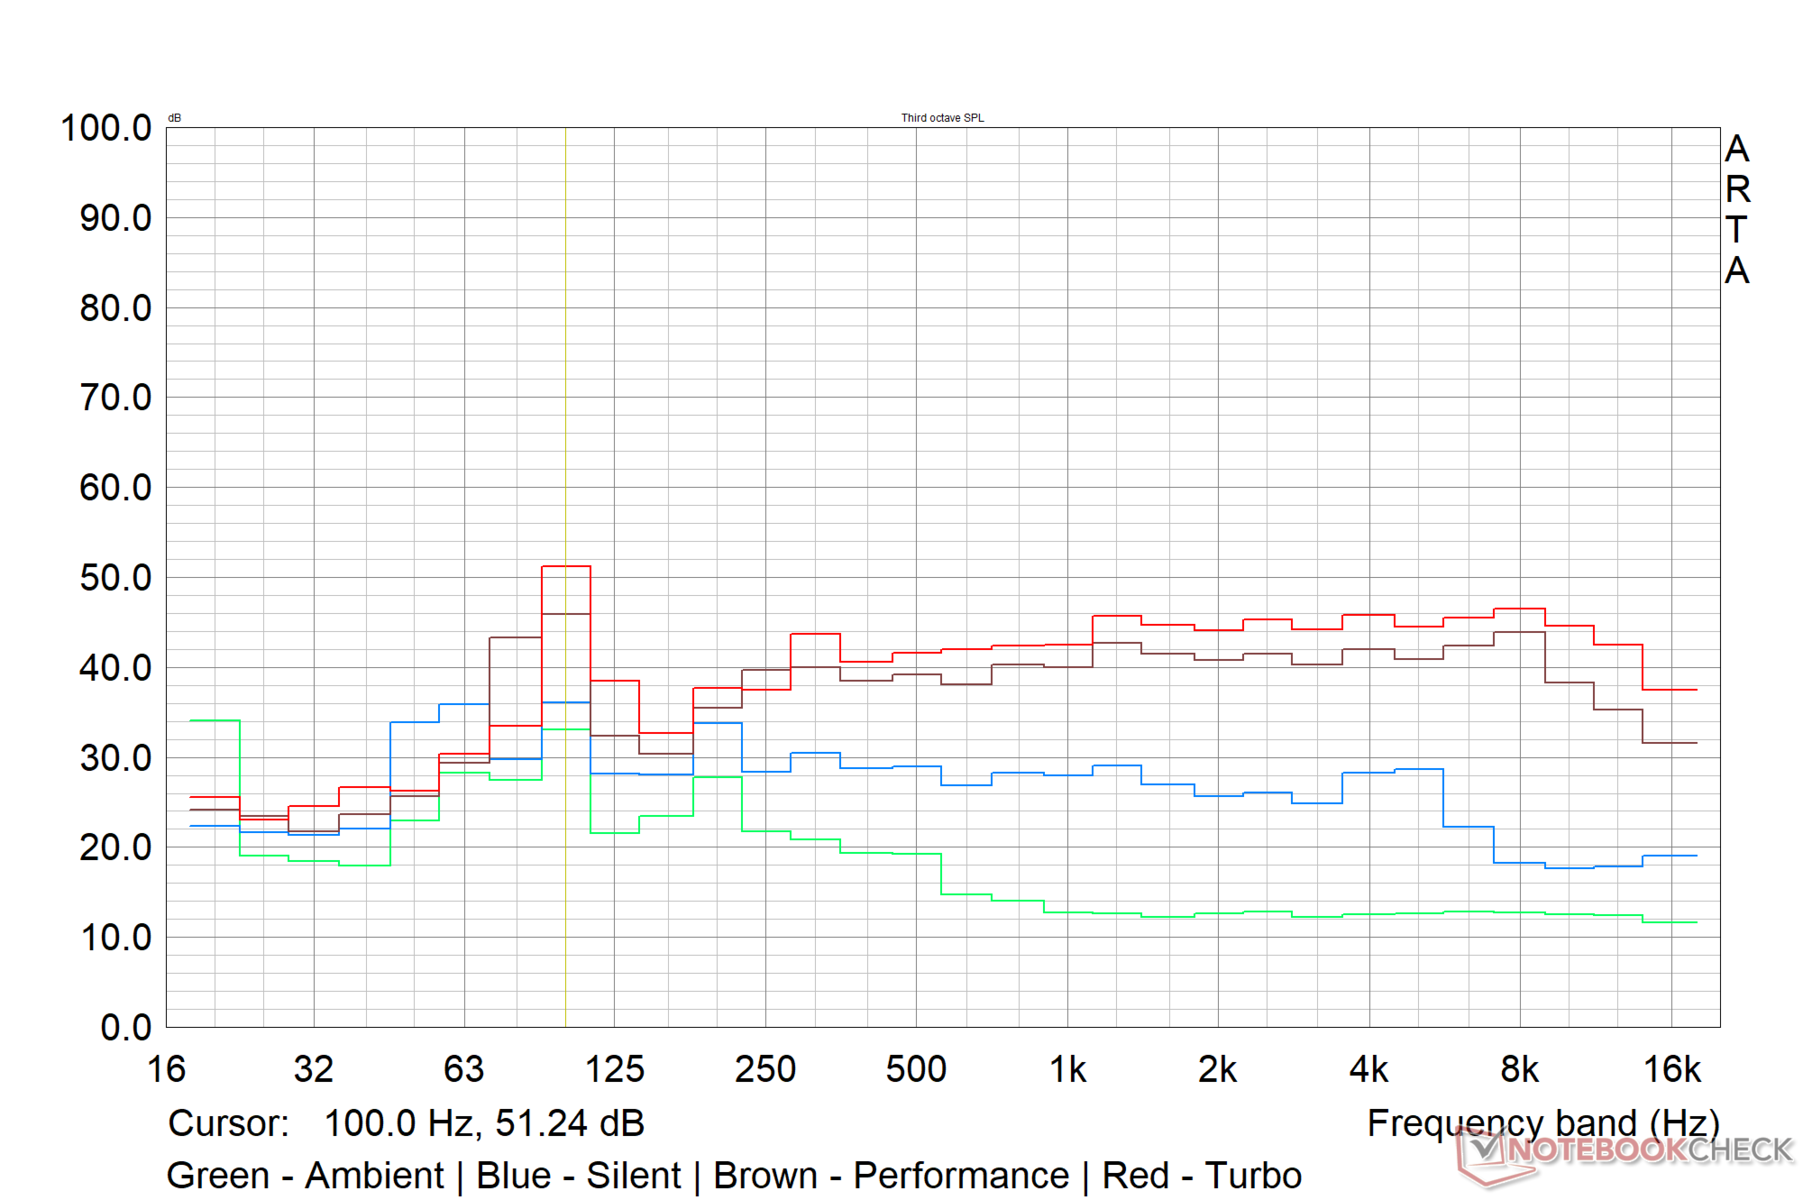
Ruido del sistema
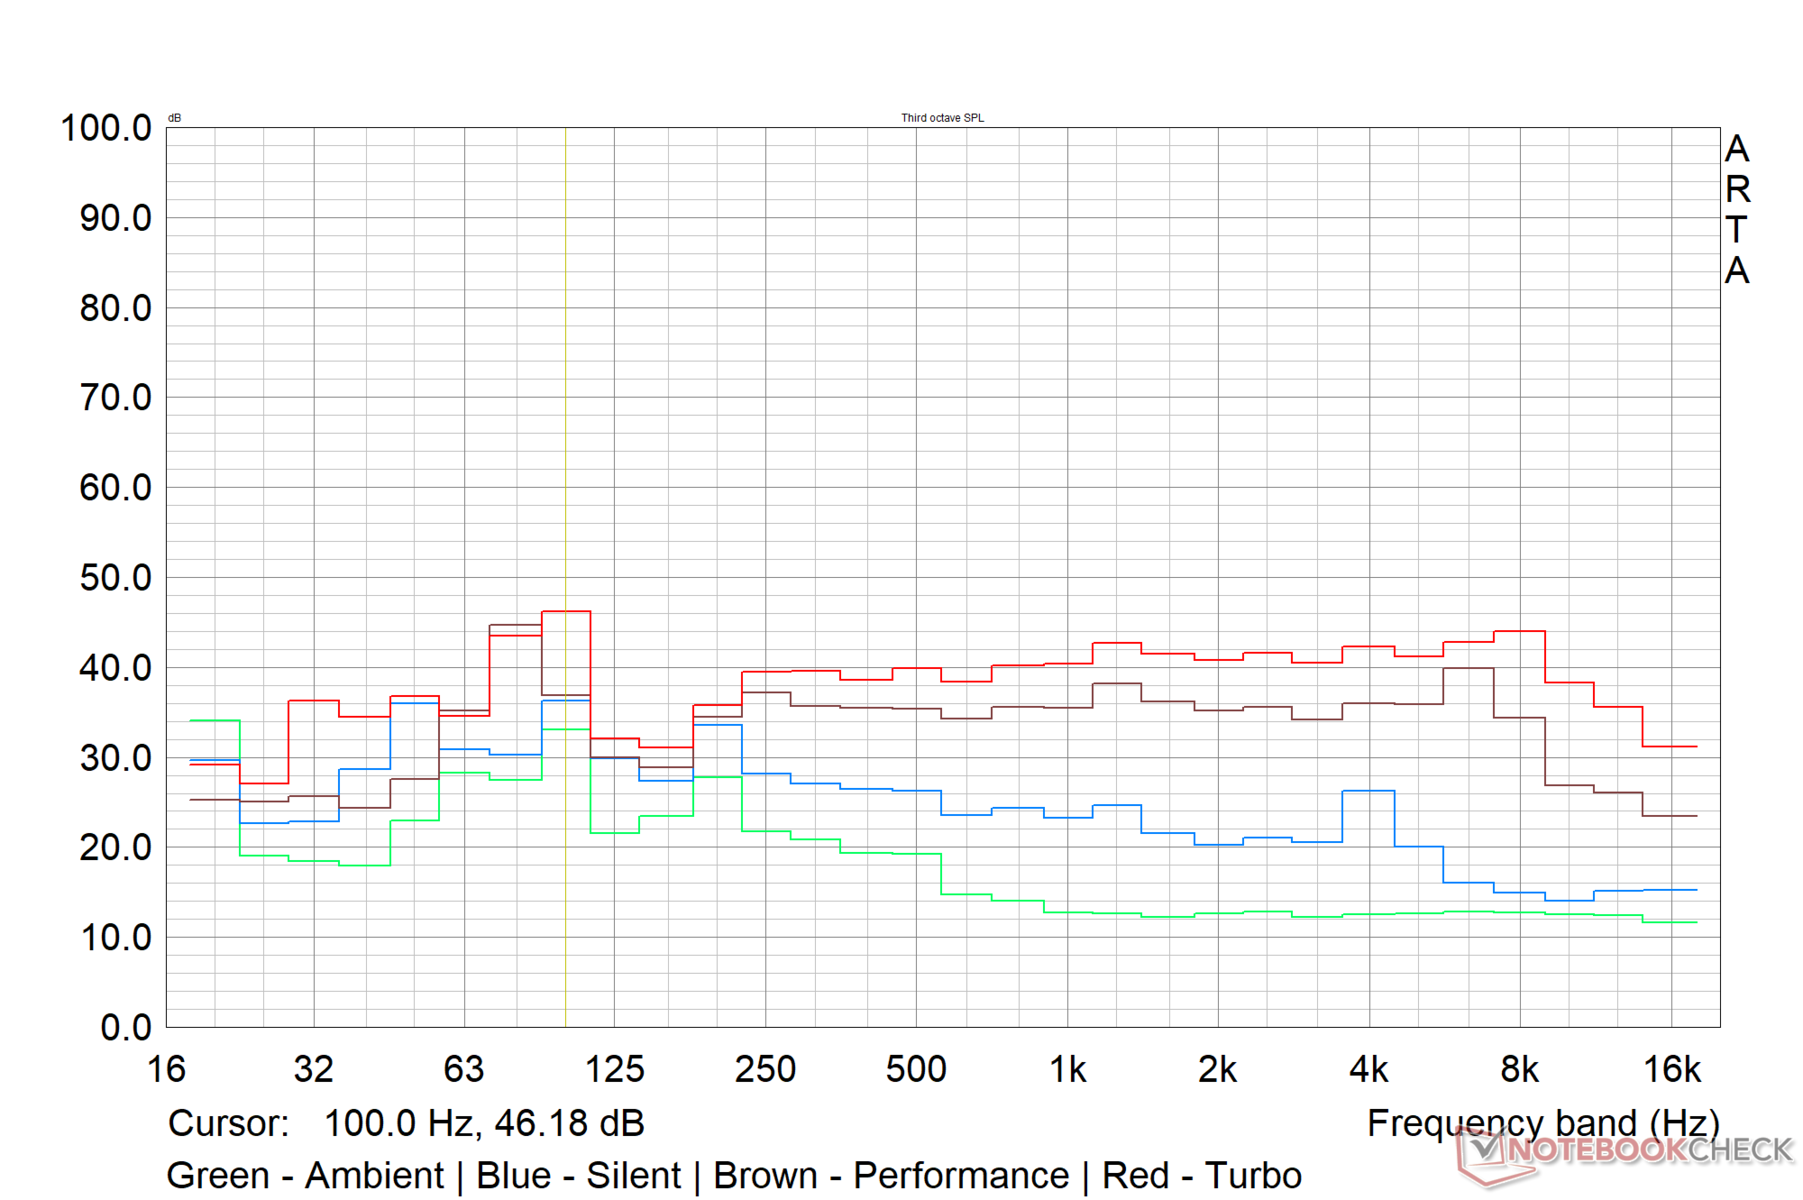
El doble ventilador del ROG Strix Scar 15 es capaz de mantener el rendimiento del portátil bajo carga. Sin embargo, esto viene a costa de niveles de ruido más altos, particularmente en el modo de rendimiento Turbo.
Para medir el ruido de los ventiladores, utilizamos el micrófono omnidireccional de referencia Earthworks M23R conectado a una interfaz de audio USB Focusrite Scarlett 2i2 3rd gen y calibrado a un nivel de presión sonora de 94 dB(A). La configuración se colocó a una distancia fija de 15 cm del portátil durante la grabación.
Asus afirma que el ruido máximo de funcionamiento bajo carga en los modos Turbo y Rendimiento sería de 48 dB(A), pero registramos niveles de ruido del ventilador de hasta 56.6 dB(A) en ambos escenarios de carga máxima y The Witcher 3
Ultra. Los niveles de ruido en reposo también fueron superiores en Turbo, pero rondaron los 29 dB(A) en los modos Silencio y Rendimiento.Registramos 39,01 dB(A) como nivel máximo de ruido del ventilador a plena carga en el perfil Silencioso.
Ruido
| Ocioso |
| 39.07 / 39.07 / 39.07 dB(A) |
| Carga |
| 53.34 / 56.6 dB(A) |
 | ||
30 dB silencioso 40 dB(A) audible 50 dB(A) ruidosamente alto |
||
min: | ||
| Asus ROG Strix Scar 15 G533ZW Intel Core i9-12900H, NVIDIA GeForce RTX 3070 Ti Laptop GPU | MSI Raider GE66 12UHS Intel Core i9-12900HK, NVIDIA GeForce RTX 3080 Ti Laptop GPU | Lenovo Legion 5 Pro 16 G7 i7 RTX 3070Ti Intel Core i7-12700H, NVIDIA GeForce RTX 3070 Ti Laptop GPU | Asus ROG Zephyrus G14 GA402RK AMD Ryzen 9 6900HS, AMD Radeon RX 6800S | Razer Blade 15 2022 Intel Core i7-12800H, NVIDIA GeForce RTX 3080 Ti Laptop GPU | |
|---|---|---|---|---|---|
| Noise | 16% | 16% | 23% | 20% | |
| apagado / medio ambiente * (dB) | 26.86 | 26 3% | 24.6 8% | 24 11% | 25.4 5% |
| Idle Minimum * (dB) | 39.07 | 27 31% | 28.4 27% | 24 39% | 26.2 33% |
| Idle Average * (dB) | 39.07 | 30 23% | 28.4 27% | 26 33% | 26.2 33% |
| Idle Maximum * (dB) | 39.07 | 39 -0% | 28.4 27% | 31 21% | 28.4 27% |
| Load Average * (dB) | 53.34 | 45 16% | 49.4 7% | 45 16% | 44.7 16% |
| Witcher 3 ultra * (dB) | 56.6 | 45 20% | 49.4 13% | 43 24% | 44.7 21% |
| Load Maximum * (dB) | 56.6 | 47 17% | 54.7 3% | 45 20% | 51.9 8% |
* ... más pequeño es mejor
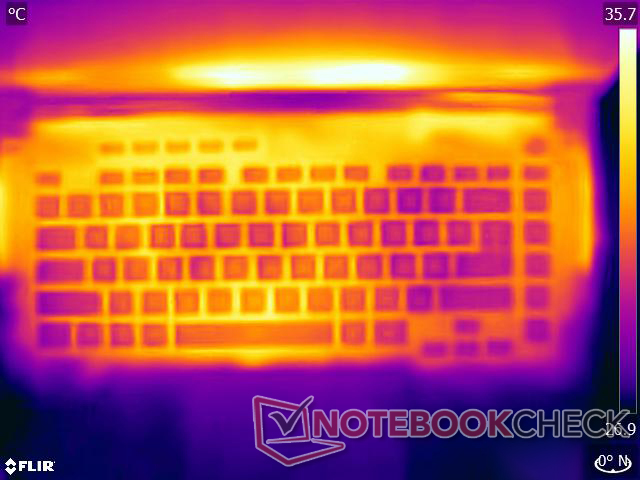
Temperatura
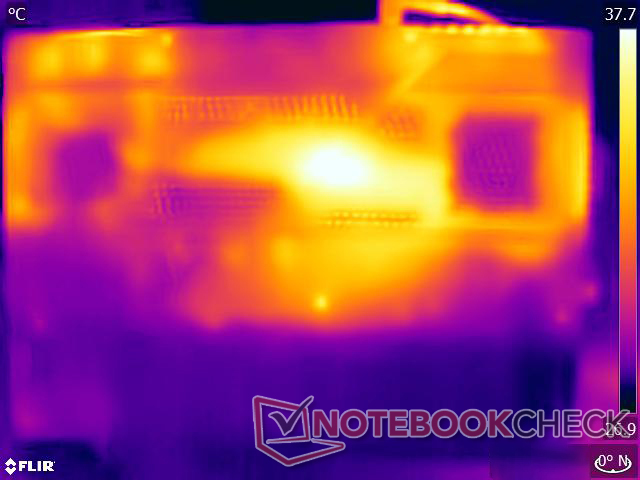
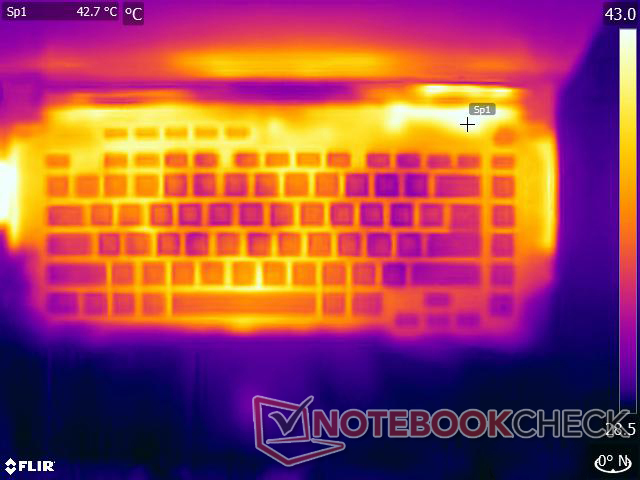
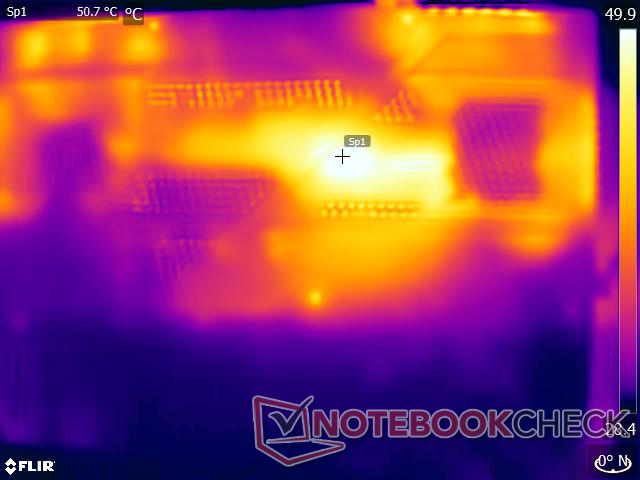
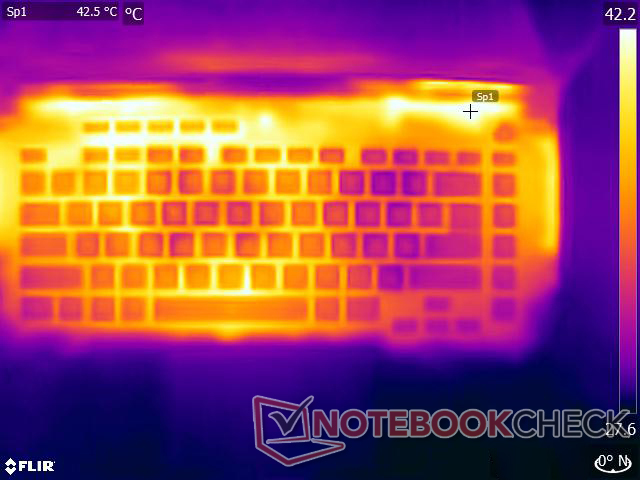
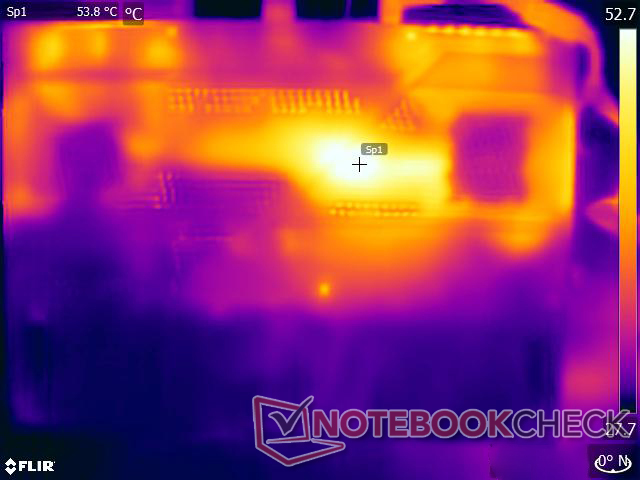
Incluso con una configuración de doble ventilador y ocho tubos de calor, las temperaturas de la superficie pueden ser altas bajo carga, como suele ser la norma cuando se trata de portátiles de juego. Registramos un máximo de 42.6 °C en la superficie superior y 50.2 °C en la inferior bajo una carga combinada de Prime95 + FurMark. Con The Witcher 3, los puntos calientes superior e inferior fueron de 48.4 °C y 54.4 °C, respectivamente.
A pesar de que las temperaturas superficiales son más altas en otras partes del chasis, Asus hace un buen trabajo al mantener las áreas de descanso de las palmas relativamente frescas. Si quieres usar el dispositivo en el regazo, recomendamos cambiar al perfil silencioso y no estresar mucho el dispositivo.
(±) La temperatura máxima en la parte superior es de 42.6 °C / 109 F, frente a la media de 40.4 °C / 105 F, que oscila entre 21.2 y 68.8 °C para la clase Gaming.
(-) El fondo se calienta hasta un máximo de 50.2 °C / 122 F, frente a la media de 43.2 °C / 110 F
(±) En reposo, la temperatura media de la parte superior es de 33.4 °C / 92# F, frente a la media del dispositivo de 33.9 °C / 93 F.
(-) Jugando a The Witcher 3, la temperatura media de la parte superior es de 41.3 °C / 106 F, frente a la media del dispositivo de 33.9 °C / 93 F.
(+) Los reposamanos y el panel táctil alcanzan como máximo la temperatura de la piel (33.4 °C / 92.1 F) y, por tanto, no están calientes.
(-) La temperatura media de la zona del reposamanos de dispositivos similares fue de 28.8 °C / 83.8 F (-4.6 °C / -8.3 F).
| Asus ROG Strix Scar 15 G533ZW Intel Core i9-12900H, NVIDIA GeForce RTX 3070 Ti Laptop GPU | MSI Raider GE66 12UHS Intel Core i9-12900HK, NVIDIA GeForce RTX 3080 Ti Laptop GPU | Lenovo Legion 5 Pro 16 G7 i7 RTX 3070Ti Intel Core i7-12700H, NVIDIA GeForce RTX 3070 Ti Laptop GPU | Asus ROG Zephyrus G14 GA402RK AMD Ryzen 9 6900HS, AMD Radeon RX 6800S | Razer Blade 15 2022 Intel Core i7-12800H, NVIDIA GeForce RTX 3080 Ti Laptop GPU | |
|---|---|---|---|---|---|
| Heat | -7% | 4% | -1% | -3% | |
| Maximum Upper Side * (°C) | 42.6 | 54 -27% | 45.3 -6% | 55 -29% | 50 -17% |
| Maximum Bottom * (°C) | 50.2 | 65 -29% | 61.2 -22% | 55 -10% | 47 6% |
| Idle Upper Side * (°C) | 36.2 | 30 17% | 28.6 21% | 30 17% | 37.4 -3% |
| Idle Bottom * (°C) | 40.2 | 35 13% | 31.4 22% | 32 20% | 38.4 4% |
* ... más pequeño es mejor
Prueba de esfuerzo
Si se acentúa el Scar 15 en el perfil Turbo, se puede ver cómo varían los TDP, las temperaturas y los relojes y cómo se distribuye la energía disponible entre la CPU y la GPU.
Sólo con Prime95, observamos que el Core i9-12900H es capaz de consumir 130 W durante un breve periodo de tiempo antes de bajar a 120 W y finalmente establecerse entre 100 y 110 W; vimos una utilización del TDP similar durante la prueba de bucle Cinebench R15 anterior en modo Turbo. Como resultado, las temperaturas de la CPU pueden mantenerse cerca de la marca de los 90 °C con frecuencias constantes de casi 3.5 GHz.
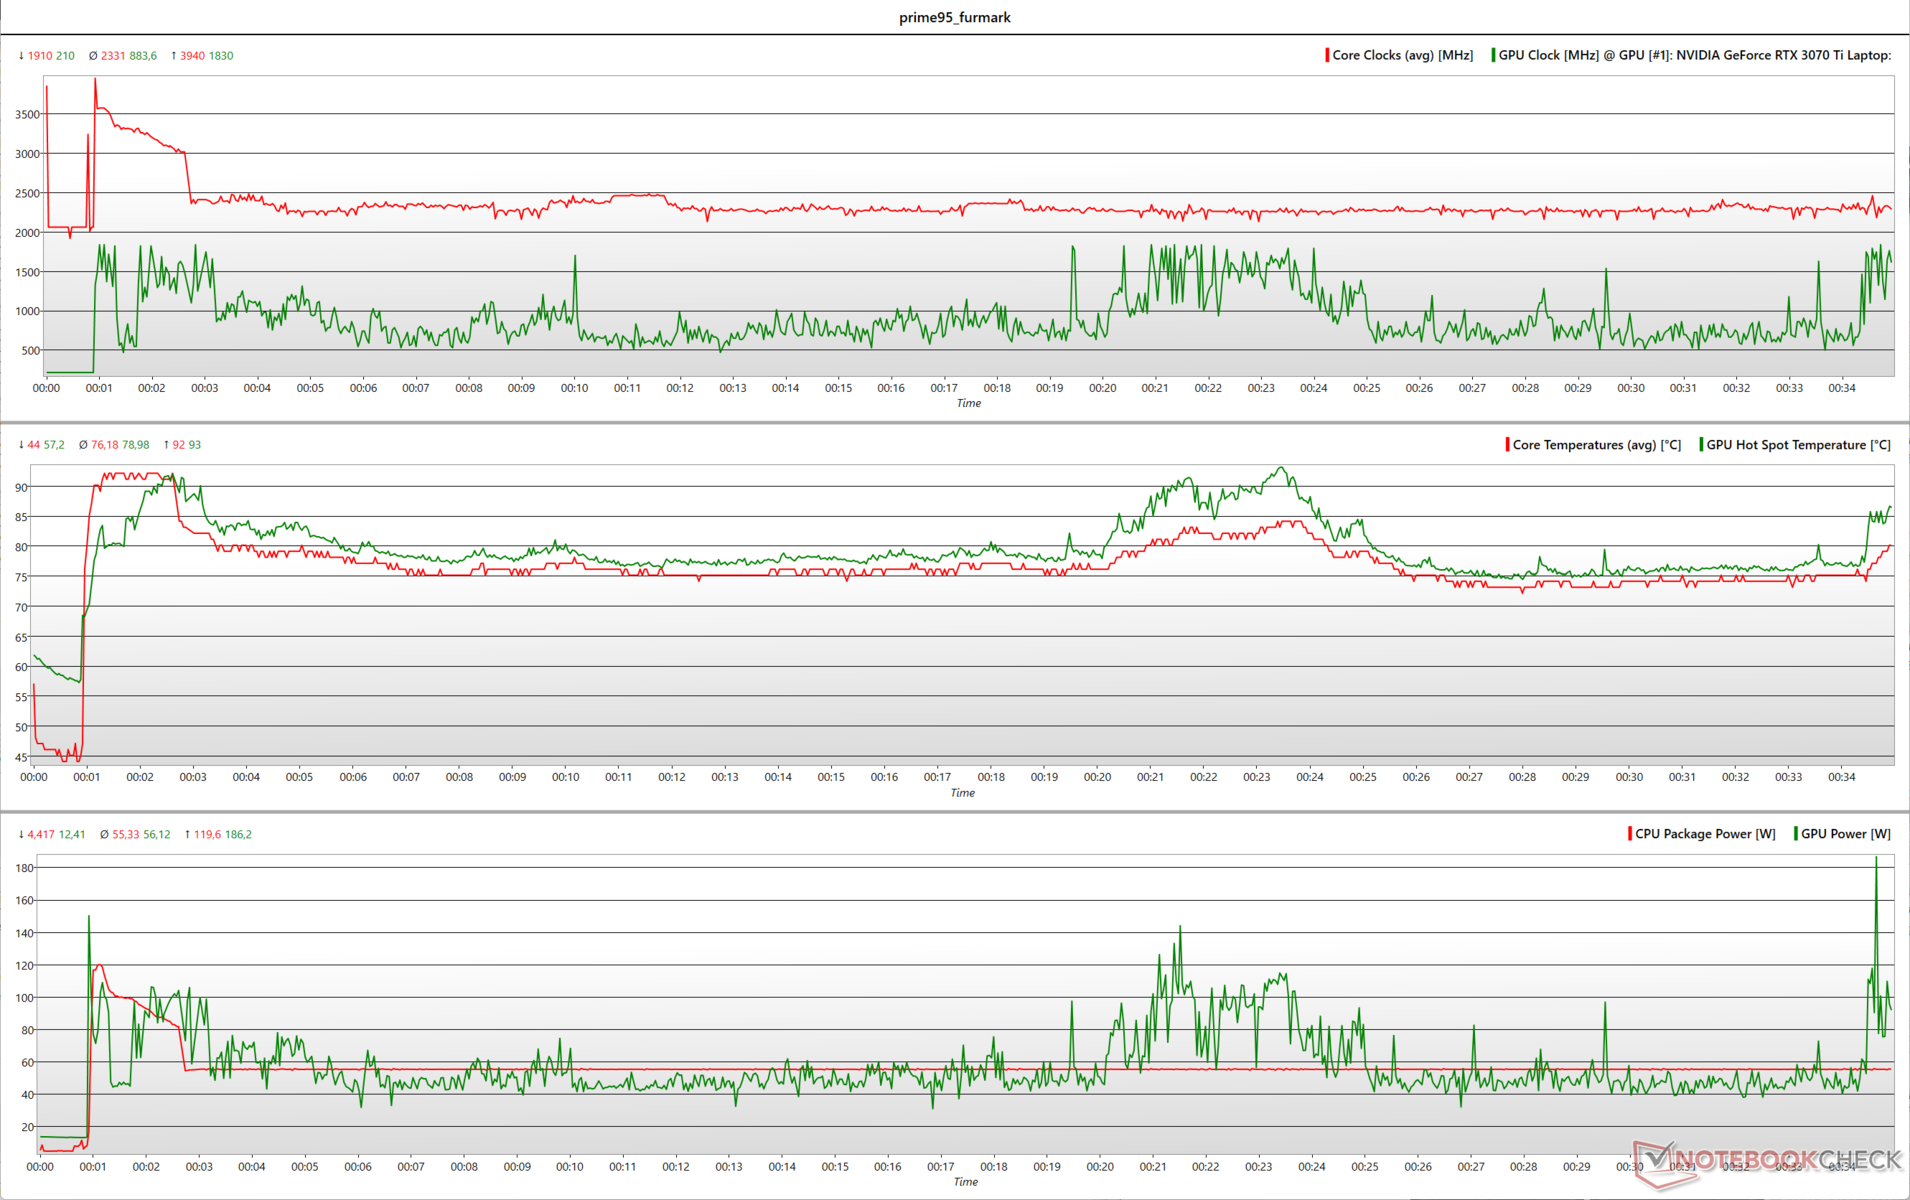
Añadiendo FurMark a la mezcla, la RTX 3070 Ti entra en acción. El TDP de la CPU cae justo por debajo de la marca de 60 W, dejando más espacio térmico y energético para la GPU, lo que permite a esta última aumentar su velocidad por encima de la marca de 1.500 MHz, aunque sólo durante un breve periodo de tiempo.
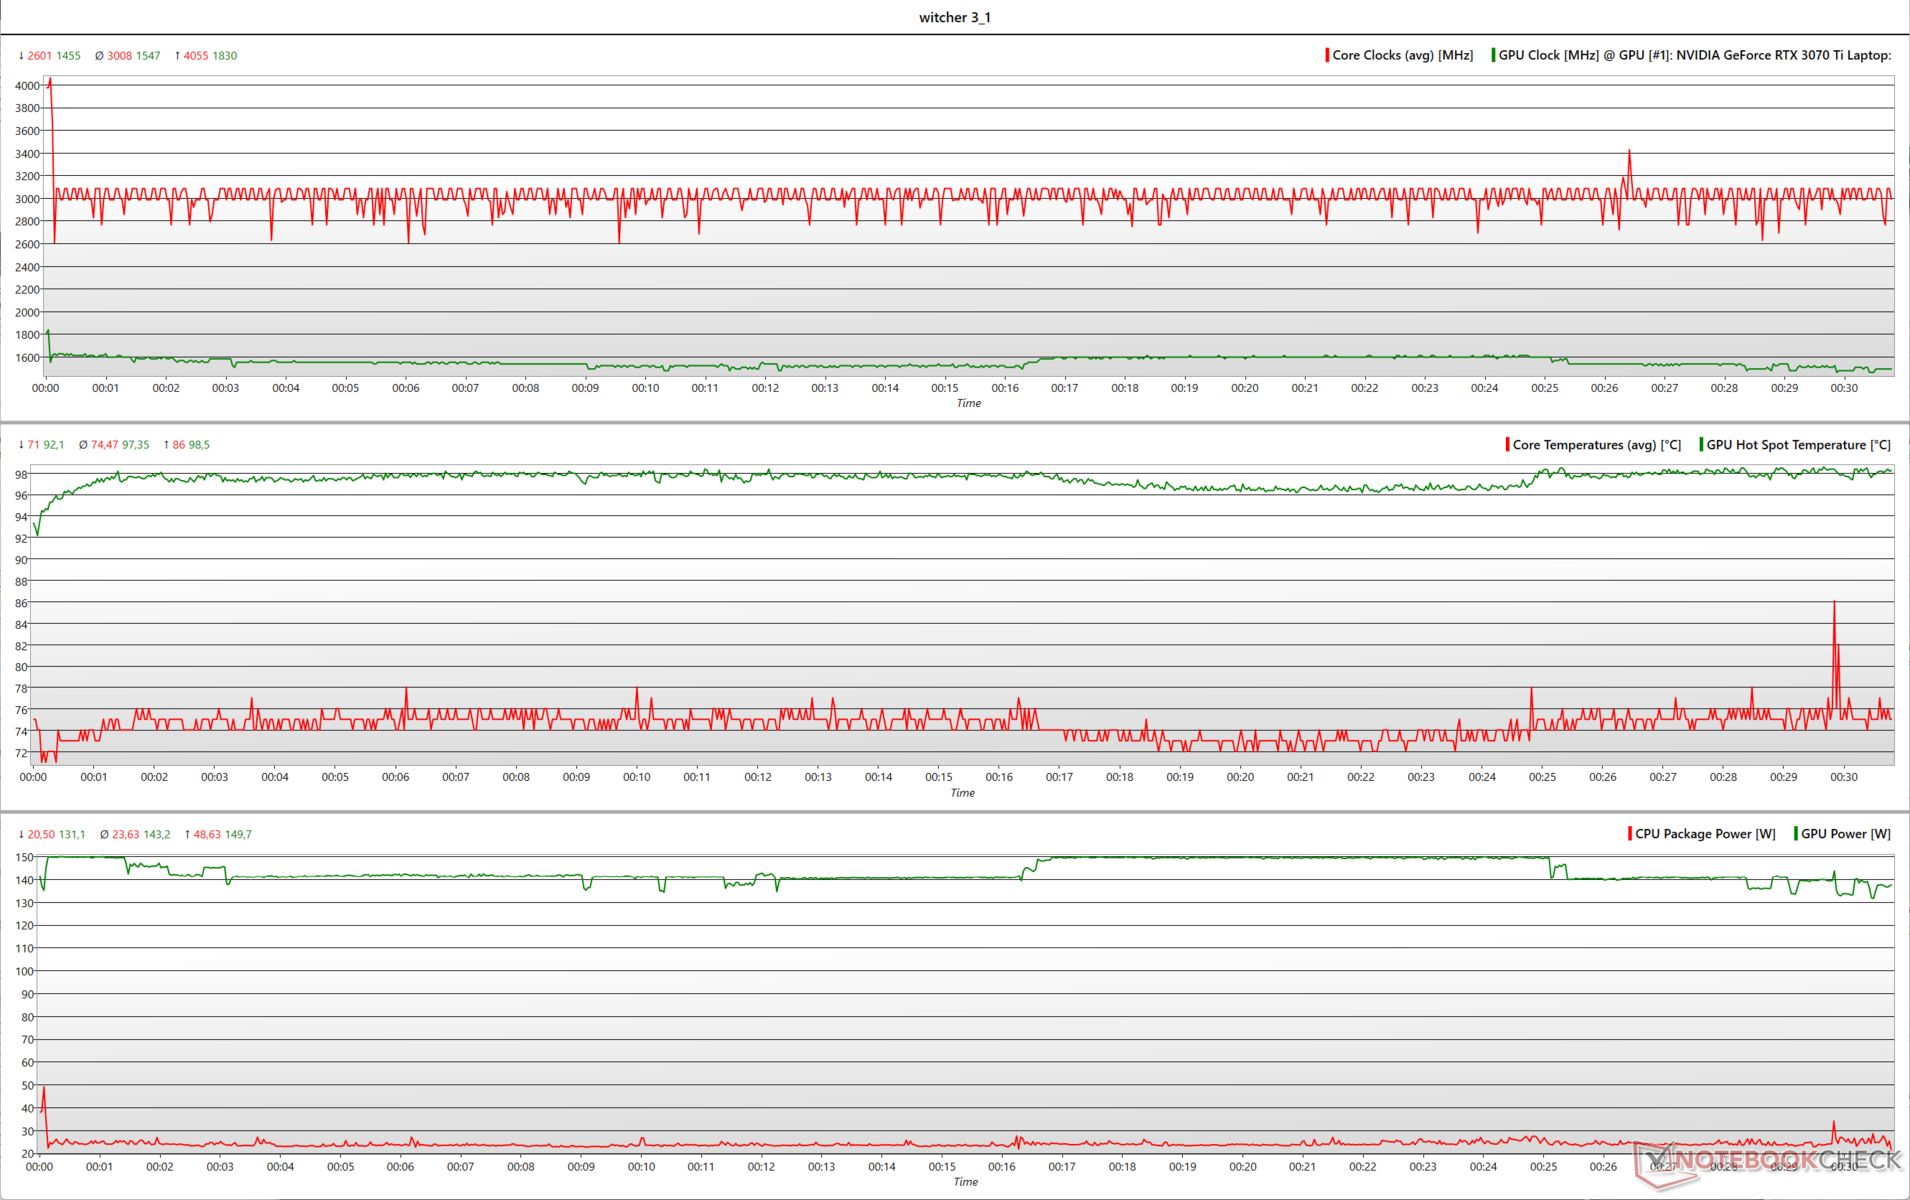
La página Witcher 3
presenta una imagen más real de cómo pueden cambiar las métricas de la CPU y la GPU durante los juegos. Aquí también vemos que Dynamic Boost entra en acción con la RTX 3070 Ti, que ahora es capaz de sostener bastante bien entre 140 W y 150 W TGP y aumentar los relojes a 1.800 MHz. El Core i9-12900H se conforma con un reloj de 3 GHz a un requisito de TDP mucho menor, de apenas unos 25 W.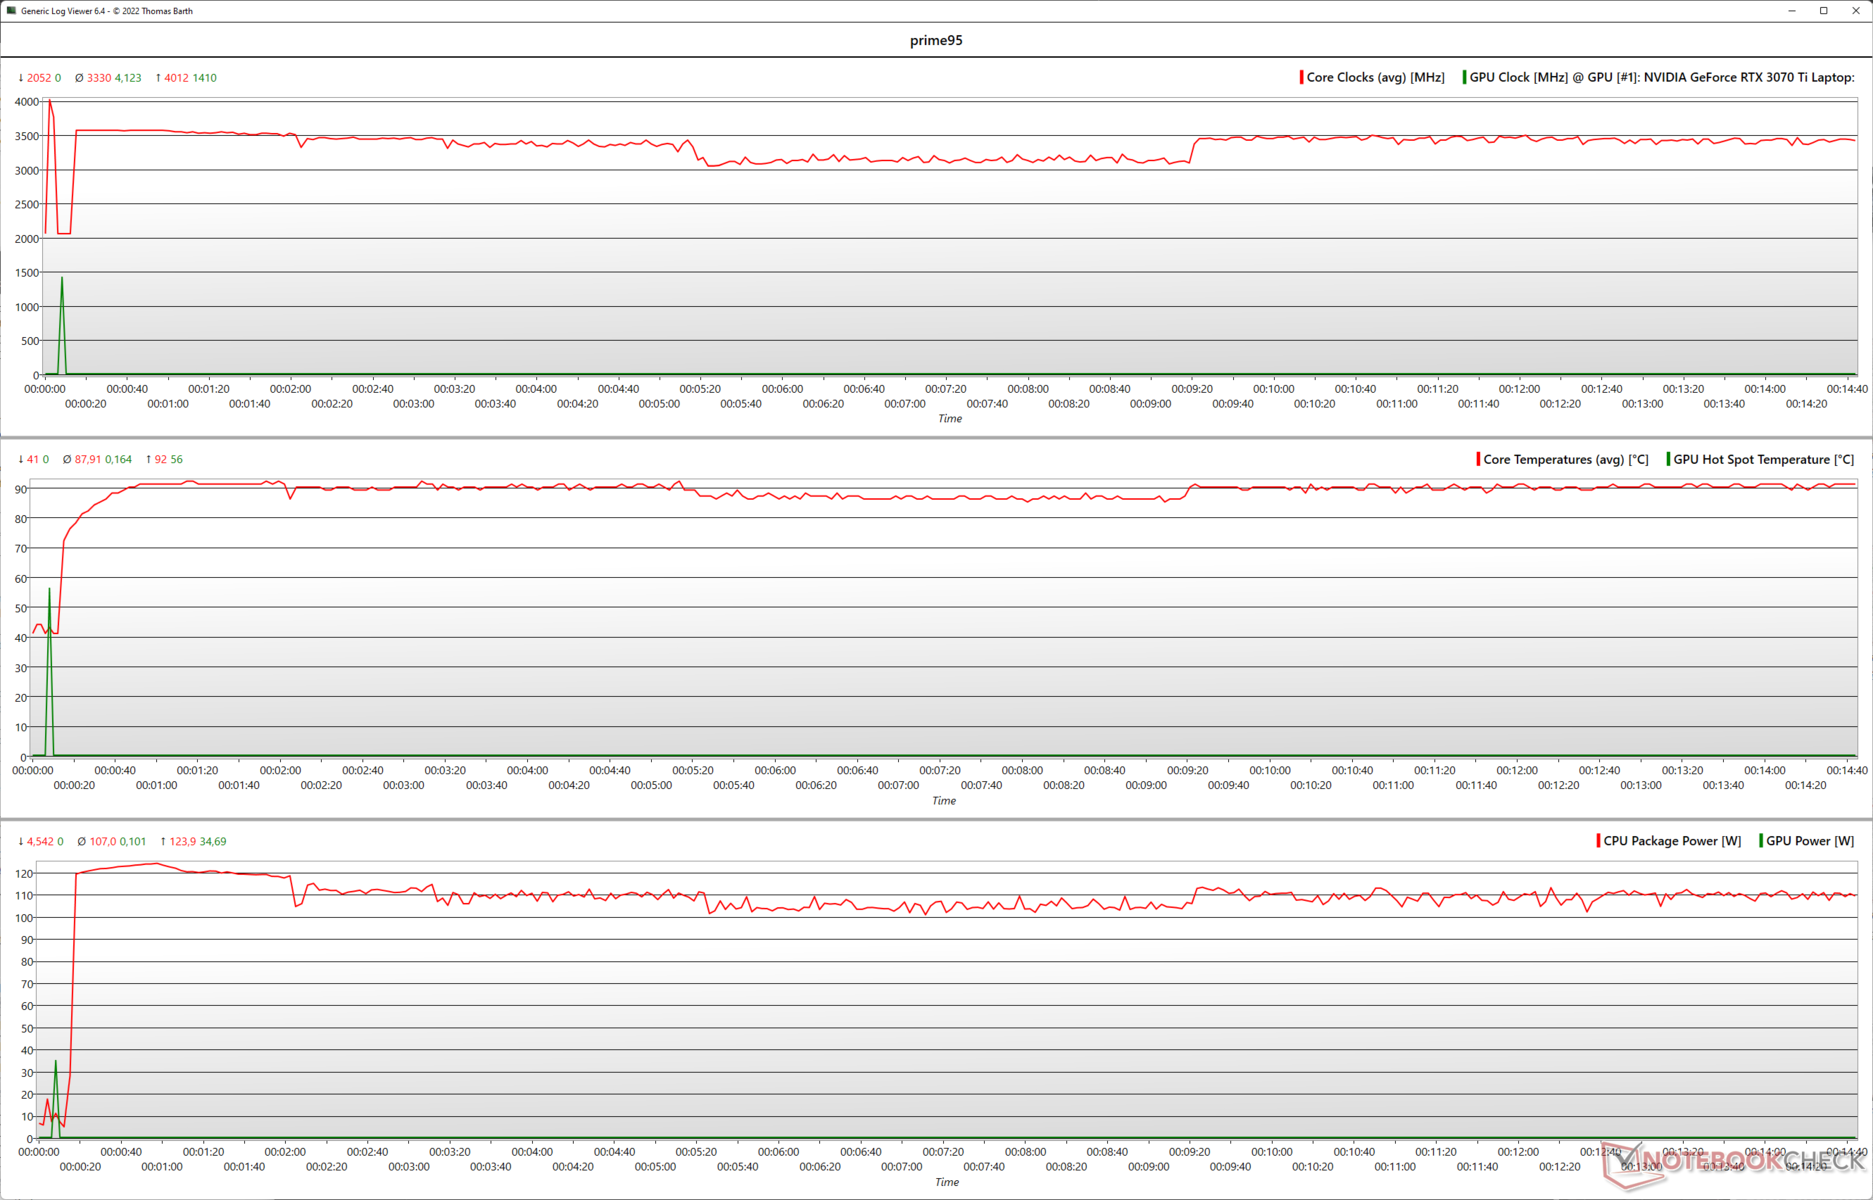
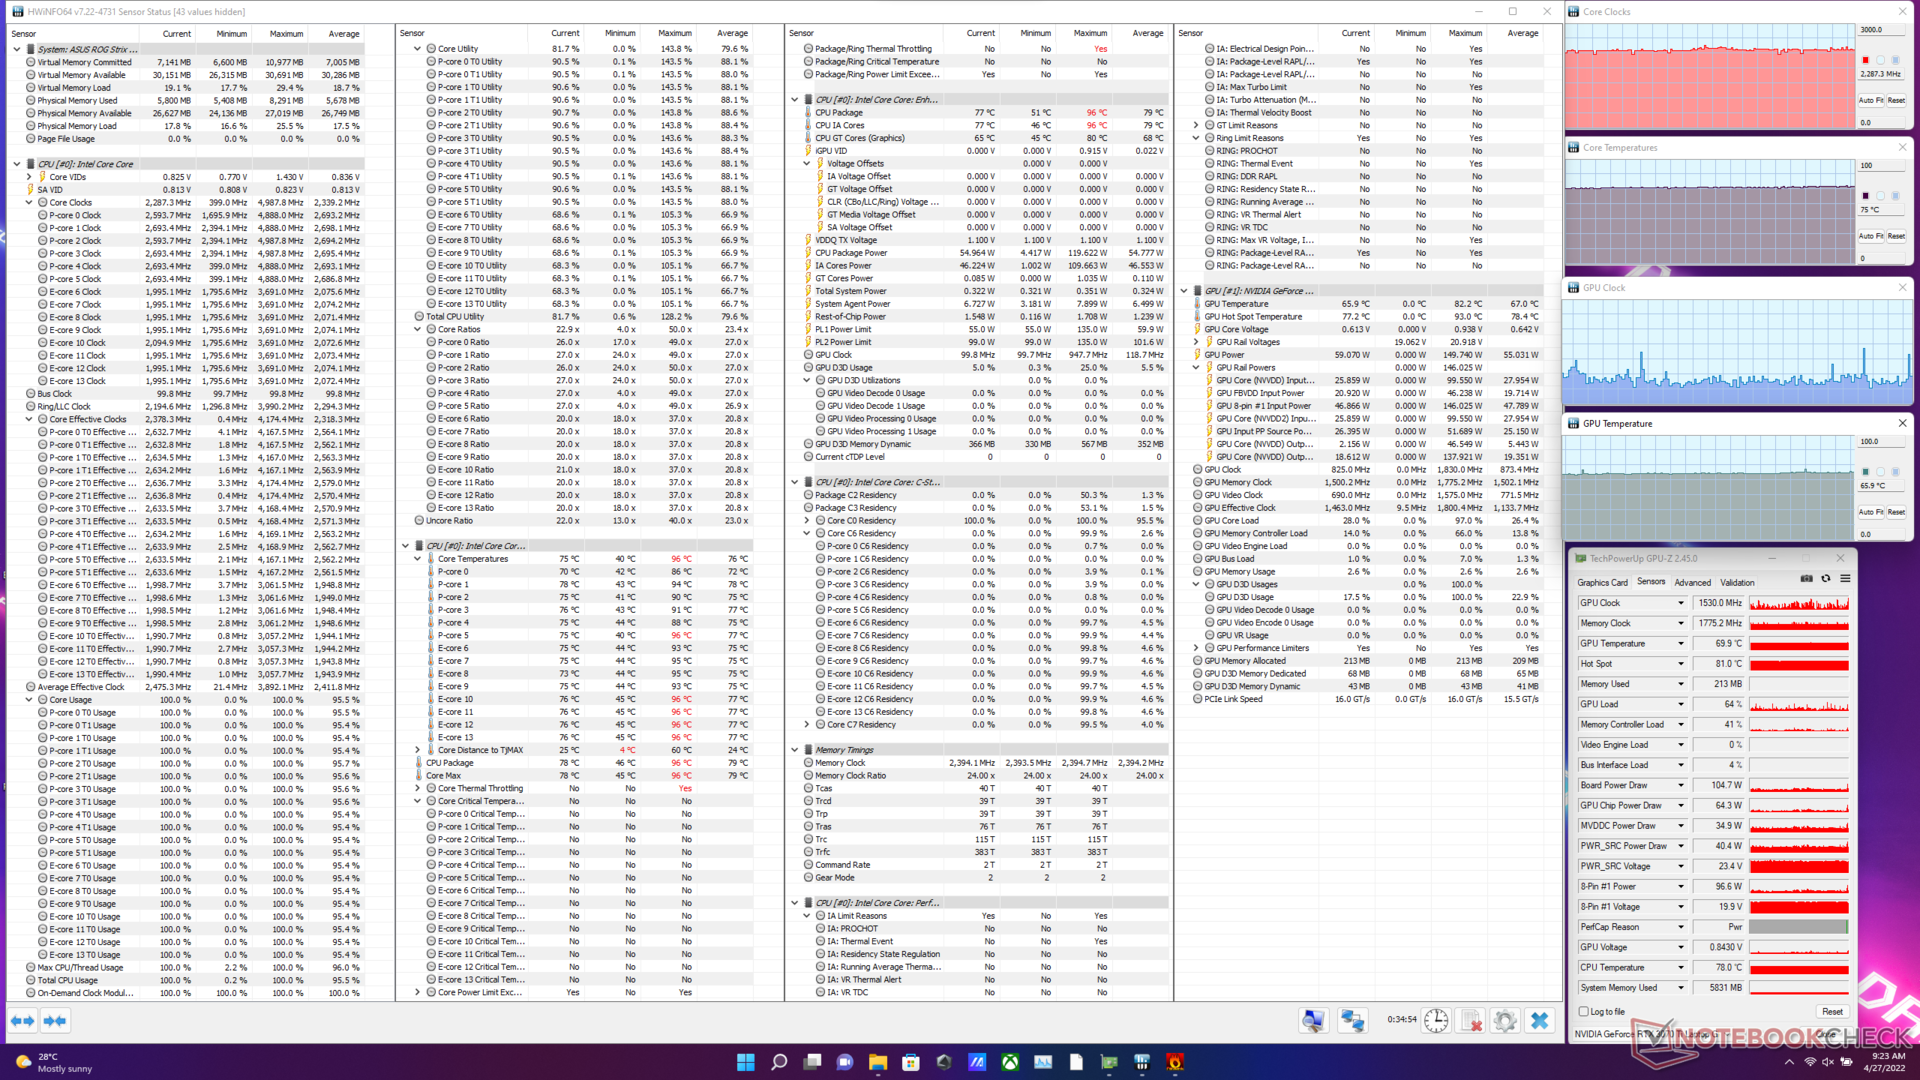
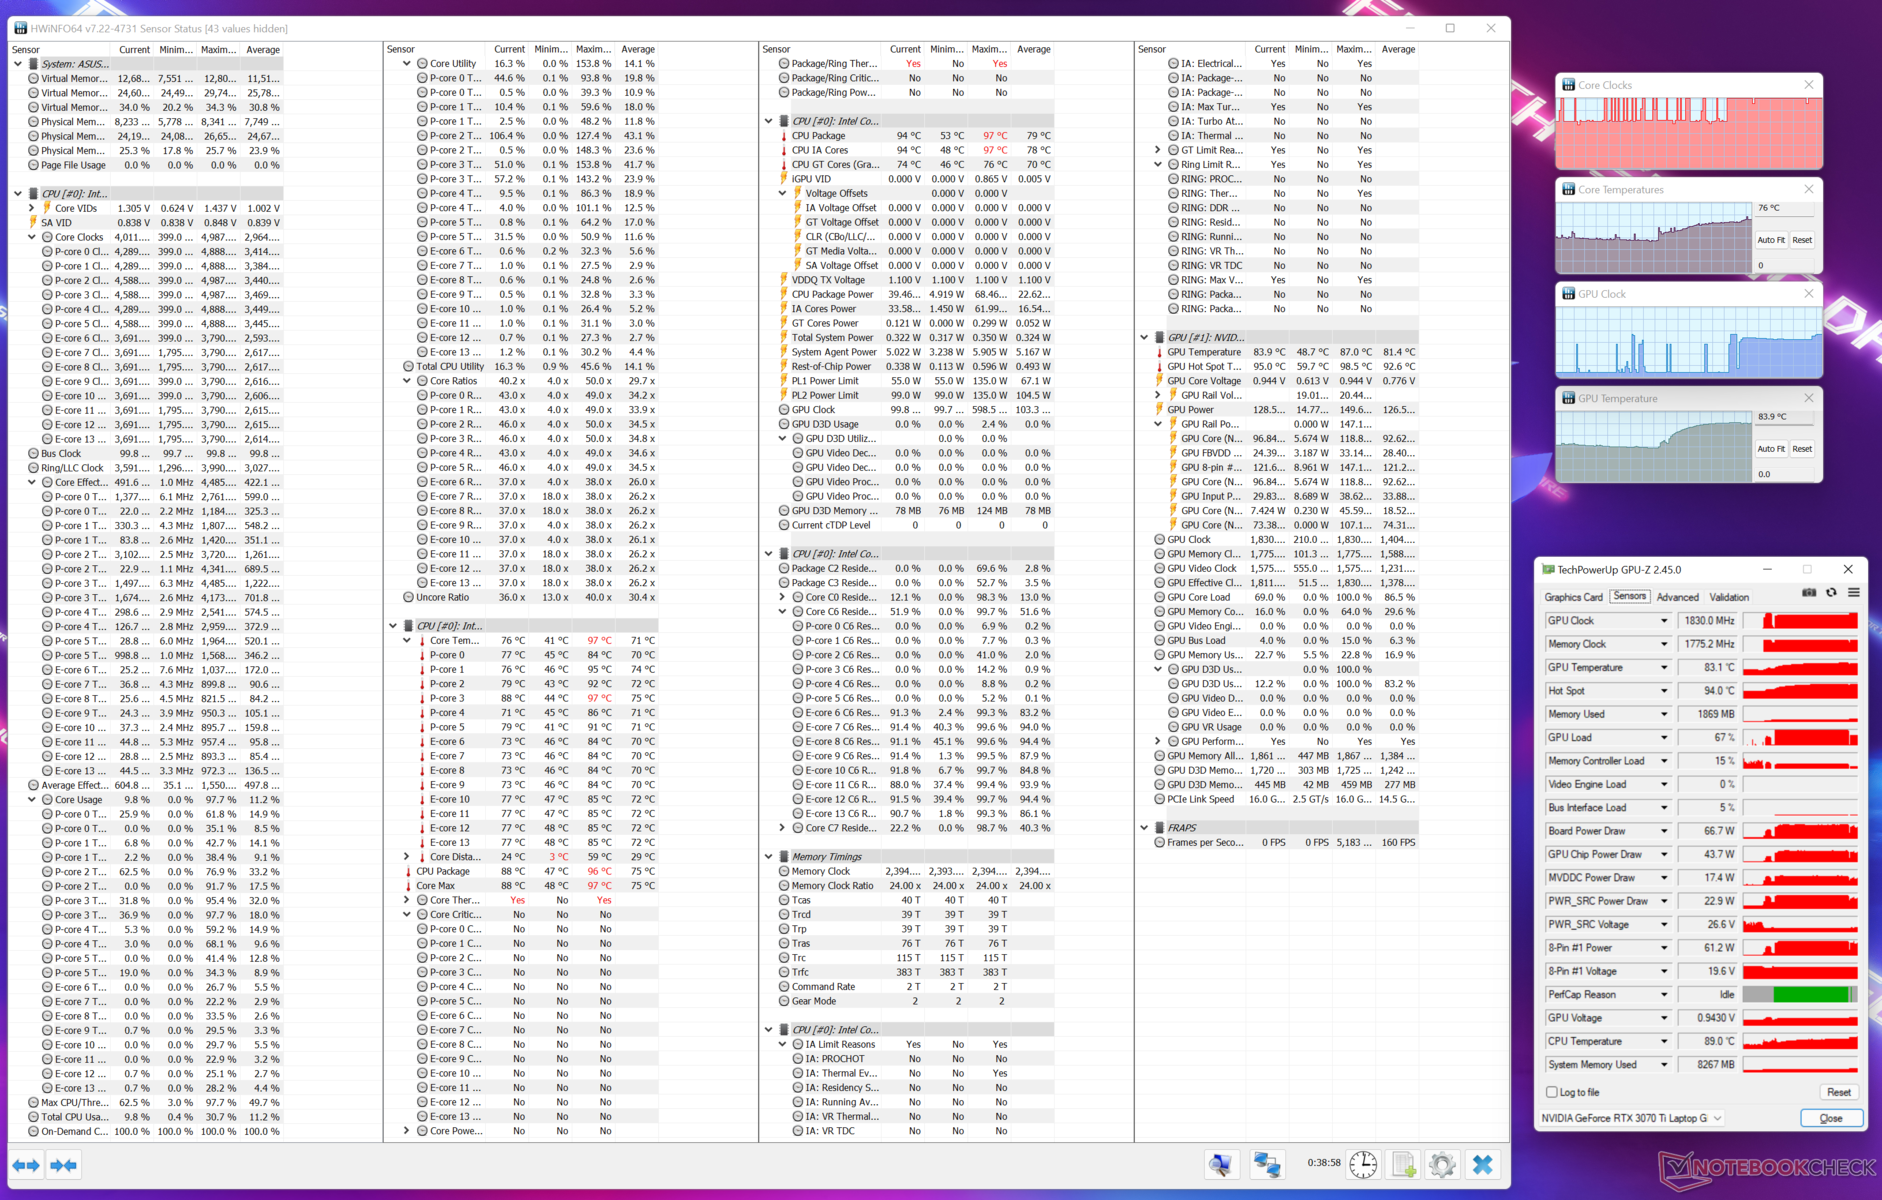
| Prueba de esfuerzo | Relojdela CPU (GHz) | Reloj de la GPU (MHz) | Temperaturamediadela CPU (°C) | Temperatura media de la GPU (°C) |
| Sistema en reposo | 2,05 | 99,8 | 45 | 45 |
| Prime95 | 3,49 | 99,8 | 87,9 | 44,8 |
| Prime95+ FurMark | 2,28 | 1.530 | 76 | 67 |
| El Witcher 3 | 4,0 | 1.830 | 71 | 81,4 |
Altavoces
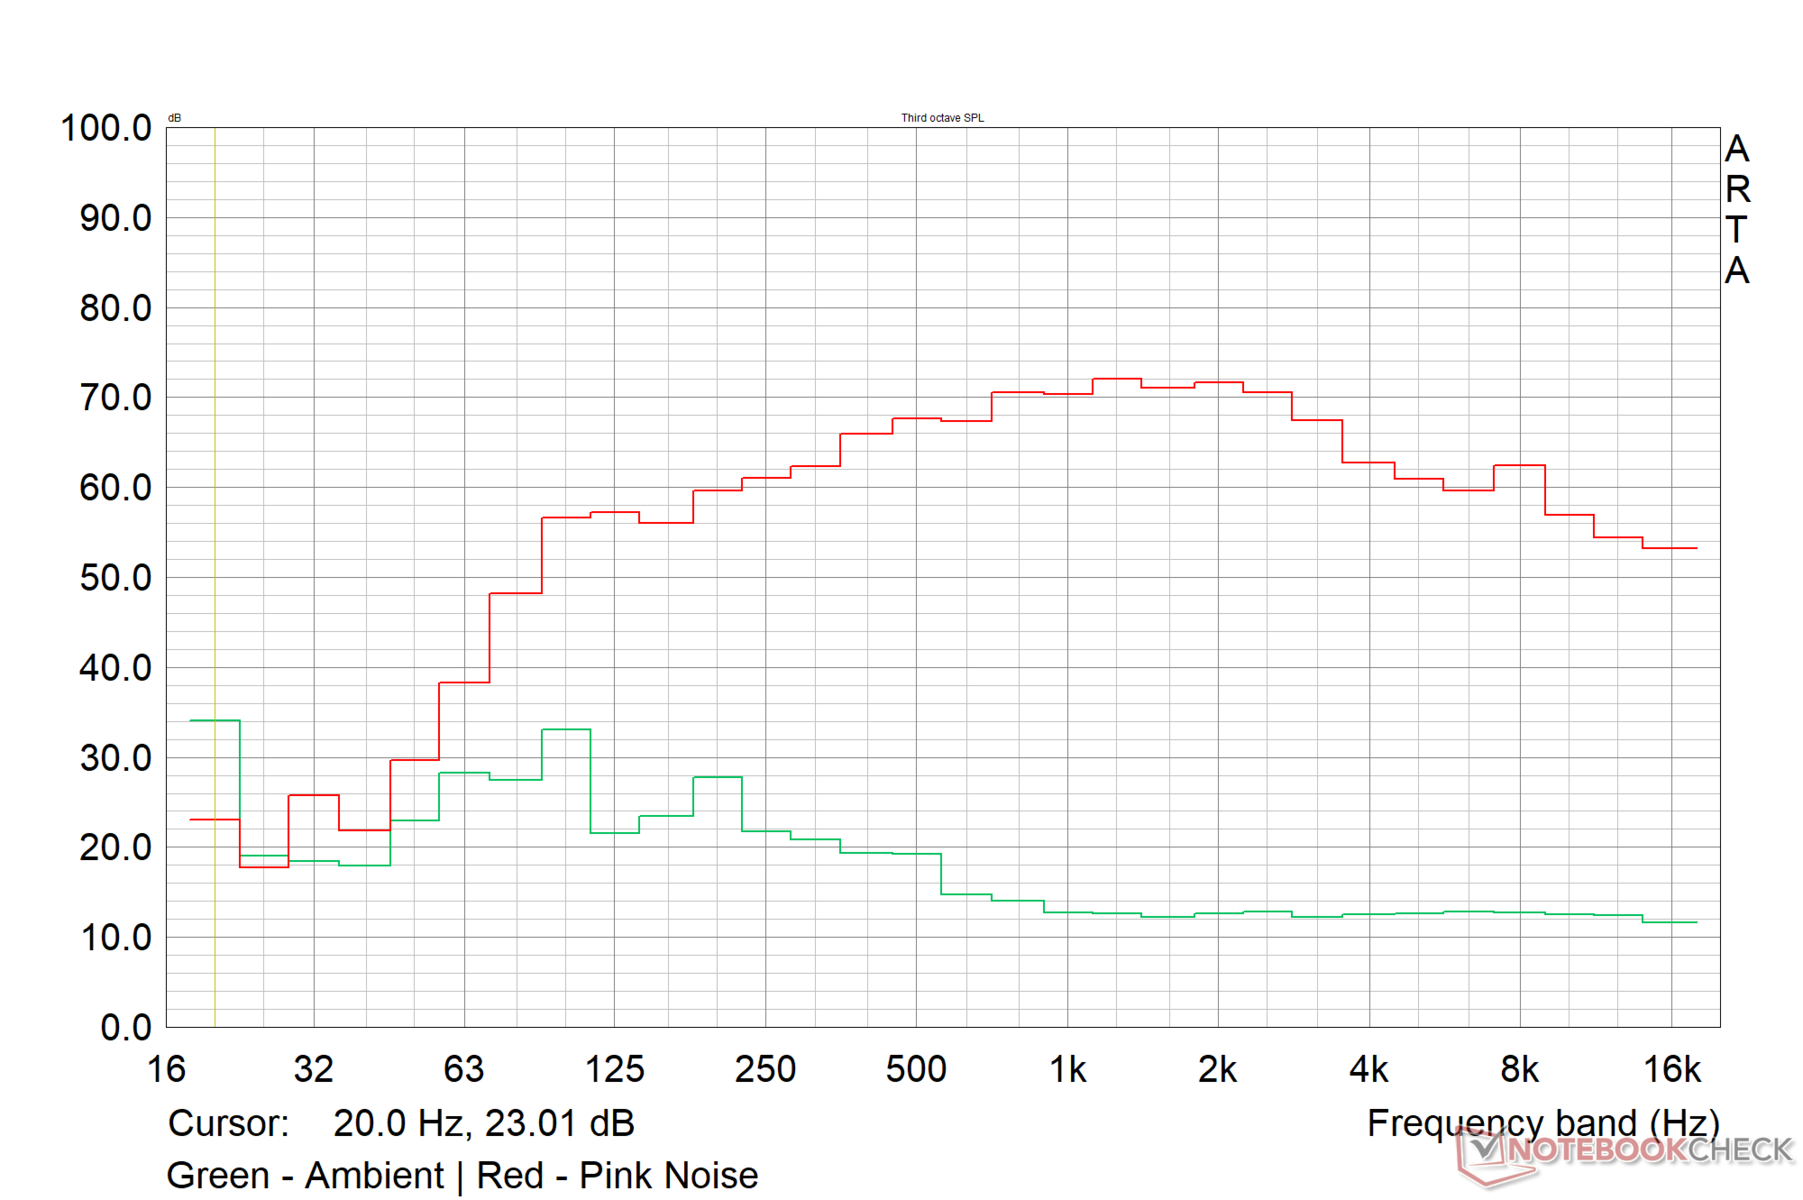
Asus no menciona la potencia de los altavoces del Scar 15 en sus materiales y sólo indica que el portátil usa un sistema de cuatro altavoces con Dolby Atmos y Smart Amp. Lo más probable es que el sistema de altavoces no haya cambiado respecto a la versión 2021, que tenía 2 altavoces de 4 W hacia abajo en el frontal y 2 tweeters de 2 W cerca de la zona de la bisagra bajo el display. Los altavoces tienen una sonoridad de unos 80.5 dB en una habitación cerrada de tamaño medio, lo que es decente.
La separación de los woofers de radiación pasiva y los tweeters da como resultado una respuesta de bajos decente dadas las limitaciones del chasis. Los medios son lineales y los agudos, equilibrados. Subjetivamente, la calidad de audio del ROG Strix Scar 15 es bastante útil para la mayoría de los propósitos. No hay distorsión perceptible a volúmenes altos.
Los altavoces están certificados para Dolby Atmos, y la app oficial Dolby Access viene preinstalada con licencias totalmente habilitadas para Dolby Atmos para auriculares y Dolby Atmos para altavoces integrados. La aplicación permite cambiar entre varios perfiles de sonido disponibles y crear hasta tres preajustes de ecualización personalizados.
Asus ROG Strix Scar 15 G533ZW-LN106WS análisis de audio
(±) | la sonoridad del altavoz es media pero buena (80.5 dB)
Graves 100 - 315 Hz
(+) | buen bajo - sólo 3.7% lejos de la mediana
(+) | el bajo es lineal (5.5% delta a la frecuencia anterior)
Medios 400 - 2000 Hz
(±) | medias más altas - de media 7.1% más altas que la mediana
(+) | los medios son lineales (3.1% delta a la frecuencia anterior)
Altos 2 - 16 kHz
(+) | máximos equilibrados - a sólo 3.3% de la mediana
(+) | los máximos son lineales (5.9% delta a la frecuencia anterior)
Total 100 - 16.000 Hz
(+) | el sonido global es lineal (12.2% de diferencia con la mediana)
En comparación con la misma clase
» 13% de todos los dispositivos probados de esta clase eran mejores, 4% similares, 83% peores
» El mejor tuvo un delta de 6%, la media fue 18%, el peor fue ###max##%
En comparación con todos los dispositivos probados
» 10% de todos los dispositivos probados eran mejores, 3% similares, 88% peores
» El mejor tuvo un delta de 4%, la media fue 23%, el peor fue ###max##%
Apple MacBook Pro 16 2021 M1 Pro análisis de audio
(+) | los altavoces pueden reproducir a un volumen relativamente alto (#84.7 dB)
Graves 100 - 315 Hz
(+) | buen bajo - sólo 3.8% lejos de la mediana
(+) | el bajo es lineal (5.2% delta a la frecuencia anterior)
Medios 400 - 2000 Hz
(+) | medios equilibrados - a sólo 1.3% de la mediana
(+) | los medios son lineales (2.1% delta a la frecuencia anterior)
Altos 2 - 16 kHz
(+) | máximos equilibrados - a sólo 1.9% de la mediana
(+) | los máximos son lineales (2.7% delta a la frecuencia anterior)
Total 100 - 16.000 Hz
(+) | el sonido global es lineal (4.6% de diferencia con la mediana)
En comparación con la misma clase
» 0% de todos los dispositivos probados de esta clase eran mejores, 0% similares, 100% peores
» El mejor tuvo un delta de 5%, la media fue 17%, el peor fue ###max##%
En comparación con todos los dispositivos probados
» 0% de todos los dispositivos probados eran mejores, 0% similares, 100% peores
» El mejor tuvo un delta de 4%, la media fue 23%, el peor fue ###max##%
Gestión de la energía: El combo Core i9-12900H y RTX 3070 Ti puede ser exigente
Consumo de energía
Asus suministra un adaptador de corriente de 280 W con el Scar 15 de este año, y vemos que el portátil es capaz de casi maximizar el consumo de energía bajo carga máxima. El consumo general de energía bajo carga parece estar en el lado más alto dadas las potentes tripas. El consumo de energía durante el modo de espera podría haber sido menor
El Razer Blade 14 con un Ryzen 9 6900HX parece ser alrededor de un 20% menos económico en general, principalmente debido a los altos consumos de energía en reposo.
| Off / Standby | |
| Ocioso | |
| Carga |
|
Clave:
min: | |
| Asus ROG Strix Scar 15 G533ZW i9-12900H, GeForce RTX 3070 Ti Laptop GPU, Samsung PM9A1 MZVL22T0HBLB, IPS-level, 2560x1440, 15.6" | MSI Raider GE66 12UHS i9-12900HK, GeForce RTX 3080 Ti Laptop GPU, Samsung PM9A1 MZVL22T0HBLB, IPS, 3840x2160, 15.6" | Lenovo Legion 5 Pro 16 G7 i7 RTX 3070Ti i7-12700H, GeForce RTX 3070 Ti Laptop GPU, Samsung PM9A1 MZVL21T0HCLR, IPS, 2560x1600, 16" | Razer Blade 14 Ryzen 9 6900HX R9 6900HX, GeForce RTX 3070 Ti Laptop GPU, Samsung PM9A1 MZVL21T0HCLR, IPS, 2560x1440, 14" | Razer Blade 15 2022 i7-12800H, GeForce RTX 3080 Ti Laptop GPU, SSSTC CA6-8D1024, IPS, 2560x1440, 15.6" | Medio NVIDIA GeForce RTX 3070 Ti Laptop GPU | Media de la clase Gaming | |
|---|---|---|---|---|---|---|---|
| Power Consumption | -31% | -10% | -20% | -99% | -36% | -28% | |
| Idle Minimum * (Watt) | 7.56 | 16 -112% | 8.6 -14% | 10.2 -35% | 33.2 -339% | 14.2 ? -88% | 13 ? -72% |
| Idle Average * (Watt) | 13.5 | 19 -41% | 17.6 -30% | 26 -93% | 36.4 -170% | 19.9 ? -47% | 19 ? -41% |
| Idle Maximum * (Watt) | 16.87 | 26 -54% | 18.5 -10% | 26.7 -58% | 37.6 -123% | 26.2 ? -55% | 24.6 ? -46% |
| Load Average * (Watt) | 128.9 | 110 15% | 110 15% | 89.3 31% | 116.7 9% | 125.8 ? 2% | 110.7 ? 14% |
| Witcher 3 ultra * (Watt) | 196.2 | 202 -3% | 227 -16% | 158.7 19% | 172 12% | ||
| Load Maximum * (Watt) | 274.86 | 242 12% | 294.6 -7% | 227.5 17% | 228.6 17% | 248 ? 10% | 259 ? 6% |
* ... más pequeño es mejor
Power Consumption - The Witcher 3 / Stress test
Power Consumption - External Monitor
Duración de la batería
El ROG Strix Scar 15 cuenta con una batería 4S1P de 90 Whr. Los tiempos de funcionamiento son decentes teniendo en cuenta la potencia interna. Asus afirma que el tiempo de reproducción de vídeo es de hasta 10,5 horas - nosotros registramos 8,5 horas con nuestro bucle de vídeo H.264 1080p.
Los tiempos de navegación web a brillo reducido con nuestro script estándar duran casi 8,5 horas. Curiosamente, los dos portátiles AMD Ryzen 9 de la comparación - el Asus ROG Zephyrus G14 y el Razer Blade 14 - son capaces de permitirse unos 70 minutos más de autonomía en esta prueba a pesar de llevar baterías mucho más pequeñas.
Jugar con la batería resulta en apenas 70 minutos de autonomía incluso con el brillo reducido.
| Asus ROG Strix Scar 15 G533ZW i9-12900H, GeForce RTX 3070 Ti Laptop GPU, 90 Wh | MSI Raider GE66 12UHS i9-12900HK, GeForce RTX 3080 Ti Laptop GPU, 99 Wh | Lenovo Legion 5 Pro 16 G7 i7 RTX 3070Ti i7-12700H, GeForce RTX 3070 Ti Laptop GPU, 80 Wh | Asus ROG Zephyrus G14 GA402RK R9 6900HS, Radeon RX 6800S, 76 Wh | Razer Blade 14 Ryzen 9 6900HX R9 6900HX, GeForce RTX 3070 Ti Laptop GPU, 62 Wh | Razer Blade 15 2022 i7-12800H, GeForce RTX 3080 Ti Laptop GPU, 80 Wh | Media de la clase Gaming | |
|---|---|---|---|---|---|---|---|
| Duración de Batería | 14% | -32% | 7% | 46% | -42% | 17% | |
| H.264 (h) | 8.5 | 7.1 -16% | 6.3 -26% | 8.32 ? -2% | |||
| WiFi v1.3 (h) | 8.4 | 5.7 -32% | 5.4 -36% | 9.5 13% | 9.5 13% | 4.9 -42% | 7.11 ? -15% |
| Witcher 3 ultra (h) | 1.2 | ||||||
| Load (h) | 0.9 | 1.7 89% | 0.6 -33% | 0.9 0% | 1.6 78% | 1.502 ? 67% | |
| Reader / Idle (h) | 18.1 | 12.2 | 8.27 ? |
Pro
Contra
Veredicto: una máquina de juego QHD que cumple en la mayoría de los frentes
Asus sigue perfeccionando la línea ROG Strix Scar con nuevas actualizaciones. El Asus ROG Strix Scar 15 G533 (2022) ofrece casi todo lo que se puede esperar de un portátil para juegos de este precio. La calidad de construcción es genial, las opciones de conectividad son decentes, y también hay suficiente margen para las actualizaciones internas. Ciertas versiones en algunas regiones pueden no venir con la webcam externa ROG Eye, así que tenlo en cuenta.
Asus vuelve a los interruptores de membrana para el teclado - aunque no son tan "clicks" como los opto-mecánicos que vimos en el modelo del año pasado, siguen siendo una experiencia decente para escribir y jugar. La falta de biometría en cualquier forma es un punto negativo.
Las características de la pantalla parecen buenas para el uso general y los juegos, con resolución QHD, soporte Dolby Vision, calibración de color decente, refresco de 240 Hz y tiempos de respuesta rápidos. Sin embargo, los niveles de negro medidos parecen inadecuados.
Con una conectividad sin obstáculos, rendimiento, y un montón de posibilidades de personalización, el Asus ROG Strix Scar 15 G533 definitivamente merece una consideración de primer orden si estás a la caza de un portátil de juego QHD capaz siempre que puedas soportar mayores emisiones de calor y ruido."
Asus permite que tanto el Core i9-12900H como la RTX 3070 Ti se flexionen completamente sin muchos problemas. Todavía se puede tener un rendimiento adecuado en movimiento con perfiles de rendimiento más bajos, pero la batería de 90 Whr podría haber durado más idealmente.
El ROG Strix Scar 15 no está sin competencia, sin embargo. El MSI Vector GP66 12UGS se presenta como un competidor capaz, y su pantalla 1080p 360 Hz podría llamar la atención de los jugadores competitivos. El Lenovo Legion 5i Pro 16 con su Core i7-12700H logra evocar la sorpresa con su rendimiento superlativo de la CPU que supera incluso al Core i9-12900HK de algunos portátiles
El rendimiento del Core i9-12900H del Scar 15 también está muy por encima de los dos contendientes con Ryzen 9 - elAsus ROG Zephyrus G14 y el Razer Blade 14- aunque estos portátiles con Ryzen 6000 tienen ventaja en términos de consumo de energía y duración de la batería.
Con un precio de ₹2.64.990 (3.419 dólares), el ROG Strix Scar 15 tiene un precio elevado en el mercado indio, pero te llevas un dispositivo que cumple con casi todos los requisitos y que te permitirá jugar a muchos juegos actuales y futuros en QHD Ultra sin sudar.
Precio y disponibilidad
El Asus ROG Strix Scar 15 G533 está disponible en Amazon Indiaasí como en Amazon EE.UUpor 3.269 dólares. También puedes conseguir un Scar 15 G533 más barato con un Core i9-12900H, RTX 3060, y pantalla FHD por US$1,736.99 en BestBuy.
Asus ROG Strix Scar 15 G533ZW-LN106WS
- 05/31/2022 v7 (old)
Vaidyanathan Subramaniam
Price comparison

