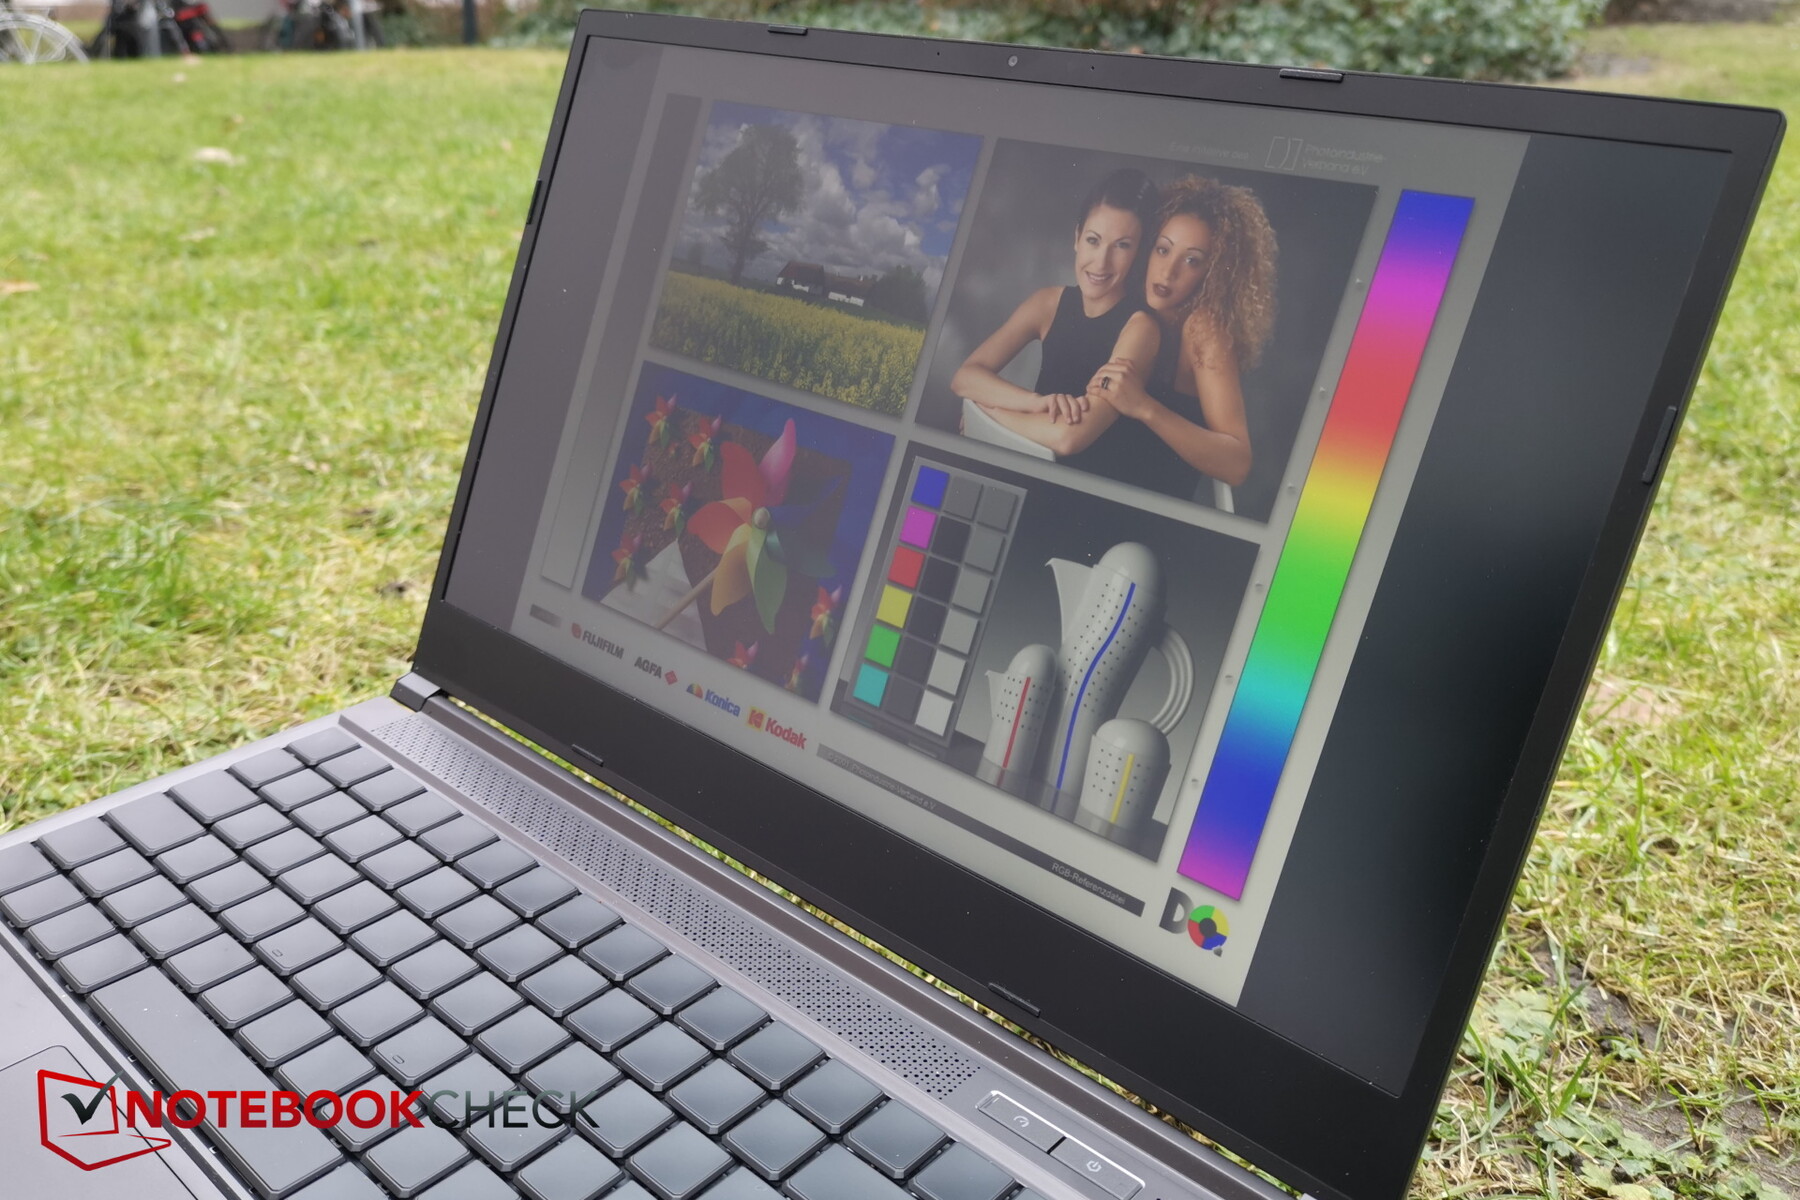
Análisis preliminar del XMG Neo 15 E22 con RTX 3080 Ti (Tongfang GM5AG8W): ¿Es la refrigeración por agua una solución provisional pero viable para los portátiles de juego?
Nota: Tanto el Neo 15 como el Oasis son explícitamente dispositivos de preproducción. Todavía pueden cambiar muchas cosas en el periodo previo al lanzamiento y pueden existir fallos de producción. Recomendamos a los lectores que tengan esto en cuenta al considerar los puntos de referencia que aparecen a continuación. Los sistemas terminados podrían tener un rendimiento diferente.
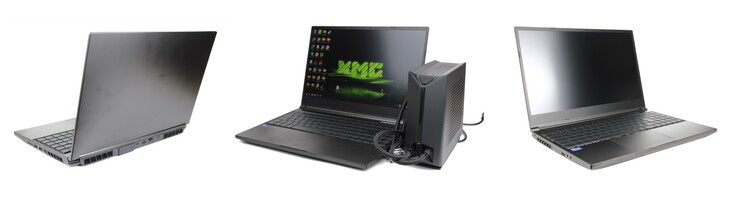
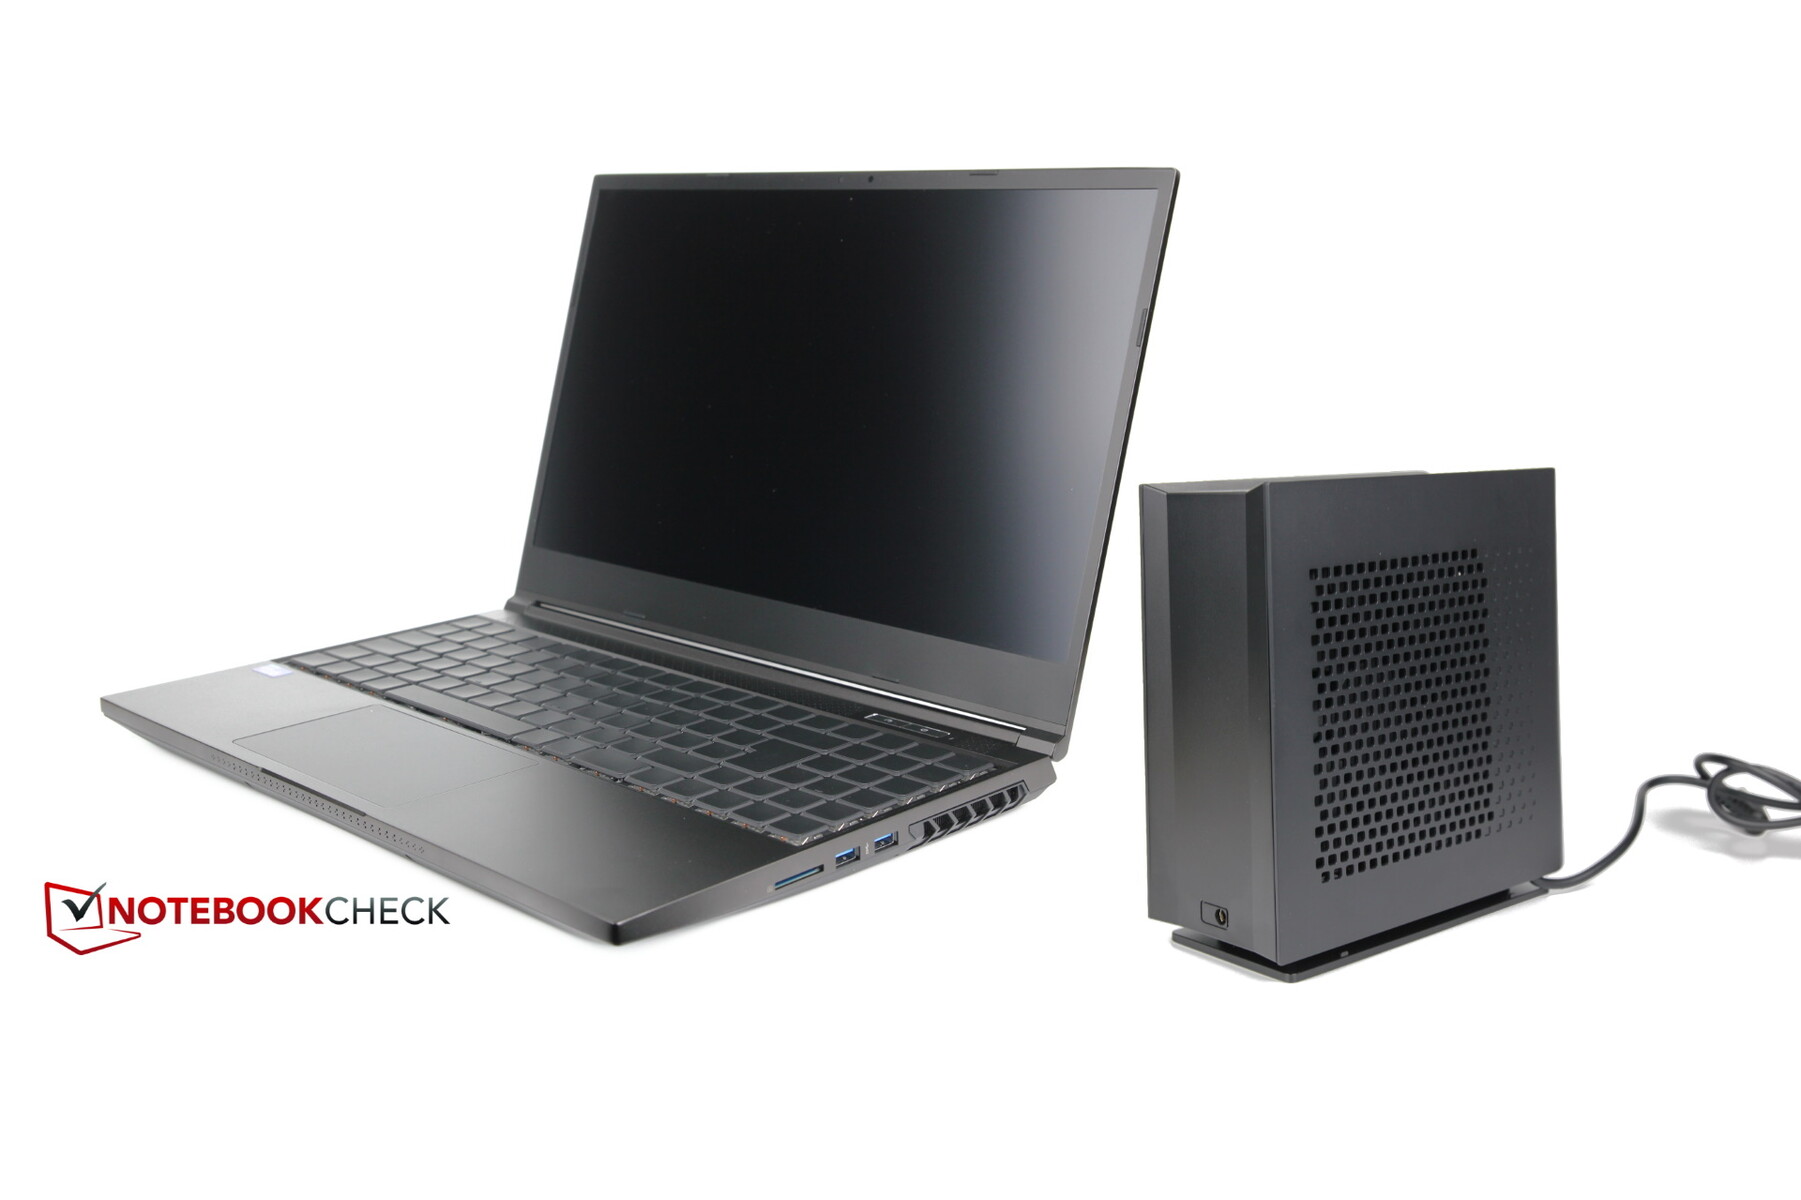
Schenker se atreve a dar un paso hacia lo desconocido con el nuevo XMG Neo 15 E22. El fabricante equipa ahora el portátil con un nuevo puerto para un sistema opcional de refrigeración por agua. También se puede pedir el XMG Oasis por 199 euros al comprar el Neo. Se supone que esto reducirá las temperaturas y los niveles de ruido de forma drástica durante los juegos o cualquier otro tipo de estrés. Pero, ¿aceptarán los clientes la compra y el funcionamiento de un dispositivo adicional de este tipo? ¿Cómo se comporta el XMG Neo con una RTX 3080 Ti hotspur sin refrigeración por agua? Analizamos estos aspectos en nuestra prueba.
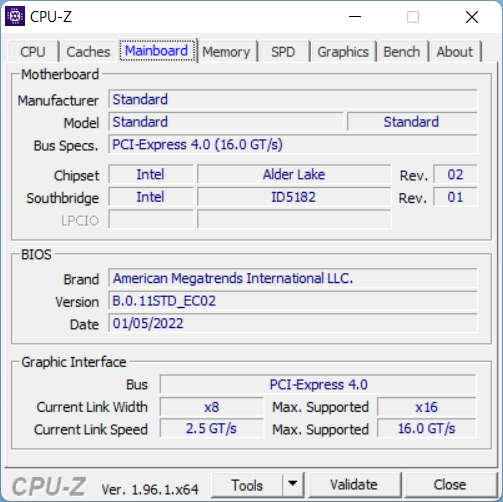
Schenker mejora el XMG Neo en varias áreas. La nueva GPU RTX 3080 Ti para portátiles en lugar de una RTX 3080, se utiliza una CPU Alder Lake-H en lugar de Tiger Lake, y luego está este nuevo puerto para la refrigeración por agua. Nuestra configuración cuesta unos 3.442 Euros sin el XMG Oasis (la refrigeración por agua externa), optar por ella añade otros 199 Euros.
Comparamos el nuevo Neo 15 E22 con su predecesor igualmente fuerte del año pasado (87% de puntuación). También creamos un elemento de comparación llamado "XMG Neo más XMG Oasis" y lo añadimos a las comparaciones de referencia. Además, también consideramos otros portátiles para juegos de gama alta para comparar. Estos incluyen el Asus ROG Strix Scar 15 G533QSy elRazer Blade 15 Modelo Avanzado, elAlienware m15 R6, y también elAnálisis del portátil MSI GE76 Raider: Con Alder Lake y RTX 3080 Ti al cielo de los juegos MSI Raider GE76 de 17 pulgadascon Alder Lake y RTX 3080 Ti debido a la falta de una comparación CPU/GPU de la nueva generación.
Posibles contendientes en la comparación
Valoración | Fecha | Modelo | Peso | Altura | Tamaño | Resolución | Precio |
|---|---|---|---|---|---|---|---|
v (old) | 03/2022 | Schenker XMG Neo 15 E22 (Early 2022, RTX 3080 Ti) i7-12700H, GeForce RTX 3080 Ti Laptop GPU | 2.2 kg | 26.6 mm | 15.60" | 2560x1440 | |
| 87 % v7 (old) | 06/2021 | Schenker XMG Neo 15 Tiger Lake i7-11800H, GeForce RTX 3080 Laptop GPU | 2.2 kg | 26 mm | 15.60" | 2560x1440 | |
| 88.9 % v7 (old) | 07/2021 | Razer Blade 15 Advanced (Mid 2021) i7-11800H, GeForce RTX 3080 Laptop GPU | 2 kg | 16.99 mm | 15.60" | 1920x1080 | |
| 86.3 % v7 (old) | 07/2021 | Asus ROG Strix Scar 15 G533QS R9 5900HX, GeForce RTX 3080 Laptop GPU | 2.3 kg | 27.2 mm | 15.60" | 2560x1440 | |
| 86.1 % v7 (old) | 11/2021 | Alienware m15 R6, i7-11800H RTX 3080 i7-11800H, GeForce RTX 3080 Laptop GPU | 2.5 kg | 22.85 mm | 15.60" | 1920x1080 | |
| 87.5 % v7 (old) | 01/2022 | MSI GE76 Raider i9-12900HK, GeForce RTX 3080 Ti Laptop GPU | 3 kg | 26 mm | 17.30" | 1920x1080 |
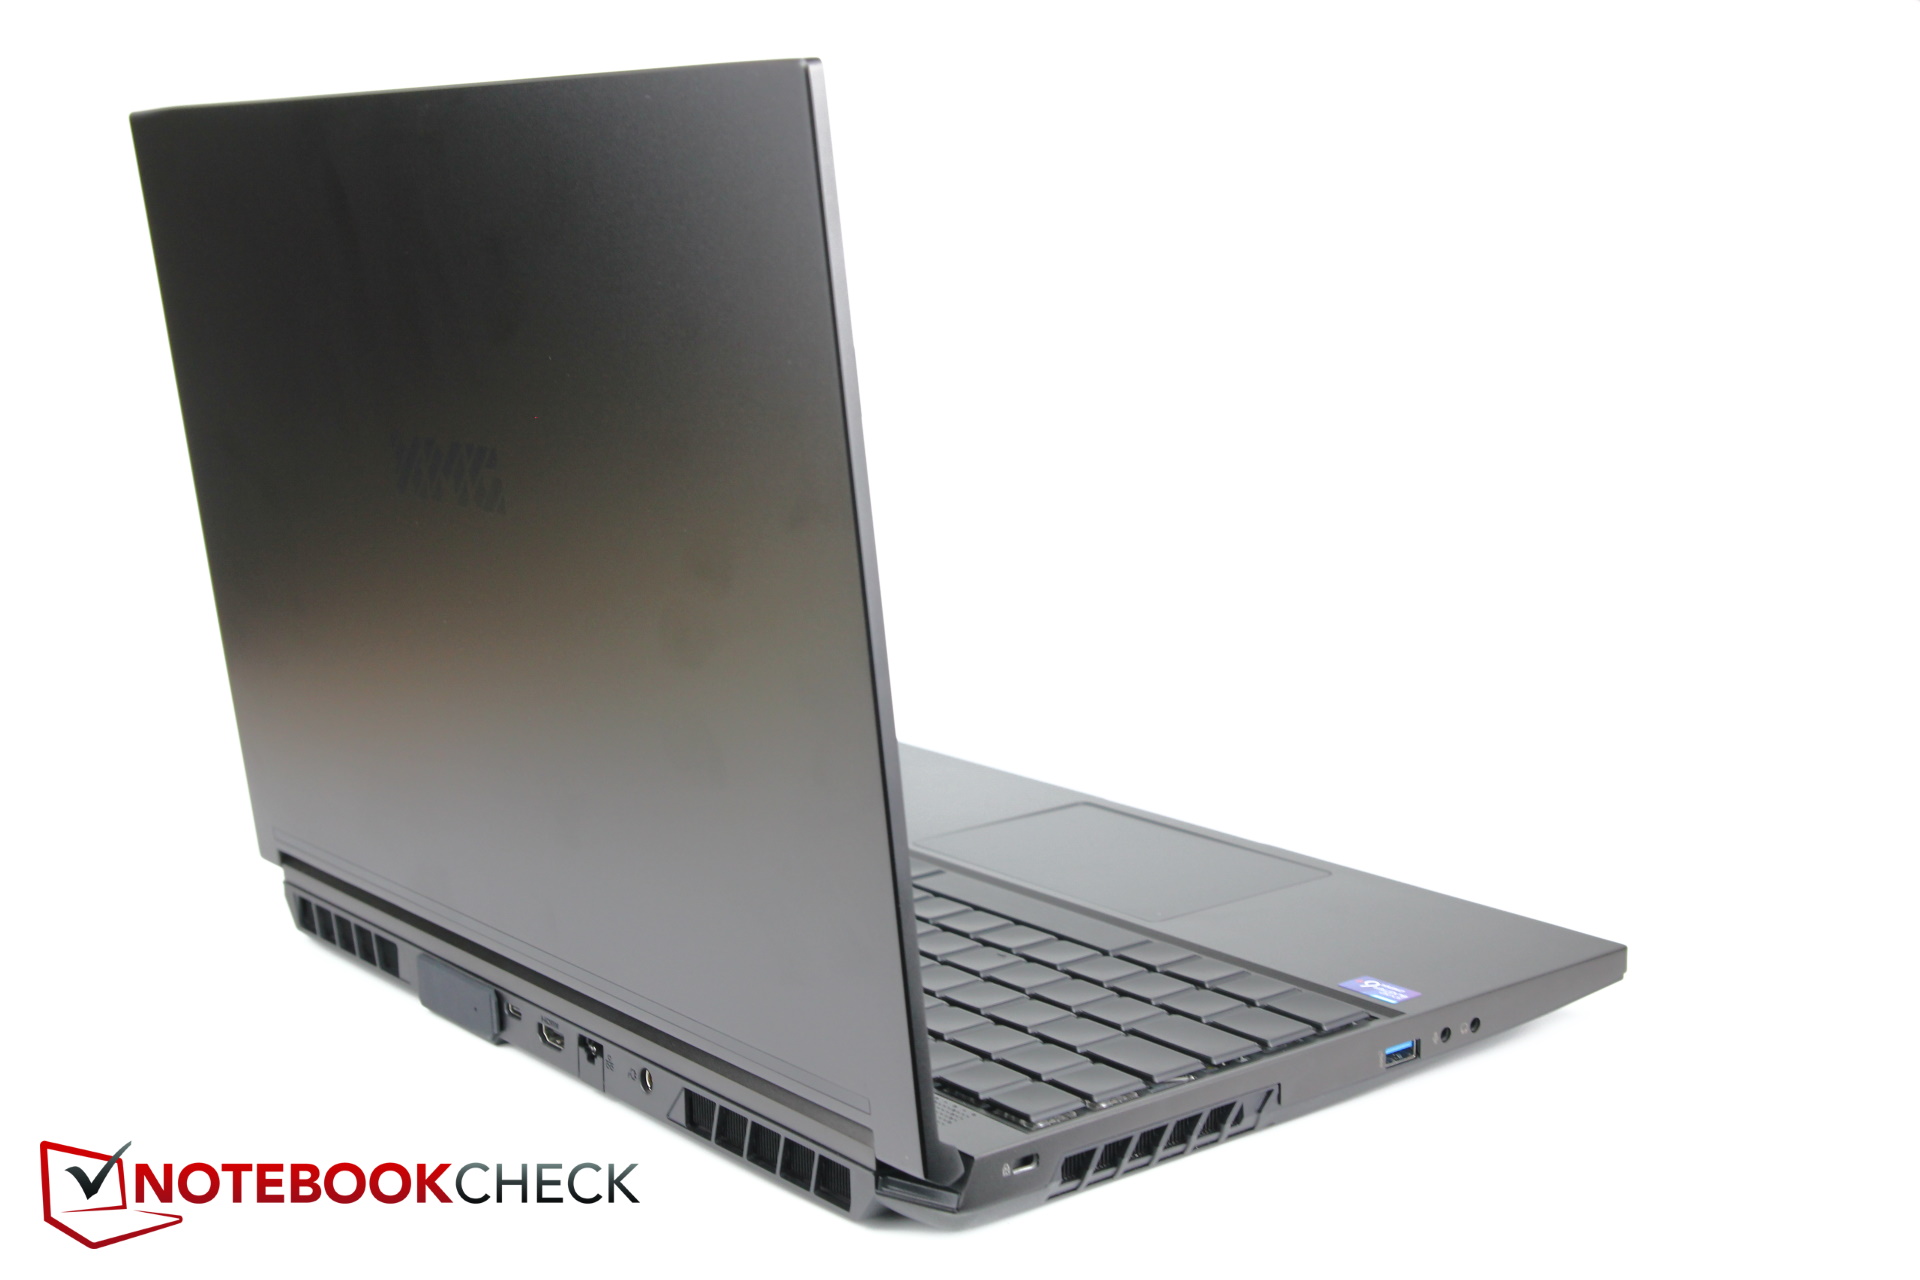
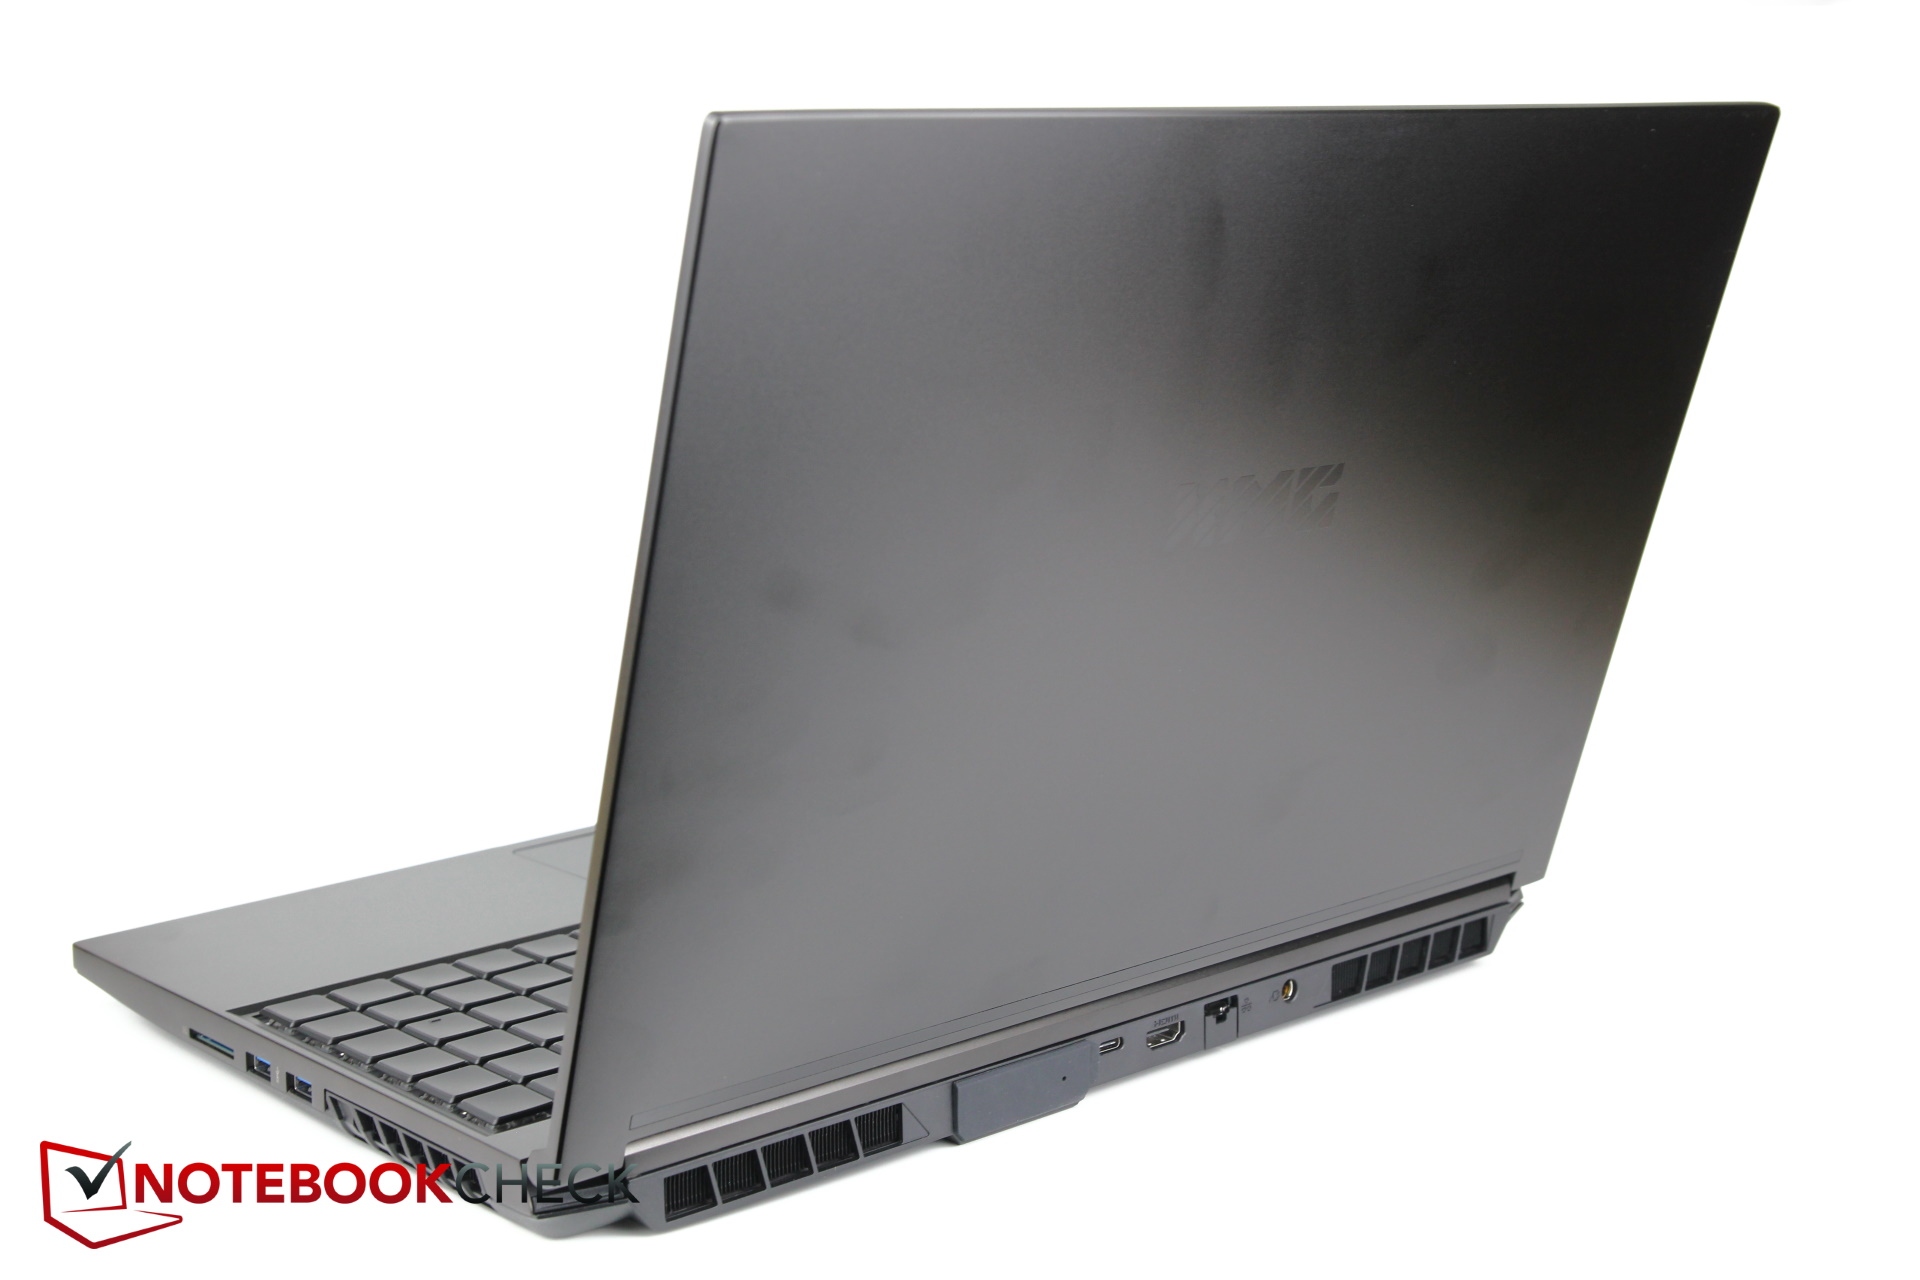
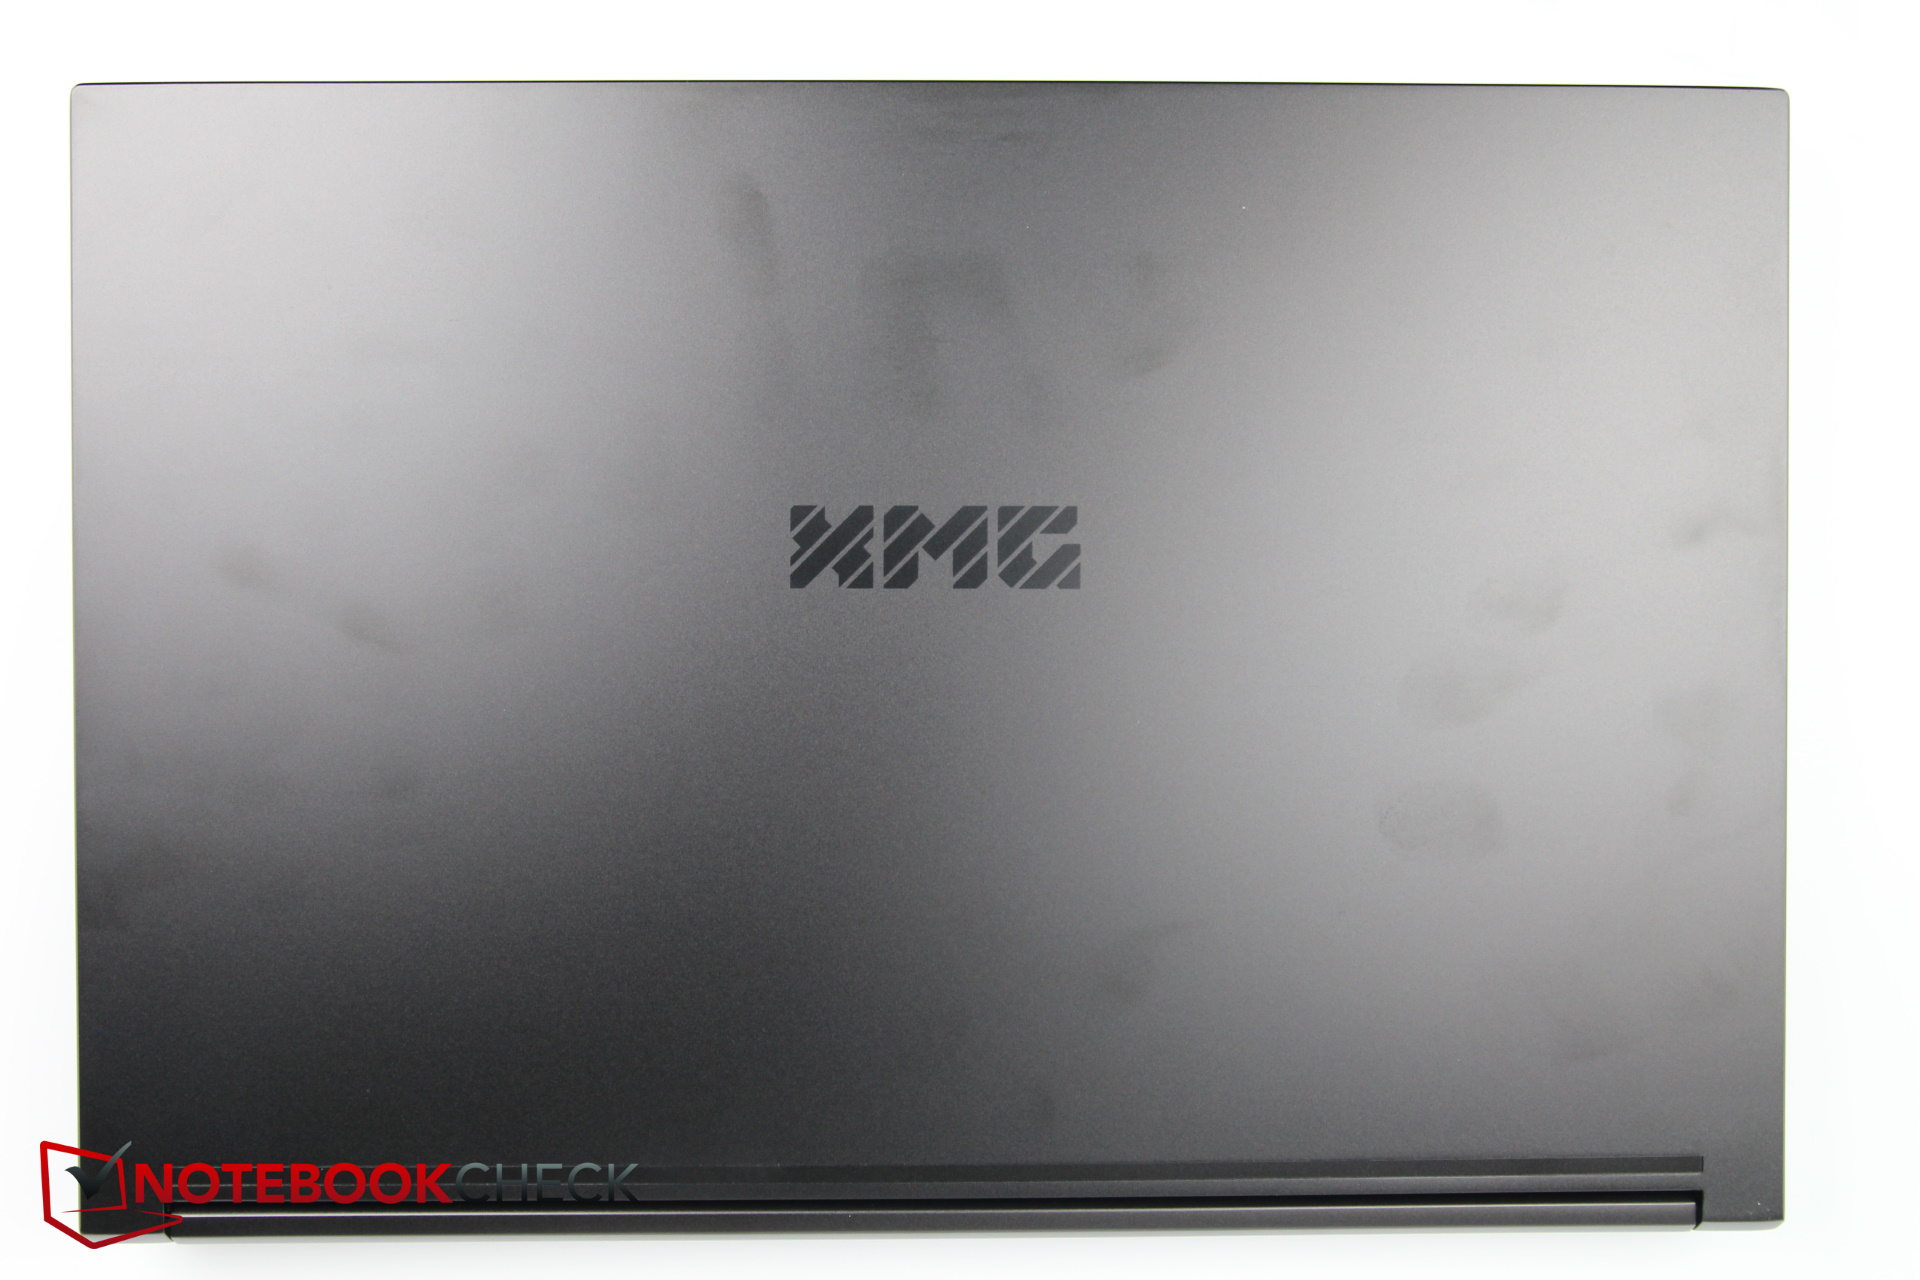
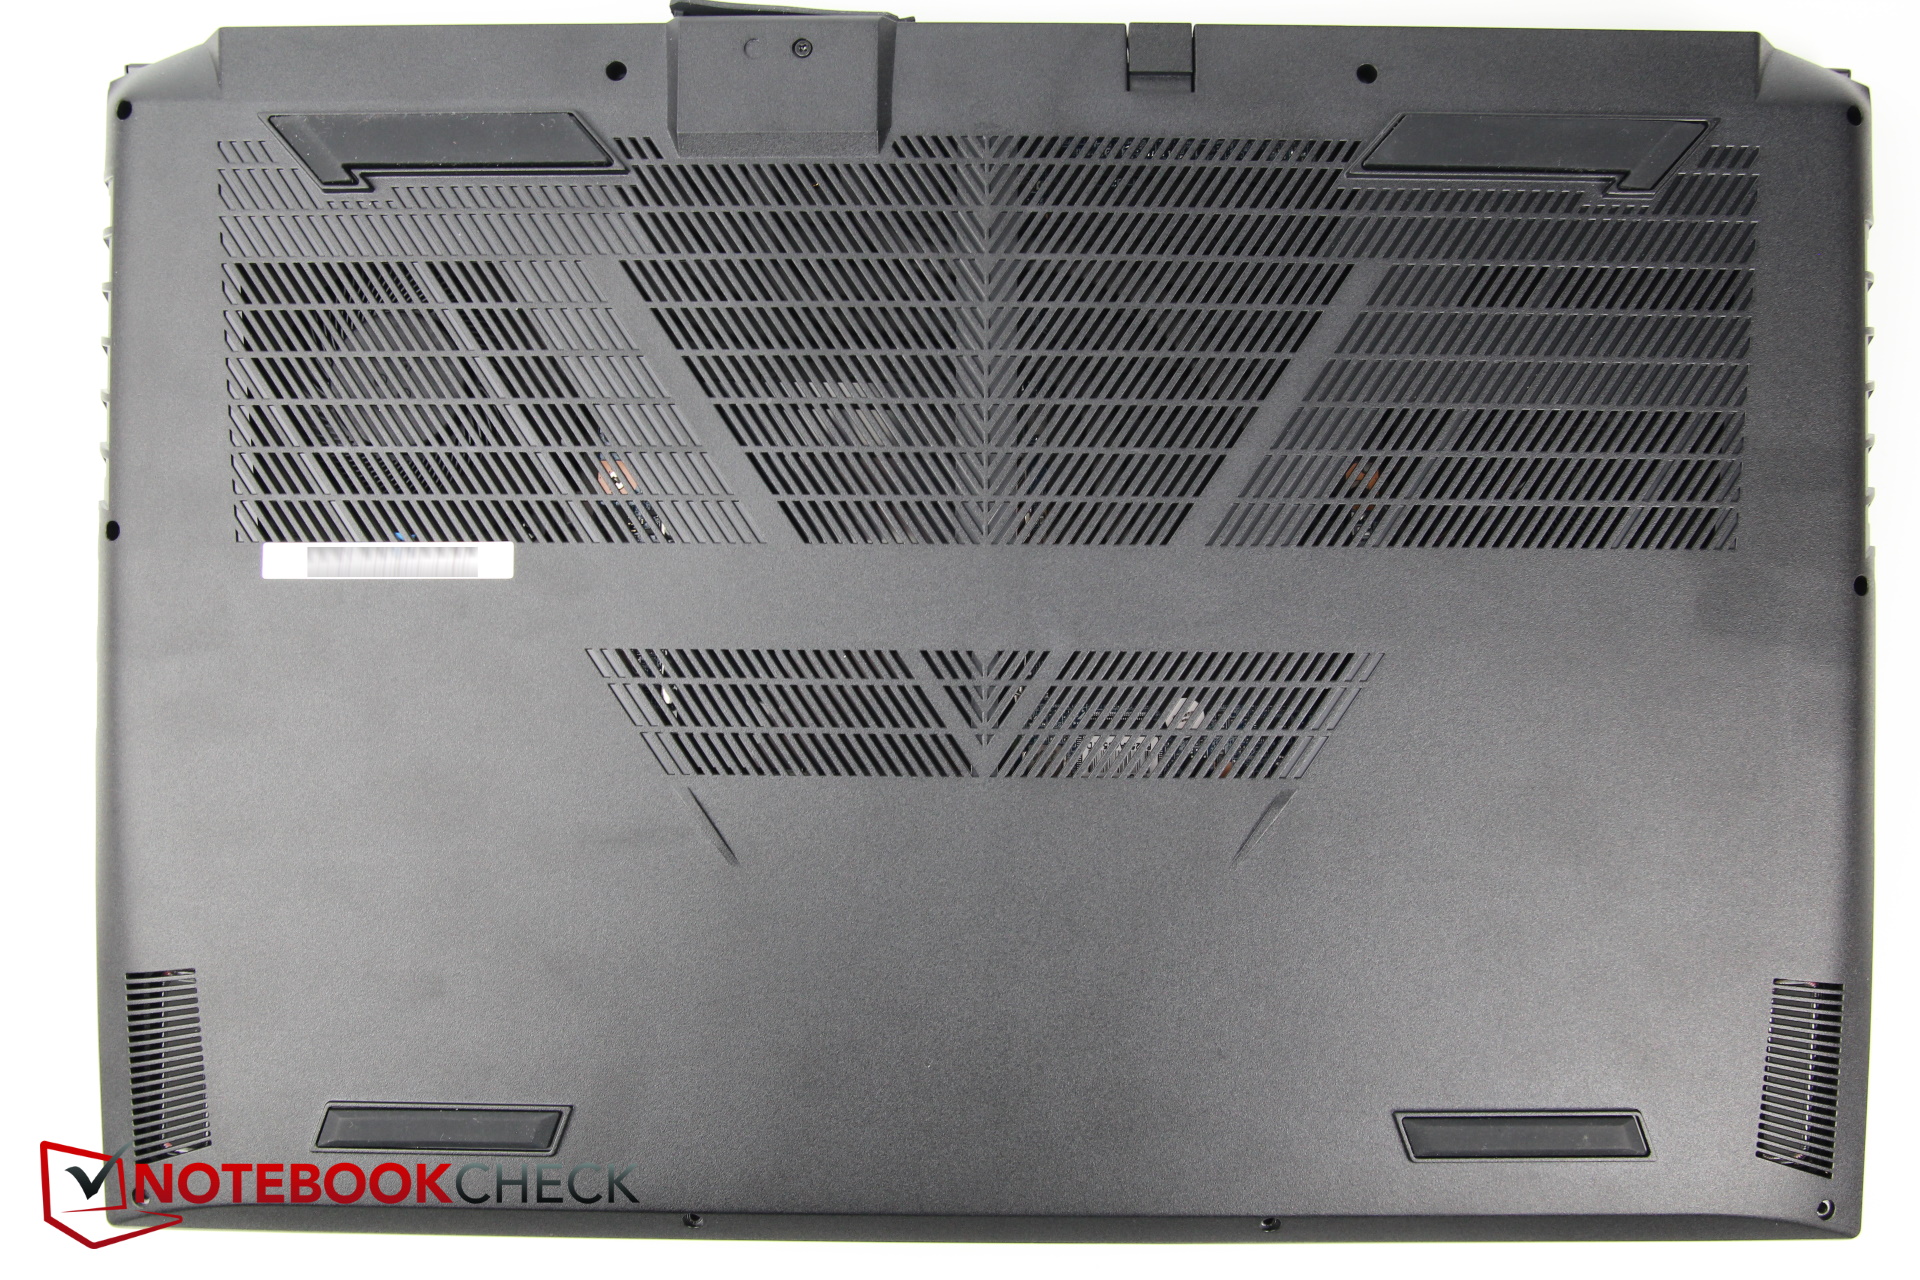
Caja: ¡Un puerto para la refrigeración por agua!
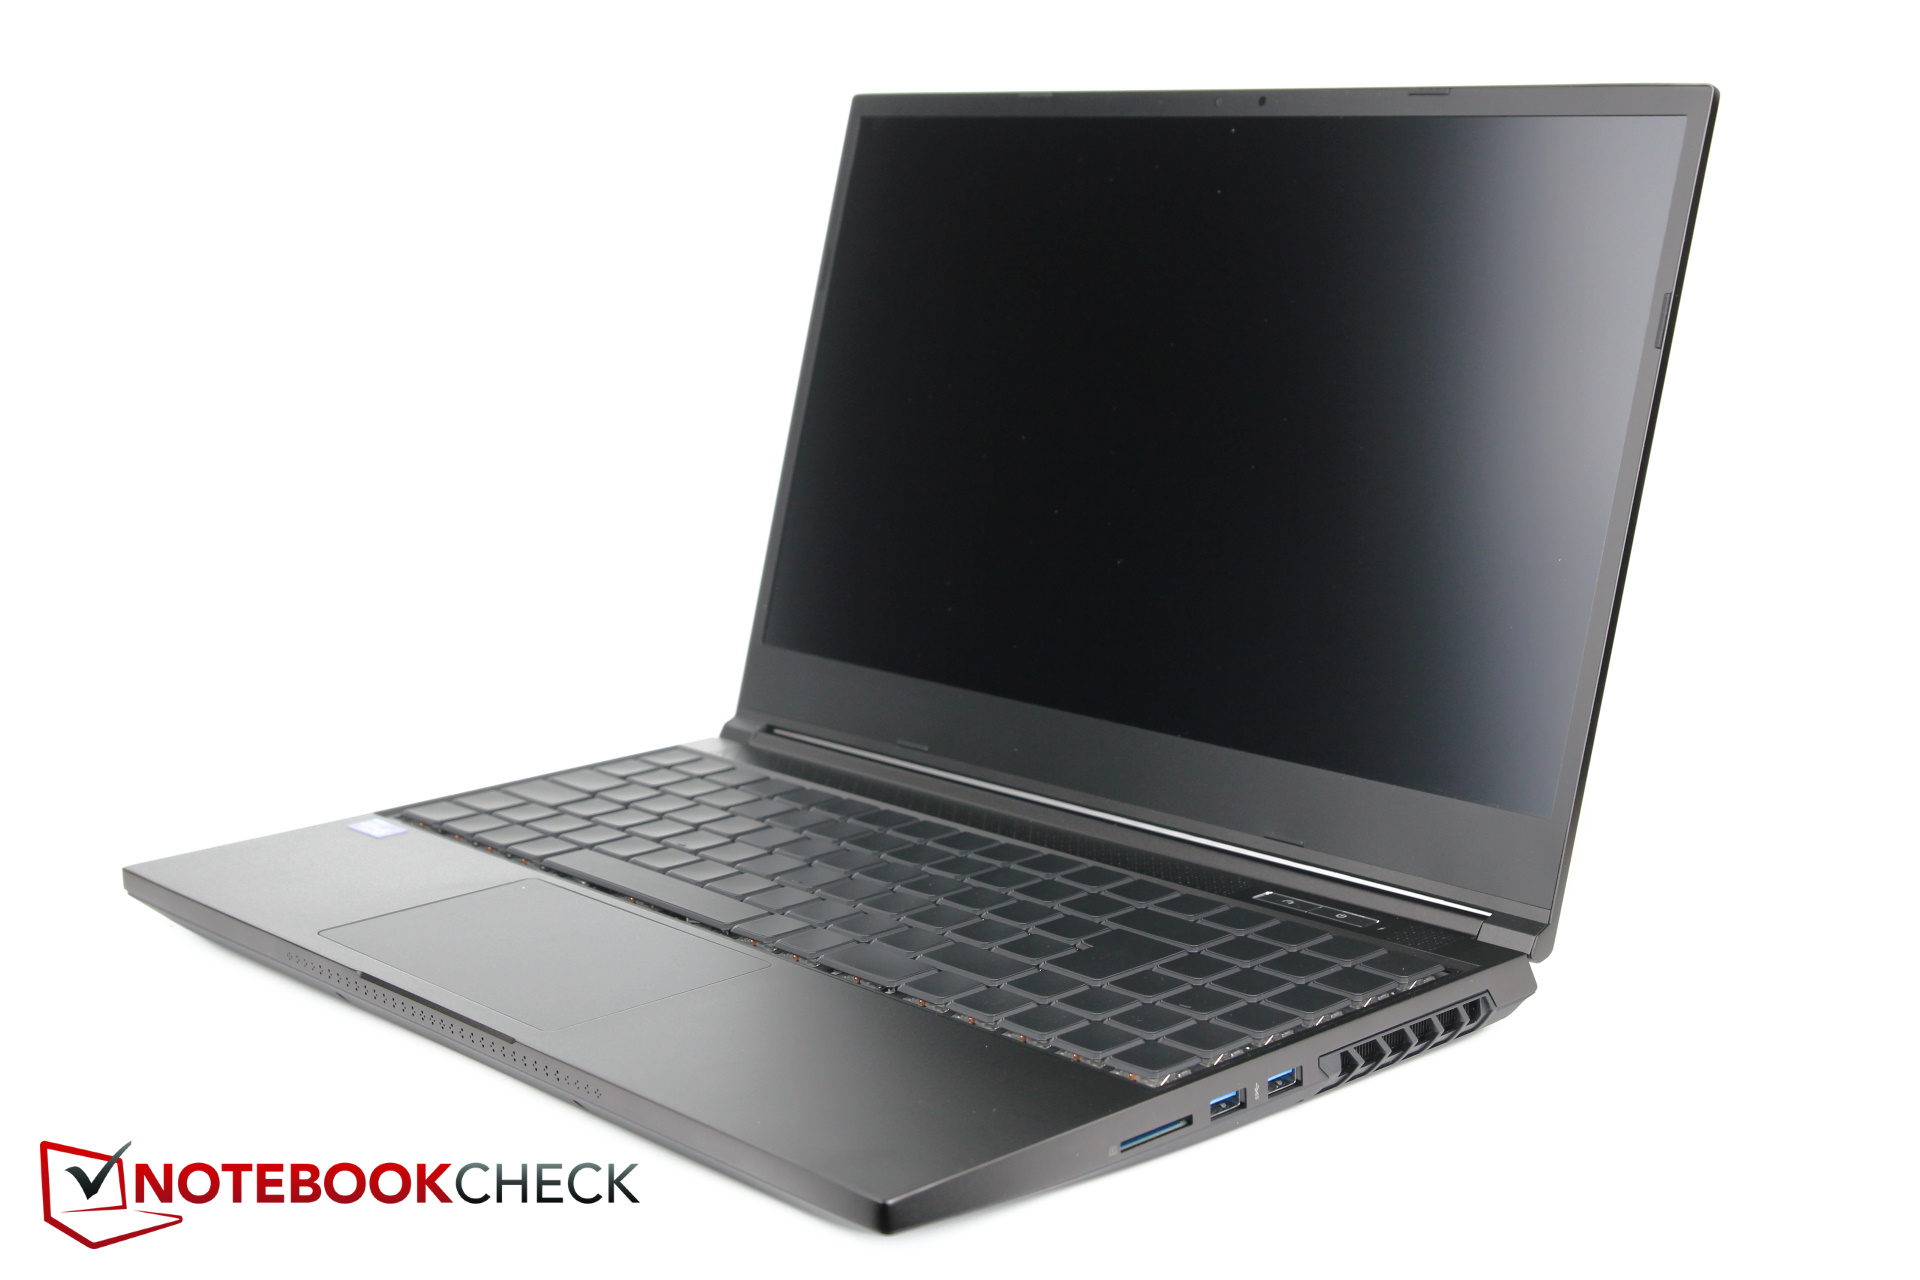
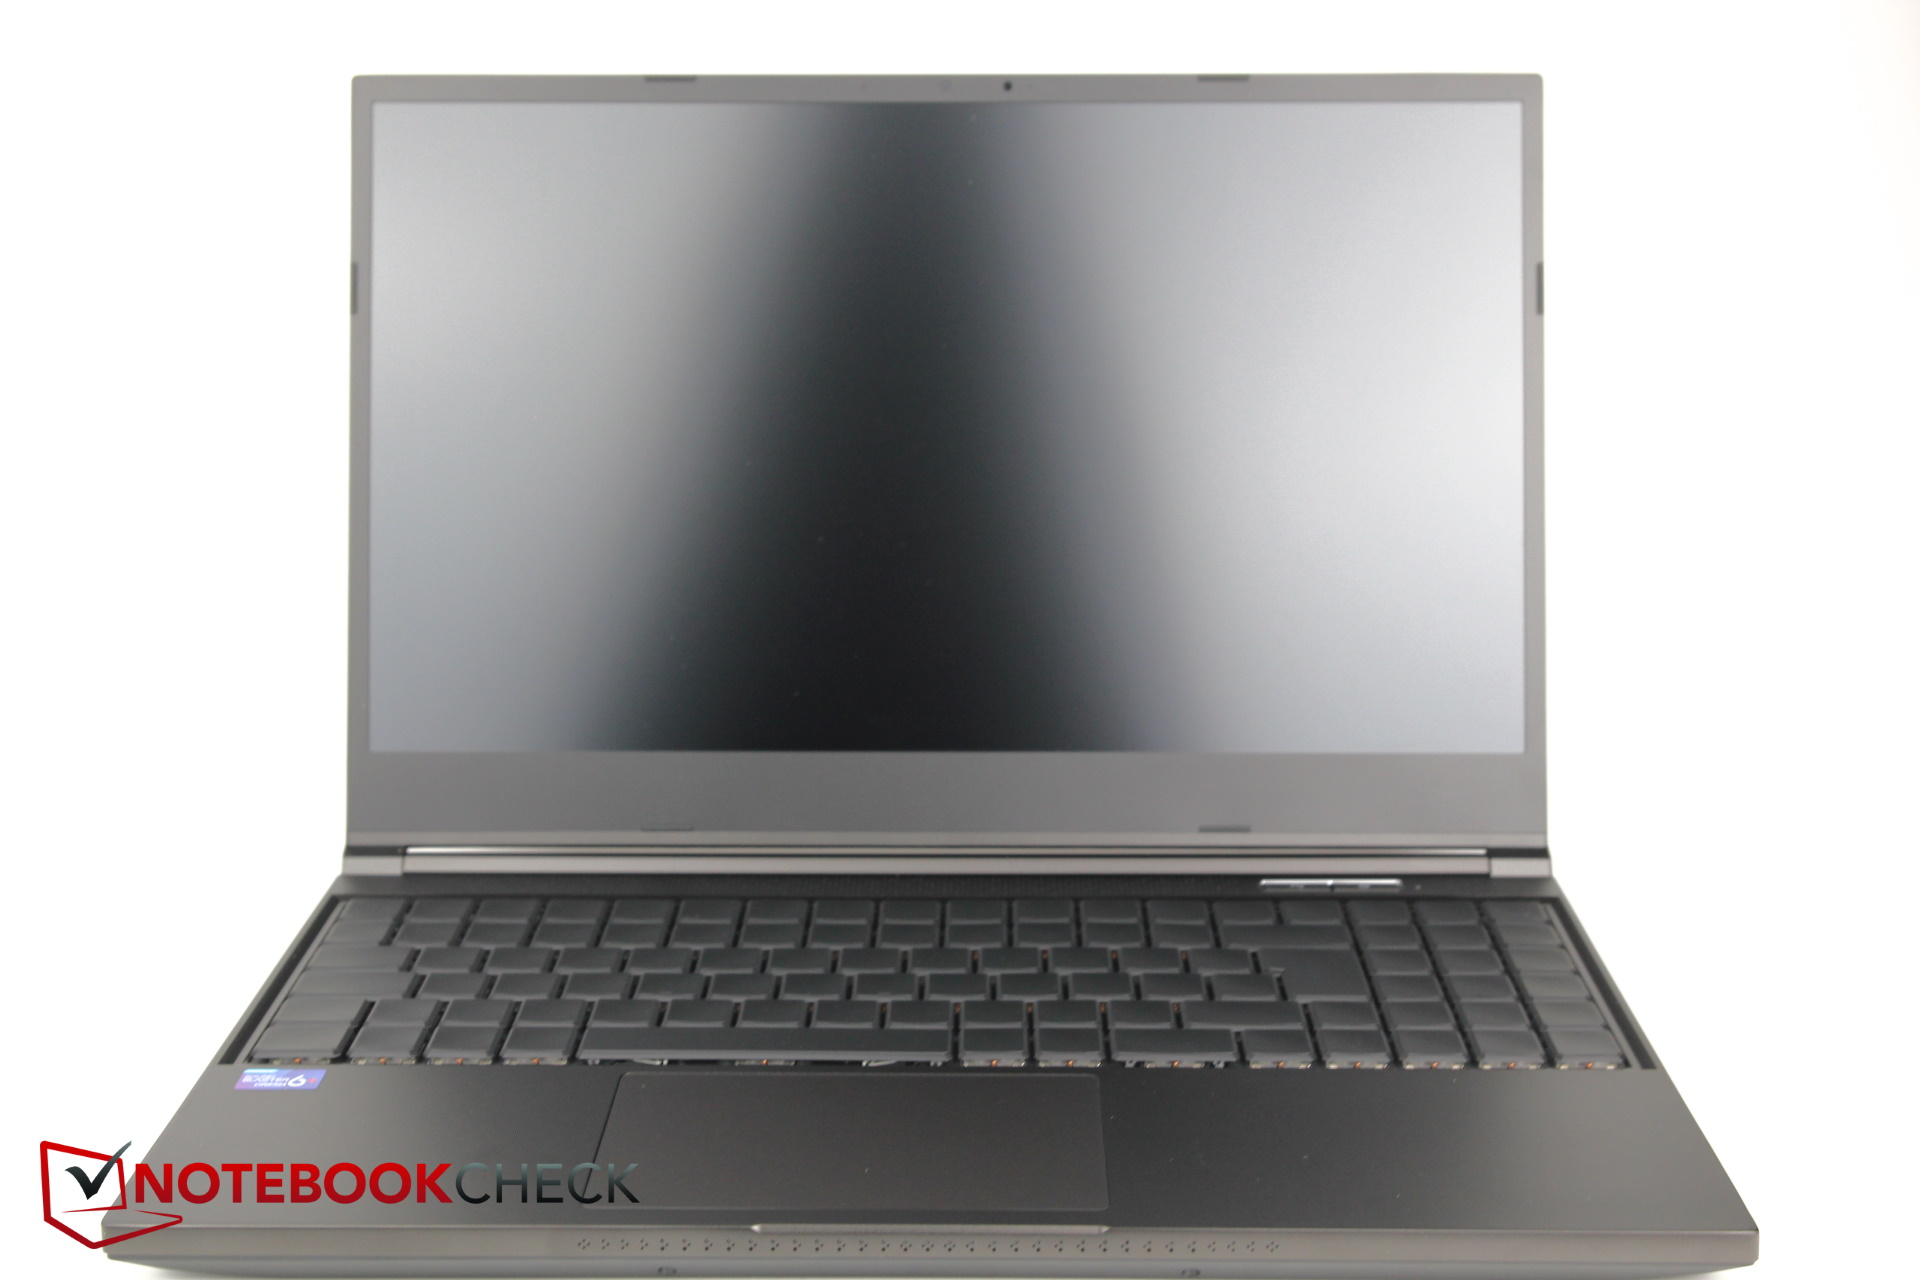
La carcasa es en gran medida idéntica a la de su predecesor, sólo la conexión de agua en la parte trasera es una nueva adición. Además, el enchufe se ha hecho más robusto. La base es de plástico, mientras que el resto del chasis, incluyendo la tapa e incluso los bordes de la pantalla, son de aluminio negro mate. La base en particular parece muy robusta, pero la tapa de la pantalla también es relativamente resistente a la torsión aunque su superficie atrae mucho las huellas dactilares. La calidad general de construcción es muy buena
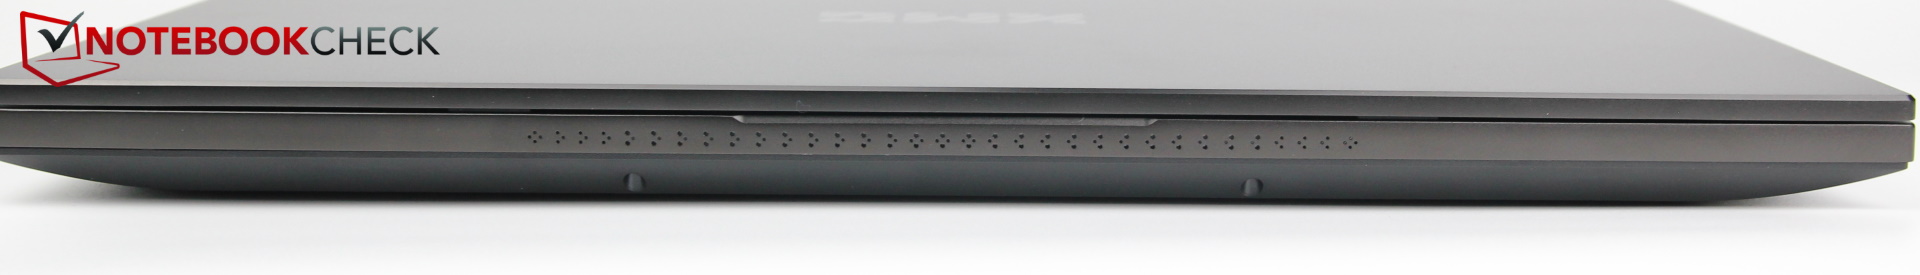
El diseño es más bien sencillo, por lo que el portátil no sólo parece apropiado en el escritorio para jugadores, sino también para usuarios creativos y profesionales. Hay una franja con pequeños agujeros en la carcasa en el borde frontal, lo que significa que la iluminación del teclado brilla débilmente hacia el frente como una "franja LED".
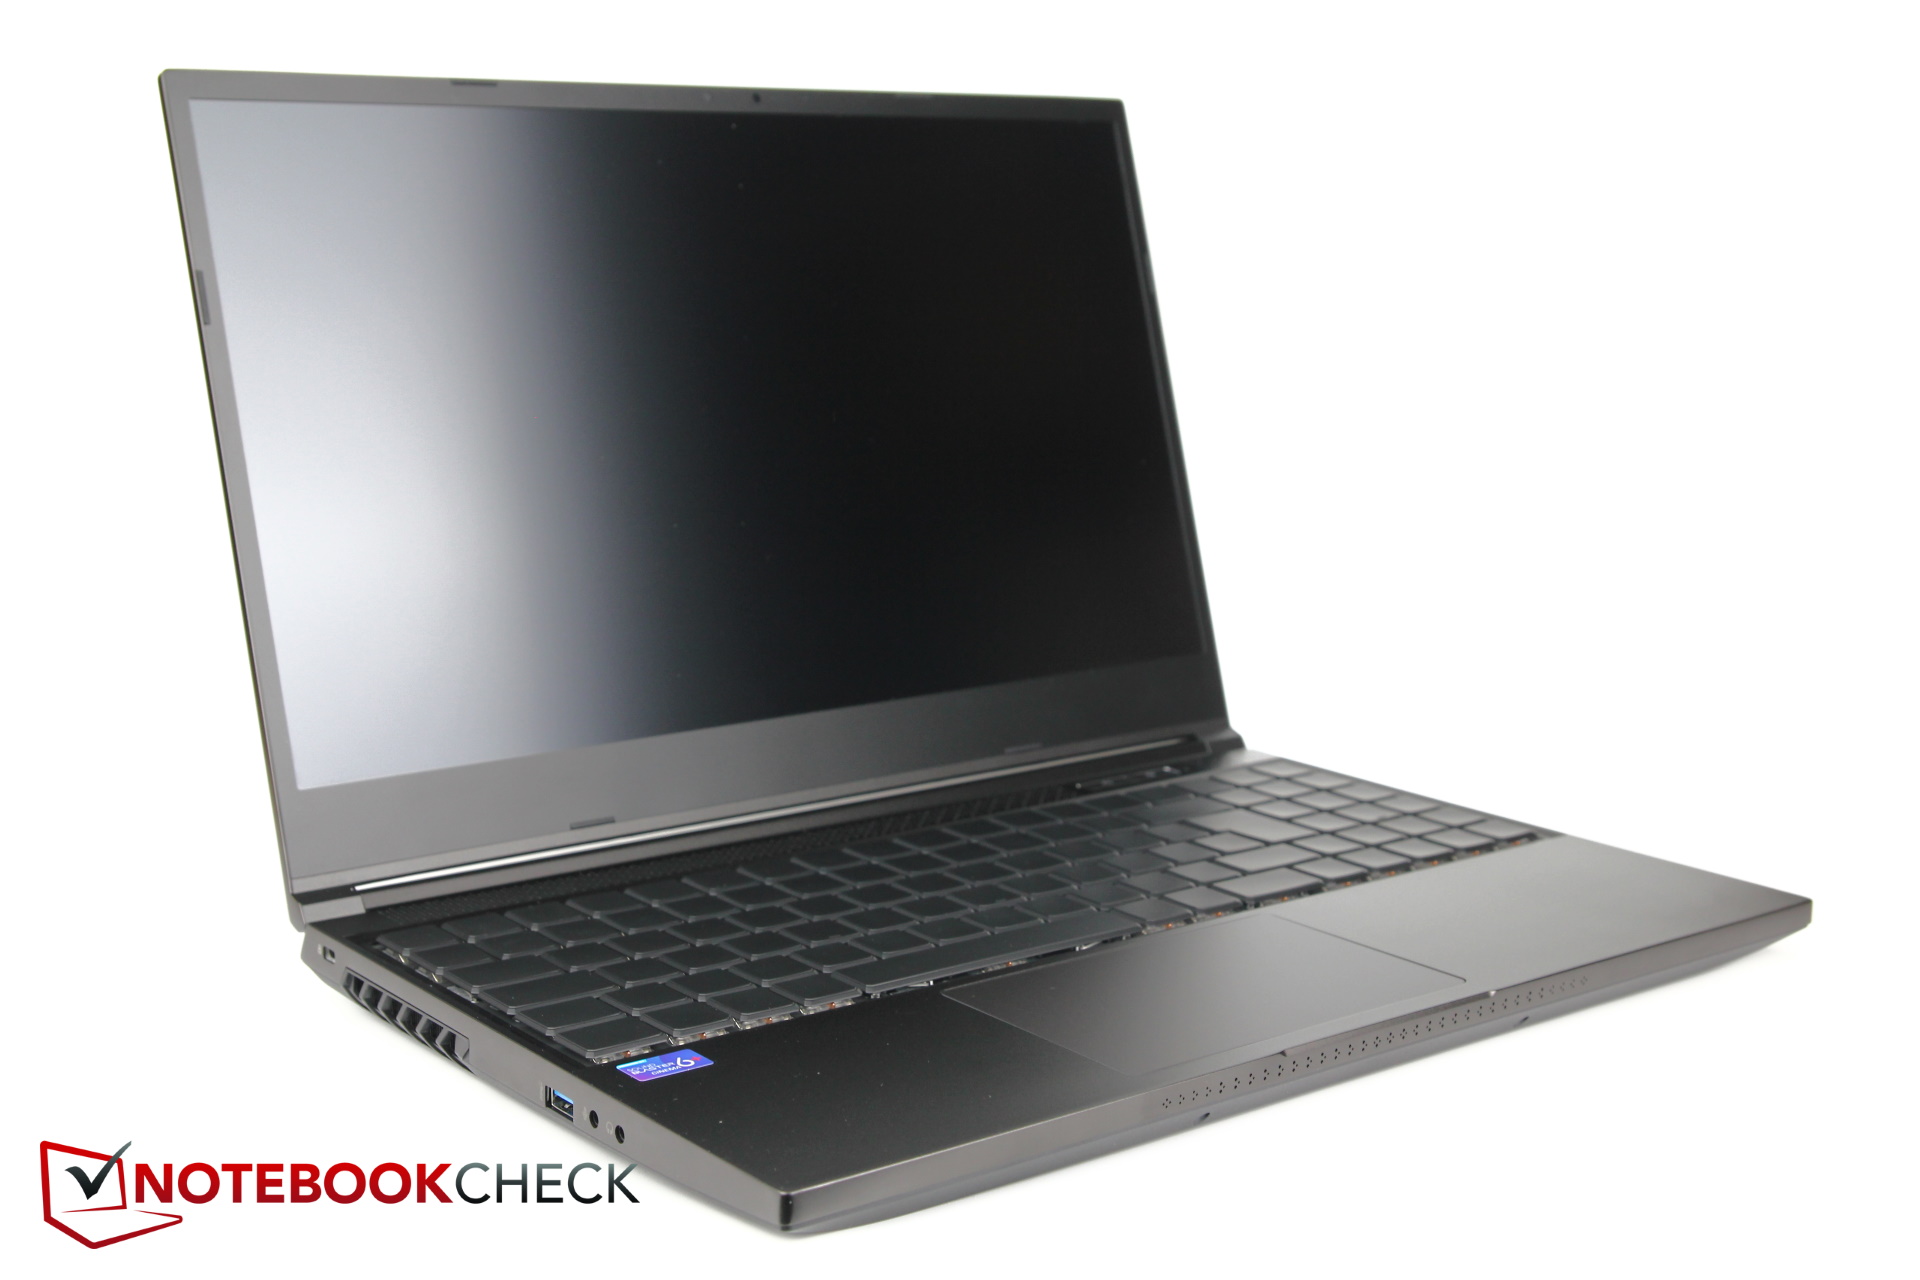
A pesar del circuito de agua adicional, el portátil no se ha vuelto más grueso. Definitivamente no pertenece al grupo de los delgados, pero tampoco es particularmente grueso en vista del hardware extremadamente potente. Sin embargo, el Razer Blade y el Alienware M15 son notablemente más delgados.
El peso de 2,2 kg también es moderado teniendo en cuenta el hardware. El Razer Blade es 200 g más ligero, mientras que el Alienware es 300 g más pesado.
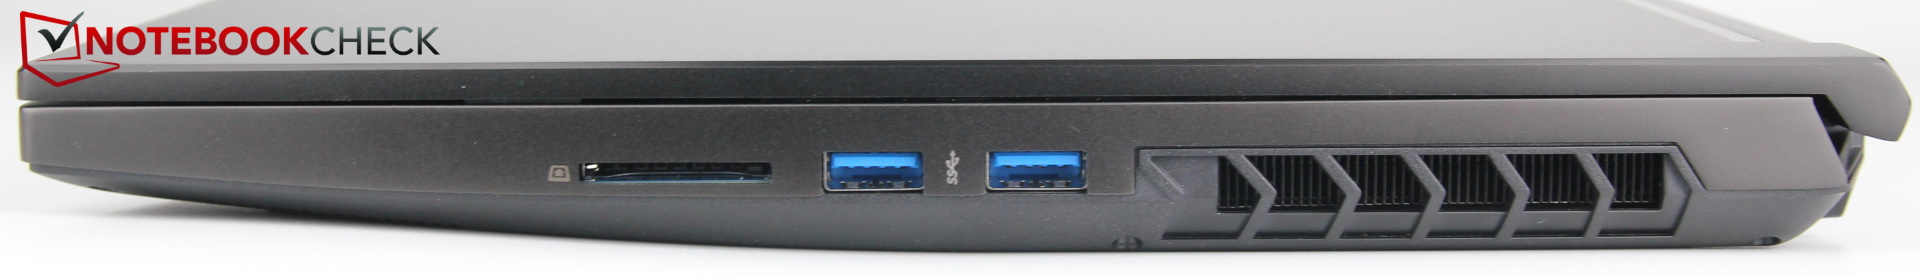
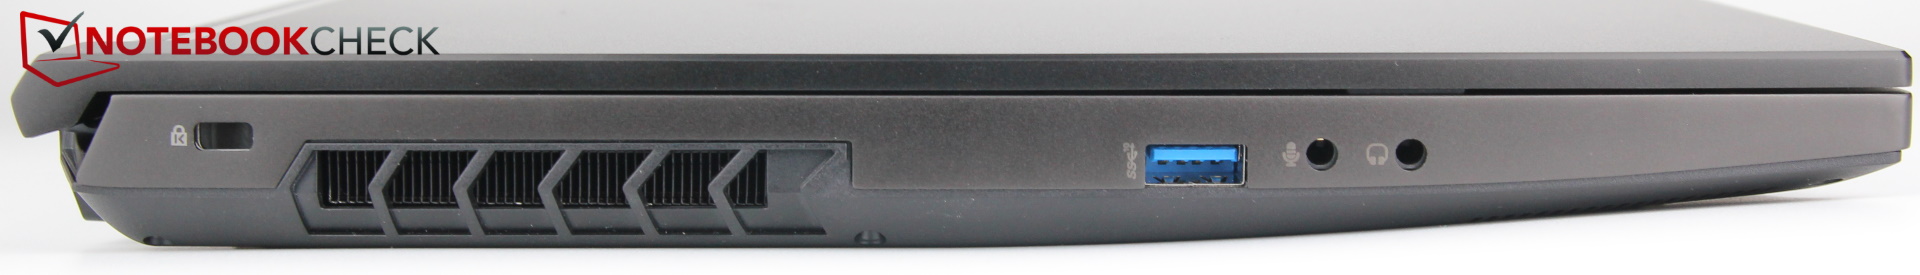
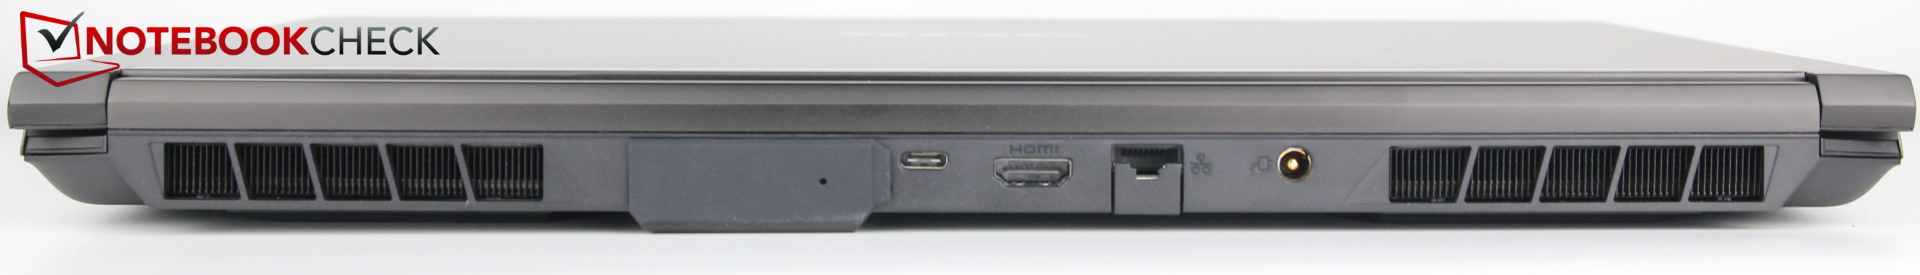
Equipamiento: ¡Thunderbolt 4 y conexión de agua!
Aunque el puerto de agua ocupa algo de espacio, Schenker no renuncia a los demás puertos. Desde lectores de tarjetas SD hasta USB-C con Thunderbolt 4 y dos tomas de audio, todo está a bordo. El portátil no se puede cargar por USB-C. Además, los portátiles Alder Lake con Thunderbolt 4 no están preparados para la RV per se porque las señales DisplayPort ya no se envían directamente a la dGPU sino a través de la iGPU. Solo están preparados para la RV cuando hay un segundo puerto USB-C con conexión a la dGPU o un DisplayPort dedicado
Los puertos están bastante cerca el uno del otro, pero eso solo es molesto en ciertas situaciones. El considerablemente más baratoMSI GP66 Leopard 11UH muestra cómo la ubicación de los puertos puede ser mejor.
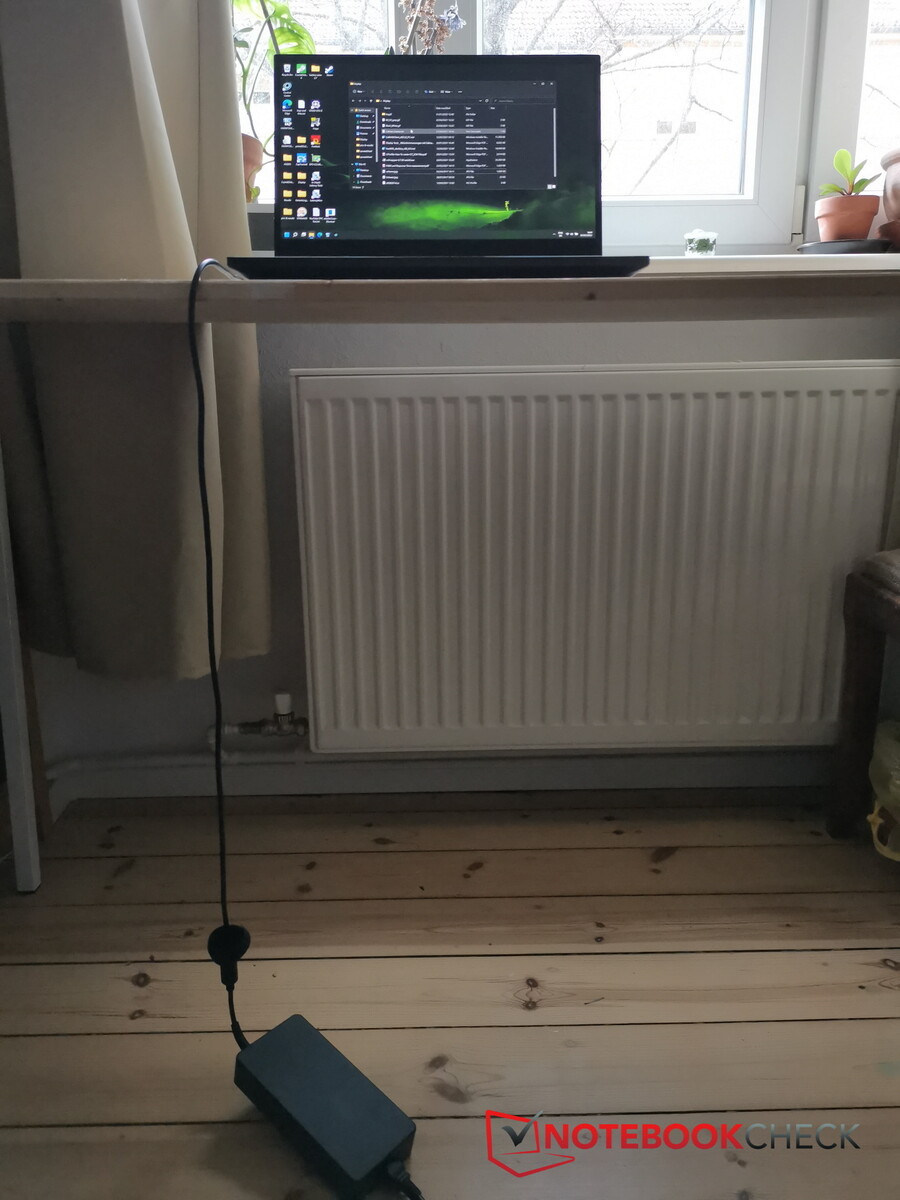
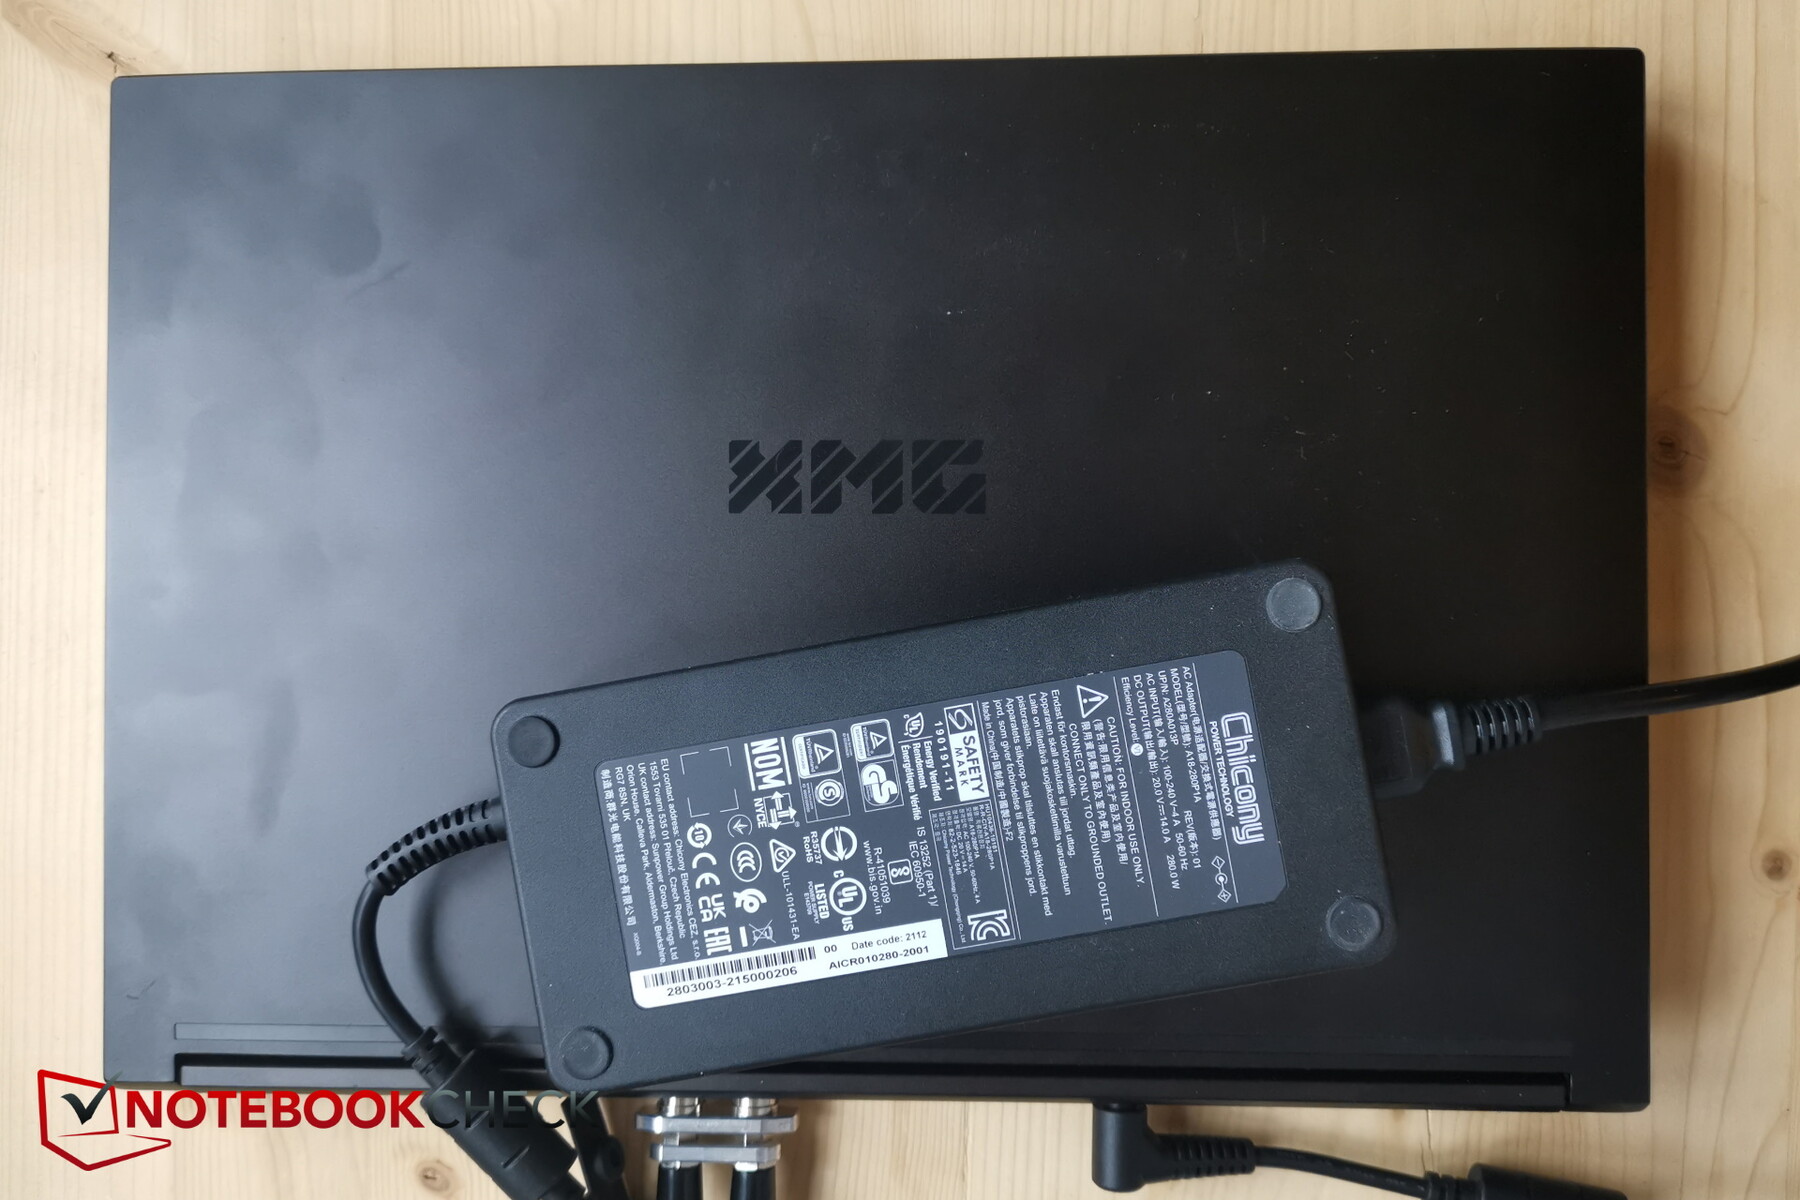
Unas palabras sobre la fuente de alimentación: El cable que va de la fuente de alimentación al portátil es muy corto y por tanto molesto. Si tienes una mesa un poco más alta y tienes que tirar del cable desde la parte delantera de la mesa hasta la parte trasera del puerto del portátil, la fuente de alimentación cuelga en el aire y se tensa de forma muy molesta. Hubiera sido deseable un cable un poco más largo.
Lector de tarjetas SD
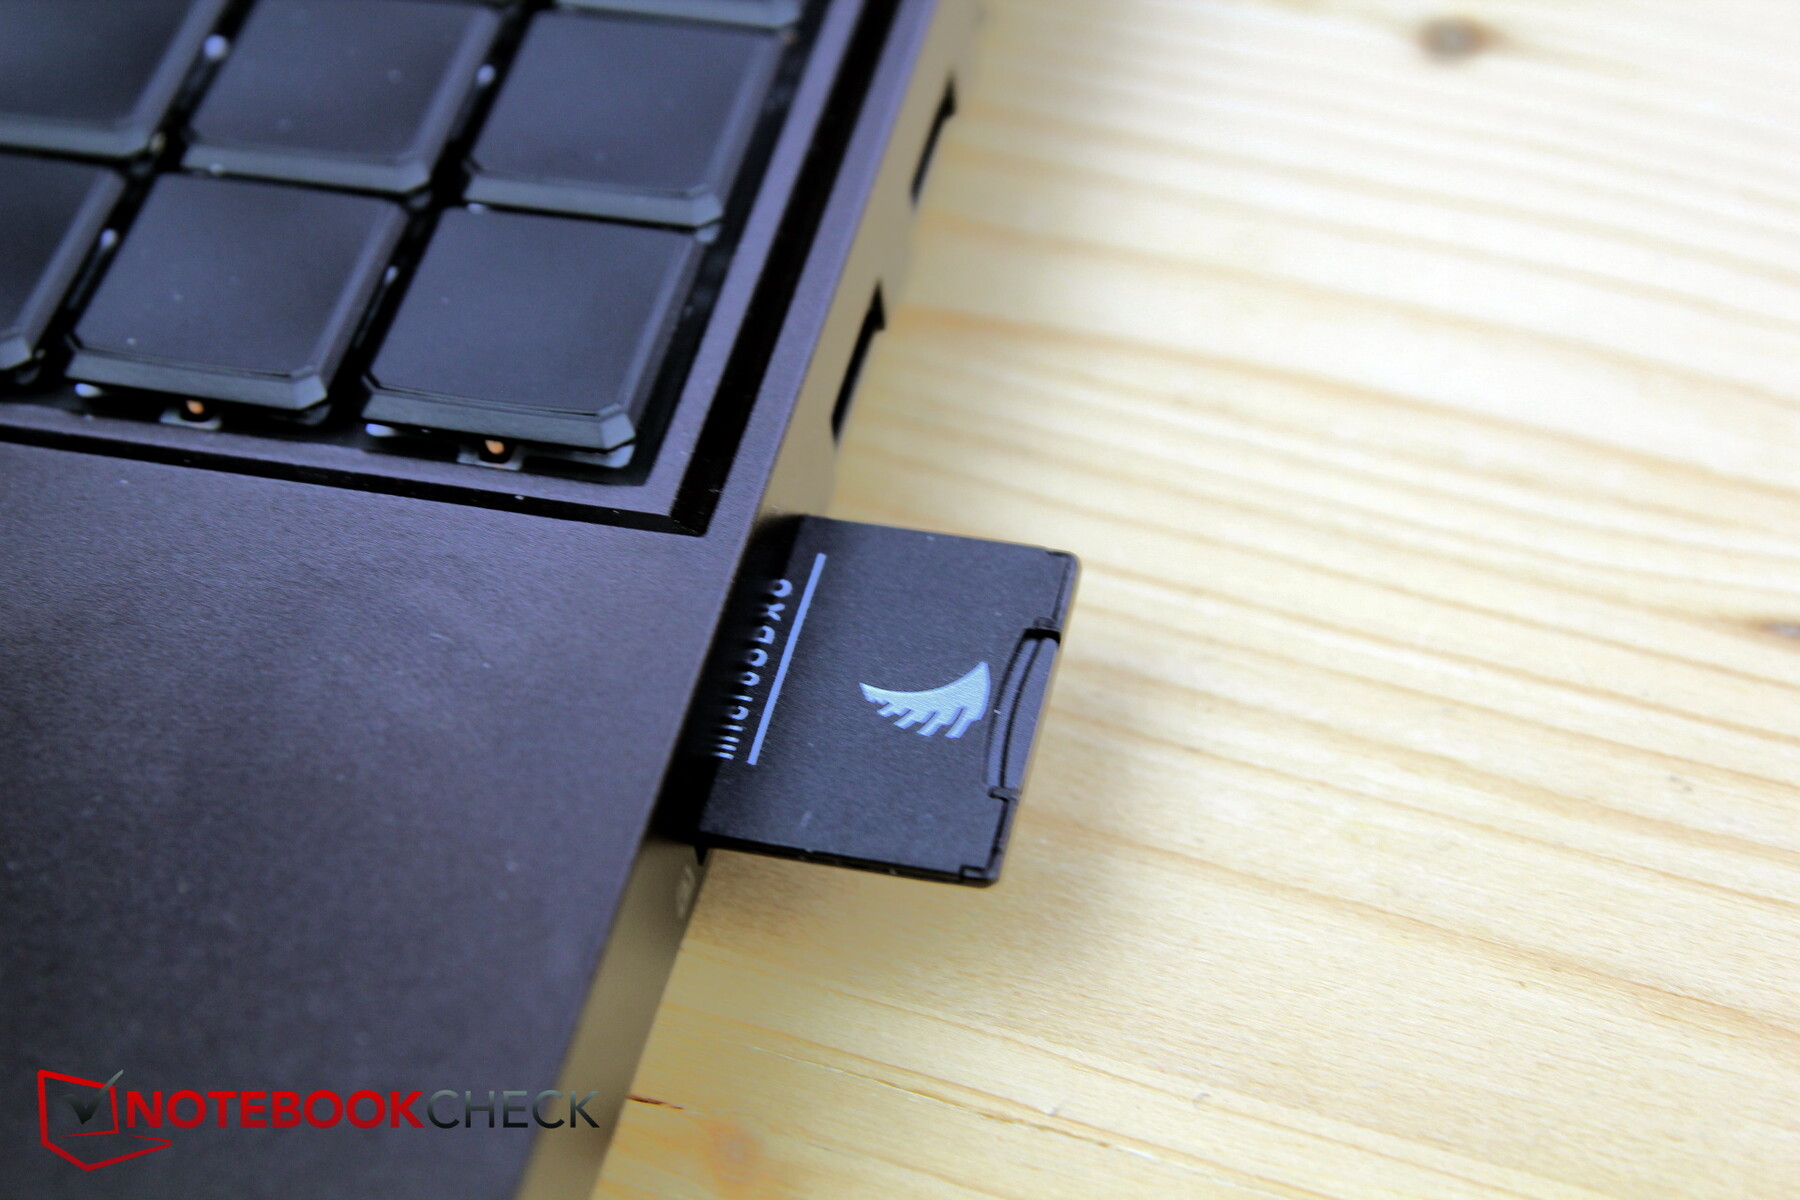
El lector SD instalado es uno de los más lentos desde hace al menos dos generaciones. La media de la clase es aproximadamente el doble de rápida - si es que se instala uno, porque muchos de los fabricantes de la competencia ya ni siquiera instalan un lector de tarjetas SD.
Nuestra tarjeta de prueba AV PRO microSD 128 GB V60 no se encaja, sino que sólo se inserta y con la mitad de la tarjeta sobresaliendo fuera de la ranura.
| SD Card Reader | |
| average JPG Copy Test (av. of 3 runs) | |
| Media de la clase Gaming (20.9 - 210, n=54, últimos 2 años) | |
| MSI GE76 Raider (AV PRO microSD 128 GB V60) | |
| Schenker XMG Neo 15 Tiger Lake (AV PRO microSD 128 GB V60) | |
| Schenker XMG Neo 15 E22 (Early 2022, RTX 3080 Ti) | |
| maximum AS SSD Seq Read Test (1GB) | |
| Media de la clase Gaming (25.5 - 261, n=51, últimos 2 años) | |
| Schenker XMG Neo 15 Tiger Lake (AV PRO microSD 128 GB V60) | |
| Schenker XMG Neo 15 E22 (Early 2022, RTX 3080 Ti) | |
Comunicación
El Intel AX201 es el mismo módulo WLAN que en el predecesor y puede cambiarse si es necesario.
Sin embargo, medimos tasas de transferencia de poco menos de 1 GBit/s, mientras que el predecesor lograba más de 1.5 GBit/s. Queda por ver si esto puede optimizarse con actualizaciones de drivers.
Cámara web
Schenker instala una cámara Full HD. Las desviaciones de color están bien, pero la imagen sigue siendo muy ruidosa incluso en condiciones de luz media y parece lavada.

 GeForce RTX 3080 Ti Laptop GPU, i7-12700H, Samsung SSD 980 Pro 250GB MZ-V8P250BW")
 GeForce RTX 3080 Ti Laptop GPU, i7-12700H, Samsung SSD 980 Pro 250GB MZ-V8P250BW")
Seguridad
Hay un puerto de bloqueo Kensington y un chip TPM 2.0. Sin embargo, se echa en falta un sensor de huellas dactilares.
Accesorios
Dado que se trata de un modelo de preproducción, aún no se pueden hacer declaraciones sobre los accesorios. Como es típico de Schenker, el CD de controladores y la memoria USB deberían estar incluidos. El XMG Oasis, que se menciona a menudo en la reseña, puede adquirirse por 199 euros adicionales (~199 dólares).
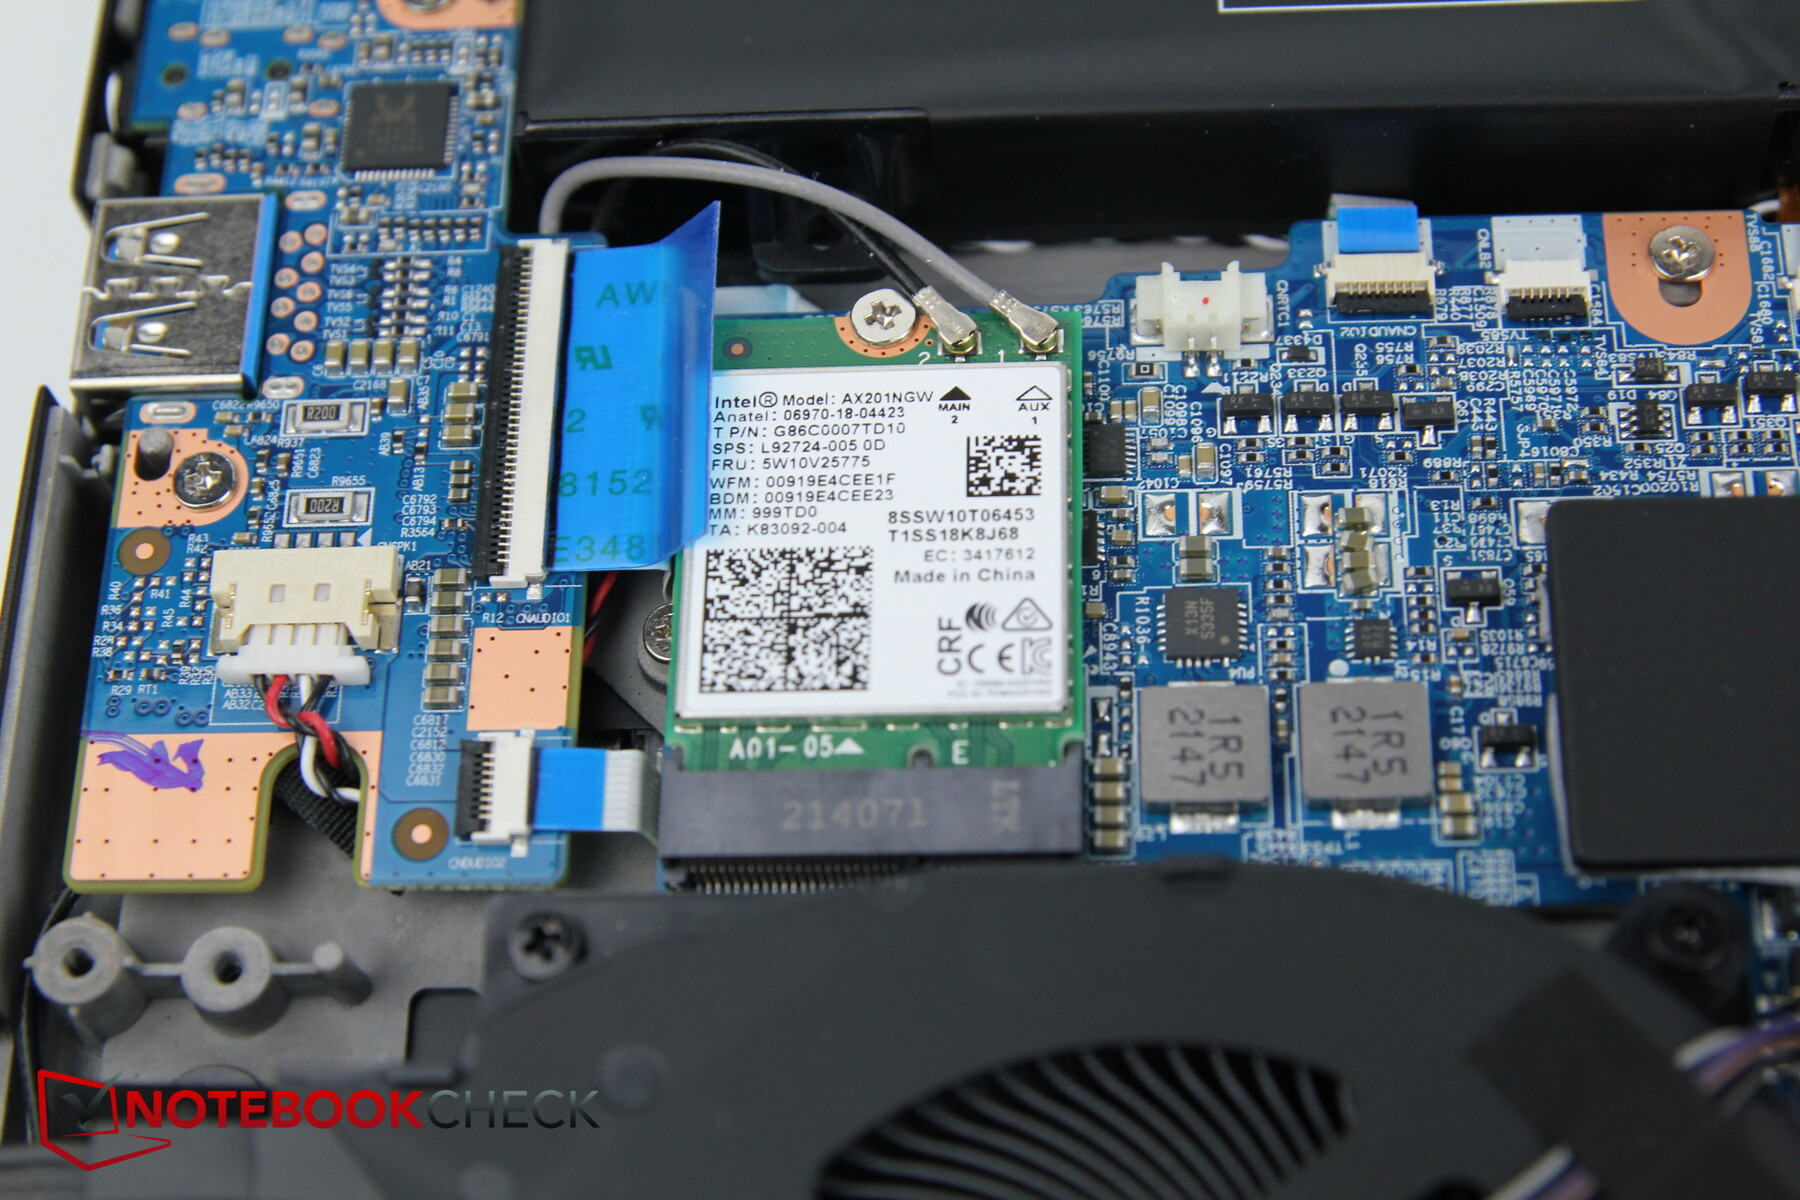
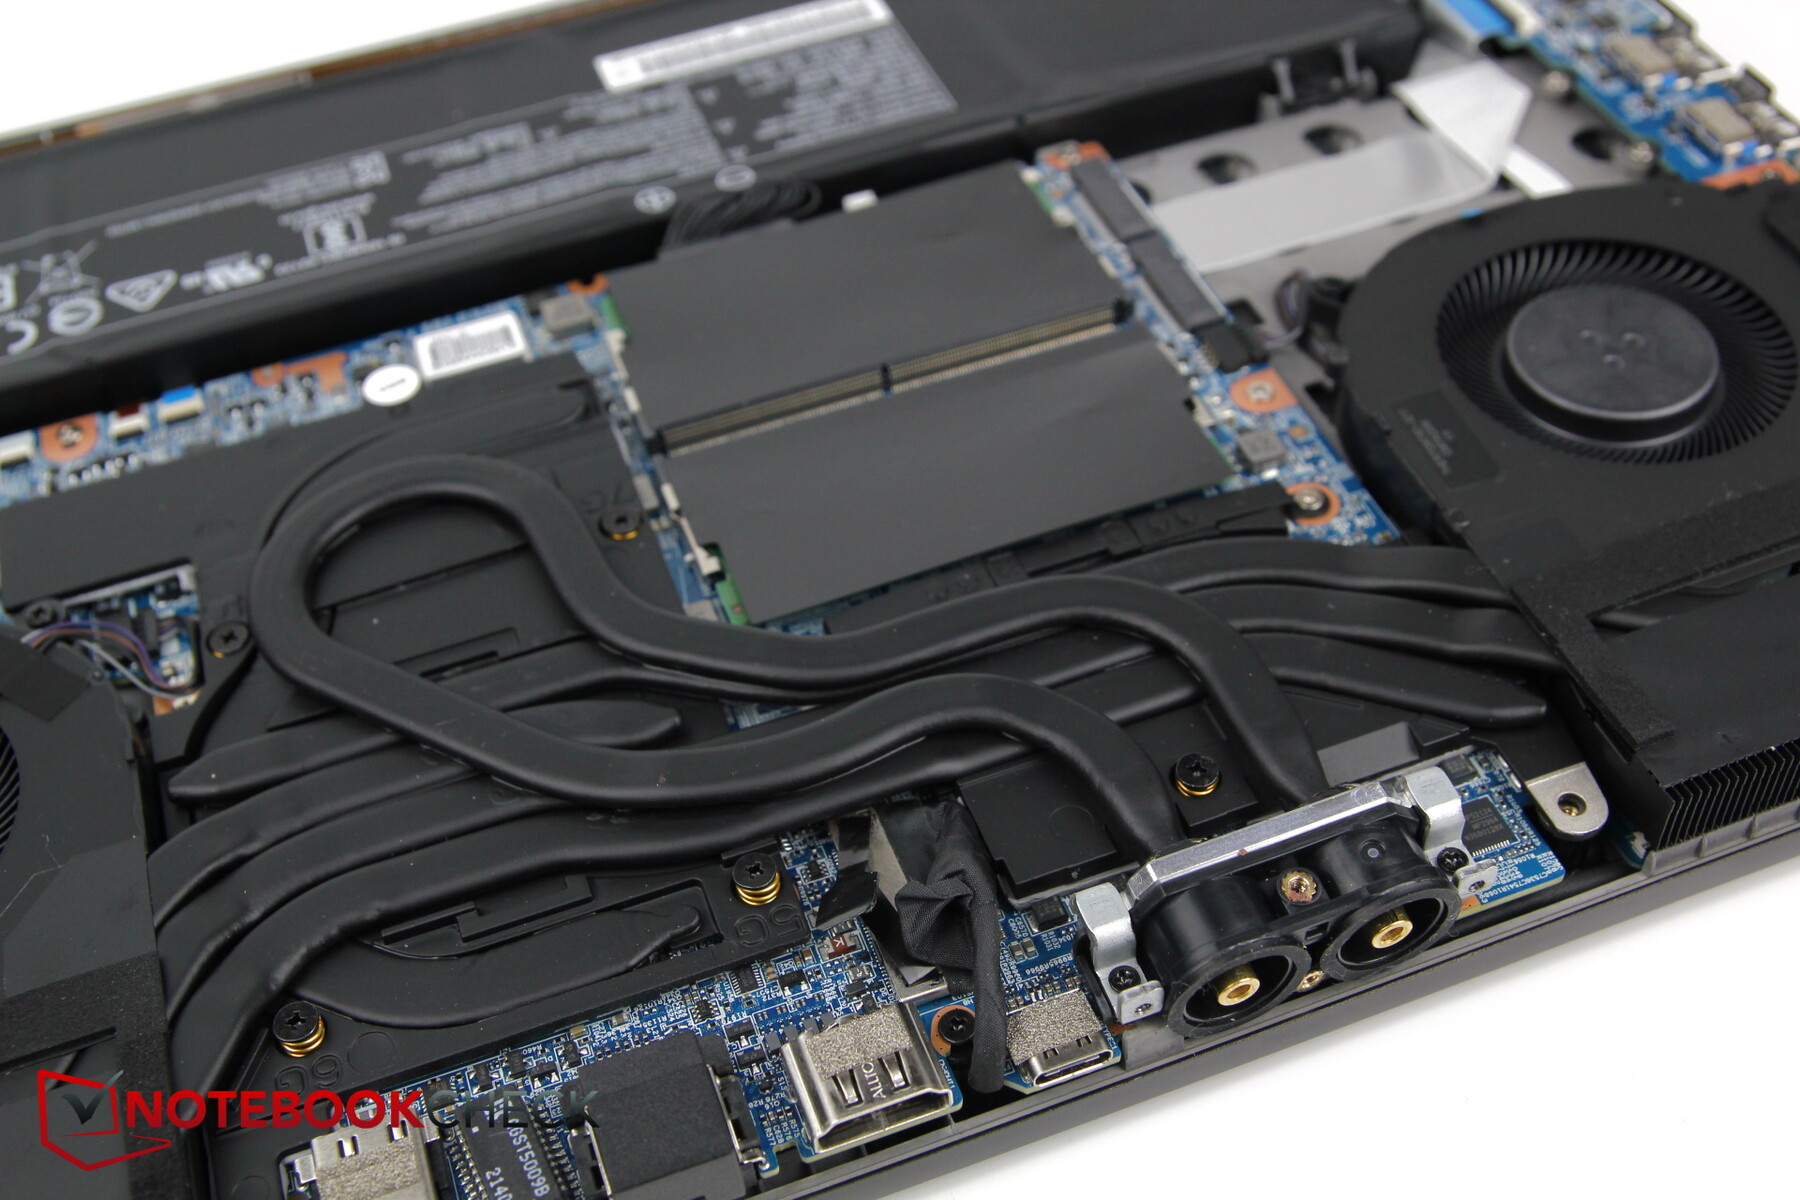
Mantenimiento
El mantenimiento general es bastante sencillo. El sistema de refrigeración por agua sólo requiere retirar cuatro tornillos Phillips adicionales (14 en total). Después de eso, la carcasa puede abrirse con relativa facilidad.
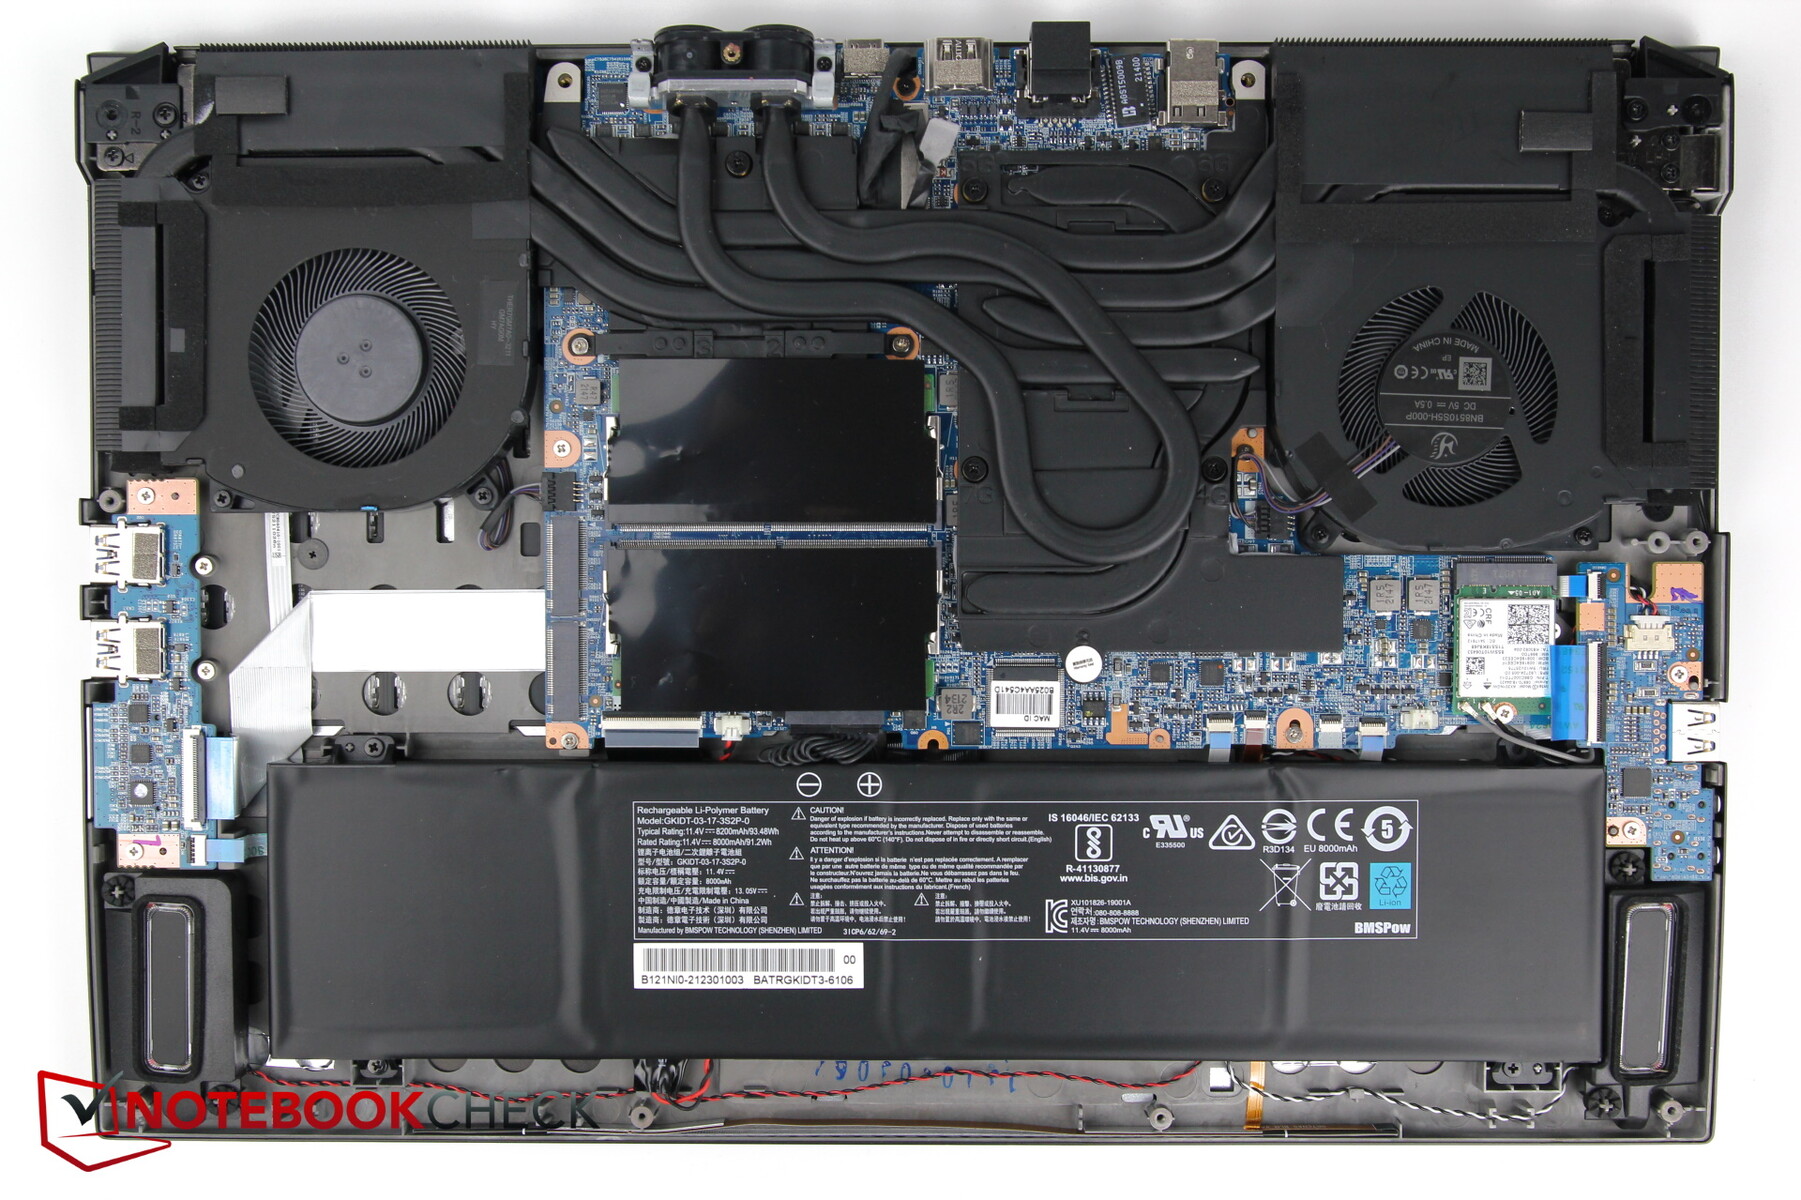
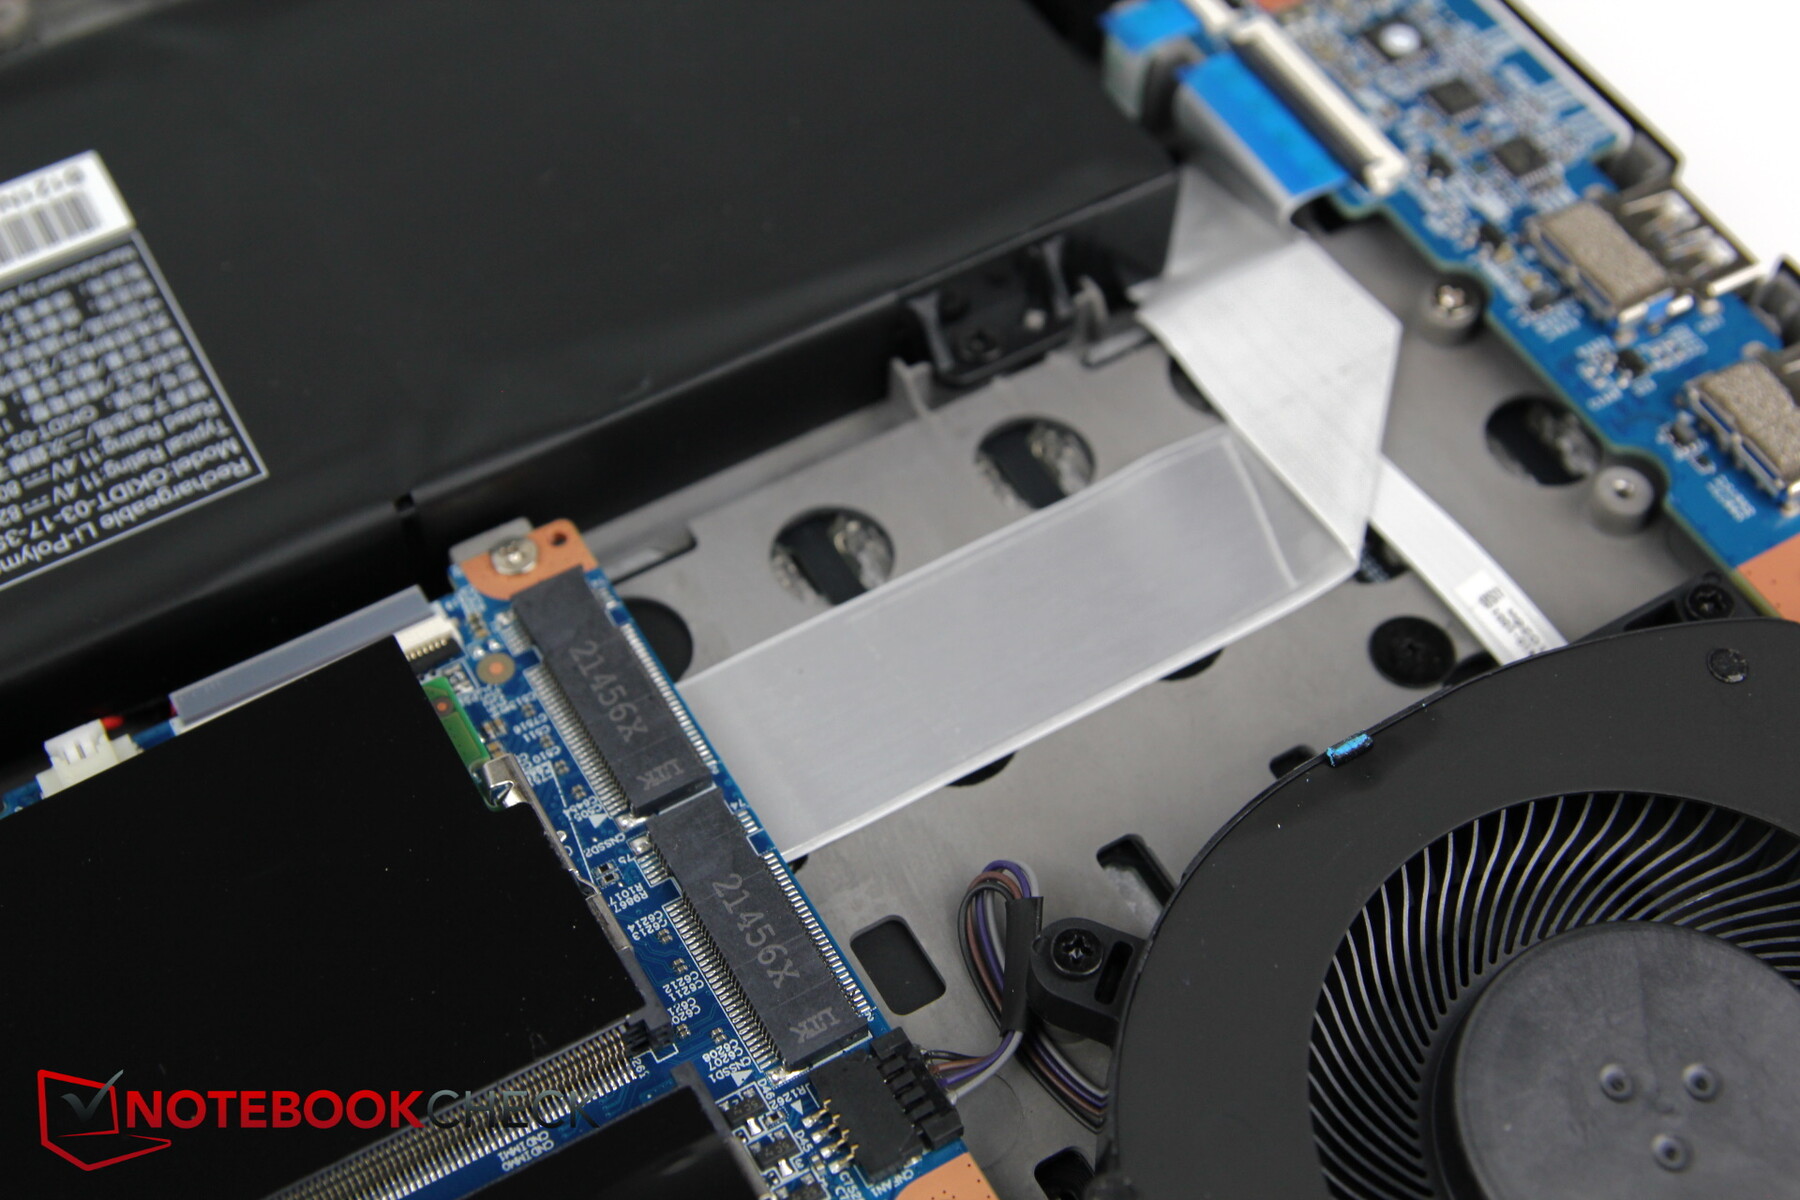
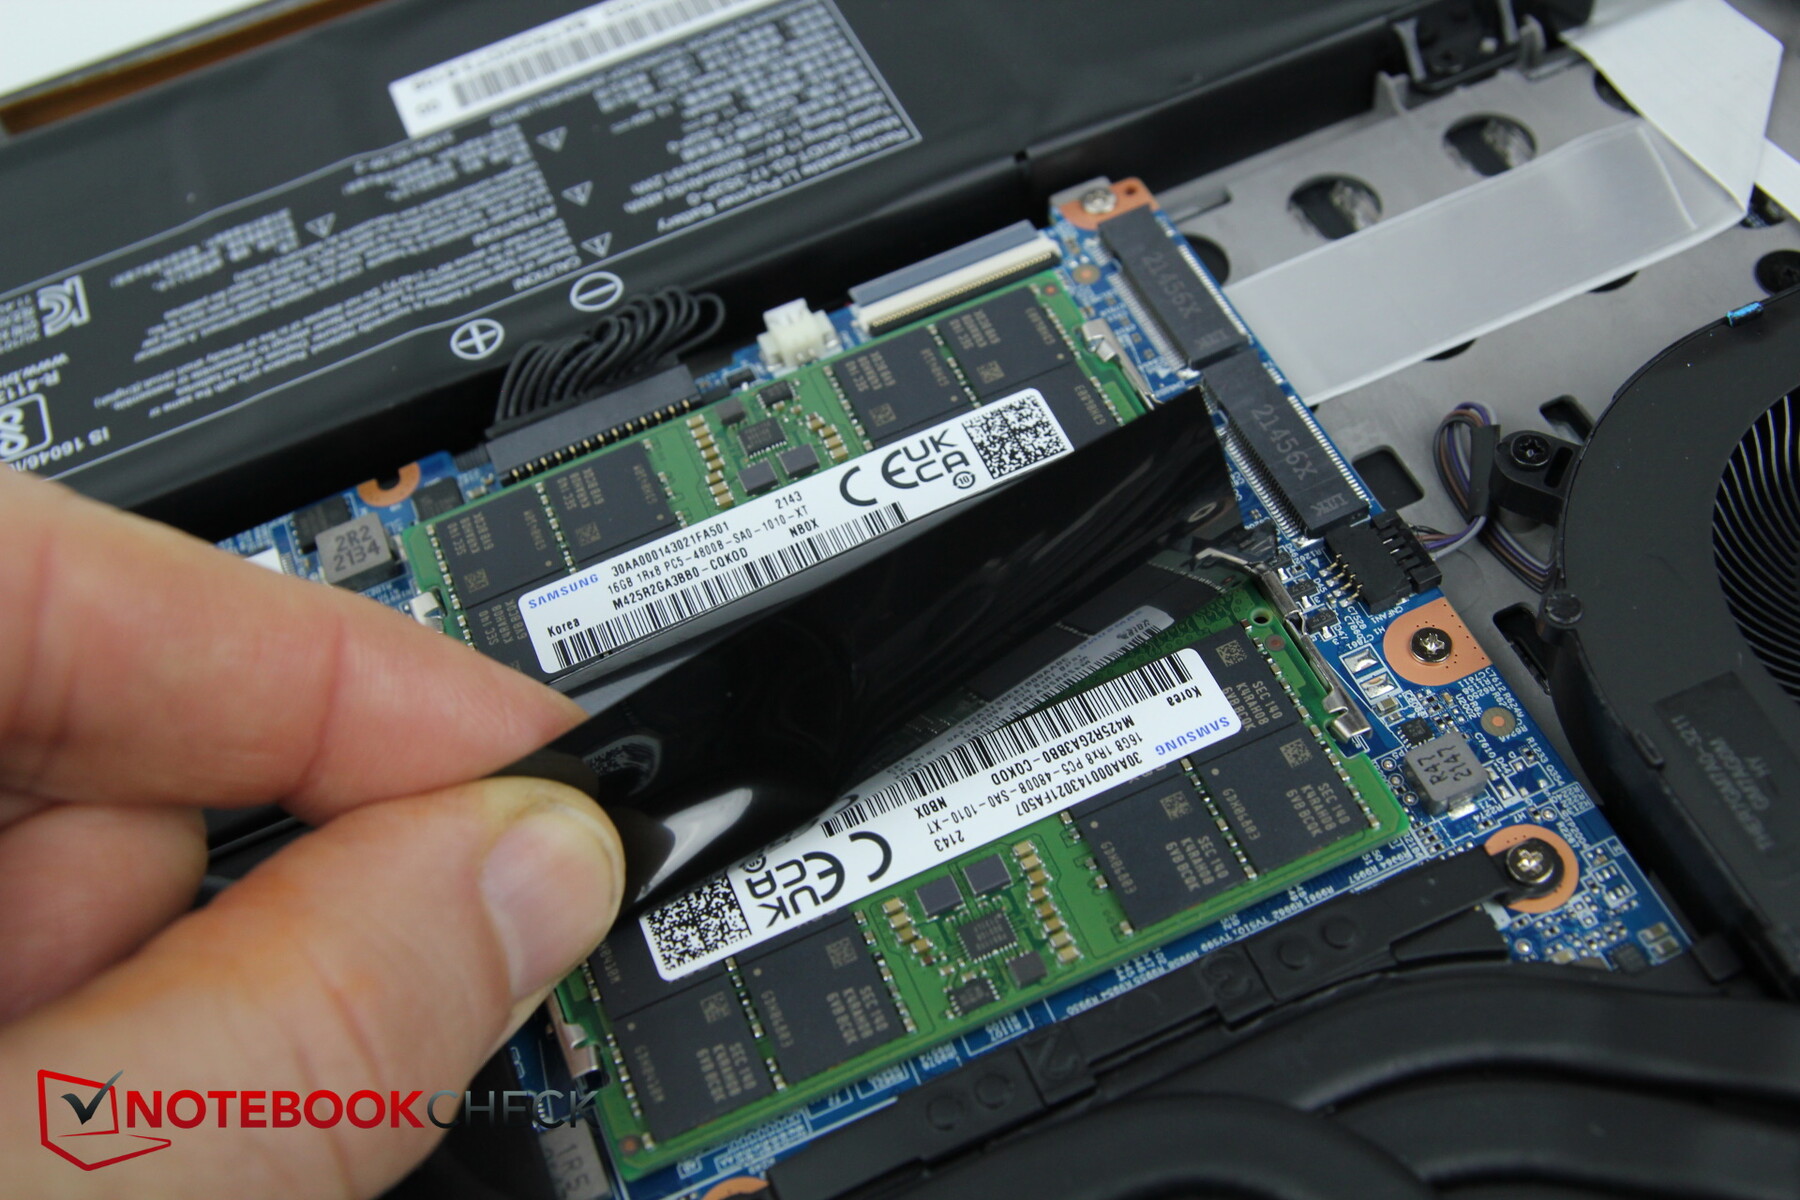
Los ventiladores, los conductos de calor, incluyendo el circuito de agua, dos ranuras para RAM y SSD M.2, así como el módulo Wi-Fi son accesibles. Esto también muestra lo fácil que sería implementar un circuito de agua adicional y eficaz para el fabricante en caso de que el modelo se haga popular.
Garantía
Schenker suele conceder una garantía de dos años para sus portátiles
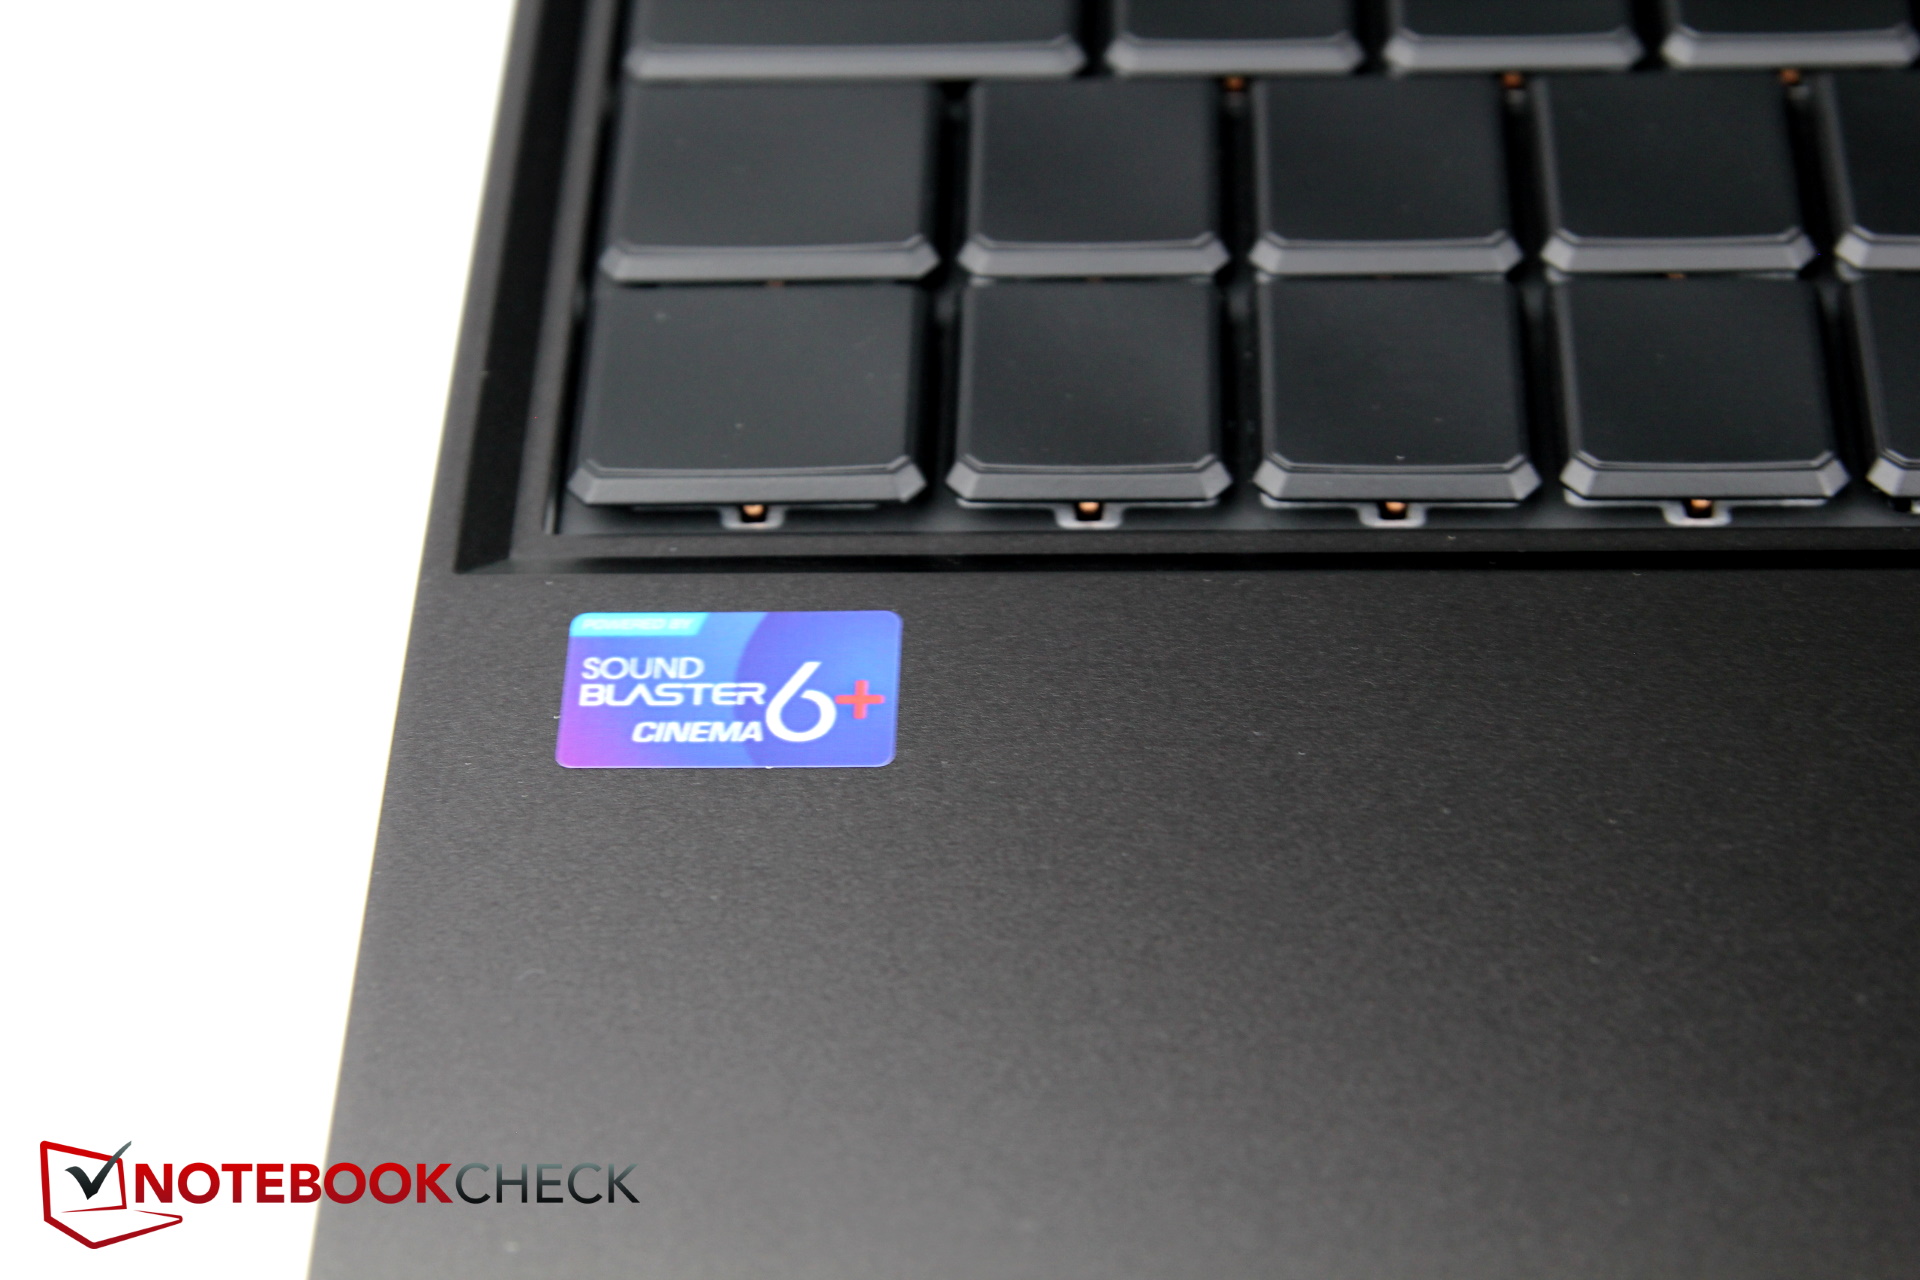
Dispositivos de entrada: Teclado optomecánico
Teclado
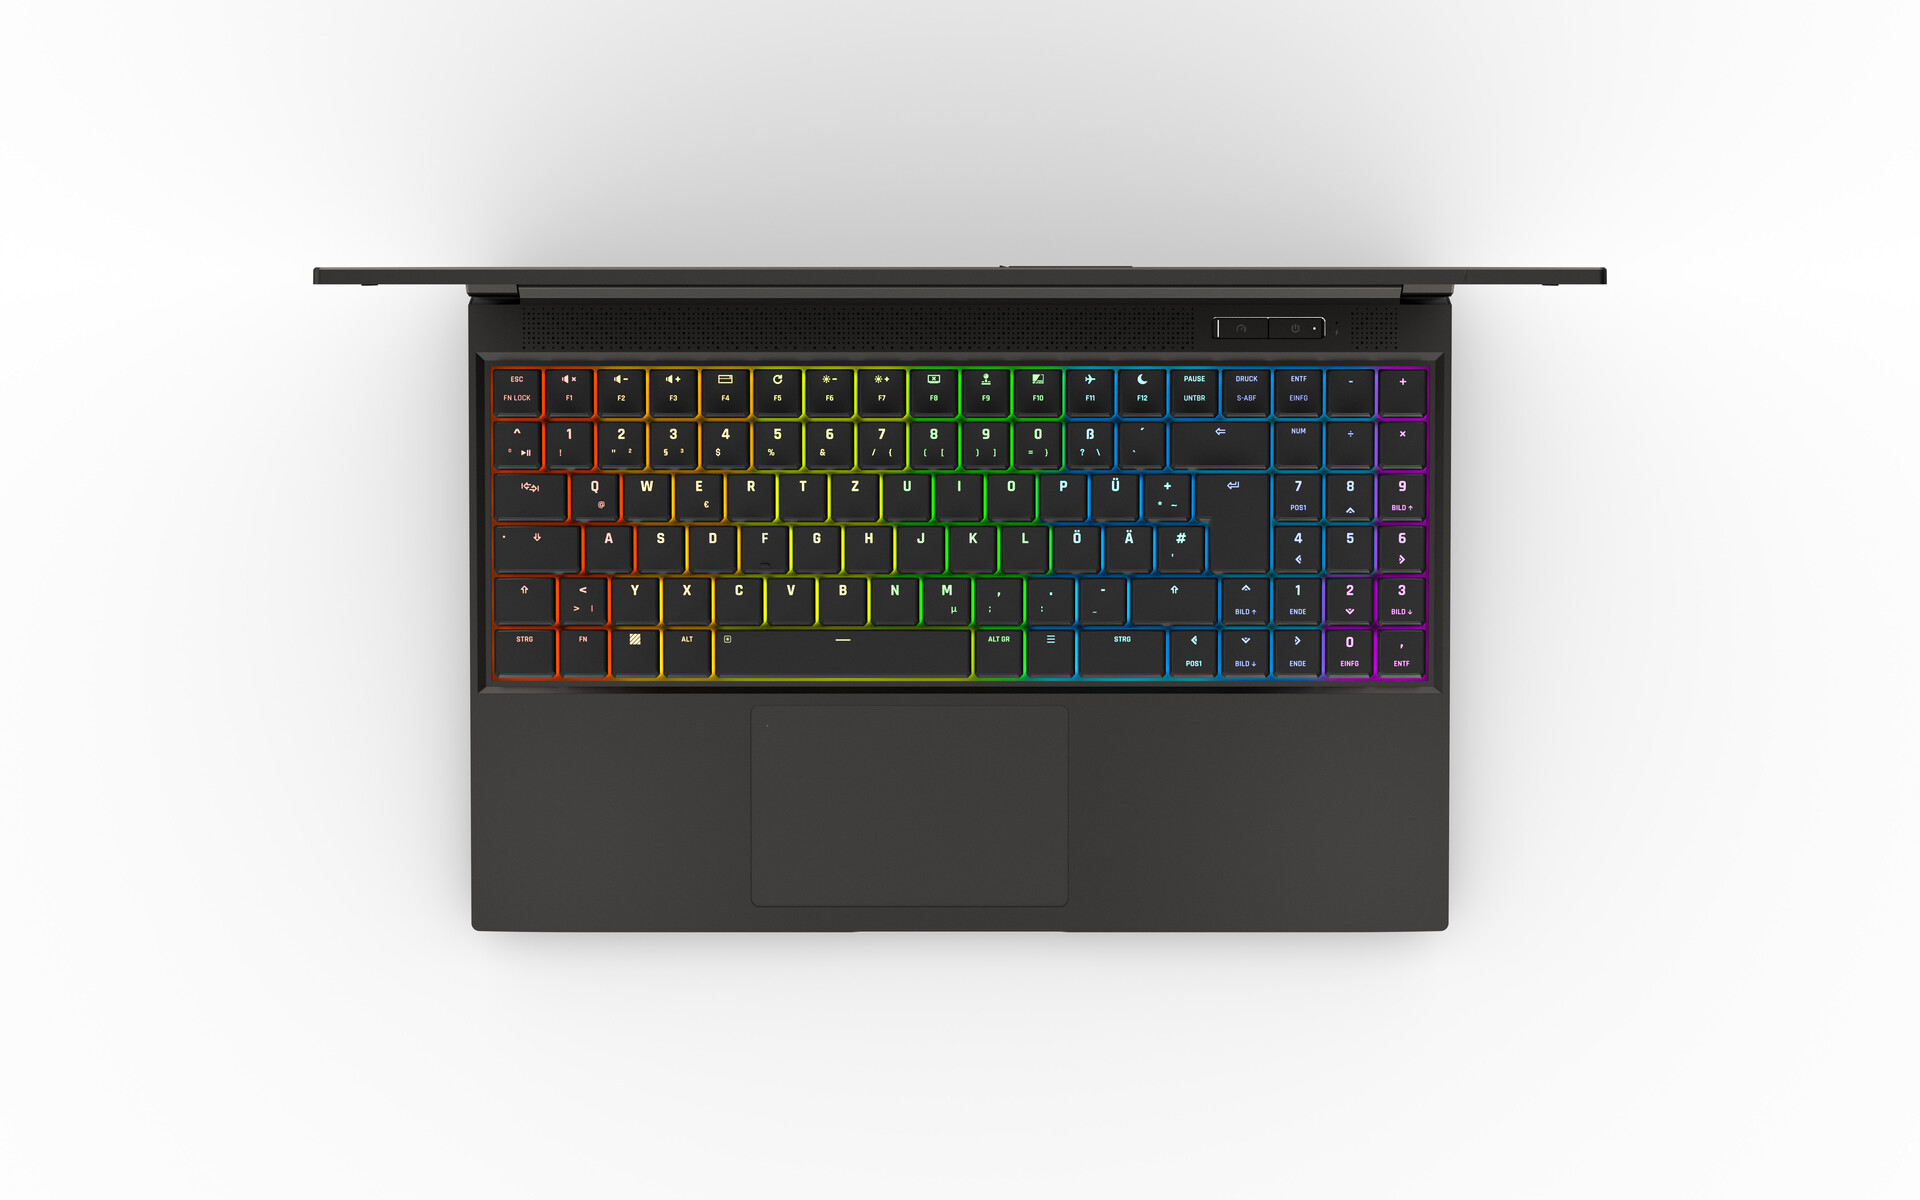
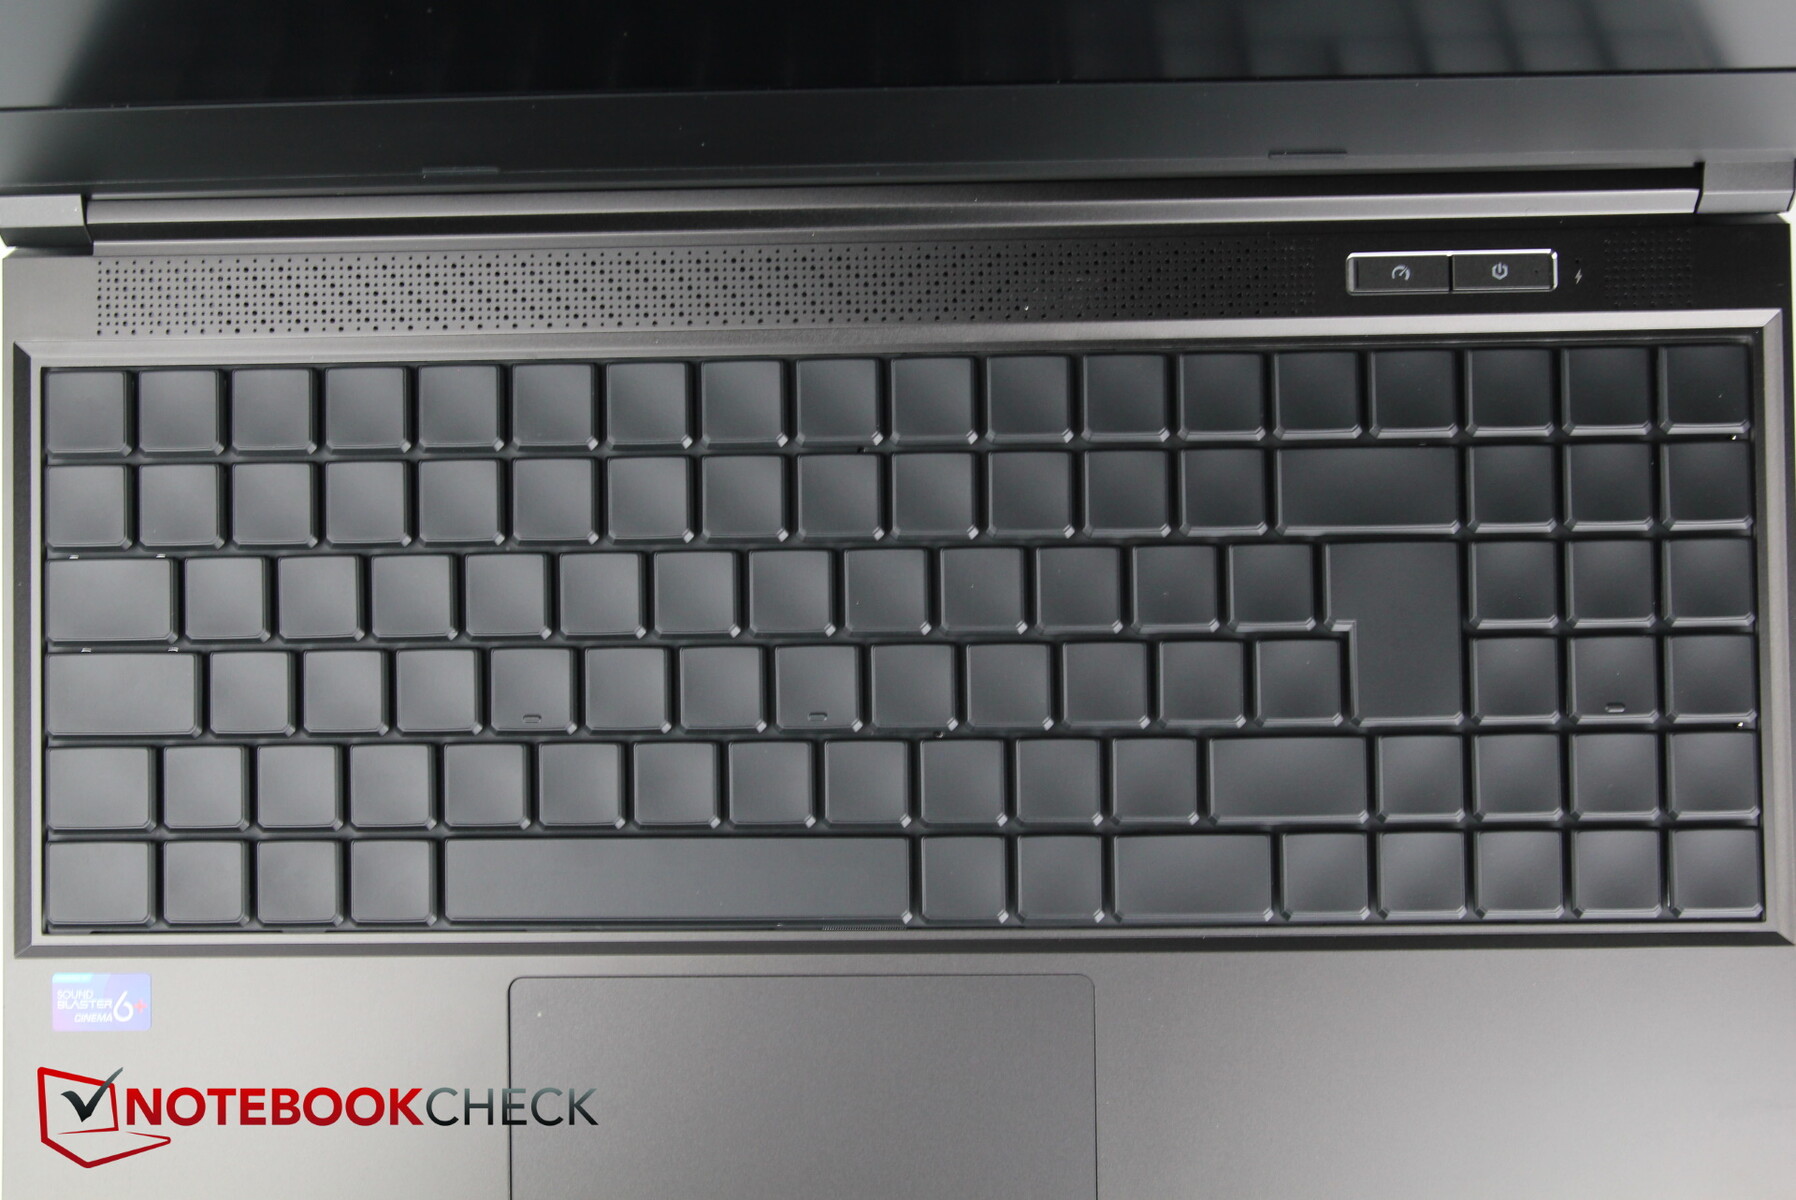
El fabricante utiliza un teclado optomecánico con iluminación RGB de una sola tecla, teclado numérico, rollover de la tecla N y características anti-ghosting. Los interruptores táctiles silenciosos tienen un recorrido de 2 mm y una carrera de 1 mm.
Las teclas se activan con una respuesta clara al principio del recorrido; la sensación de tecleo es buena y rápida.
Nuestro modelo de preproducción venía con las teclas en blanco, por lo que no podemos decir nada sobre las letras todavía. El teclado numérico sin etiqueta parece muy apretado a la derecha, y no hay espacio con el resto del teclado. Sin embargo, las teclas de dirección son de tamaño normal, aunque están algo apretadas entre el teclado y el numpad
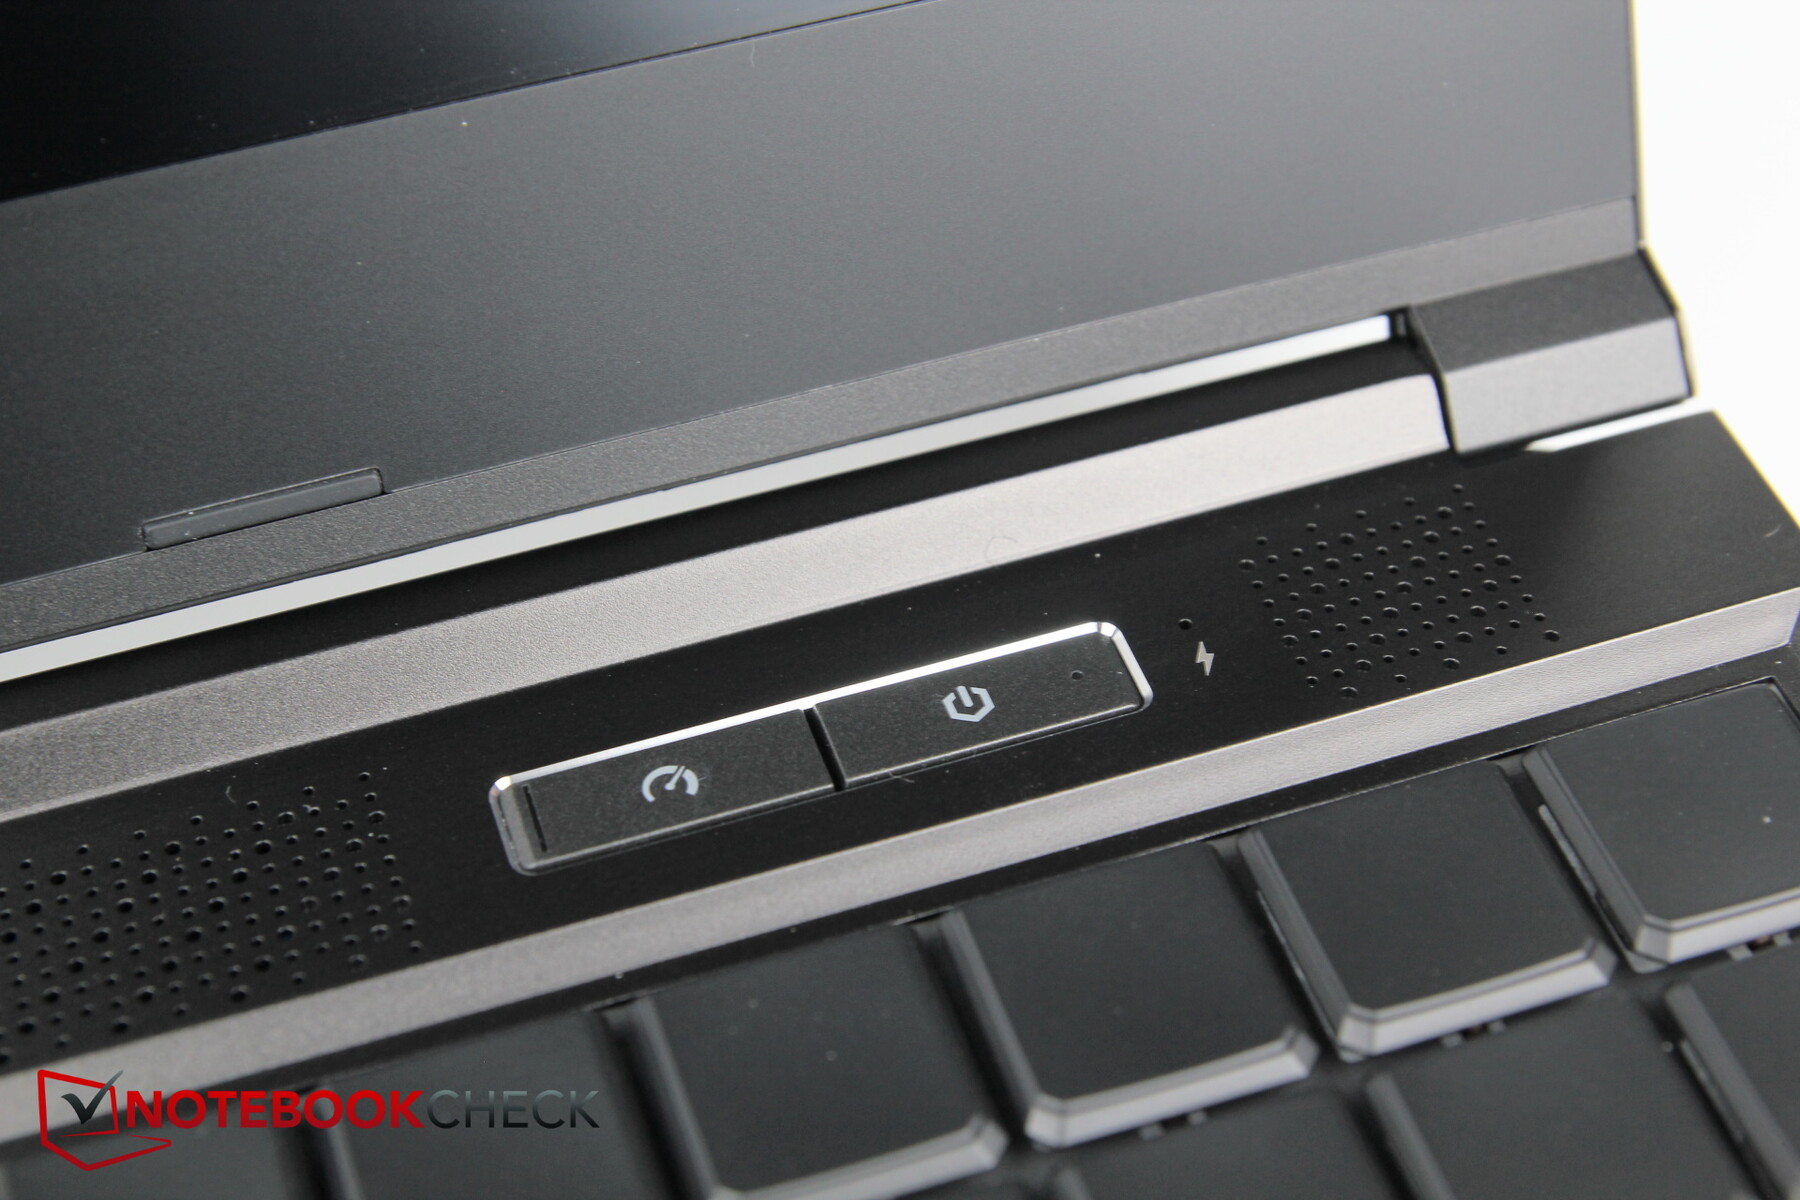
El interruptor de encendido, así como un interruptor dedicado para alternar entre varios modos de rendimiento, están incorporados encima de la derecha del teclado
El ruido es ligeramente más alto que el de algunos teclados chiclet más silenciosos debido a los interruptores optomecánicos. Sin embargo, es mucho más silencioso que los teclados mecánicos de tamaño normal.
Panel táctil
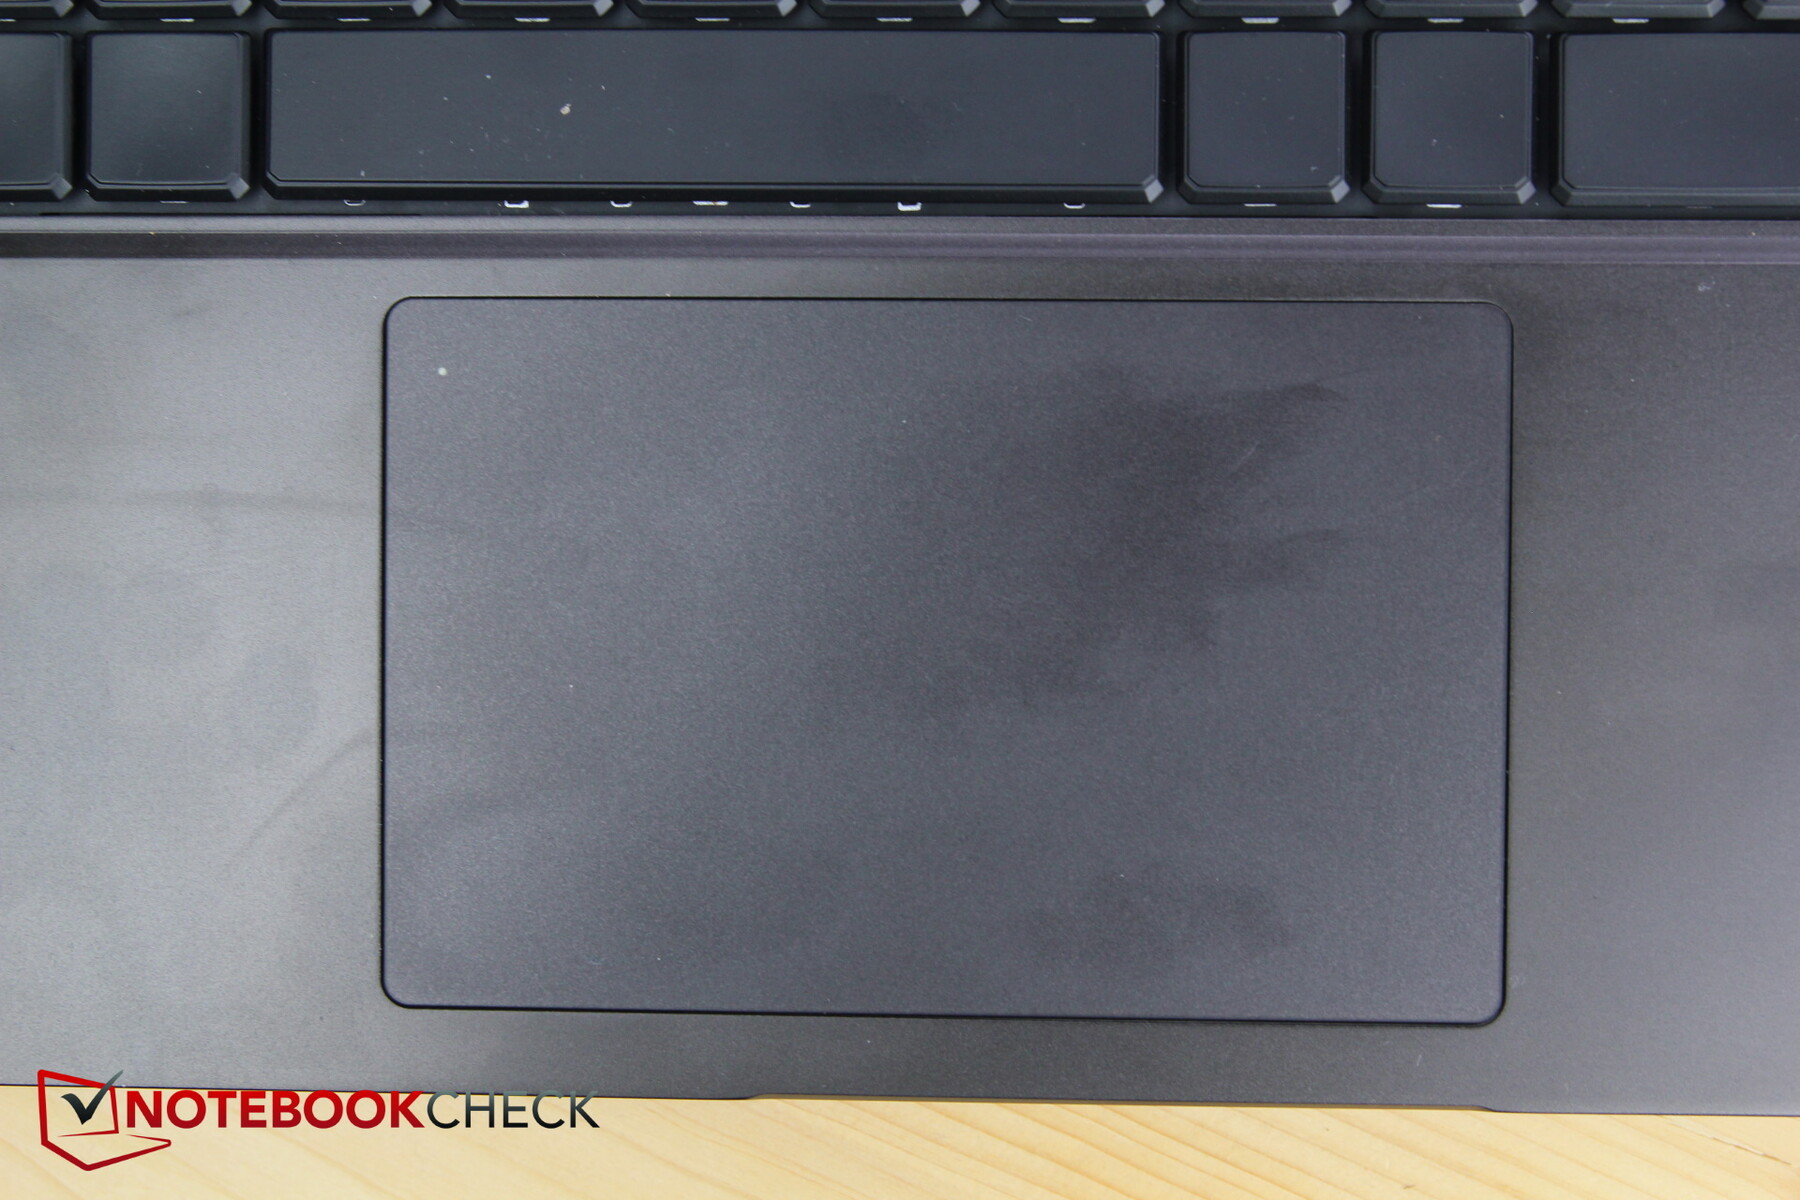
El panel táctil, bastante grande, mide unos 11,6 cm x 7,4 cm y tiene una superficie muy suave, que apenas flaquea incluso durante los movimientos lentos.
Al tocar dos veces la esquina superior izquierda se desactiva el touchpad y se vuelve a activar de la misma manera, lo que resulta muy cómodo.
Los botones integrados son bastante nítidos y dejan una impresión fiable. No encontramos ningún problema al utilizar el touchpad.
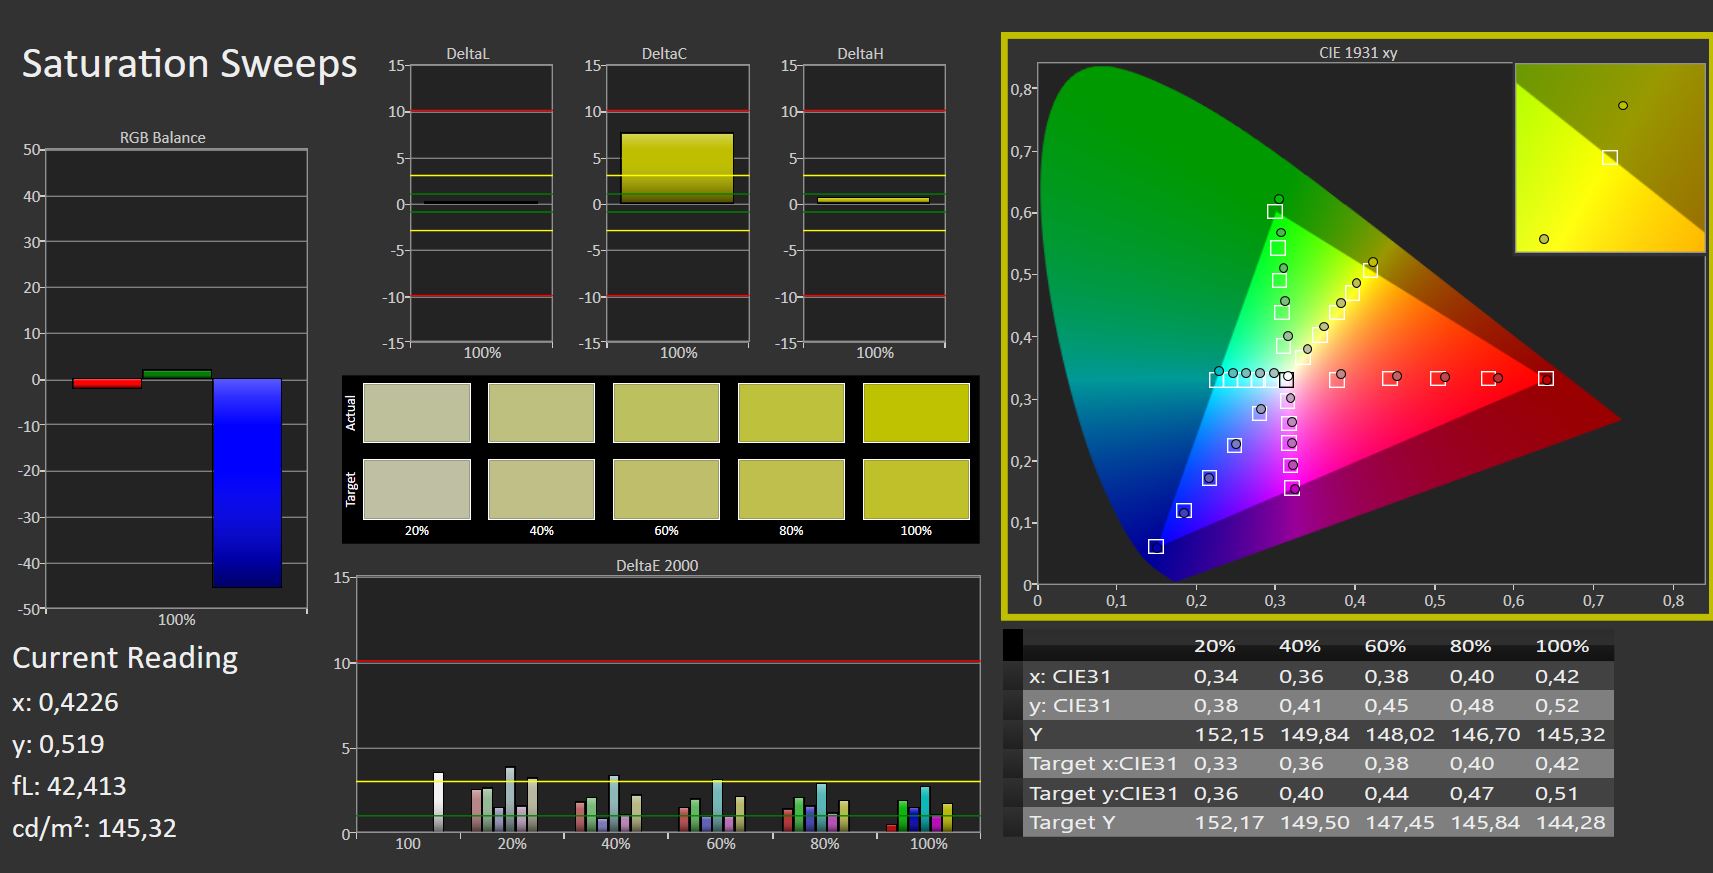
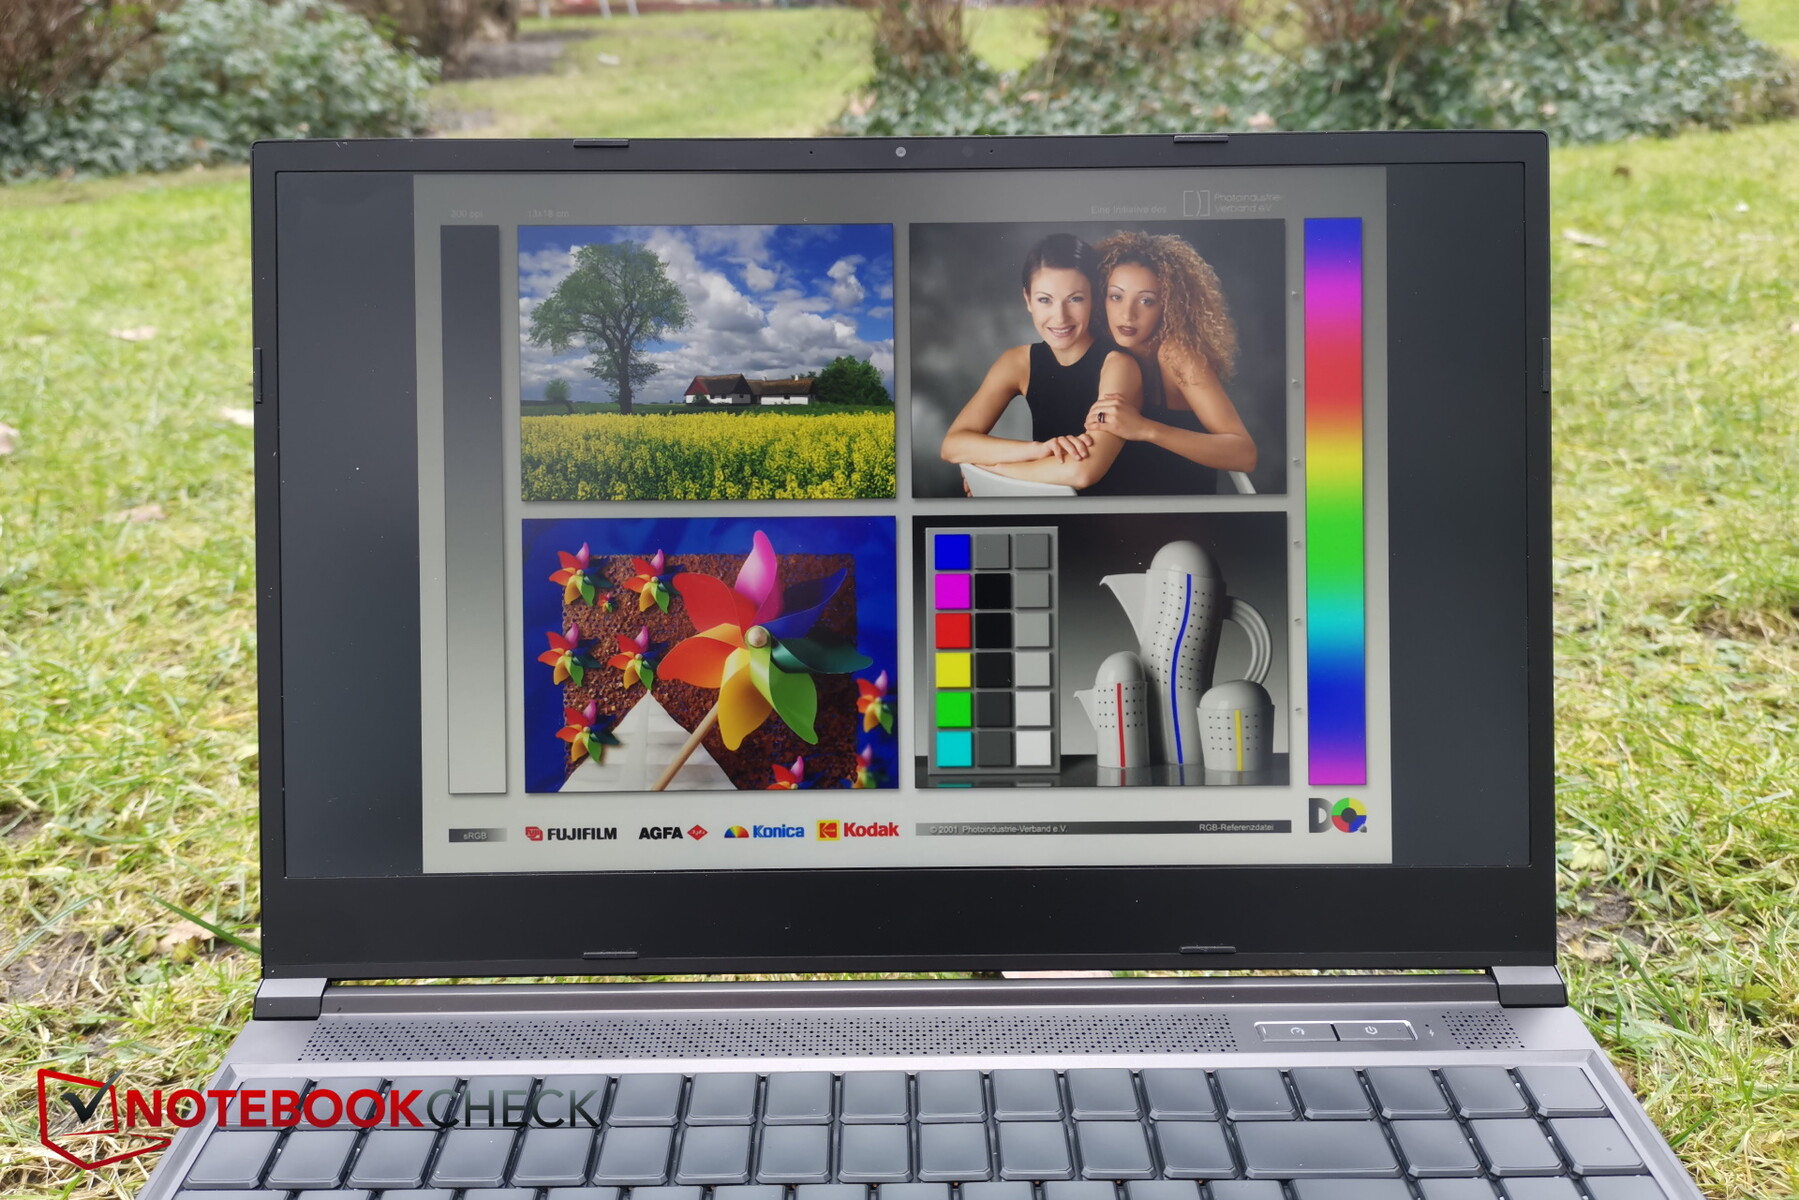
Visualización: Un modelo de preproducción que hay que resolver
Al igual que su predecesor, Schenker utiliza una pantalla IPS mate de BOE con una resolución WQHD (2.560 x 1.440 píxeles). Sin embargo, los modelos difieren ligeramente. En lugar de 165 Hz, ahora hay un panel de 240 Hz. Sin embargo, como en el modelo anterior, el actual no llega a los 350 nits anunciados por el fabricante; medimos sólo 273 nits de media.
La distribución del brillo del modelo de preproducción también es muy mala, con sólo un 62%. Schenker nos aseguró que un panel así no se vendería. Por lo tanto, todavía habrá algunos cambios hasta el lanzamiento. Por lo tanto, no mediremos el espacio de color por el momento
| |||||||||||||||||||||||||
iluminación: 62 %
Brillo con batería: 293 cd/m²
Contraste: 1054:1 (Negro: 0.28 cd/m²)
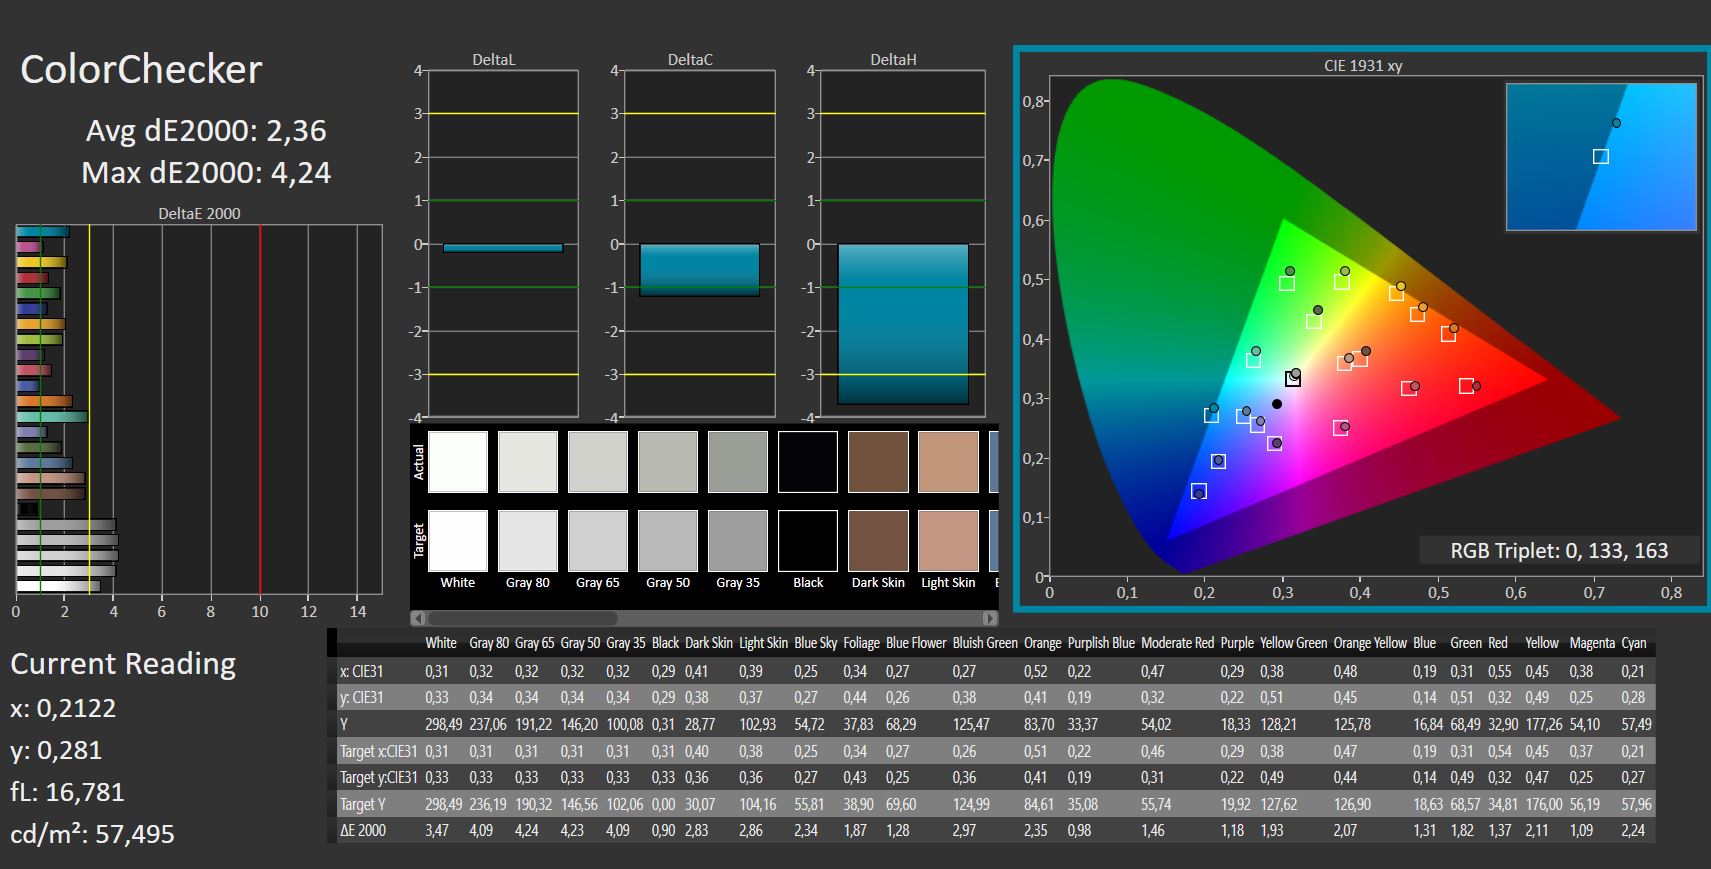
ΔE ColorChecker Calman: 2.36 | ∀{0.5-29.43 Ø4.71}
ΔE Greyscale Calman: 3.43 | ∀{0.09-98 Ø4.96}
Gamma: 2.44
CCT: 6266 K
| Schenker XMG Neo 15 E22 (Early 2022, RTX 3080 Ti) BOE0A67 (BOE CQ NE156QHM-NZ1), IPS, 2560x1440, 15.6" | Schenker XMG Neo 15 Tiger Lake BOE CQ NE156QHM-NY2, IPS, 2560x1440, 15.6" | Razer Blade 15 Advanced (Mid 2021) TL156VDXP02-0, IPS, 1920x1080, 15.6" | Asus ROG Strix Scar 15 G533QS BOE CQ NE156QHM-NY1, IPS, 2560x1440, 15.6" | Alienware m15 R6, i7-11800H RTX 3080 AU Optronics AUO9092 (B156HAN), IPS, 1920x1080, 15.6" | MSI GE76 Raider AU Optronics B173HAN05.4 (AUOE295), IPS-Level, 1920x1080, 17.3" | |
|---|---|---|---|---|---|---|
| Display | ||||||
| Display P3 Coverage (%) | 68.6 | 66.9 | 97.6 | 74.1 | 63.1 | |
| sRGB Coverage (%) | 98.6 | 97.1 | 99.9 | 99.5 | 94 | |
| AdobeRGB 1998 Coverage (%) | 69.3 | 69 | 85.3 | 75.7 | 65.2 | |
| Response Times | -11% | 39% | -6% | 65% | 36% | |
| Response Time Grey 50% / Grey 80% * (ms) | 14.4 ? | 16 ? -11% | 4.2 ? 71% | 14 ? 3% | 2.8 81% | 5.6 ? 61% |
| Response Time Black / White * (ms) | 10.8 ? | 12 ? -11% | 10 ? 7% | 12.4 ? -15% | 5.6 48% | 9.6 ? 11% |
| PWM Frequency (Hz) | ||||||
| Screen | -20% | 8% | -8% | -1% | 23% | |
| Brightness middle (cd/m²) | 295 | 324 10% | 353.4 20% | 304.3 3% | 359 22% | 290 -2% |
| Brightness (cd/m²) | 277 | 307 11% | 340 23% | 286 3% | 344 24% | 290 5% |
| Brightness Distribution (%) | 62 | 91 47% | 92 48% | 76 23% | 85 37% | 96 55% |
| Black Level * (cd/m²) | 0.28 | 0.27 4% | 0.31 -11% | 0.33 -18% | 0.35 -25% | 0.23 18% |
| Contrast (:1) | 1054 | 1200 14% | 1140 8% | 922 -13% | 1026 -3% | 1261 20% |
| Colorchecker dE 2000 * | 2.36 | 3.36 -42% | 2.17 8% | 2.76 -17% | 3.3 -40% | 1.59 33% |
| Colorchecker dE 2000 max. * | 4.24 | 9.87 -133% | 5.69 -34% | 5.57 -31% | 4.84 -14% | 3.17 25% |
| Greyscale dE 2000 * | 3.43 | 5.8 -69% | 3.4 1% | 4 -17% | 3.66 -7% | 2.5 27% |
| Gamma | 2.44 90% | 2.311 95% | 2.2 100% | 2.14 103% | 2.43 91% | 2.253 98% |
| CCT | 6266 104% | 7087 92% | 6830 95% | 6844 95% | 5896 110% | 6640 98% |
| Colorchecker dE 2000 calibrated * | 1.23 | 1.05 | 2.38 | 3.28 | 0.87 | |
| Color Space (Percent of AdobeRGB 1998) (%) | 69 | |||||
| Color Space (Percent of sRGB) (%) | 93 | |||||
| Media total (Programa/Opciones) | -16% /
-18% | 24% /
14% | -7% /
-8% | 32% /
12% | 30% /
25% |
* ... más pequeño es mejor
Dicho esto, la pantalla está bastante bien calibrada de fábrica y los valores Delta E son bajos. Los niveles de negro y el contraste están muy por encima de la media.

Tiempos de respuesta del display
| ↔ Tiempo de respuesta de Negro a Blanco | ||
|---|---|---|
| 10.8 ms ... subida ↗ y bajada ↘ combinada | ↗ 5.4 ms subida | 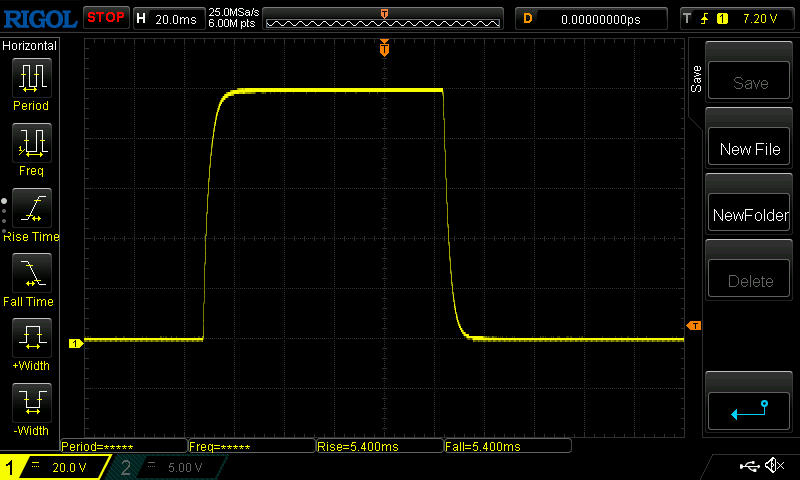 |
| ↘ 5.4 ms bajada | ||
| La pantalla mostró buenos tiempos de respuesta en nuestros tests pero podría ser demasiado lenta para los jugones competitivos. En comparación, todos los dispositivos de prueba van de ##min### (mínimo) a 240 (máximo) ms. » 29 % de todos los dispositivos son mejores. Esto quiere decir que el tiempo de respuesta medido es mejor que la media (19.8 ms) de todos los dispositivos testados. | ||
| ↔ Tiempo de respuesta 50% Gris a 80% Gris | ||
| 14.4 ms ... subida ↗ y bajada ↘ combinada | ↗ 6.6 ms subida | 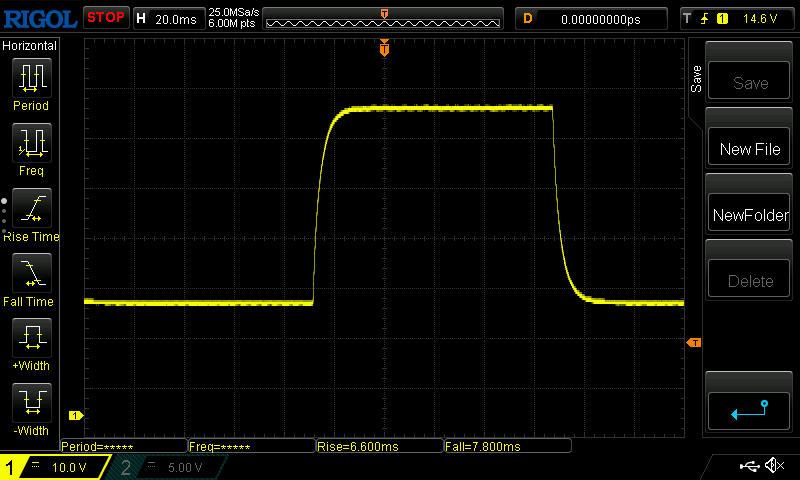 |
| ↘ 7.8 ms bajada | ||
| La pantalla mostró buenos tiempos de respuesta en nuestros tests pero podría ser demasiado lenta para los jugones competitivos. En comparación, todos los dispositivos de prueba van de ##min### (mínimo) a 636 (máximo) ms. » 28 % de todos los dispositivos son mejores. Esto quiere decir que el tiempo de respuesta medido es mejor que la media (31 ms) de todos los dispositivos testados. | ||
Parpadeo de Pantalla / PWM (Pulse-Width Modulation)
| Parpadeo de Pantalla / PWM no detectado | 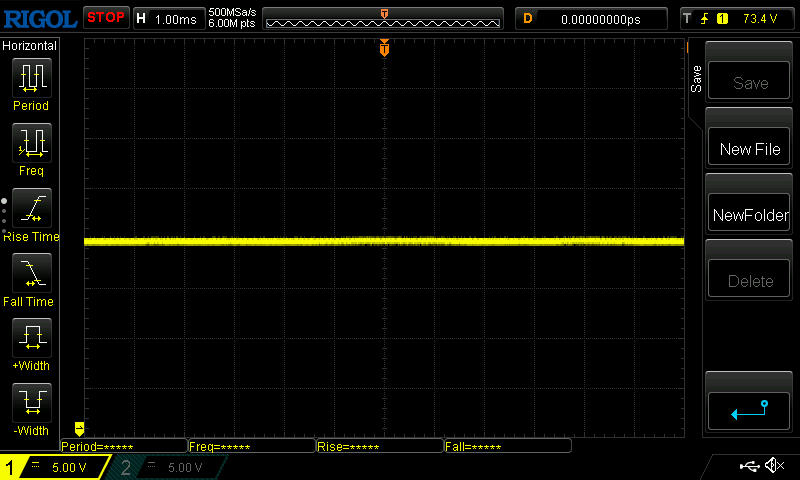 | ||
Comparación: 52 % de todos los dispositivos testados no usaron PWM para atenuar el display. Si se usó, medimos una media de 7757 (mínimo: 5 - máxmo: 343500) Hz. | |||
Los tiempos de respuesta son algo bajos para los juegos. El panel no utiliza PWM.
En exteriores, el revestimiento mate elimina la mayoría de los reflejos. Los niveles de negro y el contraste también son lo suficientemente buenos como para seguir viendo bien el contenido de la pantalla, al menos en días nublados y a la sombra.
La estabilidad del ángulo de visión es buena. Incluso en ángulos extremos, la disminución de la calidad de la imagen es bastante baja

Rendimiento: ¡Alto!
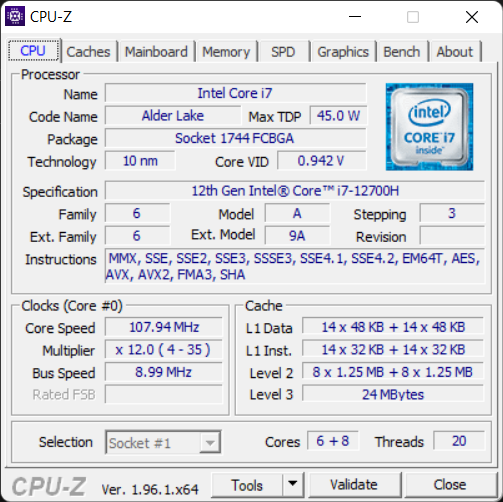
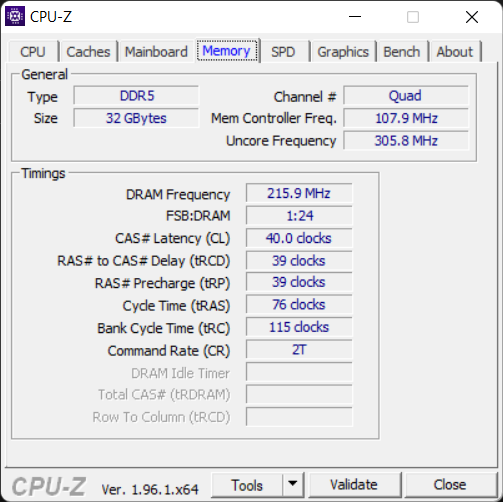
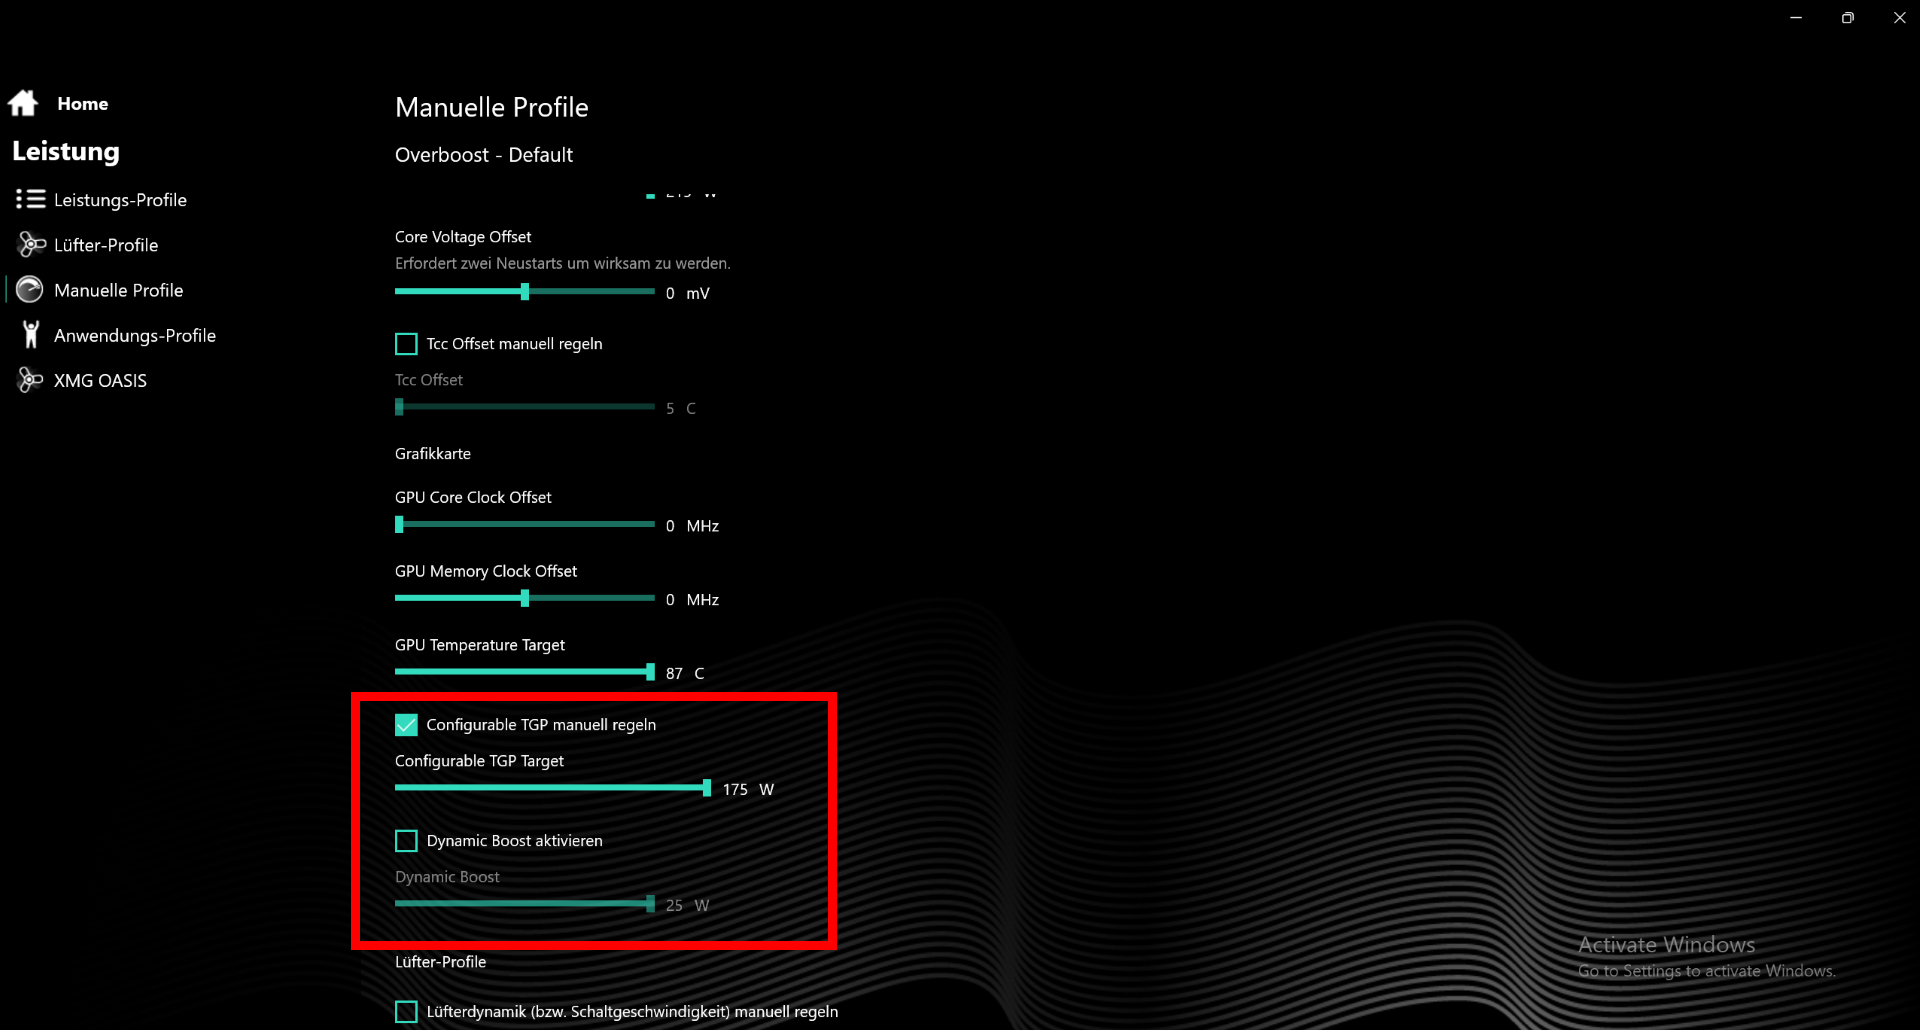
Estamos ante un hardware de gama absolutamente alta, especialmente la nueva RTX 3080 Ti que puede funcionar con un TGP máximo de 175 W a través del Centro de Control. Los nuevos Alder Lake Intel Core i7-12700Hy, por primera vez, 32 GB de memoria RAM DDR5 convierten al "nuevo Neo" en un auténtico portátil para juegos de alto rendimiento


Condiciones de la prueba
Para obtener los mejores resultados en los benchmarks, activamos el modo Overboost en el Centro de Control y también maximizamos los valores de PL de la CPU en los ajustes manuales de rendimiento.
En cuanto a la GPU, hemos ajustado el Dynamic Boost a 25 W. Con el Dynamic Boost ajustado, ya no se puede configurar el TGP de la GPU. La opción está en gris y está fijada en 150 W, por lo que el máximo de 175 W está al tope en total.


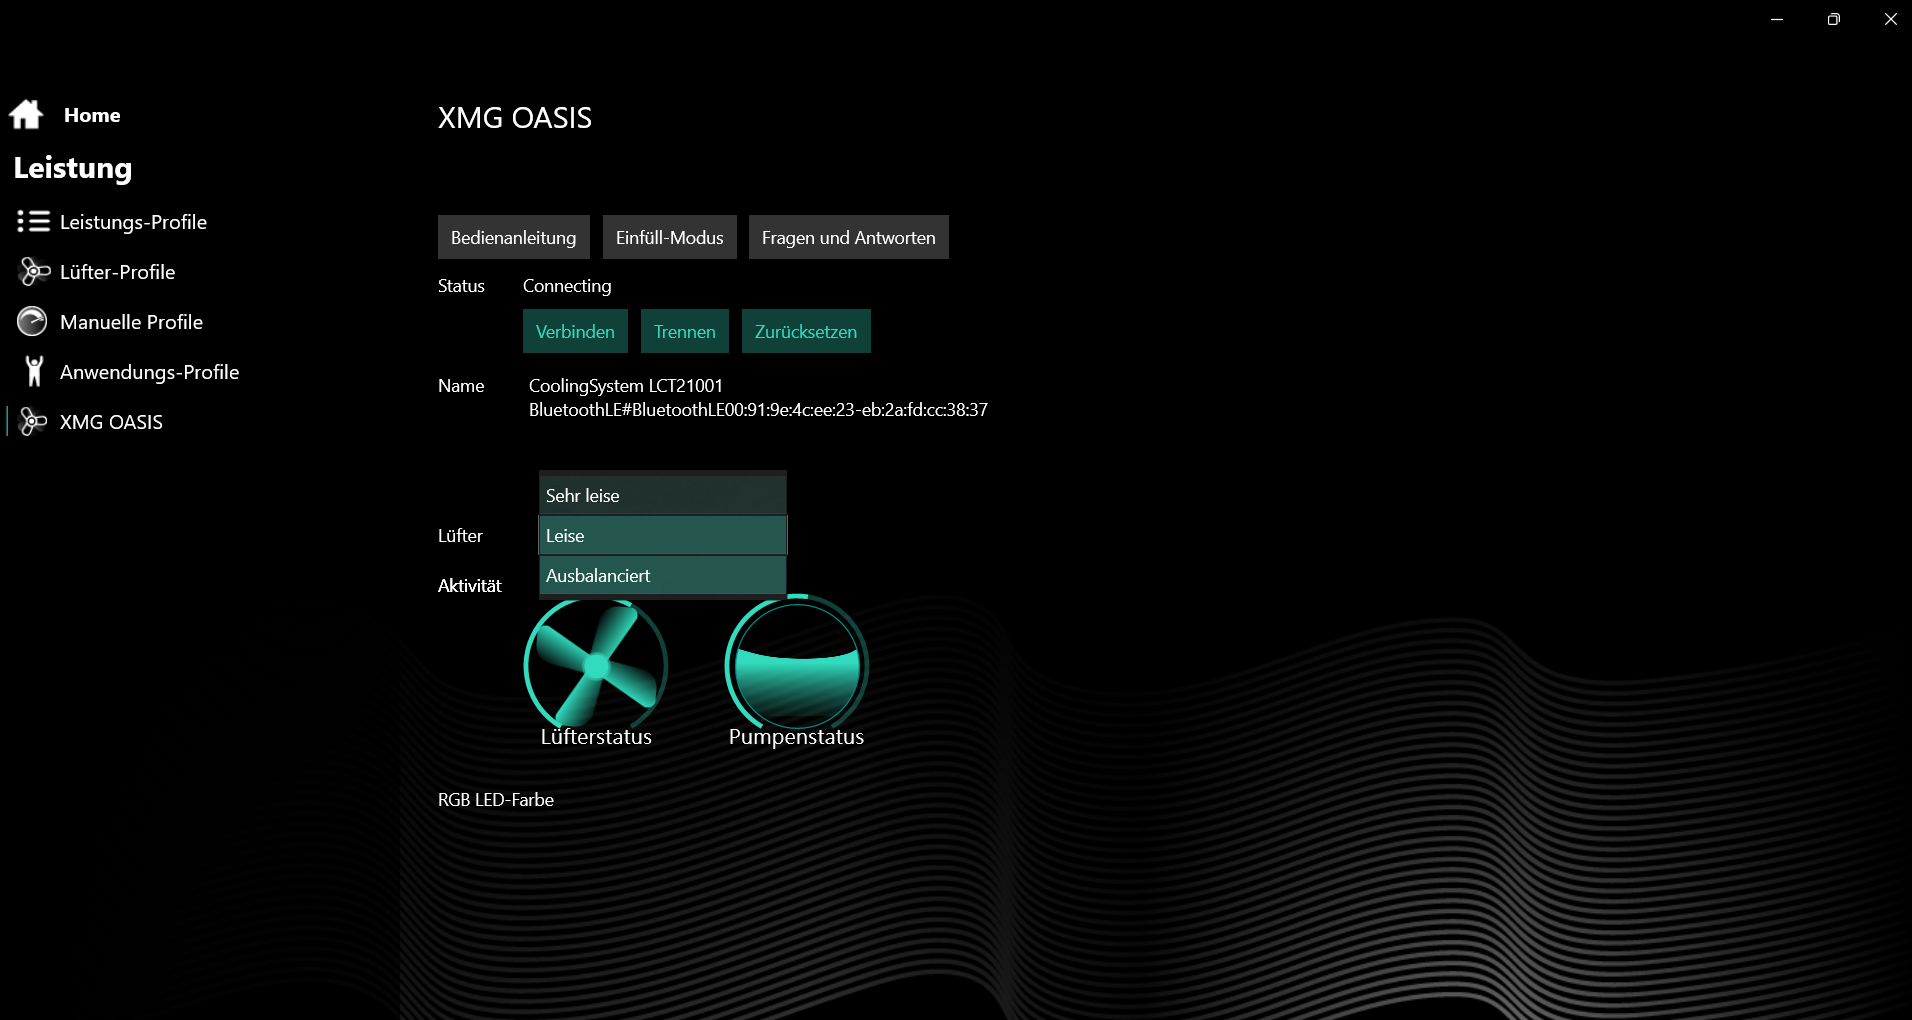
El XMG Oasis también ofrece varios perfiles de ventilador (muy silencioso, silencioso y equilibrado). A menos que se especifique, utilizamos el modo Equilibrado para obtener el mejor rendimiento de refrigeración.
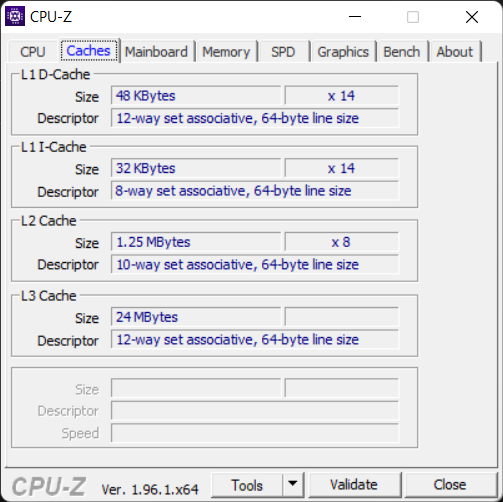
Procesador
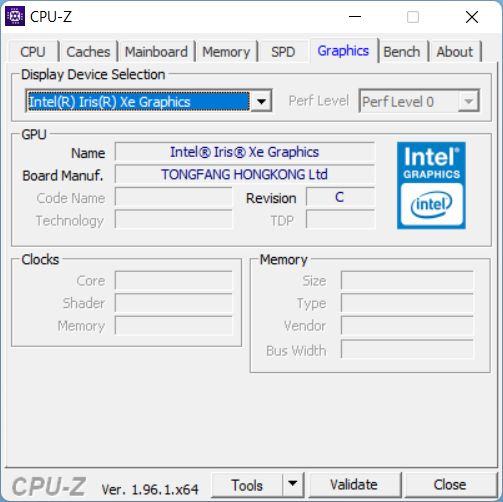
ElIntel Core i7-12700H es una CPU de gama alta basada en la nueva arquitectura Alder Lake. Tiene un total de 14 núcleos, que se dividen en núcleos de rendimiento (6 núcleos P) y núcleos de eficiencia (8 núcleos E) por primera vez como en los procesadores ARM. Solo los núcleos P soportan Hyperthreading, por lo que tiene un total de 20 hilos. Una unidad gráfica Intel Xe con 96 UE y un reloj de hasta 1,4 GHz está integrada en la CPU.
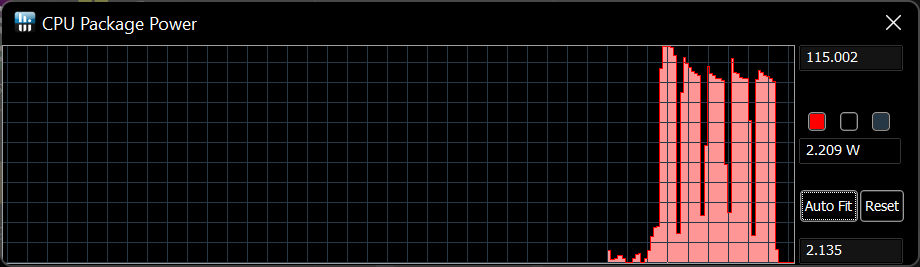
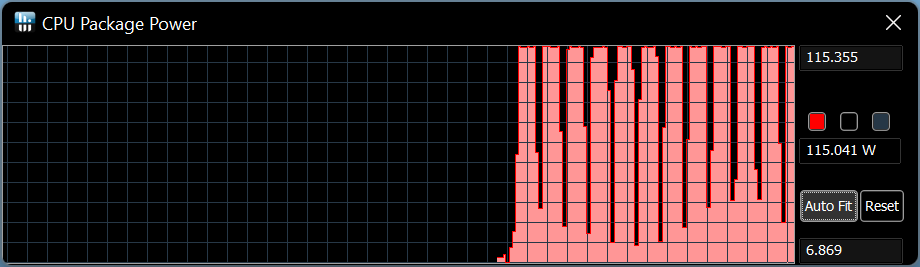
En el bucle Cinebench de una hora de duración, la CPU se enfrenta a su modelo hermano de velocidad ligeramente superior Core i9-12900HKe incluso le gana por un estrecho margen en el tiempo. Sólo la potencia de salida del Core i9-12900HK es mayor
El rendimiento es mínimamente superior con Oasis que sin él, y no se produce la pequeña caída de rendimiento observada al principio. Sin embargo, no hay diferencia en el rendimiento a corto plazo.
La potencia del paquete es de un máximo de 115 W en la primera ejecución y de sólo 100 W después. Con Oasis, la potencia del paquete no baja a 100 W sino que se mantiene bastante estable en 115 W
El Core i7-12700H supera a su predecesor Tiger Lake en un 30% en la prueba multihilo Lo mismo ocurre con elAMD Ryzen 9 5900HX en el Asus ROG Strix Scar 15. Las dos CPUs Alder Lake también están prácticamente a la par en las demás pruebas y lideran las tablas
Más del 50% del rendimiento de la CPU se pierde en modo batería. Sólo se logran 1,214 puntos en Cinebench R15 Multi comparado con 2,824 puntos en corriente continua.


Cinebench R15 Multi Dauertest
Cinebench R23: Multi Core | Single Core
Cinebench R20: CPU (Multi Core) | CPU (Single Core)
Cinebench R15: CPU Multi 64Bit | CPU Single 64Bit
Blender: v2.79 BMW27 CPU
7-Zip 18.03: 7z b 4 | 7z b 4 -mmt1
Geekbench 5.5: Multi-Core | Single-Core
HWBOT x265 Benchmark v2.2: 4k Preset
LibreOffice : 20 Documents To PDF
R Benchmark 2.5: Overall mean
| CPU Performance rating | |
| Media de la clase Gaming | |
| MSI GE76 Raider | |
| Schenker XMG Neo 15 E22 (Early 2022, RTX 3080 Ti) | |
| Schenker XMG Oasis | |
| Medio Intel Core i7-12700H | |
| Schenker XMG Neo 15 Tiger Lake | |
| Asus ROG Strix Scar 15 G533QS -2! | |
| Alienware m15 R6, i7-11800H RTX 3080 | |
| Razer Blade 15 Advanced (Mid 2021) -2! | |
| Cinebench R23 / Multi Core | |
| Media de la clase Gaming (10488 - 42661, n=107, últimos 2 años) | |
| Schenker XMG Neo 15 E22 (Early 2022, RTX 3080 Ti) | |
| Schenker XMG Oasis | |
| MSI GE76 Raider | |
| Medio Intel Core i7-12700H (4032 - 19330, n=64) | |
| Schenker XMG Neo 15 Tiger Lake | |
| Asus ROG Strix Scar 15 G533QS | |
| Alienware m15 R6, i7-11800H RTX 3080 | |
| Razer Blade 15 Advanced (Mid 2021) | |
| Cinebench R23 / Single Core | |
| Media de la clase Gaming (1166 - 2415, n=107, últimos 2 años) | |
| MSI GE76 Raider | |
| Schenker XMG Oasis | |
| Schenker XMG Neo 15 E22 (Early 2022, RTX 3080 Ti) | |
| Medio Intel Core i7-12700H (778 - 1826, n=63) | |
| Schenker XMG Neo 15 Tiger Lake | |
| Razer Blade 15 Advanced (Mid 2021) | |
| Alienware m15 R6, i7-11800H RTX 3080 | |
| Asus ROG Strix Scar 15 G533QS | |
| Cinebench R20 / CPU (Multi Core) | |
| Media de la clase Gaming (4029 - 16433, n=106, últimos 2 años) | |
| Schenker XMG Oasis | |
| Schenker XMG Neo 15 E22 (Early 2022, RTX 3080 Ti) | |
| MSI GE76 Raider | |
| Medio Intel Core i7-12700H (1576 - 7407, n=64) | |
| Schenker XMG Neo 15 Tiger Lake | |
| Asus ROG Strix Scar 15 G533QS | |
| Razer Blade 15 Advanced (Mid 2021) | |
| Alienware m15 R6, i7-11800H RTX 3080 | |
| Cinebench R20 / CPU (Single Core) | |
| Media de la clase Gaming (442 - 913, n=106, últimos 2 años) | |
| MSI GE76 Raider | |
| Schenker XMG Neo 15 E22 (Early 2022, RTX 3080 Ti) | |
| Schenker XMG Oasis | |
| Medio Intel Core i7-12700H (300 - 704, n=64) | |
| Razer Blade 15 Advanced (Mid 2021) | |
| Schenker XMG Neo 15 Tiger Lake | |
| Alienware m15 R6, i7-11800H RTX 3080 | |
| Asus ROG Strix Scar 15 G533QS | |
| Cinebench R15 / CPU Multi 64Bit | |
| Media de la clase Gaming (1578 - 6330, n=105, últimos 2 años) | |
| MSI GE76 Raider | |
| Schenker XMG Oasis | |
| Schenker XMG Neo 15 E22 (Early 2022, RTX 3080 Ti) | |
| Medio Intel Core i7-12700H (1379 - 2916, n=70) | |
| Asus ROG Strix Scar 15 G533QS | |
| Schenker XMG Neo 15 Tiger Lake | |
| Alienware m15 R6, i7-11800H RTX 3080 | |
| Razer Blade 15 Advanced (Mid 2021) | |
| Cinebench R15 / CPU Single 64Bit | |
| Media de la clase Gaming (188.8 - 350, n=106, últimos 2 años) | |
| MSI GE76 Raider | |
| Schenker XMG Neo 15 E22 (Early 2022, RTX 3080 Ti) | |
| Schenker XMG Oasis | |
| Medio Intel Core i7-12700H (113 - 263, n=65) | |
| Asus ROG Strix Scar 15 G533QS | |
| Schenker XMG Neo 15 Tiger Lake | |
| Razer Blade 15 Advanced (Mid 2021) | |
| Alienware m15 R6, i7-11800H RTX 3080 | |
| Blender / v2.79 BMW27 CPU | |
| Alienware m15 R6, i7-11800H RTX 3080 | |
| Razer Blade 15 Advanced (Mid 2021) | |
| Asus ROG Strix Scar 15 G533QS | |
| Medio Intel Core i7-12700H (168 - 732, n=63) | |
| Schenker XMG Neo 15 Tiger Lake | |
| MSI GE76 Raider | |
| Schenker XMG Neo 15 E22 (Early 2022, RTX 3080 Ti) | |
| Schenker XMG Oasis | |
| Media de la clase Gaming (79 - 330, n=104, últimos 2 años) | |
| 7-Zip 18.03 / 7z b 4 | |
| Media de la clase Gaming (33491 - 148086, n=105, últimos 2 años) | |
| Schenker XMG Oasis | |
| Schenker XMG Neo 15 E22 (Early 2022, RTX 3080 Ti) | |
| MSI GE76 Raider | |
| Asus ROG Strix Scar 15 G533QS | |
| Medio Intel Core i7-12700H (22844 - 73067, n=63) | |
| Schenker XMG Neo 15 Tiger Lake | |
| Razer Blade 15 Advanced (Mid 2021) | |
| Alienware m15 R6, i7-11800H RTX 3080 | |
| 7-Zip 18.03 / 7z b 4 -mmt1 | |
| Media de la clase Gaming (4199 - 7436, n=105, últimos 2 años) | |
| MSI GE76 Raider | |
| Schenker XMG Oasis | |
| Schenker XMG Neo 15 E22 (Early 2022, RTX 3080 Ti) | |
| Schenker XMG Neo 15 Tiger Lake | |
| Medio Intel Core i7-12700H (2743 - 5972, n=63) | |
| Asus ROG Strix Scar 15 G533QS | |
| Razer Blade 15 Advanced (Mid 2021) | |
| Alienware m15 R6, i7-11800H RTX 3080 | |
| Geekbench 5.5 / Multi-Core | |
| Media de la clase Gaming (6460 - 28263, n=105, últimos 2 años) | |
| Schenker XMG Neo 15 E22 (Early 2022, RTX 3080 Ti) | |
| MSI GE76 Raider | |
| Schenker XMG Oasis | |
| Medio Intel Core i7-12700H (5144 - 13745, n=64) | |
| Schenker XMG Neo 15 Tiger Lake | |
| Alienware m15 R6, i7-11800H RTX 3080 | |
| Geekbench 5.5 / Single-Core | |
| Media de la clase Gaming (986 - 2474, n=105, últimos 2 años) | |
| MSI GE76 Raider | |
| Schenker XMG Neo 15 E22 (Early 2022, RTX 3080 Ti) | |
| Schenker XMG Oasis | |
| Medio Intel Core i7-12700H (803 - 1851, n=64) | |
| Schenker XMG Neo 15 Tiger Lake | |
| Alienware m15 R6, i7-11800H RTX 3080 | |
| HWBOT x265 Benchmark v2.2 / 4k Preset | |
| Media de la clase Gaming (11.5 - 44.4, n=105, últimos 2 años) | |
| Schenker XMG Oasis | |
| Schenker XMG Neo 15 E22 (Early 2022, RTX 3080 Ti) | |
| MSI GE76 Raider | |
| Schenker XMG Neo 15 Tiger Lake | |
| Medio Intel Core i7-12700H (4.67 - 21.8, n=64) | |
| Asus ROG Strix Scar 15 G533QS | |
| Razer Blade 15 Advanced (Mid 2021) | |
| Alienware m15 R6, i7-11800H RTX 3080 | |
| LibreOffice / 20 Documents To PDF | |
| Asus ROG Strix Scar 15 G533QS | |
| Media de la clase Gaming (33.2 - 88.8, n=105, últimos 2 años) | |
| Schenker XMG Oasis | |
| Schenker XMG Neo 15 Tiger Lake | |
| Medio Intel Core i7-12700H (34.2 - 95.3, n=63) | |
| Razer Blade 15 Advanced (Mid 2021) | |
| Alienware m15 R6, i7-11800H RTX 3080 | |
| Schenker XMG Neo 15 E22 (Early 2022, RTX 3080 Ti) | |
| MSI GE76 Raider | |
| R Benchmark 2.5 / Overall mean | |
| Alienware m15 R6, i7-11800H RTX 3080 | |
| Schenker XMG Neo 15 Tiger Lake | |
| Razer Blade 15 Advanced (Mid 2021) | |
| Asus ROG Strix Scar 15 G533QS | |
| Medio Intel Core i7-12700H (0.4441 - 1.052, n=63) | |
| Schenker XMG Neo 15 E22 (Early 2022, RTX 3080 Ti) | |
| Schenker XMG Oasis | |
| Media de la clase Gaming (0.3439 - 0.759, n=106, últimos 2 años) | |
| MSI GE76 Raider | |
* ... más pequeño es mejor
AIDA64: FP32 Ray-Trace | FPU Julia | CPU SHA3 | CPU Queen | FPU SinJulia | FPU Mandel | CPU AES | CPU ZLib | FP64 Ray-Trace | CPU PhotoWorxx
| Performance rating | |
| Media de la clase Gaming | |
| Asus ROG Strix Scar 15 G533QS | |
| Alienware m15 R6, i7-11800H RTX 3080 | |
| MSI GE76 Raider | |
| Schenker XMG Oasis | |
| Schenker XMG Neo 15 E22 (Early 2022, RTX 3080 Ti) | |
| Medio Intel Core i7-12700H | |
| AIDA64 / FP32 Ray-Trace | |
| Media de la clase Gaming (10227 - 85542, n=105, últimos 2 años) | |
| Alienware m15 R6, i7-11800H RTX 3080 | |
| Asus ROG Strix Scar 15 G533QS | |
| Medio Intel Core i7-12700H (2585 - 17957, n=64) | |
| Schenker XMG Oasis | |
| Schenker XMG Neo 15 E22 (Early 2022, RTX 3080 Ti) | |
| MSI GE76 Raider | |
| AIDA64 / FPU Julia | |
| Media de la clase Gaming (51376 - 238426, n=105, últimos 2 años) | |
| Asus ROG Strix Scar 15 G533QS | |
| Alienware m15 R6, i7-11800H RTX 3080 | |
| Medio Intel Core i7-12700H (12439 - 90760, n=64) | |
| Schenker XMG Neo 15 E22 (Early 2022, RTX 3080 Ti) | |
| Schenker XMG Oasis | |
| MSI GE76 Raider | |
| AIDA64 / CPU SHA3 | |
| Media de la clase Gaming (2180 - 10115, n=105, últimos 2 años) | |
| Alienware m15 R6, i7-11800H RTX 3080 | |
| Asus ROG Strix Scar 15 G533QS | |
| Schenker XMG Oasis | |
| Schenker XMG Neo 15 E22 (Early 2022, RTX 3080 Ti) | |
| MSI GE76 Raider | |
| Medio Intel Core i7-12700H (833 - 4242, n=64) | |
| AIDA64 / CPU Queen | |
| Media de la clase Gaming (49785 - 173351, n=90, últimos 2 años) | |
| MSI GE76 Raider | |
| Asus ROG Strix Scar 15 G533QS | |
| Schenker XMG Oasis | |
| Schenker XMG Neo 15 E22 (Early 2022, RTX 3080 Ti) | |
| Medio Intel Core i7-12700H (57923 - 103202, n=63) | |
| Alienware m15 R6, i7-11800H RTX 3080 | |
| AIDA64 / FPU SinJulia | |
| Media de la clase Gaming (4424 - 33636, n=105, últimos 2 años) | |
| Asus ROG Strix Scar 15 G533QS | |
| MSI GE76 Raider | |
| Schenker XMG Oasis | |
| Schenker XMG Neo 15 E22 (Early 2022, RTX 3080 Ti) | |
| Alienware m15 R6, i7-11800H RTX 3080 | |
| Medio Intel Core i7-12700H (3249 - 9939, n=64) | |
| AIDA64 / FPU Mandel | |
| Media de la clase Gaming (25115 - 128721, n=105, últimos 2 años) | |
| Asus ROG Strix Scar 15 G533QS | |
| Alienware m15 R6, i7-11800H RTX 3080 | |
| Medio Intel Core i7-12700H (7135 - 44760, n=64) | |
| Schenker XMG Oasis | |
| Schenker XMG Neo 15 E22 (Early 2022, RTX 3080 Ti) | |
| MSI GE76 Raider | |
| AIDA64 / CPU AES | |
| Alienware m15 R6, i7-11800H RTX 3080 | |
| Asus ROG Strix Scar 15 G533QS | |
| Media de la clase Gaming (39258 - 247074, n=105, últimos 2 años) | |
| MSI GE76 Raider | |
| Medio Intel Core i7-12700H (31839 - 144360, n=64) | |
| Schenker XMG Neo 15 E22 (Early 2022, RTX 3080 Ti) | |
| Schenker XMG Oasis | |
| AIDA64 / CPU ZLib | |
| Media de la clase Gaming (574 - 2531, n=105, últimos 2 años) | |
| Schenker XMG Neo 15 E22 (Early 2022, RTX 3080 Ti) | |
| Schenker XMG Oasis | |
| MSI GE76 Raider | |
| Medio Intel Core i7-12700H (305 - 1171, n=64) | |
| Asus ROG Strix Scar 15 G533QS | |
| Alienware m15 R6, i7-11800H RTX 3080 | |
| AIDA64 / FP64 Ray-Trace | |
| Media de la clase Gaming (5509 - 45446, n=105, últimos 2 años) | |
| Alienware m15 R6, i7-11800H RTX 3080 | |
| Asus ROG Strix Scar 15 G533QS | |
| Medio Intel Core i7-12700H (1437 - 9692, n=64) | |
| Schenker XMG Oasis | |
| Schenker XMG Neo 15 E22 (Early 2022, RTX 3080 Ti) | |
| MSI GE76 Raider | |
| AIDA64 / CPU PhotoWorxx | |
| Media de la clase Gaming (12271 - 89891, n=105, últimos 2 años) | |
| Schenker XMG Oasis | |
| Schenker XMG Neo 15 E22 (Early 2022, RTX 3080 Ti) | |
| MSI GE76 Raider | |
| Medio Intel Core i7-12700H (12863 - 52207, n=64) | |
| Asus ROG Strix Scar 15 G533QS | |
| Alienware m15 R6, i7-11800H RTX 3080 | |
Rendimiento del sistema
Las puntuaciones en PCMark 10 no son convincentes en general. El Razer Blade 15 supera al Neo 15 en la puntuación general. Por otro lado, el Neo 15 queda justo por detrás del MSI GE76 Raider con hardware similar en la prueba de Creación de Contenido Digital, pero el portátil queda un poco por detrás en Esenciales y Productividad. En esta última, el Neo con el accesorio Oasis rinde un 10% más.

| PCMark 10 / Score | |
| Media de la clase Gaming (5828 - 12414, n=93, últimos 2 años) | |
| MSI GE76 Raider | |
| Schenker XMG Oasis | |
| Medio Intel Core i7-12700H, NVIDIA GeForce RTX 3080 Ti Laptop GPU (6868 - 7638, n=7) | |
| Razer Blade 15 Advanced (Mid 2021) | |
| Schenker XMG Neo 15 E22 (Early 2022, RTX 3080 Ti) | |
| Asus ROG Strix Scar 15 G533QS | |
| Schenker XMG Neo 15 Tiger Lake | |
| Alienware m15 R6, i7-11800H RTX 3080 | |
| PCMark 10 / Essentials | |
| Razer Blade 15 Advanced (Mid 2021) | |
| MSI GE76 Raider | |
| Media de la clase Gaming (8810 - 11935, n=97, últimos 2 años) | |
| Medio Intel Core i7-12700H, NVIDIA GeForce RTX 3080 Ti Laptop GPU (9987 - 11318, n=7) | |
| Schenker XMG Neo 15 Tiger Lake | |
| Asus ROG Strix Scar 15 G533QS | |
| Schenker XMG Neo 15 E22 (Early 2022, RTX 3080 Ti) | |
| Alienware m15 R6, i7-11800H RTX 3080 | |
| Schenker XMG Oasis | |
| PCMark 10 / Productivity | |
| Media de la clase Gaming (6845 - 25323, n=95, últimos 2 años) | |
| MSI GE76 Raider | |
| Asus ROG Strix Scar 15 G533QS | |
| Schenker XMG Oasis | |
| Medio Intel Core i7-12700H, NVIDIA GeForce RTX 3080 Ti Laptop GPU (8944 - 10726, n=7) | |
| Alienware m15 R6, i7-11800H RTX 3080 | |
| Razer Blade 15 Advanced (Mid 2021) | |
| Schenker XMG Neo 15 Tiger Lake | |
| Schenker XMG Neo 15 E22 (Early 2022, RTX 3080 Ti) | |
| PCMark 10 / Digital Content Creation | |
| Media de la clase Gaming (7602 - 19954, n=95, últimos 2 años) | |
| MSI GE76 Raider | |
| Schenker XMG Oasis | |
| Schenker XMG Neo 15 E22 (Early 2022, RTX 3080 Ti) | |
| Medio Intel Core i7-12700H, NVIDIA GeForce RTX 3080 Ti Laptop GPU (8956 - 12249, n=7) | |
| Schenker XMG Neo 15 Tiger Lake | |
| Razer Blade 15 Advanced (Mid 2021) | |
| Alienware m15 R6, i7-11800H RTX 3080 | |
| Asus ROG Strix Scar 15 G533QS | |
| PCMark 10 Score | 7240 puntos | |
ayuda | ||
| AIDA64 / Memory Copy | |
| Media de la clase Gaming (21750 - 129946, n=105, últimos 2 años) | |
| Schenker XMG Neo 15 E22 (Early 2022, RTX 3080 Ti) | |
| MSI GE76 Raider | |
| Schenker XMG Oasis | |
| Medio Intel Core i7-12700H (25615 - 80511, n=64) | |
| Alienware m15 R6, i7-11800H RTX 3080 | |
| Asus ROG Strix Scar 15 G533QS | |
| AIDA64 / Memory Read | |
| Media de la clase Gaming (22956 - 118858, n=105, últimos 2 años) | |
| Schenker XMG Oasis | |
| Schenker XMG Neo 15 E22 (Early 2022, RTX 3080 Ti) | |
| MSI GE76 Raider | |
| Medio Intel Core i7-12700H (25586 - 79442, n=64) | |
| Alienware m15 R6, i7-11800H RTX 3080 | |
| Asus ROG Strix Scar 15 G533QS | |
| AIDA64 / Memory Write | |
| Media de la clase Gaming (22297 - 135096, n=105, últimos 2 años) | |
| Schenker XMG Oasis | |
| Schenker XMG Neo 15 E22 (Early 2022, RTX 3080 Ti) | |
| MSI GE76 Raider | |
| Medio Intel Core i7-12700H (23679 - 88660, n=64) | |
| Asus ROG Strix Scar 15 G533QS | |
| Alienware m15 R6, i7-11800H RTX 3080 | |
| AIDA64 / Memory Latency | |
| Media de la clase Gaming (75.3 - 259, n=105, últimos 2 años) | |
| Alienware m15 R6, i7-11800H RTX 3080 | |
| MSI GE76 Raider | |
| Asus ROG Strix Scar 15 G533QS | |
| Medio Intel Core i7-12700H (76.2 - 133.9, n=62) | |
| Schenker XMG Neo 15 Tiger Lake | |
| Razer Blade 15 Advanced (Mid 2021) | |
| Schenker XMG Neo 15 E22 (Early 2022, RTX 3080 Ti) | |
| Schenker XMG Oasis | |
* ... más pequeño es mejor
Latencias del CPD
LatencyMon ya muestra un aumento de la latencia al abrir el navegador Edge. Empeora un poco cuando se abren varias pestañas y se reproduce nuestro vídeo 4K/60 fps de YouTube. No obstante, el vídeo se reproduce sin pérdida de fotogramas.


| DPC Latencies / LatencyMon - interrupt to process latency (max), Web, Youtube, Prime95 | |
| Razer Blade 15 Advanced (Mid 2021) | |
| MSI GE76 Raider | |
| Asus ROG Strix Scar 15 G533QS | |
| Alienware m15 R6, i7-11800H RTX 3080 | |
| Schenker XMG Neo 15 E22 (Early 2022, RTX 3080 Ti) | |
| Schenker XMG Neo 15 Tiger Lake | |
* ... más pequeño es mejor
Almacenamiento masivo
Nuestro modelo de preproducción de China no tenía inicialmente un SSD. Schenker nos envió un rápido Samsung 980 Pro con lamentablemente sólo 250 GB para las pruebas, que casi nunca se instalará debido a su pequeño tamaño y que ni siquiera aparece en nuestraLista de los mejores SSD hasta ahora.
Con Windows 11 Home instalado, sólo quedaban entre 60 y 80 GB para otros programas. El modelo de producción probablemente tendrá al menos 512 GB.

* ... más pequeño es mejor
Continuous load read: DiskSpd Read Loop, Queue Depth 8
Tarjeta gráfica
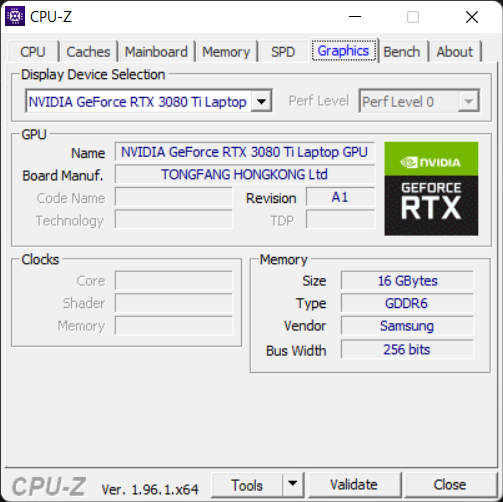
La nuevaNvidia GeForce RTX 3080 Ti para portátiles es actualmente la tarjeta gráfica más rápida para portátiles. Están disponibles los modos Max-Q y Whisper, pero no hay Advanced Optimus en el Neo 15. La tarjeta tiene una memoria de vídeo GDDR6 de 16 GB.
Una vez más, Nvidia permite a los fabricantes decidir sobre el consumo de energía y, por tanto, el rendimiento. Schenker transmite esta decisión al cliente a través del Centro de Control
En las pruebas 3DMark, el Neo 15 suele quedar justo por detrás del MSI GE76 Raider, que también ejecuta la RTX 3080 Ti a pleno rendimiento de 175 W. Sin embargo, el predecesor del Neo 15 queda sólo unos pocos puntos porcentuales por detrás en muchas pruebas 3DMark y alrededor de un 12% por detrás en la clasificación general de rendimiento.
Apenas hay diferencias dignas de mención con Oasis, y la combinación suele quedar incluso por detrás de los índices de sólo Neo.
Lejos de la toma de corriente, el rendimiento 3D cae considerablemente. En 3DMark 11, el portátil pierde todo un 87% de rendimiento. En The Witcher 3 WQHD, la tasa de frames cae de algo menos de 100 fps a sólo unos 10 a 11 fps - ¡una pérdida de casi el 90% también! Desgraciadamente, esto es lo normal teniendo en cuenta el alto consumo de energía de las GPU actuales.
| 3DMark 11 Performance | 35910 puntos | |
| 3DMark Cloud Gate Standard Score | 63903 puntos | |
| 3DMark Fire Strike Score | 27983 puntos | |
| 3DMark Time Spy Score | 12480 puntos | |
ayuda | ||
Rendimiento de los juegos
Con la RTX 3080 Ti en configuración completa, el Neo 15 reproduce todos los juegos actuales sin problemas en la resolución nativa WQHD. También debería haber suficientes reservas para 4K la mayor parte del tiempo.
El Witcher 3 funciona a unos 95 fps en 2.560 x 1.440 píxeles en ultra y a 120 fps en full HD. Far Cry 5 también funciona a más de 100 fps en resolución nativa
Los portátiles con unaRTX 3080van a la zaga en torno a un 10%, mientras que el MSI GE76 Raider es mínimamente más rápido. No pudimos instalar GTA Vya que la capacidad del SSD es demasiado pequeña y Windows 11 consume demasiado espacio. Con suerte, podremos compensar eso en el modelo de producción.
Con la refrigeración Oasis, The Witcher 3 y Far Cry 5 se ejecutan entre un 3 y un 5% más rápido, lo que normalmente no se nota en la práctica, pero da lugar a mayores diferencias de temperatura.
La evaluación de una hora de estrés de The Witcher 3muestra que la GPU del Neo 15 es capaz de funcionar a unos 150 MHz más de media con Oasis, se mantiene 16 °C más fría, consume más energía y puede utilizar más memoria.


El efecto es algo menor en la CPU en el estrés de Witcher 3. La velocidad de reloj es casi la misma, y no hay estrangulamiento térmico aparente con la CPU incluso sin Oasis. Sin embargo, las temperaturas de la CPU son unos 11 °C más bajas con Oasis conectado.


La tasa de fotogramas enThe Witcher 3 sólo disminuye ligeramente a lo largo de una hora, pero tampoco se comporta de forma bastante consistente. Con Oasis, la tasa de fotogramas es similar pero siempre está un 7% por encima de lo que hemos visto sin la refrigeración por agua. Por tanto, el rendimiento a largo plazo es mínimamente mejor.
The Witcher 3 - FPS Diagram
| bajo | medio | alto | ultra | QHD | |
|---|---|---|---|---|---|
| The Witcher 3 (2015) | 388.4 | 325.6 | 212.4 | 121 | |
| Dota 2 Reborn (2015) | 175 | 162 | 153 | 147 | |
| Final Fantasy XV Benchmark (2018) | 151 | 115 | 87.4 | ||
| X-Plane 11.11 (2018) | 142 | 124 | 101 | ||
| Far Cry 5 (2018) | 164 | 145 | 140 | 131 | 116 |
Emisiones: ¿Hemos mencionado la refrigeración por agua?
Emisiones acústicas
El modo Overboost que utilizamos con valores TDP/TGP maximizados manualmente no es ciertamente el caso de uso habitual. El hardware ofrece suficiente potencia para funcionar también en los modos Enthusiast o Balanced (con el modo Whisper), mucho más silenciosos
Incluso en el modo Overboost, el dispositivo no es, al menos, más ruidoso que el predecesor con una RTX 3080. Los dispositivos de la comparación también son ligeramente más silenciosos.
Con Oasis, las emisiones de ruido desgraciadamente caen sólo marginalmente (Oasis Balanced) - de unos 54 a 53 dB en The Witcher 3. La caída del nivel de ruido es igualmente baja en la prueba de estrés. El ventilador no necesariamente silencioso del Oasis añade su volumen al del ventilador interno, que gira a menor velocidad. En general, la diferencia es menor de lo que nos gustaría.
Sin embargo, estos valores se midieron después de una hora de juegos y pruebas de estrés. Durante cargas cortas, como una subprueba de 3DMark06, notamos que los ventiladores internos no se pusieron en marcha en absoluto debido a Oasis. Desde este punto de vista, las emisiones de ruido ya son significativamente menores en teoría. Además, se pueden configurar tres perfiles de ventilador para Oasis (Equilibrado, Silencioso, Muy Silencioso). Bajo Quiet, el Witcher 3 sólo produce 49 dB en lugar de 53 o 54 dB (medido a una distancia de 15 - 20 cm).
Bajo carga, escuchamos un zumbido de la caja Neo, pero se desvanece en el fondo debido al sonido general del ventilador.
Ruido
| Ocioso |
| 24 / 24 / 27.76 dB(A) |
| Carga |
| 38.81 / 54.18 dB(A) |
 | ||
30 dB silencioso 40 dB(A) audible 50 dB(A) ruidosamente alto |
||
min: | ||
| Schenker XMG Neo 15 E22 (Early 2022, RTX 3080 Ti) GeForce RTX 3080 Ti Laptop GPU, i7-12700H, Samsung SSD 980 Pro 250GB MZ-V8P250BW | Schenker XMG Neo 15 Tiger Lake GeForce RTX 3080 Laptop GPU, i7-11800H, Samsung SSD 980 Pro 1TB MZ-V8P1T0BW | Razer Blade 15 Advanced (Mid 2021) GeForce RTX 3080 Laptop GPU, i7-11800H, SSSTC CA6-8D1024 | Asus ROG Strix Scar 15 G533QS GeForce RTX 3080 Laptop GPU, R9 5900HX, ADATA Swordfish 2 TB | Alienware m15 R6, i7-11800H RTX 3080 GeForce RTX 3080 Laptop GPU, i7-11800H, Samsung PM9A1 MZVL21T0HCLR | MSI GE76 Raider GeForce RTX 3080 Ti Laptop GPU, i9-12900HK, Samsung PM9A1 MZVL22T0HBLB | |
|---|---|---|---|---|---|---|
| Noise | -11% | 1% | -6% | 0% | -14% | |
| apagado / medio ambiente * (dB) | 24 | 25 -4% | 25.1 -5% | 25.5 -6% | 23 4% | 26 -8% |
| Idle Minimum * (dB) | 24 | 27 -13% | 25.3 -5% | 25.5 -6% | 23 4% | 26 -8% |
| Idle Average * (dB) | 24 | 30 -25% | 25.3 -5% | 25.5 -6% | 23 4% | 27 -13% |
| Idle Maximum * (dB) | 27.76 | 32 -15% | 25.3 9% | 37.1 -34% | 30 -8% | 40 -44% |
| Load Average * (dB) | 38.81 | 46 -19% | 42 -8% | 39.2 -1% | 41.26 -6% | 50 -29% |
| Witcher 3 ultra * (dB) | 54.2 | 52 4% | 45.6 16% | 50.5 7% | 53.4 1% | 53 2% |
| Load Maximum * (dB) | 54.18 | 55 -2% | 51.6 5% | 51.8 4% | 53.37 1% | 53 2% |
* ... más pequeño es mejor
Temperatura
El Oasis finalmente puede mostrar sus puntos fuertes en las emisiones de temperatura. Vimos las temperaturas significativamente más bajas de la GPU y la CPU arriba, y eso se traslada al menos parcialmente a las temperaturas superficiales.
Debido a la RTX 3080 Ti sin obstáculos, medimos hasta 68 °C en la parte inferior tras una hora de pruebas de estrés. Sin embargo, Schenker también sospecha de un defecto del modelo de pre-lanzamiento aquí. Con Oasis, este valor se reduce a unos mucho más tolerables 51 °C.
(-) La temperatura máxima en la parte superior es de 52 °C / 126 F, frente a la media de 40.4 °C / 105 F, que oscila entre 21.2 y 68.8 °C para la clase Gaming.
(-) El fondo se calienta hasta un máximo de 68 °C / 154 F, frente a la media de 43.2 °C / 110 F
(+) En reposo, la temperatura media de la parte superior es de 29 °C / 84# F, frente a la media del dispositivo de 33.9 °C / 93 F.
(-) Jugando a The Witcher 3, la temperatura media de la parte superior es de 39 °C / 102 F, frente a la media del dispositivo de 33.9 °C / 93 F.
(±) El reposamanos y el touchpad pueden calentarse mucho al tacto con un máximo de 36 °C / 96.8 F.
(-) La temperatura media de la zona del reposamanos de dispositivos similares fue de 28.8 °C / 83.8 F (-7.2 °C / -13 F).
| Schenker XMG Neo 15 E22 (Early 2022, RTX 3080 Ti) Intel Core i7-12700H, NVIDIA GeForce RTX 3080 Ti Laptop GPU | Schenker XMG Oasis | Schenker XMG Neo 15 Tiger Lake Intel Core i7-11800H, NVIDIA GeForce RTX 3080 Laptop GPU | Razer Blade 15 Advanced (Mid 2021) Intel Core i7-11800H, NVIDIA GeForce RTX 3080 Laptop GPU | Asus ROG Strix Scar 15 G533QS AMD Ryzen 9 5900HX, NVIDIA GeForce RTX 3080 Laptop GPU | Alienware m15 R6, i7-11800H RTX 3080 Intel Core i7-11800H, NVIDIA GeForce RTX 3080 Laptop GPU | MSI GE76 Raider Intel Core i9-12900HK, NVIDIA GeForce RTX 3080 Ti Laptop GPU | |
|---|---|---|---|---|---|---|---|
| Heat | 22% | 11% | 3% | 8% | -5% | 11% | |
| Maximum Upper Side * (°C) | 52 | 42 19% | 39 25% | 51 2% | 43.4 17% | 61 -17% | 43 17% |
| Maximum Bottom * (°C) | 68 | 51 25% | 50 26% | 52 24% | 48.2 29% | 58 15% | 47 31% |
| Idle Upper Side * (°C) | 32 | 34 -6% | 35.2 -10% | 35.2 -10% | 38 -19% | 33 -3% | |
| Idle Bottom * (°C) | 36 | 37 -3% | 37.8 -5% | 37 -3% | 36 -0% | 37 -3% |
* ... más pequeño es mejor
Prueba de esfuerzo
Los núcleos comienzan nuestra prueba de estrés a aproximadamente 3,6 GHz. En el transcurso de la hora, el reloj disminuye y luego fluctúa entre 2,2 y 3 GHz. El reloj medio está en torno a los 2,6 GHz. Con Oasis, los relojes medios están a unos 3,1 GHz mucho más altos, con temperaturas de los núcleos 8 °C más bajas al mismo tiempo, ¡mientras que la potencia del paquete se eleva en 25 W!


El reloj de la GPU parece ser más o menos el mismo, pero el reloj de la memoria aparentemente cae más a menudo sin Oasis. Al mismo tiempo, Oasis proporciona una media de 20 °C menos de temperatura en la GPU
Una nueva ejecución de 3DMark 11 directamente después del estrés produjo la misma puntuación que una ejecución sin estrés previo.


| Refrigeración por aire/Oasis | |||
| Reloj dela CPU (GHz) | Reloj de la GPU (MHz) | Temperatura media dela CPU (°C) | Temperatura media de la GPU (°C) |
| Prime95 + FurMarkStress | 2,6/3,1 | 1,3 | 88/80 |
| Witcher 3 Estrés | 2,5/2,6 | 1,5/1,6 | 71/60 |
Altavoz
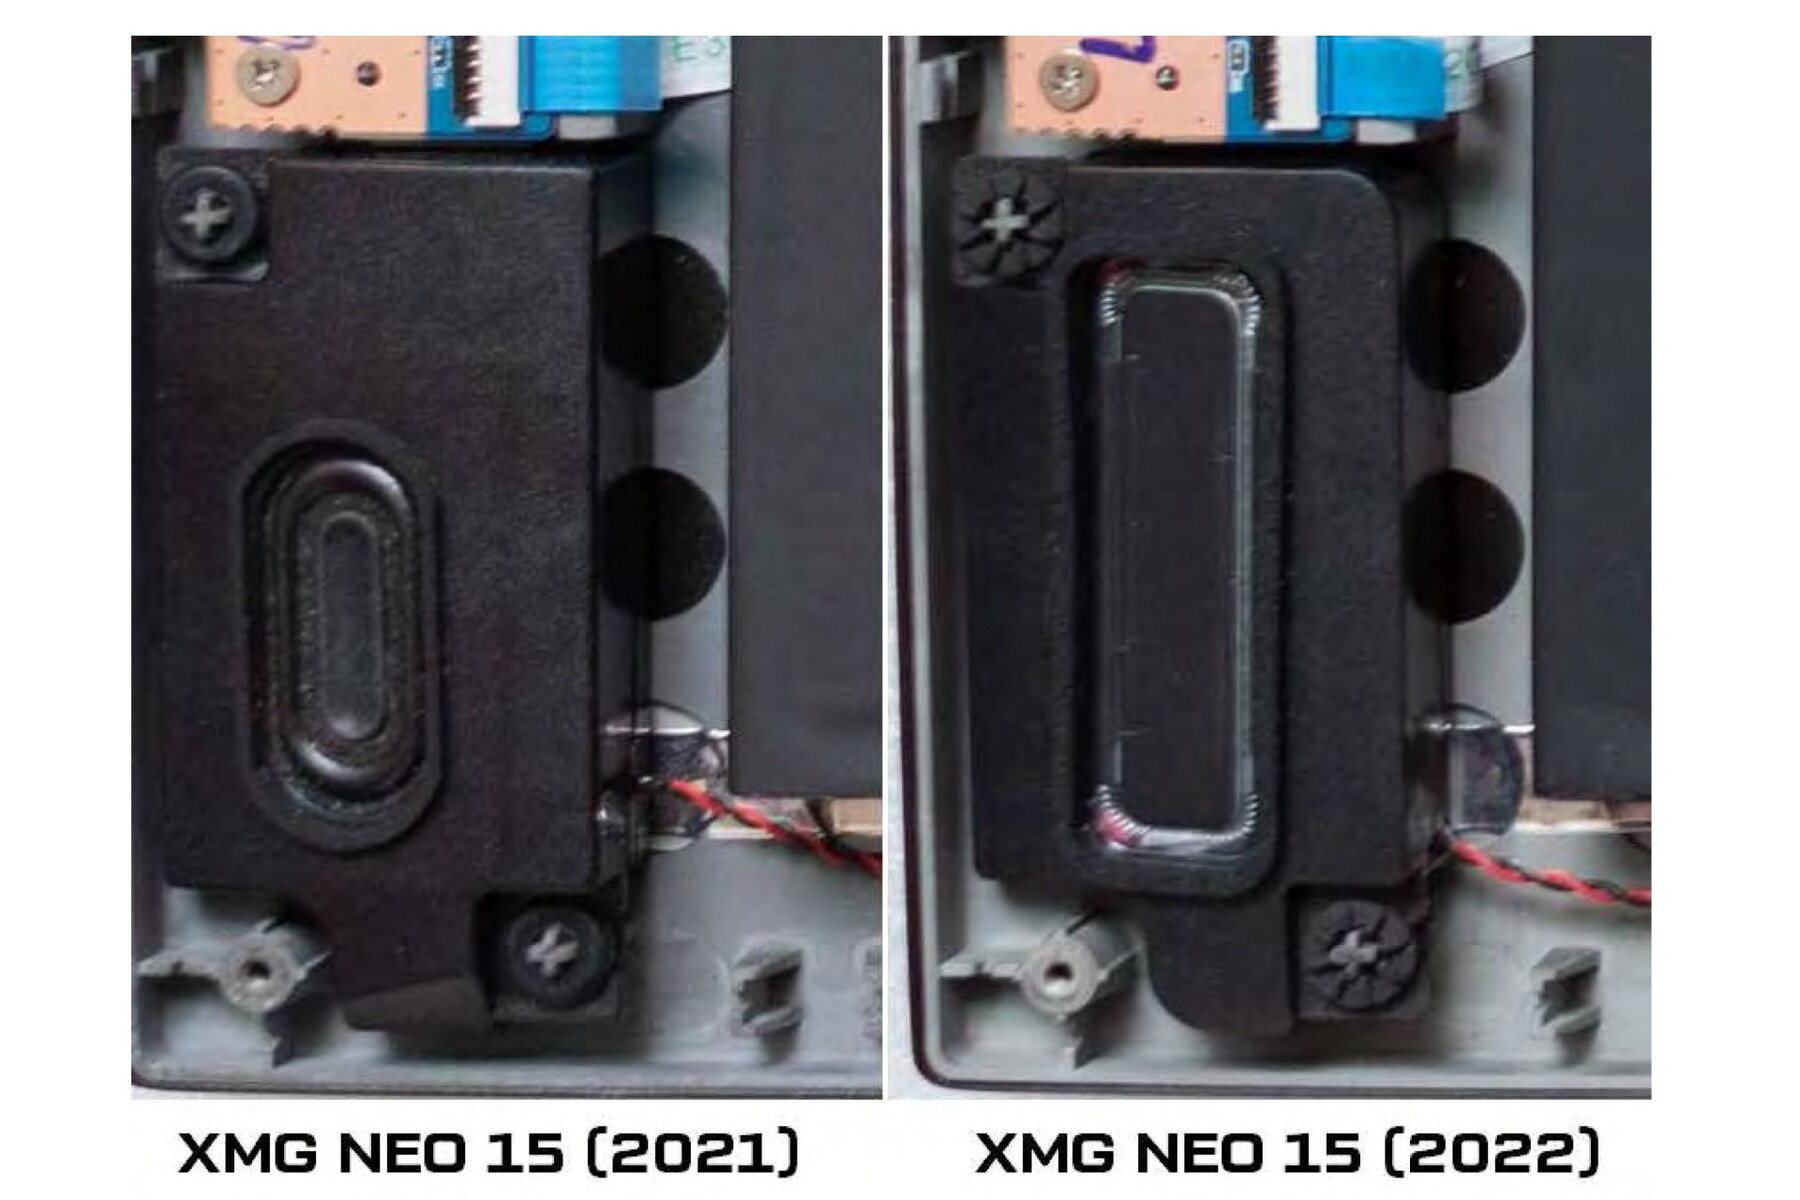
Schenker ha ampliado los altavoces del nuevo Neo. Ahora son mínimamente más fuertes y ofrecen mínimamente más graves, pero siguen siendo claramente demasiado bajos.
Dispone de un micrófono/línea de entrada y un puerto de auriculares para dispositivos analógicos de terceros.
Schenker XMG Neo 15 E22 (Early 2022, RTX 3080 Ti) análisis de audio
(±) | la sonoridad del altavoz es media pero buena (80.8 dB)
Graves 100 - 315 Hz
(-) | casi sin bajos - de media 16.5% inferior a la mediana
(±) | la linealidad de los graves es media (7.6% delta a frecuencia anterior)
Medios 400 - 2000 Hz
(±) | medias más altas - de media 6.7% más altas que la mediana
(±) | la linealidad de los medios es media (7.5% delta respecto a la frecuencia anterior)
Altos 2 - 16 kHz
(+) | máximos equilibrados - a sólo 2.8% de la mediana
(+) | los máximos son lineales (5.2% delta a la frecuencia anterior)
Total 100 - 16.000 Hz
(±) | la linealidad del sonido global es media (17% de diferencia con la mediana)
En comparación con la misma clase
» 45% de todos los dispositivos probados de esta clase eran mejores, 12% similares, 43% peores
» El mejor tuvo un delta de 6%, la media fue 18%, el peor fue ###max##%
En comparación con todos los dispositivos probados
» 31% de todos los dispositivos probados eran mejores, 8% similares, 61% peores
» El mejor tuvo un delta de 4%, la media fue 23%, el peor fue ###max##%
Schenker XMG Neo 15 Tiger Lake análisis de audio
(±) | la sonoridad del altavoz es media pero buena (79 dB)
Graves 100 - 315 Hz
(-) | casi sin bajos - de media 22.6% inferior a la mediana
(±) | la linealidad de los graves es media (9.5% delta a frecuencia anterior)
Medios 400 - 2000 Hz
(+) | medios equilibrados - a sólo 4.7% de la mediana
(±) | la linealidad de los medios es media (9.1% delta respecto a la frecuencia anterior)
Altos 2 - 16 kHz
(+) | máximos equilibrados - a sólo 4.1% de la mediana
(+) | los máximos son lineales (5.3% delta a la frecuencia anterior)
Total 100 - 16.000 Hz
(±) | la linealidad del sonido global es media (19.4% de diferencia con la mediana)
En comparación con la misma clase
» 67% de todos los dispositivos probados de esta clase eran mejores, 7% similares, 26% peores
» El mejor tuvo un delta de 6%, la media fue 18%, el peor fue ###max##%
En comparación con todos los dispositivos probados
» 48% de todos los dispositivos probados eran mejores, 7% similares, 45% peores
» El mejor tuvo un delta de 4%, la media fue 23%, el peor fue ###max##%
Gestión de la energía: Alto consumo, buen rendimiento de la batería
Consumo de energía
La RTX 3080 Ti, naturalmente, plantea ciertas exigencias a la fuente de alimentación. El sistema extrae una media de 228 W de la toma de corriente en The Witcher 3,
que aumenta en unos 10 W con el XMG Oasis. Sin embargo, el consumo también puede dispararse hasta los 280 W especialmente al principio.Incluso se consume más energía durante la prueba de estrés. Medimos una media de 242 W y picos de carga de hasta 330 W, además de un consumo fluctuante que siempre salta a unos 280 W en el largo recorrido. En general, el consumo de energía es tan alto como el rendimiento.
La gran fuente de alimentación de conexión corta (~18 x 8,5 x 3,4 cm) está diseñada para una potencia de salida de 280 W y, en realidad, debería poder acomodarse a los valores medidos al principio, pero la carga fiable en todas las situaciones puede no ser una posibilidad. Hay planes para una fuente de alimentación de 330 W.
| Ocioso | |
| Carga |
|
Clave:
min: | |
| Schenker XMG Neo 15 E22 (Early 2022, RTX 3080 Ti) i7-12700H, GeForce RTX 3080 Ti Laptop GPU, Samsung SSD 980 Pro 250GB MZ-V8P250BW, IPS, 2560x1440, 15.6" | Schenker XMG Neo 15 Tiger Lake i7-11800H, GeForce RTX 3080 Laptop GPU, Samsung SSD 980 Pro 1TB MZ-V8P1T0BW, IPS, 2560x1440, 15.6" | Razer Blade 15 Advanced (Mid 2021) i7-11800H, GeForce RTX 3080 Laptop GPU, SSSTC CA6-8D1024, IPS, 1920x1080, 15.6" | Asus ROG Strix Scar 15 G533QS R9 5900HX, GeForce RTX 3080 Laptop GPU, ADATA Swordfish 2 TB, IPS, 2560x1440, 15.6" | Alienware m15 R6, i7-11800H RTX 3080 i7-11800H, GeForce RTX 3080 Laptop GPU, Samsung PM9A1 MZVL21T0HCLR, IPS, 1920x1080, 15.6" | MSI GE76 Raider i9-12900HK, GeForce RTX 3080 Ti Laptop GPU, Samsung PM9A1 MZVL22T0HBLB, IPS-Level, 1920x1080, 17.3" | Medio NVIDIA GeForce RTX 3080 Ti Laptop GPU | Media de la clase Gaming | |
|---|---|---|---|---|---|---|---|---|
| Power Consumption | 6% | -19% | 5% | 3% | -5% | -22% | -2% | |
| Idle Minimum * (Watt) | 14 | 15 -7% | 19.5 -39% | 11.2 20% | 14 -0% | 12 14% | 17.2 ? -23% | 13 ? 7% |
| Idle Average * (Watt) | 18 | 17 6% | 23.3 -29% | 16.4 9% | 18 -0% | 17 6% | 23.3 ? -29% | 19 ? -6% |
| Idle Maximum * (Watt) | 19 | 22 -16% | 40.1 -111% | 29.4 -55% | 29 -53% | 28 -47% | 30.8 ? -62% | 24.6 ? -29% |
| Load Average * (Watt) | 115 | 101 12% | 98.9 14% | 106.2 8% | 93 19% | 118 -3% | 121.2 ? -5% | 110.7 ? 4% |
| Witcher 3 ultra * (Watt) | 228 | 195 14% | 174 24% | 189 17% | 190 17% | 252 -11% | ||
| Load Maximum * (Watt) | 307 | 230 25% | 214 30% | 213.6 30% | 203 34% | 272 11% | 276 ? 10% | 259 ? 16% |
* ... más pequeño es mejor
Power consumption - The Witcher 3 / Stress test
Power consumption with external monitor
Duración de la batería
La batería de 93 Wh lo hace bien. Aparentemente, se pueden hacer algunas mejoras en los mecanismos de ahorro de energía a través de los perfiles de rendimiento ofrecidos. El predecesor dura menos con el mismo tamaño de batería. Medimos alrededor de 6 a 7 horas en nuestro test de Wi-Fi y vídeo.
| Schenker XMG Neo 15 E22 (Early 2022, RTX 3080 Ti) i7-12700H, GeForce RTX 3080 Ti Laptop GPU, 93 Wh | Schenker XMG Neo 15 Tiger Lake i7-11800H, GeForce RTX 3080 Laptop GPU, 93 Wh | Razer Blade 15 Advanced (Mid 2021) i7-11800H, GeForce RTX 3080 Laptop GPU, 80 Wh | Asus ROG Strix Scar 15 G533QS R9 5900HX, GeForce RTX 3080 Laptop GPU, 90 Wh | Alienware m15 R6, i7-11800H RTX 3080 i7-11800H, GeForce RTX 3080 Laptop GPU, 84 Wh | MSI GE76 Raider i9-12900HK, GeForce RTX 3080 Ti Laptop GPU, 99.99 Wh | Media de la clase Gaming | |
|---|---|---|---|---|---|---|---|
| Duración de Batería | -20% | -12% | -27% | -34% | -24% | -11% | |
| H.264 (h) | 6.9 | 5.9 -14% | 5.6 -19% | 8.32 ? 21% | |||
| WiFi v1.3 (h) | 6.7 | 5.6 -16% | 5.9 -12% | 7.3 9% | 5 -25% | 5.1 -24% | 7.11 ? 6% |
| Load (h) | 3.8 | 2.7 -29% | 1.4 -63% | 1.6 -58% | 1.502 ? -60% | ||
| Reader / Idle (h) | 11.1 | 8.27 ? |
Veredicto: Valor añadido real a través de Oasis
El XMG Neo 15 es un gran portátil para juegos con un valor añadido único: el puerto de agua. El estrangulamiento térmico no interfiere demasiado incluso cuando está refrigerado por aire, lo que resulta no sólo en un rendimiento de juego muy alto sino también en temperaturas superficiales muy altas.
Con el sistema de refrigeración por agua externo de 200 euros, el XMG Oasis, las temperaturas descienden de forma perceptible. En consecuencia, el ruido también disminuye y el rendimiento también puede ser mayor dependiendo de la aplicación siempre que se evite el estrangulamiento térmico debido a la caída de temperatura. En general, el paisaje sonoro del Oasis aún podría optimizarse, quizás en la bomba o en el gorgoteo que se produce a pesar de la ventilación. Dicho esto, en conjunto, las ventajas nos han convencido. La combinación puede ser definitivamente rentable para los jugadores con altas exigencias de rendimiento y también en términos de longevidad del sistema.
Los detalles, como la pantalla, tendrán que aclararse primero en nuestra prueba de un modelo de producción. Pero el modelo de preproducción ya hace muchas cosas bien.
El XMG Neo 15 tiene un rendimiento extremadamente alto y tiene un verdadero punto de venta de valor añadido en la forma del XMG Oasis, que, sin embargo, cuesta 199 euros adicionales. Sin refrigeración por agua, el modelo de preproducción se calienta mucho.
Precio y disponibilidad
El modelo de preproducción aún no está disponible. Sin embargo, ya puede reservarse en bestwarey se espera que la entrega comience a principios de abril. Nuestra configuración de prueba, pero con un SSD de 512 GB en lugar de 250 GB, cuesta allí 3.427 euros.
Price comparison
