Veredicto
Aunque el XMG Core 16 VE se comercializa como una Value Edition, este portátil para juegos de 16 pulgadas no se encuentra precisamente entre los modelos RTX 5060 más baratos. Con un precio de partida de 1.479 euros (unos 1.711 dólares) y un precio configurado de más de 1.900 euros (unos 2.198 dólares con 64 GB de RAM, 2 TB de SSD y Windows 11), compite más bien en el rango de precios de muchos equipos RTX 5070 Ti. Basándonos en nuestras mediciones y pruebas, el precio está justificado al menos en parte.
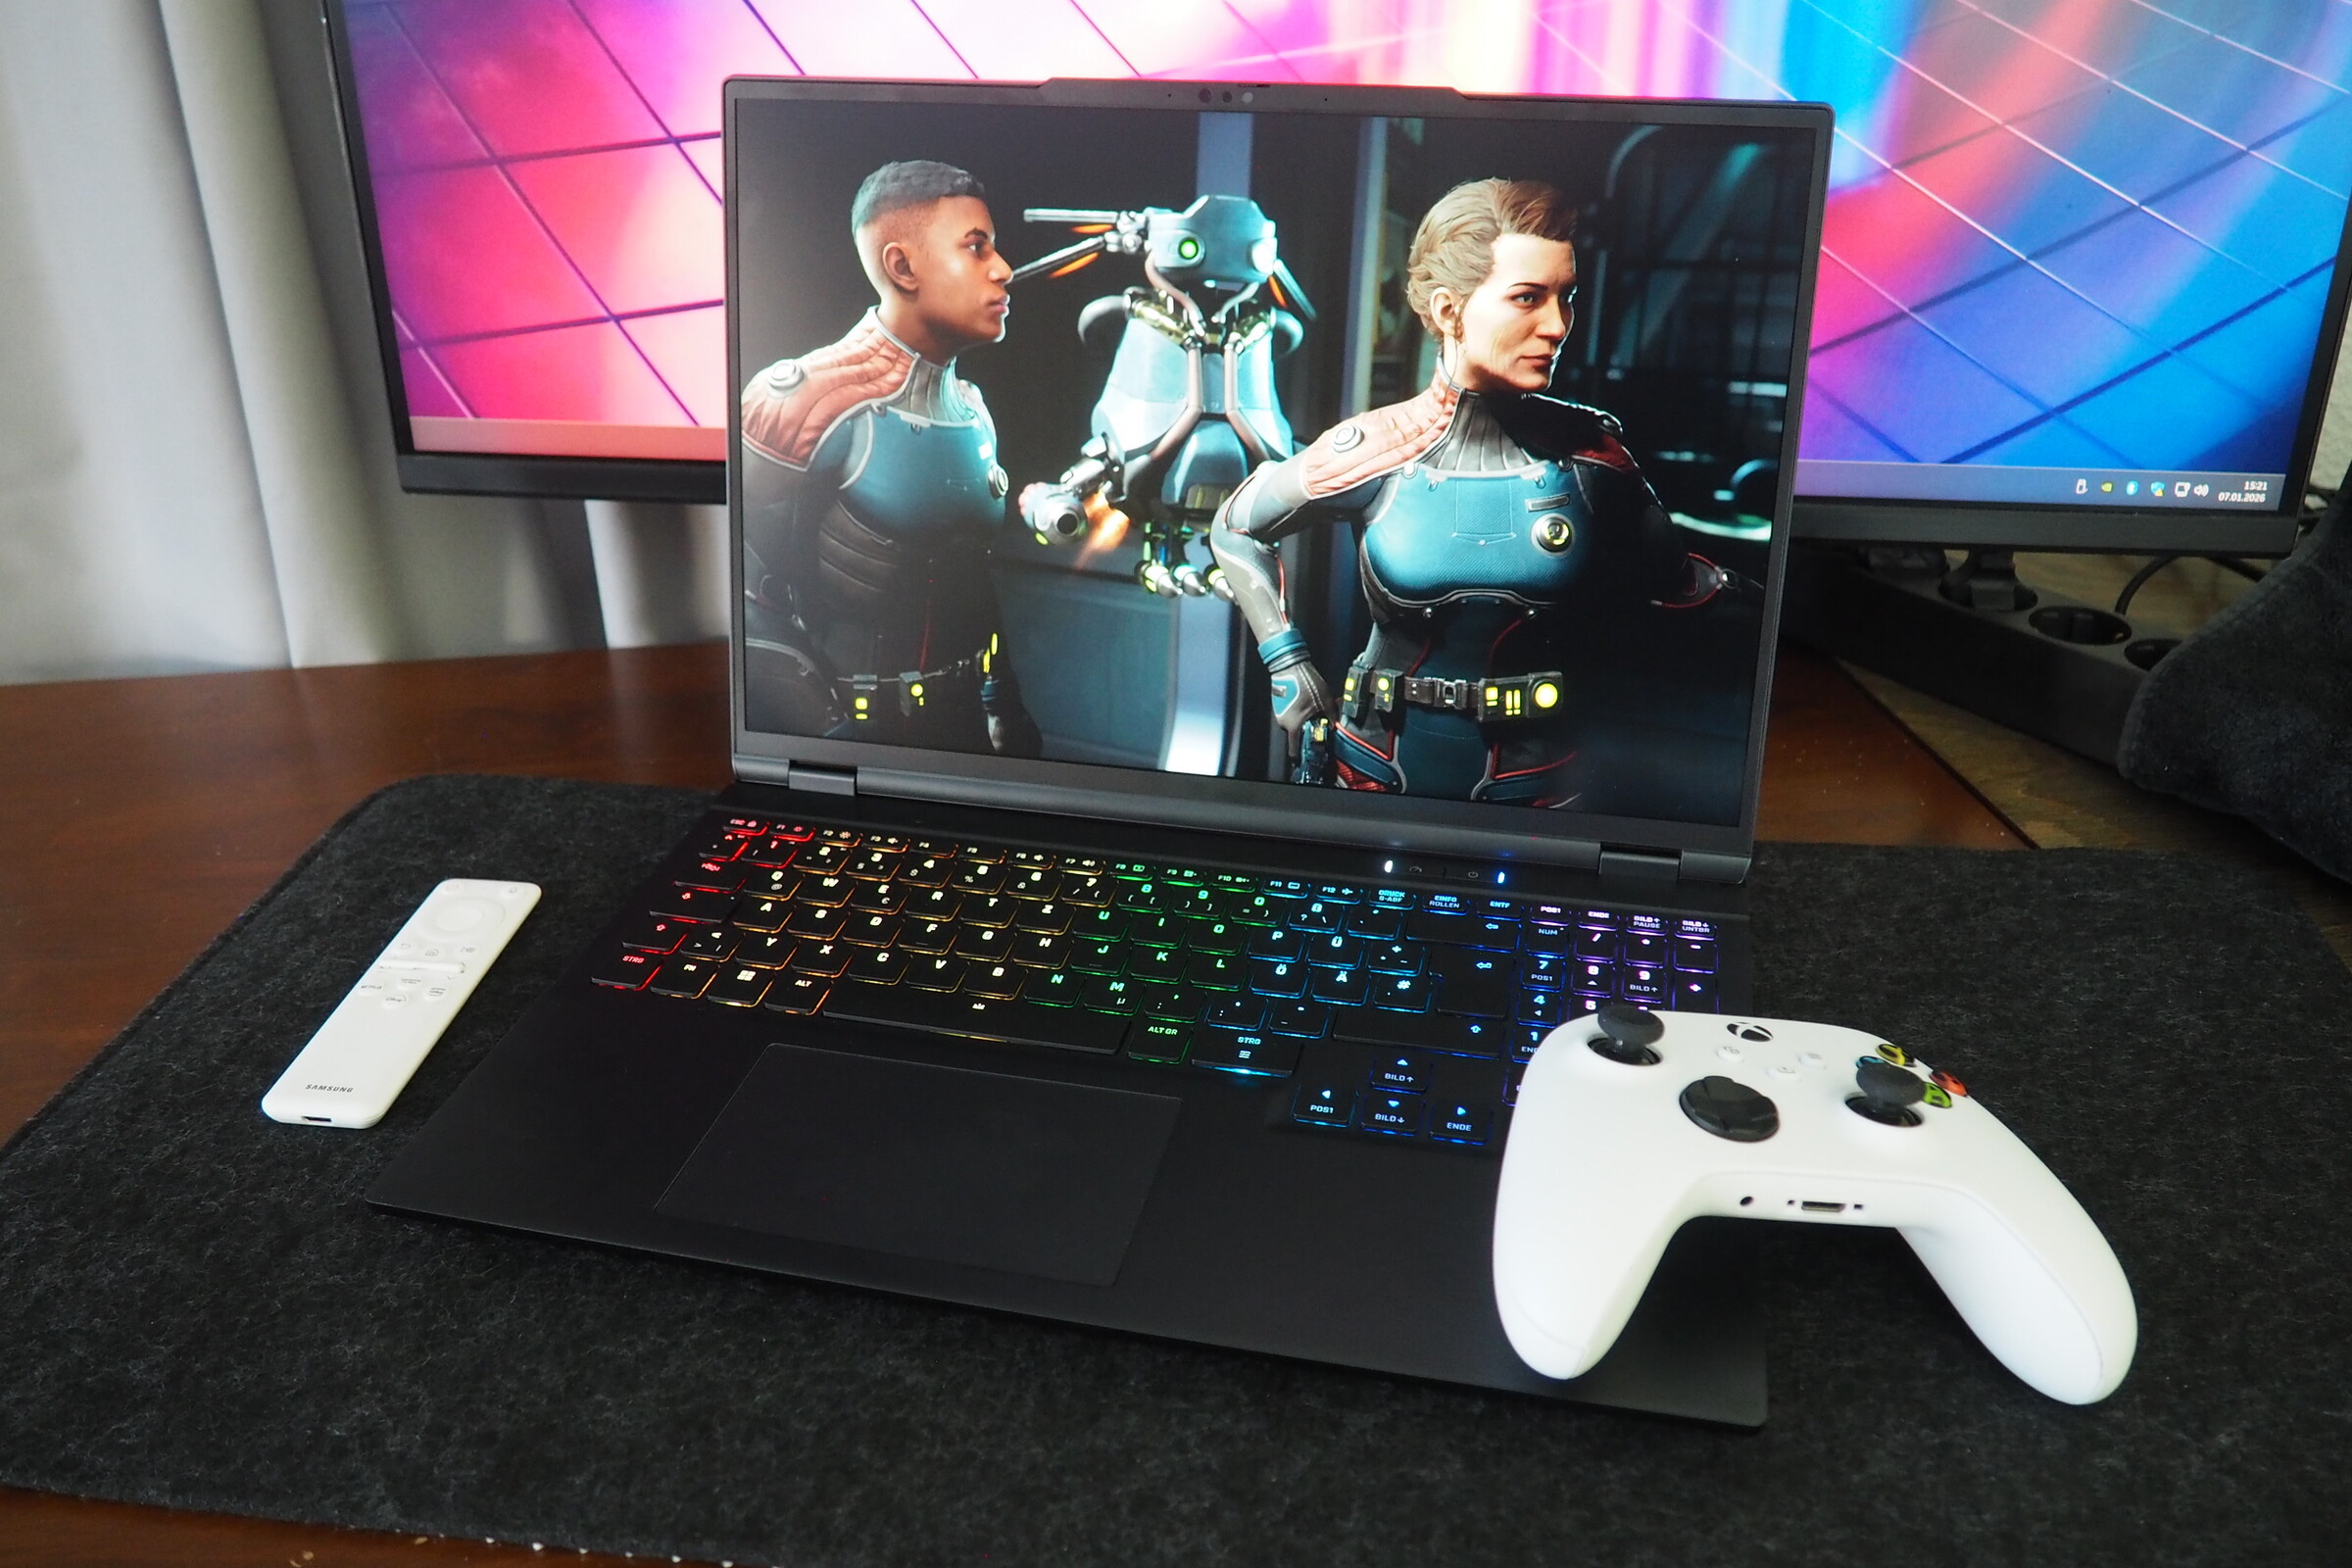
Uno de sus mayores puntos fuertes es el elegante y en gran medida robusto chasis metálico, que combina buenos dispositivos de entrada con una amplia selección de puertos y una pantalla IPS bastante brillante. Las opciones de mantenimiento y actualización también son sólidas. El rendimiento de la CPU y la GPU también es convincente. Aunque el Ryzen 7 255 no es una potencia en comparación con otras CPU para juegos, el chip Zen 4 ofrece un rendimiento constante. La calidad del sonido, sin embargo, podría mejorarse. Los altavoces integrados ofrecen un audio más bien modesto.
En general, la puntuación no alcanza la de su principal rival, el Lenovo Legion 7 16, pero el XMG Core 16 VE supera a muchos otros portátiles RTX 5060, como el Tulpar T6 V3.5 y el HP Omen 16. Nuestras tablas comparativas también incluyen un portátil RTX 5070 o RTX 5070 Ti más potente para contextualizar.
Pro
Contra
Precio y disponibilidad
Como ya se ha mencionado, el XMG Core 16 VE (M25) está disponible directamente del fabricante a partir de 1.479 euros (unos 1.711 dólares).
Nota del traductor: Los portátiles XMG no están disponibles oficialmente en Norteamérica.
Especificaciones
Caso
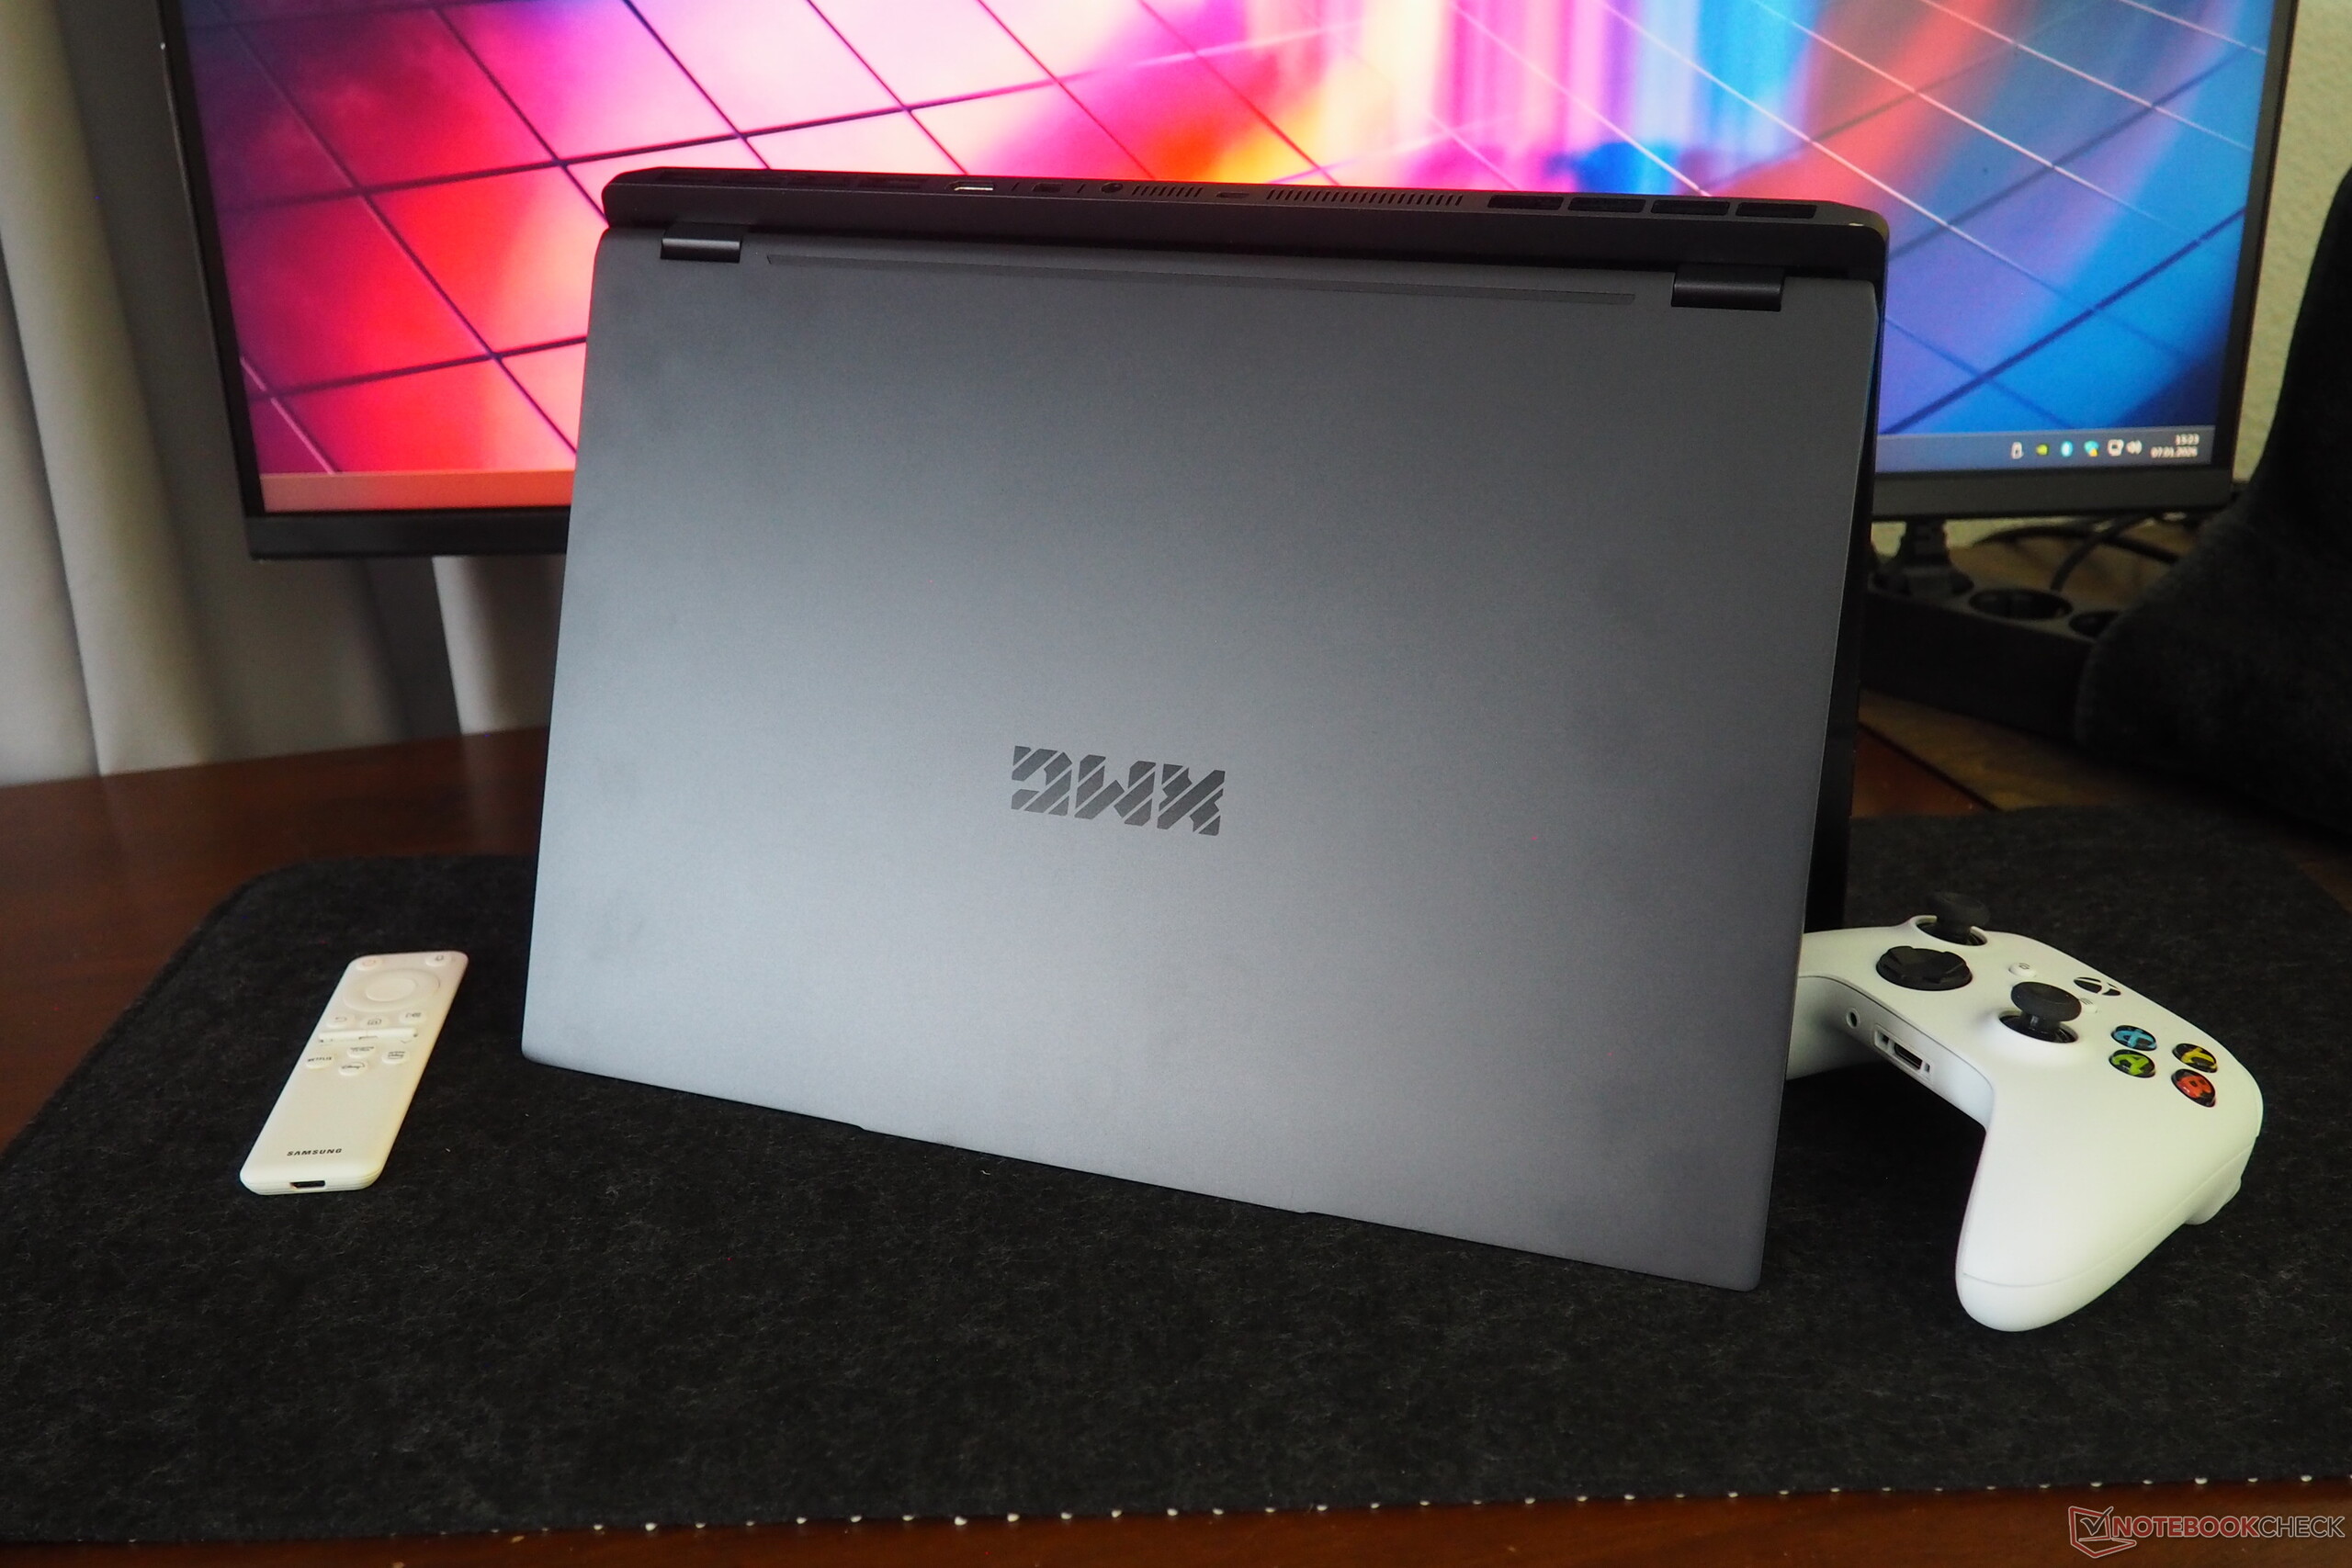
El chasis se siente de primera calidad gracias al uso de componentes metálicos. Aunque las superficies oscuras son propensas a las huellas dactilares, la rigidez es impresionante en la mayoría de las zonas. El generoso ángulo de apertura de 180° también merece elogios. Con 2,1 kg, el XMG Core 16 VE se sitúa en el extremo inferior del grupo de comparación, por lo que no resulta excesivamente pesado. Con 2,3 cm de grosor, también se mantiene dentro de unos límites razonables.
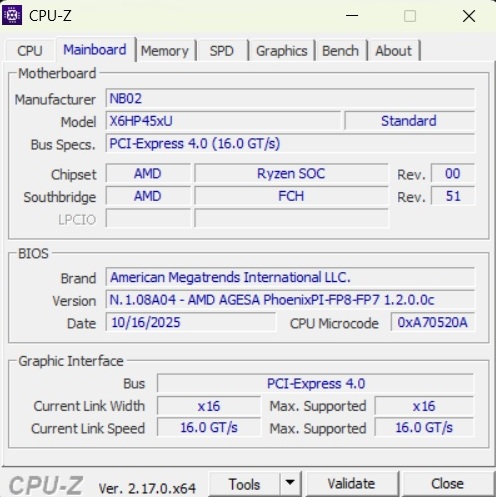
Equipamiento
Schenker deja poco de lo que quejarse en lo que se refiere a conectividad. Además de tres puertos USB-A y dos USB-C, también hay dos salidas de pantalla (HDMI y Mini DisplayPort). El portátil también incluye una toma de audio, un puerto LAN, un lector de tarjetas muy rápido y una ranura de bloqueo Kensington.
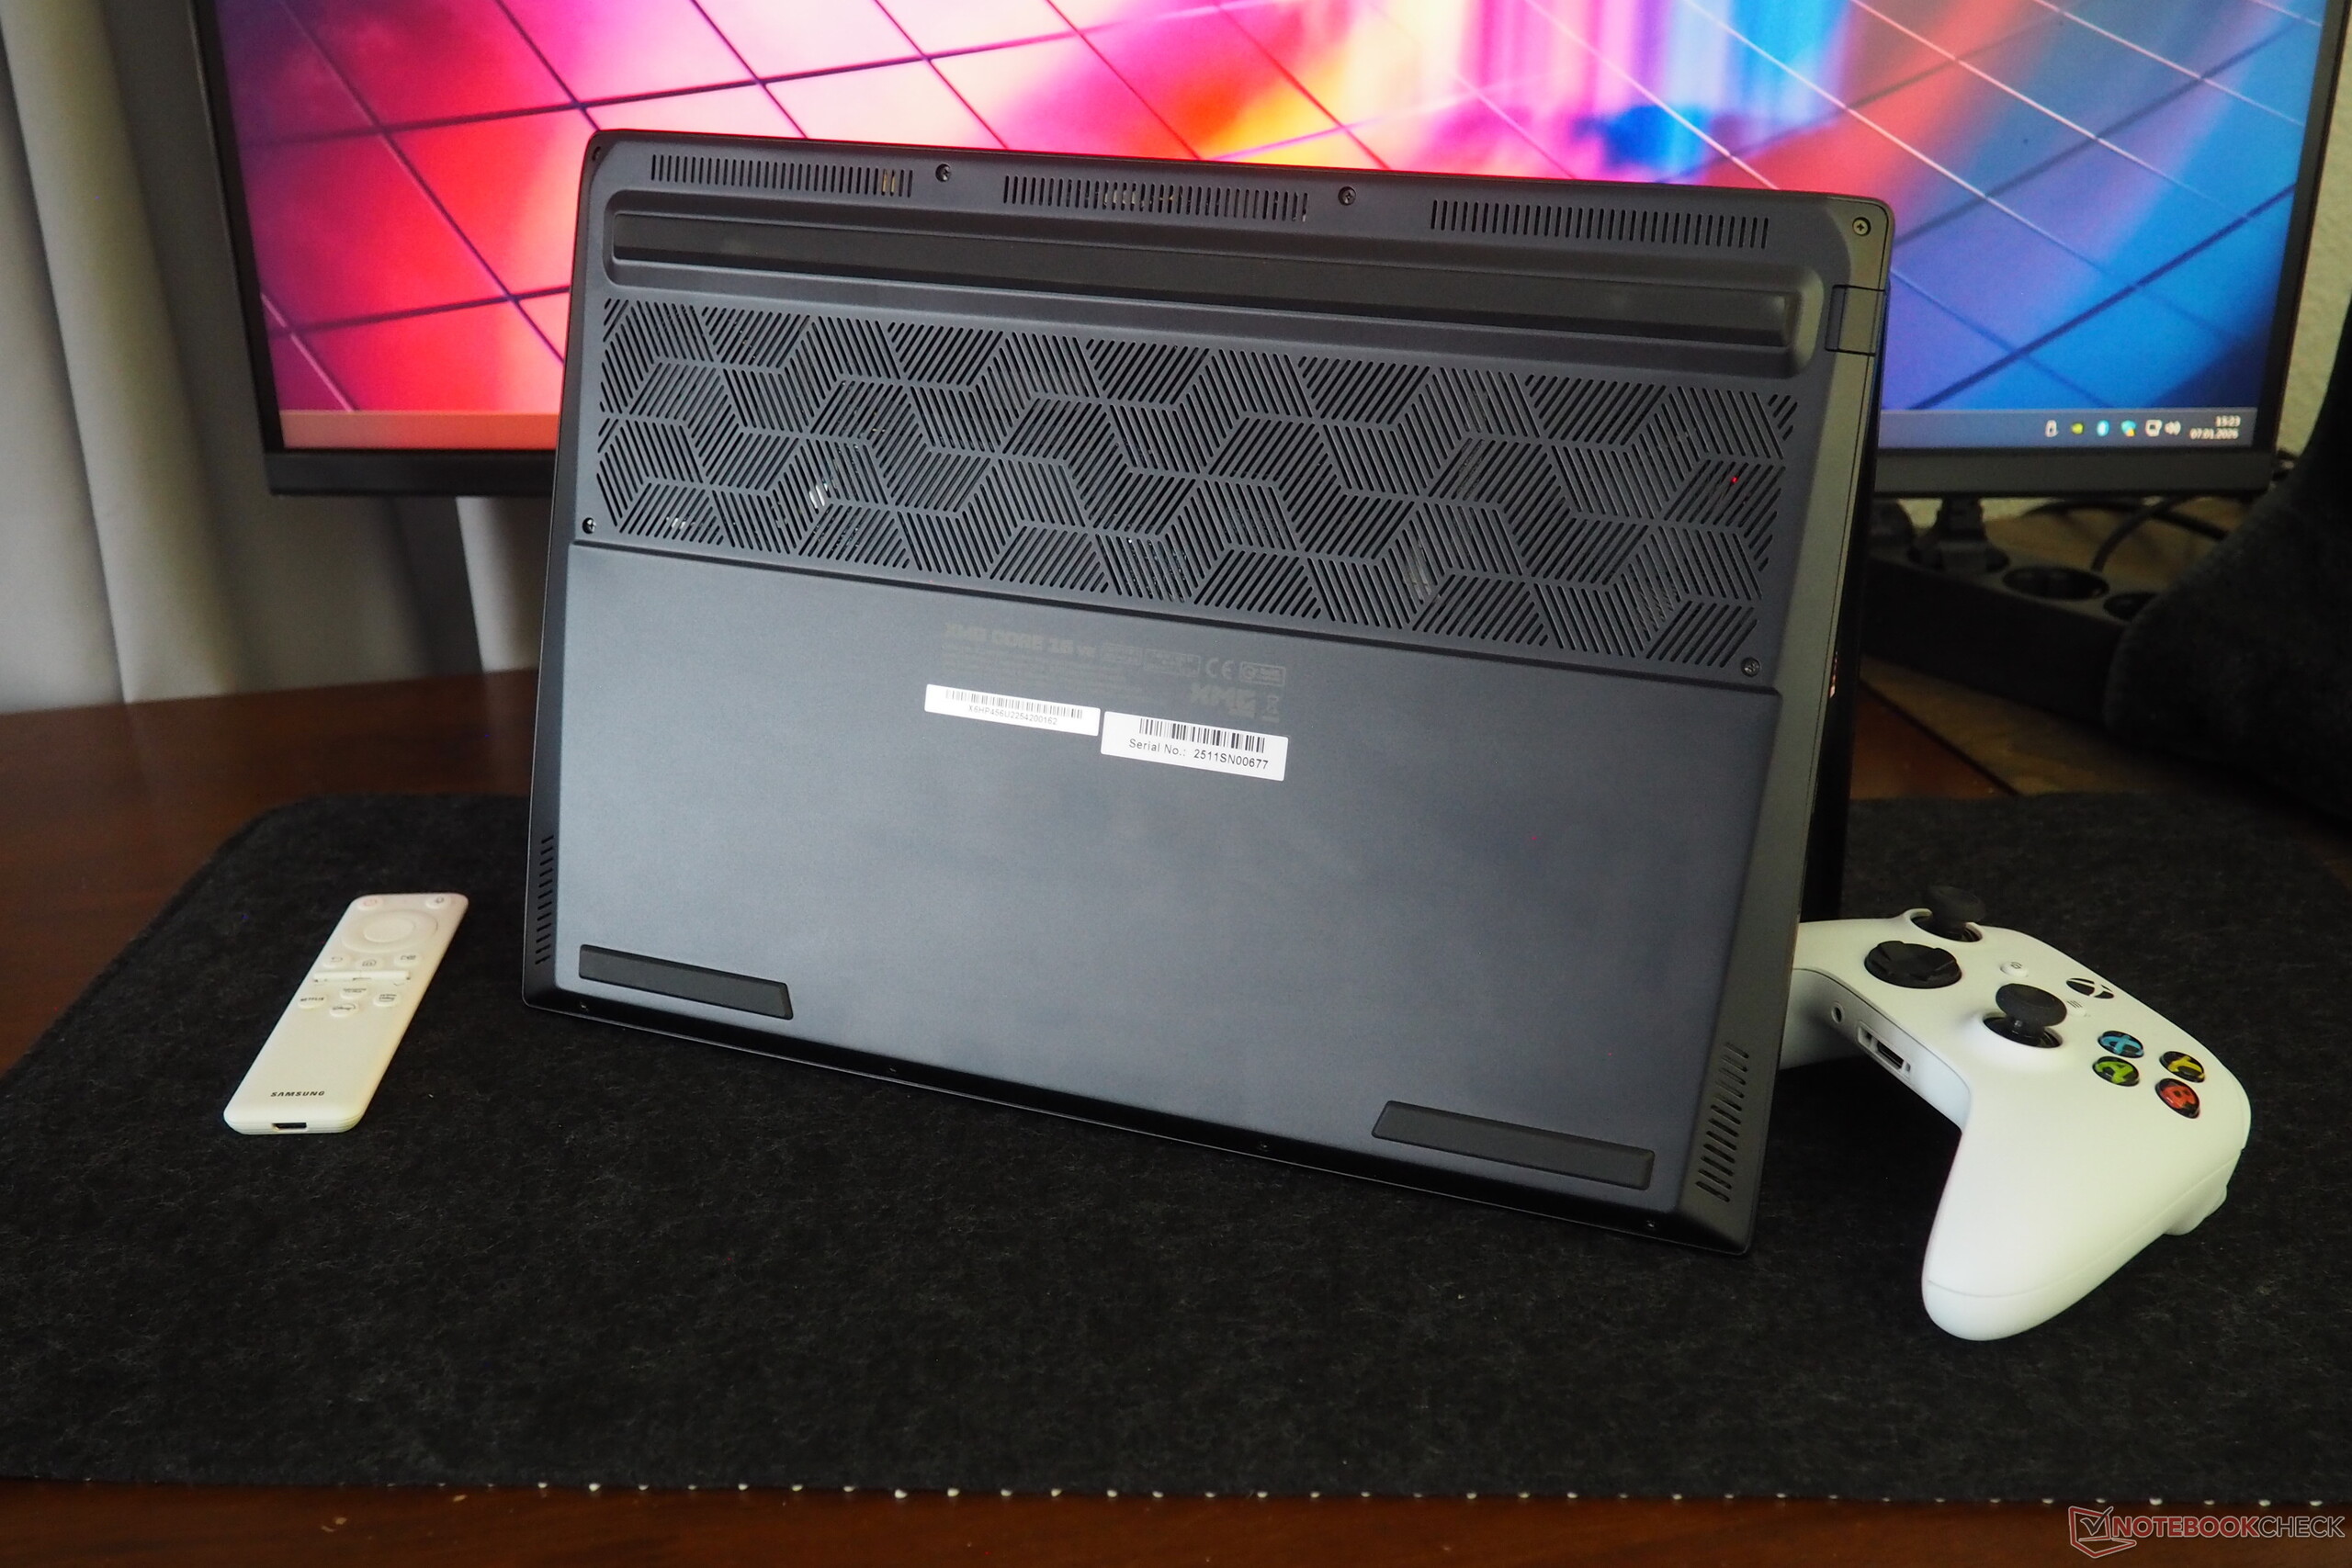
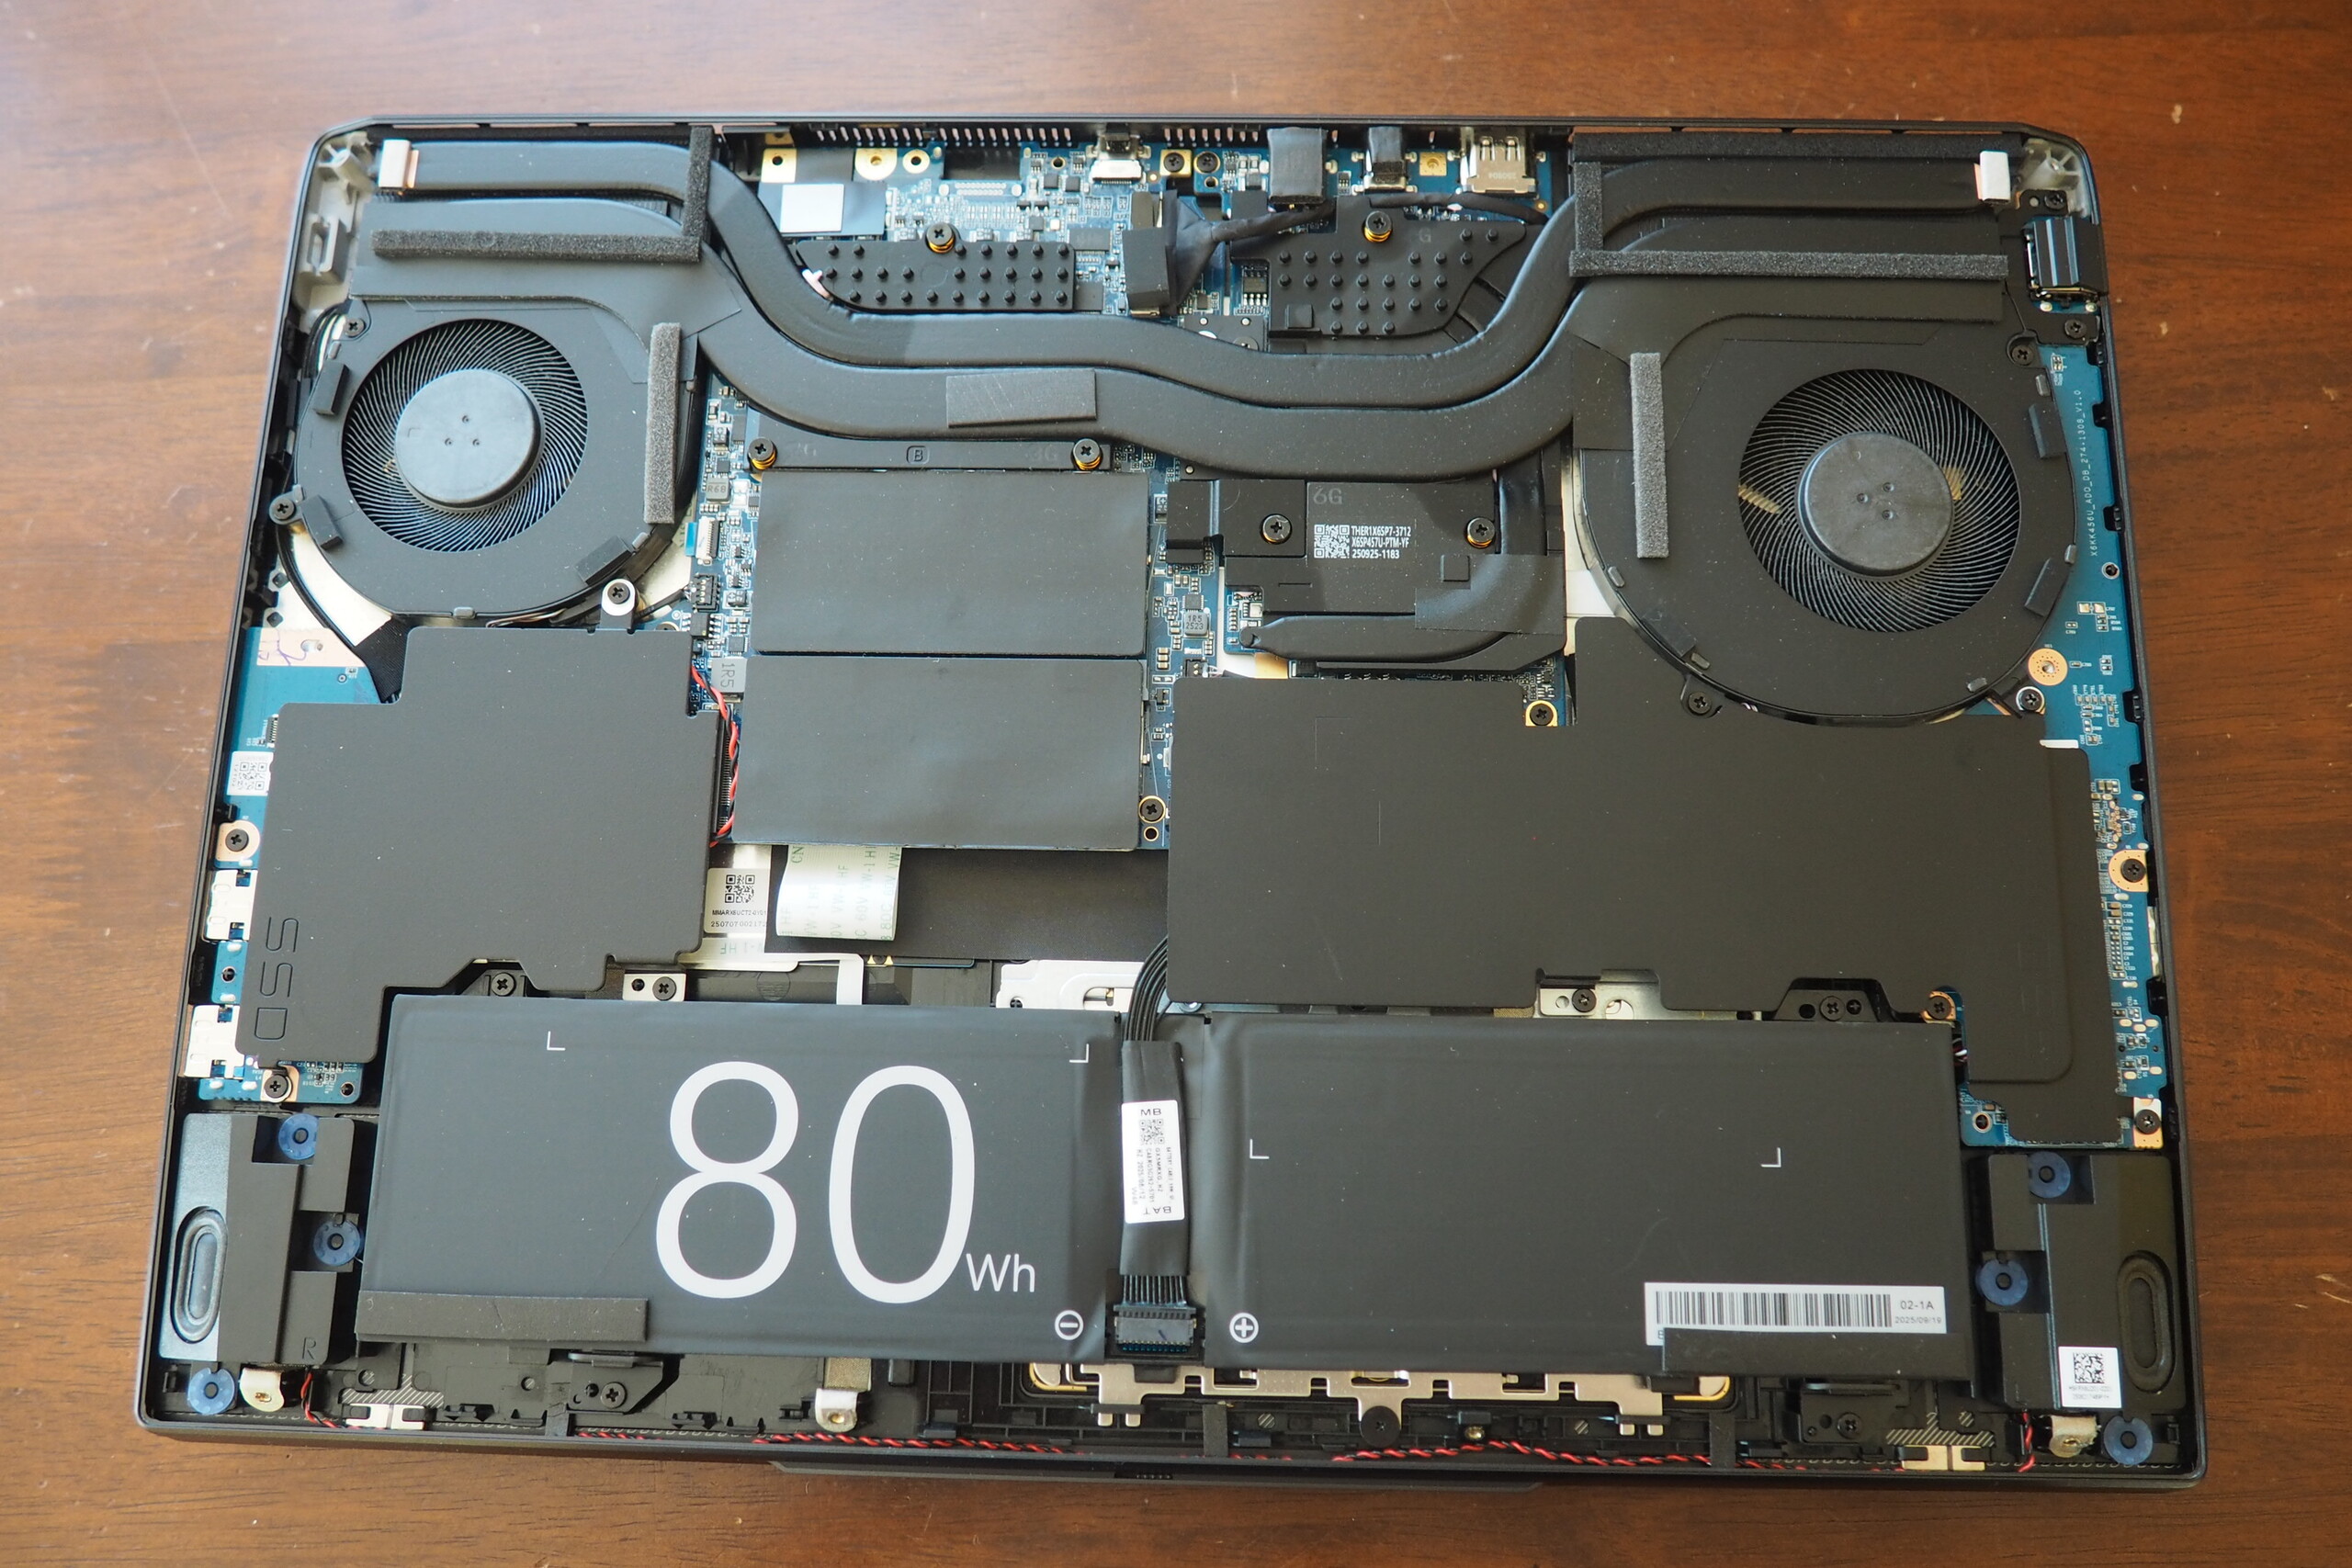
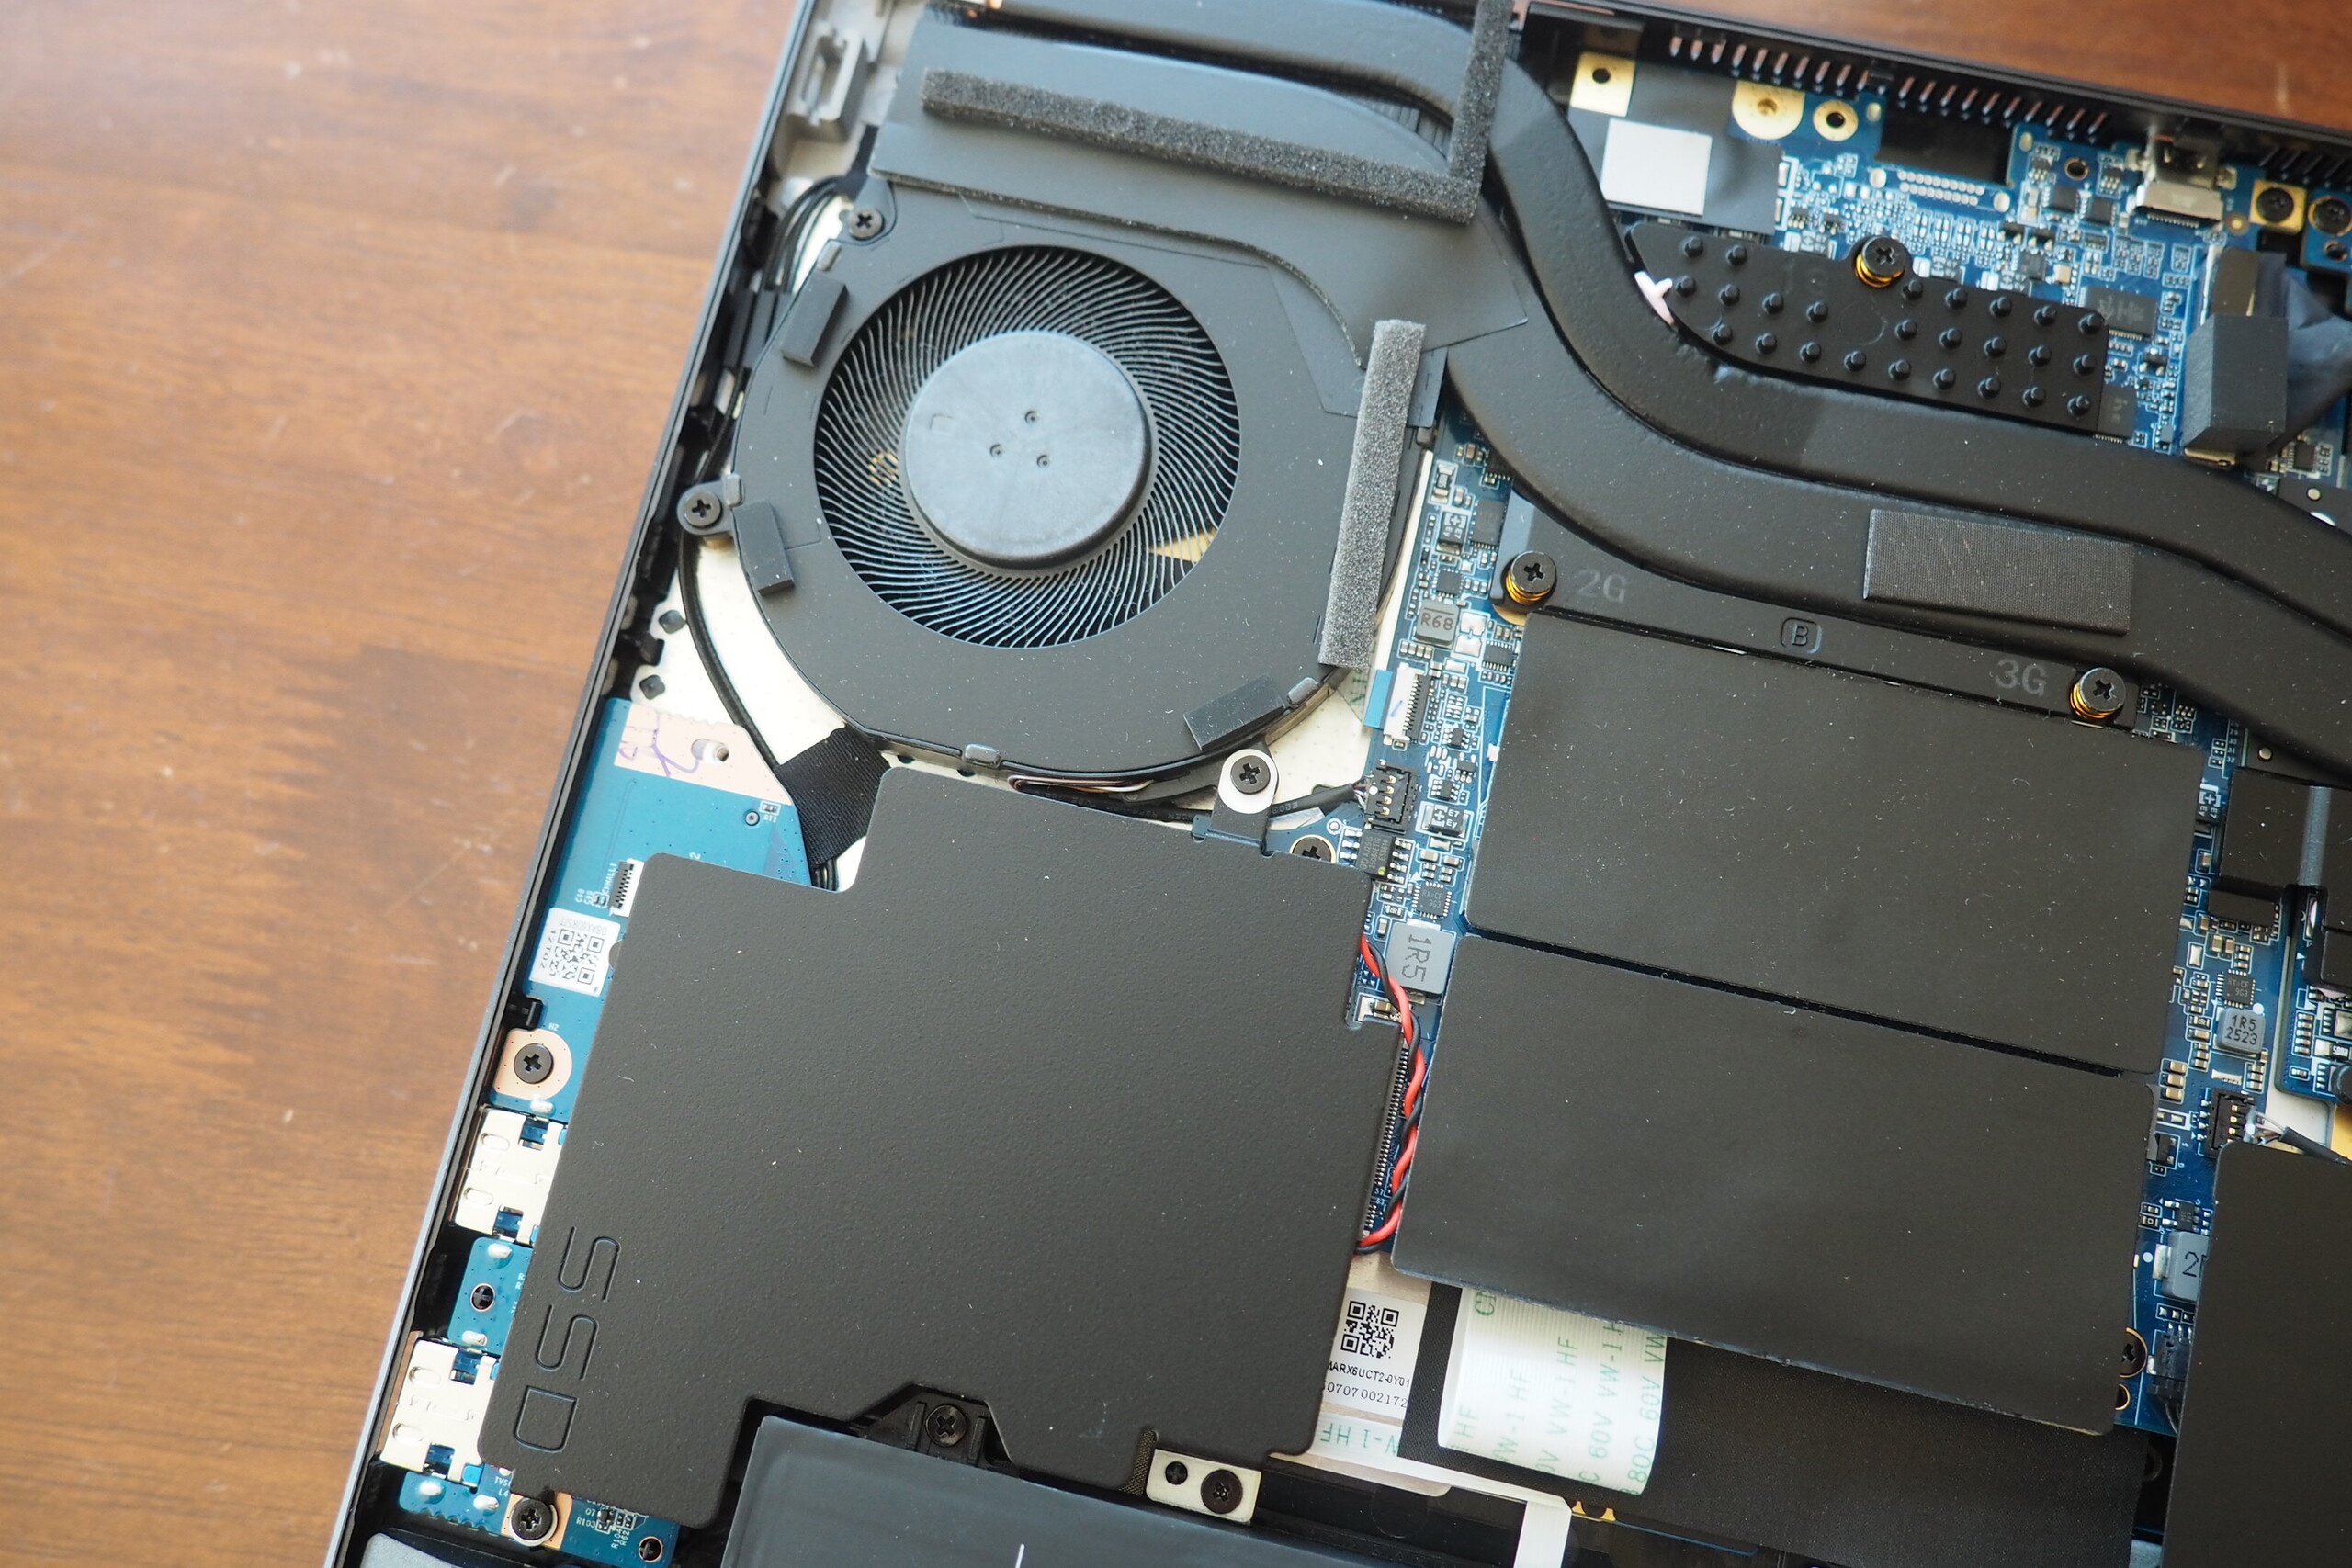
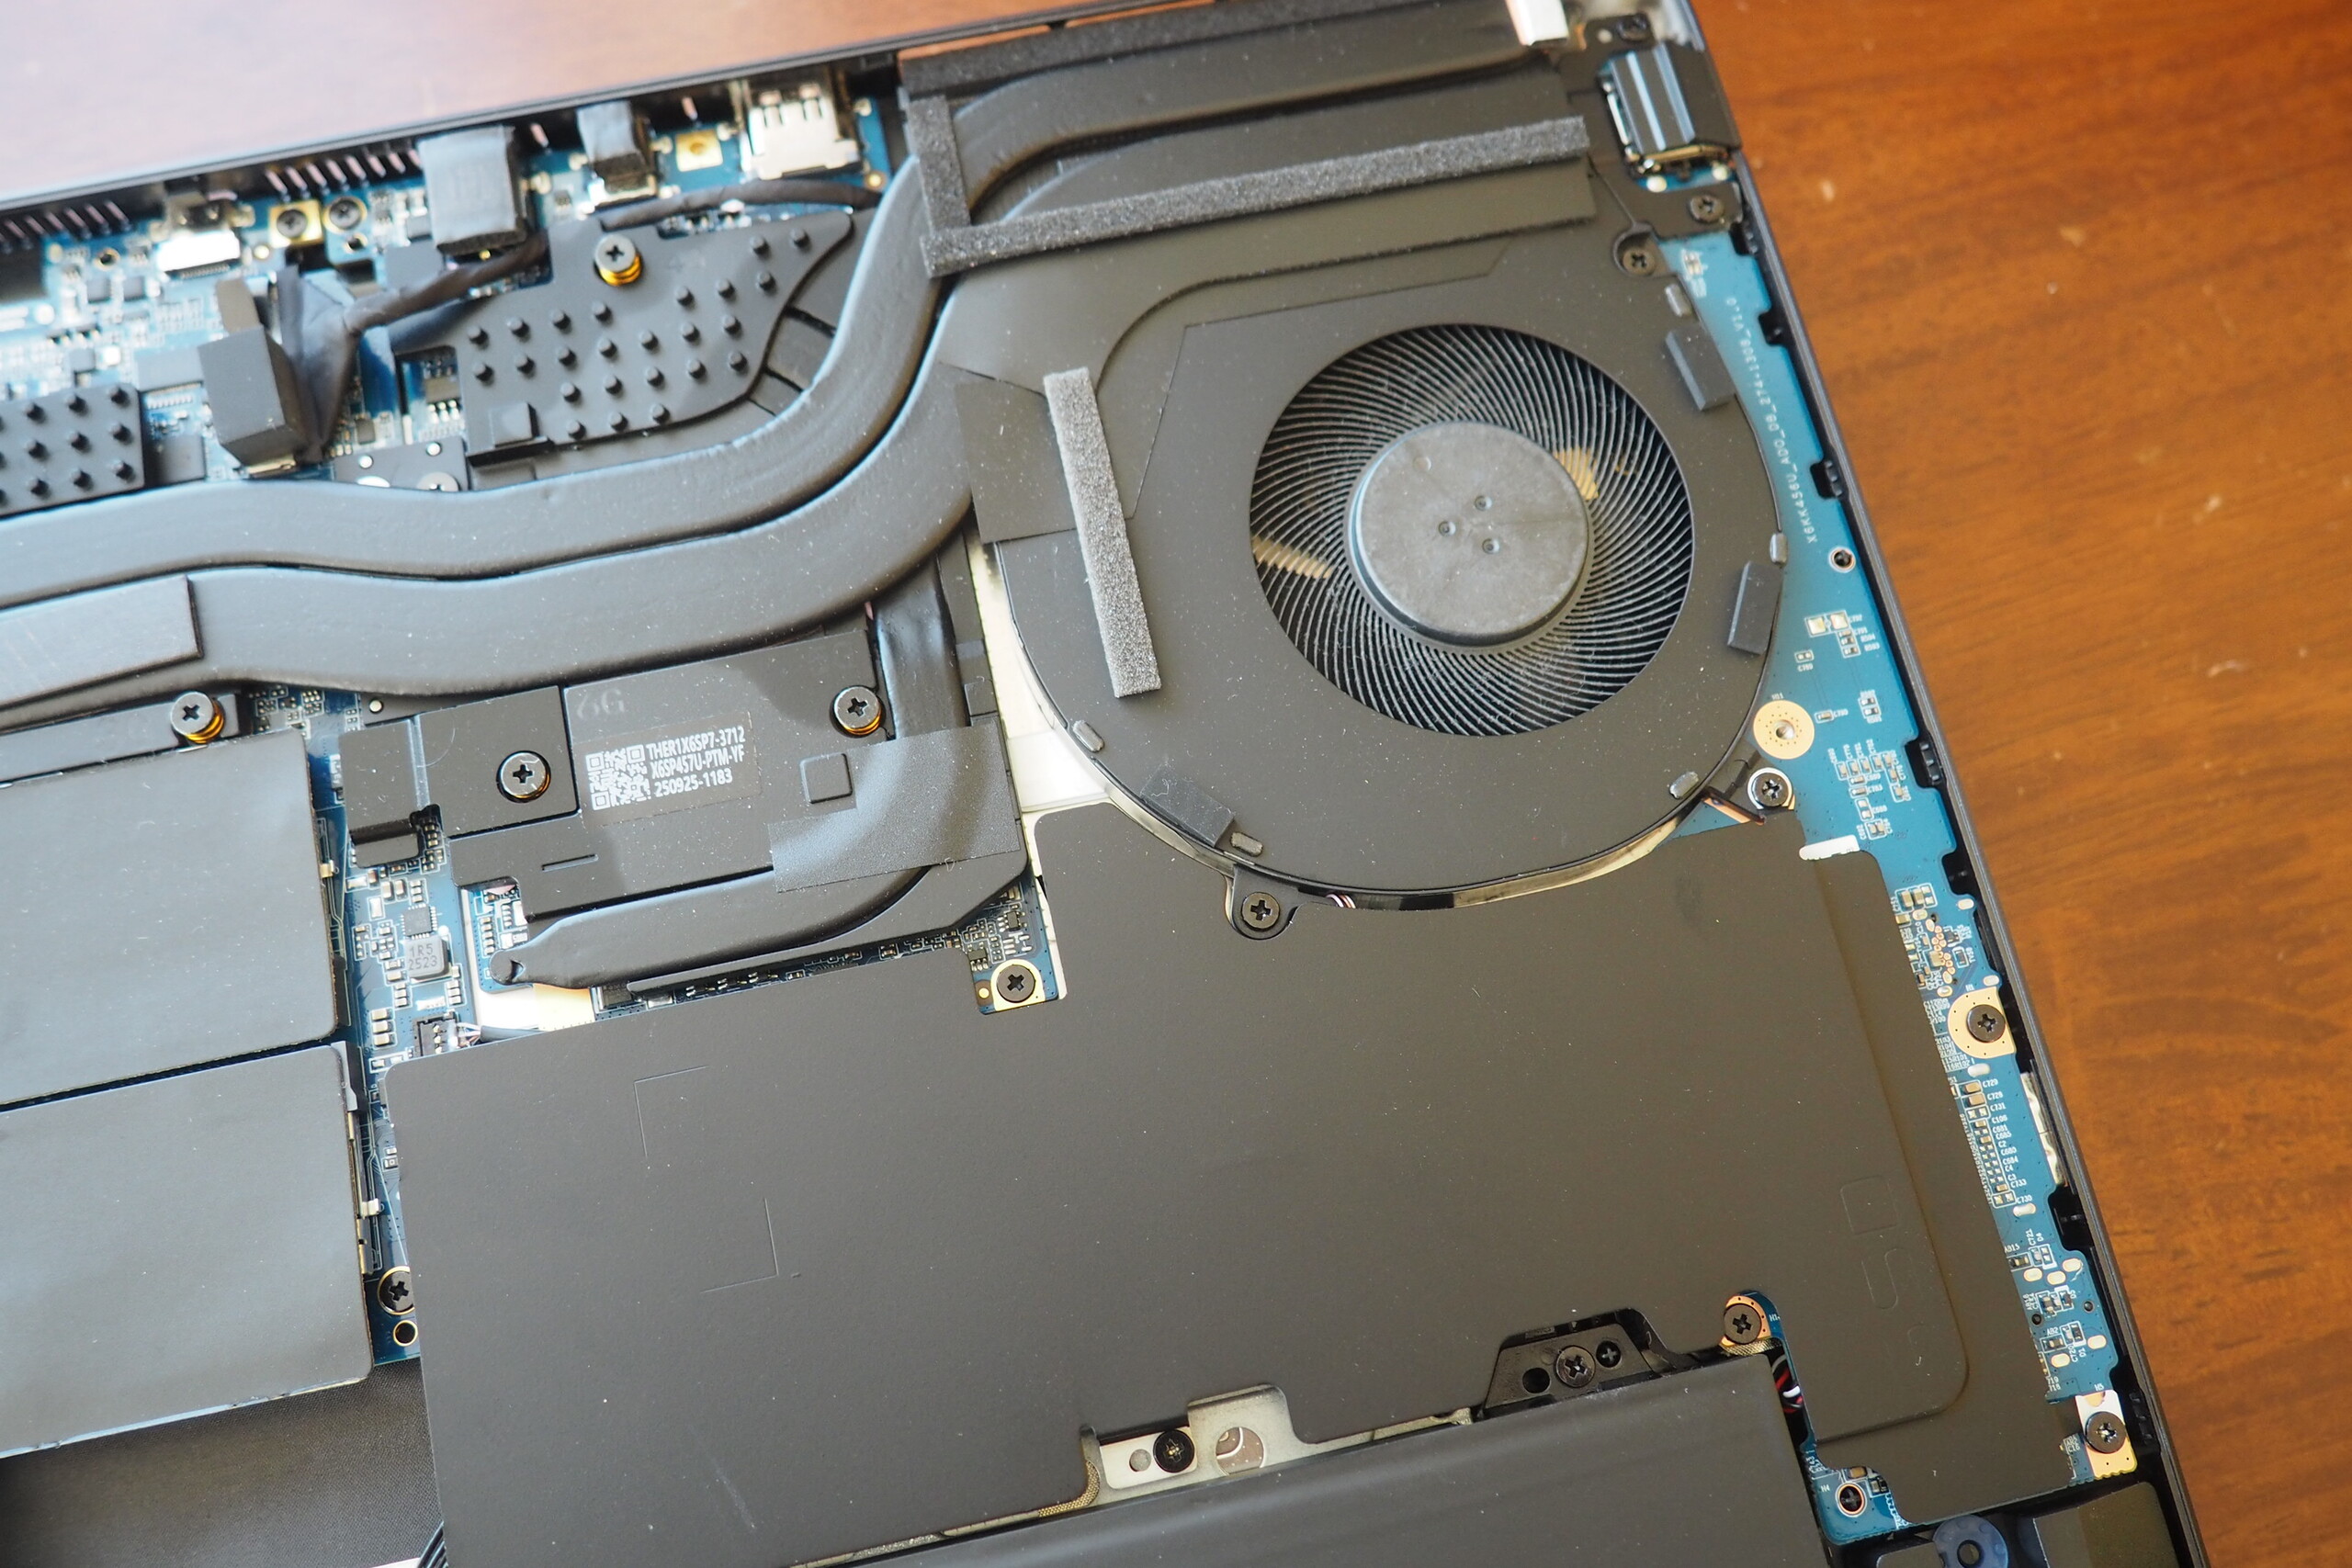
El módulo Wi-Fi MediaTek ofrece velocidades de carga decentes y velocidades de descarga muy buenas. A continuación está la cámara web FHD, que ofrece imágenes bastante nítidas para los estándares de los portátiles e incluye un obturador físico de privacidad. Acceder a las partes internas es fácil tras retirar 10 tornillos de cabeza Phillips; encontrará fotos de las partes internas a continuación.


Lector de tarjetas SD
| SD Card Reader - average JPG Copy Test (av. of 3 runs) | |
| Schenker XMG Core 16 VE M25 (AV PRO microSD 128 GB V60) | |
| Schenker XMG Core 16 M25 (Angelbird AV Pro V60) | |
| Media de la clase Gaming (20.9 - 210, n=54, últimos 2 años) | |
| Lenovo Legion 7 16IAX10 (Toshiba Exceria Pro SDXC 64 GB UHS-II) | |
| Acer Predator Helios Neo 16S AI PHN16S-71-94L9 (AV PRO microSD 128 GB V60) | |
Comunicación
Cámara web


Mantenimiento
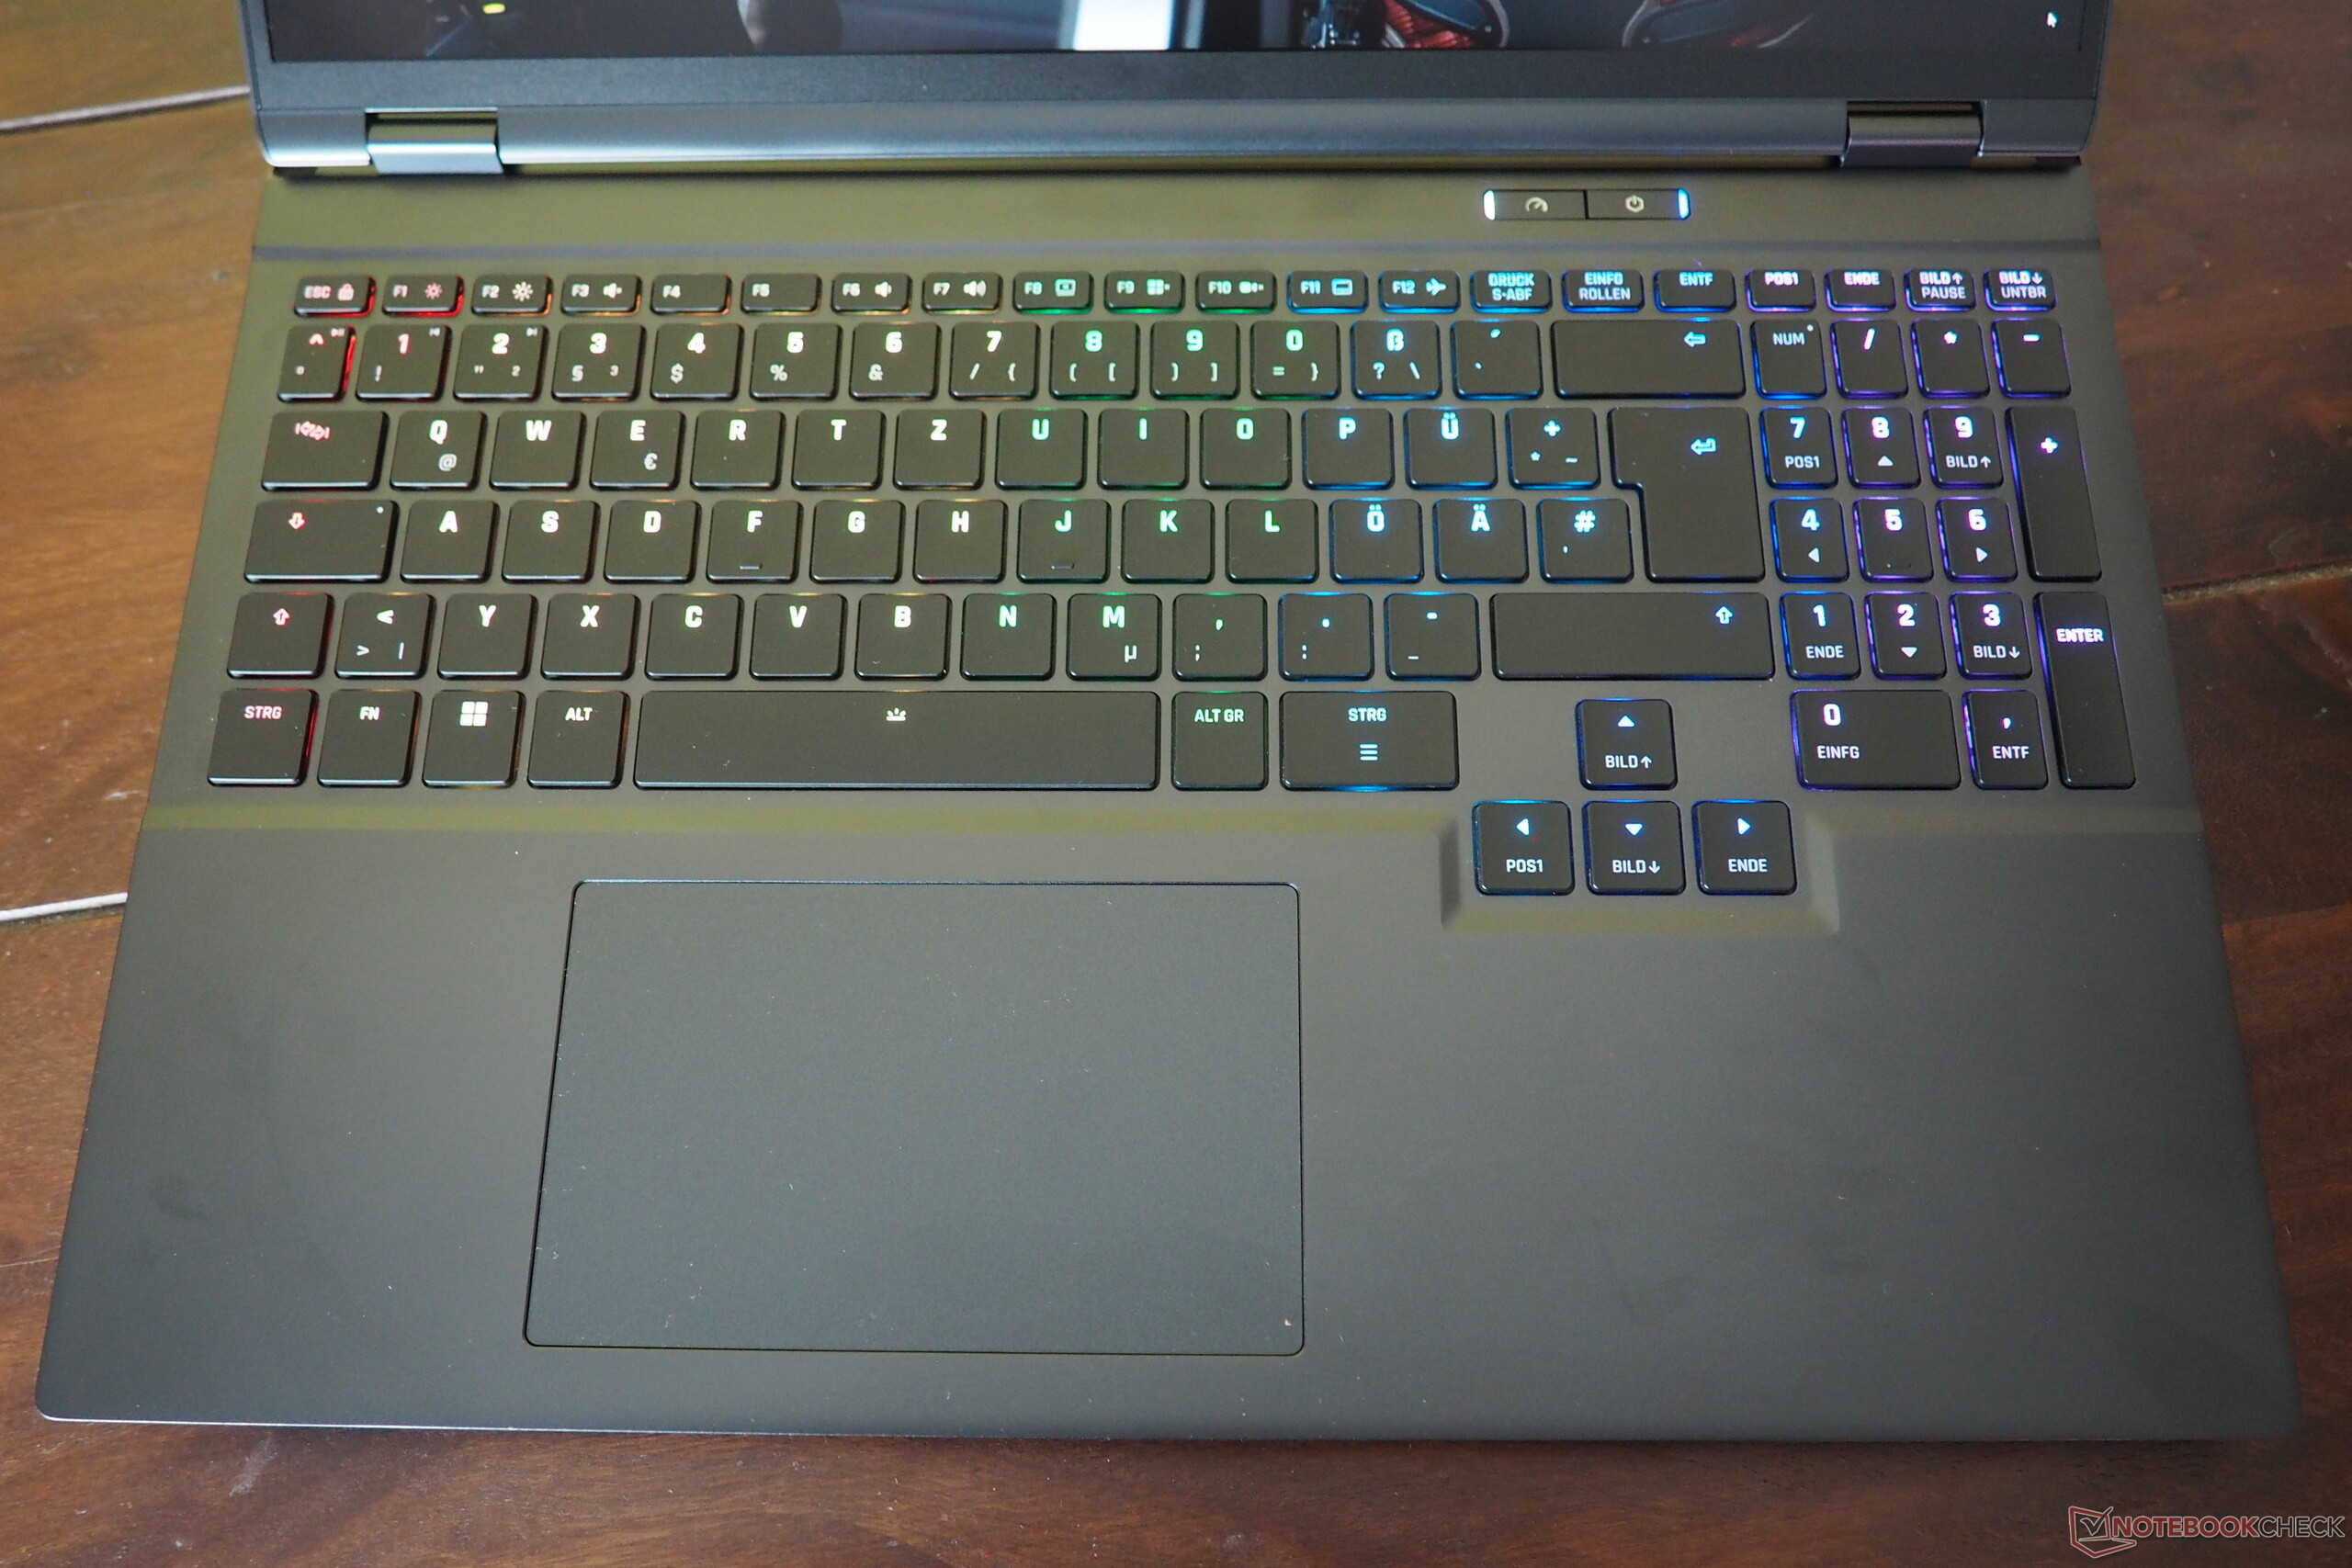
Dispositivos de entrada
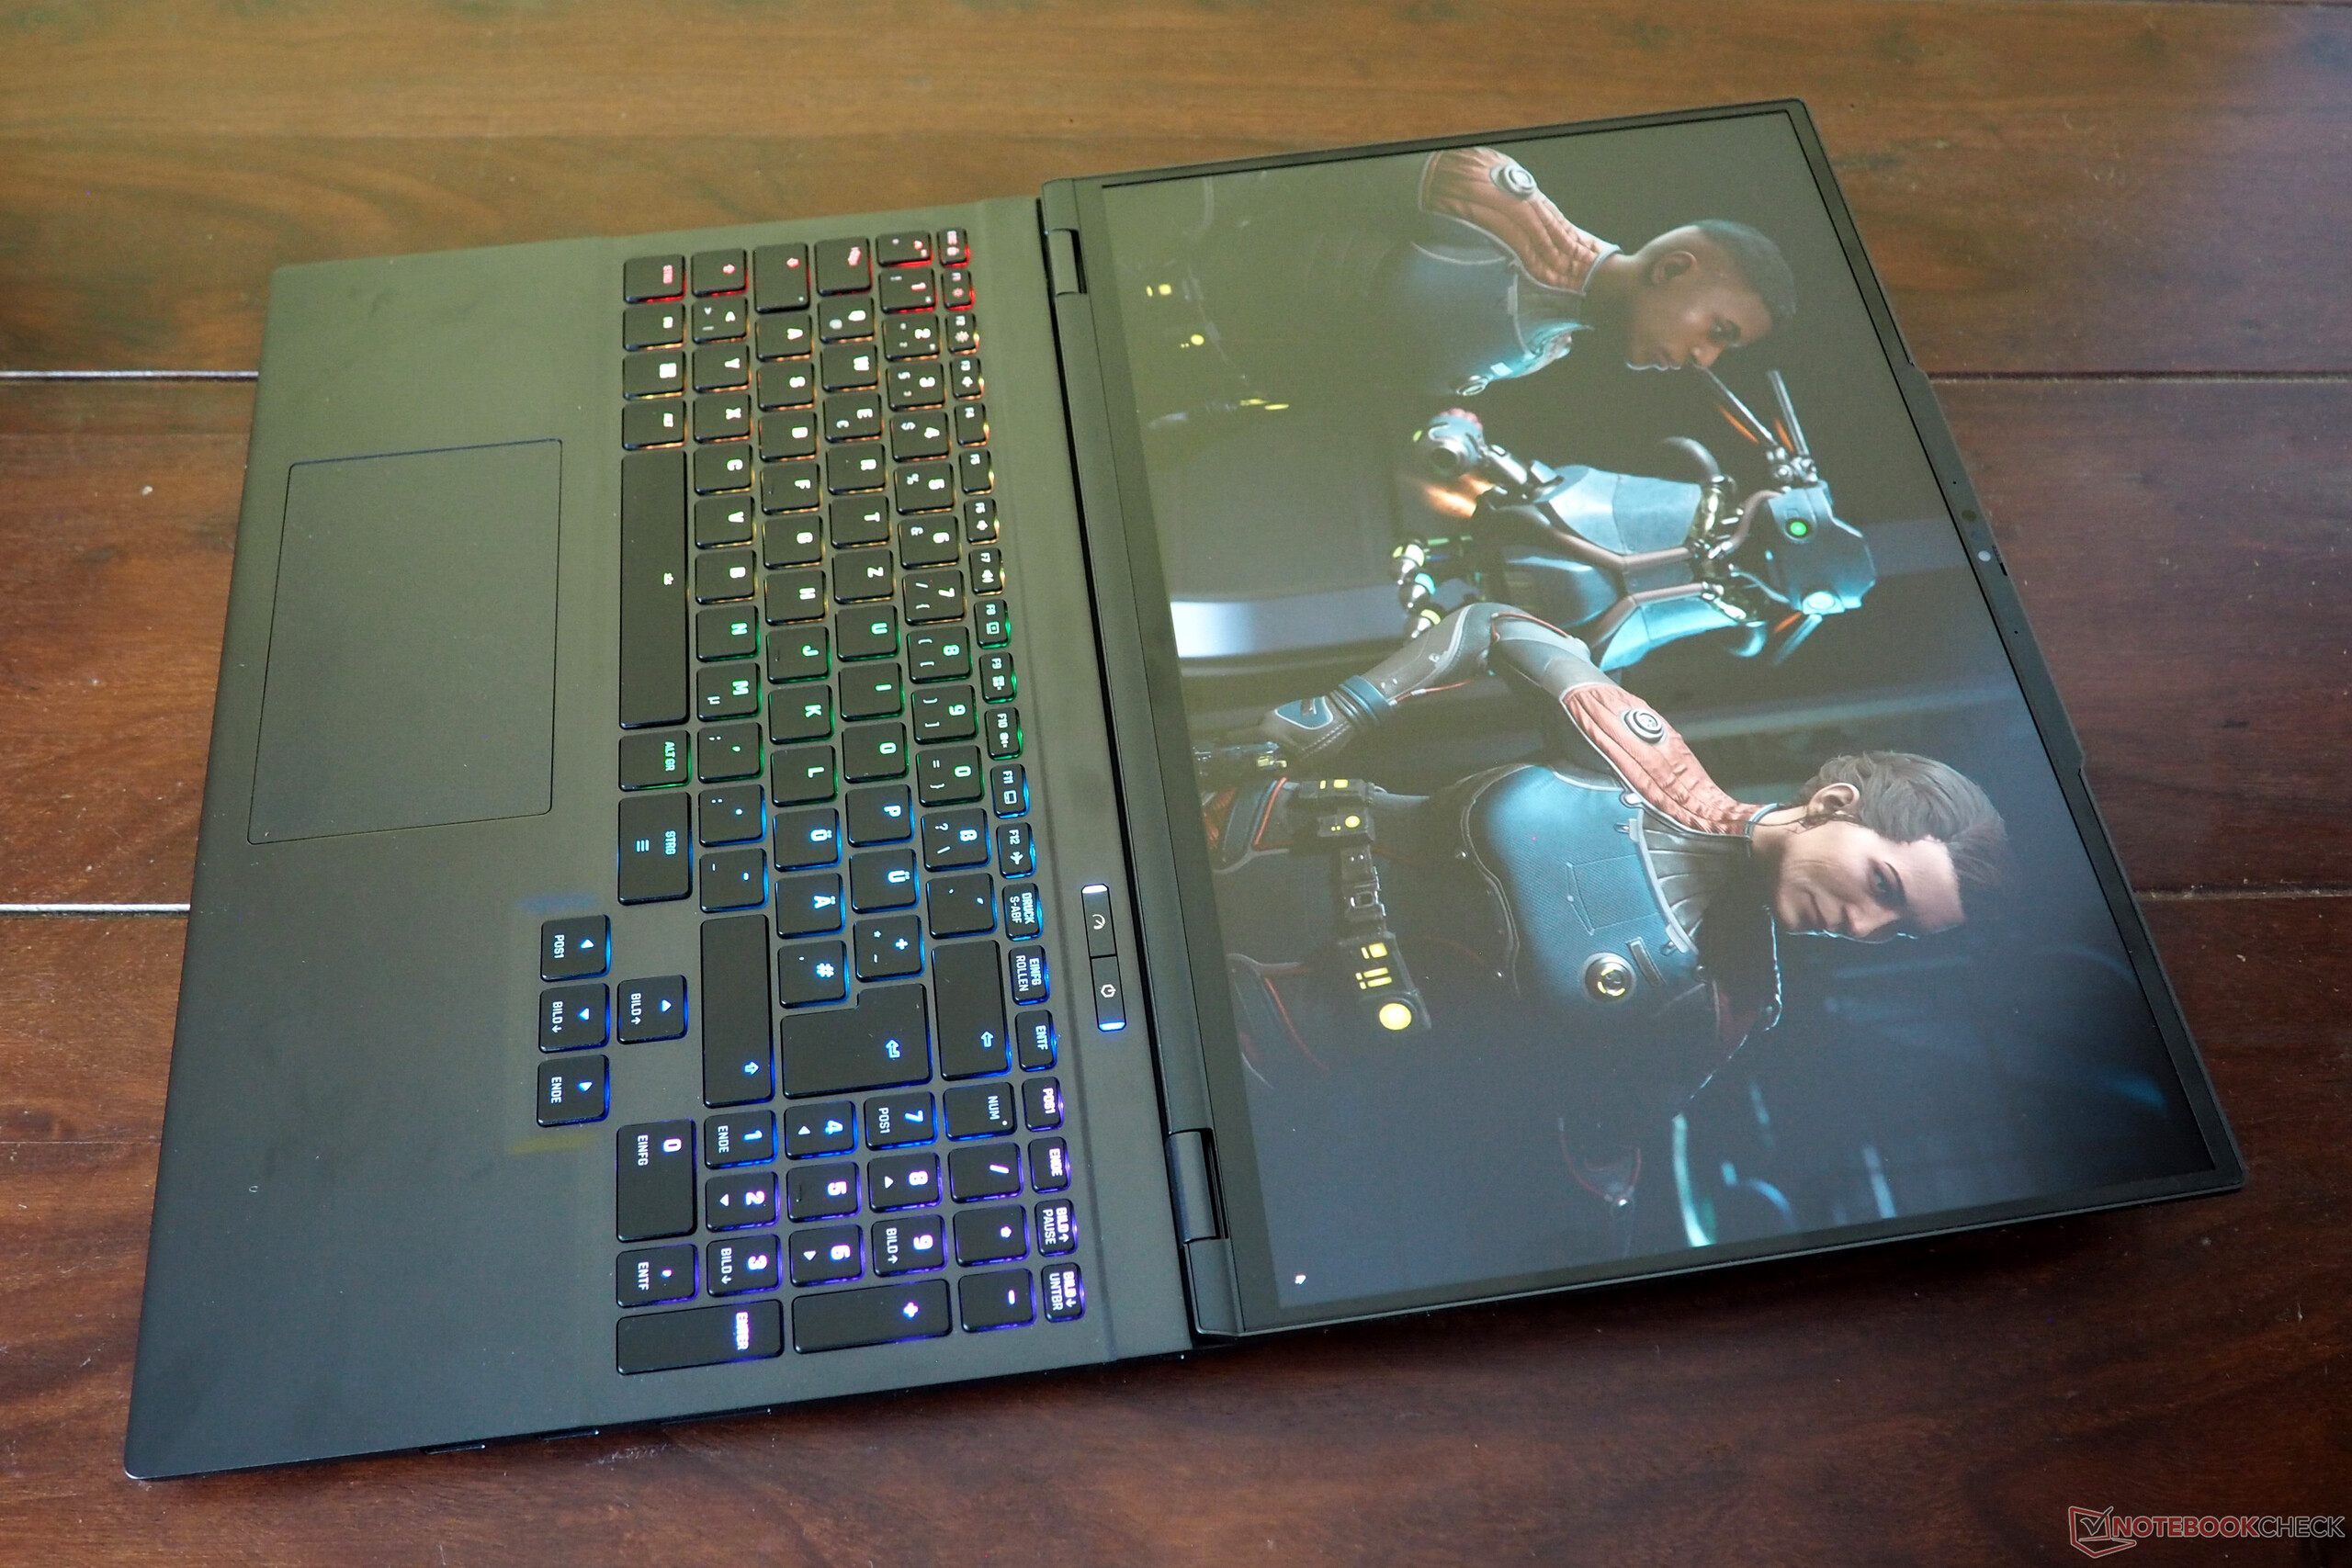
Para ser un teclado de cúpula de goma, la sensación al escribir es relativamente buena. Nos impresionó especialmente la disposición, que incluye teclas de flecha de tamaño normal y una disposición de teclas bien ejecutada que sigue en gran medida las convenciones estándar. Por supuesto, también incluye retroiluminación RGB.
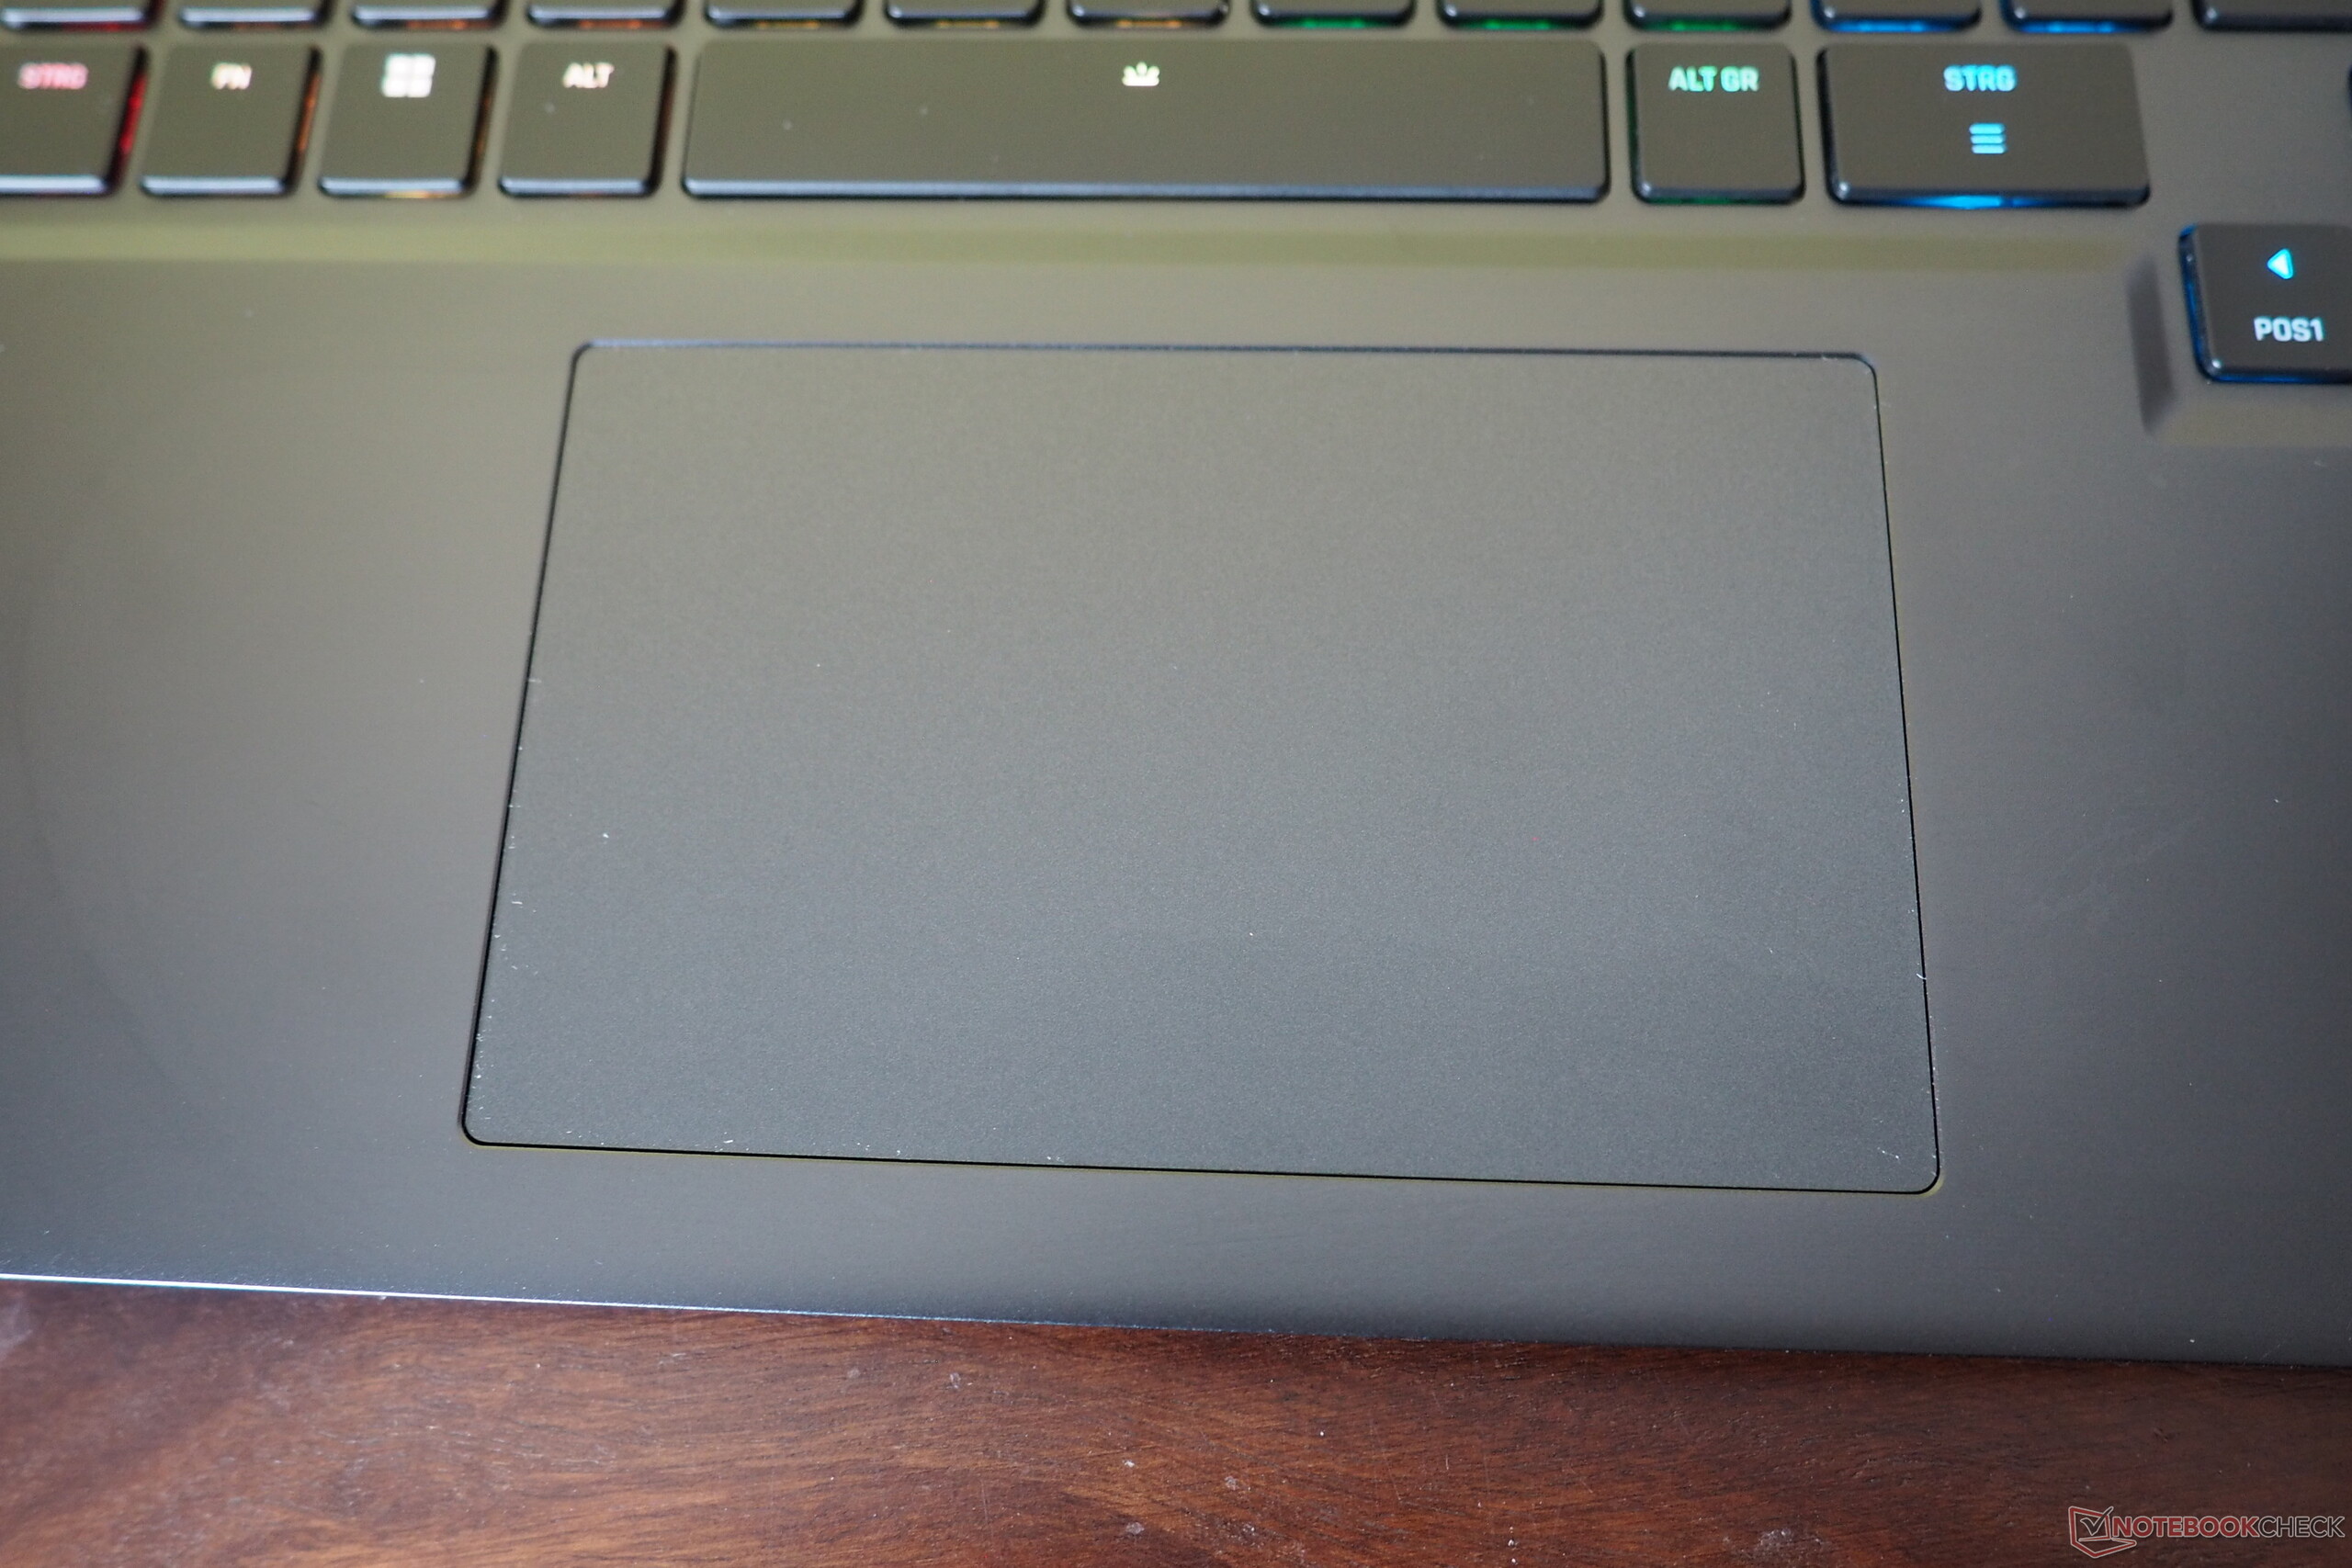
El panel táctil mide aproximadamente 12,3 × 7,6 cm, lo que es apropiado para un portátil de este tamaño. Un pequeño inconveniente: las zonas de clic son bastante ruidosas y se sienten un poco traqueteantes.

Mostrar
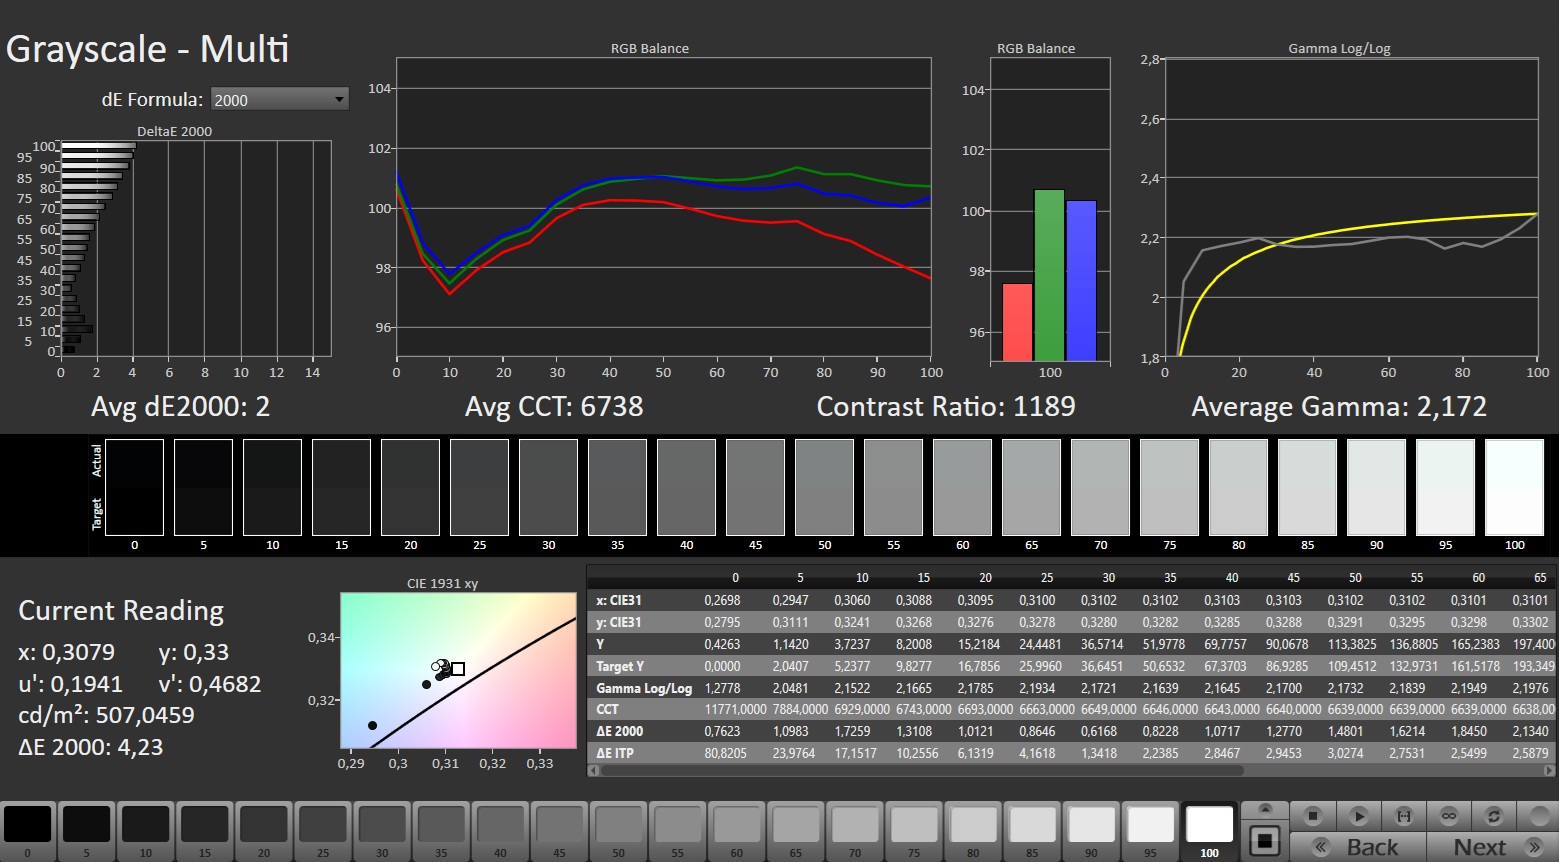
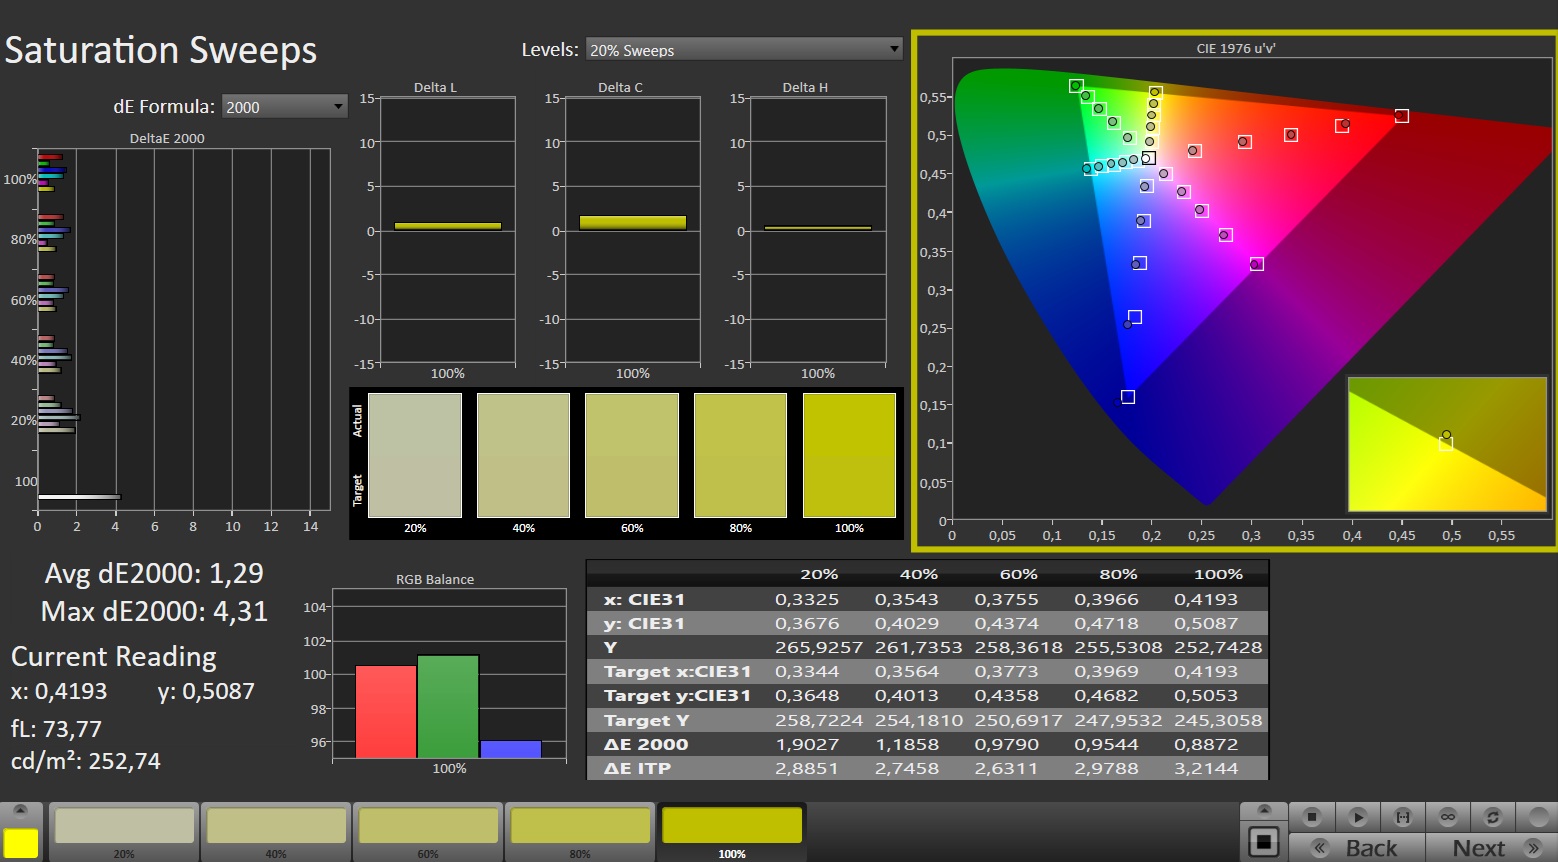
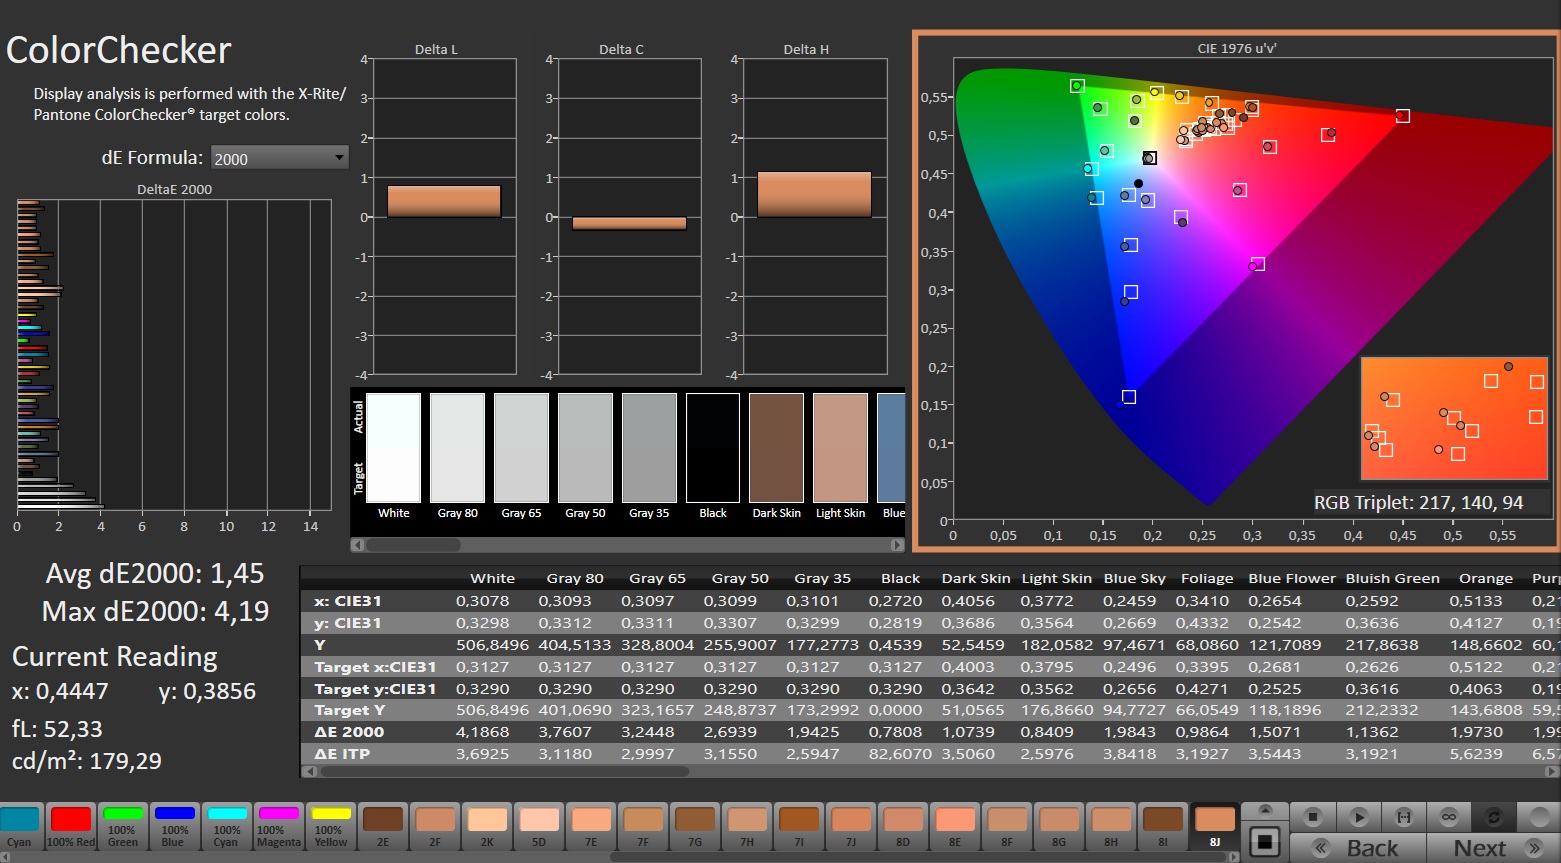
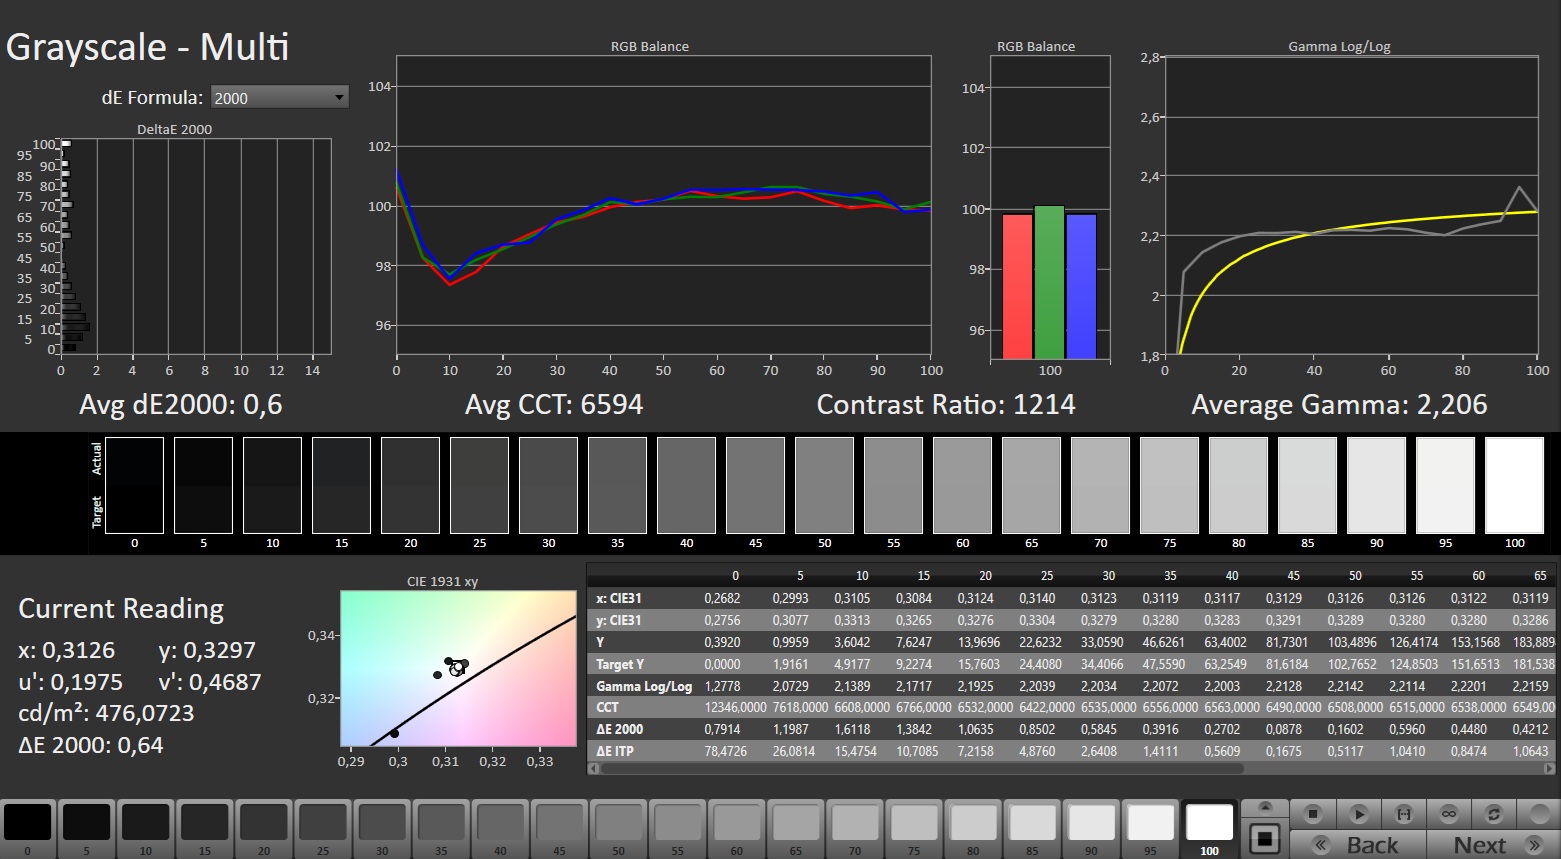
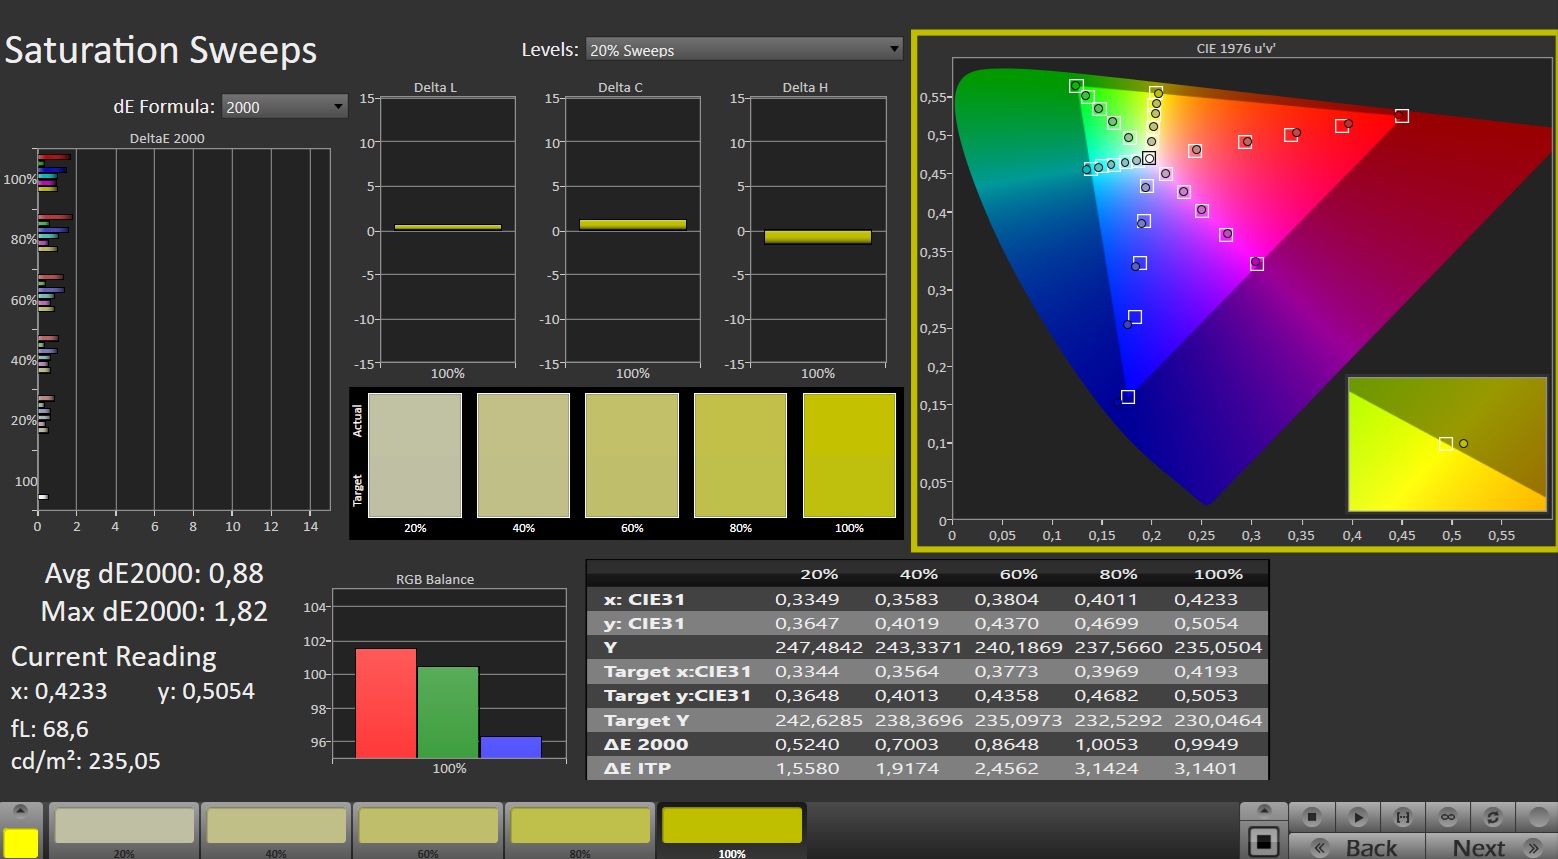
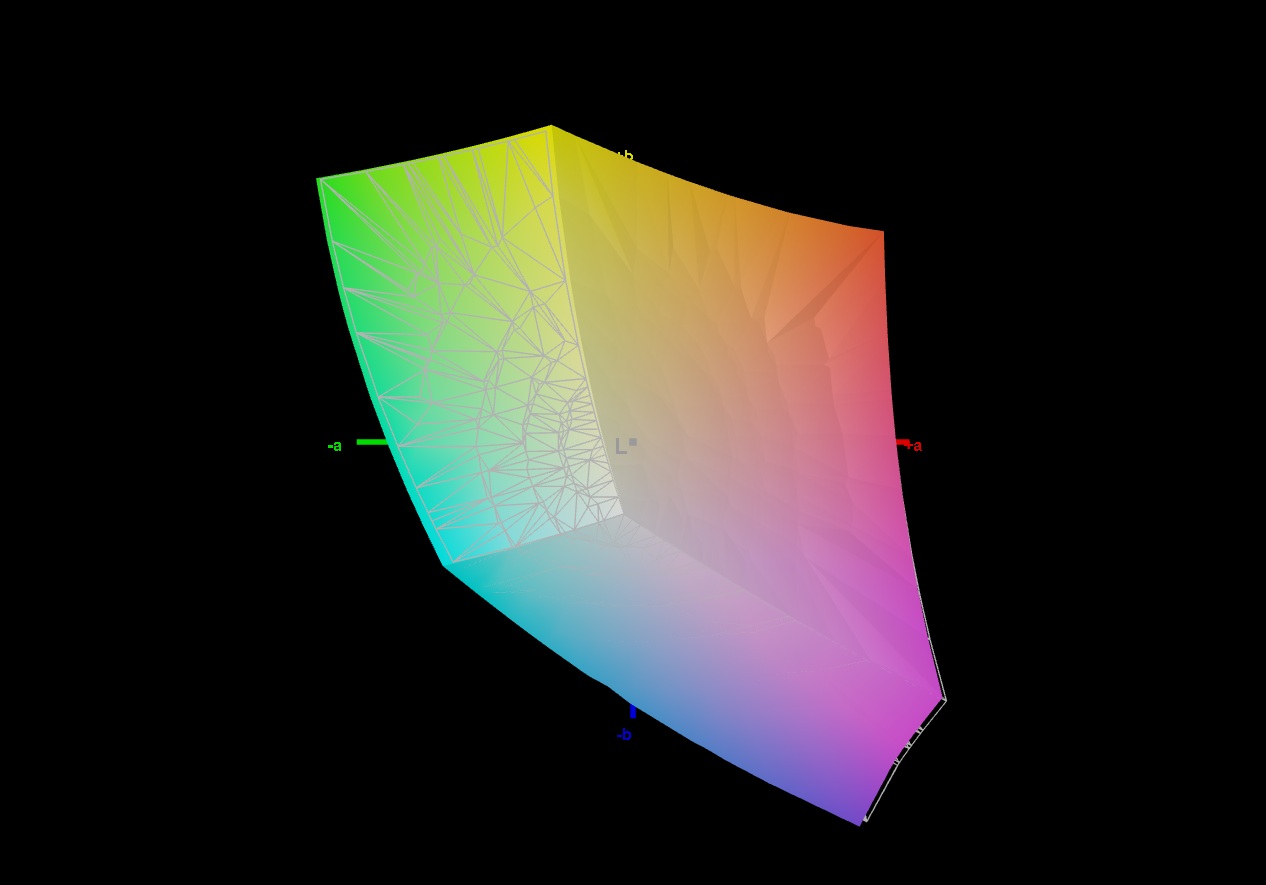
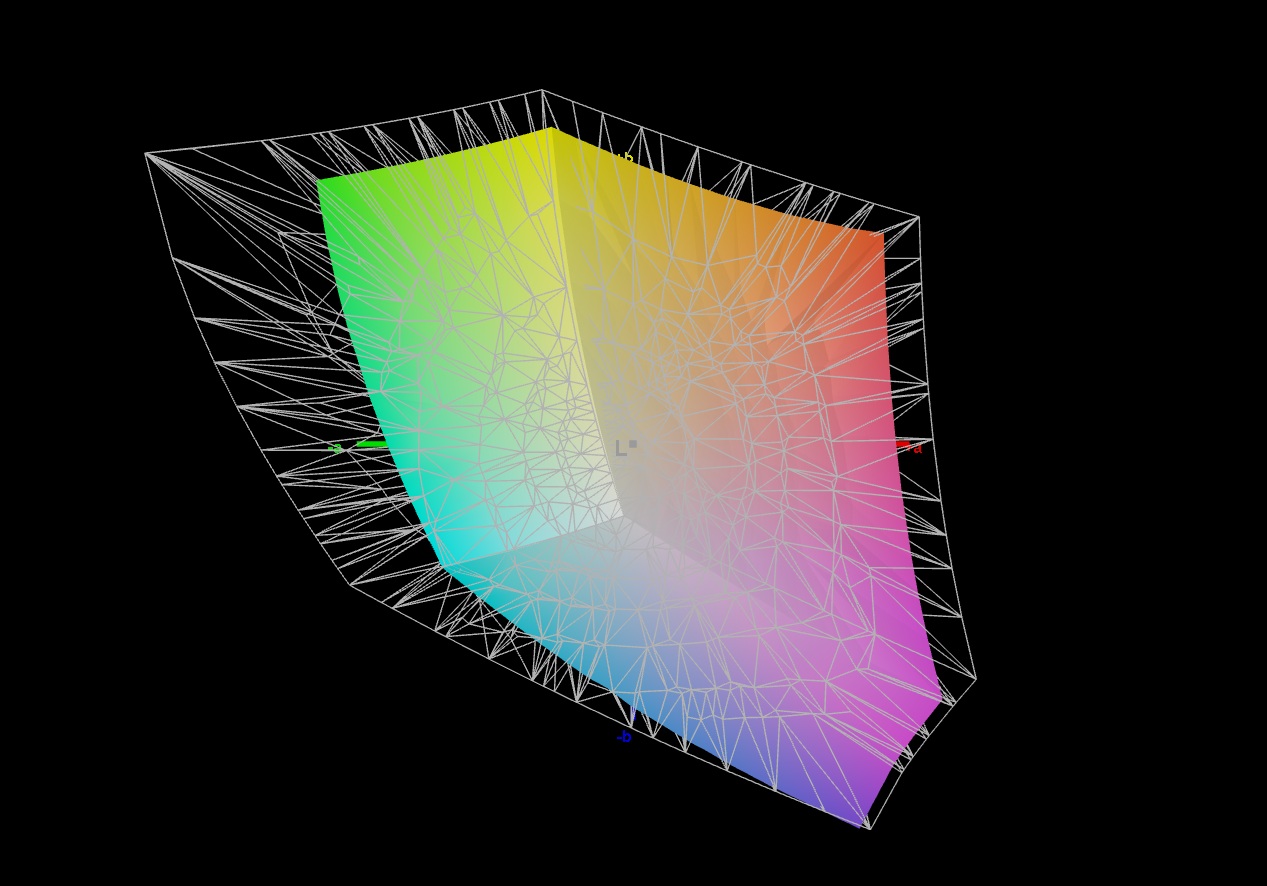
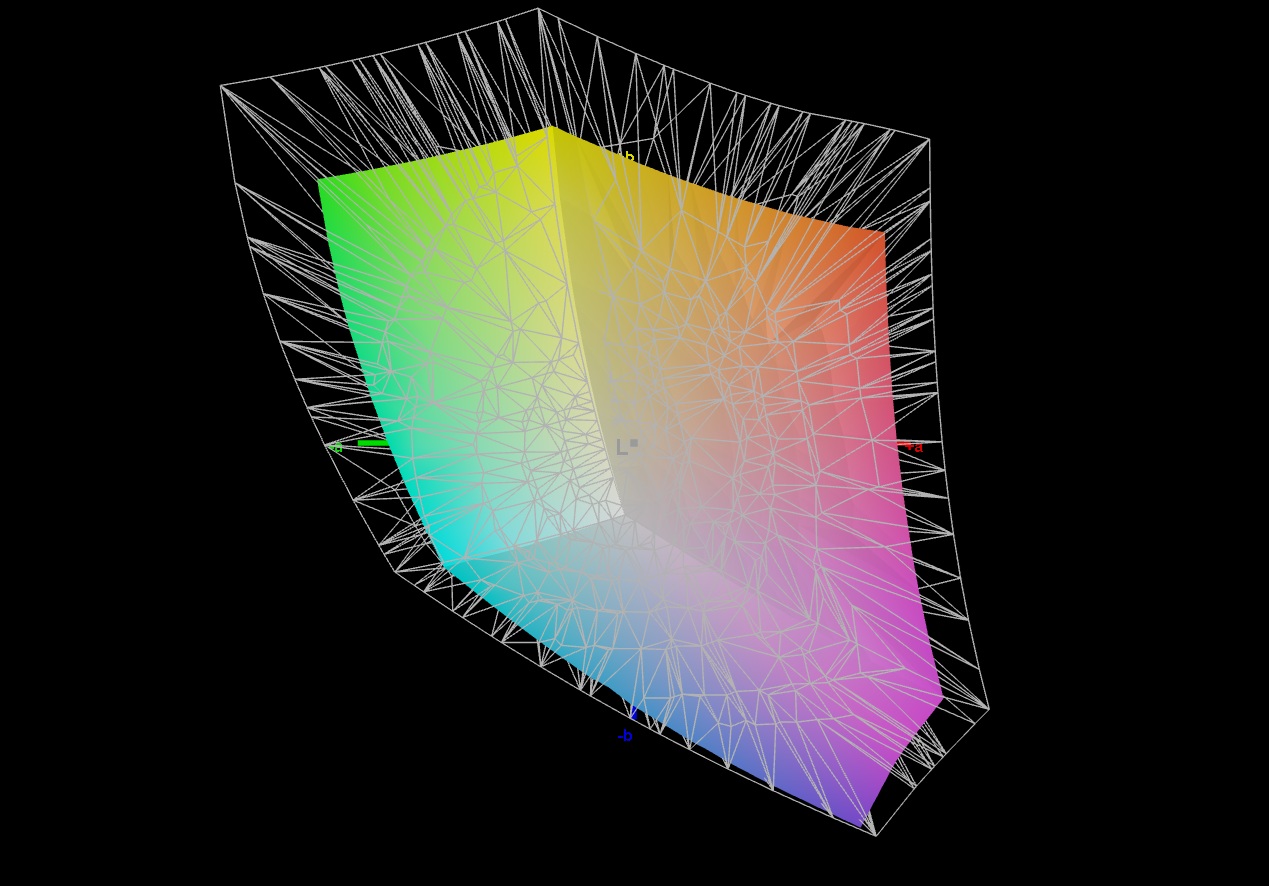
Schenker prescinde del OLED y apuesta por un panel IPS clásico, que resulta especialmente agradable en términos de brillo. Una media de 488 cd/m² está bastante bien y permite su uso en exteriores si es necesario. 2б560 x 1.600 píxeles y 180 Hz también deberían satisfacer a la mayoría de los compradores. El nivel de negro y el contraste se basan en el típico nivel IPS. El espacio de color (cobertura sRGB completa) y los ángulos de visión son similares. Tampoco hay mucho de lo que quejarse en cuanto al tiempo de respuesta.
| |||||||||||||||||||||||||
iluminación: 95 %
Brillo con batería: 490 cd/m²
Contraste: 1167:1 (Negro: 0.42 cd/m²)
ΔE ColorChecker Calman: 1.45 | ∀{0.5-29.43 Ø4.72}
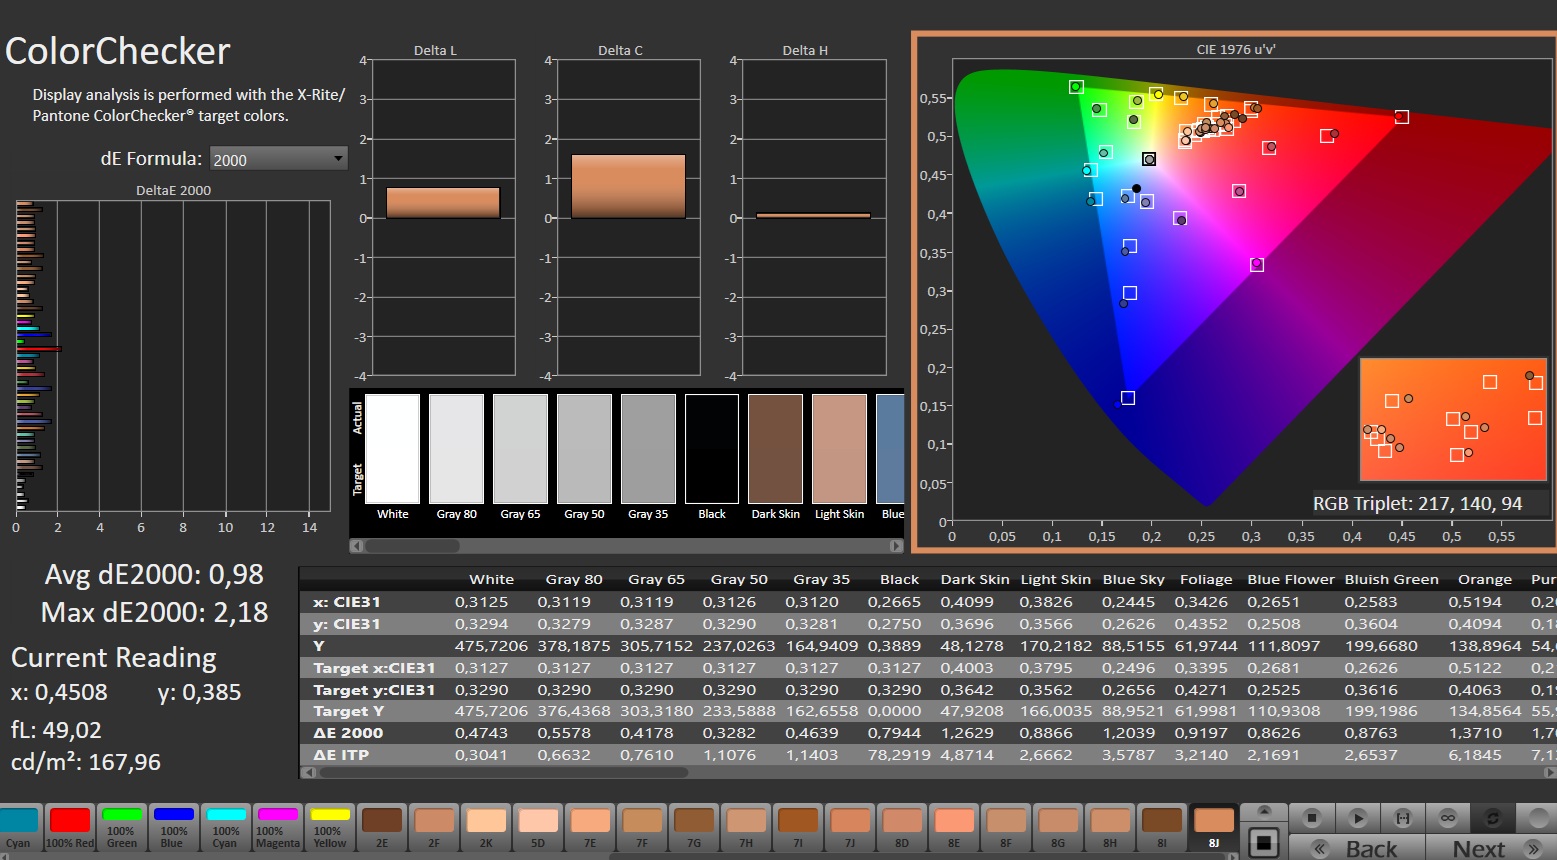
calibrated: 0.98
ΔE Greyscale Calman: 2 | ∀{0.09-98 Ø4.97}
71.4% AdobeRGB 1998 (Argyll 3D)
98.7% sRGB (Argyll 3D)
69% Display P3 (Argyll 3D)
Gamma: 2.172
CCT: 6738 K
| Schenker XMG Core 16 VE M25 MNG007DA5-4, IPS, 2560x1600, 16", 180 Hz | Tulpar T6 V3.5 B160UANAC.J (AUO33B7), IPS, 1920x1200, 16", 165 Hz | HP Omen 16-ap0091ng AUODBB2, IPS, 1920x1200, 16", 144 Hz | Lenovo Legion 7 16IAX10 Samsung ATNA60HS01-0, OLED, 2560x1600, 16", 165 Hz | Schenker XMG Core 16 M25 MNG007DA6-4, IPS, 2560x1600, 16", 300 Hz | Acer Predator Helios Neo 16S AI PHN16S-71-94L9 Samsung ATNA60DL03-0, OLED, 2560x1600, 16", 240 Hz | |
|---|---|---|---|---|---|---|
| Display | -1% | -43% | 25% | 23% | 27% | |
| Display P3 Coverage (%) | 69 | 68.6 -1% | 40 -42% | 99.6 44% | 98.8 43% | 99.9 45% |
| sRGB Coverage (%) | 98.7 | 98.7 0% | 58.1 -41% | 100 1% | 100 1% | 100 1% |
| AdobeRGB 1998 Coverage (%) | 71.4 | 70.6 -1% | 38.7 -46% | 93.5 31% | 88.4 24% | 96.5 35% |
| Response Times | -32% | -208% | 90% | 7% | 97% | |
| Response Time Grey 50% / Grey 80% * (ms) | 12.1 ? | 12.4 ? -2% | 27.6 ? -128% | 0.6 ? 95% | 10.7 ? 12% | 0.2 ? 98% |
| Response Time Black / White * (ms) | 5 ? | 8.1 ? -62% | 19.4 ? -288% | 0.8 ? 84% | 4.9 ? 2% | 0.25 ? 95% |
| PWM Frequency (Hz) | 1317 ? | 960 | ||||
| PWM Amplitude * (%) | 23 | 50 | ||||
| Screen | -33% | -100% | -12% | -12% | 86% | |
| Brightness middle (cd/m²) | 490 | 456 -7% | 328 -33% | 477.6 -3% | 512 4% | 390 -20% |
| Brightness (cd/m²) | 488 | 403 -17% | 313 -36% | 483 -1% | 483 -1% | 394 -19% |
| Brightness Distribution (%) | 95 | 79 -17% | 91 -4% | 95 0% | 91 -4% | 98 3% |
| Black Level * (cd/m²) | 0.42 | 0.39 7% | 0.26 38% | 0.43 -2% | 0.04 90% | |
| Contrast (:1) | 1167 | 1169 0% | 1262 8% | 1191 2% | 9750 735% | |
| Colorchecker dE 2000 * | 1.45 | 3.05 -110% | 4.73 -226% | 3.11 -114% | 2.4 -66% | 1.61 -11% |
| Colorchecker dE 2000 max. * | 4.19 | 6.56 -57% | 17.47 -317% | 5.99 -43% | 3.8 9% | 3.49 17% |
| Colorchecker dE 2000 calibrated * | 0.98 | 1.03 -5% | 4.22 -331% | 0.79 19% | 0.9 8% | 1.59 -62% |
| Greyscale dE 2000 * | 2 | 3.9 -95% | 2.05 -2% | 0.9 55% | 3.1 -55% | 1.2 40% |
| Gamma | 2.172 101% | 2.279 97% | 2.63 84% | 2.18 101% | 2.41 91% | 2.235 98% |
| CCT | 6738 96% | 7198 90% | 6718 97% | 6405 101% | 6534 99% | 6580 99% |
| Media total (Programa/Opciones) | -22% /
-26% | -117% /
-103% | 34% /
14% | 6% /
-2% | 70% /
75% |
* ... más pequeño es mejor


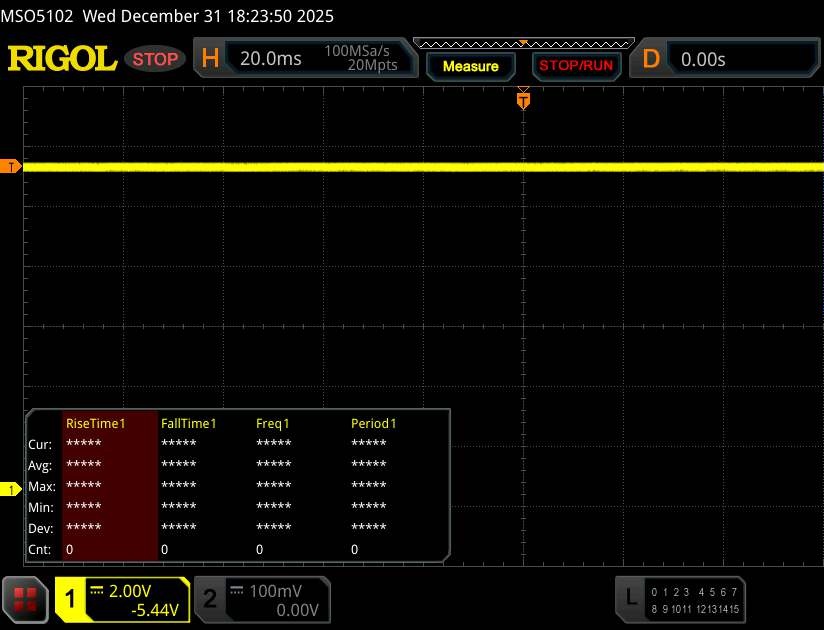
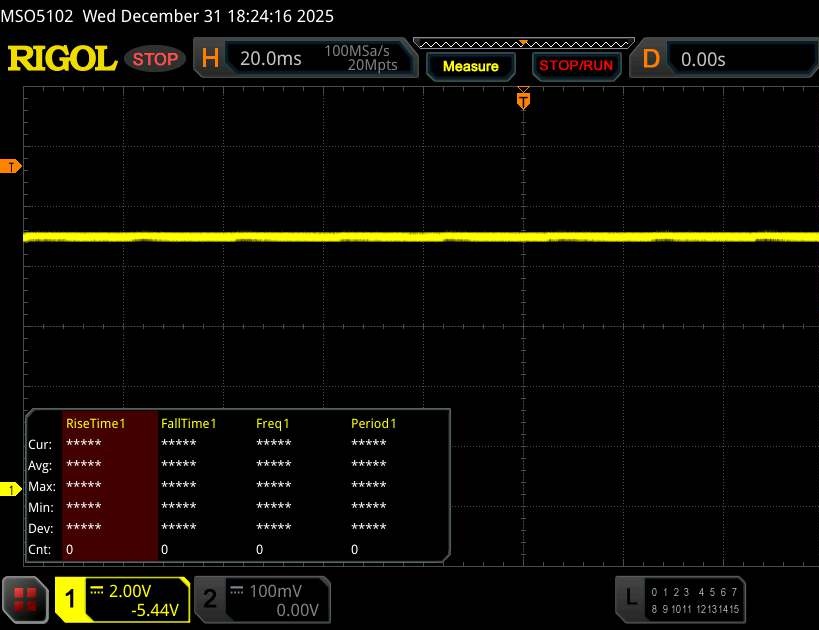
Parpadeo de Pantalla / PWM (Pulse-Width Modulation)
| Parpadeo de Pantalla / PWM no detectado | 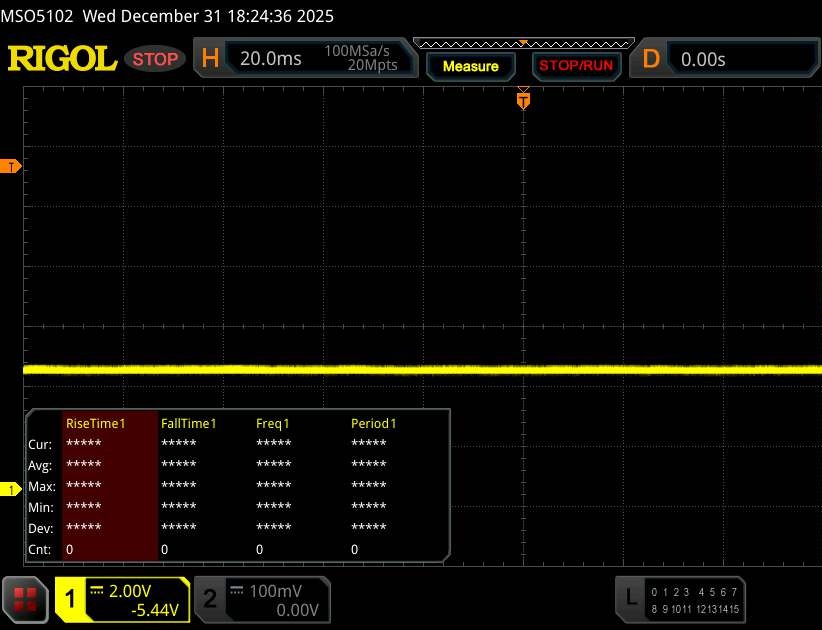 | ||
Comparación: 52 % de todos los dispositivos testados no usaron PWM para atenuar el display. Si se usó, medimos una media de 7747 (mínimo: 5 - máxmo: 343500) Hz. | |||
Tiempos de respuesta del display
| ↔ Tiempo de respuesta de Negro a Blanco | ||
|---|---|---|
| 5 ms ... subida ↗ y bajada ↘ combinada | ↗ 1.8 ms subida | 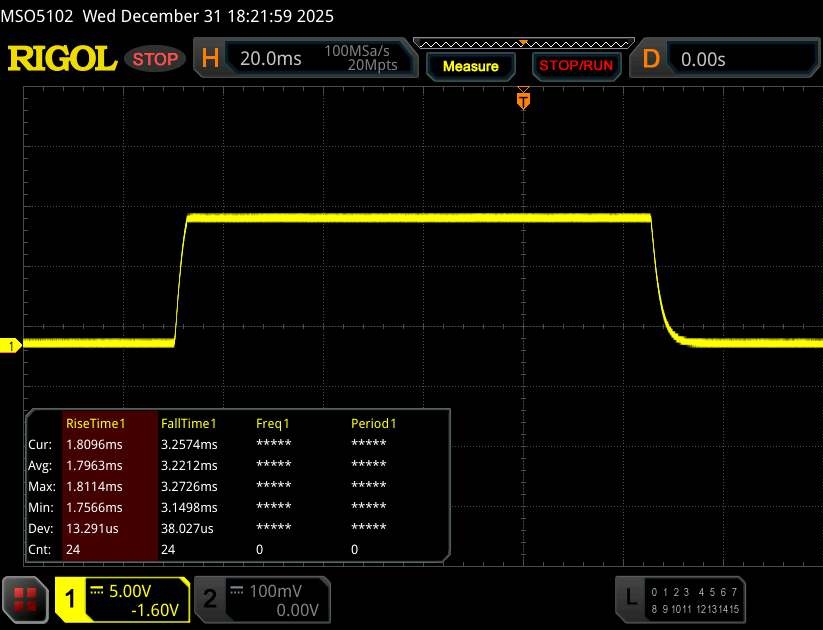 |
| ↘ 3.2 ms bajada | ||
| La pantalla mostró tiempos de respuesta muy rápidos en nuestros tests y debería ser adecuada para juegos frenéticos. En comparación, todos los dispositivos de prueba van de ##min### (mínimo) a 240 (máximo) ms. » 18 % de todos los dispositivos son mejores. Esto quiere decir que el tiempo de respuesta medido es mejor que la media (19.8 ms) de todos los dispositivos testados. | ||
| ↔ Tiempo de respuesta 50% Gris a 80% Gris | ||
| 12.1 ms ... subida ↗ y bajada ↘ combinada | ↗ 5.9 ms subida | 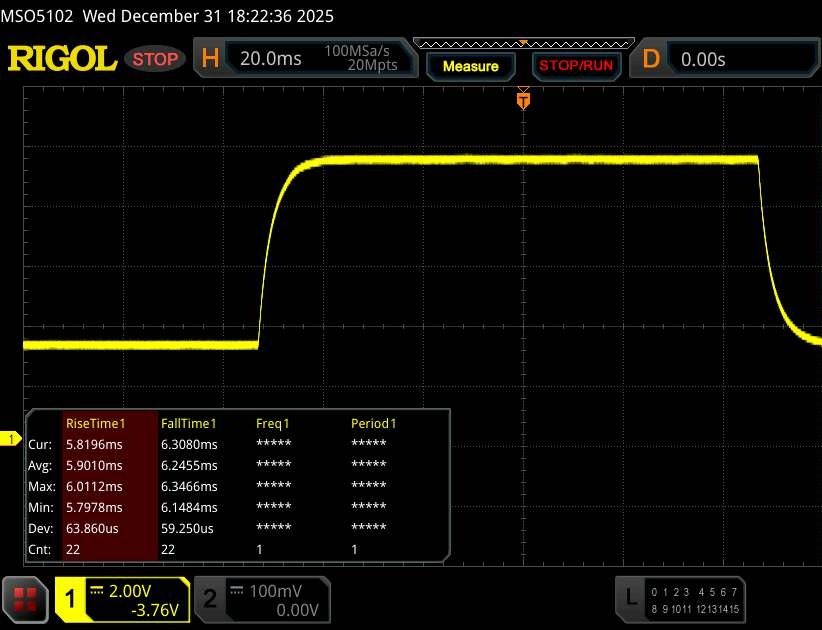 |
| ↘ 6.2 ms bajada | ||
| La pantalla mostró buenos tiempos de respuesta en nuestros tests pero podría ser demasiado lenta para los jugones competitivos. En comparación, todos los dispositivos de prueba van de ##min### (mínimo) a 636 (máximo) ms. » 26 % de todos los dispositivos son mejores. Esto quiere decir que el tiempo de respuesta medido es mejor que la media (31 ms) de todos los dispositivos testados. | ||
Rendimiento
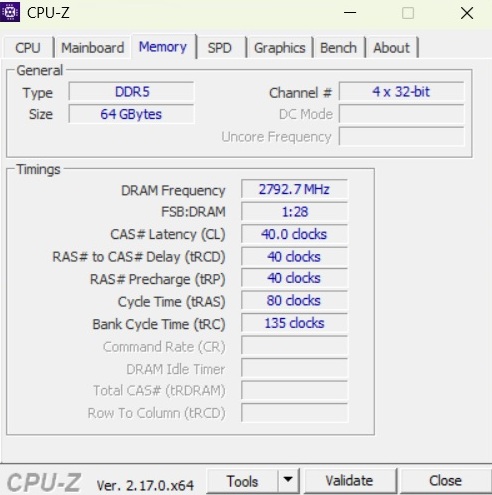
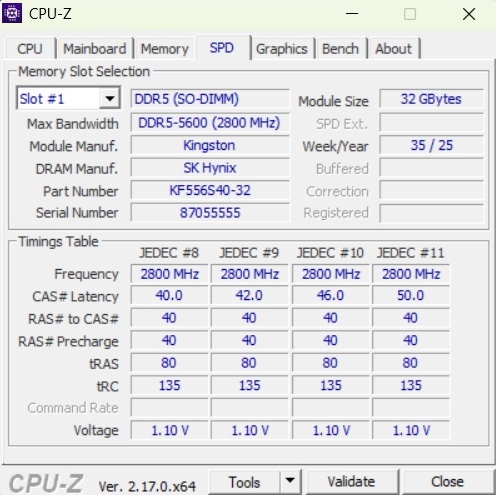
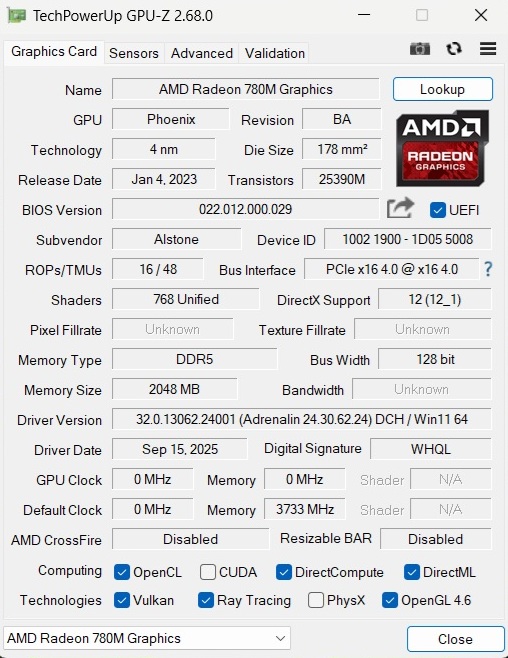
En términos de rendimiento de CPU y GPU, el XMG Core 16 VE se sitúa en la gama media. Dos ranuras SO-DIMM y dos ranuras M.2 facilitan las futuras actualizaciones.
Condiciones de la prueba
En el Centro de Control, los usuarios pueden elegir entre tres modos diferentes (véase la tabla para más detalles). A excepción de la prueba de la batería, todas las mediciones se realizaron en el modo Overboost "Normal" sin overclocking de la GPU.
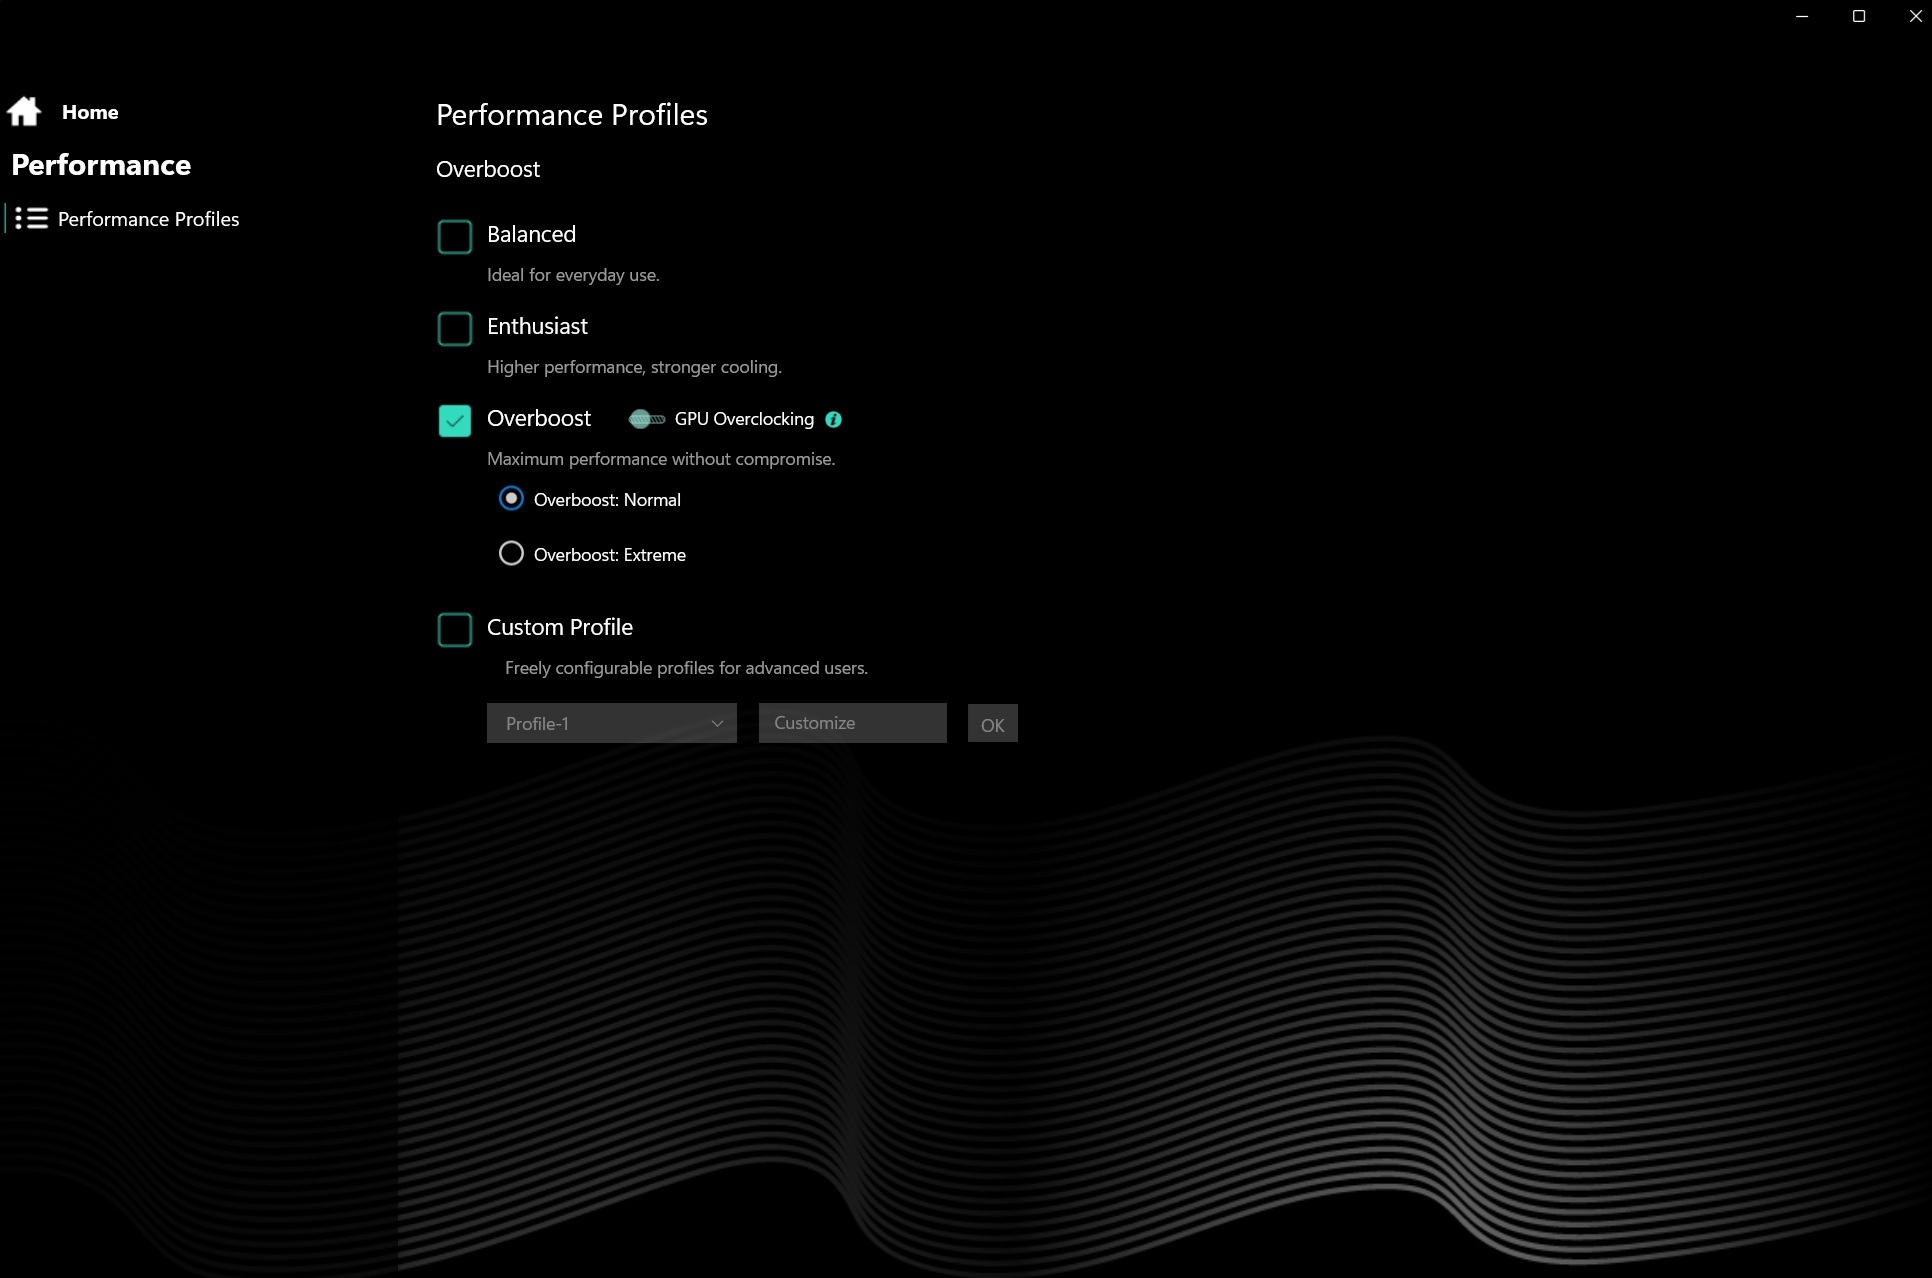
| Modo | Equilibrado | Entusiasta | Sobrealimentación |
| Cyberpunk 2077 Ruido | 33 dB(A) | 46 dB(A) | 49 dB(A) |
| Velocidad de fotogramas de Cyberpunk 2077 (FHD/Ultra) | 35,4 fps | 78,6 fps | 85 fps |
| Consumo de energía de la GPU | ~30 W | ~80 W | ~110 W |
| CPU PL1 | 45 W | 54 W | 70 W |
| CPU PL2 | 65 W | 65 W | 105 W |
| Cinebench R15 Puntuación múltiple | 2075 Puntos | 2670 Puntos | 2815 Puntos |
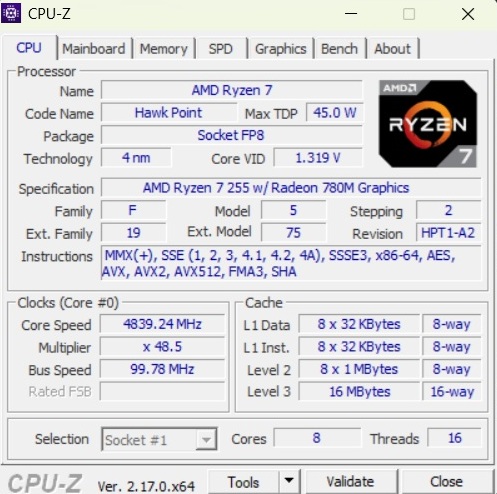
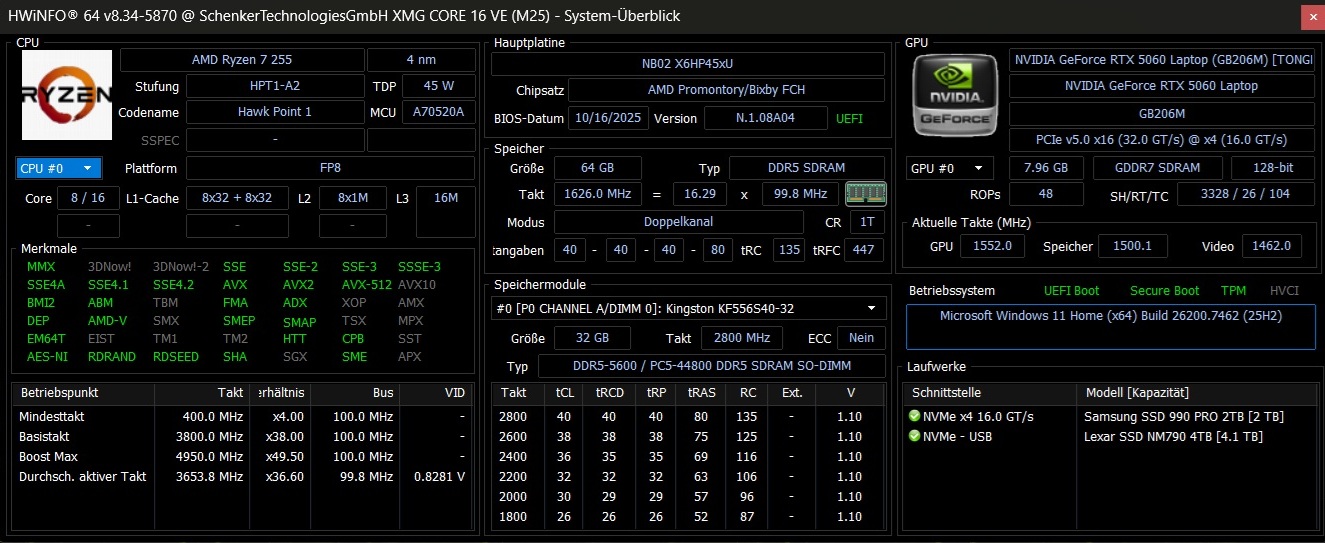
Procesador
El Ryzen 7 255 sigue siendo poco frecuente en portátiles. Construido sobre un proceso de 4 nm, el chip ofrece ocho núcleos y puede manejar hasta 16 hilos. A diferencia del Core i7-14700HX en el Tulpar T6 V3.5, el rendimiento se mantiene constante incluso bajo carga prolongada, aunque sigue estando por debajo de procesadores como el Core Ultra 7 255HX, Core Ultra 9 275HX, Ryzen 9 8940HX y Ryzen AI 9 HX 370.
Cinebench R15 Prueba de resistencia múltiple
* ... más pequeño es mejor
AIDA64: FP32 Ray-Trace | FPU Julia | CPU SHA3 | CPU Queen | FPU SinJulia | FPU Mandel | CPU AES | CPU ZLib | FP64 Ray-Trace | CPU PhotoWorxx
| Performance rating | |
| HP Omen 16-ap0091ng | |
| Schenker XMG Core 16 M25 | |
| Lenovo Legion 7 16IAX10 | |
| Acer Predator Helios Neo 16S AI PHN16S-71-94L9 | |
| Media de la clase Gaming | |
| Schenker XMG Core 16 VE M25 | |
| Medio AMD Ryzen 7 255 | |
| Tulpar T6 V3.5 | |
| AIDA64 / FP32 Ray-Trace | |
| HP Omen 16-ap0091ng | |
| Schenker XMG Core 16 M25 | |
| Media de la clase Gaming (10227 - 85542, n=103, últimos 2 años) | |
| Lenovo Legion 7 16IAX10 | |
| Schenker XMG Core 16 VE M25 | |
| Acer Predator Helios Neo 16S AI PHN16S-71-94L9 | |
| Medio AMD Ryzen 7 255 (27202 - 28101, n=2) | |
| Tulpar T6 V3.5 | |
| AIDA64 / FPU Julia | |
| HP Omen 16-ap0091ng | |
| Lenovo Legion 7 16IAX10 | |
| Schenker XMG Core 16 M25 | |
| Acer Predator Helios Neo 16S AI PHN16S-71-94L9 | |
| Media de la clase Gaming (51376 - 238426, n=103, últimos 2 años) | |
| Schenker XMG Core 16 VE M25 | |
| Medio AMD Ryzen 7 255 (110760 - 114847, n=2) | |
| Tulpar T6 V3.5 | |
| AIDA64 / CPU SHA3 | |
| HP Omen 16-ap0091ng | |
| Lenovo Legion 7 16IAX10 | |
| Acer Predator Helios Neo 16S AI PHN16S-71-94L9 | |
| Media de la clase Gaming (2180 - 9817, n=103, últimos 2 años) | |
| Schenker XMG Core 16 M25 | |
| Schenker XMG Core 16 VE M25 | |
| Medio AMD Ryzen 7 255 (4831 - 5045, n=2) | |
| Tulpar T6 V3.5 | |
| AIDA64 / CPU Queen | |
| HP Omen 16-ap0091ng | |
| Lenovo Legion 7 16IAX10 | |
| Tulpar T6 V3.5 | |
| Schenker XMG Core 16 VE M25 | |
| Acer Predator Helios Neo 16S AI PHN16S-71-94L9 | |
| Medio AMD Ryzen 7 255 (118448 - 124528, n=2) | |
| Media de la clase Gaming (49785 - 173351, n=89, últimos 2 años) | |
| Schenker XMG Core 16 M25 | |
| AIDA64 / FPU SinJulia | |
| HP Omen 16-ap0091ng | |
| Schenker XMG Core 16 M25 | |
| Schenker XMG Core 16 VE M25 | |
| Medio AMD Ryzen 7 255 (15213 - 15342, n=2) | |
| Media de la clase Gaming (4424 - 33636, n=103, últimos 2 años) | |
| Lenovo Legion 7 16IAX10 | |
| Acer Predator Helios Neo 16S AI PHN16S-71-94L9 | |
| Tulpar T6 V3.5 | |
| AIDA64 / FPU Mandel | |
| HP Omen 16-ap0091ng | |
| Schenker XMG Core 16 M25 | |
| Lenovo Legion 7 16IAX10 | |
| Acer Predator Helios Neo 16S AI PHN16S-71-94L9 | |
| Media de la clase Gaming (25115 - 128721, n=103, últimos 2 años) | |
| Schenker XMG Core 16 VE M25 | |
| Medio AMD Ryzen 7 255 (59408 - 61675, n=2) | |
| Tulpar T6 V3.5 | |
| AIDA64 / CPU AES | |
| HP Omen 16-ap0091ng | |
| Schenker XMG Core 16 M25 | |
| Lenovo Legion 7 16IAX10 | |
| Media de la clase Gaming (39258 - 247074, n=103, últimos 2 años) | |
| Acer Predator Helios Neo 16S AI PHN16S-71-94L9 | |
| Schenker XMG Core 16 VE M25 | |
| Medio AMD Ryzen 7 255 (88405 - 90655, n=2) | |
| Tulpar T6 V3.5 | |
| AIDA64 / CPU ZLib | |
| Lenovo Legion 7 16IAX10 | |
| HP Omen 16-ap0091ng | |
| Acer Predator Helios Neo 16S AI PHN16S-71-94L9 | |
| Media de la clase Gaming (574 - 2531, n=103, últimos 2 años) | |
| Schenker XMG Core 16 M25 | |
| Schenker XMG Core 16 VE M25 | |
| Medio AMD Ryzen 7 255 (1088 - 1134, n=2) | |
| Tulpar T6 V3.5 | |
| AIDA64 / FP64 Ray-Trace | |
| HP Omen 16-ap0091ng | |
| Schenker XMG Core 16 M25 | |
| Media de la clase Gaming (5509 - 45446, n=103, últimos 2 años) | |
| Lenovo Legion 7 16IAX10 | |
| Acer Predator Helios Neo 16S AI PHN16S-71-94L9 | |
| Schenker XMG Core 16 VE M25 | |
| Medio AMD Ryzen 7 255 (13661 - 14945, n=2) | |
| Tulpar T6 V3.5 | |
| AIDA64 / CPU PhotoWorxx | |
| Acer Predator Helios Neo 16S AI PHN16S-71-94L9 | |
| Schenker XMG Core 16 M25 | |
| Lenovo Legion 7 16IAX10 | |
| Tulpar T6 V3.5 | |
| Schenker XMG Core 16 VE M25 | |
| Media de la clase Gaming (12271 - 89891, n=103, últimos 2 años) | |
| Medio AMD Ryzen 7 255 (39932 - 45359, n=2) | |
| HP Omen 16-ap0091ng | |
Rendimiento del sistema
El rendimiento general del sistema no es destacable, en un sentido positivo. No hubo valores atípicos durante las pruebas.
PCMark 10: Score | Essentials | Productivity | Digital Content Creation
CrossMark: Overall | Productivity | Creativity | Responsiveness
WebXPRT 3: Overall
WebXPRT 4: Overall
Mozilla Kraken 1.1: Total
| Performance rating | |
| Acer Predator Helios Neo 16S AI PHN16S-71-94L9 | |
| Schenker XMG Core 16 M25 -4! | |
| Media de la clase Gaming | |
| Lenovo Legion 7 16IAX10 | |
| Schenker XMG Core 16 VE M25 | |
| Medio AMD Ryzen 7 255, NVIDIA GeForce RTX 5060 Laptop | |
| HP Omen 16-ap0091ng | |
| Tulpar T6 V3.5 | |
| PCMark 10 / Score | |
| Media de la clase Gaming (5828 - 11730, n=92, últimos 2 años) | |
| Acer Predator Helios Neo 16S AI PHN16S-71-94L9 | |
| Schenker XMG Core 16 VE M25 | |
| Medio AMD Ryzen 7 255, NVIDIA GeForce RTX 5060 Laptop (n=1) | |
| HP Omen 16-ap0091ng | |
| Lenovo Legion 7 16IAX10 | |
| Tulpar T6 V3.5 | |
| PCMark 10 / Essentials | |
| Lenovo Legion 7 16IAX10 | |
| Acer Predator Helios Neo 16S AI PHN16S-71-94L9 | |
| HP Omen 16-ap0091ng | |
| Media de la clase Gaming (8810 - 11935, n=96, últimos 2 años) | |
| Tulpar T6 V3.5 | |
| Schenker XMG Core 16 VE M25 | |
| Medio AMD Ryzen 7 255, NVIDIA GeForce RTX 5060 Laptop (n=1) | |
| PCMark 10 / Productivity | |
| Schenker XMG Core 16 VE M25 | |
| Medio AMD Ryzen 7 255, NVIDIA GeForce RTX 5060 Laptop (n=1) | |
| Media de la clase Gaming (6845 - 21327, n=94, últimos 2 años) | |
| Lenovo Legion 7 16IAX10 | |
| HP Omen 16-ap0091ng | |
| Acer Predator Helios Neo 16S AI PHN16S-71-94L9 | |
| Tulpar T6 V3.5 | |
| PCMark 10 / Digital Content Creation | |
| Acer Predator Helios Neo 16S AI PHN16S-71-94L9 | |
| Media de la clase Gaming (7602 - 19954, n=94, últimos 2 años) | |
| HP Omen 16-ap0091ng | |
| Tulpar T6 V3.5 | |
| Schenker XMG Core 16 VE M25 | |
| Medio AMD Ryzen 7 255, NVIDIA GeForce RTX 5060 Laptop (n=1) | |
| Lenovo Legion 7 16IAX10 | |
| CrossMark / Overall | |
| Acer Predator Helios Neo 16S AI PHN16S-71-94L9 | |
| Lenovo Legion 7 16IAX10 | |
| Schenker XMG Core 16 M25 | |
| Media de la clase Gaming (1366 - 2409, n=93, últimos 2 años) | |
| Schenker XMG Core 16 VE M25 | |
| Medio AMD Ryzen 7 255, NVIDIA GeForce RTX 5060 Laptop (n=1) | |
| HP Omen 16-ap0091ng | |
| Tulpar T6 V3.5 | |
| CrossMark / Productivity | |
| Acer Predator Helios Neo 16S AI PHN16S-71-94L9 | |
| Lenovo Legion 7 16IAX10 | |
| Media de la clase Gaming (1386 - 2254, n=93, últimos 2 años) | |
| HP Omen 16-ap0091ng | |
| Schenker XMG Core 16 M25 | |
| Schenker XMG Core 16 VE M25 | |
| Medio AMD Ryzen 7 255, NVIDIA GeForce RTX 5060 Laptop (n=1) | |
| Tulpar T6 V3.5 | |
| CrossMark / Creativity | |
| Schenker XMG Core 16 M25 | |
| Acer Predator Helios Neo 16S AI PHN16S-71-94L9 | |
| Lenovo Legion 7 16IAX10 | |
| Tulpar T6 V3.5 | |
| Media de la clase Gaming (1343 - 2729, n=93, últimos 2 años) | |
| HP Omen 16-ap0091ng | |
| Schenker XMG Core 16 VE M25 | |
| Medio AMD Ryzen 7 255, NVIDIA GeForce RTX 5060 Laptop (n=1) | |
| CrossMark / Responsiveness | |
| Lenovo Legion 7 16IAX10 | |
| Acer Predator Helios Neo 16S AI PHN16S-71-94L9 | |
| Media de la clase Gaming (1226 - 2334, n=93, últimos 2 años) | |
| Schenker XMG Core 16 VE M25 | |
| Medio AMD Ryzen 7 255, NVIDIA GeForce RTX 5060 Laptop (n=1) | |
| Schenker XMG Core 16 M25 | |
| HP Omen 16-ap0091ng | |
| Tulpar T6 V3.5 | |
| WebXPRT 3 / Overall | |
| Schenker XMG Core 16 M25 | |
| Lenovo Legion 7 16IAX10 | |
| Acer Predator Helios Neo 16S AI PHN16S-71-94L9 | |
| HP Omen 16-ap0091ng | |
| Media de la clase Gaming (220 - 532, n=97, últimos 2 años) | |
| Tulpar T6 V3.5 | |
| Schenker XMG Core 16 VE M25 | |
| Medio AMD Ryzen 7 255, NVIDIA GeForce RTX 5060 Laptop (n=1) | |
| WebXPRT 4 / Overall | |
| Schenker XMG Core 16 M25 | |
| Lenovo Legion 7 16IAX10 | |
| Acer Predator Helios Neo 16S AI PHN16S-71-94L9 | |
| Tulpar T6 V3.5 | |
| Media de la clase Gaming (165 - 354, n=97, últimos 2 años) | |
| Schenker XMG Core 16 VE M25 | |
| Medio AMD Ryzen 7 255, NVIDIA GeForce RTX 5060 Laptop (n=1) | |
| HP Omen 16-ap0091ng | |
| Mozilla Kraken 1.1 / Total | |
| HP Omen 16-ap0091ng | |
| Schenker XMG Core 16 VE M25 | |
| Medio AMD Ryzen 7 255, NVIDIA GeForce RTX 5060 Laptop (n=1) | |
| Tulpar T6 V3.5 | |
| Media de la clase Gaming (391 - 590, n=99, últimos 2 años) | |
| Lenovo Legion 7 16IAX10 | |
| Schenker XMG Core 16 M25 | |
| Acer Predator Helios Neo 16S AI PHN16S-71-94L9 | |
* ... más pequeño es mejor
| PCMark 10 Score | 8166 puntos | |
ayuda | ||
| AIDA64 / Memory Copy | |
| Lenovo Legion 7 16IAX10 | |
| Acer Predator Helios Neo 16S AI PHN16S-71-94L9 | |
| Tulpar T6 V3.5 | |
| Schenker XMG Core 16 M25 | |
| Media de la clase Gaming (21750 - 129946, n=103, últimos 2 años) | |
| Schenker XMG Core 16 VE M25 | |
| Medio AMD Ryzen 7 255 (67909 - 69008, n=2) | |
| HP Omen 16-ap0091ng | |
| AIDA64 / Memory Read | |
| Acer Predator Helios Neo 16S AI PHN16S-71-94L9 | |
| Tulpar T6 V3.5 | |
| Lenovo Legion 7 16IAX10 | |
| Schenker XMG Core 16 M25 | |
| Media de la clase Gaming (22956 - 118858, n=103, últimos 2 años) | |
| Medio AMD Ryzen 7 255 (60500 - 61434, n=2) | |
| Schenker XMG Core 16 VE M25 | |
| HP Omen 16-ap0091ng | |
| AIDA64 / Memory Write | |
| Acer Predator Helios Neo 16S AI PHN16S-71-94L9 | |
| Schenker XMG Core 16 VE M25 | |
| Medio AMD Ryzen 7 255 (82539 - 83452, n=2) | |
| Schenker XMG Core 16 M25 | |
| Lenovo Legion 7 16IAX10 | |
| Tulpar T6 V3.5 | |
| Media de la clase Gaming (22297 - 135096, n=103, últimos 2 años) | |
| HP Omen 16-ap0091ng | |
| AIDA64 / Memory Latency | |
| Acer Predator Helios Neo 16S AI PHN16S-71-94L9 | |
| Media de la clase Gaming (75.3 - 259, n=103, últimos 2 años) | |
| Lenovo Legion 7 16IAX10 | |
| Medio AMD Ryzen 7 255 (87 - 91.2, n=2) | |
| Schenker XMG Core 16 VE M25 | |
| Schenker XMG Core 16 M25 | |
| Tulpar T6 V3.5 | |
| HP Omen 16-ap0091ng | |
* ... más pequeño es mejor
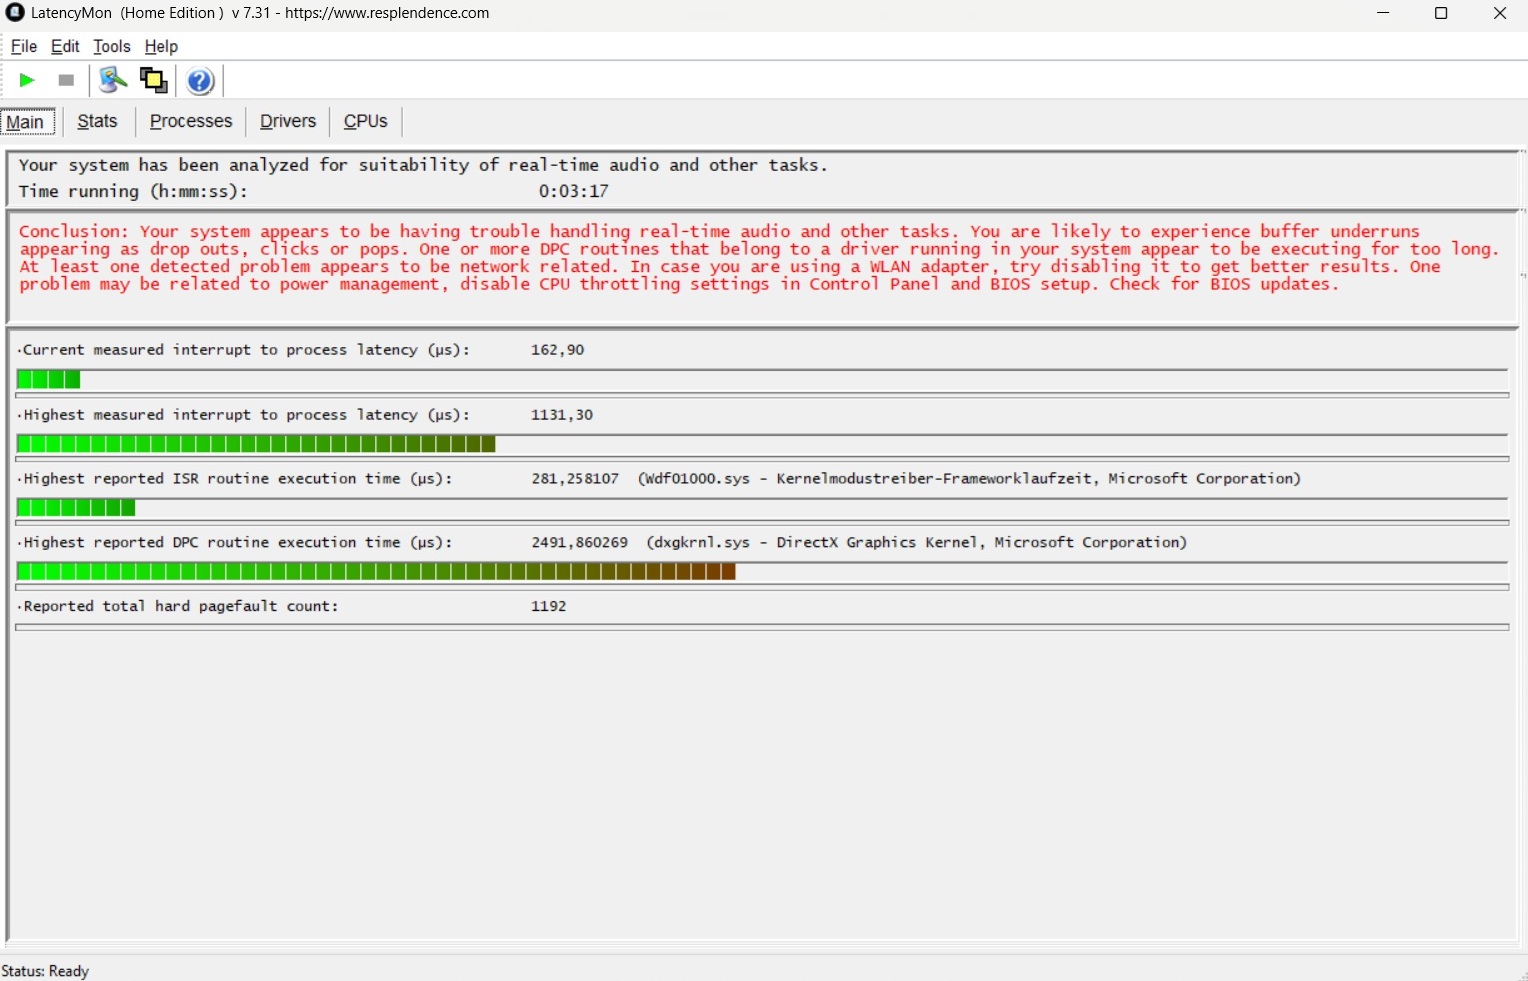
Latencias del CPD
En términos de latencia, el XMG Core 16 VE se sitúa directamente en el medio del pelotón entre sus competidores.
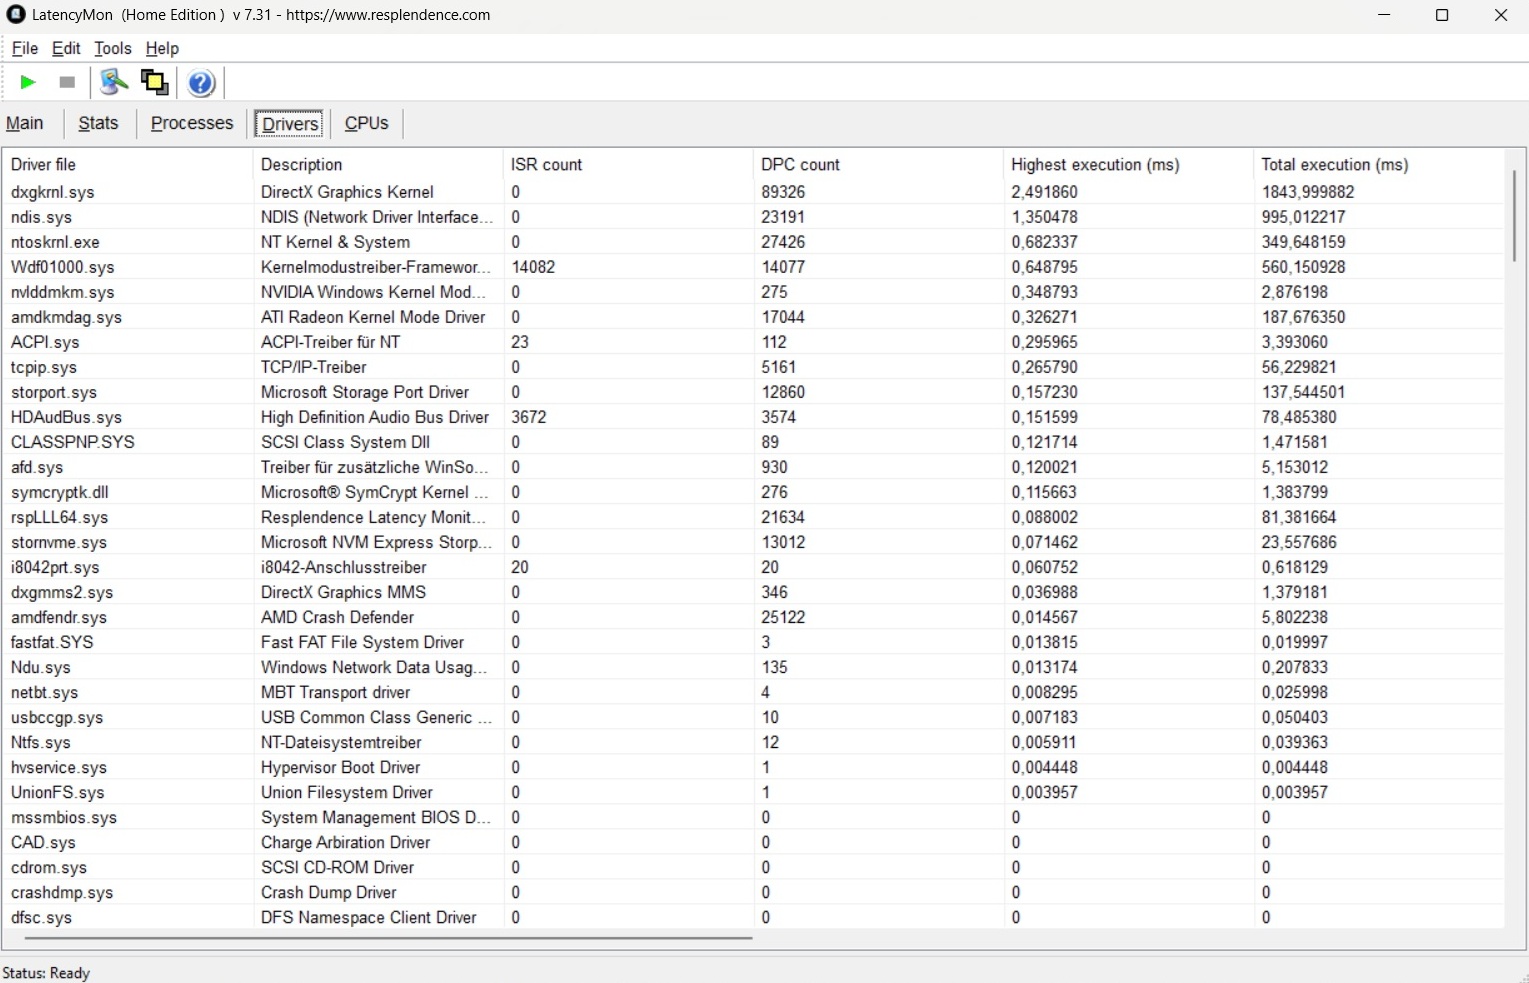
| DPC Latencies / LatencyMon - interrupt to process latency (max), Web, Youtube, Prime95 | |
| Tulpar T6 V3.5 | |
| Acer Predator Helios Neo 16S AI PHN16S-71-94L9 | |
| HP Omen 16-ap0091ng | |
| Schenker XMG Core 16 VE M25 | |
| Lenovo Legion 7 16IAX10 | |
| Schenker XMG Core 16 M25 | |
* ... más pequeño es mejor
Dispositivos de almacenamiento
Un aspecto destacado de nuestra unidad de prueba fue la relativamente rápida SSD. La 990 Pro de Samsung obtuvo una excelente puntuación global en la prueba comparativa AS SSD.

* ... más pequeño es mejor
Rendimiento continuo de lectura: Bucle de lectura DiskSpd, profundidad de cola 8
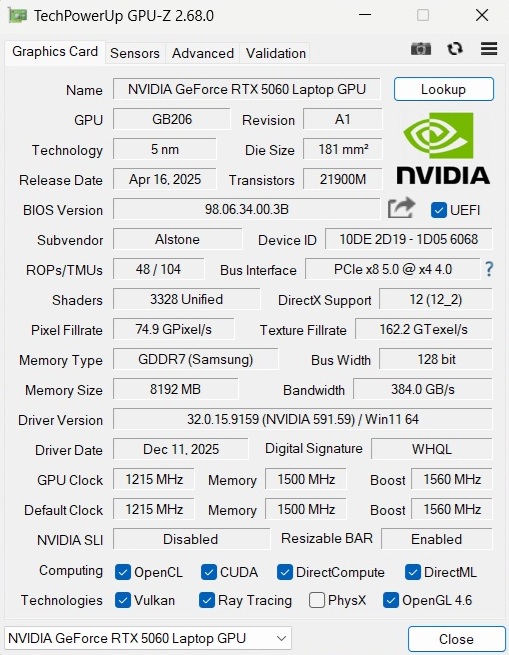
Rendimiento de la GPU
| 3DMark 11 Performance | 33268 puntos | |
| 3DMark Cloud Gate Standard Score | 50474 puntos | |
| 3DMark Fire Strike Score | 25692 puntos | |
| 3DMark Time Spy Score | 11440 puntos | |
ayuda | ||
* ... más pequeño es mejor
Rendimiento en juegos
Sin DLSS y tecnologías similares, correr a la resolución nativa (2.560 × 1.440) puede ser un poco exigente en ocasiones. Títulos muy intensivos en CPU como The Outer Worlds 2, Anno 117 y Black Ops 7 sólo se ejecutan sin problemas con el upscaling activado o con ajustes reducidos.
Las cosas se ven mejor en ARC Raiderspor ejemplo: con los ajustes al máximo, el juego ofrece unos sólidos 48 FPS. A modo de comparación, la calidad DLSS aumenta el rendimiento hasta unos suaves 76 FPS, mientras que la generación de fotogramas 4× lo eleva a 174 FPS sobre el papel (la suavidad percibida en el mundo real puede variar).
| Final Fantasy XV Benchmark - 1920x1080 High Quality | |
| Media de la clase Gaming (41 - 215, n=94, últimos 2 años) | |
| Schenker XMG Core 16 M25 | |
| Lenovo Legion 7 16IAX10 | |
| Medio NVIDIA GeForce RTX 5060 Laptop (107 - 133.6, n=12) | |
| HP Omen 16-ap0091ng | |
| Tulpar T6 V3.5 | |
| Schenker XMG Core 16 VE M25 | |
| bajo | medio | alto | ultra | QHD | |
|---|---|---|---|---|---|
| Dota 2 Reborn (2015) | 145.2 | 140.7 | 133.2 | ||
| Final Fantasy XV Benchmark (2018) | 143.9 | 107 | |||
| X-Plane 11.11 (2018) | 97.7 | 79.6 | |||
| Baldur's Gate 3 (2023) | 114.2 | 95.4 | 90.7 | ||
| Cyberpunk 2077 (2023) | 107.6 | 93.4 | 85 | ||
| The Outer Worlds 2 (2025) | 91.7 | 72.7 | 40.9 | 26.7 | |
| ARC Raiders (2025) | 136.7 | 104.9 | 70.2 | 47.8 | |
| Anno 117: Pax Romana (2025) | 91.3 | 67 | 33.9 | 23.4 | |
| Call of Duty Black Ops 7 (2025) | 138 | 103 | 38 | 18 |
| ARC Raiders | |
| 1920x1080 Epic Preset + Epic Raytracing AA:TSR | |
| Acer Predator Helios Neo 16S AI PHN16S-71-94L9 | |
| Schenker XMG Core 16 VE M25 | |
| Media de la clase Gaming (43.5 - 98.6, n=11, últimos 2 años) | |
| Medio NVIDIA GeForce RTX 5060 Laptop (55 - 70.2, n=4) | |
| Tulpar T6 V3.5 | |
| 2560x1440 Epic Preset + Epic Raytracing AA:TSR | |
| Media de la clase Gaming (47.8 - 68.3, n=5, últimos 2 años) | |
| Acer Predator Helios Neo 16S AI PHN16S-71-94L9 | |
| Schenker XMG Core 16 VE M25 | |
| Medio NVIDIA GeForce RTX 5060 Laptop (n=1) | |
| The Outer Worlds 2 | |
| 1920x1080 Very High Preset AA:T | |
| Acer Predator Helios Neo 16S AI PHN16S-71-94L9 | |
| Schenker XMG Core 16 VE M25 | |
| Media de la clase Gaming (26.4 - 58.4, n=11, últimos 2 años) | |
| Medio NVIDIA GeForce RTX 5060 Laptop (31.1 - 40.9, n=4) | |
| Tulpar T6 V3.5 | |
| 2560x1440 Very High Preset AA:T | |
| Acer Predator Helios Neo 16S AI PHN16S-71-94L9 | |
| Media de la clase Gaming (21.5 - 37.8, n=6, últimos 2 años) | |
| Schenker XMG Core 16 VE M25 | |
| Medio NVIDIA GeForce RTX 5060 Laptop (n=1) | |
| Call of Duty Black Ops 7 | |
| 1920x1080 Extreme Preset + Raytracing | |
| Acer Predator Helios Neo 16S AI PHN16S-71-94L9 | |
| Media de la clase Gaming (24 - 60, n=11, últimos 2 años) | |
| Schenker XMG Core 16 VE M25 | |
| Medio NVIDIA GeForce RTX 5060 Laptop (32 - 38, n=4) | |
| Tulpar T6 V3.5 | |
| 2560x1440 Extreme Preset + Raytracing | |
| Acer Predator Helios Neo 16S AI PHN16S-71-94L9 | |
| Media de la clase Gaming (18 - 39, n=7, últimos 2 años) | |
| Medio NVIDIA GeForce RTX 5060 Laptop (18 - 23, n=2) | |
| Schenker XMG Core 16 VE M25 | |
Cyberpunk 2077 ultra FPS gráfico
Emisiones y energía
Emisiones sonoras
Bajo carga, los niveles de ruido son similares a los de la HP Omen 16 y la Core 16 "normal". A 49 dB(A) en Cyberpunk 2077los ventiladores son claramente audibles, pero no excesivamente ruidosos. En reposo, el portátil de 16 pulgadas suele permanecer agradablemente silencioso. Los ventiladores se apagan por completo o funcionan a un nivel bastante discreto.
Ruido
| Ocioso |
| 24 / 27 / 32 dB(A) |
| Carga |
| 41 / 50 dB(A) |
 | ||
30 dB silencioso 40 dB(A) audible 50 dB(A) ruidosamente alto |
||
min: | ||
| Schenker XMG Core 16 VE M25 Ryzen 7 255, GeForce RTX 5060 Laptop | Tulpar T6 V3.5 i7-14700HX, GeForce RTX 5060 Laptop | HP Omen 16-ap0091ng R9 8940HX, GeForce RTX 5060 Laptop | Lenovo Legion 7 16IAX10 Ultra 7 255HX, GeForce RTX 5060 Laptop | Schenker XMG Core 16 M25 Ryzen AI 9 HX 370, GeForce RTX 5070 Laptop | Acer Predator Helios Neo 16S AI PHN16S-71-94L9 Ultra 9 275HX, GeForce RTX 5070 Ti Laptop | |
|---|---|---|---|---|---|---|
| Noise | -7% | 1% | 1% | 3% | -9% | |
| apagado / medio ambiente * (dB) | 24 | 24 -0% | 23 4% | 23.9 -0% | 24.8 -3% | 24 -0% |
| Idle Minimum * (dB) | 24 | 26 -8% | 23 4% | 24 -0% | 24.8 -3% | 24 -0% |
| Idle Average * (dB) | 27 | 29 -7% | 23 15% | 26 4% | 24.8 8% | 30 -11% |
| Idle Maximum * (dB) | 32 | 31 3% | 27.64 14% | 29.4 8% | 27.1 15% | 35 -9% |
| Load Average * (dB) | 41 | 52 -27% | 49.5 -21% | 35.4 14% | 40.2 2% | 53 -29% |
| Cyberpunk 2077 ultra * (dB) | 49 | 52 -6% | 49.5 -1% | 54.6 -11% | 49.2 -0% | 52 -6% |
| Load Maximum * (dB) | 50 | 53 -6% | 52.73 -5% | 54.7 -9% | 49.2 2% | 54 -8% |
* ... más pequeño es mejor
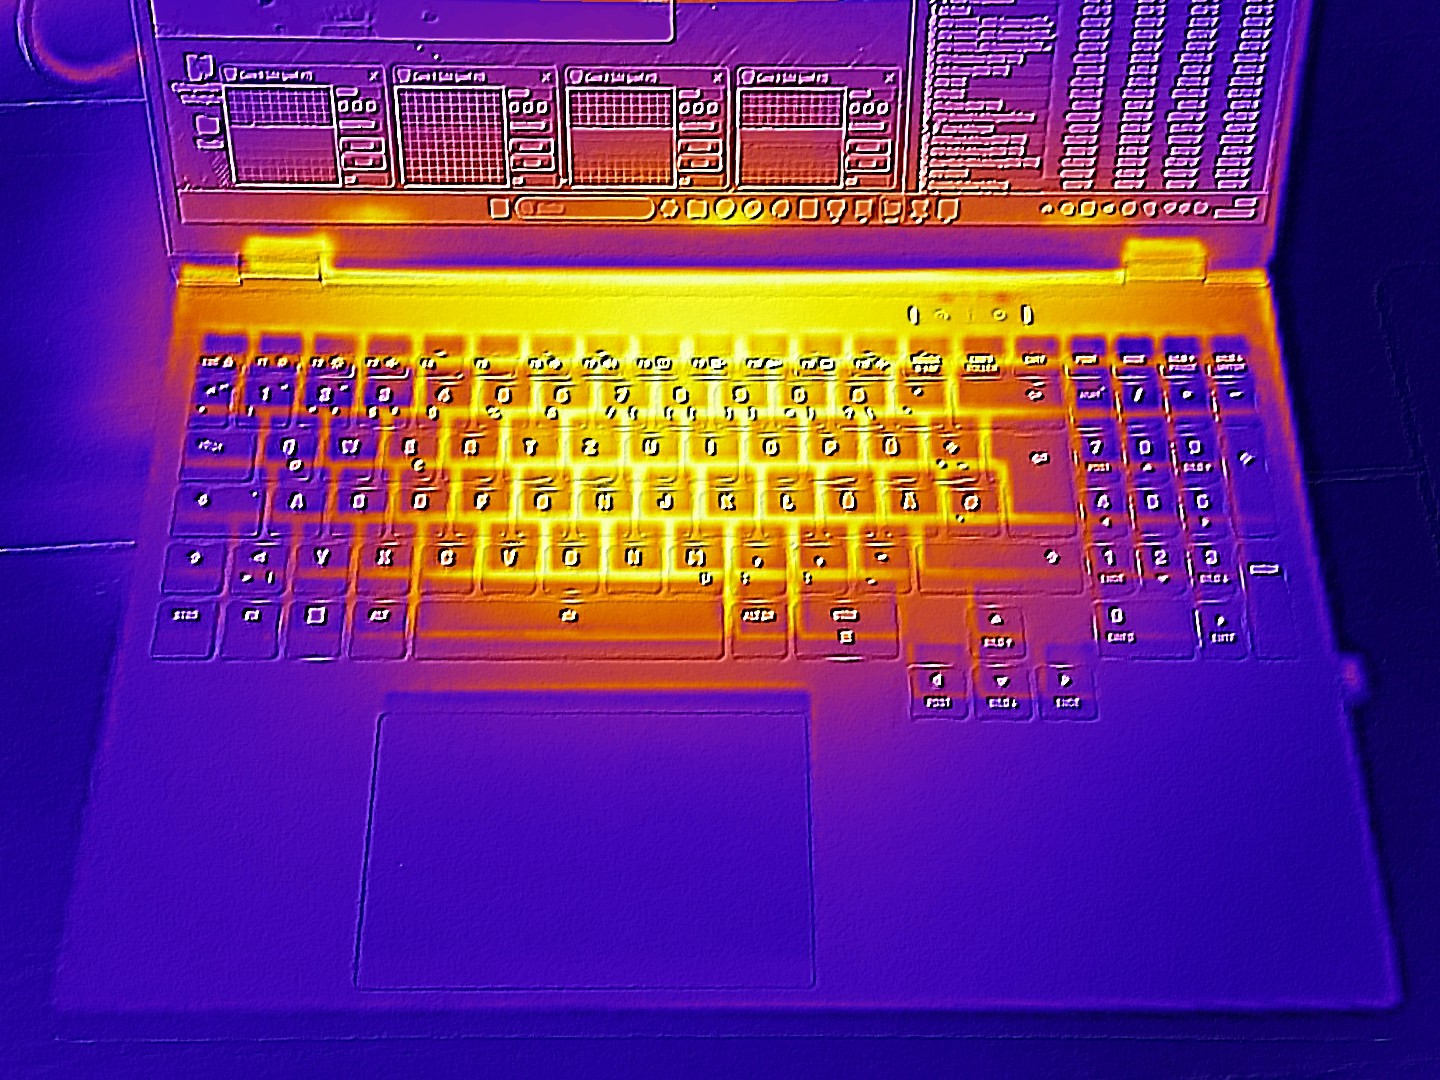
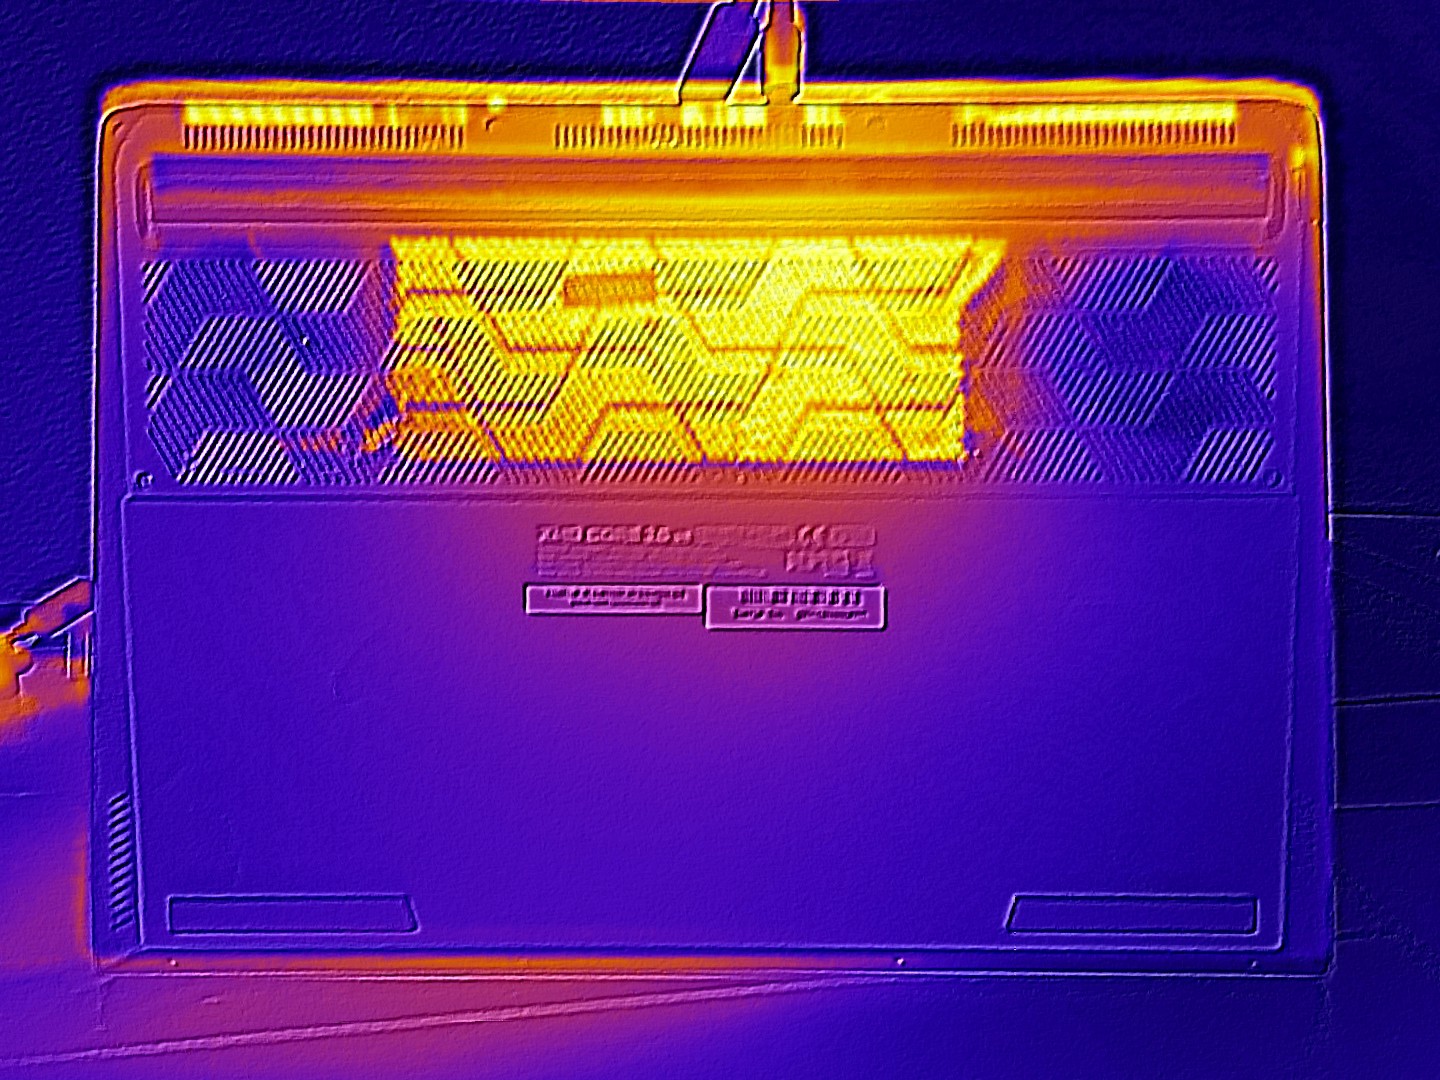
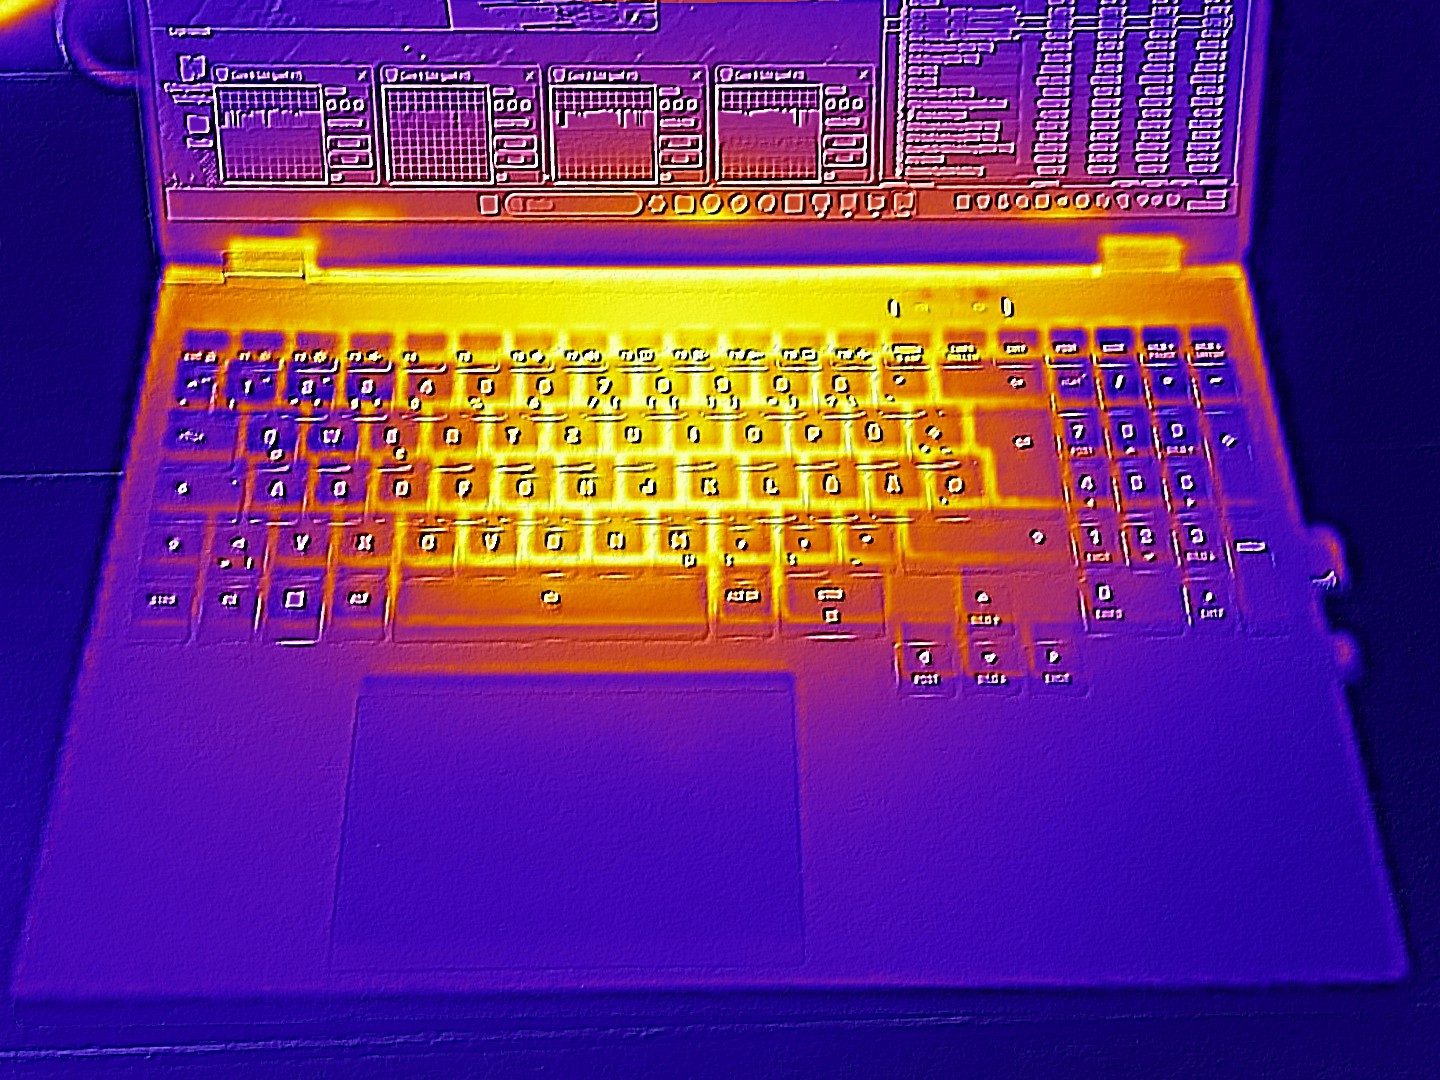
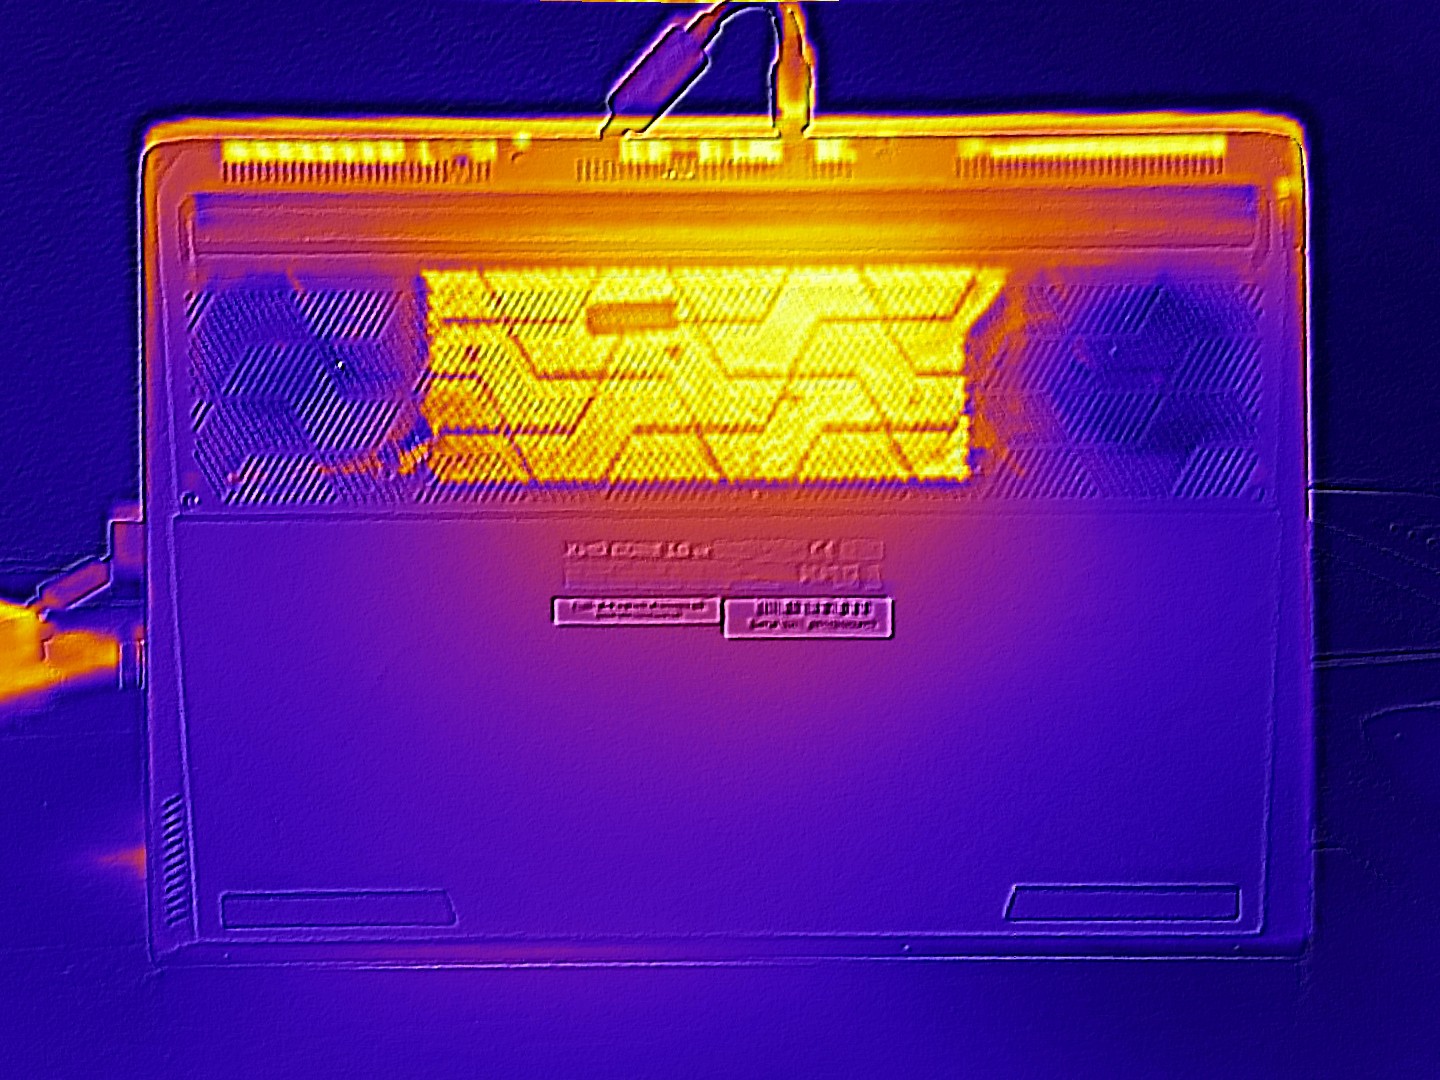
Temperatura
Bajo carga, la parte inferior del chasis se calienta más, alcanzando un máximo de 57 °C, mientras que la superior alcanza los 46 °C. En reposo, el chasis se asienta en unos moderados 25 a 31 °C.
(-) La temperatura máxima en la parte superior es de 46 °C / 115 F, frente a la media de 40.4 °C / 105 F, que oscila entre 21.2 y 68.8 °C para la clase Gaming.
(-) El fondo se calienta hasta un máximo de 57 °C / 135 F, frente a la media de 43.2 °C / 110 F
(+) En reposo, la temperatura media de la parte superior es de 27.3 °C / 81# F, frente a la media del dispositivo de 33.9 °C / 93 F.
(-) 3: The average temperature for the upper side is 39.7 °C / 103 F, compared to the average of 33.9 °C / 93 F for the class Gaming.
(+) El reposamanos y el panel táctil están a una temperatura inferior a la de la piel, con un máximo de 31 °C / 87.8 F y, por tanto, son fríos al tacto.
(-) La temperatura media de la zona del reposamanos de dispositivos similares fue de 28.8 °C / 83.8 F (-2.2 °C / -4 F).
| Schenker XMG Core 16 VE M25 Ryzen 7 255, GeForce RTX 5060 Laptop | Tulpar T6 V3.5 i7-14700HX, GeForce RTX 5060 Laptop | HP Omen 16-ap0091ng R9 8940HX, GeForce RTX 5060 Laptop | Lenovo Legion 7 16IAX10 Ultra 7 255HX, GeForce RTX 5060 Laptop | Schenker XMG Core 16 M25 Ryzen AI 9 HX 370, GeForce RTX 5070 Laptop | Acer Predator Helios Neo 16S AI PHN16S-71-94L9 Ultra 9 275HX, GeForce RTX 5070 Ti Laptop | |
|---|---|---|---|---|---|---|
| Heat | 4% | 13% | -4% | 0% | 3% | |
| Maximum Upper Side * (°C) | 46 | 40 13% | 36 22% | 47 -2% | 46.7 -2% | 47 -2% |
| Maximum Bottom * (°C) | 57 | 47 18% | 37 35% | 44 23% | 58.5 -3% | 55 4% |
| Idle Upper Side * (°C) | 29 | 30 -3% | 30 -3% | 35.6 -23% | 28.3 2% | 28 3% |
| Idle Bottom * (°C) | 31 | 35 -13% | 32 -3% | 35.2 -14% | 29.9 4% | 29 6% |
* ... más pequeño es mejor
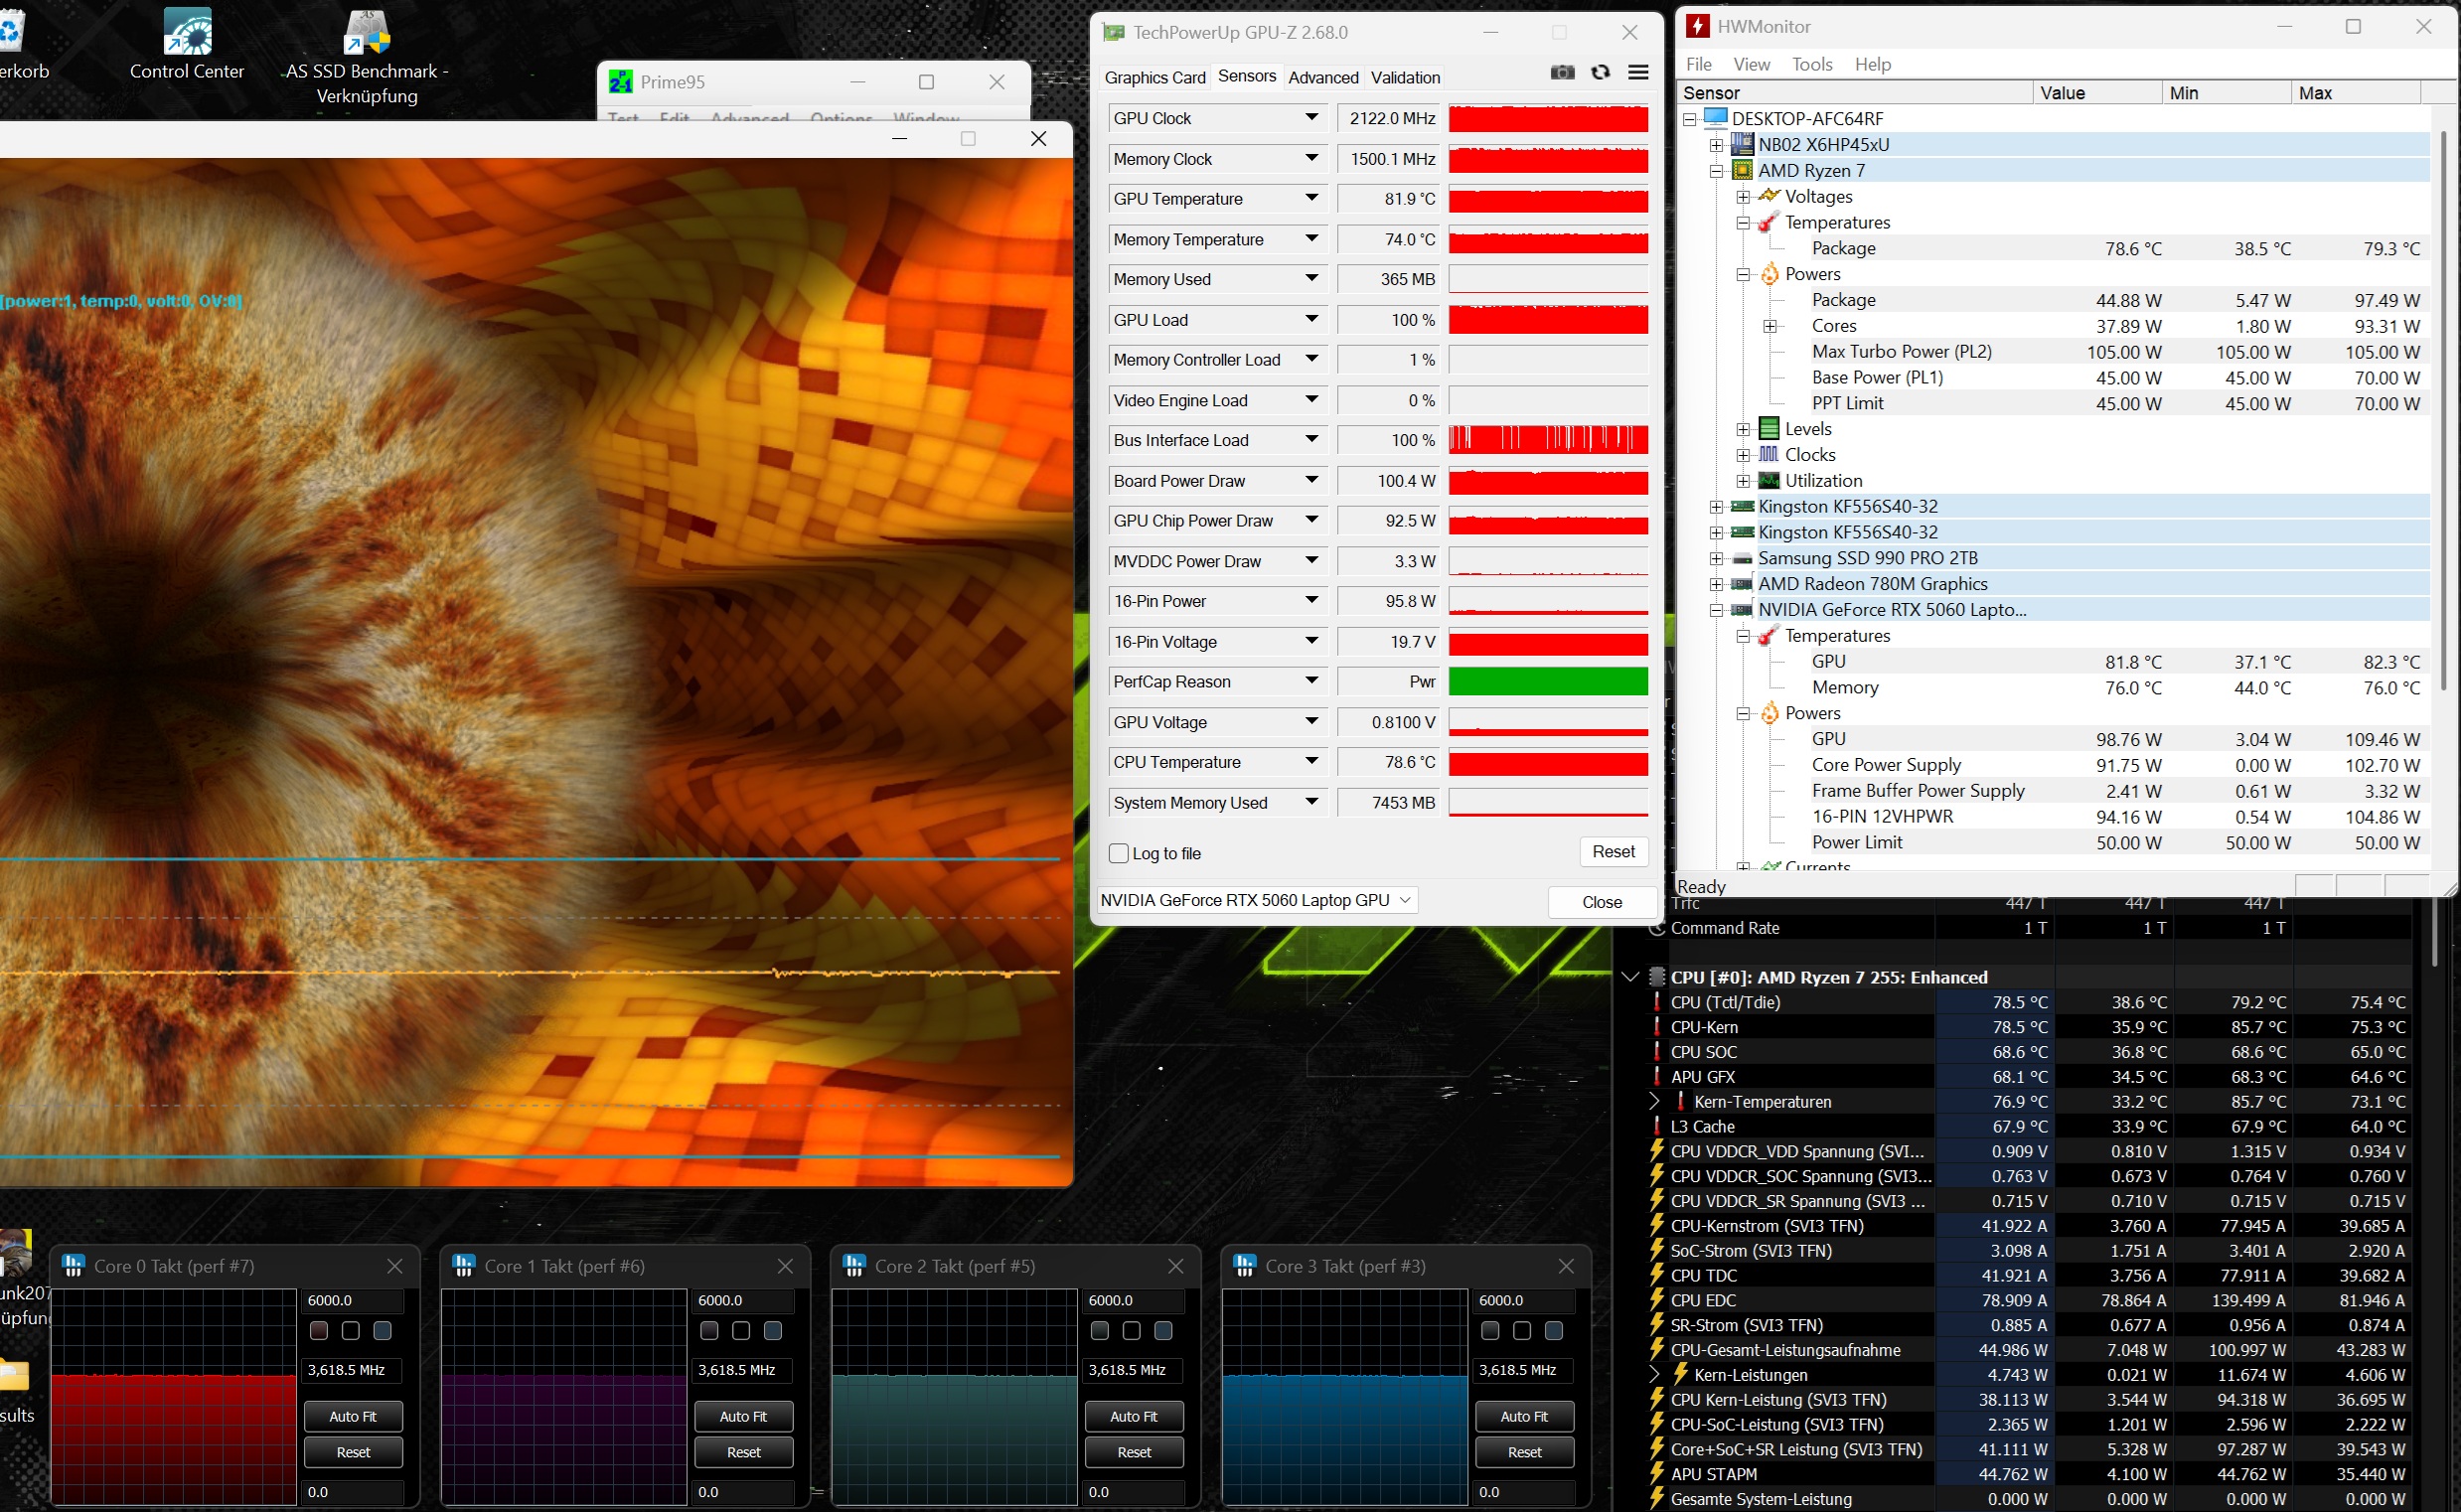
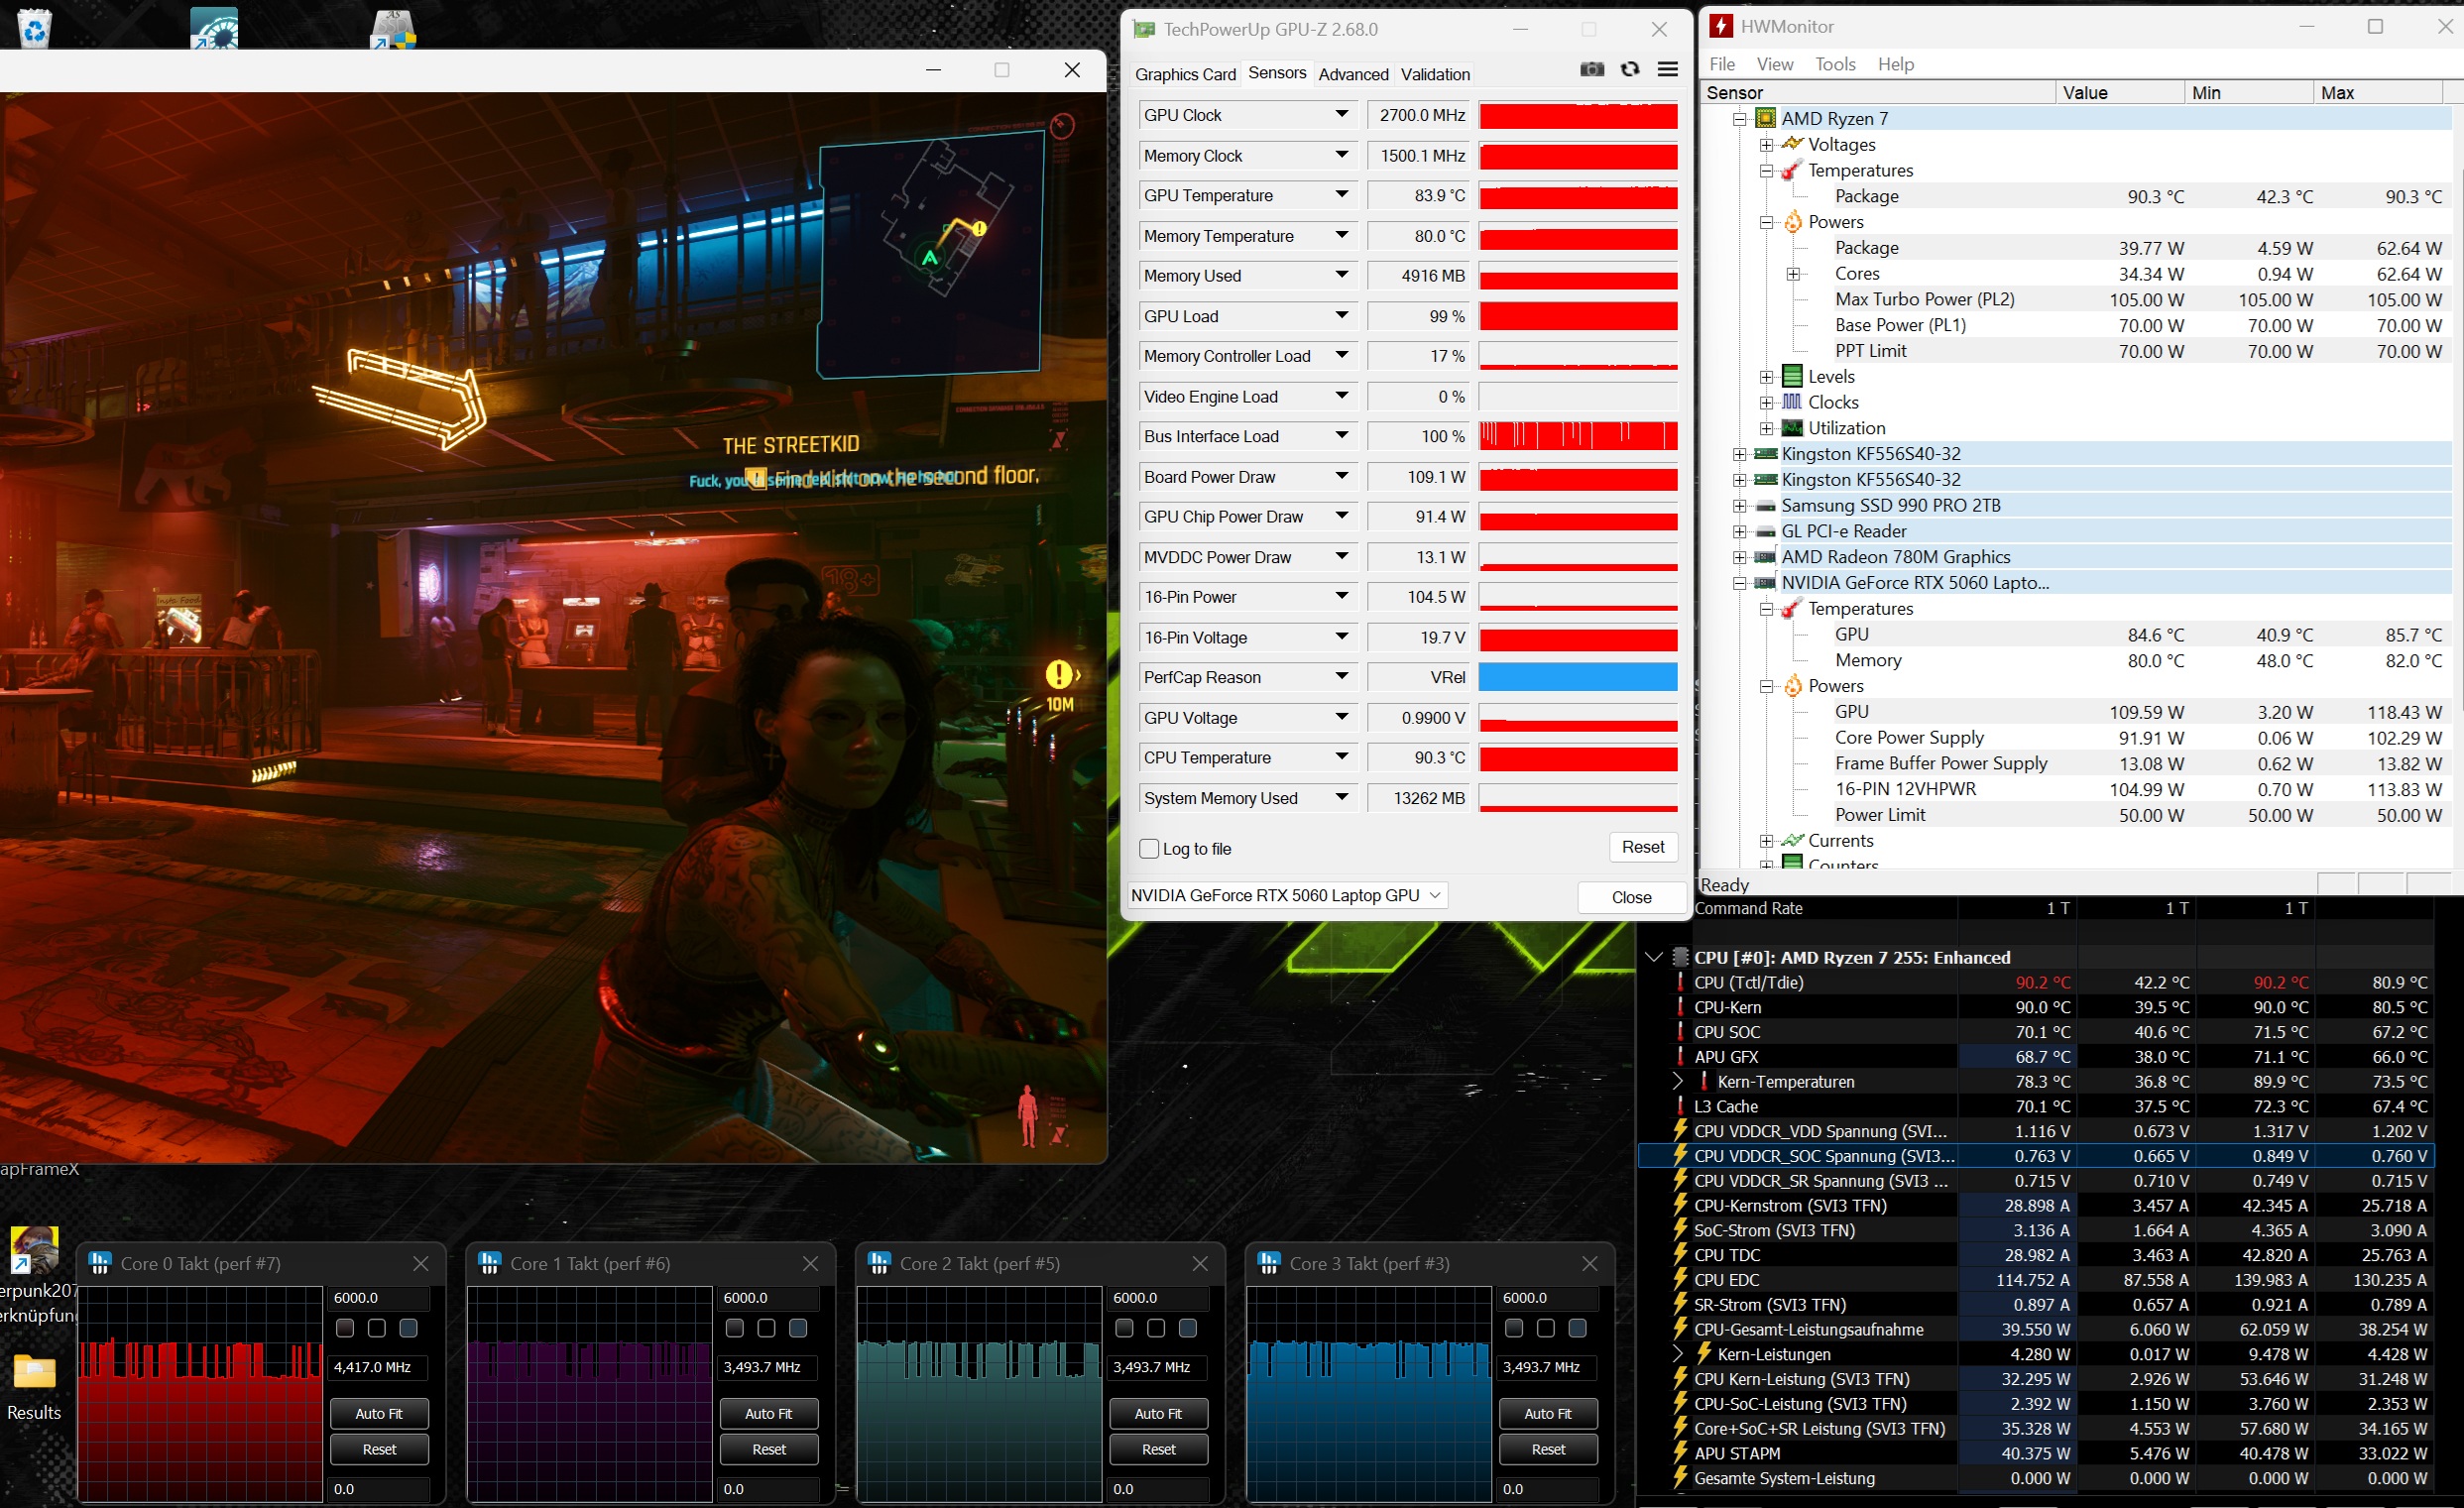
Prueba de esfuerzo
Los componentes tampoco mueren de calor. Nuestra prueba de estrés con las herramientas Furmark y Prime llevó la CPU y la GPU a poco menos de 80 °C.
Altavoces
La calidad del sonido es bastante débil. El Lenovo Legion 7 rinde notablemente mejor en este aspecto.
Schenker XMG Core 16 VE M25 análisis de audio
(±) | la sonoridad del altavoz es media pero buena (76 dB)
Graves 100 - 315 Hz
(-) | casi sin bajos - de media 19.1% inferior a la mediana
(±) | la linealidad de los graves es media (10.5% delta a frecuencia anterior)
Medios 400 - 2000 Hz
(±) | medias más altas - de media 6.3% más altas que la mediana
(±) | la linealidad de los medios es media (7.2% delta respecto a la frecuencia anterior)
Altos 2 - 16 kHz
(+) | máximos equilibrados - a sólo 1.8% de la mediana
(+) | los máximos son lineales (6% delta a la frecuencia anterior)
Total 100 - 16.000 Hz
(±) | la linealidad del sonido global es media (18.7% de diferencia con la mediana)
En comparación con la misma clase
» 62% de todos los dispositivos probados de esta clase eran mejores, 8% similares, 30% peores
» El mejor tuvo un delta de 6%, la media fue 18%, el peor fue ###max##%
En comparación con todos los dispositivos probados
» 43% de todos los dispositivos probados eran mejores, 8% similares, 50% peores
» El mejor tuvo un delta de 4%, la media fue 23%, el peor fue ###max##%
Lenovo Legion 7 16IAX10 análisis de audio
(±) | la sonoridad del altavoz es media pero buena (77.6 dB)
Graves 100 - 315 Hz
(±) | lubina reducida - en promedio 9.5% inferior a la mediana
(±) | la linealidad de los graves es media (9.8% delta a frecuencia anterior)
Medios 400 - 2000 Hz
(+) | medios equilibrados - a sólo 1.5% de la mediana
(+) | los medios son lineales (4% delta a la frecuencia anterior)
Altos 2 - 16 kHz
(+) | máximos equilibrados - a sólo 3% de la mediana
(+) | los máximos son lineales (4.9% delta a la frecuencia anterior)
Total 100 - 16.000 Hz
(+) | el sonido global es lineal (11.5% de diferencia con la mediana)
En comparación con la misma clase
» 10% de todos los dispositivos probados de esta clase eran mejores, 3% similares, 87% peores
» El mejor tuvo un delta de 6%, la media fue 18%, el peor fue ###max##%
En comparación con todos los dispositivos probados
» 8% de todos los dispositivos probados eran mejores, 2% similares, 90% peores
» El mejor tuvo un delta de 4%, la media fue 23%, el peor fue ###max##%
Consumo de energía
Consumo de energía
Con entre 10 y 19 vatios en ralentí y entre 181 y 246 vatios bajo carga, el consumo de energía está en línea con las expectativas.
| Off / Standby | |
| Ocioso | |
| Carga |
|
Clave:
min: | |
| Schenker XMG Core 16 VE M25 Ryzen 7 255, GeForce RTX 5060 Laptop | Tulpar T6 V3.5 i7-14700HX, GeForce RTX 5060 Laptop | HP Omen 16-ap0091ng R9 8940HX, GeForce RTX 5060 Laptop | Lenovo Legion 7 16IAX10 Ultra 7 255HX, GeForce RTX 5060 Laptop | Schenker XMG Core 16 M25 Ryzen AI 9 HX 370, GeForce RTX 5070 Laptop | Acer Predator Helios Neo 16S AI PHN16S-71-94L9 Ultra 9 275HX, GeForce RTX 5070 Ti Laptop | Media de la clase Gaming | |
|---|---|---|---|---|---|---|---|
| Power Consumption | 8% | 11% | -12% | 5% | 22% | -26% | |
| Idle Minimum * (Watt) | 10.5 | 6.7 36% | 7.8 26% | 9.4 10% | 7.4 30% | 3.9 63% | 13 ? -24% |
| Idle Average * (Watt) | 13 | 13.7 -5% | 8.8 32% | 10.6 18% | 14.9 -15% | 11 15% | 18.7 ? -44% |
| Idle Maximum * (Watt) | 18.8 | 21.8 -16% | 21.5 -14% | 36.4 -94% | 15.2 19% | 16.9 10% | 24.3 ? -29% |
| Cyberpunk 2077 ultra * (Watt) | 182.5 | 156.7 14% | 192 -5% | 188 -3% | 184.8 -1% | 152.7 16% | |
| Cyberpunk 2077 ultra external monitor * (Watt) | 181.1 | 151.9 16% | 164.5 9% | 187.5 -4% | 181.4 -0% | 144.9 20% | |
| Load Maximum * (Watt) | 246 | 242 2% | 208 15% | 247 -0% | 251.1 -2% | 229 7% | 258 ? -5% |
| Load Average * (Watt) | 127 | 119 | 107.7 | 100.8 | 123 | 110.2 ? |
* ... más pequeño es mejor
consumo de energía Cyberpunk / Prueba de estrés
consumo de energía con monitor externo
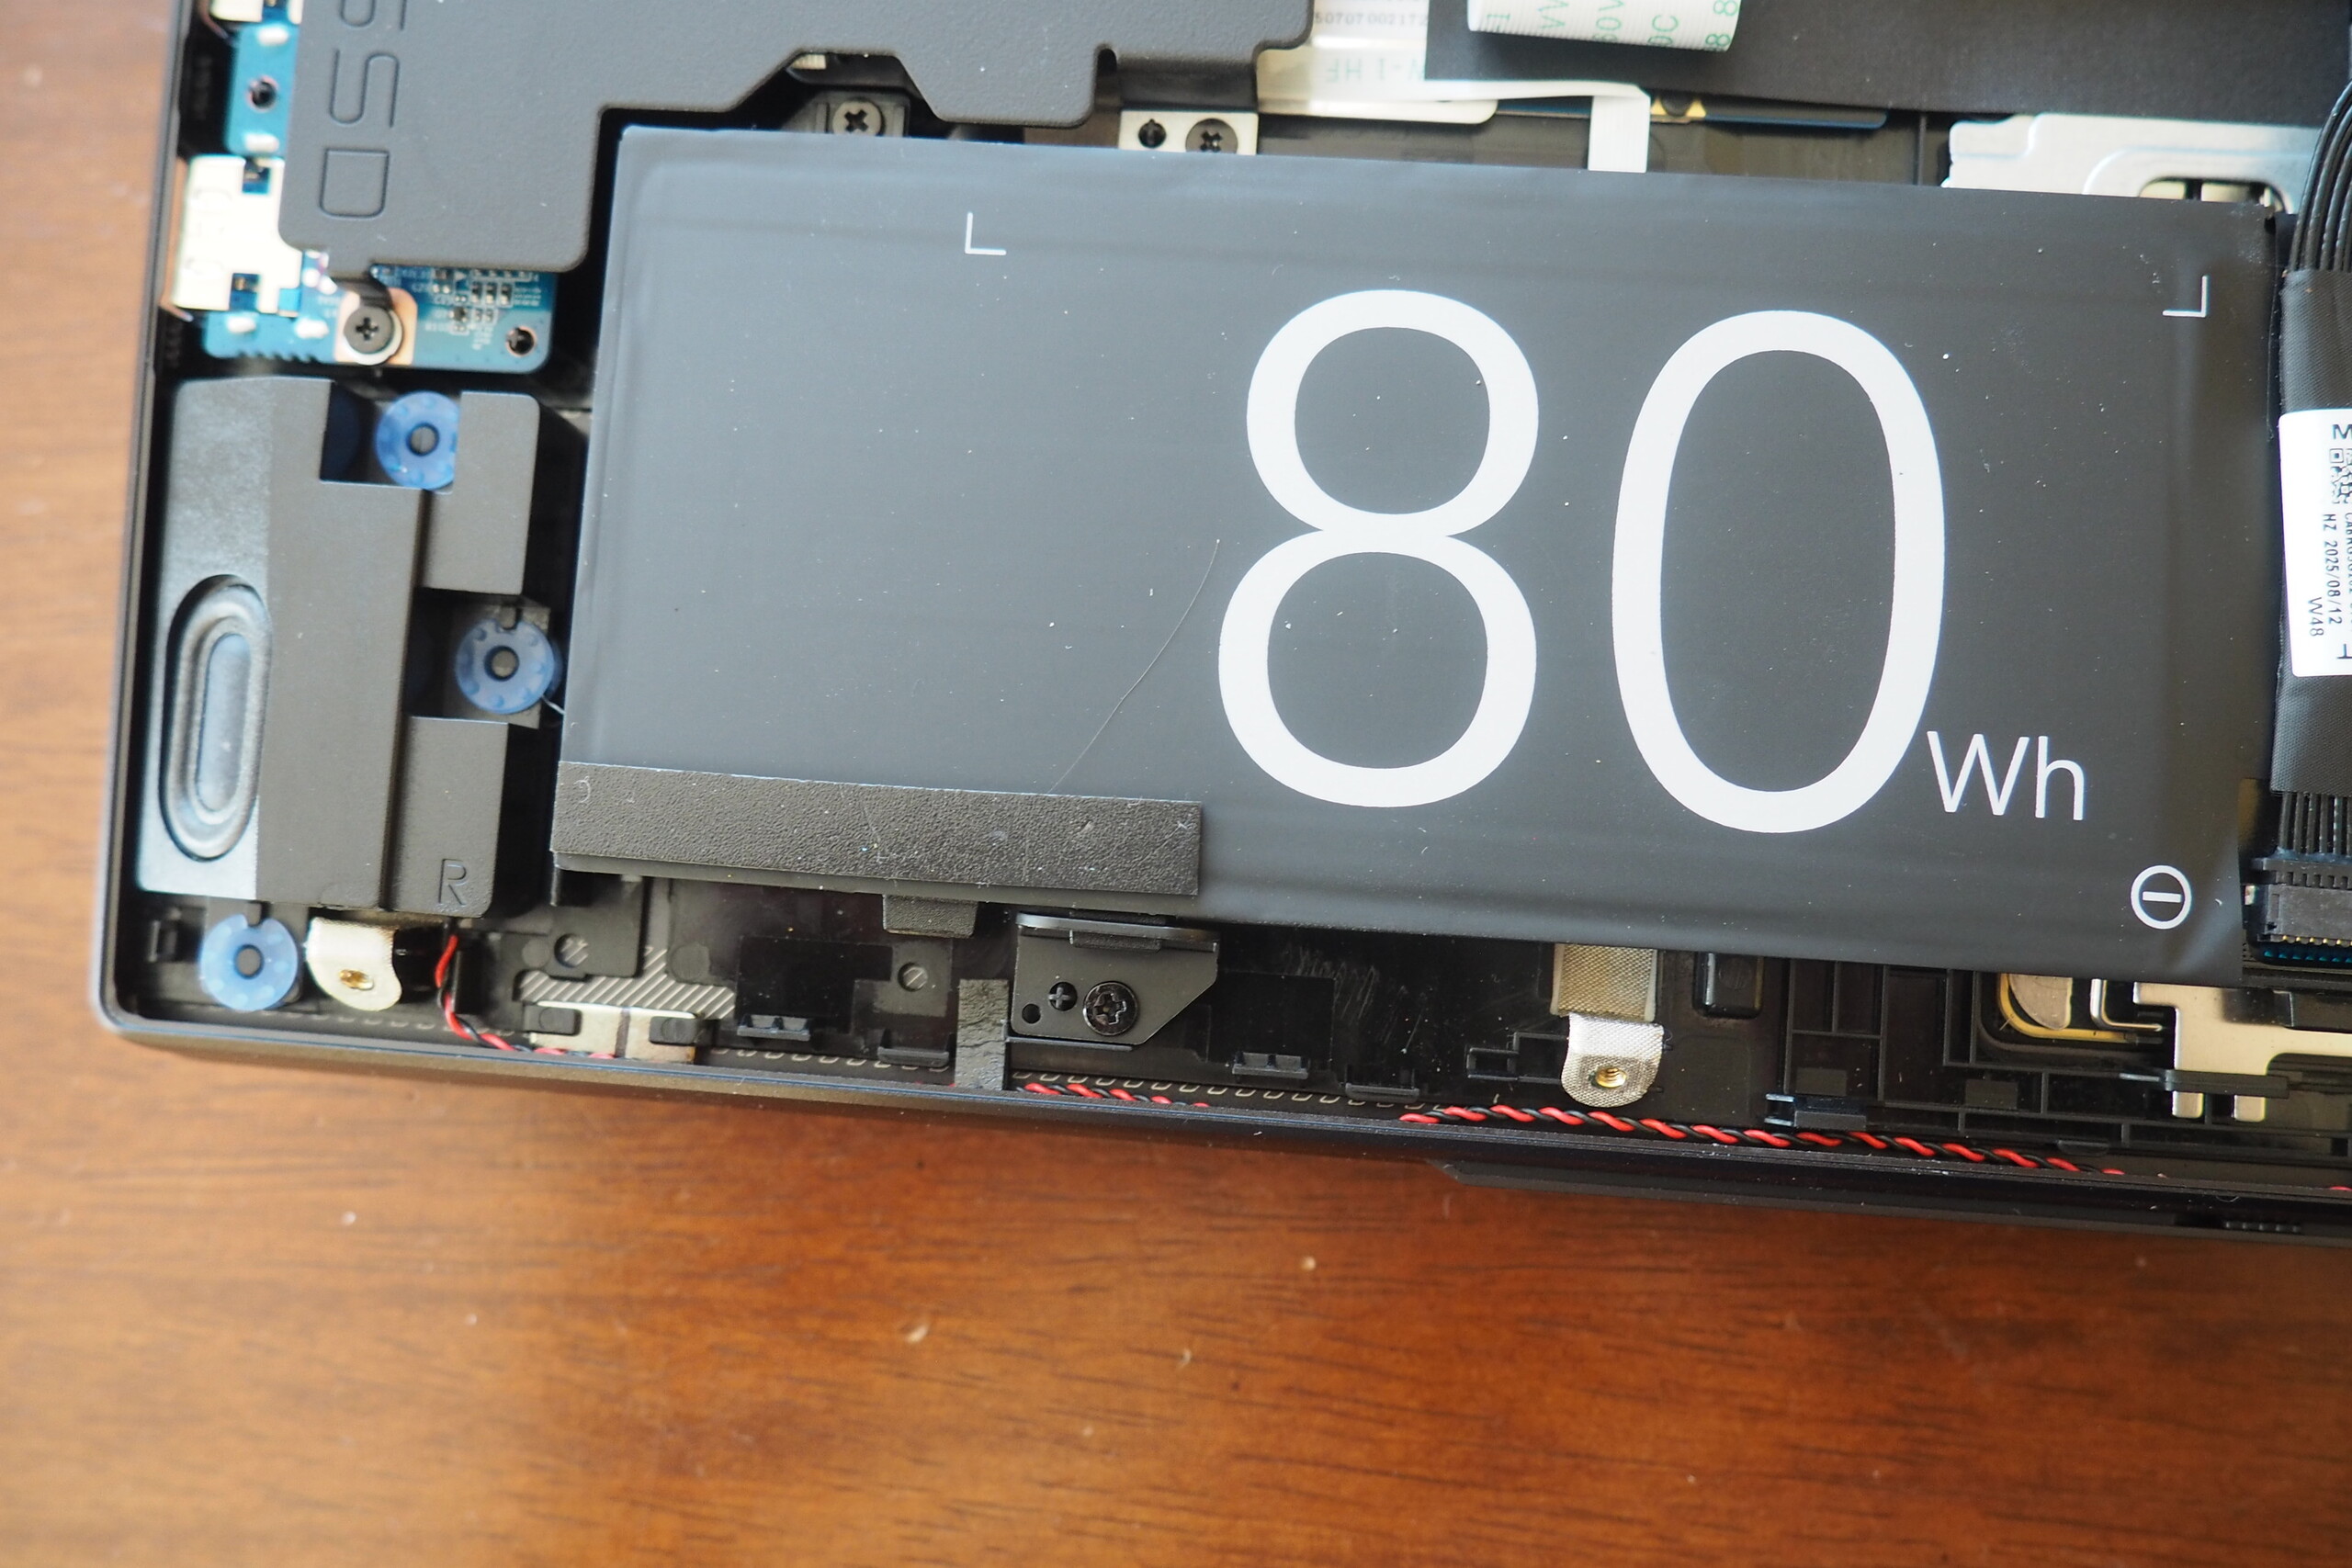
Duración de las pilas
Describiríamos la duración de la batería como relativamente buena. Casi ningún dispositivo comparable consiguió más de 7 horas en nuestra prueba Wi-Fi (brillo reducido a 150 cd/m²). El Core 16 normal, que viene con una batería de 99 Wh en lugar de 80 Wh, alcanza incluso alrededor de 11 horas.
| Schenker XMG Core 16 VE M25 Ryzen 7 255, GeForce RTX 5060 Laptop, 80 Wh | Tulpar T6 V3.5 i7-14700HX, GeForce RTX 5060 Laptop, 53.35 Wh | HP Omen 16-ap0091ng R9 8940HX, GeForce RTX 5060 Laptop, 70 Wh | Lenovo Legion 7 16IAX10 Ultra 7 255HX, GeForce RTX 5060 Laptop, 84 Wh | Schenker XMG Core 16 M25 Ryzen AI 9 HX 370, GeForce RTX 5070 Laptop, 99.8 Wh | Acer Predator Helios Neo 16S AI PHN16S-71-94L9 Ultra 9 275HX, GeForce RTX 5070 Ti Laptop, 76 Wh | Media de la clase Gaming | |
|---|---|---|---|---|---|---|---|
| Duración de Batería | -40% | -32% | -36% | 49% | -32% | -2% | |
| WiFi v1.3 (h) | 7.3 | 4.4 -40% | 5 -32% | 4.7 -36% | 10.9 49% | 5 -32% | 7.15 ? -2% |
| H.264 (h) | 5.1 | 8.64 ? | |||||
| Load (h) | 1.3 | 1.502 ? |
Valoración general de Notebookcheck
Aunque el XMG Core 16 VE se queda por poco por debajo del Lenovo Legion 7 16, sigue demostrando ser un portátil para juegos completo y de alta calidad con muy pocos puntos débiles.
Schenker XMG Core 16 VE M25
- 01/09/2026 v8
Florian Glaser
 Total Sustainability Score:
 Posibles alternativas en comparación
Imagen | Modelo | Precio | Peso | Altura | Pantalla |
|---|---|---|---|---|---|
1. 83.9%  | Schenker XMG Core 16 VE M25 AMD Ryzen 7 255 ⎘ NVIDIA GeForce RTX 5060 Laptop ⎘ 64 GB Memoría, 2048 GB SSD | Amazon: Precio de catálogo: 1935 EUR | 2.1 kg | 23 mm | 16.00" 2560x1600 189 PPI IPS |
2. 77.8%  | Tulpar T6 V3.5 Intel Core i7-14700HX ⎘ NVIDIA GeForce RTX 5060 Laptop ⎘ 32 GB Memoría, 1000 GB SSD | Amazon: Precio de catálogo: 1160 EUR | 2.4 kg | 25 mm | 16.00" 1920x1200 142 PPI IPS |
3. 82.5%  | HP Omen 16-ap0091ng AMD Ryzen 9 8940HX ⎘ NVIDIA GeForce RTX 5060 Laptop ⎘ 16 GB Memoría, 1000 GB SSD | Amazon: Precio de catálogo: 1500 Euro | 2.4 kg | 23.7 mm | 16.00" 1920x1200 162 PPI IPS |
4. 86.6%  | Lenovo Legion 7 16IAX10 Intel Core Ultra 7 255HX ⎘ NVIDIA GeForce RTX 5060 Laptop ⎘ 32 GB Memoría, 1024 GB SSD | Amazon: Precio de catálogo: 1650 USD | 2 kg | 17.9 mm | 16.00" 2560x1600 189 PPI OLED |
5. 86.2%  | Schenker XMG Core 16 M25 AMD Ryzen AI 9 HX 370 ⎘ NVIDIA GeForce RTX 5070 Laptop ⎘ 64 GB Memoría, 2048 GB SSD | Amazon: Precio de catálogo: 2100€ | 2.1 kg | 23 mm | 16.00" 2560x1600 189 PPI IPS |
6. 82%  | Acer Predator Helios Neo 16S AI PHN16S-71-94L9 Intel Core Ultra 9 275HX ⎘ NVIDIA GeForce RTX 5070 Ti Laptop ⎘ 32 GB Memoría, 1024 GB SSD | Amazon: Precio de catálogo: 2400 EUR | 2.2 kg | 19.9 mm | 16.00" 2560x1600 189 PPI OLED |
Transparencia
La selección de los dispositivos que se van a reseñar corre a cargo de nuestro equipo editorial. La muestra de prueba fue proporcionada al autor en calidad de préstamo por el fabricante o el minorista a los efectos de esta reseña. El prestamista no tuvo ninguna influencia en esta reseña, ni el fabricante recibió una copia de la misma antes de su publicación. No había ninguna obligación de publicar esta reseña. Como empresa de medios independiente, Notebookcheck no está sujeta a la autoridad de fabricantes, minoristas o editores.
Así es como prueba Notebookcheck
Cada año, Notebookcheck revisa de forma independiente cientos de portátiles y smartphones utilizando procedimientos estandarizados para asegurar que todos los resultados son comparables. Hemos desarrollado continuamente nuestros métodos de prueba durante unos 20 años y hemos establecido los estándares de la industria en el proceso. En nuestros laboratorios de pruebas, técnicos y editores experimentados utilizan equipos de medición de alta calidad. Estas pruebas implican un proceso de validación en varias fases. Nuestro complejo sistema de clasificación se basa en cientos de mediciones y puntos de referencia bien fundamentados, lo que mantiene la objetividad.