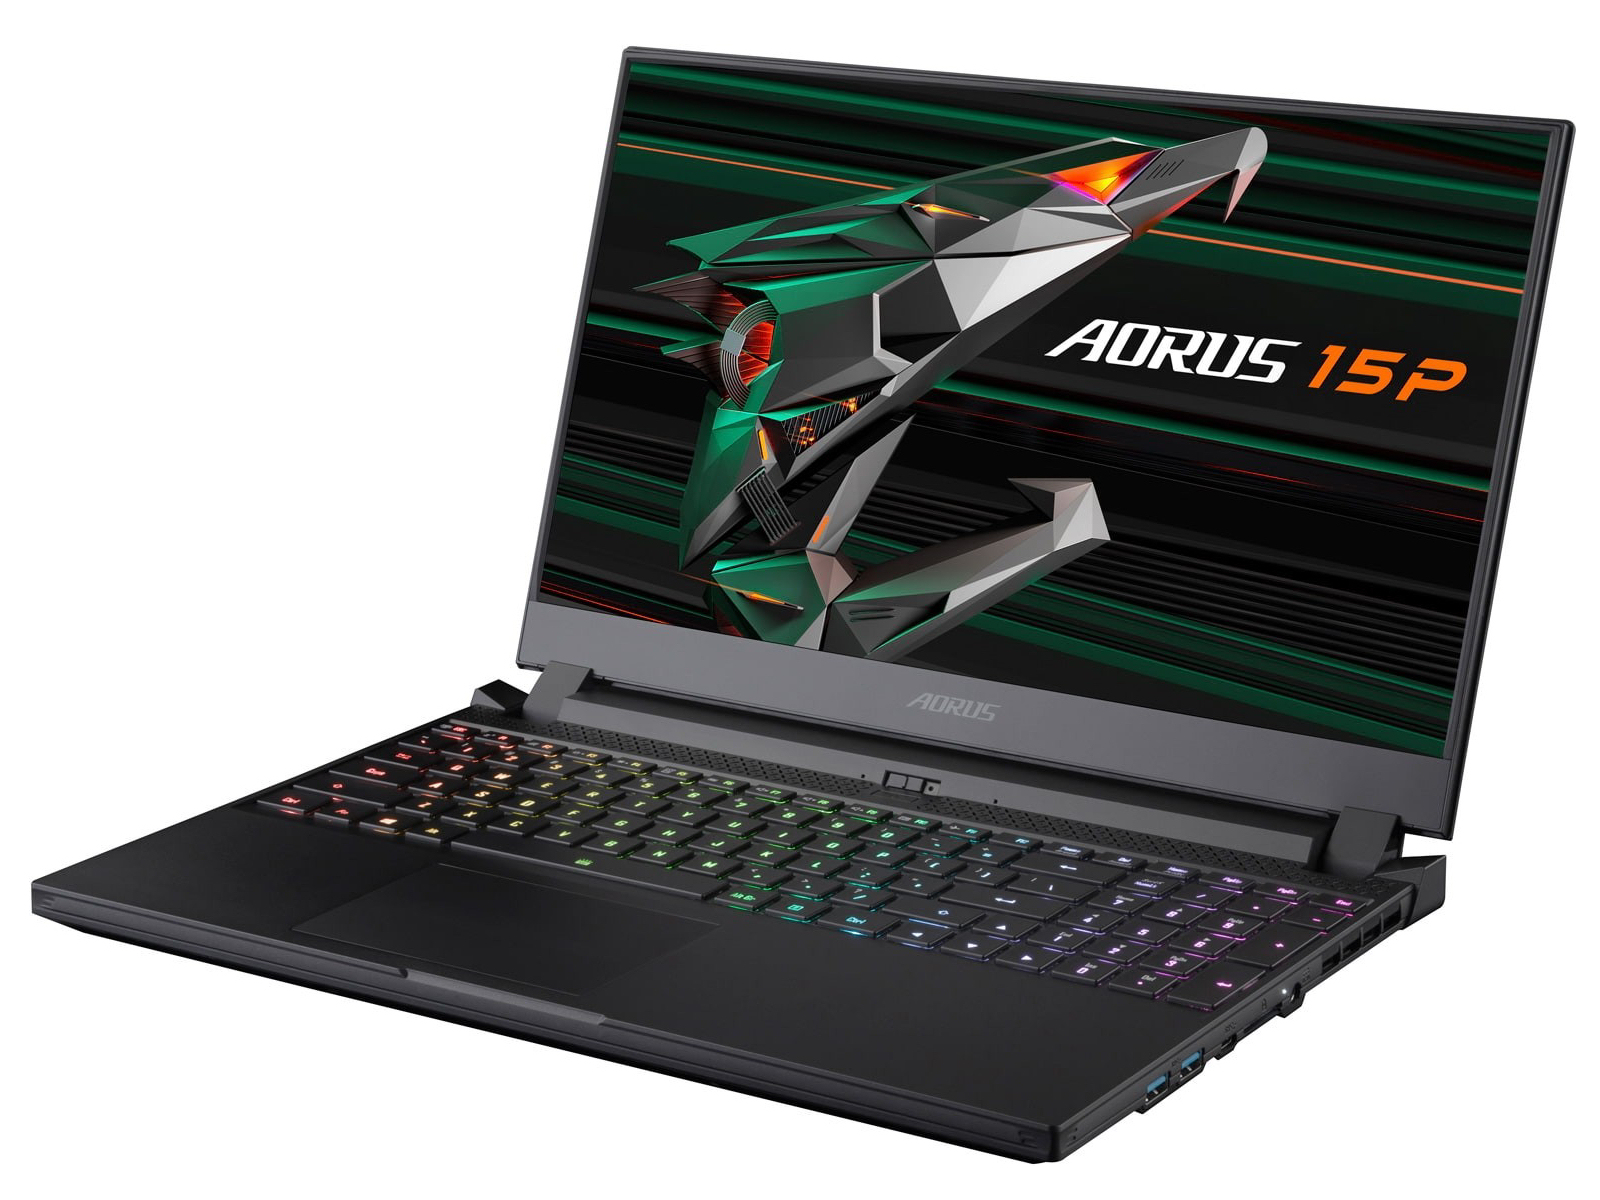
Análisis del portátil Aorus 15P XC: Mucha potencia informática en una carcasa compacta

Gigabyte ha creado un portátil de juegos compacto de 15,6 pulgadas que funciona con un octa-core Core i7 10870Hy un GeForce RTX 3070. El modelo es casi idéntico a sus modelos hermanos Aorus 15G XCy Aorus 15P. Su competencia incluye dispositivos como elMSI GS66 Stealth 10UG, elSchenker XMG Neo 15, elAsus TUF Dash F15 FX516PRy el Asus ROG Strix G15 G513QR
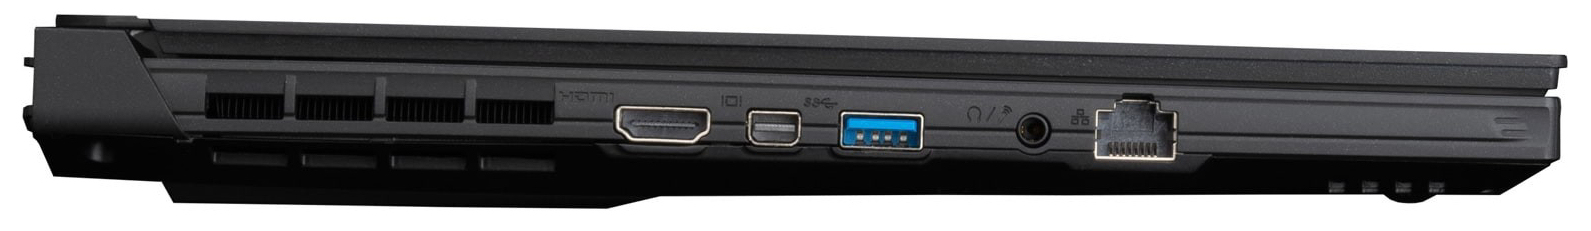
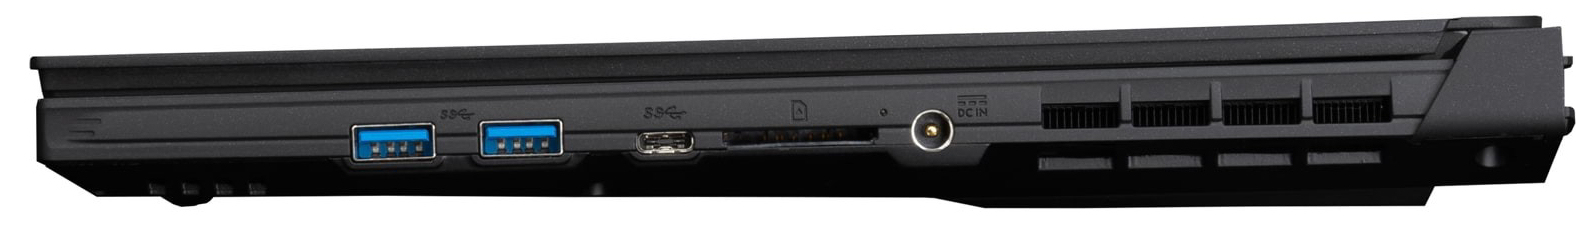
Como ya hemos analizado dos modelos con una construcción muy similar, no entraremos en detalles sobre la carcasa, la conectividad, los dispositivos de entrada, los altavoces o la pantalla en este análisis, a menos que observemos alguna diferencia. Consulte nuestros análisis de los modelos Aorus 15P WBy Aorus 15G XCpara conocer los detalles de estos aspectos.
possible competitors in comparison
Valoración | Fecha | Modelo | Peso | Altura | Tamaño | Resolución | Precio |
|---|---|---|---|---|---|---|---|
| 86.1 % v7 (old) | 02/2021 | Aorus 15P XC i7-10870H, GeForce RTX 3070 Laptop GPU | 2.2 kg | 27 mm | 15.60" | 1920x1080 | |
| 84 % v7 (old) | 02/2021 | MSI GS66 Stealth 10UG i7-10870H, GeForce RTX 3070 Laptop GPU | 2.1 kg | 19.8 mm | 15.60" | 1920x1080 | |
| 82.4 % v7 (old) | 02/2021 | Asus TUF Dash F15 FX516PR i7-11370H, GeForce RTX 3070 Laptop GPU | 2 kg | 20 mm | 15.60" | 1920x1080 | |
| 85.9 % v7 (old) | 11/2020 | Schenker XMG Neo 15 Comet Lake i7-10875H, GeForce RTX 2070 Super Mobile | 2.2 kg | 23 mm | 15.60" | 1920x1080 | |
| 85 % v7 (old) | 02/2021 | Asus ROG Strix G15 G513QR R9 5900HX, GeForce RTX 3070 Laptop GPU | 2.3 kg | 27.2 mm | 15.60" | 1920x1080 |
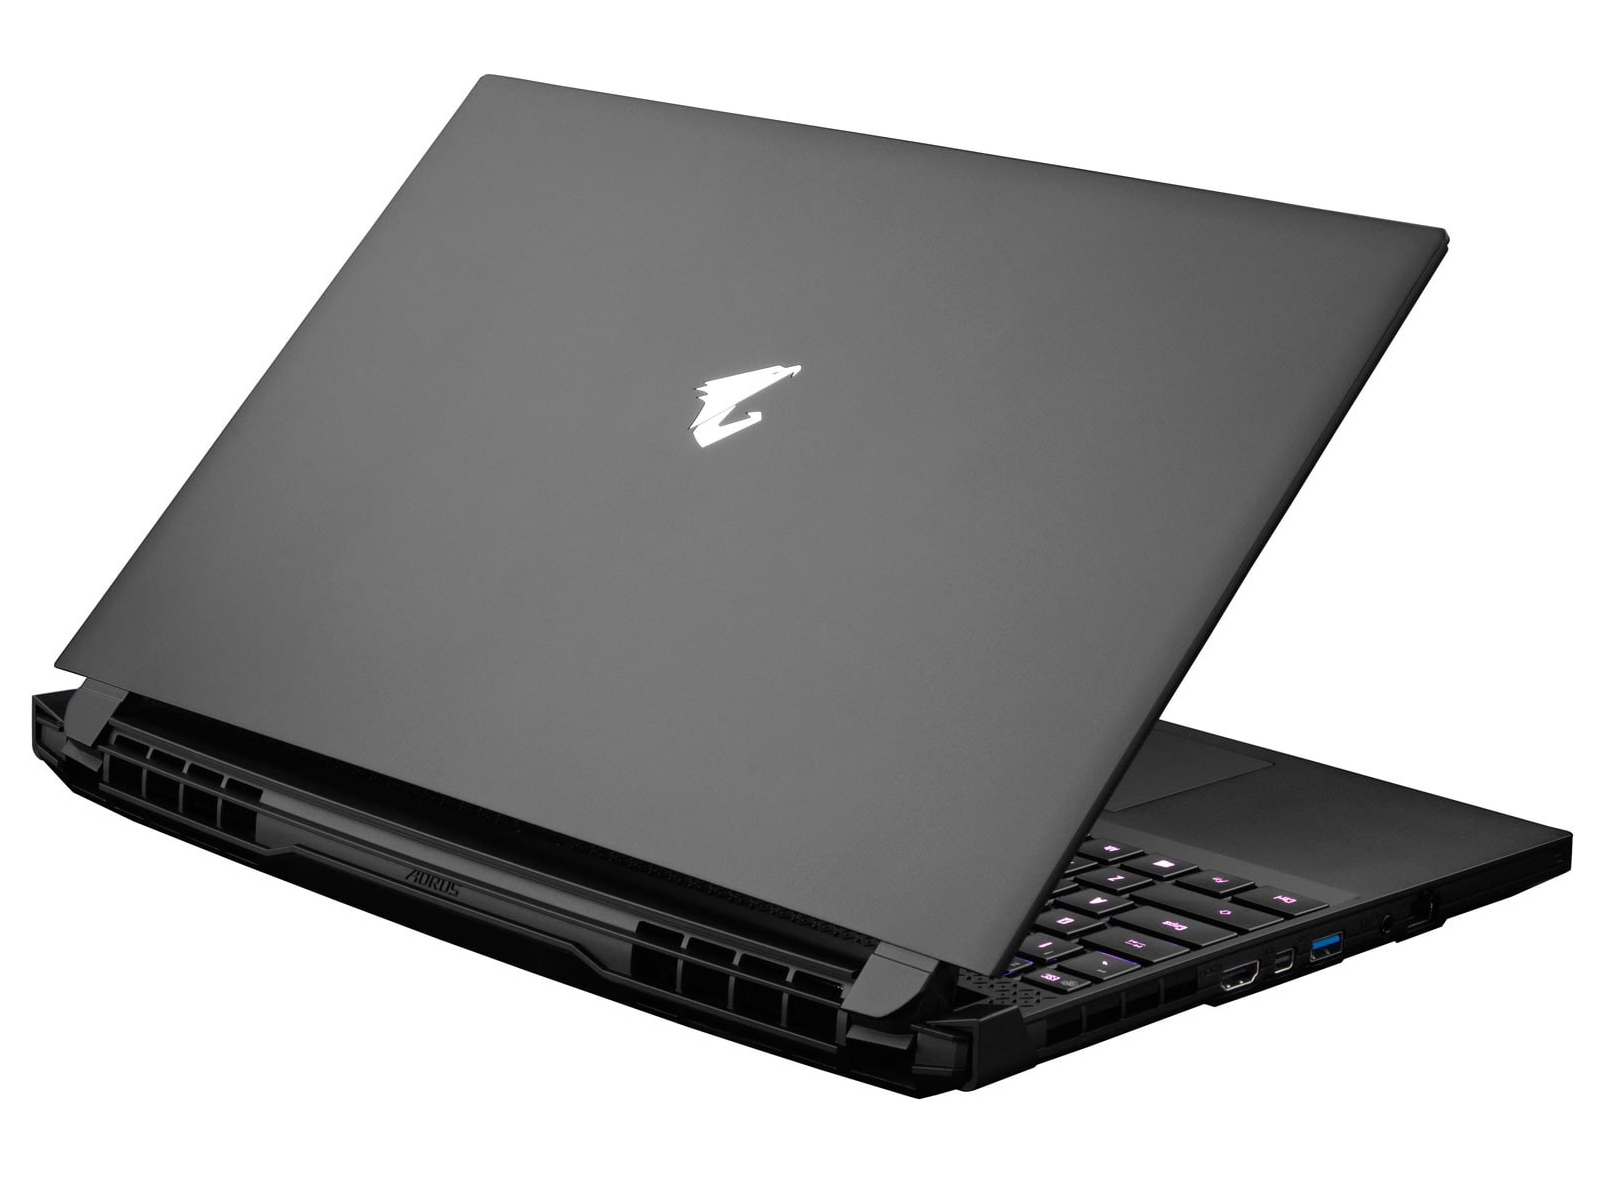
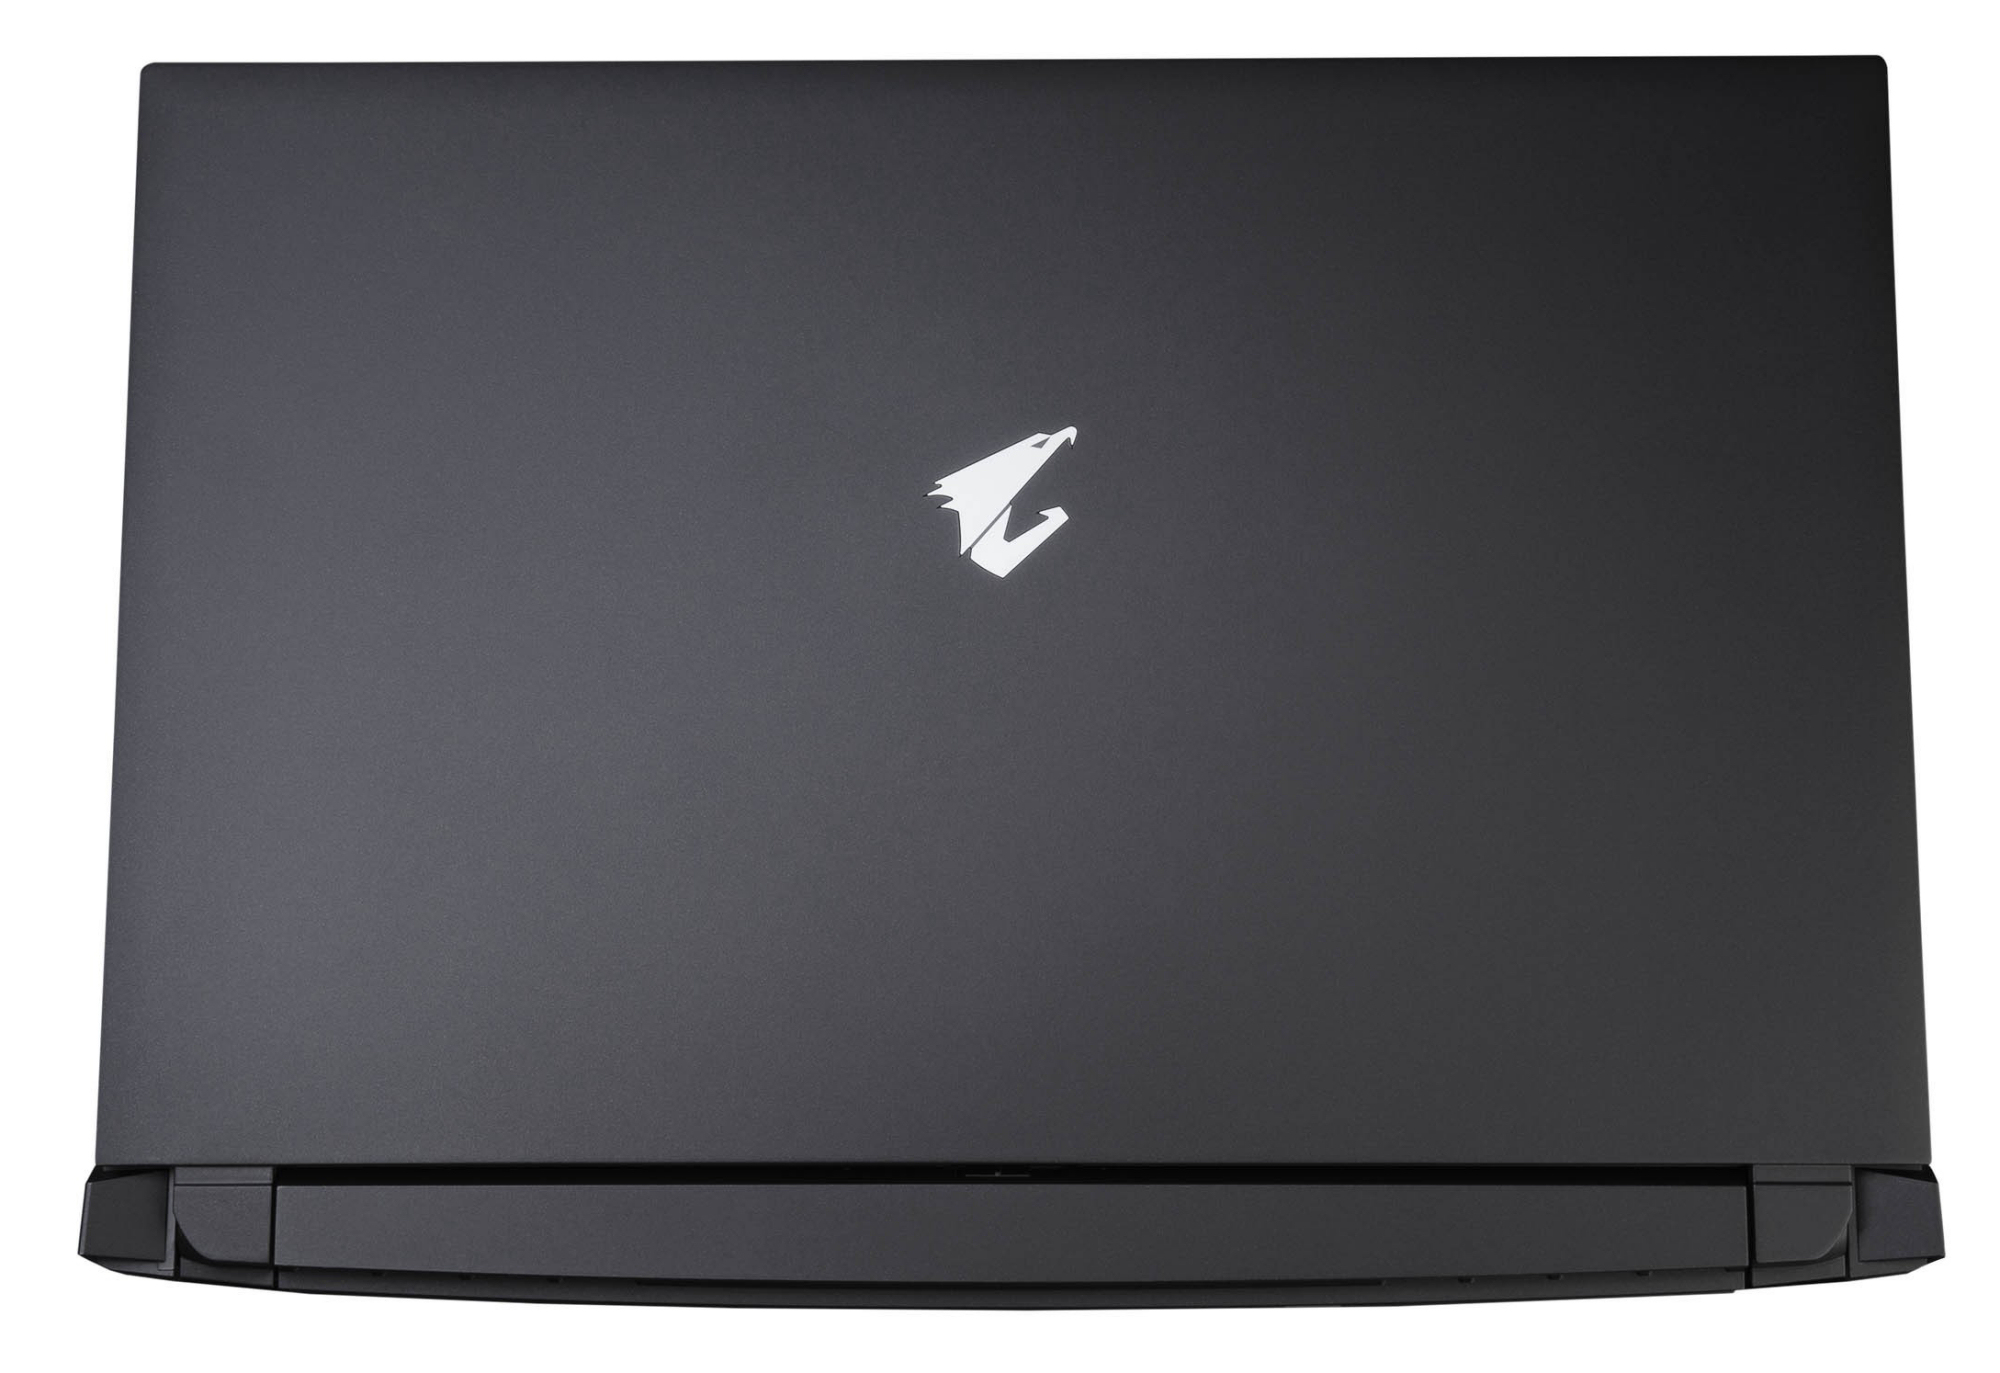
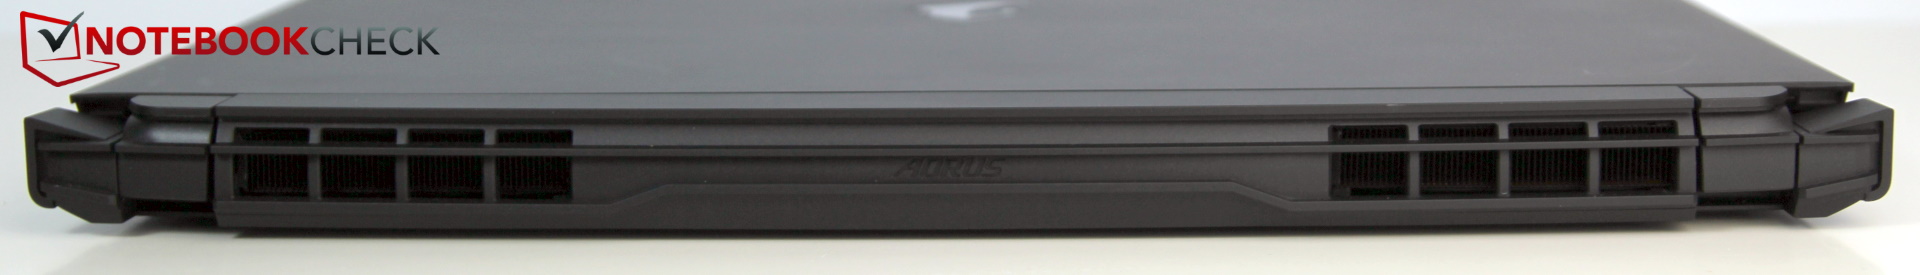
Caja - 15P XC ligeramente más pesada que sus modelos hermanos
El 15P XC, el 15P WBy el15G XCtienen el mismo aspecto a primera e incluso a segunda vista. La carcasa tiene el mismo diseño y la misma posición de los puertos. Sin embargo, hay algunas diferencias muy pequeñas: El 15P XC es 4 mm más alto y unos 200 gramos más pesado que sus dos modelos hermanos. La carcasa más gruesa del 15P XC puede reconocerse por las ranuras de ventilación adicionales a lo largo de la parte trasera

| SD Card Reader | |
| average JPG Copy Test (av. of 3 runs) | |
| Aorus 15P WB (Toshiba Exceria Pro SDXC 64 GB UHS-II) | |
| Aorus 15P XC (Toshiba Exceria Pro SDXC 64 GB UHS-II) | |
| Aorus 15G XC (Toshiba Exceria Pro SDXC 64 GB UHS-II) | |
| Media de la clase Gaming (20.9 - 210, n=54, últimos 2 años) | |
| Schenker XMG Neo 15 Comet Lake (Toshiba Exceria Pro SDXC 64 GB UHS-II) | |
| maximum AS SSD Seq Read Test (1GB) | |
| Aorus 15P WB (Toshiba Exceria Pro SDXC 64 GB UHS-II) | |
| Aorus 15G XC (Toshiba Exceria Pro SDXC 64 GB UHS-II) | |
| Aorus 15P XC (Toshiba Exceria Pro SDXC 64 GB UHS-II) | |
| Media de la clase Gaming (25.5 - 261, n=51, últimos 2 años) | |
| Schenker XMG Neo 15 Comet Lake (Toshiba Exceria Pro SDXC 64 GB UHS-II) | |


")
")


Pantalla - IPS de 240 Hz
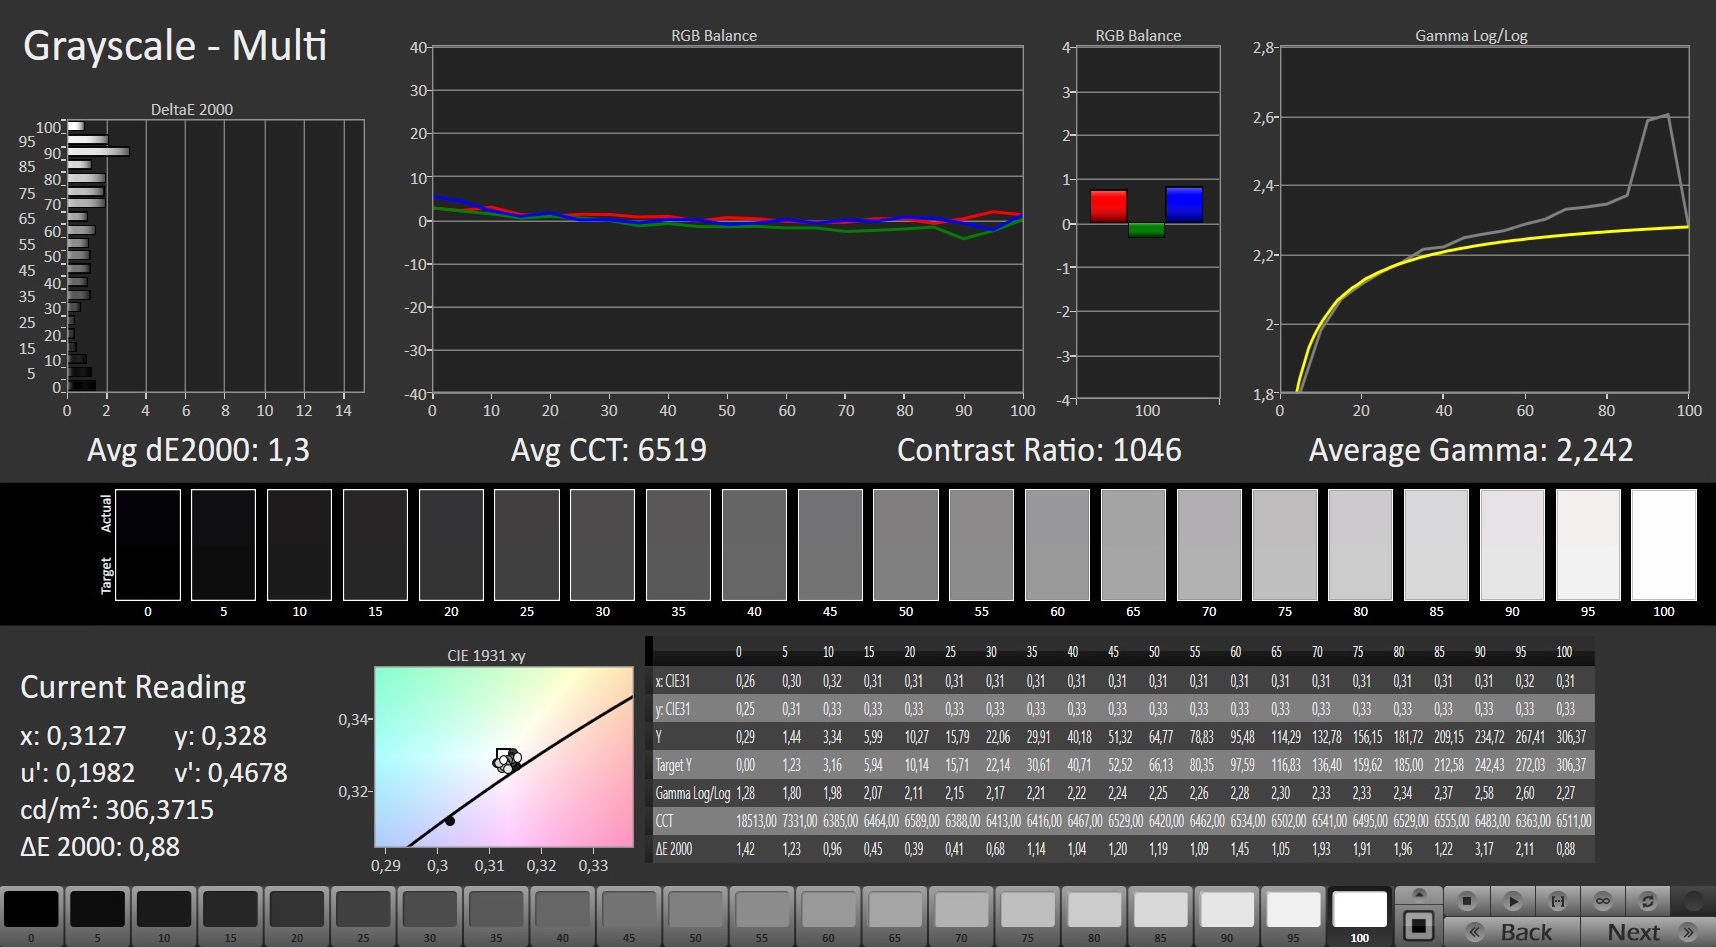
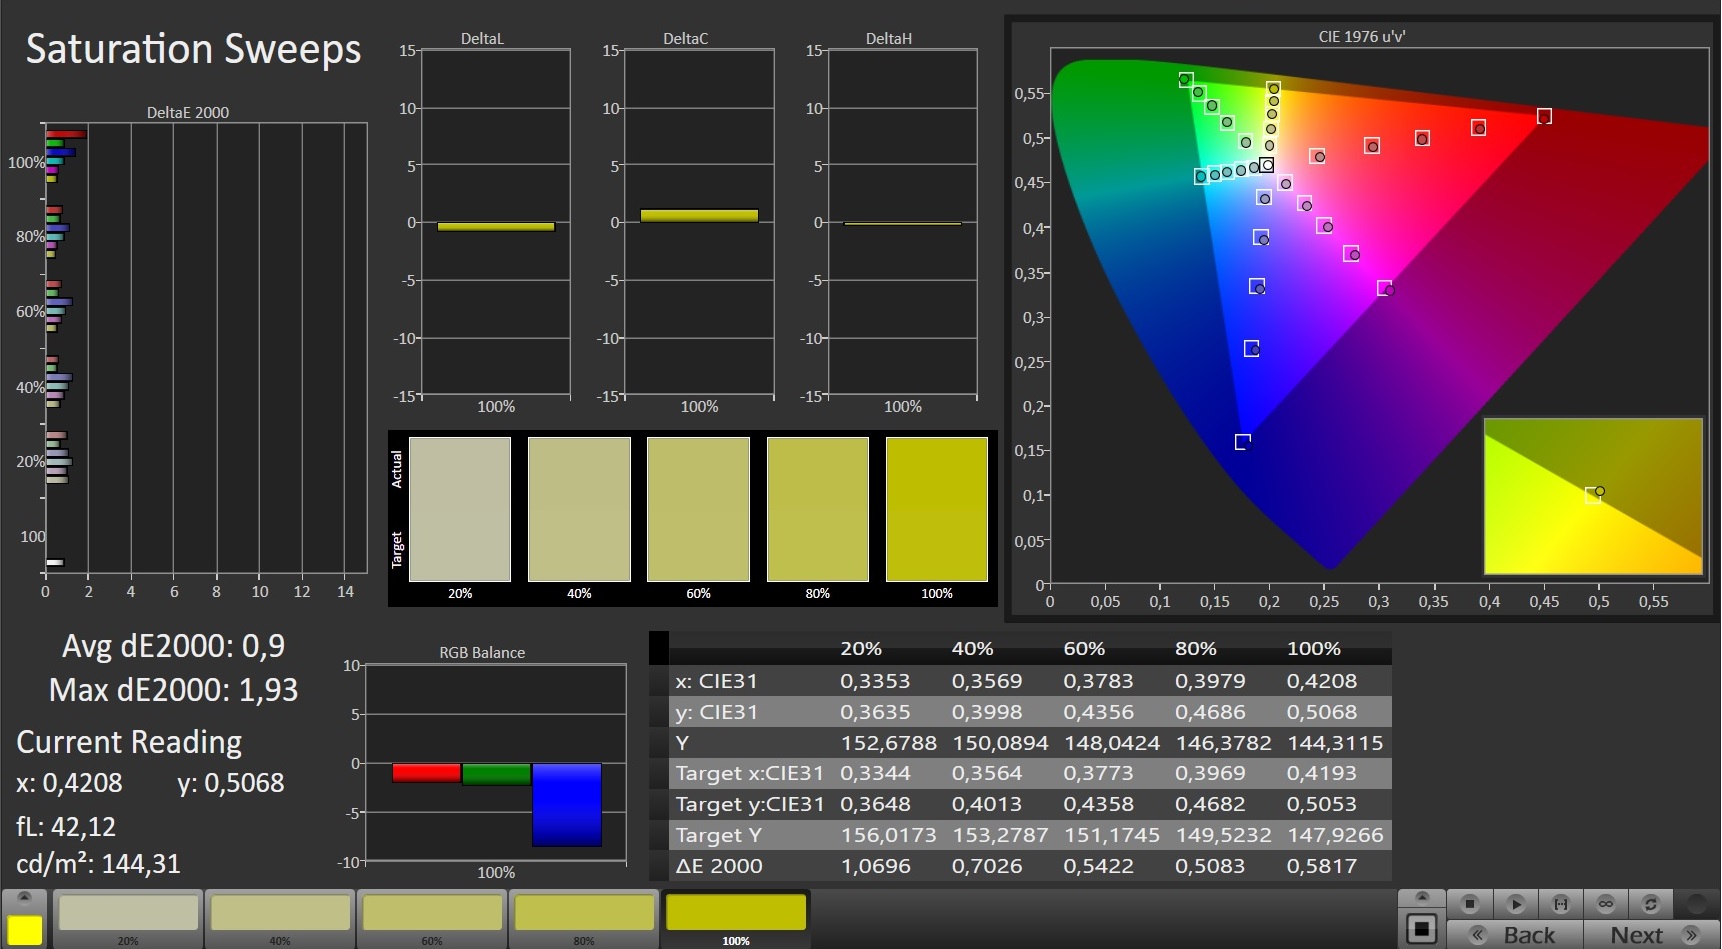
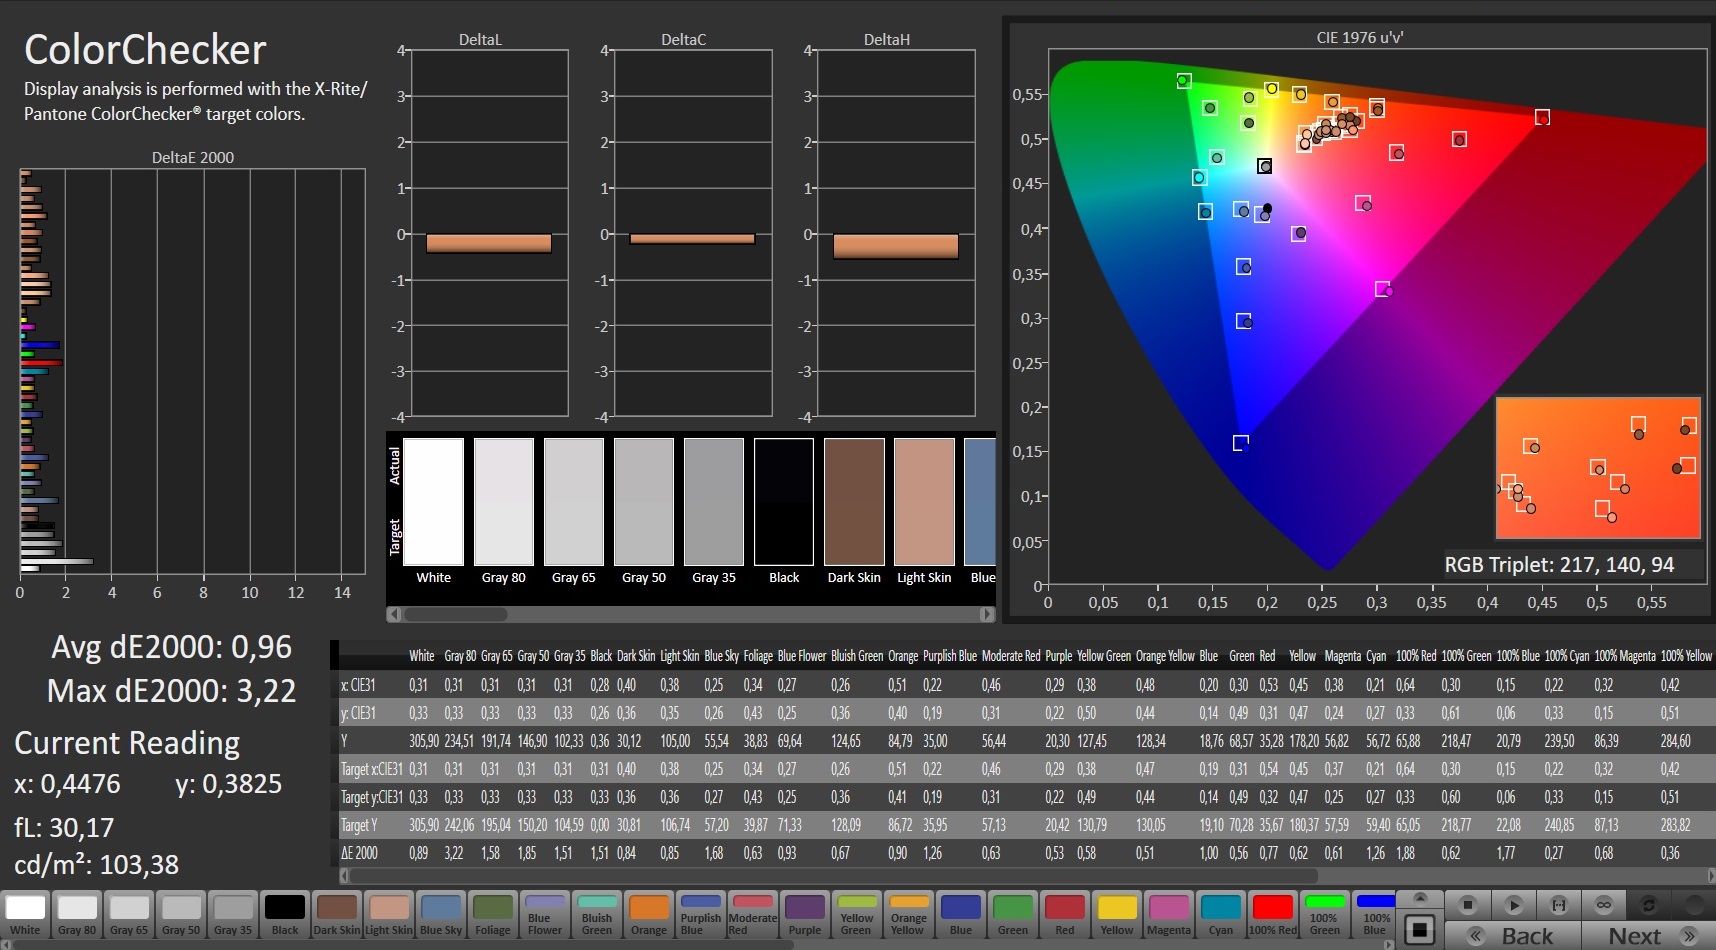
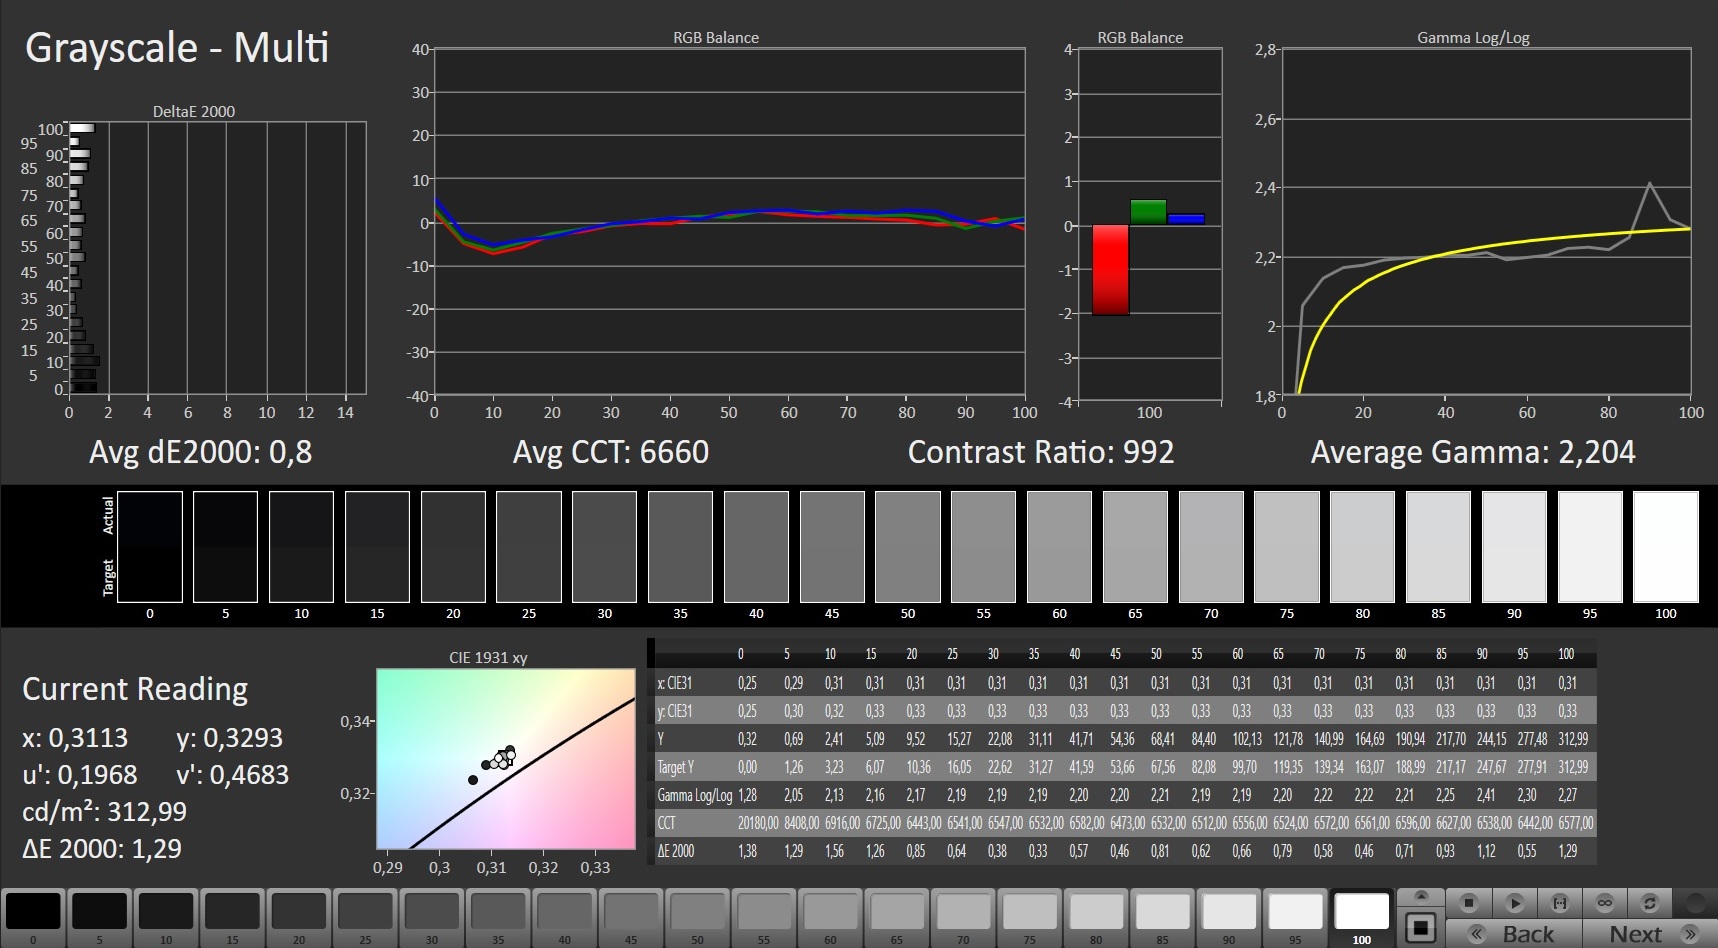
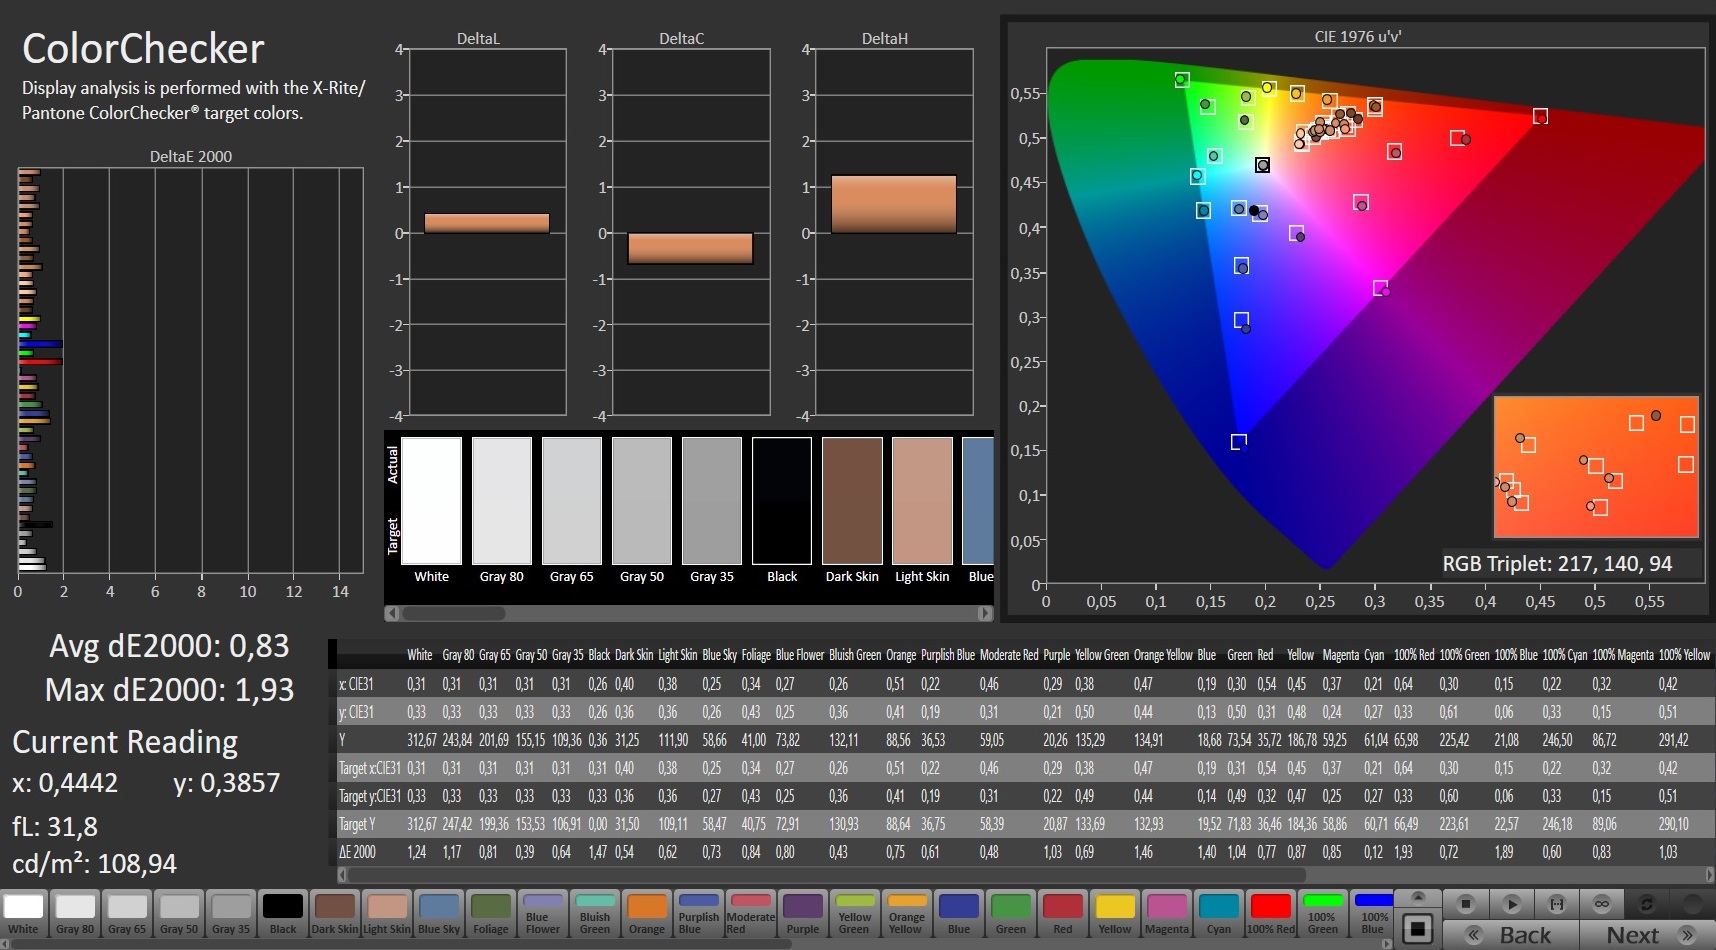
Mientras que el ratio de contraste (1028:1) de la pantalla de 15.6 pulgadas con ángulos de visión estables y altas tasas de respuesta (FHD, IPS, 240 Hz) está casi dentro del rango ideal ( 1000:1), el brillo medio es demasiado bajo con 278 nits. Consideramos que los valores superiores a 300 nits son buenos. Gracias a su certificación Pantone, la pantalla ya ofrece grandes colores de fábrica. Por desgracia, el display usa PWM para regular el brillo por debajo del 25% a una frecuencia de 24040 Hz.
Este es el mismo panel que en elAorus 15G XC. Es bastante normal que los resultados difieran ligeramente. Dos pantallas de la misma construcción nunca coinciden al 100%.
| |||||||||||||||||||||||||
iluminación: 88 %
Brillo con batería: 298 cd/m²
Contraste: 1028:1 (Negro: 0.29 cd/m²)
ΔE ColorChecker Calman: 0.96 | ∀{0.5-29.43 Ø4.73}
calibrated: 0.83
ΔE Greyscale Calman: 1.3 | ∀{0.09-98 Ø4.97}
91% sRGB (Argyll 1.6.3 3D)
69% AdobeRGB 1998 (Argyll 1.6.3 3D)
68.6% AdobeRGB 1998 (Argyll 3D)
98.7% sRGB (Argyll 3D)
67.2% Display P3 (Argyll 3D)
Gamma: 2.242
CCT: 6519 K
| Aorus 15P XC Sharp LQ156M1JW03, IPS, 1920x1080, 15.6" | Aorus 15G XC Sharp LQ156M1JW03, IPS, 1920x1080, 15.6" | MSI GS66 Stealth 10UG AU Optronics B156HAN12.0, IPS, 1920x1080, 15.6" | Asus TUF Dash F15 FX516PR LQ156M1JW26 (SHP1532), IPS, 1920x1080, 15.6" | Schenker XMG Neo 15 Comet Lake IPS, 1920x1080, 15.6" | Aorus 15P WB BOE HF NV156FHM-N4G, IPS, 1920x1080, 15.6" | Asus ROG Strix G15 G513QR LQ156M1JW25, IPS, 1920x1080, 15.6" | |
|---|---|---|---|---|---|---|---|
| Display | -2% | 1% | -1% | 1% | -6% | -1% | |
| Display P3 Coverage (%) | 67.2 | 65.6 -2% | 67.7 1% | 66.9 0% | 69.5 3% 67.9 1% | 63 -6% | 67.7 1% |
| sRGB Coverage (%) | 98.7 | 97.5 -1% | 98.4 0% | 98.1 -1% | 99.2 1% 98.7 0% | 91.3 -7% | 94.3 -4% |
| AdobeRGB 1998 Coverage (%) | 68.6 | 67.1 -2% | 69.1 1% | 67.9 -1% | 70.7 3% 68.8 0% | 64.6 -6% | 68.2 -1% |
| Response Times | 7% | -25% | -6% | -22% | 13% | 16% | |
| Response Time Grey 50% / Grey 80% * (ms) | 11.2 ? | 9.6 ? 14% | 14.4 ? -29% | 12 ? -7% | 15.2 ? -36% | 8.8 ? 21% | 8.2 ? 27% |
| Response Time Black / White * (ms) | 9.6 ? | 9.6 ? -0% | 11.6 ? -21% | 10 ? -4% | 10.4 ? -8% | 9.2 ? 4% | 9.2 ? 4% |
| PWM Frequency (Hz) | 24040 ? | 24040 ? | 23580 ? | 23580 ? | |||
| Screen | -3% | -36% | -36% | -46% | -45% | -58% | |
| Brightness middle (cd/m²) | 298 | 288 -3% | 259.5 -13% | 286 -4% | 308 3% | 275 -8% | 308 3% |
| Brightness (cd/m²) | 278 | 270 -3% | 264 -5% | 275 -1% | 284 2% | 268 -4% | 288 4% |
| Brightness Distribution (%) | 88 | 89 1% | 90 2% | 91 3% | 87 -1% | 91 3% | 86 -2% |
| Black Level * (cd/m²) | 0.29 | 0.25 14% | 0.25 14% | 0.25 14% | 0.32 -10% | 0.33 -14% | 0.23 21% |
| Contrast (:1) | 1028 | 1152 12% | 1038 1% | 1144 11% | 963 -6% | 833 -19% | 1339 30% |
| Colorchecker dE 2000 * | 0.96 | 1.19 -24% | 2.52 -163% | 2.43 -153% | 2.45 -155% | 2.72 -183% | 3.28 -242% |
| Colorchecker dE 2000 max. * | 3.22 | 3.79 -18% | 5.55 -72% | 6.33 -97% | 7.74 -140% | 4.45 -38% | 8.51 -164% |
| Colorchecker dE 2000 calibrated * | 0.83 | 0.71 14% | 1.93 -133% | 0.83 -0% | 0.83 -0% | 2.09 -152% | 0.83 -0% |
| Greyscale dE 2000 * | 1.3 | 1.6 -23% | 1.7 -31% | 3.5 -169% | 3.9 -200% | 2.3 -77% | 5 -285% |
| Gamma | 2.242 98% | 2.229 99% | 2.04 108% | 2.32 95% | 2.211 100% | 2.266 97% | 2.057 107% |
| CCT | 6519 100% | 6539 99% | 6414 101% | 7145 91% | 7434 87% | 6933 94% | 7393 88% |
| Color Space (Percent of AdobeRGB 1998) (%) | 69 | 67 -3% | 63.3 -8% | 68 -1% | 69 0% | 65 -6% | 68 -1% |
| Color Space (Percent of sRGB) (%) | 91 | 90 -1% | 98.8 9% | 91 0% | 91 0% | 90 -1% | 90 -1% |
| Media total (Programa/Opciones) | 1% /
-2% | -20% /
-28% | -14% /
-26% | -22% /
-29% | -13% /
-31% | -14% /
-38% |
* ... más pequeño es mejor

Tiempos de respuesta del display
| ↔ Tiempo de respuesta de Negro a Blanco | ||
|---|---|---|
| 9.6 ms ... subida ↗ y bajada ↘ combinada | ↗ 5.2 ms subida | 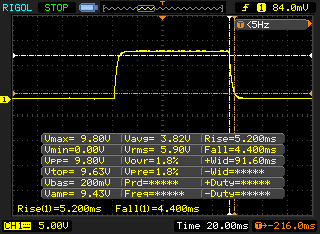 |
| ↘ 4.4 ms bajada | ||
| La pantalla mostró tiempos de respuesta rápidos en nuestros tests y debería ser adecuada para juegos. En comparación, todos los dispositivos de prueba van de ##min### (mínimo) a 240 (máximo) ms. » 26 % de todos los dispositivos son mejores. Esto quiere decir que el tiempo de respuesta medido es mejor que la media (19.9 ms) de todos los dispositivos testados. | ||
| ↔ Tiempo de respuesta 50% Gris a 80% Gris | ||
| 11.2 ms ... subida ↗ y bajada ↘ combinada | ↗ 6 ms subida | 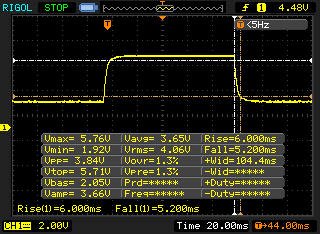 |
| ↘ 5.2 ms bajada | ||
| La pantalla mostró buenos tiempos de respuesta en nuestros tests pero podría ser demasiado lenta para los jugones competitivos. En comparación, todos los dispositivos de prueba van de ##min### (mínimo) a 636 (máximo) ms. » 25 % de todos los dispositivos son mejores. Esto quiere decir que el tiempo de respuesta medido es mejor que la media (31.1 ms) de todos los dispositivos testados. | ||
Parpadeo de Pantalla / PWM (Pulse-Width Modulation)
| Parpadeo de Pantalla / PWM detectado | 24040 Hz | ≤ 25 % de brillo | 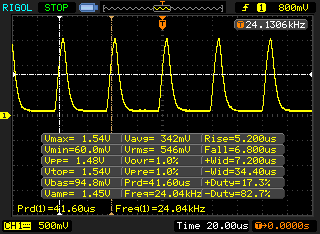 |
La retroiluminación del display parpadea a 24040 Hz (seguramente usa PWM - Pulse-Width Modulation) a un brillo del 25 % e inferior. Sobre este nivel de brillo no debería darse parpadeo / PWM. La frecuencia de 24040 Hz es bastante alta, por lo que la mayoría de gente sensible al parpadeo no debería ver parpadeo o tener fatiga visual. Comparación: 52 % de todos los dispositivos testados no usaron PWM para atenuar el display. Si se usó, medimos una media de 7794 (mínimo: 5 - máxmo: 343500) Hz. | |||
Rendimiento: sin problemas en los próximos años
El Gigabyte Aorus 15P XC es un portátil para juegos de 15,6 pulgadas que puede mostrar todos los juegos actuales con fluidez y también hace un buen trabajo en todas las demás áreas de uso.
Condiciones de prueba
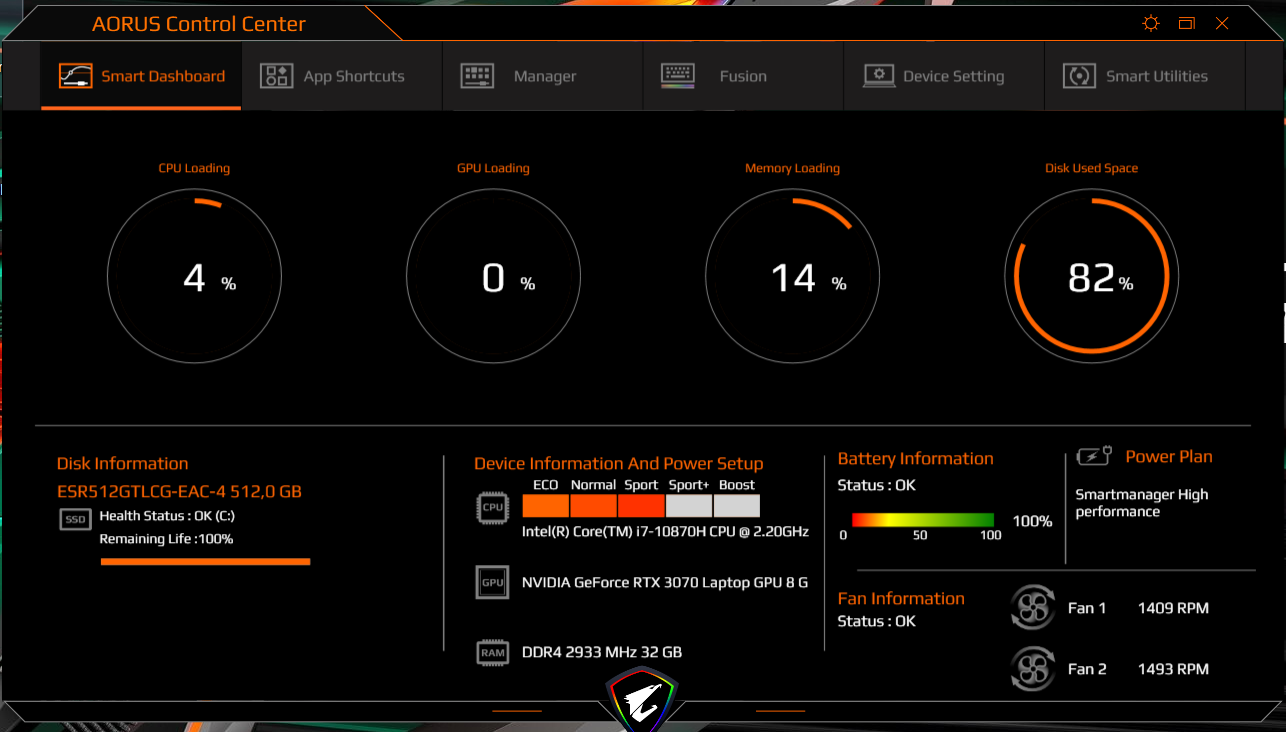
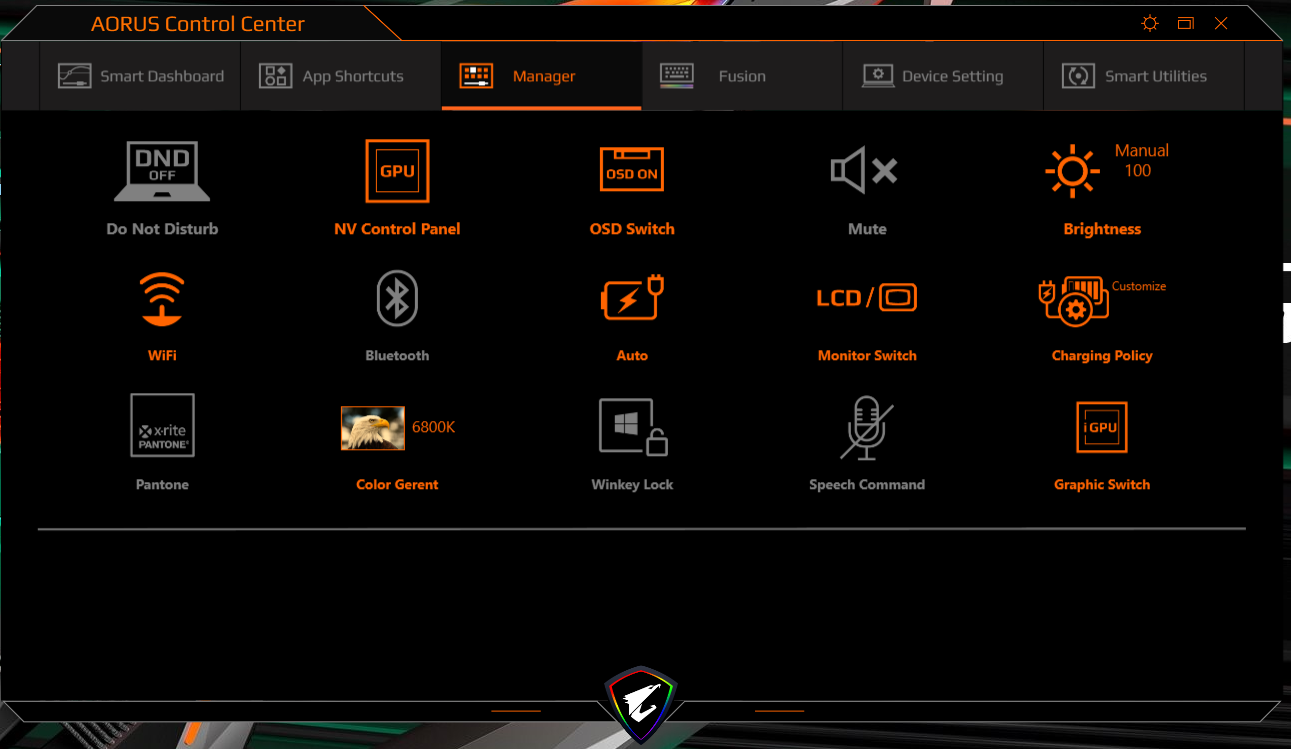
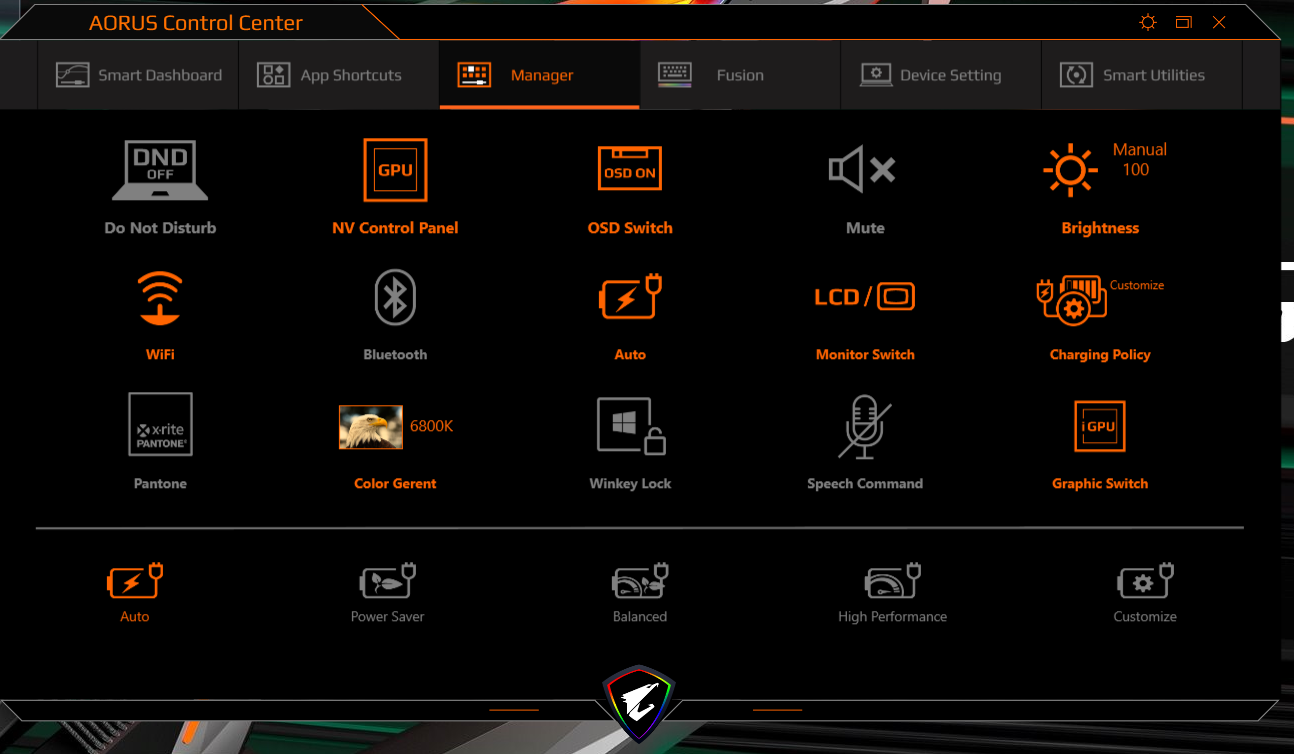
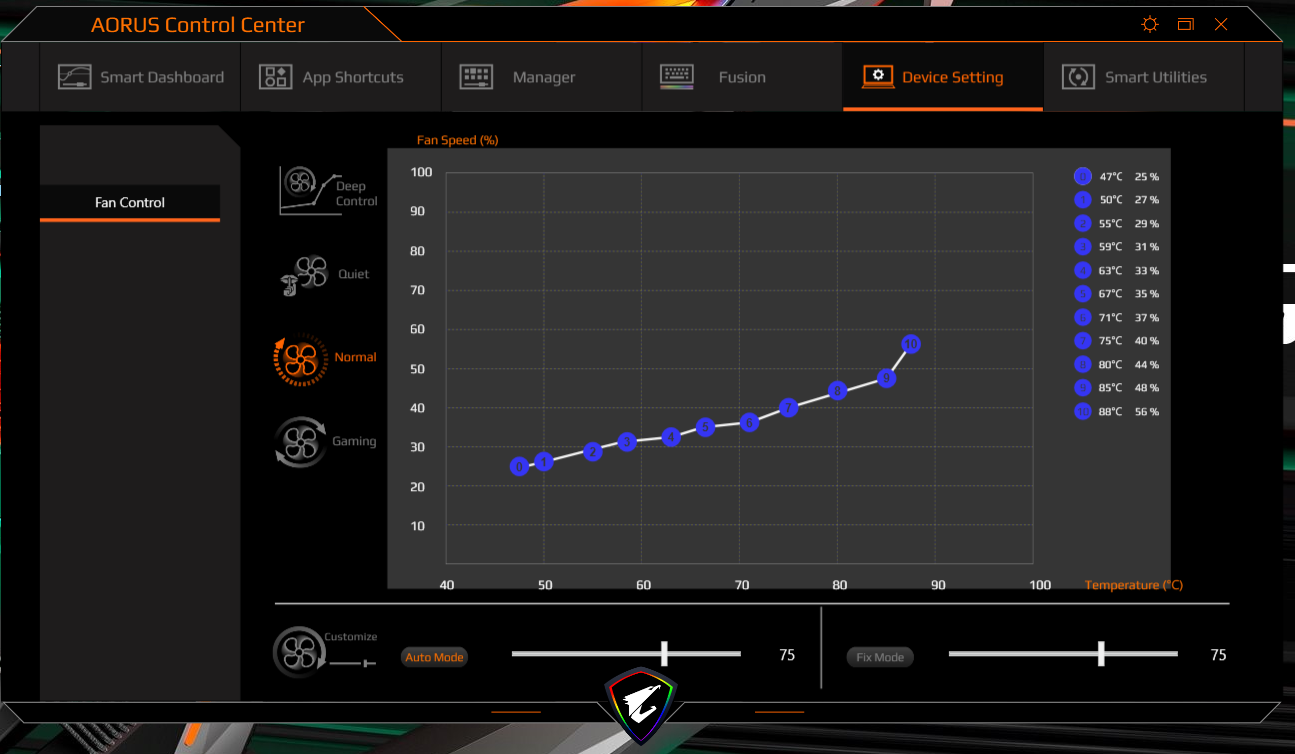
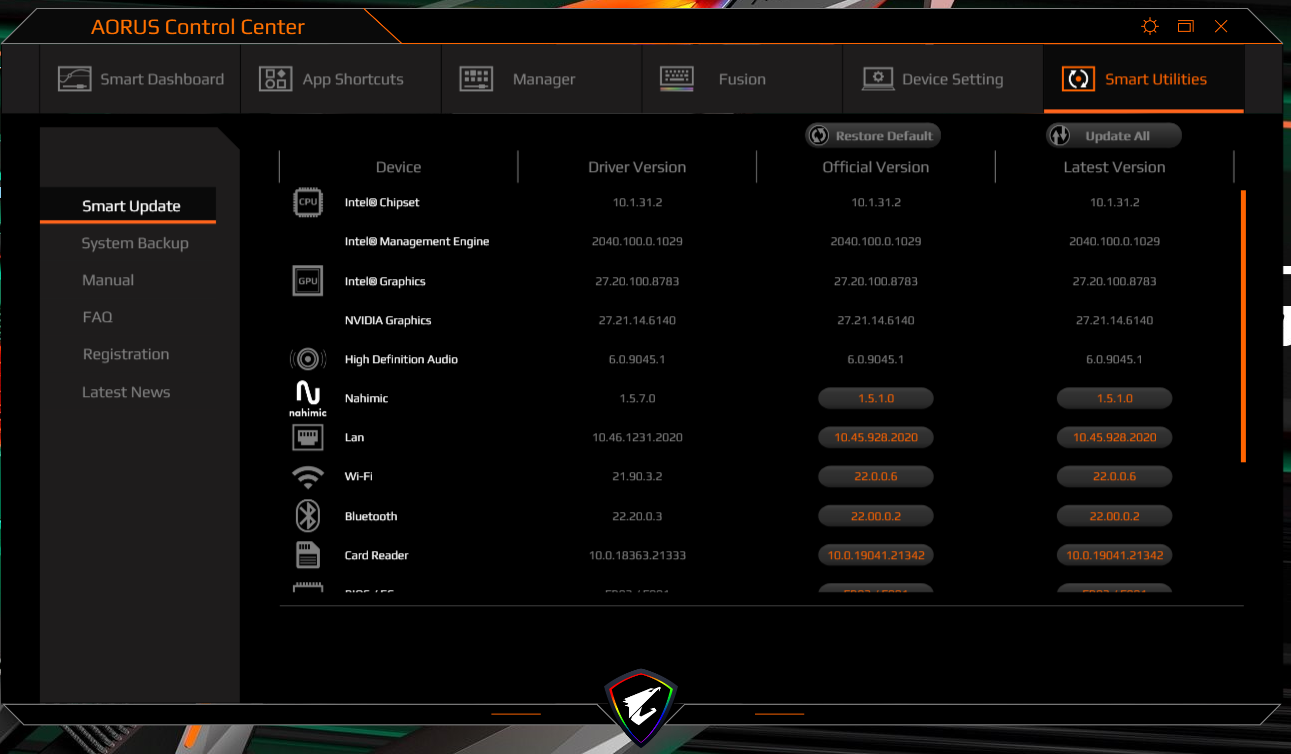
El Aorus Control Center preinstalado permite a los usuarios establecer perfiles de energía, entre otras cosas. Usamos la opción "auto" (con la IA activada) para nuestras pruebas. Esto permite que el Centro de Control seleccione los ajustes adecuados por sí mismo. El control del ventilador se puso en "normal".

Procesador
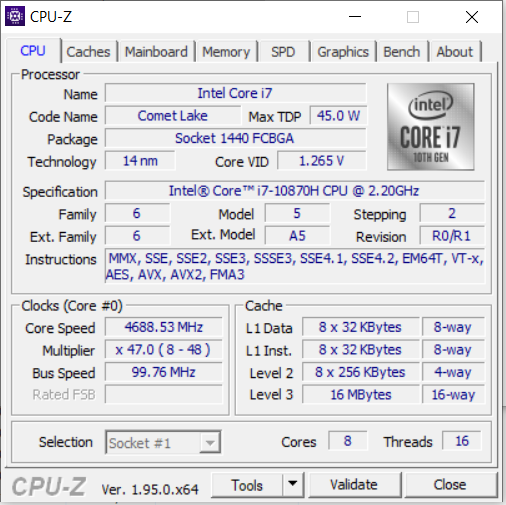
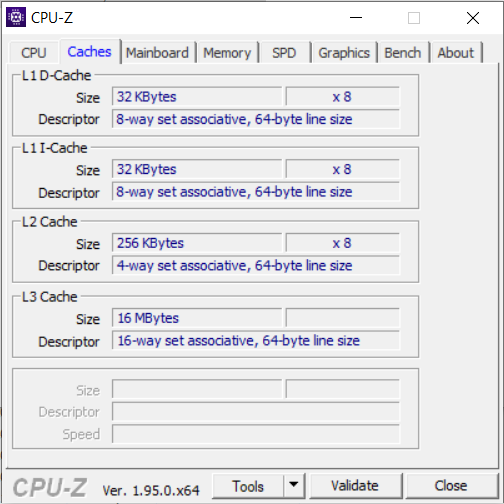
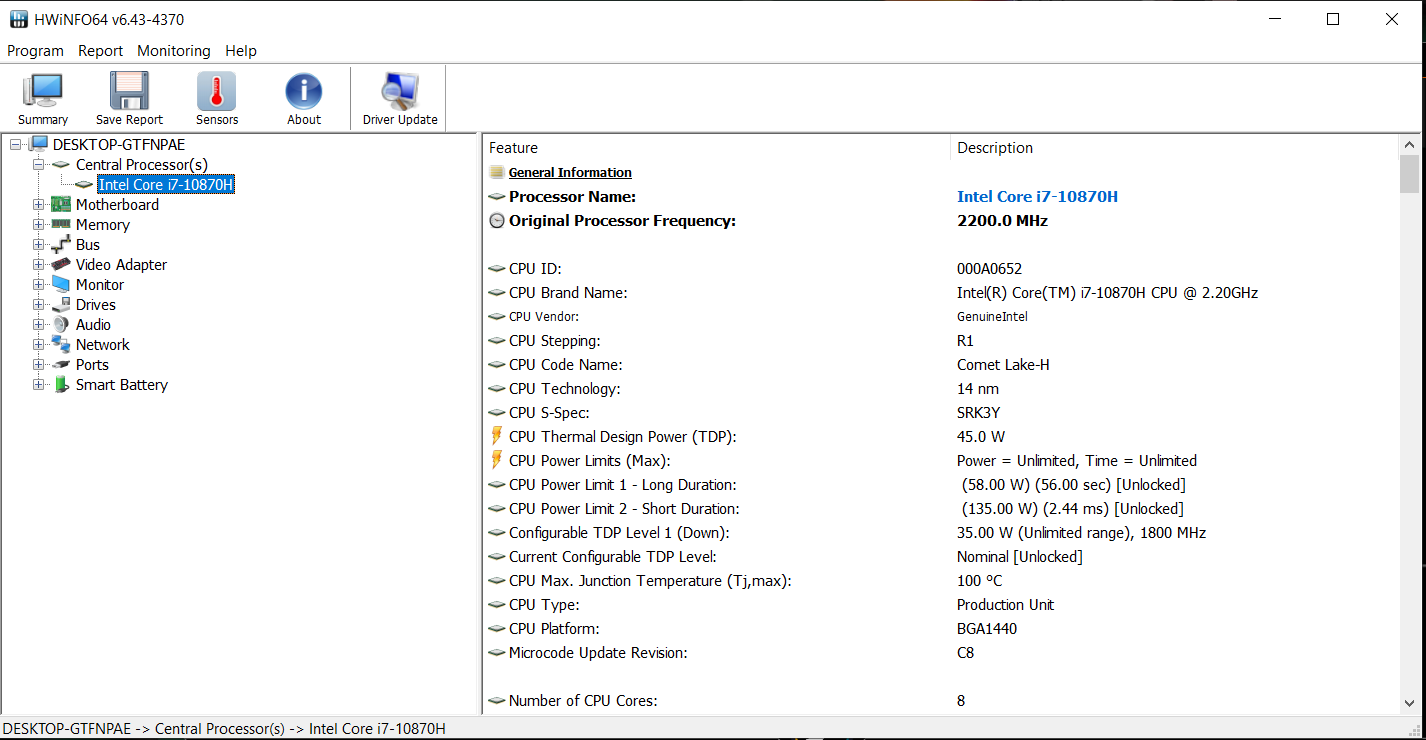
El procesador octa-core Core i7 10870H(Comet Lake) tiene una velocidad de reloj base de 2,2 GHz que puede aumentarse a 4,2 GHz (ocho núcleos) o 5 GHz (un núcleo) mediante Turbo Boost. Soporta hyperthreading con dos hilos por núcleo
Las pruebas de CPU de los benchmarks CineBench R15 se trabajan a 4 GHz (multihilo) y de 4 a 4,7 GHz (monohilo). La CPU reduce su velocidad de reloj a 1,7 GHz (multihilo y monohilo) cuando funciona con batería.
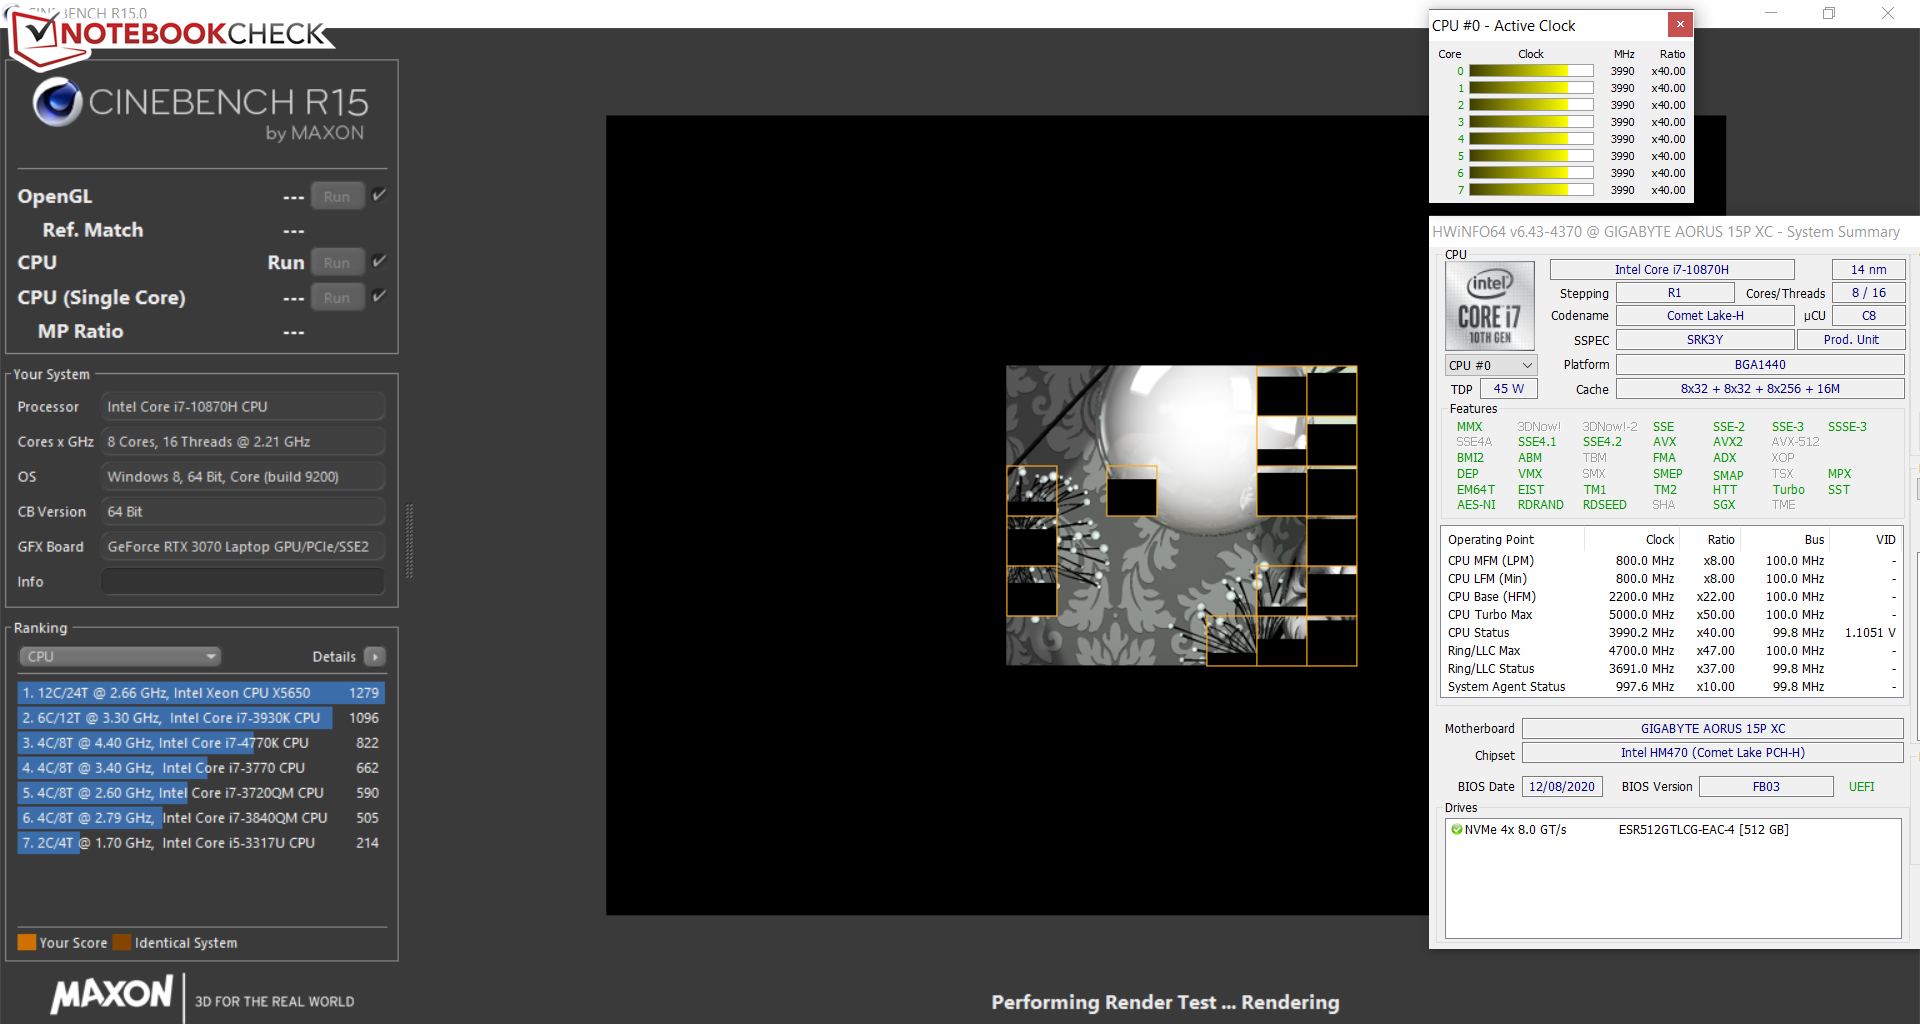
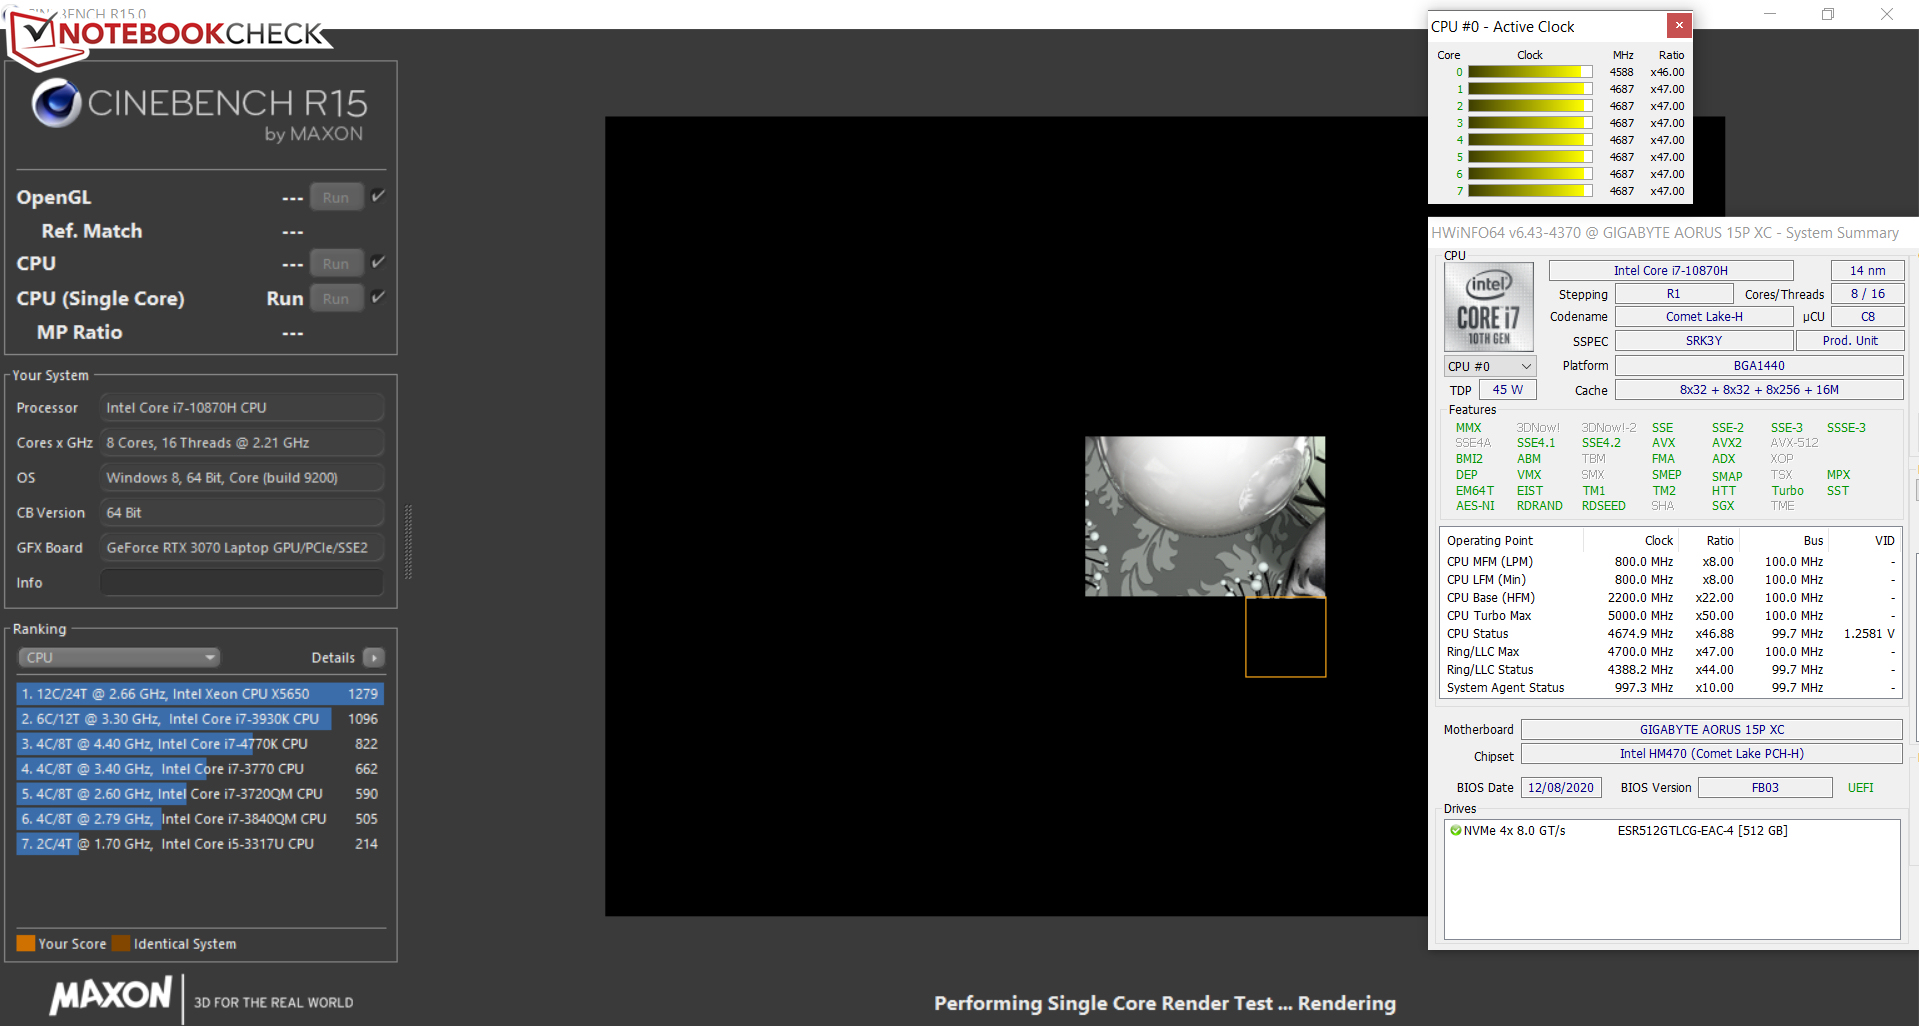
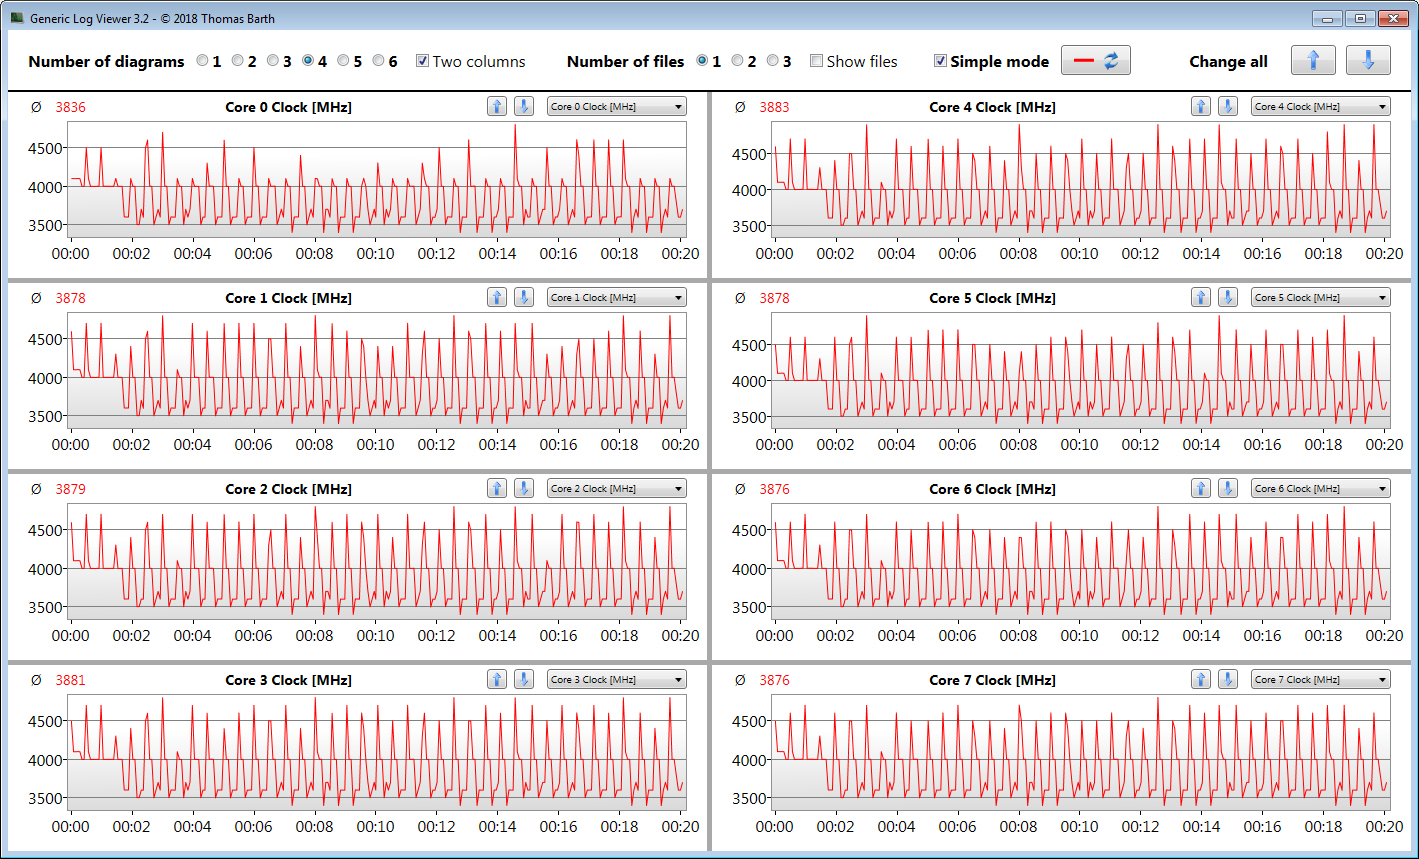
Ejecutamos la versión multihilo del benchmark Cinebench R15 en bucle durante al menos 30 minutos en la red eléctrica para averiguar cómo se comporta el turbo de la CPU bajo carga continua. La unidad de prueba de hoy sigue utilizando el turbo a un nivel alto.
* ... más pequeño es mejor
Rendimiento del sistema
El sistema, rápido y fluido, debería ofrecer un rendimiento suficiente para los próximos años en todos los ámbitos de uso: juegos, procesamiento de imágenes, corte de vídeo, oficina y uso de Internet. Los resultados de los benchmarks PCMark también son buenos.
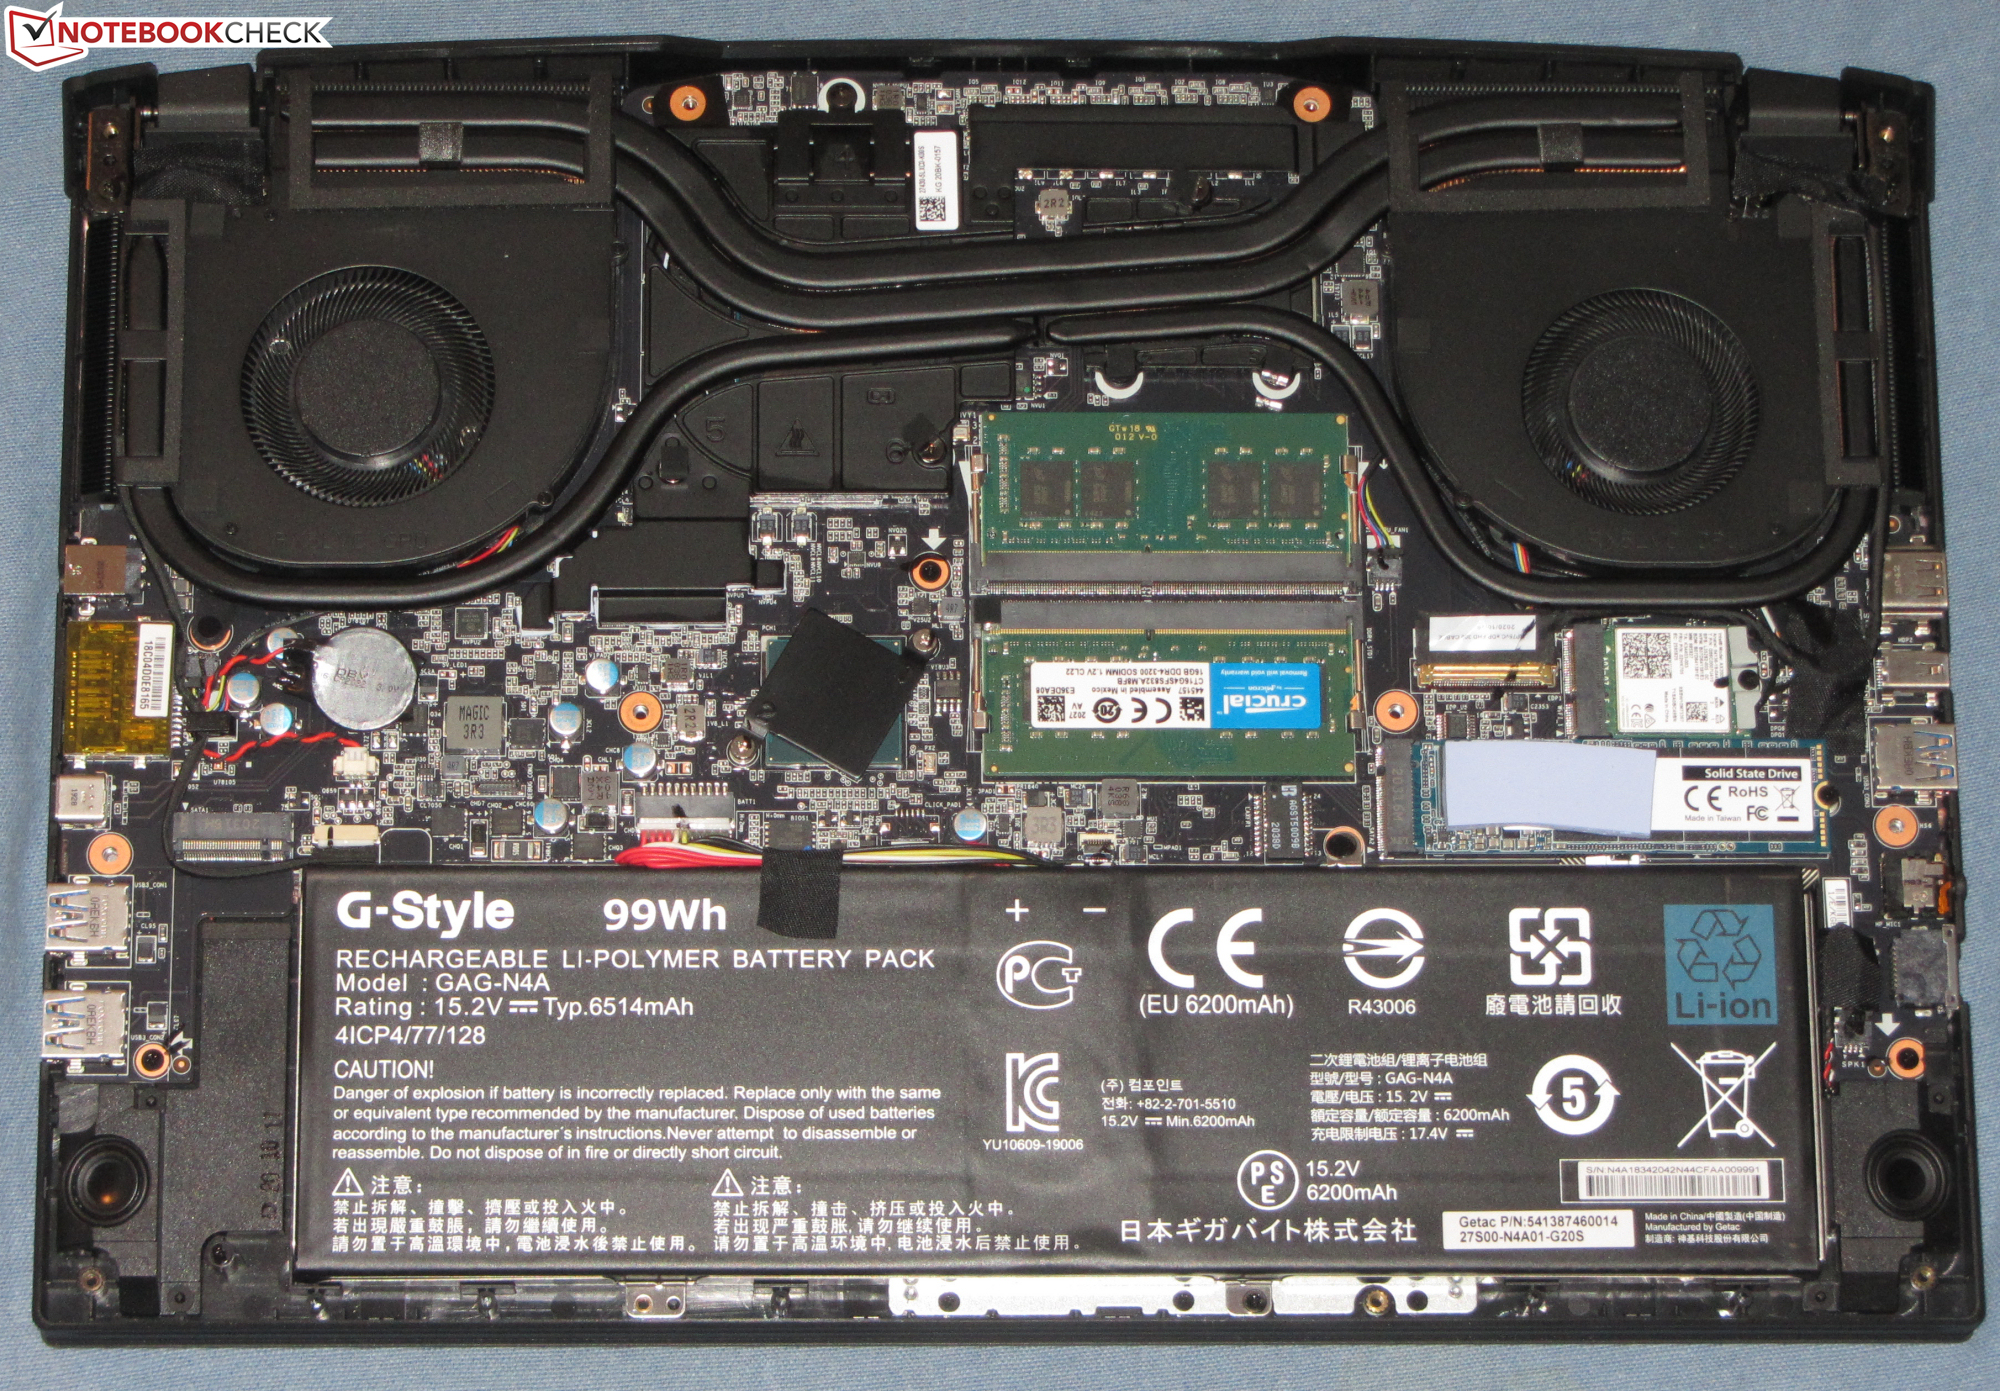
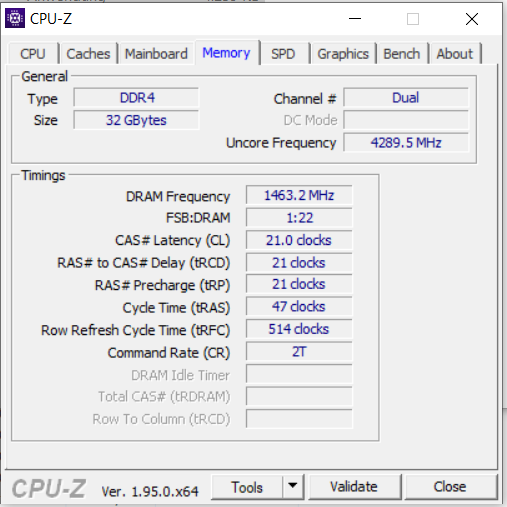
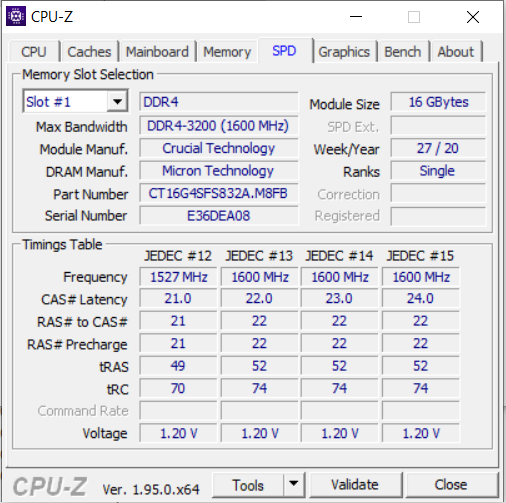
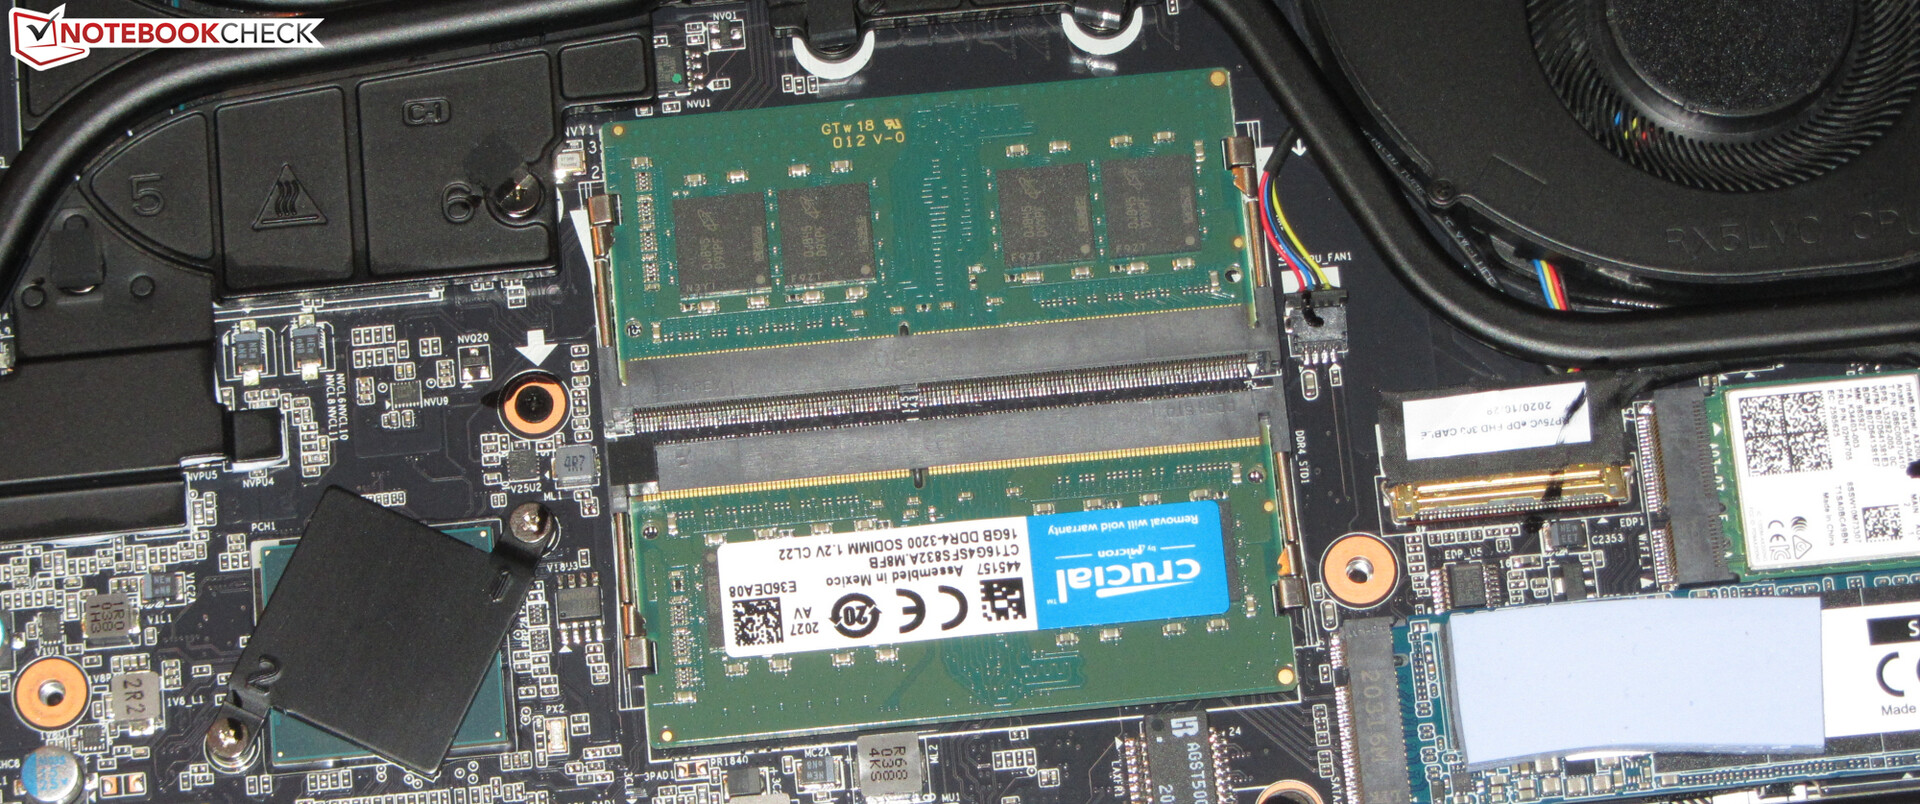
La memoria RAM (DDR4-3200) del portátil de 15,6 pulgadas funciona en modo de doble canal. Los dos bancos de memoria están ocupados cada uno por un módulo de 16 GB.
| PCMark 8 Home Score Accelerated v2 | 4486 puntos | |
| PCMark 8 Creative Score Accelerated v2 | 6694 puntos | |
| PCMark 8 Work Score Accelerated v2 | 5970 puntos | |
| PCMark 10 Score | 6463 puntos | |
ayuda | ||
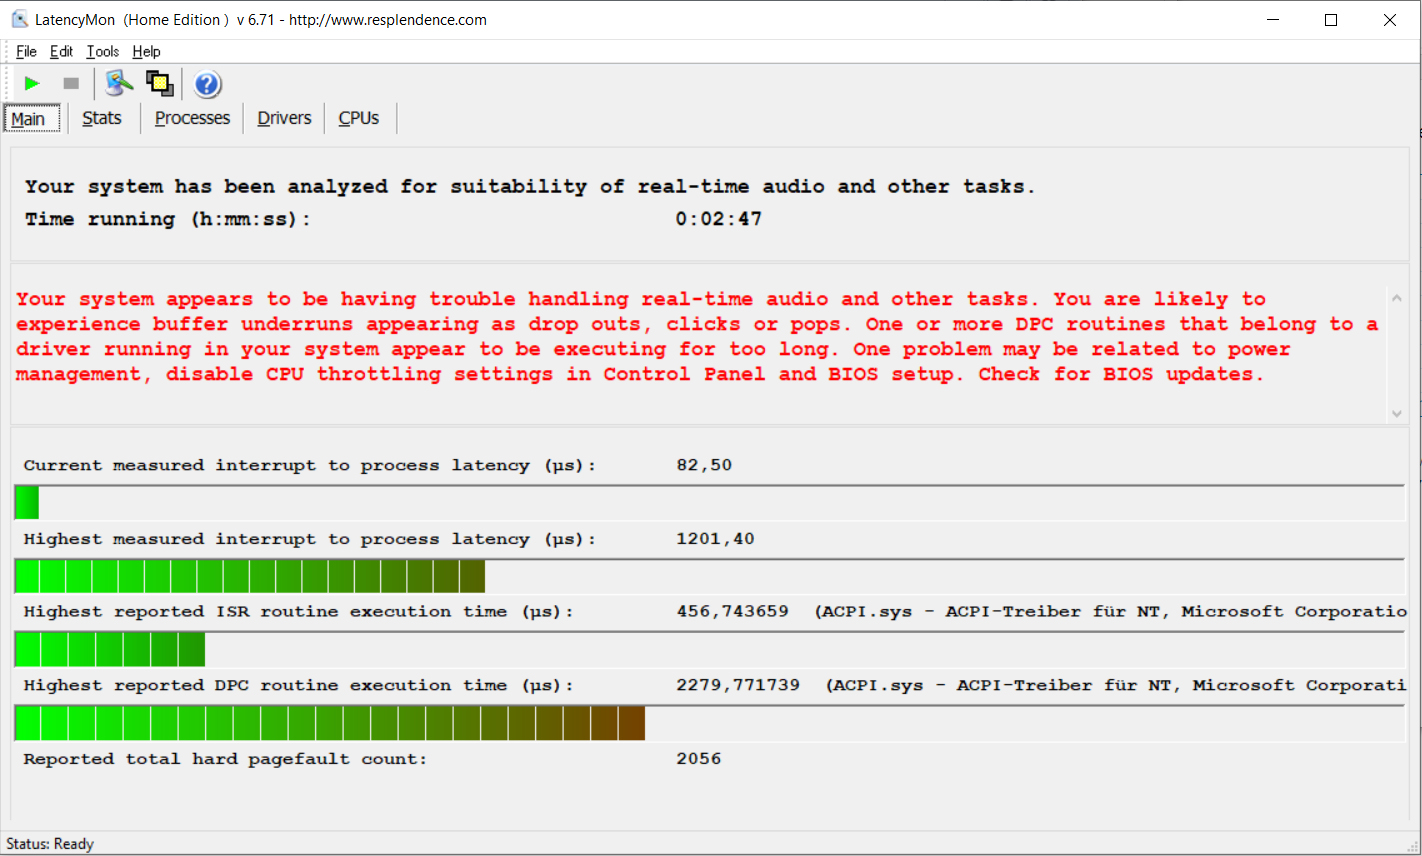
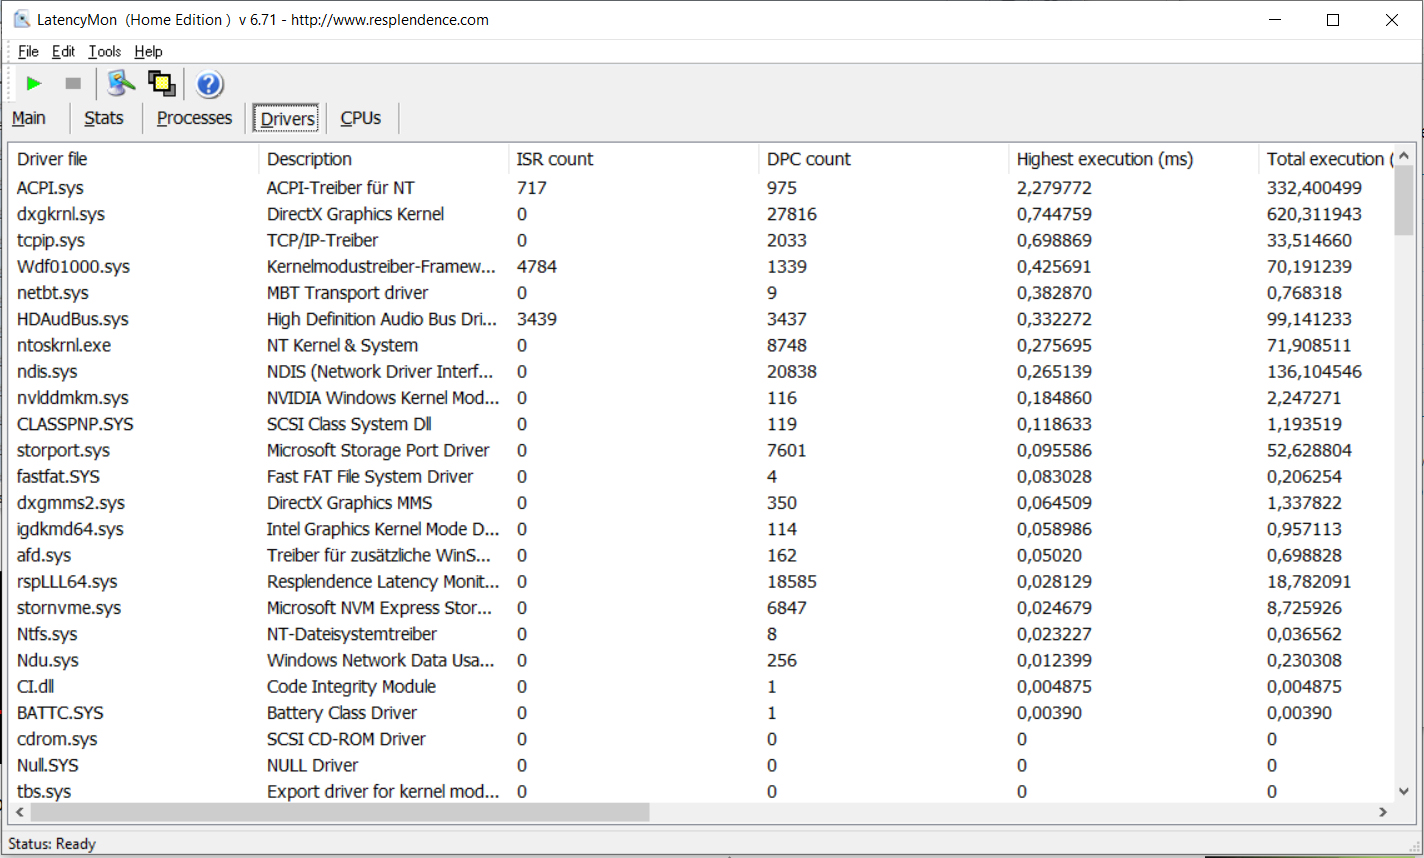
Latencias del CPD
Nuestra prueba estandarizada de Latency Monitor (navegar por la web, streaming de vídeo 4K, Prime95 High Load) mostró varios problemas con las latencias del CPD. El sistema no parece adecuado para editar vídeo y audio en tiempo real.
| DPC Latencies / LatencyMon - interrupt to process latency (max), Web, Youtube, Prime95 | |
| Aorus 15G XC | |
| Aorus 15P XC | |
| Asus TUF Dash F15 FX516PR | |
| Aorus 15P WB | |
| MSI GS66 Stealth 10UG | |
| Schenker XMG Neo 15 Comet Lake | |
| Asus ROG Strix G15 G513QR | |
* ... más pequeño es mejor
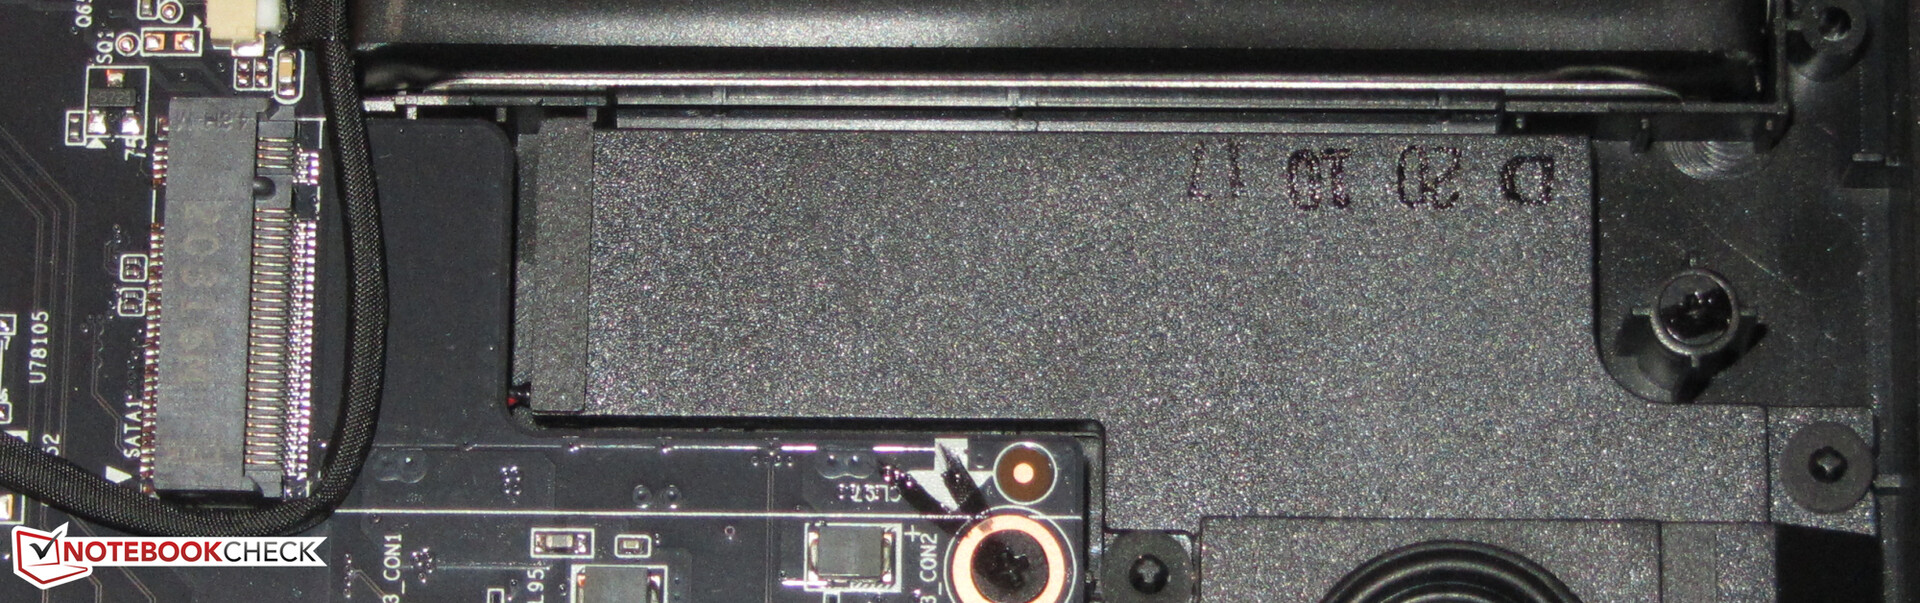
Dispositivos de almacenamiento
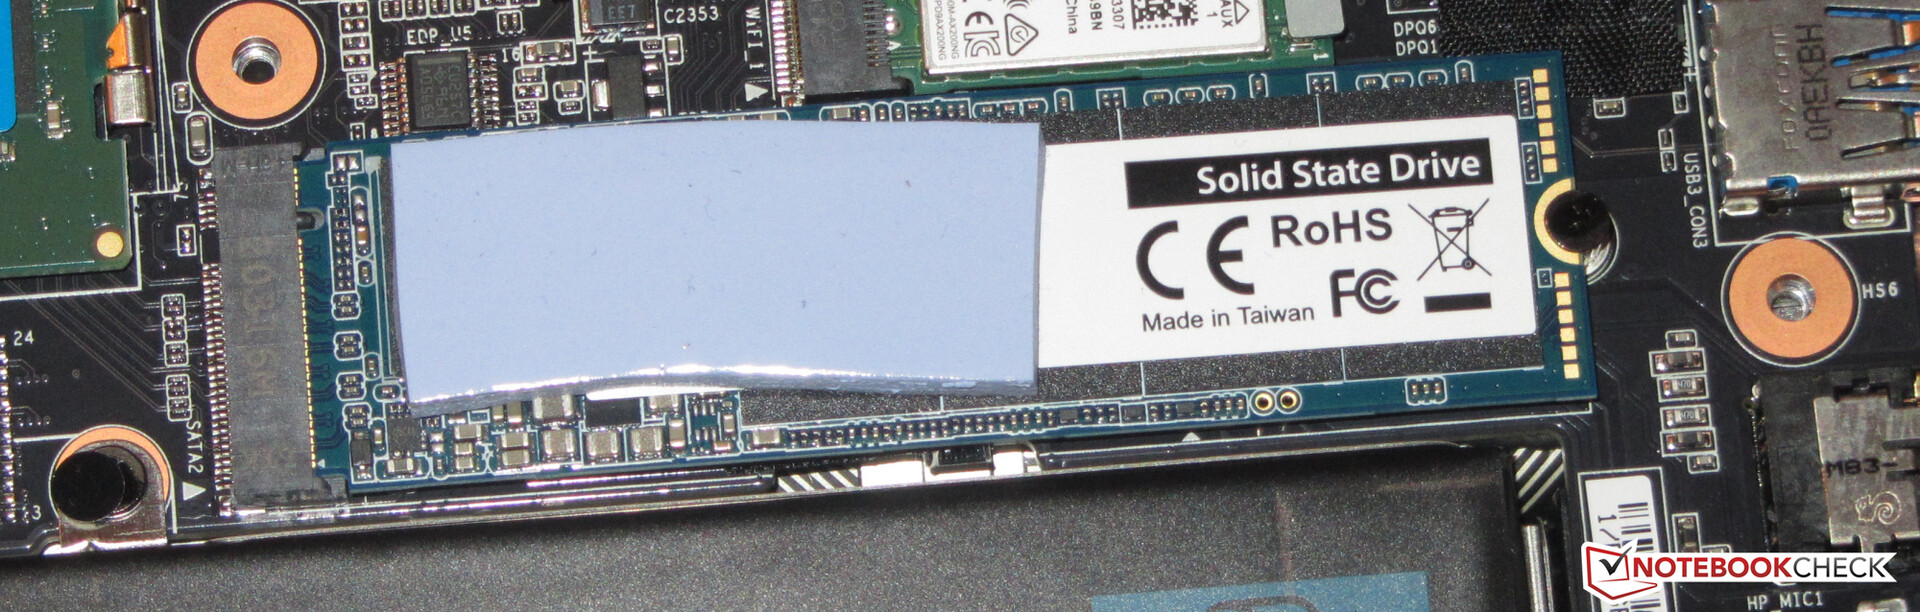
El dispositivo de almacenamiento de nuestra unidad de pruebas es un SSD NVMe de 512 GB (M.2-2280) de Phison. Ofrece buenas tasas de transferencia. El portátil tiene otra ranura disponible para un SSD M.2 2280 (1x NVMe, 1x NVMe/SATA). No soporta RAID-0/1.

| Aorus 15P XC ESR512GTLCG-EAC-4 | MSI GS66 Stealth 10UG WDC PC SN730 SDBPNTY-1T00 | Asus TUF Dash F15 FX516PR SK Hynix HFM001TD3JX013N | Schenker XMG Neo 15 Comet Lake Samsung SSD 970 EVO Plus 1TB | Aorus 15P WB ADATA XPG SX8200 Pro (ASX8200PNP-512GT) | Aorus 15G XC ESR512GTLCG-EAC-4 | Asus ROG Strix G15 G513QR SK Hynix HFM001TD3JX013N | |
|---|---|---|---|---|---|---|---|
| CrystalDiskMark 5.2 / 6 | 6% | -11% | 22% | 5% | -2% | ||
| Write 4K (MB/s) | 130.2 | 163.1 25% | 129.6 0% | 182.6 40% | 131.7 1% | 137.6 6% | |
| Read 4K (MB/s) | 45.47 | 48.97 8% | 44.71 -2% | 53.5 18% | 55.7 22% | 45.87 1% | |
| Write Seq (MB/s) | 2269 | 2607 15% | 1929 -15% | 3035 34% | 2273 0% | 2304 2% | |
| Read Seq (MB/s) | 1643 | 2316 41% | 2035 24% | 2520 53% | 2533 54% | 1052 -36% | |
| Write 4K Q32T1 (MB/s) | 547 | 338 -38% | 425.9 -22% | 524 -4% | 475.1 -13% | 601 10% | |
| Read 4K Q32T1 (MB/s) | 654 | 475.6 -27% | 433.4 -34% | 617 -6% | 590 -10% | 677 4% | |
| Write Seq Q32T1 (MB/s) | 2512 | 3090 23% | 1390 -45% | 3316 32% | 2373 -6% | 2536 1% | |
| Read Seq Q32T1 (MB/s) | 3382 | 3421 1% | 3505 4% | 3548 5% | 3068 -9% | 3372 0% | |
| AS SSD | -12% | -26% | 19% | -21% | -16% | -0% | |
| Seq Read (MB/s) | 2694 | 2198 -18% | 2671 -1% | 2970 10% | 2241 -17% | 2048 -24% | 2881 7% |
| Seq Write (MB/s) | 2327 | 2596 12% | 1501 -35% | 2559 10% | 2121 -9% | 2403 3% | 1570 -33% |
| 4K Read (MB/s) | 47.77 | 43.81 -8% | 39.65 -17% | 56.6 18% | 52.3 9% | 48.27 1% | 52.4 10% |
| 4K Write (MB/s) | 98.8 | 115.5 17% | 69 -30% | 145 47% | 116.2 18% | 101.6 3% | 124 26% |
| 4K-64 Read (MB/s) | 1746 | 1692 -3% | 1209 -31% | 1938 11% | 713 -59% | 1606 -8% | 1334 -24% |
| 4K-64 Write (MB/s) | 2267 | 2162 -5% | 1650 -27% | 2307 2% | 827 -64% | 1473 -35% | 2189 -3% |
| Access Time Read * (ms) | 0.079 | 0.056 29% | 0.093 -18% | 0.035 56% | 0.054 32% | 0.131 -66% | 0.055 30% |
| Access Time Write * (ms) | 0.039 | 0.098 -151% | 0.055 -41% | 0.025 36% | 0.031 21% | 0.038 3% | 0.03 23% |
| Score Read (Points) | 2063 | 1956 -5% | 1516 -27% | 2291 11% | 989 -52% | 1859 -10% | 1675 -19% |
| Score Write (Points) | 2598 | 2537 -2% | 1869 -28% | 2708 4% | 1155 -56% | 1815 -30% | 2470 -5% |
| Score Total (Points) | 5698 | 5513 -3% | 4105 -28% | 6152 8% | 2659 -53% | 4645 -18% | 4943 -13% |
| Media total (Programa/Opciones) | -3% /
-5% | -19% /
-20% | 21% /
20% | -8% /
-10% | -9% /
-10% | 0% /
-0% |
* ... más pequeño es mejor
Disk Throttling: DiskSpd Read Loop, Queue Depth 8
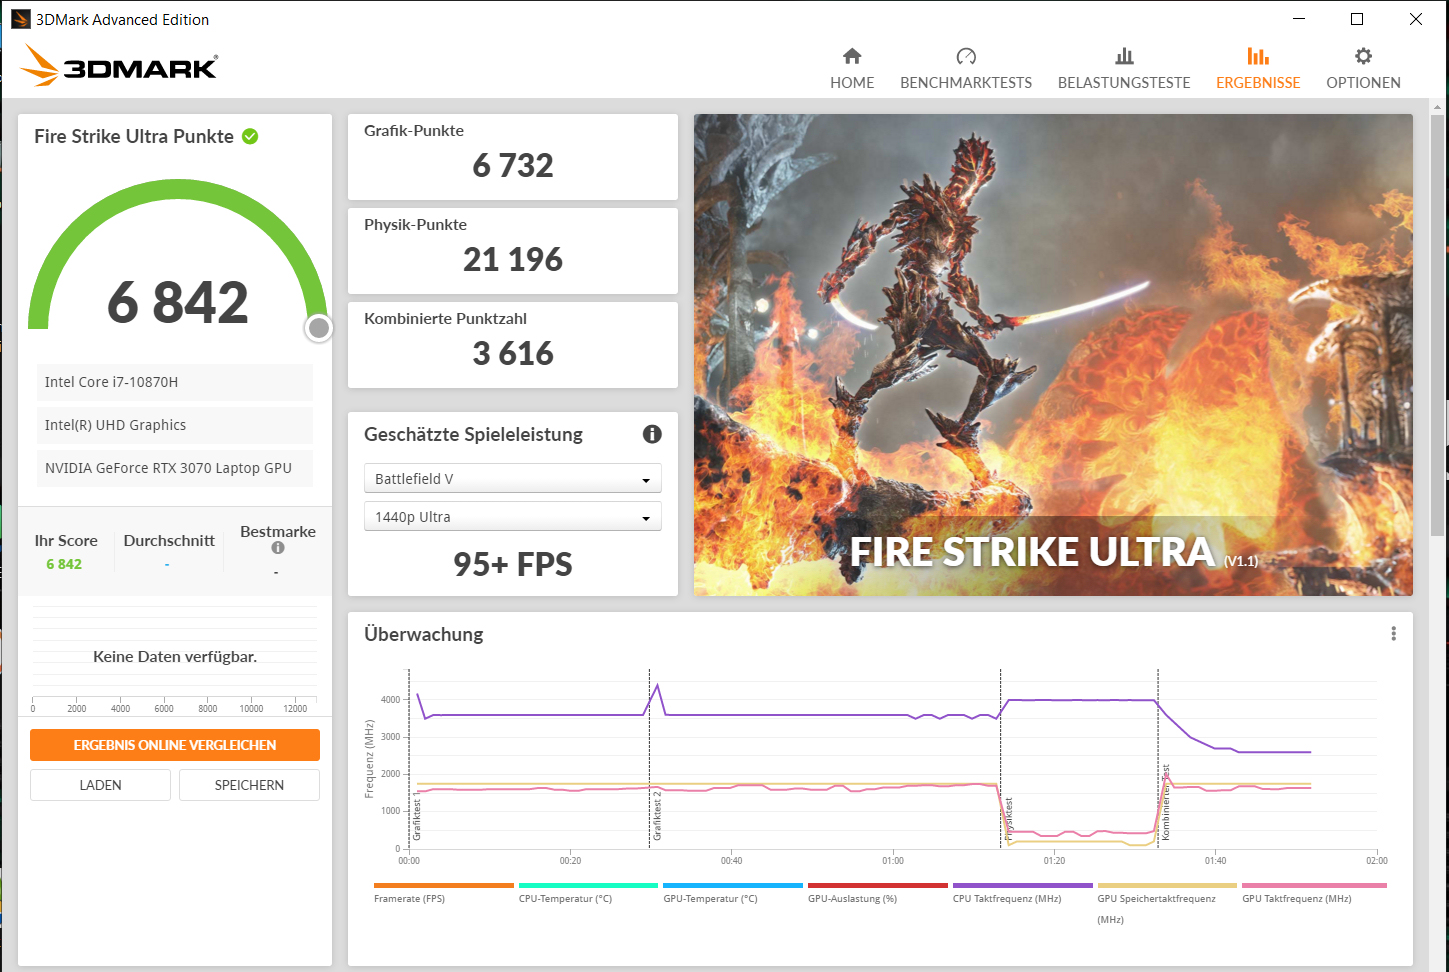
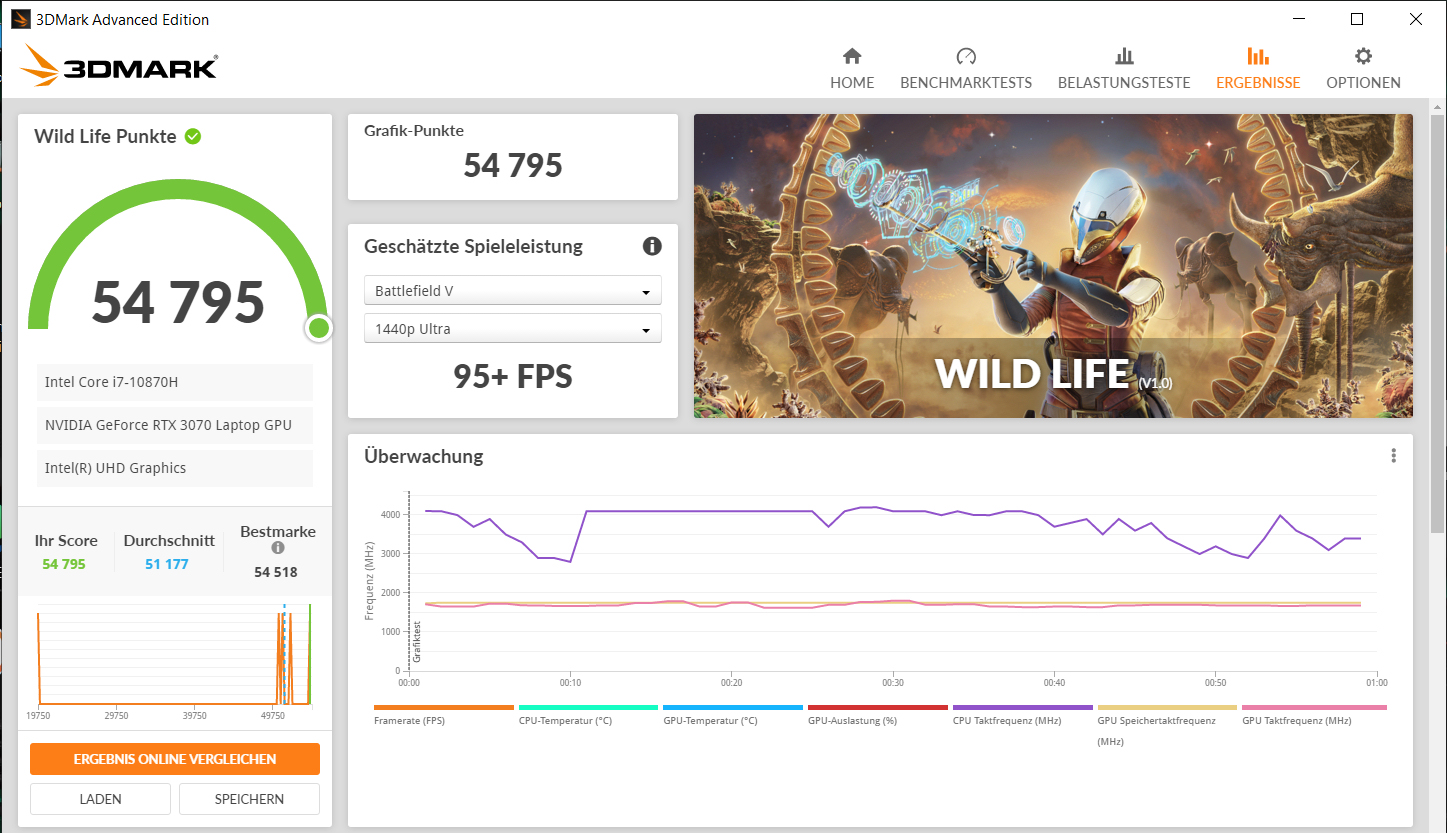
Rendimiento gráfico
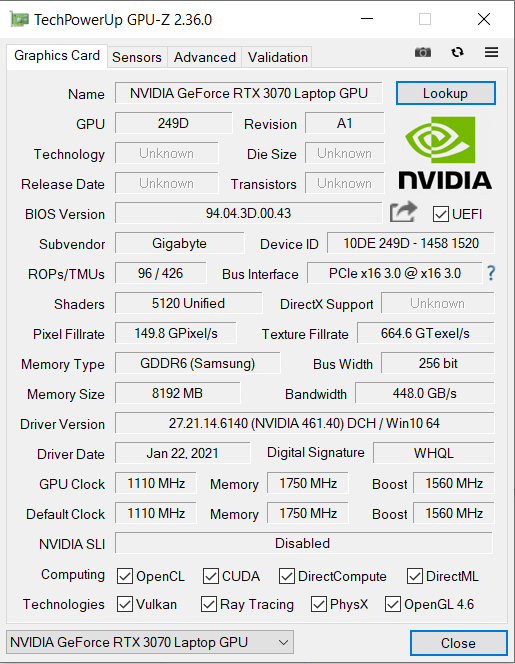
NVIDIA GeForce RTX 3070 Mobile GPU - Benchmarks and SpecsMientras que elGeForce RTX 3070portátil se sitúa en el extremo superior de la escala, su nombre por sí solo no da ninguna indicación de su rendimiento real. Los fabricantes pueden establecer individualmente el TGP dentro de un rango definido por Nvidia. Esto es lo que realmente decide el nivel de rendimiento que ofrecerá la GPU.
Gigabyte casi lleva al máximo su GPU con un TGB de 130 vatios (el máximo establecido por Nvidia es de 140 vatios). El fabricante ha declarado este valor en supágina web global. Nuestras pruebas confirmaron el TGB de 130 vatios.
Como resultado del mayor TGB, el 15P alcanza resultados de benchmark significativamente mejores que sus competidores equipados con la misma GPU, como elMSI GS66 Stealth 10UG(TGP: 95 vatios) y elAsus TUF Dash F15 FX516PR(TGP: 85 vatios). El 15P también puede superar a su modelo hermano con casi la misma construcción, el Aorus15G XC, quetiene un TGP de 105 vatios. Hemoscreado un resumen de todos los portátiles RTX 3070 incluyendo sus TGP.
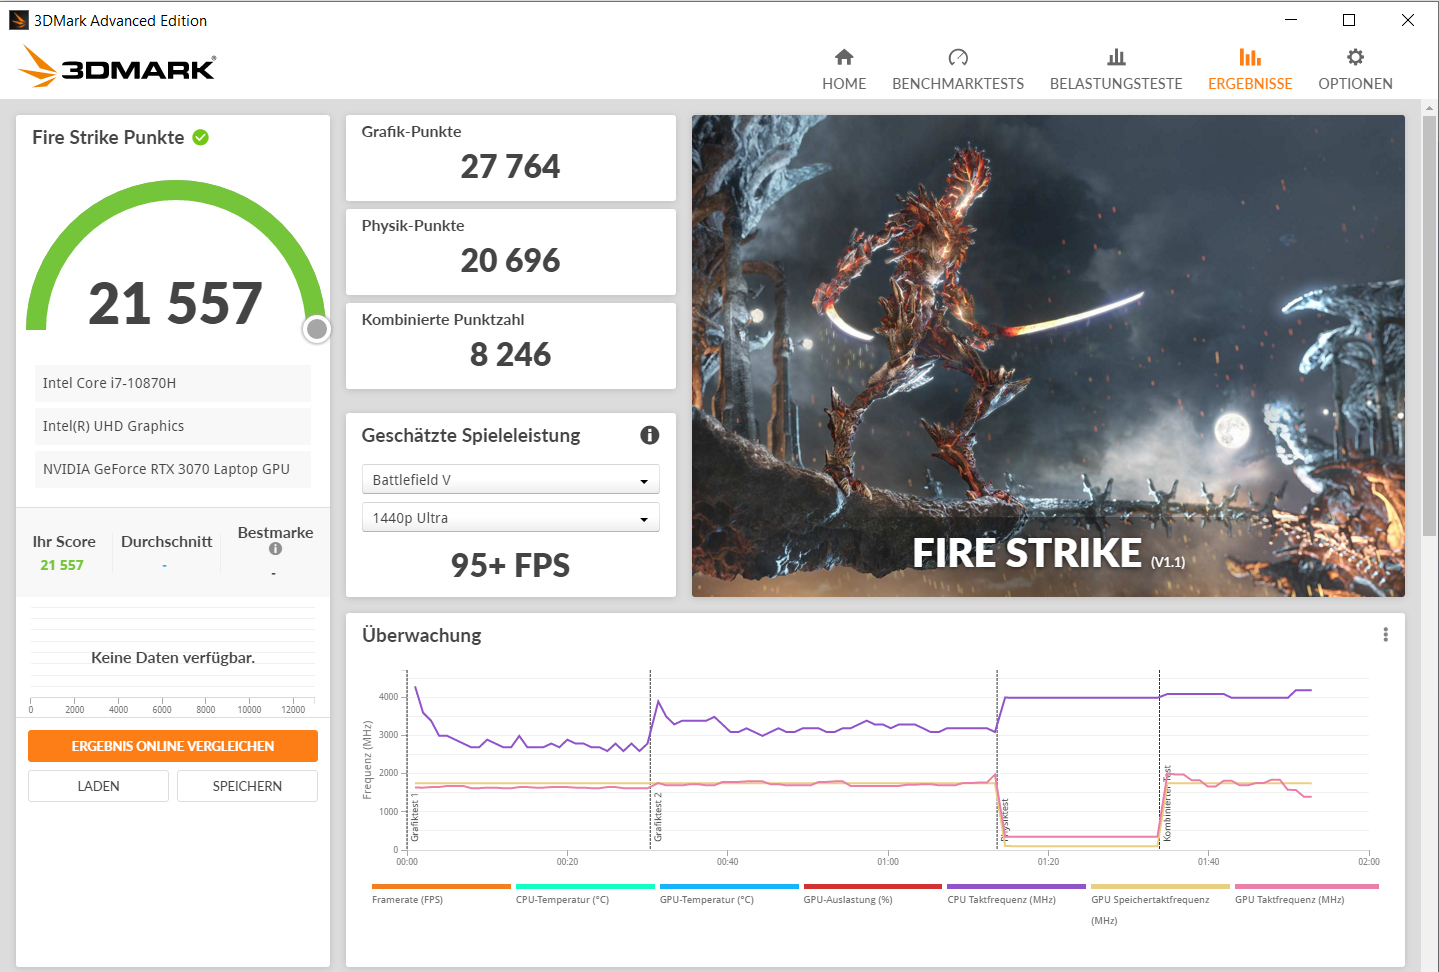

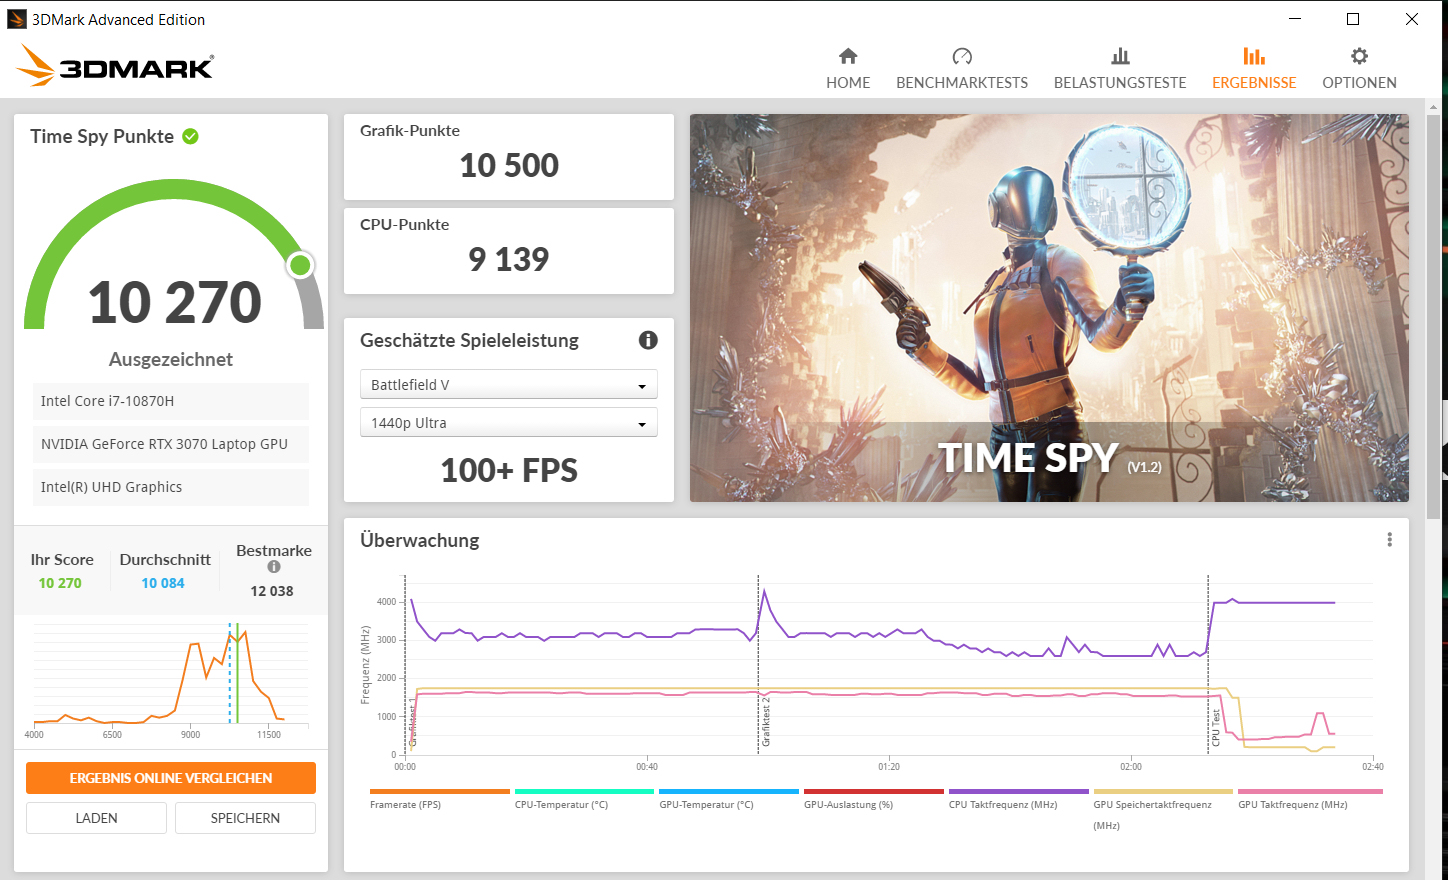
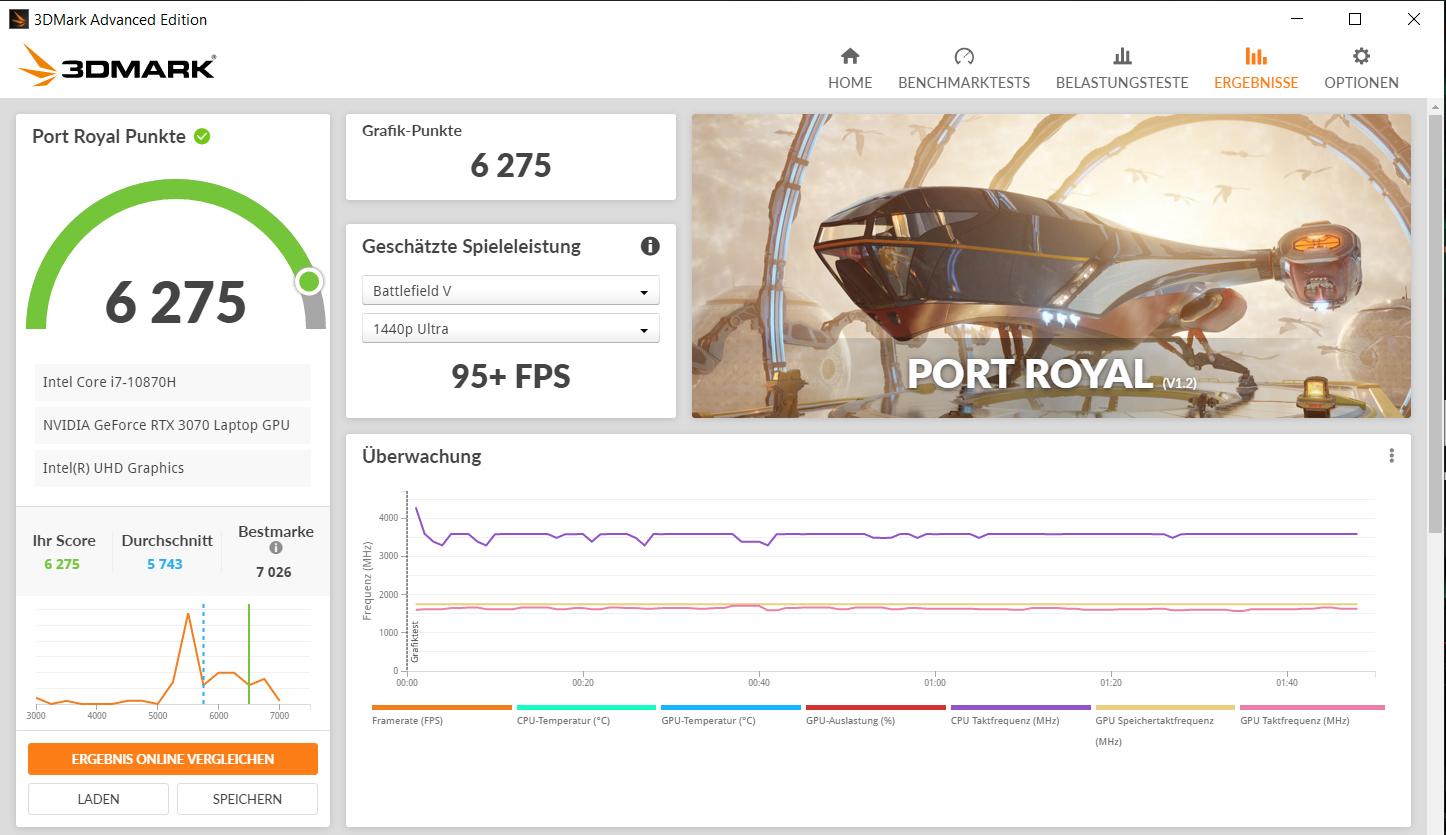
| 3DMark 11 Performance | 27446 puntos | |
| 3DMark Cloud Gate Standard Score | 51836 puntos | |
| 3DMark Fire Strike Score | 21557 puntos | |
| 3DMark Time Spy Score | 10270 puntos | |
ayuda | ||
Rendimiento de los juegos
El hardware de nuestra unidad de pruebas es capaz de mostrar todos los juegos actuales sin problemas en resolución Full-HD y con los ajustes de calidad máximos. Las resoluciones más altas (que requerirían que los usuarios conectaran un monitor externo adecuado) pueden requerir una reducción de los ajustes de calidad.
| The Witcher 3 - 1920x1080 Ultra Graphics & Postprocessing (HBAO+) | |
| Media de la clase Gaming (95 - 240, n=8, últimos 2 años) | |
| Aorus 15P XC | |
| Asus ROG Strix G15 G513QR | |
| Aorus 15G XC | |
| Medio NVIDIA GeForce RTX 3070 Laptop GPU (34.9 - 109, n=52) | |
| MSI GS66 Stealth 10UG | |
| Schenker XMG Neo 15 Comet Lake | |
| Asus TUF Dash F15 FX516PR | |
| Aorus 15P WB | |
| Watch Dogs Legion - 1920x1080 Ultra Preset (DX12) | |
| Aorus 15P XC | |
| Medio NVIDIA GeForce RTX 3070 Laptop GPU (55 - 73, n=7) | |
| Asus TUF Dash F15 FX516PR | |
| Aorus 15P WB | |
| Immortals Fenyx Rising - 1920x1080 Very High Preset | |
| Aorus 15P XC | |
| Medio NVIDIA GeForce RTX 3070 Laptop GPU (69 - 94, n=4) | |
| Asus TUF Dash F15 FX516PR | |
| Aorus 15P WB | |
| Serious Sam 4 - 1920x1080 Ultra (DX12) AA:2xMS | |
| Aorus 15P XC | |
| Medio NVIDIA GeForce RTX 3070 Laptop GPU (66.4 - 82.1, n=5) | |
| Asus TUF Dash F15 FX516PR | |
| Shadow of the Tomb Raider - 1920x1080 Highest Preset AA:T | |
| Medio NVIDIA GeForce RTX 3070 Laptop GPU (86 - 133.7, n=6) | |
| Aorus 15G XC | |
| Aorus 15P XC | |
| Media de la clase Gaming (96 - 116, n=2, últimos 2 años) | |
| Asus TUF Dash F15 FX516PR | |
| F1 2020 - 1920x1080 Ultra High Preset AA:T AF:16x | |
| Medio NVIDIA GeForce RTX 3070 Laptop GPU (97 - 173, n=7) | |
| Aorus 15P XC | |
| Asus TUF Dash F15 FX516PR | |
| Cyberpunk 2077 1.0 - 1920x1080 Ultra Preset | |
| Aorus 15P XC | |
| Medio NVIDIA GeForce RTX 3070 Laptop GPU (50 - 70.5, n=11) | |
| Asus TUF Dash F15 FX516PR | |
| Aorus 15P WB | |
Ejecutamos el juego "Witcher 3" durante unos 60 minutos a resolución Full-HD y con los ajustes de máxima calidad para averiguar si las velocidades de fotogramas se mantienen constantes durante un largo periodo de tiempo. El personaje del juego no se movió durante toda la prueba. No registramos ninguna caída en la velocidad de fotogramas.
| bajo | medio | alto | ultra | |
|---|---|---|---|---|
| The Witcher 3 (2015) | 672 | 265 | 176 | 101 |
| Dota 2 Reborn (2015) | 128 | 120 | ||
| X-Plane 11.11 (2018) | 111 | 96.3 | 79.5 | |
| Far Cry 5 (2018) | 146 | 119 | 115 | 108 |
| Shadow of the Tomb Raider (2018) | 132 | 111 | 108 | 107 |
| Total War: Three Kingdoms (2019) | 202.3 | 135.6 | 100.7 | 78.9 |
| Red Dead Redemption 2 (2019) | 128 | 108 | 88.4 | 60.7 |
| F1 2020 (2020) | 186 | 157 | 177 | 130 |
| Death Stranding (2020) | 150 | 143 | 137 | 134 |
| Horizon Zero Dawn (2020) | 127 | 99 | 92 | 86 |
| Flight Simulator 2020 (2020) | 59.1 | 41.6 | 42.2 | 38 |
| Serious Sam 4 (2020) | 131 | 98.1 | 91.8 | 82.1 |
| Watch Dogs Legion (2020) | 108 | 104 | 94.7 | 72.3 |
| Assassin´s Creed Valhalla (2020) | 126 | 95 | 84 | 75 |
| Yakuza Like a Dragon (2020) | 134 | 114 | 115 | 106 |
| Immortals Fenyx Rising (2020) | 127 | 112 | 101 | 94 |
| Cyberpunk 2077 1.0 (2020) | 106 | 89.5 | 76.9 | 67.8 |
| Hitman 3 (2021) | 174.4 | 128 | 120.7 | 134.8 |
Emisiones: el portátil Aorus se calienta considerablemente bajo carga
Ruido del sistema
Los dos ventiladores funcionan casi constantemente incluso en ralentí, aunque a bajas velocidades. Apenas son audibles en este escenario. Esto cambia bajo carga. El Aorus 15P puede producir un nivel de ruido máximo de 53 dB(A) (test de estrés) o 49 dB(A) (Witcher 3 test). Recomendamos usar unos auriculares con estos niveles de ruido.
Ruido
| Ocioso |
| 25 / 29 / 34 dB(A) |
| Carga |
| 44 / 53 dB(A) |
 | ||
30 dB silencioso 40 dB(A) audible 50 dB(A) ruidosamente alto |
||
min: | ||
| Aorus 15P XC i7-10870H, GeForce RTX 3070 Laptop GPU | MSI GS66 Stealth 10UG i7-10870H, GeForce RTX 3070 Laptop GPU | Asus TUF Dash F15 FX516PR i7-11370H, GeForce RTX 3070 Laptop GPU | Schenker XMG Neo 15 Comet Lake i7-10875H, GeForce RTX 2070 Super Mobile | Aorus 15G XC i7-10870H, GeForce RTX 3070 Laptop GPU | Aorus 15P WB i7-10750H, GeForce RTX 2070 Max-Q | Asus ROG Strix G15 G513QR R9 5900HX, GeForce RTX 3070 Laptop GPU | Media de la clase Gaming | |
|---|---|---|---|---|---|---|---|---|
| Noise | -10% | -4% | -5% | 0% | 3% | 0% | 3% | |
| apagado / medio ambiente * (dB) | 24 | 26.2 -9% | 24 -0% | 25 -4% | 25 -4% | 25 -4% | 24 -0% | 24.1 ? -0% |
| Idle Minimum * (dB) | 25 | 34 -36% | 25 -0% | 26 -4% | 29 -16% | 29 -16% | 25 -0% | 25.8 ? -3% |
| Idle Average * (dB) | 29 | 34 -17% | 30 -3% | 28 3% | 30 -3% | 30 -3% | 31 -7% | 27.4 ? 6% |
| Idle Maximum * (dB) | 34 | 34 -0% | 35 -3% | 33 3% | 31 9% | 31 9% | 33 3% | 30 ? 12% |
| Load Average * (dB) | 44 | 47.2 -7% | 53 -20% | 52 -18% | 41 7% | 41 7% | 45 -2% | 43 ? 2% |
| Witcher 3 ultra * (dB) | 49 | 46.3 6% | 48 2% | 55 -12% | 47 4% | 43 12% | 48 2% | |
| Load Maximum * (dB) | 53 | 58.2 -10% | 54 -2% | 56 -6% | 51 4% | 45 15% | 50 6% | 54 ? -2% |
* ... más pequeño es mejor
Temperatura
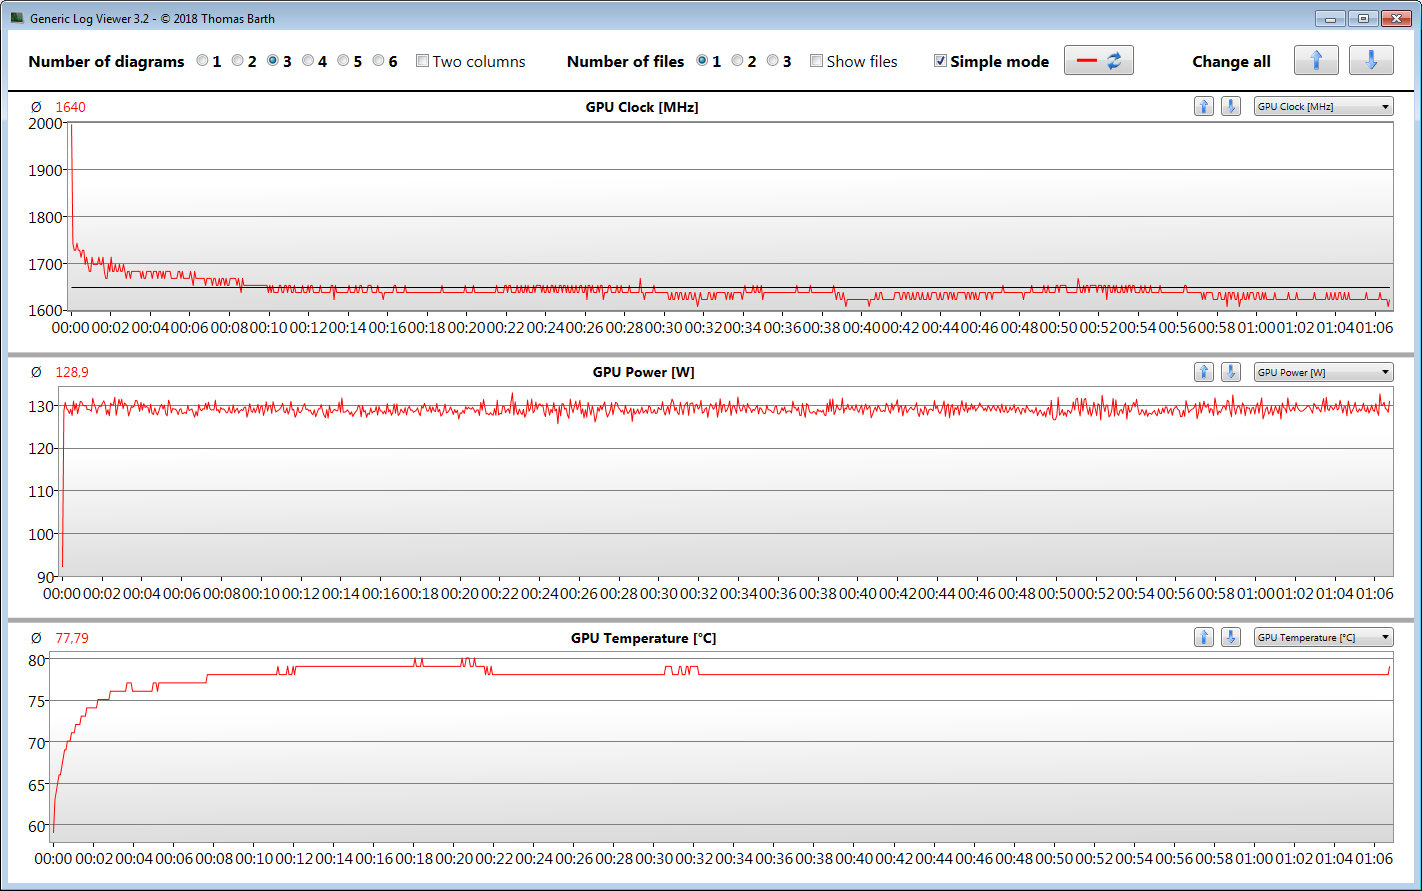
La CPU y la GPU funcionan a 2,9 GHz y 1275 MHz, respectivamente, durante nuestra prueba de estrés (Prime 95 y FurMark funcionando durante al menos una hora). La prueba de estrés representa un escenario extremo que no se dará como tal durante el uso diario. Utilizamos esta prueba para averiguar si el sistema se mantiene estable bajo carga máxima.
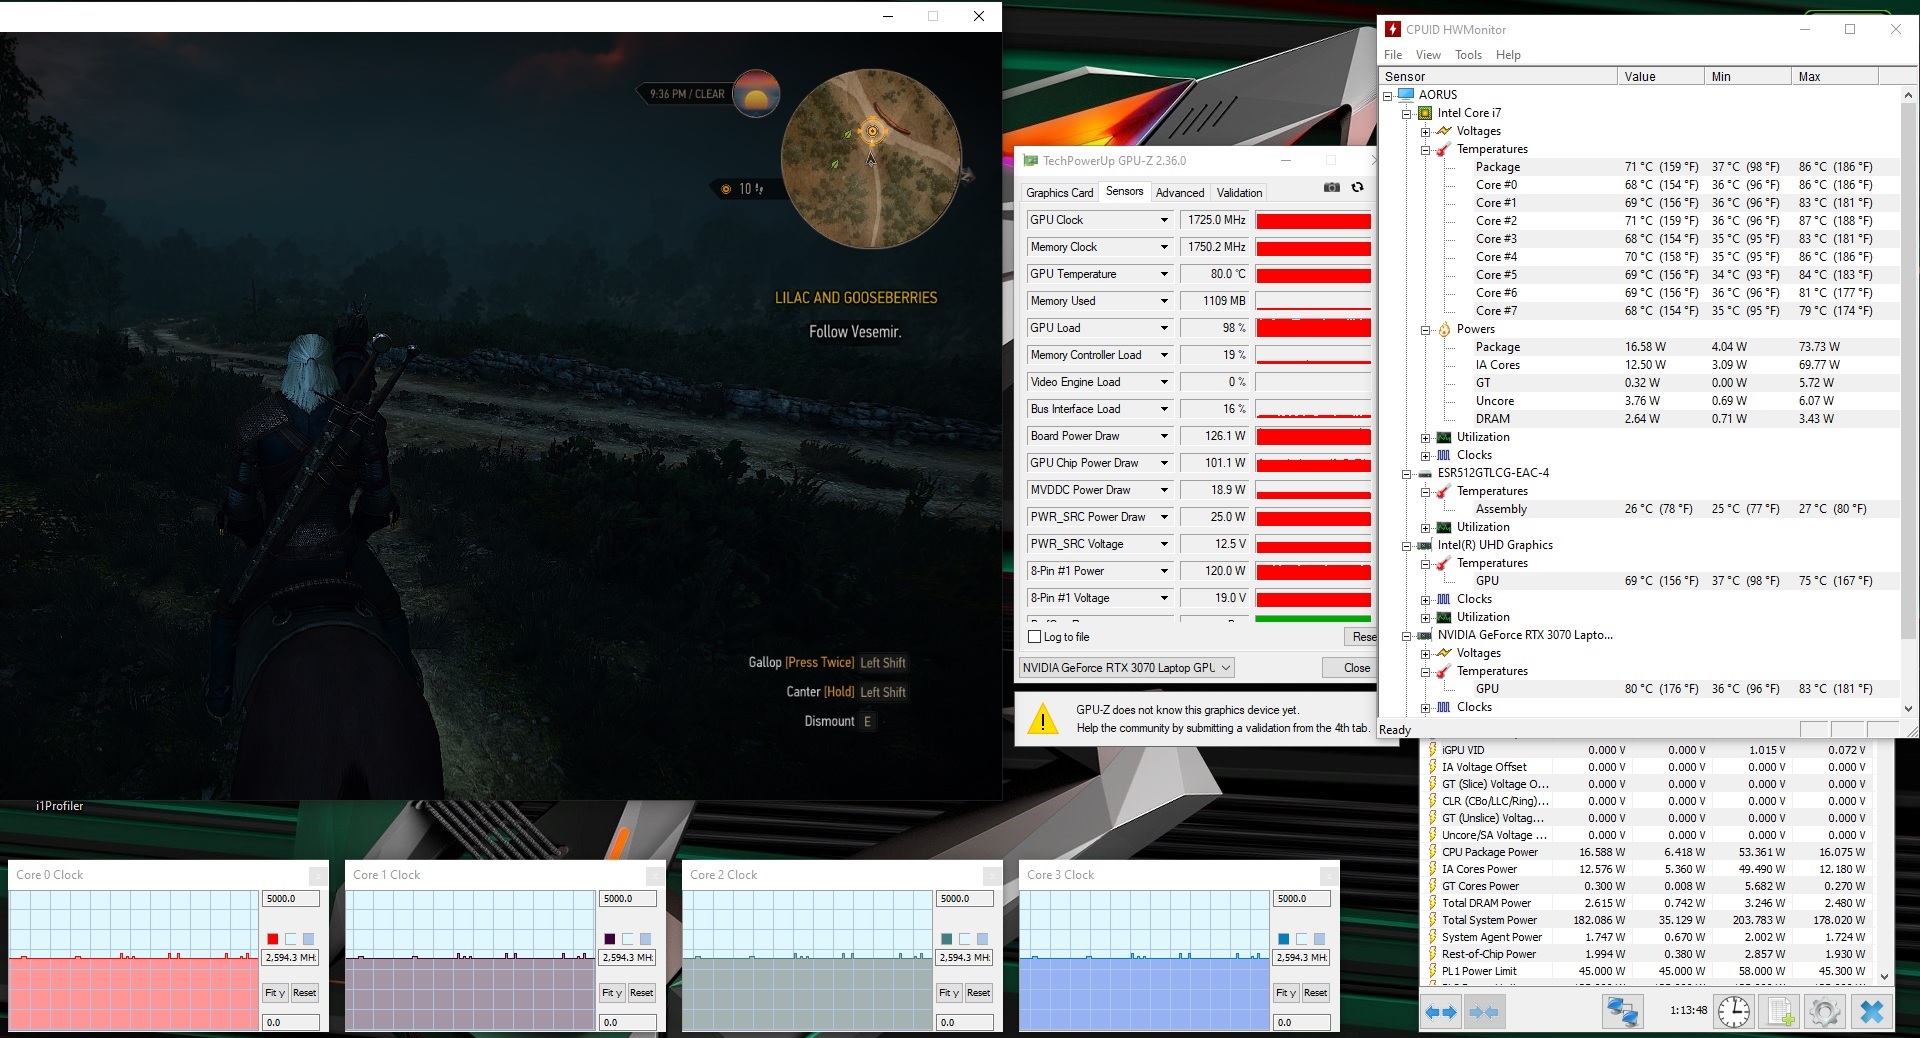
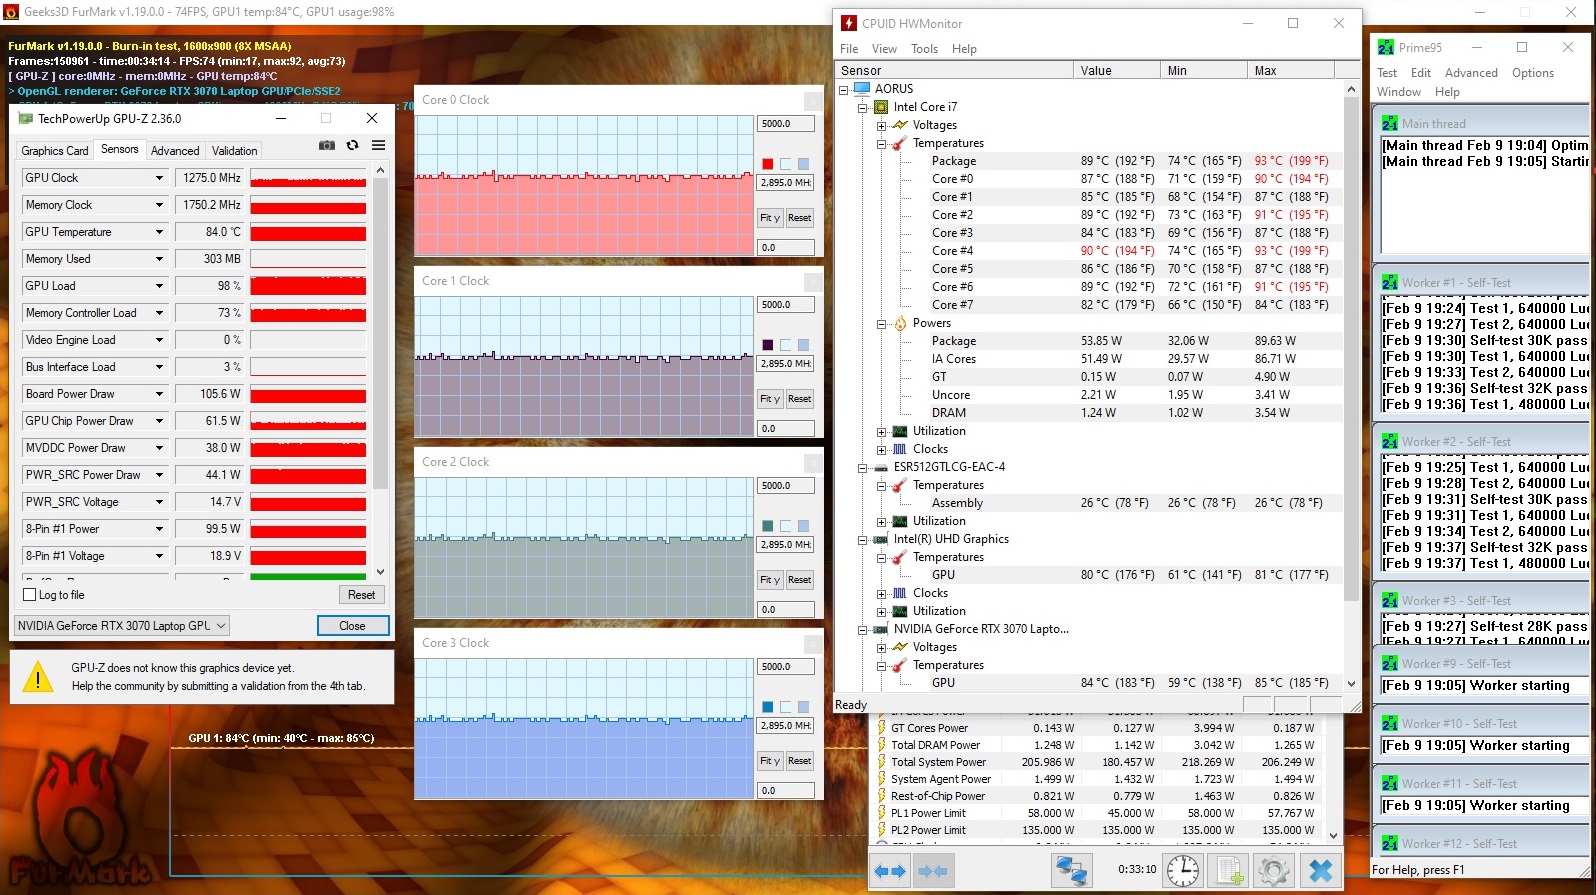
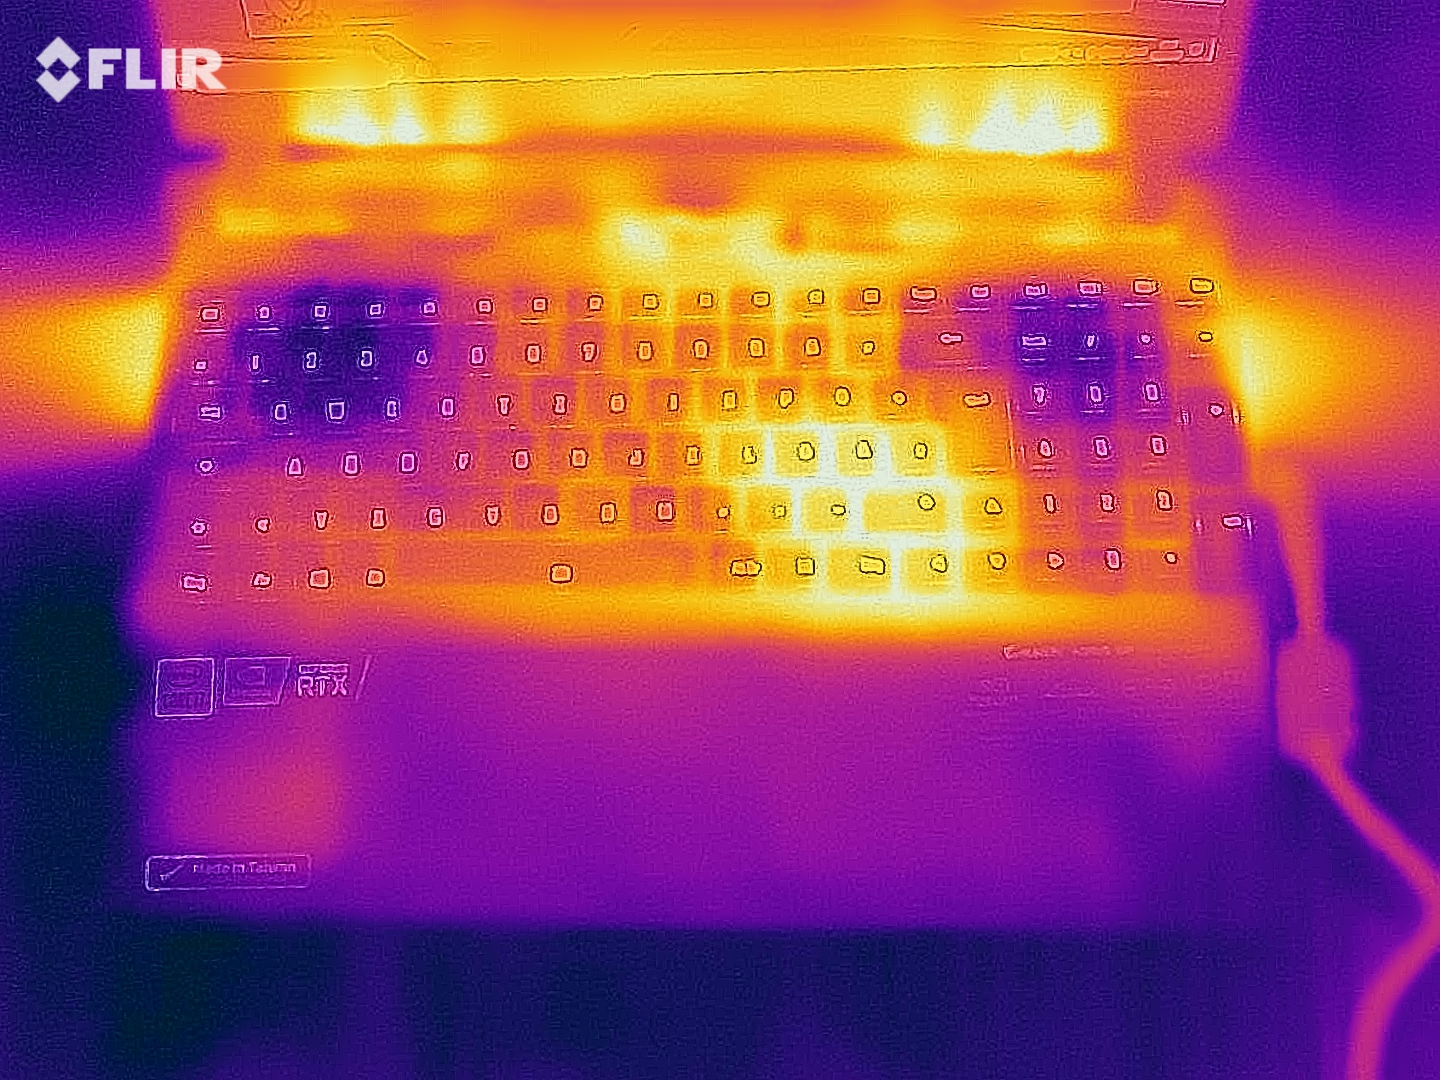
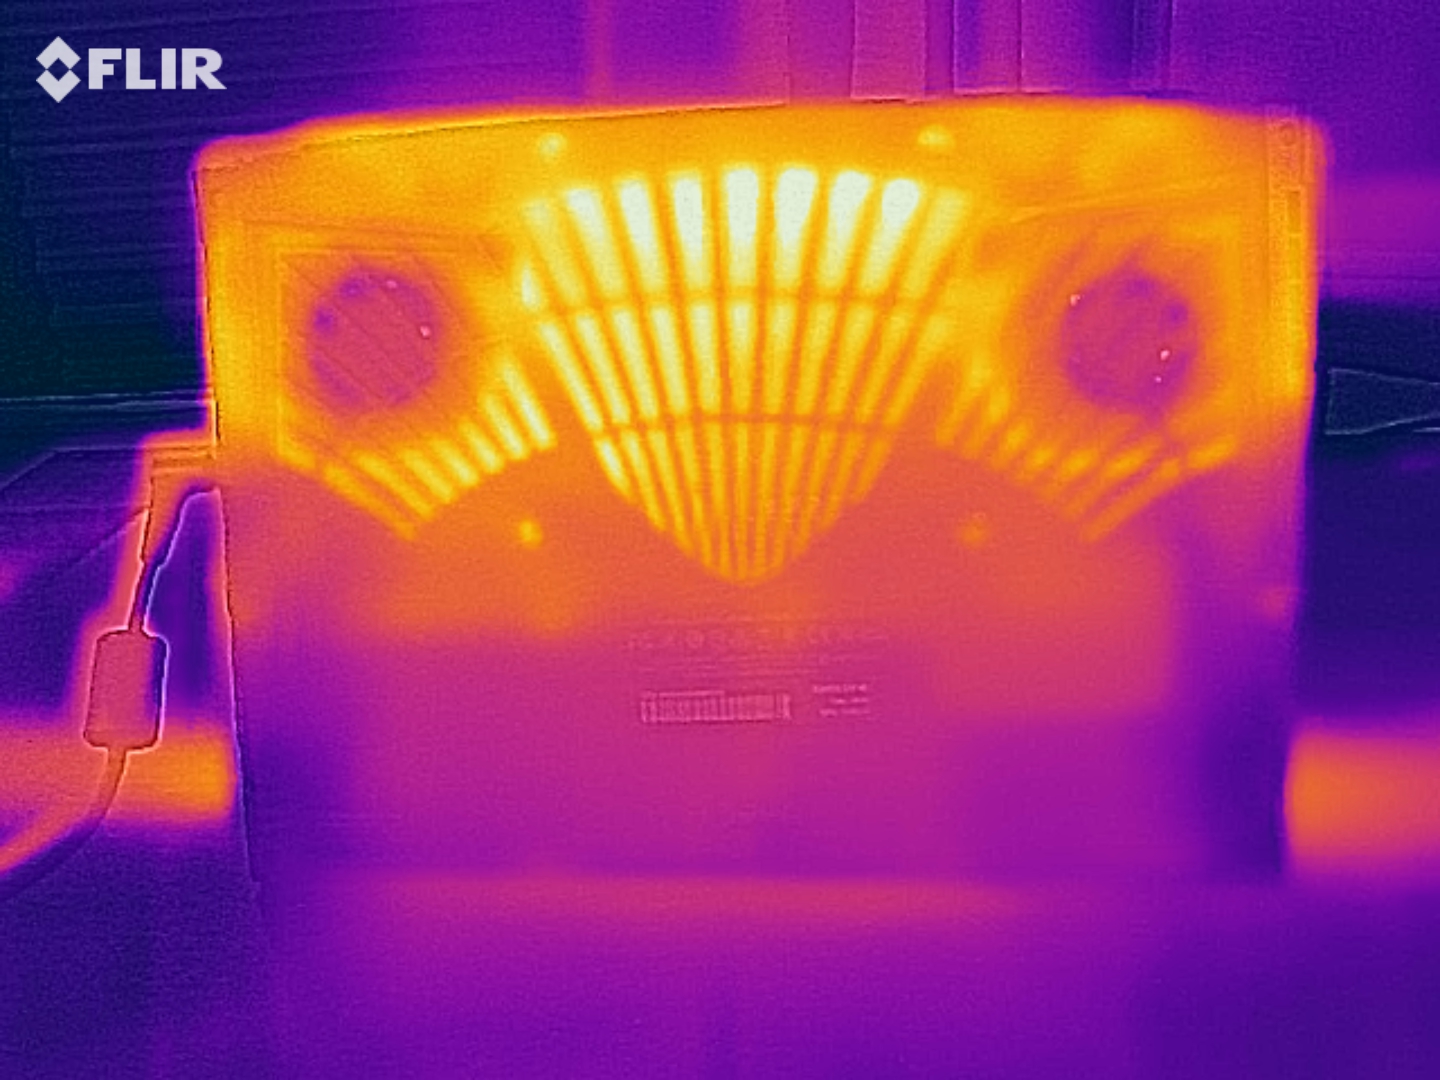
Registramos temperaturas superiores a los 50 °C en varias zonas de la carcasa. El dispositivo se calienta ligeramente menos durante la prueba de Witcher 3. Seguimos sin recomendar el uso del dispositivo sobre el regazo. Las temperaturas son aceptables durante el uso diario.
(-) La temperatura máxima en la parte superior es de 47 °C / 117 F, frente a la media de 40.4 °C / 105 F, que oscila entre 21.2 y 68.8 °C para la clase Gaming.
(-) El fondo se calienta hasta un máximo de 57 °C / 135 F, frente a la media de 43.2 °C / 110 F
(+) En reposo, la temperatura media de la parte superior es de 24.4 °C / 76# F, frente a la media del dispositivo de 33.9 °C / 93 F.
(-) Jugando a The Witcher 3, la temperatura media de la parte superior es de 39.9 °C / 104 F, frente a la media del dispositivo de 33.9 °C / 93 F.
(+) Los reposamanos y el panel táctil alcanzan como máximo la temperatura de la piel (34 °C / 93.2 F) y, por tanto, no están calientes.
(-) La temperatura media de la zona del reposamanos de dispositivos similares fue de 28.8 °C / 83.8 F (-5.2 °C / -9.4 F).
| Aorus 15P XC i7-10870H, GeForce RTX 3070 Laptop GPU | MSI GS66 Stealth 10UG i7-10870H, GeForce RTX 3070 Laptop GPU | Asus TUF Dash F15 FX516PR i7-11370H, GeForce RTX 3070 Laptop GPU | Schenker XMG Neo 15 Comet Lake i7-10875H, GeForce RTX 2070 Super Mobile | Aorus 15G XC i7-10870H, GeForce RTX 3070 Laptop GPU | Aorus 15P WB i7-10750H, GeForce RTX 2070 Max-Q | Asus ROG Strix G15 G513QR R9 5900HX, GeForce RTX 3070 Laptop GPU | Media de la clase Gaming | |
|---|---|---|---|---|---|---|---|---|
| Heat | -4% | -12% | -15% | -3% | -2% | -7% | -7% | |
| Maximum Upper Side * (°C) | 47 | 40.2 14% | 55 -17% | 46 2% | 45 4% | 47 -0% | 49 -4% | 45.2 ? 4% |
| Maximum Bottom * (°C) | 57 | 45.6 20% | 56 2% | 65 -14% | 61 -7% | 62 -9% | 48 16% | 48 ? 16% |
| Idle Upper Side * (°C) | 26 | 28.8 -11% | 29 -12% | 32 -23% | 27 -4% | 26 -0% | 31 -19% | 31.1 ? -20% |
| Idle Bottom * (°C) | 27 | 37.4 -39% | 32 -19% | 34 -26% | 28 -4% | 27 -0% | 33 -22% | 34.2 ? -27% |
* ... más pequeño es mejor
Altavoces
Aorus 15P XC análisis de audio
(+) | los altavoces pueden reproducir a un volumen relativamente alto (#84 dB)
Graves 100 - 315 Hz
(-) | casi sin bajos - de media 20.8% inferior a la mediana
(±) | la linealidad de los graves es media (10.8% delta a frecuencia anterior)
Medios 400 - 2000 Hz
(±) | medias más altas - de media 7.1% más altas que la mediana
(+) | los medios son lineales (4.9% delta a la frecuencia anterior)
Altos 2 - 16 kHz
(+) | máximos equilibrados - a sólo 1.9% de la mediana
(+) | los máximos son lineales (4.6% delta a la frecuencia anterior)
Total 100 - 16.000 Hz
(±) | la linealidad del sonido global es media (17% de diferencia con la mediana)
En comparación con la misma clase
» 45% de todos los dispositivos probados de esta clase eran mejores, 12% similares, 43% peores
» El mejor tuvo un delta de 6%, la media fue 18%, el peor fue ###max##%
En comparación con todos los dispositivos probados
» 30% de todos los dispositivos probados eran mejores, 8% similares, 62% peores
» El mejor tuvo un delta de 4%, la media fue 24%, el peor fue ###max##%
Gestión de la energía: buena duración de la batería para un portátil de juegos
Consumo de energía
Hemos medido un consumo máximo de 33 vatios en reposo. Eso es demasiado alto para nuestro gusto. El test de estrés y el test Witcher 3 dan como resultado un consumo de hasta 256 vatios y una media de 179 vatios, respectivamente. El MSIGS66 Stealth 10UG, equipadocon la misma combinación de CPU y GPU, es menos exigente debido a su menor TGP. Lapotencia nominal de la fuente de alimentación es de 230 vatios
| Off / Standby | |
| Ocioso | |
| Carga |
|
Clave:
min: | |
| Aorus 15P XC i7-10870H, GeForce RTX 3070 Laptop GPU | MSI GS66 Stealth 10UG i7-10870H, GeForce RTX 3070 Laptop GPU | Asus TUF Dash F15 FX516PR i7-11370H, GeForce RTX 3070 Laptop GPU | Schenker XMG Neo 15 Comet Lake i7-10875H, GeForce RTX 2070 Super Mobile | Aorus 15G XC i7-10870H, GeForce RTX 3070 Laptop GPU | Aorus 15P WB i7-10750H, GeForce RTX 2070 Max-Q | Asus ROG Strix G15 G513QR R9 5900HX, GeForce RTX 3070 Laptop GPU | Media de la clase Gaming | |
|---|---|---|---|---|---|---|---|---|
| Power Consumption | 8% | 30% | -8% | 9% | 13% | 15% | 2% | |
| Idle Minimum * (Watt) | 14 | 12.9 8% | 9 36% | 17 -21% | 13 7% | 13 7% | 4 71% | 13.2 ? 6% |
| Idle Average * (Watt) | 17 | 15.4 9% | 11 35% | 19 -12% | 16 6% | 15 12% | 9 47% | 18.9 ? -11% |
| Idle Maximum * (Watt) | 33 | 27.1 18% | 16 52% | 29 12% | 30 9% | 19 42% | 36 -9% | 24.3 ? 26% |
| Load Average * (Watt) | 96 | 98.2 -2% | 107 -11% | 120 -25% | 92 4% | 100 -4% | 130 -35% | 108 ? -13% |
| Witcher 3 ultra * (Watt) | 179 | 164.9 8% | 121 32% | 186 -4% | 154 14% | 150 16% | 174 3% | |
| Load Maximum * (Watt) | 256 | 232.9 9% | 162 37% | 250 2% | 223 13% | 249 3% | 227 11% | 254 ? 1% |
* ... más pequeño es mejor
Duración de la batería
El Aorus 15P alcanza una duración de batería de 6:39 o 6:58 horas en nuestro test Wi-Fi (abriendo webs según un guión) y nuestro test de vídeo (ejecutando el corto Big Buck Bunny (códec H.264, FHD) en bucle), respectivamente. El modo de ahorro de energía está desactivado y el brillo de la pantalla está ajustado a unos 150 nits en estas dos pruebas. Además, apagamos los módulos de red para la prueba de vídeo.
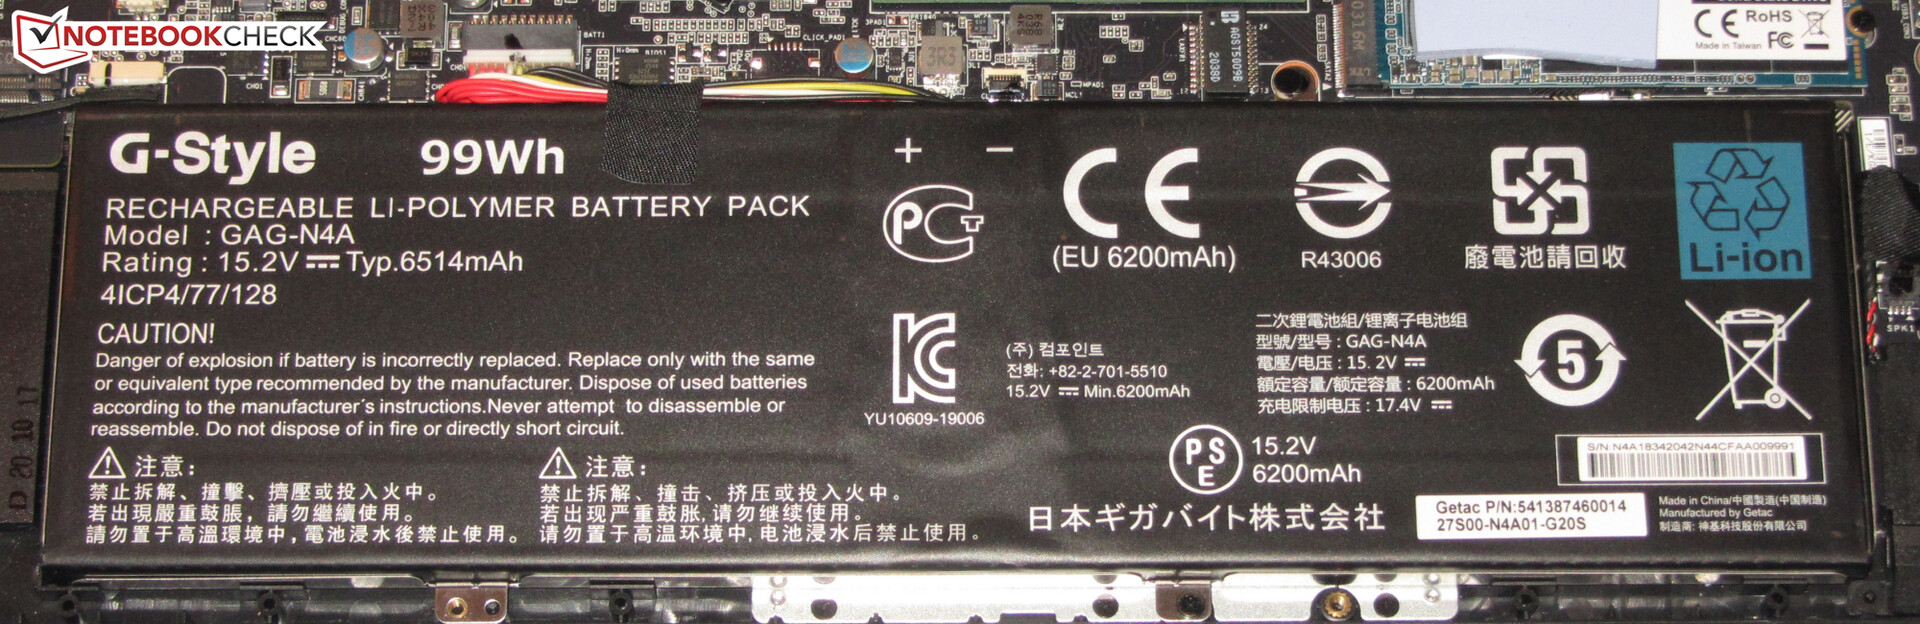
| Aorus 15P XC i7-10870H, GeForce RTX 3070 Laptop GPU, 99 Wh | MSI GS66 Stealth 10UG i7-10870H, GeForce RTX 3070 Laptop GPU, 99.9 Wh | Asus TUF Dash F15 FX516PR i7-11370H, GeForce RTX 3070 Laptop GPU, 76 Wh | Schenker XMG Neo 15 Comet Lake i7-10875H, GeForce RTX 2070 Super Mobile, 93 Wh | Aorus 15P WB i7-10750H, GeForce RTX 2070 Max-Q, 94.24 Wh | Aorus 15G XC i7-10870H, GeForce RTX 3070 Laptop GPU, 99 Wh | Asus ROG Strix G15 G513QR R9 5900HX, GeForce RTX 3070 Laptop GPU, 90 Wh | Media de la clase Gaming | |
|---|---|---|---|---|---|---|---|---|
| Duración de Batería | 22% | 52% | 12% | 24% | 10% | 39% | 3% | |
| Reader / Idle (h) | 9.5 | 10.8 14% | 16 68% | 11.3 19% | 9.6 1% | 8.71 ? -8% | ||
| H.264 (h) | 7 | 8.1 16% | 6.5 -7% | 13.5 93% | 8.26 ? 18% | |||
| WiFi v1.3 (h) | 6.7 | 7.1 6% | 9.1 36% | 7.5 12% | 7.1 6% | 6.3 -6% | 7.4 10% | 7.02 ? 5% |
| Load (h) | 1.5 | 2.2 47% | 2.3 53% | 2.3 53% | 1.7 13% | 1.47 ? -2% |
Pro
Contra
Veredicto
El 15P XC logra mostrar todos los juegos actuales con fluidez gracias a suCPU Corei7-10870H octa-core y suGPUGeForce RTX 3070 Laptop. No hay compromisos: Gigabyte ha fijado el TGP de la GPU en 130 vatios, lo que significa que casi funciona a su máxima capacidad (140 vatios).
Gigabyte ha creado un portátil para juegos muy completo con mucha potencia de cálculo: el Aorus 15P XC.
Fuerte CPU, fuerte GPU, 32 GB de RAM (2x 16 GB, modo dual-channel, máx. 64 GB) - pero sólo un SSD de 512 GB. La capacidad de almacenamiento no es particularmente generosa para un portátil de juego. Muchos compradores tendrán que ampliar el almacenamiento tarde o temprano. Esto no debería suponer un gran problema ya que el portátil tiene una segunda ranura disponible para un SSD NVMe adicional.
El display (FHD, IPS, 240 Hz) tiene ángulos de visión estables, una superficie mate, tasas de respuesta cortas, una cobertura de espacio de color decente, y - gracias a su certificación Pantone - una gran precisión de color. El brillo máximo es demasiado bajo, sin embargo, para un portátil de este rango de precios en particular. El teclado (retroiluminación RGB) es adecuado para el uso diario y la duración de la batería es buena, con una carga que dura entre 6 y 7 horas de uso normal.
Precio y disponibilidad
El Aorus 15P XC aún no aparece en las tiendas online de los principales distribuidores en el momento de escribir este artículo. Actualmente tiene un precio de 1.900 euros (~2.400 dólares) en Alemania.
Aorus 15P XC
- 02/24/2021 v7 (old)
Sascha Mölck
Price comparison

