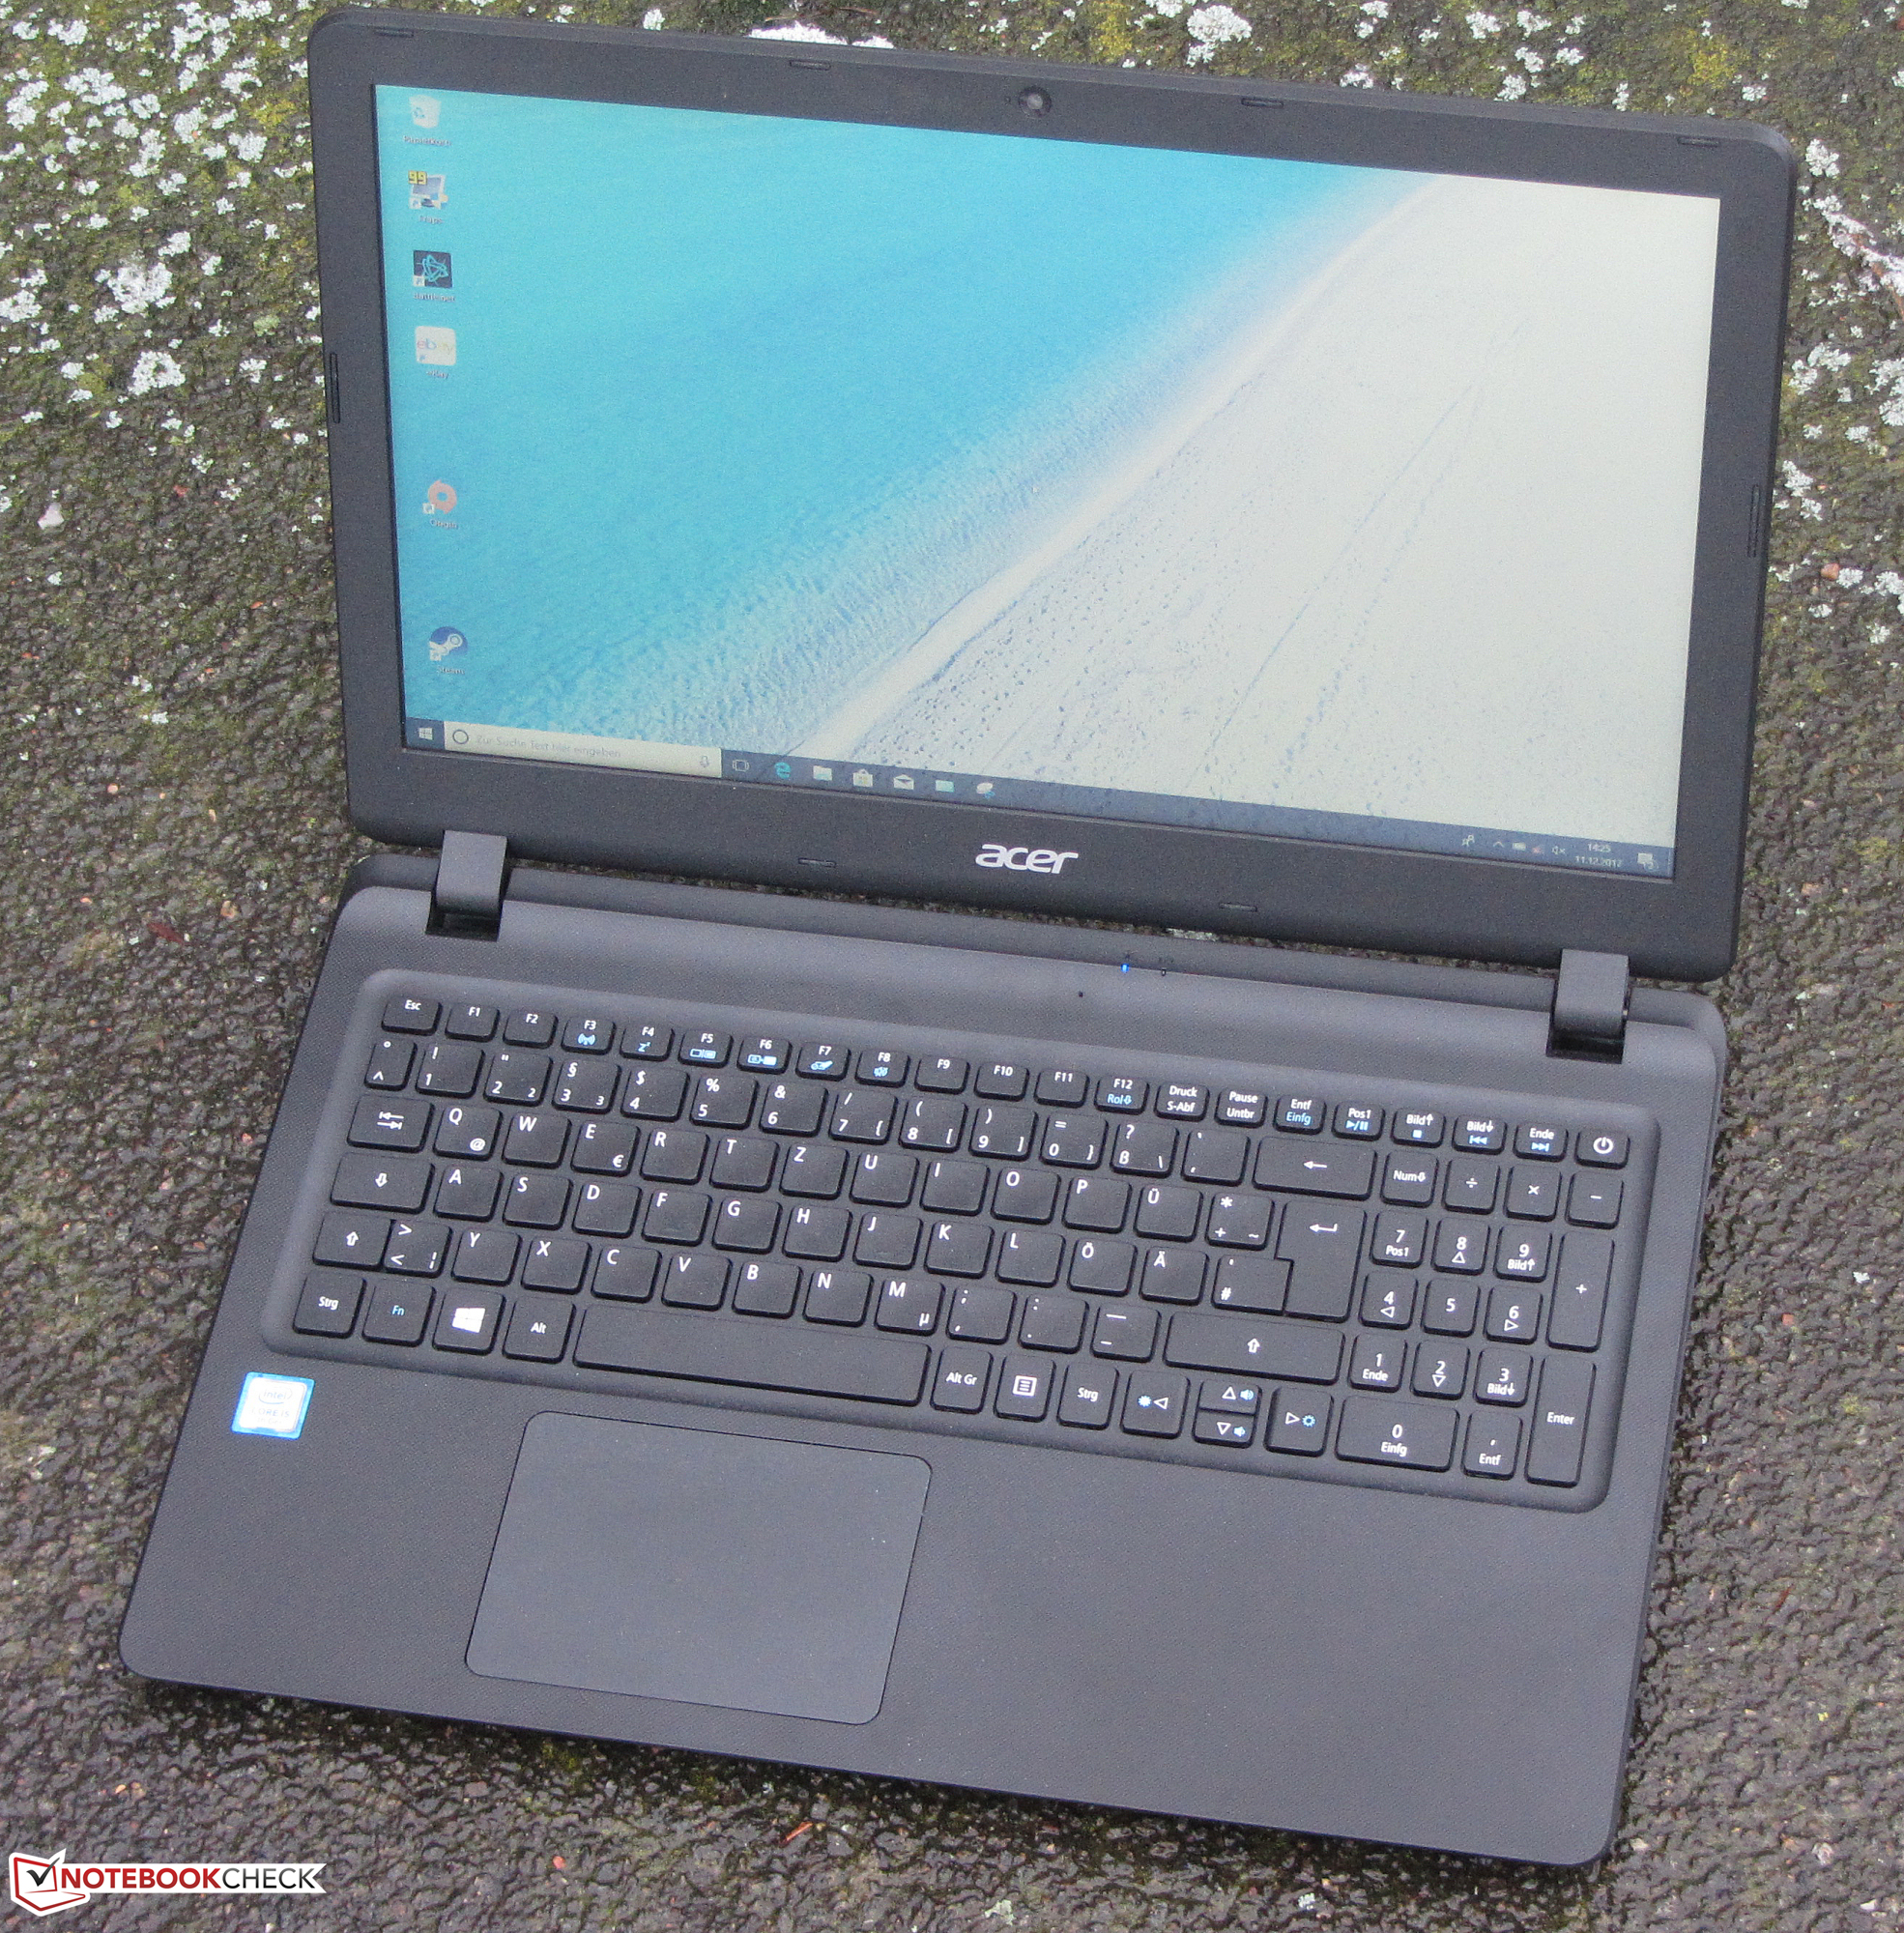
Breve análisis del Acer Extensa 2540-580K (i5-7200U, FHD)
| SD Card Reader | |
| average JPG Copy Test (av. of 3 runs) | |
| Asus ASUSPRO P541UA-GQ1532 (Toshiba Exceria Pro SDXC 64 GB UHS-II) | |
| Acer Aspire 3 A315-21-651Y (Toshiba Exceria Pro SDXC 64 GB UHS-II) | |
| Asus VivoBook S15 S510UA (Toshiba Exceria Pro SDXC 64 GB UHS-II) | |
| HP 15-ba077ng (Toshiba Exceria Pro SDXC 64 GB UHS-II) | |
| Lenovo Ideapad 110-15ACL 80TJ00H0GE (Toshiba Exceria Pro SDXC 64 GB UHS-II) | |
| Lenovo IdeaPad V110-15IKB 80TH001SGE (Toshiba Exceria Pro SDXC 64 GB UHS-II) | |
| Acer Extensa 2540-580K (Toshiba Exceria Pro SDXC 64 GB UHS-II) | |
| HP 15-ay116ng (Toshiba Exceria Pro SDXC 64 GB UHS-II) | |
| maximum AS SSD Seq Read Test (1GB) | |
| Acer Aspire 3 A315-21-651Y (Toshiba Exceria Pro SDXC 64 GB UHS-II) | |
| Lenovo Ideapad 110-15ACL 80TJ00H0GE (Toshiba Exceria Pro SDXC 64 GB UHS-II) | |
| HP 15-ba077ng (Toshiba Exceria Pro SDXC 64 GB UHS-II) | |
| Asus VivoBook S15 S510UA (Toshiba Exceria Pro SDXC 64 GB UHS-II) | |
| Lenovo IdeaPad V110-15IKB 80TH001SGE (Toshiba Exceria Pro SDXC 64 GB UHS-II) | |
| Acer Extensa 2540-580K (Toshiba Exceria Pro SDXC 64 GB UHS-II) | |
| HP 15-ay116ng (Toshiba Exceria Pro SDXC 64 GB UHS-II) | |
| |||||||||||||||||||||||||
iluminación: 92 %
Brillo con batería: 215 cd/m²
Contraste: 316:1 (Negro: 0.68 cd/m²)
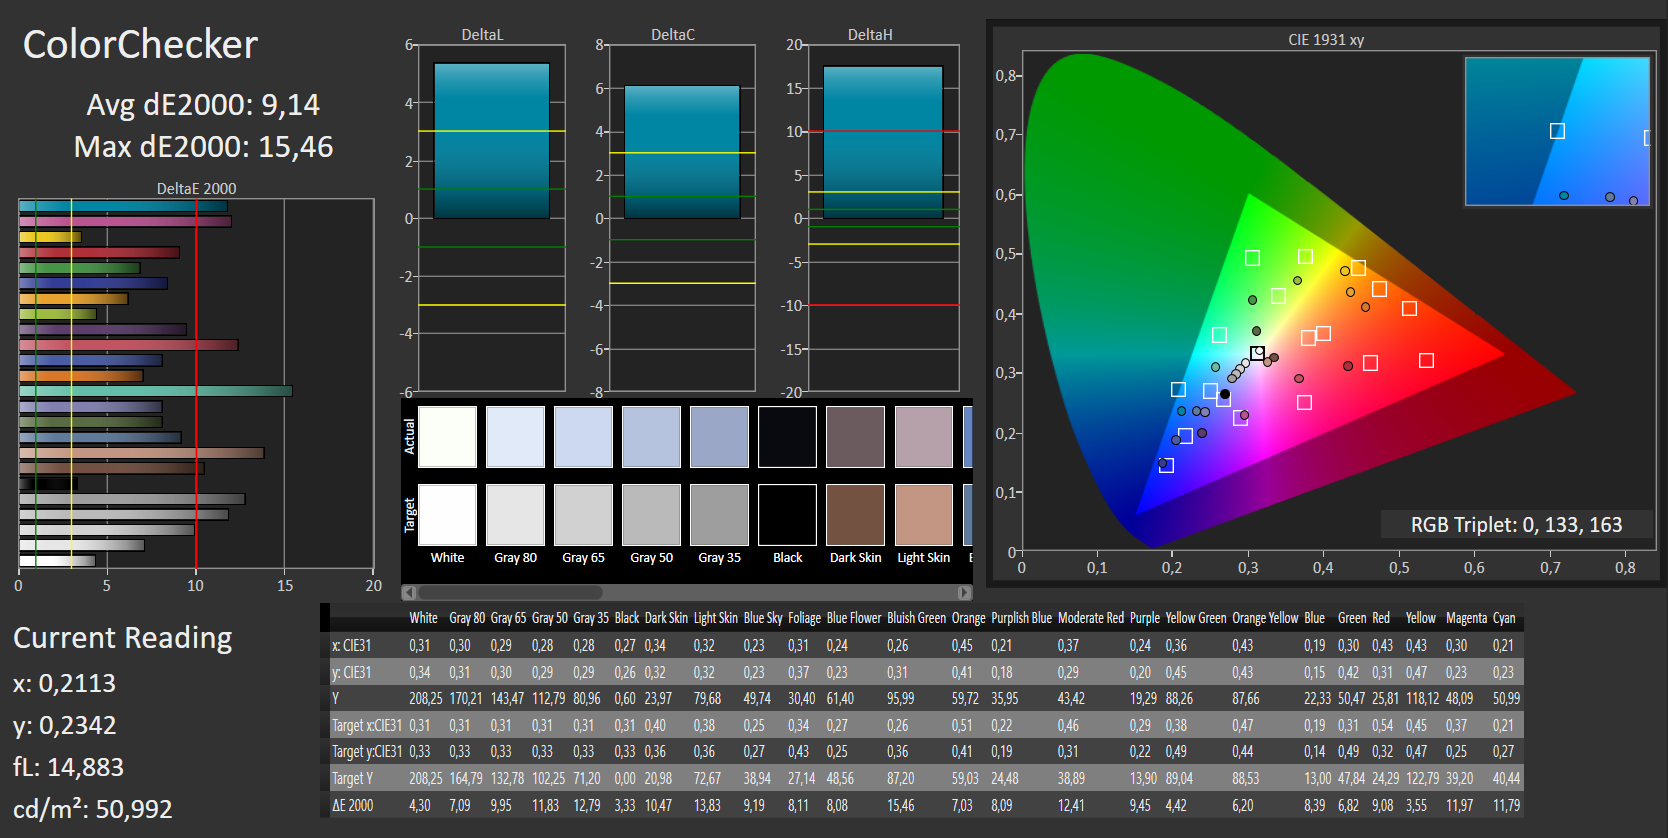
ΔE ColorChecker Calman: 9.14 | ∀{0.5-29.43 Ø4.71}
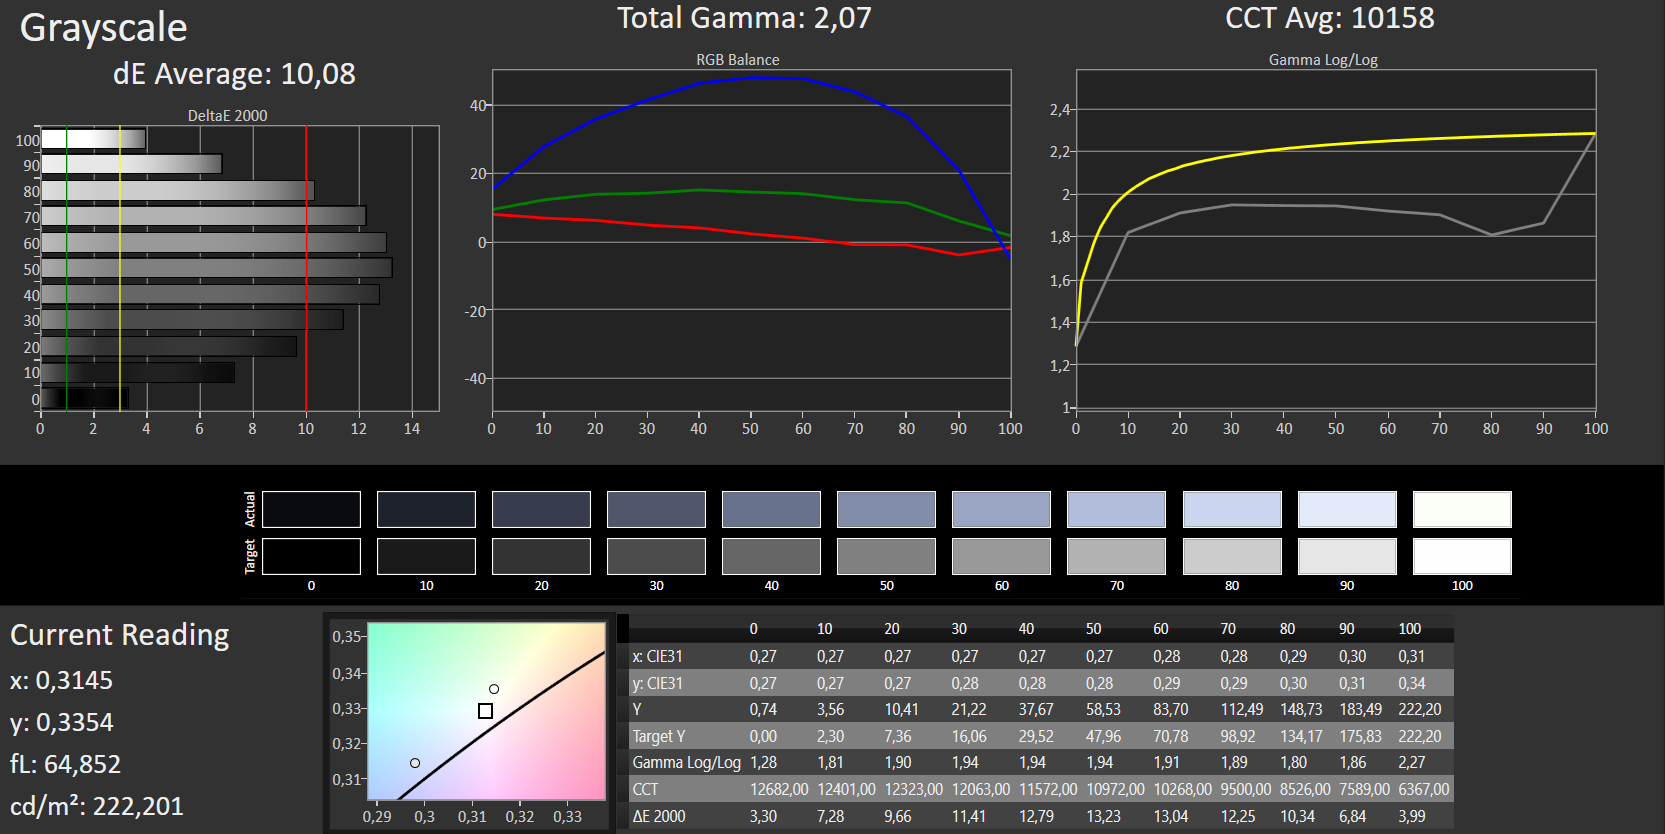
ΔE Greyscale Calman: 10.08 | ∀{0.09-98 Ø4.96}
56% sRGB (Argyll 1.6.3 3D)
36% AdobeRGB 1998 (Argyll 1.6.3 3D)
38.84% AdobeRGB 1998 (Argyll 3D)
56.5% sRGB (Argyll 3D)
37.59% Display P3 (Argyll 3D)
Gamma: 2.07
CCT: 10158 K
| Acer Extensa 2540-580K TN LED, 1920x1080, 15.6" | Lenovo IdeaPad V110-15IKB 80TH001SGE TN LED, 1366x768, 15.6" | HP 15-ba077ng TN LED, 1920x1080, 15.6" | HP 15-ay116ng TN LED, 1920x1080, 15.6" | Asus ASUSPRO P541UA-GQ1532 TN LED, 1366x768, 15.6" | Acer Aspire 3 A315-21-651Y TN LED, 1366x768, 15.6" | Lenovo Ideapad 110-15ACL 80TJ00H0GE TN LED, 1366x768, 15.6" | |
|---|---|---|---|---|---|---|---|
| Display | 4% | 6% | -1% | 5% | -1% | ||
| Display P3 Coverage (%) | 37.59 | 38.91 4% | 39.98 6% | 37.34 -1% | 39.48 5% | 37.39 -1% | |
| sRGB Coverage (%) | 56.5 | 58.6 4% | 60.2 7% | 56.2 -1% | 59.2 5% | 56.2 -1% | |
| AdobeRGB 1998 Coverage (%) | 38.84 | 40.2 4% | 41.31 6% | 38.58 -1% | 40.81 5% | 38.63 -1% | |
| Response Times | 10% | -1% | -2% | 18% | -9% | -23% | |
| Response Time Grey 50% / Grey 80% * (ms) | 41 ? | 39 ? 5% | 42 ? -2% | 40 ? 2% | 47 ? -15% | 48 ? -17% | 58 -41% |
| Response Time Black / White * (ms) | 22 ? | 19 ? 14% | 22 ? -0% | 23 ? -5% | 11 ? 50% | 22 ? -0% | 23 -5% |
| PWM Frequency (Hz) | 27000 ? | 10000 ? | 50 ? | 200 ? | 25000 ? | 200 ? | |
| Screen | 3% | -7% | 5% | 7% | 5% | 12% | |
| Brightness middle (cd/m²) | 215 | 243 13% | 209 -3% | 249 16% | 262 22% | 223 4% | 253 18% |
| Brightness (cd/m²) | 217 | 233 7% | 200 -8% | 234 8% | 250 15% | 220 1% | 246 13% |
| Brightness Distribution (%) | 92 | 75 -18% | 88 -4% | 89 -3% | 83 -10% | 88 -4% | 86 -7% |
| Black Level * (cd/m²) | 0.68 | 0.45 34% | 0.56 18% | 0.44 35% | 0.47 31% | 0.44 35% | |
| Contrast (:1) | 316 | 540 71% | 373 18% | 566 79% | 474 50% | 575 82% | |
| Colorchecker dE 2000 * | 9.14 | 11.69 -28% | 12.21 -34% | 11.71 -28% | 10.72 -17% | 9.2 -1% | |
| Colorchecker dE 2000 max. * | 15.46 | 20.08 -30% | 20.66 -34% | 19.51 -26% | 17.7 -14% | 17.68 -14% | |
| Greyscale dE 2000 * | 10.08 | 13.12 -30% | 13.48 -34% | 13.13 -30% | 10.07 -0% | 11.81 -17% | 11.05 -10% |
| Gamma | 2.07 106% | 2.24 98% | 2.34 94% | 2.57 86% | 2.36 93% | 2.32 95% | 2.55 86% |
| CCT | 10158 64% | 16905 38% | 15364 42% | 15273 43% | 10532 62% | 13530 48% | 11451 57% |
| Color Space (Percent of AdobeRGB 1998) (%) | 36 | 37 3% | 38 6% | 36 0% | 38 6% | 36 0% | |
| Color Space (Percent of sRGB) (%) | 56 | 59 5% | 60 7% | 56 0% | 59 5% | 56 0% | |
| Media total (Programa/Opciones) | 6% /
4% | -1% /
-3% | 1% /
3% | 13% /
10% | 0% /
3% | -4% /
4% |
* ... más pequeño es mejor
Parpadeo de Pantalla / PWM (Pulse-Width Modulation)
| Parpadeo de Pantalla / PWM detectado | 27000 Hz | ≤ 90 % de brillo | 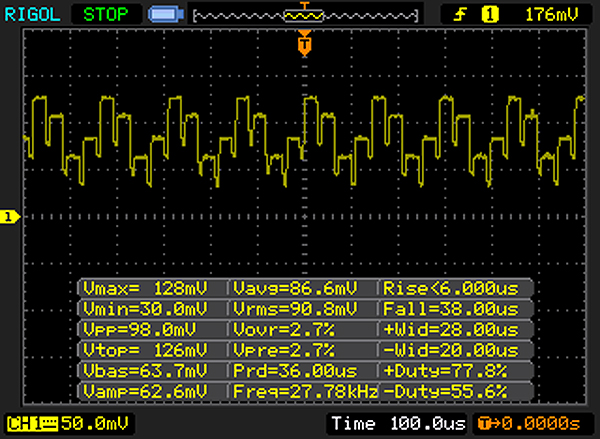 |
La retroiluminación del display parpadea a 27000 Hz (seguramente usa PWM - Pulse-Width Modulation) a un brillo del 90 % e inferior. Sobre este nivel de brillo no debería darse parpadeo / PWM. La frecuencia de 27000 Hz es bastante alta, por lo que la mayoría de gente sensible al parpadeo no debería ver parpadeo o tener fatiga visual. Comparación: 52 % de todos los dispositivos testados no usaron PWM para atenuar el display. Si se usó, medimos una media de 7757 (mínimo: 5 - máxmo: 343500) Hz. | |||
Tiempos de respuesta del display
| ↔ Tiempo de respuesta de Negro a Blanco | ||
|---|---|---|
| 22 ms ... subida ↗ y bajada ↘ combinada | ↗ 18 ms subida | 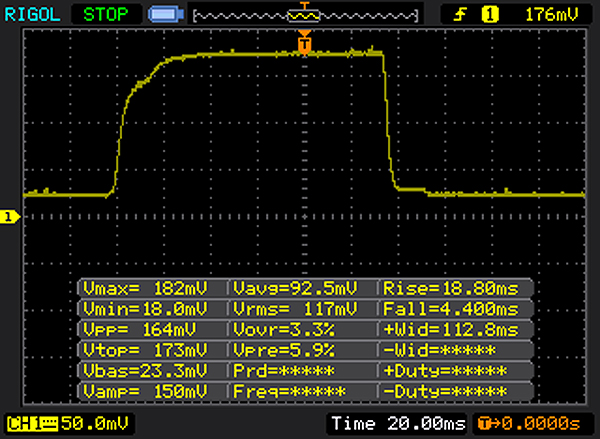 |
| ↘ 4 ms bajada | ||
| La pantalla mostró buenos tiempos de respuesta en nuestros tests pero podría ser demasiado lenta para los jugones competitivos. En comparación, todos los dispositivos de prueba van de ##min### (mínimo) a 240 (máximo) ms. » 49 % de todos los dispositivos son mejores. Eso quiere decir que el tiempo de respuesta es peor que la media (19.8 ms) de todos los dispositivos testados. | ||
| ↔ Tiempo de respuesta 50% Gris a 80% Gris | ||
| 41 ms ... subida ↗ y bajada ↘ combinada | ↗ 21 ms subida | 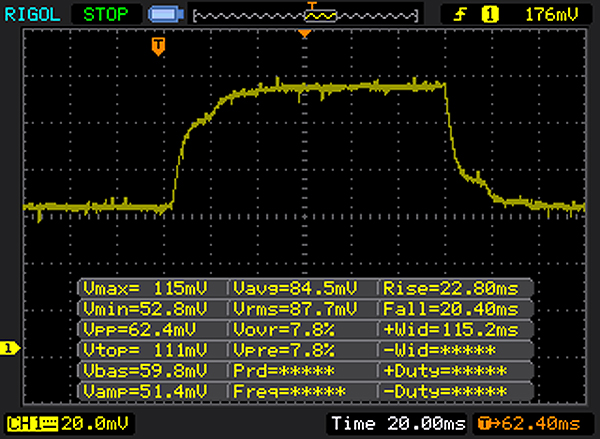 |
| ↘ 20 ms bajada | ||
| La pantalla mostró tiempos de respuesta lentos en nuestros tests y podría ser demasiado lenta para los jugones. En comparación, todos los dispositivos de prueba van de ##min### (mínimo) a 636 (máximo) ms. » 65 % de todos los dispositivos son mejores. Eso quiere decir que el tiempo de respuesta es peor que la media (31 ms) de todos los dispositivos testados. | ||
| Cinebench R15 | |
| CPU Single 64Bit | |
| Acer Spin 5 SP513-52N-54SF | |
| HP 15-bs103ng | |
| Acer Extensa 2540-580K | |
| HP 15-ay116ng | |
| Lenovo IdeaPad V110-15IKB 80TH001SGE | |
| Asus ASUSPRO P541UA-GQ1532 | |
| HP 15-ba077ng | |
| Acer Aspire 3 A315-21-651Y | |
| Lenovo Ideapad 110-15ACL 80TJ00H0GE | |
| CPU Multi 64Bit | |
| Acer Spin 5 SP513-52N-54SF | |
| HP 15-bs103ng | |
| Acer Extensa 2540-580K | |
| HP 15-ay116ng | |
| Lenovo IdeaPad V110-15IKB 80TH001SGE | |
| HP 15-ba077ng | |
| Asus ASUSPRO P541UA-GQ1532 | |
| Lenovo Ideapad 110-15ACL 80TJ00H0GE | |
| Acer Aspire 3 A315-21-651Y | |
| Cinebench R11.5 | |
| CPU Multi 64Bit | |
| HP 15-bs103ng | |
| Acer Extensa 2540-580K | |
| HP 15-ay116ng | |
| Lenovo IdeaPad V110-15IKB 80TH001SGE | |
| HP 15-ba077ng | |
| Acer Aspire 3 A315-21-651Y | |
| CPU Single 64Bit | |
| HP 15-bs103ng | |
| Acer Extensa 2540-580K | |
| HP 15-ay116ng | |
| Lenovo IdeaPad V110-15IKB 80TH001SGE | |
| HP 15-ba077ng | |
| Acer Aspire 3 A315-21-651Y | |
| Cinebench R10 | |
| Rendering Multiple CPUs 32Bit | |
| HP 15-bs103ng | |
| Acer Spin 5 SP513-52N-54SF | |
| HP 15-ay116ng | |
| Acer Extensa 2540-580K | |
| Lenovo IdeaPad V110-15IKB 80TH001SGE | |
| Asus ASUSPRO P541UA-GQ1532 | |
| HP 15-ba077ng | |
| Lenovo Ideapad 110-15ACL 80TJ00H0GE | |
| Acer Aspire 3 A315-21-651Y | |
| Rendering Single 32Bit | |
| Acer Spin 5 SP513-52N-54SF | |
| HP 15-bs103ng | |
| Acer Extensa 2540-580K | |
| HP 15-ay116ng | |
| Lenovo IdeaPad V110-15IKB 80TH001SGE | |
| Asus ASUSPRO P541UA-GQ1532 | |
| HP 15-ba077ng | |
| Acer Aspire 3 A315-21-651Y | |
| Lenovo Ideapad 110-15ACL 80TJ00H0GE | |
| Geekbench 3 | |
| 32 Bit Multi-Core Score | |
| HP 15-bs103ng | |
| Acer Spin 5 SP513-52N-54SF | |
| Acer Extensa 2540-580K | |
| HP 15-ay116ng | |
| HP 15-ba077ng | |
| Lenovo IdeaPad V110-15IKB 80TH001SGE | |
| Asus ASUSPRO P541UA-GQ1532 | |
| Lenovo Ideapad 110-15ACL 80TJ00H0GE | |
| Acer Aspire 3 A315-21-651Y | |
| 32 Bit Single-Core Score | |
| Acer Spin 5 SP513-52N-54SF | |
| Acer Extensa 2540-580K | |
| HP 15-bs103ng | |
| HP 15-ay116ng | |
| Lenovo IdeaPad V110-15IKB 80TH001SGE | |
| HP 15-ba077ng | |
| Asus ASUSPRO P541UA-GQ1532 | |
| Acer Aspire 3 A315-21-651Y | |
| Lenovo Ideapad 110-15ACL 80TJ00H0GE | |
| Geekbench 4.0 | |
| 64 Bit Multi-Core Score | |
| Acer Spin 5 SP513-52N-54SF | |
| HP 15-bs103ng | |
| Acer Extensa 2540-580K | |
| HP 15-ay116ng | |
| Lenovo IdeaPad V110-15IKB 80TH001SGE | |
| Asus ASUSPRO P541UA-GQ1532 | |
| HP 15-ba077ng | |
| Lenovo Ideapad 110-15ACL 80TJ00H0GE | |
| Acer Aspire 3 A315-21-651Y | |
| 64 Bit Single-Core Score | |
| Acer Spin 5 SP513-52N-54SF | |
| HP 15-bs103ng | |
| Acer Extensa 2540-580K | |
| HP 15-ay116ng | |
| Lenovo IdeaPad V110-15IKB 80TH001SGE | |
| Asus ASUSPRO P541UA-GQ1532 | |
| HP 15-ba077ng | |
| Acer Aspire 3 A315-21-651Y | |
| Lenovo Ideapad 110-15ACL 80TJ00H0GE | |
| Geekbench 4.4 | |
| 64 Bit Multi-Core Score | |
| Acer Spin 5 SP513-52N-54SF | |
| HP 15-bs103ng | |
| Acer Extensa 2540-580K | |
| Lenovo IdeaPad V110-15IKB 80TH001SGE | |
| Asus ASUSPRO P541UA-GQ1532 | |
| Acer Aspire 3 A315-21-651Y | |
| 64 Bit Single-Core Score | |
| Acer Spin 5 SP513-52N-54SF | |
| HP 15-bs103ng | |
| Acer Extensa 2540-580K | |
| Lenovo IdeaPad V110-15IKB 80TH001SGE | |
| Asus ASUSPRO P541UA-GQ1532 | |
| Acer Aspire 3 A315-21-651Y | |
| JetStream 1.1 - 1.1 Total | |
| Acer Spin 5 SP513-52N-54SF (Edge 41) | |
| HP 15-bs103ng (Edge 41) | |
| Acer Extensa 2540-580K (Edge 41) | |
| HP 15-ay116ng (Edge 38) | |
| Lenovo IdeaPad V110-15IKB 80TH001SGE (Edge 40) | |
| Asus ASUSPRO P541UA-GQ1532 (Edge 40) | |
| HP 15-ba077ng (Edge 38) | |
| Acer Aspire 3 A315-21-651Y (Edge 41) | |
| Asus ASUSPRO P541UA-GQ1532 (Chromium 59.0.3071.86 (Linux)) | |
| Lenovo Ideapad 110-15ACL 80TJ00H0GE (Edge 38) | |
| PCMark 7 Score | 5549 puntos | |
| PCMark 8 Home Score Accelerated v2 | 3752 puntos | |
| PCMark 8 Creative Score Accelerated v2 | 4518 puntos | |
| PCMark 8 Work Score Accelerated v2 | 4642 puntos | |
| PCMark 10 Score | 3228 puntos | |
ayuda | ||
| PCMark 8 | |
| Home Score Accelerated v2 | |
| Acer Extensa 2540-580K | |
| HP 15-ay116ng | |
| Asus ASUSPRO P541UA-GQ1532 | |
| Lenovo IdeaPad V110-15IKB 80TH001SGE | |
| HP 15-ba077ng | |
| Acer Aspire 3 A315-21-651Y | |
| Lenovo Ideapad 110-15ACL 80TJ00H0GE | |
| Work Score Accelerated v2 | |
| Acer Extensa 2540-580K | |
| HP 15-ay116ng | |
| Lenovo IdeaPad V110-15IKB 80TH001SGE | |
| Acer Aspire 3 A315-21-651Y | |
| HP 15-ba077ng | |

| Acer Extensa 2540-580K Kingston RBUSC180DS37256GH | Lenovo IdeaPad V110-15IKB 80TH001SGE Ramxel S121 RTNRB256RFM4KWDL | HP 15-ba077ng SanDisk Z400s SD8SNAT-256G | HP 15-ay116ng Samsung CM871a MZNTY256HDHP | Lenovo Ideapad 110-15ACL 80TJ00H0GE Seagate Mobile HDD 1TB ST1000LM035 | Asus ASUSPRO P541UA-GQ1532 SK Hynix HFS128G32TND | |
|---|---|---|---|---|---|---|
| CrystalDiskMark 3.0 | -16% | -31% | 4% | -93% | -26% | |
| Read Seq (MB/s) | 473.9 | 477.4 1% | 447.4 -6% | 501 6% | 92.1 -81% | 514 8% |
| Write Seq (MB/s) | 467.1 | 284.2 -39% | 243.3 -48% | 483.9 4% | 88.5 -81% | 133.5 -71% |
| Read 512 (MB/s) | 318.3 | 356.3 12% | 333.4 5% | 413.8 30% | 32.94 -90% | 333.7 5% |
| Write 512 (MB/s) | 441.3 | 282.3 -36% | 283.1 -36% | 294.9 -33% | 26.71 -94% | 133.7 -70% |
| Read 4k (MB/s) | 33.06 | 24.15 -27% | 20.99 -37% | 34.91 6% | 0.372 -99% | 30.67 -7% |
| Write 4k (MB/s) | 77.7 | 71.9 -7% | 62.7 -19% | 95.7 23% | 0.283 -100% | 74.7 -4% |
| Read 4k QD32 (MB/s) | 310.1 | 283.7 -9% | 143.1 -54% | 370.9 20% | 0.921 -100% | 287.2 -7% |
| Write 4k QD32 (MB/s) | 317.1 | 257.3 -19% | 138 -56% | 243.6 -23% | 0.473 -100% | 134.1 -58% |
| 3DMark 06 Standard Score | 9984 puntos | |
| 3DMark 11 Performance | 1769 puntos | |
| 3DMark Ice Storm Standard Score | 65670 puntos | |
| 3DMark Cloud Gate Standard Score | 6693 puntos | |
| 3DMark Fire Strike Score | 994 puntos | |
| 3DMark Fire Strike Extreme Score | 473 puntos | |
| 3DMark Time Spy Score | 384 puntos | |
ayuda | ||
| 3DMark 11 - 1280x720 Performance GPU | |
| HP 15-ba077ng | |
| Acer Extensa 2540-580K | |
| Asus VivoBook S15 S510UA | |
| HP 15-ay116ng | |
| Asus ASUSPRO P541UA-GQ1532 | |
| Acer Aspire 3 A315-21-651Y | |
| Lenovo Ideapad 110-15ACL 80TJ00H0GE | |
| Lenovo IdeaPad V110-15IKB 80TH001SGE | |
| 3DMark | |
| 1280x720 Cloud Gate Standard Graphics | |
| Asus VivoBook S15 S510UA | |
| Acer Extensa 2540-580K | |
| HP 15-ba077ng | |
| HP 15-ay116ng | |
| Lenovo IdeaPad V110-15IKB 80TH001SGE | |
| Acer Aspire 3 A315-21-651Y | |
| 1920x1080 Fire Strike Graphics | |
| HP 15-ba077ng | |
| Acer Extensa 2540-580K | |
| Asus VivoBook S15 S510UA | |
| HP 15-ay116ng | |
| Lenovo IdeaPad V110-15IKB 80TH001SGE | |
| Acer Aspire 3 A315-21-651Y | |
| bajo | medio | alto | ultra | |
|---|---|---|---|---|
| StarCraft 2 (2010) | 181.4 | 54.6 | 30.6 | 17.7 |
| Tomb Raider (2013) | 88.5 | 43.7 | 27.3 | 12.5 |
| BioShock Infinite (2013) | 53.8 | 30.3 | 25.9 | 9.2 |
| Rise of the Tomb Raider (2016) | 18.9 | 12.2 | 6.4 | 4.2 |
| FIFA 18 (2017) | 70.6 | 36.5 | 28.3 | 25.8 |
| Need for Speed Payback (2017) | 14.7 | 8.7 | ||
| Star Wars Battlefront 2 (2017) | 23.4 | 6.7 |
Ruido
| Ocioso |
| 30.3 / 30.3 / 30.3 dB(A) |
| DVD |
| 35.3 / dB(A) |
| Carga |
| 34.7 / 37.4 dB(A) |
 | ||
30 dB silencioso 40 dB(A) audible 50 dB(A) ruidosamente alto |
||
min: | ||
| Acer Extensa 2540-580K i5-7200U, HD Graphics 620 | Lenovo IdeaPad V110-15IKB 80TH001SGE Pentium 4415U, HD Graphics 610 | HP 15-ba077ng A12-9700P, Radeon R7 (Bristol Ridge) | HP 15-ay116ng i5-7200U, HD Graphics 620 | Asus ASUSPRO P541UA-GQ1532 6006U, HD Graphics 520 | Acer Aspire 3 A315-21-651Y A6-9220, Radeon R4 (Stoney Ridge) | Lenovo Ideapad 110-15ACL 80TJ00H0GE A8-7410, Radeon R5 (Beema/Carrizo-L) | |
|---|---|---|---|---|---|---|---|
| Noise | 0% | 1% | -2% | -5% | 3% | 3% | |
| apagado / medio ambiente * (dB) | 30.3 | 30.5 -1% | 30.6 -1% | 30.5 -1% | 30 1% | 30.4 -0% | 30.4 -0% |
| Idle Minimum * (dB) | 30.3 | 30.5 -1% | 31.5 -4% | 31.3 -3% | 32.1 -6% | 30.4 -0% | 30.9 -2% |
| Idle Average * (dB) | 30.3 | 30.5 -1% | 31.8 -5% | 31.3 -3% | 32.6 -8% | 31.6 -4% | 30.9 -2% |
| Idle Maximum * (dB) | 30.3 | 31.6 -4% | 31.8 -5% | 31.3 -3% | 32.6 -8% | 31.6 -4% | 31 -2% |
| Load Average * (dB) | 34.7 | 34.3 1% | 31.4 10% | 35.6 -3% | 35.7 -3% | 31.9 8% | 31.8 8% |
| Load Maximum * (dB) | 37.4 | 34.8 7% | 33.4 11% | 36.15 3% | 40 -7% | 31.9 15% | 31.9 15% |
* ... más pequeño es mejor
(+) La temperatura máxima en la parte superior es de 34 °C / 93 F, frente a la media de 34.3 °C / 94 F, que oscila entre 21.2 y 62.5 °C para la clase Office.
(+) El fondo se calienta hasta un máximo de 33.2 °C / 92 F, frente a la media de 36.8 °C / 98 F
(+) En reposo, la temperatura media de la parte superior es de 24 °C / 75# F, frente a la media del dispositivo de 29.5 °C / 85 F.
(+) El reposamanos y el panel táctil están a una temperatura inferior a la de la piel, con un máximo de 23.9 °C / 75 F y, por tanto, son fríos al tacto.
(+) La temperatura media de la zona del reposamanos de dispositivos similares fue de 27.5 °C / 81.5 F (+3.6 °C / 6.5 F).
| Acer Extensa 2540-580K i5-7200U, HD Graphics 620 | Lenovo IdeaPad V110-15IKB 80TH001SGE Pentium 4415U, HD Graphics 610 | HP 15-ba077ng A12-9700P, Radeon R7 (Bristol Ridge) | HP 15-ay116ng i5-7200U, HD Graphics 620 | Asus ASUSPRO P541UA-GQ1532 6006U, HD Graphics 520 | Acer Aspire 3 A315-21-651Y A6-9220, Radeon R4 (Stoney Ridge) | Lenovo Ideapad 110-15ACL 80TJ00H0GE A8-7410, Radeon R5 (Beema/Carrizo-L) | |
|---|---|---|---|---|---|---|---|
| Heat | 5% | 1% | 2% | -4% | -6% | -8% | |
| Maximum Upper Side * (°C) | 34 | 32.5 4% | 34.8 -2% | 33.8 1% | 32.6 4% | 30.5 10% | 32.9 3% |
| Maximum Bottom * (°C) | 33.2 | 31.7 5% | 38.3 -15% | 36.6 -10% | 30.7 8% | 33 1% | 34.5 -4% |
| Idle Upper Side * (°C) | 26.1 | 24.7 5% | 23.2 11% | 23.6 10% | 28.9 -11% | 30.2 -16% | 31.4 -20% |
| Idle Bottom * (°C) | 25.7 | 24 7% | 23.3 9% | 23.8 7% | 30 -17% | 30.4 -18% | 28 -9% |
* ... más pequeño es mejor
Acer Extensa 2540-580K análisis de audio
(-) | altavoces no muy altos (#69.8 dB)
Graves 100 - 315 Hz
(-) | casi sin bajos - de media 25% inferior a la mediana
(±) | la linealidad de los graves es media (12% delta a frecuencia anterior)
Medios 400 - 2000 Hz
(+) | medios equilibrados - a sólo 3.1% de la mediana
(+) | los medios son lineales (6.9% delta a la frecuencia anterior)
Altos 2 - 16 kHz
(+) | máximos equilibrados - a sólo 4.4% de la mediana
(±) | la linealidad de los máximos es media (7.9% delta a frecuencia anterior)
Total 100 - 16.000 Hz
(±) | la linealidad del sonido global es media (24.2% de diferencia con la mediana)
En comparación con la misma clase
» 70% de todos los dispositivos probados de esta clase eran mejores, 8% similares, 22% peores
» El mejor tuvo un delta de 7%, la media fue 21%, el peor fue ###max##%
En comparación con todos los dispositivos probados
» 73% de todos los dispositivos probados eran mejores, 6% similares, 21% peores
» El mejor tuvo un delta de 4%, la media fue 23%, el peor fue ###max##%
Apple MacBook 12 (Early 2016) 1.1 GHz análisis de audio
(+) | los altavoces pueden reproducir a un volumen relativamente alto (#83.6 dB)
Graves 100 - 315 Hz
(±) | lubina reducida - en promedio 11.3% inferior a la mediana
(±) | la linealidad de los graves es media (14.2% delta a frecuencia anterior)
Medios 400 - 2000 Hz
(+) | medios equilibrados - a sólo 2.4% de la mediana
(+) | los medios son lineales (5.5% delta a la frecuencia anterior)
Altos 2 - 16 kHz
(+) | máximos equilibrados - a sólo 2% de la mediana
(+) | los máximos son lineales (4.5% delta a la frecuencia anterior)
Total 100 - 16.000 Hz
(+) | el sonido global es lineal (10.2% de diferencia con la mediana)
En comparación con la misma clase
» 7% de todos los dispositivos probados de esta clase eran mejores, 2% similares, 90% peores
» El mejor tuvo un delta de 5%, la media fue 18%, el peor fue ###max##%
En comparación con todos los dispositivos probados
» 5% de todos los dispositivos probados eran mejores, 1% similares, 94% peores
» El mejor tuvo un delta de 4%, la media fue 23%, el peor fue ###max##%
| Off / Standby | |
| Ocioso | |
| Carga |
|
Clave:
min: | |
| Acer Extensa 2540-580K i5-7200U, HD Graphics 620 | Lenovo IdeaPad V110-15IKB 80TH001SGE Pentium 4415U, HD Graphics 610 | HP 15-ba077ng A12-9700P, Radeon R7 (Bristol Ridge) | HP 15-ay116ng i5-7200U, HD Graphics 620 | Asus ASUSPRO P541UA-GQ1532 6006U, HD Graphics 520 | Acer Aspire 3 A315-21-651Y A6-9220, Radeon R4 (Stoney Ridge) | Lenovo Ideapad 110-15ACL 80TJ00H0GE A8-7410, Radeon R5 (Beema/Carrizo-L) | |
|---|---|---|---|---|---|---|---|
| Power Consumption | 10% | -7% | 10% | -15% | 6% | 4% | |
| Idle Minimum * (Watt) | 4.5 | 2.8 38% | 4.4 2% | 3.2 29% | 6.9 -53% | 4.6 -2% | 5.4 -20% |
| Idle Average * (Watt) | 6.7 | 6.8 -1% | 6.8 -1% | 6.3 6% | 8.9 -33% | 7.3 -9% | 6.8 -1% |
| Idle Maximum * (Watt) | 7.4 | 8.2 -11% | 8.9 -20% | 7.4 -0% | 9.6 -30% | 8.7 -18% | 7.3 1% |
| Load Average * (Watt) | 29 | 24 17% | 30.9 -7% | 24 17% | 19 34% | 20 31% | 21.1 27% |
| Load Maximum * (Watt) | 29 | 26.3 9% | 31 -7% | 29 -0% | 27 7% | 21.6 26% | 25.5 12% |
* ... más pequeño es mejor
| Acer Extensa 2540-580K i5-7200U, HD Graphics 620, 48 Wh | Lenovo IdeaPad V110-15IKB 80TH001SGE Pentium 4415U, HD Graphics 610, 32 Wh | HP 15-ba077ng A12-9700P, Radeon R7 (Bristol Ridge), 41 Wh | HP 15-ay116ng i5-7200U, HD Graphics 620, 41 Wh | Asus ASUSPRO P541UA-GQ1532 6006U, HD Graphics 520, 34.5 Wh | Acer Aspire 3 A315-21-651Y A6-9220, Radeon R4 (Stoney Ridge), 37 Wh | Lenovo Ideapad 110-15ACL 80TJ00H0GE A8-7410, Radeon R5 (Beema/Carrizo-L), 24 Wh | Asus ASUSPRO P541UA-GQ1532 6006U, HD Graphics 520, 34.5 Wh | |
|---|---|---|---|---|---|---|---|---|
| Duración de Batería | -52% | -30% | -15% | -52% | -49% | -58% | -17% | |
| Reader / Idle (h) | 18.9 | 12.4 -34% | 14.5 -23% | |||||
| H.264 (h) | 7.7 | 4.6 -40% | 7.2 -6% | |||||
| WiFi v1.3 (h) | 8.1 | 3.9 -52% | 4.9 -40% | 6.9 -15% | 3.9 -52% | 4.1 -49% | 3.4 -58% | 6.7 -17% |
| Load (h) | 1.8 | 1.7 -6% | 1.5 -17% |
Pro
Contra
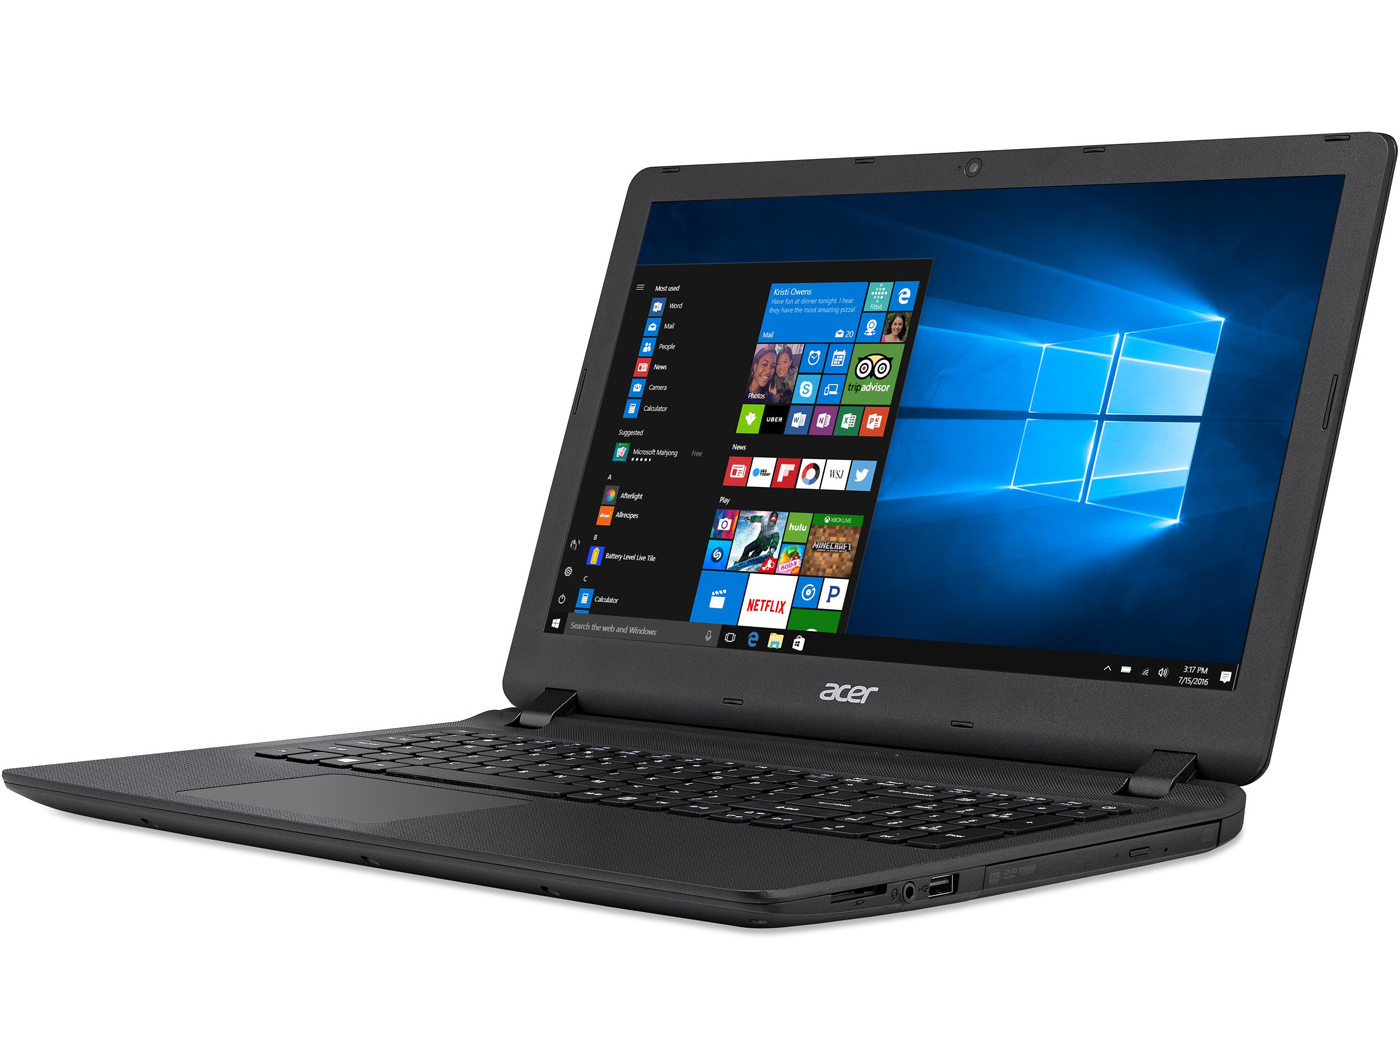
El Acer Extensa 2540-580K tiene una potente CPU, un veloz SSD, y RAM en dual-channel. El dispositivo no se calienta bajo ningún tipo de carga y funciona casi en silencio. Así pues, el Extensa ofrece características y atributos que se asocian a la mayoría de portátiles ofimáticos.
Con el Extensa 2540, Acer ofrece un dispositivo de oficina muy duradero que tendrá que buscar su público. El display va a ser un problema importante para muchos posibles compradores.
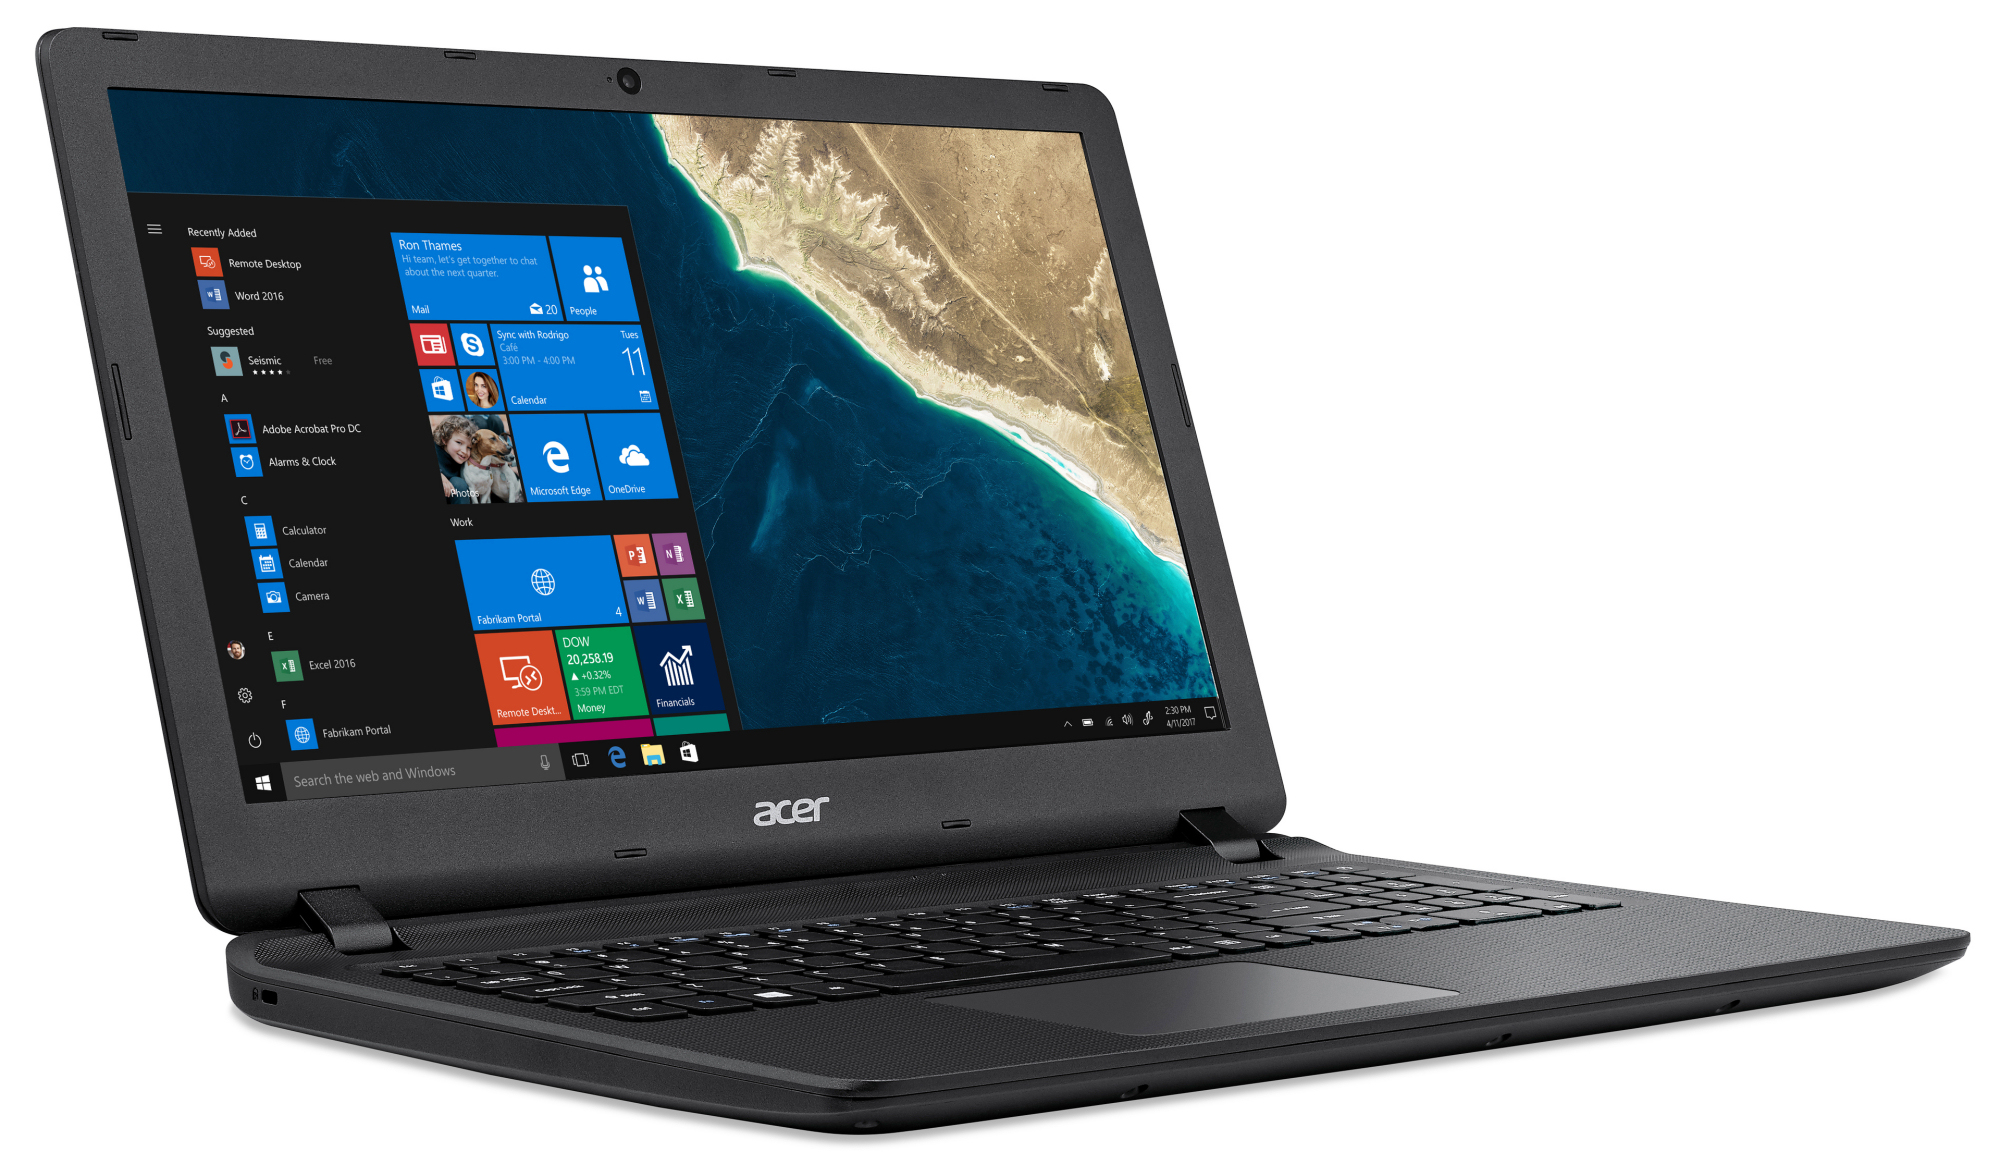
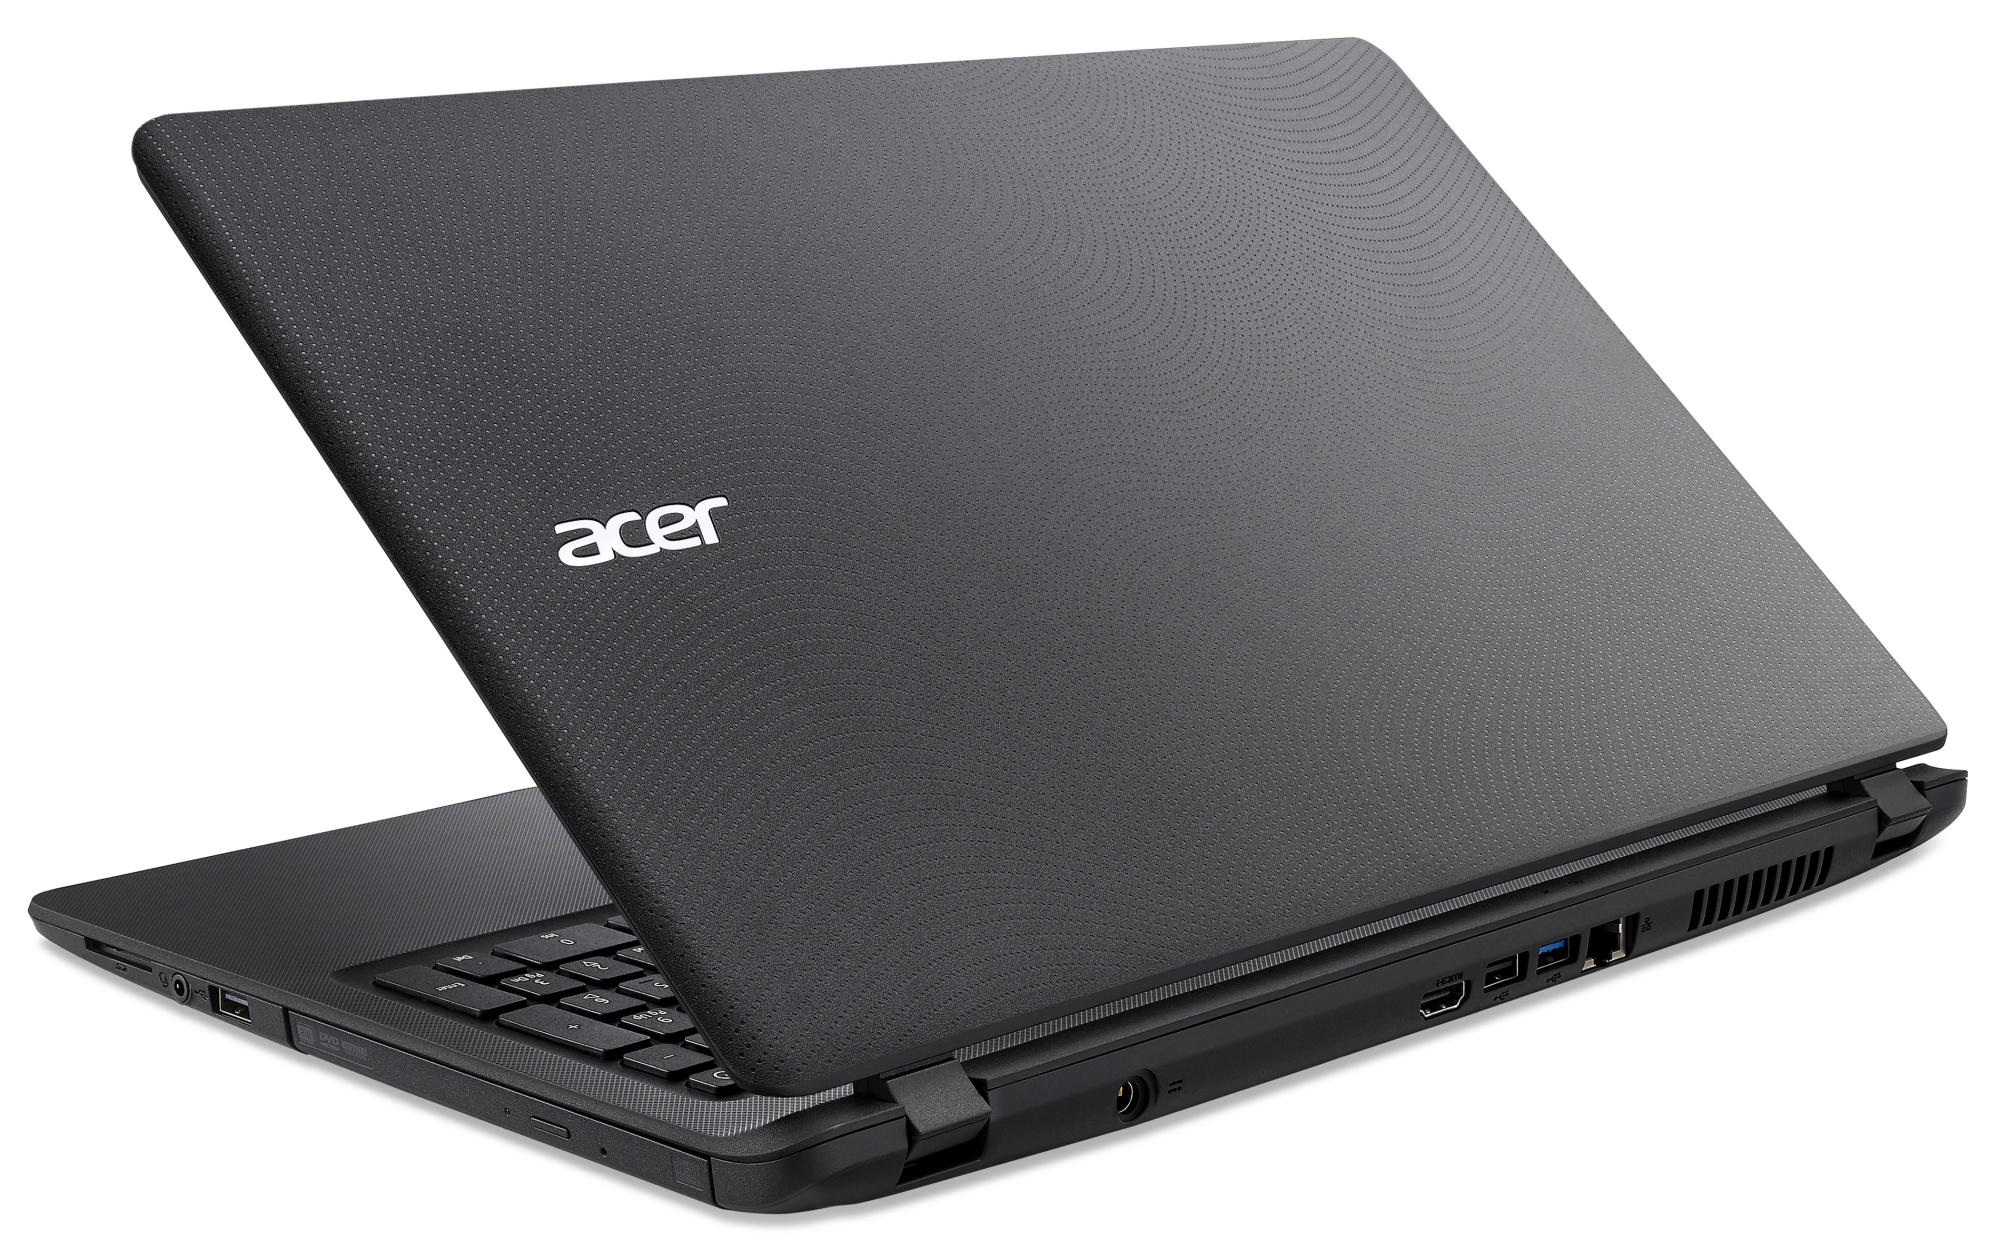
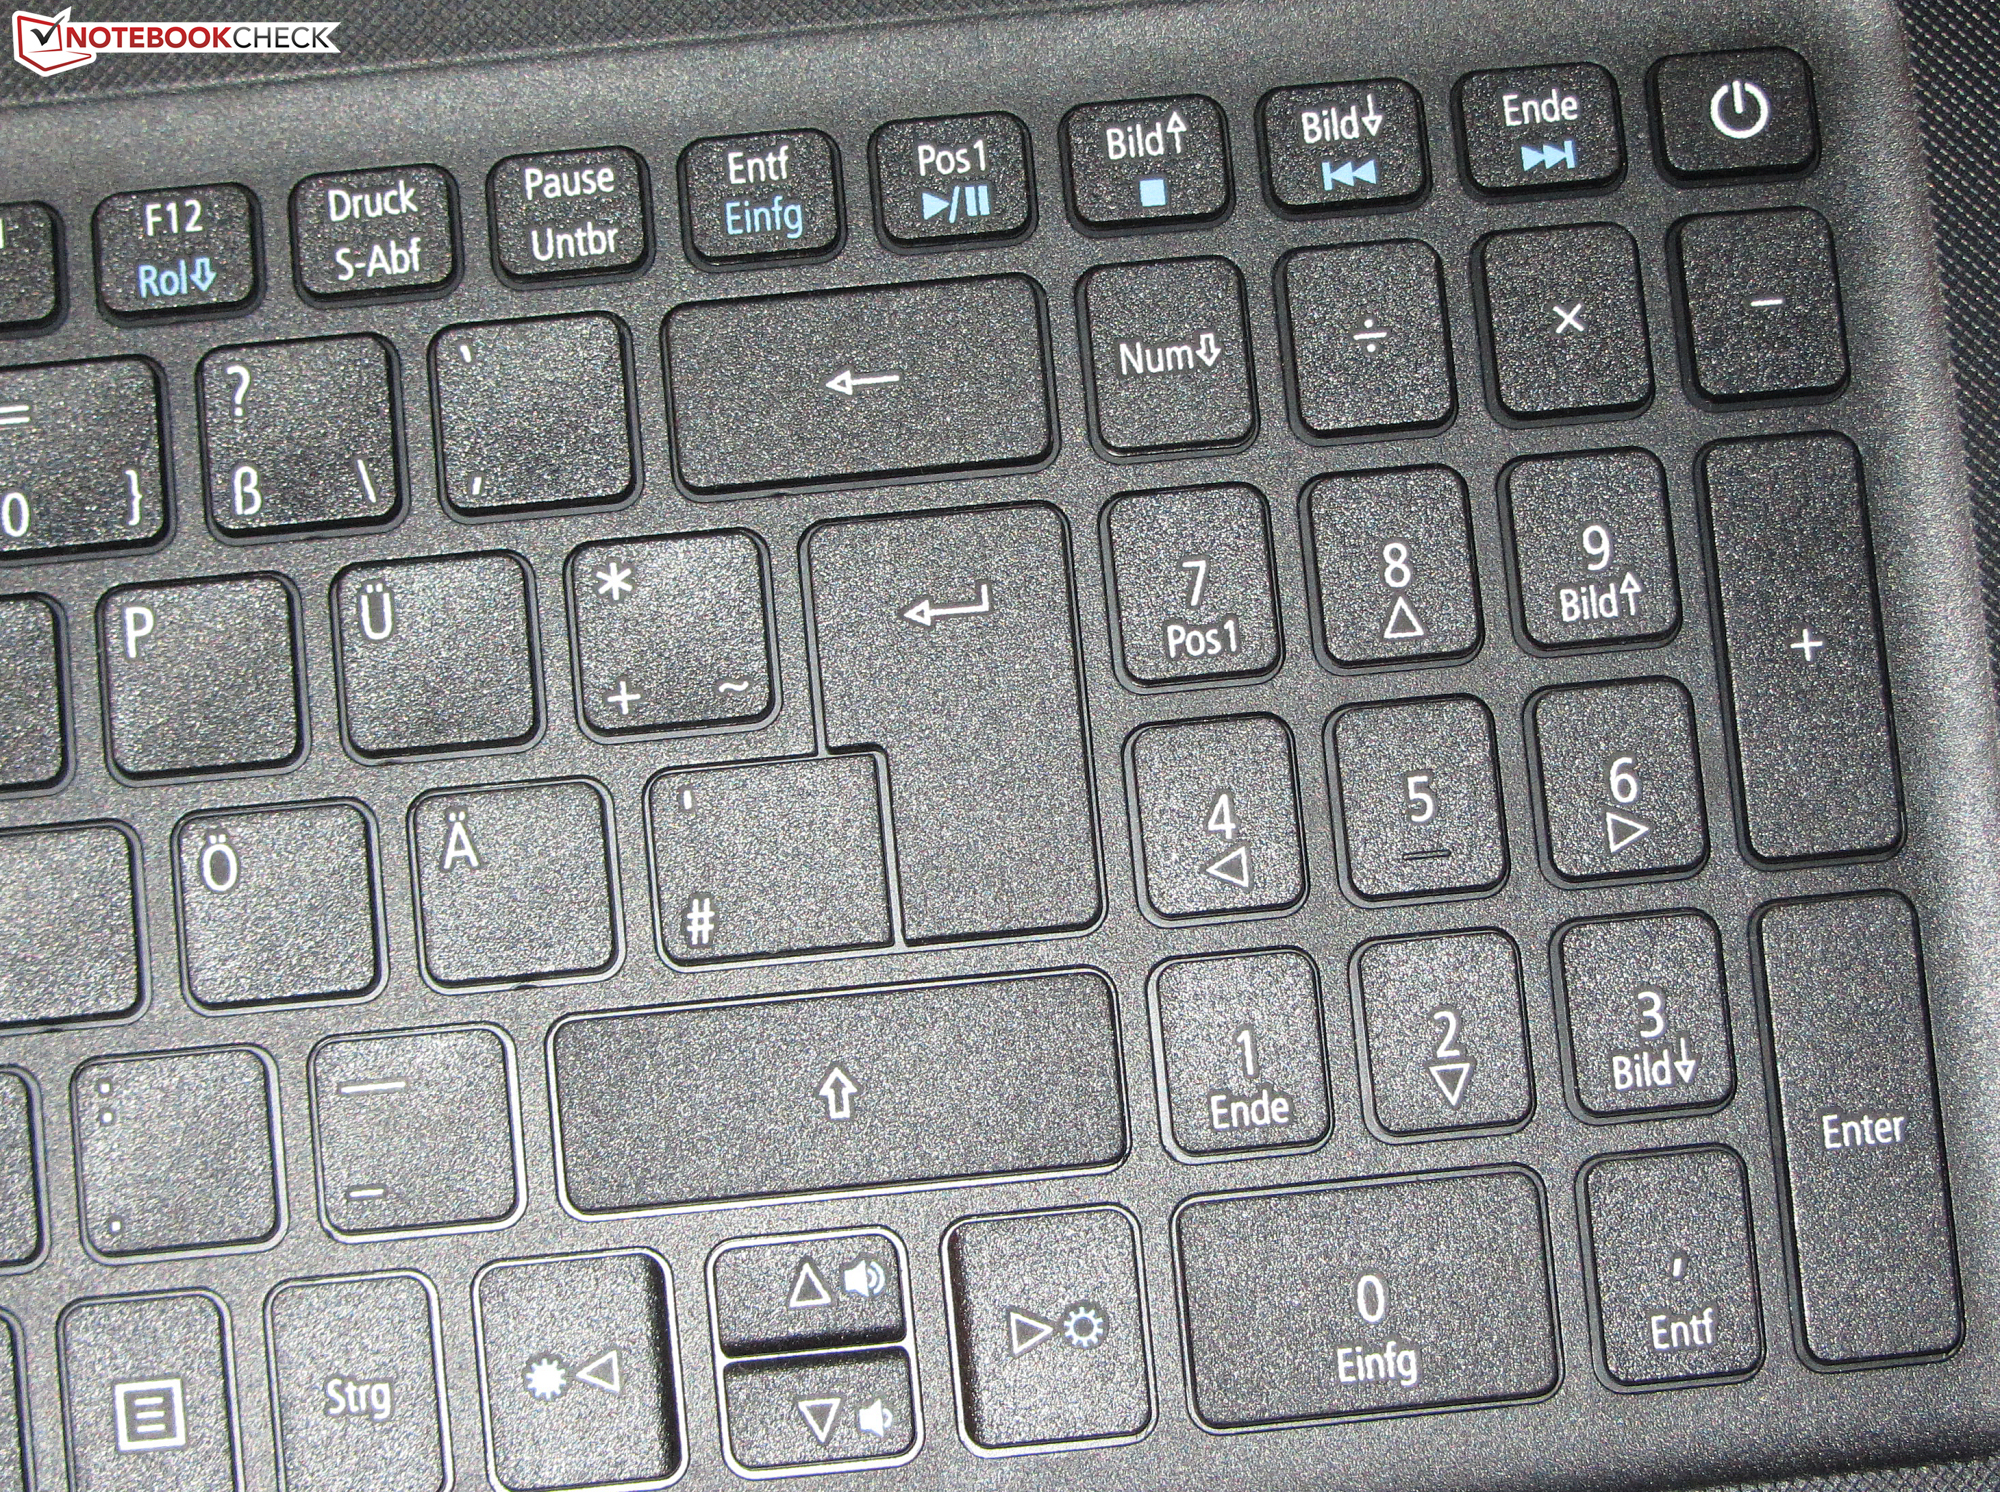
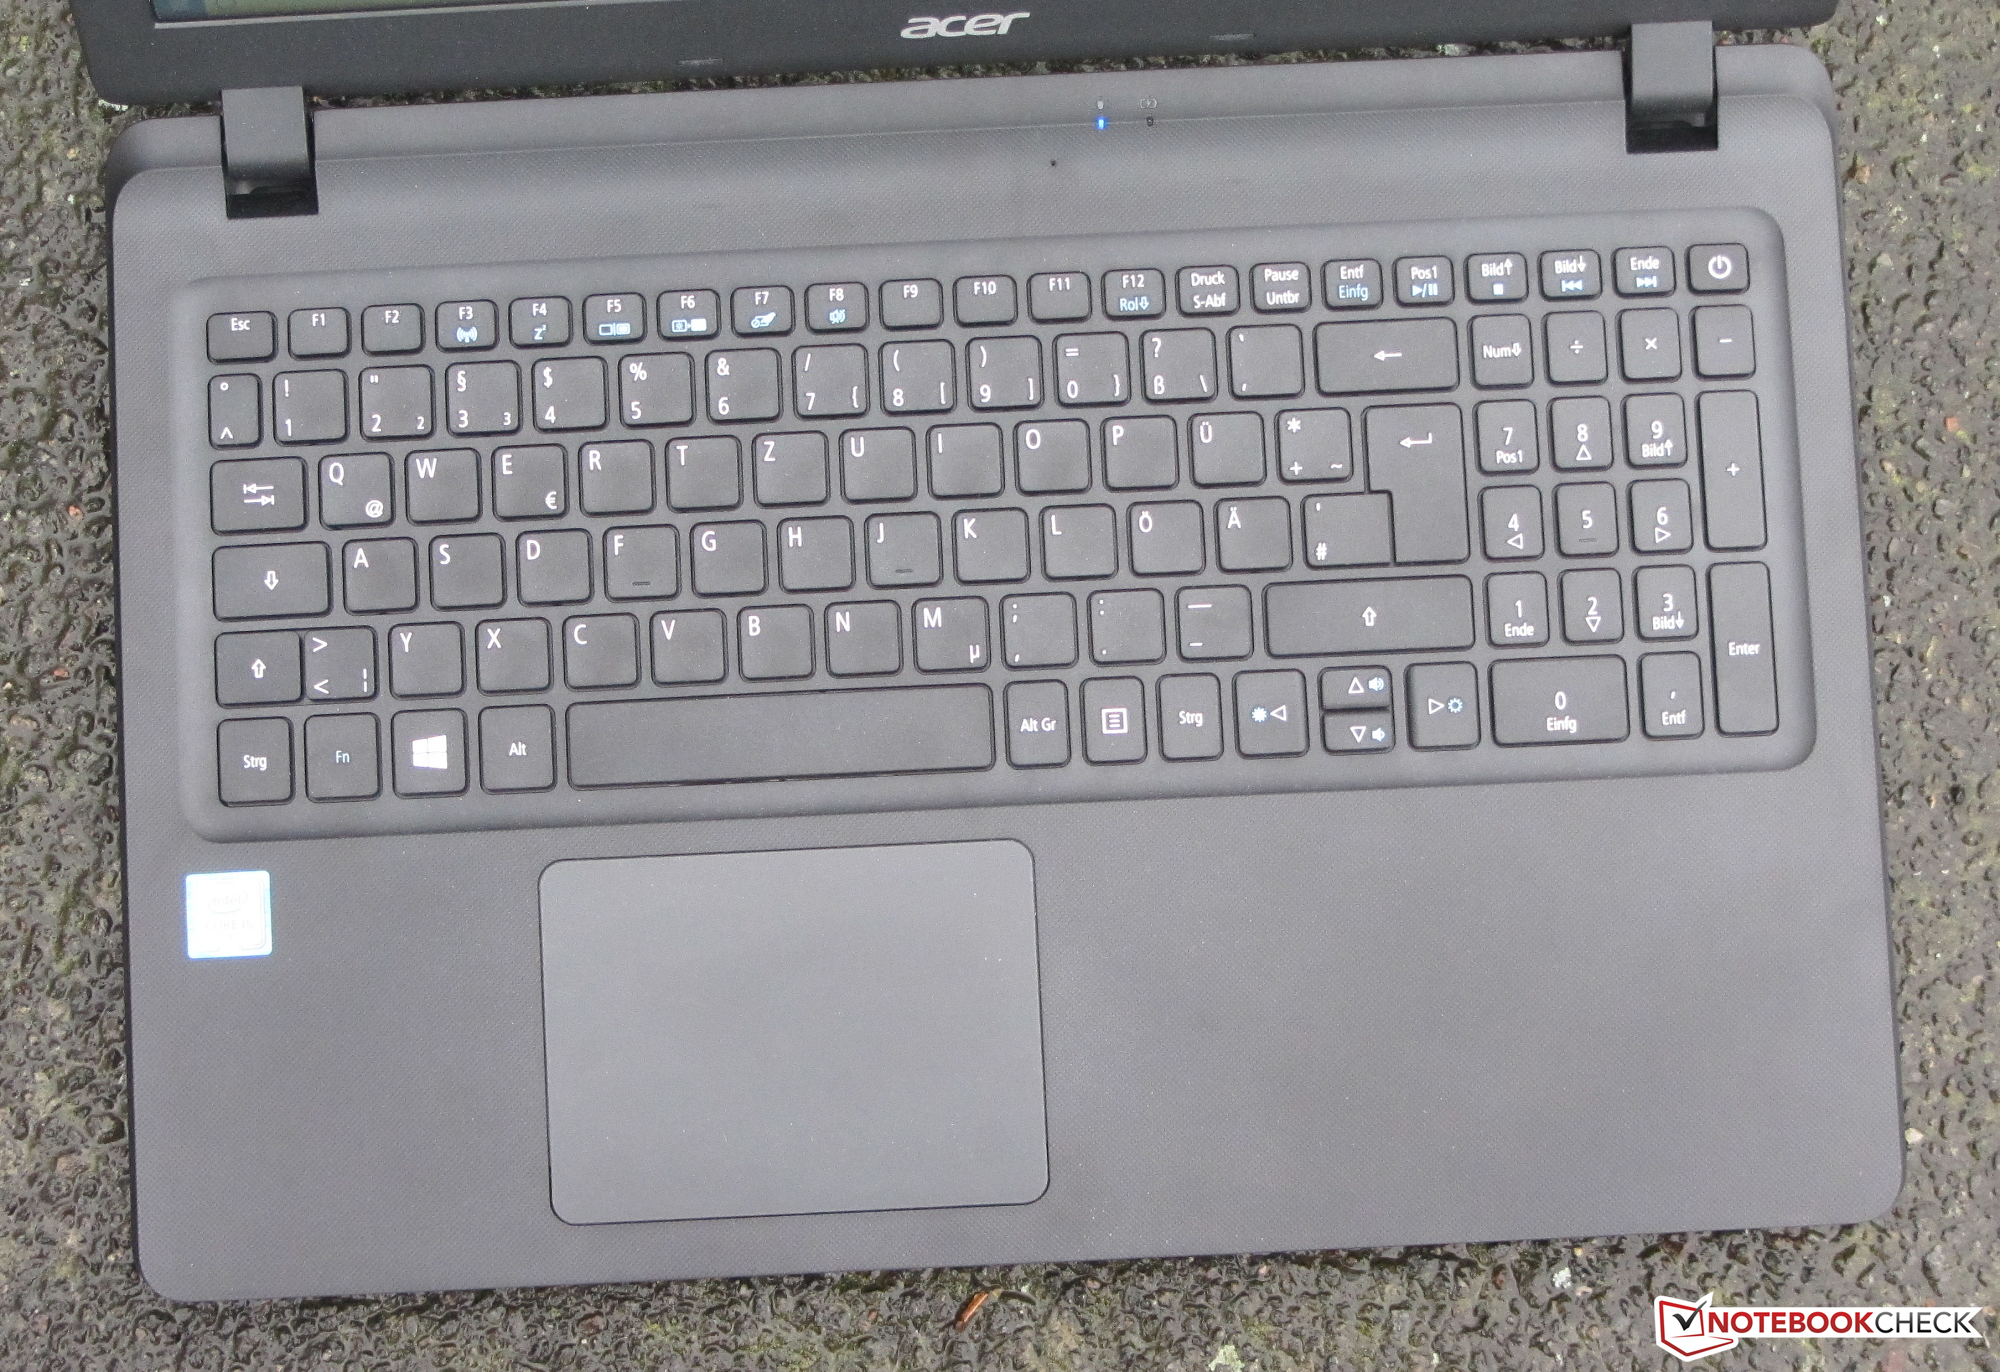
Por suerte, Acer ha equipado al portátil con una pequeña escotilla de mantenimiento, detrás de la cual se encuentran SSD y RAM. Por ello, cambiar o mejorar esos componentes no debería dar problemas. El teclado dejó una impresión de "vale". Sin embargo, nos habría gustado verlo iluminado. Con ello,. Acer podría haber rematado el dispositivo de oficina, que es lo que debería ser el Extensa. El soberbio aguante de batería también añade valor al portátil.
El punto más débil del dispositivo - como suele ser - es el display. Acer usa un panel ténue con poco contraste y mal ángulo de visión, algo inapropiado incluso en un portátil de 400 Euros ($470).
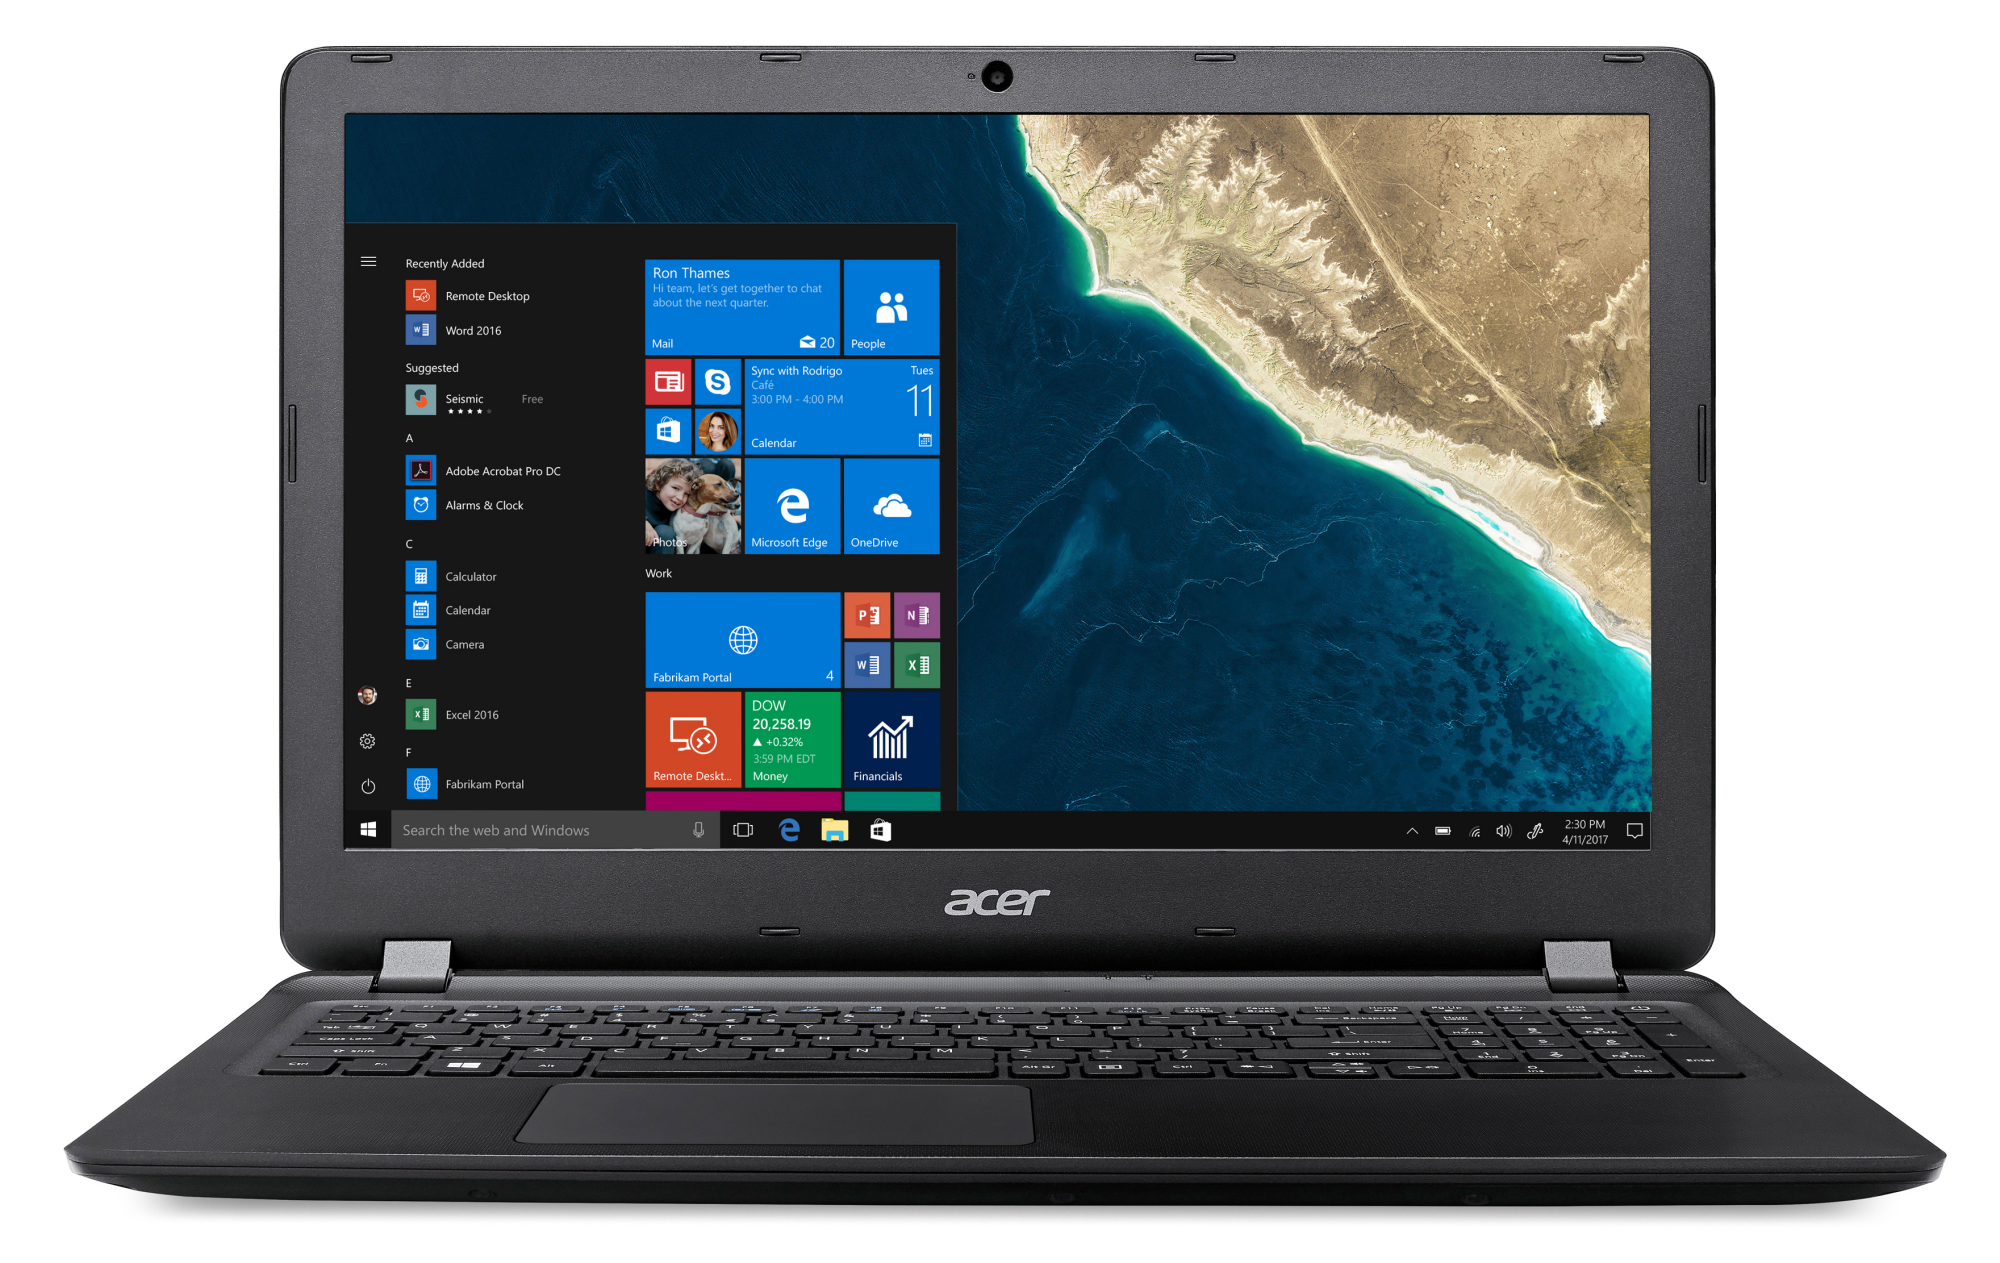
Con este modelo, Acer busca, principalmente, a usuarios profesionales, de ahí la copia preinstalada de Windows 10 Pro. La versión pro aumenta un poco el precio del dispositivo, lo que hace que el portátil no resulte atractivo a los usuarios casuales. Acer no ofrece una versión alternativa de equipación idéntica con Windows 10 Home. El Extensa 2540-56GC es lo que más se acerca a nuestro modelo de pruebas. Sin embargo, sólo trae un display HD (1366x768).
Actualización 13.12.2017: Acer nos informa que el modelo que hemos testado en nuestro análisis ya no está disponible y que ha sido sustituido por el Extensa 2540-54C0, de idéntica construcción.
Ésta es una versión acortada del análisis original. Puedes leer el análisis completo en inglés aquí.
Acer Extensa 2540-580K
- 12/12/2017 v6 (old)
Sascha Mölck